

Compact Muon Solenoid
LHC, CERN
| CMS-FSQ-15-006 ; CERN-EP-2018-308 | ||
| Measurement of the energy density as a function of pseudorapidity in proton-proton collisions at $\sqrt{s} = $ 13 TeV | ||
| CMS Collaboration | ||
| 10 December 2018 | ||
| Eur. Phys. J. C 79 (2019) 391 | ||
| Abstract: A measurement of the energy density in proton-proton collisions at a centre-of-mass energy of $\sqrt{s}= $ 13 TeV is presented. The data have been recorded with the CMS experiment at the LHC during low luminosity operations in 2015. The energy density is studied as a function of pseudorapidity in the ranges $-6.6 < \eta < -5.2$ and $ 3.15 < | {\eta} | < 5.20 $. The results are compared with the predictions of several models. All the models considered suggest a different shape of the pseudorapidity dependence compared to that observed in the data. A comparison with LHC proton-proton collision data at $\sqrt{s}=$ 0.9 and 7 TeV confirms the compatibility of the data with the hypothesis of limiting fragmentation. | ||
| Links: e-print arXiv:1812.04095 [hep-ex] (PDF) ; CDS record ; inSPIRE record ; CADI line (restricted) ; | ||
| Figures | |
png pdf |
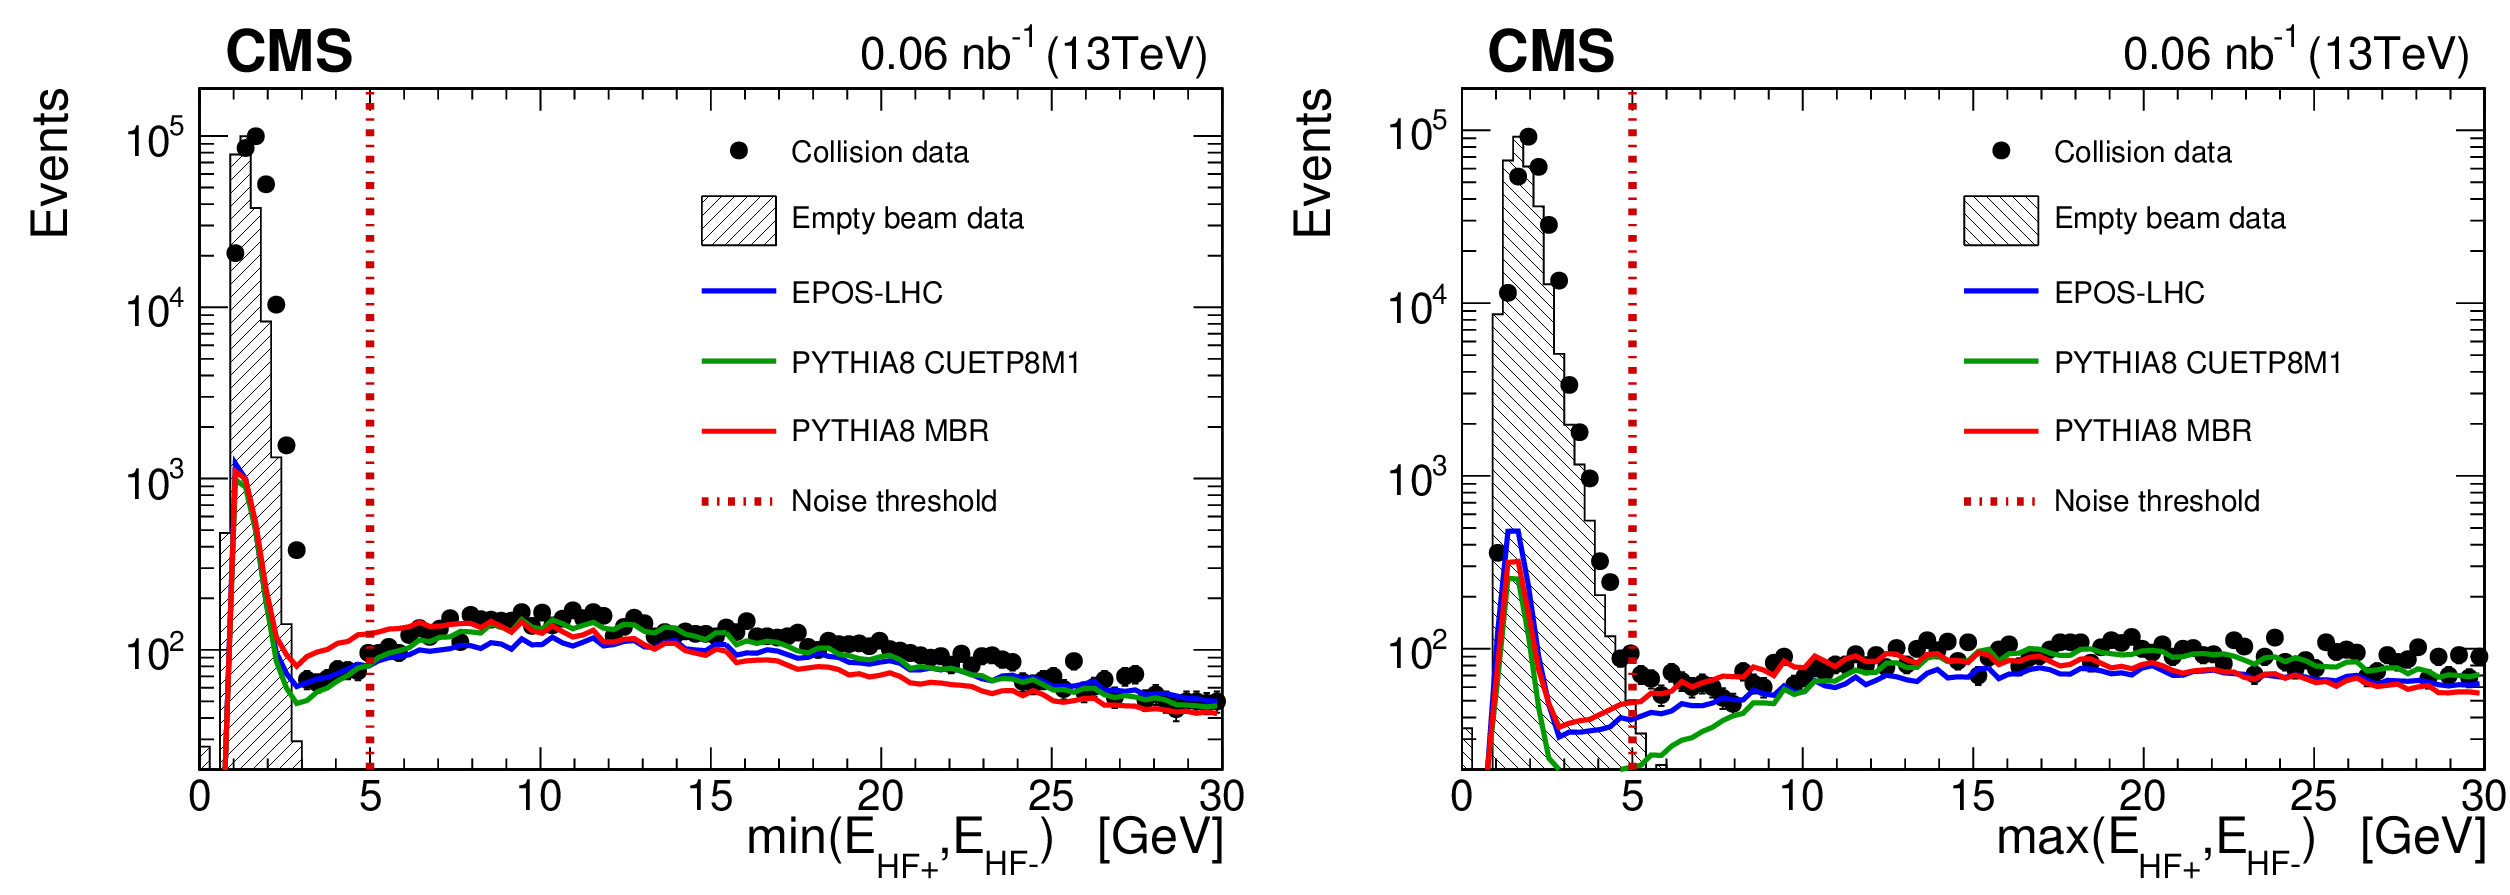
Figure 1:
Distribution of the absolute number of events as a function of the highest energy tower, $E_\mathrm {HF+}$ and $E_\mathrm {HF-}$, in the HF$+$ and HF$-$ calorimeters. The left panel shows the smaller of the two HF calorimeter energies, min($E_\mathrm {HF-},E_\mathrm {HF+}$), whereas the right panel shows the higher of the two energies, max($E_\mathrm {HF-},E_\mathrm {HF+}$). The lines represent the simulations, while the markers represent the data. The measured detector noise distributions are shown as shaded areas. |
png pdf |
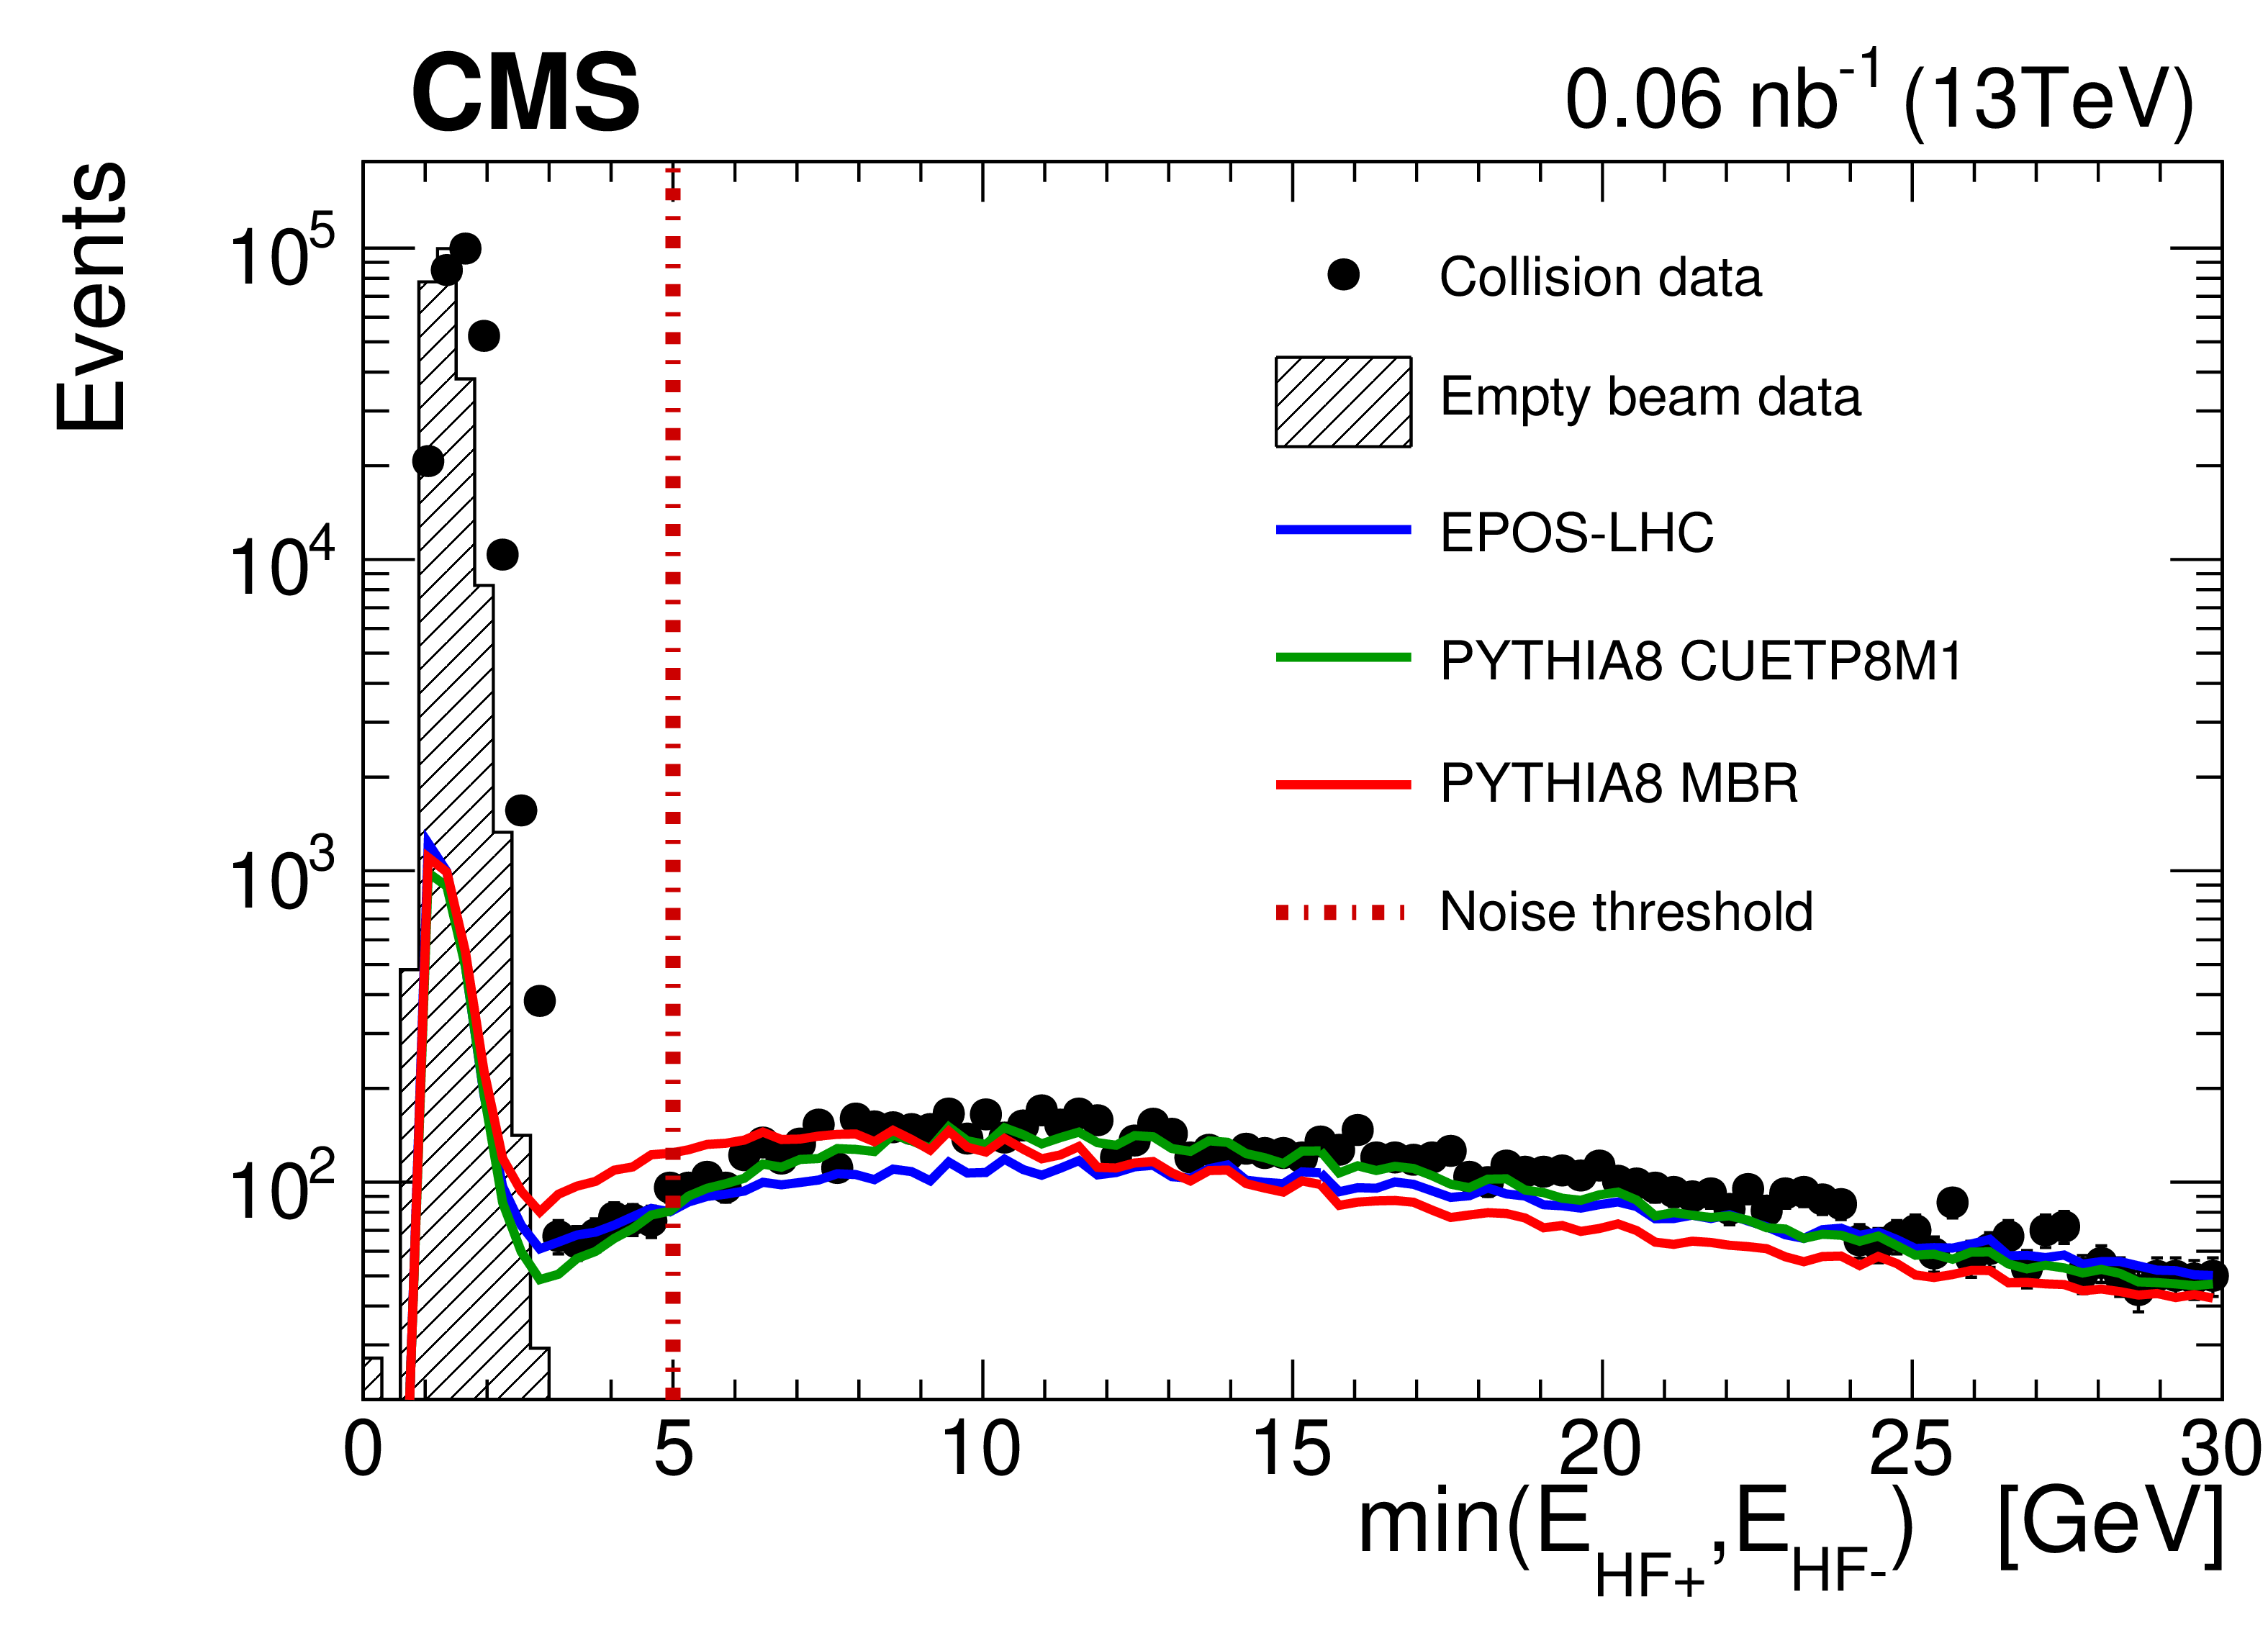
Figure 1-a:
Distribution of the absolute number of events as a function of the highest energy tower, $E_\mathrm {HF+}$ and $E_\mathrm {HF-}$, in the HF$+$ and HF$-$ calorimeters. The panel shows the smaller of the two HF calorimeter energies, min($E_\mathrm {HF-},E_\mathrm {HF+}$). The lines represent the simulations, while the markers represent the data. The measured detector noise distributions are shown as shaded areas. |
png pdf |
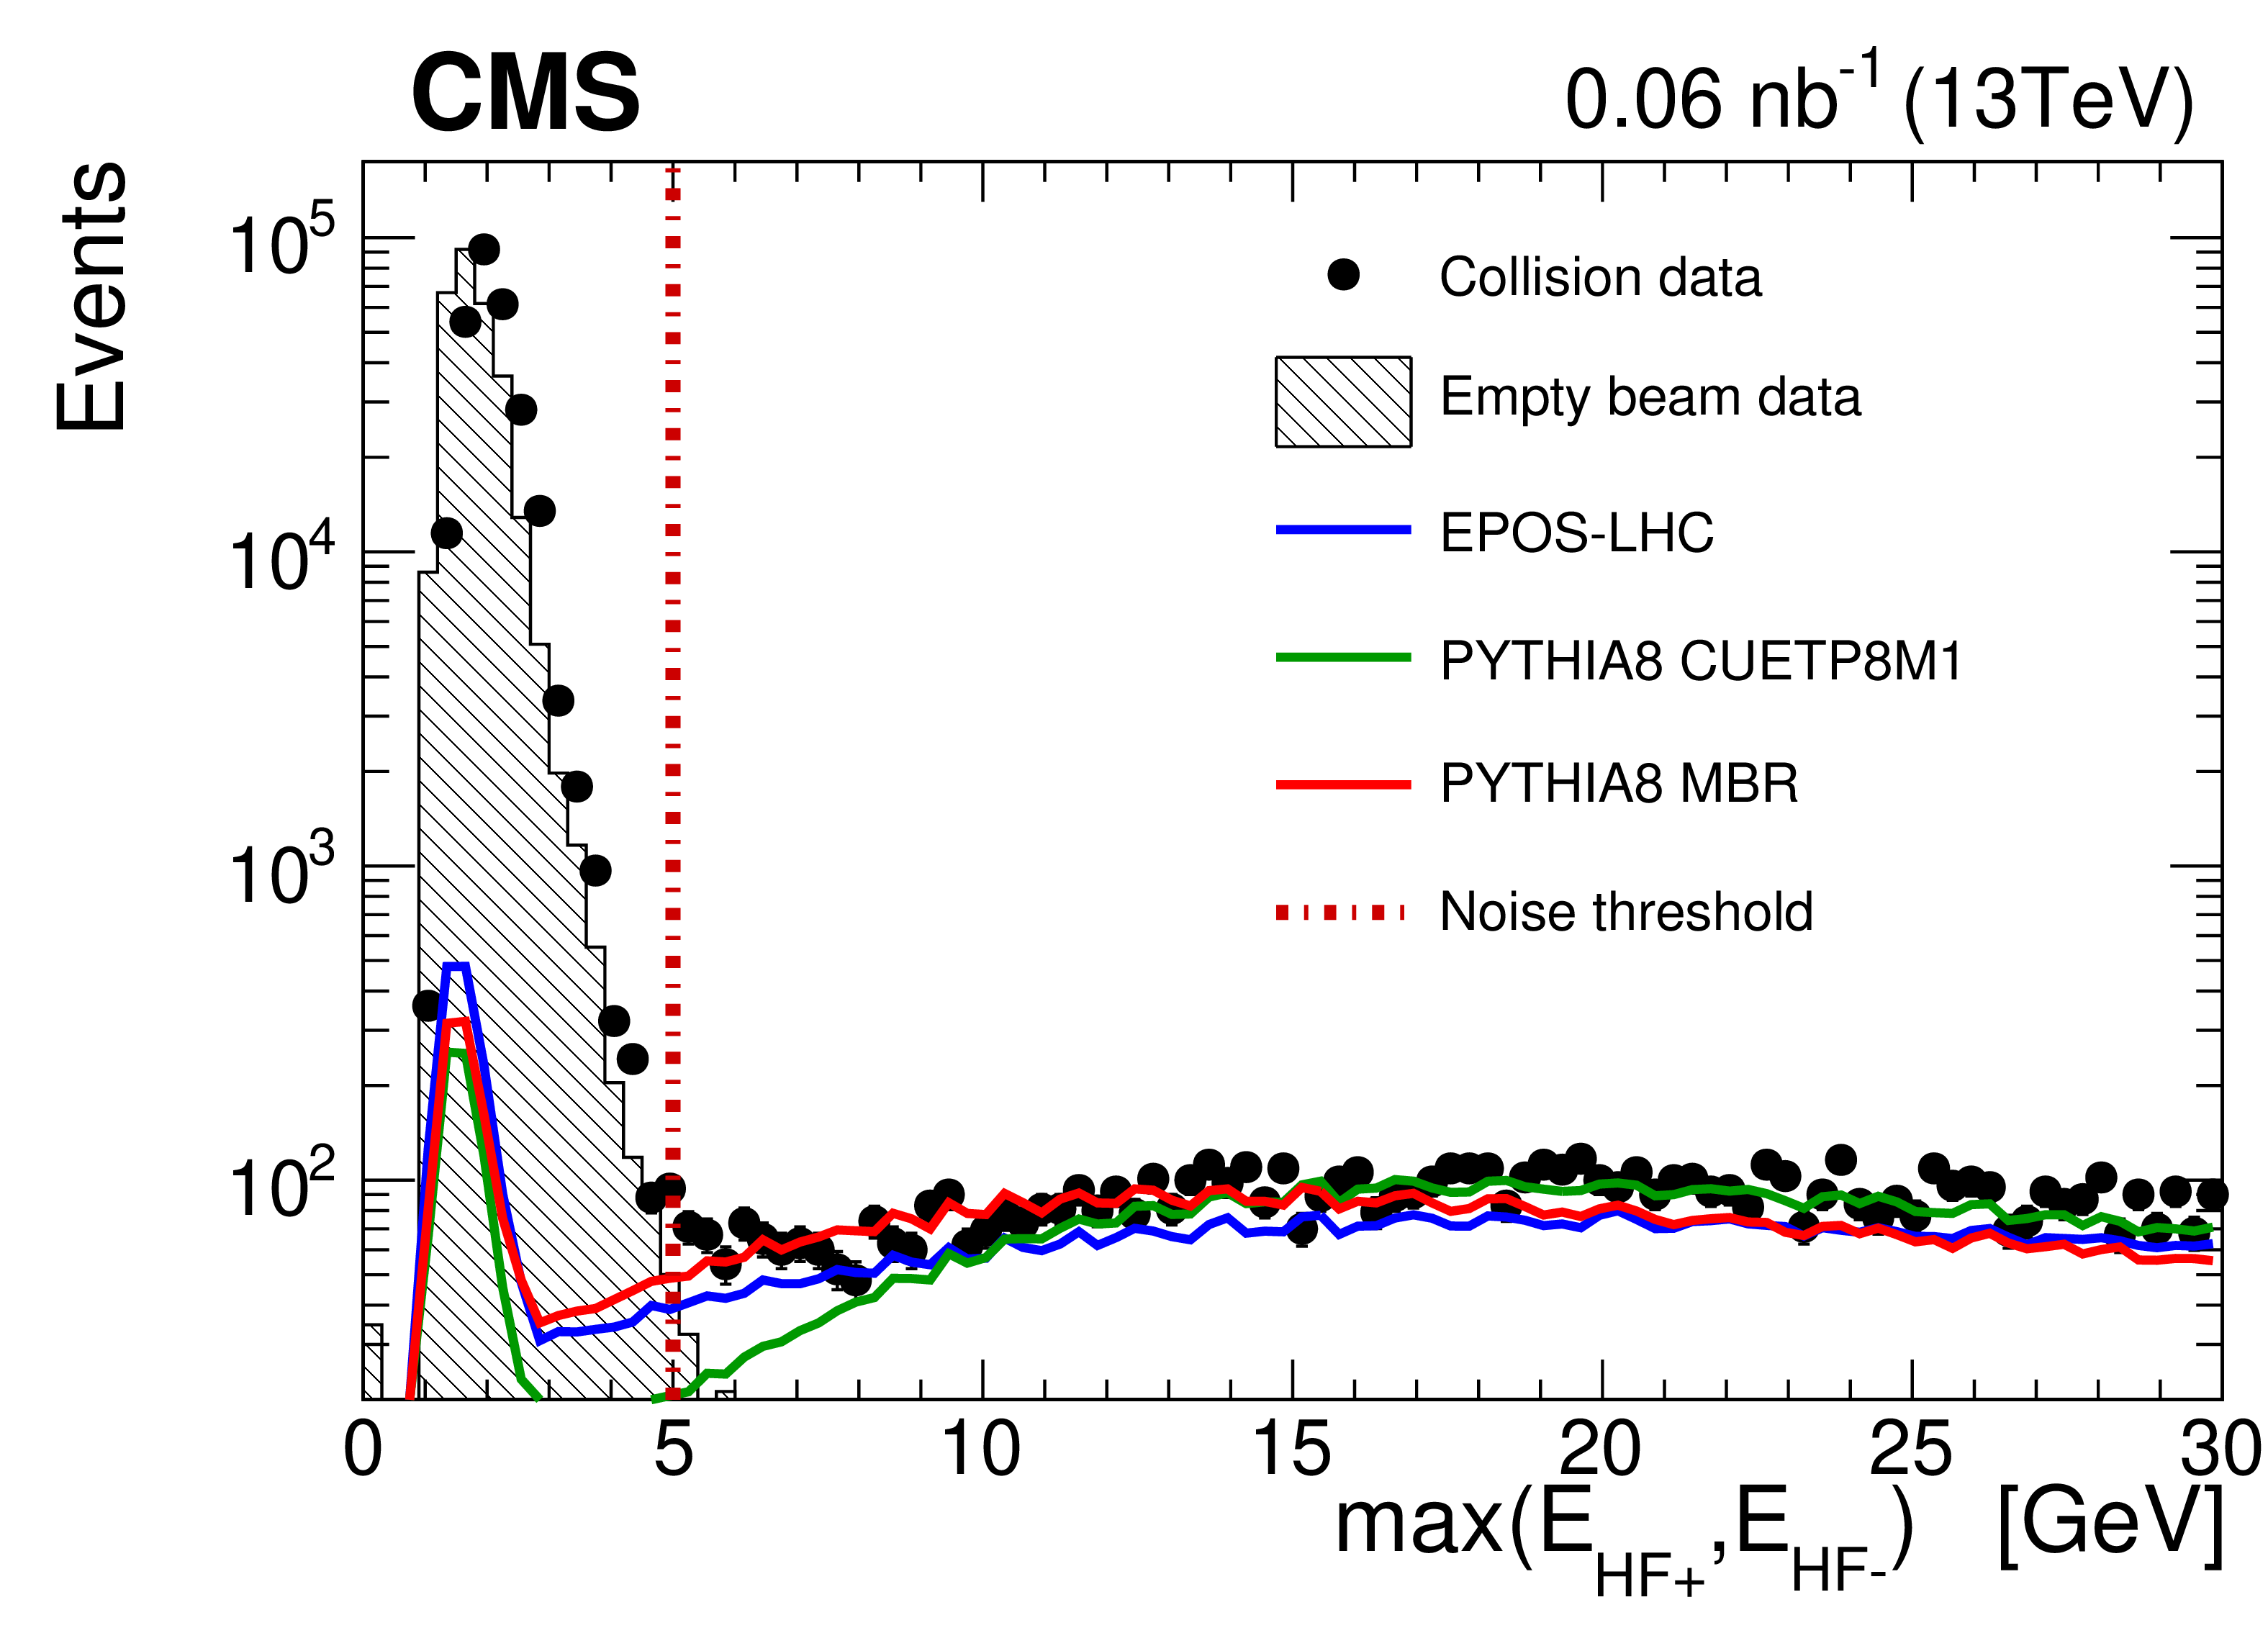
Figure 1-b:
Distribution of the absolute number of events as a function of the highest energy tower, $E_\mathrm {HF+}$ and $E_\mathrm {HF-}$, in the HF$+$ and HF$-$ calorimeters. The panel shows the higher of the two energies, max($E_\mathrm {HF-},E_\mathrm {HF+}$). The lines represent the simulations, while the markers represent the data. The measured detector noise distributions are shown as shaded areas. |
png pdf |
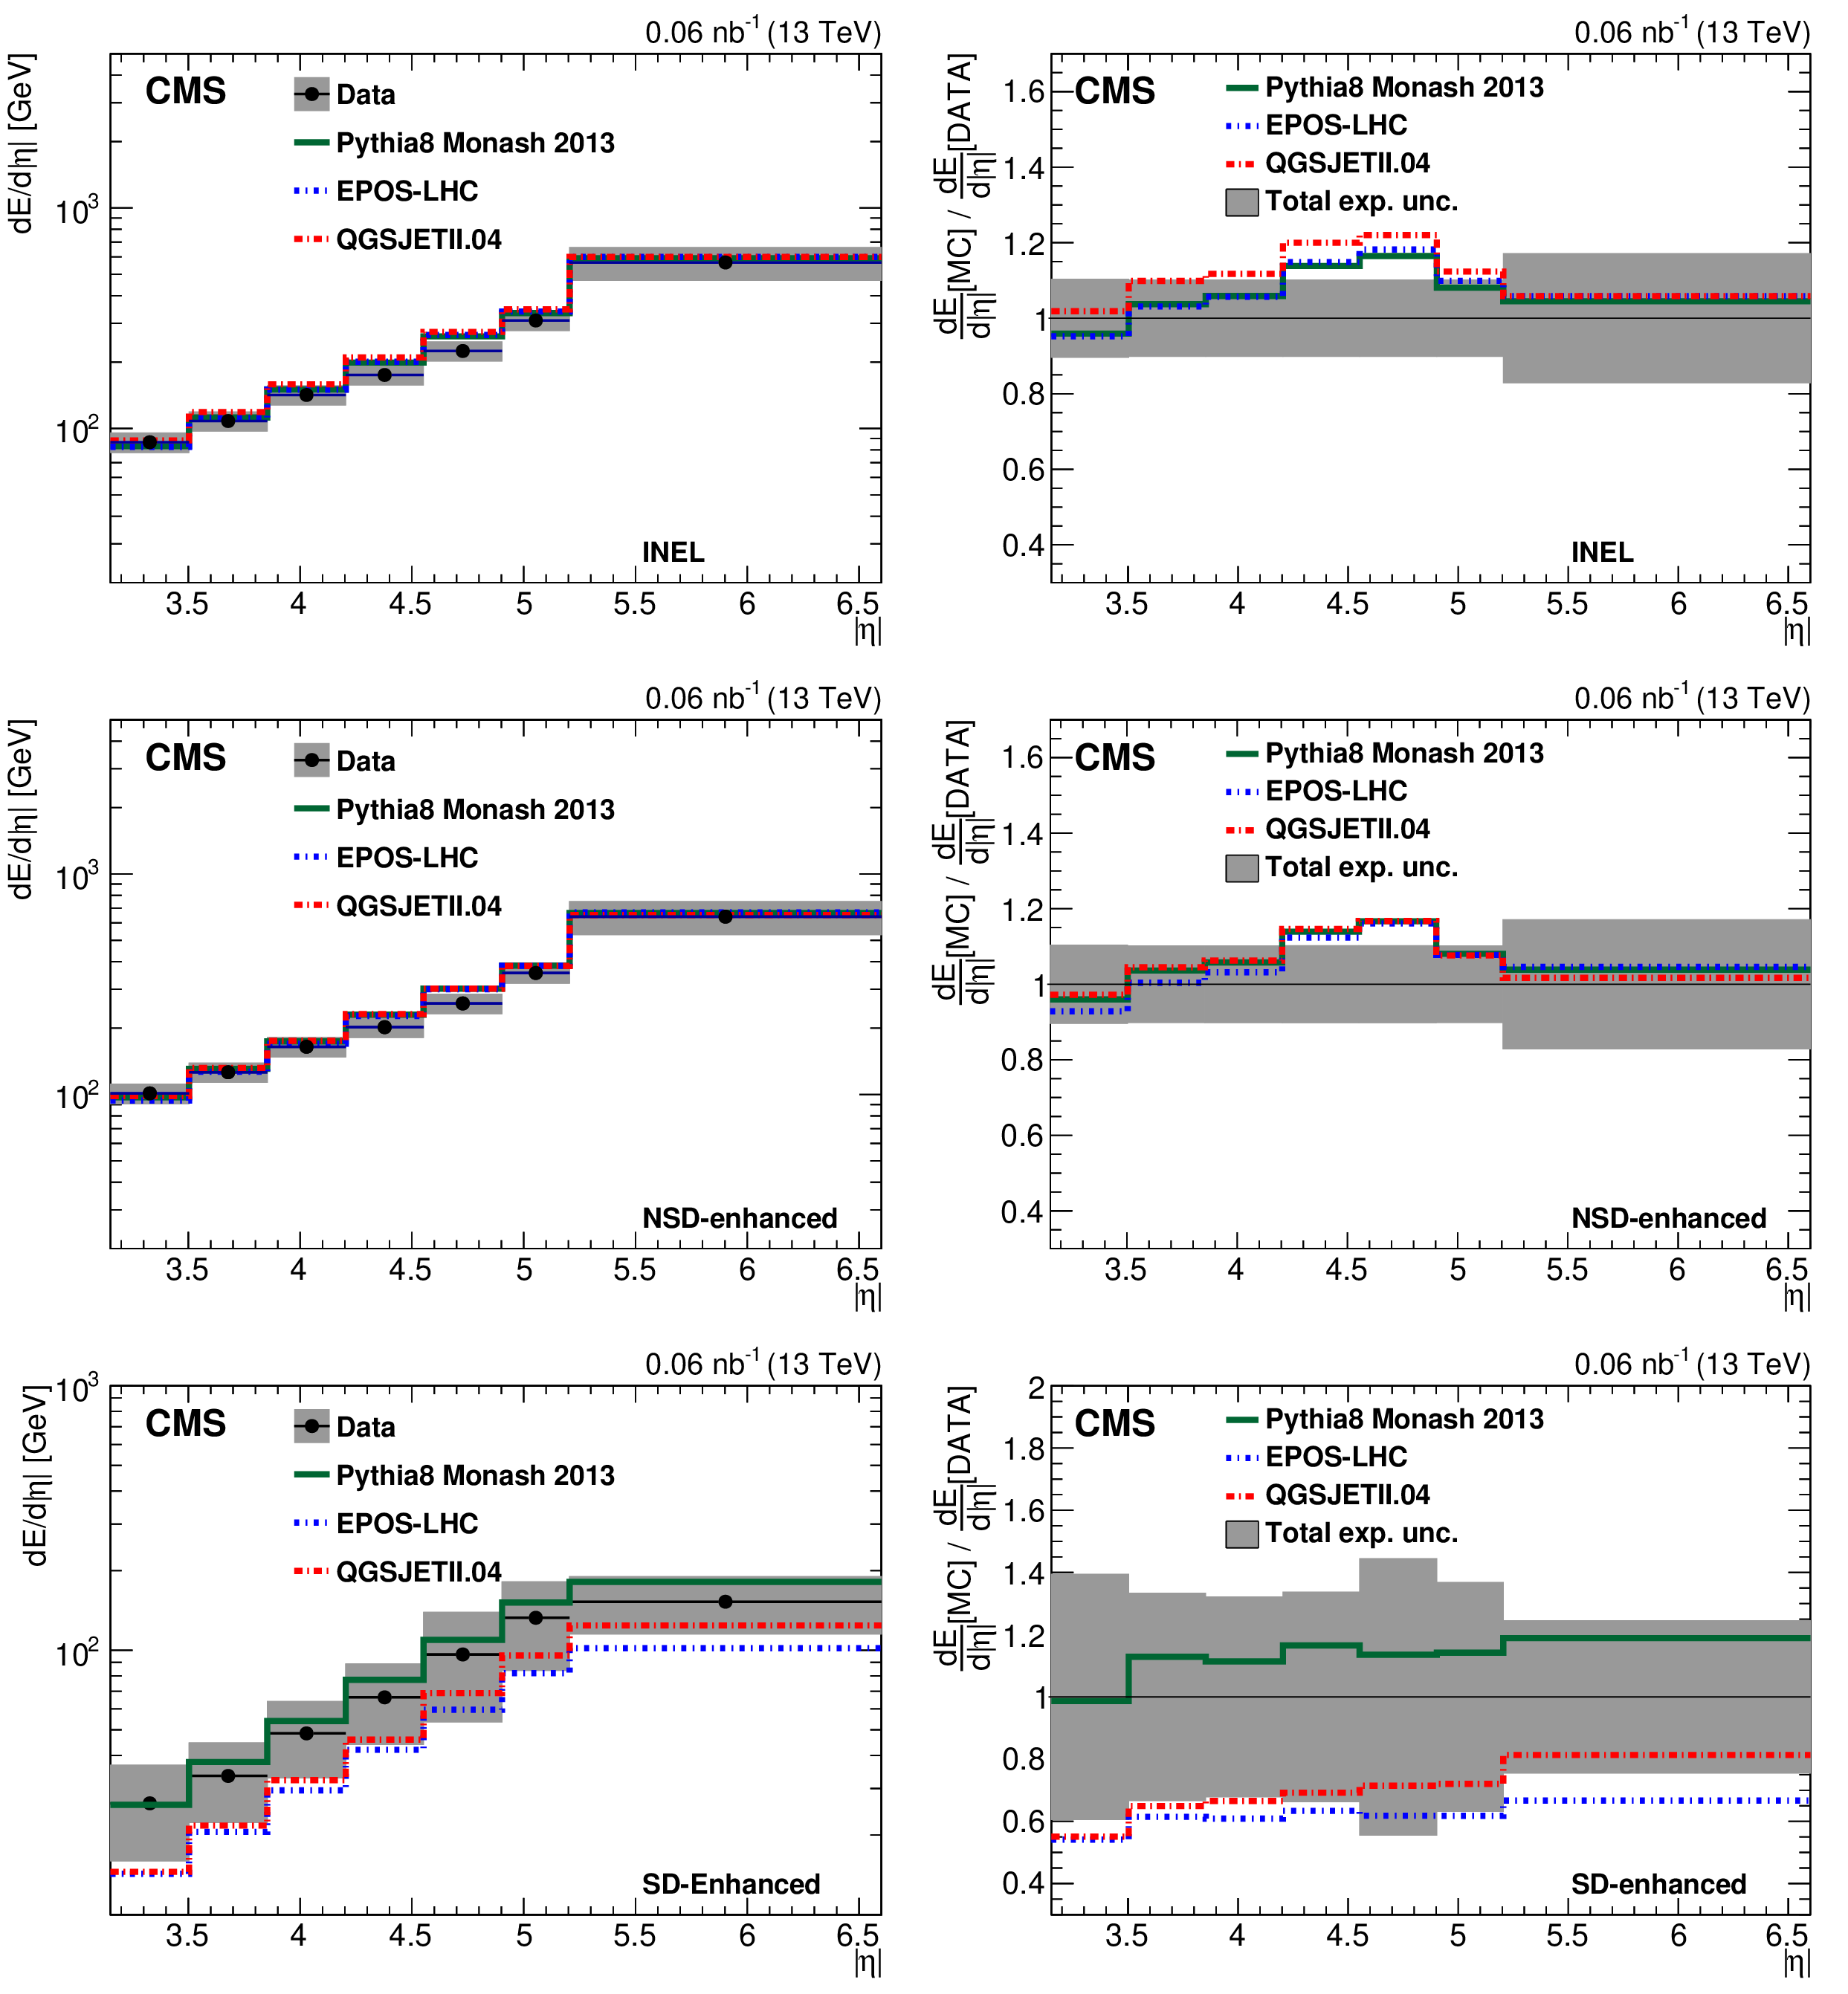
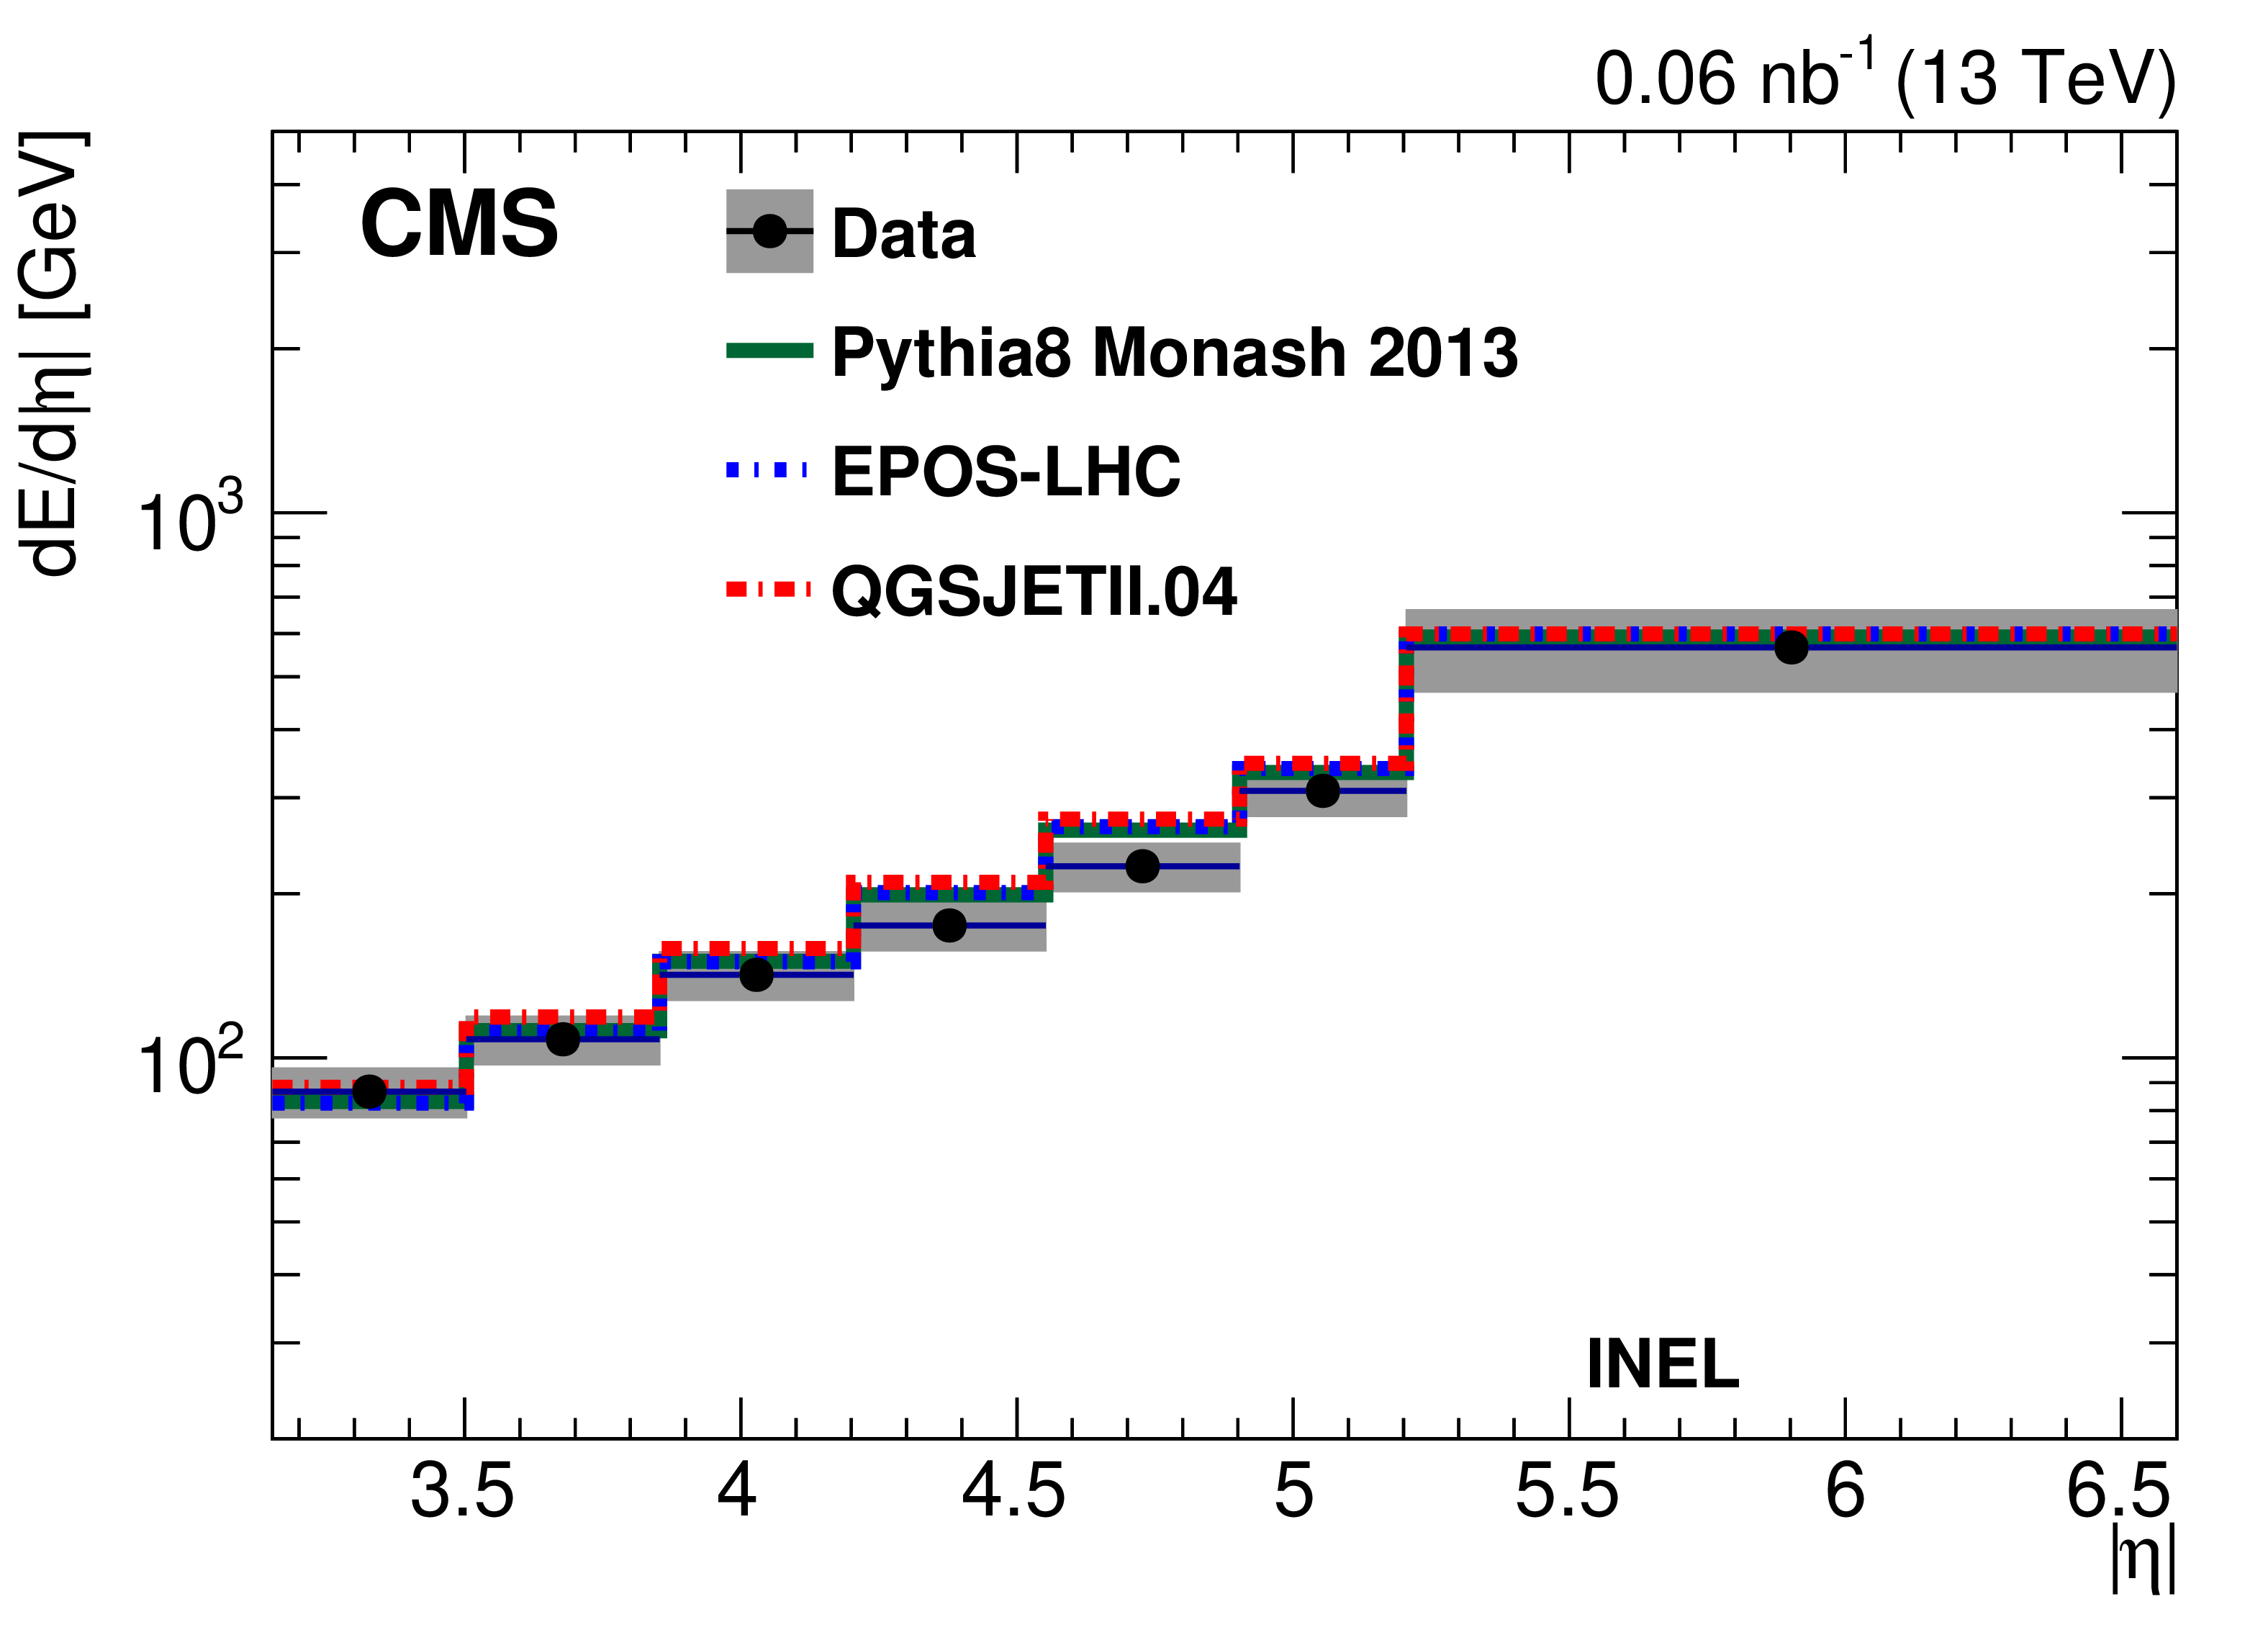
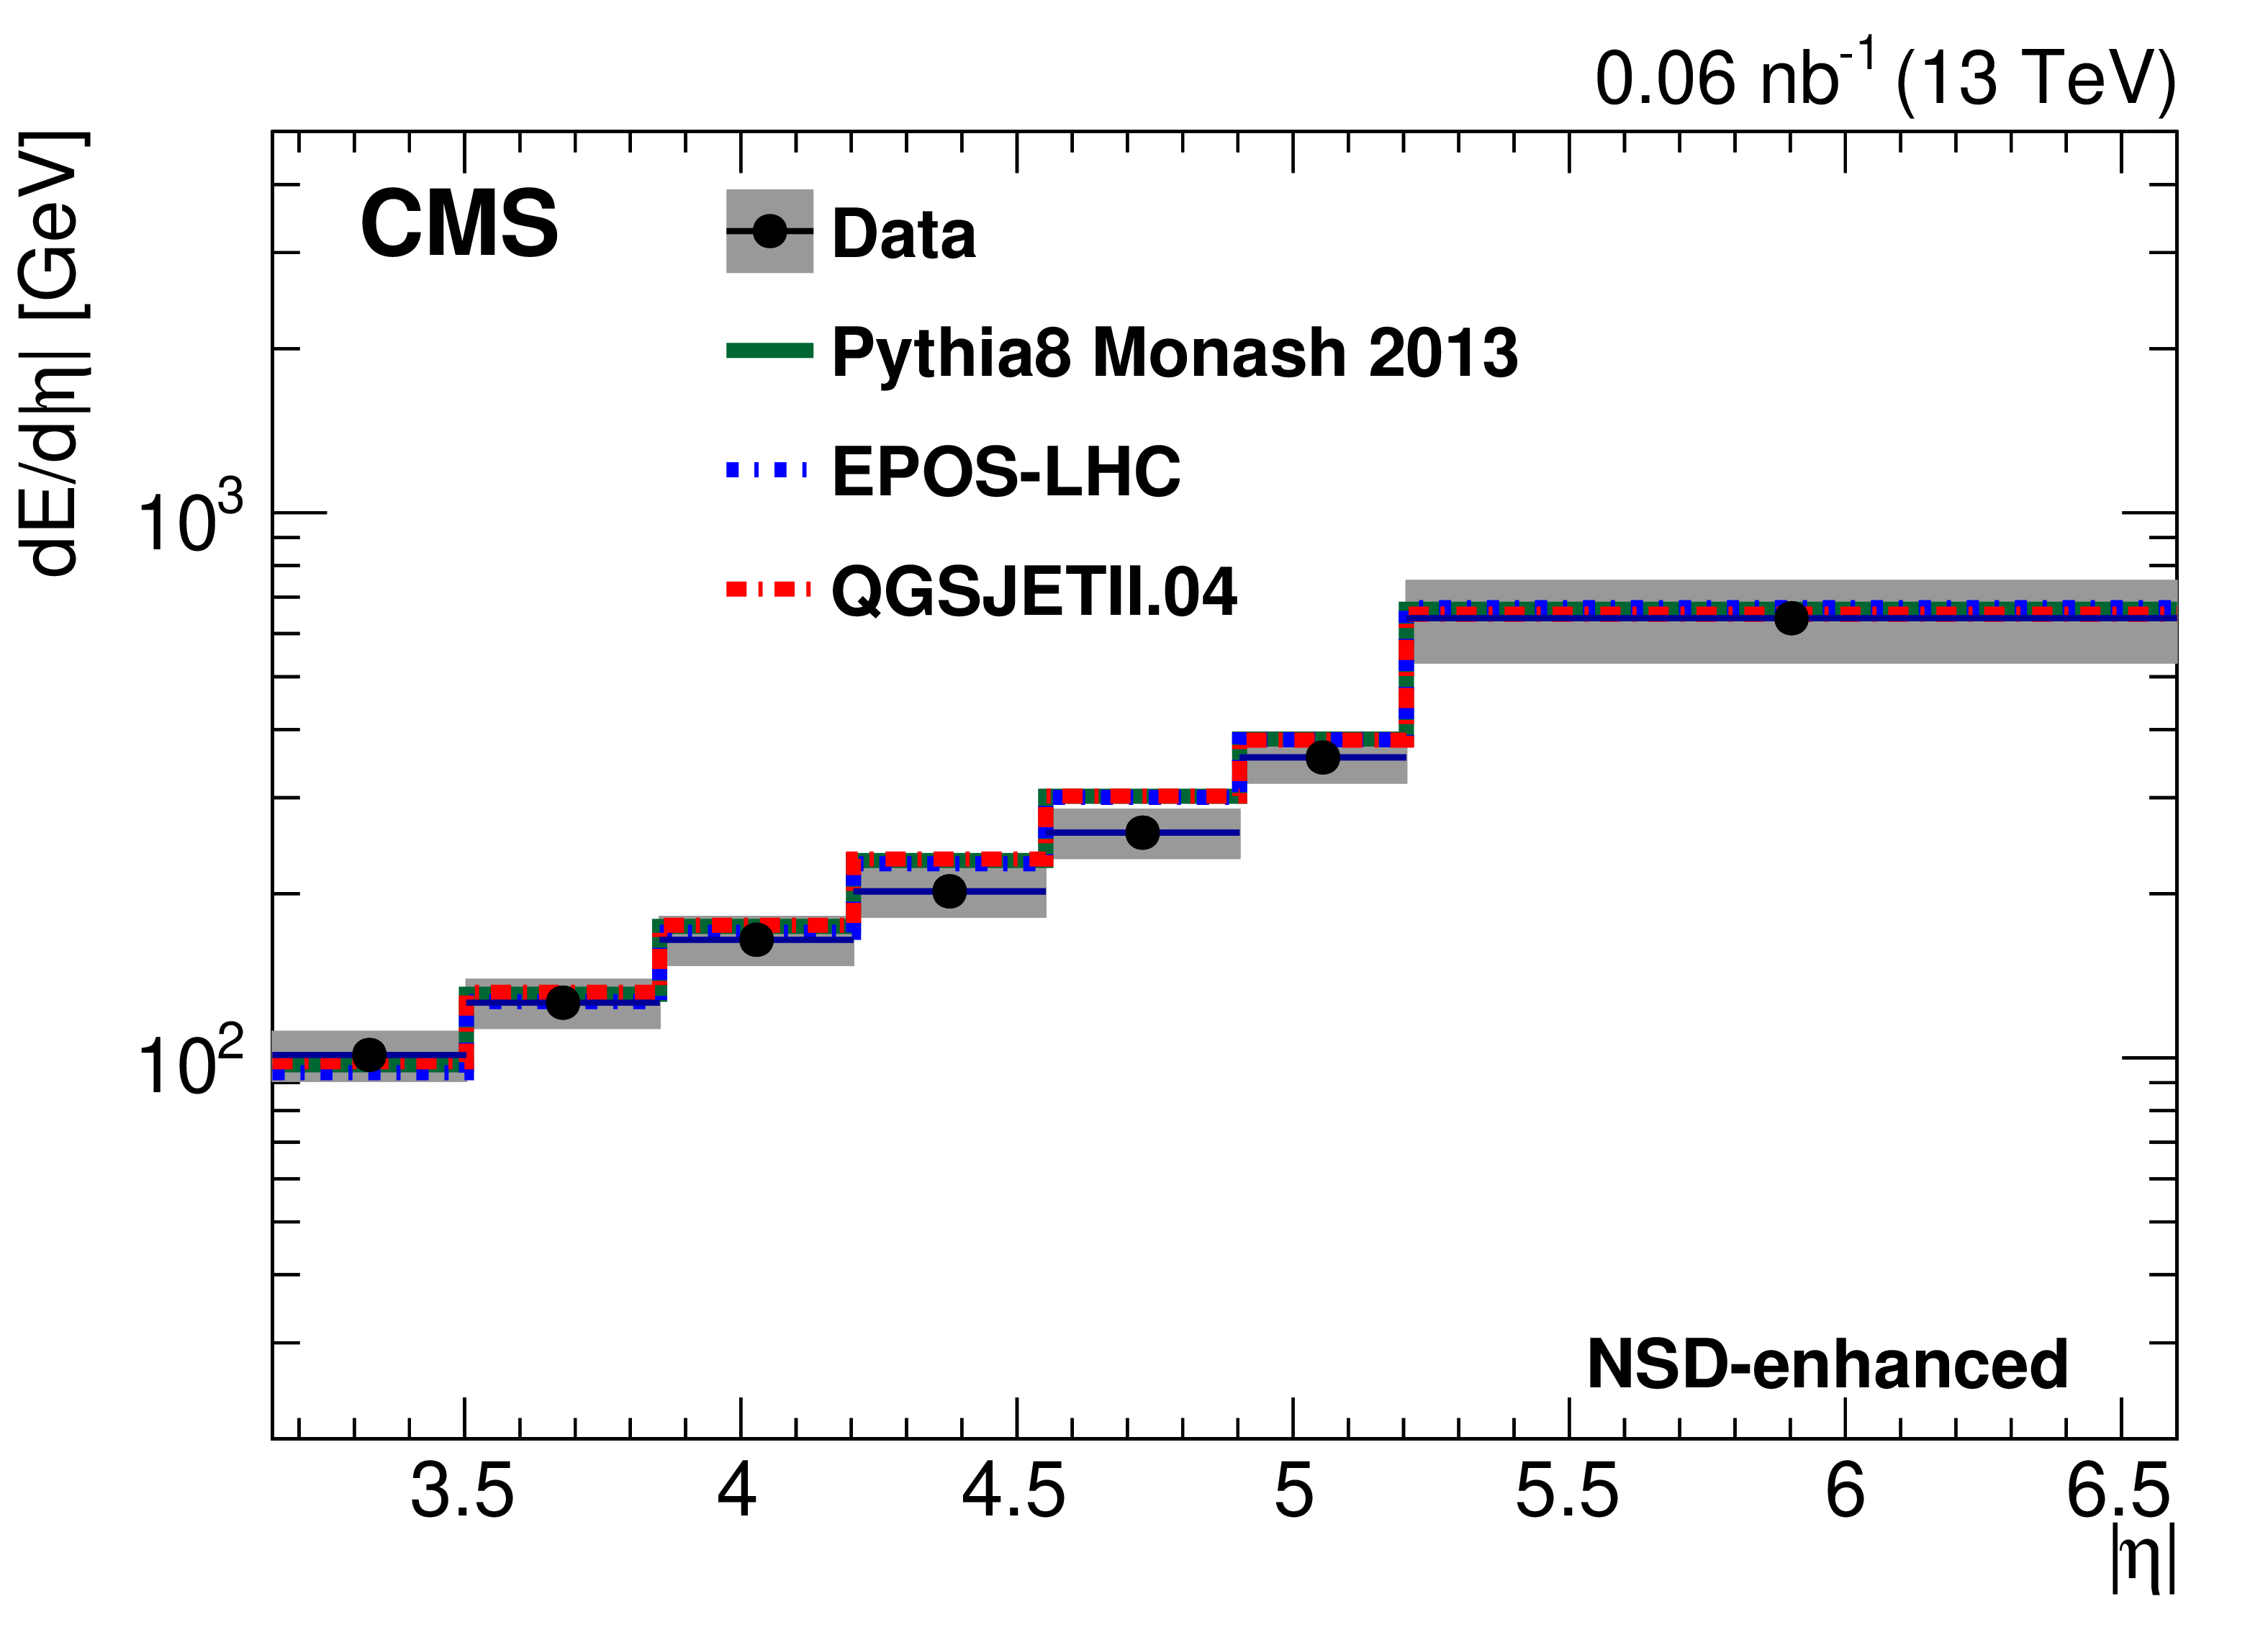
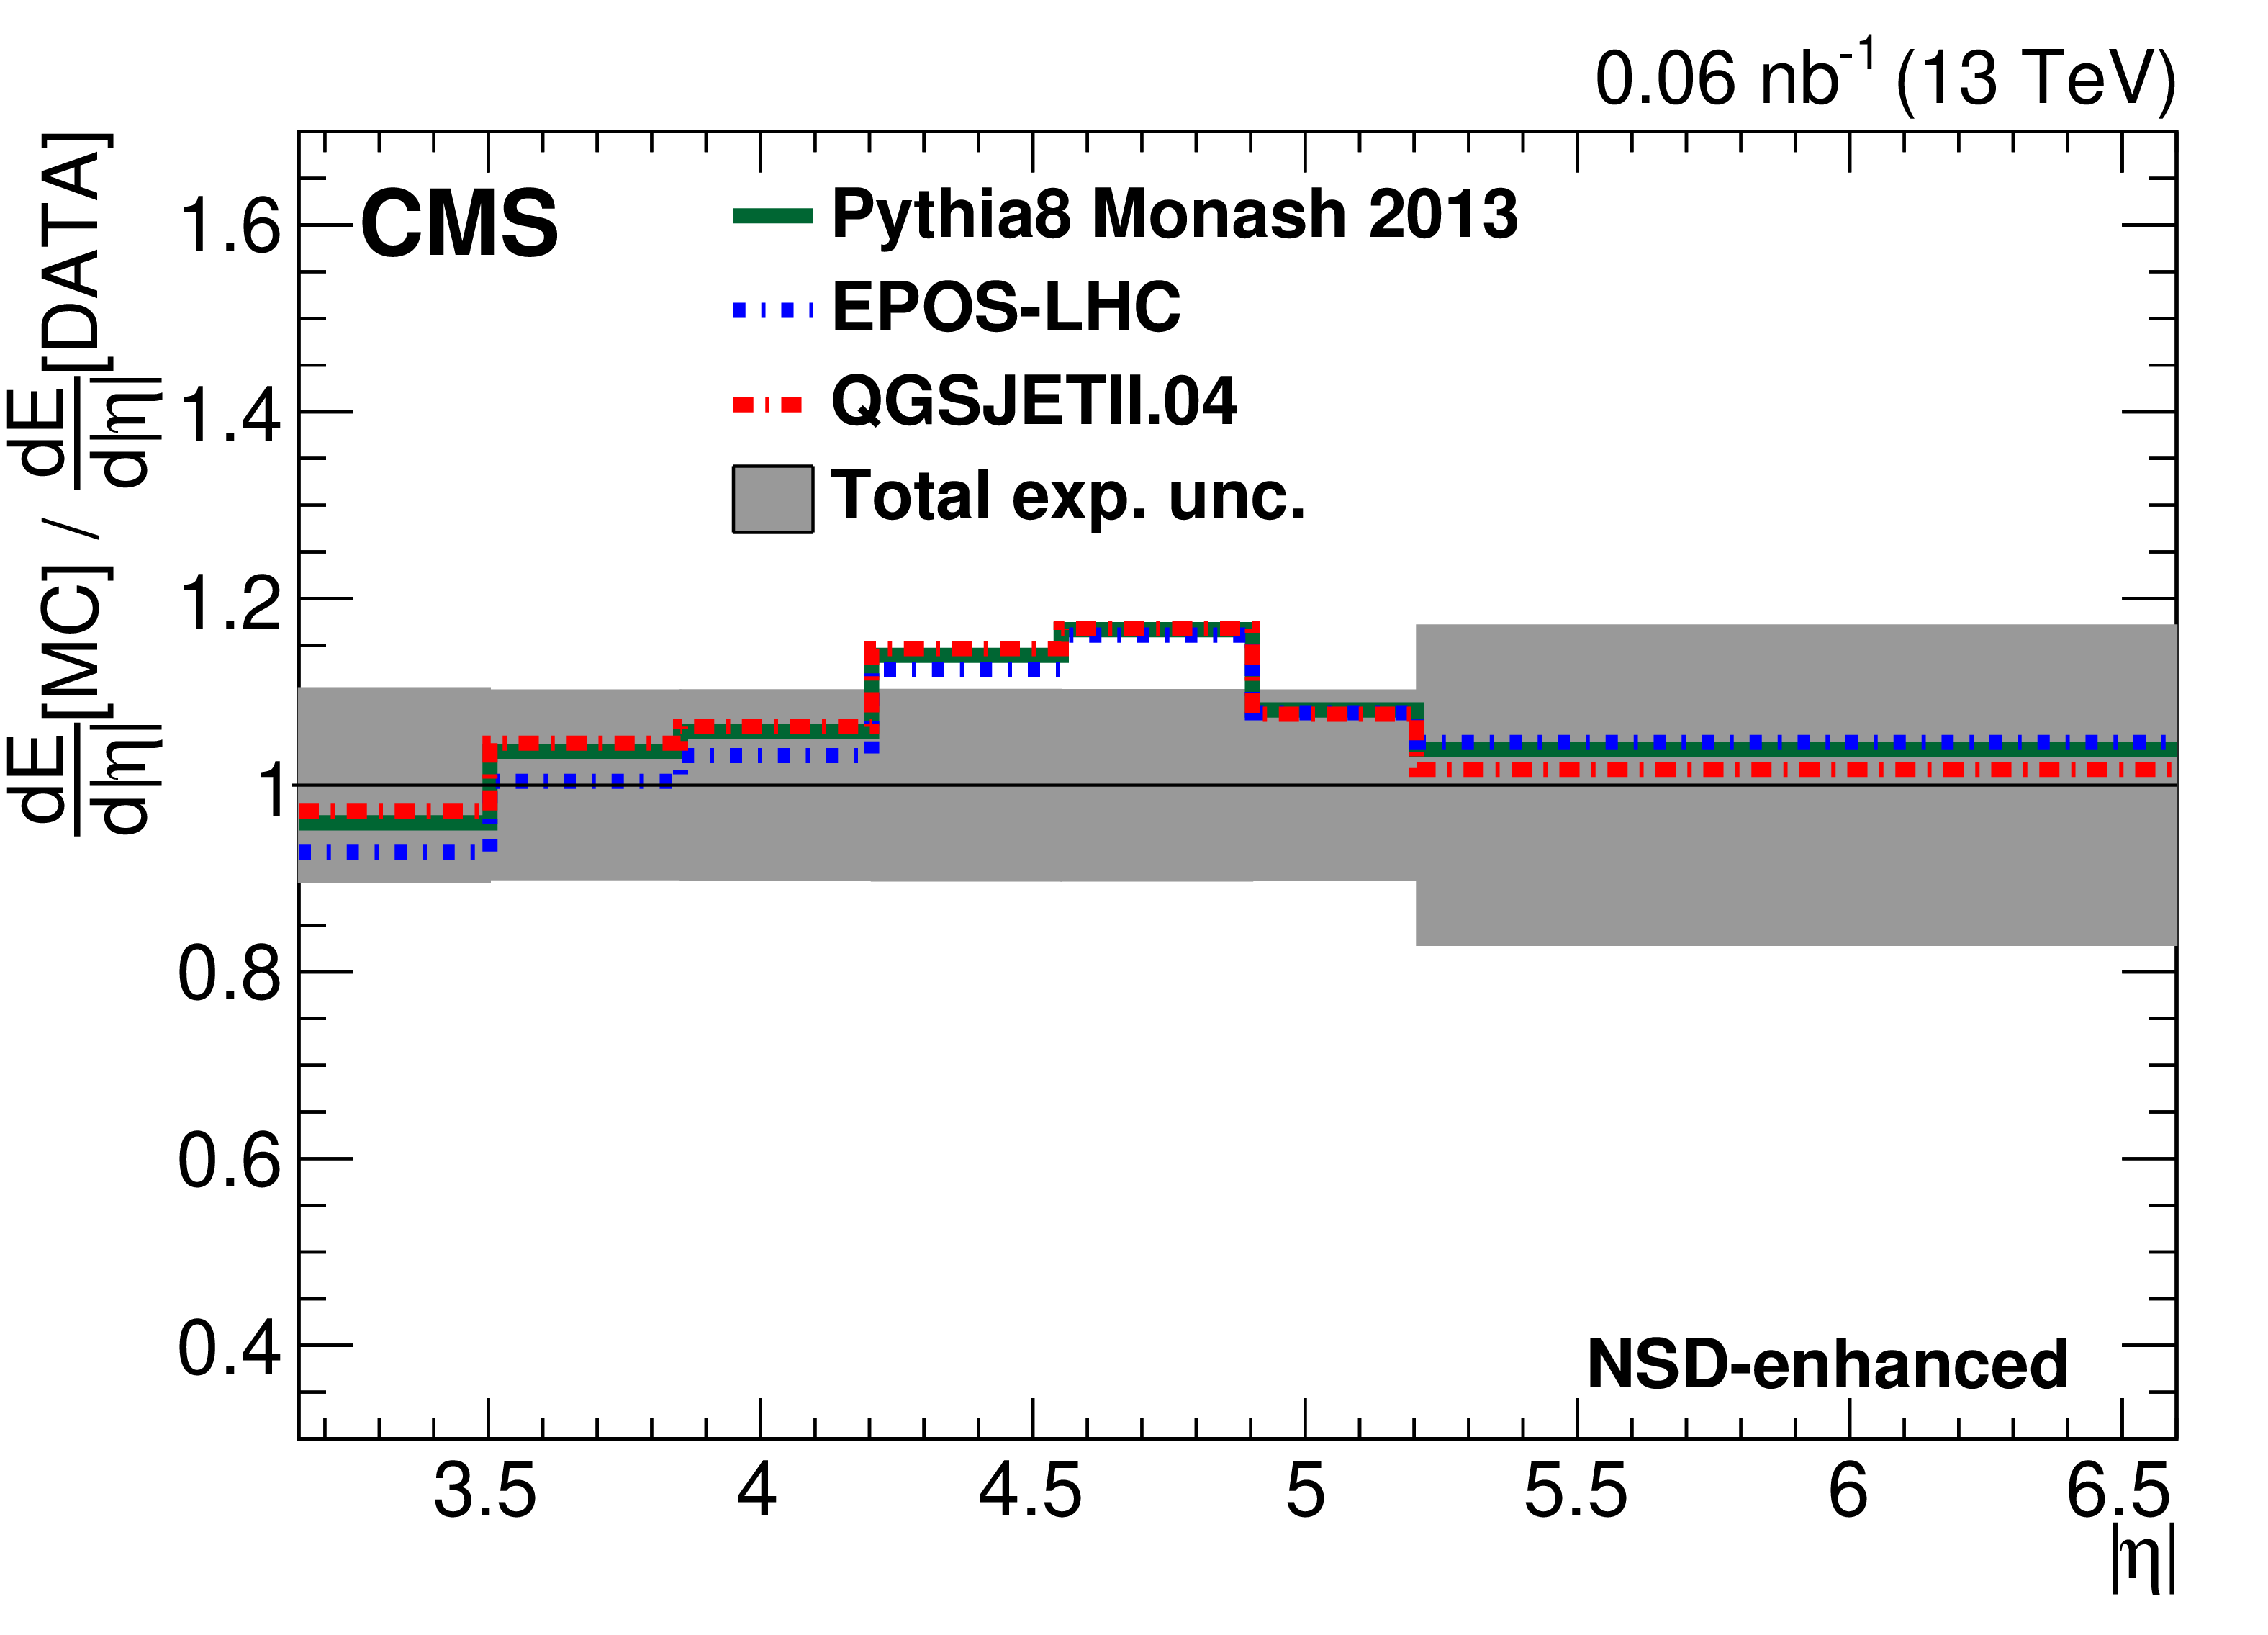
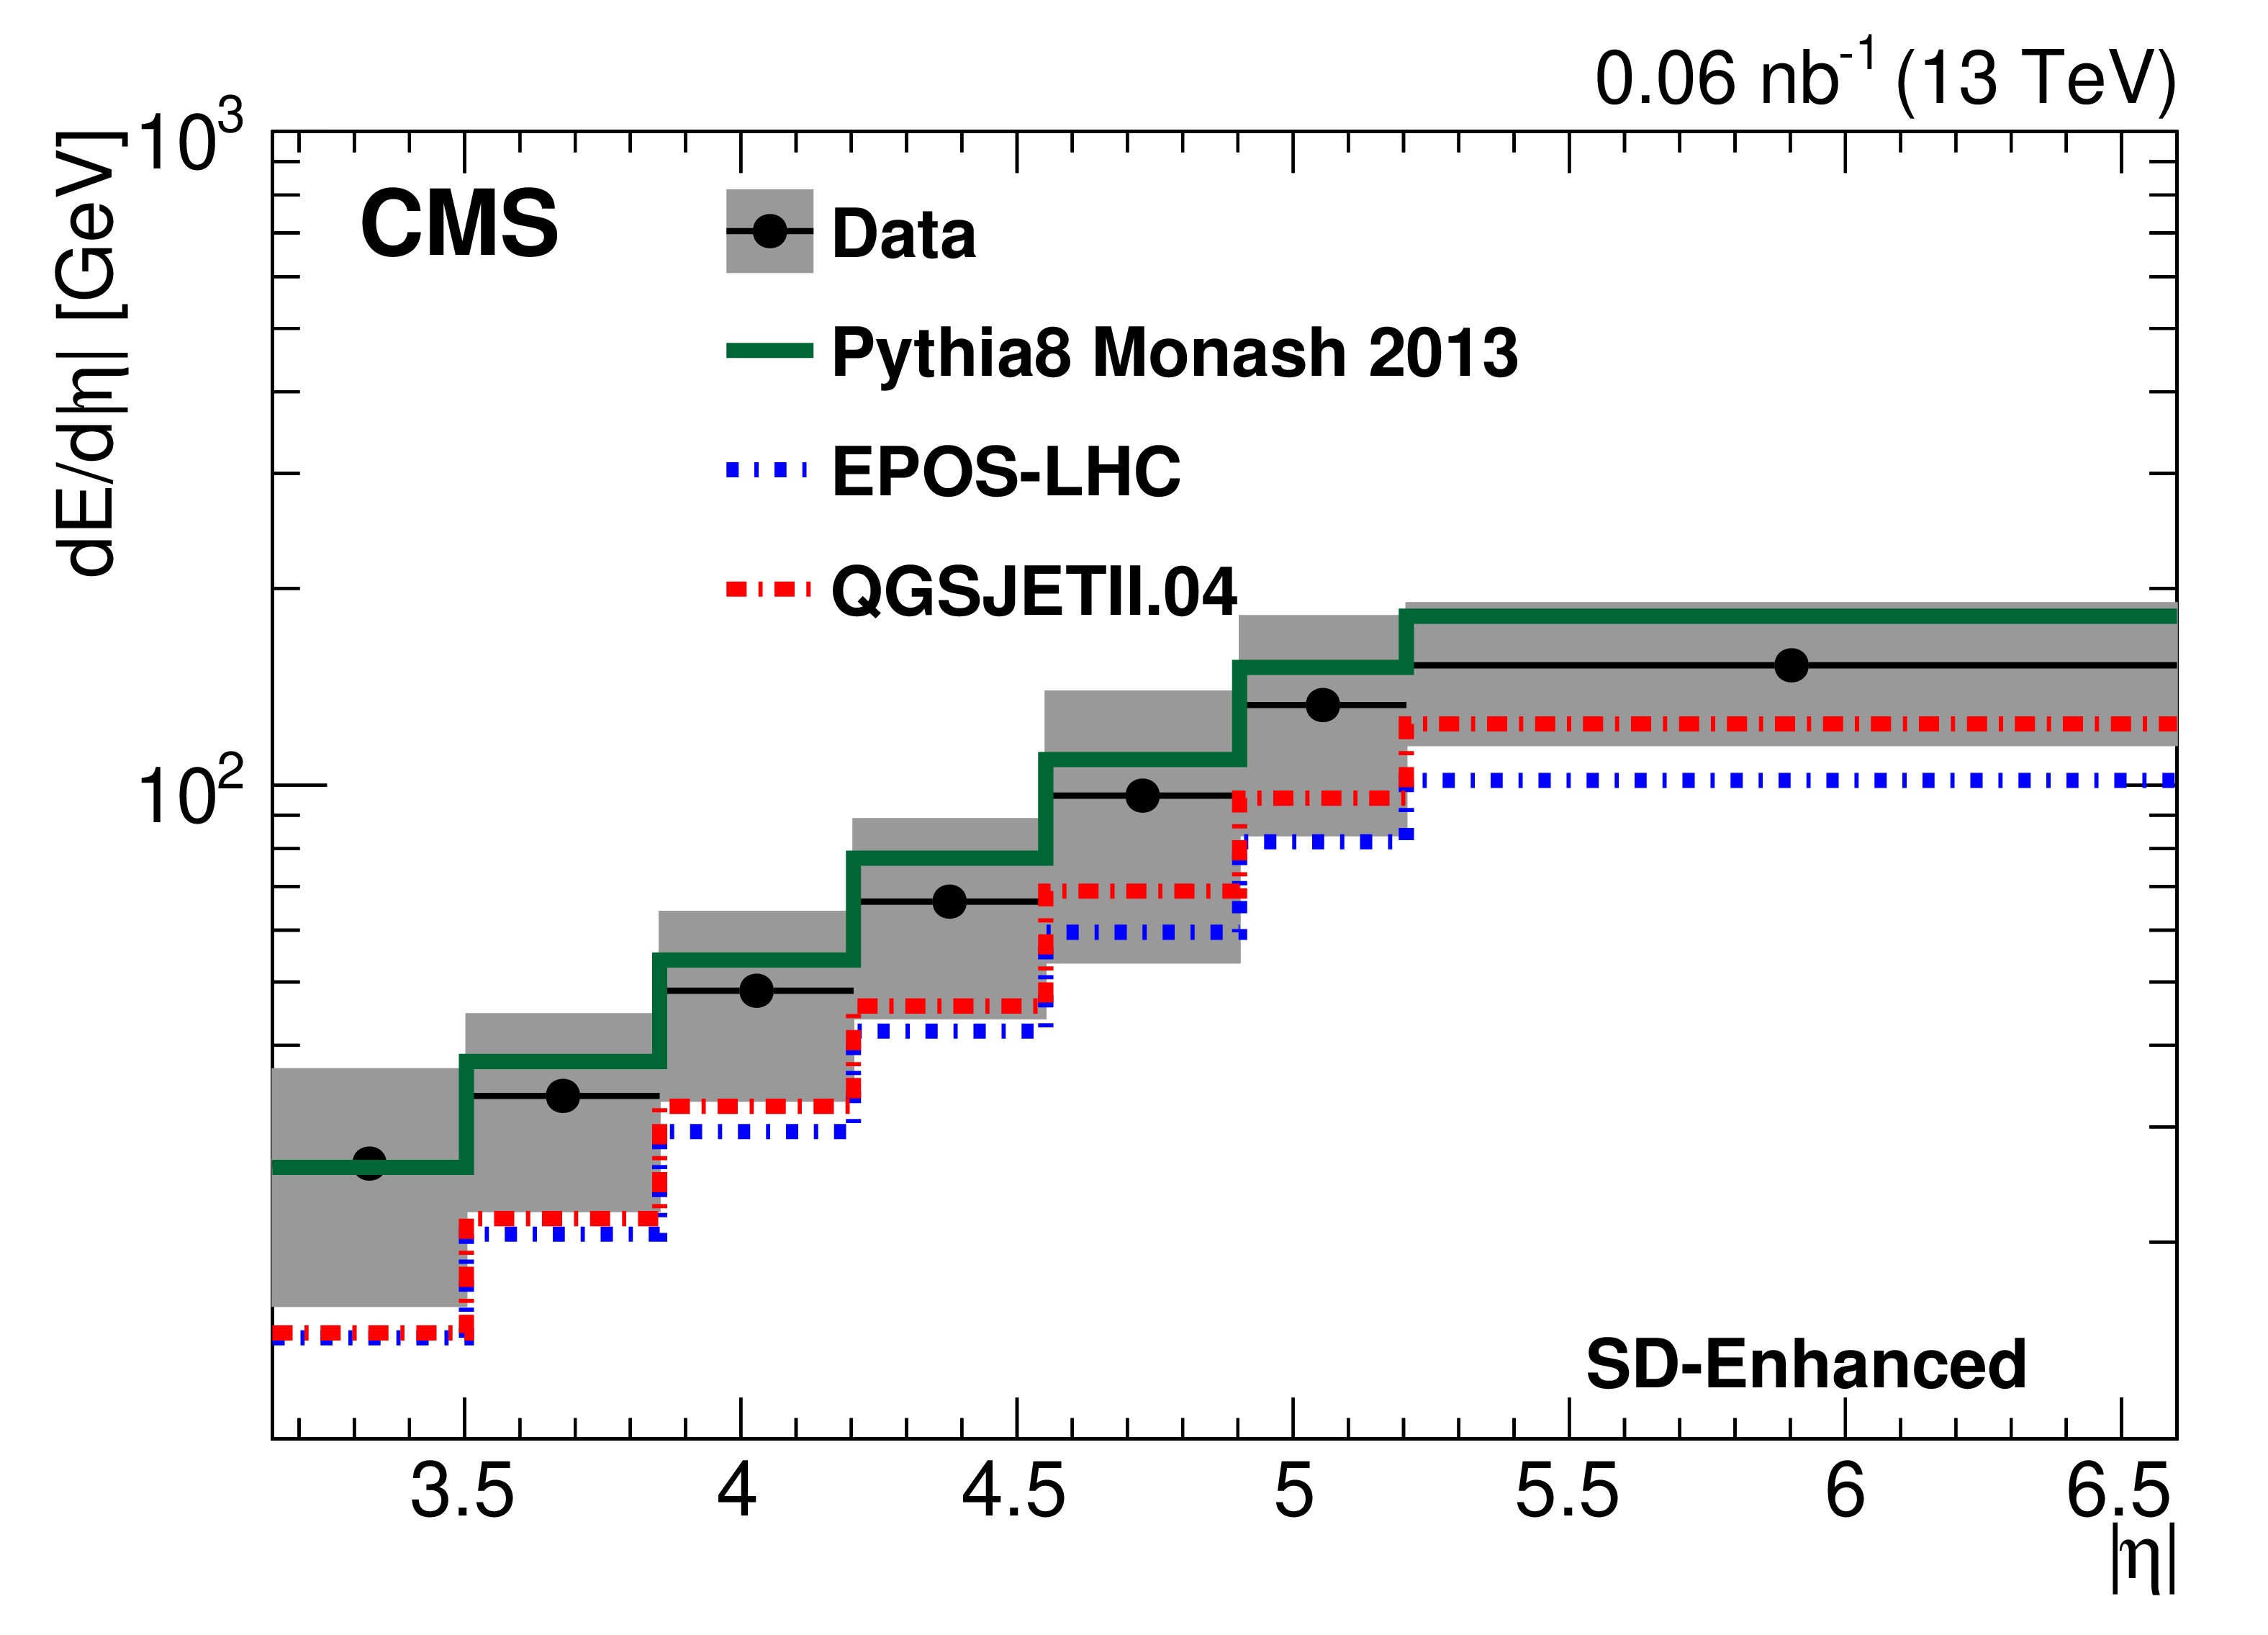
Figure 2:
Energy density at the stable-particle level for the INEL (upper row), NSD-enhanced (middle row), and SD-enhanced (lower row) event selections categories compared to predictions from PYTHIA 8 MONASH, EPOS-LHC, and QGSJETLL.04. The gray band shows the total systematic uncertainty. The right panels show the ratio of model predictions to measured data. |
png pdf |
Figure 2-a:
Energy density at the stable-particle level for the INEL event selection category compared to predictions from PYTHIA 8 MONASH, EPOS-LHC, and QGSJETLL.04. The gray band shows the total systematic uncertainty. |

png pdf |
Figure 2-b:
Energy density at the stable-particle level for the INEL event selection category compared to predictions from PYTHIA 8 MONASH, EPOS-LHC, and QGSJETLL.04. The gray band shows the total systematic uncertainty. The panel shows the ratio of model predictions to measured data. |
png pdf |
Figure 2-c:
Energy density at the stable-particle level for the NSD-enhanced event selection category compared to predictions from PYTHIA 8 MONASH, EPOS-LHC, and QGSJETLL.04. The gray band shows the total systematic uncertainty. |
png pdf |
Figure 2-d:
Energy density at the stable-particle level for the NSD-enhanced event selection category compared to predictions from PYTHIA 8 MONASH, EPOS-LHC, and QGSJETLL.04. The gray band shows the total systematic uncertainty. The panel shows the ratio of model predictions to measured data. |
png pdf |
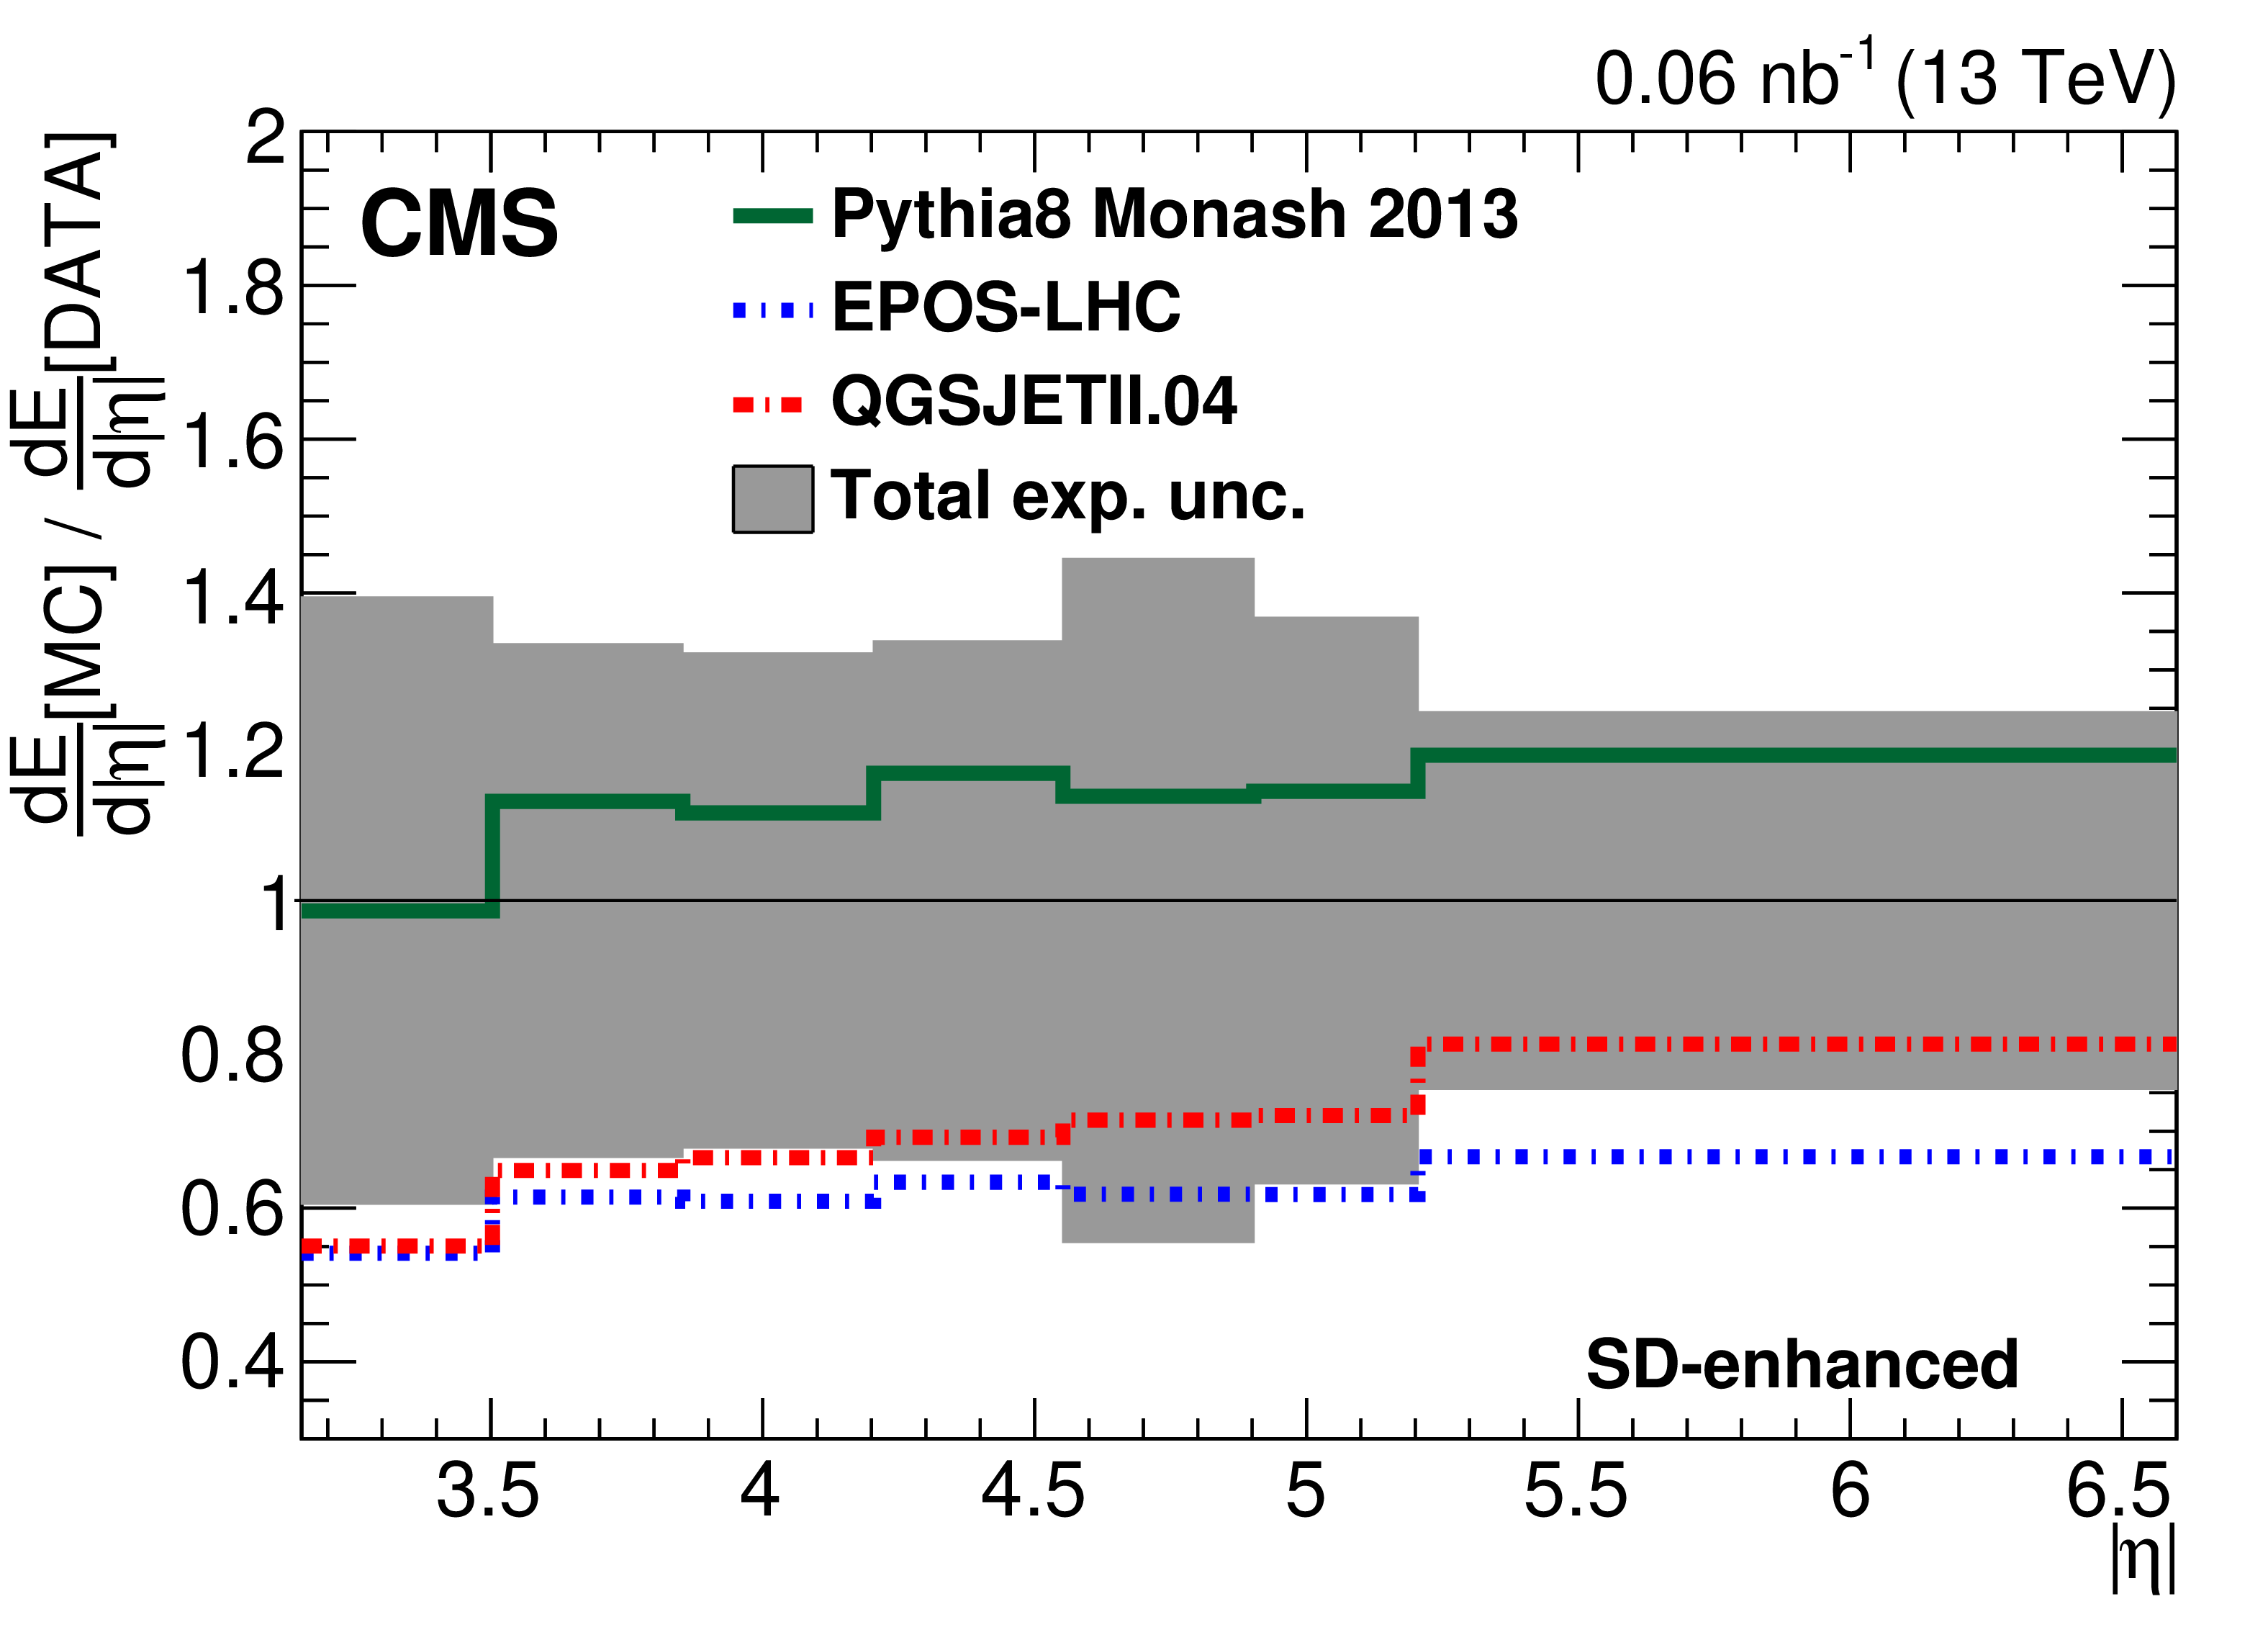
Figure 2-e:
Energy density at the stable-particle level for the SD-enhanced event selection category compared to predictions from PYTHIA 8 MONASH, EPOS-LHC, and QGSJETLL.04. The gray band shows the total systematic uncertainty. |
png pdf |
Figure 2-f:
Energy density at the stable-particle level for the SD-enhanced event selection category compared to predictions from PYTHIA 8 MONASH, EPOS-LHC, and QGSJETLL.04. The gray band shows the total systematic uncertainty. The panel shows the ratio of model predictions to measured data. |
png pdf |
Figure 3:
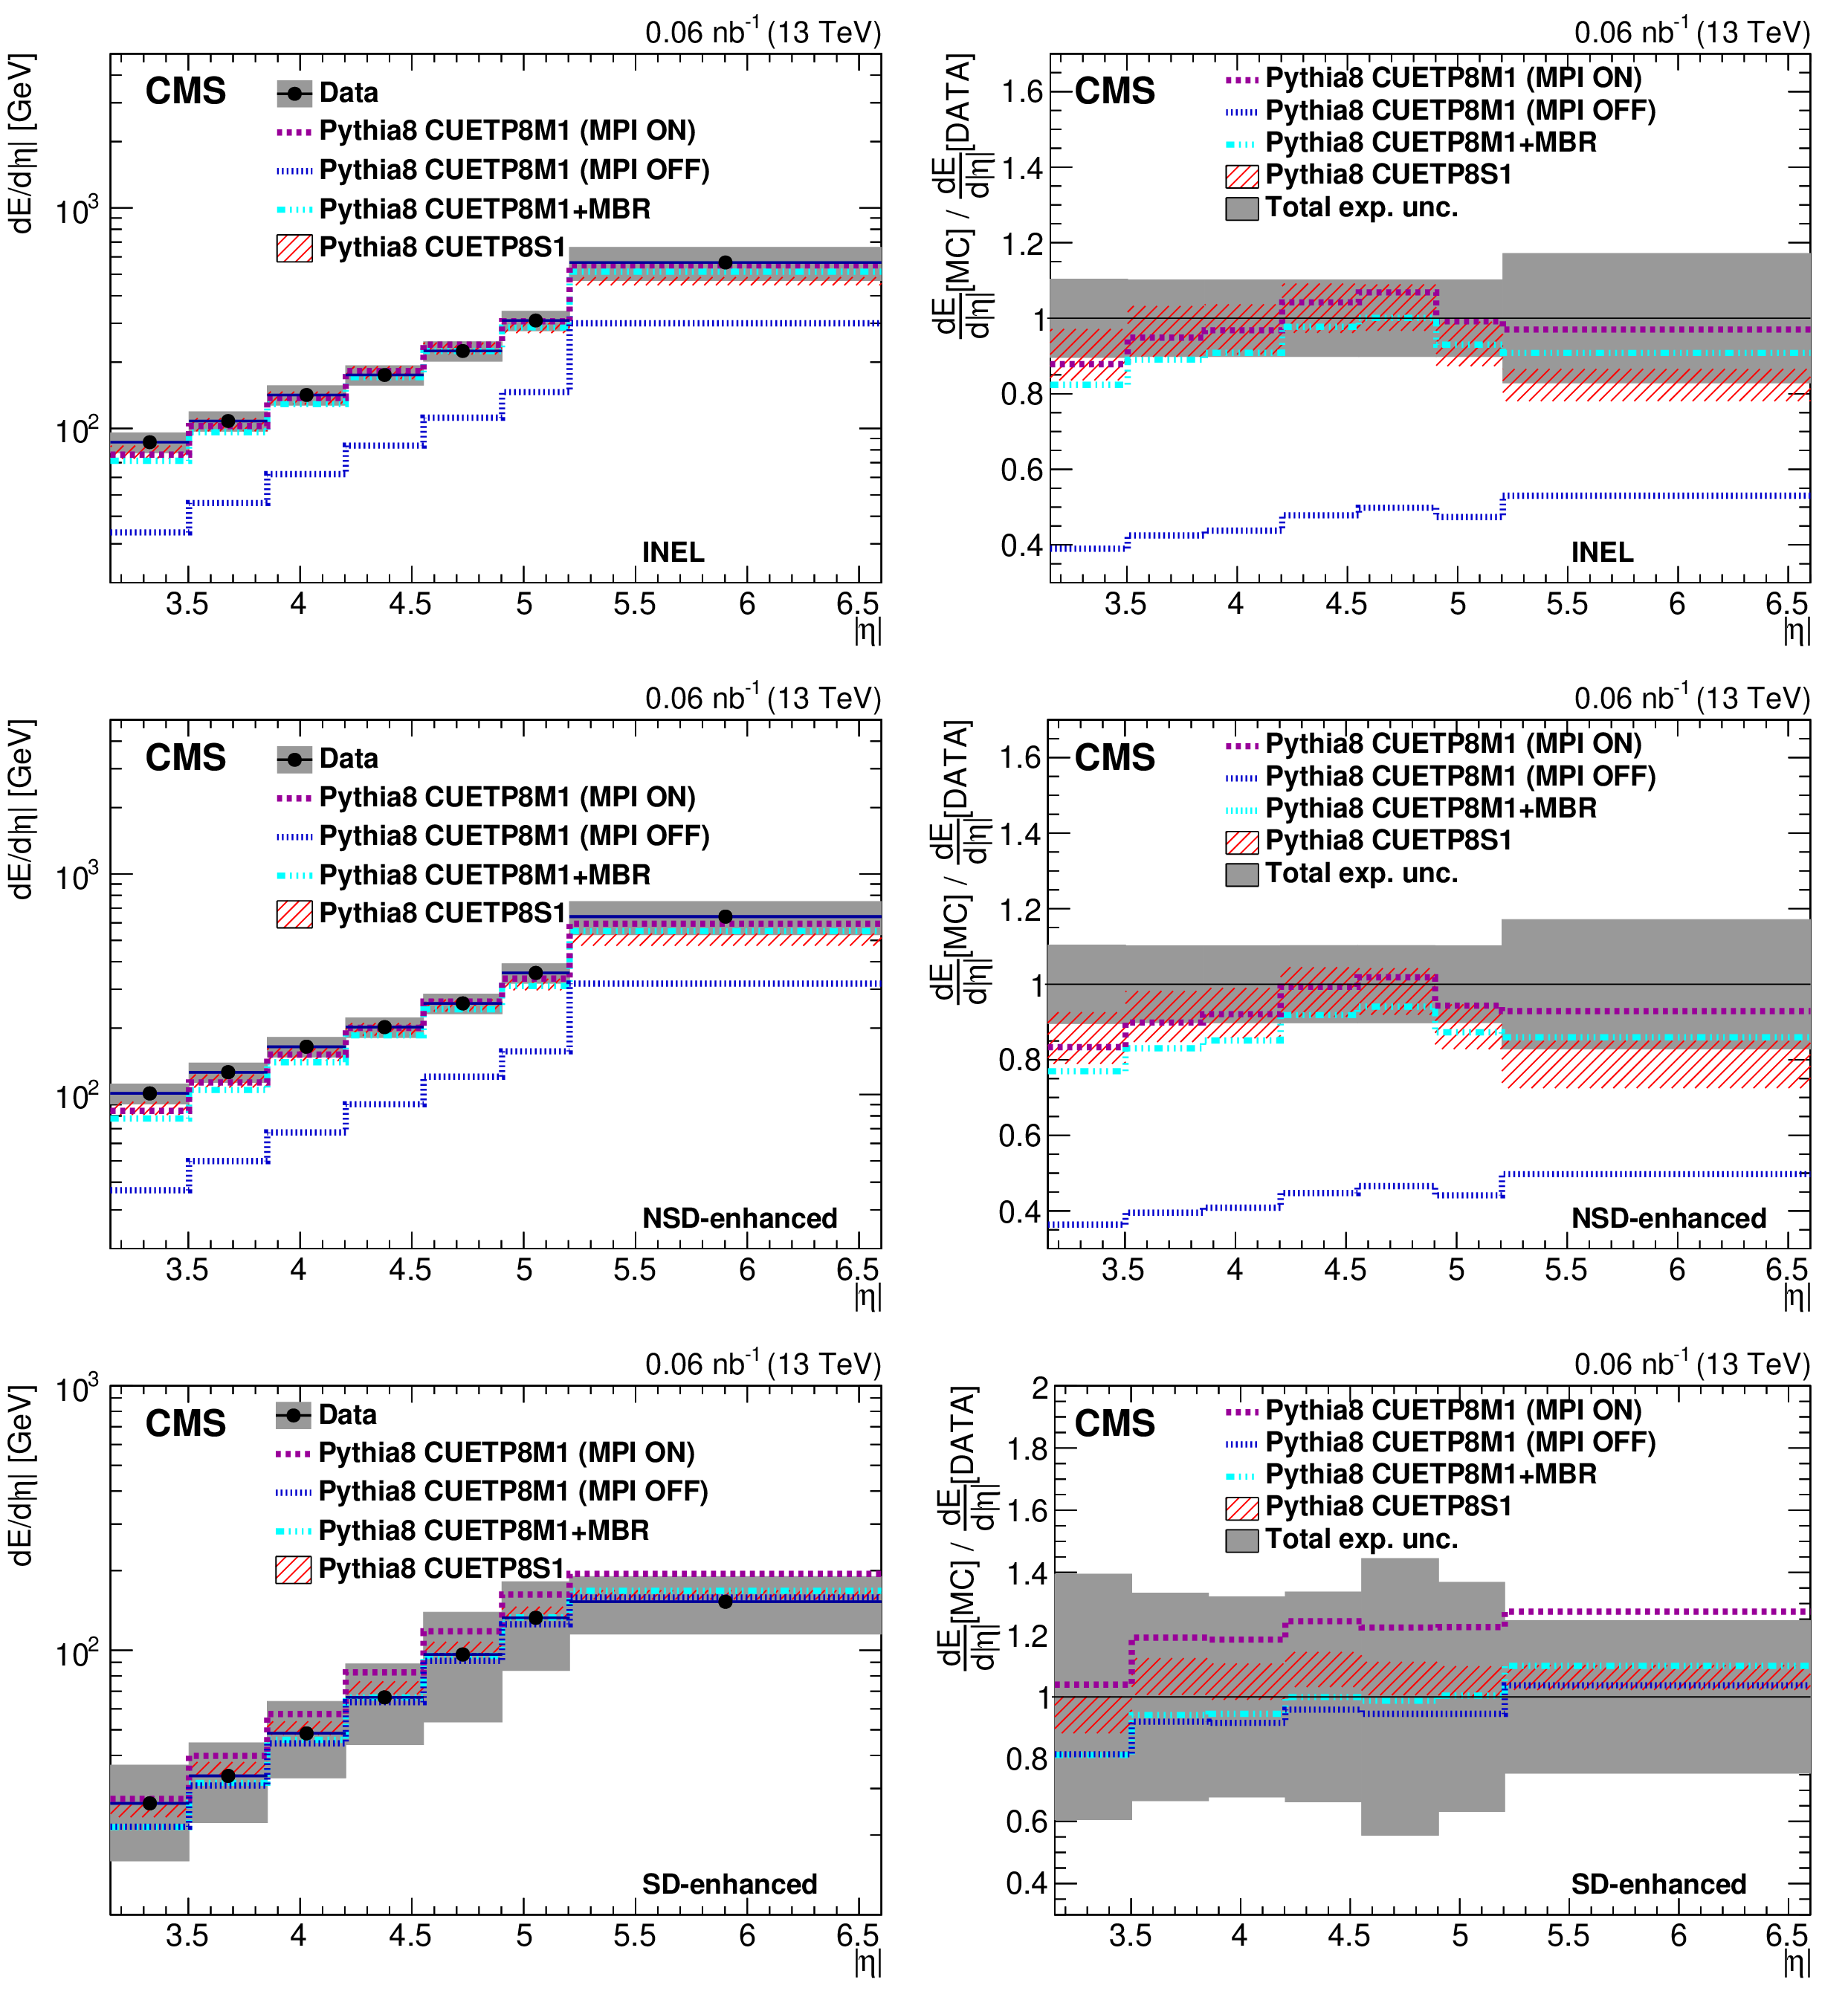
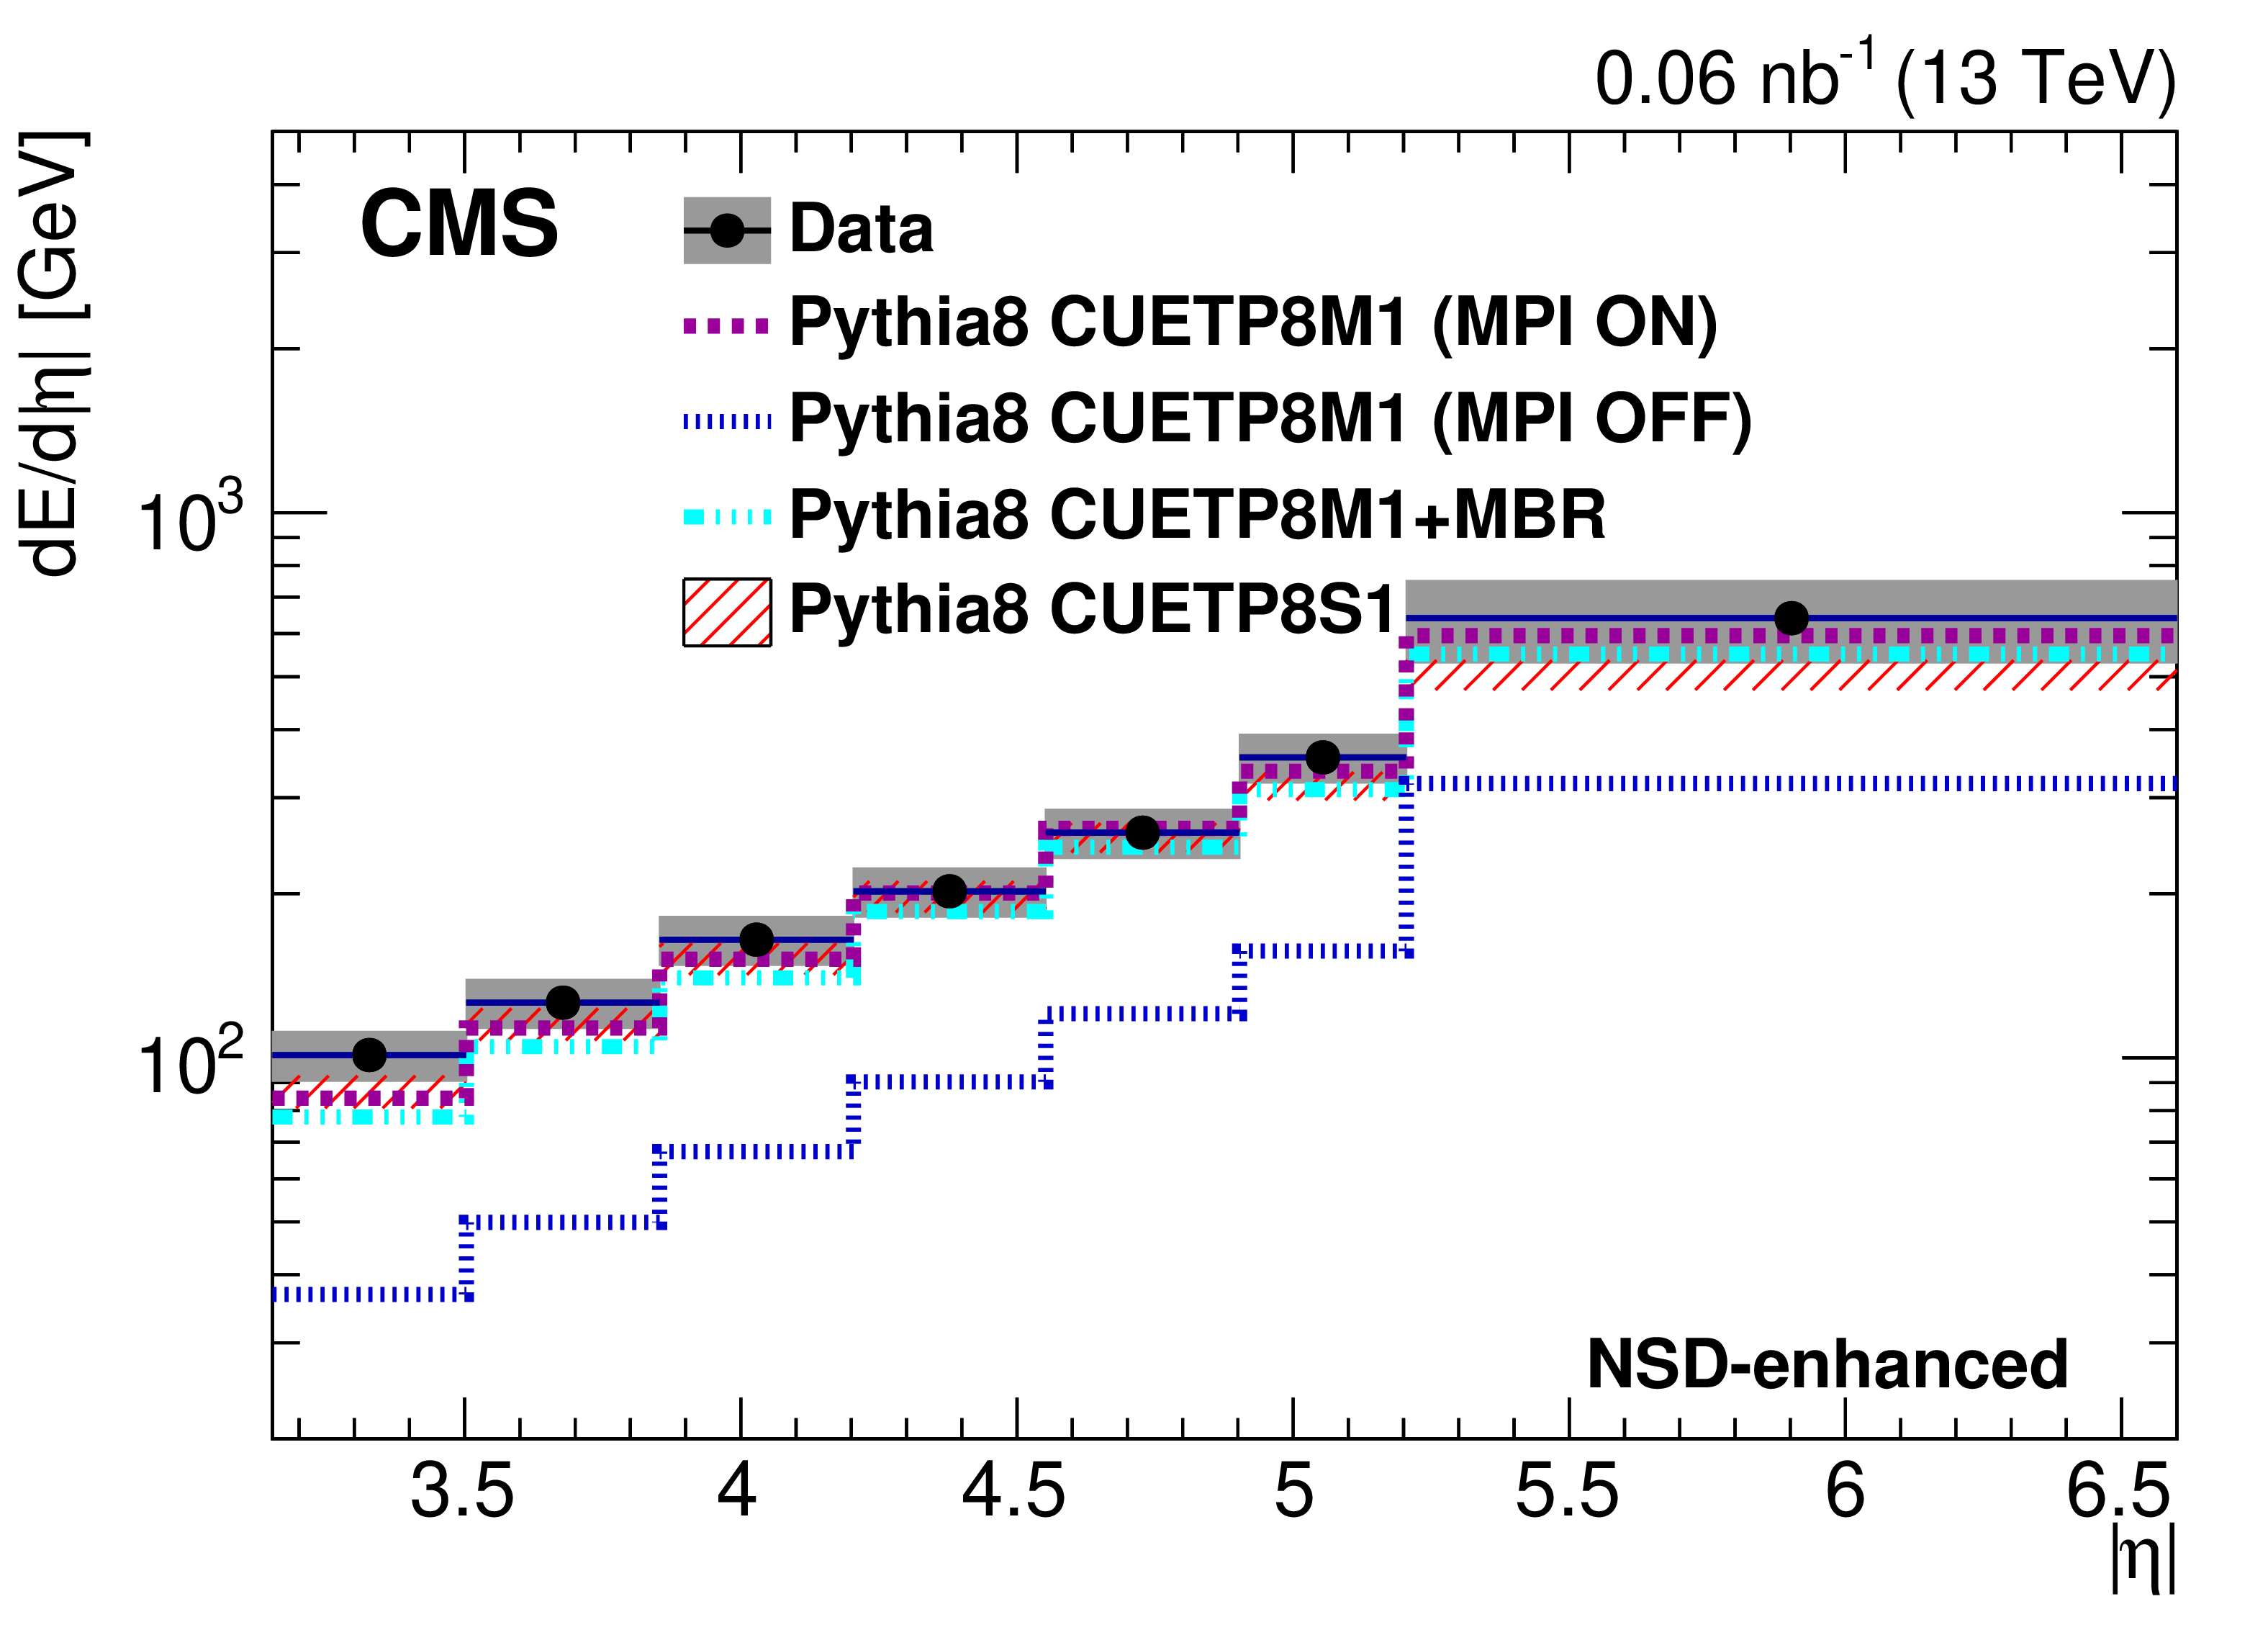
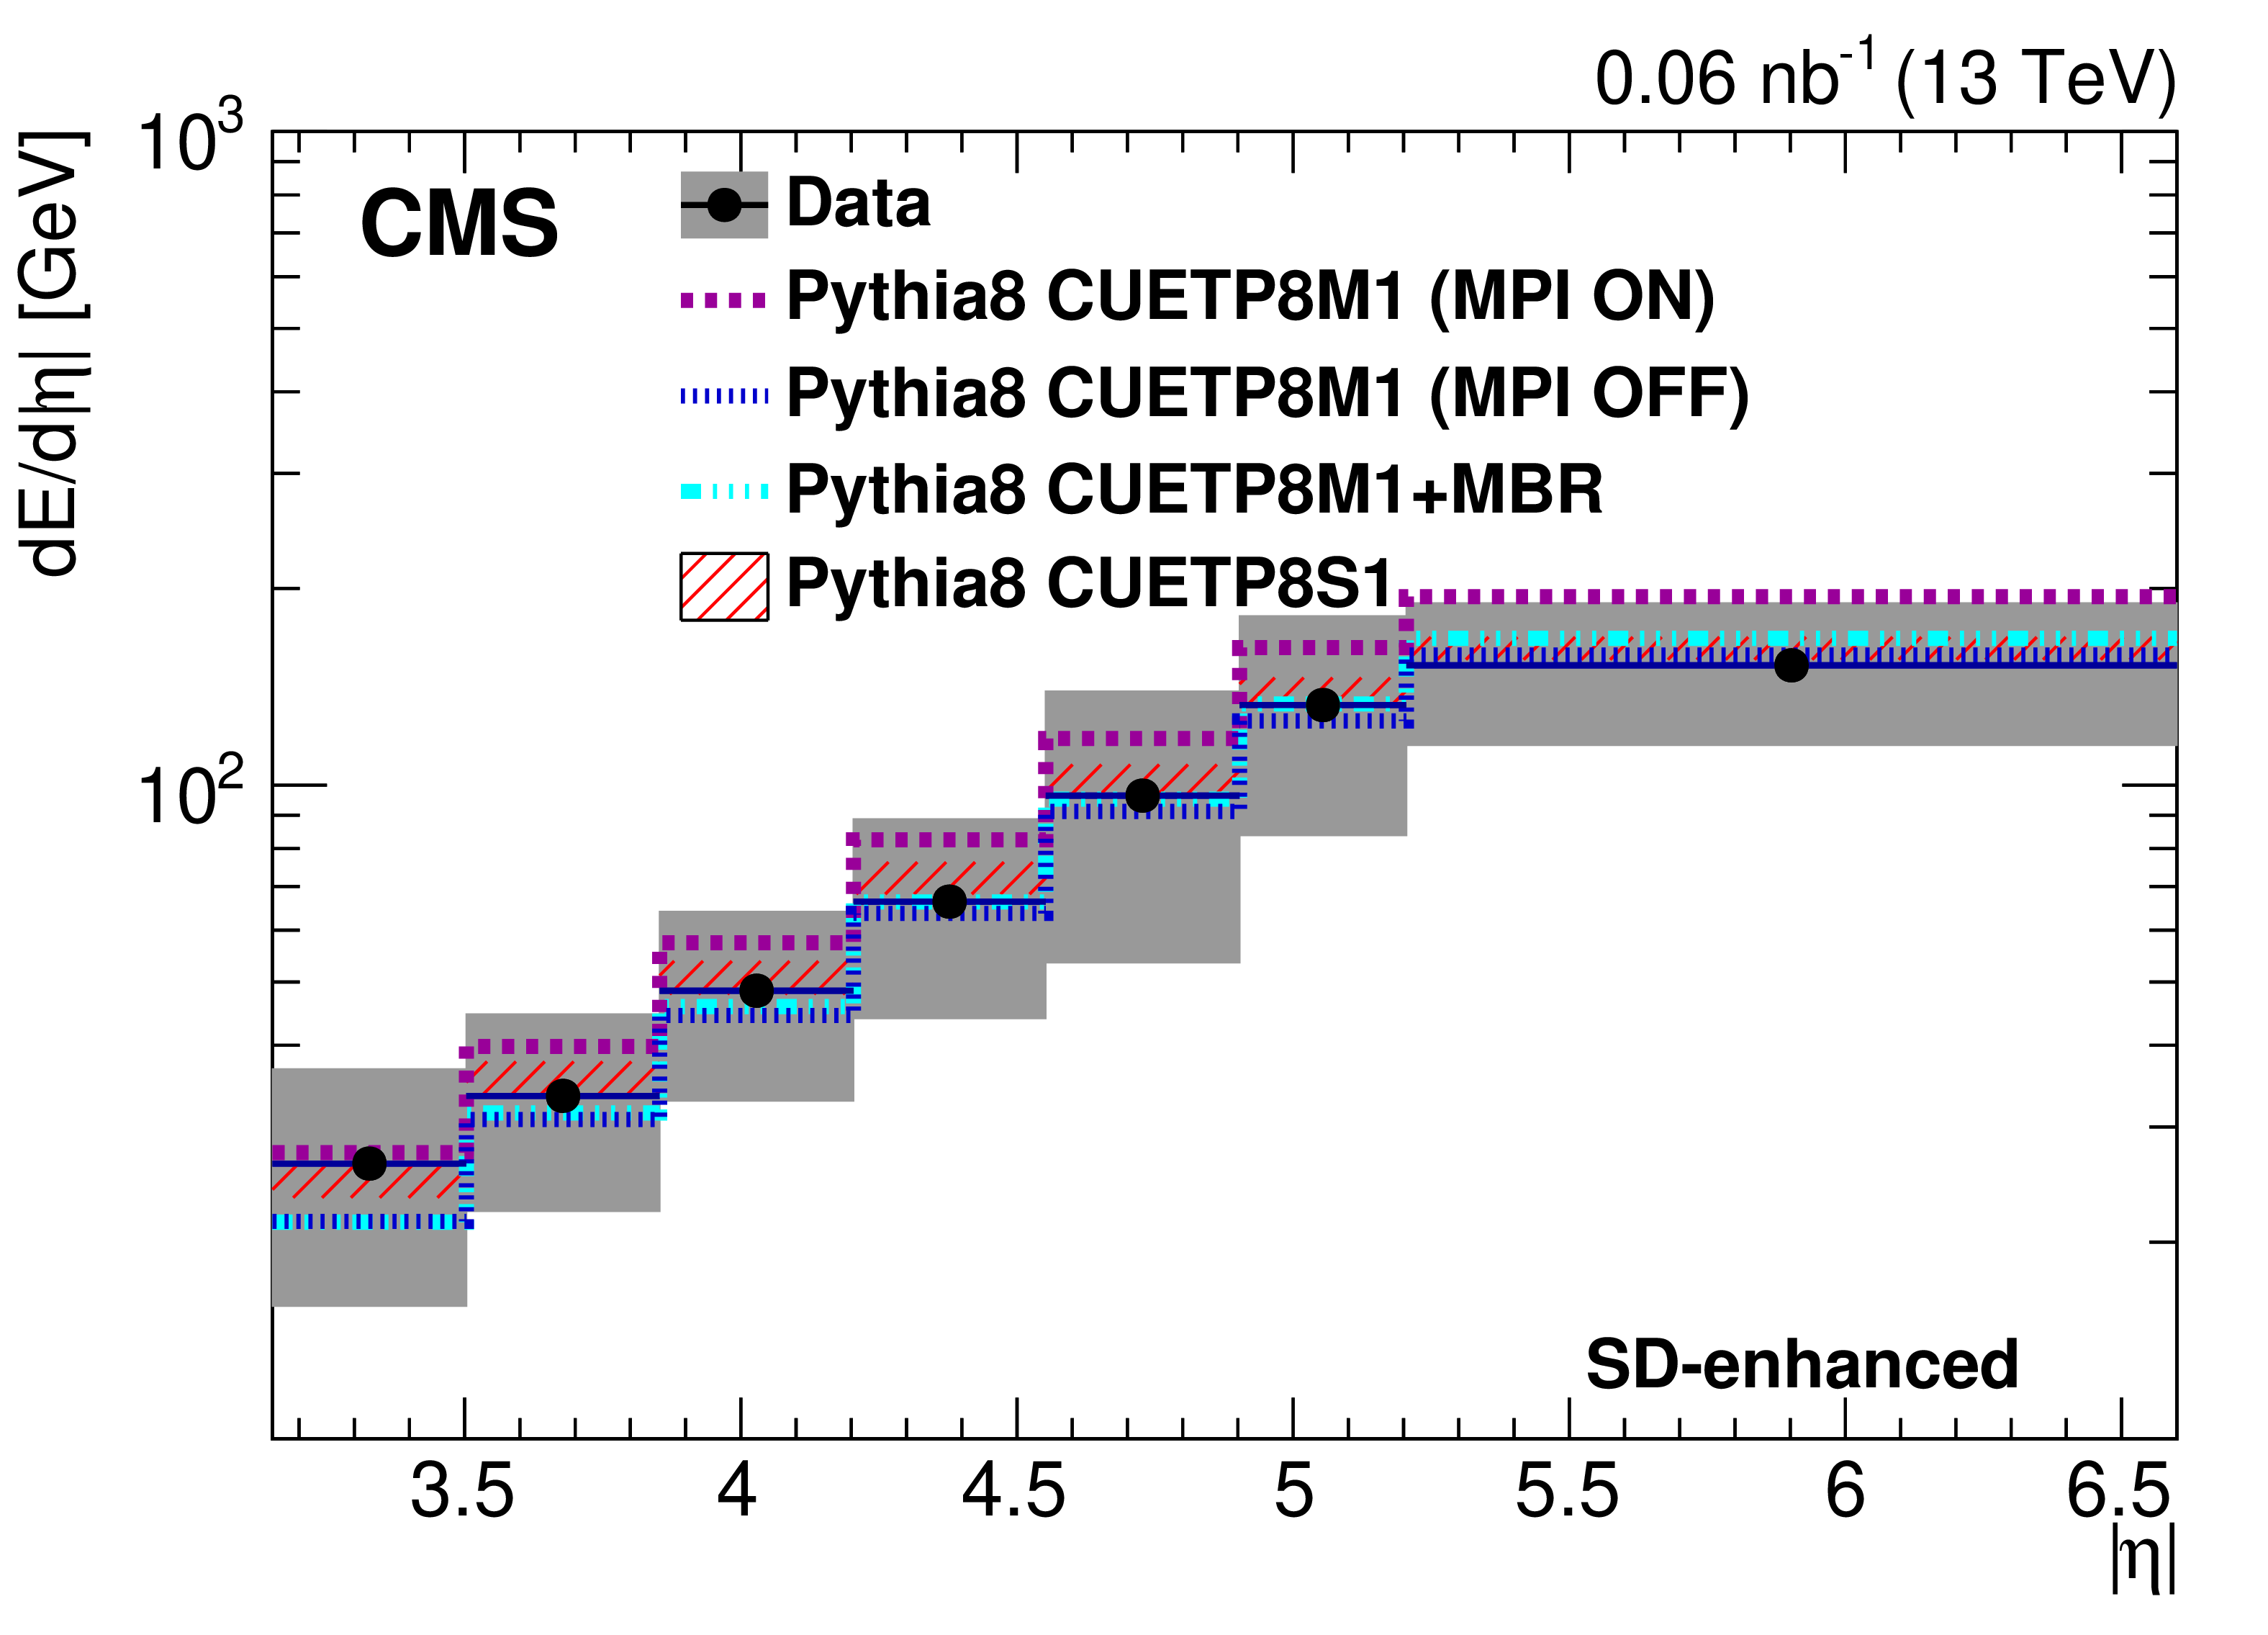
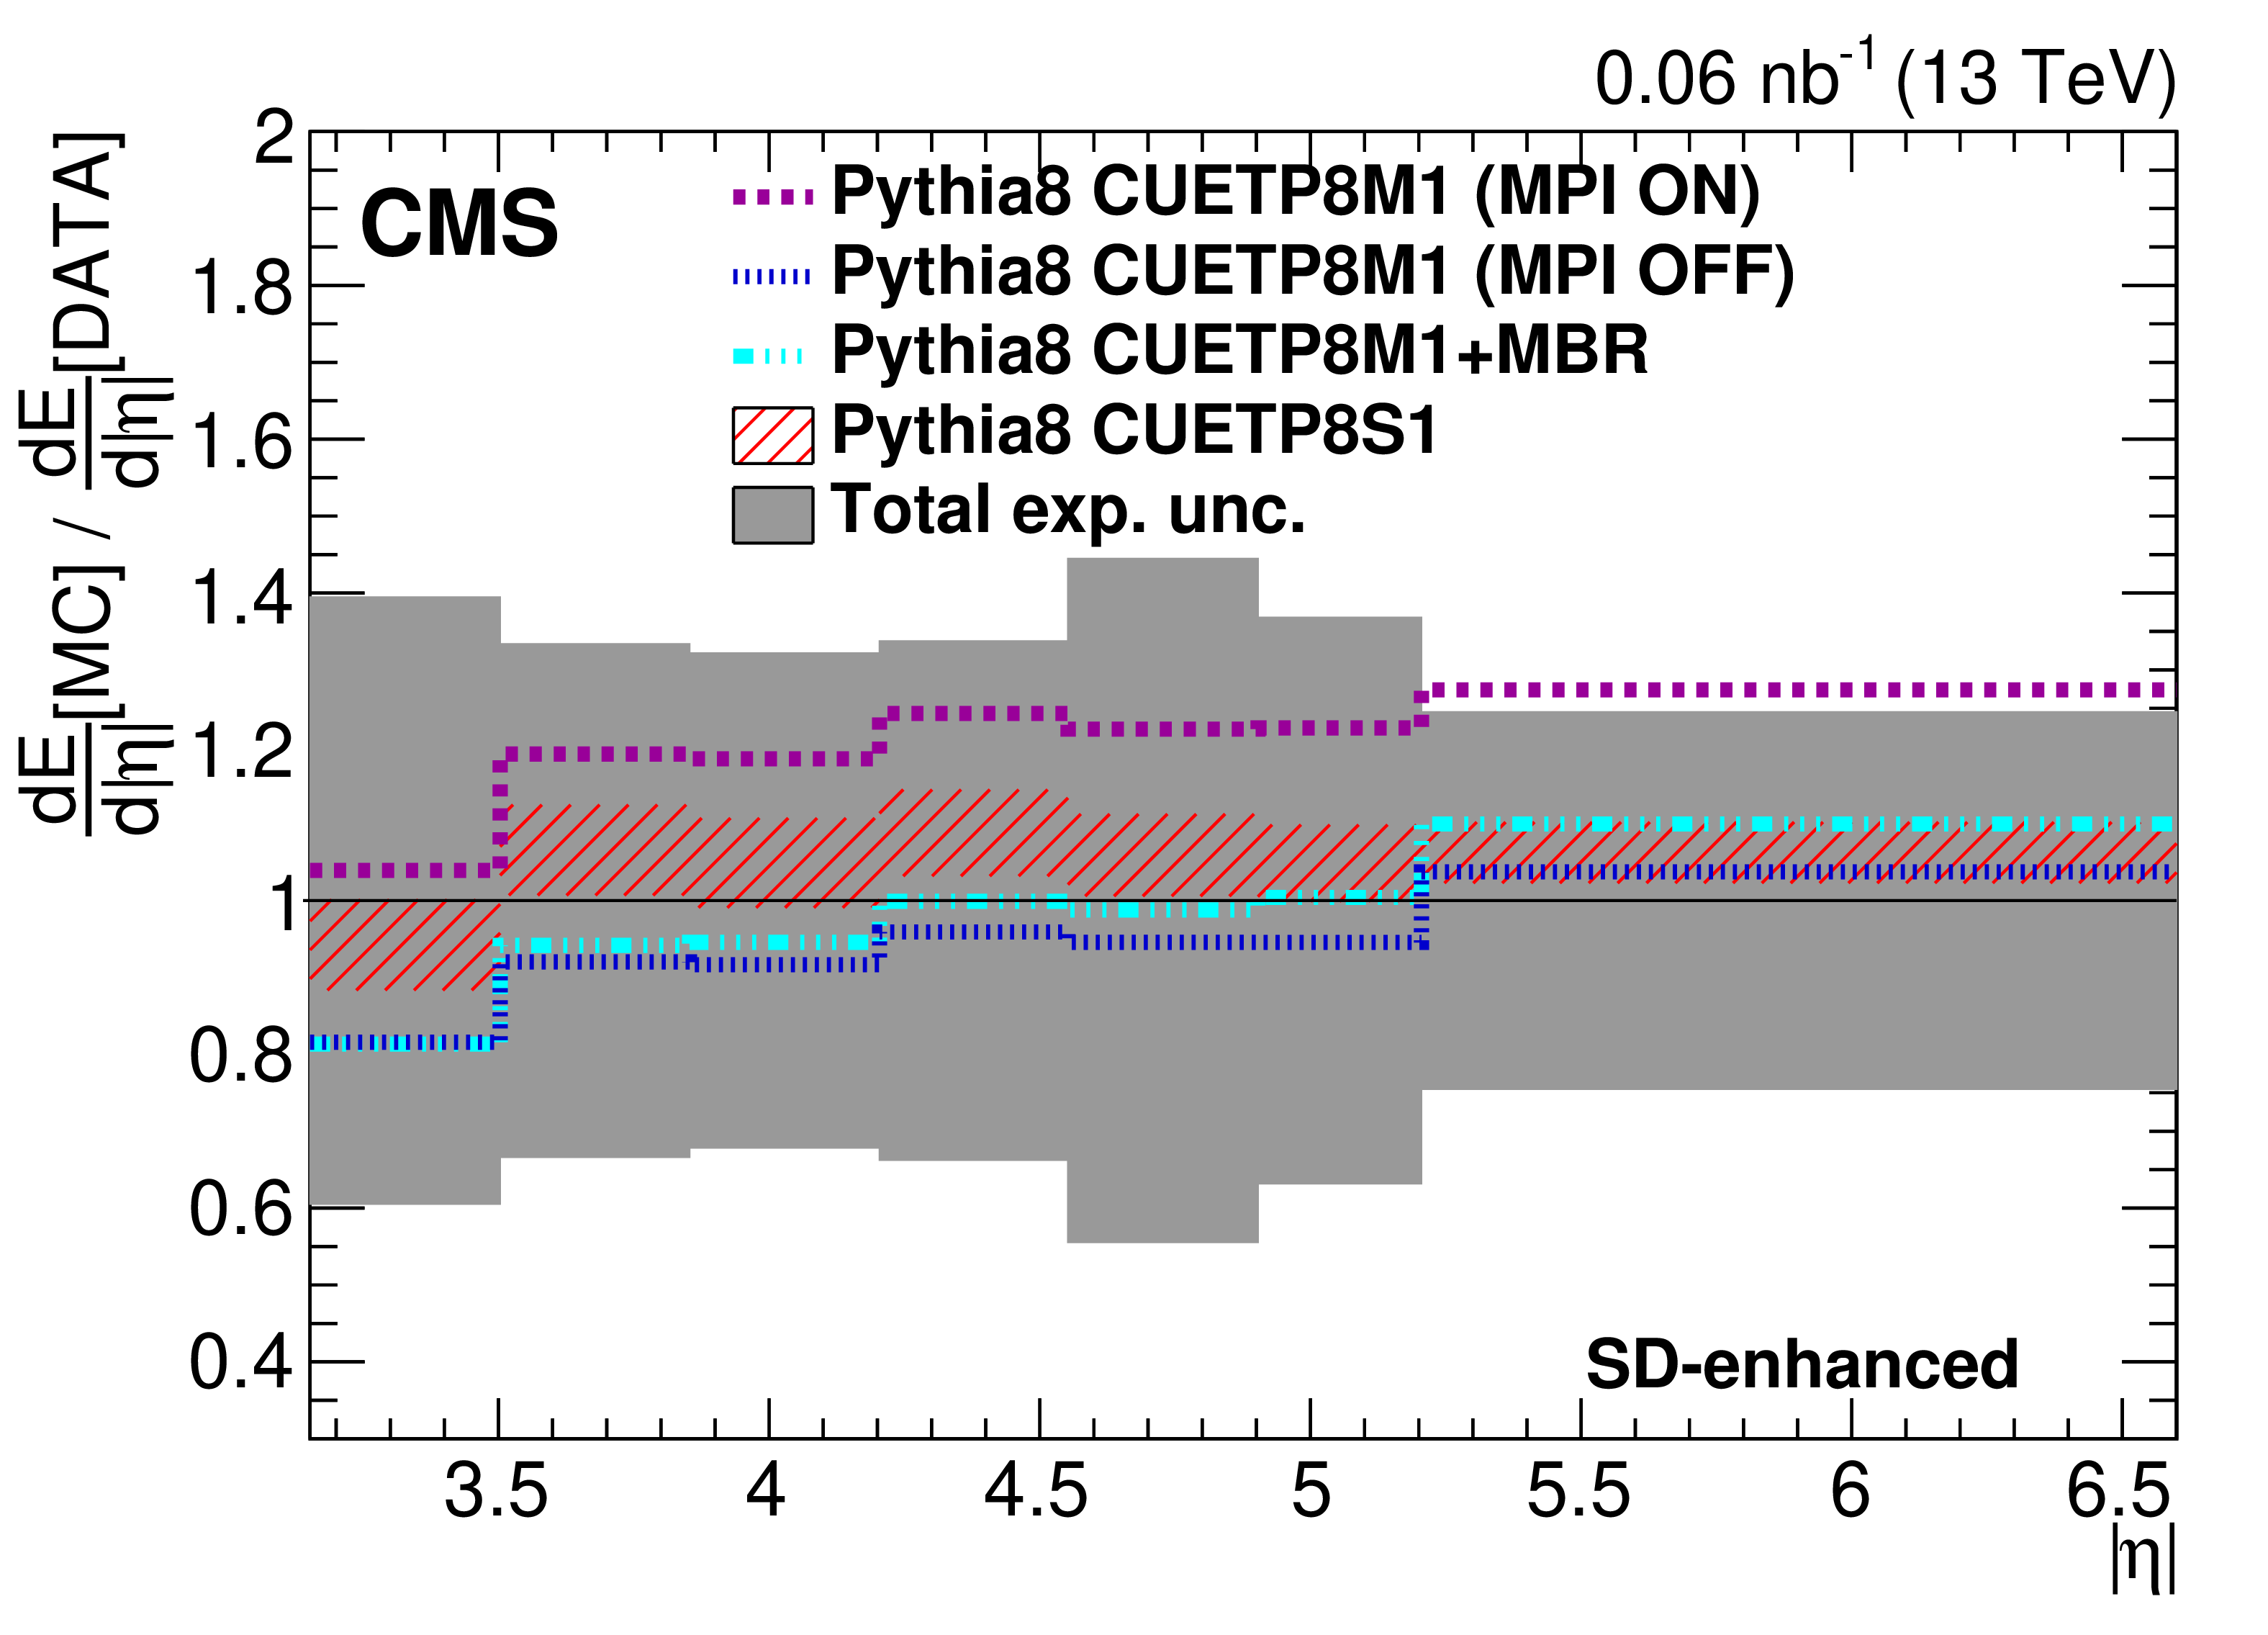
Energy density at the stable-particle level for the INEL (upper row), NSD-enhanced (middle row), and SD-enhanced (lower row) event selections categories compared to predictions from PYTHIA 8 with the tunes CUETP8M1, CUETP8M1+MBR, and CUETP8S1. The gray band shows the total systematic uncertainty. The band around PYTHIA 8 CUETP8S1 corresponds to the uncertainties of the tune parameters. The right panels show the ratio of model predictions to measured data. |
png pdf |
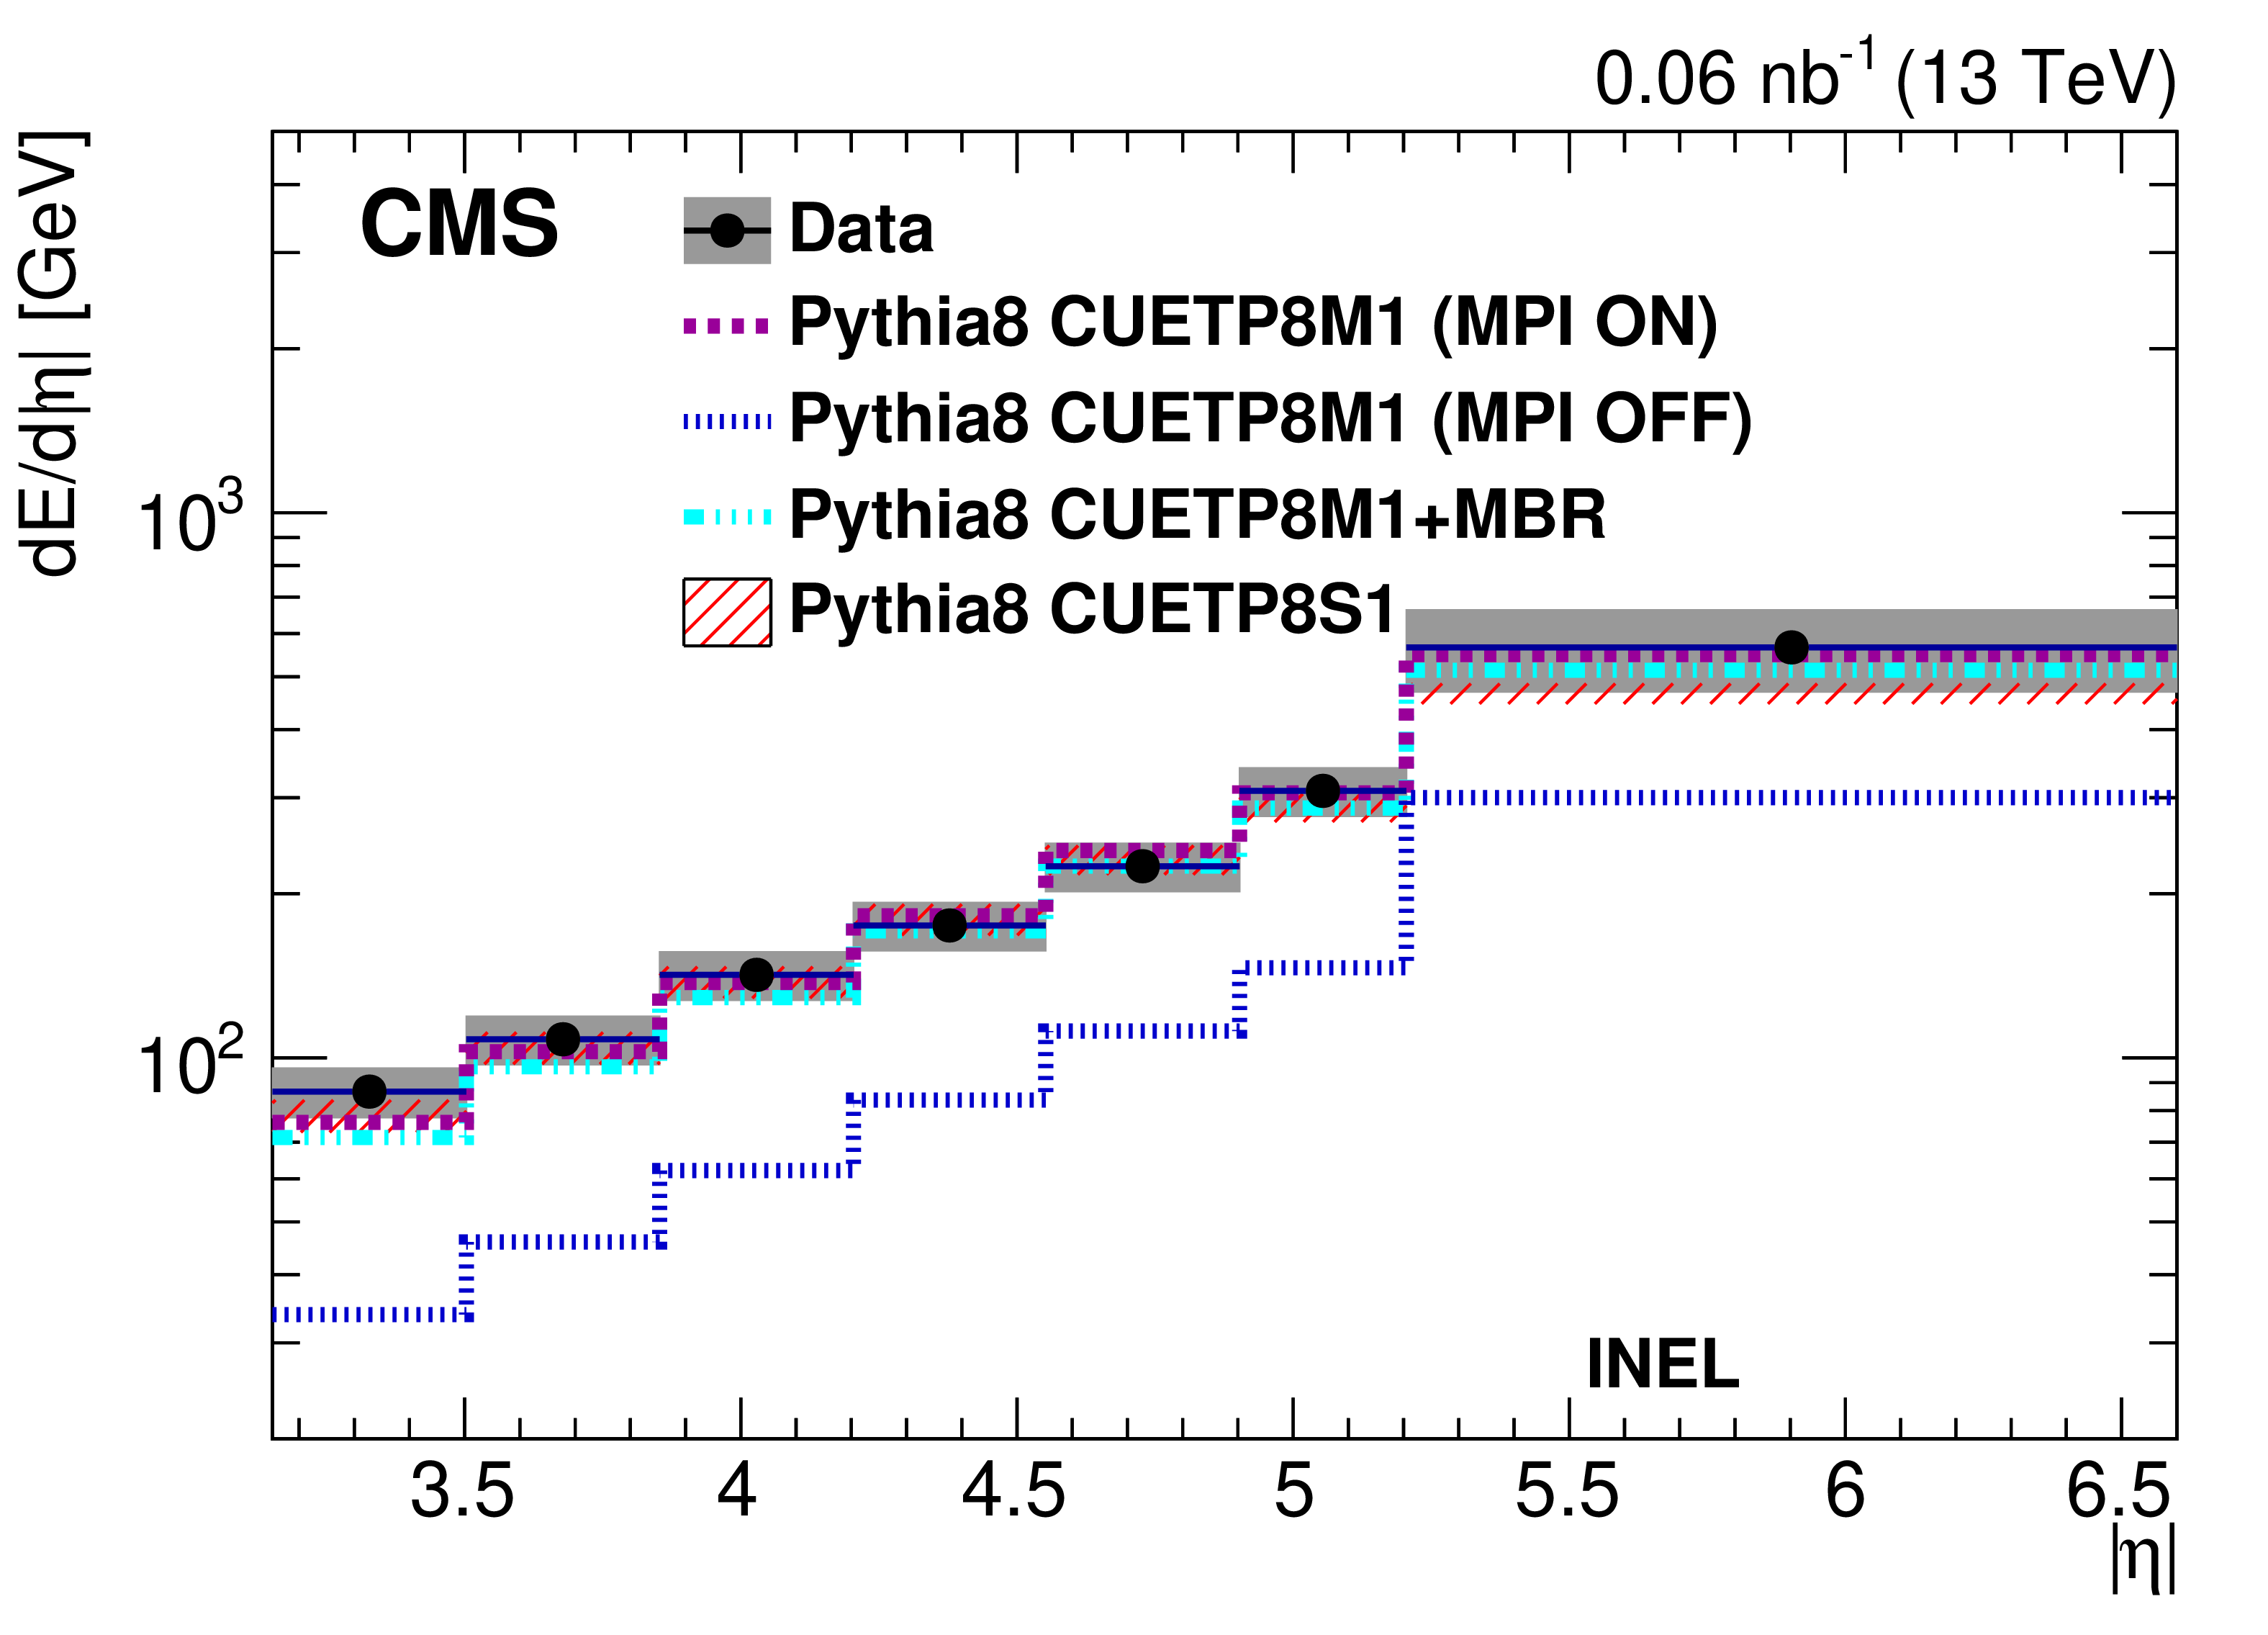
Figure 3-a:
Energy density at the stable-particle level for the INEL event selection category compared to predictions from PYTHIA 8 with the tunes CUETP8M1, CUETP8M1+MBR, and CUETP8S1. The gray band shows the total systematic uncertainty. The band around PYTHIA 8 CUETP8S1 corresponds to the uncertainties of the tune parameters. |
png pdf |
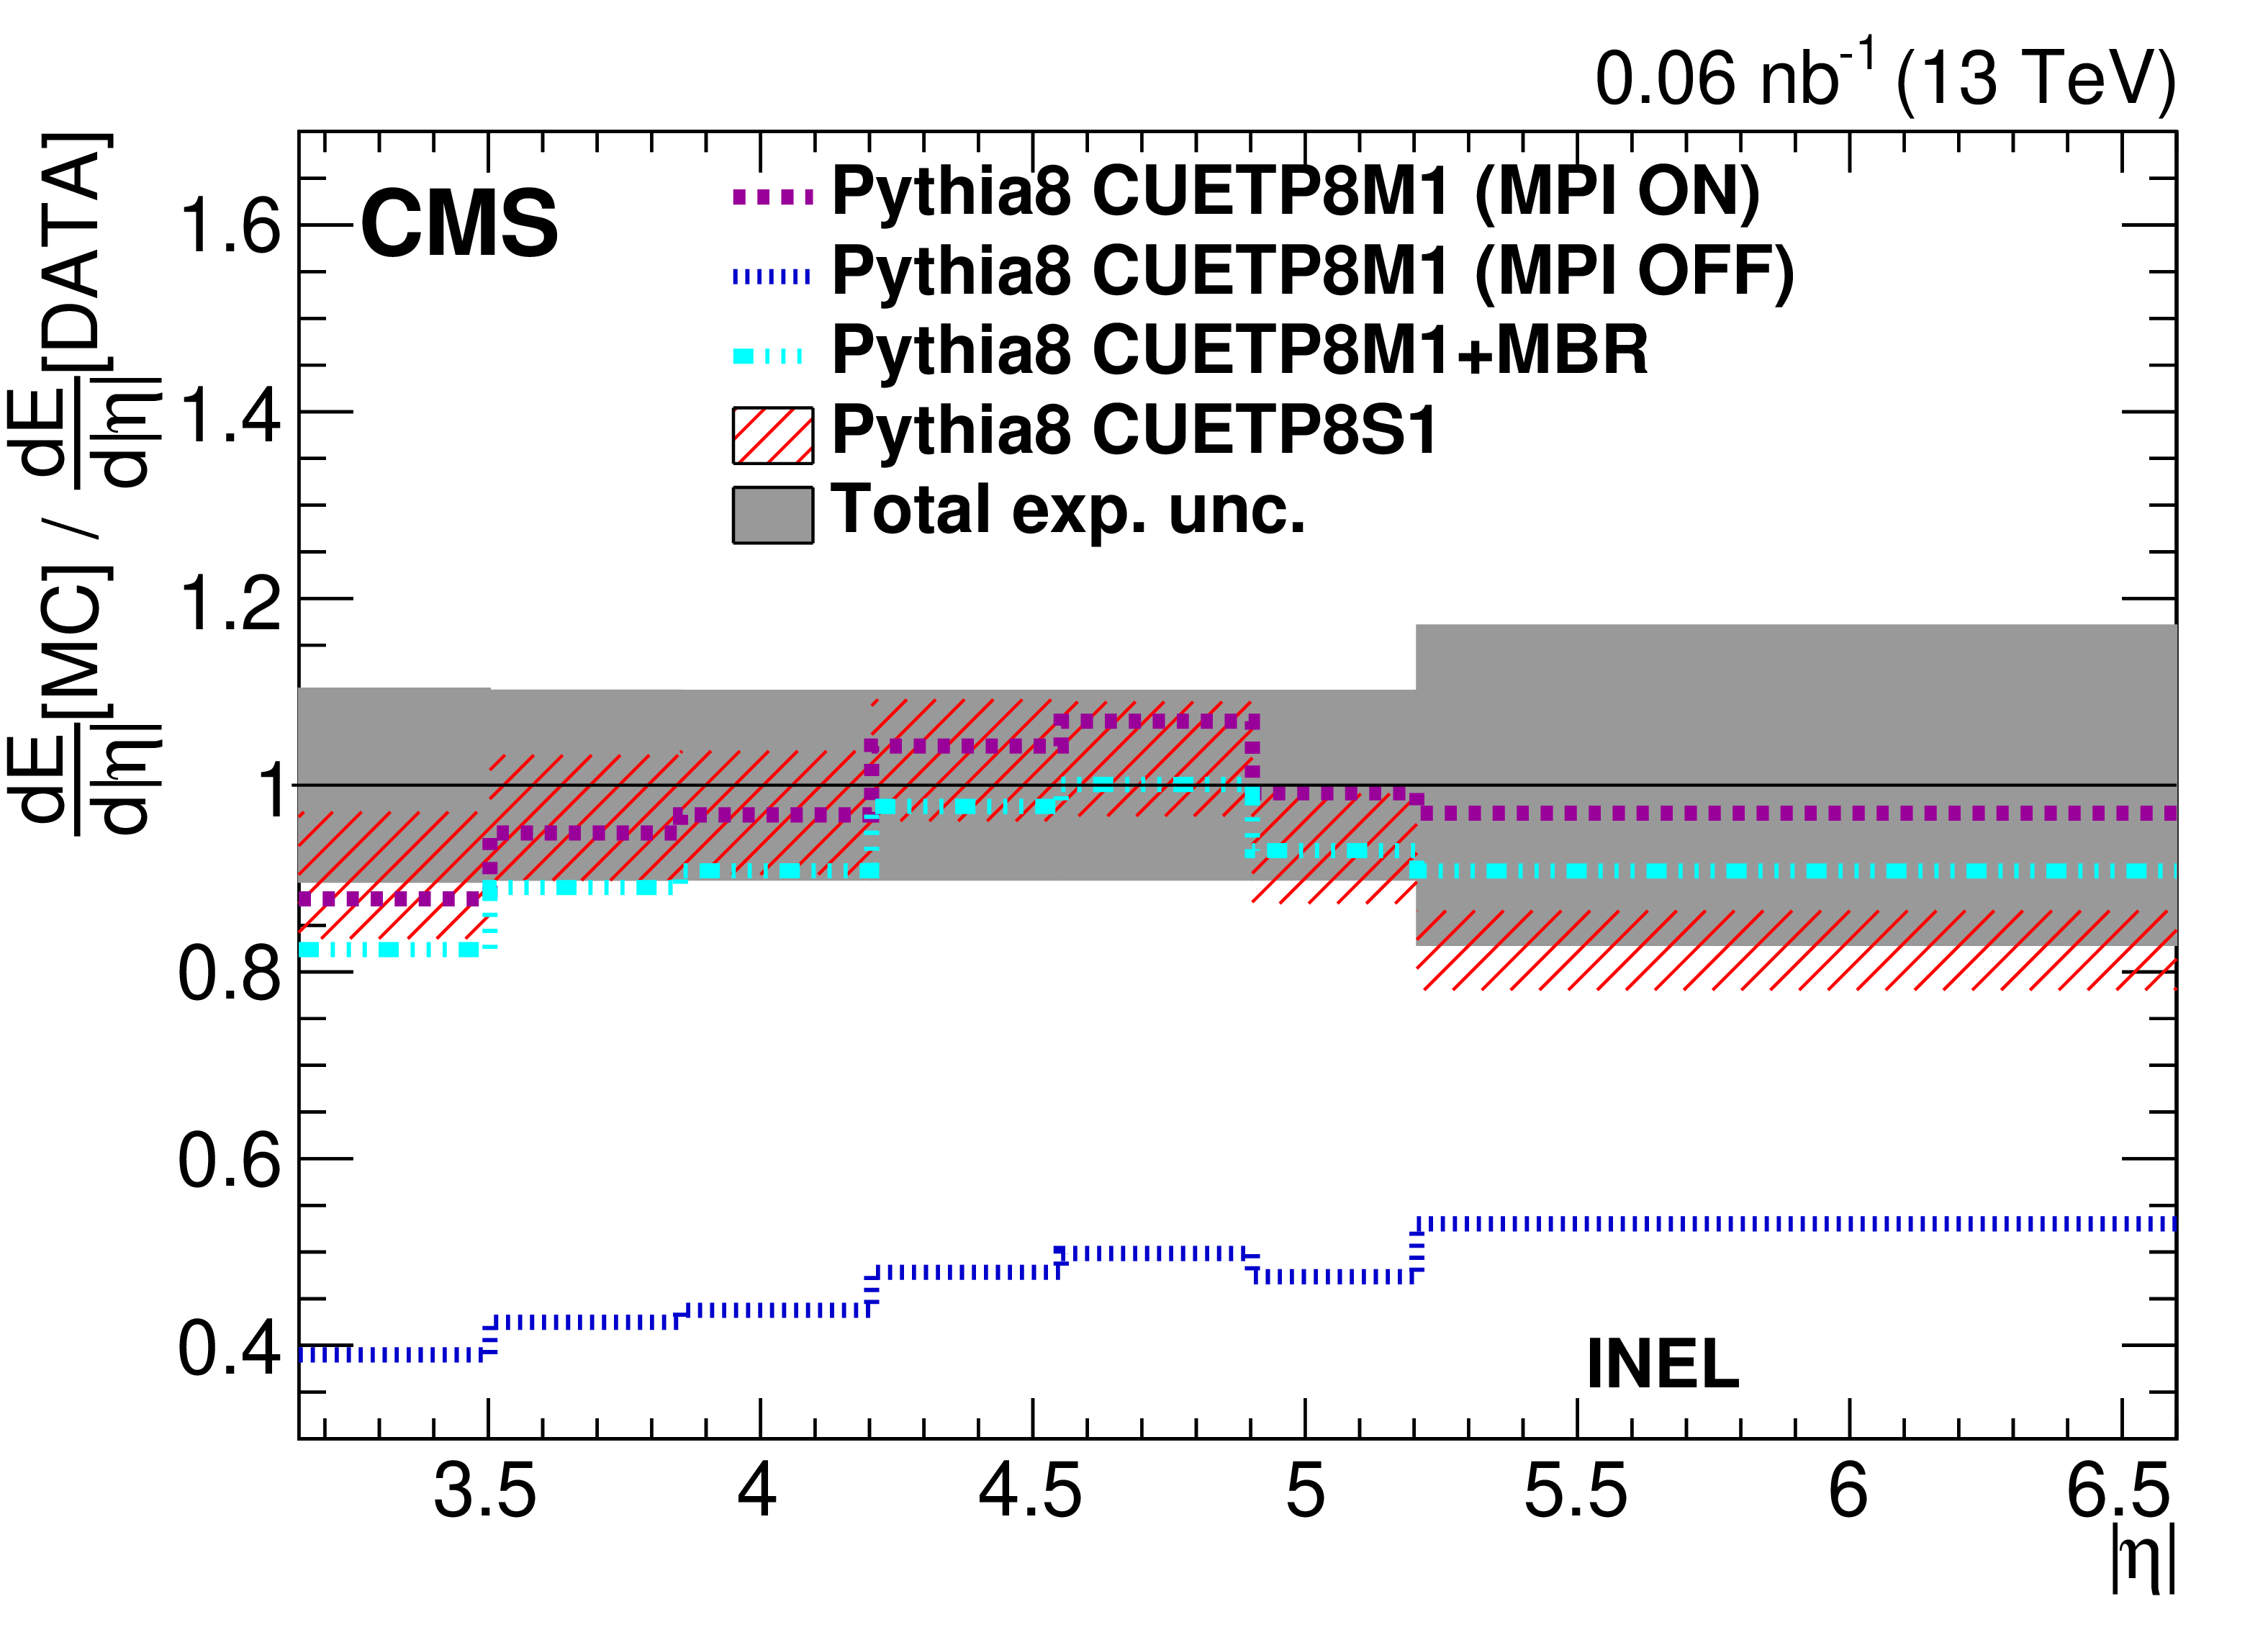
Figure 3-b:
Energy density at the stable-particle level for the INEL event selection category compared to predictions from PYTHIA 8 with the tunes CUETP8M1, CUETP8M1+MBR, and CUETP8S1. The gray band shows the total systematic uncertainty. The band around PYTHIA 8 CUETP8S1 corresponds to the uncertainties of the tune parameters. The panel shows the ratio of model predictions to measured data. |
png pdf |
Figure 3-c:
Energy density at the stable-particle level for the NSD-enhanced event selection category compared to predictions from PYTHIA 8 with the tunes CUETP8M1, CUETP8M1+MBR, and CUETP8S1. The gray band shows the total systematic uncertainty. The band around PYTHIA 8 CUETP8S1 corresponds to the uncertainties of the tune parameters. |

png pdf |
Figure 3-d:
Energy density at the stable-particle level for the NSD-enhanced event selection category compared to predictions from PYTHIA 8 with the tunes CUETP8M1, CUETP8M1+MBR, and CUETP8S1. The gray band shows the total systematic uncertainty. The band around PYTHIA 8 CUETP8S1 corresponds to the uncertainties of the tune parameters. The panel shows the ratio of model predictions to measured data. |
png pdf |
Figure 3-e:
Energy density at the stable-particle level for the SD-enhanced event selection category compared to predictions from PYTHIA 8 with the tunes CUETP8M1, CUETP8M1+MBR, and CUETP8S1. The gray band shows the total systematic uncertainty. The band around PYTHIA 8 CUETP8S1 corresponds to the uncertainties of the tune parameters. |
png pdf |
Figure 3-f:
Energy density at the stable-particle level for the SD-enhanced event selection category compared to predictions from PYTHIA 8 with the tunes CUETP8M1, CUETP8M1+MBR, and CUETP8S1. The gray band shows the total systematic uncertainty. The band around PYTHIA 8 CUETP8S1 corresponds to the uncertainties of the tune parameters. The panel shows the ratio of model predictions to measured data. |

png pdf |
Figure 4:
A comparison of the measurements of the transverse energy density, $ {{\mathrm {d}} E_{\mathrm {T}}}/ {{\mathrm {d}}\eta '}$, at $\sqrt {s} = $ 13 TeV, as a function of shifted pseudorapidity, $\eta '=\eta - y_{\mathrm {beam}}$, to the predictions and to earlier proton-proton data [6] for NSD-enhanced events at several different centre-of-mass energies. The error bars indicate the total systematic uncertainties. The beam rapidities $ y_{\mathrm {beam}}$ are about 9.5, 8.9, and 6.8 at $\sqrt {s} $ of 13, 7 and 0.9 TeV, respectively. |
| Tables | |
png pdf |
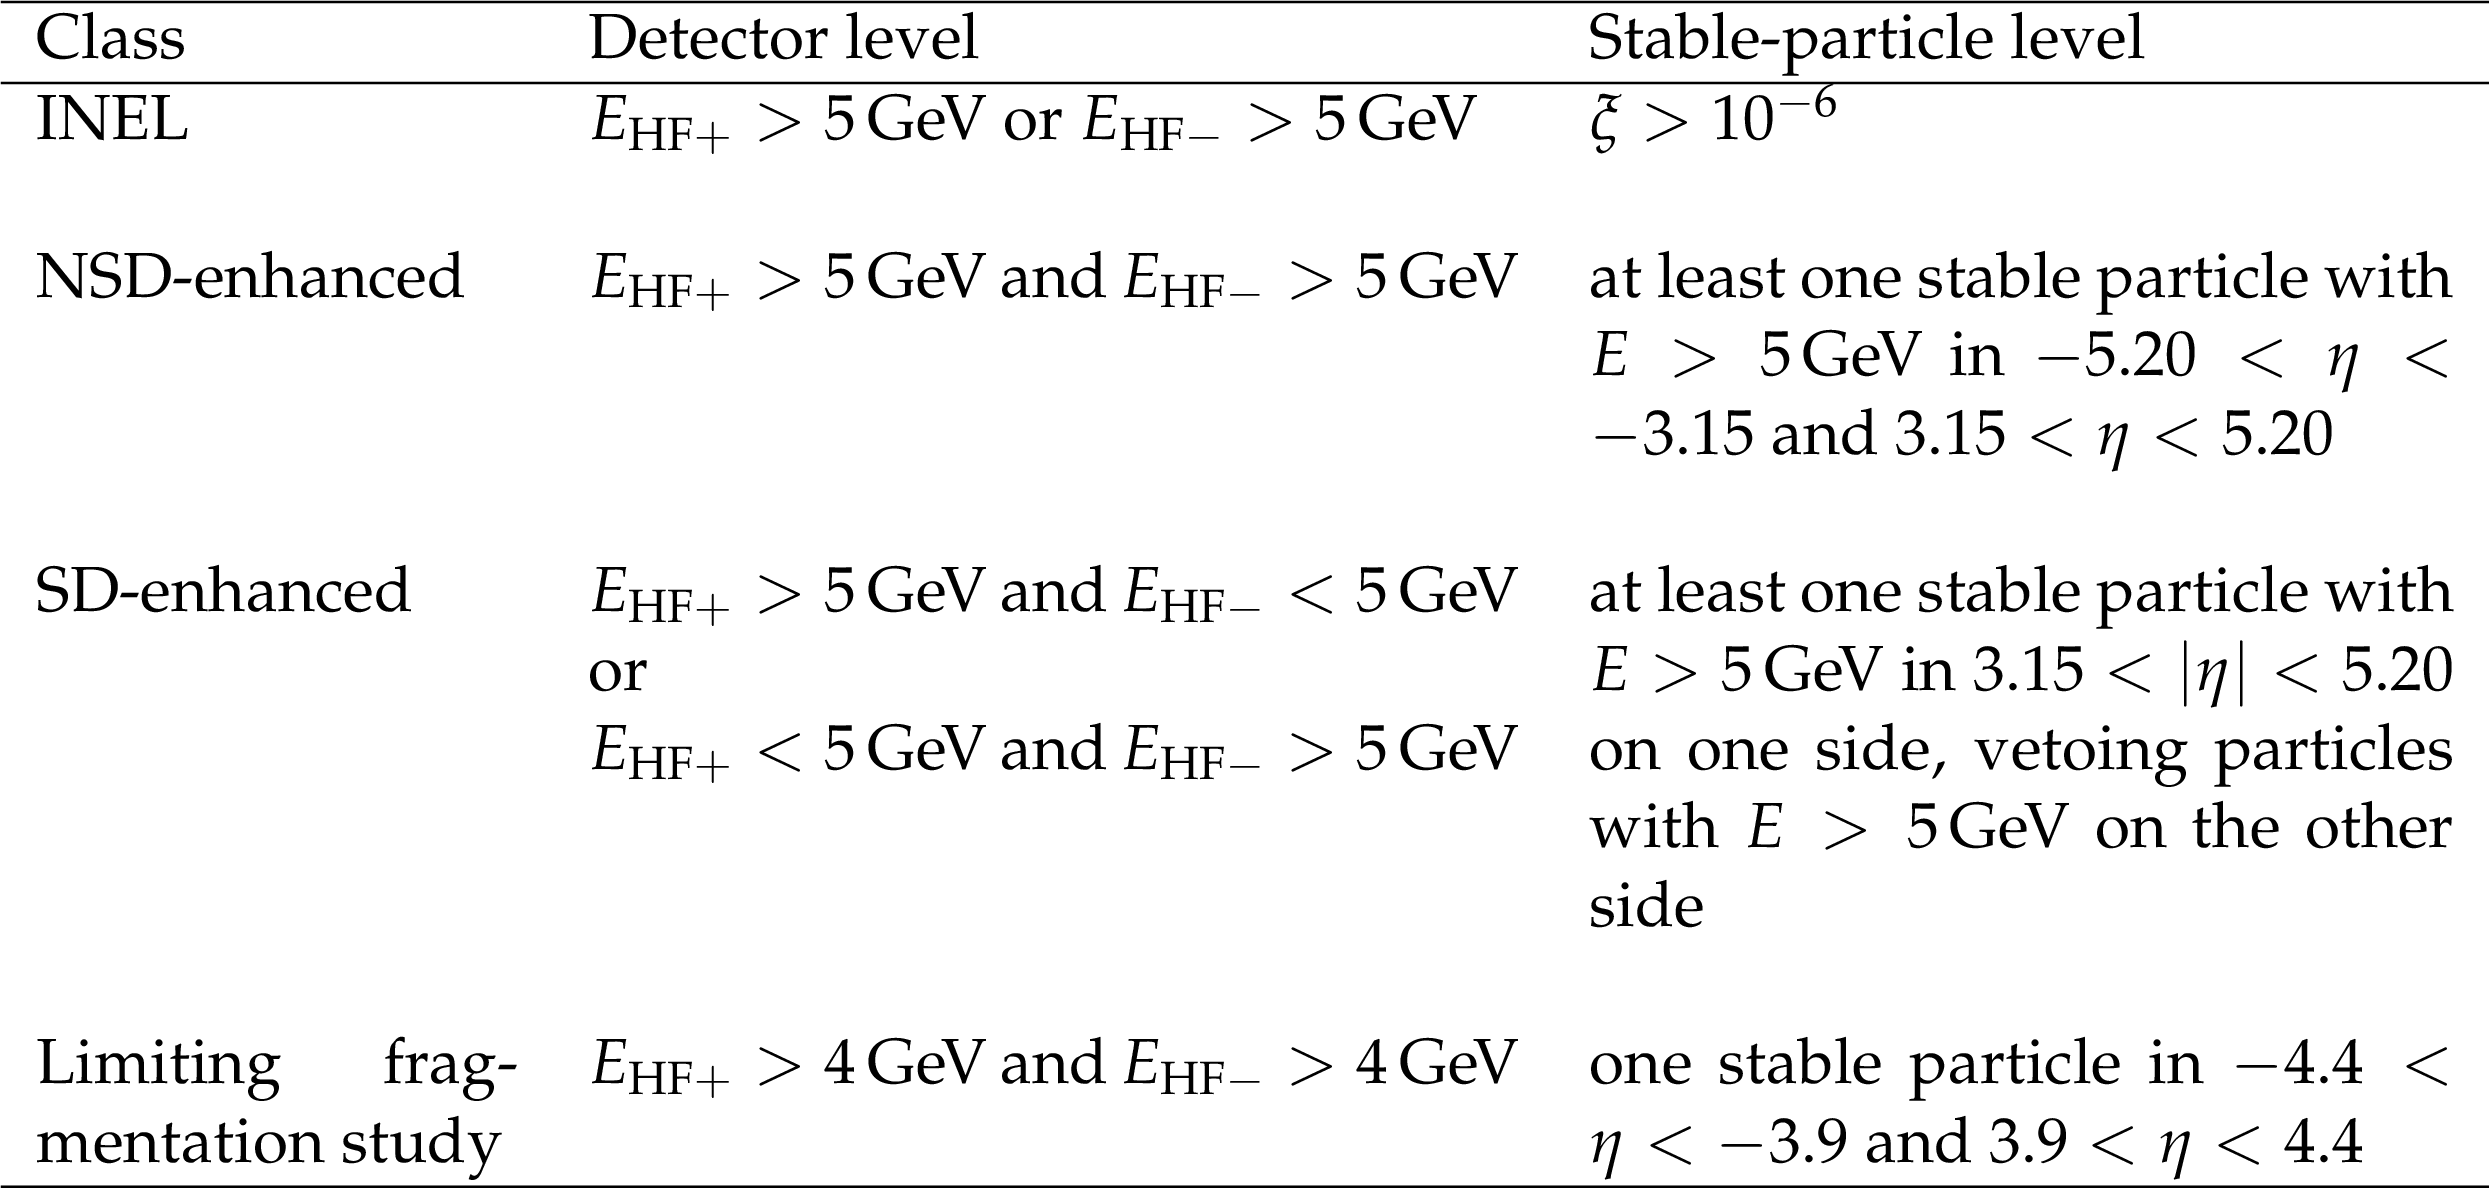
Table 1:
Summary of the event selections used for the different event categories in data at the detector level and in simulations at the stable-particle level. |
png pdf |
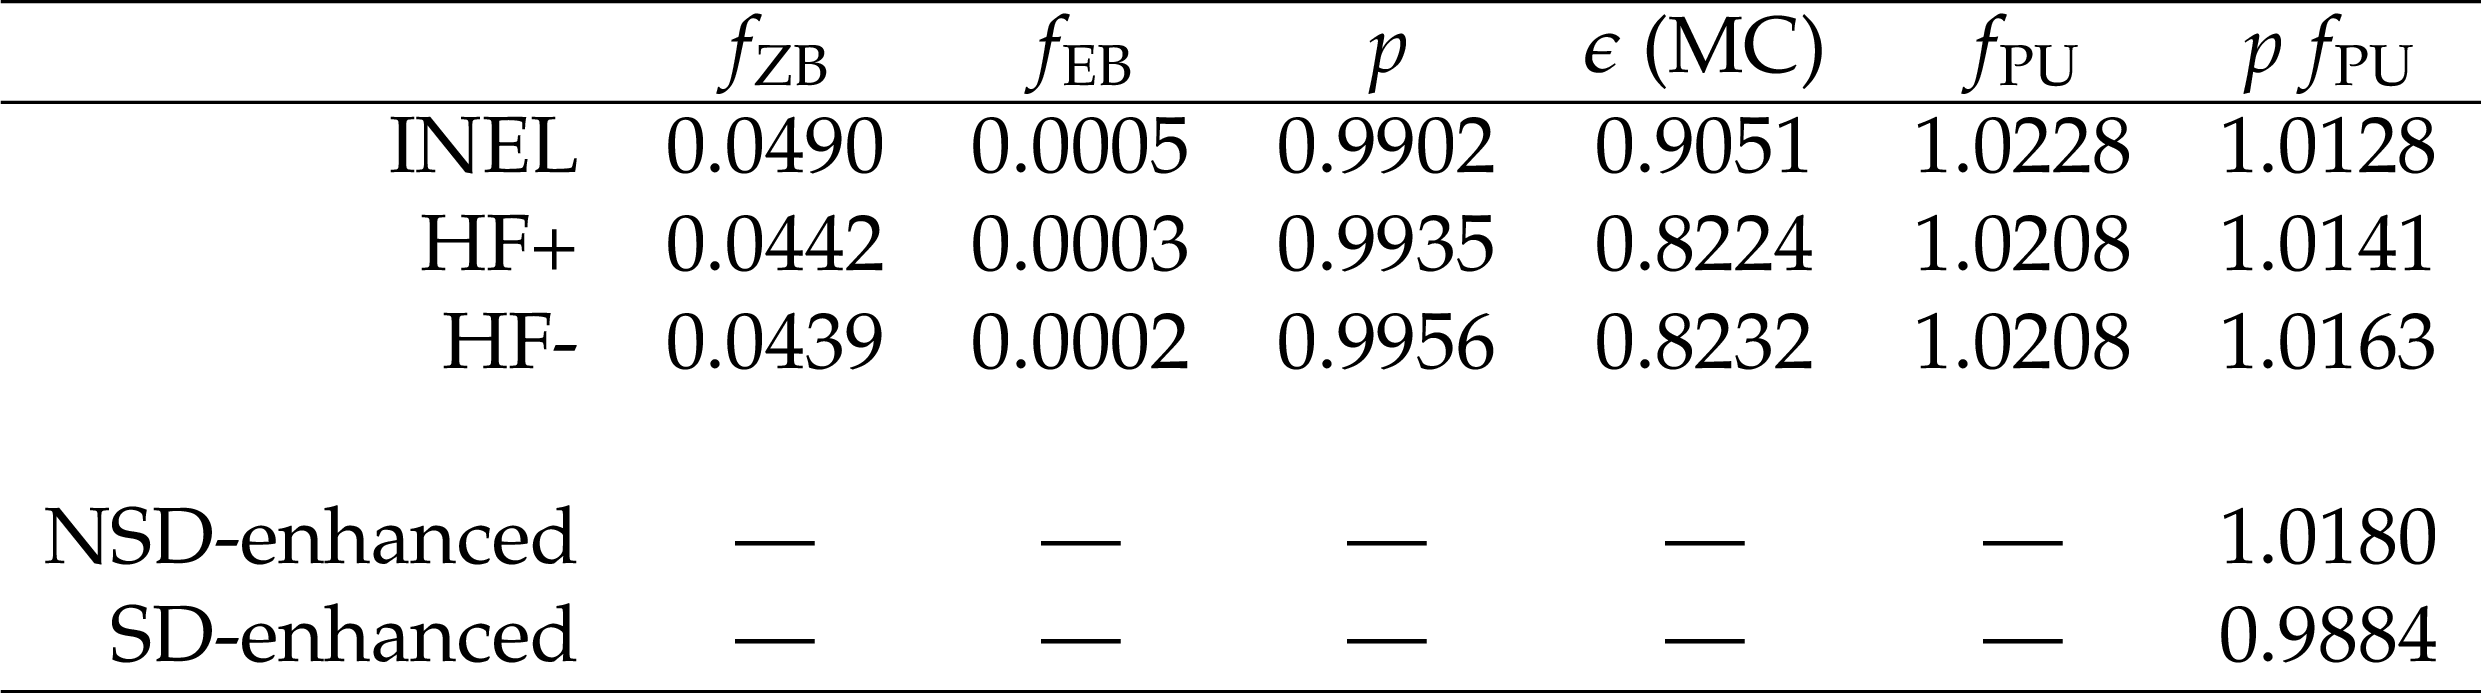
Table 2:
Selection factors and purities for various event categories. The last two rows are derived using the formulae in the text. The event selection probability $\epsilon $ is determined from simulations, and the value quoted here is the average value from all event generators, with a maximal model dependence of 2%. The rightmost column quantifies the combined correction due to noise and pileup. All statistical uncertainties are negligible. |
png pdf |
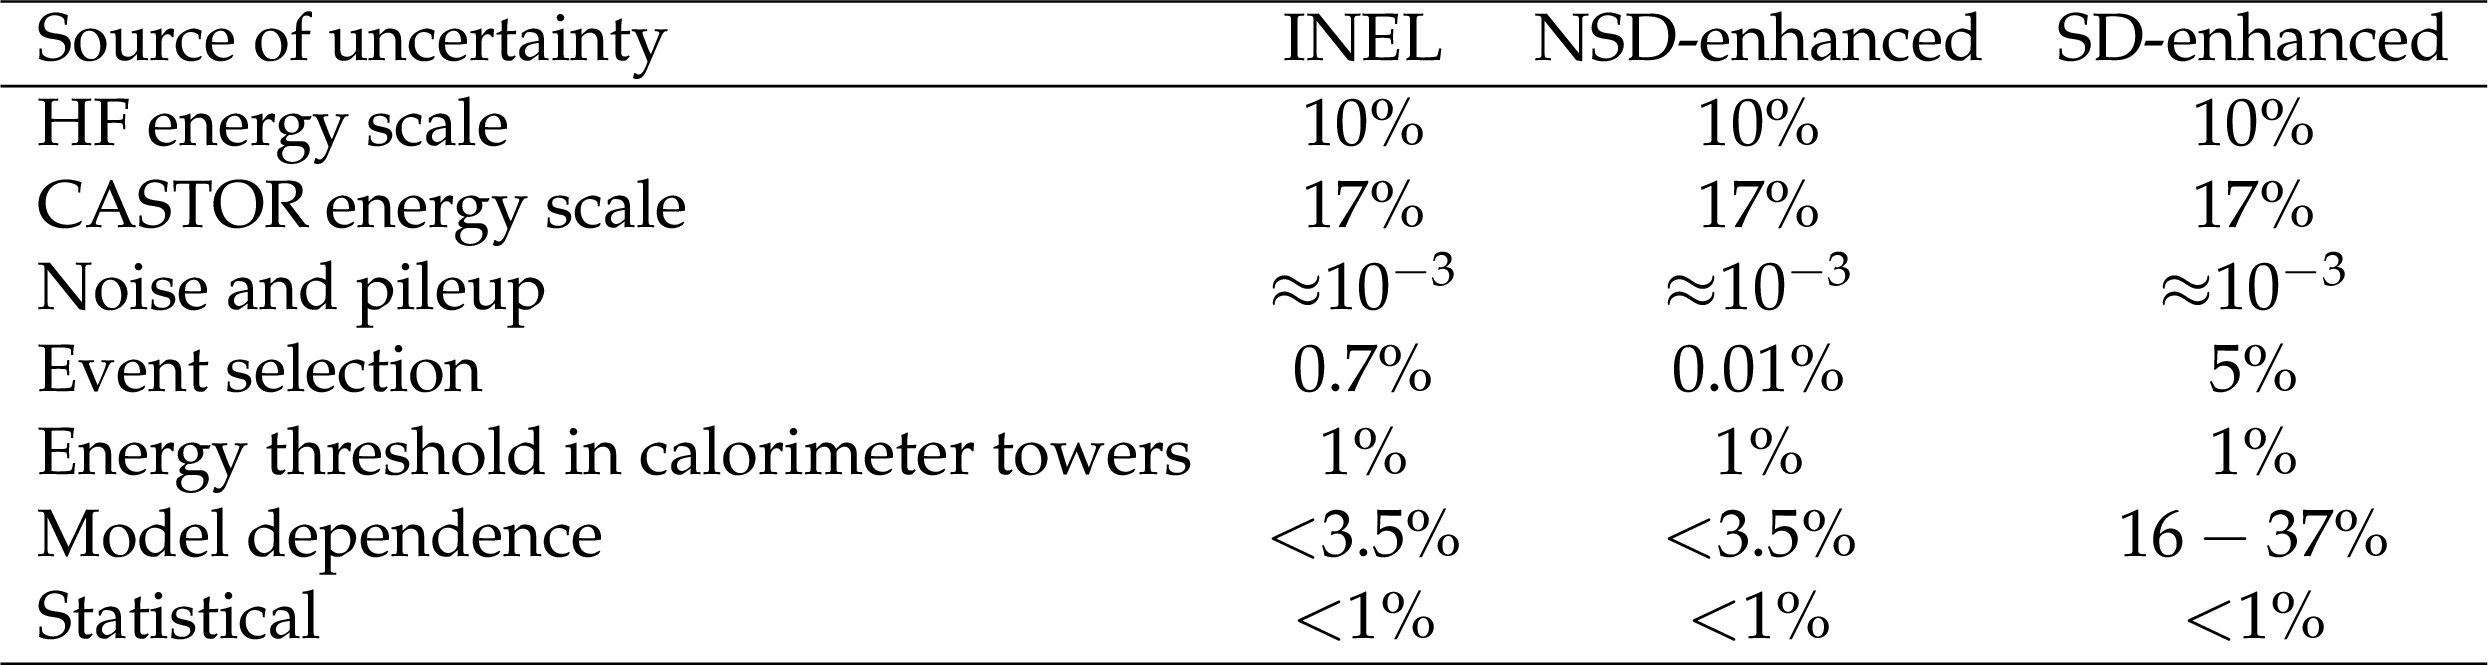
Table 3:
The uncertainties in the energy density measurement for the three event categories. The results depend slightly on the pseudorapidity. |
| Summary |
|
The energy density, $\mathrm{d} E / \mathrm{d} \eta$, is measured in the pseudorapidity range $-6.6 < \eta < -5.2$ and 3.15 $ < | {\eta} | < $ 5.20. Special low-luminosity data recorded by the CMS experiment during proton-proton collisions at the centre-of-mass energy $\sqrt{s} = $ 13 TeV are analysed for this purpose. The data are presented at the stable-particle level to allow a straightforward comparison to any theory prediction or model simulation. The measurements are compared to models tuned to describe high-energy hadronic interactions (PYTHIA{8}) and to the predictions of models used in cosmic ray physics (EPOS, QGSJET) for inclusive inelastic (INEL), NSD (NSD-enhanced), and SD (SD-enhanced) event selections. It is shown that the INEL and NSD-enhanced data are extremely sensitive to multi-parton interactions, while the SD-enhanced are essentially unaffected. The shape of the measured $\eta$ dependencies suggest a difference in the models compared to the data. However, the predictions of PYTHIA{8} tune cuetp8s1 are in satisfactory agreement with all measurements when the experimental and tune uncertainties are combined. The EPOS and QGSJET models exhibit the largest differences when compared to the SD results. At high energies, the hypothesis of limiting fragmentation [9,10] assumes a longitudinal scaling behaviour in terms of shifted pseudorapidity $\eta'=\eta-y_{\text{beam}}$ (where $y_{\text{beam}}$ is the beam rapidity) and thus soft-particle production in the projectile fragmentation region, $\eta' \approx 0$, is predicted to be independent of the centre-of-mass energy. This is studied by measuring the transverse energy density $\mathrm{d} E_{\mathrm{T}} / \mathrm{d} \eta$, with $E_{\mathrm{T}}=E \cosh(\eta)$, and comparing it to measurements performed in proton-proton collisions at different centre-of-mass energies. The predictions of the EPOS and QGSJET models nicely describe the combined data in the forward pseudorapidity range close to the projectile fragmentation region. The result supports the mechanism of limiting fragmentation. Since this predicts the independence of very forward particle production on the energy of the projectile particle, these data are very important for the modelling of ultra-high energy interactions that typically occur in cosmic ray collisions. |
| References | ||||
| 1 | T. Sjostrand and M. van Zijl | Multiple parton-parton interactions in an impact parameter picture | PLB 188 (1987) 149 | |
| 2 | T. Sjostrand and M. van Zijl | A multiple-interaction model for the event structure in hadron collisions | PRD 36 (1987) 2019 | |
| 3 | I. Borozan and M. H. Seymour | An eikonal model for multiparticle production in hadron-hadron interactions | JHEP 09 (2002) 015 | hep-ph/0207283 |
| 4 | T. Sjostrand and P. Z. Skands | Multiple interactions and the structure of beam remnants | JHEP 03 (2004) 053 | hep-ph/0402078 |
| 5 | CMS Collaboration | First measurement of the underlying event activity at the LHC with $ \sqrt{s} = $ 0.9 TeV | EPJC 70 (2010) 555 | CMS-QCD-10-001 1006.2083 |
| 6 | CMS Collaboration | Measurement of energy flow at large pseudorapidities in pp collisions at $ \sqrt{s} = $ 0.9 and 7 TeV | JHEP 11 (2011) 148 | CMS-FWD-10-011 1110.0211 |
| 7 | ATLAS Collaboration | Measurements of the pseudorapidity dependence of the total transverse energy in proton-proton collisions at $ \sqrt{s}= $ 7 TeV with ATLAS | JHEP 11 (2012) 033 | 1208.6256 |
| 8 | LHCb Collaboration | Measurement of the forward energy flow in pp collisions at $ \sqrt{s}= $ 7 TeV | EPJC 73 (2013) 2421 | 1212.4755 |
| 9 | J. Benecke, T. T. Chou, C.-N. Yang, and E. Yen | Hypothesis of limiting fragmentation in high-energy collisions | PR188 (1969) 2159 | |
| 10 | J. Ruan and W. Zhu | Particle multiplicities at energies available at the CERN Large Hadron Collider (LHC) and deviations from limiting fragmentation | PRC 81 (2010) 055210 | 1005.2790 |
| 11 | R. Ulrich, R. Engel, and M. Unger | Hadronic multiparticle production at ultra-high energies and extensive air showers | PRD 83 (2011) 054026 | 1010.4310 |
| 12 | D. d'Enterria et al. | Constraints from the first LHC data on hadronic event generators for ultra-high energy cosmic-ray physics | Astropart. Phys. 35 (2011) 98 | 1101.5596 |
| 13 | CMS Collaboration | The CMS experiment at the CERN LHC | JINST 3 (2008) S08004 | CMS-00-001 |
| 14 | T. Sjostrand et al. | An Introduction to PYTHIA 8.2 | CPC 191 (2015) 159 | 1410.3012 |
| 15 | V. N. Gribov and L. N. Lipatov | Deep inelastic ep scattering in perturbation theory | Sov. J. NP 15 (1972) 438.[Yad.\ Fiz.\ 15 (1972) 781] | |
| 16 | V. N. Gribov and L. N. Lipatov | e$ ^+ $e$ ^- $ pair annihilation and deep inelastic ep scattering in perturbation theory | Sov. J. NP 15 (1972) 675.[Yad. Fiz. 15 (1972) 1218] | |
| 17 | L. N. Lipatov | The parton model and perturbation theory | Sov. J. NP 20 (1975) 94, .[Yad. Fiz. 20 (1974) 181] | |
| 18 | G. Altarelli and G. Parisi | Asymptotic freedom in parton language | NPB 126 (1977) 298 | |
| 19 | Y. L. Dokshitzer | Calculation of the structure functions for deep inelastic scattering and e$ ^+ $e$ ^- $ annihilation by perturbation theory in quantum chromodynamics. | Sov. Phys. JETP 46 (1977) 641.[Zh. Eksp. Teor. Fiz. 73 (1977) 1216] | |
| 20 | B. Andersson, G. Gustafson, G. Ingelman, and T. Sjostrand | Parton fragmentation and string dynamics | PR 97 (1983) 31 | |
| 21 | CMS Collaboration | Event generator tunes obtained from underlying event and multiparton scattering measurements | EPJC 76 (2016) 155 | CMS-GEN-14-001 1512.00815 |
| 22 | P. Skands, S. Carrazza, and J. Rojo | Tuning PYTHIA 8.1: the Monash 2013 Tune | EPJC 74 (2014) 3024 | 1404.5630 |
| 23 | R. Ciesielski and K. Goulianos | MBR Monte Carlo Simulation in PYTHIA8 | PoS ICHEP2012 (2013) 301 | 1205.1446 |
| 24 | R. Corke and T. Sjostrand | Interleaved parton showers and tuning prospects | JHEP 03 (2011) 032 | 1011.1759 |
| 25 | NNPDF Collaboration | Parton distributions with LHC data | NPB 867 (2013) 244 | 1207.1303 |
| 26 | J. Pumplin et al. | New generation of parton distributions with uncertainties from global QCD analysis | JHEP 07 (2002) 012 | hep-ph/0201195 |
| 27 | T. Pierog et al. | EPOS LHC: Test of collective hadronization with data measured at the CERN Large Hadron Collider | PRC 92 (2015) 034906 | 1306.0121 |
| 28 | S. Ostapchenko | Monte Carlo treatment of hadronic interactions in enhanced Pomeron scheme: I. QGSJET-II model | PRD 83 (2011) 014018 | 1010.1869 |
| 29 | H. J. Drescher et al. | Parton-Based Gribov-Regge Theory | PR 350 (2001) 93 | hep-ph/0007198 |
| 30 | GEANT4 Collaboration | GEANT4--a simulation toolkit | NIMA 506 (2003) 250 | |
| 31 | CMS Collaboration | The CMS trigger system | JINST 12 (2017) P01020 | CMS-TRG-12-001 1609.02366 |
| 32 | CMS Collaboration | Measurement of the inelastic proton-proton cross section at $ \sqrt{s}= $ 13 TeV | JHEP 07 (2018) 161 | CMS-FSQ-15-005 1802.02613 |
| 33 | V. Andreev et al. | Performance studies of a full-length prototype for the CASTOR forward calorimeter at the CMS experiment | EPJC 67 (2010) 601 | |
| 34 | CMS Collaboration | Studies of the nuclear stopping power in PbPb collisions at 2.76 TeV with CMS | NP A 904-905 (2013) 787c | |
|
|
Compact Muon Solenoid LHC, CERN |
|

|

|

|

|

|