

Compact Muon Solenoid
LHC, CERN
| CMS-PRF-18-003 ; CERN-EP-2019-266 | ||
| Measurements of dose-rate effects in the radiation damage of plastic scintillator tiles using silicon photomultipliers | ||
| CMS Collaboration | ||
| 18 January 2020 | ||
| JINST 15 (2020) P06009 | ||
| Abstract: Measurements are presented of the reduction of signal output due to radiation damage for plastic scintillator tiles used in the hadron endcap (HE) calorimeter of the CMS detector. The tiles were exposed to particles produced in proton-proton (pp) collisions at the CERN LHC with a center-of-mass energy of 13 TeV, corresponding to a delivered luminosity of 50 fb$^{-1}$. The measurements are based on readout channels of the HE that were instrumented with silicon photomultipliers, and are derived using data from several sources: a laser calibration system, a movable radioactive source, as well as hadrons and muons produced in pp collisions. Results from several irradiation campaigns using $^{60}\mathrm{Co}$ sources are also discussed. The damage is presented as a function of dose rate. Within the range of these measurements, for a fixed dose the damage increases with decreasing dose rate. | ||
| Links: e-print arXiv:2001.06553 [physics.ins-det] (PDF) ; CDS record ; inSPIRE record ; CADI line (restricted) ; | ||
| Figures | |
png pdf |
Figure 1:
Polystyrene. |
png pdf |
Figure 2:
Examples of changes to polystyrene undergoing irradiation. The change on the right can only occur in the presence of oxygen. |
png pdf |
Figure 3:
Details of an HE megatile showing the scintillator tiles, the WLS fibers, and the clear readout fibers. Also shown are the quartz fibers, which carry the laser light and the tubes through which the radioactive source moves. In layer 1, the inner size of the megatile is around 7.3 cm, while the outer size is 38.5 cm and the radial extent is 175 cm. The sizes (the longer base and the height) of enclosing trapezoids vary between 9.6 cm $\times$ 12.1 cm for the smallest ($ {i\eta} = $ 27), and 13.6 cm $\times$ 26.5 cm for the largest ($ {i\eta} = $ 21) tile used in this analysis. |
png pdf |
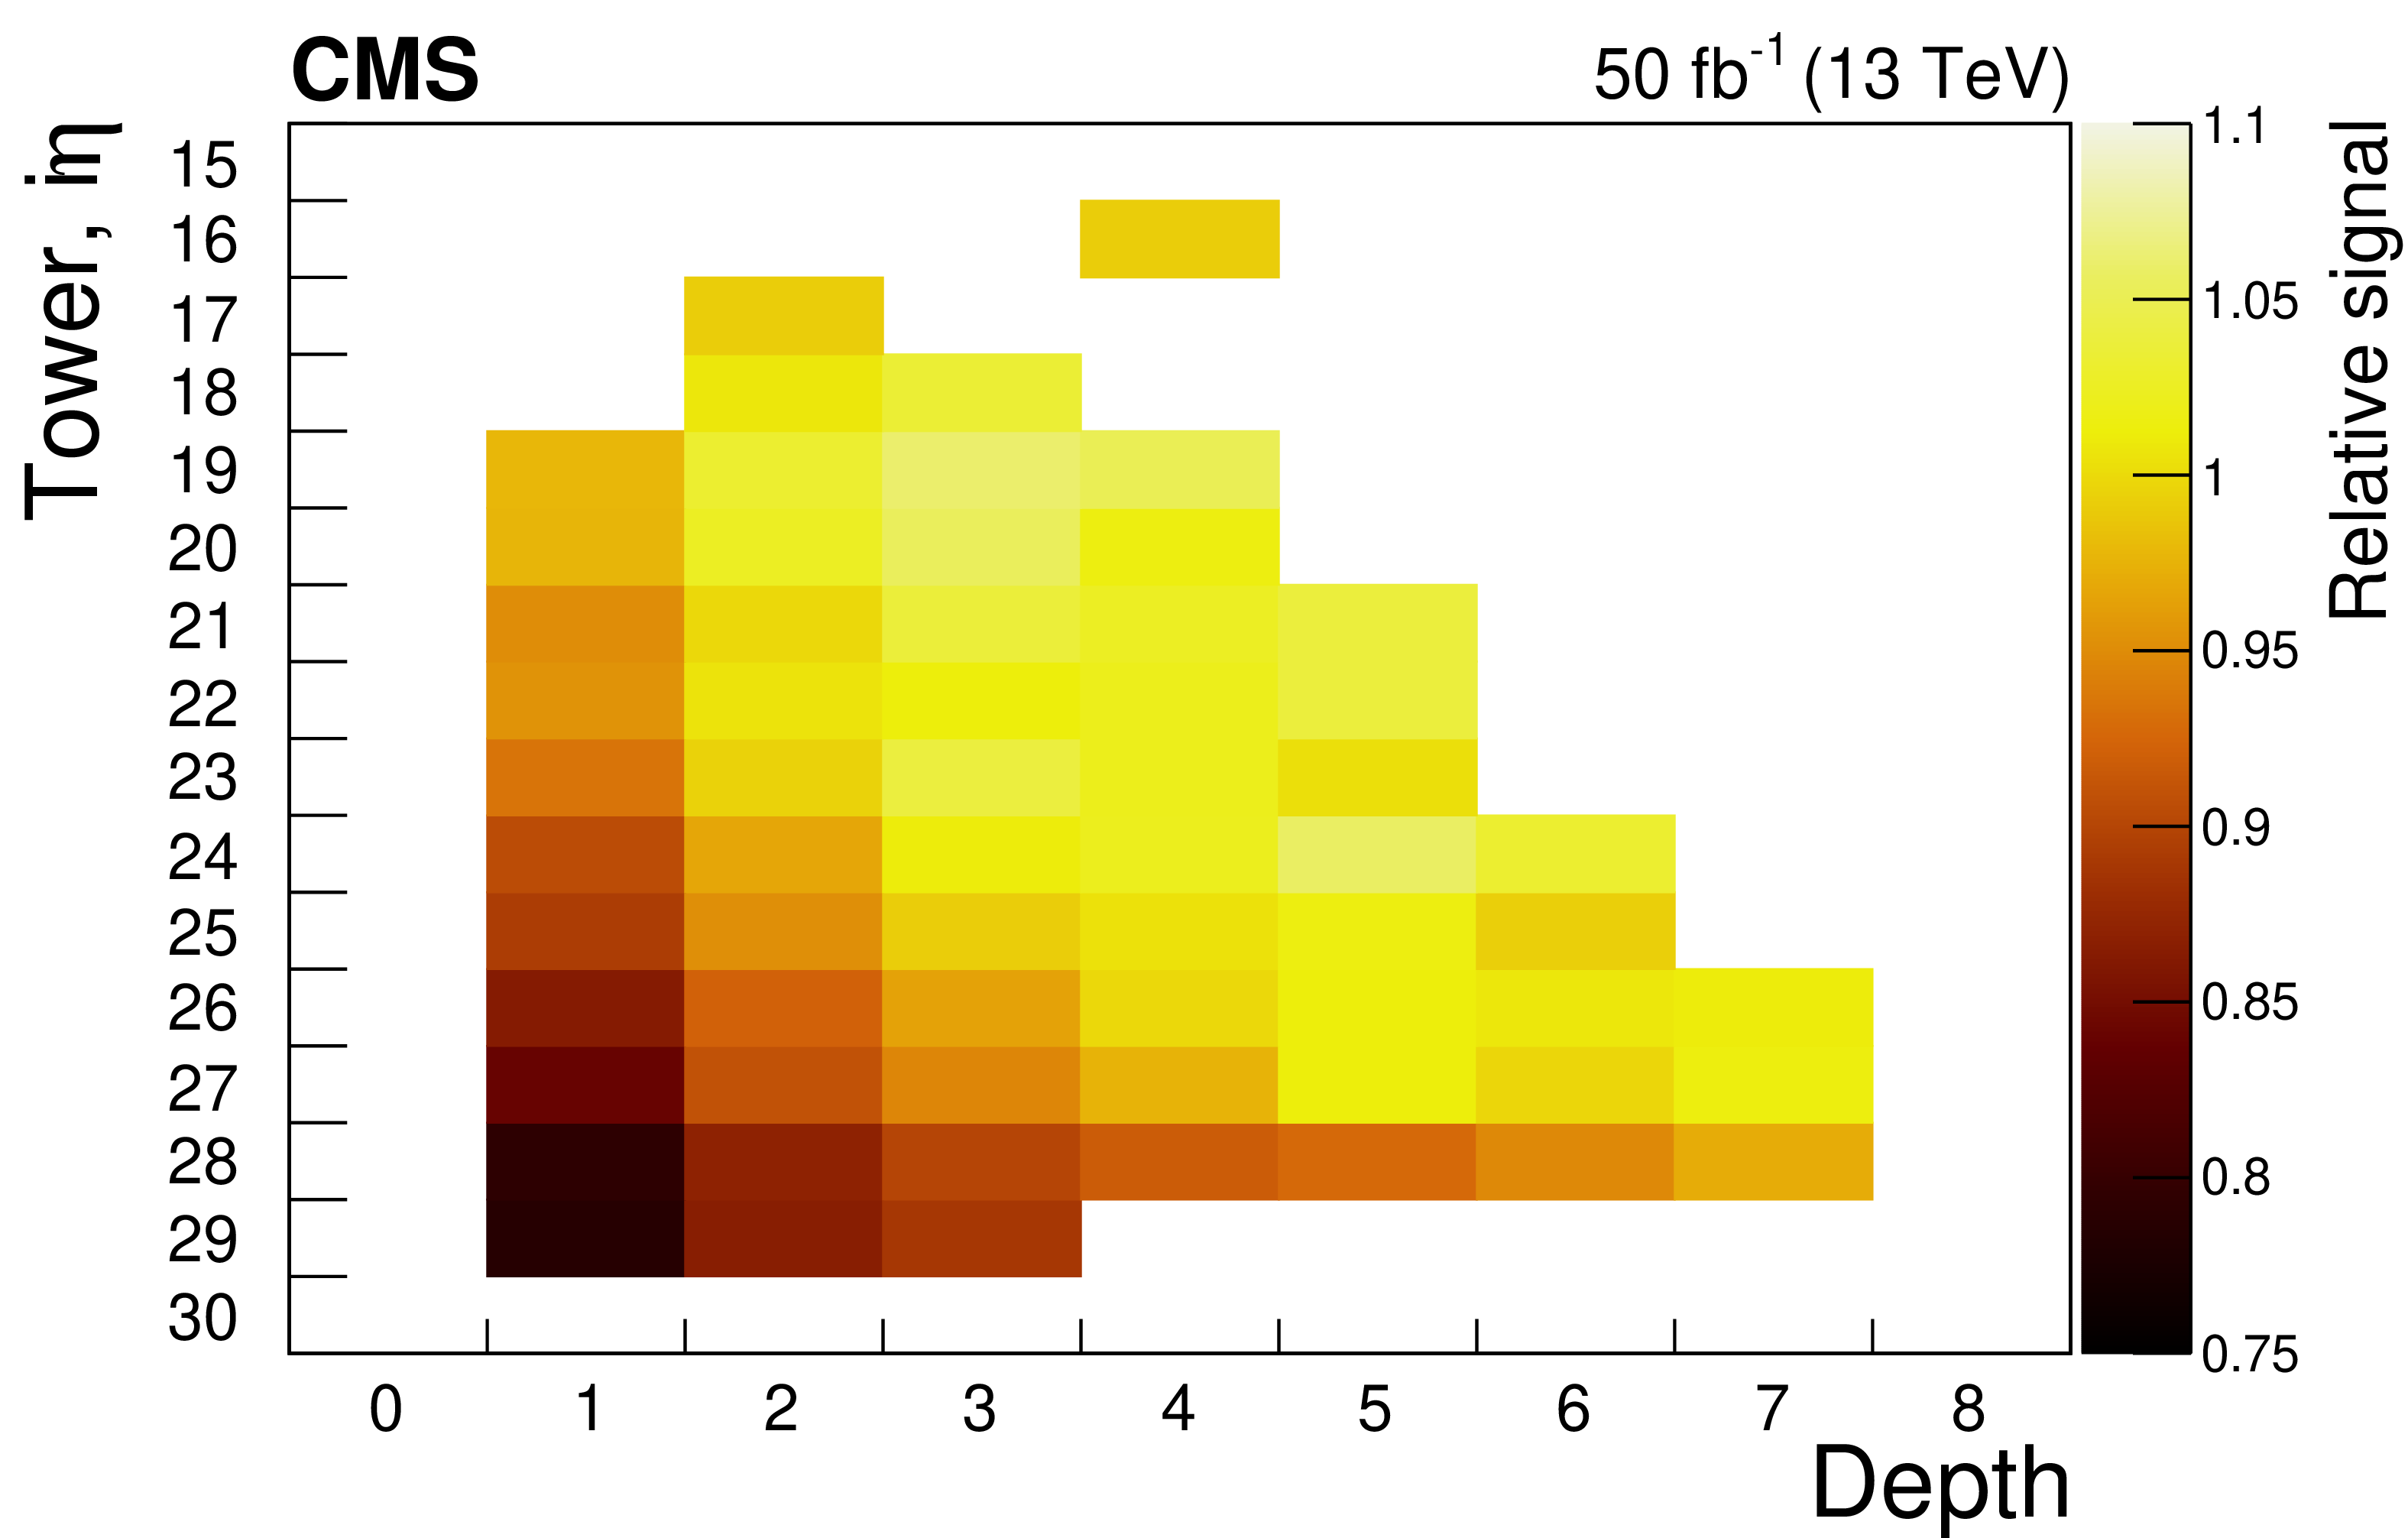
Figure 4:
Schematic of the readout segmentation of the HE for channels instrumented with {SiPM}s. Scintillator tiles within a tower that have the same color ("depth'') are connected to a single photodetector. The numbers 0-17 refer to the scintillator layers, and the numbers 16-29 on the perimeter of the figure denote the ${i\eta}$ indices of the towers (the $\eta $ values for the boundaries of the towers are also shown). |
png pdf |
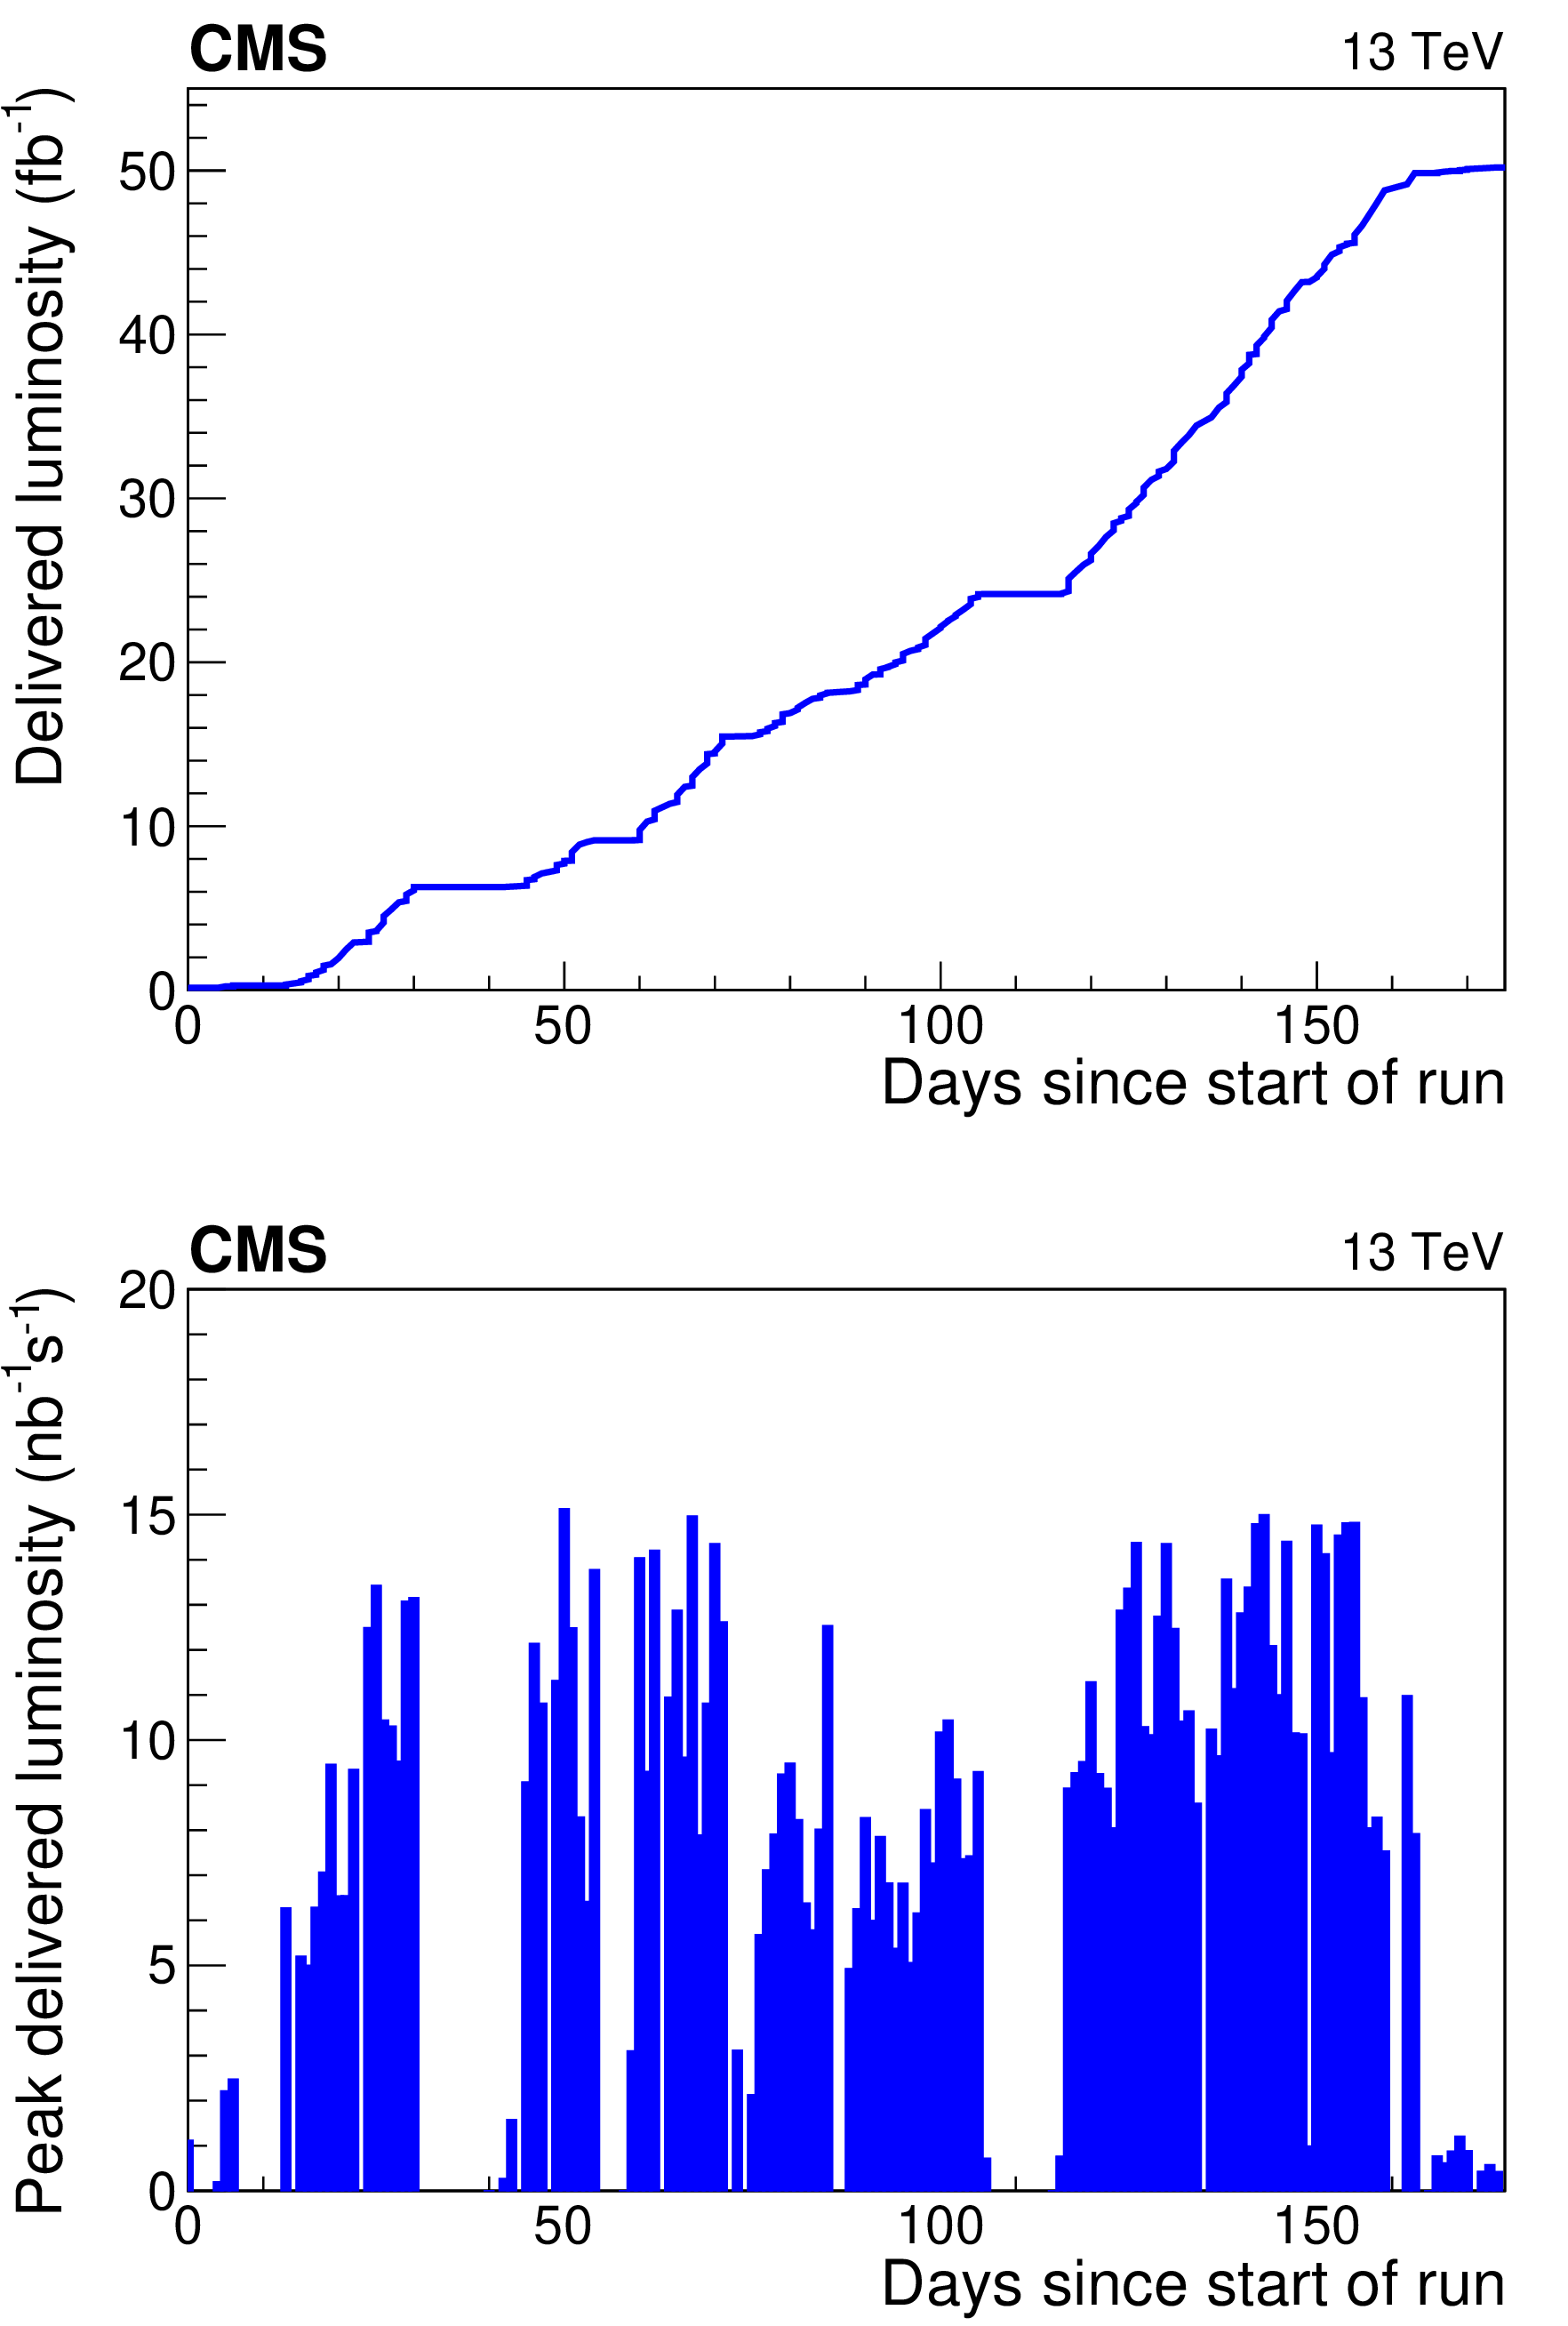
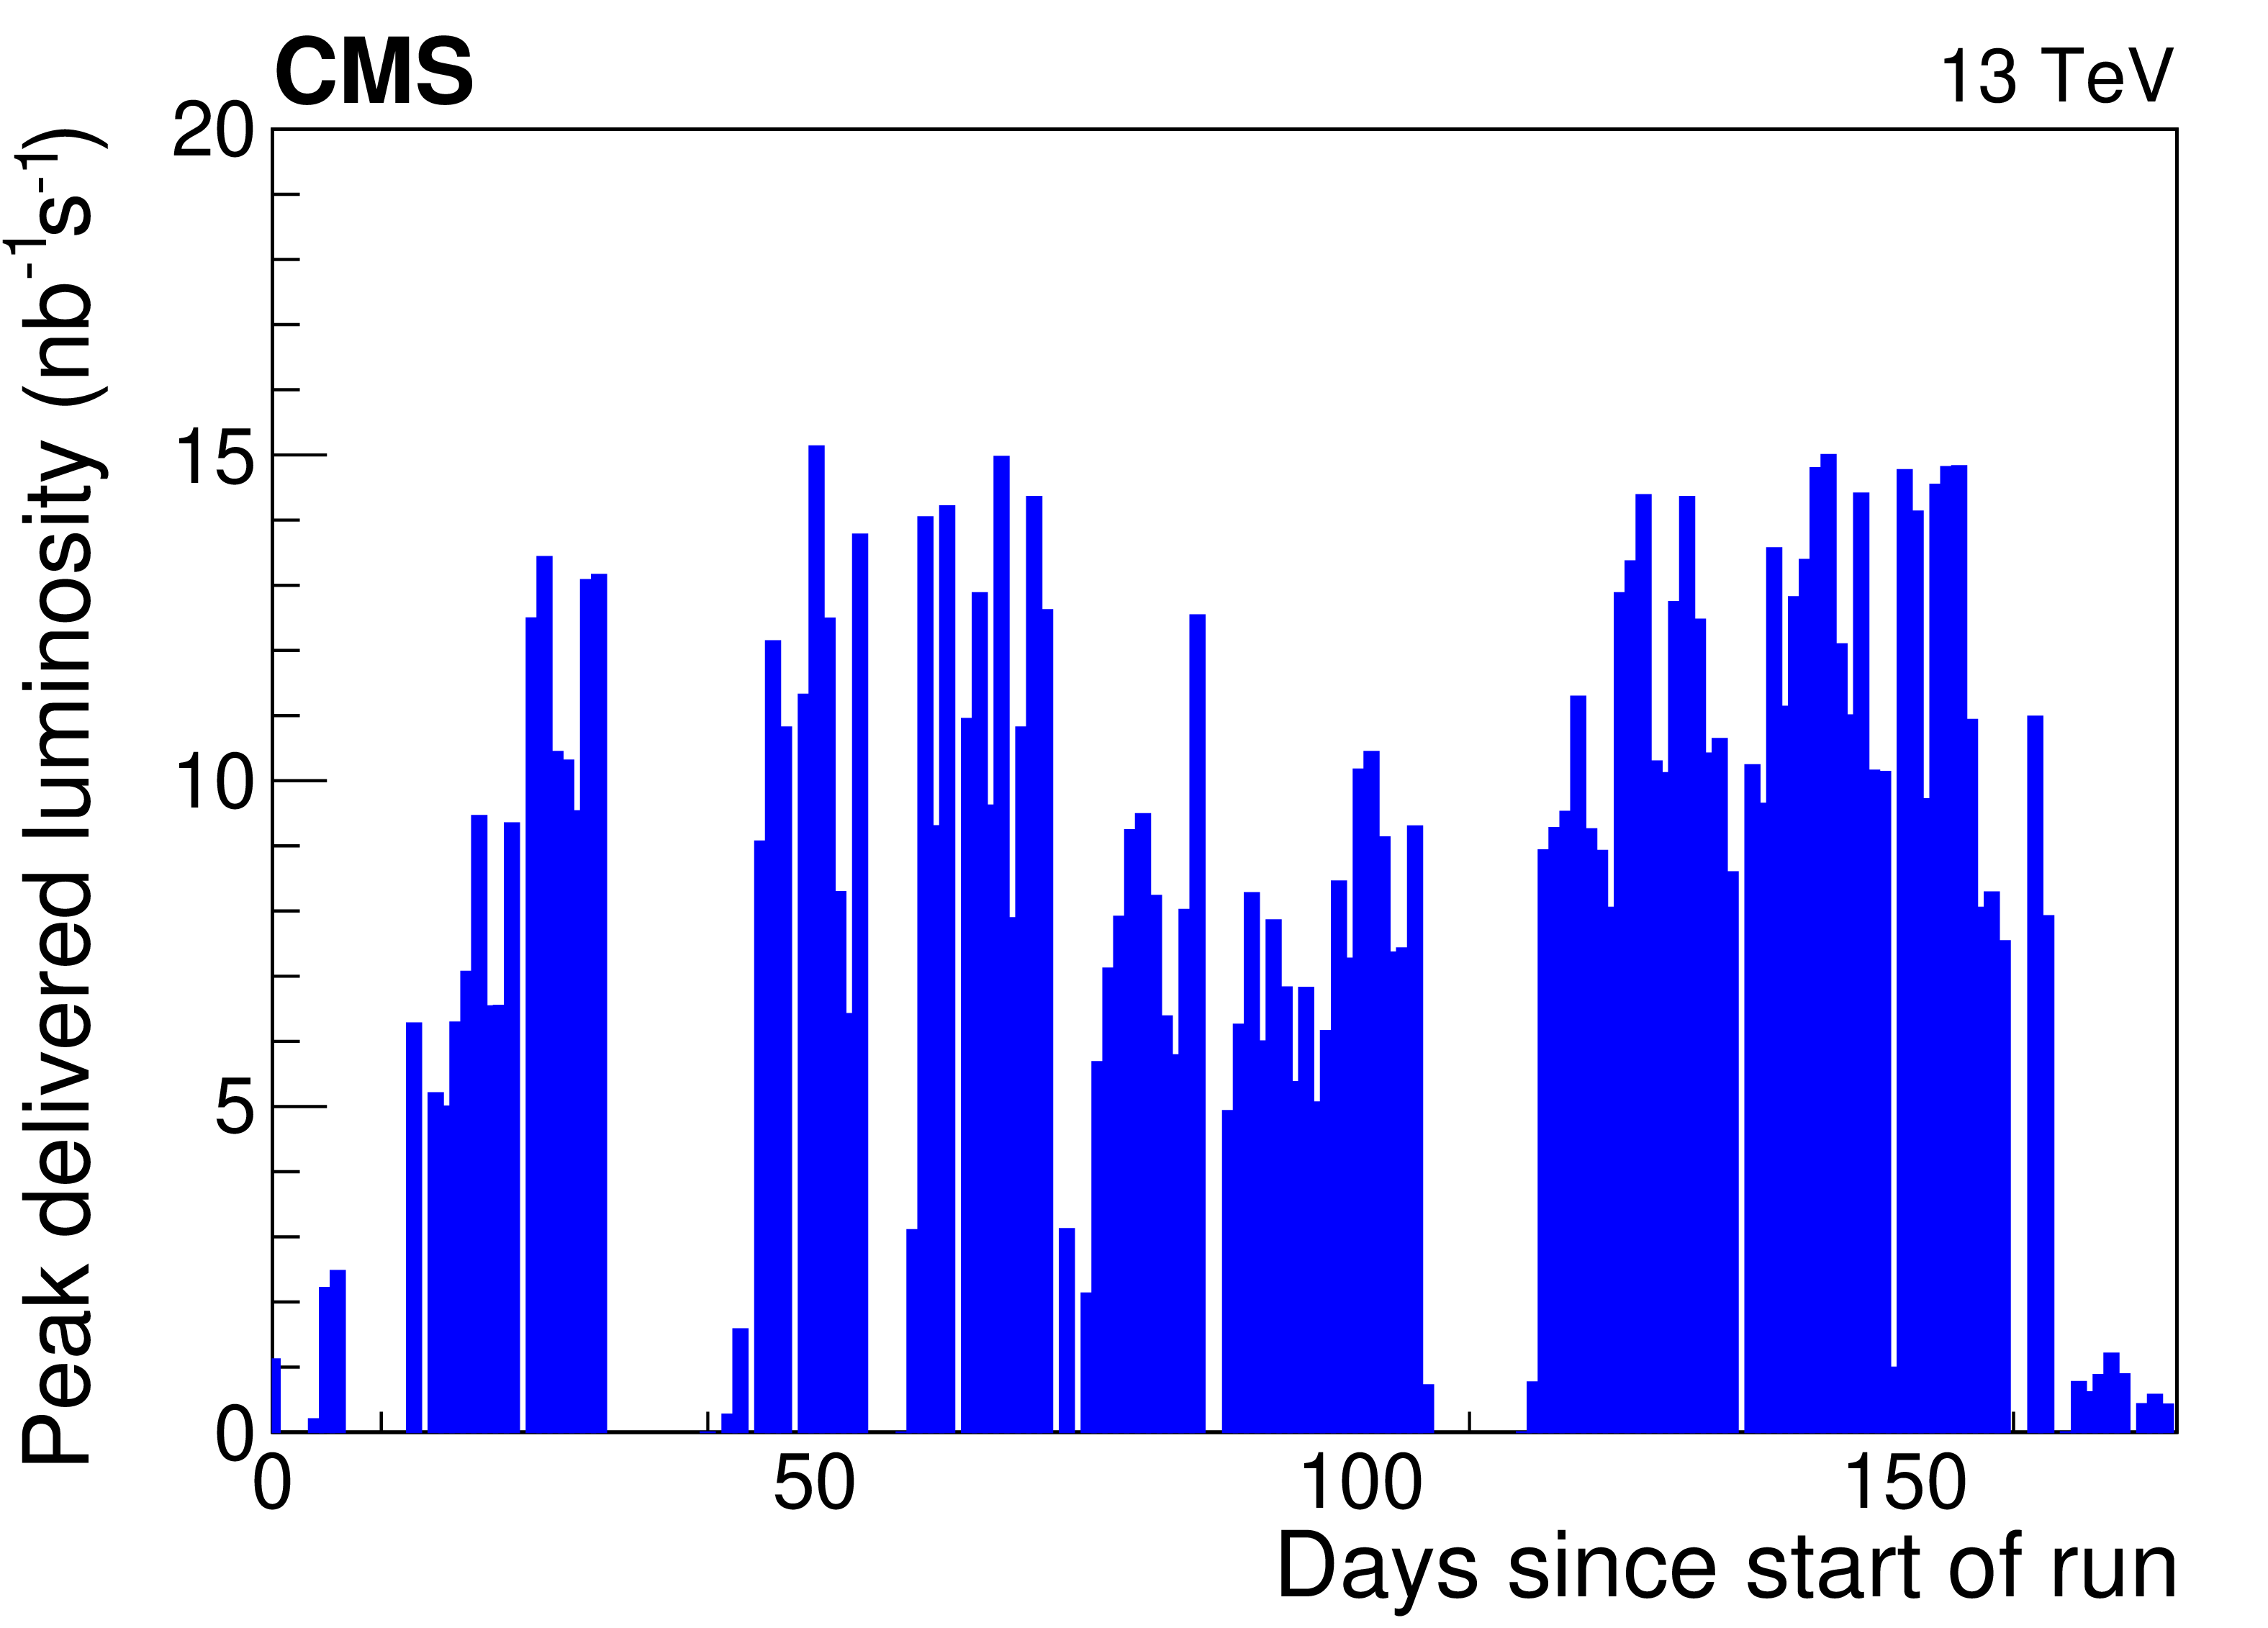
Figure 5:
Integrated luminosity delivered to CMS by the LHC in the 2017 pp data-taking period, as a function of time (upper) and maximum daily (peak) luminosity delivered to CMS in 2017 (lower). Intervals of constant luminosity in the upper plot, or with no entries in the lower plot, indicate periods with no beam, e.g., technical stops. |
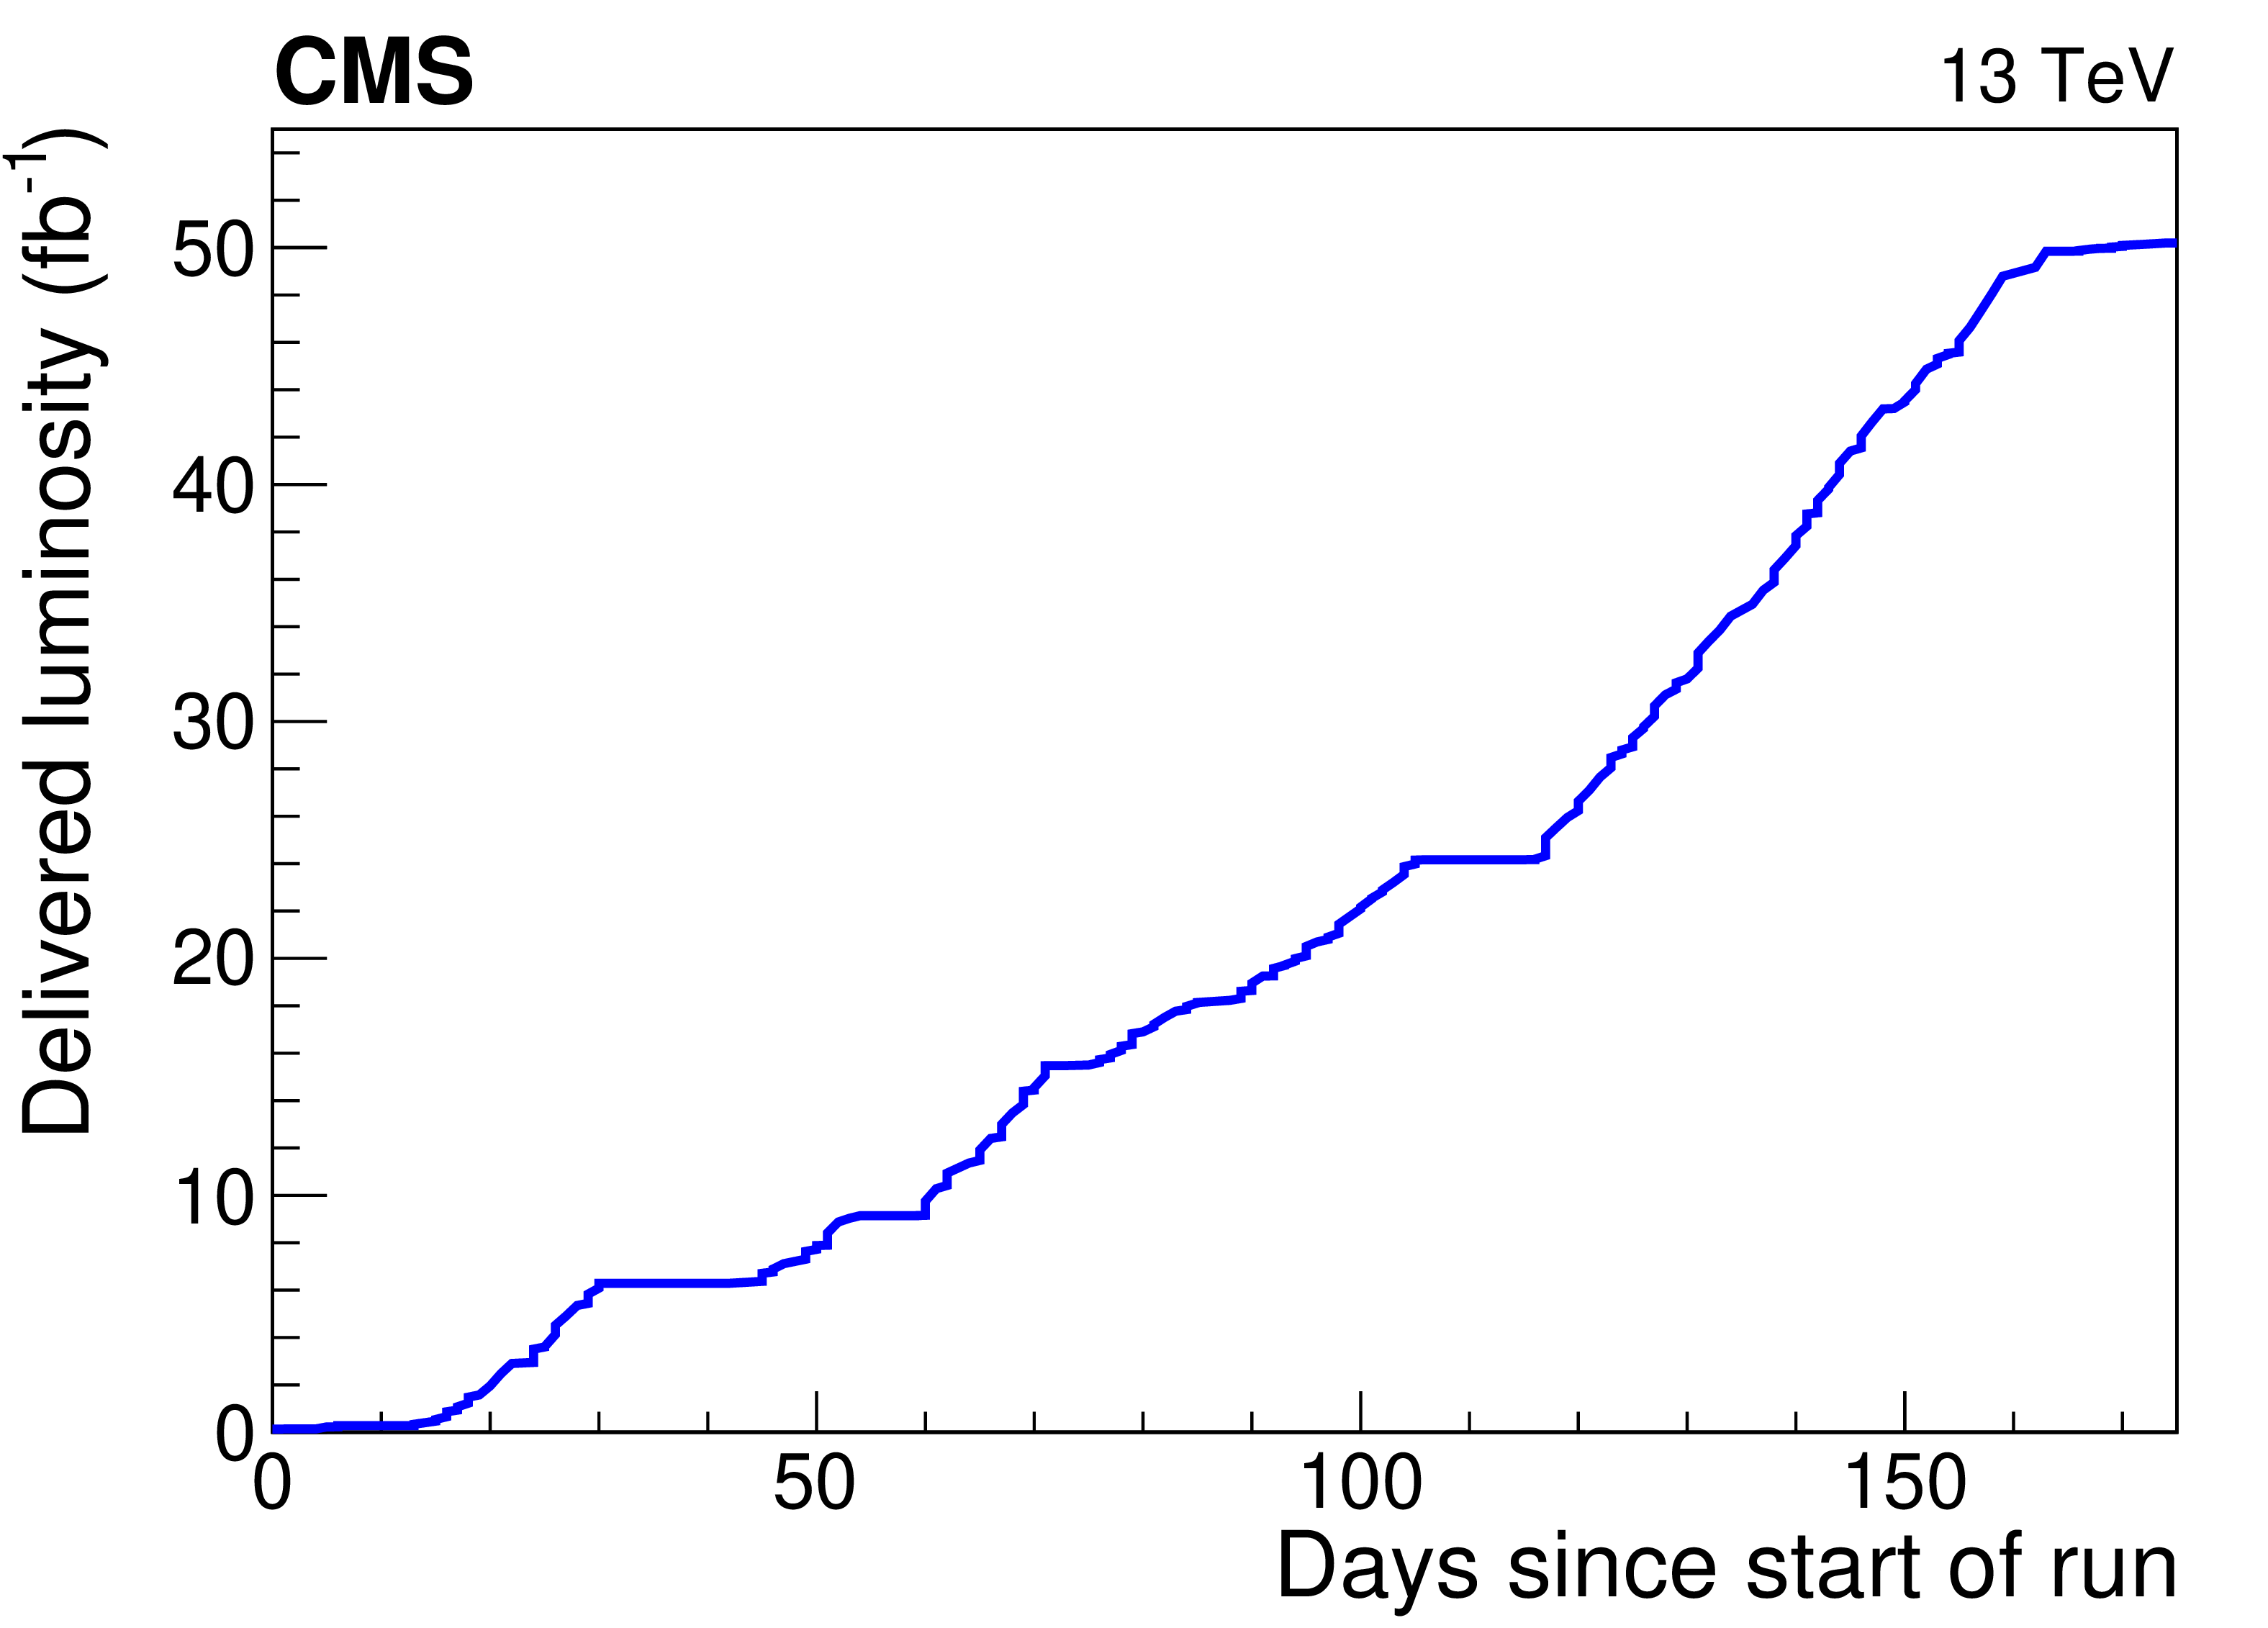
png pdf |
Figure 5-a:
Integrated luminosity delivered to CMS by the LHC in the 2017 pp data-taking period, as a function of time (upper) and maximum daily (peak) luminosity delivered to CMS in 2017 (lower). Intervals of constant luminosity in the upper plot, or with no entries in the lower plot, indicate periods with no beam, e.g., technical stops. |
png pdf |
Figure 5-b:
Integrated luminosity delivered to CMS by the LHC in the 2017 pp data-taking period, as a function of time (upper) and maximum daily (peak) luminosity delivered to CMS in 2017 (lower). Intervals of constant luminosity in the upper plot, or with no entries in the lower plot, indicate periods with no beam, e.g., technical stops. |

png pdf |
Figure 6:
Doses calculated by FLUKA for the HE tiles in layers 1 and 7 as a function of ${i\eta}$ for 50 fb$^{-1}$ of LHC running at 13 TeV in 2017. |
png pdf |
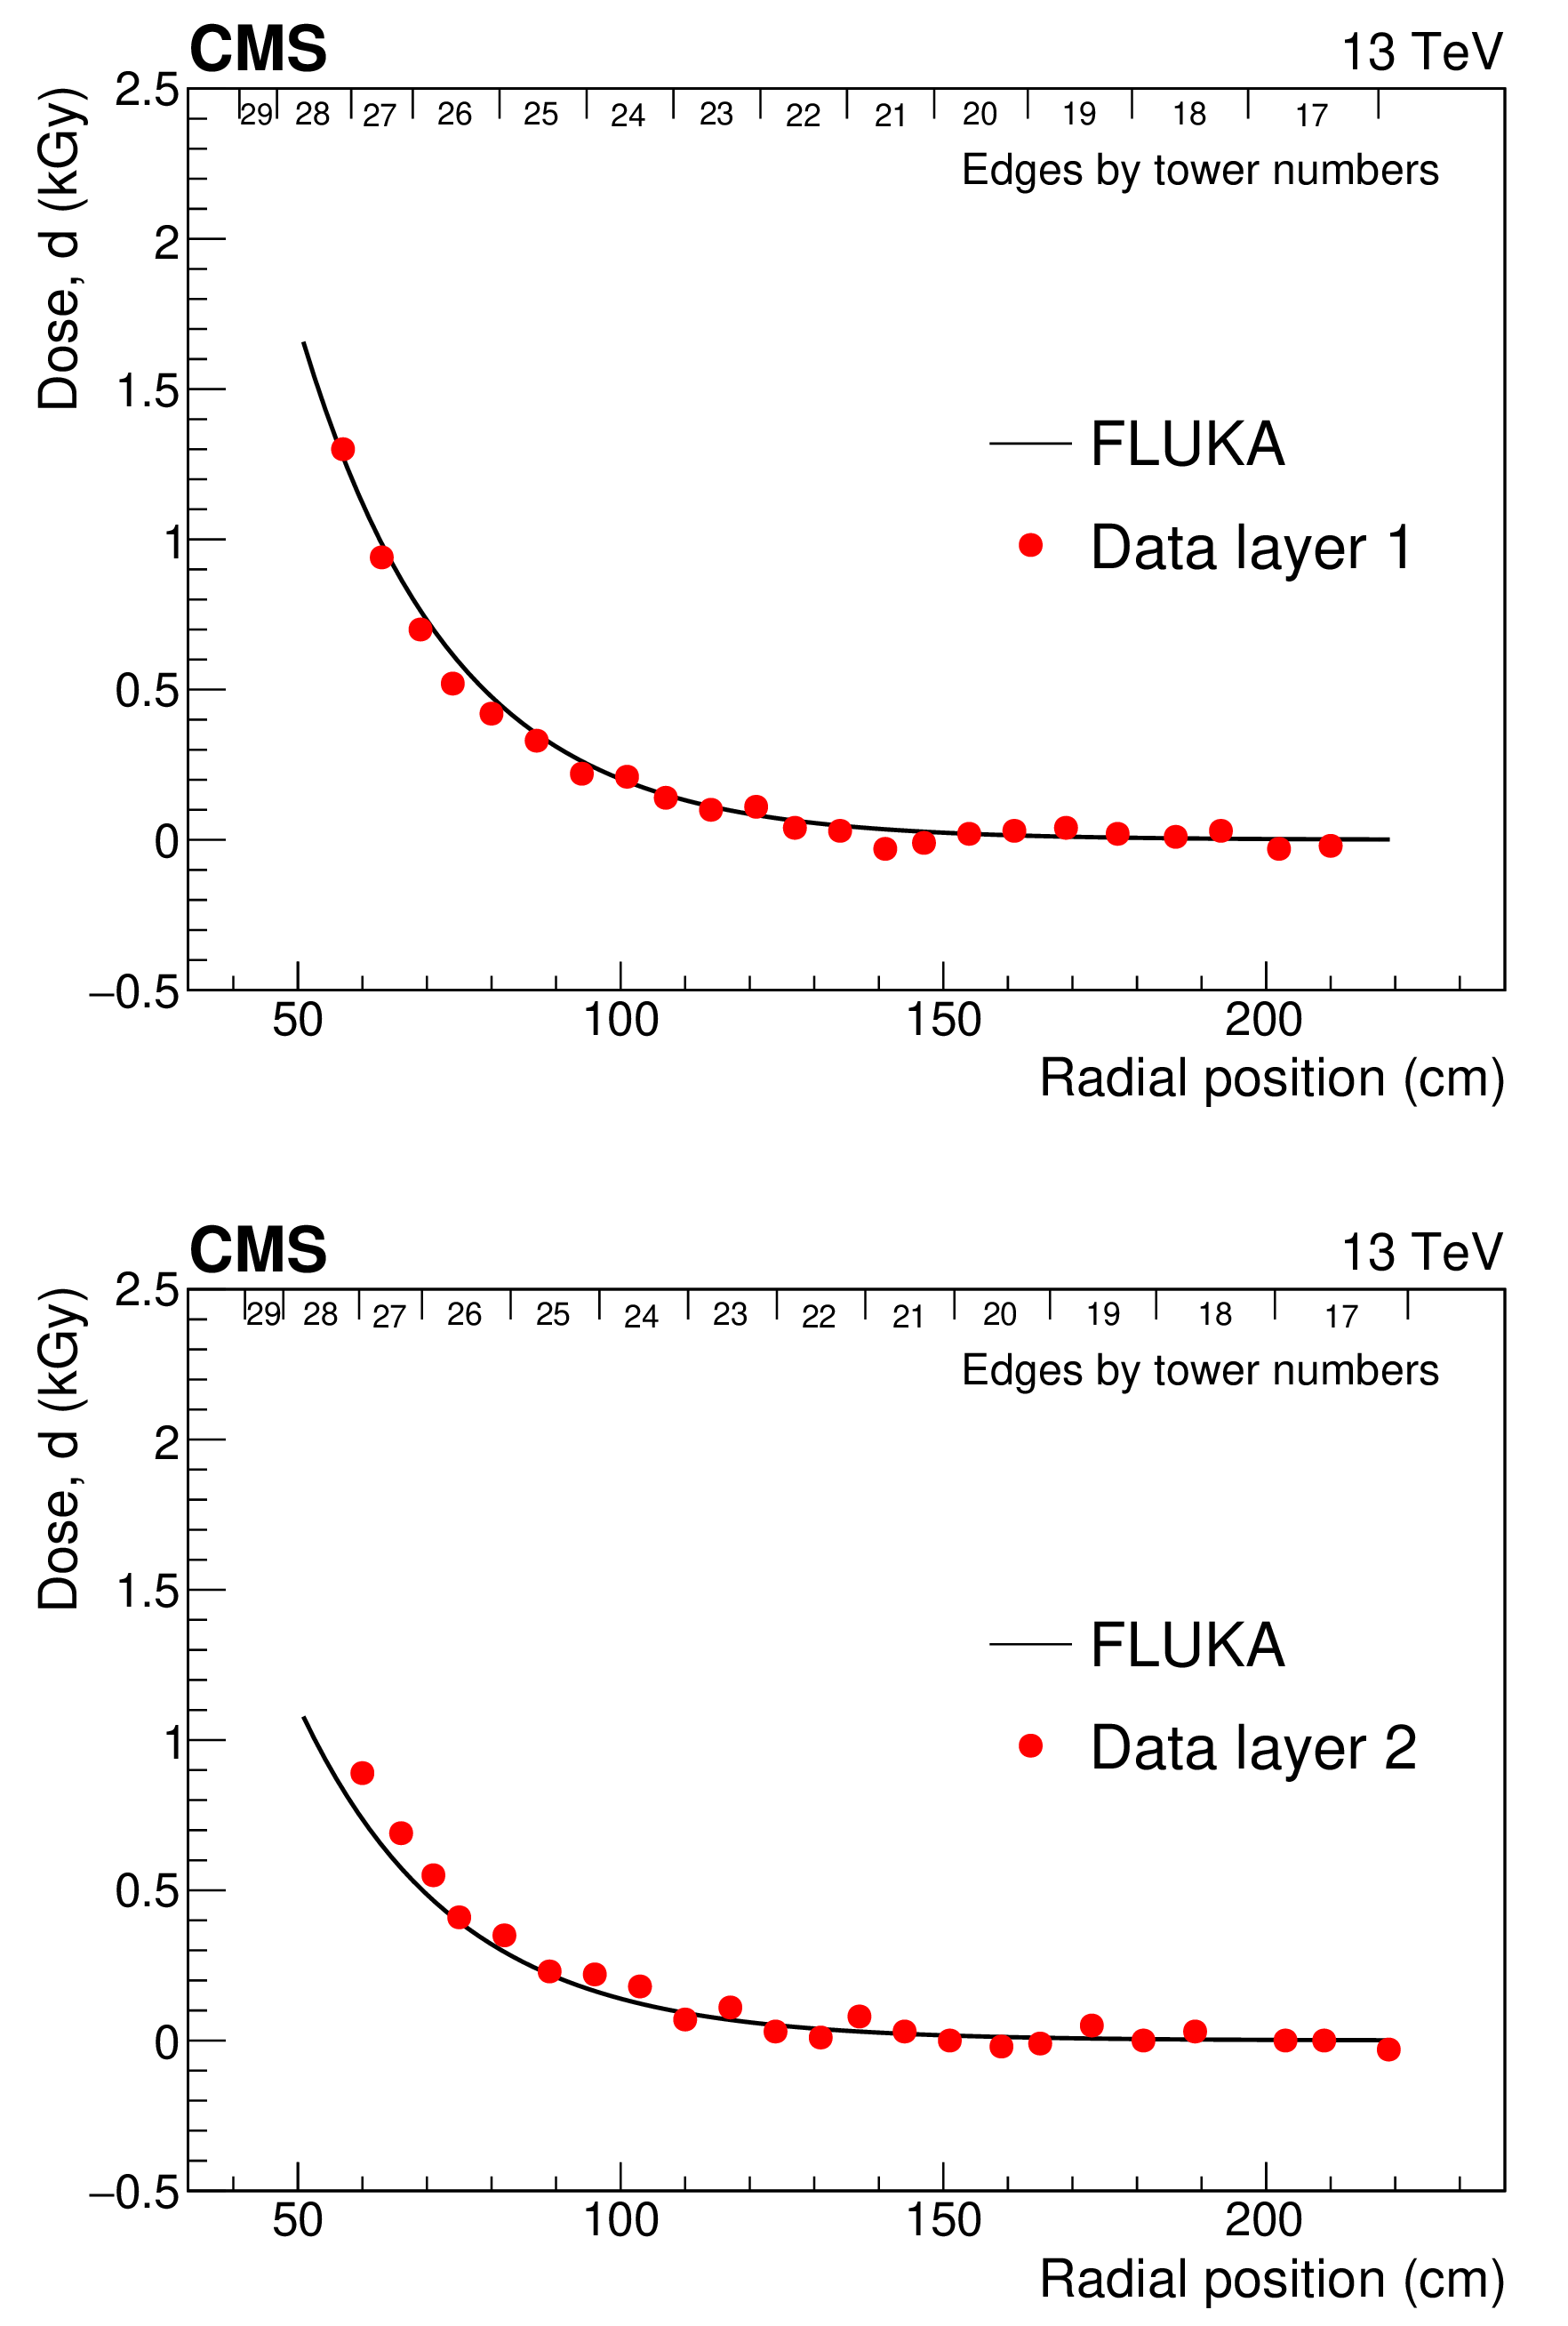
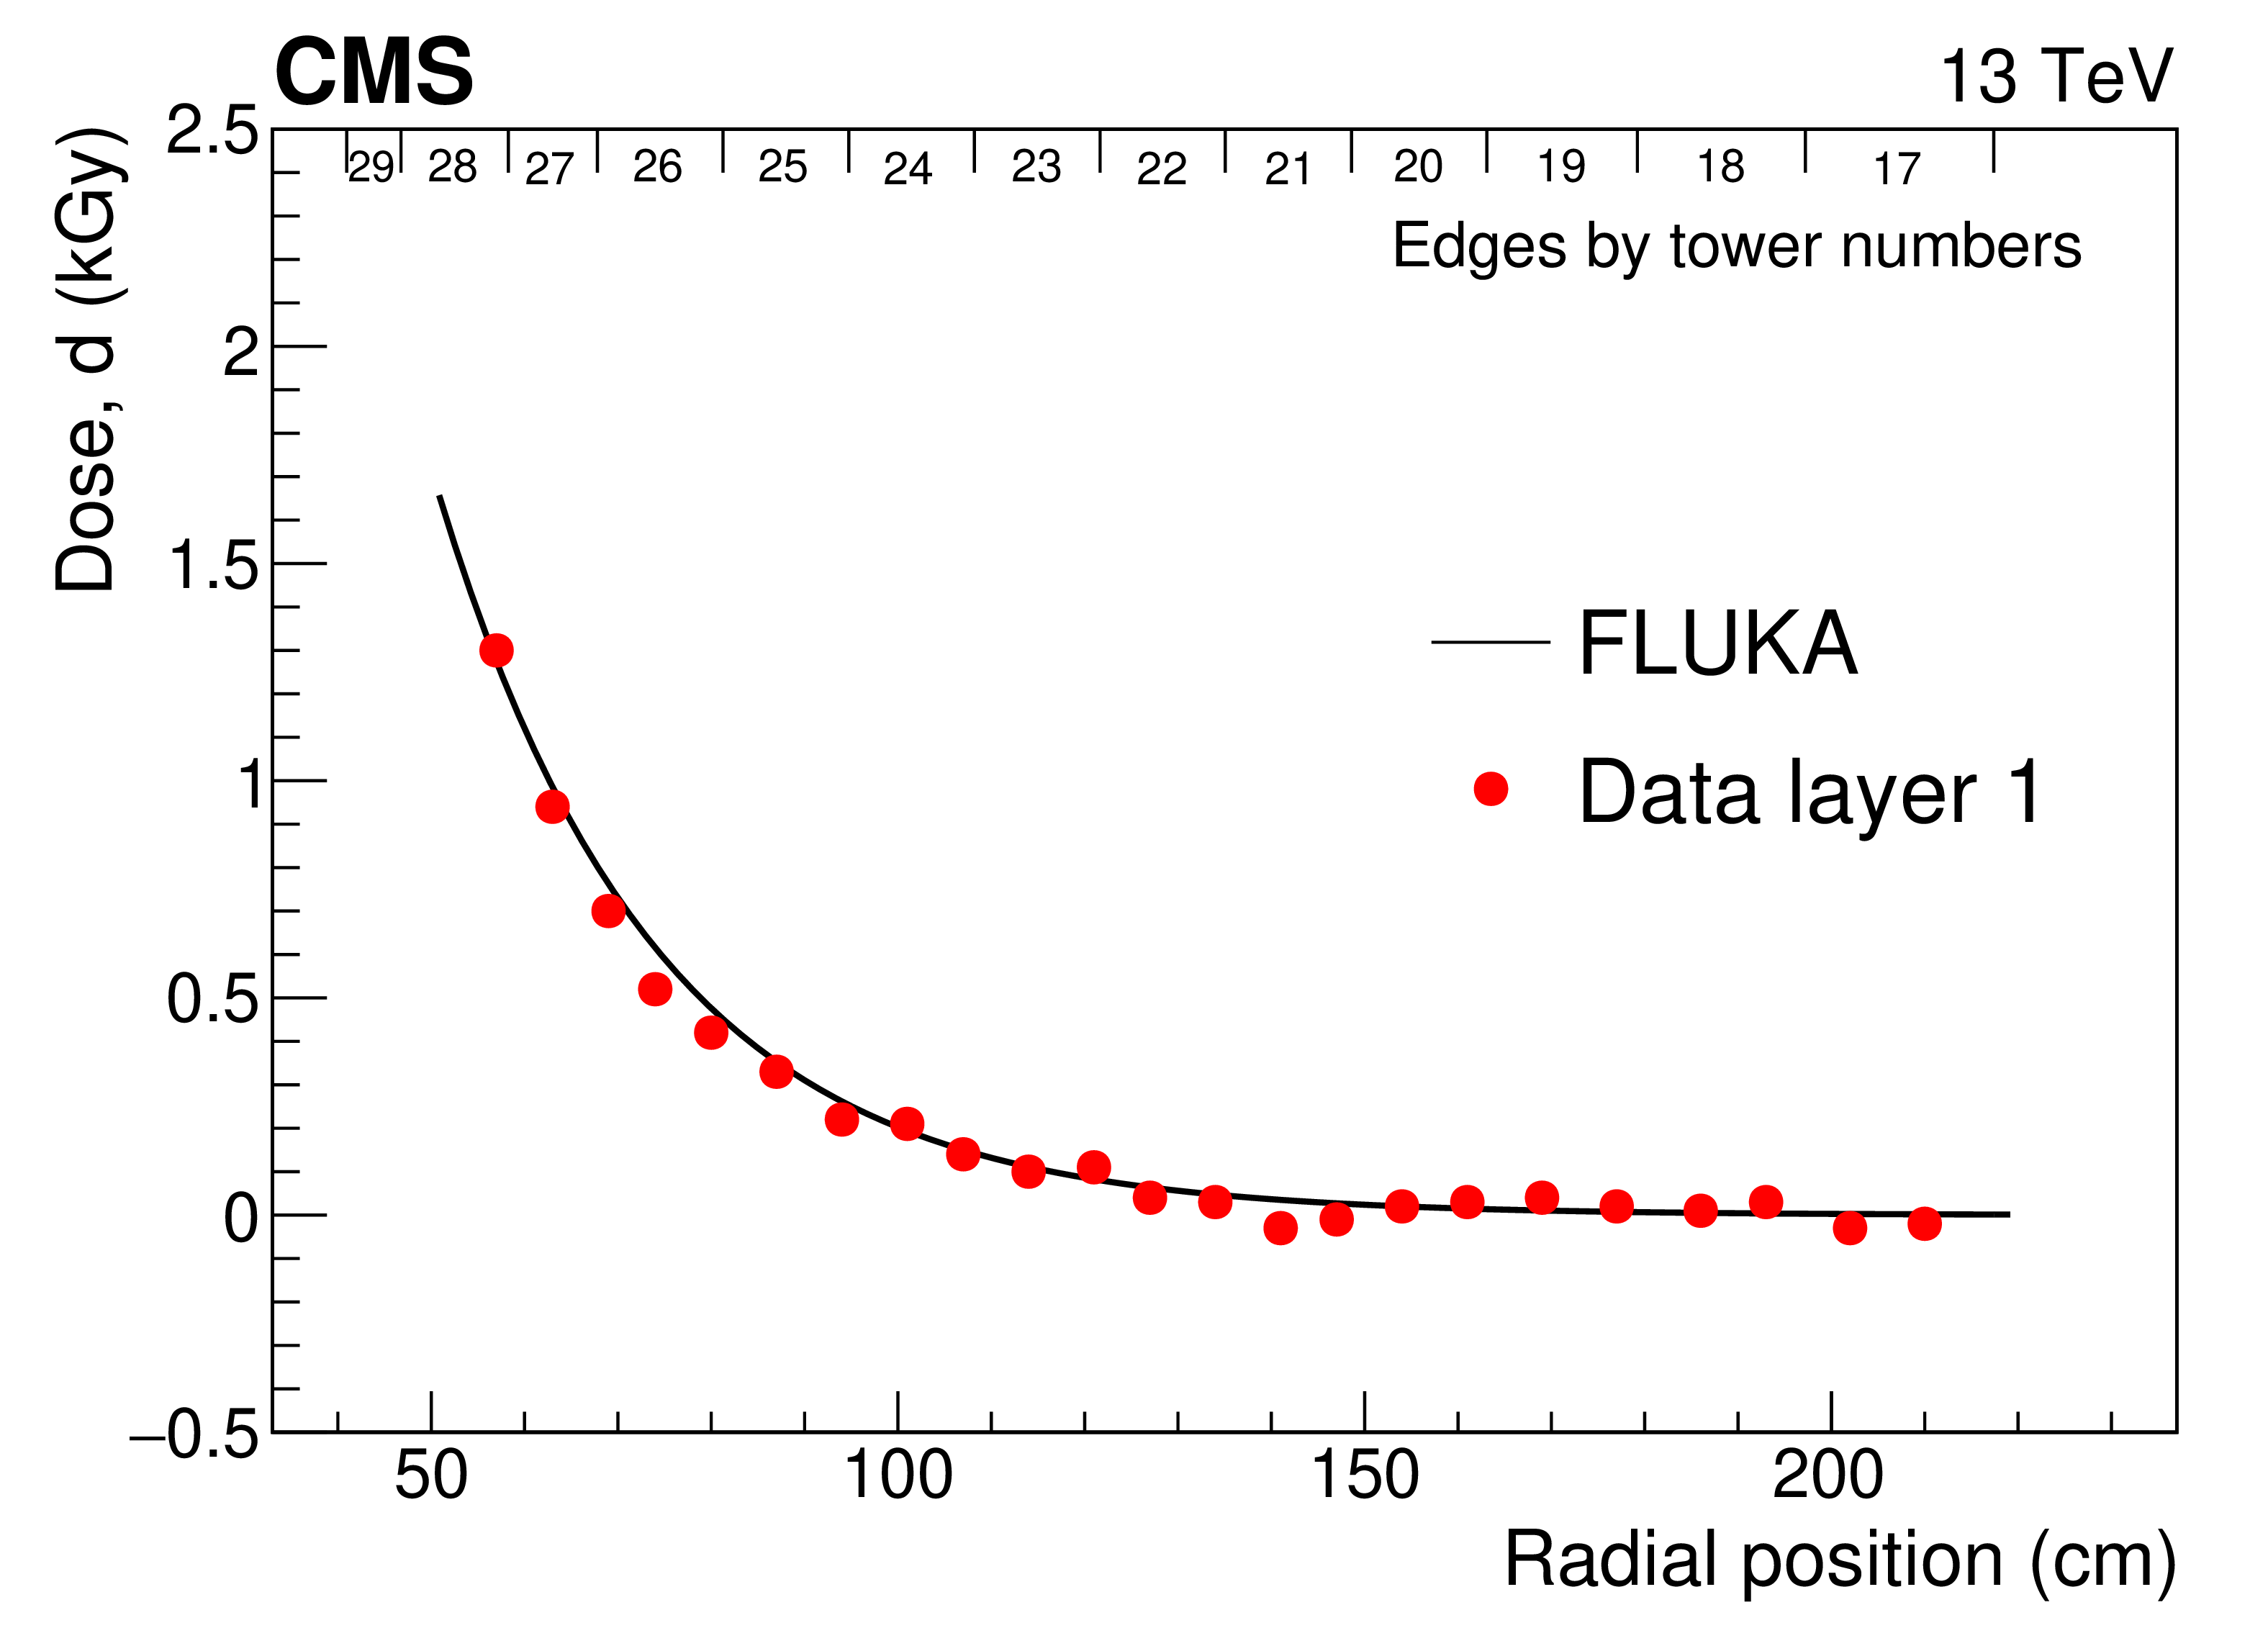
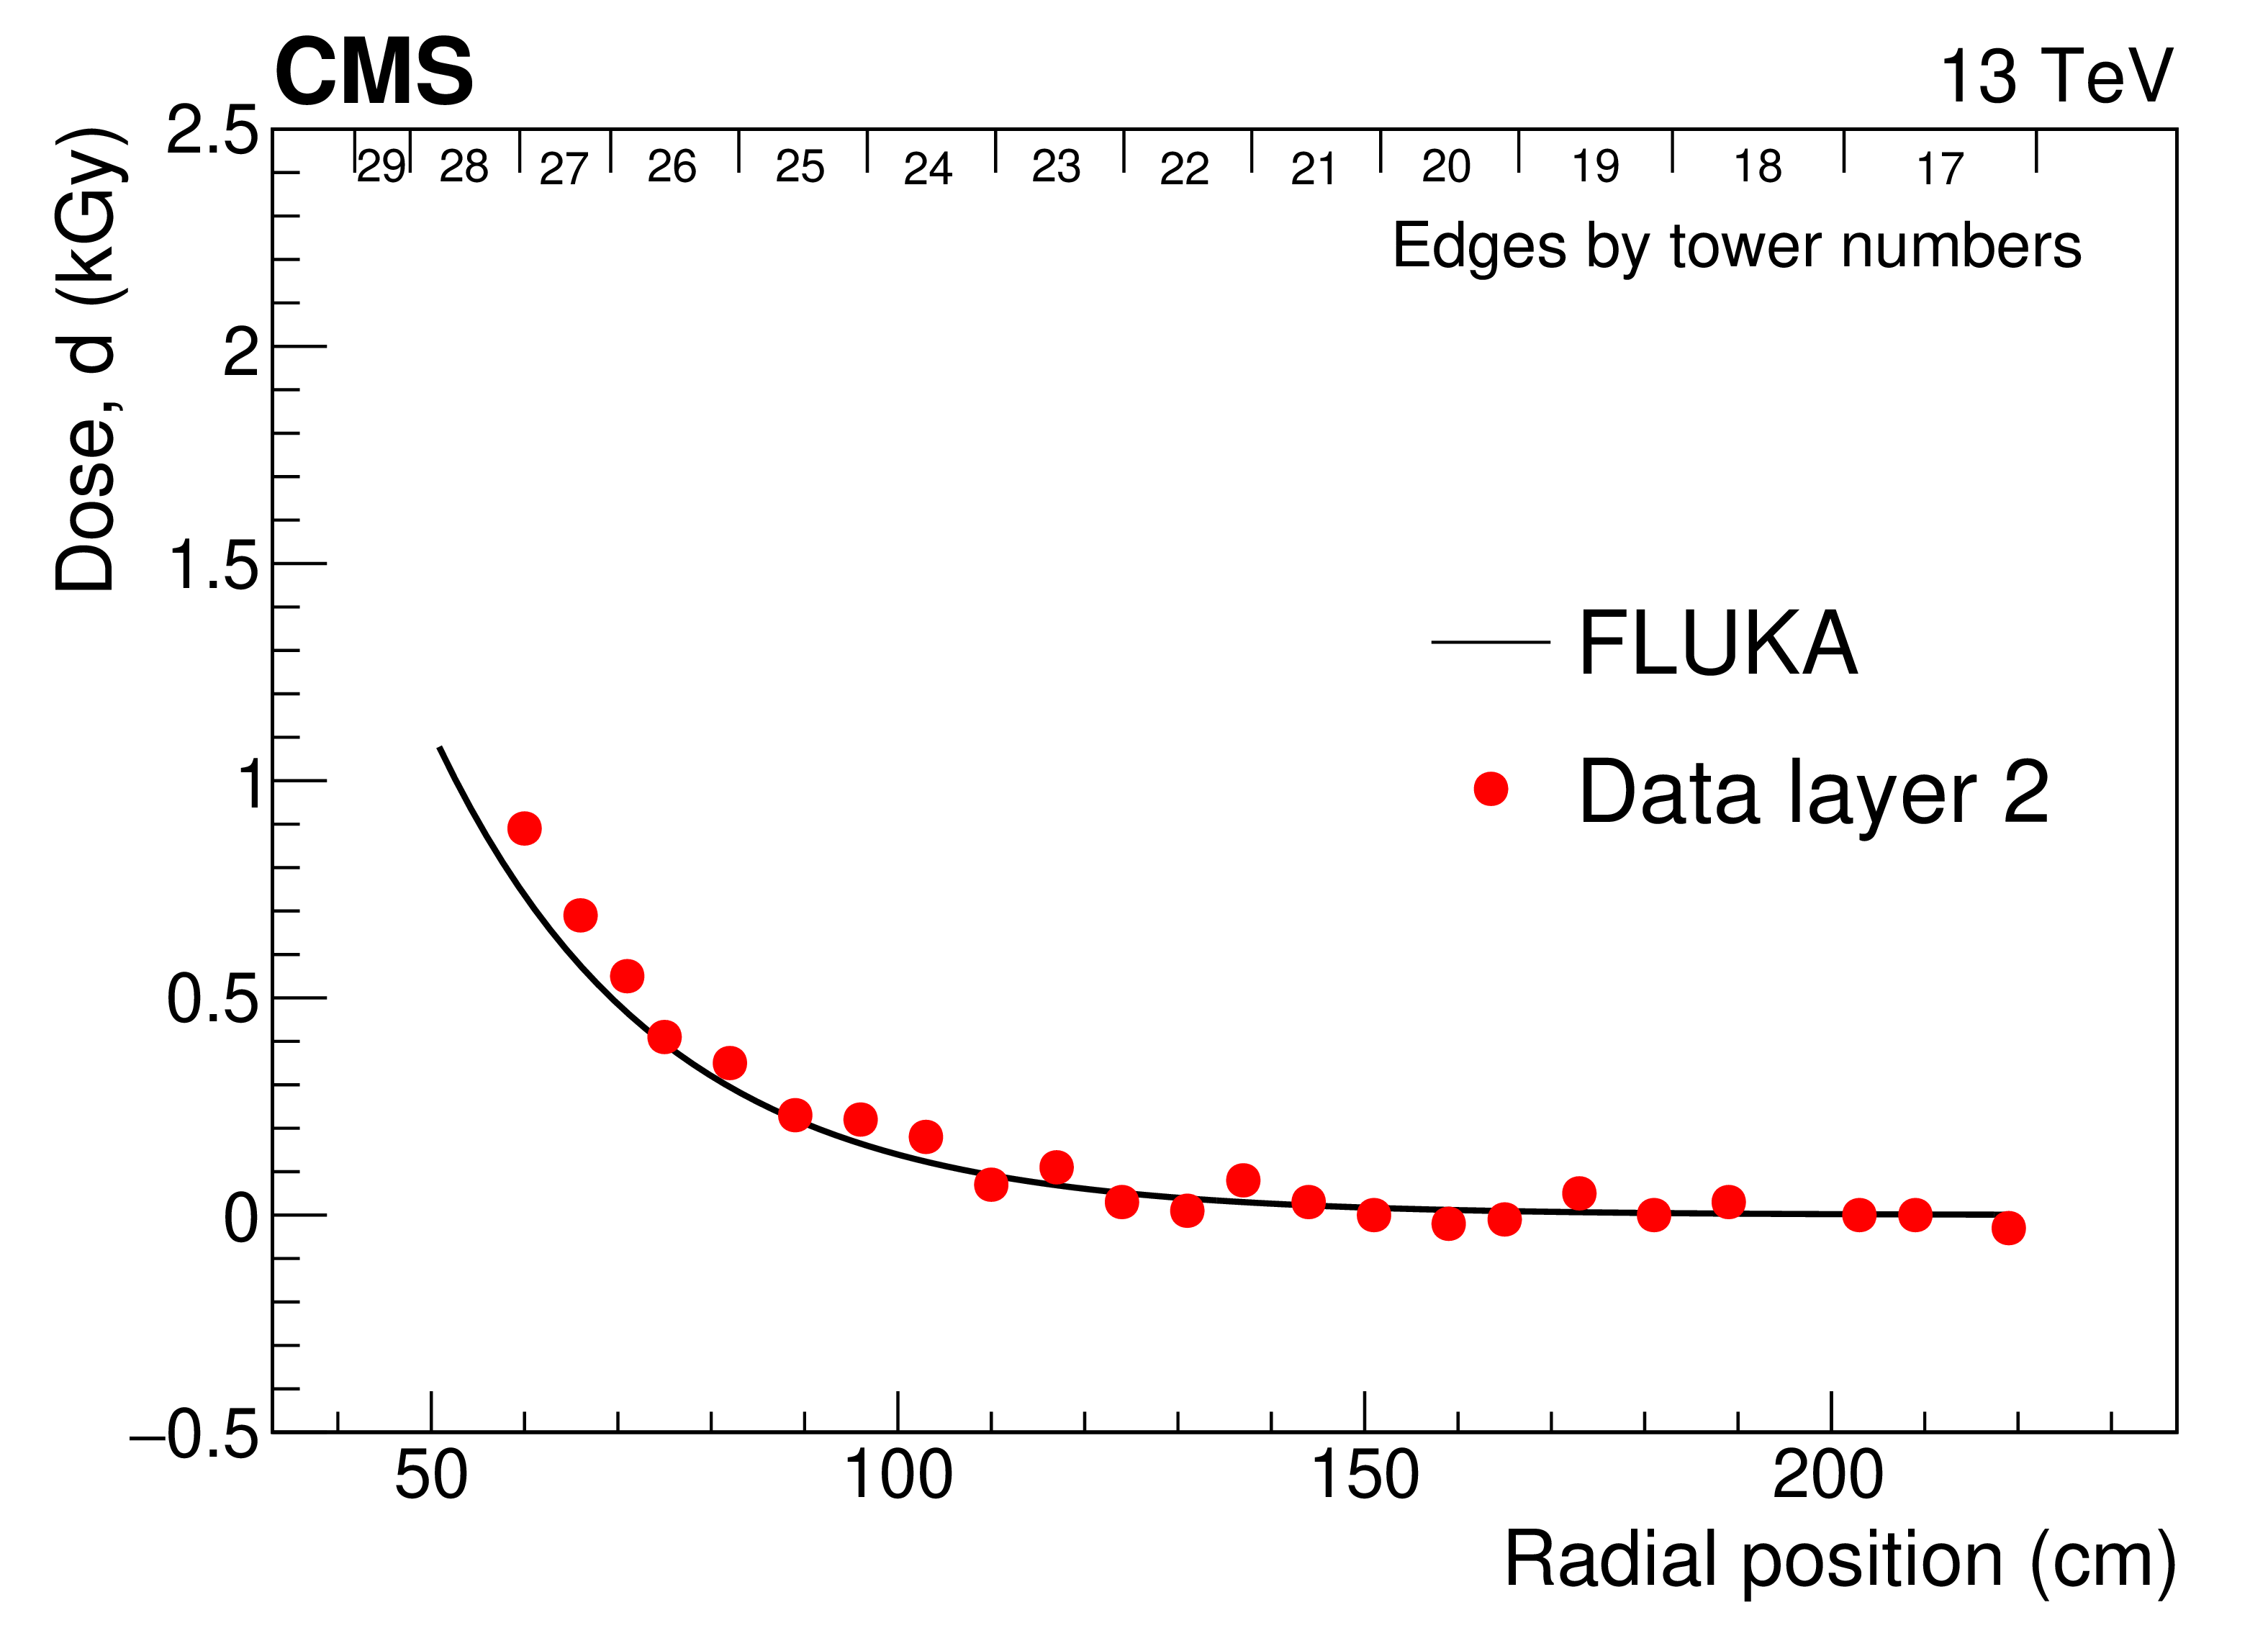
Figure 7:
Comparison of doses for the 2015-2016 data-taking periods calculated using FLUKA and measured from dosimeter films in layer 1 (upper) and layer 2 (lower), as a function of radial distance from the beam. Positions of the tile edges in the radial direction are indicated along the tops of the figures. |
png pdf |
Figure 7-a:
Comparison of doses for the 2015-2016 data-taking periods calculated using FLUKA and measured from dosimeter films in layer 1 (upper) and layer 2 (lower), as a function of radial distance from the beam. Positions of the tile edges in the radial direction are indicated along the tops of the figures. |
png pdf |
Figure 7-b:
Comparison of doses for the 2015-2016 data-taking periods calculated using FLUKA and measured from dosimeter films in layer 1 (upper) and layer 2 (lower), as a function of radial distance from the beam. Positions of the tile edges in the radial direction are indicated along the tops of the figures. |
png pdf |
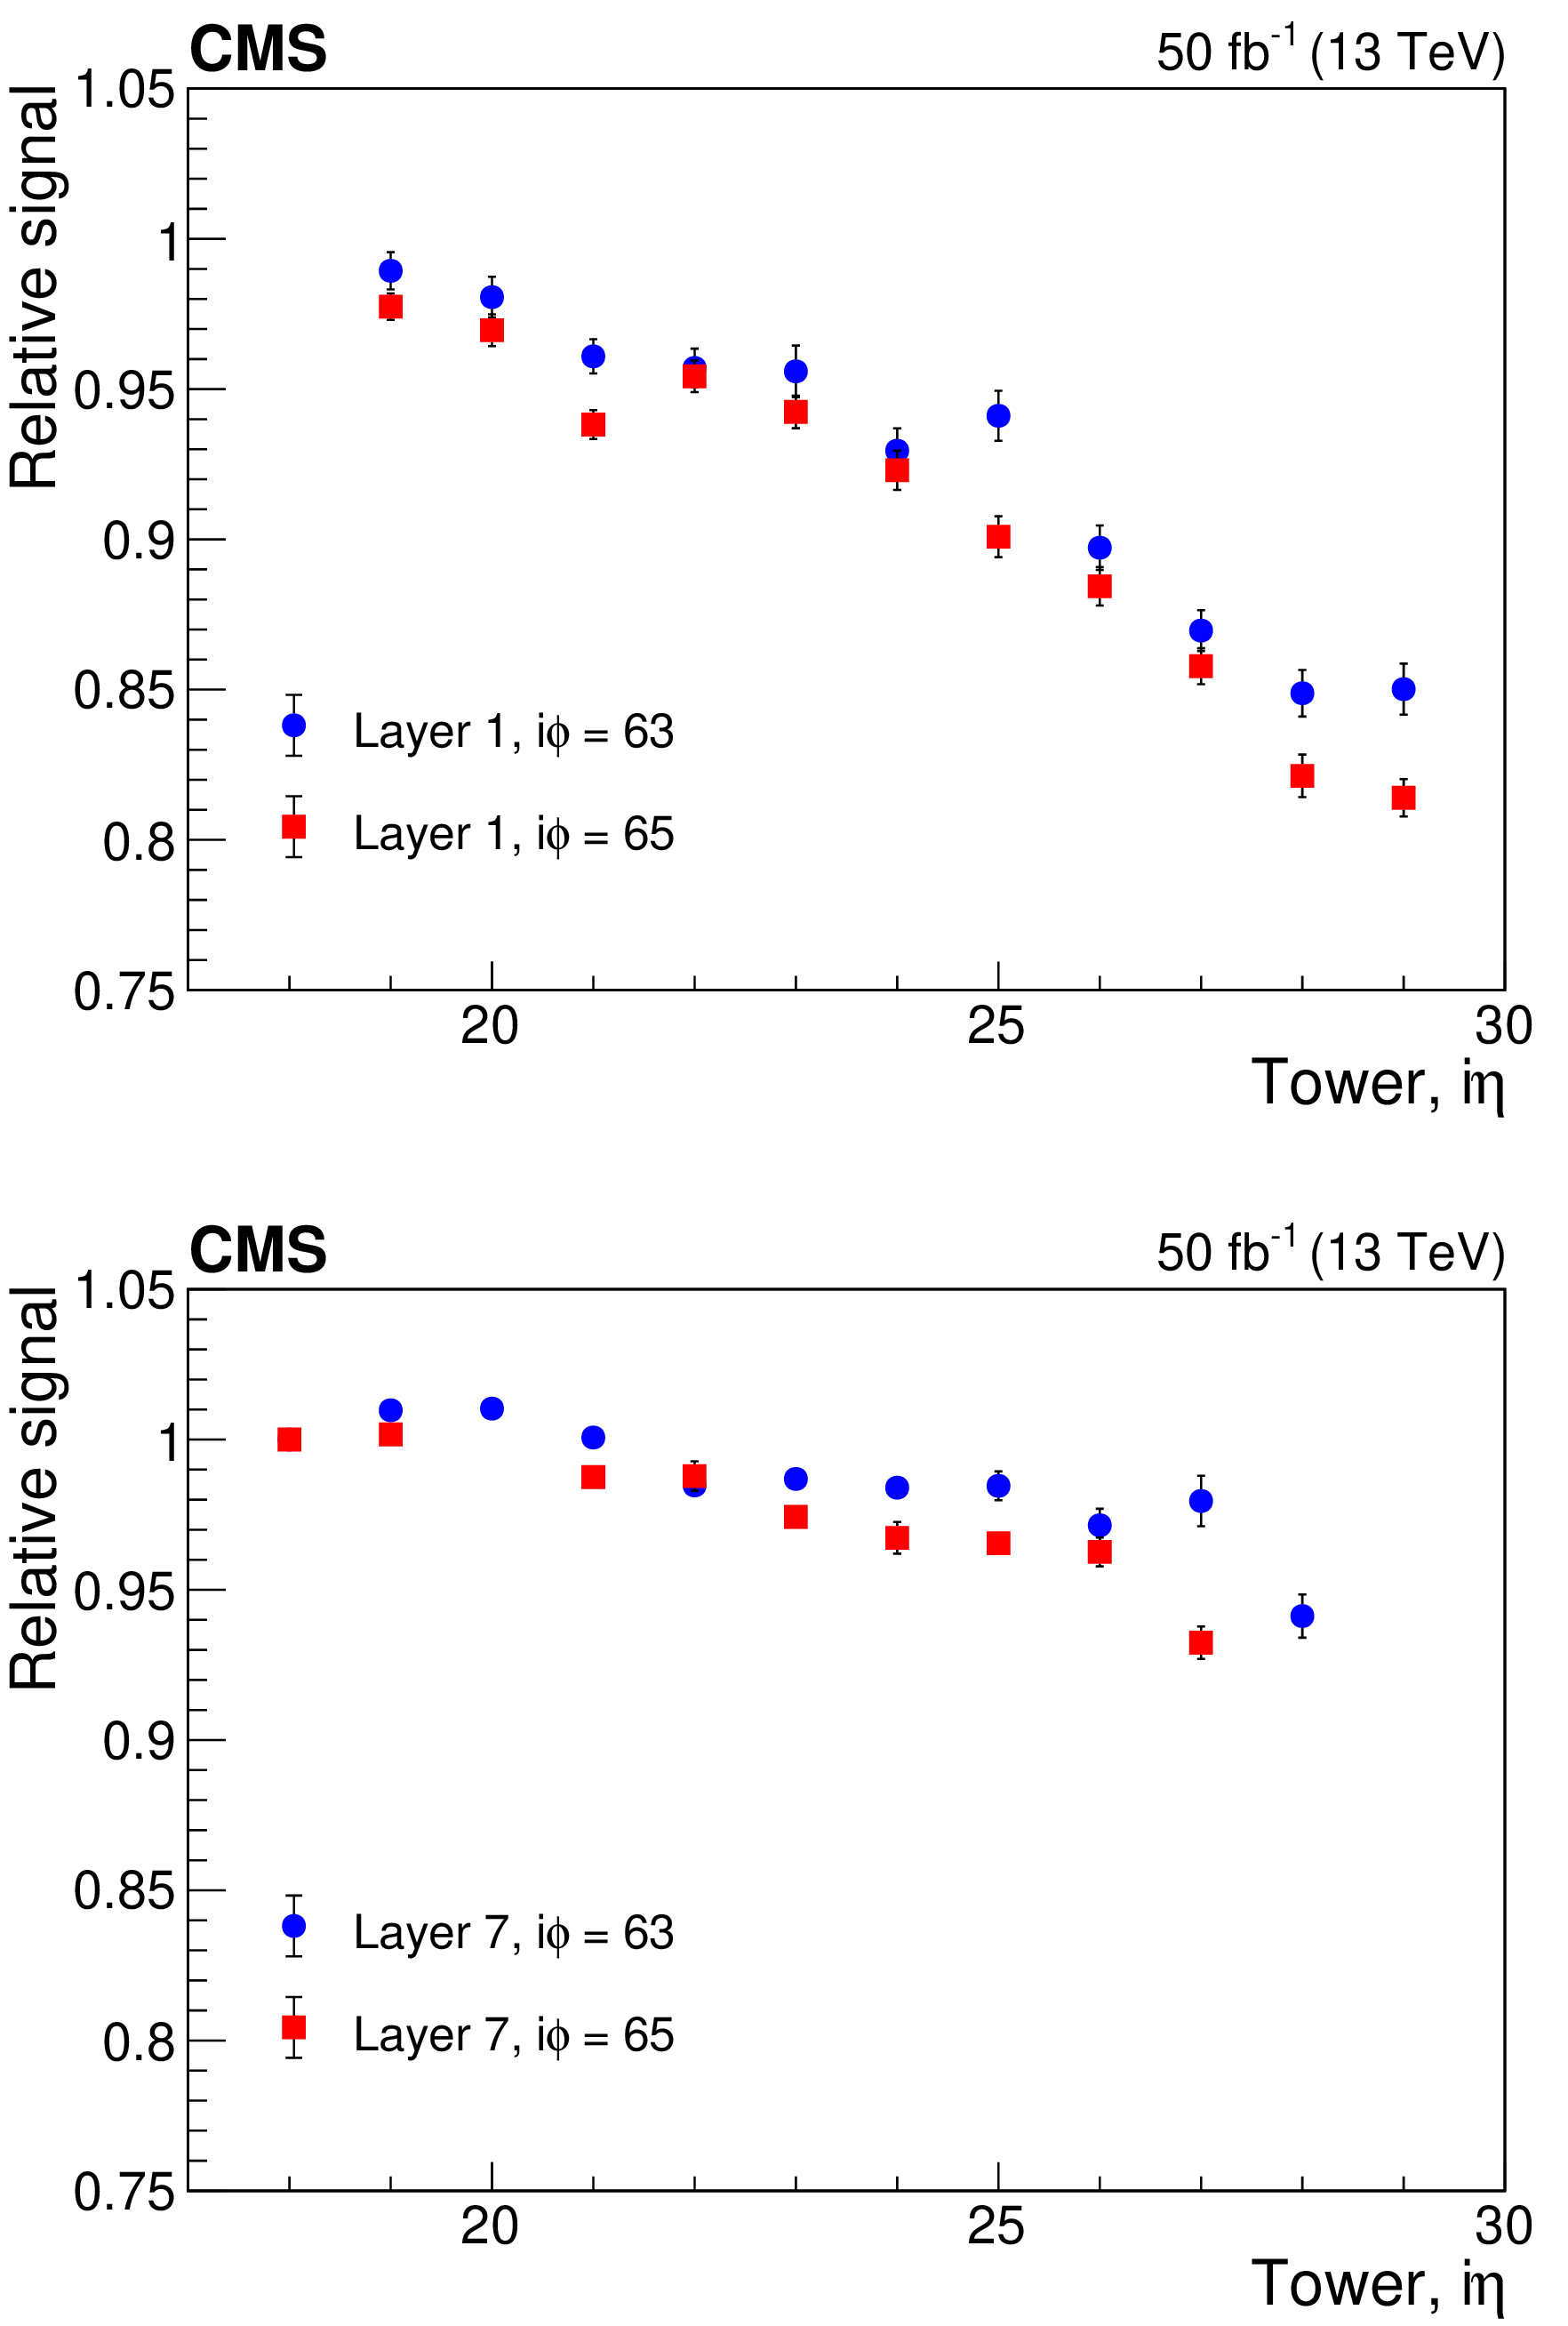
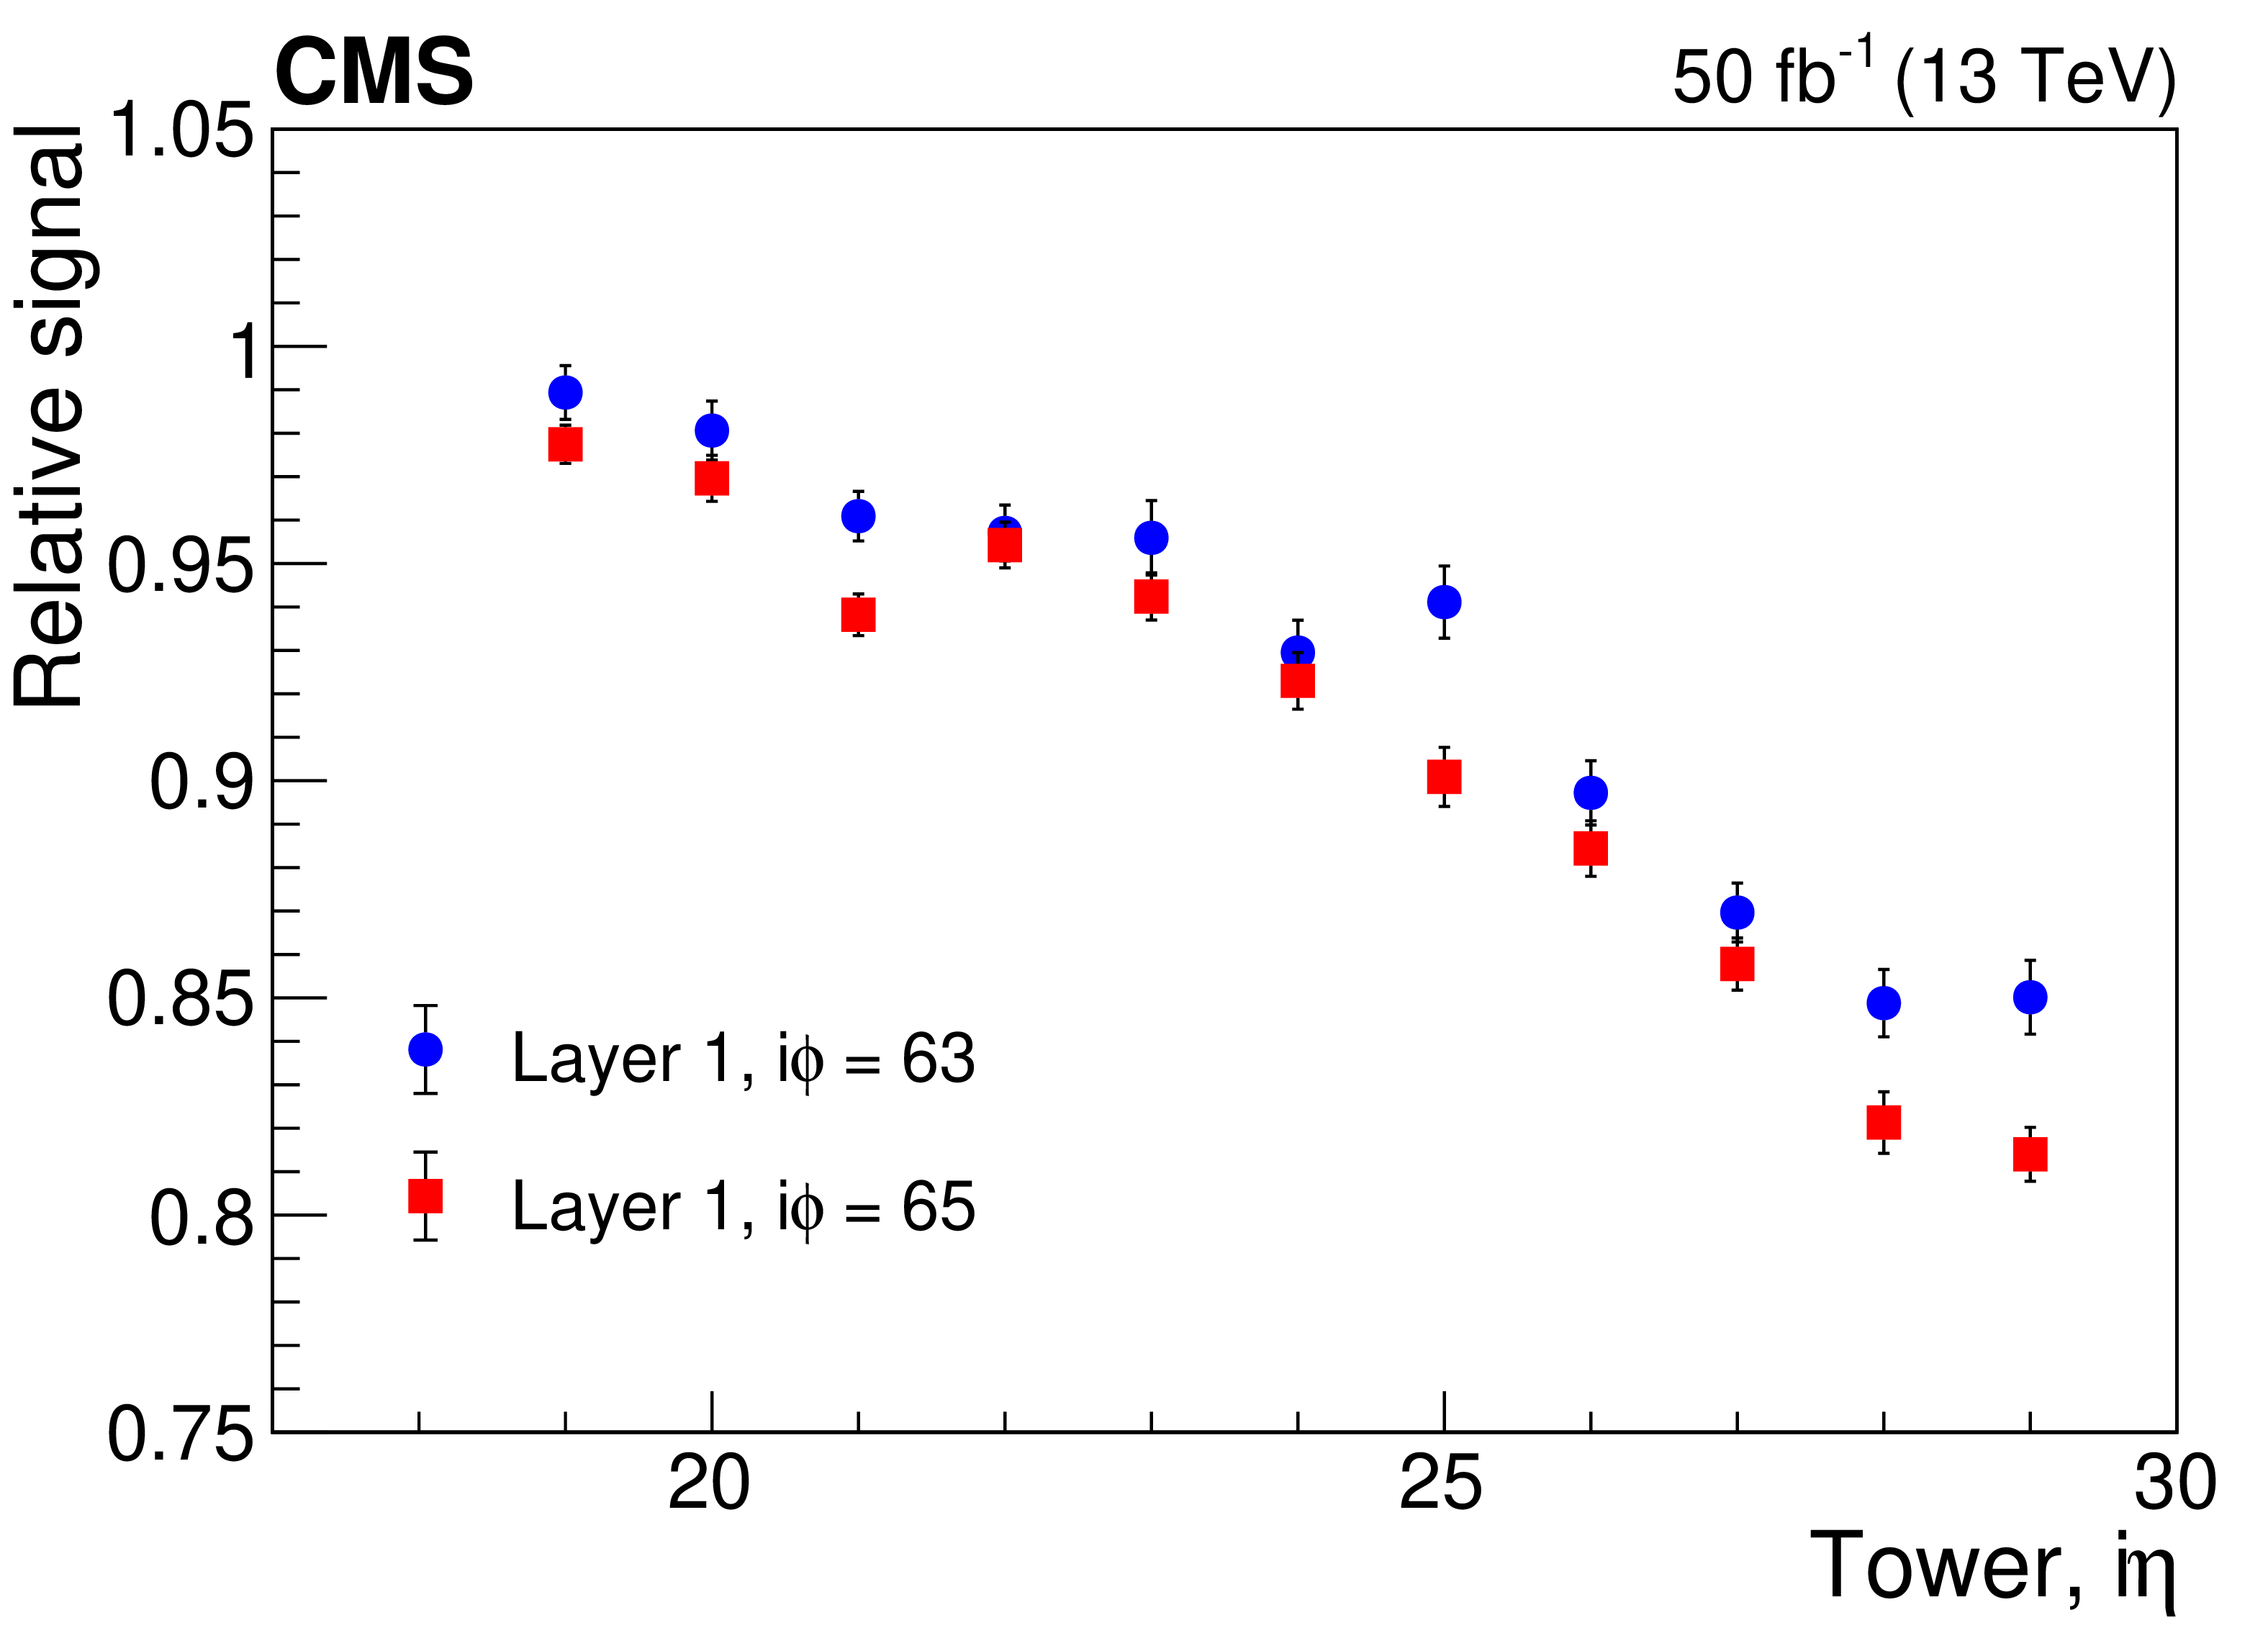
Figure 8:
Signal at the end of the 2017 data-taking period from the HE {SiPM}s, relative to that at the start, as measured using the laser calibration system versus ${{i\eta}}$ for layer 1 (upper) and layer 7 (lower). Only unscaled statistical uncertainties are shown. |
png pdf |
Figure 8-a:
Signal at the end of the 2017 data-taking period from the HE {SiPM}s, relative to that at the start, as measured using the laser calibration system versus ${{i\eta}}$ for layer 1 (upper) and layer 7 (lower). Only unscaled statistical uncertainties are shown. |
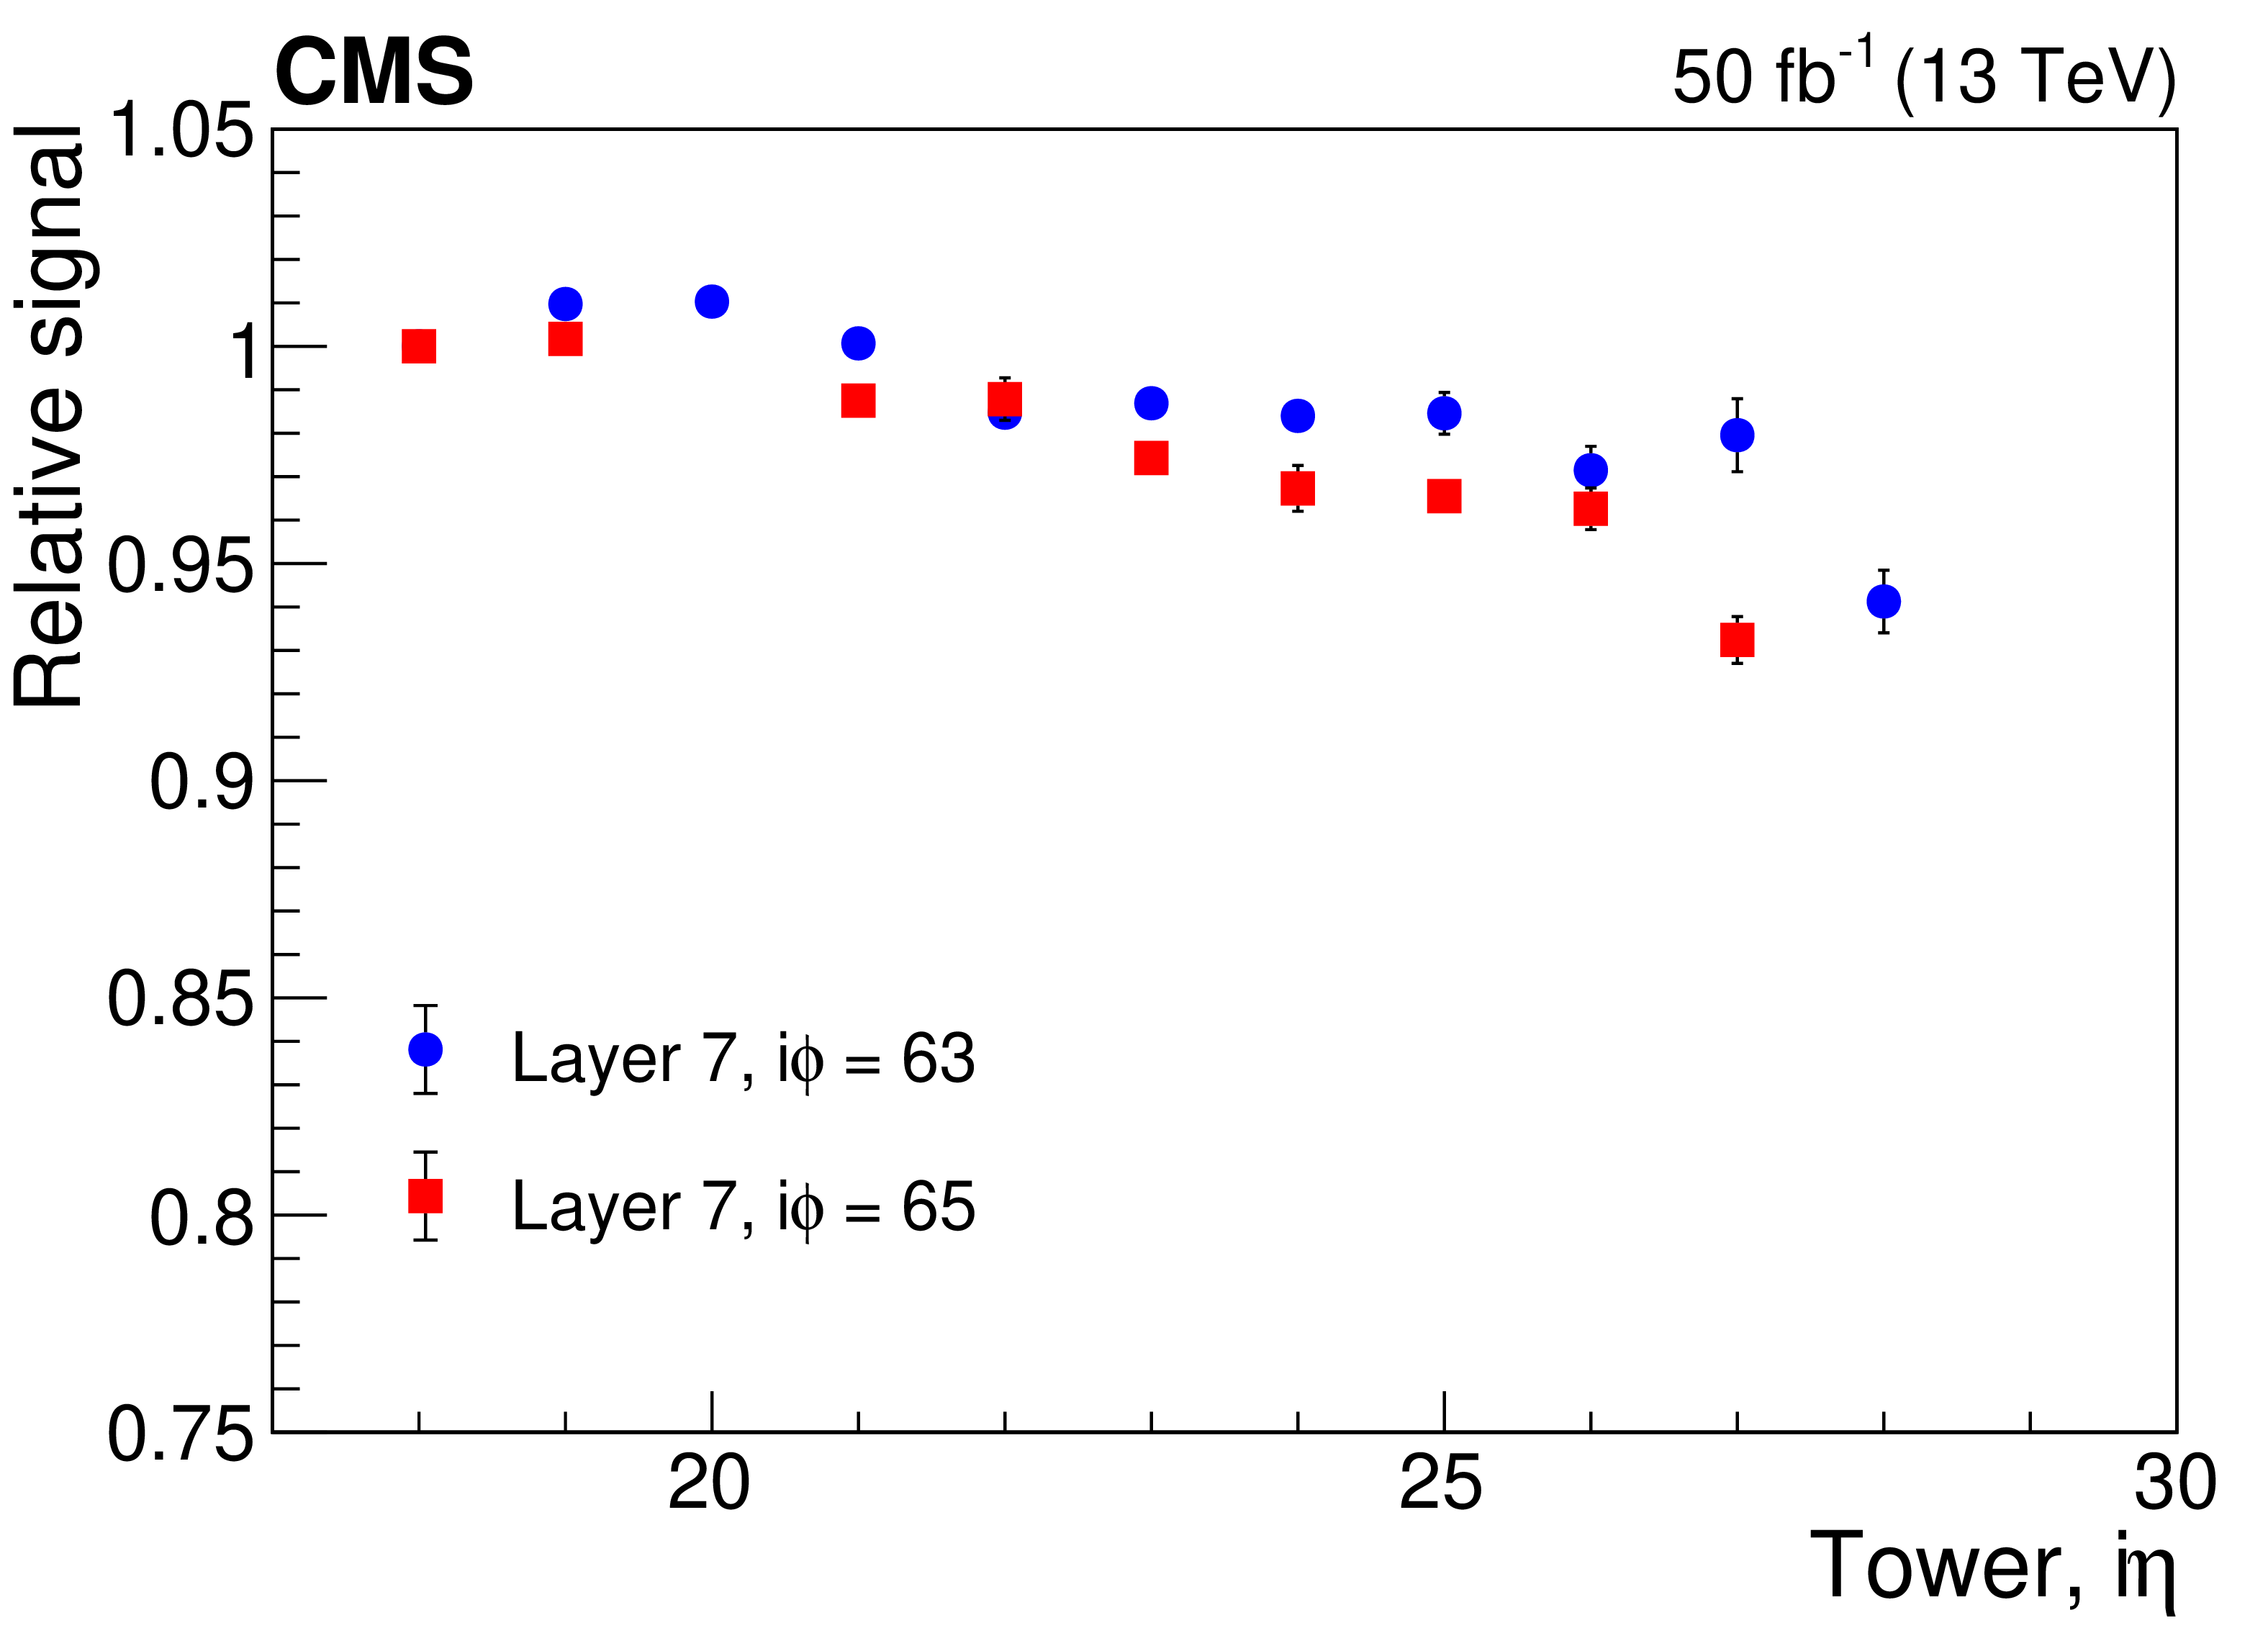
png pdf |
Figure 8-b:
Signal at the end of the 2017 data-taking period from the HE {SiPM}s, relative to that at the start, as measured using the laser calibration system versus ${{i\eta}}$ for layer 1 (upper) and layer 7 (lower). Only unscaled statistical uncertainties are shown. |

png pdf |
Figure 9:
Relative signal measured using the laser calibration system versus delivered luminosity for the tile in layer 1 with $ {i\eta} = $ 27 and $ {i\phi} = $ 63. Scaled statistical uncertainties are shown (see text). For this tile, the estimated dose at the end of data taking was $d= $ 1.5 kGy, and the average dose rate was $ {R} = $ 0.89 kGy. The dashed line represents a fit to the data to obtain the value of the exponential slope. Note that the vertical scale is logarithmic. |
png pdf |
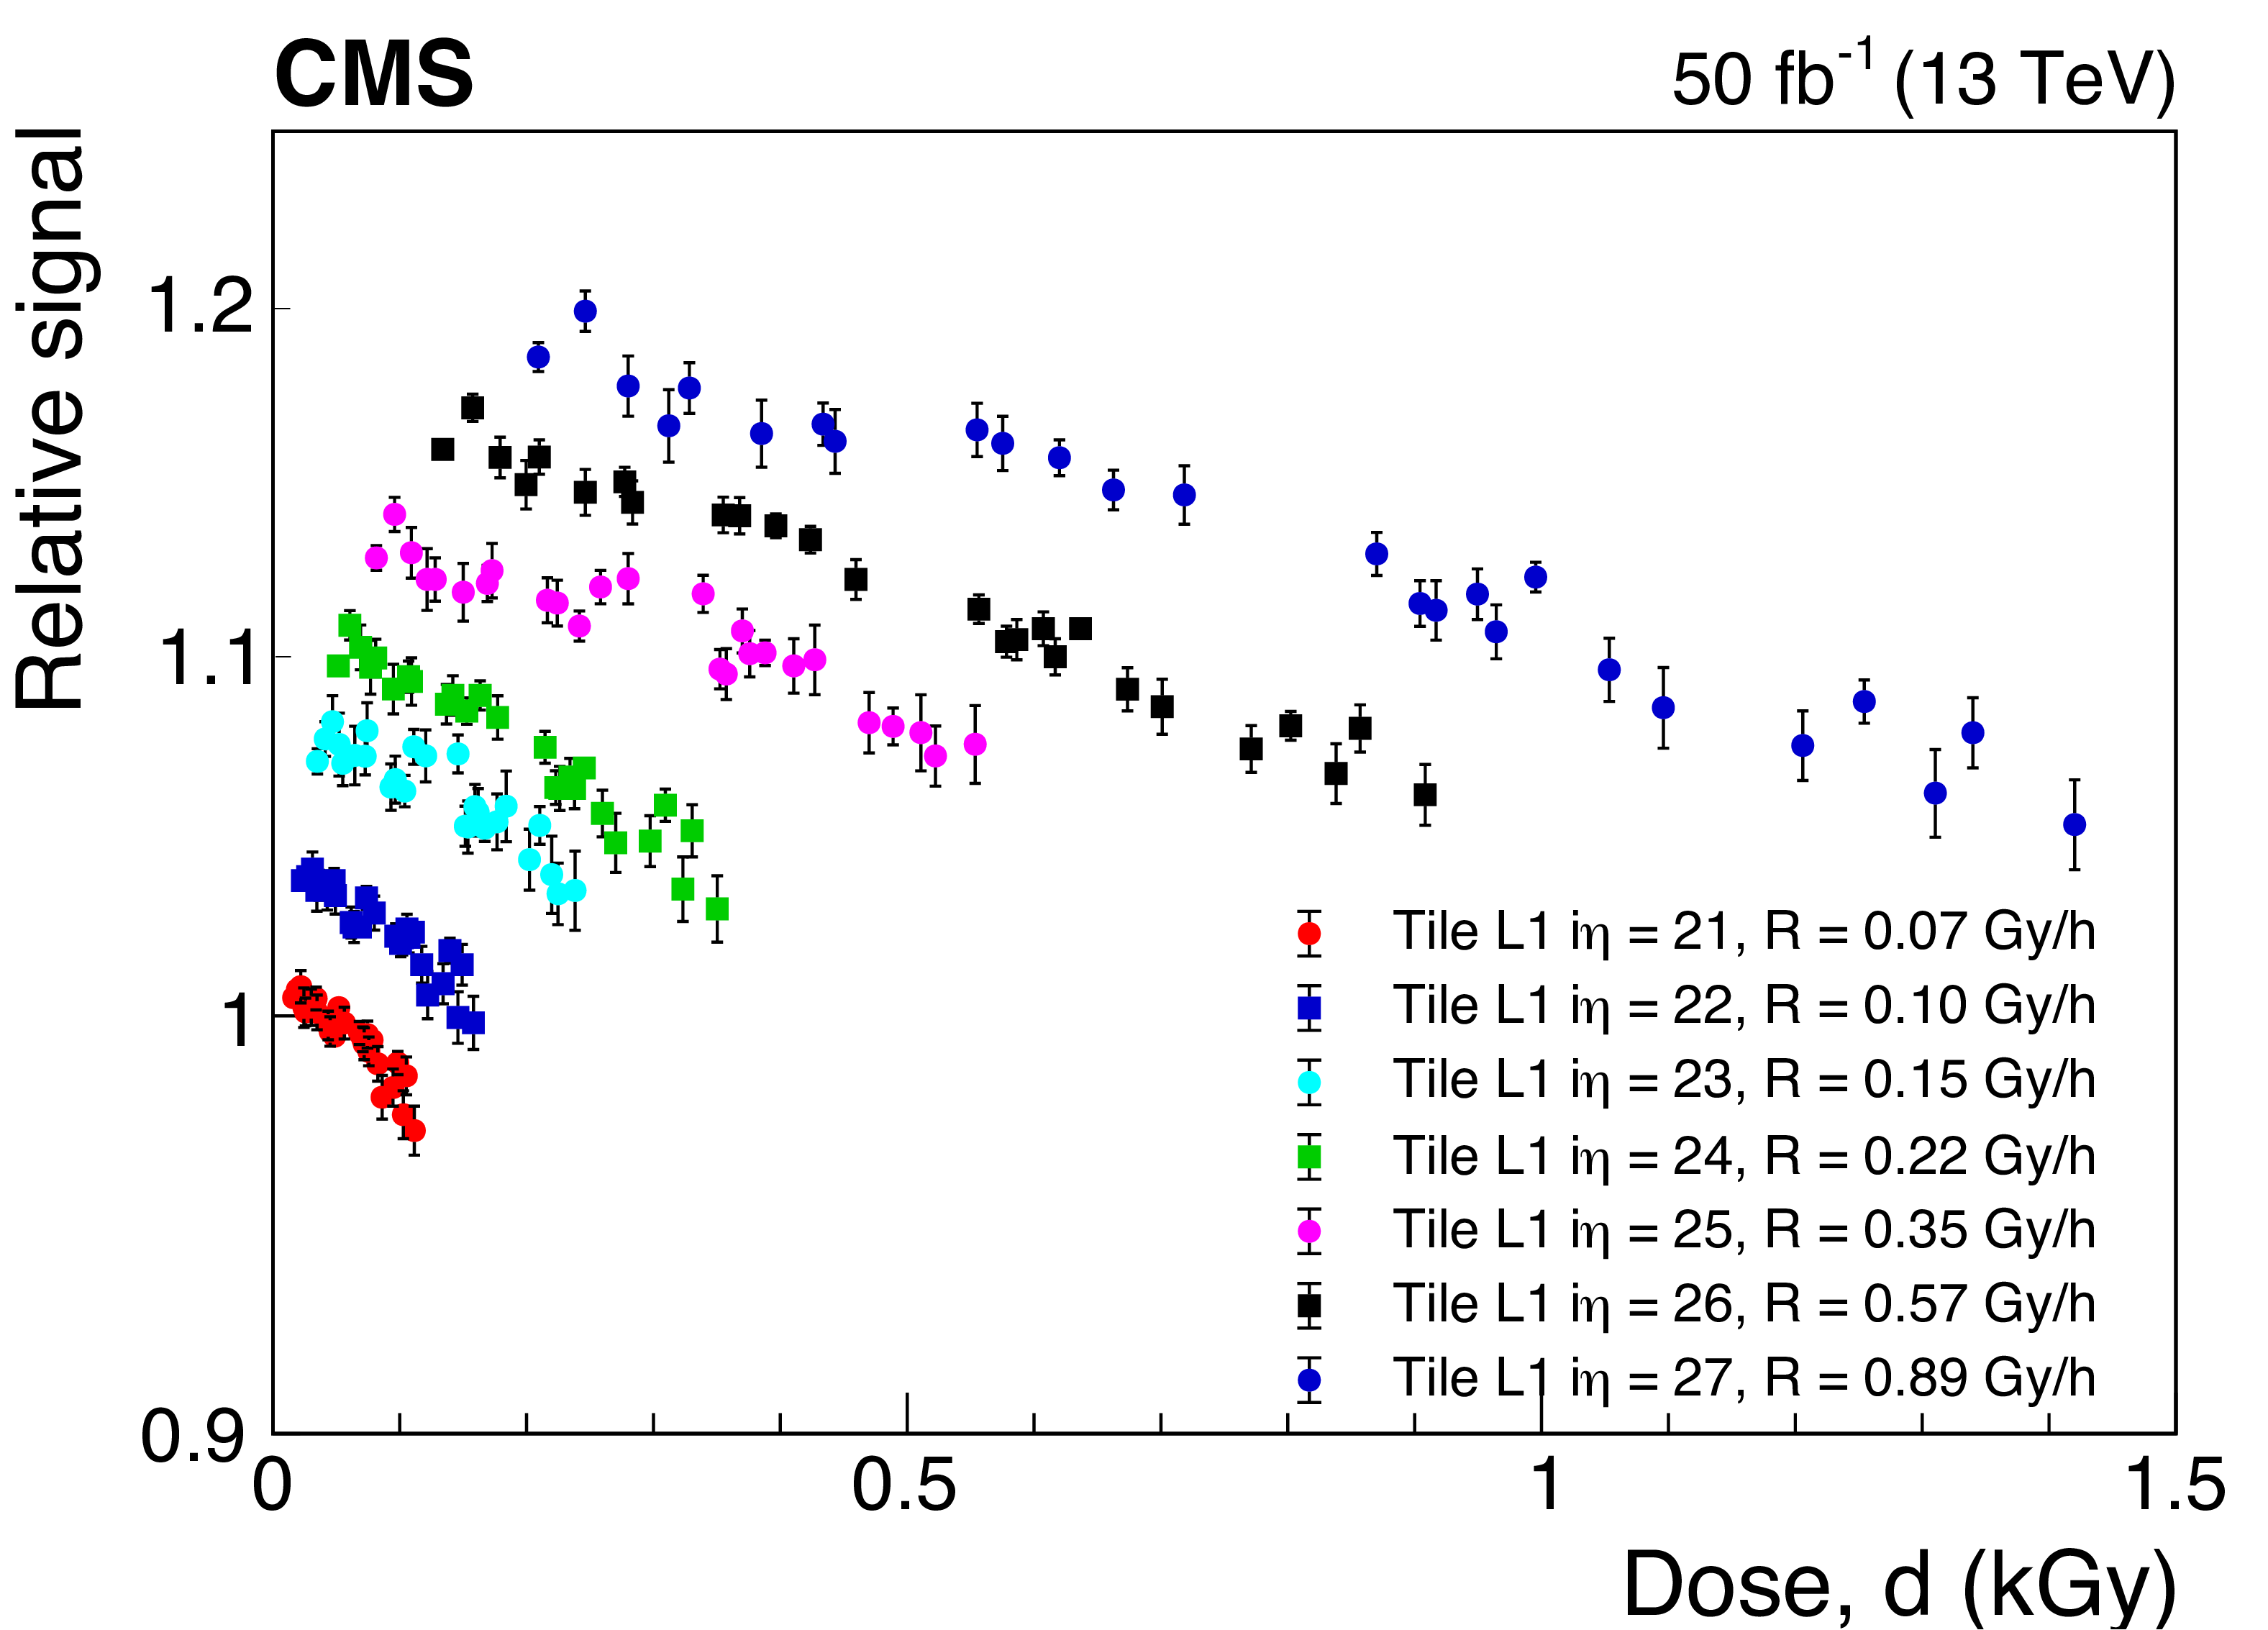
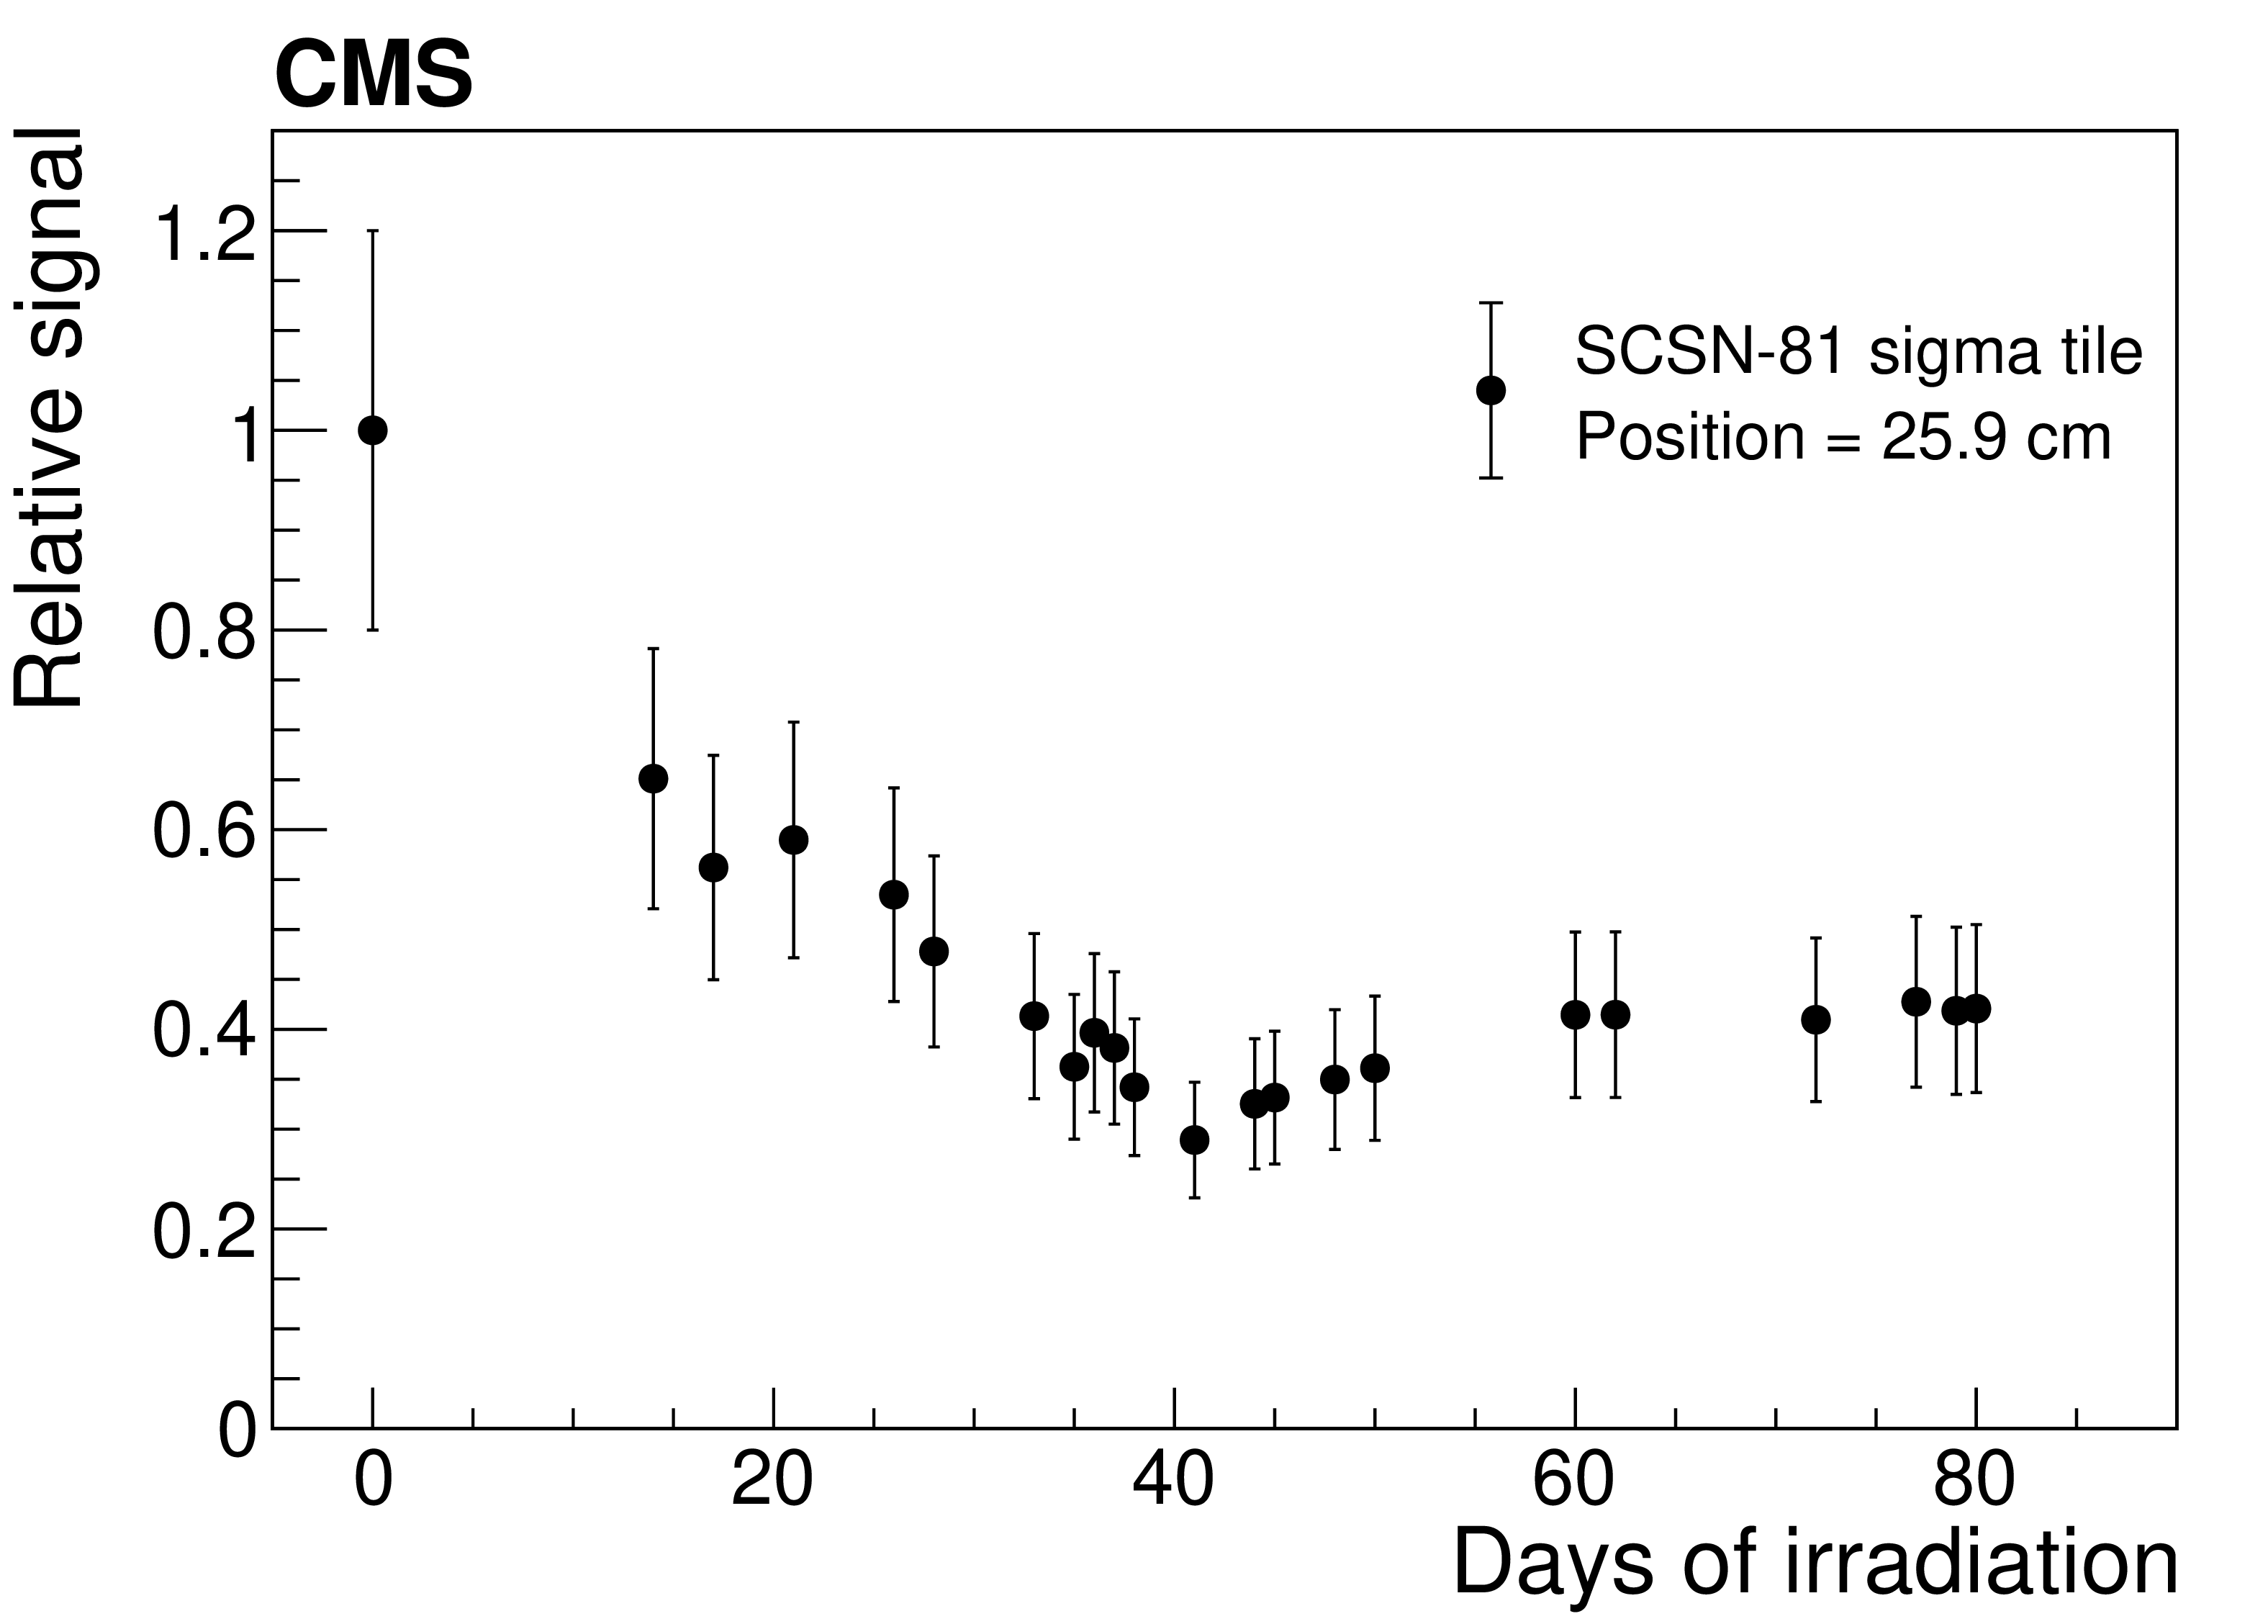
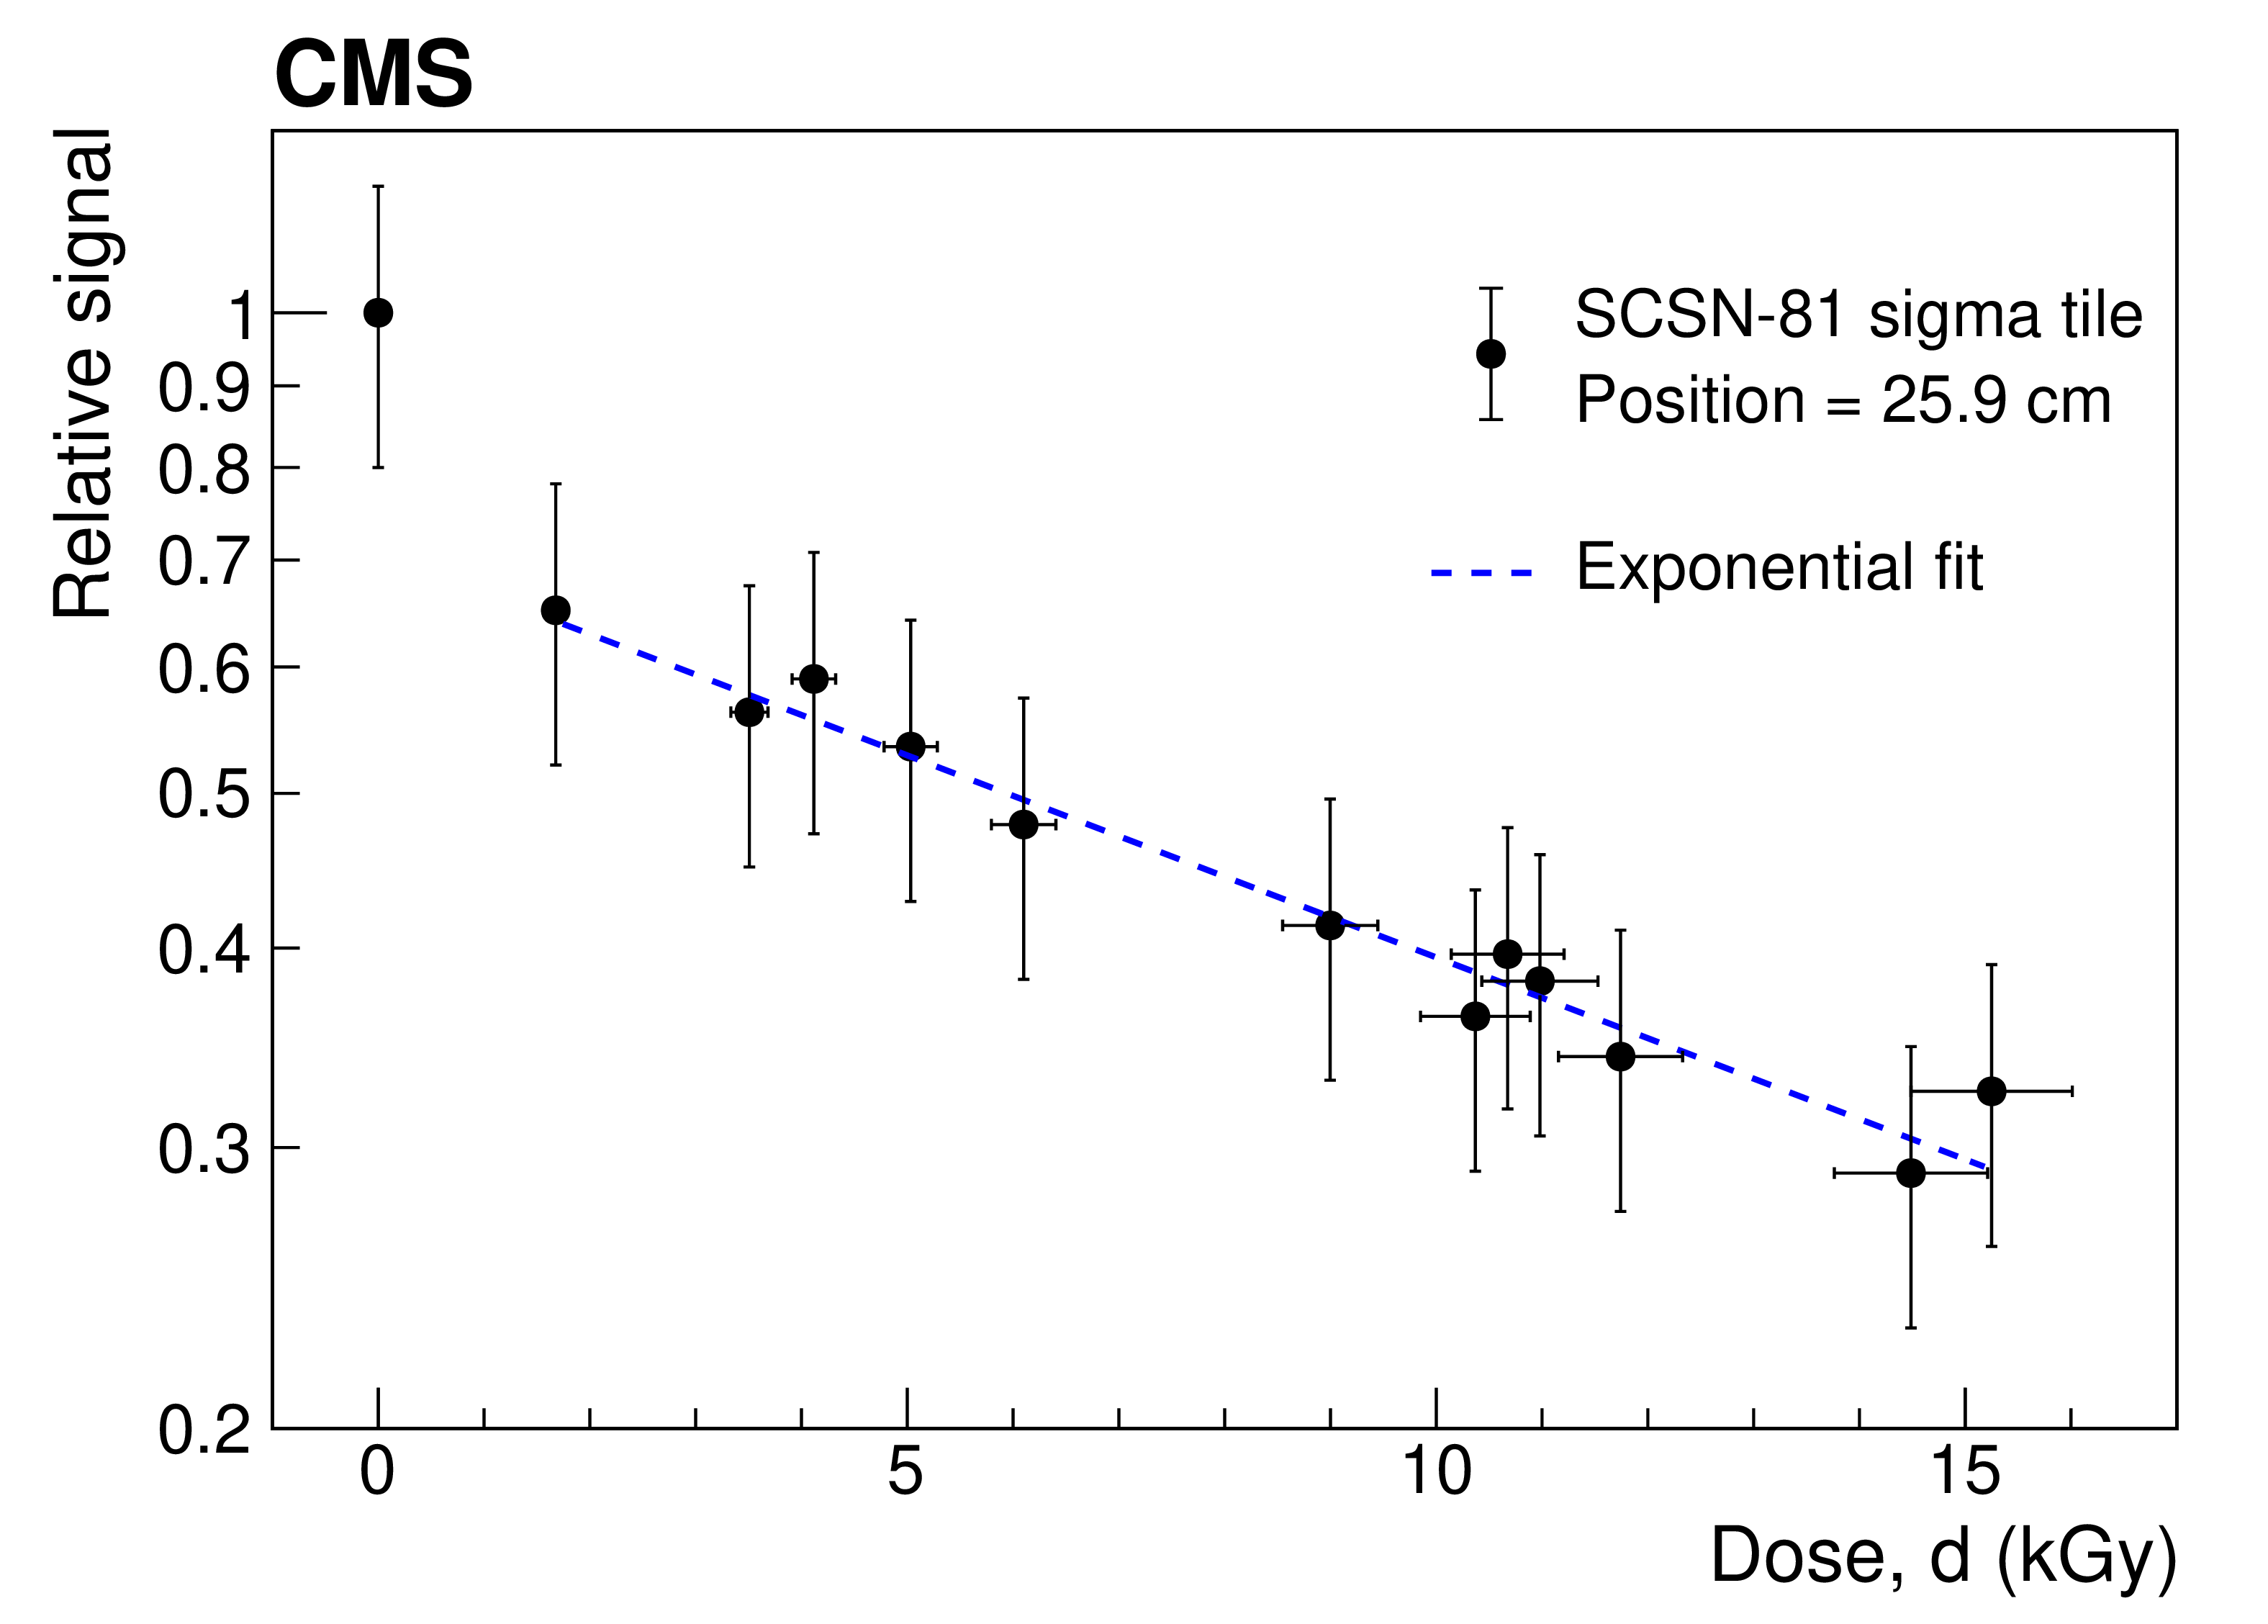
Figure 10:
Relative signal for laser light versus accumulated dose for the tiles in layer 1 with $ {i\eta} = $ 21-27. The average dose rates are shown for each set of points. The vertical scale is logarithmic and subsequent sets are shifted by a factor of 1.03 relative to the previous set for better visibility. Each set starts at the dose corresponding to integrated luminosity of 7 fb$^{-1}$. Scaled statistical uncertainties are shown (see text). |
png pdf |
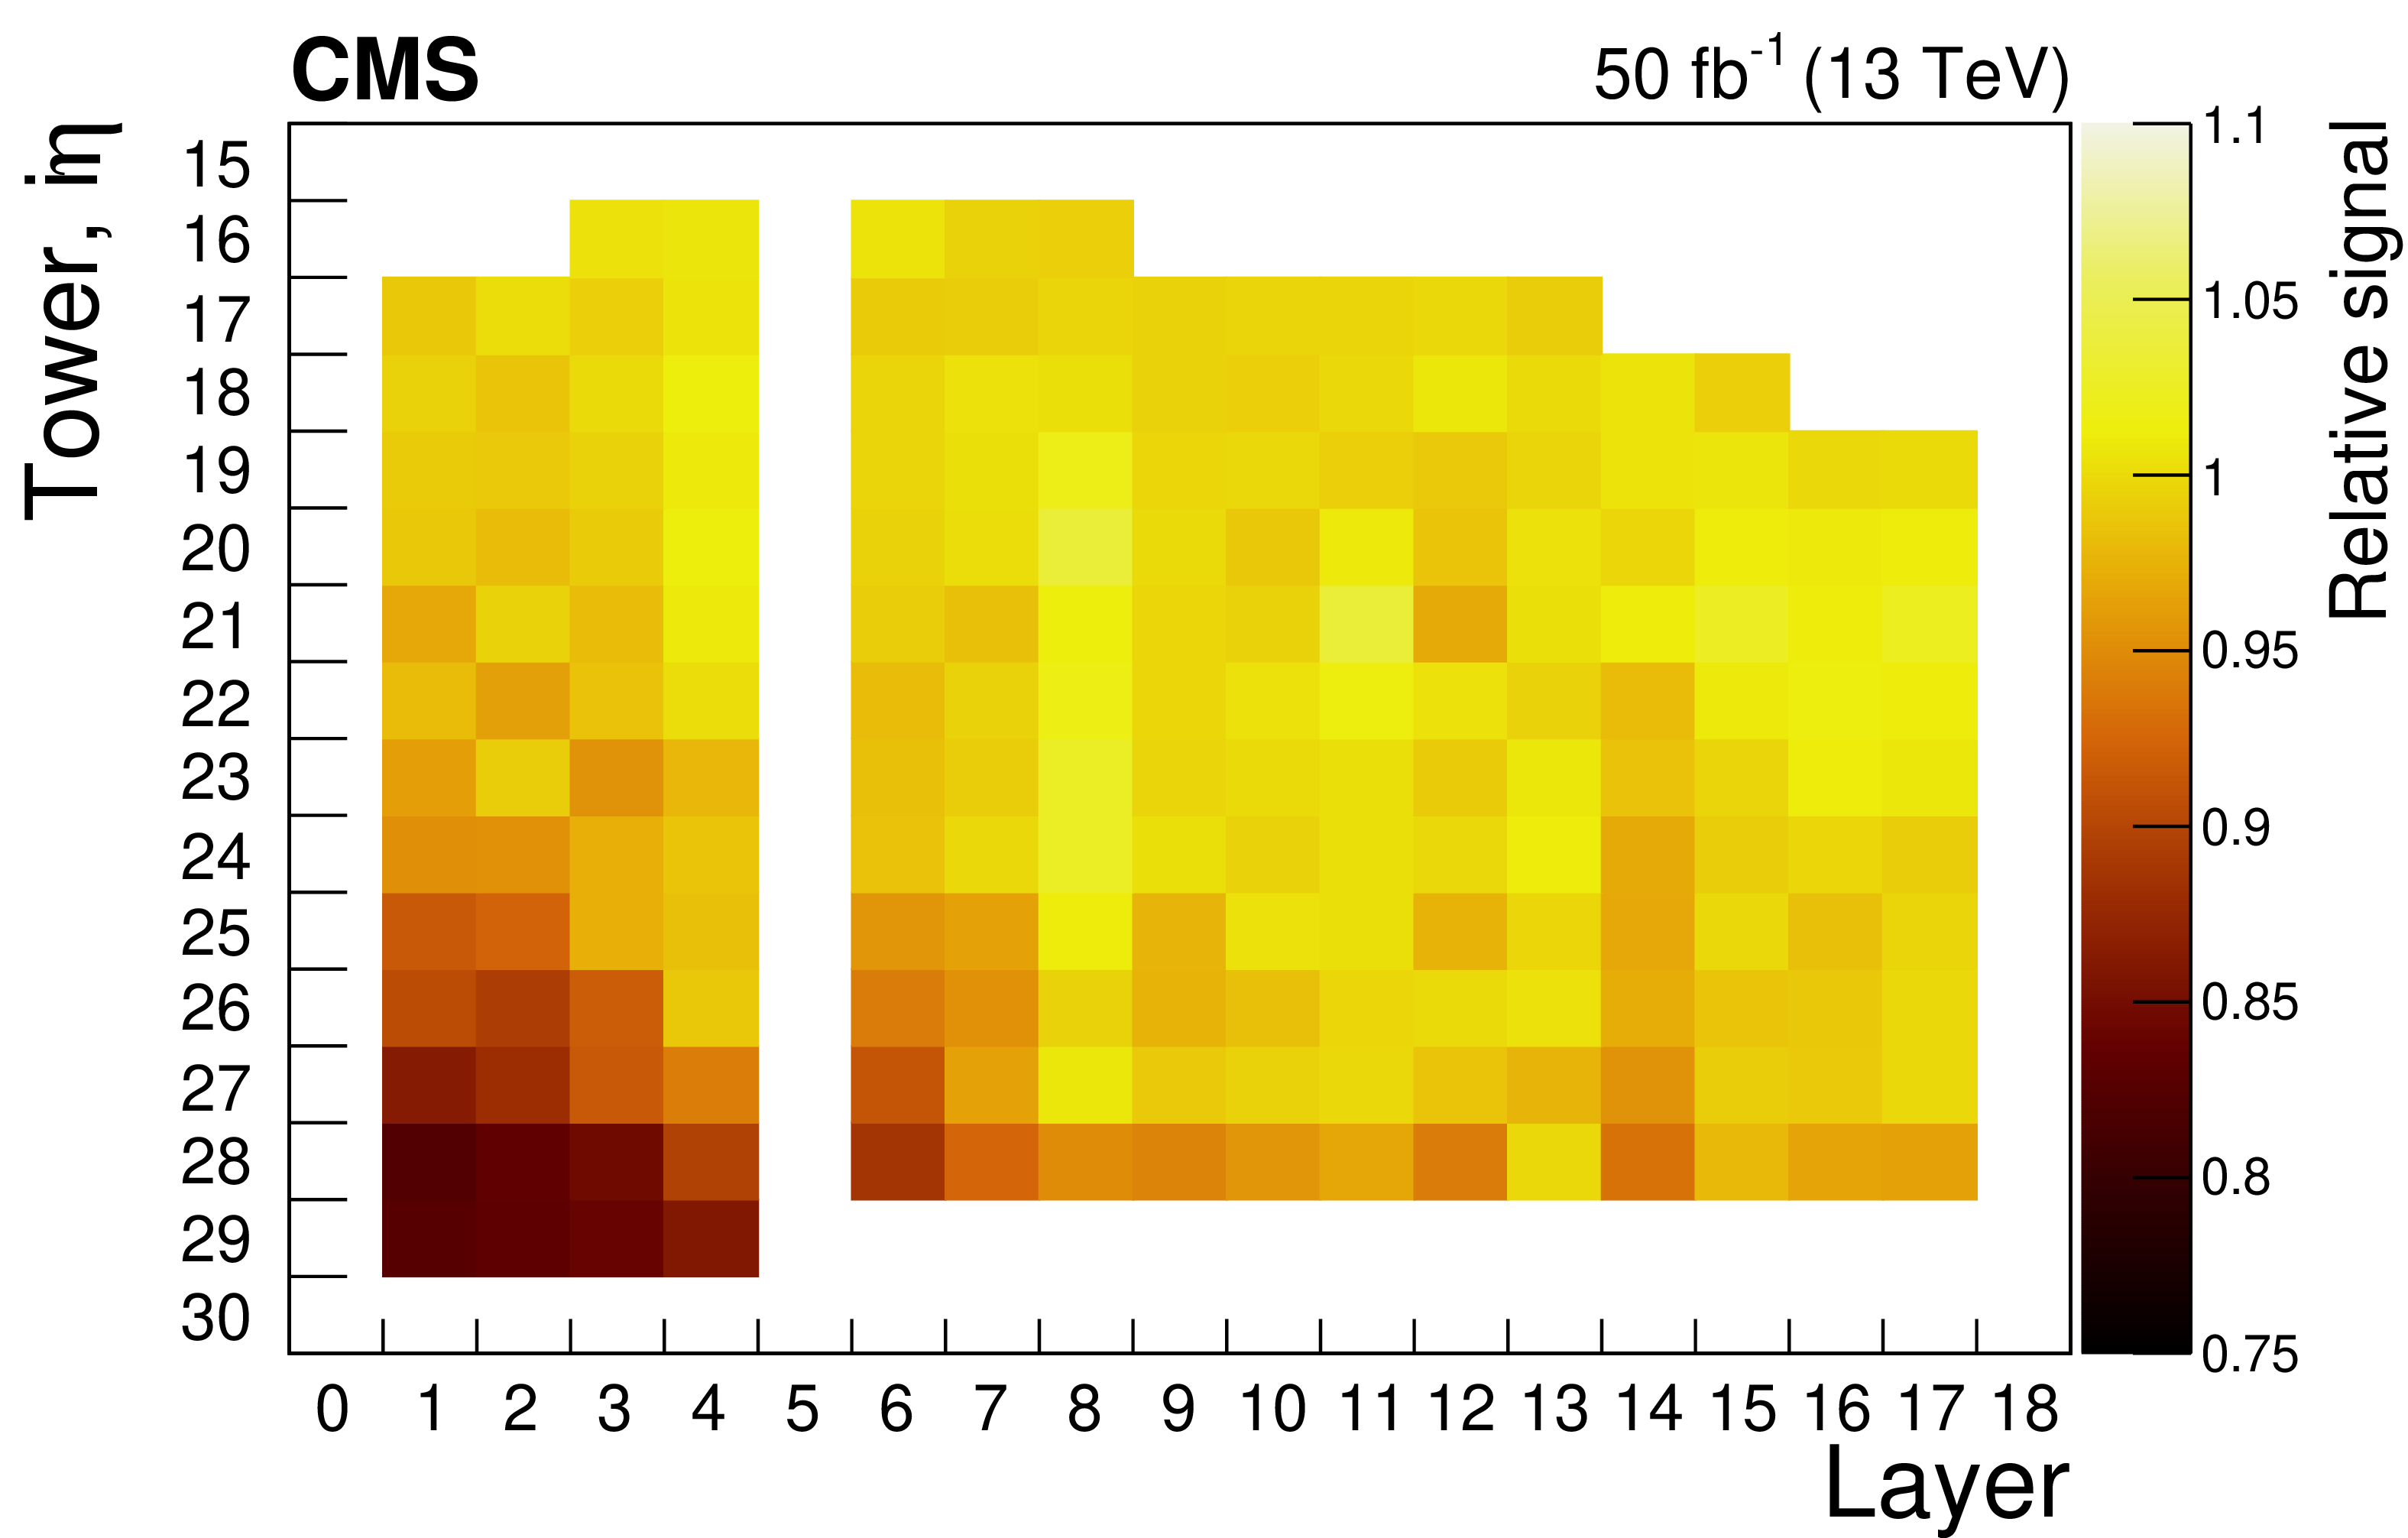
Figure 11:
Ratio of $^{60}\mathrm {Co}$ source signals observed before and after the 2017 data-taking period, as a function of ${i\eta}$ and layer number of scintillator tiles in the HE. Tubes in layers 0 and 5 have obstructions and cannot be accessed. |

png pdf |
Figure 12:
The value of ${< \mu >}$ as a function of ${R}$ for laser and source data, parametrized by a power-law behavior, which is shown as a dashed line. |

png pdf |
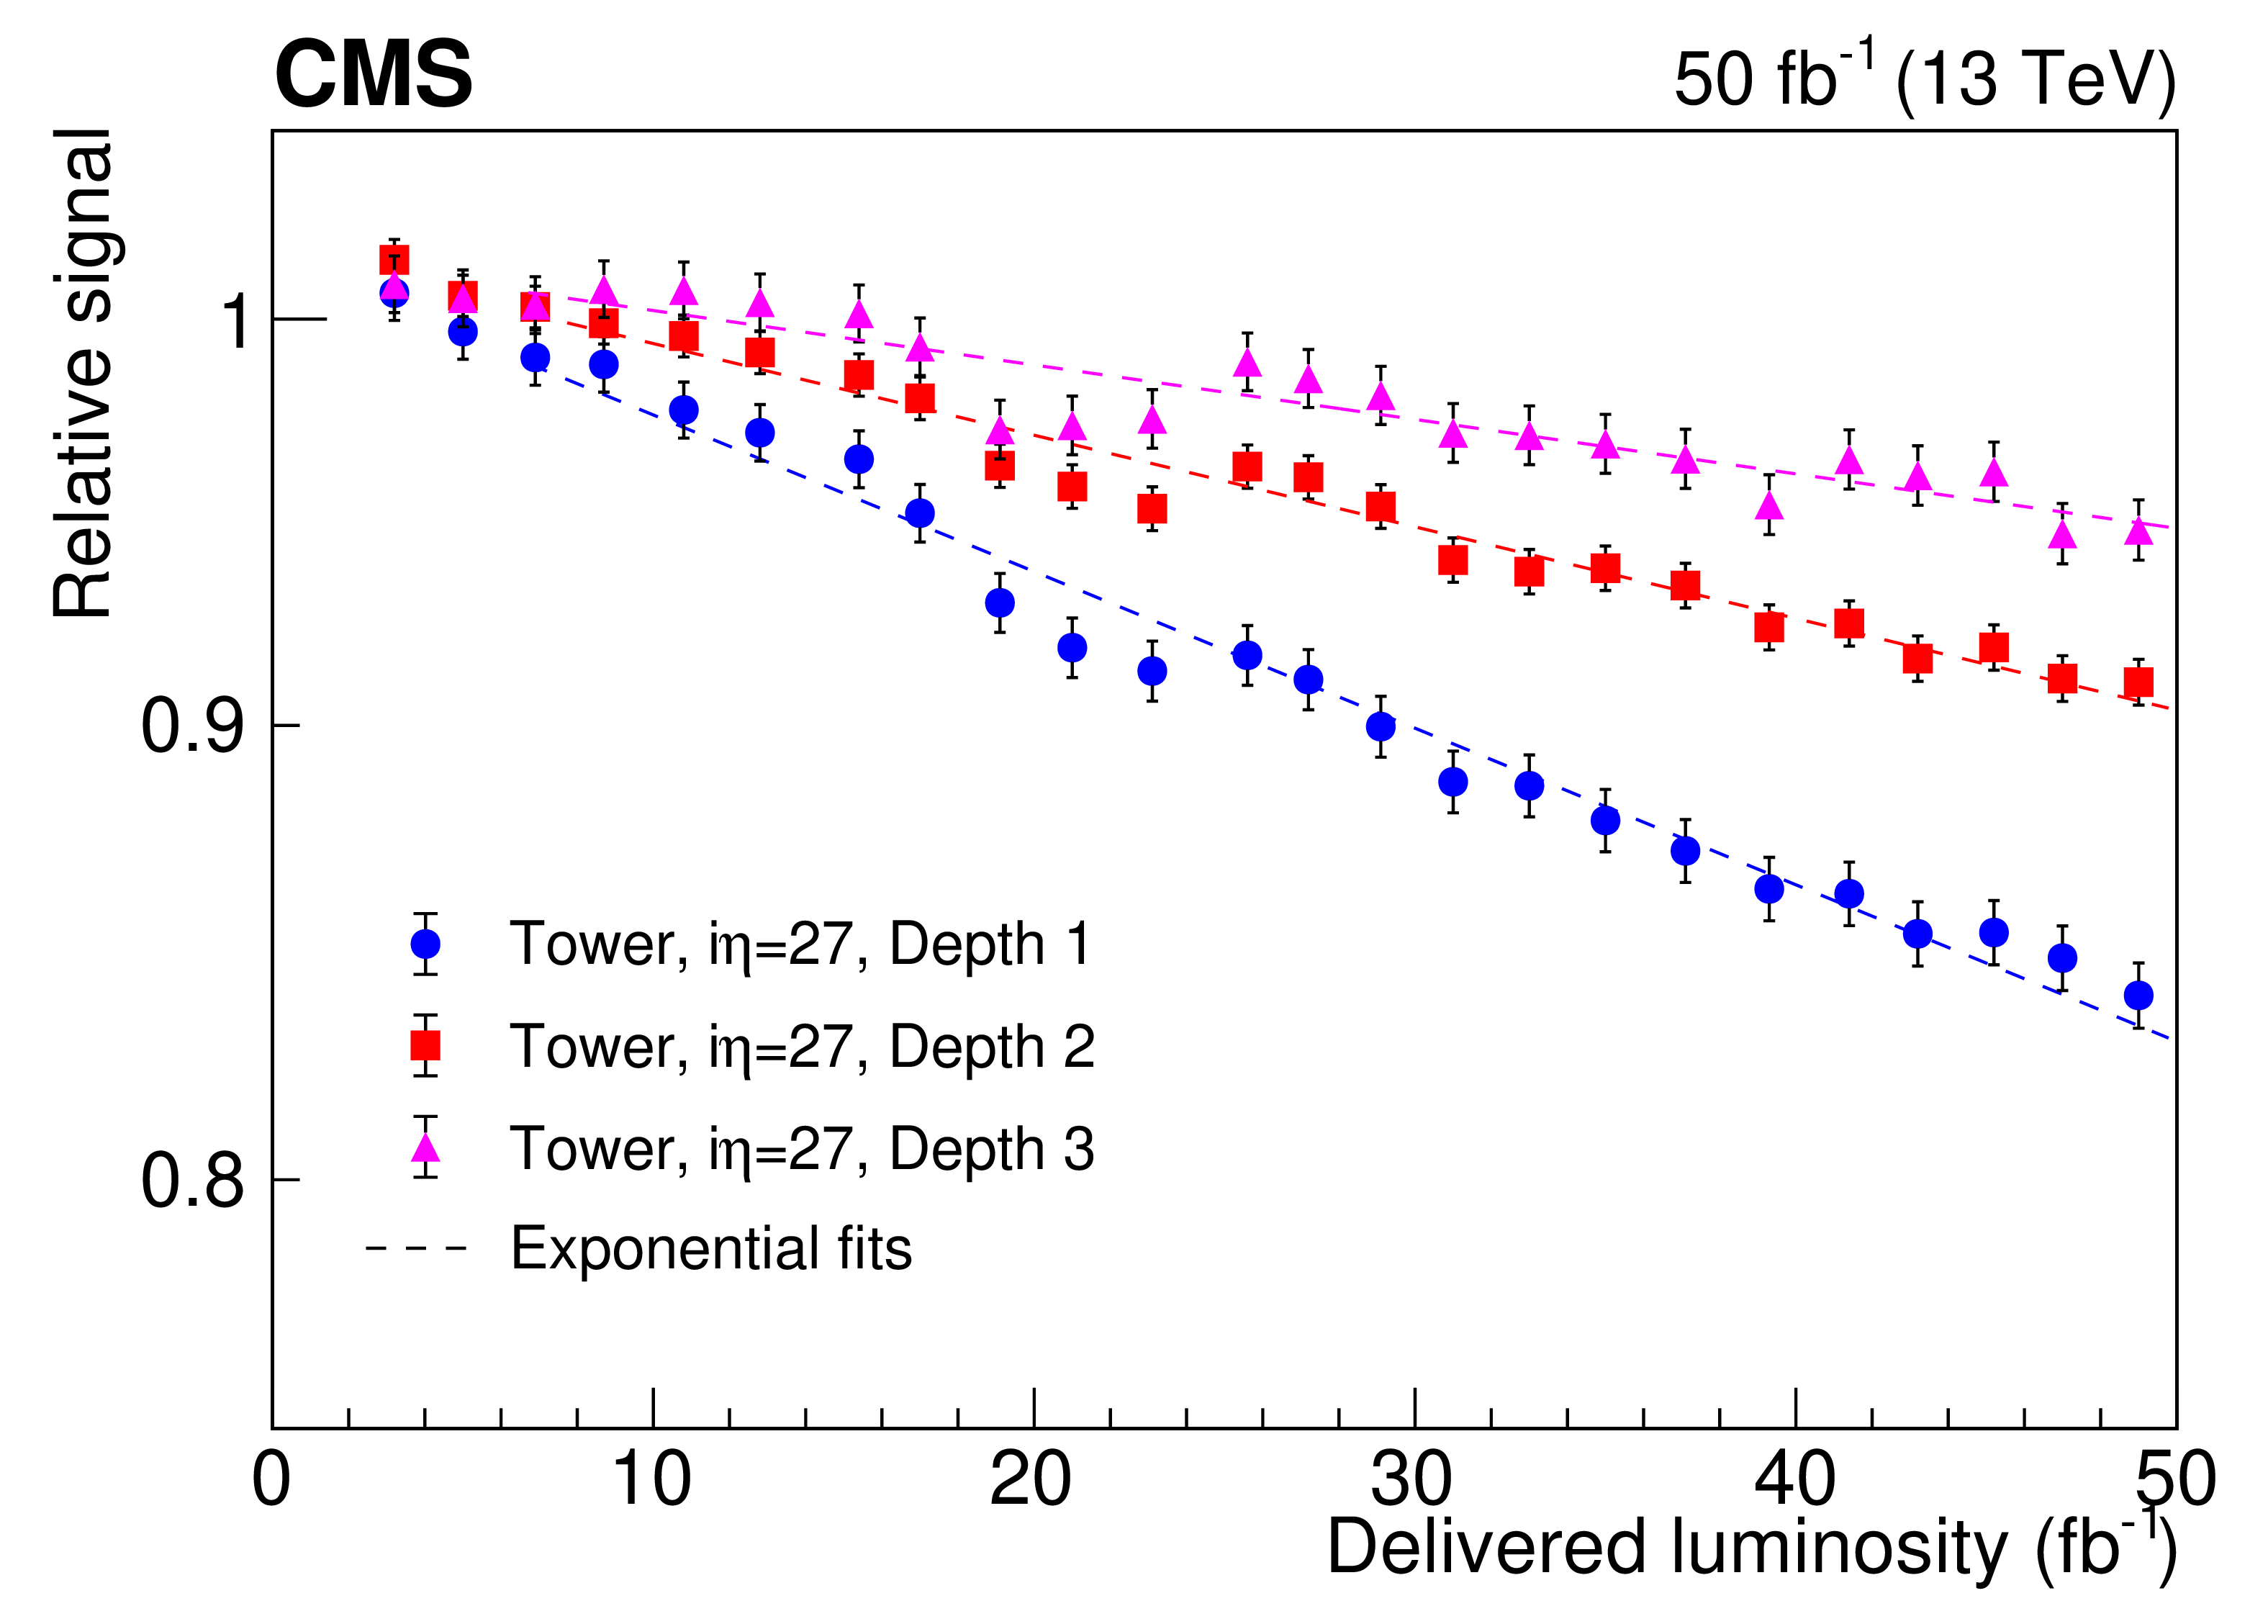
Figure 13:
Upper: Relative signal $F$ for $ {i\eta} = $ 27 in depths 1, 2, and 3 versus delivered luminosity using the in situ "inclusive'' method; the dashed lines show the results of fits with an exponential function, after excluding the first 7 fb$^{-1}$ of data, as was done in the laser data analysis (Sec. 4.2). For the tile in depth 1 (i.e., layer 0), the estimated dose at the end of data taking was $d=$ 1.5 kGy and the average dose rate was $ {R} = $ 0.89 kGy. Lower: Relative signal $F$ for towers with $ {i\eta} = $ 16-29 at different depths measured after 50 fb$^{-1}$ of delivered luminosity; only results with a relative uncertainty of 3% or lower on measured values of $F$ are shown. |
png pdf |
Figure 13-a:
Upper: Relative signal $F$ for $ {i\eta} = $ 27 in depths 1, 2, and 3 versus delivered luminosity using the in situ "inclusive'' method; the dashed lines show the results of fits with an exponential function, after excluding the first 7 fb$^{-1}$ of data, as was done in the laser data analysis (Sec. 4.2). For the tile in depth 1 (i.e., layer 0), the estimated dose at the end of data taking was $d=$ 1.5 kGy and the average dose rate was $ {R} = $ 0.89 kGy. Lower: Relative signal $F$ for towers with $ {i\eta} = $ 16-29 at different depths measured after 50 fb$^{-1}$ of delivered luminosity; only results with a relative uncertainty of 3% or lower on measured values of $F$ are shown. |
png pdf |
Figure 13-b:
Upper: Relative signal $F$ for $ {i\eta} = $ 27 in depths 1, 2, and 3 versus delivered luminosity using the in situ "inclusive'' method; the dashed lines show the results of fits with an exponential function, after excluding the first 7 fb$^{-1}$ of data, as was done in the laser data analysis (Sec. 4.2). For the tile in depth 1 (i.e., layer 0), the estimated dose at the end of data taking was $d=$ 1.5 kGy and the average dose rate was $ {R} = $ 0.89 kGy. Lower: Relative signal $F$ for towers with $ {i\eta} = $ 16-29 at different depths measured after 50 fb$^{-1}$ of delivered luminosity; only results with a relative uncertainty of 3% or lower on measured values of $F$ are shown. |
png pdf |
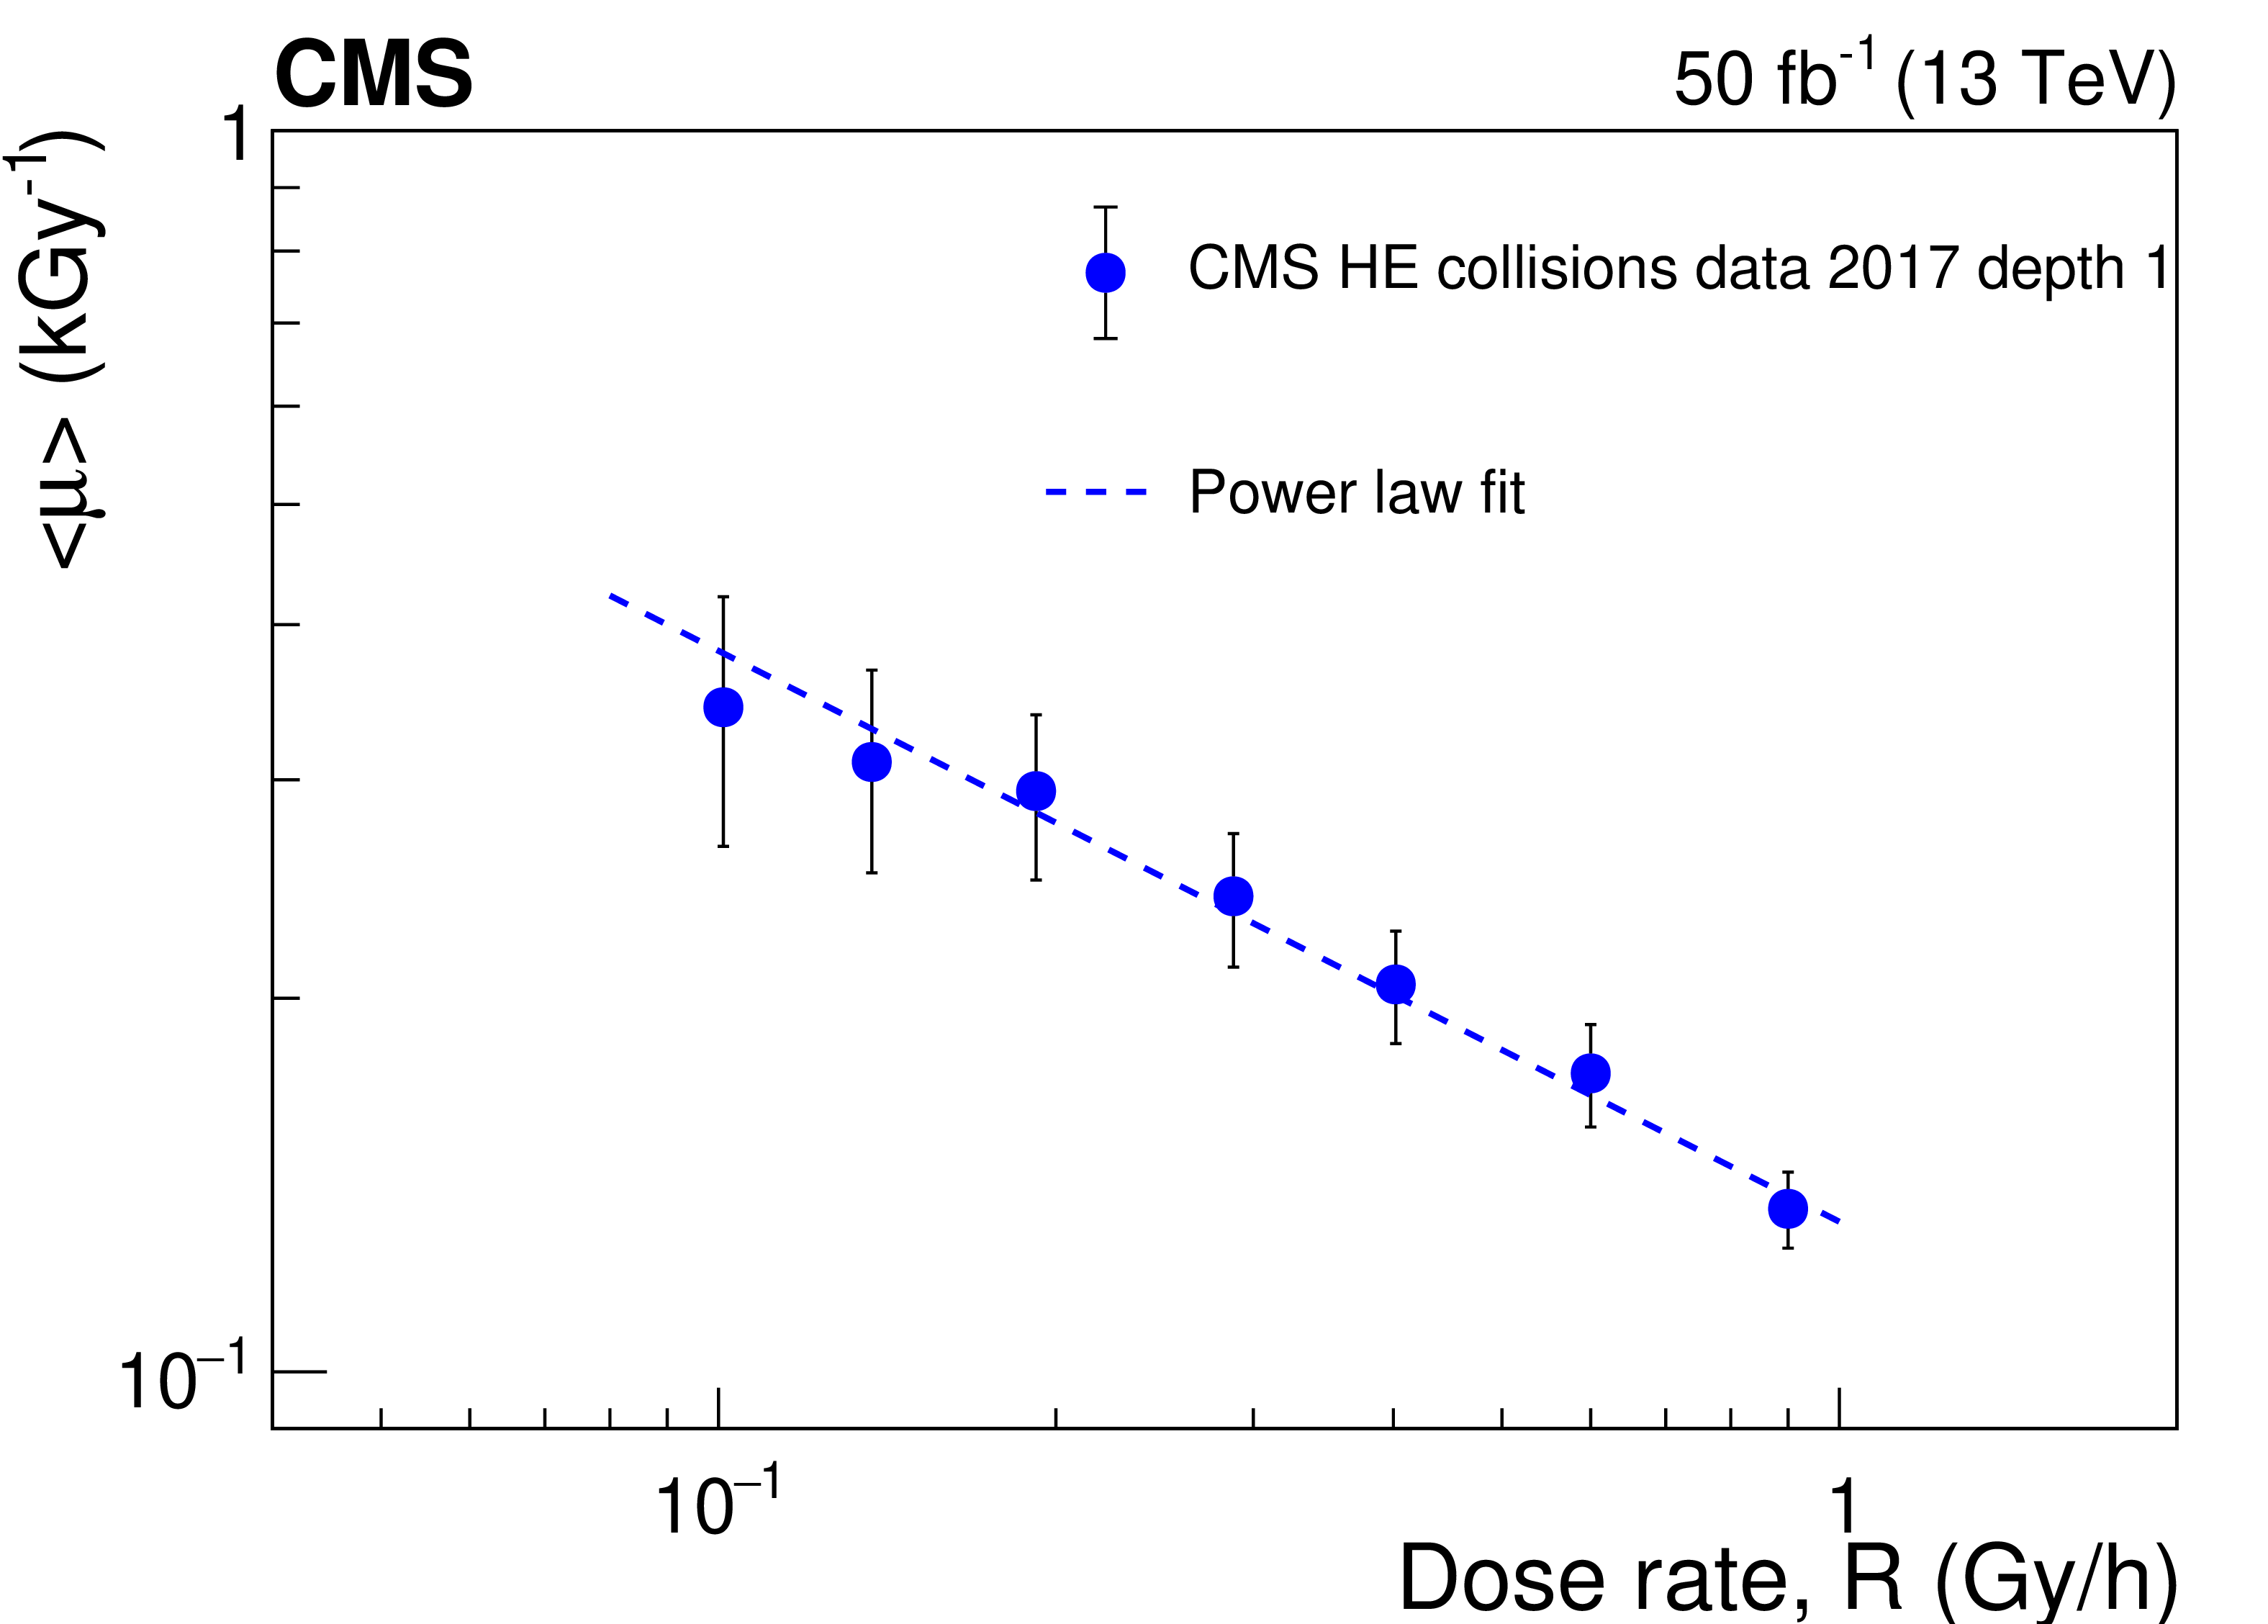
Figure 14:
The value of ${< \mu >}$ as a function of ${R}$ for in situ collision data in depth 1, parametrized by a power law behavior, which is shown as a dashed line. |
png pdf |
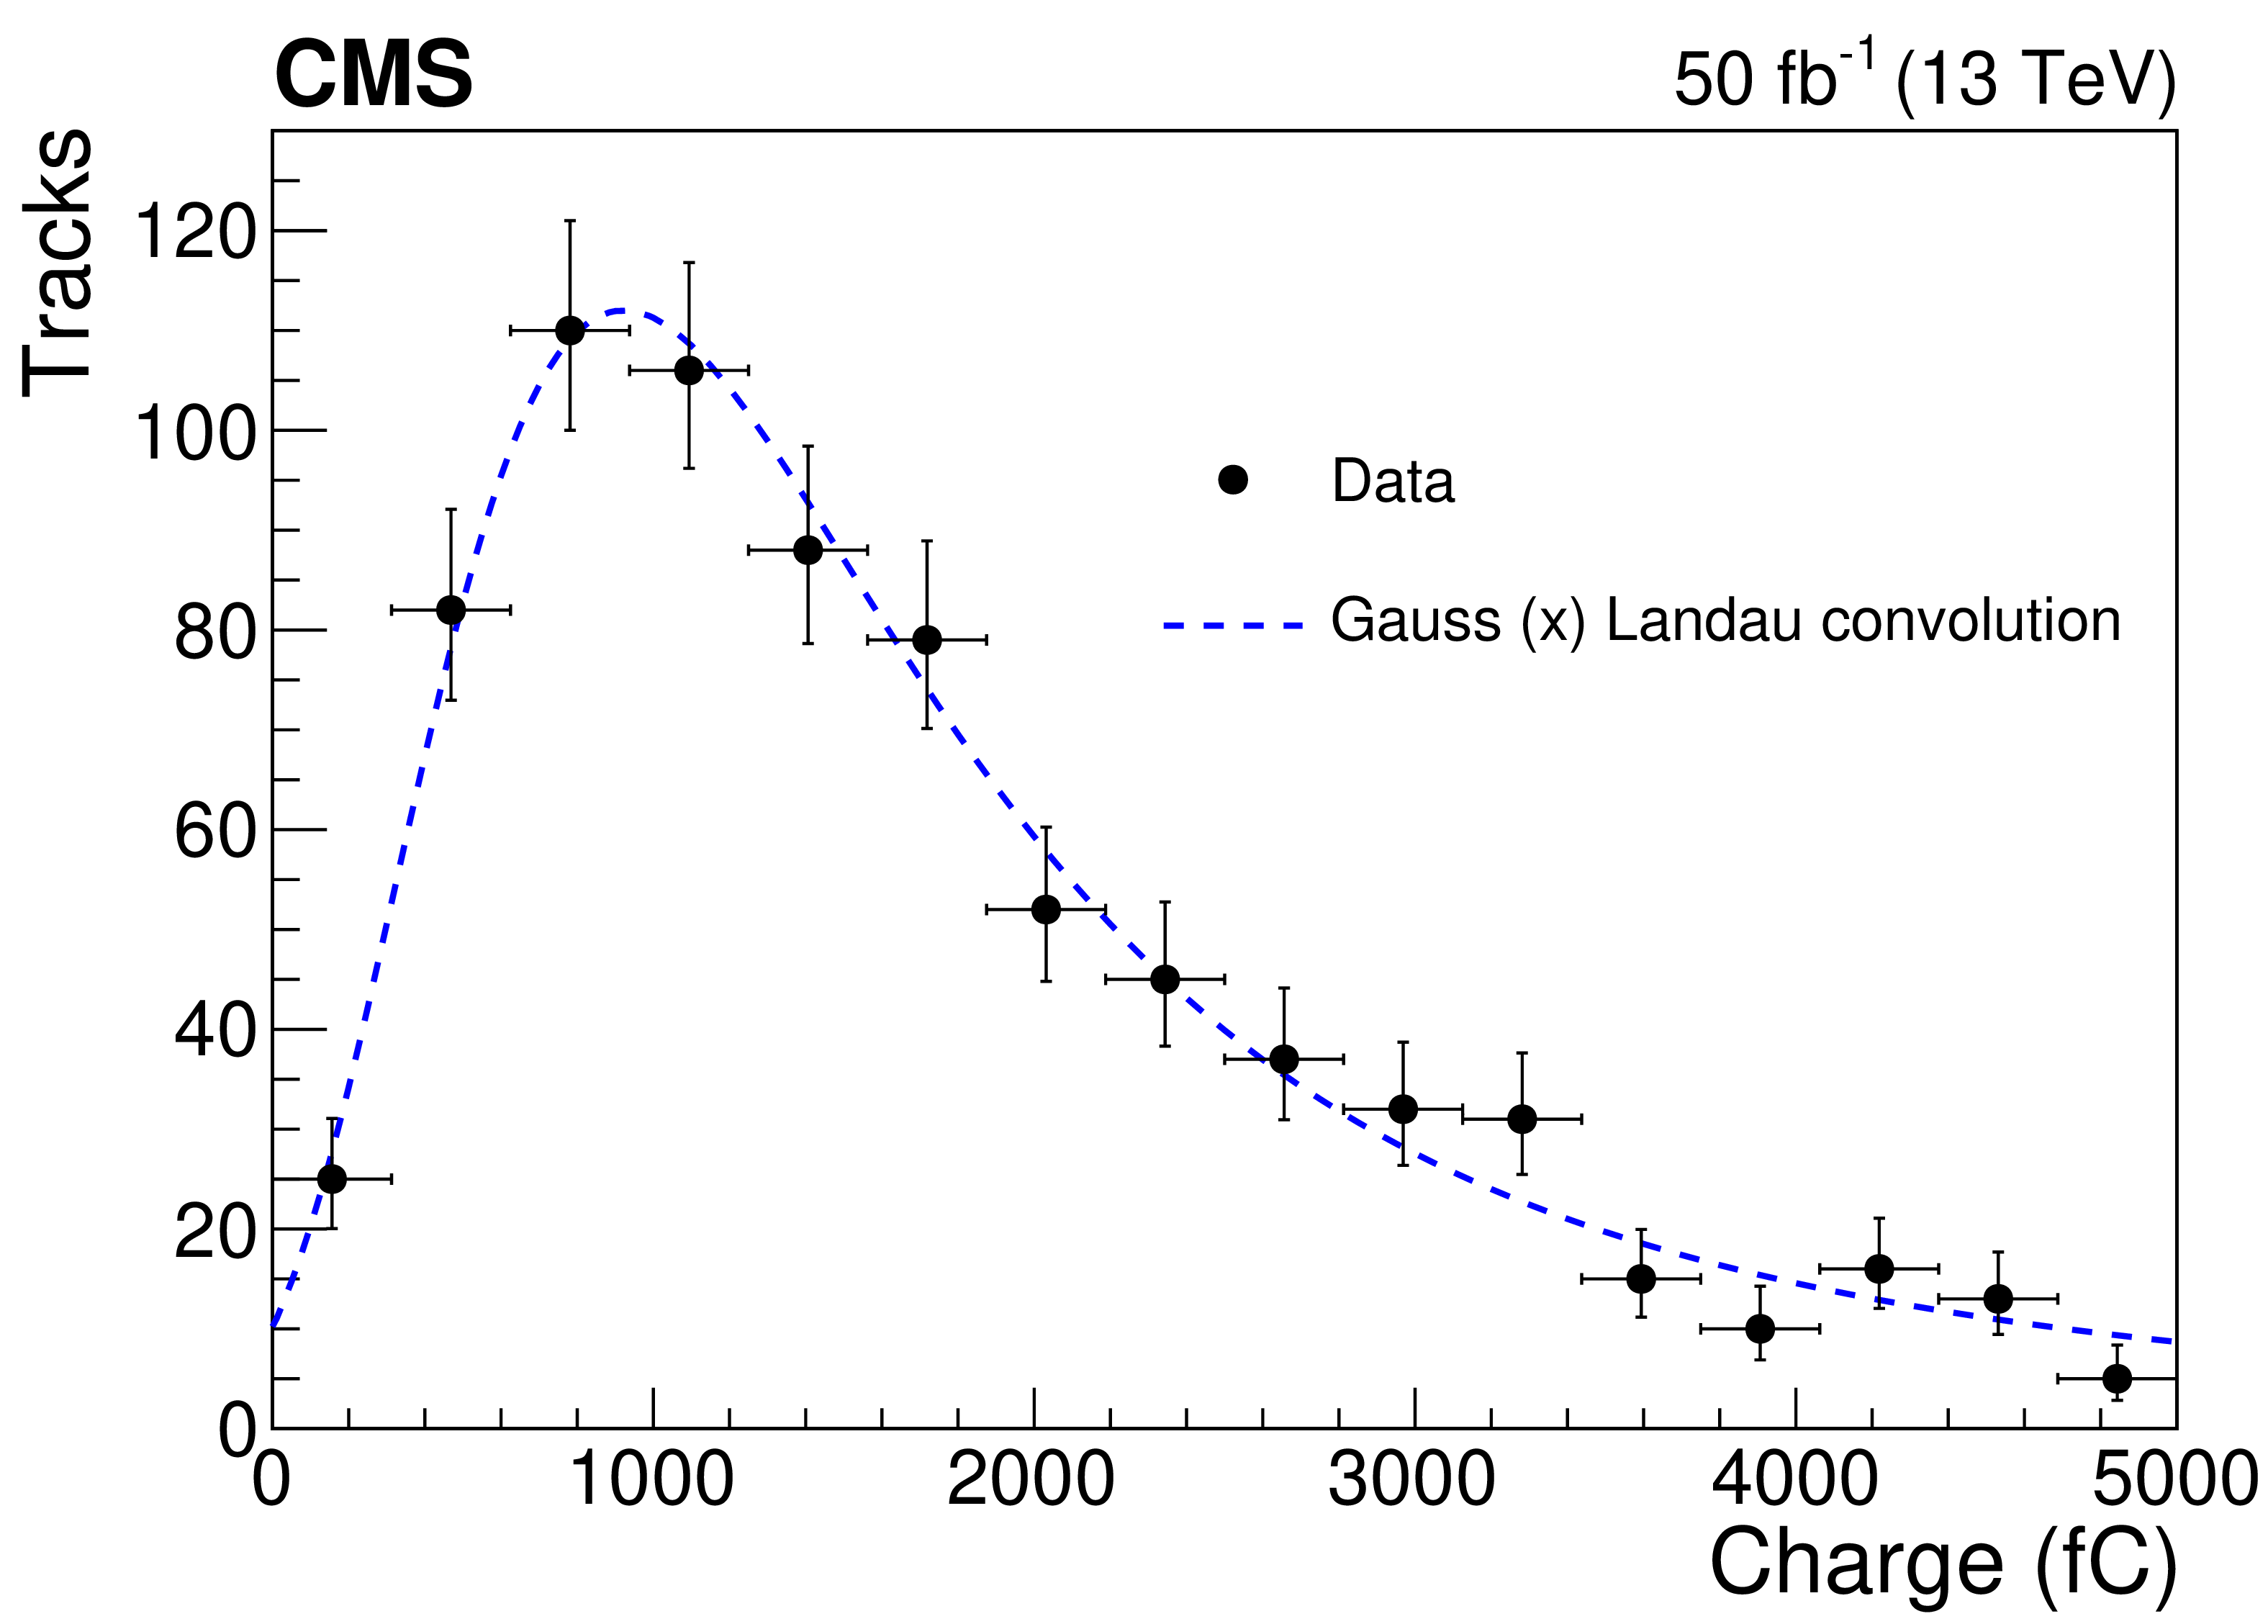
Figure 15:
Fit to the charge distribution in an HE tower $ {i\eta} = $ 26 depth 1 due to an isolated muon from one of the event samples of 2017 data. |
png pdf |
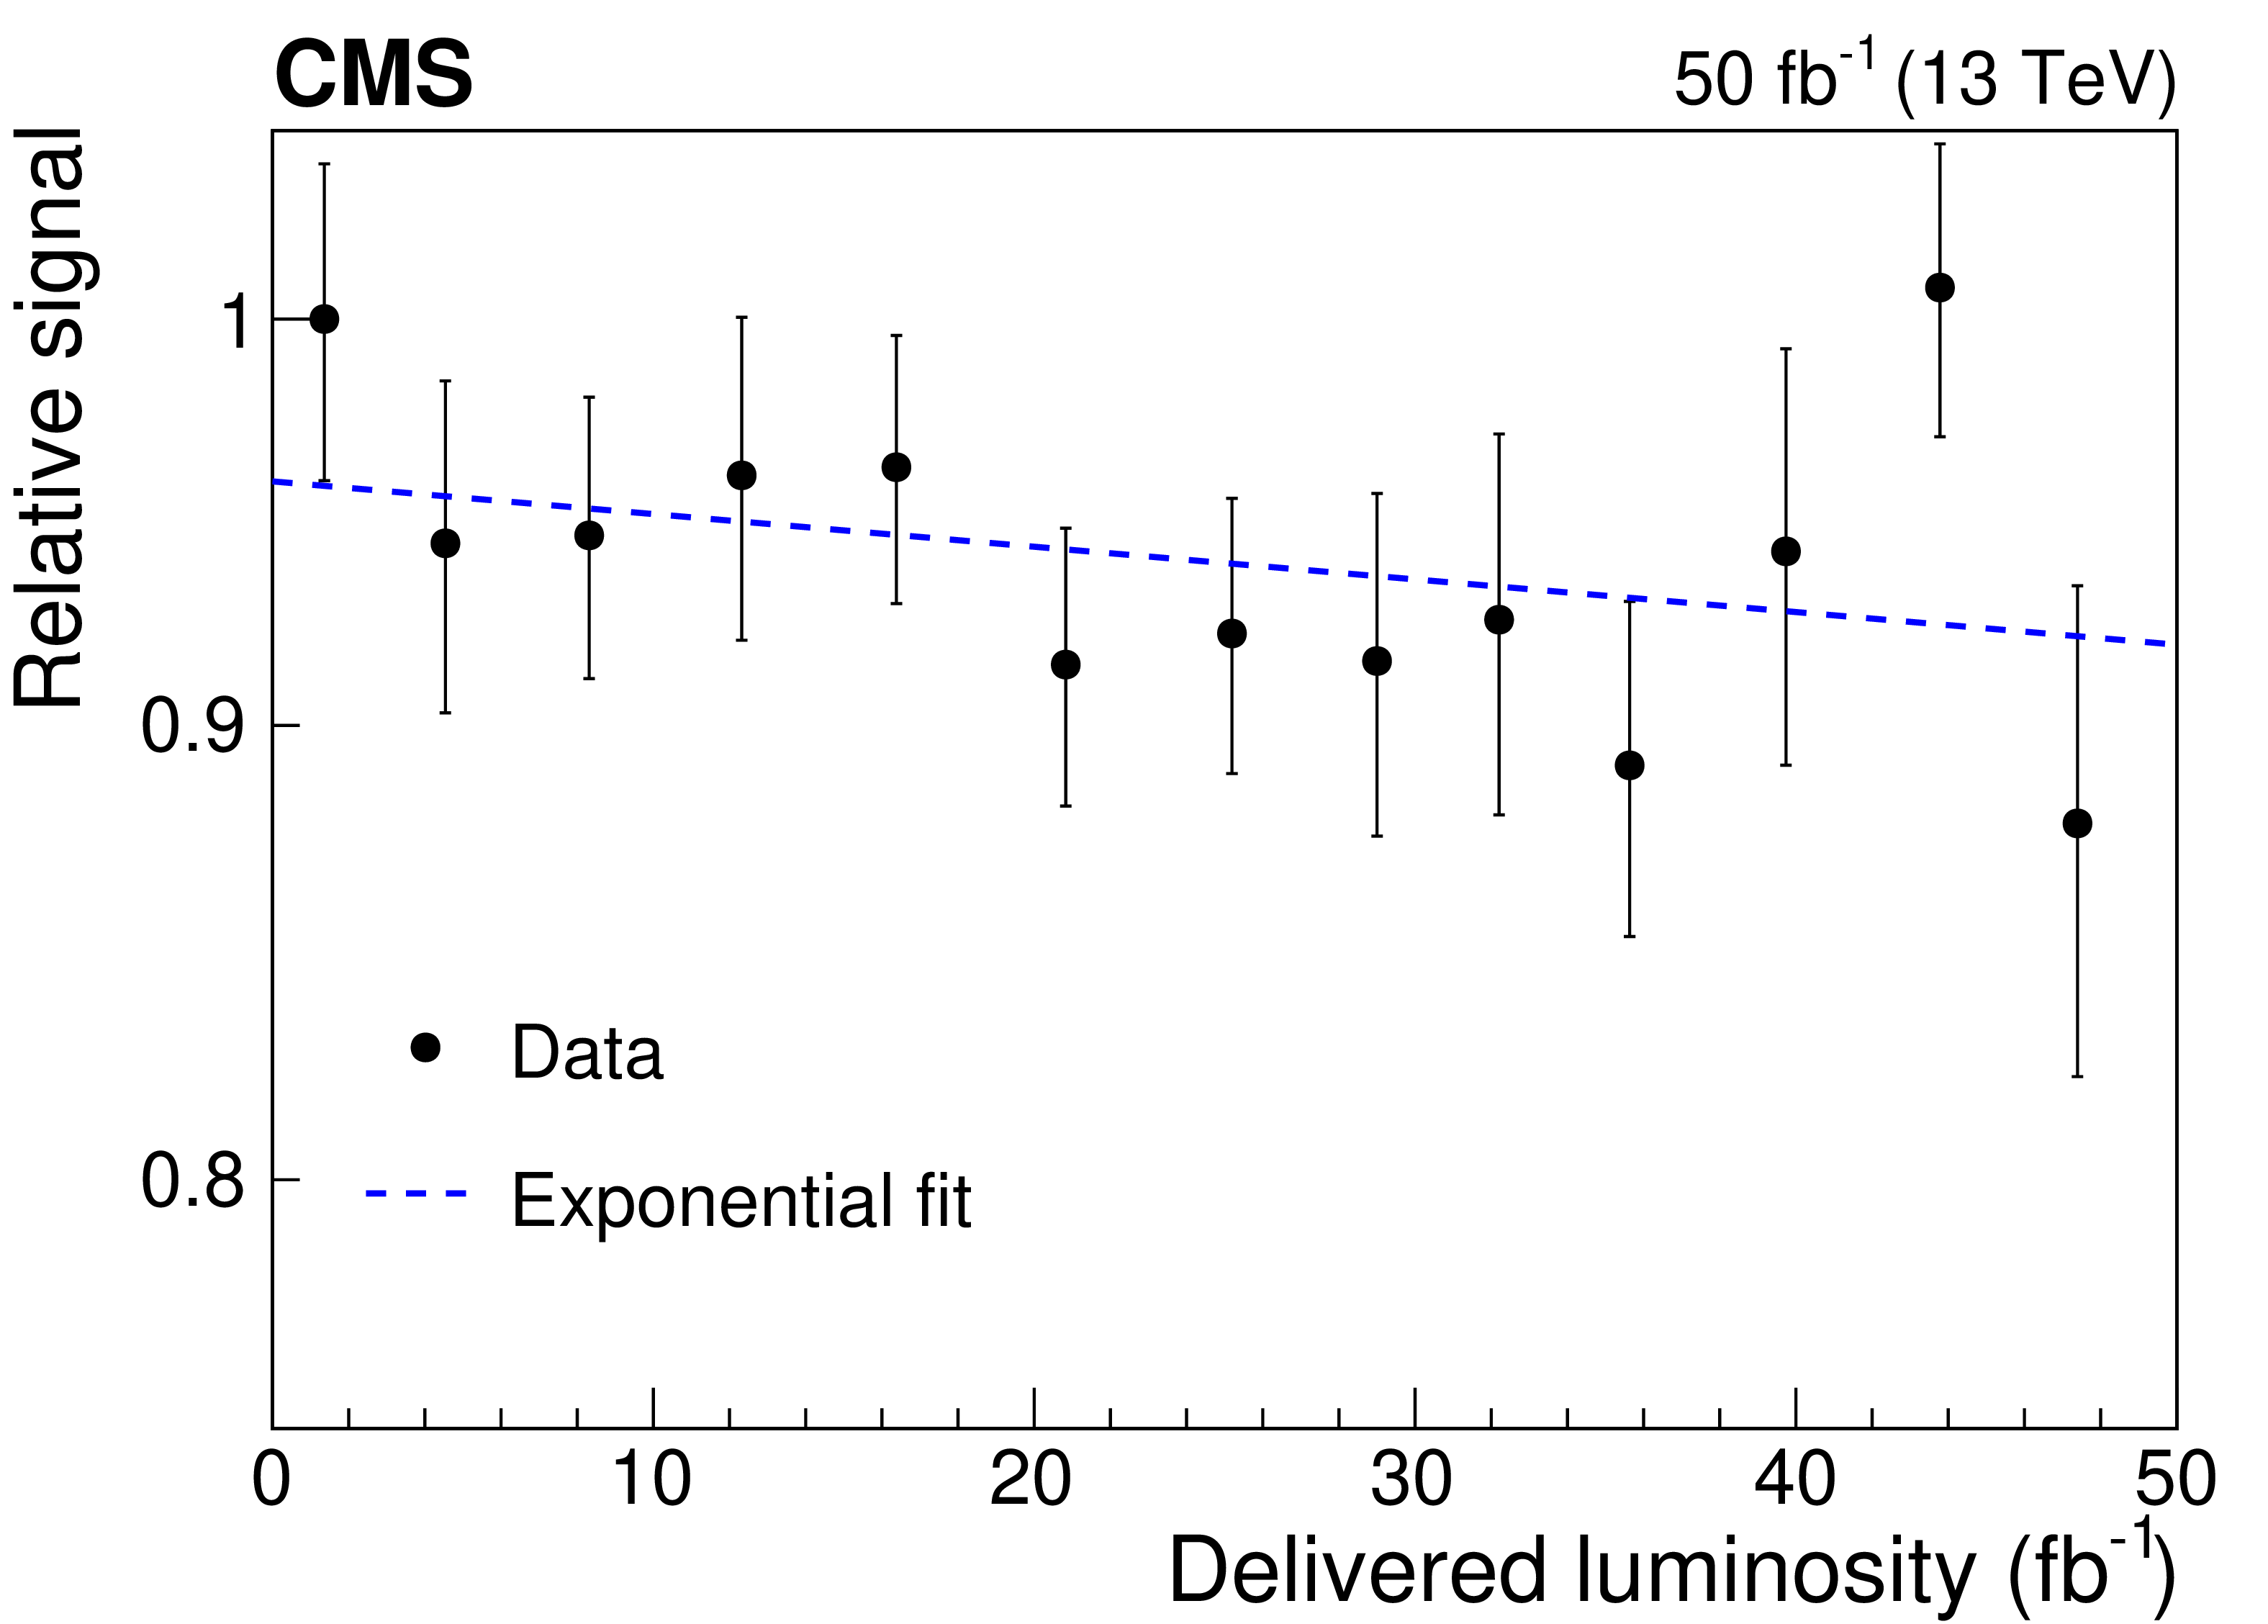
Figure 16:
Relative muon signal in an HE tower with $ {i\eta} = $ 26 and depth 1 versus delivered luminosity. The dashed line shown on the figure is the result of a fit to an exponential distribution. |
png pdf |
Figure 17:
Relative signal for a tile in the CRF radiation zone, plotted versus time (upper) and versus received dose (lower), for $ {R} = $ 42 kGy. |
png pdf |
Figure 17-a:
Relative signal for a tile in the CRF radiation zone, plotted versus time (upper) and versus received dose (lower), for $ {R} = $ 42 kGy. |
png pdf |
Figure 17-b:
Relative signal for a tile in the CRF radiation zone, plotted versus time (upper) and versus received dose (lower), for $ {R} = $ 42 kGy. |
png pdf |
Figure 18:
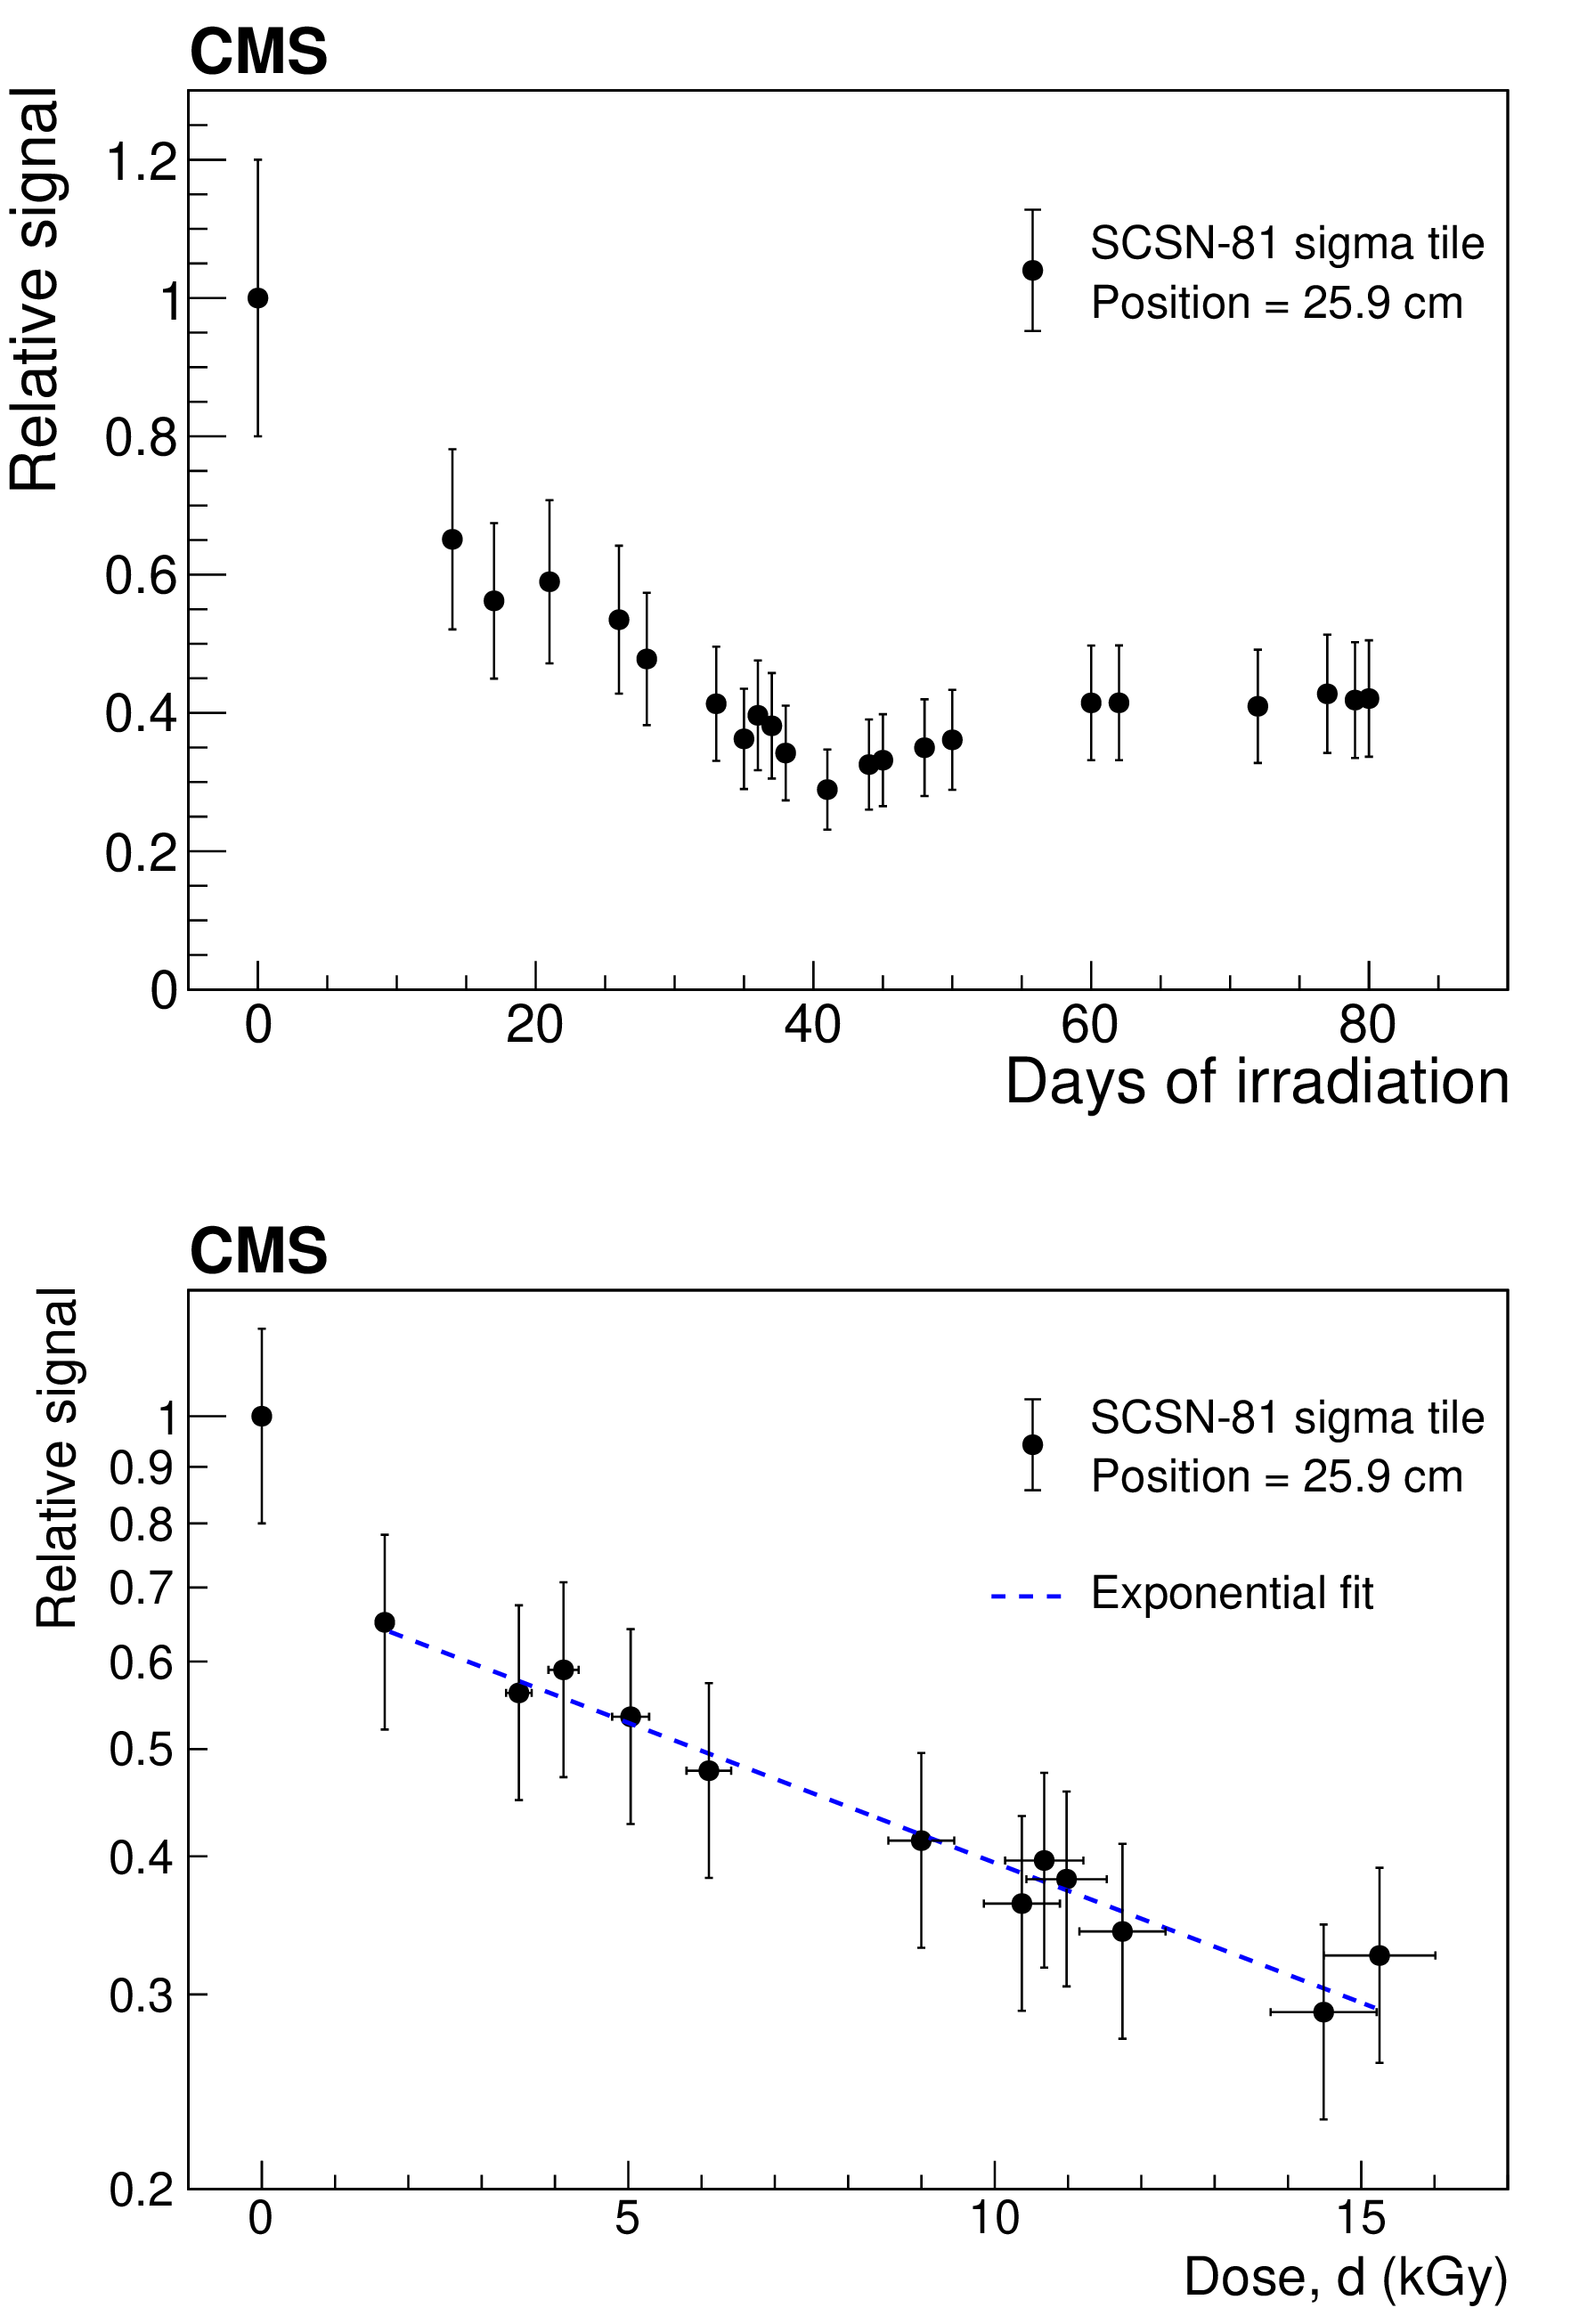
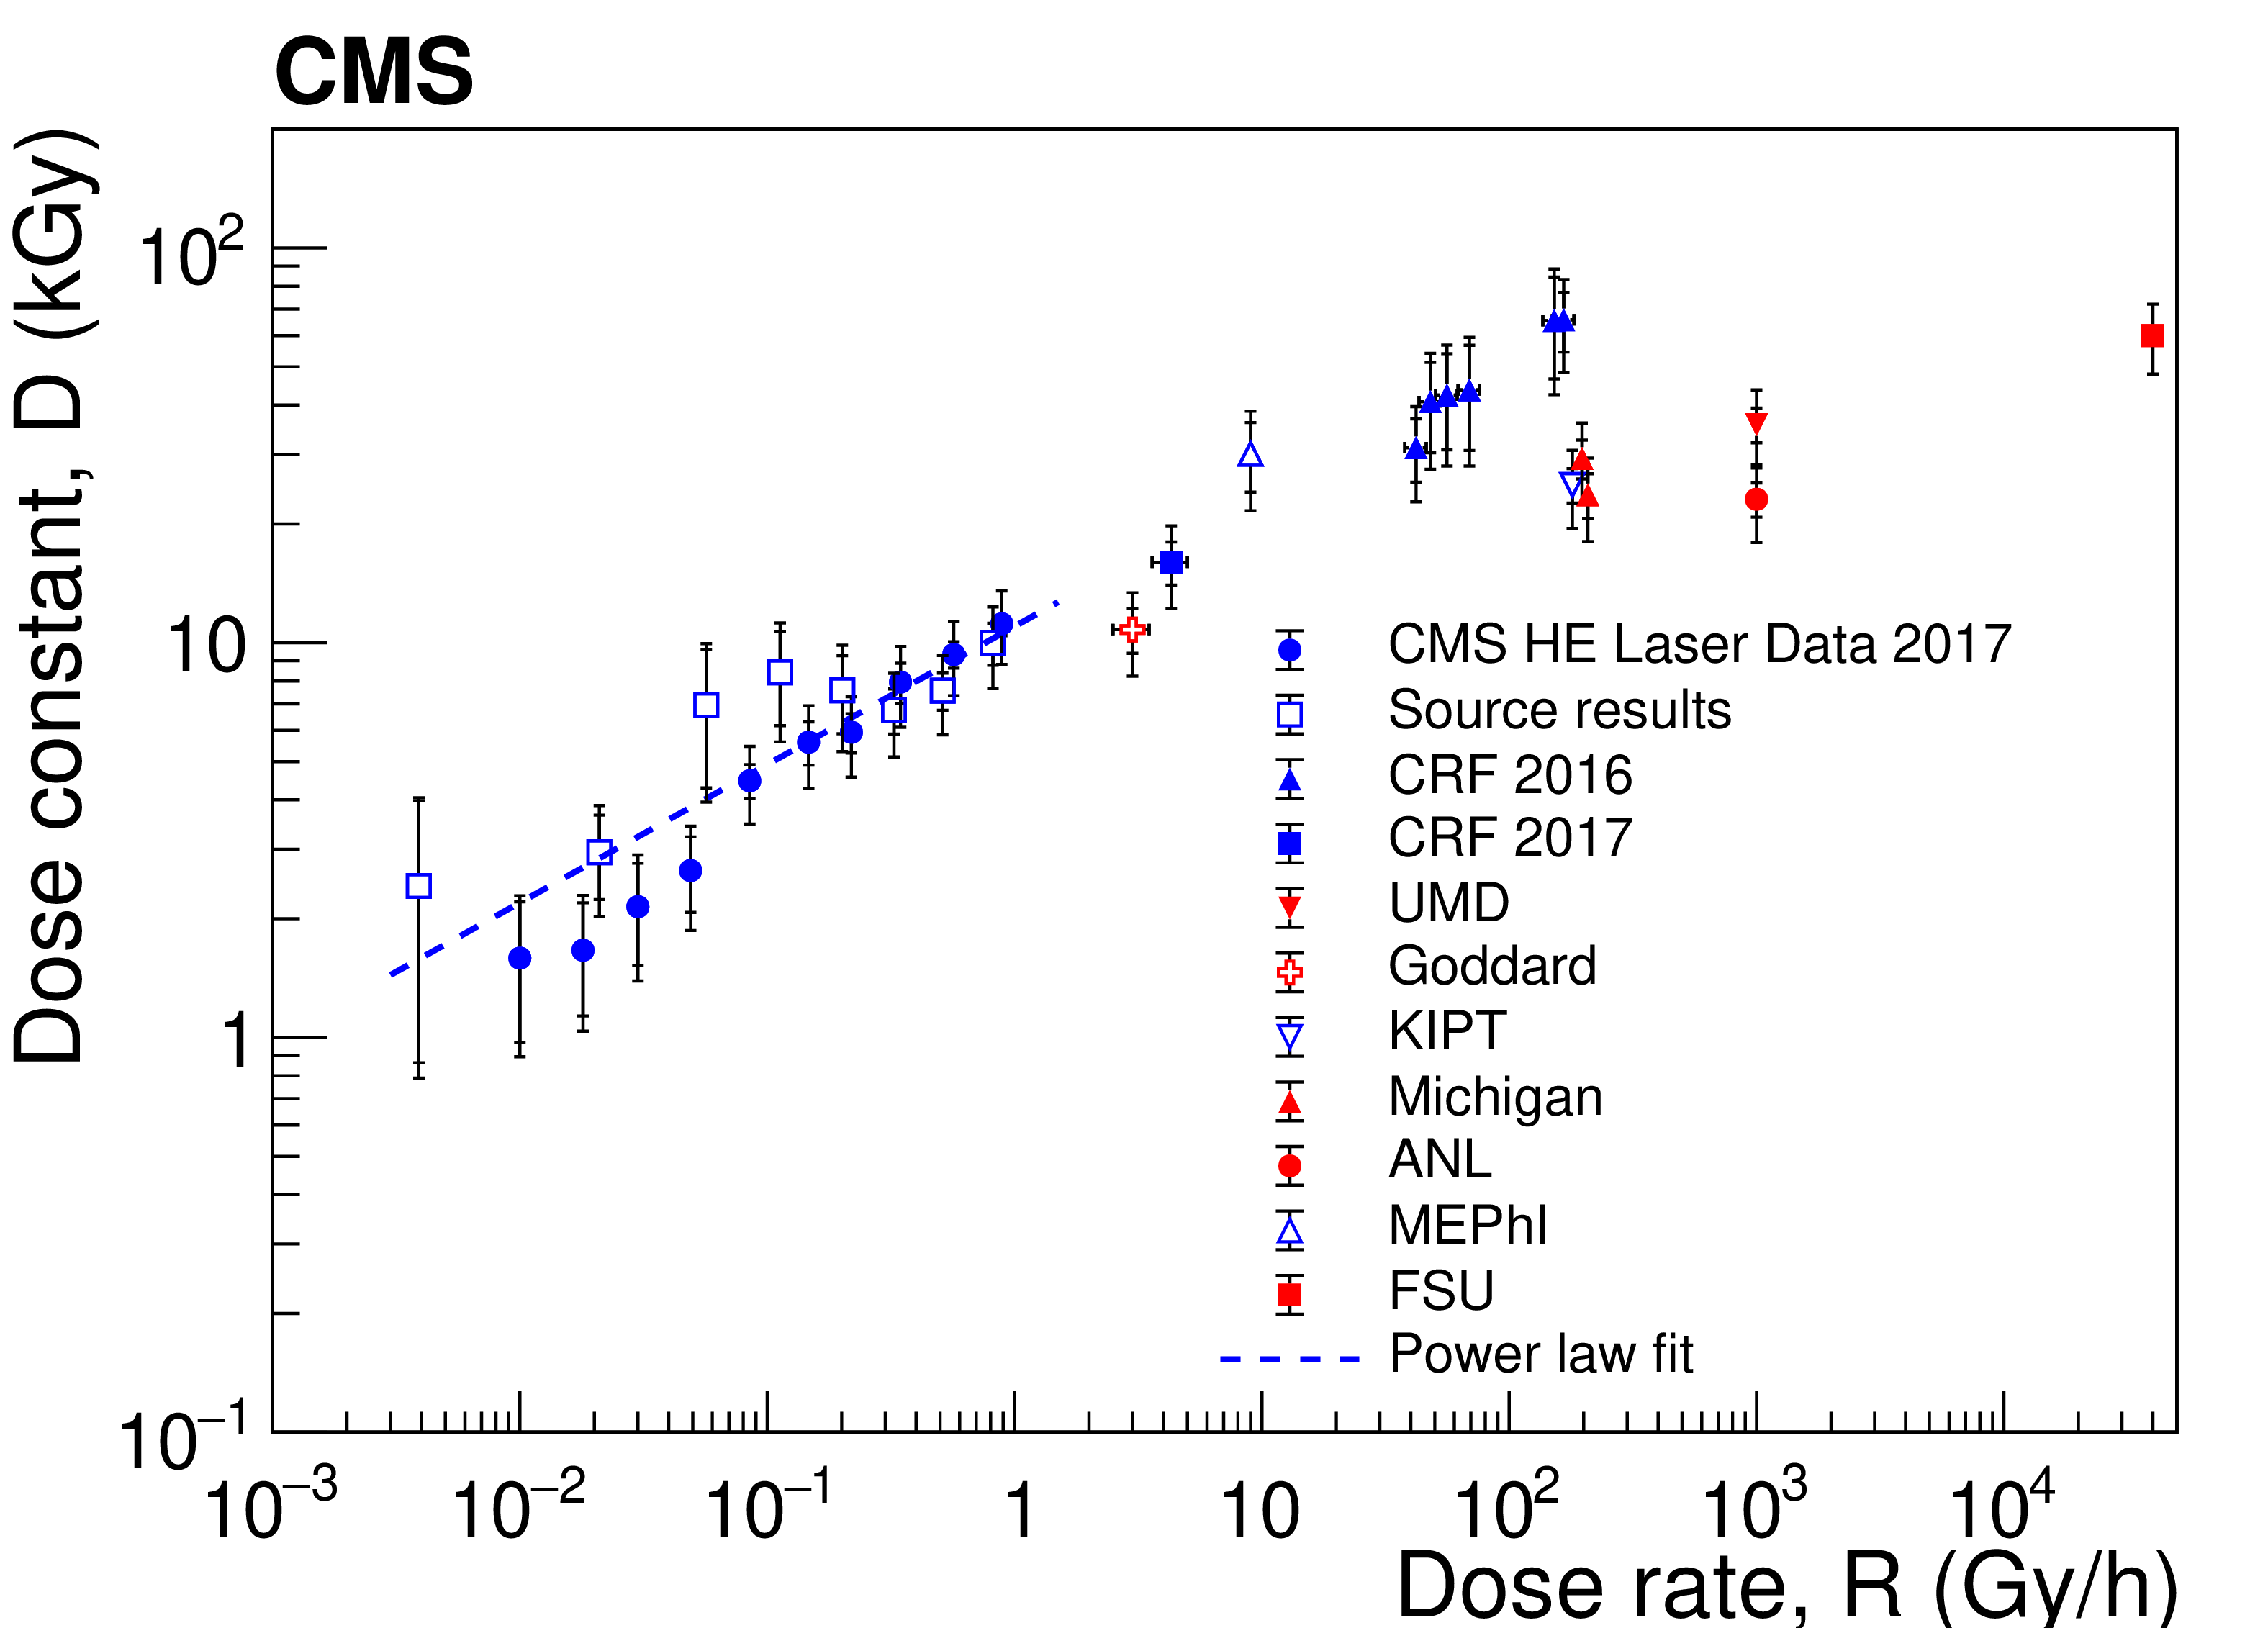
Values of ${{D(R)}}$ versus ${{R}}$ for high-${{R}}$ data taken with gamma irradiation sources at KIPT, National Research Nuclear University MEPhI, Goddard, Michigan, ANL, and UMD, an electron beam at FSU, and in the collider environment in the CRF, along with the results from the HE laser and source calibration data. The statistical uncertainties are shown as the inner bars, and the outer bars include the systematic uncertainties added in quadrature. The error bars on the irradiation data are dominated by systematic uncertainties. |
png pdf |
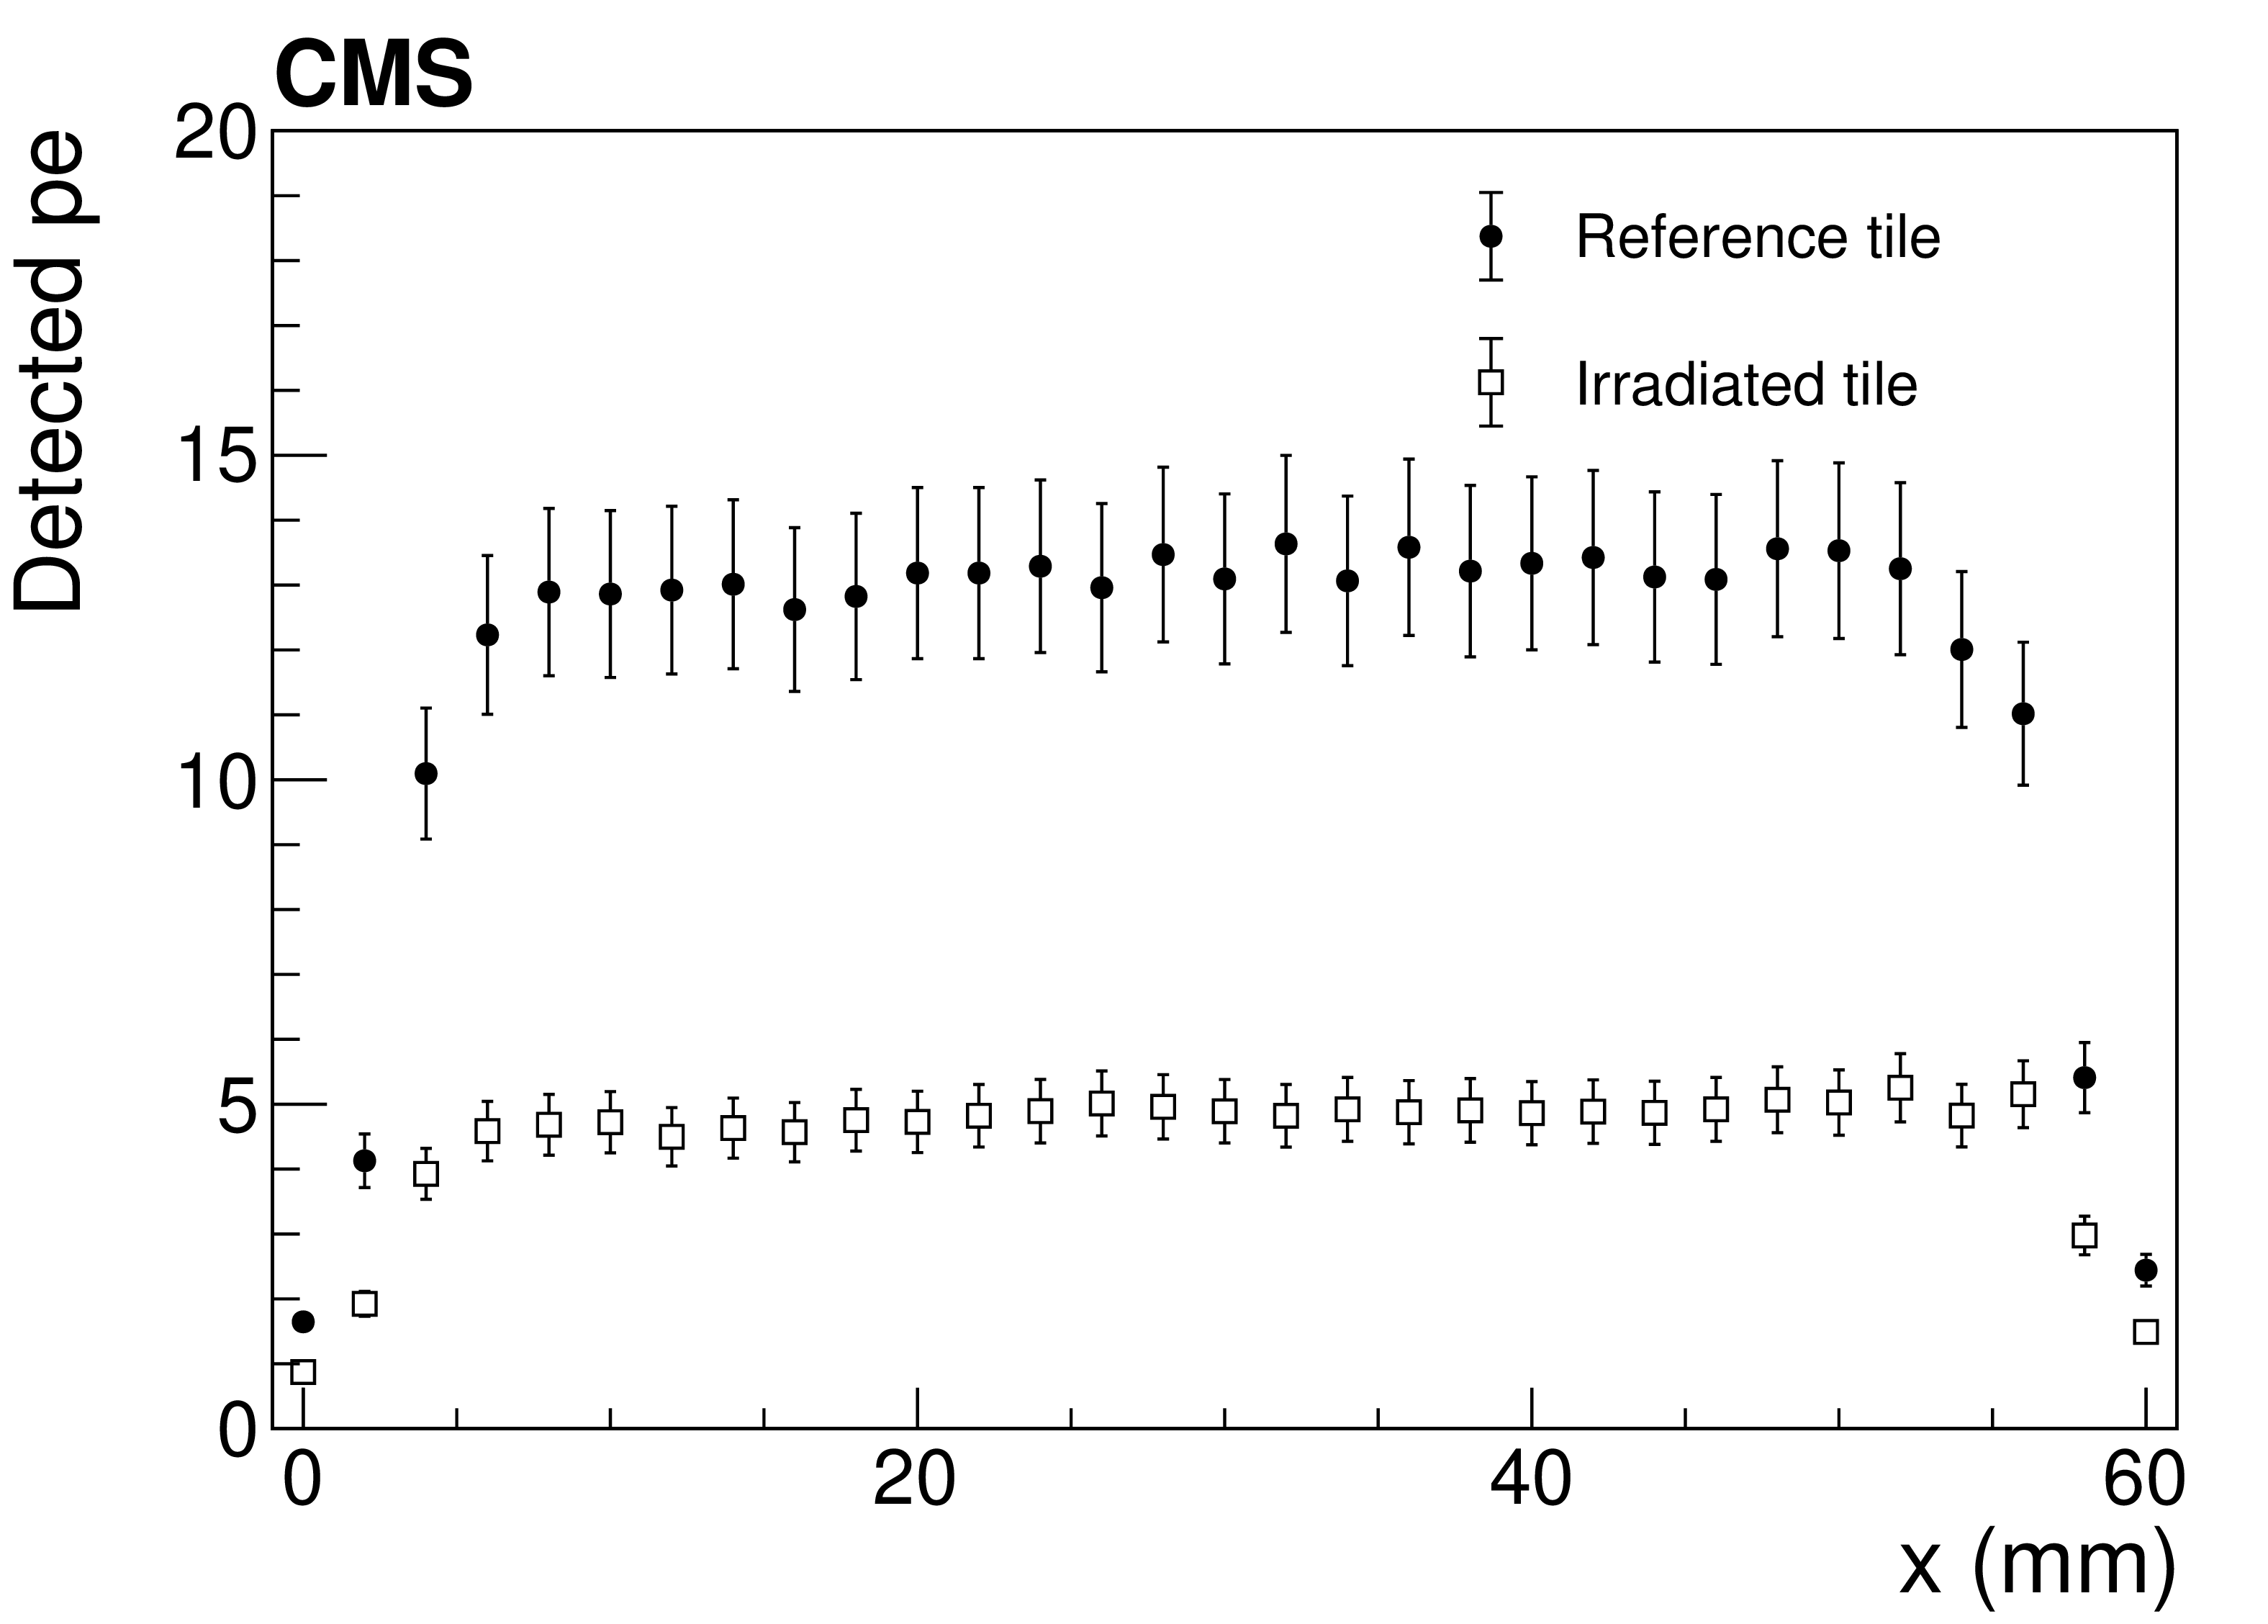
Figure 19:
Number of detected photoelectrons for a tile before and after an irradiation dose of 30 kGy at ${R}$ of 9 Gy/h, as a function of the position of a radioactive-scan source along an axis through the center of the tile and parallel to one of its sides. The error bars are dominated by systematic uncertainty in normalization of the measurements; statistical point uncertainties are $ < $2%. |
| Summary |
|
Radiation damage due to particles produced in pp collisions at $\sqrt{s} = $ 13 TeV in plastic scintillator tiles has been studied using data from several sources: a laser calibration system, a movable radioactive source, as well as hadrons and muons produced in pp collisions. Within the range of our measurements, the results from the various methods indicate that at a fixed dose the damage to the scintillators increases with decreasing dose rate. The dose-rate dependence is most accurately measured by the laser system, with larger uncertainties in the other measurements. The signal has an exponential decrease with dose characterized by dose constant D, which as a function of dose rate ${R}$ is compatible with a power law with an exponent of about 0.4 for both PS and PVT-based tiles, in between the values predicted by bimolecular and unimolecular terminations of radicals [32,33,34,35,36,13,11]. The PVT-based tiles indicate more damage than the PS-based tiles for the same exposure. For $R\approx $ 100 Gy/h, approximately 20% of the damage occurs in the fiber. The results are compared to damage produced by irradiations with $^{60}\mathrm{Co}$ sources and by an electron beam. At dose rates less than 10 Gy/h, relevant for future experiments at particle colliders, where oxygen has saturated the plastic, the amount of damage does not depend on the particle type. The parameters of the power-law fit are functions of the detector geometry, materials, ambient conditions, etc. More studies are required to derive a general parametrization. Nonetheless, fits such as these above have been used to predict the future behavior of the CMS hadron barrel and endcap calorimeters [41,6]. Several aspects of the data-taking conditions in the CMS detector give rise to systematic uncertainties that are difficult to estimate. A set of identical tile + WLS fiber assemblies subjected to varying dose-rate exposures in a temperature-controlled laboratory, with careful monitoring throughout a year-long exposure, would allow for a large reduction in the systematic uncertainties. At high dose rates, the amount of damage has a considerable spread, possibly indicating underestimated systematic uncertainties, motivating further studies to determine the underlying cause. It would be interesting to have data over this wide range of dose rates separately for the fibers and for the plastic tiles, to see their separate power dependencies. Studies of tiles at low dose rates in an oxygen-free environment, like a nitrogen atmosphere as suggested in Ref. [39], are needed to test directly if the cause is dose-rate dependent polymer oxidation. It would also be helpful to make measurements above 10 Gy/h using a set of tiles made in a uniform way and irradiated at a known temperature. Dose-rate effects can be large at low dose rates and should be measured for new tile systems. |
| References | ||||
| 1 | C. Zorn | Plastic and liquid organic scintillators | in Instrumentation in High Energy Physics, F. Sauli, ed., p. 218 World Scientific, 2nd edition | |
| 2 | CMS Collaboration | The CMS experiment at the CERN LHC | JINST 3 (2008) S08004 | CMS-00-001 |
| 3 | CMS Collaboration | Design, performance, and calibration of CMS hadron-barrel calorimeter wedges | Euro. Phys. J. C 55 (2008) 159 | |
| 4 | CMS Collaboaration | The CMS hadron calorimeter project | CERN-LHCC-97-031 | |
| 5 | L. Evans and P. Bryant (editors) | LHC Machine | JINST 3 (2008) S08001 | |
| 6 | CMS Collaboration | The Phase-2 upgrade of the CMS endcap calorimeter | CDS | |
| 7 | CMS Collaboration | Dose-rate effects in the radiation damage of the plastic scintillators of the CMS hadron endcap calorimeter | JINST 11 (2016) T10004 | 1608.07267 |
| 8 | R. A. Shukla et al. | Microscopic characterisation of photodetectors used in the hadron calorimeter of the Compact Muon Solenoid experiment | Rev. Sci. Instrum. 90 (2019) 023303 | |
| 9 | T. Forster | Zwischenmolekulare energiewanderung und fluoreszenz | Ann. Phys. (Berl.) 437 (1947) 55 | |
| 10 | J. B. Birks | International Series of Monographs on Electronics and Instrumentation, Volume 27. Pergamon Press, The Macmillan Company, New York, 1964 , ISBN 1483123642 | ||
| 11 | E. Biagtan et al. | Gamma dose and dose-rate effects on scintillator light output | NIMB 108 (1996) 125 | |
| 12 | U. Holm and K. Wick | Radiation stability of plastic scintillators and wave-length shifters | IEEE Trans. Nucl. Sci. 36 (1989) 579 | |
| 13 | K. Wick et al. | Recovery and dose-rate dependence of radiation damage in scintillators, wavelength shifters and light guides | NIMB 61 (1991) 472 | |
| 14 | B. Bicken et al. | Recovery and permanent radiation damage of plastic scintillators at different dose rates | IEEE Trans. Nucl. Sci. 38 (1991) 188 | |
| 15 | B. Bicken et al. | Influence of temperature treatment on radiation stability of plastic scintillator and wave-length shifter | IEEE Trans. Nucl. Sci. 39 (1992) 1212 | |
| 16 | A. D. Bross and A. Pla-Dalmau | Radiation damage of plastic scintillators | IEEE Trans. Nucl. Sci. 39 (1992) 1199 | |
| 17 | N. D. Giokaris et al. | Study of dose-rate effects on the radiation damage of polymer-based SCSN23, SCSN81, SCSN81+Y7, SCSN81+Y8 and 3HF scintillators | Radiat. Phys. Chem. 41 (1993) 315 | |
| 18 | K. Gillen and M. Celina | Predicting polymer degradation and mechanical property changes for combined radiation-thermal aging environments | Rubber Chemistry \& Technology 91 (2018) 27 | |
| 19 | I. B. Berlman | The effect of massive $ \rm{^{60}Co} $ doses on the light output of a scintillator solution | Argonne National Laboratory: Radiological Physics Division Semiannual Report for July through December 1957 (1958) | |
| 20 | R. Clough et al. | Discoloration and subsequent recovery of optical polymers exposed to ionizing radiation | Poly. Degrad. and Stab. 49 (1995) 305 | |
| 21 | CMS Collaboration | Description and performance of track and primary-vertex reconstruction with the CMS tracker | JINST 9 (2014) P10009 | CMS-TRK-11-001 1405.6569 |
| 22 | CMS Collaboration | The CMS trigger system | JINST 12 (2017) P01020 | CMS-TRG-12-001 1609.02366 |
| 23 | P. Cushman, A. Heering, and A. Ronzhin | Custom HPD readout for the CMS HCAL | NIMA 442 (2000) 289 | |
| 24 | A. Heering et al. | Parameters of the preproduction series SiPMs for the CMS HCAL Phase-1 upgrade | NIMA 824 (2016) 115 | |
| 25 | T. M. Shaw et al. | Front-end readout electronics for the CMS Hadron Calorimeter | in Proceedings, Nuclear Science Symposium Conference Record, 2002, (IEEE), p. 194 2002 | |
| 26 | A. Ferrari, P. R. Sala, A. Fasso, and J. Ranft | FLUKA: A multi-particle transport code | CERN-2005-010, SLAC-R-773, INFN-TC-05-11 | |
| 27 | T. T. Bohlen et al. | The FLUKA code: Developments and challenges for high energy and medical applications | Nucl. Data Sheets 120 (2014) 211 | |
| 28 | K. Gillen, J. Wallace, and R. Clough | Dose-rate dependence of the radiation-induced discoloration of polystyrene | Radiat. Phys. Chem. 41 (1993) 101 | |
| 29 | V. Hagopian et al. | Single tile-fiber unit of SDC calorimeter | Radiat. Phys. Chem. 41 (1993) 401 | |
| 30 | H. Jivan et al. | Radiation hardness of plastic scintillators for the tile calorimeter of the ATLAS detector | J. Phys.: Conf. Series 645 (2015) 012019 | |
| 31 | GEANT4 Collaboration | GEANT4--a simulation toolkit | NIMA 506 (2003) 250 | |
| 32 | S. W. Shalaby and R. L. Clough | Radiation effects on polymers | Am. Chem. Soc. Symp. Ser. 475 (1991) 457 | |
| 33 | J. L. Bolland | Kinetic studies in the chemistry of rubber and related materials | J. L. Proc. R. Soc. A 186 (1946) 218 | |
| 34 | J. Bolland | Kinetic studies in the chemistry of rubber and related materials. VII.---influence of chemical structure on the $ \alpha $-methylenic reactivity of olefins | Trans. Faraday Soc. 46 (1950) 358 | |
| 35 | L. Q. Bateman | Olefin oxidation | Q. Rev. Chem. Soc 8 (1954) 147 | |
| 36 | A. V. Cunliffe and A. Davis | Photo-oxidation of thick polymer samples --- Part II: The influence of oxygen diffusion on the natural and artificial weathering of polyolefins | Polym. Degrad. Stab. 4 (1982) 17 | |
| 37 | T. Seguchi et al. | Radiation induced oxidative degradation of polymers---I: Oxidation region in polymer films irradiated in oxygen under pressure | Radiat. Phys. Chem. 17 (1981) 195 | |
| 38 | K. Gillen and R. Clough | Rigorous experimental confirmation of a theoretical model for diffusion-limited oxidation | Polymer 38 (1992) 1929 | |
| 39 | Y. Sirois and R. Wigmans | Effects of long-term low-level exposure to radiation as observed in acrylic scintillator | NIMA 240 (1985) 262 | |
| 40 | R. Clough and K. Gillen | Polymer degradation under ionizing radiation: The role of ozone | J. Polym. Sci. A: Polymer Chemistry 27 (1989) 2313 | |
| 41 | CMS Collaboration | The Phase-2 upgrade of the CMS barrel calorimeters technical design report | CDS | |
|
|
Compact Muon Solenoid LHC, CERN |
|

|

|

|

|

|