

Compact Muon Solenoid
LHC, CERN
| CMS-SUS-15-010 ; CERN-EP-2016-094 | ||
| Phenomenological MSSM interpretation of CMS searches in pp collisions at $\sqrt{s}= $ 7 and 8 TeV | ||
| CMS Collaboration | ||
| 11 June 2016 | ||
| JHEP 10 (2016) 129 | ||
| Abstract: Searches for new physics by the CMS collaboration are interpreted in the framework of the phenomenological minimal supersymmetric standard model (pMSSM). The data samples used in this study were collected at $\sqrt{s} = $ 7 and 8 TeV and have integrated luminosities of 5.0 fb$^{-1}$ and 19.5 fb$^{-1}$, respectively. A global Bayesian analysis is performed, incorporating results from a broad range of CMS supersymmetry searches, as well as constraints from other experiments. Because the pMSSM incorporates several well-motivated assumptions that reduce the 120 parameters of the MSSM to just 19 parameters defined at the electroweak scale, it is possible to assess the results of the study in a relatively straightforward way. Approximately half of the model points in a potentially accessible subspace of the pMSSM are excluded, including all pMSSM model points with a gluino mass below 500 GeV, as well as models with a squark mass less than 300 GeV. Models with chargino and neutralino masses below 200 GeV are disfavored, but no mass range of model points can be ruled out based on the analyses considered. The nonexcluded regions in the pMSSM parameter space are characterized in terms of physical processes and key observables, and implications for future searches are discussed. | ||
| Links: e-print arXiv:1606.03577 [hep-ex] (PDF) ; CDS record ; inSPIRE record ; CADI line (restricted) ; | ||
| Figures | |
png pdf |
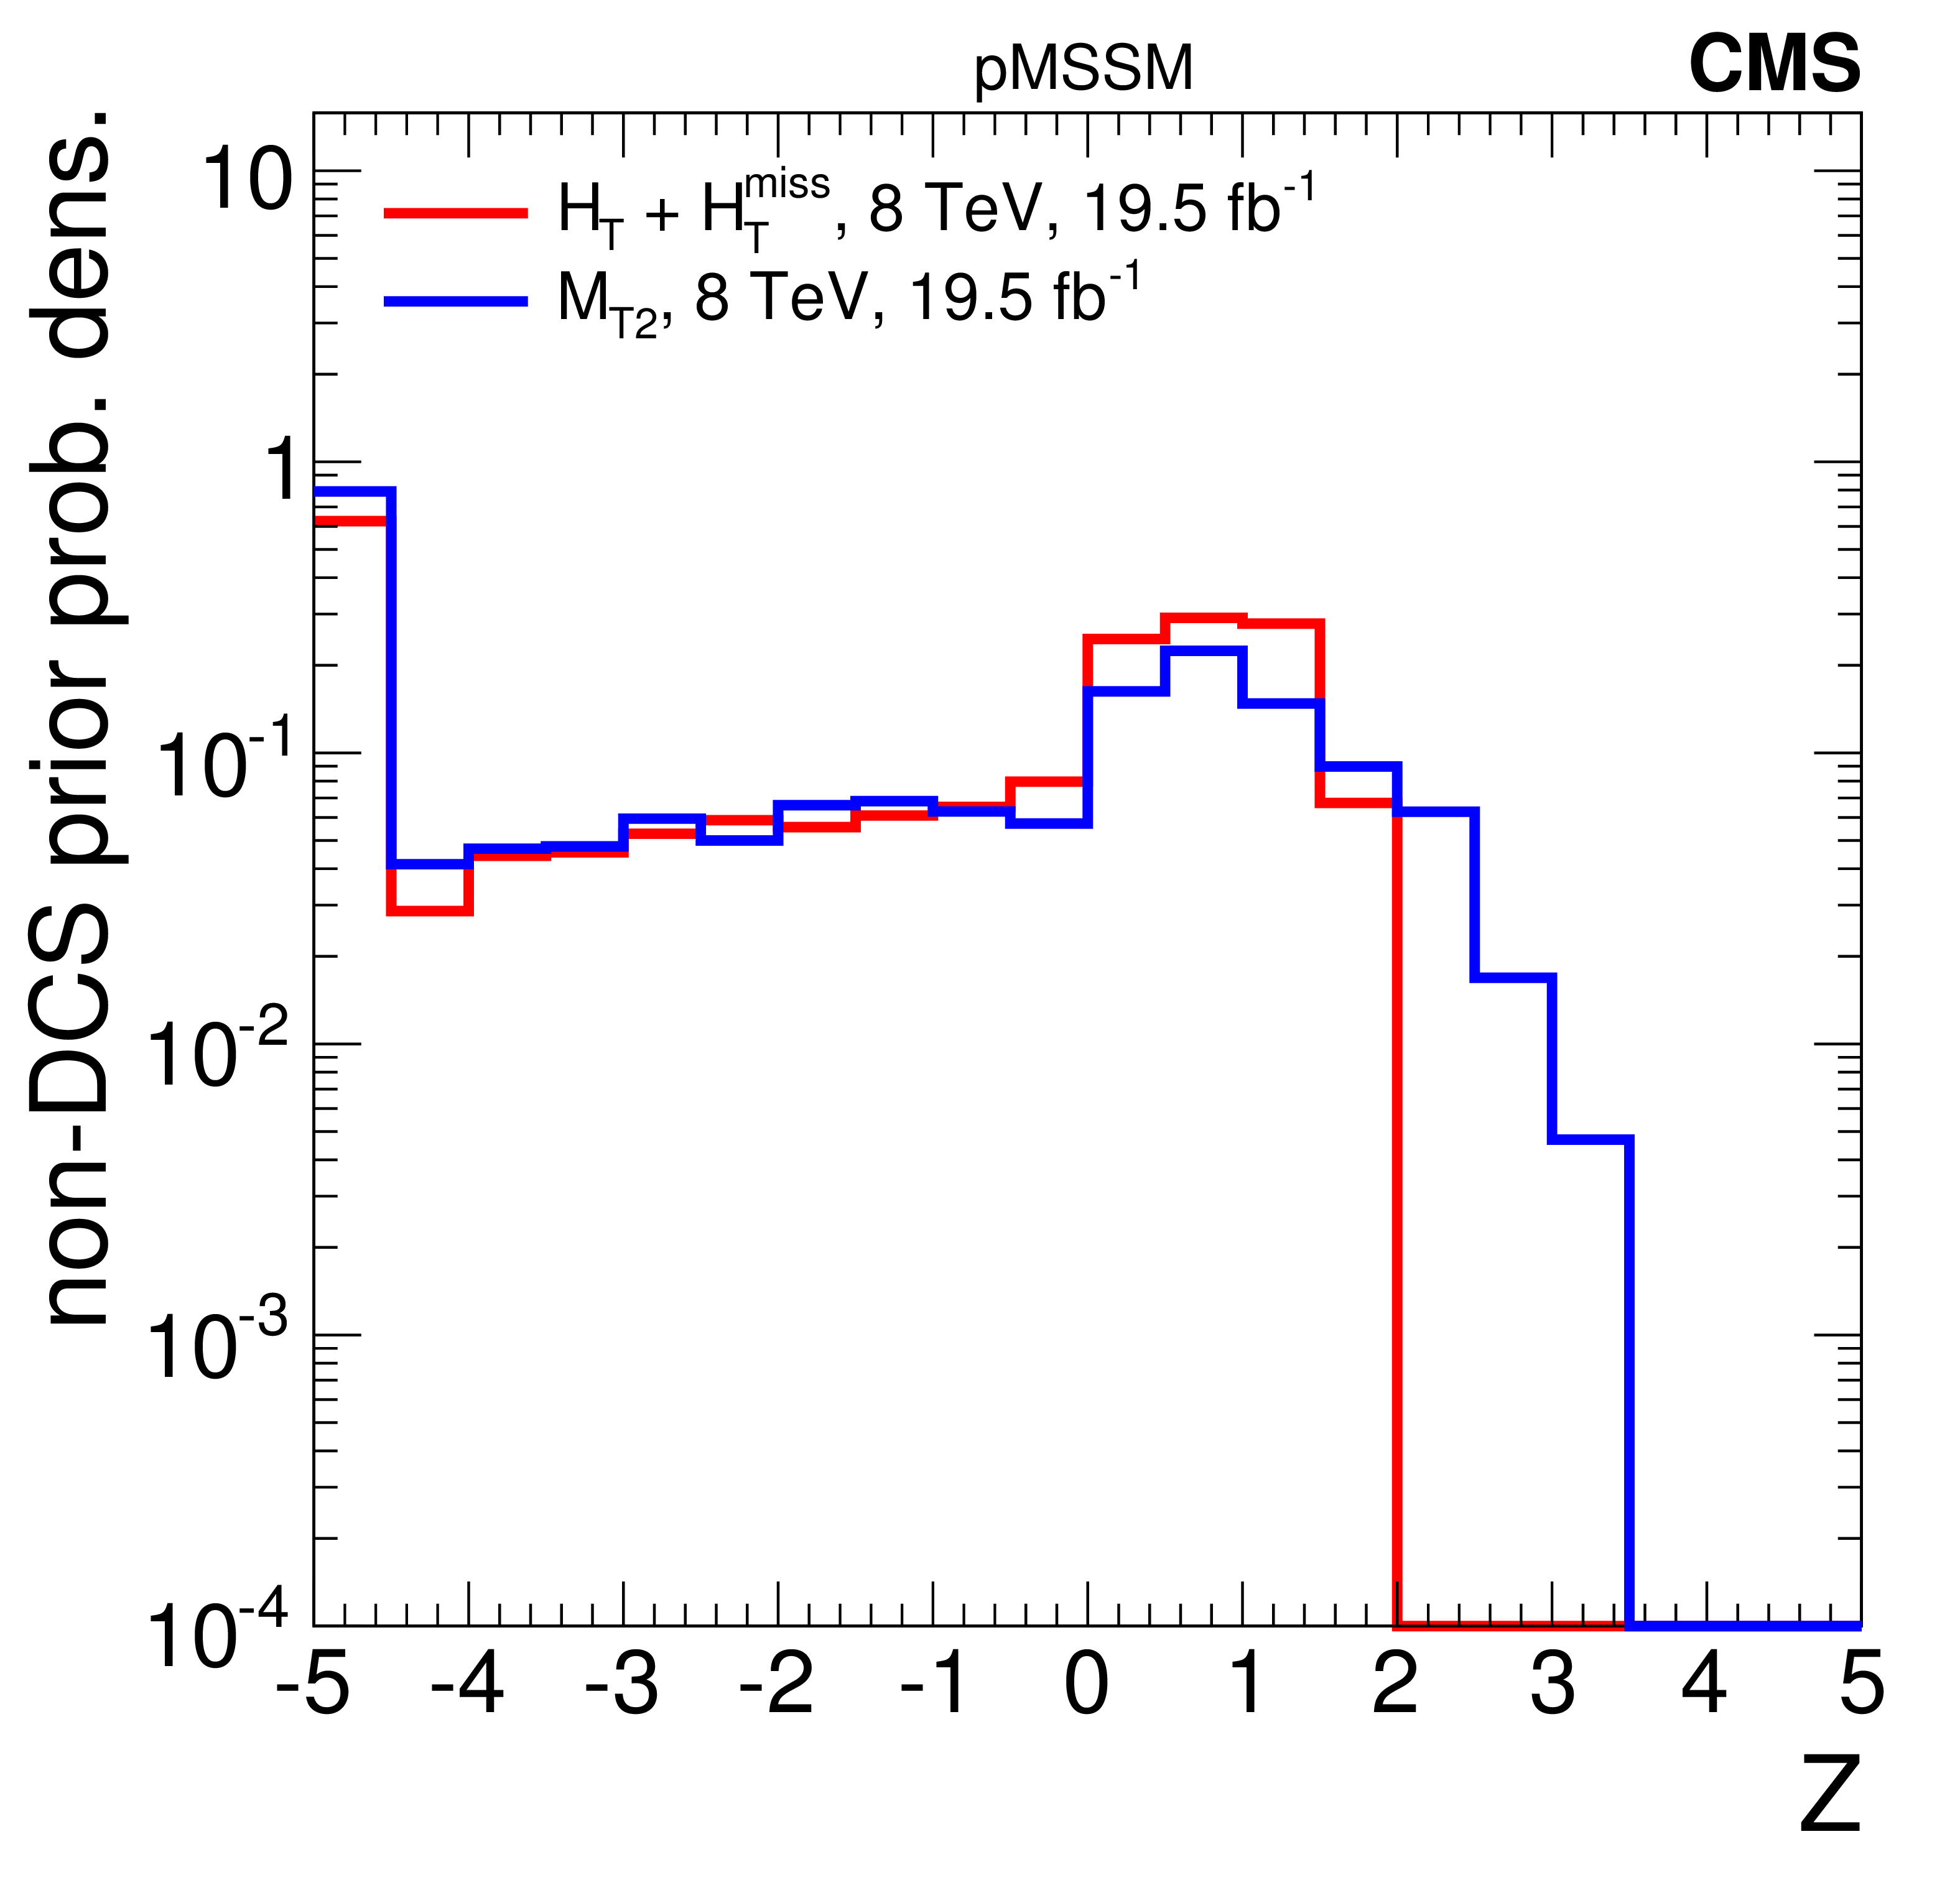
Figure 1-a:
The distribution of the $Z$-significance of model points, weighted by the non-DCS prior density of each model point, for the individual 8 TeV searches (a-d), and for 7 TeV combined and 7+8 TeV combined searches (f). The leftmost bins contain the underflow entries. |
png pdf |
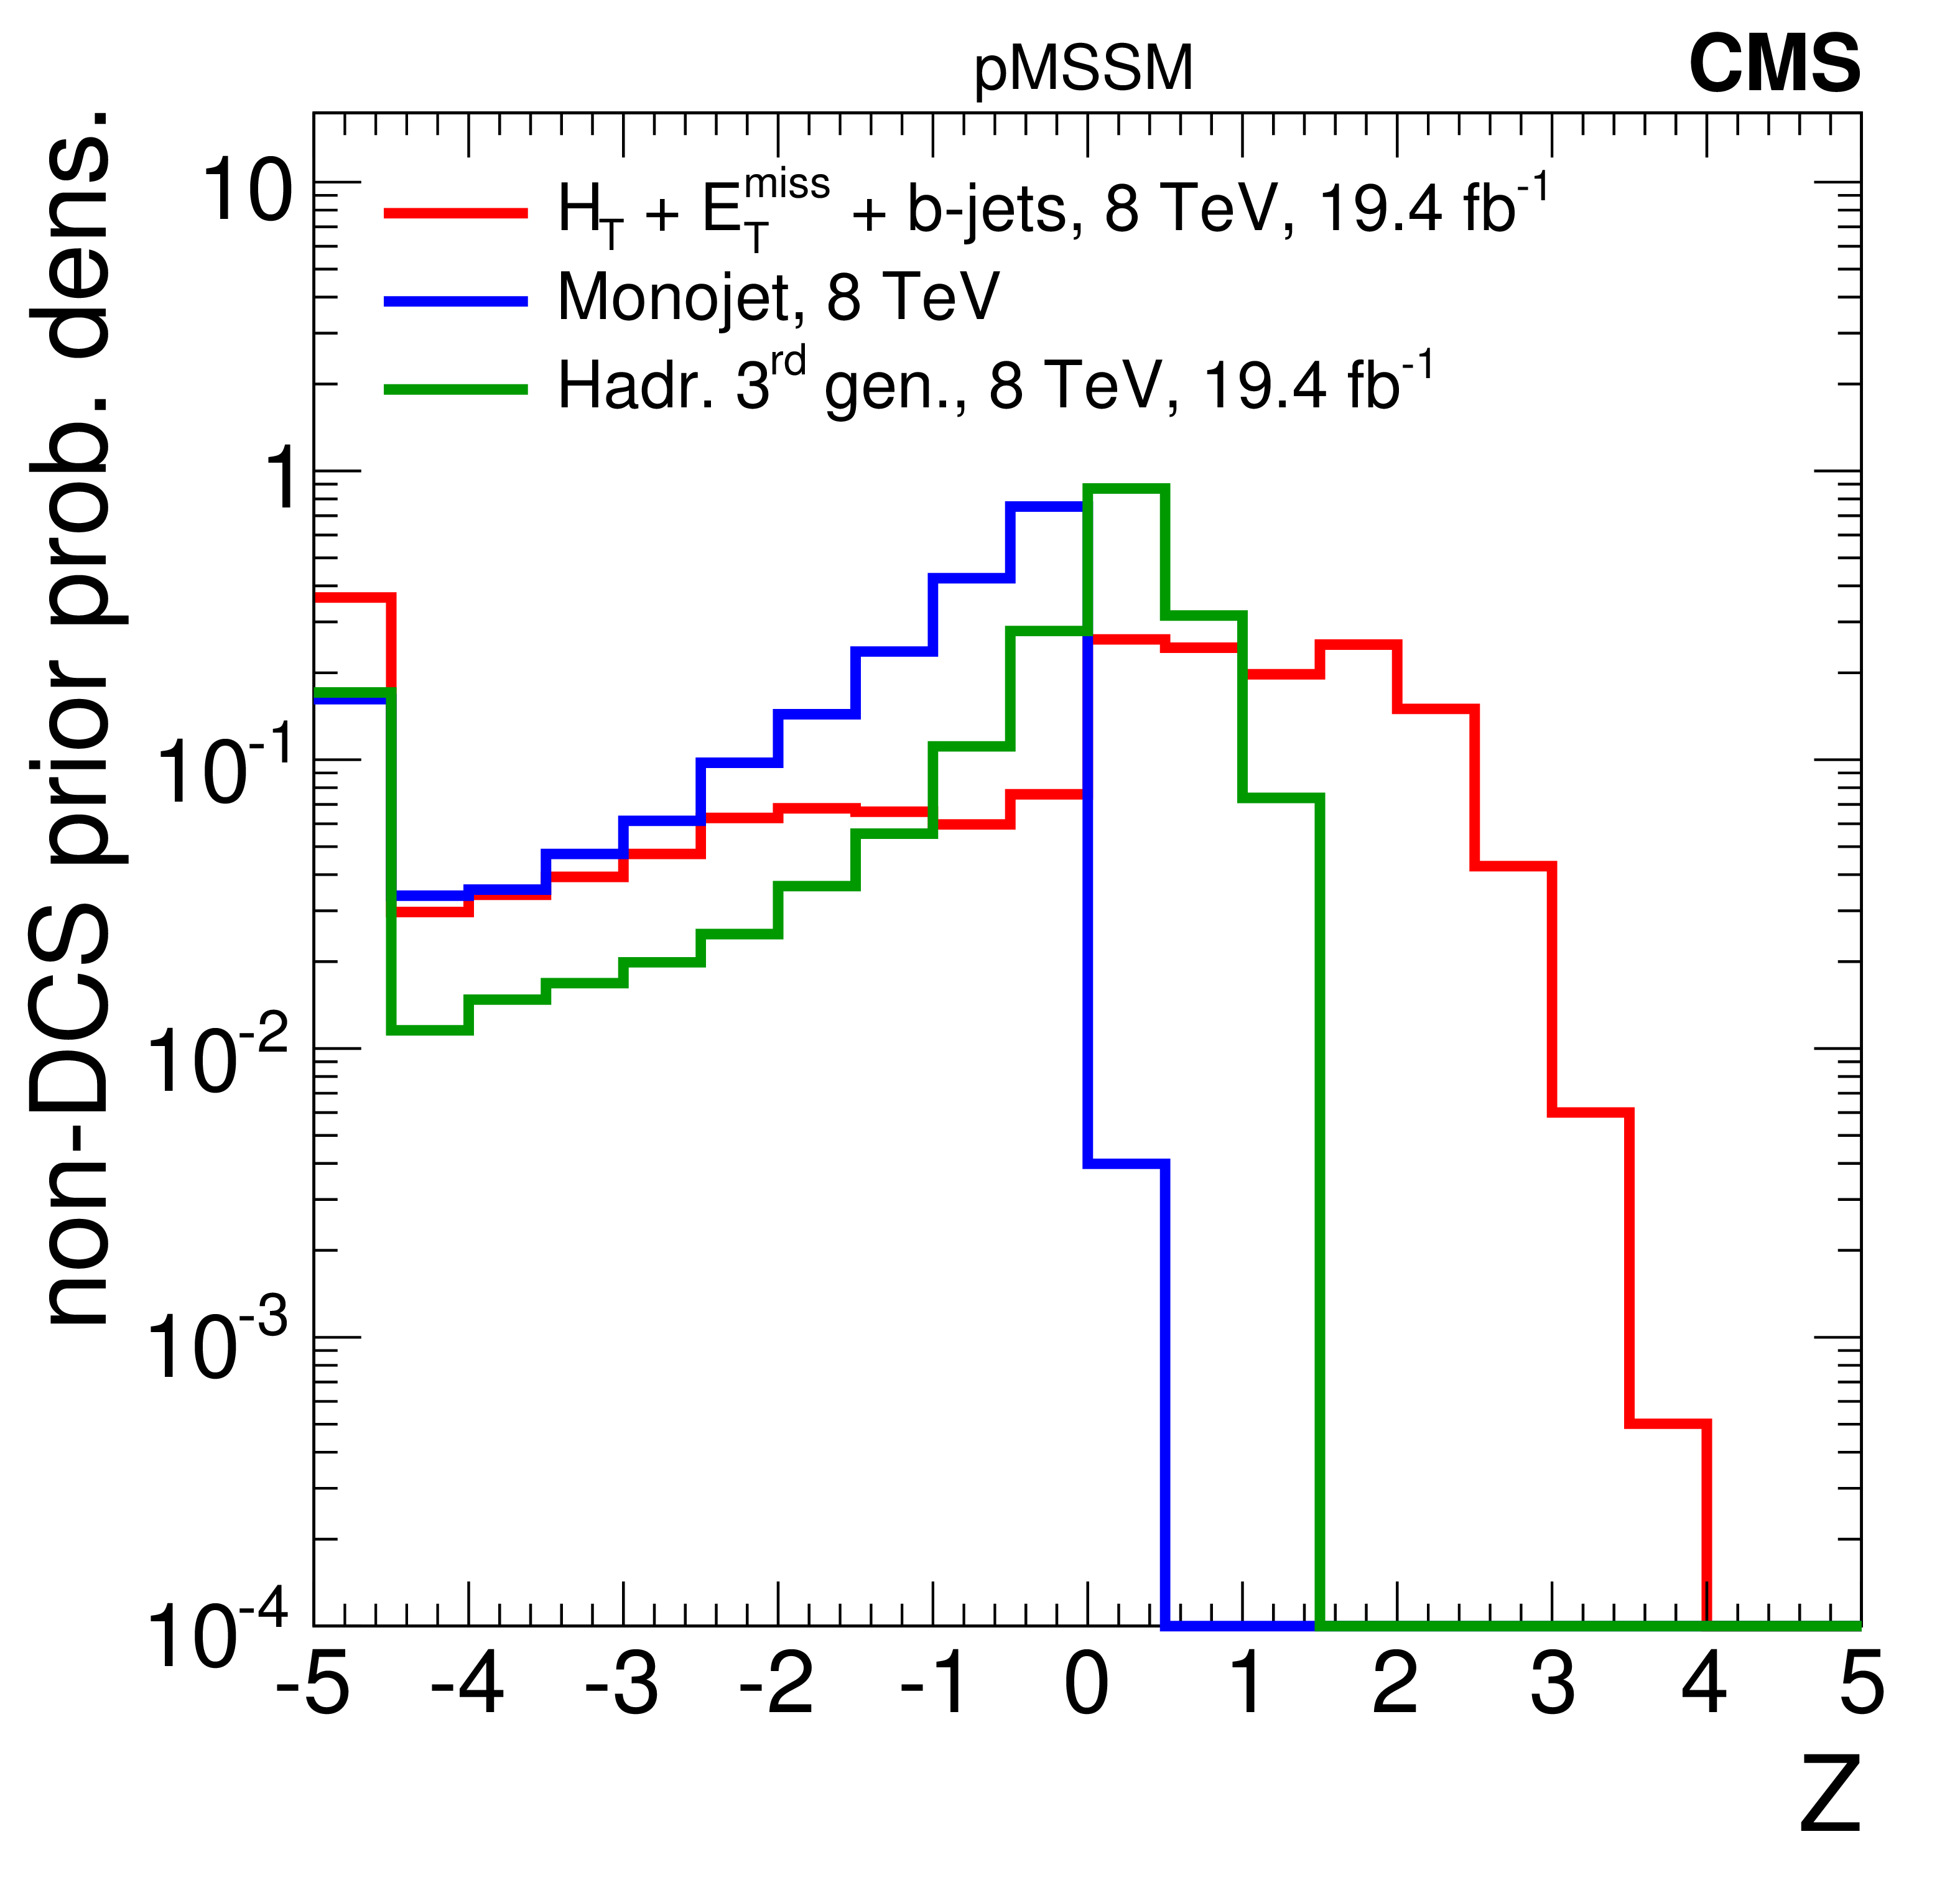
Figure 1-b:
The distribution of the $Z$-significance of model points, weighted by the non-DCS prior density of each model point, for the individual 8 TeV searches (a-d), and for 7 TeV combined and 7+8 TeV combined searches (f). The leftmost bins contain the underflow entries. |
png pdf |
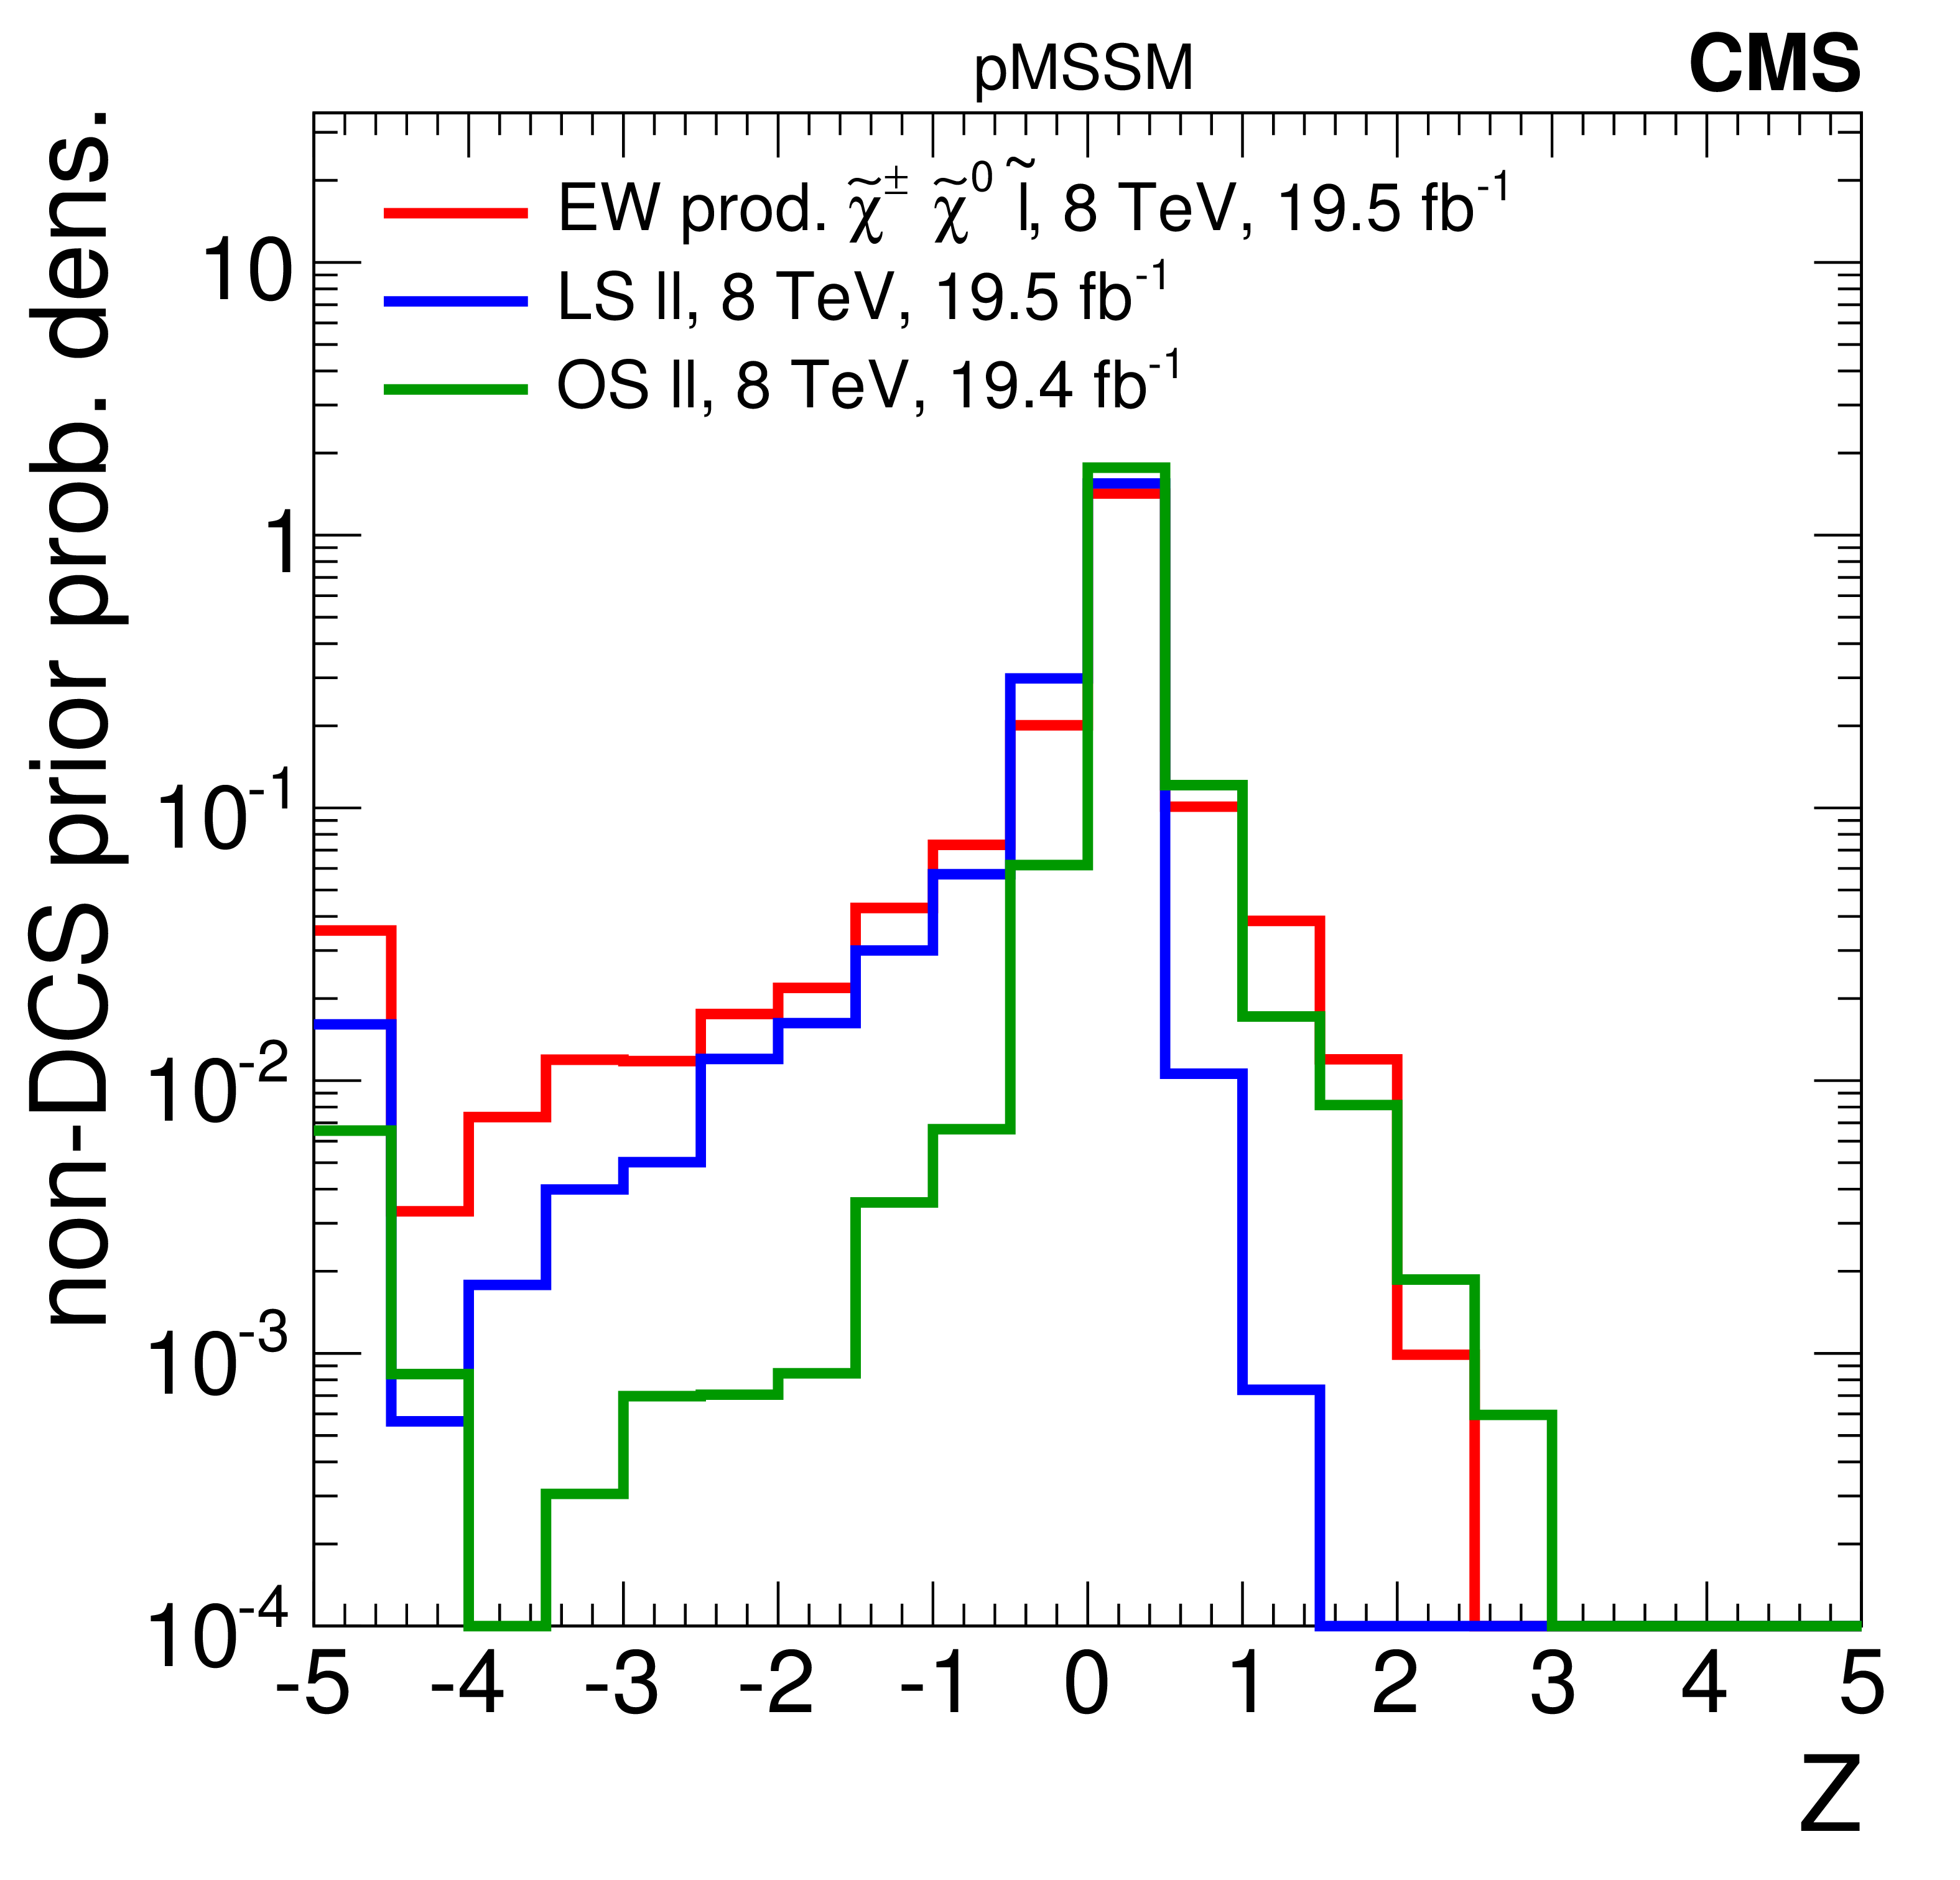
Figure 1-c:
The distribution of the $Z$-significance of model points, weighted by the non-DCS prior density of each model point, for the individual 8 TeV searches (a-d), and for 7 TeV combined and 7+8 TeV combined searches (f). The leftmost bins contain the underflow entries. |
png pdf |
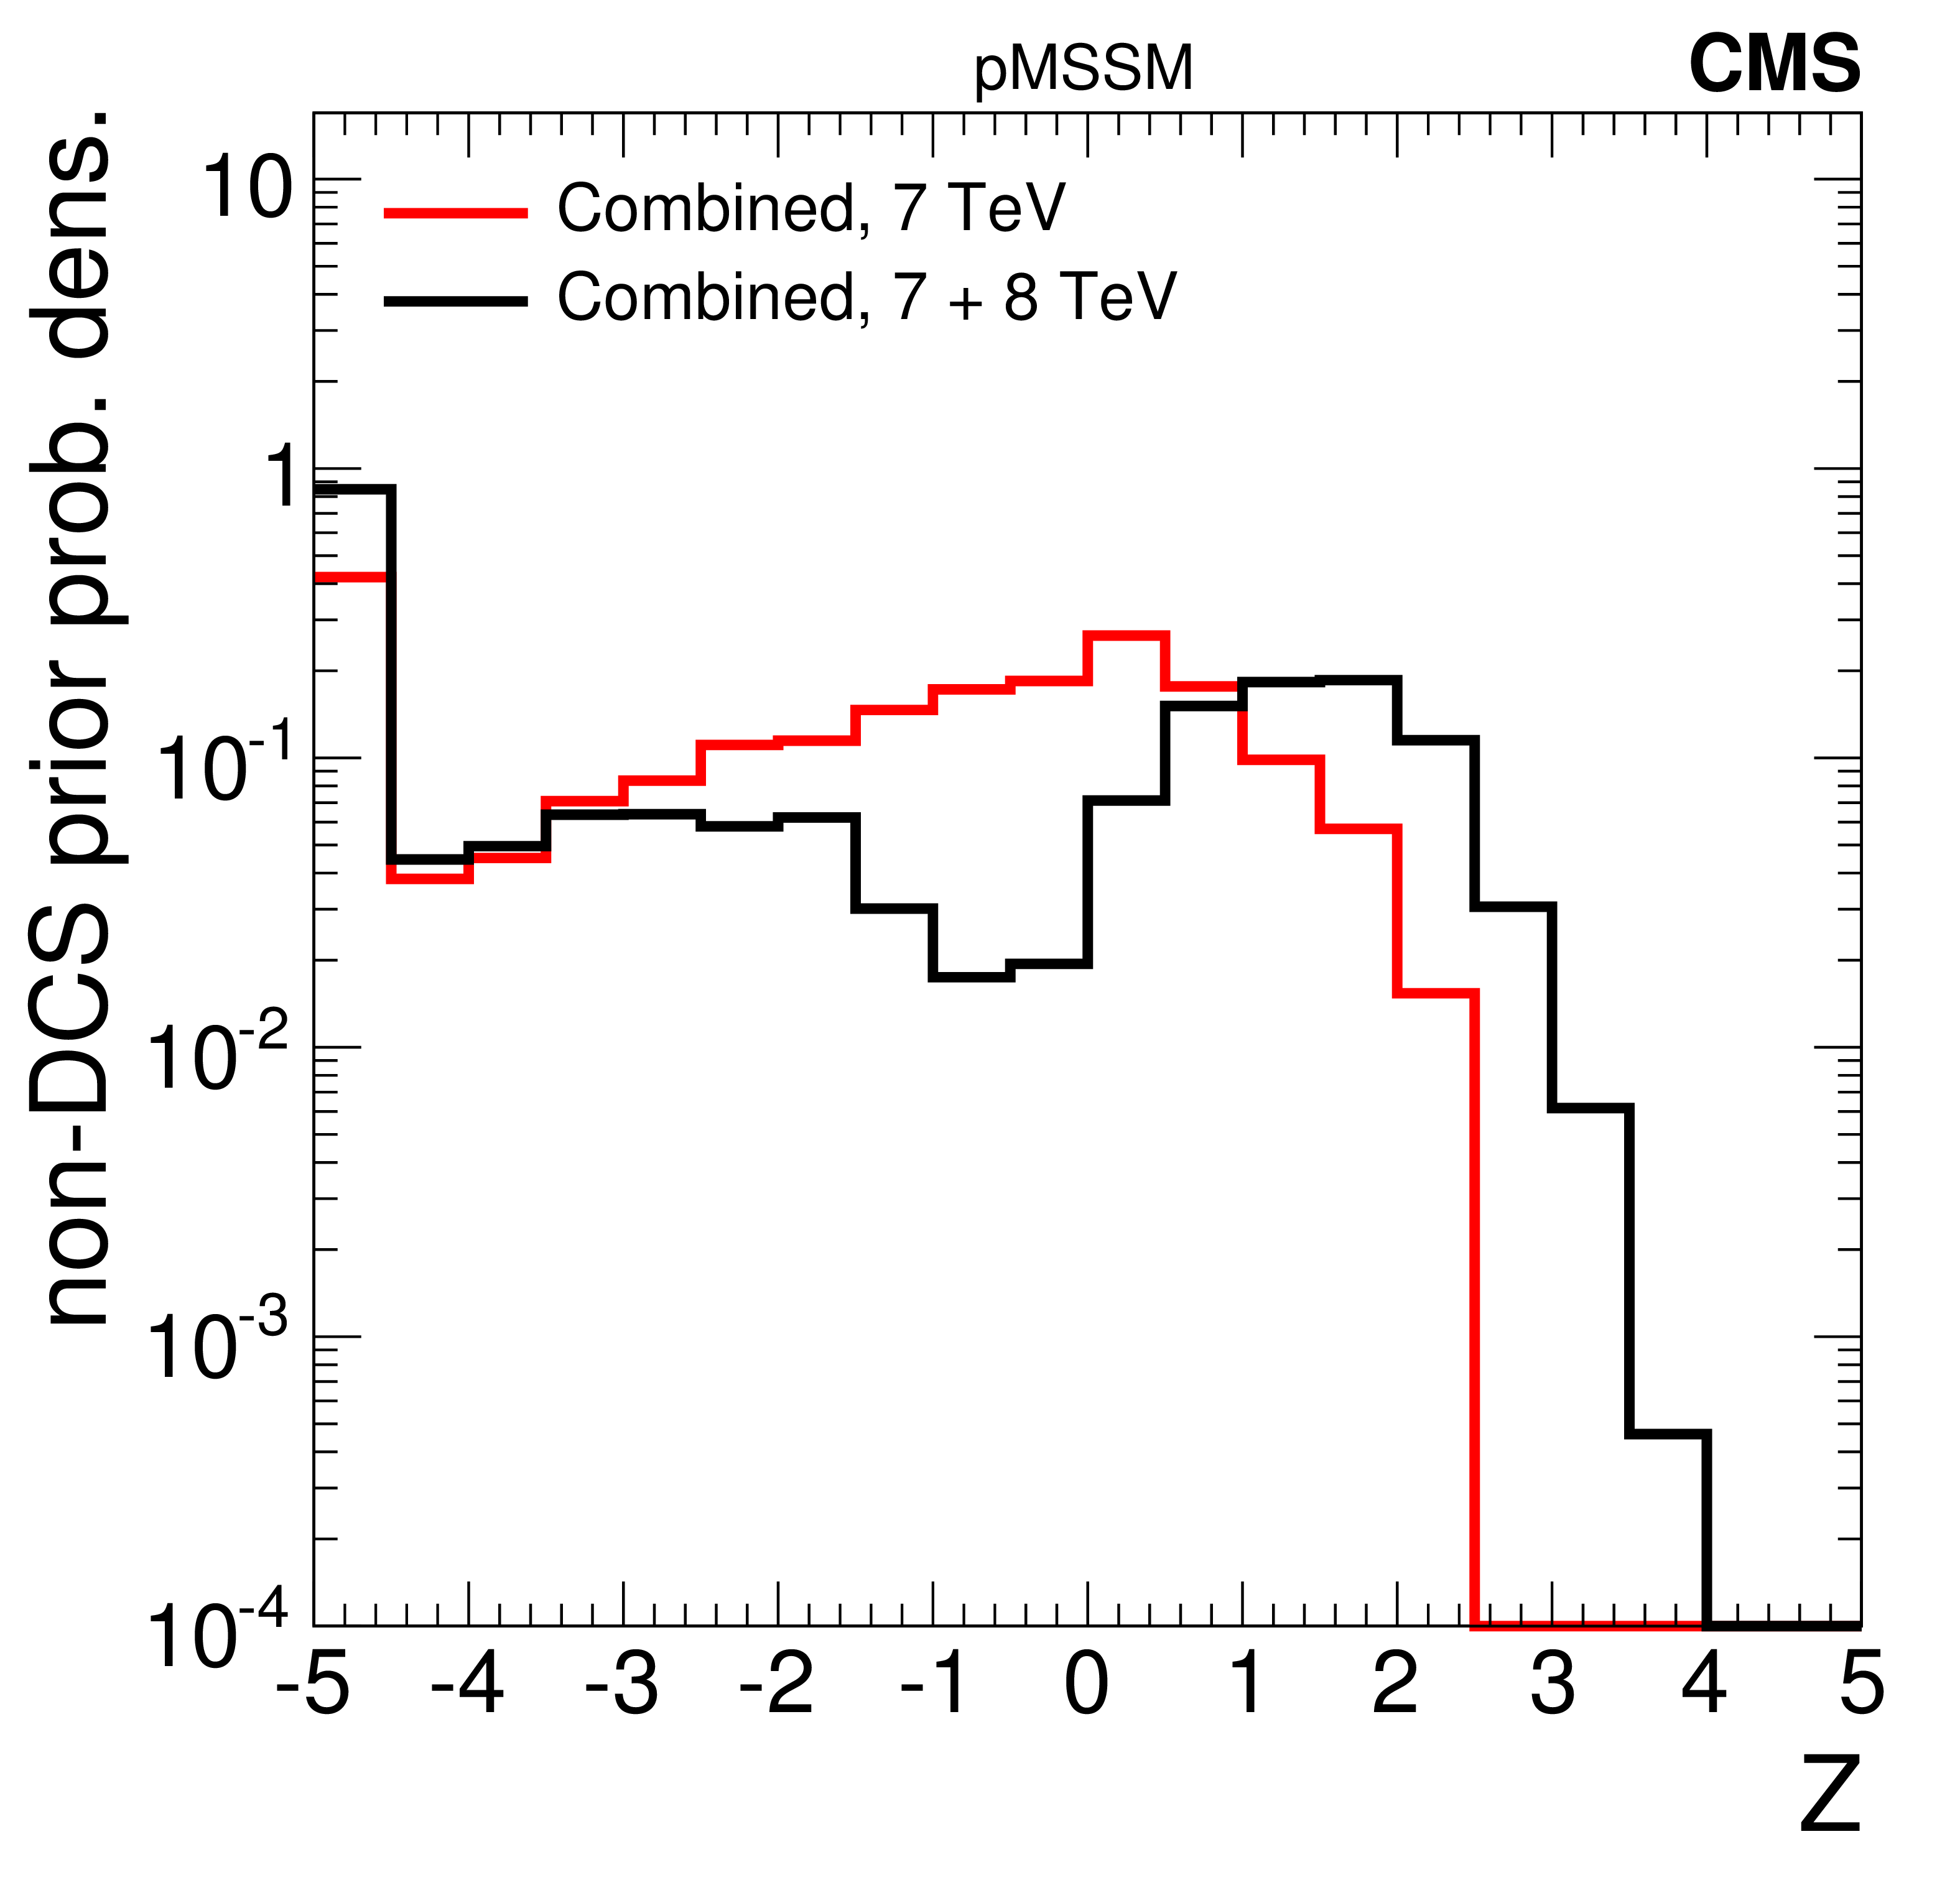
Figure 1-d:
The distribution of the $Z$-significance of model points, weighted by the non-DCS prior density of each model point, for the individual 8 TeV searches (a-d), and for 7 TeV combined and 7+8 TeV combined searches (f). The leftmost bins contain the underflow entries. |
png pdf |
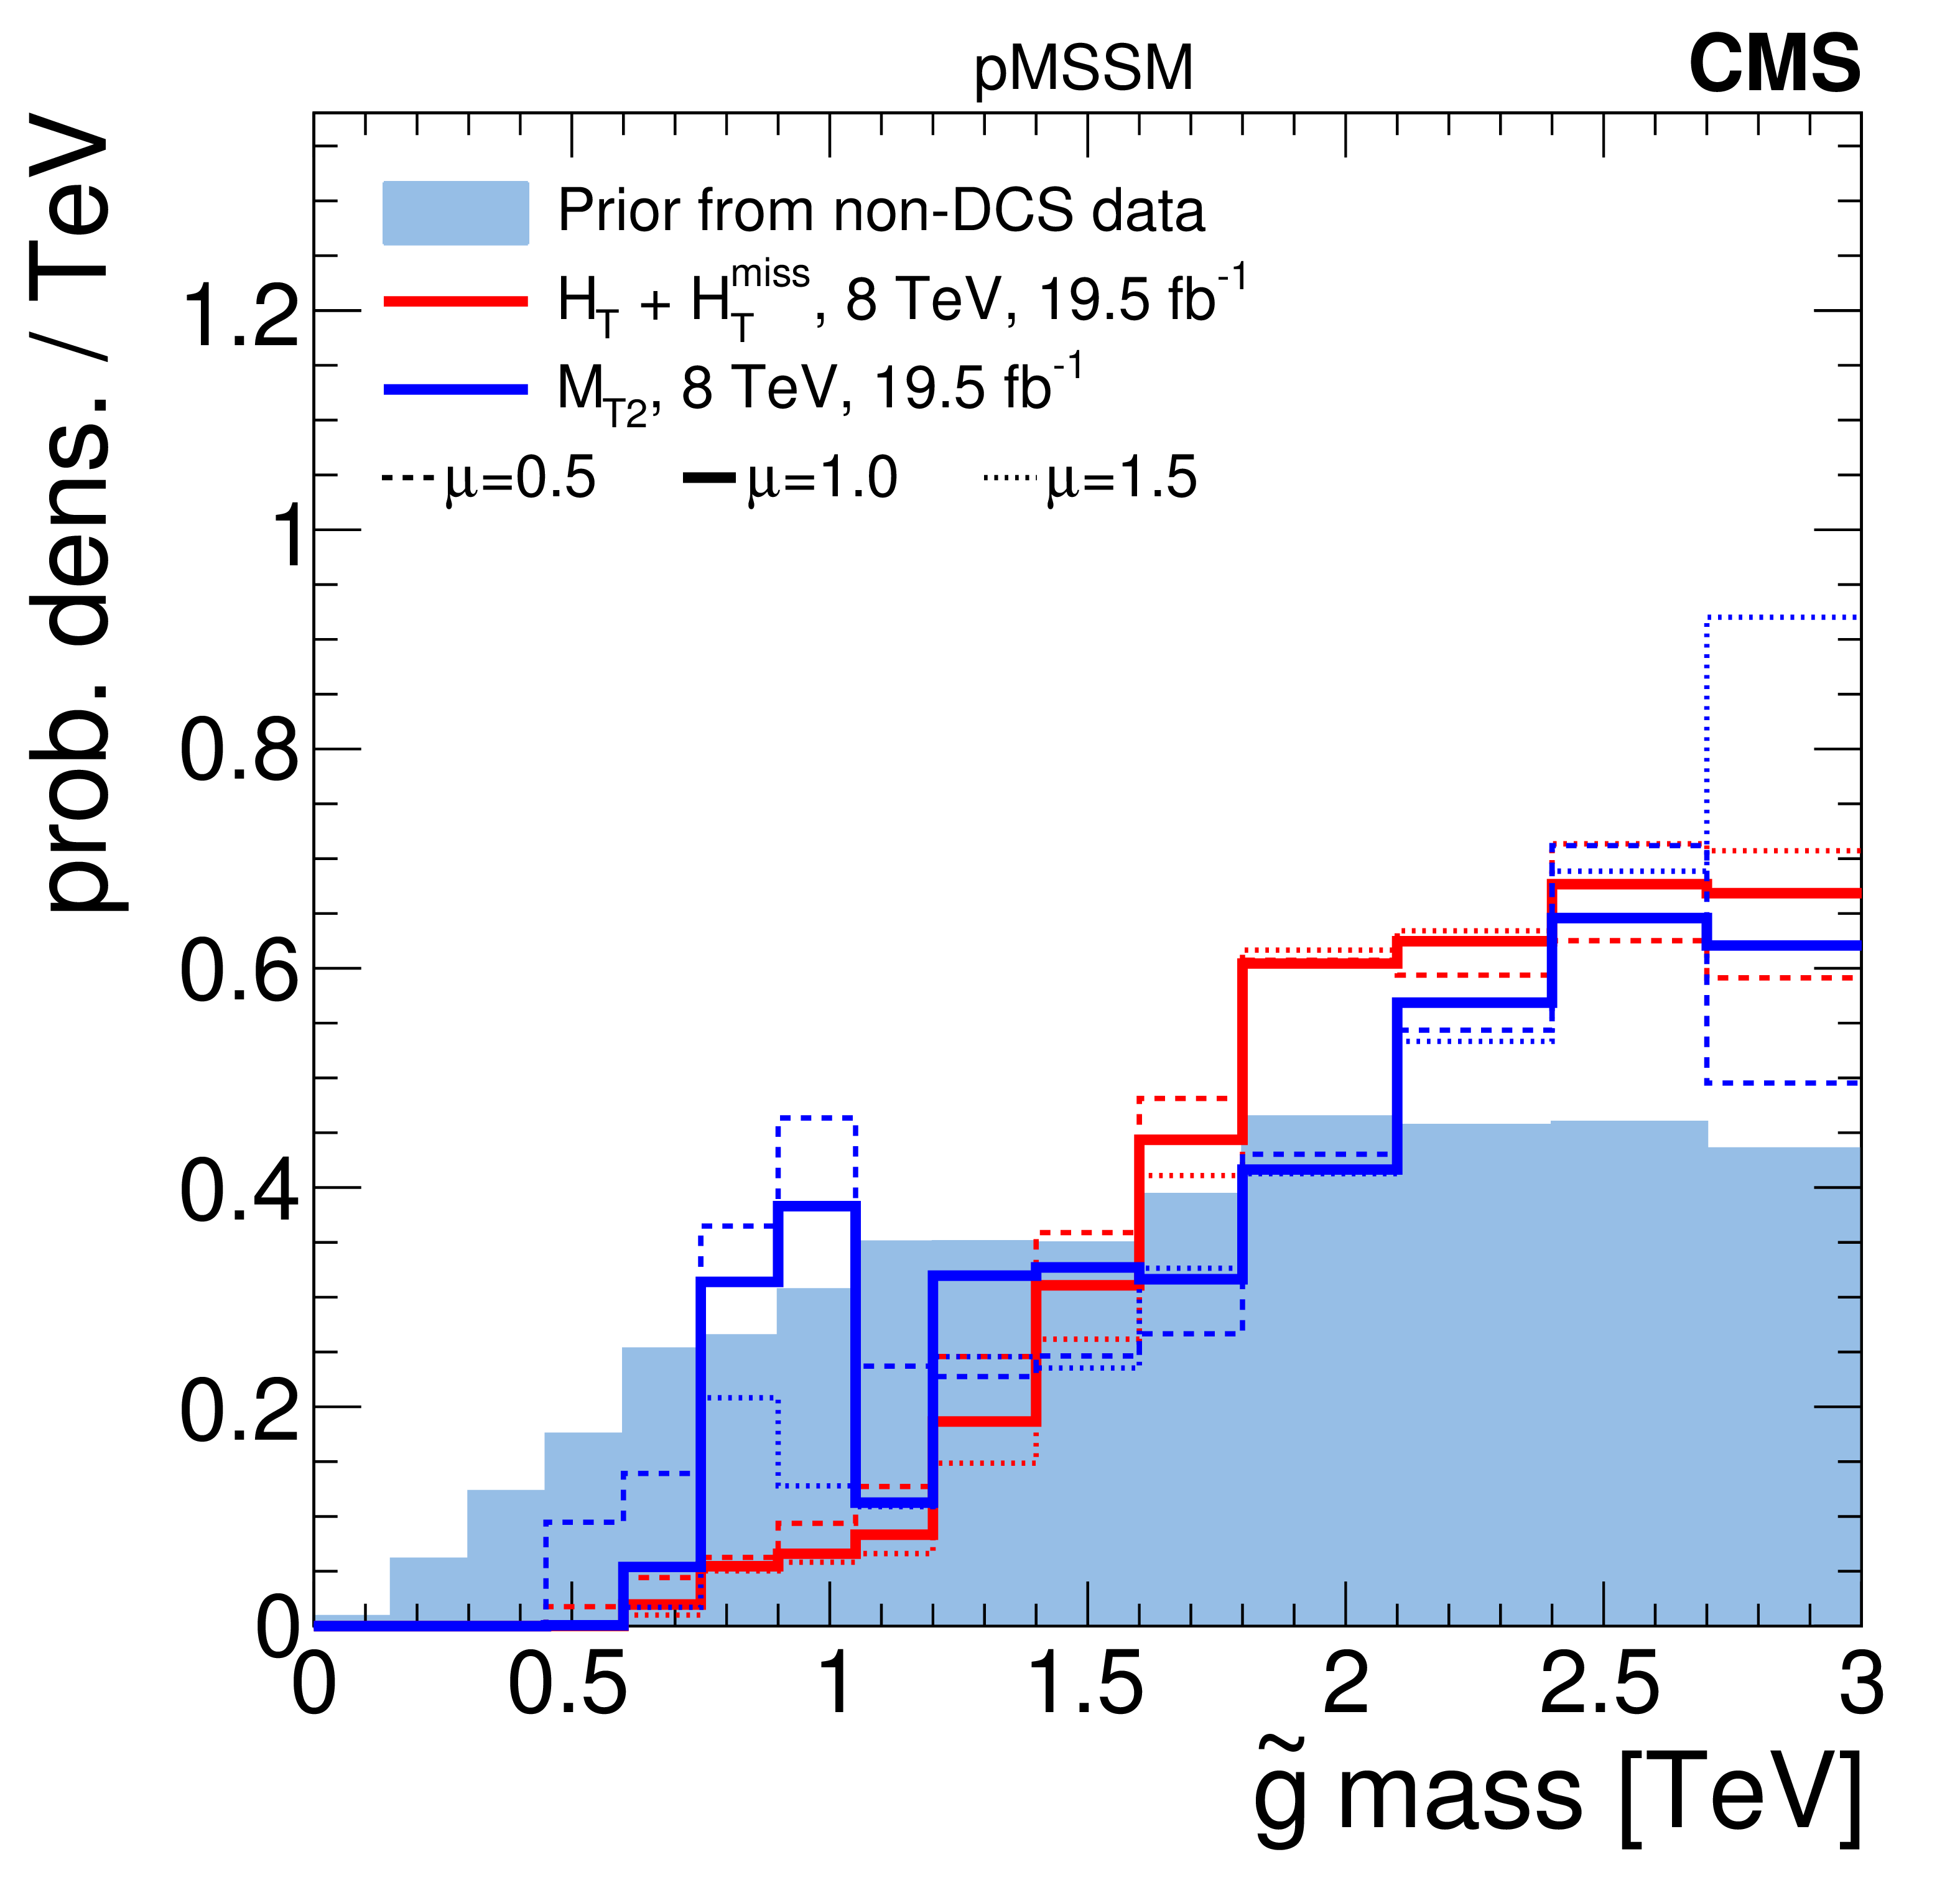
Figure 2-a:
A summary of the impact of CMS searches on the probability density of the gluino mass in the pMSSM parameter space. Plots (a-d) compare the non-DCS prior distribution of the gluino mass (blue filled histograms) to posterior distributions after data from various CMS searches (line histograms), where plot (d) shows the combined effect of CMS searches and the Higgs boson results. Plot (e) shows survival probabilities as a function of the gluino mass for various combinations of CMS data and data from Higgs boson measurements, where the shaded grey band gives the statistical uncertainty on the black histogram. Plot (f) shows the distribution of the gluino mass versus the $Z$-significance calculated from the combination of all searches. |
png pdf |
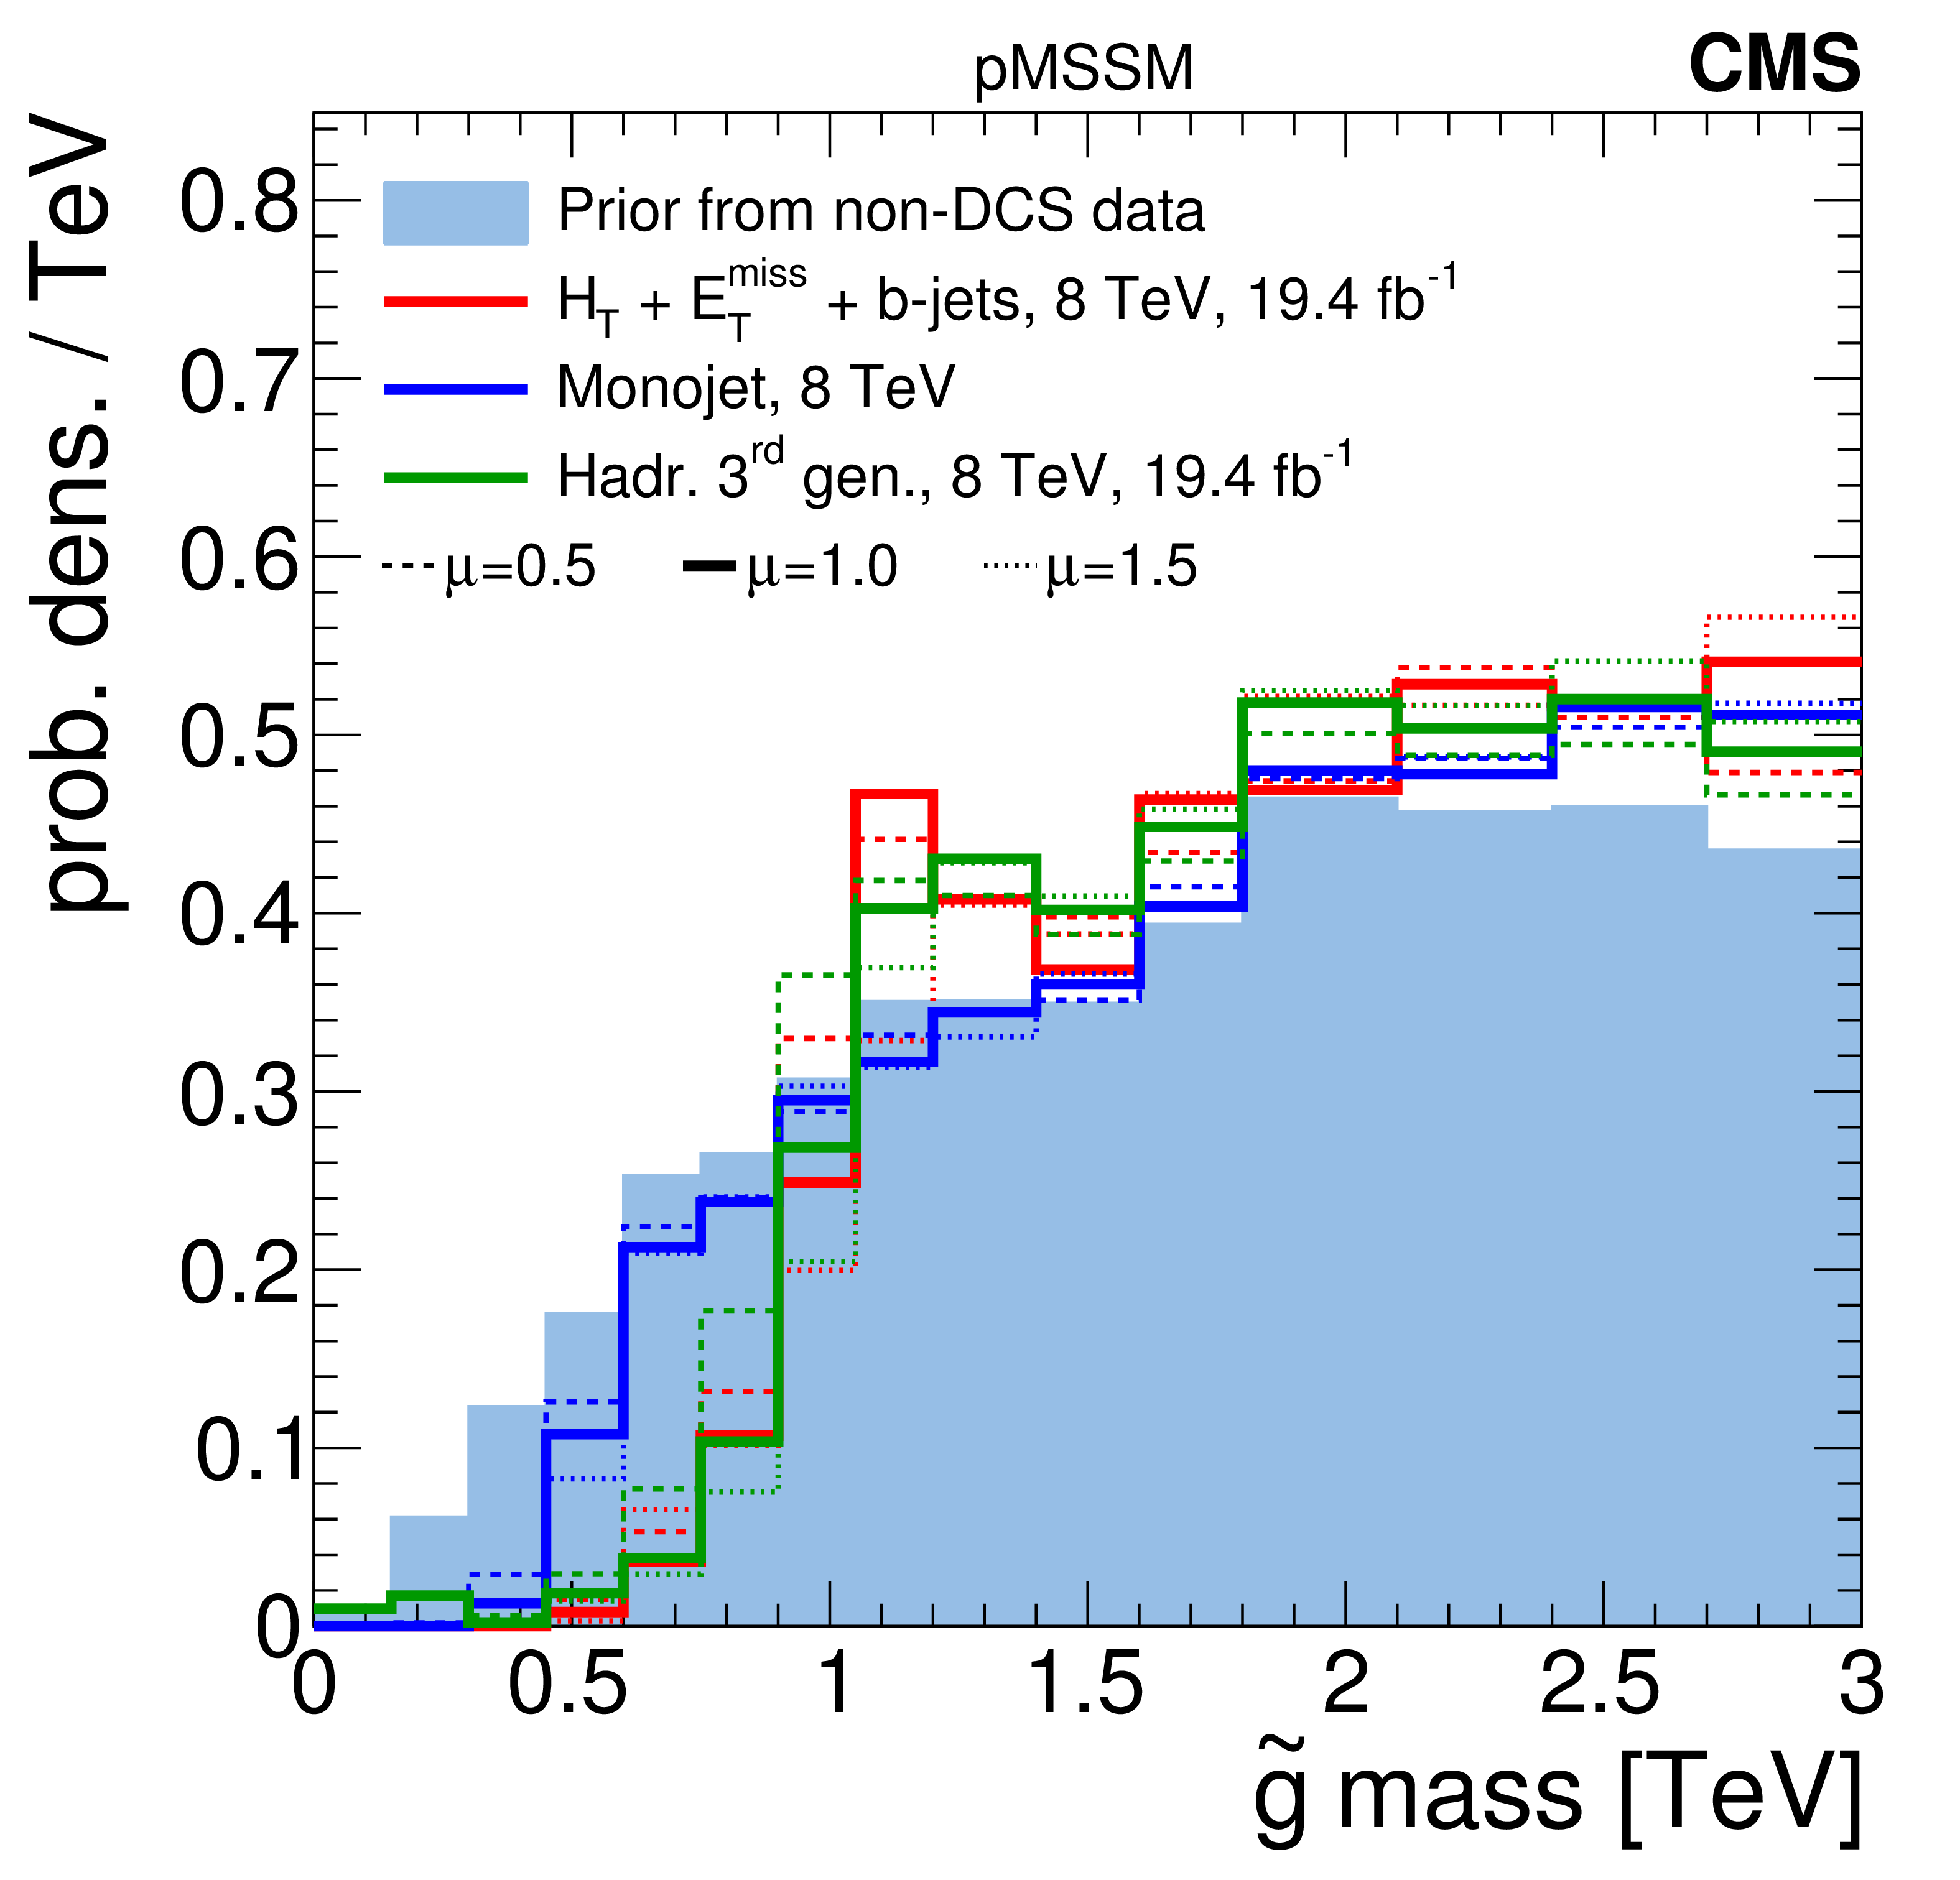
Figure 2-b:
A summary of the impact of CMS searches on the probability density of the gluino mass in the pMSSM parameter space. Plots (a-d) compare the non-DCS prior distribution of the gluino mass (blue filled histograms) to posterior distributions after data from various CMS searches (line histograms), where plot (d) shows the combined effect of CMS searches and the Higgs boson results. Plot (e) shows survival probabilities as a function of the gluino mass for various combinations of CMS data and data from Higgs boson measurements, where the shaded grey band gives the statistical uncertainty on the black histogram. Plot (f) shows the distribution of the gluino mass versus the $Z$-significance calculated from the combination of all searches. |
png pdf |
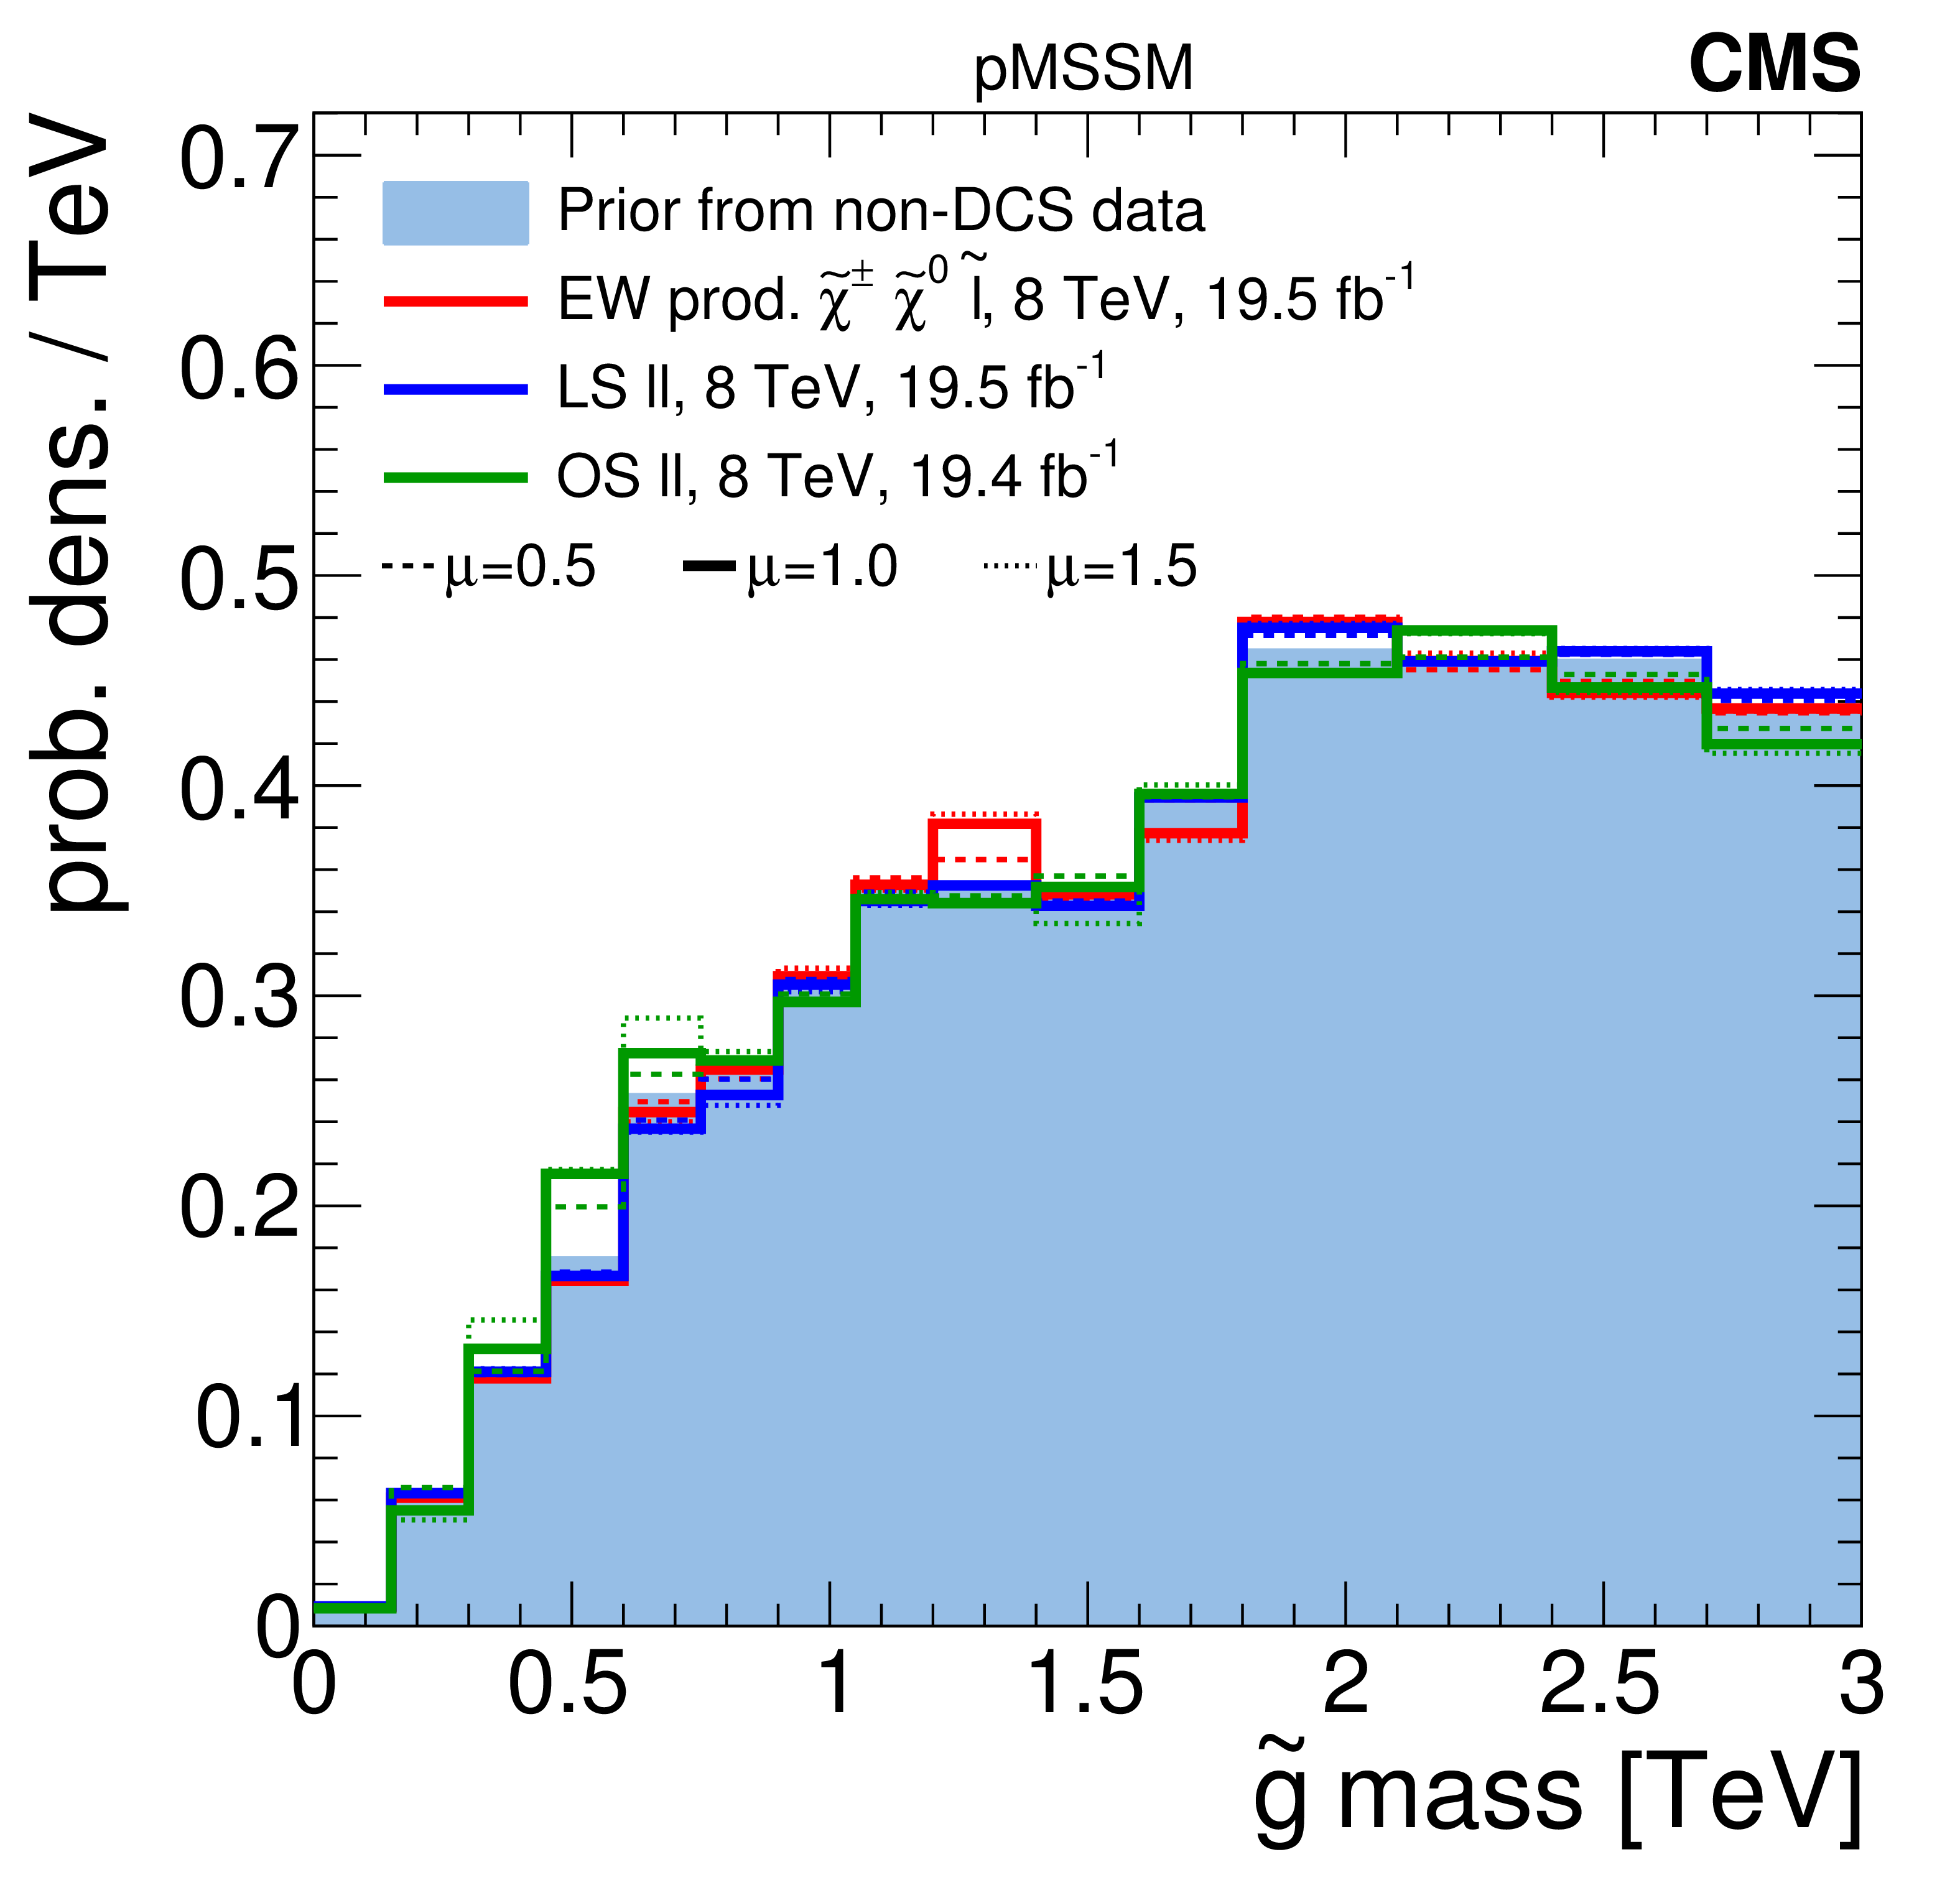
Figure 2-c:
A summary of the impact of CMS searches on the probability density of the gluino mass in the pMSSM parameter space. Plots (a-d) compare the non-DCS prior distribution of the gluino mass (blue filled histograms) to posterior distributions after data from various CMS searches (line histograms), where plot (d) shows the combined effect of CMS searches and the Higgs boson results. Plot (e) shows survival probabilities as a function of the gluino mass for various combinations of CMS data and data from Higgs boson measurements, where the shaded grey band gives the statistical uncertainty on the black histogram. Plot (f) shows the distribution of the gluino mass versus the $Z$-significance calculated from the combination of all searches. |
png pdf |
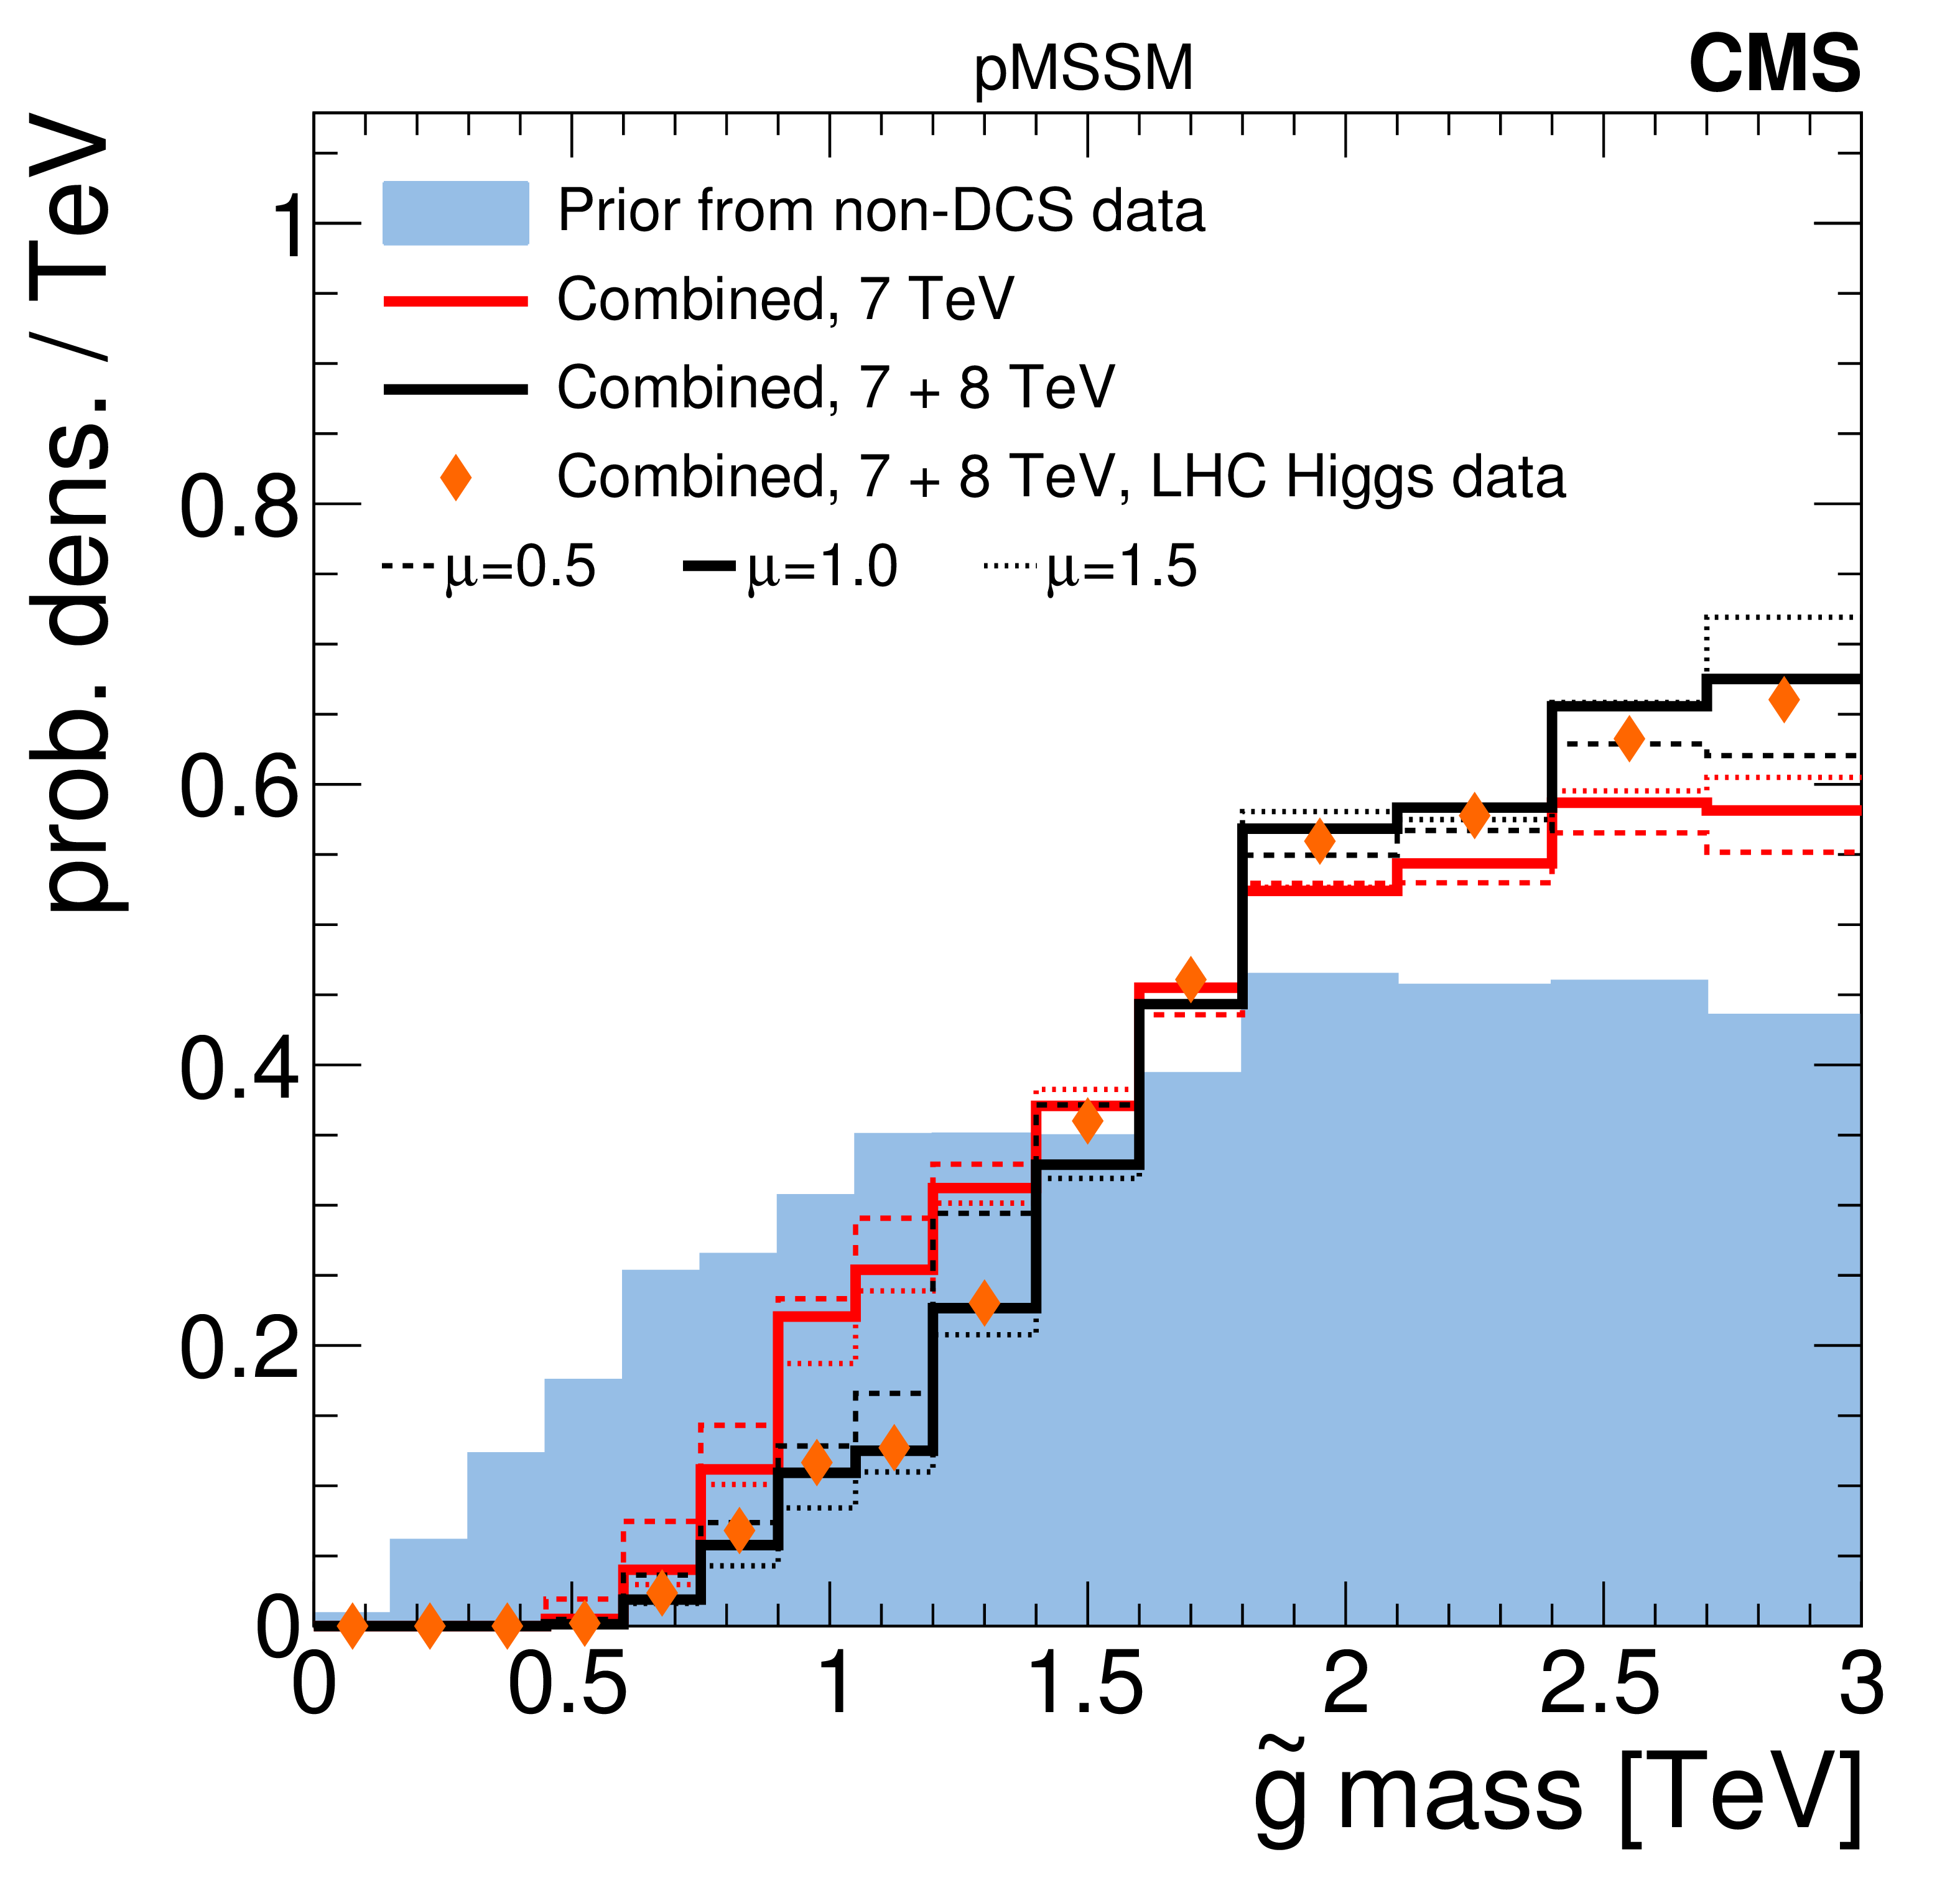
Figure 2-d:
A summary of the impact of CMS searches on the probability density of the gluino mass in the pMSSM parameter space. Plots (a-d) compare the non-DCS prior distribution of the gluino mass (blue filled histograms) to posterior distributions after data from various CMS searches (line histograms), where plot (d) shows the combined effect of CMS searches and the Higgs boson results. Plot (e) shows survival probabilities as a function of the gluino mass for various combinations of CMS data and data from Higgs boson measurements, where the shaded grey band gives the statistical uncertainty on the black histogram. Plot (f) shows the distribution of the gluino mass versus the $Z$-significance calculated from the combination of all searches. |
png pdf |
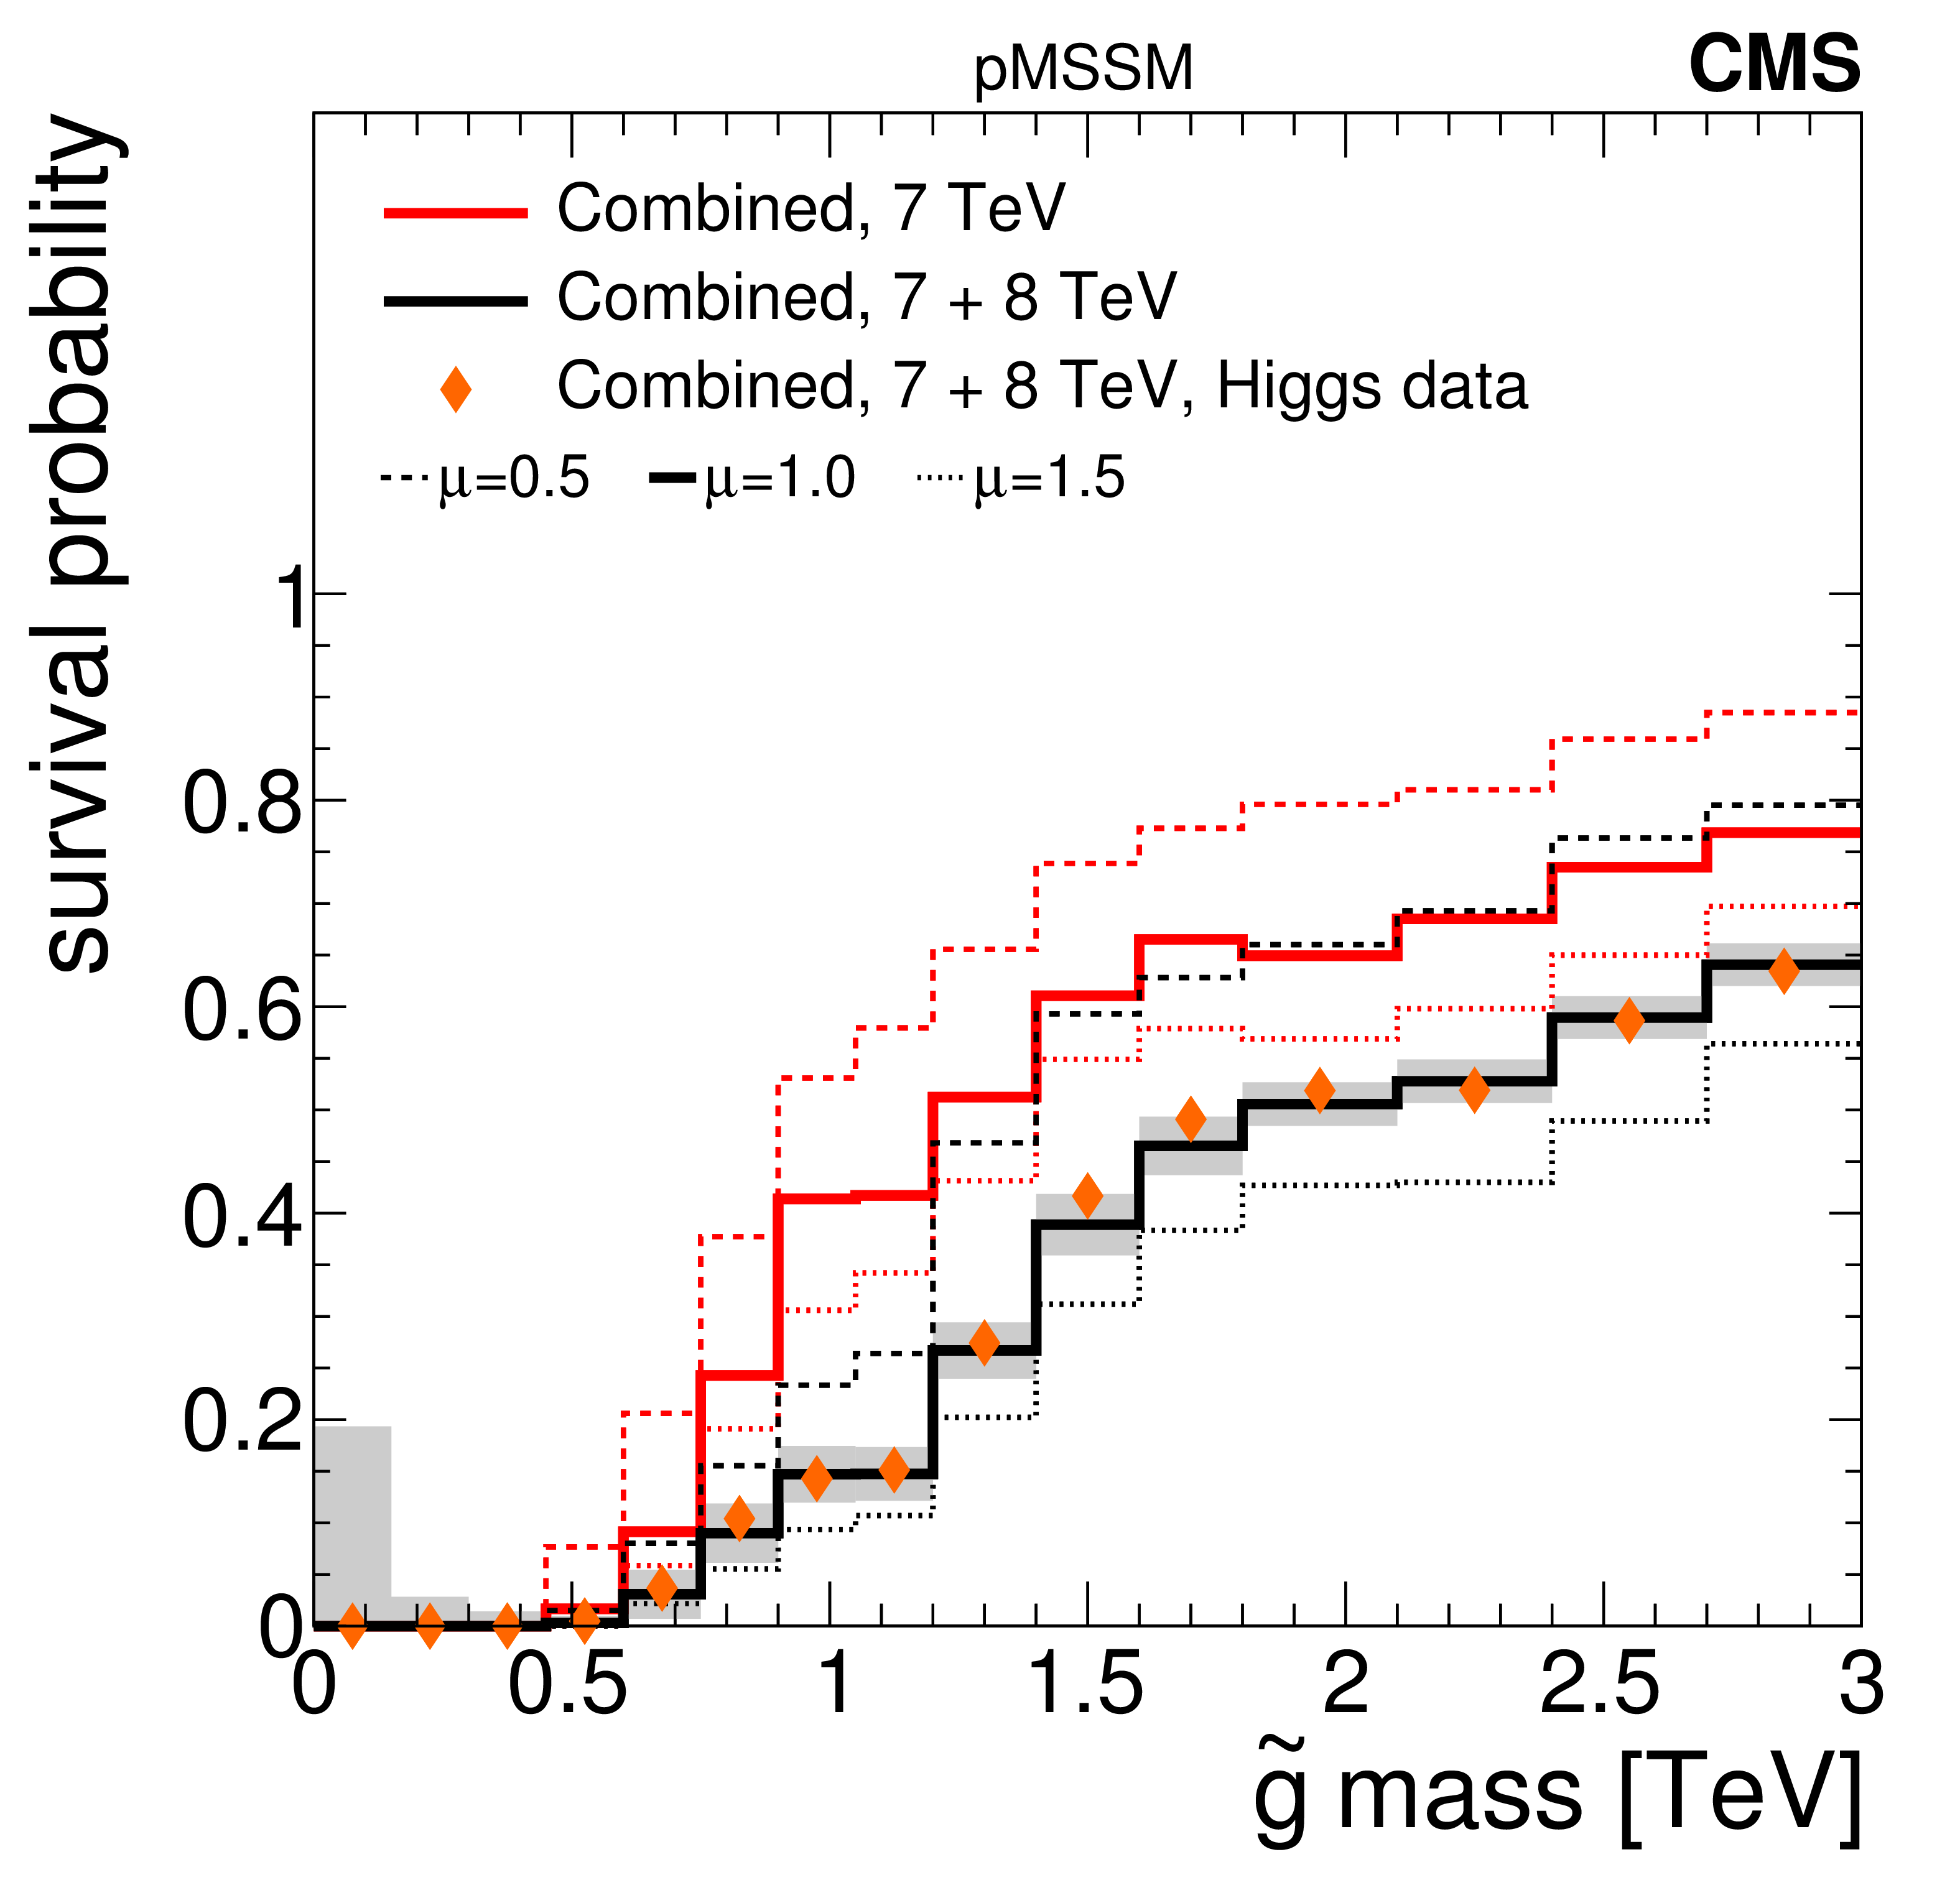
Figure 2-e:
A summary of the impact of CMS searches on the probability density of the gluino mass in the pMSSM parameter space. Plots (a-d) compare the non-DCS prior distribution of the gluino mass (blue filled histograms) to posterior distributions after data from various CMS searches (line histograms), where plot (d) shows the combined effect of CMS searches and the Higgs boson results. Plot (e) shows survival probabilities as a function of the gluino mass for various combinations of CMS data and data from Higgs boson measurements, where the shaded grey band gives the statistical uncertainty on the black histogram. Plot (f) shows the distribution of the gluino mass versus the $Z$-significance calculated from the combination of all searches. |

png pdf |
Figure 2-f:
A summary of the impact of CMS searches on the probability density of the gluino mass in the pMSSM parameter space. Plots (a-d) compare the non-DCS prior distribution of the gluino mass (blue filled histograms) to posterior distributions after data from various CMS searches (line histograms), where plot (d) shows the combined effect of CMS searches and the Higgs boson results. Plot (e) shows survival probabilities as a function of the gluino mass for various combinations of CMS data and data from Higgs boson measurements, where the shaded grey band gives the statistical uncertainty on the black histogram. Plot (f) shows the distribution of the gluino mass versus the $Z$-significance calculated from the combination of all searches. |
png pdf |
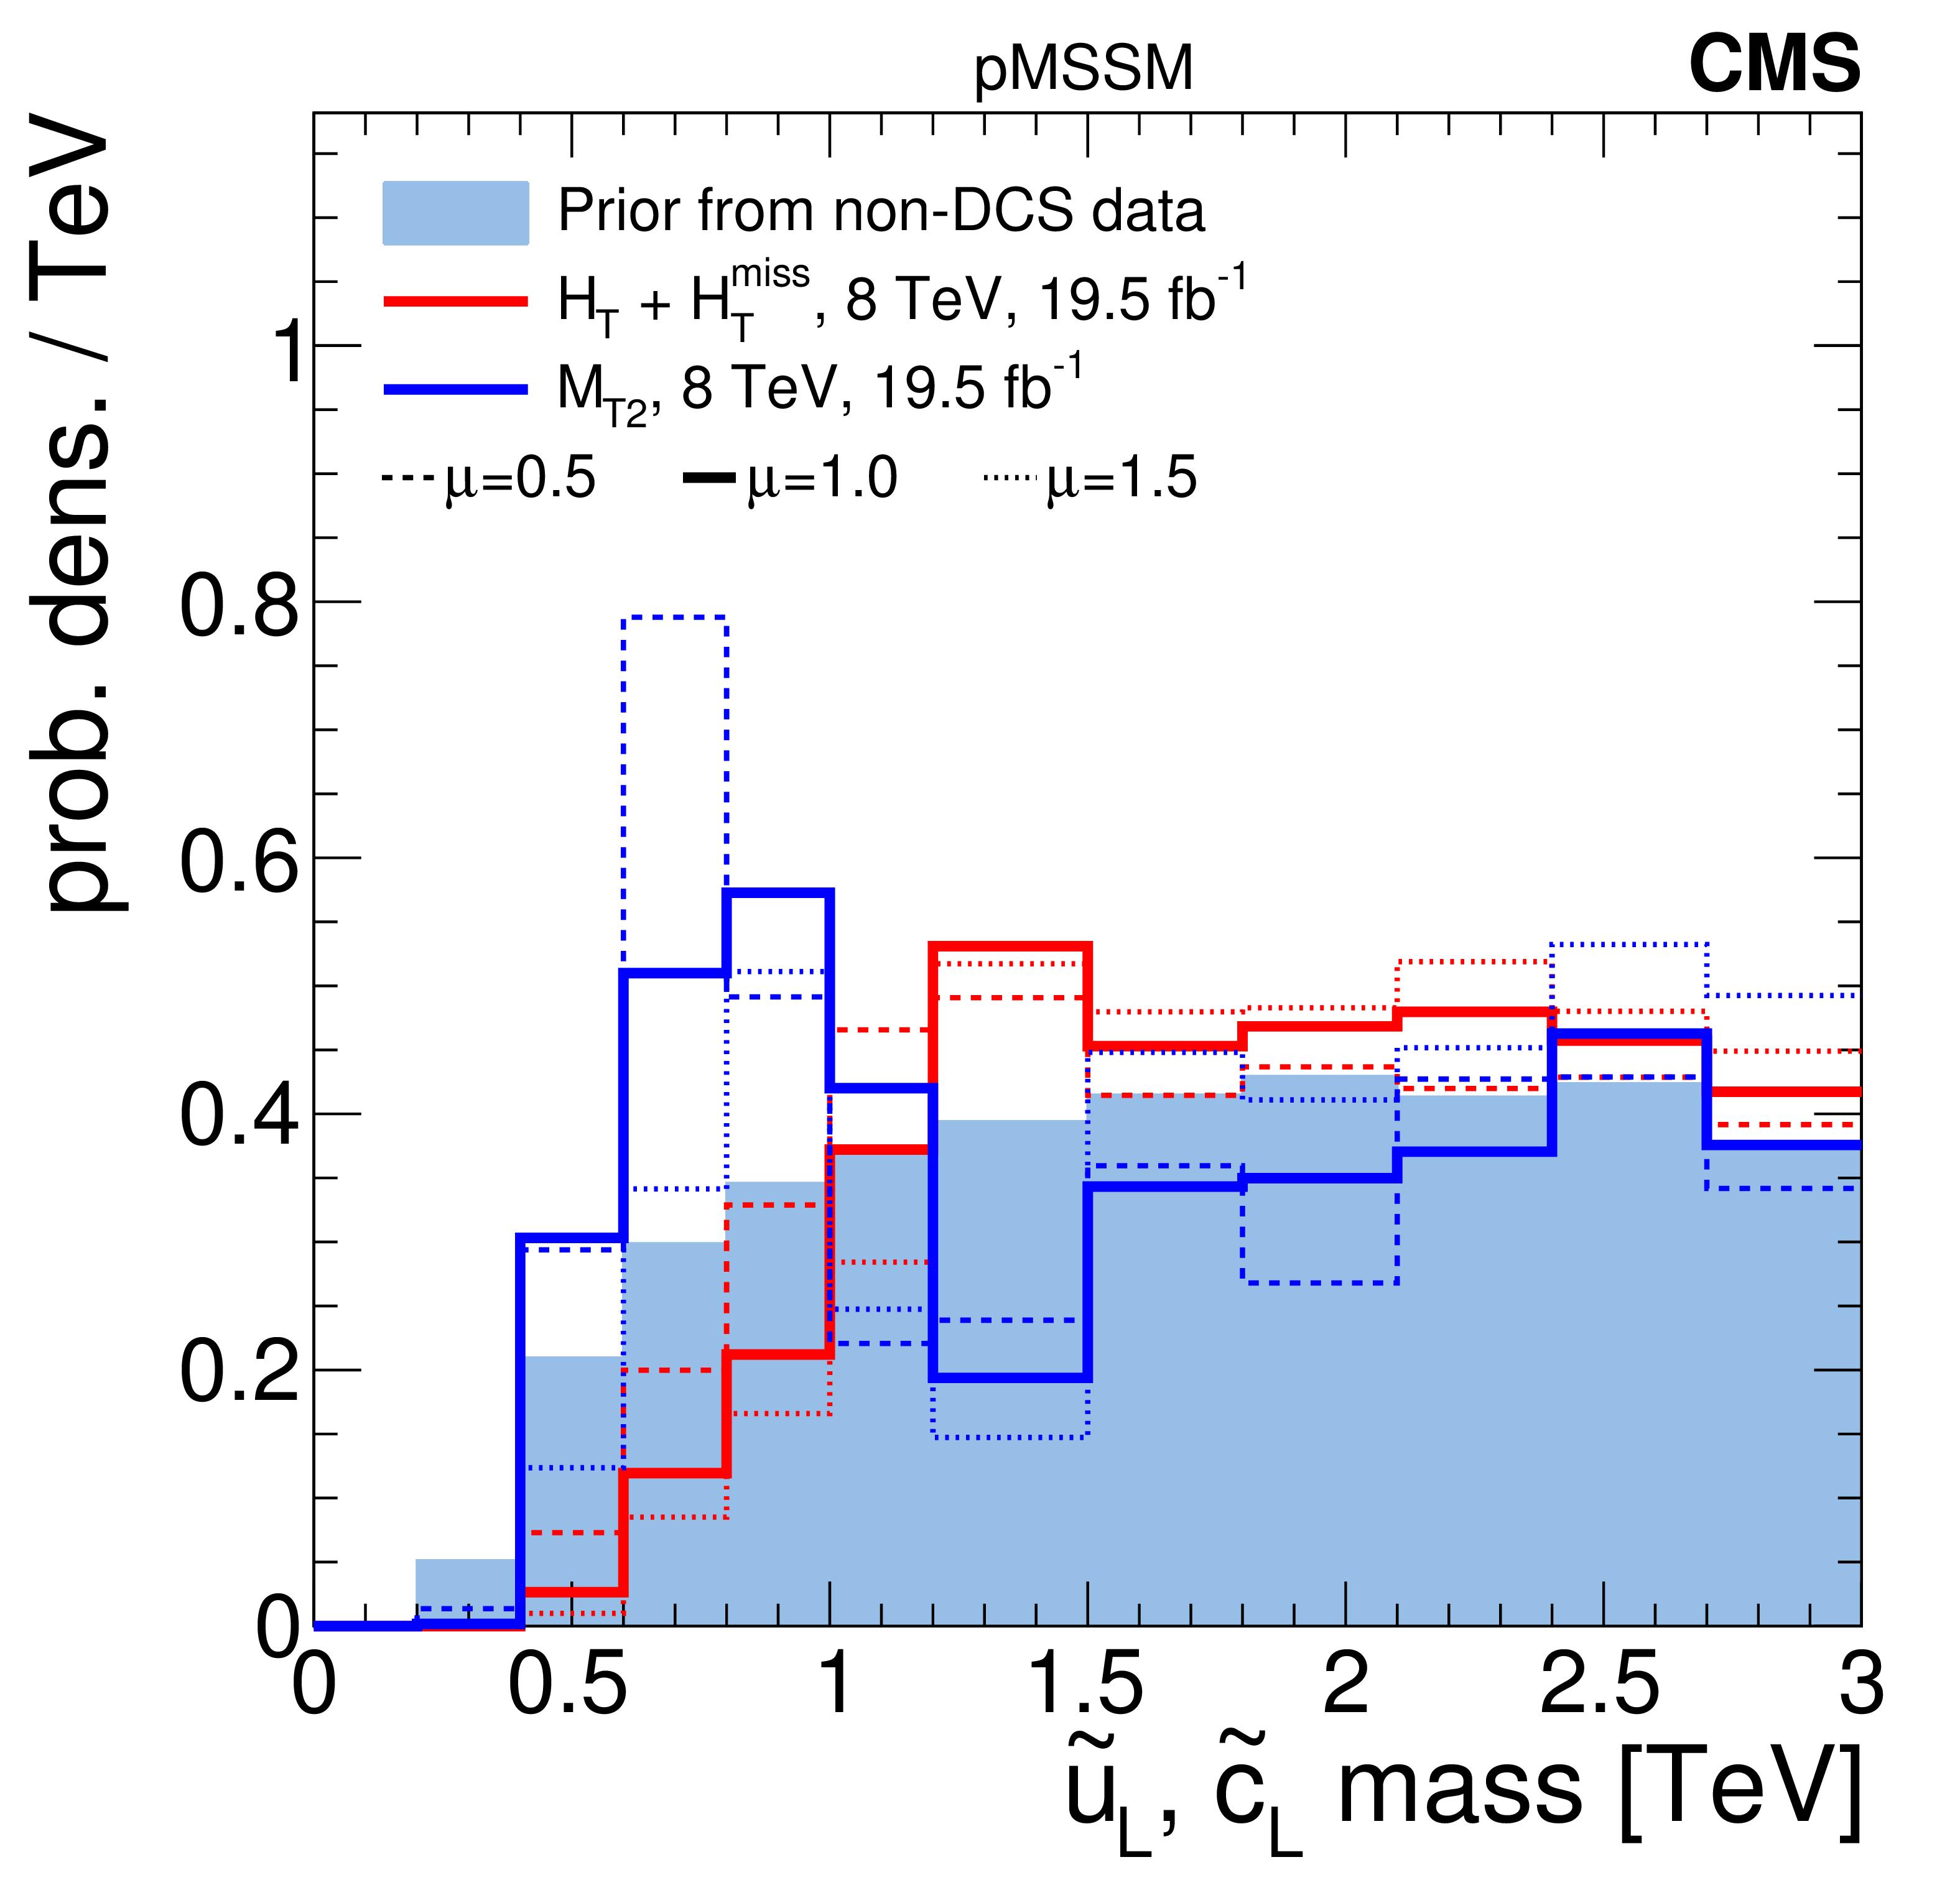
Figure 3-a:
A summary of the impact of CMS searches on the probability density of the $\mathrm{ \tilde{u}_L } $ mass (equivalently, the $ \mathrm{ \tilde{c}_L } $ mass) in the pMSSM parameter space. Plots (a-d) compare the non-DCS prior distribution of the $\mathrm{ \tilde{u}_L } $ mass to posterior distributions after data from various CMS searches, where plot (d) shows the combined effect of CMS searches and the Higgs boson results. Plot (e) shows survival probabilities as a function of the $\mathrm{ \tilde{u}_L } $ mass for various combinations of CMS data and data from Higgs boson measurements. Plot (f) shows the distribution of the $\mathrm{ \tilde{u}_L } $ mass versus the $Z$-significance calculated from the combination of all searches. See Fig. 2 for a description of the shading. |
png pdf |
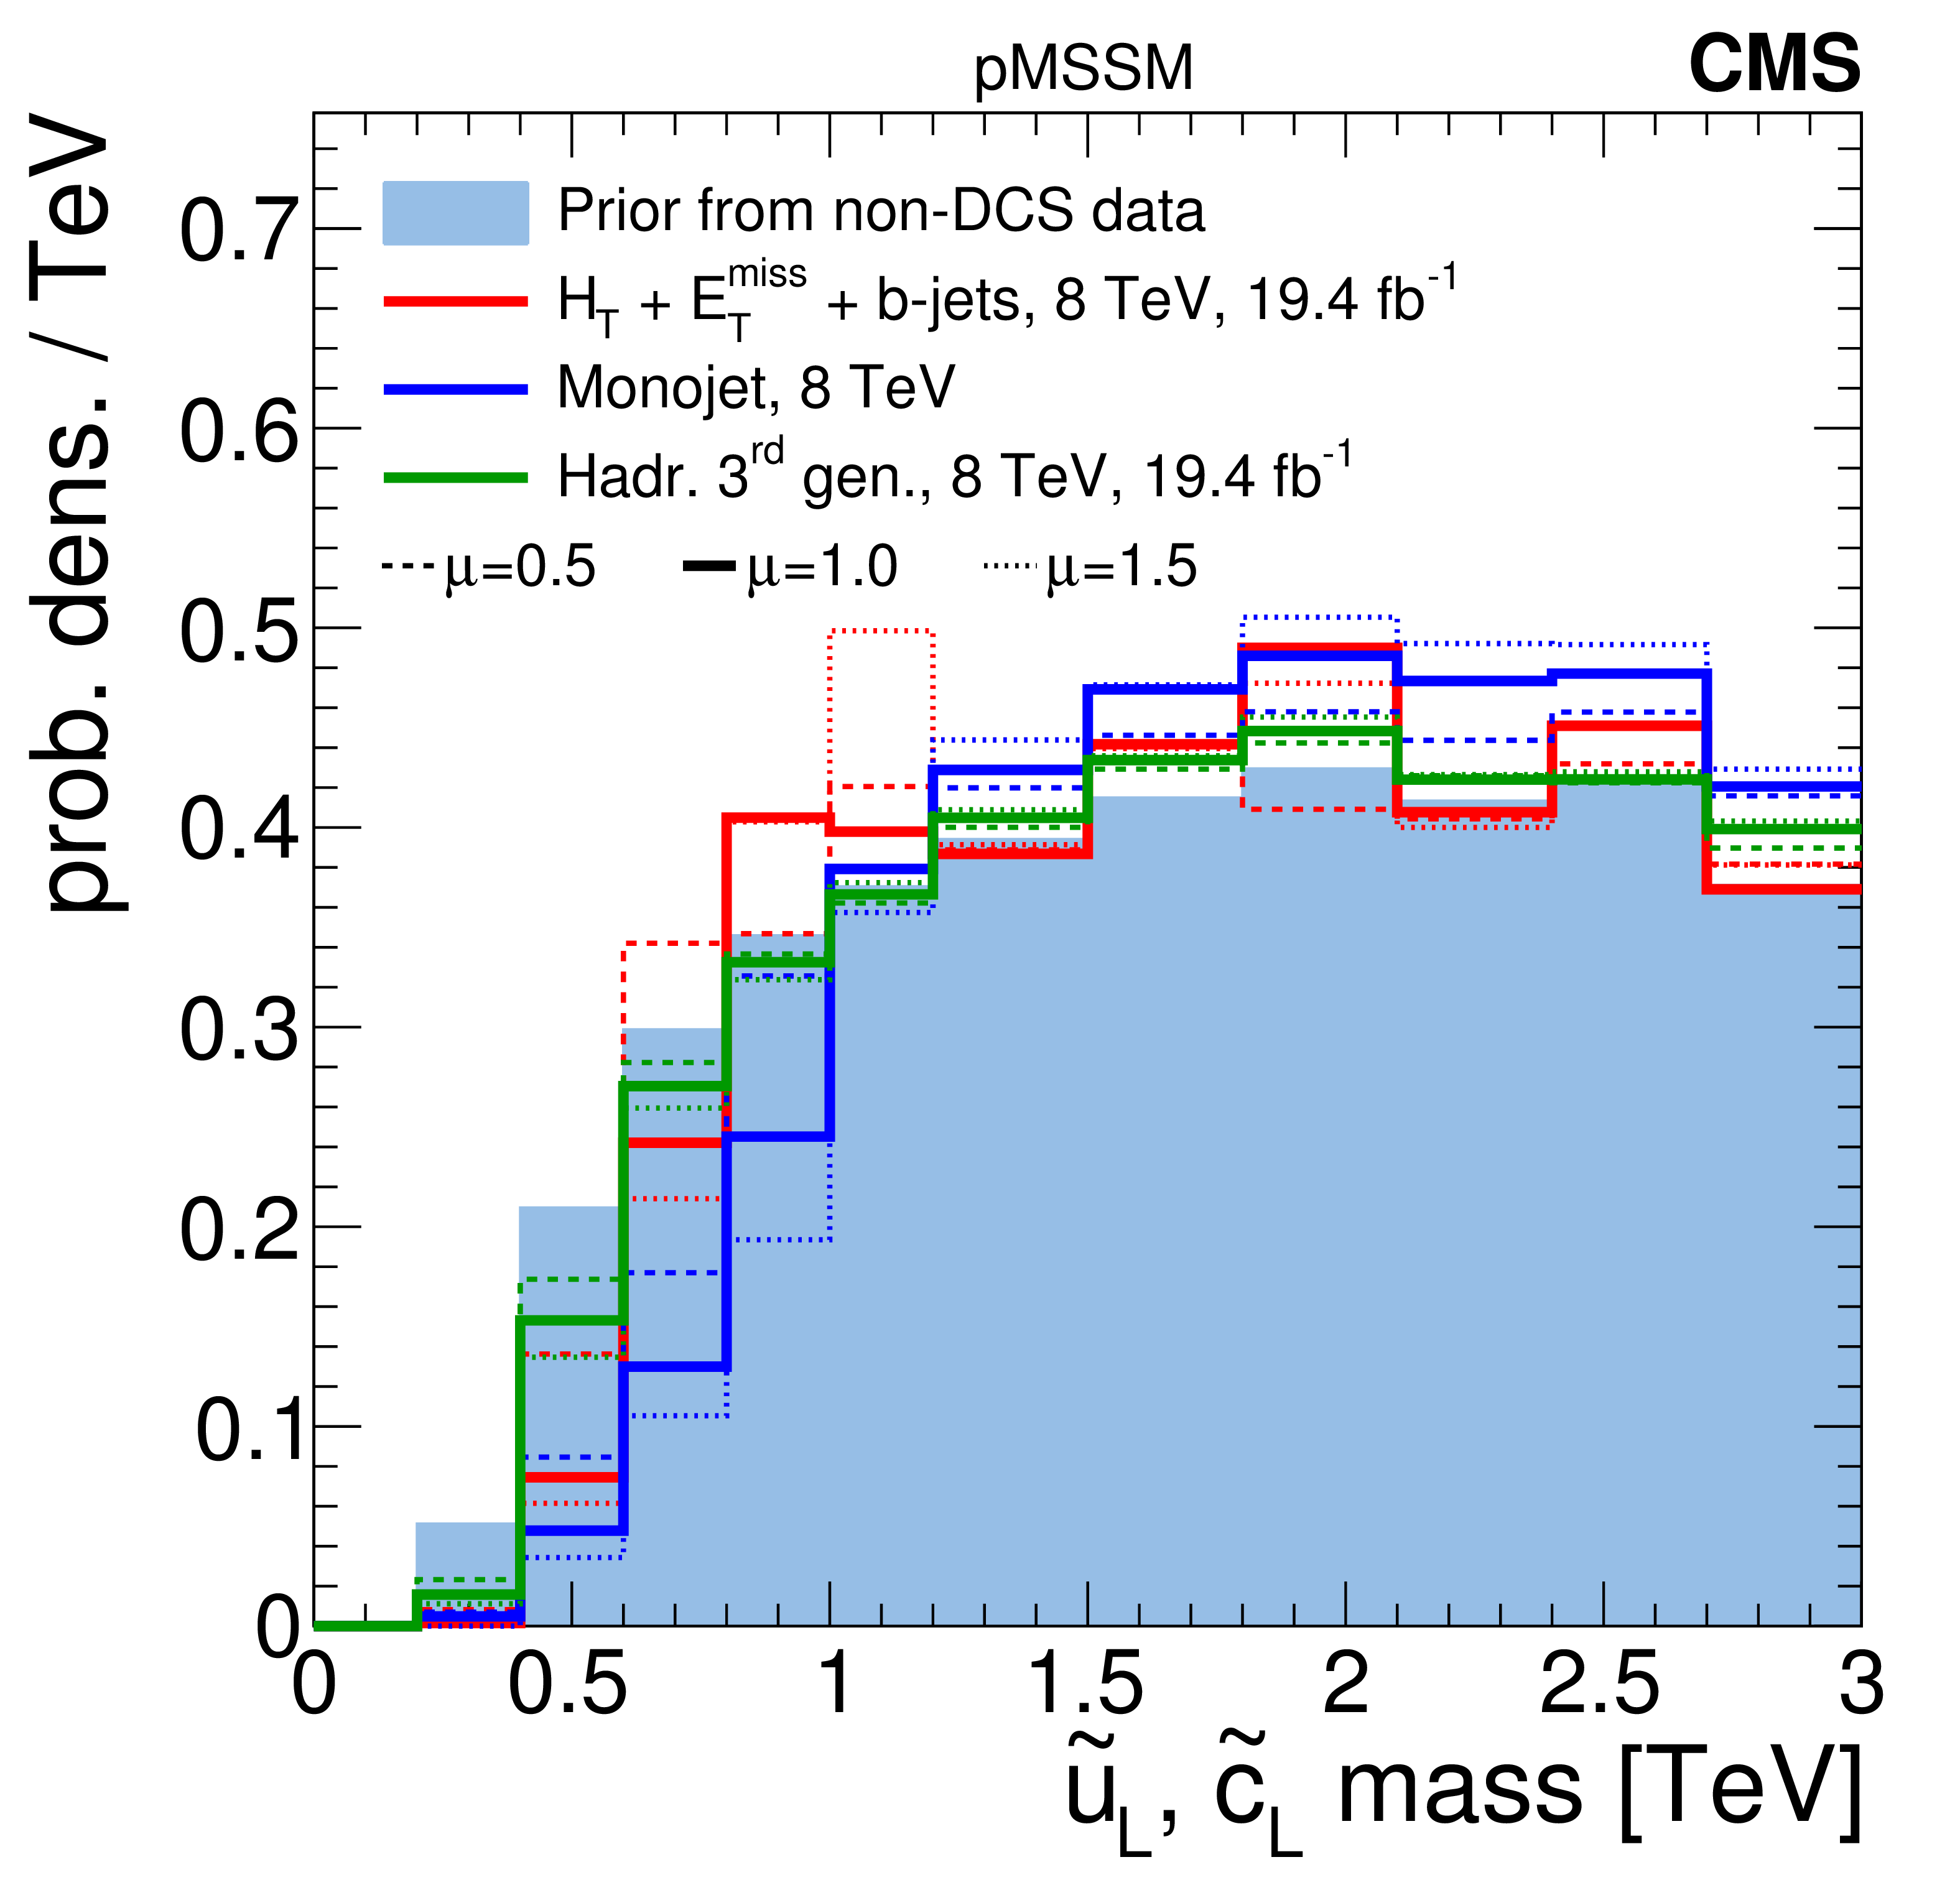
Figure 3-b:
A summary of the impact of CMS searches on the probability density of the $\mathrm{ \tilde{u}_L } $ mass (equivalently, the $ \mathrm{ \tilde{c}_L } $ mass) in the pMSSM parameter space. Plots (a-d) compare the non-DCS prior distribution of the $\mathrm{ \tilde{u}_L } $ mass to posterior distributions after data from various CMS searches, where plot (d) shows the combined effect of CMS searches and the Higgs boson results. Plot (e) shows survival probabilities as a function of the $\mathrm{ \tilde{u}_L } $ mass for various combinations of CMS data and data from Higgs boson measurements. Plot (f) shows the distribution of the $\mathrm{ \tilde{u}_L } $ mass versus the $Z$-significance calculated from the combination of all searches. See Fig. 2 for a description of the shading. |
png pdf |
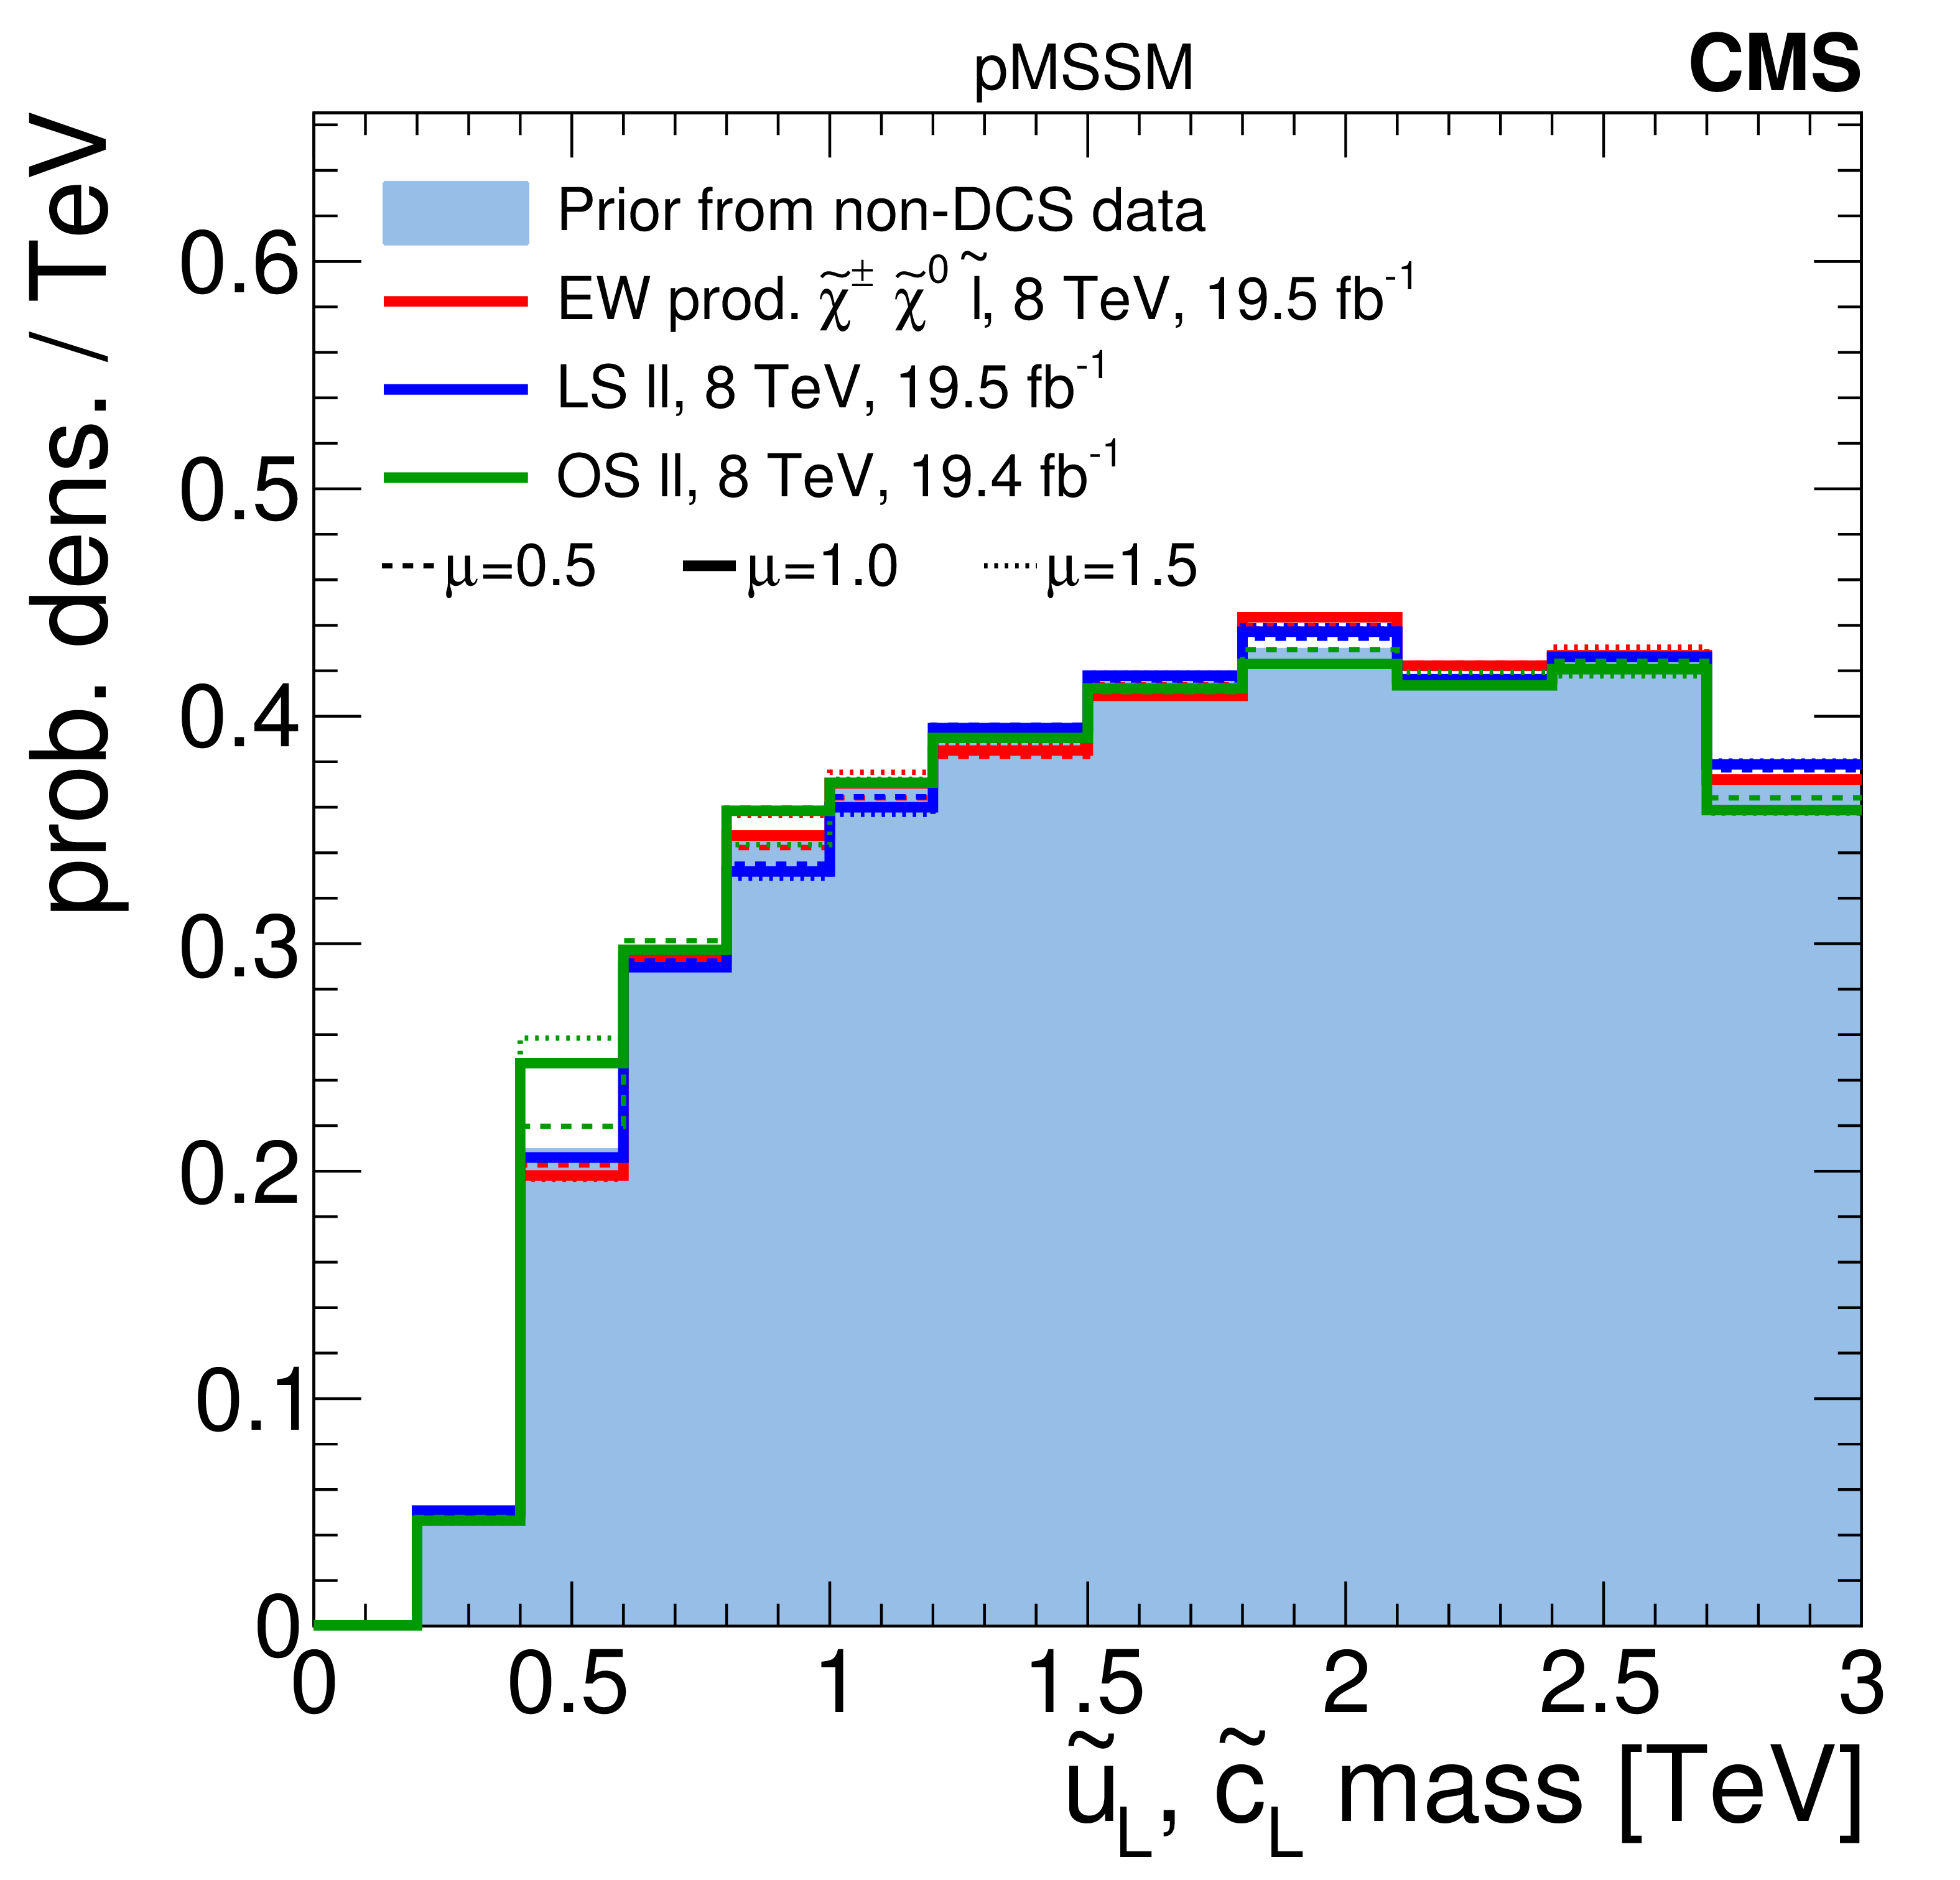
Figure 3-c:
A summary of the impact of CMS searches on the probability density of the $\mathrm{ \tilde{u}_L } $ mass (equivalently, the $ \mathrm{ \tilde{c}_L } $ mass) in the pMSSM parameter space. Plots (a-d) compare the non-DCS prior distribution of the $\mathrm{ \tilde{u}_L } $ mass to posterior distributions after data from various CMS searches, where plot (d) shows the combined effect of CMS searches and the Higgs boson results. Plot (e) shows survival probabilities as a function of the $\mathrm{ \tilde{u}_L } $ mass for various combinations of CMS data and data from Higgs boson measurements. Plot (f) shows the distribution of the $\mathrm{ \tilde{u}_L } $ mass versus the $Z$-significance calculated from the combination of all searches. See Fig. 2 for a description of the shading. |

png pdf |
Figure 3-d:
A summary of the impact of CMS searches on the probability density of the $\mathrm{ \tilde{u}_L } $ mass (equivalently, the $ \mathrm{ \tilde{c}_L } $ mass) in the pMSSM parameter space. Plots (a-d) compare the non-DCS prior distribution of the $\mathrm{ \tilde{u}_L } $ mass to posterior distributions after data from various CMS searches, where plot (d) shows the combined effect of CMS searches and the Higgs boson results. Plot (e) shows survival probabilities as a function of the $\mathrm{ \tilde{u}_L } $ mass for various combinations of CMS data and data from Higgs boson measurements. Plot (f) shows the distribution of the $\mathrm{ \tilde{u}_L } $ mass versus the $Z$-significance calculated from the combination of all searches. See Fig. 2 for a description of the shading. |
png pdf |
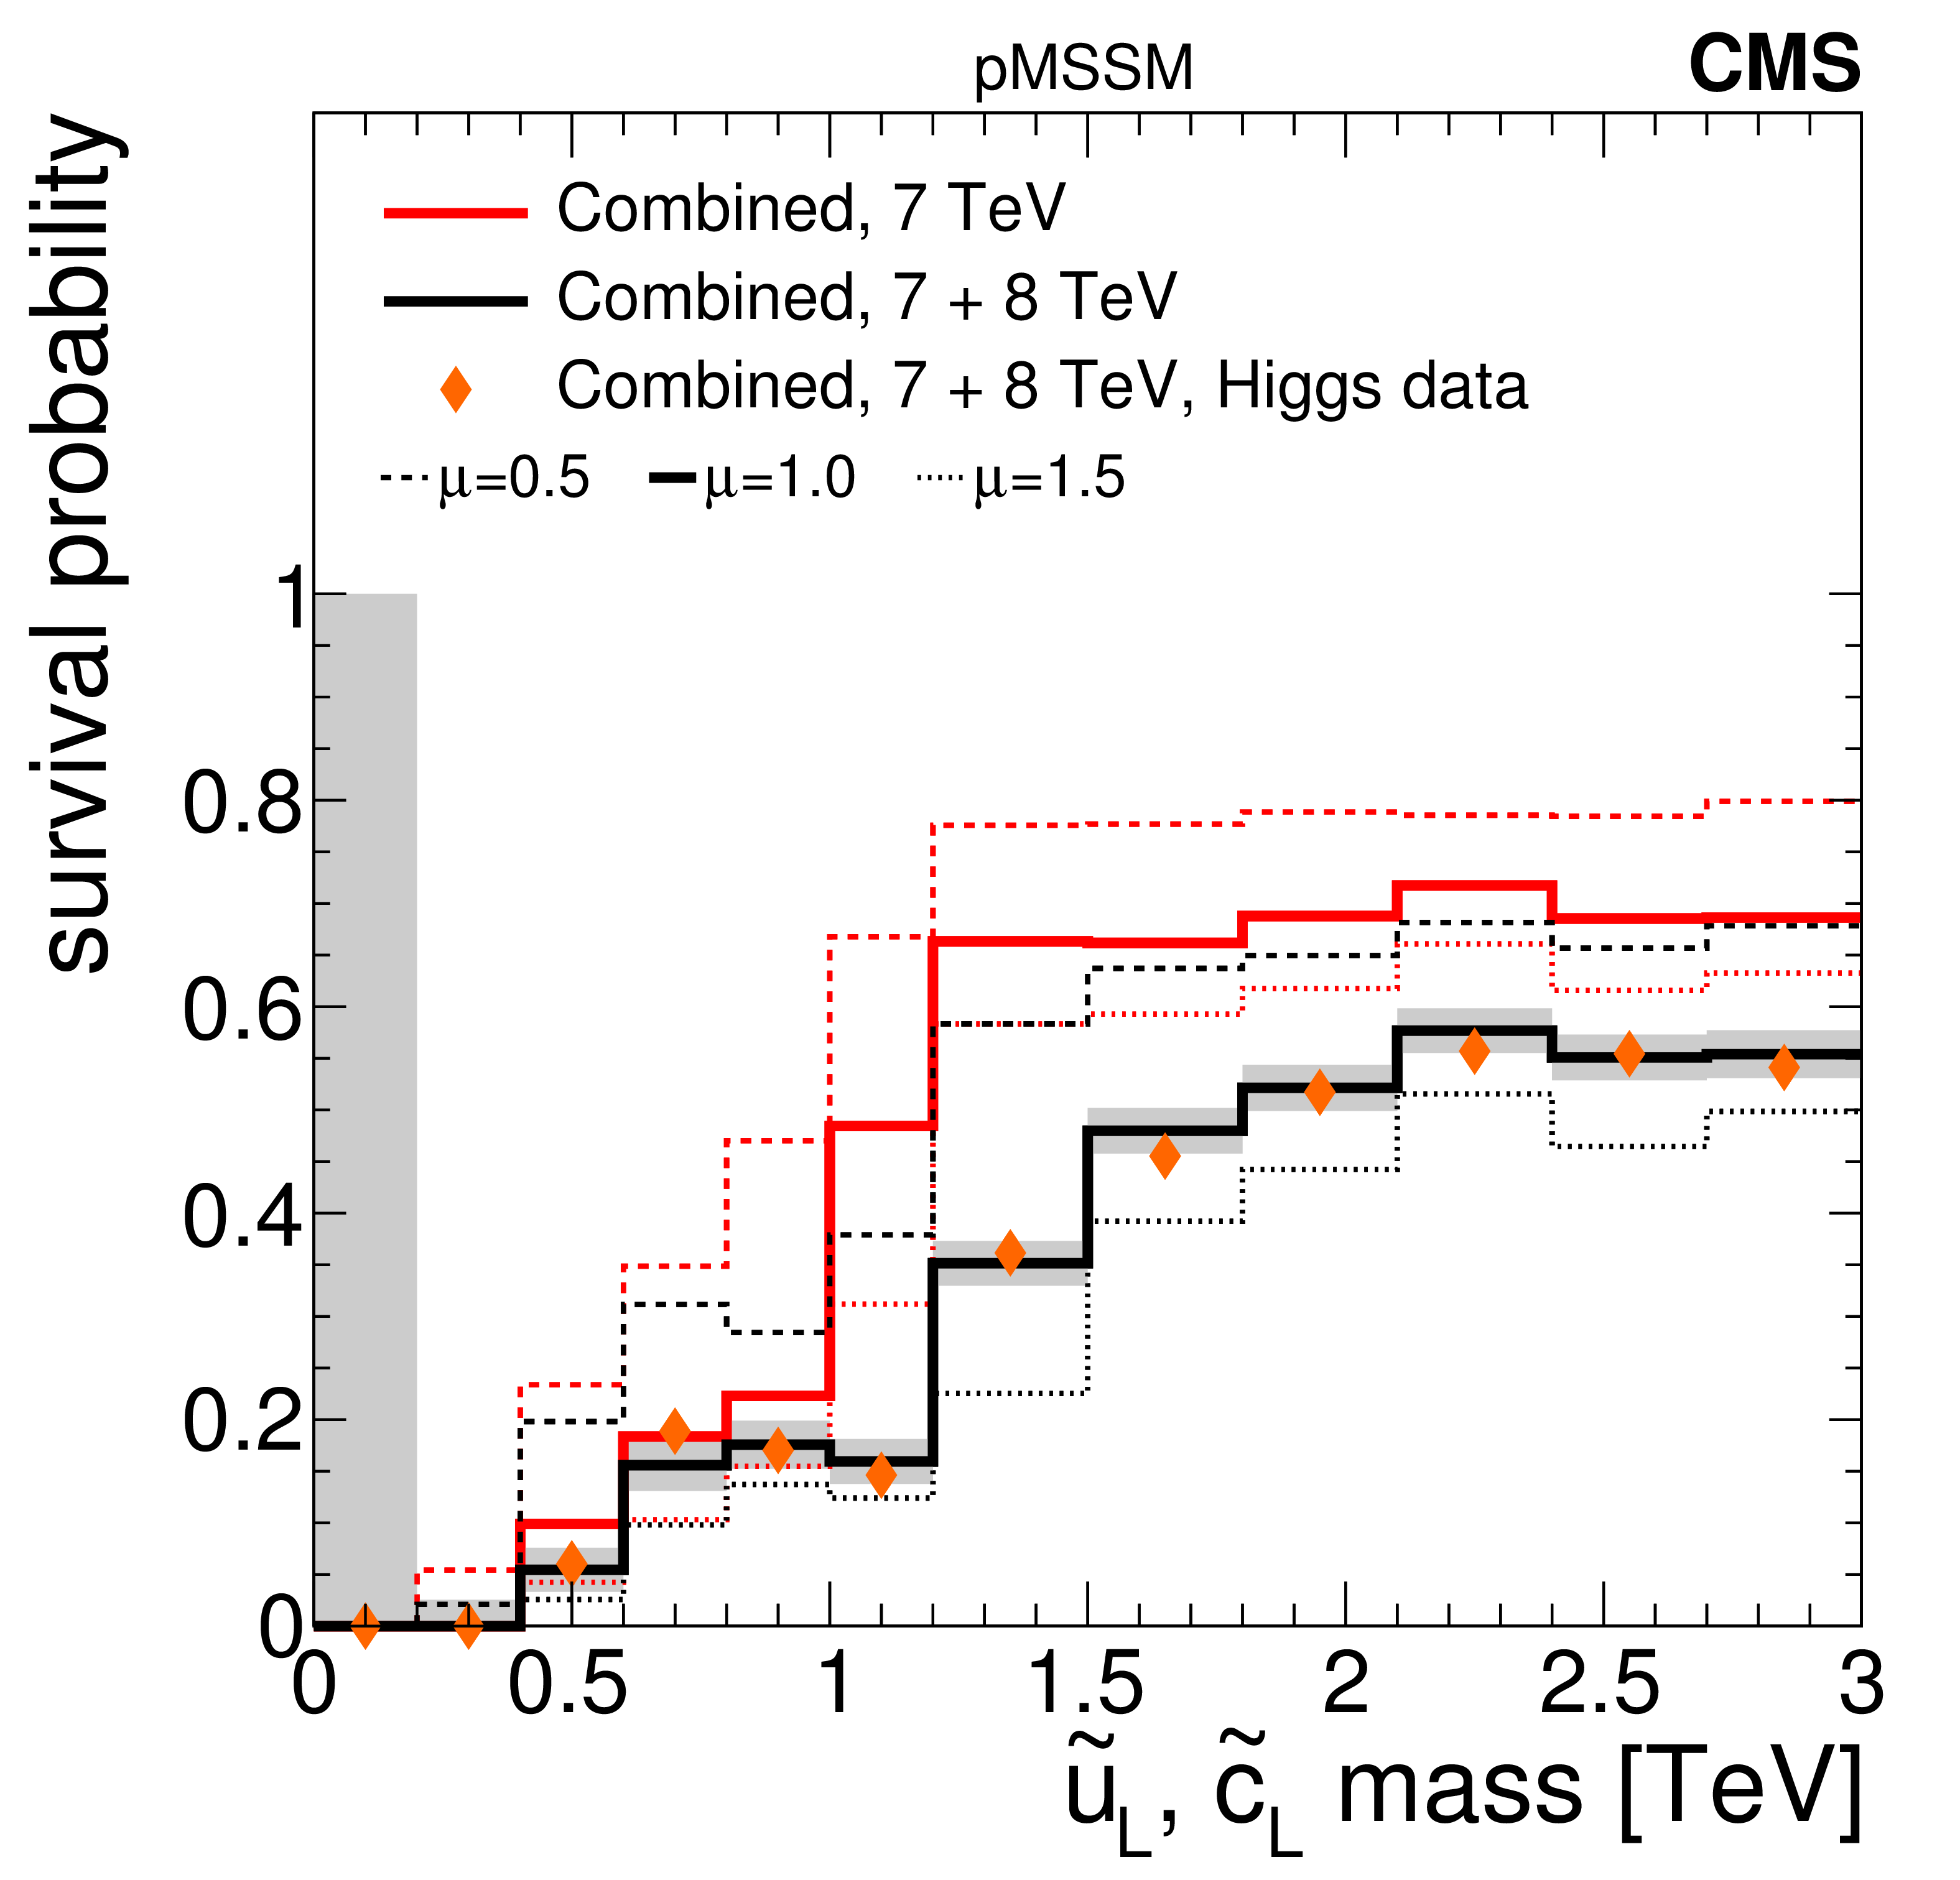
Figure 3-e:
A summary of the impact of CMS searches on the probability density of the $\mathrm{ \tilde{u}_L } $ mass (equivalently, the $ \mathrm{ \tilde{c}_L } $ mass) in the pMSSM parameter space. Plots (a-d) compare the non-DCS prior distribution of the $\mathrm{ \tilde{u}_L } $ mass to posterior distributions after data from various CMS searches, where plot (d) shows the combined effect of CMS searches and the Higgs boson results. Plot (e) shows survival probabilities as a function of the $\mathrm{ \tilde{u}_L } $ mass for various combinations of CMS data and data from Higgs boson measurements. Plot (f) shows the distribution of the $\mathrm{ \tilde{u}_L } $ mass versus the $Z$-significance calculated from the combination of all searches. See Fig. 2 for a description of the shading. |
png pdf |
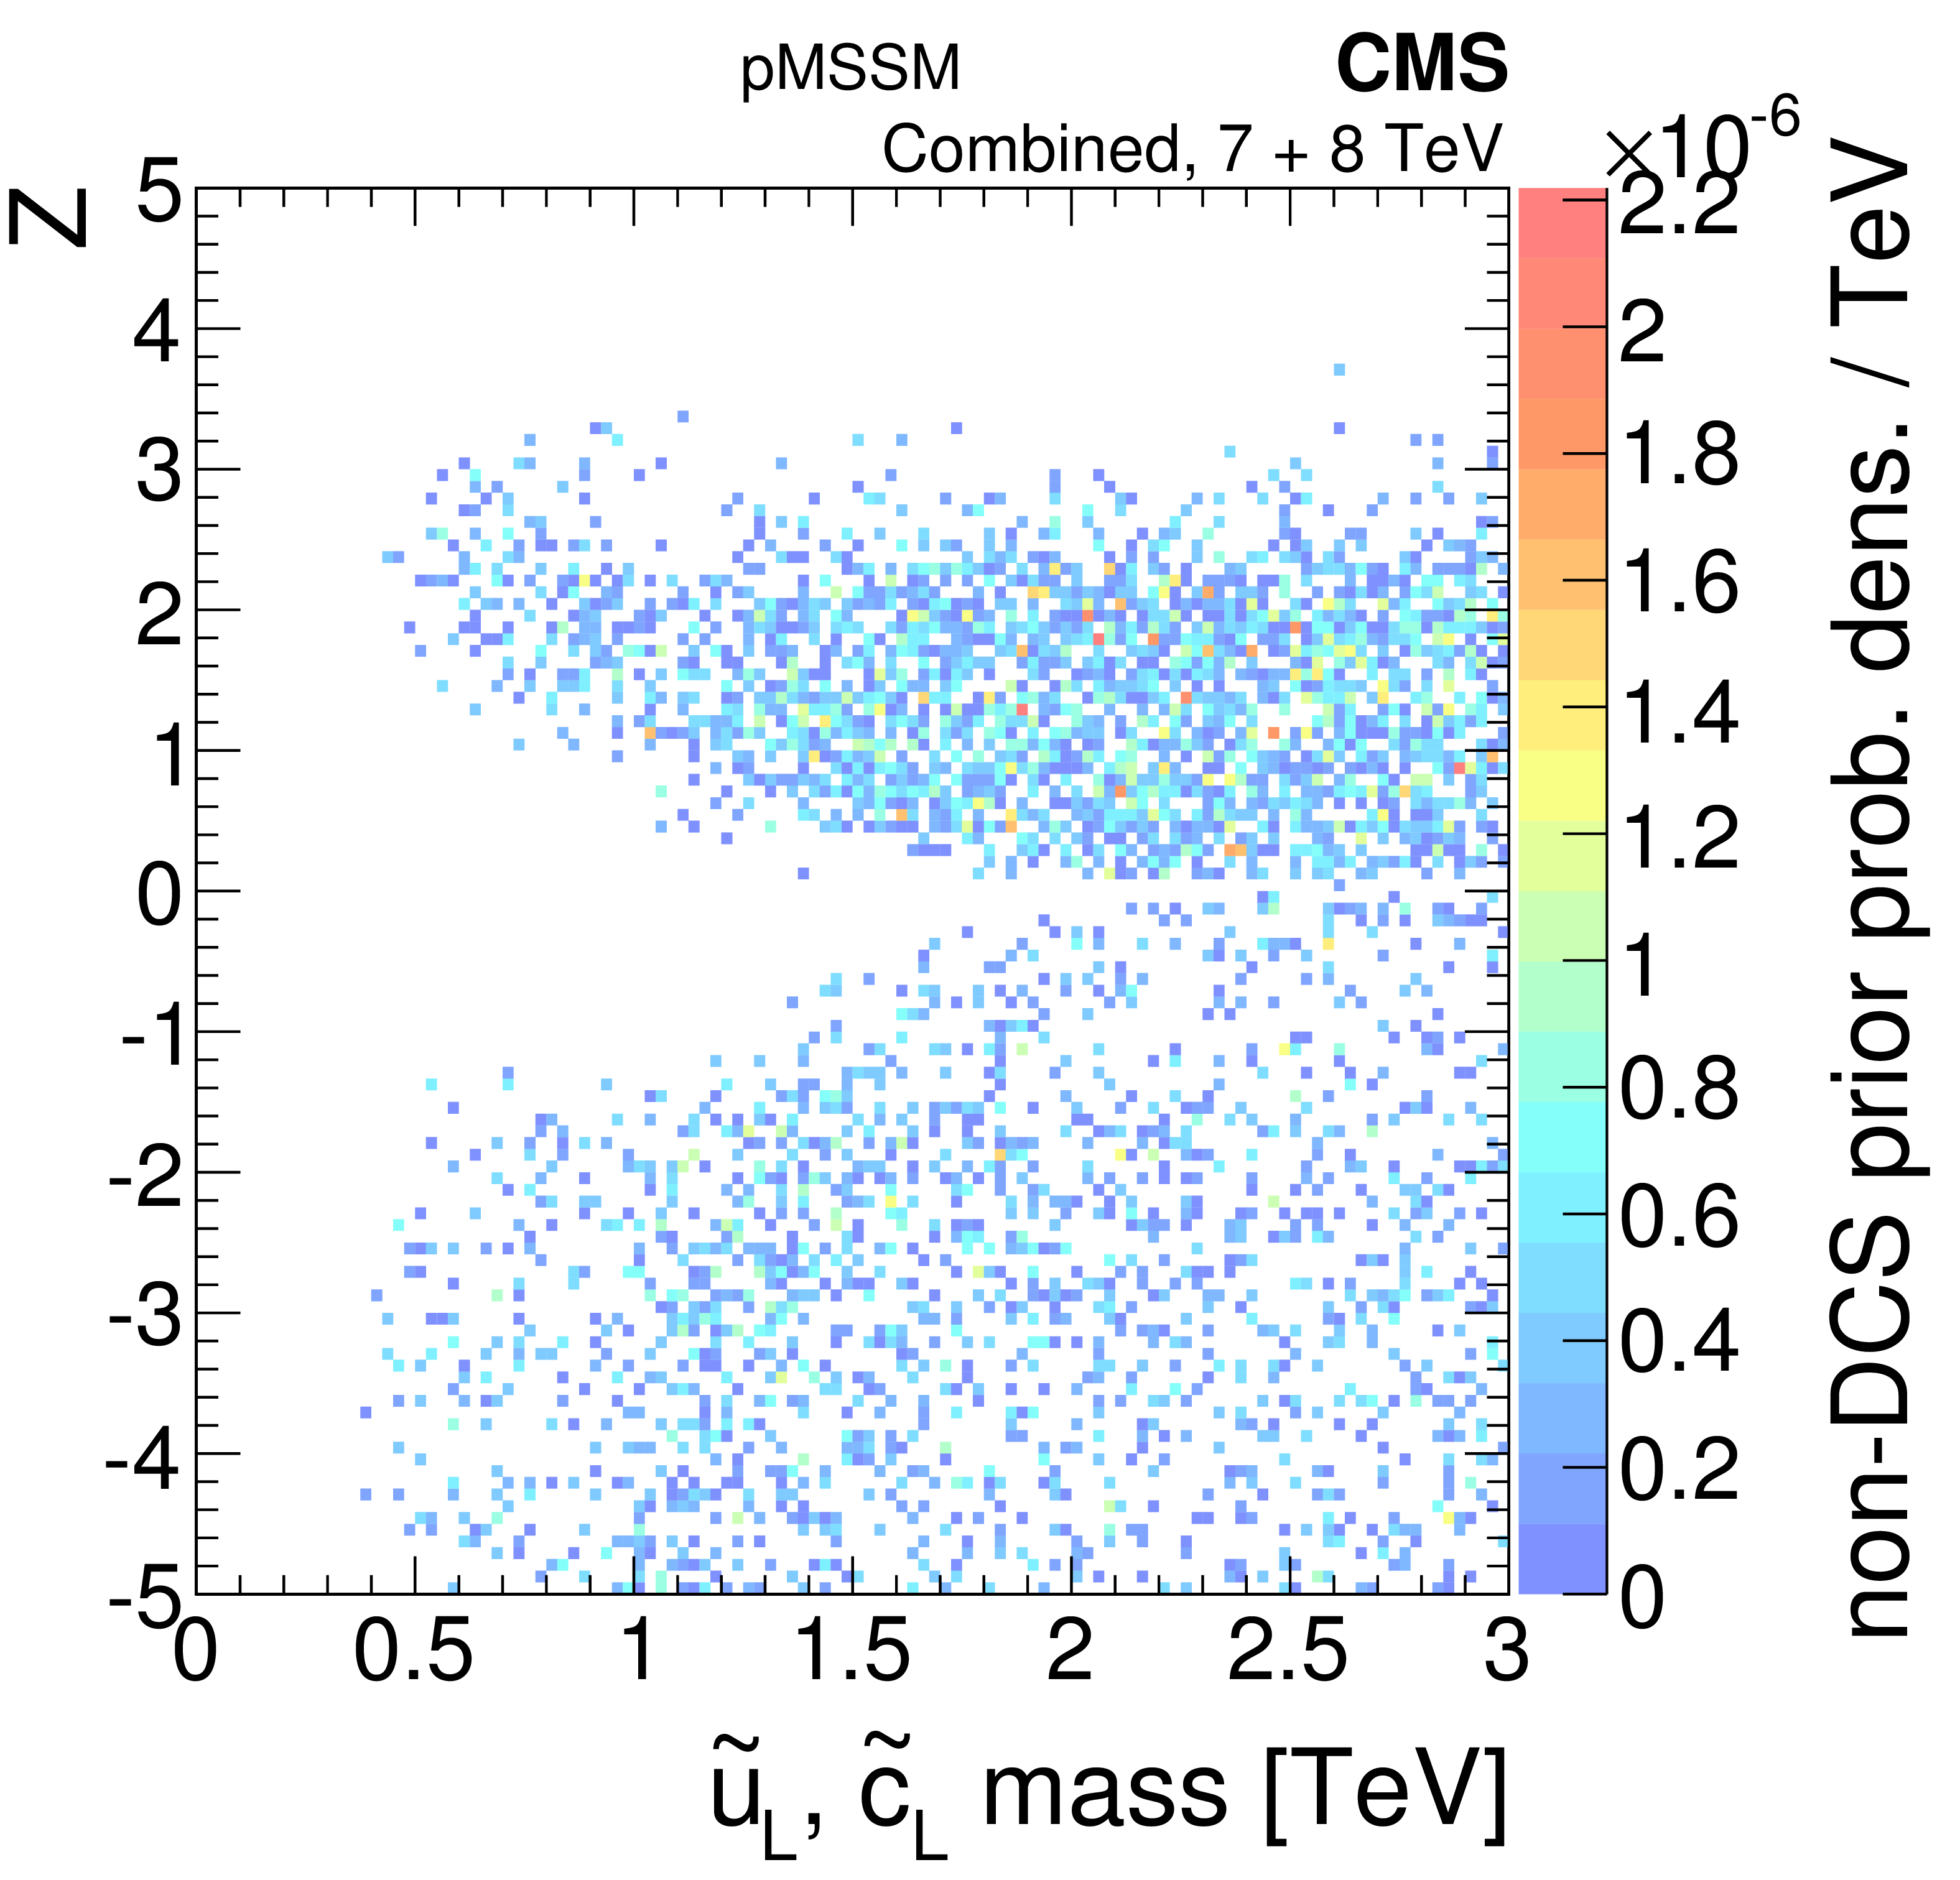
Figure 3-f:
A summary of the impact of CMS searches on the probability density of the $\mathrm{ \tilde{u}_L } $ mass (equivalently, the $ \mathrm{ \tilde{c}_L } $ mass) in the pMSSM parameter space. Plots (a-d) compare the non-DCS prior distribution of the $\mathrm{ \tilde{u}_L } $ mass to posterior distributions after data from various CMS searches, where plot (d) shows the combined effect of CMS searches and the Higgs boson results. Plot (e) shows survival probabilities as a function of the $\mathrm{ \tilde{u}_L } $ mass for various combinations of CMS data and data from Higgs boson measurements. Plot (f) shows the distribution of the $\mathrm{ \tilde{u}_L } $ mass versus the $Z$-significance calculated from the combination of all searches. See Fig. 2 for a description of the shading. |
png pdf |
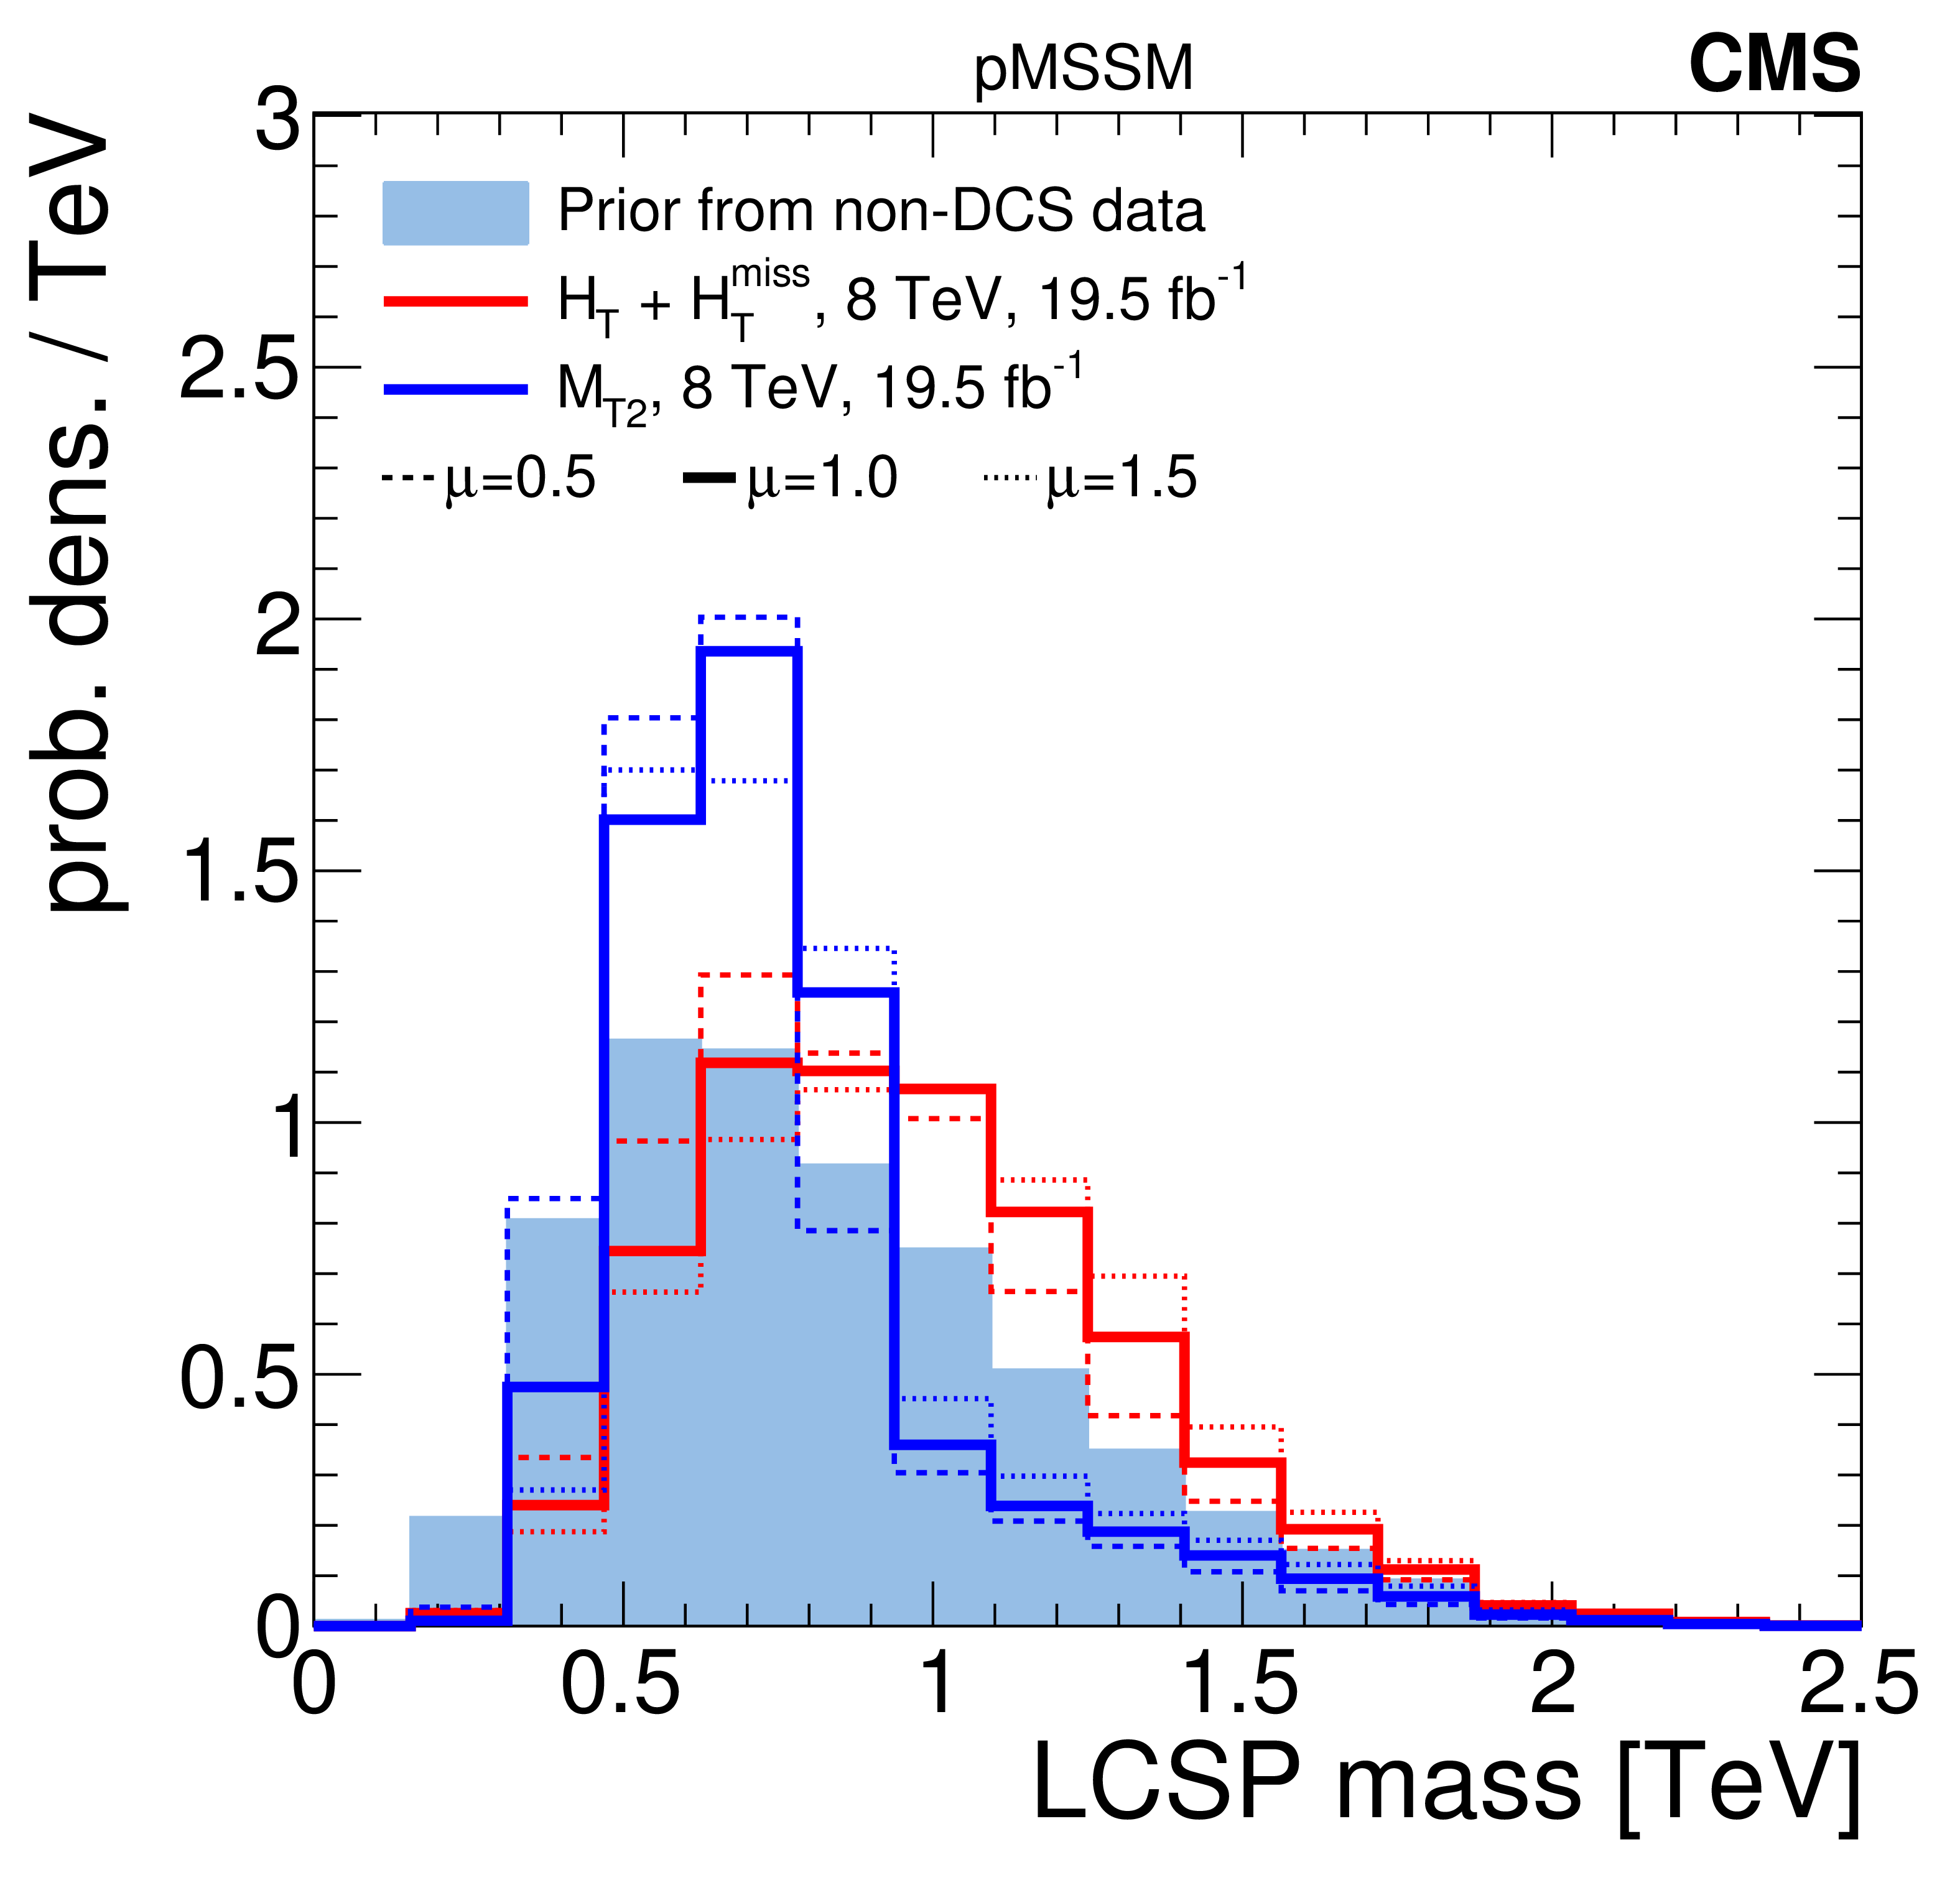
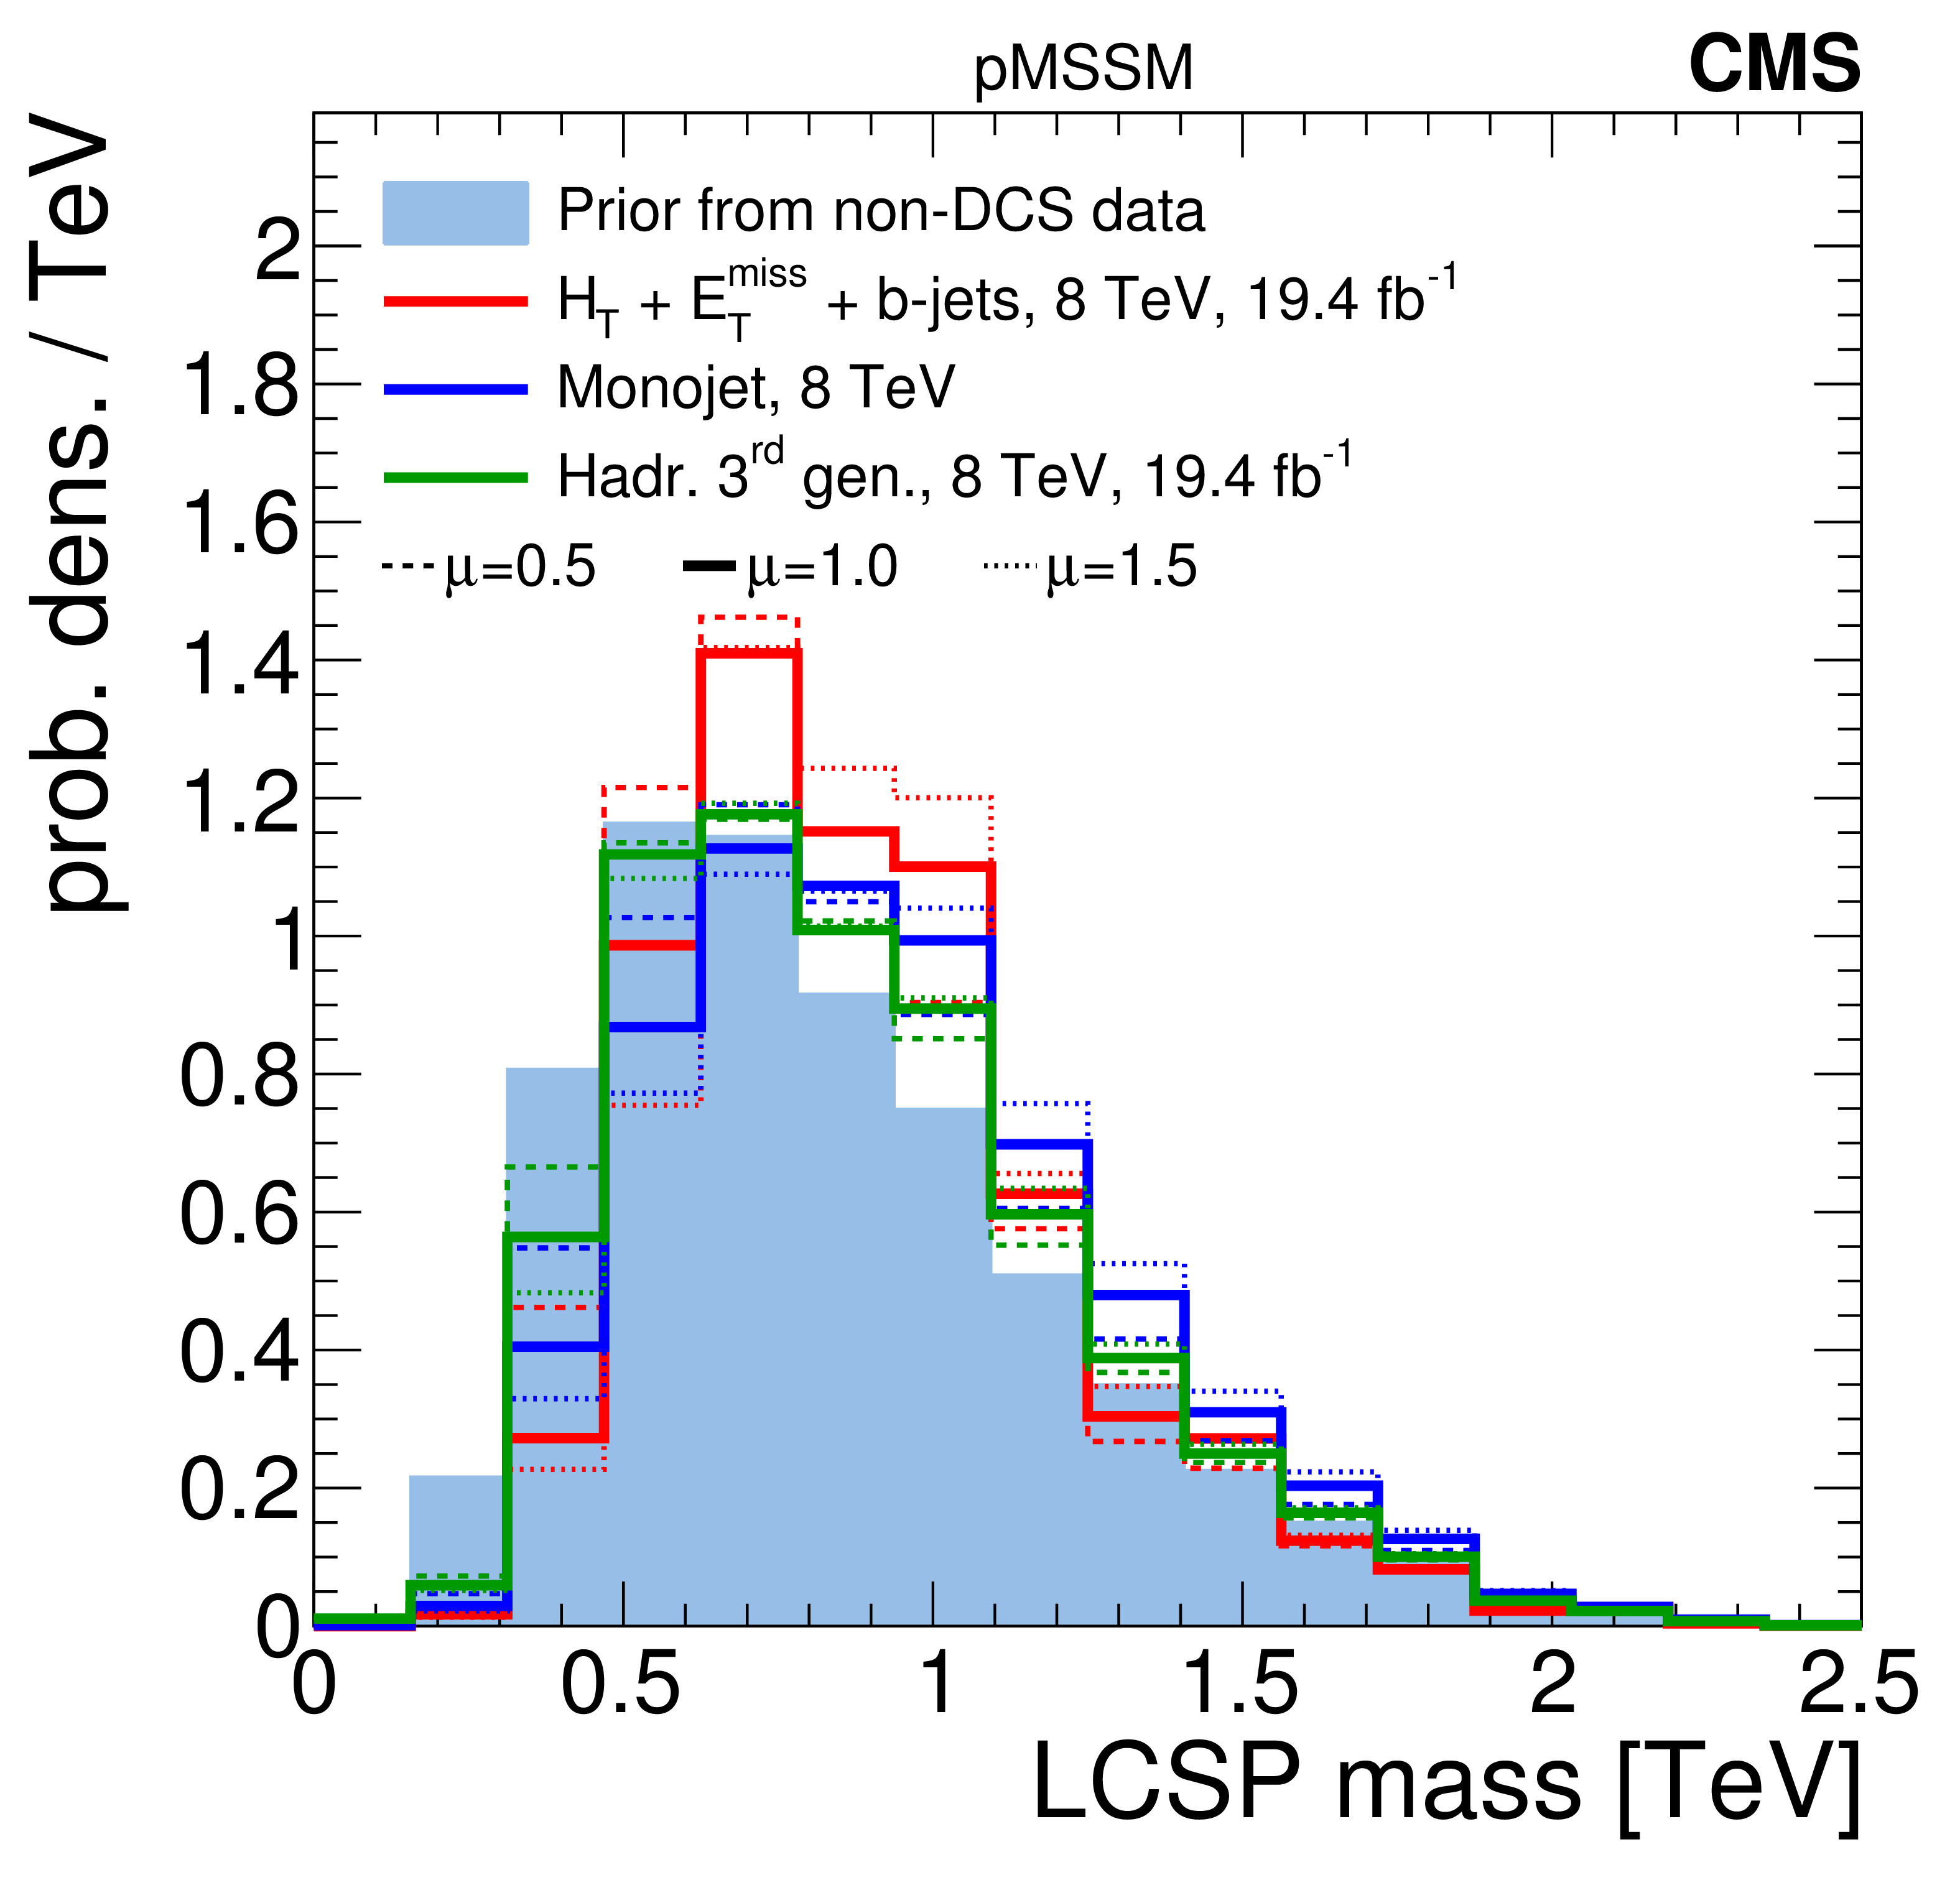
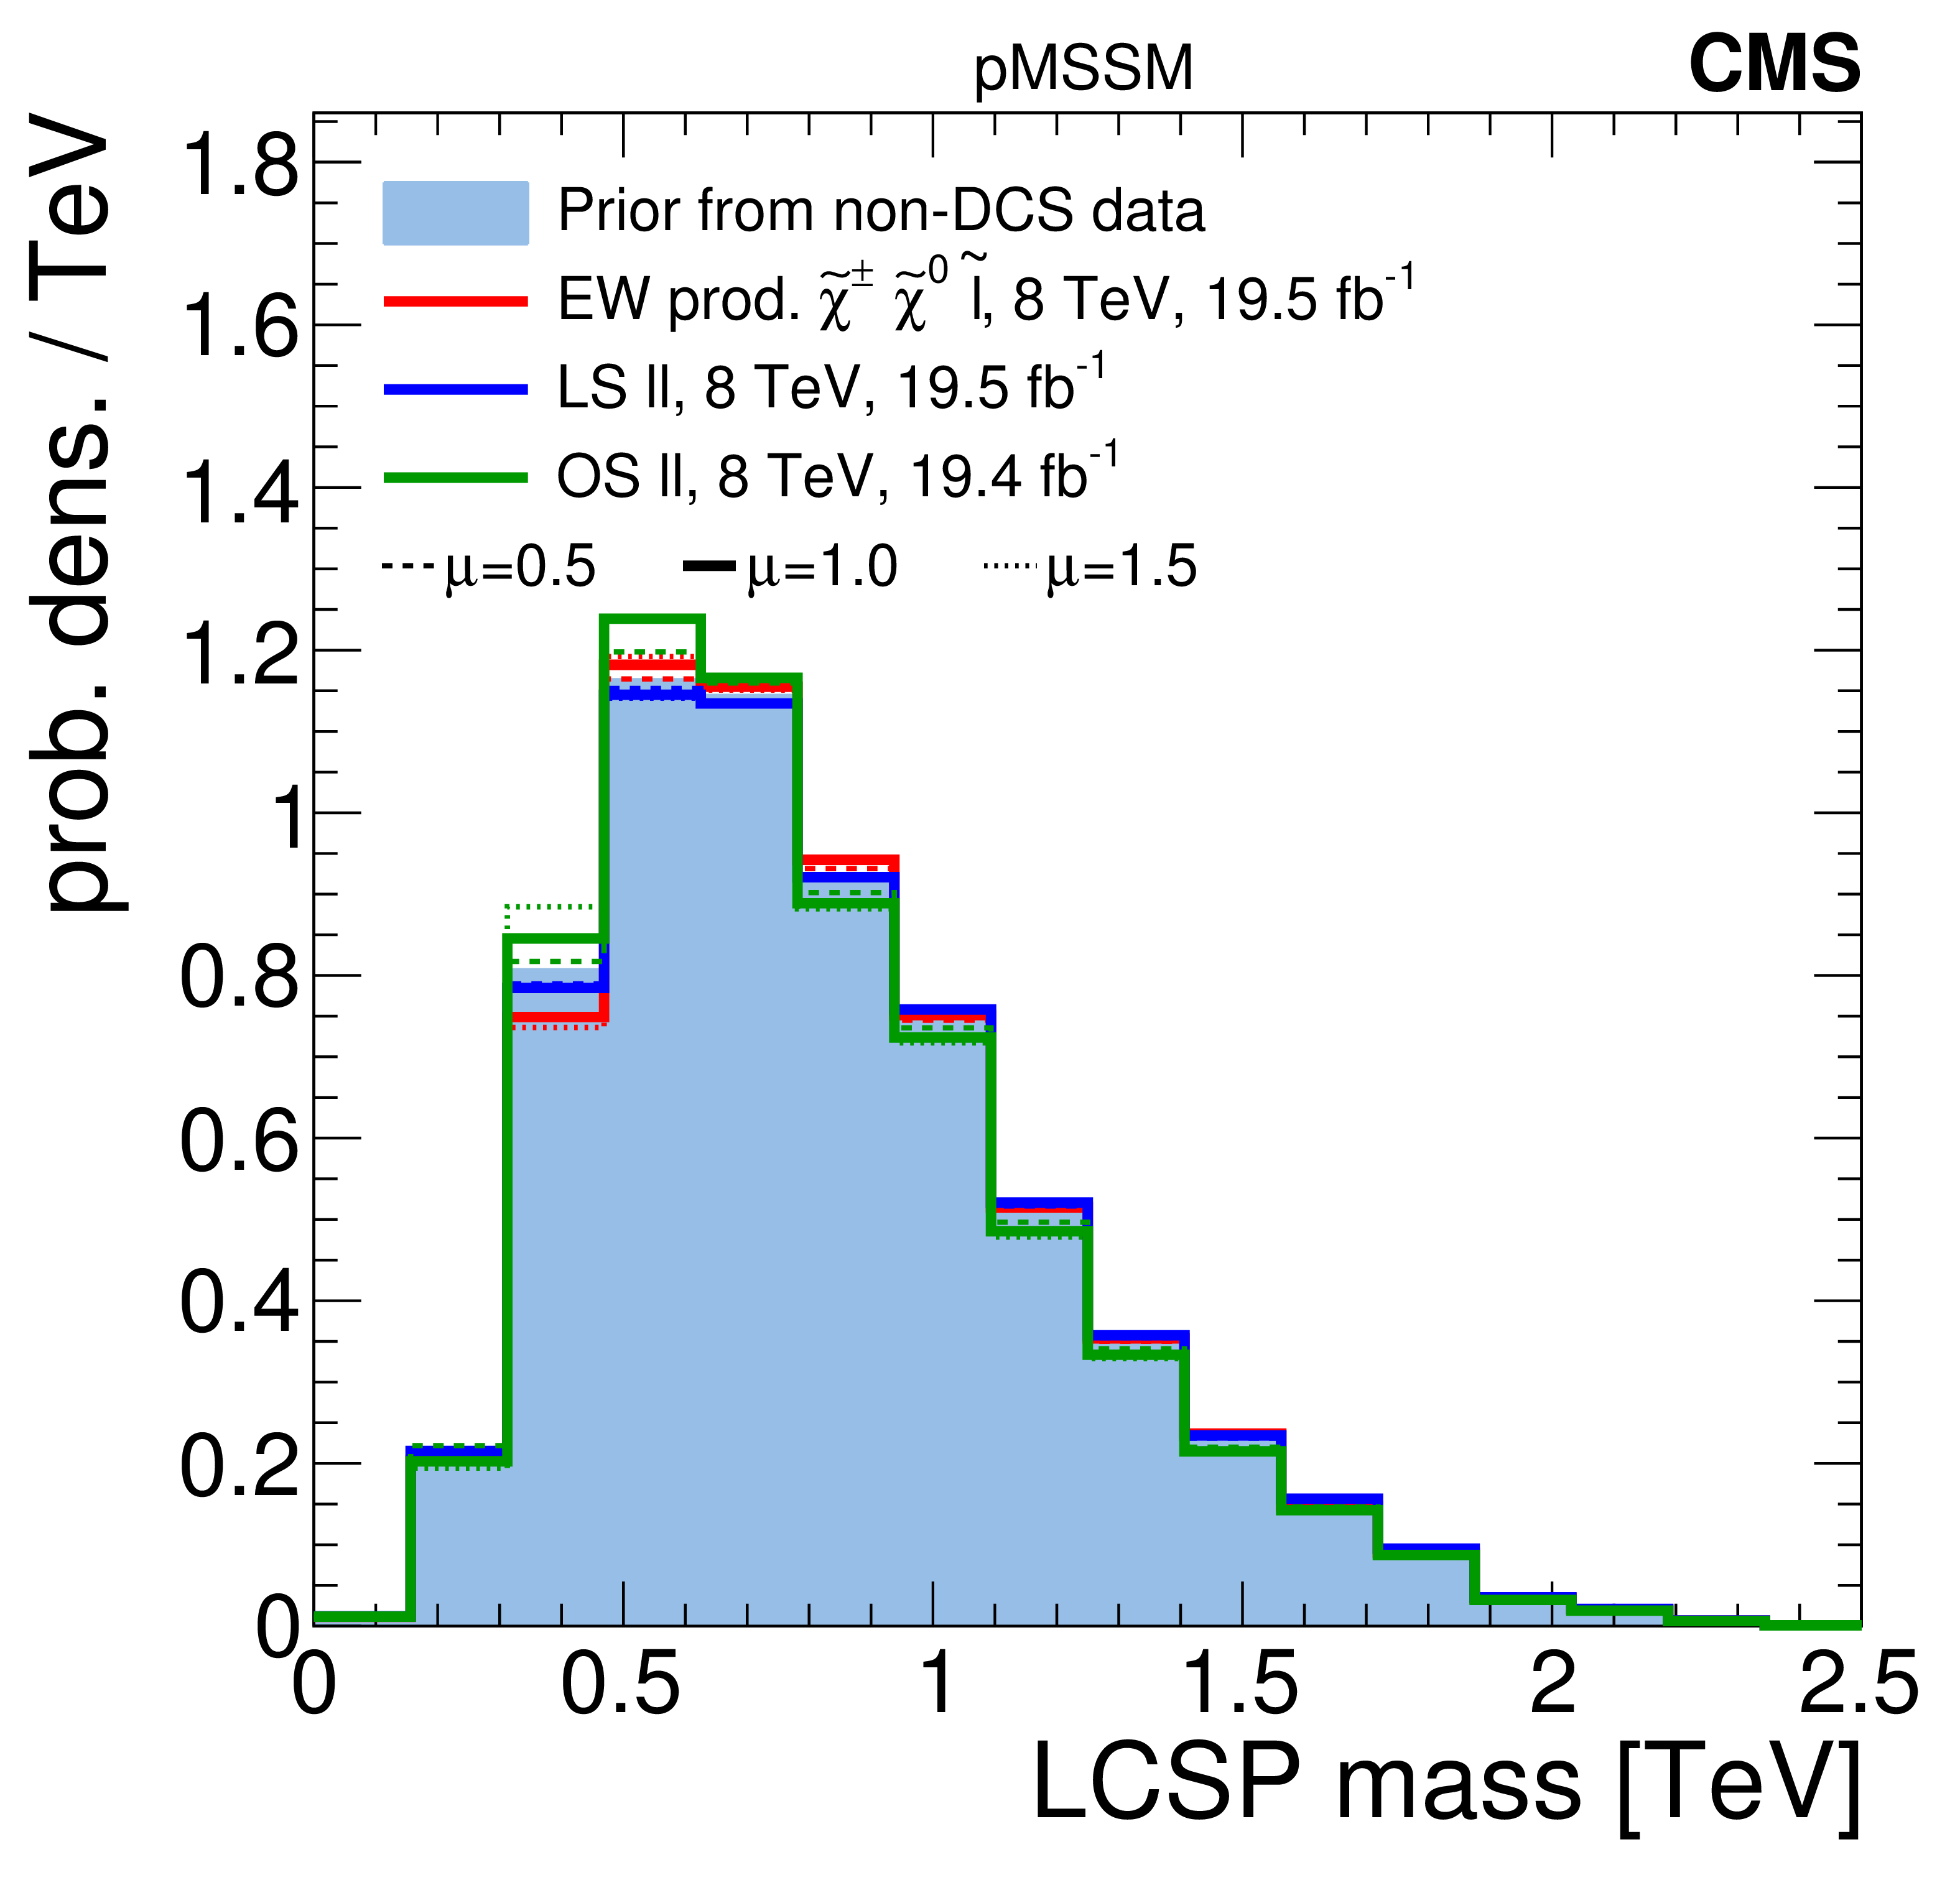
Figure 4-a:
A summary of the impact of CMS searches on the probability density of the mass of the lightest colored SUSY particle (LCSP) in the pMSSM parameter space. Plots (a-d) compare the non-DCS prior distribution of the LCSP mass to posterior distributions after data from various CMS searches, where plot (d) shows the combined effect of CMS searches and the Higgs boson results. Plot (e) shows survival probabilities as a function of the LCSP mass for various combinations of CMS data and data from Higgs boson measurements. Plot (f) shows the distribution of the LCSP mass versus the $Z$-significance calculated from the combination of all searches. See Fig. 2 for a description of the shading. |
png pdf |
Figure 4-b:
A summary of the impact of CMS searches on the probability density of the mass of the lightest colored SUSY particle (LCSP) in the pMSSM parameter space. Plots (a-d) compare the non-DCS prior distribution of the LCSP mass to posterior distributions after data from various CMS searches, where plot (d) shows the combined effect of CMS searches and the Higgs boson results. Plot (e) shows survival probabilities as a function of the LCSP mass for various combinations of CMS data and data from Higgs boson measurements. Plot (f) shows the distribution of the LCSP mass versus the $Z$-significance calculated from the combination of all searches. See Fig. 2 for a description of the shading. |
png pdf |
Figure 4-c:
A summary of the impact of CMS searches on the probability density of the mass of the lightest colored SUSY particle (LCSP) in the pMSSM parameter space. Plots (a-d) compare the non-DCS prior distribution of the LCSP mass to posterior distributions after data from various CMS searches, where plot (d) shows the combined effect of CMS searches and the Higgs boson results. Plot (e) shows survival probabilities as a function of the LCSP mass for various combinations of CMS data and data from Higgs boson measurements. Plot (f) shows the distribution of the LCSP mass versus the $Z$-significance calculated from the combination of all searches. See Fig. 2 for a description of the shading. |
png pdf |
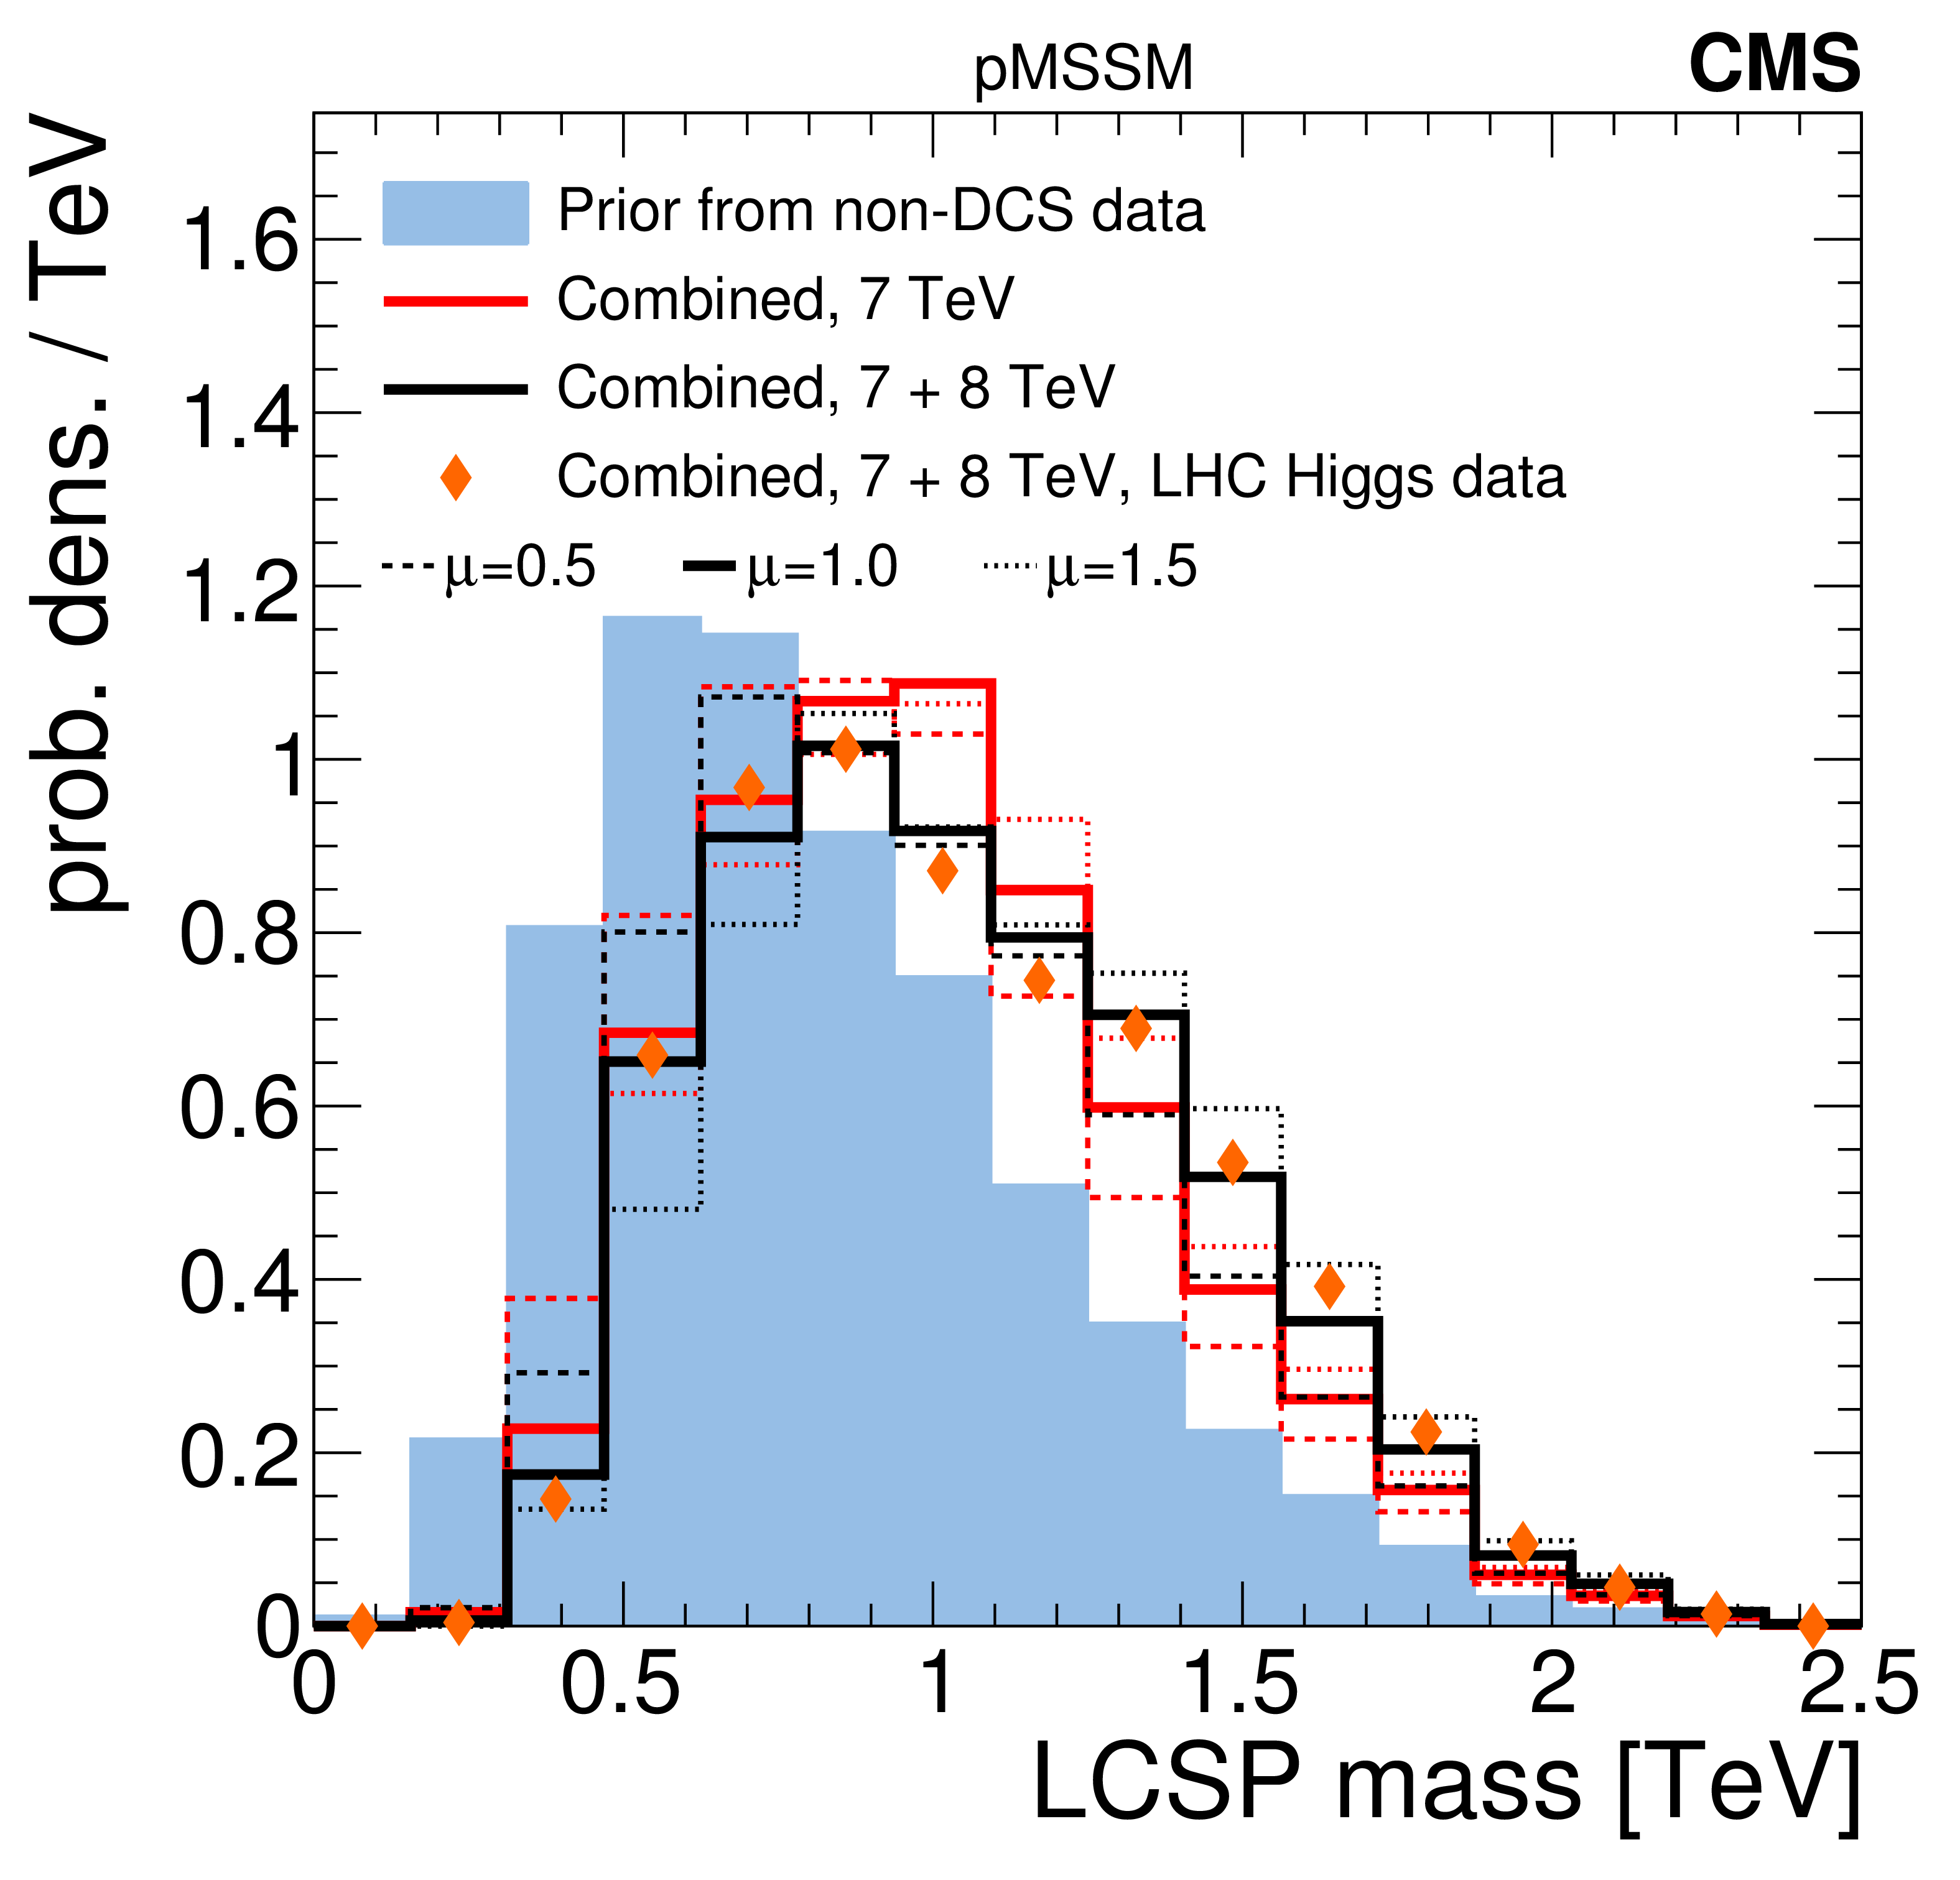
Figure 4-d:
A summary of the impact of CMS searches on the probability density of the mass of the lightest colored SUSY particle (LCSP) in the pMSSM parameter space. Plots (a-d) compare the non-DCS prior distribution of the LCSP mass to posterior distributions after data from various CMS searches, where plot (d) shows the combined effect of CMS searches and the Higgs boson results. Plot (e) shows survival probabilities as a function of the LCSP mass for various combinations of CMS data and data from Higgs boson measurements. Plot (f) shows the distribution of the LCSP mass versus the $Z$-significance calculated from the combination of all searches. See Fig. 2 for a description of the shading. |
png pdf |
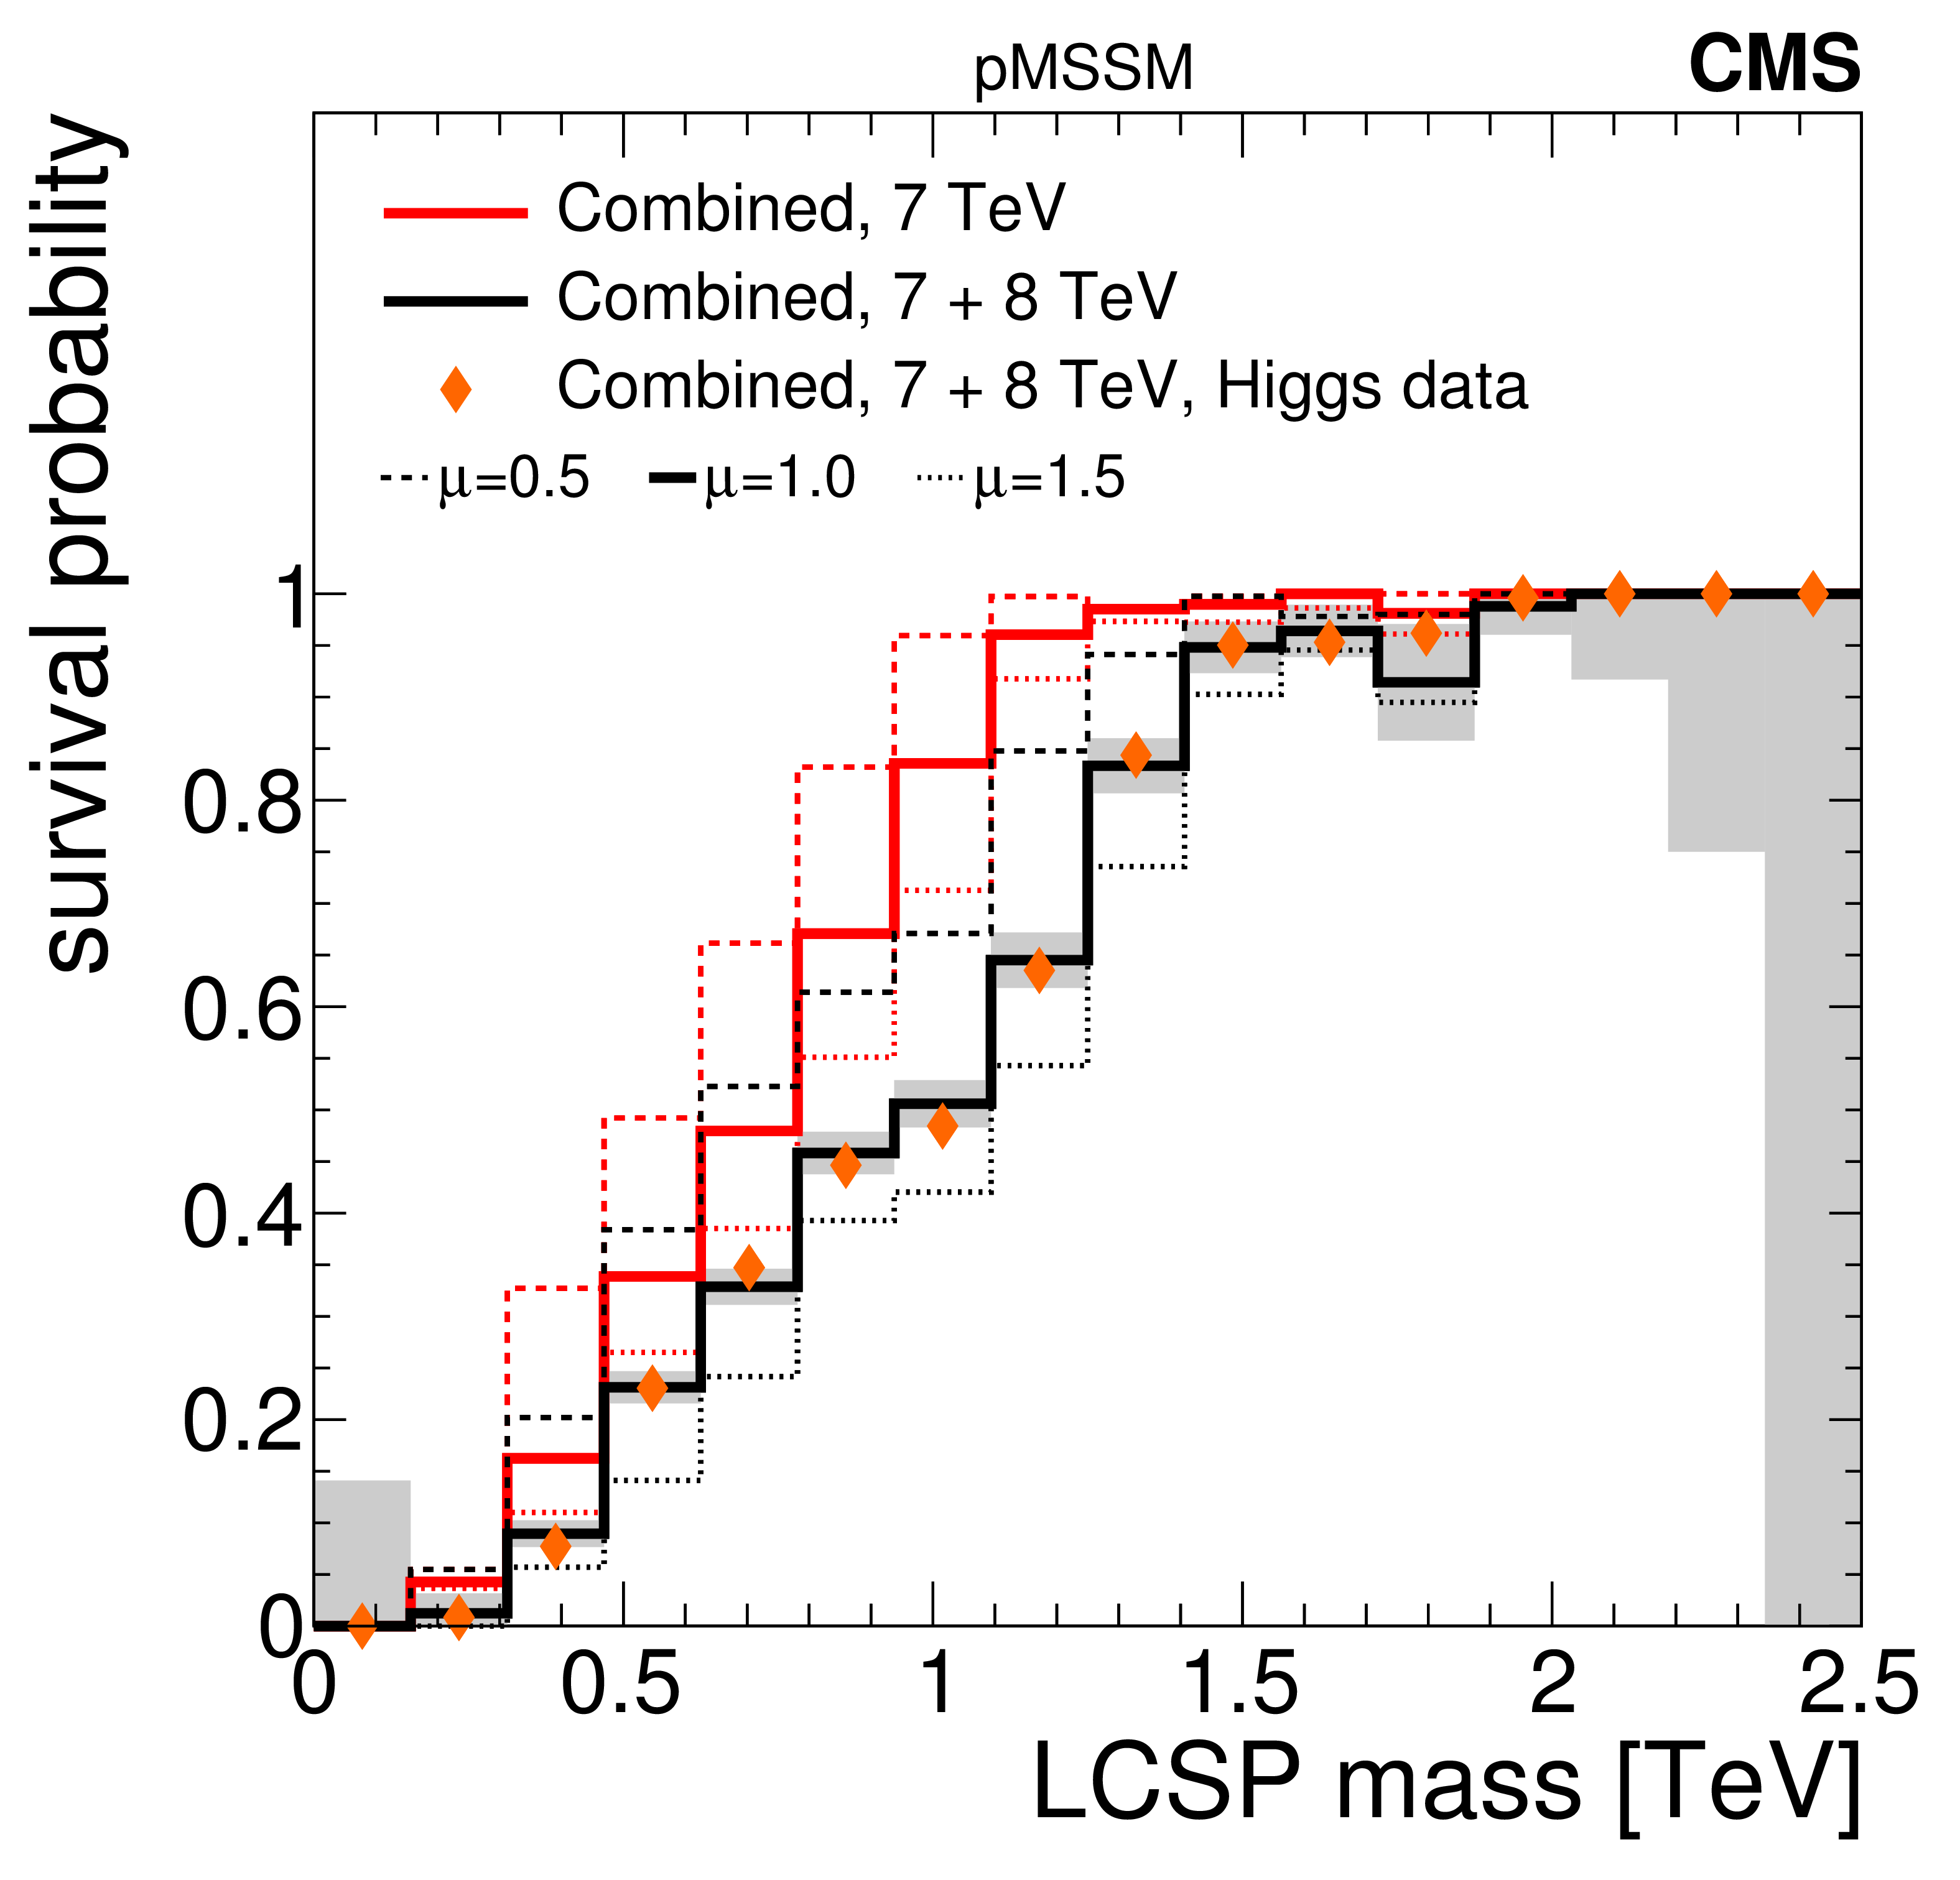
Figure 4-e:
A summary of the impact of CMS searches on the probability density of the mass of the lightest colored SUSY particle (LCSP) in the pMSSM parameter space. Plots (a-d) compare the non-DCS prior distribution of the LCSP mass to posterior distributions after data from various CMS searches, where plot (d) shows the combined effect of CMS searches and the Higgs boson results. Plot (e) shows survival probabilities as a function of the LCSP mass for various combinations of CMS data and data from Higgs boson measurements. Plot (f) shows the distribution of the LCSP mass versus the $Z$-significance calculated from the combination of all searches. See Fig. 2 for a description of the shading. |

png pdf |
Figure 4-f:
A summary of the impact of CMS searches on the probability density of the mass of the lightest colored SUSY particle (LCSP) in the pMSSM parameter space. Plots (a-d) compare the non-DCS prior distribution of the LCSP mass to posterior distributions after data from various CMS searches, where plot (d) shows the combined effect of CMS searches and the Higgs boson results. Plot (e) shows survival probabilities as a function of the LCSP mass for various combinations of CMS data and data from Higgs boson measurements. Plot (f) shows the distribution of the LCSP mass versus the $Z$-significance calculated from the combination of all searches. See Fig. 2 for a description of the shading. |
png pdf |
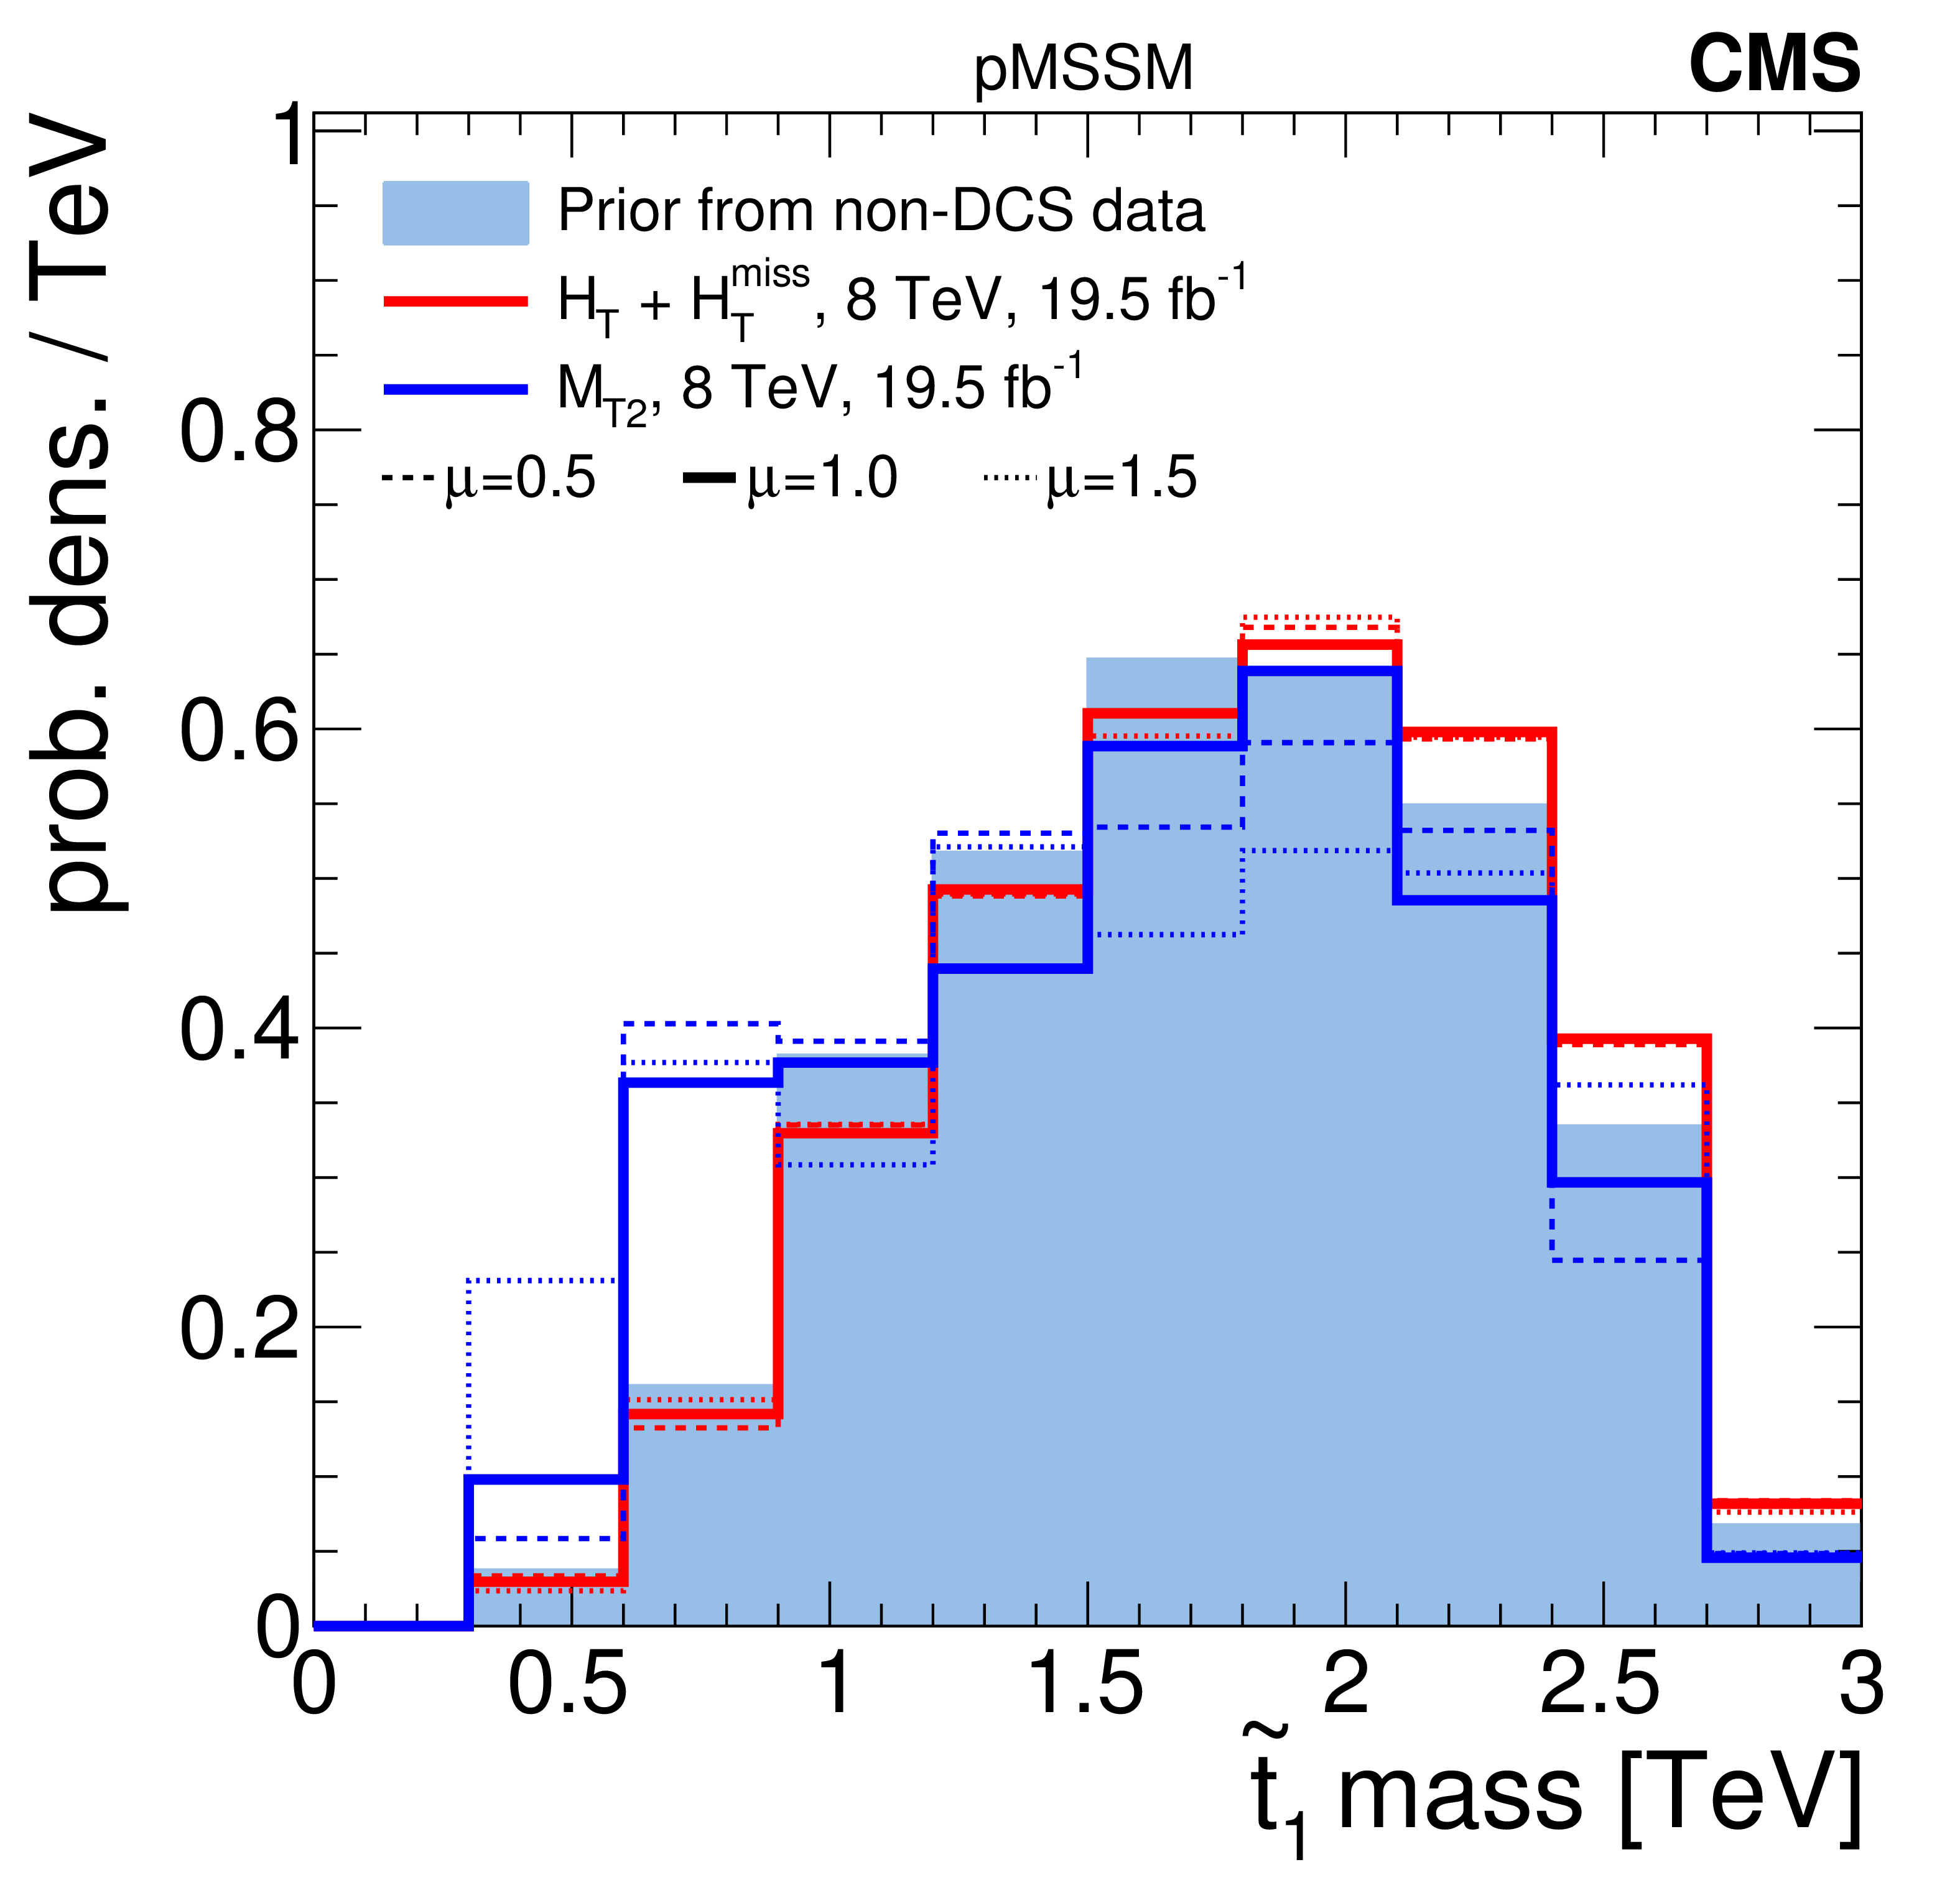
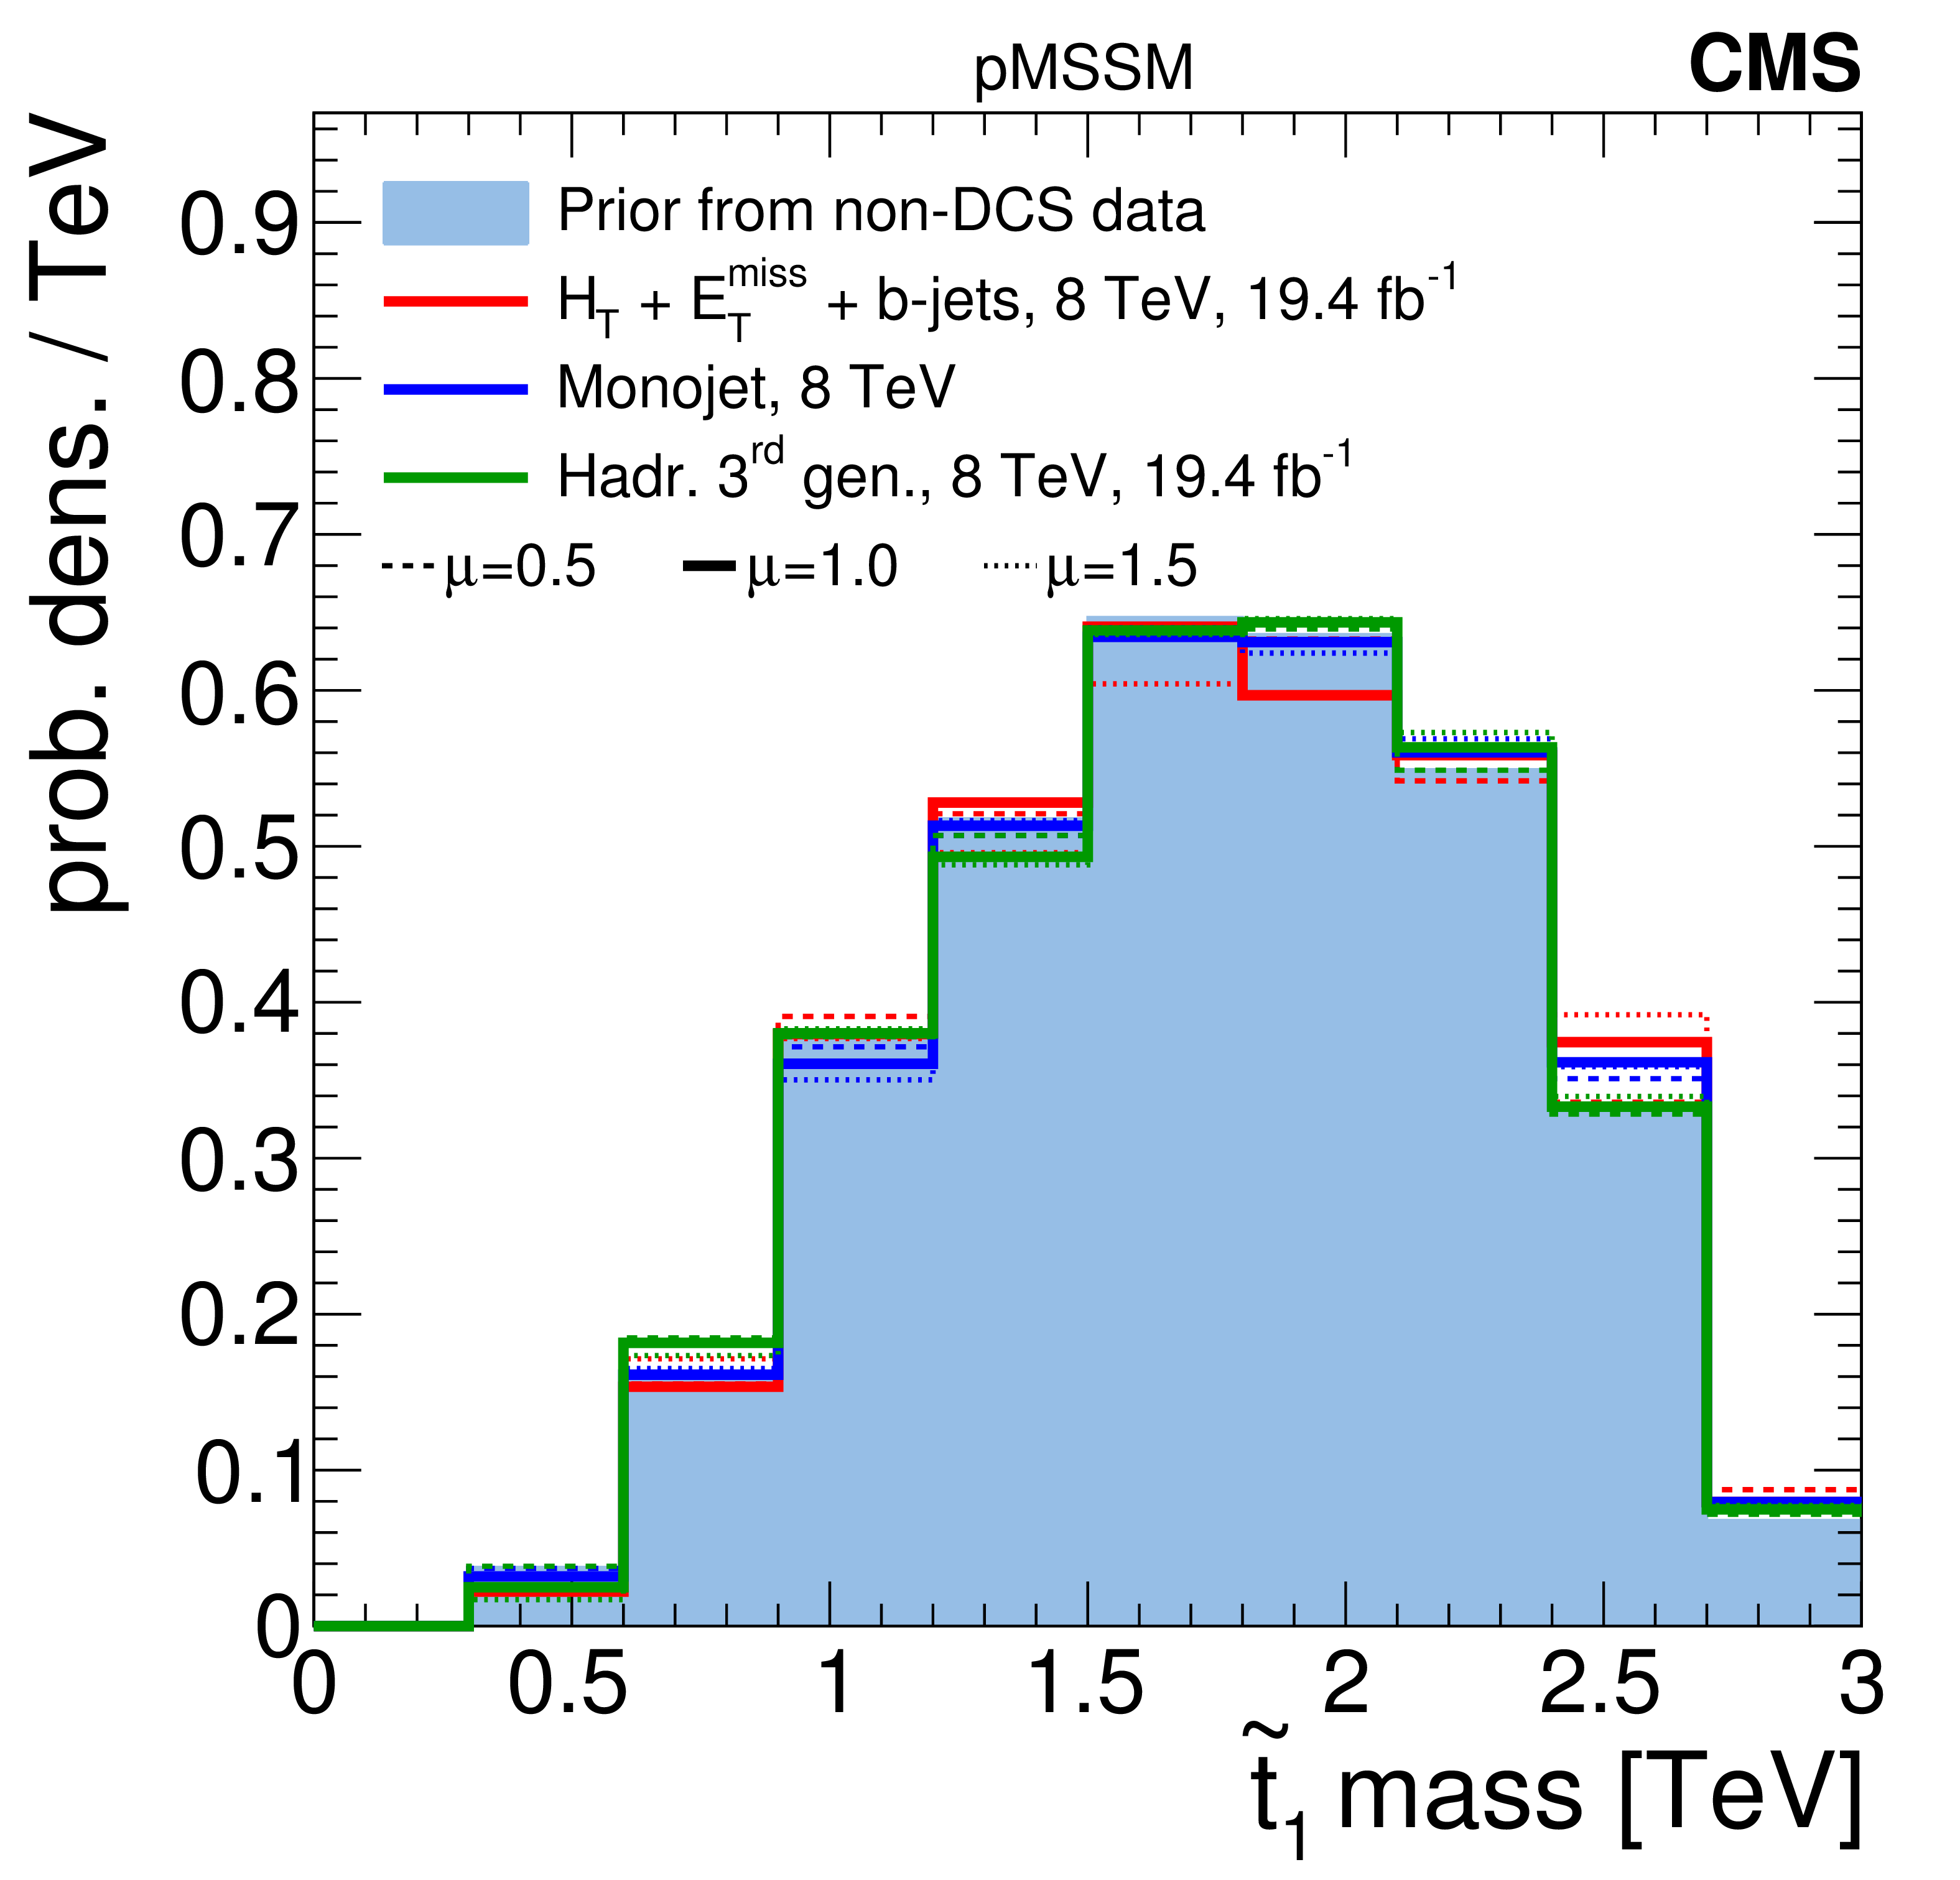
Figure 5-a:
A summary of the impact of CMS searches on the probability density of the $\tilde{ mathrm{ t } } _1$ mass in the pMSSM parameter space. Plots (a-d) compare the non-DCS prior distribution of the $\tilde{ mathrm{ t } } _1$ mass to posterior distributions after data from various CMS searches, where plot (d) shows the combined effect of CMS searches and the Higgs boson results. Plot (e) shows survival probabilities as a function of the $\tilde{ mathrm{ t } } _1$ mass for various combinations of CMS data and data from Higgs boson measurements. Plot (f) shows the distribution of the $\tilde{ mathrm{ t } } _1$ mass versus the $Z$-significance calculated from the combination of all searches. See Fig. 2 for a description of the shading. |
png pdf |
Figure 5-b:
A summary of the impact of CMS searches on the probability density of the $\tilde{ mathrm{ t } } _1$ mass in the pMSSM parameter space. Plots (a-d) compare the non-DCS prior distribution of the $\tilde{ mathrm{ t } } _1$ mass to posterior distributions after data from various CMS searches, where plot (d) shows the combined effect of CMS searches and the Higgs boson results. Plot (e) shows survival probabilities as a function of the $\tilde{ mathrm{ t } } _1$ mass for various combinations of CMS data and data from Higgs boson measurements. Plot (f) shows the distribution of the $\tilde{ mathrm{ t } } _1$ mass versus the $Z$-significance calculated from the combination of all searches. See Fig. 2 for a description of the shading. |

png pdf |
Figure 5-c:
A summary of the impact of CMS searches on the probability density of the $\tilde{ mathrm{ t } } _1$ mass in the pMSSM parameter space. Plots (a-d) compare the non-DCS prior distribution of the $\tilde{ mathrm{ t } } _1$ mass to posterior distributions after data from various CMS searches, where plot (d) shows the combined effect of CMS searches and the Higgs boson results. Plot (e) shows survival probabilities as a function of the $\tilde{ mathrm{ t } } _1$ mass for various combinations of CMS data and data from Higgs boson measurements. Plot (f) shows the distribution of the $\tilde{ mathrm{ t } } _1$ mass versus the $Z$-significance calculated from the combination of all searches. See Fig. 2 for a description of the shading. |
png pdf |
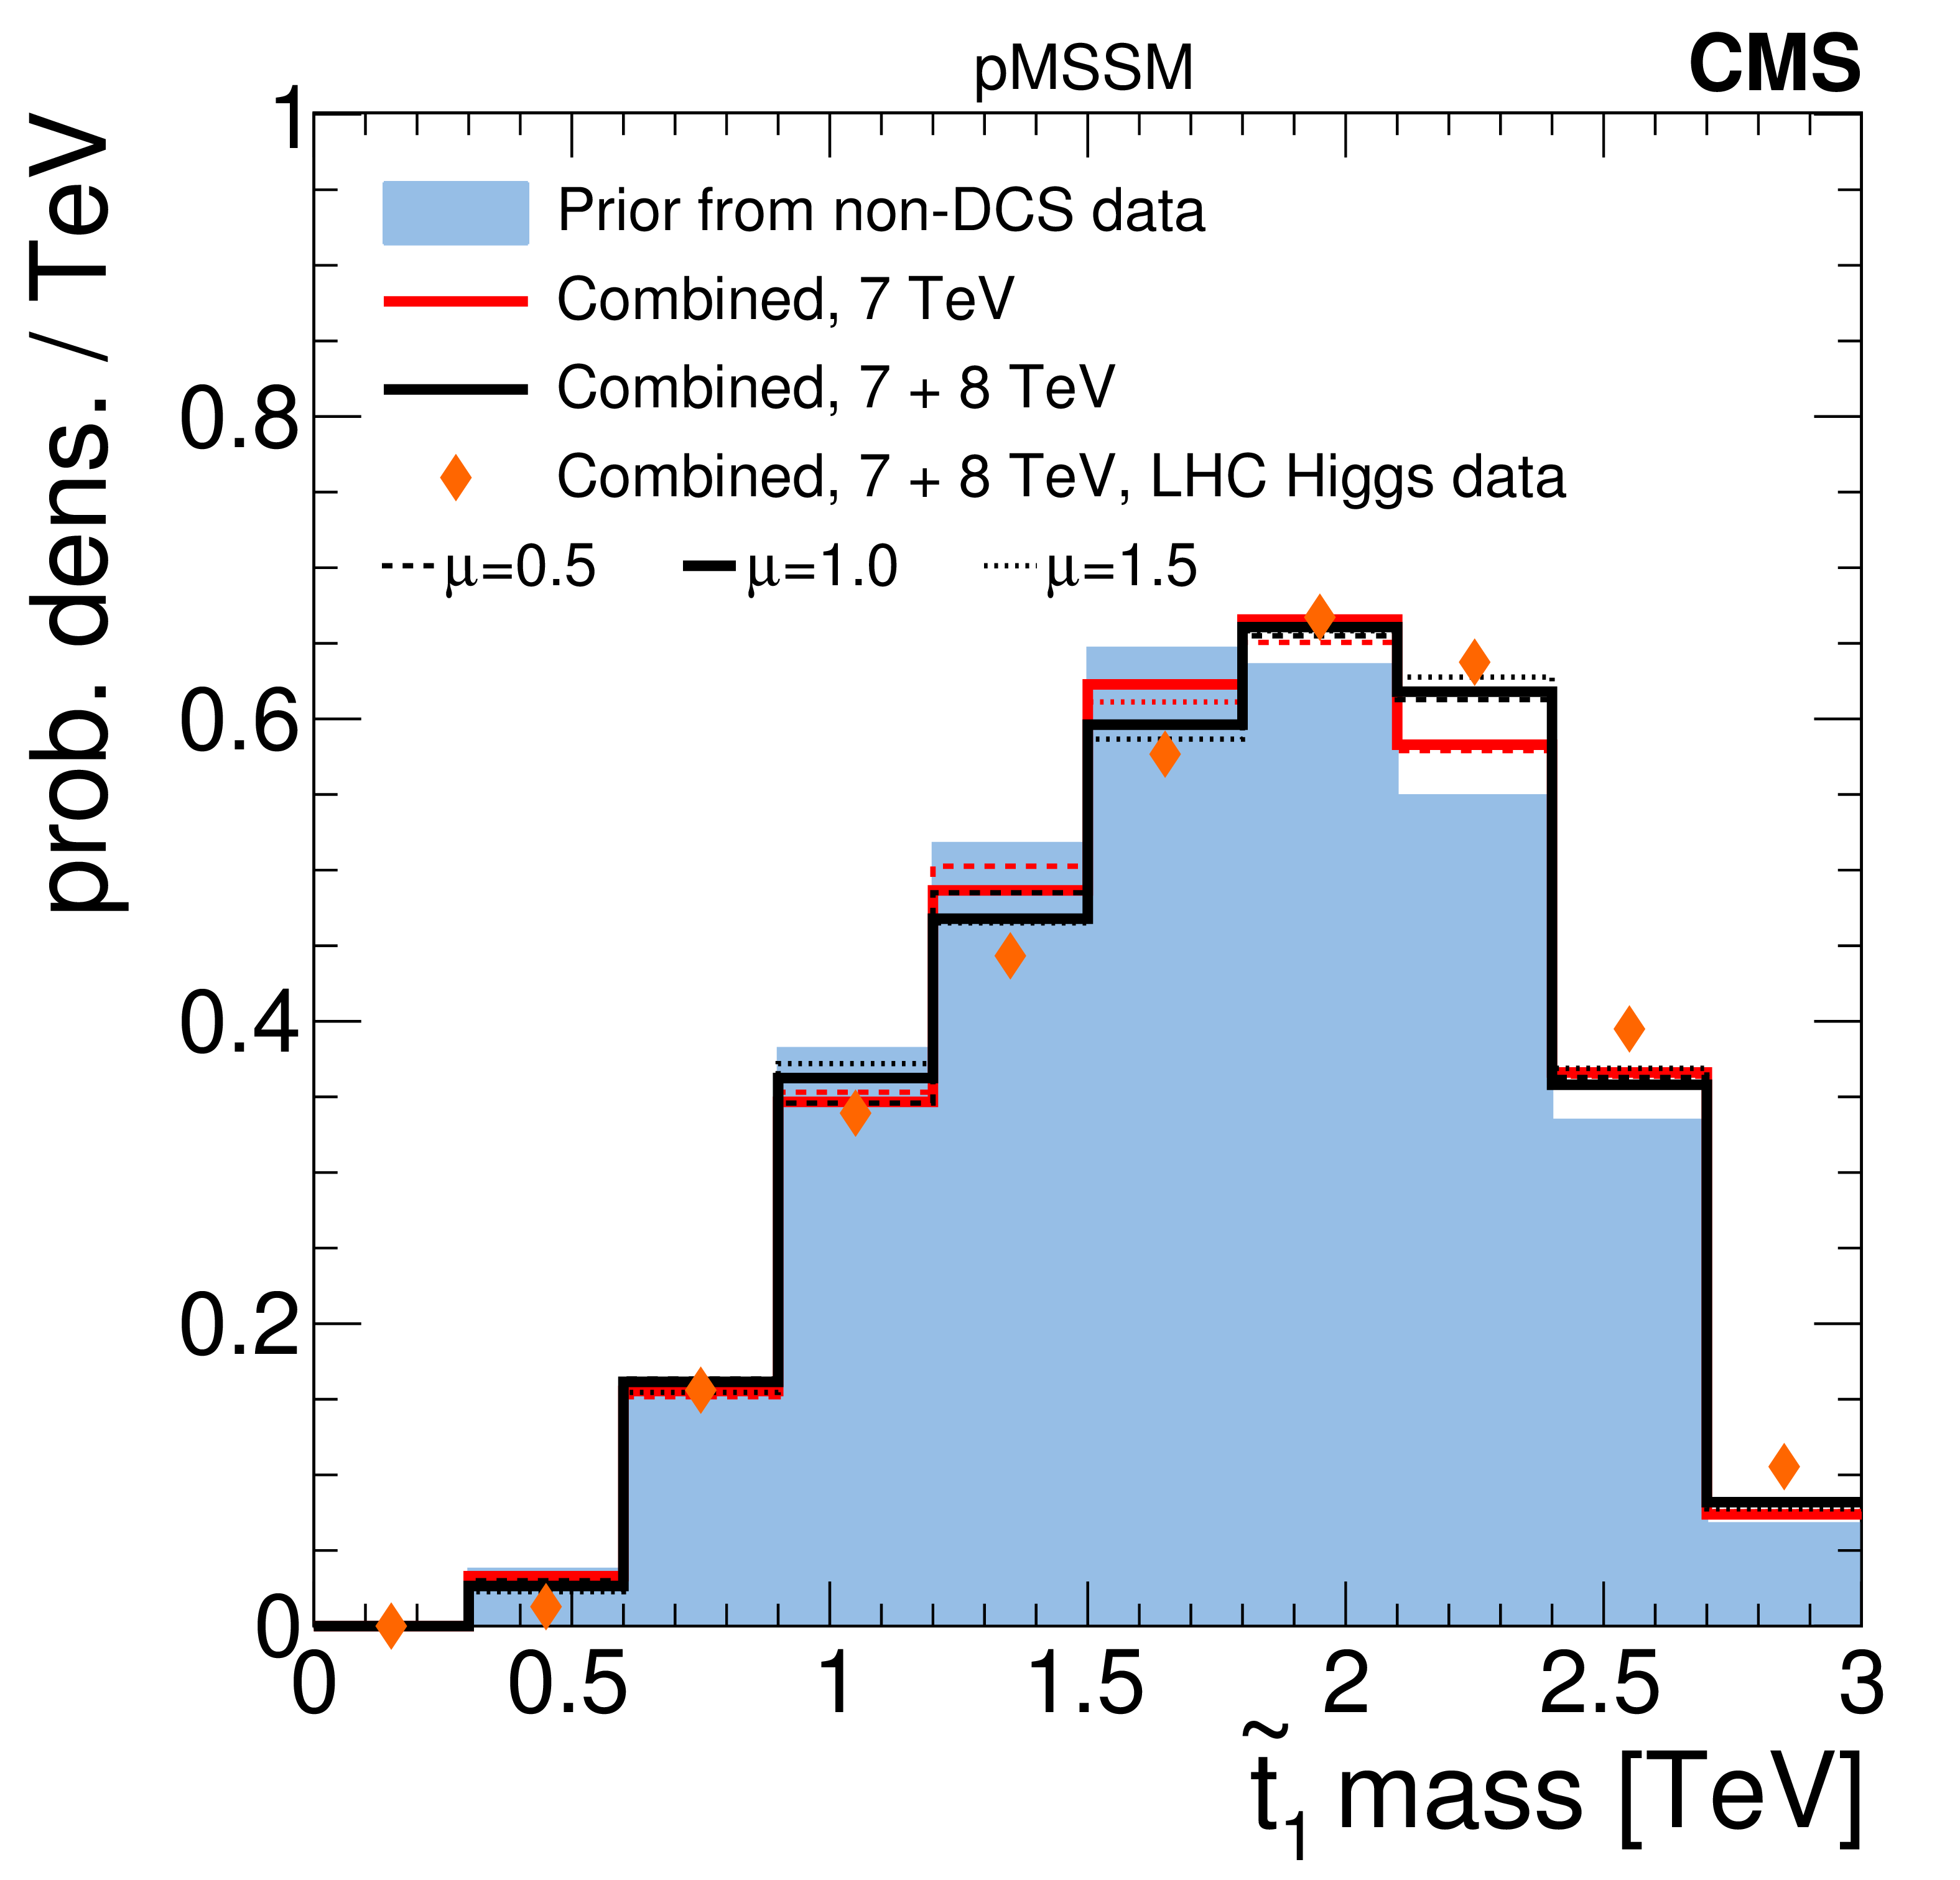
Figure 5-d:
A summary of the impact of CMS searches on the probability density of the $\tilde{ mathrm{ t } } _1$ mass in the pMSSM parameter space. Plots (a-d) compare the non-DCS prior distribution of the $\tilde{ mathrm{ t } } _1$ mass to posterior distributions after data from various CMS searches, where plot (d) shows the combined effect of CMS searches and the Higgs boson results. Plot (e) shows survival probabilities as a function of the $\tilde{ mathrm{ t } } _1$ mass for various combinations of CMS data and data from Higgs boson measurements. Plot (f) shows the distribution of the $\tilde{ mathrm{ t } } _1$ mass versus the $Z$-significance calculated from the combination of all searches. See Fig. 2 for a description of the shading. |
png pdf |
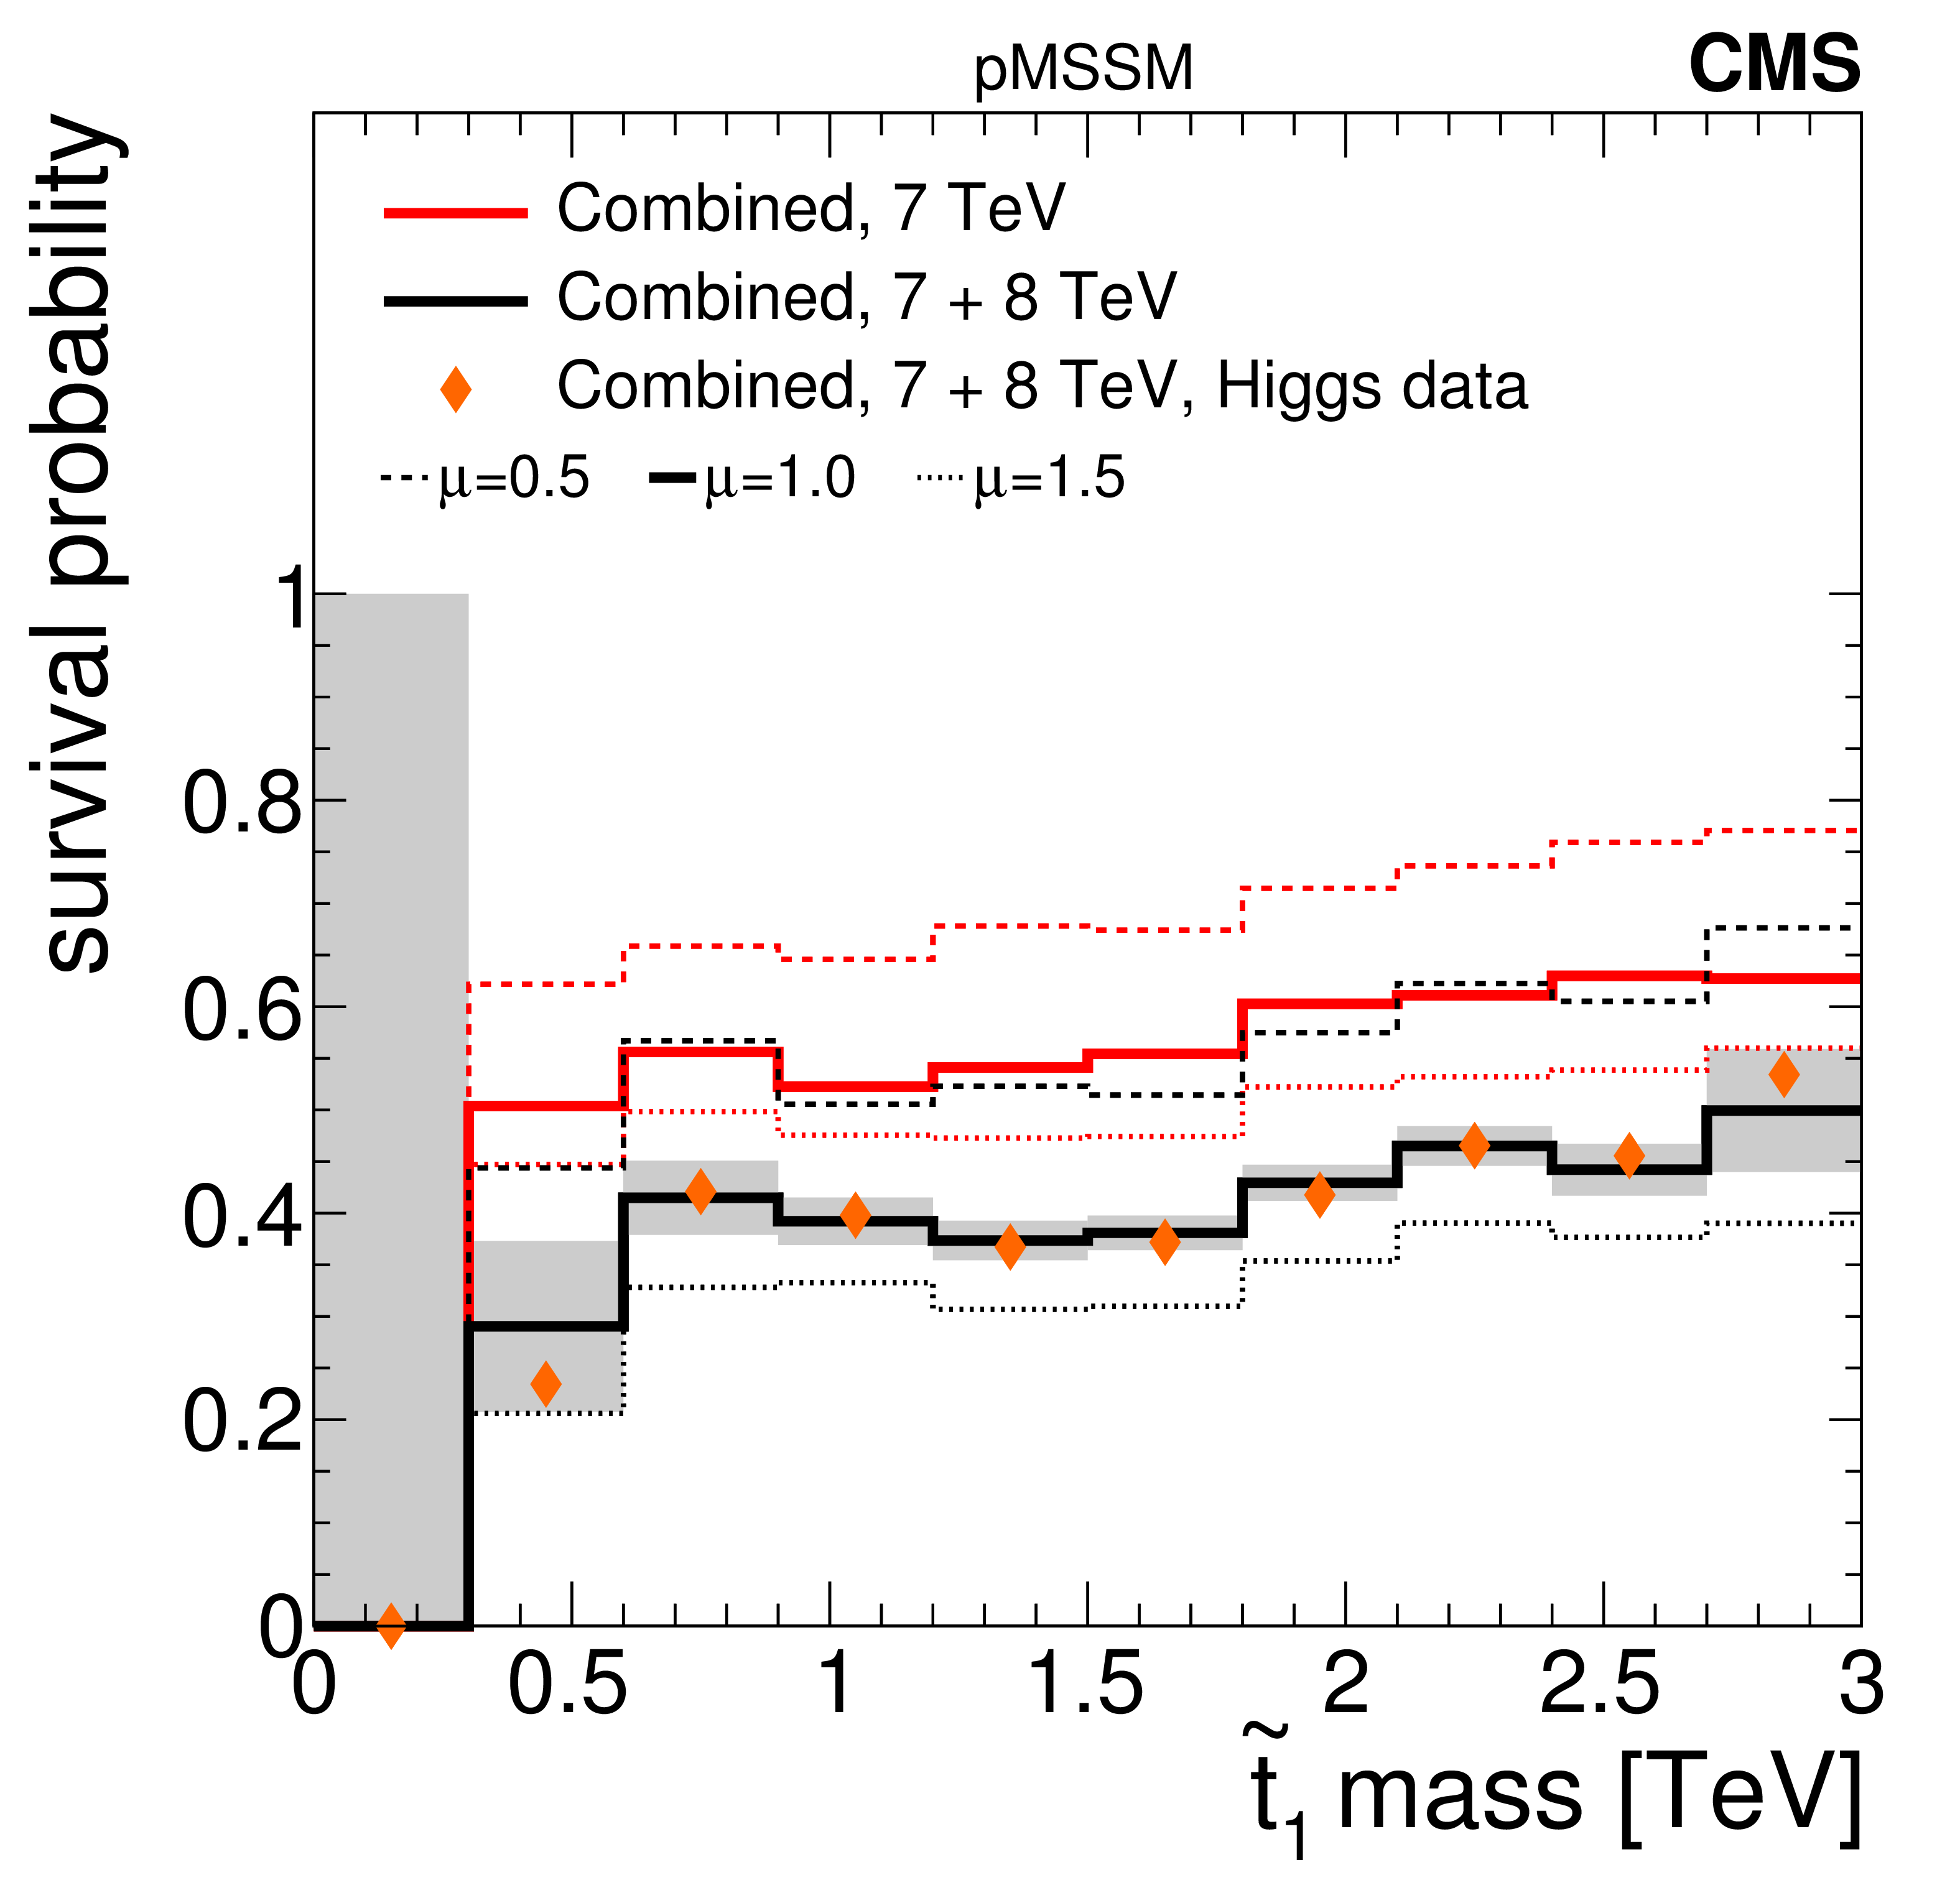
Figure 5-e:
A summary of the impact of CMS searches on the probability density of the $\tilde{ mathrm{ t } } _1$ mass in the pMSSM parameter space. Plots (a-d) compare the non-DCS prior distribution of the $\tilde{ mathrm{ t } } _1$ mass to posterior distributions after data from various CMS searches, where plot (d) shows the combined effect of CMS searches and the Higgs boson results. Plot (e) shows survival probabilities as a function of the $\tilde{ mathrm{ t } } _1$ mass for various combinations of CMS data and data from Higgs boson measurements. Plot (f) shows the distribution of the $\tilde{ mathrm{ t } } _1$ mass versus the $Z$-significance calculated from the combination of all searches. See Fig. 2 for a description of the shading. |
png pdf |
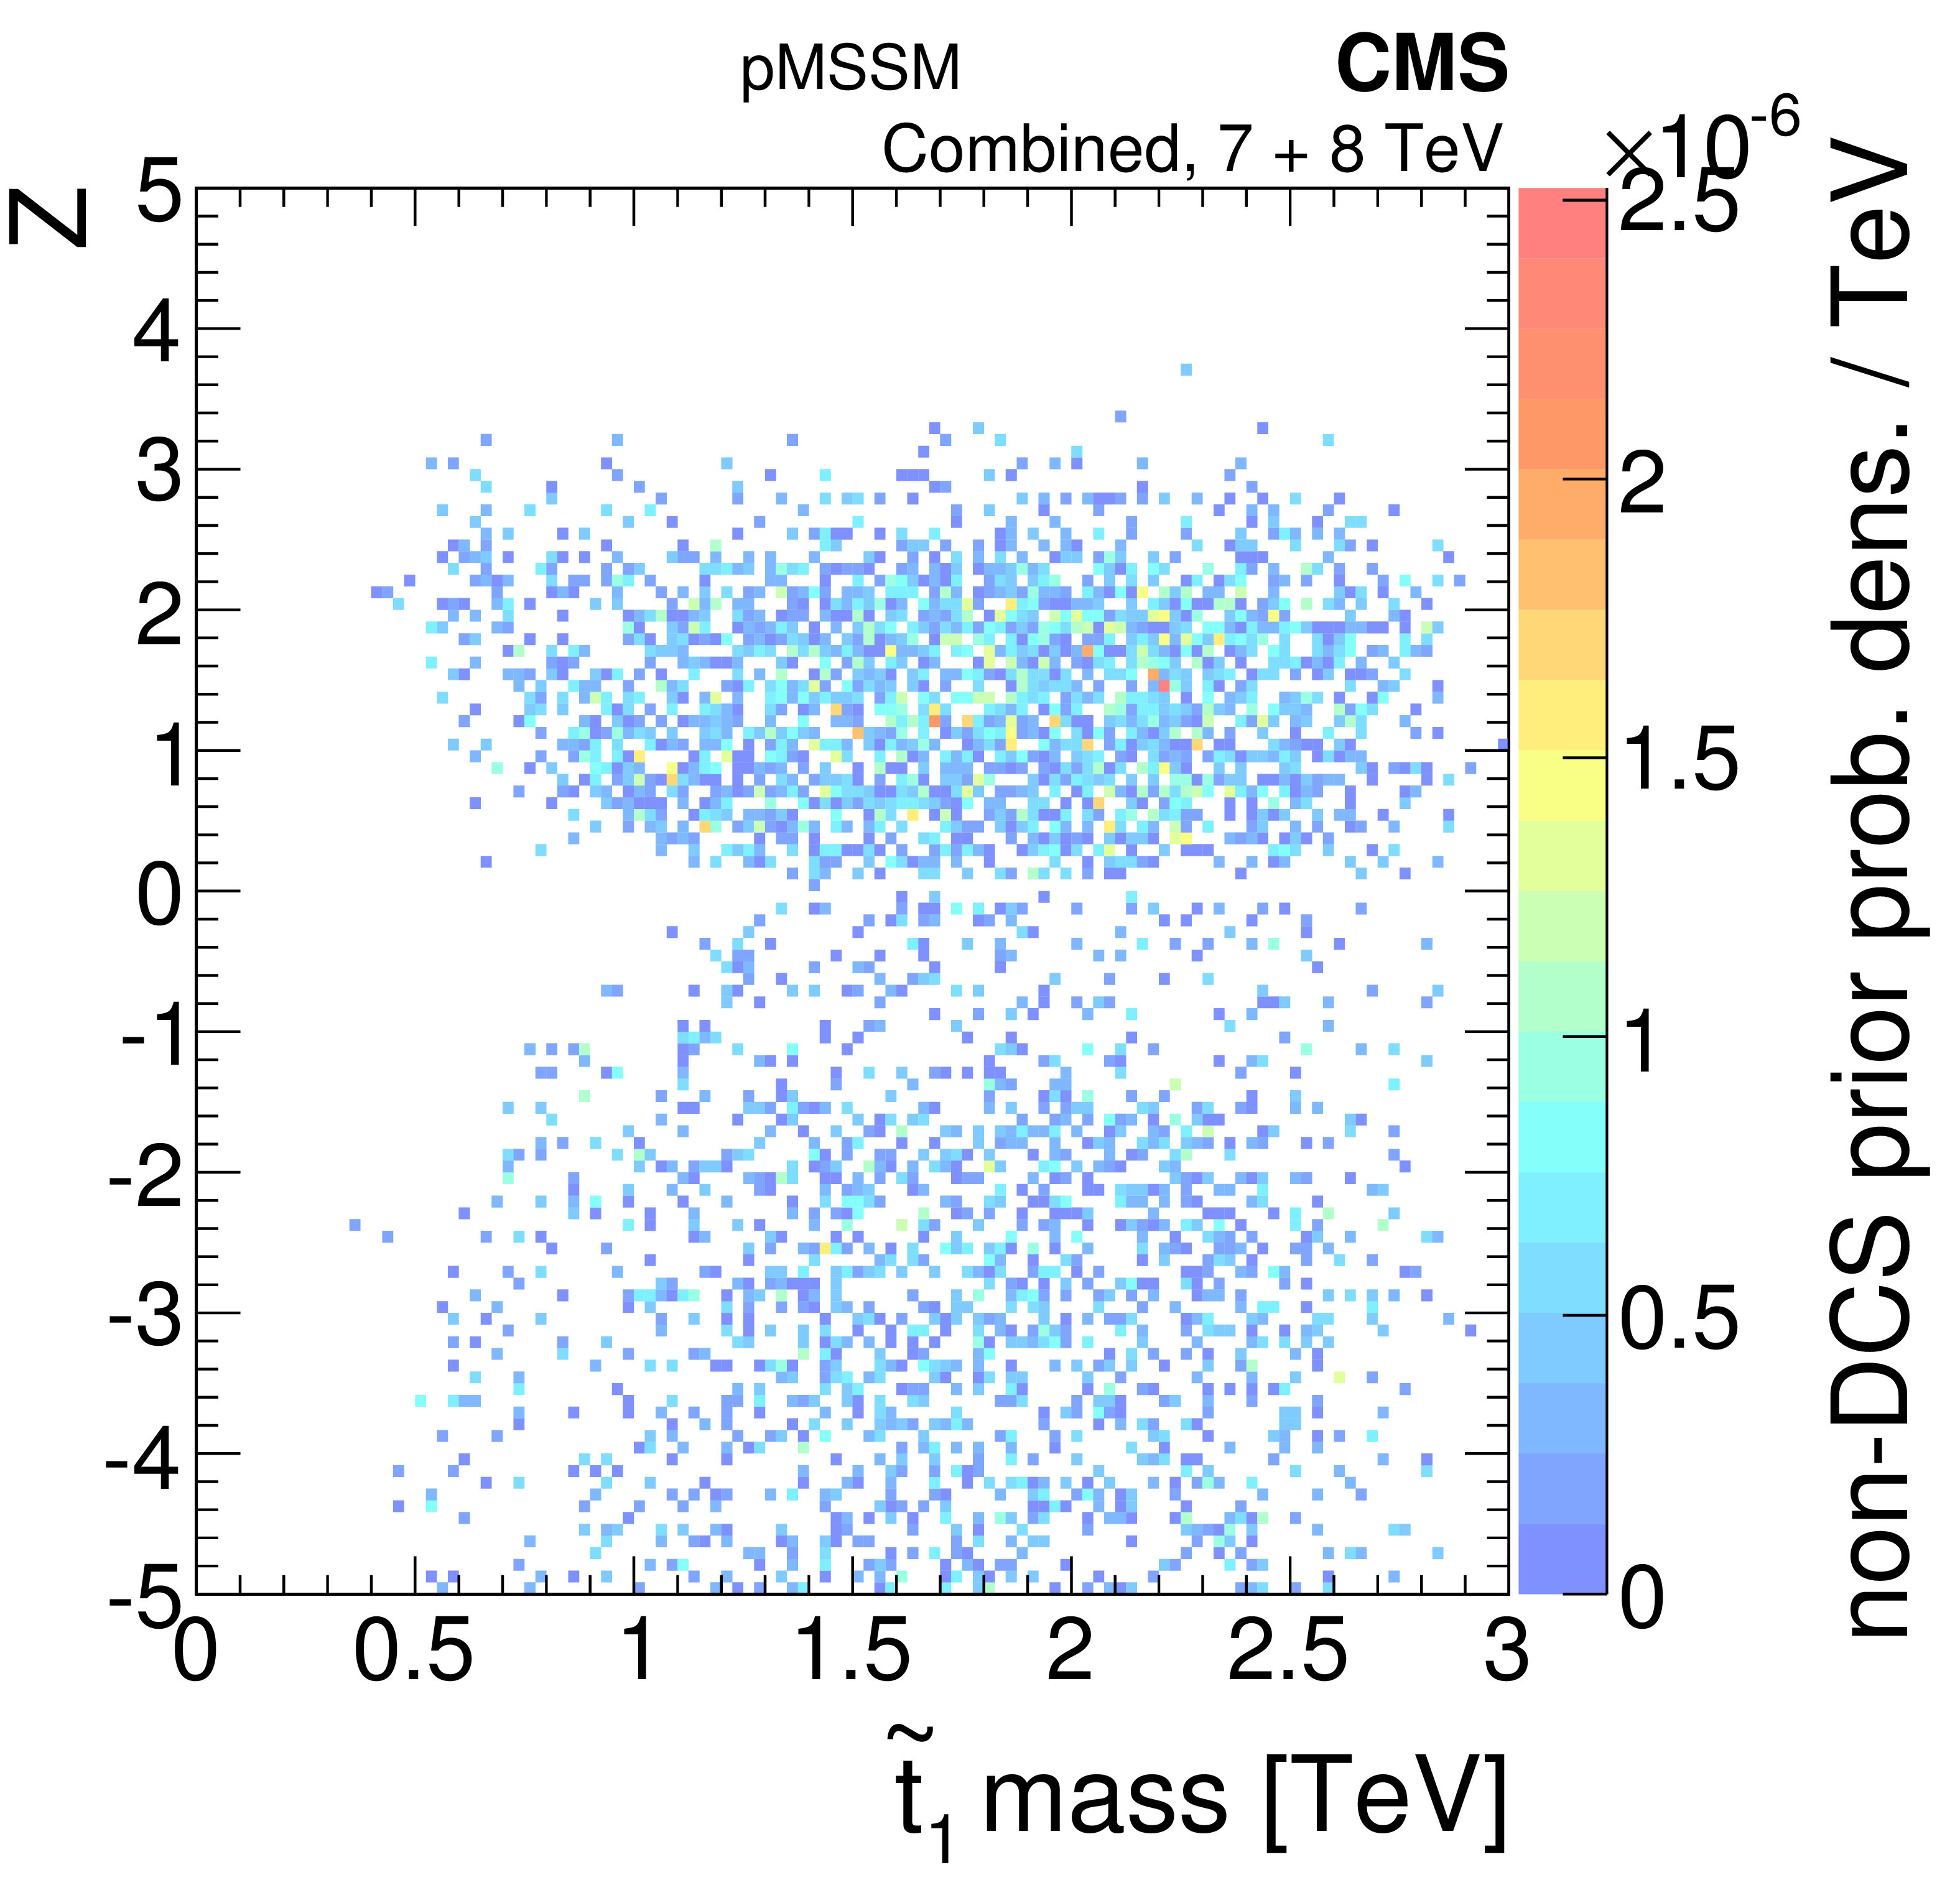
Figure 5-f:
A summary of the impact of CMS searches on the probability density of the $\tilde{ mathrm{ t } } _1$ mass in the pMSSM parameter space. Plots (a-d) compare the non-DCS prior distribution of the $\tilde{ mathrm{ t } } _1$ mass to posterior distributions after data from various CMS searches, where plot (d) shows the combined effect of CMS searches and the Higgs boson results. Plot (e) shows survival probabilities as a function of the $\tilde{ mathrm{ t } } _1$ mass for various combinations of CMS data and data from Higgs boson measurements. Plot (f) shows the distribution of the $\tilde{ mathrm{ t } } _1$ mass versus the $Z$-significance calculated from the combination of all searches. See Fig. 2 for a description of the shading. |

png pdf |
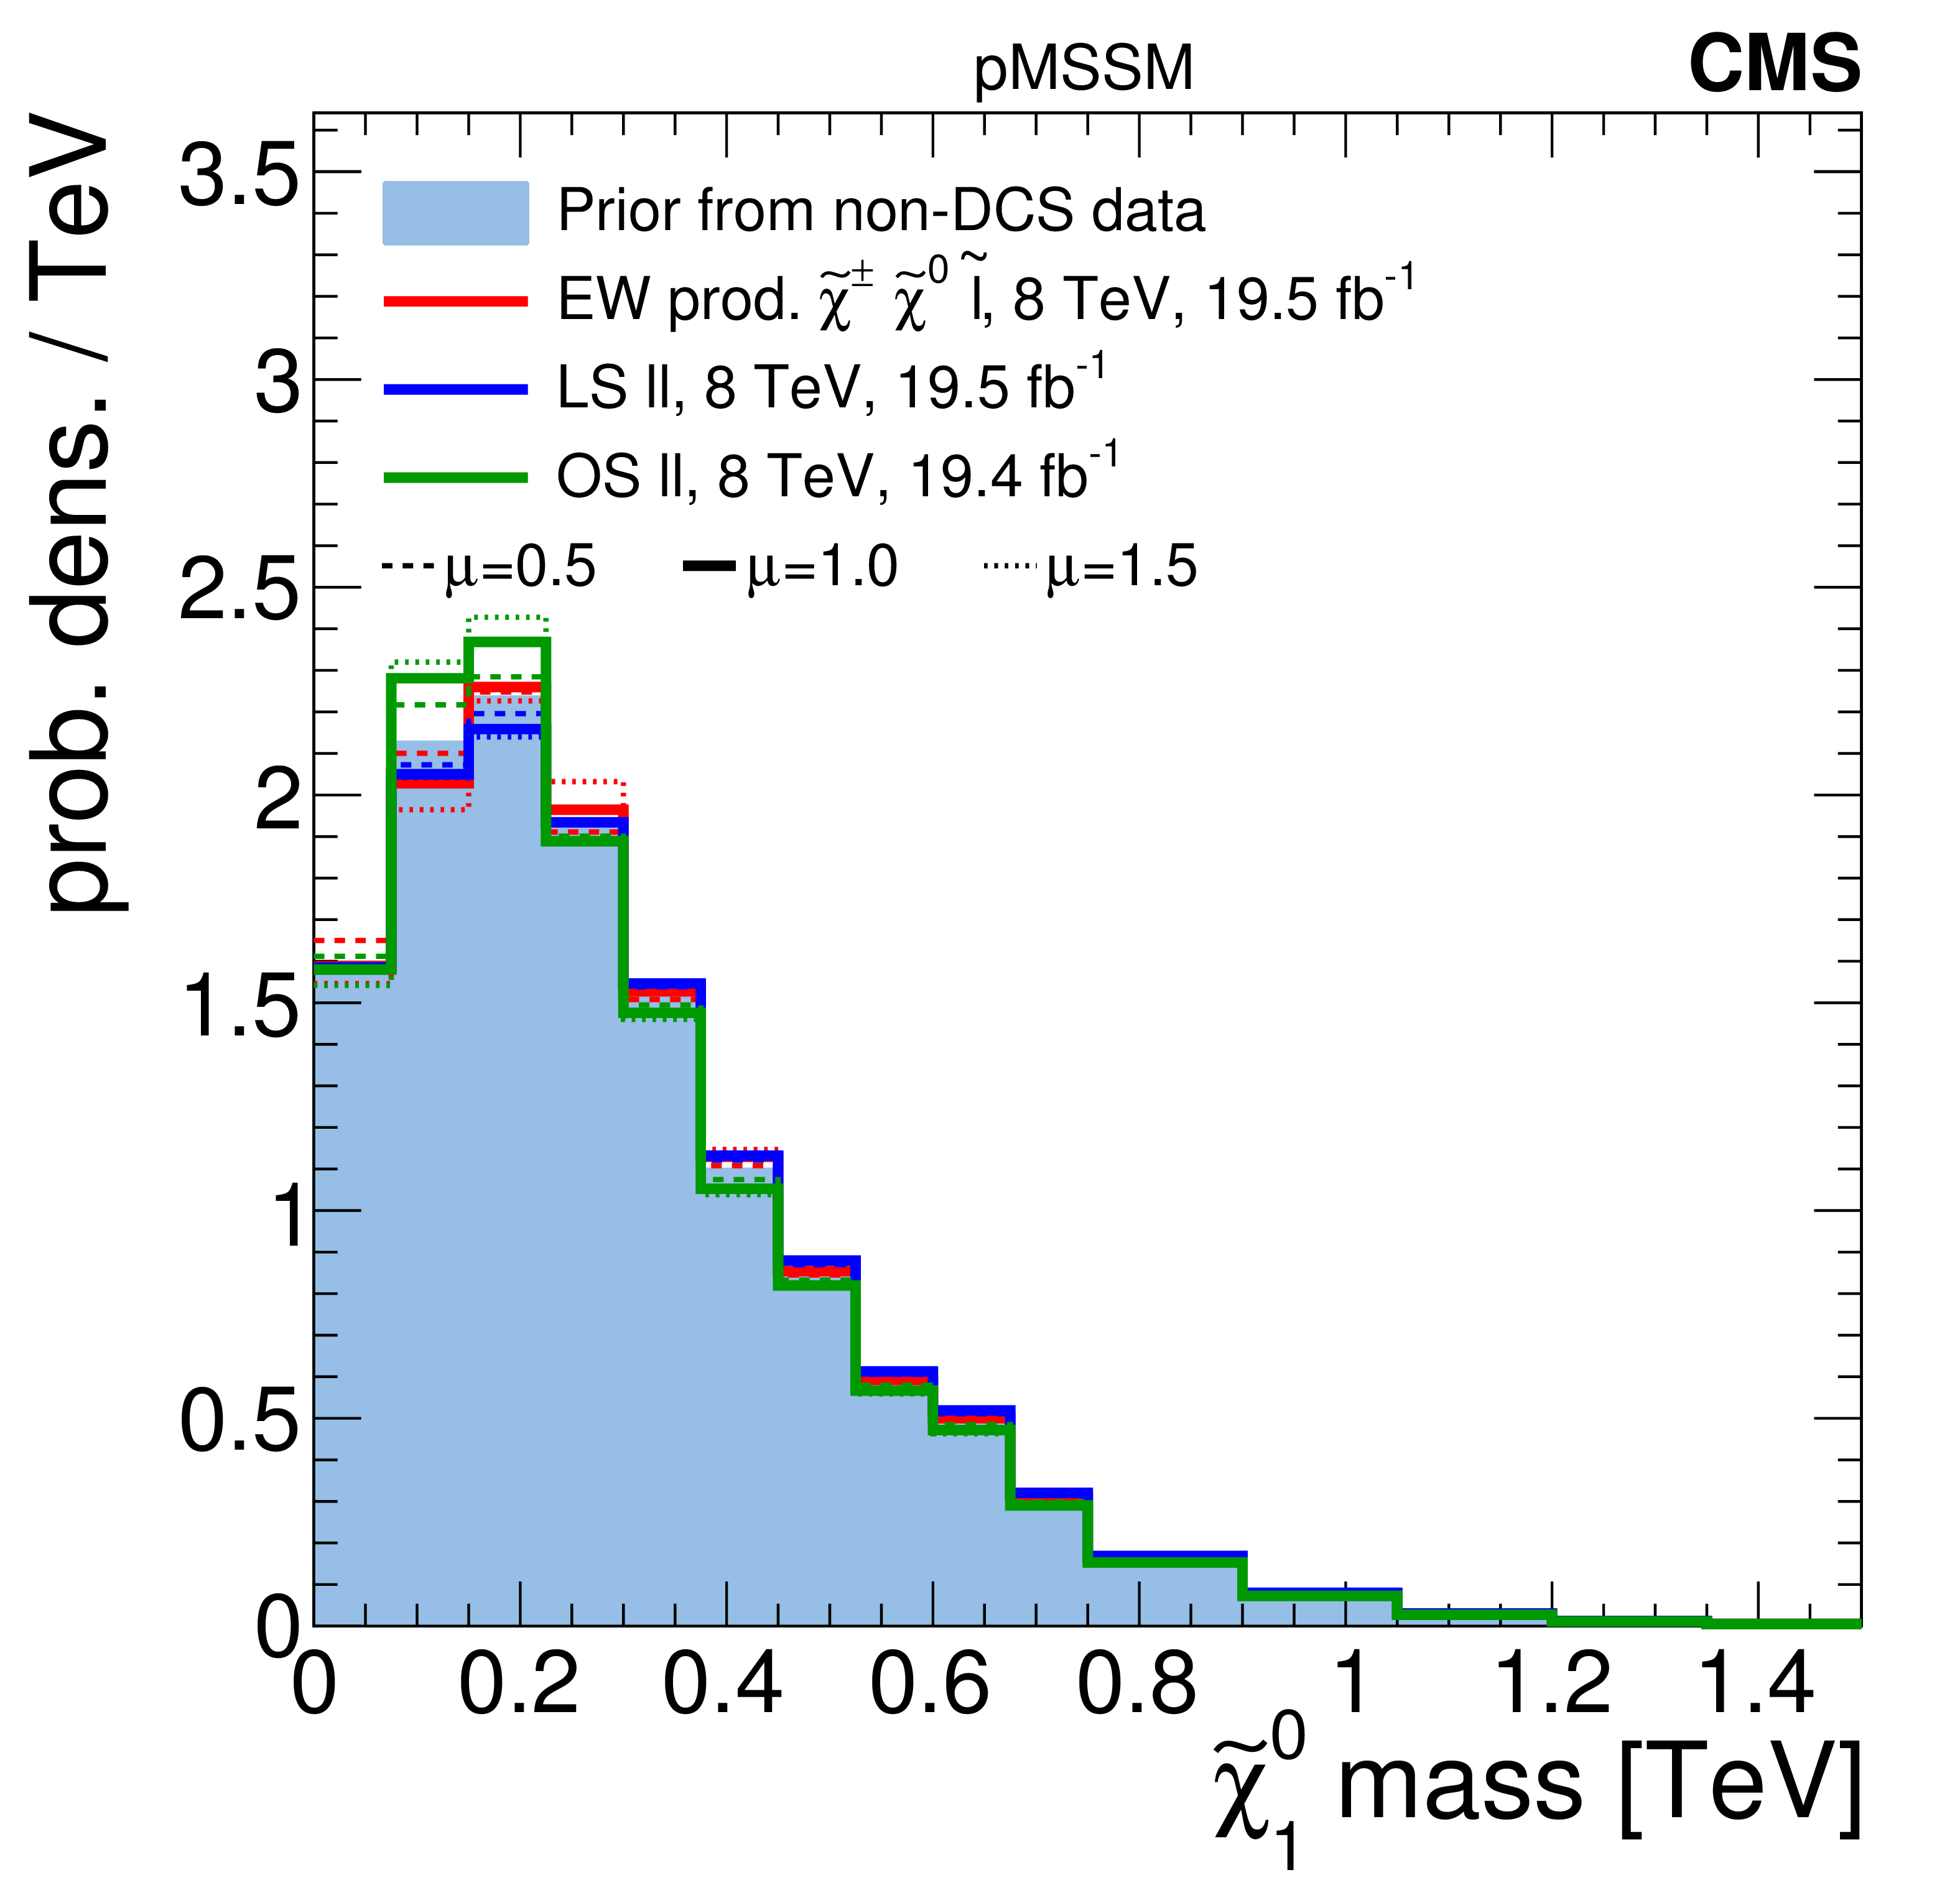
Figure 6-a:
A summary of the impact of CMS searches on the probability density of the $\tilde{\chi}^0_1 $ mass in the pMSSM parameter space. Plots (a-d) compare the non-DCS prior distribution of the $\tilde{\chi}^0_1 $ mass to posterior distributions after data from various CMS searches, where plot (d) shows the combined effect of CMS searches and the Higgs boson results. Plot (e) shows survival probabilities as a function of the $\tilde{\chi}^0_1 $ mass for various combinations of CMS data and data from Higgs boson measurements. Plot (f) shows the distribution of the $\tilde{\chi}^0_1 $ mass versus the $Z$-significance calculated from the combination of all searches. See Fig. 2 for a description of the shading. |

png pdf |
Figure 6-b:
A summary of the impact of CMS searches on the probability density of the $\tilde{\chi}^0_1 $ mass in the pMSSM parameter space. Plots (a-d) compare the non-DCS prior distribution of the $\tilde{\chi}^0_1 $ mass to posterior distributions after data from various CMS searches, where plot (d) shows the combined effect of CMS searches and the Higgs boson results. Plot (e) shows survival probabilities as a function of the $\tilde{\chi}^0_1 $ mass for various combinations of CMS data and data from Higgs boson measurements. Plot (f) shows the distribution of the $\tilde{\chi}^0_1 $ mass versus the $Z$-significance calculated from the combination of all searches. See Fig. 2 for a description of the shading. |
png pdf |
Figure 6-c:
A summary of the impact of CMS searches on the probability density of the $\tilde{\chi}^0_1 $ mass in the pMSSM parameter space. Plots (a-d) compare the non-DCS prior distribution of the $\tilde{\chi}^0_1 $ mass to posterior distributions after data from various CMS searches, where plot (d) shows the combined effect of CMS searches and the Higgs boson results. Plot (e) shows survival probabilities as a function of the $\tilde{\chi}^0_1 $ mass for various combinations of CMS data and data from Higgs boson measurements. Plot (f) shows the distribution of the $\tilde{\chi}^0_1 $ mass versus the $Z$-significance calculated from the combination of all searches. See Fig. 2 for a description of the shading. |
png pdf |
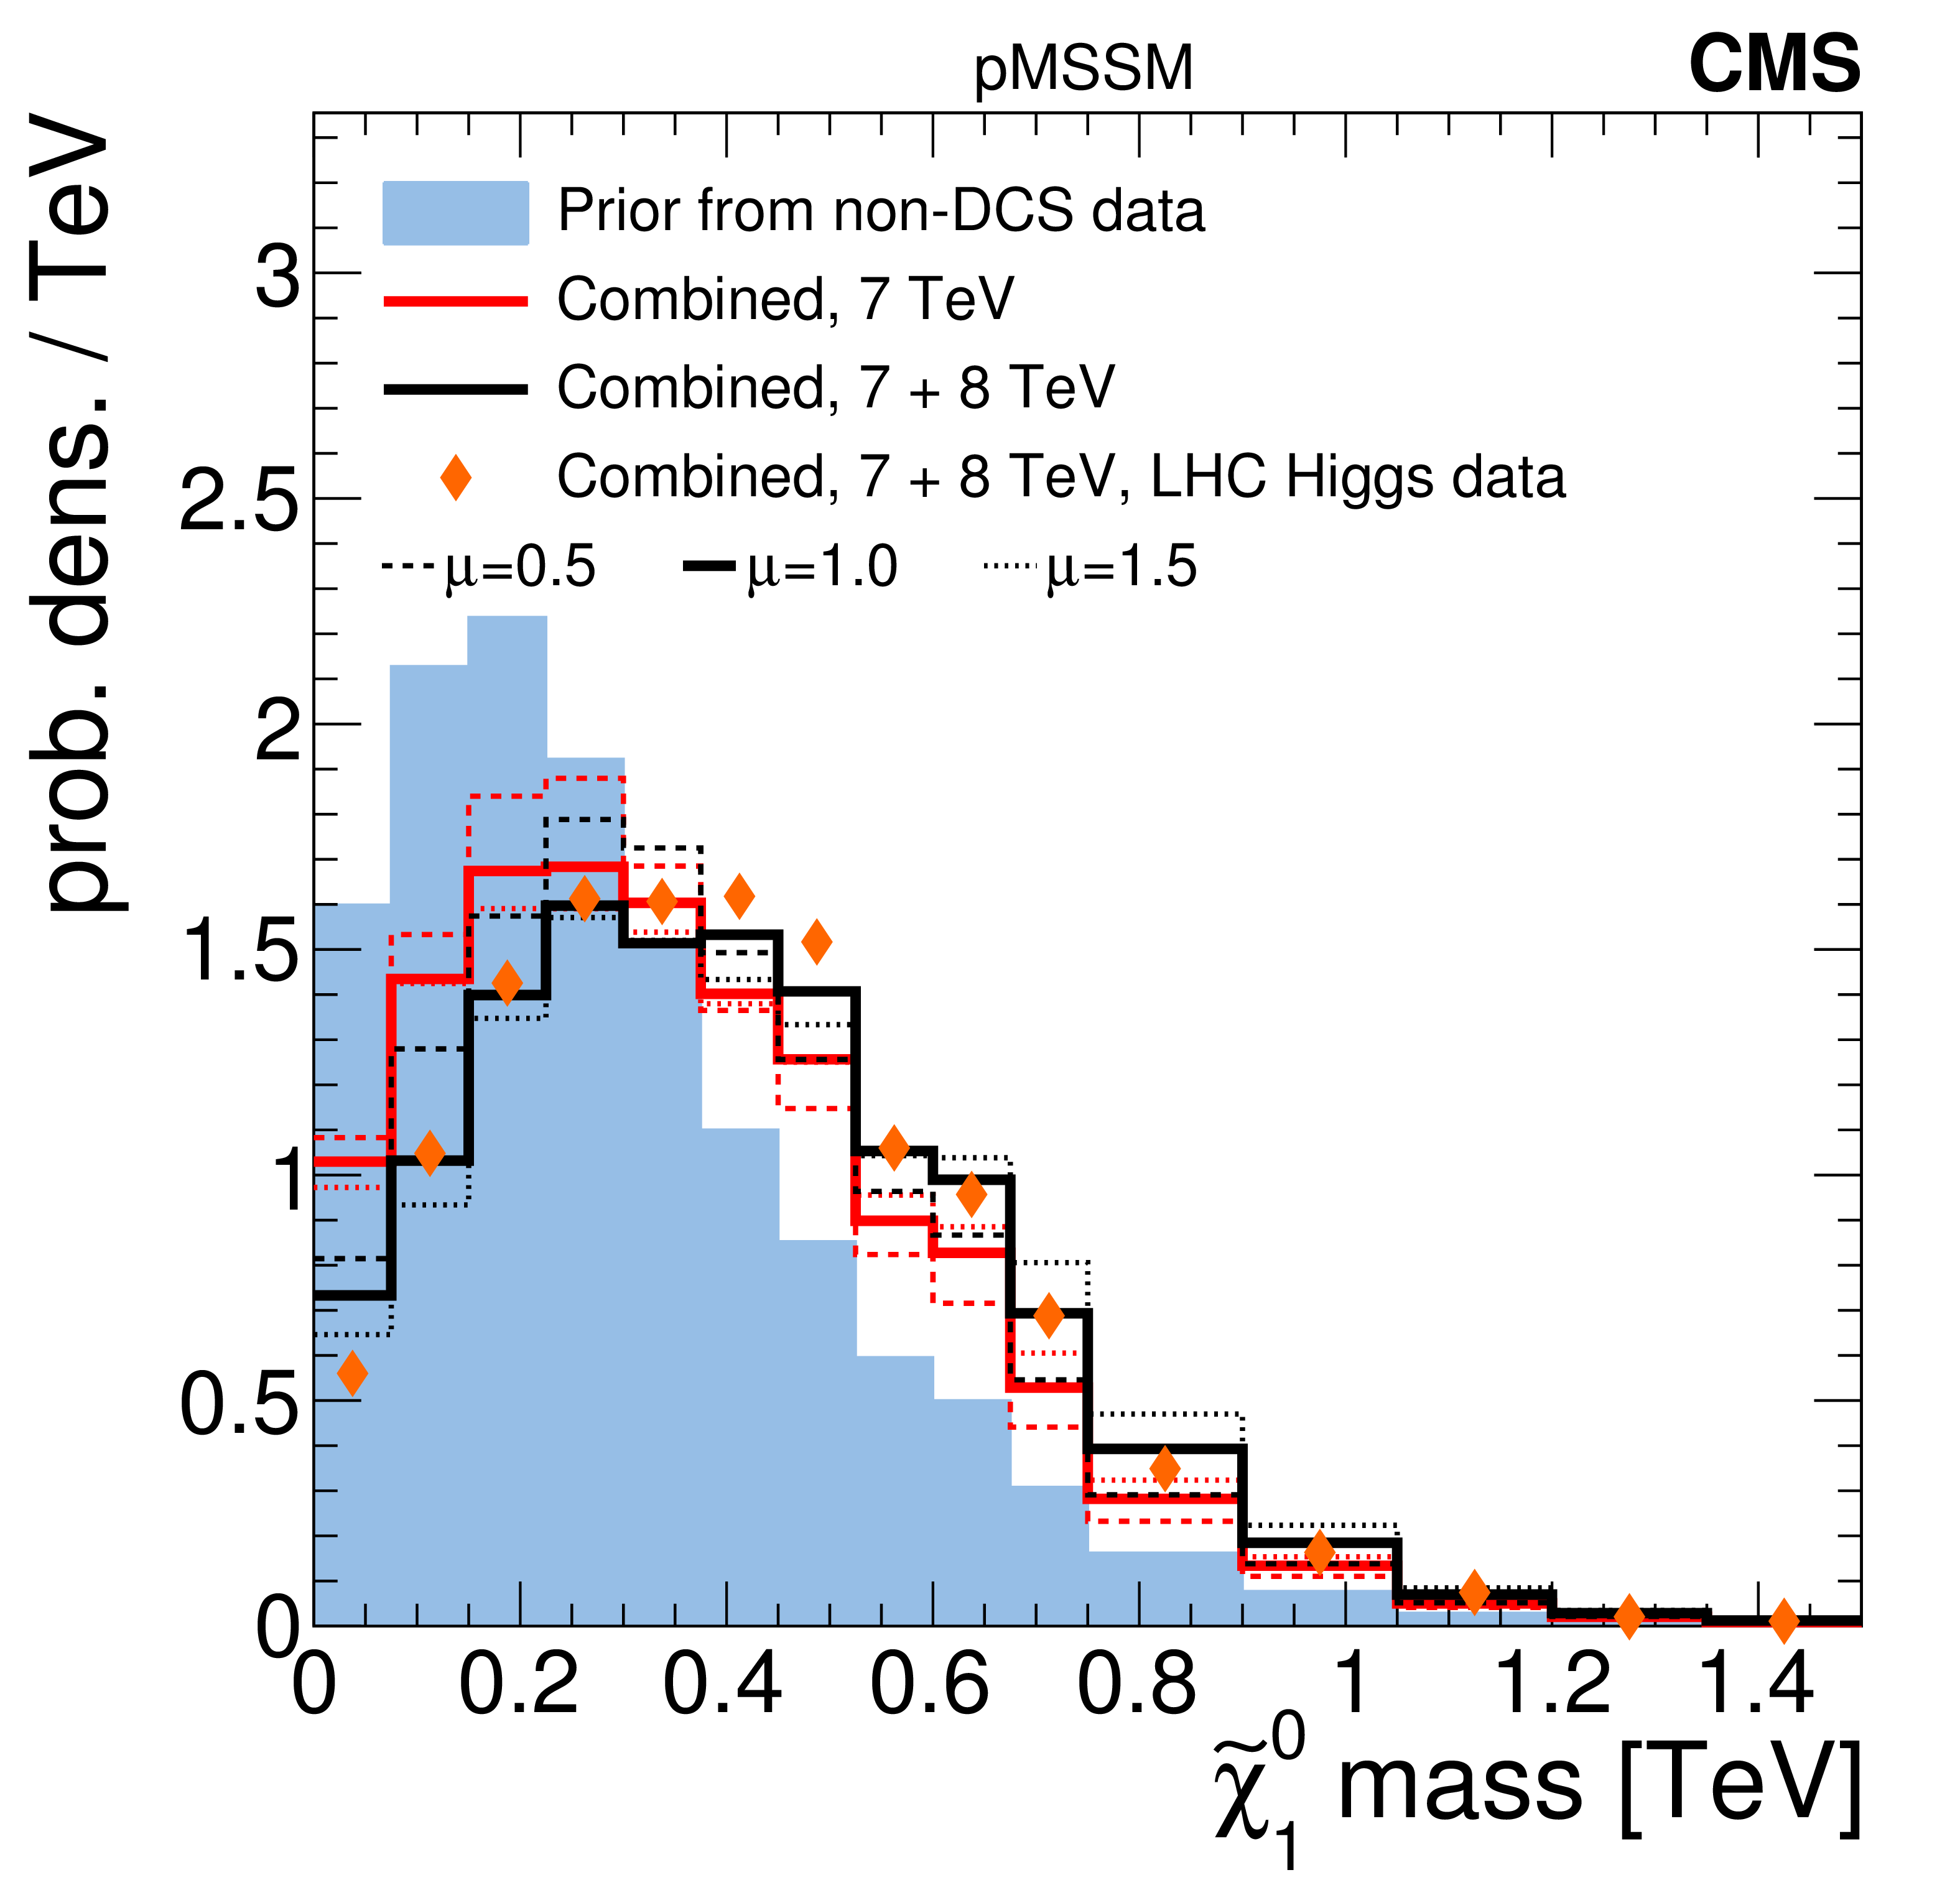
Figure 6-d:
A summary of the impact of CMS searches on the probability density of the $\tilde{\chi}^0_1 $ mass in the pMSSM parameter space. Plots (a-d) compare the non-DCS prior distribution of the $\tilde{\chi}^0_1 $ mass to posterior distributions after data from various CMS searches, where plot (d) shows the combined effect of CMS searches and the Higgs boson results. Plot (e) shows survival probabilities as a function of the $\tilde{\chi}^0_1 $ mass for various combinations of CMS data and data from Higgs boson measurements. Plot (f) shows the distribution of the $\tilde{\chi}^0_1 $ mass versus the $Z$-significance calculated from the combination of all searches. See Fig. 2 for a description of the shading. |
png pdf |
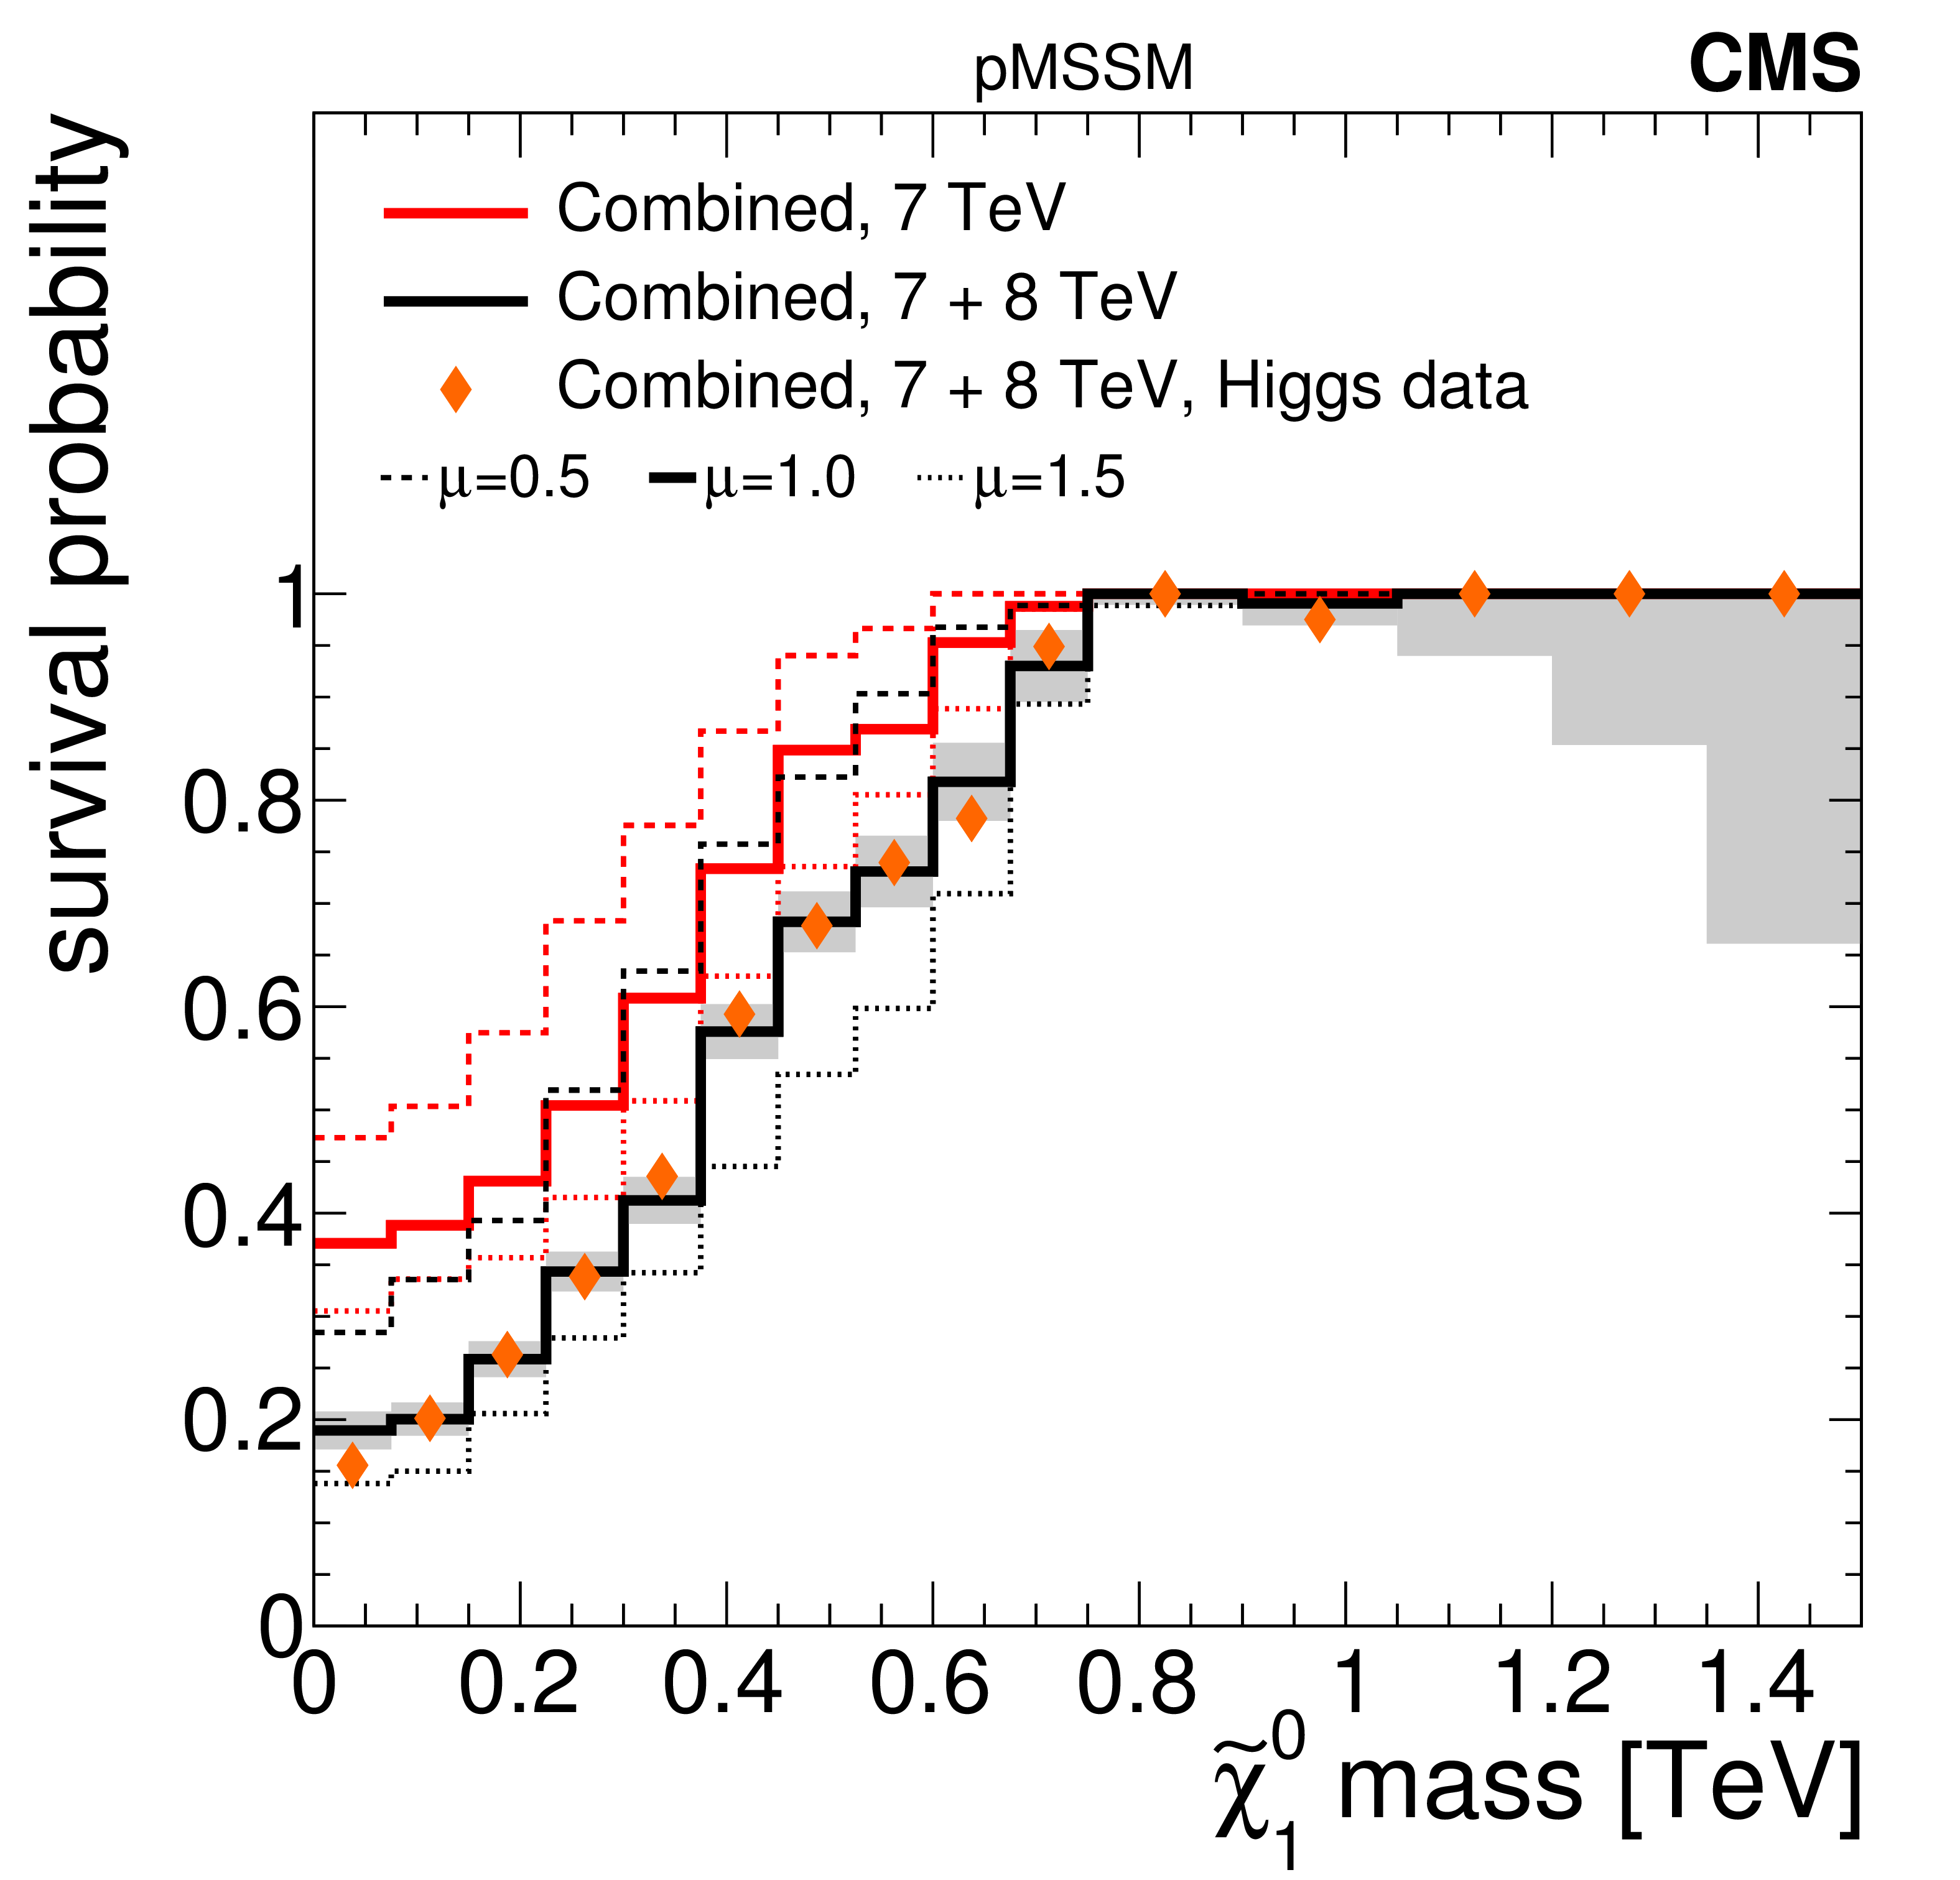
Figure 6-e:
A summary of the impact of CMS searches on the probability density of the $\tilde{\chi}^0_1 $ mass in the pMSSM parameter space. Plots (a-d) compare the non-DCS prior distribution of the $\tilde{\chi}^0_1 $ mass to posterior distributions after data from various CMS searches, where plot (d) shows the combined effect of CMS searches and the Higgs boson results. Plot (e) shows survival probabilities as a function of the $\tilde{\chi}^0_1 $ mass for various combinations of CMS data and data from Higgs boson measurements. Plot (f) shows the distribution of the $\tilde{\chi}^0_1 $ mass versus the $Z$-significance calculated from the combination of all searches. See Fig. 2 for a description of the shading. |

png pdf |
Figure 6-f:
A summary of the impact of CMS searches on the probability density of the $\tilde{\chi}^0_1 $ mass in the pMSSM parameter space. Plots (a-d) compare the non-DCS prior distribution of the $\tilde{\chi}^0_1 $ mass to posterior distributions after data from various CMS searches, where plot (d) shows the combined effect of CMS searches and the Higgs boson results. Plot (e) shows survival probabilities as a function of the $\tilde{\chi}^0_1 $ mass for various combinations of CMS data and data from Higgs boson measurements. Plot (f) shows the distribution of the $\tilde{\chi}^0_1 $ mass versus the $Z$-significance calculated from the combination of all searches. See Fig. 2 for a description of the shading. |
png pdf |
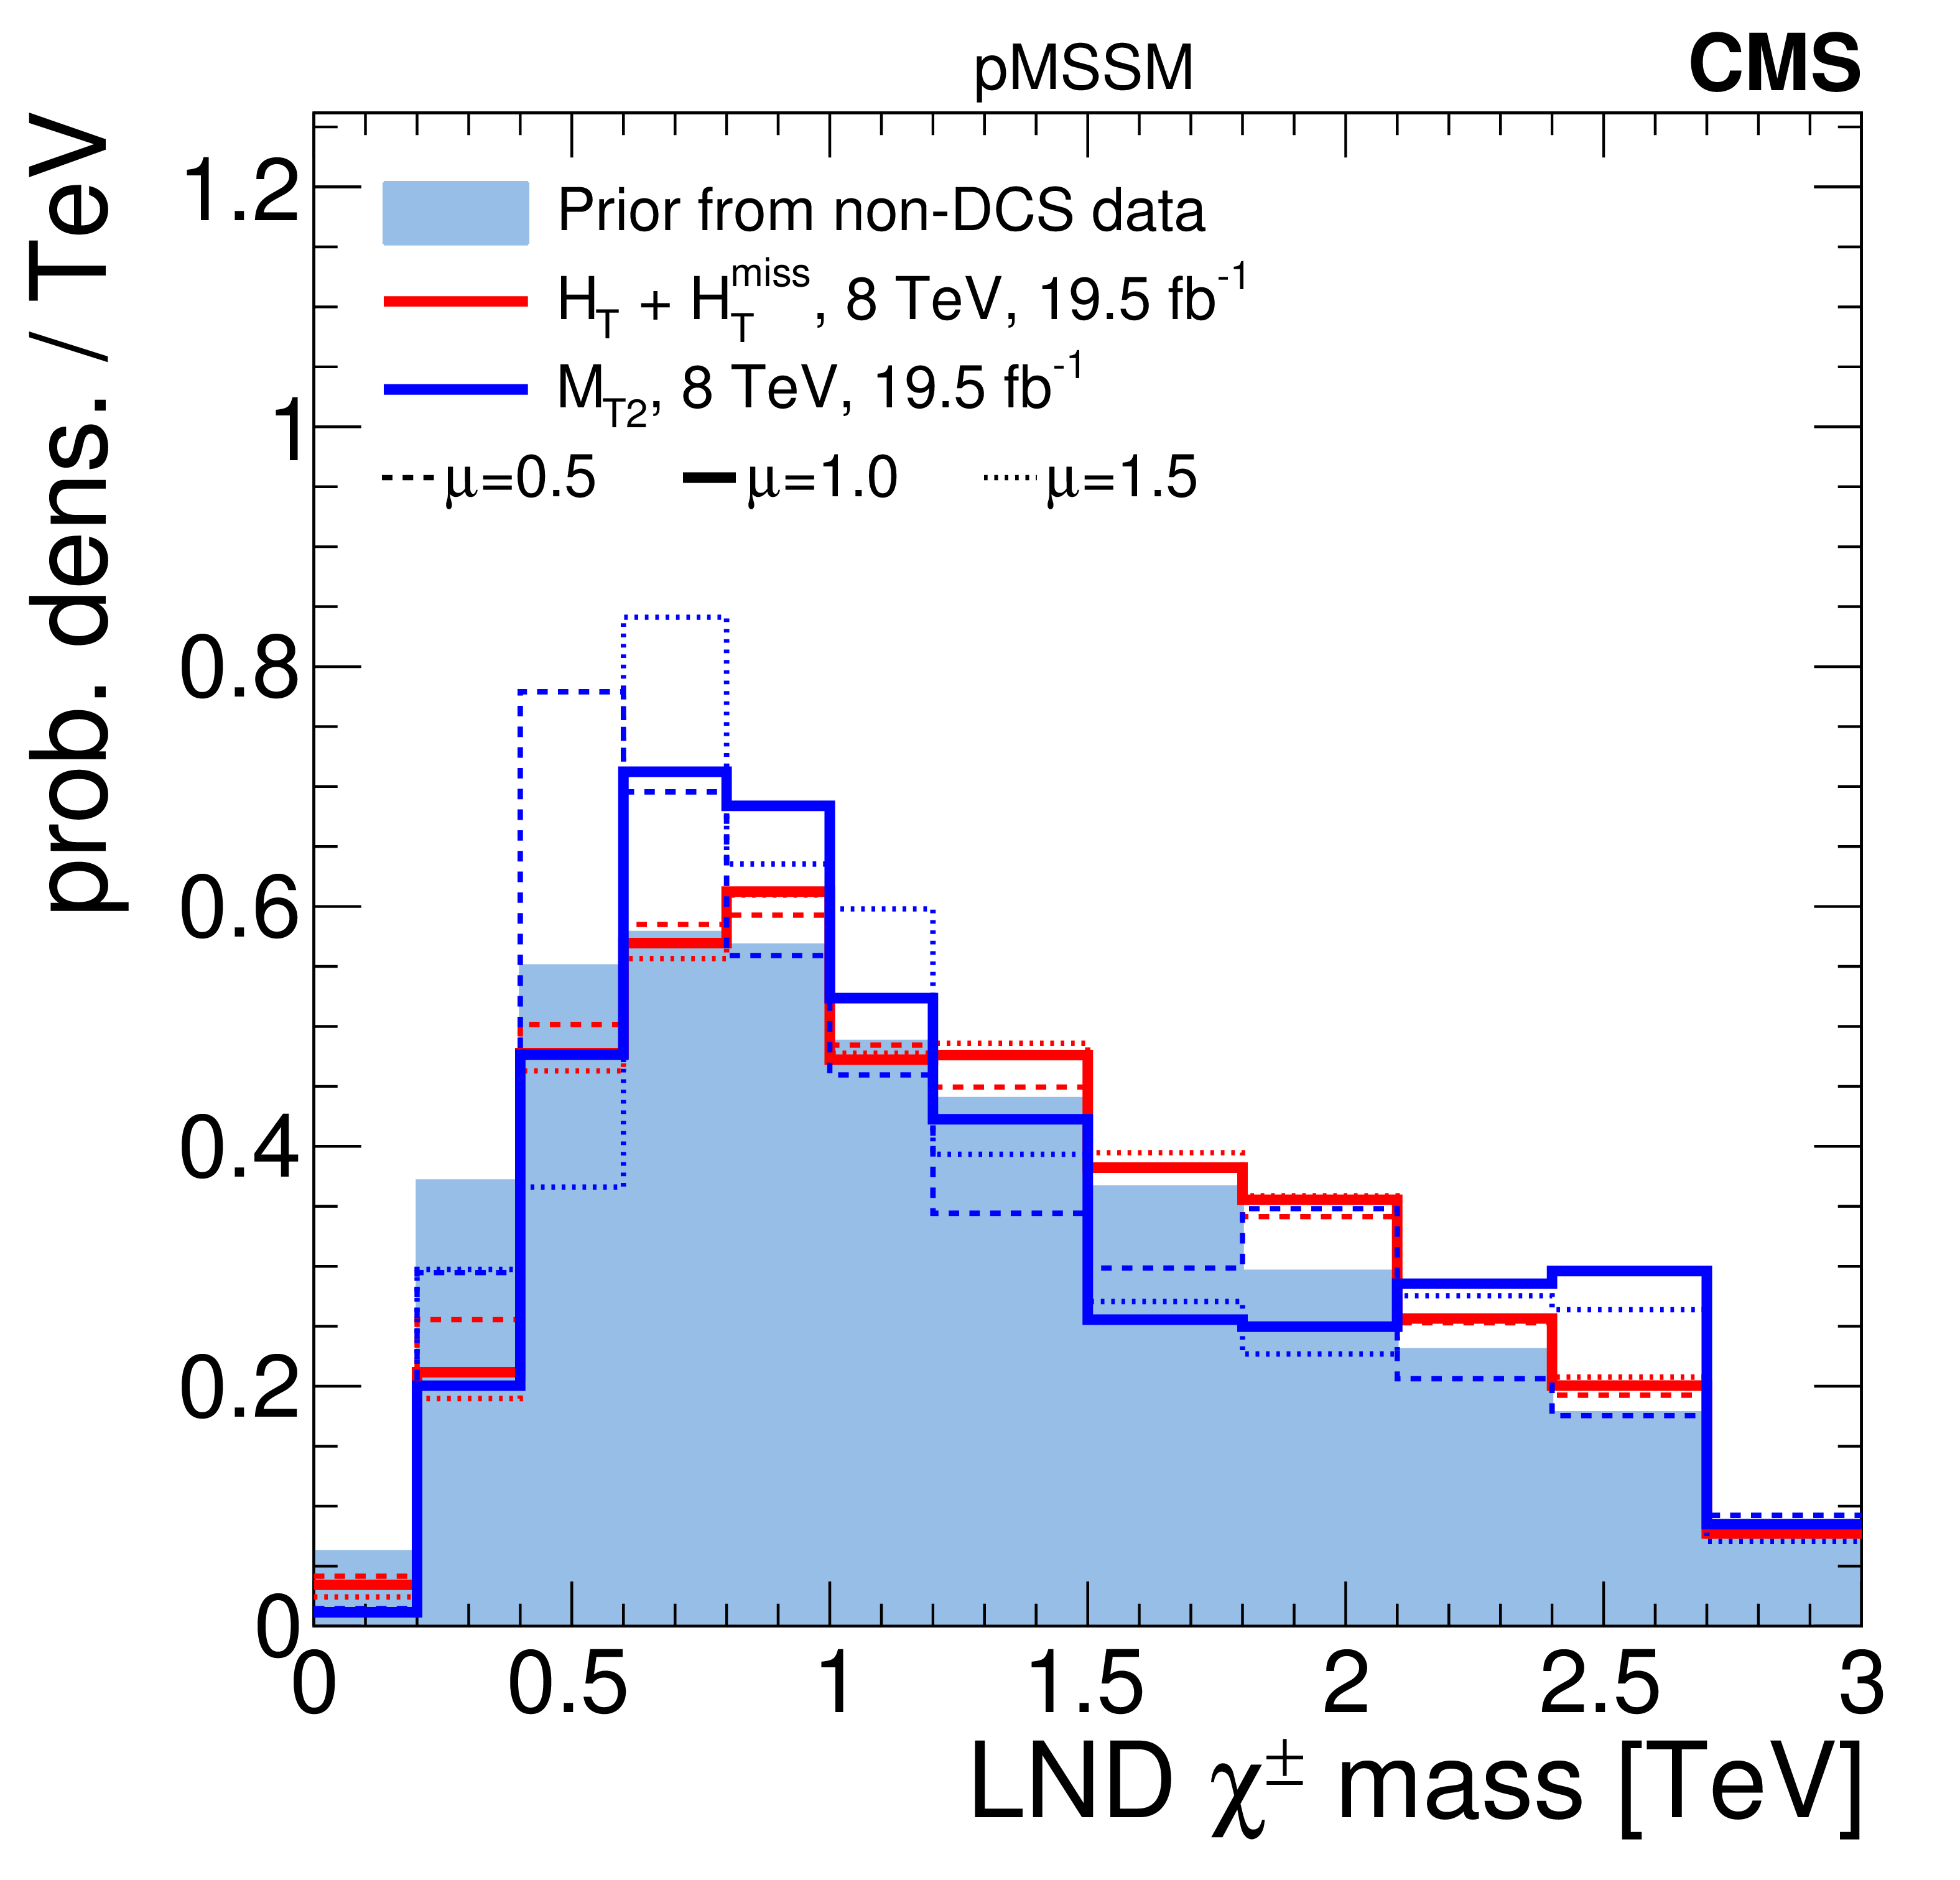
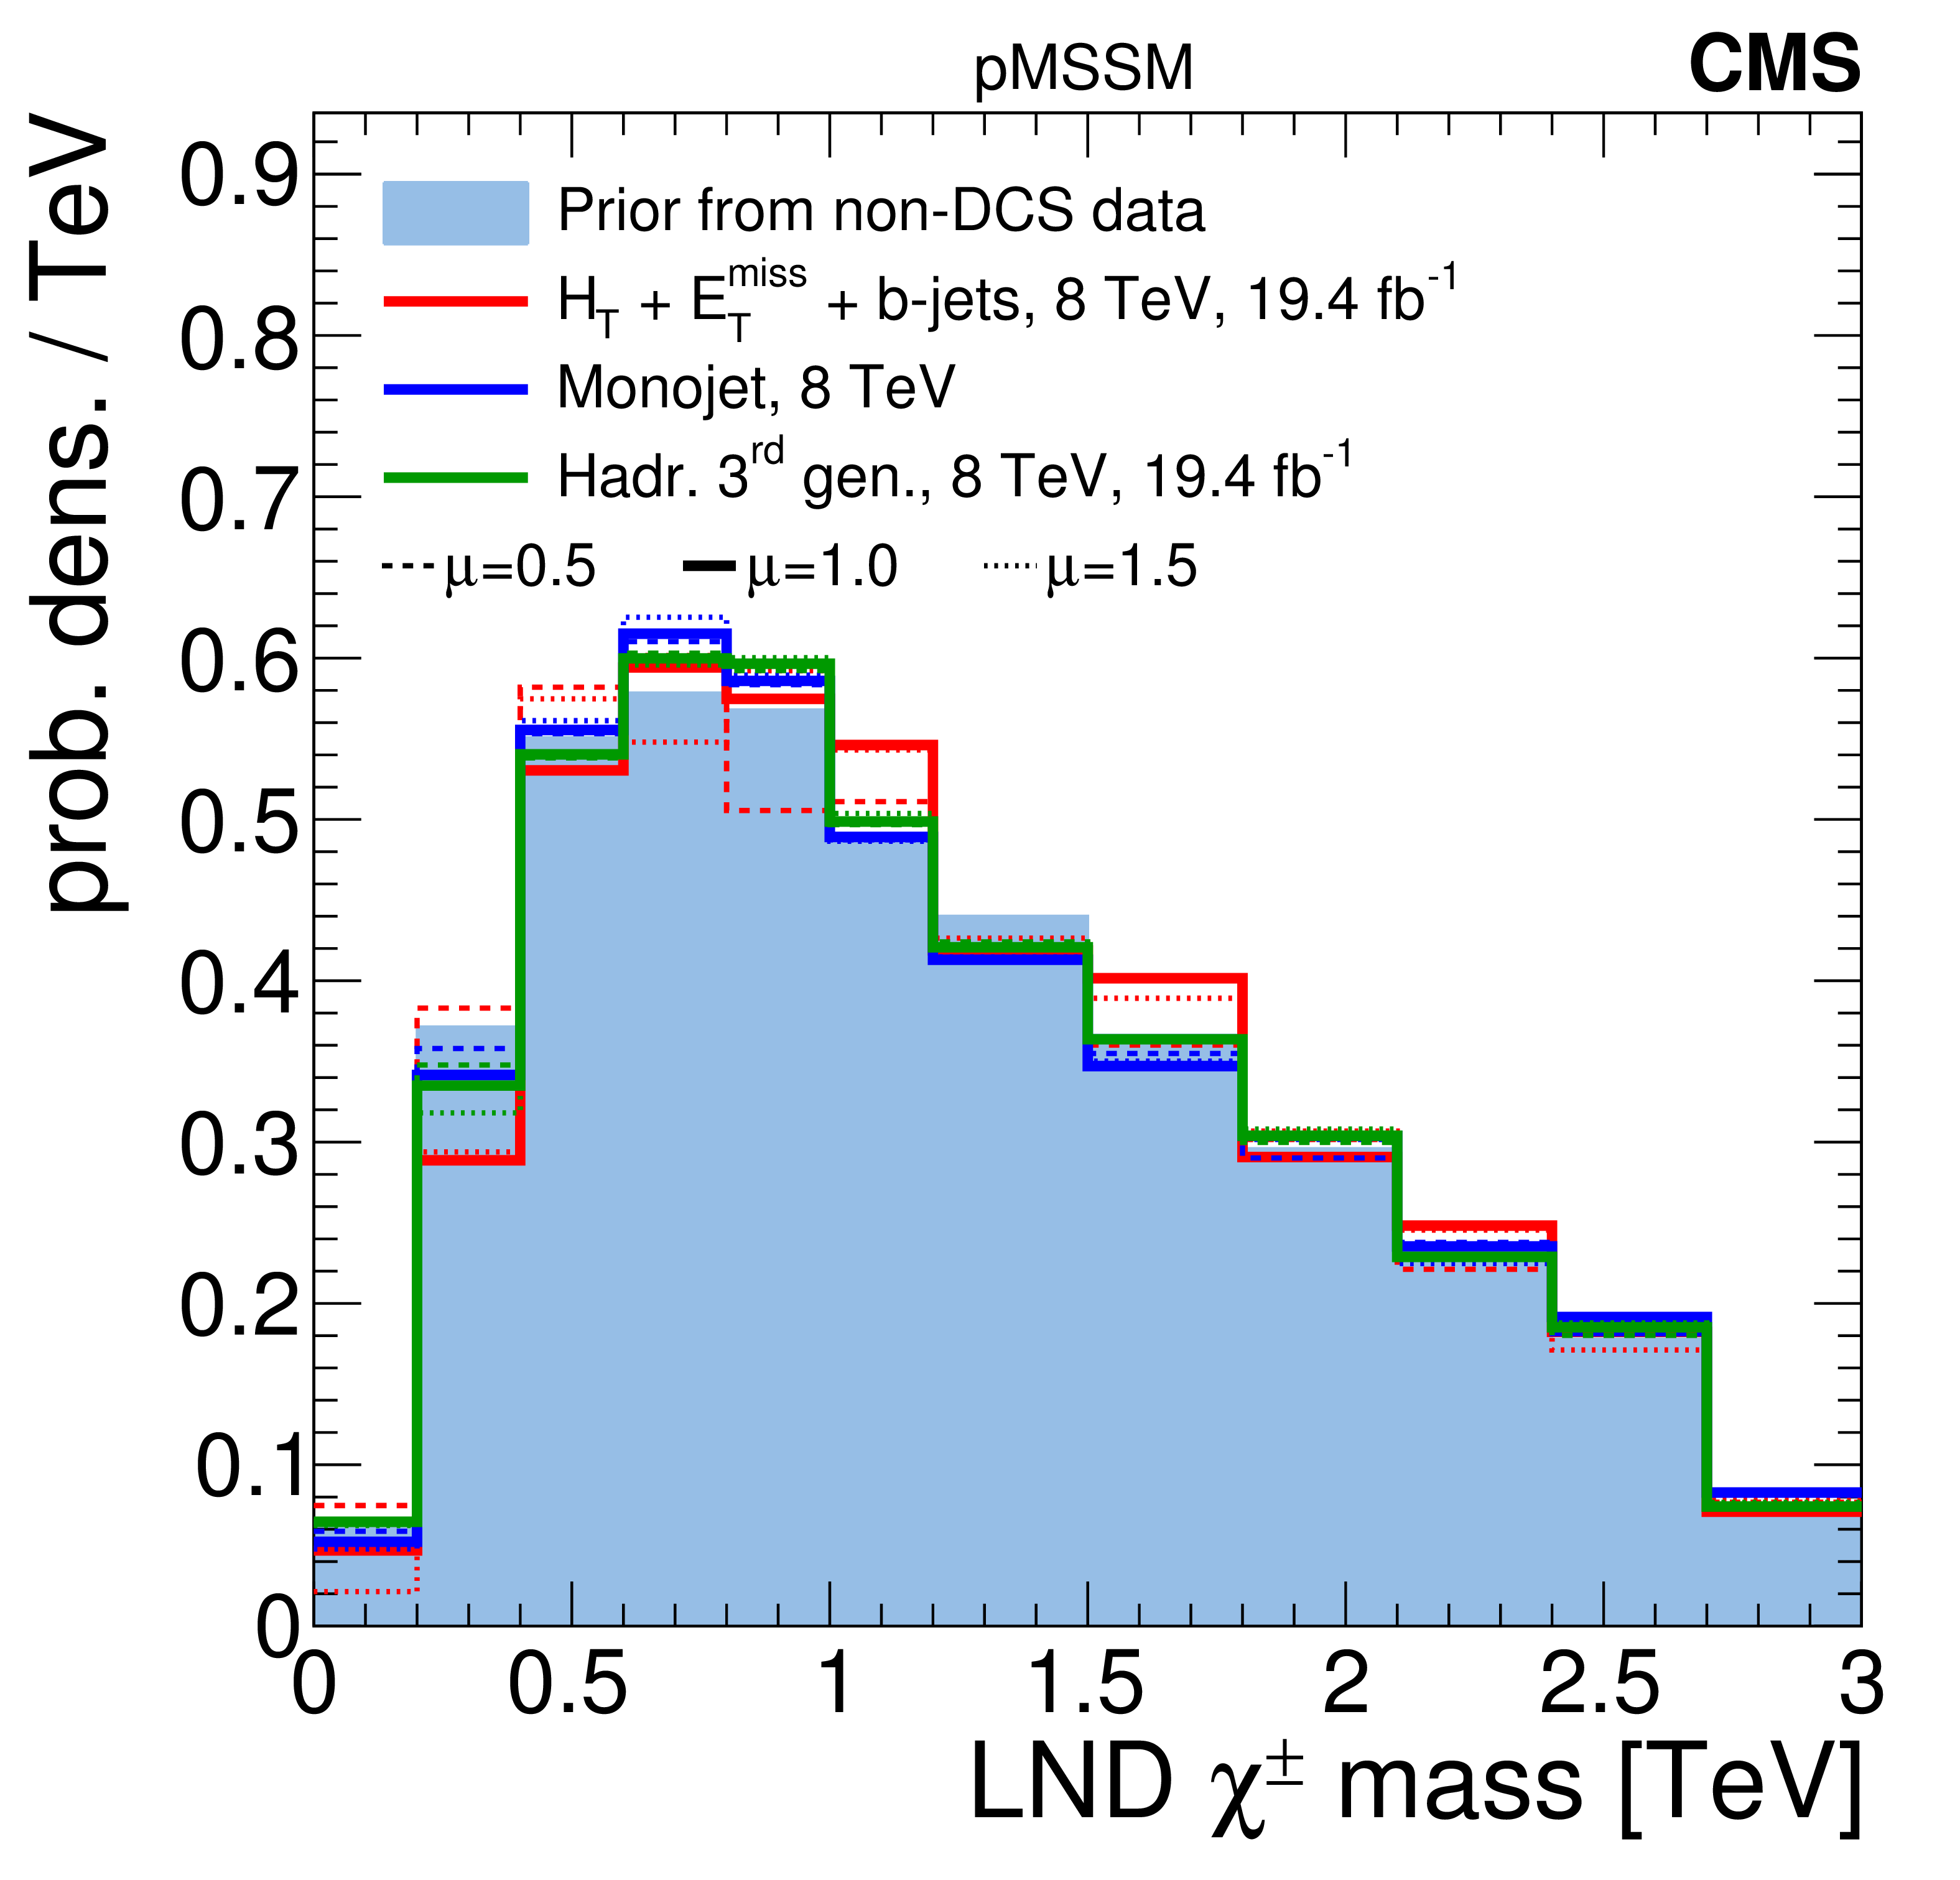
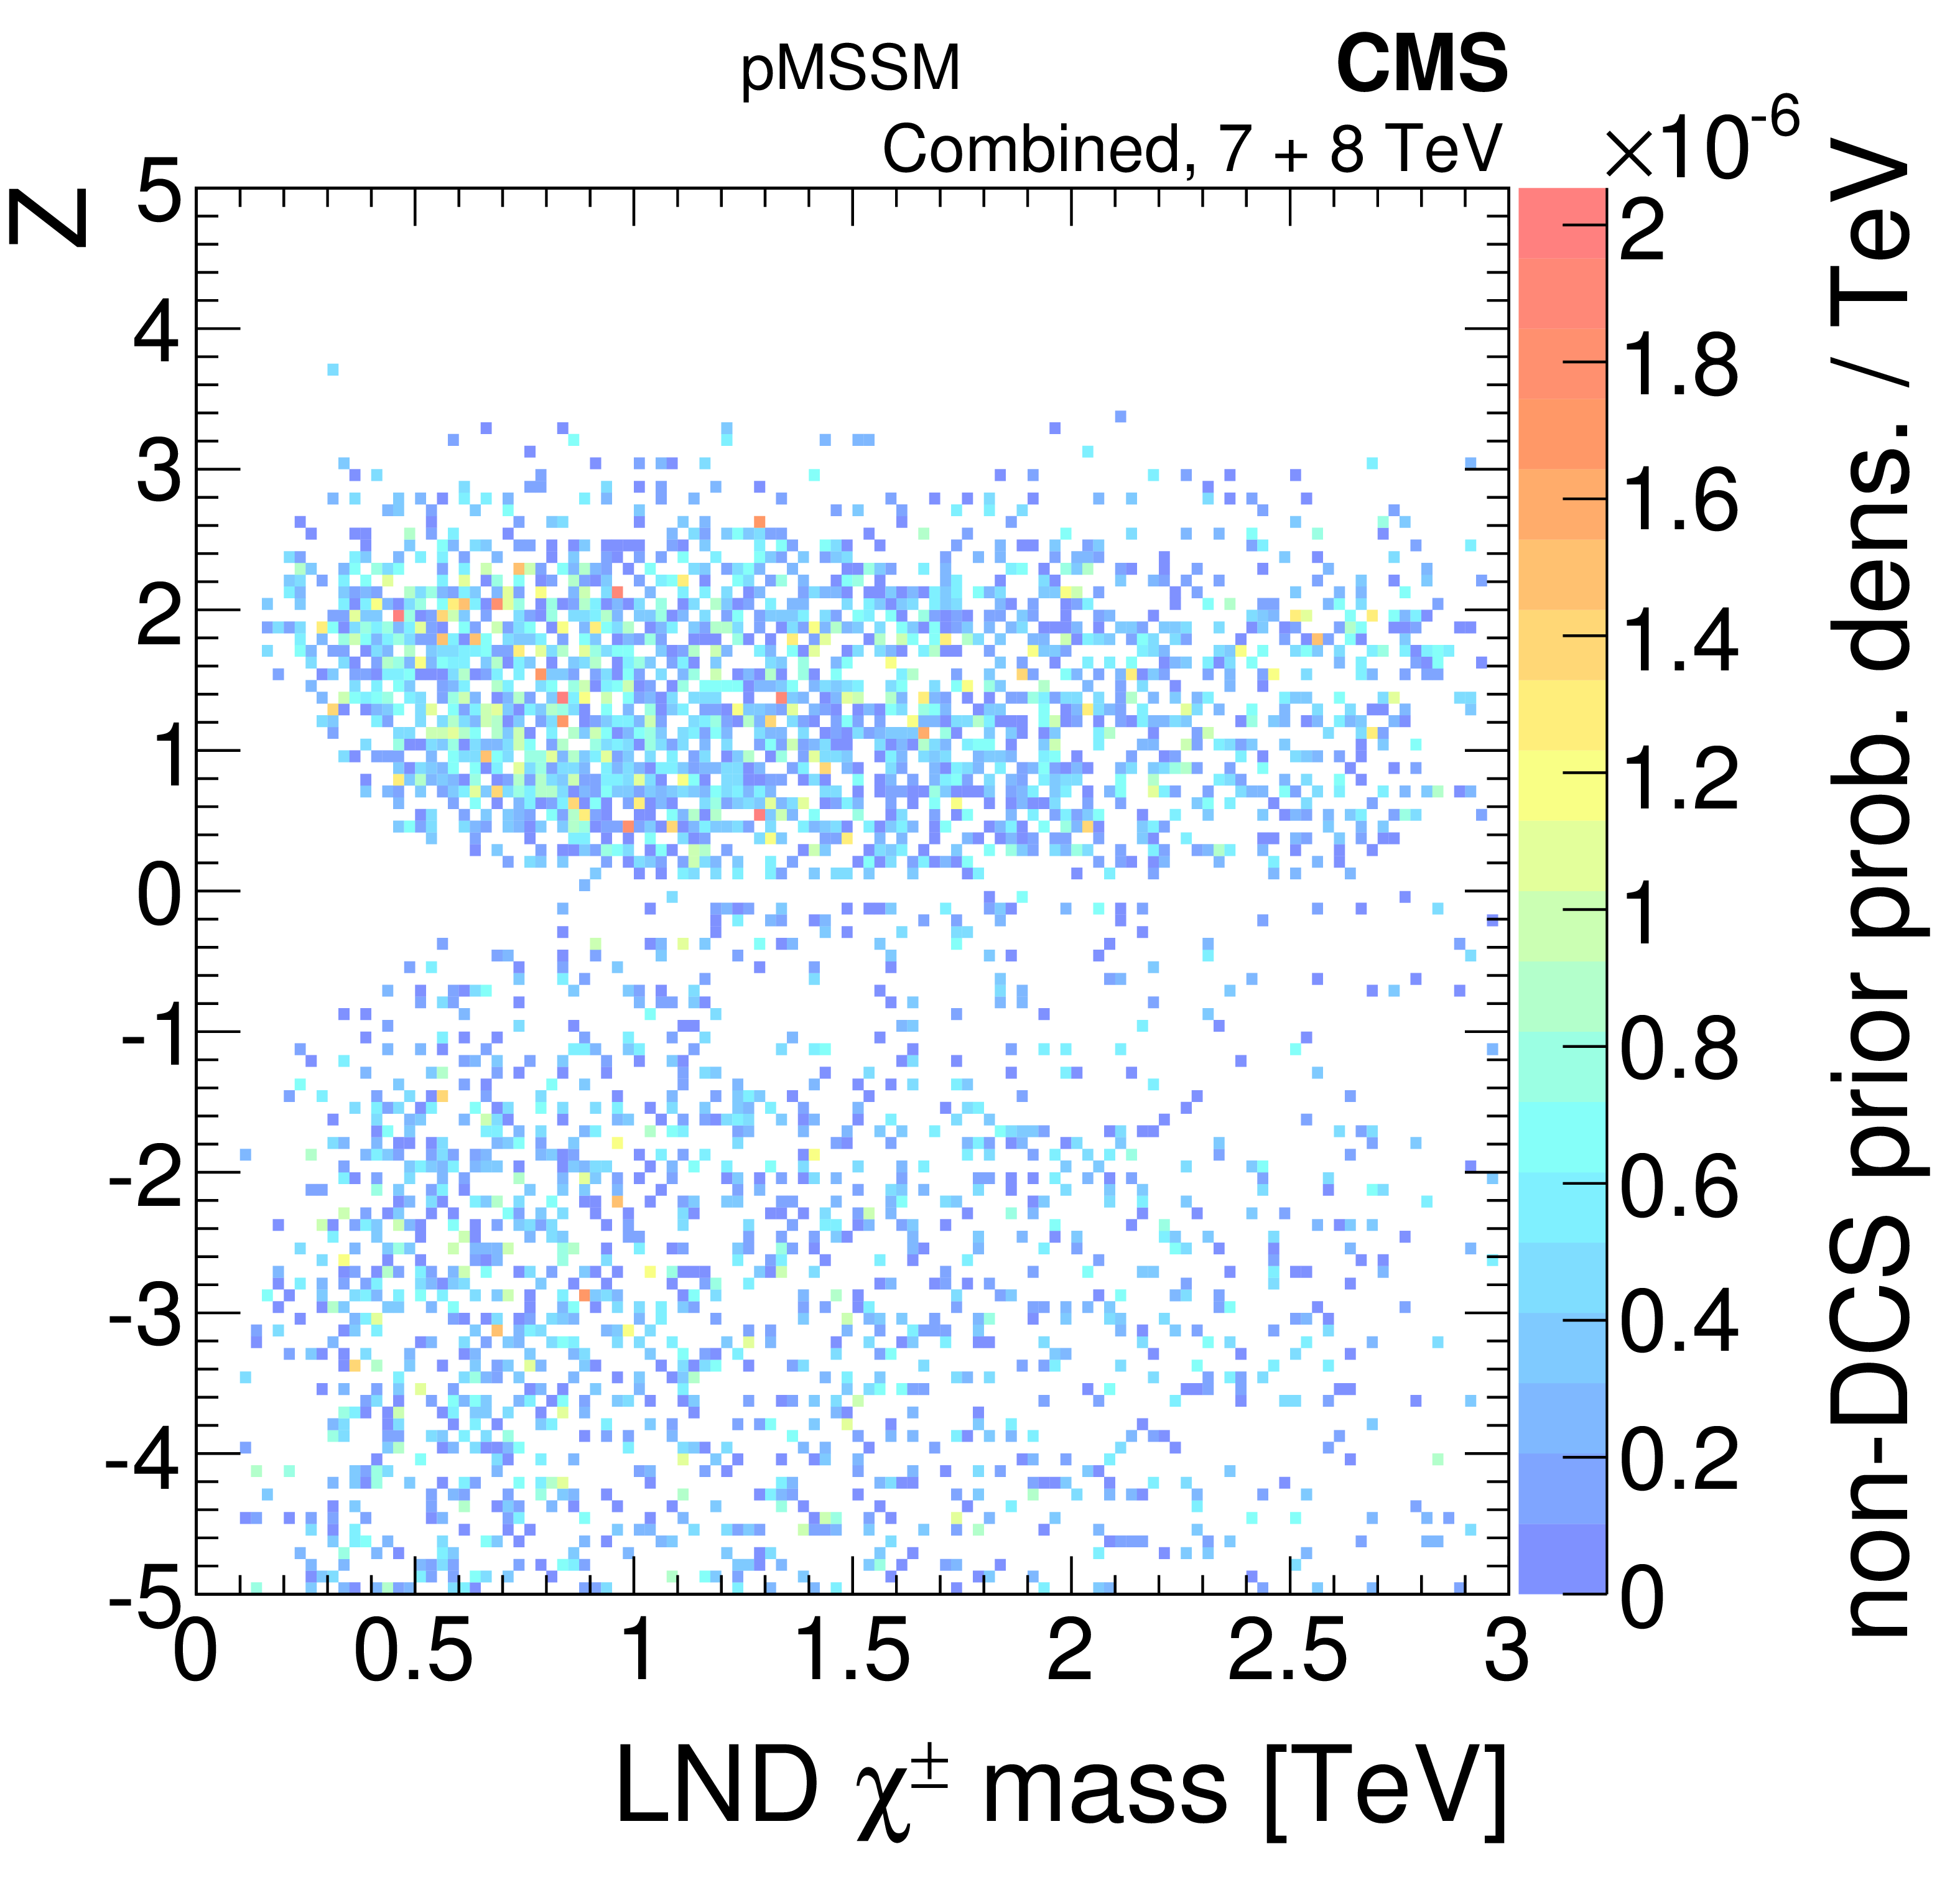
Figure 7-a:
A summary of the impact of CMS searches on the probability density of the mass of the lightest non-degenerate (LND) chargino in the pMSSM parameter space. Plots (a-d) compare the non-DCS prior distribution of the LND $\tilde{\chi}^{\pm} $ mass to posterior distributions after data from various CMS searches, where plot (d) shows the combined effect of CMS searches and the Higgs boson results. Plot (e) shows survival probabilities as a function of the LND $\tilde{\chi}^{\pm} $ mass for various combinations of CMS data and data from Higgs boson measurements. Plot (f) shows the distribution of the LND $\tilde{\chi}^{\pm} $ mass versus the $Z$-significance calculated from the combination of all searches. See Fig. 2 for a description of the shading. |
png pdf |
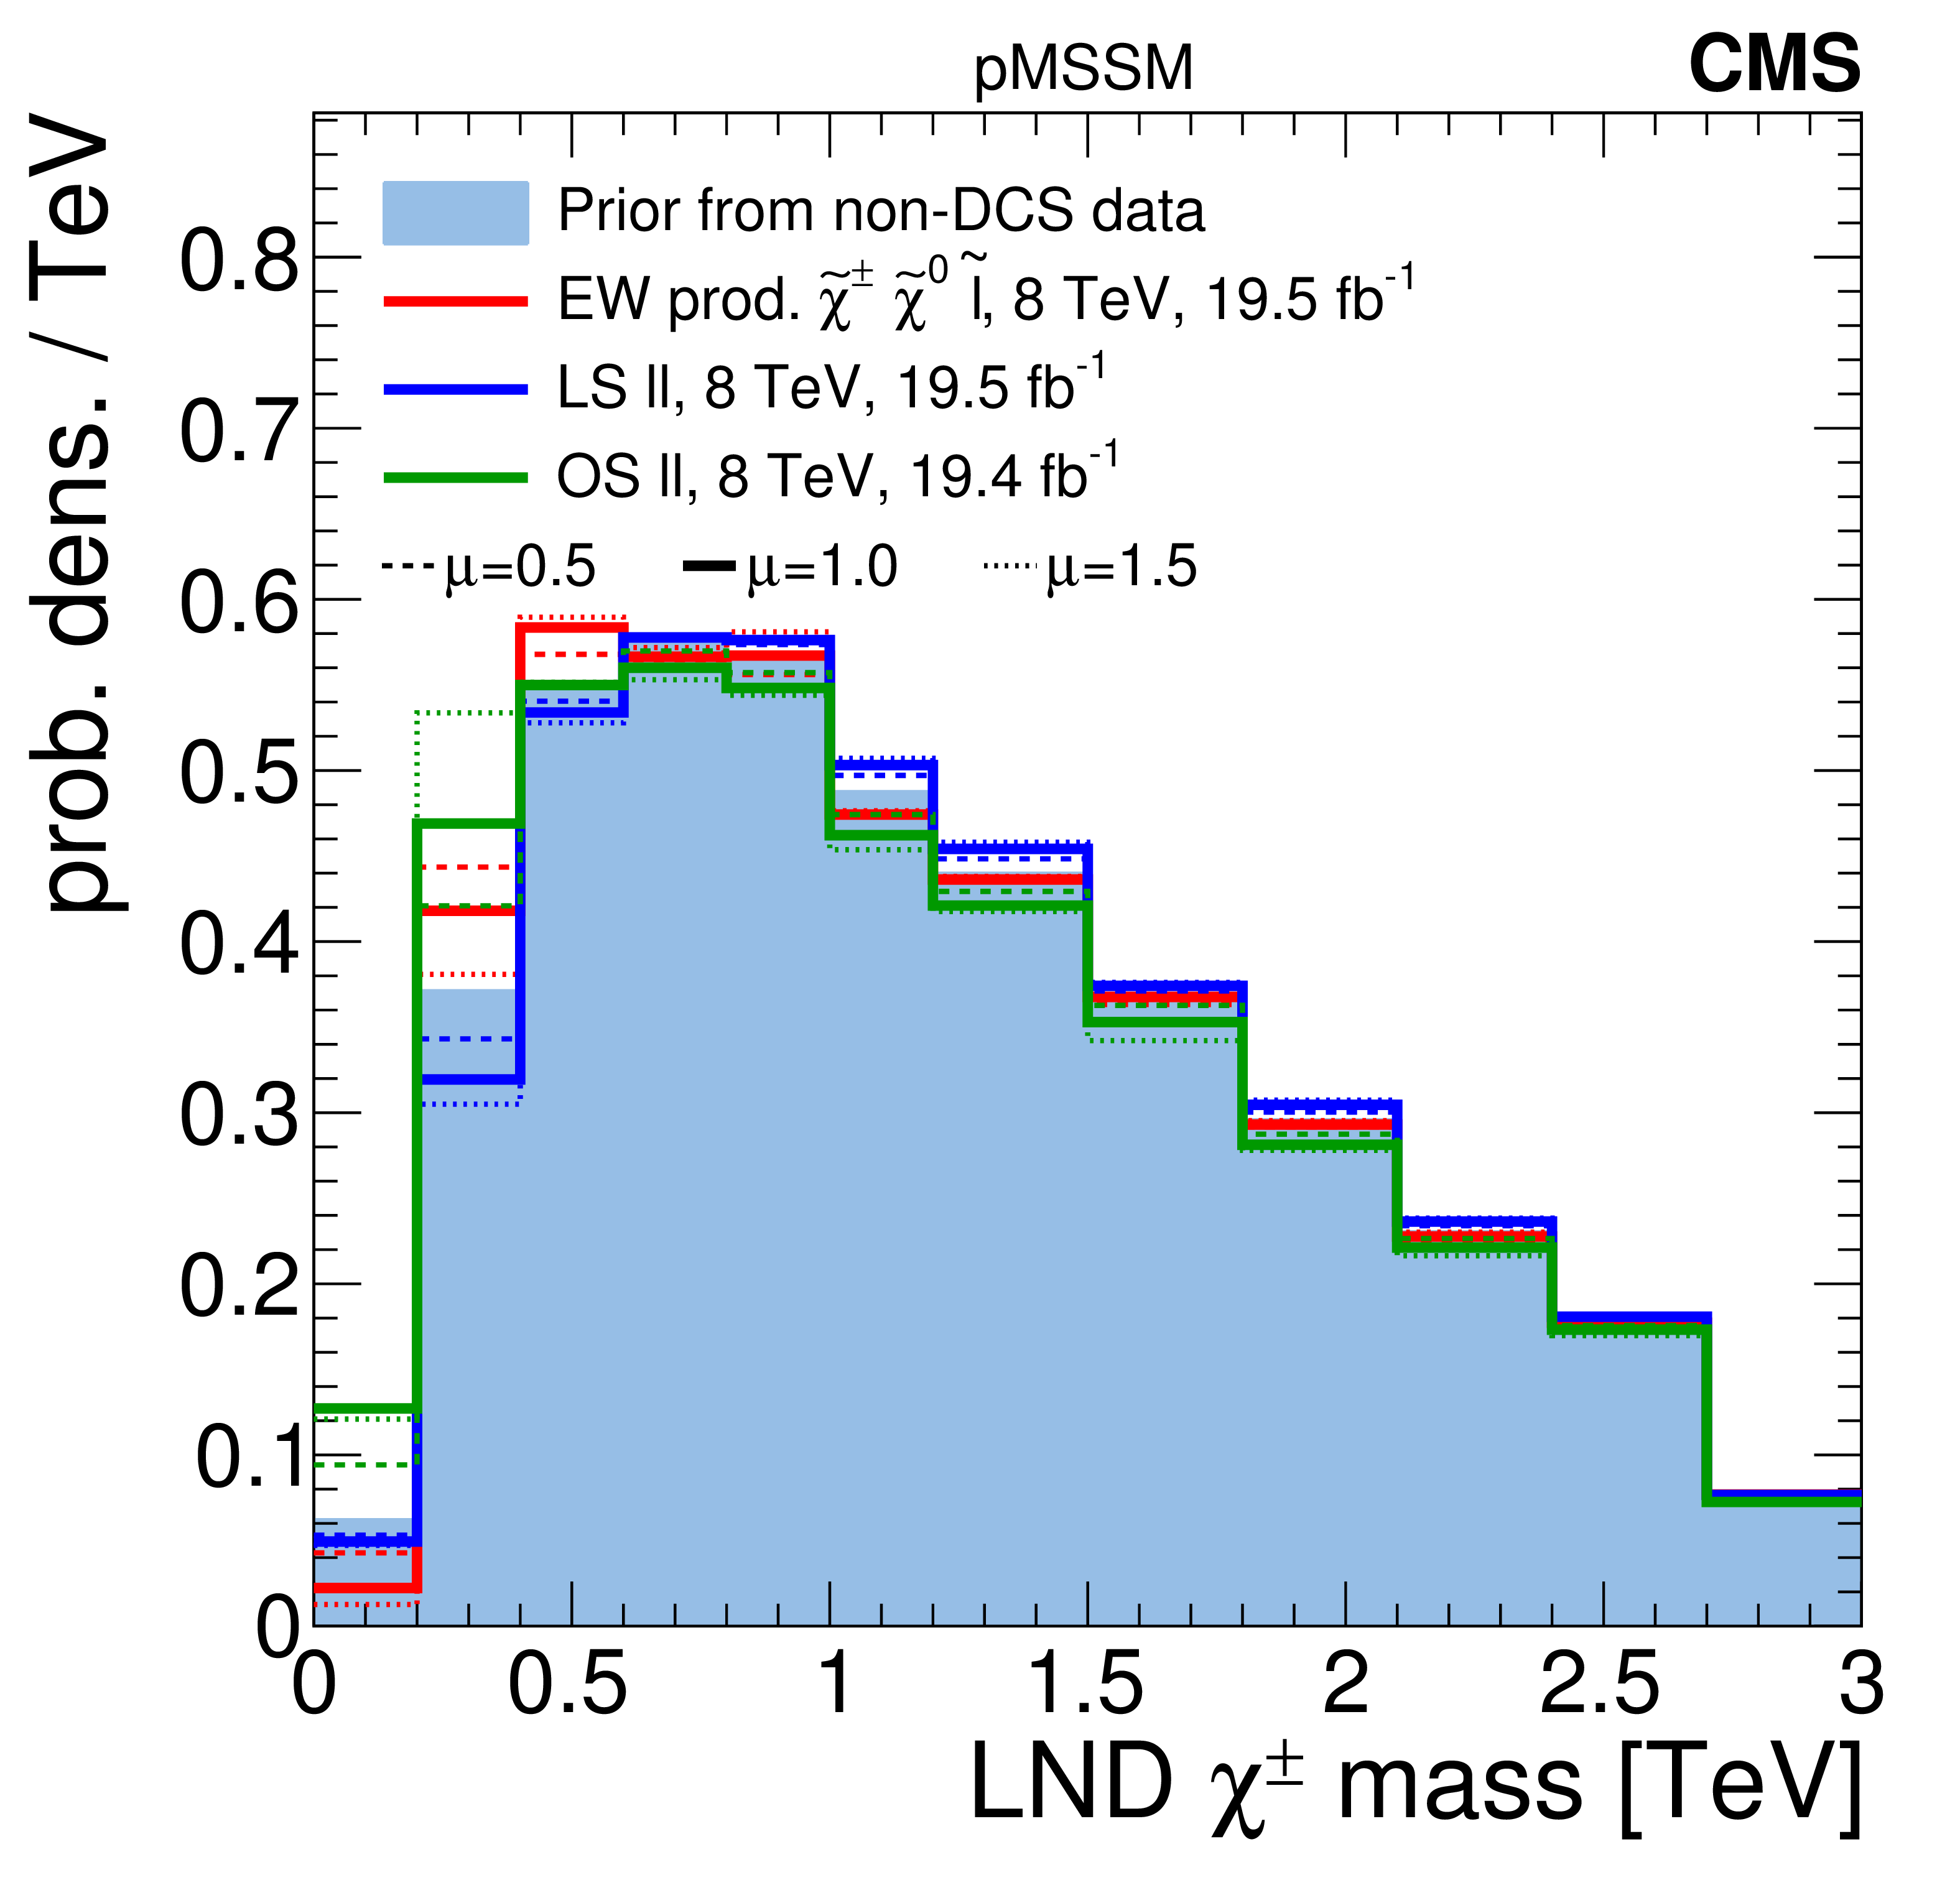
Figure 7-b:
A summary of the impact of CMS searches on the probability density of the mass of the lightest non-degenerate (LND) chargino in the pMSSM parameter space. Plots (a-d) compare the non-DCS prior distribution of the LND $\tilde{\chi}^{\pm} $ mass to posterior distributions after data from various CMS searches, where plot (d) shows the combined effect of CMS searches and the Higgs boson results. Plot (e) shows survival probabilities as a function of the LND $\tilde{\chi}^{\pm} $ mass for various combinations of CMS data and data from Higgs boson measurements. Plot (f) shows the distribution of the LND $\tilde{\chi}^{\pm} $ mass versus the $Z$-significance calculated from the combination of all searches. See Fig. 2 for a description of the shading. |
png pdf |
Figure 7-c:
A summary of the impact of CMS searches on the probability density of the mass of the lightest non-degenerate (LND) chargino in the pMSSM parameter space. Plots (a-d) compare the non-DCS prior distribution of the LND $\tilde{\chi}^{\pm} $ mass to posterior distributions after data from various CMS searches, where plot (d) shows the combined effect of CMS searches and the Higgs boson results. Plot (e) shows survival probabilities as a function of the LND $\tilde{\chi}^{\pm} $ mass for various combinations of CMS data and data from Higgs boson measurements. Plot (f) shows the distribution of the LND $\tilde{\chi}^{\pm} $ mass versus the $Z$-significance calculated from the combination of all searches. See Fig. 2 for a description of the shading. |
png pdf |
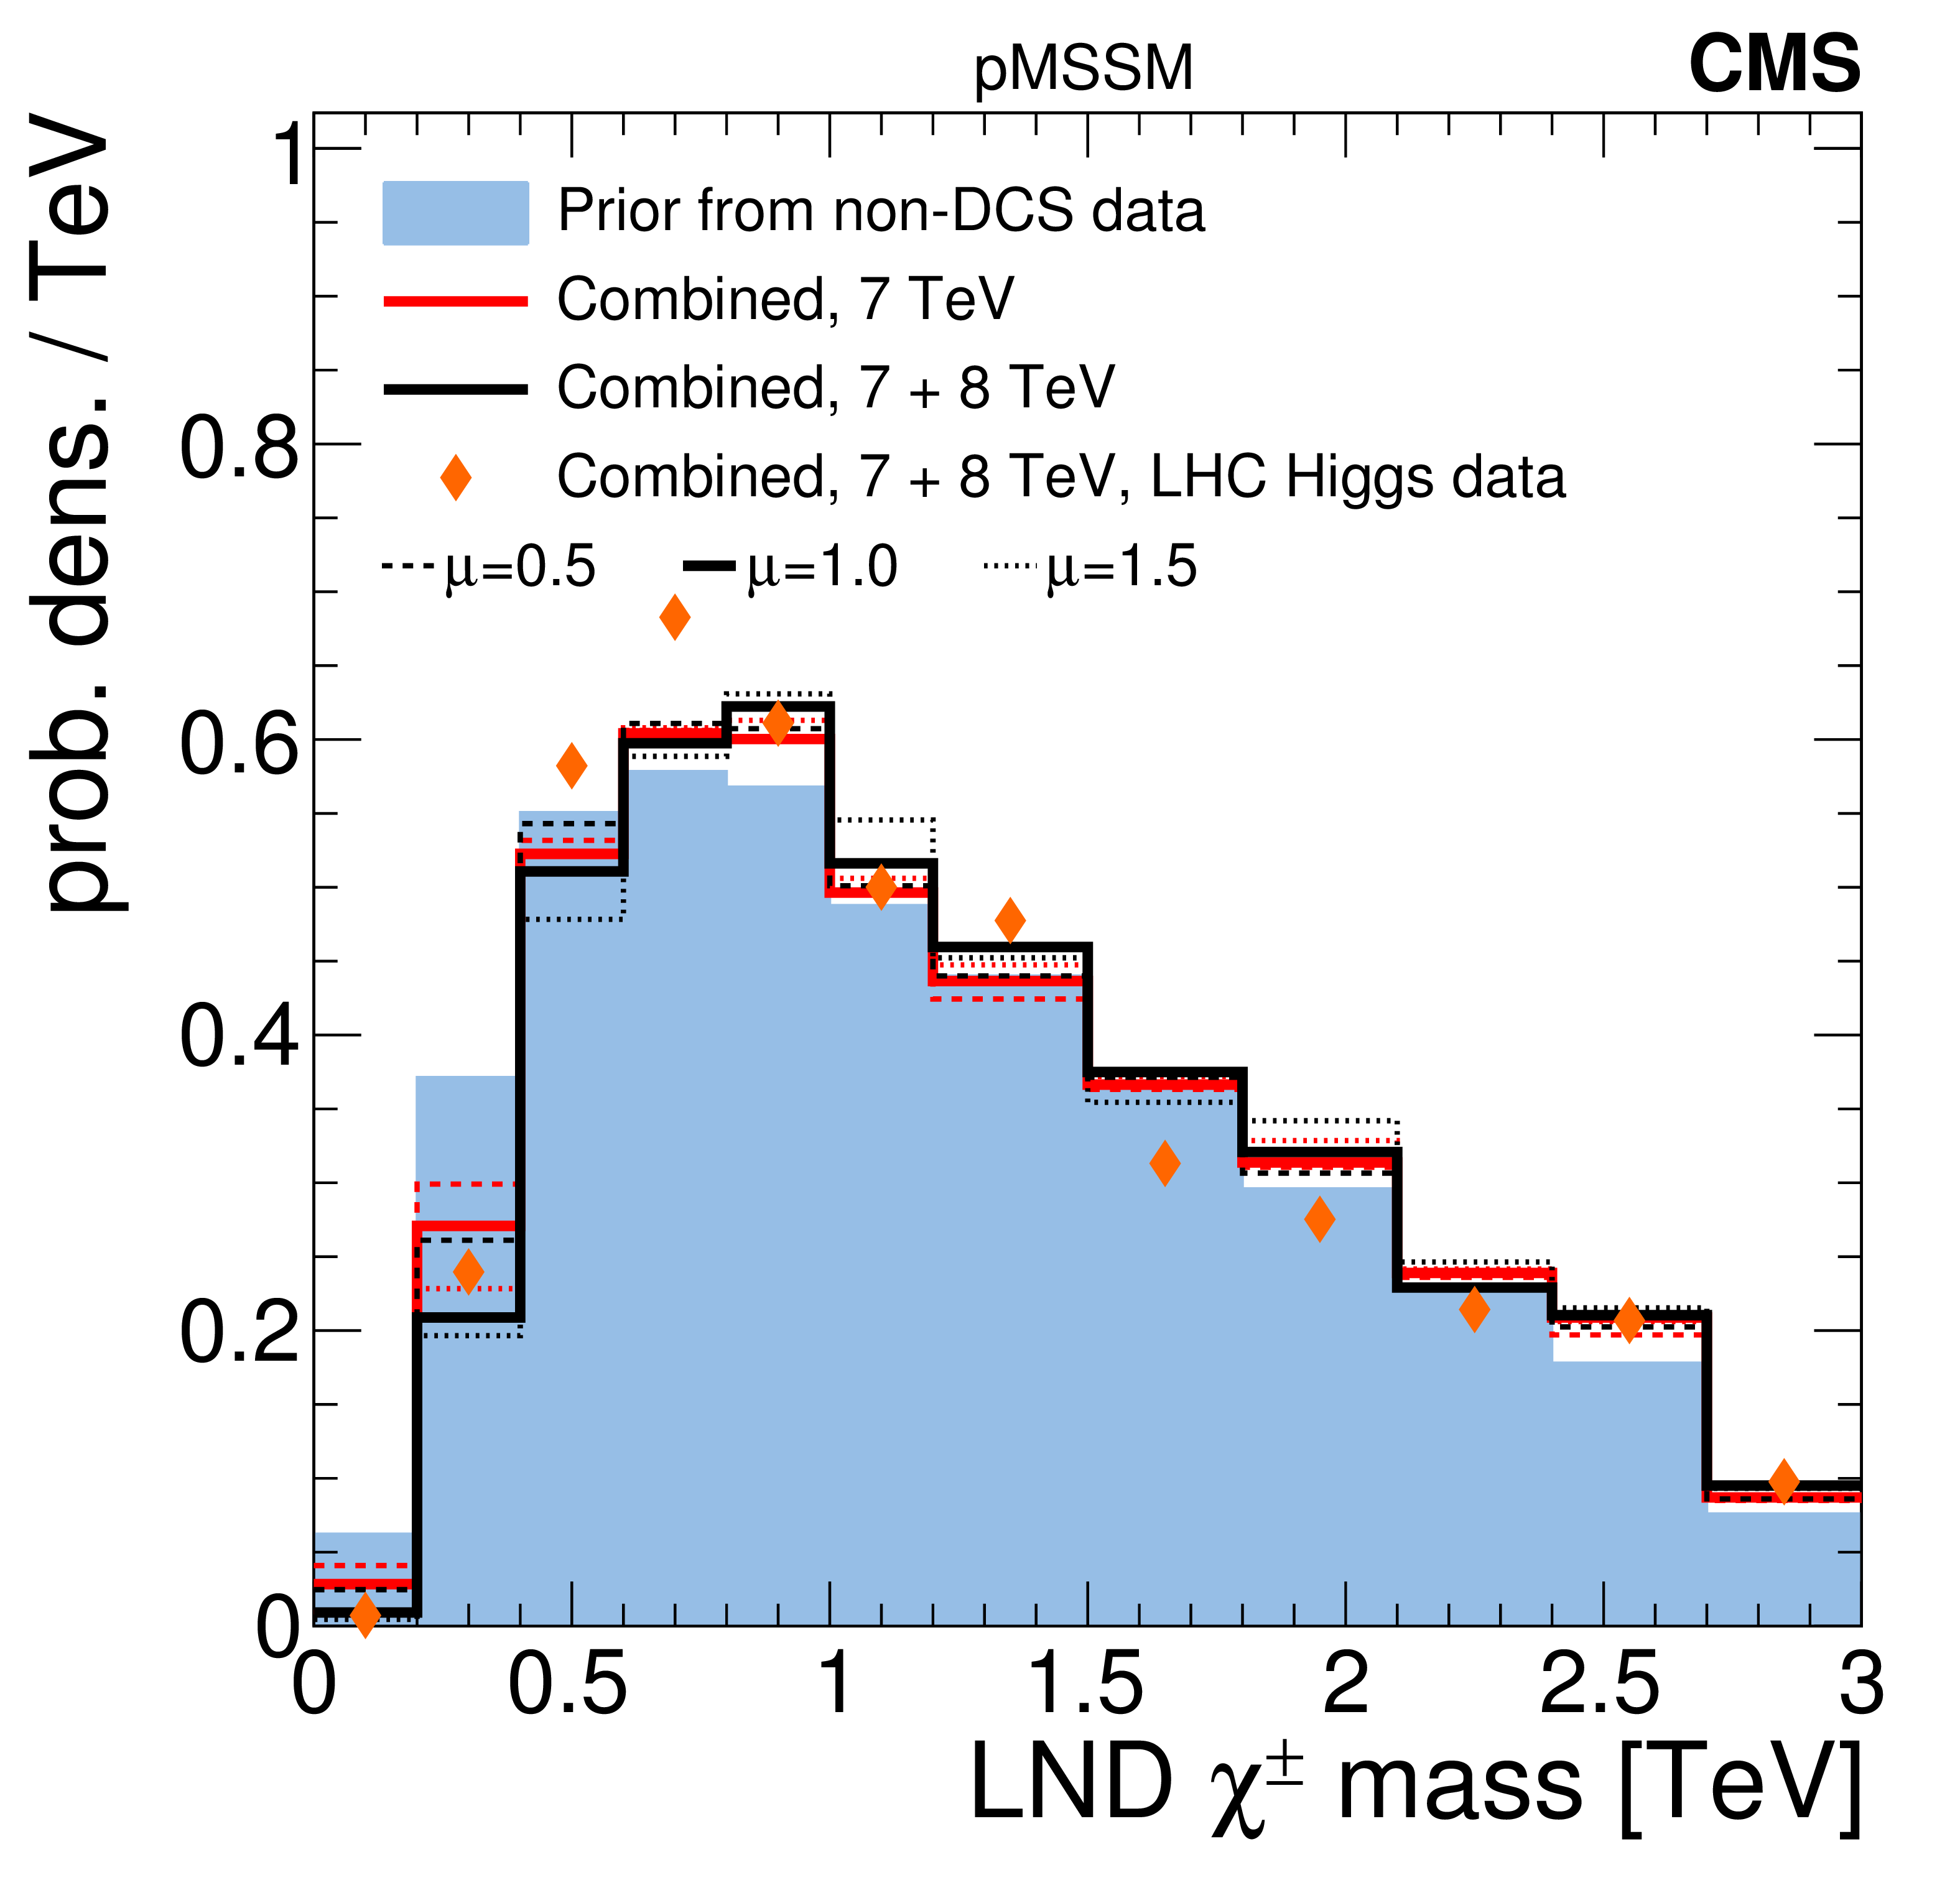
Figure 7-d:
A summary of the impact of CMS searches on the probability density of the mass of the lightest non-degenerate (LND) chargino in the pMSSM parameter space. Plots (a-d) compare the non-DCS prior distribution of the LND $\tilde{\chi}^{\pm} $ mass to posterior distributions after data from various CMS searches, where plot (d) shows the combined effect of CMS searches and the Higgs boson results. Plot (e) shows survival probabilities as a function of the LND $\tilde{\chi}^{\pm} $ mass for various combinations of CMS data and data from Higgs boson measurements. Plot (f) shows the distribution of the LND $\tilde{\chi}^{\pm} $ mass versus the $Z$-significance calculated from the combination of all searches. See Fig. 2 for a description of the shading. |
png pdf |
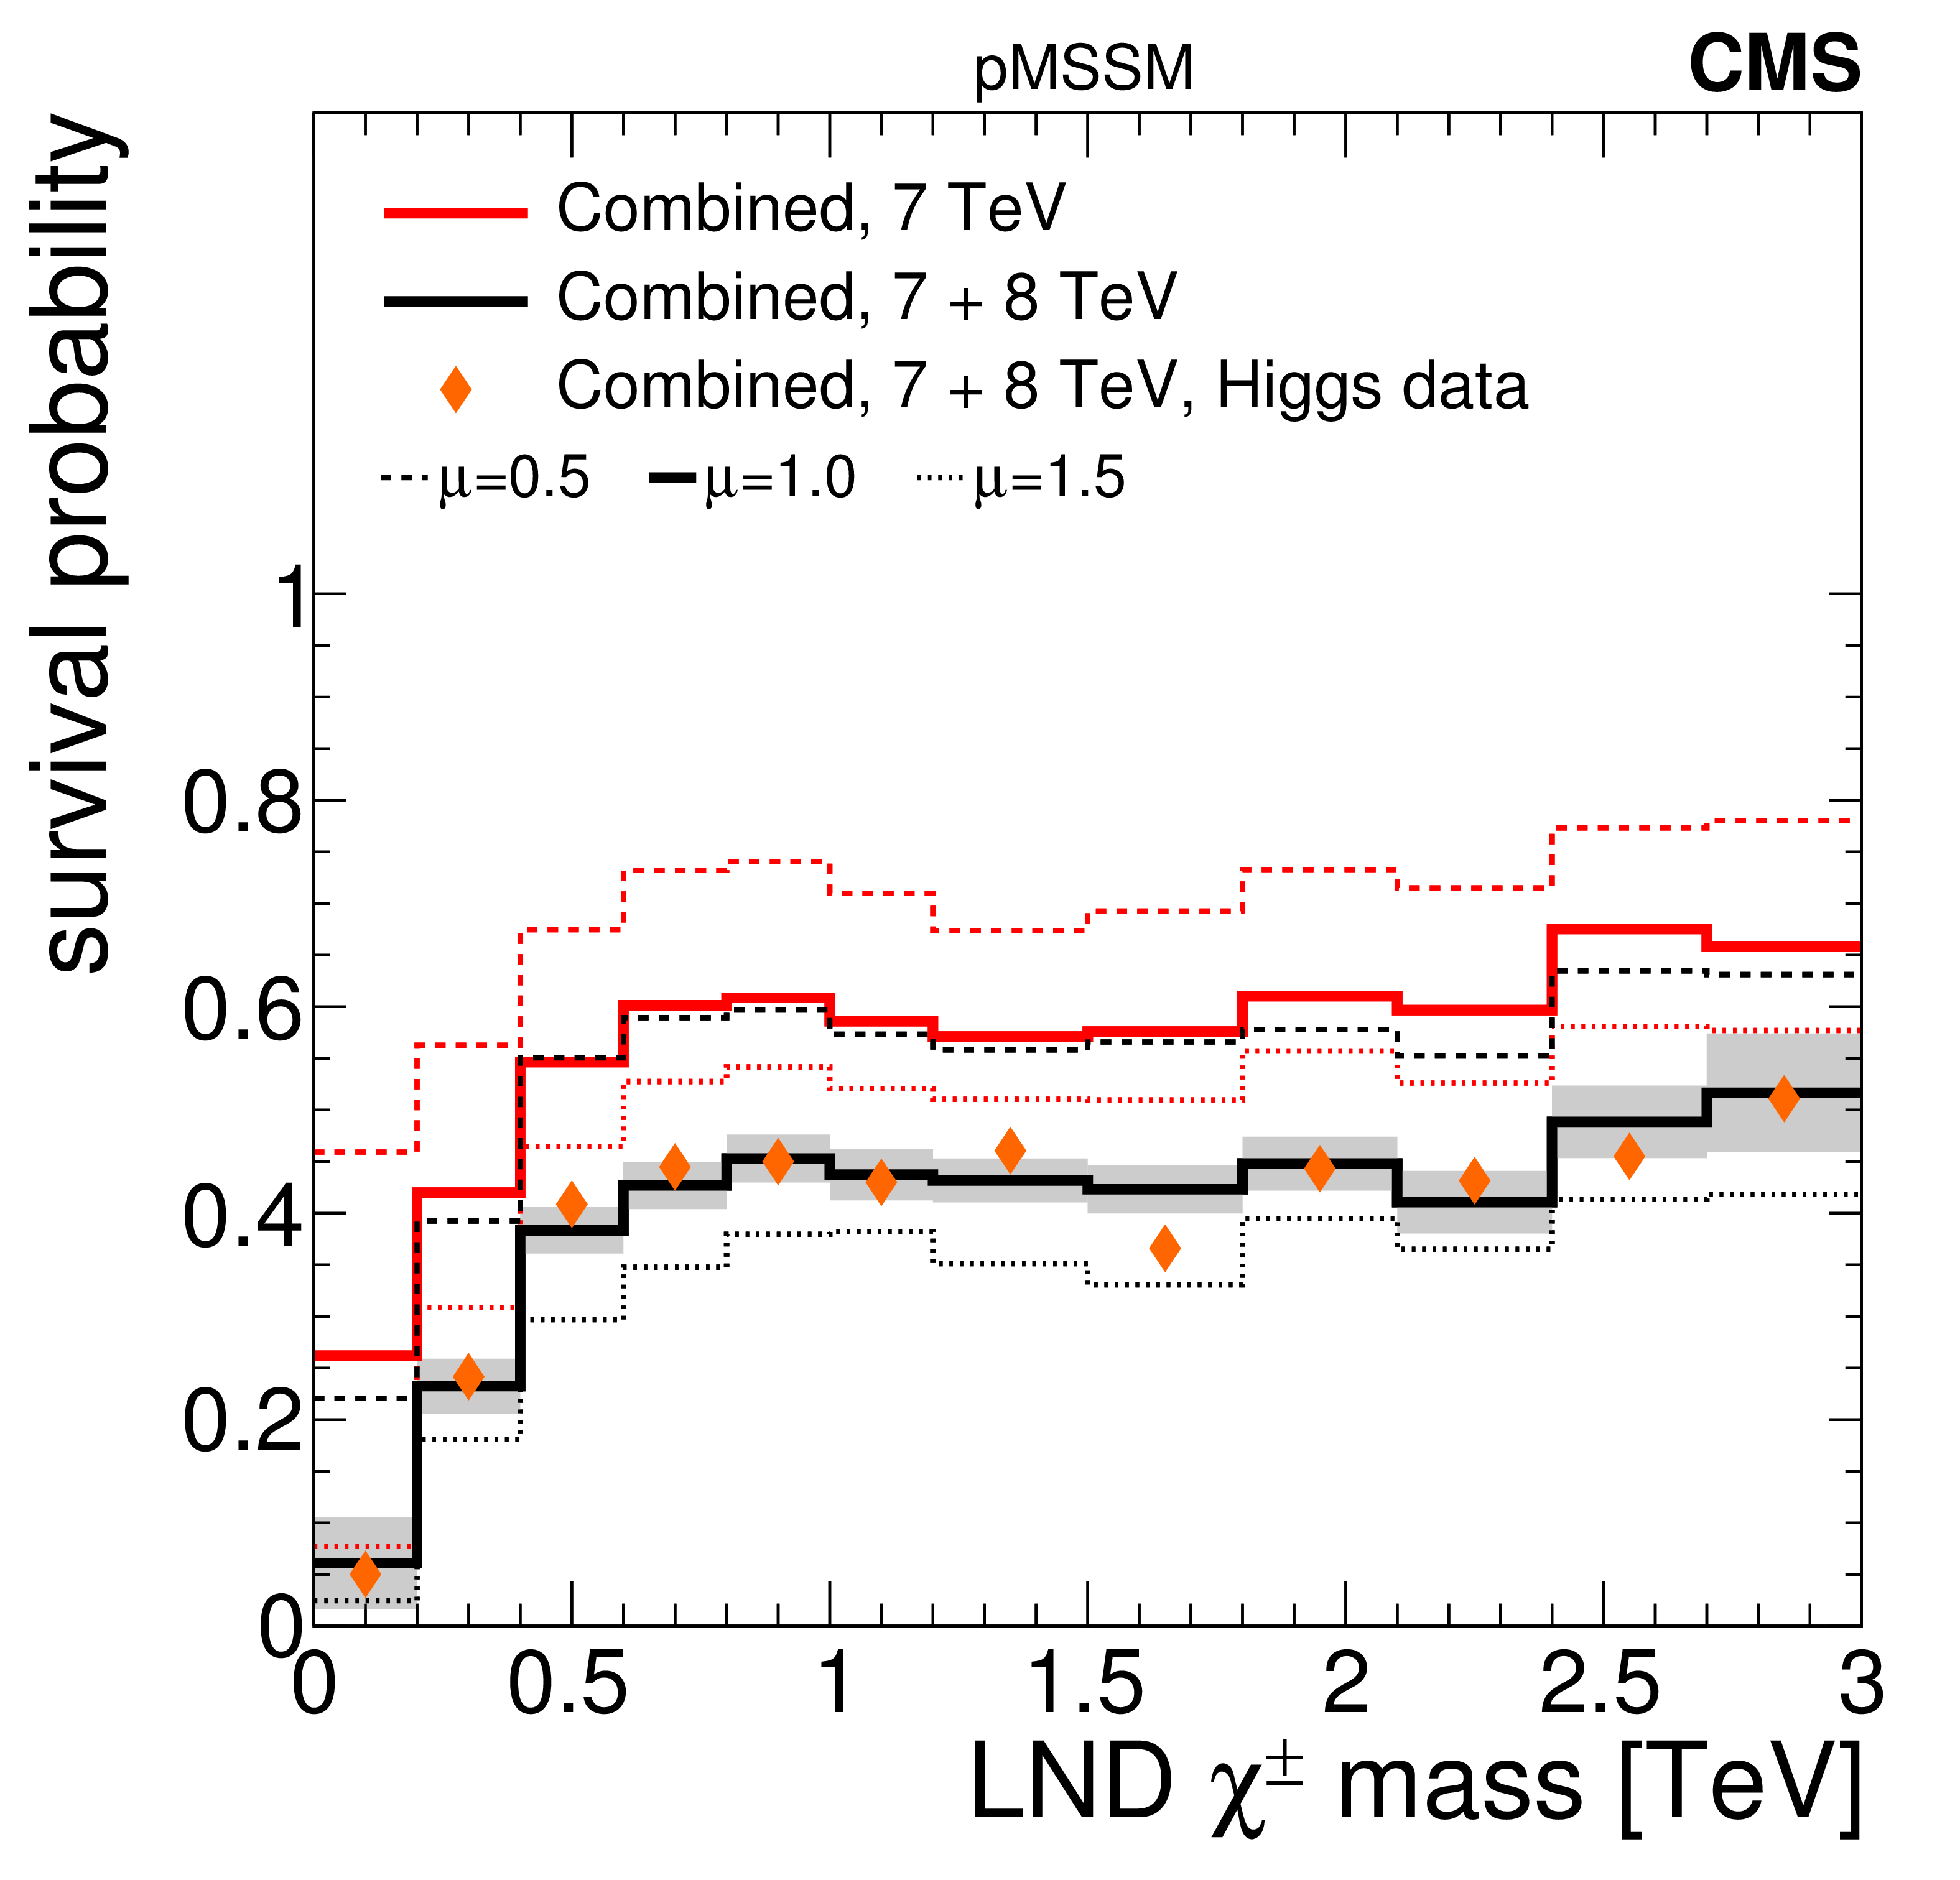
Figure 7-e:
A summary of the impact of CMS searches on the probability density of the mass of the lightest non-degenerate (LND) chargino in the pMSSM parameter space. Plots (a-d) compare the non-DCS prior distribution of the LND $\tilde{\chi}^{\pm} $ mass to posterior distributions after data from various CMS searches, where plot (d) shows the combined effect of CMS searches and the Higgs boson results. Plot (e) shows survival probabilities as a function of the LND $\tilde{\chi}^{\pm} $ mass for various combinations of CMS data and data from Higgs boson measurements. Plot (f) shows the distribution of the LND $\tilde{\chi}^{\pm} $ mass versus the $Z$-significance calculated from the combination of all searches. See Fig. 2 for a description of the shading. |
png pdf |
Figure 7-f:
A summary of the impact of CMS searches on the probability density of the mass of the lightest non-degenerate (LND) chargino in the pMSSM parameter space. Plots (a-d) compare the non-DCS prior distribution of the LND $\tilde{\chi}^{\pm} $ mass to posterior distributions after data from various CMS searches, where plot (d) shows the combined effect of CMS searches and the Higgs boson results. Plot (e) shows survival probabilities as a function of the LND $\tilde{\chi}^{\pm} $ mass for various combinations of CMS data and data from Higgs boson measurements. Plot (f) shows the distribution of the LND $\tilde{\chi}^{\pm} $ mass versus the $Z$-significance calculated from the combination of all searches. See Fig. 2 for a description of the shading. |

png pdf |
Figure 8-a:
A summary of the impact of CMS searches on the probability density of the logarithm of the cross section for inclusive sparticle production in 8 TeV pp collisions, $\log_{10}(\sigma ^{8\ \text{TeV} }_\mathrm {SUSY})$, in the pMSSM parameter space. Plots (a-d) compare the non-DCS prior distribution of the $\log_{10}(\sigma ^{8\ \text{TeV} }_\mathrm {SUSY})$ to posterior distributions after data from various CMS searches, where plot (d) shows the combined effect of CMS searches and the Higgs boson results. Plot (e) shows survival probabilities as a function of the $\log_{10}(\sigma ^{8\ \text{TeV} }_\mathrm {SUSY})$ for various combinations of CMS data and data from Higgs boson measurements. Plot (f) shows the distribution of the $\log_{10}(\sigma ^{8\ \text{TeV} }_\mathrm {SUSY})$ versus the $Z$-significance calculated from the combination of all searches. See Fig. 2 for a description of the shading. In plot (bottom left), the apparent enhancement of the left tail of the posterior density with respect to the prior is due to the suppression of the right tail and an overall renormalization. |
png pdf |
Figure 8-b:
A summary of the impact of CMS searches on the probability density of the logarithm of the cross section for inclusive sparticle production in 8 TeV pp collisions, $\log_{10}(\sigma ^{8\ \text{TeV} }_\mathrm {SUSY})$, in the pMSSM parameter space. Plots (a-d) compare the non-DCS prior distribution of the $\log_{10}(\sigma ^{8\ \text{TeV} }_\mathrm {SUSY})$ to posterior distributions after data from various CMS searches, where plot (d) shows the combined effect of CMS searches and the Higgs boson results. Plot (e) shows survival probabilities as a function of the $\log_{10}(\sigma ^{8\ \text{TeV} }_\mathrm {SUSY})$ for various combinations of CMS data and data from Higgs boson measurements. Plot (f) shows the distribution of the $\log_{10}(\sigma ^{8\ \text{TeV} }_\mathrm {SUSY})$ versus the $Z$-significance calculated from the combination of all searches. See Fig. 2 for a description of the shading. In plot (bottom left), the apparent enhancement of the left tail of the posterior density with respect to the prior is due to the suppression of the right tail and an overall renormalization. |

png pdf |
Figure 8-c:
A summary of the impact of CMS searches on the probability density of the logarithm of the cross section for inclusive sparticle production in 8 TeV pp collisions, $\log_{10}(\sigma ^{8\ \text{TeV} }_\mathrm {SUSY})$, in the pMSSM parameter space. Plots (a-d) compare the non-DCS prior distribution of the $\log_{10}(\sigma ^{8\ \text{TeV} }_\mathrm {SUSY})$ to posterior distributions after data from various CMS searches, where plot (d) shows the combined effect of CMS searches and the Higgs boson results. Plot (e) shows survival probabilities as a function of the $\log_{10}(\sigma ^{8\ \text{TeV} }_\mathrm {SUSY})$ for various combinations of CMS data and data from Higgs boson measurements. Plot (f) shows the distribution of the $\log_{10}(\sigma ^{8\ \text{TeV} }_\mathrm {SUSY})$ versus the $Z$-significance calculated from the combination of all searches. See Fig. 2 for a description of the shading. In plot (bottom left), the apparent enhancement of the left tail of the posterior density with respect to the prior is due to the suppression of the right tail and an overall renormalization. |
png pdf |
Figure 8-d:
A summary of the impact of CMS searches on the probability density of the logarithm of the cross section for inclusive sparticle production in 8 TeV pp collisions, $\log_{10}(\sigma ^{8\ \text{TeV} }_\mathrm {SUSY})$, in the pMSSM parameter space. Plots (a-d) compare the non-DCS prior distribution of the $\log_{10}(\sigma ^{8\ \text{TeV} }_\mathrm {SUSY})$ to posterior distributions after data from various CMS searches, where plot (d) shows the combined effect of CMS searches and the Higgs boson results. Plot (e) shows survival probabilities as a function of the $\log_{10}(\sigma ^{8\ \text{TeV} }_\mathrm {SUSY})$ for various combinations of CMS data and data from Higgs boson measurements. Plot (f) shows the distribution of the $\log_{10}(\sigma ^{8\ \text{TeV} }_\mathrm {SUSY})$ versus the $Z$-significance calculated from the combination of all searches. See Fig. 2 for a description of the shading. In plot (bottom left), the apparent enhancement of the left tail of the posterior density with respect to the prior is due to the suppression of the right tail and an overall renormalization. |
png pdf |
Figure 8-e:
A summary of the impact of CMS searches on the probability density of the logarithm of the cross section for inclusive sparticle production in 8 TeV pp collisions, $\log_{10}(\sigma ^{8\ \text{TeV} }_\mathrm {SUSY})$, in the pMSSM parameter space. Plots (a-d) compare the non-DCS prior distribution of the $\log_{10}(\sigma ^{8\ \text{TeV} }_\mathrm {SUSY})$ to posterior distributions after data from various CMS searches, where plot (d) shows the combined effect of CMS searches and the Higgs boson results. Plot (e) shows survival probabilities as a function of the $\log_{10}(\sigma ^{8\ \text{TeV} }_\mathrm {SUSY})$ for various combinations of CMS data and data from Higgs boson measurements. Plot (f) shows the distribution of the $\log_{10}(\sigma ^{8\ \text{TeV} }_\mathrm {SUSY})$ versus the $Z$-significance calculated from the combination of all searches. See Fig. 2 for a description of the shading. In plot (bottom left), the apparent enhancement of the left tail of the posterior density with respect to the prior is due to the suppression of the right tail and an overall renormalization. |

png pdf |
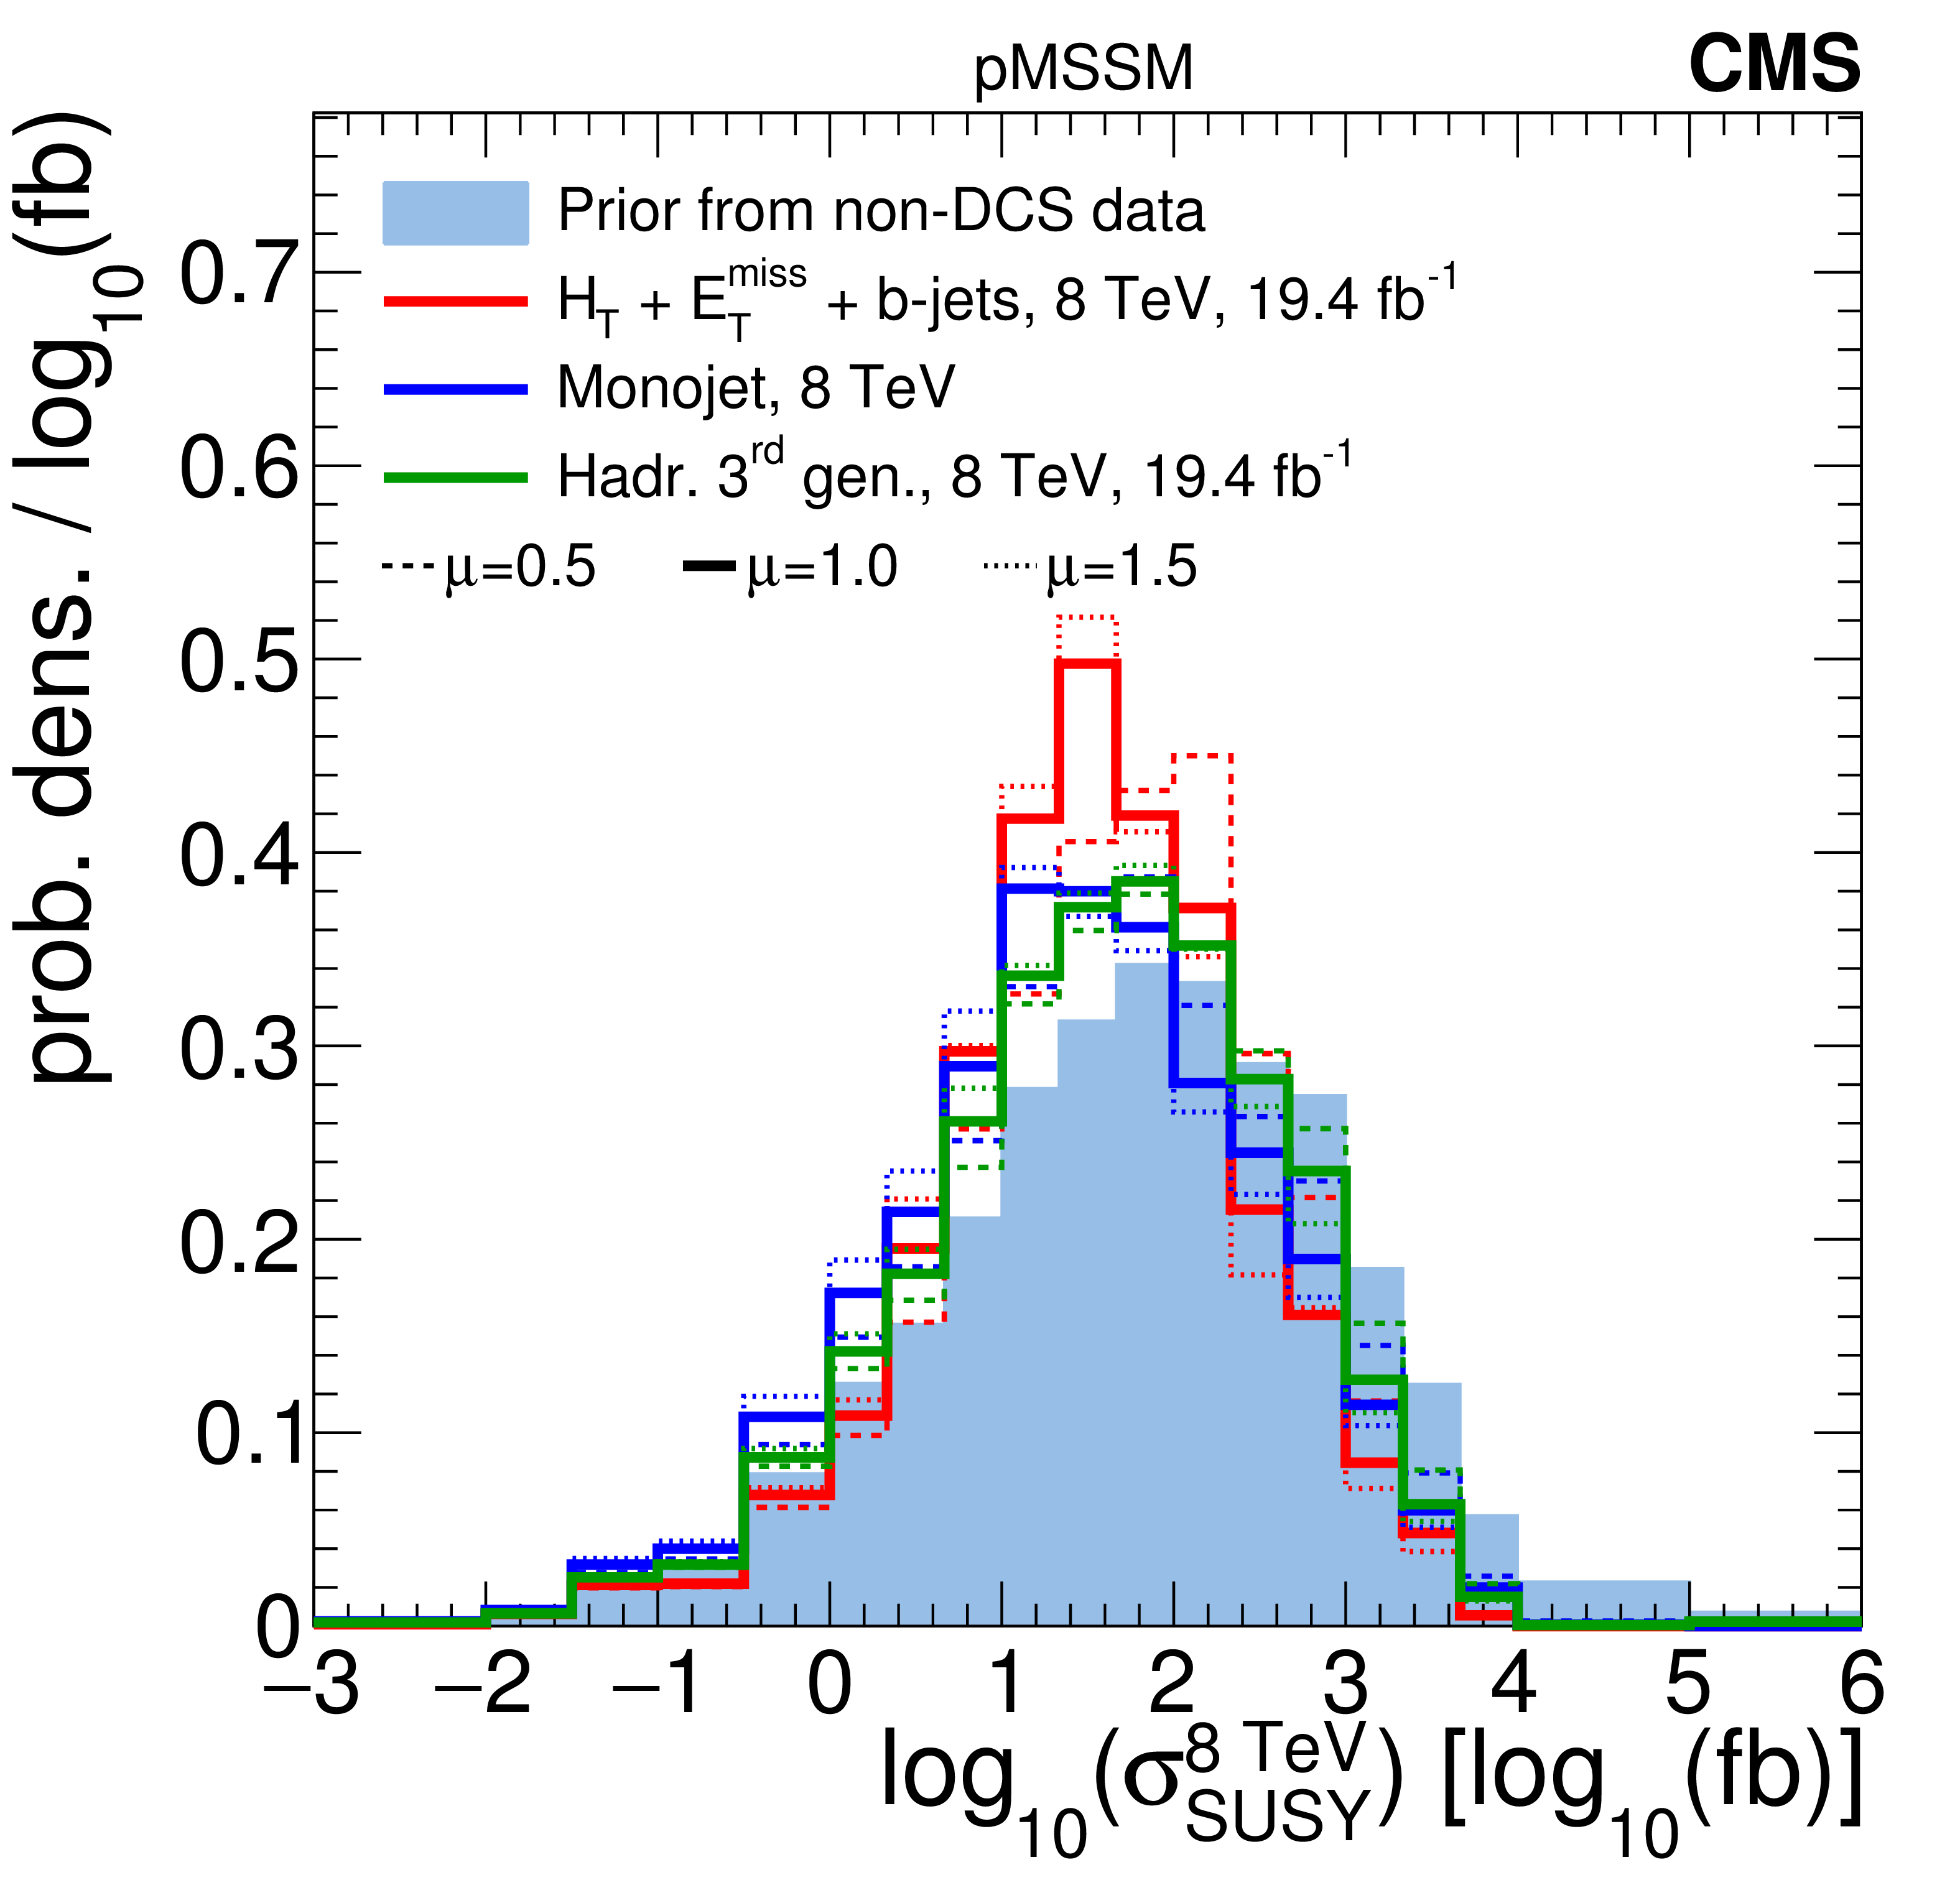
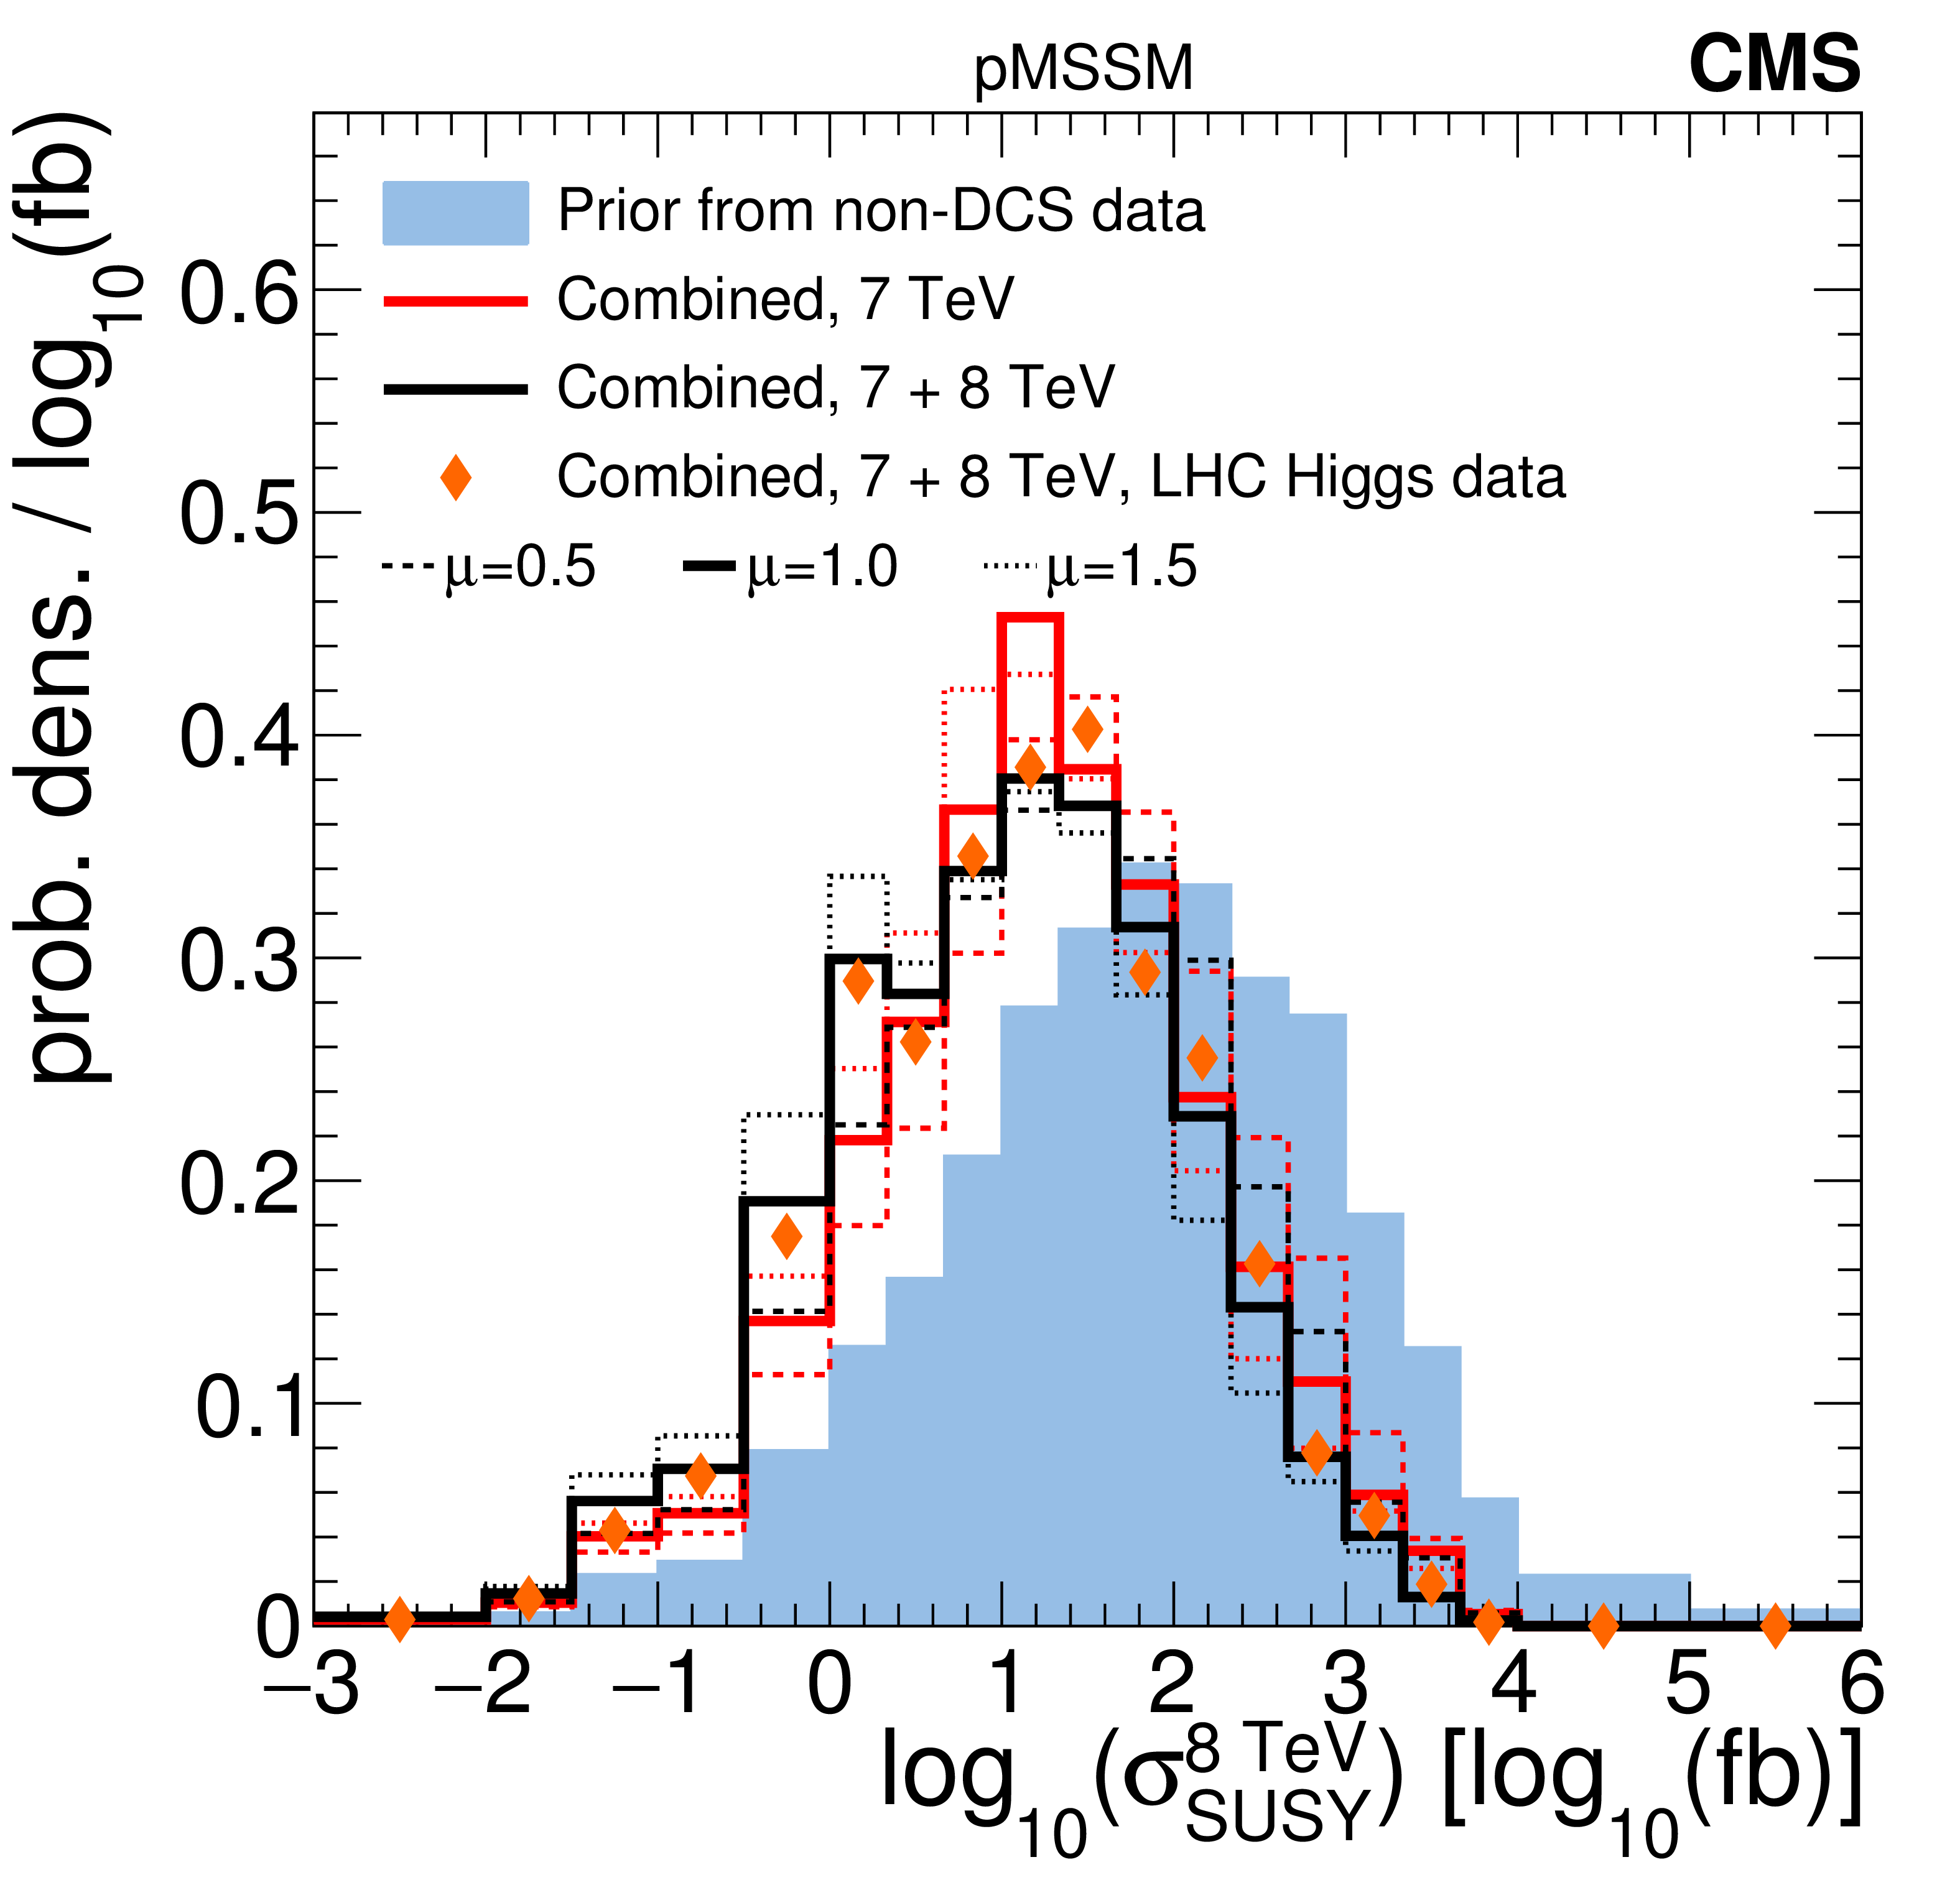
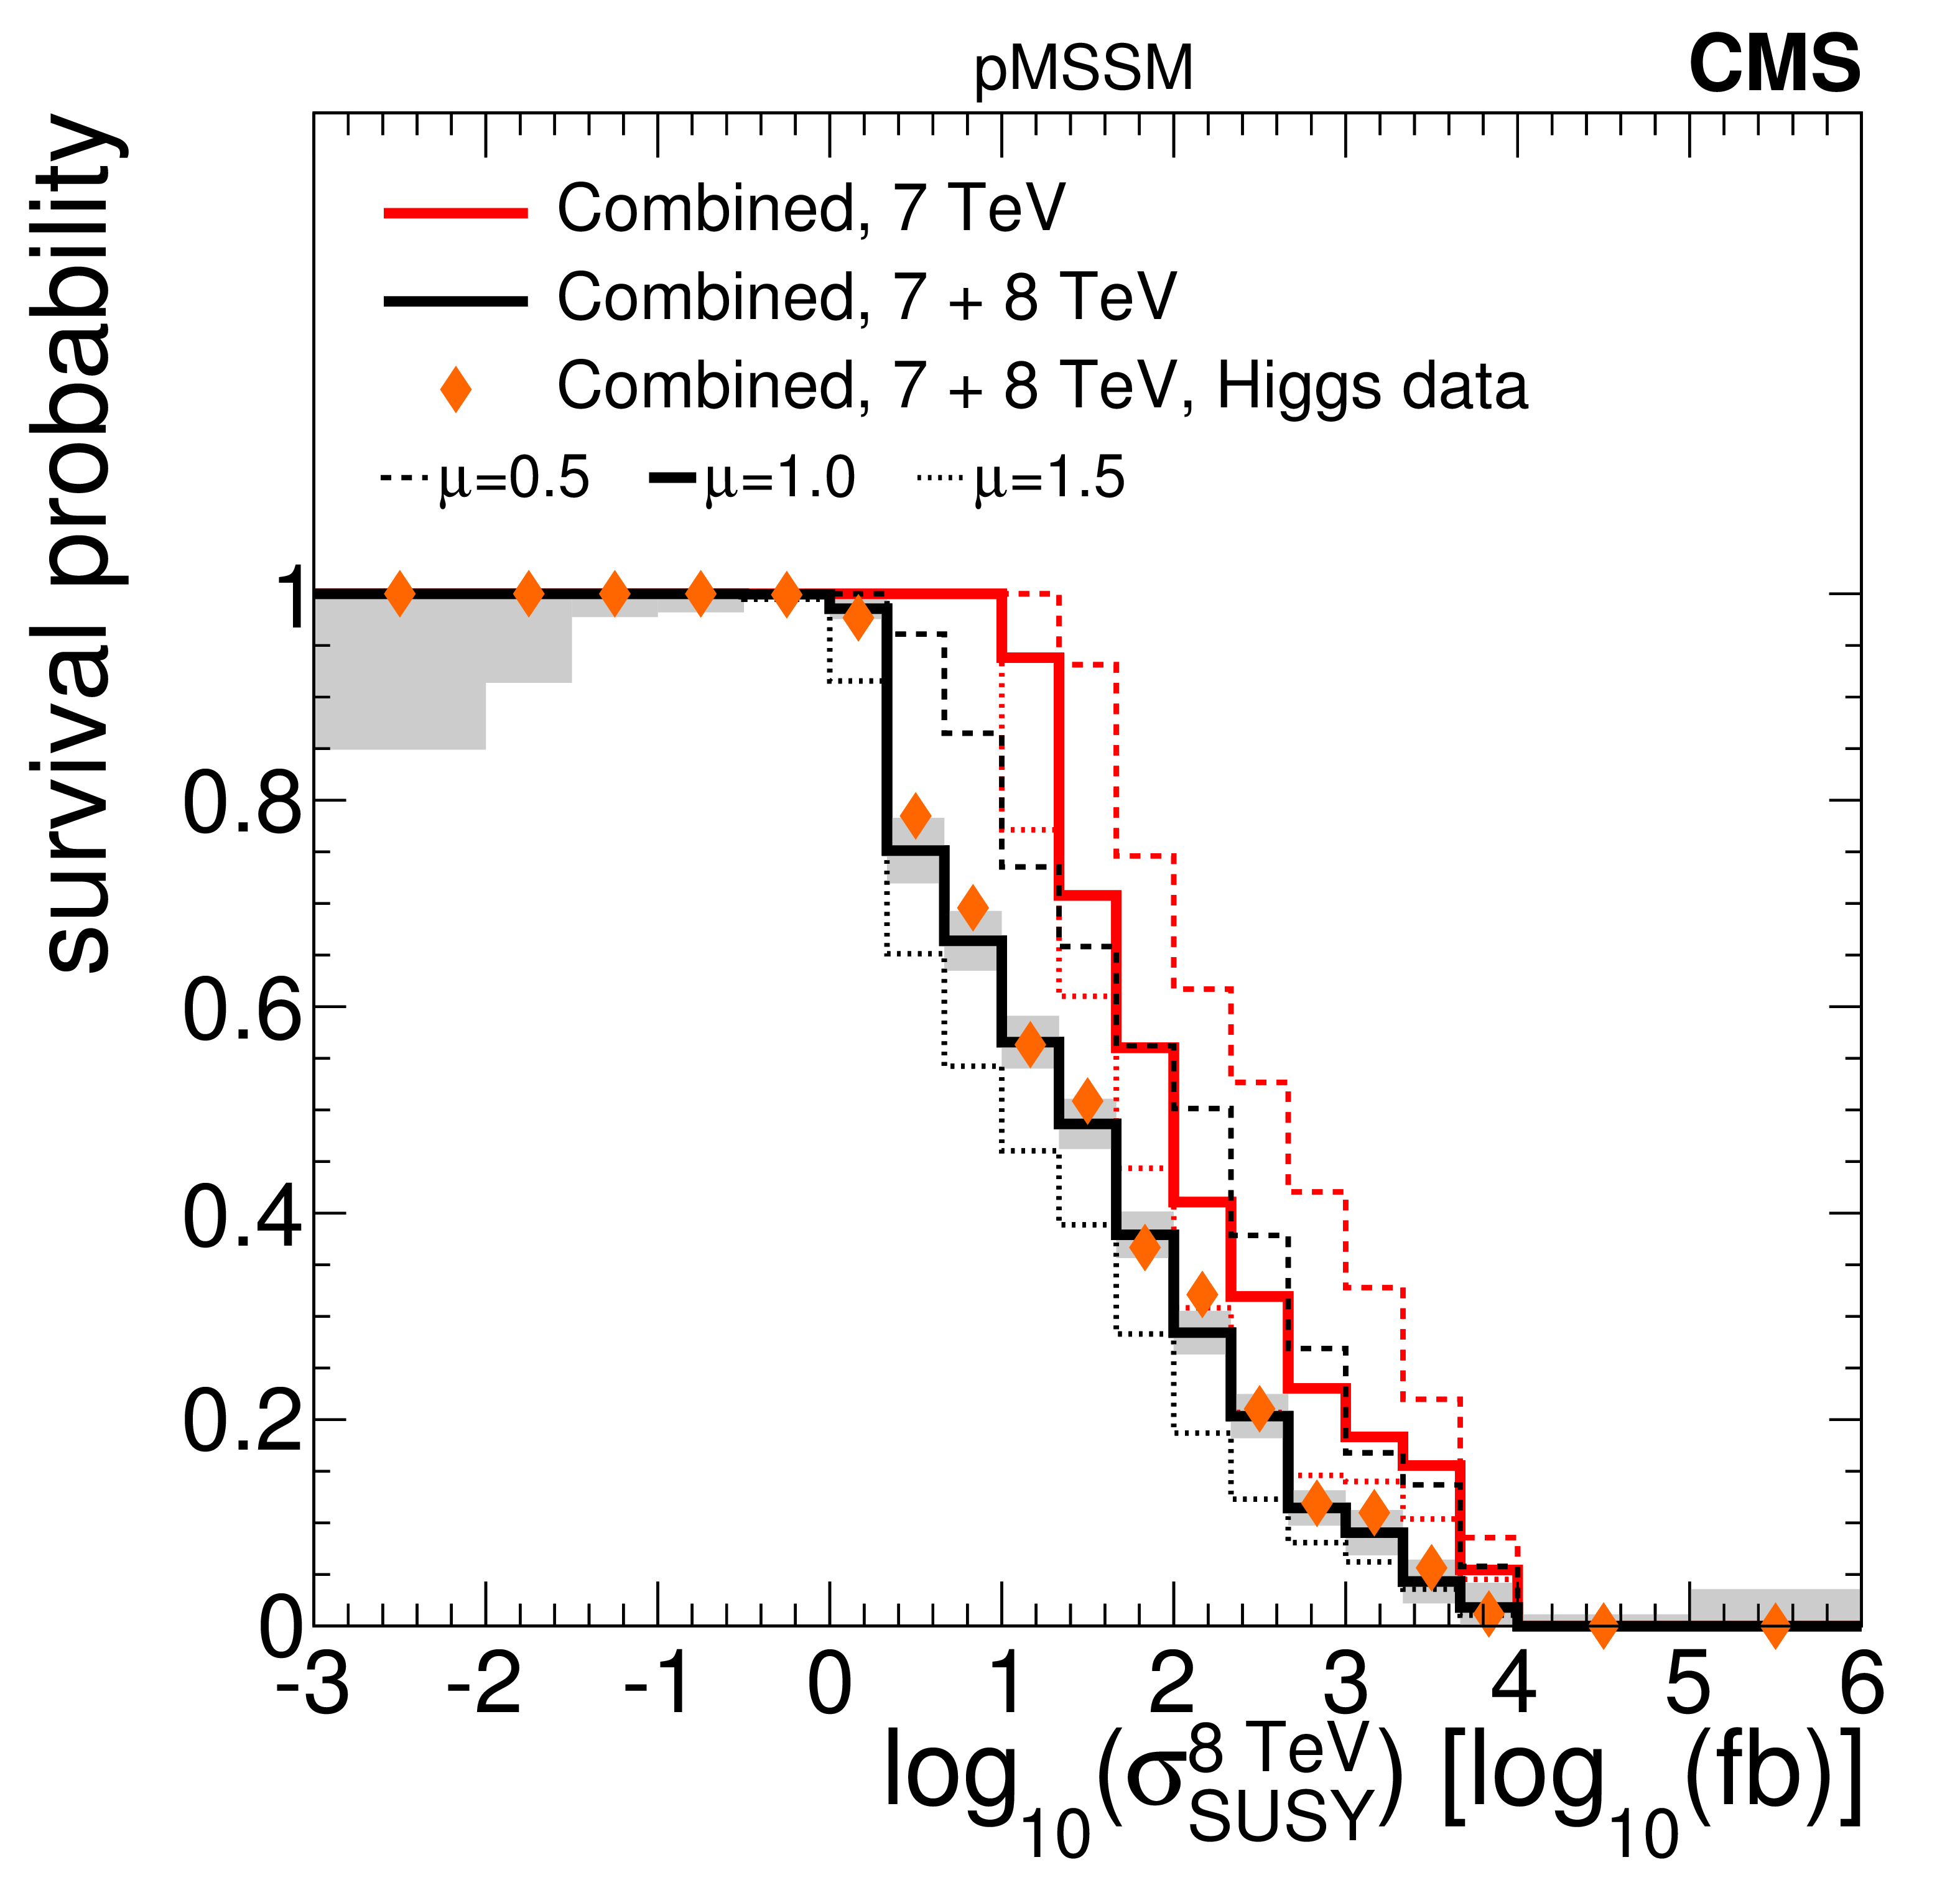
Figure 8-f:
A summary of the impact of CMS searches on the probability density of the logarithm of the cross section for inclusive sparticle production in 8 TeV pp collisions, $\log_{10}(\sigma ^{8\ \text{TeV} }_\mathrm {SUSY})$, in the pMSSM parameter space. Plots (a-d) compare the non-DCS prior distribution of the $\log_{10}(\sigma ^{8\ \text{TeV} }_\mathrm {SUSY})$ to posterior distributions after data from various CMS searches, where plot (d) shows the combined effect of CMS searches and the Higgs boson results. Plot (e) shows survival probabilities as a function of the $\log_{10}(\sigma ^{8\ \text{TeV} }_\mathrm {SUSY})$ for various combinations of CMS data and data from Higgs boson measurements. Plot (f) shows the distribution of the $\log_{10}(\sigma ^{8\ \text{TeV} }_\mathrm {SUSY})$ versus the $Z$-significance calculated from the combination of all searches. See Fig. 2 for a description of the shading. In plot (bottom left), the apparent enhancement of the left tail of the posterior density with respect to the prior is due to the suppression of the right tail and an overall renormalization. |
png pdf |
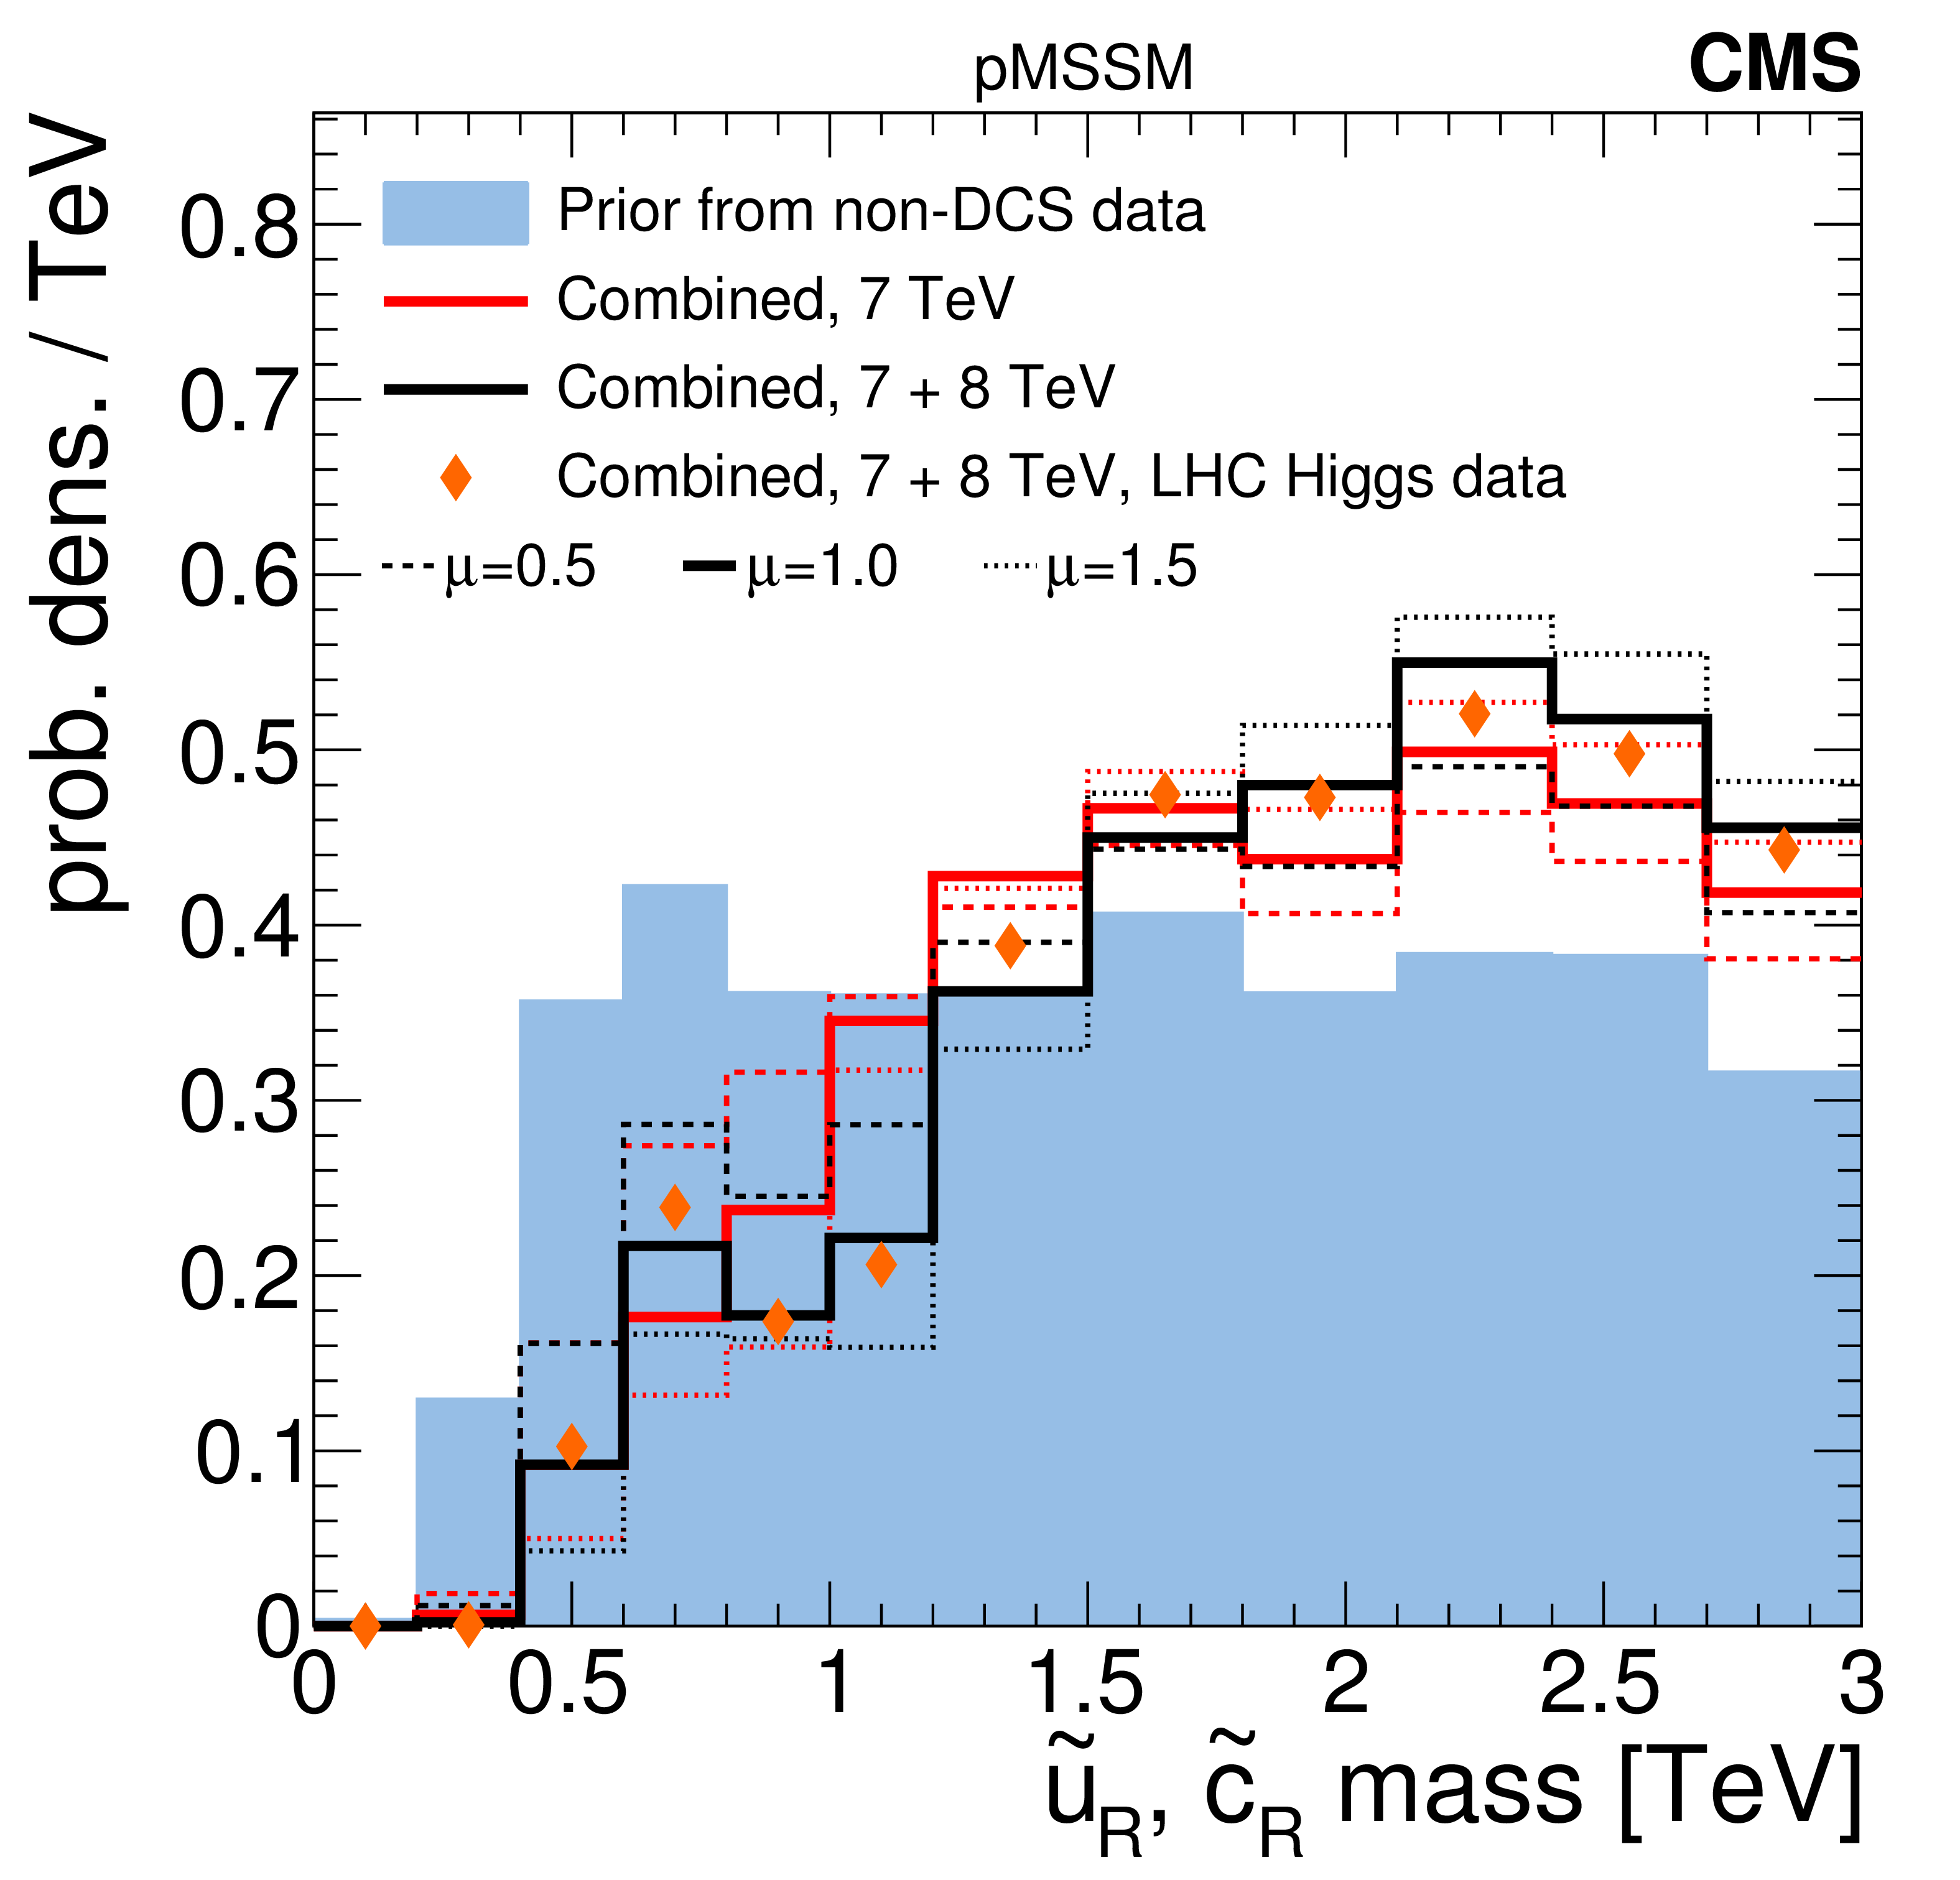
Figure 9-a:
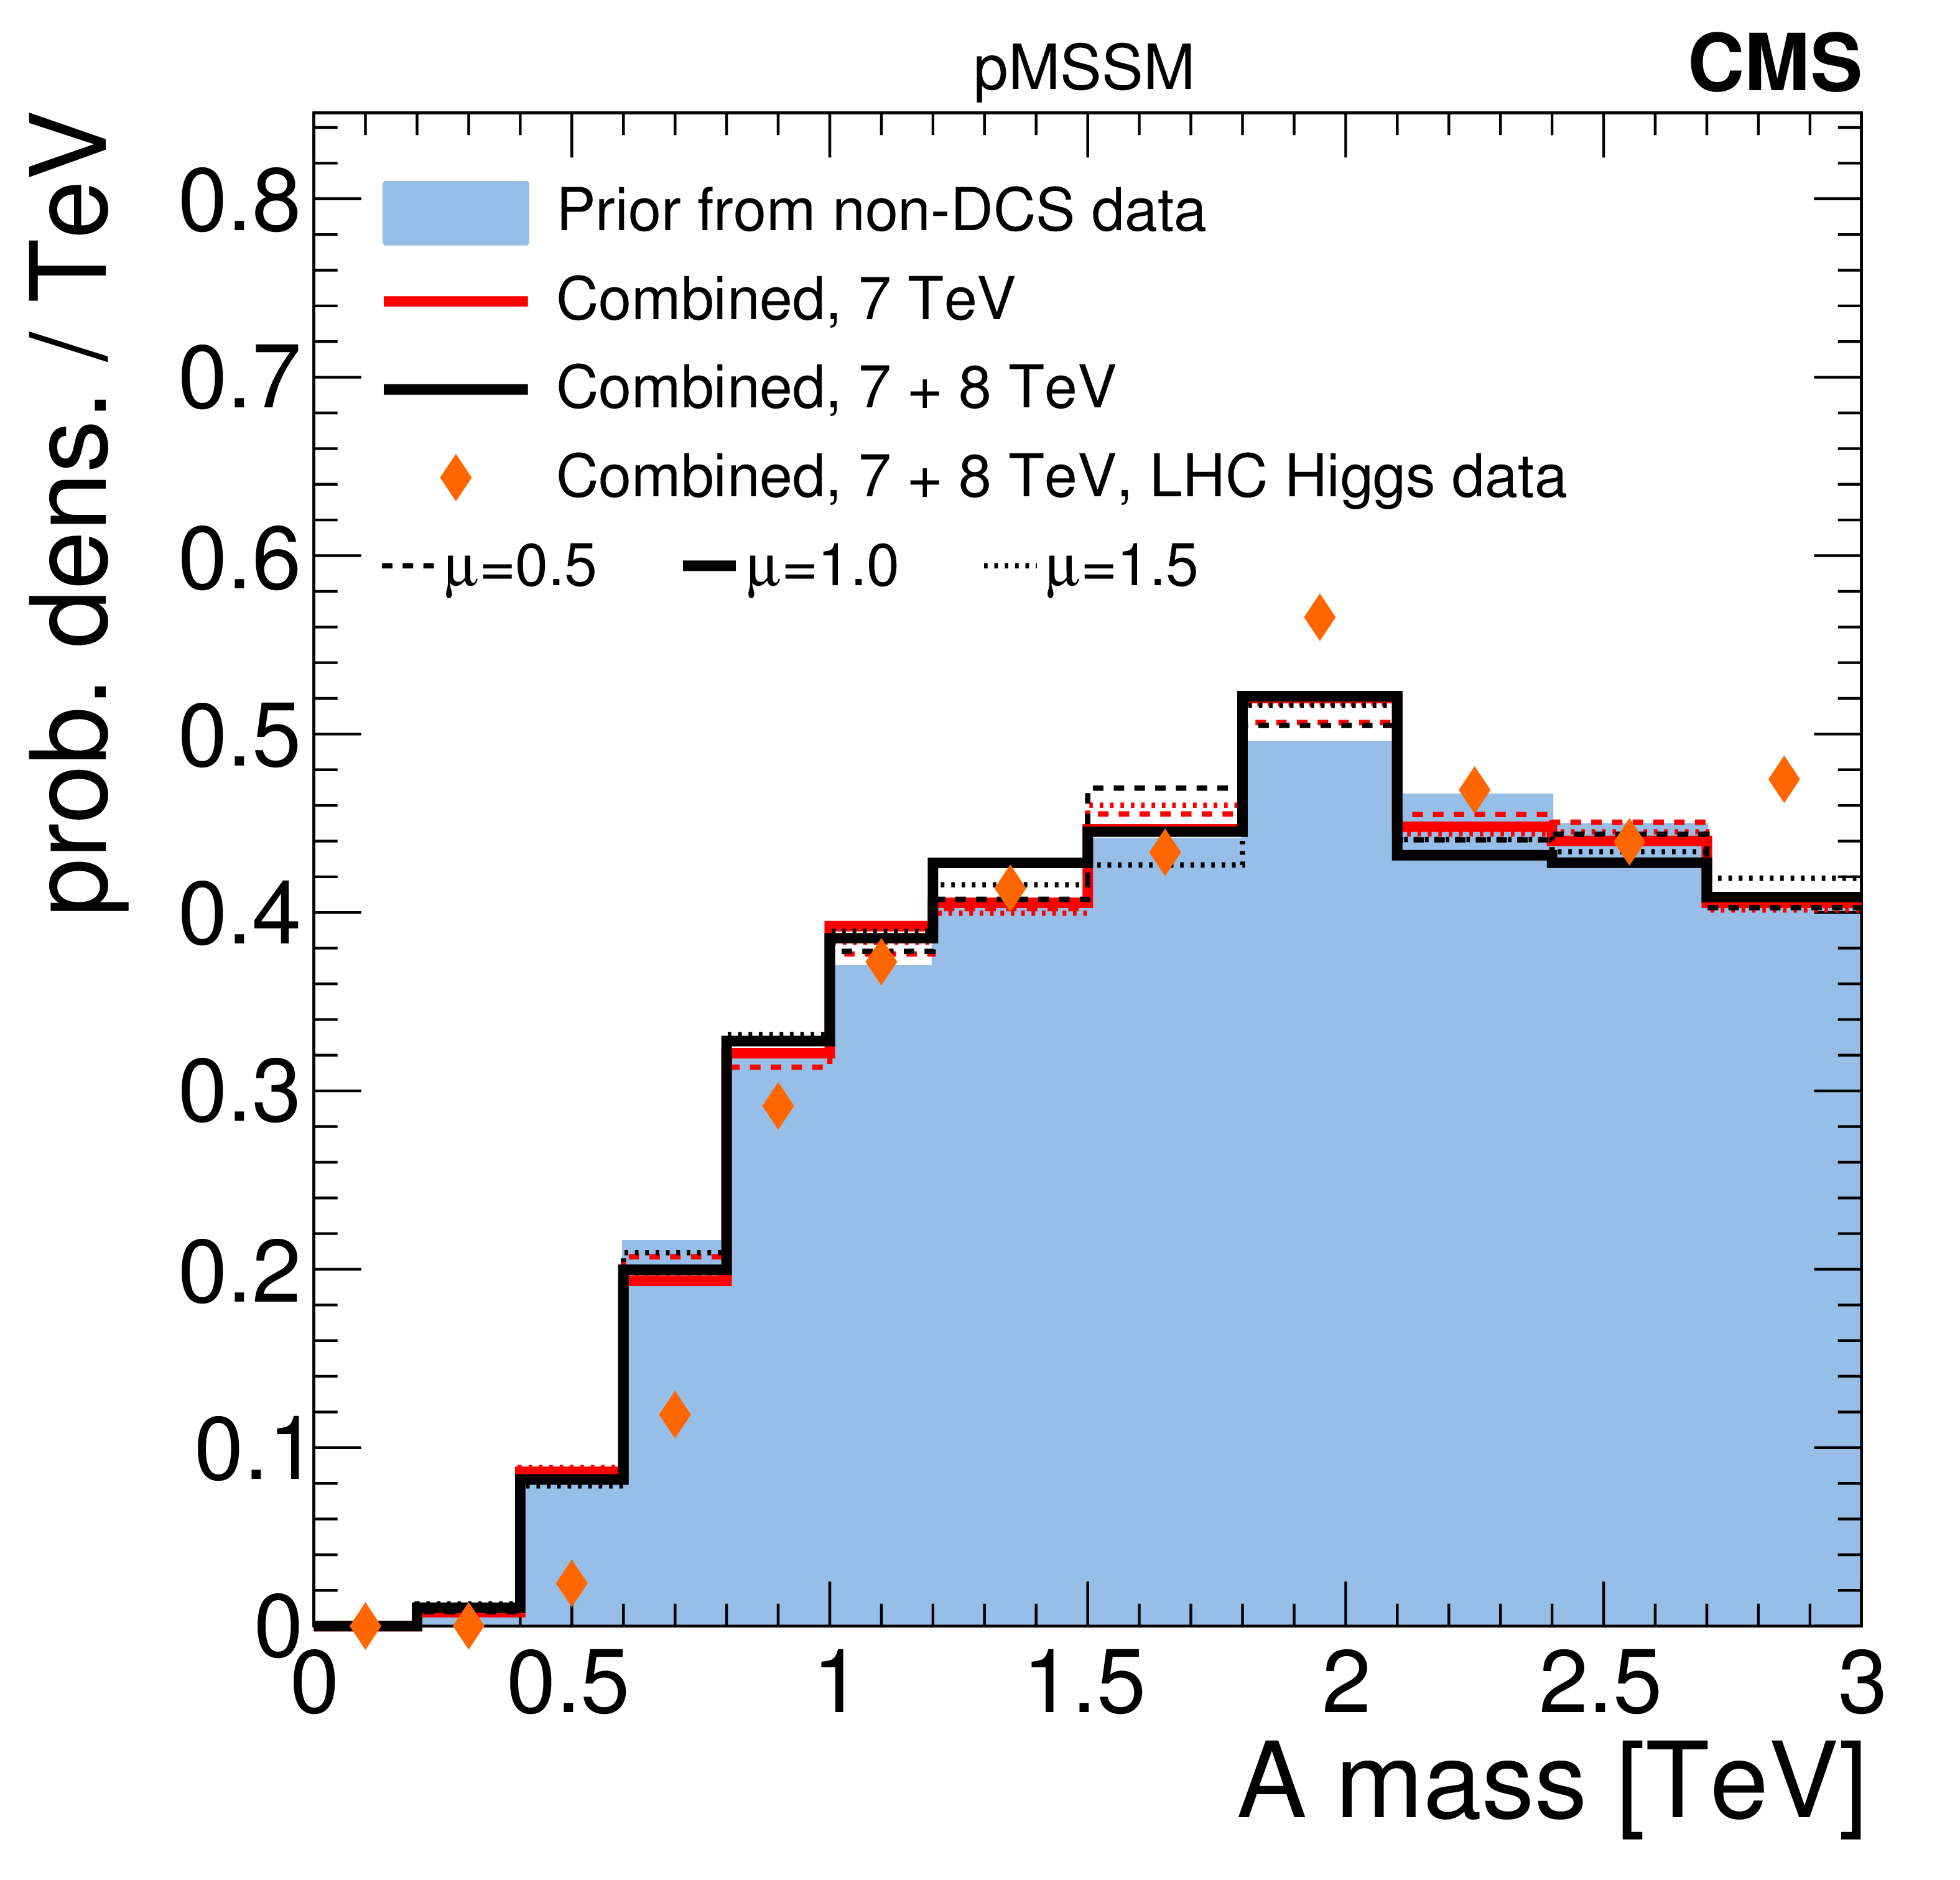
Comparison of prior and posterior distributions after several combinations of data from the CMS searches for the $\mathrm{ \tilde{u}_R }, {\mathrm{ \tilde{c} } _\mathrm {R}} $ mass, $\tilde{ mathrm{ b } }_1 $ mass, $\mathrm{ \tilde{e}_L } , {\tilde{\mu} _\mathrm {L}} $ mass, $ {\tilde{\tau} _1} $ mass, $\tilde{\chi}^0 _2$ mass, $\tilde{\chi}^{\pm} $ mass, the higgsino mass parameter $\mu $, $\tan\beta$, and A mass. |
png pdf |
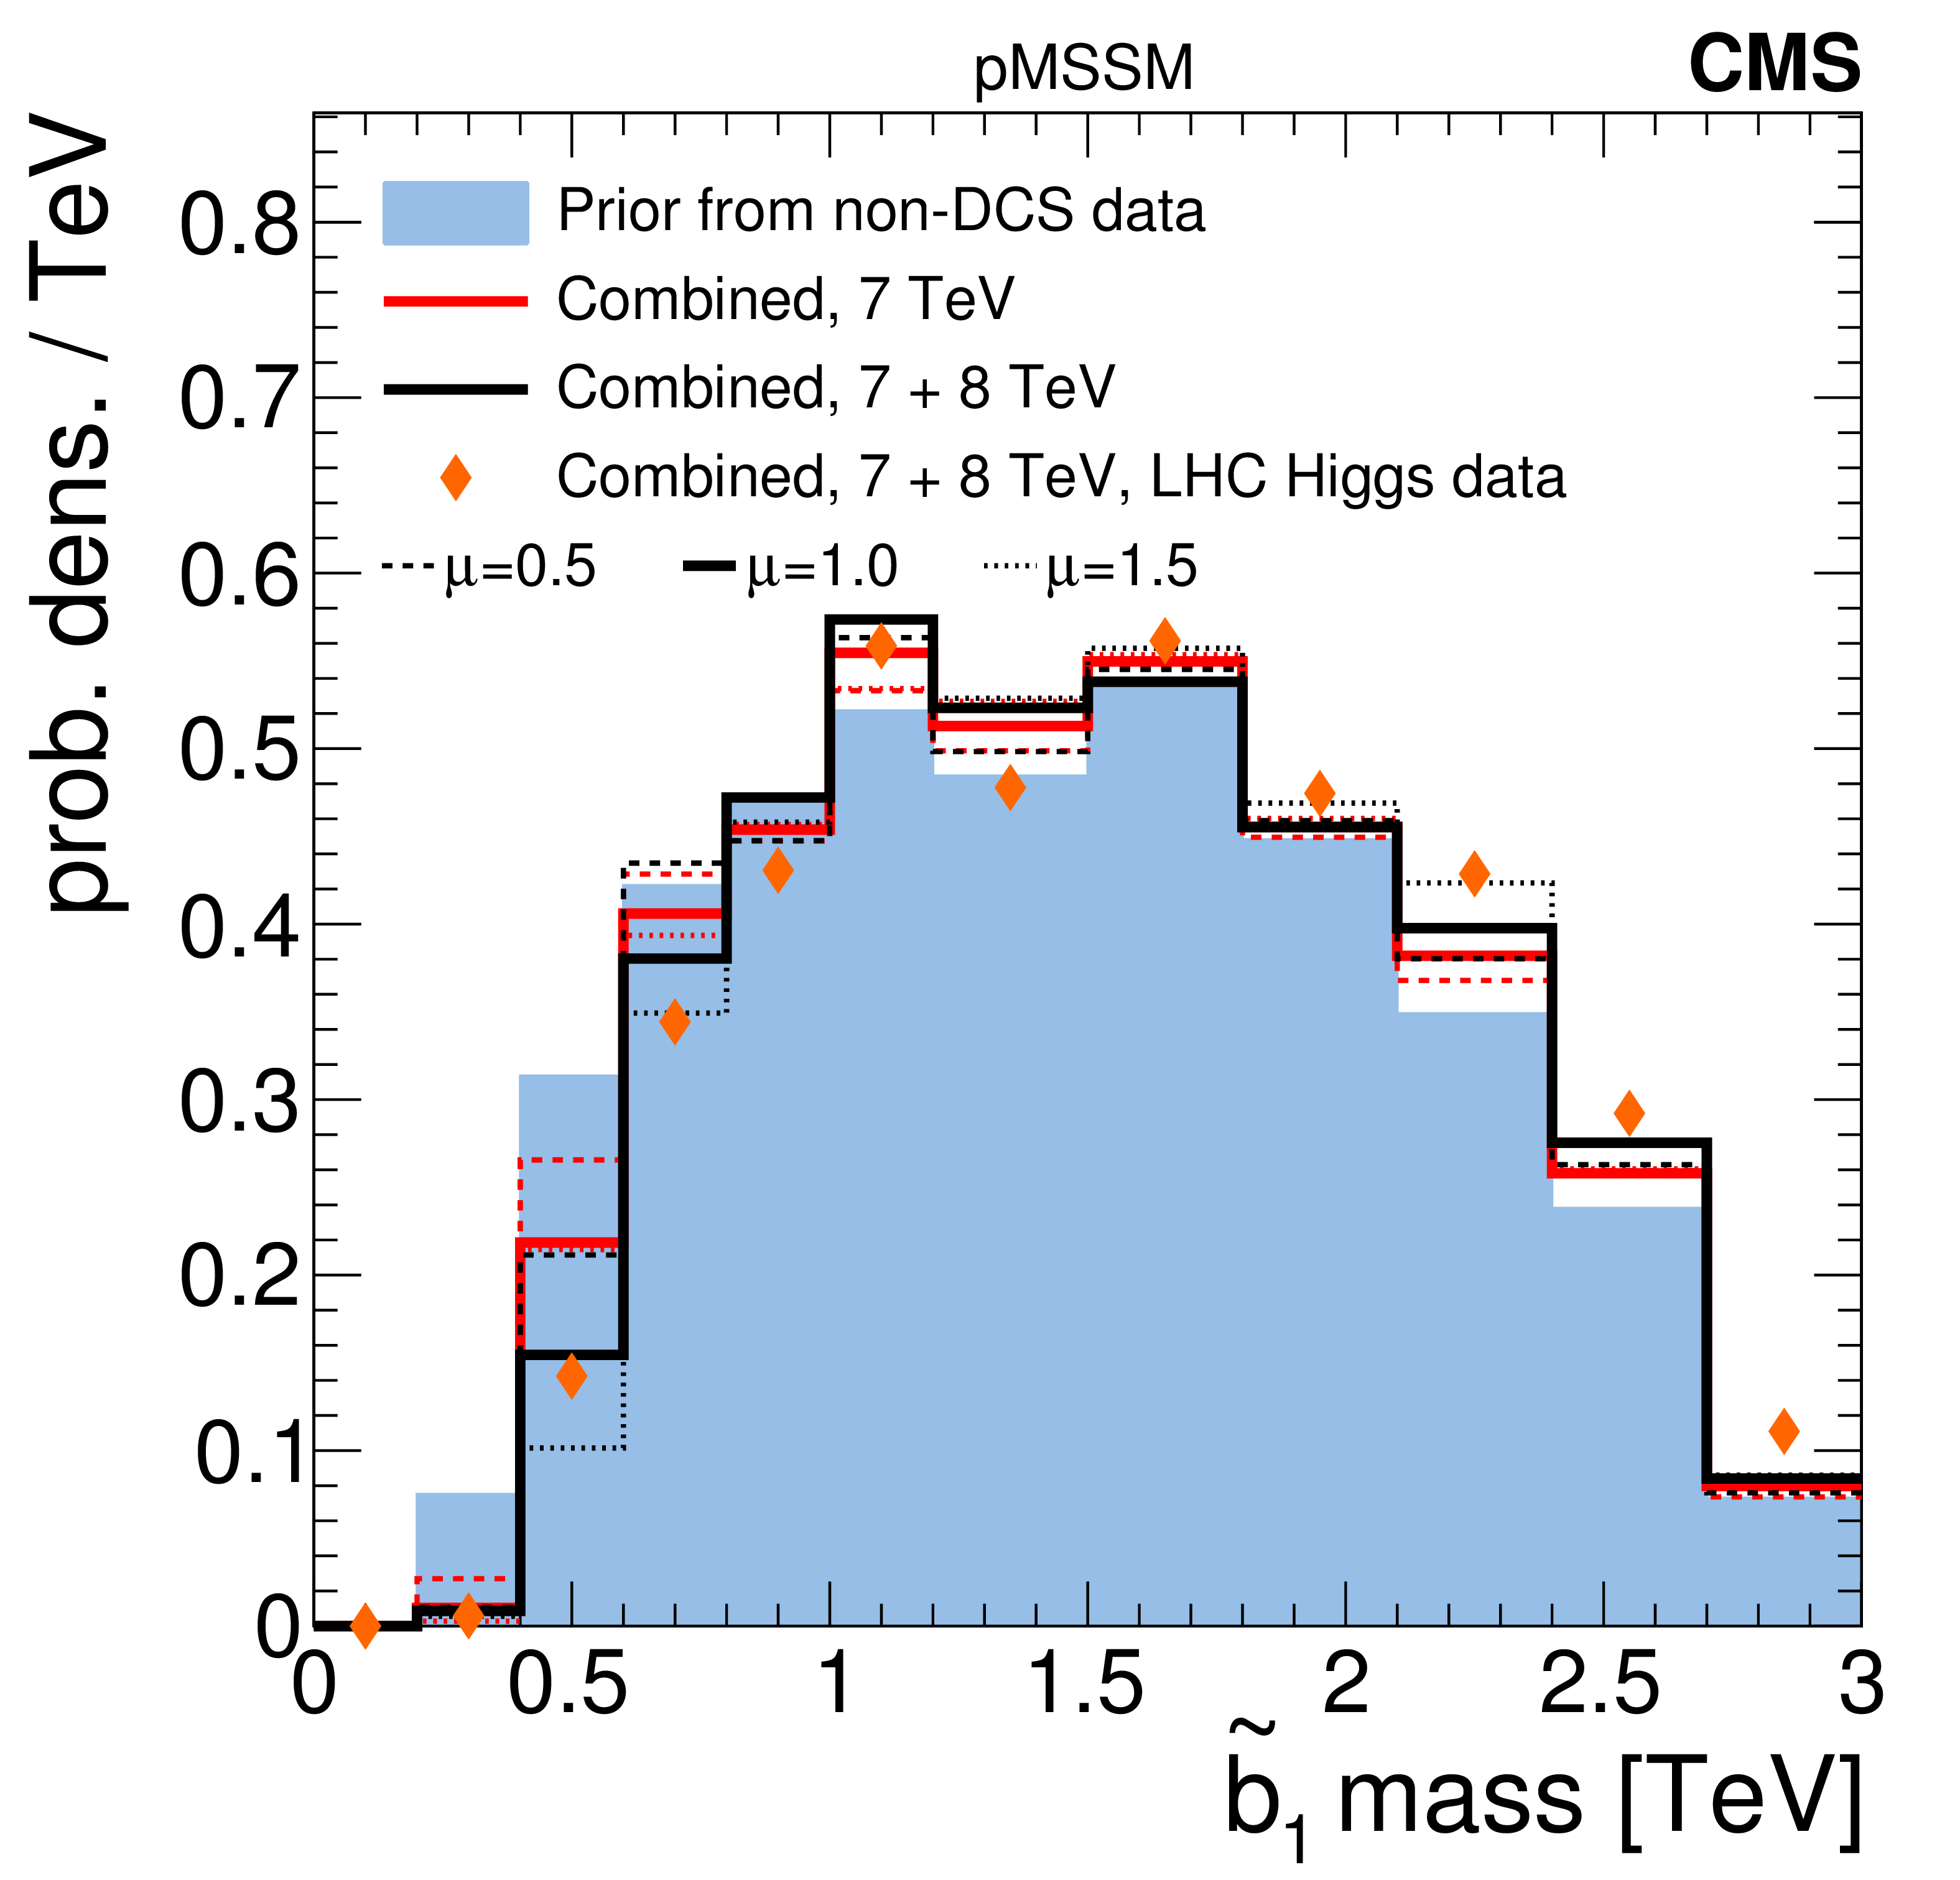
Figure 9-b:
Comparison of prior and posterior distributions after several combinations of data from the CMS searches for the $\mathrm{ \tilde{u}_R }, {\mathrm{ \tilde{c} } _\mathrm {R}} $ mass, $\tilde{ mathrm{ b } }_1 $ mass, $\mathrm{ \tilde{e}_L } , {\tilde{\mu} _\mathrm {L}} $ mass, $ {\tilde{\tau} _1} $ mass, $\tilde{\chi}^0 _2$ mass, $\tilde{\chi}^{\pm} $ mass, the higgsino mass parameter $\mu $, $\tan\beta$, and A mass. |

png pdf |
Figure 9-c:
Comparison of prior and posterior distributions after several combinations of data from the CMS searches for the $\mathrm{ \tilde{u}_R }, {\mathrm{ \tilde{c} } _\mathrm {R}} $ mass, $\tilde{ mathrm{ b } }_1 $ mass, $\mathrm{ \tilde{e}_L } , {\tilde{\mu} _\mathrm {L}} $ mass, $ {\tilde{\tau} _1} $ mass, $\tilde{\chi}^0 _2$ mass, $\tilde{\chi}^{\pm} $ mass, the higgsino mass parameter $\mu $, $\tan\beta$, and A mass. |

png pdf |
Figure 9-d:
Comparison of prior and posterior distributions after several combinations of data from the CMS searches for the $\mathrm{ \tilde{u}_R }, {\mathrm{ \tilde{c} } _\mathrm {R}} $ mass, $\tilde{ mathrm{ b } }_1 $ mass, $\mathrm{ \tilde{e}_L } , {\tilde{\mu} _\mathrm {L}} $ mass, $ {\tilde{\tau} _1} $ mass, $\tilde{\chi}^0 _2$ mass, $\tilde{\chi}^{\pm} $ mass, the higgsino mass parameter $\mu $, $\tan\beta$, and A mass. |

png pdf |
Figure 9-e:
Comparison of prior and posterior distributions after several combinations of data from the CMS searches for the $\mathrm{ \tilde{u}_R }, {\mathrm{ \tilde{c} } _\mathrm {R}} $ mass, $\tilde{ mathrm{ b } }_1 $ mass, $\mathrm{ \tilde{e}_L } , {\tilde{\mu} _\mathrm {L}} $ mass, $ {\tilde{\tau} _1} $ mass, $\tilde{\chi}^0 _2$ mass, $\tilde{\chi}^{\pm} $ mass, the higgsino mass parameter $\mu $, $\tan\beta$, and A mass. |

png pdf |
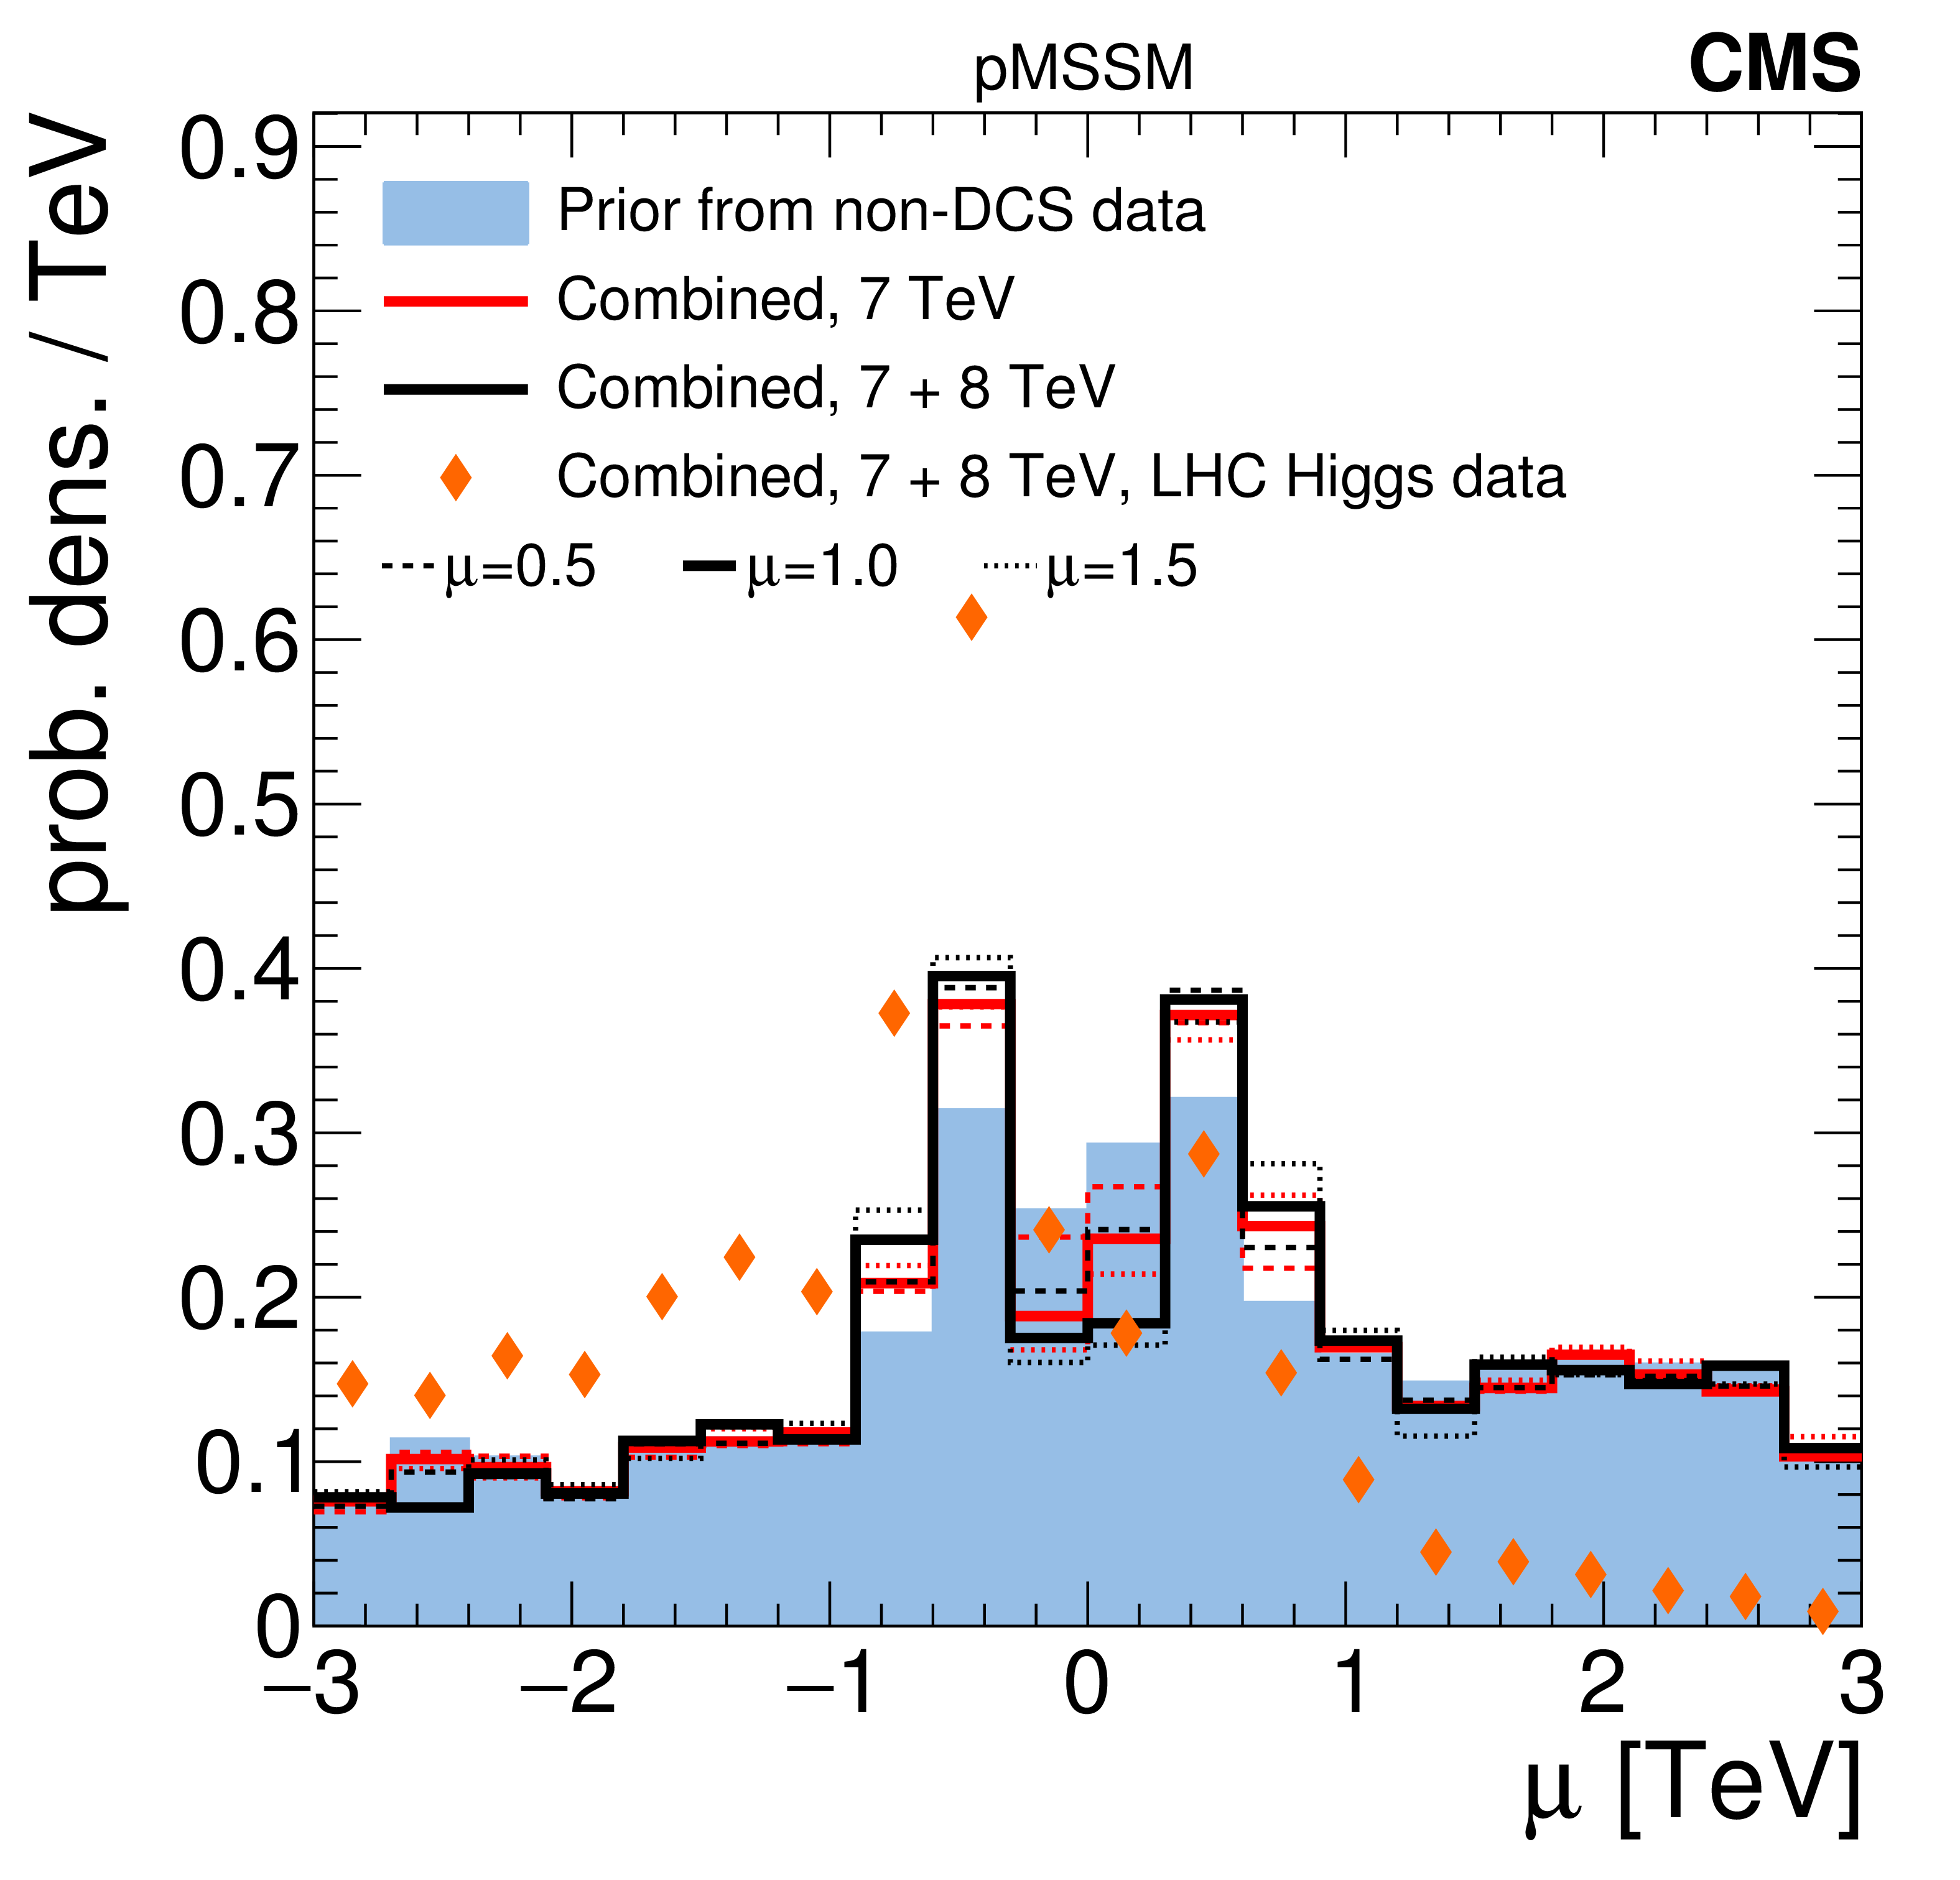
Figure 9-f:
Comparison of prior and posterior distributions after several combinations of data from the CMS searches for the $\mathrm{ \tilde{u}_R }, {\mathrm{ \tilde{c} } _\mathrm {R}} $ mass, $\tilde{ mathrm{ b } }_1 $ mass, $\mathrm{ \tilde{e}_L } , {\tilde{\mu} _\mathrm {L}} $ mass, $ {\tilde{\tau} _1} $ mass, $\tilde{\chi}^0 _2$ mass, $\tilde{\chi}^{\pm} $ mass, the higgsino mass parameter $\mu $, $\tan\beta$, and A mass. |
png pdf |
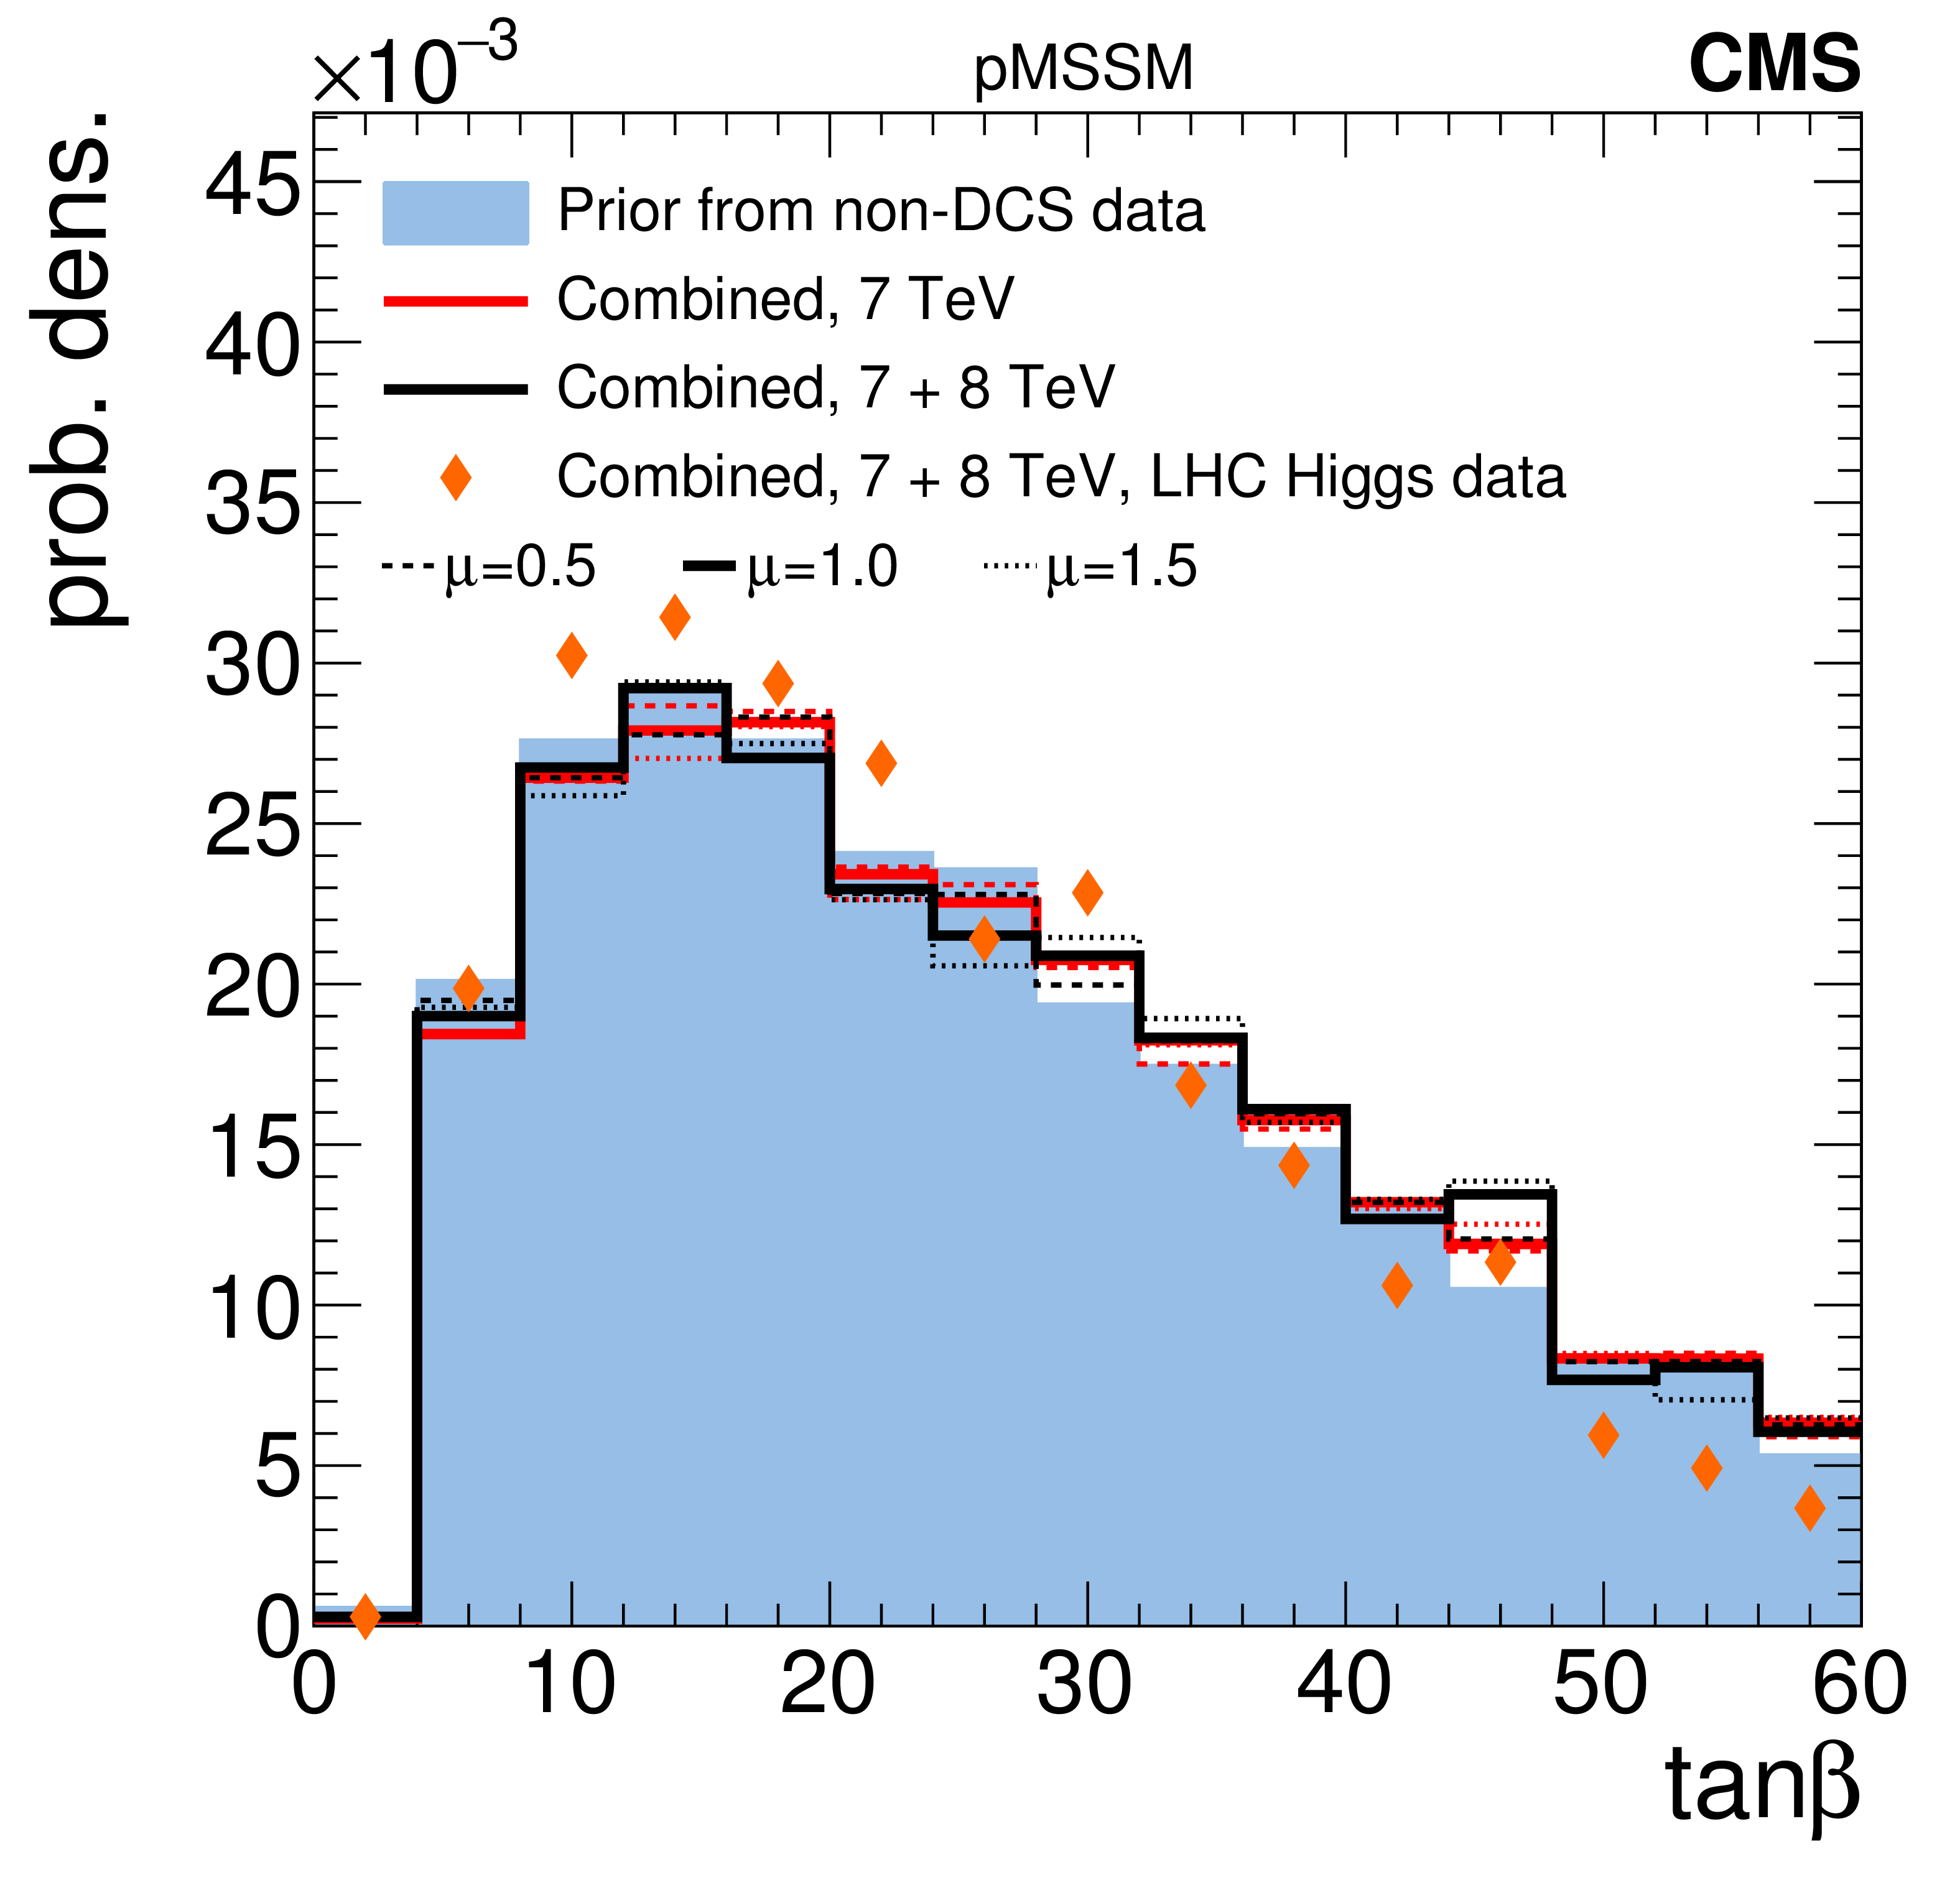
Figure 9-g:
Comparison of prior and posterior distributions after several combinations of data from the CMS searches for the $\mathrm{ \tilde{u}_R }, {\mathrm{ \tilde{c} } _\mathrm {R}} $ mass, $\tilde{ mathrm{ b } }_1 $ mass, $\mathrm{ \tilde{e}_L } , {\tilde{\mu} _\mathrm {L}} $ mass, $ {\tilde{\tau} _1} $ mass, $\tilde{\chi}^0 _2$ mass, $\tilde{\chi}^{\pm} $ mass, the higgsino mass parameter $\mu $, $\tan\beta$, and A mass. |
png pdf |
Figure 9-h:
Comparison of prior and posterior distributions after several combinations of data from the CMS searches for the $\mathrm{ \tilde{u}_R }, {\mathrm{ \tilde{c} } _\mathrm {R}} $ mass, $\tilde{ mathrm{ b } }_1 $ mass, $\mathrm{ \tilde{e}_L } , {\tilde{\mu} _\mathrm {L}} $ mass, $ {\tilde{\tau} _1} $ mass, $\tilde{\chi}^0 _2$ mass, $\tilde{\chi}^{\pm} $ mass, the higgsino mass parameter $\mu $, $\tan\beta$, and A mass. |
png pdf |
Figure 9-i:
Comparison of prior and posterior distributions after several combinations of data from the CMS searches for the $\mathrm{ \tilde{u}_R }, {\mathrm{ \tilde{c} } _\mathrm {R}} $ mass, $\tilde{ mathrm{ b } }_1 $ mass, $\mathrm{ \tilde{e}_L } , {\tilde{\mu} _\mathrm {L}} $ mass, $ {\tilde{\tau} _1} $ mass, $\tilde{\chi}^0 _2$ mass, $\tilde{\chi}^{\pm} $ mass, the higgsino mass parameter $\mu $, $\tan\beta$, and A mass. |
png pdf |
Figure 10-a:
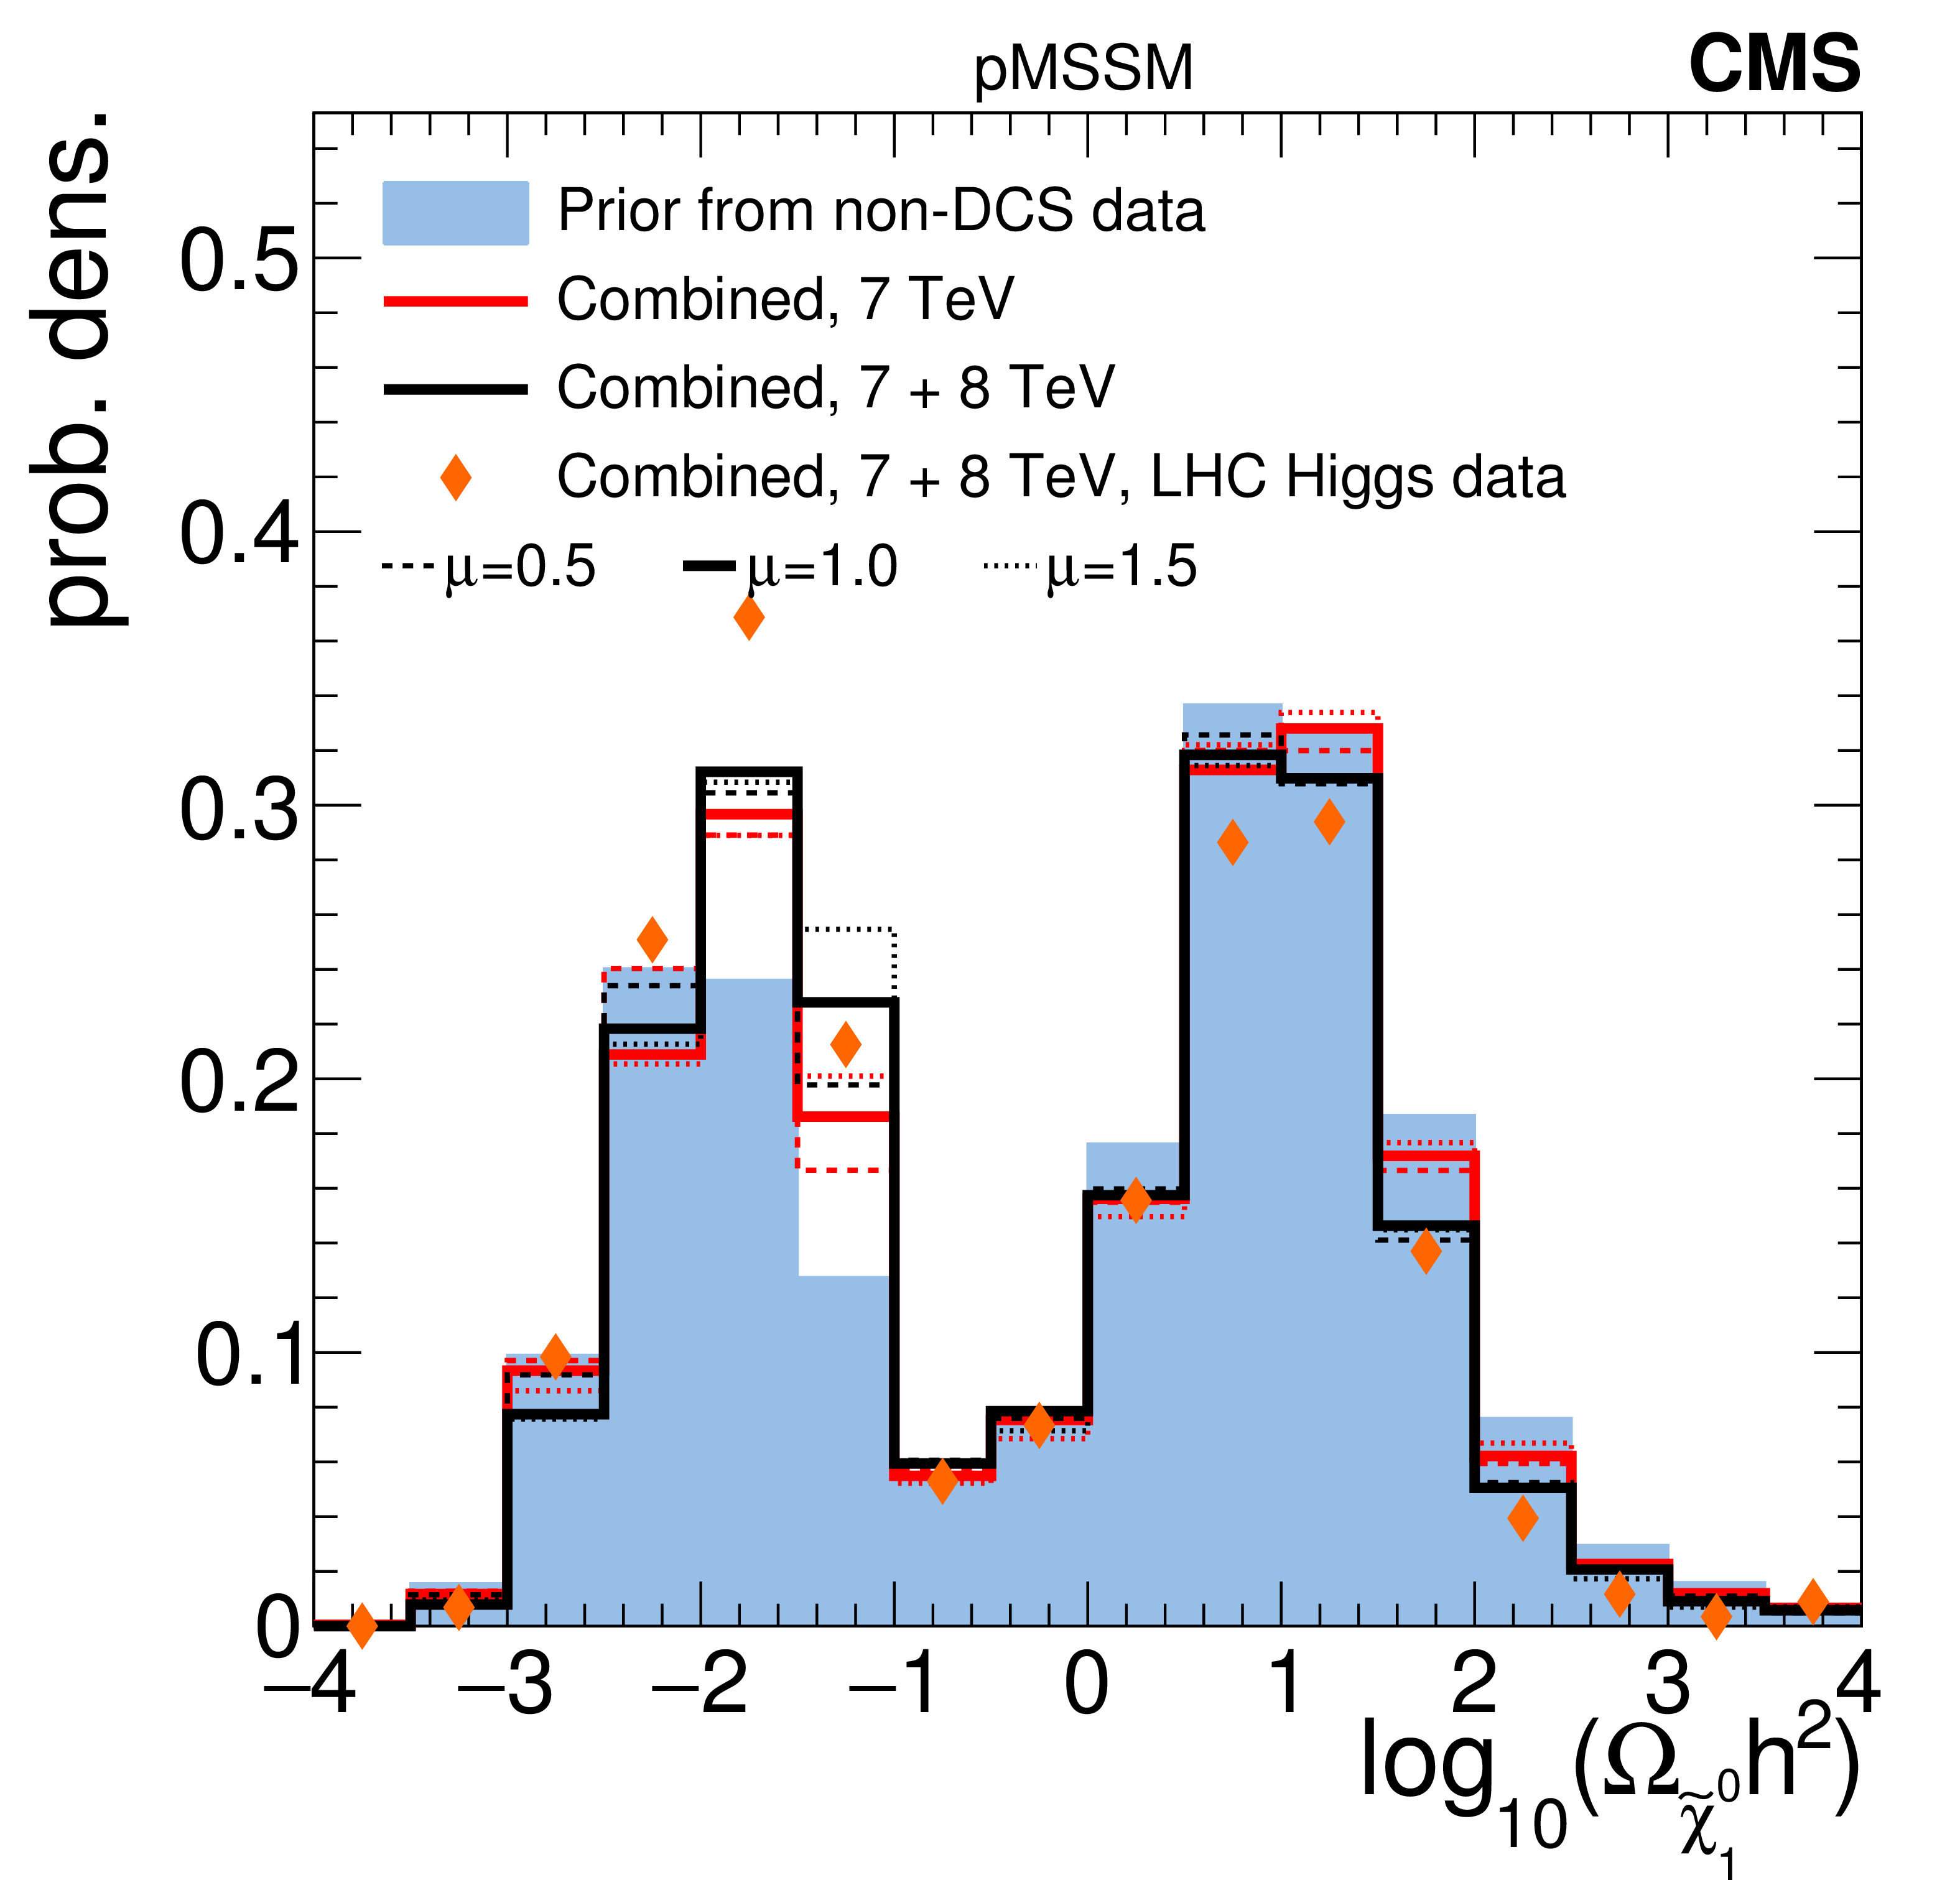
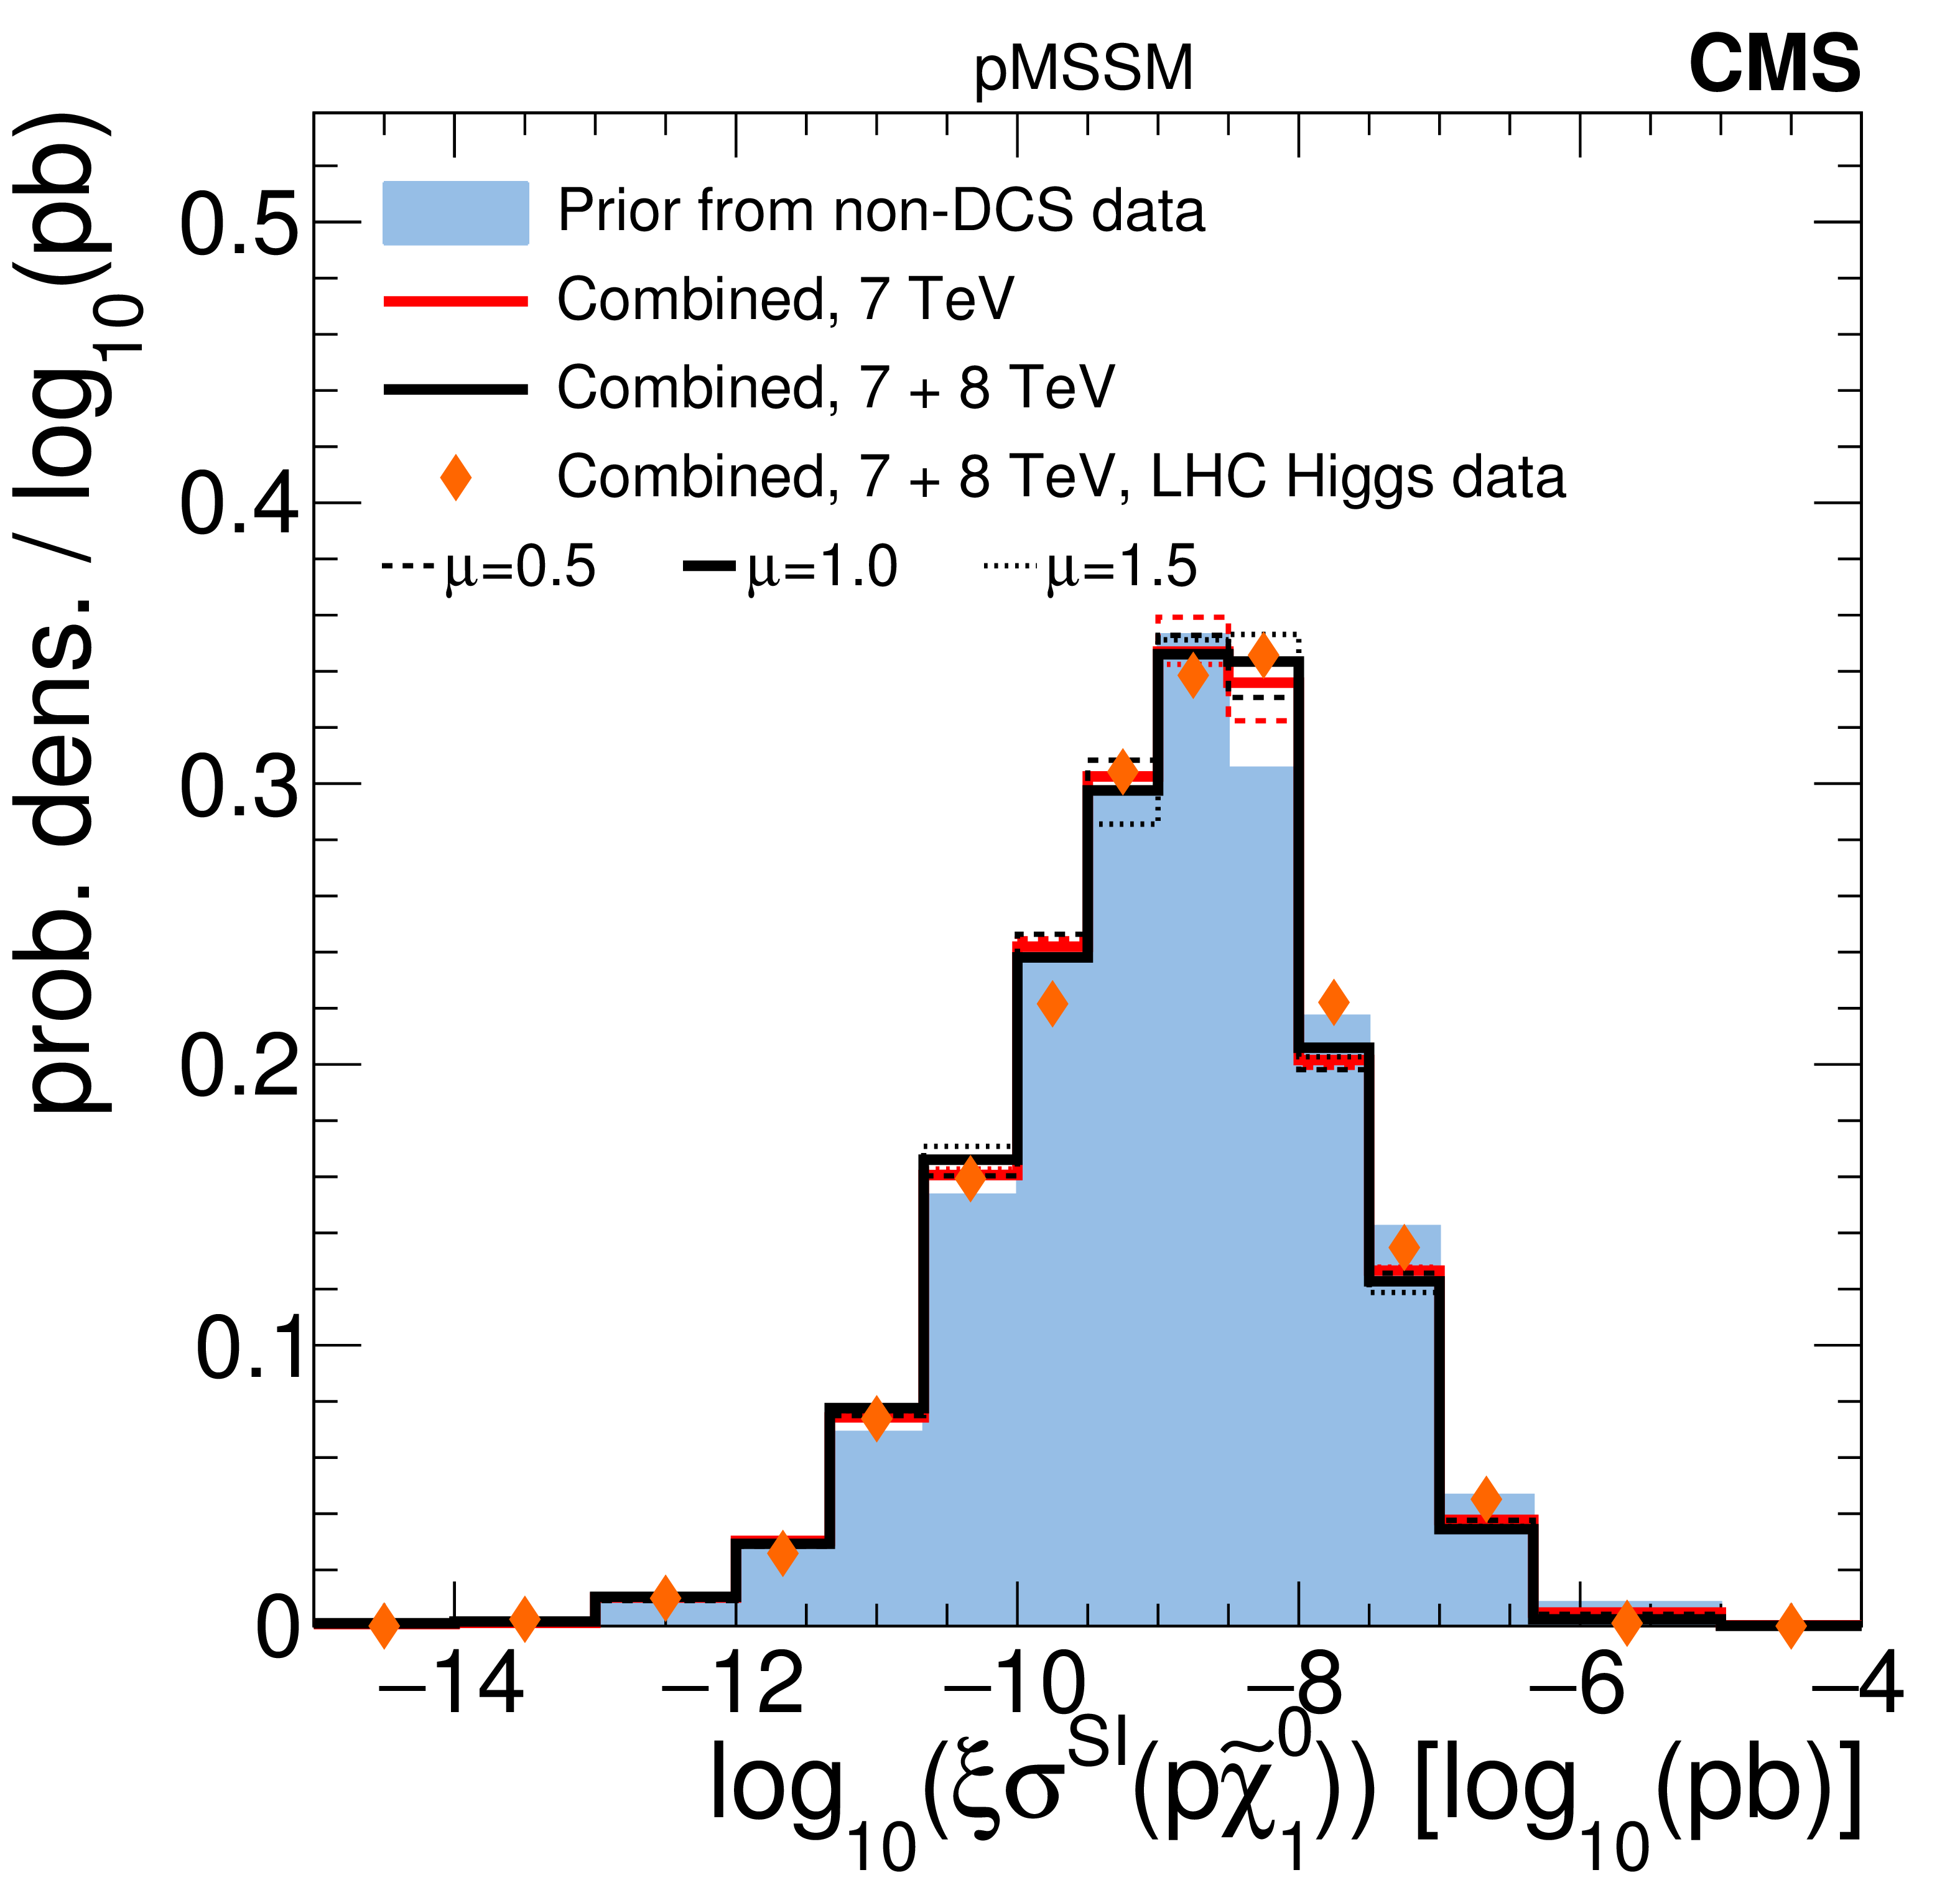
Comparison of prior and posterior distributions after several combinations of data from the CMS searches for $\Omega _{\tilde{\chi}^0 _{1}}$, $\xi \sigma ^{\text {SD}}(p \tilde{\chi}^0_1 )$, and $\xi \sigma ^{\text {SI}}(p \tilde{\chi}^0_1 )$. |

png pdf |
Figure 10-b:
Comparison of prior and posterior distributions after several combinations of data from the CMS searches for $\Omega _{\tilde{\chi}^0 _{1}}$, $\xi \sigma ^{\text {SD}}(p \tilde{\chi}^0_1 )$, and $\xi \sigma ^{\text {SI}}(p \tilde{\chi}^0_1 )$. |
png pdf |
Figure 10-c:
Comparison of prior and posterior distributions after several combinations of data from the CMS searches for $\Omega _{\tilde{\chi}^0 _{1}}$, $\xi \sigma ^{\text {SD}}(p \tilde{\chi}^0_1 )$, and $\xi \sigma ^{\text {SI}}(p \tilde{\chi}^0_1 )$. |
png pdf |
Figure 11-a:
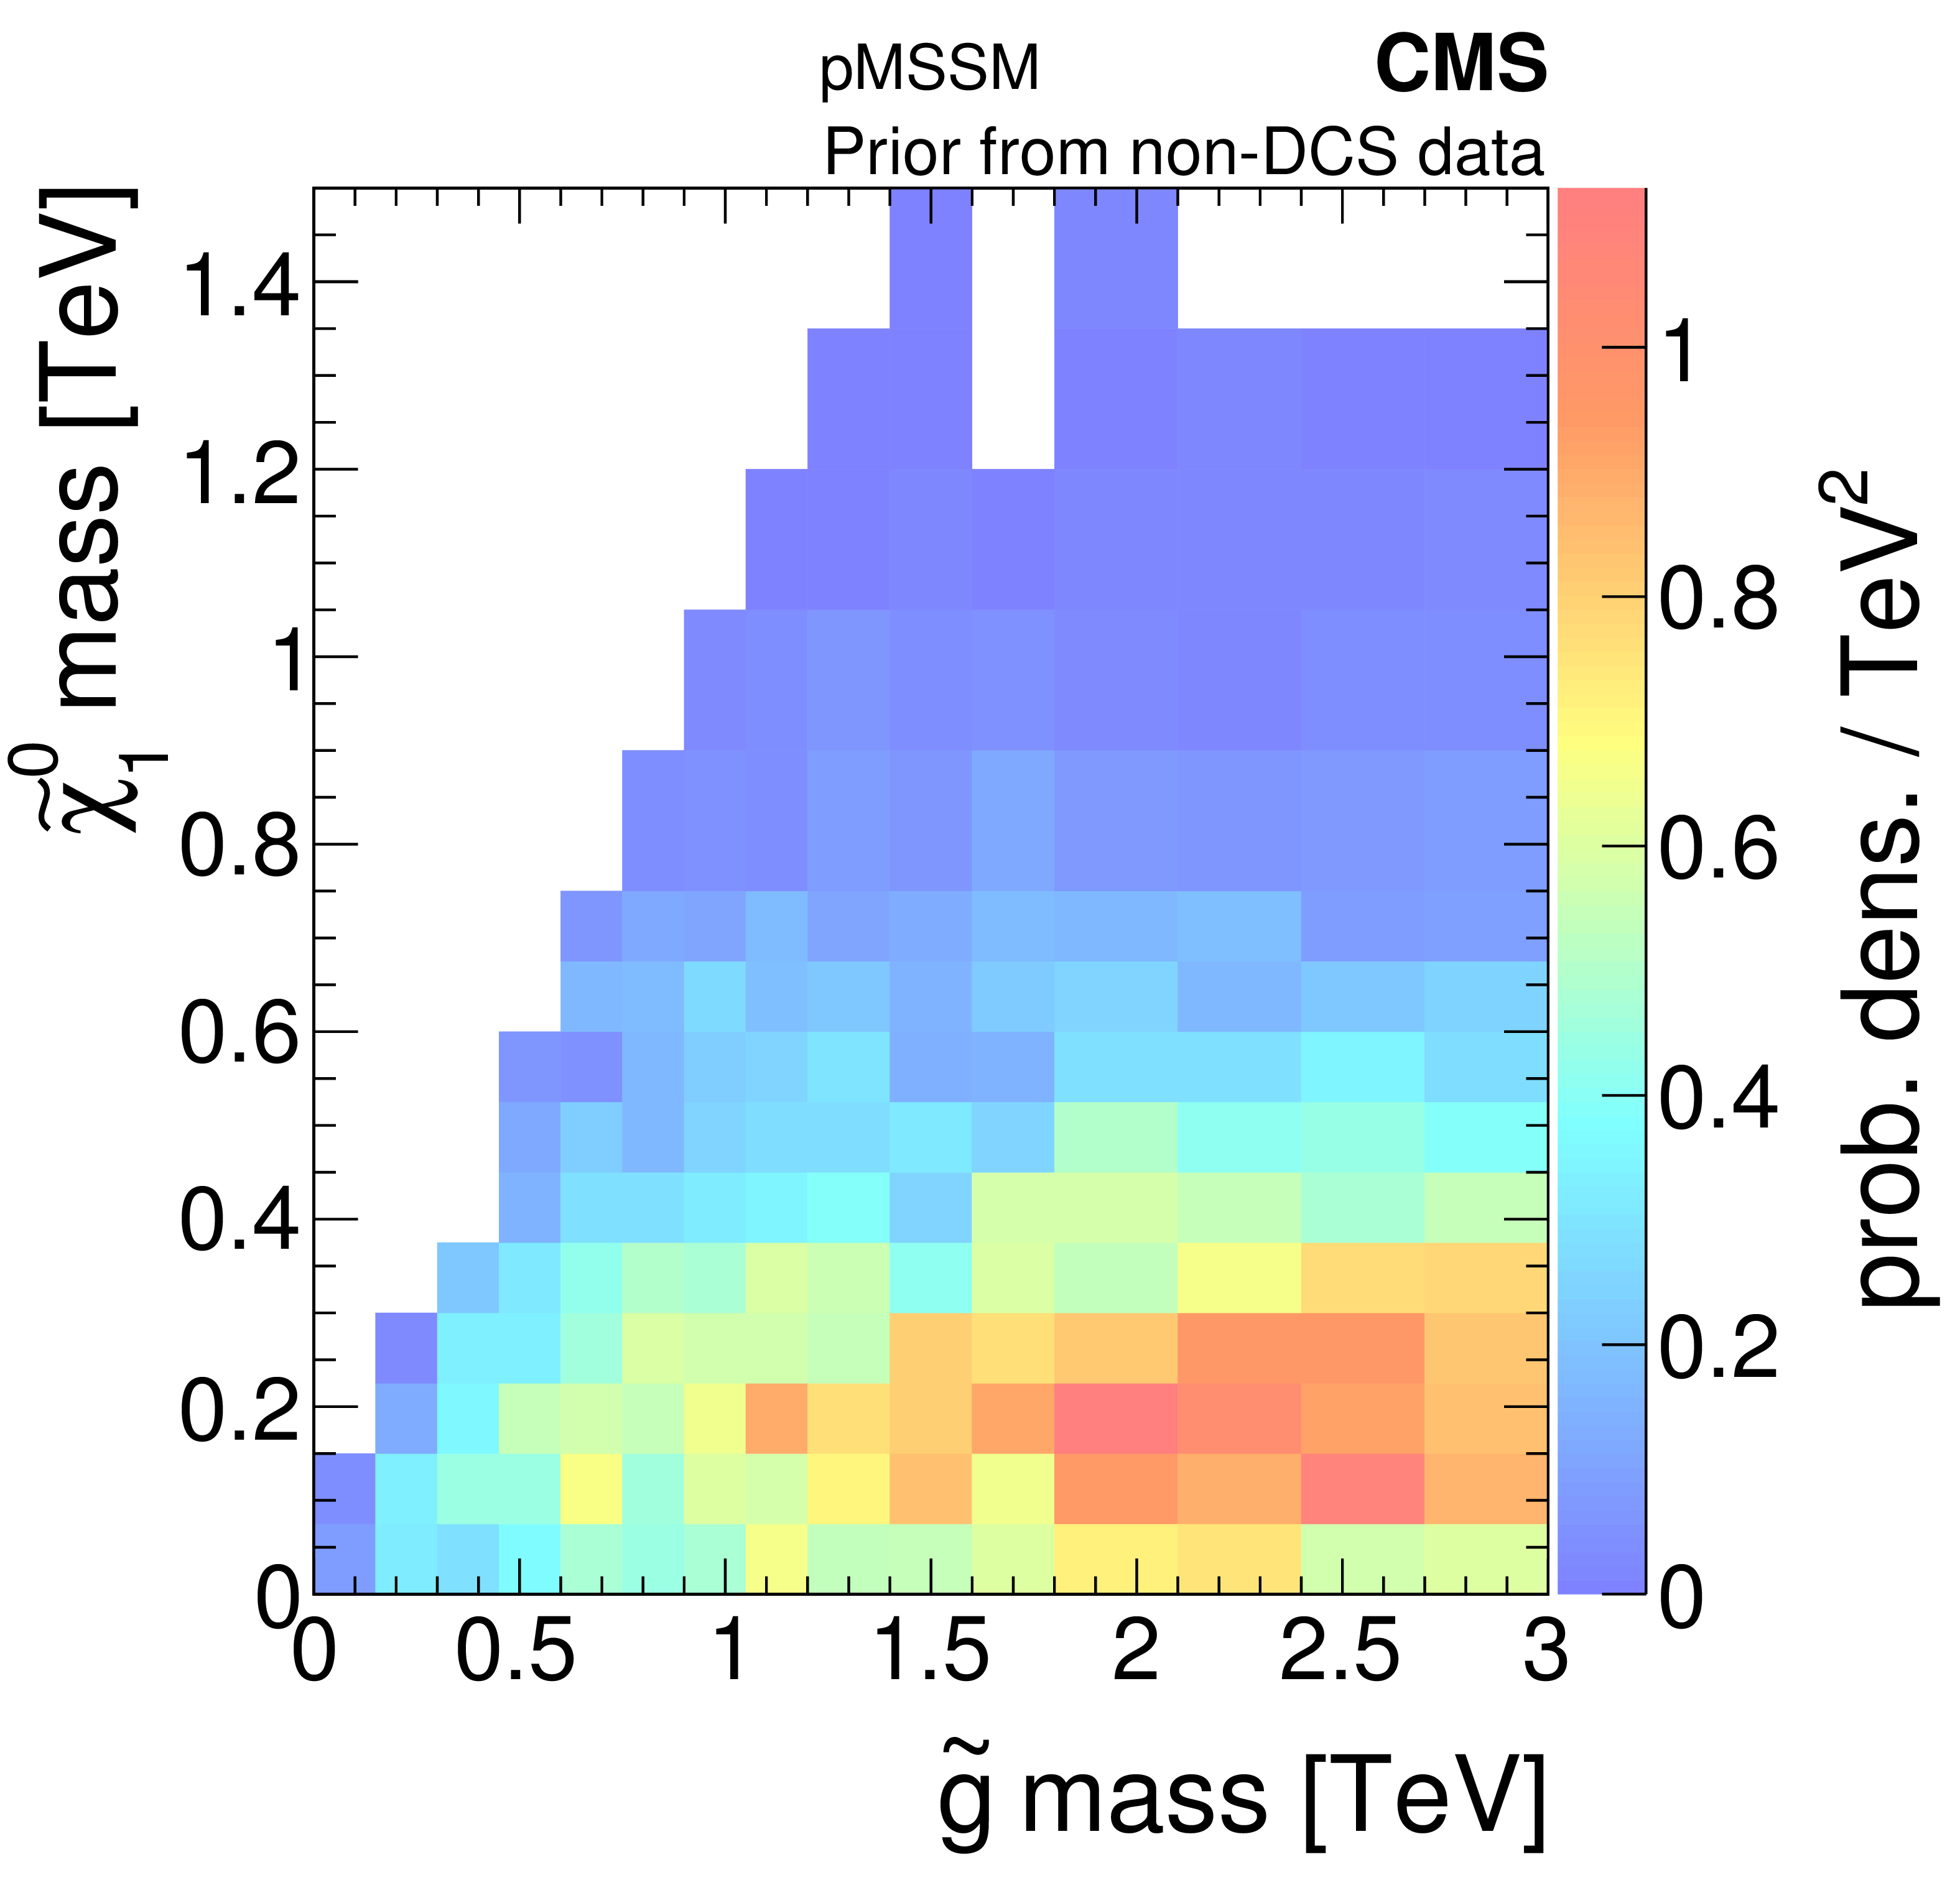
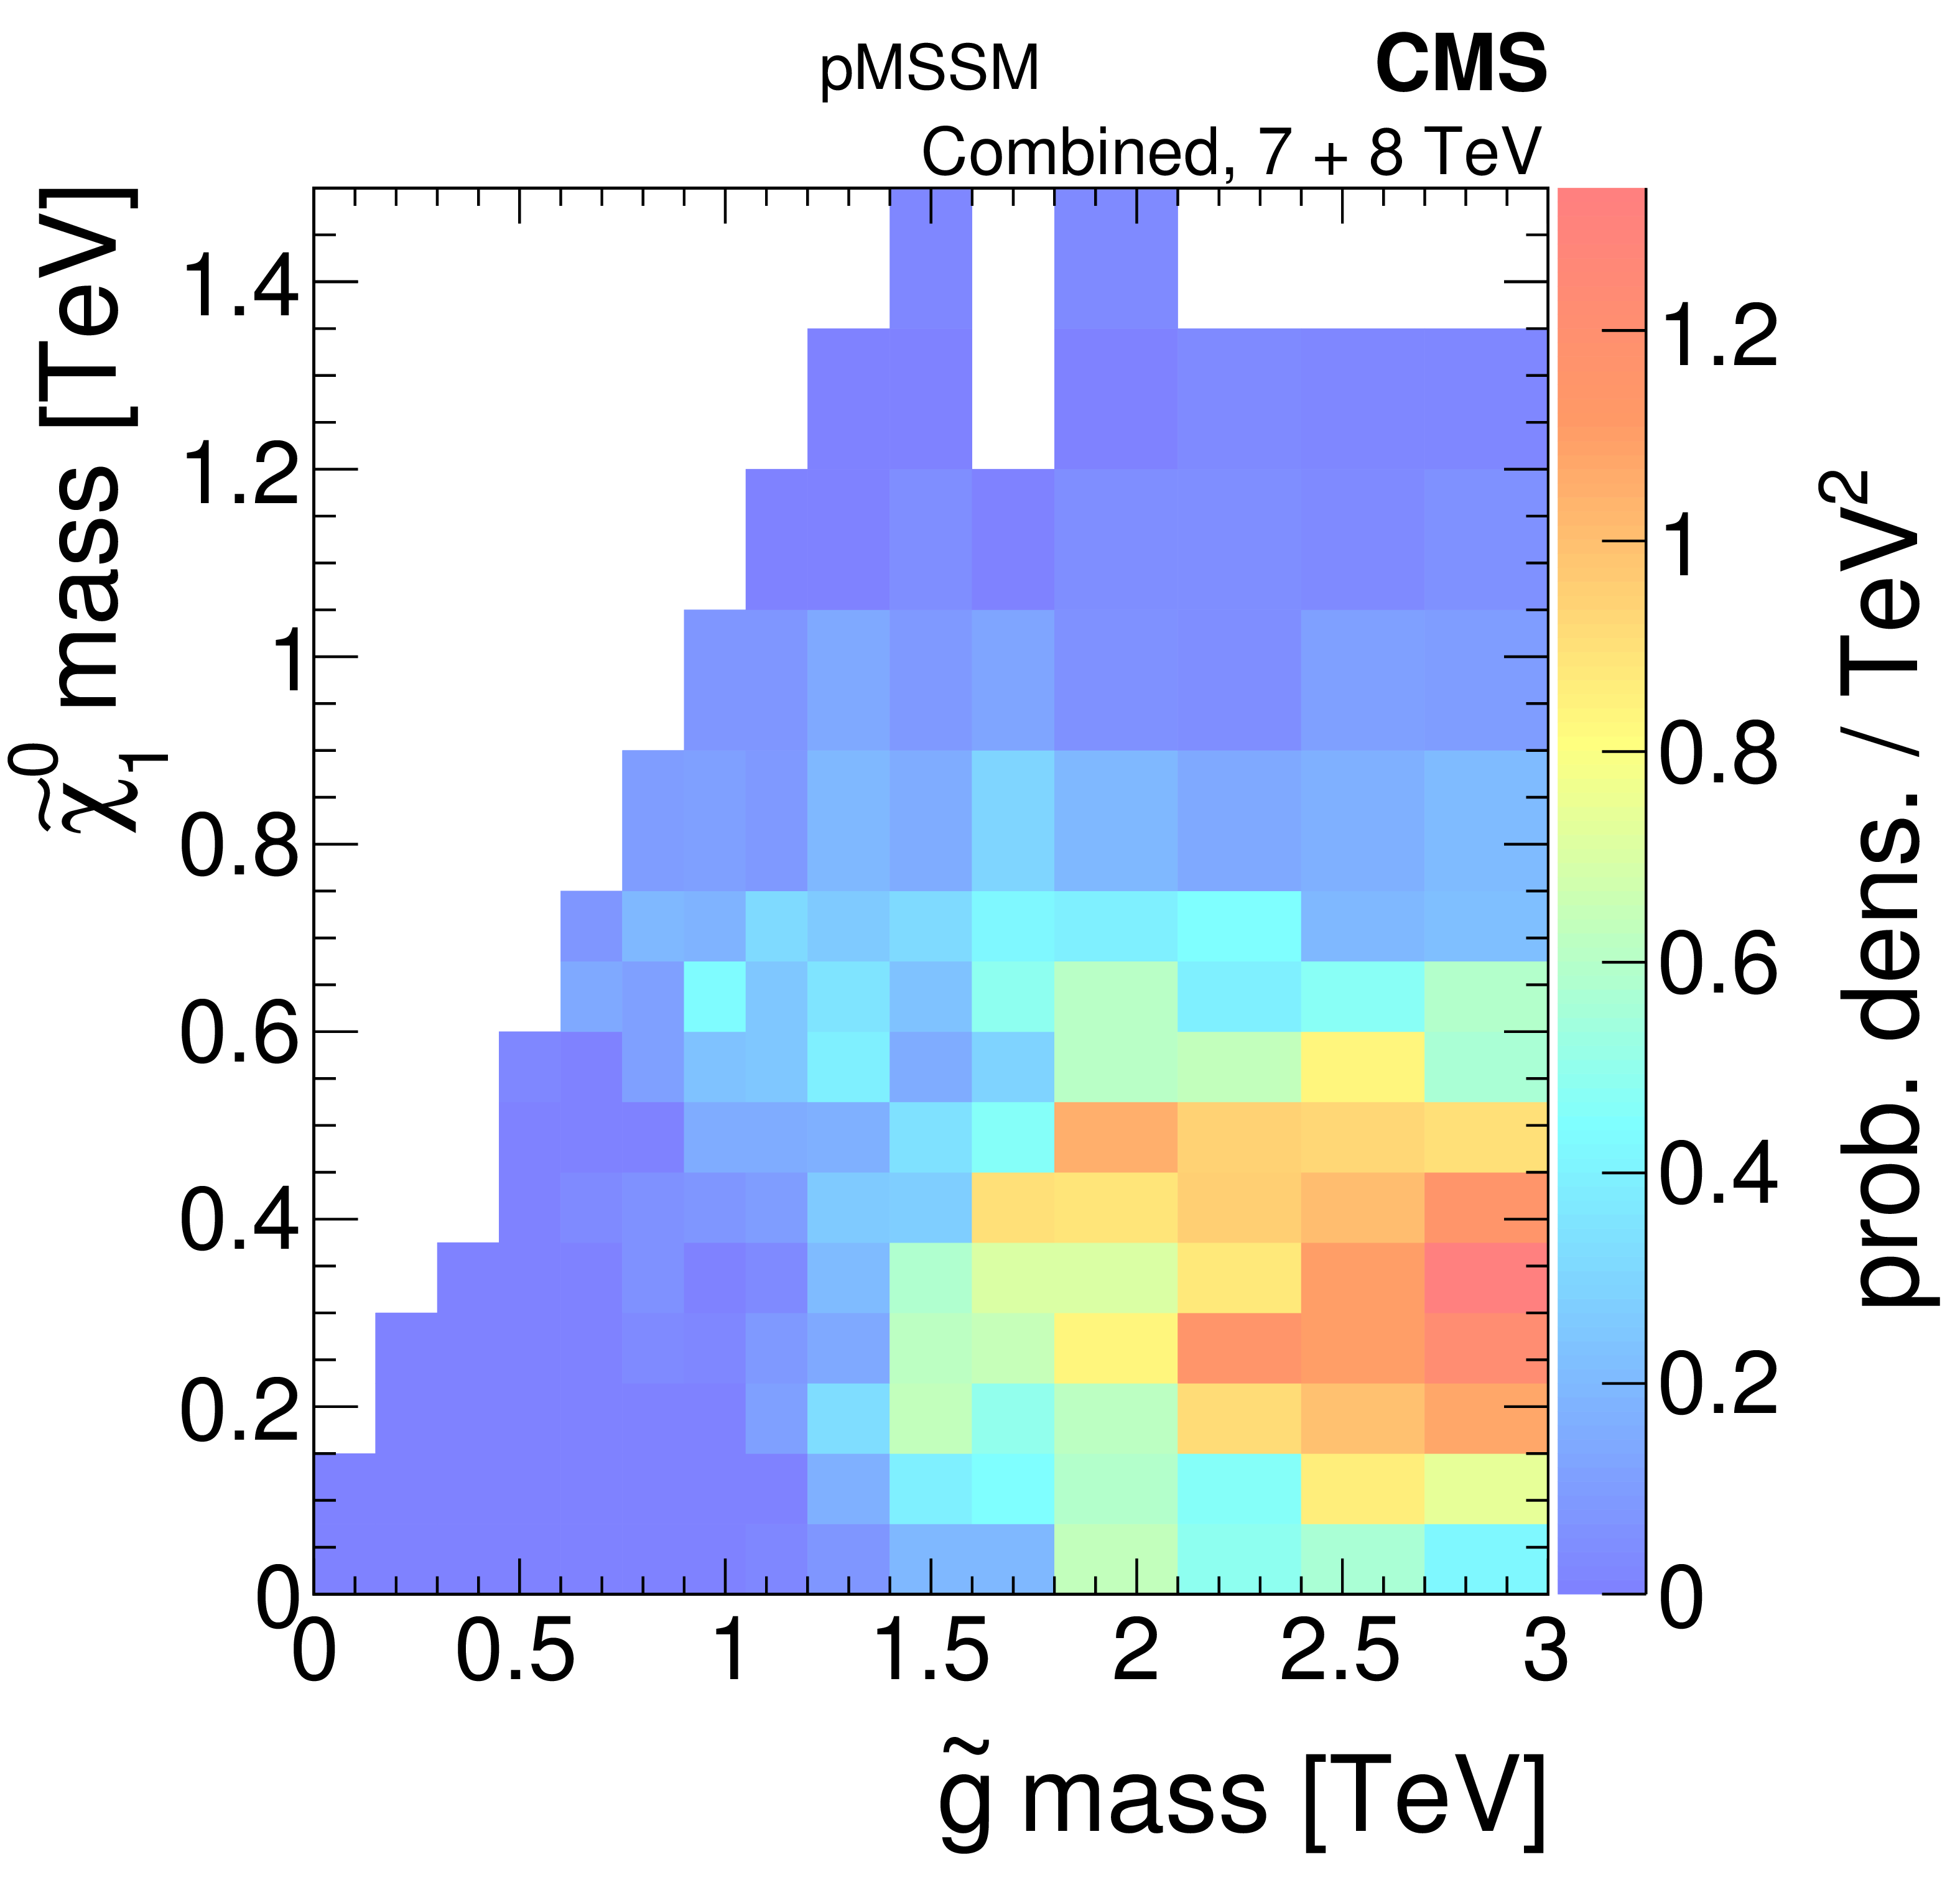
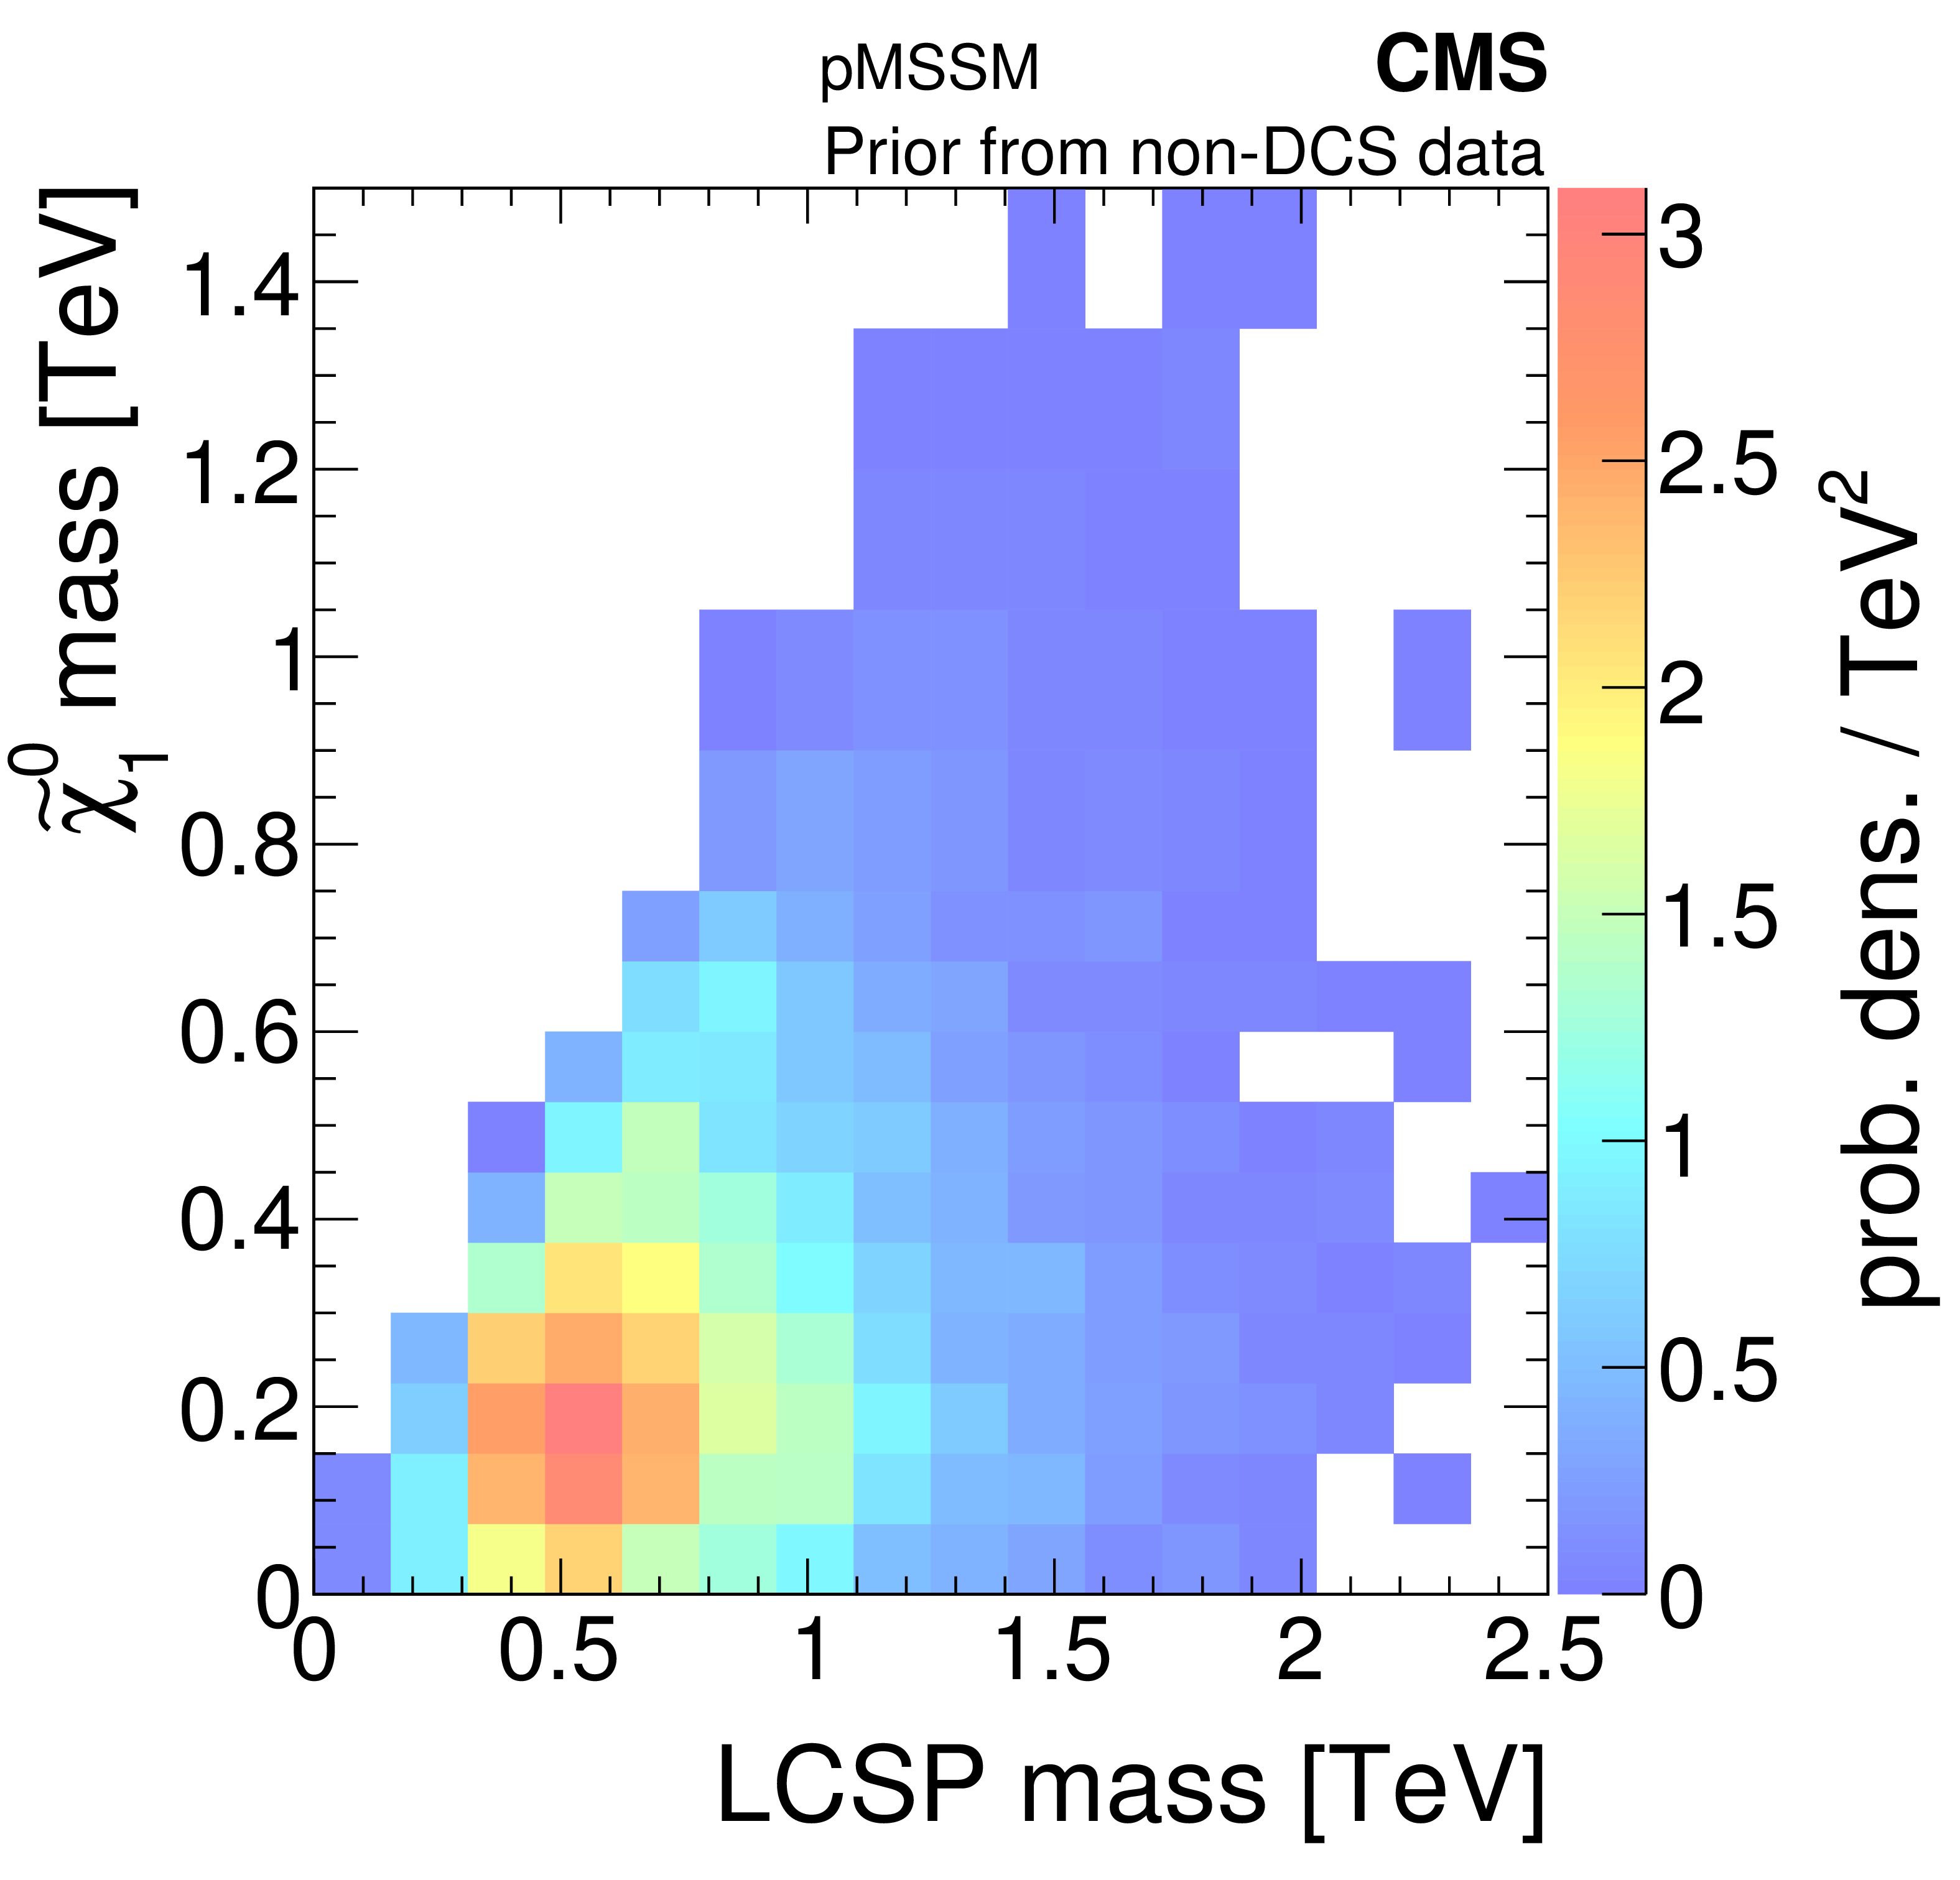
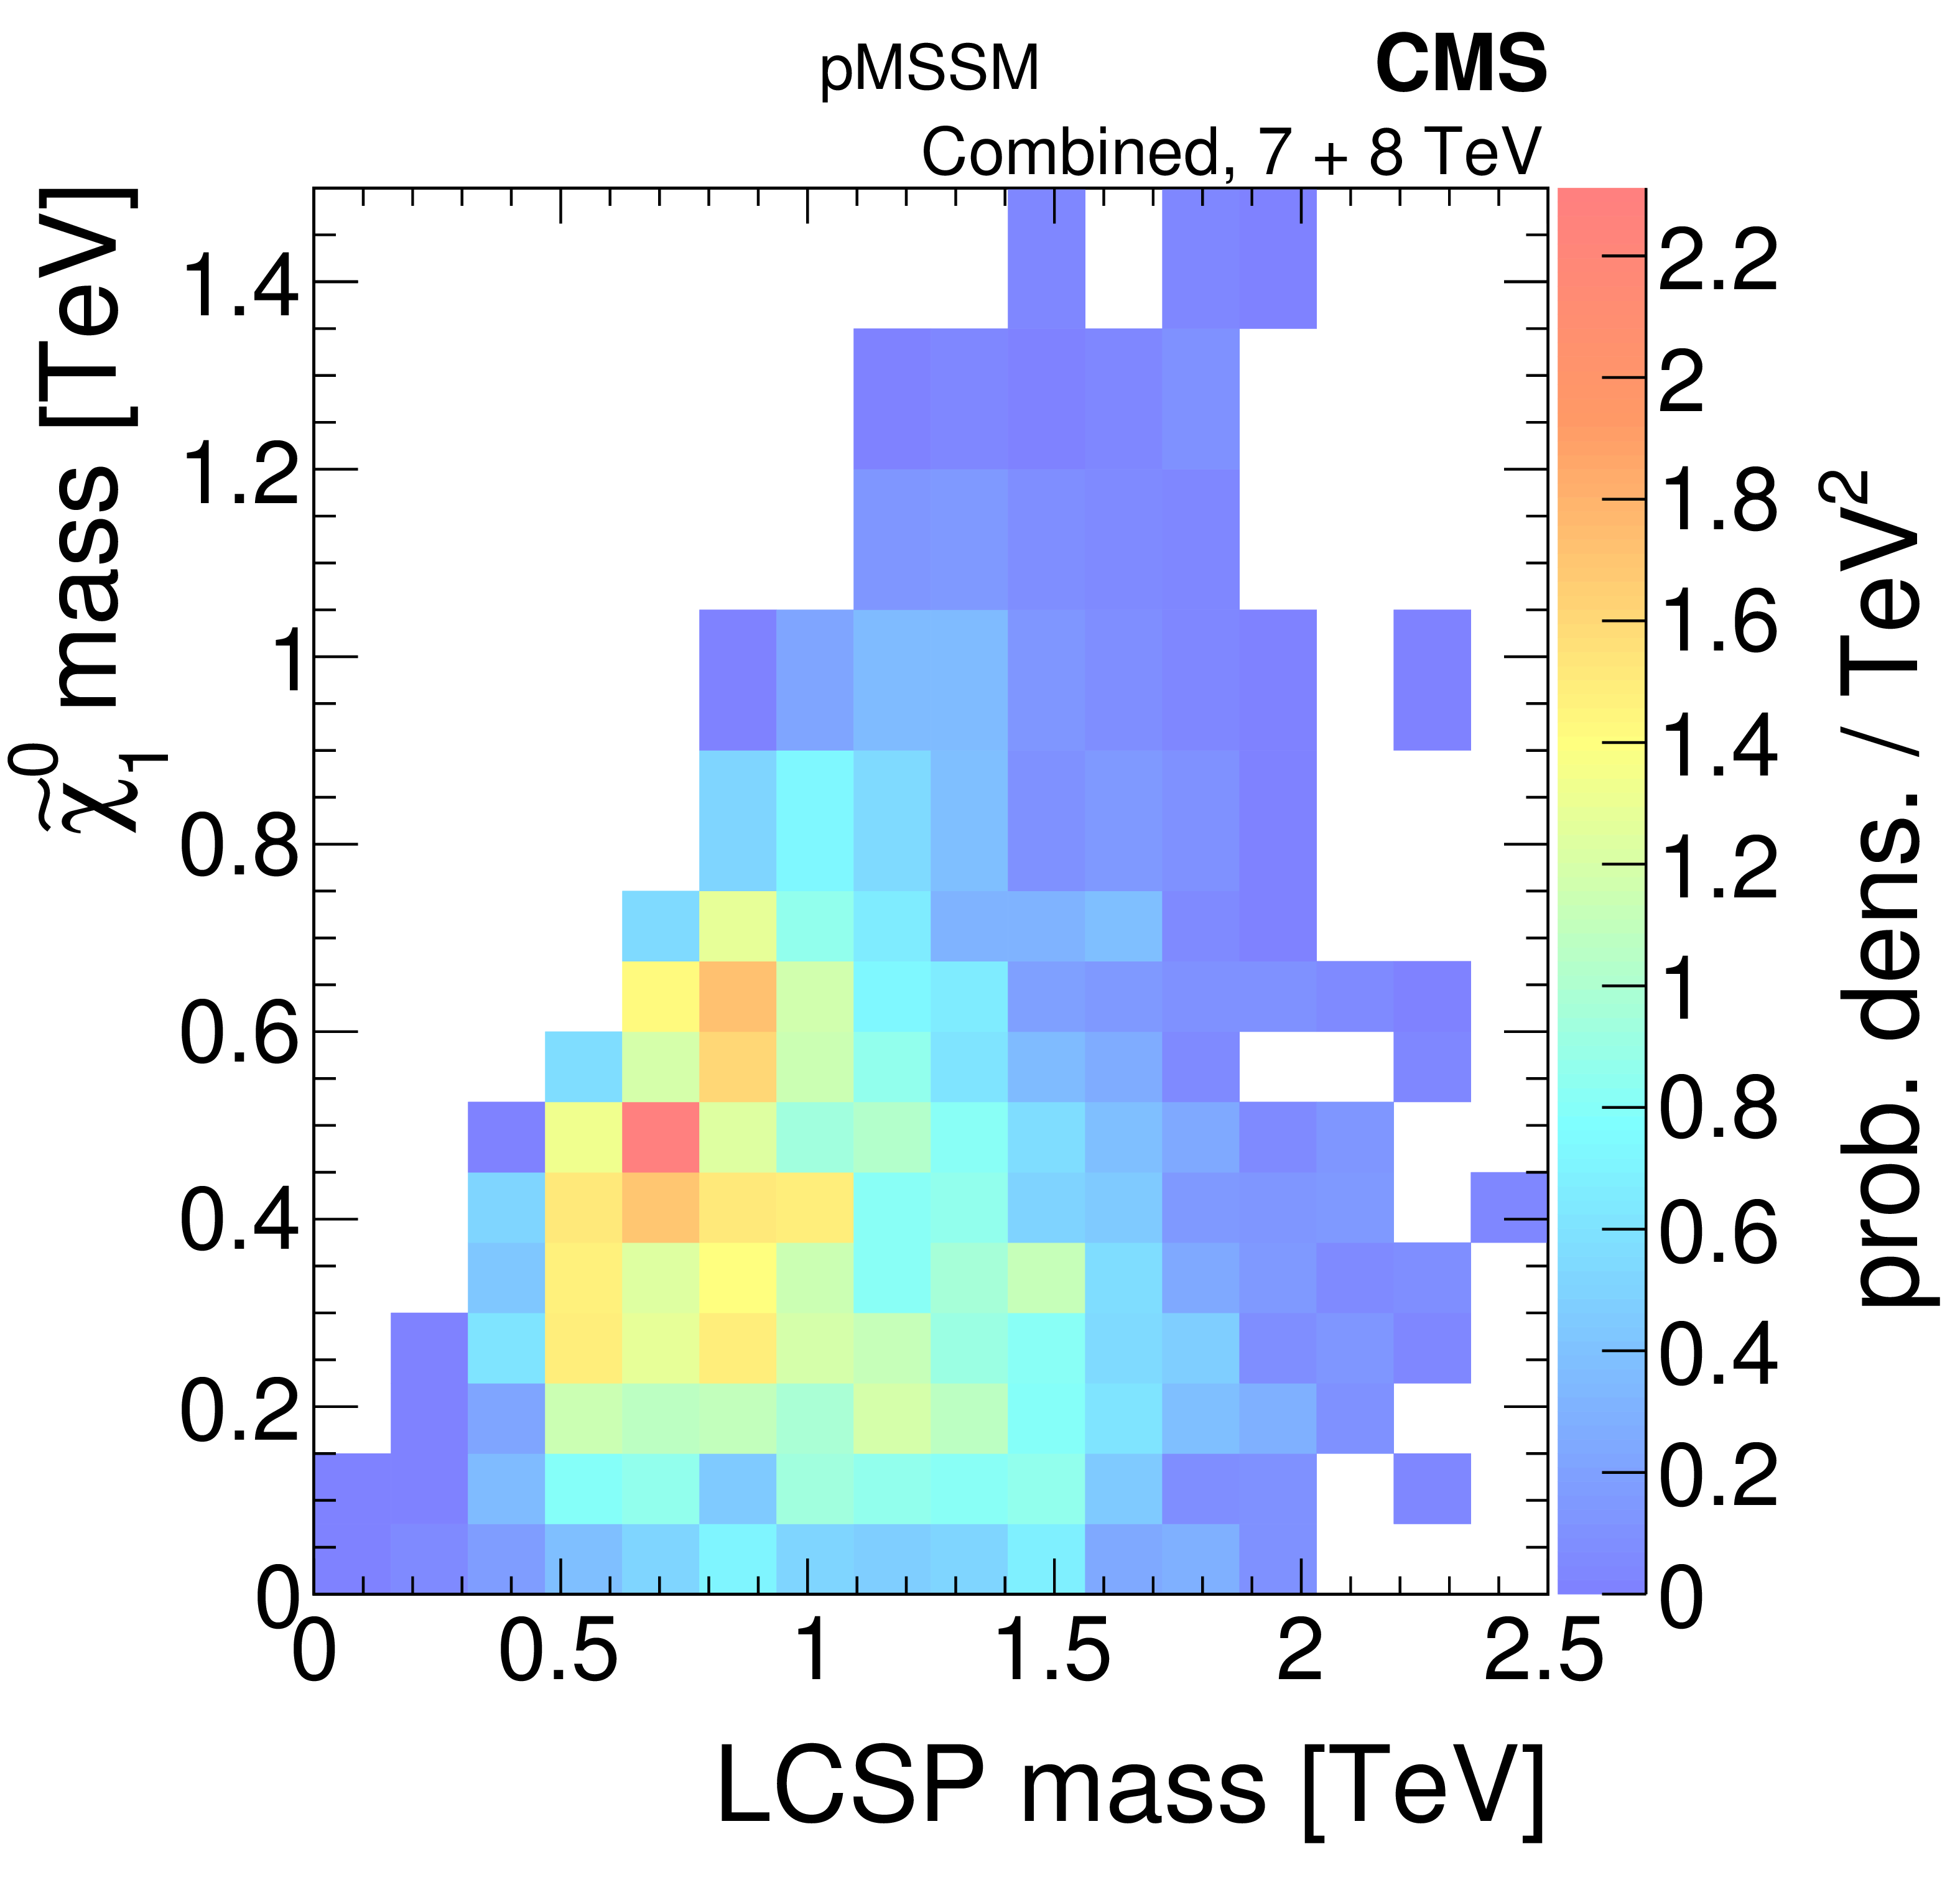
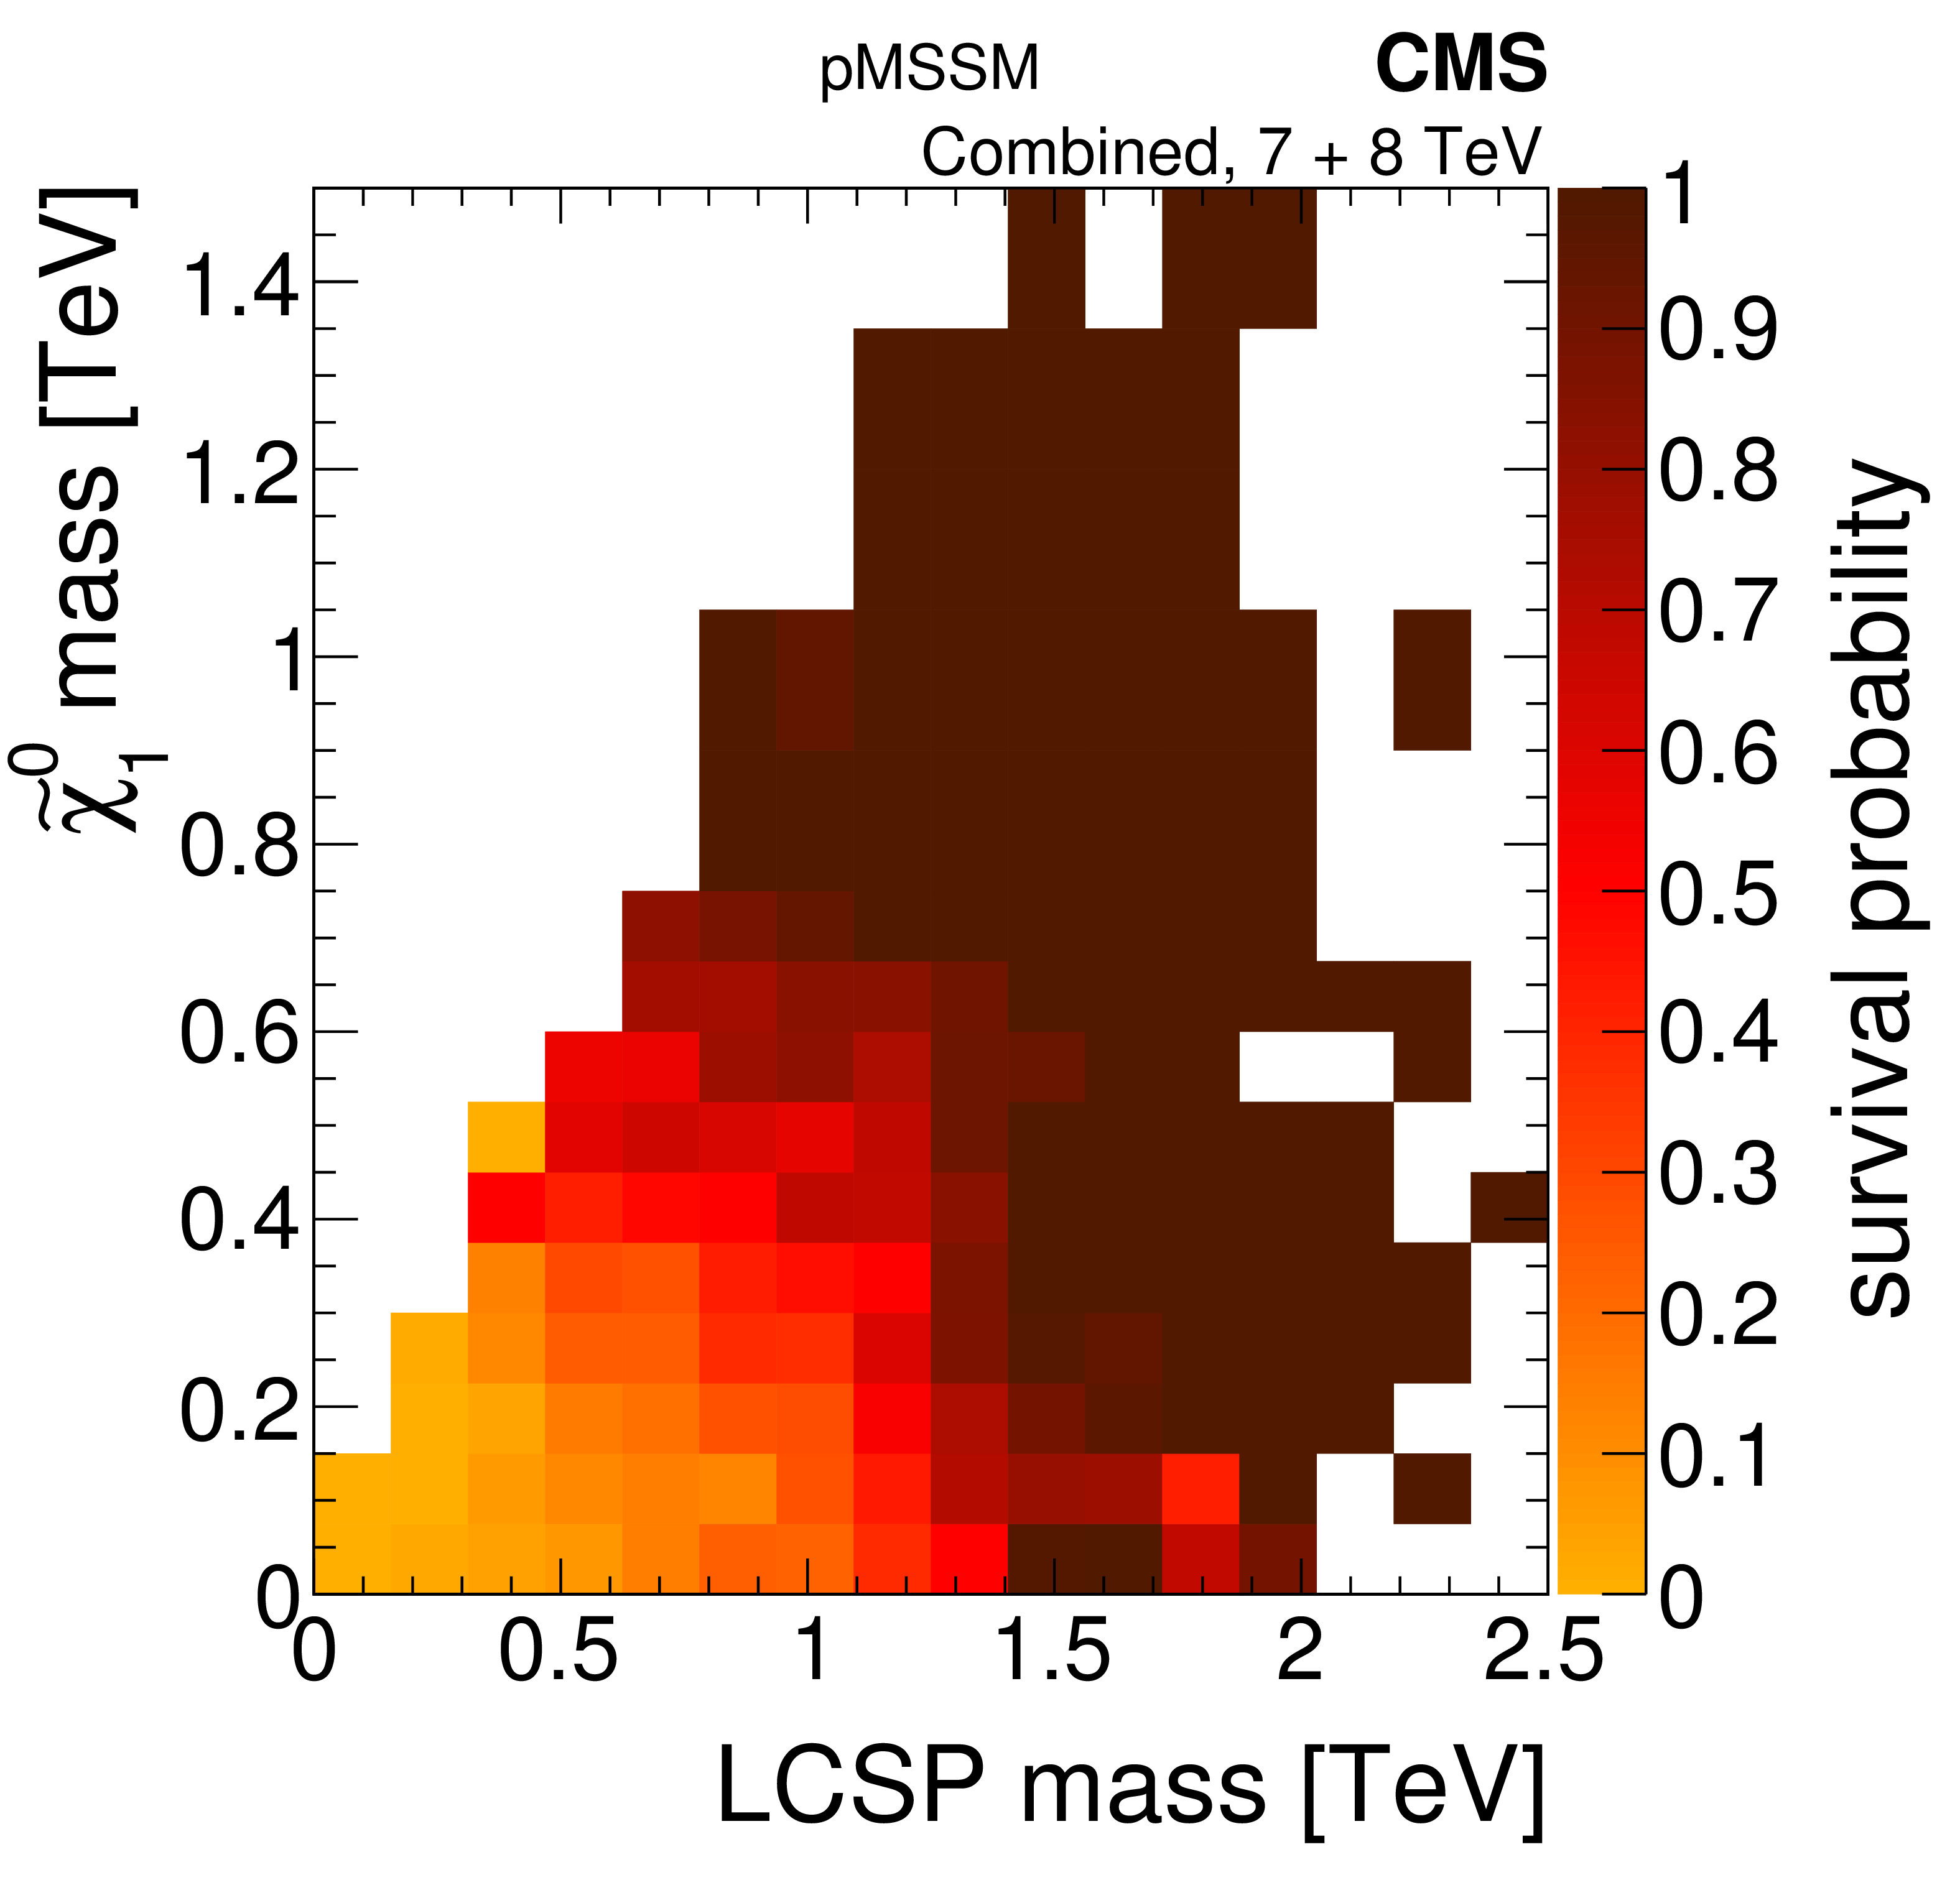
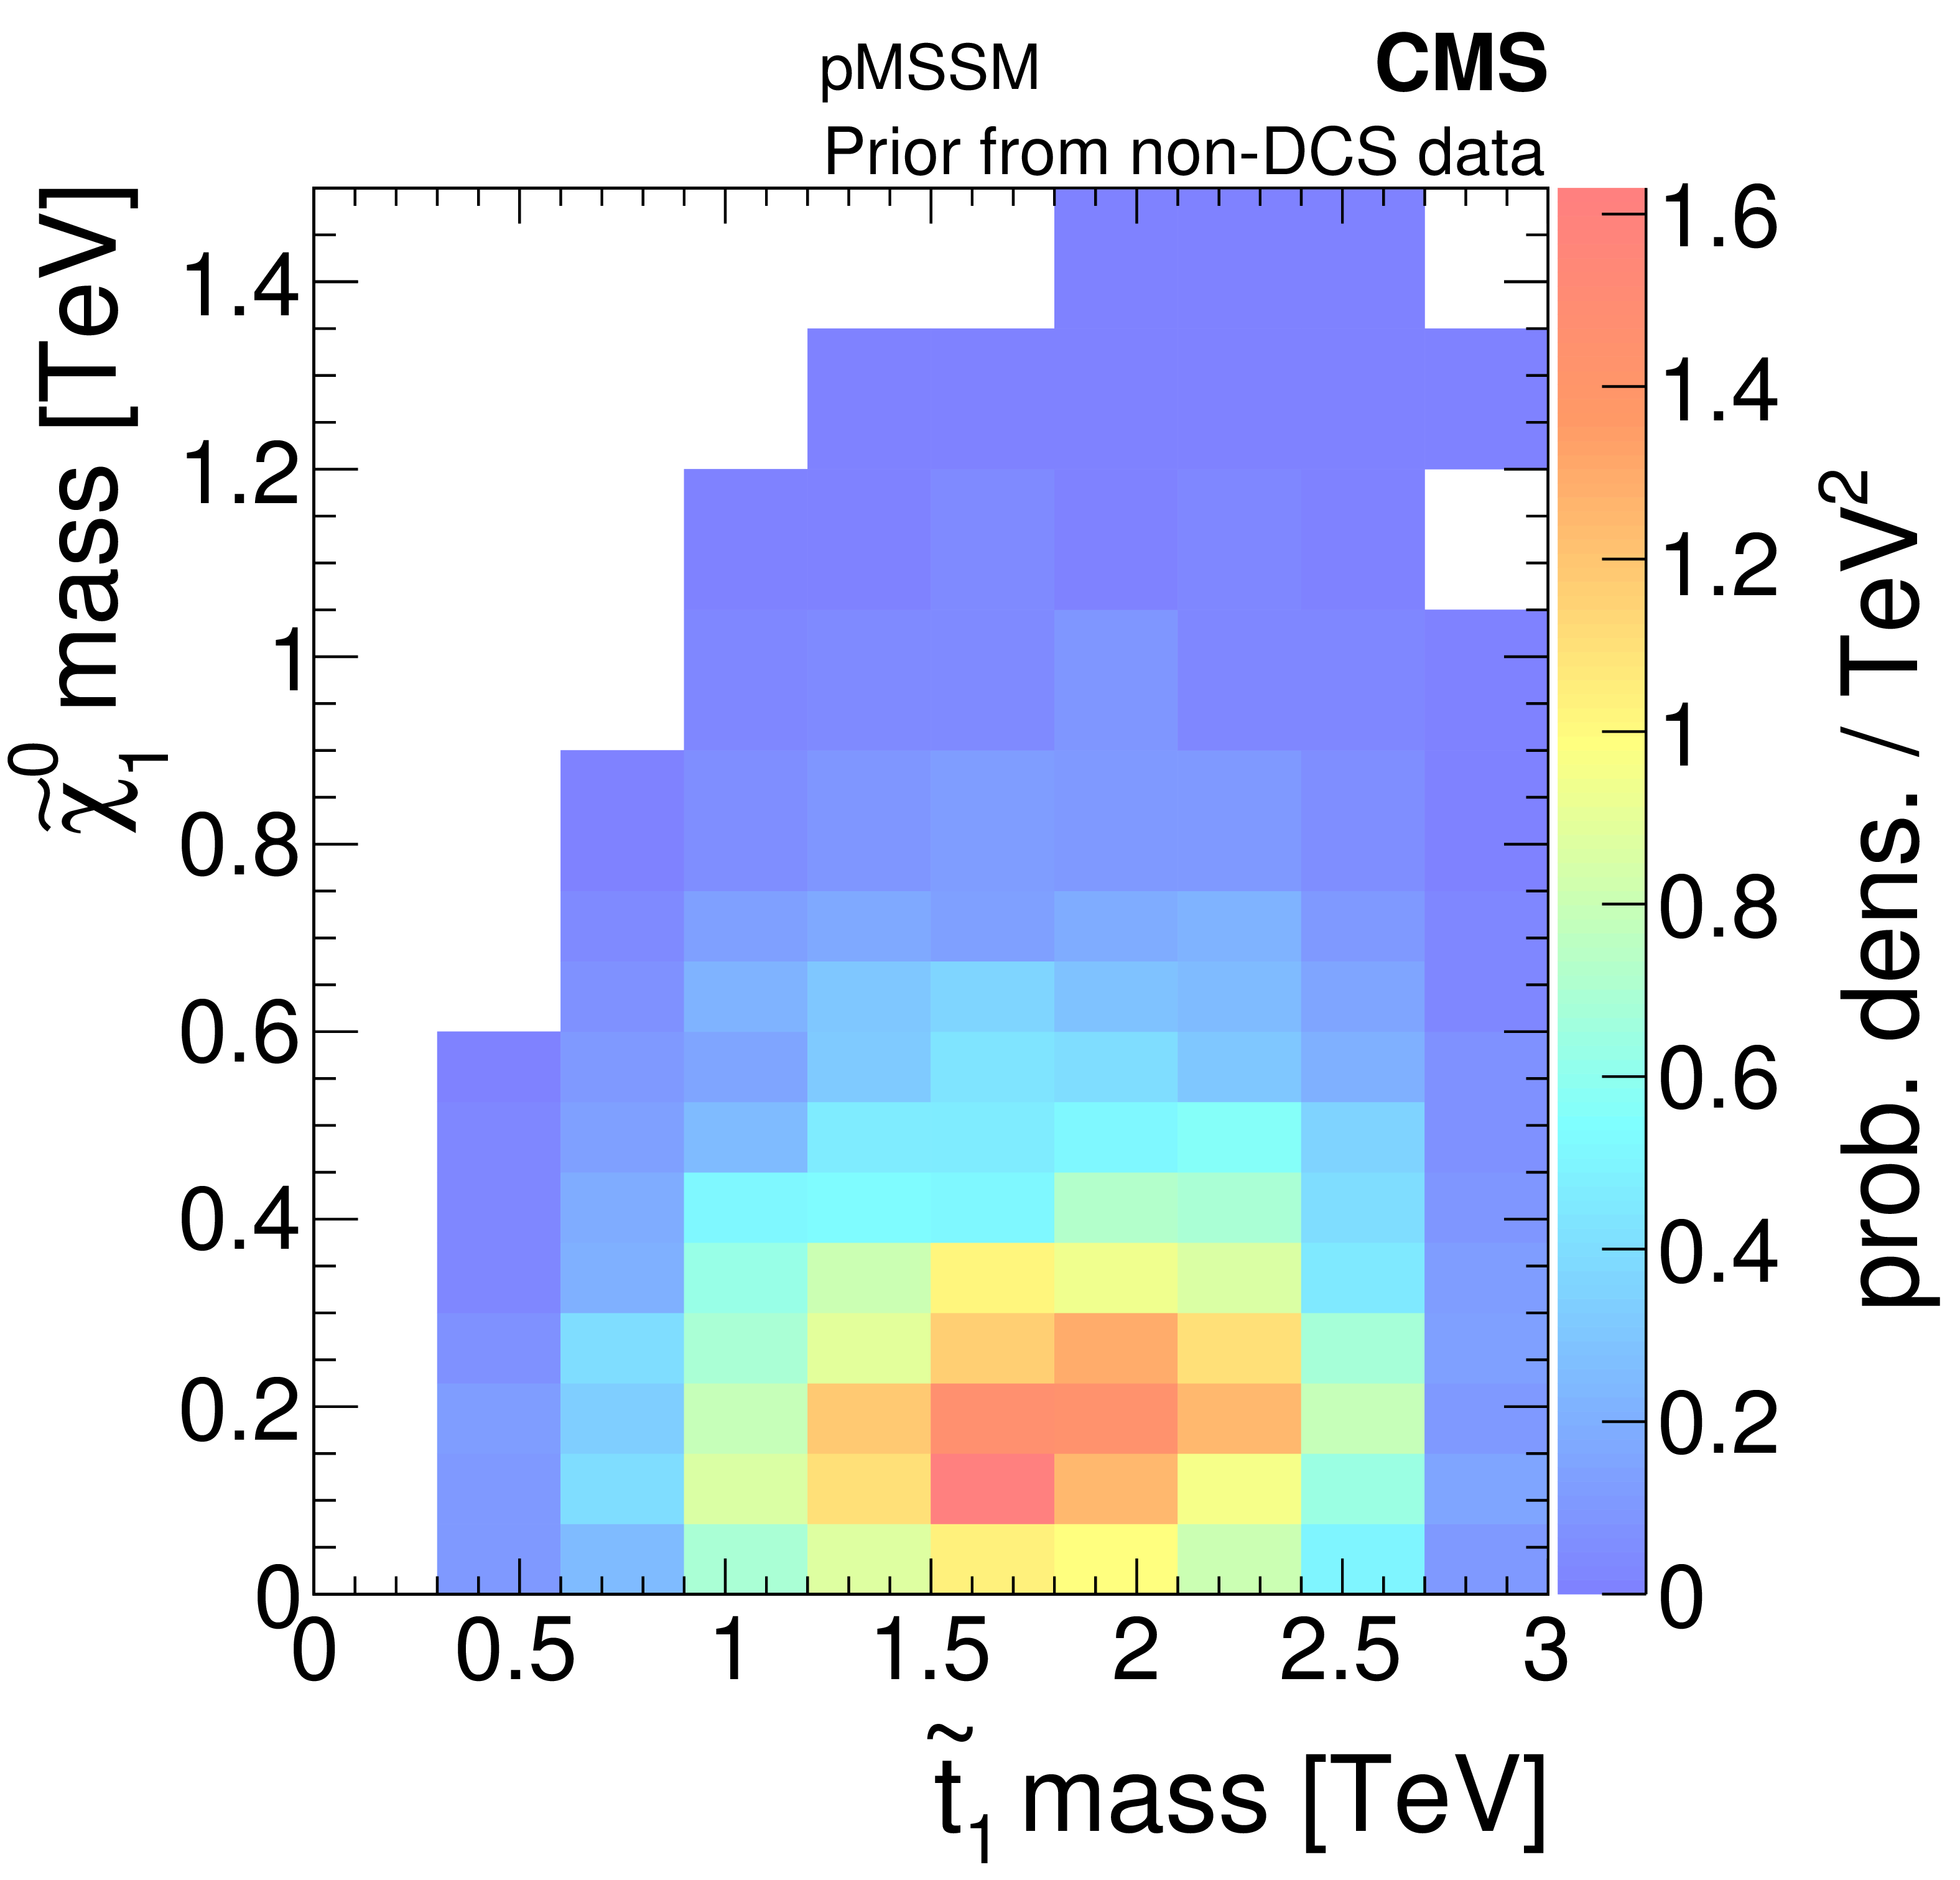
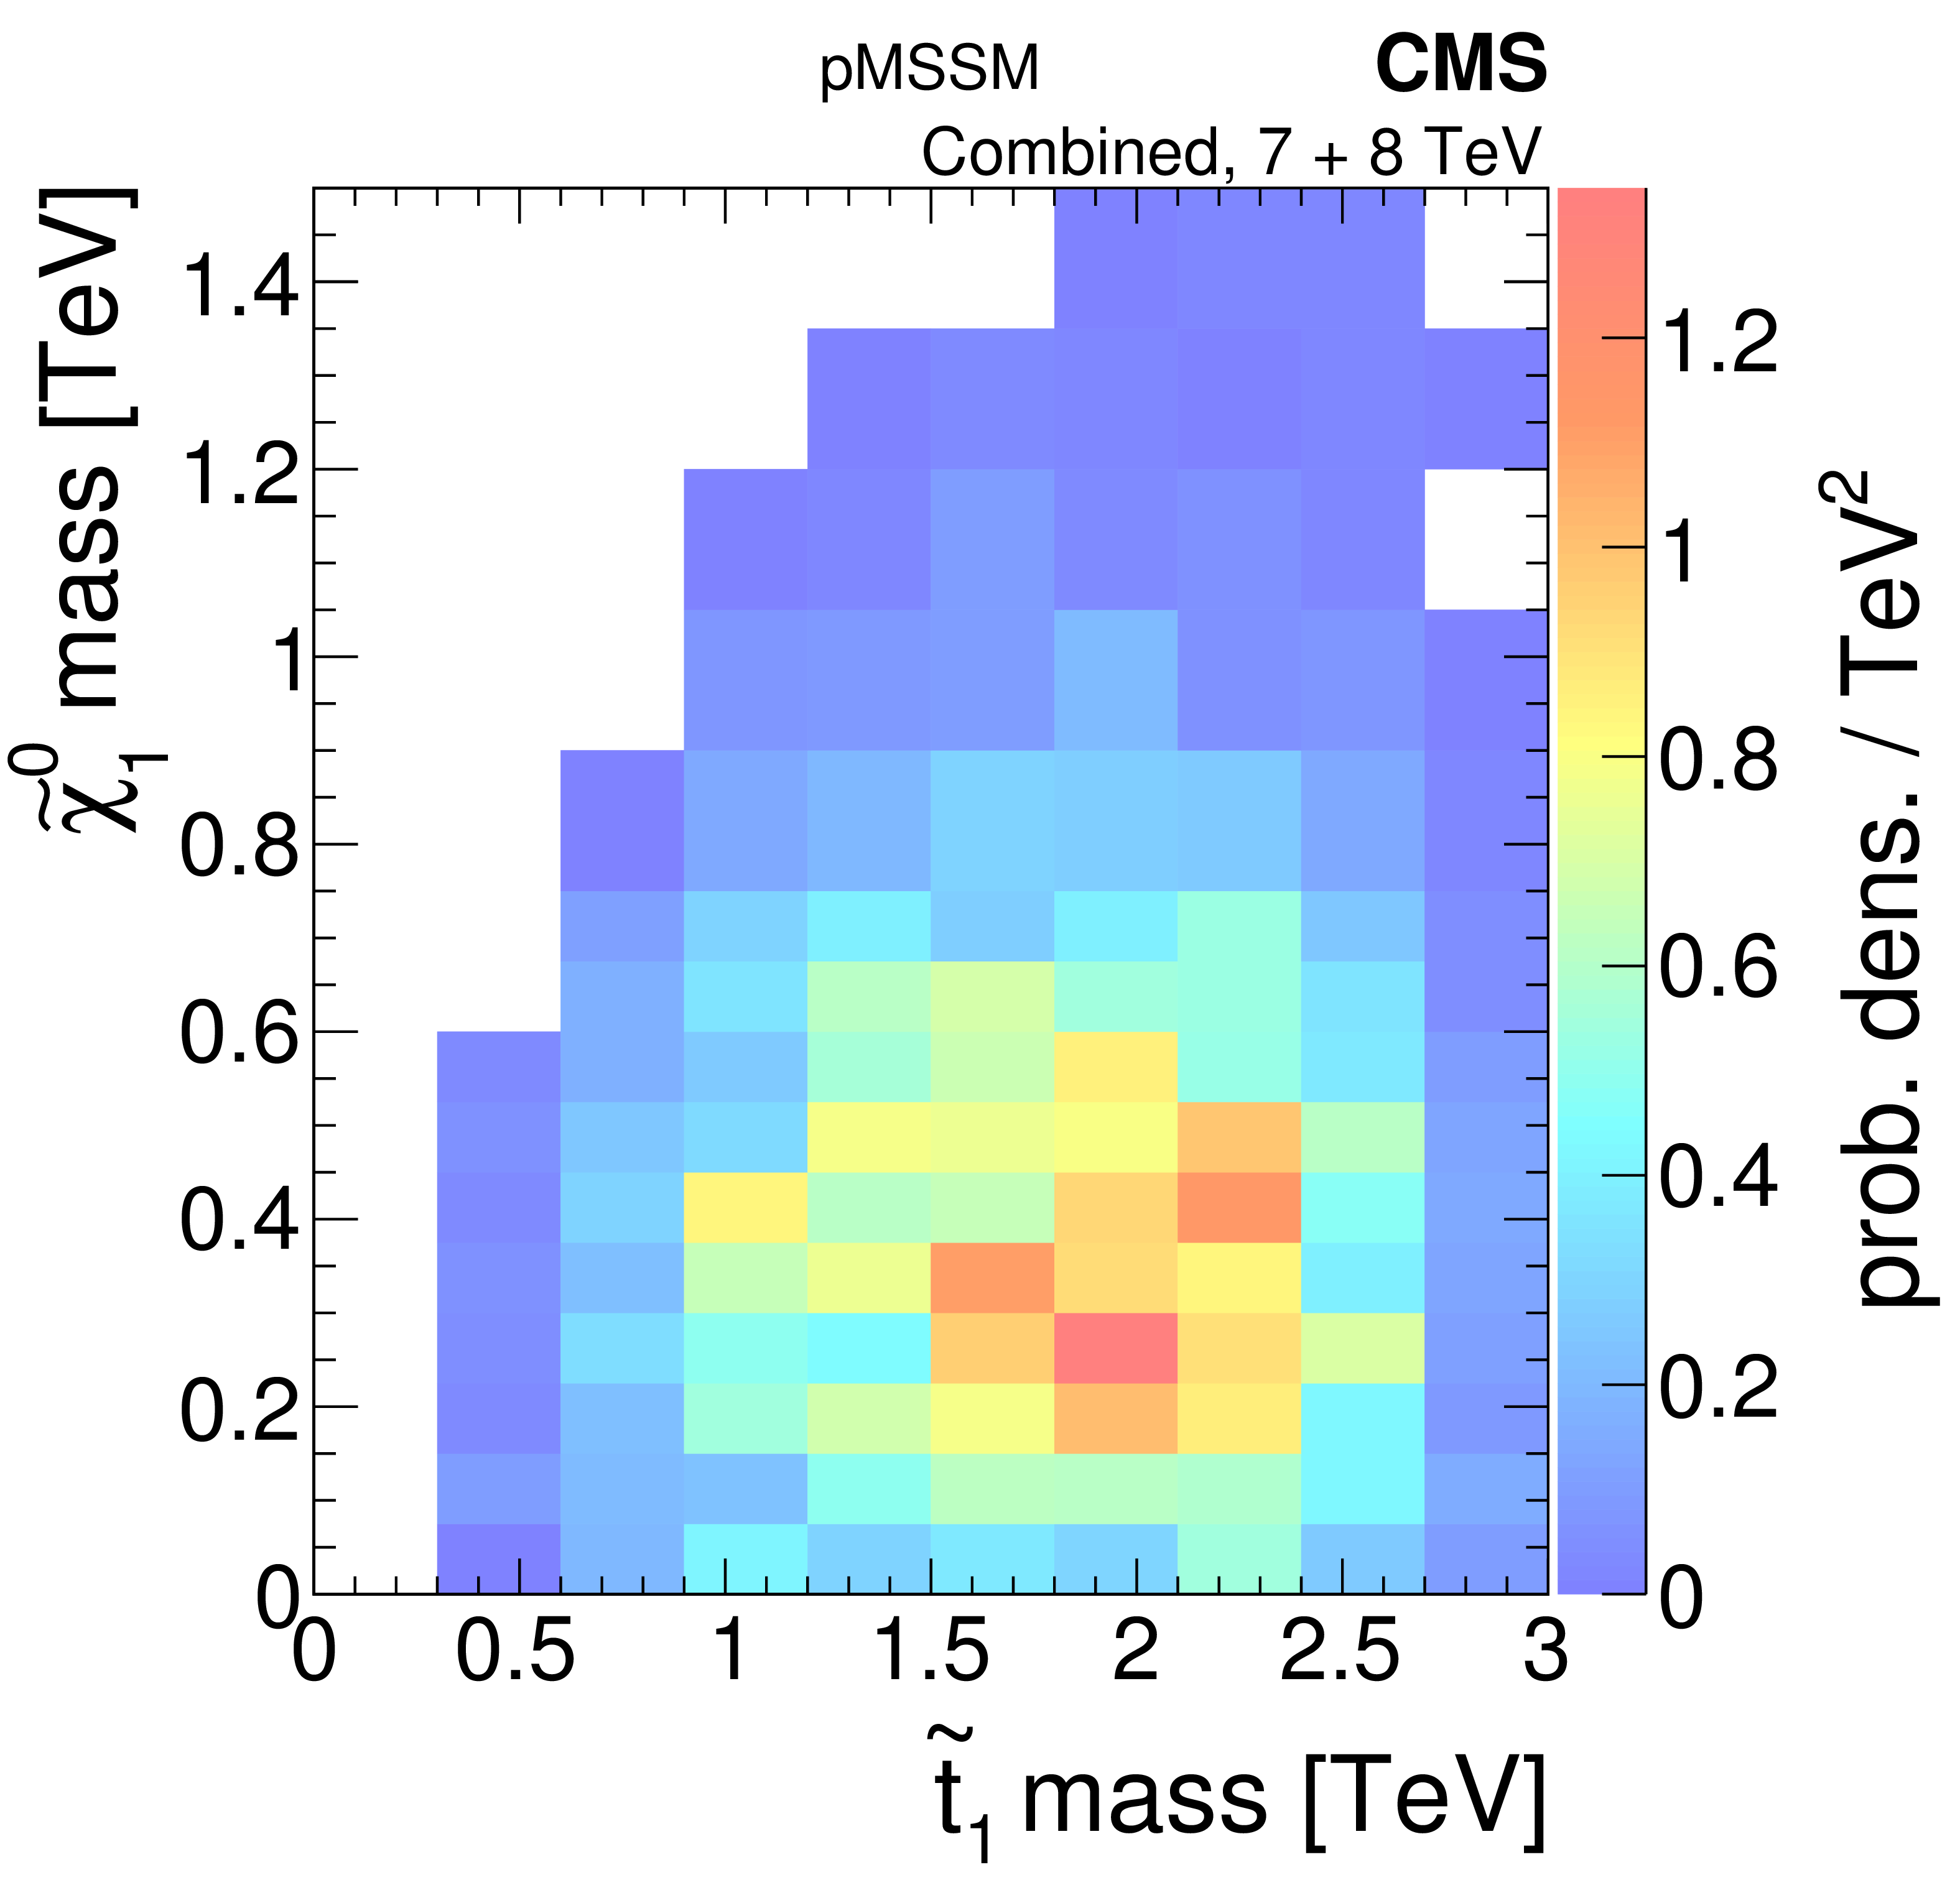
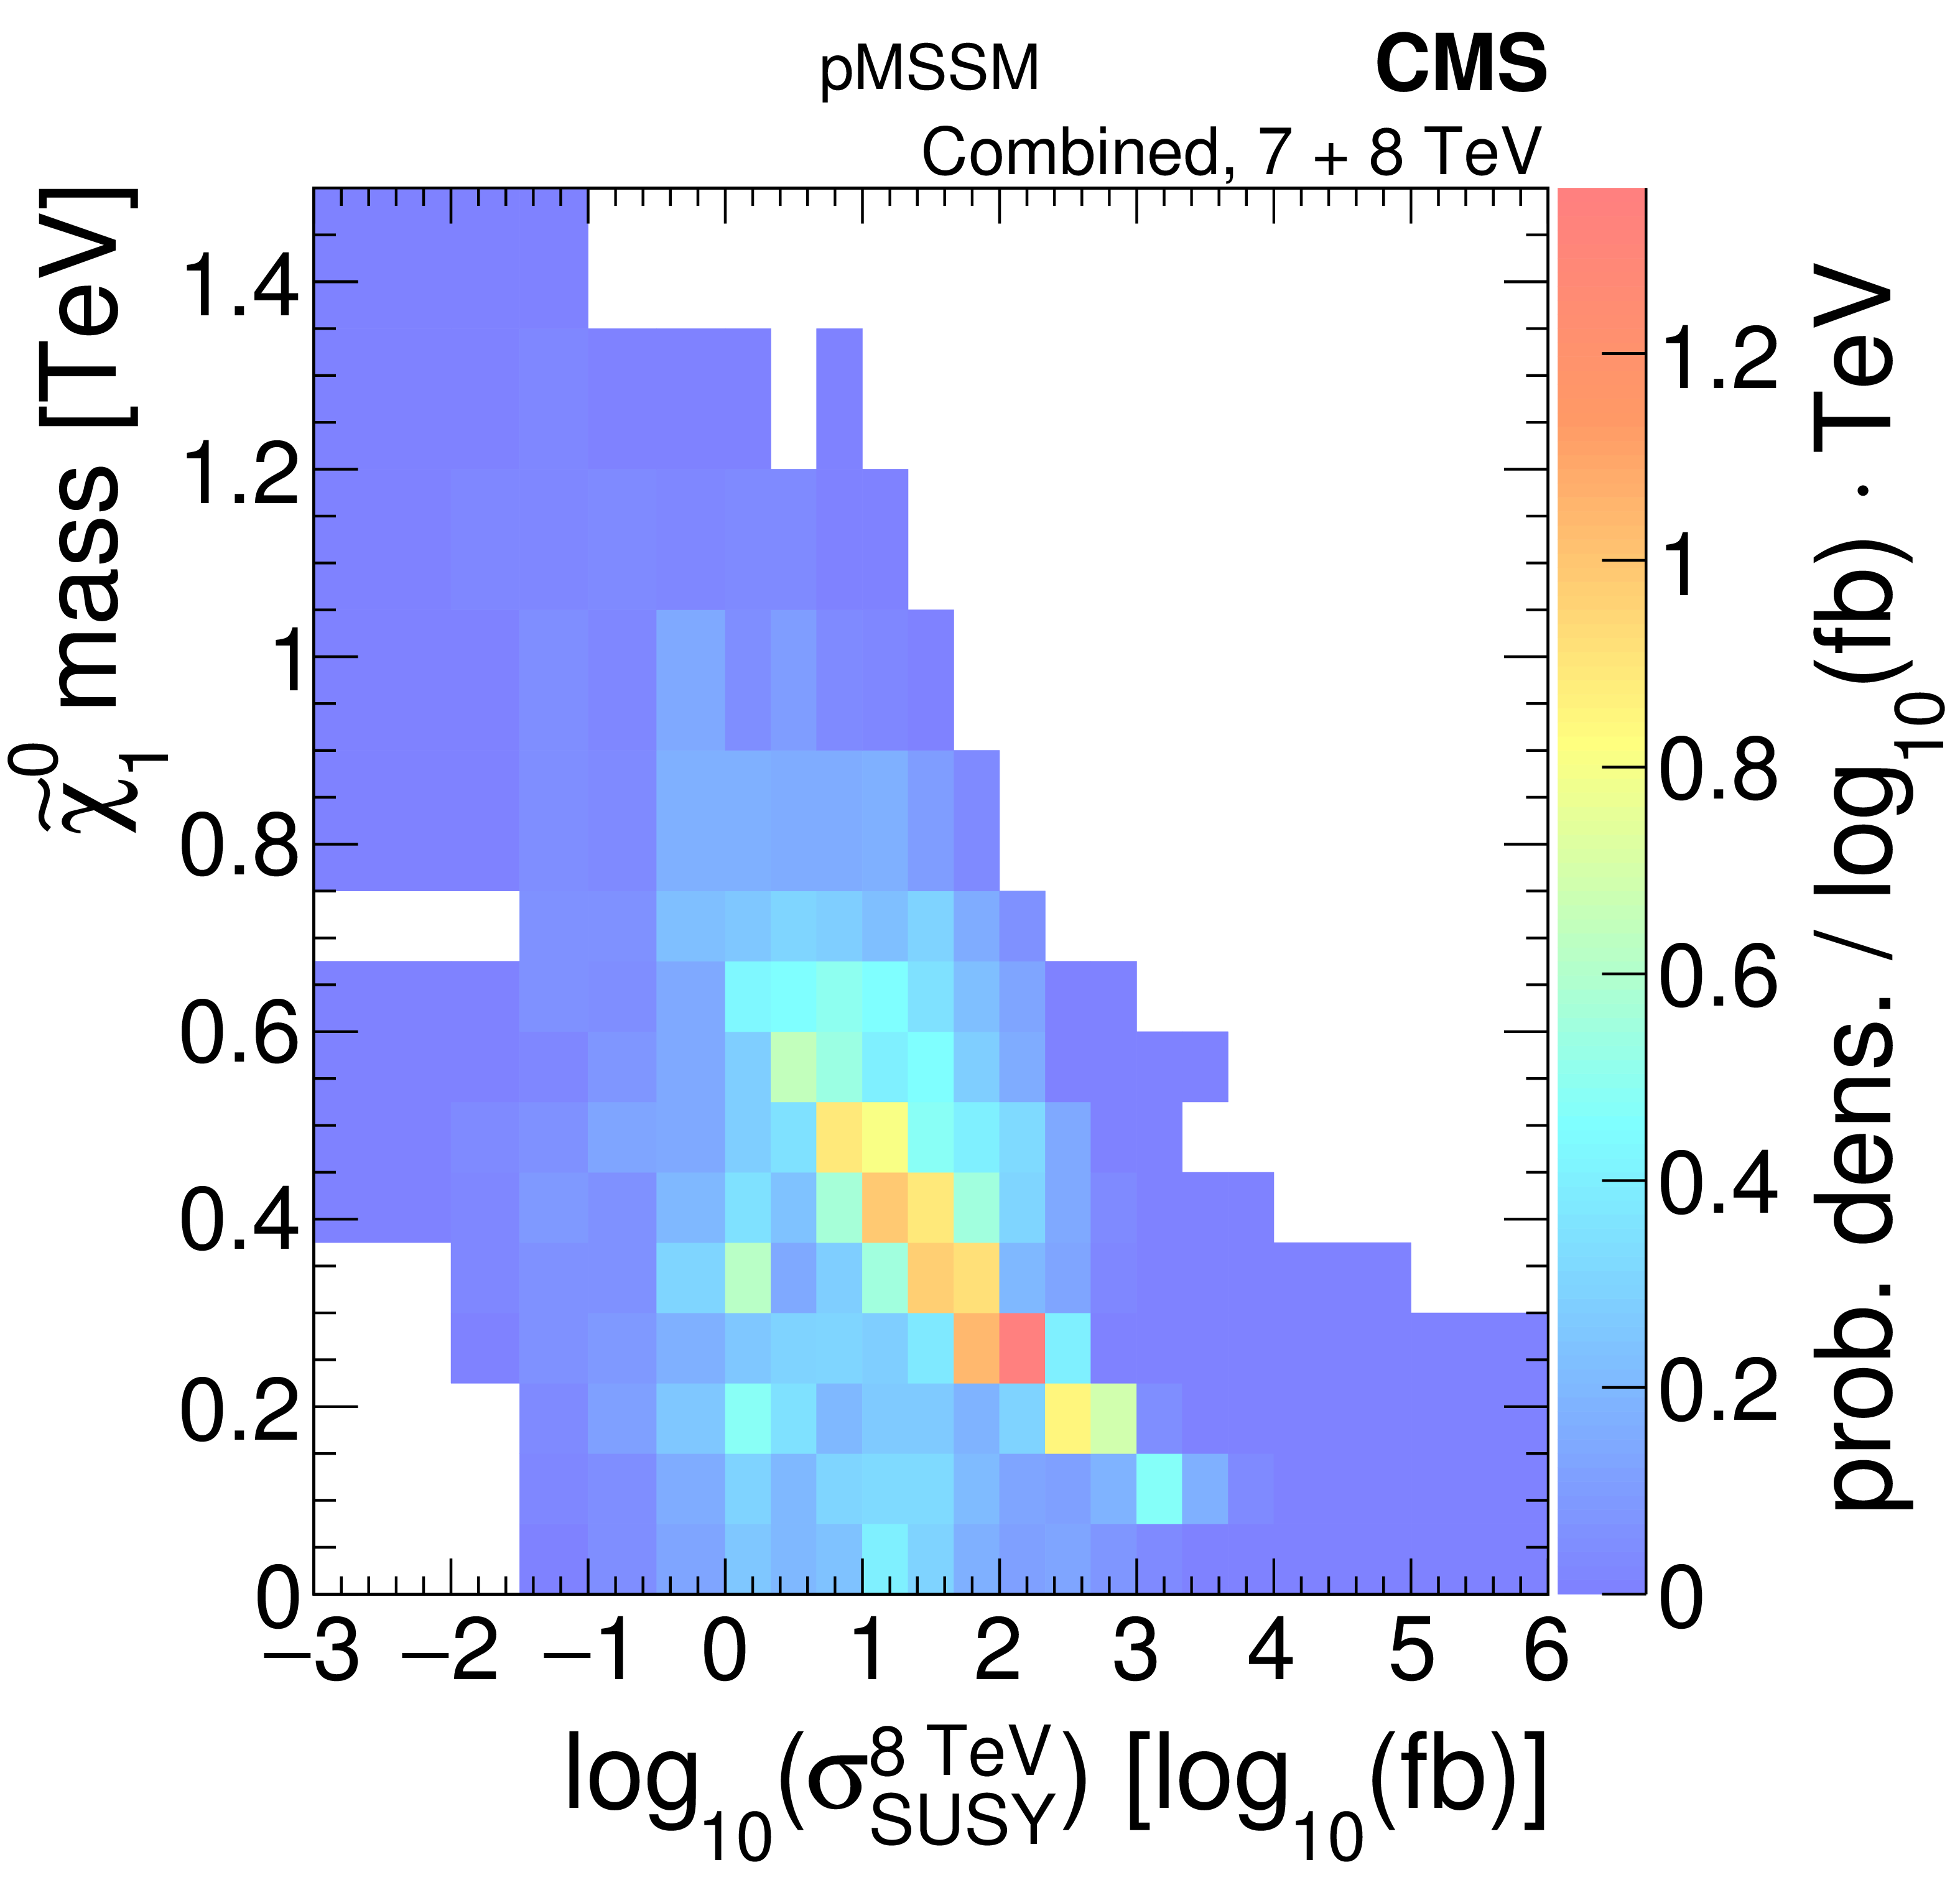
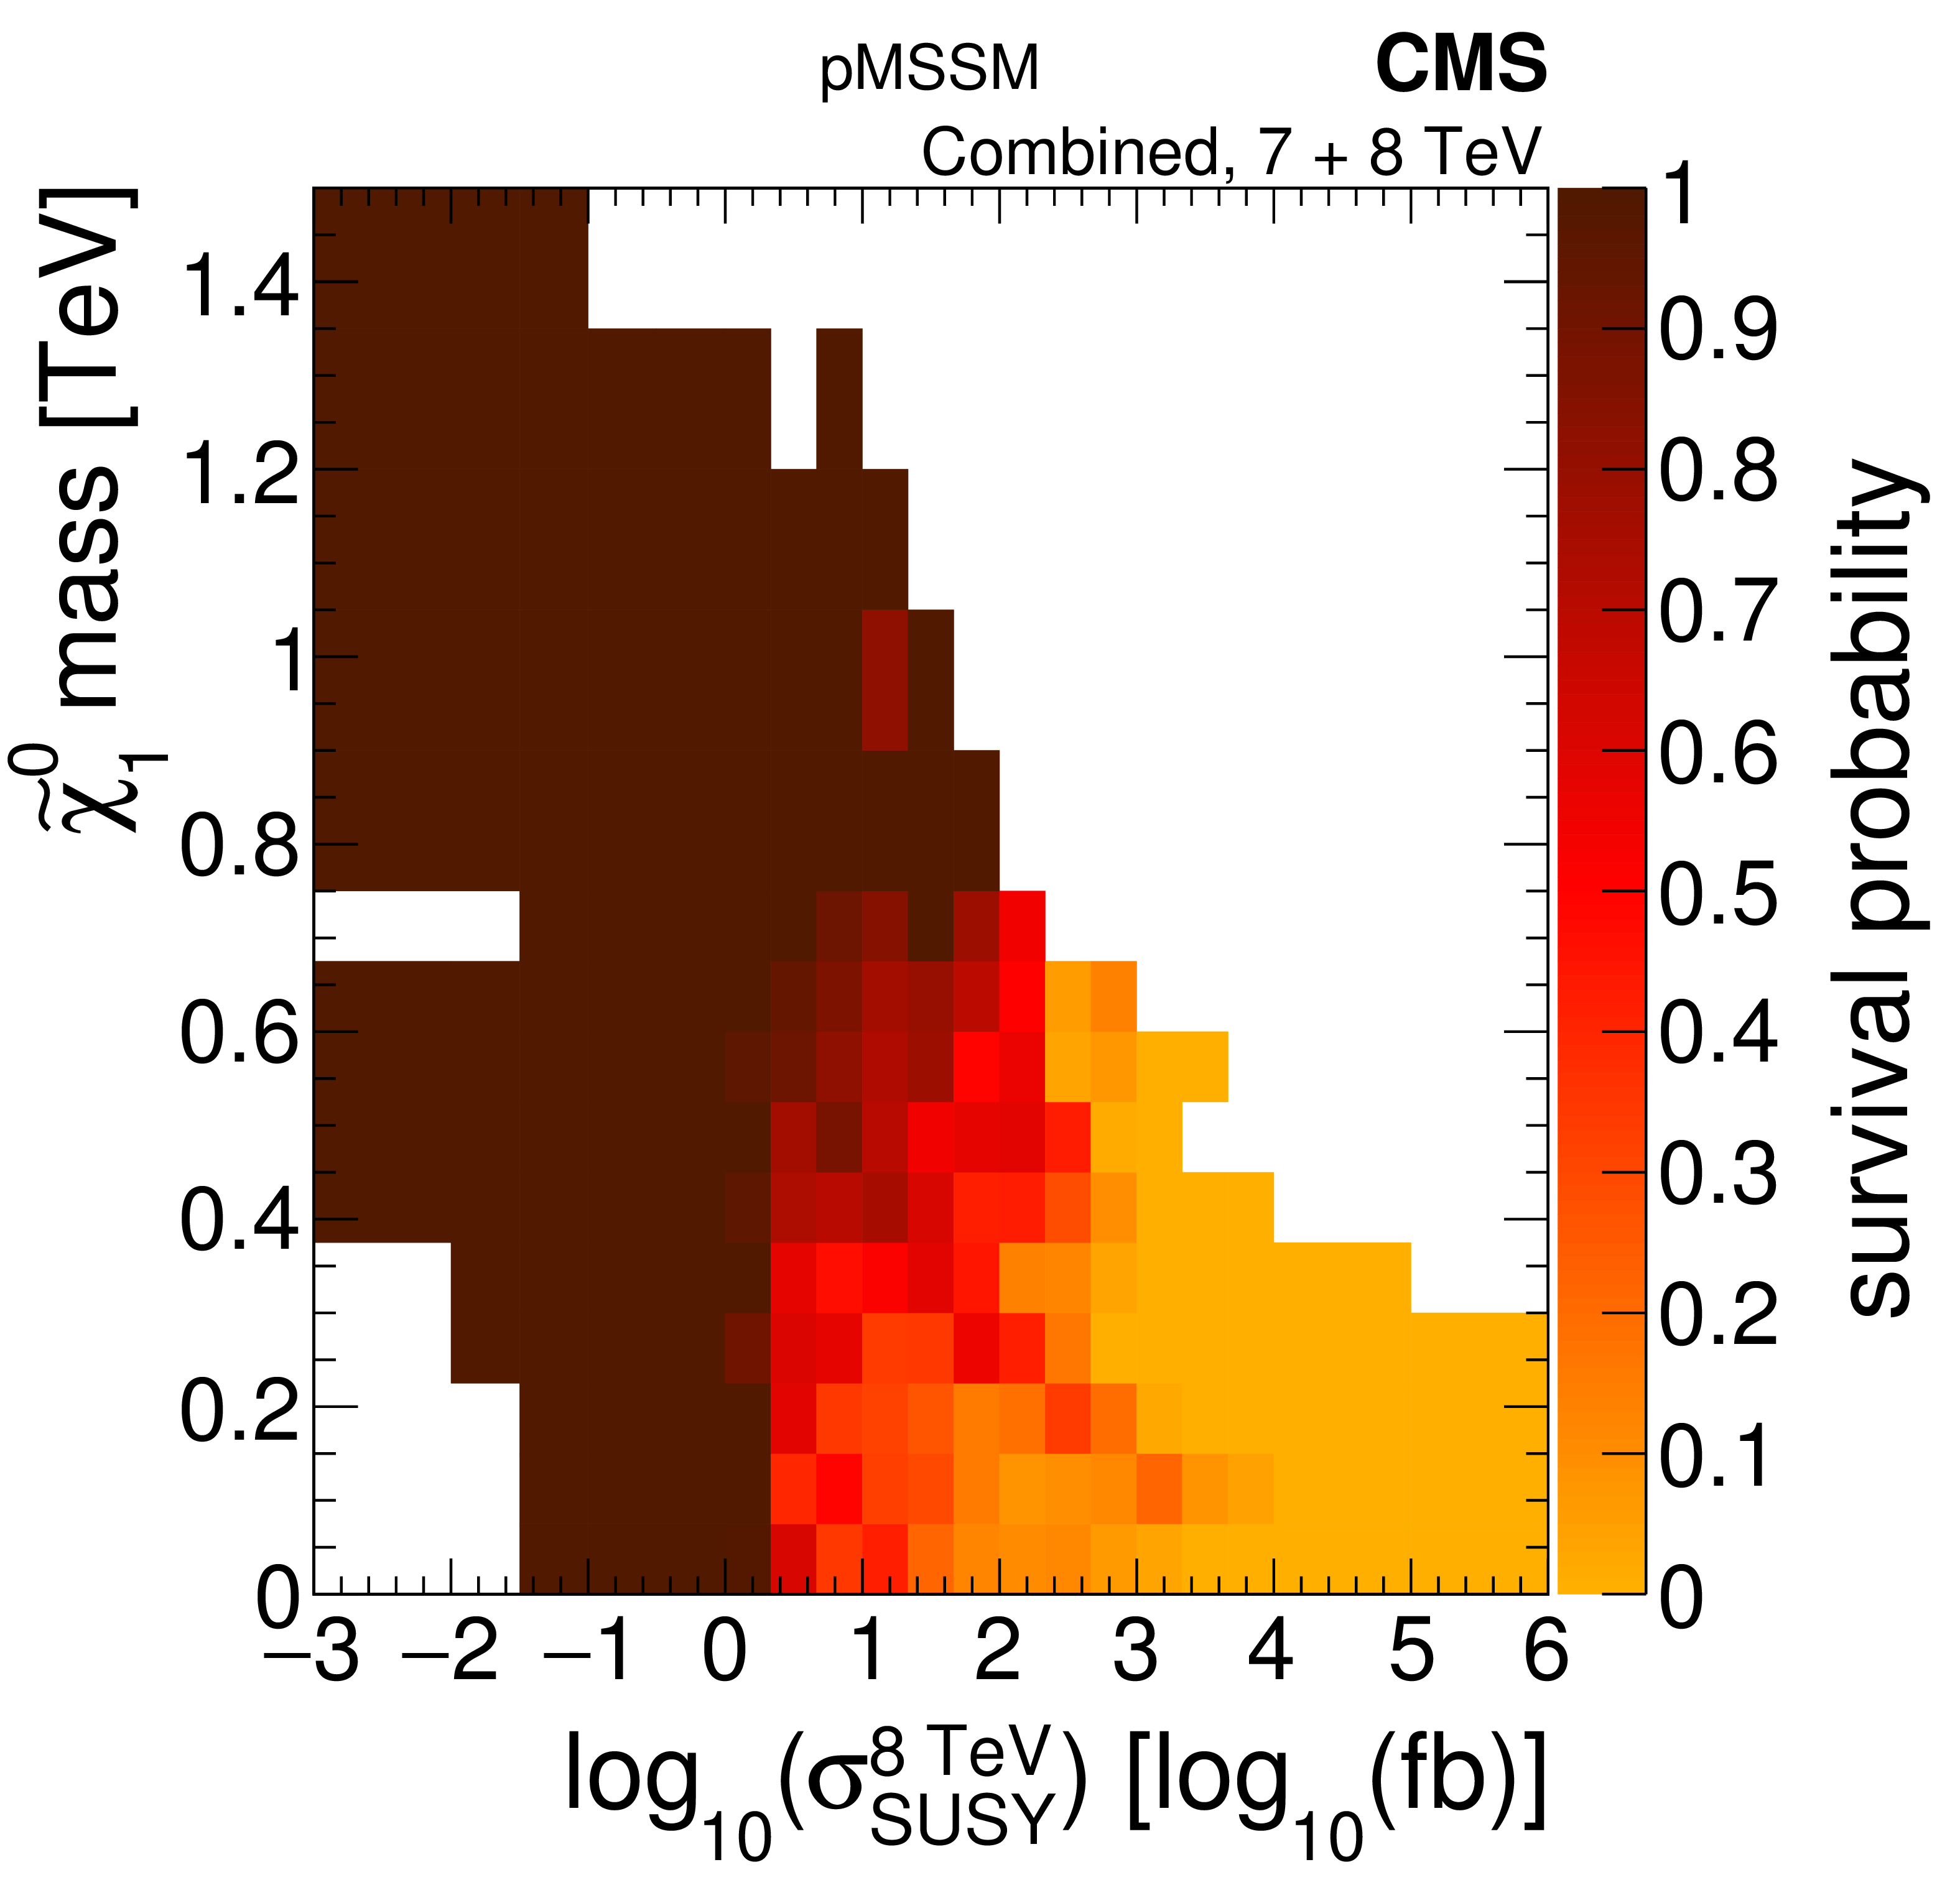
Marginalized non-DCS distributions (first column), compared with posterior distributions (second column) and survival probabilities (third column) after inclusion of the considered CMS searches, are shown for the $\tilde{\chi}^0_1 $ mass versus gluino mass (first row), the LCSP mass (second row), the top squark mass (third row), and the logarithm of the cross section for inclusive sparticle production at 8 TeV (bottom row). |
png pdf |
Figure 11-b:
Marginalized non-DCS distributions (first column), compared with posterior distributions (second column) and survival probabilities (third column) after inclusion of the considered CMS searches, are shown for the $\tilde{\chi}^0_1 $ mass versus gluino mass (first row), the LCSP mass (second row), the top squark mass (third row), and the logarithm of the cross section for inclusive sparticle production at 8 TeV (bottom row). |

png pdf |
Figure 11-c:
Marginalized non-DCS distributions (first column), compared with posterior distributions (second column) and survival probabilities (third column) after inclusion of the considered CMS searches, are shown for the $\tilde{\chi}^0_1 $ mass versus gluino mass (first row), the LCSP mass (second row), the top squark mass (third row), and the logarithm of the cross section for inclusive sparticle production at 8 TeV (bottom row). |
png pdf |
Figure 11-d:
Marginalized non-DCS distributions (first column), compared with posterior distributions (second column) and survival probabilities (third column) after inclusion of the considered CMS searches, are shown for the $\tilde{\chi}^0_1 $ mass versus gluino mass (first row), the LCSP mass (second row), the top squark mass (third row), and the logarithm of the cross section for inclusive sparticle production at 8 TeV (bottom row). |
png pdf |
Figure 11-e:
Marginalized non-DCS distributions (first column), compared with posterior distributions (second column) and survival probabilities (third column) after inclusion of the considered CMS searches, are shown for the $\tilde{\chi}^0_1 $ mass versus gluino mass (first row), the LCSP mass (second row), the top squark mass (third row), and the logarithm of the cross section for inclusive sparticle production at 8 TeV (bottom row). |
png pdf |
Figure 11-f:
Marginalized non-DCS distributions (first column), compared with posterior distributions (second column) and survival probabilities (third column) after inclusion of the considered CMS searches, are shown for the $\tilde{\chi}^0_1 $ mass versus gluino mass (first row), the LCSP mass (second row), the top squark mass (third row), and the logarithm of the cross section for inclusive sparticle production at 8 TeV (bottom row). |
png pdf |
Figure 11-g:
Marginalized non-DCS distributions (first column), compared with posterior distributions (second column) and survival probabilities (third column) after inclusion of the considered CMS searches, are shown for the $\tilde{\chi}^0_1 $ mass versus gluino mass (first row), the LCSP mass (second row), the top squark mass (third row), and the logarithm of the cross section for inclusive sparticle production at 8 TeV (bottom row). |
png pdf |
Figure 11-h:
Marginalized non-DCS distributions (first column), compared with posterior distributions (second column) and survival probabilities (third column) after inclusion of the considered CMS searches, are shown for the $\tilde{\chi}^0_1 $ mass versus gluino mass (first row), the LCSP mass (second row), the top squark mass (third row), and the logarithm of the cross section for inclusive sparticle production at 8 TeV (bottom row). |

png pdf |
Figure 11-i:
Marginalized non-DCS distributions (first column), compared with posterior distributions (second column) and survival probabilities (third column) after inclusion of the considered CMS searches, are shown for the $\tilde{\chi}^0_1 $ mass versus gluino mass (first row), the LCSP mass (second row), the top squark mass (third row), and the logarithm of the cross section for inclusive sparticle production at 8 TeV (bottom row). |

png pdf |
Figure 11-j:
Marginalized non-DCS distributions (first column), compared with posterior distributions (second column) and survival probabilities (third column) after inclusion of the considered CMS searches, are shown for the $\tilde{\chi}^0_1 $ mass versus gluino mass (first row), the LCSP mass (second row), the top squark mass (third row), and the logarithm of the cross section for inclusive sparticle production at 8 TeV (bottom row). |
png pdf |
Figure 11-k:
Marginalized non-DCS distributions (first column), compared with posterior distributions (second column) and survival probabilities (third column) after inclusion of the considered CMS searches, are shown for the $\tilde{\chi}^0_1 $ mass versus gluino mass (first row), the LCSP mass (second row), the top squark mass (third row), and the logarithm of the cross section for inclusive sparticle production at 8 TeV (bottom row). |
png pdf |
Figure 11-l:
Marginalized non-DCS distributions (first column), compared with posterior distributions (second column) and survival probabilities (third column) after inclusion of the considered CMS searches, are shown for the $\tilde{\chi}^0_1 $ mass versus gluino mass (first row), the LCSP mass (second row), the top squark mass (third row), and the logarithm of the cross section for inclusive sparticle production at 8 TeV (bottom row). |
png pdf |
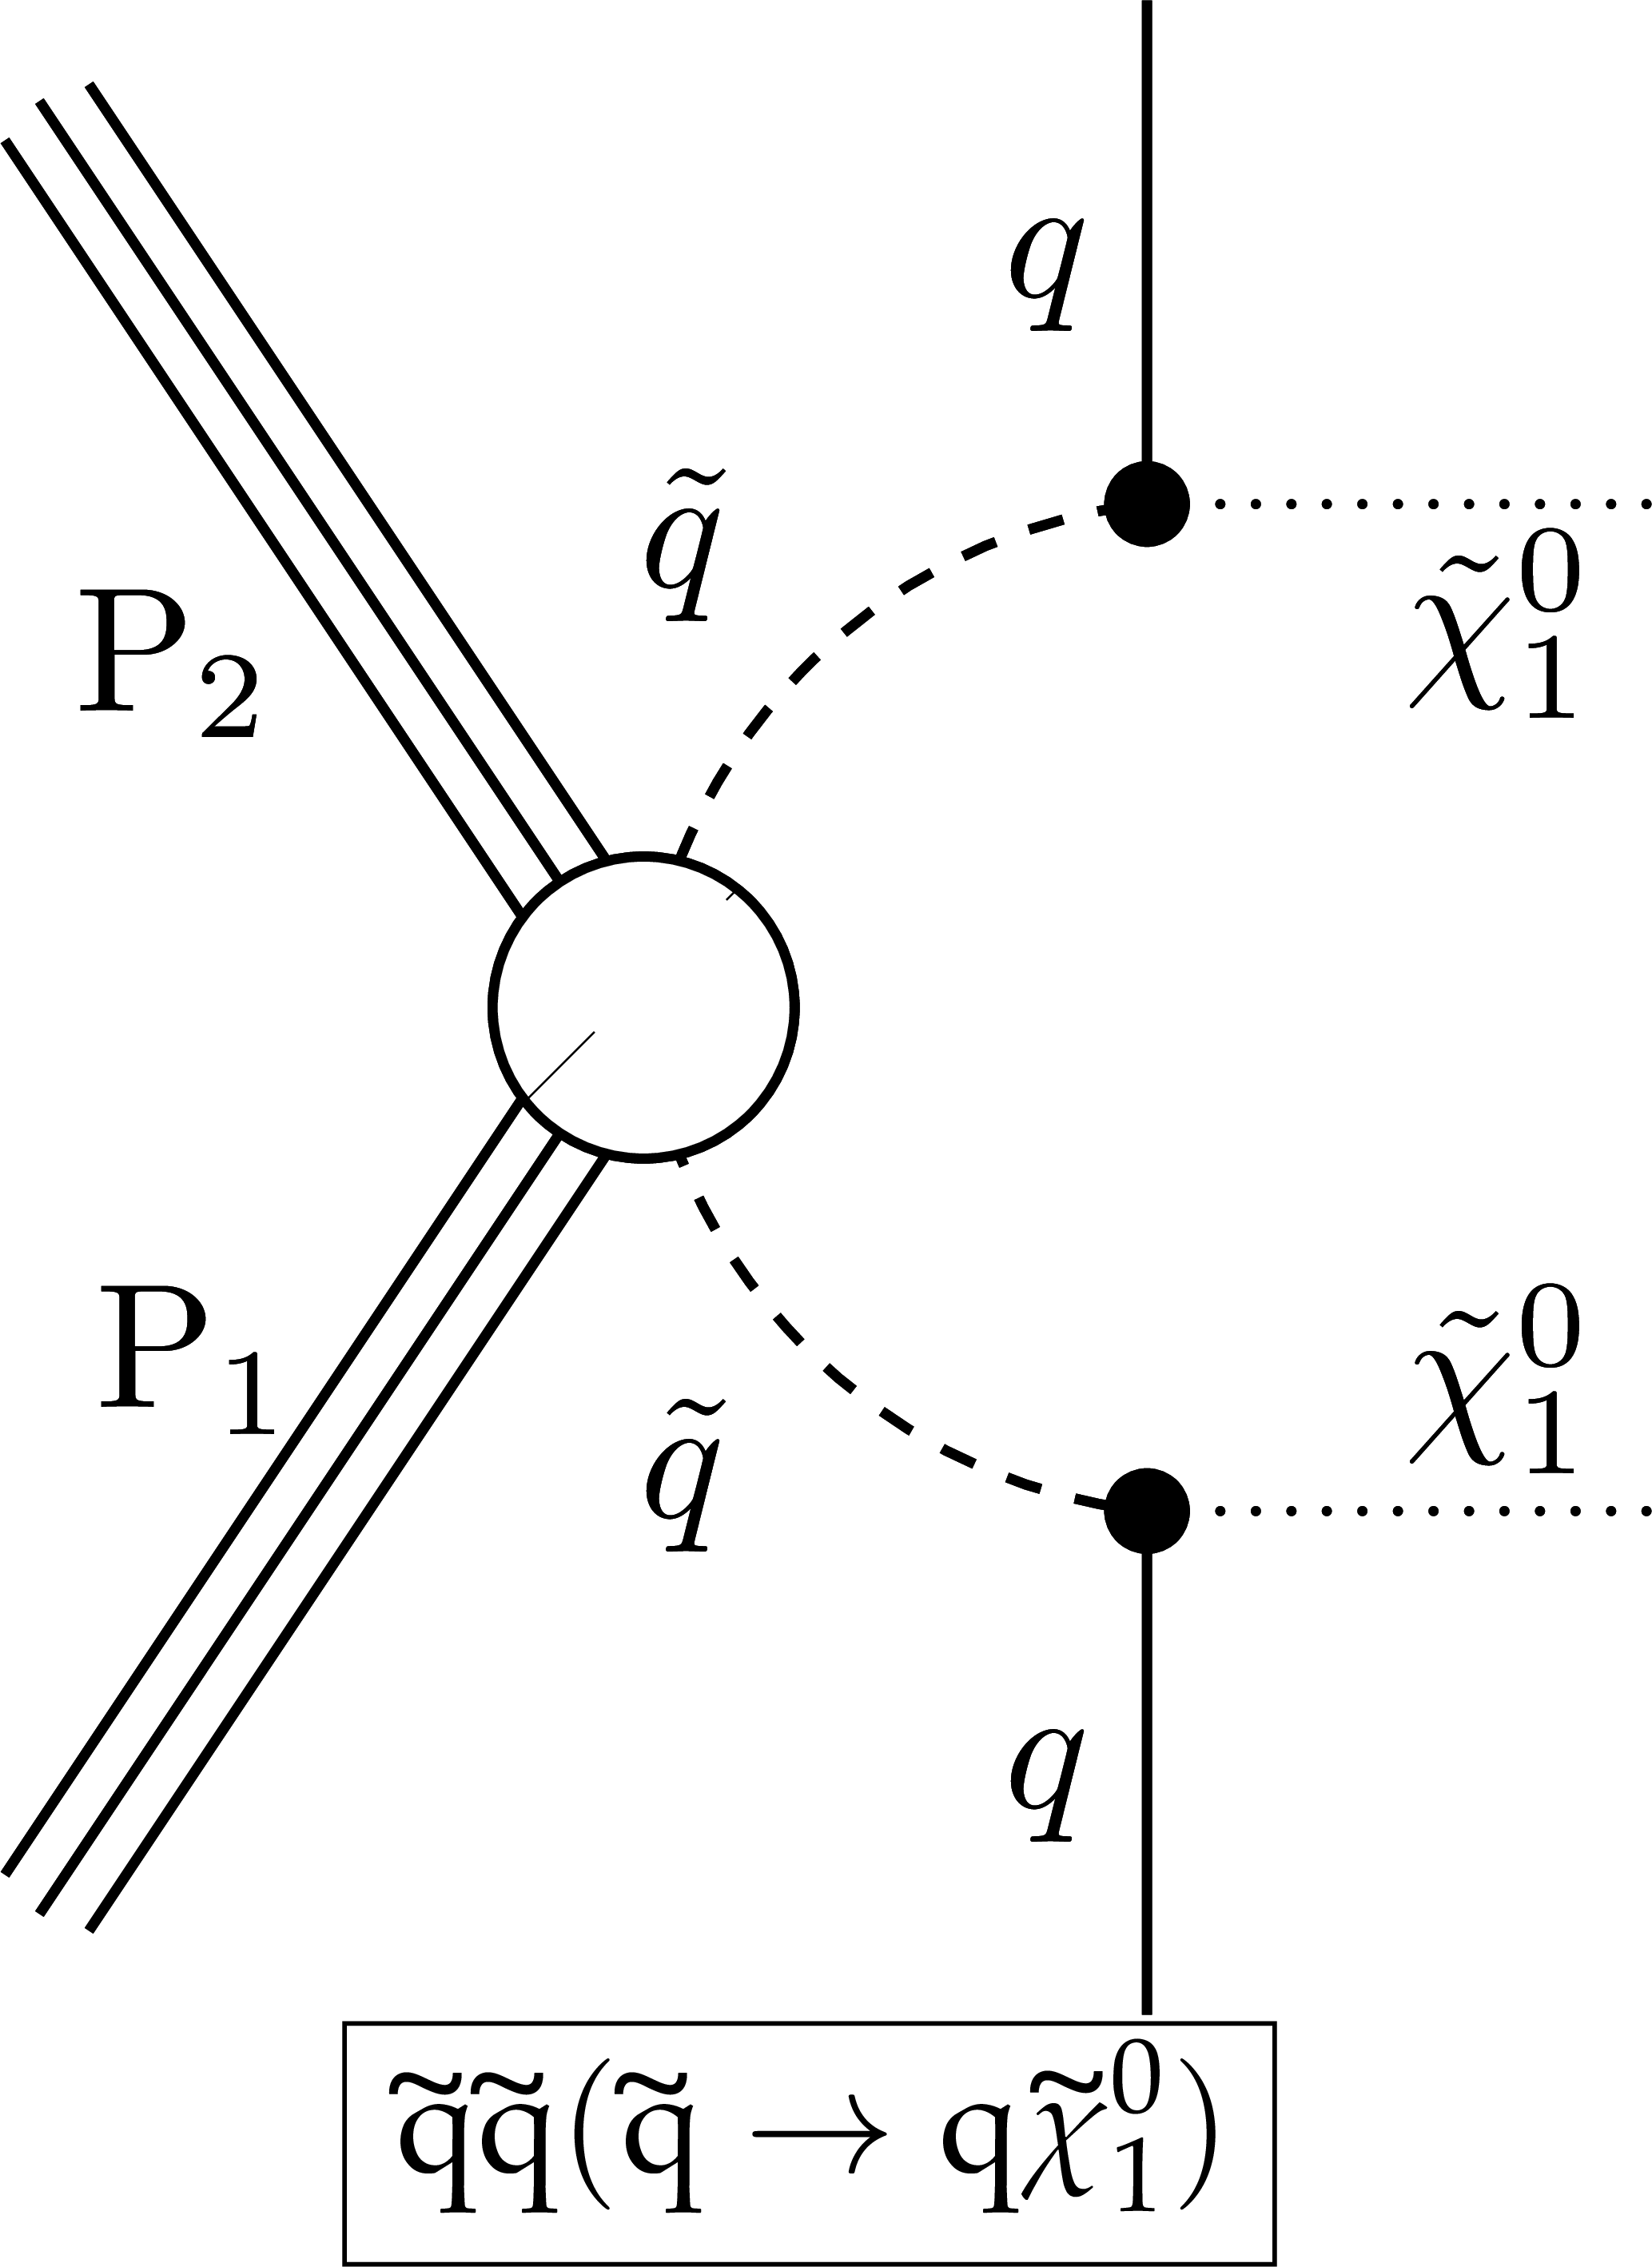
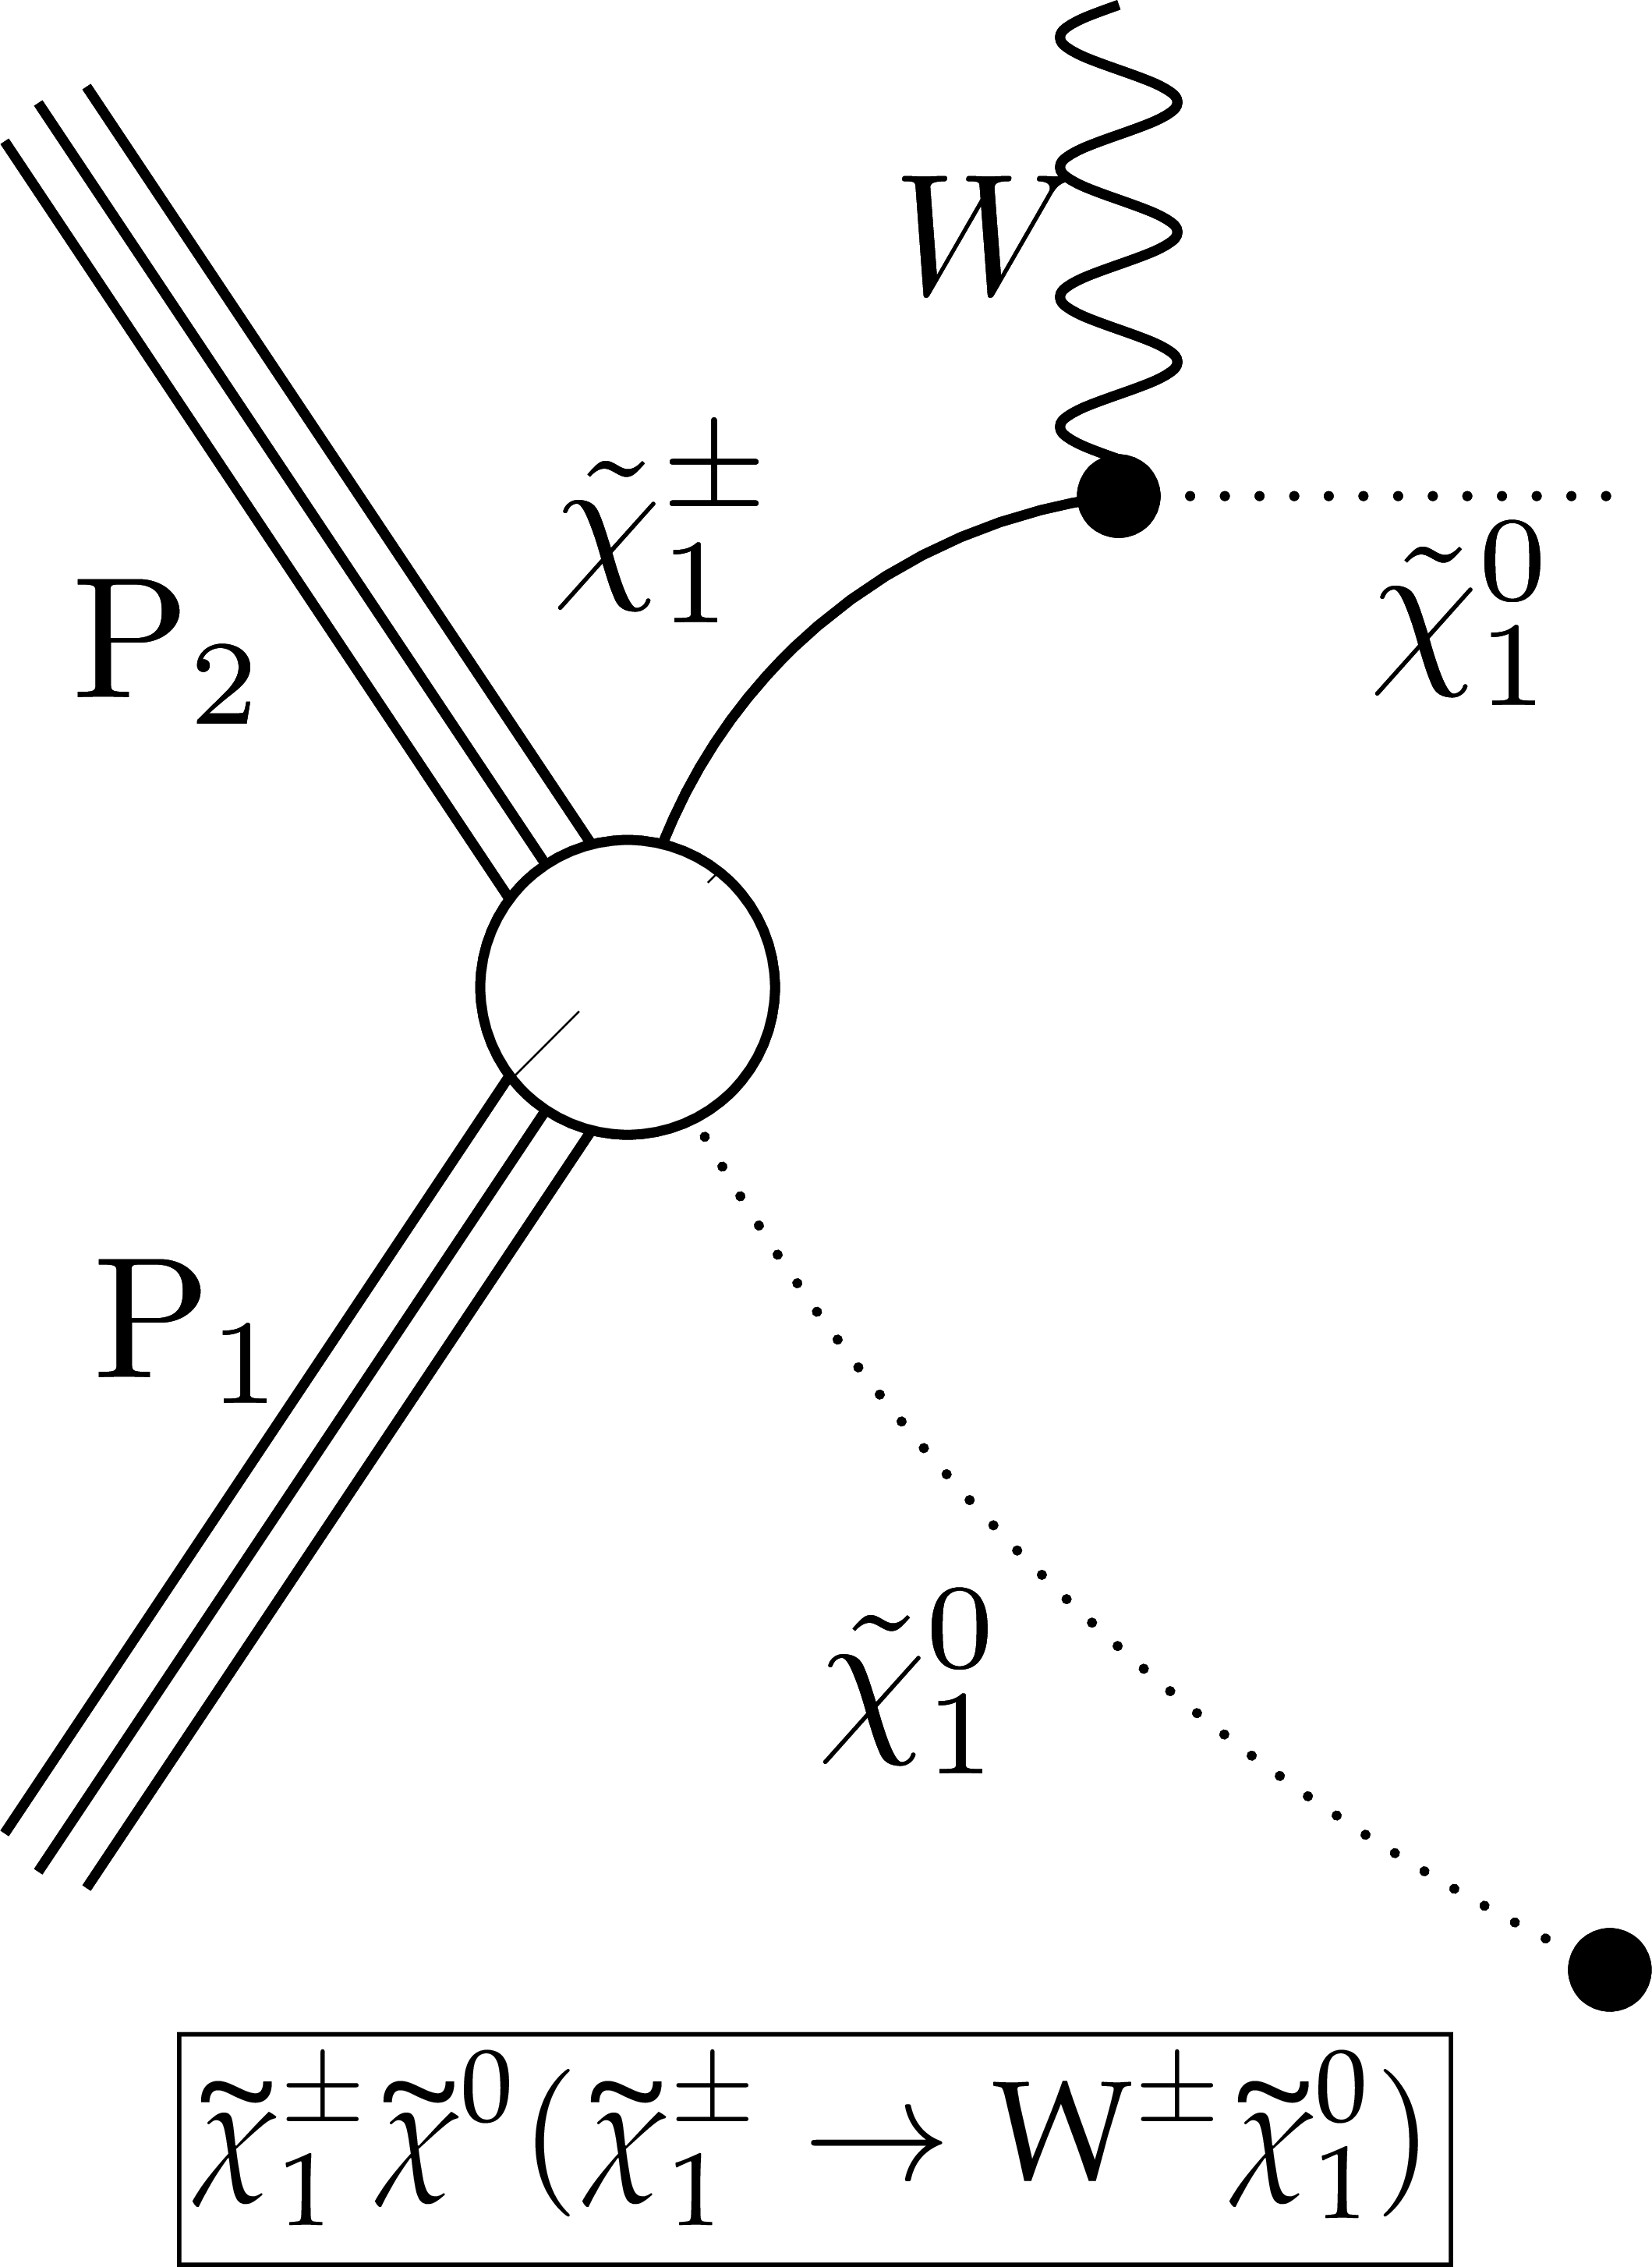
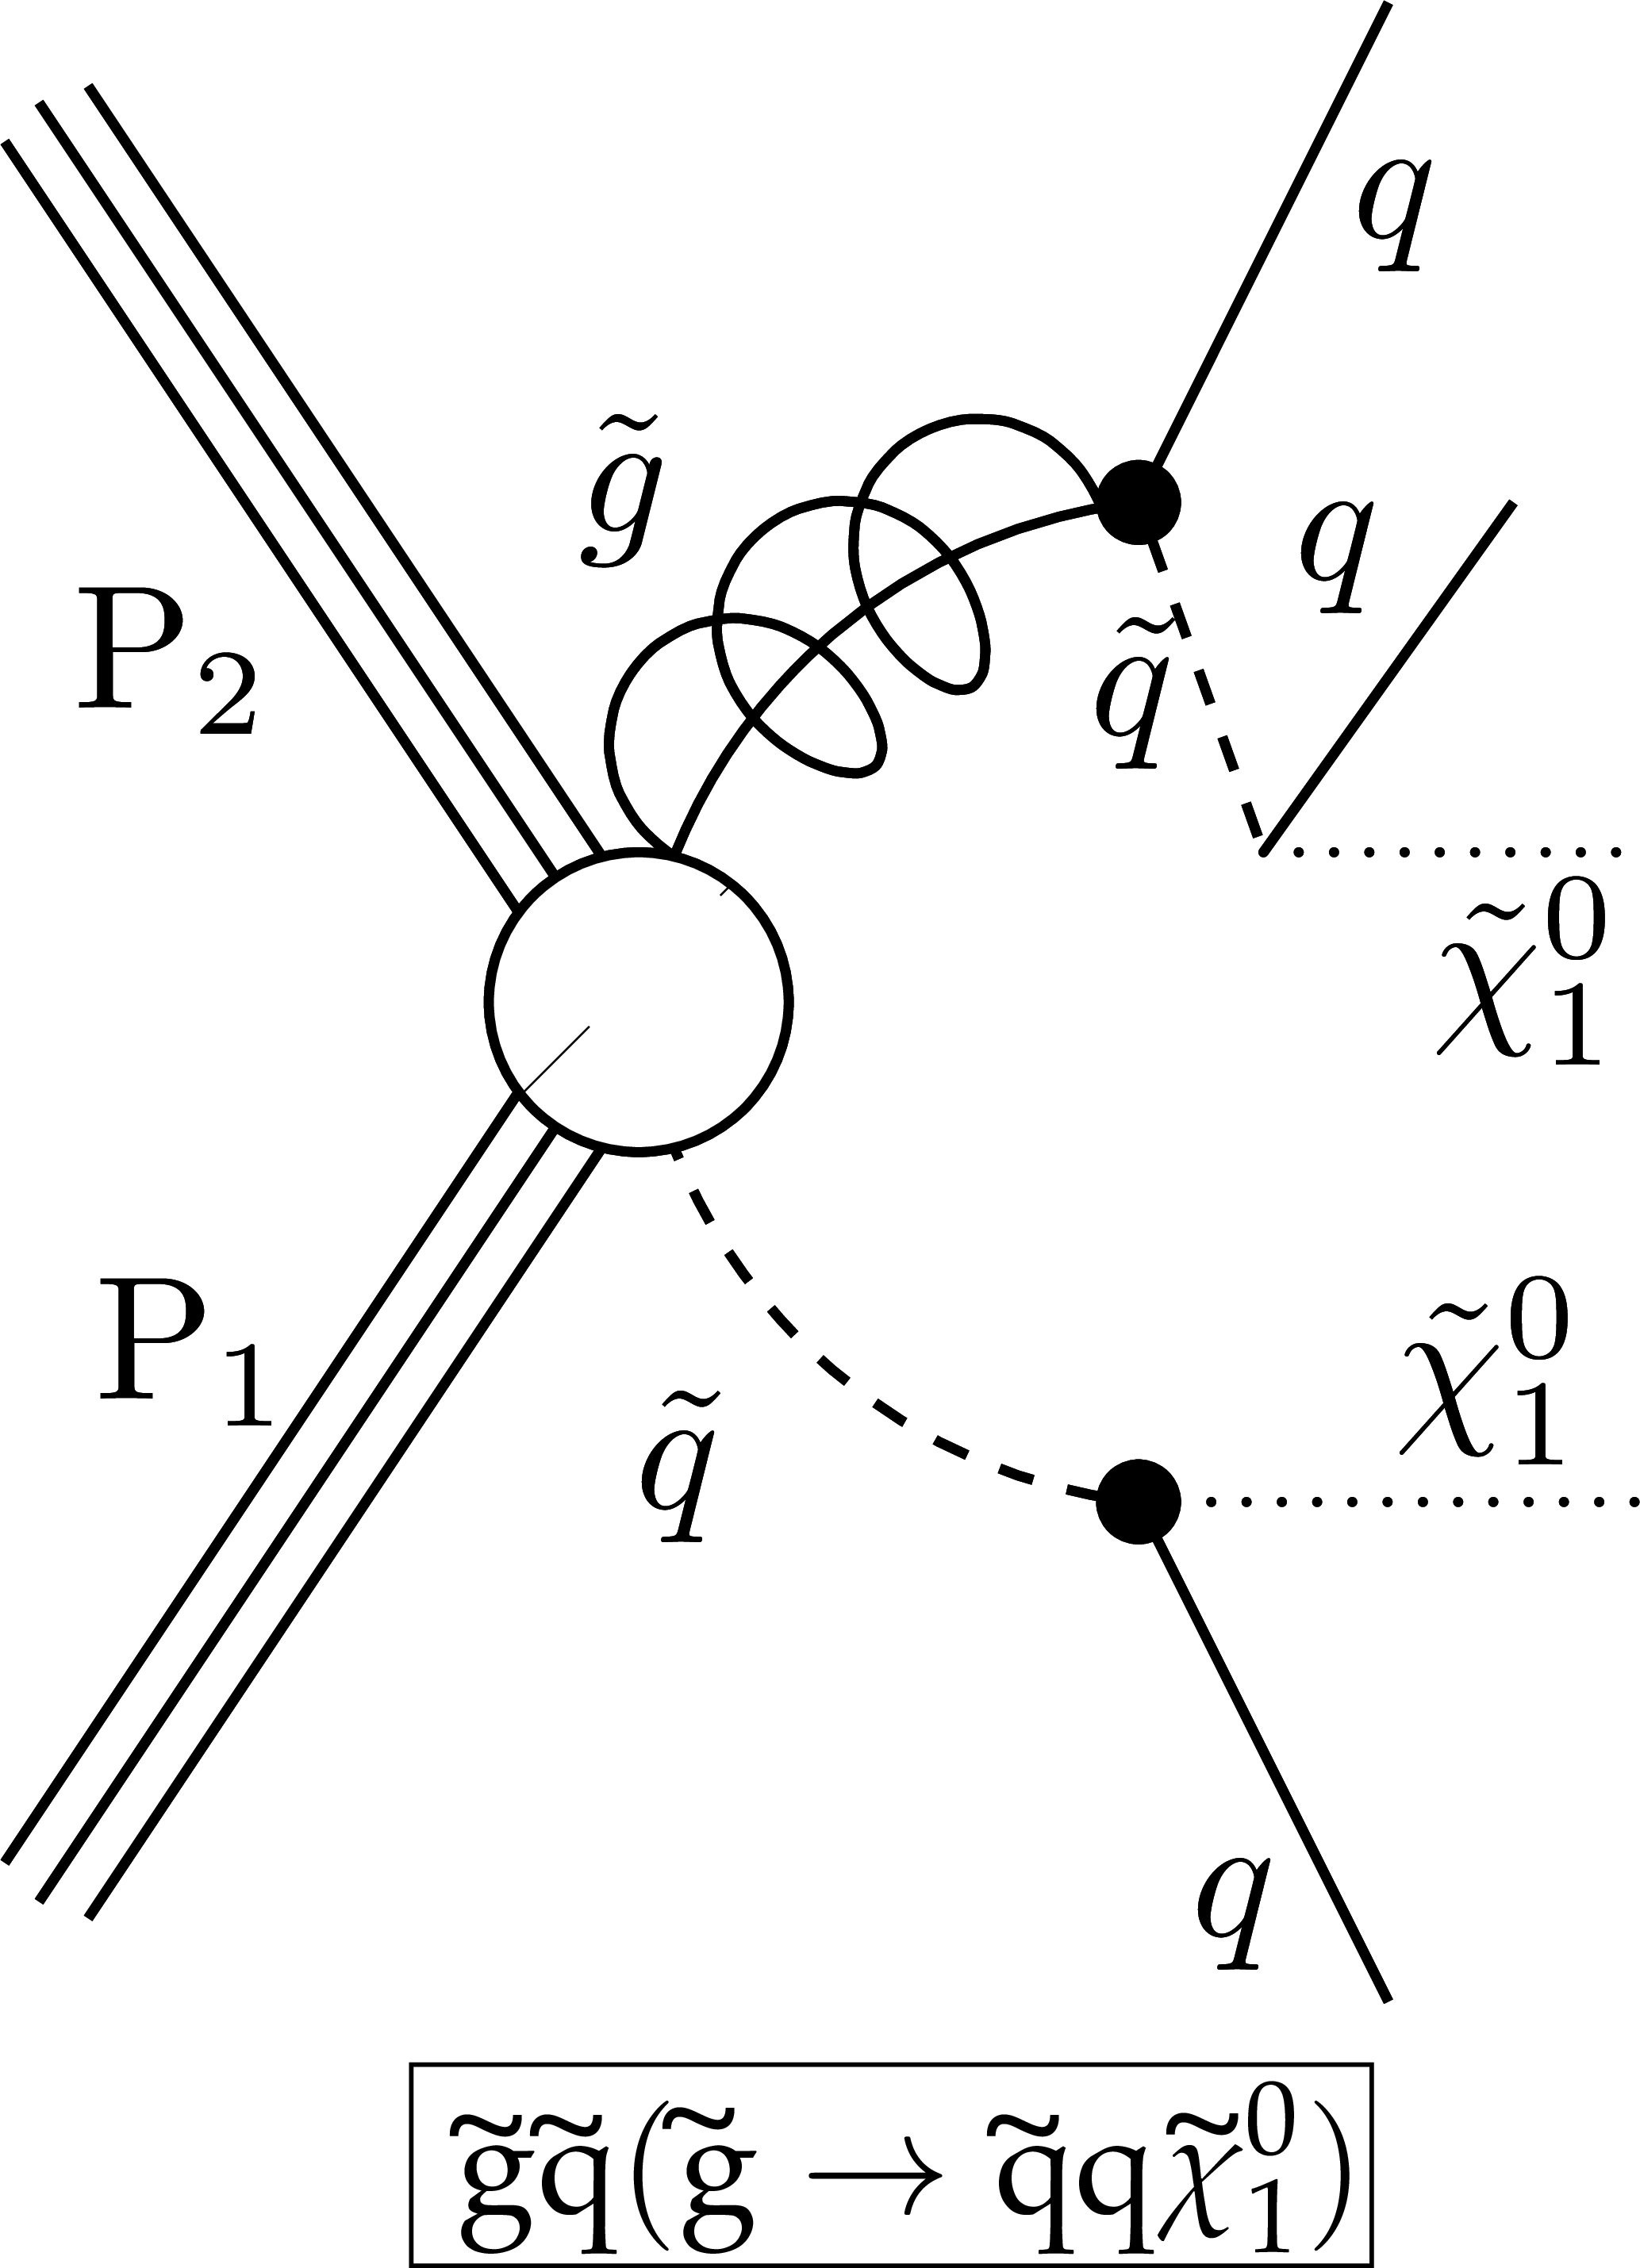
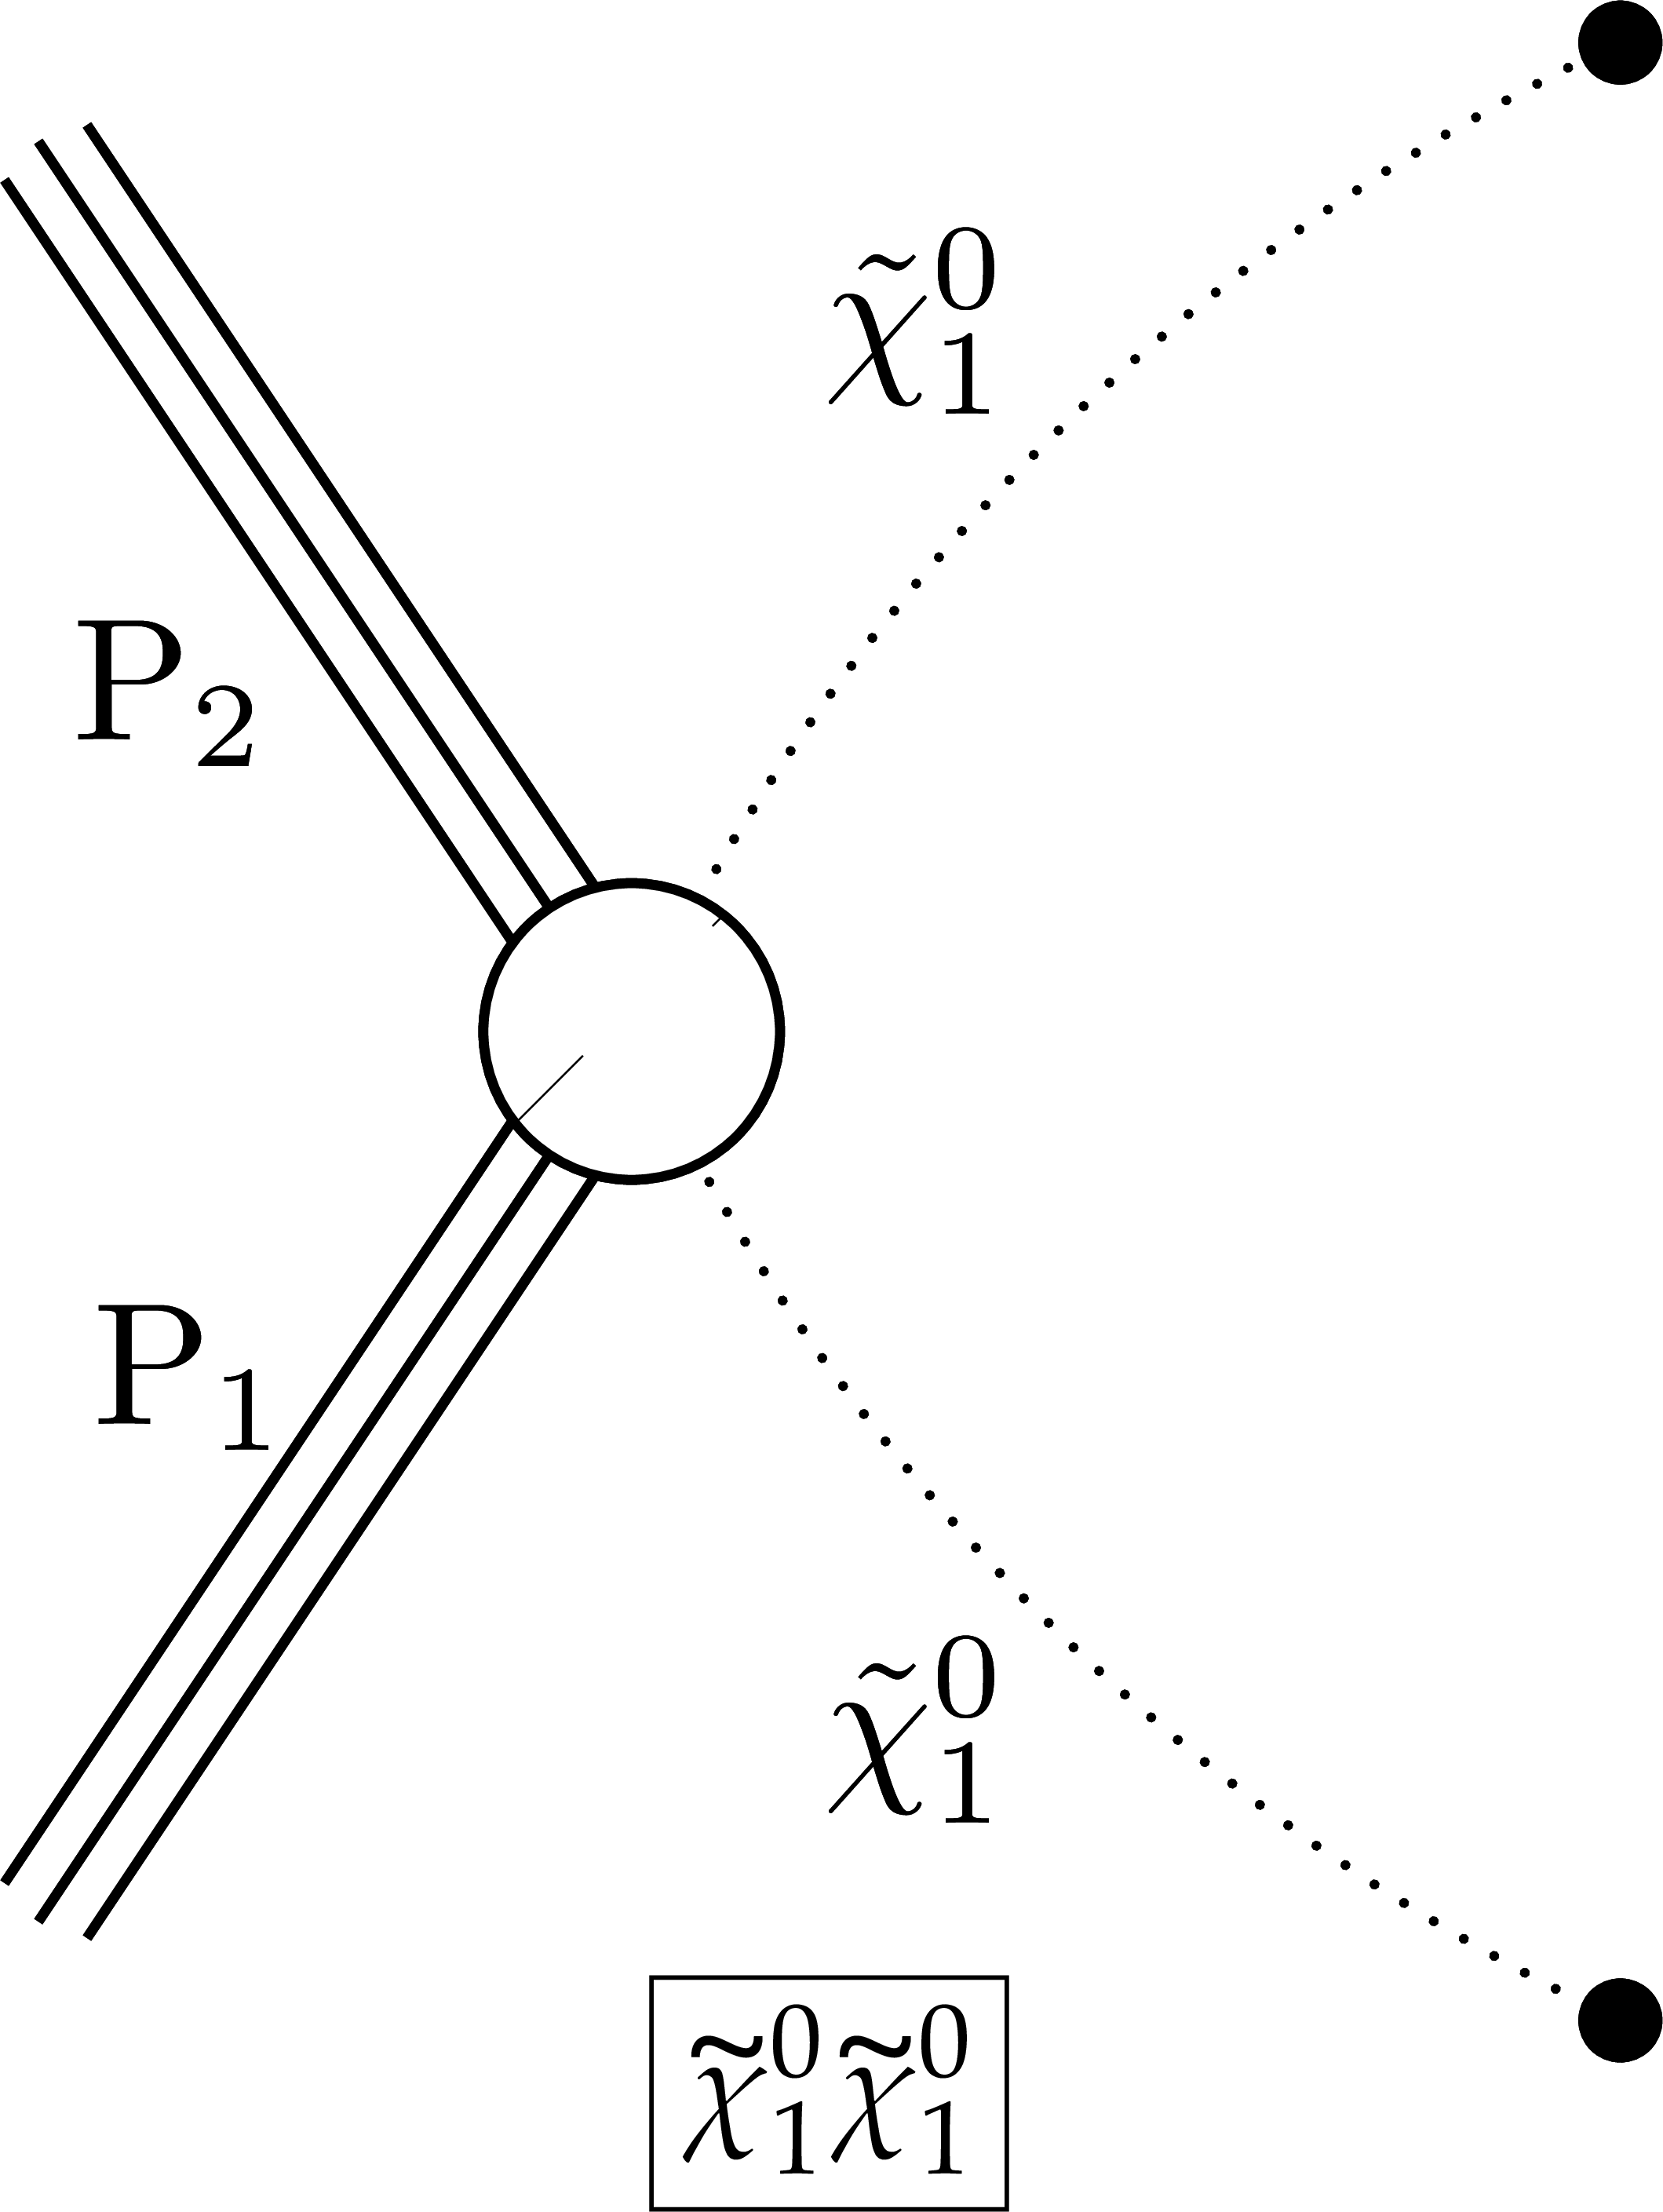
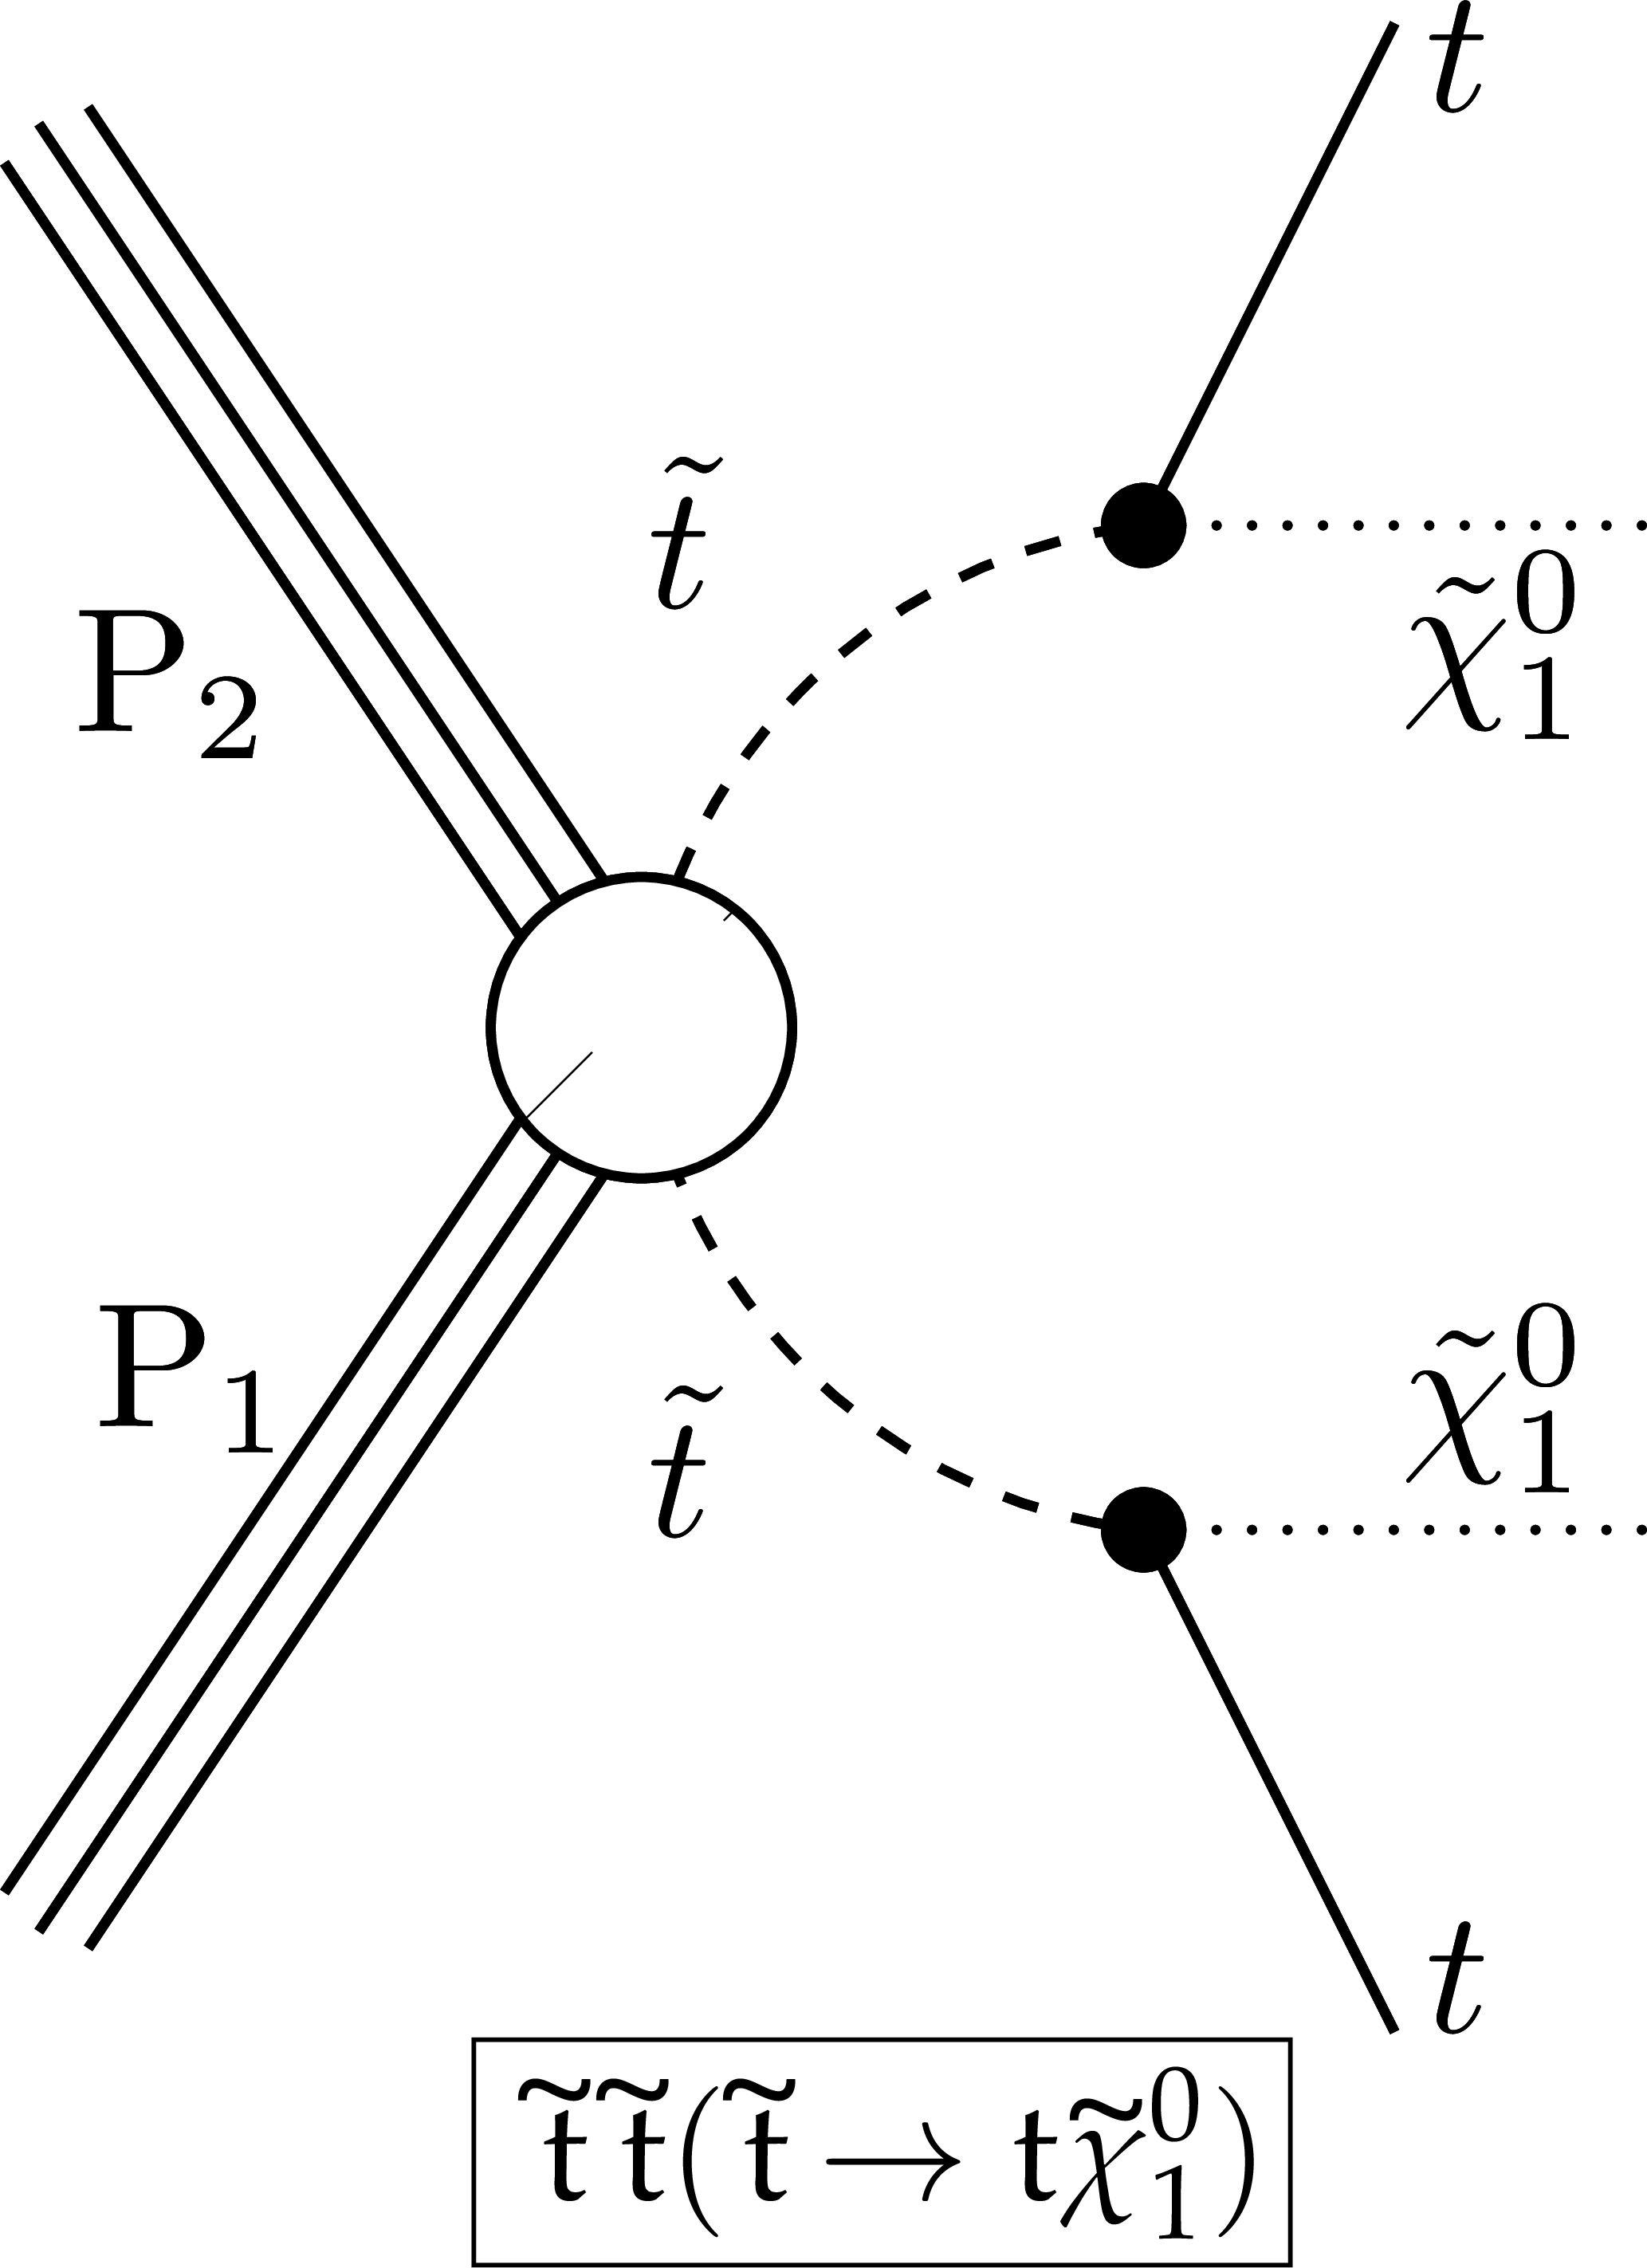
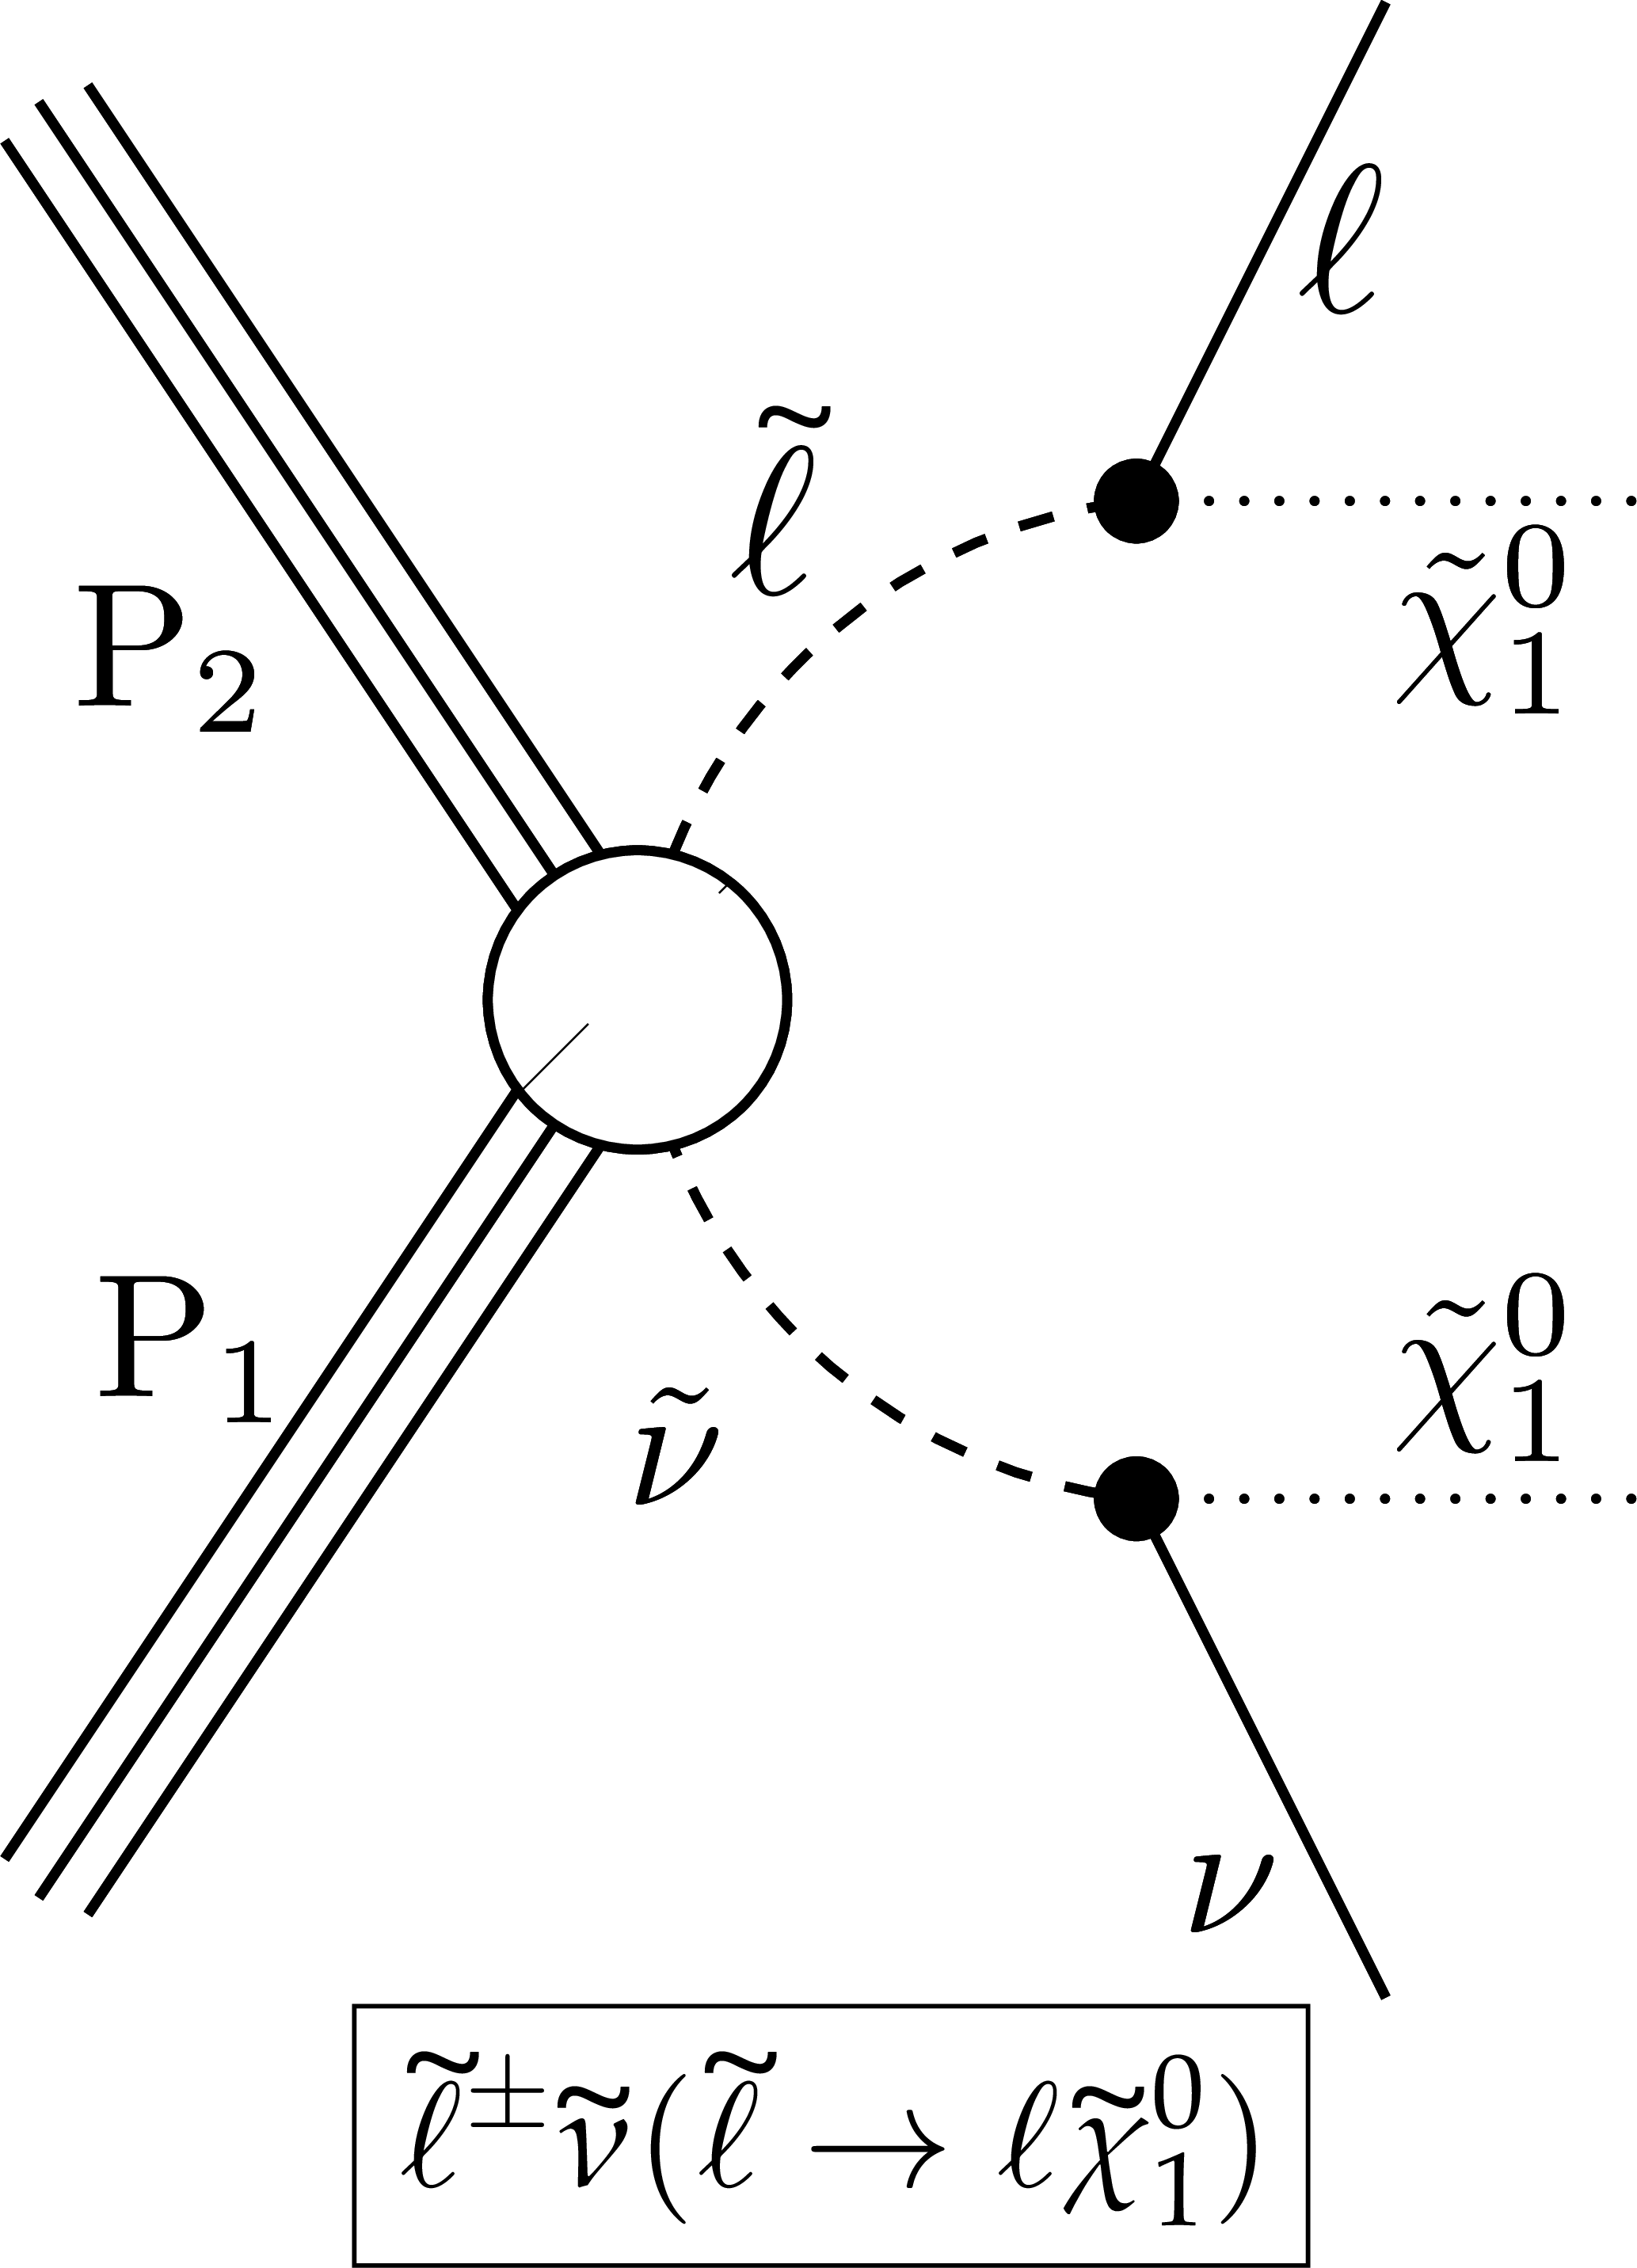
Figure 12-a:
The twelve most common principal processes in the pMSSM, listed in order of their frequency before the constraints of the CMS searches. Both on-shell and off-shell states are included. Indices of particle charge, flavor, and chirality are ignored in the construction, with the exception of the flavor of the third-generation squarks and quarks. Asterisks in the labels indicate where process names involving long decay chains have been abbreviated. |
png pdf |
Figure 12-b:
The twelve most common principal processes in the pMSSM, listed in order of their frequency before the constraints of the CMS searches. Both on-shell and off-shell states are included. Indices of particle charge, flavor, and chirality are ignored in the construction, with the exception of the flavor of the third-generation squarks and quarks. Asterisks in the labels indicate where process names involving long decay chains have been abbreviated. |

png pdf |
Figure 12-c:
The twelve most common principal processes in the pMSSM, listed in order of their frequency before the constraints of the CMS searches. Both on-shell and off-shell states are included. Indices of particle charge, flavor, and chirality are ignored in the construction, with the exception of the flavor of the third-generation squarks and quarks. Asterisks in the labels indicate where process names involving long decay chains have been abbreviated. |

png pdf |
Figure 12-d:
The twelve most common principal processes in the pMSSM, listed in order of their frequency before the constraints of the CMS searches. Both on-shell and off-shell states are included. Indices of particle charge, flavor, and chirality are ignored in the construction, with the exception of the flavor of the third-generation squarks and quarks. Asterisks in the labels indicate where process names involving long decay chains have been abbreviated. |

png pdf |
Figure 12-e:
The twelve most common principal processes in the pMSSM, listed in order of their frequency before the constraints of the CMS searches. Both on-shell and off-shell states are included. Indices of particle charge, flavor, and chirality are ignored in the construction, with the exception of the flavor of the third-generation squarks and quarks. Asterisks in the labels indicate where process names involving long decay chains have been abbreviated. |
png pdf |
Figure 12-f:
The twelve most common principal processes in the pMSSM, listed in order of their frequency before the constraints of the CMS searches. Both on-shell and off-shell states are included. Indices of particle charge, flavor, and chirality are ignored in the construction, with the exception of the flavor of the third-generation squarks and quarks. Asterisks in the labels indicate where process names involving long decay chains have been abbreviated. |

png pdf |
Figure 12-g:
The twelve most common principal processes in the pMSSM, listed in order of their frequency before the constraints of the CMS searches. Both on-shell and off-shell states are included. Indices of particle charge, flavor, and chirality are ignored in the construction, with the exception of the flavor of the third-generation squarks and quarks. Asterisks in the labels indicate where process names involving long decay chains have been abbreviated. |

png pdf |
Figure 12-h:
The twelve most common principal processes in the pMSSM, listed in order of their frequency before the constraints of the CMS searches. Both on-shell and off-shell states are included. Indices of particle charge, flavor, and chirality are ignored in the construction, with the exception of the flavor of the third-generation squarks and quarks. Asterisks in the labels indicate where process names involving long decay chains have been abbreviated. |

png pdf |
Figure 12-i:
The twelve most common principal processes in the pMSSM, listed in order of their frequency before the constraints of the CMS searches. Both on-shell and off-shell states are included. Indices of particle charge, flavor, and chirality are ignored in the construction, with the exception of the flavor of the third-generation squarks and quarks. Asterisks in the labels indicate where process names involving long decay chains have been abbreviated. |
png pdf |
Figure 12-j:
The twelve most common principal processes in the pMSSM, listed in order of their frequency before the constraints of the CMS searches. Both on-shell and off-shell states are included. Indices of particle charge, flavor, and chirality are ignored in the construction, with the exception of the flavor of the third-generation squarks and quarks. Asterisks in the labels indicate where process names involving long decay chains have been abbreviated. |
png pdf |
Figure 12-k:
The twelve most common principal processes in the pMSSM, listed in order of their frequency before the constraints of the CMS searches. Both on-shell and off-shell states are included. Indices of particle charge, flavor, and chirality are ignored in the construction, with the exception of the flavor of the third-generation squarks and quarks. Asterisks in the labels indicate where process names involving long decay chains have been abbreviated. |
png pdf |
Figure 12-l:
The twelve most common principal processes in the pMSSM, listed in order of their frequency before the constraints of the CMS searches. Both on-shell and off-shell states are included. Indices of particle charge, flavor, and chirality are ignored in the construction, with the exception of the flavor of the third-generation squarks and quarks. Asterisks in the labels indicate where process names involving long decay chains have been abbreviated. |
png pdf |
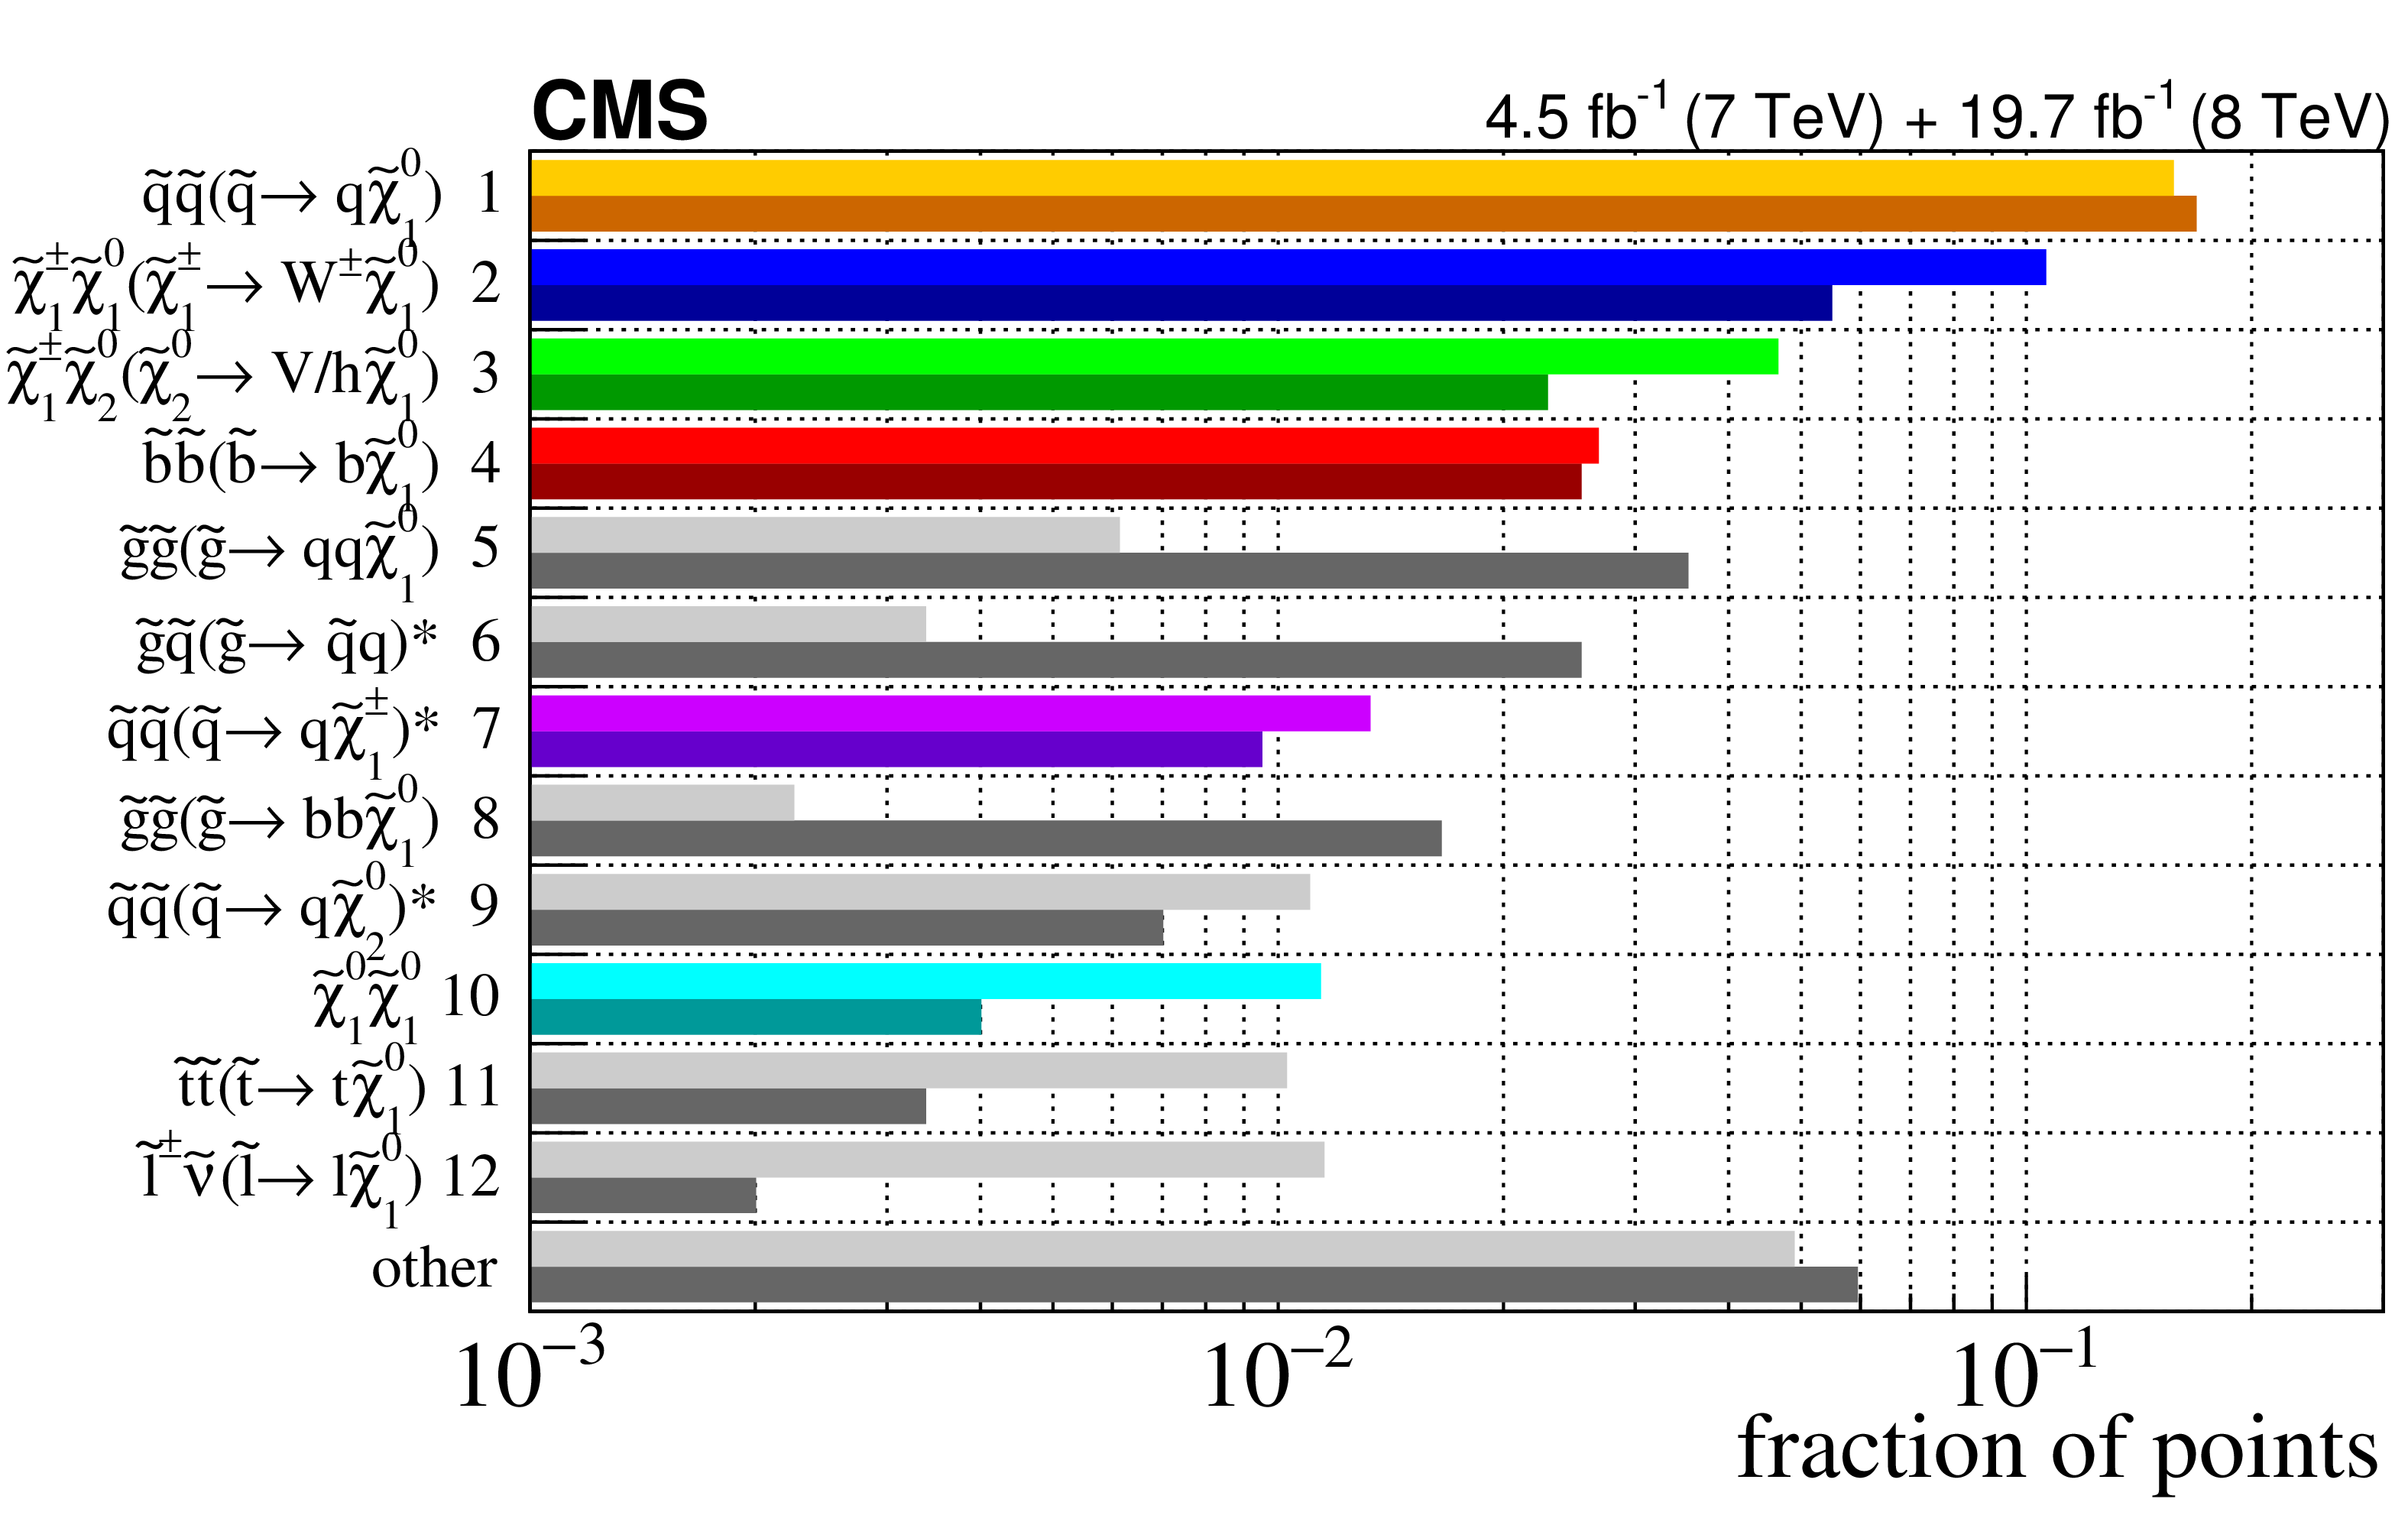
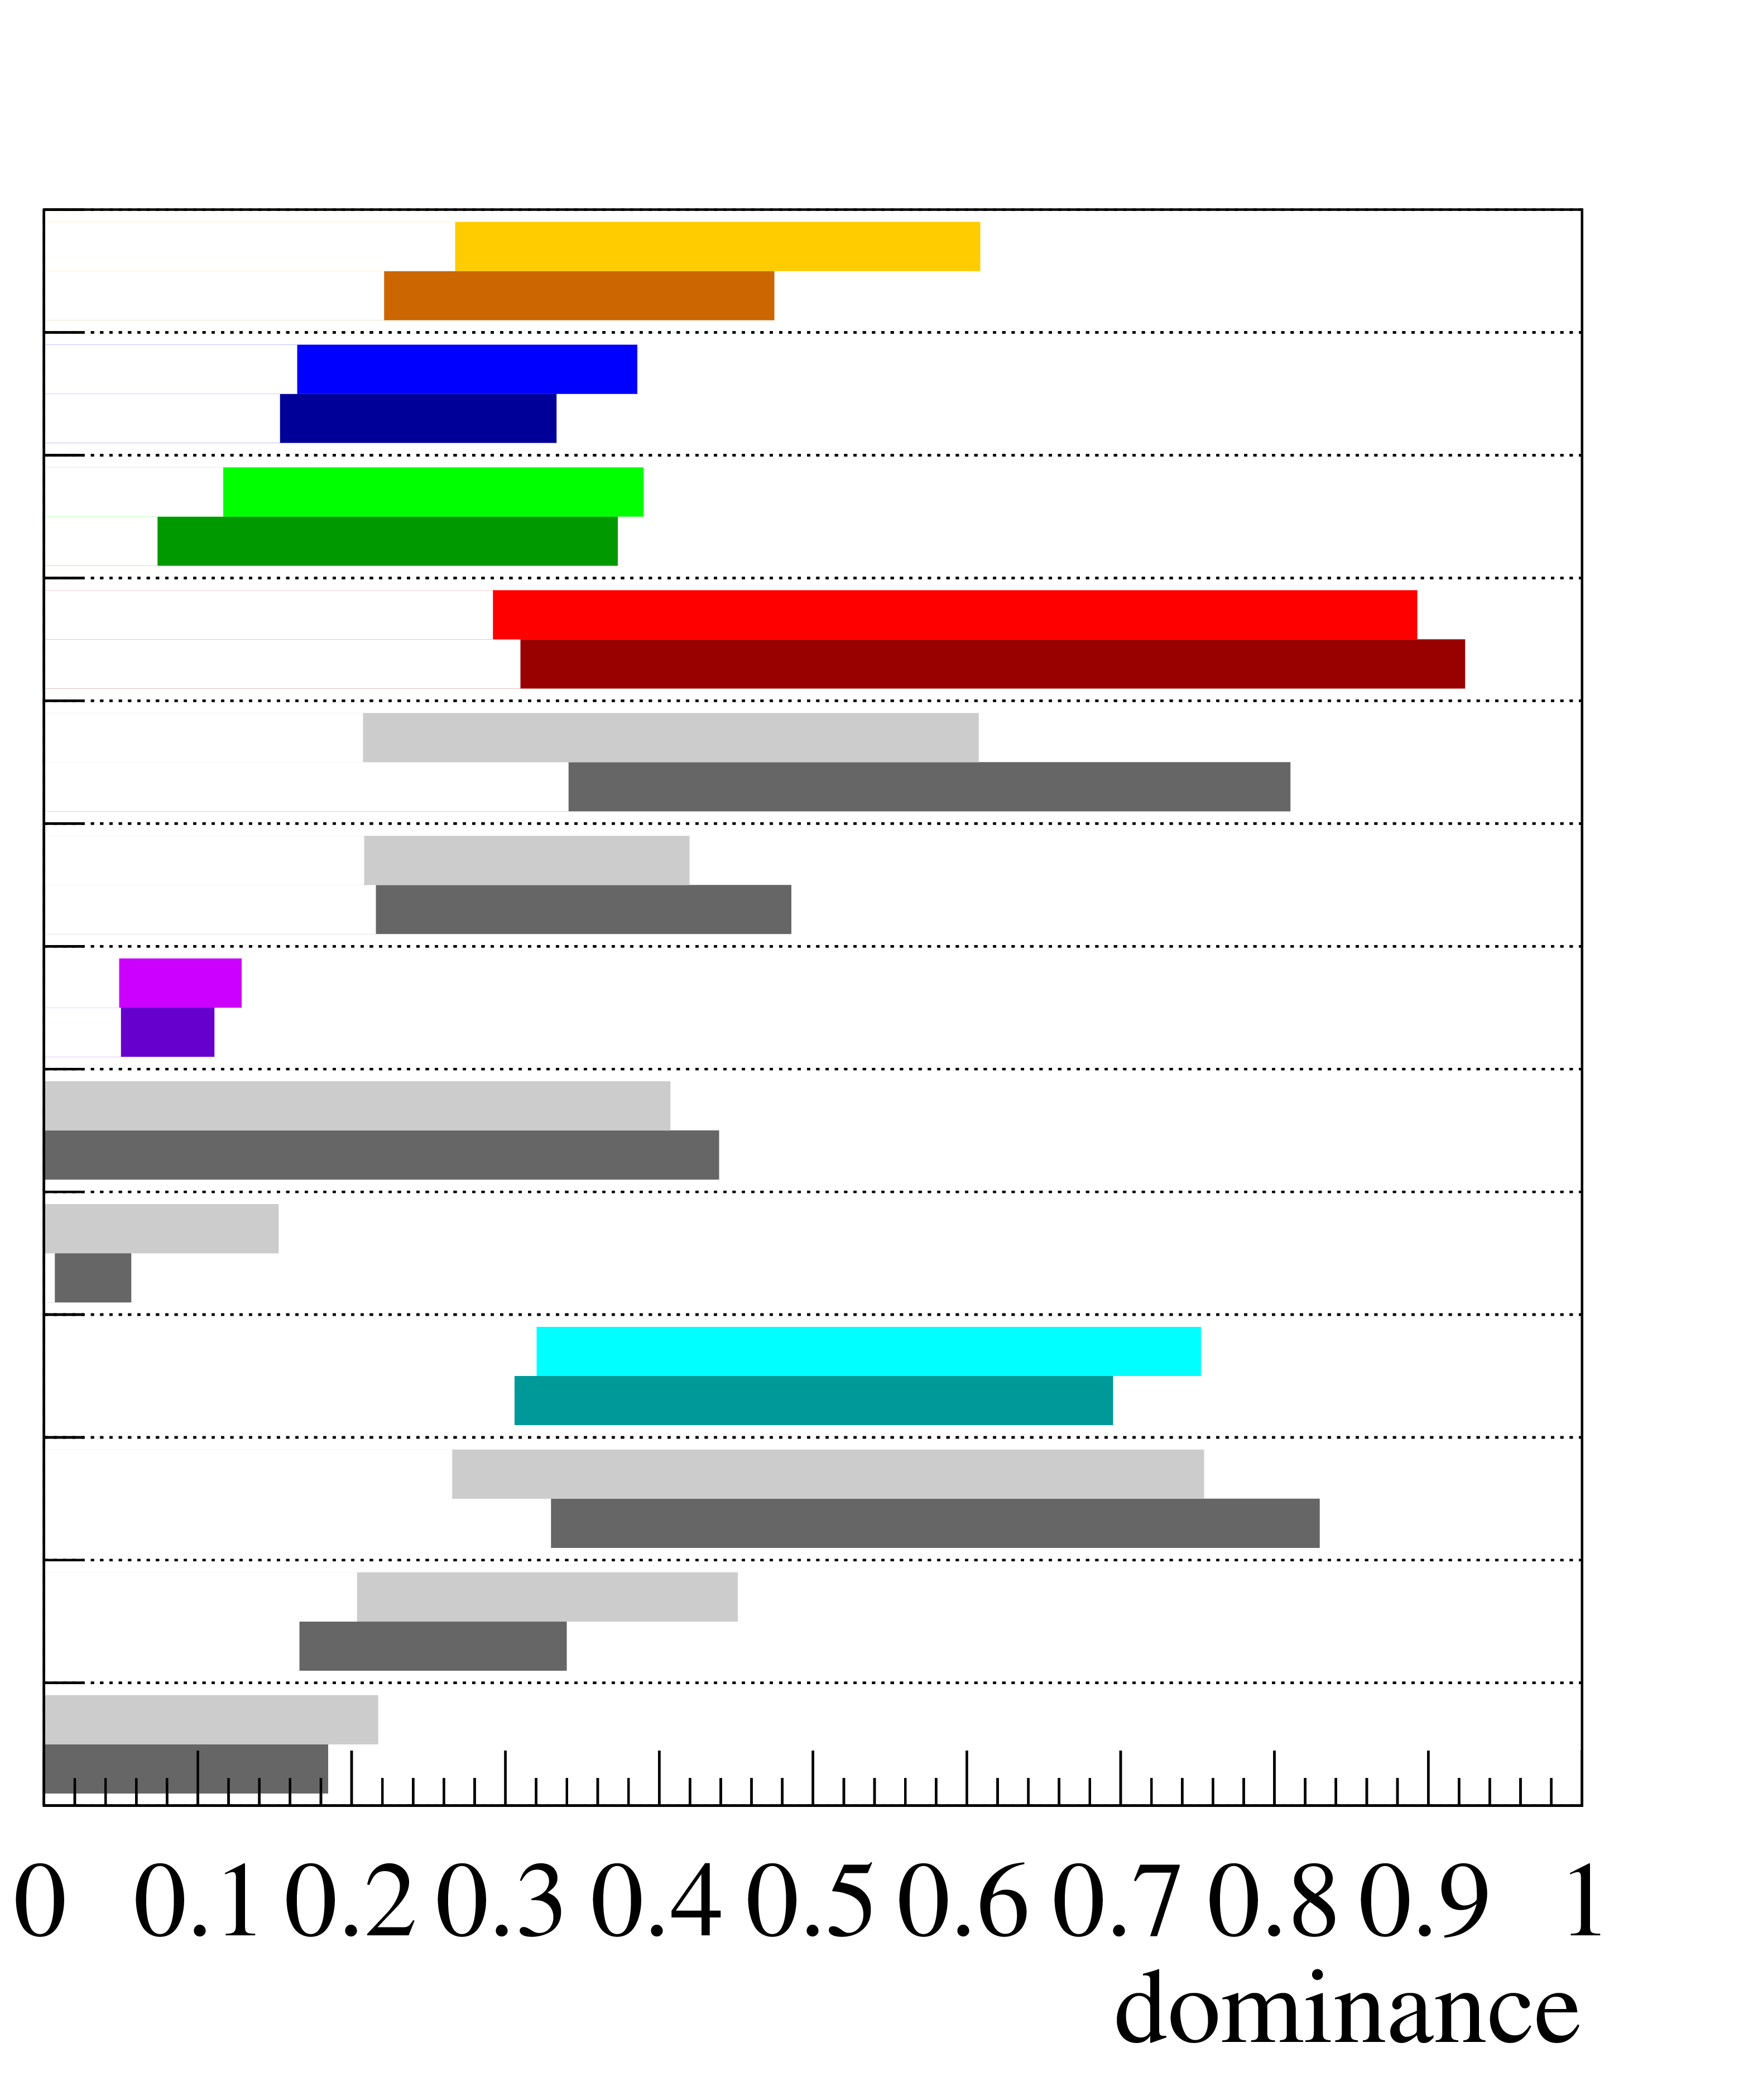
Figure 13-a:
The left plot shows the fraction of excluded (dark) and nonexcluded (light) points out of all considered points, by principal process. Color is assigned to the processes that are most common after the constraints of the CMS searches, which are selected for further study. The dominance of principal processes, as defined in Eq. {eq:dominance}, is given in (right) where the bands show the RMS range of the dominance. |
png pdf |
Figure 13-b:
The left plot shows the fraction of excluded (dark) and nonexcluded (light) points out of all considered points, by principal process. Color is assigned to the processes that are most common after the constraints of the CMS searches, which are selected for further study. The dominance of principal processes, as defined in Eq. {eq:dominance}, is given in (right) where the bands show the RMS range of the dominance. |
png pdf |
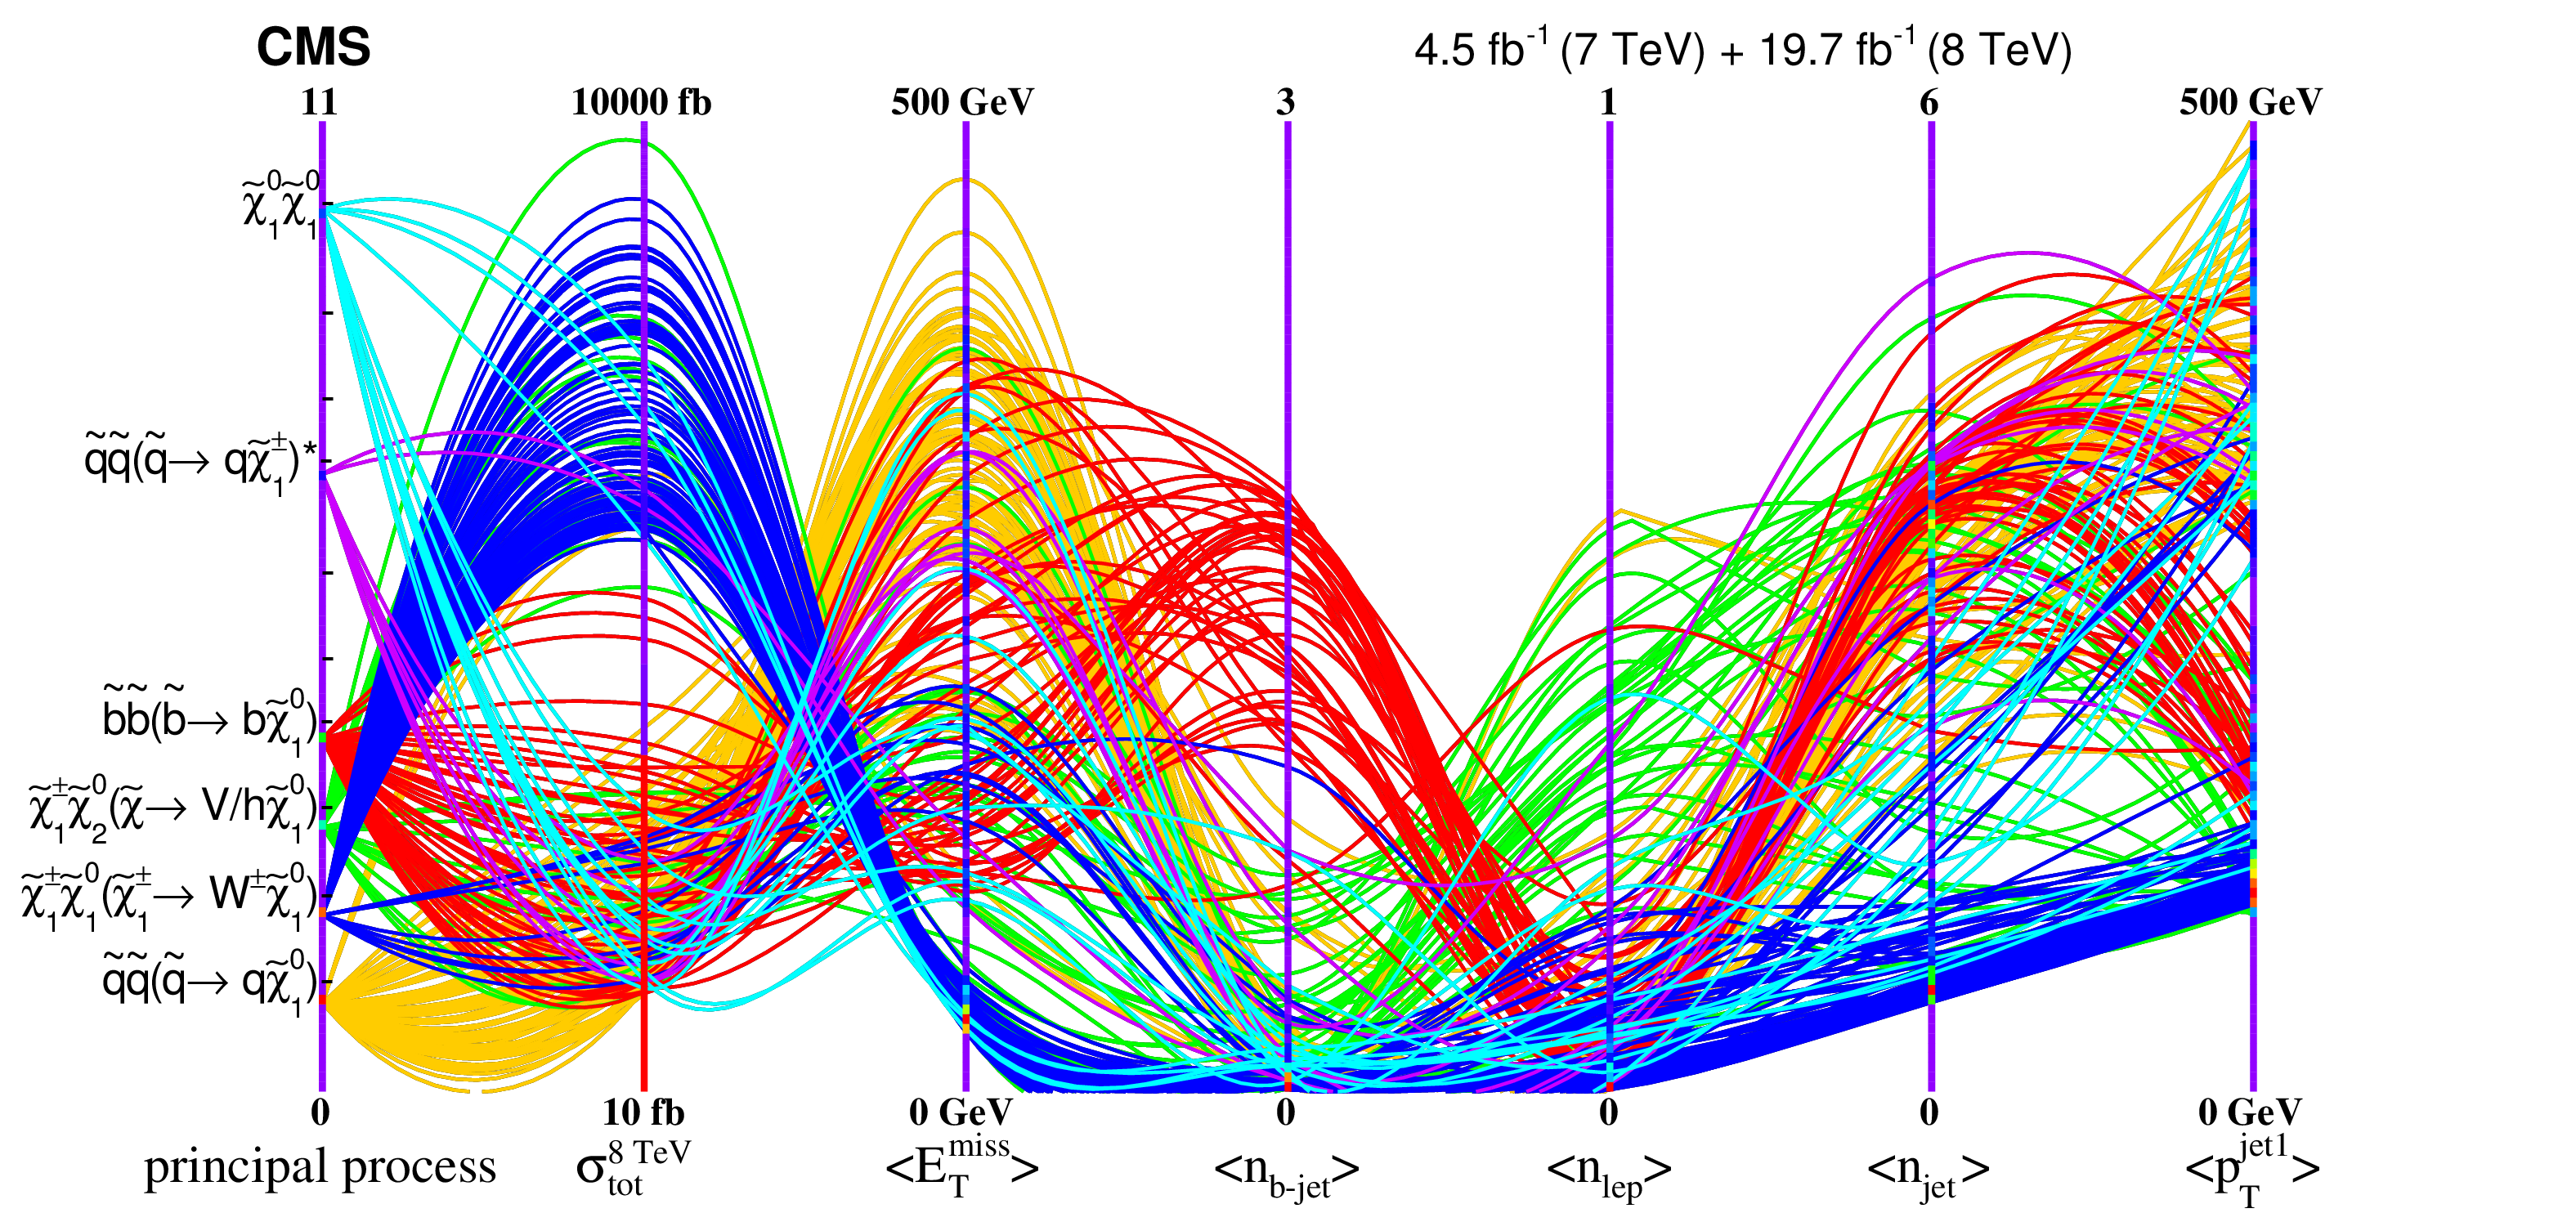
Figure 14:
A parallel coordinates plot showing several hundred selected nonexcluded model points for the six most common principal processes, with seven key properties. From the left, the selected properties are: the principal process, the 8 TeV signal production cross section (in $\log_{\text {10}}$ scale), the average value of the ${E_{\mathrm {T}}^{\text {miss}}} $, the average number of b-jets, leptons, and jets, and finally, the average ${p_{\mathrm {T}}}$ momentum of the leading jet. Color is assigned based on the principal process. Orange codes for process 1, blue for process 2, green for 3, red for 4, violet for 7, and cyan for 10. The range of each axis is given at its lower and upper end. Lines arching toward higher vertical positions typically indicate more ``discoverable'' scenarios. |
png pdf |
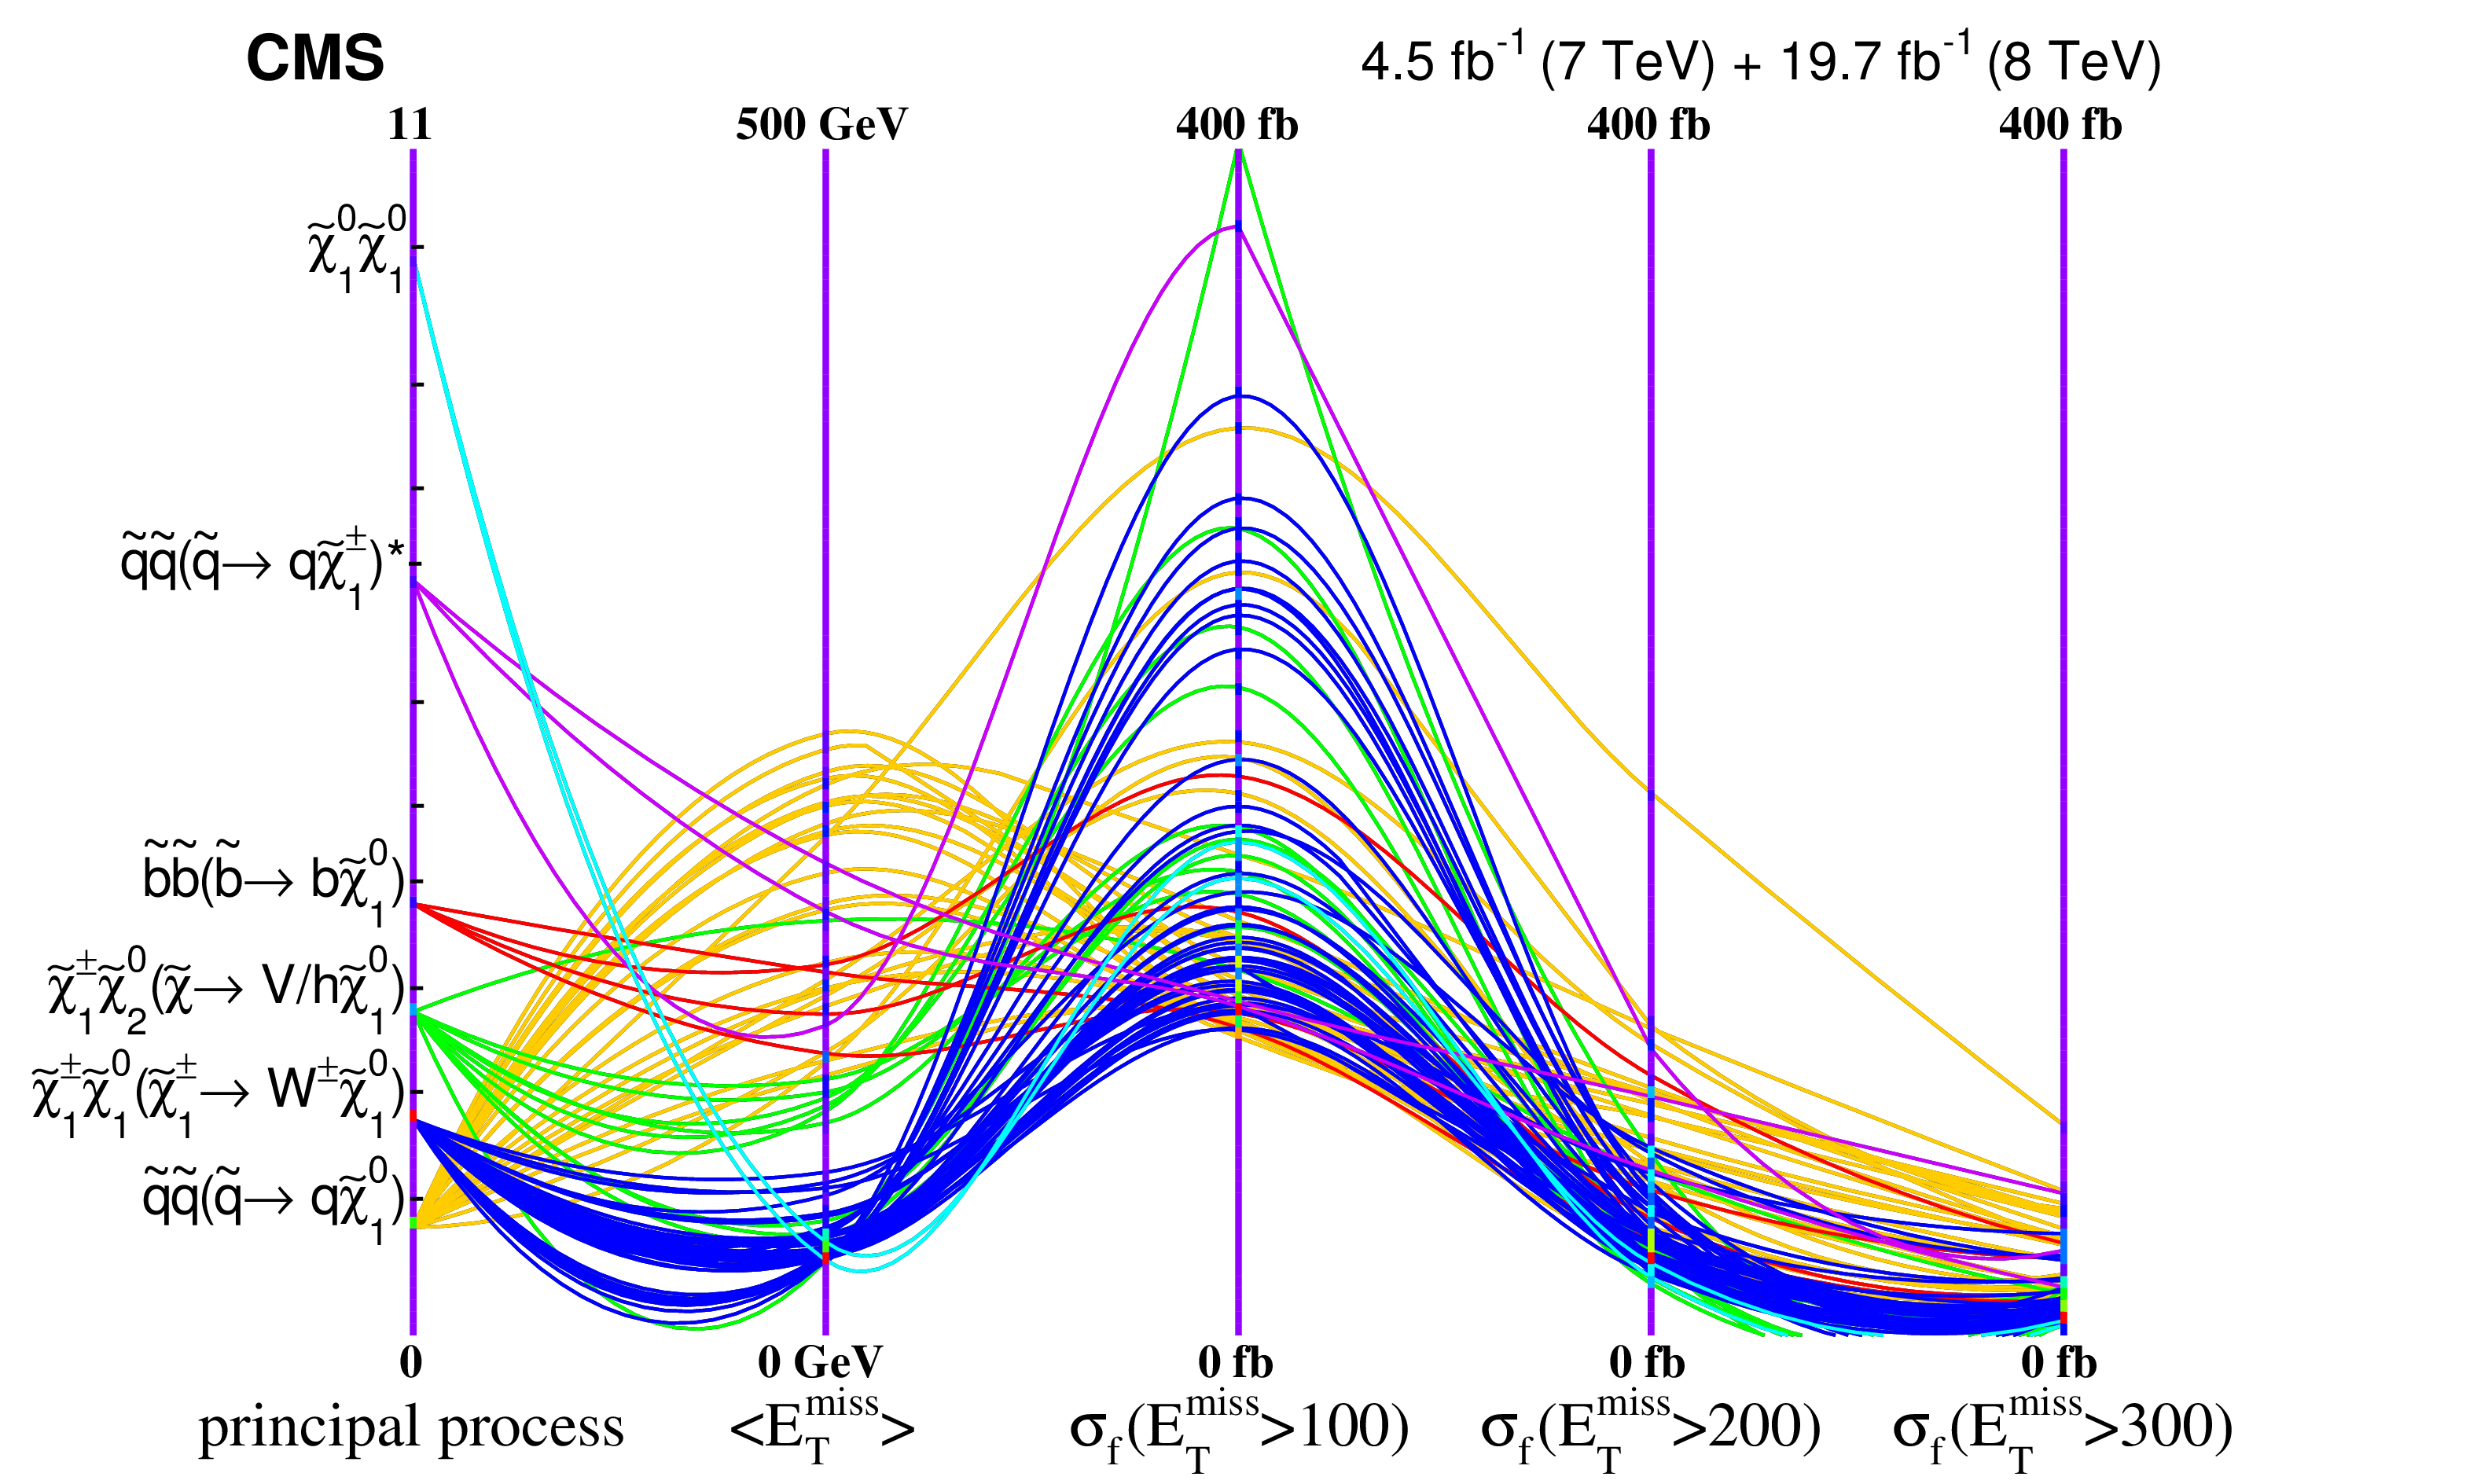
Figure 15:
A parallel coordinates plot of the nonexcluded pMSSM points with the axes set as the principal process, the average ${E_{\mathrm {T}}^{\text {miss}}} $ (in GeV), and the fiducial cross section (in linear scale) for various thresholds on the ${E_{\mathrm {T}}^{\text {miss}}} $. All nonexcluded points corresponding to processes 1, 2, 3, 4, 7, and 10 that have a fiducial cross section greater than 100 fb are shown. Color is assigned to values of the principal process in the same manner as in Fig. 14. |
png pdf |
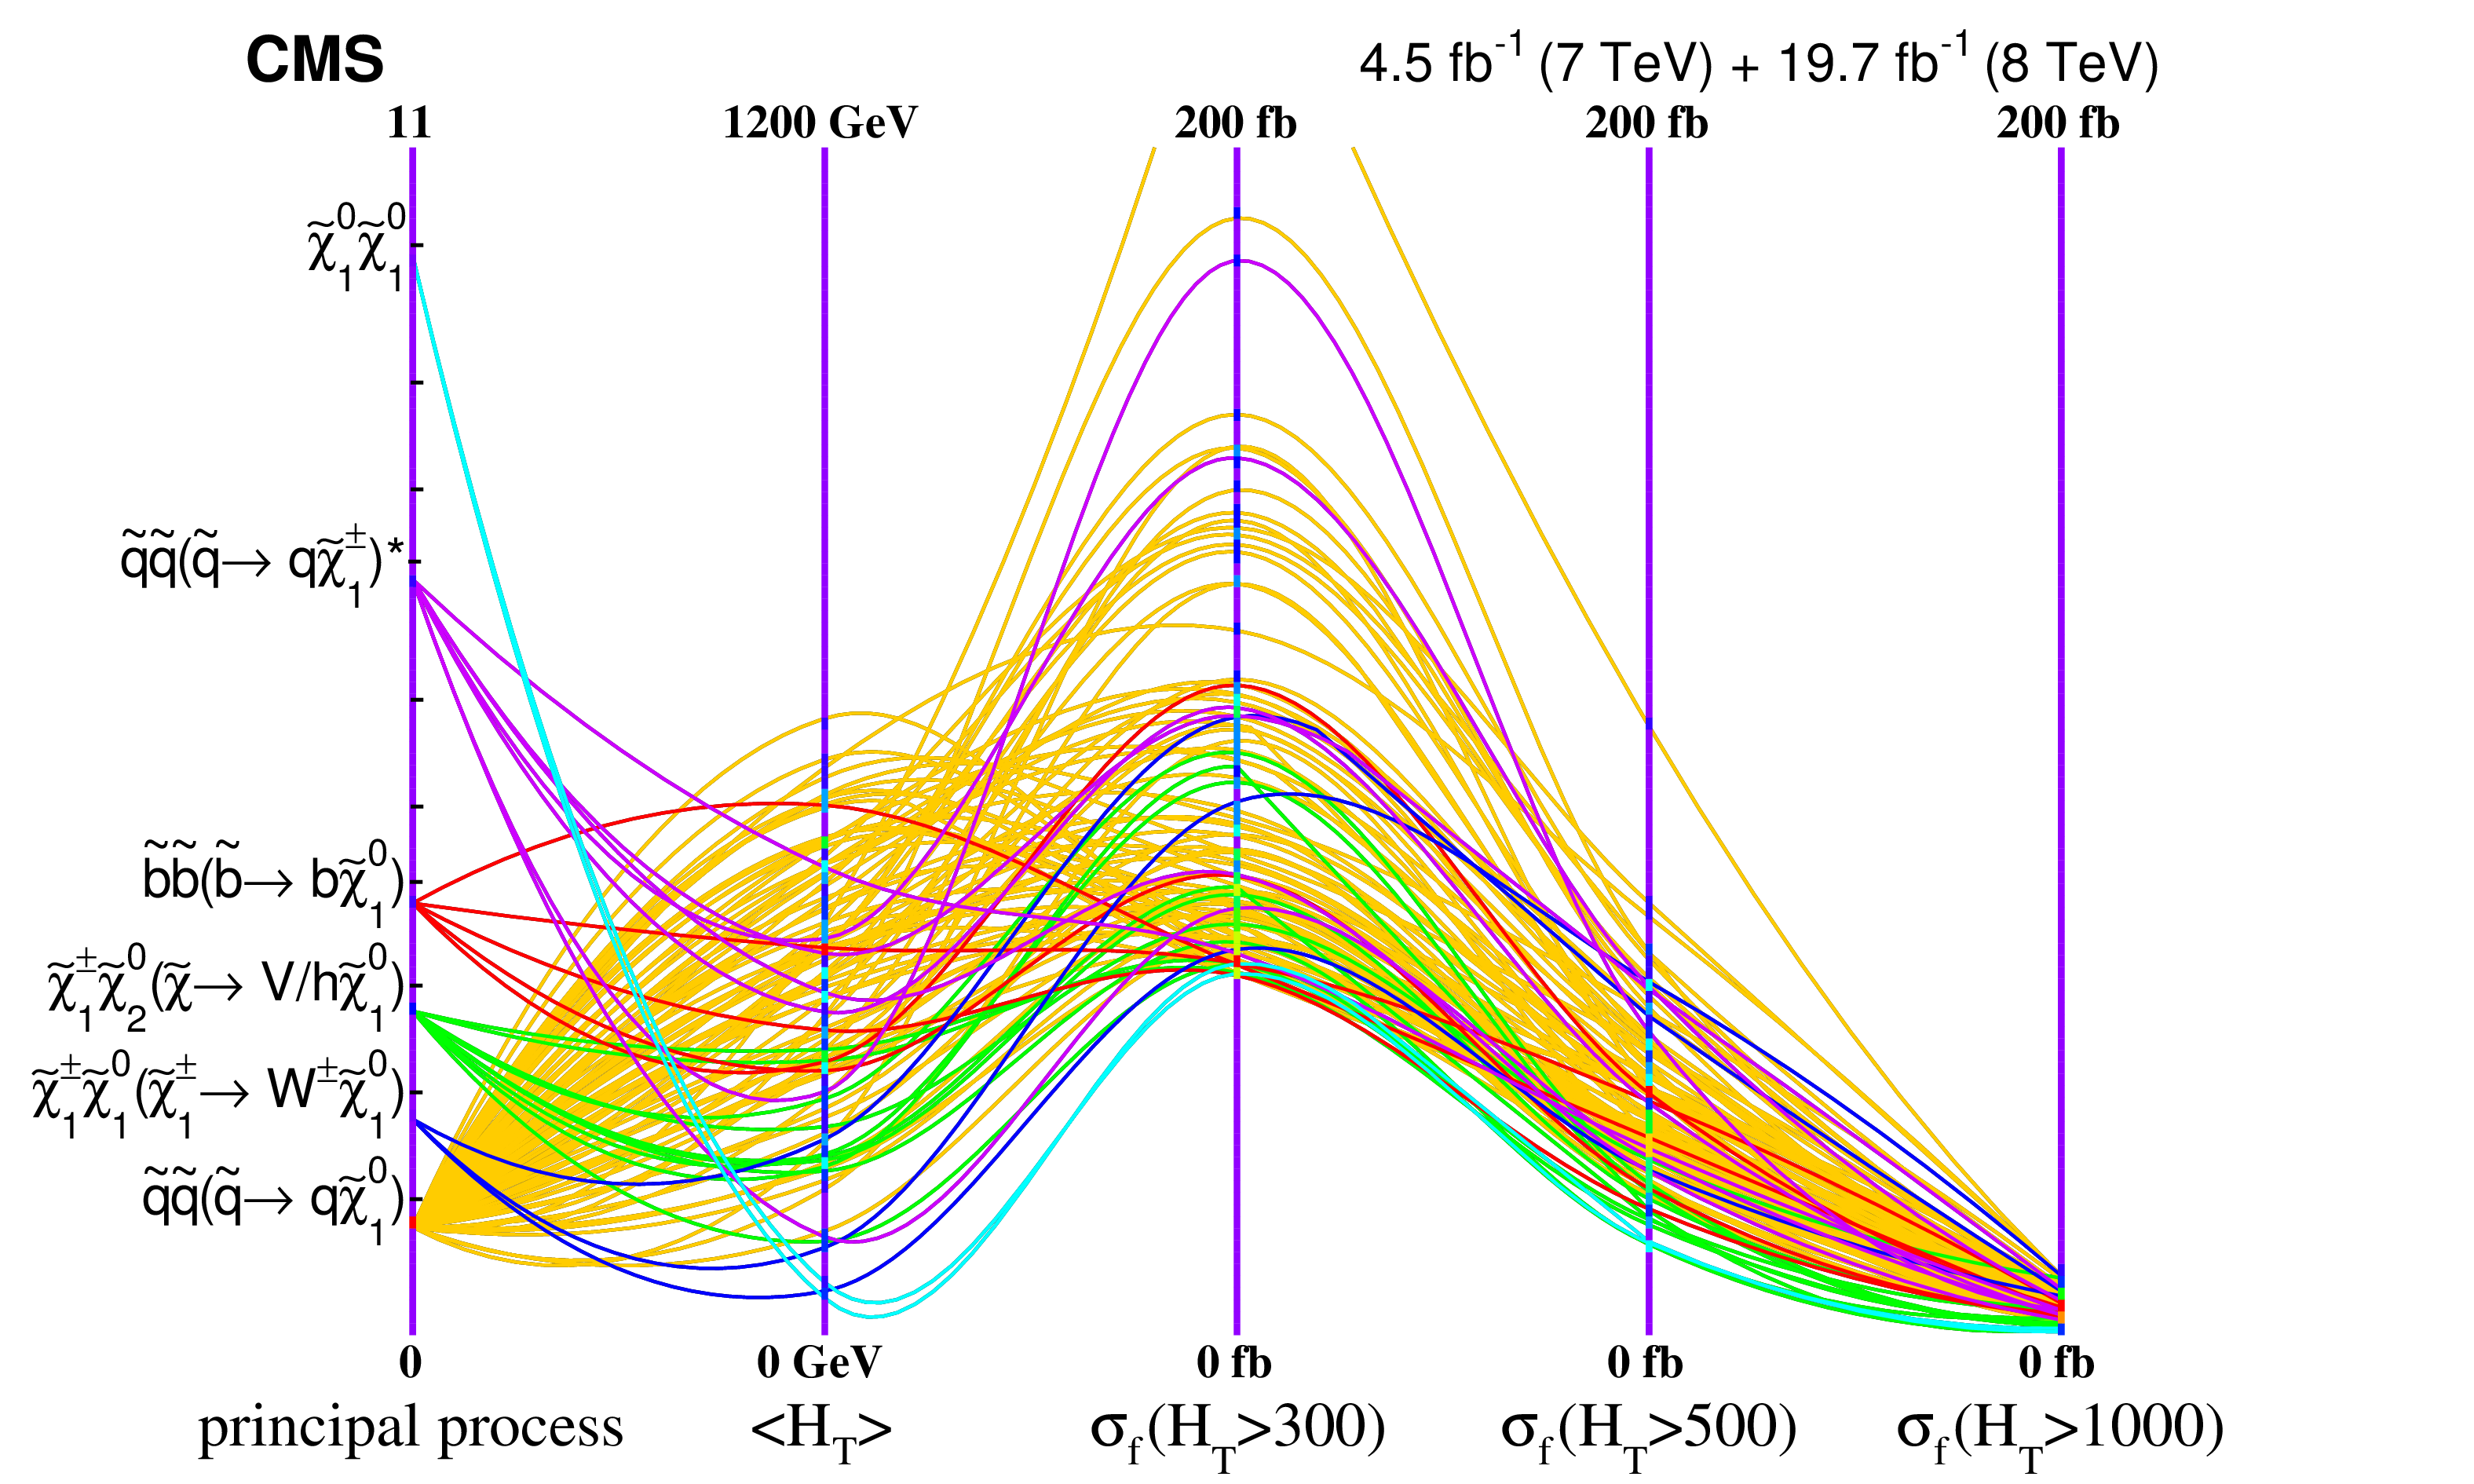
Figure 16:
A parallel coordinates plot of the nonexcluded pMSSM points with the axes set as the principal process, the average ${H_{\mathrm {T}}} $ (in GeV), and the fiducial cross section (in linear scale) for various thresholds on the ${H_{\mathrm {T}}} $. All nonexcluded points corresponding to processes 1, 2, 3, 4, 7, and 10 that have a fiducial cross section greater than 60 fb are shown. Color is assigned to values of the principal process in the same manner as in Fig. 14. |
png pdf |
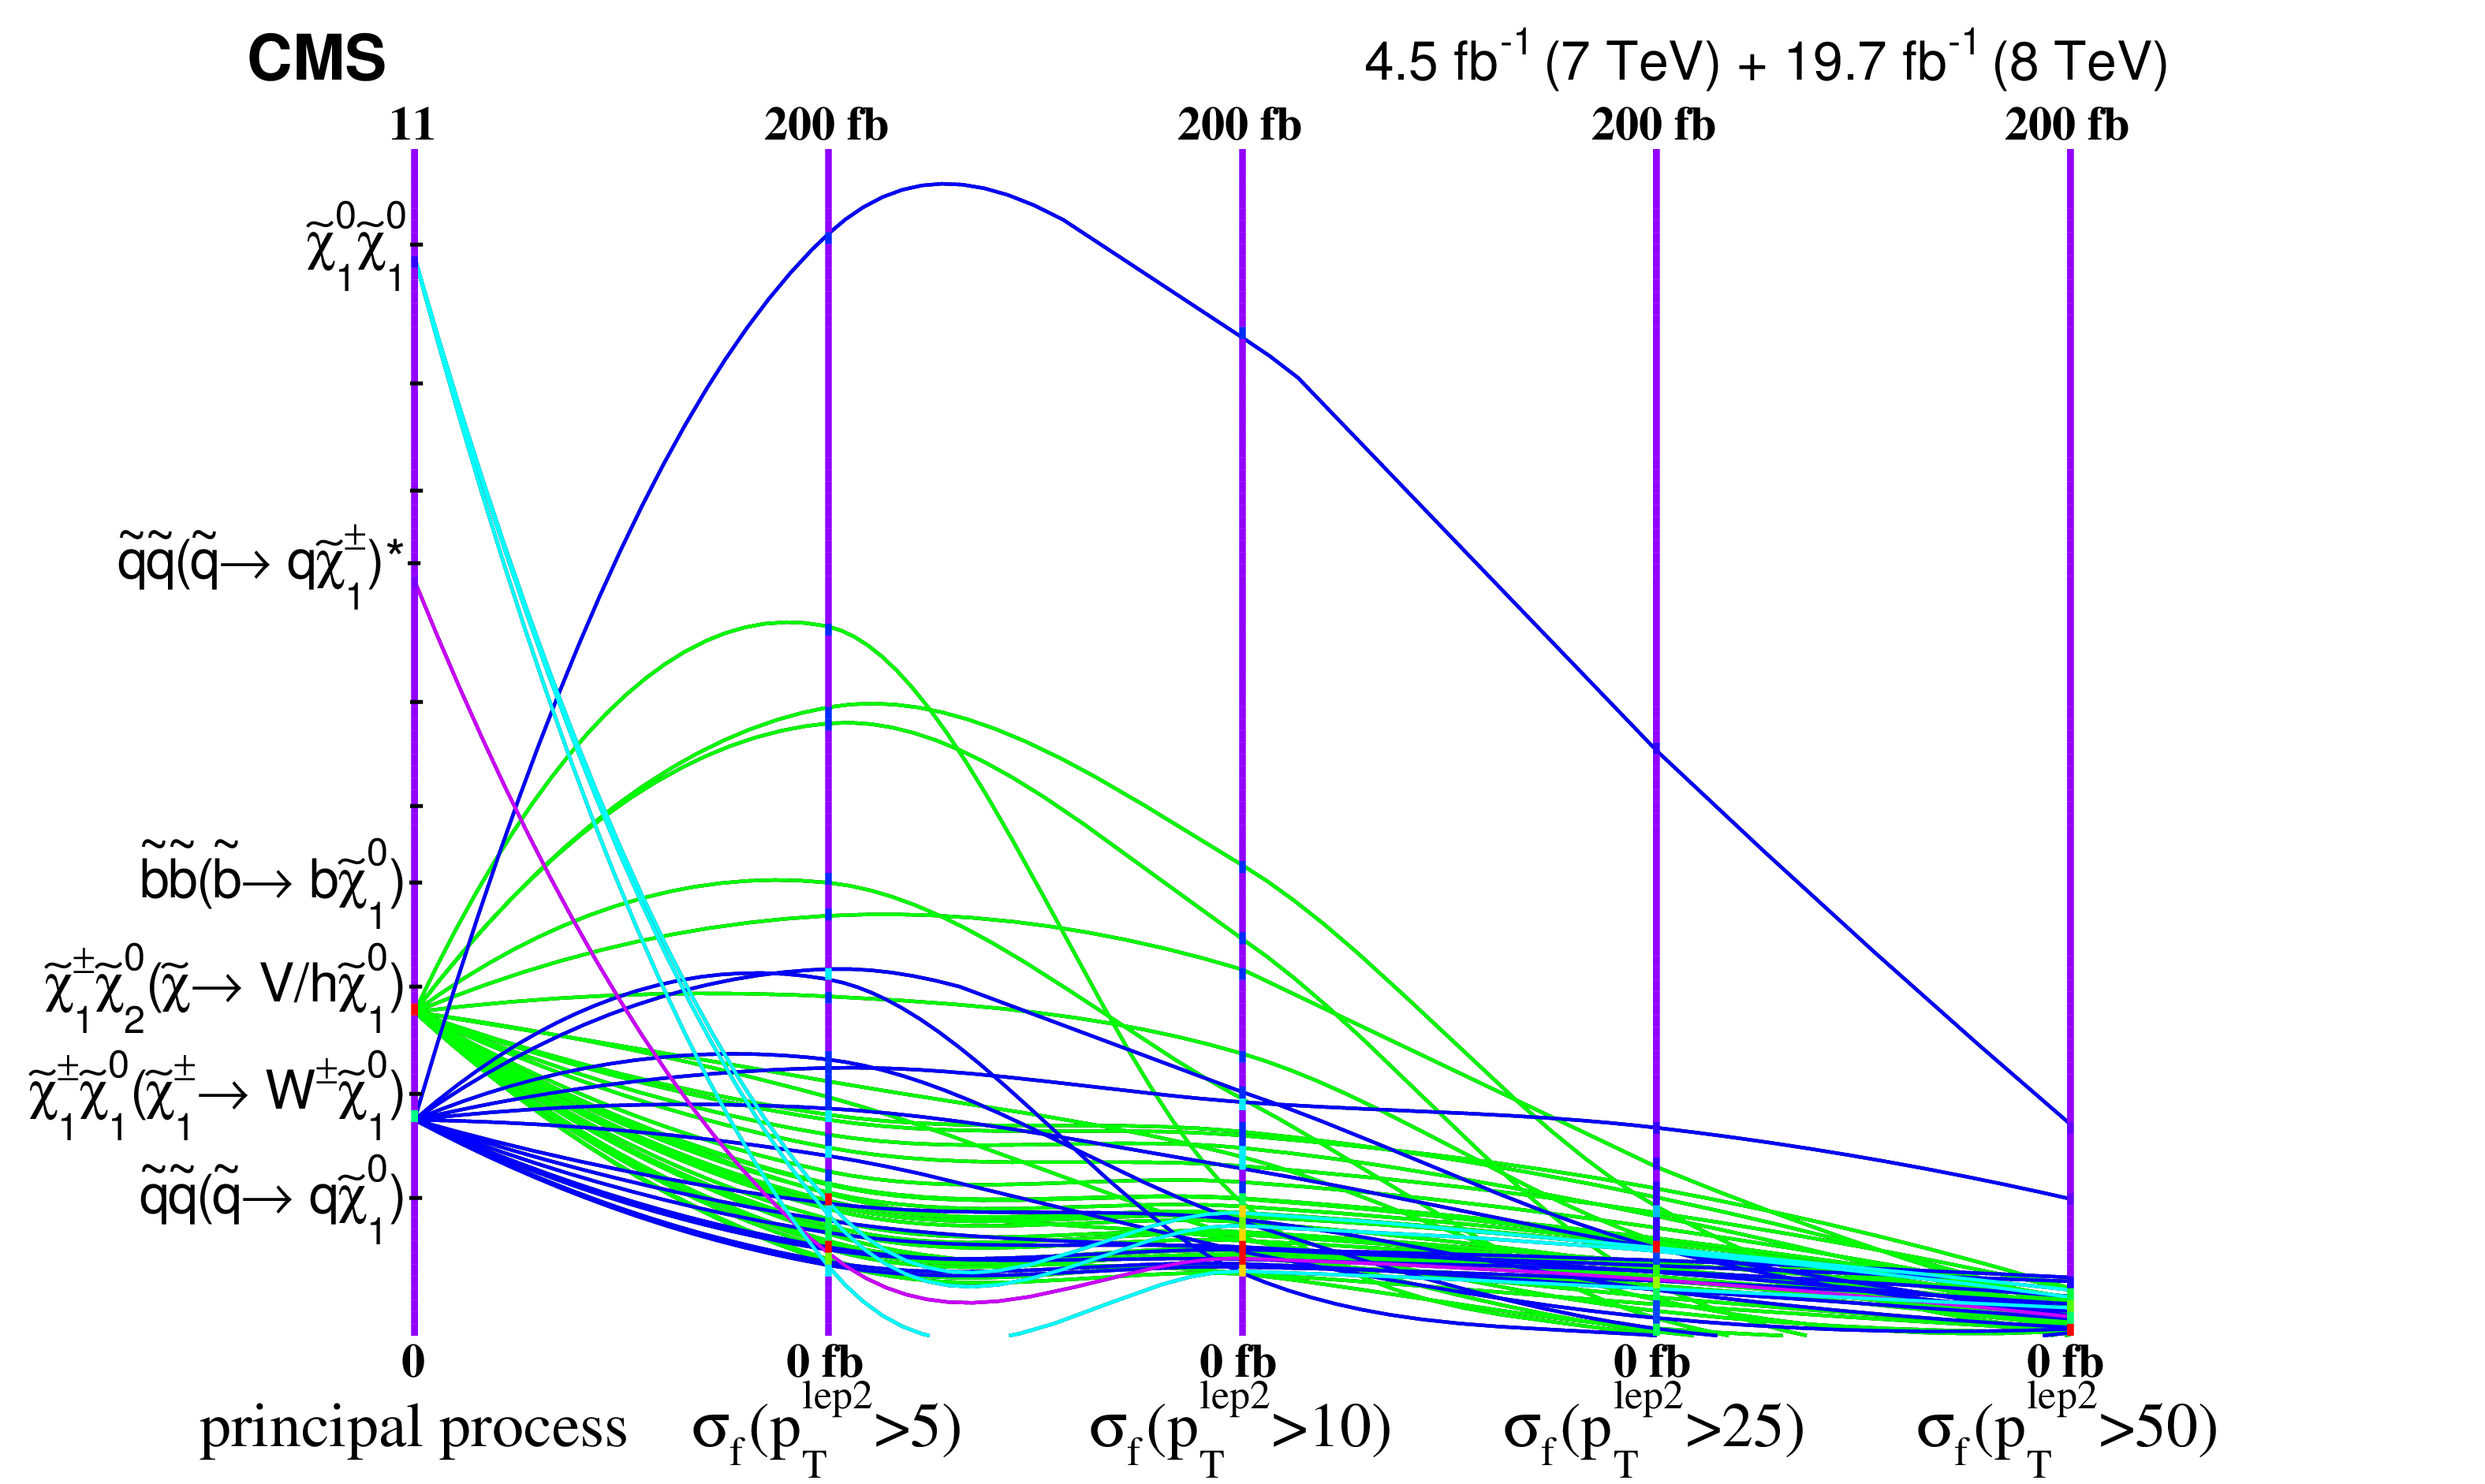
Figure 17:
A parallel coordinates plot of the nonexcluded pMSSM points with the axes set as the principal process and the fiducial cross section (in linear scale) for various thresholds on the sub-leading lepton ${p_{\mathrm {T}}}$ (in GeV). All nonexcluded points corresponding to processes 1, 2, 3, 4, 7, and 10 that have a fiducial cross section greater than 30 fb are shown. Color is assigned to values of the principal process in the same manner as in Fig. 14. |
| Tables | |
png pdf |
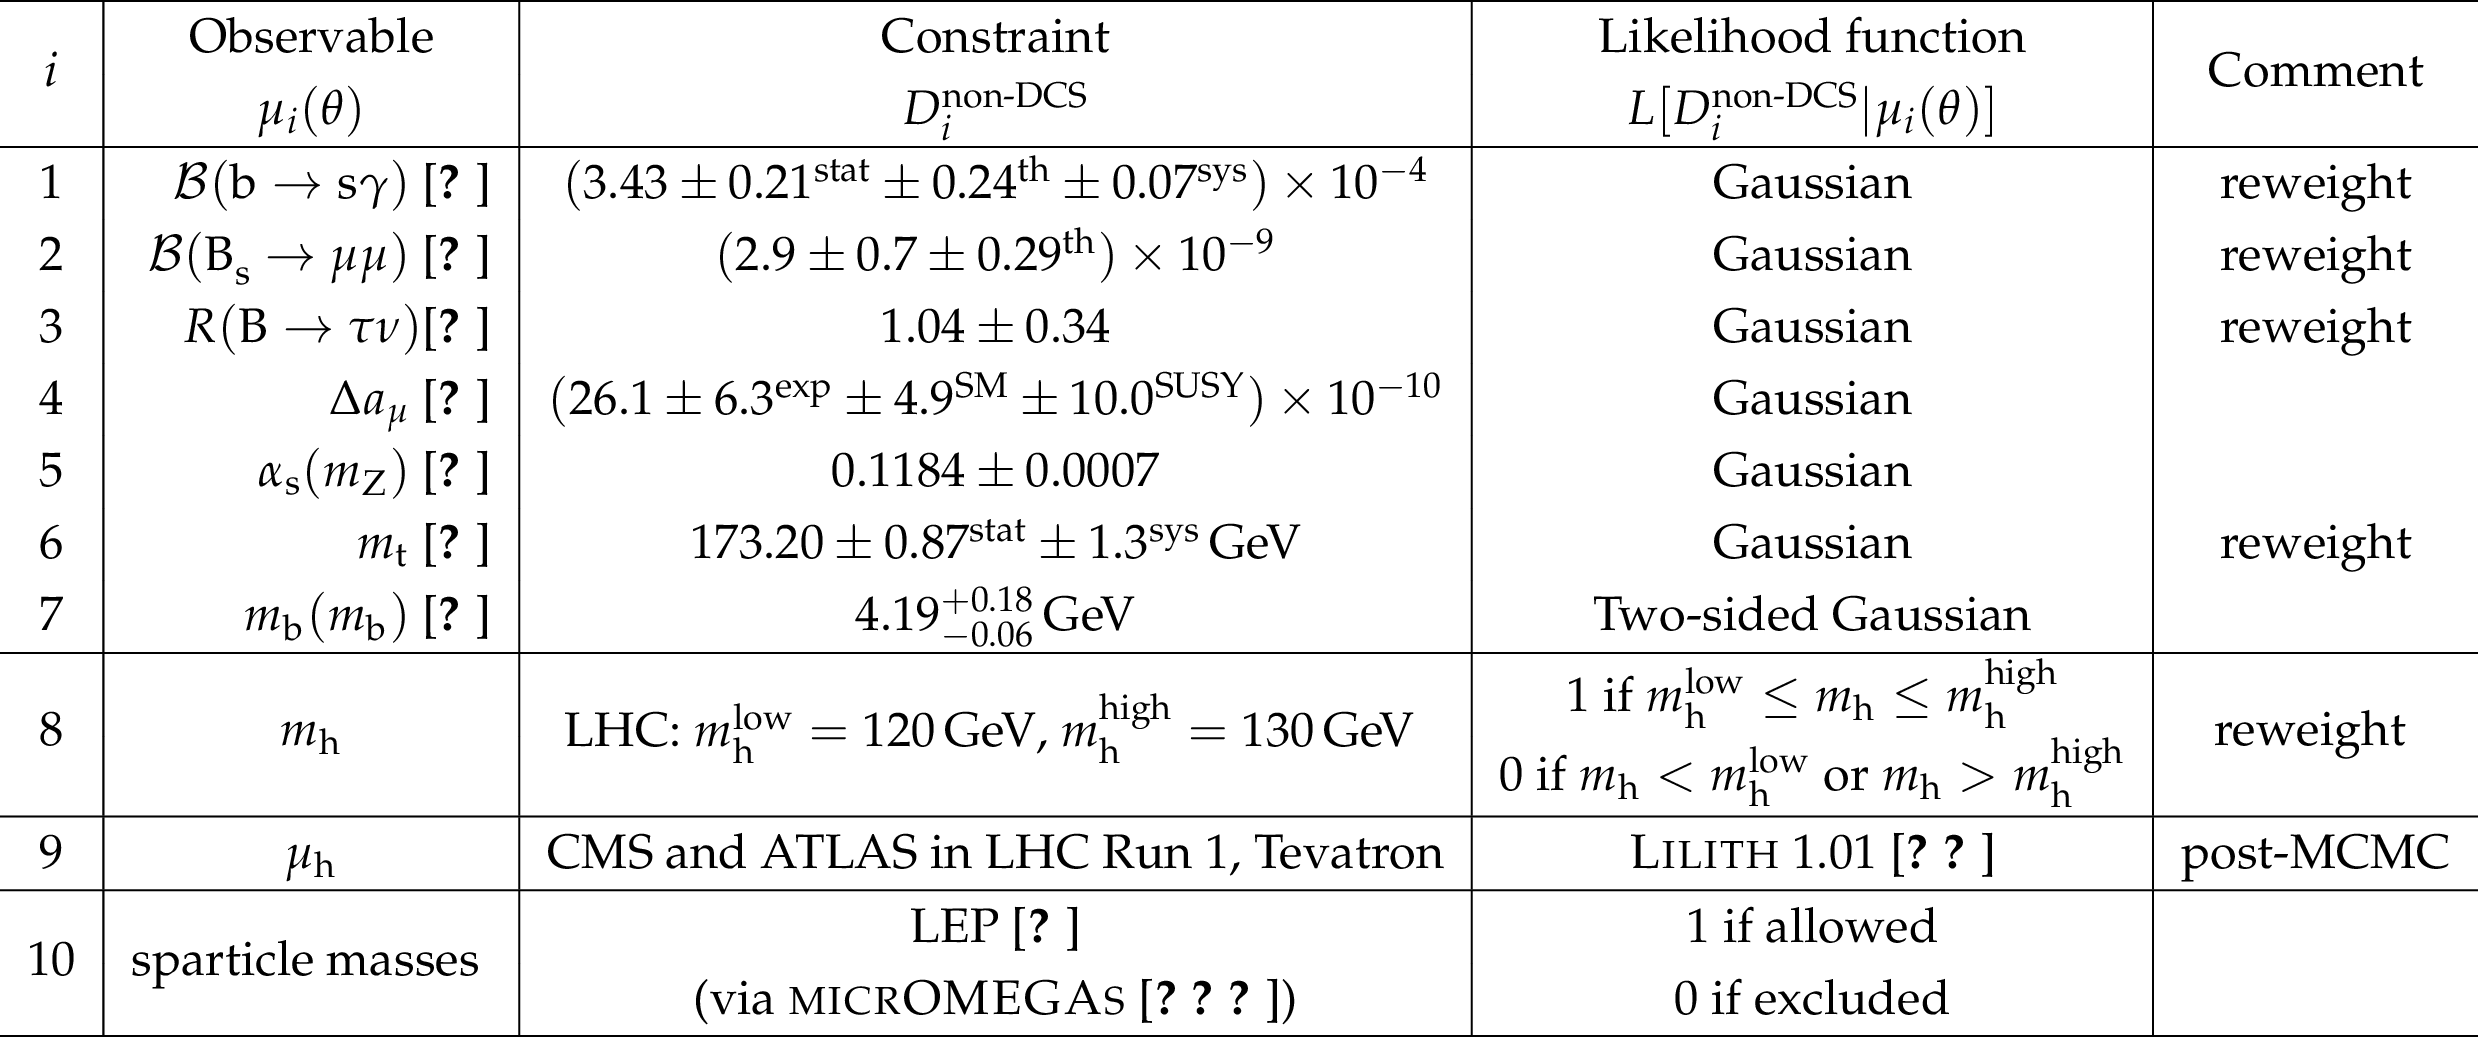
Table 1:
The measurements that form the basis of the non-DCS prior $p^{\textrm {non-DCS}}(\theta )$ for the pMSSM parameters, their observed values and likelihoods. The observables are the decay branching fractions $\mathcal {B}( \mathrm{ b } \to \mathrm{s} \gamma )$ and $\mathcal {B}(\mathrm{B_s} \to \mu \mu )$, the SUSY to SM ratio for the branching fraction of the decay $\mathrm{B} \to \tau \nu $, $R(\mathrm{B} \to \tau \nu )$, the difference in the muon anomolous magnetic moment from its SM prediction $\Delta a_\mu $, the strong coupling constant at the Z boson mass $\alpha _\mathrm {s}(m_{\mathrm{ Z } })$, the top and bottom quark masses $m_{\mathrm{ t } }$ and $m_{\mathrm{ b } }(m_{\mathrm{ b } })$, the Higgs boson mass $m_{\mathrm{h} }$ and signal strength $\mu _{\mathrm{h} }$, and sparticle mass limits from LEP. All data except $\mu _{\mathrm{h} }$ were used in the initial MCMC scan. Details are given in the text. |
png pdf |
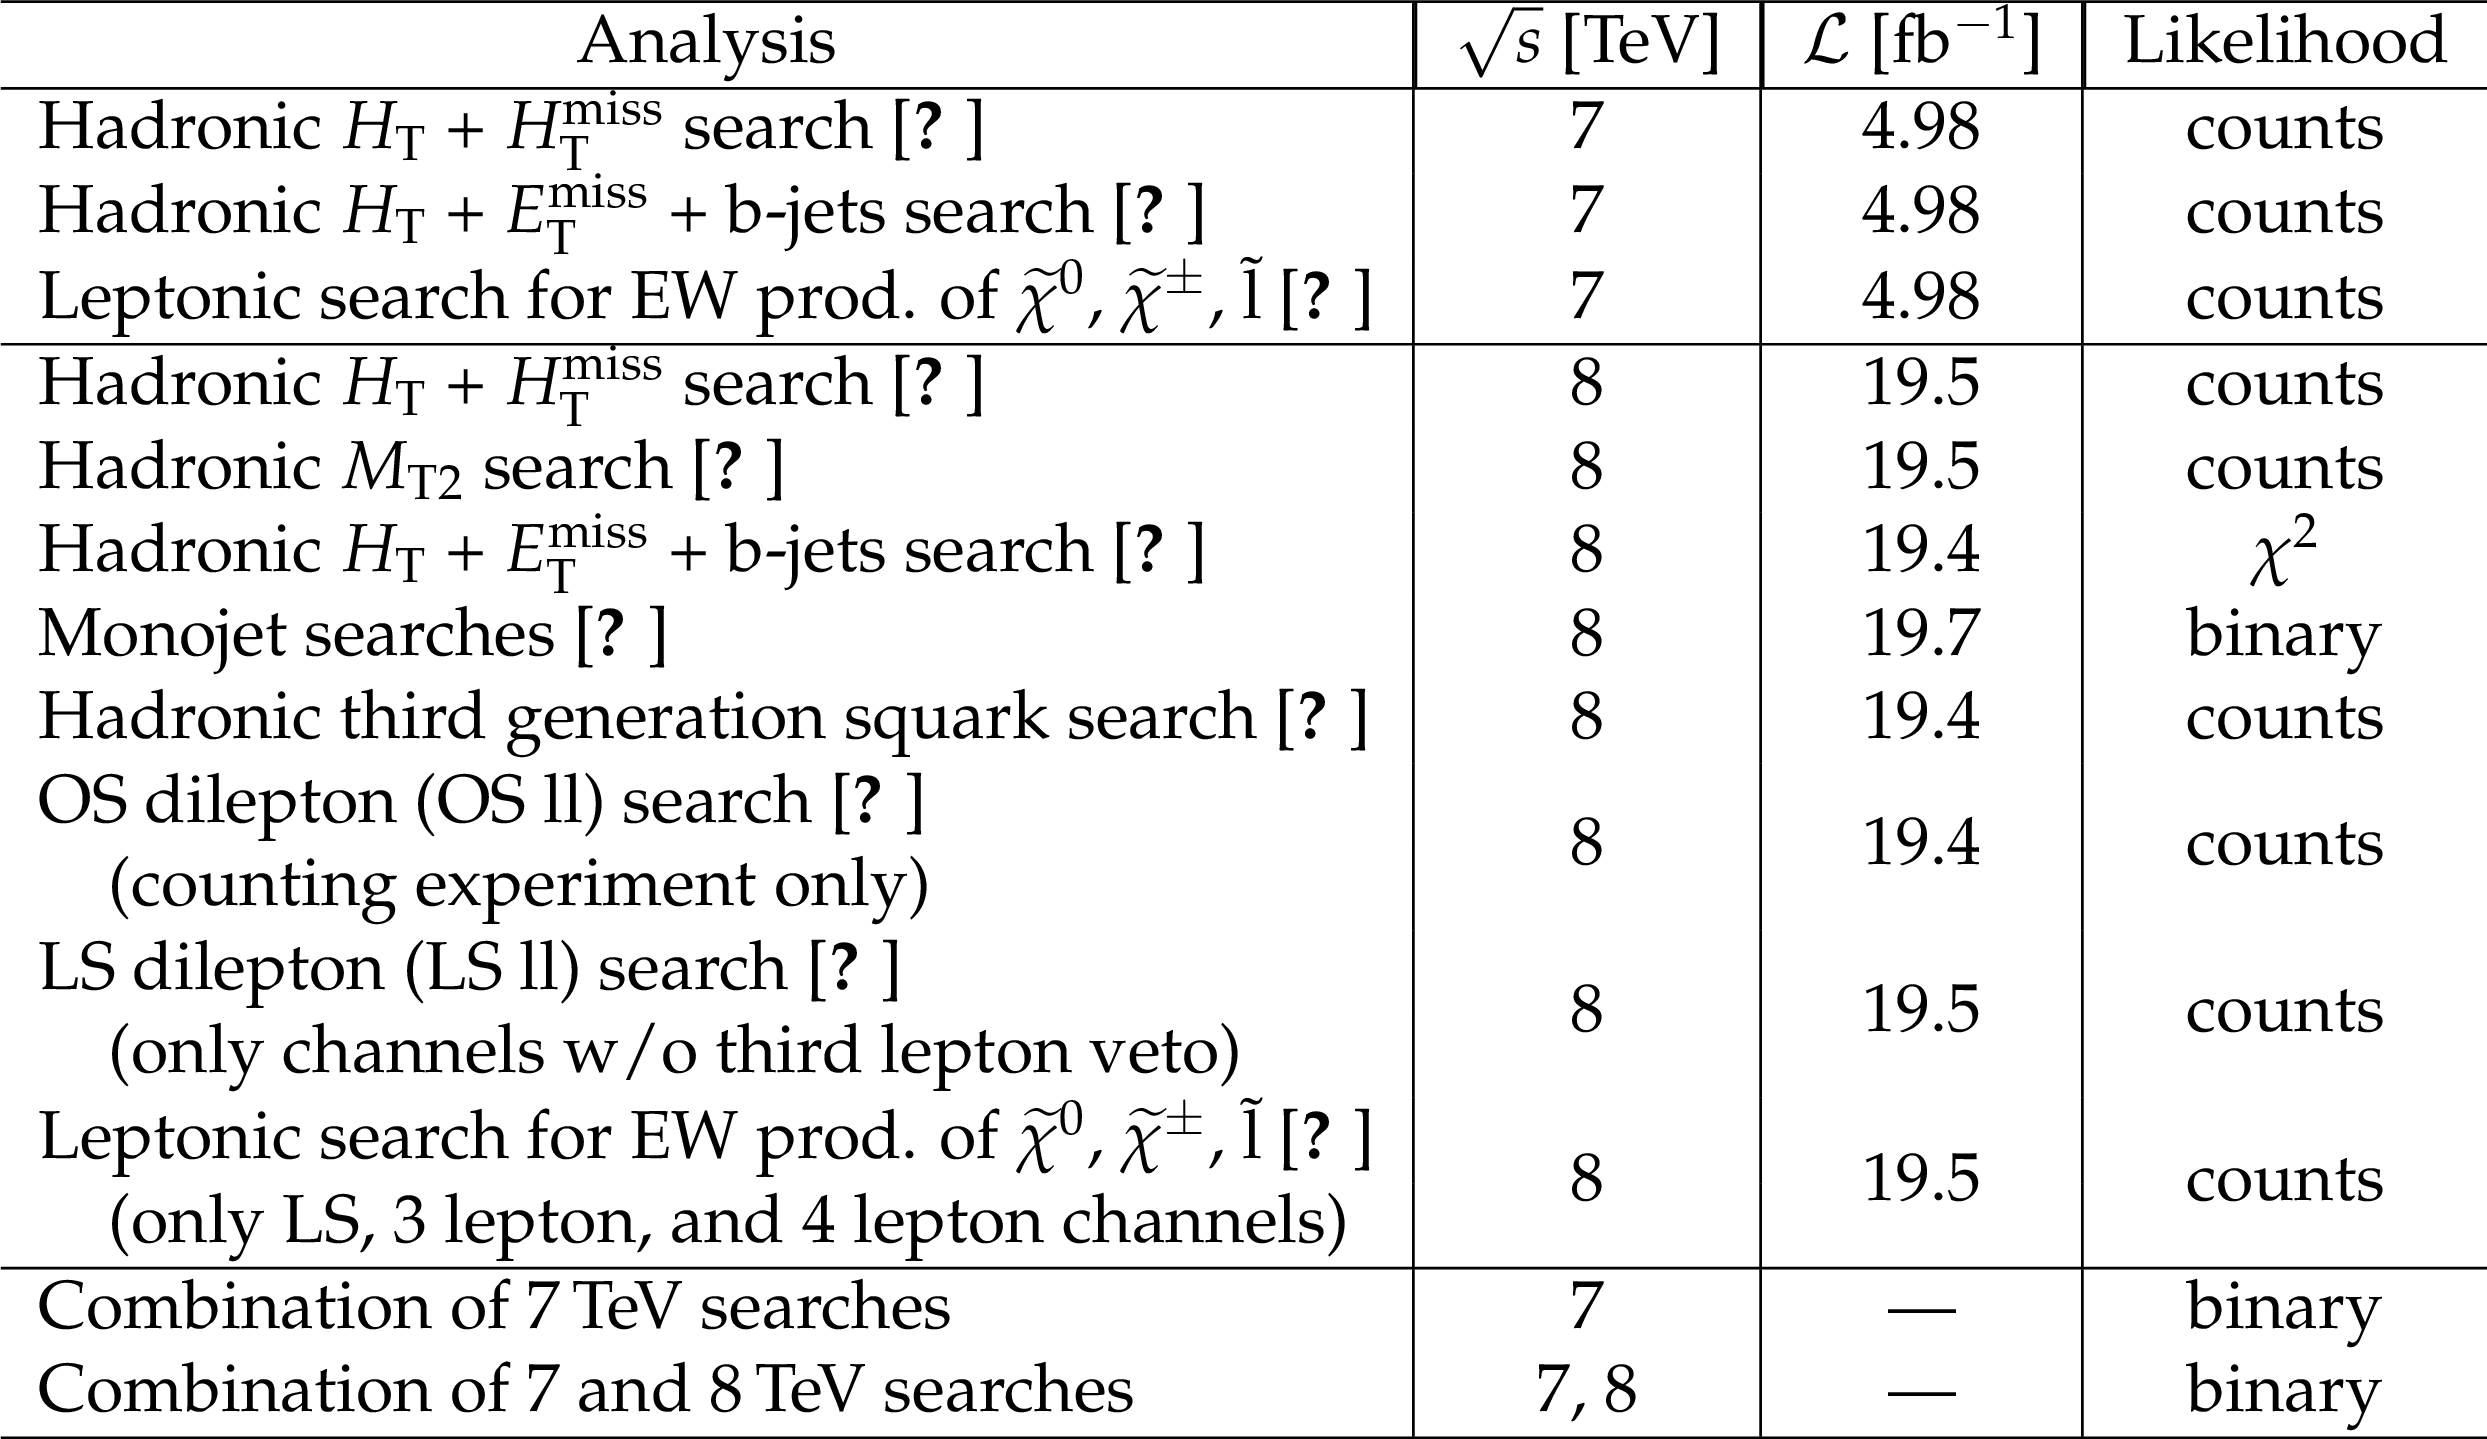
Table 2:
The CMS analyses considered in this study. Each row gives the analysis description, the center-of-mass energy at which data were collected, the associated integrated luminosity, the likelihood used, and the reference to the analysis documentation. |
| Summary |
|
The impact of a representative set of the 7 and 8 TeV CMS SUSY searches on a potentially accessible subspace of the minimal supersymmetric standard model (pMSSM) has been investigated. The subspace of the pMSSM is defined by restricting the ranges of the 19 pMSSM parameters to values that are either physically motivated or that correspond to models that are potentially accessible in the long-term LHC program. An additional restriction is imposed that the lightest chargino decay promptly or with a lifetime that leads to at most a short decay length in the detector. The set of searches, taken individually and in combination, include those with all-hadronic final states, like-sign and opposite-sign charged leptons, and multiple leptons in configurations sensitive to electroweak production of superpartner particles. They are found to exclude all analyzed pMSSM points with a gluino mass less than 500 GeV, and 98% of scenarios in which the lightest colored supersymmetric particle is less than 300 GeV. While the sensitivity of searches to top squarks extends up to $m_{\tilde{\text{t}}_1}\approx$ 700 GeV, the overall impact on the top squark mass is small because the region of highest sensitivity, $m_{\tilde{\text{t}}_1} \leq$ 500 GeV, is already suppressed by the results of previous experiments, such as the measurement of the $\mathrm{ b }\to\mathrm{s}\gamma$ branching fraction. Neutralino and chargino masses less than $300 GeV$ are significantly disfavored, but not ruled out, by the CMS data. Measurements of the Higgs boson mass and signal strengths are included in this study, but add little to the model constraints. Approximately half of this potentially-accessible subspace of the pMSSM is excluded by the CMS data. Of the surviving points, about half have cross sections greater than 10 fb, and some have cross sections greater than 1 pb. Most high cross section points correspond to electroweak gaugino production with mass splittings between the second-lightest and the lightest SUSY particle less than 3 GeV. Nonexcluded model points with low-mass gluinos correspond to processes involving intermediate electroweak gauginos that are nearly degenerate with the lightest SUSY particle. The surviving points evade the experimental constraints largely because they overlap with the kinematical parameter space of more copiously produced standard model processes. Some of these may be probed by future searches that target the nonexcluded processes detailed in Section 5, benefiting as well from the higher energy and luminosity of the LHC. |
| References | ||||
| 1 | P. Ramond | Dual theory for free fermions | PRD 3 (1971) 2415 | |
| 2 | \relax Yu. A. Gol'fand and E. P. Likhtman | Extension of the algebra of Poincar$ \'e $ group generators and violation of P invariance | JEPTL 13 (1971)323 | |
| 3 | D. V. Volkov and V. P. Akulov | Possible universal neutrino interaction | JEPTL 16 (1972)438 | |
| 4 | J. Wess and B. Zumino | Supergauge transformations in four-dimensions | Nucl. Phys. B 70 (1974) 39 | |
| 5 | P. Fayet | Supergauge invariant extension of the Higgs mechanism and a model for the electron and its neutrino | Nucl. Phys. B 90 (1975) 104 | |
| 6 | D. J. H. Chung et al. | The soft supersymmetry breaking Lagrangian: theory and applications | PR 407 (2005) 1 | hep-ph/0312378 |
| 7 | ATLAS Collaboration | Summary of the searches for squarks and gluinos using $ \sqrt{s} = $ 8 TeV pp collisions with the ATLAS experiment at the LHC | JHEP 10 (2015) 054 | 1507.05525 |
| 8 | CMS Collaboration | Search for new physics in the multijet and missing transverse momentum final state in proton-proton collisions at $ \sqrt{s} = $ 7 TeV | PRL 109 (2012) 171803 | CMS-SUS-12-011 1207.1898 |
| 9 | CMS Collaboration | Search for supersymmetry in events with b-quark jets and missing transverse energy in pp collisions at 7$ TeV $ | PRD 86 (2012) 072010 | CMS-SUS-12-003 1208.4859 |
| 10 | CMS Collaboration | Search for electroweak production of charginos and neutralinos using leptonic final states in pp collisions at $ \sqrt{s} = $ 7 TeV | JHEP 11 (2012) 147 | CMS-SUS-12-006 1209.6620 |
| 11 | CMS Collaboration | Search for new physics in the multijet and missing transverse momentum final state in proton-proton collisions at $ \sqrt{s} = $ 8 TeV | JHEP 06 (2014) 055 | CMS-SUS-13-012 1402.4770 |
| 12 | CMS Collaboration | Search for supersymmetry in hadronic final states using MT2 in pp collisions at $ \sqrt{s} = $ 7 TeV | JHEP 10 (2012) 018 | CMS-SUS-12-002 1207.1798 |
| 13 | CMS Collaboration | Search for gluino mediated bottom- and top-squark production in multijet final states in pp collisions at 8$ TeV $ | PLB 725 (2013) 243 | CMS-SUS-12-024 1305.2390 |
| 14 | CMS Collaboration | Search for dark matter, extra dimensions, and unparticles in monojet events in proton-proton collisions at $ \sqrt{s} = $ 8 TeV | EPJC 75 (2015) 235 | CMS-EXO-12-048 1408.3583 |
| 15 | CMS Collaboration | Searches for third-generation squark production in fully hadronic final states in proton-proton collisions at $ \sqrt{s} = $ 8 TeV | JHEP 06 (2015) 116 | CMS-SUS-14-001 1503.08037 |
| 16 | CMS Collaboration | Search for physics beyond the standard model in events with two leptons, jets, and missing transverse momentum in pp collisions at $ \sqrt{s} = $ 8 TeV | JHEP 04 (2015) 124 | CMS-SUS-14-014 1502.06031 |
| 17 | CMS Collaboration | Search for new physics in events with same-sign dileptons and jets in pp collisions at $ \sqrt{s} $ = 8 TeV | JHEP 01 (2014) 163, , Erratum: \DOI10.1007/JHEP01(2015)014 | CMS-SUS-13-013 1311.6736 |
| 18 | CMS Collaboration | Searches for electroweak production of charginos, neutralinos, and sleptons decaying to leptons and W, Z, and Higgs bosons in pp collisions at 8$ TeV $ | EPJC 74 (2014) 3036 | CMS-SUS-13-006 1405.7570 |
| 19 | A. H. Chamseddine, R. L. Arnowitt, and P. Nath | Locally supersymmetric grand unification | PRL 49 (1982) 970 | |
| 20 | R. Barbieri, S. Ferrara, and C. A. Savoy | Gauge models with spontaneously broken local supersymmetry | PLB 119 (1982) 343 | |
| 21 | L. E. Ibanez | Locally supersymmetric SU(5) grand unification | PLB 118 (1982) 73 | |
| 22 | L. J. Hall, J. D. Lykken, and S. Weinberg | Supergravity as the messenger of supersymmetry breaking | PRD 27 (1983) 2359 | |
| 23 | P. Nath | Twenty years of SUGRA | in Beyond the desert. Proceedings, 4th International Conference, Particle physics beyond the standard model, BEYOND 2003, Castle Ringberg, Tegernsee, Germany, June 9-14, 2003, p. 3 2003 | hep-ph/0307123 |
| 24 | G. L. Kane, C. F. Kolda, L. Roszkowski, and J. D. Wells | Study of constrained minimal supersymmetry | PRD 49 (1994) 6173 | hep-ph/9312272 |
| 25 | H. Baer et al. | Multichannel search for minimal supergravity at $ \mathrm{ p \bar{p} } $ and $ \mathrm{ e^{+} e^{-} } $ colliders | PRD 51 (1995) 1046 | hep-ph/9408265 |
| 26 | J. Alwall, P. Schuster, and N. Toro | Simplified models for a first characterization of new physics at the LHC | PRD 79 (2009) 075020 | 0810.3921 |
| 27 | LHC New Physics Working Group | Simplified models for LHC new physics searches | JPG 39 (2012) 105005 | 1105.2838 |
| 28 | CMS Collaboration | Interpretation of searches for supersymmetry with simplified models | PRD 88 (2013) 052017 | CMS-SUS-11-016 1301.2175 |
| 29 | MSSM Working Group | The minimal supersymmetric standard model: group summary report | in GDR (Groupement De Recherche) - Supersym\'etrie Montpellier, France, April 15-17, 1998 1998 | hep-ph/9901246 |
| 30 | G. R. Farrar and S. Weinberg | Supersymmetry at ordinary energies. 2. R invariance, Goldstone bosons, and gauge fermion masses | PRD 27 (1983) 2732 | |
| 31 | CMS Collaboration | The fast simulation of the CMS detector at LHC | J. Phys. Conf. Ser. 331 (2011) 032049 | |
| 32 | CMS Collaboration | Validation and tuning of the CMS full simulation | J. Phys. Conf. Ser. 331 (2011) 032015 | |
| 33 | C. P. Robert | The Bayesian choice: from decision-theoretic foundations to computational implementation | Springer Verlag, New York, 2nd edition | |
| 34 | A. O'Hagan | Bayesian inference | volume 2B of Kendall's Advanced Theory of Statistics Edward Arnold, London | |
| 35 | S. Sekmen et al. | Interpreting LHC SUSY searches in the phenomenological MSSM | JHEP 02 (2012) 075 | 1109.5119 |
| 36 | CMS Collaboration | Search for supersymmetry at the LHC in events with Jets and missing transverse energy | PRL 107 (2011) 221804 | CMS-SUS-11-003 1109.2352 |
| 37 | CMS Collaboration | Search for new physics with same-sign isolated dilepton events with jets and missing transverse energy | PRL 109 (2012) 071803 | CMS-SUS-11-010 1205.6615 |
| 38 | CMS Collaboration | Search for new physics in events with opposite-sign leptons, jets, and missing transverse energy in pp collisions at $ \sqrt{s} = $ 7 TeV | PLB 718 (2013) 815 | CMS-SUS-11-011 1206.3949 |
| 39 | ATLAS Collaboration | Summary of the ATLAS experiment's sensitivity to supersymmetry after LHC Run 1 -- interpreted in the phenomenological MSSM | JHEP 10 (2015) 134 | 1508.06608 |
| 40 | C. R. Das and M. K. Parida | New formulas and predictions for running fermion masses at higher scales in SM, 2 HDM, and MSSM | EPJC 20 (2001) 121 | hep-ph/0010004 |
| 41 | A. A. Markov | Extension of the limit theorems of probability theory to a sum of variables connected in a chain | reprinted in Appendix B of: R. Howard, \it Dynamic Probabilistic Systems, volume 1: Markov Chains, John Wiley and Sons | |
| 42 | N. Metropolis et al. | Equation of state calculations by fast computing machines | J. Chem. Phys 21 (1953) 1087 | |
| 43 | W. K. Hastings | Monte Carlo sampling methods using Markov chains and their applications | Biometrika 57 (1970) 97 | |
| 44 | B. A. Berg | Markov chain Monte Carlo simulations and their statistical analysis | World Scientific, Singapore | |
| 45 | Heavy Flavor Averaging Group (HFAG) Collaboration | Averages of b-hadron, c-hadron, and $ \tau $-lepton properties as of summer 2014 | 1412.7515 | |
| 46 | LHCb and CMS Collaborations | Observation of the rare $ \mathrm{B_{s}}^0\rightarrow\mu^+\mu^- $ decay from the combined analysis of CMS and LHCb data | Nature 522 (2015) 68 | CMS-BPH-13-007 1411.4413 |
| 47 | K. Hagiwara et al. | $ (g-2)_{\mu} $ and $ \alpha(M_Z^2) $ re-evaluated using new precise data | JPG 38 (2011) 085003 | 1105.3149 |
| 48 | Particle Data Group, K. A. Olive et al. | Review of Particle Physics | CPC 38 (2014) 090001 | |
| 49 | Tevatron Electroweak Working Group, CDF and D0 Collaborations | Combination of CDF and D0 results on the mass of the top quark using up to 8.7 fb$ ^{-1} $ at the Tevatron | 1305.3929 | |
| 50 | J. Bernon, B. Dumont, and S. Kraml | Status of Higgs couplings after run 1 of the LHC | PRD 90 (2014) 071301 | 1409.1588 |
| 51 | J. Bernon and B. Dumont | Lilith: a tool for constraining new physics from Higgs measurements | EPJC 75 (2015), no. 9, 440 | 1502.04138 |
|
|
Compact Muon Solenoid LHC, CERN |
|

|

|

|

|

|