

Compact Muon Solenoid
LHC, CERN
| CMS-TOP-13-013 ; CERN-PH-EP-2015-189 | ||
| Measurement of the charge asymmetry in top quark pair production in pp collisions at $\sqrt{s} =$ 8 TeV using a template method | ||
| CMS Collaboration | ||
| 16 August 2015 | ||
| Phys. Rev. D93 (2016) 034014 | ||
| Abstract: The charge asymmetry in the production of top quark and antiquark pairs is measured in proton-proton collisions at a center-of-mass energy of 8 TeV. The data, corresponding to an integrated luminosity of 19.6 fb$^{-1}$, were collected by the CMS experiment at the LHC. Events with a single isolated electron or muon, and four or more jets, at least one of which is likely to have originated from hadronization of a bottom quark, are selected. A template technique is used to measure the asymmetry in the distribution of differences in the top quark and antiquark absolute rapidities. The measured asymmetry is $A_c^y = $ [ 0.33 $\pm$ 0.26 (stat) $\pm$ 0.33 (syst) ]%, which is the most precise result to date. The results are compared to calculations based on the standard model and on several beyond-the-standard-model scenarios. | ||
| Links: e-print arXiv:1508.03862 [hep-ex] (PDF) ; CDS record ; inSPIRE record ; HepData record ; CADI line (restricted) ; | ||
| Figures | |
png pdf |
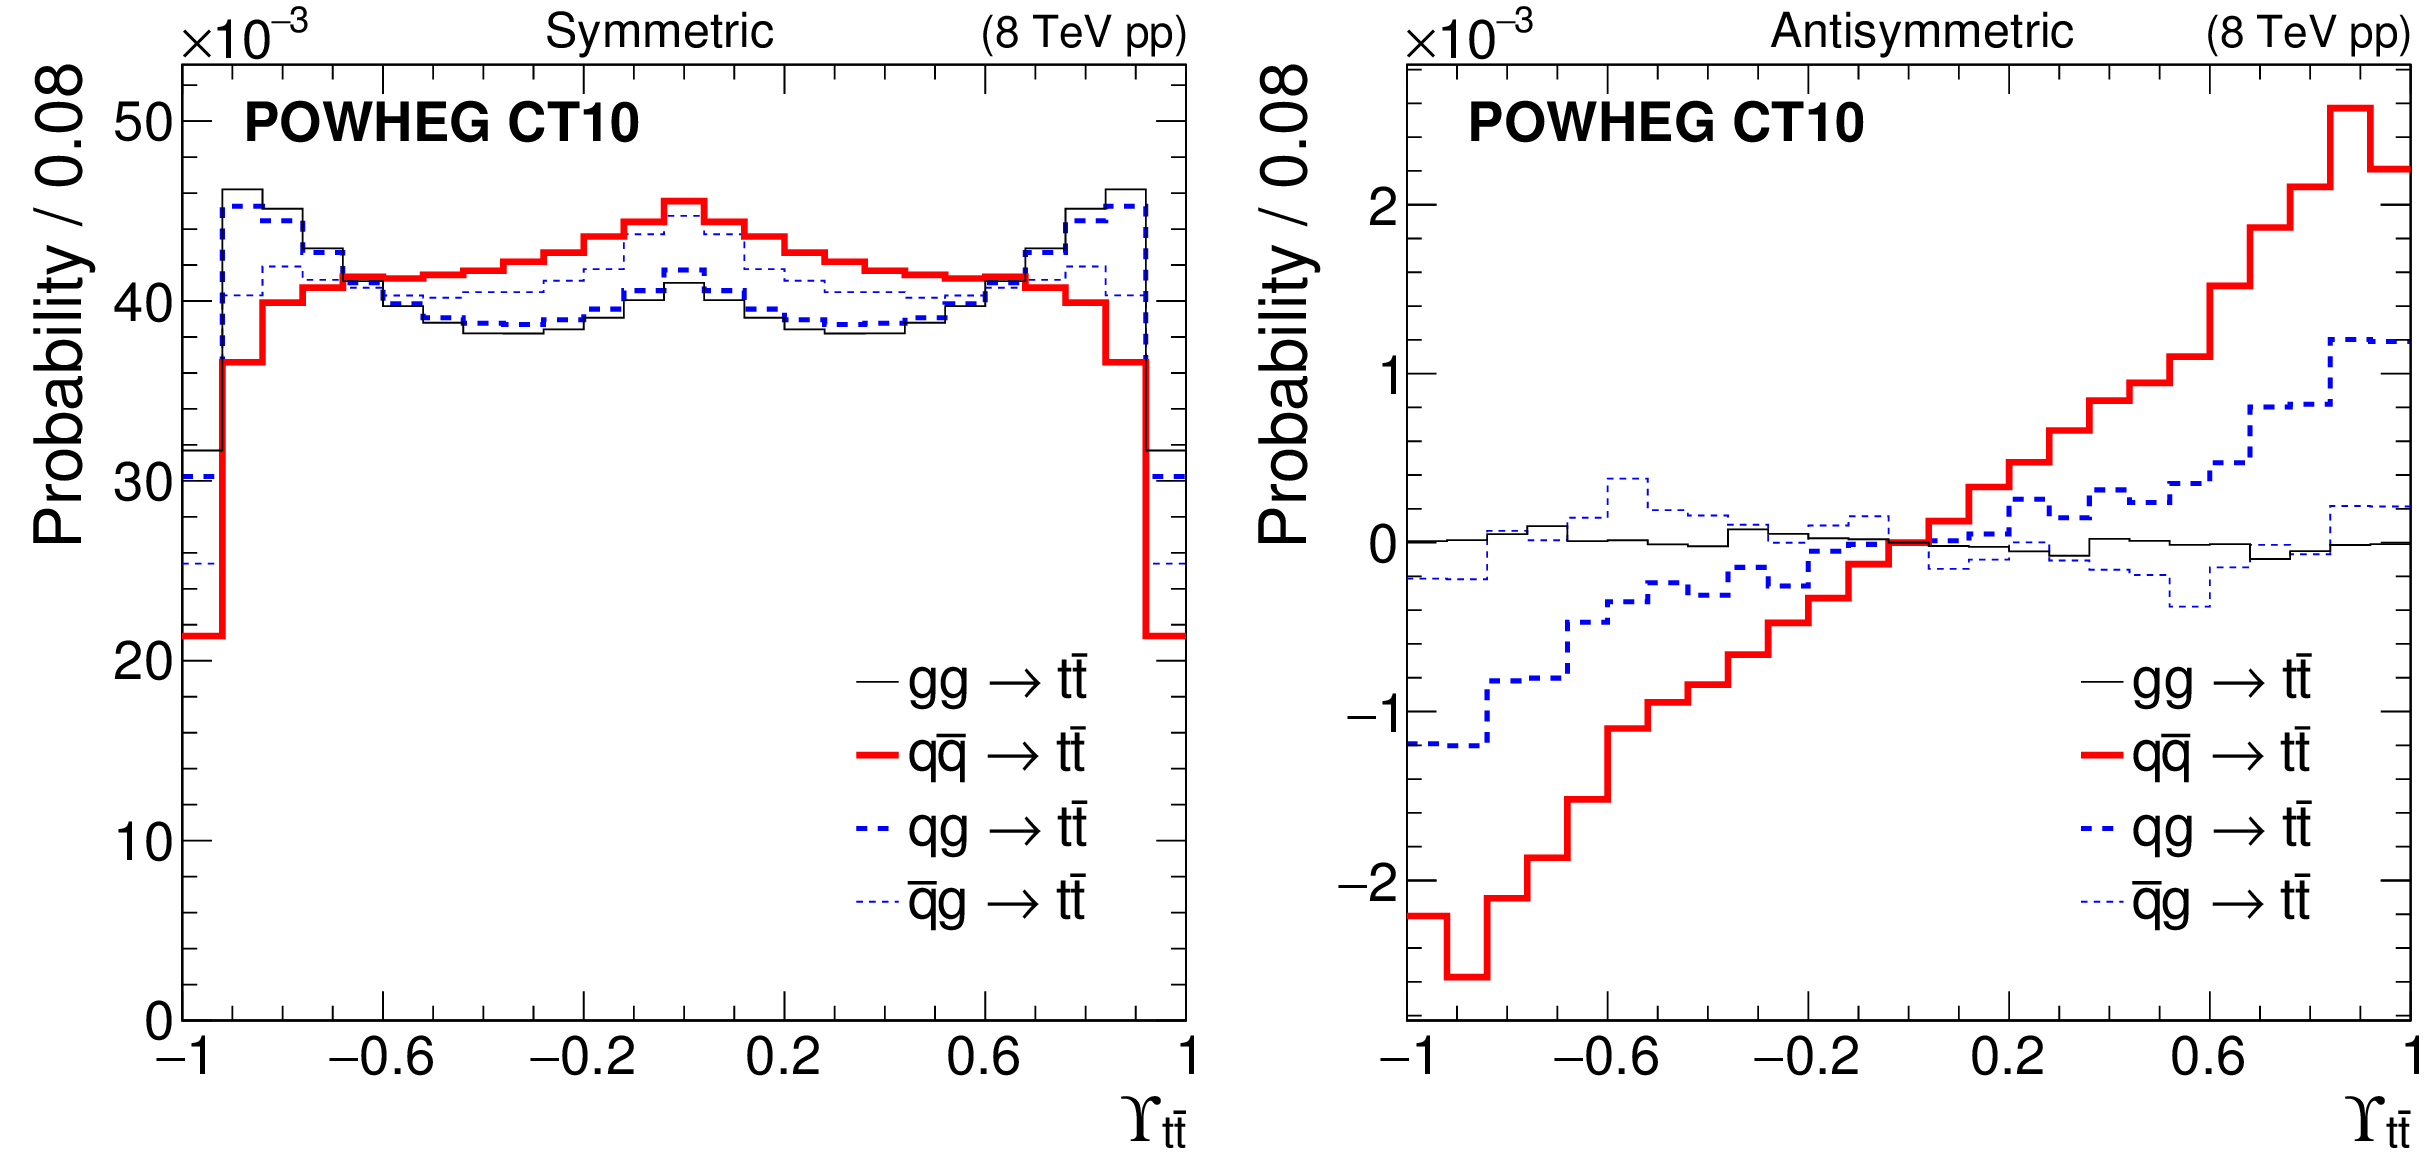
Figure 1:
The (left) symmetric $\vec{x}^+$ and (right) antisymmetric $\vec{x}^-$ components of the binned probability distributions in the observable $ {\varUpsilon _{{\mathrm {t}\overline {\mathrm {t}}}}} $, constructed using POWHEG [20] with CT10 PDFs [21], for $ {\mathrm {t}\overline {\mathrm {t}}} $ production from $ {{{\mathrm {g}} {\mathrm {g}}}} $, $ {{\mathrm {q}} {\overline {\mathrm {q}}}} $, $ {{{\mathrm {q}} {\mathrm {g}}}} $, and $ {{{\overline {\mathrm {q}}} {\mathrm {g}}}} $ initial states. |

png pdf |
Figure 1-a:
The symmetric $\vec{x}^+$ components of the binned probability distributions in the observable $ {\varUpsilon _{{\mathrm {t}\overline {\mathrm {t}}}}} $, constructed using POWHEG [20] with CT10 PDFs [21], for $ {\mathrm {t}\overline {\mathrm {t}}} $ production from $ {{{\mathrm {g}} {\mathrm {g}}}} $, $ {{\mathrm {q}} {\overline {\mathrm {q}}}} $, $ {{{\mathrm {q}} {\mathrm {g}}}} $, and $ {{{\overline {\mathrm {q}}} {\mathrm {g}}}} $ initial states. |

png pdf |
Figure 1-b:
The antisymmetric $\vec{x}^-$ components of the binned probability distributions in the observable $ {\varUpsilon _{{\mathrm {t}\overline {\mathrm {t}}}}} $, constructed using POWHEG [20] with CT10 PDFs [21], for $ {\mathrm {t}\overline {\mathrm {t}}} $ production from $ {{{\mathrm {g}} {\mathrm {g}}}} $, $ {{\mathrm {q}} {\overline {\mathrm {q}}}} $, $ {{{\mathrm {q}} {\mathrm {g}}}} $, and $ {{{\overline {\mathrm {q}}} {\mathrm {g}}}} $ initial states. |
png pdf |
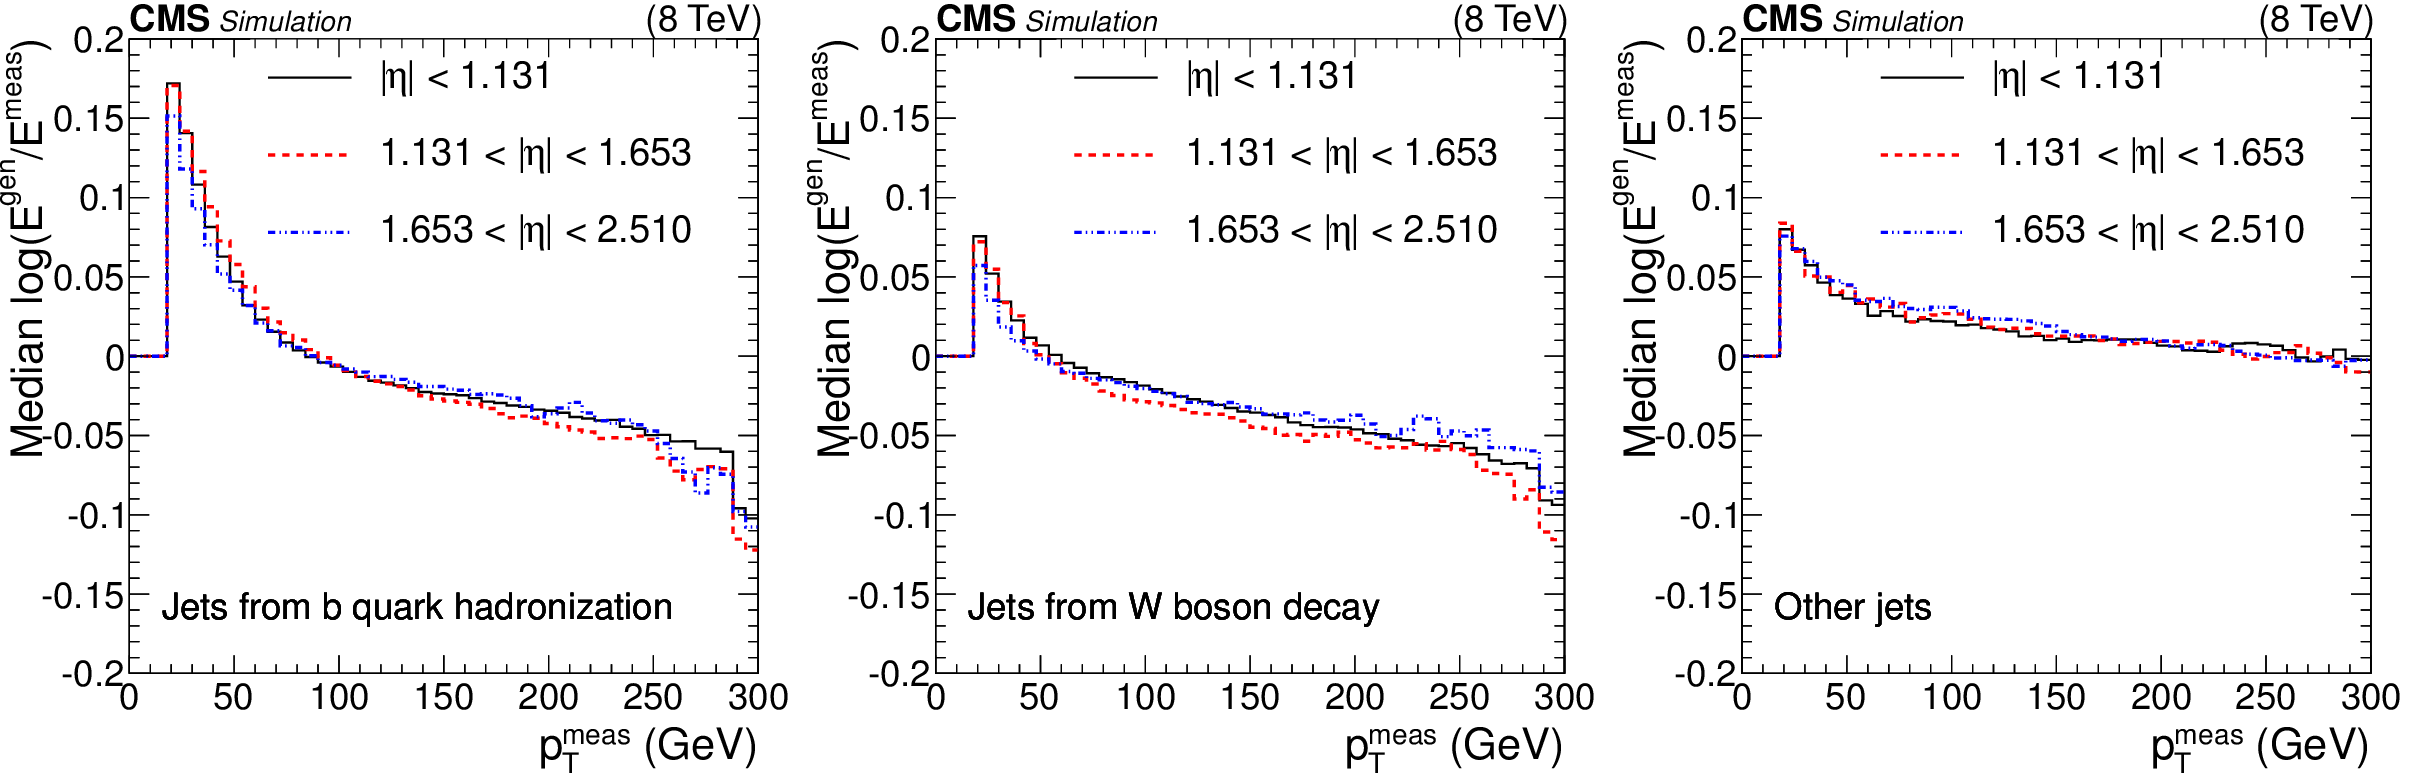
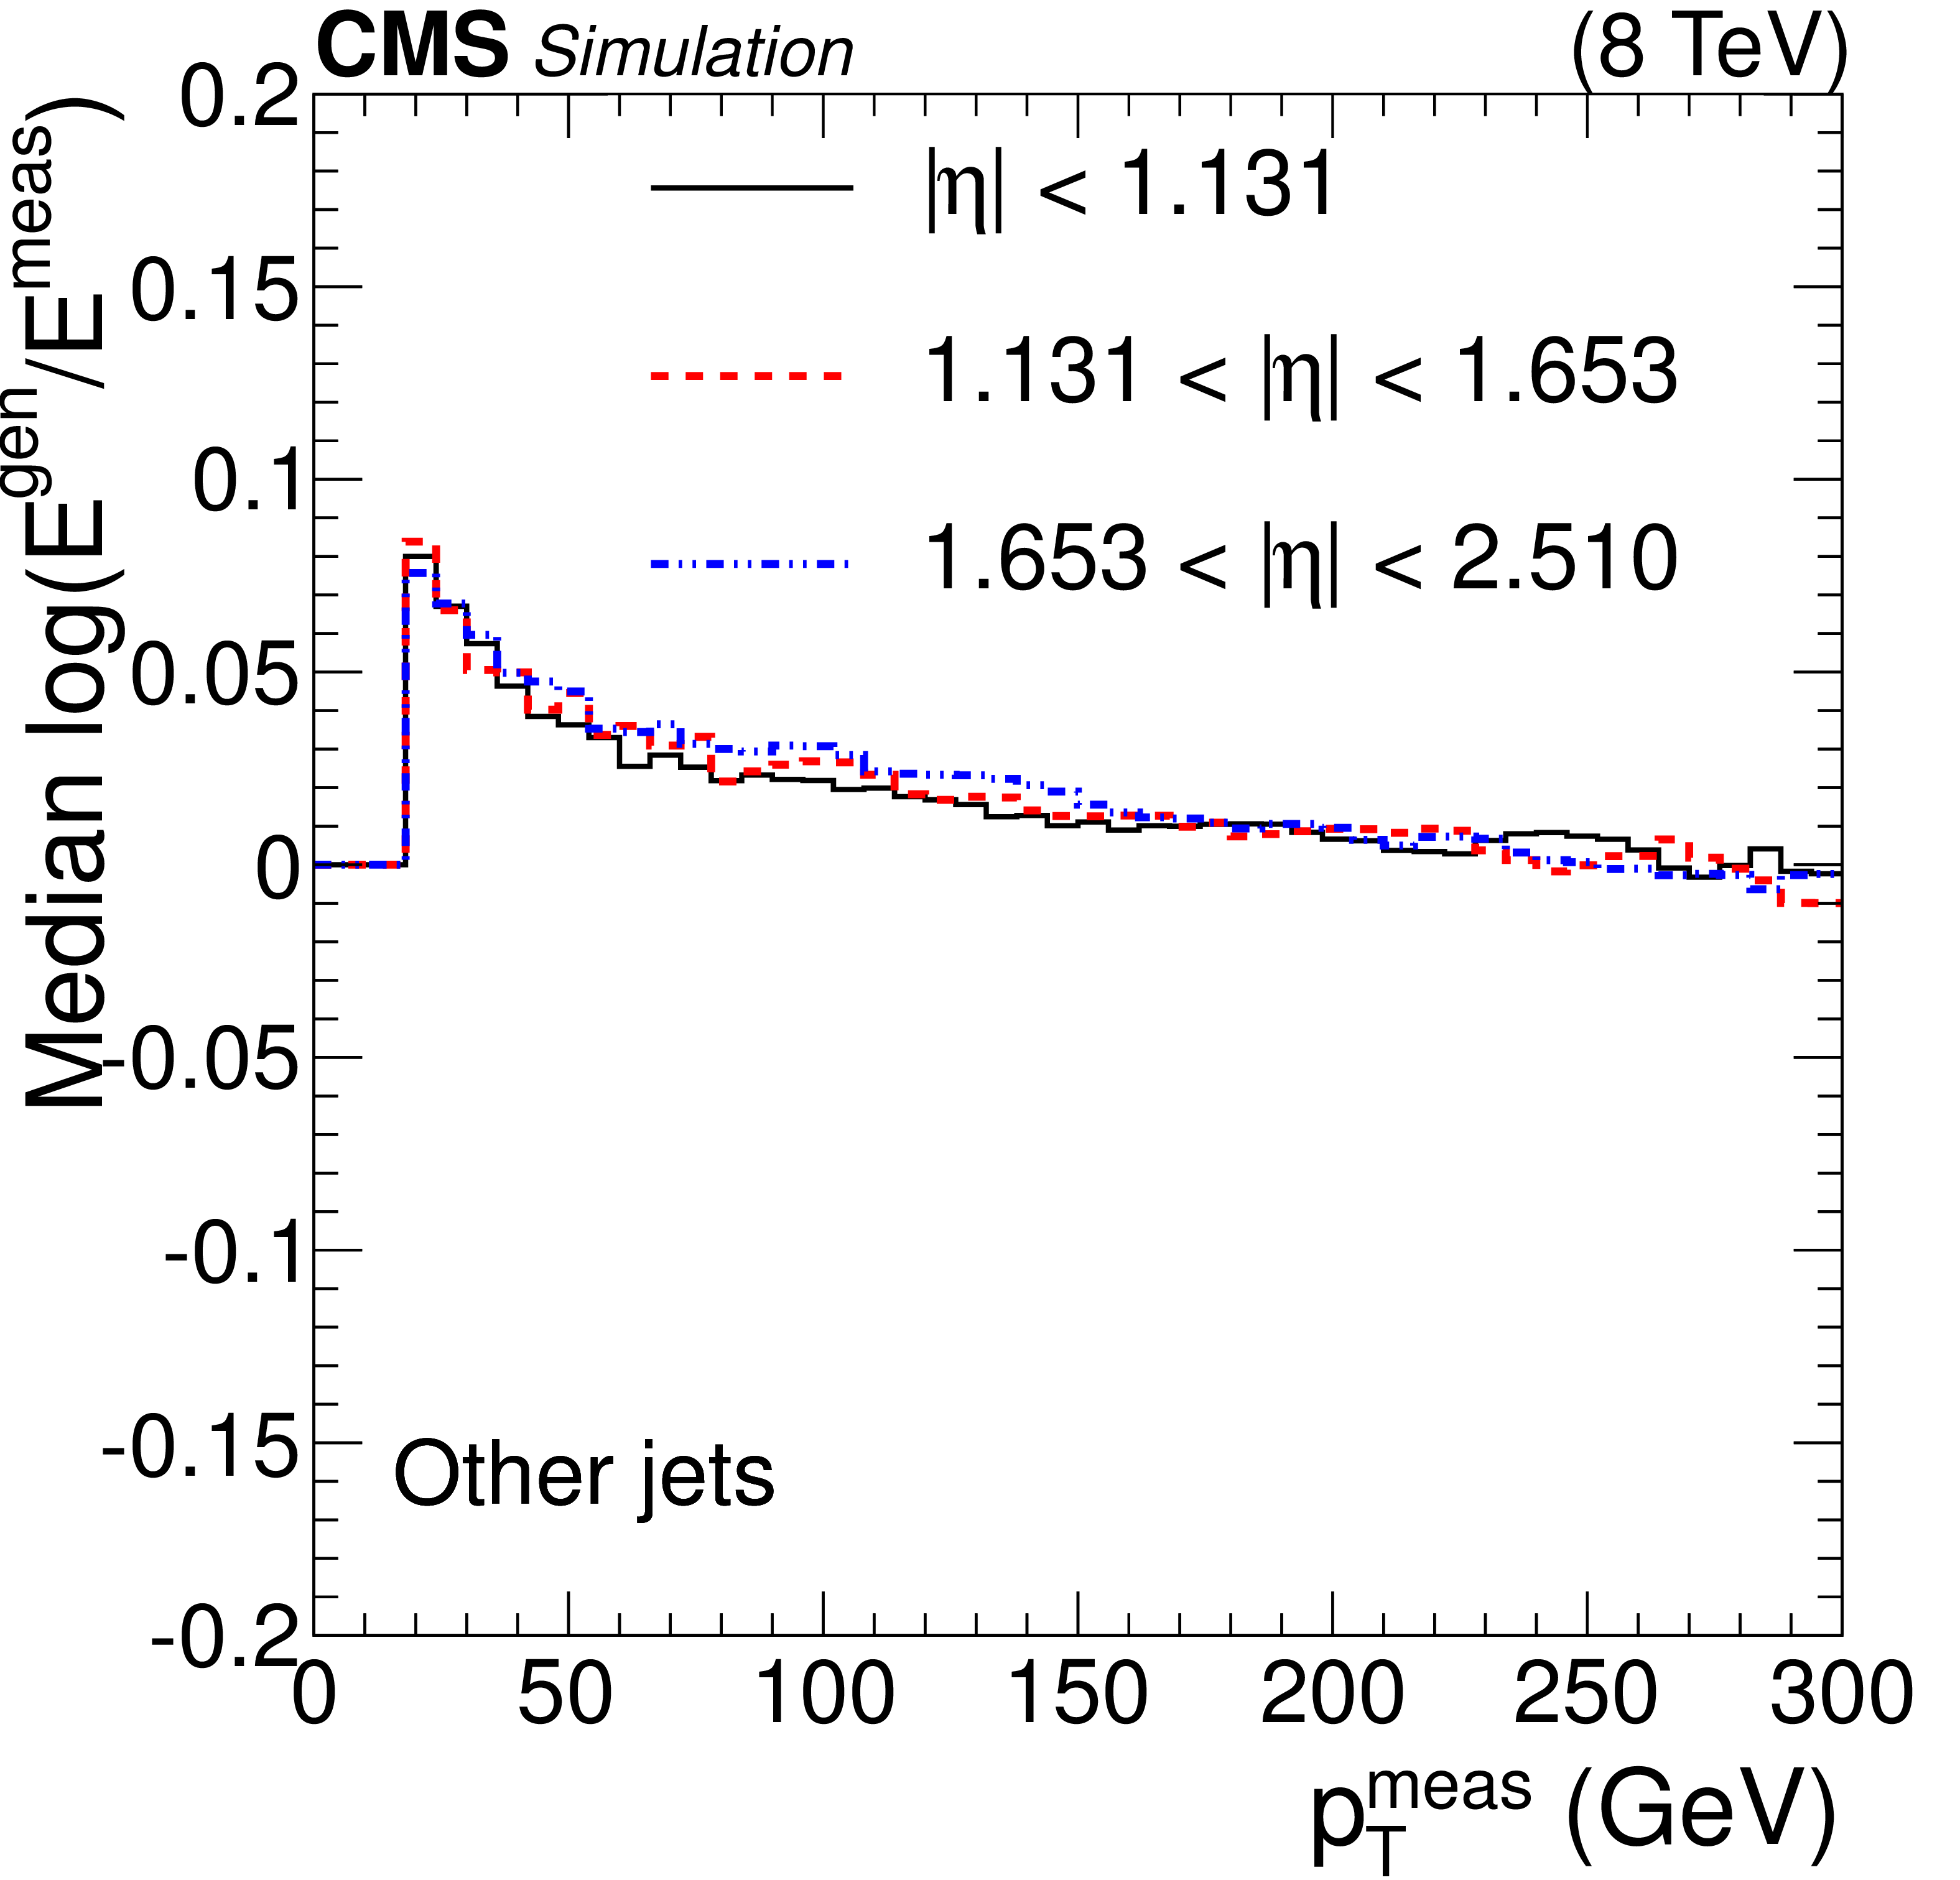
Figure 2:
The median value of the logarithm of the ratio of parton energy to measured energy, as a function of measured $ {p_{\mathrm {T}}} $ in three bins of $ | \eta | $, for (left) b jets from top quark decay, (center) jets from W boson decay, and (right) other jets. |
png pdf |
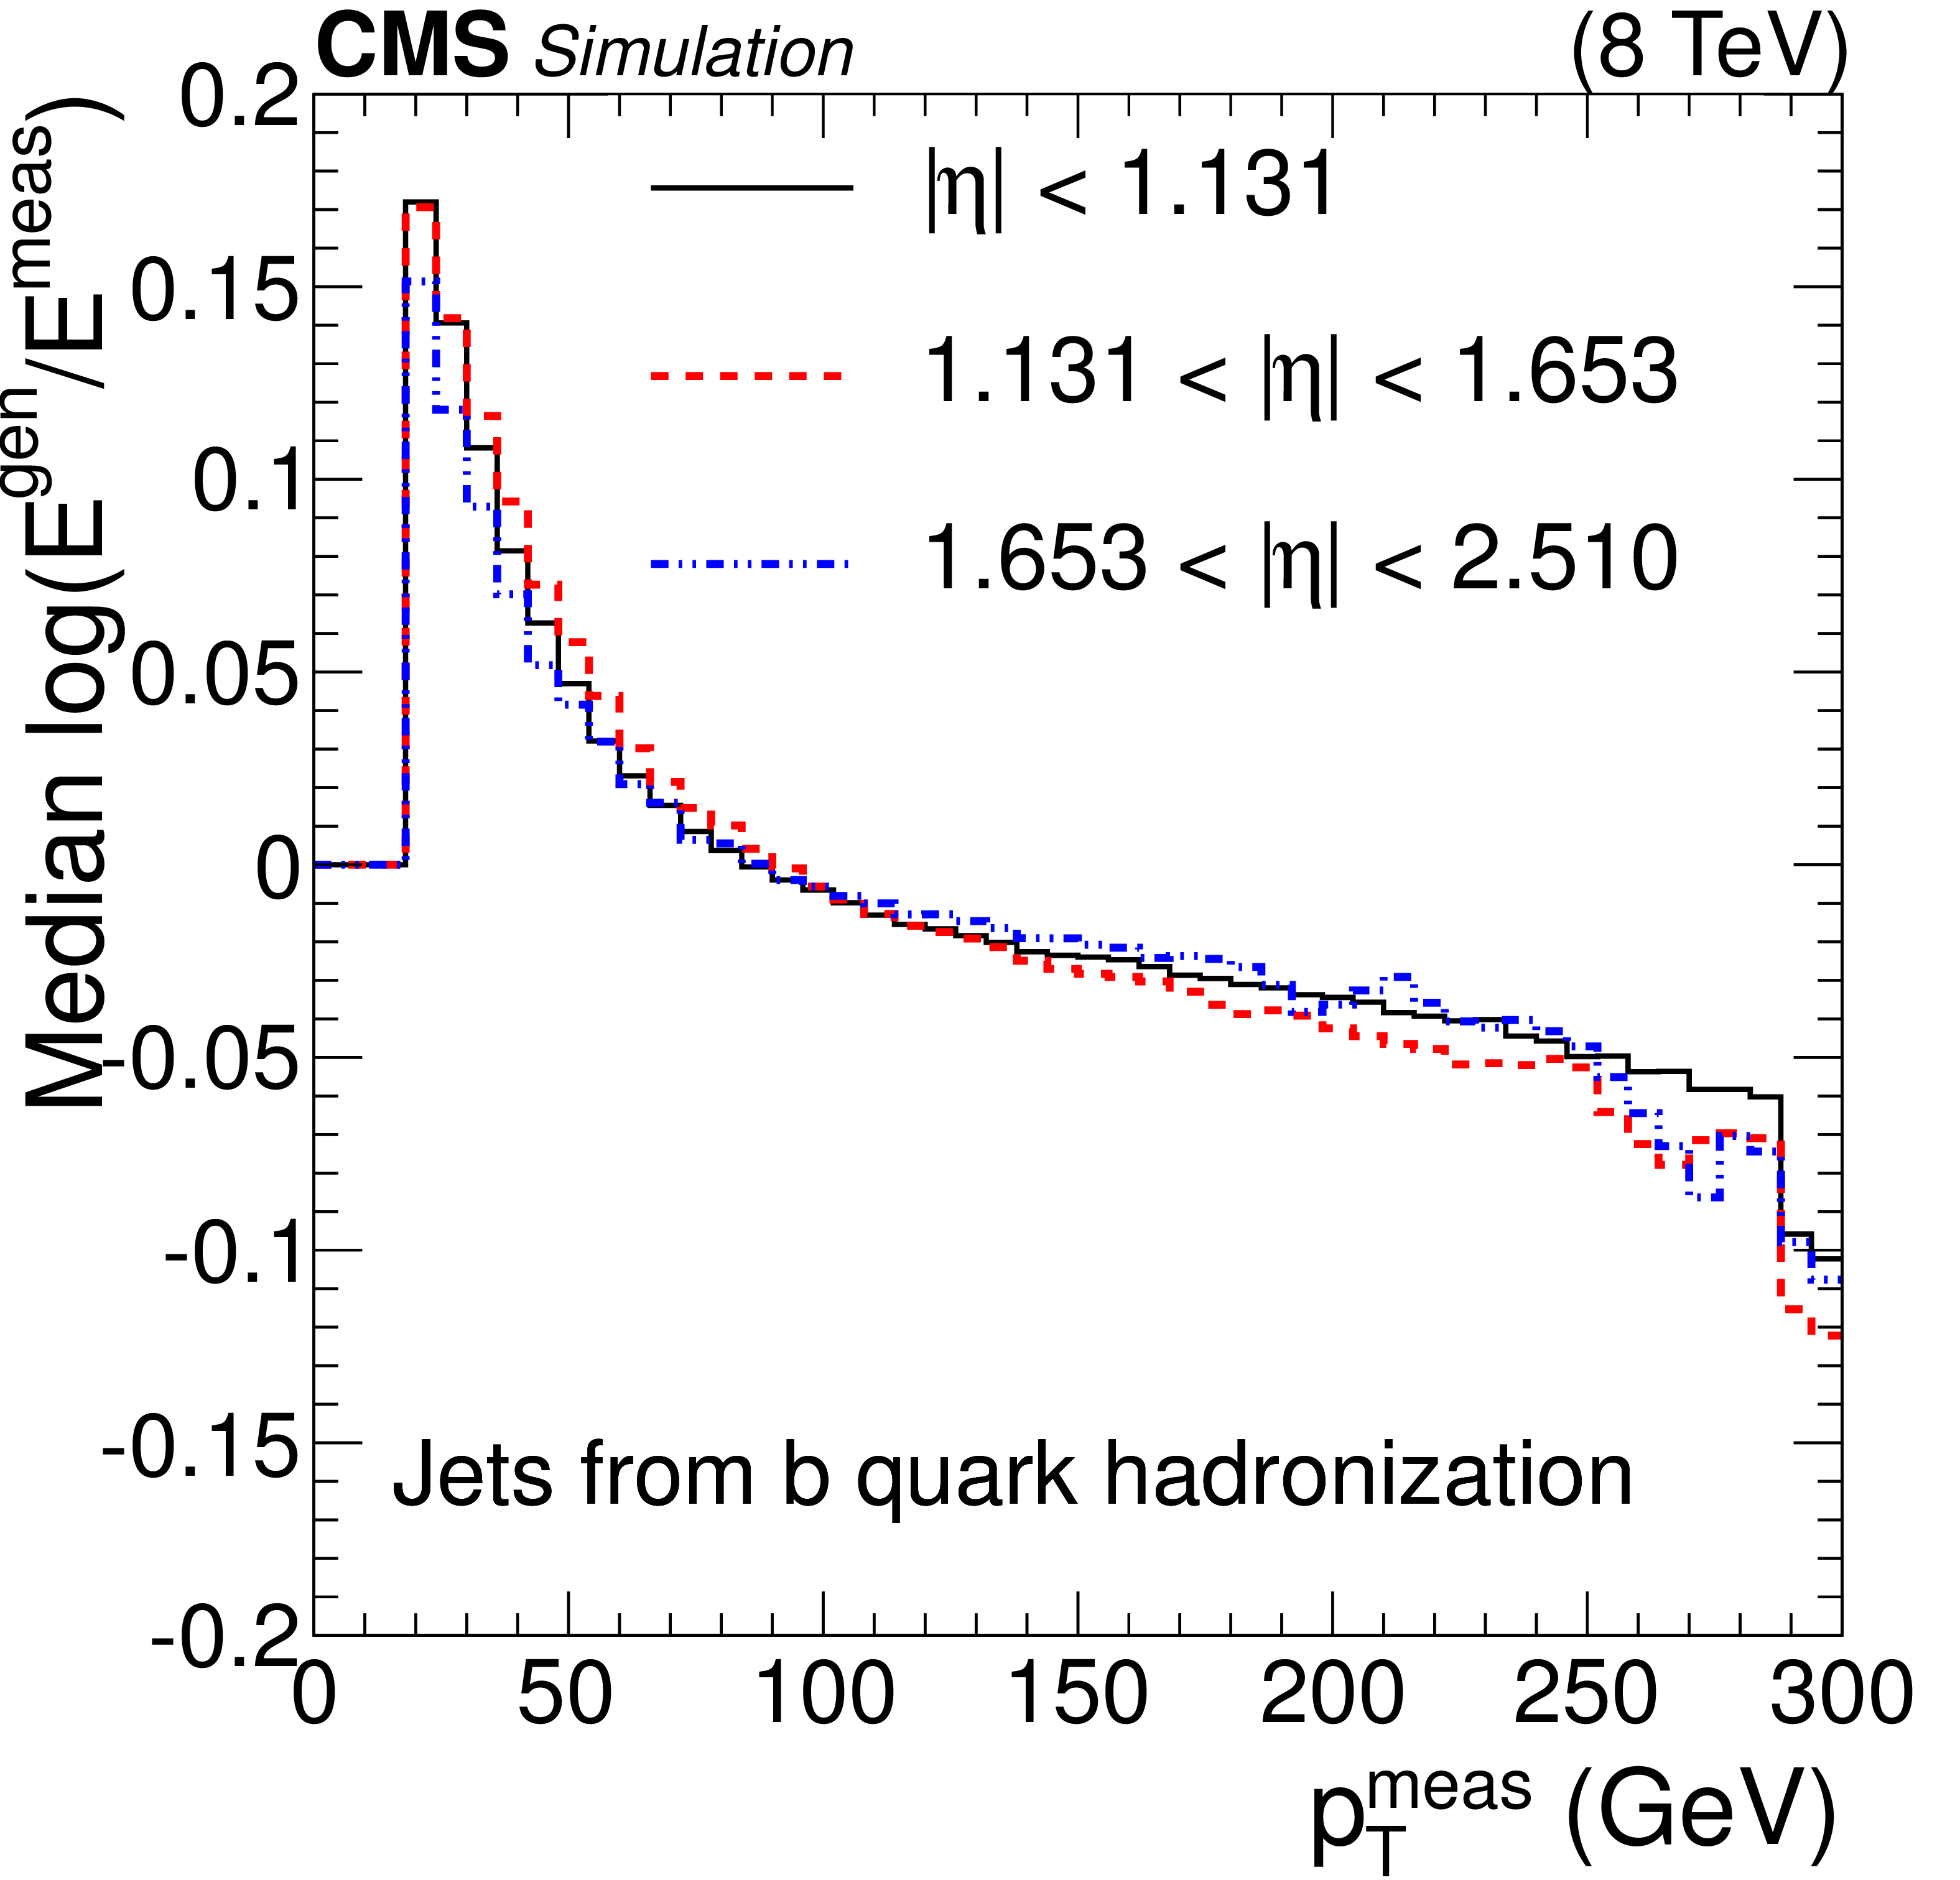
Figure 2-a:
The median value of the logarithm of the ratio of parton energy to measured energy, as a function of measured $ {p_{\mathrm {T}}} $ in three bins of $ | \eta | $, for b jets from top quark decay. |
png pdf |
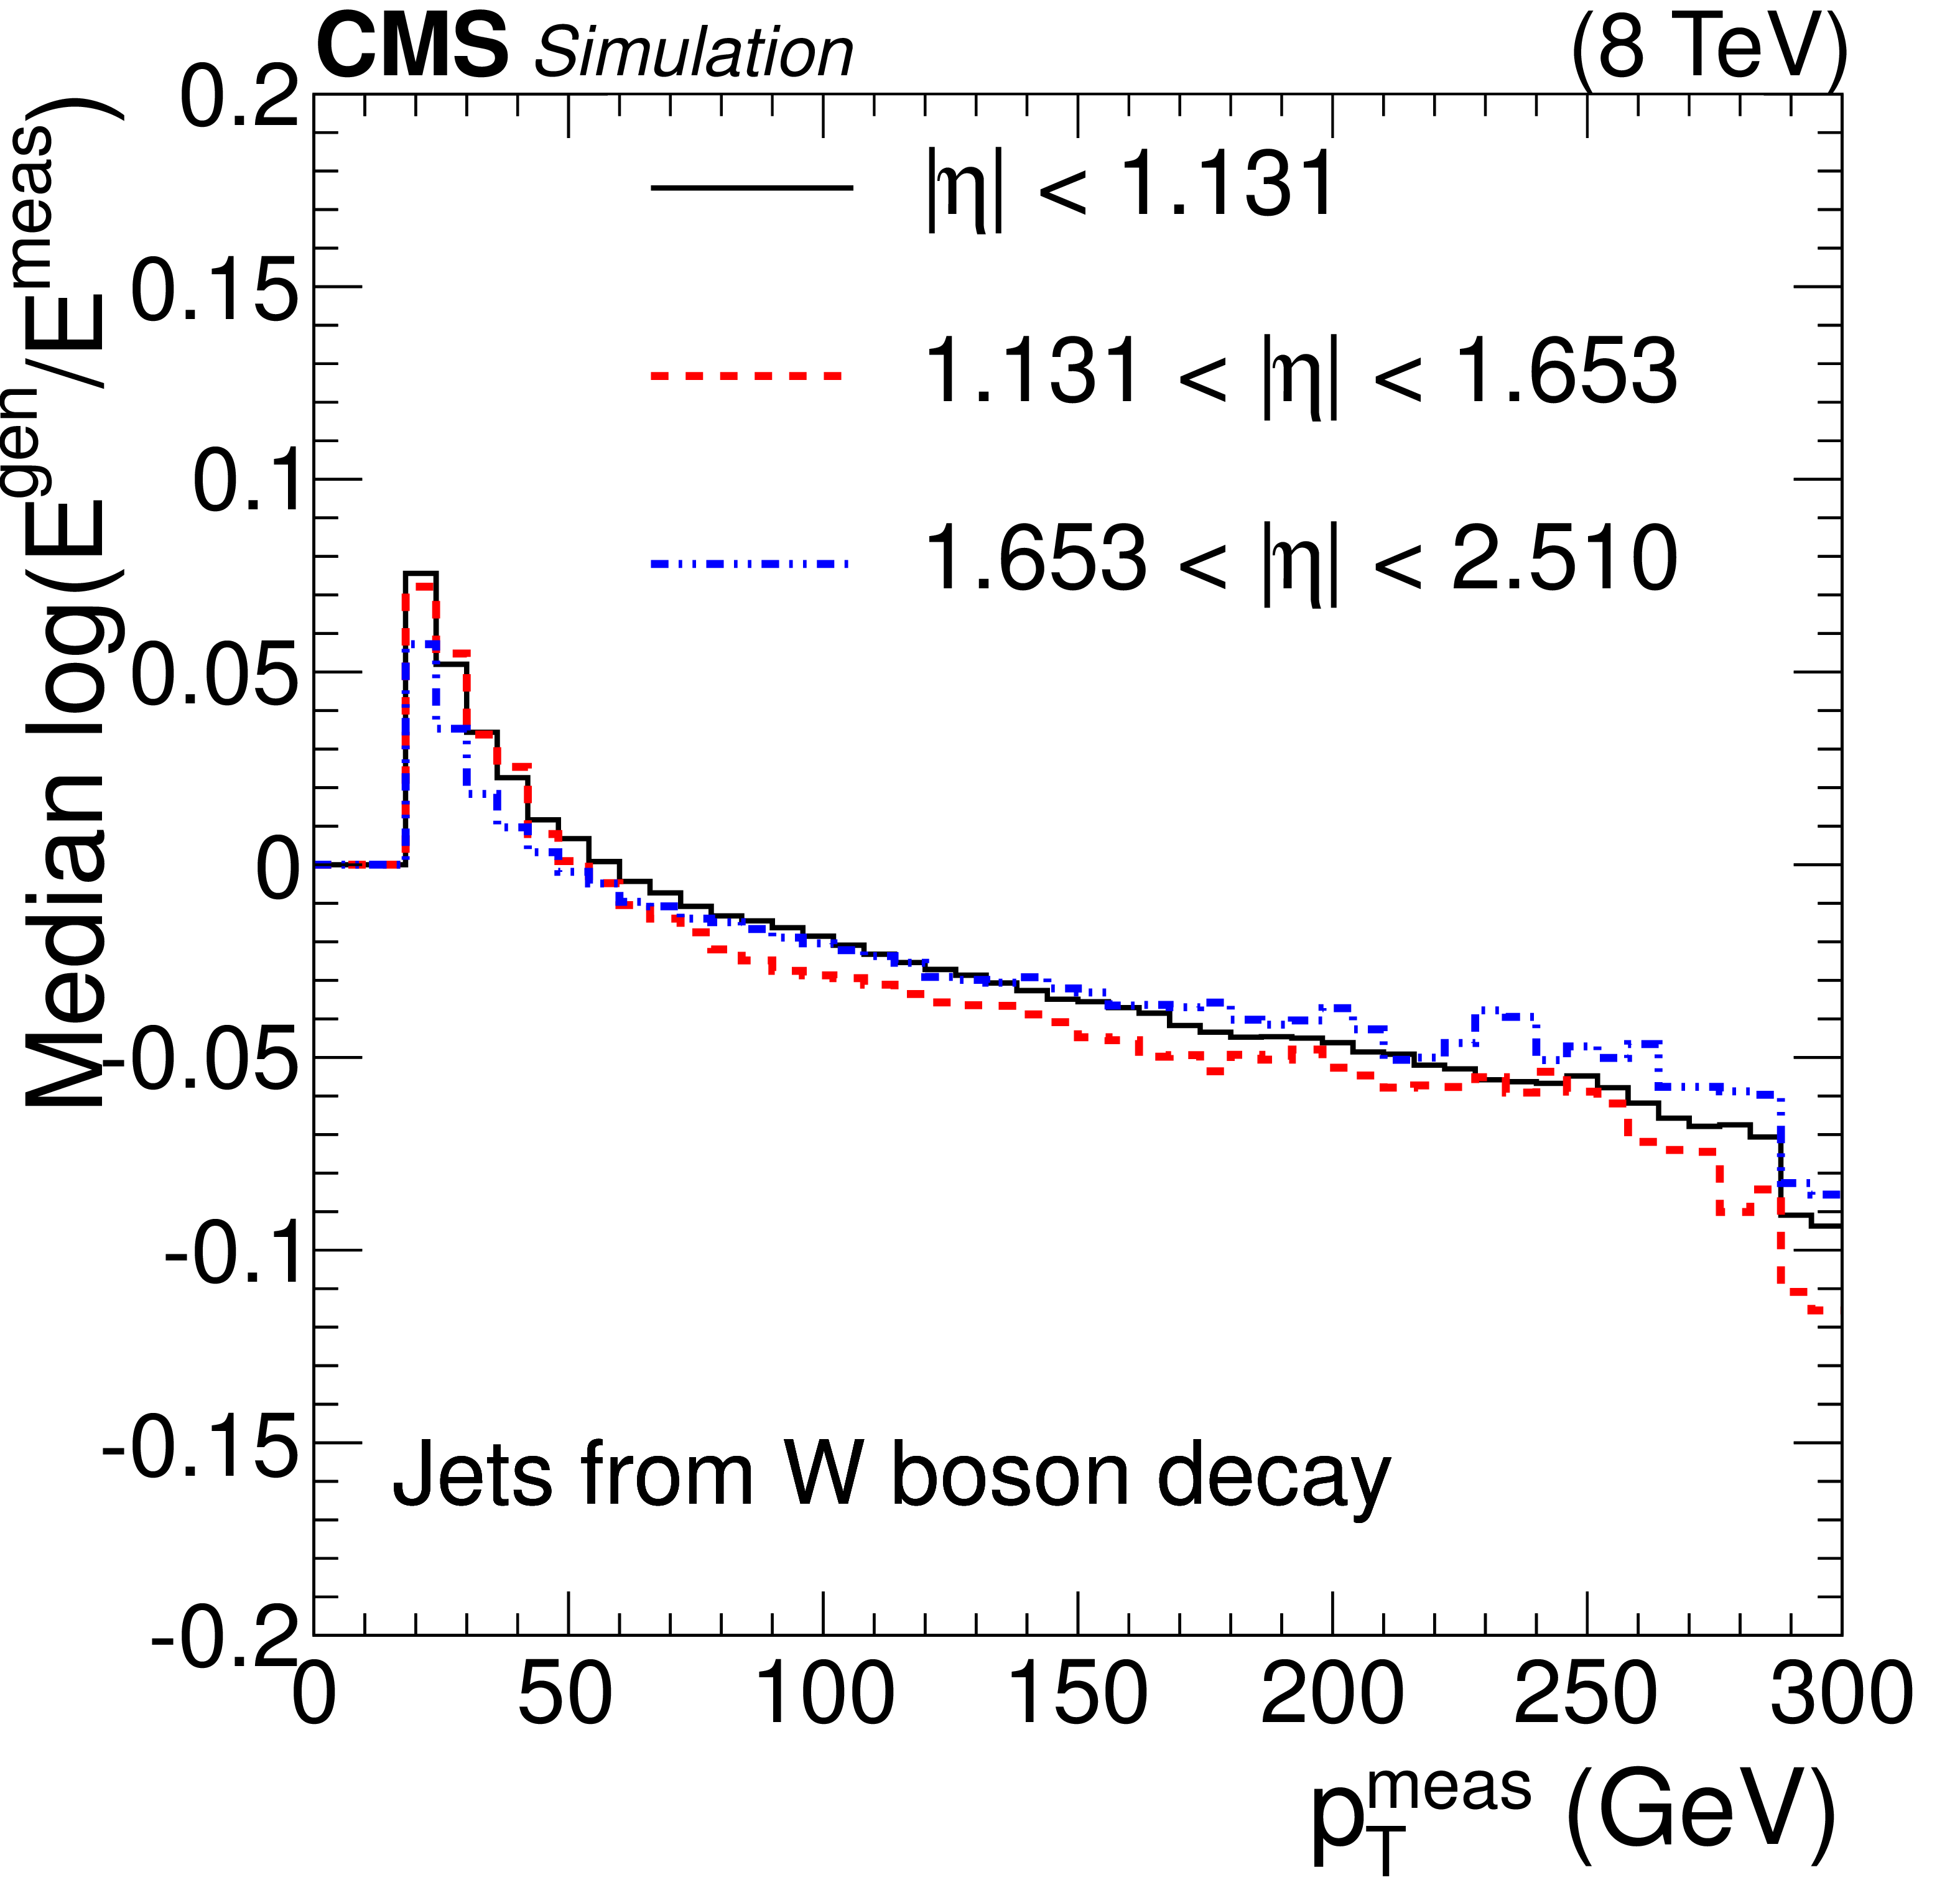
Figure 2-b:
The median value of the logarithm of the ratio of parton energy to measured energy, as a function of measured $ {p_{\mathrm {T}}} $ in three bins of $ | \eta | $, for jets from W boson decay. |
png pdf |
Figure 2-c:
The median value of the logarithm of the ratio of parton energy to measured energy, as a function of measured $ {p_{\mathrm {T}}} $ in three bins of $ | \eta | $, for other jets. |
png pdf |
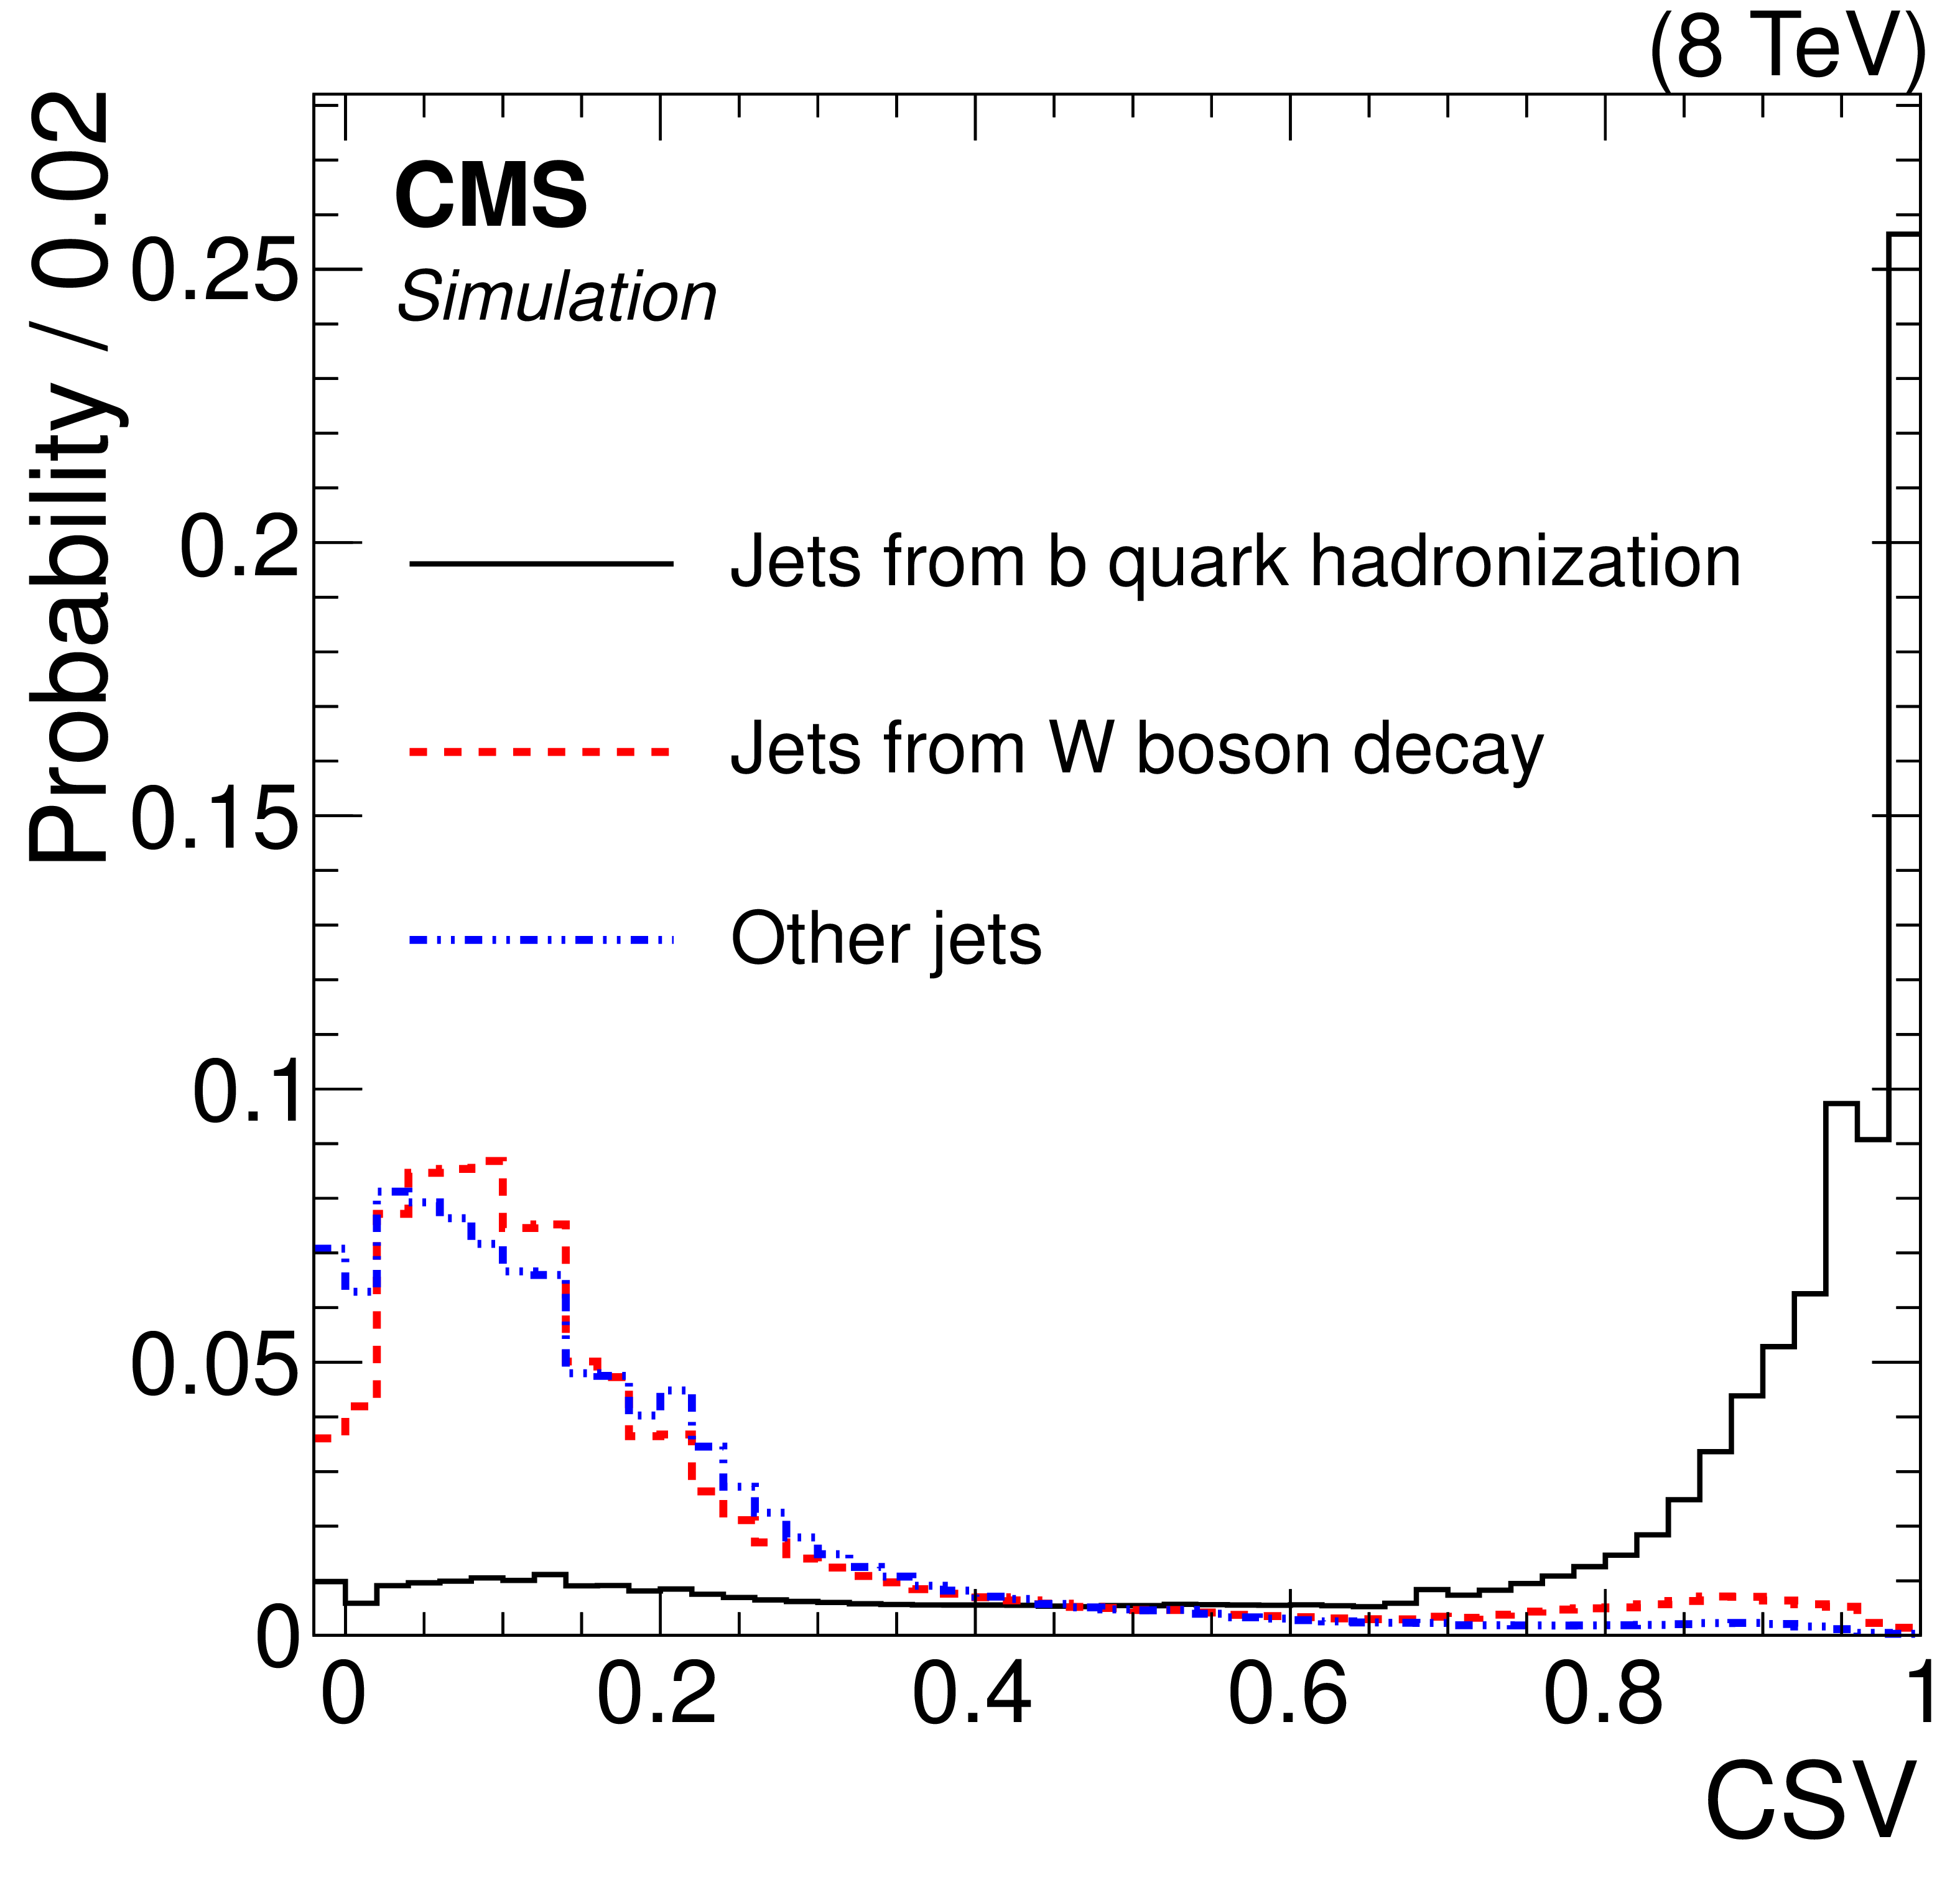
Figure 3:
The conditional probability densities of the CSV b tagging discriminant from simulation for jets from b quarks, jets from W boson decay, and other jets. |
png pdf |
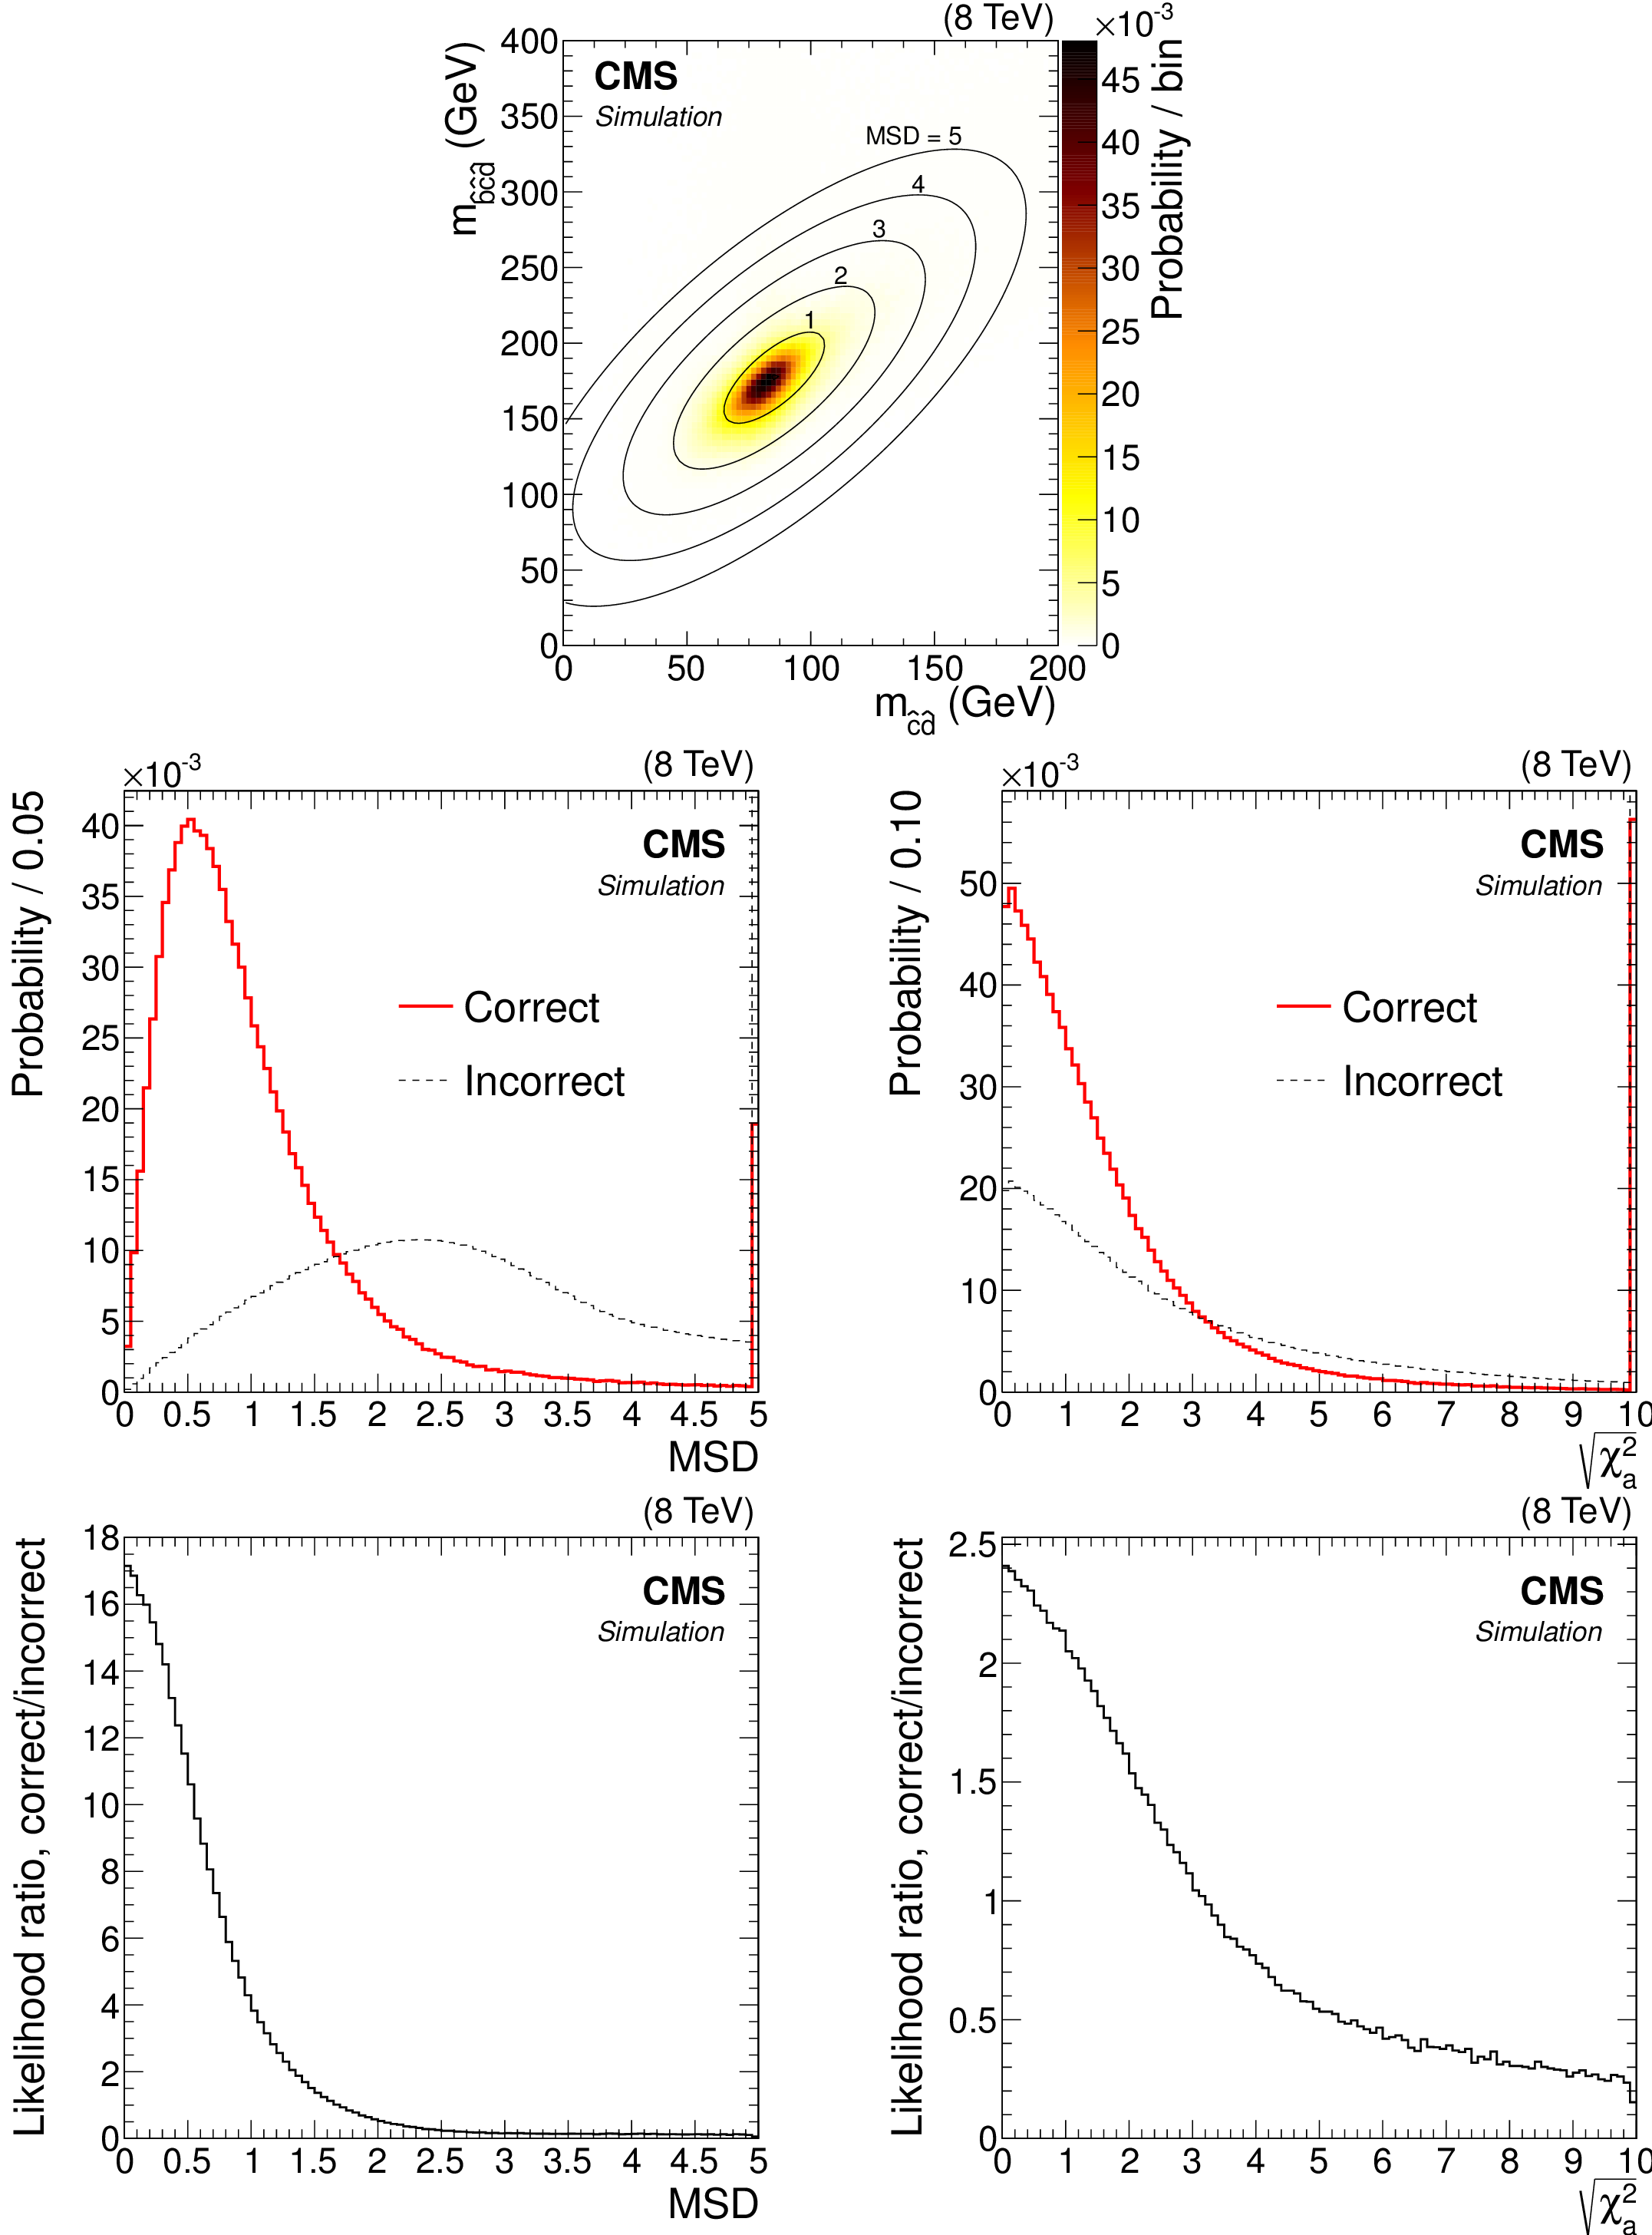
Figure 4:
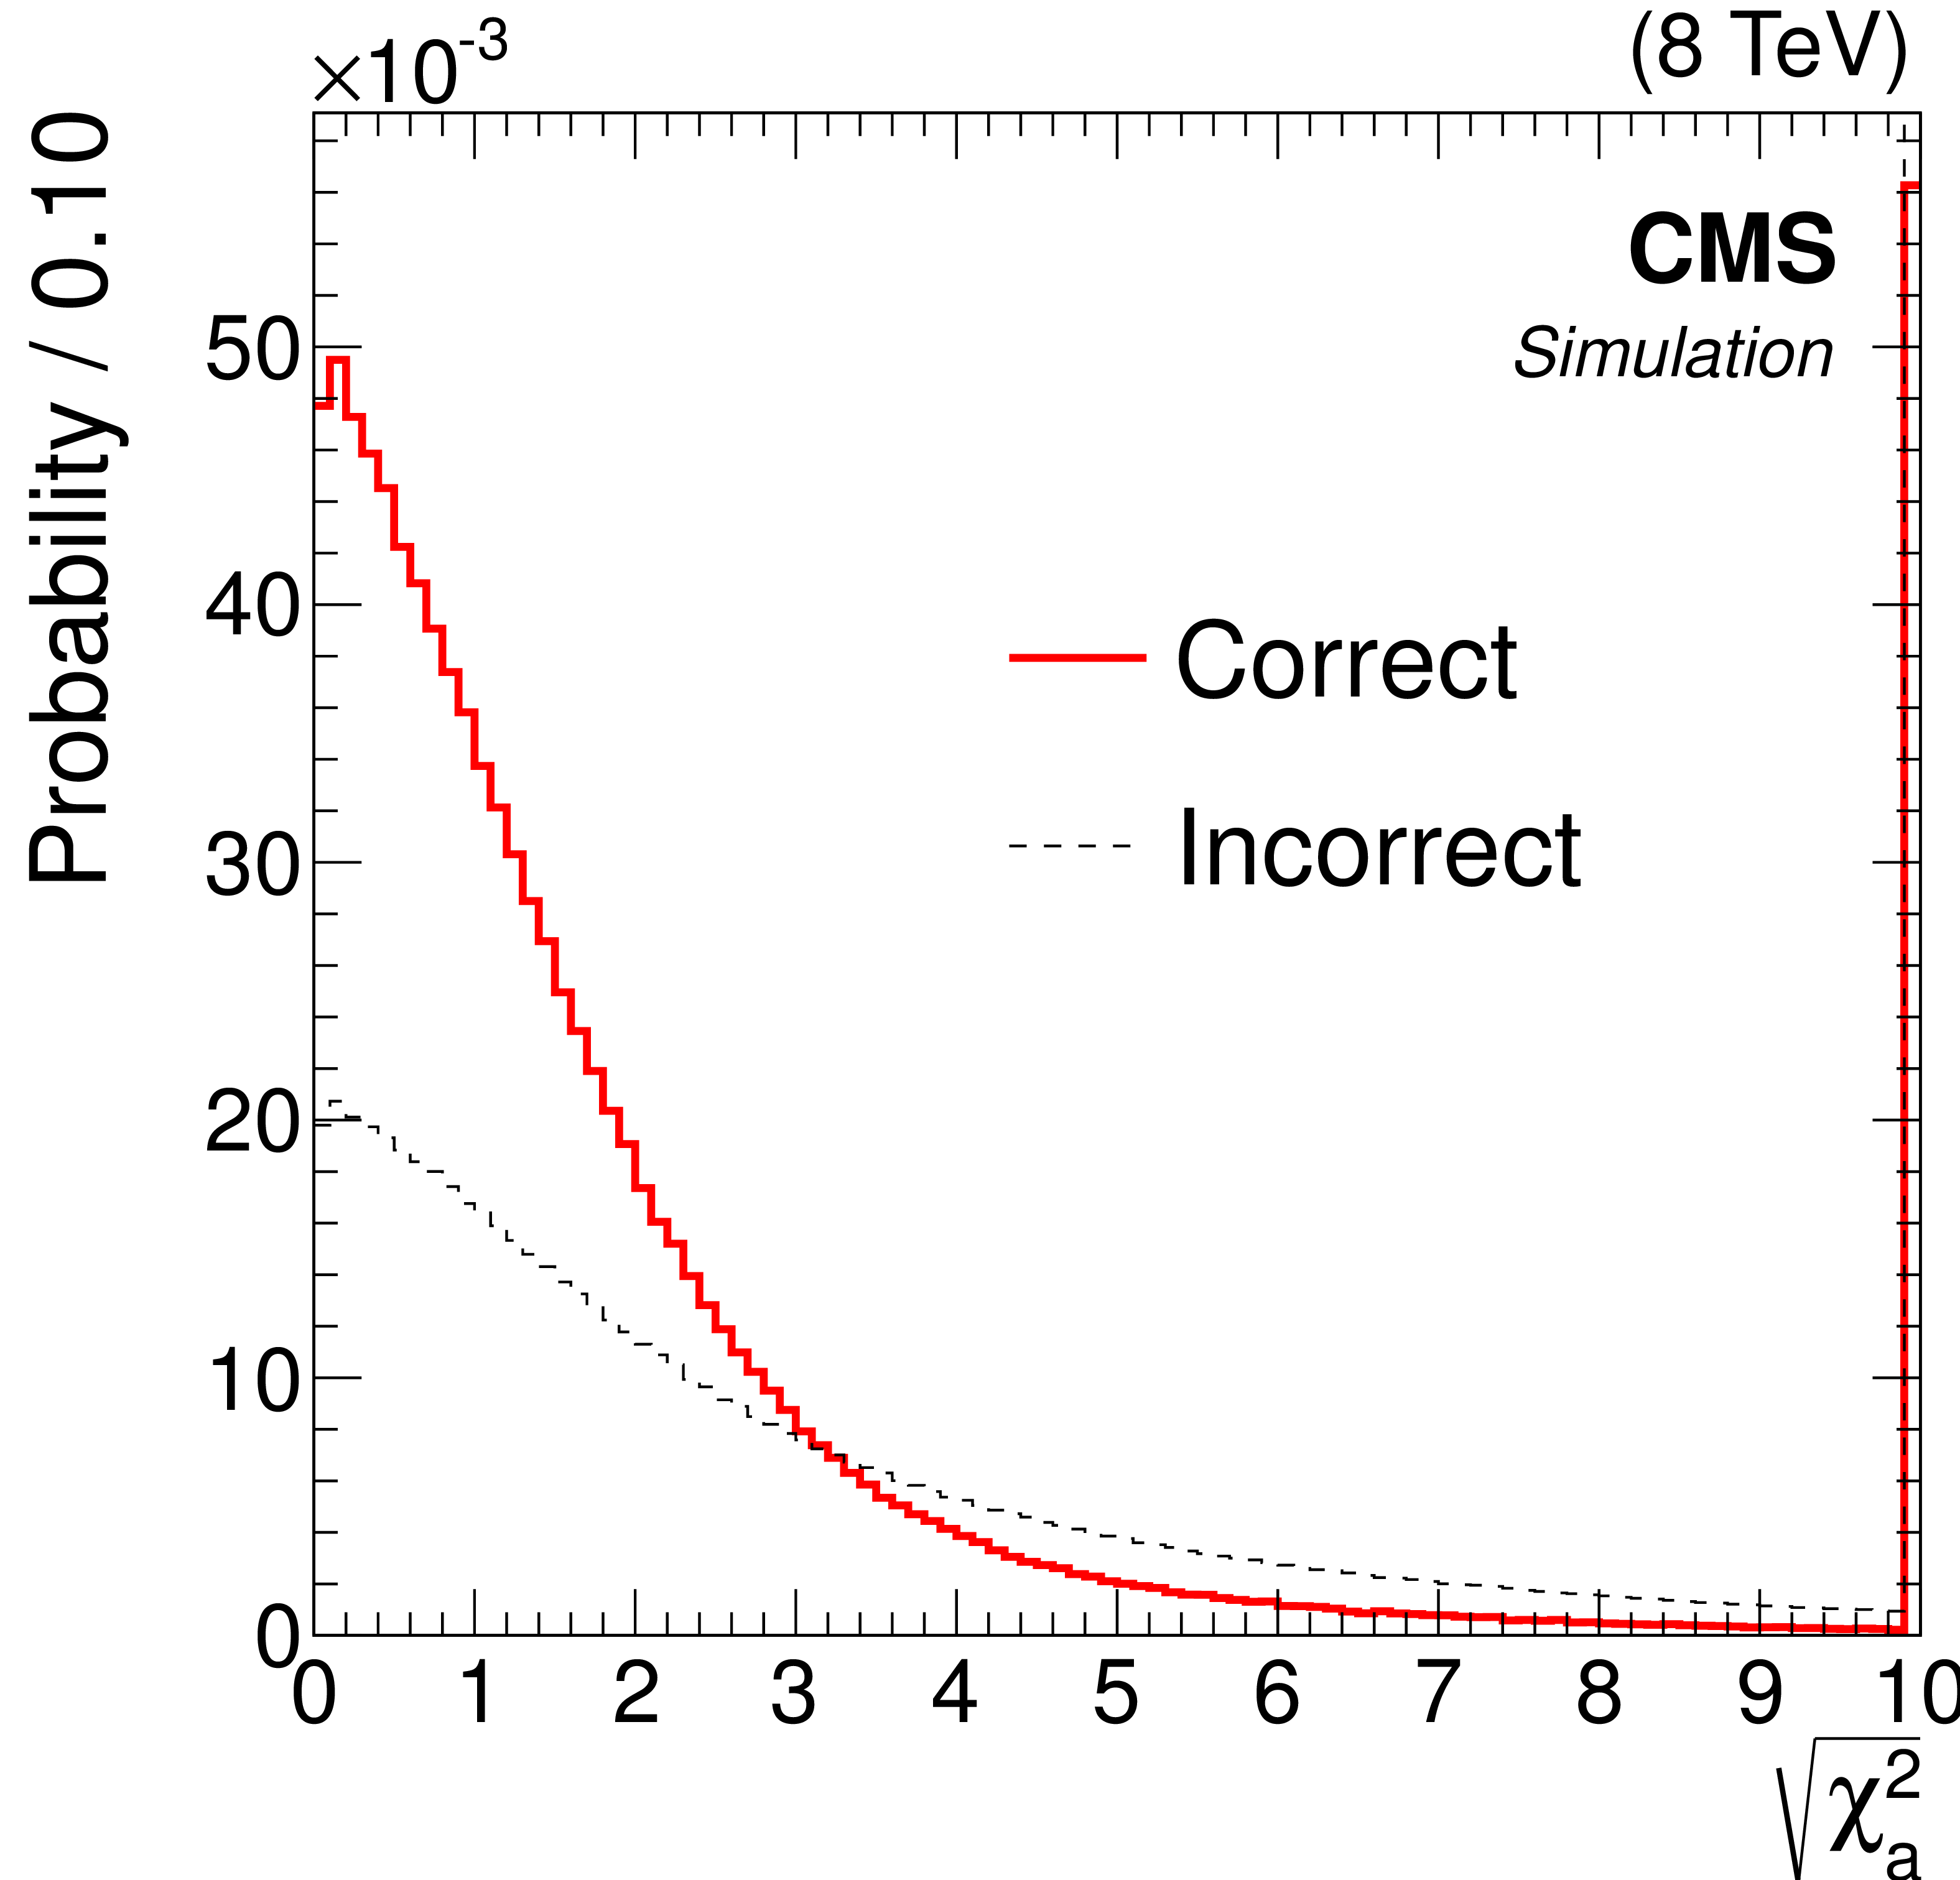
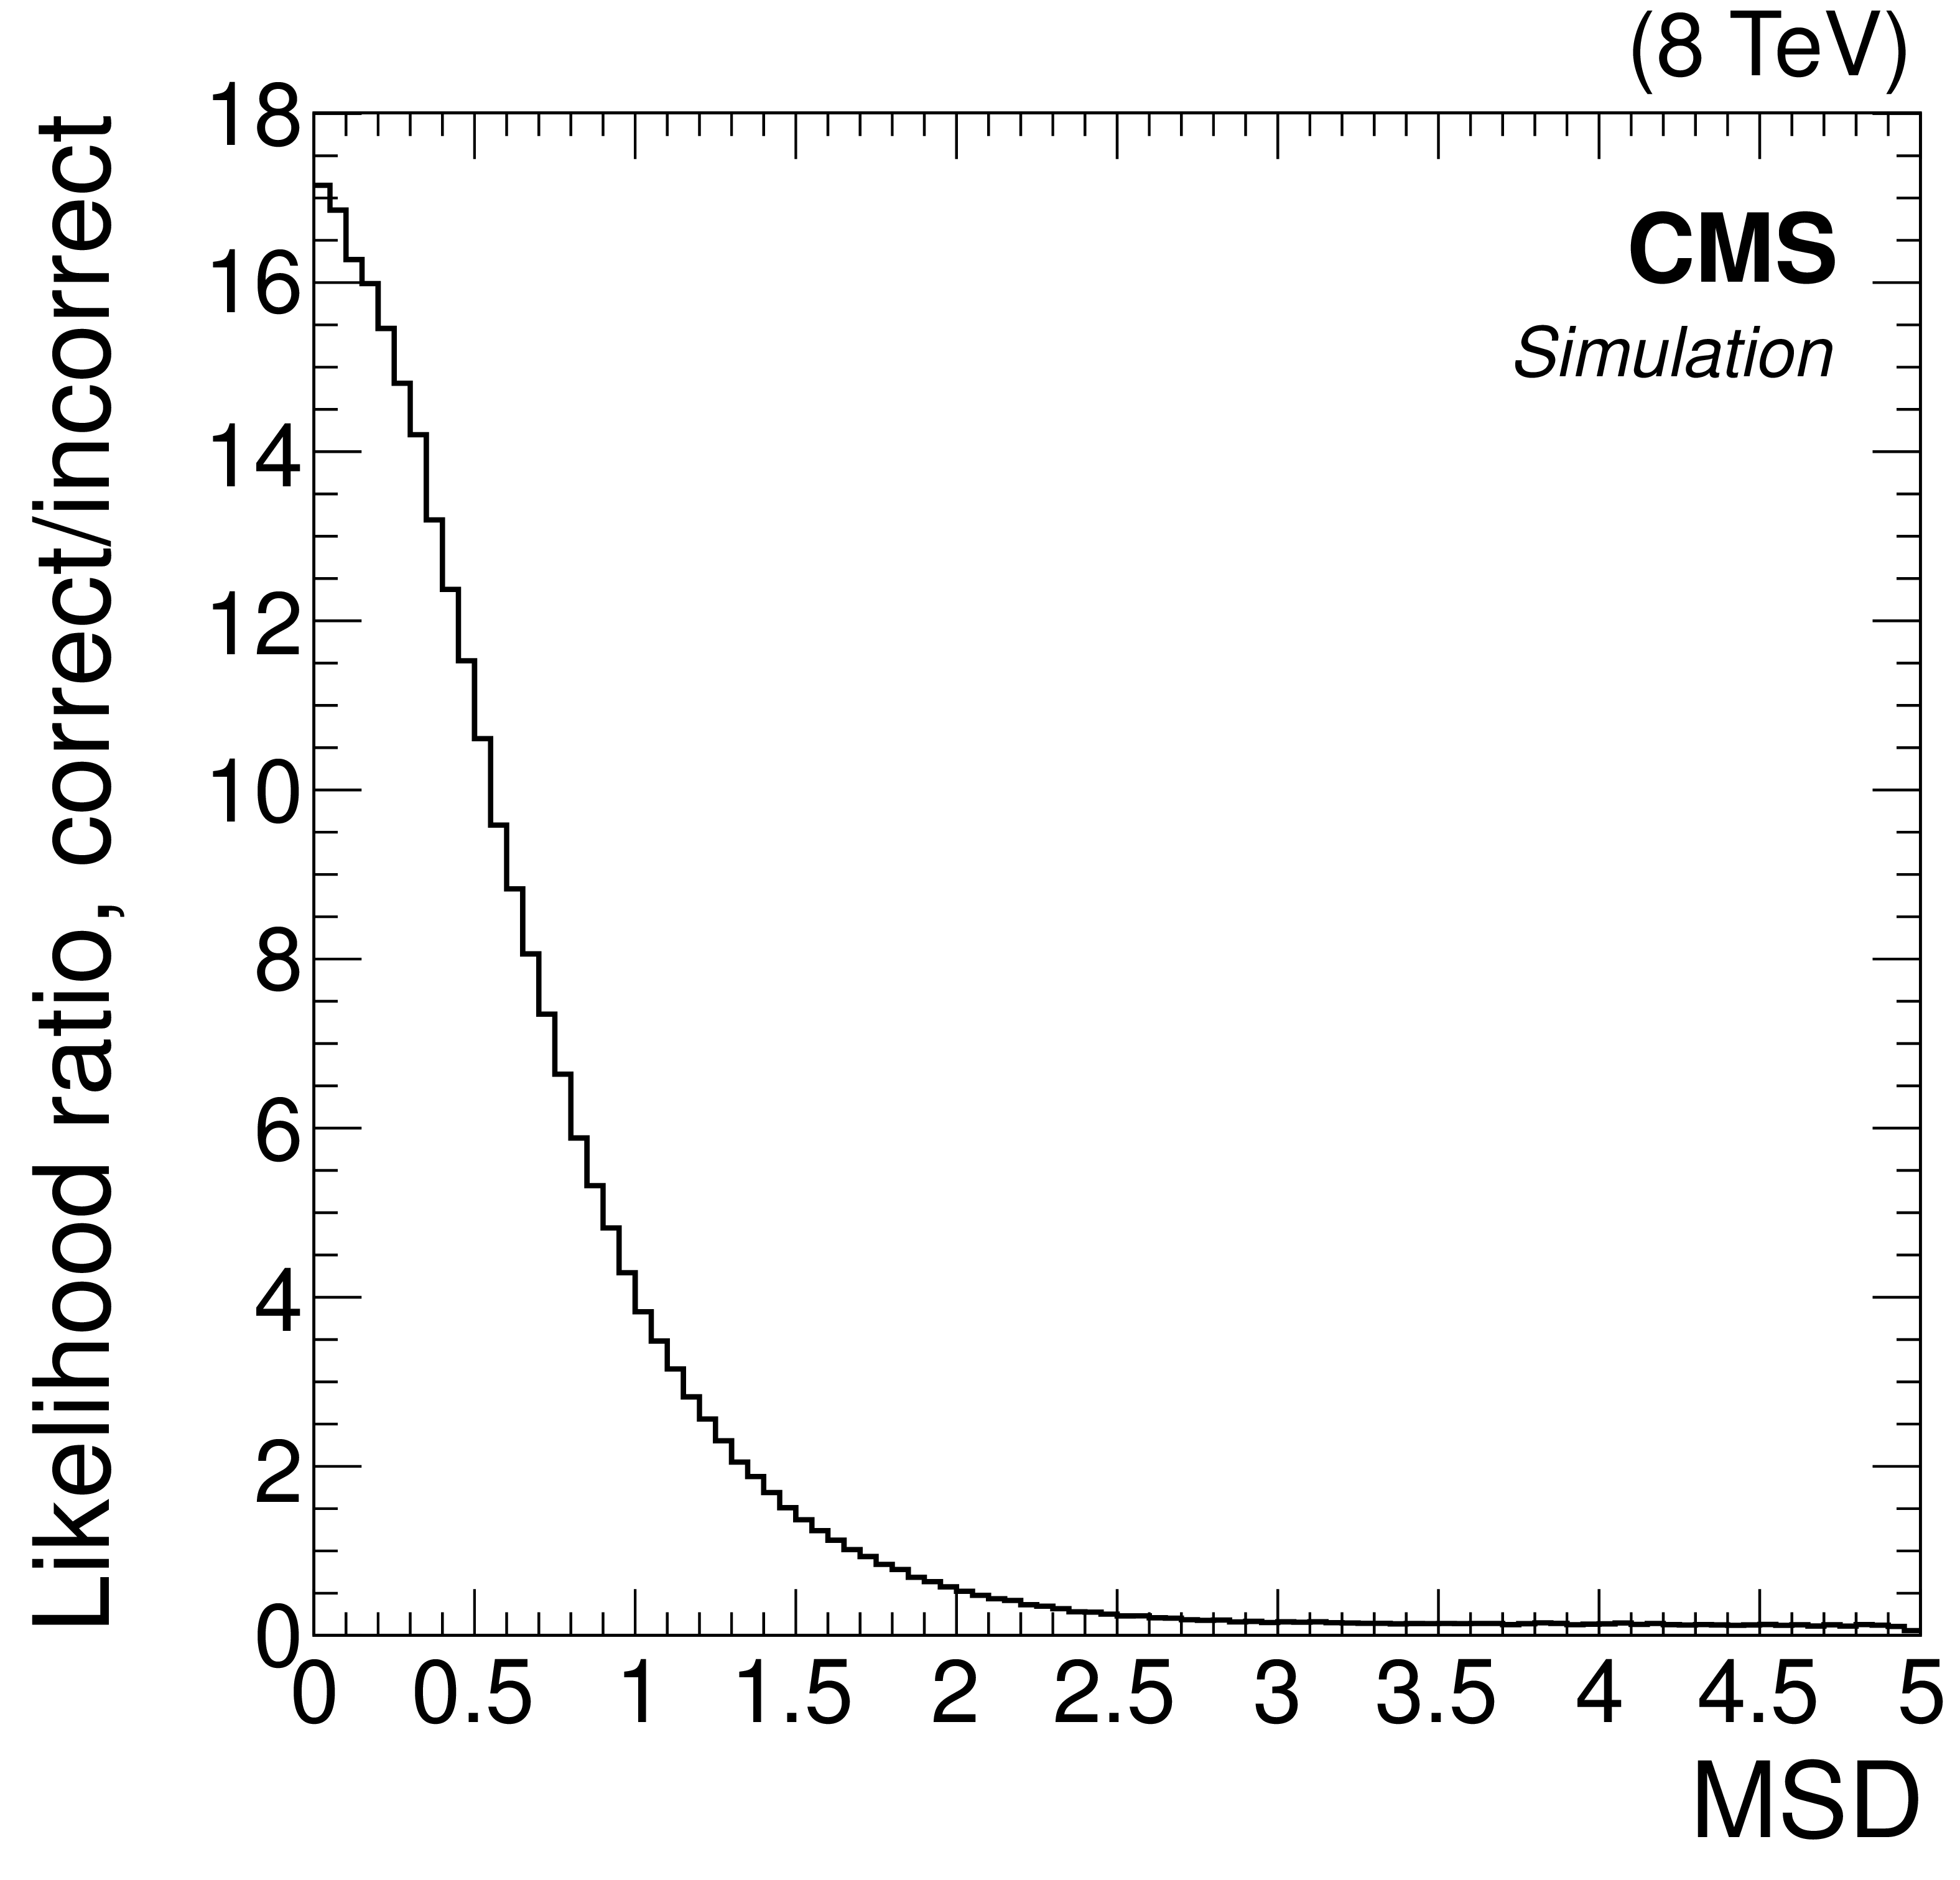
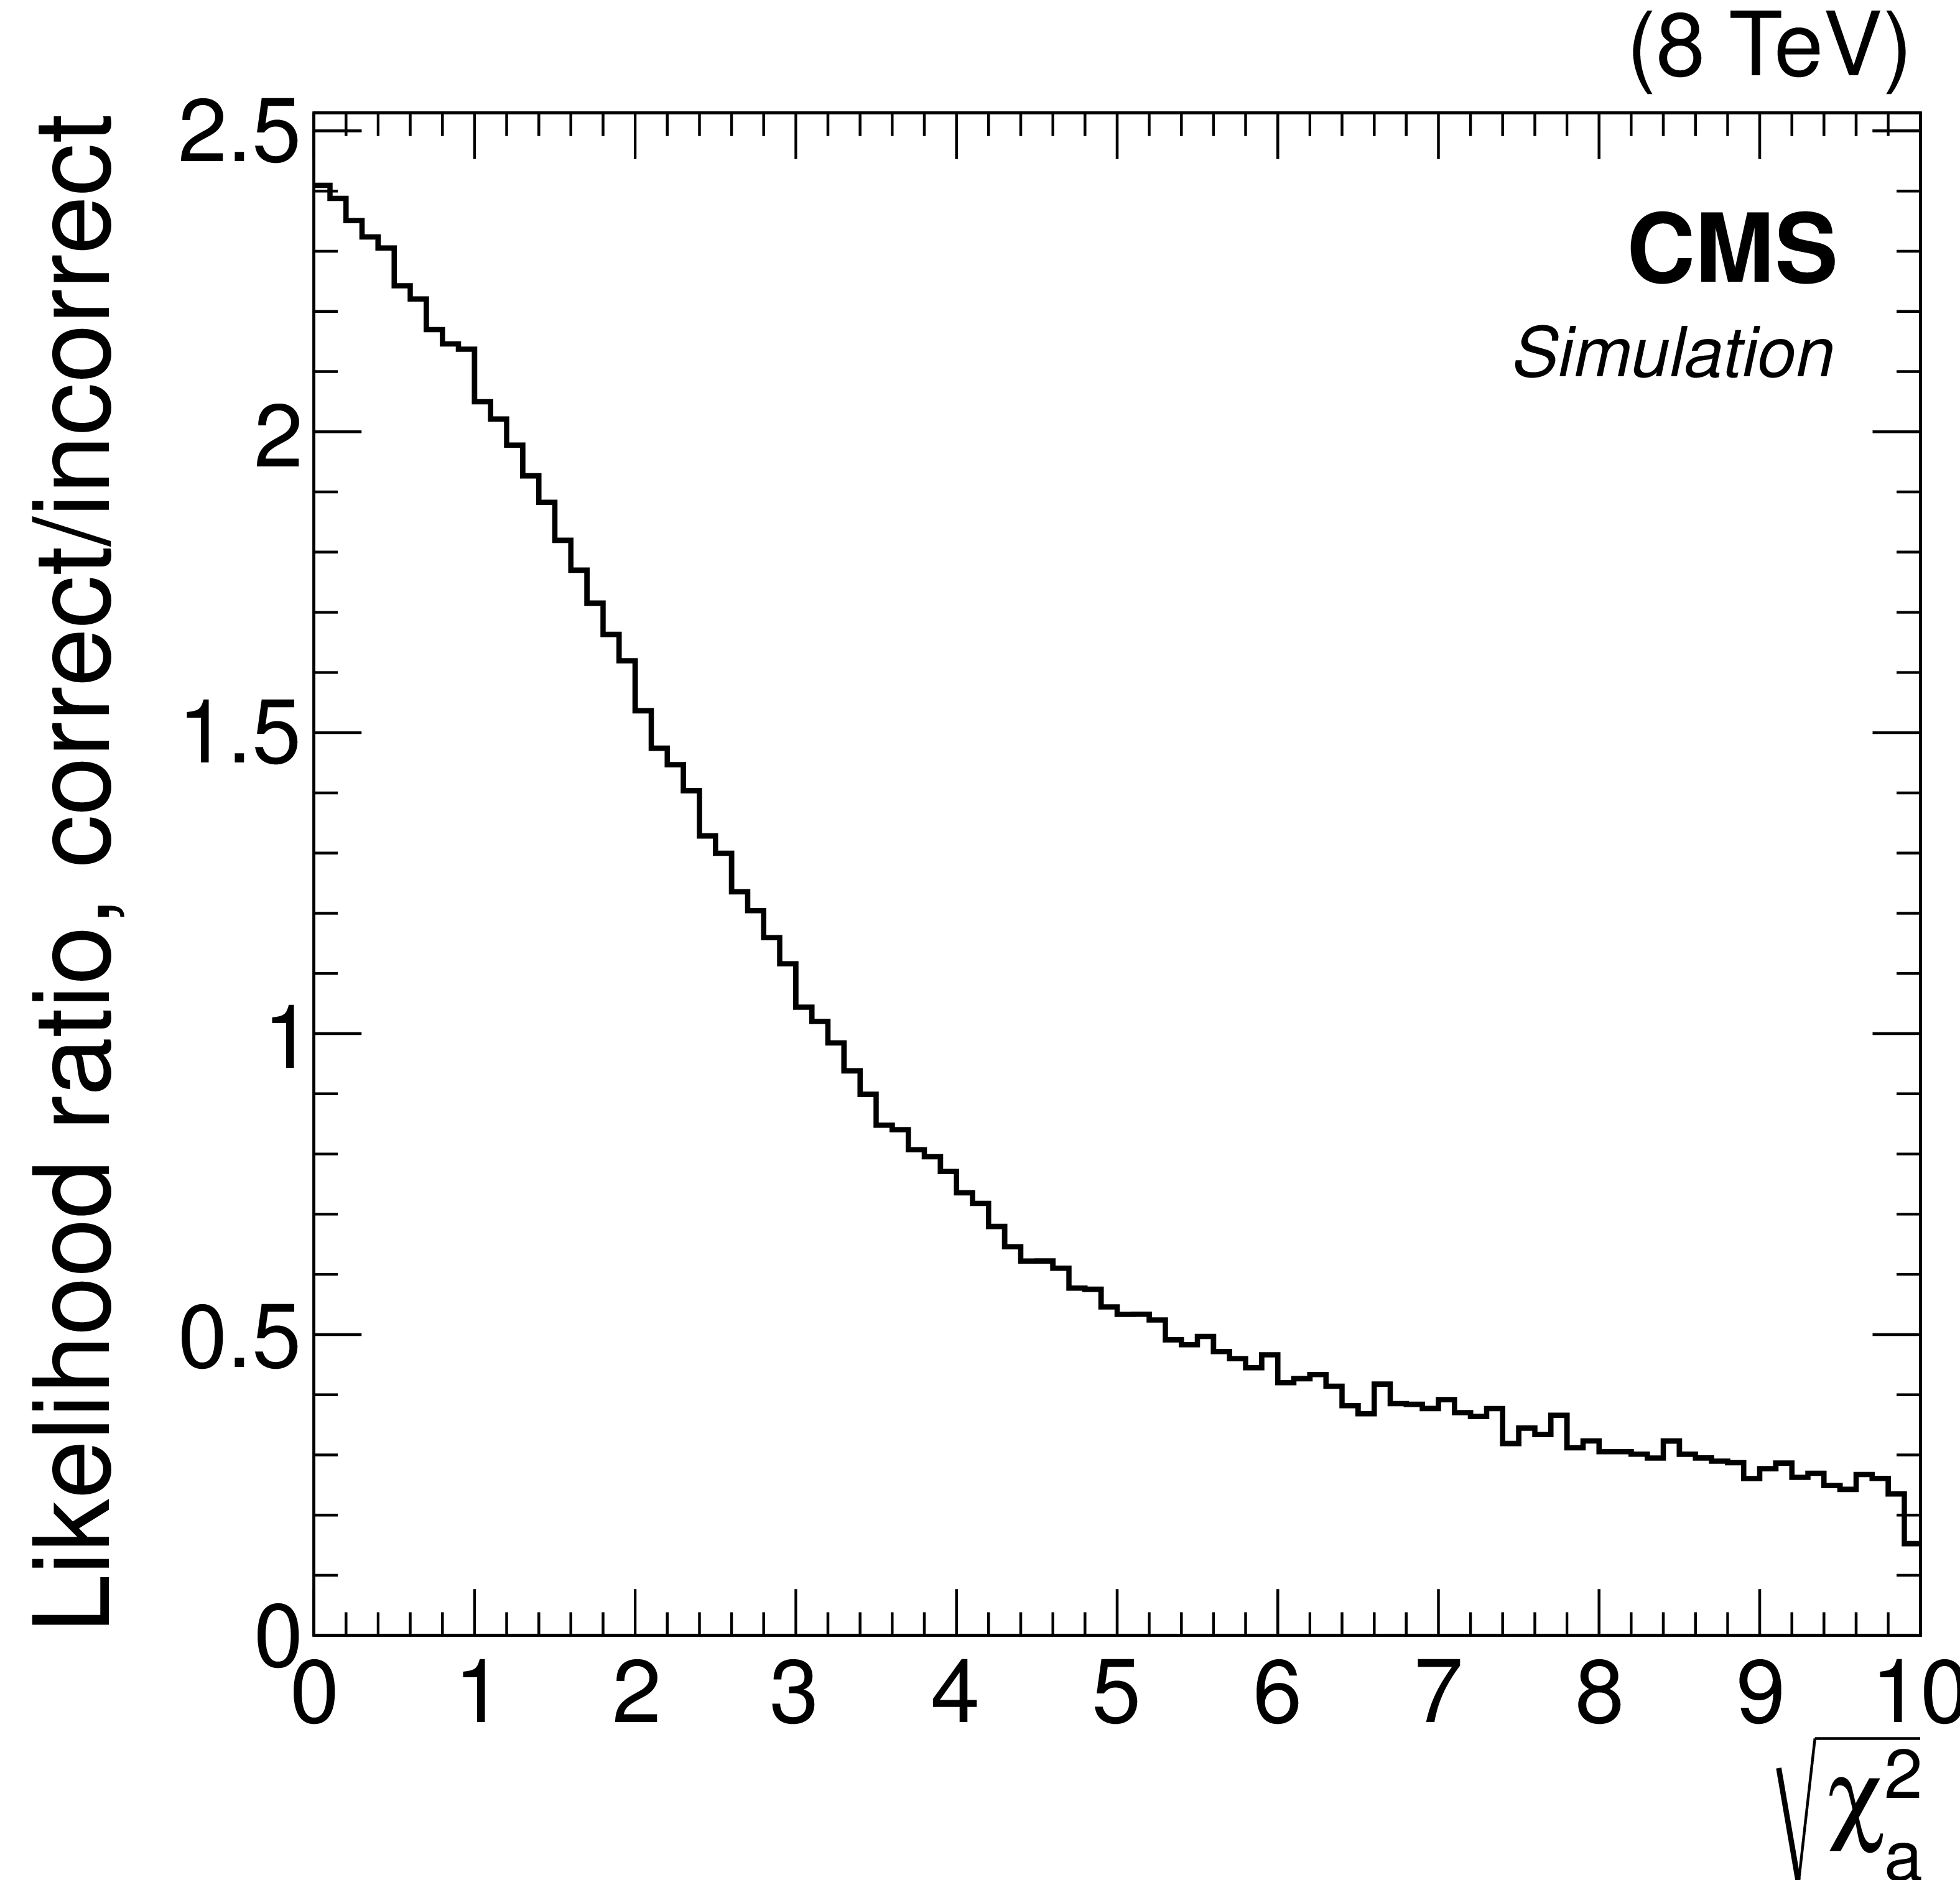
The two-dimensional probability density from simulation of jet invariant masses from W boson ($m_{\hat{c}\hat{d}}$) and top quark ($m_{\hat{b}\hat{c}\hat{d}}$) decay is shown (top), along with contours in standard deviations (MSD) of the corresponding Gaussian approximation. Probability densities for correct and incorrect jet assignments (middle) are shown (left) for MSD and (right) for $\sqrt {\chi _a^2}$ of the leptonically decaying top quark reconstruction. The corresponding likelihood ratios are shown below. |
png pdf |
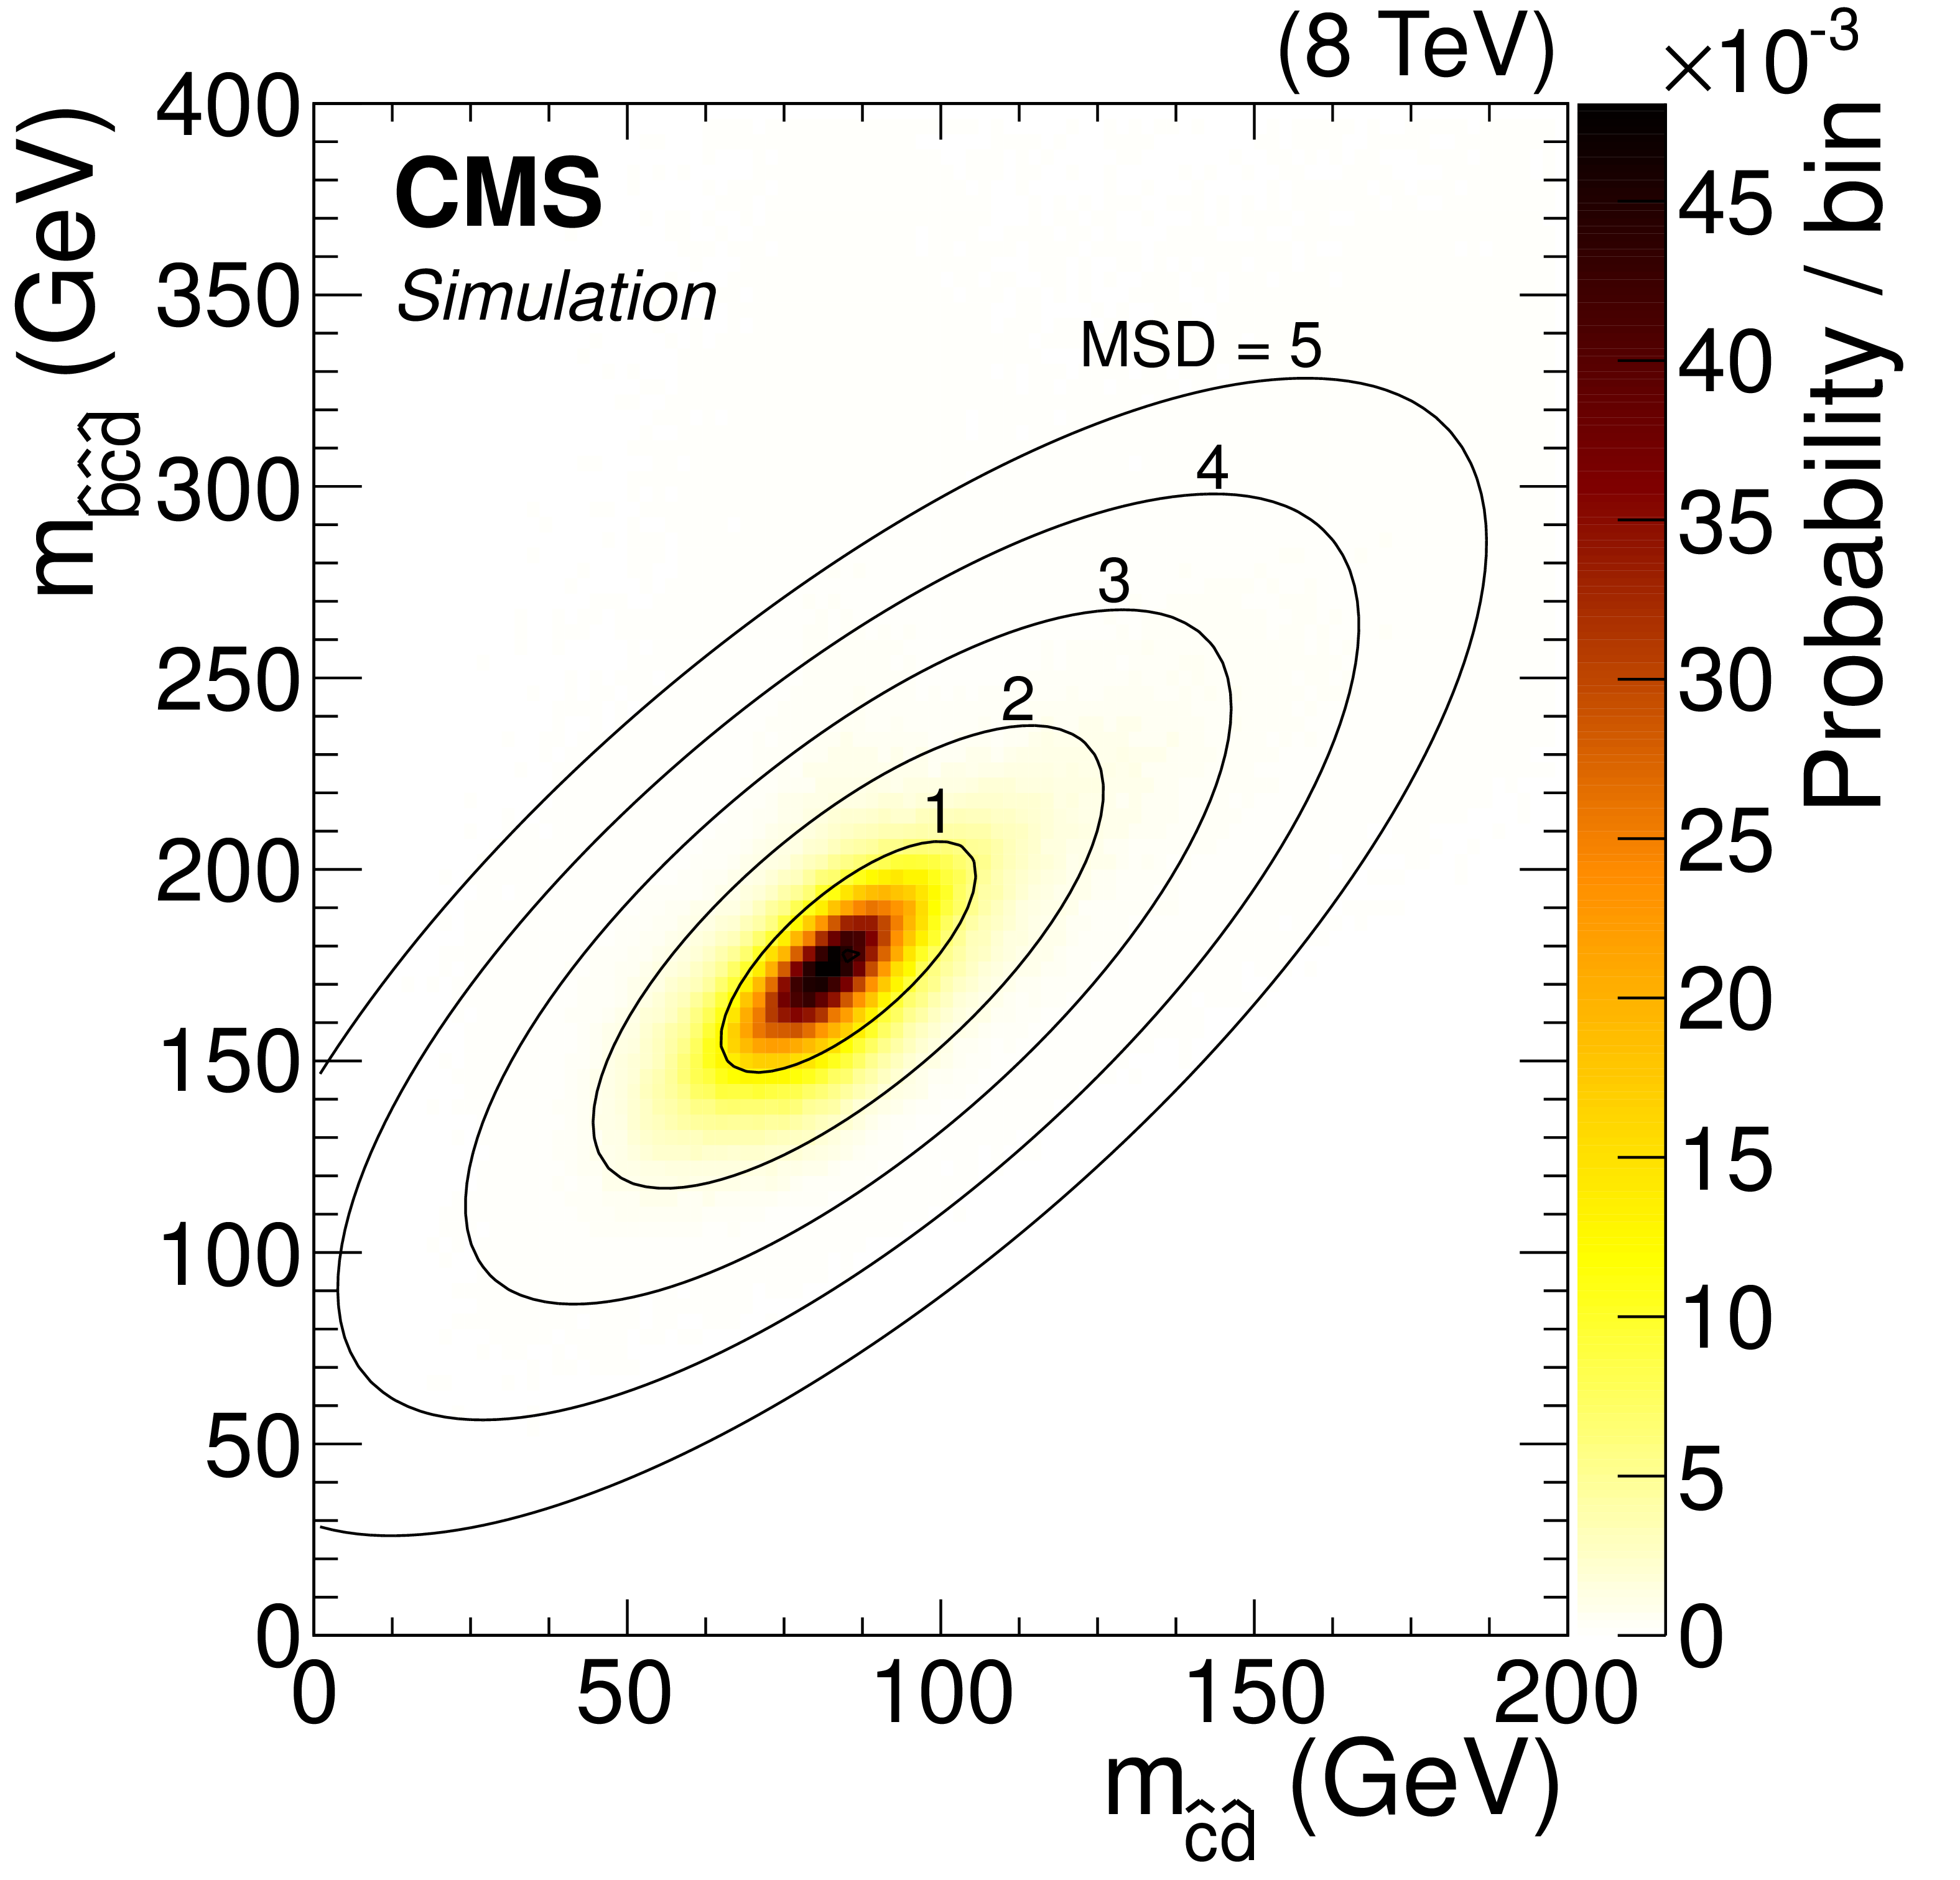
Figure 4-a:
The two-dimensional probability density from simulation of jet invariant masses from W boson ($m_{\hat{c}\hat{d}}$) and top quark ($m_{\hat{b}\hat{c}\hat{d}}$) decay is shown, along with contours in standard deviations (MSD) of the corresponding Gaussian approximation. |

png pdf |
Figure 4-b:
Probability densities for correct and incorrect jet assignments are shown for MSD of the leptonically decaying top quark reconstruction. |
png pdf |
Figure 4-c:
Probability densities for correct and incorrect jet assignments are shown for $\sqrt {\chi _a^2}$ of the leptonically decaying top quark reconstruction. |
png pdf |
Figure 4-d:
Likelihood ratios for correct and incorrect jet assignments are shown for MSD of the leptonically decaying top quark reconstruction. |
png pdf |
Figure 4-e:
Likelihood ratios for correct and incorrect jet assignments are shown for $\sqrt {\chi _a^2}$ of the leptonically decaying top quark reconstruction. |
png pdf |
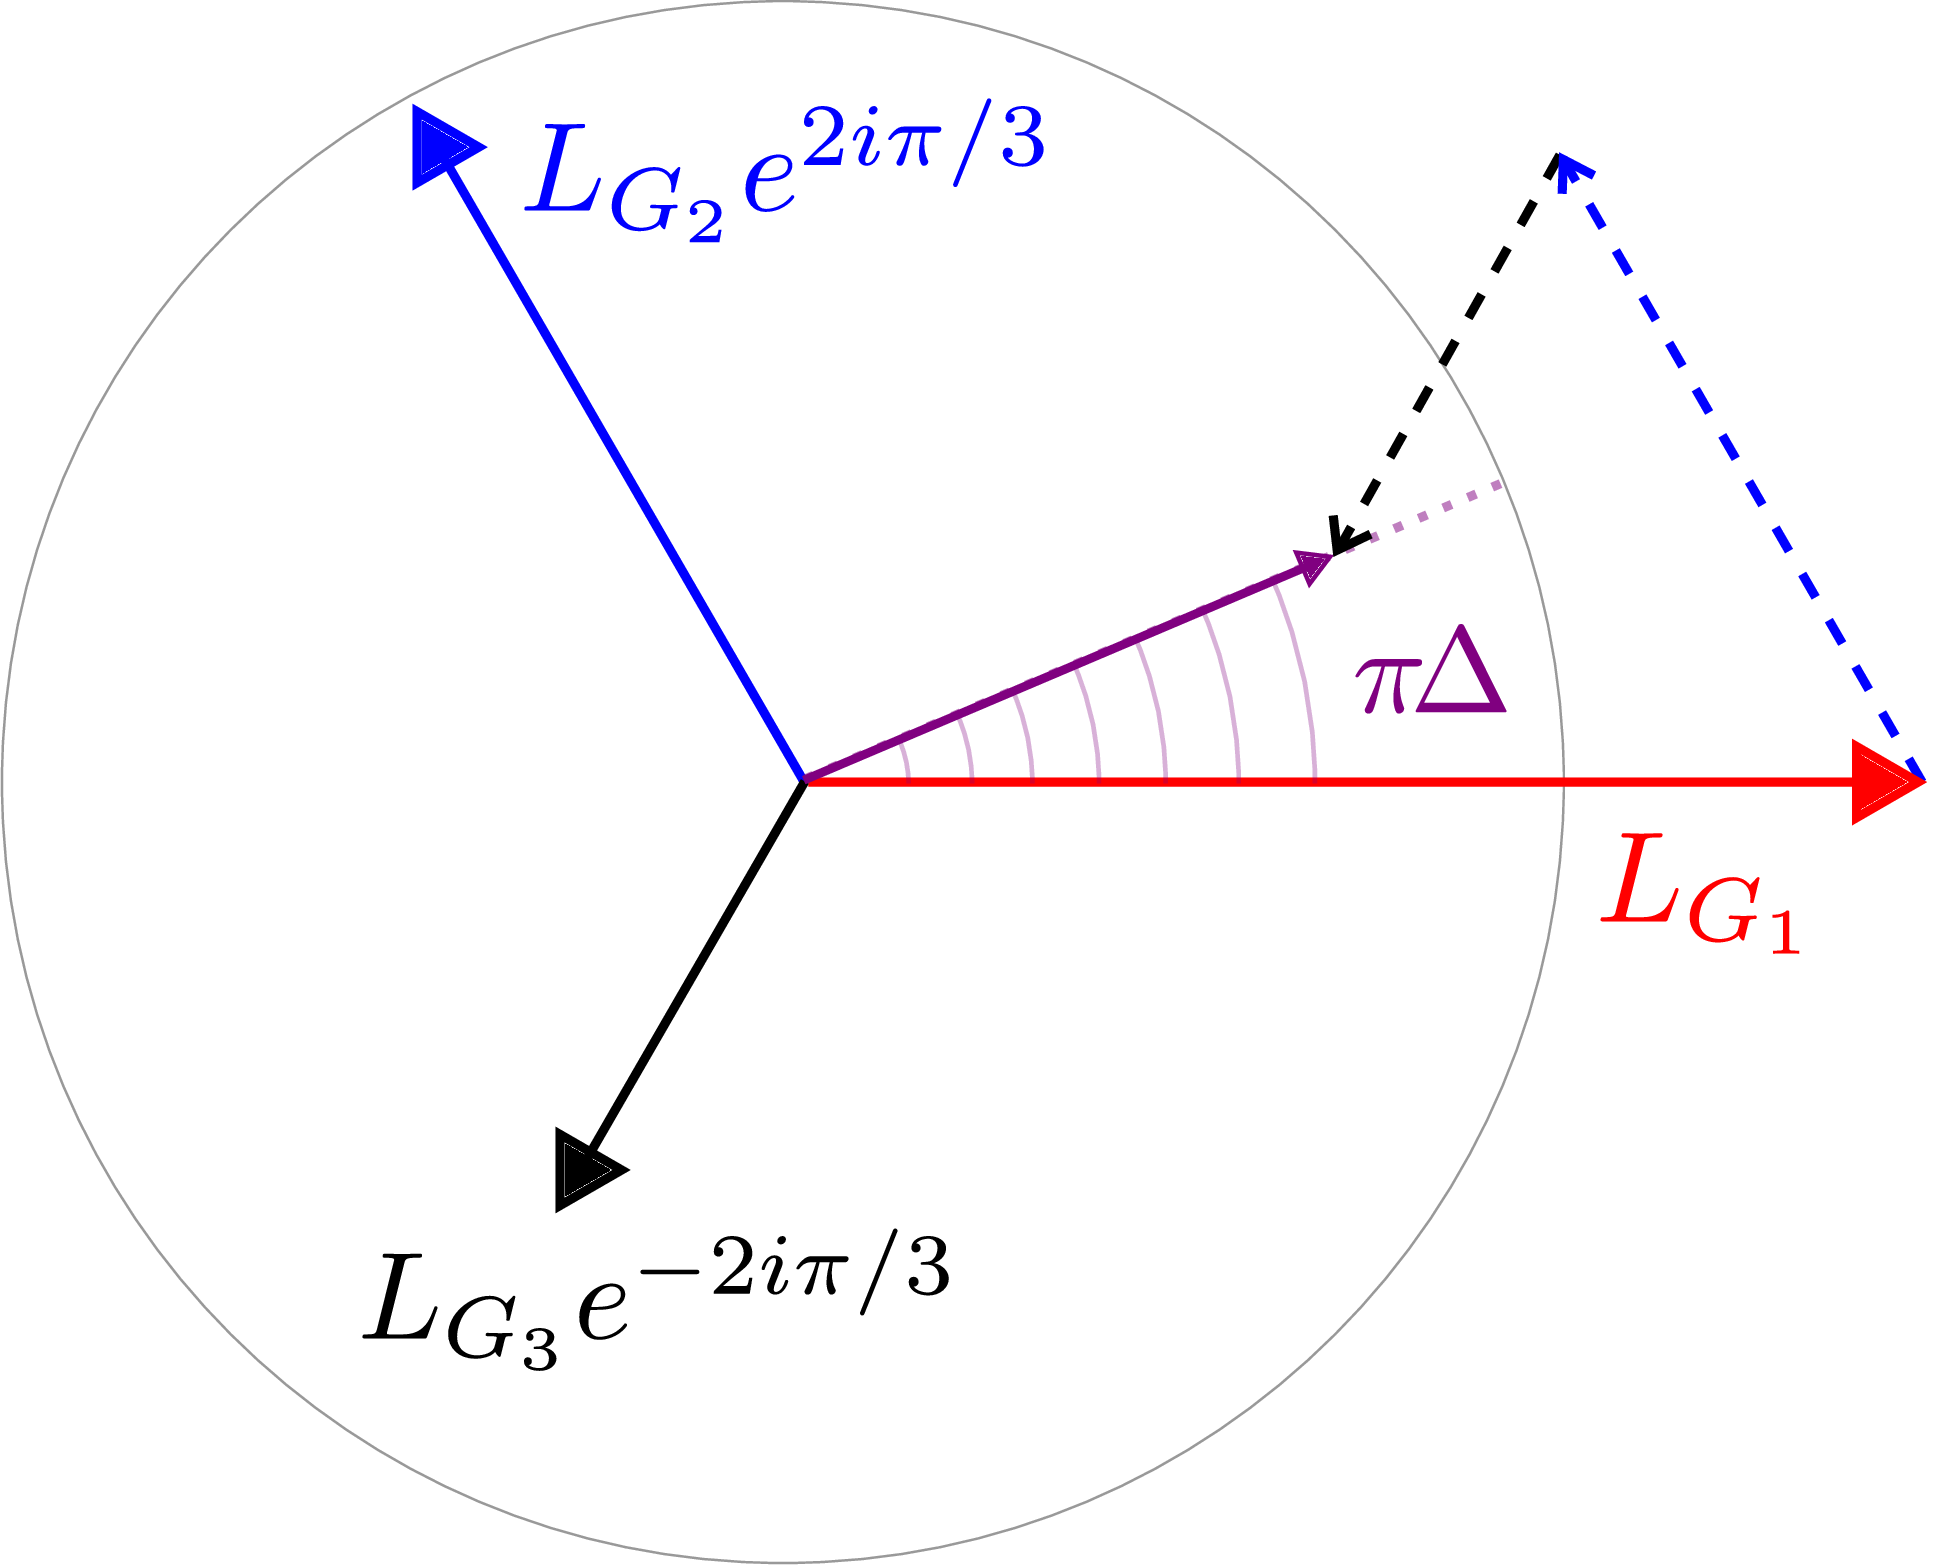
Figure 5:
The angle $\pi {\Delta} $ of the resultant sum of three vectors spaced at equal angles, in which the magnitude of each is the likelihood of the respective population. The dashed arrows are translations of the $ {\mathrm {e}}^{2i\pi /3}$ and $ {\mathrm {e}}^{-2i\pi /3}$ vectors which illustrate the construction of the sum. The circle is shown to indicate the relative scale. |

png pdf |
Figure 6:
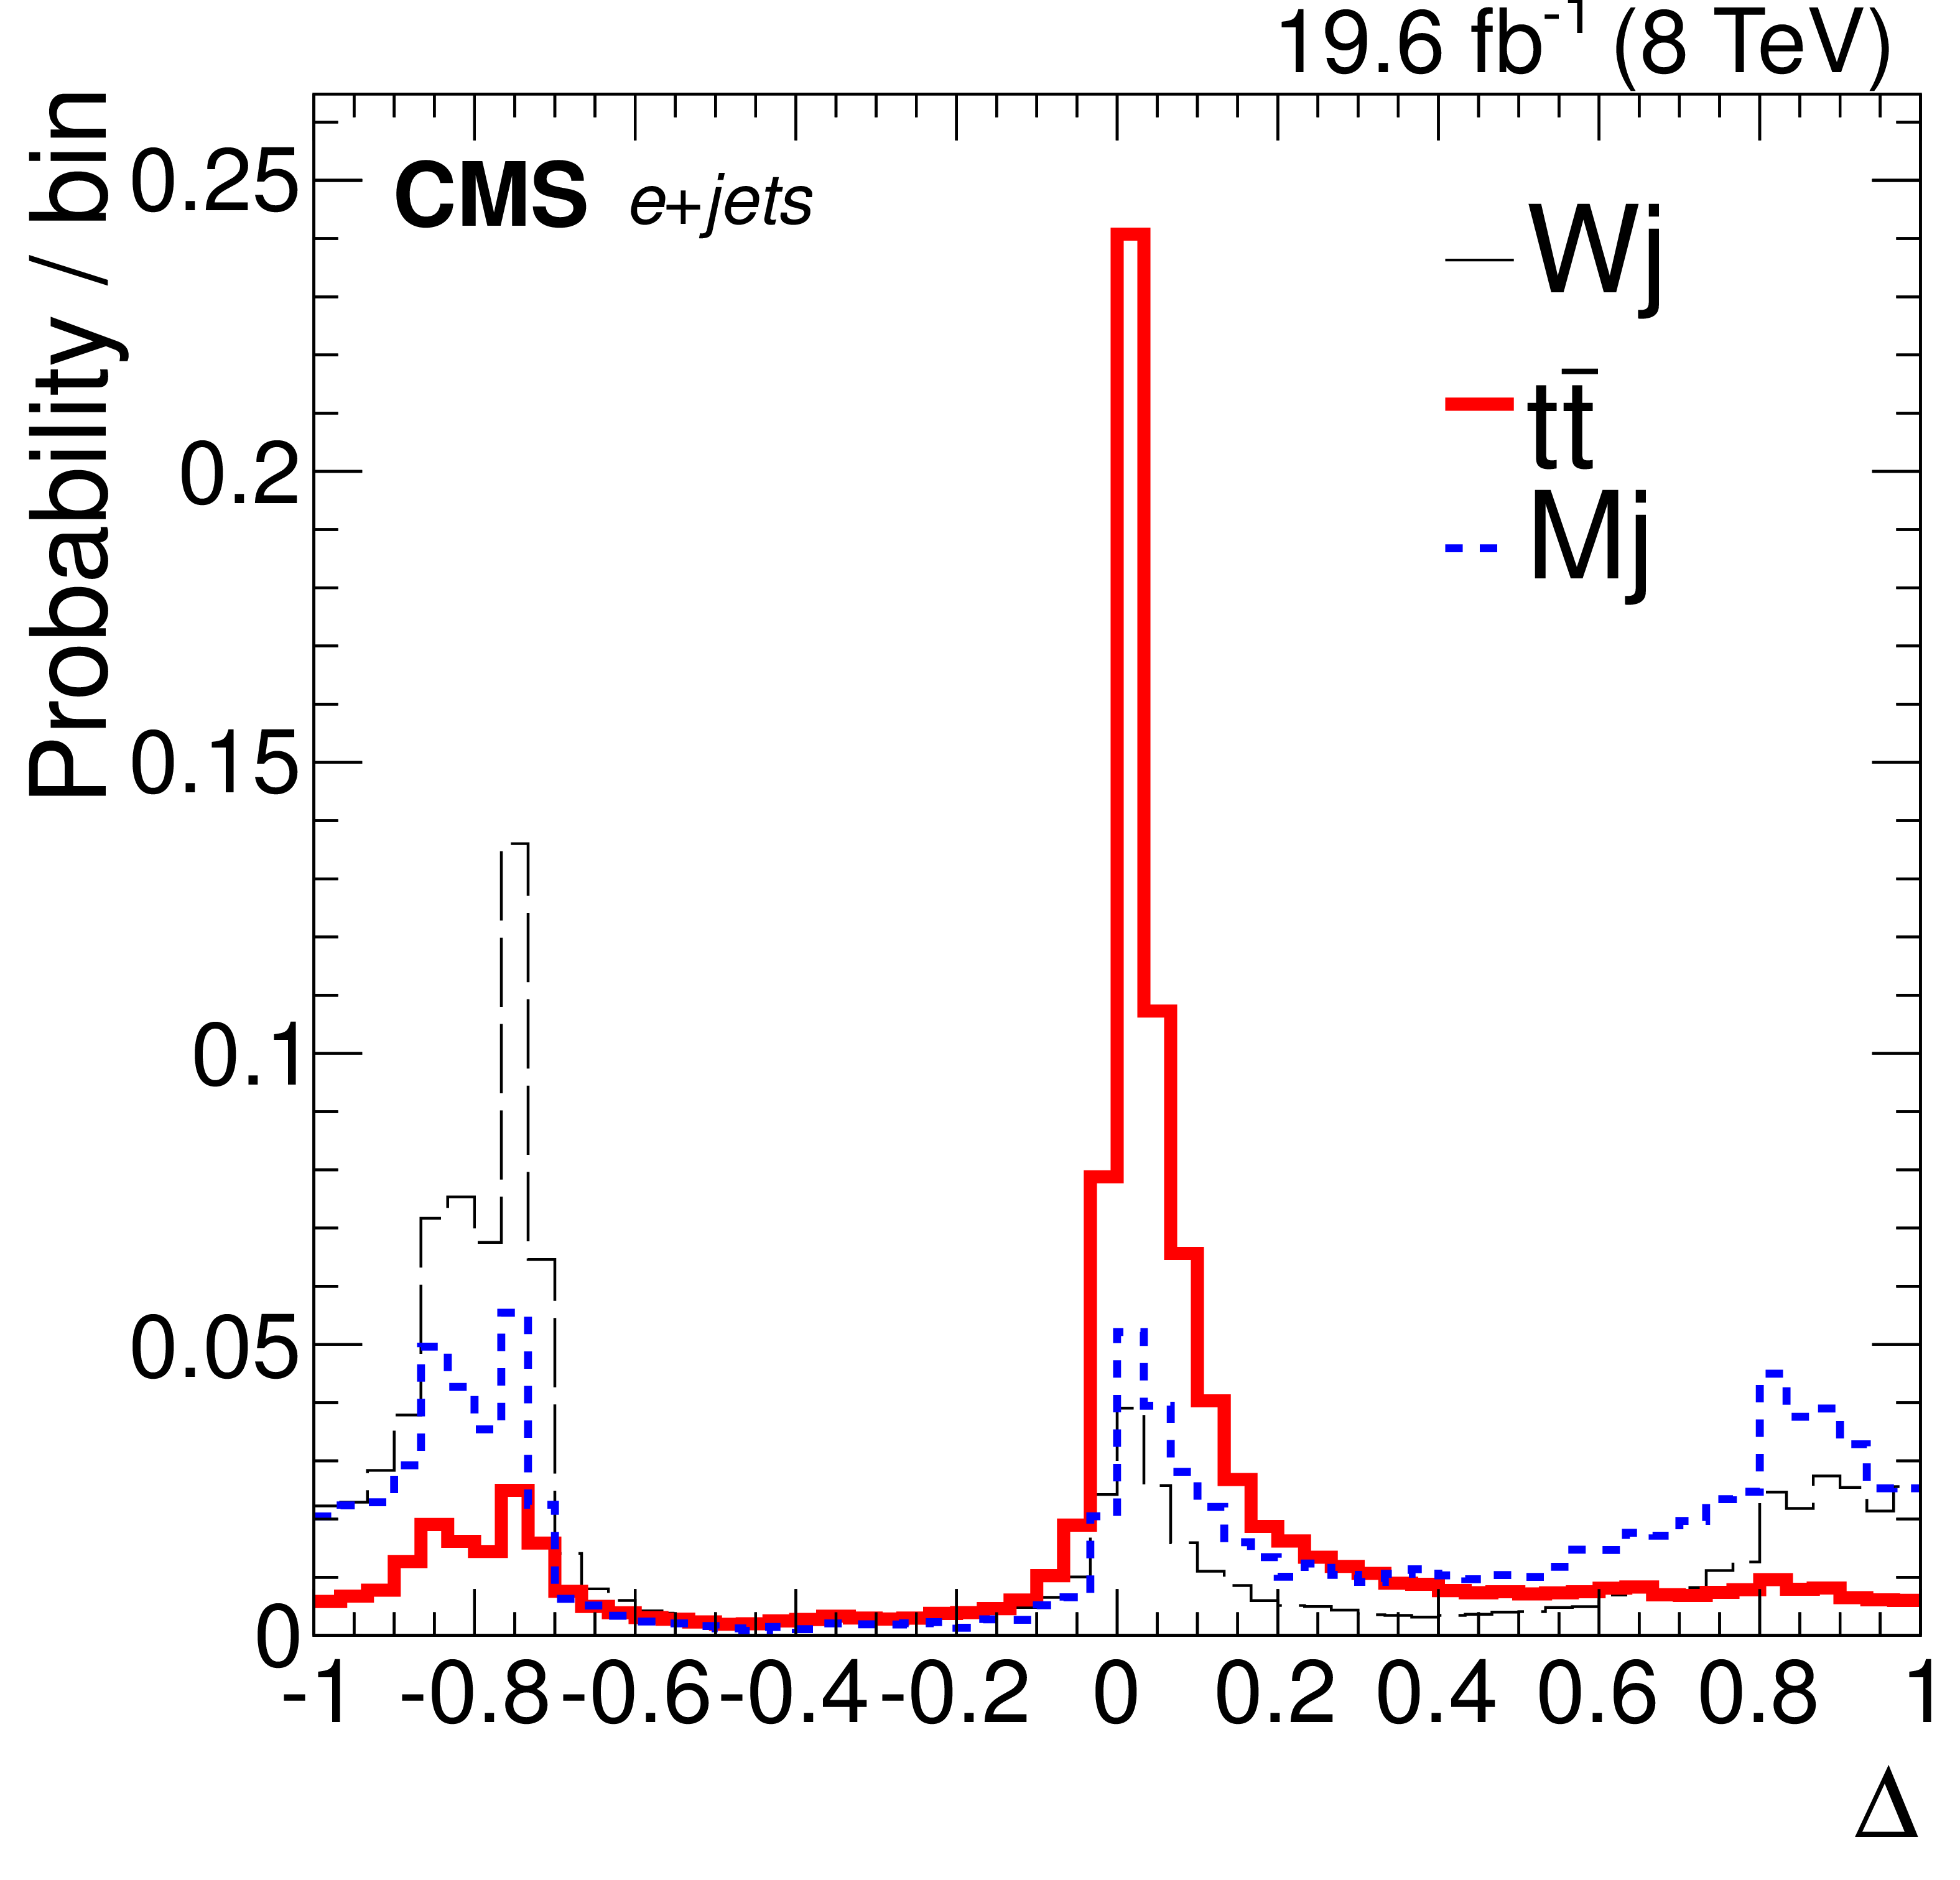
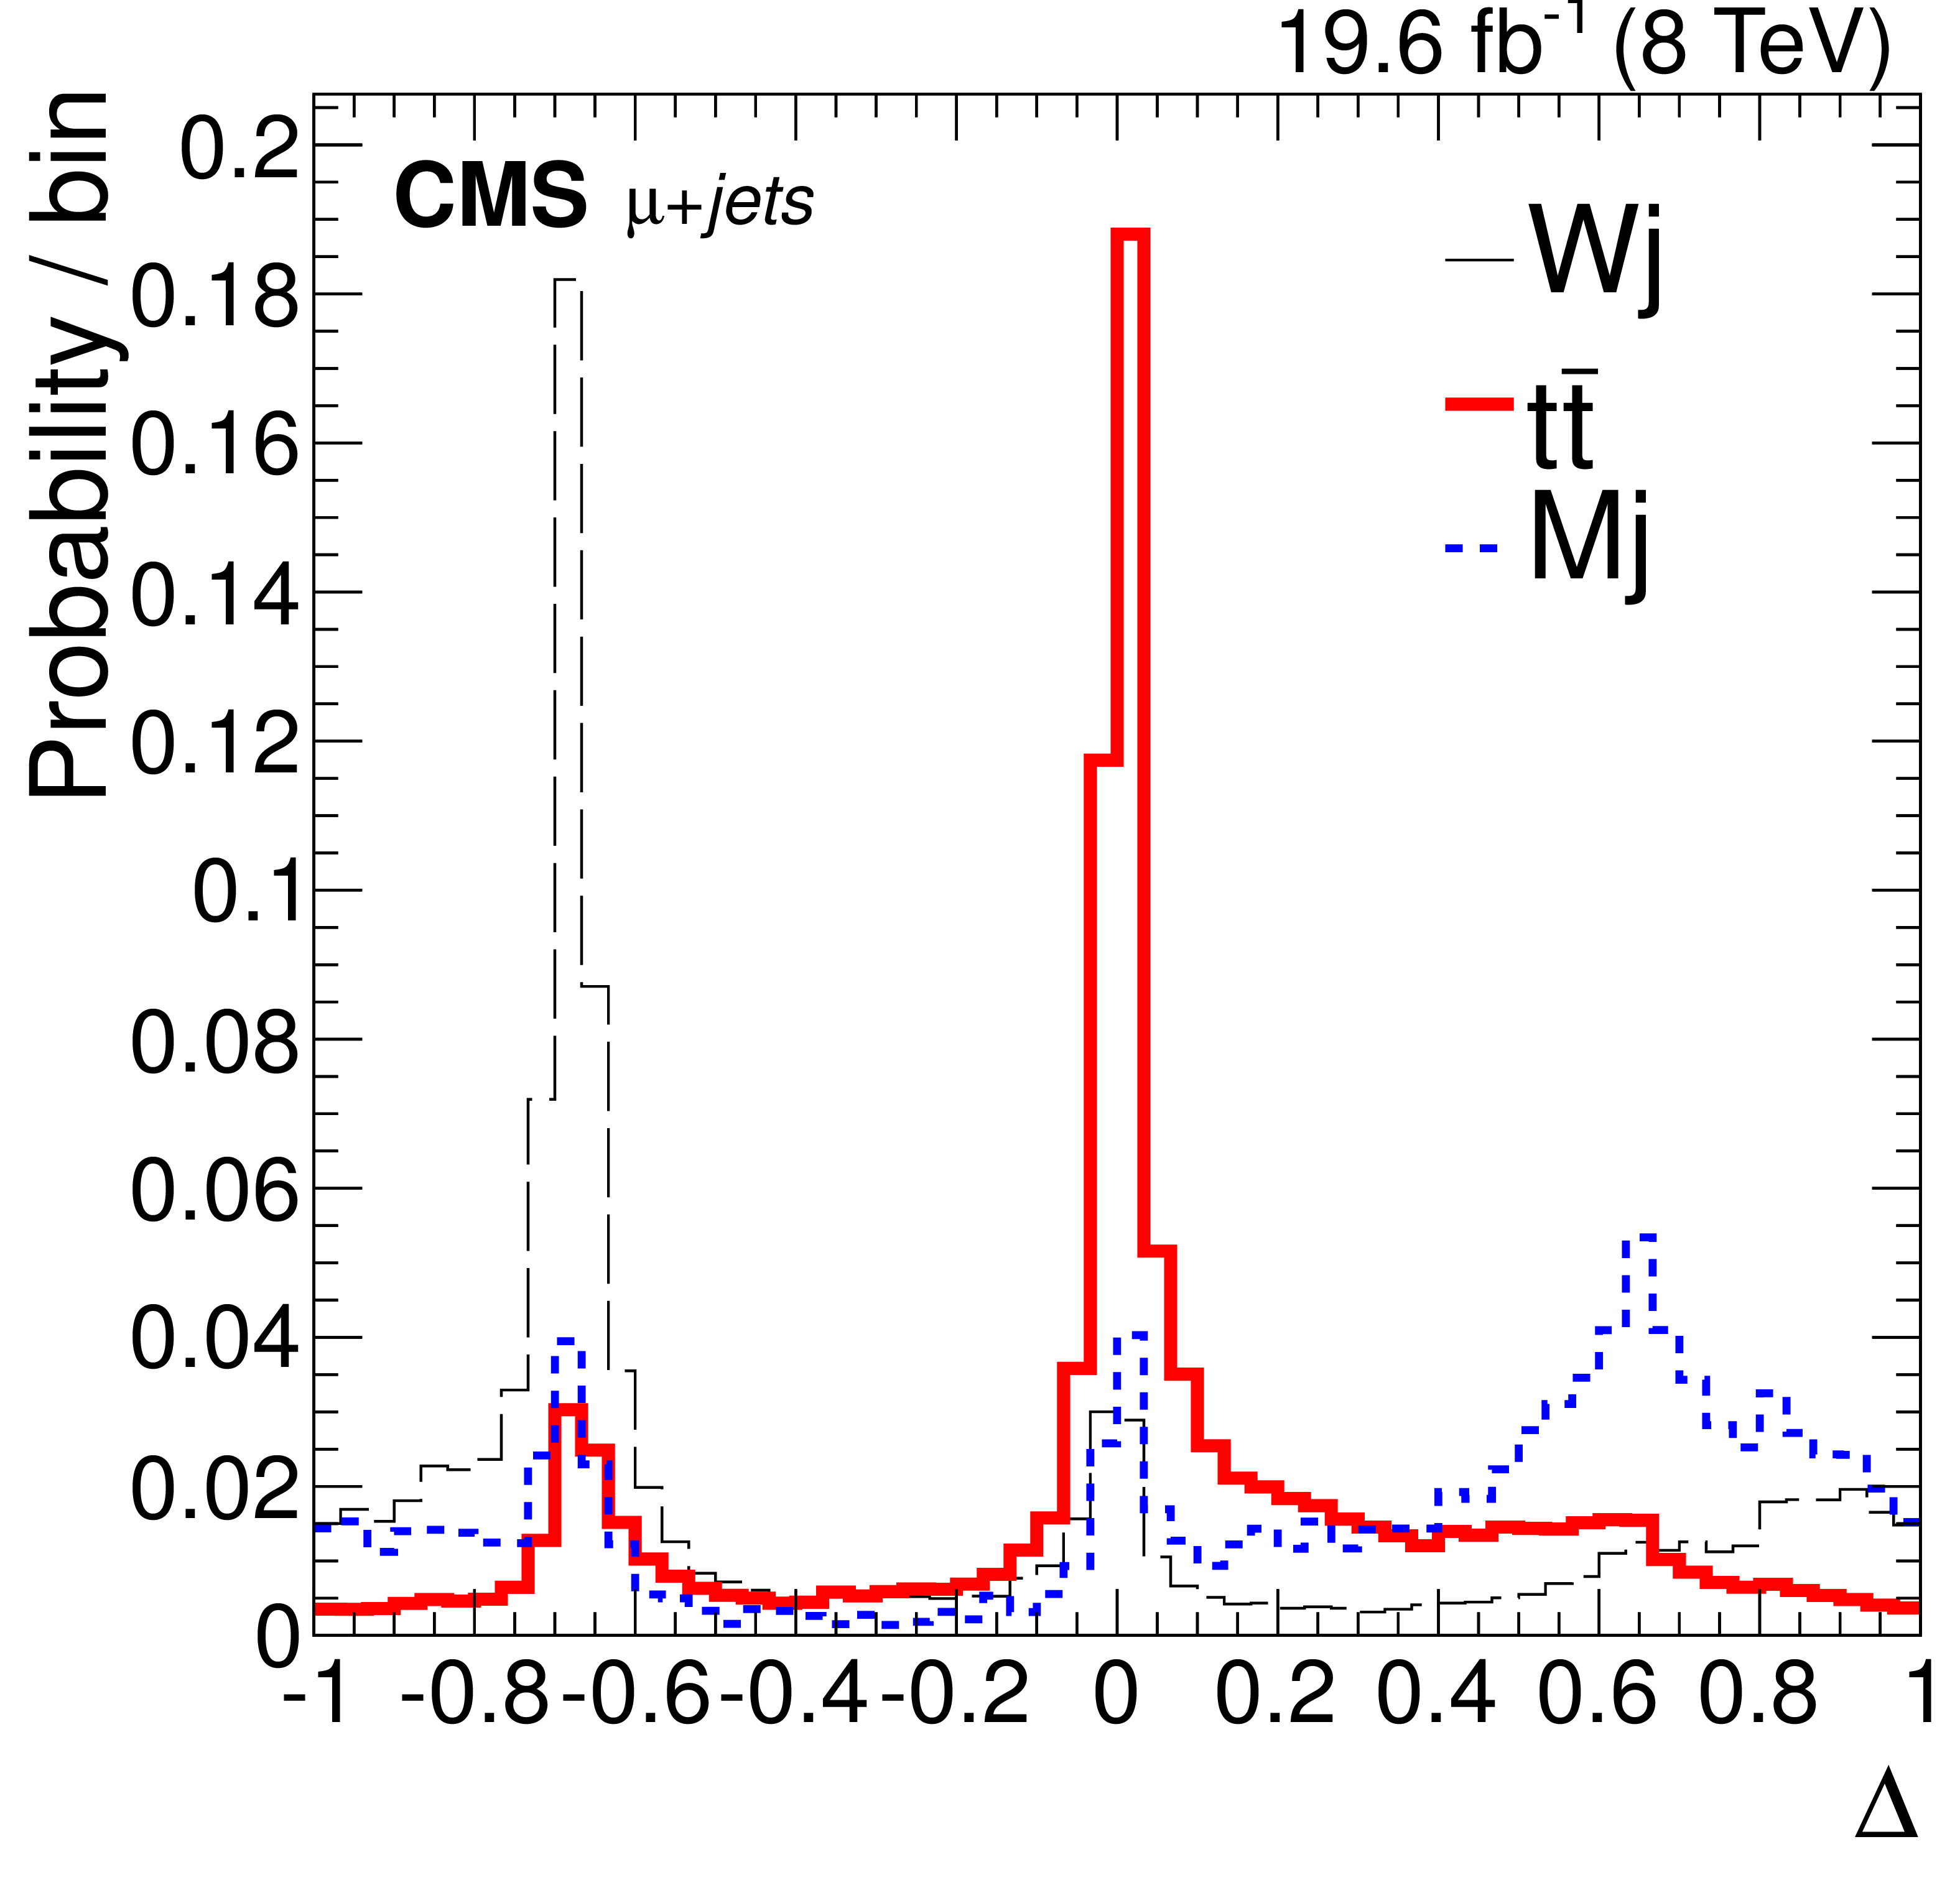
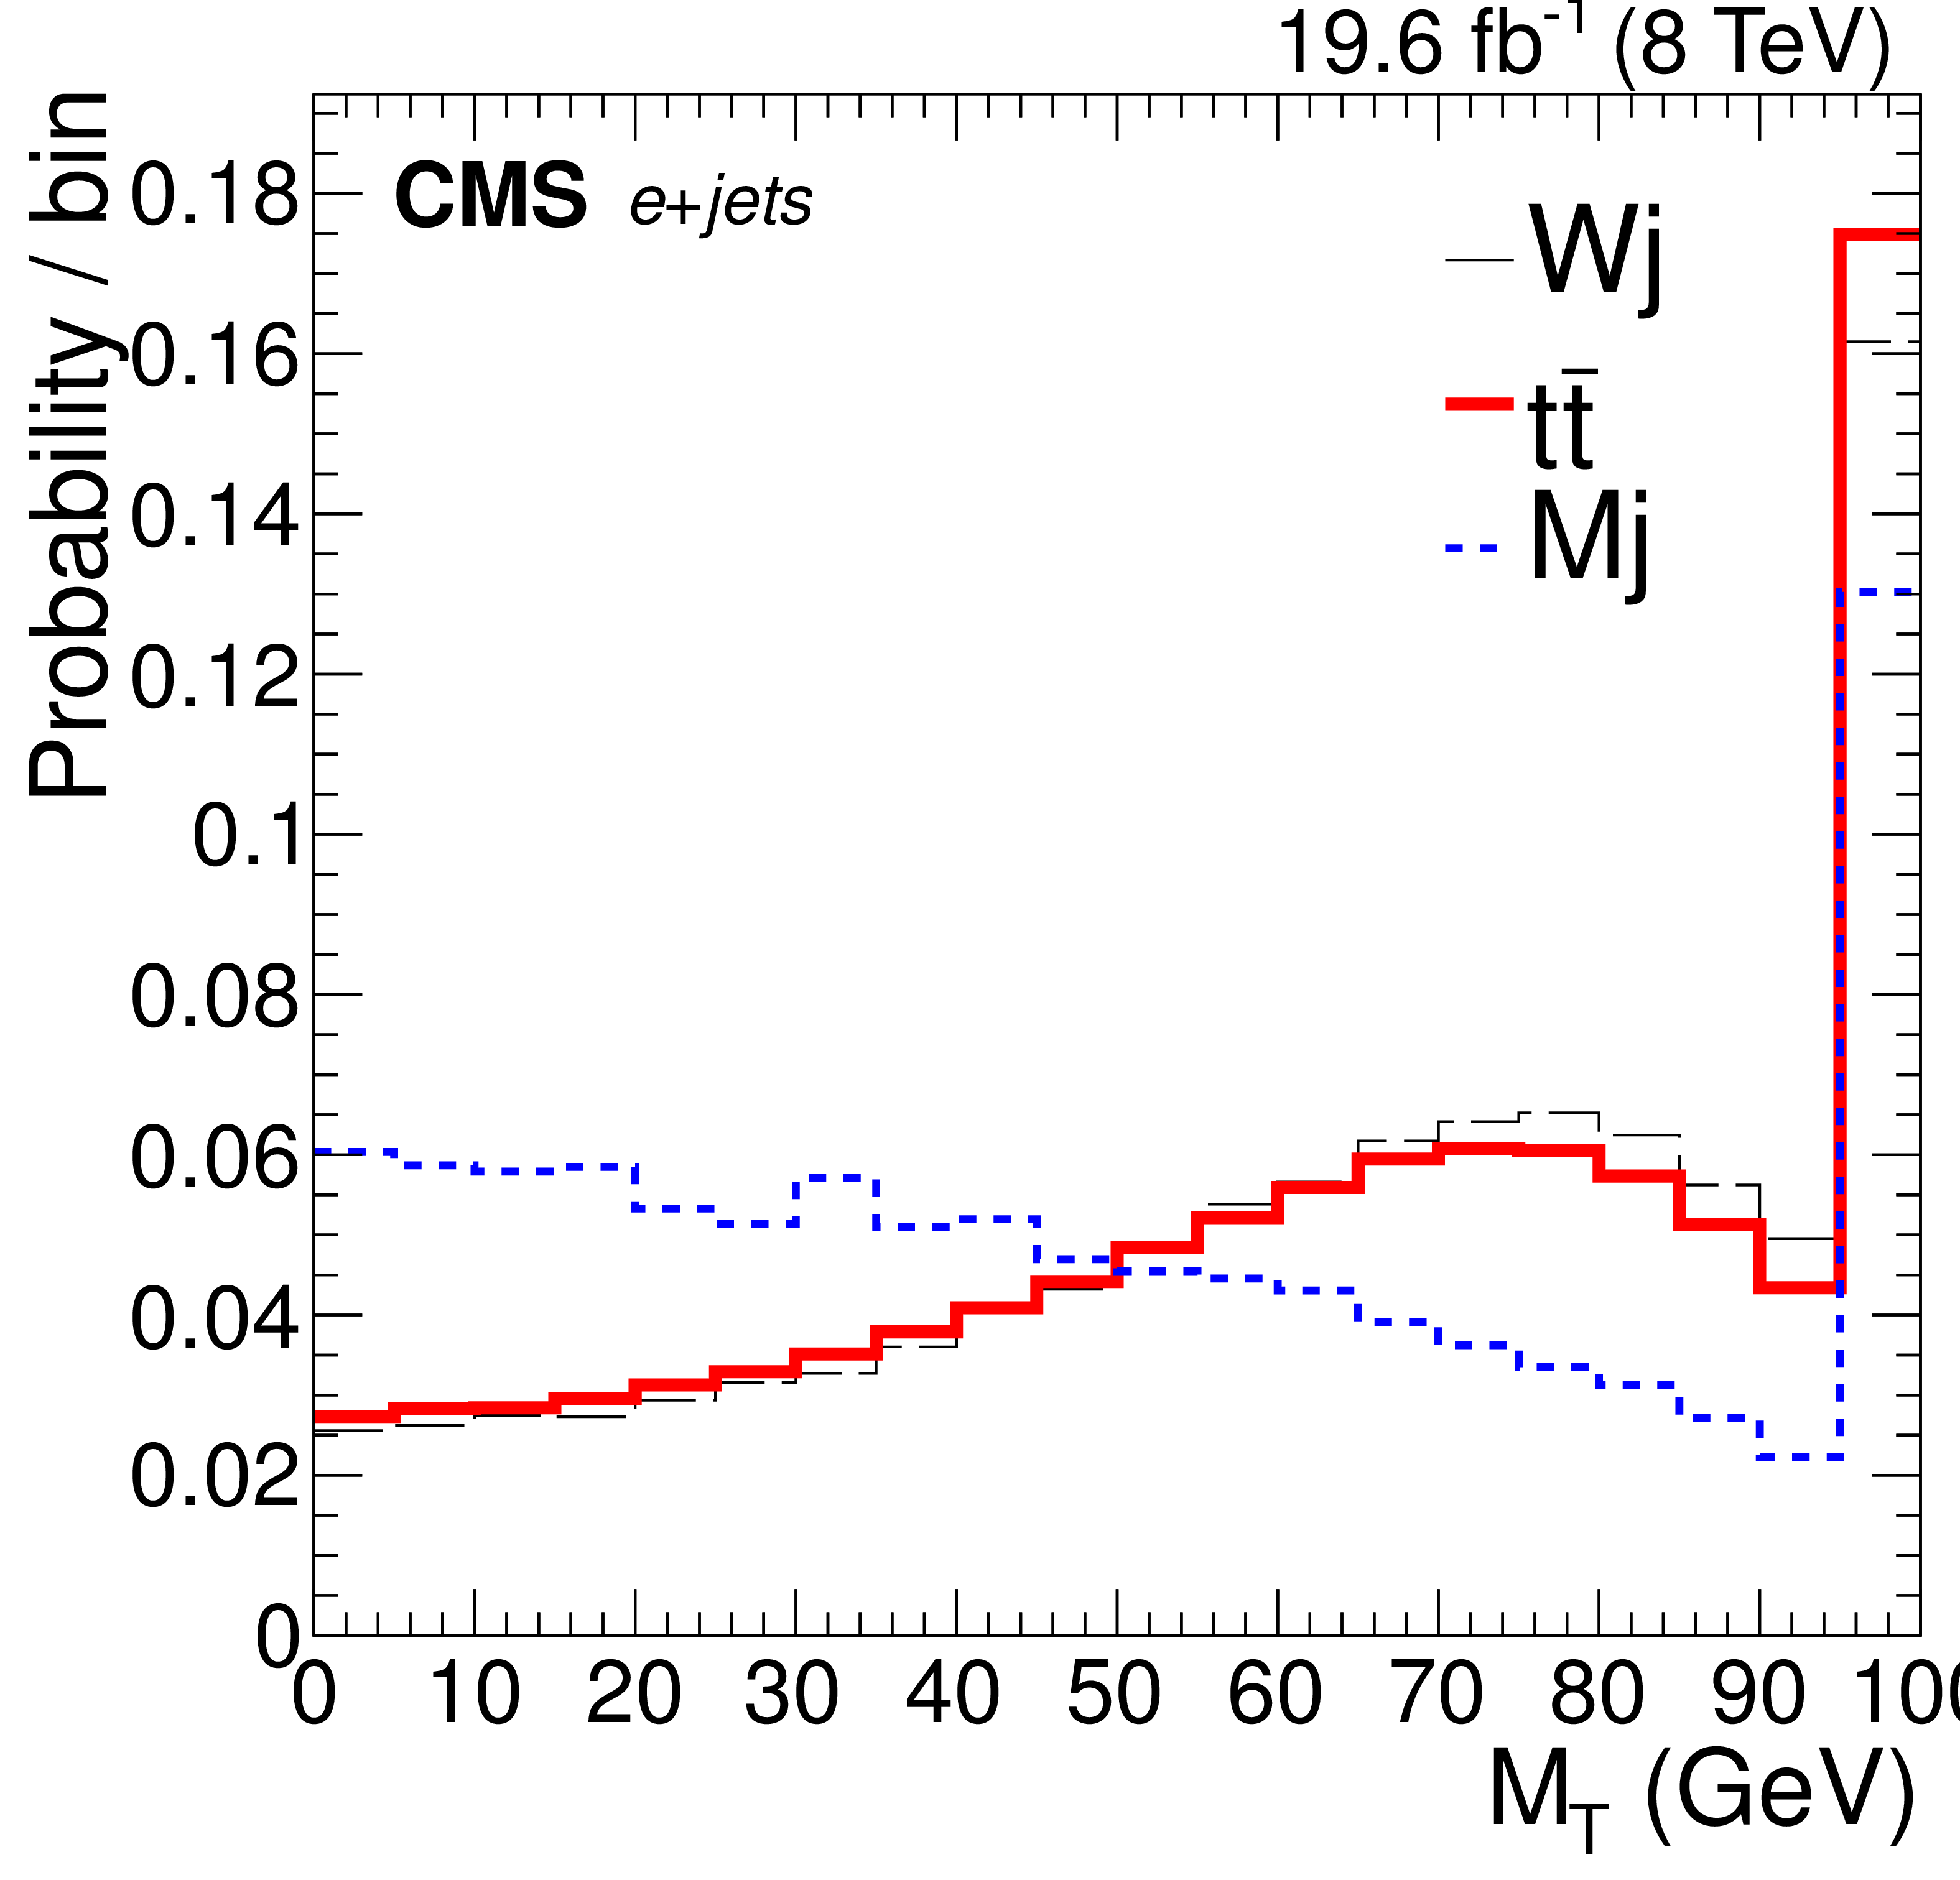
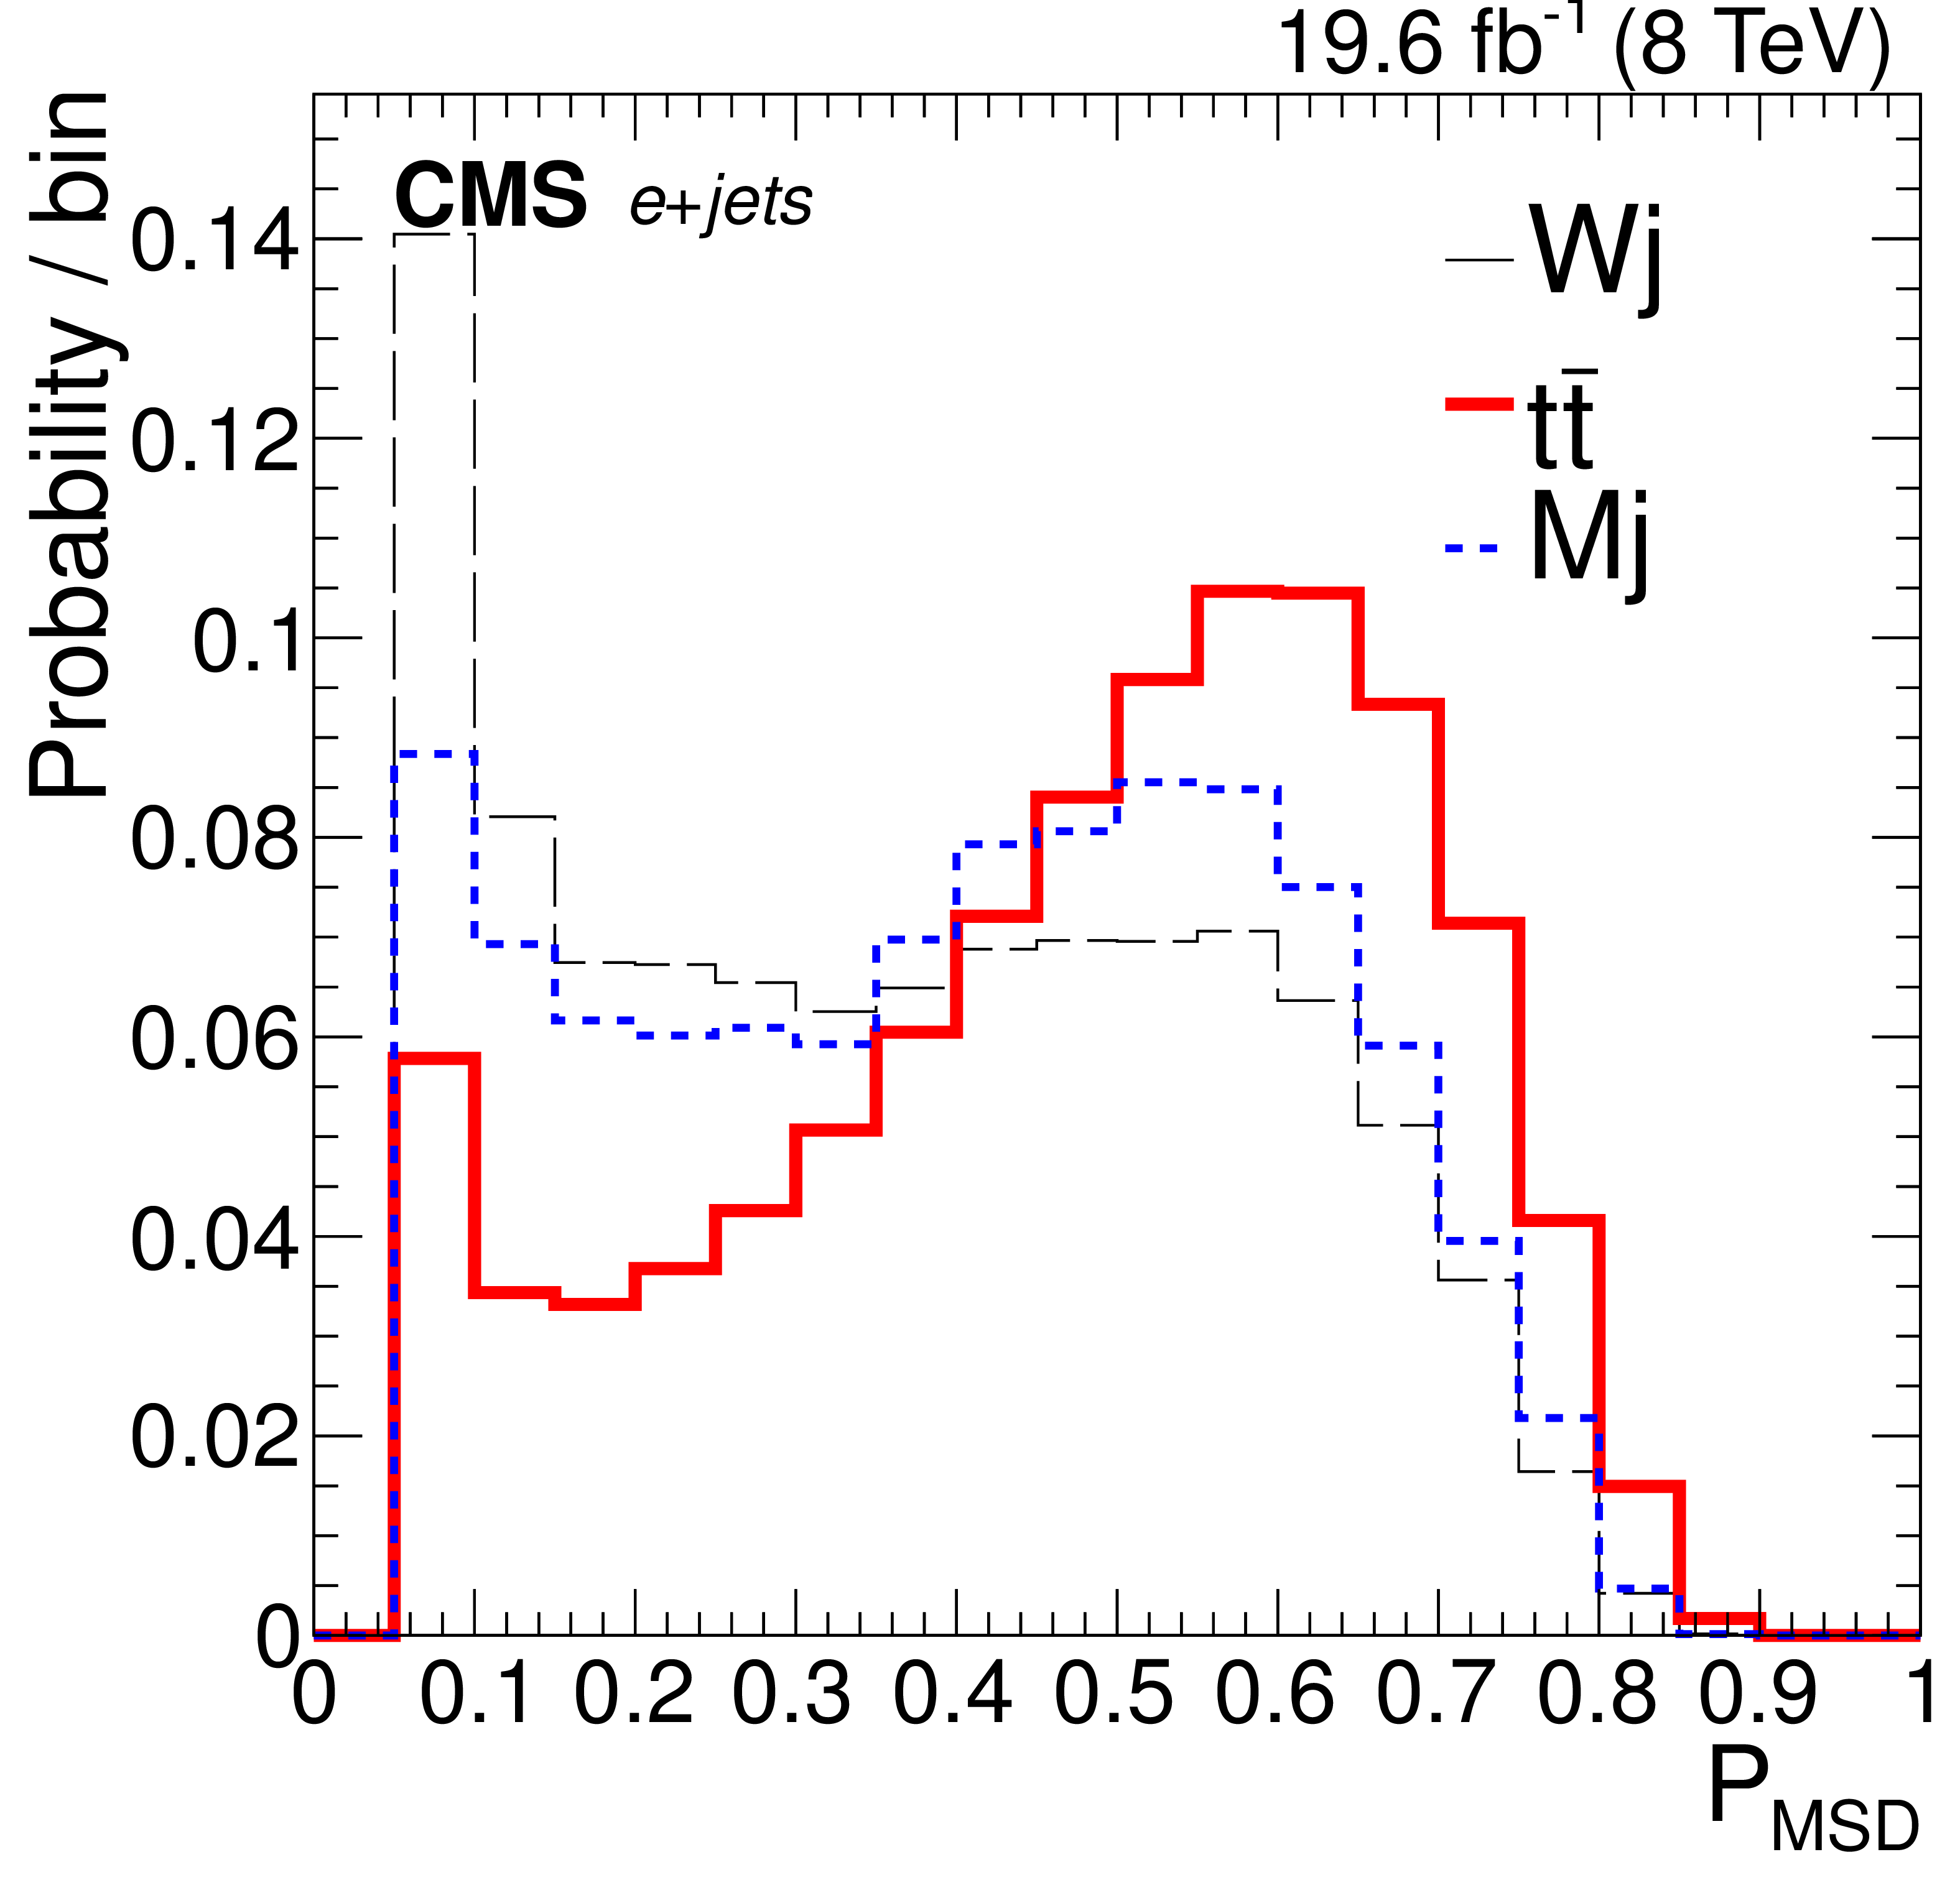
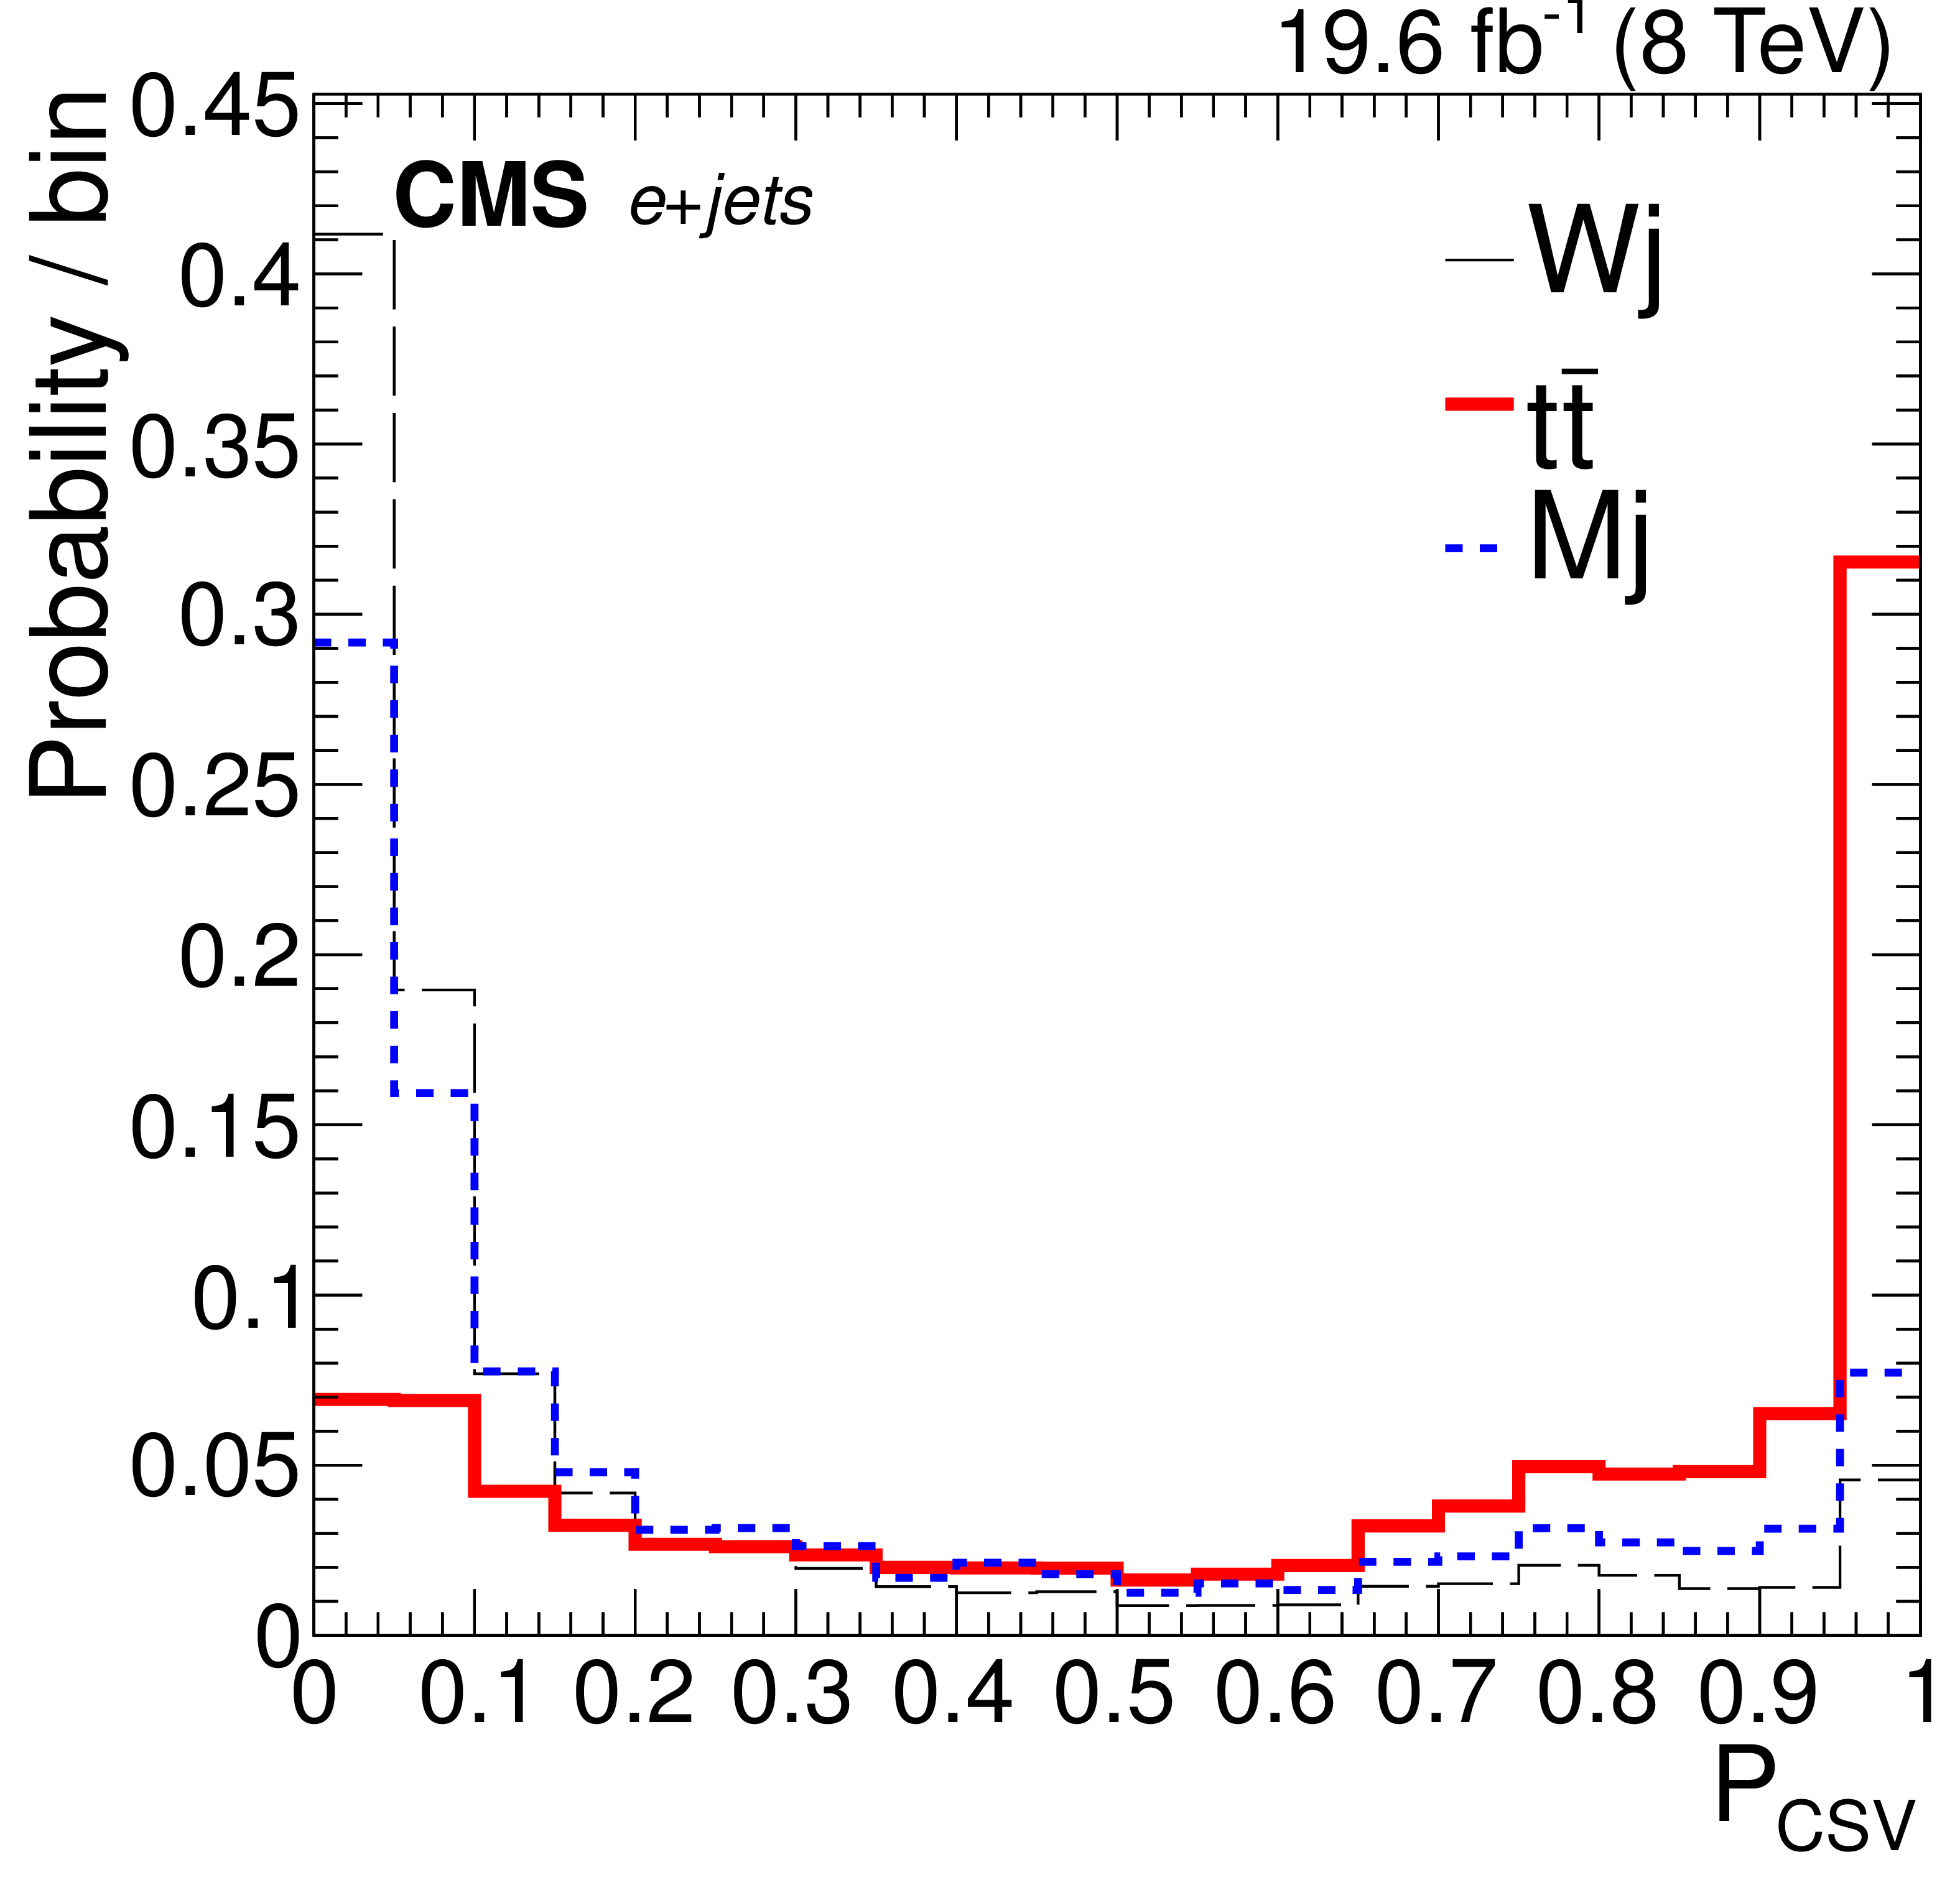
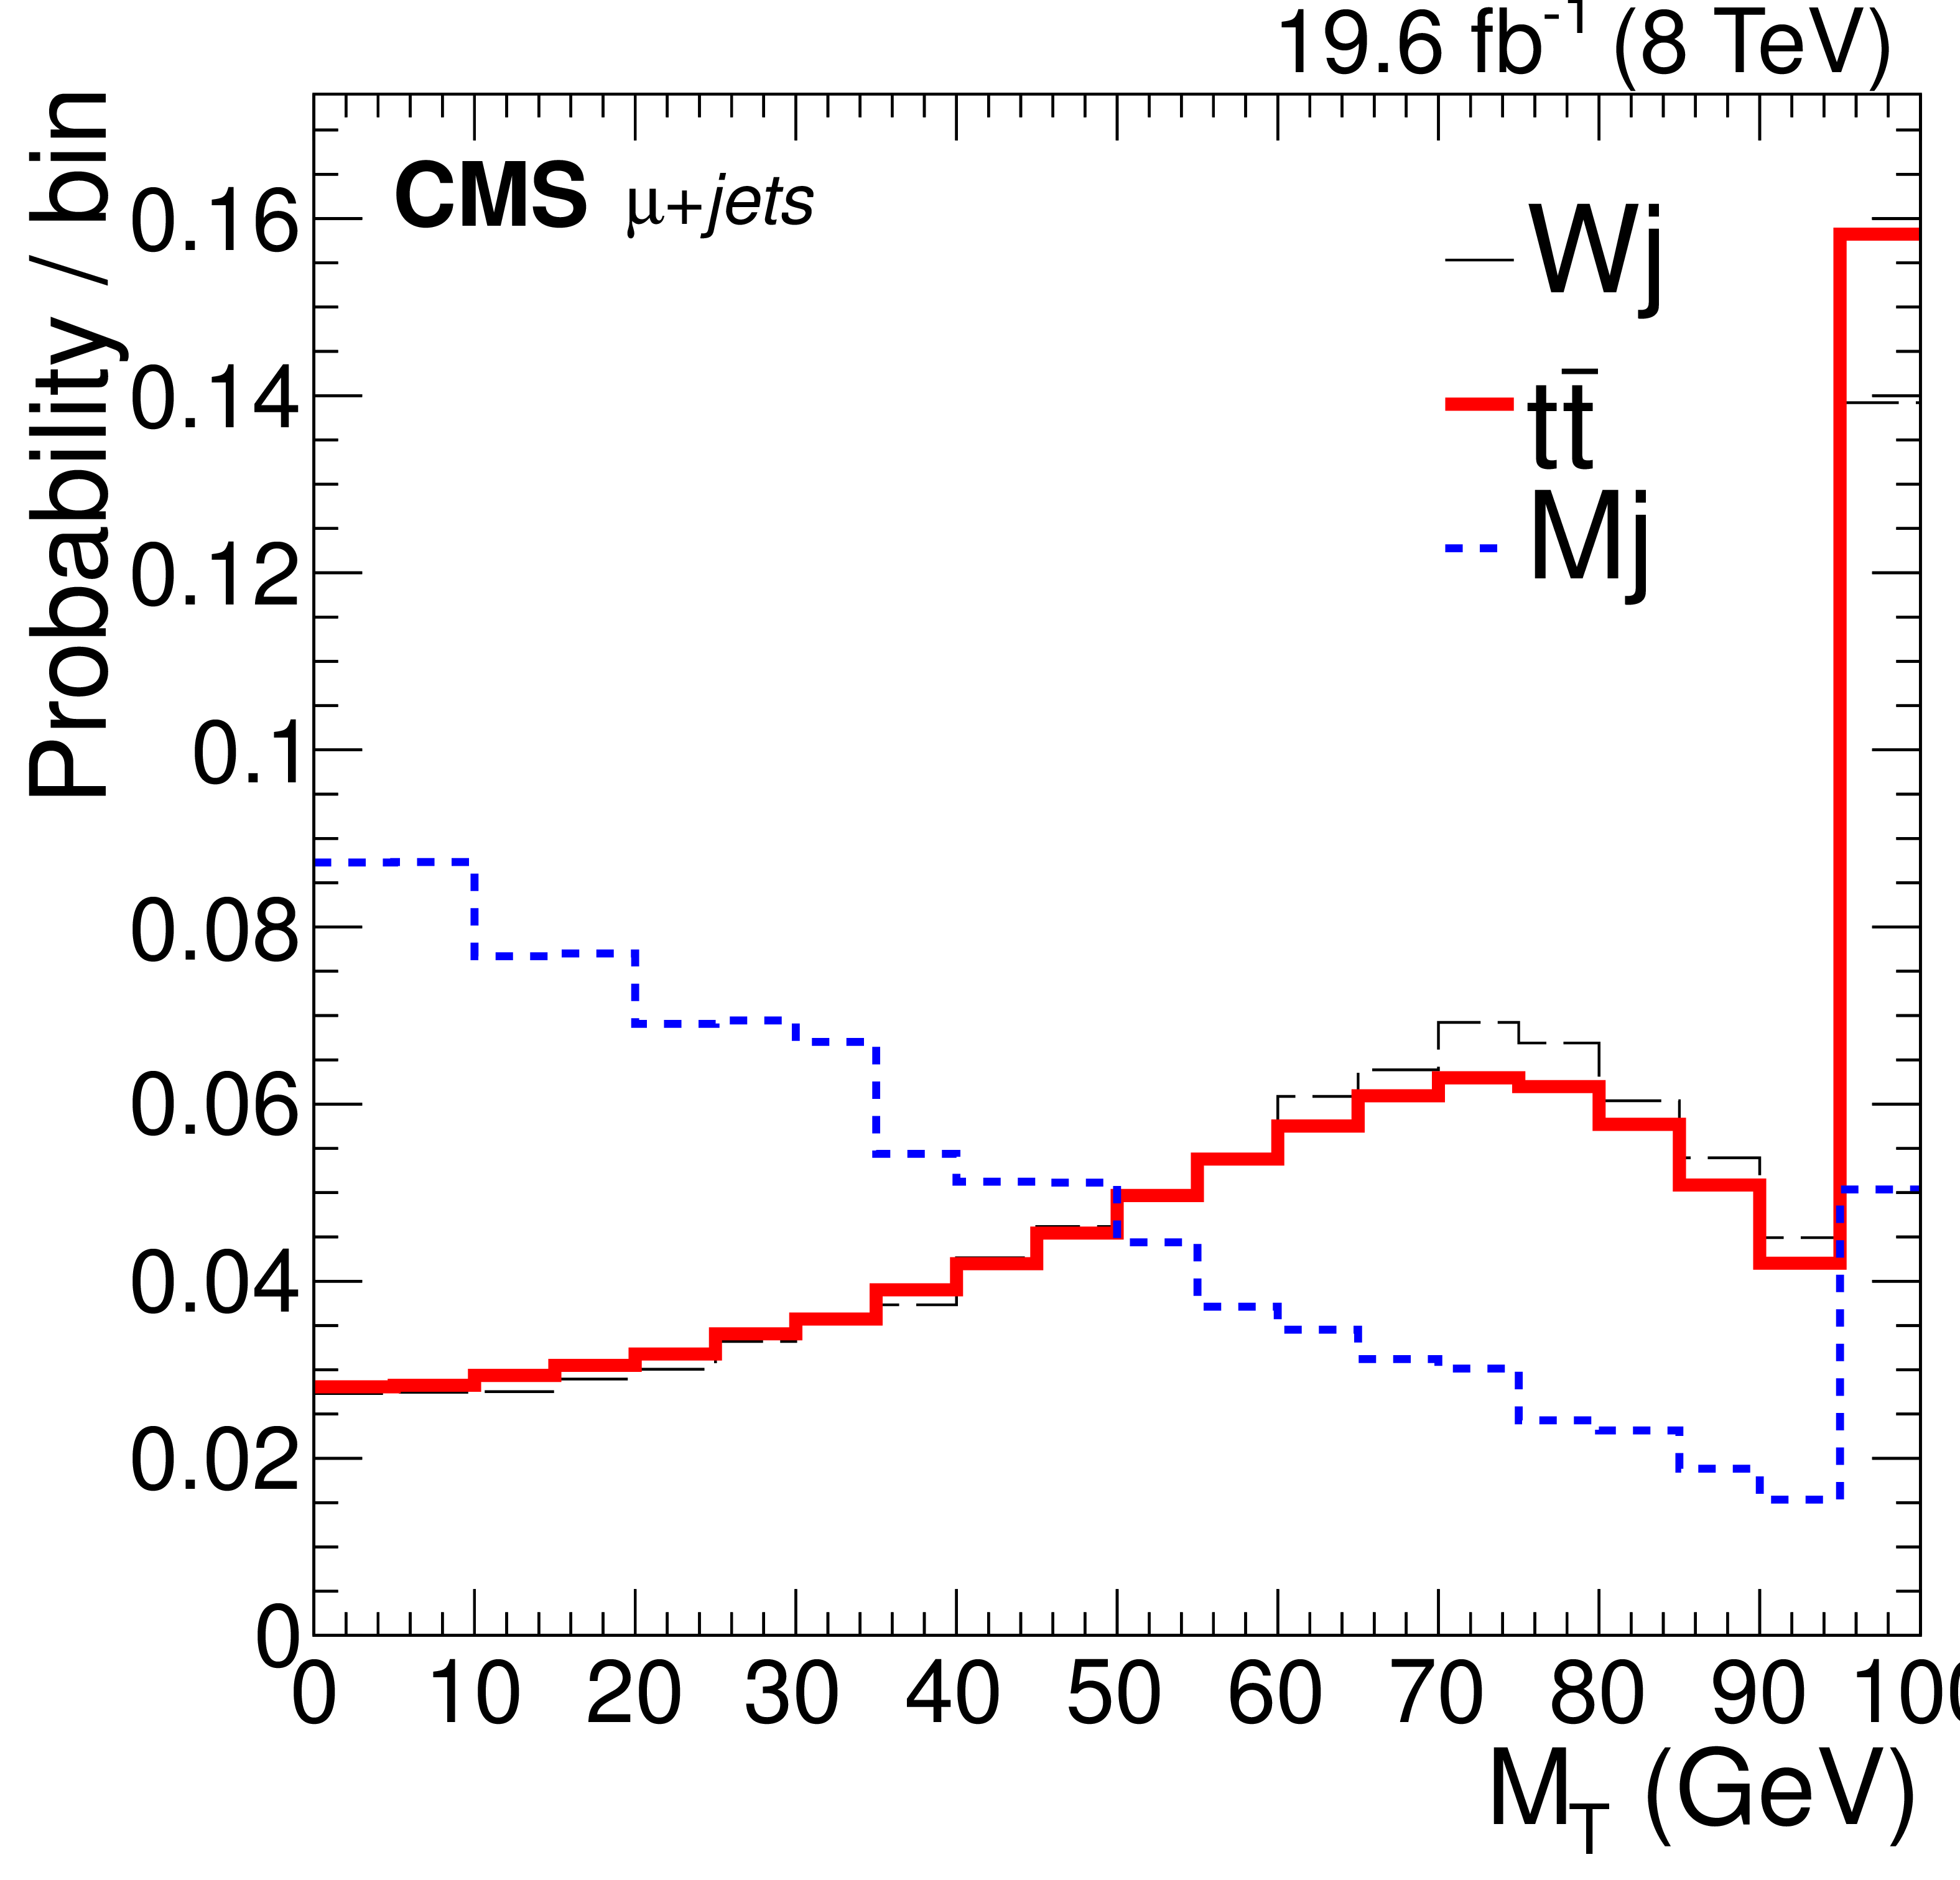
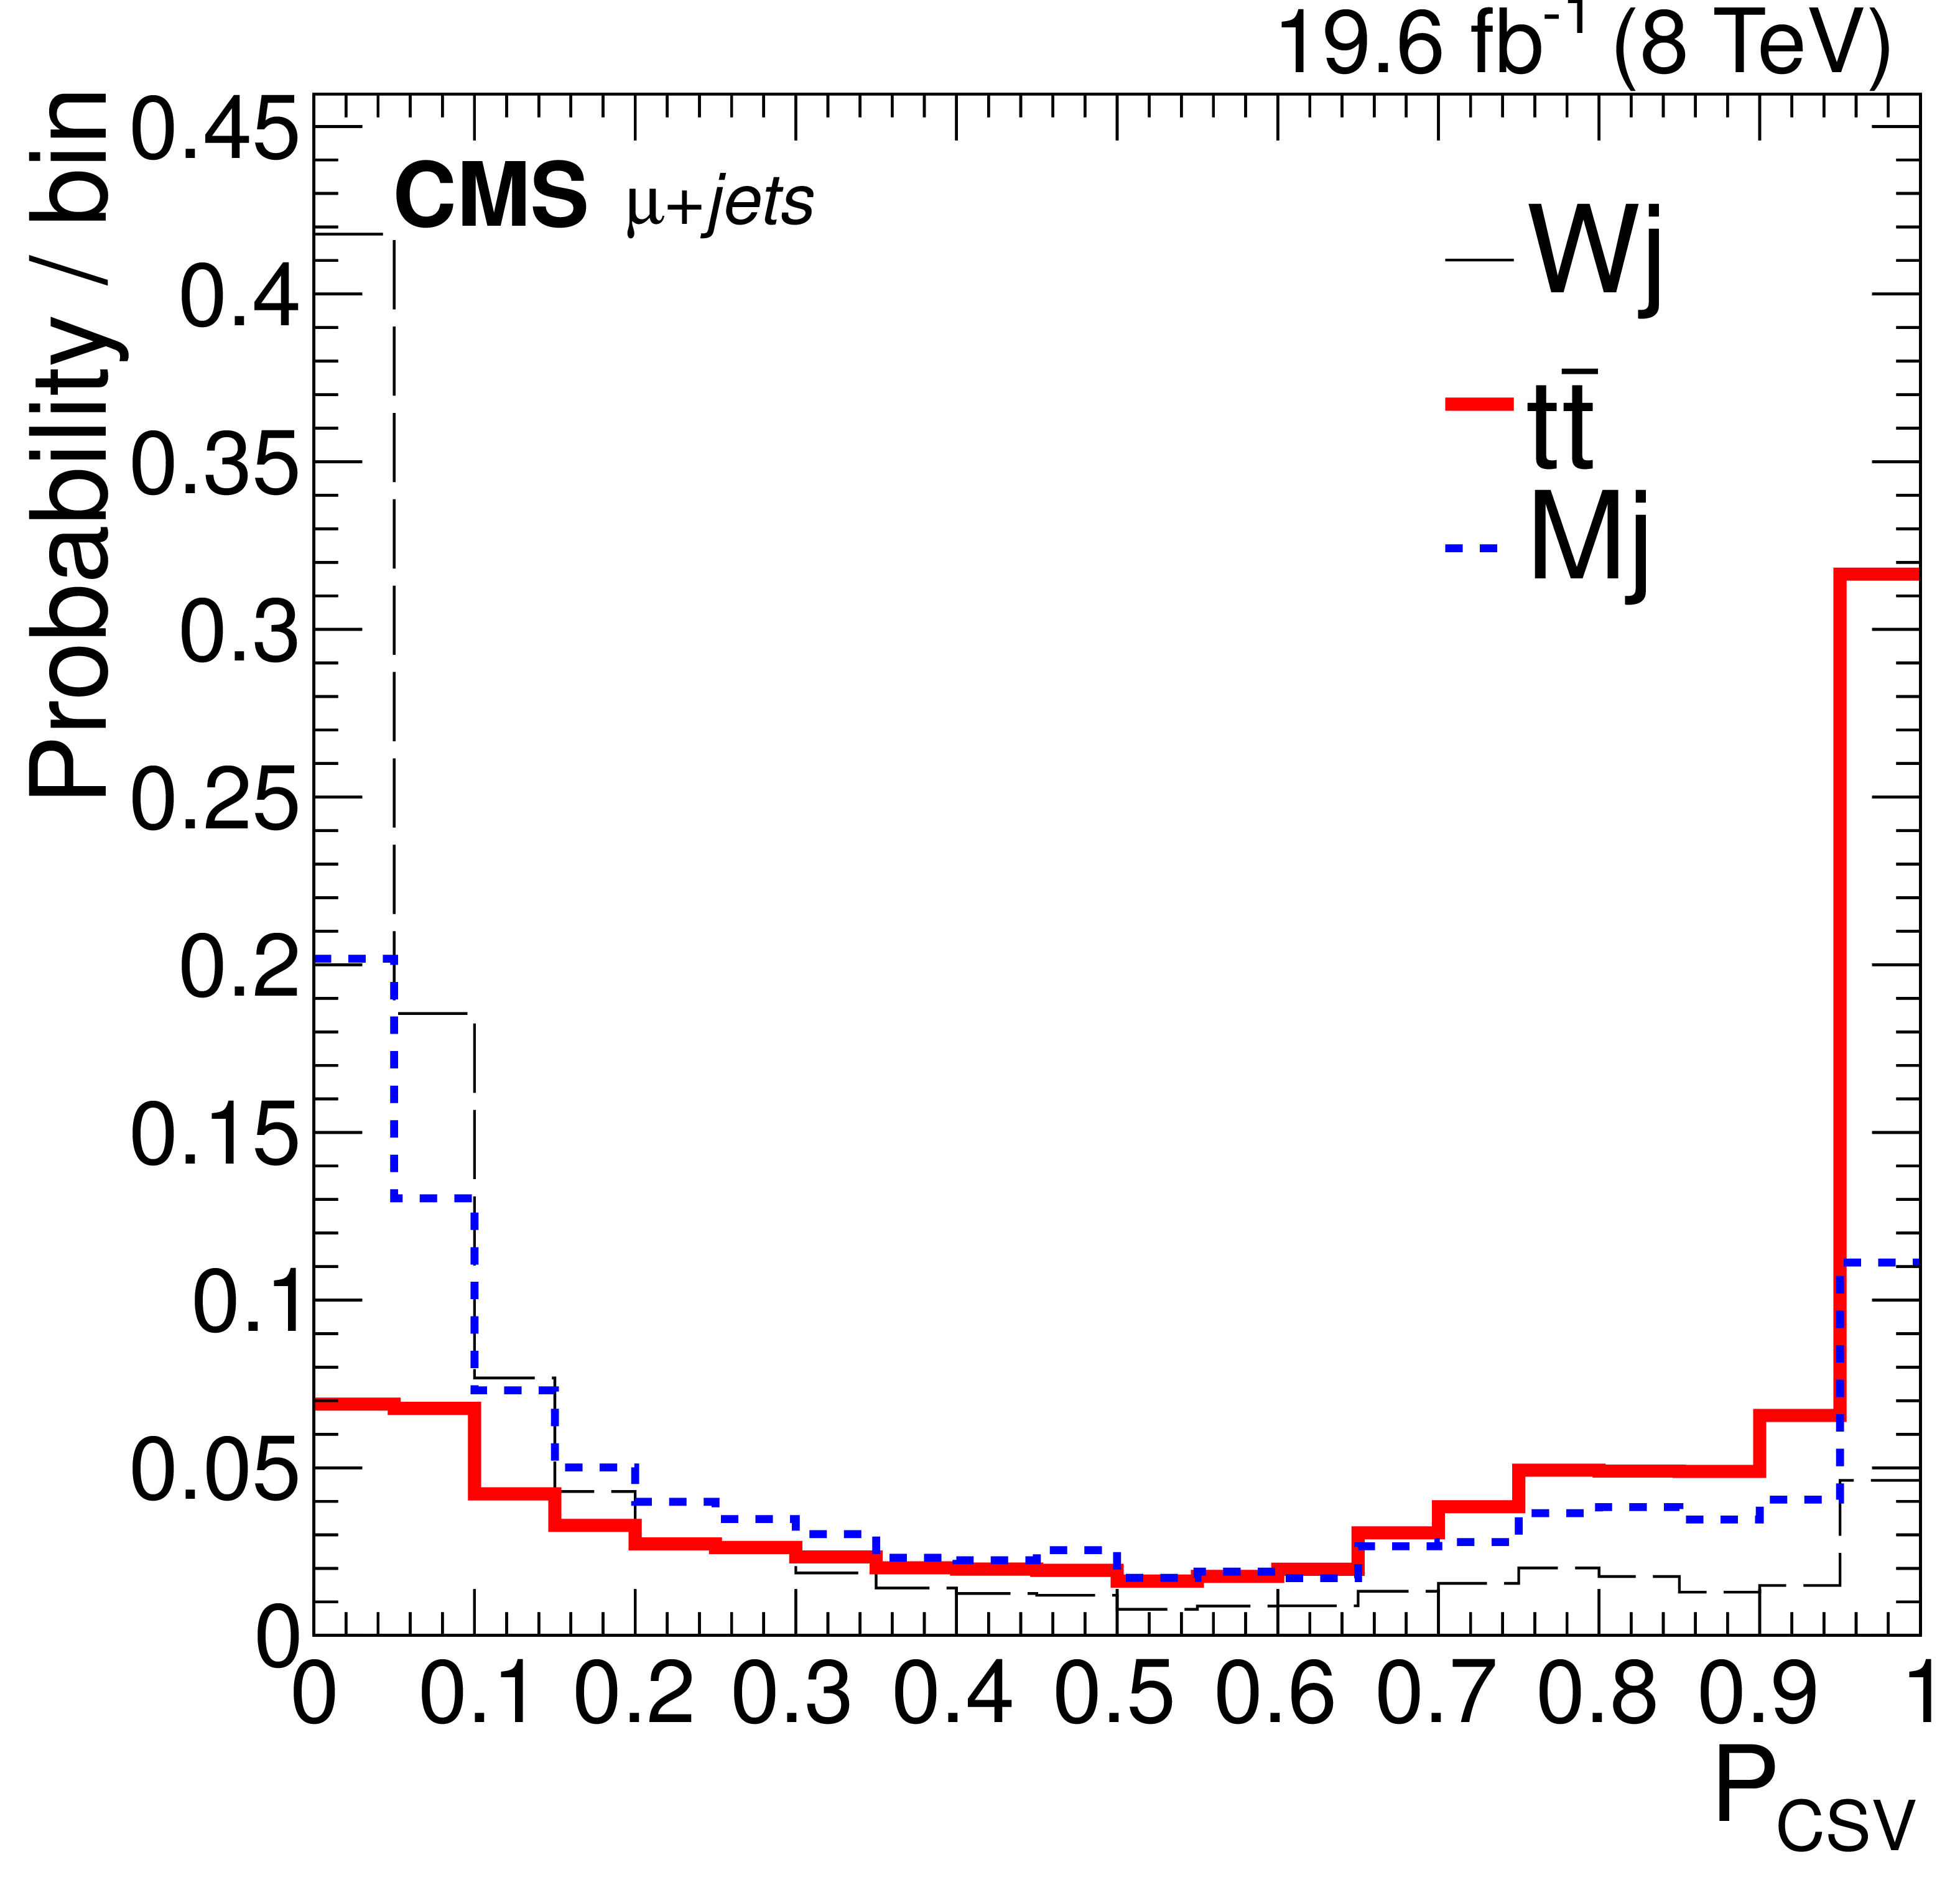
The probability distribution of the discriminant $ {\Delta} $ for (top left) selected e+jets events and (top right) selected $\mu$+jets events, for the simulated Wj and $ {\mathrm {t}\overline {\mathrm {t}}} $ populations, and for the Mj population, which is modeled from the sideband data with simulated contributions subtracted. The probability distributions in each observable used to construct the discriminant are shown for (middle) e+jets and (bottom) $\mu$+jets channels. The overflow is included in the rightmost bin of the $ {M_\mathrm {T}} $ distributions. |
png pdf |
Figure 6-a:
The probability distribution of the discriminant $ {\Delta} $ for selected e+jets events, for the simulated Wj and $ {\mathrm {t}\overline {\mathrm {t}}} $ populations, and for the Mj population, which is modeled from the sideband data with simulated contributions subtracted. |
png pdf |
Figure 6-b:
The probability distribution of the discriminant $ {\Delta} $ for selected $\mu$+jets events, for the simulated Wj and $ {\mathrm {t}\overline {\mathrm {t}}} $ populations, and for the Mj population, which is modeled from the sideband data with simulated contributions subtracted. |
png pdf |
Figure 6-c:
The probability distribution in an observable used to construct the discriminant are shown for e+jets channel. The overflow is included in the rightmost bin. |
png pdf |
Figure 6-d:
The probability distribution in an observable used to construct the discriminant are shown for e+jets channel. |
png pdf |
Figure 6-e:
The probability distribution in an observable used to construct the discriminant are shown for e+jets channel. |
png pdf |
Figure 6-f:
The probability distribution in an observable used to construct the discriminant are shown for $\mu$+jets channel. The overflow is included in the rightmost bin. |

png pdf |
Figure 6-g:
The probability distribution in an observable used to construct the discriminant are shown for $\mu$+jets channel. |
png pdf |
Figure 6-h:
The probability distribution in an observable used to construct the discriminant are shown for $\mu$+jets channel. |
png pdf |
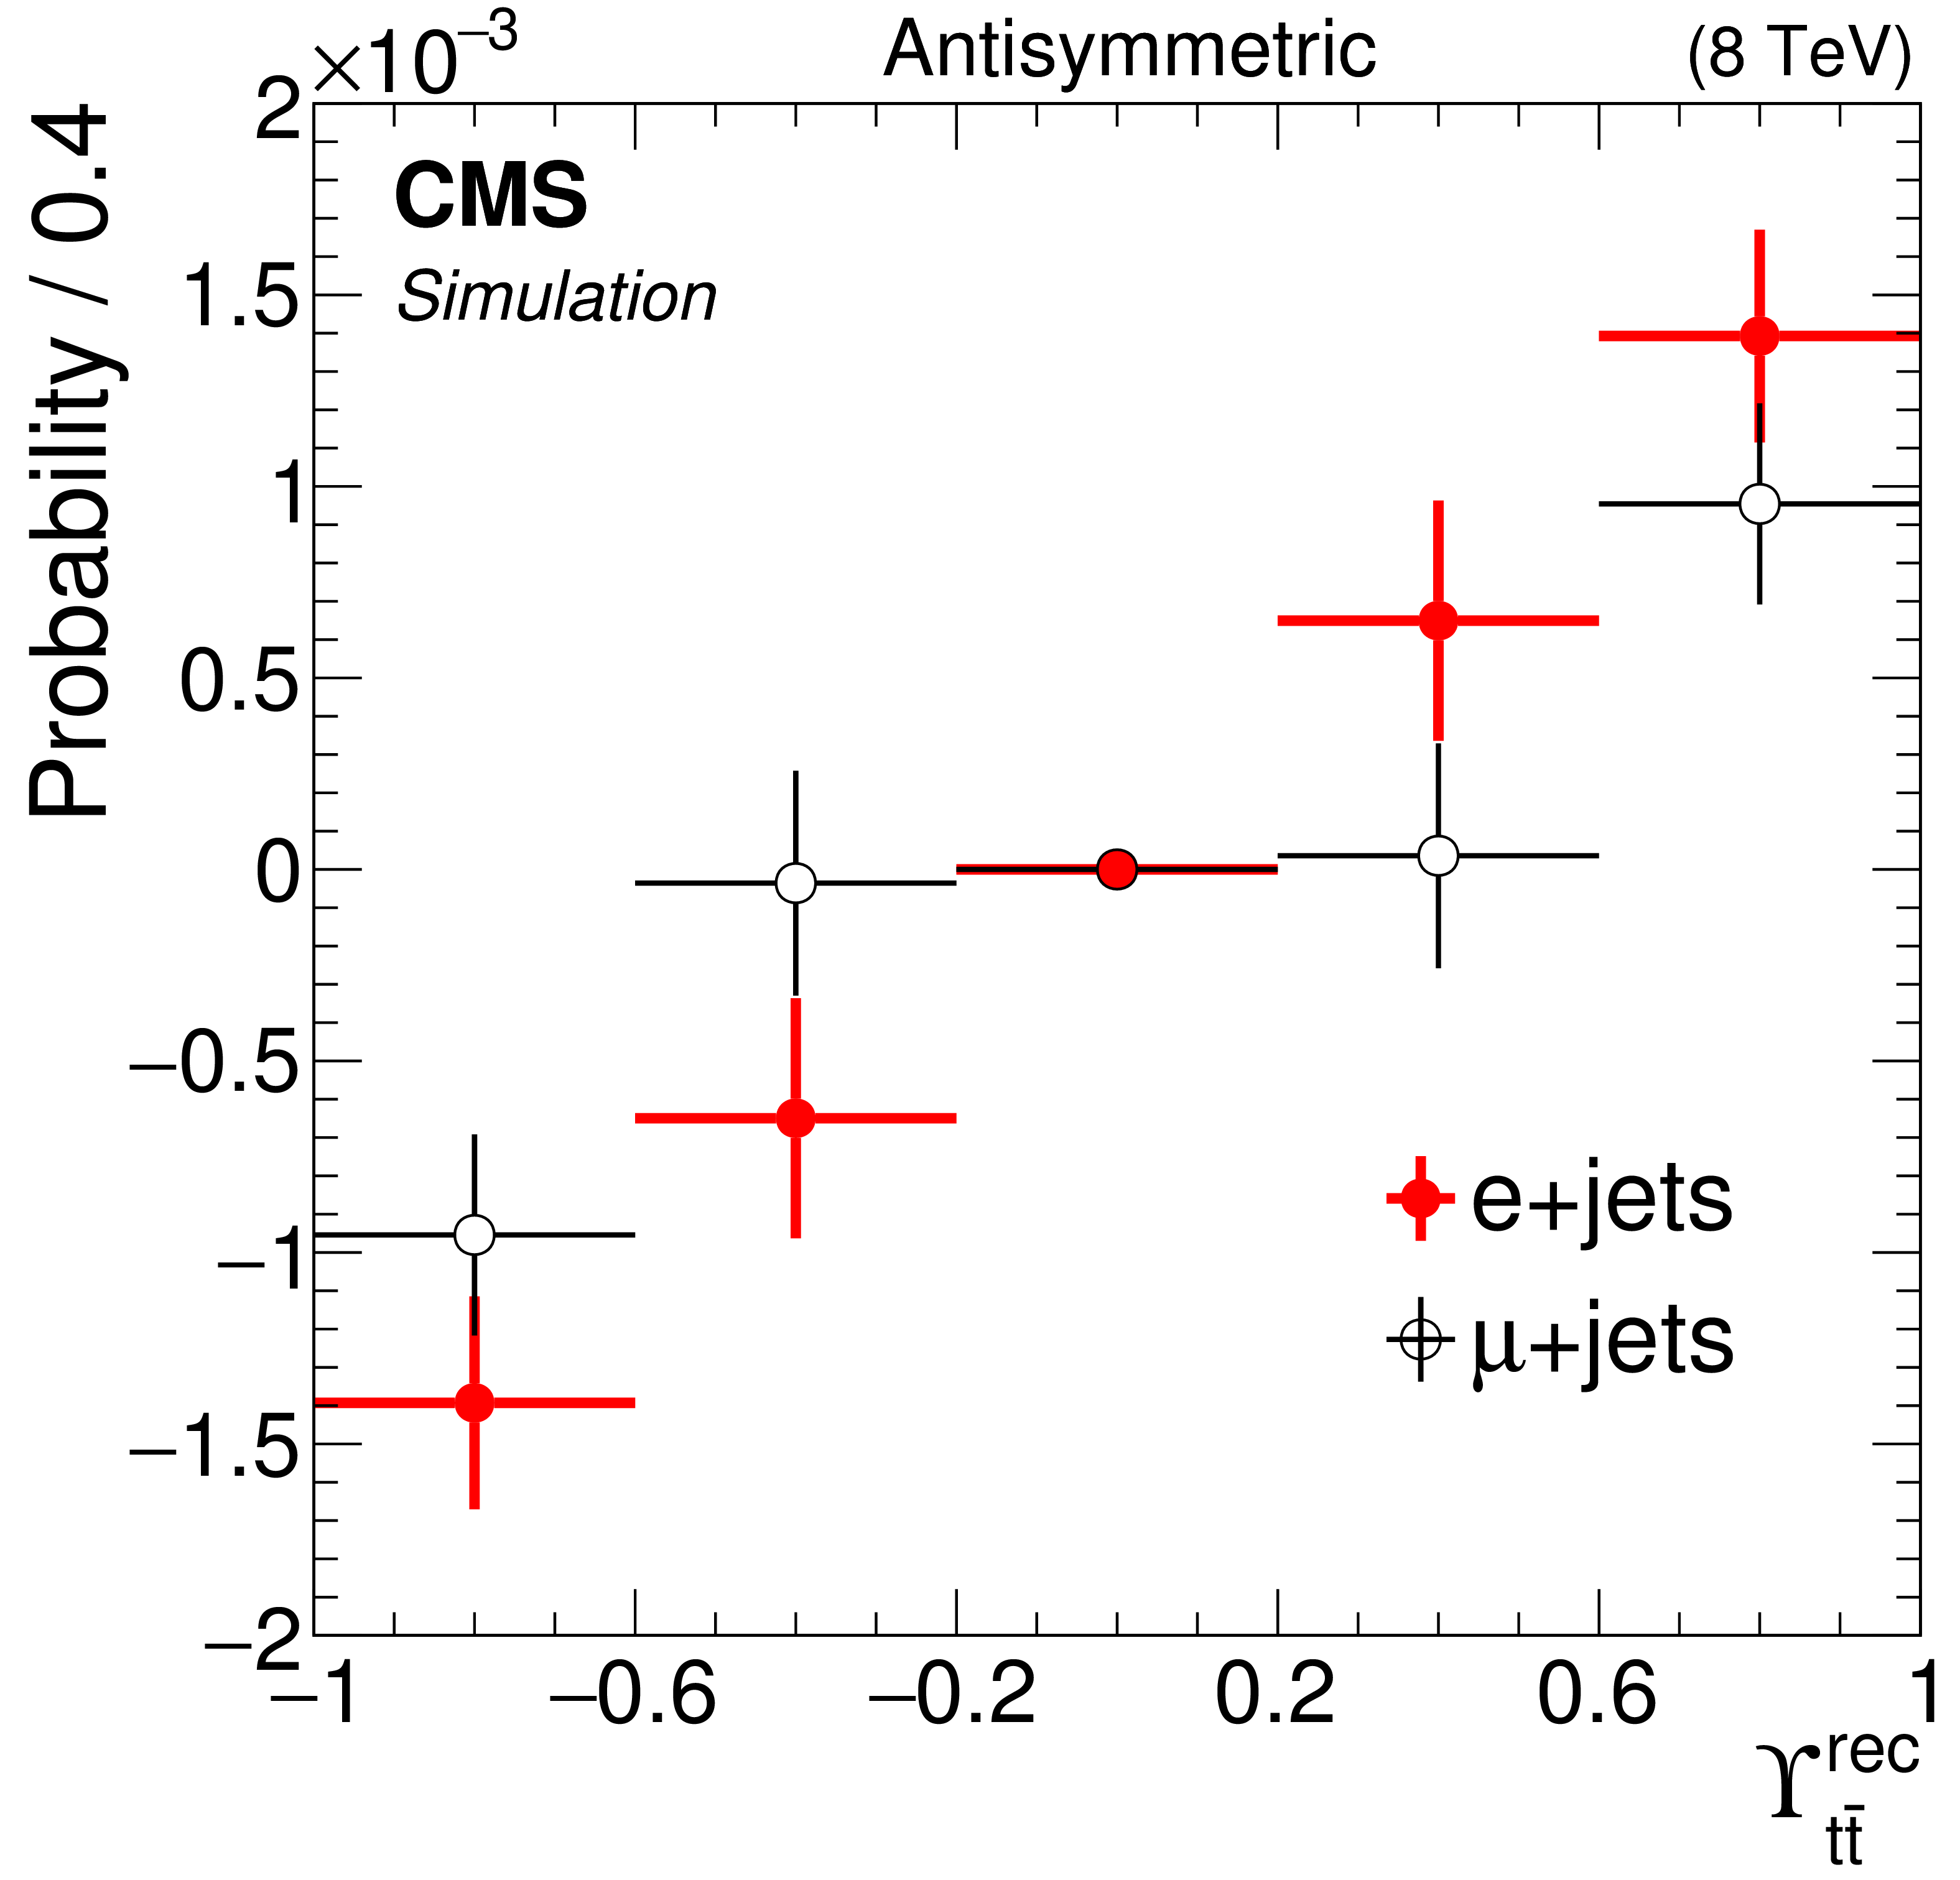
Figure 7:
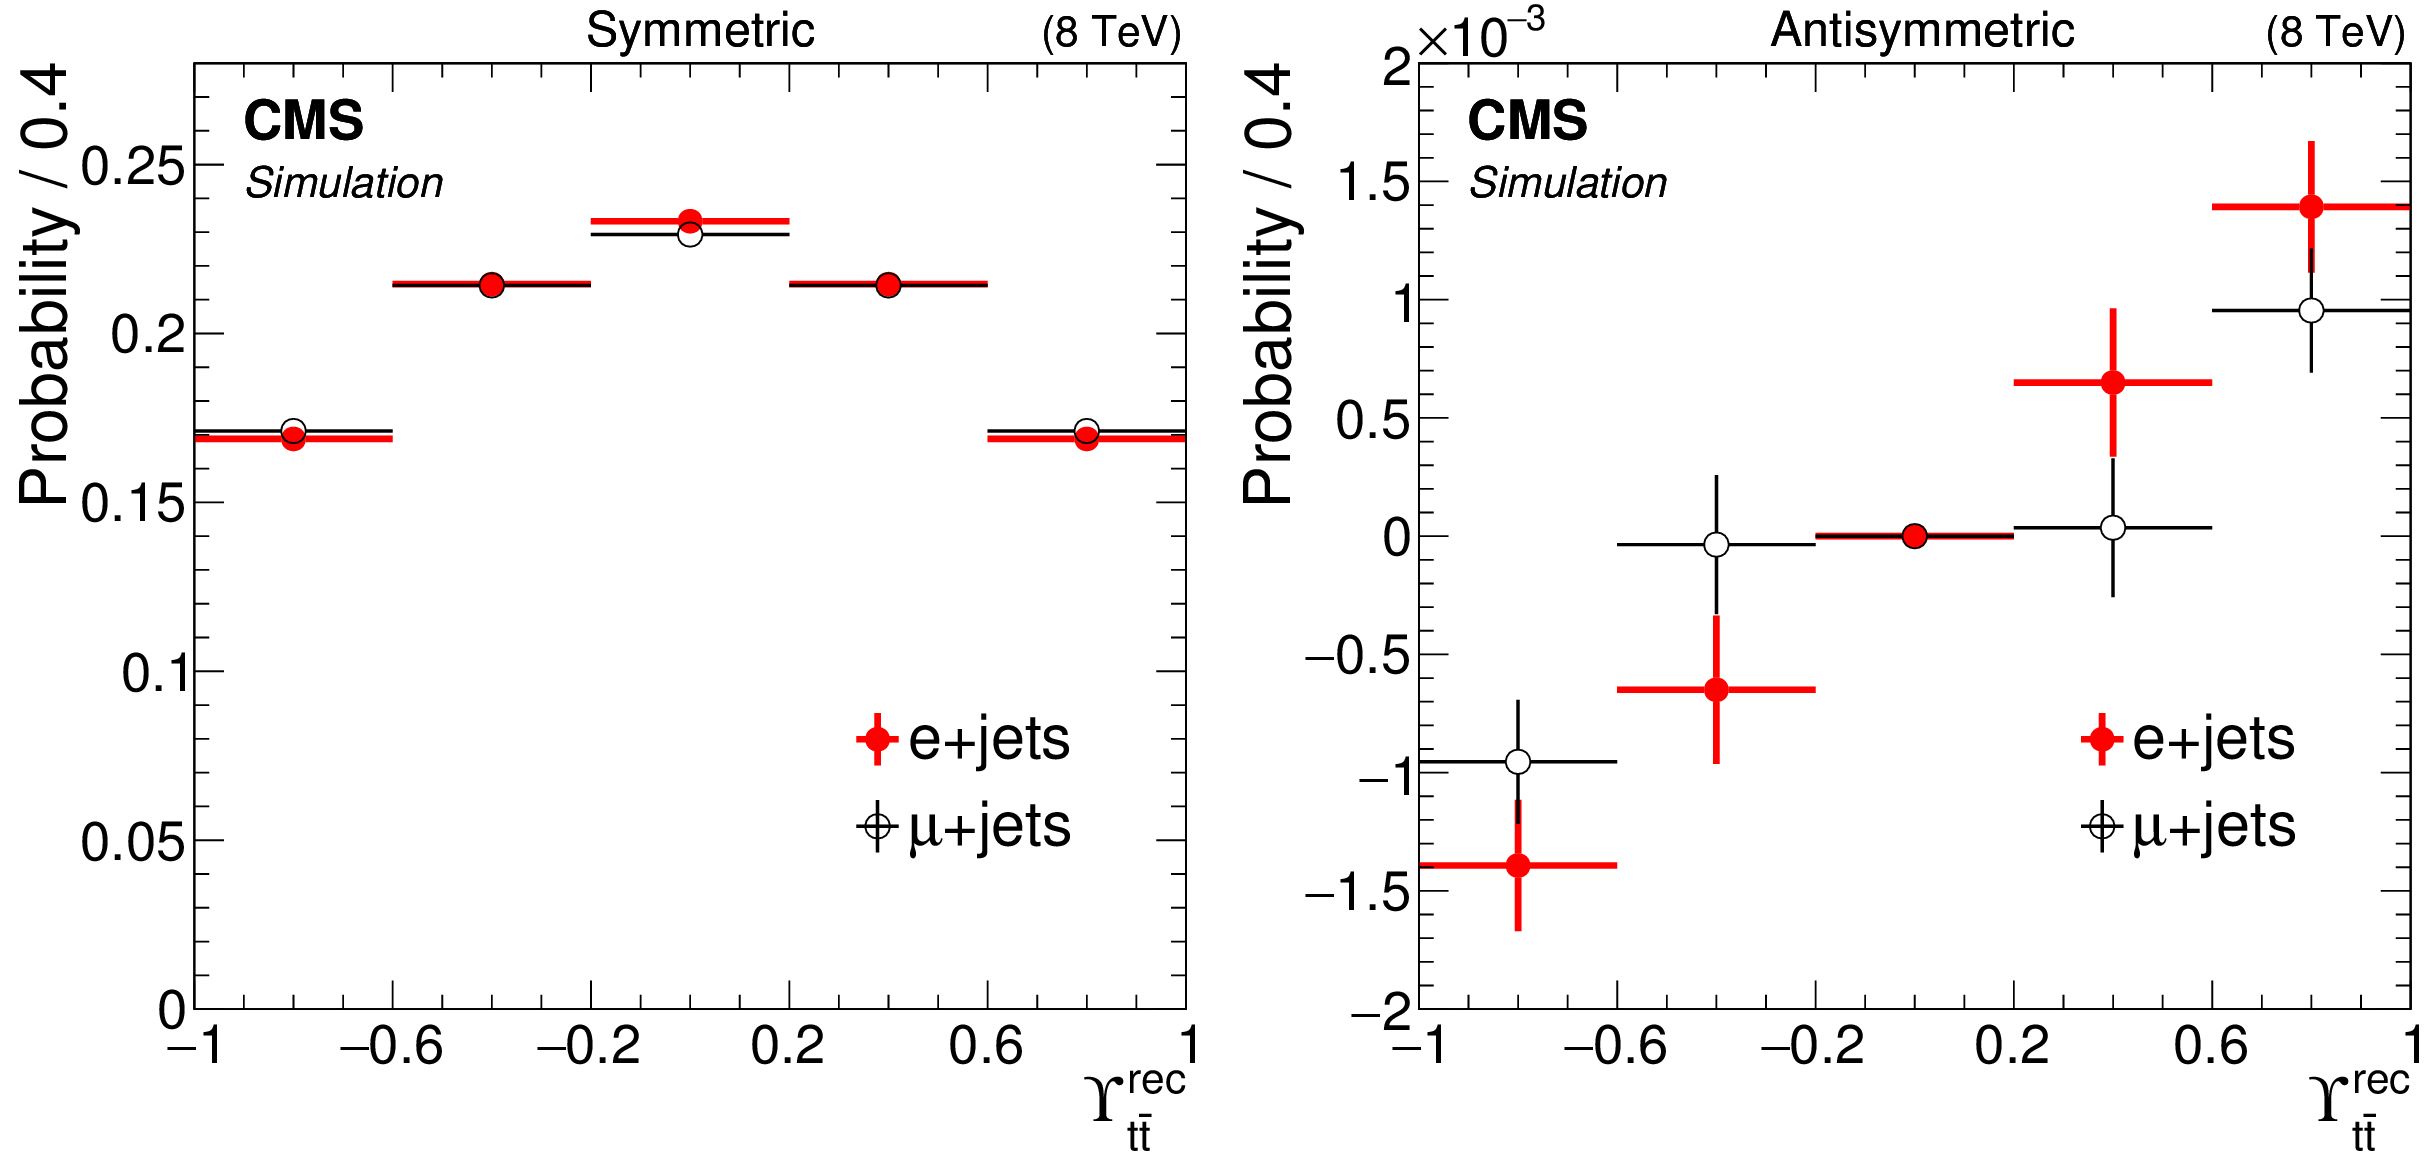
The (left) symmetric and (right) antisymmetric components of the $ {{\varUpsilon _{{\mathrm {t}\overline {\mathrm {t}}}}} ^{\text {rec}}} $ probability distribution for selected $ {\mathrm {t}\overline {\mathrm {t}}} $ simulation events in the e+jets and $\mu$+jets channels. The vertical bars show the statistical uncertainties, while the horizontal bars display the bin widths. |

png pdf |
Figure 7-a:
The symmetric component of the $ {{\varUpsilon _{{\mathrm {t}\overline {\mathrm {t}}}}} ^{\text {rec}}} $ probability distribution for selected $ {\mathrm {t}\overline {\mathrm {t}}} $ simulation events in the e+jets and $\mu$+jets channels. The vertical bars show the statistical uncertainties, while the horizontal bars display the bin widths. |
png pdf |
Figure 7-b:
The antisymmetric component of the $ {{\varUpsilon _{{\mathrm {t}\overline {\mathrm {t}}}}} ^{\text {rec}}} $ probability distribution for selected $ {\mathrm {t}\overline {\mathrm {t}}} $ simulation events in the e+jets and $\mu$+jets channels. The vertical bars show the statistical uncertainties, while the horizontal bars display the bin widths. |
png pdf |
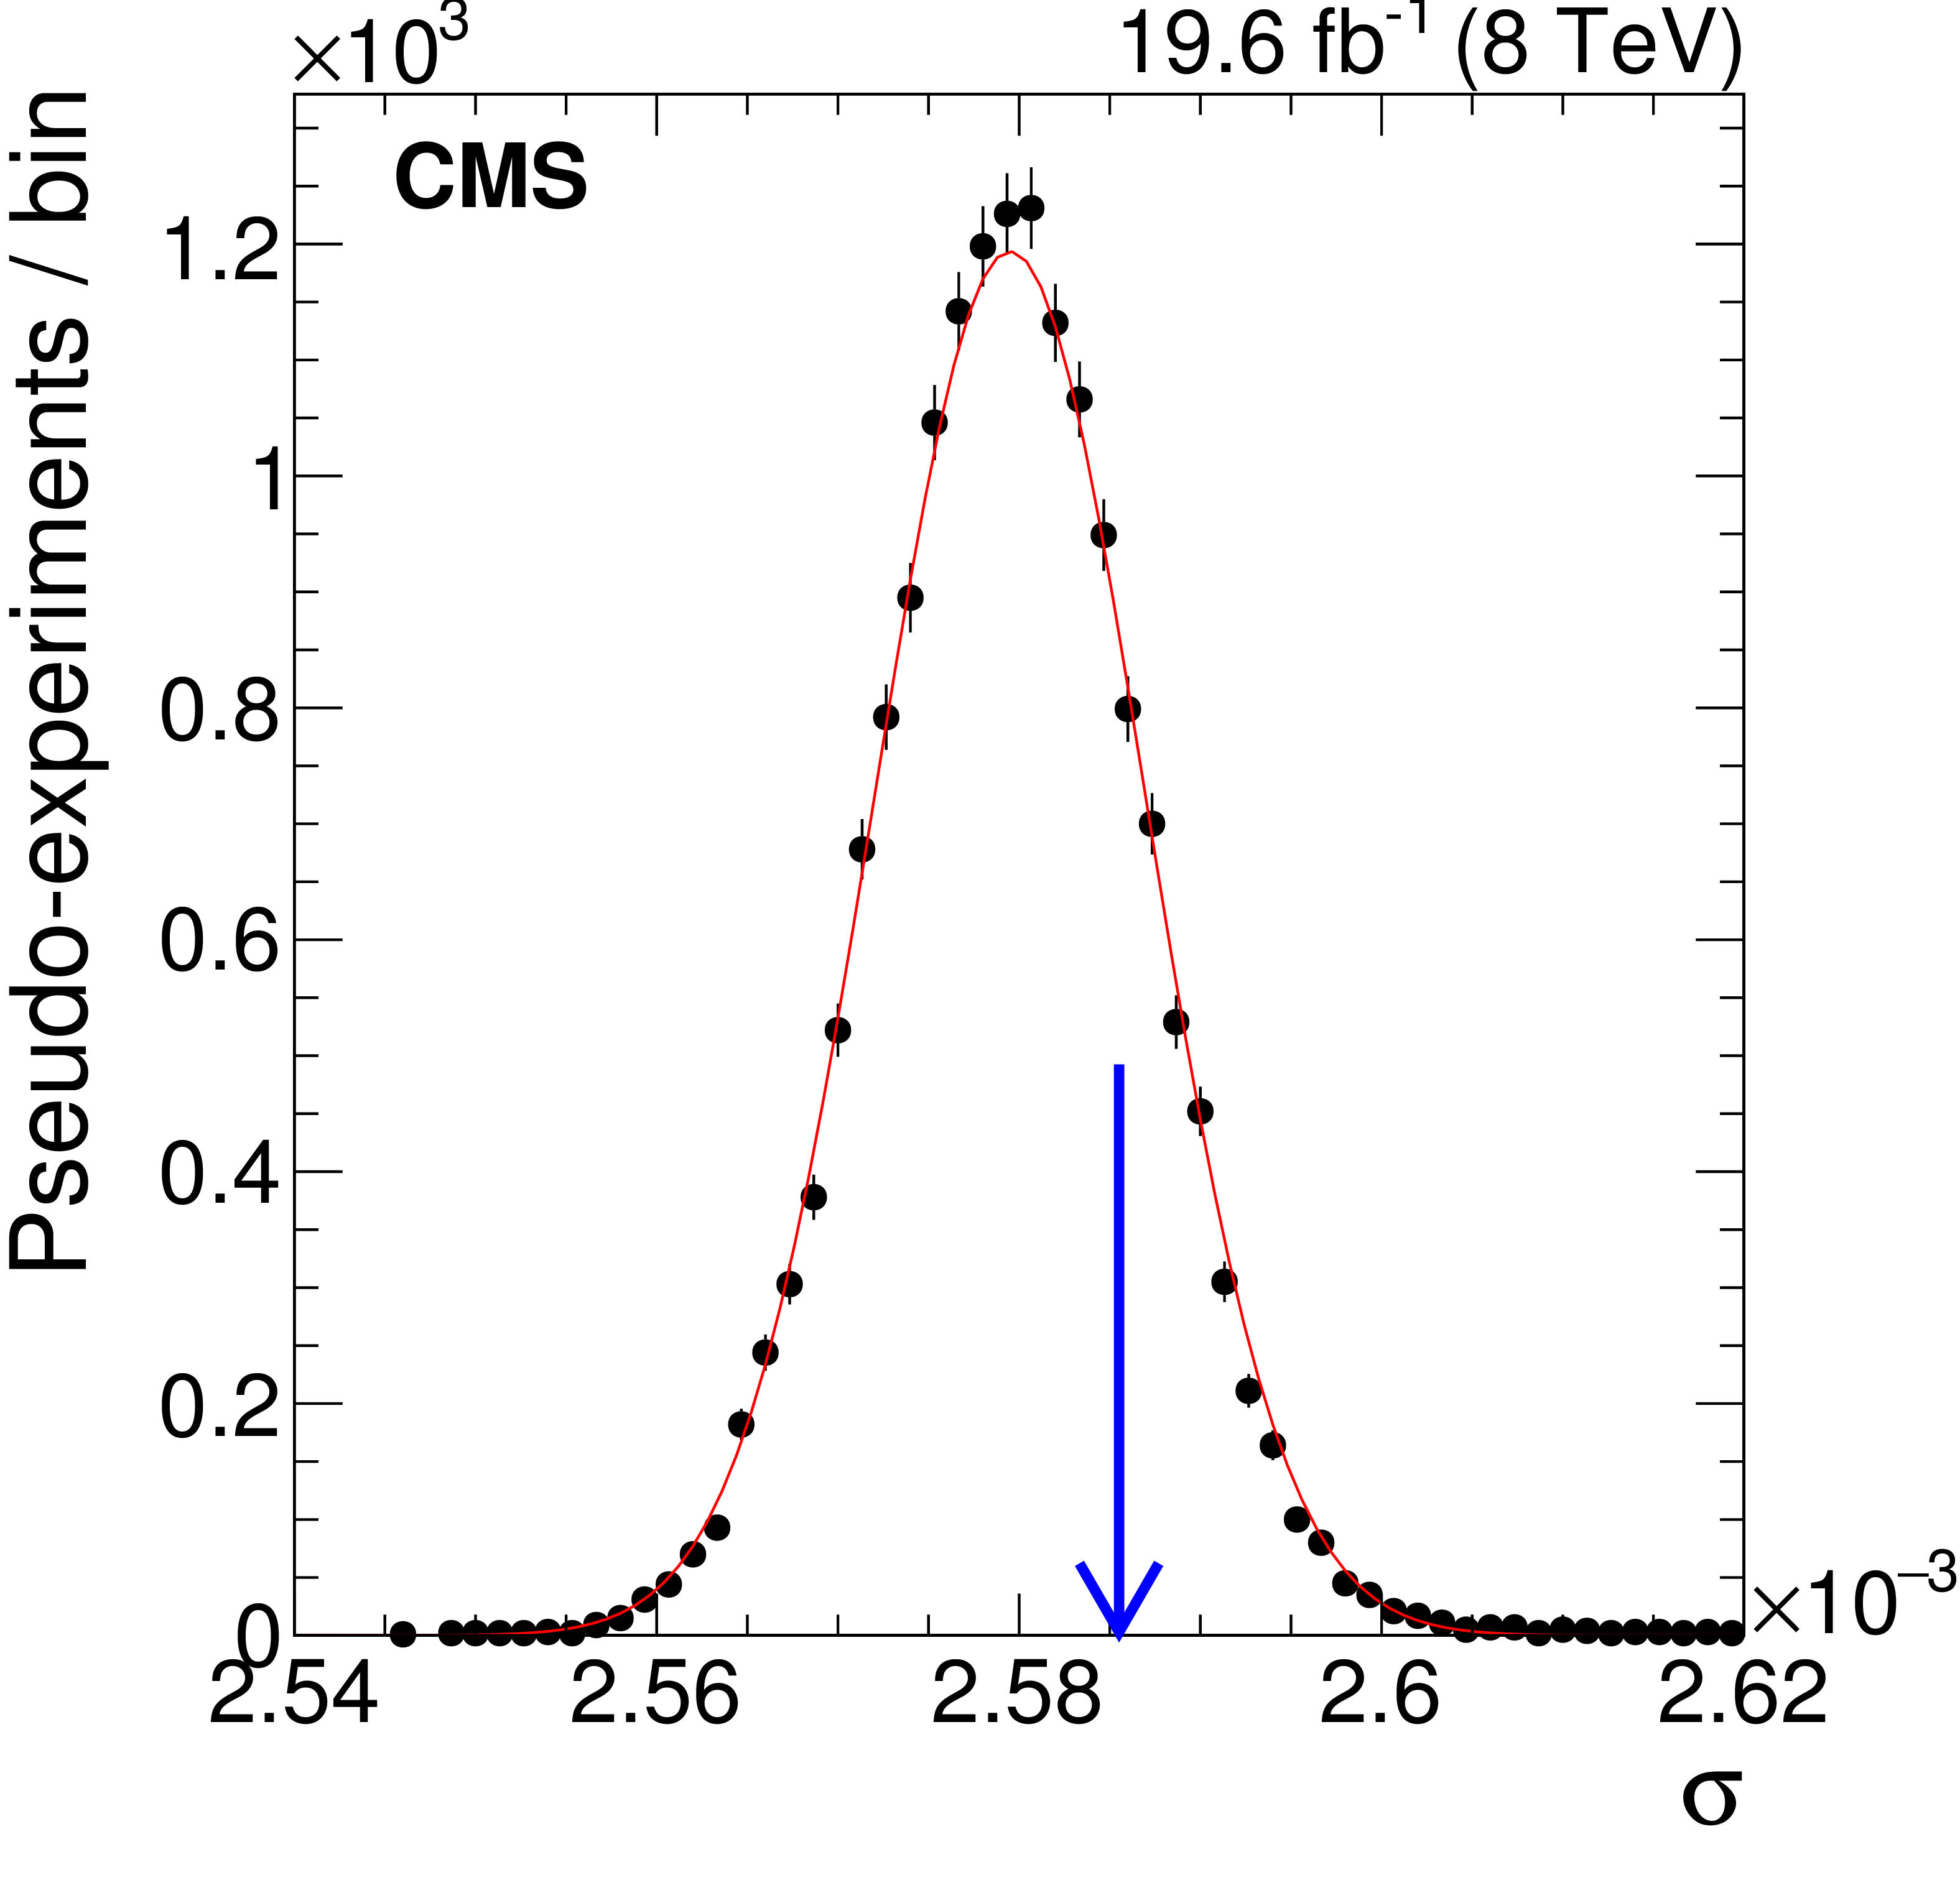
Figure 8:
The distribution of the statistical uncertainty in $A_c^y$ from measurements using pseudo-experiments, with an expected value of 0.258%. The statistical uncertainty extracted from the data is marked by the arrow. |
png pdf |
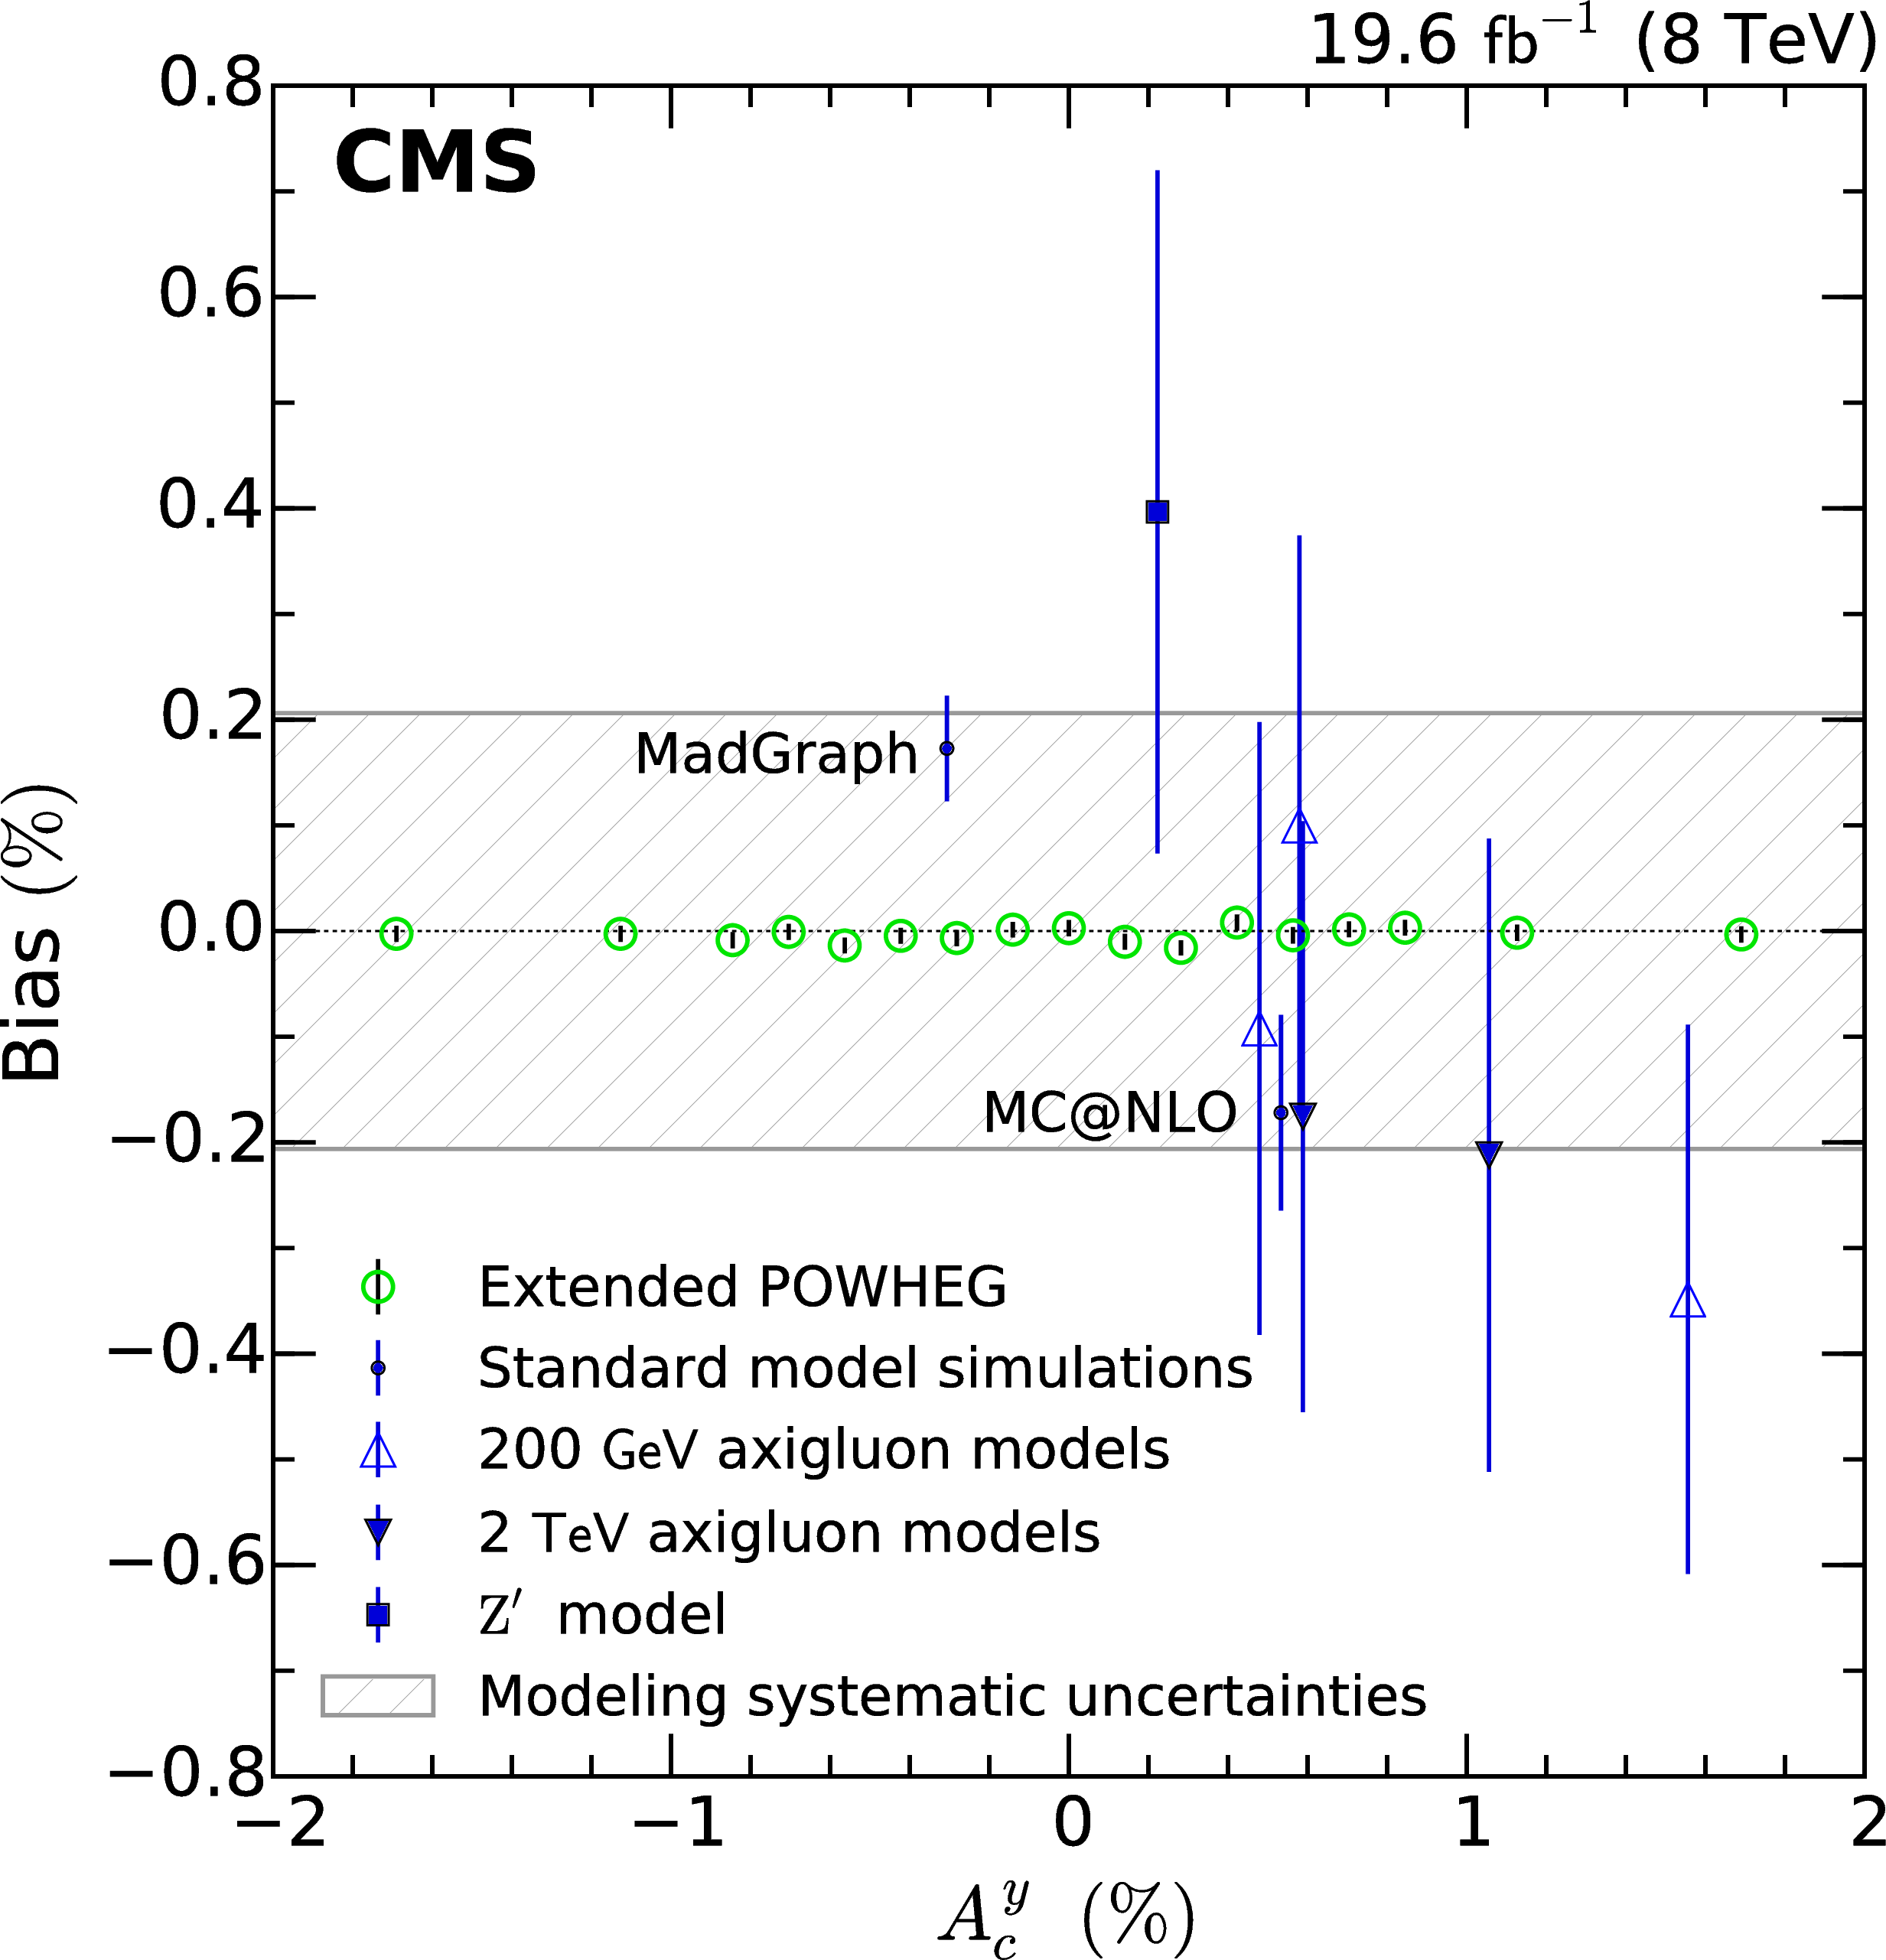
Figure 9:
The bias in the measured charge asymmetry for SM simulations and alternative $ {\mathrm {t}\overline {\mathrm {t}}} $ models, based on extended POWHEG SM templates, versus the charge asymmetry in each sample. The beyond-SM samples are MadGraph simulations of Z' bosons and axigluons with masses of 200 GeV and 2 TeV. Uncertainty in the bias of the extended POWHEG model is dominated by the number of pseudo-experiments used, while the uncertainty in the bias of each alternative model is dominated by the statistical uncertainty in the sample. The hatched area shows the systematic uncertainty in the measurement of $A_c^y$ from sources related to the modeling, including simulation statistical uncertainty, renormalization and factorization scales, choice of $ {\mathrm {t}\overline {\mathrm {t}}} $ generator, top quark mass, and PDFs. |
png pdf |
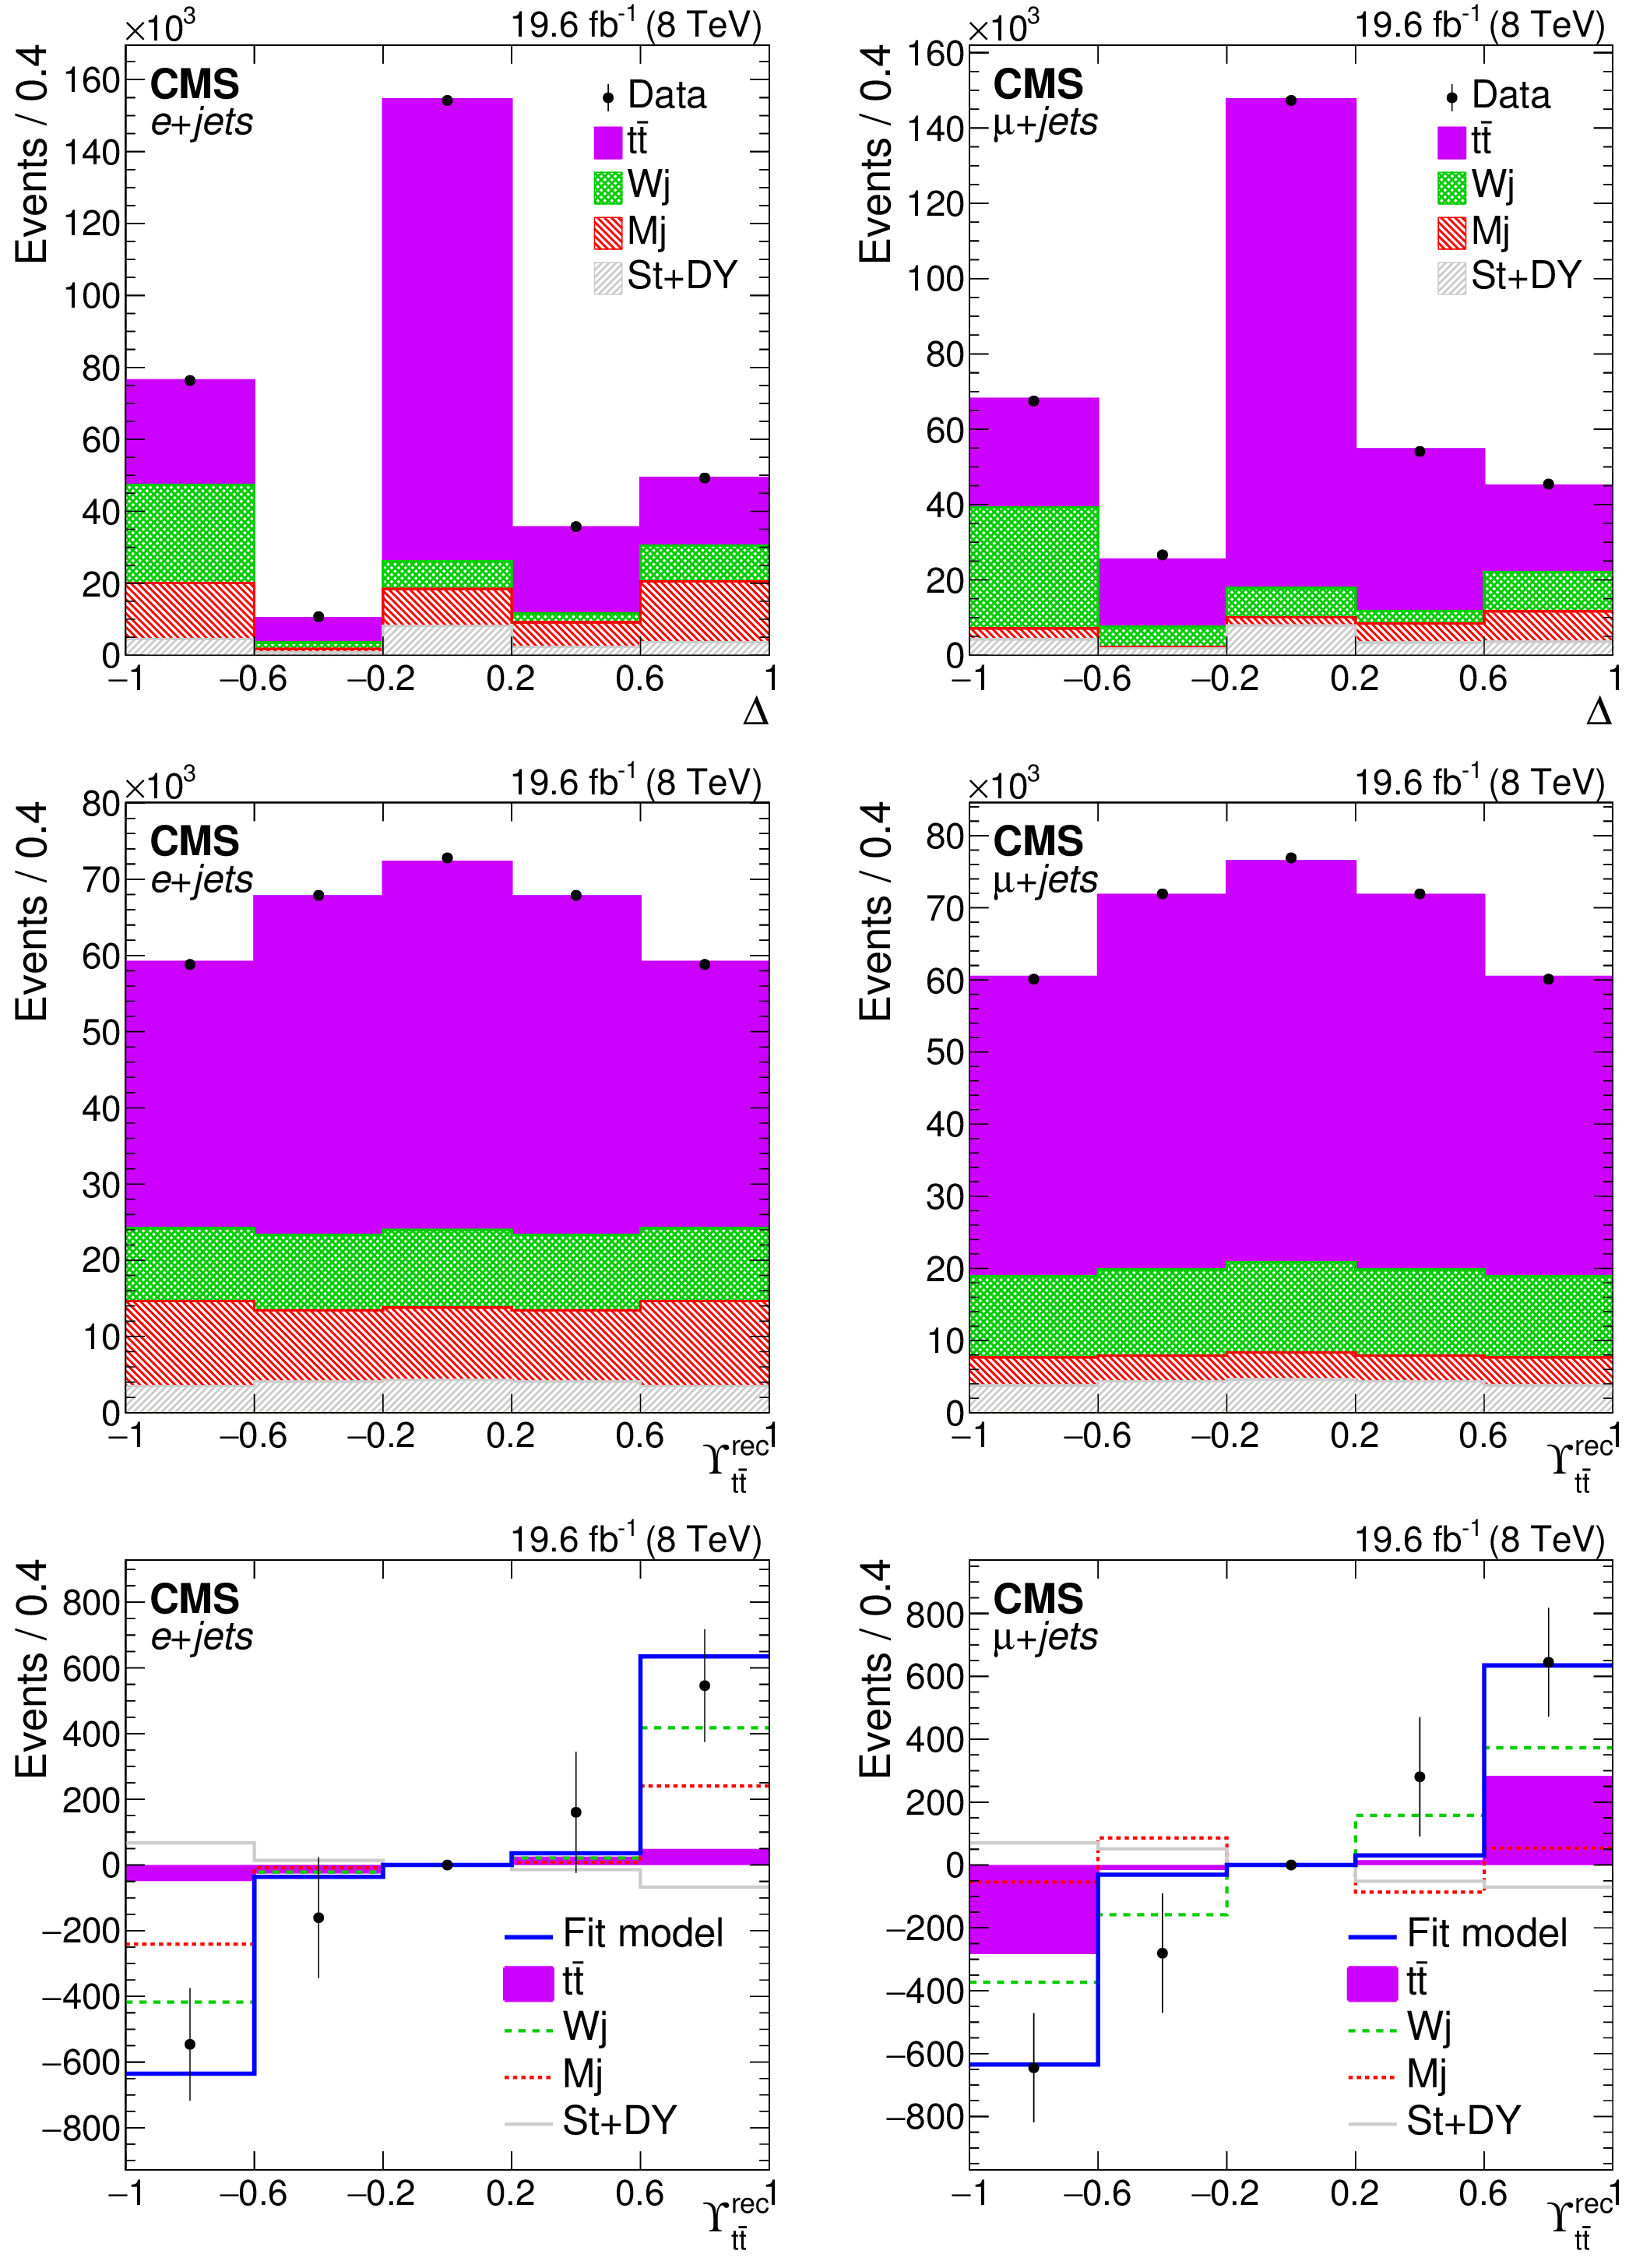
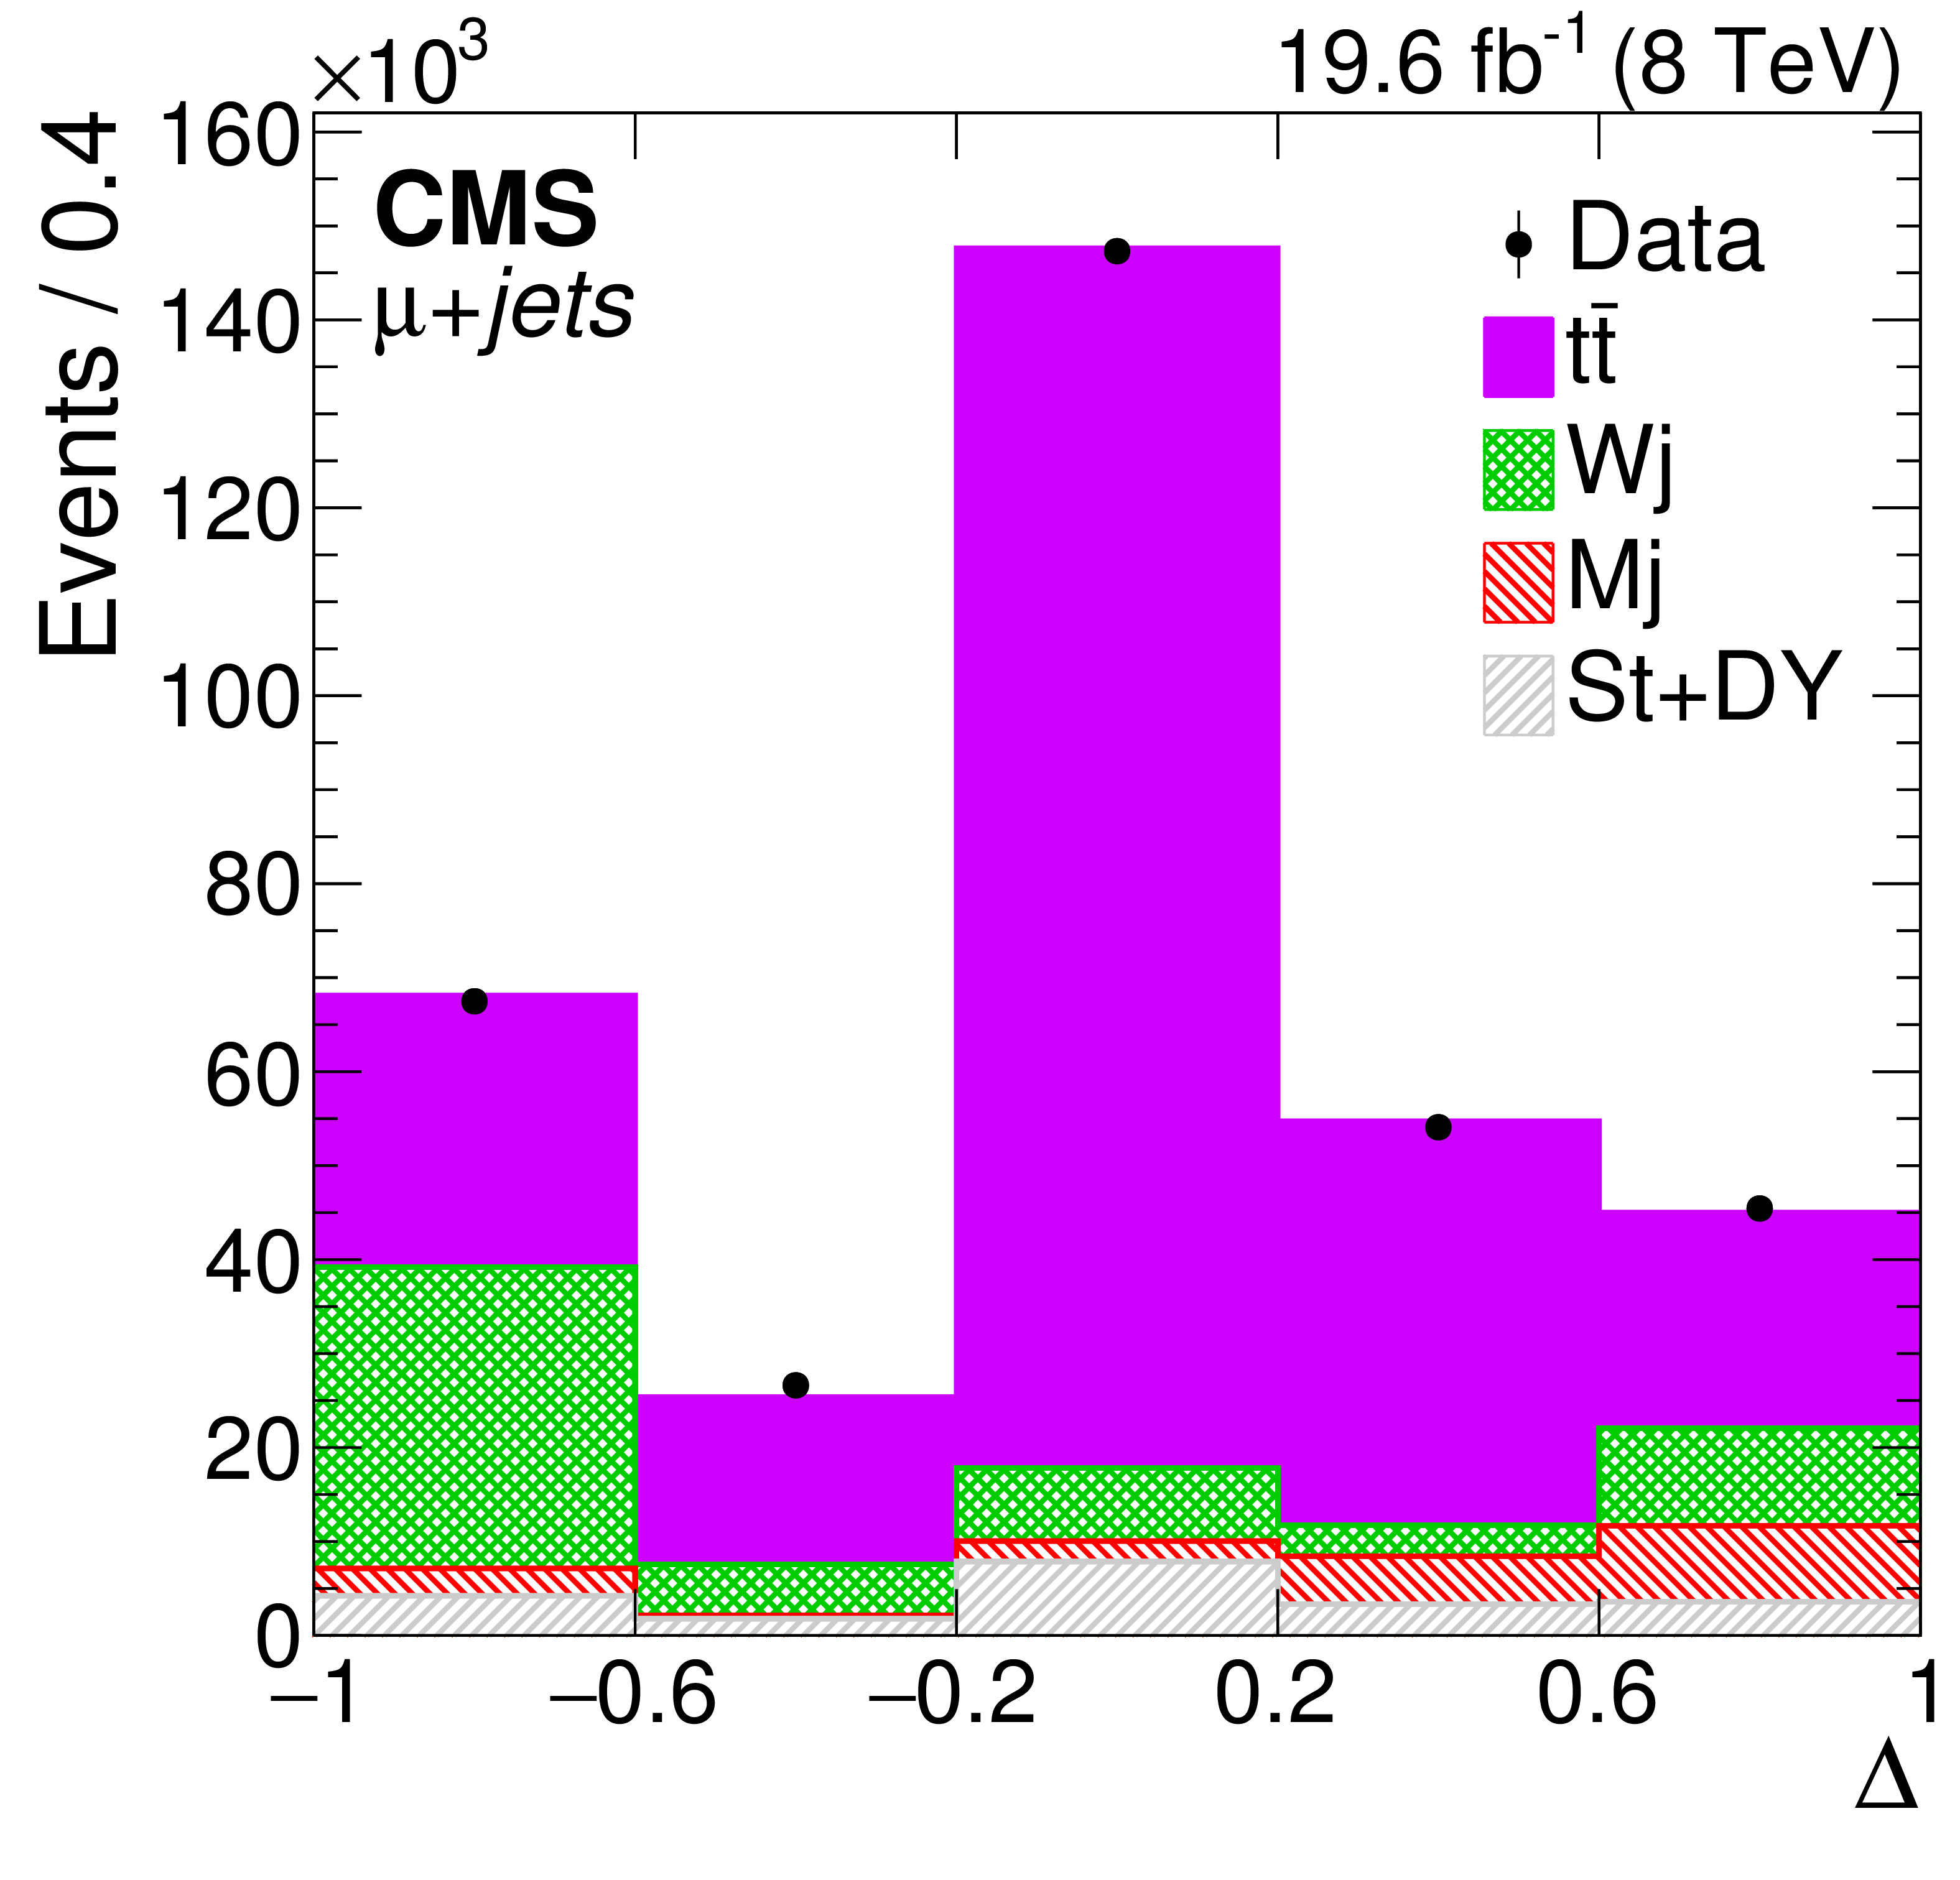
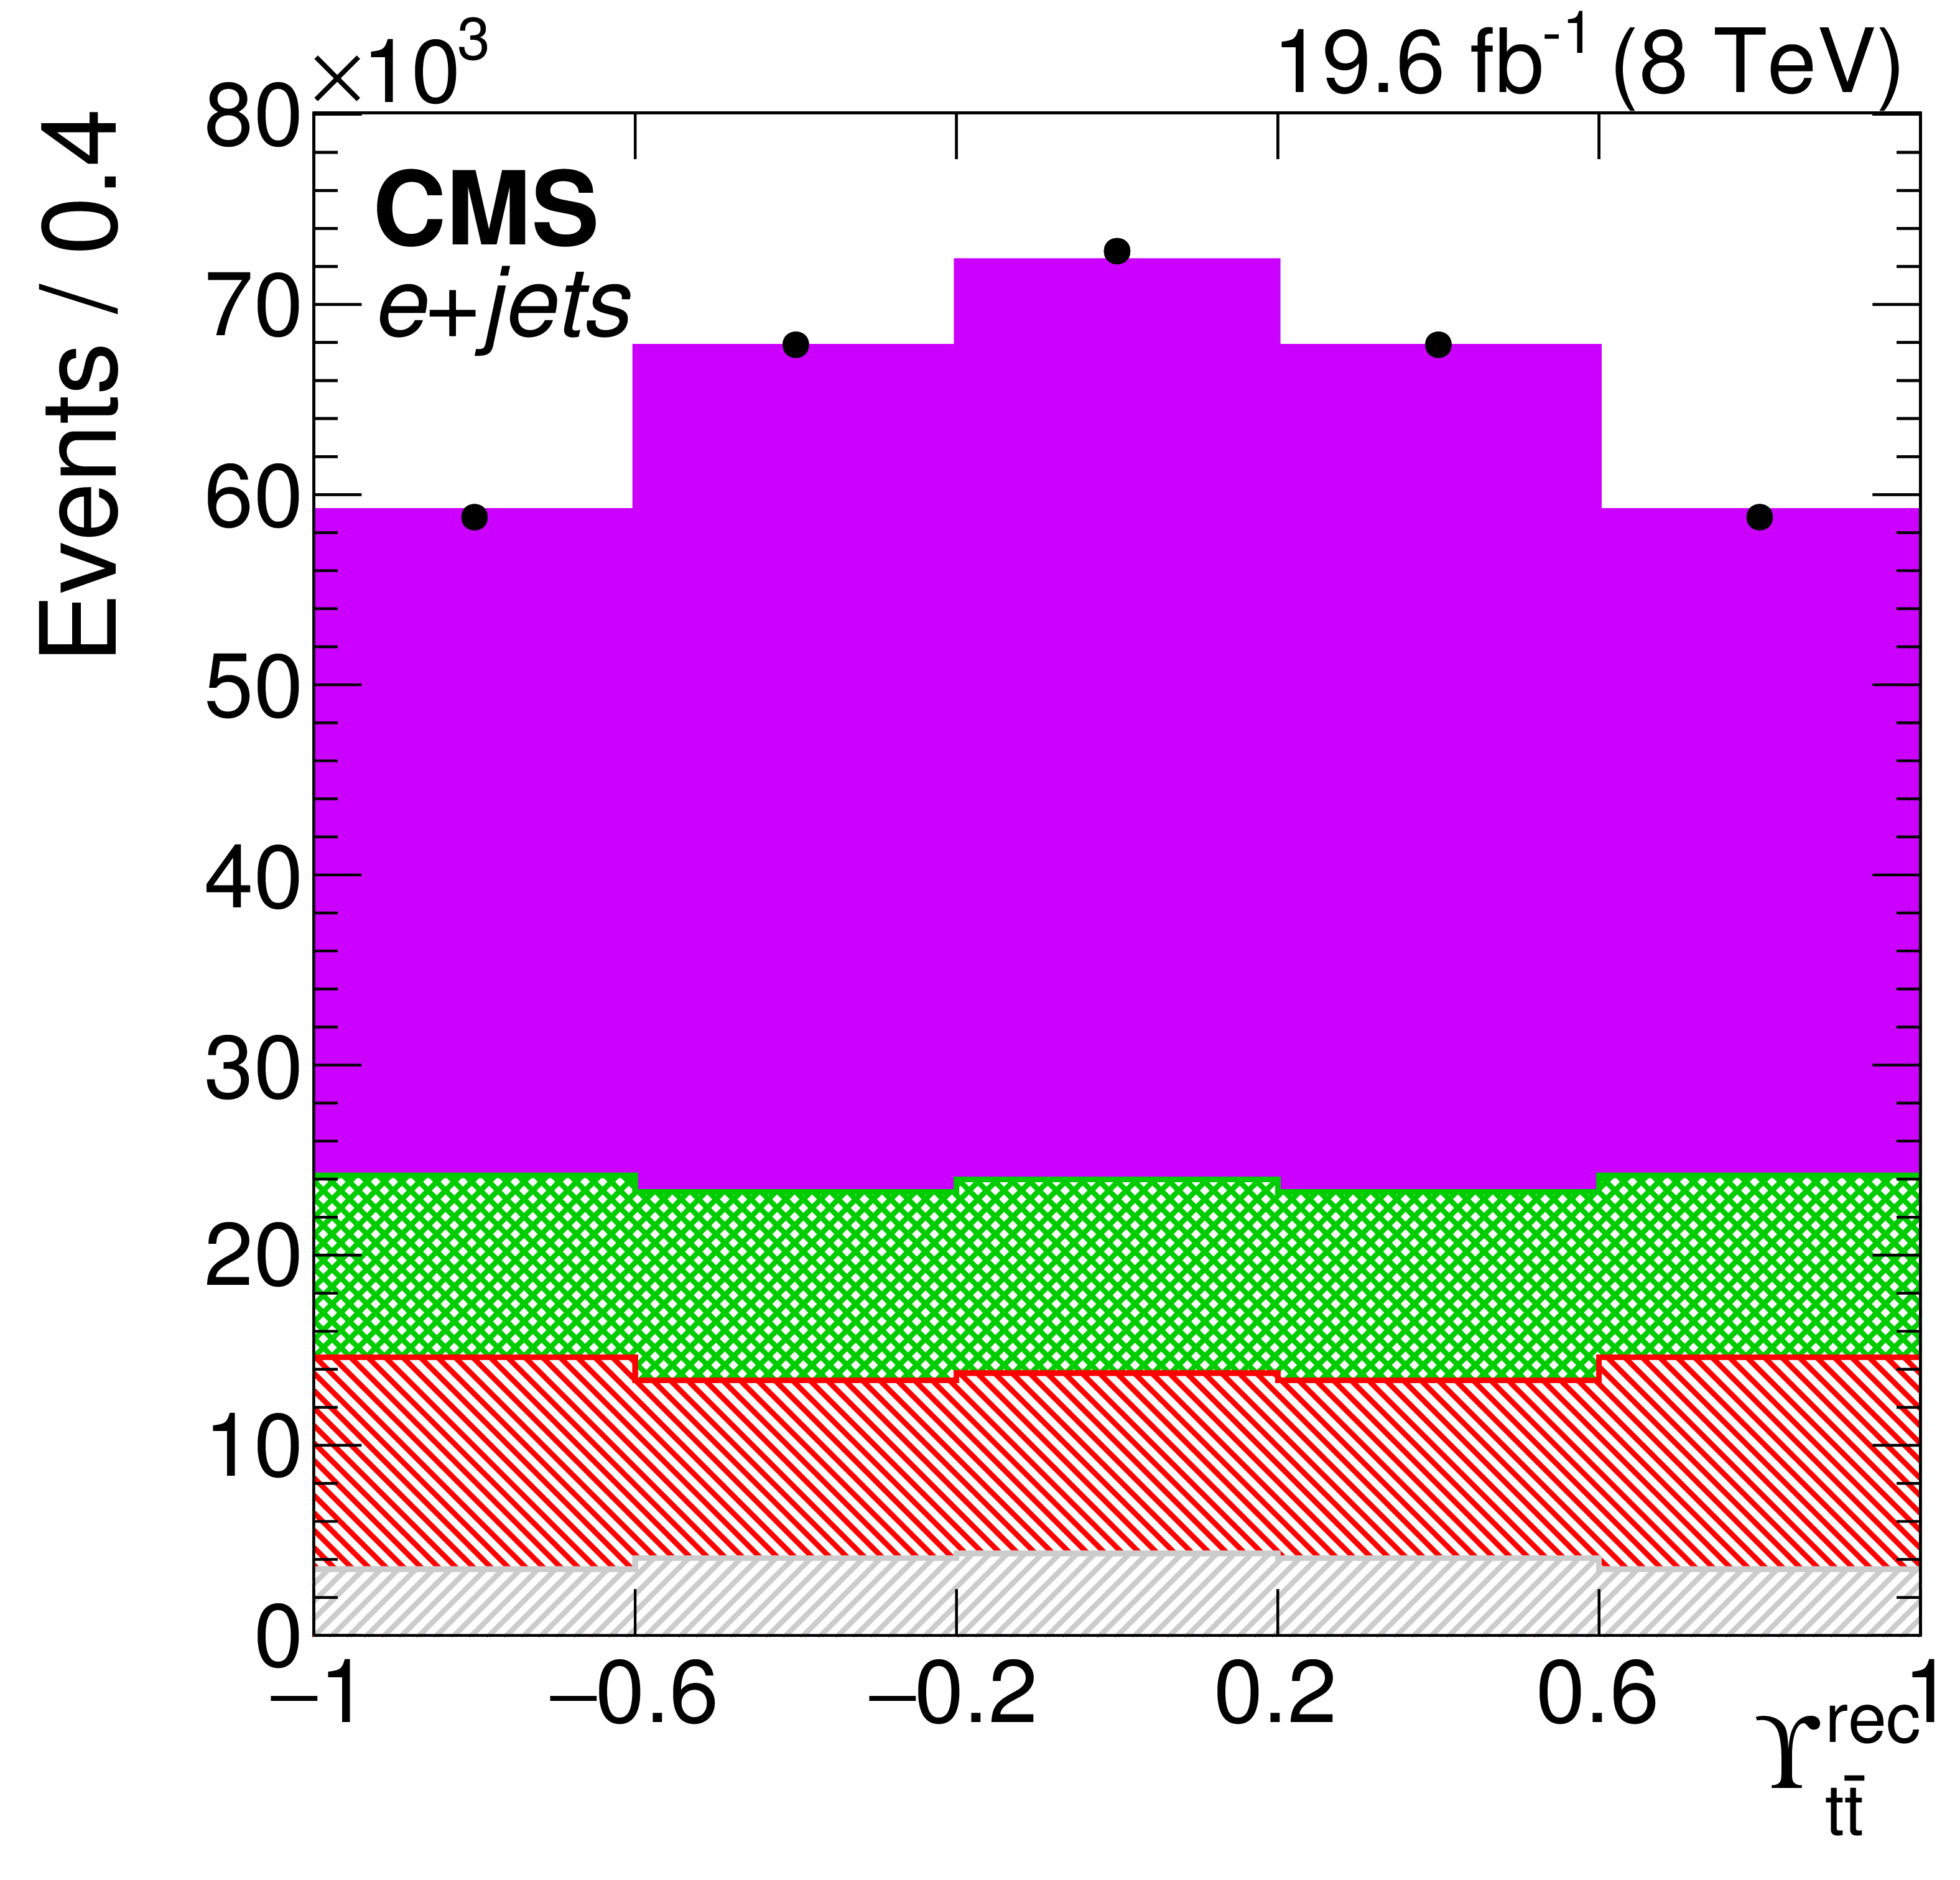
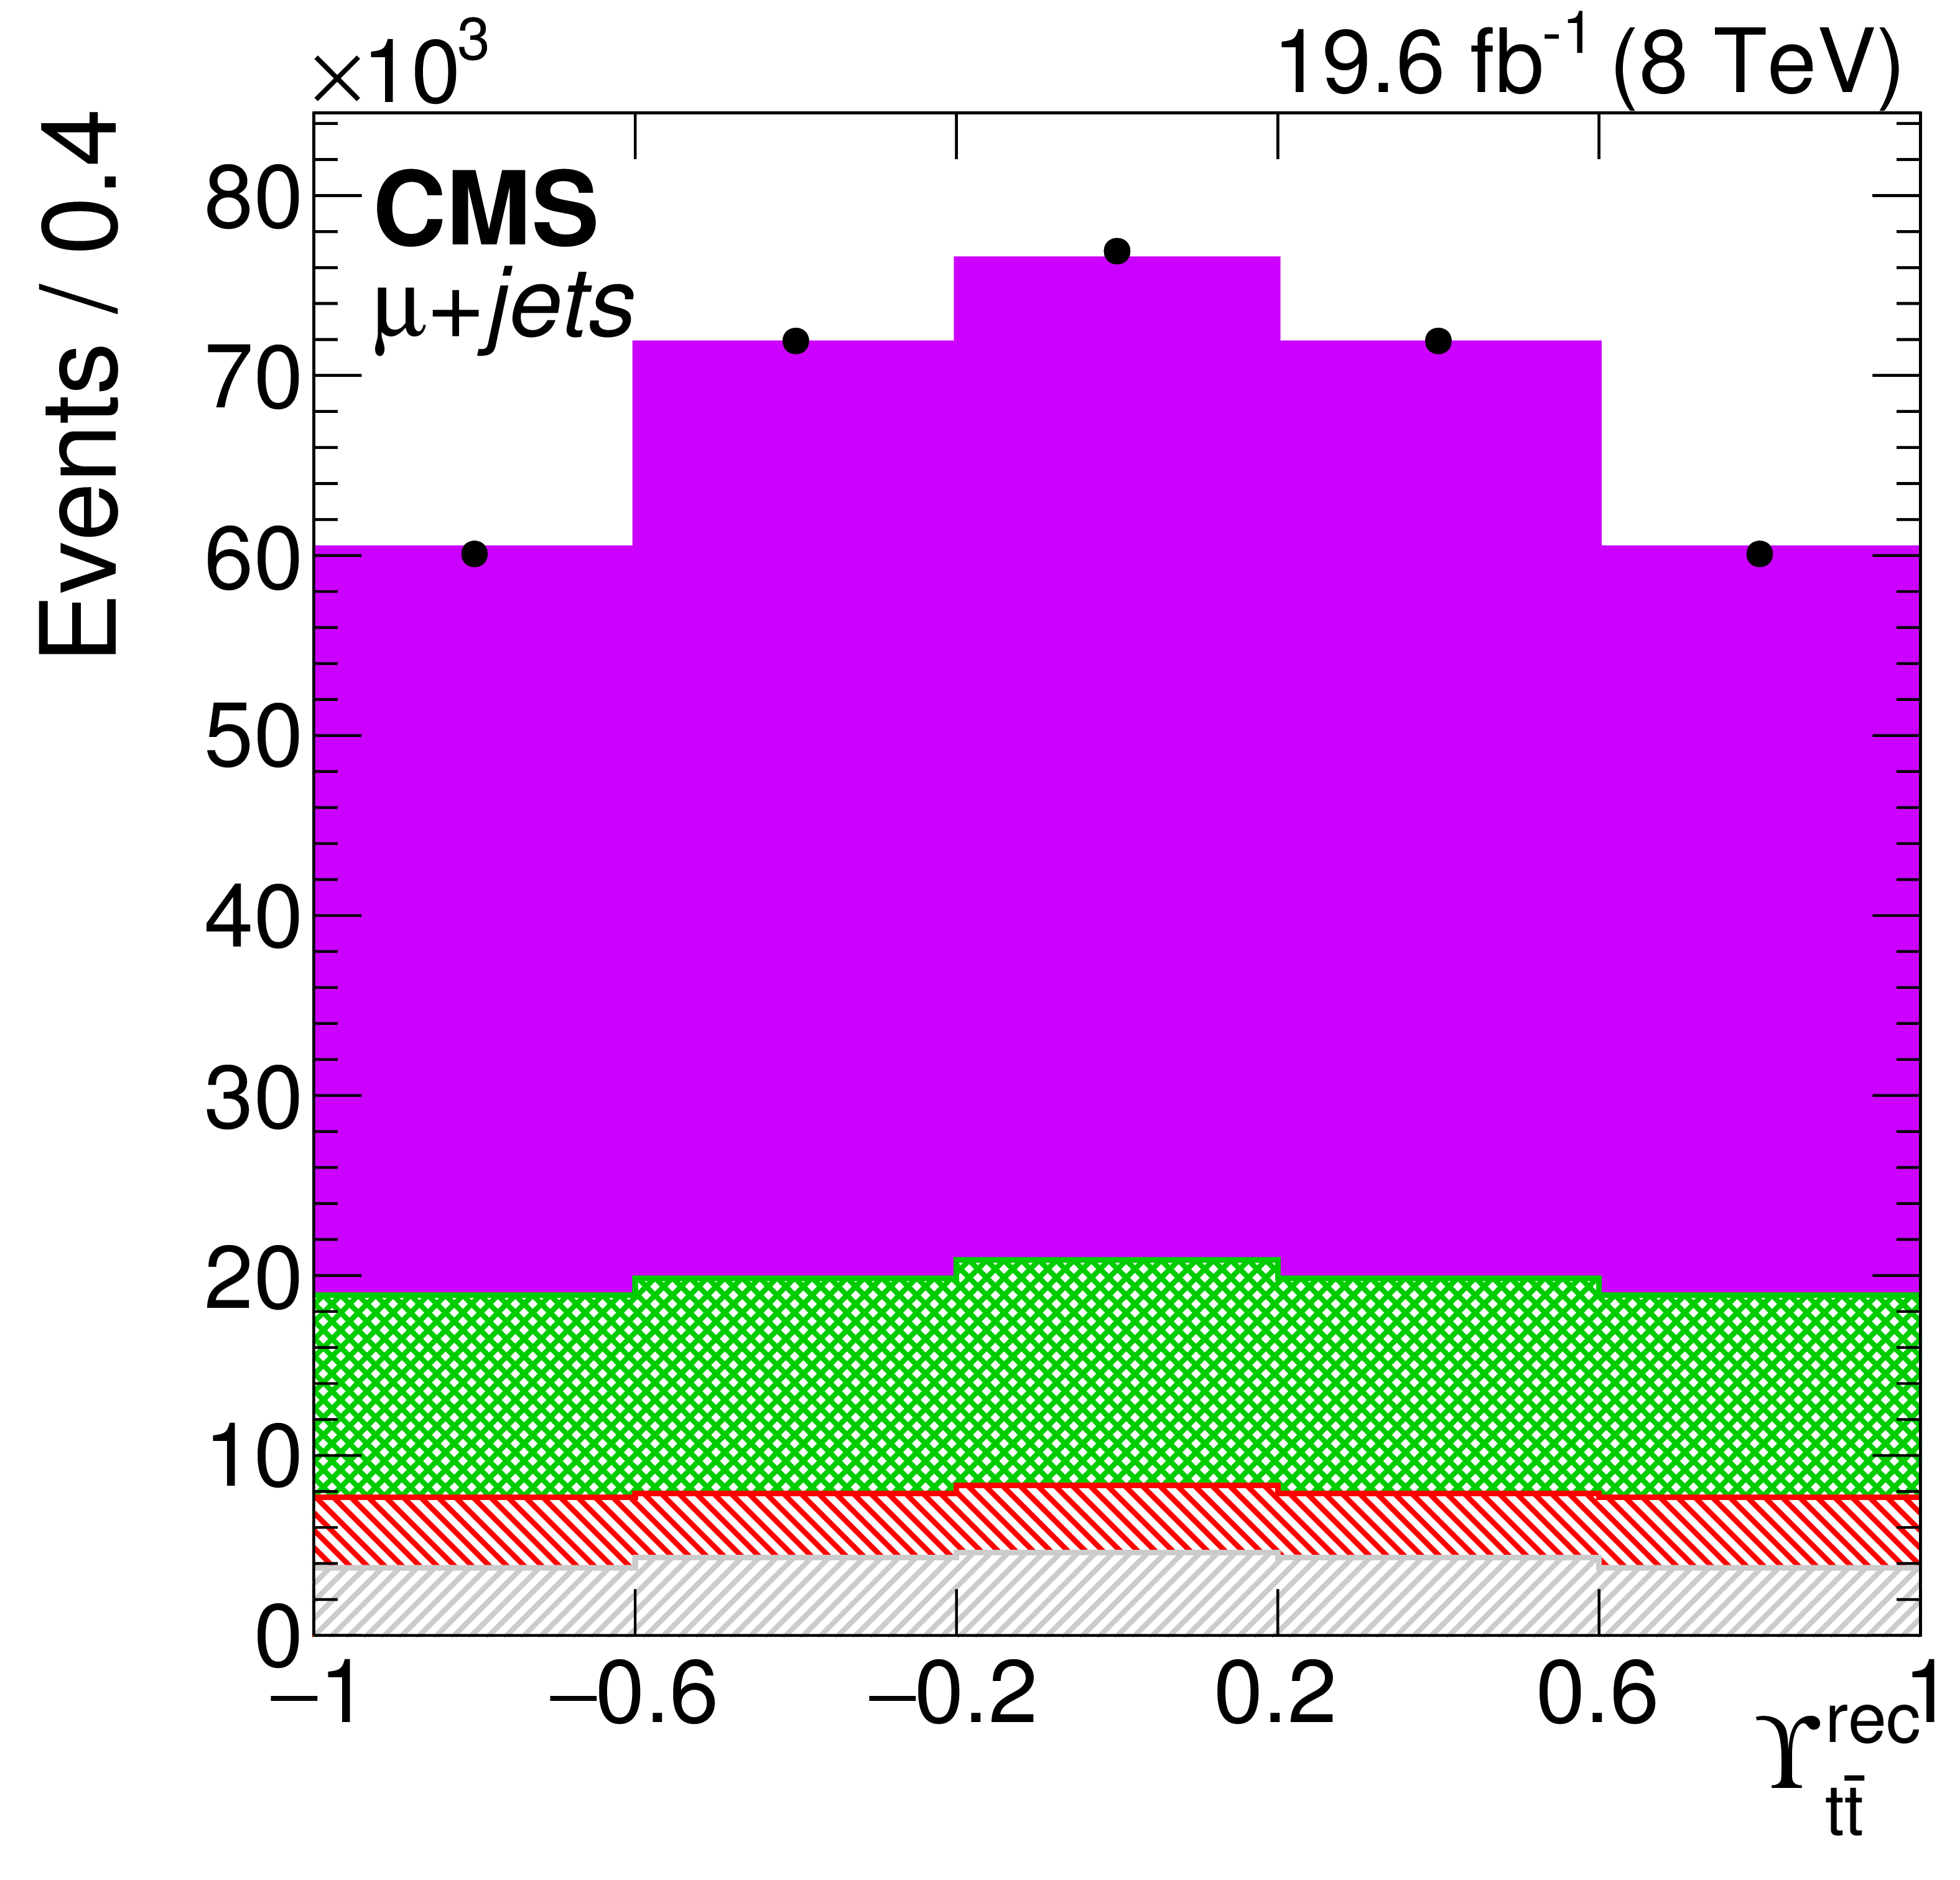
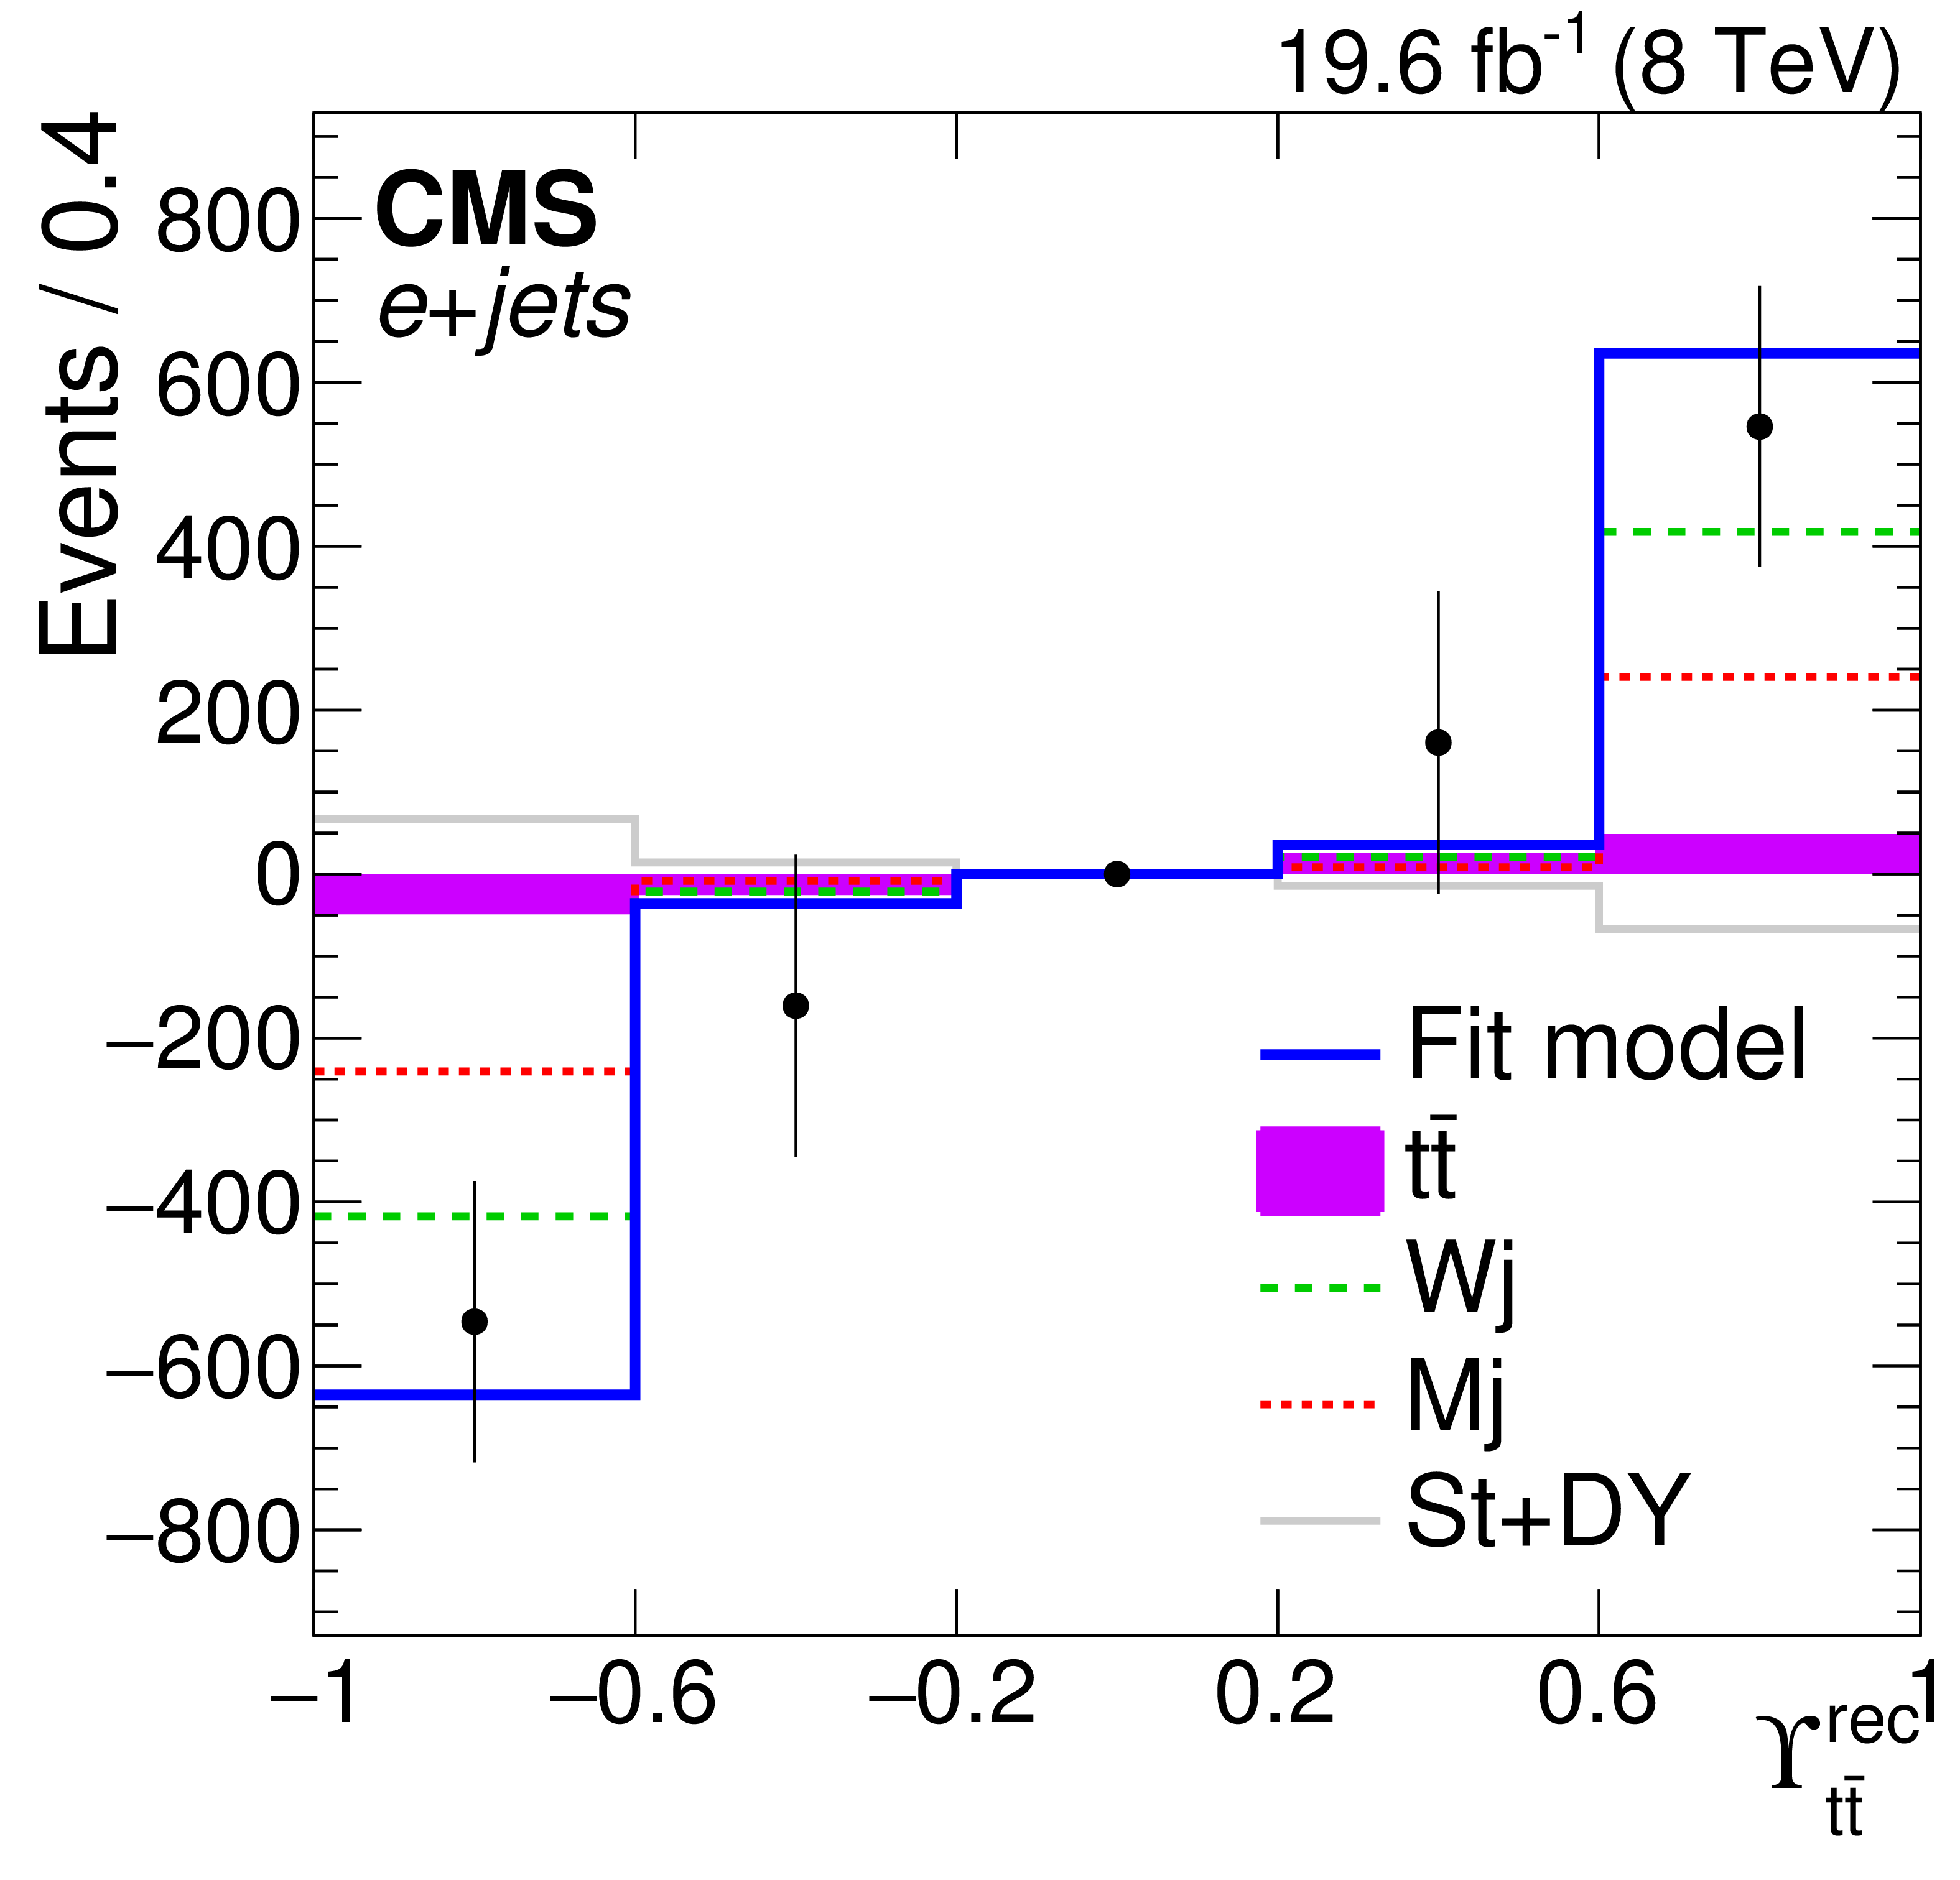
Figure 10:
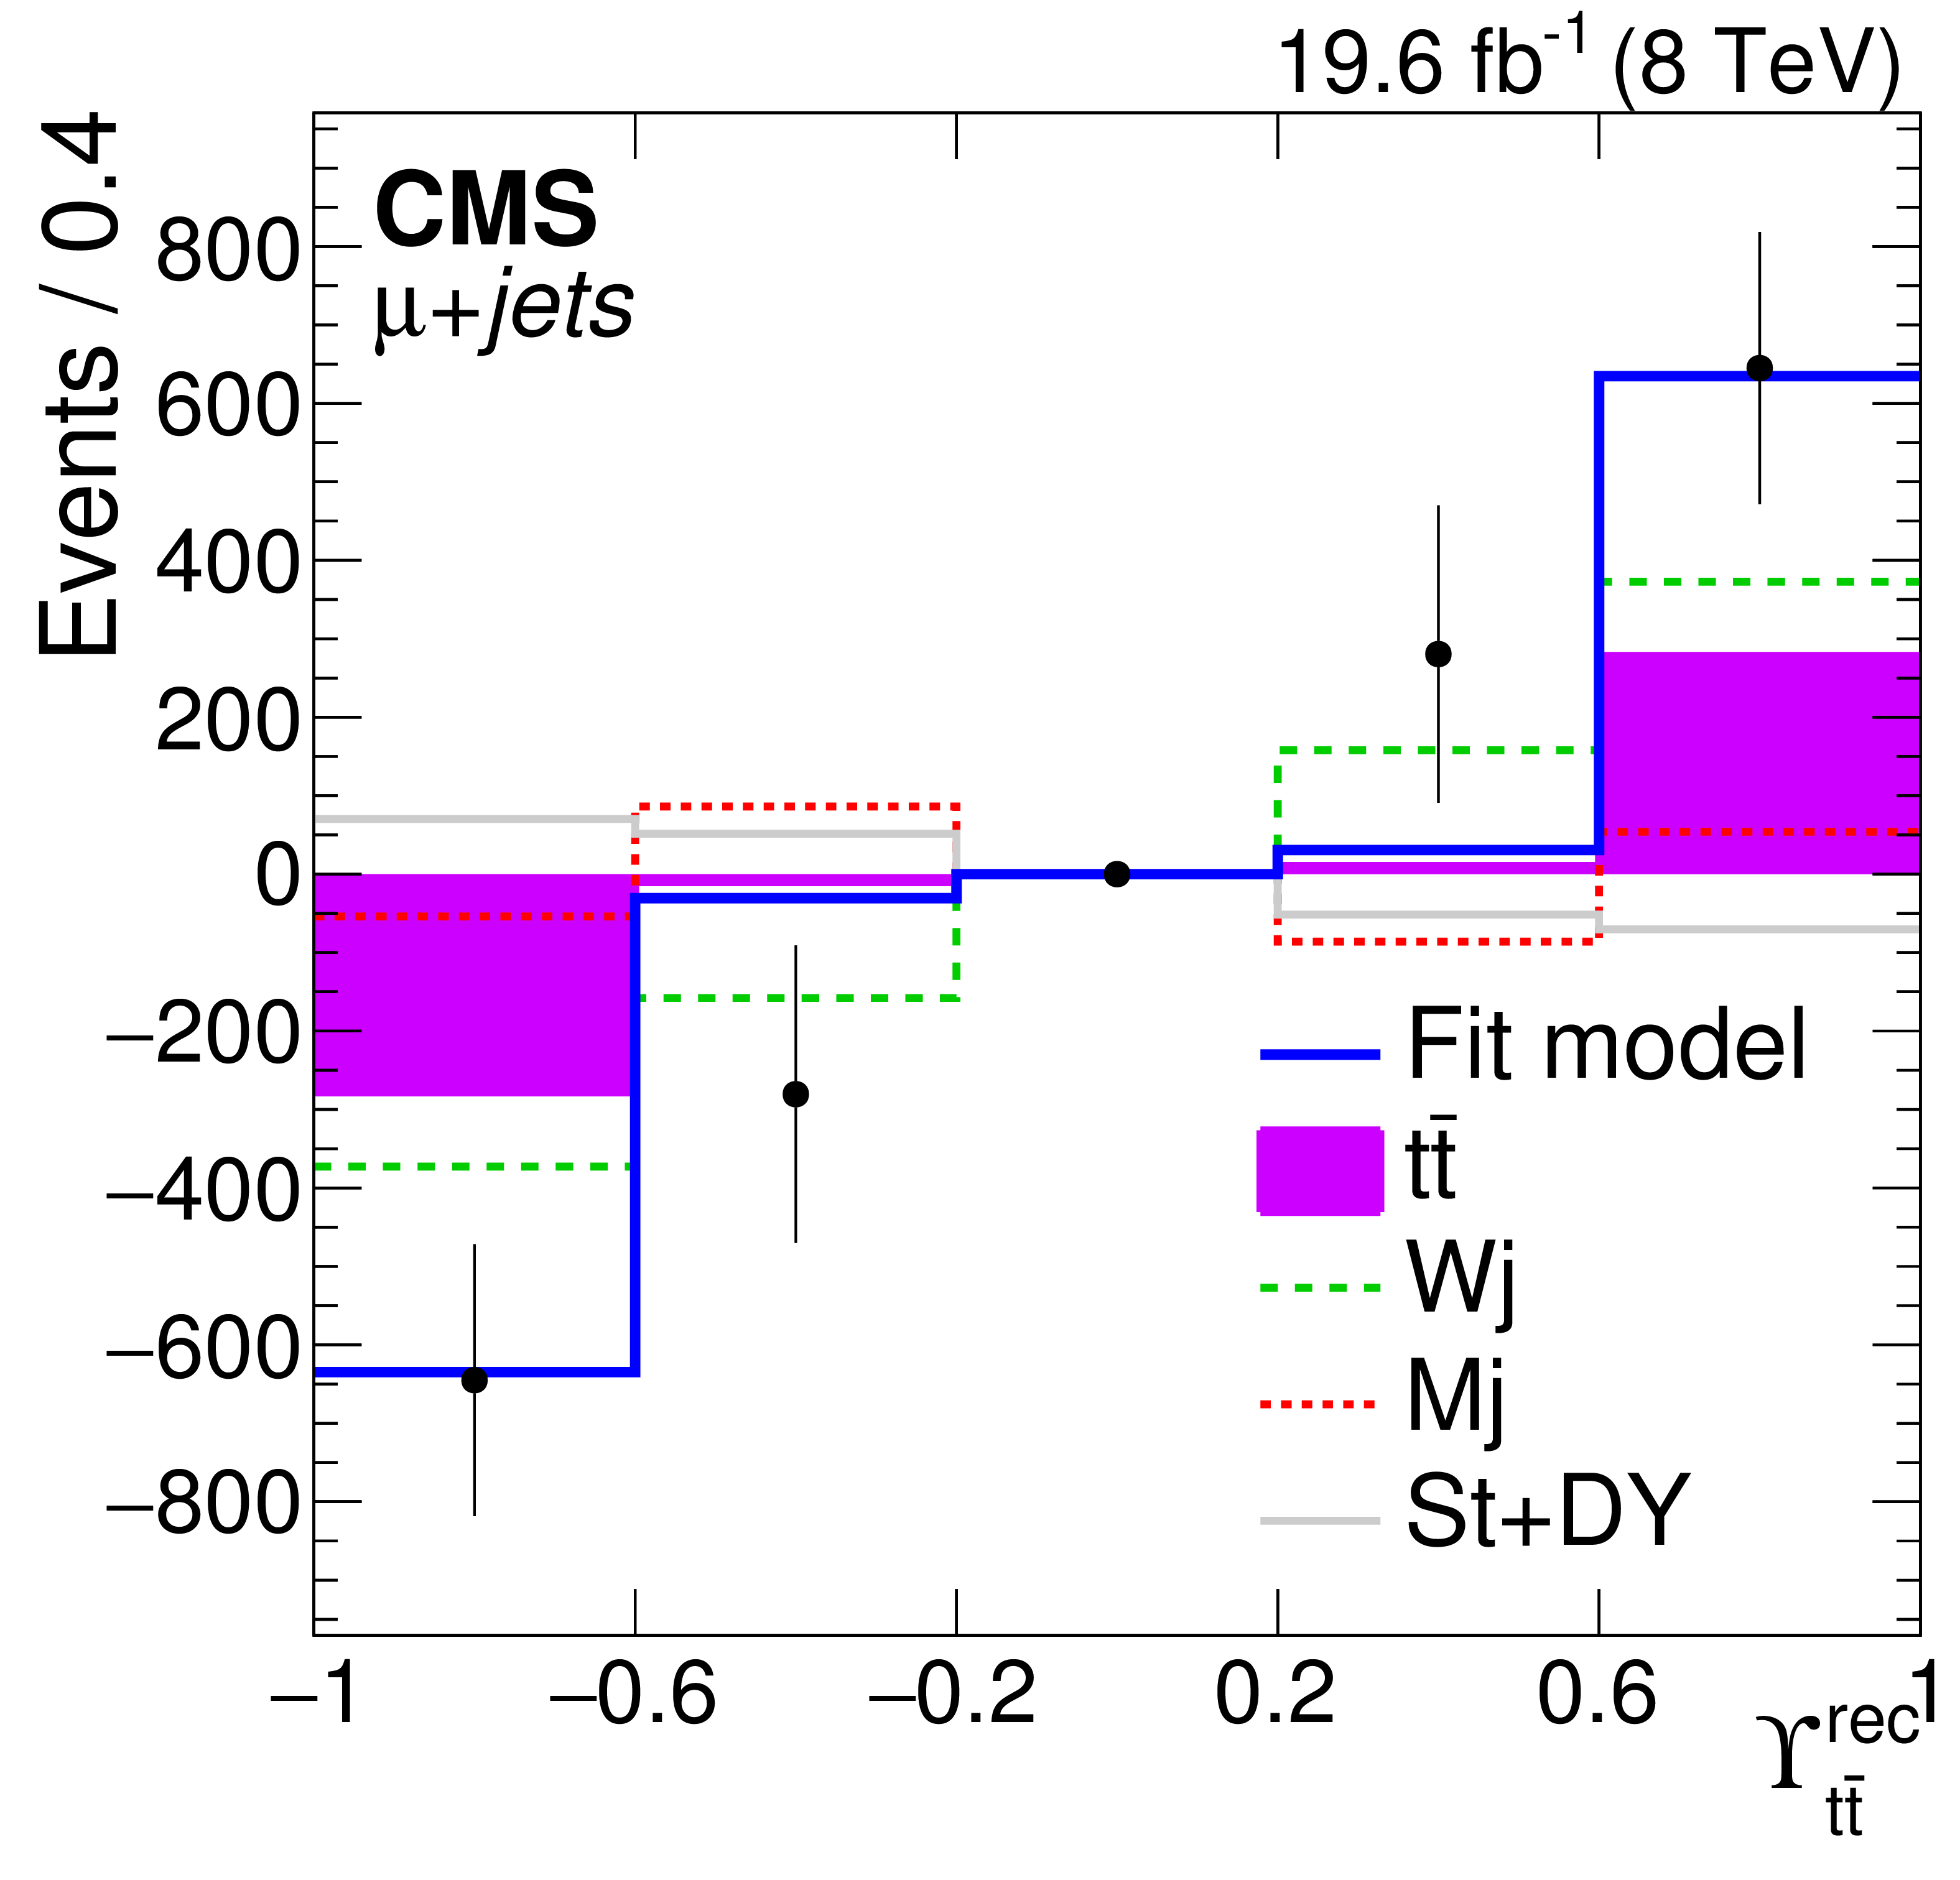
Sample composition is measured using the discriminant $ {\Delta} $ distribution (top), in a model with contributions from $ {\mathrm {t}\overline {\mathrm {t}}} $, Wj, Mj, and St+DY. With the sample composition subsequently fixed, the amplitude of the antisymmetric $ {\mathrm {t}\overline {\mathrm {t}}} $ contribution is measured in the $ {{\varUpsilon _{{\mathrm {t}\overline {\mathrm {t}}}}} ^{\text {rec}}} $ distribution, shown decomposed into symmetric (middle) and antisymmetric (bottom) components. The thick line shows the antisymmetric component of the fit model. The measurements are performed independently on the (left) e+jets and (right) $\mu$+jets samples. |

png pdf |
Figure 10-a:
Sample composition is measured using the discriminant $ {\Delta} $ distribution, in a model with contributions from $ {\mathrm {t}\overline {\mathrm {t}}} $, Wj, Mj, and St+DY. The measurements are performed on the e+jets sample. |
png pdf |
Figure 10-b:
Sample composition is measured using the discriminant $ {\Delta} $ distribution, in a model with contributions from $ {\mathrm {t}\overline {\mathrm {t}}} $, Wj, Mj, and St+DY. The measurements are performed on the $\mu$+jets sample. |
png pdf |
Figure 10-c:
With the sample composition subsequently fixed, the amplitude of the antisymmetric $ {\mathrm {t}\overline {\mathrm {t}}} $ contribution is measured in the $ {{\varUpsilon _{{\mathrm {t}\overline {\mathrm {t}}}}} ^{\text {rec}}} $ distribution, symmetric component. The measurements are performed on the e+jets sample. |
png pdf |
Figure 10-d:
With the sample composition subsequently fixed, the amplitude of the antisymmetric $ {\mathrm {t}\overline {\mathrm {t}}} $ contribution is measured in the $ {{\varUpsilon _{{\mathrm {t}\overline {\mathrm {t}}}}} ^{\text {rec}}} $ distribution, symmetric component. The measurements are performed on the $\mu$+jets sample. |
png pdf |
Figure 10-e:
With the sample composition subsequently fixed, the amplitude of the antisymmetric $ {\mathrm {t}\overline {\mathrm {t}}} $ contribution is measured in the $ {{\varUpsilon _{{\mathrm {t}\overline {\mathrm {t}}}}} ^{\text {rec}}} $ distribution, antisymmetric component. The thick line shows the antisymmetric component of the fit model. The measurements are performed on the e+jets sample. |
png pdf |
Figure 10-f:
With the sample composition subsequently fixed, the amplitude of the antisymmetric $ {\mathrm {t}\overline {\mathrm {t}}} $ contribution is measured in the $ {{\varUpsilon _{{\mathrm {t}\overline {\mathrm {t}}}}} ^{\text {rec}}} $ distribution, antisymmetric component. The thick line shows the antisymmetric component of the fit model. The measurements are performed on the $\mu$+jets sample. |
png pdf |
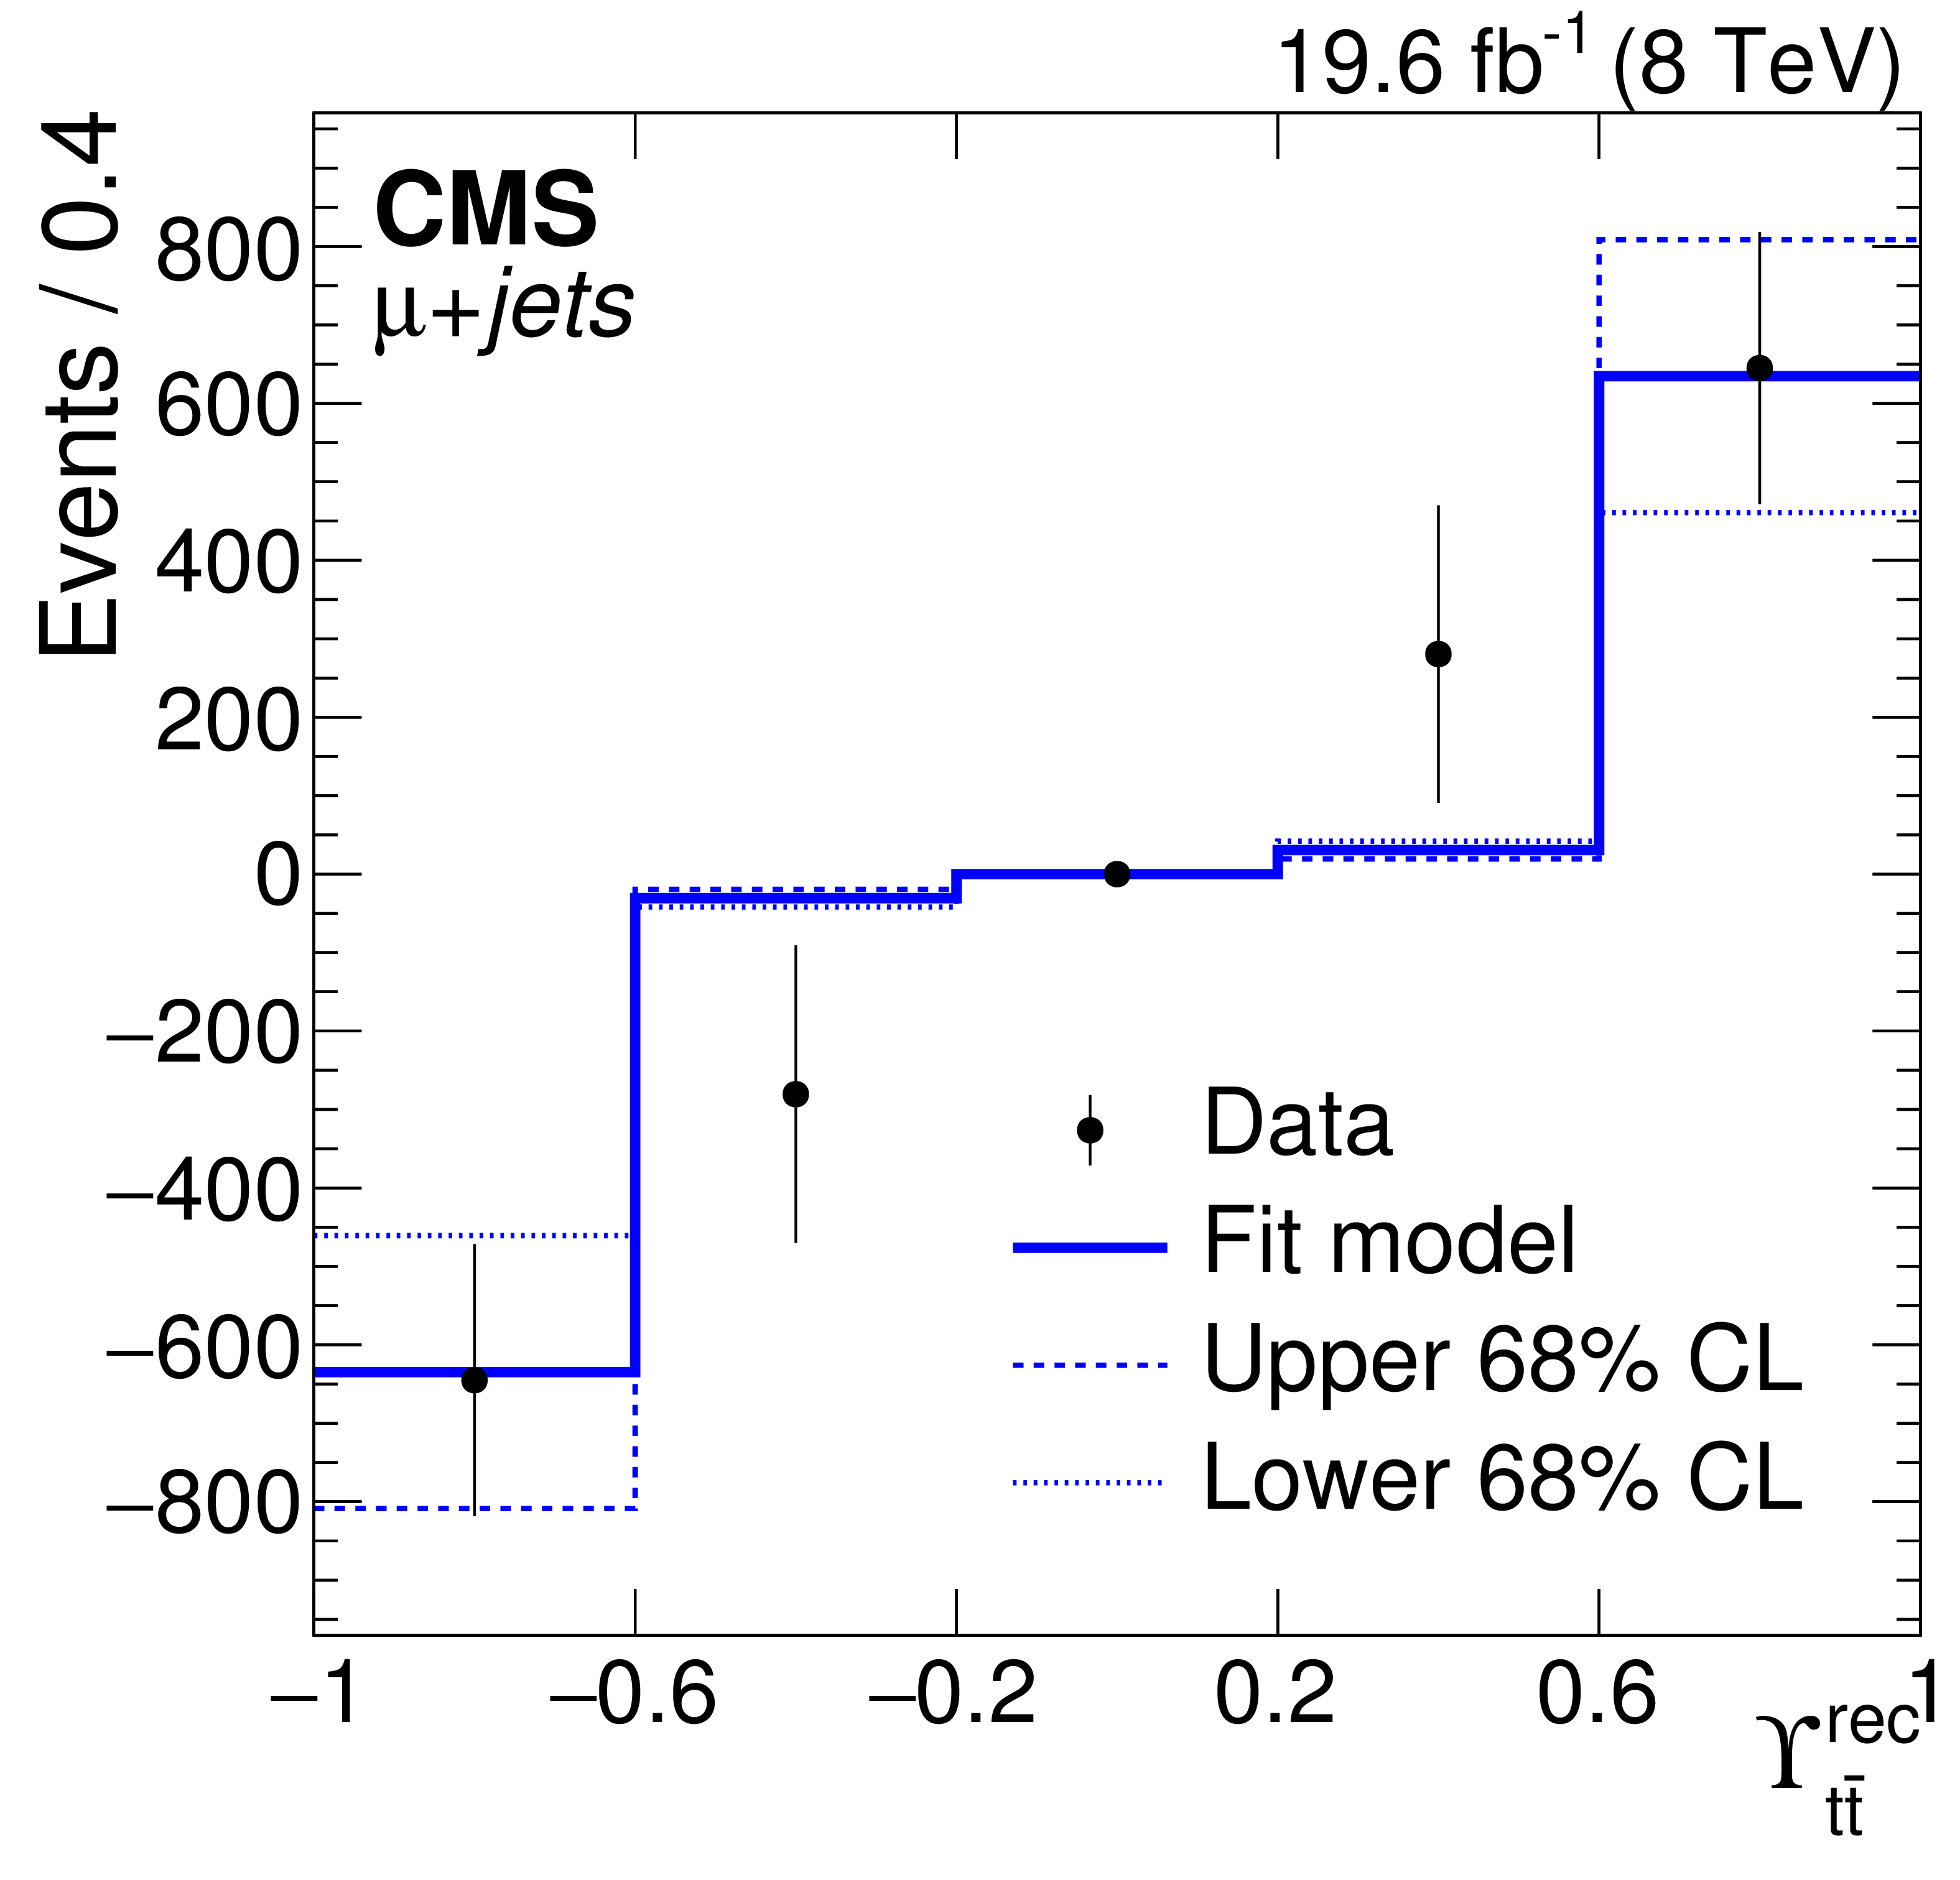
Figure 11:
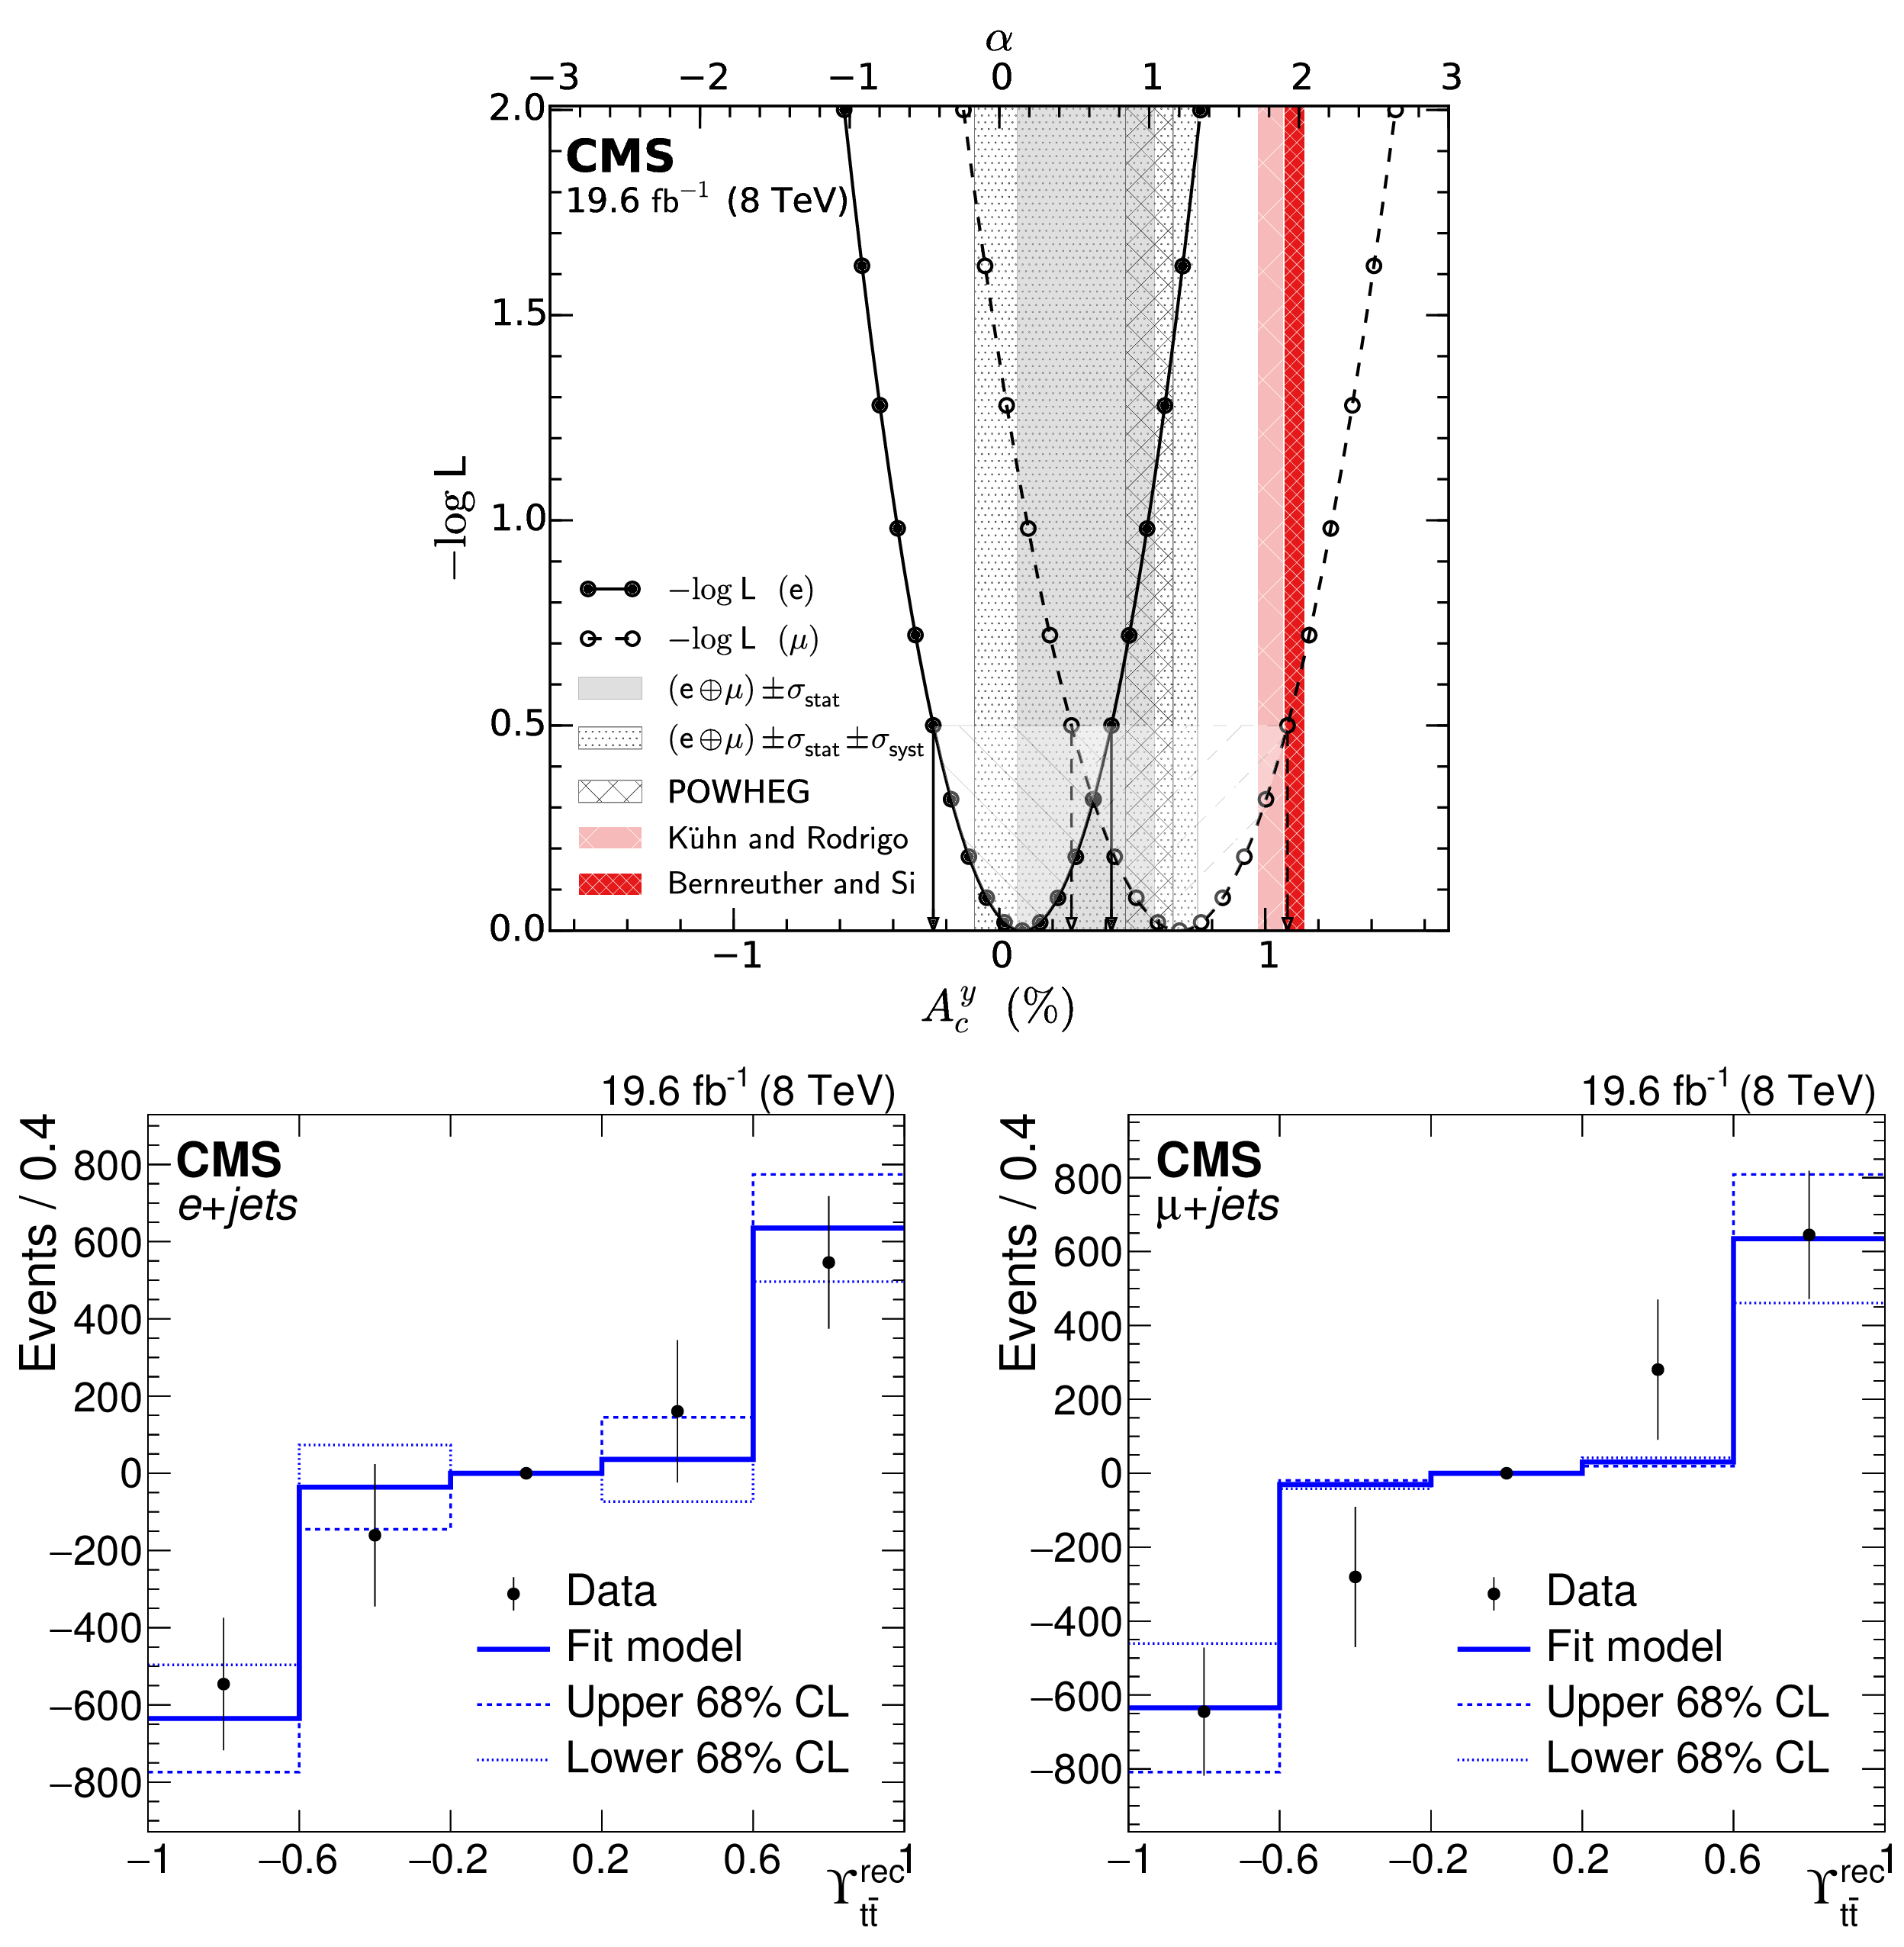
At top, the negative logarithm of the likelihood is shown as a function of $\alpha $ (upper axis) and $A_c^y$ (lower axis), for e+jets (closed circles) and $\mu$+jets (open circles) measurements. The statistical uncertainty in each is given by the intersections of the parabolas with $-\log{L}=$ 0.5, which are marked by arrows. The 68% confidence interval of the combined $A_c^y$ measurement is compared with those of the SM predictions by POWHEG, Kuhn and Rodrigo [8], and Bernreuther and Si [9]. At bottom, the antisymmetric component of the $ {{\varUpsilon _{{\mathrm {t}\overline {\mathrm {t}}}}} ^{\text {rec}}} $ distributions in data and the model are shown for (left) e+jets and (right) $\mu$+jets, for the central value (solid), and for the upper (dashed) and lower (dotted) limits of the 68% statistical confidence intervals. |
png pdf |
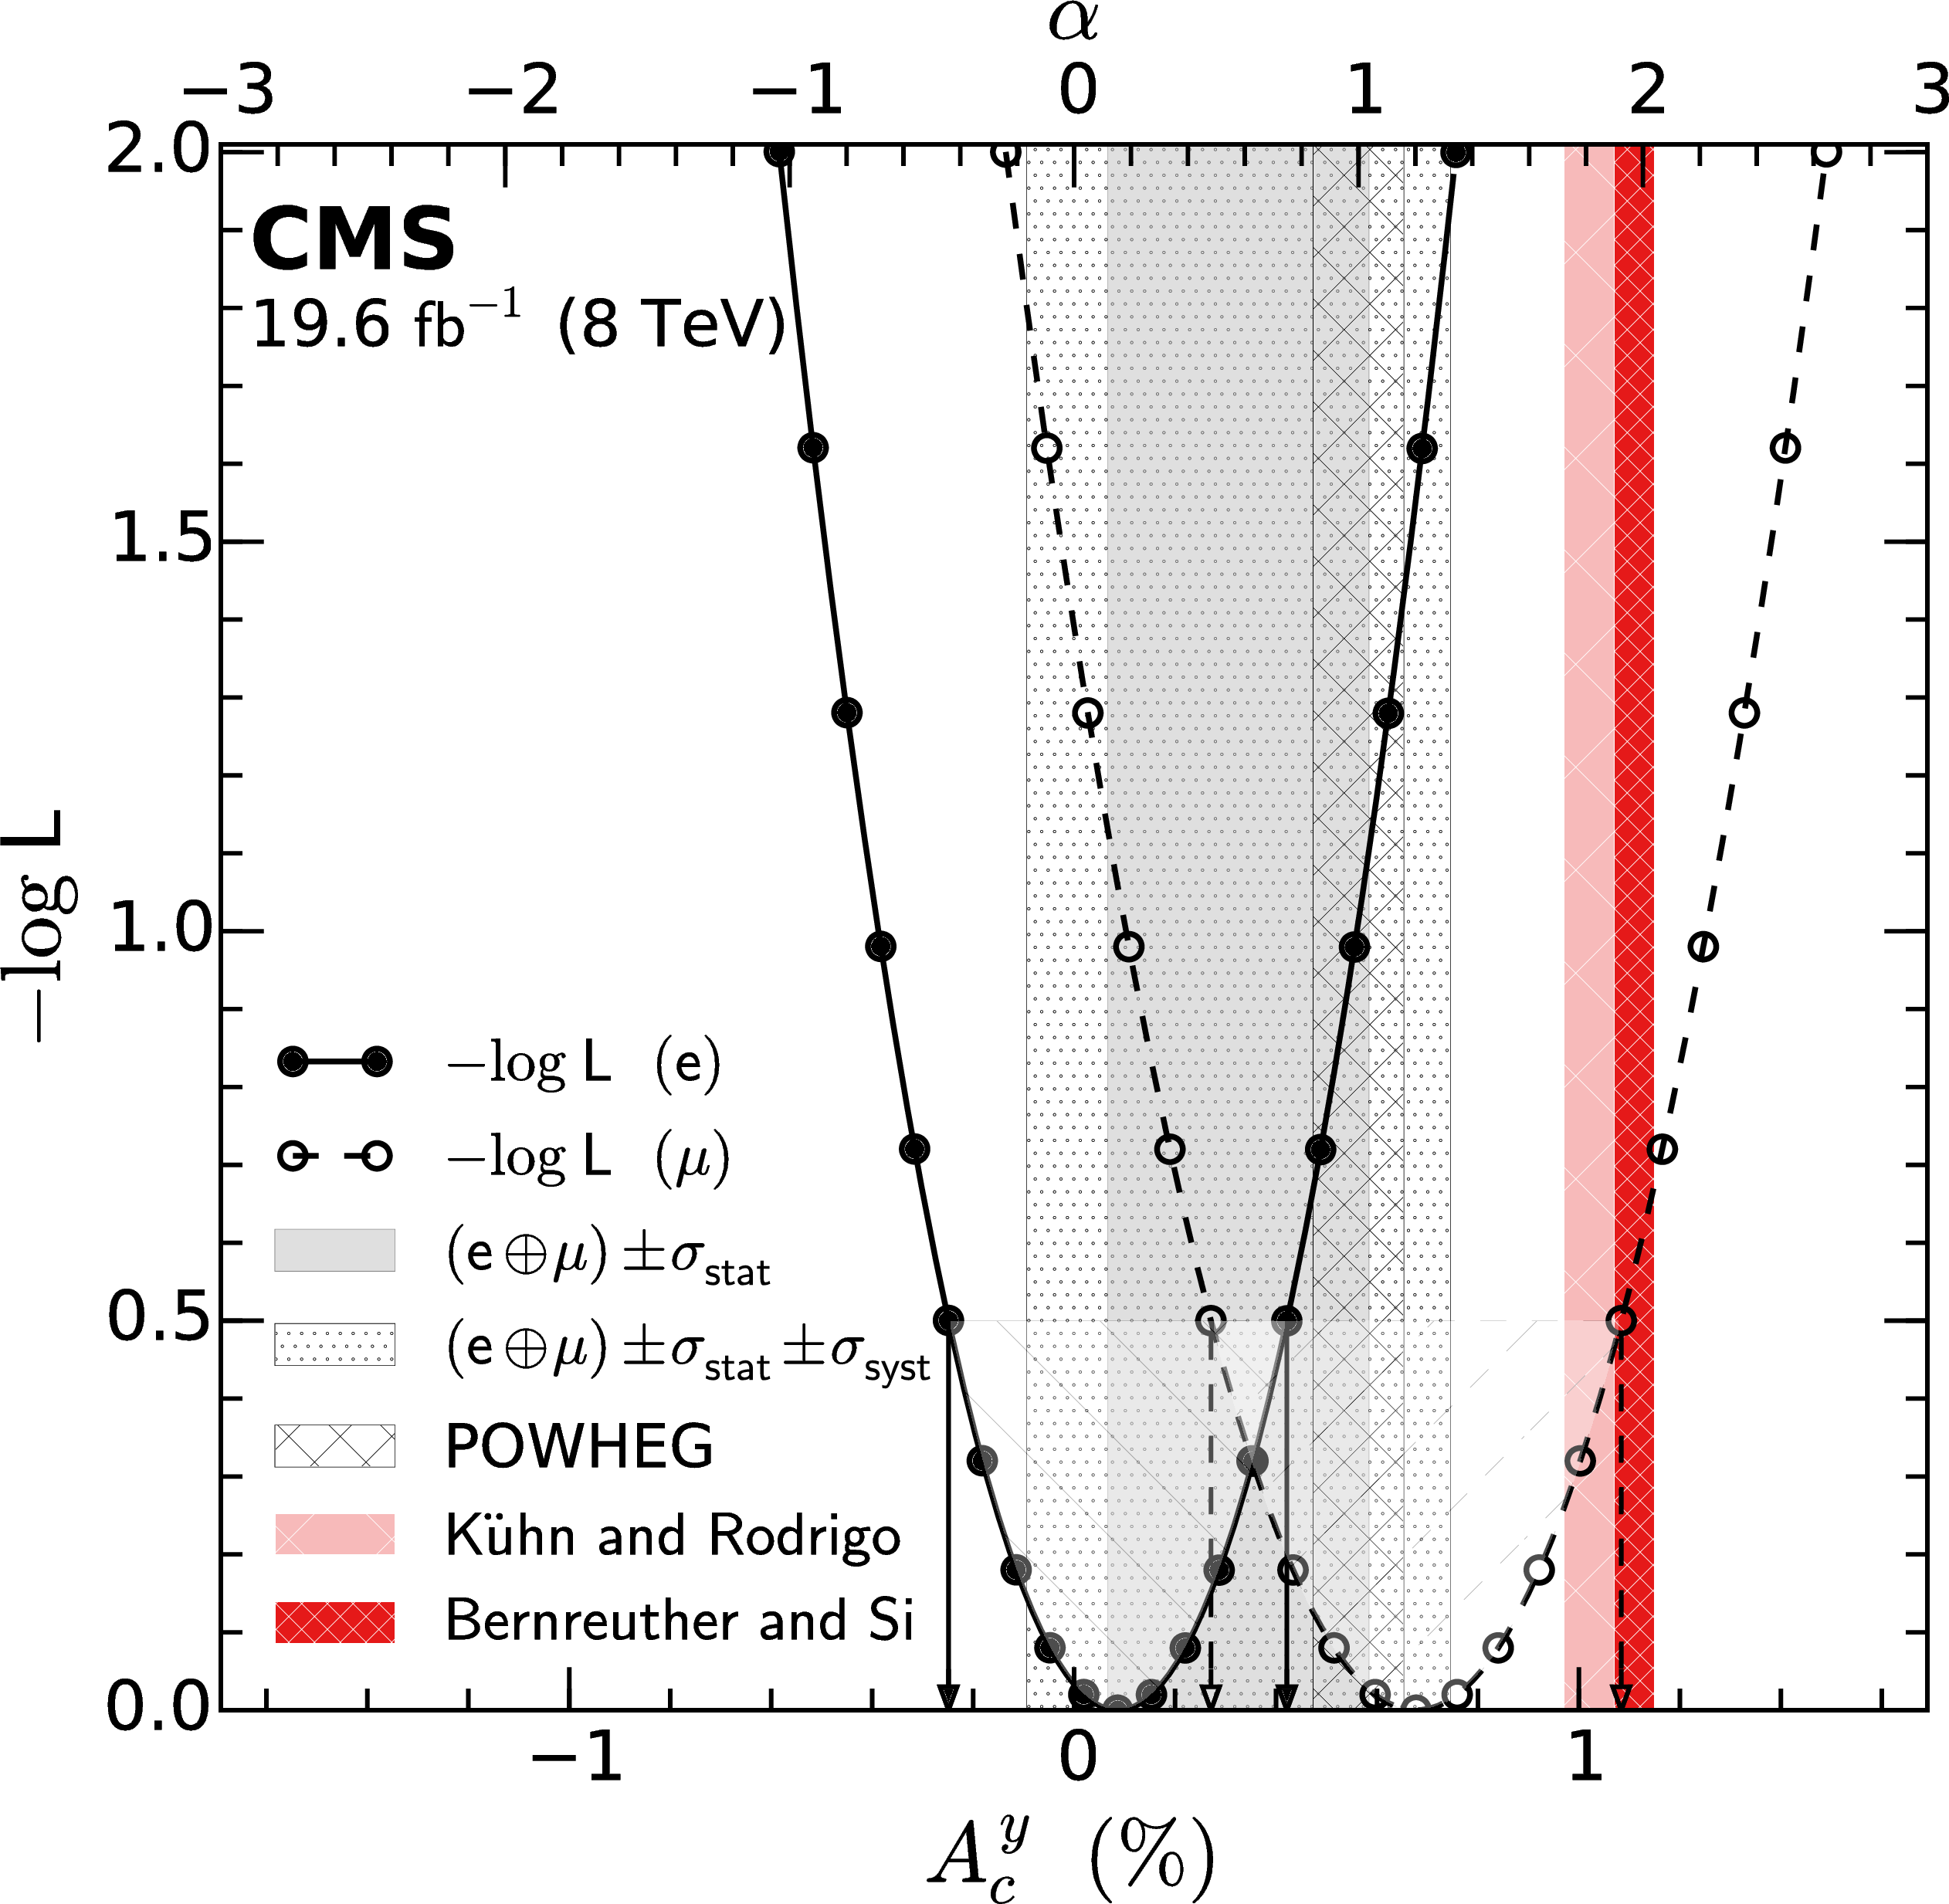
Figure 11-a:
At top, the negative logarithm of the likelihood is shown as a function of $\alpha $ (upper axis) and $A_c^y$ (lower axis), for e+jets (closed circles) and $\mu$+jets (open circles) measurements. The statistical uncertainty in each is given by the intersections of the parabolas with $-\log{L}=$ 0.5, which are marked by arrows. The 68% confidence interval of the combined $A_c^y$ measurement is compared with those of the SM predictions by POWHEG, Kuhn and Rodrigo [8], and Bernreuther and Si [9]. |
png pdf |
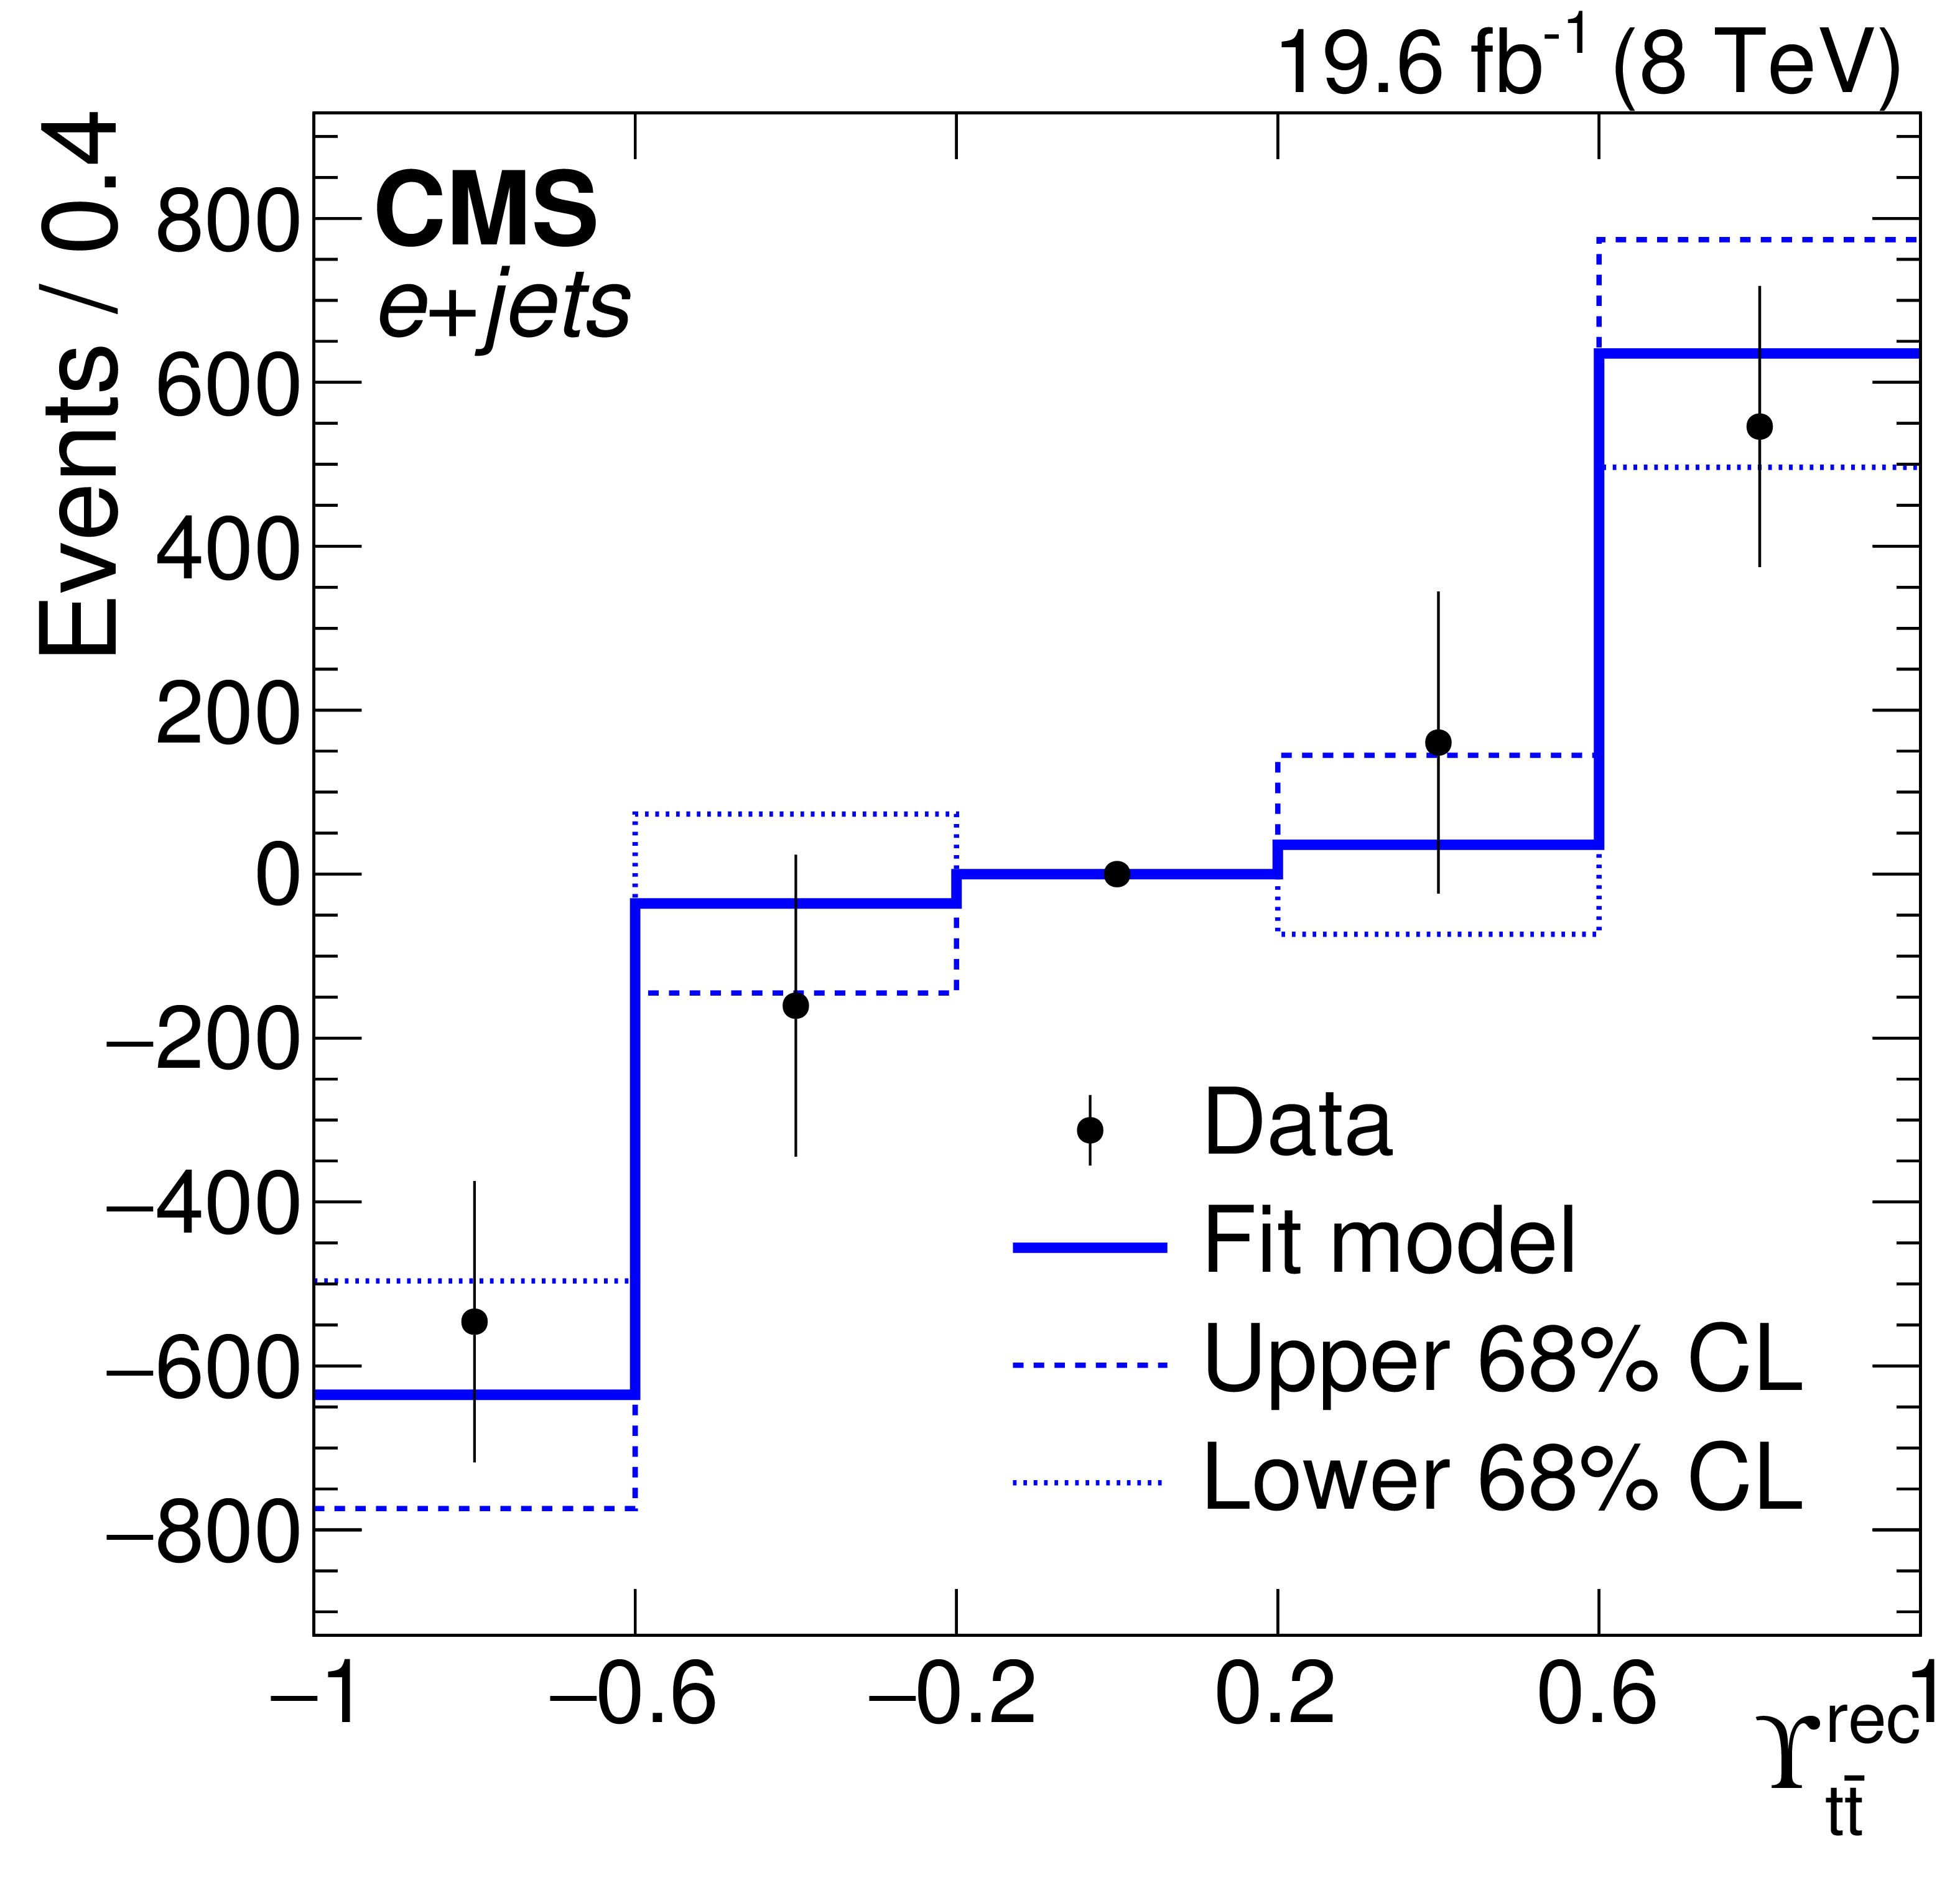
Figure 11-b:
The antisymmetric component of the $ {{\varUpsilon _{{\mathrm {t}\overline {\mathrm {t}}}}} ^{\text {rec}}} $ distributions in data and the model are shown for e+jets, for the central value (solid), and for the upper (dashed) and lower (dotted) limits of the 68% statistical confidence intervals. |
png pdf |
Figure 11-c:
The antisymmetric component of the $ {{\varUpsilon _{{\mathrm {t}\overline {\mathrm {t}}}}} ^{\text {rec}}} $ distributions in data and the model are shown for $\mu$+jets, for the central value (solid), and for the upper (dashed) and lower (dotted) limits of the 68% statistical confidence intervals. |

png pdf |
Figure 12:
Comparison of results from this analysis (template) with those of the CMS 8 TeV unfolding analysis [19], and SM predictions from theoretical calculations of K{u}hn and Rodrigo [8], Bernreuther and Si [9], POWHEG, and mc@nlo. The shaded bands correspond to 68% and 95% confidence intervals of the current measurement. The inner bars on the CMS measurements indicate the statistical uncertainty, the outer bars the statistical and systematic uncertainty added in quadrature. |
| Tables | |
png pdf |
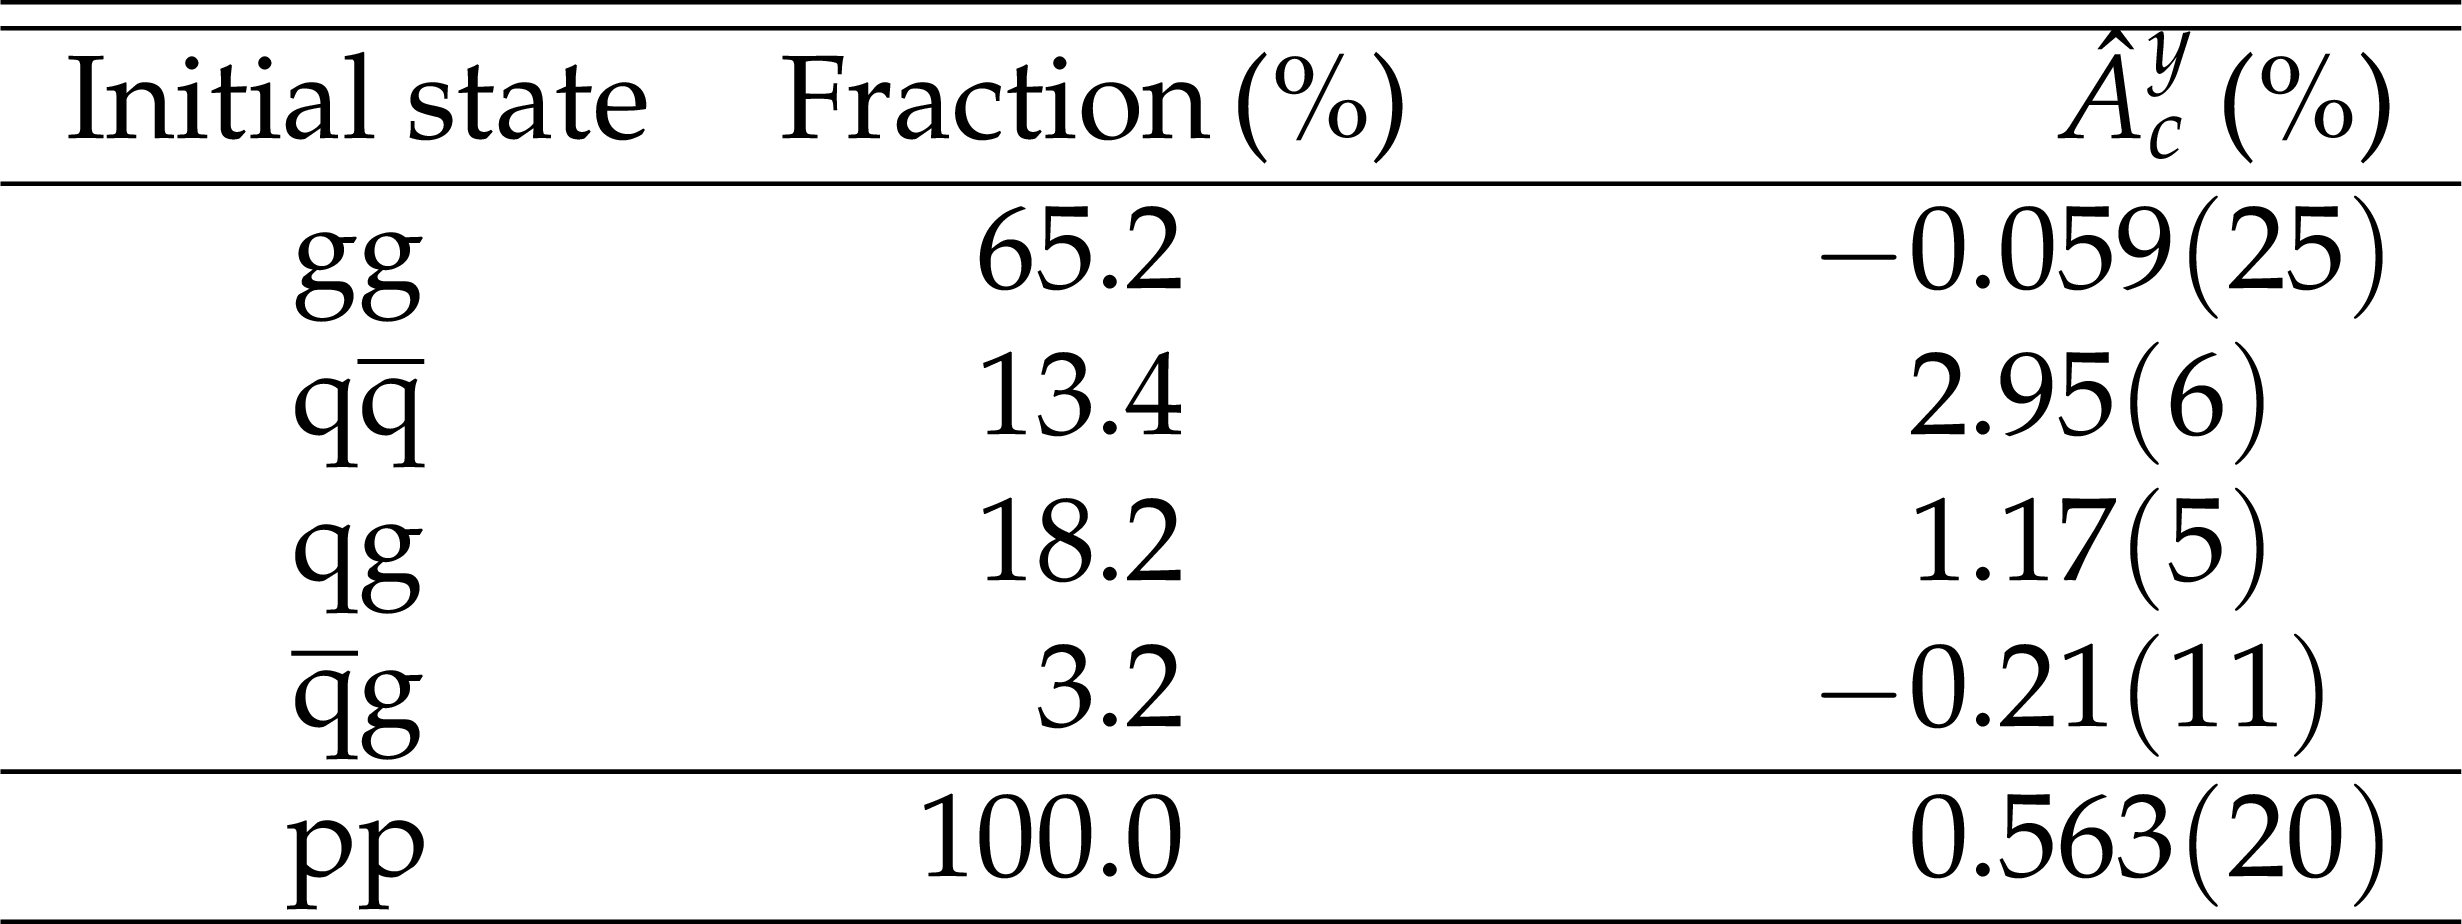
Table 1:
The $ {\mathrm {t}\overline {\mathrm {t}}} $ initial-state fractions and charge asymmetries in the observable $ {\varUpsilon _{{\mathrm {t}\overline {\mathrm {t}}}}} $, calculated with POWHEG using the CT10 PDFs. The statistical uncertainty in the last digits is indicated in parentheses. |
png pdf |
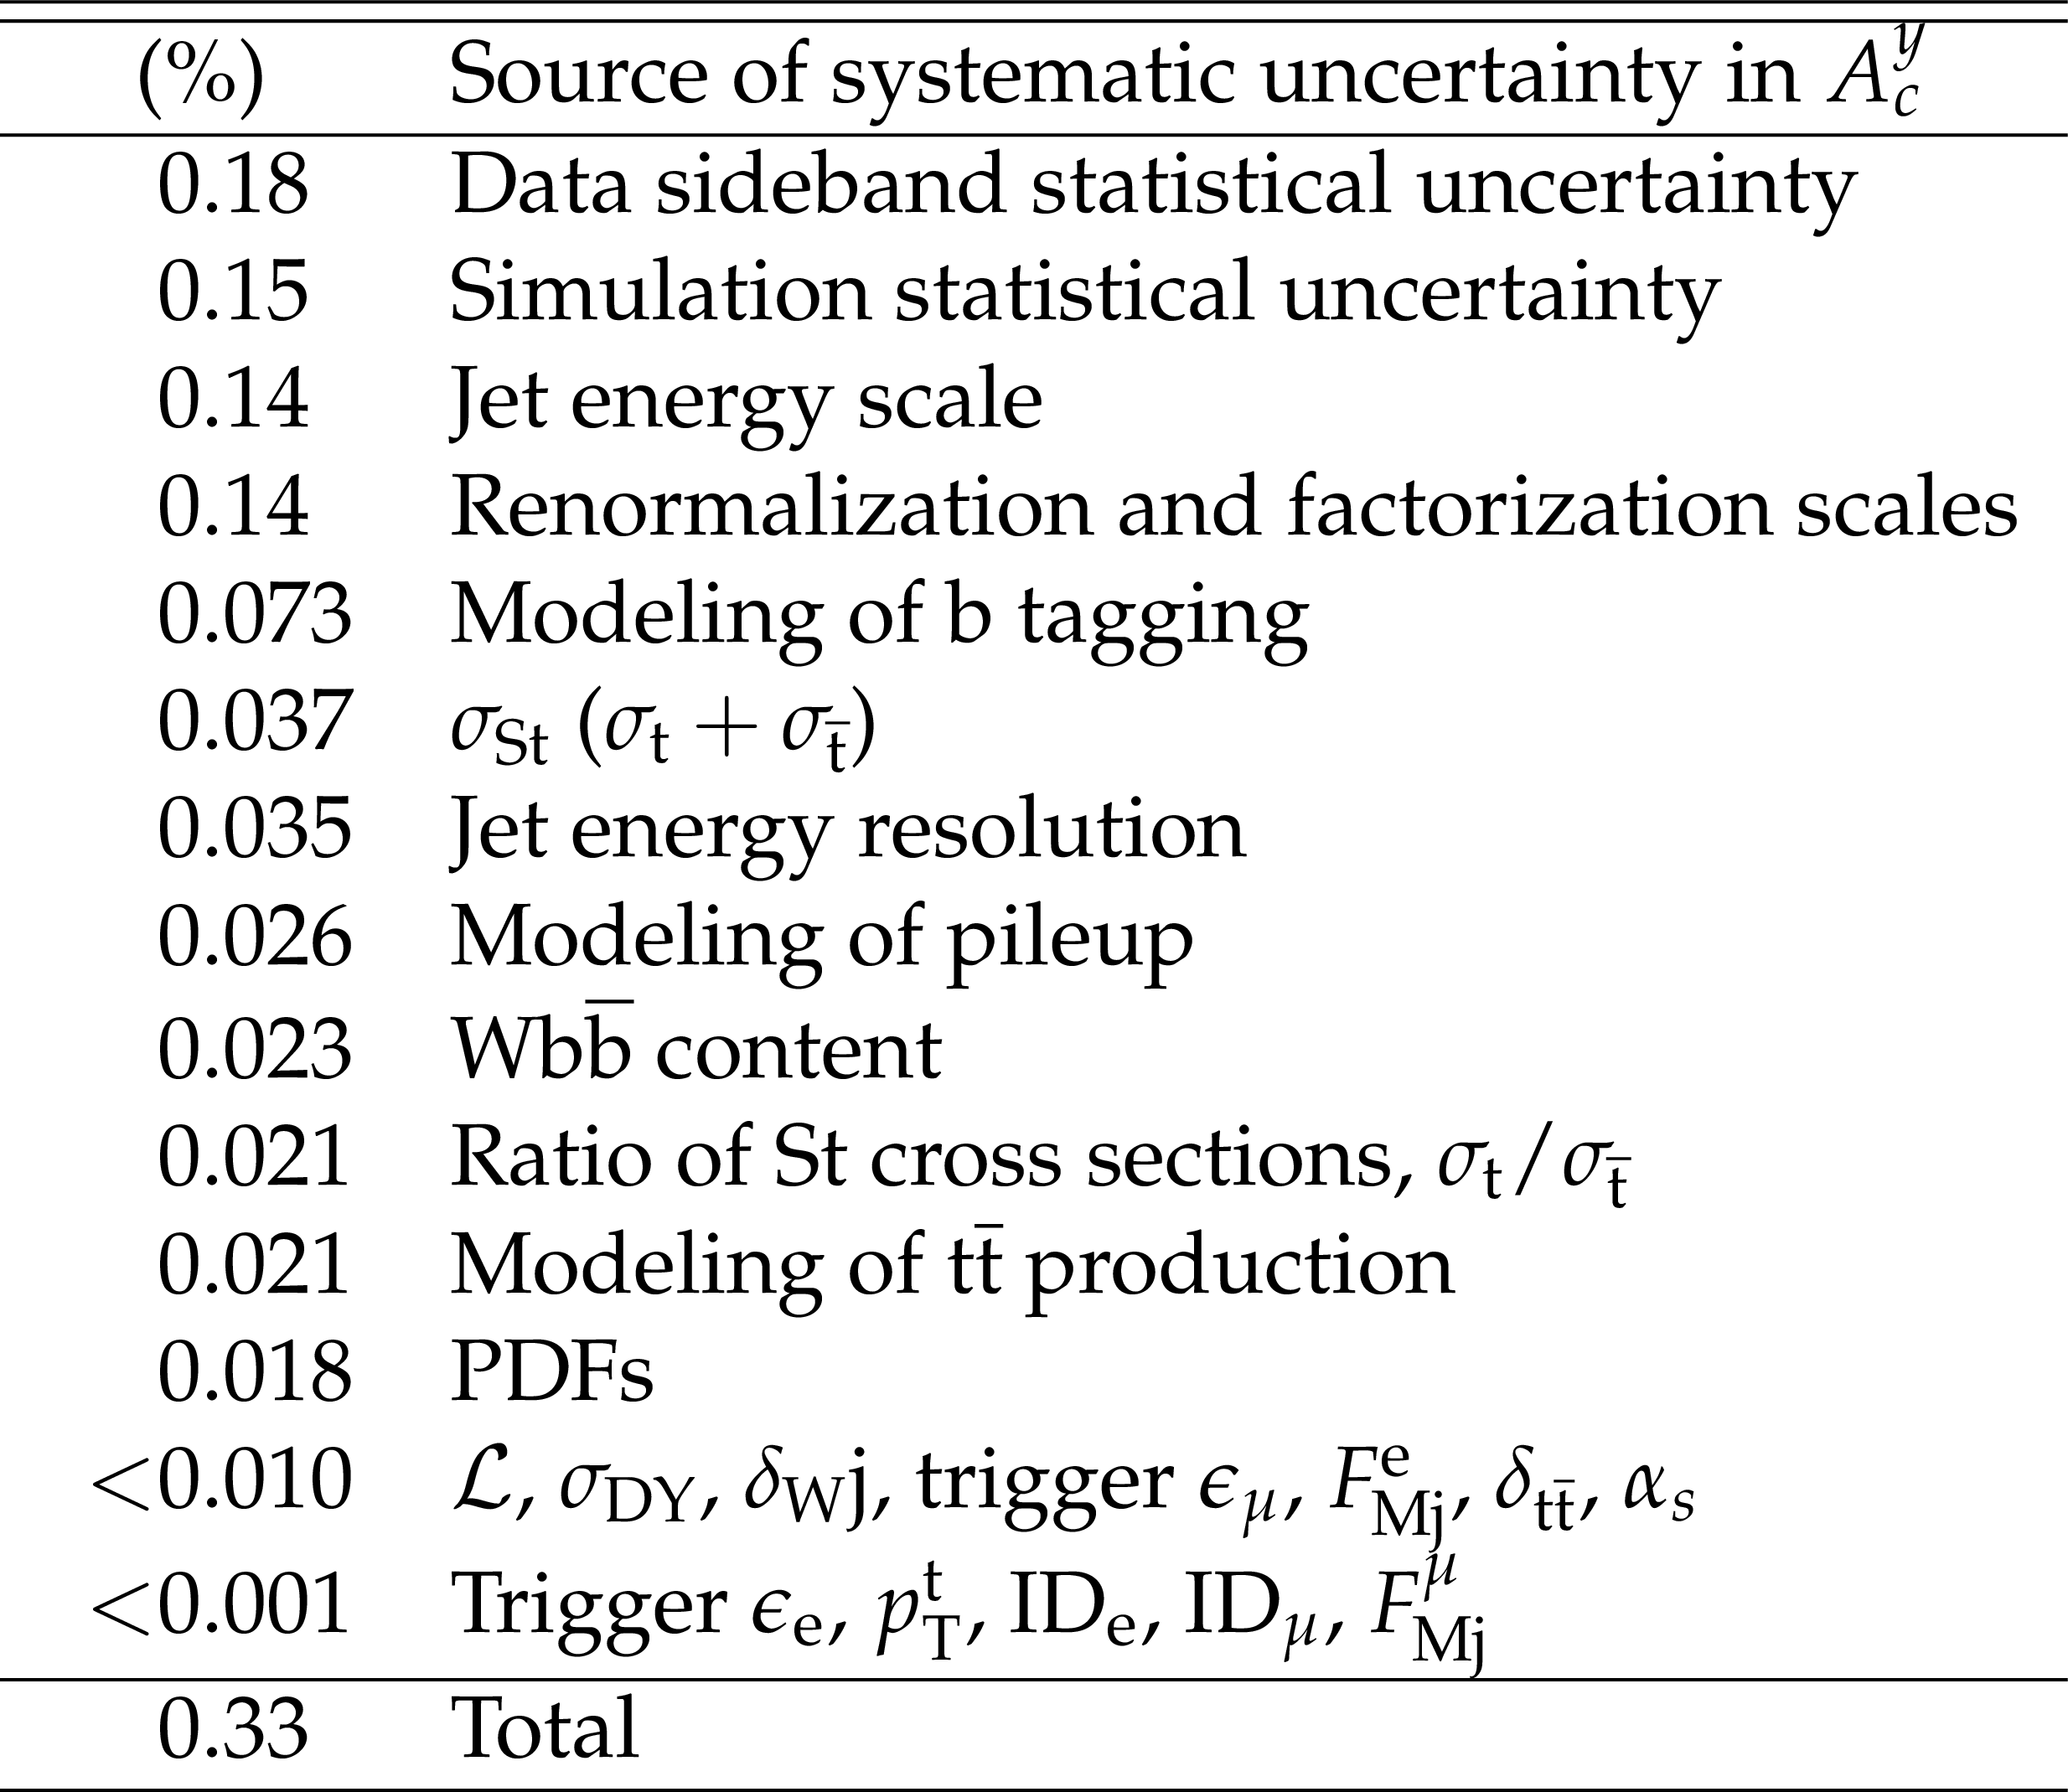
Table 2:
Uncertainty in the combined measurement of $A_c^y$ from systematic sources, ordered by decreasing magnitude. |

png pdf |
Table 3:
Results from the fit of the sample composition, in thousands of events, for the e+jets and $\mu$+jets channels. The statistical uncertainty in the last digits is indicated in parentheses. The results of the simultaneous fit in both channels are included only for comparison and are not used in the measurement of $A_c^{y}$. |
png pdf |
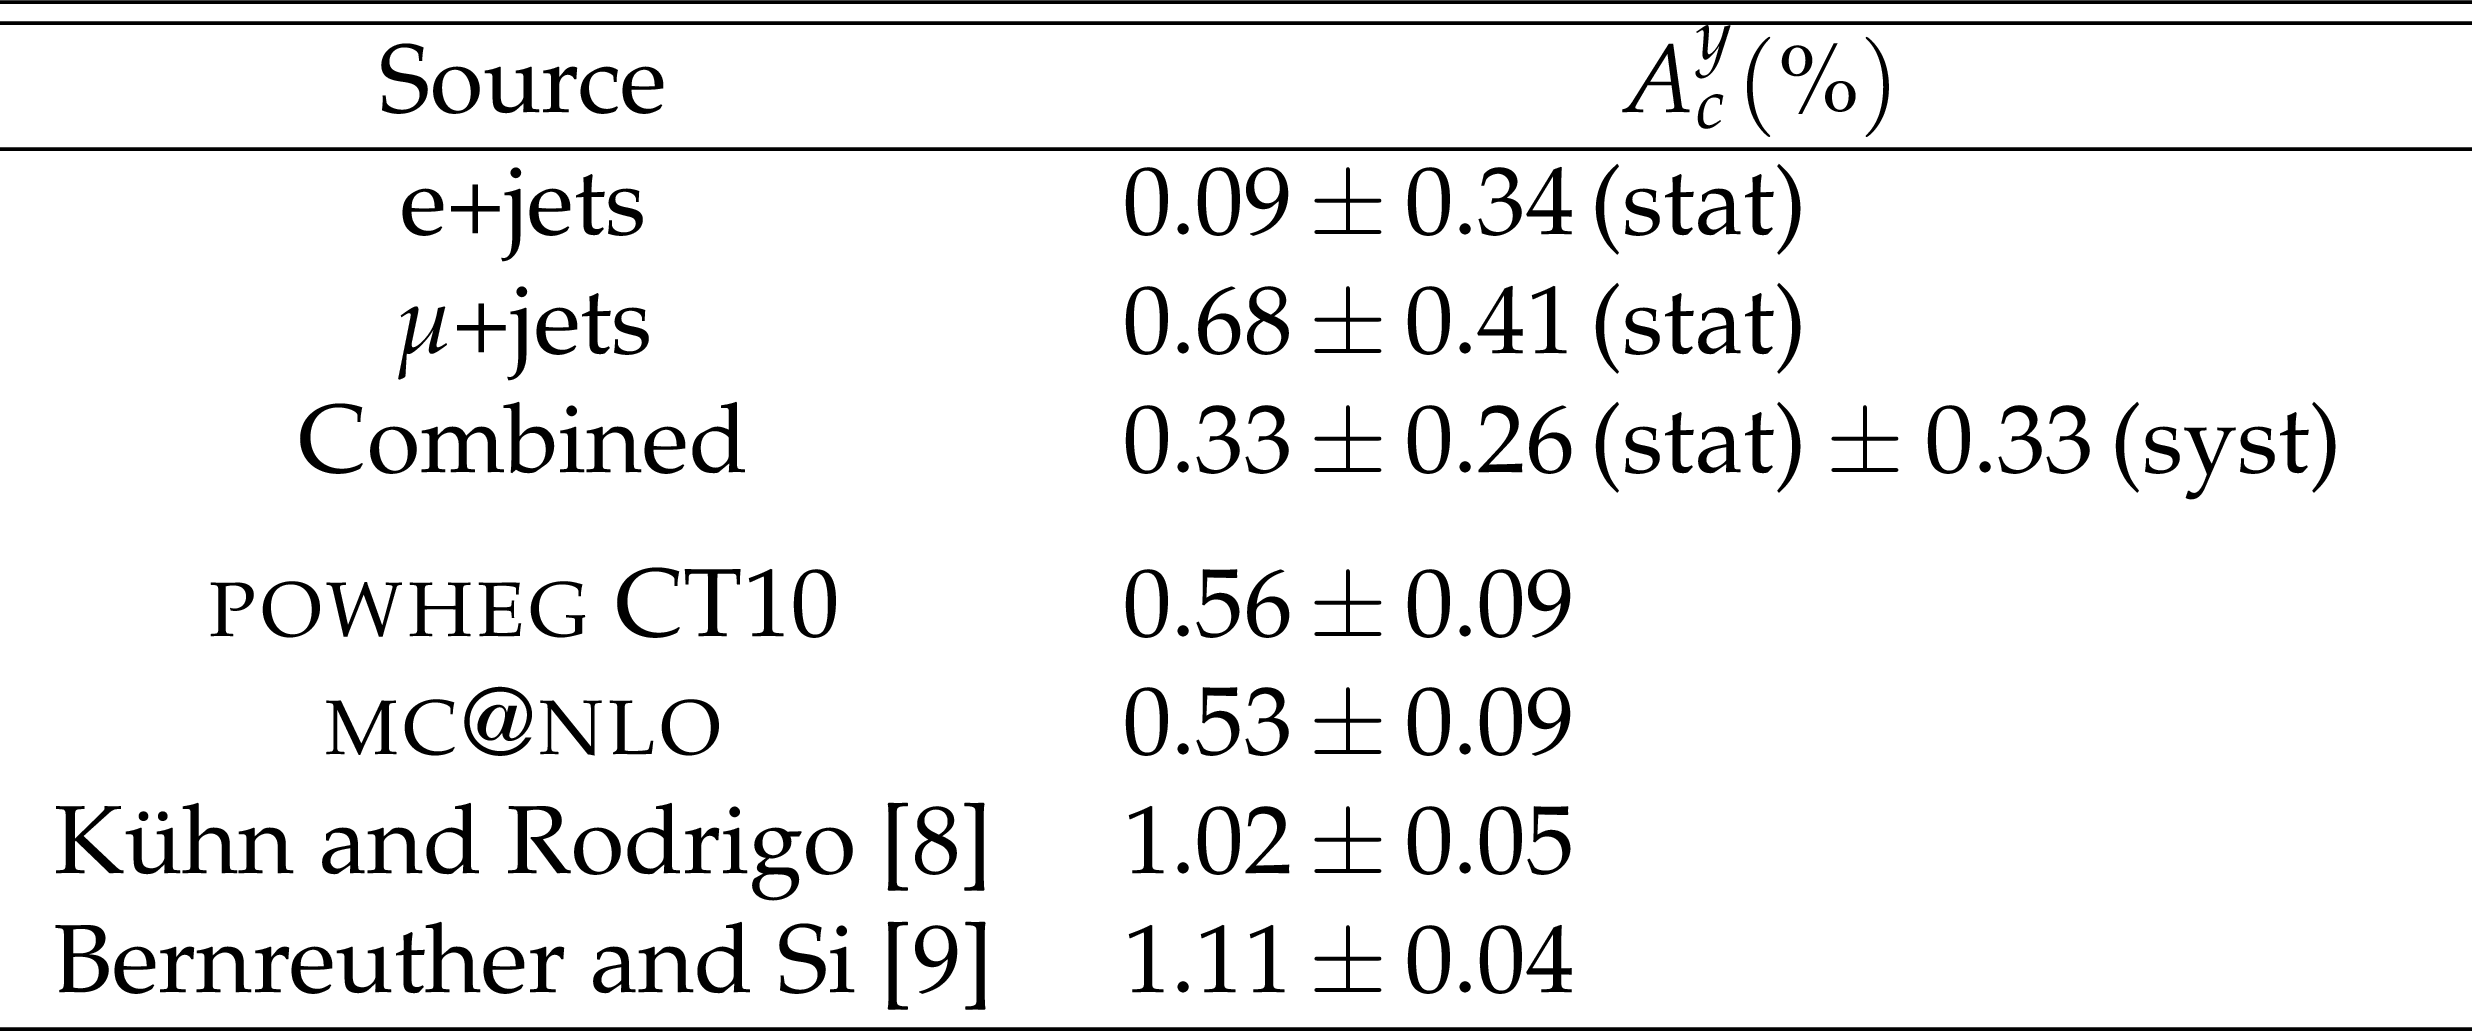
Table 4:
Comparison of charge asymmetry measurements and predictions. |
| Summary |
| The forward-central $\mathrm{t\bar{t}} $ charge asymmetry in proton-proton collisions at 8 TeV center-of-mass energy has been measured using lepton+jets events from data corresponding to an integrated luminosity of 19.6 fb$^{-1}$ . Novel techniques in top quark reconstruction and background discrimination have been employed, which are likely to be of interest in future analyses. The measurement utilizes a template technique based on a parametrization of the SM. The result, $A_c^y = $ [ 0.33 $\pm$ 0.26 (stat) $\pm$ 0.33 (syst) ]%, is the most precise to date. It is consistent with SM predictions, but does not rule out the alternative models considered. The forward-central $\mathrm{ t \bar{t} }$ charge asymmetry in proton-proton collisions at 8 TeV center-of-mass energy has been measured using lepton+jets events from data corresponding to an integrated luminosity of 19.6 fb$^{-1}$. Novel techniques in top quark reconstruction and background discrimination have been employed, which are likely to be of interest in future analyses. The measurement utilizes a template technique based on a parametrization of the SM. The result, $A^y_c =$ 0.33 $\pm$ 0.26 (stat) $\pm$ 0.33 (syst) %, is the most precise to date. It is consistent with SM predictions, but does not rule out the alternative models considered. |
| References | ||||
| 1 | Particle Data Group Collaboration | Review of Particle Physics | CPC 38 (2014) 090001 | |
| 2 | P. H. Frampton and S. L. Glashow | Chiral Color: An Alternative to the Standard Model | PLB 190 (1987) 157 | |
| 3 | R. Budny | Effects of neutral weak currents in annihilation | PLB 45 (1973) 340 | |
| 4 | D0 Collaboration | Forward-backward asymmetry in top quark-antiquark production | PRD 84 (2011) 112005 | 1107.4995 |
| 5 | CDF Collaboration | Evidence for a Mass Dependent Forward-Backward Asymmetry in Top Quark Pair Production | PRD 83 (2011) 112003 | 1101.0034 |
| 6 | CDF Collaboration | Measurement of the top quark forward-backward production asymmetry and its dependence on event kinematic properties | PRD 87 (2013) 092002 | 1211.1003 |
| 7 | D0 Collaboration | Measurement of the forward-backward asymmetry in top quark-antiquark production in $ p\bar{p} $ collisions using the lepton $ + $ jets channel | PRD 90 (2014) 072011 | 1405.0421 |
| 8 | J. H. Kuhn and G. Rodrigo | Charge asymmetries of top quarks at hadron colliders revisited | JHEP 01 (2012) 063 | 1109.6830 |
| 9 | W. Bernreuther and Z.-G. Si | Top quark and leptonic charge asymmetries for the Tevatron and LHC | PRD 86 (2012) 034026 | 1205.6580 |
| 10 | CMS Collaboration | Search for narrow resonances using the dijet mass spectrum in $ pp $ collisions at $ \sqrt{s} = $ 8 ~TeV | PRD 87 (2013) 114015 | CMS-EXO-12-016 1302.4794 |
| 11 | ATLAS Collaboration | Search for new phenomena in the dijet mass distribution using pp collision data at $ \sqrt{s} = $ 8 TeV with the ATLAS detector | PRD 91 (2015) 052007 | 1407.1376 |
| 12 | ATLAS Collaboration | ATLAS search for new phenomena in dijet mass and angular distributions using pp collisions at $ \sqrt{s} = $ 7 TeV | JHEP 01 (2013) 029 | 1210.1718 |
| 13 | A. Carmona et al. | From Tevatron's top and lepton-based asymmetries to the LHC | JHEP 07 (2014) 005 | 1401.2443 |
| 14 | A. Atre, R. S. Chivukula, P. Ittisamai, and E. H. Simmons | Distinguishing color-octet and color-singlet resonances at the Large Hadron Collider | PRD 88 (2013) 055021 | 1306.4715 |
| 15 | CMS Collaboration | Measurement of the charge asymmetry in top-quark pair production in proton-proton collisions at $ \sqrt{s} = $ 7 TeV | PLB 709 (2012) 28 | CMS-TOP-11-014 1112.5100 |
| 16 | CMS Collaboration | Inclusive and differential measurements of the $ \mathrm{t}\overline{\mathrm{t}} $ charge asymmetry in proton-proton collisions at $ \sqrt{s} = $ 7 TeV | PLB 717 (2012) 129 | CMS-TOP-11-030 1207.0065 |
| 17 | ATLAS Collaboration | Measurement of the charge asymmetry in top quark pair production in pp collisions at $ \sqrt{s} = $ 7 TeV using the ATLAS detector | EPJC 72 (2012) 2039 | 1203.4211 |
| 18 | ATLAS Collaboration | Measurement of the top quark pair production charge asymmetry in proton-proton collisions at $ \sqrt{s} = $ 7 TeV using the ATLAS detector | JHEP 02 (2014) 107 | 1311.6724 |
| 19 | CMS Collaboration | Inclusive and differential measurements of the $ \mathrm{t}\overline{\mathrm{t}} $ charge asymmetry in pp collisions at $ \sqrt{s} = $ 8 TeV | Submitted to PLB | CMS-TOP-12-033 1507.03119 |
| 20 | S. Frixione, P. Nason, and G. Ridolfi | A positive-weight next-to-leading-order Monte Carlo for heavy flavour hadroproduction | JHEP 09 (2007) 126 | 0707.3088 |
| 21 | H.-L. Lai et al. | New parton distributions for collider physics | PRD 82 (2010) 074024 | 1007.2241 |
| 22 | CMS Collaboration | Particle--flow event reconstruction in CMS and performance for jets, taus, and $ E_{\mathrm{T}}^{\text{miss}} $ | CMS-PAS-PFT-09-001 | |
| 23 | CMS Collaboration | Commissioning of the particle-flow event reconstruction with the first LHC collisions recorded in the CMS detector | CMS-PAS-PFT-10-001 | |
| 24 | CMS Collaboration | Performance of electron reconstruction and selection with the CMS detector in proton-proton collisions at $ \sqrt{s} = $ 8 TeV | JINST 10 (2015) P06005 | CMS-EGM-13-001 1502.02701 |
| 25 | M. Cacciari, G. P. Salam, and G. Soyez | The anti-$ k_t $ jet clustering algorithm | JHEP 04 (2008) 063 | 0802.1189 |
| 26 | CMS Collaboration | Determination of jet energy calibration and transverse momentum resolution in CMS | JINST 6 (2011) P11002 | CMS-JME-10-011 1107.4277 |
| 27 | CMS Collaboration | Identification of b-quark jets with the CMS experiment | JINST 8 (2013) P04013 | CMS-BTV-12-001 1211.4462 |
| 28 | CMS Collaboration | The CMS experiment at the CERN LHC | JINST 3 (2008) S08004 | CMS-00-001 |
| 29 | J. L. Leonard | Luminosity measurement at CMS | in Proceedings, 3rd International Conference on Technology and Instrumentation in Particle Physics (TIPP 2014), p. 348 SISSA, 2014PoS(TIPP2014)348 | |
| 30 | CMS Collaboration | Performance of CMS muon reconstruction in pp collision events at $ \sqrt{s} = $ 7 TeV | JINST 7 (2012) P10002 | CMS-MUO-10-004 1206.4071 |
| 31 | GEANT4 Collaboration | GEANT4---simulation toolkit | NIMA 506 (2003) 250 | |
| 32 | T. Sjostrand, S. Mrenna, and P. Z. Skands | PYTHIA 6.4 physics and manual | JHEP 05 (2006) 026 | hep-ph/0603175 |
| 33 | T. Sjostrand, S. Mrenna, and P. Z. Skands | A Brief Introduction to PYTHIA 8.1 | CPC 178 (2008) 852 | 0710.3820 |
| 34 | R. Corke and T. Sjostrand | Improved Parton Showers at Large Transverse Momenta | EPJC 69 (2010) 1 | 1003.2384 |
| 35 | J. Alwall et al. | MadGraph 5: going beyond | JHEP 06 (2011) 128 | 1106.0522 |
| 36 | J. Pumplin et al. | Parton distributions and the strong coupling: CTEQ6AB PDFs | JHEP 02 (2006) 032 | hep-ph/0512167 |
| 37 | S. Alioli, P. Nason, C. Oleari, and E. Re | NLO single-top production matched with shower in POWHEG: $ s $- and $ t $-channel contributions | JHEP 09 (2009) 111 | 0907.4076 |
| 38 | E. Re | Single-top $ W t $-channel production matched with parton showers using the POWHEG method | EPJC 71 (2011) 1547 | 1009.2450 |
| 39 | S. Frixione and B. R. Webber | Matching NLO QCD computations and parton shower simulations | JHEP 06 (2002) 029 | hep-ph/0204244 |
| 40 | A. Giammanco | The Fast Simulation of the CMS Experiment | J. Phys. Conf. Ser. 513 (2014) 022012 | |
| 41 | S. Jung, A. Pierce, and J. D. Wells | Top quark asymmetry from a non-Abelian horizontal symmetry | PRD 83 (2011) 114039 | 1103.4835 |
| 42 | B. A. Betchart, R. Demina, and A. Harel | Analytic solutions for neutrino momenta in decay of top quarks | NIMA 736 (2014) 169 | 1305.1878 |
| 43 | B. L. Welch | Note on discriminant functions | Biometrika 31 (1939) 218 | |
| 44 | W. Verkerke and D. P. Kirkby | The RooFit toolkit for data modeling | in Proceedings of the 13th Int. Conf. for Computing in High-Energy and Nuclear Phys 2003 | physics/0306116 |
| 45 | M. Botje et al. | The PDF4LHC Working Group Interim Recommendations | 1101.0538 | |
| 46 | J. M. Campbell and R. K. Ellis | MCFM for the Tevatron and the LHC | NPPS 205 (2010) 10 | 1007.3492 |
|
|
Compact Muon Solenoid LHC, CERN |
|

|

|

|

|

|