

Compact Muon Solenoid
LHC, CERN
| CMS-TOP-16-005 ; CERN-EP/2016-265 | ||
| Measurement of the $\mathrm{ t \bar{t} }$ production cross section using events in the e$\mu$ final state in pp collisions at $ \sqrt{s} = $ 13 TeV | ||
| CMS Collaboration | ||
| 13 November 2016 | ||
| EPJC 77 (2017) 172 | ||
| Abstract: The cross section of top quark-antiquark pair production in proton-proton collisions at $ \sqrt{s} = $ 13 TeV is measured by the CMS experiment at the LHC, using data corresponding to an integrated luminosity of 2.2 fb$^{-1}$. The measurement is performed by analyzing events in which the final state includes one electron, one muon, and two or more jets, at least one of which is identified as originating from hadronization of a b quark. The measured cross section is 815 $\pm$ 9 (stat) $\pm$ 38 (syst) $\pm$ 19 (lumi) pb, in agreement with the expectation from the standard model. | ||
| Links: e-print arXiv:1611.04040 [hep-ex] (PDF) ; CDS record ; inSPIRE record ; HepData record ; CADI line (restricted) ; | ||
| Figures | |
png pdf |
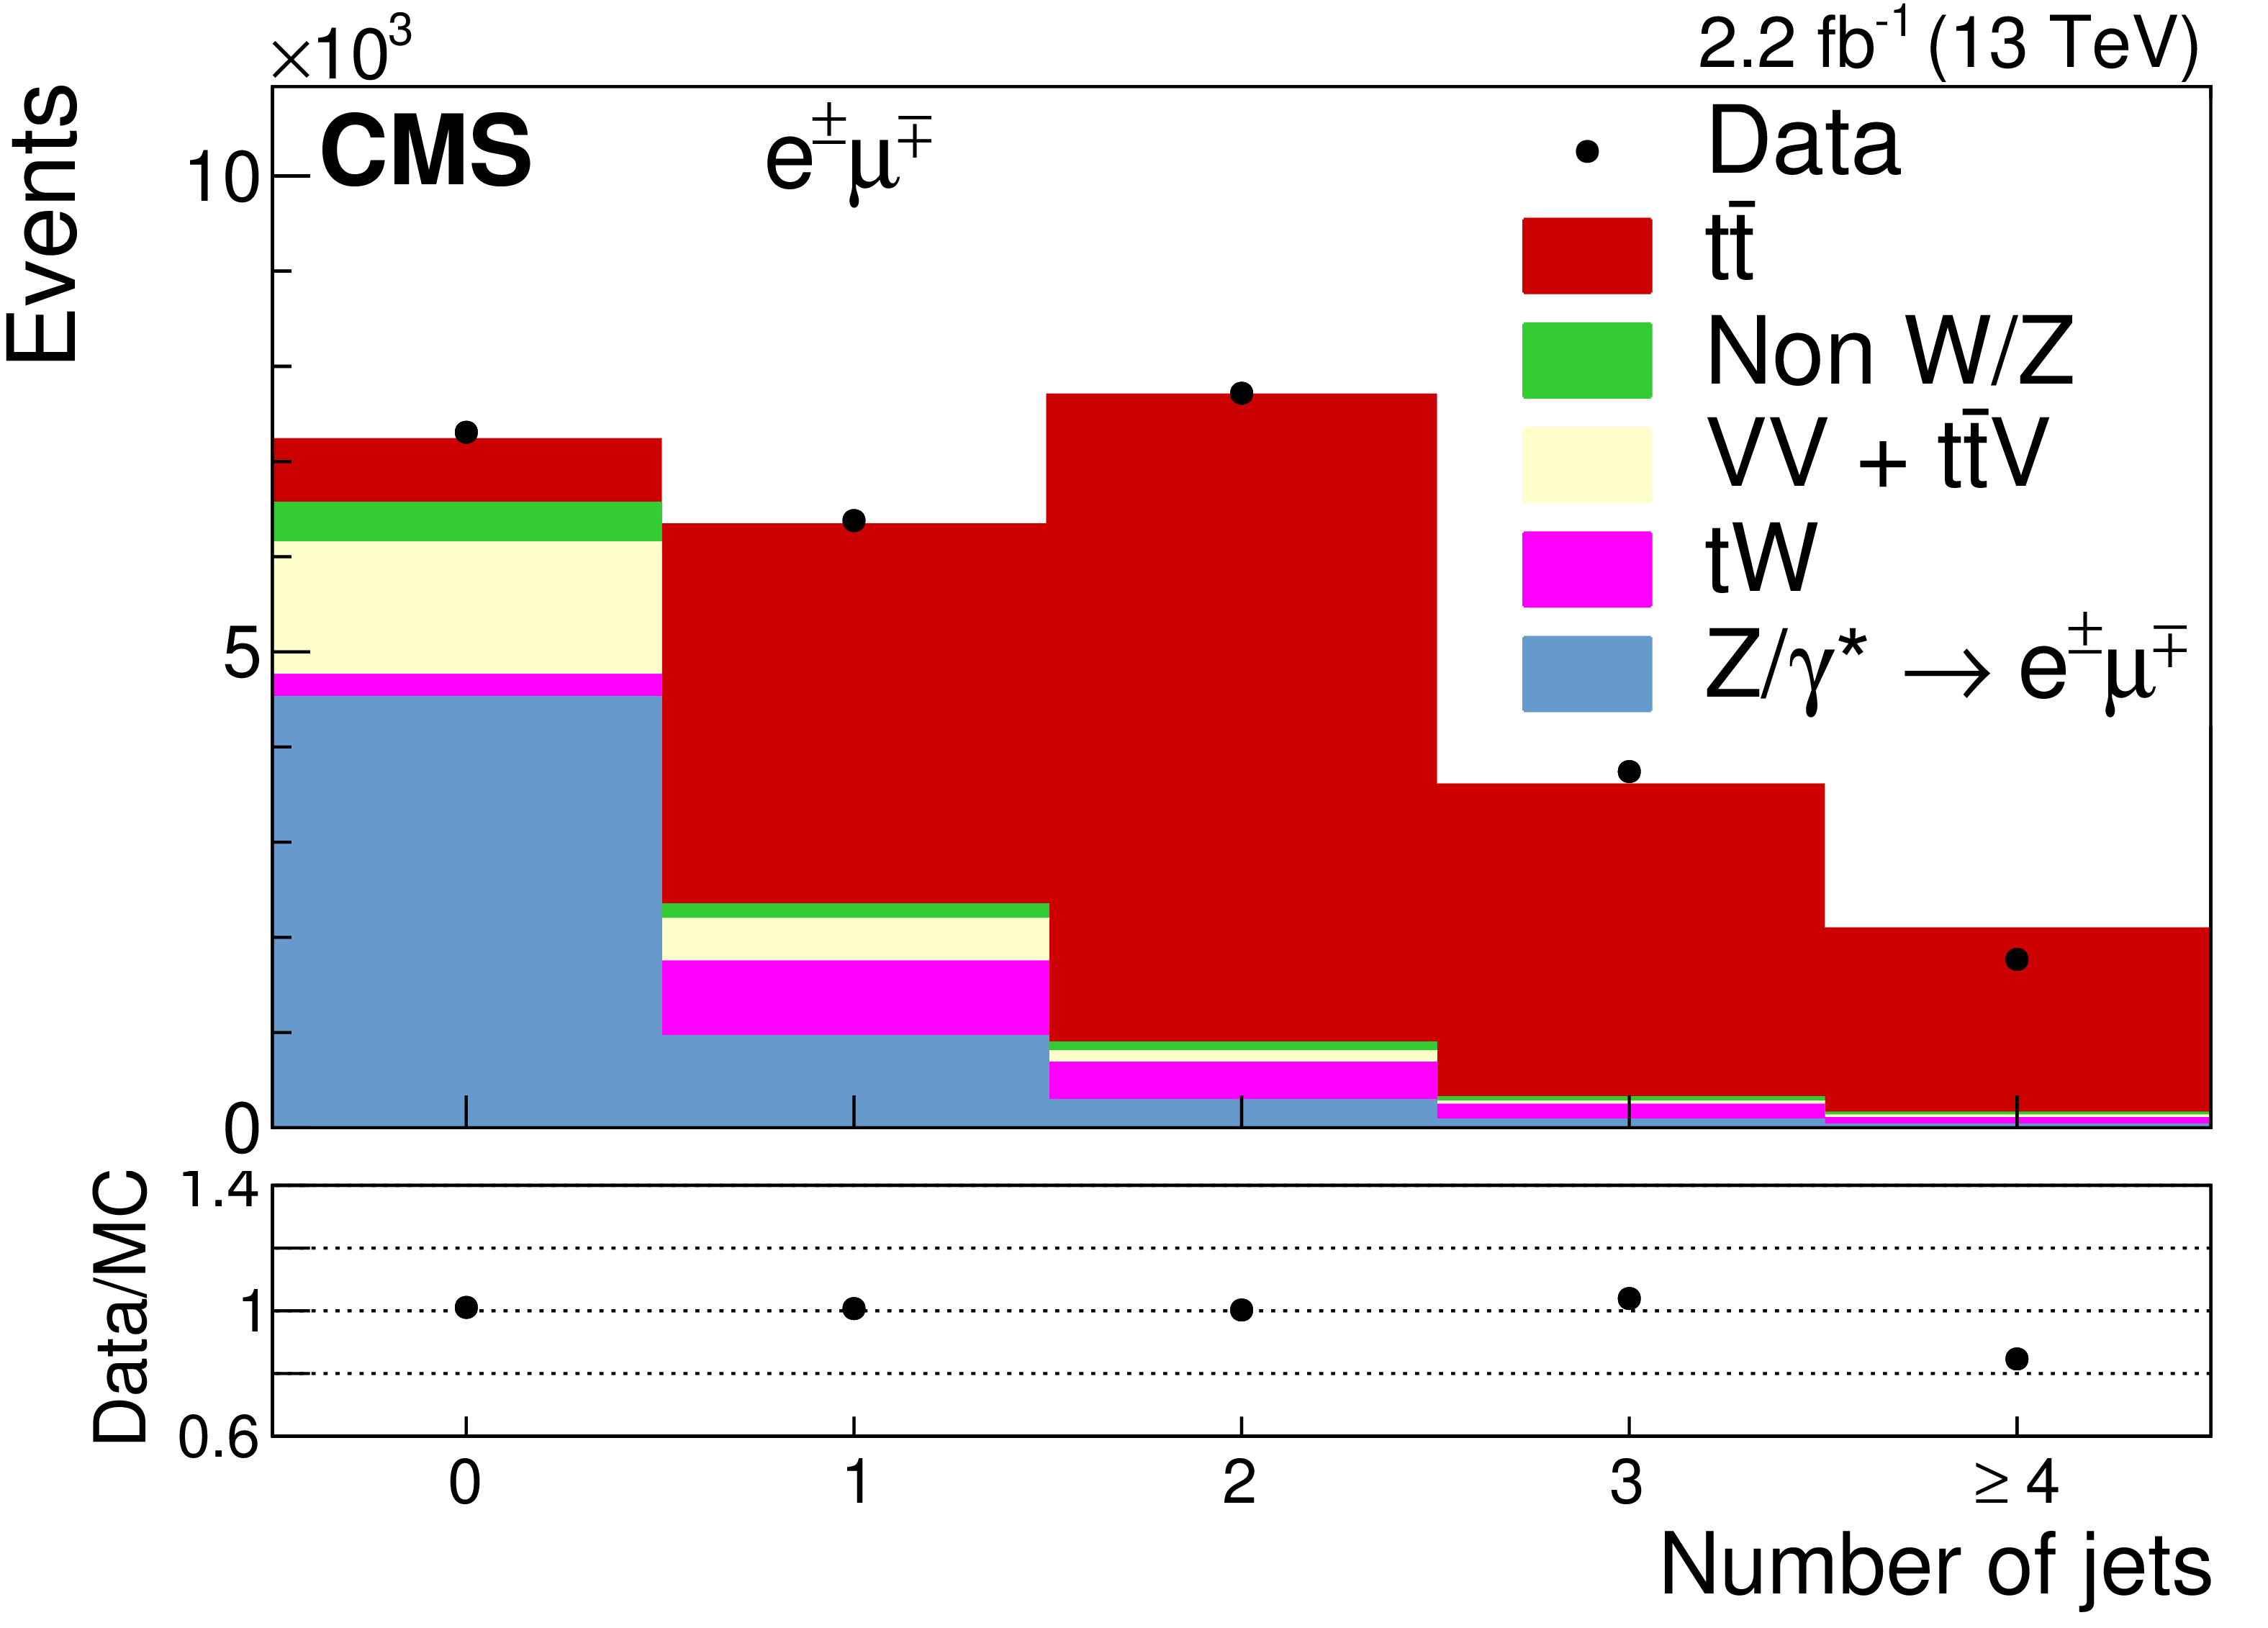
Figure 1:
Distribution of the jet multiplicity in events passing the dilepton selection criteria. The expected distributions for $ {\mathrm{ t } {}\mathrm{ \bar{t} } } $ signal and individual backgrounds are shown after corrections based on control regions in data are applied; the last bin contains the overflow events. The ratio of data to the sum of the expected yields is given at the bottom of the figure. The error bars, which are within the size of the points, indicate the statistical uncertainties. |
png pdf |
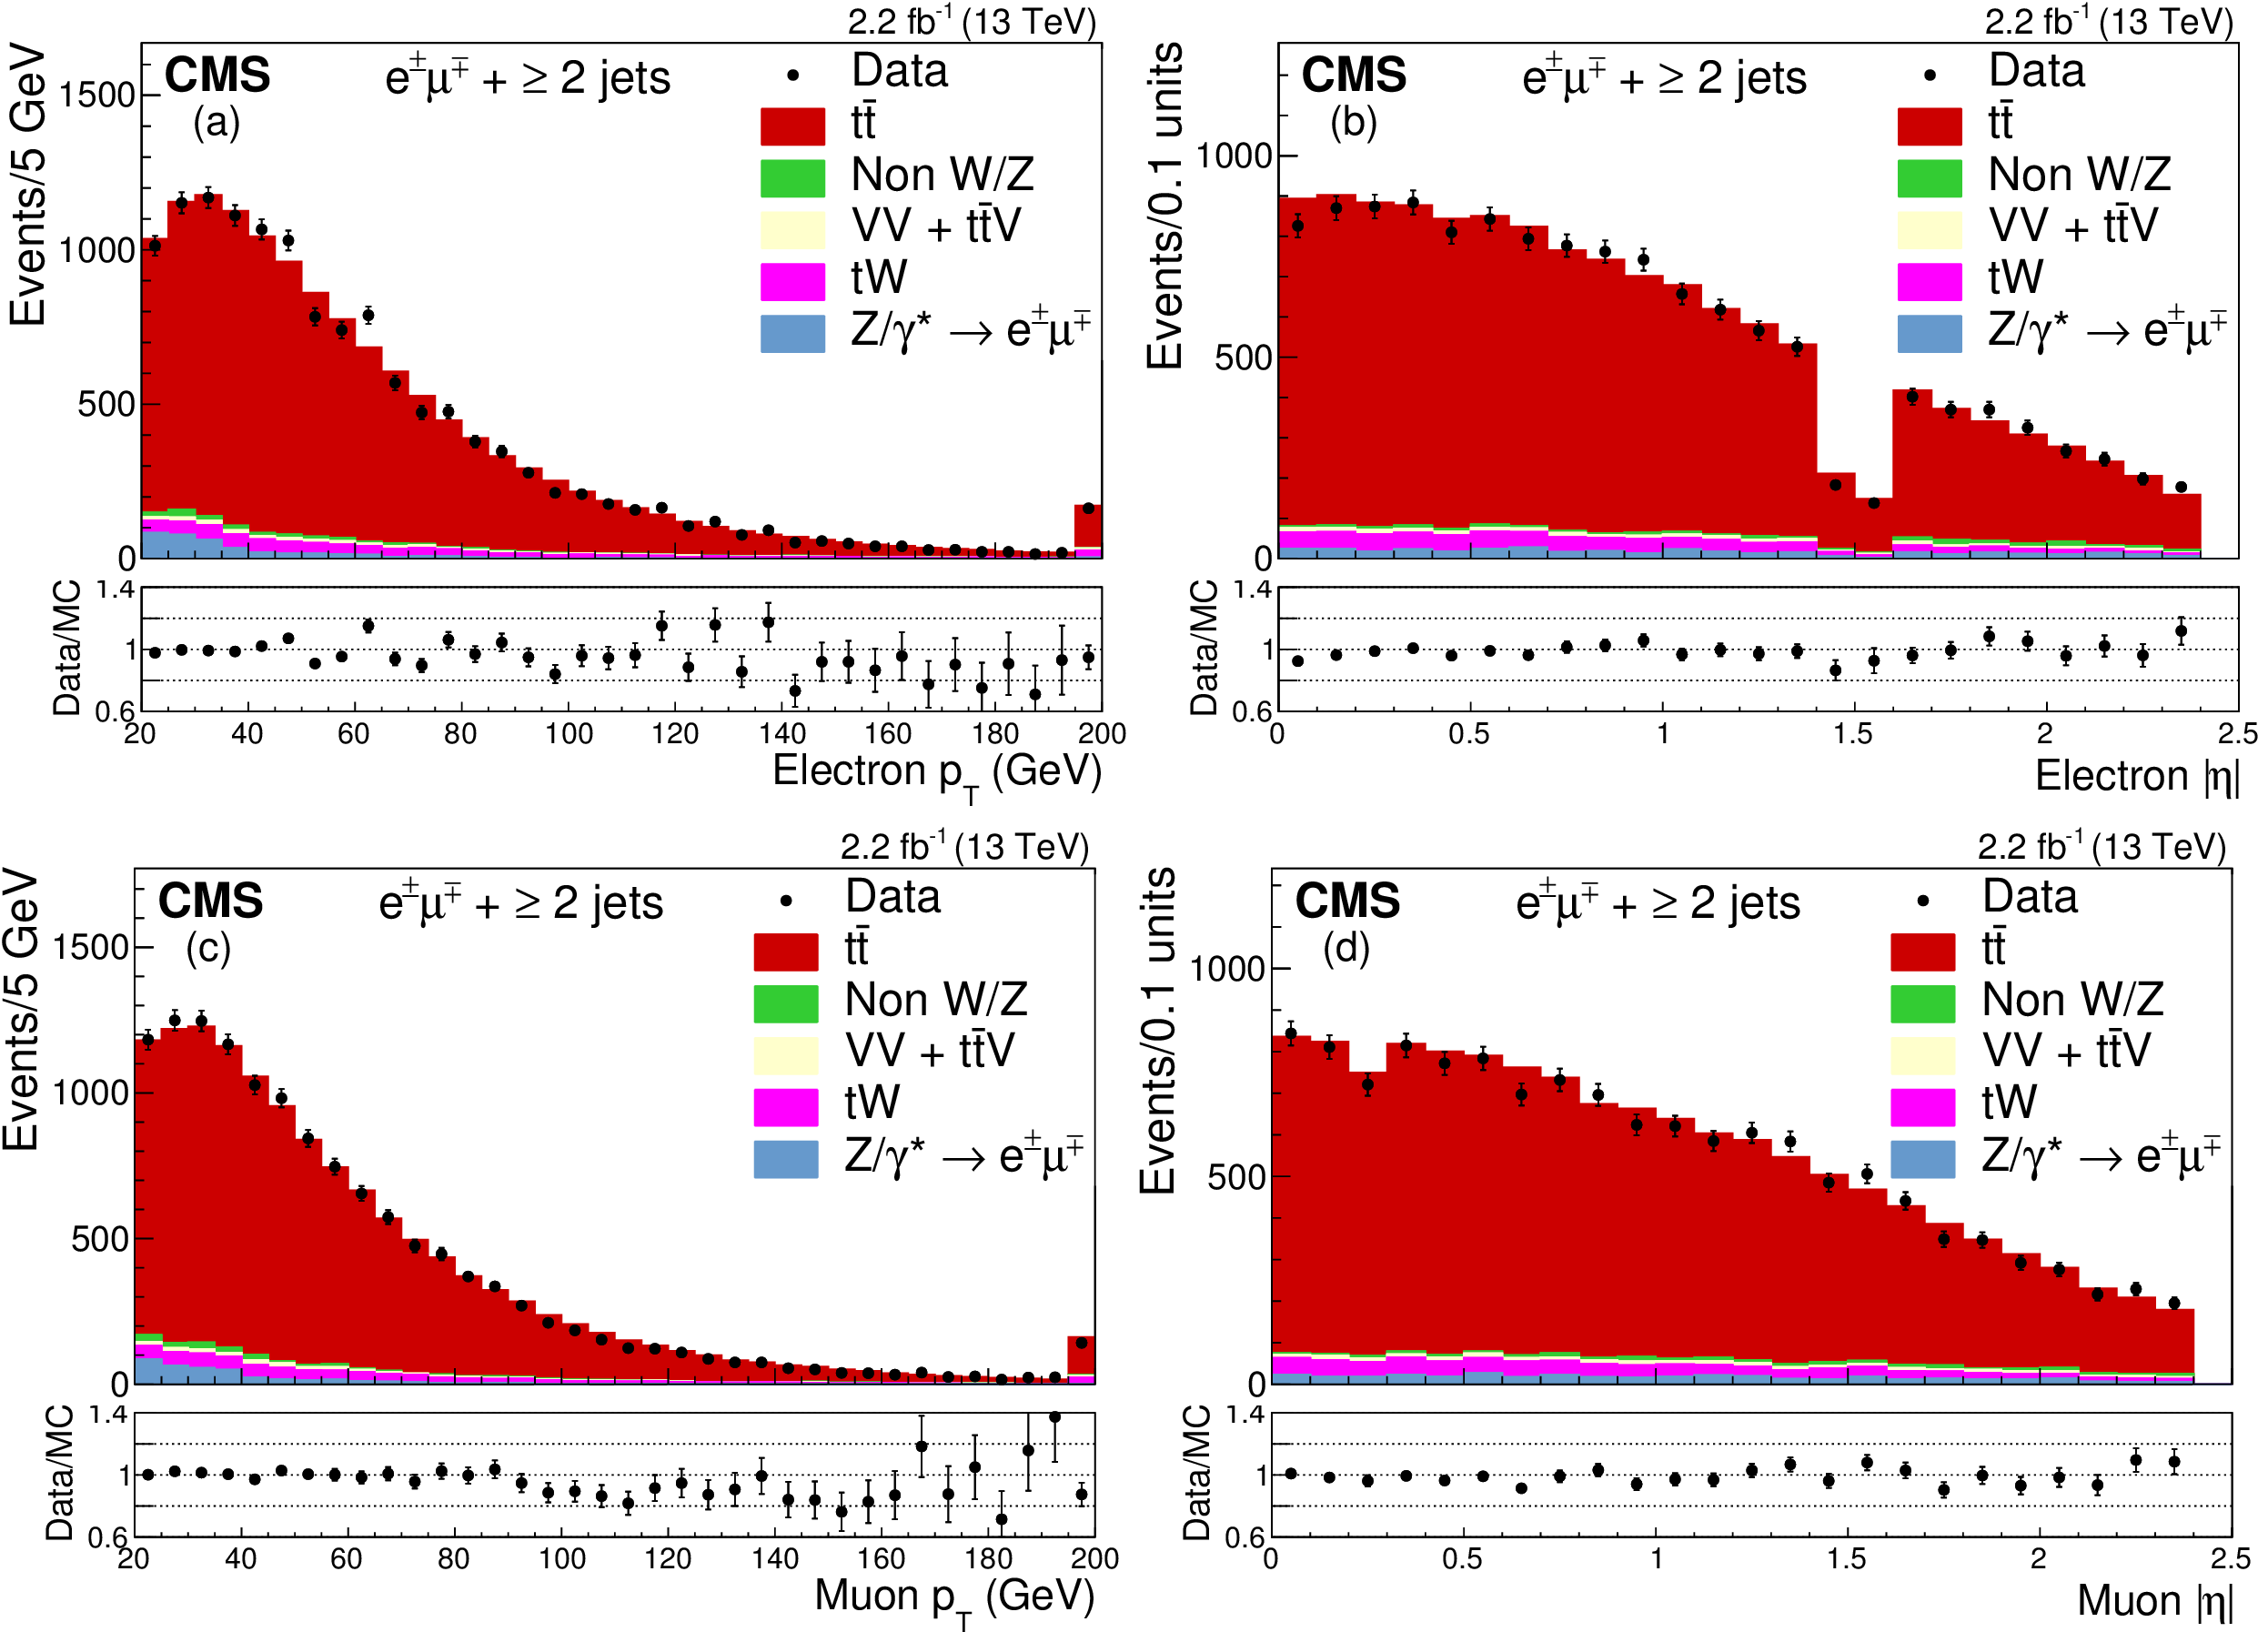
Figure 2:
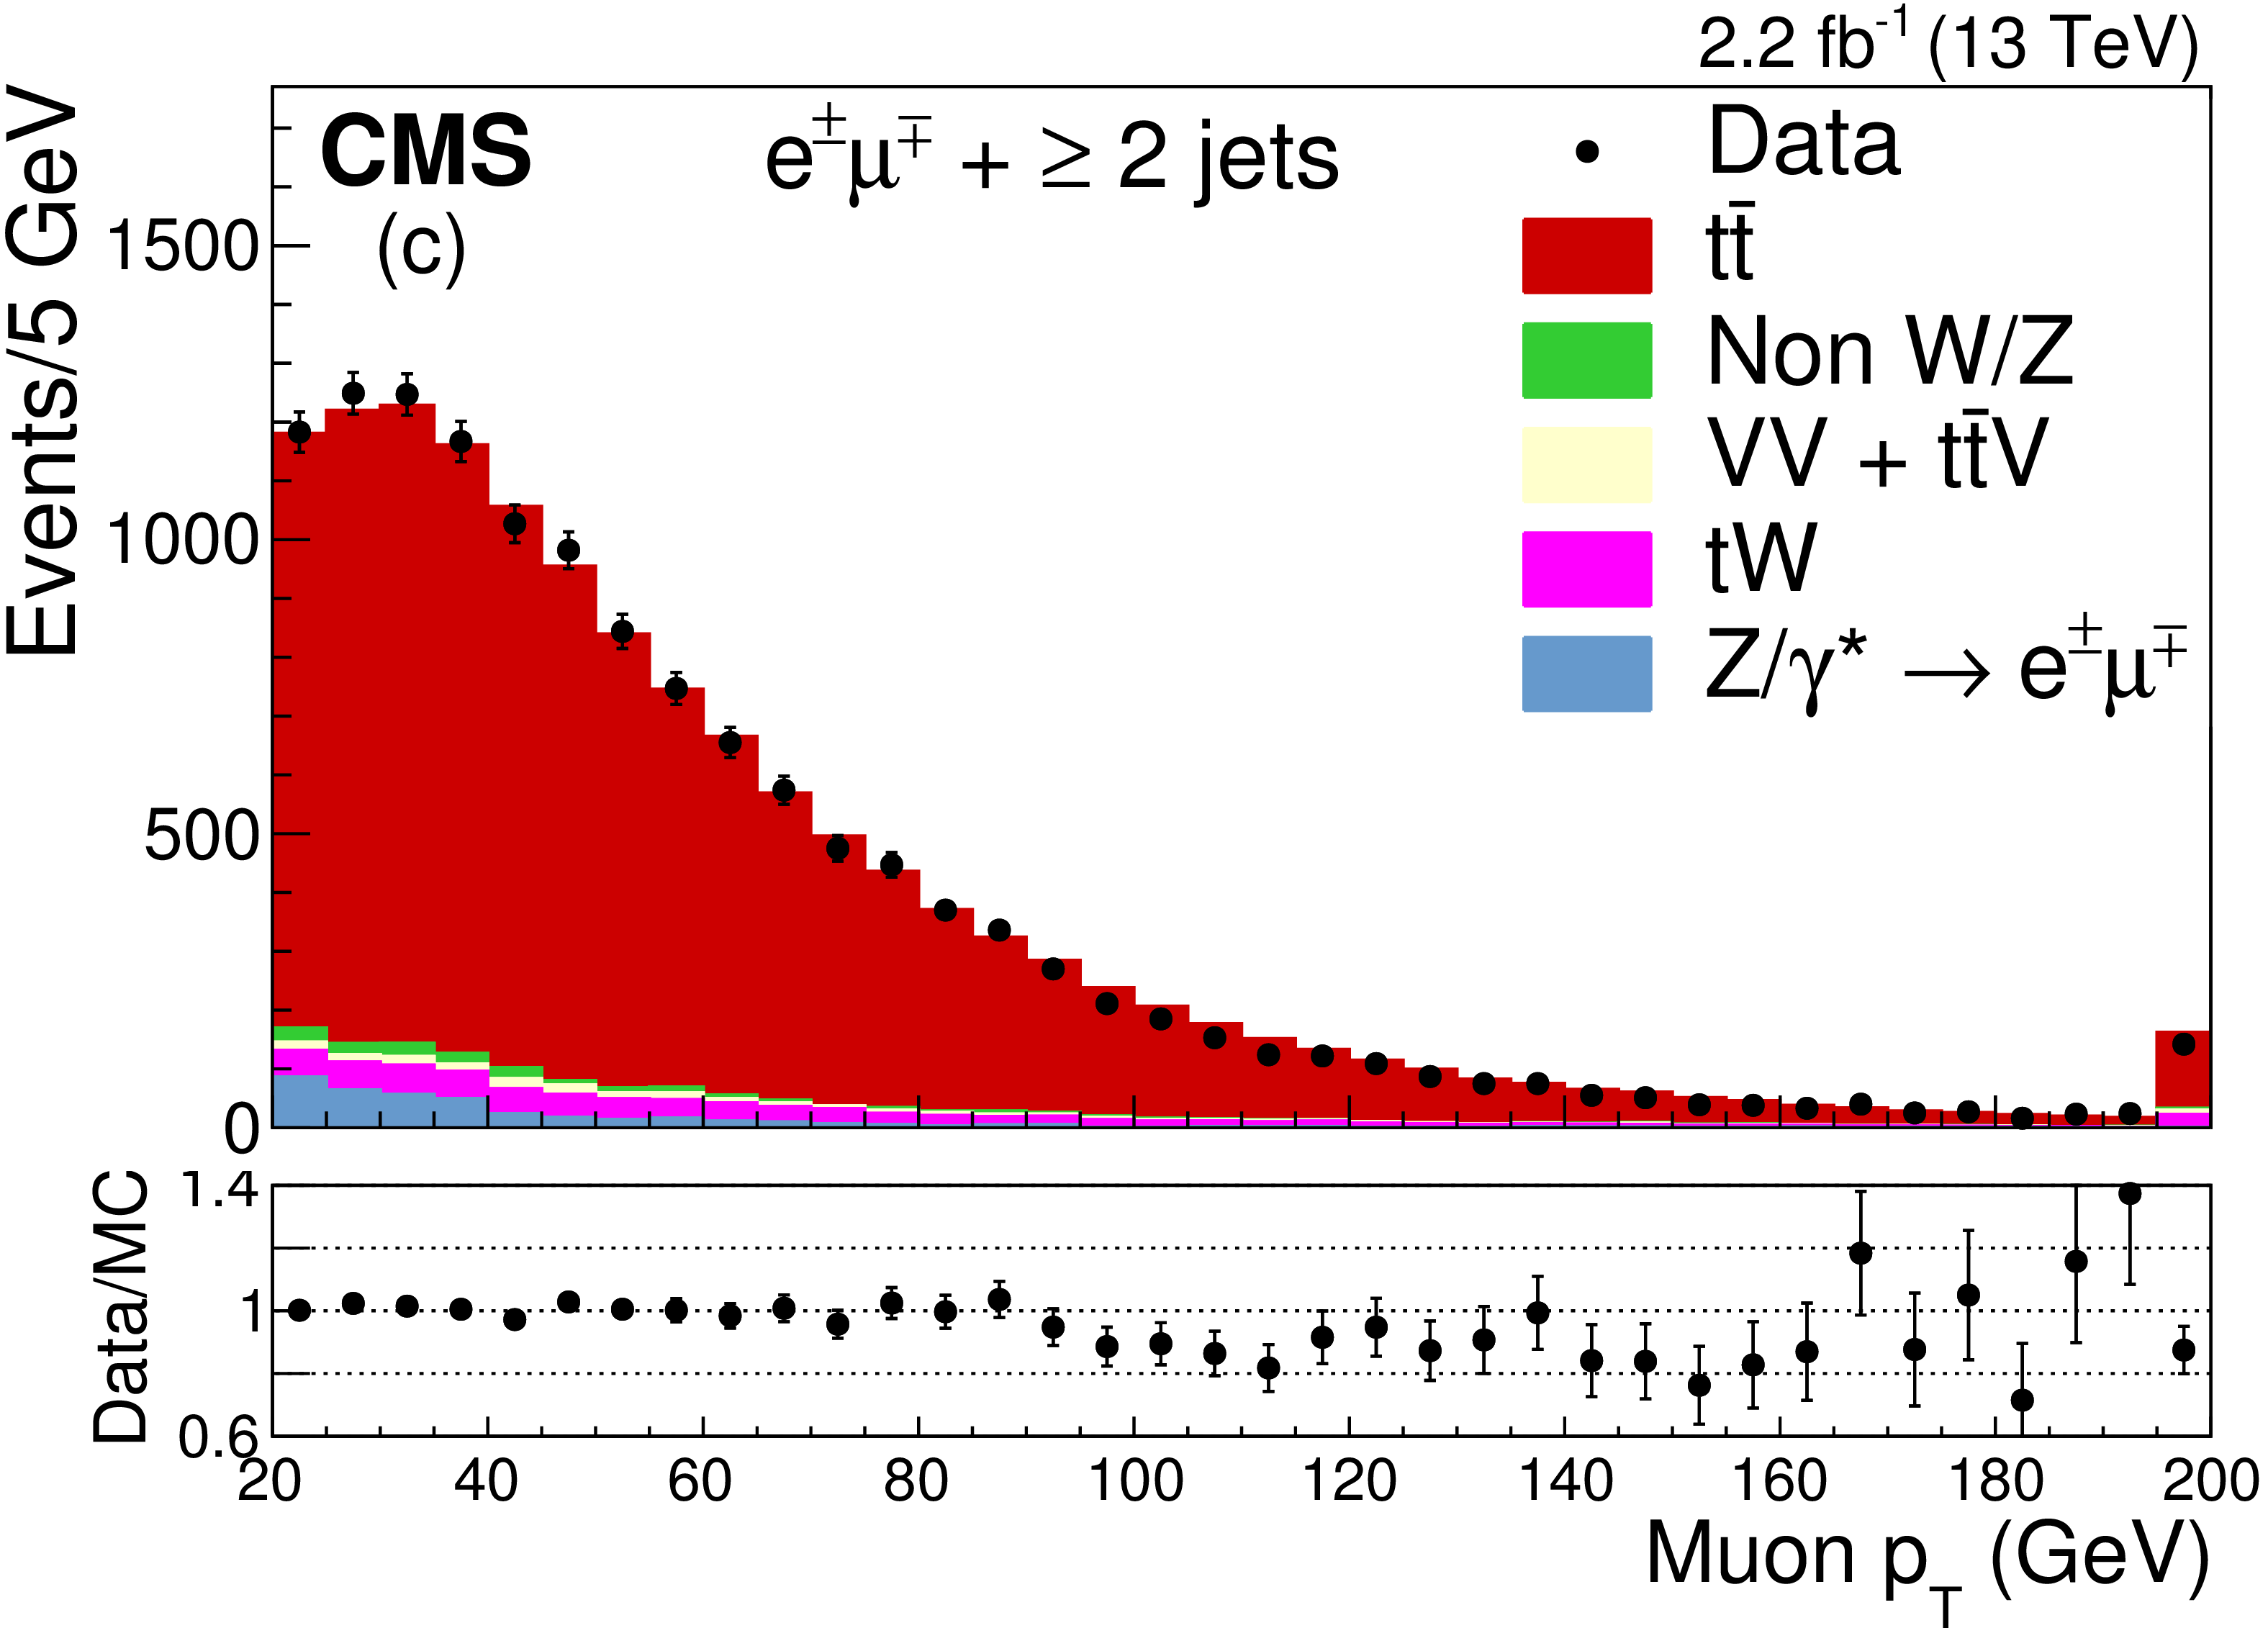
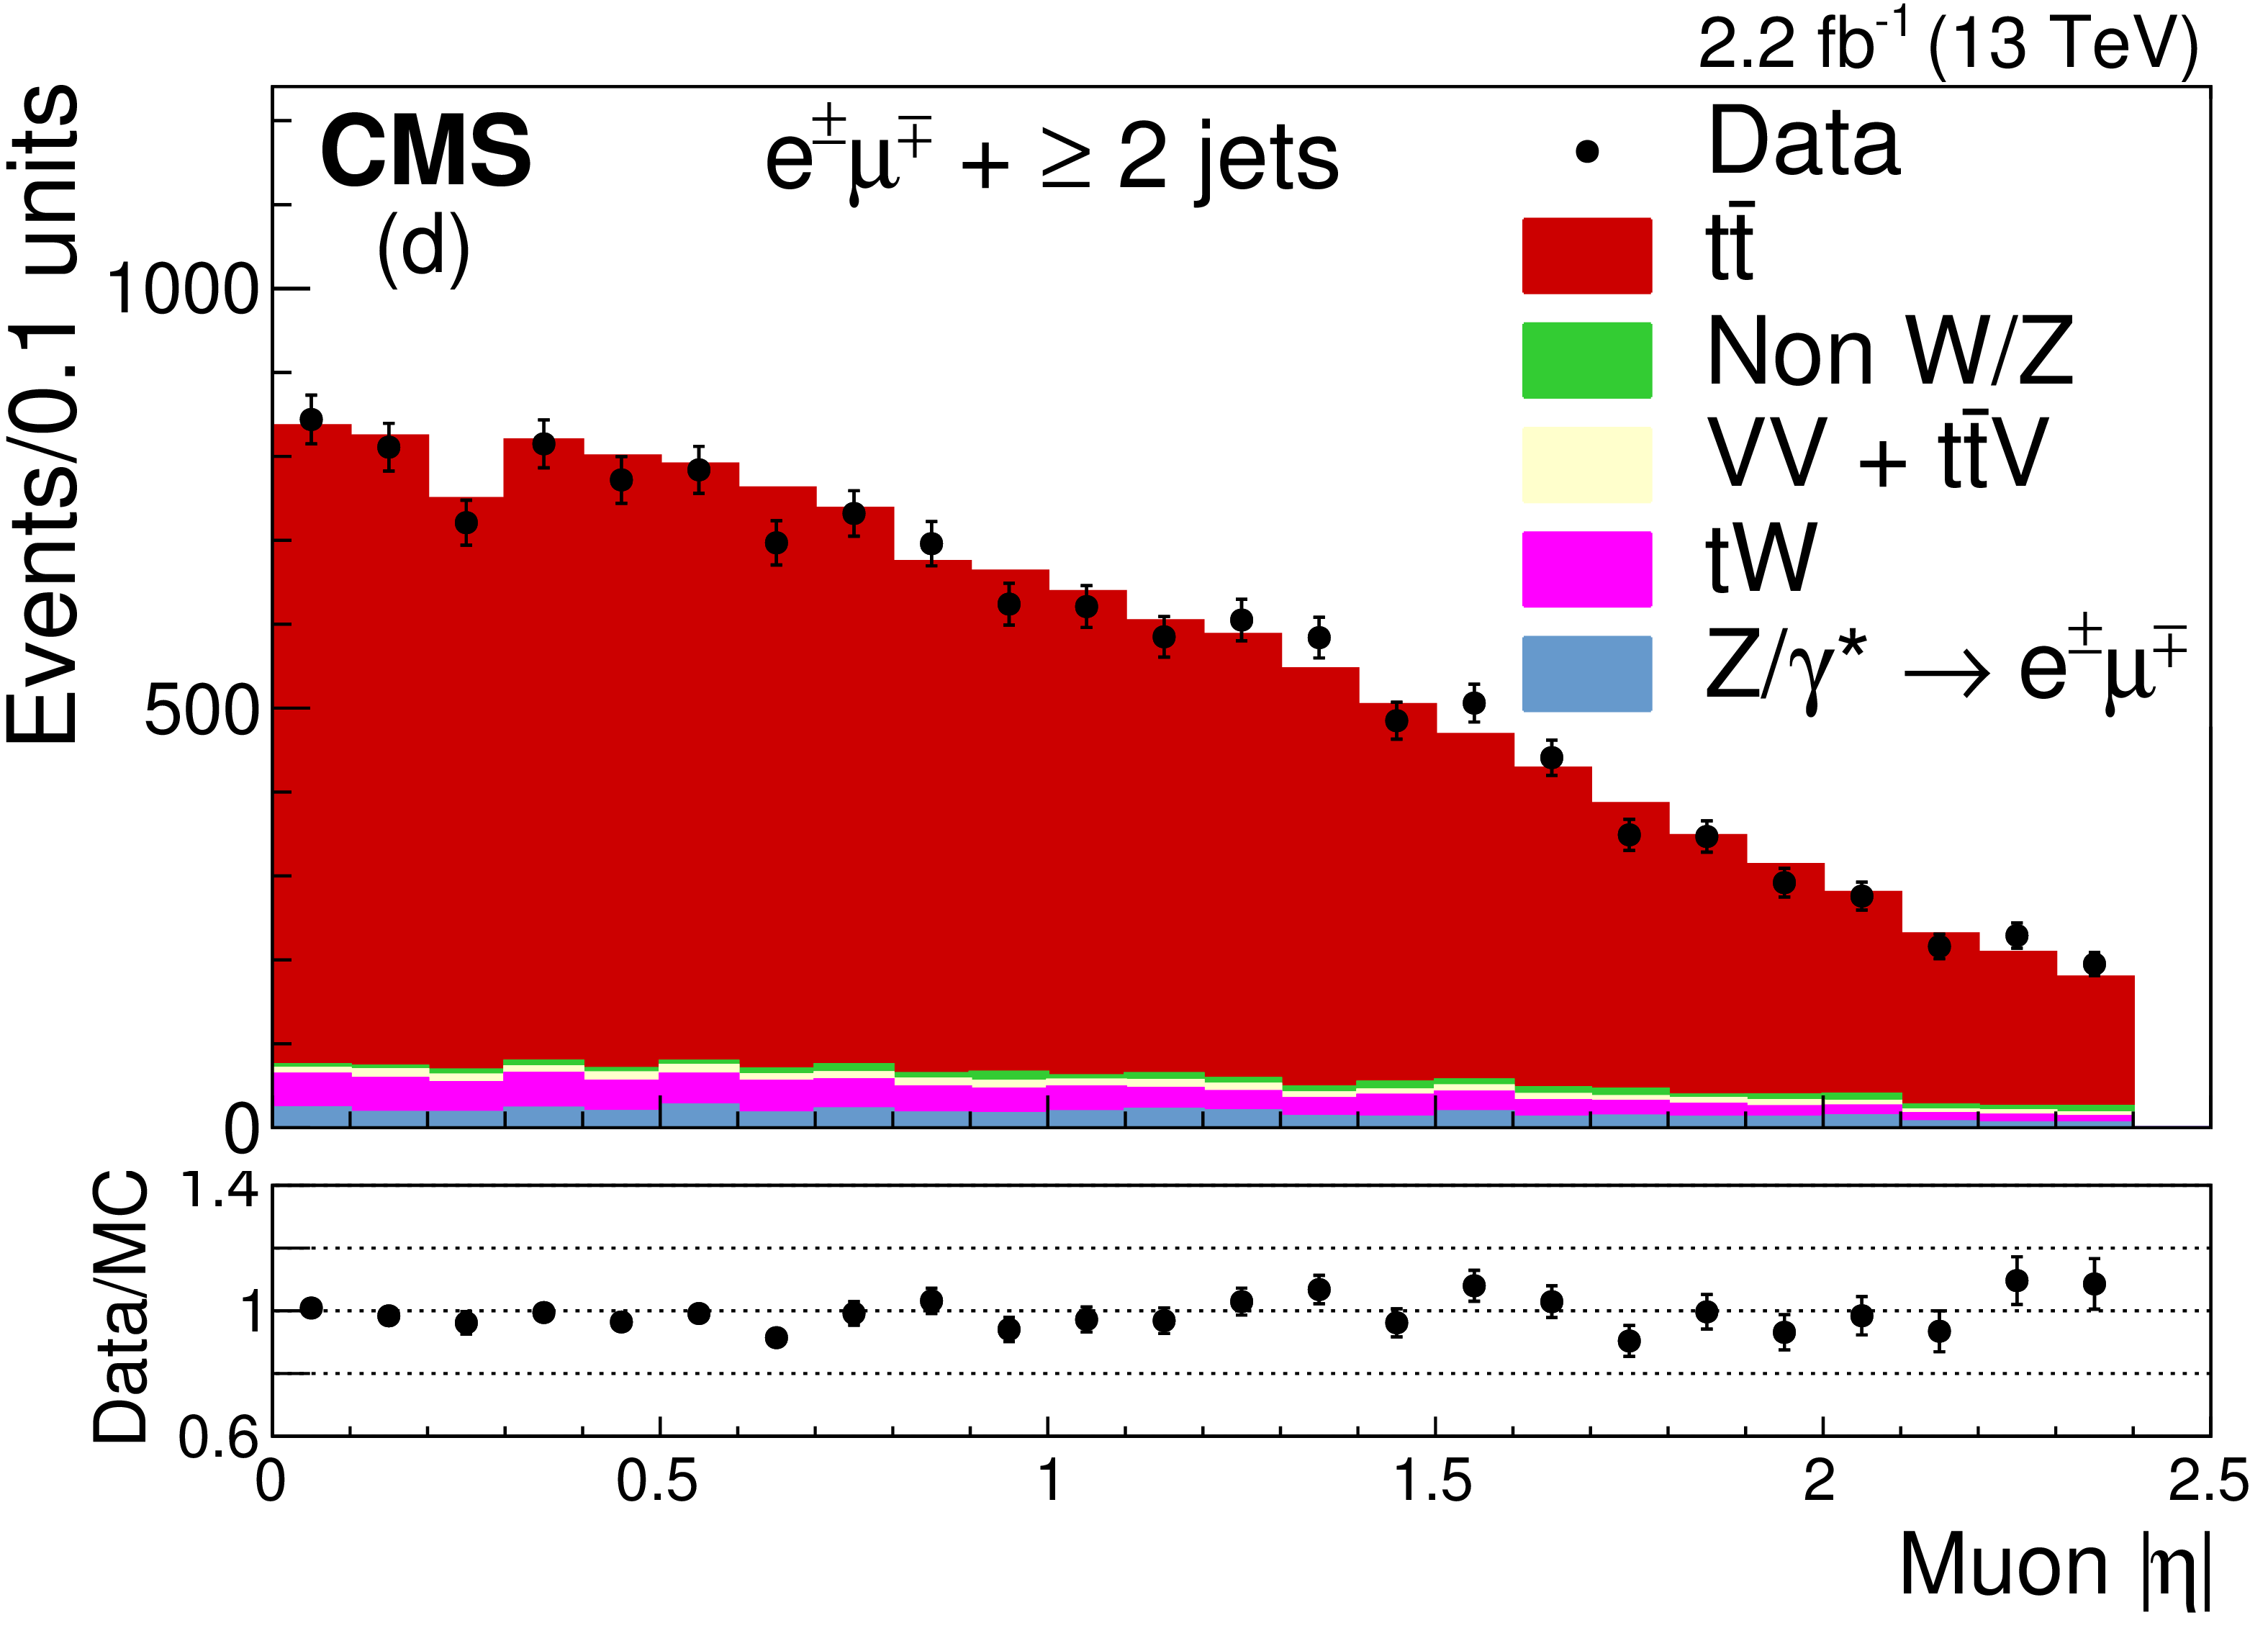
The distributions of (a) $ {p_{\mathrm {T}}} $ and (b) $ {| \eta | }$ of the electron, and (c) $ {p_{\mathrm {T}}} $ and (d) $ {| \eta | }$ of the muon after the selection of jets and before the b jet requirement. The expected distributions for $ {\mathrm{ t } {}\mathrm{ \bar{t} } } $ signal and individual backgrounds are shown after corrections based on control regions in data are applied; for the left plots (a, c) the last bin contains the overflow events. The ratios of data to the sum of the expected yields are given at the bottom of each panel. The error bars indicate the statistical uncertainties. |
png pdf |
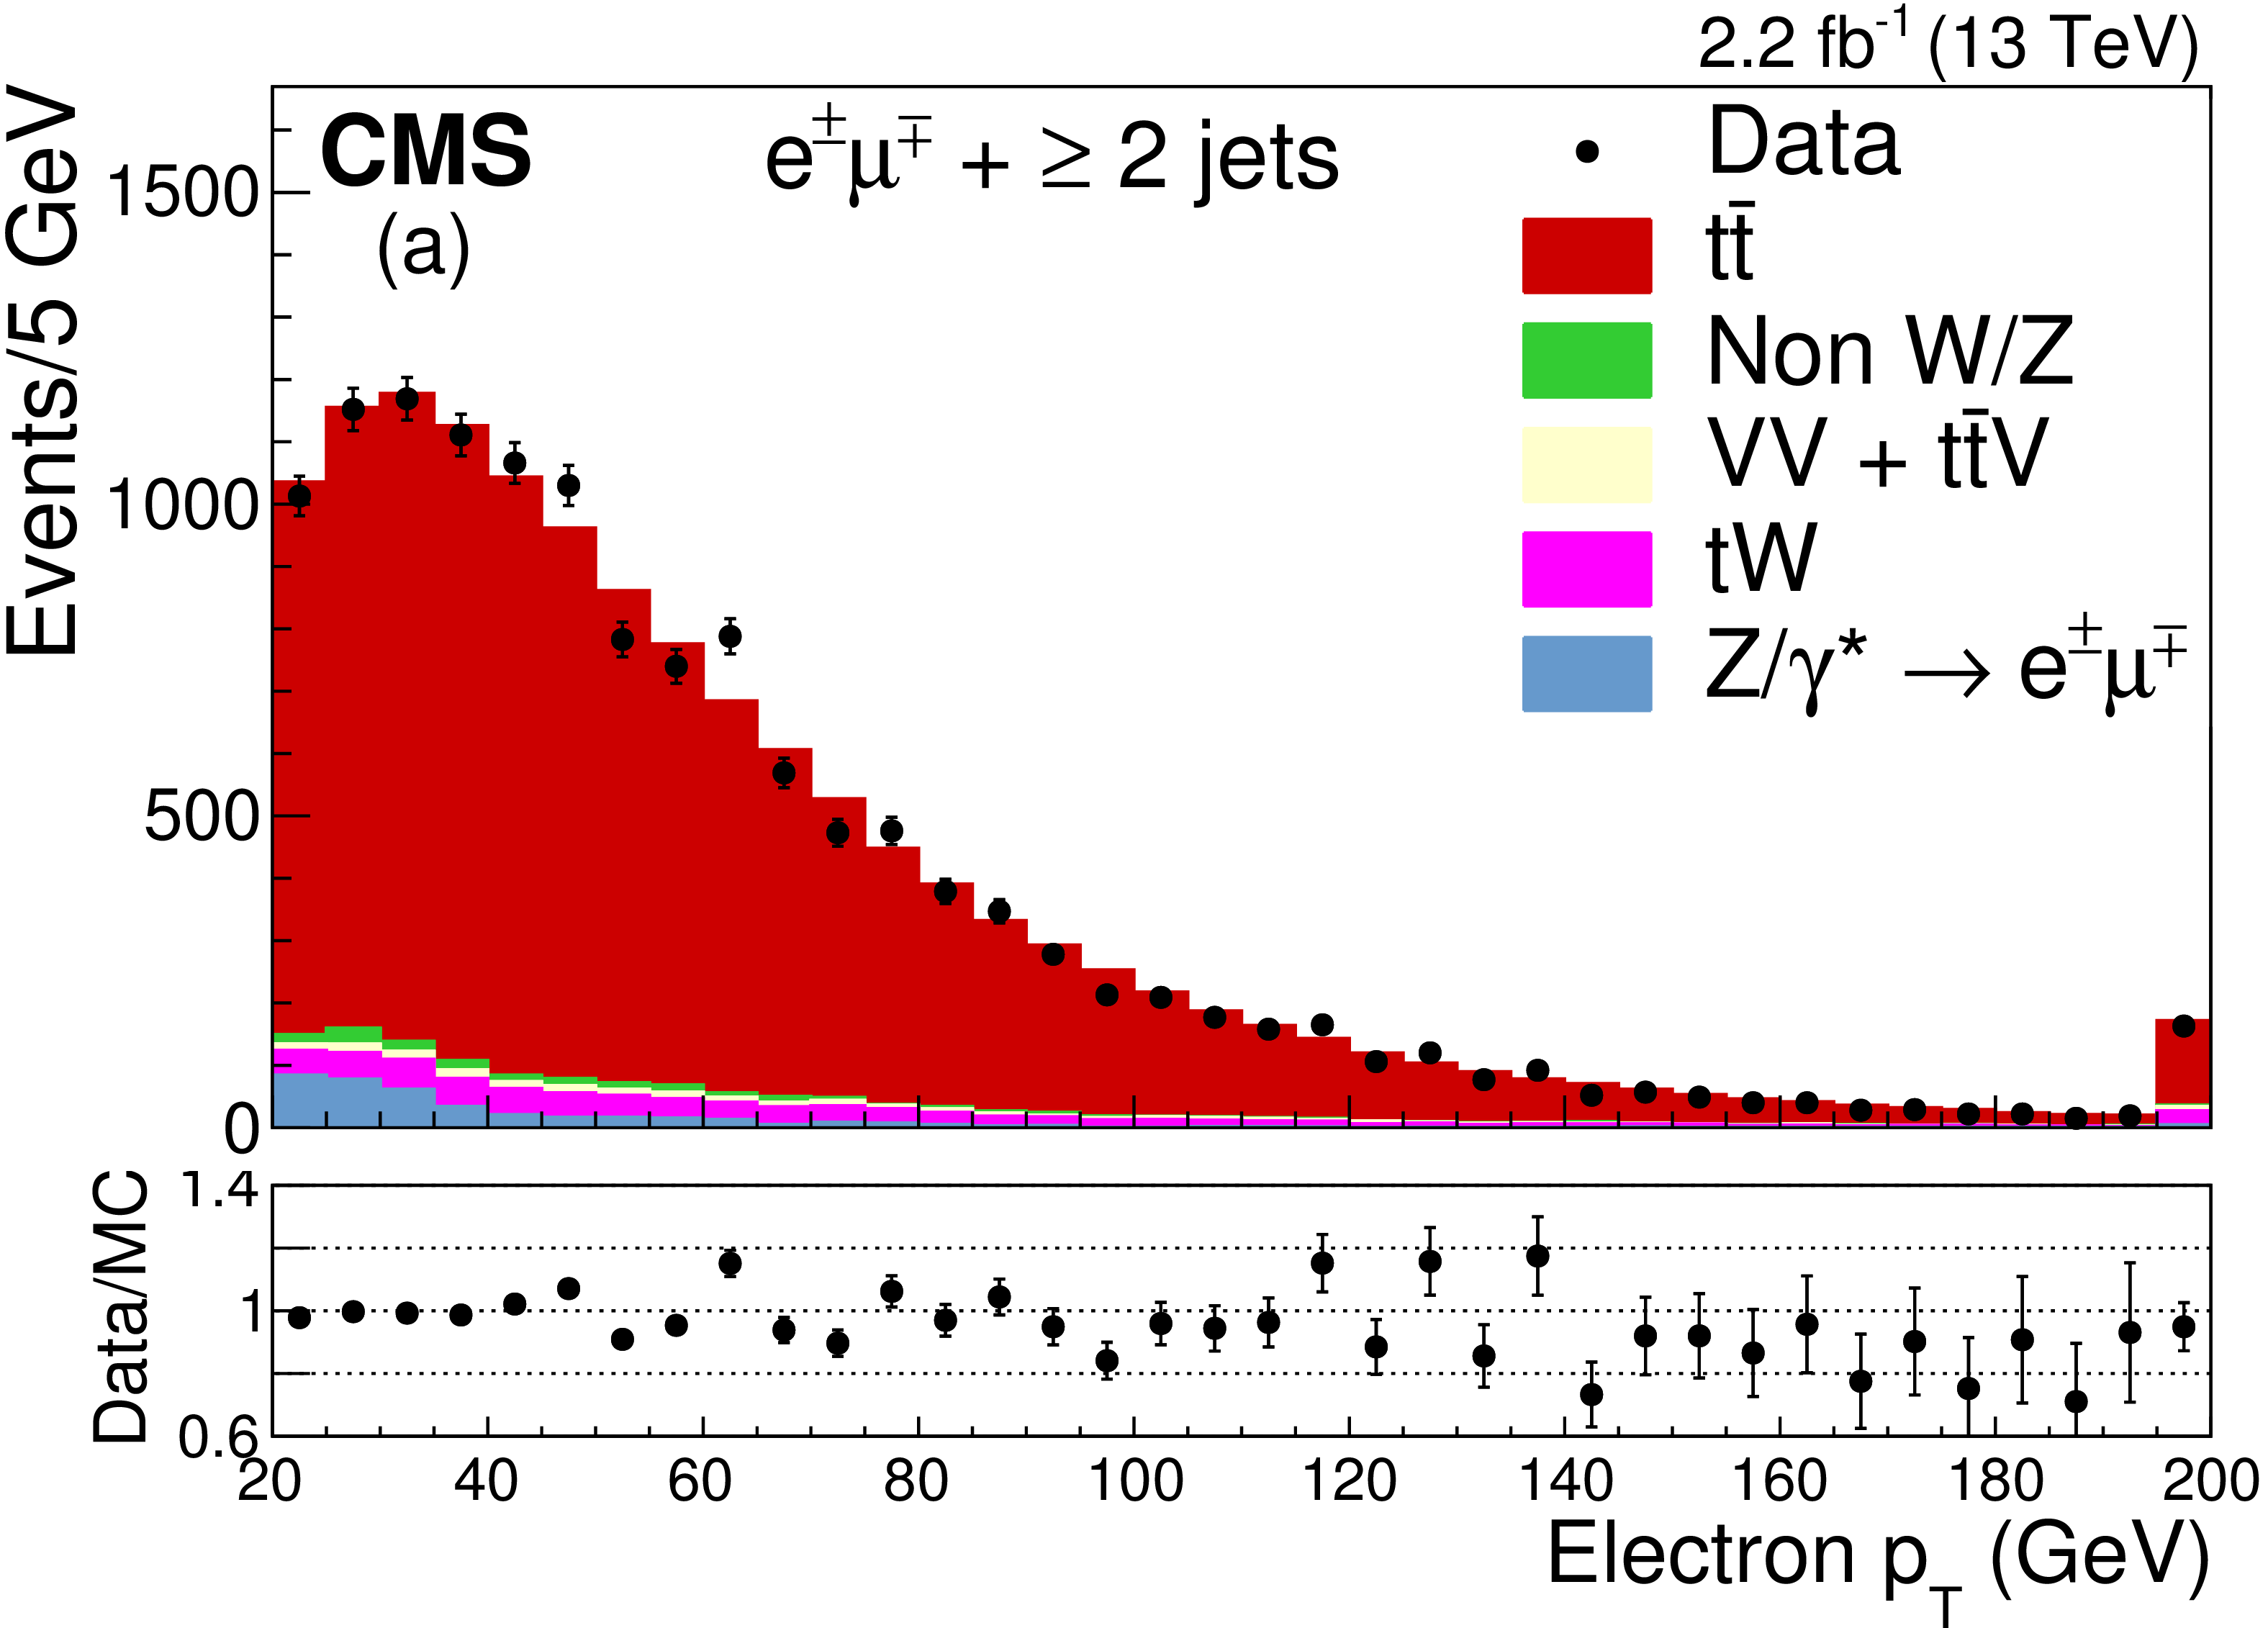
Figure 2-a:
The distributions of (a) $ {p_{\mathrm {T}}} $ and (b) $ {| \eta | }$ of the electron, and (c) $ {p_{\mathrm {T}}} $ and (d) $ {| \eta | }$ of the muon after the selection of jets and before the b jet requirement. The expected distributions for $ {\mathrm{ t } {}\mathrm{ \bar{t} } } $ signal and individual backgrounds are shown after corrections based on control regions in data are applied; for the left plots (a, c) the last bin contains the overflow events. The ratios of data to the sum of the expected yields are given at the bottom of each panel. The error bars indicate the statistical uncertainties. |
png pdf |
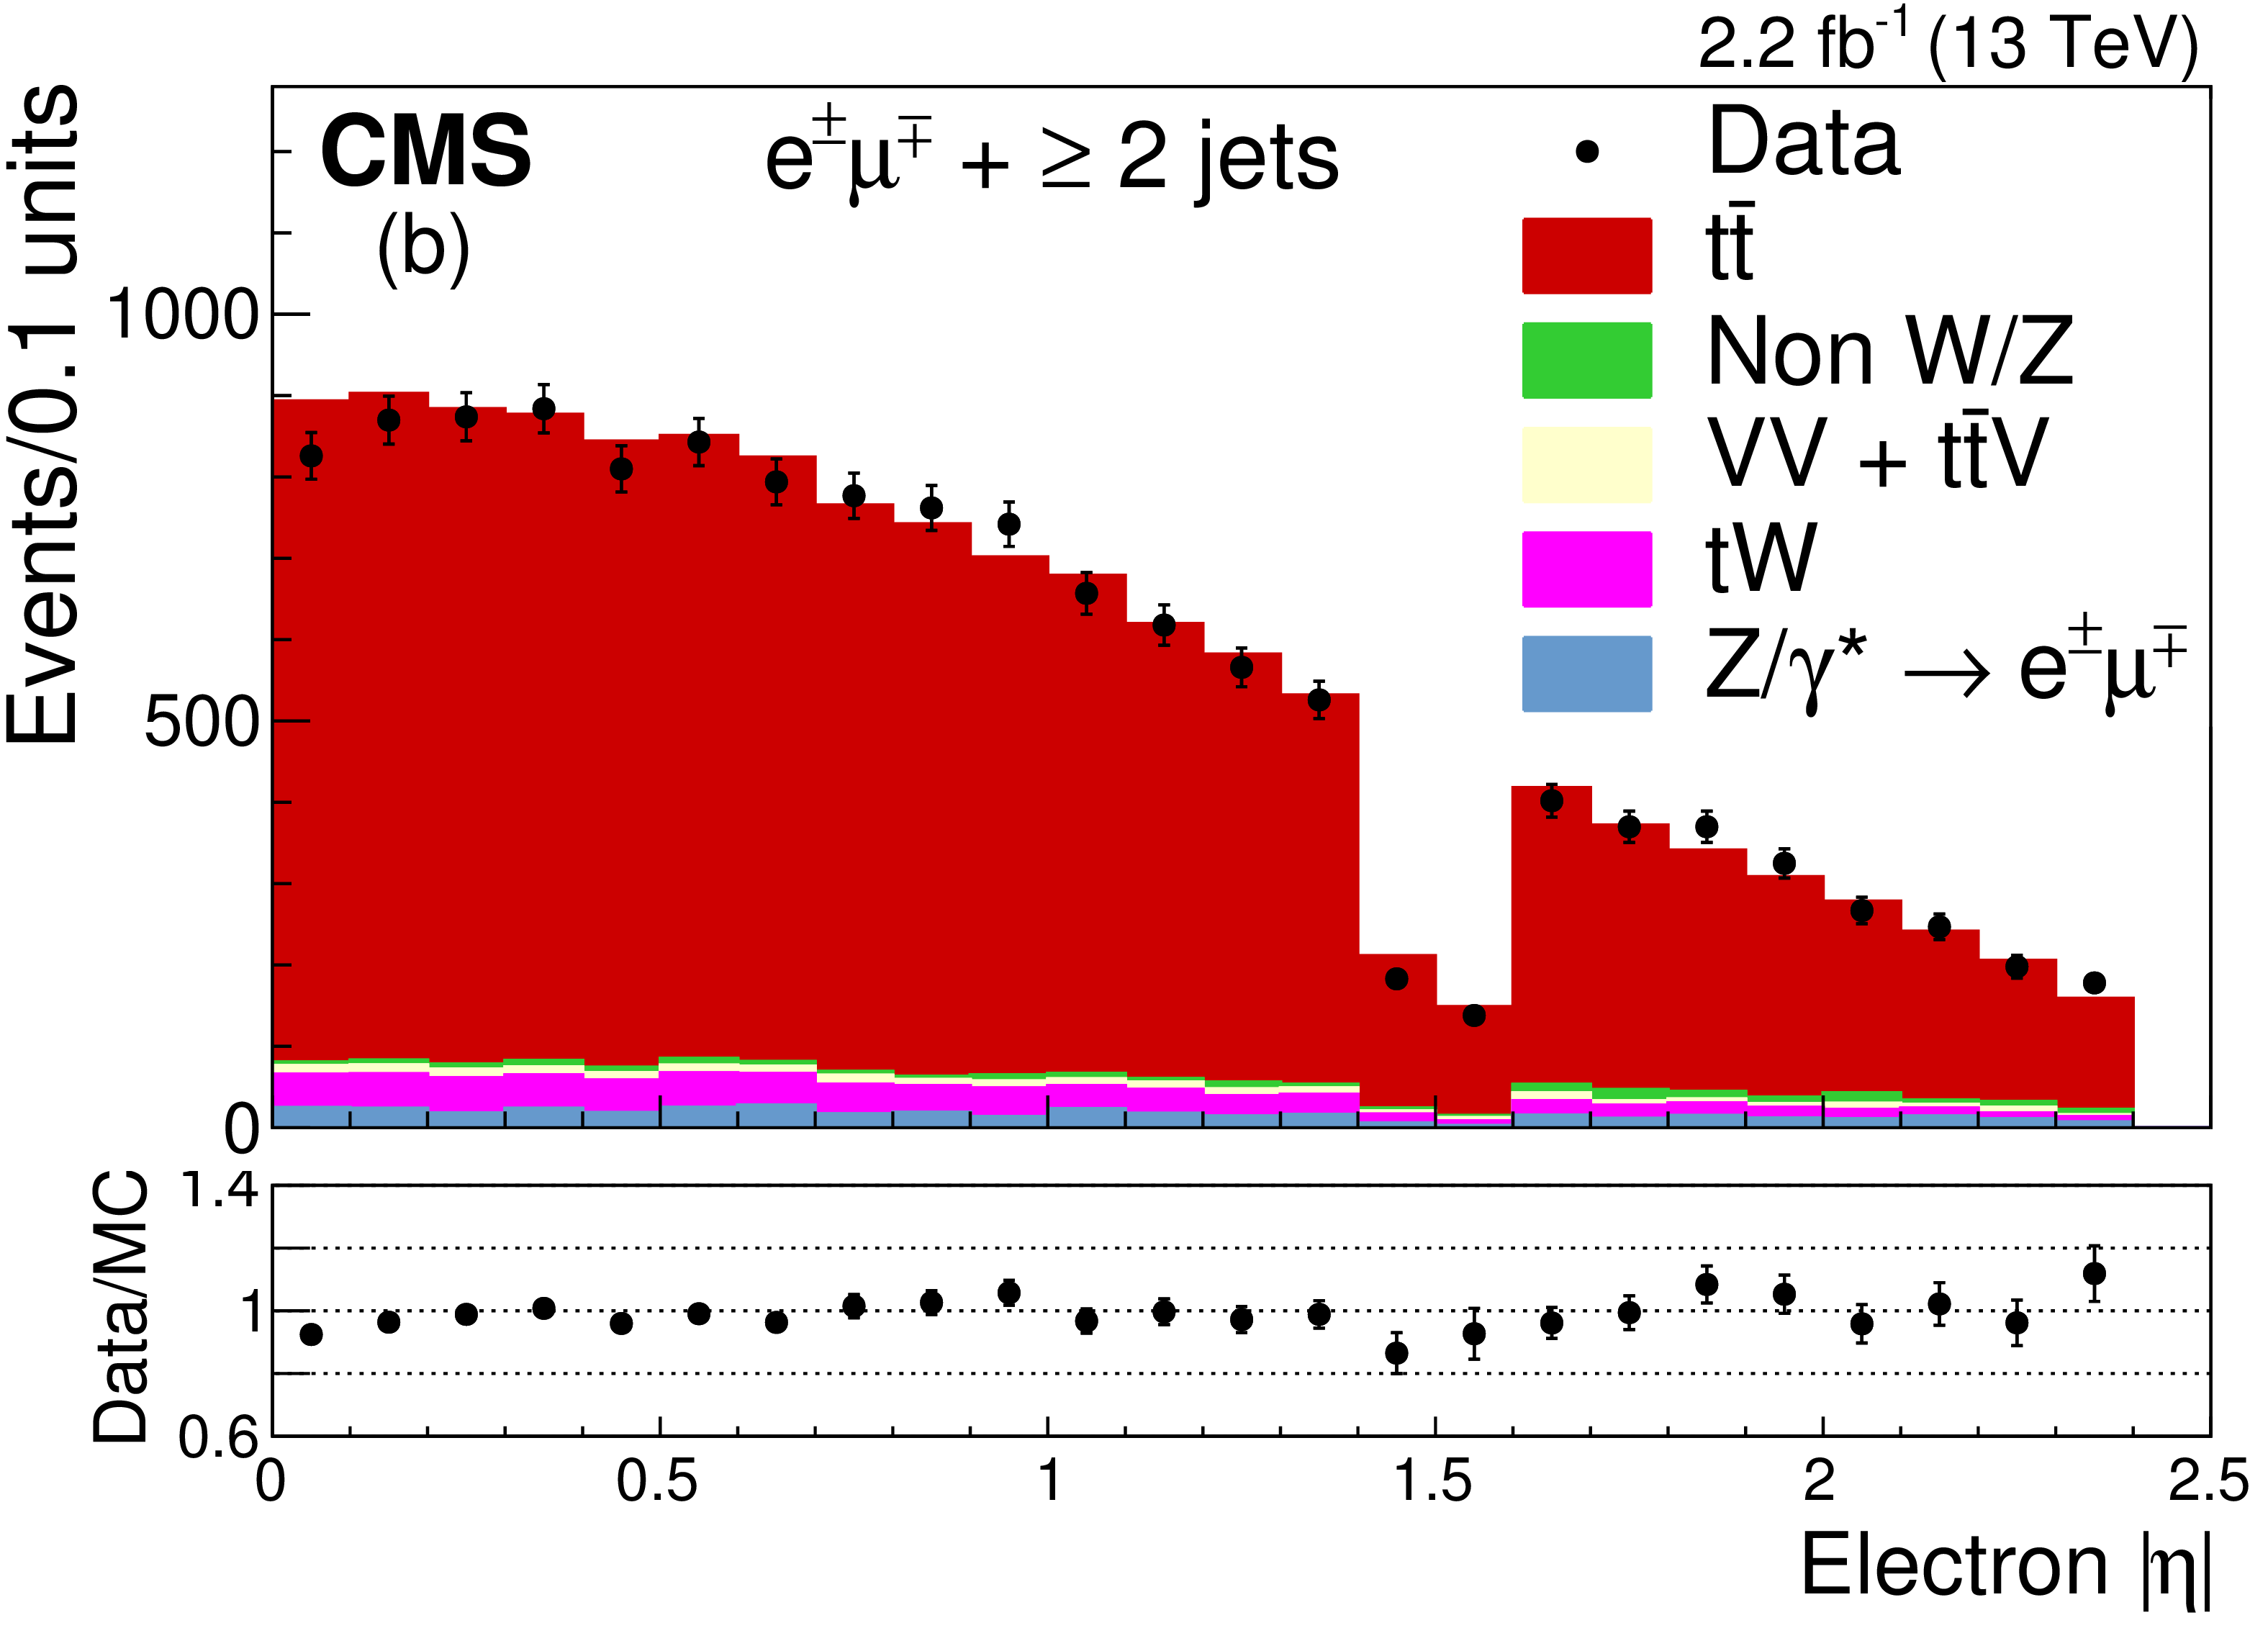
Figure 2-b:
The distributions of (a) $ {p_{\mathrm {T}}} $ and (b) $ {| \eta | }$ of the electron, and (c) $ {p_{\mathrm {T}}} $ and (d) $ {| \eta | }$ of the muon after the selection of jets and before the b jet requirement. The expected distributions for $ {\mathrm{ t } {}\mathrm{ \bar{t} } } $ signal and individual backgrounds are shown after corrections based on control regions in data are applied; for the left plots (a, c) the last bin contains the overflow events. The ratios of data to the sum of the expected yields are given at the bottom of each panel. The error bars indicate the statistical uncertainties. |
png pdf |
Figure 2-c:
The distributions of (a) $ {p_{\mathrm {T}}} $ and (b) $ {| \eta | }$ of the electron, and (c) $ {p_{\mathrm {T}}} $ and (d) $ {| \eta | }$ of the muon after the selection of jets and before the b jet requirement. The expected distributions for $ {\mathrm{ t } {}\mathrm{ \bar{t} } } $ signal and individual backgrounds are shown after corrections based on control regions in data are applied; for the left plots (a, c) the last bin contains the overflow events. The ratios of data to the sum of the expected yields are given at the bottom of each panel. The error bars indicate the statistical uncertainties. |
png pdf |
Figure 2-d:
The distributions of (a) $ {p_{\mathrm {T}}} $ and (b) $ {| \eta | }$ of the electron, and (c) $ {p_{\mathrm {T}}} $ and (d) $ {| \eta | }$ of the muon after the selection of jets and before the b jet requirement. The expected distributions for $ {\mathrm{ t } {}\mathrm{ \bar{t} } } $ signal and individual backgrounds are shown after corrections based on control regions in data are applied; for the left plots (a, c) the last bin contains the overflow events. The ratios of data to the sum of the expected yields are given at the bottom of each panel. The error bars indicate the statistical uncertainties. |
png pdf |
Figure 3:
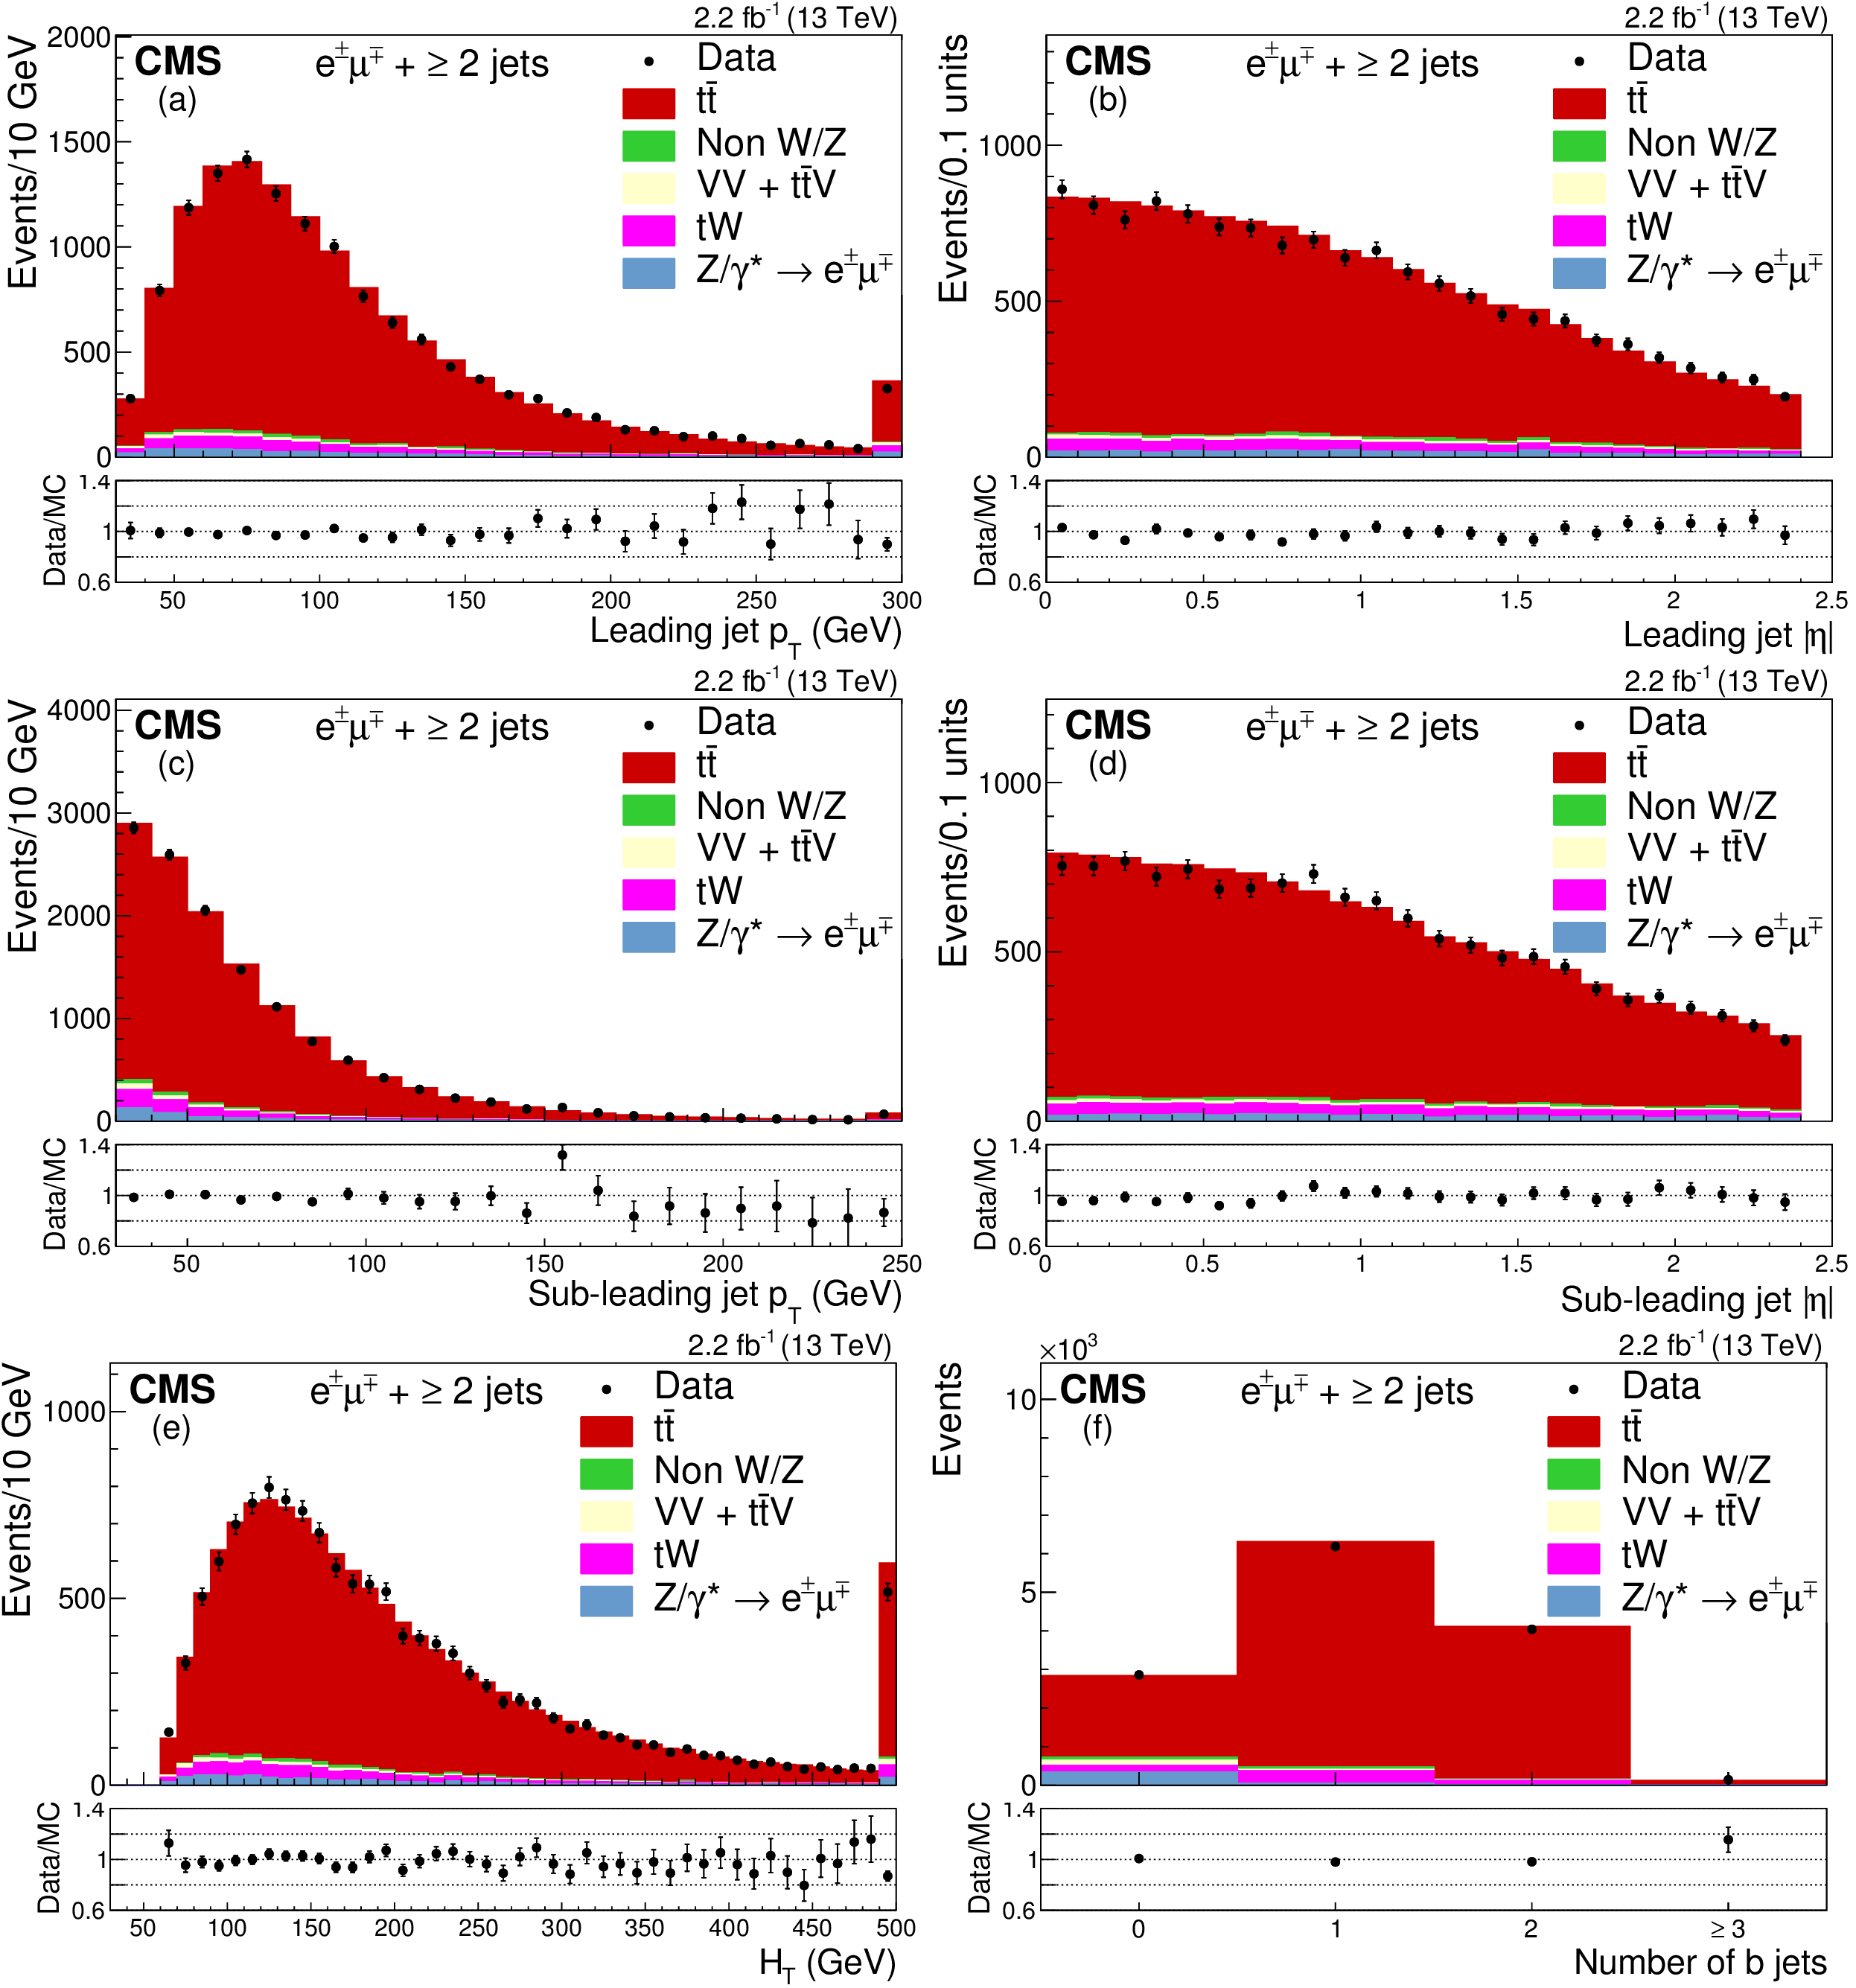
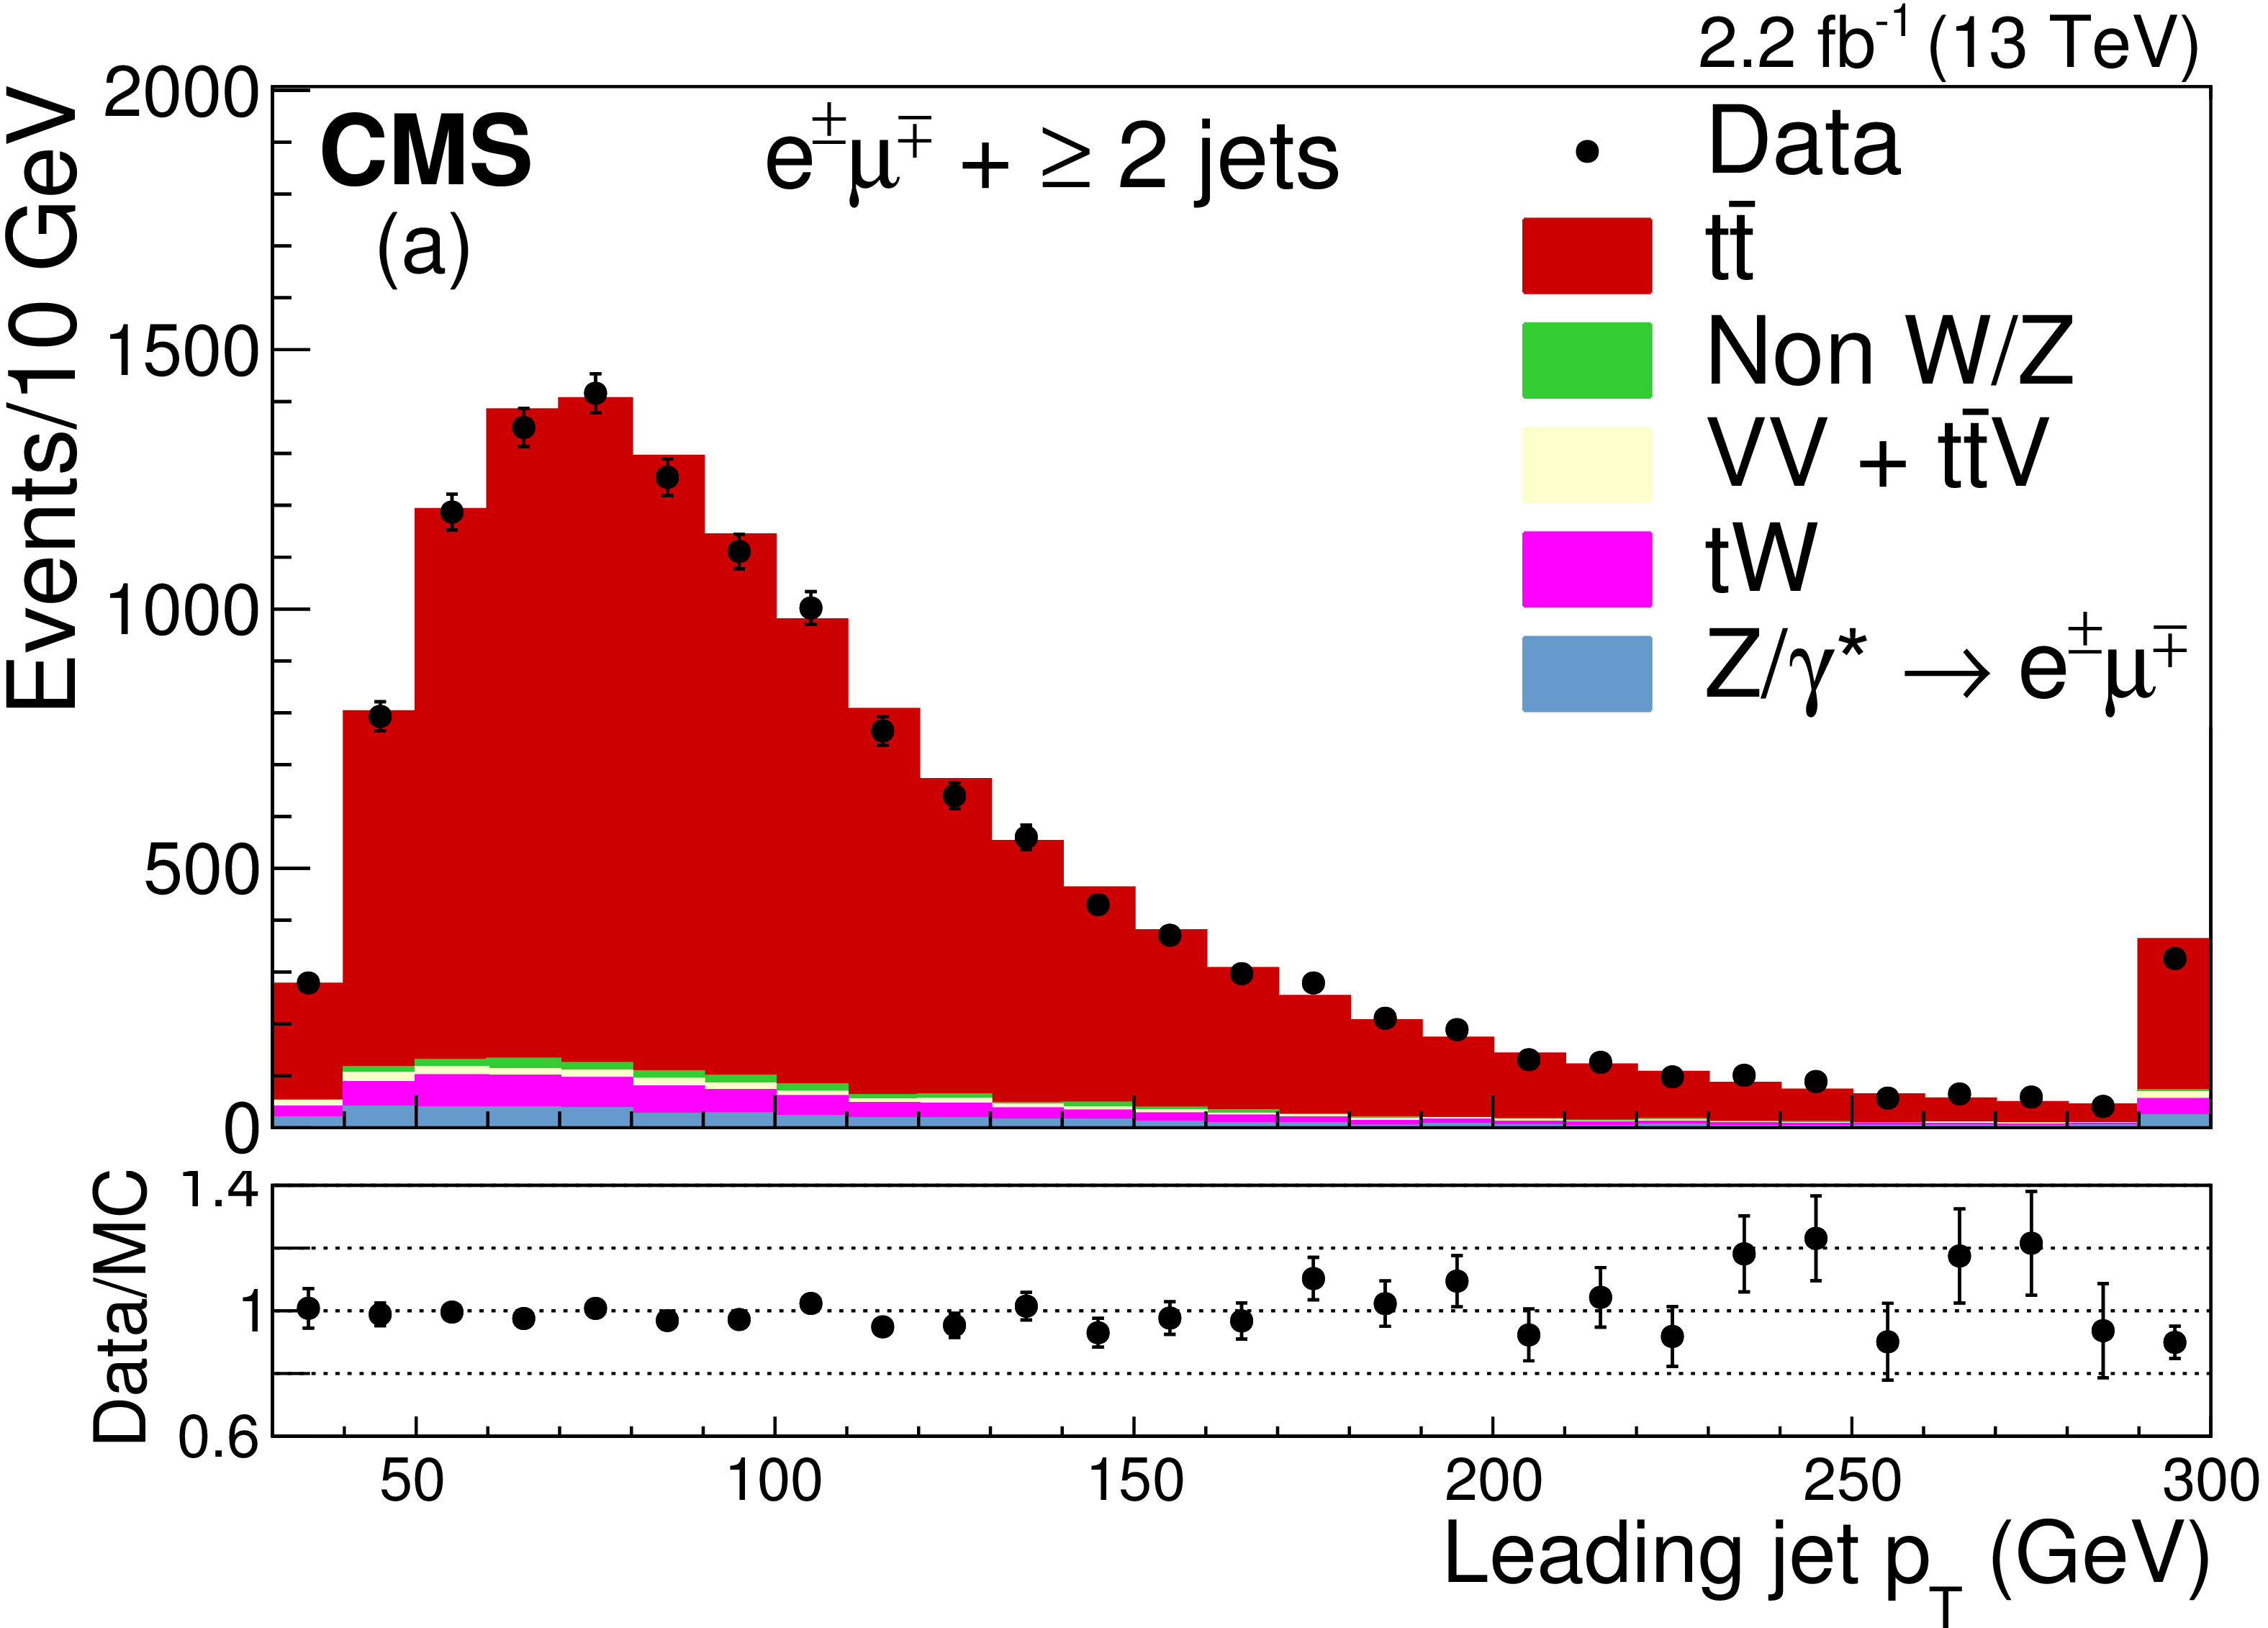
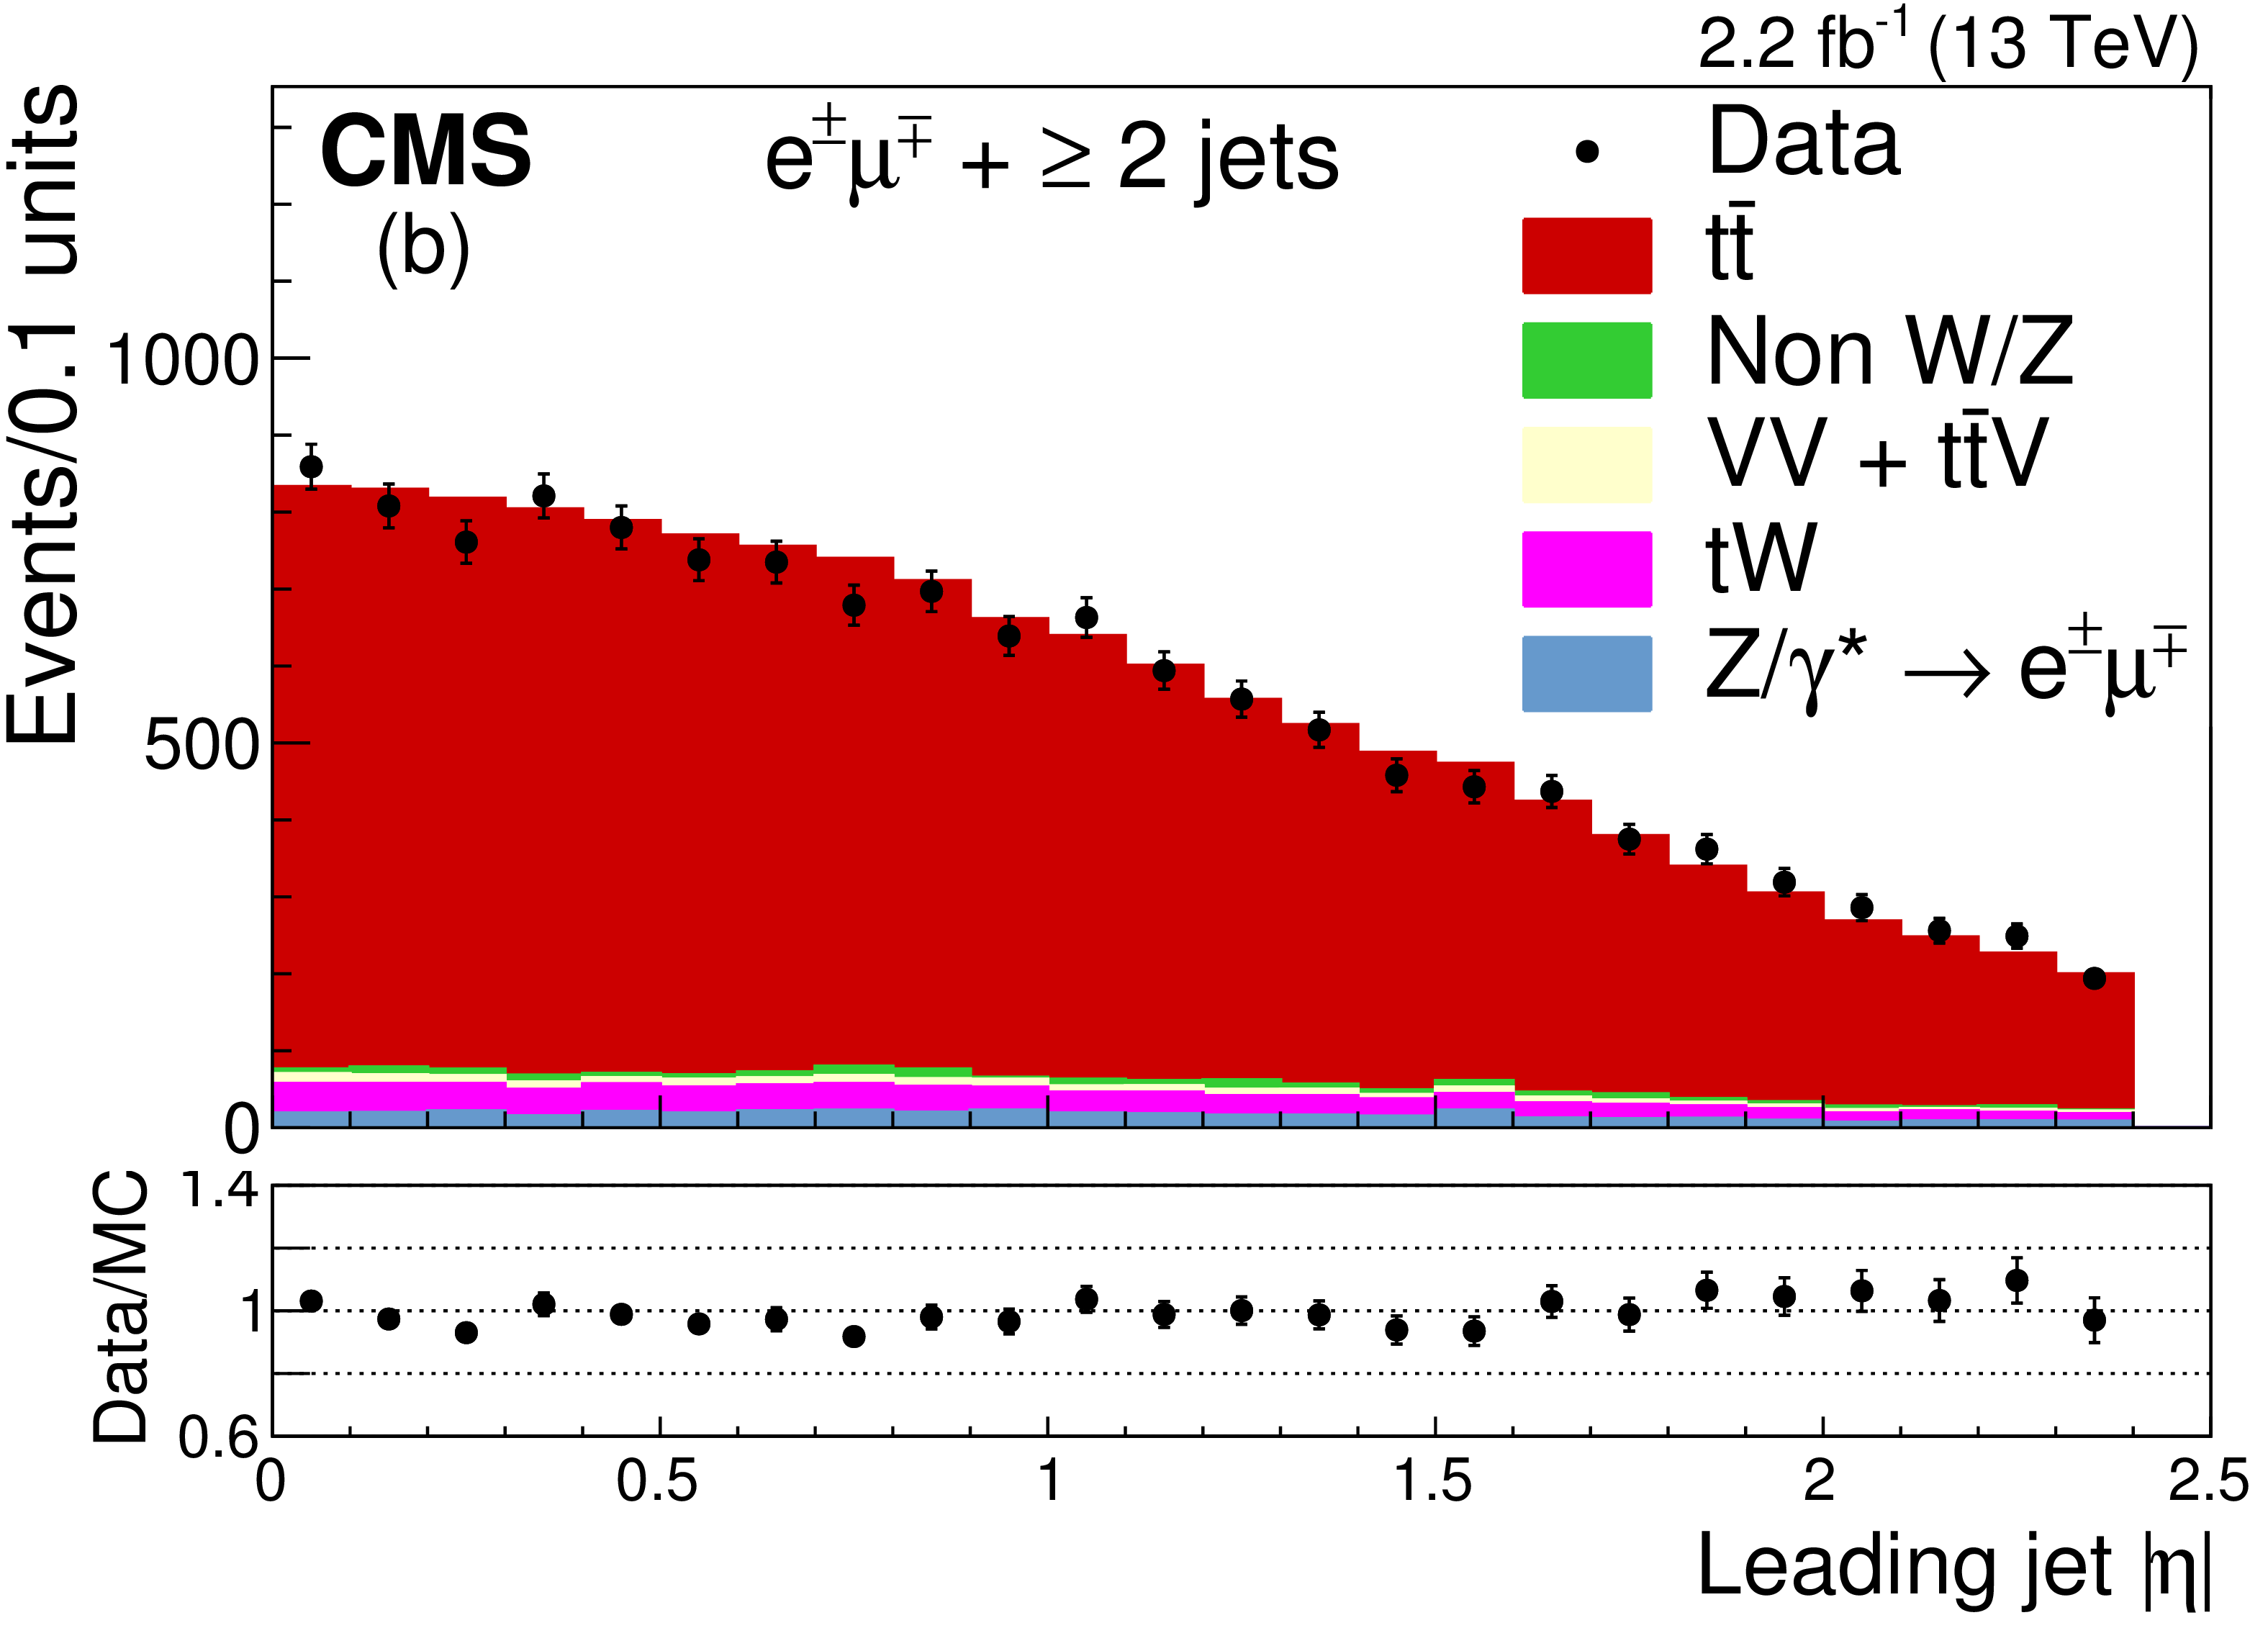
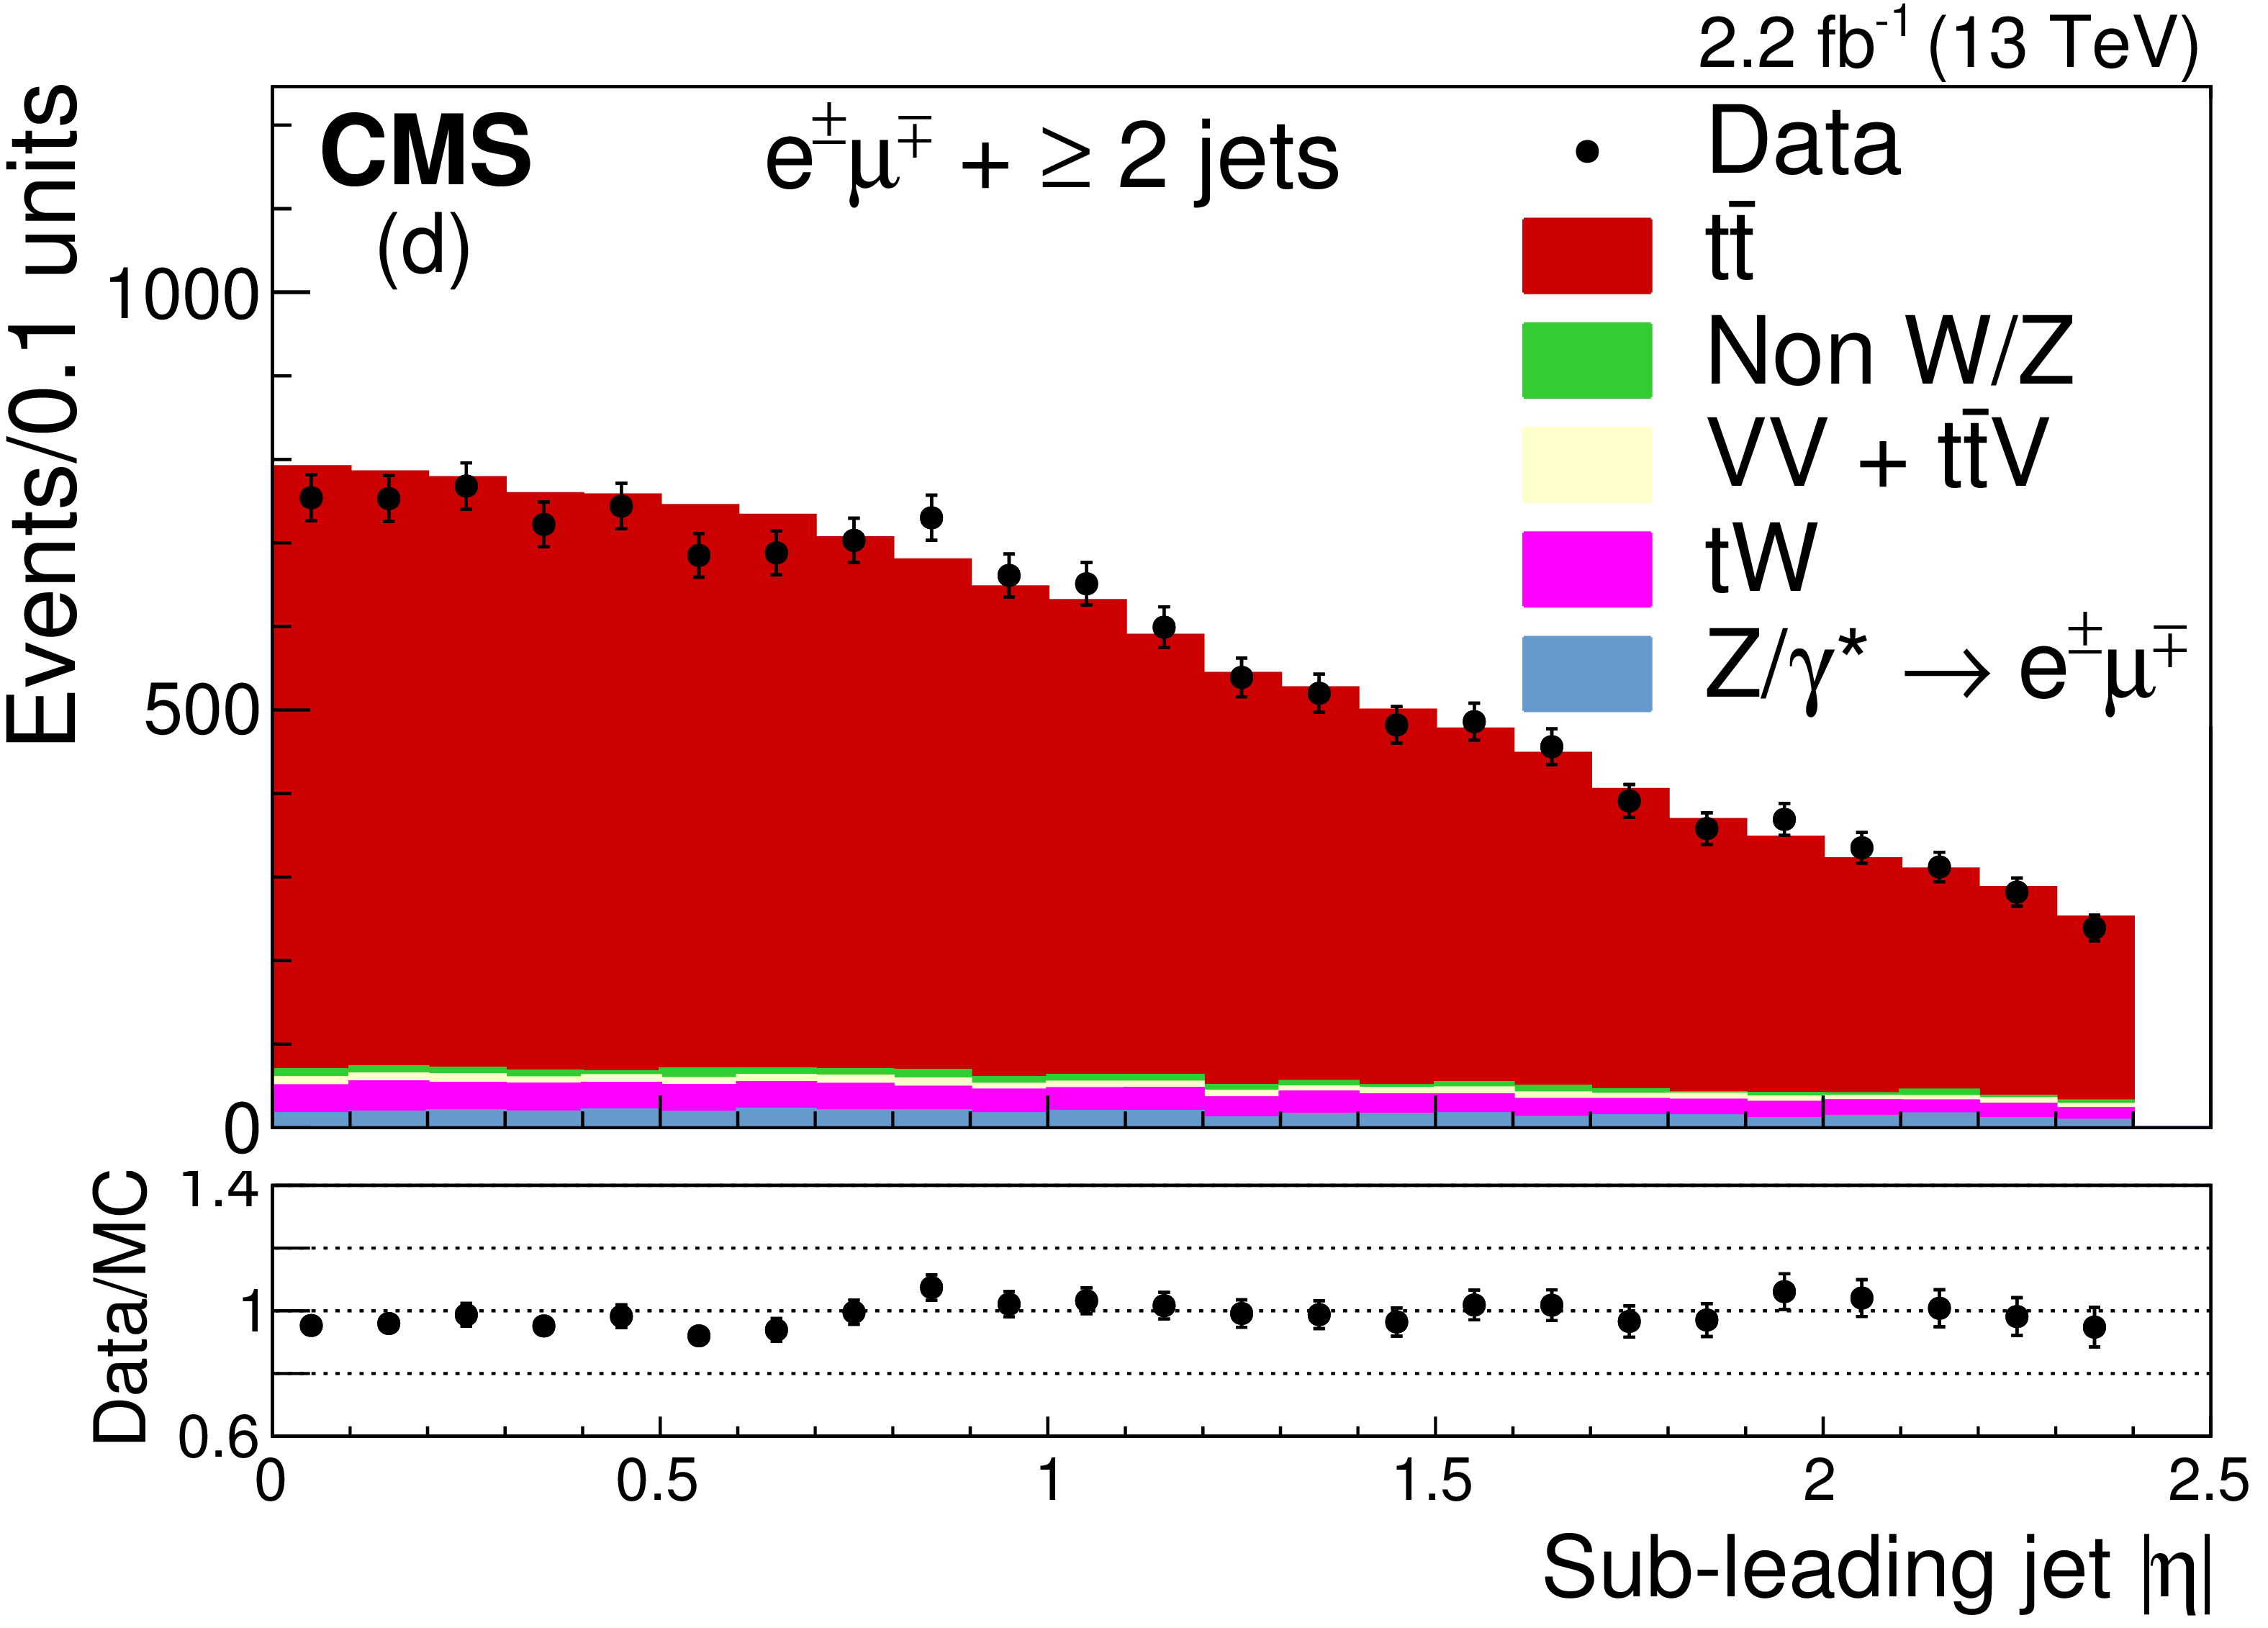
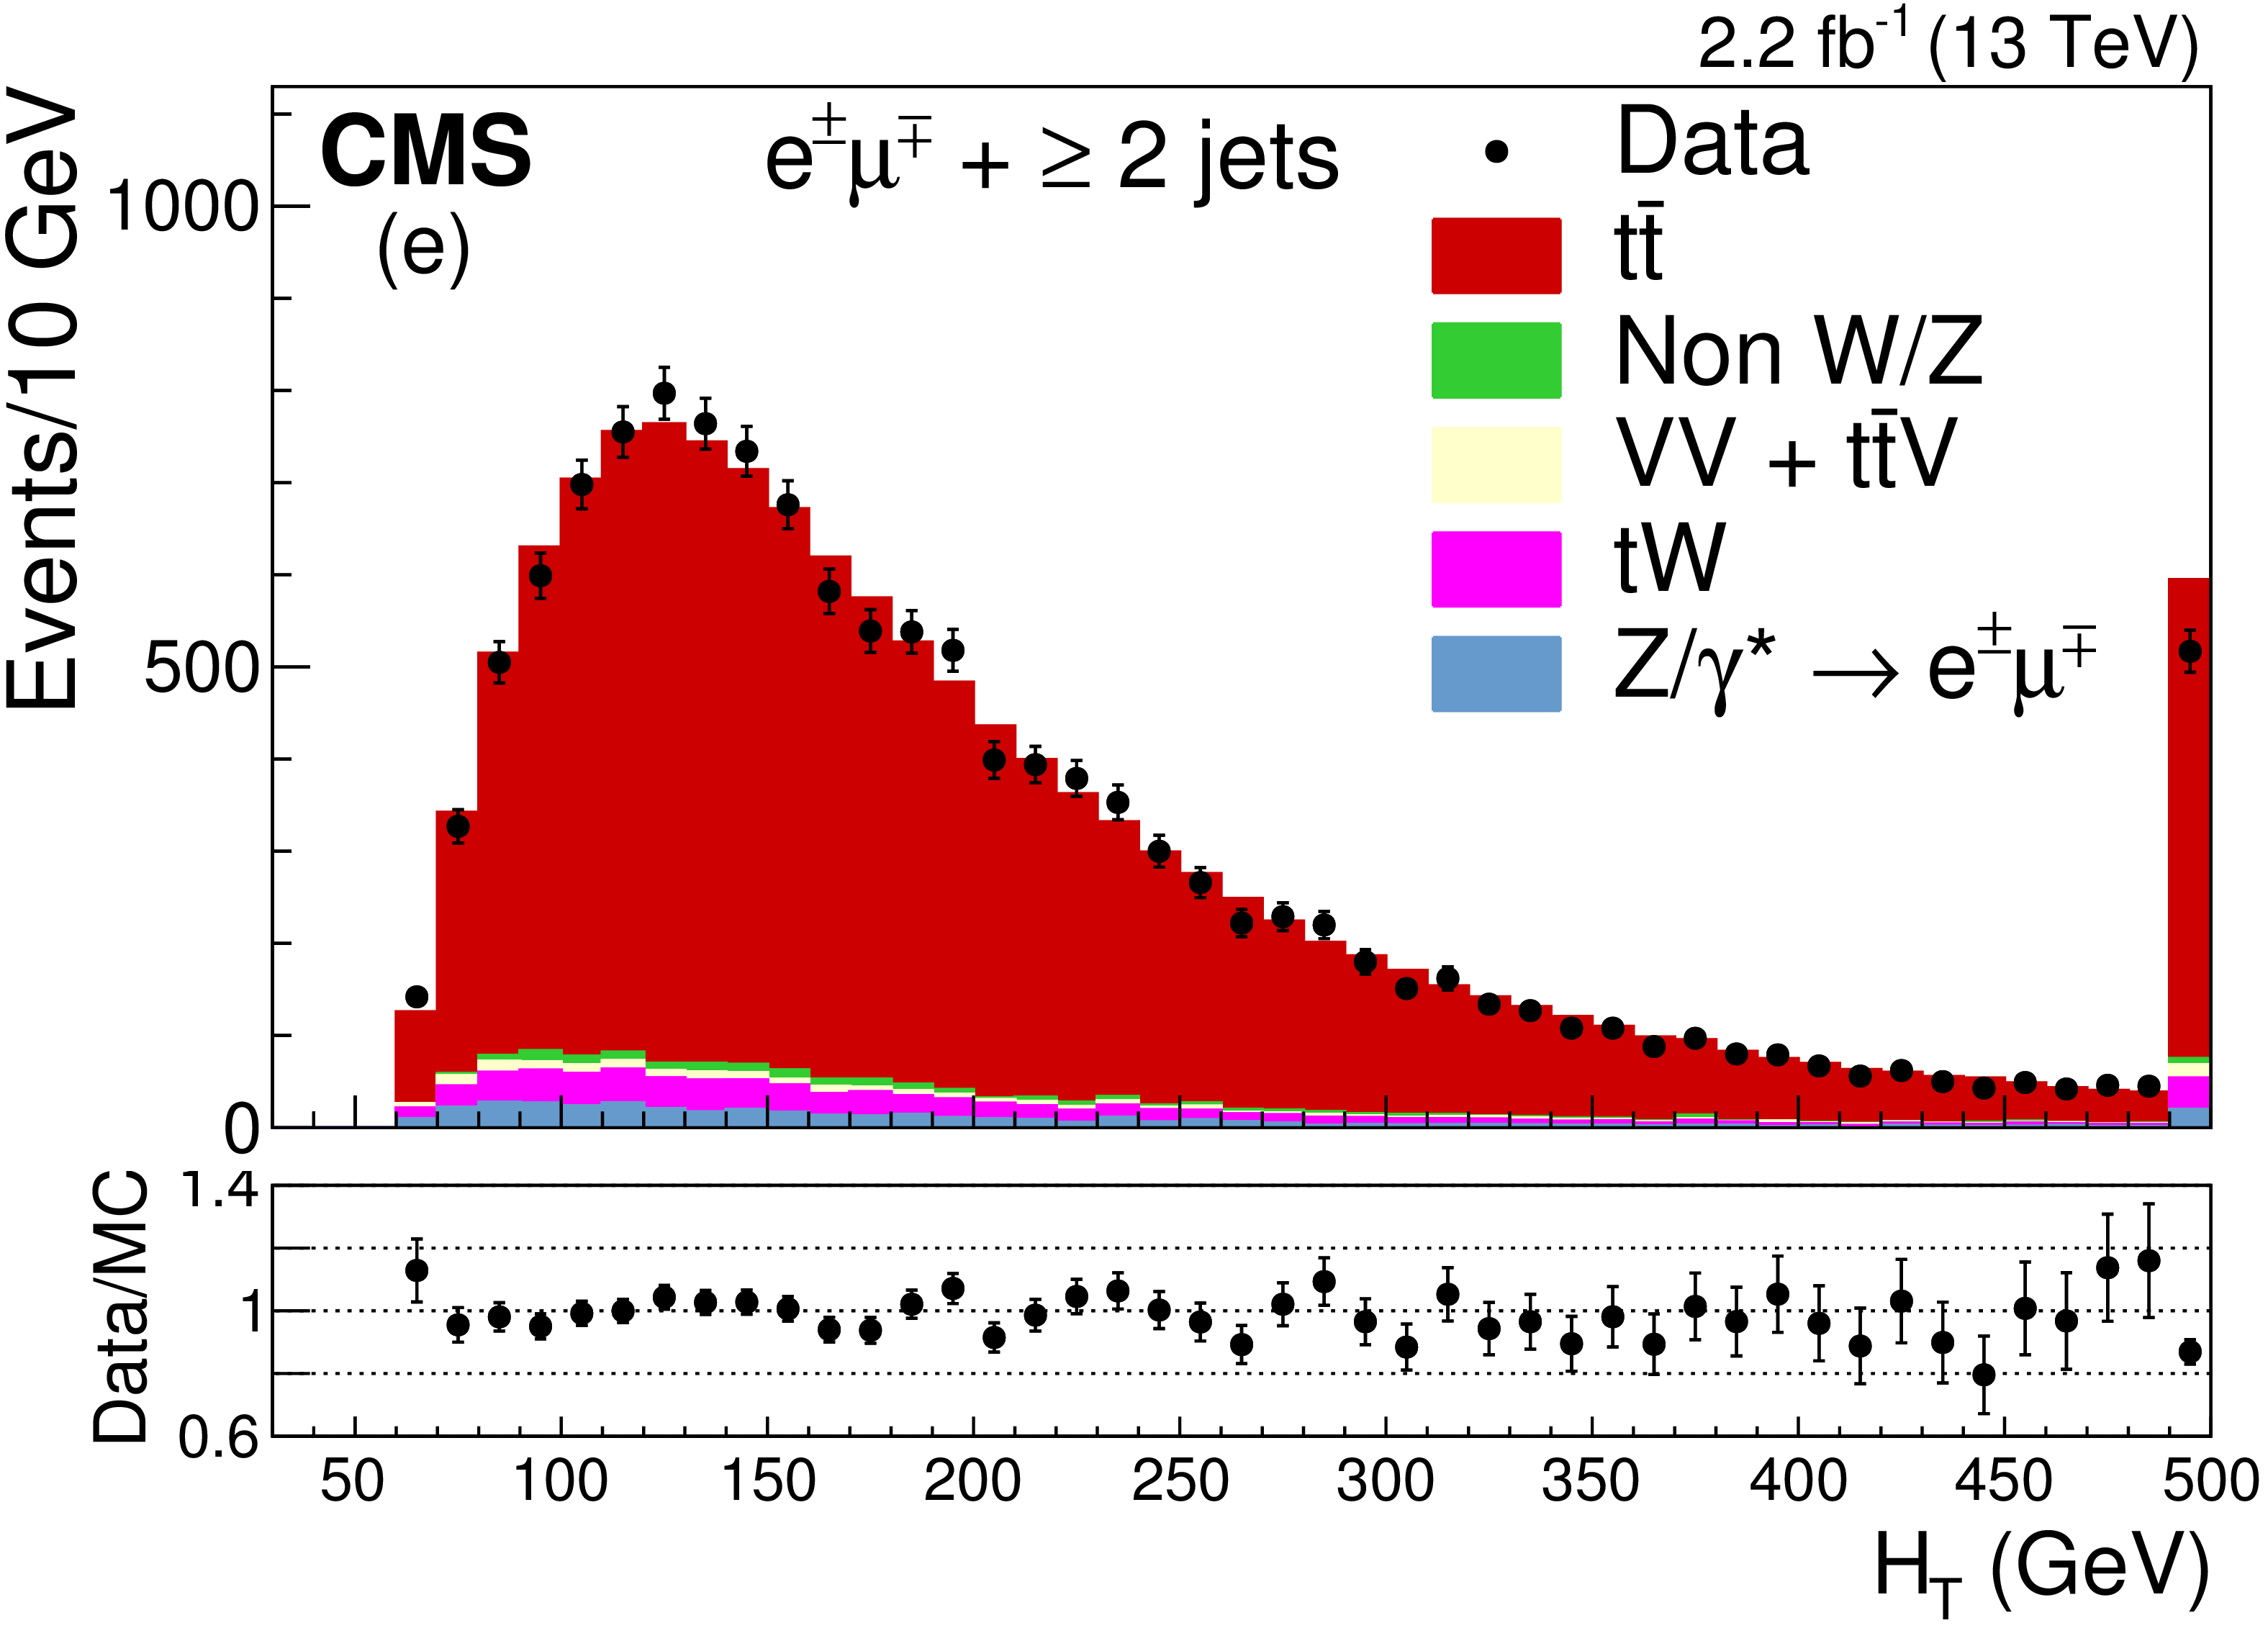
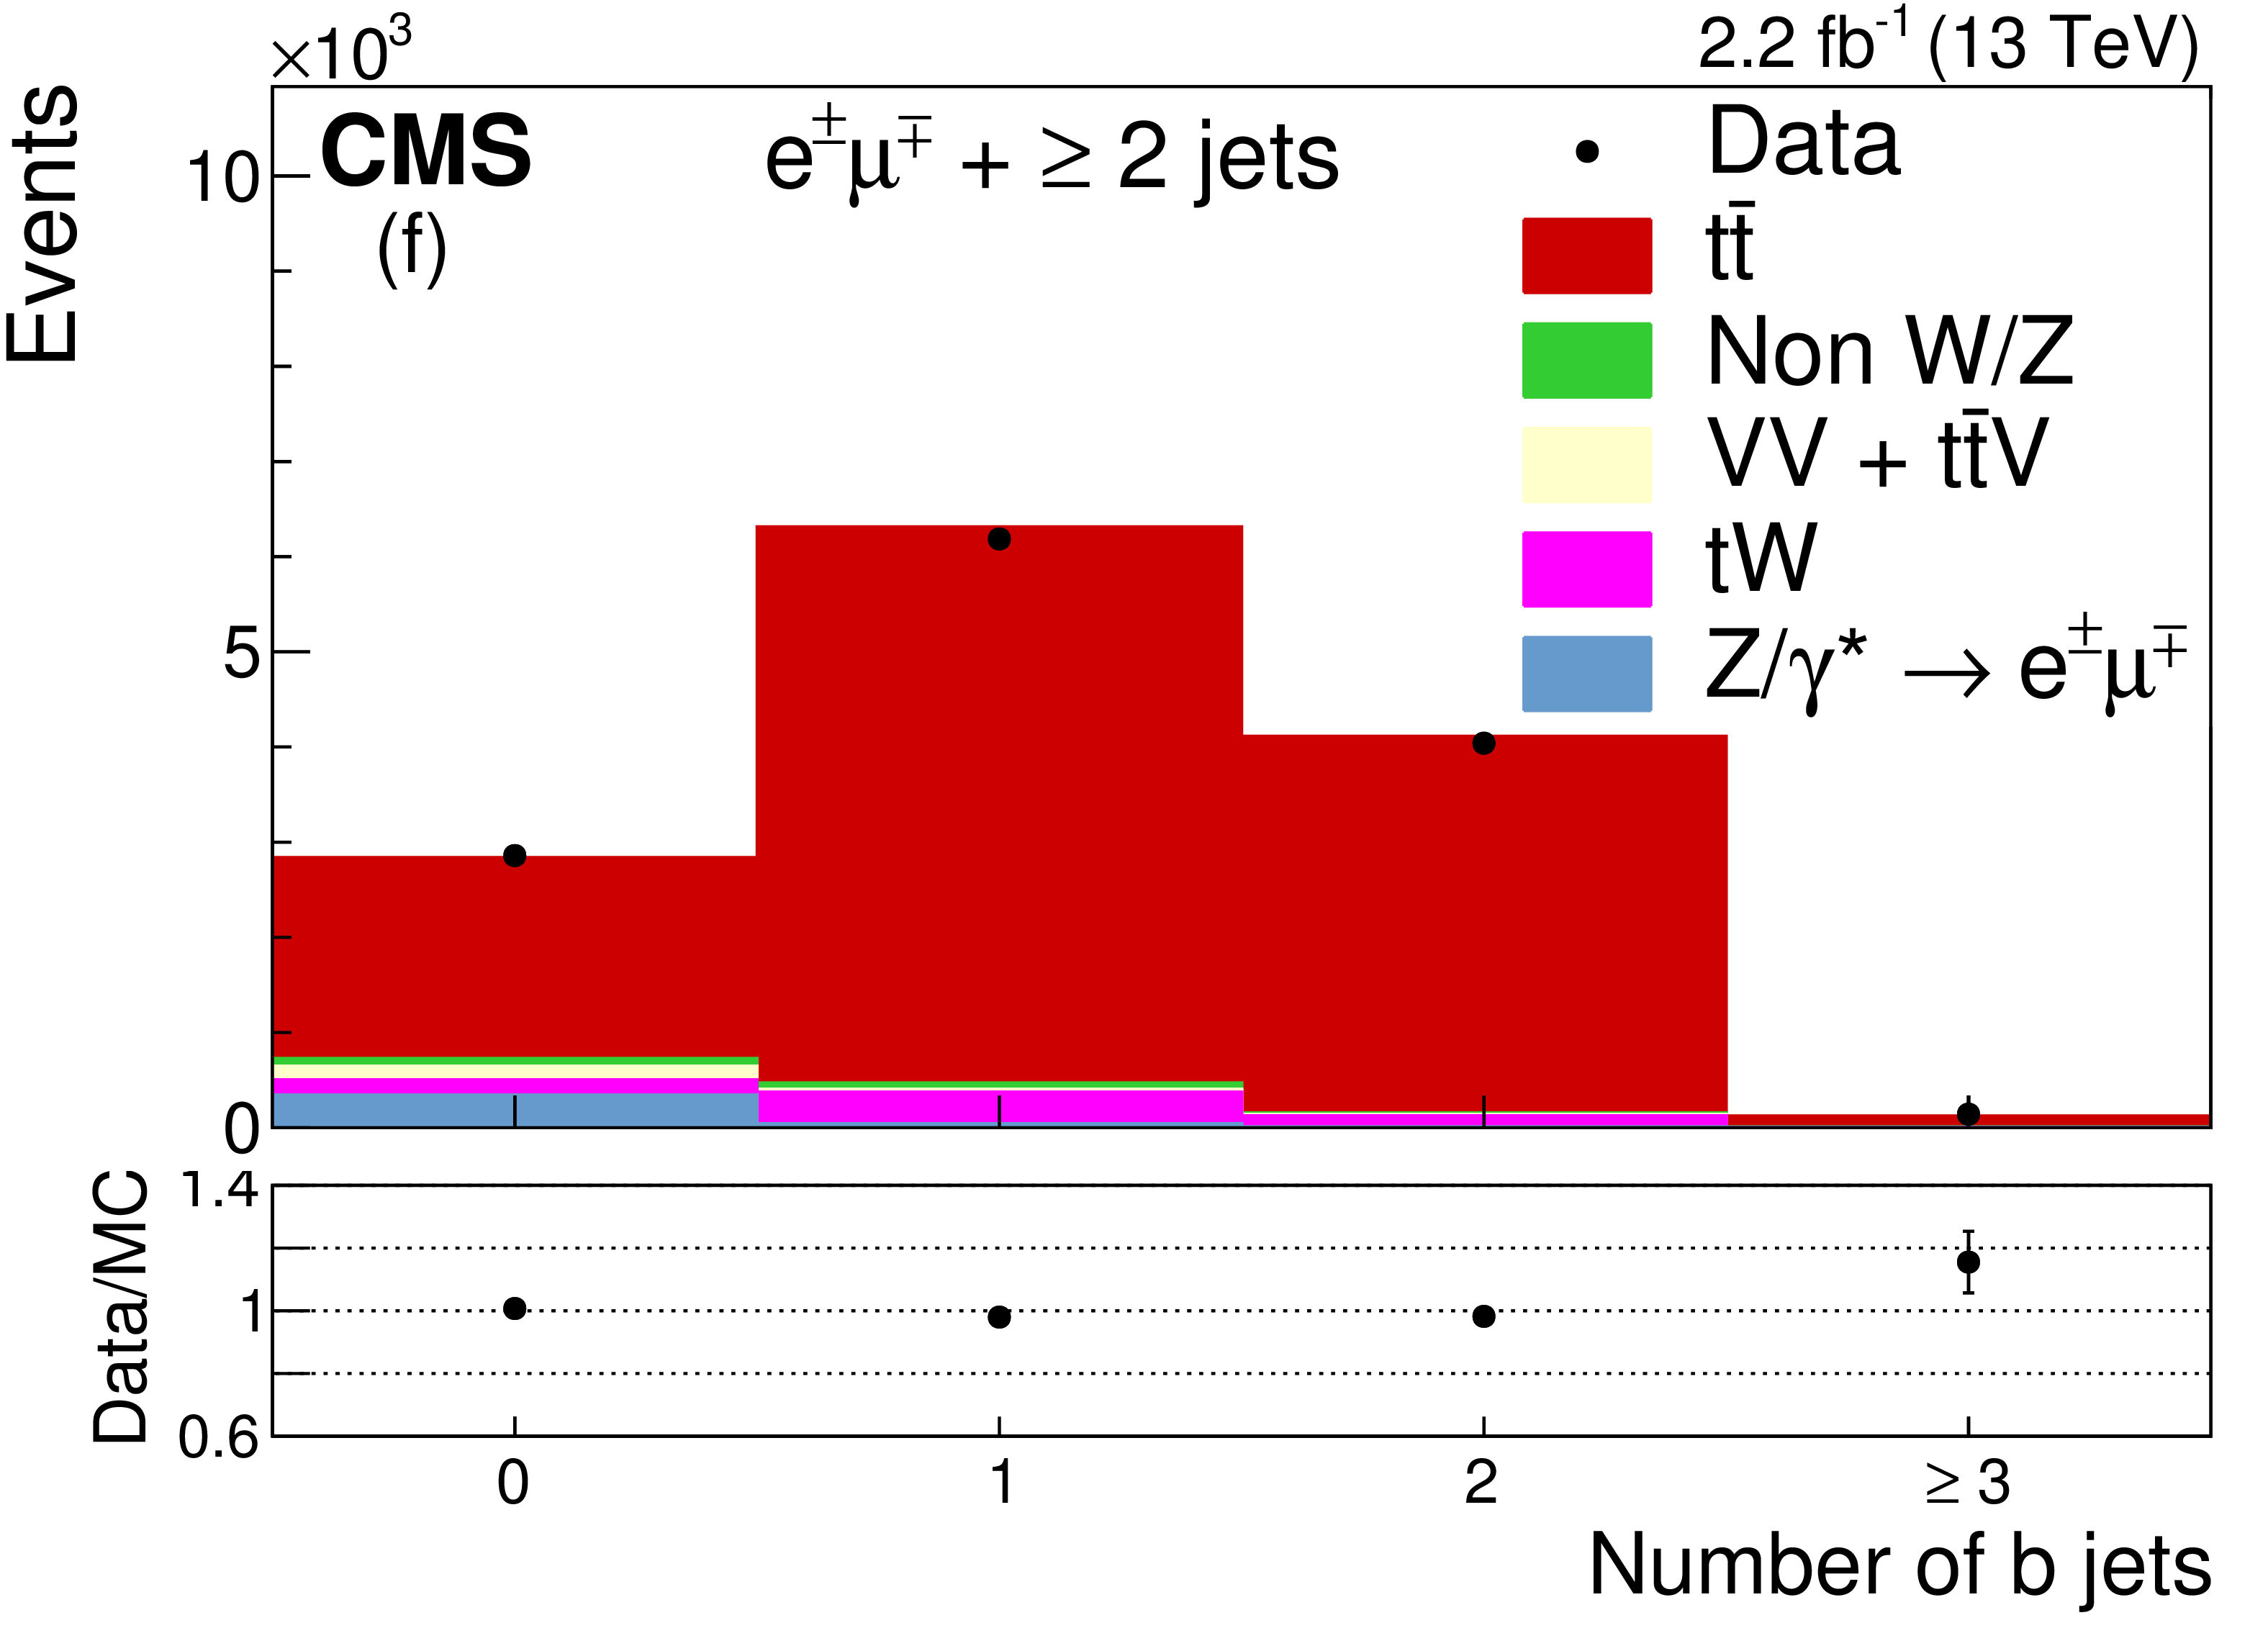
The distributions of (a) $ {p_{\mathrm {T}}} $ and (b) $ {| \eta | }$ for the leading jet, (c) $ {p_{\mathrm {T}}} $ and (d) $ {| \eta | }$ for the sub-leading jet, (e) $H_\mathrm {T}$, and (f) b jet multiplicity after the jets selection and before the b jet requirement. The expected distributions for $ {\mathrm{ t } {}\mathrm{ \bar{t} } } $ signal and individual backgrounds are shown after corrections based on control regions in data are applied; in each plot the last bin contains the overflow events. The ratios of data to the sum of the expected yields are given at the bottom of each panel. The error bars indicate the statistical uncertainties. |
png pdf |
Figure 3-a:
The distributions of (a) $ {p_{\mathrm {T}}} $ and (b) $ {| \eta | }$ for the leading jet, (c) $ {p_{\mathrm {T}}} $ and (d) $ {| \eta | }$ for the sub-leading jet, (e) $H_\mathrm {T}$, and (f) b jet multiplicity after the jets selection and before the b jet requirement. The expected distributions for $ {\mathrm{ t } {}\mathrm{ \bar{t} } } $ signal and individual backgrounds are shown after corrections based on control regions in data are applied; in each plot the last bin contains the overflow events. The ratios of data to the sum of the expected yields are given at the bottom of each panel. The error bars indicate the statistical uncertainties. |
png pdf |
Figure 3-b:
The distributions of (a) $ {p_{\mathrm {T}}} $ and (b) $ {| \eta | }$ for the leading jet, (c) $ {p_{\mathrm {T}}} $ and (d) $ {| \eta | }$ for the sub-leading jet, (e) $H_\mathrm {T}$, and (f) b jet multiplicity after the jets selection and before the b jet requirement. The expected distributions for $ {\mathrm{ t } {}\mathrm{ \bar{t} } } $ signal and individual backgrounds are shown after corrections based on control regions in data are applied; in each plot the last bin contains the overflow events. The ratios of data to the sum of the expected yields are given at the bottom of each panel. The error bars indicate the statistical uncertainties. |

png pdf |
Figure 3-c:
The distributions of (a) $ {p_{\mathrm {T}}} $ and (b) $ {| \eta | }$ for the leading jet, (c) $ {p_{\mathrm {T}}} $ and (d) $ {| \eta | }$ for the sub-leading jet, (e) $H_\mathrm {T}$, and (f) b jet multiplicity after the jets selection and before the b jet requirement. The expected distributions for $ {\mathrm{ t } {}\mathrm{ \bar{t} } } $ signal and individual backgrounds are shown after corrections based on control regions in data are applied; in each plot the last bin contains the overflow events. The ratios of data to the sum of the expected yields are given at the bottom of each panel. The error bars indicate the statistical uncertainties. |
png pdf |
Figure 3-d:
The distributions of (a) $ {p_{\mathrm {T}}} $ and (b) $ {| \eta | }$ for the leading jet, (c) $ {p_{\mathrm {T}}} $ and (d) $ {| \eta | }$ for the sub-leading jet, (e) $H_\mathrm {T}$, and (f) b jet multiplicity after the jets selection and before the b jet requirement. The expected distributions for $ {\mathrm{ t } {}\mathrm{ \bar{t} } } $ signal and individual backgrounds are shown after corrections based on control regions in data are applied; in each plot the last bin contains the overflow events. The ratios of data to the sum of the expected yields are given at the bottom of each panel. The error bars indicate the statistical uncertainties. |
png pdf |
Figure 3-e:
The distributions of (a) $ {p_{\mathrm {T}}} $ and (b) $ {| \eta | }$ for the leading jet, (c) $ {p_{\mathrm {T}}} $ and (d) $ {| \eta | }$ for the sub-leading jet, (e) $H_\mathrm {T}$, and (f) b jet multiplicity after the jets selection and before the b jet requirement. The expected distributions for $ {\mathrm{ t } {}\mathrm{ \bar{t} } } $ signal and individual backgrounds are shown after corrections based on control regions in data are applied; in each plot the last bin contains the overflow events. The ratios of data to the sum of the expected yields are given at the bottom of each panel. The error bars indicate the statistical uncertainties. |
png pdf |
Figure 3-f:
The distributions of (a) $ {p_{\mathrm {T}}} $ and (b) $ {| \eta | }$ for the leading jet, (c) $ {p_{\mathrm {T}}} $ and (d) $ {| \eta | }$ for the sub-leading jet, (e) $H_\mathrm {T}$, and (f) b jet multiplicity after the jets selection and before the b jet requirement. The expected distributions for $ {\mathrm{ t } {}\mathrm{ \bar{t} } } $ signal and individual backgrounds are shown after corrections based on control regions in data are applied; in each plot the last bin contains the overflow events. The ratios of data to the sum of the expected yields are given at the bottom of each panel. The error bars indicate the statistical uncertainties. |
| Tables | |
png pdf |
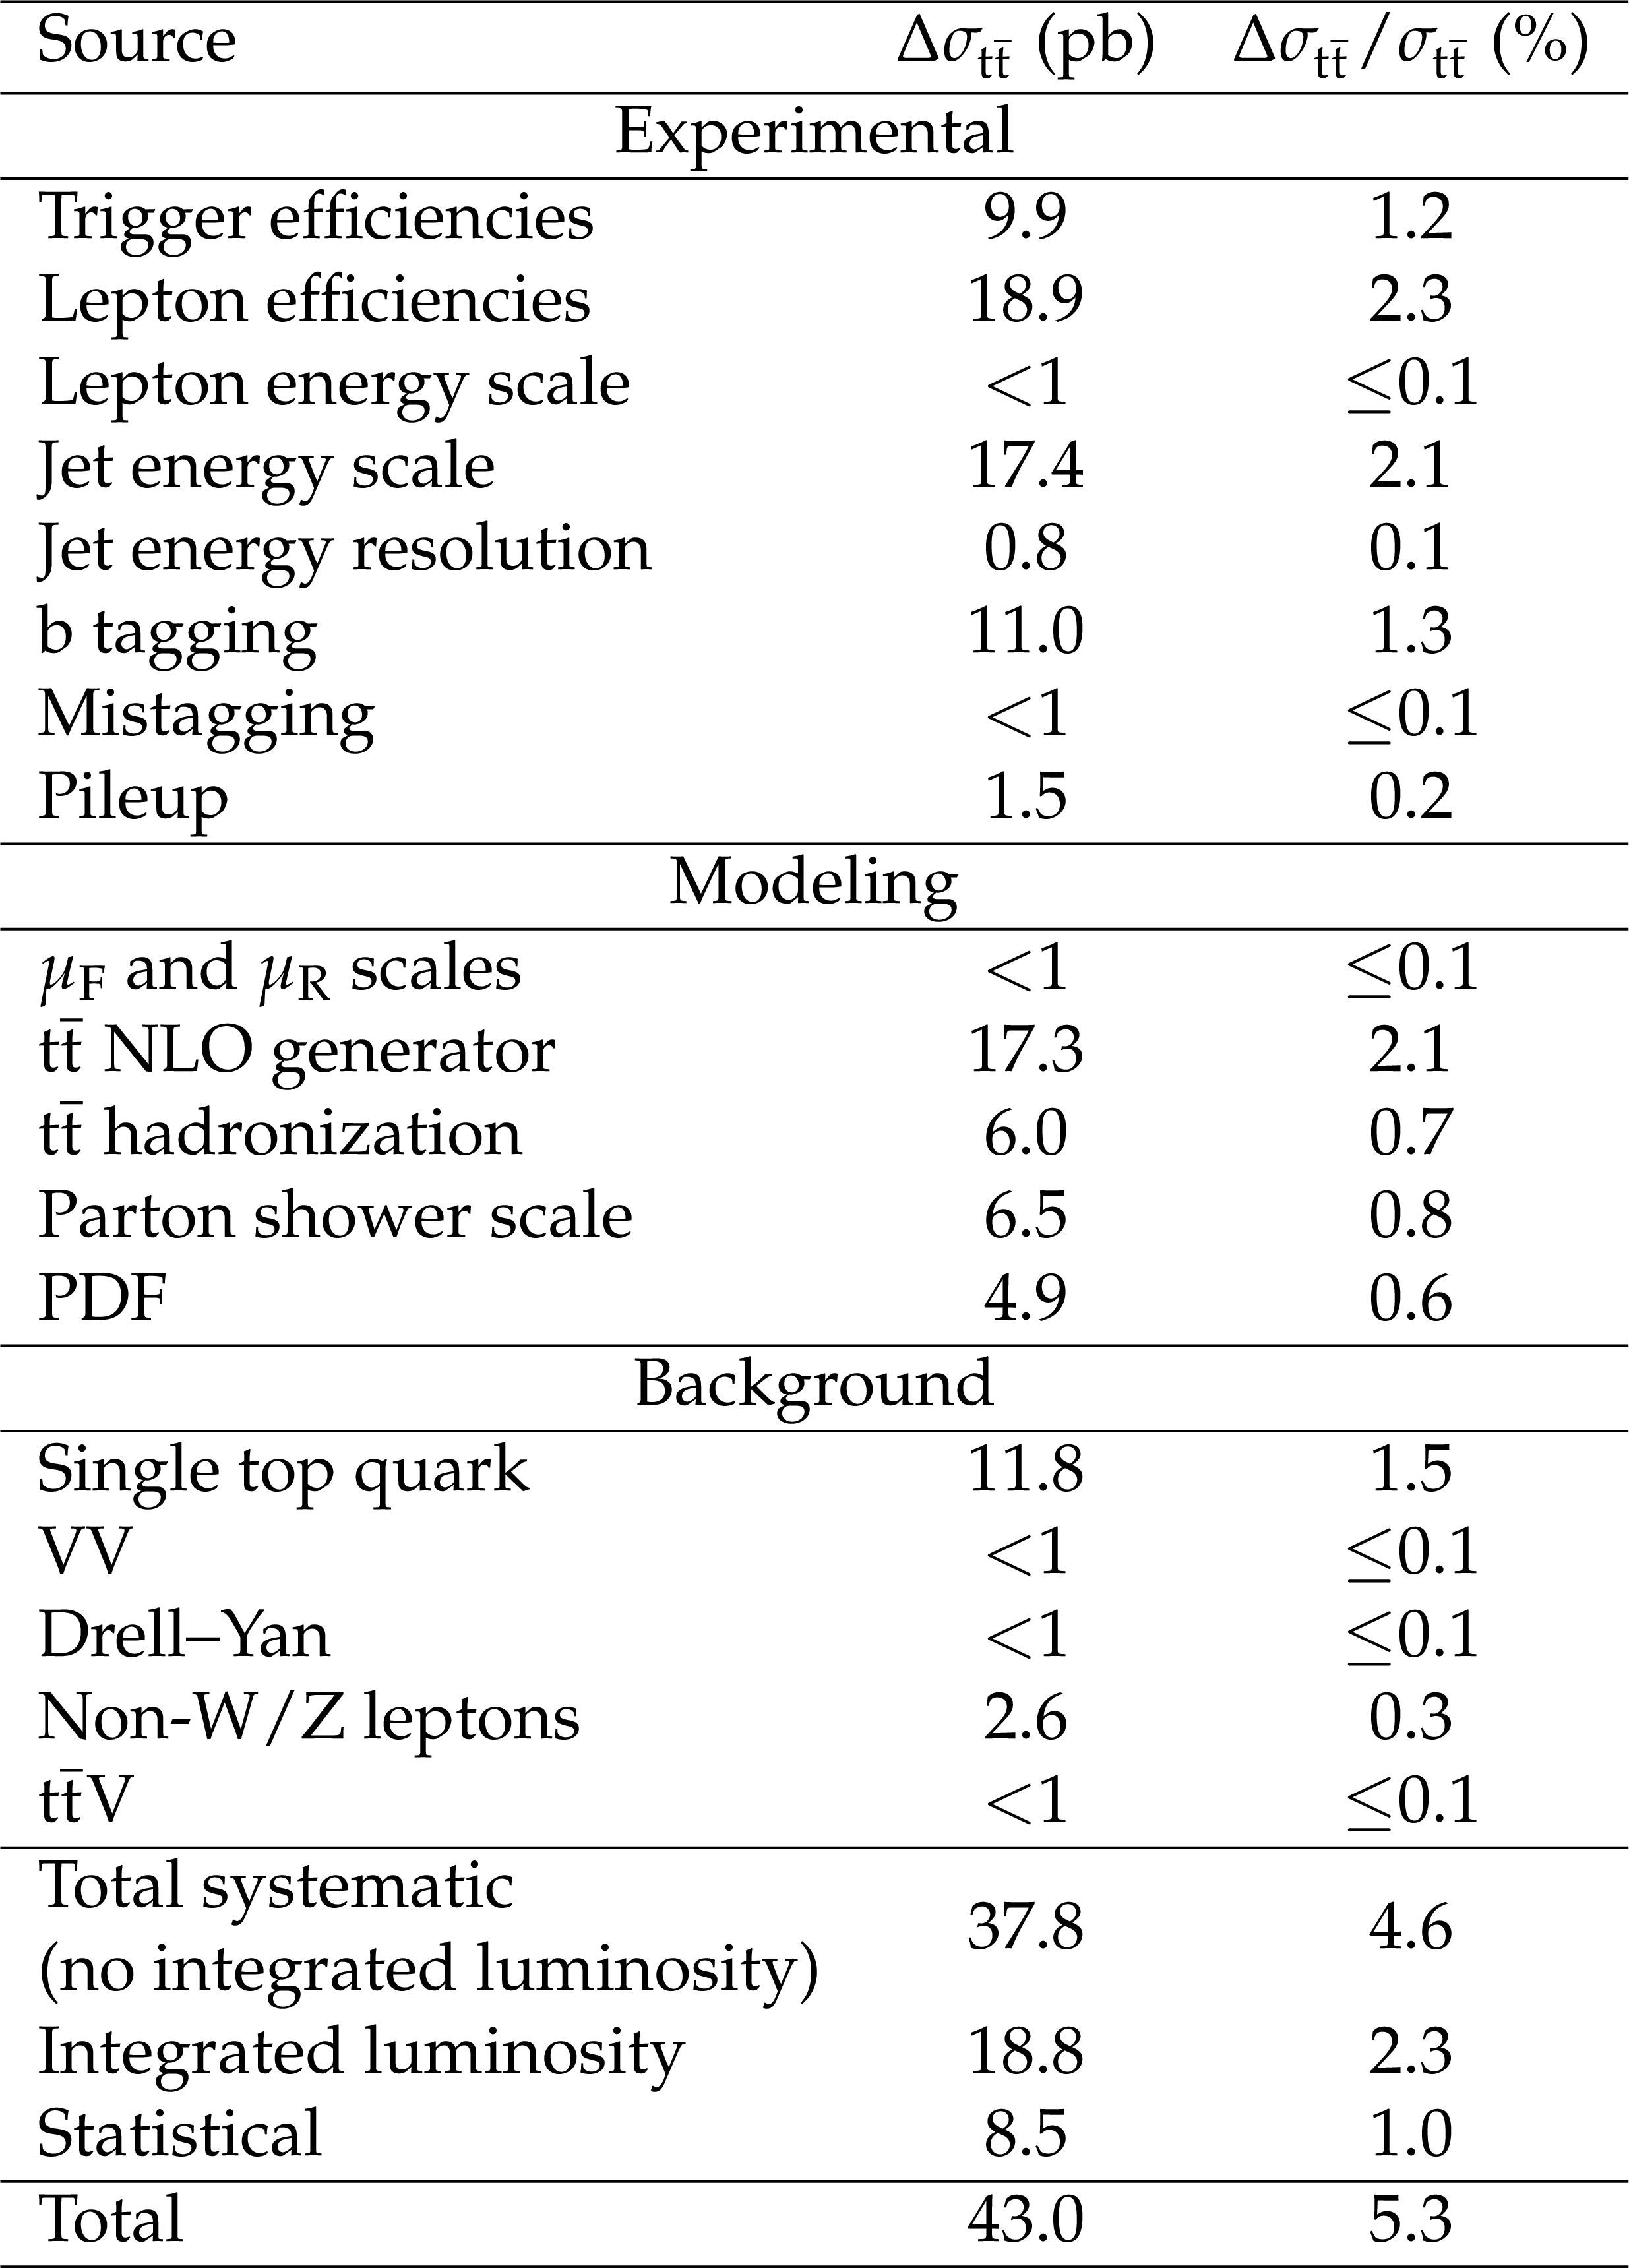
Table 1:
Summary of the individual contributions to the uncertainty in the $\sigma _{{\mathrm{ t } {}\mathrm{ \bar{t} } } }$ measurement. The first and second uncertainty corresponds to the total and relative component, respectively. The total uncertainty in the result, calculated as the quadratic sum of the individual components, is also given. |
png pdf |
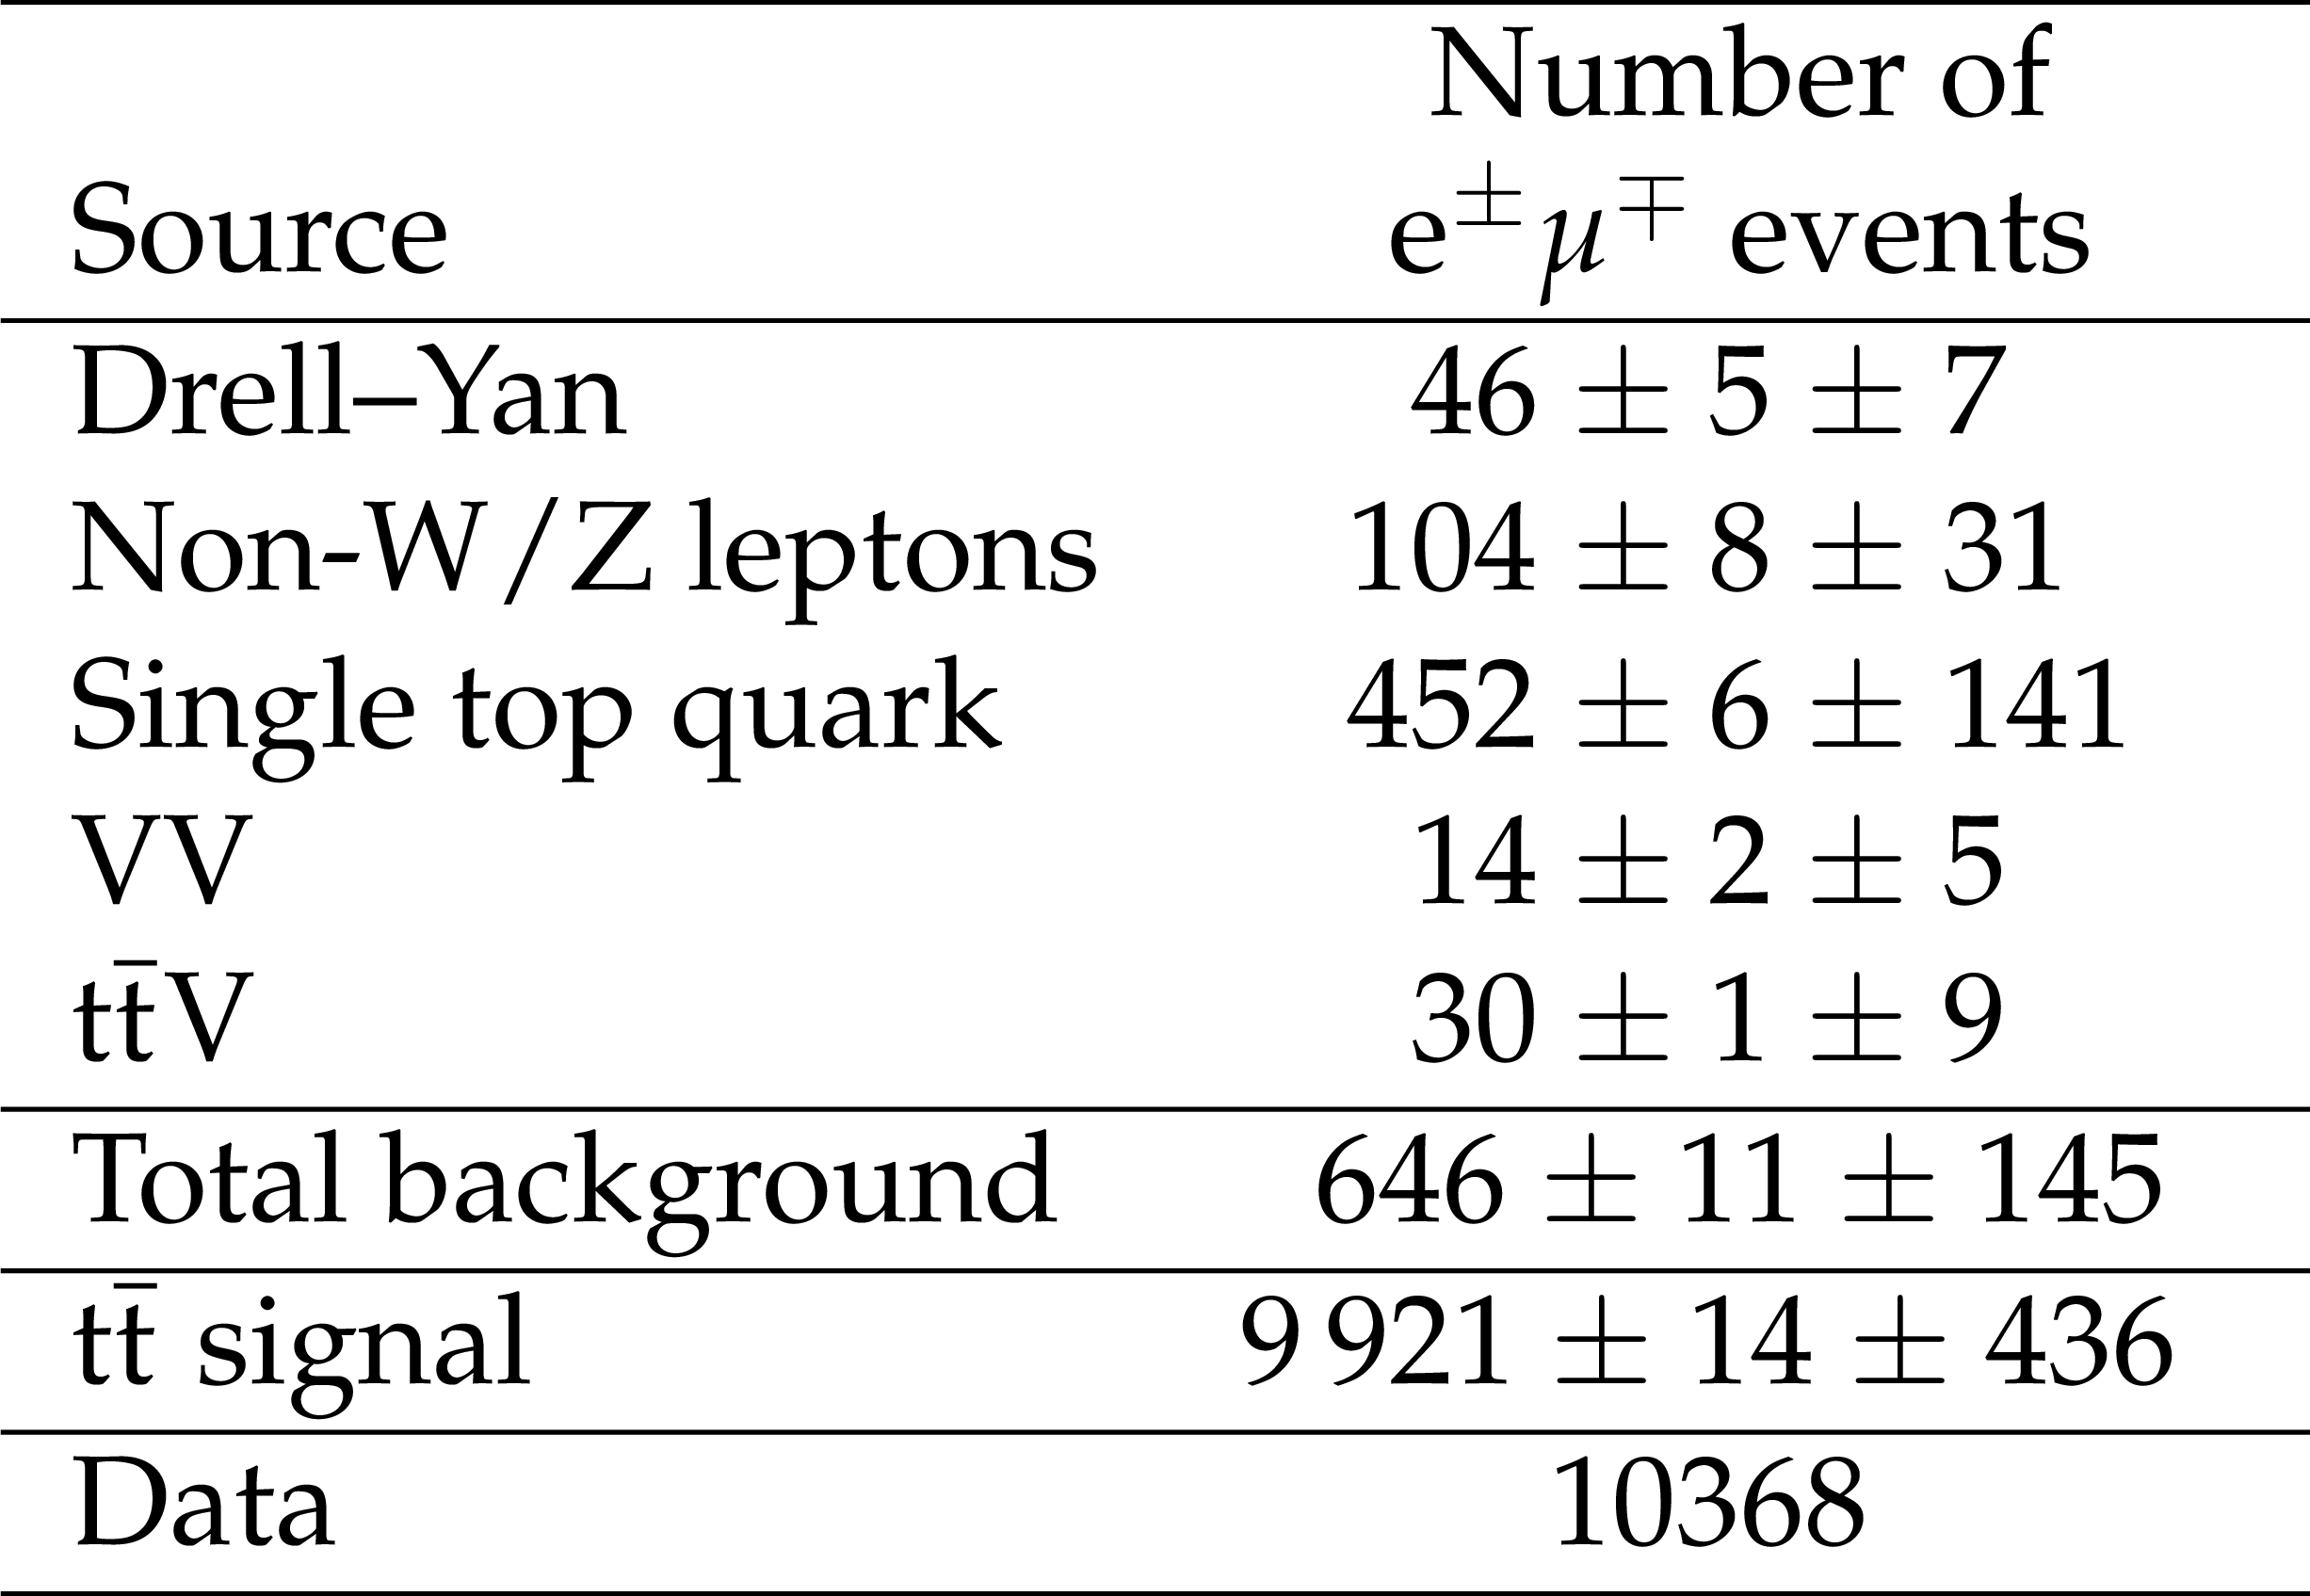
Table 2:
Number of dilepton events obtained after applying the full selection. The results are given for the individual sources of background, $ {\mathrm{ t } {}\mathrm{ \bar{t} } } $ signal with a top quark mass of 172.5 GeV and ${\sigma _{{\mathrm{ t } {}\mathrm{ \bar{t} } } }} =$ 832$^{+40}_{-46}$ pb, and data. The uncertainties correspond to the statistical component. |
| Summary |
|
A measurement of the $\mathrm{ t \bar{t} }$ production cross section in proton-proton collisions at $ \sqrt{s} = $ 13 TeV is presented for events containing an oppositely charged electron-muon pair, and two or more jets, of which at least one is tagged as originating from a b quark. The measurement is performed through an event-counting method based on a data sample corresponding to an integrated luminosity of 2.2 fb$^{-1}$. The measured cross section is |
| References | ||||
| 1 | CMS Collaboration | First measurement of the cross section for top-quark pair production in proton-proton collisions at $ \sqrt{s} $ = 7 TeV | PLB 695 (2010) 424 | |
| 2 | CMS Collaboration | Measurement of the $ \mathrm{t}\overline{\mathrm{t}} $ production cross section and the top quark mass in the dilepton channel in pp collisions at $ \sqrt{s} =7 $ TeV | JHEP 07 (2011) 049 | |
| 3 | CMS Collaboration | Measurement of the $ \mathrm{t}\overline{\mathrm{t}} $ production cross section in pp collisions at $ {\sqrt{s}=7 TeV} $ using the kinematic properties of events with leptons and jets | EPJC 71 (2011) 1721 | |
| 4 | CMS Collaboration | Measurement of the $ t\bar{t} $ production cross section in $ pp $ collisions at 7 TeV in lepton + jets events using $ b $-quark jet identification | PRD 84 (2011) 092004 | |
| 5 | CMS Collaboration | Measurement of the top quark pair production cross section in pp collisions at $ \sqrt{s} = 7 $ TeV in dilepton final states containing a $ \tau $ | PRD 85 (2012) 112007 | CMS-TOP-11-006 1203.6810 |
| 6 | CMS Collaboration | Measurement of the $ \mathrm{ t \bar{t} } $ production cross section in the dilepton channel in pp collisions at $ \sqrt{s}=7 $ TeV | JHEP 11 (2012) 067 | CMS-TOP-11-005 1208.2671 |
| 7 | CMS Collaboration | Measurement of the $ \mathrm{ t \bar{t} } $ production cross section in pp collisions at $ \sqrt{s}=7 $ TeV with lepton + jets final states | PLB 720 (2013) 83 | CMS-TOP-11-003 1212.6682 |
| 8 | CMS Collaboration | Measurement of the $ \mathrm{ t \bar{t} } $ production cross section in the $ \tau $+jets channel in pp collisions at $ \sqrt{s}=7 $$ TeV $ | EPJC 73 (2013) 2386 | |
| 9 | CMS Collaboration | Measurement of the $ \mathrm{ t \bar{t} } $ production cross section in the all-jet final state in pp collisions at $ \sqrt{s} $ = 7 TeV | JHEP 05 (2013) 065 | CMS-TOP-11-007 1302.0508 |
| 10 | CMS Collaboration | Measurement of the $ \mathrm{ t \bar{t} } $ production cross section in the dilepton channel in pp collisions at $ \sqrt{s} $ = 8 TeV | JHEP 02 (2014) 024, , [Erratum: \DOI10.1007/JHEP02(2014)102] | CMS-TOP-12-007 1312.7582 |
| 11 | CMS Collaboration | Measurement of the $ \mathrm{ t \bar{t} } $ production cross section in pp collisions at $ \sqrt s = 8 $ TeV in dilepton final states containing one $ \tau $ lepton | PLB 739 (2014) 23 | CMS-TOP-12-026 1407.6643 |
| 12 | CMS Collaboration | Measurement of the Top Quark Pair Production Cross Section in Proton-Proton Collisions at $ \sqrt{s}=13 $ TeV | PRL 116 (2016) 052002 | CMS-TOP-15-003 1510.05302 |
| 13 | CMS Collaboration | Measurement of the $ \mathrm{ t \bar{t} } $ production cross section in the e$ \mu $ channel in proton-proton collisions at $ \sqrt{s} = 7 $ and $ 8 $ TeV | JHEP 08 (2016) 029 | CMS-TOP-13-004 1603.02303 |
| 14 | ATLAS Collaboration | Measurement of the top quark-pair production cross section with ATLAS in $ pp $ collisions at $ \sqrt{s}=7 $ TeV | EPJC 71 (2011) 1577 | 1012.1792 |
| 15 | ATLAS Collaboration | Measurement of the top quark pair production cross section in $ pp $ collisions at $ \sqrt{s}=7 $ TeV in dilepton final states with ATLAS | PLB 707 (2012) 459 | 1108.3699 |
| 16 | ATLAS Collaboration | Measurement of the top quark pair production cross-section with ATLAS in the single lepton channel | PLB 711 (2012) 244 | 1201.1889 |
| 17 | ATLAS Collaboration | Measurement of the cross section for top-quark pair production in $ pp $ collisions at $ \sqrt{s}=7 $ TeV with the ATLAS detector using final states with two high-$ p_{\rm T} $ leptons | JHEP 05 (2012) 059 | 1202.4892 |
| 18 | ATLAS Collaboration | Measurement of $ t \bar{t} $ production with a veto on additional central jet activity in $ pp $ collisions at $ \sqrt{s}=7 $ TeV using the ATLAS detector | EPJC 72 (2012) 2043 | 1203.5015 |
| 19 | ATLAS Collaboration | Measurement of the top quark pair cross section with ATLAS in $ pp $ collisions at sqrt(s) = 7 TeV using final states with an electron or a muon and a hadronically decaying $ \tau $ lepton | PLB 717 (2012) 89 | 1205.2067 |
| 20 | ATLAS Collaboration | Measurement of the $ t\bar t $ production cross section in the tau+jets channel using the ATLAS detector | EPJC 73 (2013) 2328 | 1211.7205 |
| 21 | ATLAS Collaboration | Measurement of the $ t\overline{t} $ production cross-section using $ e\mu $ events with $ b $-tagged jets in $ pp $ collisions at $ \sqrt{s}=7 $ and 8 TeV with the ATLAS detector | EPJC 74 (2014) 3109 | 1406.5375 |
| 22 | ATLAS Collaboration | Measurement of the $ t\overline{t} $ production cross-section as a function of jet multiplicity and jet transverse momentum in 7 TeV proton-proton collisions with the ATLAS detector | JHEP 01 (2015) 020 | 1407.0891 |
| 23 | ATLAS Collaboration | Measurement of the top pair production cross section in 8 TeV proton-proton collisions using kinematic information in the lepton+jets final state with ATLAS | PRD 91 (2015) 112013 | 1504.04251 |
| 24 | ATLAS Collaboration | Measurement of the $ t\bar{t} $ production cross-section using $ e\mu $ events with b-tagged jets in pp collisions at $ \sqrt{s} $ = 13 TeV with the ATLAS detector | PLB 761 (2016) 136 | 1606.02699 |
| 25 | M. Czakon, M. L. Mangano, A. Mitov, and J. Rojo | Constraints on the gluon PDF from top quark pair production at hadron colliders | JHEP 07 (2013) 167 | 1303.7215 |
| 26 | ATLAS Collaboration | ATLAS Run 1 searches for direct pair production of third-generation squarks at the Large Hadron Collider | EPJC 75 (2015) 510, , [Erratum:\DOI10.1140/epjc/s10052-016-3935-x] | 1506.08616 |
| 27 | CMS Collaboration | The CMS experiment at the CERN LHC | JINST 3 (2008) S08004 | CMS-00-001 |
| 28 | S. Frixione, P. Nason, and C. Oleari | Matching NLO QCD computations with parton shower simulations: the POWHEG method | JHEP 11 (2007) 070 | 0709.2092 |
| 29 | S. Alioli, P. Nason, C. Oleari, and E. Re | A general framework for implementing NLO calculations in shower Monte Carlo programs: the POWHEG BOX | JHEP 06 (2010) 043 | 1002.2581 |
| 30 | F. Demartin et al. | The impact of PDF and $ \alpha_s $ uncertainties on Higgs Production in gluon fusion at hadron colliders | PRD 82 (2010) 014002 | 1004.0962 |
| 31 | T. Sj\"ostrand, S. Mrenna, and P. Skands | PYTHIA 6.4 physics and manual | JHEP 05 (2006) 026 | hep-ph/0603175 |
| 32 | T. Sj\"ostrand et al. | An Introduction to PYTHIA 8.2 | CPC 191 (2015) 159 | 1410.3012 |
| 33 | CMS Collaboration | Underlying Event Tunes and Double Parton Scattering | CDS | |
| 34 | P. Skands, S. Carrazza, and J. Rojo | Tuning PYTHIA 8.1: the Monash 2013 tune | EPJC 74 (2014) 3024 | 1404.5630 |
| 35 | M. B\"ahr et al. | Herwig++ physics and manual | EPJC 58 (2008) 639 | 0803.0883 |
| 36 | J. Alwall et al. | The automated computation of tree-level and next-to-leading order differential cross sections, and their matching to parton shower simulations | JHEP 07 (2014) 079 | 1405.0301 |
| 37 | P. Artoisenet, R. Frederix, O. Mattelaer, and R. Rietkerk | Automatic spin-entangled decays of heavy resonances in Monte Carlo simulations | JHEP 03 (2013) 015 | 1212.3460 |
| 38 | S. Alioli, P. Nason, C. Oleari, and E. Re | NLO single-top production matched with shower in POWHEG: $ s $- and $ t $-channel contributions | JHEP 09 (2009) 111, , [Erratum: \DOI10.1007/JHEP02(2010)011] | 0907.4076 |
| 39 | E. Re | Single-top Wt-channel production matched with parton showers using the POWHEG method | EPJC 71 (2011) 1547 | 1009.2450 |
| 40 | N. Kidonakis | Top Quark Production | Proceedings, Helmholtz International Summer School on Physics of Heavy Quarks and Hadrons (HQ 2013) (2014) 139 | 1311.0283 |
| 41 | J. M. Campbell and R. K. Ellis | MCFM for the Tevatron and the LHC | NPPS 205-206 (2010) 10 | 1007.3492 |
| 42 | M. Czakon and A. Mitov | Top++: A Program for the Calculation of the Top-Pair Cross-Section at Hadron Colliders | CPC 185 (2014) 2930 | 1112.5675 |
| 43 | M. Czakon, P. Fiedler and A. Mitov | The total top quark production cross-section at hadron colliders through O($ \alpha_S^4 $) | PRL 110 (2013) 252004 | 1303.6254 |
| 44 | S. Alekhin et al. | The PDF4LHC Working Group Interim Report | 1101.0536 | |
| 45 | M. Botje et al. | The PDF4LHC Working Group Interim Recommendations | 1101.0538 | |
| 46 | A. D. Martin, W. J. Stirling, R. S. Thorne, and G. Watt | Parton distributions for the LHC | EPJC 63 (2009) 189 | 0901.0002 |
| 47 | A. D. Martin, W. J. Stirling, R. S. Thorne, and G. Watt | Uncertainties on $ \alpha_s $ in global PDF analyses and implications for predicted hadronic cross sections | EPJC 64 (2009) 653 | 0905.3531 |
| 48 | H.-L. Lai et al. | New parton distributions for collider physics | PRD 82 (2010) 074024 | 1007.2241 |
| 49 | J. Gao et al. | CT10 next-to-next-to-leading order global analysis of QCD | PRD 89 (2014) 033009 | 1302.6246 |
| 50 | NNPDF Collaboration | Parton distributions with LHC data | Nucl. Phys. B 867 (2013) 244 | 1207.1303 |
| 51 | CMS Collaboration | Particle-Flow Event Reconstruction in CMS and Performance for Jets, Taus, and MET | CDS | |
| 52 | CMS Collaboration | Commissioning of the Particle-flow Event Reconstruction with the first LHC collisions recorded in the CMS detector | CDS | |
| 53 | CMS Collaboration | Performance of electron reconstruction and selection with the CMS detector in proton-proton collisions at $ \sqrt{s} = 8 $$ TeV $ | JINST 10 (2015) P06005 | |
| 54 | CMS Collaboration | Performance of CMS muon reconstruction in pp collision events at $ \sqrt{s}=7 $ TeV | JINST 7 (2012) P10002 | CMS-MUO-10-004 1206.4071 |
| 55 | CMS Collaboration | Measurements of Inclusive W and Z Cross Sections in pp Collisions at $ \sqrt{s}=7 $ TeV | JHEP 01 (2011) 080 | CMS-EWK-10-002 1012.2466 |
| 56 | M. Cacciari, G. P. Salam, and G. Soyez | The anti-$ k_t $ jet clustering algorithm | JHEP 04 (2008) 063 | 0802.1189 |
| 57 | M. Cacciari, G. P. Salam, and G. Soyez | FastJet user manual | EPJC 72 (2012) 1896 | 1111.6097 |
| 58 | CMS Collaboration | Determination of jet energy calibration and transverse momentum resolution in CMS | JINST 6 (2011) P11002 | |
| 59 | CMS Collaboration | Identification of b-quark jets with the CMS experiment | JINST 8 (2013) P04013 | CMS-BTV-12-001 1211.4462 |
| 60 | CMS Collaboration | Identification of b quark jets at the CMS experiment in the LHC Run2 | CDS | |
| 61 | ATLAS Collaboration | Measurement of the Inelastic Proton-Proton Cross Section at $ \sqrt{s} = 13 $ TeV with the ATLAS Detector at the LHC | PRL 117 (2016) 182002 | 1606.02625 |
| 62 | CMS Collaboration | Measurement of the single-top-quark $ t $-channel cross section in pp collisions at $ \sqrt{s} $ = 7 TeV | JHEP 12 (2012) 035 | CMS-TOP-11-021 1209.4533 |
| 63 | CMS Collaboration | Observation of the Associated Production of a Single Top Quark and a $ W $ Boson in $ pp $ Collisions at $ \sqrt{s} = $ 8 TeV | PRL 112 (2014) 231802 | |
| 64 | CMS Collaboration | Evidence for Associated Production of a Single Top Quark and $ W $ Boson in $ pp $ collisions at $ \sqrt{s} $ = 7$ TeV $ | PRL 110 (2013) 022003 | |
| 65 | CMS Collaboration | Measurement of the W$ ^+ $W$ ^- $ and ZZ production cross section in pp collisions at $ \sqrt{s} $ = 8 TeV | PLB 721 (2013) 190 | CMS-SMP-12-024 1301.4698 |
| 66 | CMS Collaboration | Measurement of the W$ ^+ $W$ ^- $ cross section in pp collisions at $ \sqrt{s}=7 $ TeV and limits on anomalous WW$ \gamma $ and WWZ couplings | EPJC 73 (2013) 2610 | CMS-SMP-12-005 1306.1126 |
| 67 | CMS Collaboration | Measurement of $ \mathrm{ W^{+} }\mathrm{ W^{-} } $ production and search for the Higgs boson in pp collisions at $ \sqrt{s} $ = 7 TeV | PLB 699 (2011) 25 | |
| 68 | CMS Collaboration | Measurement of the ZZ production cross section and $ Z\rightarrow\ell^+\ell^-\ell^{'+}\ell^{'-} $ branching fraction in pp collisions at $ \sqrt{s} $ = 13 TeV | $Submitted to PLB$ | CMS-SMP-16-001 1607.08834 |
| 69 | CMS Collaboration | Measurement of the WZ production cross section in pp collisions at $ \sqrt{s} $ = 13 TeV | $Submitted to PLB$ | CMS-SMP-16-002 1607.06943 |
| 70 | ATLAS Collaboration | Measurement of the WW cross section in $ \sqrt{s} $ = 7 TeV pp collisions with the ATLAS detector and limits on anomalous gauge couplings | PLB 712 (2012) 289 | 1203.6232 |
| 71 | ATLAS Collaboration | Measurement of the W$ ^{\pm} $Z production cross section and limits on anomalous triple gauge couplings in proton-proton collisions at $ \sqrt{s} $ = 7 TeV with the ATLAS detector | PLB 709 (2012) 341 | 1111.5570 |
| 72 | ATLAS Collaboration | Measurement of the $ ZZ $ Production Cross Section and Limits on Anomalous Neutral Triple Gauge Couplings in Proton-Proton Collisions at $ \sqrt{s} $ = 7 TeV with the ATLAS Detector | PRL 108 (2012) 041804 | 1110.5016 |
|
|
Compact Muon Solenoid LHC, CERN |
|

|

|

|

|

|