

Compact Muon Solenoid
LHC, CERN
| CMS-TOP-13-004 ; CERN-EP-2016-044 | ||
| Measurement of the $\mathrm{ t \bar{t} }$ production cross section in the $\mathrm{ e } \mu$ channel in proton-proton collisions at $\sqrt{s} = $ 7 and 8 TeV | ||
| CMS Collaboration | ||
| 7 March 2016 | ||
| J. High Energy Phys. 08 (2016) 029 | ||
| Abstract: The inclusive cross section for top quark pair production is measured in proton-proton collisions at $\sqrt{s} = $ 7 and 8 TeV, corresponding to 5.0 and 19.7 fb$^{-1}$, respectively, with the CMS experiment at the LHC. The cross sections are measured in the electron-muon channel using a binned likelihood fit to multi-differential final state distributions related to identified b quark jets and other jets in the event. The measured cross section values are 173.6 $\pm$ 2.1 (stat) $^{+\,4.5}_{-\,4.0}$ (syst) $\pm$ 3.8 (lumi) pb at $ \sqrt{s} = $ 7 TeV, and 244.9 $\pm$ 1.4 (stat) $^{+\,6.3}_{-\,5.5}$ (syst) $\pm$ 6.4 (lumi) pb at $ \sqrt{s} = $ 8 TeV, in good agreement with QCD calculations at next-to-next-to-leading-order accuracy. The ratio of the cross sections measured at 7 and 8 TeV is determined, as well as cross sections in the fiducial regions defined by the acceptance requirements on the two charged leptons in the final state. The cross section results are used to determine the top quark pole mass via the dependence of the theoretically predicted cross section on the mass, giving a best result of 173.8 $^{+1.7}_{-1.8}$ GeV. The data at $\sqrt{s}= $ 8 TeV are also used to set limits, for two neutralino mass values, on the pair production of supersymmetric partners of the top quark with masses close to the top quark mass. | ||
| Links: e-print arXiv:1603.02303 [hep-ex] (PDF) ; CDS record ; inSPIRE record ; HepData record ; CADI line (restricted) ; | ||
| Figures | |
png pdf |
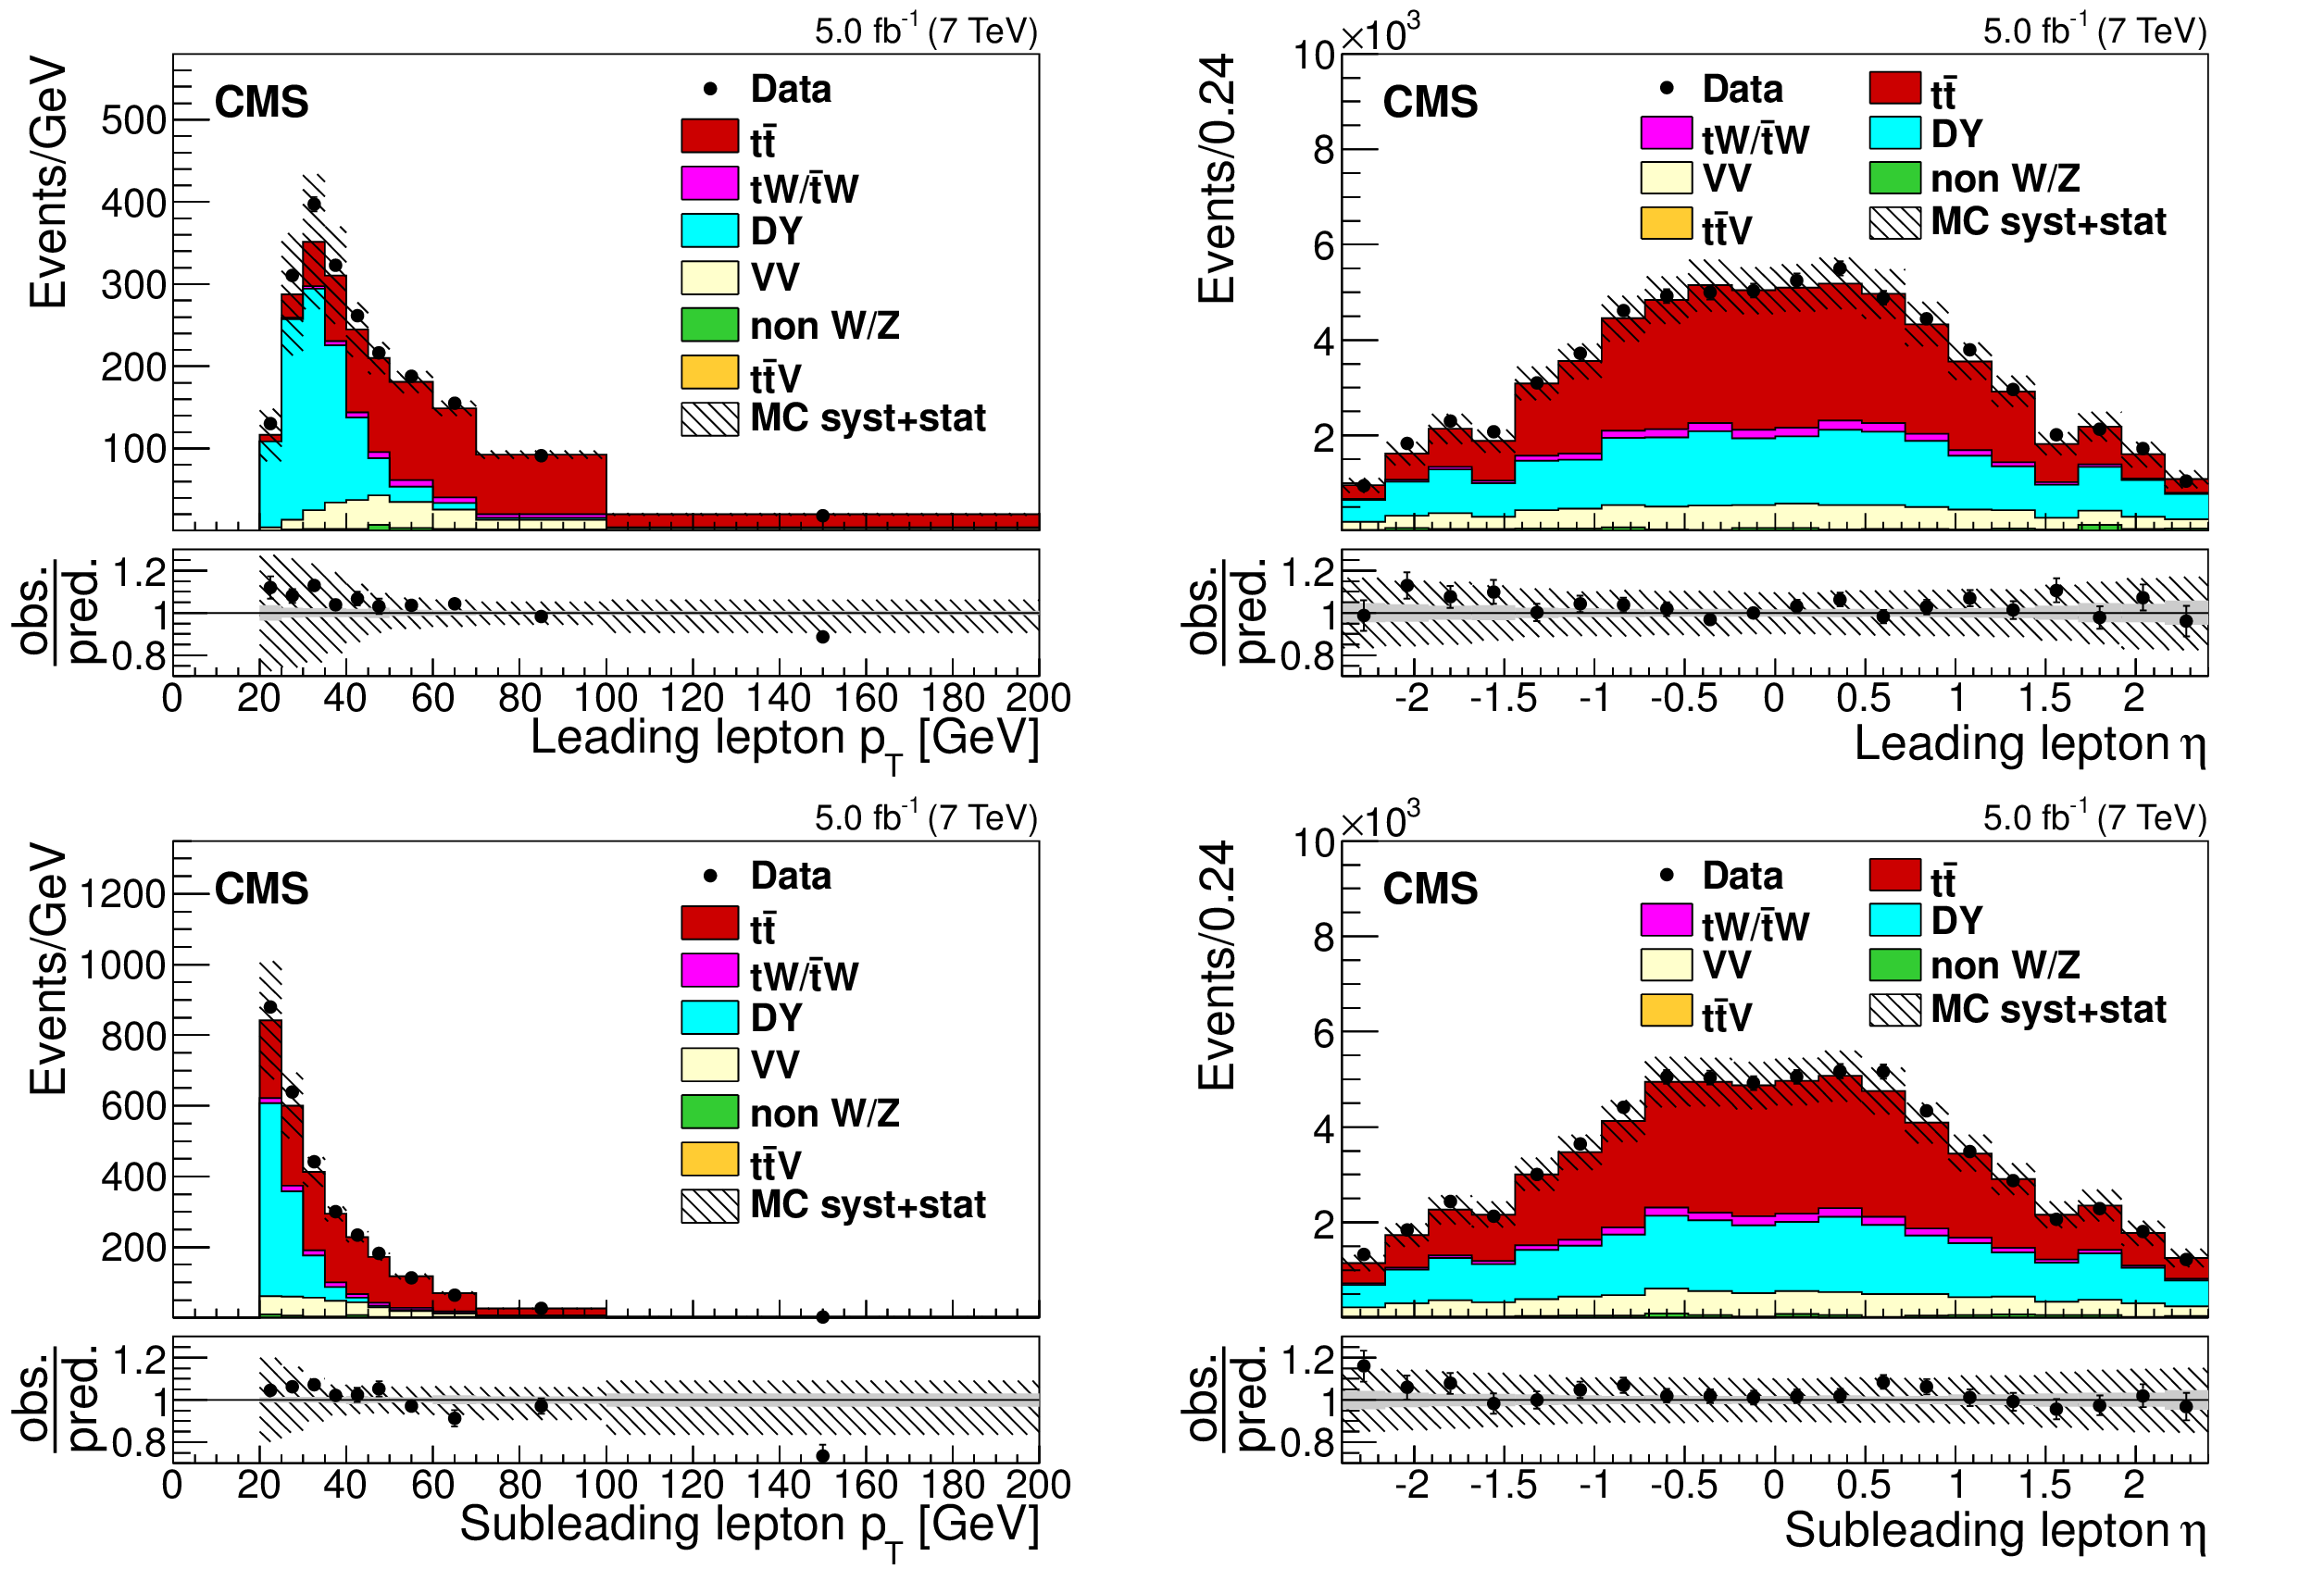
Figure 1:
Distributions of $ {p_{\mathrm {T}}} $ (left) and $\eta $ (right) of the leading (top) and subleading (bottom) leptons, after the $ {\mathrm{ e } \mu } $ selection, for the 7 TeV data. The last bin of the $ {p_{\mathrm {T}}} $ distributions includes the overflow events. The hatched bands correspond to the total uncertainty in the sum of the predicted yields. The ratios of data to the sum of the predicted yields are shown at the bottom of each plot. Here, an additional solid gray band represents the contribution from the statistical uncertainty in the MC simulation. The contributing systematic uncertainties are discussed in Section 7. |

png pdf |
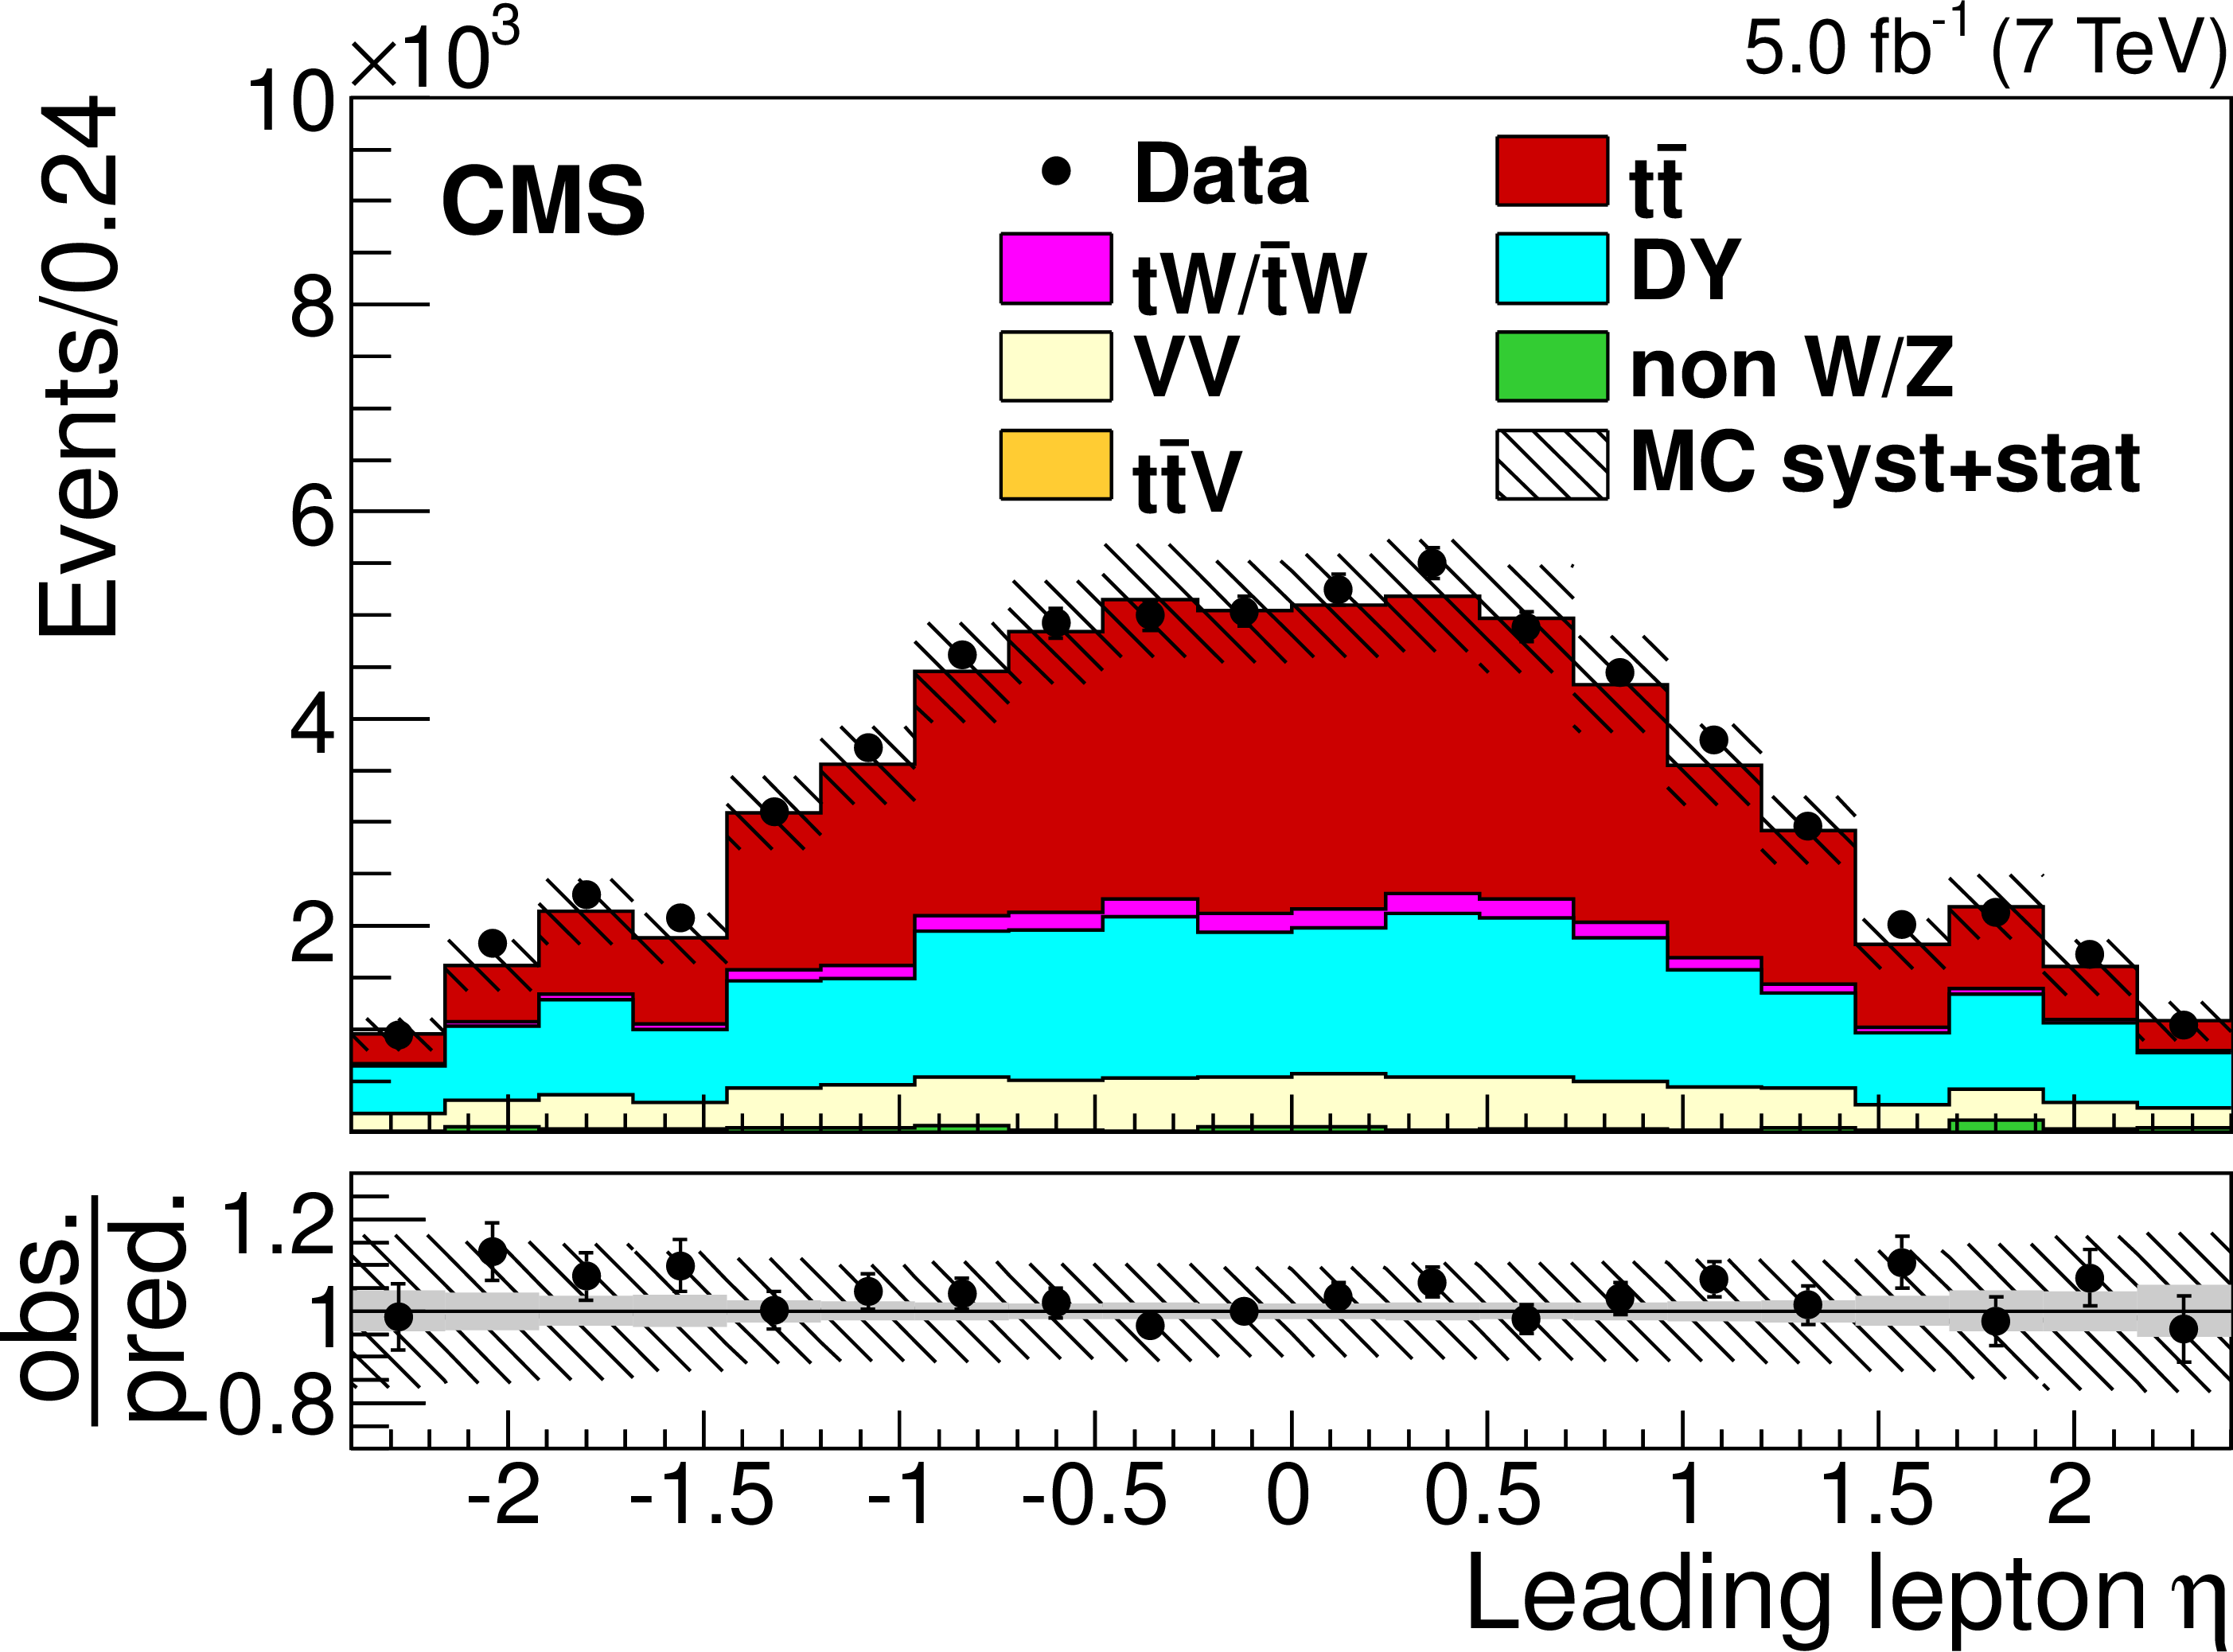
Figure 1-a:
Distribution of $ {p_{\mathrm {T}}} $ of the leading lepton, after the $ {\mathrm{ e } \mu } $ selection, for the 7 TeV data. The last bin of the $ {p_{\mathrm {T}}} $ distributions includes the overflow events. The hatched bands correspond to the total uncertainty in the sum of the predicted yields. The ratios of data to the sum of the predicted yields are shown at the bottom of each plot. Here, an additional solid gray band represents the contribution from the statistical uncertainty in the MC simulation. The contributing systematic uncertainties are discussed in Section 7. |
png pdf |
Figure 1-b:
Distribution of $\eta $ of the leading lepton, after the $ {\mathrm{ e } \mu } $ selection, for the 7 TeV data. The last bin of the $ {p_{\mathrm {T}}} $ distributions includes the overflow events. The hatched bands correspond to the total uncertainty in the sum of the predicted yields. The ratios of data to the sum of the predicted yields are shown at the bottom of each plot. Here, an additional solid gray band represents the contribution from the statistical uncertainty in the MC simulation. The contributing systematic uncertainties are discussed in Section 7. |

png pdf |
Figure 1-c:
Distribution of $ {p_{\mathrm {T}}} $ of the subleading lepton, after the $ {\mathrm{ e } \mu } $ selection, for the 7 TeV data. The last bin of the $ {p_{\mathrm {T}}} $ distributions includes the overflow events. The hatched bands correspond to the total uncertainty in the sum of the predicted yields. The ratios of data to the sum of the predicted yields are shown at the bottom of each plot. Here, an additional solid gray band represents the contribution from the statistical uncertainty in the MC simulation. The contributing systematic uncertainties are discussed in Section 7. |

png pdf |
Figure 1-d:
Distribution of $\eta $ of the subleading lepton, after the $ {\mathrm{ e } \mu } $ selection, for the 7 TeV data. The last bin of the $ {p_{\mathrm {T}}} $ distributions includes the overflow events. The hatched bands correspond to the total uncertainty in the sum of the predicted yields. The ratios of data to the sum of the predicted yields are shown at the bottom of each plot. Here, an additional solid gray band represents the contribution from the statistical uncertainty in the MC simulation. The contributing systematic uncertainties are discussed in Section 7. |
png pdf |
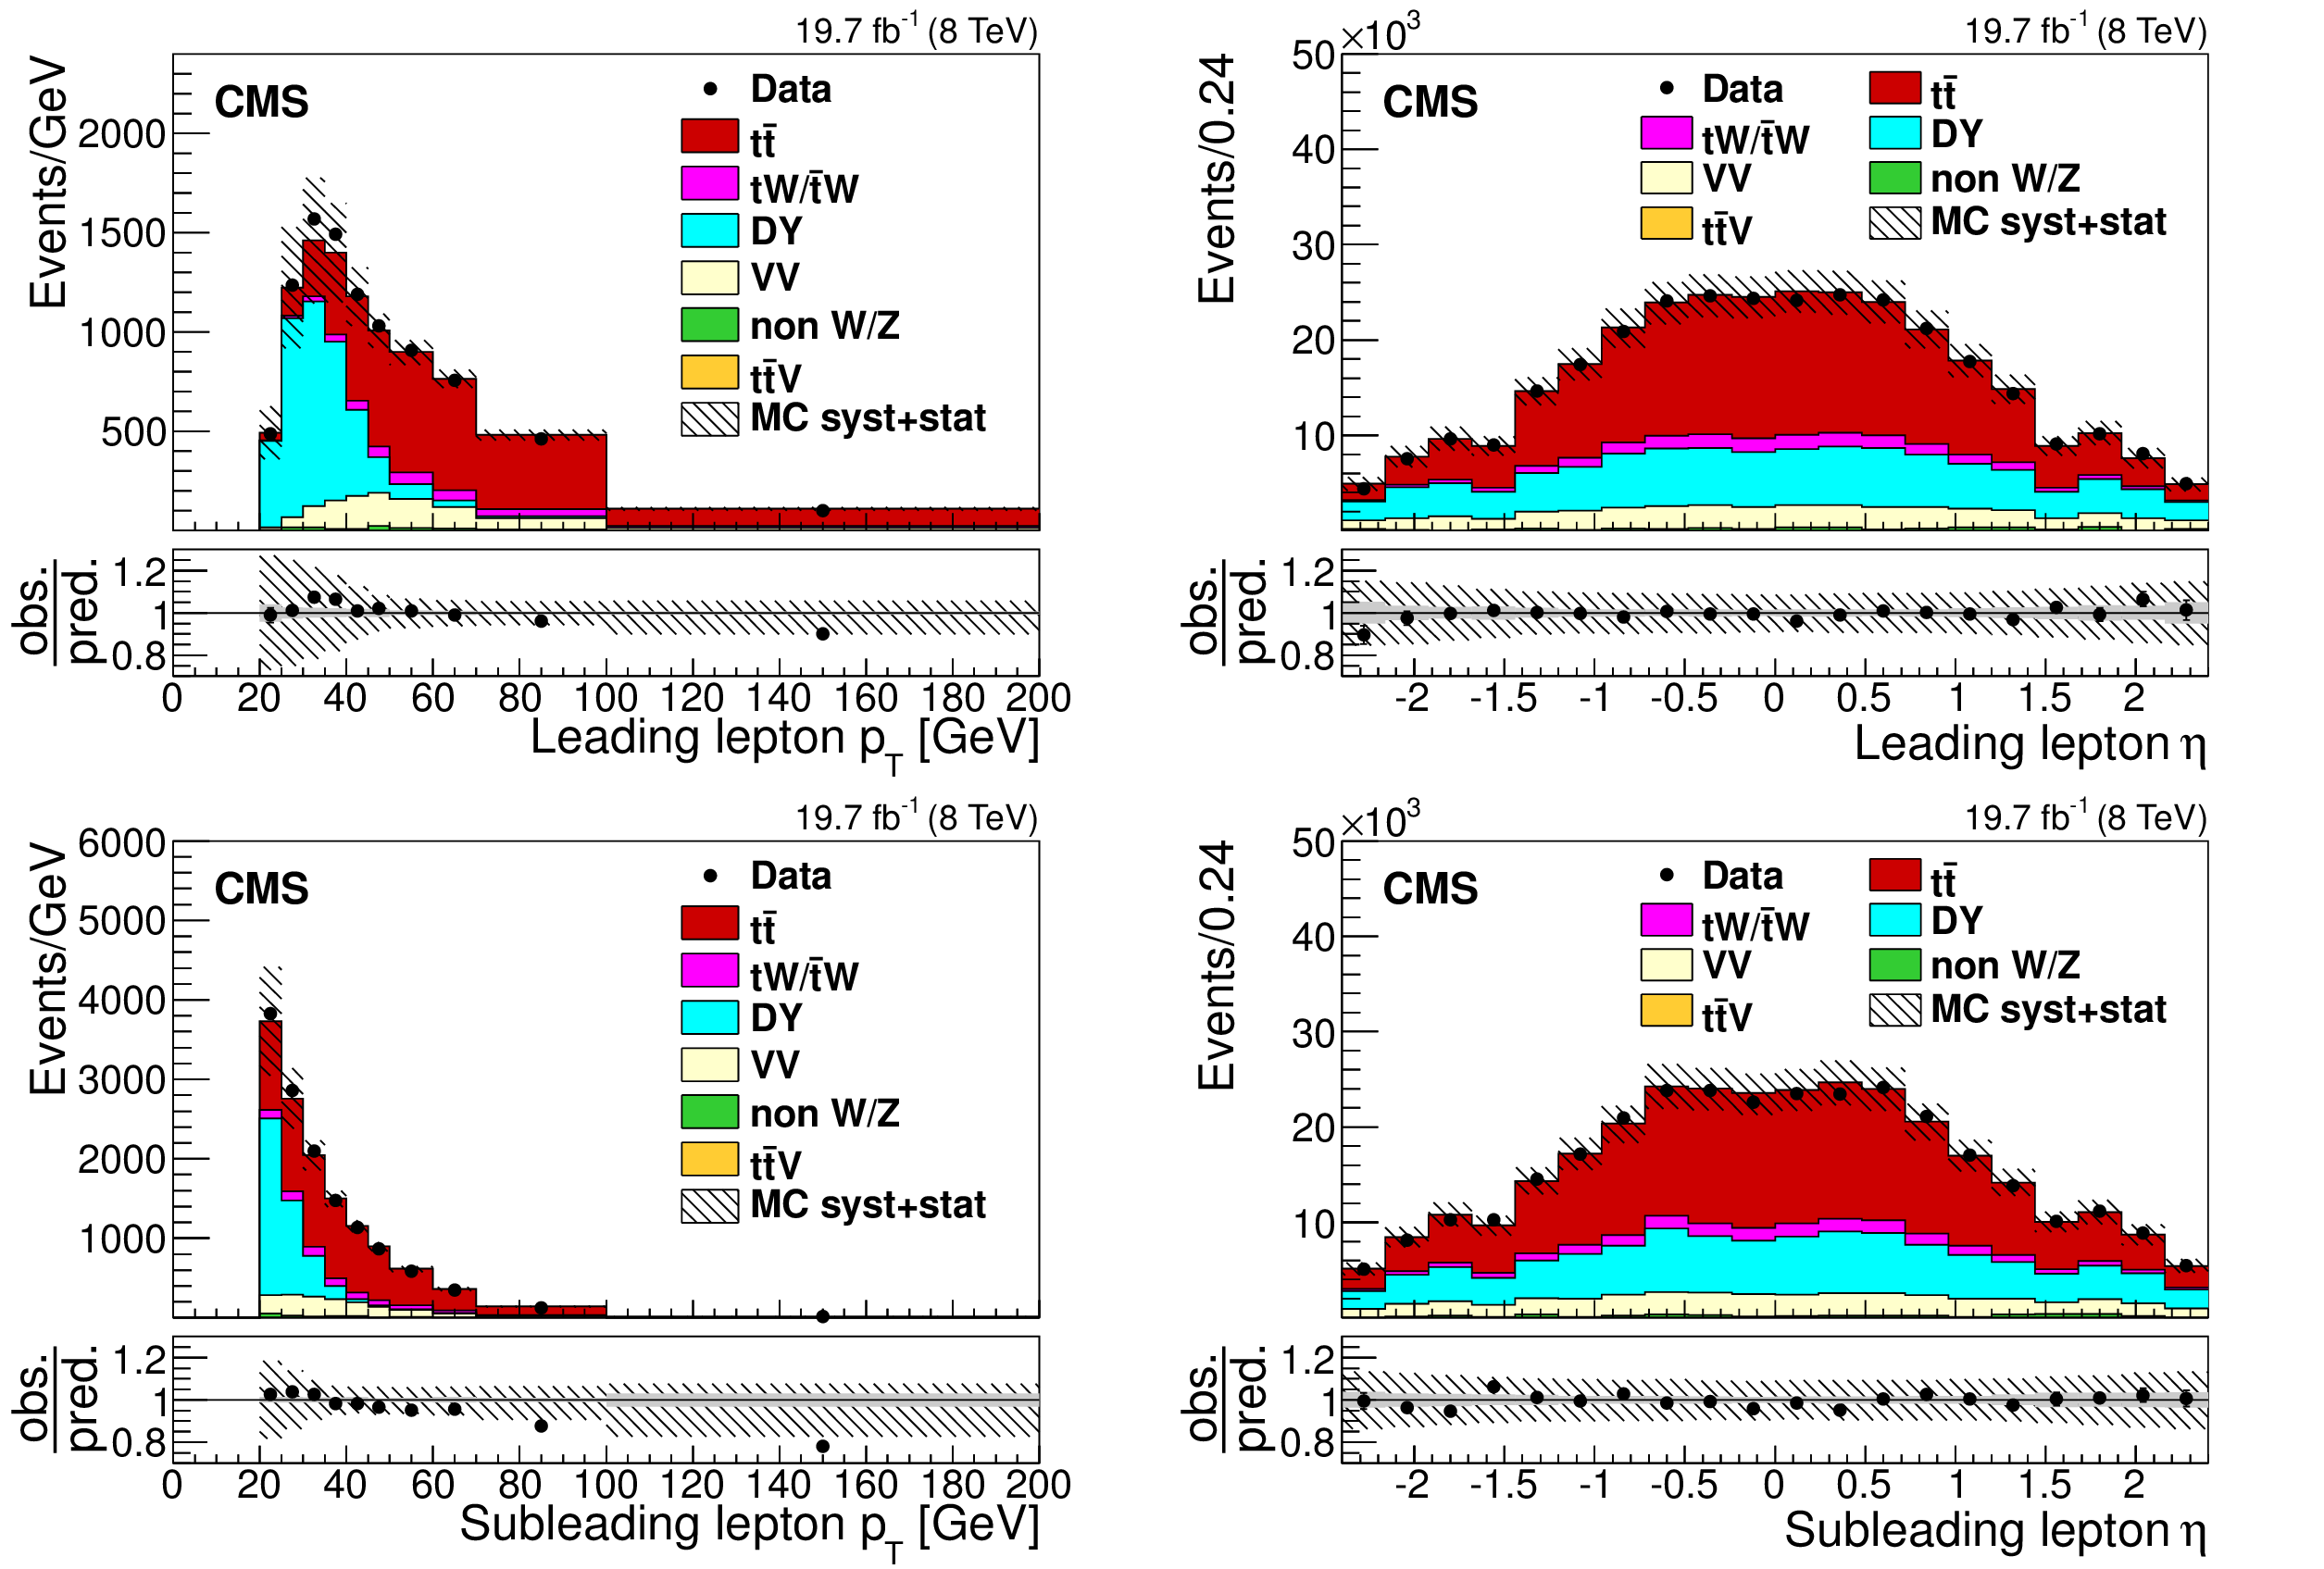
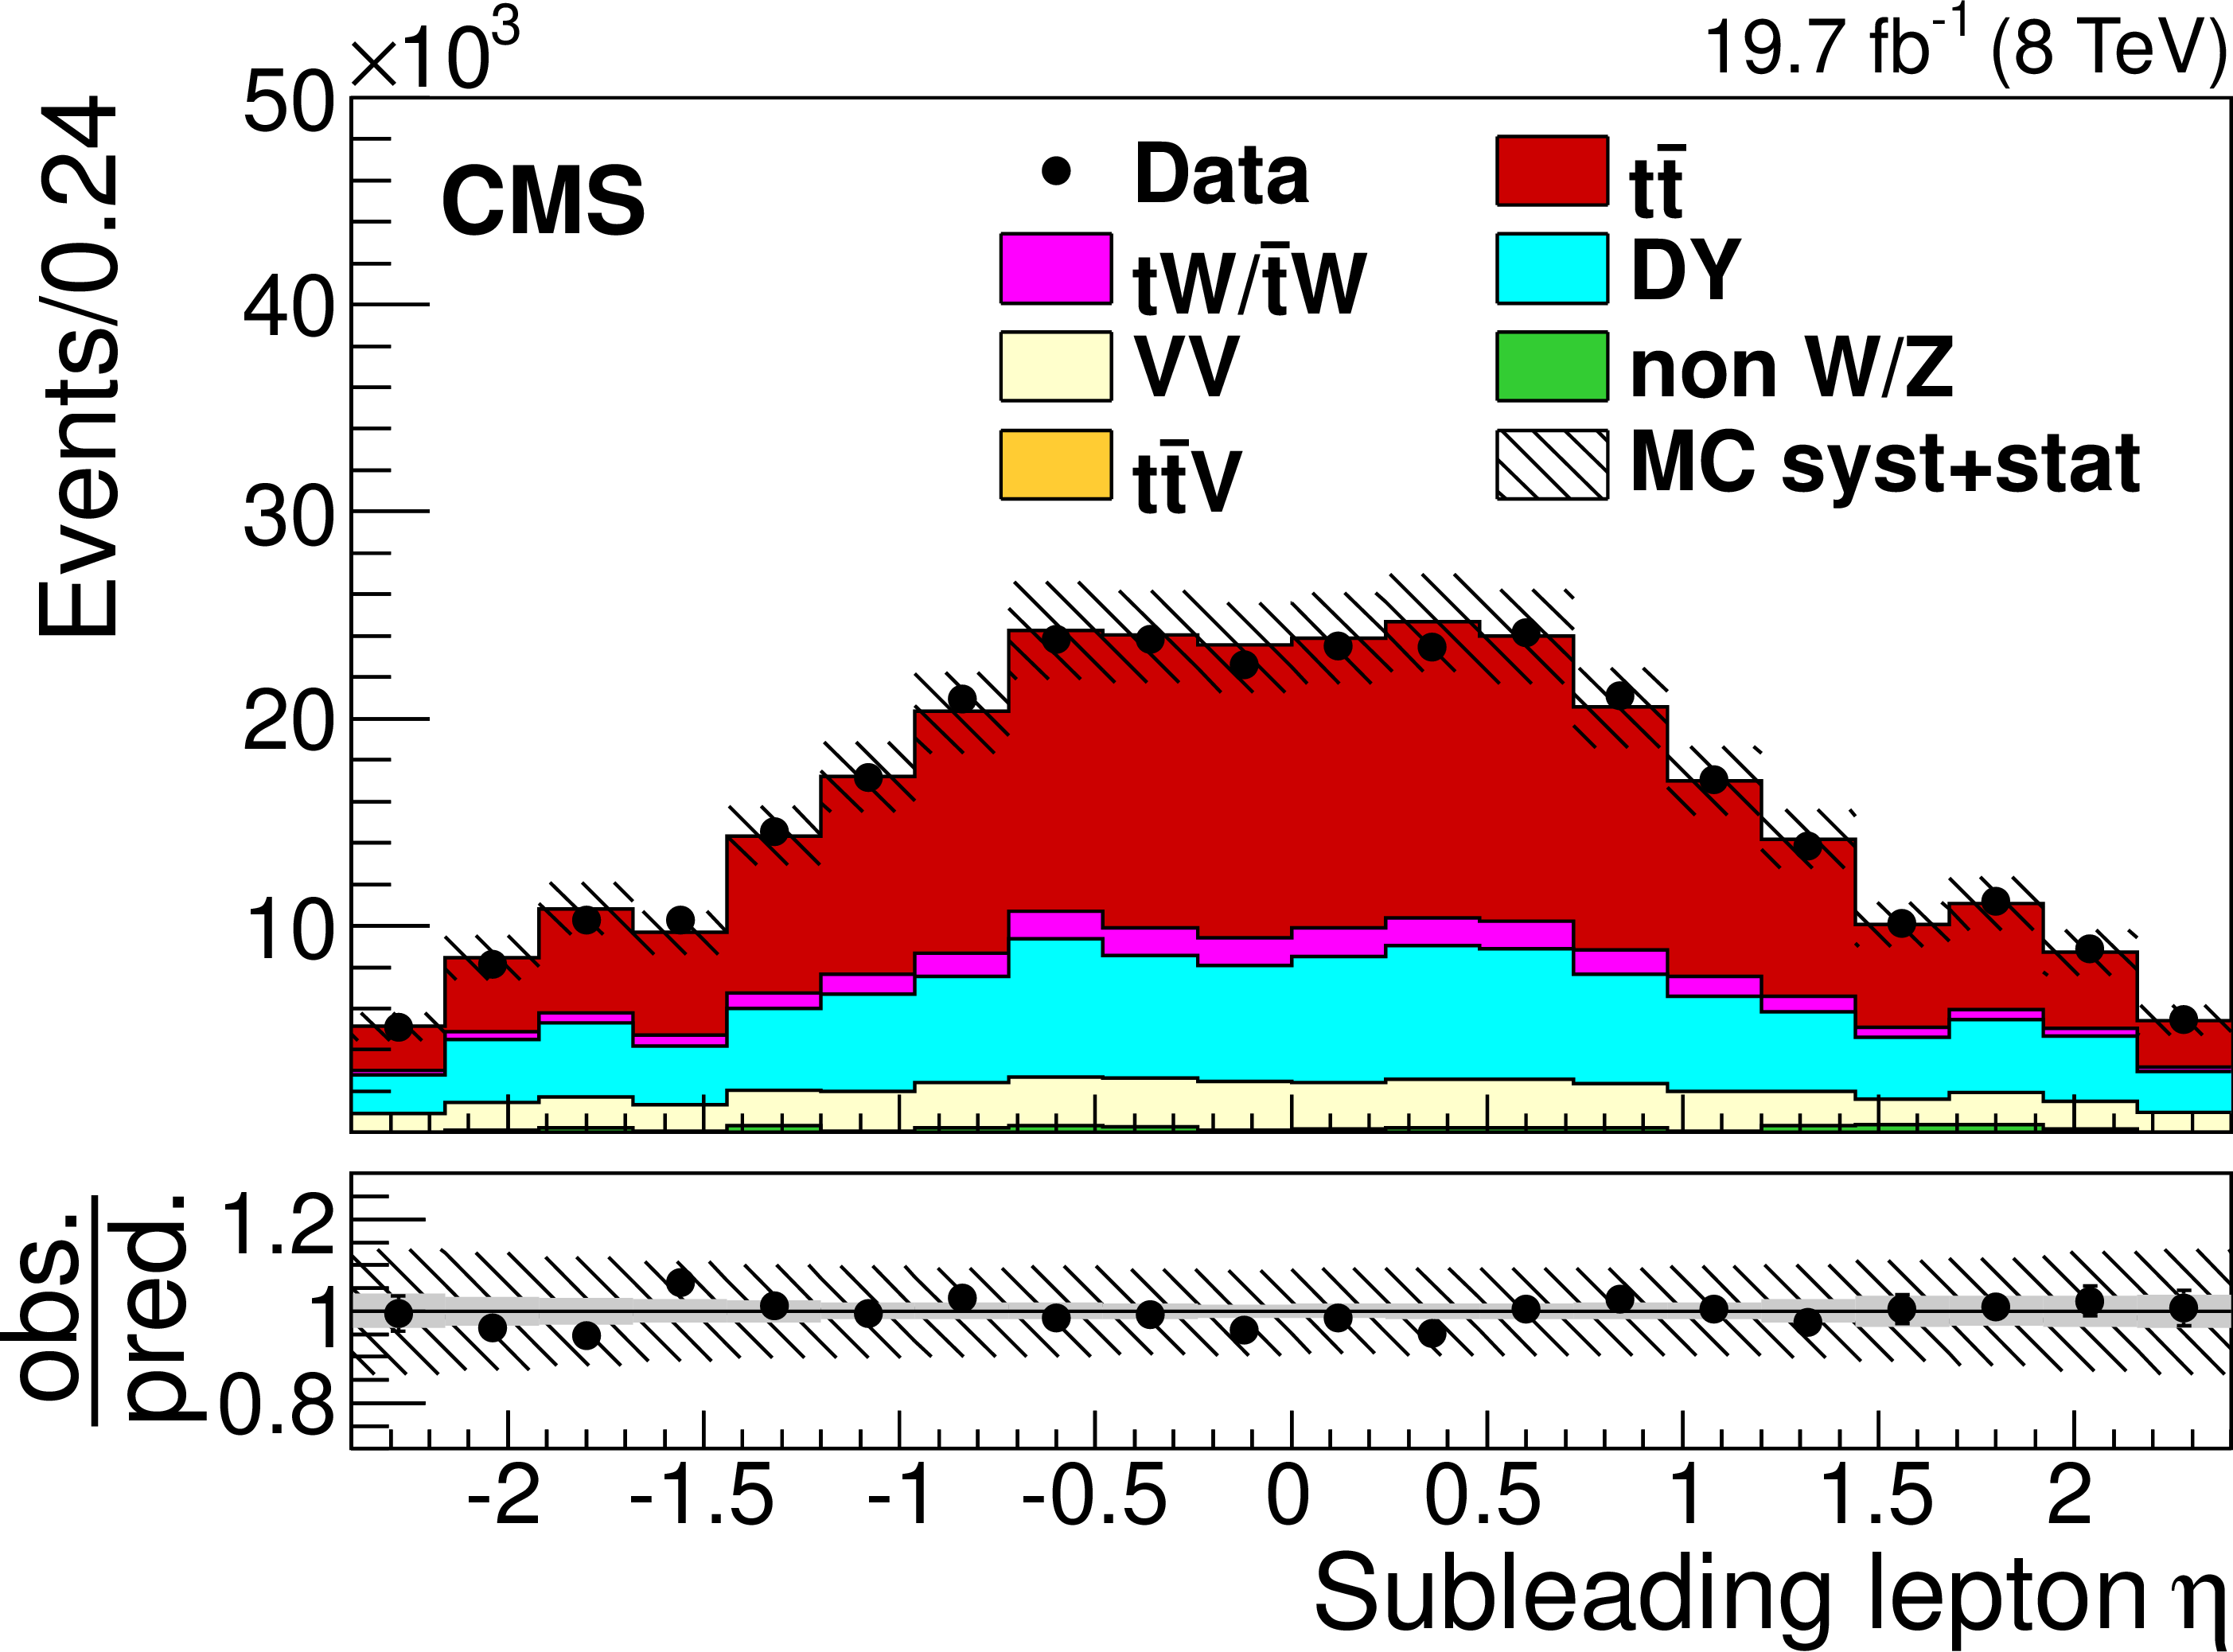
Figure 2:
Distributions of $ {p_{\mathrm {T}}} $ (left) and $\eta $ (right) of the leading (top) and subleading (bottom) leptons, after the $ {\mathrm{ e } \mu } $ selection, for the 8 TeV data. The last bin of the $ {p_{\mathrm {T}}} $ distributions includes the overflow events. The hatched bands correspond to the total uncertainty in the sum of the predicted yields. The ratios of data to the sum of the predicted yields are shown at the bottom of each plot. Here, an additional solid grey band represents the contribution from the statistical uncertainty in the MC simulation. The contributing systematic uncertainties are discussed in Section 7. |
png pdf |
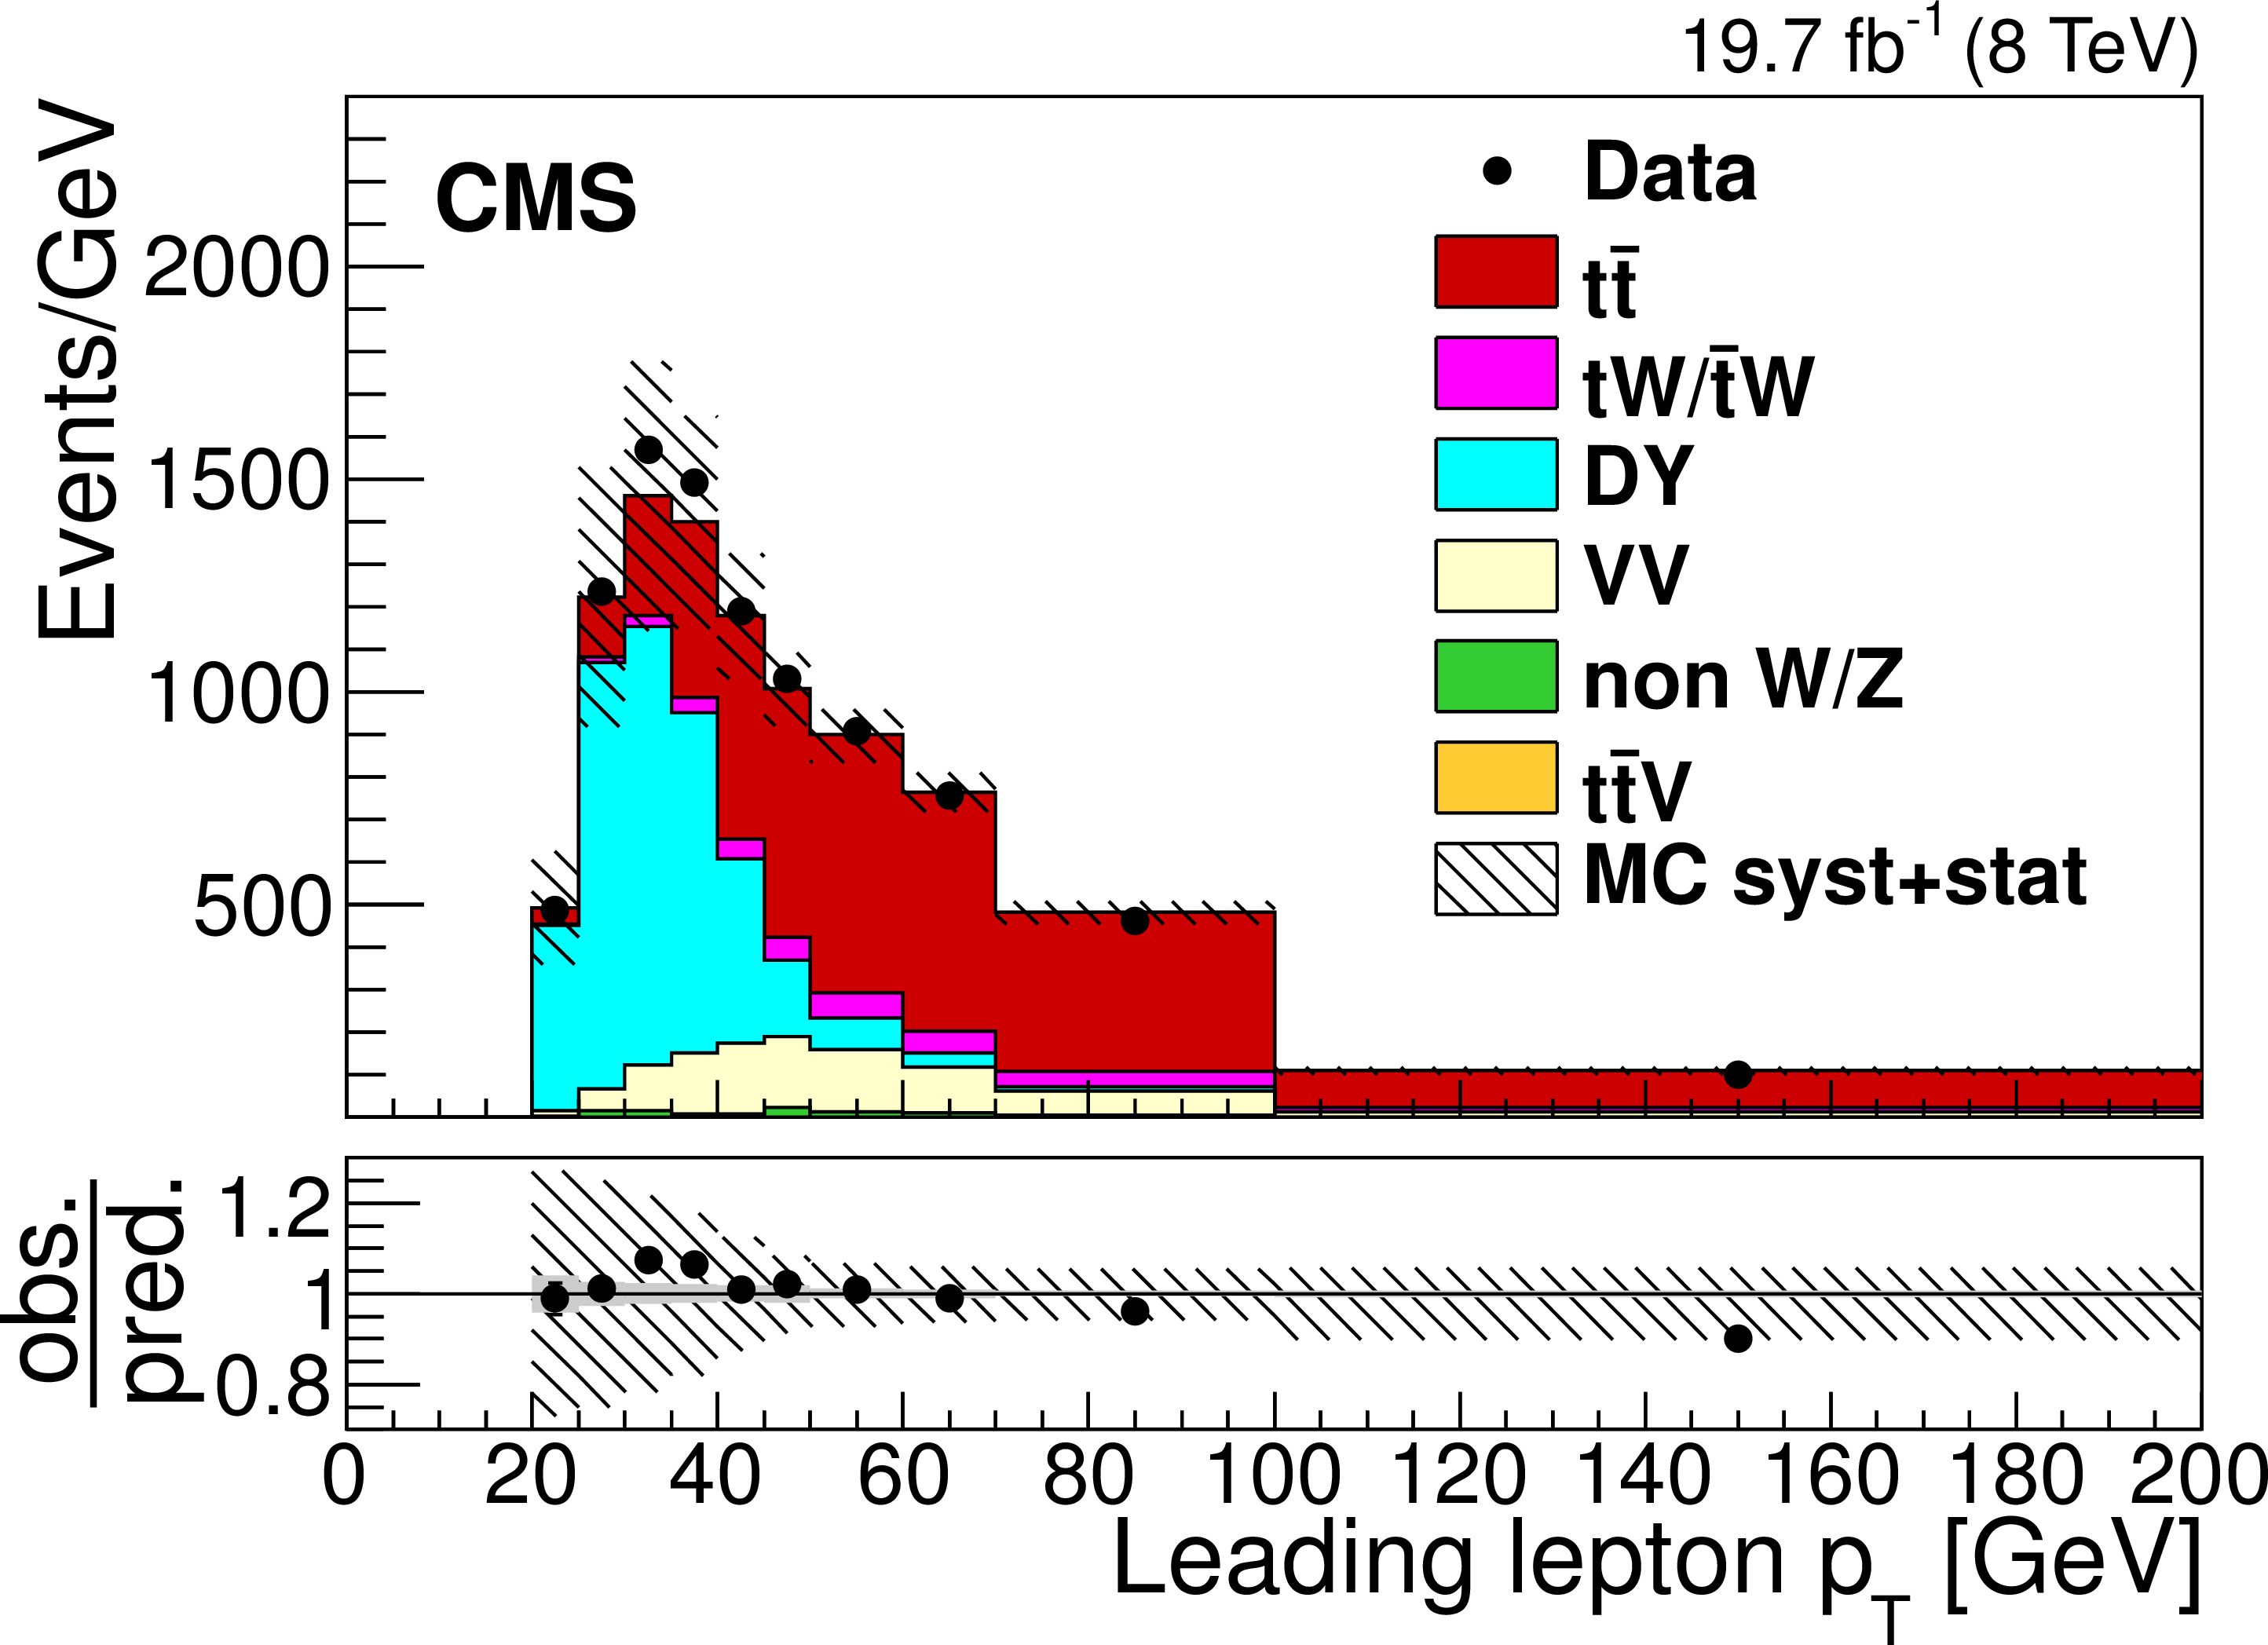
Figure 2-a:
Distribution of $ {p_{\mathrm {T}}} $ of the leading lepton, after the $ {\mathrm{ e } \mu } $ selection, for the 8 TeV data. The last bin of the $ {p_{\mathrm {T}}} $ distributions includes the overflow events. The hatched bands correspond to the total uncertainty in the sum of the predicted yields. The ratios of data to the sum of the predicted yields are shown at the bottom of each plot. Here, an additional solid grey band represents the contribution from the statistical uncertainty in the MC simulation. The contributing systematic uncertainties are discussed in Section 7. |

png pdf |
Figure 2-b:
Distribution of $\eta $ of the leading lepton, after the $ {\mathrm{ e } \mu } $ selection, for the 8 TeV data. The last bin of the $ {p_{\mathrm {T}}} $ distributions includes the overflow events. The hatched bands correspond to the total uncertainty in the sum of the predicted yields. The ratios of data to the sum of the predicted yields are shown at the bottom of each plot. Here, an additional solid grey band represents the contribution from the statistical uncertainty in the MC simulation. The contributing systematic uncertainties are discussed in Section 7. |

png pdf |
Figure 2-c:
Distribution of $ {p_{\mathrm {T}}} $ of the subleading lepton, after the $ {\mathrm{ e } \mu } $ selection, for the 8 TeV data. The last bin of the $ {p_{\mathrm {T}}} $ distributions includes the overflow events. The hatched bands correspond to the total uncertainty in the sum of the predicted yields. The ratios of data to the sum of the predicted yields are shown at the bottom of each plot. Here, an additional solid grey band represents the contribution from the statistical uncertainty in the MC simulation. The contributing systematic uncertainties are discussed in Section 7. |
png pdf |
Figure 2-d:
Distribution of $\eta $ of the subleading lepton, after the $ {\mathrm{ e } \mu } $ selection, for the 8 TeV data. The last bin of the $ {p_{\mathrm {T}}} $ distributions includes the overflow events. The hatched bands correspond to the total uncertainty in the sum of the predicted yields. The ratios of data to the sum of the predicted yields are shown at the bottom of each plot. Here, an additional solid grey band represents the contribution from the statistical uncertainty in the MC simulation. The contributing systematic uncertainties are discussed in Section 7. |

png pdf |
Figure 3:
Number of b-tagged jets after the $ {\mathrm{ e } \mu } $ selection for 7 TeV (left) and 8 TeV (right). The hatched bands correspond to the total uncertainty in the sum of the predicted yields. The ratios of data to the sum of the predicted yields are shown at the bottom of each plot. Here, an additional solid grey band represents the contribution from the statistical uncertainty in the MC simulation. The contributing systematic uncertainties are discussed in Section 7. |
png pdf |
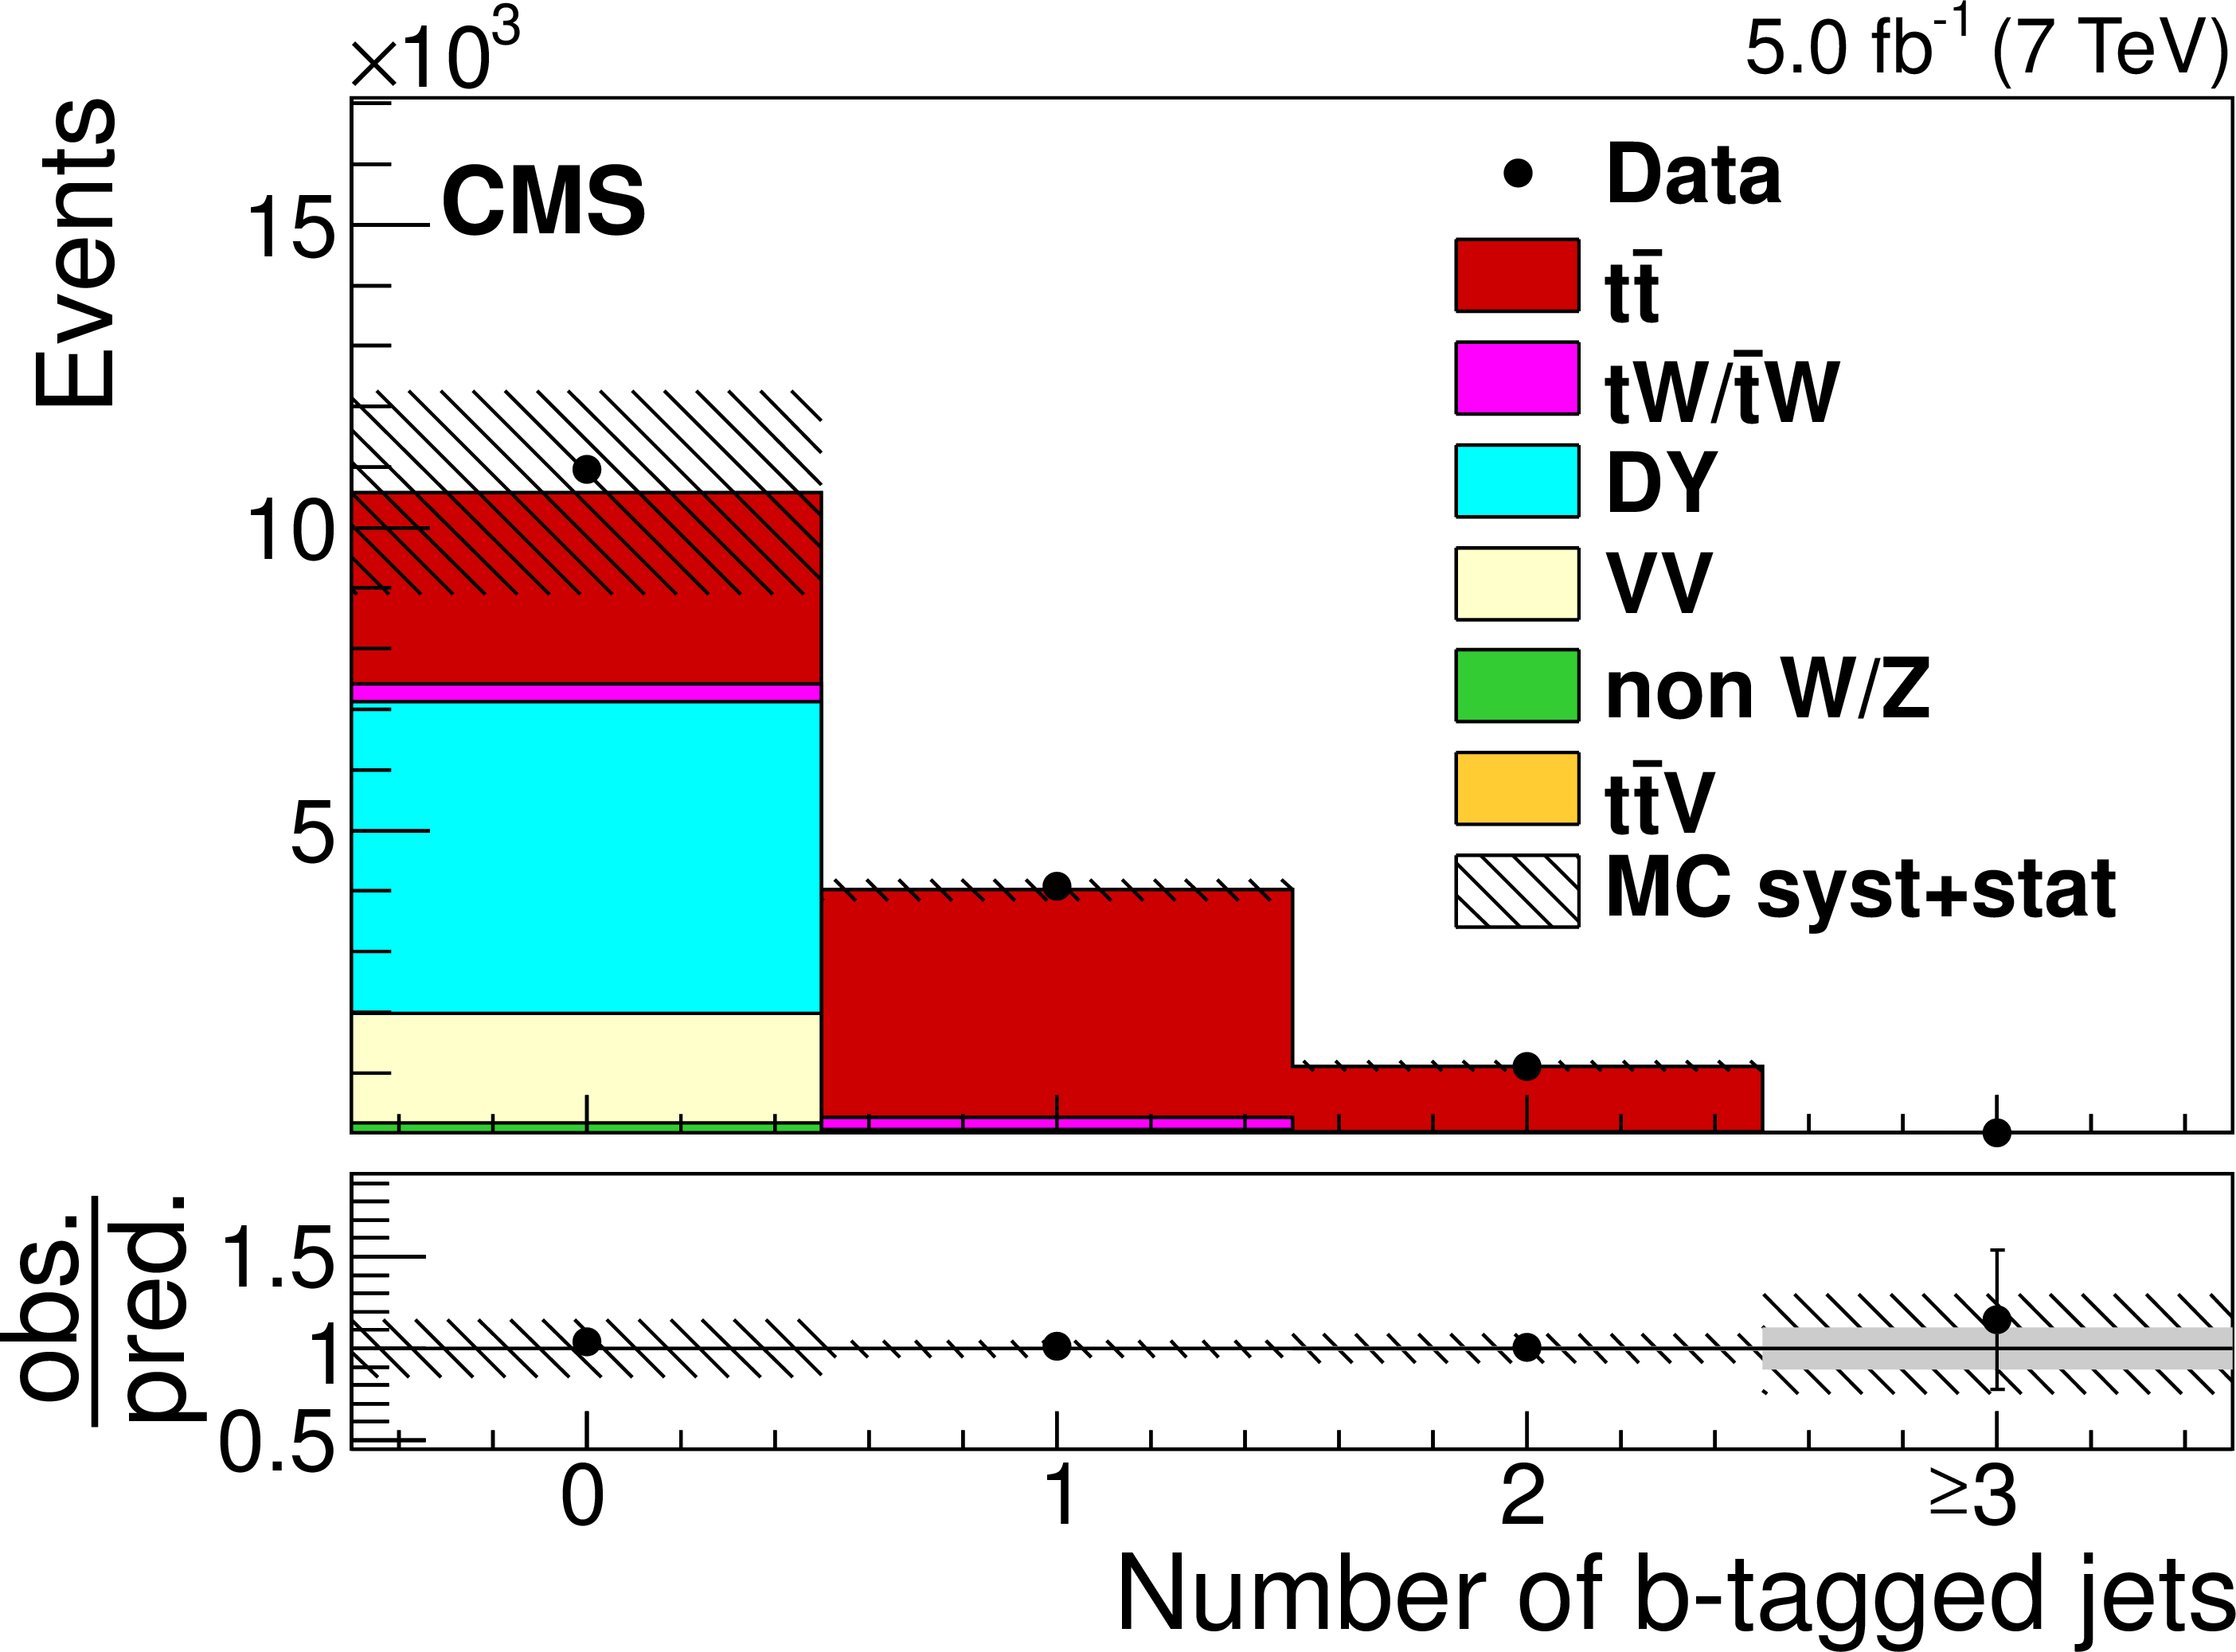
Figure 3-a:
Number of b-tagged jets after the $ {\mathrm{ e } \mu } $ selection for 7 TeV. The hatched bands correspond to the total uncertainty in the sum of the predicted yields. The ratios of data to the sum of the predicted yields are shown at the bottom of each plot. Here, an additional solid grey band represents the contribution from the statistical uncertainty in the MC simulation. The contributing systematic uncertainties are discussed in Section 7. |
png pdf |
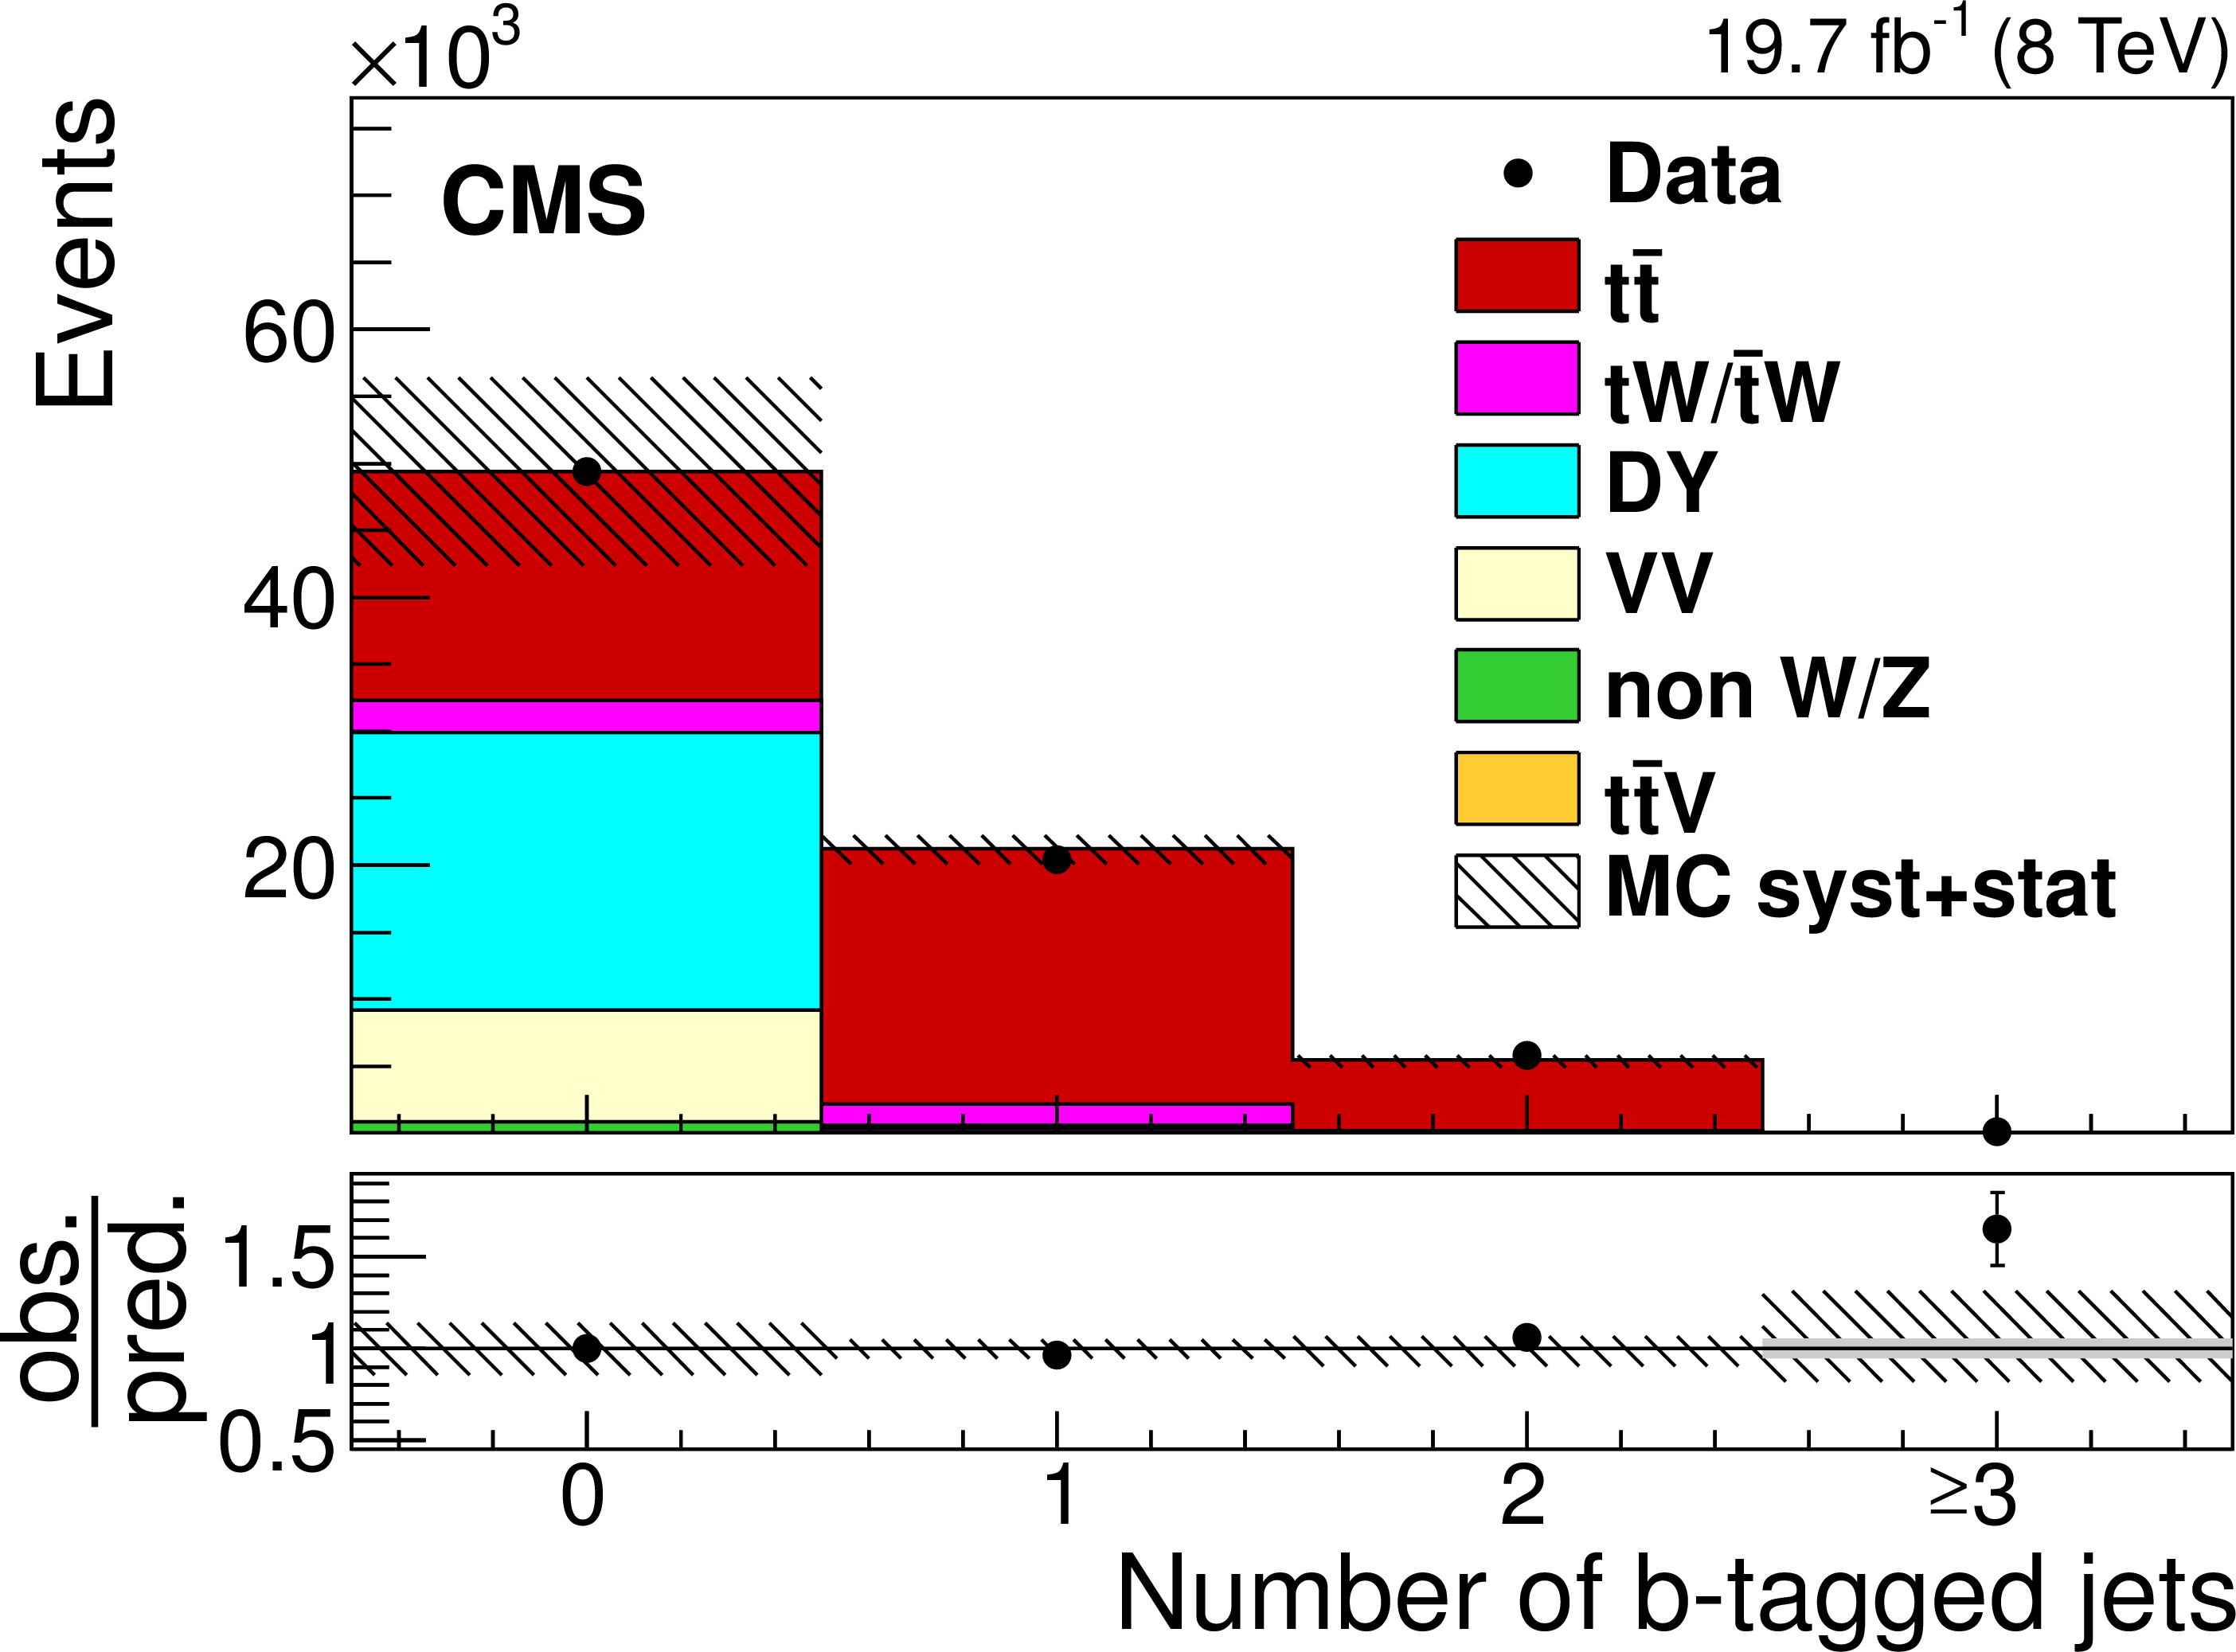
Figure 3-b:
Number of b-tagged jets after the $ {\mathrm{ e } \mu } $ selection for 8 TeV (right). The hatched bands correspond to the total uncertainty in the sum of the predicted yields. The ratios of data to the sum of the predicted yields are shown at the bottom of each plot. Here, an additional solid grey band represents the contribution from the statistical uncertainty in the MC simulation. The contributing systematic uncertainties are discussed in Section 7. |
png pdf |
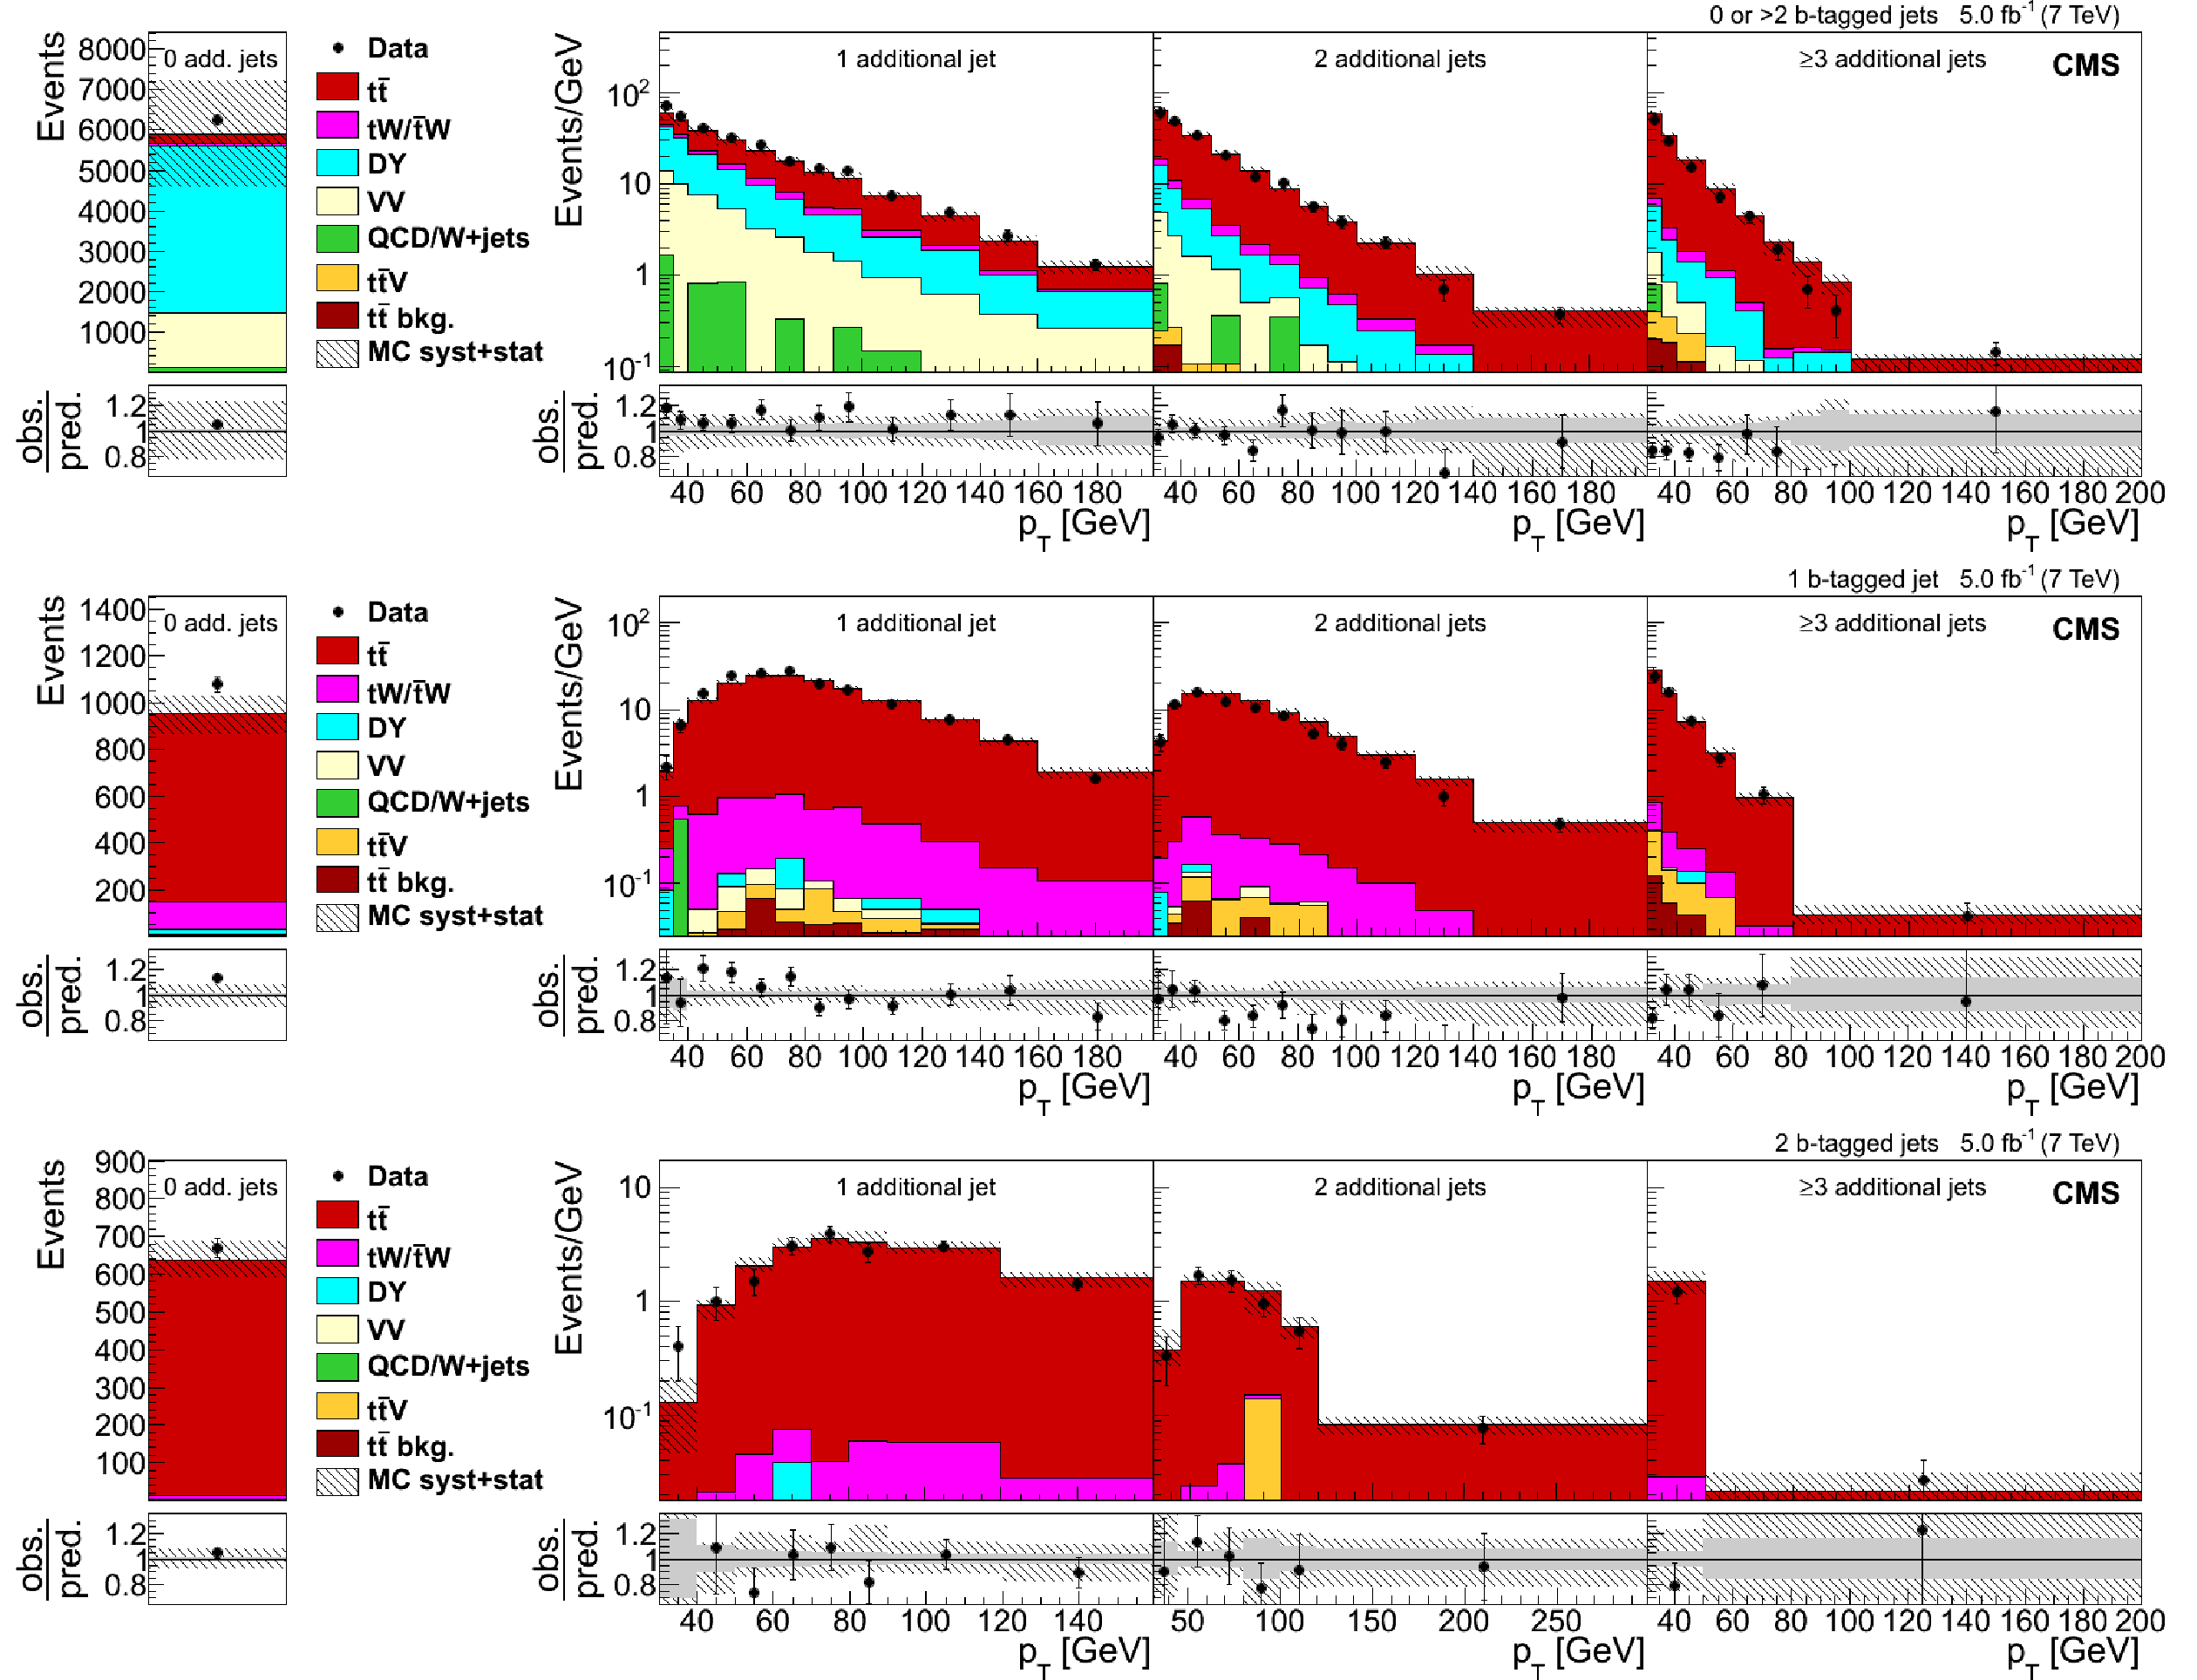
Figure 4:
Total event yield for zero additional non-b-tagged jets (left) and $ {p_{\mathrm {T}}} $ of the non-b-tagged jet with the lowest $ {p_{\mathrm {T}}} $ in the event (right) for events with one, two, and at least three additional non-b-tagged jets, and with zero or more than two (top row), one (middle row), and two (bottom row) b-tagged jets at $ \sqrt{s} = $ 7 TeV. The last bin of the $ {p_{\mathrm {T}}} $ distributions includes the overflow events. The hatched bands correspond to the sum of statistical and systematic uncertainties in the event yield for the sum of signal and background predictions. The ratios of data to the sum of the predicted yields are shown at the bottom of each plot. Here, an additional solid grey band represents the contribution from the statistical uncertainty in the MC simulation. |

png pdf |
Figure 4-a:
Total event yield for zero additional non-b-tagged jets (left) and $ {p_{\mathrm {T}}} $ of the non-b-tagged jet with the lowest $ {p_{\mathrm {T}}} $ in the event (right) for events with one, two, and at least three additional non-b-tagged jets, and with zero or more than two (top row), one (middle row), and two (bottom row) b-tagged jets at $ \sqrt{s} = $ 7 TeV. The last bin of the $ {p_{\mathrm {T}}} $ distributions includes the overflow events. The hatched bands correspond to the sum of statistical and systematic uncertainties in the event yield for the sum of signal and background predictions. The ratios of data to the sum of the predicted yields are shown at the bottom of each plot. Here, an additional solid grey band represents the contribution from the statistical uncertainty in the MC simulation. |
png pdf |
Figure 4-b:
Total event yield for zero additional non-b-tagged jets (left) and $ {p_{\mathrm {T}}} $ of the non-b-tagged jet with the lowest $ {p_{\mathrm {T}}} $ in the event (right) for events with one, two, and at least three additional non-b-tagged jets, and with one b-tagged jets at $ \sqrt{s} = $ 7 TeV. The last bin of the $ {p_{\mathrm {T}}} $ distributions includes the overflow events. The hatched bands correspond to the sum of statistical and systematic uncertainties in the event yield for the sum of signal and background predictions. The ratios of data to the sum of the predicted yields are shown at the bottom of each plot. Here, an additional solid grey band represents the contribution from the statistical uncertainty in the MC simulation. |
png pdf |
Figure 4-c:
Total event yield for zero additional non-b-tagged jets (left) and $ {p_{\mathrm {T}}} $ of the non-b-tagged jet with the lowest $ {p_{\mathrm {T}}} $ in the event (right) for events with one, two, and at least three additional non-b-tagged jets, and with two b-tagged jets at $ \sqrt{s} = $ 7 TeV. The last bin of the $ {p_{\mathrm {T}}} $ distributions includes the overflow events. The hatched bands correspond to the sum of statistical and systematic uncertainties in the event yield for the sum of signal and background predictions. The ratios of data to the sum of the predicted yields are shown at the bottom of each plot. Here, an additional solid grey band represents the contribution from the statistical uncertainty in the MC simulation. |
png pdf |
Figure 5:
Total event yield for zero additional non-b-tagged jets (left) and $ {p_{\mathrm {T}}} $ of the additional non-b-tagged jet with the lowest $ {p_{\mathrm {T}}} $ in the event (right) for events with one, two, and at least three additional non-b-tagged jets, and with zero or more than two (top row), one (middle row), and two (bottom row) b-tagged jets at $ \sqrt{s} = $ 8 TeV. The last bin of the $ {p_{\mathrm {T}}} $ distributions includes the overflow events. The hatched bands correspond to the sum of statistical and systematic uncertainties in the event yield for the sum of signal and background predictions. The ratios of data to the sum of the predicted yields are shown at the bottom of each plot. Here, an additional solid grey band represents the contribution from the statistical uncertainty in the MC simulation. |
png pdf |
Figure 5-a:
Total event yield for zero additional non-b-tagged jets (left) and $ {p_{\mathrm {T}}} $ of the additional non-b-tagged jet with the lowest $ {p_{\mathrm {T}}} $ in the event (right) for events with one, two, and at least three additional non-b-tagged jets, and with zero or more than two b-tagged jets at $ \sqrt{s} = $ 8 TeV. The last bin of the $ {p_{\mathrm {T}}} $ distributions includes the overflow events. The hatched bands correspond to the sum of statistical and systematic uncertainties in the event yield for the sum of signal and background predictions. The ratios of data to the sum of the predicted yields are shown at the bottom of each plot. Here, an additional solid grey band represents the contribution from the statistical uncertainty in the MC simulation. |
png pdf |
Figure 5-b:
Total event yield for zero additional non-b-tagged jets (left) and $ {p_{\mathrm {T}}} $ of the additional non-b-tagged jet with the lowest $ {p_{\mathrm {T}}} $ in the event (right) for events with one, two, and at least three additional non-b-tagged jets, and with one b-tagged jets at $ \sqrt{s} = $ 8 TeV. The last bin of the $ {p_{\mathrm {T}}} $ distributions includes the overflow events. The hatched bands correspond to the sum of statistical and systematic uncertainties in the event yield for the sum of signal and background predictions. The ratios of data to the sum of the predicted yields are shown at the bottom of each plot. Here, an additional solid grey band represents the contribution from the statistical uncertainty in the MC simulation. |
png pdf |
Figure 5-c:
Total event yield for zero additional non-b-tagged jets (left) and $ {p_{\mathrm {T}}} $ of the additional non-b-tagged jet with the lowest $ {p_{\mathrm {T}}} $ in the event (right) for events with one, two, and at least three additional non-b-tagged jets, and with two b-tagged jets at $ \sqrt{s} = $ 8 TeV. The last bin of the $ {p_{\mathrm {T}}} $ distributions includes the overflow events. The hatched bands correspond to the sum of statistical and systematic uncertainties in the event yield for the sum of signal and background predictions. The ratios of data to the sum of the predicted yields are shown at the bottom of each plot. Here, an additional solid grey band represents the contribution from the statistical uncertainty in the MC simulation. |
png pdf |
Figure 6:
Fitted total event yield for zero additional non-b-tagged jets (left) and $ {p_{\mathrm {T}}} $ of the non-b-tagged jet with the lowest $ {p_{\mathrm {T}}} $ in the event (right) for events with one, two, and at least three additional non-b-tagged jets, and with zero or more than two (top row), one (middle row), and two (bottom row) b-tagged jets at $ \sqrt{s} = $ 7 TeV. The last bin of the $ {p_{\mathrm {T}}} $ distributions includes the overflow events. The hatched bands correspond to the sum of statistical and systematic uncertainties in the event yield for the sum of signal and background predictions after the fit, and include all correlations. The ratios of data to the sum of the predicted yields are shown at the bottom of each plot. Here, an additional solid grey band represents the contribution from the statistical uncertainty in the MC simulation. |
png pdf |
Figure 6-a:
Fitted total event yield for zero additional non-b-tagged jets (left) and $ {p_{\mathrm {T}}} $ of the non-b-tagged jet with the lowest $ {p_{\mathrm {T}}} $ in the event (right) for events with one, two, and at least three additional non-b-tagged jets, and with zero or more than two b-tagged jets at $ \sqrt{s} = $ 7 TeV. The last bin of the $ {p_{\mathrm {T}}} $ distributions includes the overflow events. The hatched bands correspond to the sum of statistical and systematic uncertainties in the event yield for the sum of signal and background predictions after the fit, and include all correlations. The ratios of data to the sum of the predicted yields are shown at the bottom of each plot. Here, an additional solid grey band represents the contribution from the statistical uncertainty in the MC simulation. |
png pdf |
Figure 6-b:
Fitted total event yield for zero additional non-b-tagged jets (left) and $ {p_{\mathrm {T}}} $ of the non-b-tagged jet with the lowest $ {p_{\mathrm {T}}} $ in the event (right) for events with one, two, and at least three additional non-b-tagged jets, and with one b-tagged jets at $ \sqrt{s} = $ 7 TeV. The last bin of the $ {p_{\mathrm {T}}} $ distributions includes the overflow events. The hatched bands correspond to the sum of statistical and systematic uncertainties in the event yield for the sum of signal and background predictions after the fit, and include all correlations. The ratios of data to the sum of the predicted yields are shown at the bottom of each plot. Here, an additional solid grey band represents the contribution from the statistical uncertainty in the MC simulation. |
png pdf |
Figure 6-c:
Fitted total event yield for zero additional non-b-tagged jets (left) and $ {p_{\mathrm {T}}} $ of the non-b-tagged jet with the lowest $ {p_{\mathrm {T}}} $ in the event (right) for events with one, two, and at least three additional non-b-tagged jets, and with two b-tagged jets at $ \sqrt{s} = $ 7 TeV. The last bin of the $ {p_{\mathrm {T}}} $ distributions includes the overflow events. The hatched bands correspond to the sum of statistical and systematic uncertainties in the event yield for the sum of signal and background predictions after the fit, and include all correlations. The ratios of data to the sum of the predicted yields are shown at the bottom of each plot. Here, an additional solid grey band represents the contribution from the statistical uncertainty in the MC simulation. |
png pdf |
Figure 7:
Fitted total event yield for zero additional non-b-tagged jets (left) and $ {p_{\mathrm {T}}} $ of the non-b-tagged jet with the lowest $ {p_{\mathrm {T}}} $ in the event (right) for events with one, two, and at least three additional non-b-tagged jets, and with zero or more than two (top row), one (middle row), and two (bottom row) b-tagged jets at $ \sqrt{s} = $ 8 TeV. The last bin of the $ {p_{\mathrm {T}}} $ distributions includes the overflow events. The hatched bands correspond to the sum of statistical and systematic uncertainties in the event yield for the sum of signal and background predictions after the fit, and include all correlations. The ratios of data to the sum of the predicted yields are shown at the bottom of each plot. Here, an additional solid grey band represents the contribution from the statistical uncertainty in the MC simulation. |
png pdf |
Figure 7-a:
Fitted total event yield for zero additional non-b-tagged jets (left) and $ {p_{\mathrm {T}}} $ of the non-b-tagged jet with the lowest $ {p_{\mathrm {T}}} $ in the event (right) for events with one, two, and at least three additional non-b-tagged jets, and with zero or more than two b-tagged jets at $ \sqrt{s} = $ 8 TeV. The last bin of the $ {p_{\mathrm {T}}} $ distributions includes the overflow events. The hatched bands correspond to the sum of statistical and systematic uncertainties in the event yield for the sum of signal and background predictions after the fit, and include all correlations. The ratios of data to the sum of the predicted yields are shown at the bottom of each plot. Here, an additional solid grey band represents the contribution from the statistical uncertainty in the MC simulation. |
png pdf |
Figure 7-b:
Fitted total event yield for zero additional non-b-tagged jets (left) and $ {p_{\mathrm {T}}} $ of the non-b-tagged jet with the lowest $ {p_{\mathrm {T}}} $ in the event (right) for events with one, two, and at least three additional non-b-tagged jets, and with one b-tagged jets at $ \sqrt{s} = $ 8 TeV. The last bin of the $ {p_{\mathrm {T}}} $ distributions includes the overflow events. The hatched bands correspond to the sum of statistical and systematic uncertainties in the event yield for the sum of signal and background predictions after the fit, and include all correlations. The ratios of data to the sum of the predicted yields are shown at the bottom of each plot. Here, an additional solid grey band represents the contribution from the statistical uncertainty in the MC simulation. |

png pdf |
Figure 7-c:
Fitted total event yield for zero additional non-b-tagged jets (left) and $ {p_{\mathrm {T}}} $ of the non-b-tagged jet with the lowest $ {p_{\mathrm {T}}} $ in the event (right) for events with one, two, and at least three additional non-b-tagged jets, and with two b-tagged jets at $ \sqrt{s} = $ 8 TeV. The last bin of the $ {p_{\mathrm {T}}} $ distributions includes the overflow events. The hatched bands correspond to the sum of statistical and systematic uncertainties in the event yield for the sum of signal and background predictions after the fit, and include all correlations. The ratios of data to the sum of the predicted yields are shown at the bottom of each plot. Here, an additional solid grey band represents the contribution from the statistical uncertainty in the MC simulation. |

png pdf |
Figure 8:
Comparison of the b jet multiplicity distributions in the $ {\mathrm{ e } \mu } $ channel for 8 TeV between the data and simulation for events fulfilling the $ {\mathrm{ e } \mu } $ selection and the requirement of having at least two jets. The hatched bands correspond to the sum of statistical and systematic uncertainties in the event yield for the signal and background predictions. The ratios of data to the predicted yields are shown at the bottom of each plot. Here, an additional solid grey band represents the contribution from the statistical uncertainty in the MC simulation. |

png pdf |
Figure 8-a:
Comparison of the b jet multiplicity distributions in the $ {\mathrm{ e } \mu } $ channel for 7 TeV between the data and simulation for events fulfilling the $ {\mathrm{ e } \mu } $ selection and the requirement of having at least two jets. The hatched bands correspond to the sum of statistical and systematic uncertainties in the event yield for the signal and background predictions. The ratios of data to the predicted yields are shown at the bottom of each plot. Here, an additional solid grey band represents the contribution from the statistical uncertainty in the MC simulation. |

png pdf |
Figure 8-b:
Comparison of the b jet multiplicity distributions in the $ {\mathrm{ e } \mu } $ channel for 8 TeV between the data and simulation for events fulfilling the $ {\mathrm{ e } \mu } $ selection and the requirement of having at least two jets. The hatched bands correspond to the sum of statistical and systematic uncertainties in the event yield for the signal and background predictions. The ratios of data to the predicted yields are shown at the bottom of each plot. Here, an additional solid grey band represents the contribution from the statistical uncertainty in the MC simulation. |
png pdf |
Figure 9:
Likelihood for the predicted dependence of the $ {\mathrm{ t } {}\mathrm{ \bar{t} } } $ production cross section on the top quark pole mass for 7 and 8 TeV determined with TOP++, employing the NNPDF3.0 PDF set. The measured dependences on the mass are given by the dashed lines, their 1$\sigma $-uncertainties are represented by the dotted lines. The extracted mass at each value of $\sqrt {s}$ is indicated by a black point, with its 1$\sigma $-uncertainty constructed from the continuous contour, corresponding to $-2\Delta \log(L_\text {pred} L_\text {exp}) =$ 1. |
png pdf |
Figure 10:
Diagram displaying the top squark pair production at the LHC in the decay mode where each top squark decays to a top quark and a neutralino $\tilde{\chi}^0_1 $. |
png pdf |
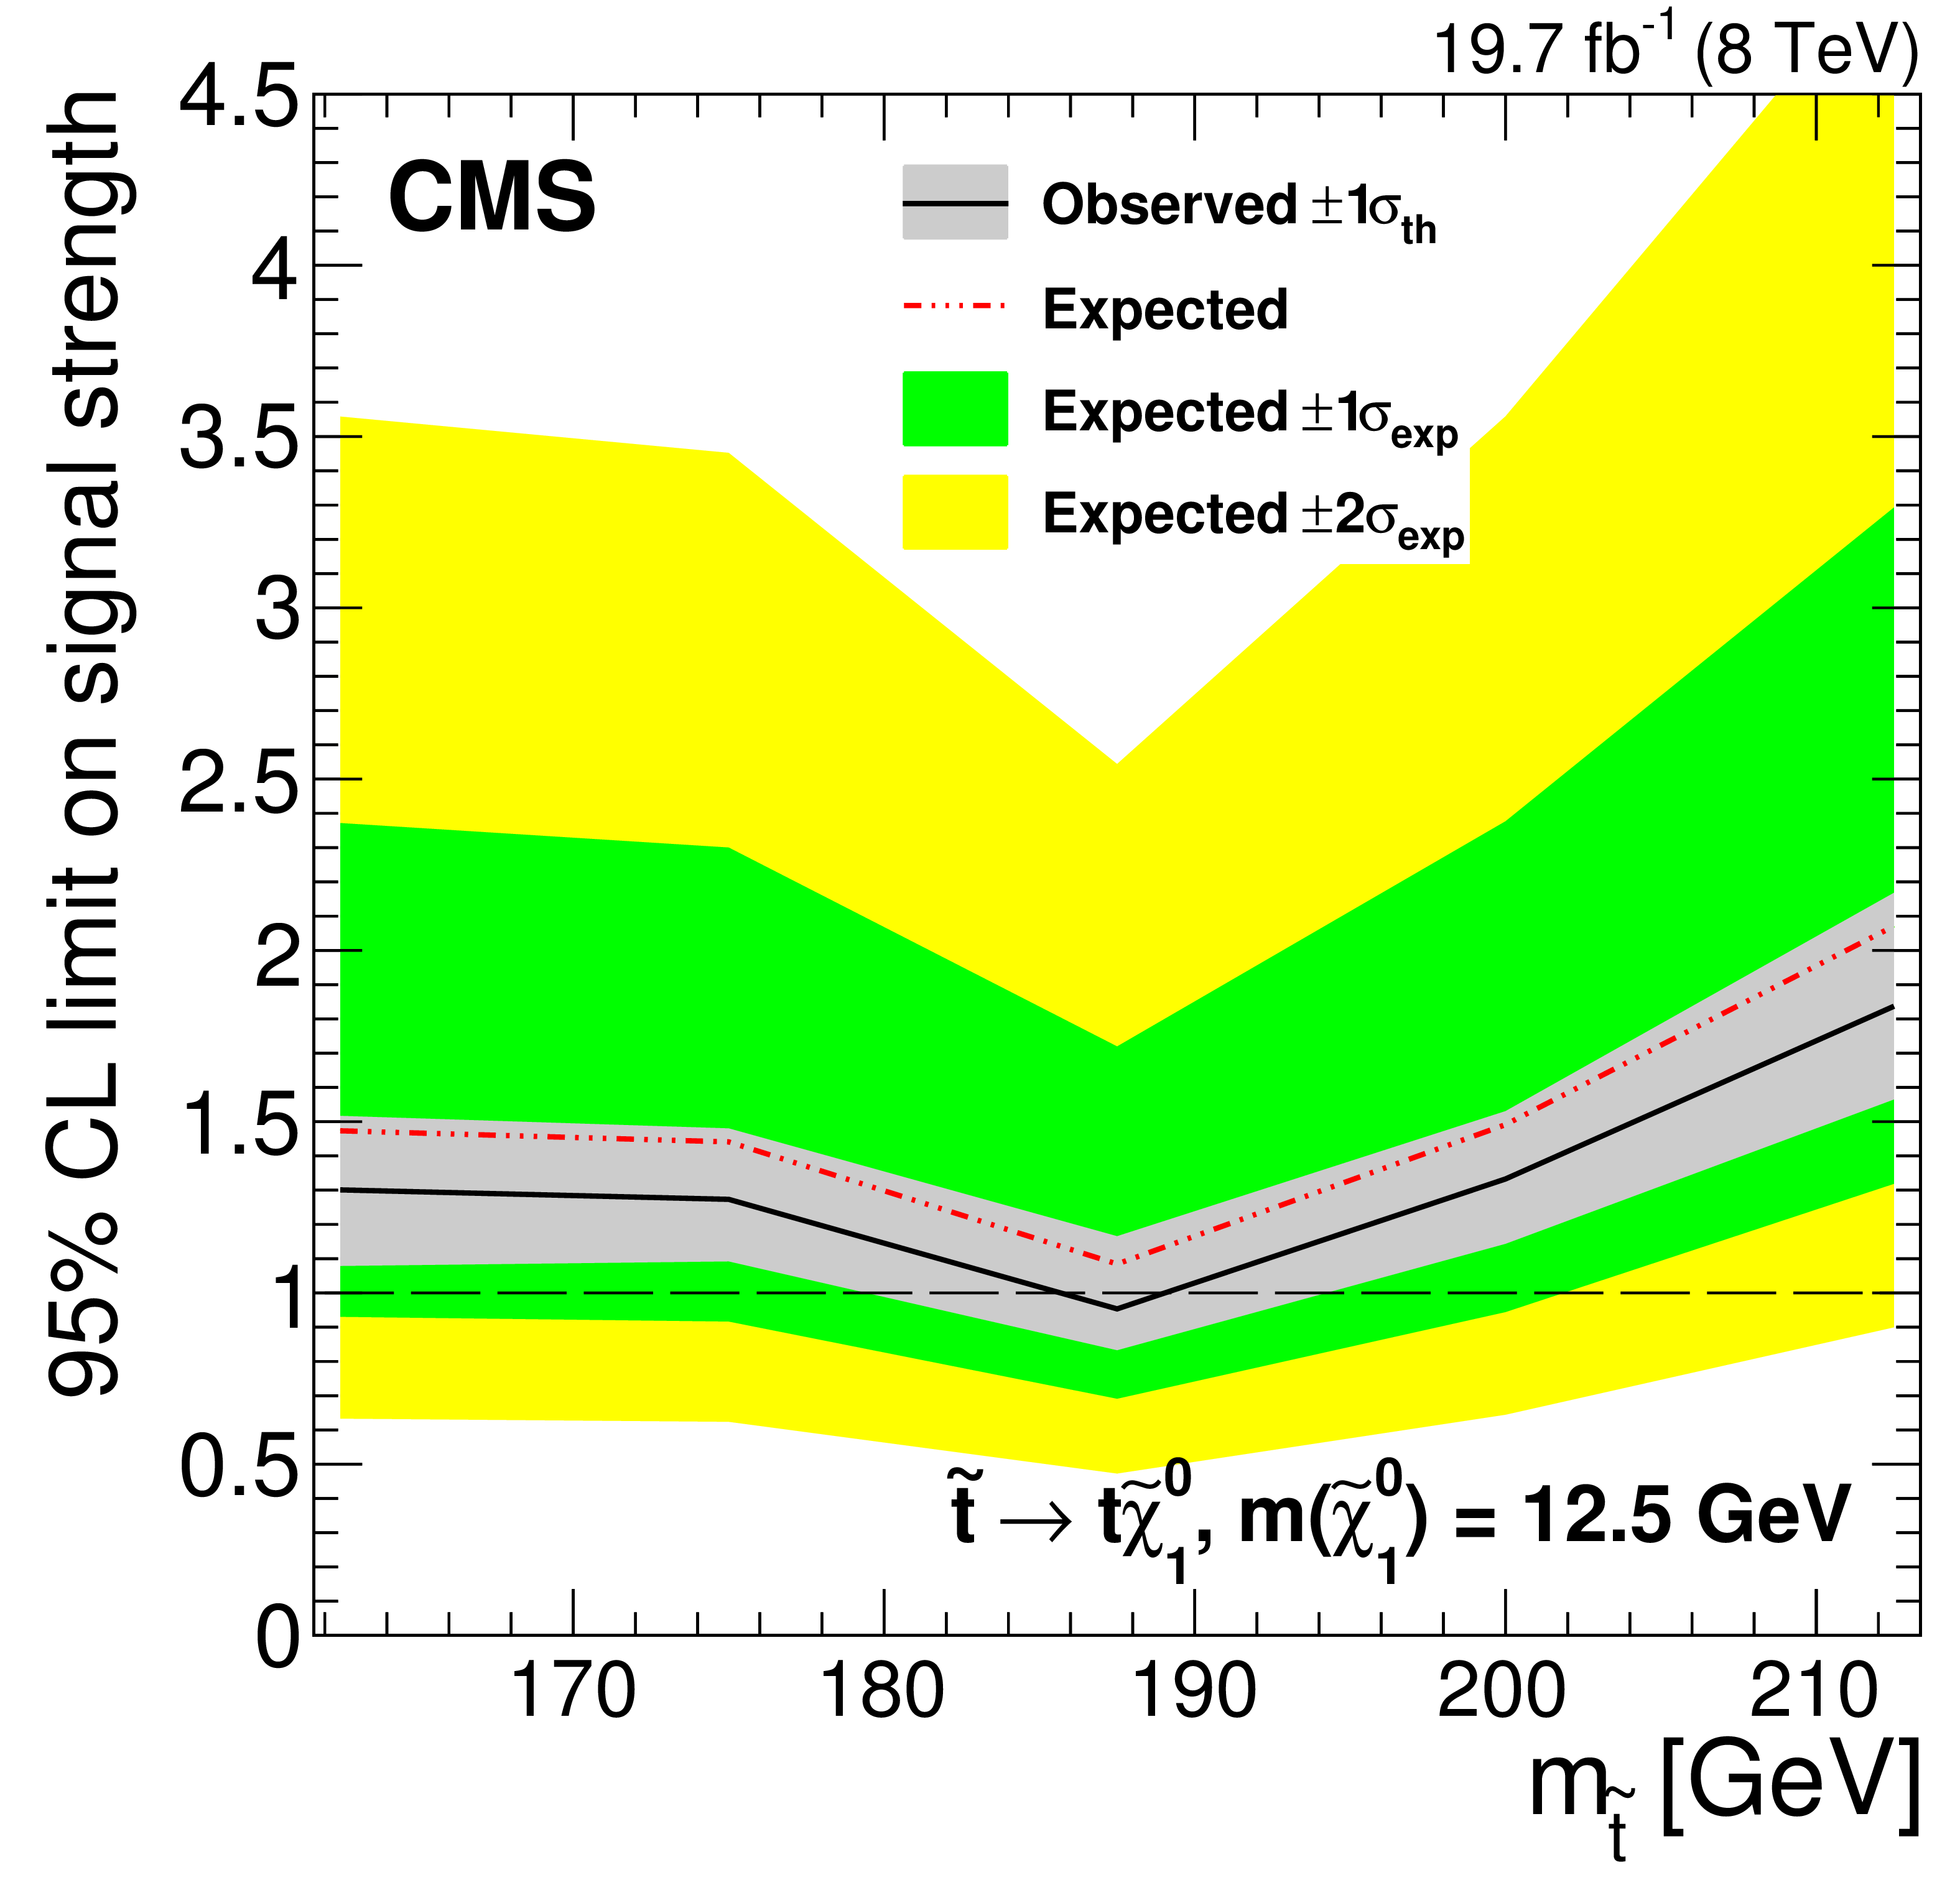
Figure 11:
Expected and observed limits at 95% CL on the signal strength (see text) as a function of the top squark mass for neutralino masses of 1 GeV (left) and 12.5 GeV (right). The widest bands show the 68% and 95% CL ranges of the expected limit. The narrowest band quantifies the impact of the theoretical uncertainty in the cross section of the SUSY signal on the observed limit. |

png pdf |
Figure 11-a:
Expected and observed limits at 95% CL on the signal strength (see text) as a function of the top squark mass for neutralino masses of 1 GeV. The widest bands show the 68% and 95% CL ranges of the expected limit. The narrowest band quantifies the impact of the theoretical uncertainty in the cross section of the SUSY signal on the observed limit. |
png pdf |
Figure 11-b:
Expected and observed limits at 95% CL on the signal strength (see text) as a function of the top squark mass for neutralino masses of 12.5 GeV. The widest bands show the 68% and 95% CL ranges of the expected limit. The narrowest band quantifies the impact of the theoretical uncertainty in the cross section of the SUSY signal on the observed limit. |
| Tables | |
png pdf |
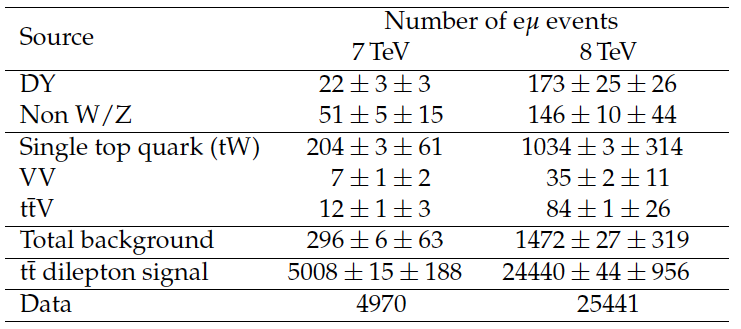
Table 1:
Number of selected events for the event counting method for the 7 and 8 TeV data sets. The results are given for the individual sources of background, $ {\mathrm{ t } {}\mathrm{ \bar{t} } } $ signal, and data. The two uncertainties quoted correspond to the statistical and systematic components (cf. Section 7), respectively. |
png pdf |
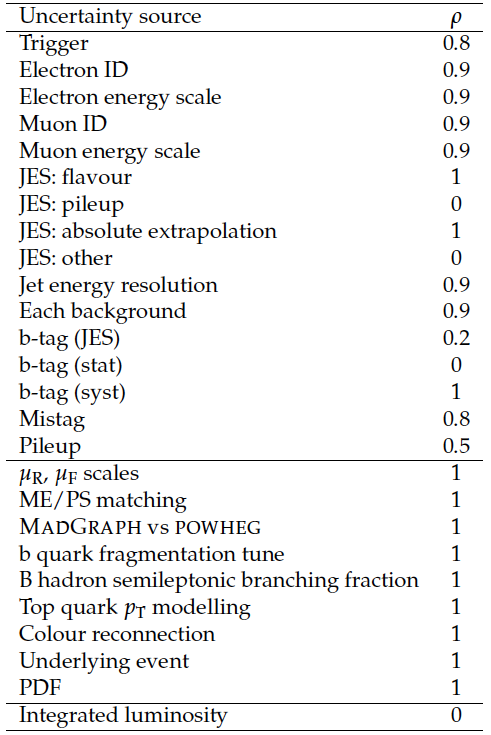
Table 2:
Assumed correlations $\rho $ between systematic uncertainties for the 7 and 8 TeV data sets. If $\rho =$ 0, the uncertainties are treated as uncorrelated between the two sets. |
png pdf |
Table 3:
Illustrative summary of the individual contributions to the total uncertainty in the visible $ {\mathrm{ t } {}\mathrm{ \bar{t} } } $ cross section measurements. |

png pdf |
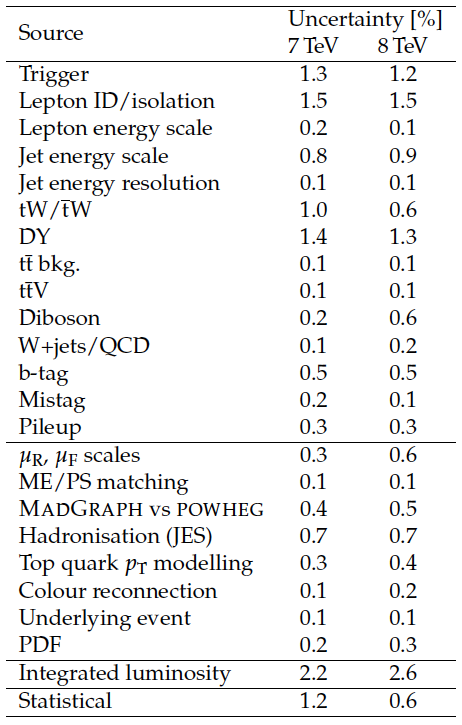
Table 4:
Individual contributions to the systematic uncertainty in the total $ {\mathrm{ t } {}\mathrm{ \bar{t} } } $ cross section measurements. The total systematic uncertainties in the fiducial cross sections $\sigma ^{\text {vis}}_{{\mathrm{ t } {}\mathrm{ \bar{t} } } }$ are given in the row ``Total (visible)'', and those in the full phase space cross section $ {\sigma _{{\mathrm{ t } {}\mathrm{ \bar{t} } } }}$ in the row ``Total''. |
png pdf |
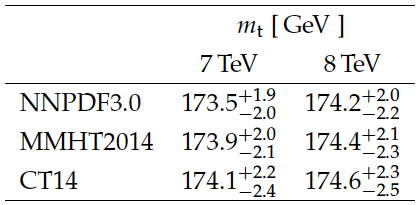
Table 5:
Top quark pole mass at NNLO+NNLL extracted by comparing the measured $ {\mathrm{ t } {}\mathrm{ \bar{t} } } $ production cross section at 7 and 8 TeV with predictions employing different PDF sets. |

png pdf |
Table 6:
Combined top quark pole mass at NNLO+NNLL extracted by comparing the measured $ {\mathrm{ t } {}\mathrm{ \bar{t} } } $ production cross section with predictions employing different PDF sets. |
| Summary |
|
A measurement of the inclusive $\mathrm{ t \bar{t} }$ production cross section in proton-proton collisions at the LHC is presented using the full 2011-2012 data samples of 5.0 fb$^{-1}$ at $ \sqrt{s} = $ 7 TeV and 19.7 fb$^{-1}$ at $ \sqrt{s} = $ 8 TeV. The analysis is performed in the ${\mathrm{ e }\mu} $ channel using an improved cross section extraction method. The cross sections are determined with a binned likelihood fit to the $p_{\mathrm{T}}$ distribution of the non-b-tagged jet with the lowest $p_{\mathrm{T}}$ among the selected jets in the event, using categories of number of b-tagged and additional non-b-tagged jets. Assuming a top quark mass of 172.5 GeV, the results are |
| References | ||||
| 1 | CMS Collaboration | Measurement of the $ \mathrm{ t \bar{t} } $ production cross section in the dilepton channel in pp collisions at $ \sqrt{s} = $ 8 TeV | JHEP 02 (2014) 024, , [Erratum: 10.1007/JHEP02(2014)102] | CMS-TOP-12-007 1312.7582 |
| 2 | CMS Collaboration | Measurement of the $ \mathrm{ t \bar{t} } $ production cross section in pp collisions at $ \sqrt{s} = $ 8 TeV in dilepton final states containing one $ \tau $ lepton | PLB 739 (2014) 23 | CMS-TOP-12-026 1407.6643 |
| 3 | CMS Collaboration | Measurement of the $ \mathrm{ t \bar{t} } $ production cross section in the all-jets final state in pp collisions at $ \sqrt{s} = $ 8 TeV | Submitted to EPJC | CMS-TOP-14-018 1509.06076 |
| 4 | CMS Collaboration | Measurement of the $ \mathrm{ t \bar{t} } $ production cross section and the top quark mass in the dilepton channel in pp collisions at $ \sqrt{s} = $ 7 TeV | JHEP 07 (2011) 049 | CMS-TOP-11-002 1105.5661 |
| 5 | CMS Collaboration | Measurement of the $ \mathrm{ t \bar{t} } $ production cross section in the all-jet final state in pp collisions at $ \sqrt{s} = $ 7 TeV | JHEP 05 (2013) 065 | CMS-TOP-11-007 1302.0508 |
| 6 | CMS Collaboration | Measurement of the $ \mathrm{ t \bar{t} } $ production cross section in the $ \tau $+jets channel in pp collisions at $ \sqrt{s} = $ 7 TeV | EPJC 73 (2013) 2386 | CMS-TOP-11-004 1301.5755 |
| 7 | CMS Collaboration | Measurement of the $ \mathrm{ t \bar{t} } $ production cross section in pp collisions at $ \sqrt{s} = $ 7 TeV with lepton + jets final states | PLB 720 (2013) 83 | CMS-TOP-11-003 1212.6682 |
| 8 | CMS Collaboration | Measurement of the $ \mathrm{ t \bar{t} }\ $ cross section in the dilepton channel in pp collisions at $ \sqrt{s} = $ 7 TeV | JHEP 11 (2012) 067 | CMS-TOP-11-005 1208.2671 |
| 9 | CMS Collaboration | Measurement of the $ \mathrm{ t \bar{t} } $ production cross section in pp collisions at $ \sqrt{s} = $ 7 TeV in dilepton final states containing a $ \tau $ | PRD 85 (2012) 112007 | CMS-TOP-11-006 1203.6810 |
| 10 | CMS Collaboration | Measurement of the $ \mathrm{ t \bar{t} } $ production cross section in pp collisions at 7$ TeV $ in lepton + jets events using $ \mathrm{ b } $-quark jet identification | PRD 84 (2011) 092004 | CMS-TOP-10-003 1108.3773 |
| 11 | CMS Collaboration | Measurement of the top-antitop production cross section in pp collisions at $ \sqrt{s} = $ 7 TeV using the kinematic properties of events with leptons and jets | EPJC 71 (2011) 1721 | CMS-TOP-10-002 1106.0902 |
| 12 | ATLAS Collaboration | Measurement of the top pair production cross section in 8$ TeV $ proton-proton collisions using kinematic information in the lepton+jets final state with ATLAS | PRD 91 (2015) 112013 | 1504.04251 |
| 13 | ATLAS Collaboration | Simultaneous measurements of the $ \mathrm{ t \bar{t} } $, $ \mathrm{ W }^+\mathrm{ W }^- $, and $ {\mathrm{ Z }} / \gamma^{*} \rightarrow \tau\tau $ production cross-sections in pp collisions at $ \sqrt{s} = $ 7 TeV with the ATLAS detector | PRD 91 (2015) 052005 | 1407.0573 |
| 14 | ATLAS Collaboration | Measurement of the $ \mathrm{ t \bar{t} } $ production cross-section using $ \mathrm{ e } \mu $ events with $ \mathrm{ b } $-tagged jets in pp collisions at $ \sqrt{s}=7 $ and 8$ TeV $ with the ATLAS detector | EPJC 74 (2014) 3109 | 1406.5375 |
| 15 | ATLAS Collaboration | Measurement of the cross section for top-quark pair production in pp collisions at $ \sqrt{s} = $ 7 TeV with the ATLAS detector using final states with two high-$ p_{\mathrm{T}} $ leptons | JHEP 05 (2012) 059 | 1202.4892 |
| 16 | ATLAS Collaboration | Measurement of the $ \mathrm{ t \bar{t} } $ production cross section in the $ \tau $+jets channel using the ATLAS detector | EPJC 73 (2013) 2328 | 1211.7205 |
| 17 | ATLAS Collaboration | Measurement of the top quark pair cross section with ATLAS in pp collisions at $ \sqrt{s} = $ 7 TeV using final states with an electron or a muon and a hadronically decaying $ \tau $ lepton | PLB 717 (2012) 89 | 1205.2067 |
| 18 | ATLAS Collaboration | Measurement of the top quark pair production cross-section with ATLAS in the single lepton channel | PLB 711 (2012) 244 | 1201.1889 |
| 19 | ATLAS Collaboration | Measurement of the top quark pair production cross section in pp collisions at $ \sqrt{s} = $ 7 TeV in dilepton final states with ATLAS | PLB 707 (2012) 459 | 1108.3699 |
| 20 | ATLAS Collaboration | Measurement of the top quark-pair production cross section with ATLAS in pp collisions at $ \sqrt{s} = $ 7 TeV | EPJC 71 (2011) 1577 | 1012.1792 |
| 21 | ATLAS Collaboration | Search for new phenomena in $ \mathrm{ t \bar{t} } $ events with large missing transverse momentum | PRL 108 (2012) 041805 | 1109.4725 |
| 22 | ATLAS Collaboration | Search for anomalous production of prompt like-sign muon pairs and constraints on physics beyond the Standard Model | PRD 88 (2012) 032004 | 1201.1091 |
| 23 | M. Czakon, P. Fiedler, and A. Mitov | The total top quark production cross-section at hadron colliders through $ \mathcal{O}(\alpha_S^4) $ | PRL 110 (2013) 252004 | 1303.6254 |
| 24 | CMS Collaboration | Determination of the top-quark pole mass and strong coupling constant from the $ {\mathrm{ t \bar{t} }} $ production cross section in pp collisions at $ \sqrt{s} = $ 7 TeV | PLB 728 (2014) 496, , [Corrigendum: 10.1016/j.physletb.2014.08.040] | CMS-TOP-12-022 1307.1907 |
| 25 | G. R. Farrar and P. Fayet | Phenomenology of the production, decay, and detection of new hadronic states associated with supersymmetry | PLB 76 (1978) 575 | |
| 26 | H. P. Nilles | Supersymmetry, supergravity and particle physics | PR 110 (1984) 1 | |
| 27 | ATLAS Collaboration | Measurement of spin correlation in top-antitop quark events and search for top squark pair production in pp collisions at $ \sqrt{s} = $ 8 TeV using the ATLAS detector | PRL 114 (2015) 142001 | 1412.4742 |
| 28 | CMS Collaboration | The CMS experiment at the CERN LHC | JINST 3 (2008) S08004 | CMS-00-001 |
| 29 | CMS Collaboration | Particle--flow event reconstruction in CMS and performance for jets, taus, and $ E_{\mathrm{T}}^{\text{miss}} $ | CDS | |
| 30 | CMS Collaboration | Commissioning of the particle--flow event reconstruction with the first LHC collisions recorded in the CMS detector | CDS | |
| 31 | J. Alwall et al. | The automated computation of tree-level and next-to-leading order differential cross sections, and their matching to parton shower simulations | JHEP 07 (2014) 079 | 1405.0301 |
| 32 | P. Artoisenet, R. Frederix, O. Mattelaer, and R. Rietkerk | Automatic spin-entangled decays of heavy resonances in Monte Carlo simulations | JHEP 03 (2013) 015 | 1212.3460 |
| 33 | J. Pumplin et al. | New generation of parton distributions with uncertainties from global QCD analysis | JHEP 07 (2002) 012 | hep-ph/0201195 |
| 34 | T. Sjostrand, S. Mrenna, and P. Z. Skands | PYTHIA 6.4 physics and manual | JHEP 05 (2006) 026 | hep-ph/0603175 |
| 35 | M. L. Mangano, M. Moretti, F. Piccinini, and M. Treccani | Matching matrix elements and shower evolution for top-quark production in hadronic collisions | JHEP 01 (2007) 013 | hep-ph/0611129 |
| 36 | N. Davidson et al. | Universal interface of TAUOLA technical and physics documentation | CPC 183 (2010) 821 | 1002.0543 |
| 37 | S. Alioli, P. Nason, C. Oleari, and E. Re | A general framework for implementing NLO calculations in shower Monte Carlo programs: the POWHEG BOX | JHEP 06 (2010) 043 | 1002.2581 |
| 38 | H.-L. Lai et al. | New parton distributions for collider physics | PRD 82 (2010) 074024 | 1007.2241 |
| 39 | R. Field | Early LHC underlying event data -- findings and surprises | in Hadron collider physics. Proceedings, 22nd Conference, HCP 2010, Toronto, Canada, August 23-27, 2010 2010 | 1010.3558 |
| 40 | GEANT4 Collaboration | GEANT4---a simulation toolkit | NIMA 506 (2003) 250 | |
| 41 | S. Alioli, P. Nason, C. Oleari, and E. Re | NLO single-top production matched with shower in POWHEG: $ s $- and $ t $-channel contributions | JHEP 09 (2009) 111, , [Erratum: \DOI10.1007/JHEP02(2010)011] | 0907.4076 |
| 42 | E. Re | Single-top $ \mathrm{ W } \mathrm{ t } $-channel production matched with parton showers using the POWHEG method | EPJC 71 (2011) 1547 | 1009.2450 |
| 43 | R. Field | Min-bias and the underlying event at the LHC | Acta Physica Polonica B 42 (2011) 2631 | |
| 44 | K. Melnikov and F. Petriello | The $ \mathrm{ W } $ boson production cross section at the LHC through $ \mathcal{O}(\alpha^2_S) $ | PRL 96 (2006) 231803 | hep-ph/0603182 |
| 45 | K. Melnikov and F. Petriello | Electroweak gauge boson production at hadron colliders through $ \mathcal{O}(\alpha_S^2) $ | PRD 74 (2006) 114017 | hep-ph/0609070 |
| 46 | N. Kidonakis | Two-loop soft anomalous dimensions for single top quark associated production with $ {\mathrm{ W }^-} $ or $ {\mathrm{ H }^-} $ | PRD 82 (2010) 054018 | hep-ph/1005.4451 |
| 47 | J. M. Campbell, R. K. Ellis, and C. Williams | Vector boson pair production at the LHC | JHEP 07 (2011) 018 | 1105.0020 |
| 48 | J. M. Campbell and R. K. Ellis | $ \mathrm{ t \bar{t} }\, \mathrm{ W }^{\pm} $ production and decay at NLO | JHEP 07 (2012) 052 | 1204.5678 |
| 49 | M. V. Garzelli, A. Kardos, C. G. Papadopoulos, and Z. Tr\'ocs\'anyi | $ \mathrm{ t \bar{t} }\, \mathrm{ W }^{\pm} $ and $ \mathrm{ t \bar{t} }\, \mathrm{ Z } $ hadroproduction at NLO accuracy in QCD with parton shower and hadronization effects | JHEP 11 (2012) 056 | 1208.2665 |
| 50 | M. Czakon and A. Mitov | Top++: a program for the calculation of the top-pair cross-section at hadron colliders | CPC 185 (2014) 2930 | 1112.5675 |
| 51 | M. Botje et al. | The PDF4LHC Working Group interim recommendations | 1101.0538 | |
| 52 | S. Alekhin et al. | The PDF4LHC Working Group interim report | 1101.0536 | |
| 53 | A. D. Martin, W. J. Stirling, R. S. Thorne, and G. Watt | Uncertainties on $ \alpha_S $ in global PDF analyses and implications for predicted hadronic cross sections | EPJC 64 (2009) 653 | 0905.3531 |
| 54 | J. Gao et al. | CT10 next-to-next-to-leading order global analysis of QCD | PRD 89 (2014) 033009 | 1302.6246 |
| 55 | NNPDF Collaboration | Parton distributions with LHC data | Nucl. Phys. B 867 (2013) 244 | 1207.1303 |
| 56 | M. Czakon, M. L. Mangano, A. Mitov, and J. Rojo | Constraints on the gluon PDF from top quark pair production at hadron colliders | JHEP 07 (2013) 167 | 1303.7215 |
| 57 | CMS Collaboration | Measurement of the differential cross section for top quark pair production in pp collisions at $ \sqrt{s} = $ 8 TeV | EPJC 75 (2015) 542 | CMS-TOP-12-028 1505.04480 |
| 58 | CMS Collaboration | CMS tracking performance results from early LHC operation | EPJC 70 (2010) 1165 | CMS-TRK-10-001 1007.1988 |
| 59 | CMS Collaboration | Performance of electron reconstruction and selection with the CMS detector in proton-proton collisions at $ \sqrt{s} = $ 8 TeV | JINST 10 (2015) P06005 | CMS-EGM-13-001 1502.02701 |
| 60 | CMS Collaboration | Performance of CMS muon reconstruction in pp collision events at $ \sqrt{s} = $ 7 TeV | JINST 7 (2012) P10002 | CMS-MUO-10-004 1206.4071 |
| 61 | CMS Collaboration | Measurements of inclusive $ \mathrm{ W } $ and $ \mathrm{ Z } $ cross sections in pp collisions at $ \sqrt{s} = $ 7 TeV | JHEP 01 (2011) 080 | CMS-EWK-10-002 1012.2466 |
| 62 | M. Cacciari, G. P. Salam, and G. Soyez | The anti-$ k_t $ jet clustering algorithm | JHEP 04 (2008) 063 | 0802.1189 |
| 63 | CMS Collaboration | Determination of jet energy calibration and transverse momentum resolution in CMS | JINST 6 (2011) P11002 | CMS-JME-10-011 1107.4277 |
| 64 | CMS Collaboration | Identification of b-quark jets with the CMS experiment | JINST 8 (2013) 04013 | CMS-BTV-12-001 1211.4462 |
| 65 | Particle Data Group, K. A. Olive et al. | Review of Particle Physics | CPC 38 (2014) 090001 | |
| 66 | F. James and M. Roos | Minuit: a system for function minimization and analysis of the parameter errors and correlations | CPC 10 (1975) 343 | |
| 67 | A. Bodek et al. | Extracting muon momentum scale corrections for hadron collider experiments | EPJC 72 (2012) 2194 | 1208.3710 |
| 68 | TOTEM Collaboration | First measurement of the total proton-proton cross section at the LHC energy of $ \sqrt{s} = $ 7 TeV | Europhys. Lett. 96 (2011) 21002 | 1110.1395 |
| 69 | CMS Collaboration | Absolute calibration of the luminosity measurement at CMS: Winter 2012 update | CDS | |
| 70 | CMS Collaboration | CMS luminosity based on pixel cluster counting --- Summer 2013 update | CMS-PAS-LUM-13-001 | CMS-PAS-LUM-13-001 |
| 71 | M. Bahr et al. | Herwig++ physics and manual | EPJC 58 (2008) 639 | 0803.0883 |
| 72 | ALEPH Collaboration | Study of the fragmentation of b quarks into B mesons at the $ \mathrm{ Z } $ peak | PLB 512 (2001) 30 | hep-ex/0106051 |
| 73 | DELPHI Collaboration | A study of the b-quark fragmentation function with the DELPHI detector at LEP I and an averaged distribution obtained at the $ \mathrm{ Z } $ pole | EPJC 71 (2011) 1557 | 1102.4748 |
| 74 | P. Z. Skands | Tuning Monte Carlo generators: the Perugia tunes | PRD 82 (2010) 074018 | 1005.3457 |
| 75 | A. Buckley et al. | General-purpose event generators for LHC physics | PR 504 (2011) 145 | 1101.2599 |
| 76 | NNPDF Collaboration | Parton distributions for the LHC Run II | JHEP 04 (2015) 040 | 1410.8849 |
| 77 | S. Dulat et al. | The CT14 global analysis of quantum chromodynamics | 1506.07443 | |
| 78 | L. A. Harland-Lang, A. D. Martin, P. Motylinski, and R. S. Thorne | Parton distributions in the LHC era: MMHT 2014 PDFs | EPJC 75 (2015) 204 | 1412.3989 |
| 79 | J. Wenninger | Energy calibration of the LHC beams at 4$ TeV $ | Technical Report CERN-ATS-2013-040 | |
| 80 | C. Boehm, A. Djouadi, and M. Drees | Light scalar top quarks and supersymmetric dark matter | PRD 62 (2000) 035012 | hep-ph/9911496 |
| 81 | C. Bal\'azs, M. Carena, and C. E. M. Wagner | Dark matter, light stops and electroweak baryogenesis | PRD 70 (2004) 015007 | hep-ph/403224 |
| 82 | J. Alwall, P. Schuster, and N. Toro | Simplified models for a first characterization of new physics at the LHC | PRD 79 (2009) 075020 | 0810.3921 |
| 83 | LHC New Physics Working Group Collaboration | Simplified models for LHC new physics searches | JPG 39 (2012) 105005 | 1105.2838 |
| 84 | CMS Collaboration | Search for top-squark pair production in the single-lepton final state in pp collisions at $ \sqrt{s} = $ 8 TeV | EPJC 73 (2013) 2677 | CMS-SUS-13-011 1308.1586 |
| 85 | CMS Collaboration | Searches for third-generation squark production in fully hadronic final states in proton-proton collisions at $ \sqrt{s} = $ 8 TeV | JHEP 06 (2015) 116 | CMS-SUS-14-001 1503.08037 |
| 86 | CMS Collaboration | Search for direct pair production of scalar top quarks in the single- and dilepton channels in proton-proton collisions at $ \sqrt{s} = $ 8 TeV | Submitted to JHEP | CMS-SUS-14-015 1602.03169 |
| 87 | ATLAS Collaboration | Search for top squark pair production in final states with one isolated lepton, jets, and missing transverse momentum in $ \sqrt{s} = $ 8 TeV pp collisions with the ATLAS detector | JHEP 11 (2014) 118 | 1407.0583 |
| 88 | ATLAS Collaboration | Search for direct pair production of the top squark in all-hadronic final states in proton-proton collisions at $ \sqrt{s} = $ 8 TeV with the ATLAS detector | JHEP 09 (2014) 015 | 1406.1122 |
| 89 | ATLAS Collaboration | Search for direct top-squark pair production in final states with two leptons in pp collisions at $ \sqrt{s} = $ 8 TeV with the ATLAS detector | JHEP 06 (2014) 124 | 1403.4853 |
| 90 | ATLAS Collaboration | ATLAS Run 1 searches for direct pair production of third-generation squarks at the Large Hadron Collider | EPJC 75 (2015) 510 | 1506.08616 |
| 91 | S. Abdullin et al. | The fast simulation of the CMS detector at LHC | J. Phys. Conf. Ser. 331 (2011) 032049 | |
| 92 | W. Beenakker, R. Hopker, M. Spira, and P. M. Zerwas | Squark and gluino production at hadron colliders | Nucl. Phys. B 492 (1997) 51 | hep-ph/9610490 |
| 93 | A. Kulesza and L. Motyka | Threshold resummation for squark-antisquark and gluino-pair production at the LHC | PRL 102 (2009) 111802 | 0807.2405 |
| 94 | A. Kulesza and L. Motyka | Soft gluon resummation for the production of gluino-gluino and squark-antisquark pairs at the LHC | PRD. 80 (2009) 095004 | 0905.4749 |
| 95 | W. Beenakker et al. | Soft-gluon resummation for squark and gluino hadroproduction | JHEP 12 (2009) 041 | 0909.4418 |
| 96 | W. Beenakker et al. | Squark and gluino hadroproduction | Int. J. Mod. Phys. A 26 (2011) 2637 | 1105.1110 |
| 97 | T. Muller, J. Ott, and J. Wagner-Kuhr | The theta framework | http://theta-framework.org | |
|
|
Compact Muon Solenoid LHC, CERN |
|

|

|

|

|

|