

Compact Muon Solenoid
LHC, CERN
| CMS-PAS-EXO-16-027 | ||
| Search for resonant production of high mass photon pairs using 12.9 fb$^{-1}$ of proton-proton collisions at $\sqrt{s} =$ 13 TeV and combined interpretation of searches at 8 and 13 TeV. | ||
| CMS Collaboration | ||
| August 2016 | ||
| Abstract: We report on a search for resonant production of high mass photon pairs. The search employs 12.9 fb$^{-1}$ of pp collision data collected by the CMS experiment in 2016 at a centre-of-mass energy of 13 TeV. It is aimed at spin-0 and spin-2 resonances of mass between 0.5 and 4.5 TeV and width, relative to the mass, up to $ 5.6 \times 10^{-2} $. The results of the search are combined statistically with those previously obtained by the CMS collaboration at $\sqrt{s}= $ 8 and 13 TeV. Limits are set on scalar resonances produced through gluon-gluon fusion, and on Randall-Sundrum gravitons. No significant excess is observed over the standard model predictions. | ||
|
Links:
CDS record (PDF) ;
inSPIRE record ;
CADI line (restricted) ;
These preliminary results are superseded in this paper, PLB 767 (2017) 147. The superseded preliminary plots can be found here. |
||
| Figures | Summary | Additional Figures | References | CMS Publications |
|---|
| Figures | |
png pdf |
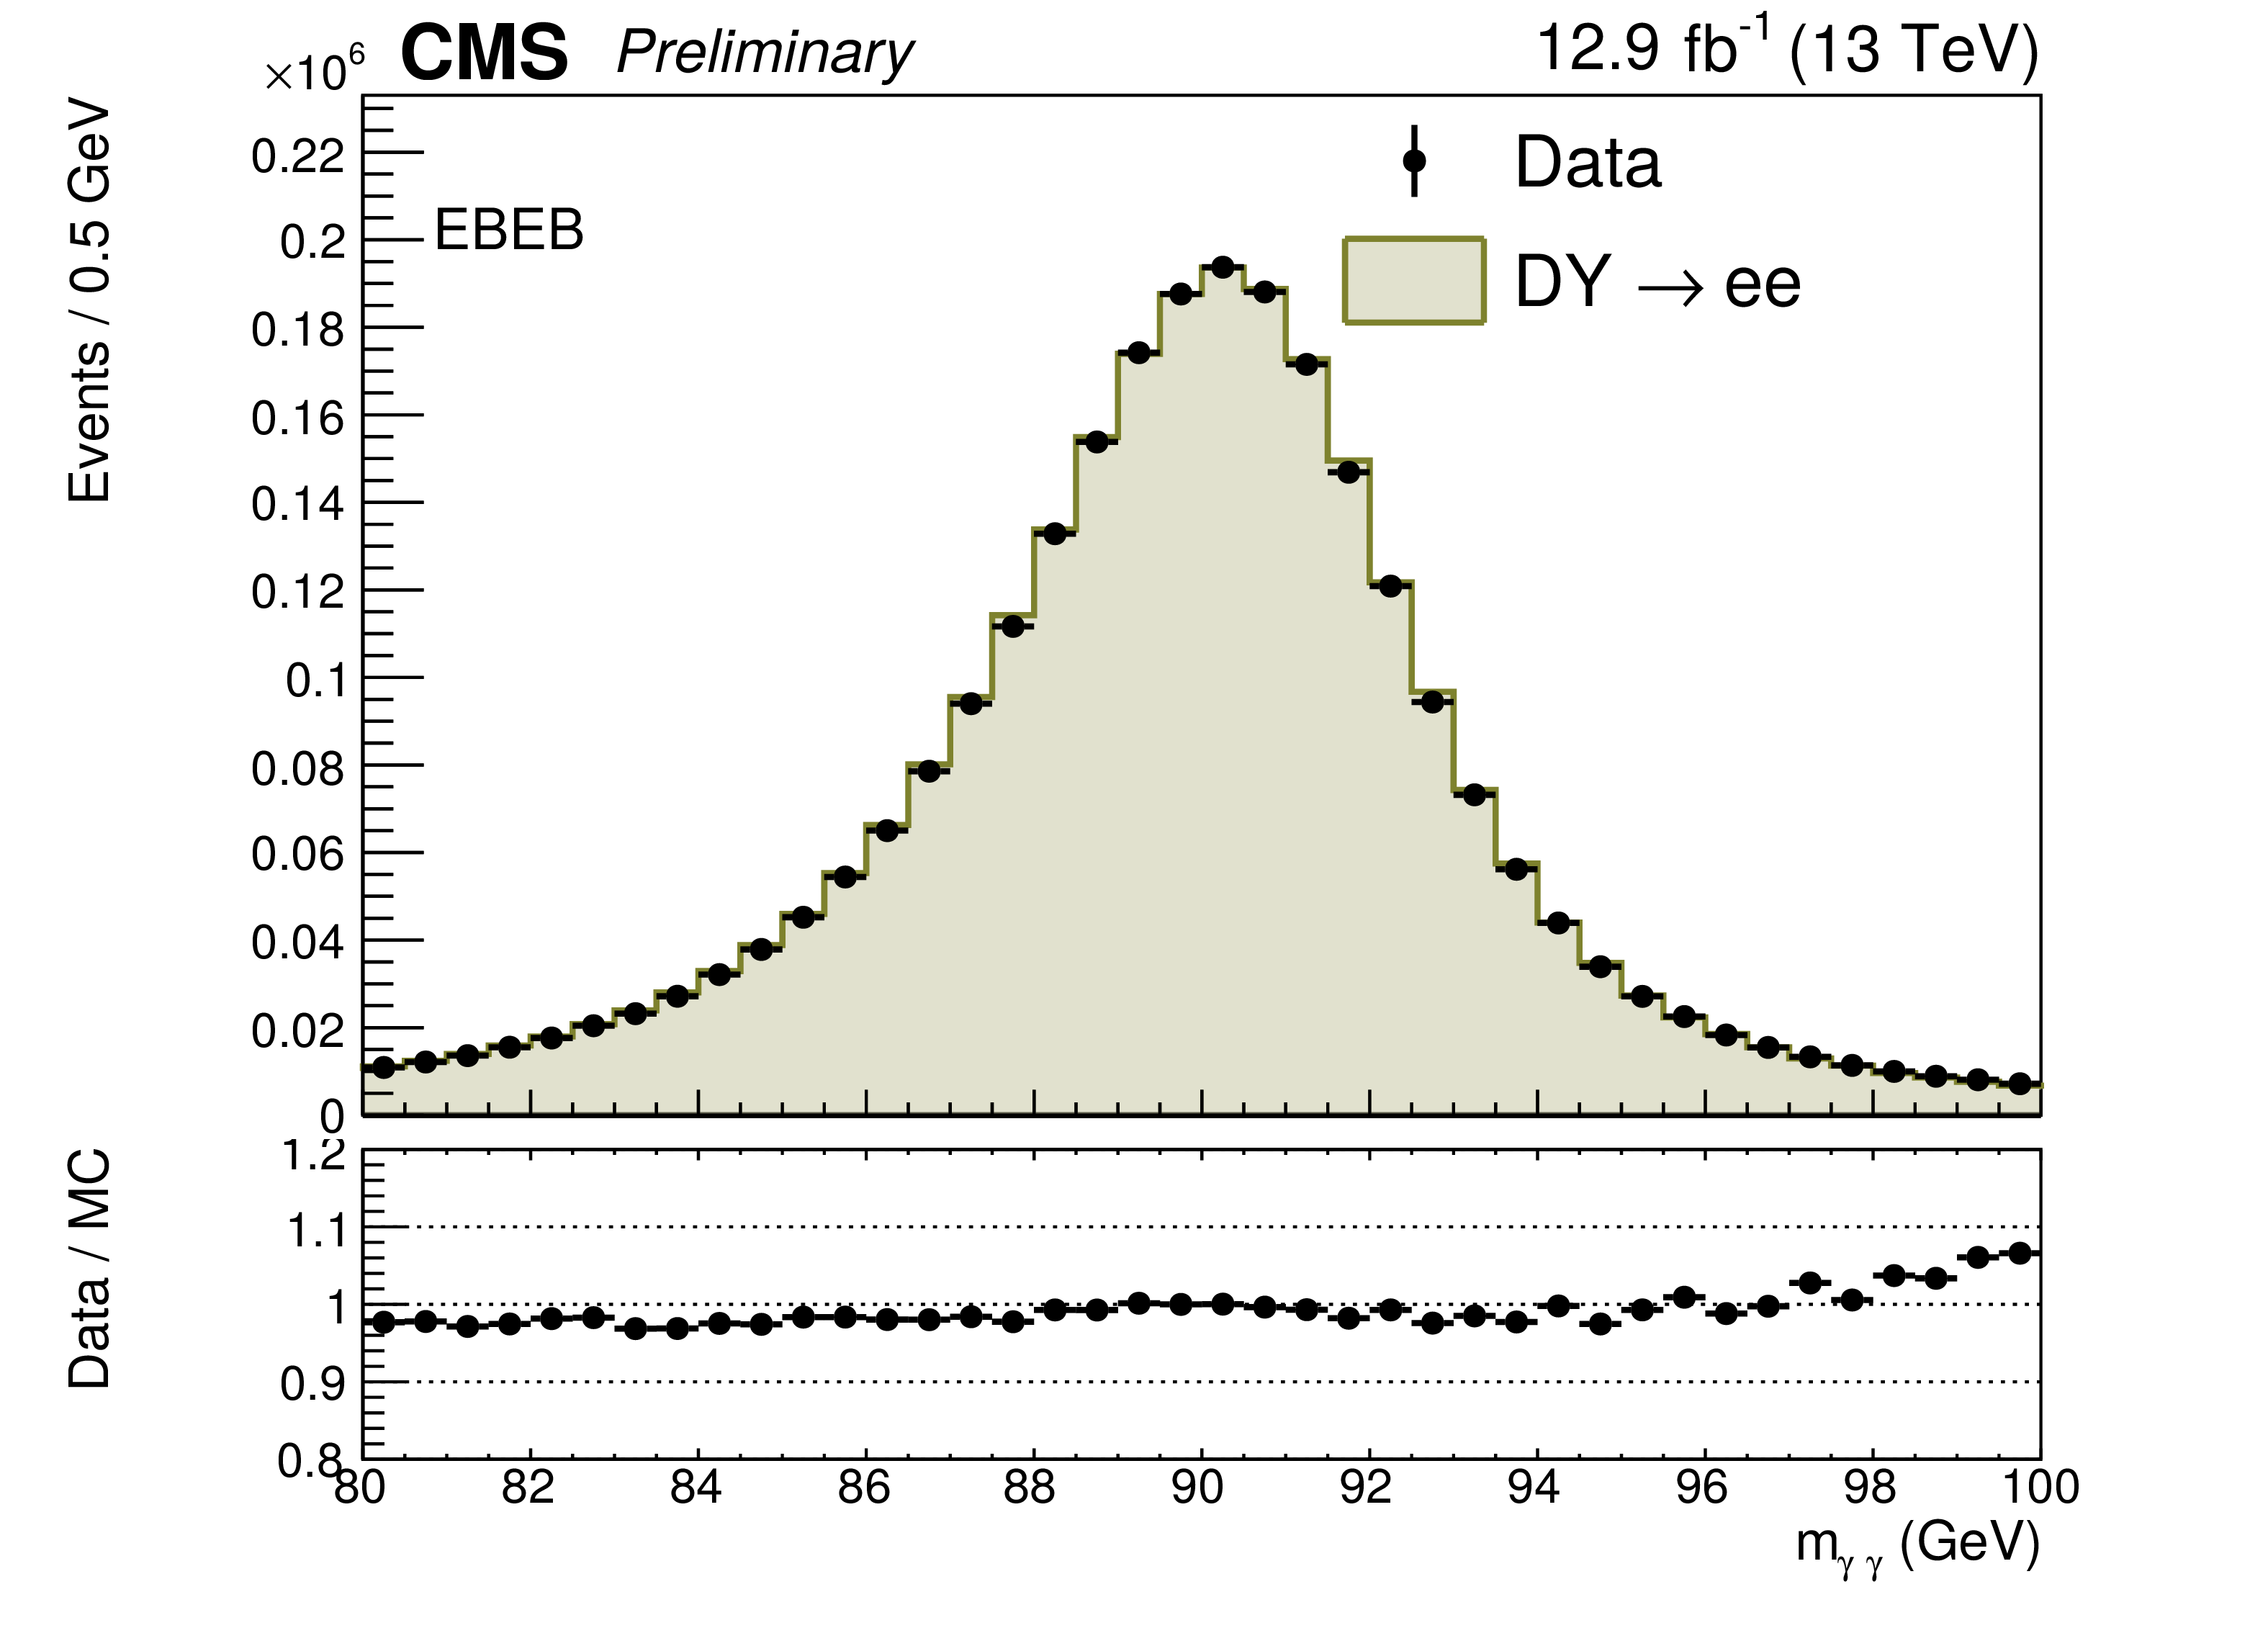
Figure 1-a:
Comparison between the predicted and observed invariant mass distribution of electron pairs obtained after the application of energy scale, resolution and identification efficiency corrections. Distributions are shown for events where both electrons are reconstructed in the barrel (a) and events where one electron is in an endcap (b). |
png pdf |
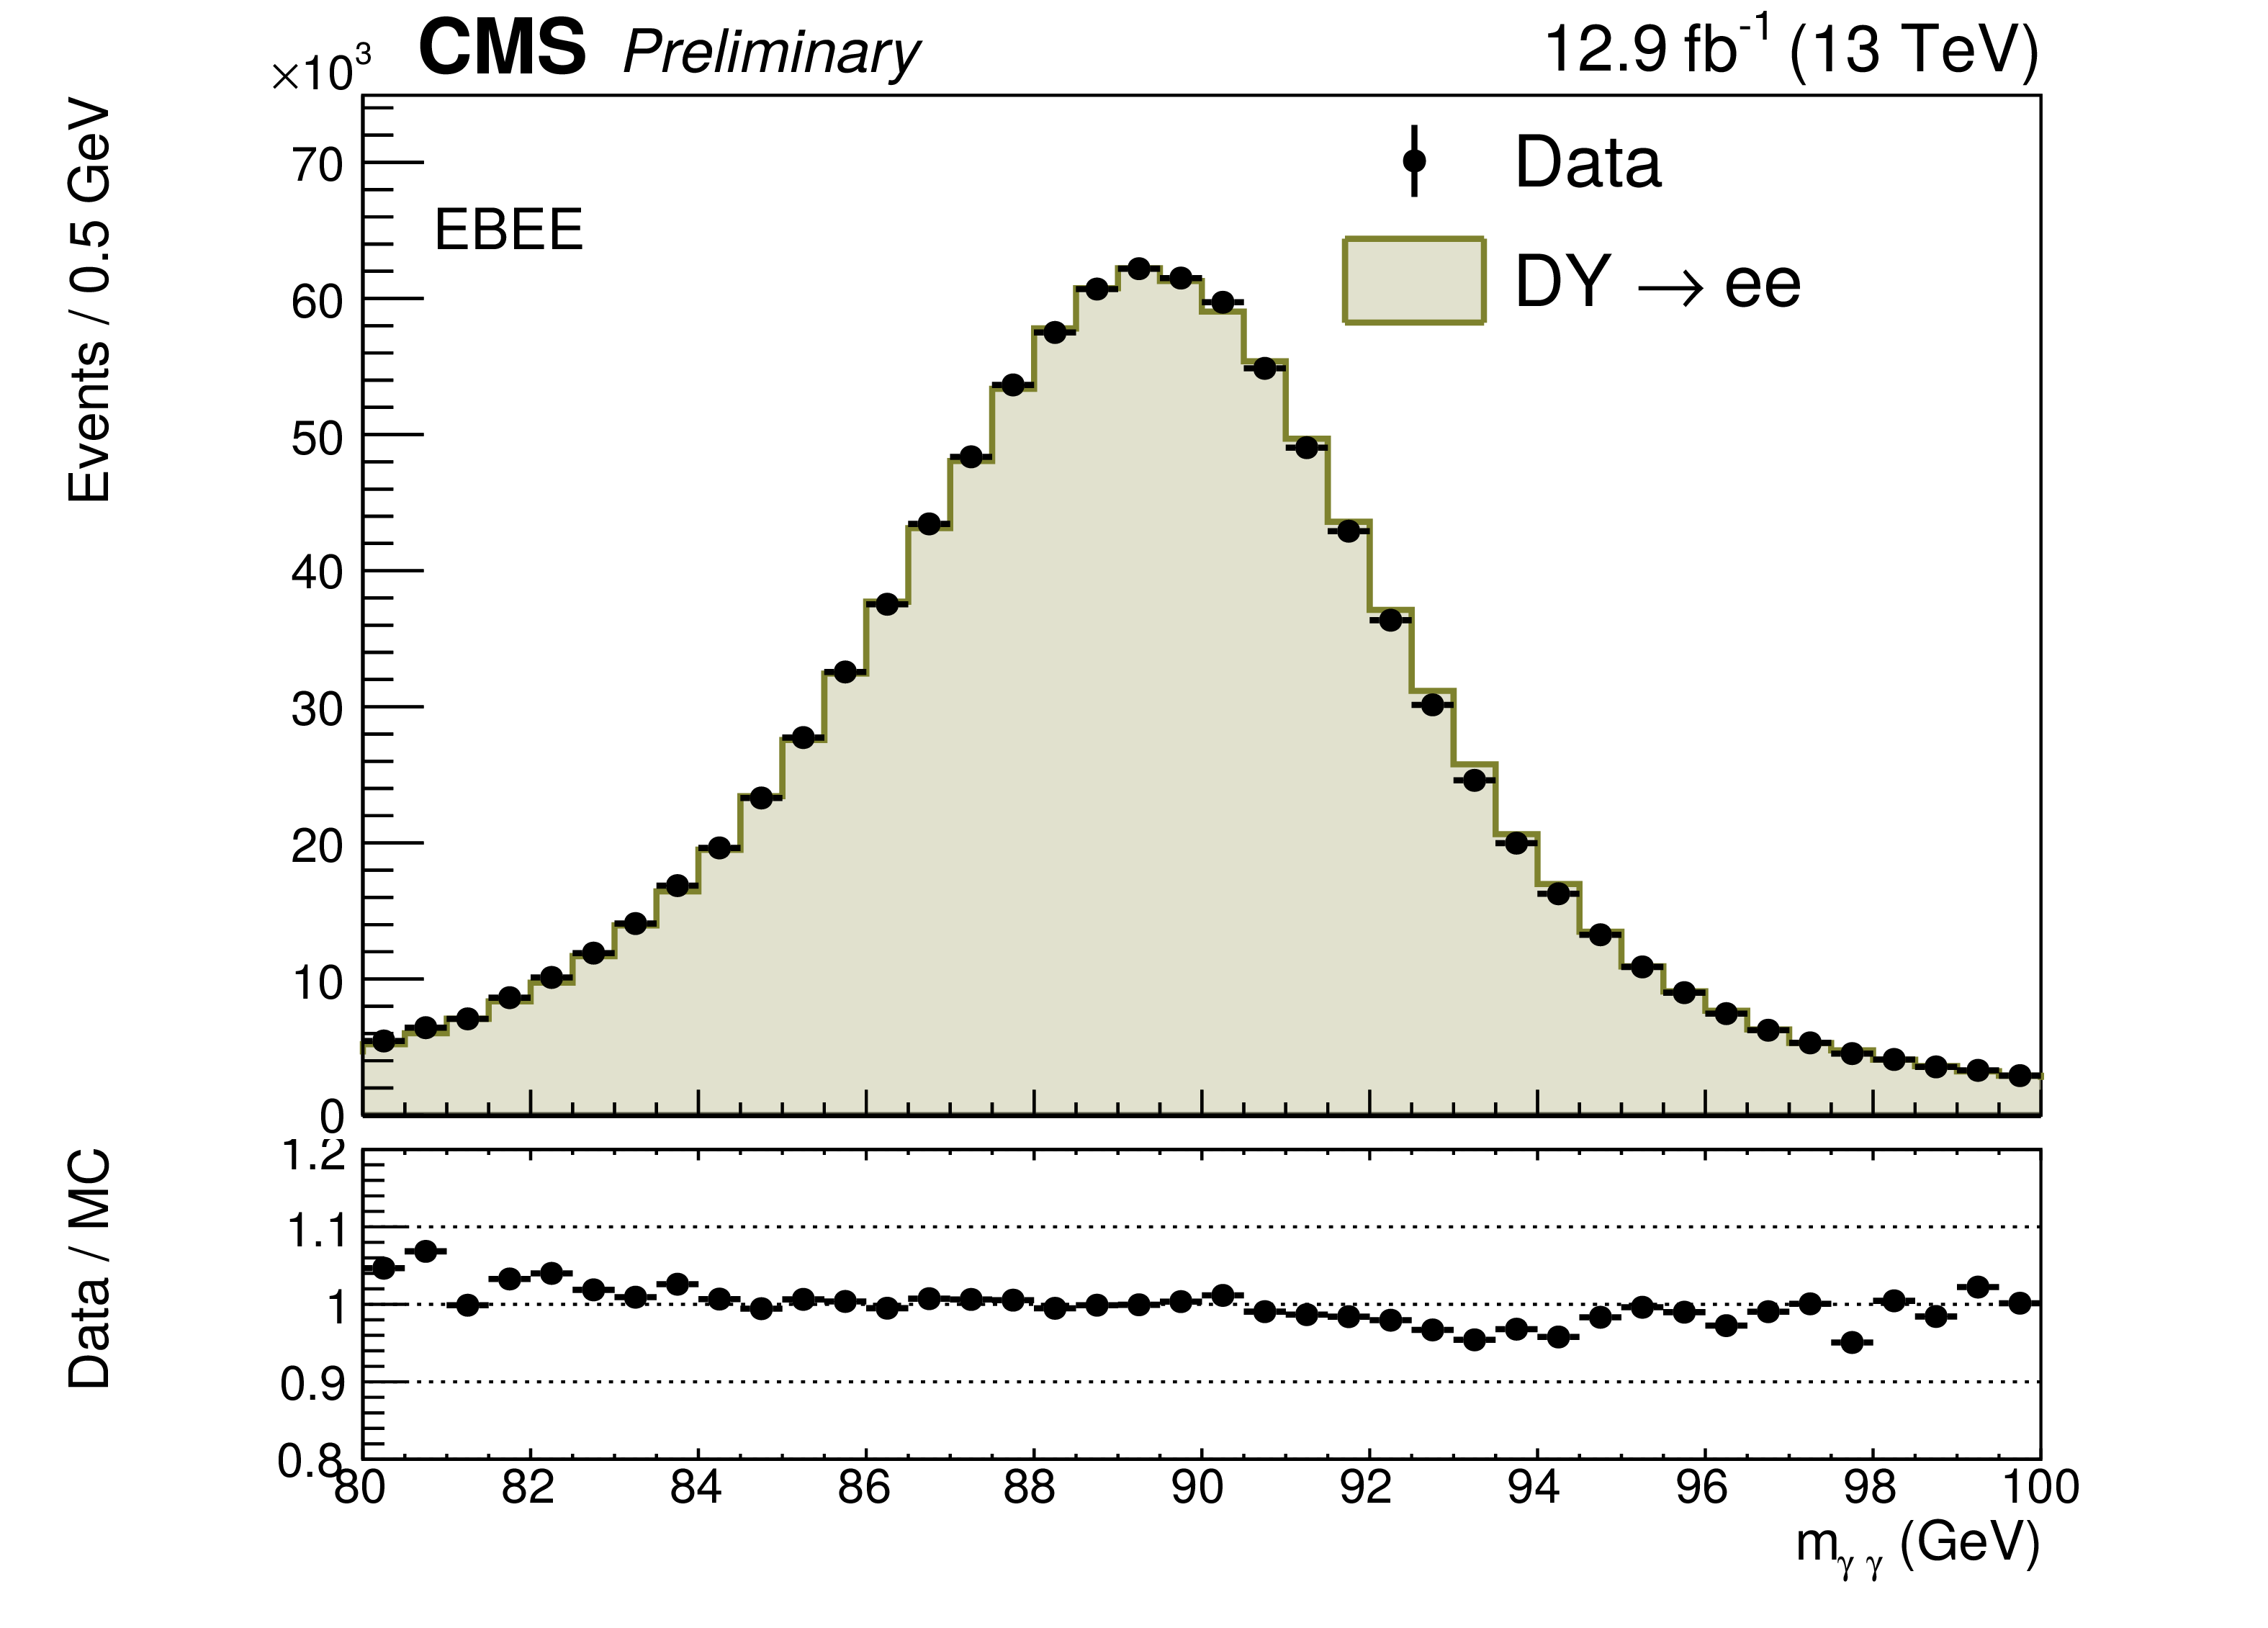
Figure 1-b:
Comparison between the predicted and observed invariant mass distribution of electron pairs obtained after the application of energy scale, resolution and identification efficiency corrections. Distributions are shown for events where both electrons are reconstructed in the barrel (a) and events where one electron is in an endcap (b). |
png pdf |
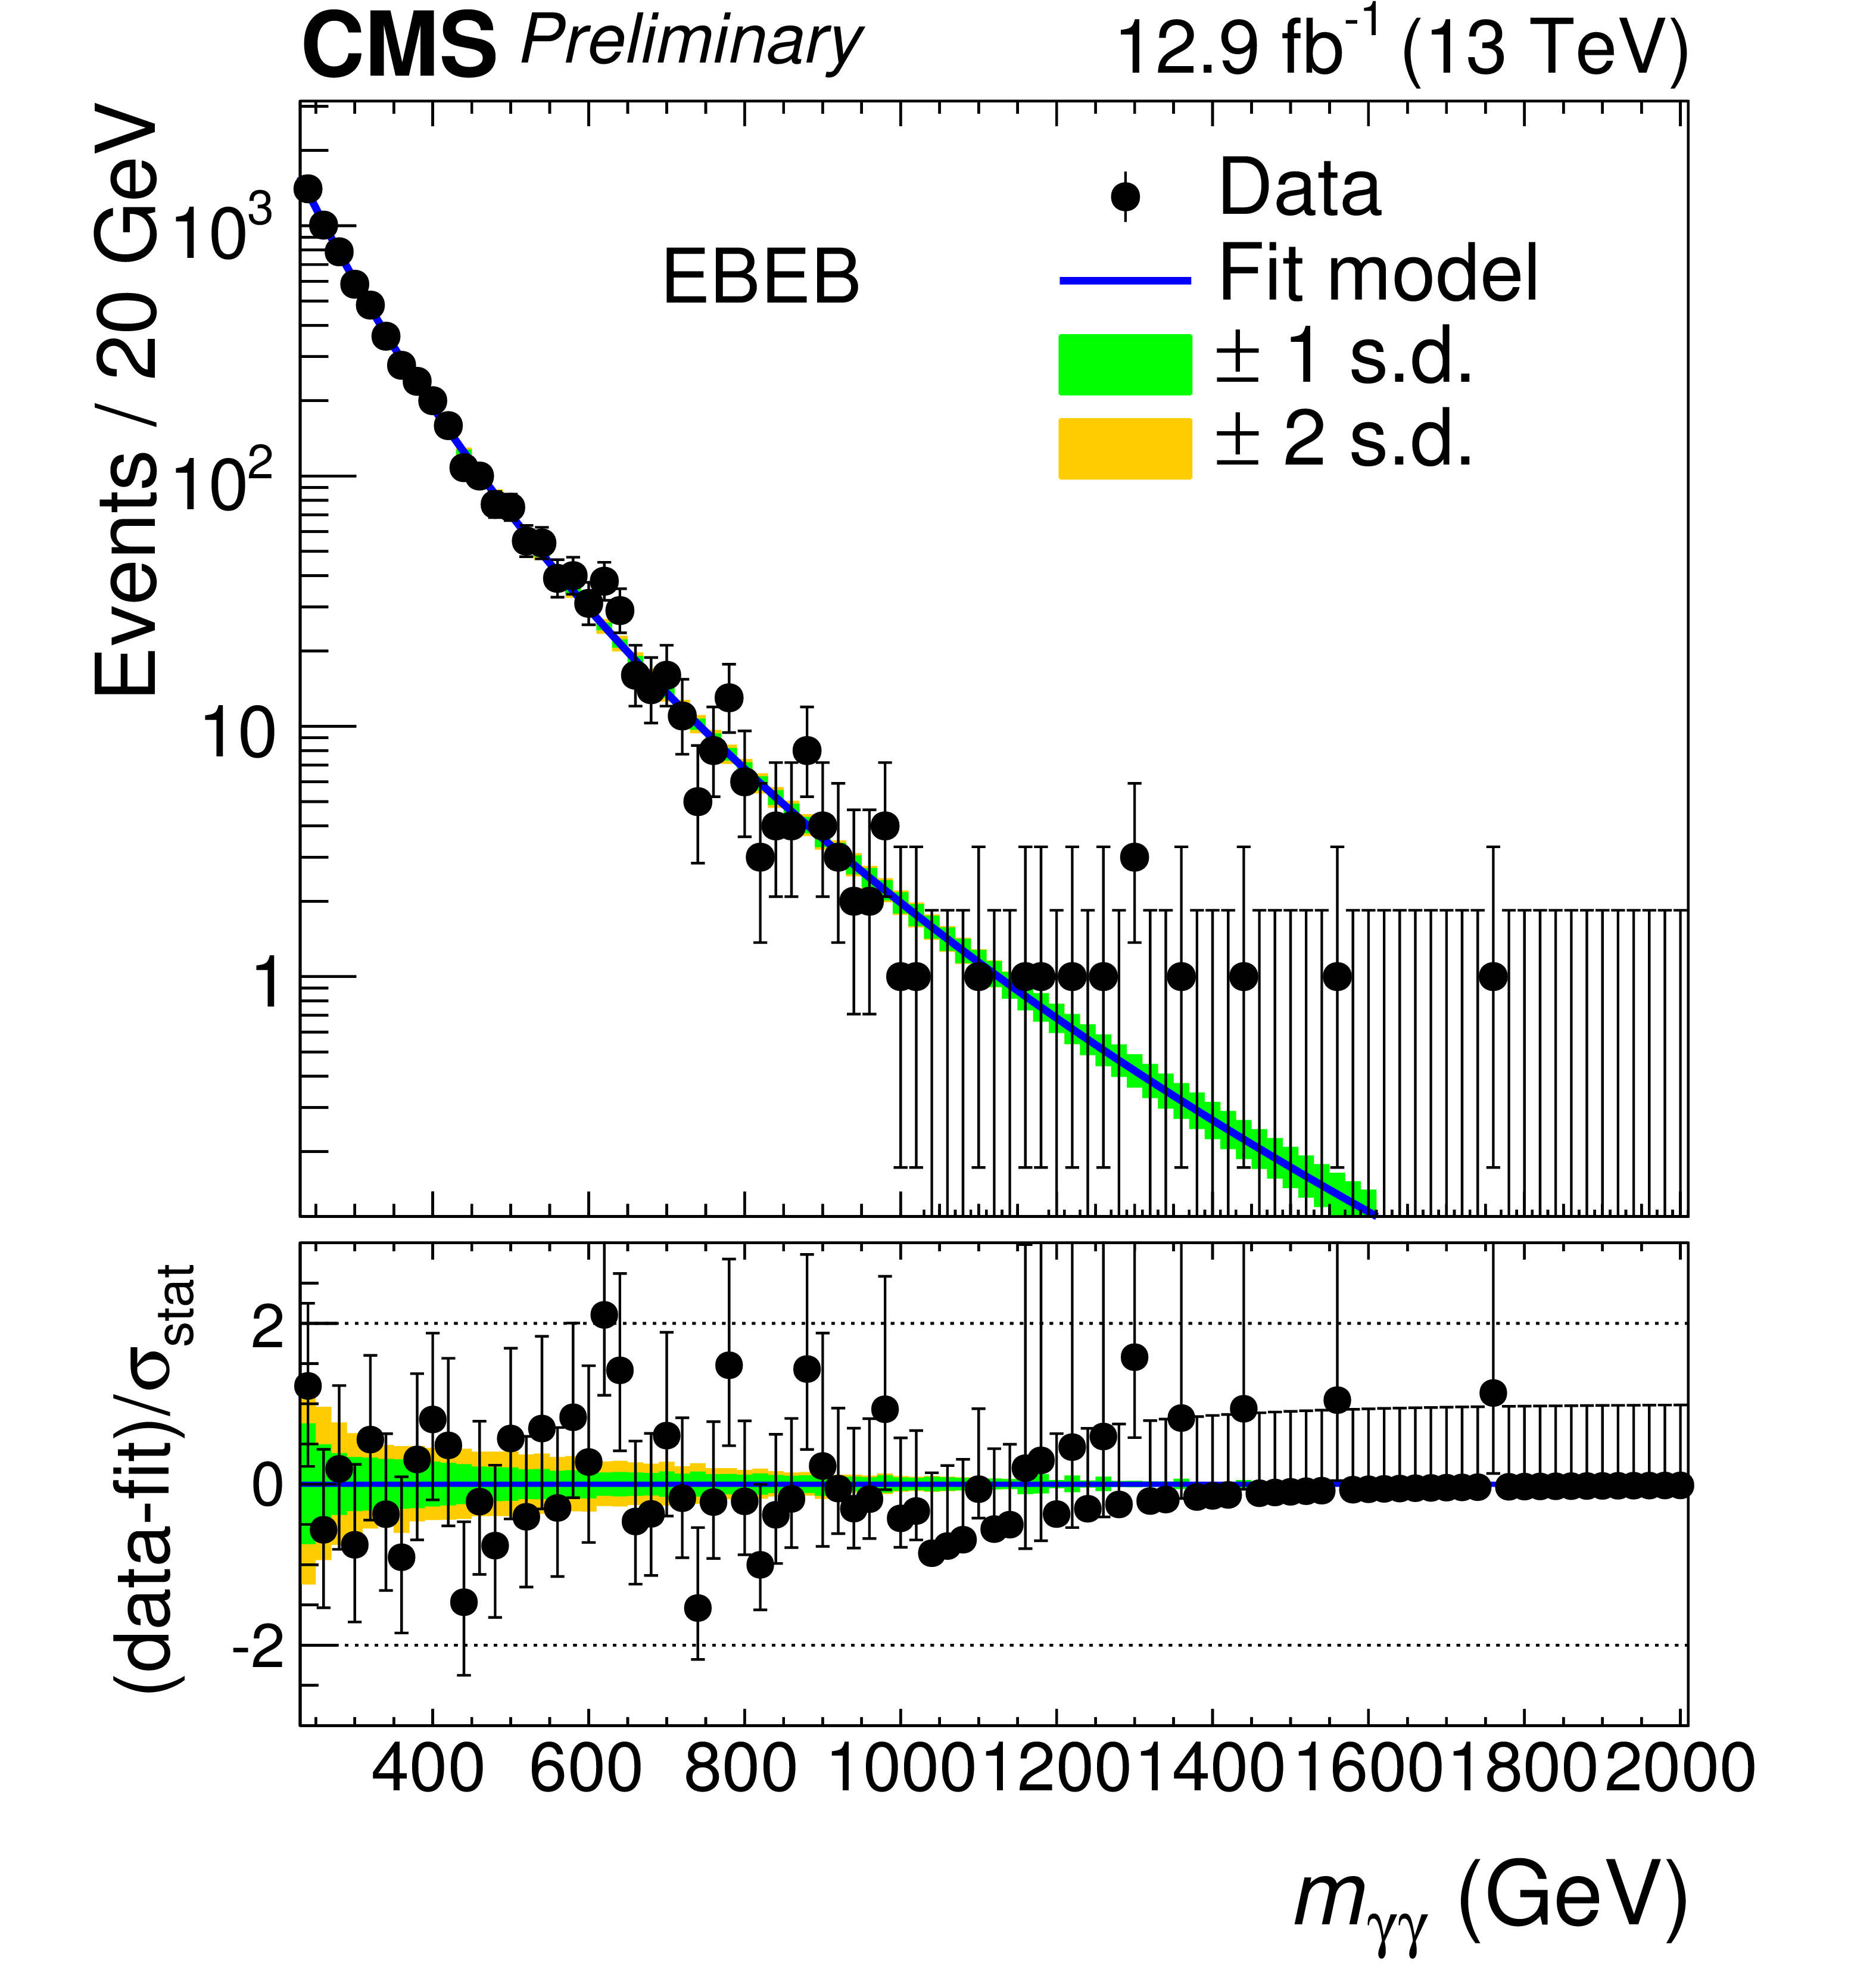
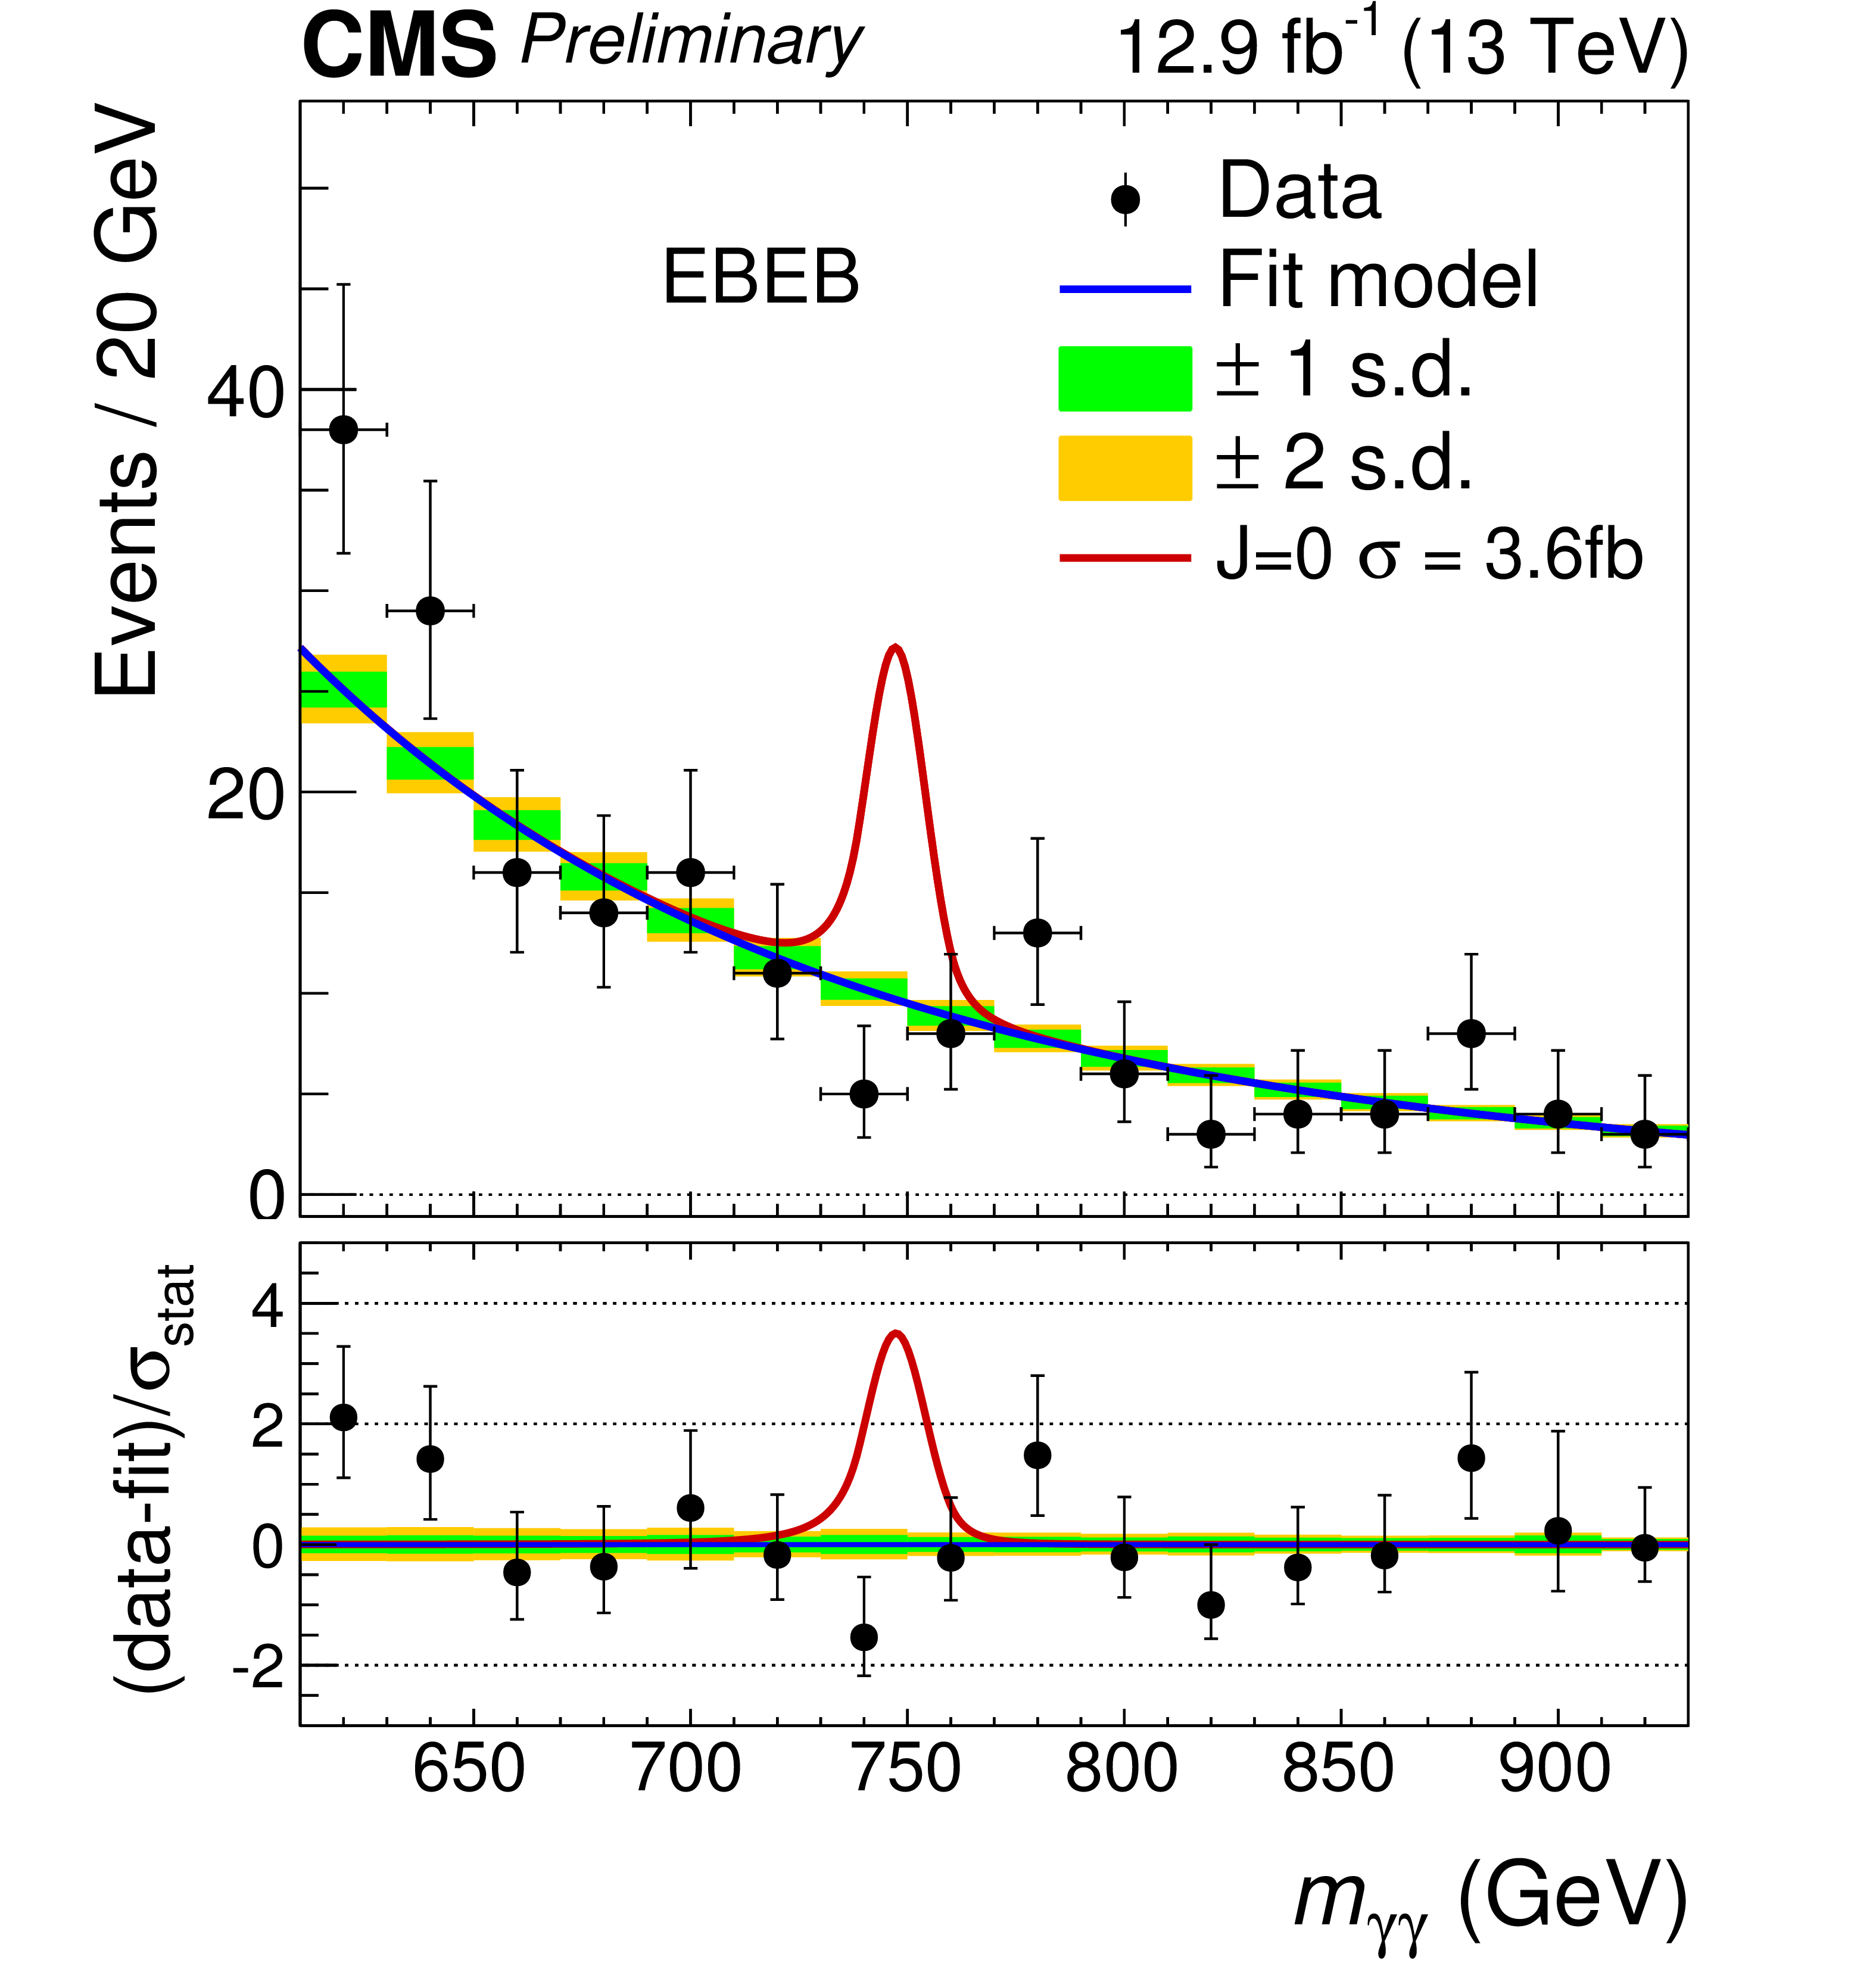
Figure 2-a:
Observed invariant mass spectra for the EBEB (a) and EBEE (b). No event with $ {m_{\gamma \gamma }} > $ 2000 GeV is selected in the analysis. The results of a likelihood fit to the background-only hypothesis are also shown. The shaded regions show the 1 and 2 standard deviation uncertainty bands associated with the fit, and reflect the statistical uncertainty of the data. The lower panels show the difference between the data and fit, divided by the statistical uncertainty in the data points. |
png pdf |
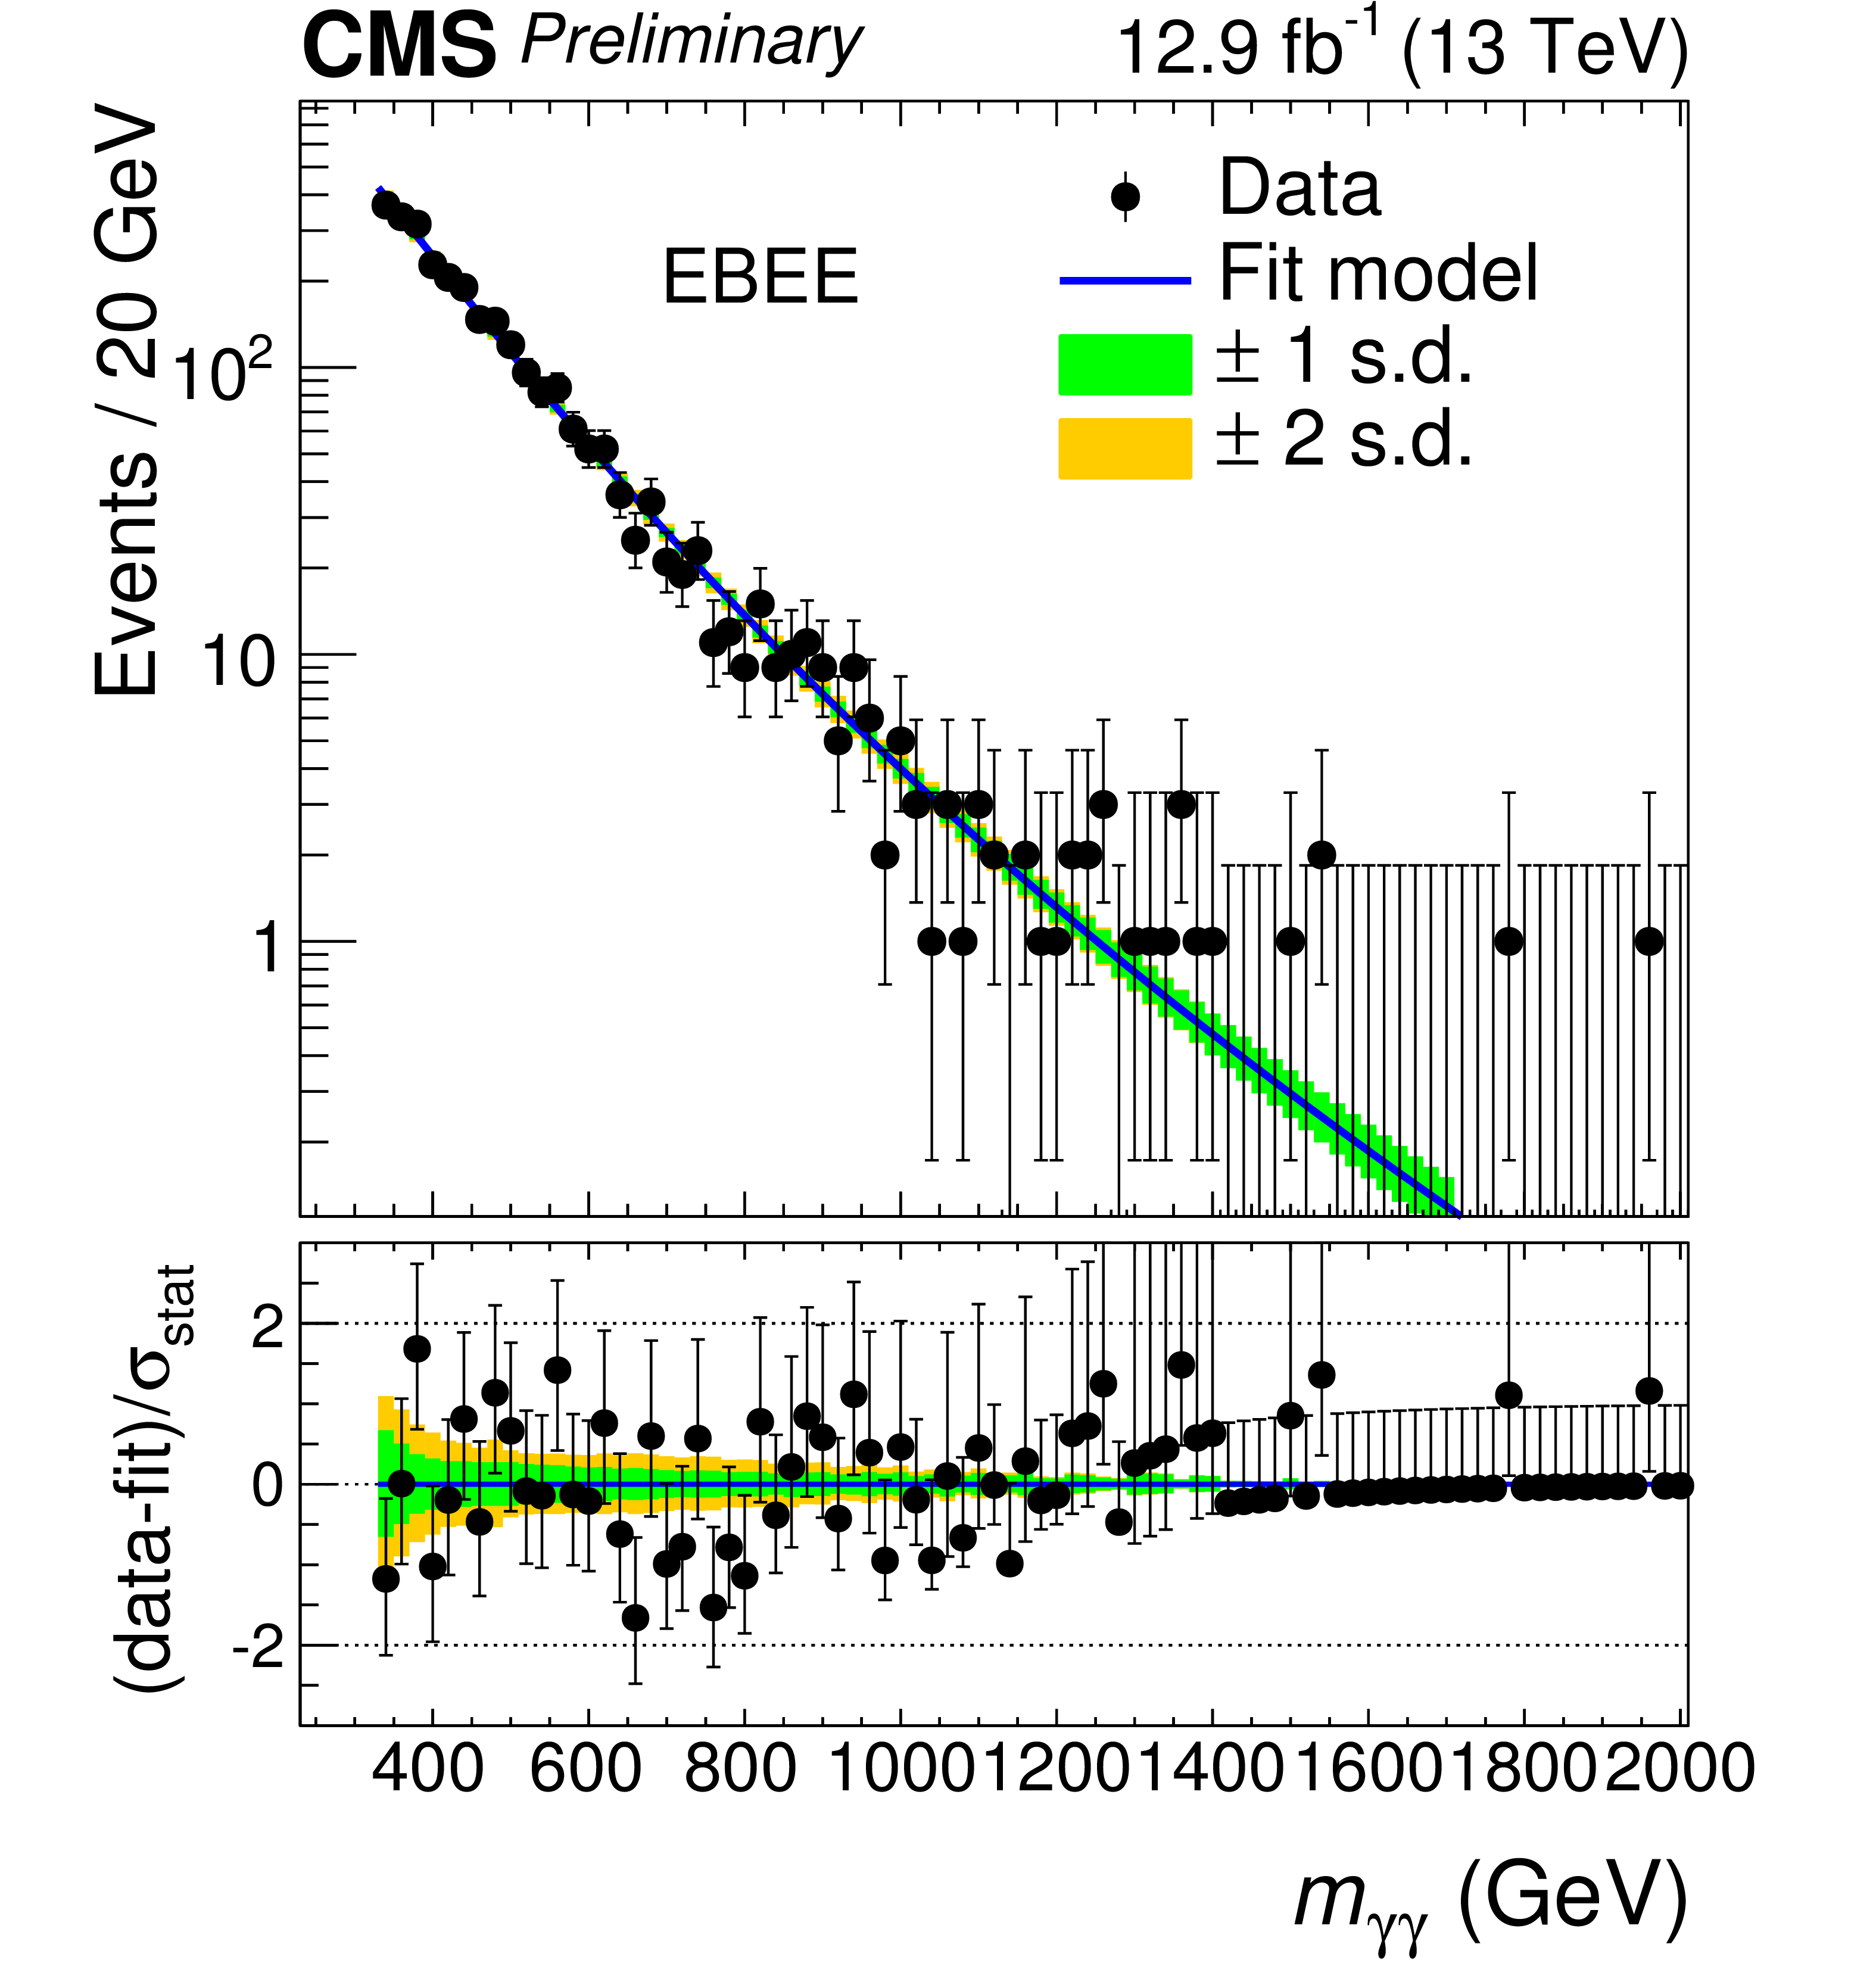
Figure 2-b:
Observed invariant mass spectra for the EBEB (a) and EBEE (b). No event with $ {m_{\gamma \gamma }} > $ 2000 GeV is selected in the analysis. The results of a likelihood fit to the background-only hypothesis are also shown. The shaded regions show the 1 and 2 standard deviation uncertainty bands associated with the fit, and reflect the statistical uncertainty of the data. The lower panels show the difference between the data and fit, divided by the statistical uncertainty in the data points. |
png pdf |
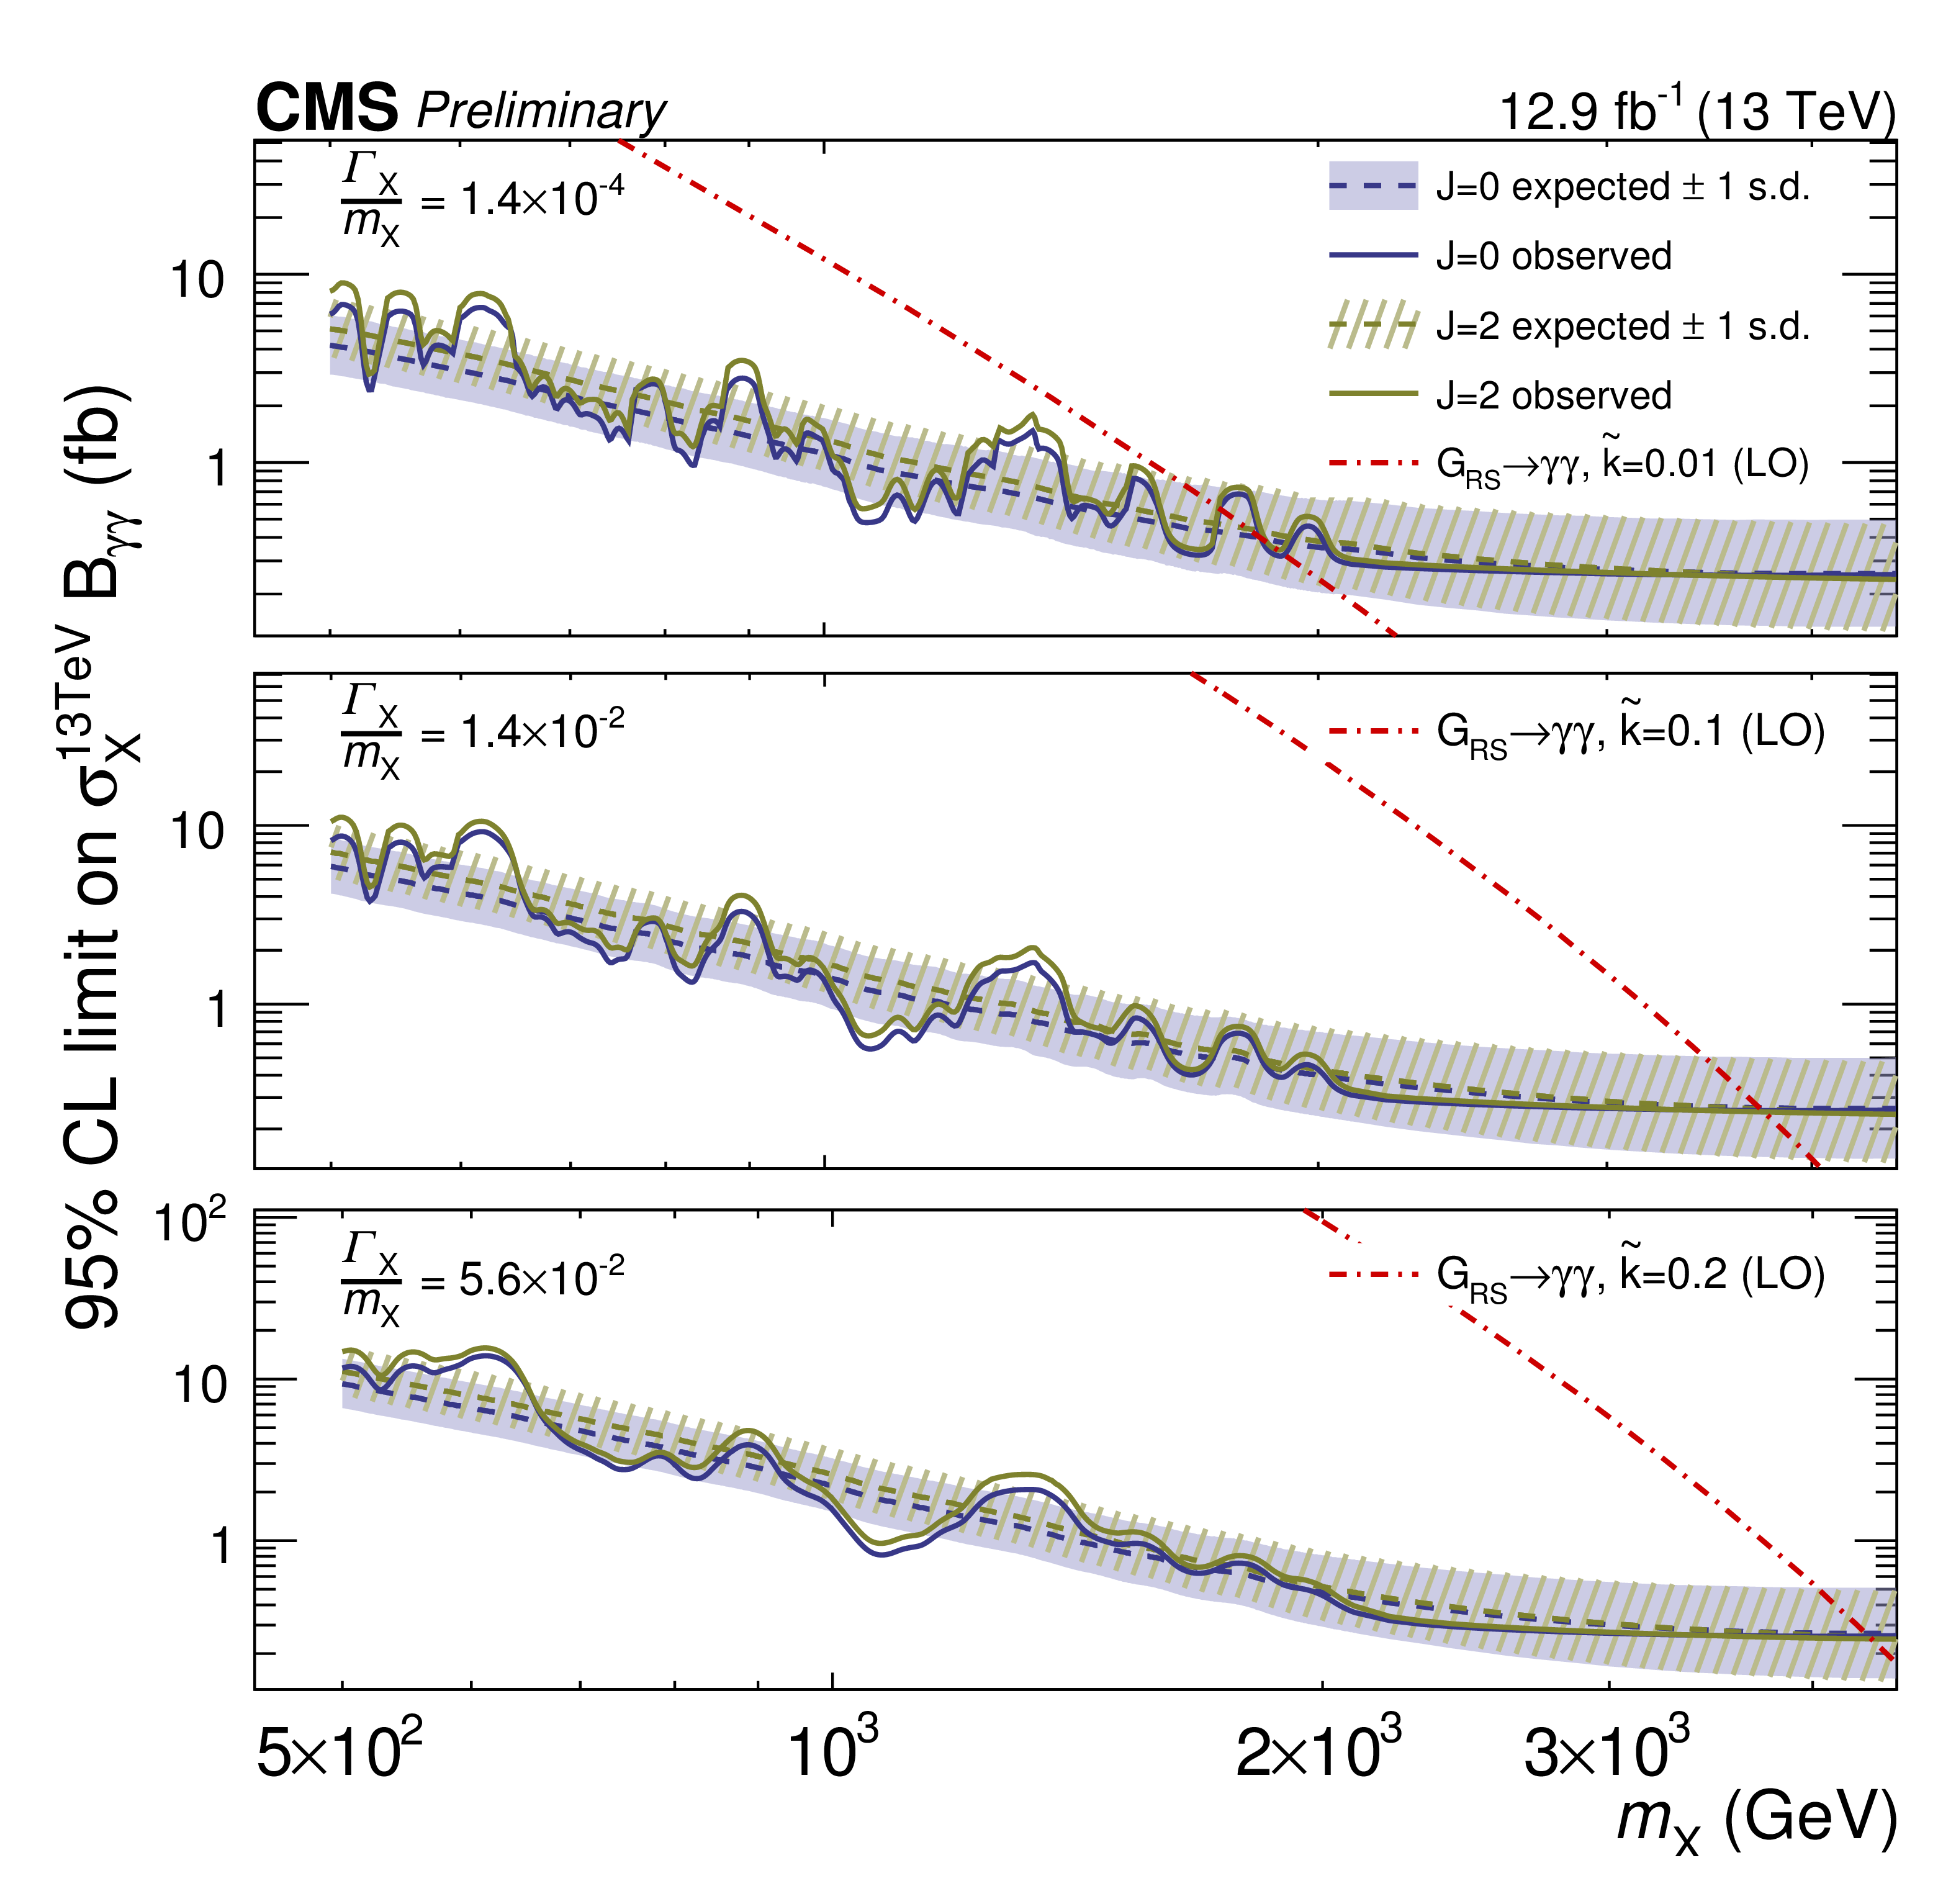
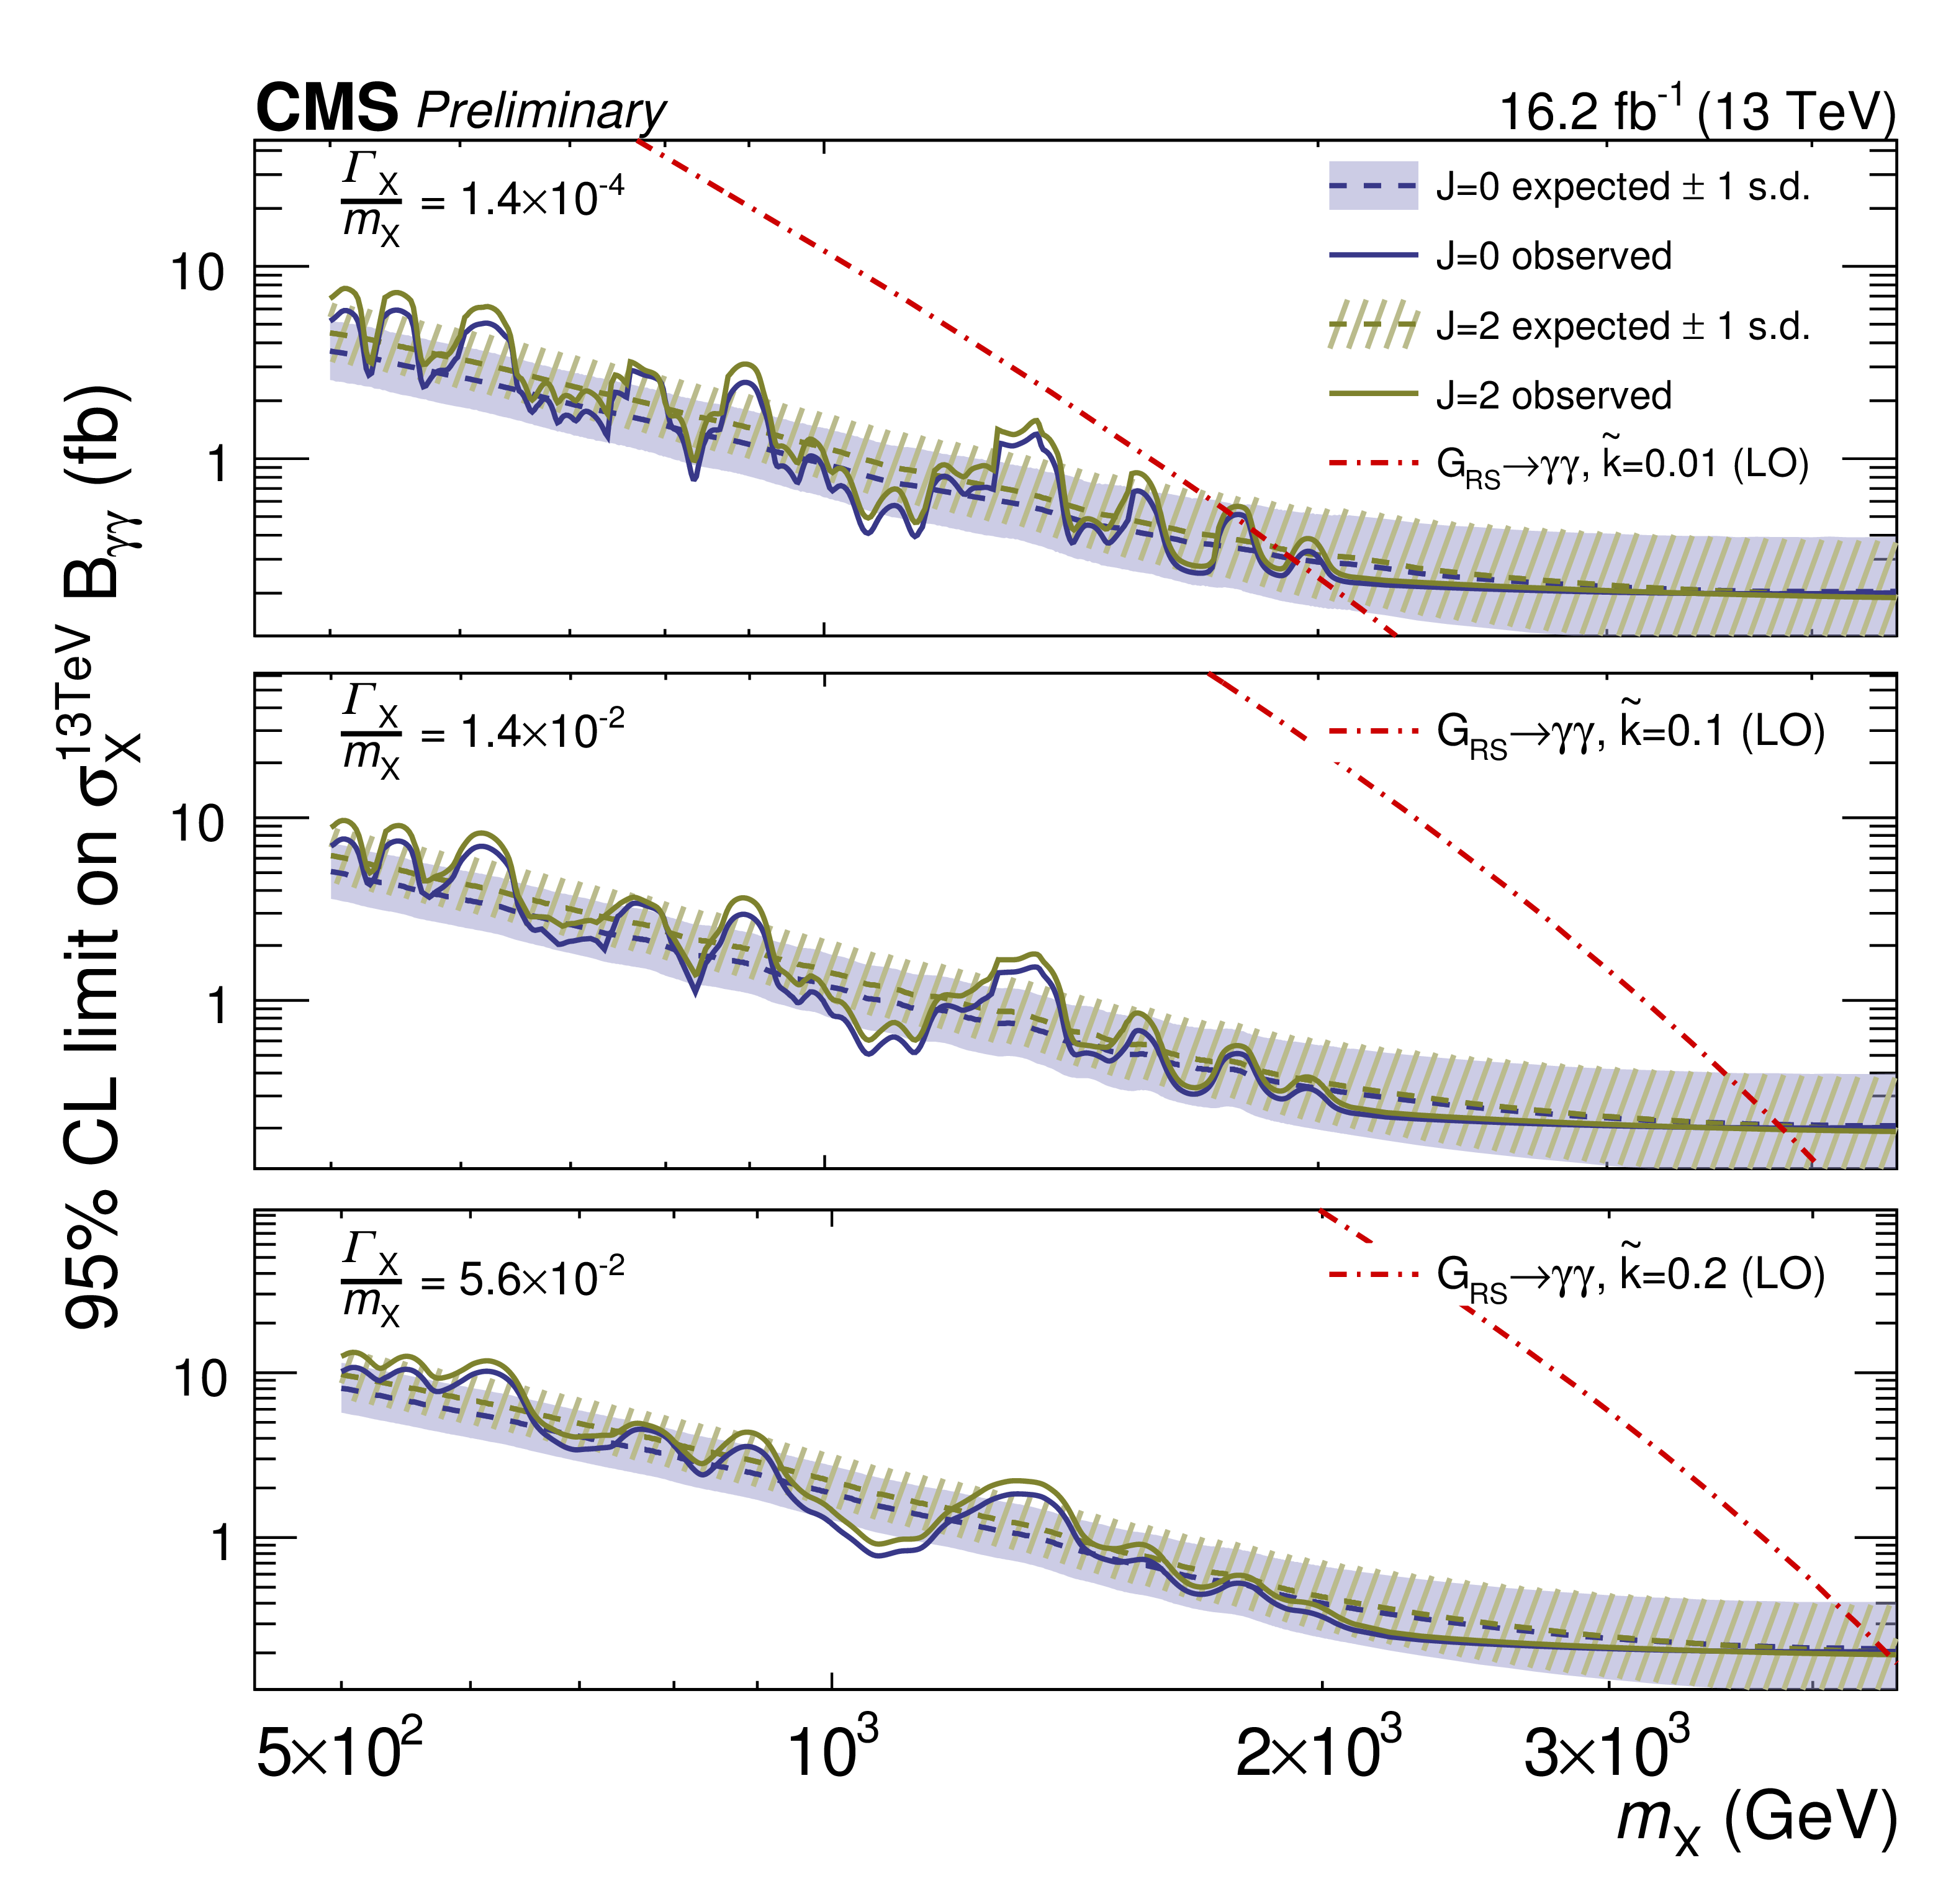
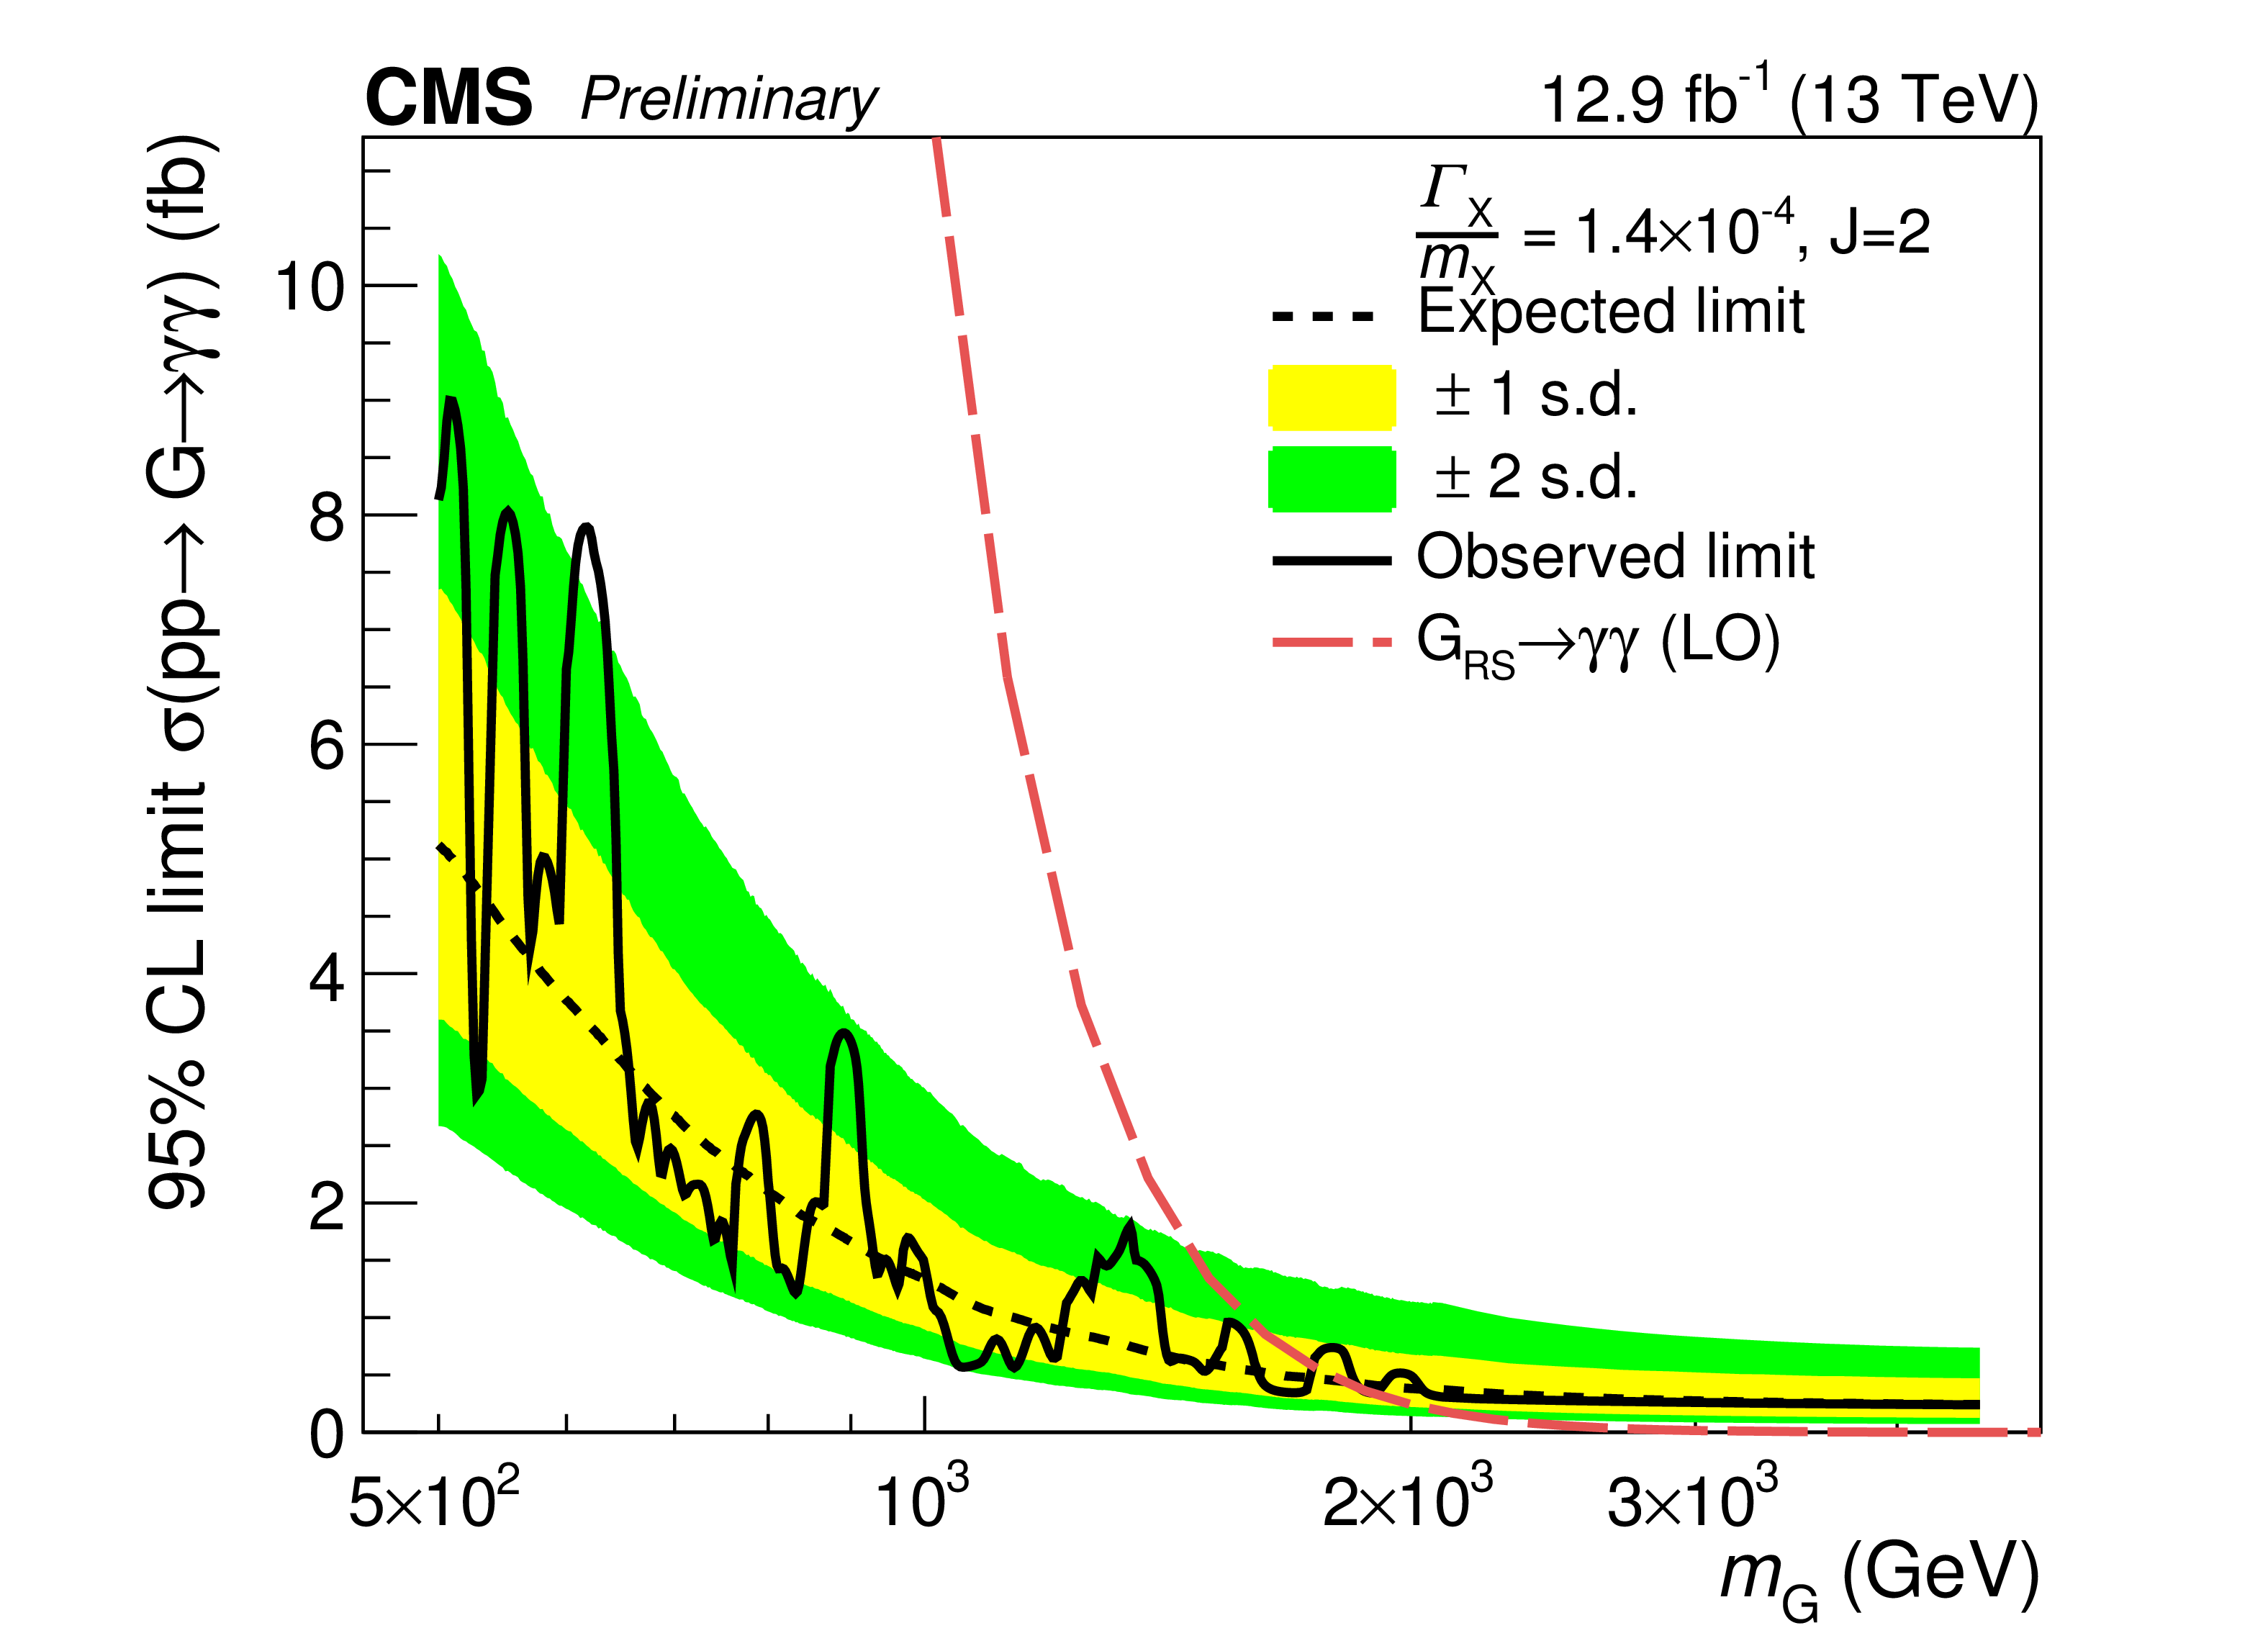
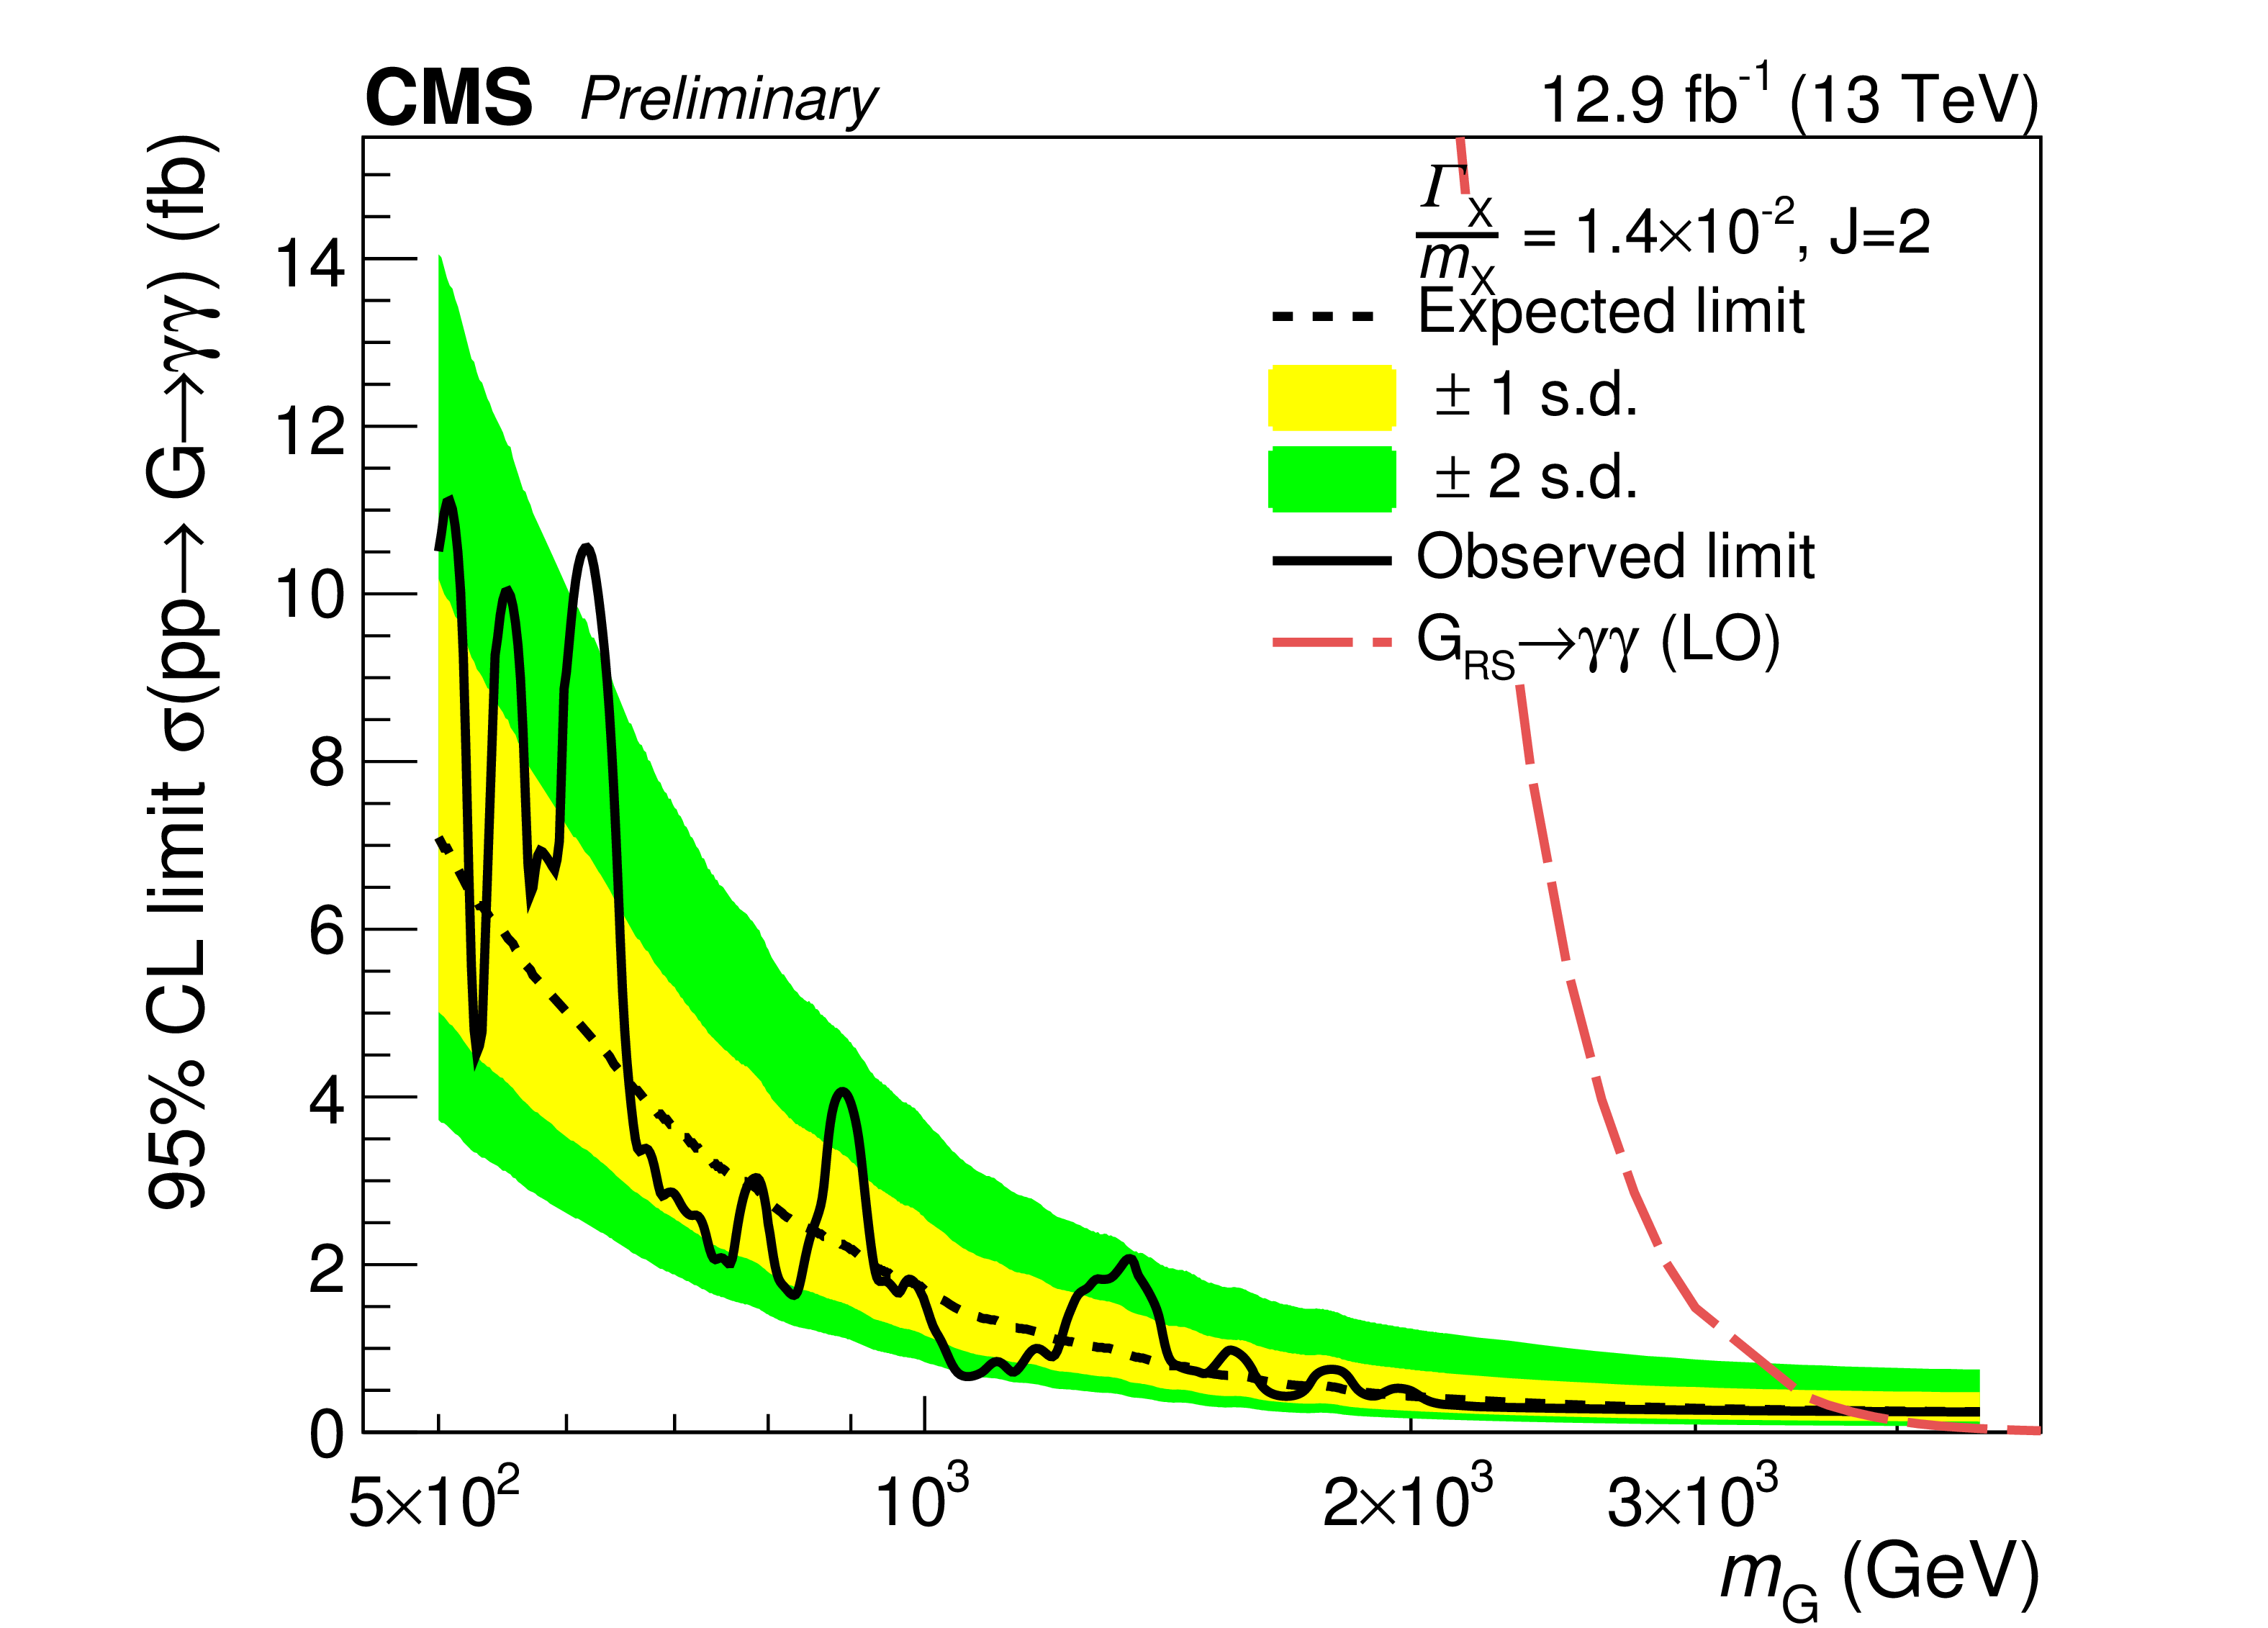
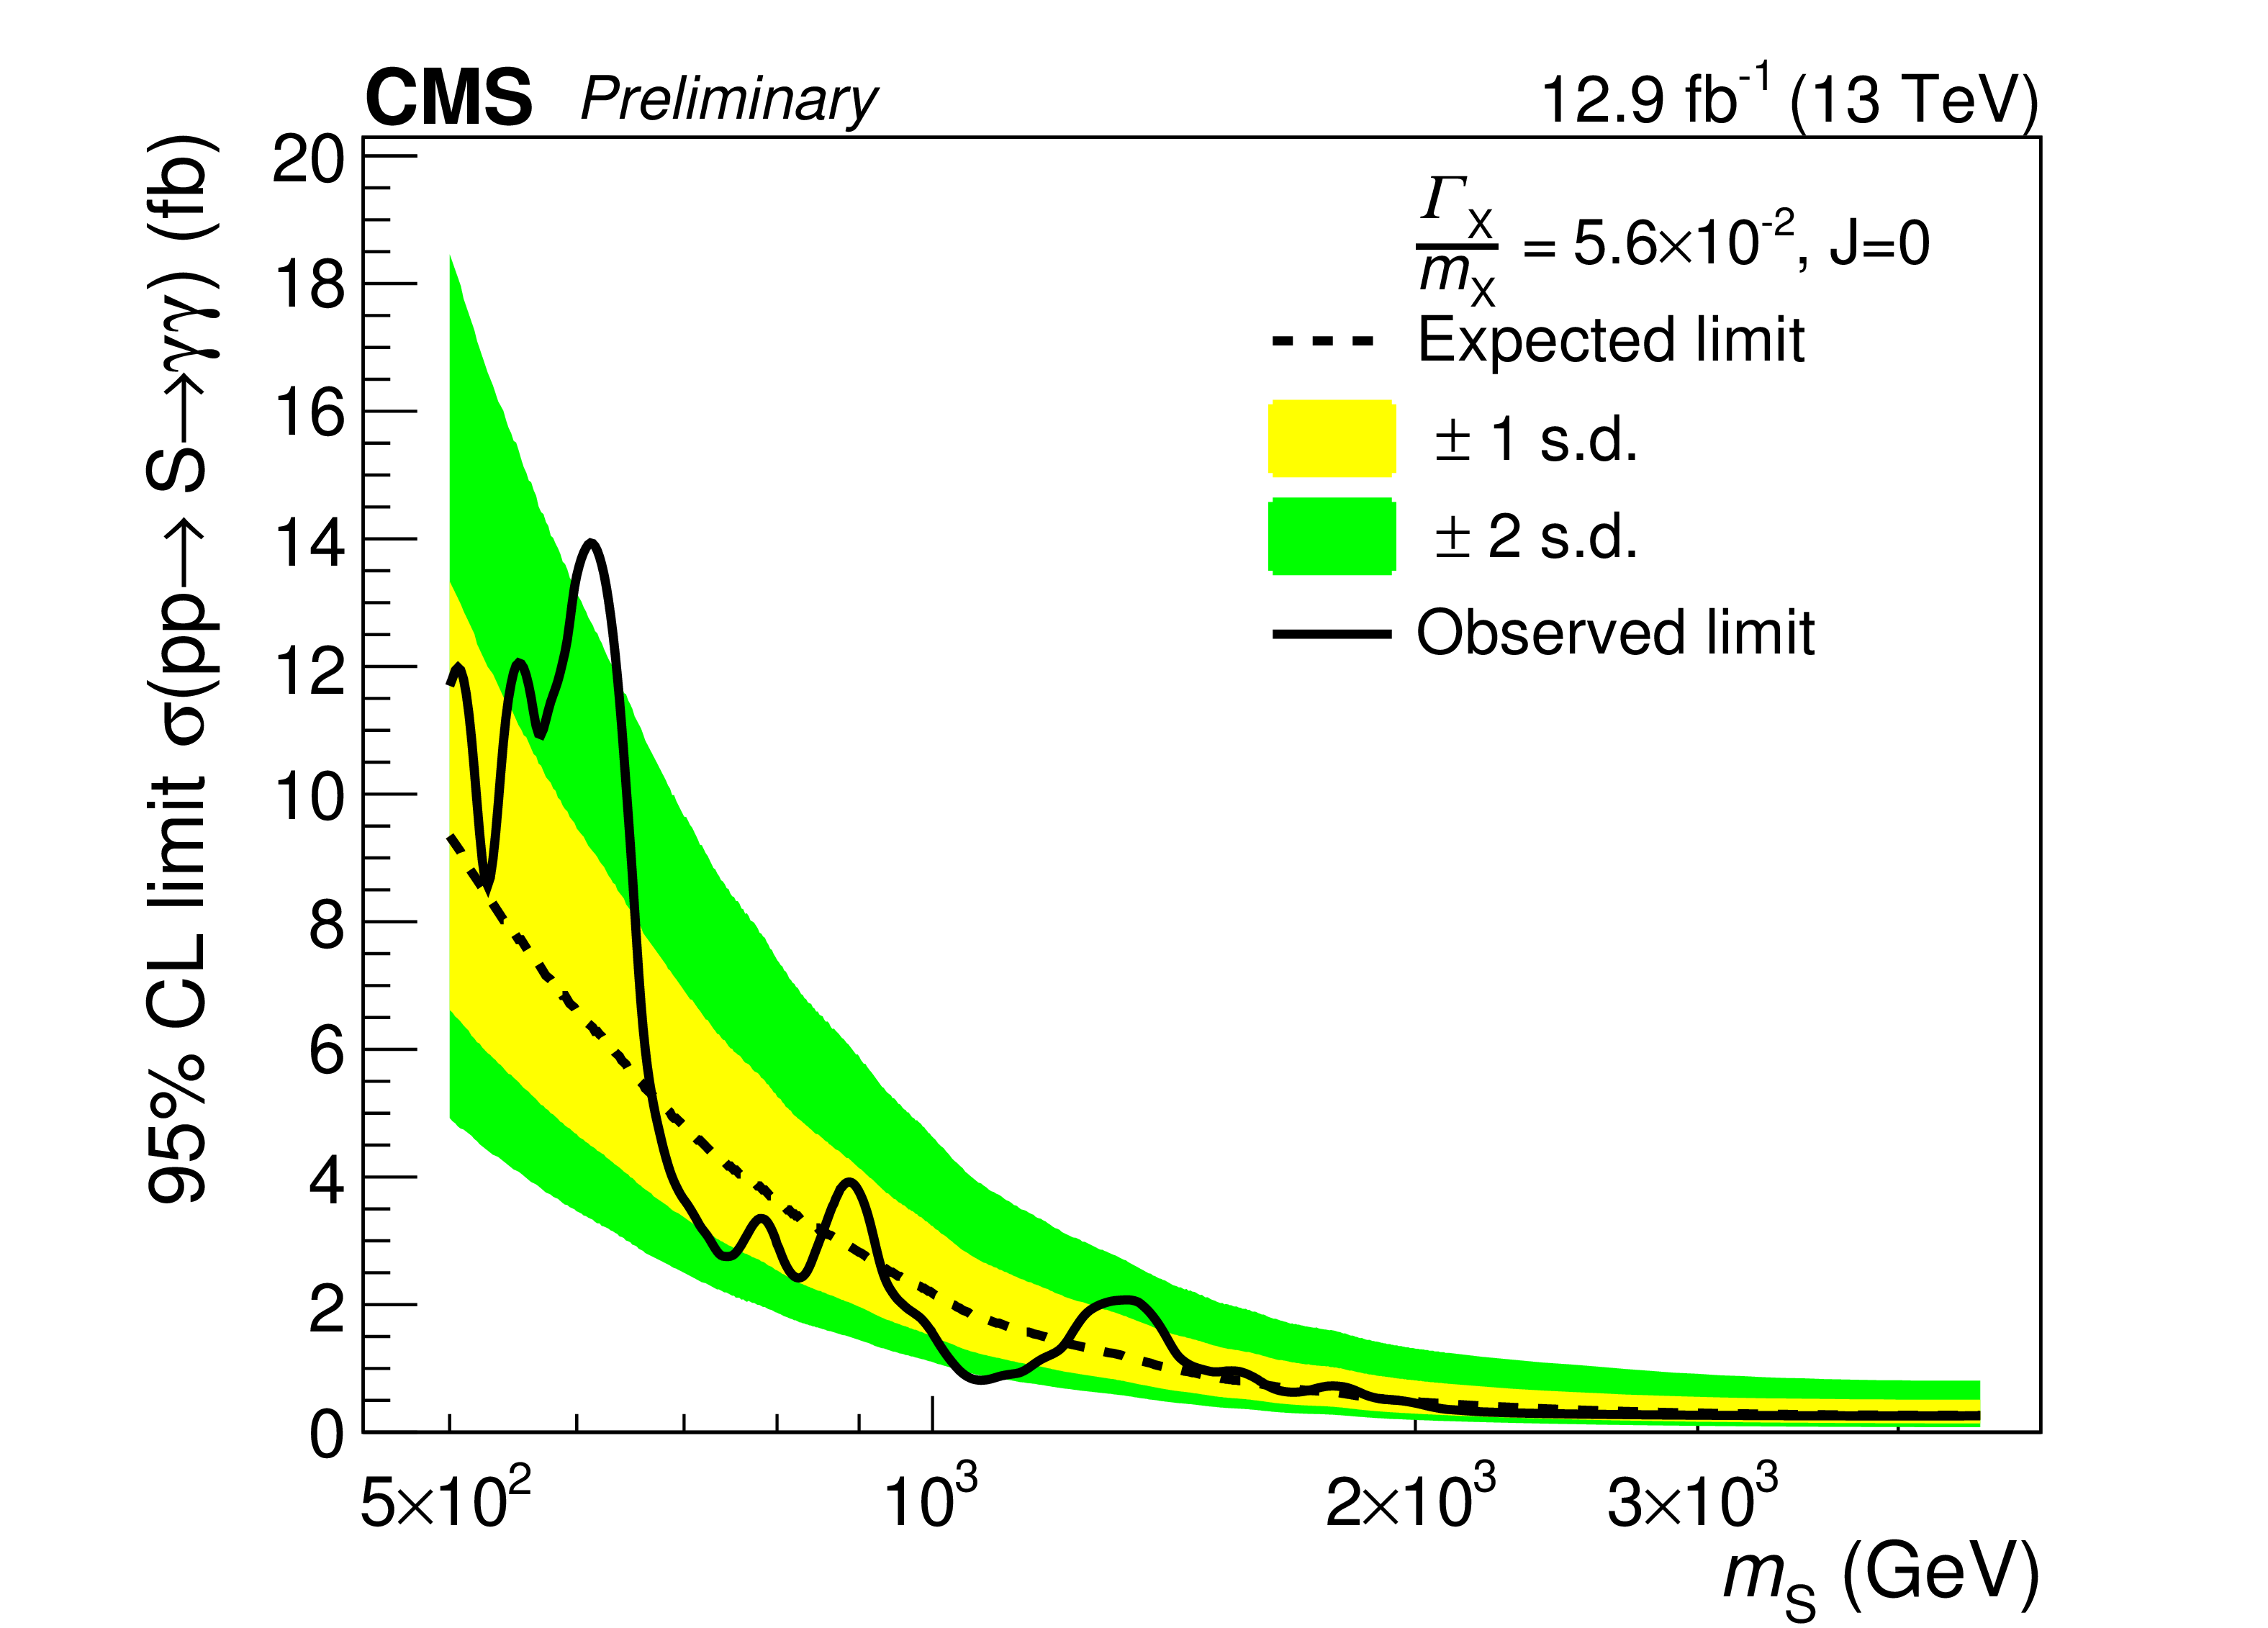
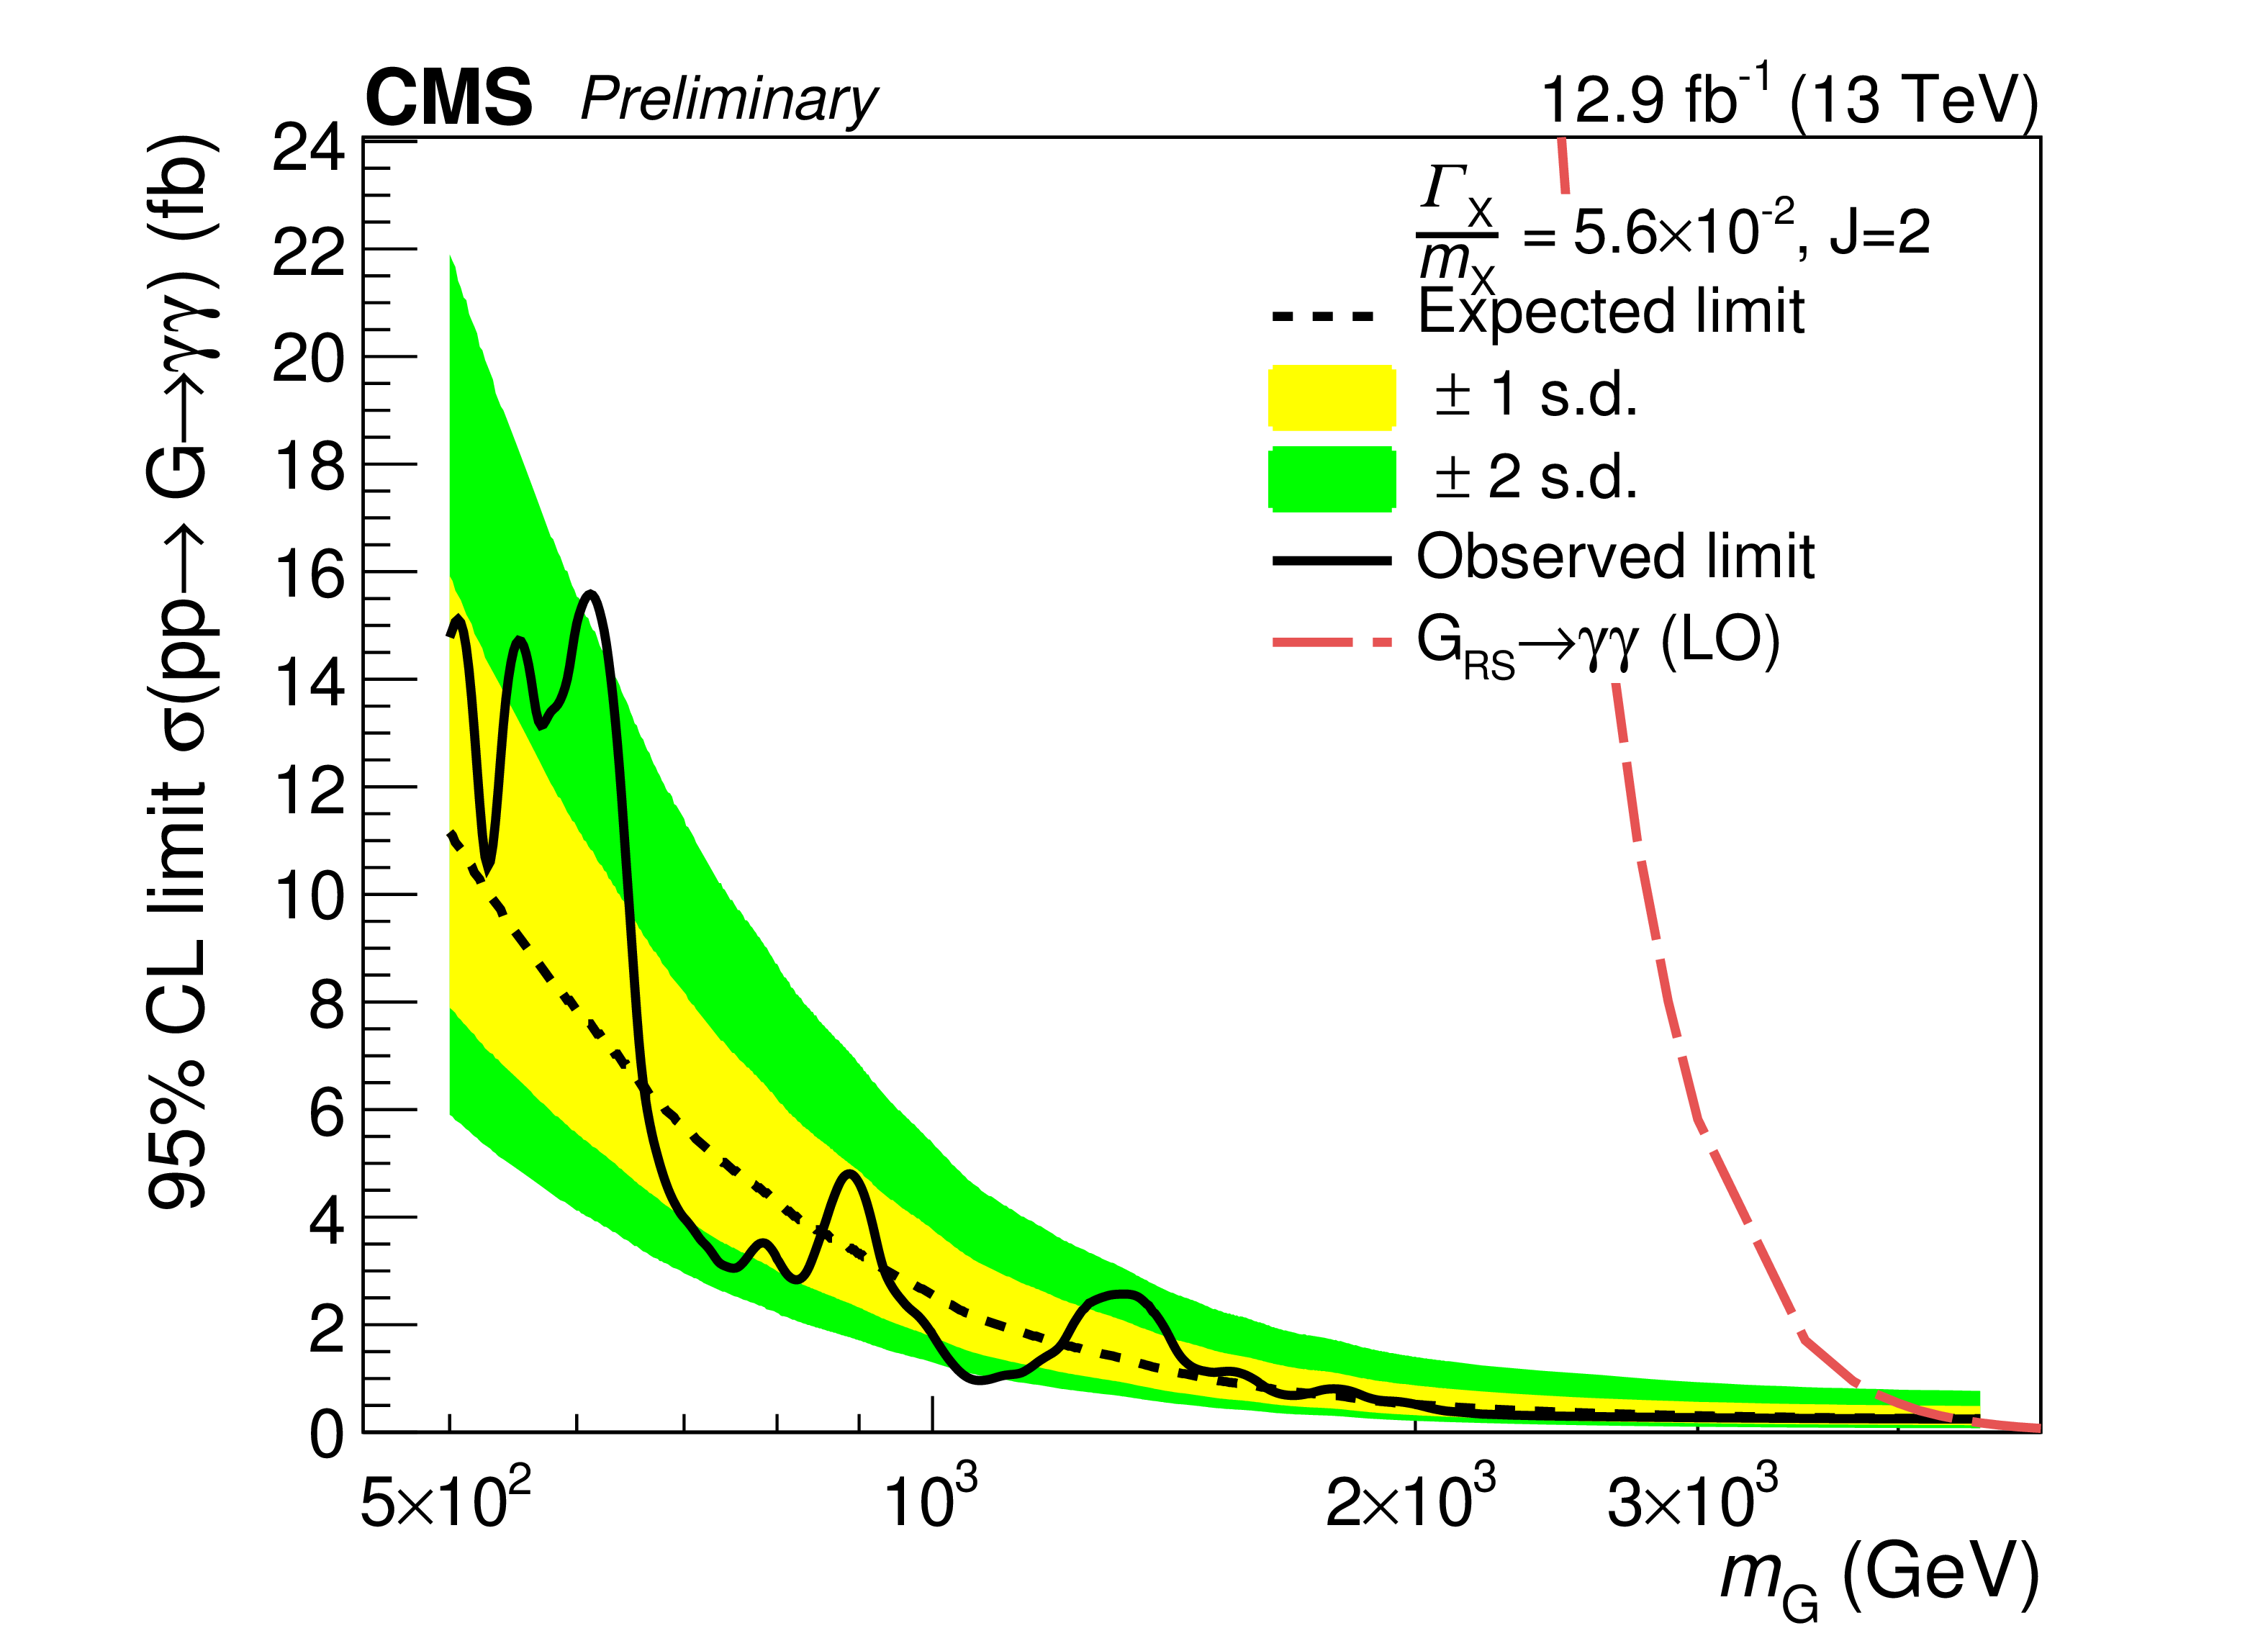
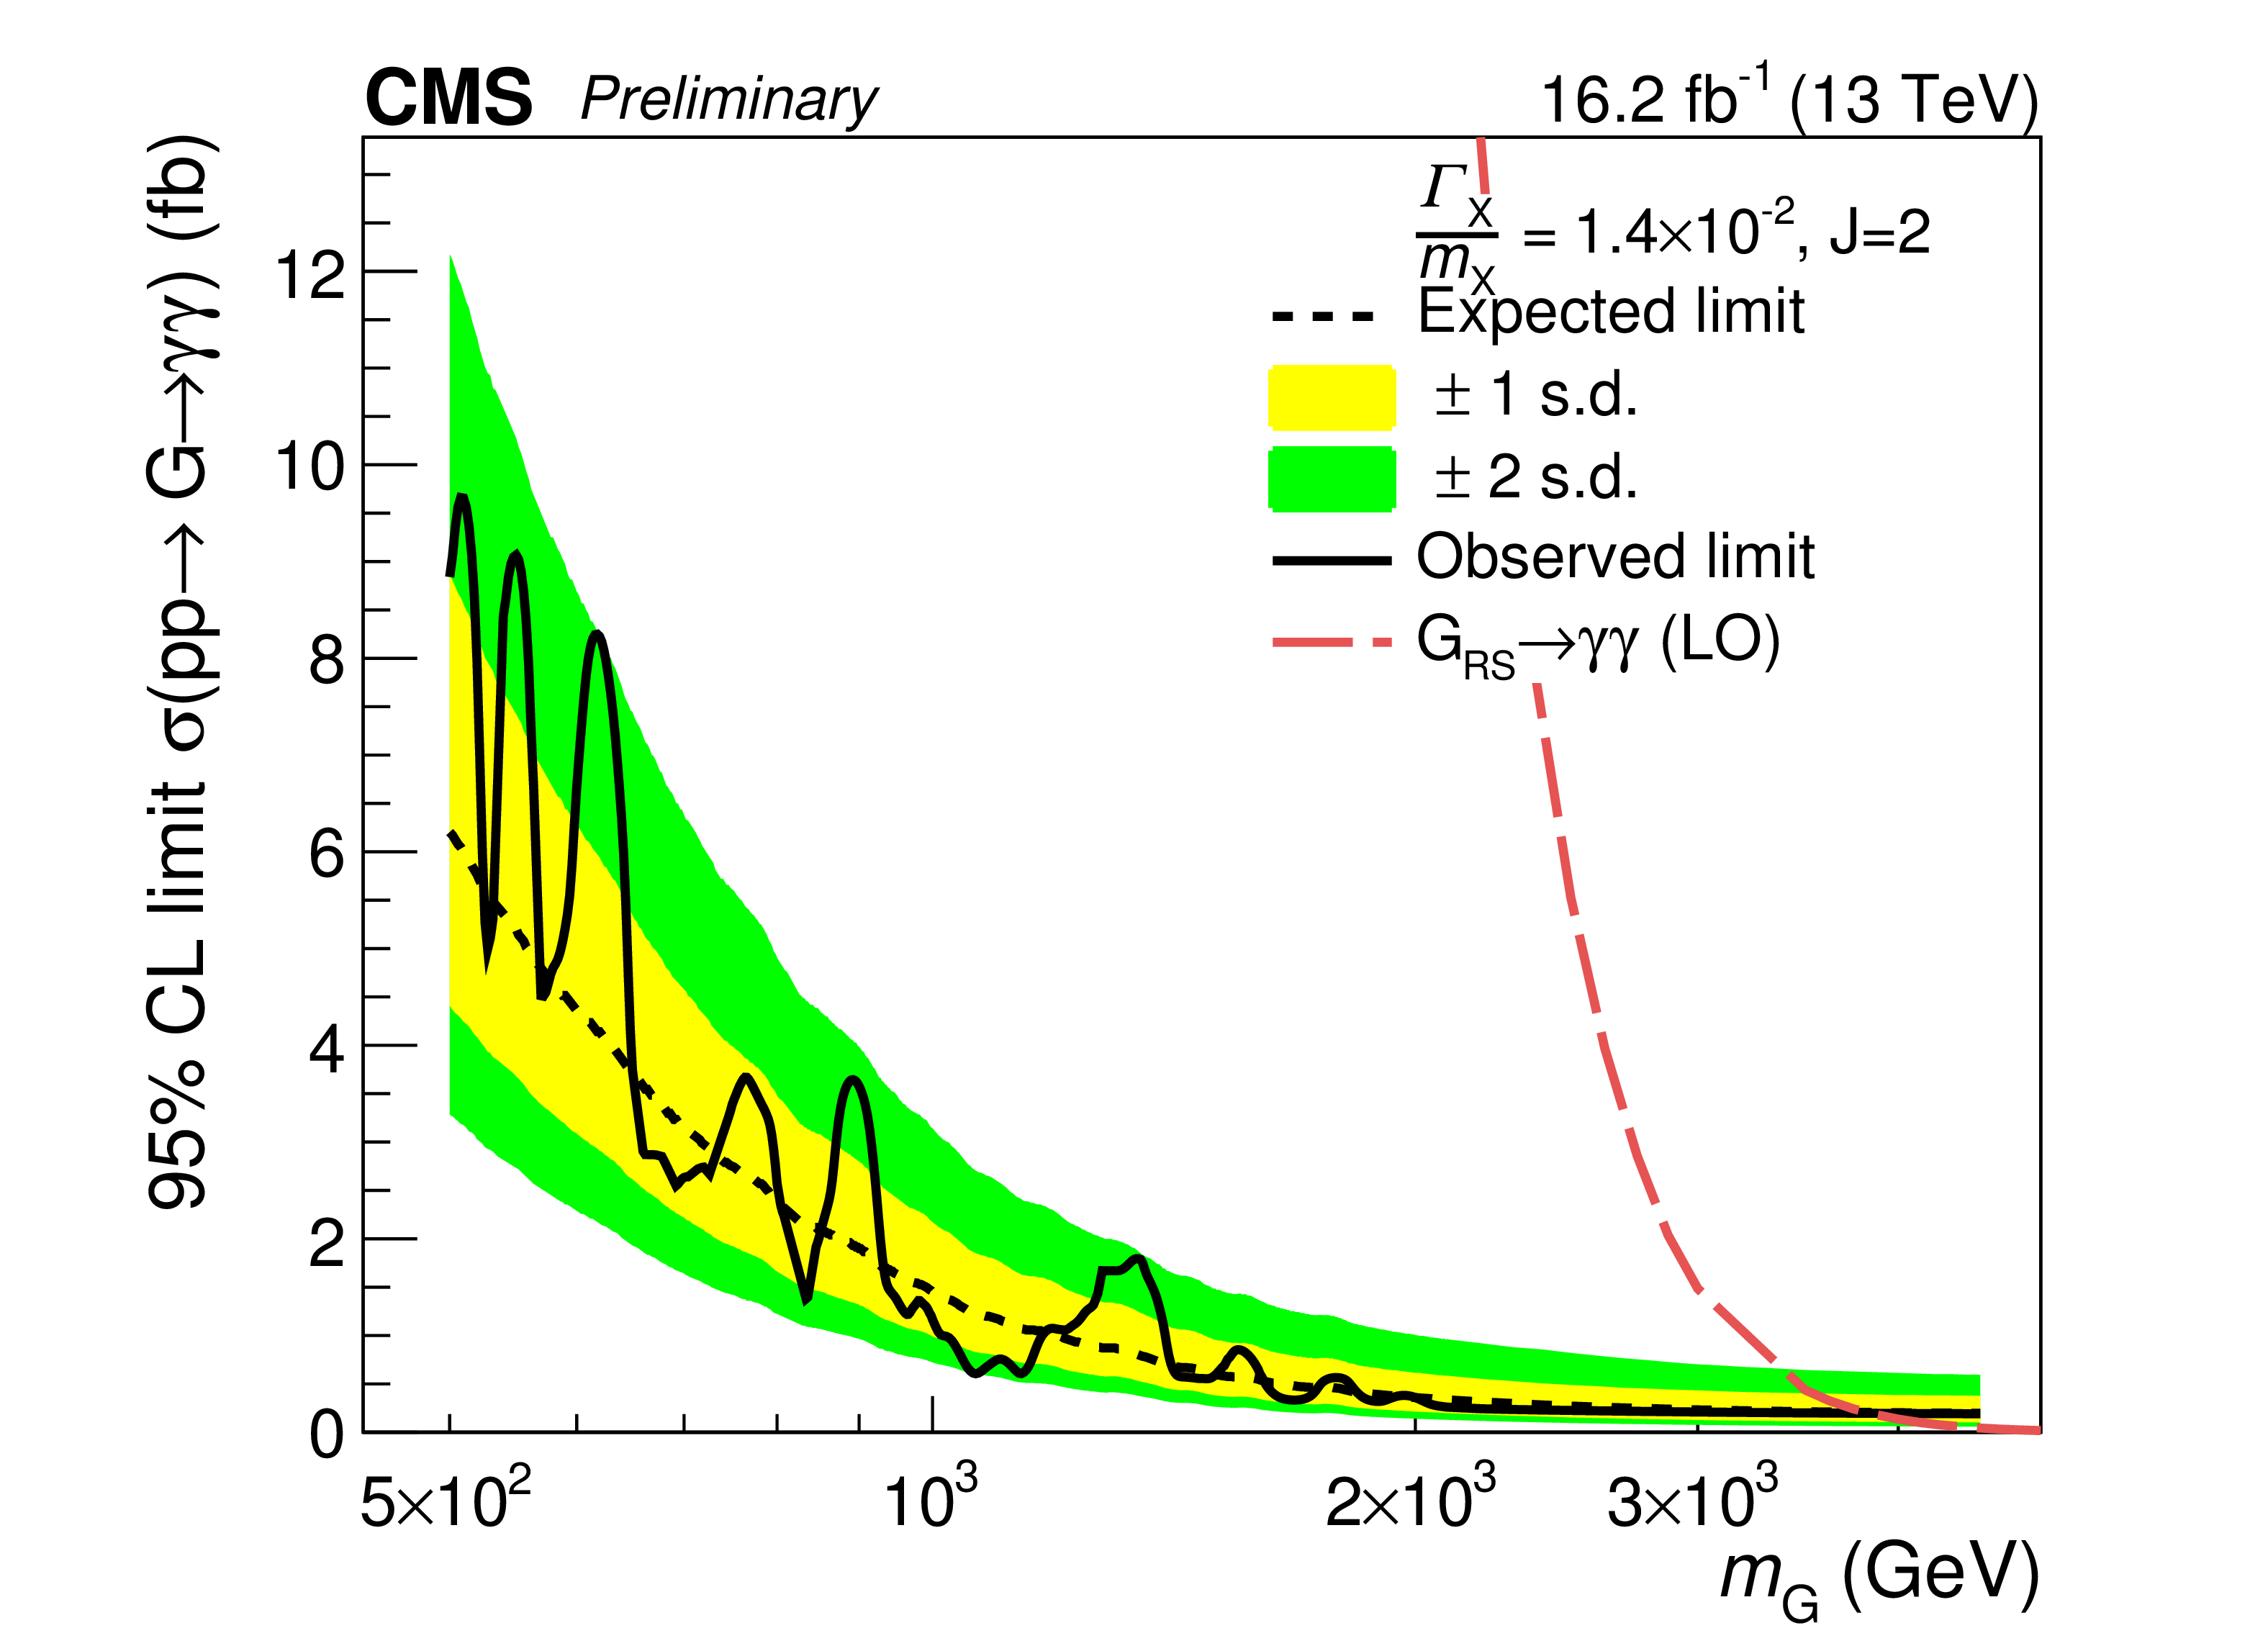
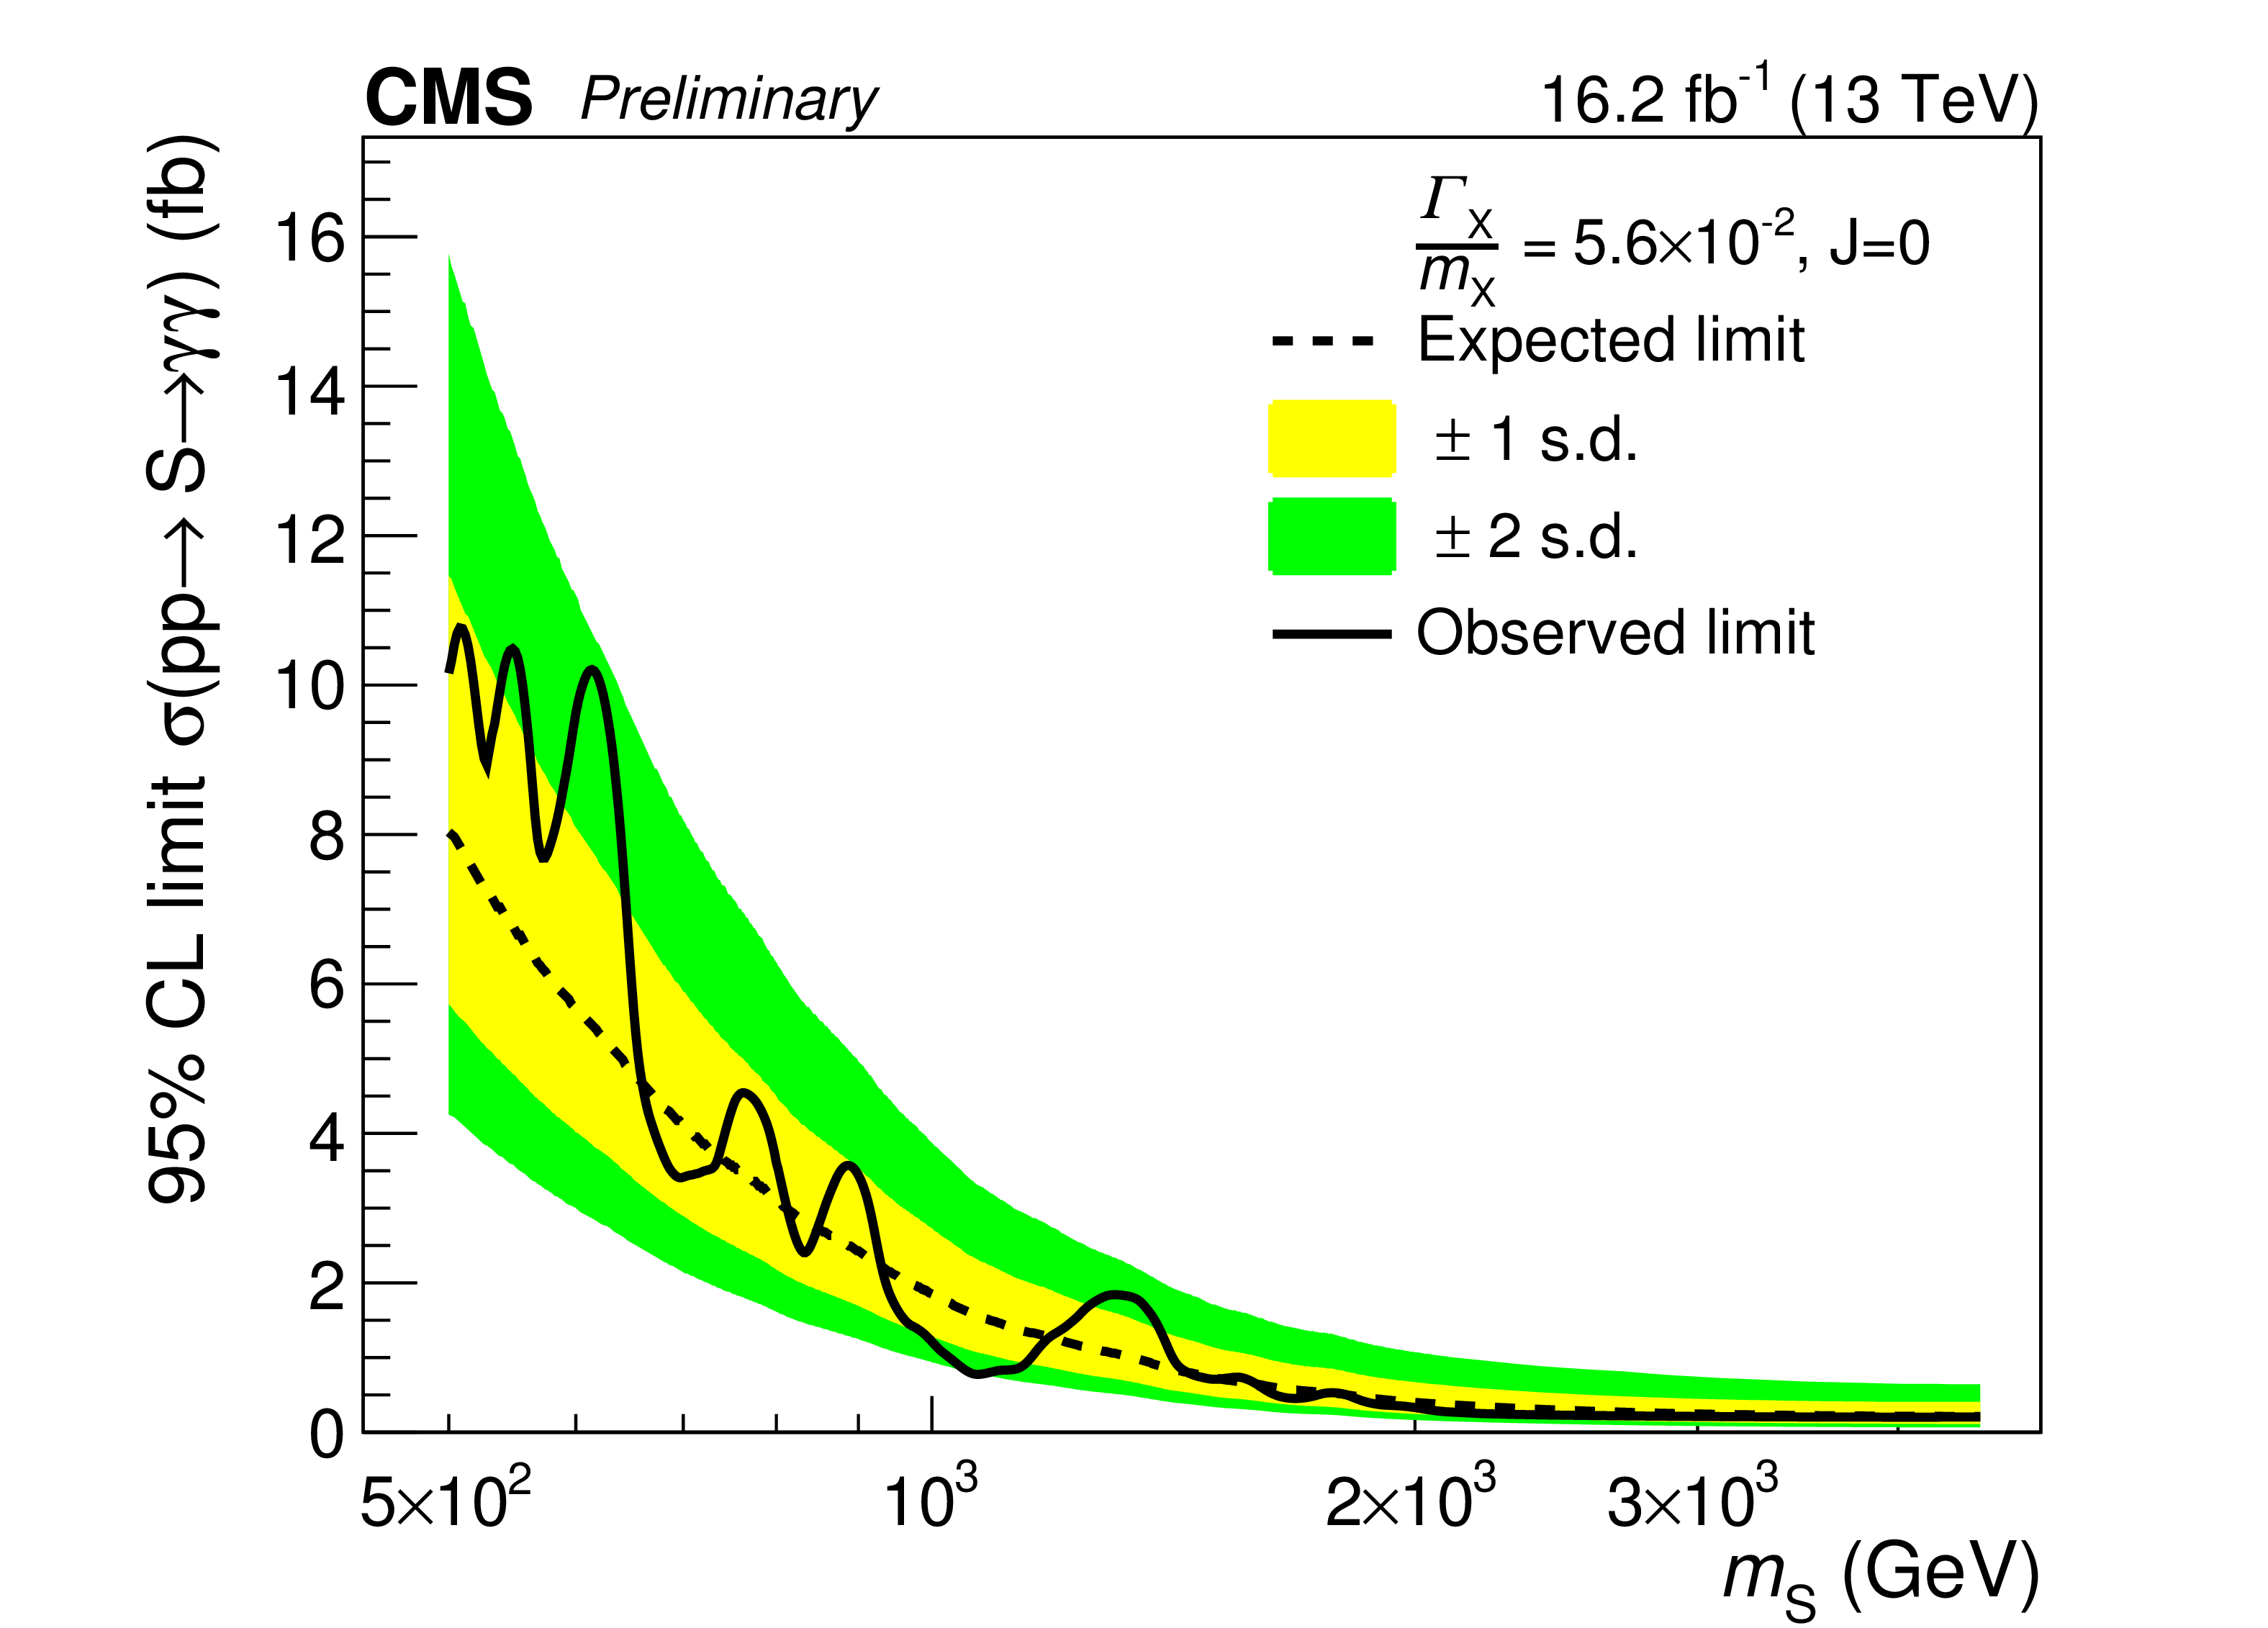
Figure 3:
The 95% CL upper limits on the production of diphoton resonances as a function of the resonance mass ${m_{ {\mathrm {X}}}} $, from the analysis of the 12.9 fb$^{-1}$ data collected in 2016 at 13 TeV . The blue-grey (darker) curves and the green (lighter) ones correspond to the scalar and RS graviton signals, respectively. Solid (dashed) curves represent the observed (median expected) exclusion limit. The expected results are shown with their 1 standard deviation dispersion bands. The leading-order RS graviton production cross section is shown by the red dot-dashed curves. The results are shown for (upper) a narrow, (middle) an intermediate-width, and (lower) a broad resonance, with the value of the width ${\Gamma _{ {\mathrm {X}}} / m_{ {\mathrm {X}}}} $, relative to the mass, indicated in the legend of each plot. |
png pdf |
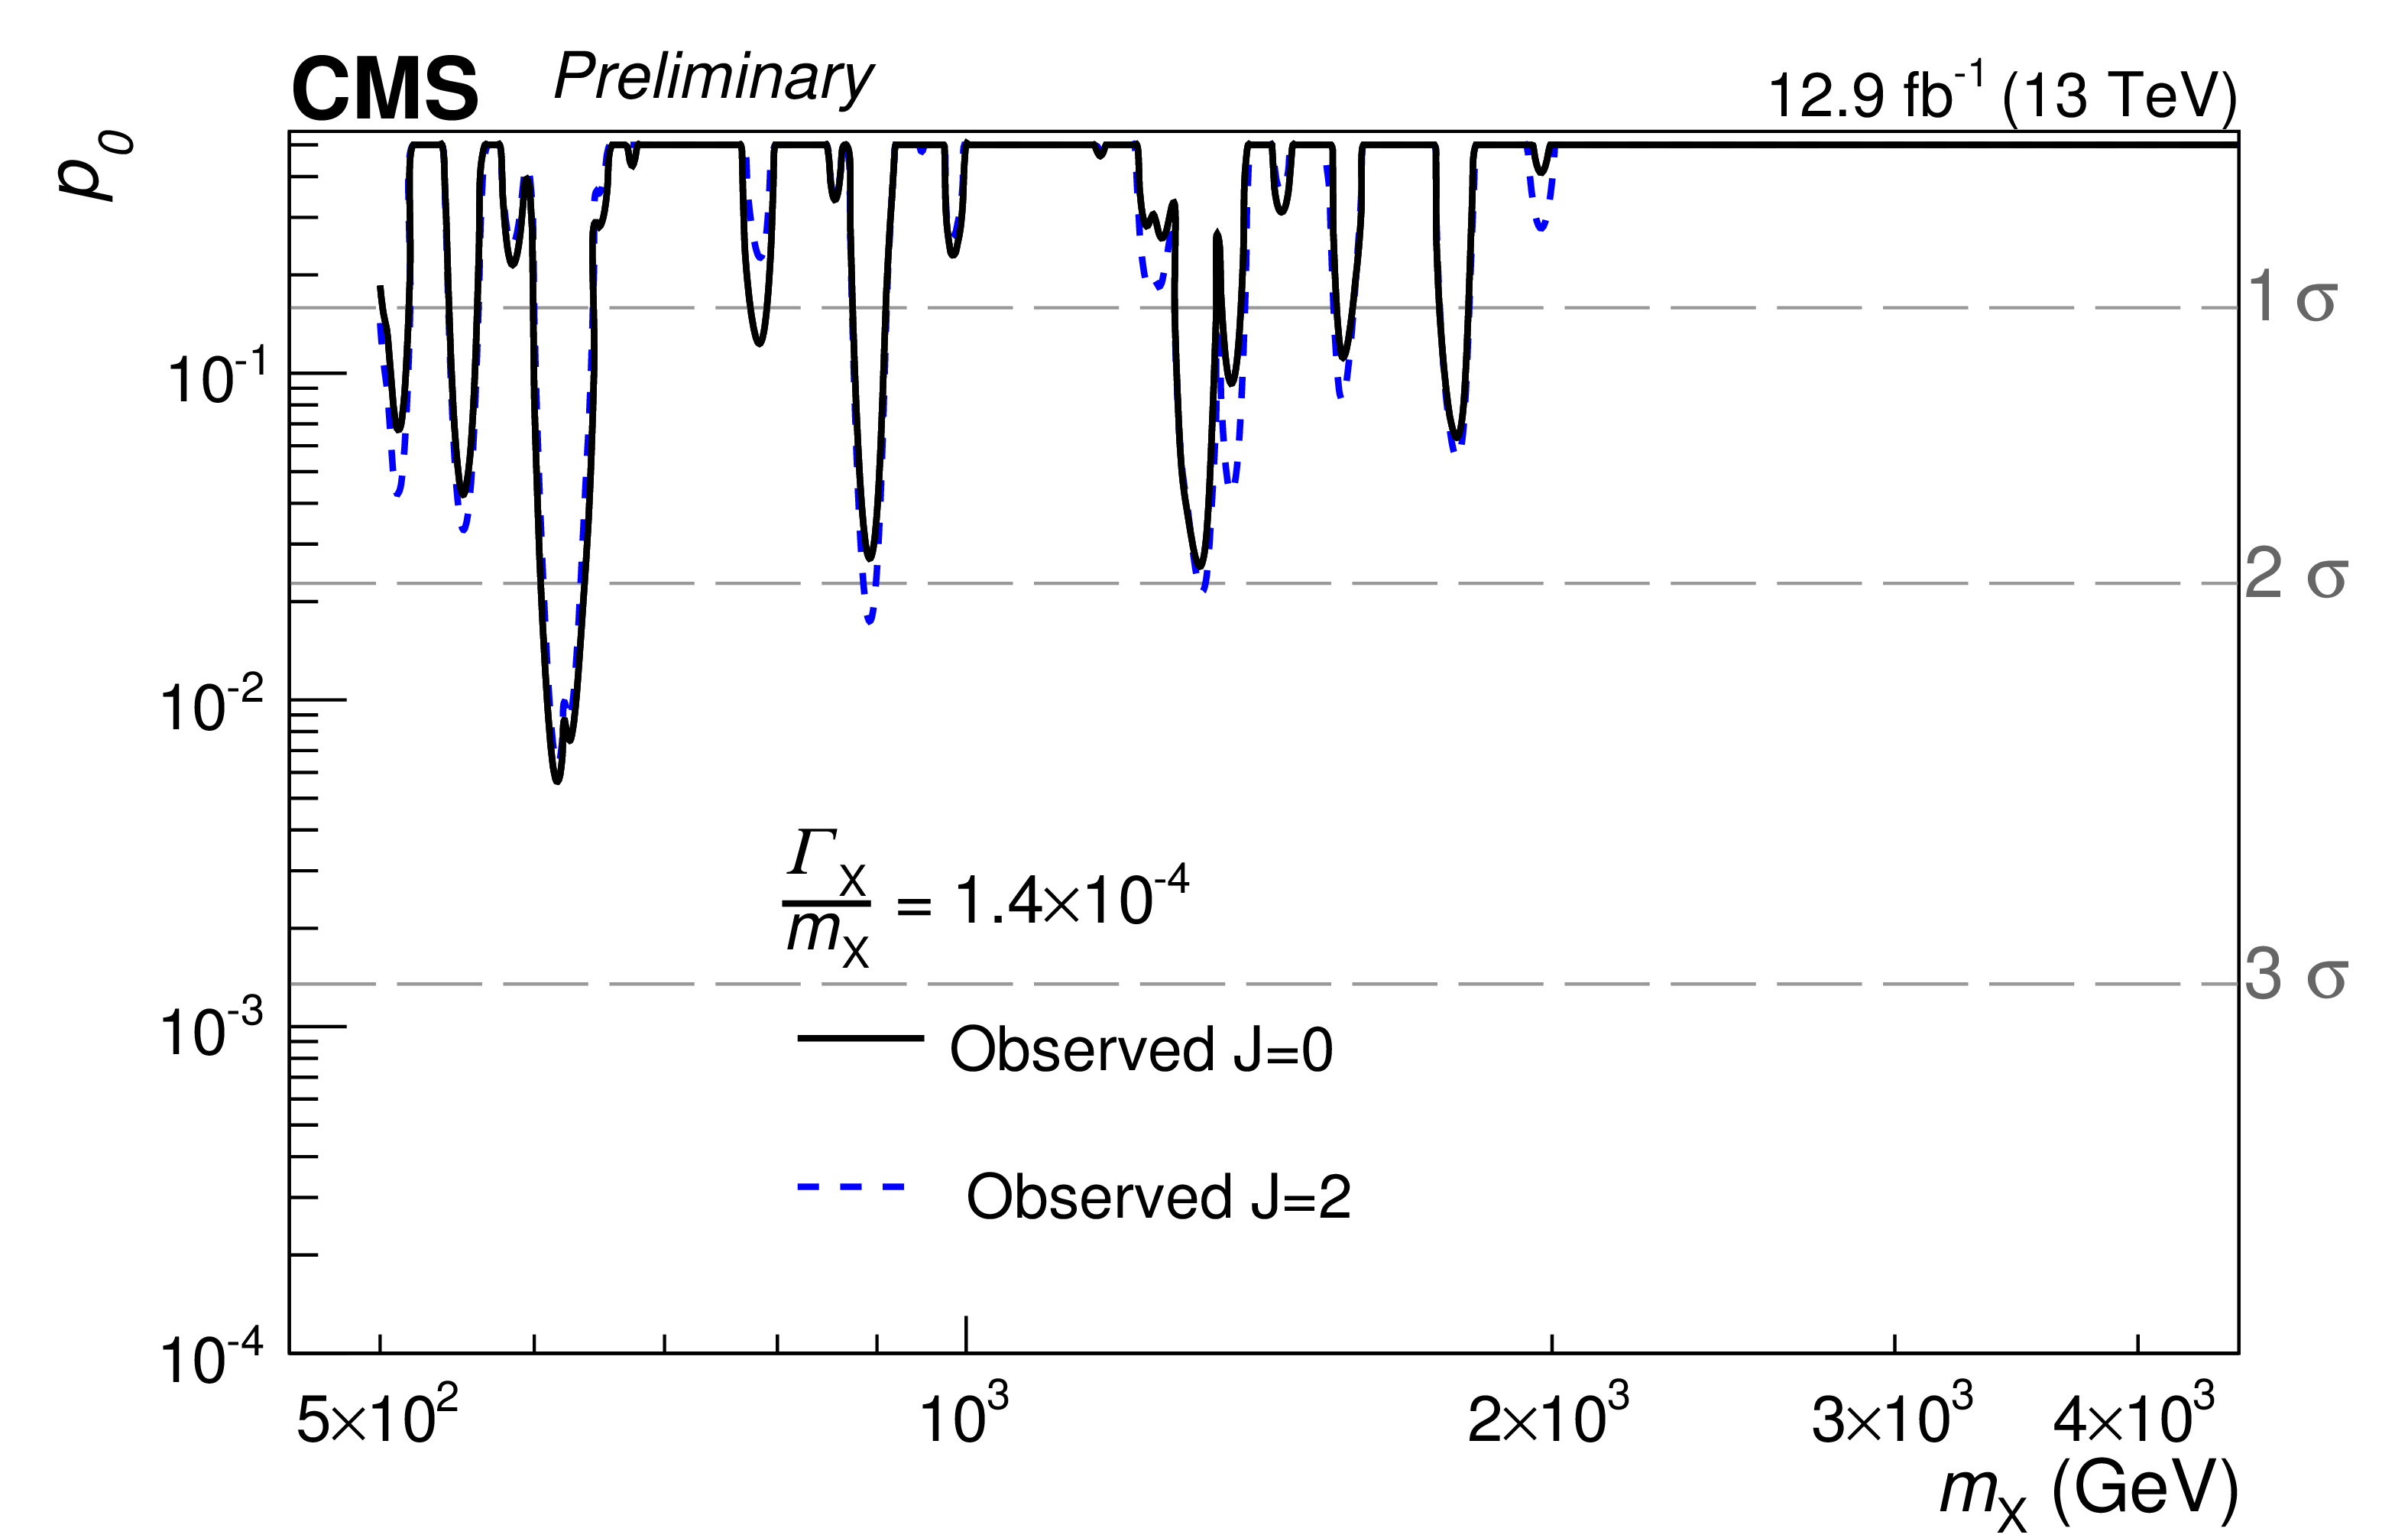
Figure 4-a:
Observed background-only $p$-values for resonances with $ {\Gamma _{ {\mathrm {X}}} / m_{ {\mathrm {X}}}} = 1.4 \times 10^{-4}$ (a), $1.4 \times 10^{-2} $ (b), and $5.6 \times 10^{-2} $ (c) as a function of the resonance mass ${m_{ {\mathrm {X}}}} $, from the analysis of the 12.9 fb$^{-1}$ data collected at ${\sqrt {s}} =$ 13 TeV in 2016. Solid black and dashed blue lines correspond to spin-0 and spin-2 resonances respectively. |
png pdf |
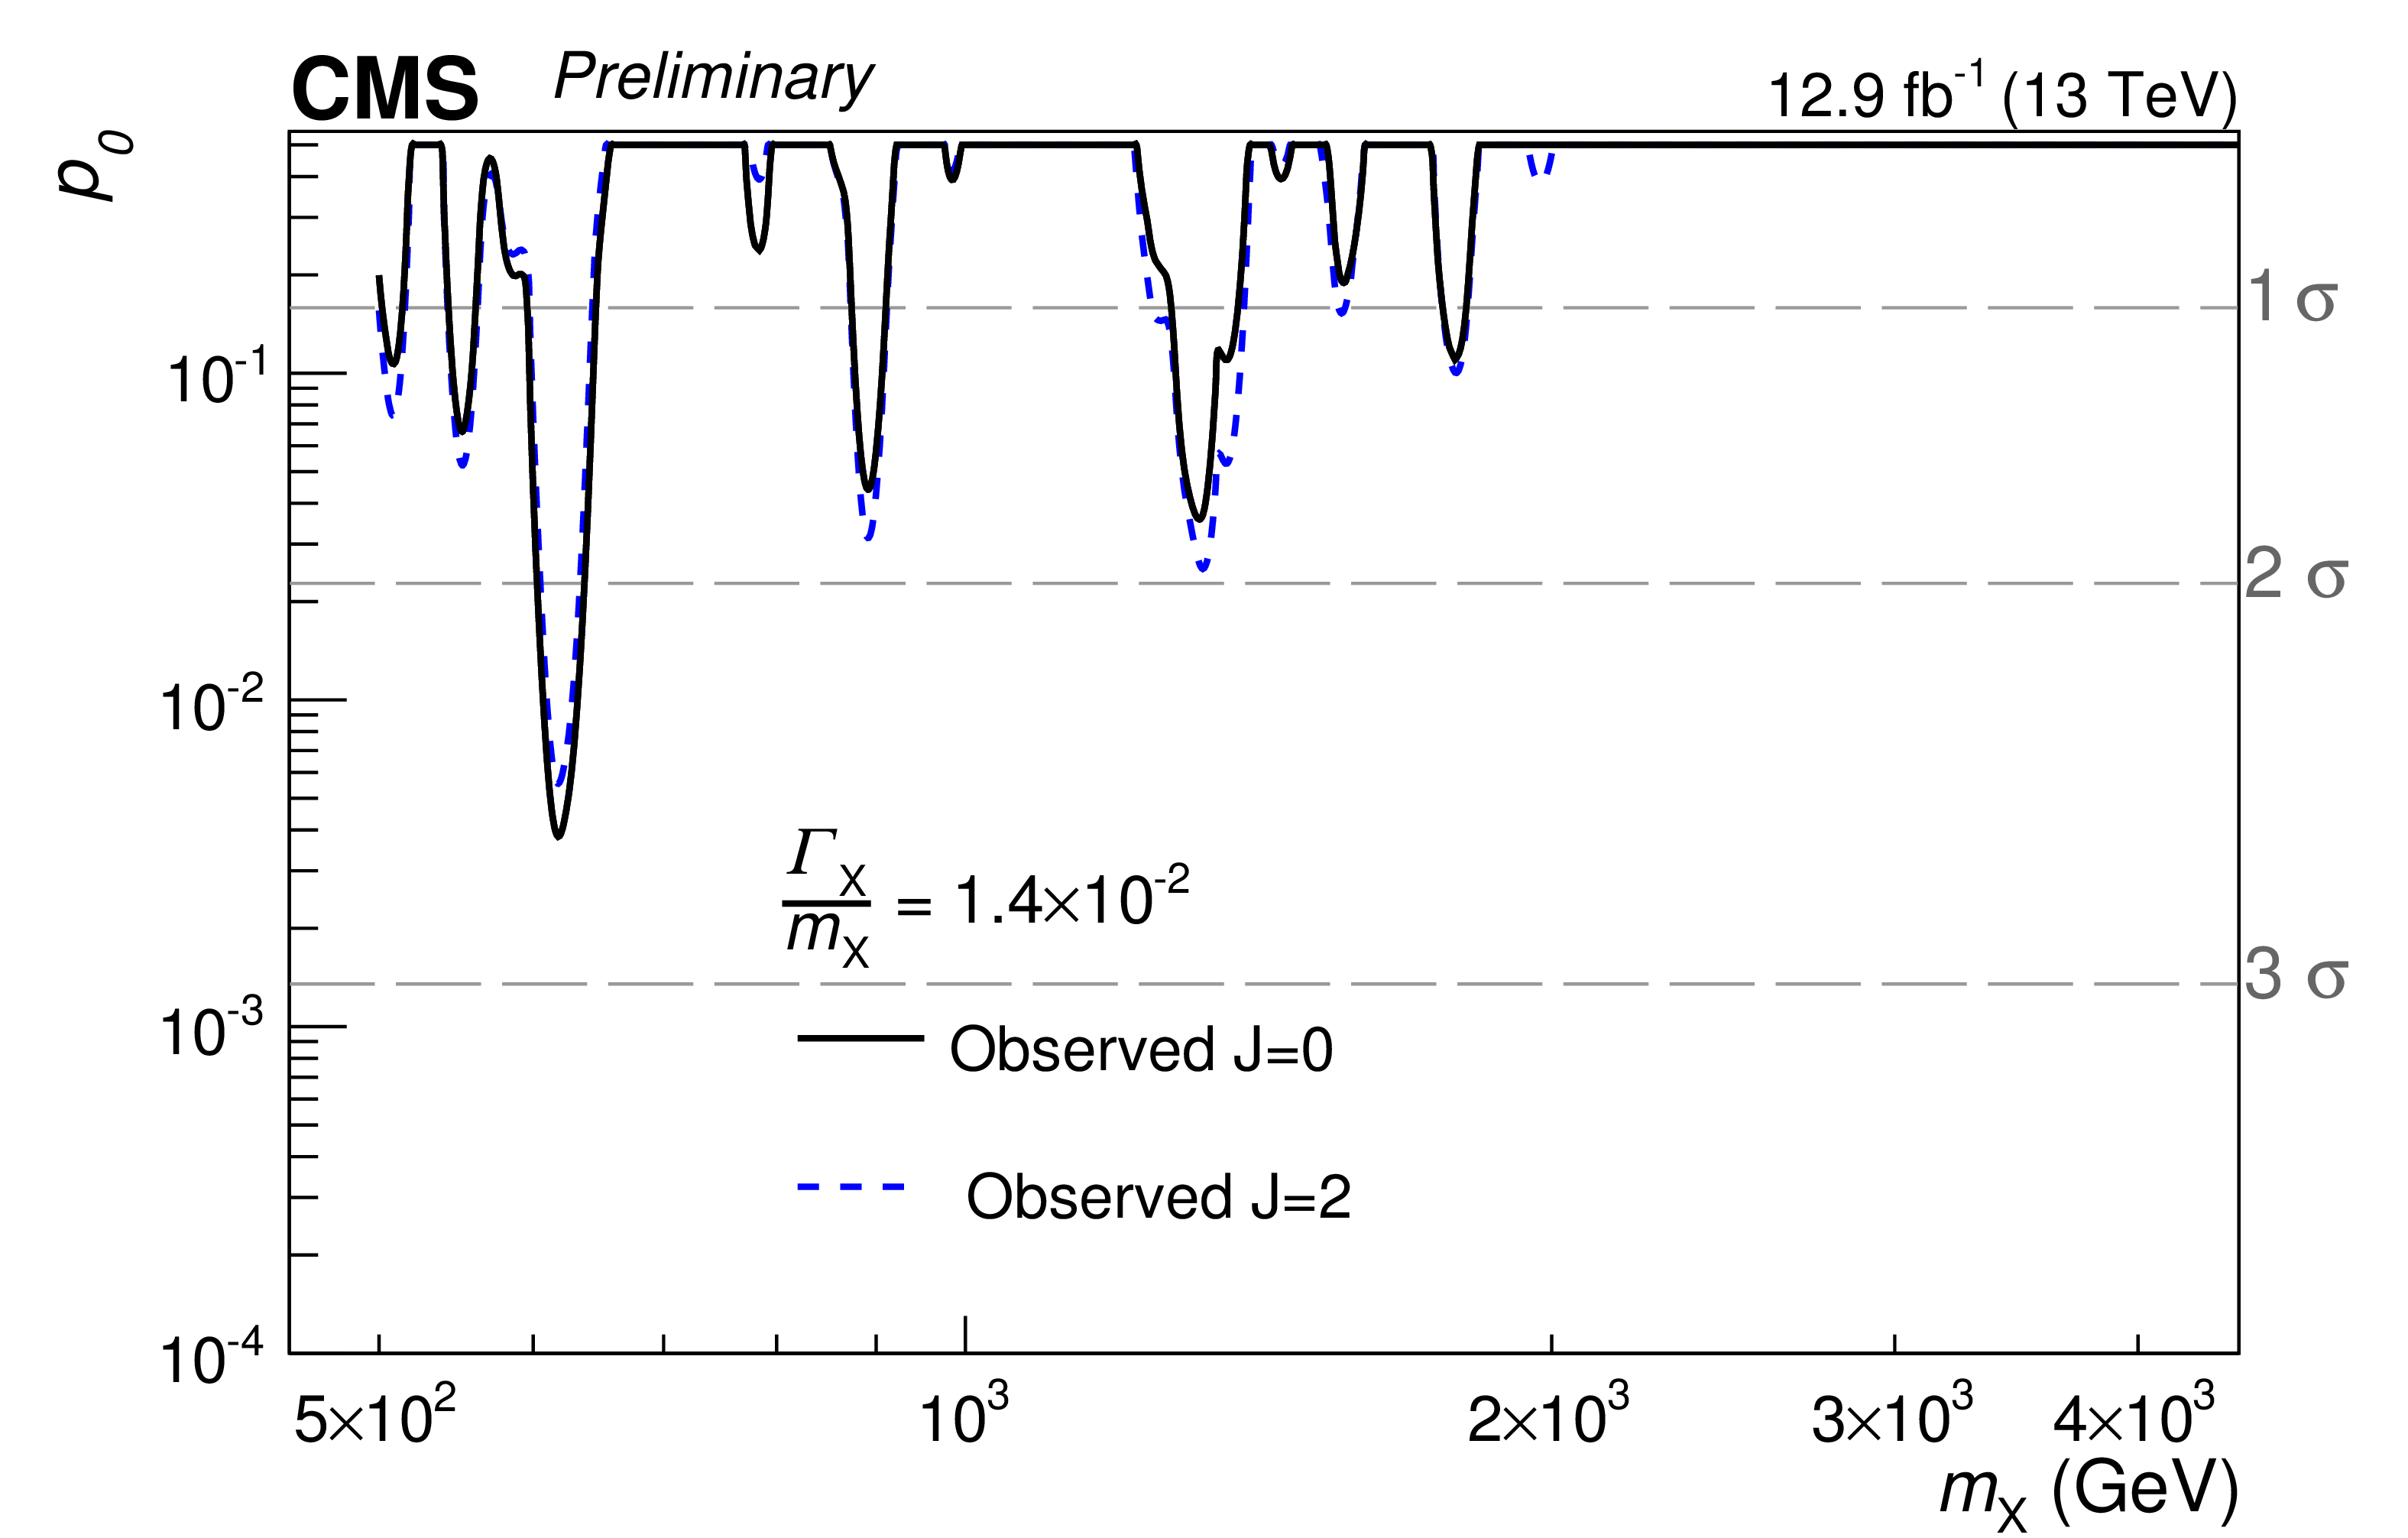
Figure 4-b:
Observed background-only $p$-values for resonances with $ {\Gamma _{ {\mathrm {X}}} / m_{ {\mathrm {X}}}} = 1.4 \times 10^{-4}$ (a), $1.4 \times 10^{-2} $ (b), and $5.6 \times 10^{-2} $ (c) as a function of the resonance mass ${m_{ {\mathrm {X}}}} $, from the analysis of the 12.9 fb$^{-1}$ data collected at ${\sqrt {s}} =$ 13 TeV in 2016. Solid black and dashed blue lines correspond to spin-0 and spin-2 resonances respectively. |
png pdf |
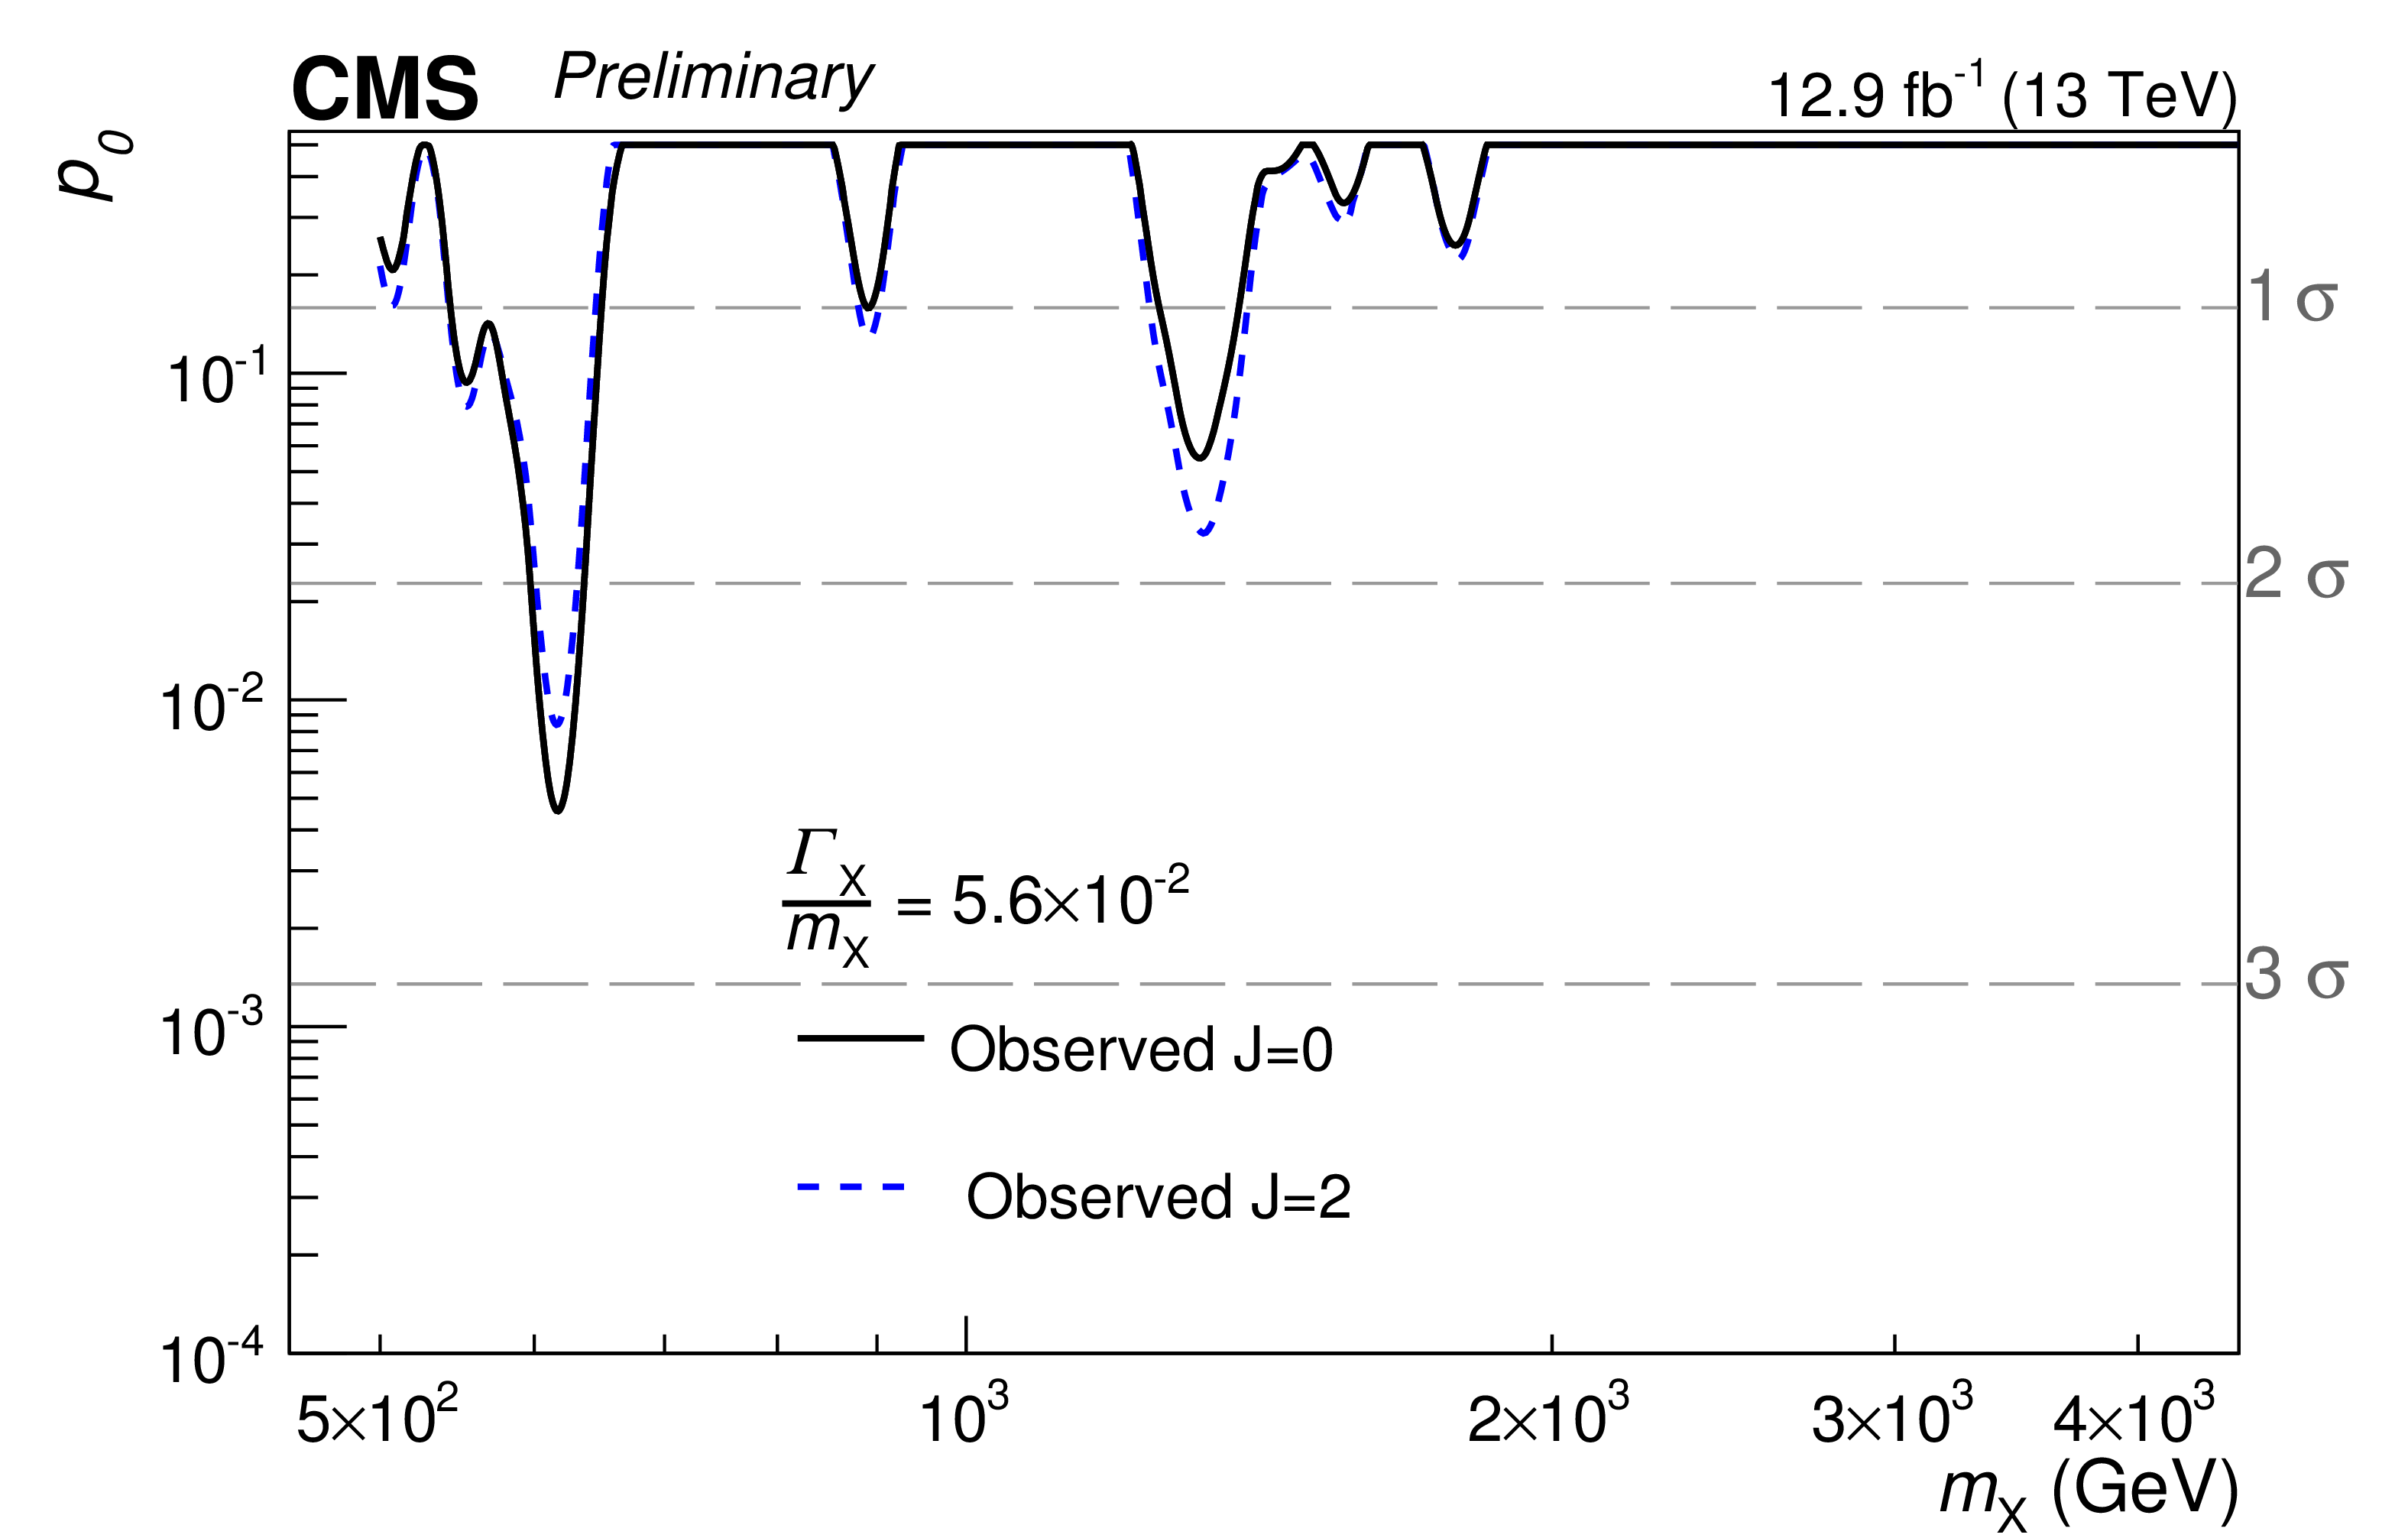
Figure 4-c:
Observed background-only $p$-values for resonances with $ {\Gamma _{ {\mathrm {X}}} / m_{ {\mathrm {X}}}} = 1.4 \times 10^{-4}$ (a), $1.4 \times 10^{-2} $ (b), and $5.6 \times 10^{-2} $ (c) as a function of the resonance mass ${m_{ {\mathrm {X}}}} $, from the analysis of the 12.9 fb$^{-1}$ data collected at ${\sqrt {s}} =$ 13 TeV in 2016. Solid black and dashed blue lines correspond to spin-0 and spin-2 resonances respectively. |
png pdf |
Figure 5:
The 95% CL upper limits on the production of diphoton resonances as a function of the resonance mass ${m_{ {\mathrm {X}}}} $, from the combined analysis of the 13 TeV data collected in 2015 and in 2016. The blue-grey (darker) curves and the green (lighter) ones correspond to the scalar and RS graviton signals, respectively. Solid (dashed) curves represent the observed (median expected) exclusion limit. The expected results are shown with their 1 standard deviation dispersion bands. The leading-order RS graviton production cross section is shown by the red dot-dashed curves. The results are shown for (upper) a narrow, (middle) an intermediate-width, and (lower) a broad resonance, with the value of the width ${\Gamma _{ {\mathrm {X}}} / m_{ {\mathrm {X}}}} $, relative to the mass, indicated in the legend of each plot. |

png pdf |
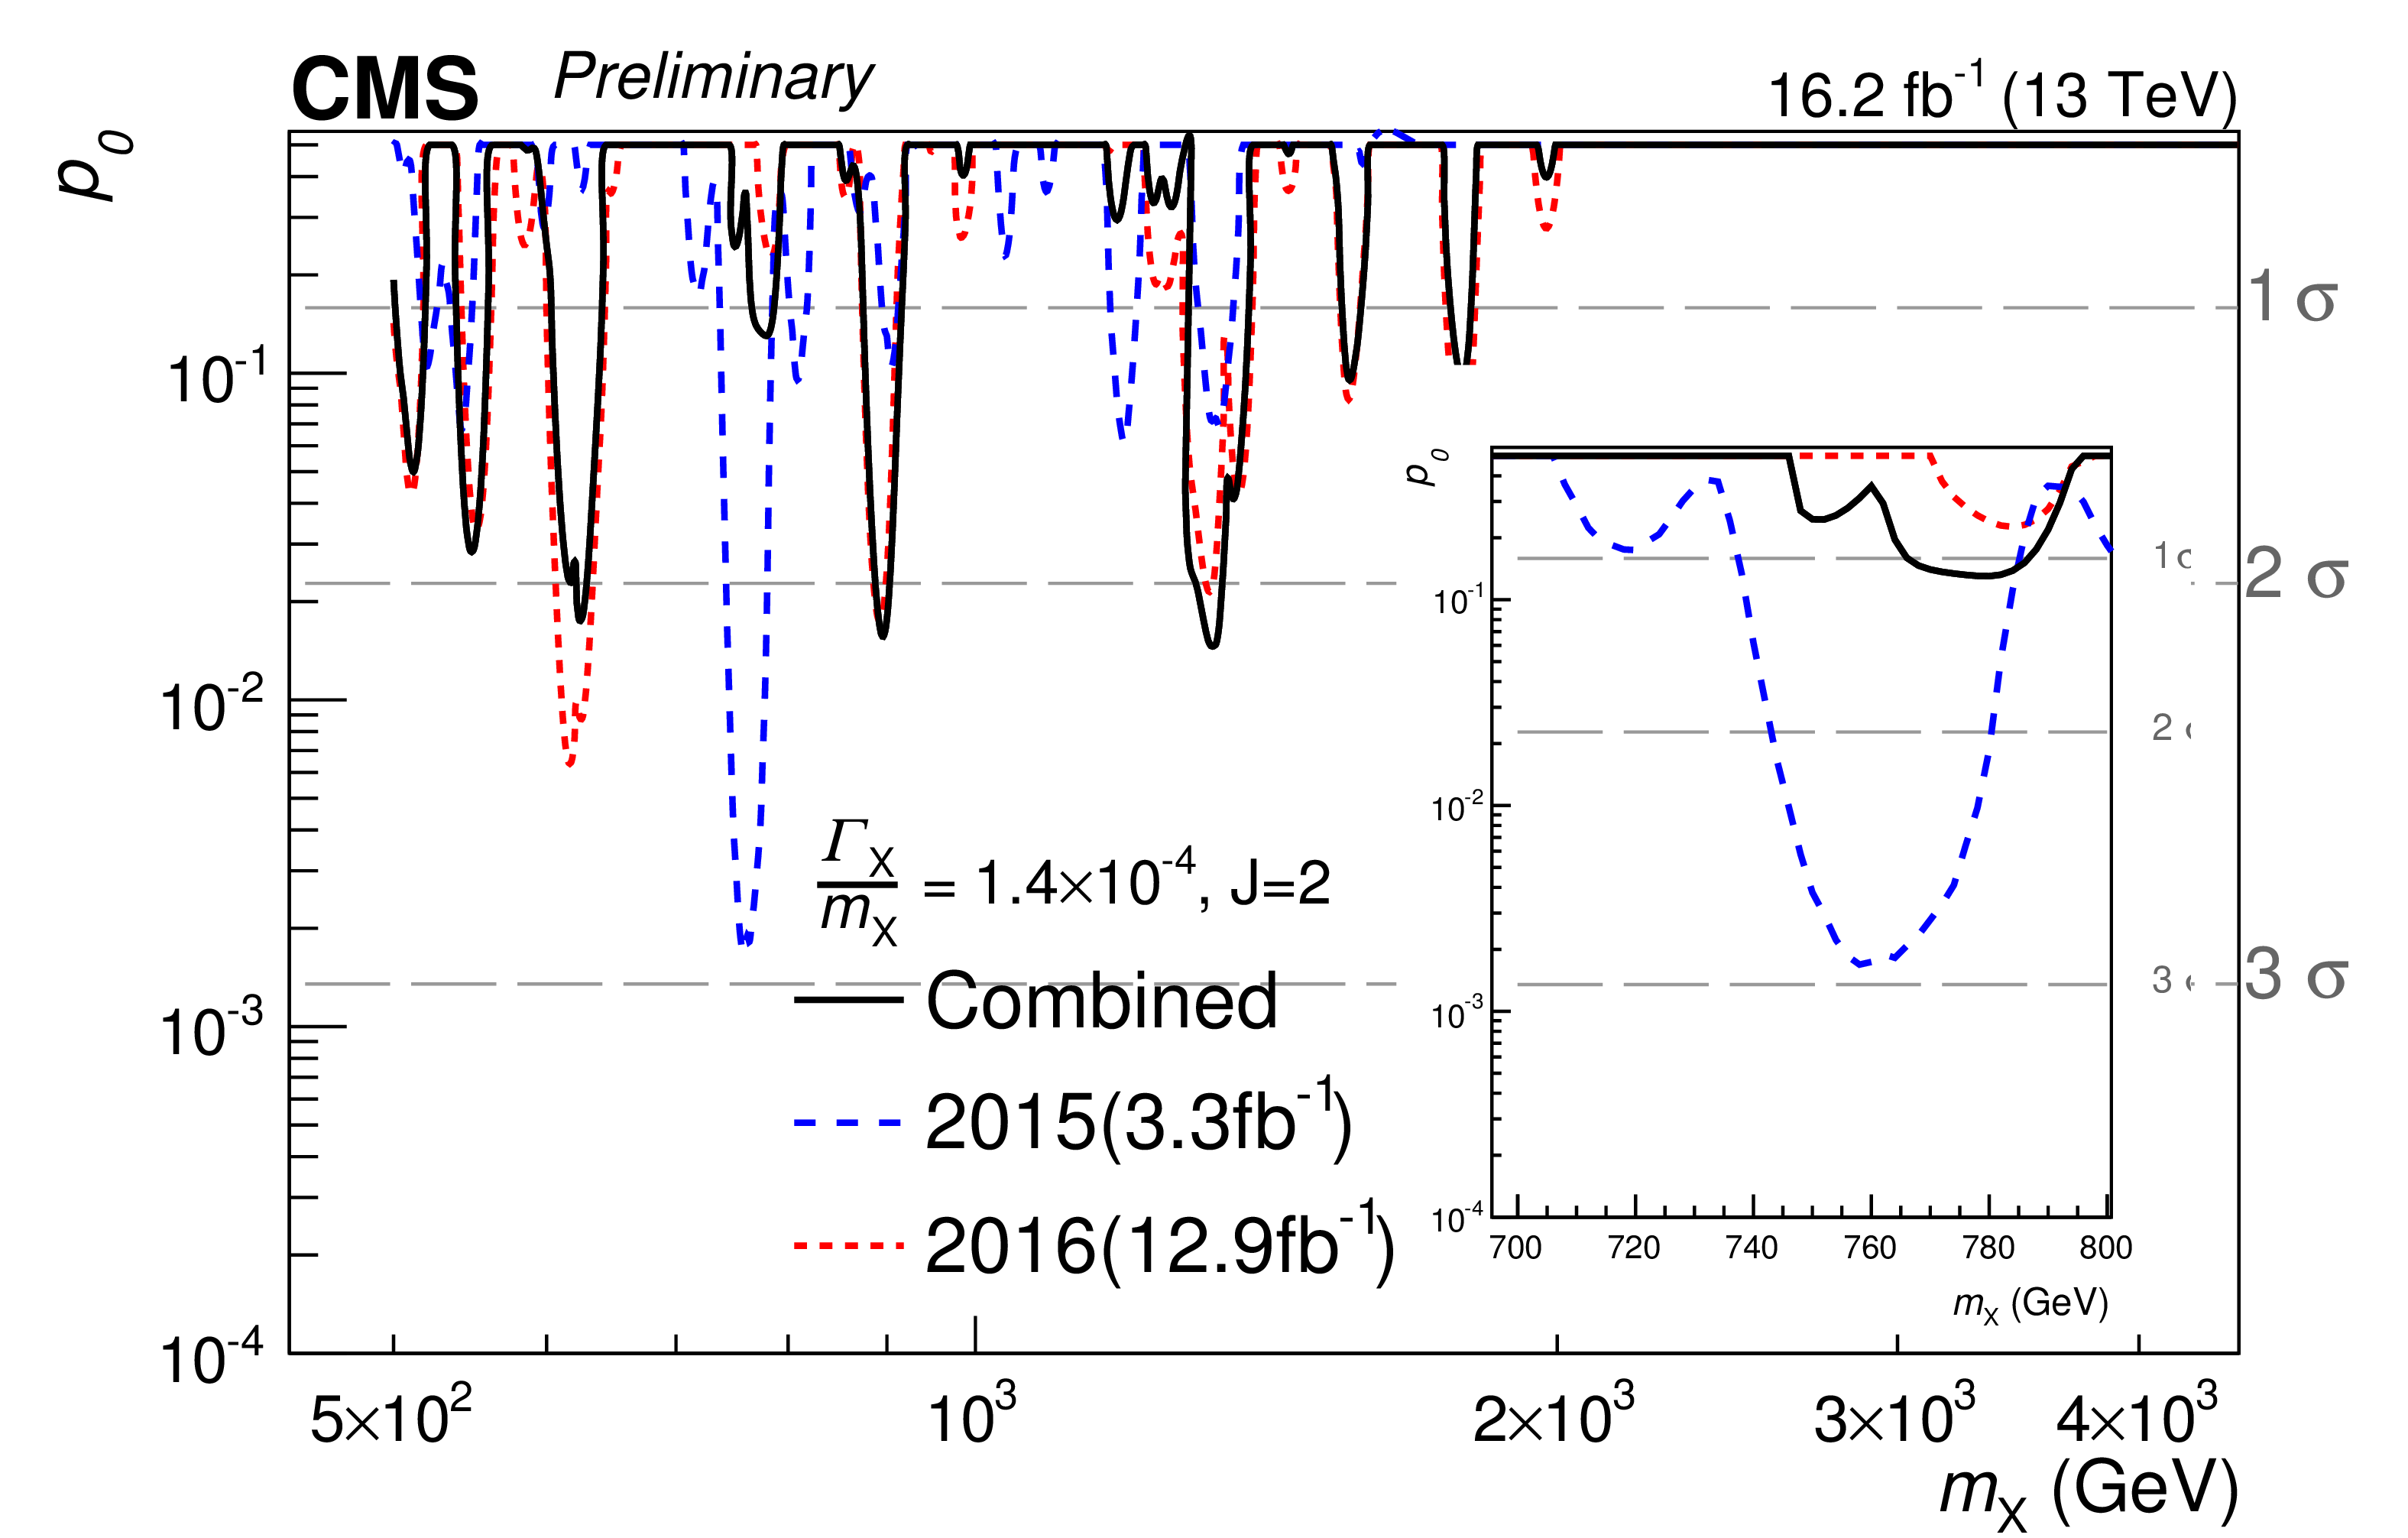
Figure 6-a:
Observed background-only $p$-values for resonances with $ {\Gamma _{ {\mathrm {X}}} / m_{ {\mathrm {X}}}} = 1.4\times 10^{-4}$ (a,b) and $ 5.6\times 10^{-2} $ (c,d) as a function of the resonance mass ${m_{ {\mathrm {X}}}} $, from the combined analysis of the 13 TeV data recorded in 2015 and 2016. The results obtained with the two individual datasets are also shown. Curves corresponding to the scalar and RS graviton hypotheses are shown in (a,c) and (b,d) respectively. |
png pdf |
Figure 6-b:
Observed background-only $p$-values for resonances with $ {\Gamma _{ {\mathrm {X}}} / m_{ {\mathrm {X}}}} = 1.4\times 10^{-4}$ (a,b) and $ 5.6\times 10^{-2} $ (c,d) as a function of the resonance mass ${m_{ {\mathrm {X}}}} $, from the combined analysis of the 13 TeV data recorded in 2015 and 2016. The results obtained with the two individual datasets are also shown. Curves corresponding to the scalar and RS graviton hypotheses are shown in (a,c) and (b,d) respectively. |
png pdf |
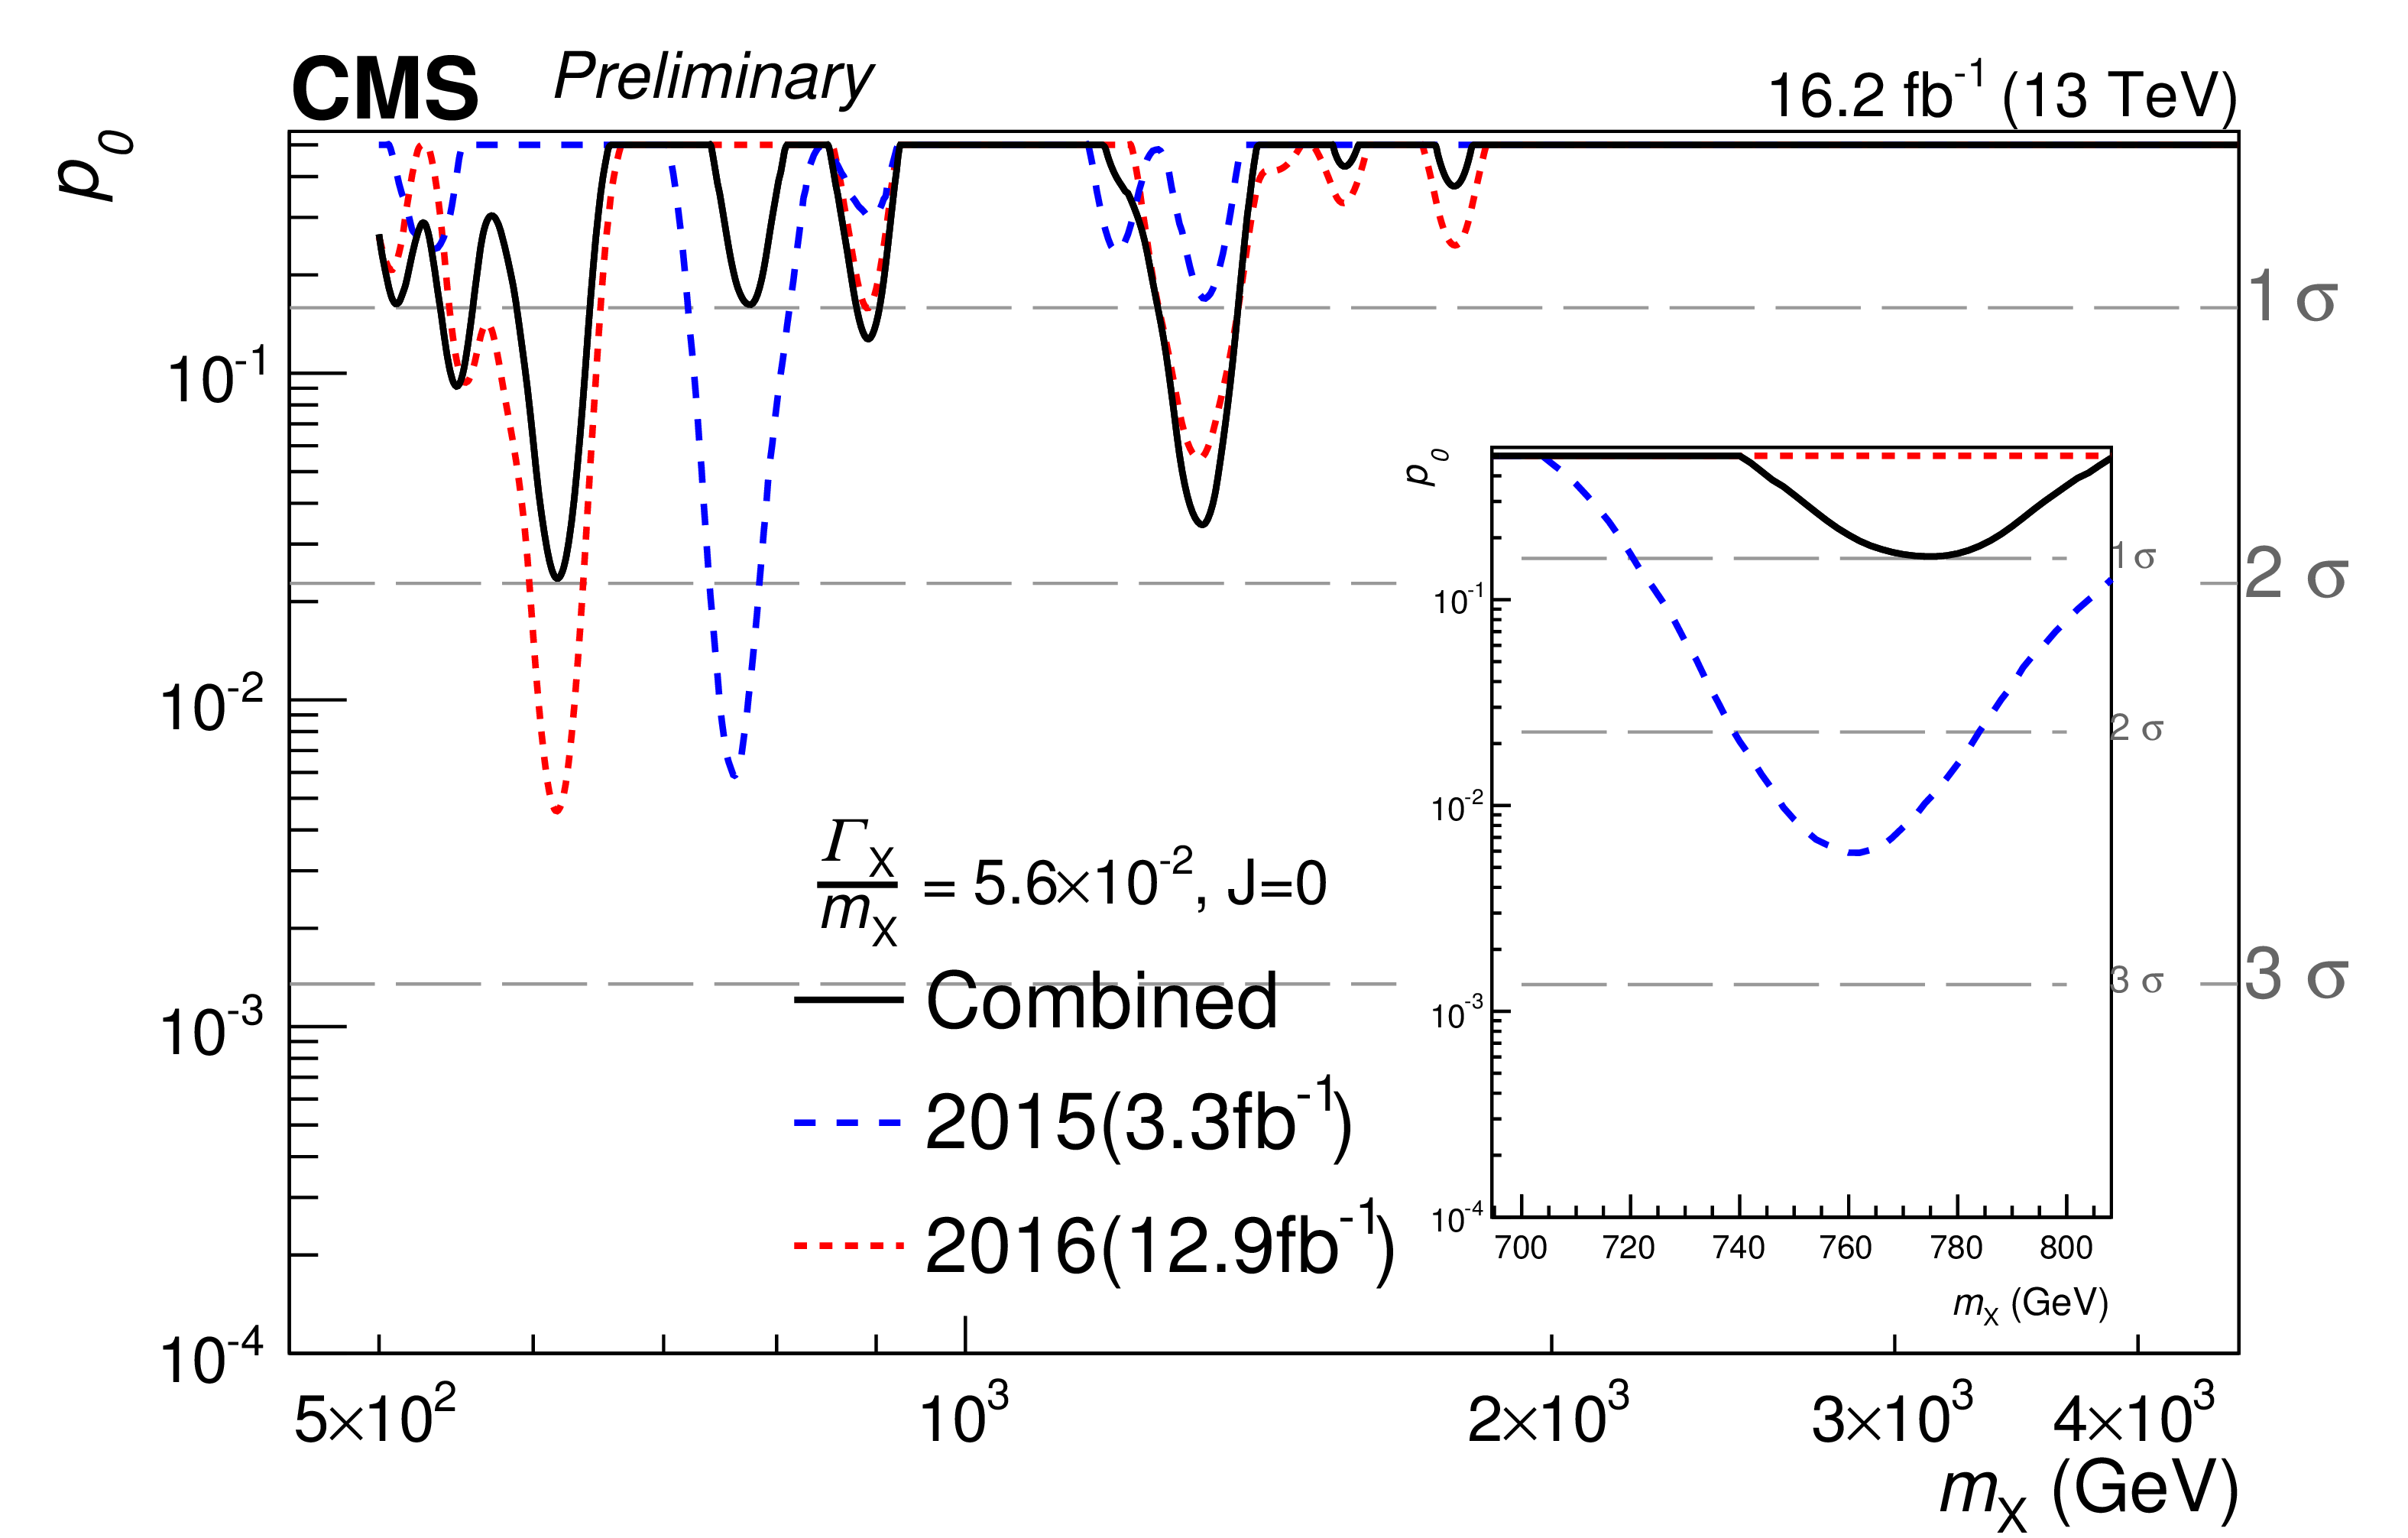
Figure 6-c:
Observed background-only $p$-values for resonances with $ {\Gamma _{ {\mathrm {X}}} / m_{ {\mathrm {X}}}} = 1.4\times 10^{-4}$ (a,b) and $ 5.6\times 10^{-2} $ (c,d) as a function of the resonance mass ${m_{ {\mathrm {X}}}} $, from the combined analysis of the 13 TeV data recorded in 2015 and 2016. The results obtained with the two individual datasets are also shown. Curves corresponding to the scalar and RS graviton hypotheses are shown in (a,c) and (b,d) respectively. |

png pdf |
Figure 6-d:
Observed background-only $p$-values for resonances with $ {\Gamma _{ {\mathrm {X}}} / m_{ {\mathrm {X}}}} = 1.4\times 10^{-4}$ (a,b) and $ 5.6\times 10^{-2} $ (c,d) as a function of the resonance mass ${m_{ {\mathrm {X}}}} $, from the combined analysis of the 13 TeV data recorded in 2015 and 2016. The results obtained with the two individual datasets are also shown. Curves corresponding to the scalar and RS graviton hypotheses are shown in (a,c) and (b,d) respectively. |
png pdf |
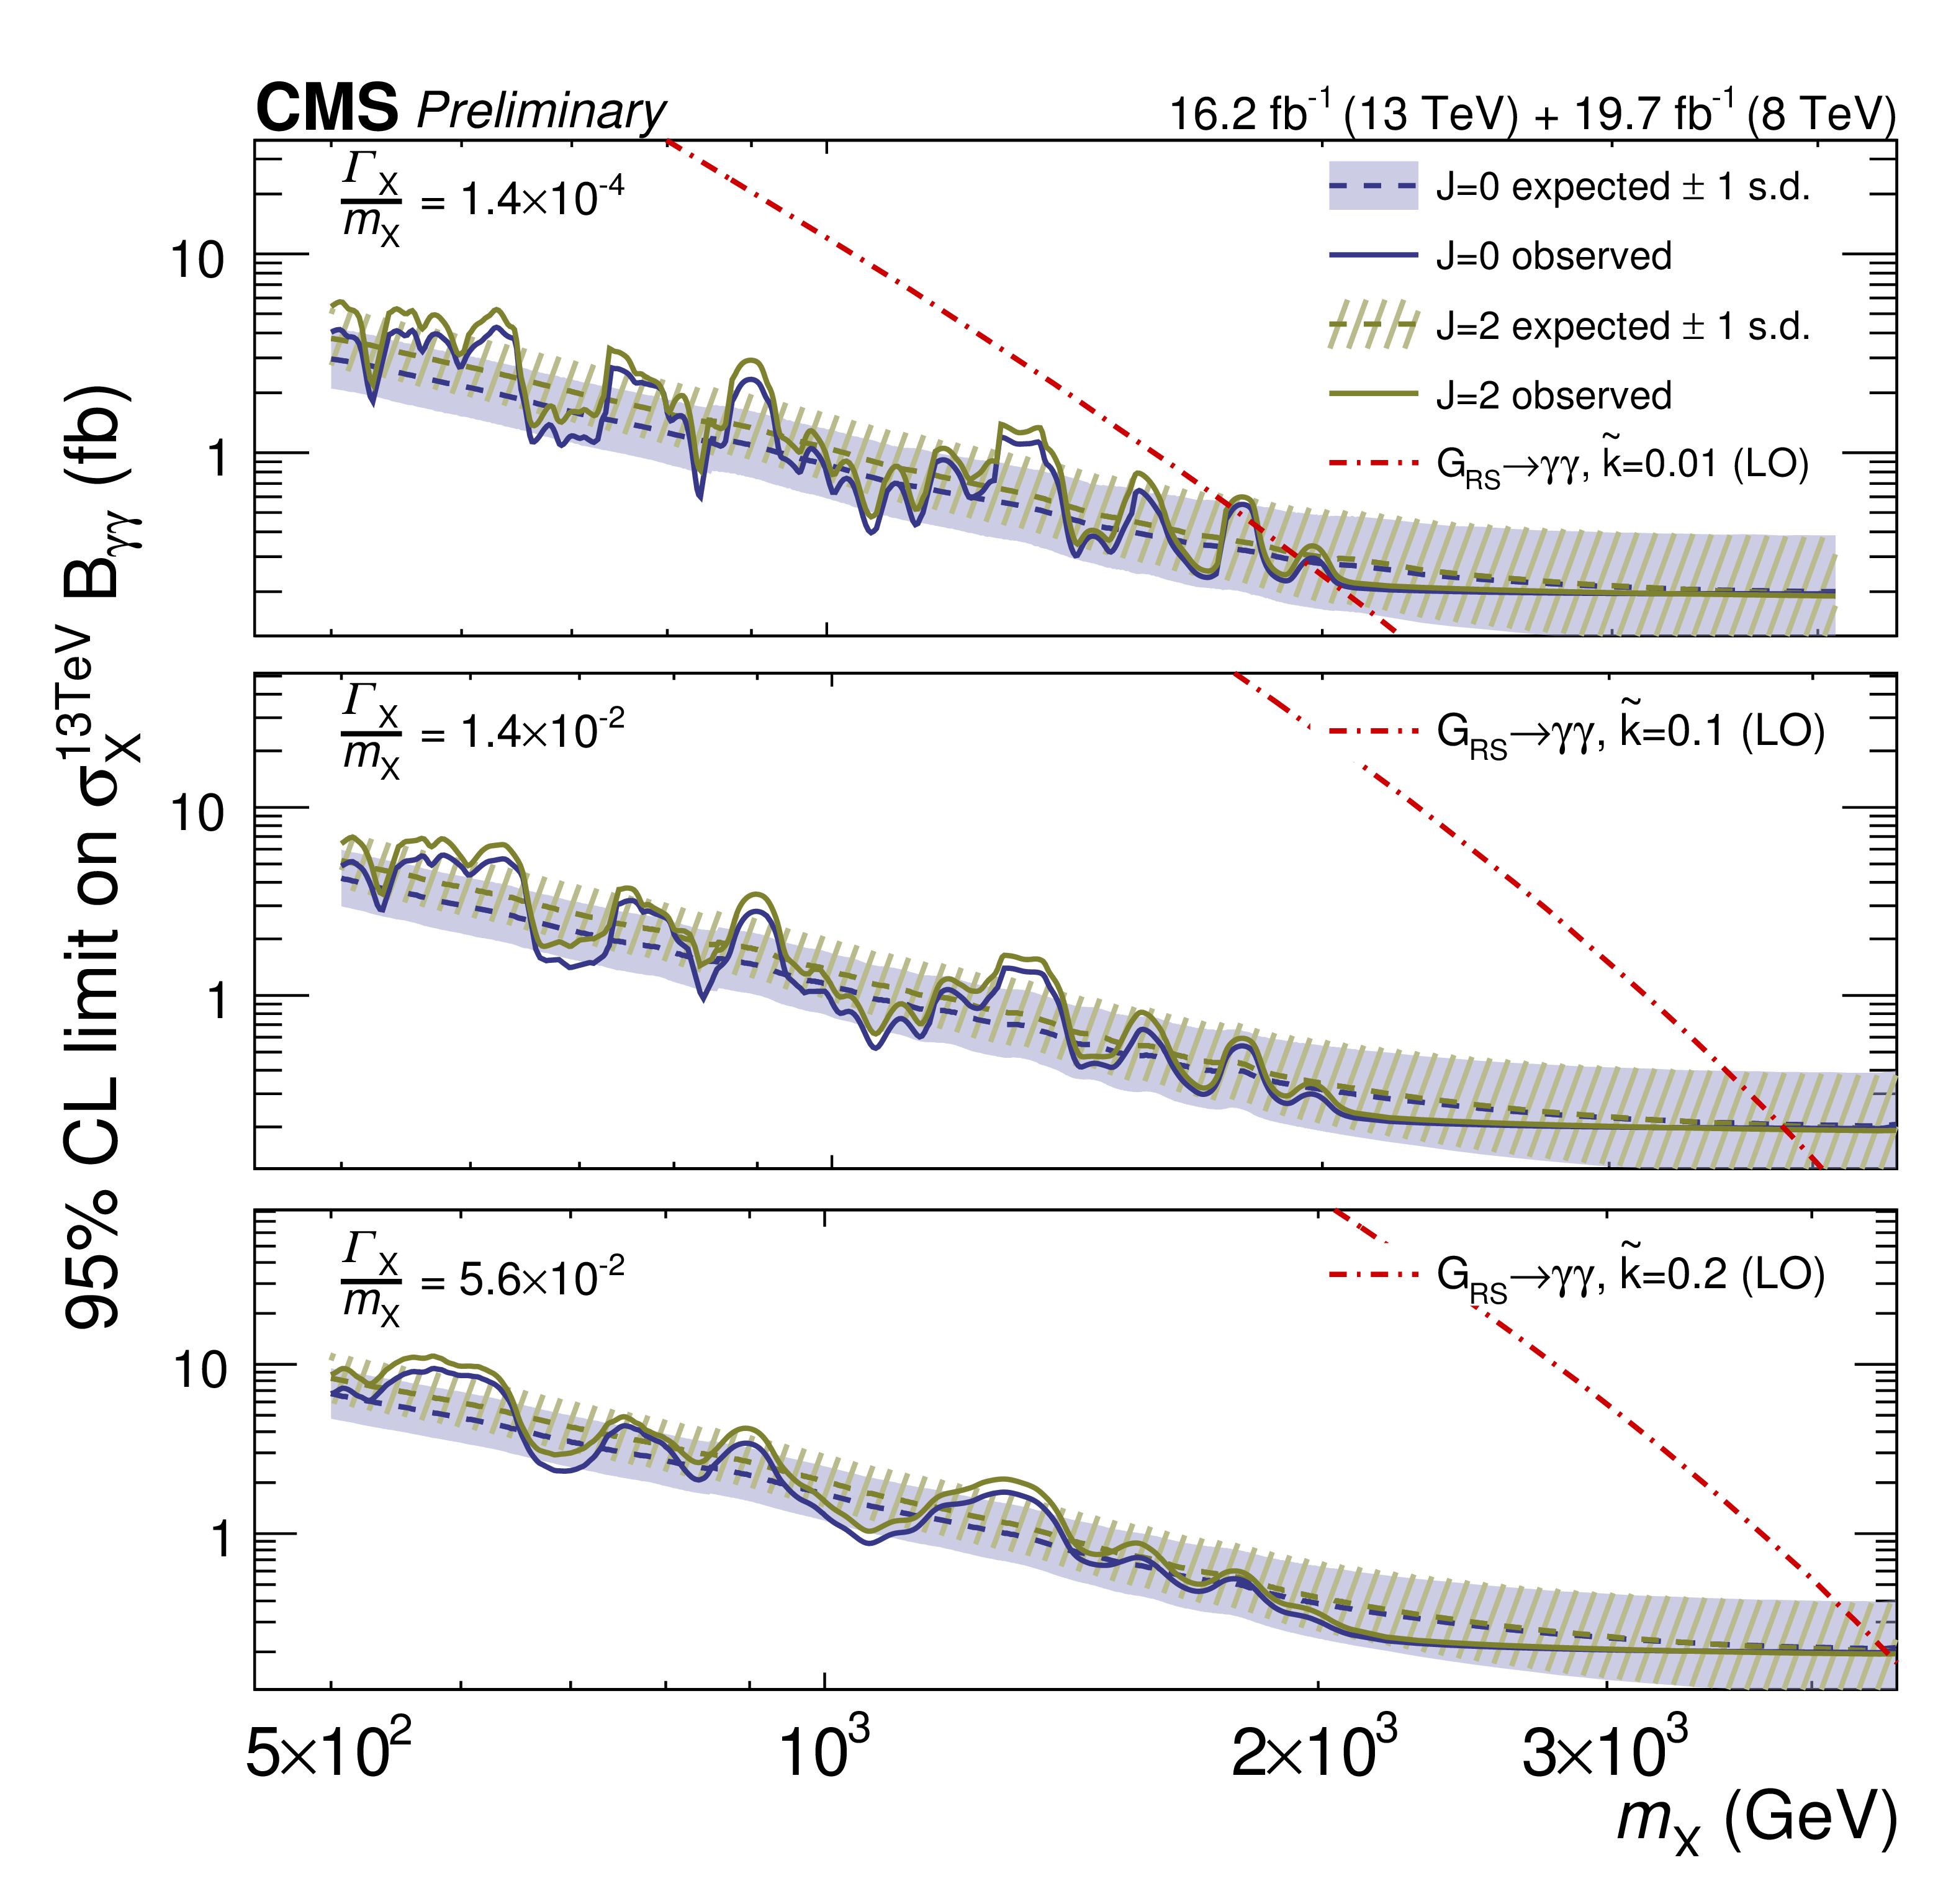
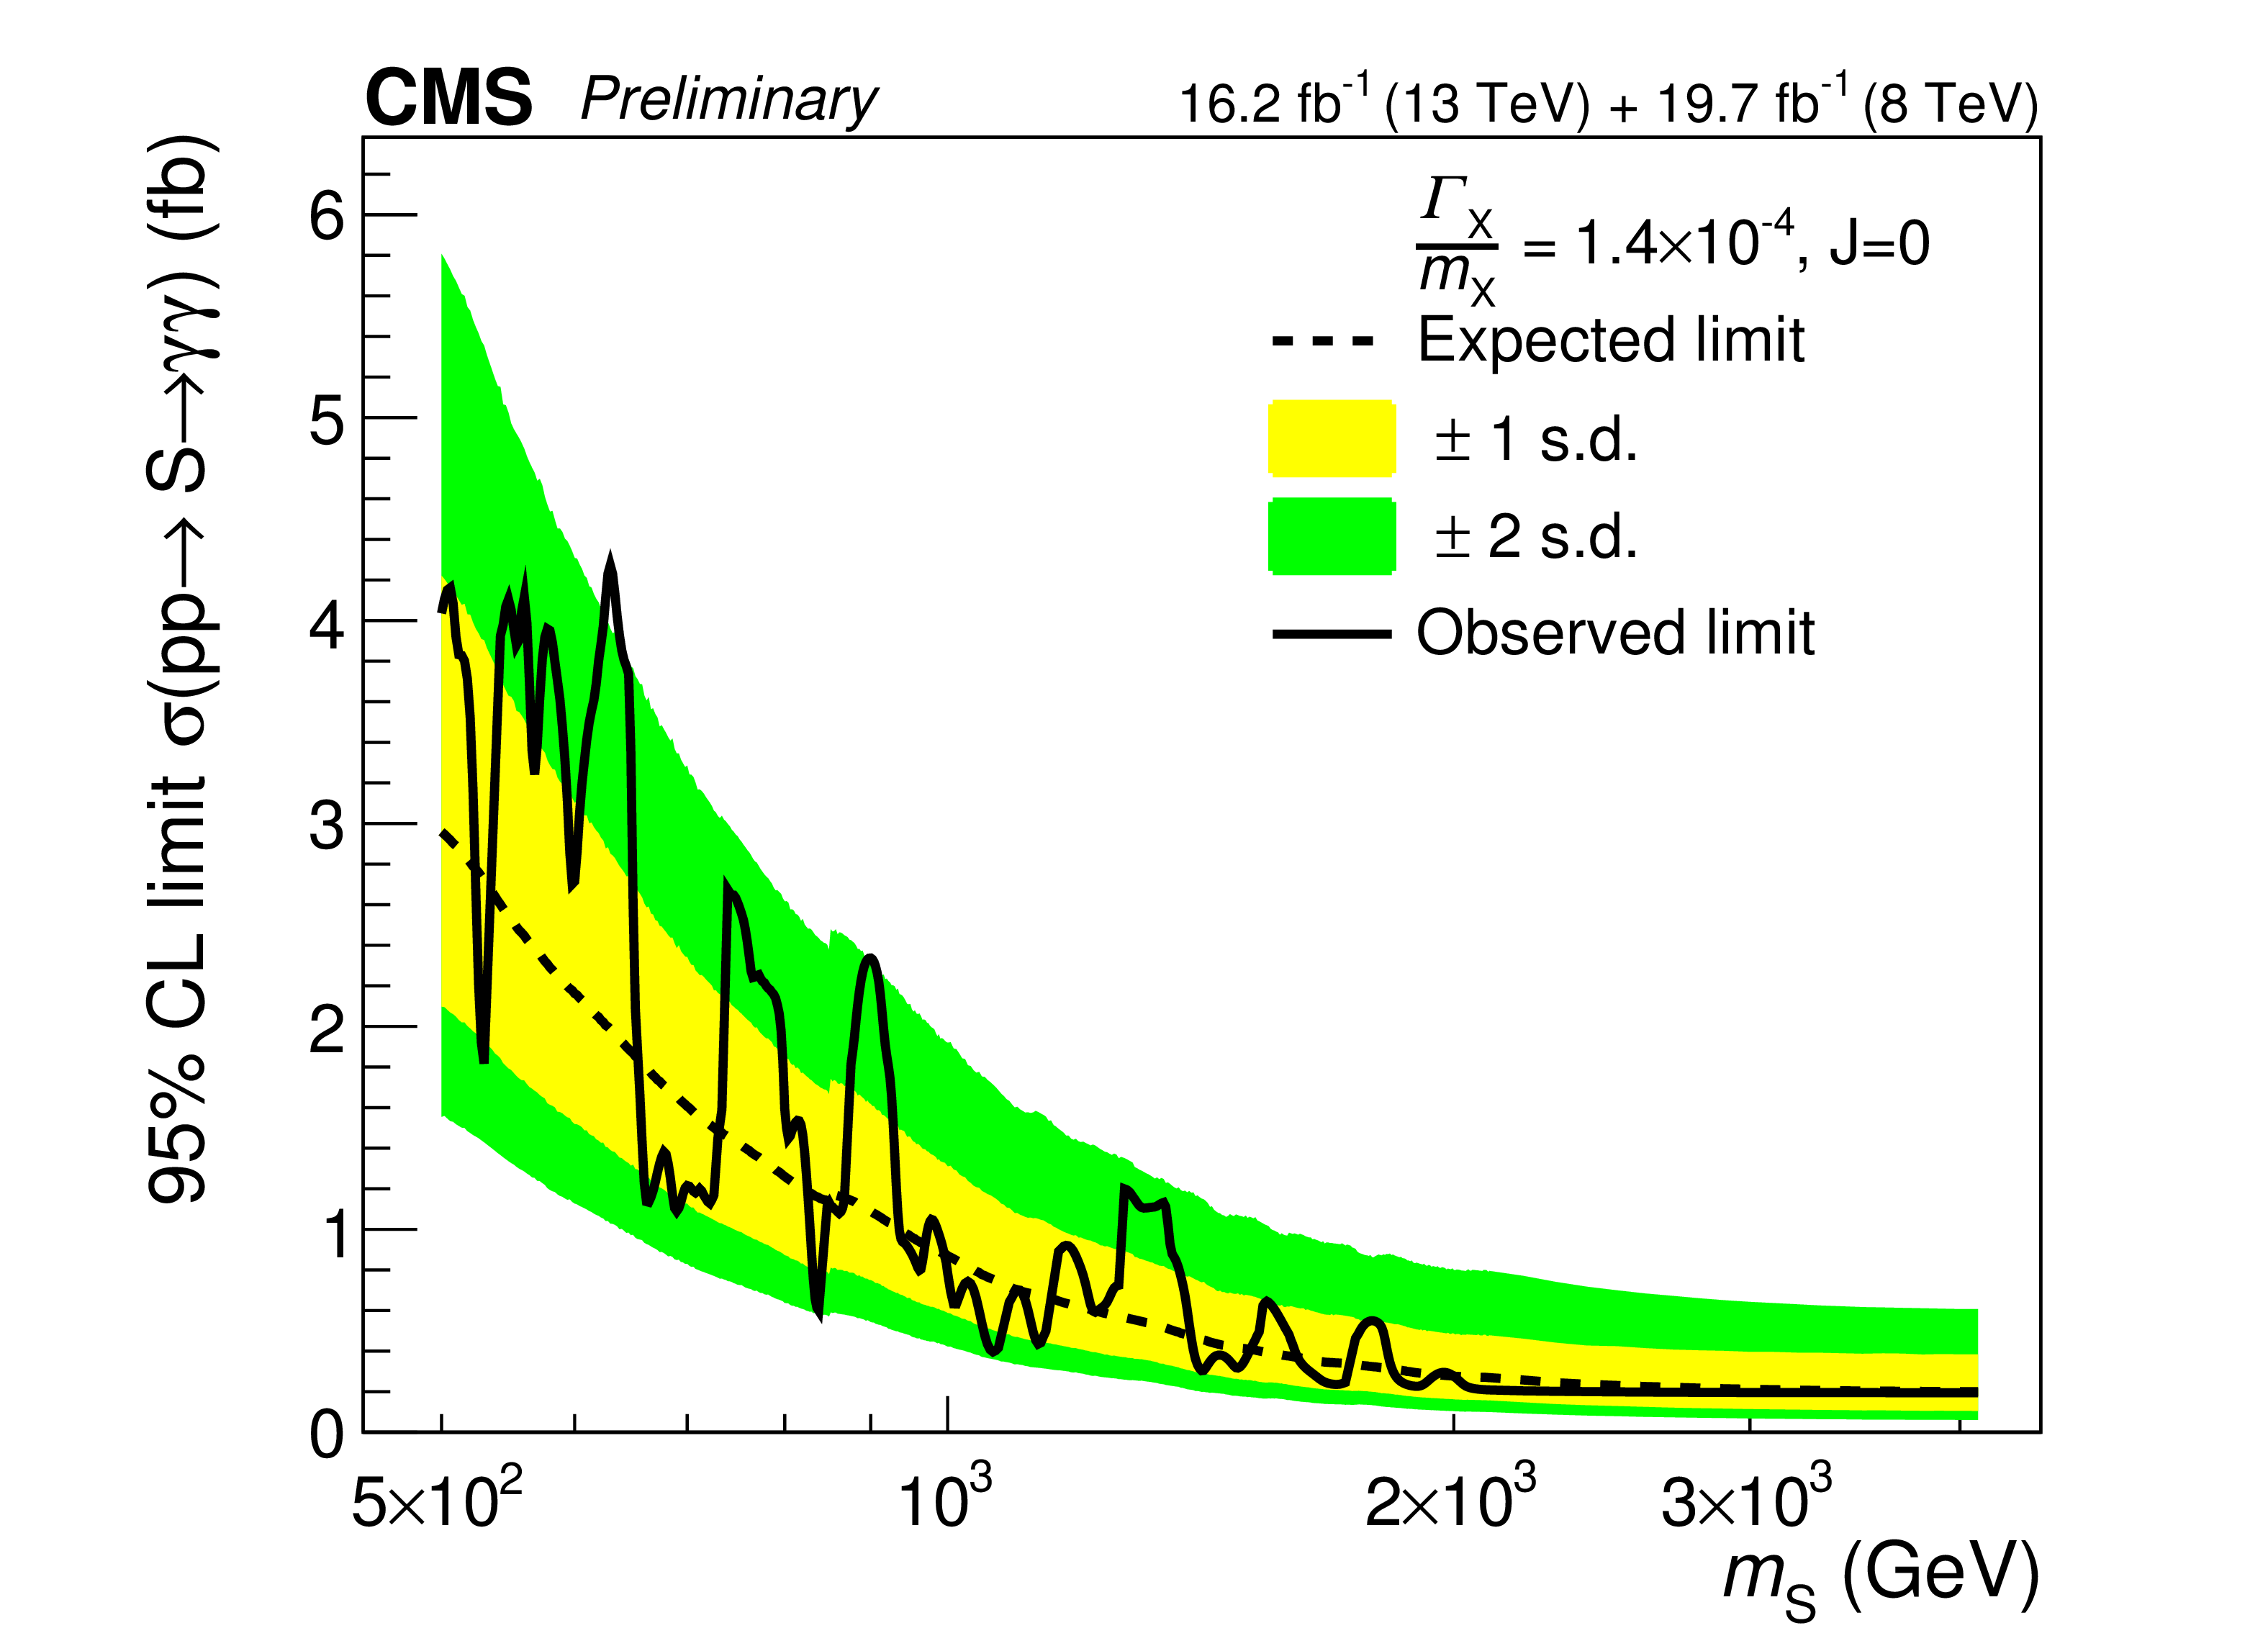
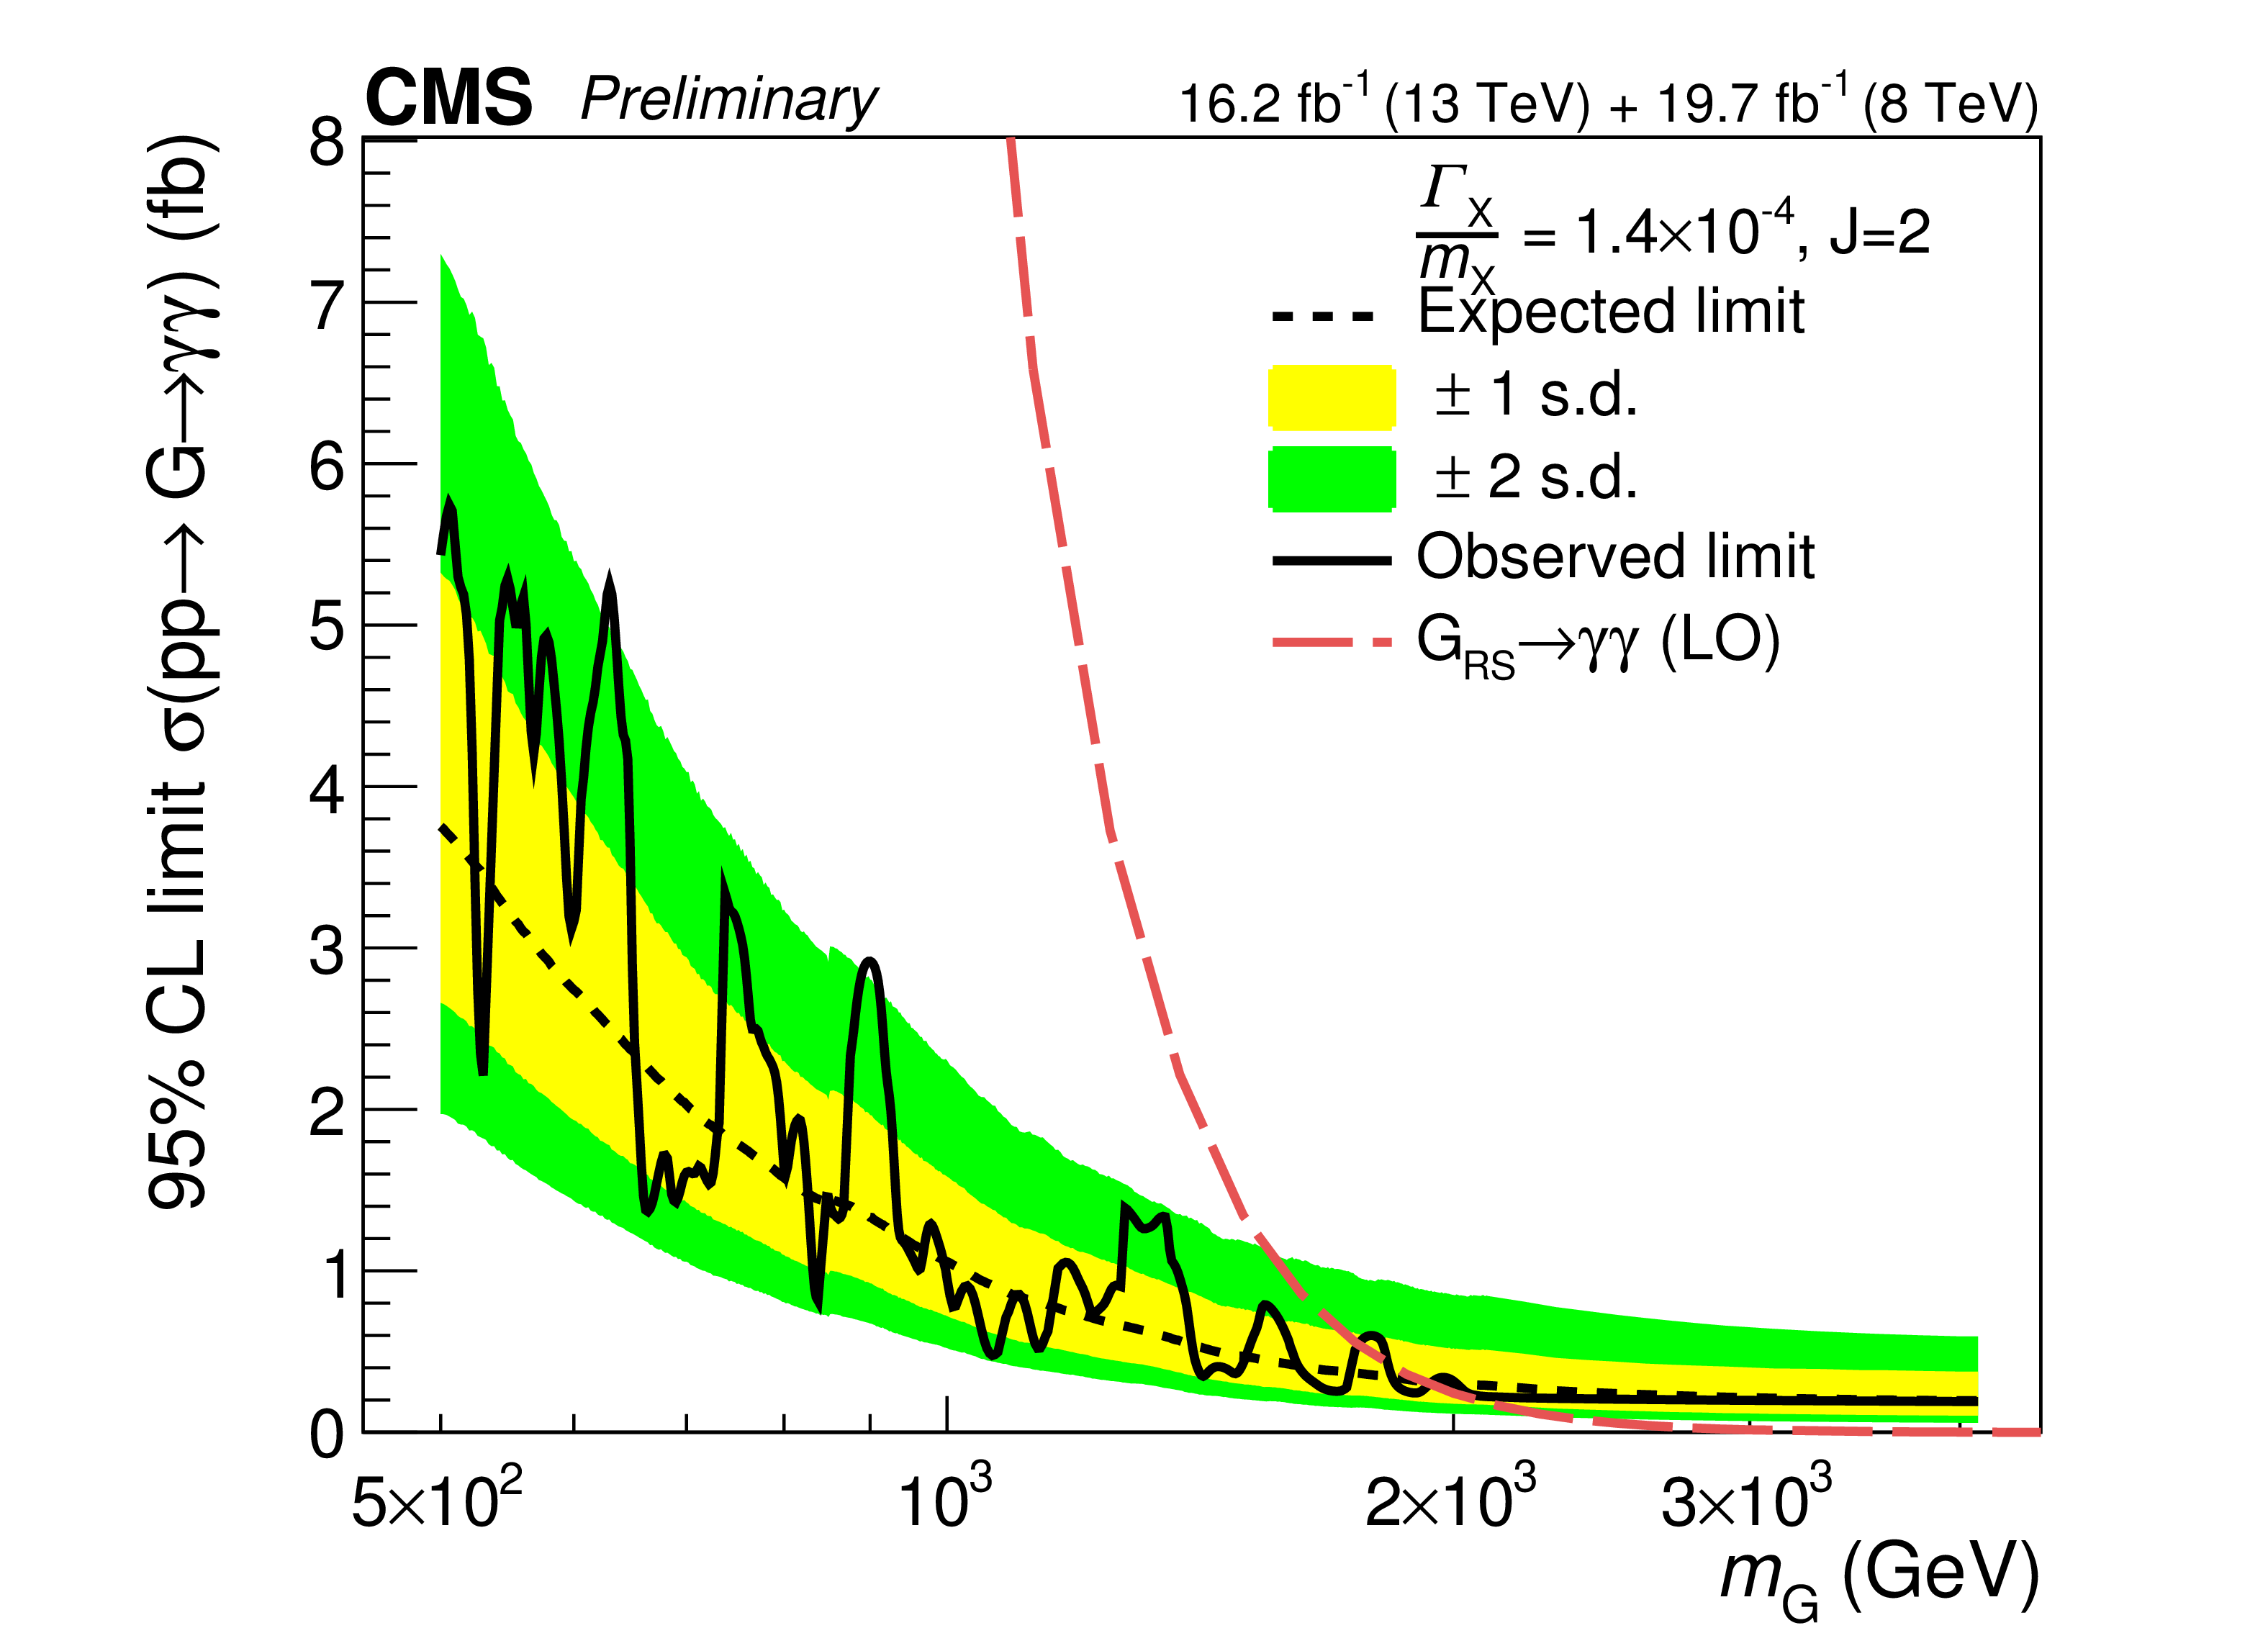
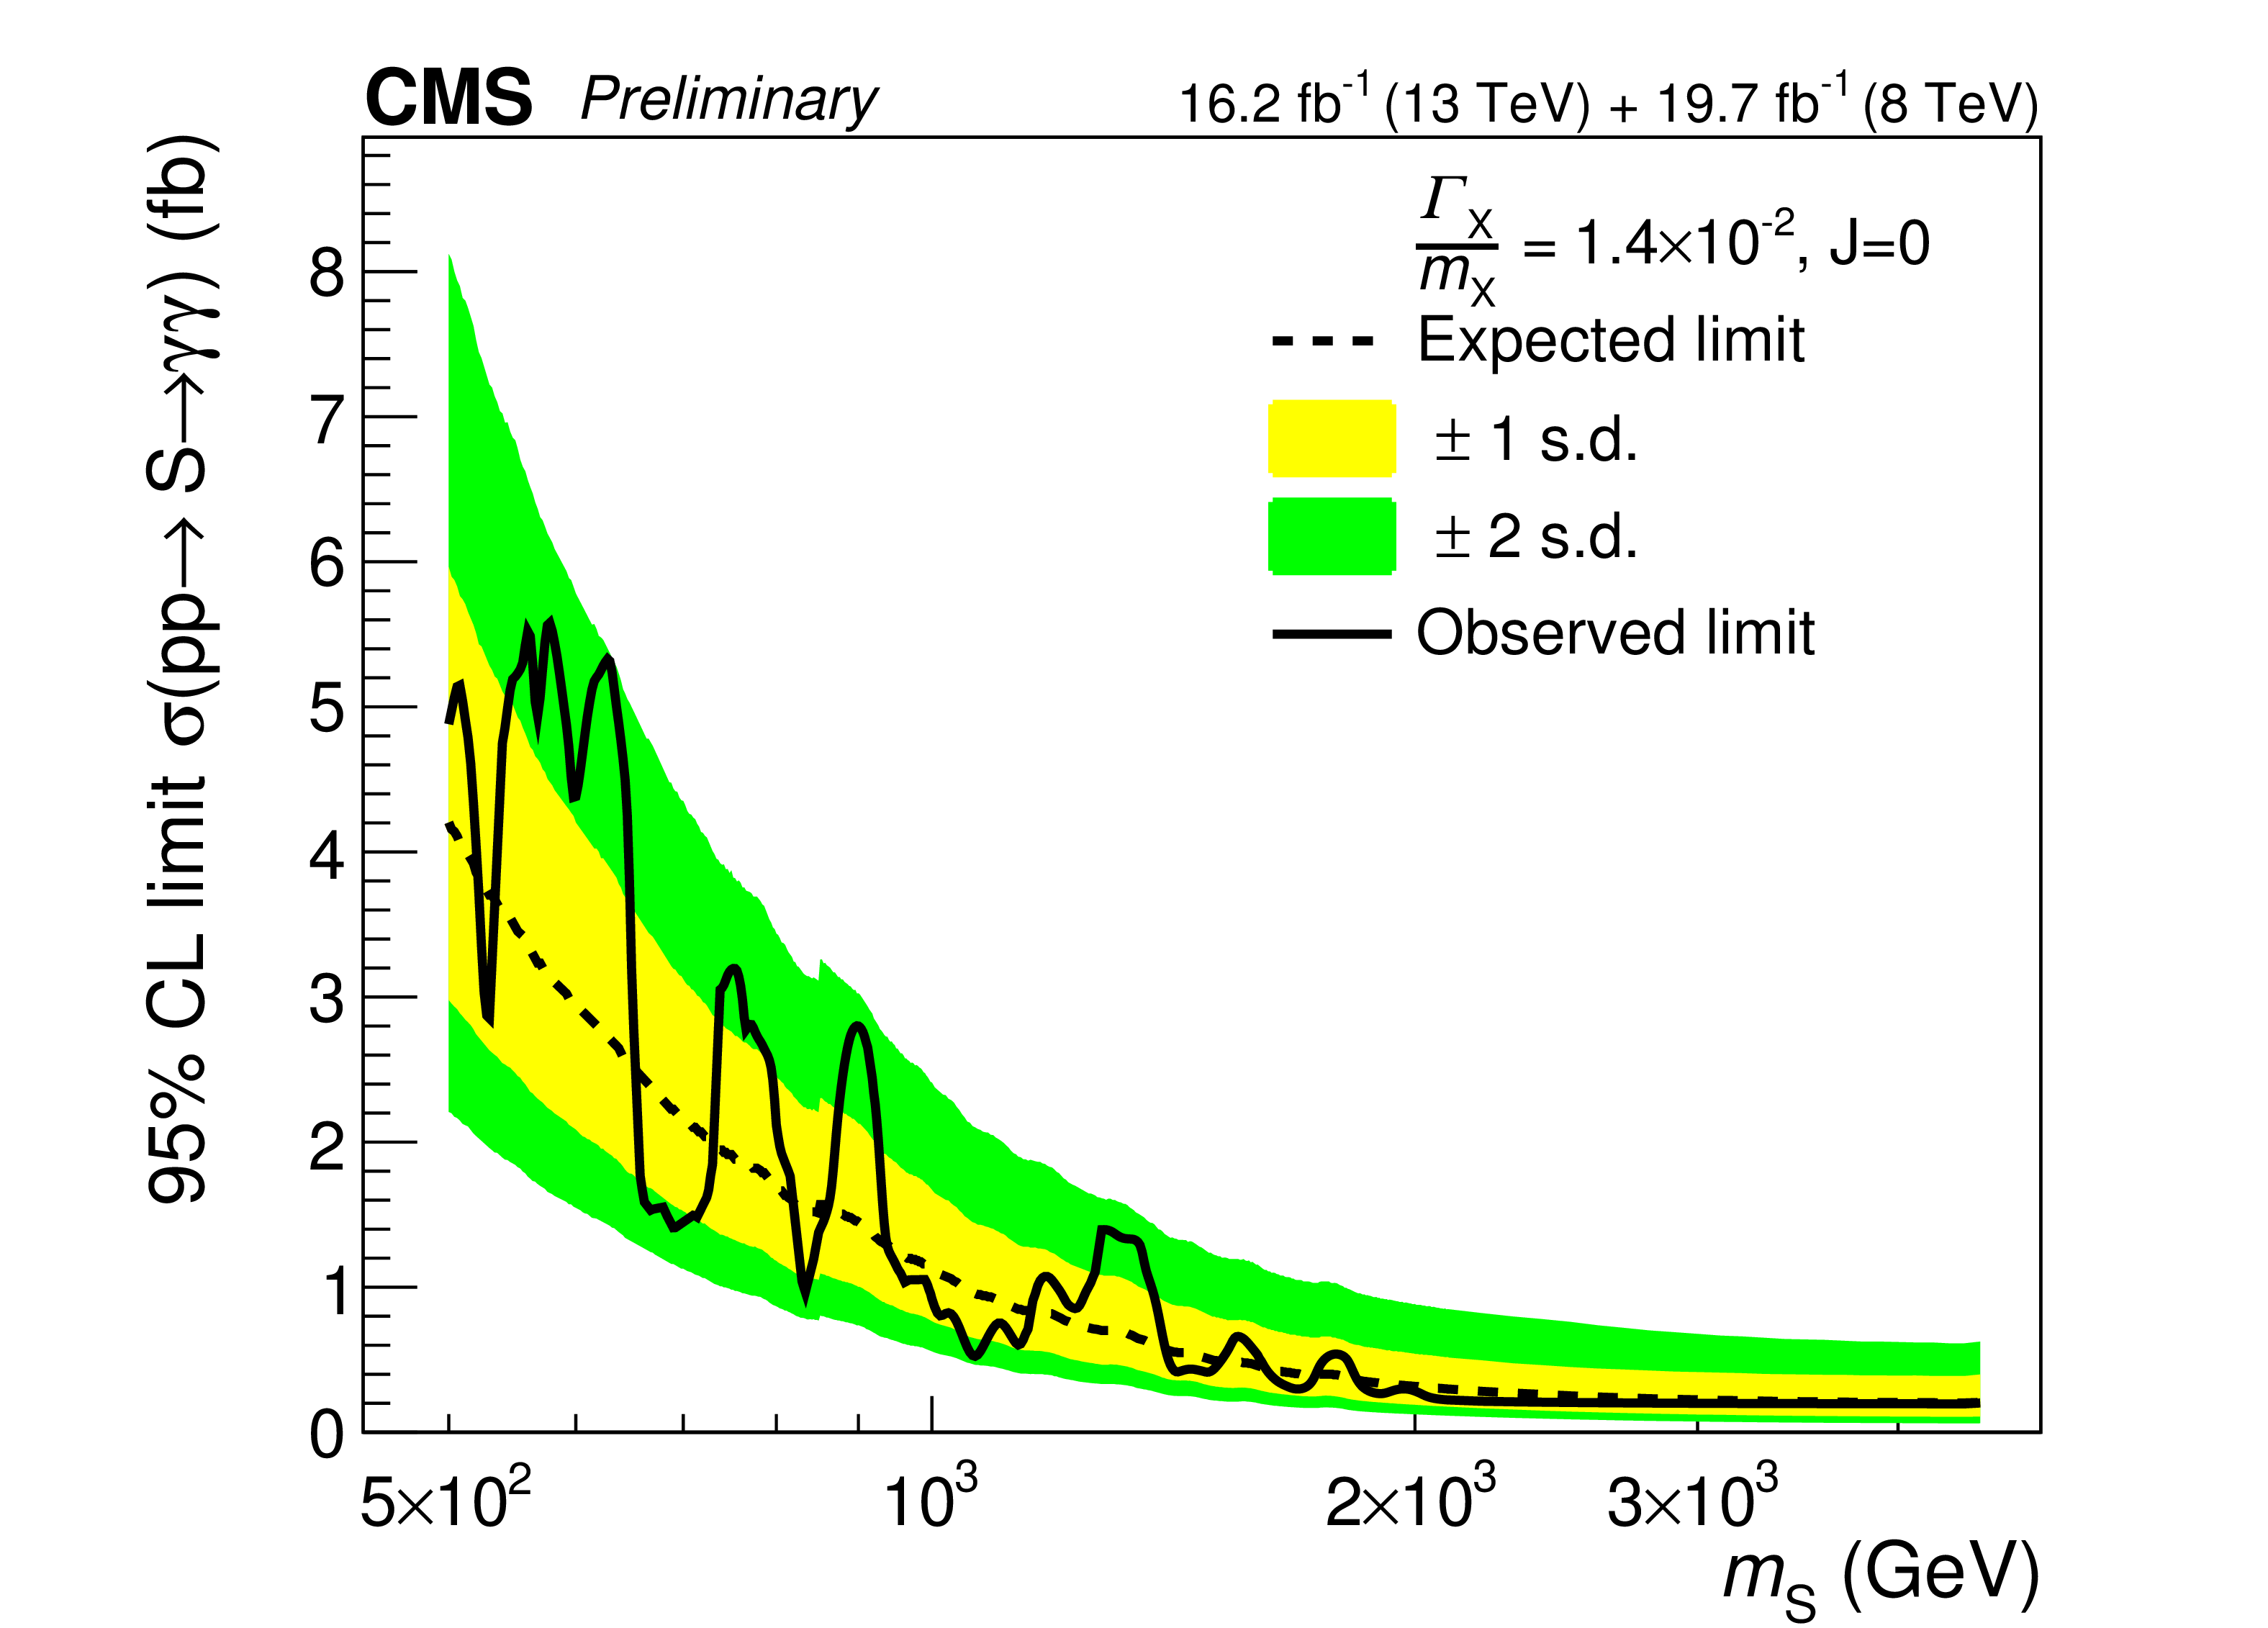
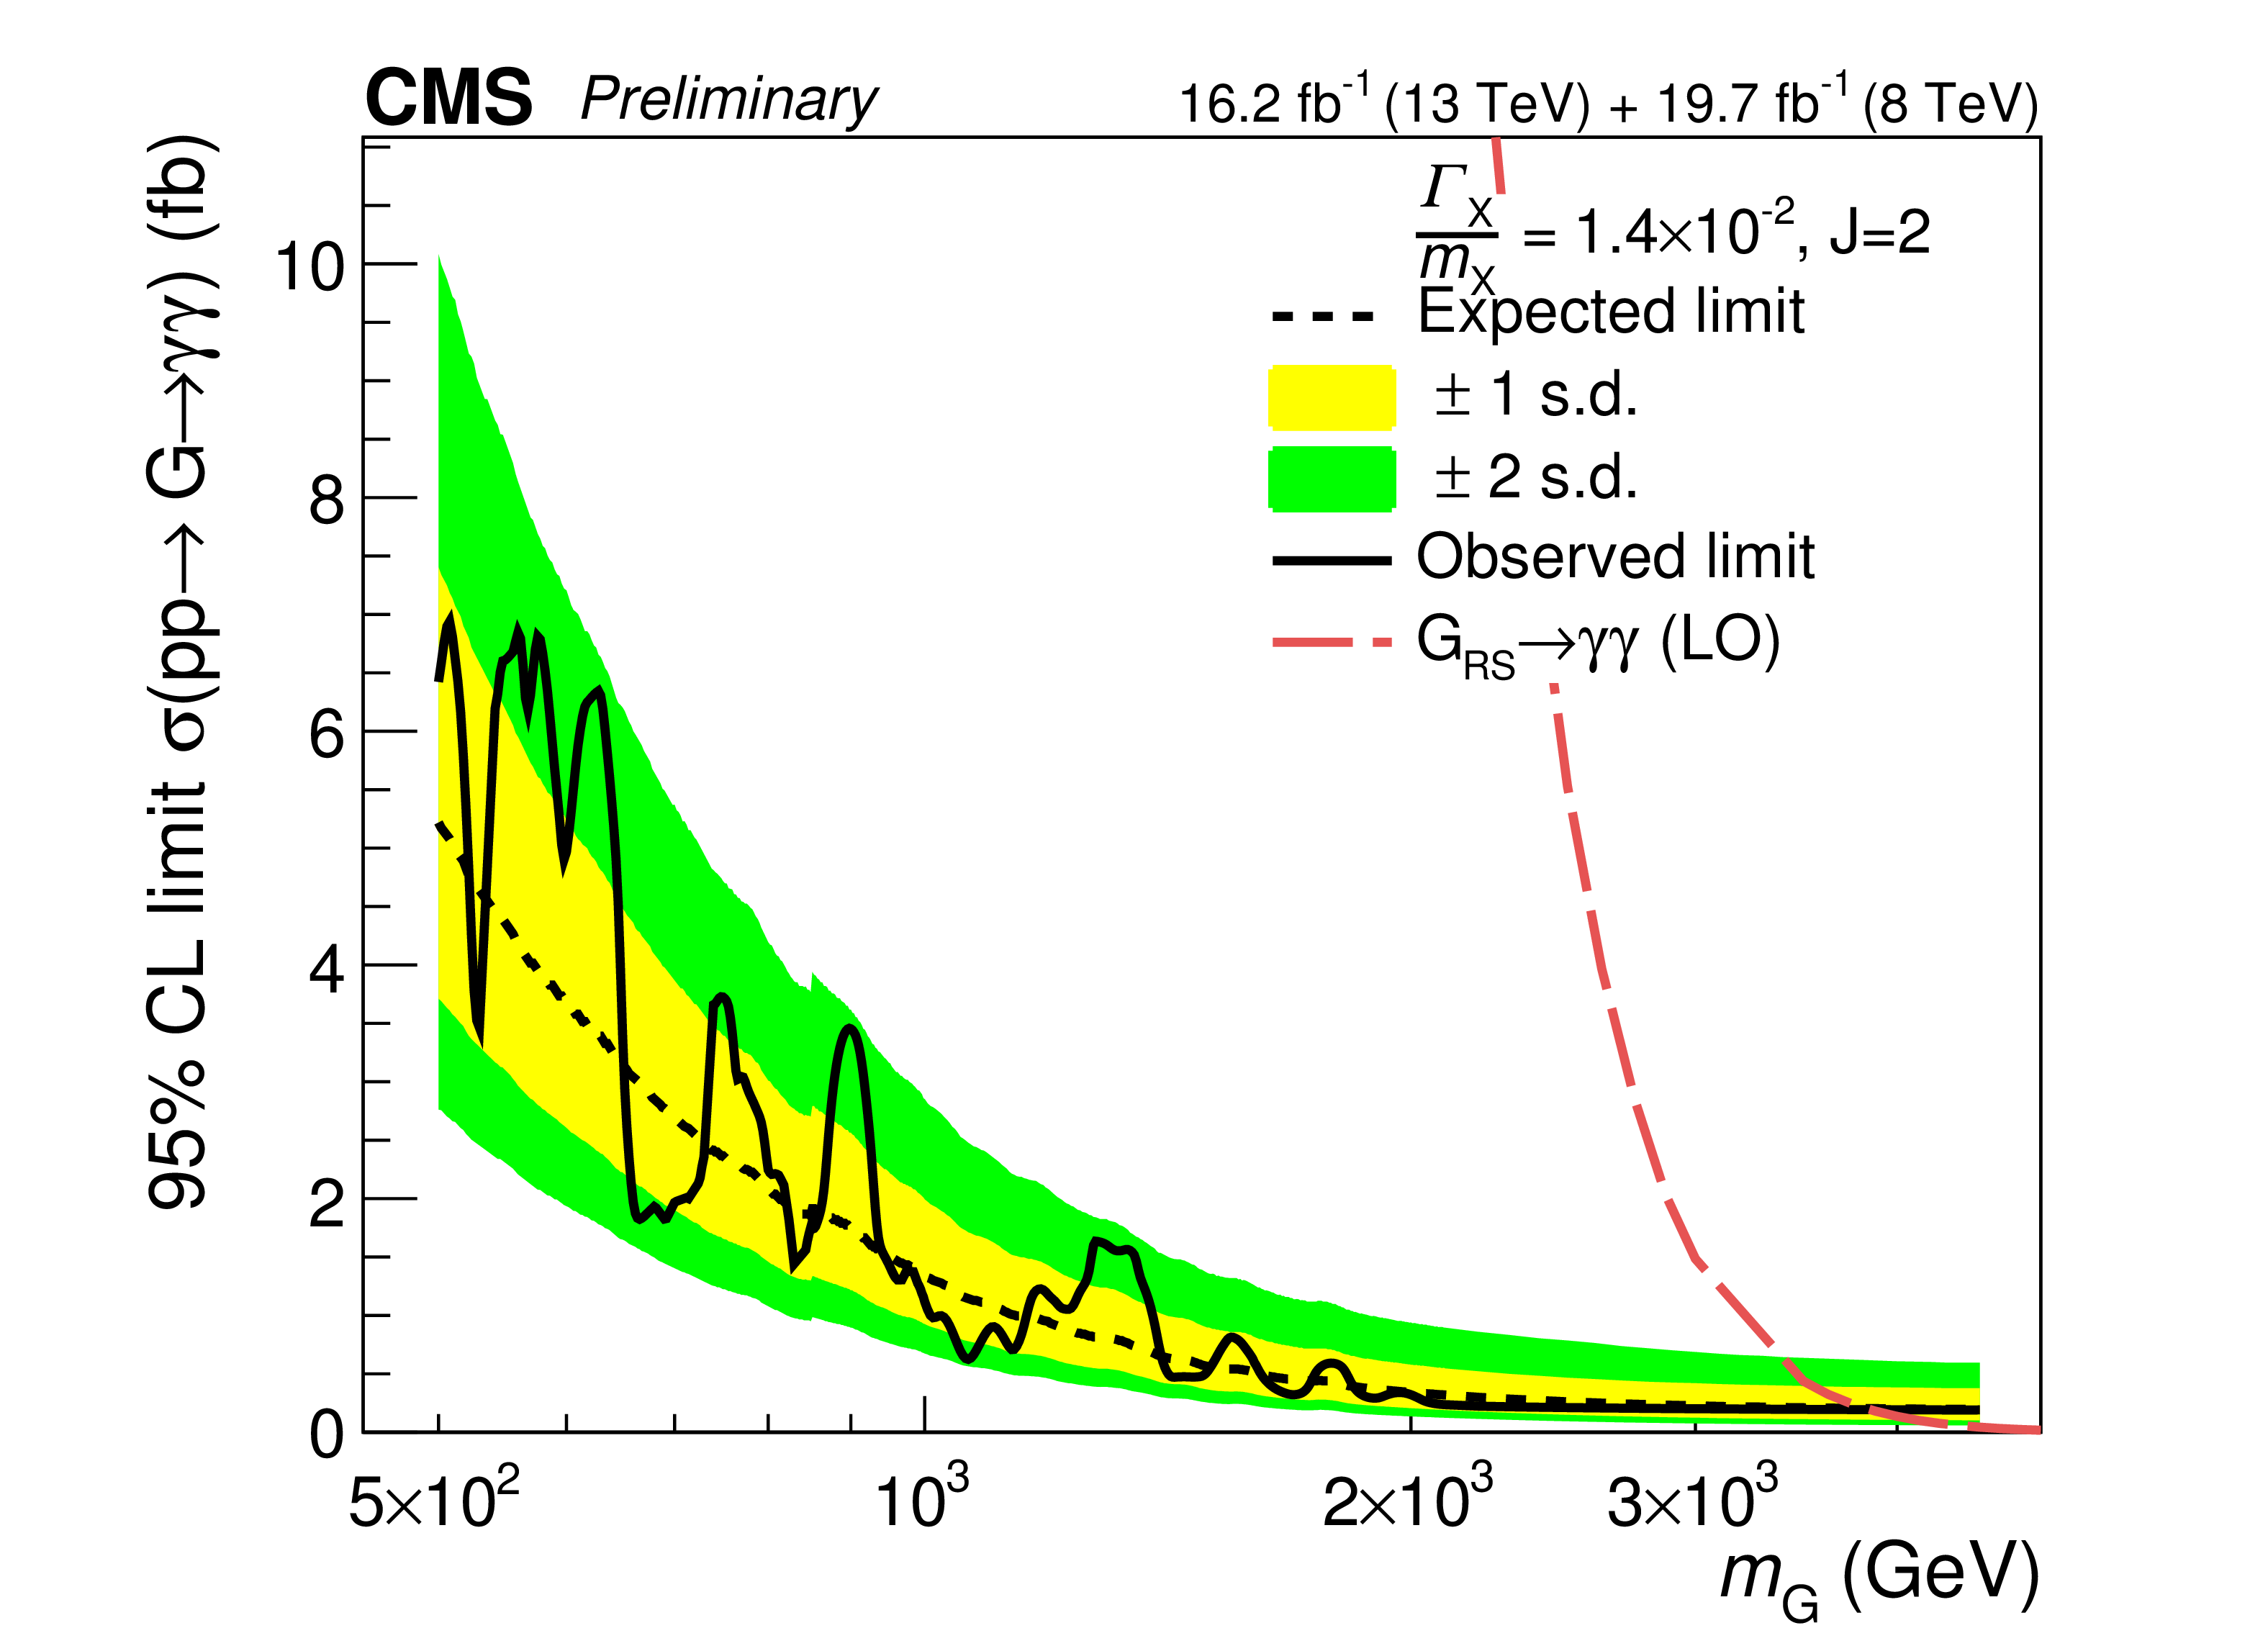
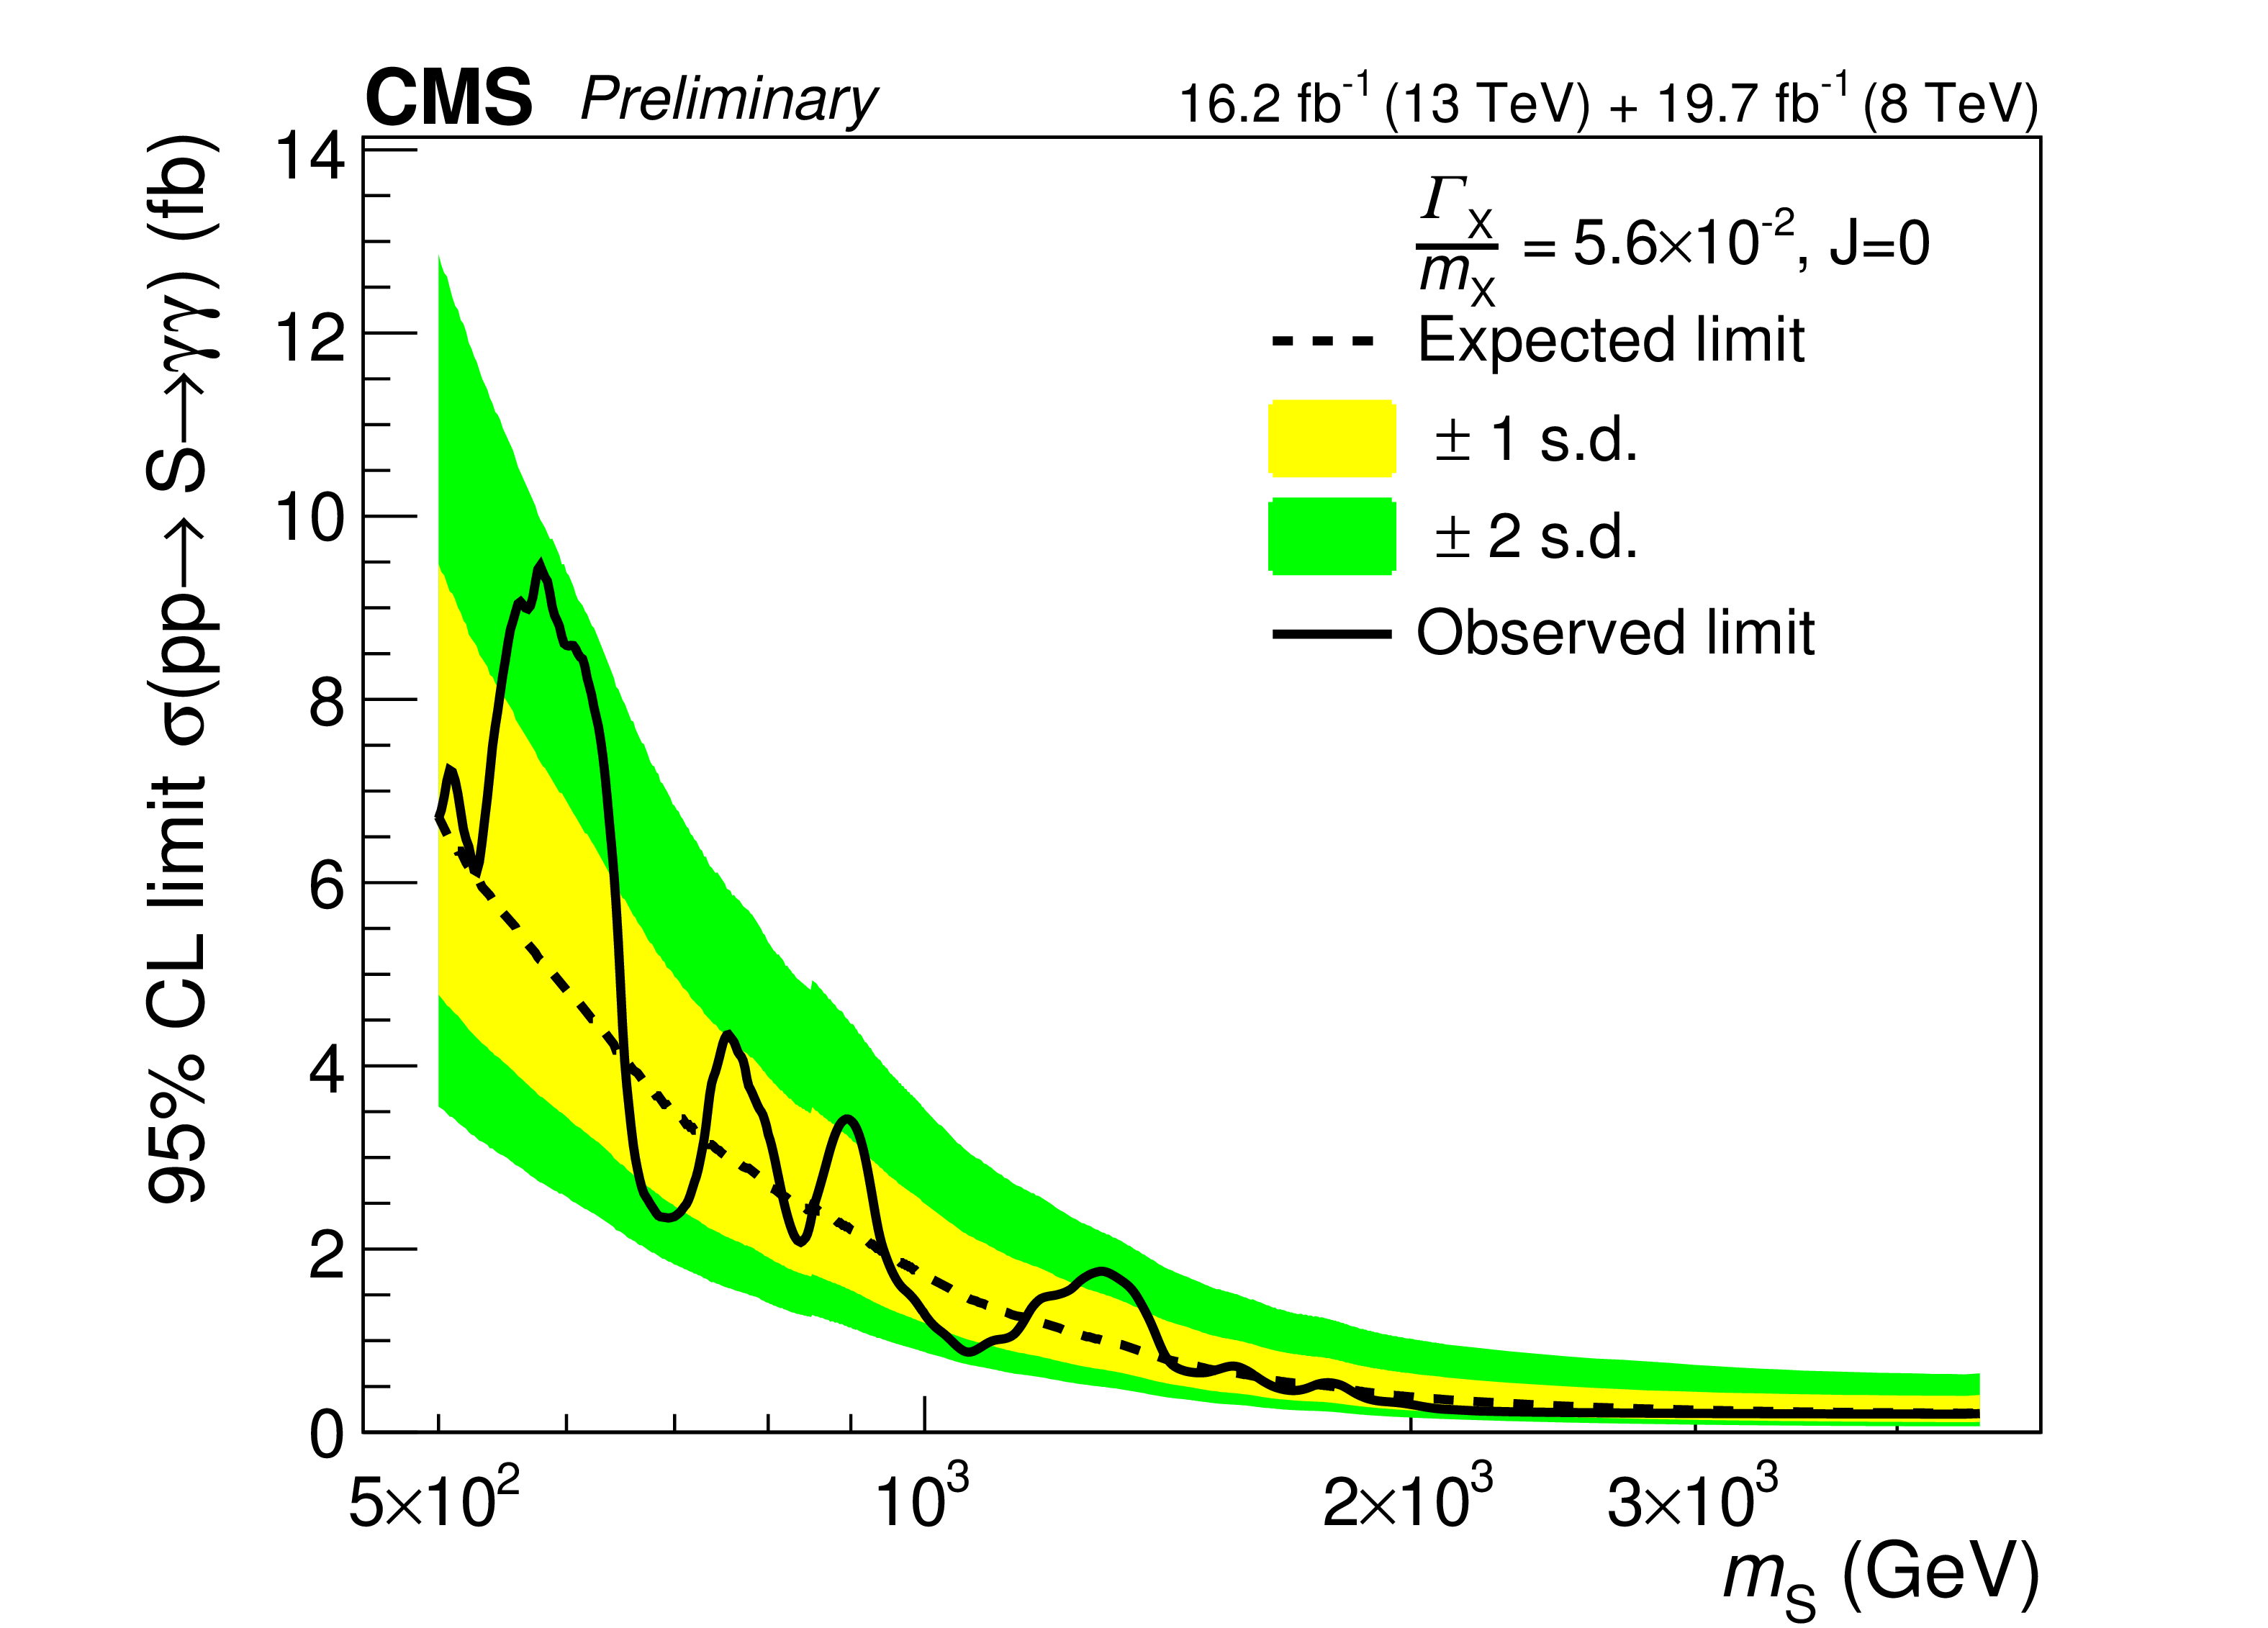
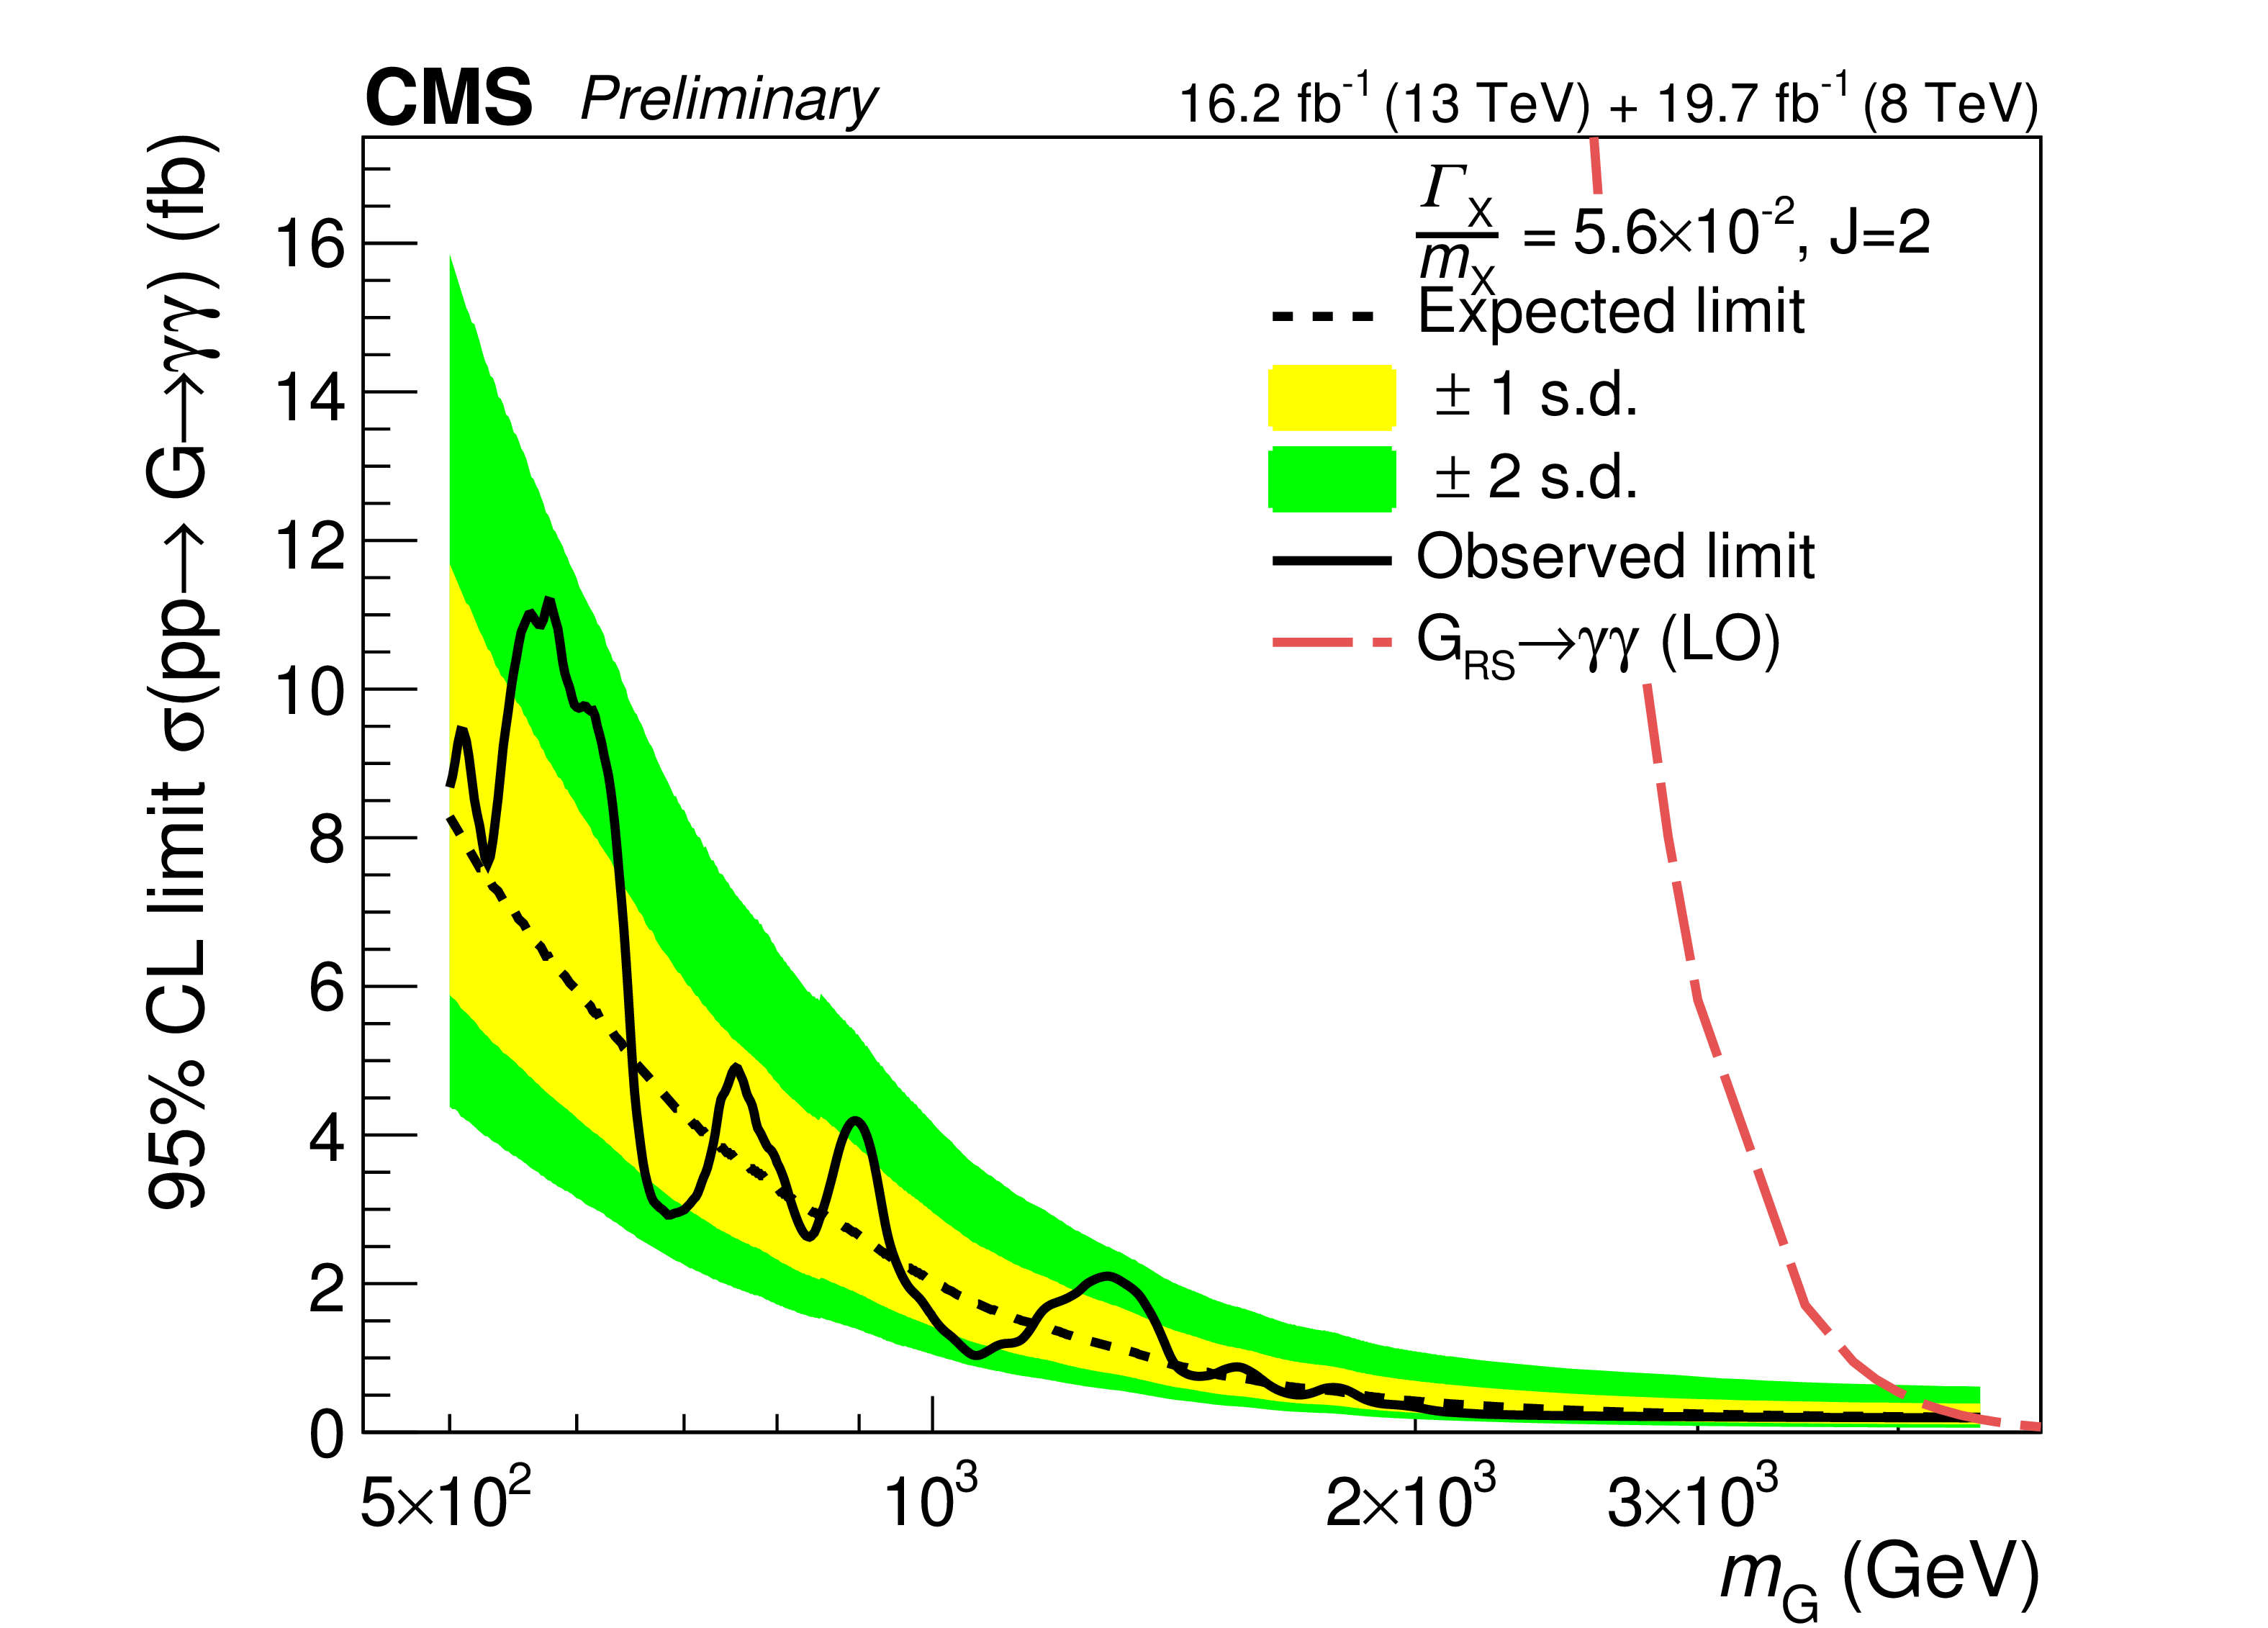
Figure 7:
The 95% CL upper limits on the production of diphoton resonances as a function of the resonance mass ${m_{ {\mathrm {X}}}} $, from the combined analysis of the 8 and 13 TeV data. The 8 TeV results are scaled by the ratio of the 8 to 13 TeV cross sections. The blue-grey (darker) curves and the green (lighter) ones correspond to the scalar and RS graviton signals, respectively. Solid (dashed) curves represent the observed (median expected) exclusion limit. The expected results are shown with their 1 standard deviation dispersion bands. The leading-order RS graviton production cross section is shown by the red dot-dashed curves. The results are shown for (upper) a narrow, (middle) an intermediate-width, and (lower) a broad resonance, with the value of the width ${\Gamma _{ {\mathrm {X}}} / m_{ {\mathrm {X}}}} $, relative to the mass, indicated in the legend of each plot. |
png pdf |
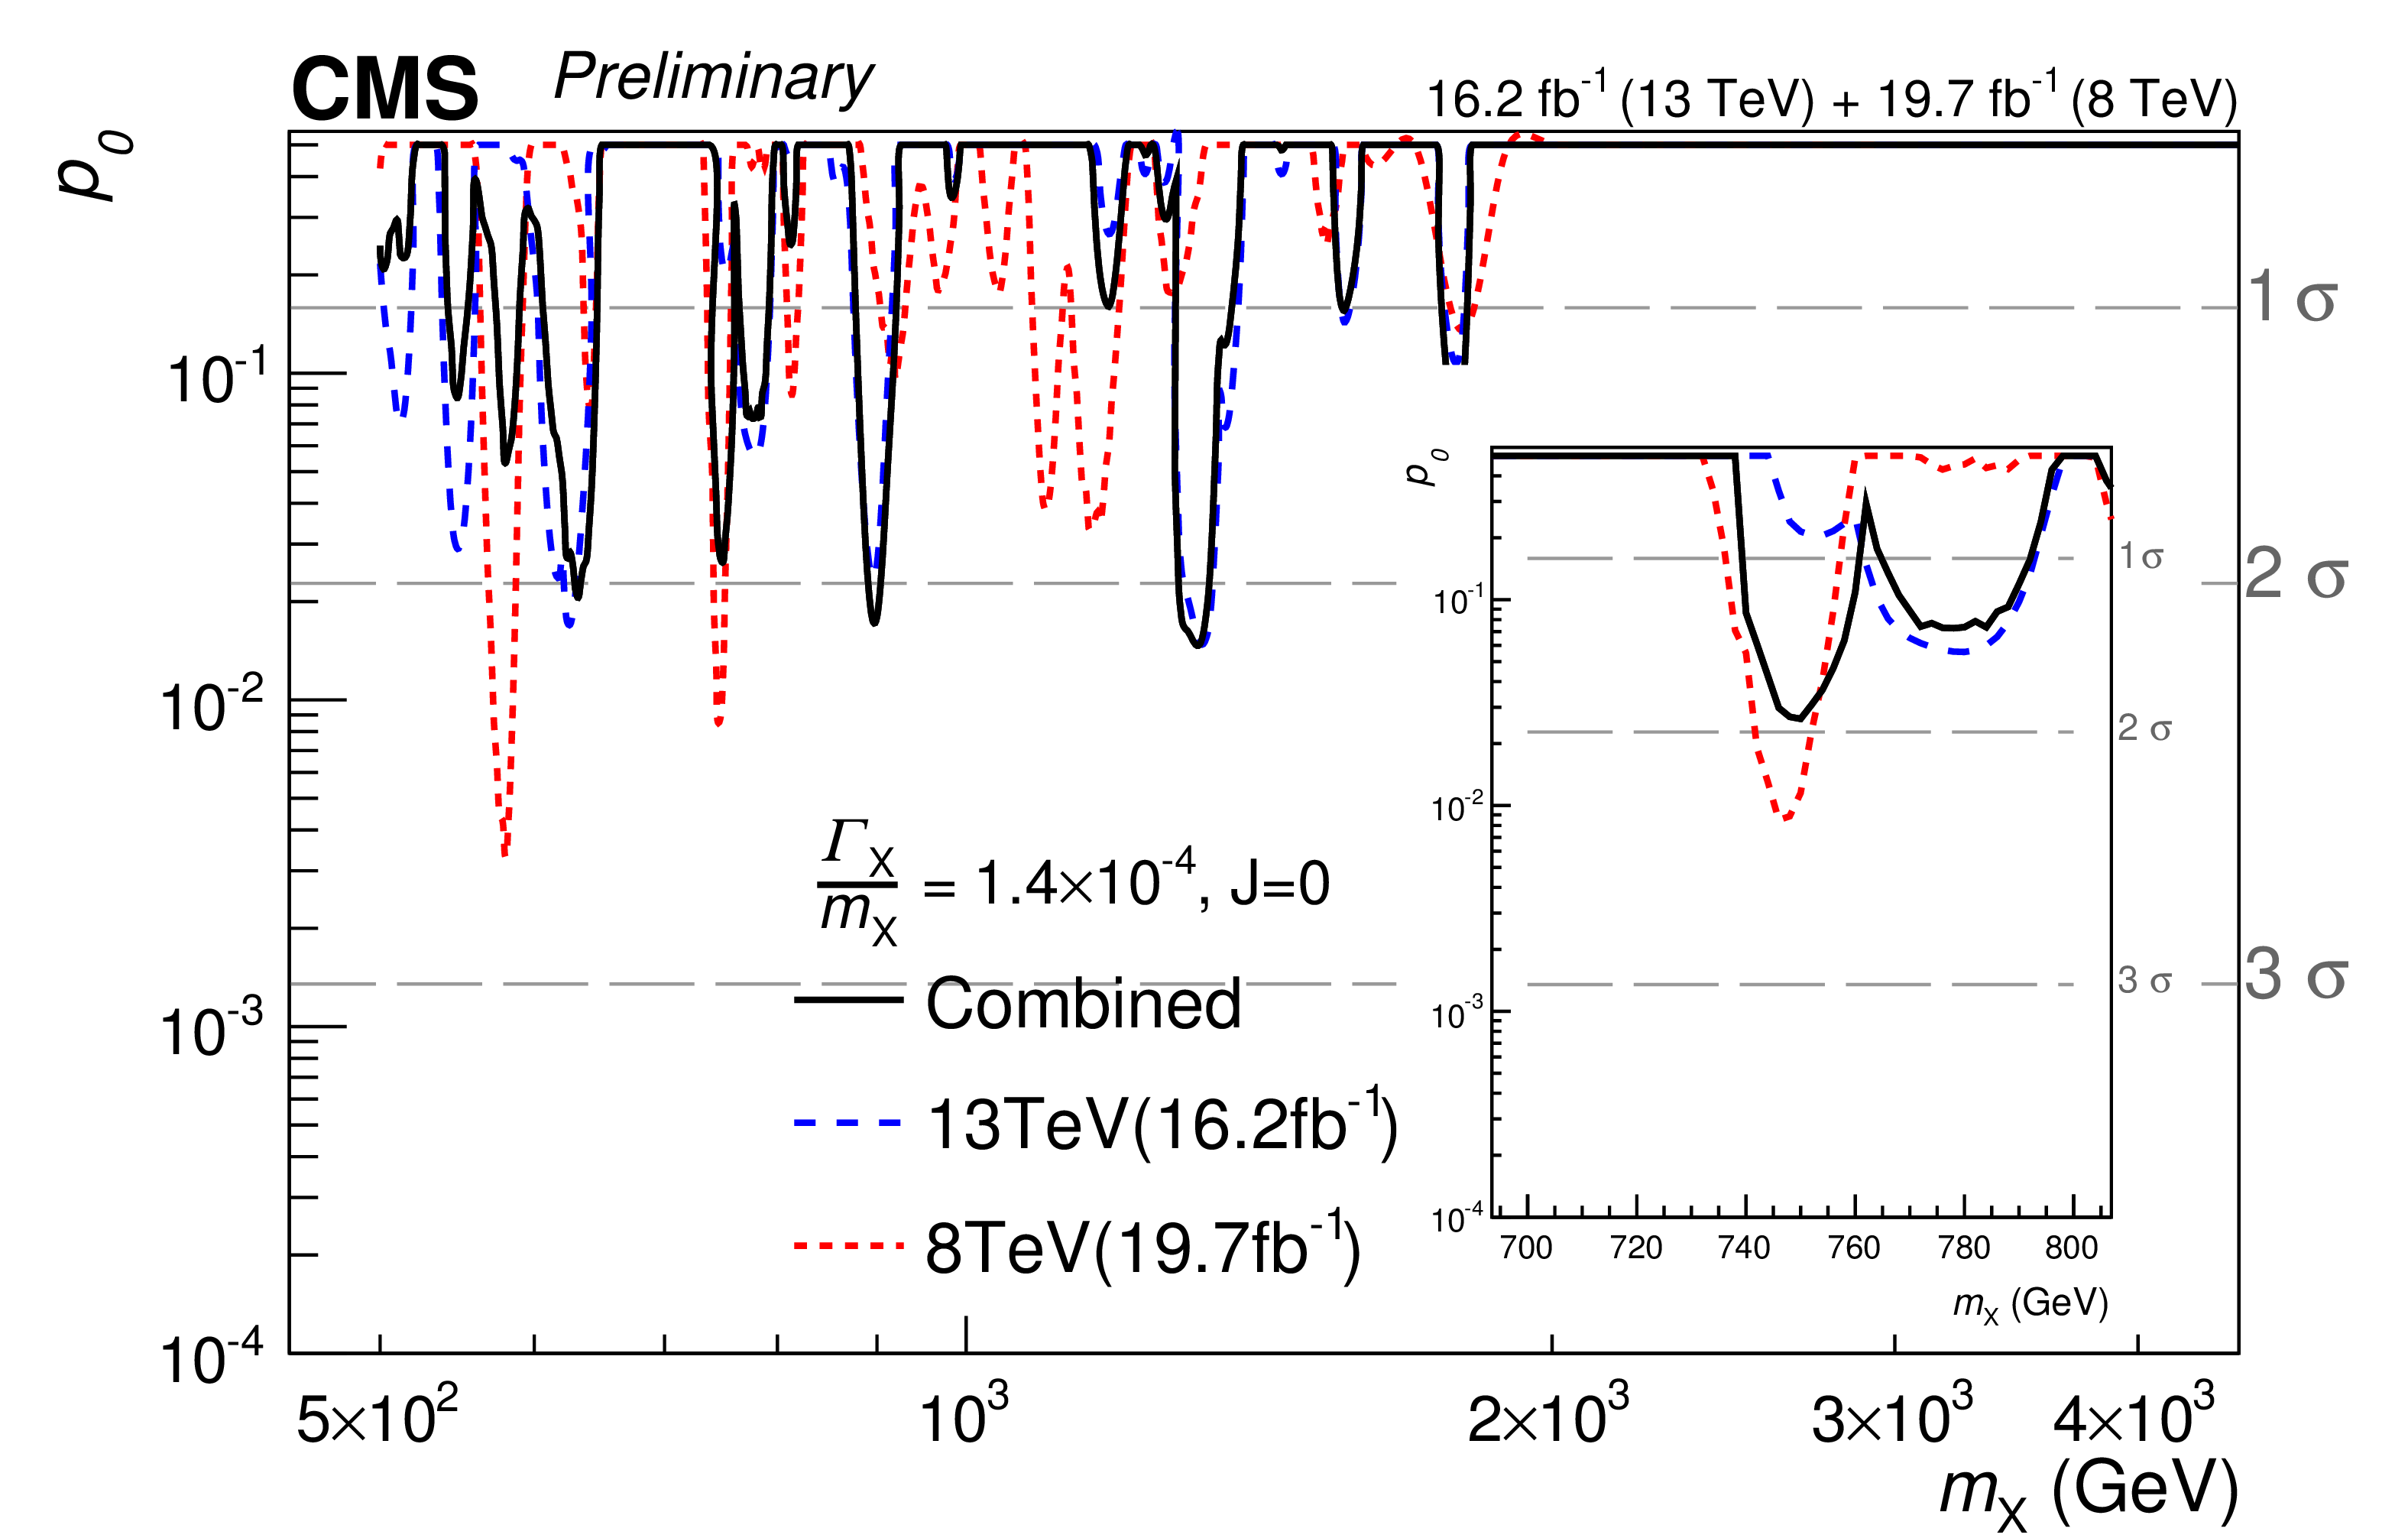
Figure 8-a:
Observed background-only $p$-values for resonances with $ {\Gamma _{ {\mathrm {X}}} / m_{ {\mathrm {X}}}} = 1.4 \times 10^{-4} $ (a,b) and $ 5.6 \times 10^{-2} $ (c,d) as a function of the resonance mass ${m_{ {\mathrm {X}}}} $, from the combined analysis of the 8 and 13 TeV data. The results obtained at the two centre of mass energies are also shown. Curves corresponding to the scalar and RS graviton hypotheses are shown in (a,c) and (b,d) columns respectively. |
png pdf |
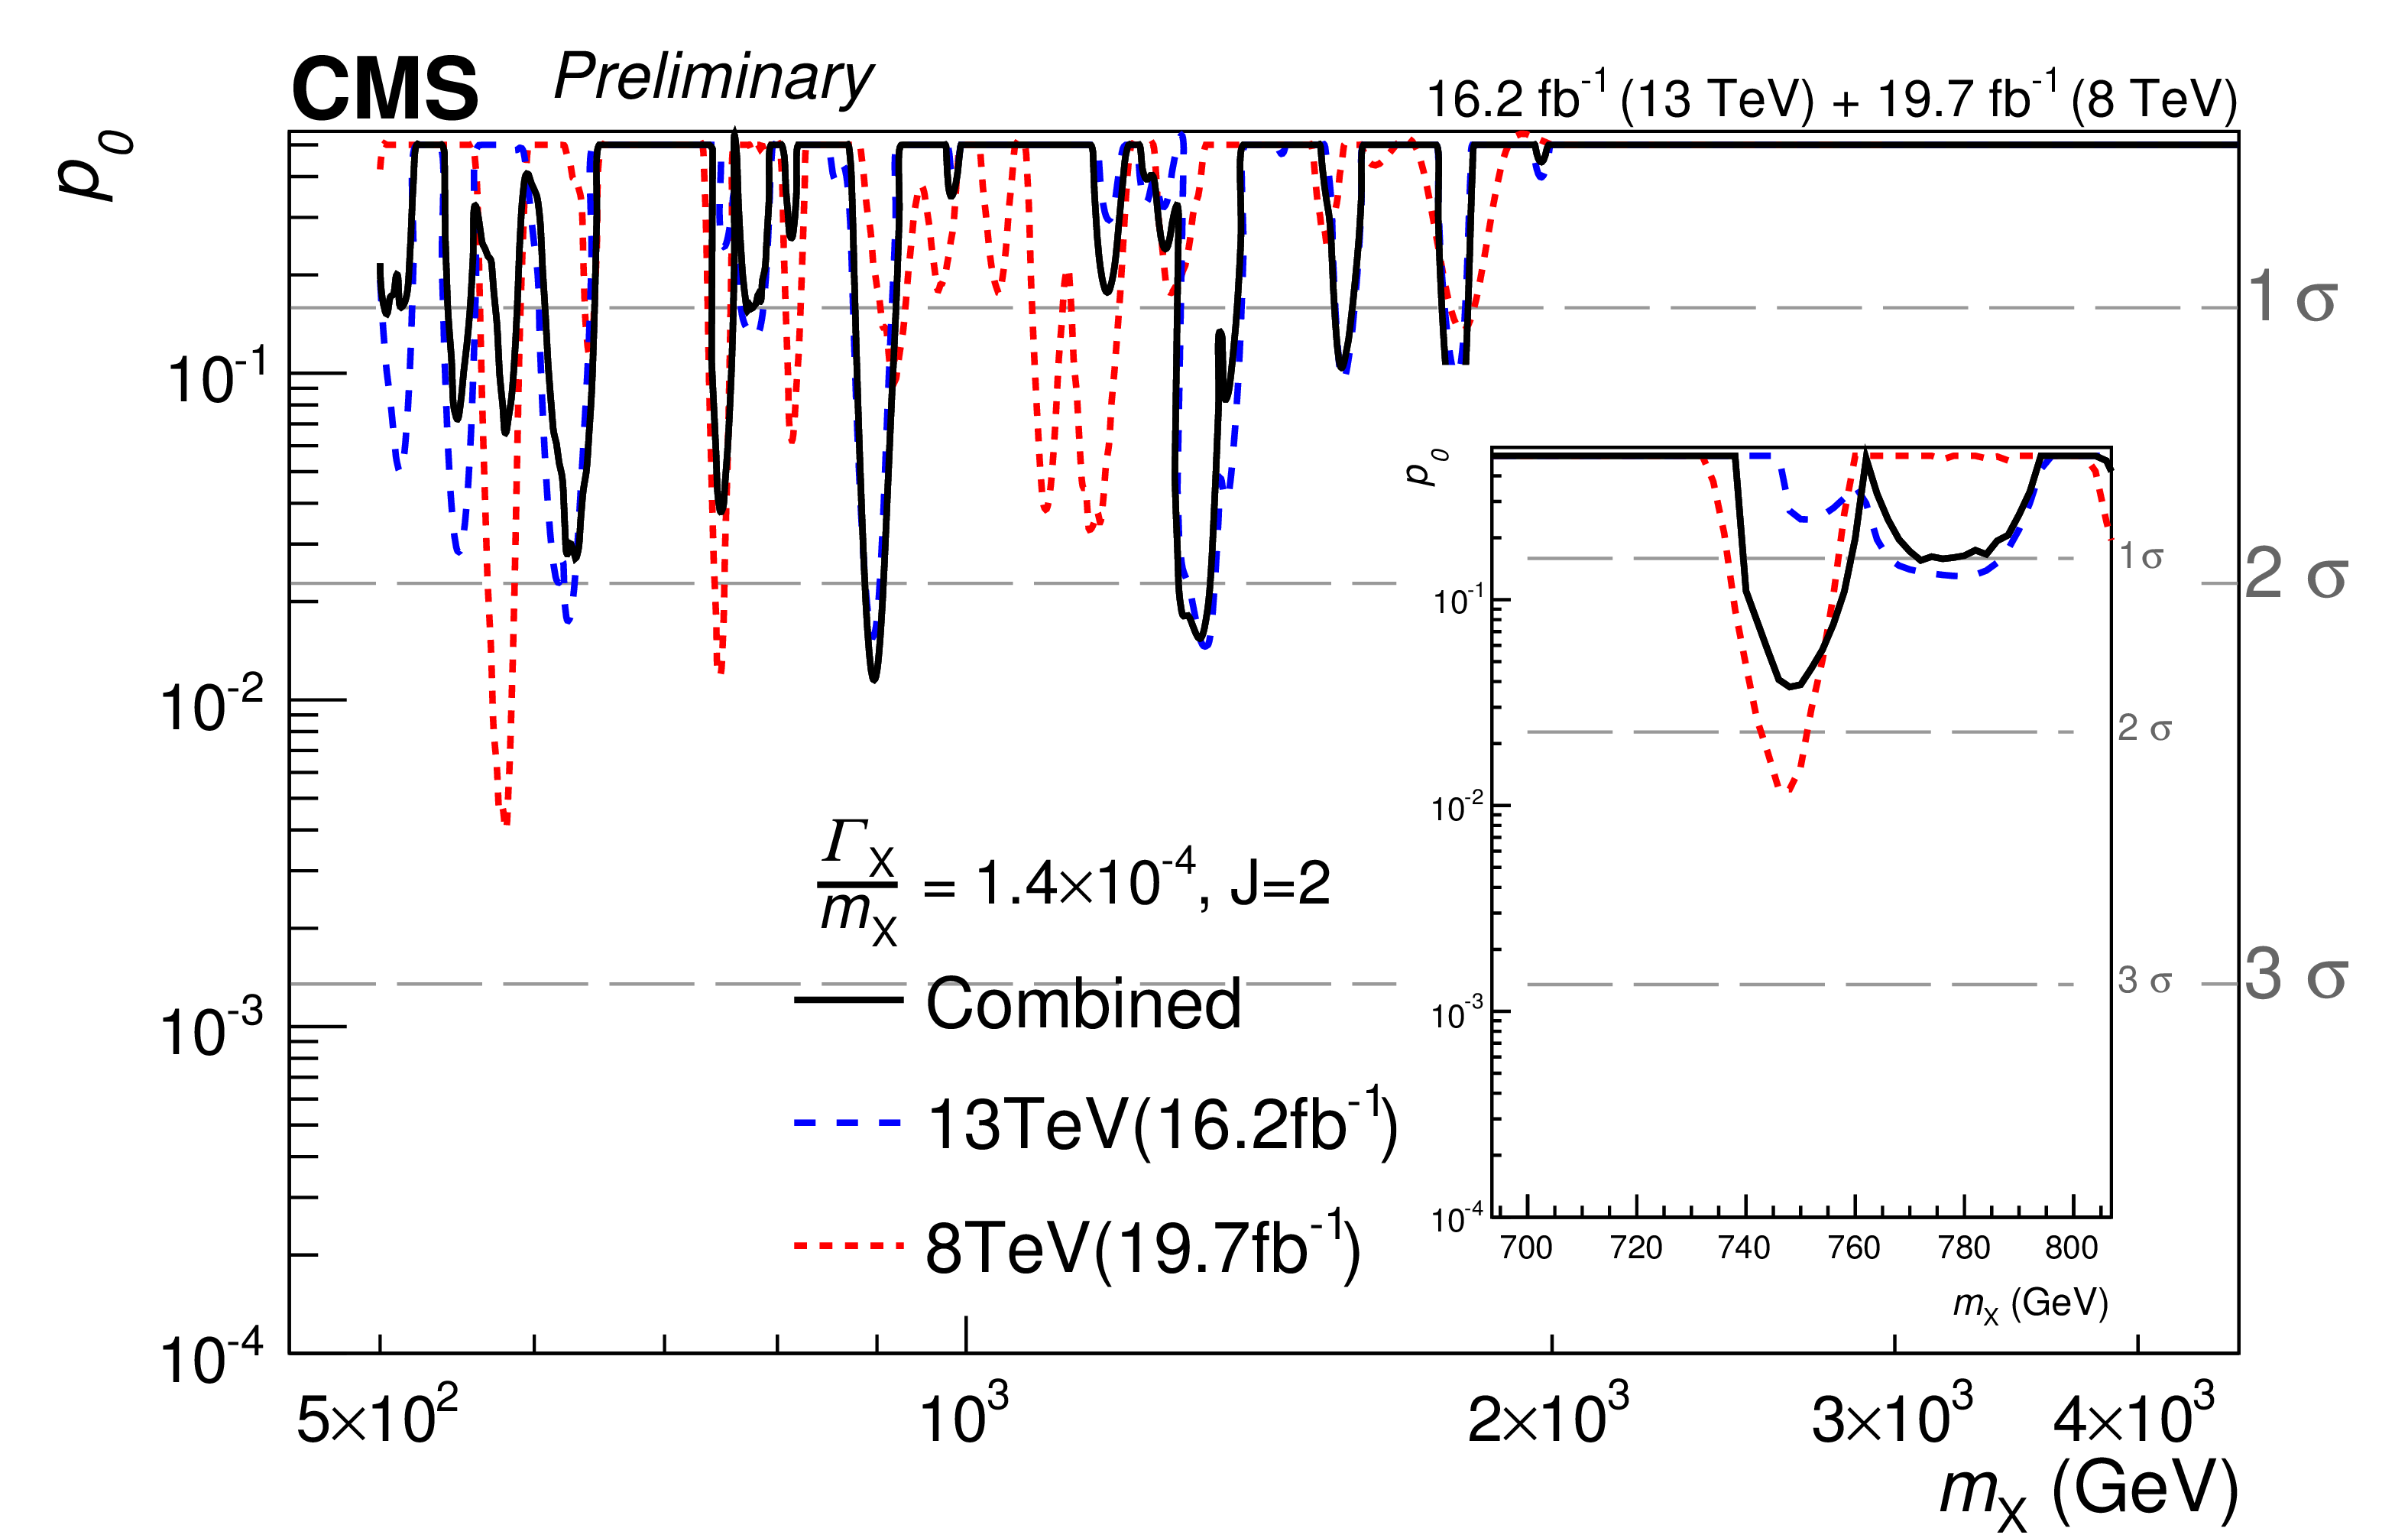
Figure 8-b:
Observed background-only $p$-values for resonances with $ {\Gamma _{ {\mathrm {X}}} / m_{ {\mathrm {X}}}} = 1.4 \times 10^{-4} $ (a,b) and $ 5.6 \times 10^{-2} $ (c,d) as a function of the resonance mass ${m_{ {\mathrm {X}}}} $, from the combined analysis of the 8 and 13 TeV data. The results obtained at the two centre of mass energies are also shown. Curves corresponding to the scalar and RS graviton hypotheses are shown in (a,c) and (b,d) columns respectively. |
png pdf |
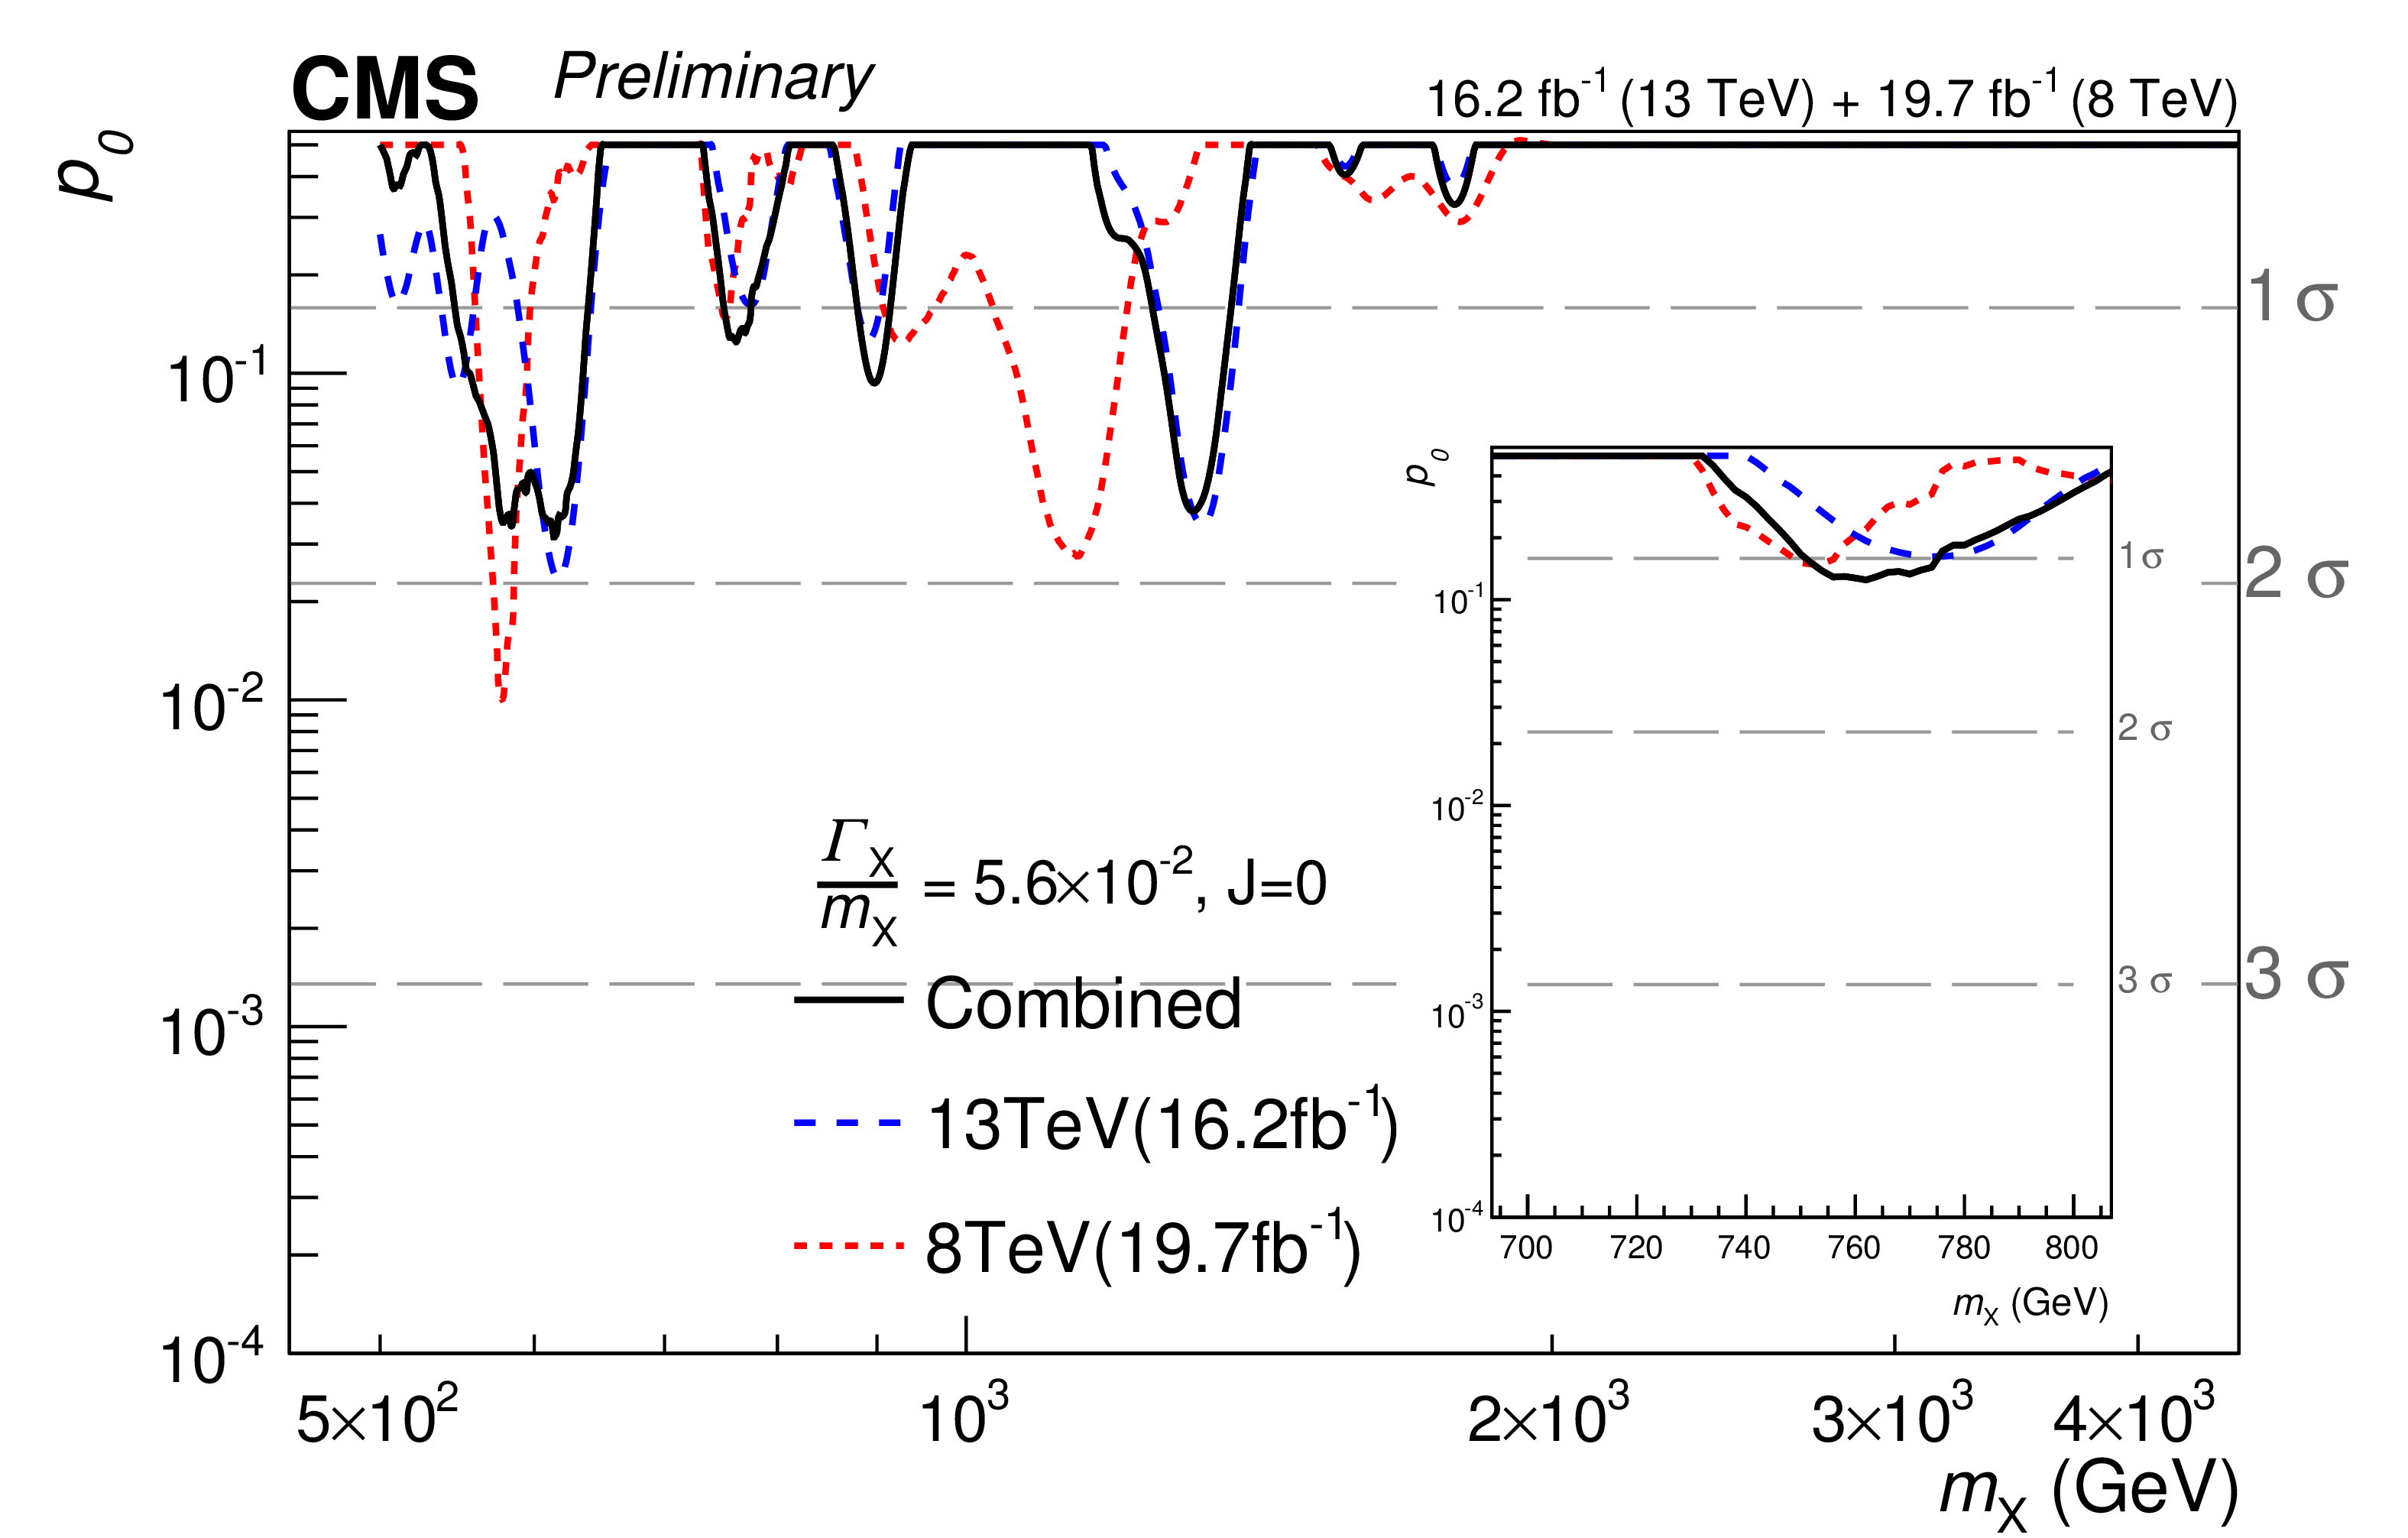
Figure 8-c:
Observed background-only $p$-values for resonances with $ {\Gamma _{ {\mathrm {X}}} / m_{ {\mathrm {X}}}} = 1.4 \times 10^{-4} $ (a,b) and $ 5.6 \times 10^{-2} $ (c,d) as a function of the resonance mass ${m_{ {\mathrm {X}}}} $, from the combined analysis of the 8 and 13 TeV data. The results obtained at the two centre of mass energies are also shown. Curves corresponding to the scalar and RS graviton hypotheses are shown in (a,c) and (b,d) columns respectively. |

png pdf |
Figure 8-d:
Observed background-only $p$-values for resonances with $ {\Gamma _{ {\mathrm {X}}} / m_{ {\mathrm {X}}}} = 1.4 \times 10^{-4} $ (a,b) and $ 5.6 \times 10^{-2} $ (c,d) as a function of the resonance mass ${m_{ {\mathrm {X}}}} $, from the combined analysis of the 8 and 13 TeV data. The results obtained at the two centre of mass energies are also shown. Curves corresponding to the scalar and RS graviton hypotheses are shown in (a,c) and (b,d) columns respectively. |
| Summary |
| A search for the resonant production of high mass photon pairs has been presented. The analysis is based on 12.9 fb$^{-1}$ of pp collisions collected by the CMS experiment in 2016 at $\sqrt{s} =$ 13 TeV. Events containing two photon candidates with transverse momenta above 75 GeV are selected. The mass spectrum above 500 GeV is inspected to search for the production of spin-0 and spin-2 resonances. Limits on the production of scalar resonances and Randall-Sundrum gravitons in the range where 0.5 TeV $ < m_{\mathrm{X}} < $ 4.5 TeV and $\Gamma_{\mathrm{X}}/m_{\mathrm{X}} < 5.6 \times 10^{-2}$ are set using the modified frequentist approach. The results obtained with the 2016 dataset are combined statistically with those obtained in Ref. [12] using data corresponding to 19.7 fb$^{-1}$ and 3.3 fb$^{-1}$ recorded at $\sqrt{s}=$ 8 and $\sqrt{s}=$ 13 TeV respectively. No significant excess is observed above the predictions from the standard model. Using the LO cross sections from PYTHIA-8.2, RS gravitons with masses below 3.85 and 4.45 TeV are excluded for $\tilde{k} =$ 0.1 and 0.2 respectively. For $\tilde{k}=0.01$, graviton masses below 1.95 TeV are excluded, except for the region between 1.75 TeV and 1.85 TeV. These are, to-date, the most stringent limits on RS graviton production. |
| Additional Figures | |
png pdf |
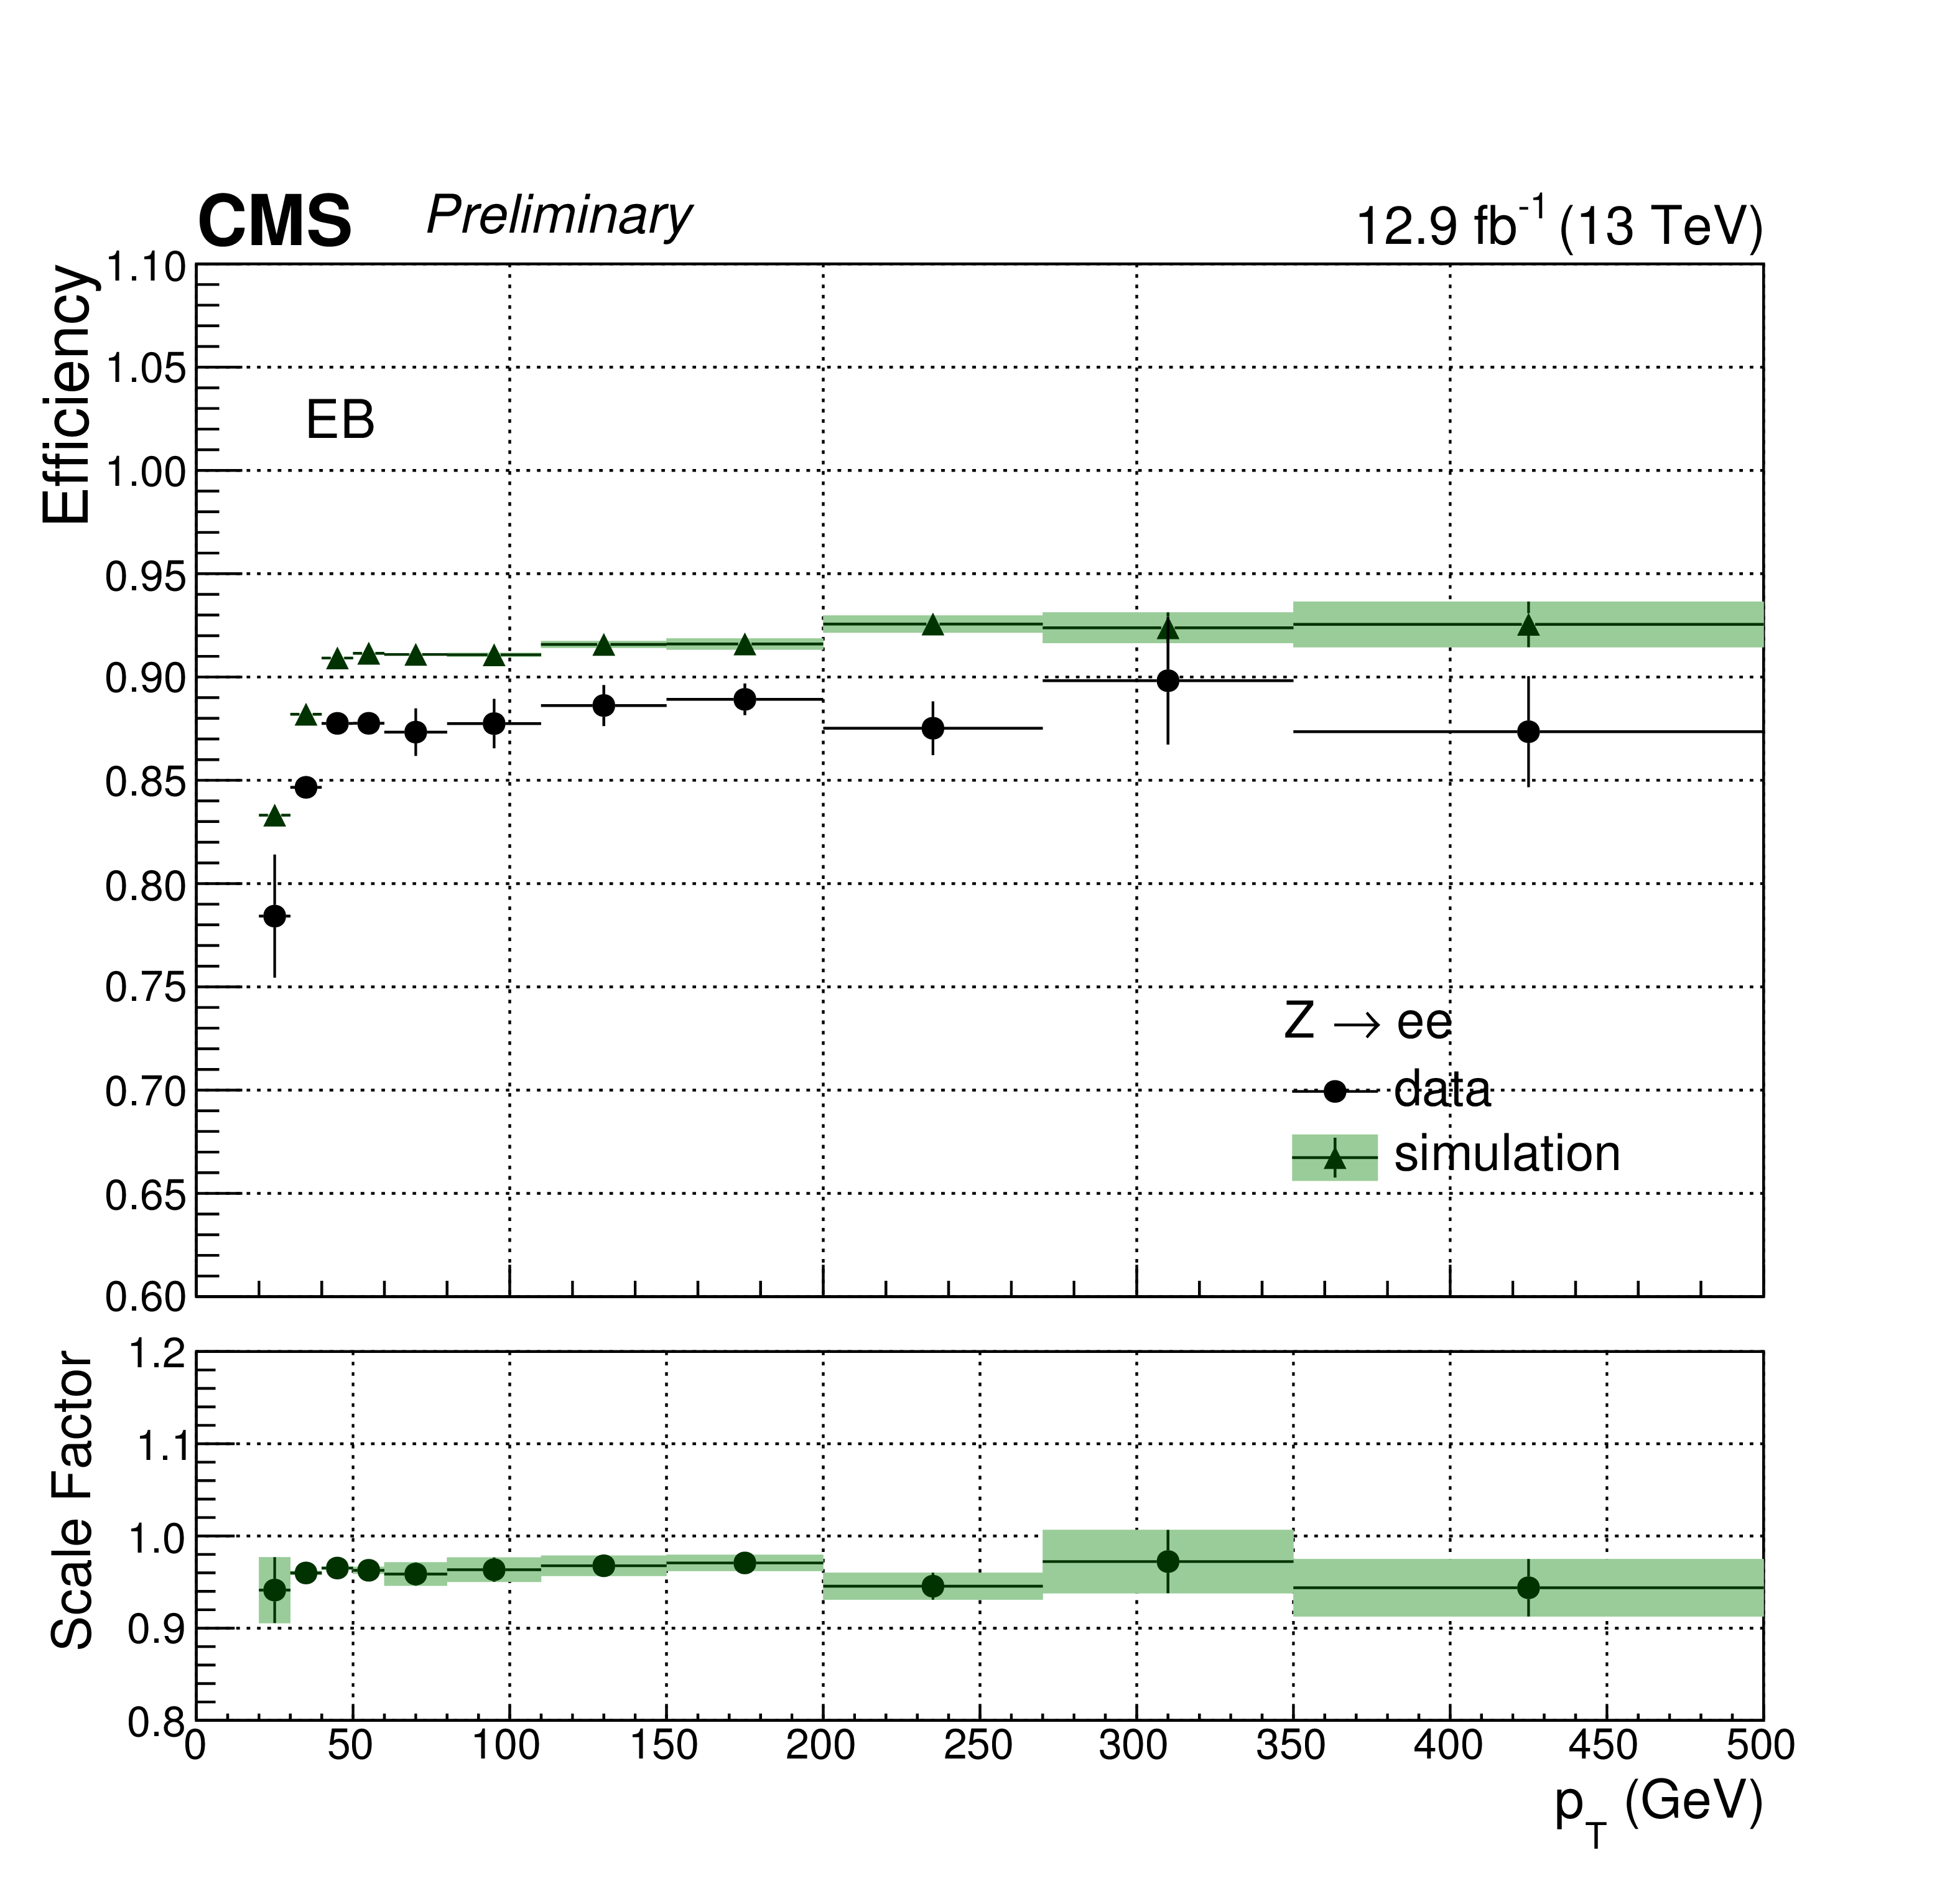
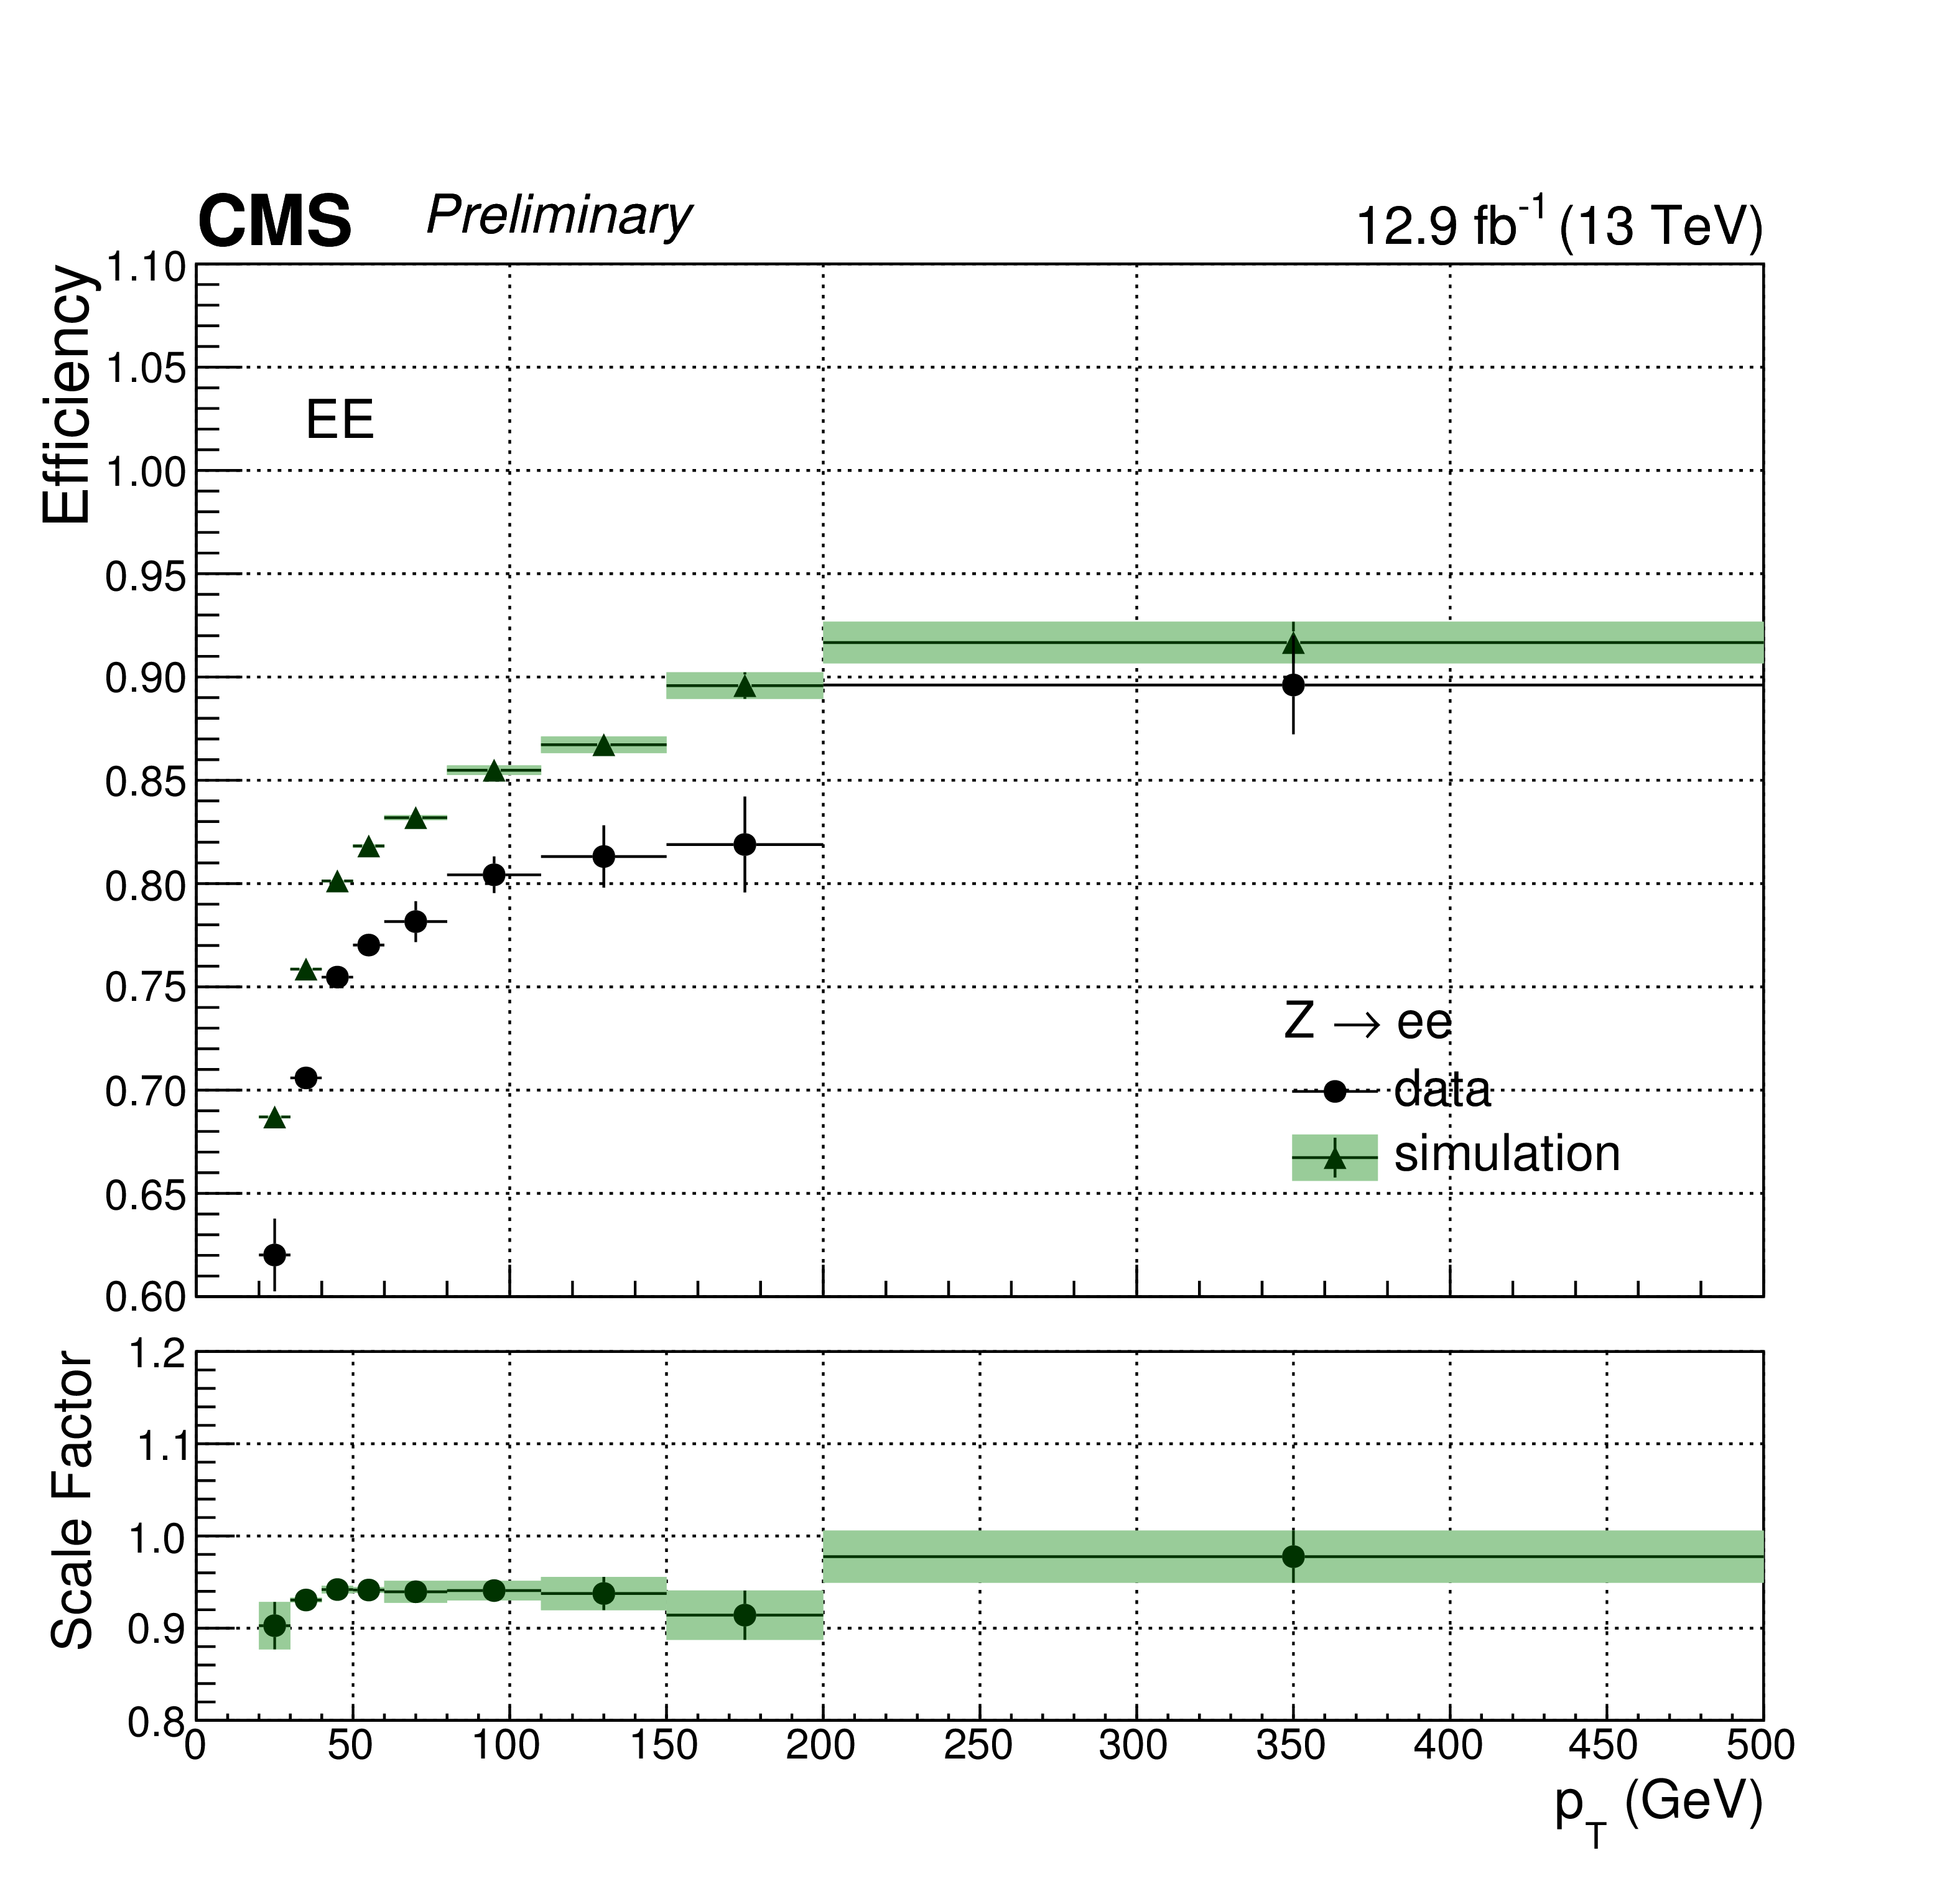
Additional Figure 1-a:
Photon identification efficiency for all selection requirements except the electron rejection, measured in barrel (a) and endcaps (b) using the tag-and-probe method for both data and simulated events. The lower panel shows the ratio between the efficiencies in data and simulation. |
png pdf |
Additional Figure 1-b:
Photon identification efficiency for all selection requirements except the electron rejection, measured in barrel (a) and endcaps (b) using the tag-and-probe method for both data and simulated events. The lower panel shows the ratio between the efficiencies in data and simulation. |

png pdf |
Additional Figure 2-a:
Observed background-only $p$-values for resonances with $\Gamma _{\mathrm{X}} / m_{\mathrm{X}} = 1.4\times 10^{-2}$ as a function of the resonance mass $m_{\mathrm{X}}$, from the combined analysis of the 13 TeV data recorded in 2015 and 2016. The results obtained with the two individual datasets are also shown. Curves corresponding to the scalar and RS graviton hypotheses are shown in (a) and (b) respectively. |

png pdf |
Additional Figure 2-b:
Observed background-only $p$-values for resonances with $\Gamma _{\mathrm{X}} / m_{\mathrm{X}} = 1.4\times 10^{-2}$ as a function of the resonance mass $m_{\mathrm{X}}$, from the combined analysis of the 13 TeV data recorded in 2015 and 2016. The results obtained with the two individual datasets are also shown. Curves corresponding to the scalar and RS graviton hypotheses are shown in (a) and (b) respectively. |

png pdf |
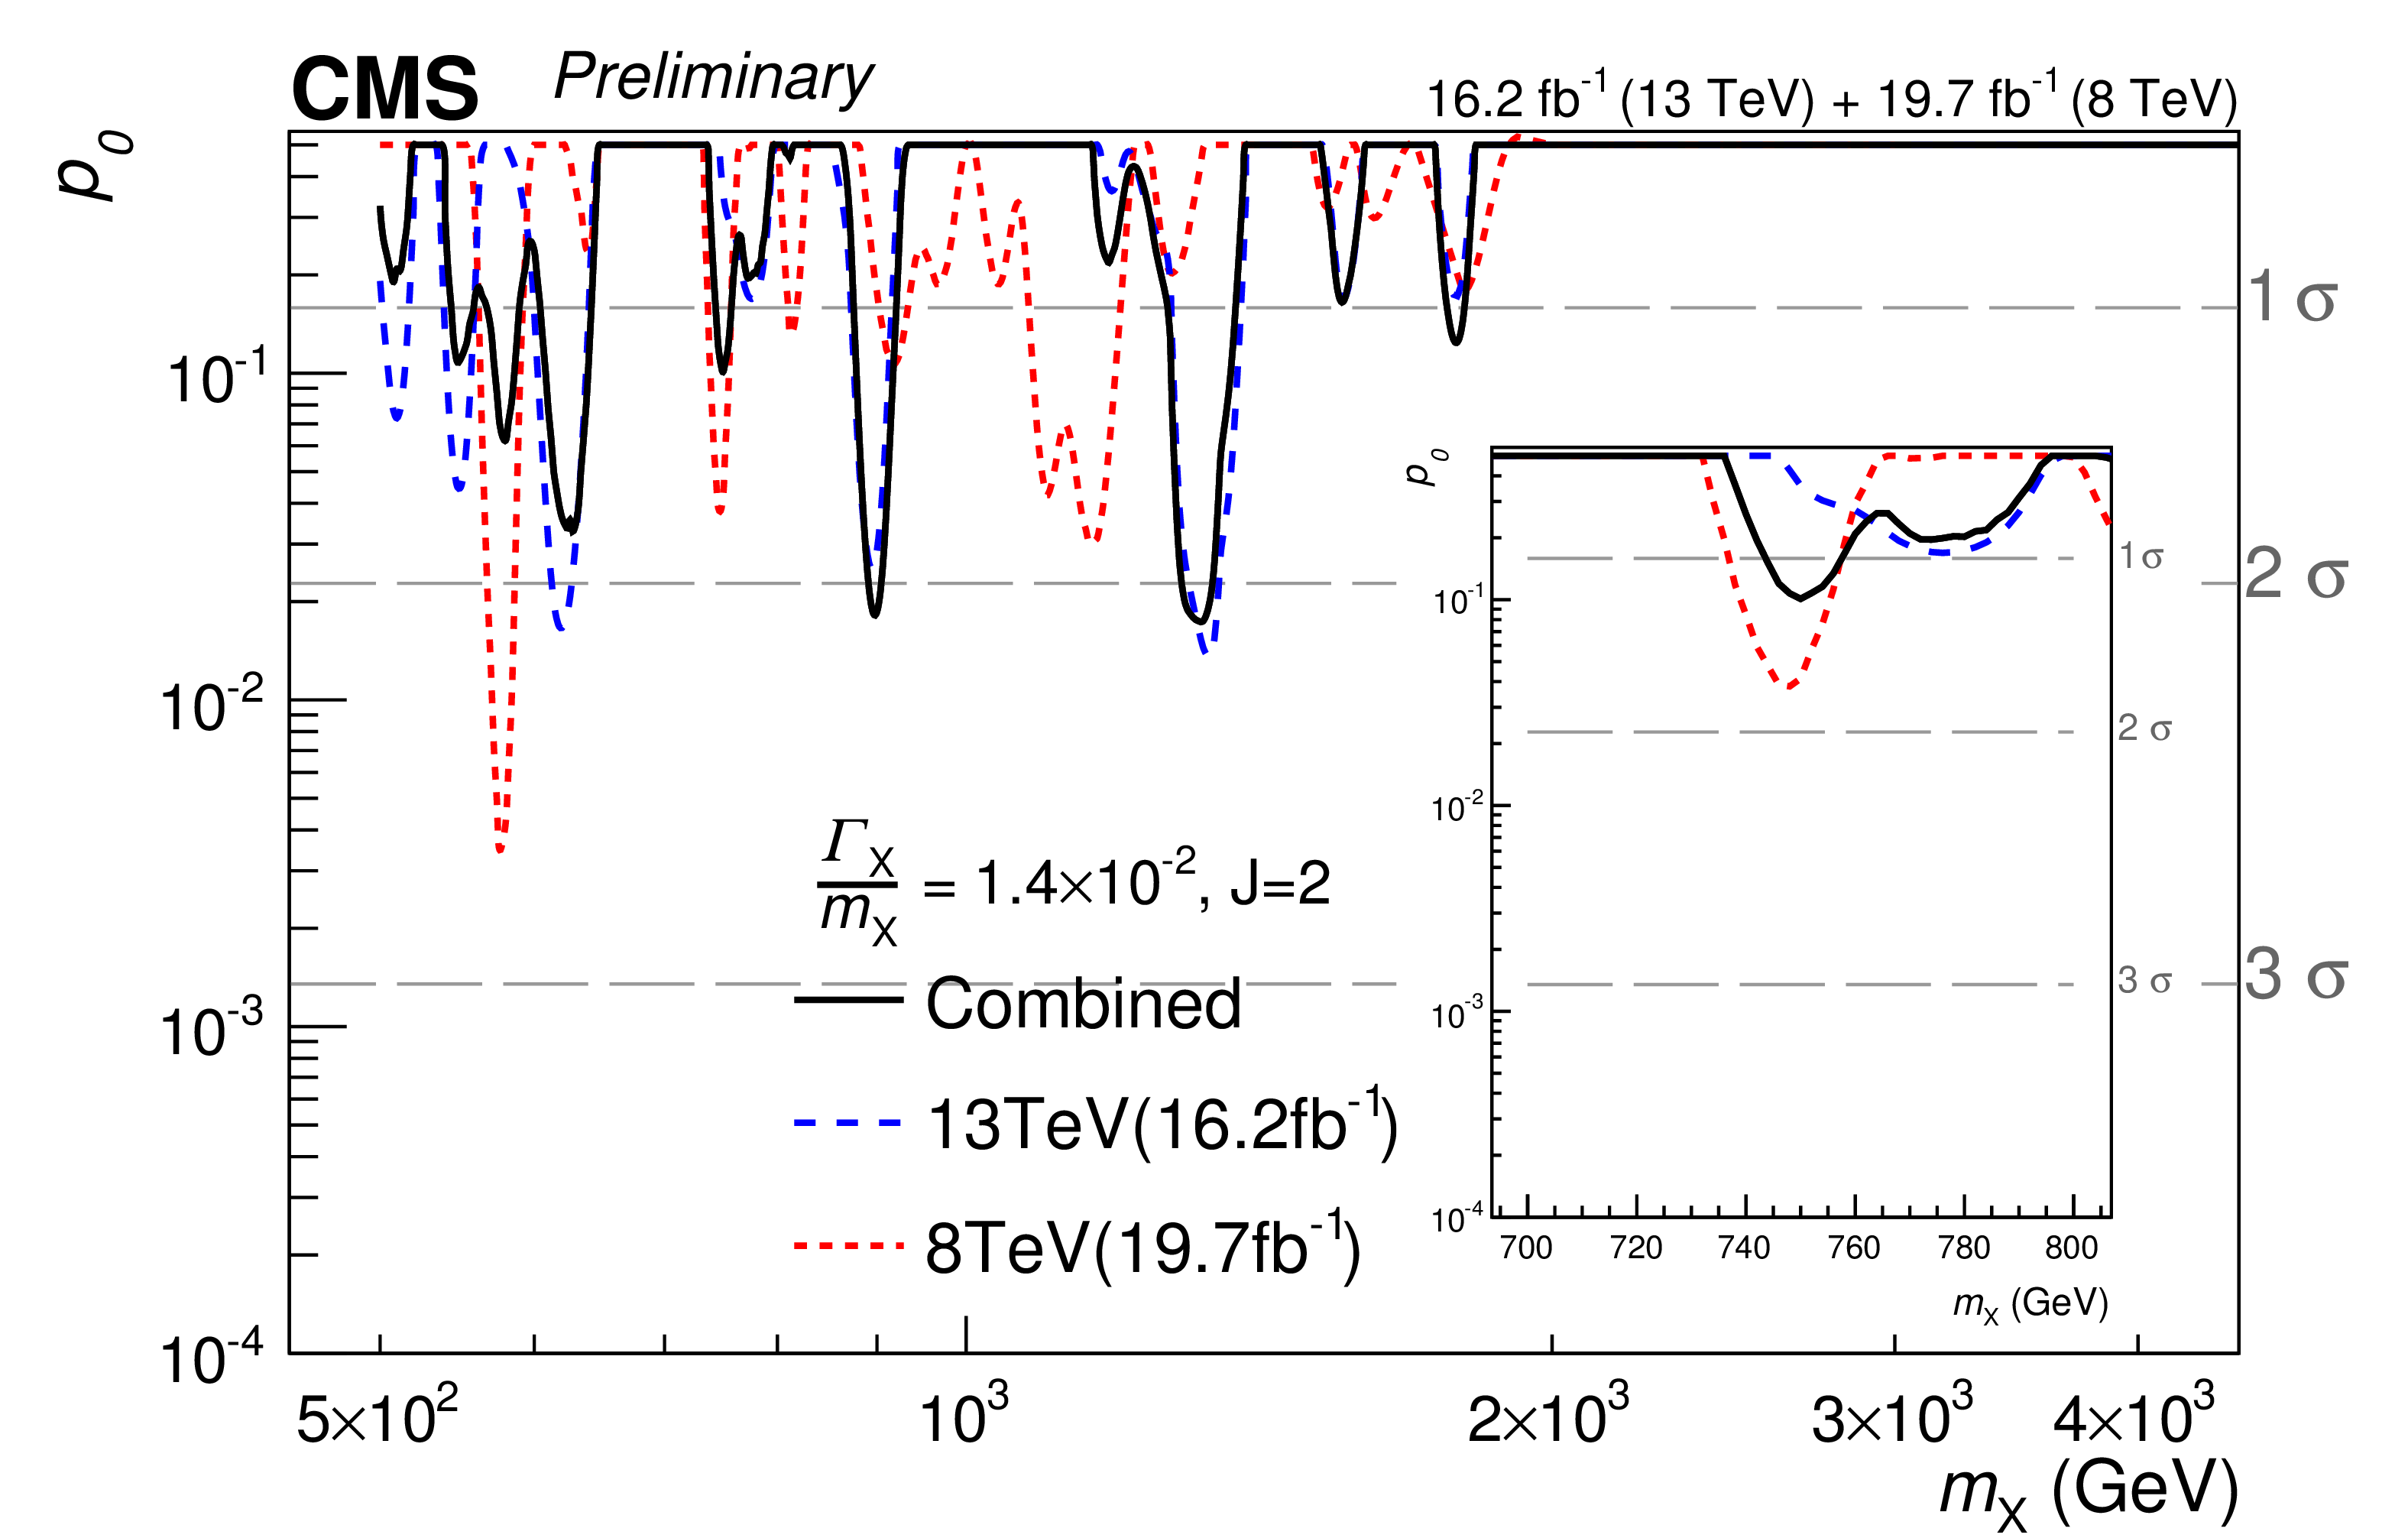
Additional Figure 3-a:
Observed background-only $p$-values for resonances with $\Gamma _{\mathrm{X}} / m_{\mathrm{X}} = 1.4\times 10^{-2}$ as a function of the resonance mass $m_{\mathrm{X}}$, from the combined analysis of the 8 and 13 TeV data. Results obtained at each of the two centre of mass energies are also shown. Curves corresponding to the scalar and RS graviton hypotheses are shown respectively in (a) and (b) respectively. |
png pdf |
Additional Figure 3-b:
Observed background-only $p$-values for resonances with $\Gamma _{\mathrm{X}} / m_{\mathrm{X}} = 1.4\times 10^{-2}$ as a function of the resonance mass $m_{\mathrm{X}}$, from the combined analysis of the 8 and 13 TeV data. Results obtained at each of the two centre of mass energies are also shown. Curves corresponding to the scalar and RS graviton hypotheses are shown respectively in (a) and (b) respectively. |
png pdf |
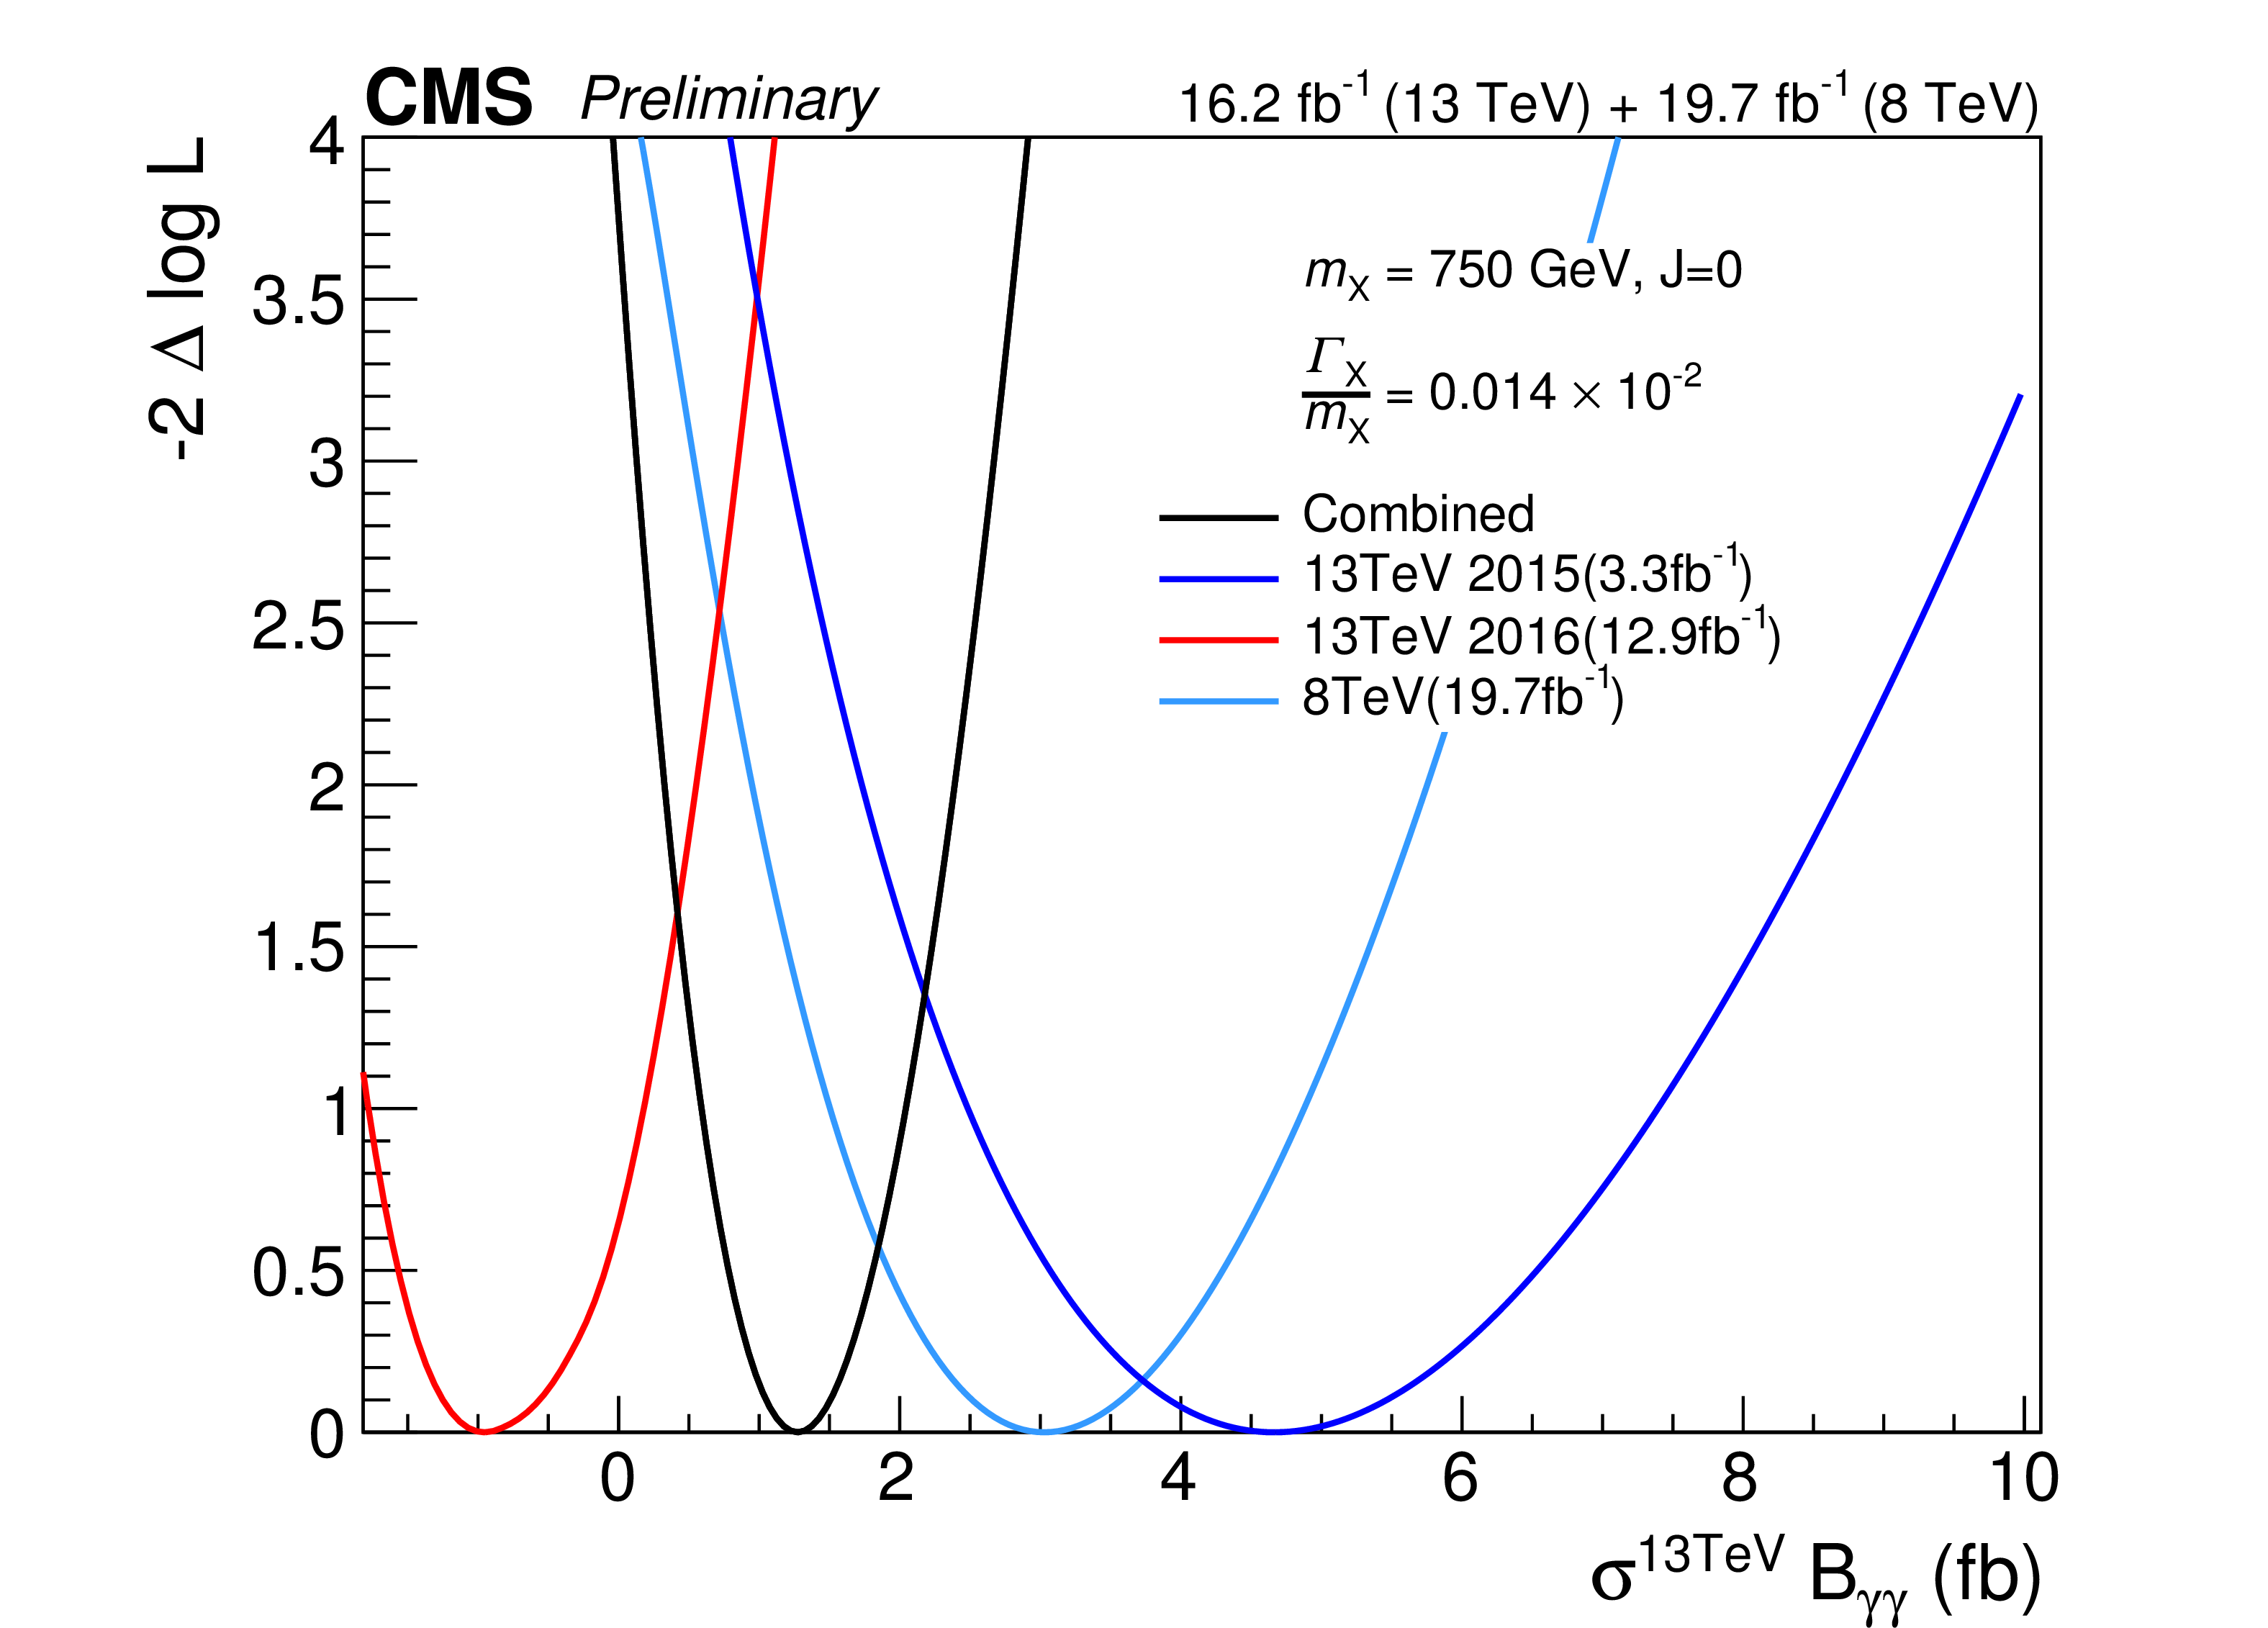
Additional Figure 4:
Likelihood scan for the cross section of a narrow-width spin-0 resonance with a mass of 750 GeV. Results for the 8 TeV data (19.7 fb$^{-1}$), 13 TeV data recorded in 2015 (3.3 fb$^{-1}$) and in 2016 (12.9 fb$^{-1}$), and their combination are shown. |
png pdf |
Additional Figure 5-a:
Observed invariant mass spectra for the EBEB (a) and EBEE (b) in the region 510 $ < m_{\gamma \gamma } < $ 1030 GeV. The results of a likelihood fit to the background-only hypothesis are also shown. The shaded regions show the 1 and 2 standard deviation uncertainty bands associated with the fit, and reflect the statistical uncertainty of the data. The red curve shows the shape expected for a spin-0 signal corresponding to the largest excess observed in the combined analysis of 8 TeV and 2015 13 TeV data. The lower panels show the difference between the data and fit, divided by the statistical uncertainty in the data points. |

png pdf |
Additional Figure 5-b:
Observed invariant mass spectra for the EBEB (a) and EBEE (b) in the region 510 $ < m_{\gamma \gamma } < $ 1030 GeV. The results of a likelihood fit to the background-only hypothesis are also shown. The shaded regions show the 1 and 2 standard deviation uncertainty bands associated with the fit, and reflect the statistical uncertainty of the data. The red curve shows the shape expected for a spin-0 signal corresponding to the largest excess observed in the combined analysis of 8 TeV and 2015 13 TeV data. The lower panels show the difference between the data and fit, divided by the statistical uncertainty in the data points. |

png pdf |
Additional Figure 6-a:
Expected and observed 95% C.L. exclusion limits obtained with the 13 TeV 2016 data for different signal hypotheses. The range 0.5 $ < m_{\mathrm{X}} < $ 4.5 TeV is shown for $ \Gamma _{\mathrm{X}} / m_{\mathrm{X}} = 1.4\times 10^{-4} $, $ 1.4\times 10^{-2} $, $ 5.6\times 10^{-2} $. Plots (a), (c), (e) and (b), (d), (f) corresponds to the scalar and RS graviton signals respectively. |
png pdf |
Additional Figure 6-b:
Expected and observed 95% C.L. exclusion limits obtained with the 13 TeV 2016 data for different signal hypotheses. The range 0.5 $ < m_{\mathrm{X}} < $ 4.5 TeV is shown for $ \Gamma _{\mathrm{X}} / m_{\mathrm{X}} = 1.4\times 10^{-4} $, $ 1.4\times 10^{-2} $, $ 5.6\times 10^{-2} $. Plots (a), (c), (e) and (b), (d), (f) corresponds to the scalar and RS graviton signals respectively. |

png pdf |
Additional Figure 6-c:
Expected and observed 95% C.L. exclusion limits obtained with the 13 TeV 2016 data for different signal hypotheses. The range 0.5 $ < m_{\mathrm{X}} < $ 4.5 TeV is shown for $ \Gamma _{\mathrm{X}} / m_{\mathrm{X}} = 1.4\times 10^{-4} $, $ 1.4\times 10^{-2} $, $ 5.6\times 10^{-2} $. Plots (a), (c), (e) and (b), (d), (f) corresponds to the scalar and RS graviton signals respectively. |
png pdf |
Additional Figure 6-d:
Expected and observed 95% C.L. exclusion limits obtained with the 13 TeV 2016 data for different signal hypotheses. The range 0.5 $ < m_{\mathrm{X}} < $ 4.5 TeV is shown for $ \Gamma _{\mathrm{X}} / m_{\mathrm{X}} = 1.4\times 10^{-4} $, $ 1.4\times 10^{-2} $, $ 5.6\times 10^{-2} $. Plots (a), (c), (e) and (b), (d), (f) corresponds to the scalar and RS graviton signals respectively. |
png pdf |
Additional Figure 6-e:
Expected and observed 95% C.L. exclusion limits obtained with the 13 TeV 2016 data for different signal hypotheses. The range 0.5 $ < m_{\mathrm{X}} < $ 4.5 TeV is shown for $ \Gamma _{\mathrm{X}} / m_{\mathrm{X}} = 1.4\times 10^{-4} $, $ 1.4\times 10^{-2} $, $ 5.6\times 10^{-2} $. Plots (a), (c), (e) and (b), (d), (f) corresponds to the scalar and RS graviton signals respectively. |
png pdf |
Additional Figure 6-f:
Expected and observed 95% C.L. exclusion limits obtained with the 13 TeV 2016 data for different signal hypotheses. The range 0.5 $ < m_{\mathrm{X}} < $ 4.5 TeV is shown for $ \Gamma _{\mathrm{X}} / m_{\mathrm{X}} = 1.4\times 10^{-4} $, $ 1.4\times 10^{-2} $, $ 5.6\times 10^{-2} $. Plots (a), (c), (e) and (b), (d), (f) corresponds to the scalar and RS graviton signals respectively. |

png pdf |
Additional Figure 7-a:
Expected and observed 95% C.L. exclusion limits obtained with the combination of the 2015 and 2016 13 TeV data for different signal hypotheses. The range 0.5 $ < m_{\mathrm{X}} < $ 4.5 TeV is shown for $ \Gamma _{\mathrm{X}} / m_{\mathrm{X}} = 1.4\times 10^{-4} $, $ 1.4\times 10^{-2}$, $ 5.6\times 10^{-2} $. Plots (a), (c), (e) and (b), (d), (f) corresponds to the scalar and RS graviton signals respectively. |

png pdf |
Additional Figure 7-b:
Expected and observed 95% C.L. exclusion limits obtained with the combination of the 2015 and 2016 13 TeV data for different signal hypotheses. The range 0.5 $ < m_{\mathrm{X}} < $ 4.5 TeV is shown for $ \Gamma _{\mathrm{X}} / m_{\mathrm{X}} = 1.4\times 10^{-4} $, $ 1.4\times 10^{-2}$, $ 5.6\times 10^{-2} $. Plots (a), (c), (e) and (b), (d), (f) corresponds to the scalar and RS graviton signals respectively. |

png pdf |
Additional Figure 7-c:
Expected and observed 95% C.L. exclusion limits obtained with the combination of the 2015 and 2016 13 TeV data for different signal hypotheses. The range 0.5 $ < m_{\mathrm{X}} < $ 4.5 TeV is shown for $ \Gamma _{\mathrm{X}} / m_{\mathrm{X}} = 1.4\times 10^{-4} $, $ 1.4\times 10^{-2}$, $ 5.6\times 10^{-2} $. Plots (a), (c), (e) and (b), (d), (f) corresponds to the scalar and RS graviton signals respectively. |
png pdf |
Additional Figure 7-d:
Expected and observed 95% C.L. exclusion limits obtained with the combination of the 2015 and 2016 13 TeV data for different signal hypotheses. The range 0.5 $ < m_{\mathrm{X}} < $ 4.5 TeV is shown for $ \Gamma _{\mathrm{X}} / m_{\mathrm{X}} = 1.4\times 10^{-4} $, $ 1.4\times 10^{-2}$, $ 5.6\times 10^{-2} $. Plots (a), (c), (e) and (b), (d), (f) corresponds to the scalar and RS graviton signals respectively. |
png pdf |
Additional Figure 7-e:
Expected and observed 95% C.L. exclusion limits obtained with the combination of the 2015 and 2016 13 TeV data for different signal hypotheses. The range 0.5 $ < m_{\mathrm{X}} < $ 4.5 TeV is shown for $ \Gamma _{\mathrm{X}} / m_{\mathrm{X}} = 1.4\times 10^{-4} $, $ 1.4\times 10^{-2}$, $ 5.6\times 10^{-2} $. Plots (a), (c), (e) and (b), (d), (f) corresponds to the scalar and RS graviton signals respectively. |

png pdf |
Additional Figure 7-f:
Expected and observed 95% C.L. exclusion limits obtained with the combination of the 2015 and 2016 13 TeV data for different signal hypotheses. The range 0.5 $ < m_{\mathrm{X}} < $ 4.5 TeV is shown for $ \Gamma _{\mathrm{X}} / m_{\mathrm{X}} = 1.4\times 10^{-4} $, $ 1.4\times 10^{-2}$, $ 5.6\times 10^{-2} $. Plots (a), (c), (e) and (b), (d), (f) corresponds to the scalar and RS graviton signals respectively. |
png pdf |
Additional Figure 8-a:
Expected and observed 95% C.L. exclusion limits obtained with the combination of the 8 and 13 TeV data for different signal hypotheses. The range 0.5 $ < m_{\mathrm{X}} < $ 4.5 TeV is shown for $\Gamma _{\mathrm{X}} / m_{\mathrm{X}} = 1.4\times 10^{-4}$, $ 1.4\times 10^{-2}$, $ 5.6\times 10^{-2} $. Plots (a), (c), (e) and (b), (d), (f) corresponds to the scalar and RS graviton signals respectively. |
png pdf |
Additional Figure 8-b:
Expected and observed 95% C.L. exclusion limits obtained with the combination of the 8 and 13 TeV data for different signal hypotheses. The range 0.5 $ < m_{\mathrm{X}} < $ 4.5 TeV is shown for $\Gamma _{\mathrm{X}} / m_{\mathrm{X}} = 1.4\times 10^{-4}$, $ 1.4\times 10^{-2}$, $ 5.6\times 10^{-2} $. Plots (a), (c), (e) and (b), (d), (f) corresponds to the scalar and RS graviton signals respectively. |
png pdf |
Additional Figure 8-c:
Expected and observed 95% C.L. exclusion limits obtained with the combination of the 8 and 13 TeV data for different signal hypotheses. The range 0.5 $ < m_{\mathrm{X}} < $ 4.5 TeV is shown for $\Gamma _{\mathrm{X}} / m_{\mathrm{X}} = 1.4\times 10^{-4}$, $ 1.4\times 10^{-2}$, $ 5.6\times 10^{-2} $. Plots (a), (c), (e) and (b), (d), (f) corresponds to the scalar and RS graviton signals respectively. |
png pdf |
Additional Figure 8-d:
Expected and observed 95% C.L. exclusion limits obtained with the combination of the 8 and 13 TeV data for different signal hypotheses. The range 0.5 $ < m_{\mathrm{X}} < $ 4.5 TeV is shown for $\Gamma _{\mathrm{X}} / m_{\mathrm{X}} = 1.4\times 10^{-4}$, $ 1.4\times 10^{-2}$, $ 5.6\times 10^{-2} $. Plots (a), (c), (e) and (b), (d), (f) corresponds to the scalar and RS graviton signals respectively. |
png pdf |
Additional Figure 8-e:
Expected and observed 95% C.L. exclusion limits obtained with the combination of the 8 and 13 TeV data for different signal hypotheses. The range 0.5 $ < m_{\mathrm{X}} < $ 4.5 TeV is shown for $\Gamma _{\mathrm{X}} / m_{\mathrm{X}} = 1.4\times 10^{-4}$, $ 1.4\times 10^{-2}$, $ 5.6\times 10^{-2} $. Plots (a), (c), (e) and (b), (d), (f) corresponds to the scalar and RS graviton signals respectively. |
png pdf |
Additional Figure 8-f:
Expected and observed 95% C.L. exclusion limits obtained with the combination of the 8 and 13 TeV data for different signal hypotheses. The range 0.5 $ < m_{\mathrm{X}} < $ 4.5 TeV is shown for $\Gamma _{\mathrm{X}} / m_{\mathrm{X}} = 1.4\times 10^{-4}$, $ 1.4\times 10^{-2}$, $ 5.6\times 10^{-2} $. Plots (a), (c), (e) and (b), (d), (f) corresponds to the scalar and RS graviton signals respectively. |
| References | ||||
| 1 | L. D. Landau | On the angular momentum of a system of two photons | Dokl. Akad. Nauk SSSR 60 (1948) 207 | |
| 2 | C. N. Yang | Selection Rules for the Dematerialization of a Particle into Two Photons | PR77 (1950) 242 | |
| 3 | G. C. Branco et al. | Theory and phenomenology of two-Higgs-doublet models | PR 516 (2012) 1 | 1106.0034 |
| 4 | T. D. Lee | A Theory of Spontaneous T Violation | PRD 8 (1973) 1226 | |
| 5 | L. Randall and R. Sundrum | A large mass hierarchy from a small extra dimension | PRL 83 (1999) 3370 | hep-ph/9905221 |
| 6 | H. Davoudiasl, J. L. Hewett, and T. G. Rizzo | Phenomenology of the Randall-Sundrum Gauge Hierarchy Model | PRL 84 (2000) 2080 | hep-ph/9909255 |
| 7 | N. Craig, J. Galloway, and S. Thomas | Searching for signs of the second Higgs doublet | 1305.2424 | |
| 8 | ATLAS Collaboration | Observation of a new particle in the search for the Standard Model Higgs boson with the ATLAS detector at the LHC | PLB 716 (2012) 1 | 1207.7214 |
| 9 | CMS Collaboration | Observation of a new boson at a mass of 125 GeV with the CMS experiment at the LHC | PLB 716 (2012) 30 | CMS-HIG-12-028 1207.7235 |
| 10 | P. S. B. Dev and A. Pilaftsis | Maximally symmetric two Higgs doublet model with natural standard model alignment | 1408.3405 | |
| 11 | ATLAS Collaboration | Search for resonances in diphoton events at $ \sqrt{s}=13 $ TeV with the ATLAS detector | Submitted to \it J. High Energy Phys | 1606.03833 |
| 12 | CMS Collaboration | Search for resonant production of high-mass photon pairs in proton-proton collisions at $ \sqrt{s}=8 $ and 13 TeV | PRL 117 (2016) 051802 | CMS-EXO-16-018 1606.04093 |
| 13 | ATLAS Collaboration | Search for high-mass diphoton resonances in $ \mathrm{ p }\mathrm{ p } $ collisions at $ \sqrt{s} = $ 8 TeV with the ATLAS detector | PRD 92 (2015) 032004 | 1504.05511 |
| 14 | ATLAS Collaboration | Search for extra dimensions in diphoton events using proton-proton collisions recorded at $ \sqrt{s} = $ 7 TeV with the ATLAS detector at the LHC | New J. Phys. 15 (2013) 043007 | 1210.8389 |
| 15 | ATLAS Collaboration | Search for high-mass dilepton resonances in $ \mathrm{ p }\mathrm{ p } $ collisions at $ \sqrt{s} = $ 8 TeV with the ATLAS detector | PRD 90 (2014) 052005 | 1405.4123 |
| 16 | ATLAS Collaboration | Search for dilepton resonances in $ \mathrm{ p }\mathrm{ p } $ collisions at $ \sqrt{s} = $ 7 TeV with the ATLAS detector | PRL 107 (2011) 272002 | 1108.1582 |
| 17 | ATLAS Collaboration | Search for new phenomena in the $ W W $ to $ \ell \nu \ell{\rm'} \nu{\rm'} $ final state in $ \mathrm{ p }\mathrm{ p } $ collisions at $ \sqrt{s} = $ 7 TeV with the ATLAS detector | PLB 718 (2013) 860 | 1208.2880 |
| 18 | ATLAS Collaboration | Search for resonant diboson production in the $ WW/WZ \to \ell \nu j j $ decay channels with the ATLAS detector at $ \sqrt{s} = $ 7 TeV | PRD 87 (2013) 112006 | 1305.0125 |
| 19 | CMS Collaboration | Search for diphoton resonances in the mass range from 150 to 850$ GeV $ in $ \mathrm{ p }\mathrm{ p } $ collisions at $ \sqrt{s} = $ 8 TeV | PLB 750 (2015) 494 | CMS-HIG-14-006 1506.02301 |
| 20 | CMS Collaboration | Search for signatures of extra dimensions in the diphoton mass spectrum at the Large Hadron Collider | PRL 108 (2012) 111801 | CMS-EXO-11-038 1112.0688 |
| 21 | CMS Collaboration | Search for physics beyond the standard model in dilepton mass spectra in proton-proton collisions at $ \sqrt{s} = $ 8 TeV | JHEP 04 (2015) 025 | CMS-EXO-12-061 1412.6302 |
| 22 | CMS Collaboration | Search for heavy narrow dilepton resonances in $ \mathrm{ p }\mathrm{ p } $ collisions at $ \sqrt{s} = $ 7 TeV and $ \sqrt{s} = $ 8 TeV | PLB 720 (2013) 63 | CMS-EXO-12-015 1212.6175 |
| 23 | CMS Collaboration | Search for narrow resonances decaying to dijets in proton-proton collisions at $ \sqrt{s} = $ 13 TeV | PRL 116 (2016) 071801 | CMS-EXO-15-001 1512.01224 |
| 24 | CMS Collaboration | Search for narrow resonances using the dijet mass spectrum in $ \mathrm{ p }\mathrm{ p } $ collisions at $ \sqrt{s} = $ 8 TeV | PRD 87 (2013) 114015 | CMS-EXO-12-016 1302.4794 |
| 25 | CMS Collaboration | Search for narrow resonances in dijet final states at $ \sqrt{s} = $ 8 TeV with the novel CMS technique of data scouting | Submitted to \it PRLett | CMS-EXO-14-005 1604.08907 |
| 26 | CMS Collaboration | Search for resonances and quantum black holes using dijet mass spectra in proton-proton collisions at $ \sqrt{s} = $ 8 TeV | PRD 91 (2015) 052009 | CMS-EXO-12-059 1501.04198 |
| 27 | CMS Collaboration | Search for massive resonances in dijet systems containing jets tagged as $ \mathrm{ W } $ or $ \mathrm{ Z } $ boson decays in $ \mathrm{ p }\mathrm{ p } $ collisions at $ \sqrt{s} = $ 8 TeV | JHEP 08 (2014) 173 | CMS-EXO-12-024 1405.1994 |
| 28 | CMS Collaboration | Search for exotic resonances decaying into $ \mathrm{ W }\mathrm{ Z }/\mathrm{ Z }\mathrm{ Z } $ in $ \mathrm{ p }\mathrm{ p } $ collisions at $ \sqrt{s} = $ 7 TeV | JHEP 02 (2013) 036 | CMS-EXO-12-014 1211.5779 |
| 29 | CMS Collaboration | Search for a narrow spin-2 resonance decaying to a pair of $ \mathrm{ Z } $ vector bosons in the semileptonic final state | PLB 718 (2013) 1208 | CMS-EXO-11-102 1209.3807 |
| 30 | ATLAS Collaboration | Search for Scalar Diphoton Resonances in the Mass Range 65--600$ GeV $ with the ATLAS Detector in $ \mathrm{ p }\mathrm{ p } $ Collision Data at $ \sqrt{s} = $ 8 TeV | PRL 113 (2014) 171801 | 1407.6583 |
| 31 | CMS Collaboration | Performance of photon reconstruction and identification with the CMS detector in proton-proton collisions at $ \sqrt{s} = $ 8 TeV | JINST 10 (2015) P08010 | CMS-EGM-14-001 1502.02702 |
| 32 | CMS Collaboration | Particle-flow event reconstruction in CMS and performance for jets, taus, and $ E_{\mathrm{T}}^{\text{miss}} $ | CDS | |
| 33 | CMS Collaboration | Commissioning of the particle-flow event with the first LHC collisions recorded in the CMS detector | CDS | |
| 34 | CMS Collaboration | The CMS experiment at the CERN LHC | JINST 3 (2008) S08004 | CMS-00-001 |
| 35 | T. Sj\"ostrand et al. | An Introduction to PYTHIA 8.2 | CPC 191 (2015) 159 | 1410.3012 |
| 36 | NNPDF Collaboration | Parton distributions with LHC data | Nucl. Phys. B 867 (2013) 244 | 1207.1303 |
| 37 | T. Gleisberg et al. | Event generation with SHERPA 1.1 | JHEP 02 (2009) 007 | 0811.4622 |
| 38 | J. Alwall et al. | The automated computation of tree-level and next-to-leading order differential cross sections, and their matching to parton shower simulations | JHEP 07 (2014) 079 | 1405.0301 |
| 39 | GEANT4 Collaboration | GEANT4 --- a simulation toolkit | NIMA 506 (2003) 250 | |
| 40 | CMS Collaboration | Observation of the diphoton decay of the Higgs boson and measurement of its properties | EPJC 74 (2014) 3076 | CMS-HIG-13-001 1407.0558 |
| 41 | T. Junk | Confidence level computation for combining searches with small statistics | Nucl. Instr. and Meth. A 434 (1999) 435 | hep-ex/9902006 |
| 42 | A. L. Read | Presentation of search results: the $ \rm CL_s $ technique | JPG 28 (2002) 2693 | |
| 43 | LHC Higgs Combination Group | Procedure for the LHC Higgs boson search combination in Summer 2011 | CMS-NOTE-2011-005 | |
| 44 | G. Cowan, K. Cranmer, E. Gross, and O. Vitells | Asymptotic formulae for likelihood-based tests of new physics | EPJC 71 (2011) 1554 | 1007.1727 |
|
|
Compact Muon Solenoid LHC, CERN |
|

|

|

|

|

|