

Compact Muon Solenoid
LHC, CERN
| CMS-PAS-HIG-16-025 | ||
| Search for a narrow heavy resonance decaying to bottom quark-antiquark pairs at $\sqrt{s}=$ 13 TeV | ||
| CMS Collaboration | ||
| August 2016 | ||
| Abstract: An inclusive search for a narrow resonance produced in proton-proton collisions and decaying to a bottom quark-antiquark pair is presented. A data sample collected at $\sqrt{s}=$ 13 TeV and comprising 2.69 fb$^{-1}$ of collision events recorded in 2015 with the CMS experiment at the CERN LHC has been analysed. The search focuses on the production of scalar resonances through gluon-gluon fusion, and of Randall-Sundrum gravitons, both with a negligible natural width relative to the experimental dijet mass resolution. A maximum likelihood fit to the dijet mass spectrum is performed to separate the signal from the continuum multijet background. No significant excess over the expectation from the background is observed. Limits on production cross sections times branching ratio are obtained for values of the resonance mass ranging from 550 to 1200 GeV. | ||
| Links: CDS record (PDF) ; inSPIRE record ; CADI line (restricted) ; | ||
| Figures | |
png pdf |
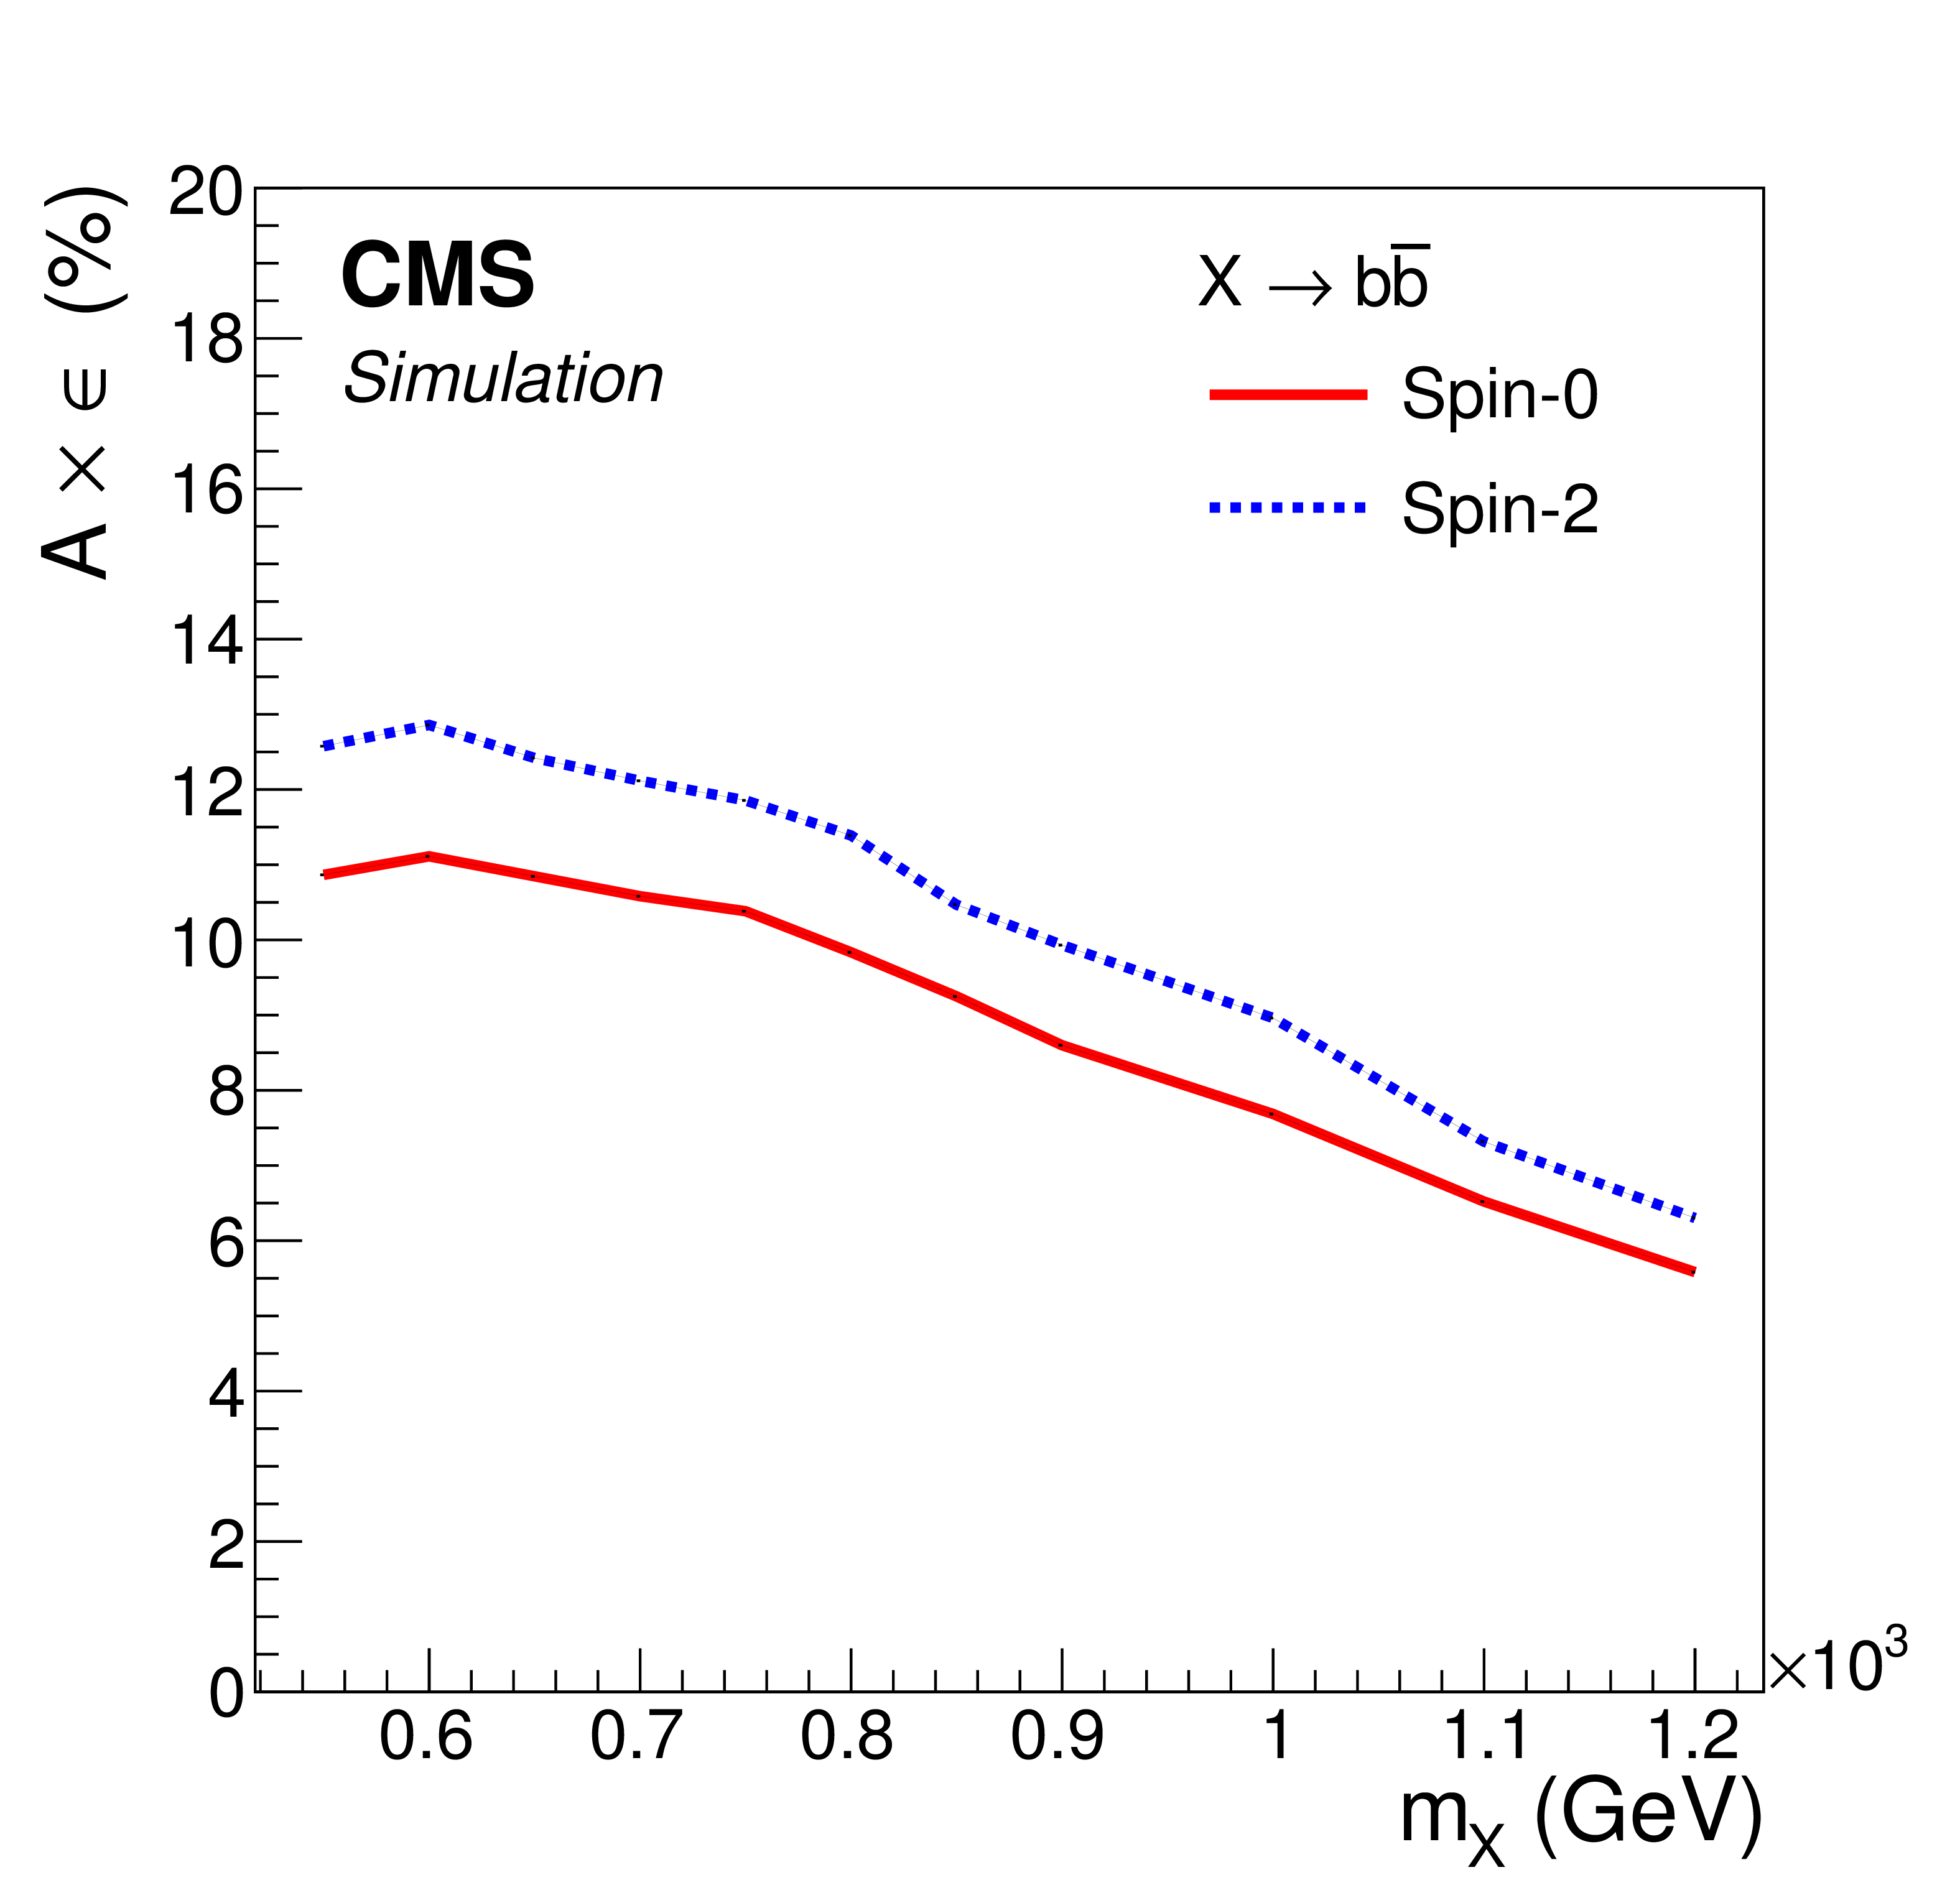
Figure 1-a:
Acceptance ($\mathrm {A}$) times reconstruction efficiency $(\epsilon )$ for the simulated ${\rm X}\to { {\mathrm {b}} {\overline {\mathrm {b}}} } $ signal samples as a function of the resonance mass ($m_{\rm X}$). For each value of $m_{\rm X}$, the acceptance includes the requirement that the dijet mass is contained in the range utilised for the final signal extraction as described in Section 7. |
png pdf |
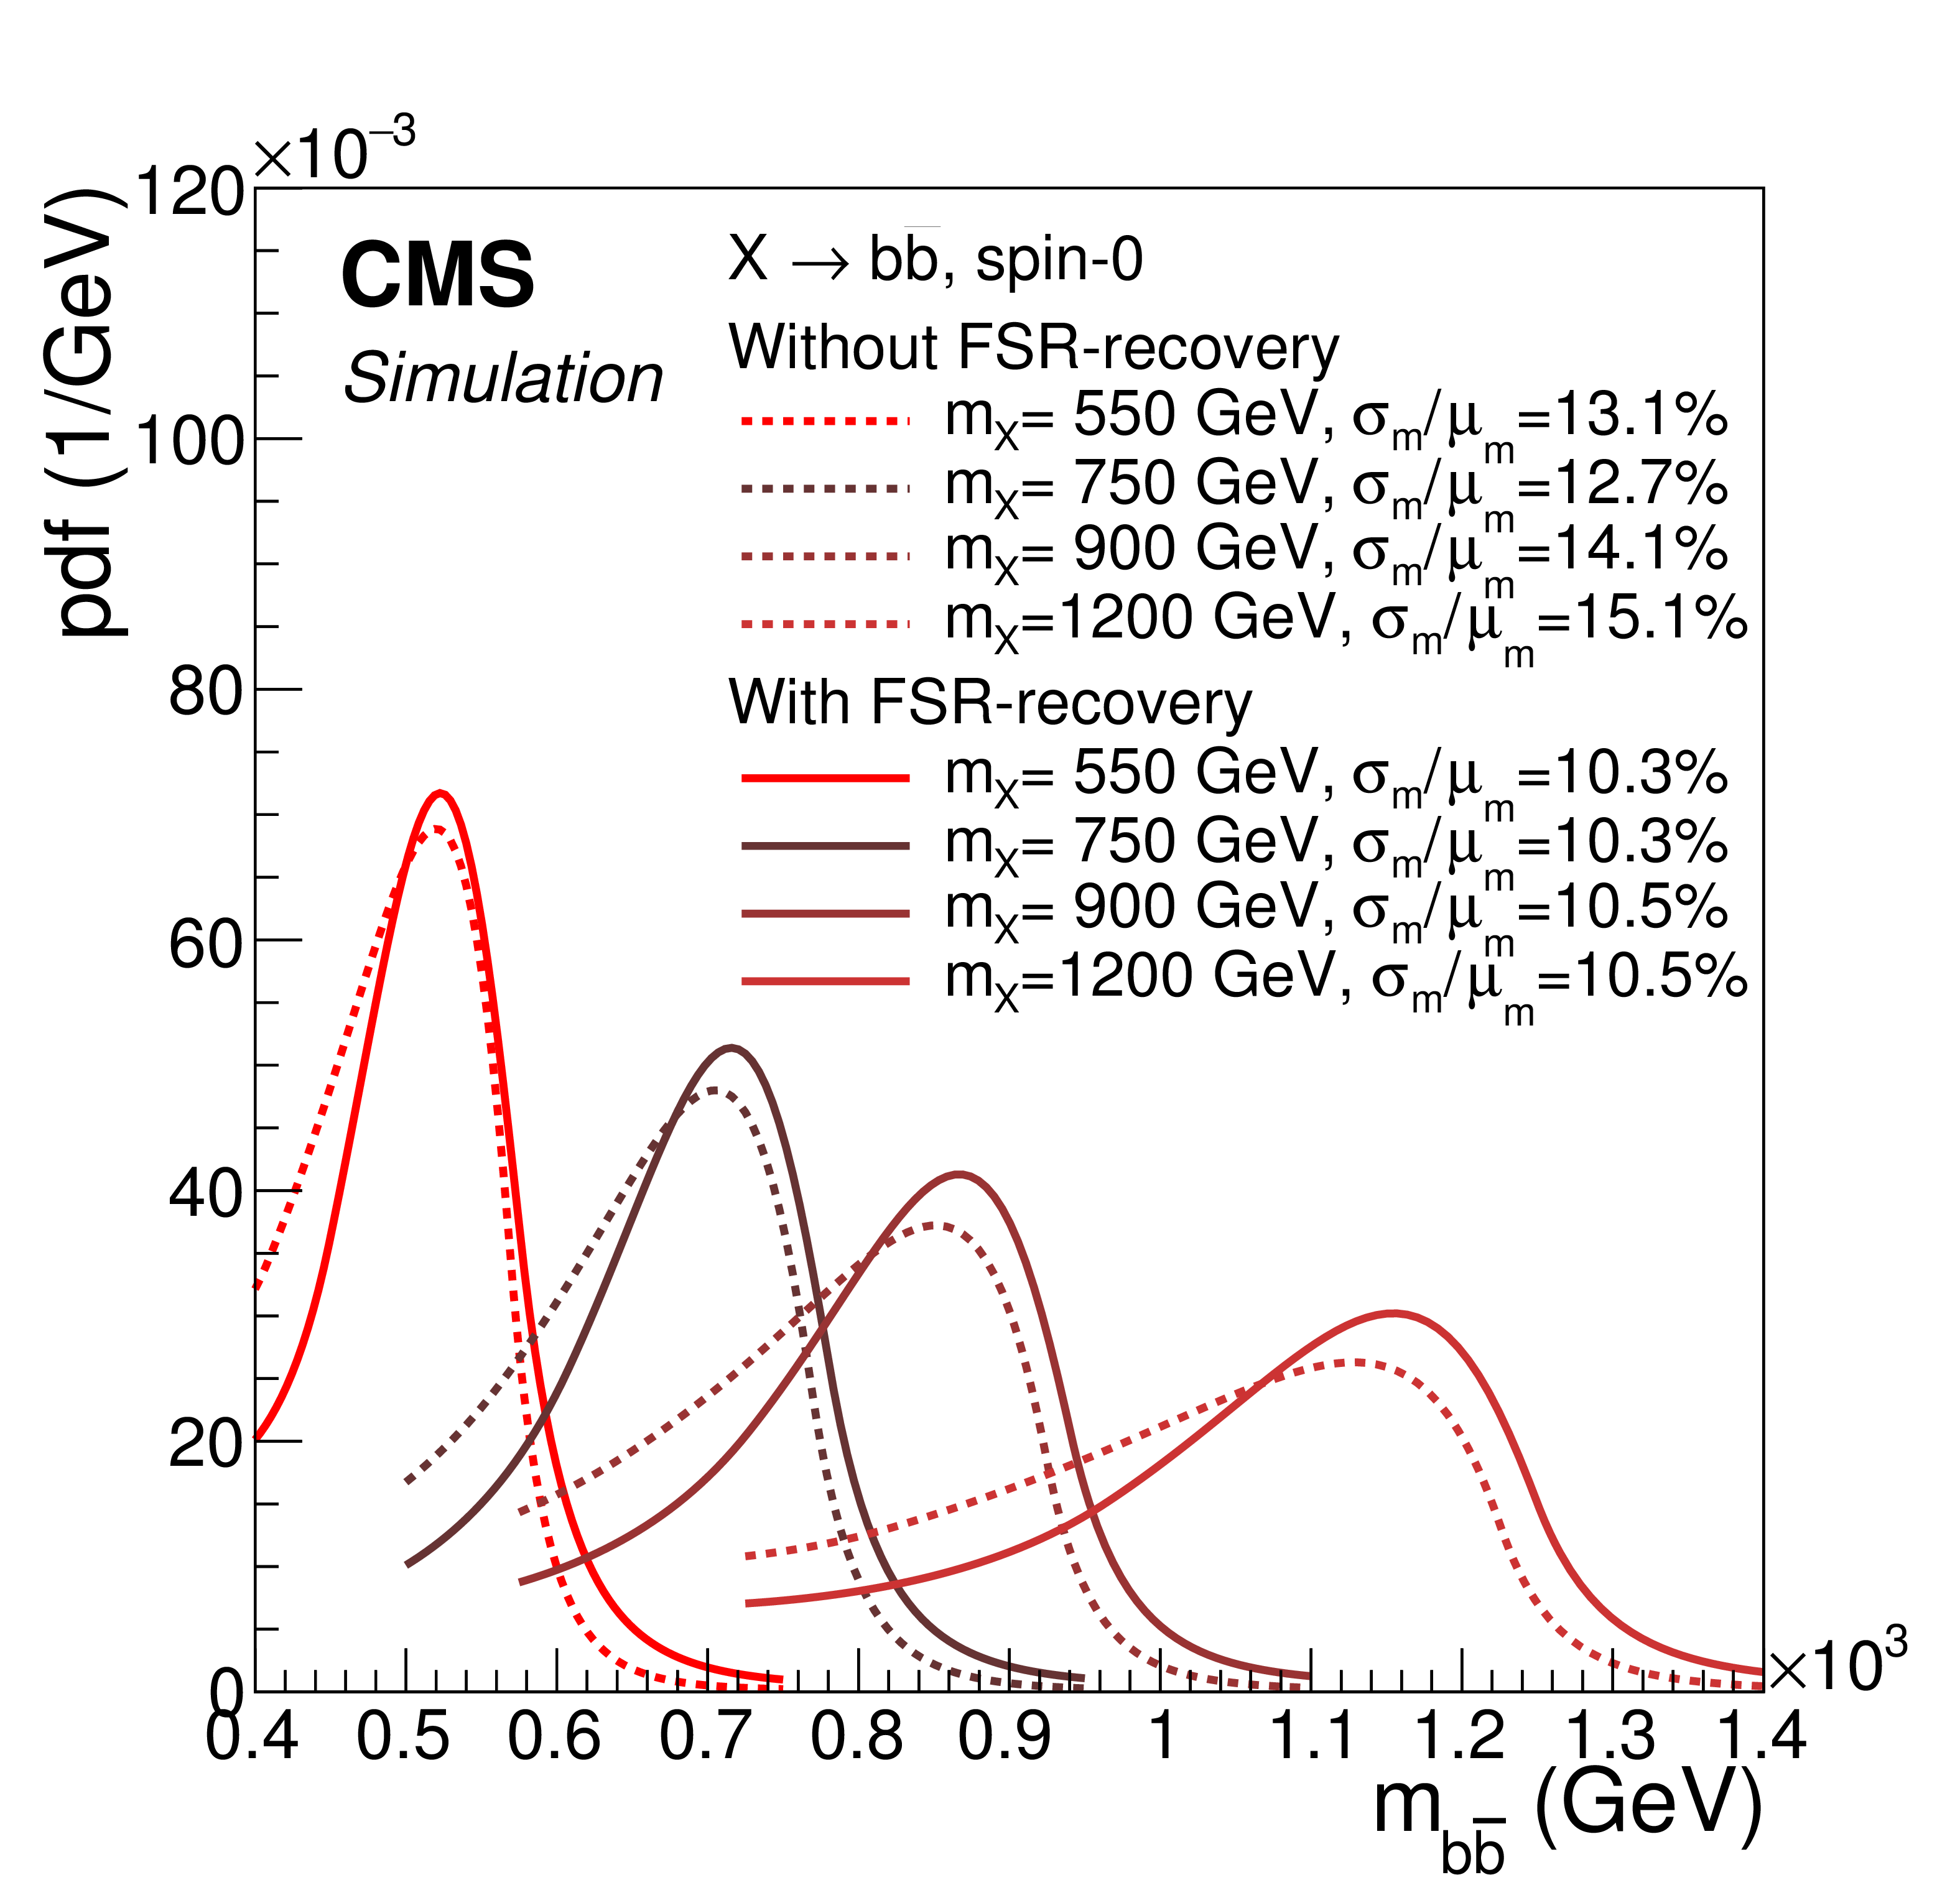
Figure 1-b:
Comparison between the probability density function used to model the dijet mass ($m_{ { {\mathrm {b}} {\overline {\mathrm {b}}} } }$) distribution for the signal in the case where $m_{ { {\mathrm {b}} {\overline {\mathrm {b}}} } }$ is computed with (solid line) or without (dashed line) the FSR-recovery algorithm. The ratio $\sigma _{\rm m}/\mu _{\rm m}$, where the $\sigma _{\rm m}$ is proportional to the full width at half maximum of the distribution and $\mu _{\rm m}$ is the peak position, is also reported. |
png pdf |
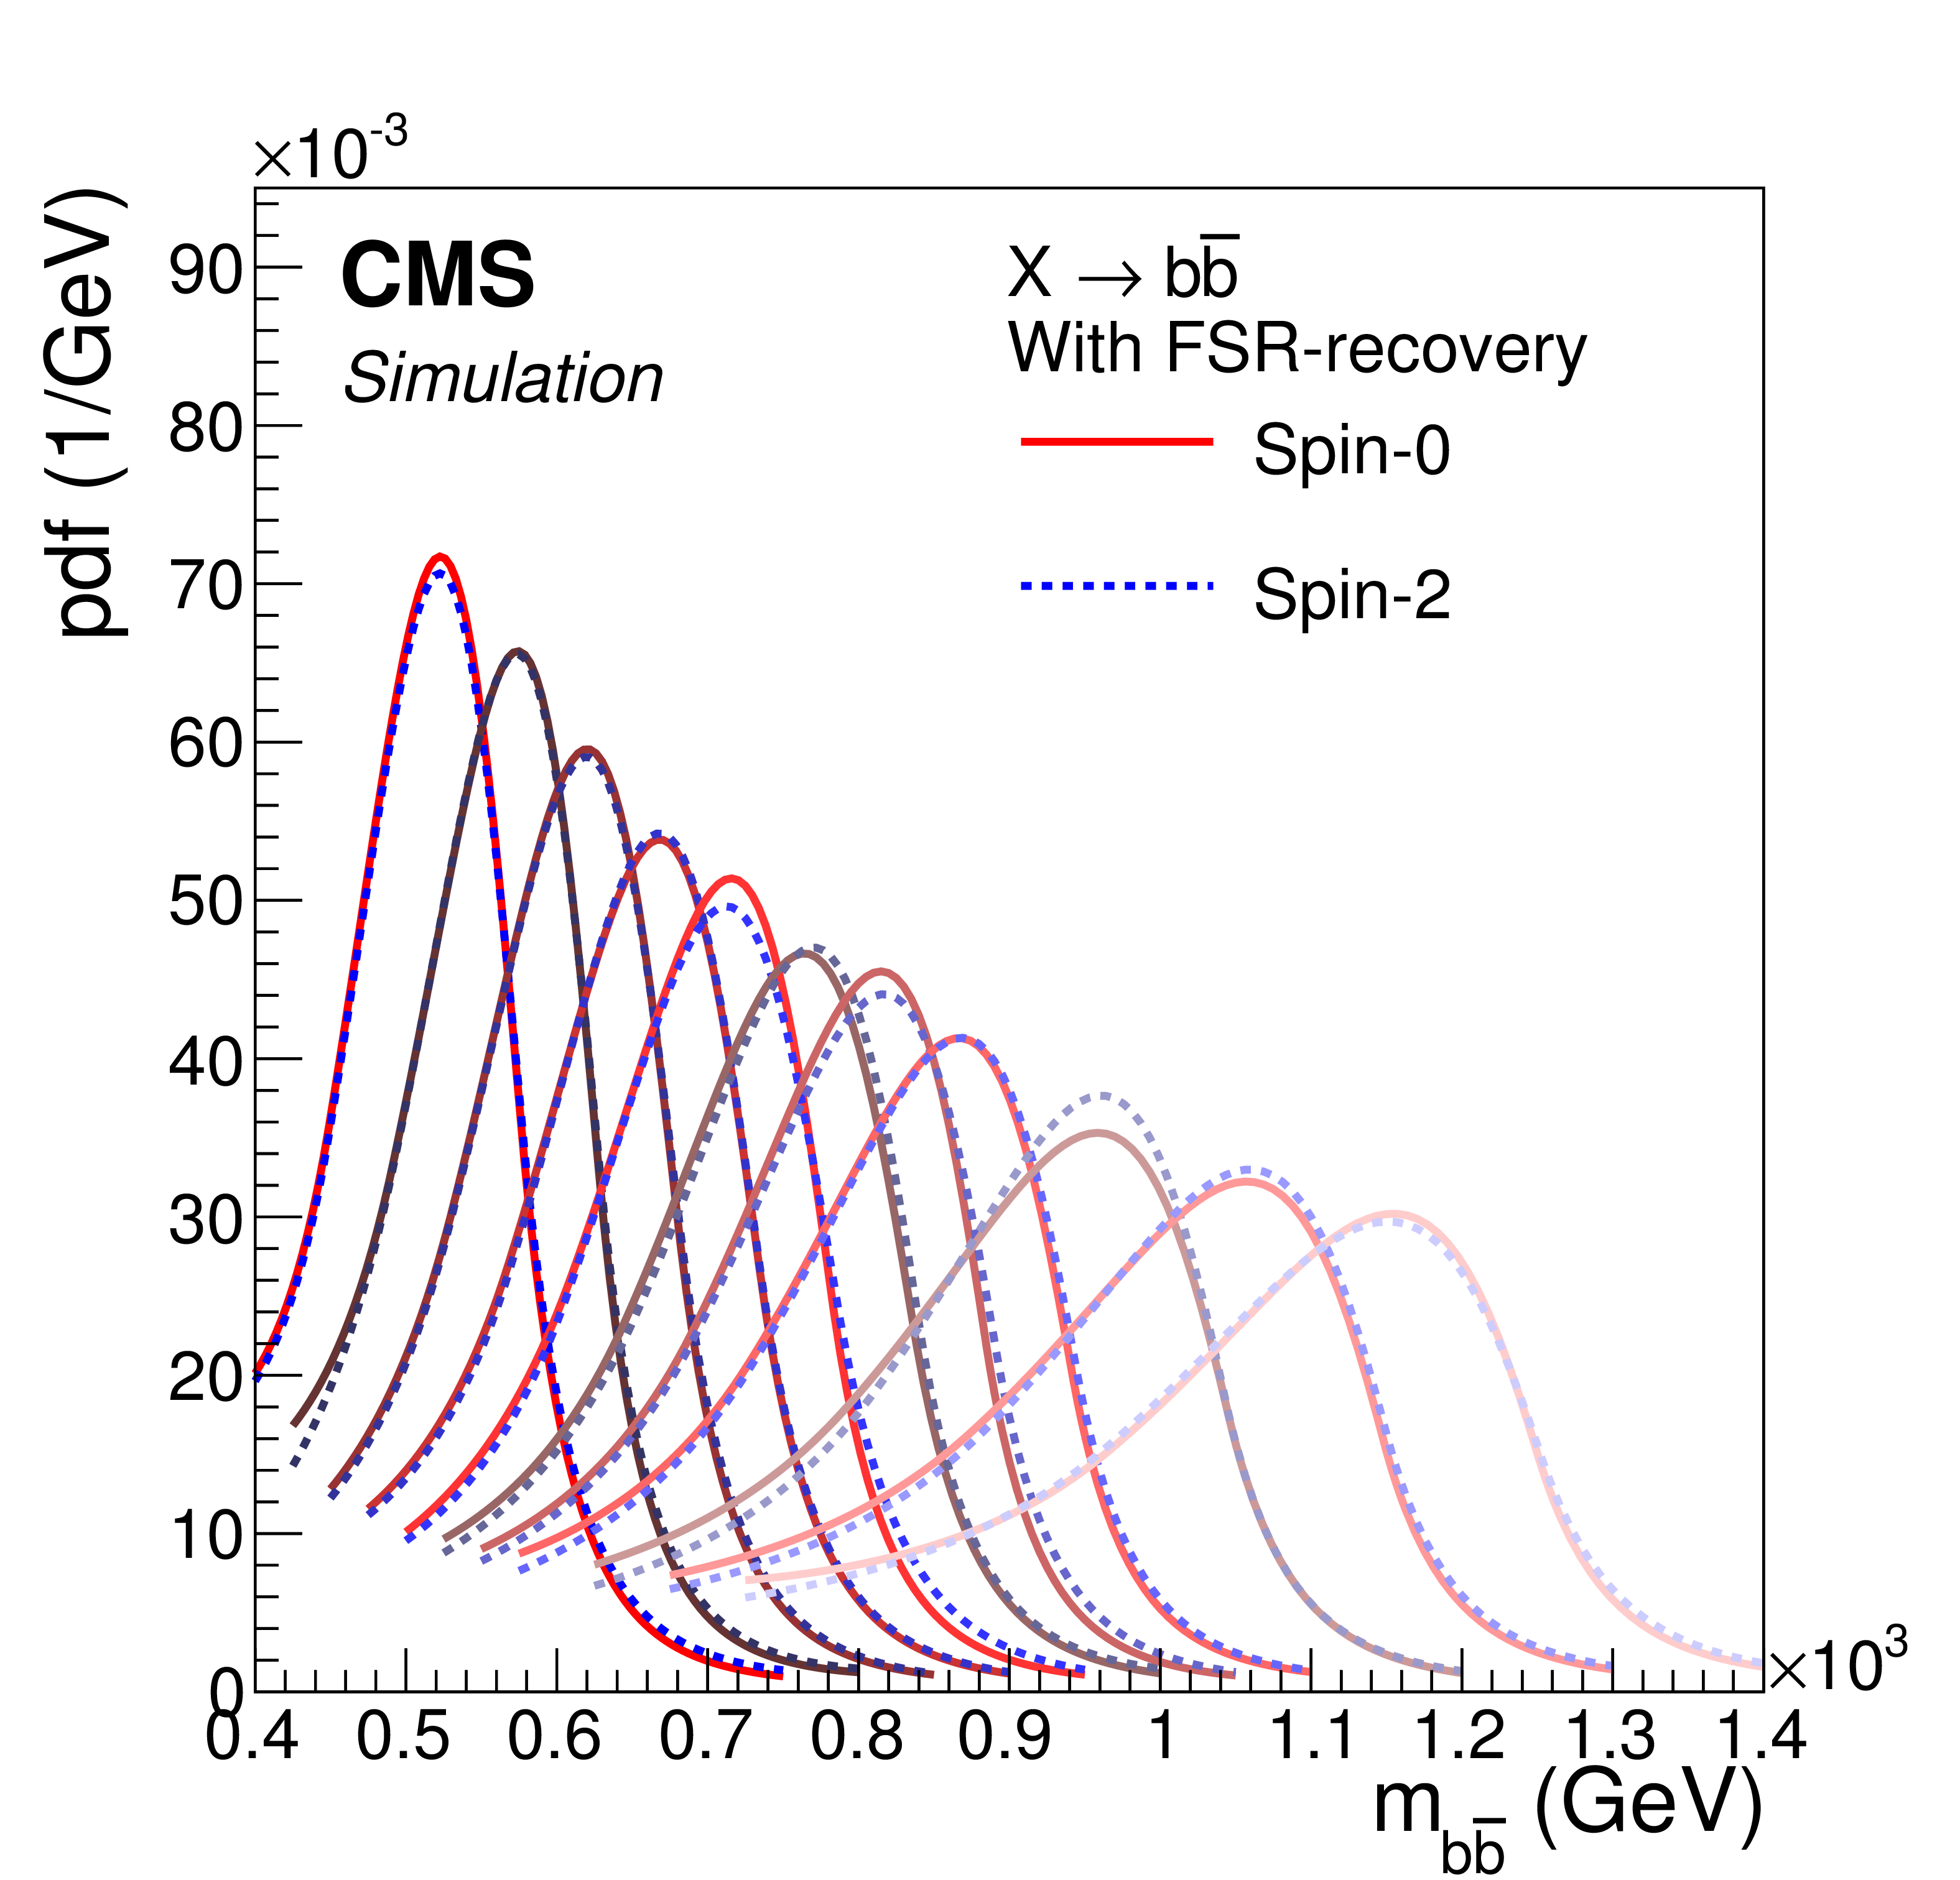
Figure 1-c:
The same probability density functions as in Fig. 1-b for different values of the resonance mass and for the two spin hypotheses, after FSR recovery. |

png pdf |
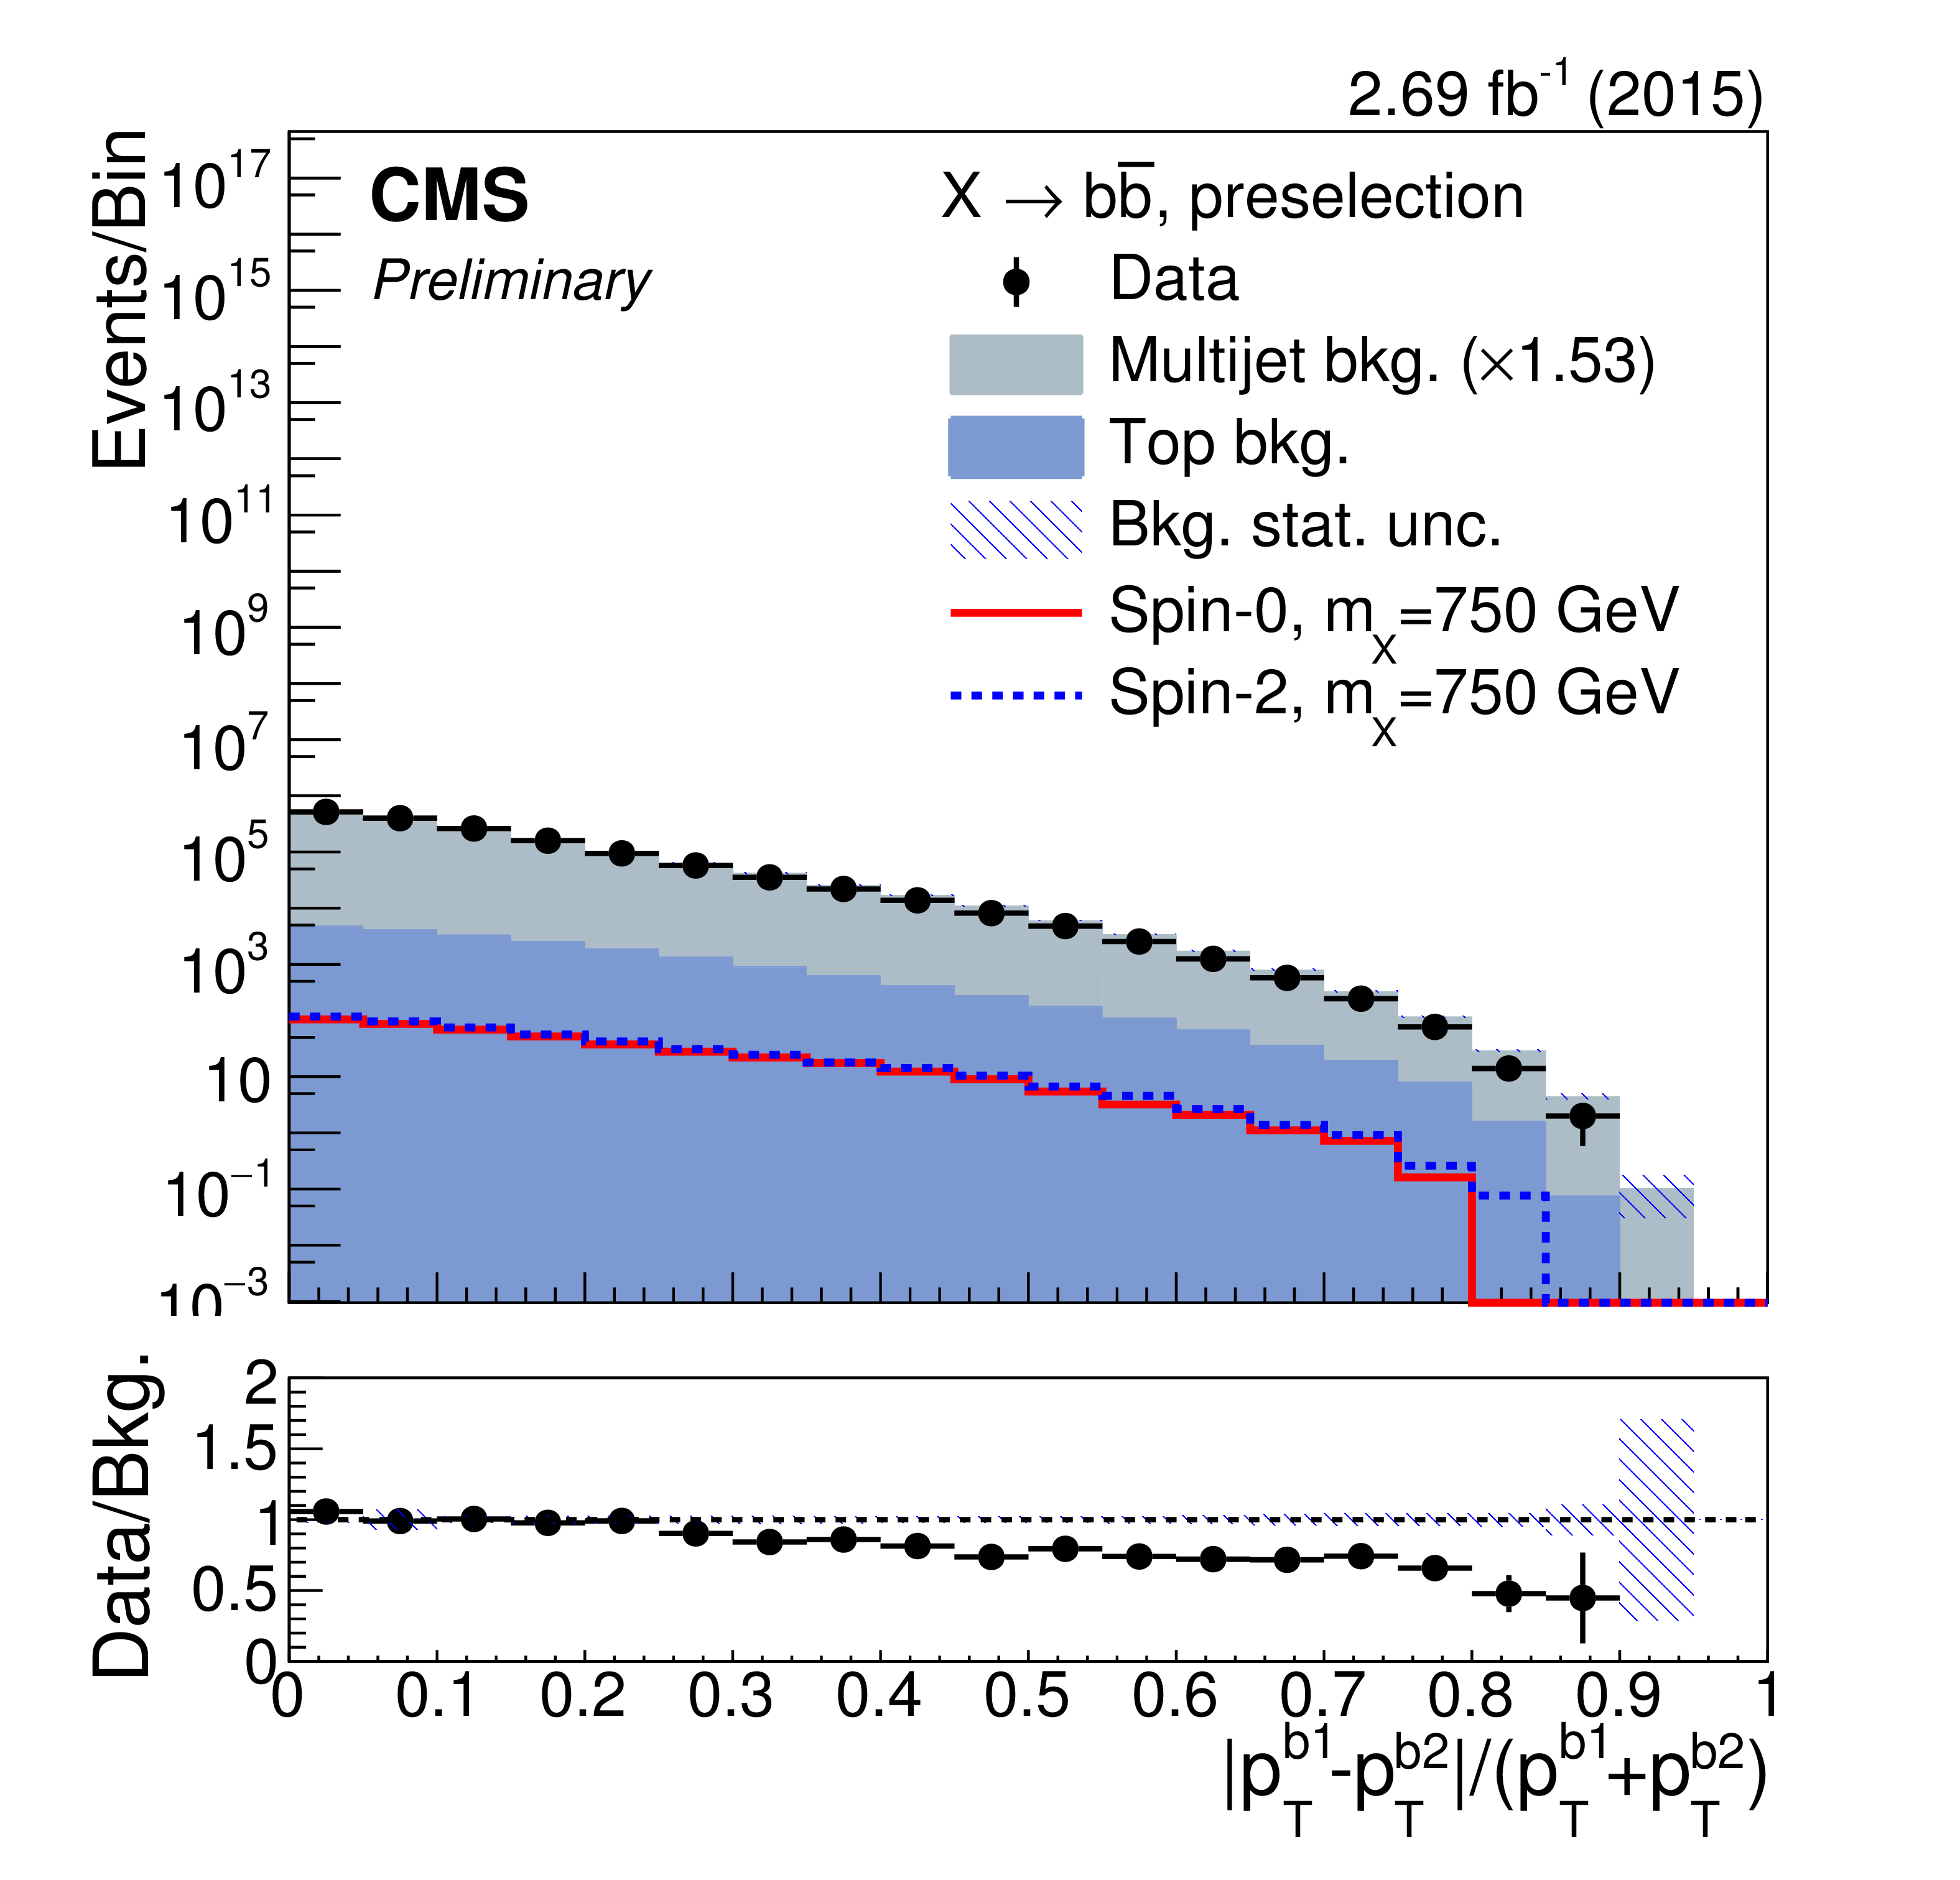
Figure 2-a:
The distributions after preselection of (a) the pseudorapidity difference between the b jets, (b) their distance in azimuth angle, (c) their ${p_{\mathrm {T}}}$ balance, and (d) leading b-jet ${p_{\mathrm {T}}}$ in units of the dijet mass. For each plot, the expected contribution from a spin-0 (solid-red line) and spin-1 (dashed-blue line) signal with $m_{\rm X}=$ 750 GeV, and normalised to a cross section of 1 pb, have been overlayed for comparison. Distributions of (e) the pseudo-rapidity difference between the b jets, and (f) the dijet mass in the top-quark sideband. |
png pdf |
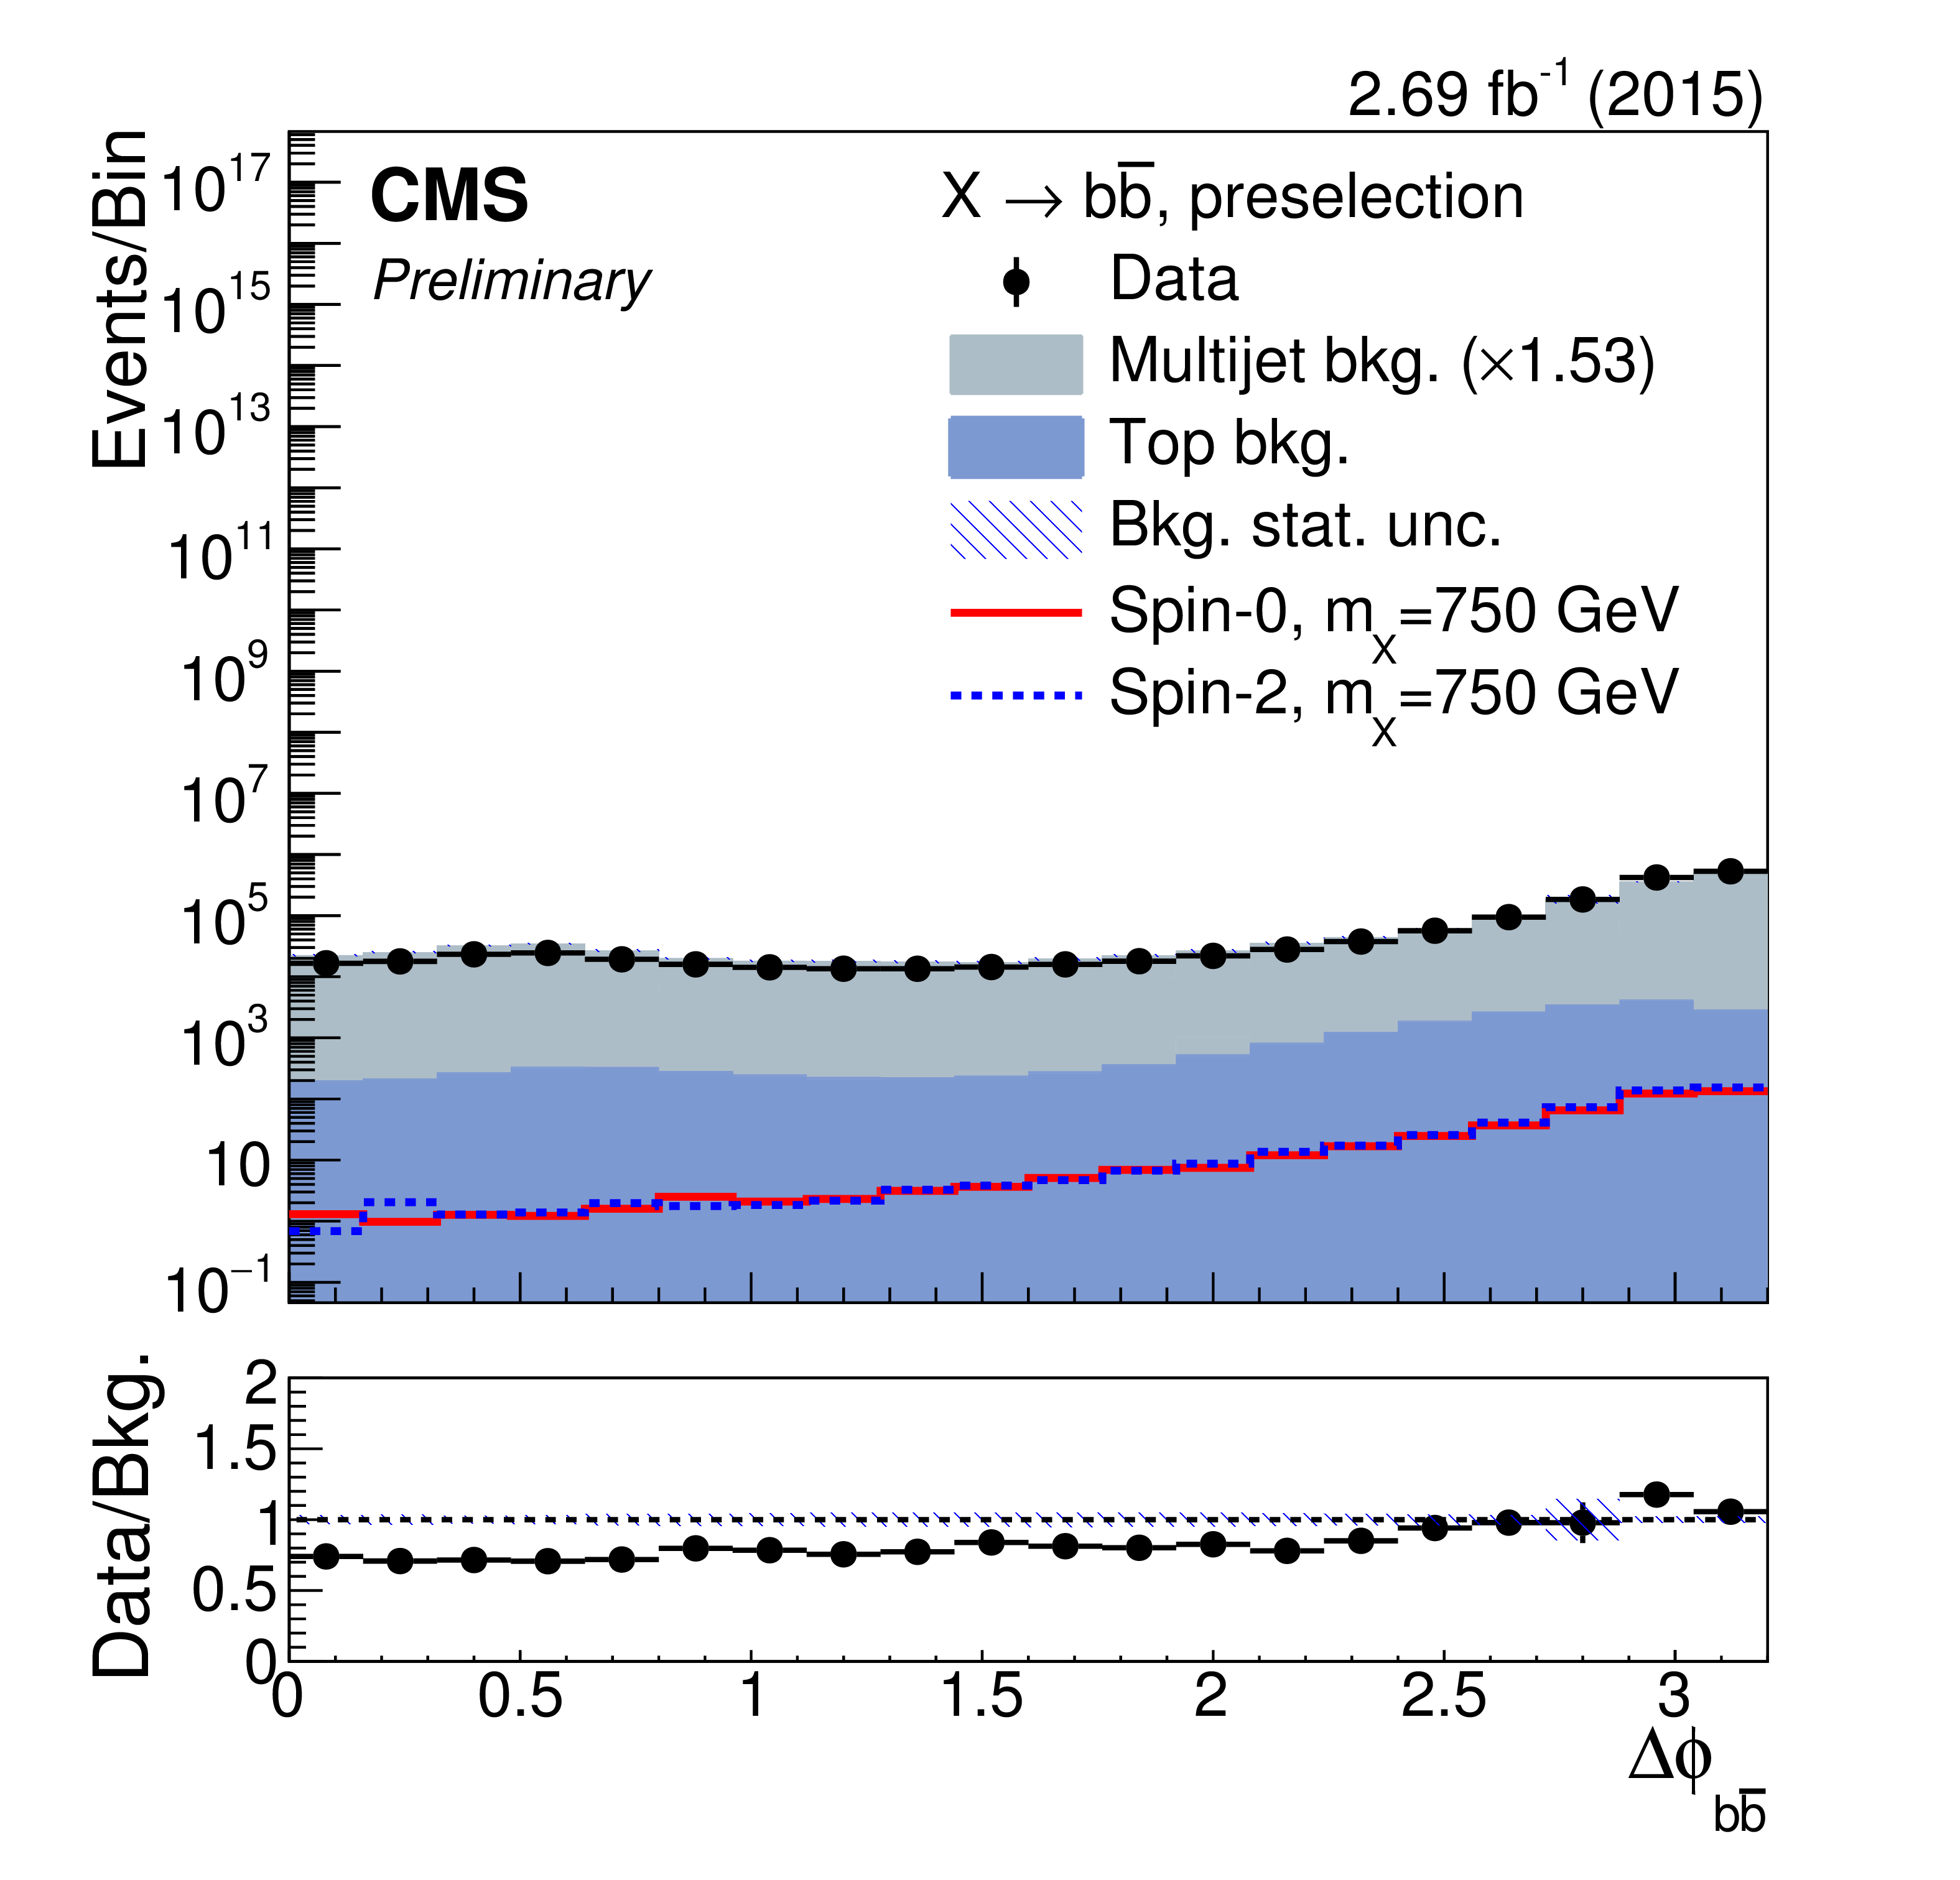
Figure 2-b:
The distributions after preselection of (a) the pseudorapidity difference between the b jets, (b) their distance in azimuth angle, (c) their ${p_{\mathrm {T}}}$ balance, and (d) leading b-jet ${p_{\mathrm {T}}}$ in units of the dijet mass. For each plot, the expected contribution from a spin-0 (solid-red line) and spin-1 (dashed-blue line) signal with $m_{\rm X}=$ 750 GeV, and normalised to a cross section of 1 pb, have been overlayed for comparison. Distributions of (e) the pseudo-rapidity difference between the b jets, and (f) the dijet mass in the top-quark sideband. |
png pdf |
Figure 2-c:
The distributions after preselection of (a) the pseudorapidity difference between the b jets, (b) their distance in azimuth angle, (c) their ${p_{\mathrm {T}}}$ balance, and (d) leading b-jet ${p_{\mathrm {T}}}$ in units of the dijet mass. For each plot, the expected contribution from a spin-0 (solid-red line) and spin-1 (dashed-blue line) signal with $m_{\rm X}=$ 750 GeV, and normalised to a cross section of 1 pb, have been overlayed for comparison. Distributions of (e) the pseudo-rapidity difference between the b jets, and (f) the dijet mass in the top-quark sideband. |
png pdf |
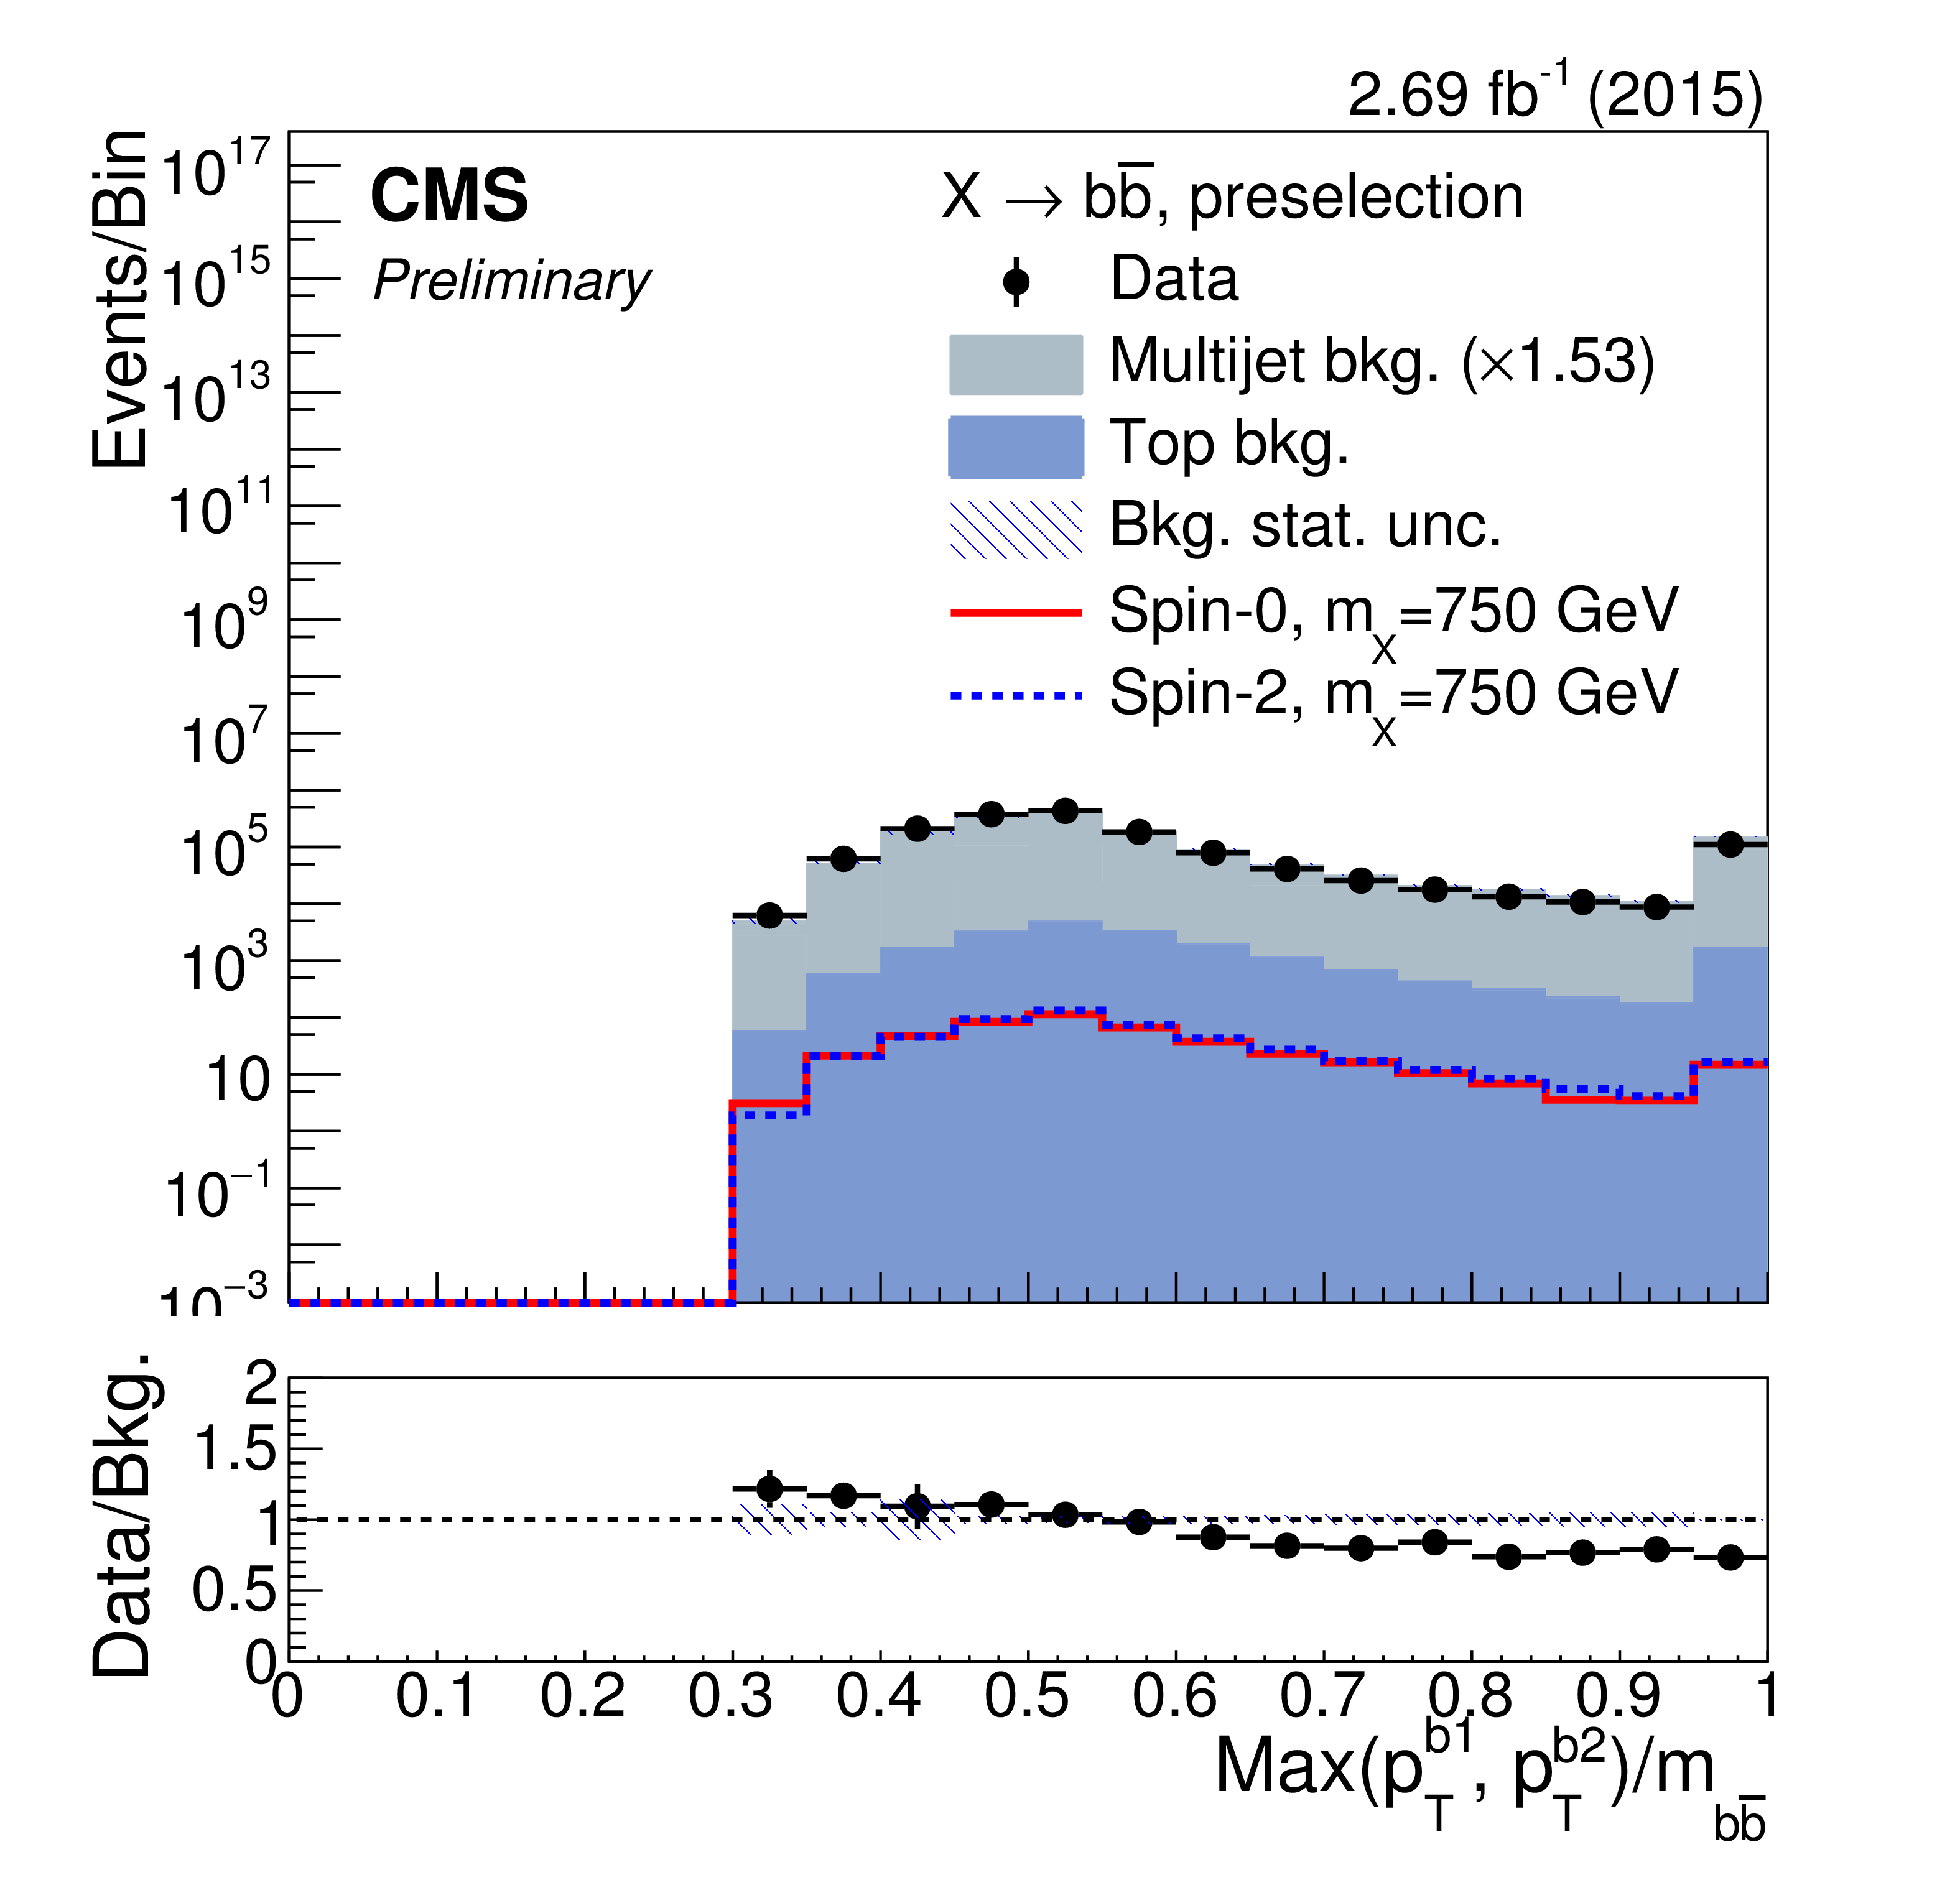
Figure 2-d:
The distributions after preselection of (a) the pseudorapidity difference between the b jets, (b) their distance in azimuth angle, (c) their ${p_{\mathrm {T}}}$ balance, and (d) leading b-jet ${p_{\mathrm {T}}}$ in units of the dijet mass. For each plot, the expected contribution from a spin-0 (solid-red line) and spin-1 (dashed-blue line) signal with $m_{\rm X}=$ 750 GeV, and normalised to a cross section of 1 pb, have been overlayed for comparison. Distributions of (e) the pseudo-rapidity difference between the b jets, and (f) the dijet mass in the top-quark sideband. |

png pdf |
Figure 2-e:
The distributions after preselection of (a) the pseudorapidity difference between the b jets, (b) their distance in azimuth angle, (c) their ${p_{\mathrm {T}}}$ balance, and (d) leading b-jet ${p_{\mathrm {T}}}$ in units of the dijet mass. For each plot, the expected contribution from a spin-0 (solid-red line) and spin-1 (dashed-blue line) signal with $m_{\rm X}=$ 750 GeV, and normalised to a cross section of 1 pb, have been overlayed for comparison. Distributions of (e) the pseudo-rapidity difference between the b jets, and (f) the dijet mass in the top-quark sideband. |
png pdf |
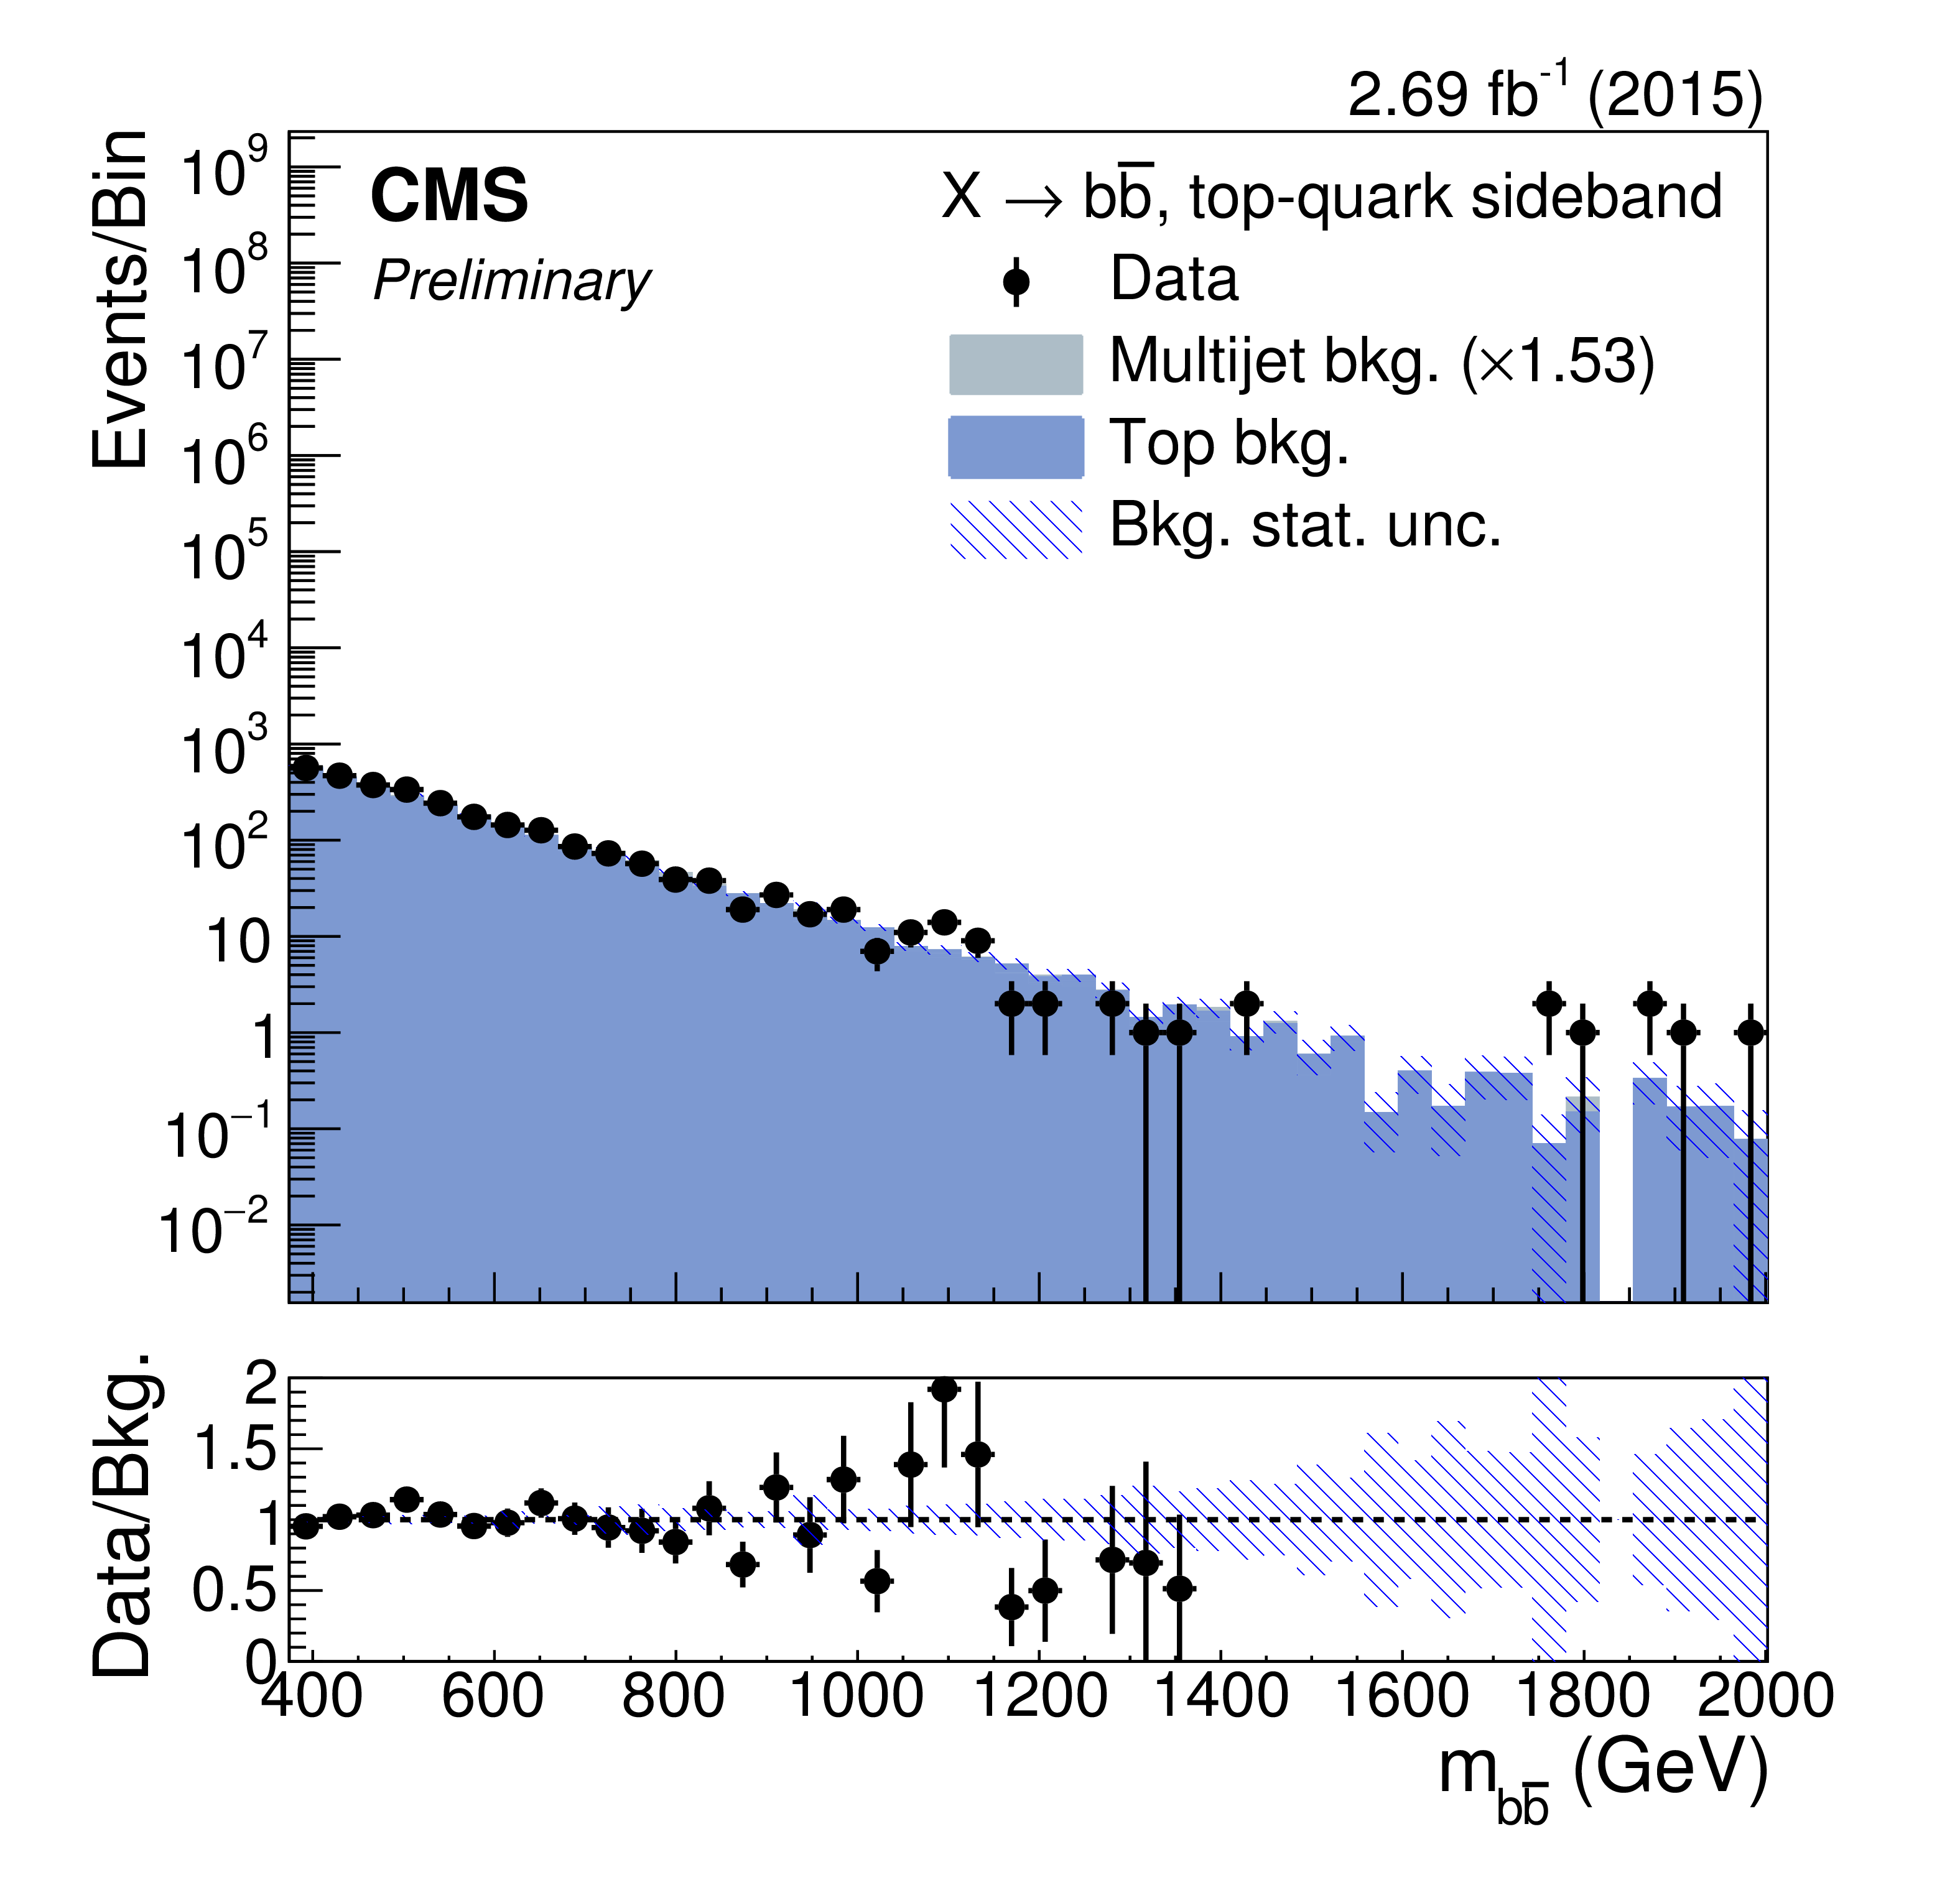
Figure 2-f:
The distributions after preselection of (a) the pseudorapidity difference between the b jets, (b) their distance in azimuth angle, (c) their ${p_{\mathrm {T}}}$ balance, and (d) leading b-jet ${p_{\mathrm {T}}}$ in units of the dijet mass. For each plot, the expected contribution from a spin-0 (solid-red line) and spin-1 (dashed-blue line) signal with $m_{\rm X}=$ 750 GeV, and normalised to a cross section of 1 pb, have been overlayed for comparison. Distributions of (e) the pseudo-rapidity difference between the b jets, and (f) the dijet mass in the top-quark sideband. |
png pdf |
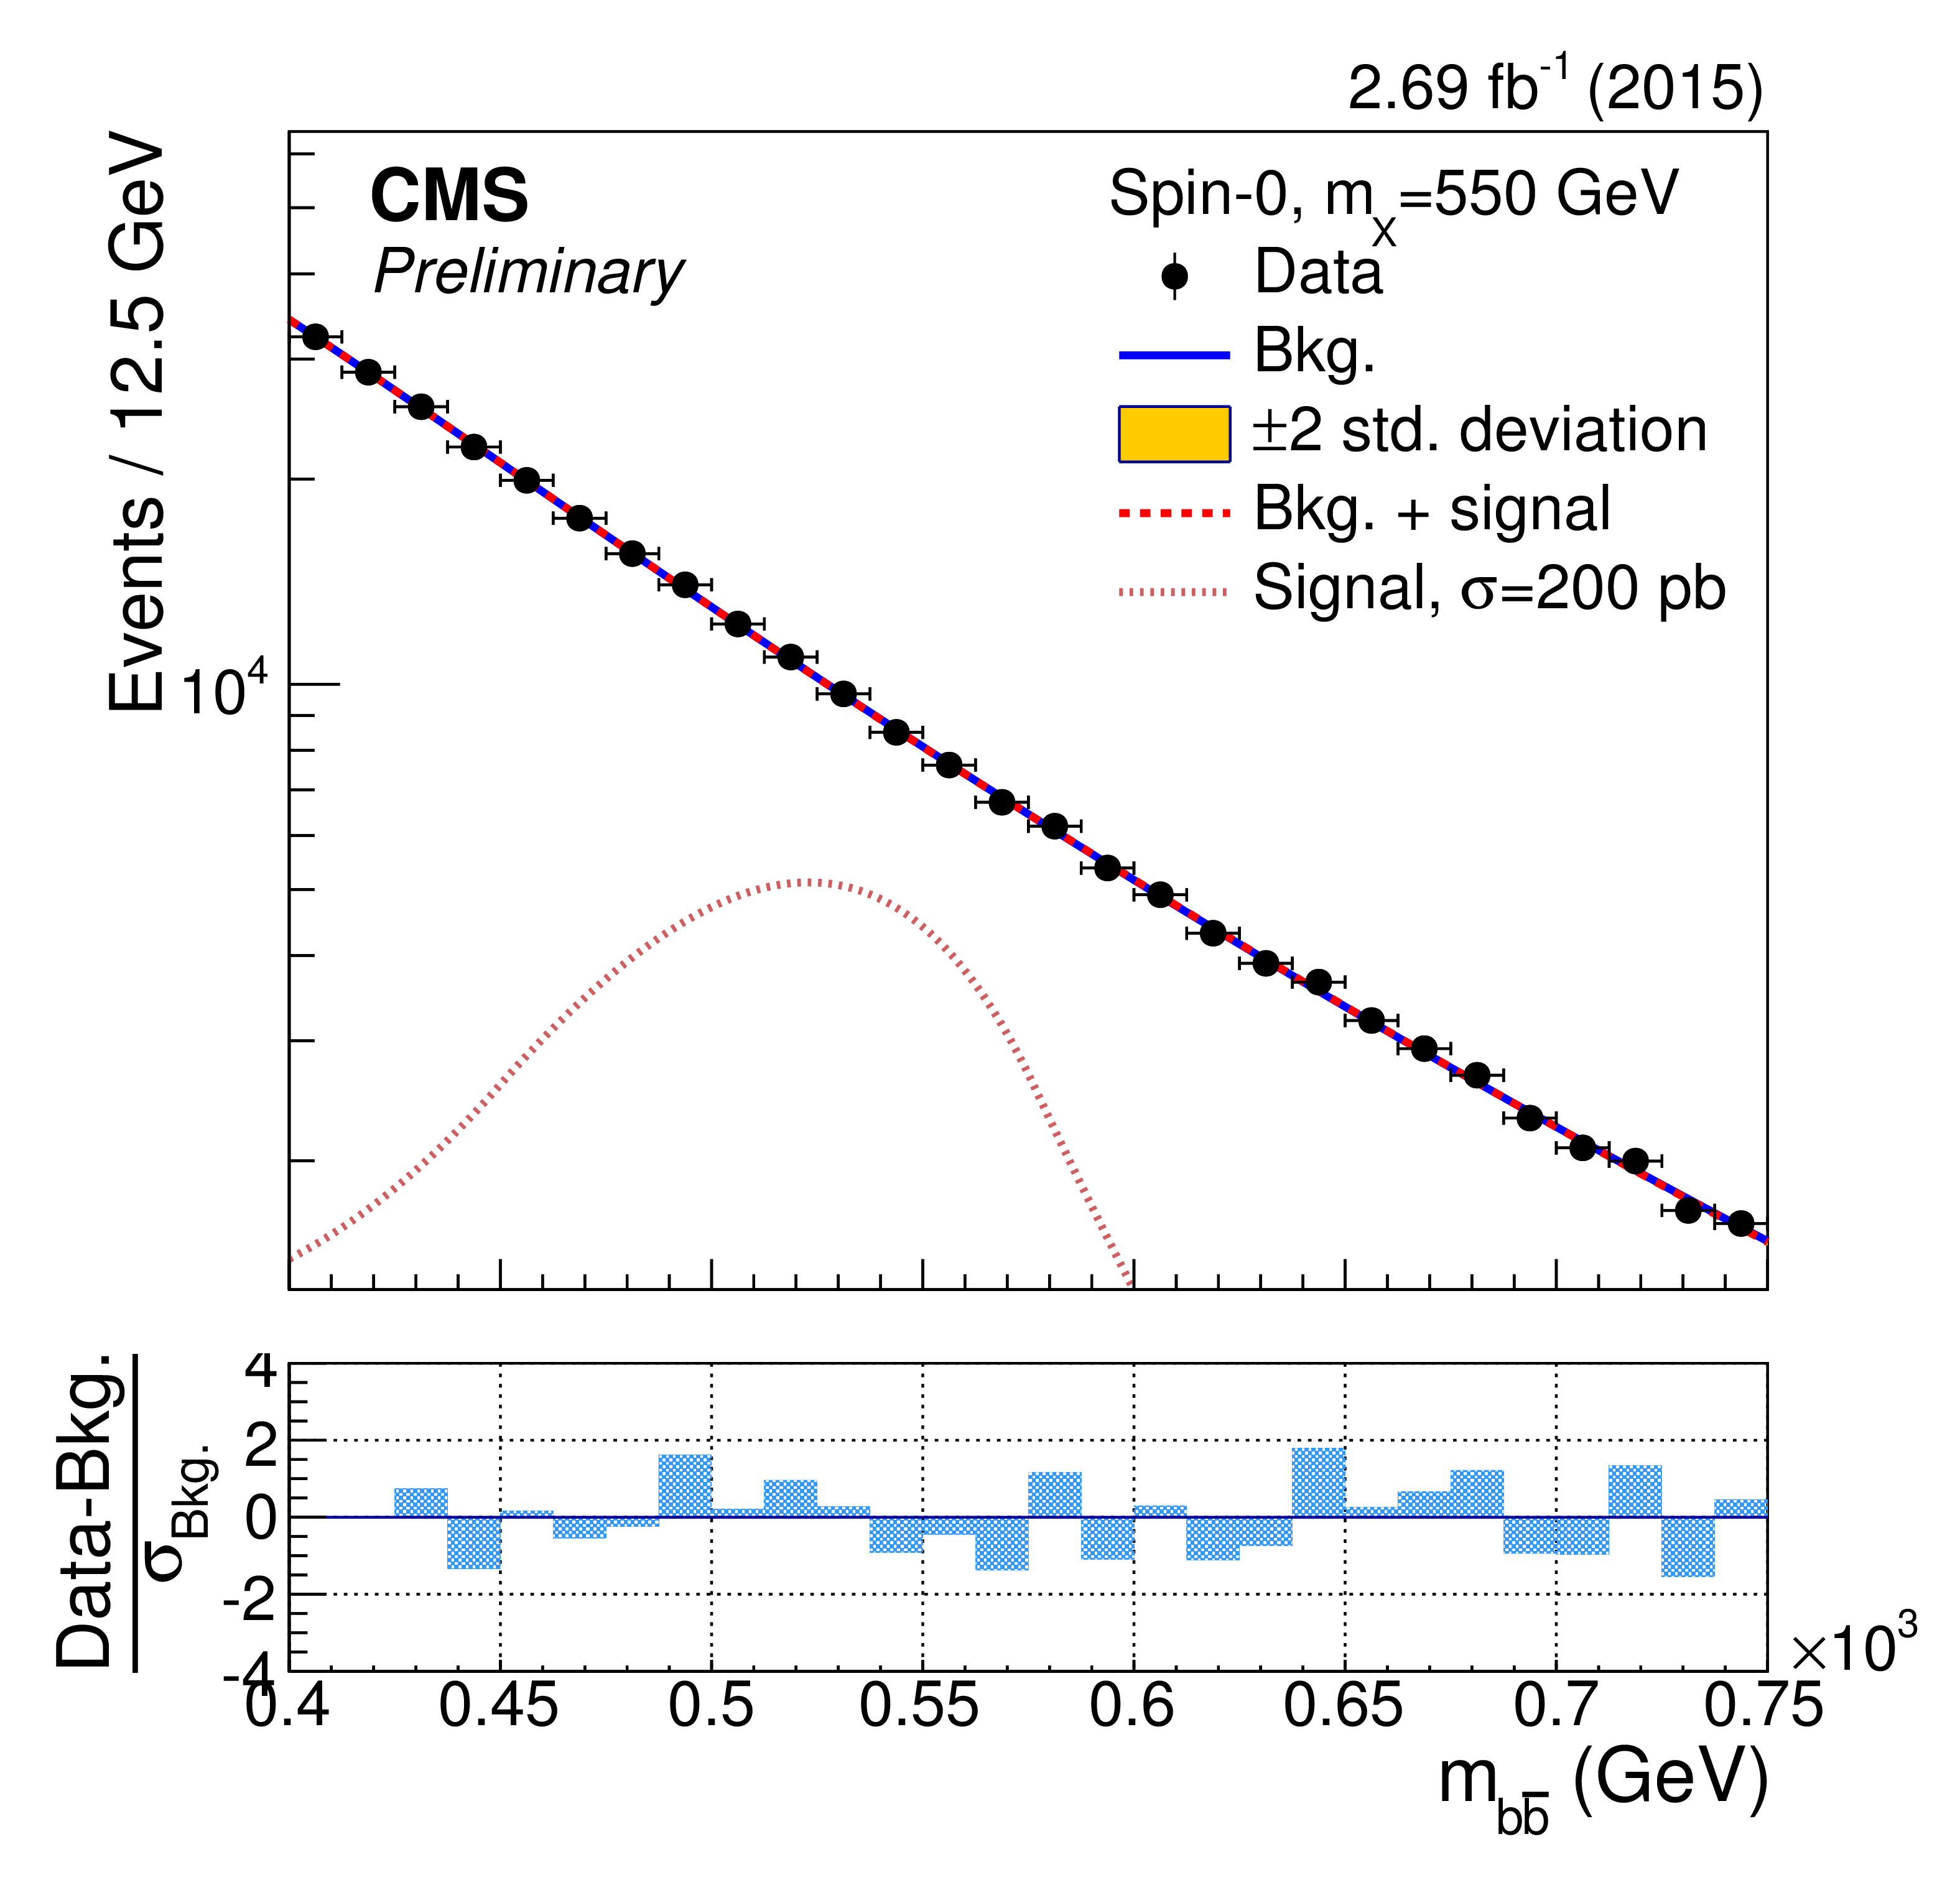
Figure 3-a:
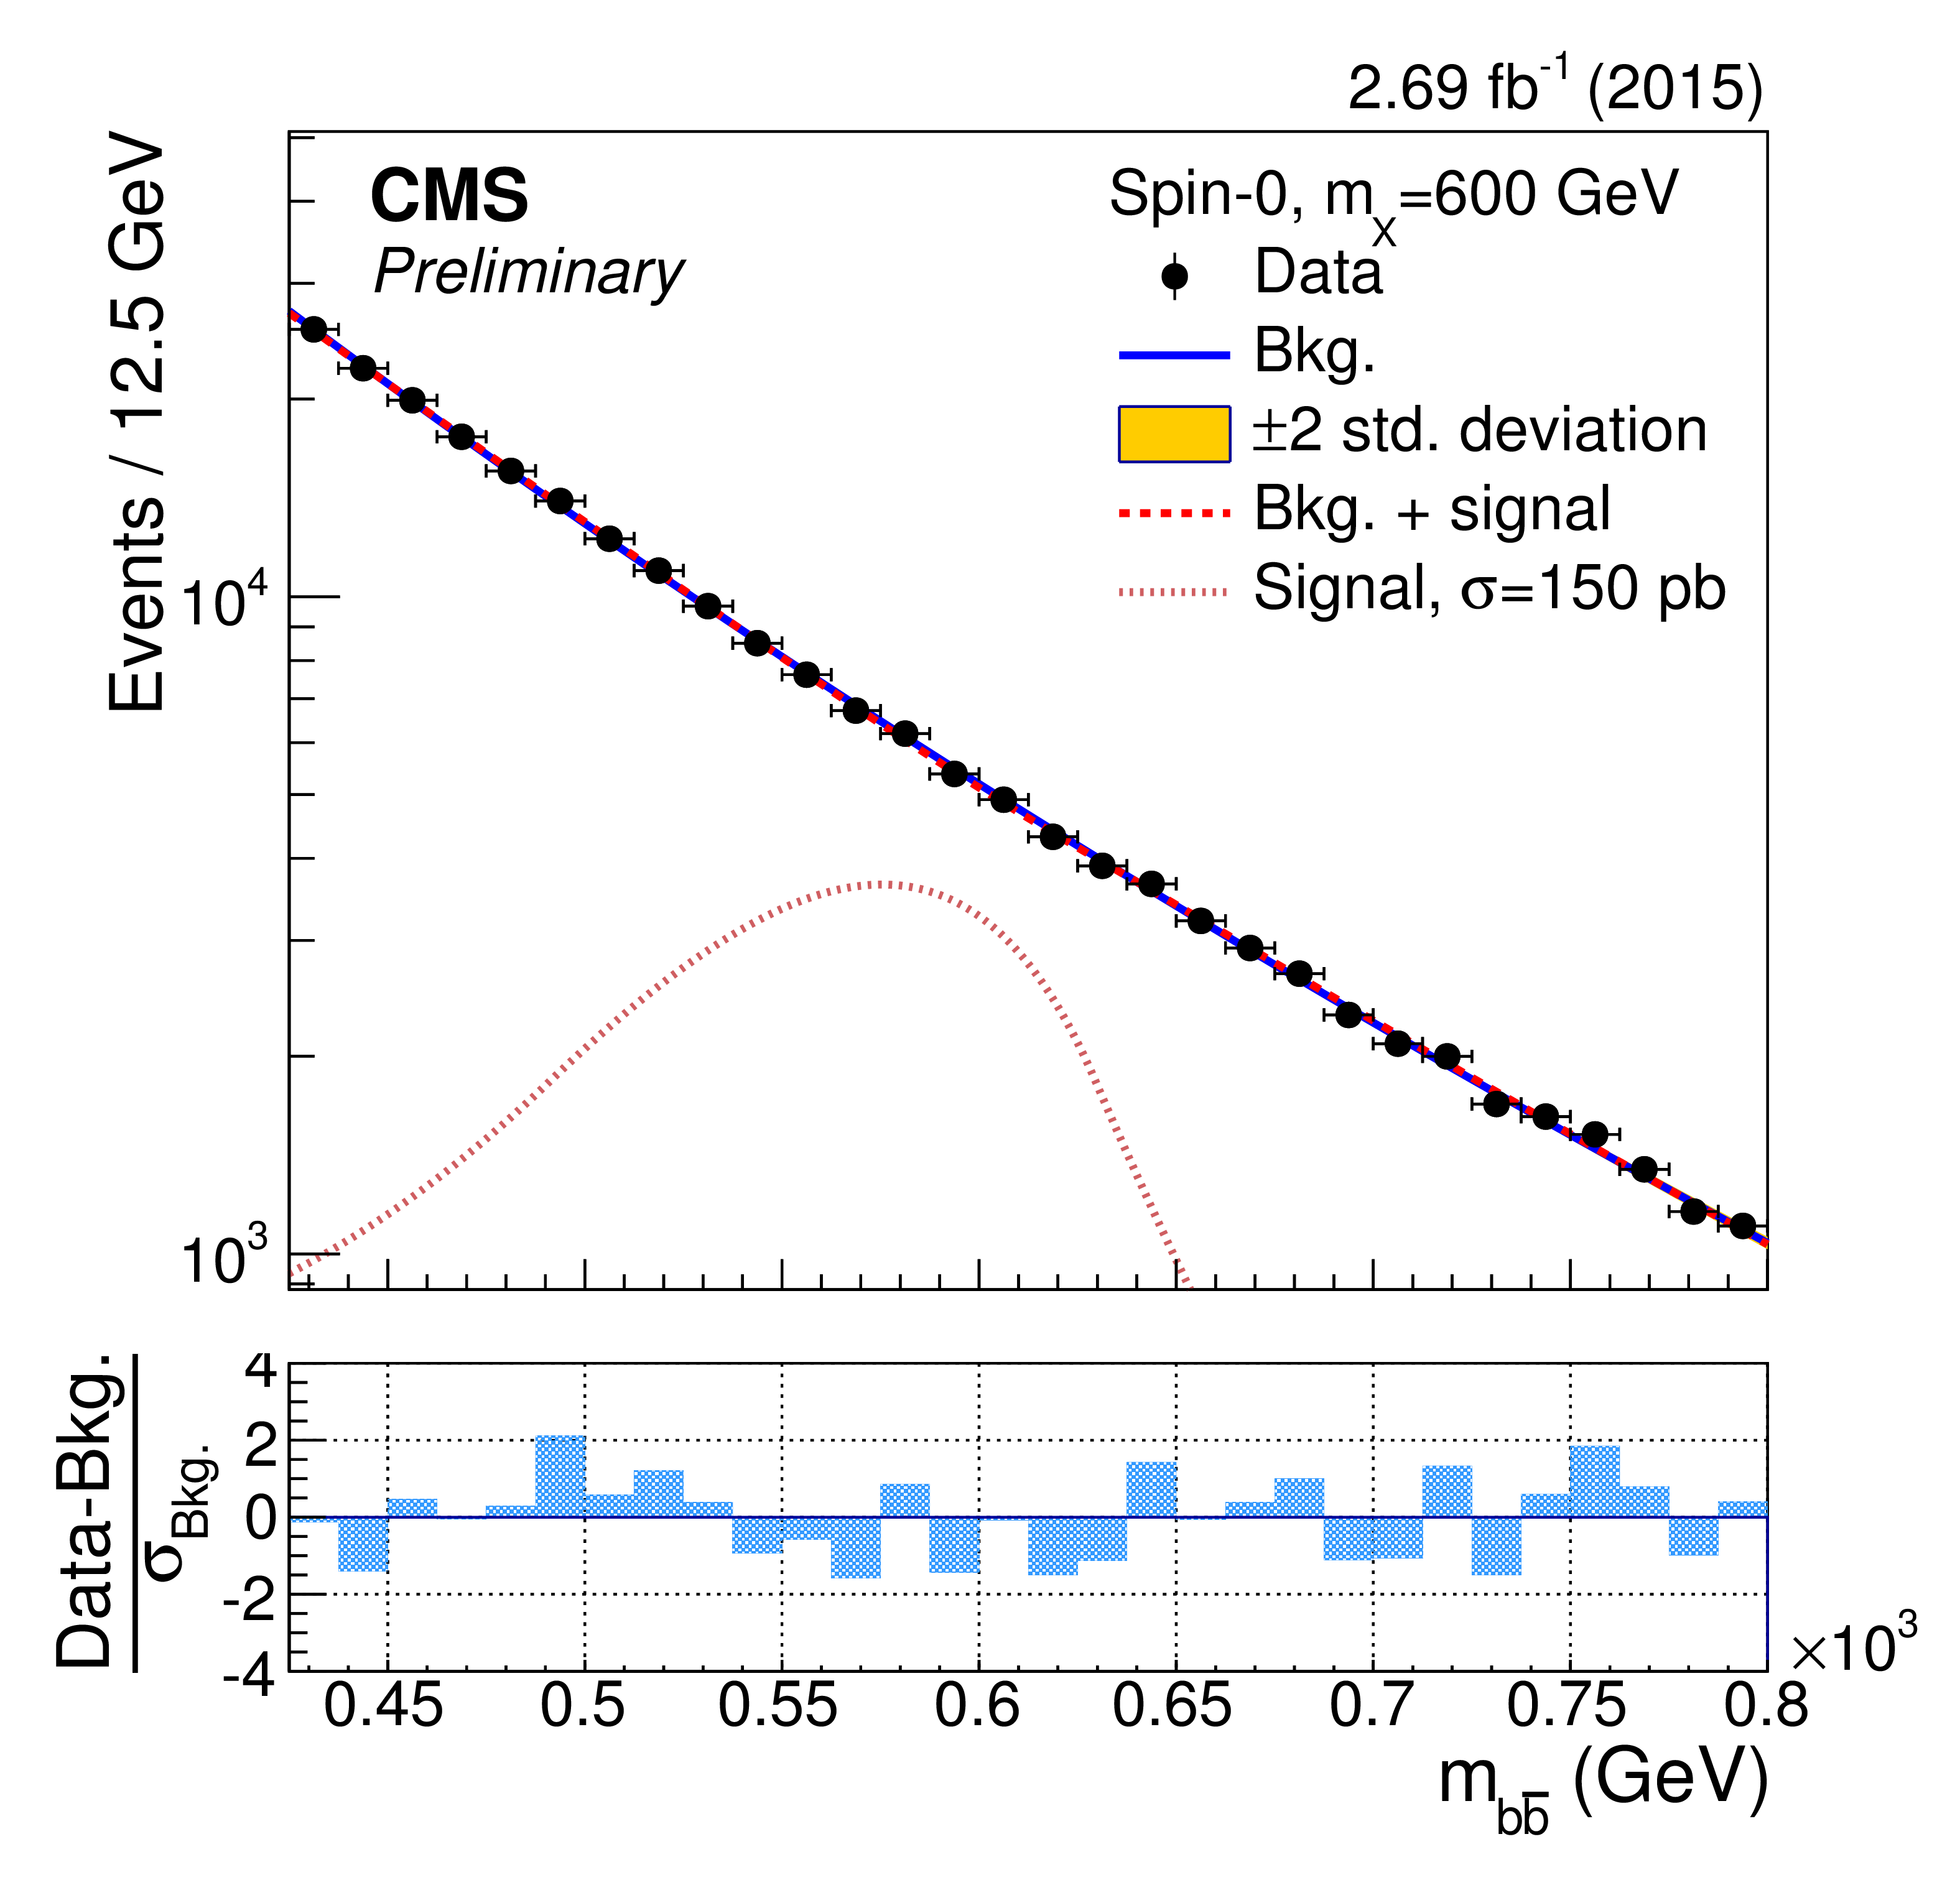
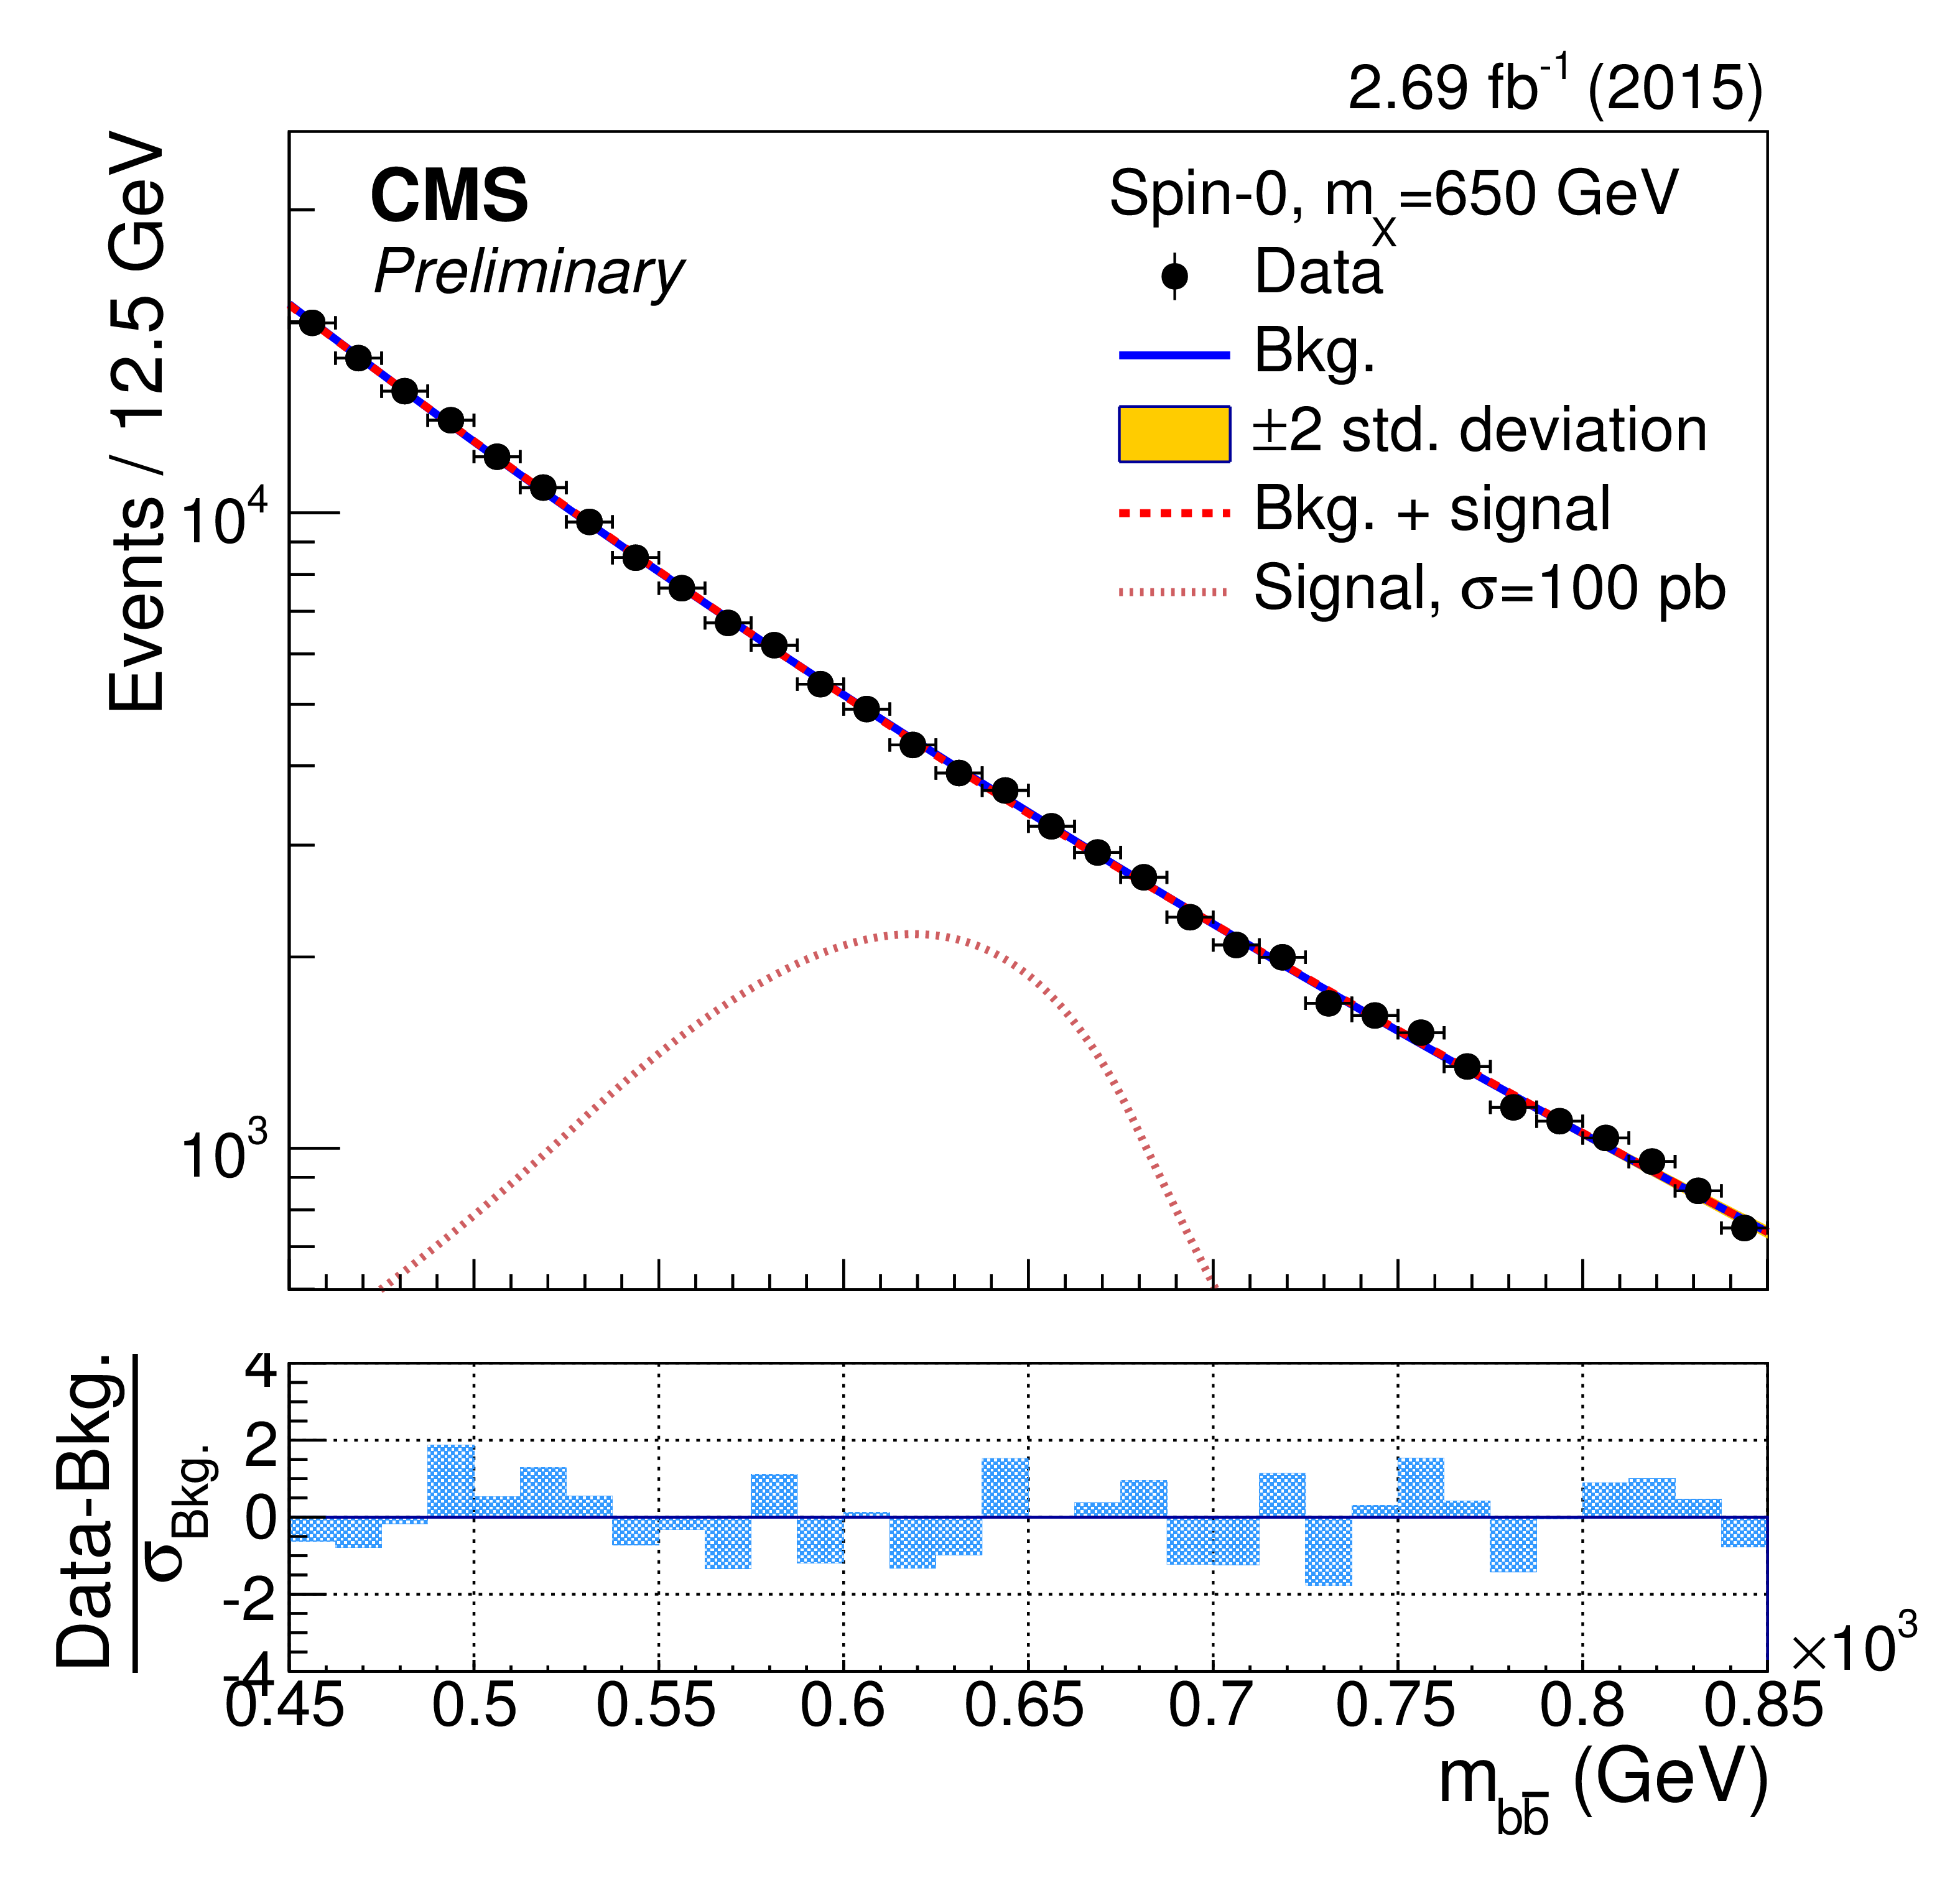
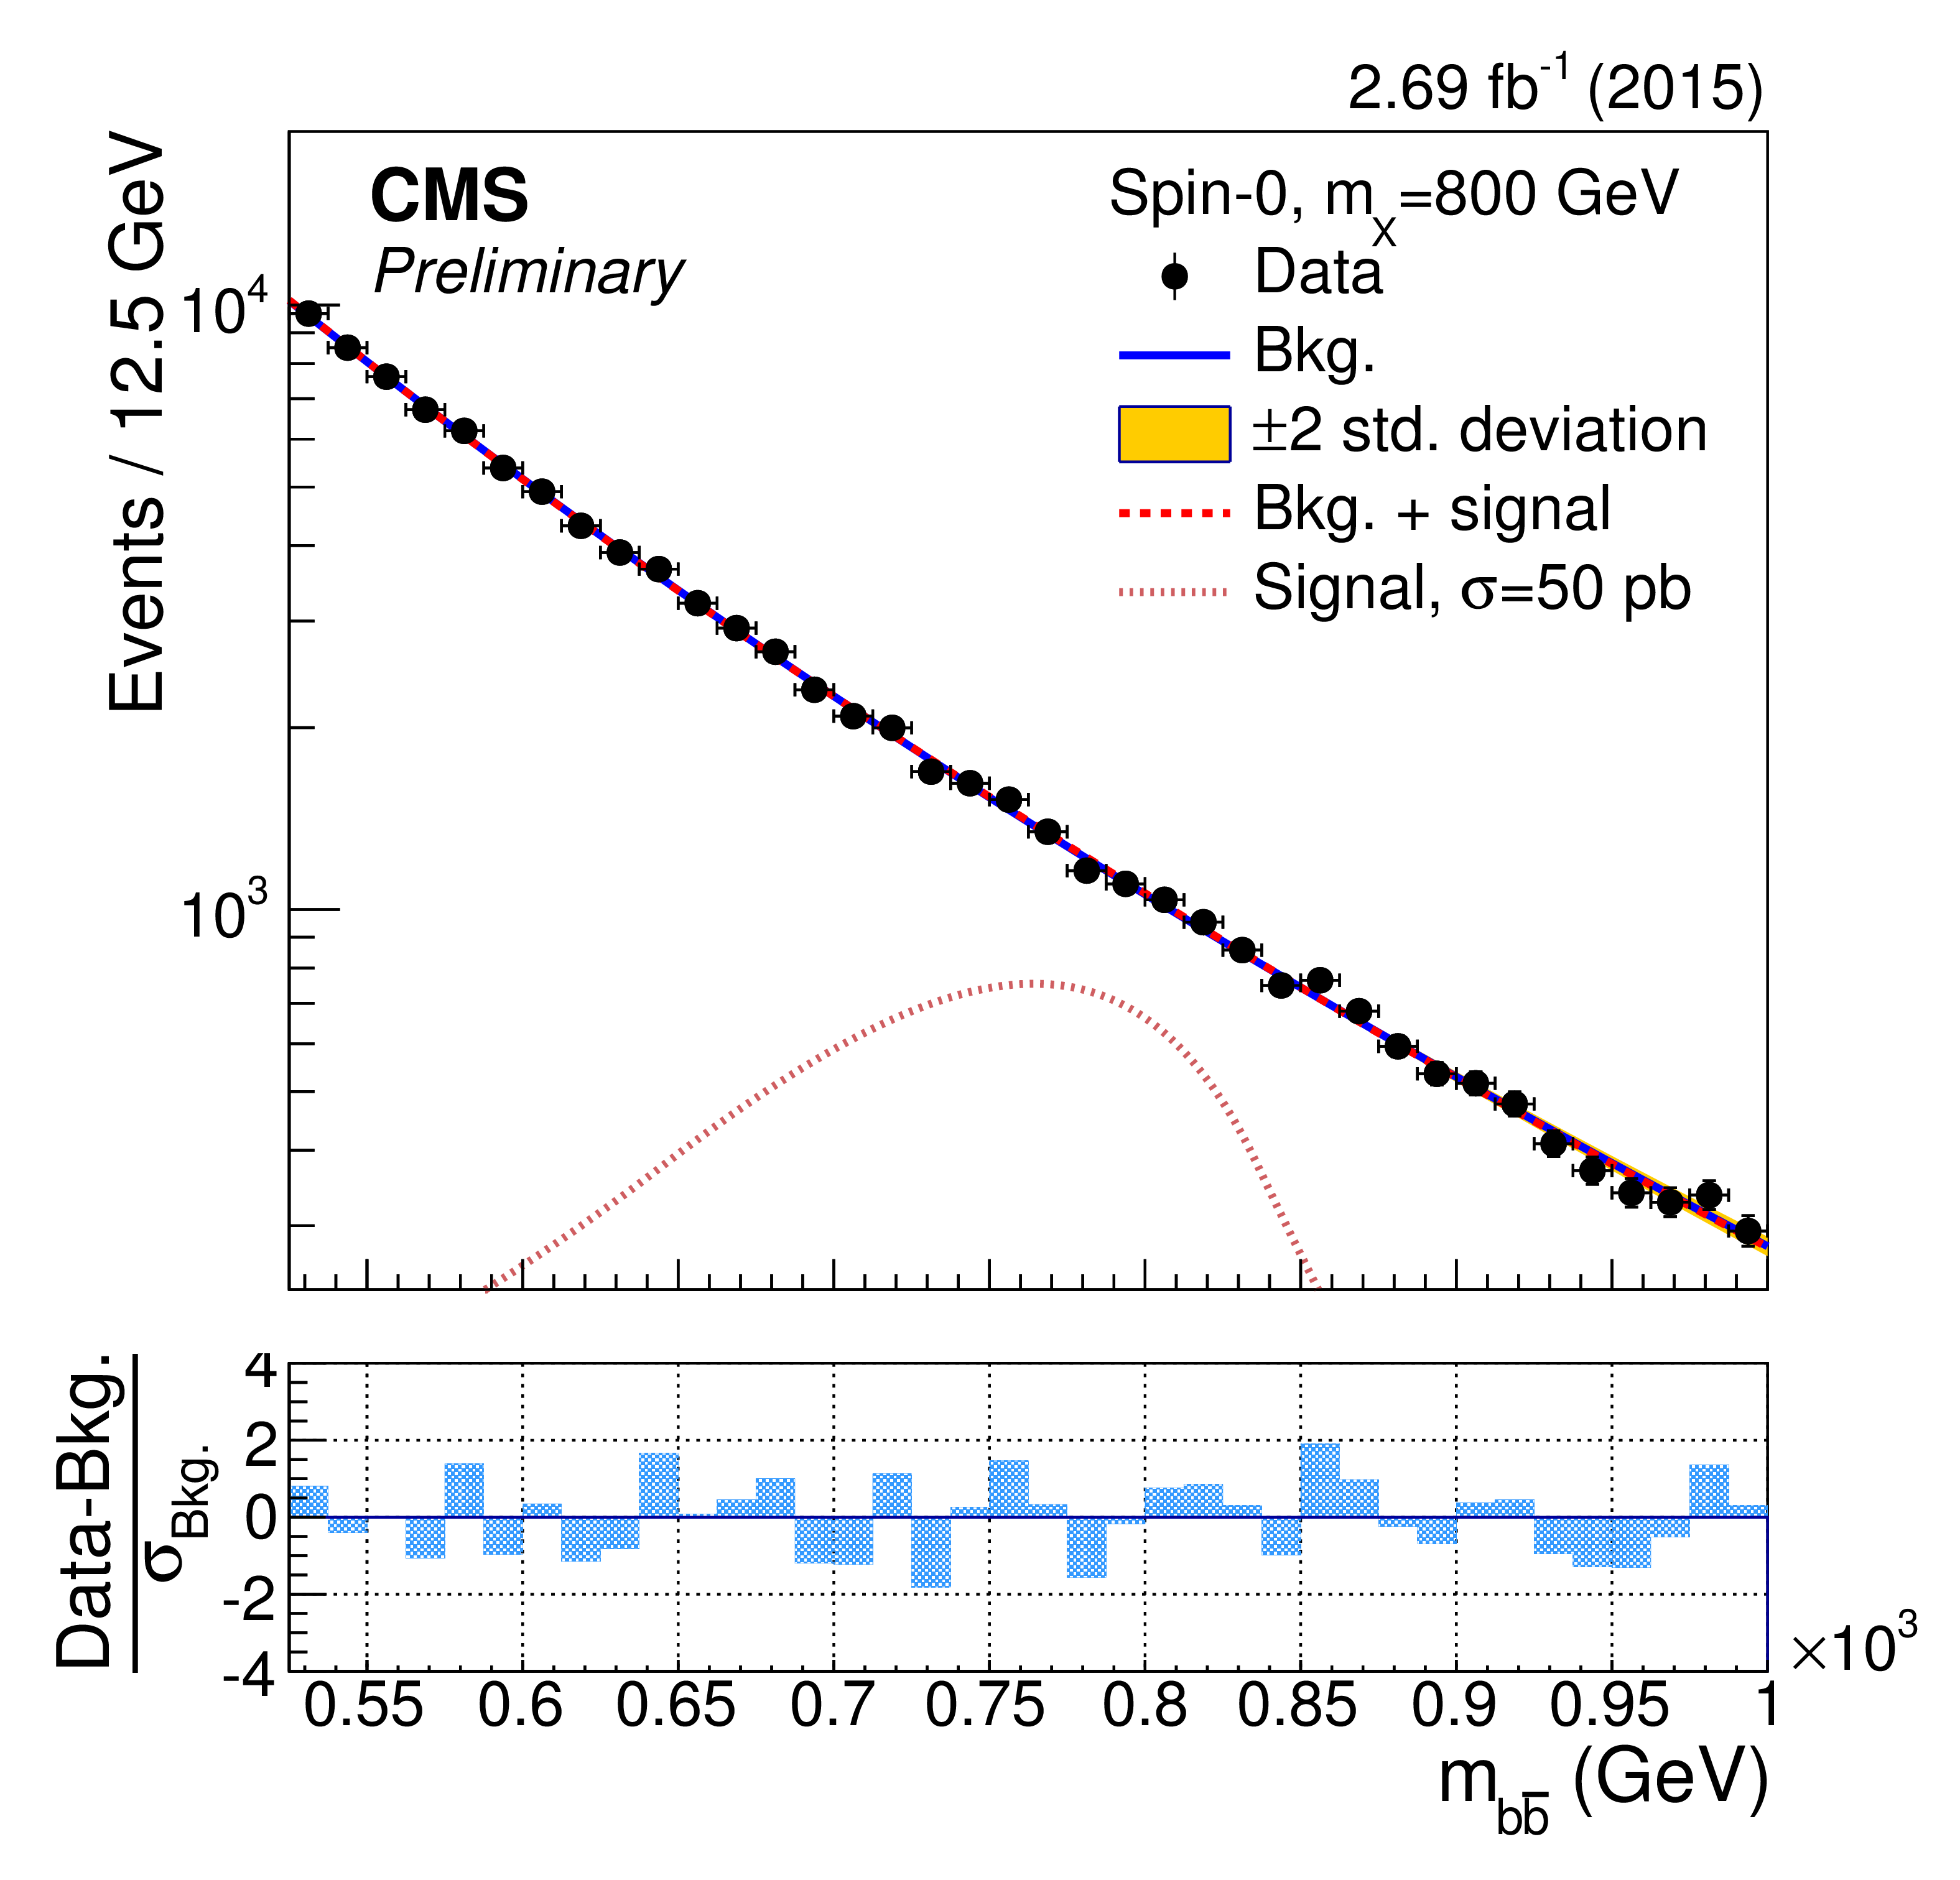
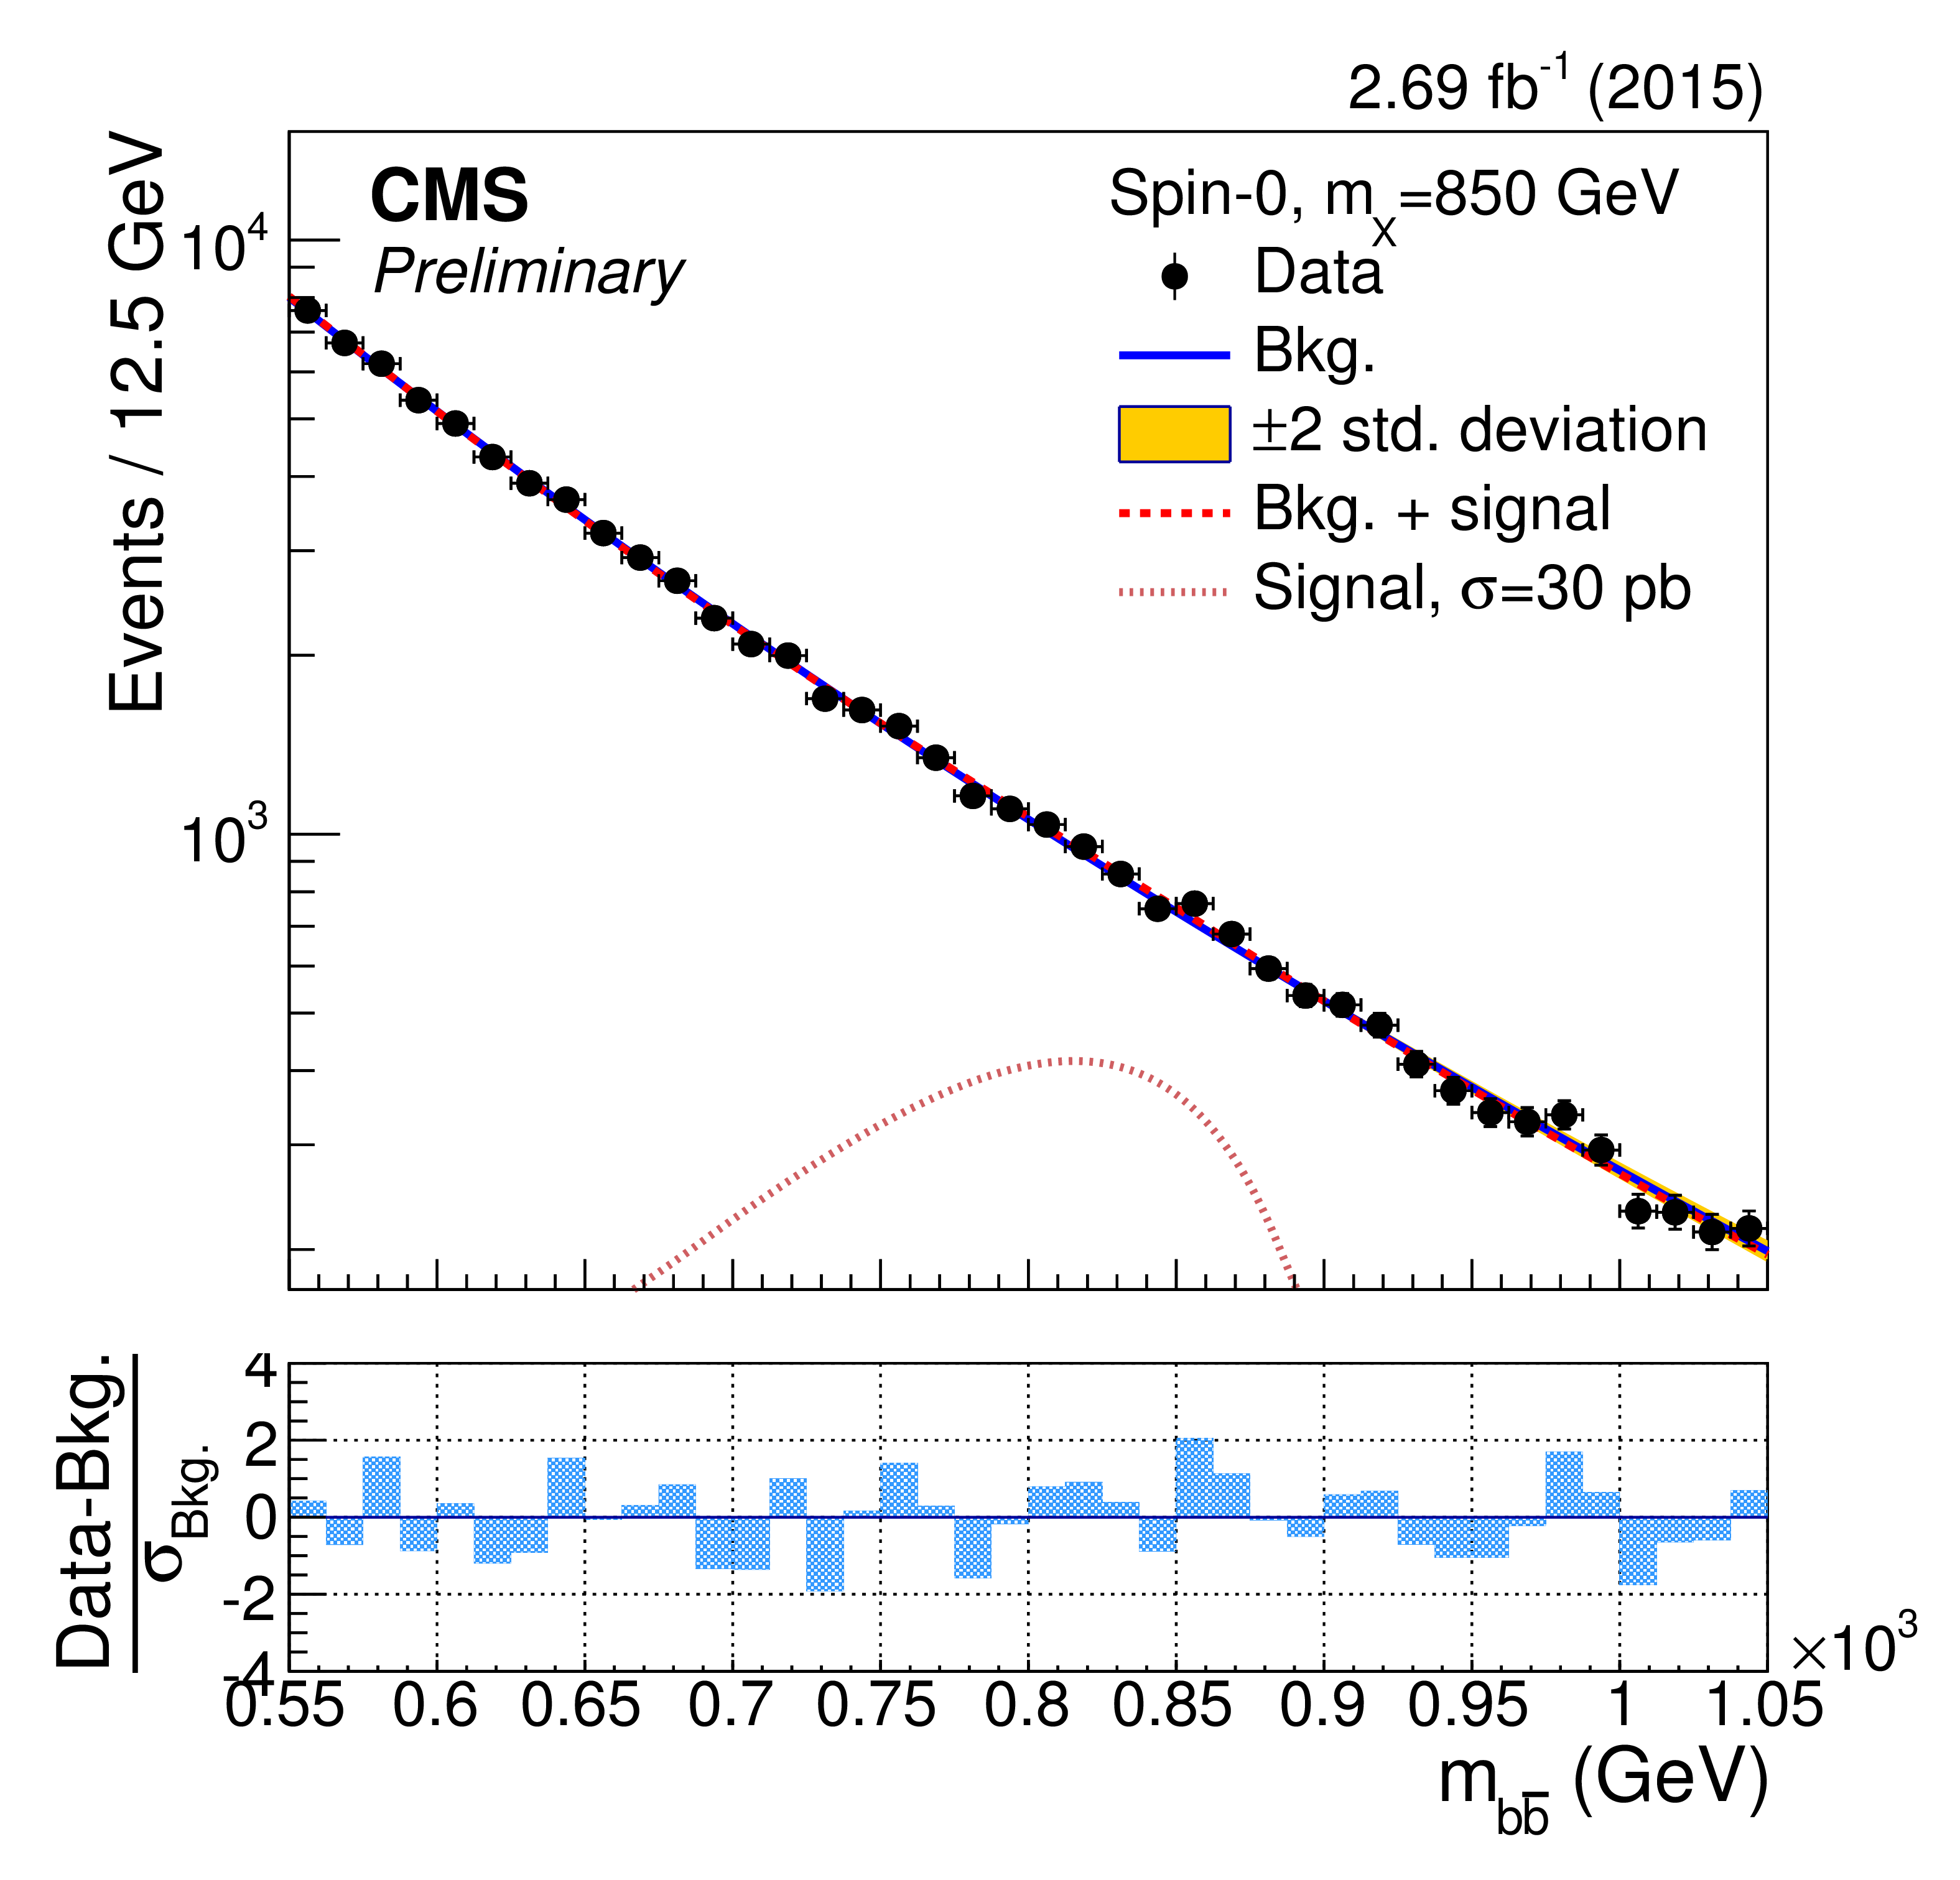
The dijet mass ($m_{ { {\mathrm {b}} {\overline {\mathrm {b}}} } }$) distributions in the ranges used to search for a resonance with mass $m_{\rm X}=$ 550, 600, 650, 700, 750, 800, 850 GeV. The results of the background-only fit are shown as a solid-blue line, while the signal plus background fit is shown as a dashed-red line. For illustrative purposes, the expected mass distribution for a spin-0 signal normalised to a large and arbitrary cross section is overlayed as a dotted light-red line. The bottom panels show the difference between the event counting and the fitted background yield in each bin, normalised to the total background uncertainty ($\sigma _{\rm Bkg.}$) in that bin. |
png pdf |
Figure 3-b:
The dijet mass ($m_{ { {\mathrm {b}} {\overline {\mathrm {b}}} } }$) distributions in the ranges used to search for a resonance with mass $m_{\rm X}=$ 550, 600, 650, 700, 750, 800, 850 GeV. The results of the background-only fit are shown as a solid-blue line, while the signal plus background fit is shown as a dashed-red line. For illustrative purposes, the expected mass distribution for a spin-0 signal normalised to a large and arbitrary cross section is overlayed as a dotted light-red line. The bottom panels show the difference between the event counting and the fitted background yield in each bin, normalised to the total background uncertainty ($\sigma _{\rm Bkg.}$) in that bin. |
png pdf |
Figure 3-c:
The dijet mass ($m_{ { {\mathrm {b}} {\overline {\mathrm {b}}} } }$) distributions in the ranges used to search for a resonance with mass $m_{\rm X}=$ 550, 600, 650, 700, 750, 800, 850 GeV. The results of the background-only fit are shown as a solid-blue line, while the signal plus background fit is shown as a dashed-red line. For illustrative purposes, the expected mass distribution for a spin-0 signal normalised to a large and arbitrary cross section is overlayed as a dotted light-red line. The bottom panels show the difference between the event counting and the fitted background yield in each bin, normalised to the total background uncertainty ($\sigma _{\rm Bkg.}$) in that bin. |

png pdf |
Figure 3-d:
The dijet mass ($m_{ { {\mathrm {b}} {\overline {\mathrm {b}}} } }$) distributions in the ranges used to search for a resonance with mass $m_{\rm X}=$ 550, 600, 650, 700, 750, 800, 850 GeV. The results of the background-only fit are shown as a solid-blue line, while the signal plus background fit is shown as a dashed-red line. For illustrative purposes, the expected mass distribution for a spin-0 signal normalised to a large and arbitrary cross section is overlayed as a dotted light-red line. The bottom panels show the difference between the event counting and the fitted background yield in each bin, normalised to the total background uncertainty ($\sigma _{\rm Bkg.}$) in that bin. |

png pdf |
Figure 3-e:
The dijet mass ($m_{ { {\mathrm {b}} {\overline {\mathrm {b}}} } }$) distributions in the ranges used to search for a resonance with mass $m_{\rm X}=$ 550, 600, 650, 700, 750, 800, 850 GeV. The results of the background-only fit are shown as a solid-blue line, while the signal plus background fit is shown as a dashed-red line. For illustrative purposes, the expected mass distribution for a spin-0 signal normalised to a large and arbitrary cross section is overlayed as a dotted light-red line. The bottom panels show the difference between the event counting and the fitted background yield in each bin, normalised to the total background uncertainty ($\sigma _{\rm Bkg.}$) in that bin. |
png pdf |
Figure 3-f:
The dijet mass ($m_{ { {\mathrm {b}} {\overline {\mathrm {b}}} } }$) distributions in the ranges used to search for a resonance with mass $m_{\rm X}=$ 550, 600, 650, 700, 750, 800, 850 GeV. The results of the background-only fit are shown as a solid-blue line, while the signal plus background fit is shown as a dashed-red line. For illustrative purposes, the expected mass distribution for a spin-0 signal normalised to a large and arbitrary cross section is overlayed as a dotted light-red line. The bottom panels show the difference between the event counting and the fitted background yield in each bin, normalised to the total background uncertainty ($\sigma _{\rm Bkg.}$) in that bin. |
png pdf |
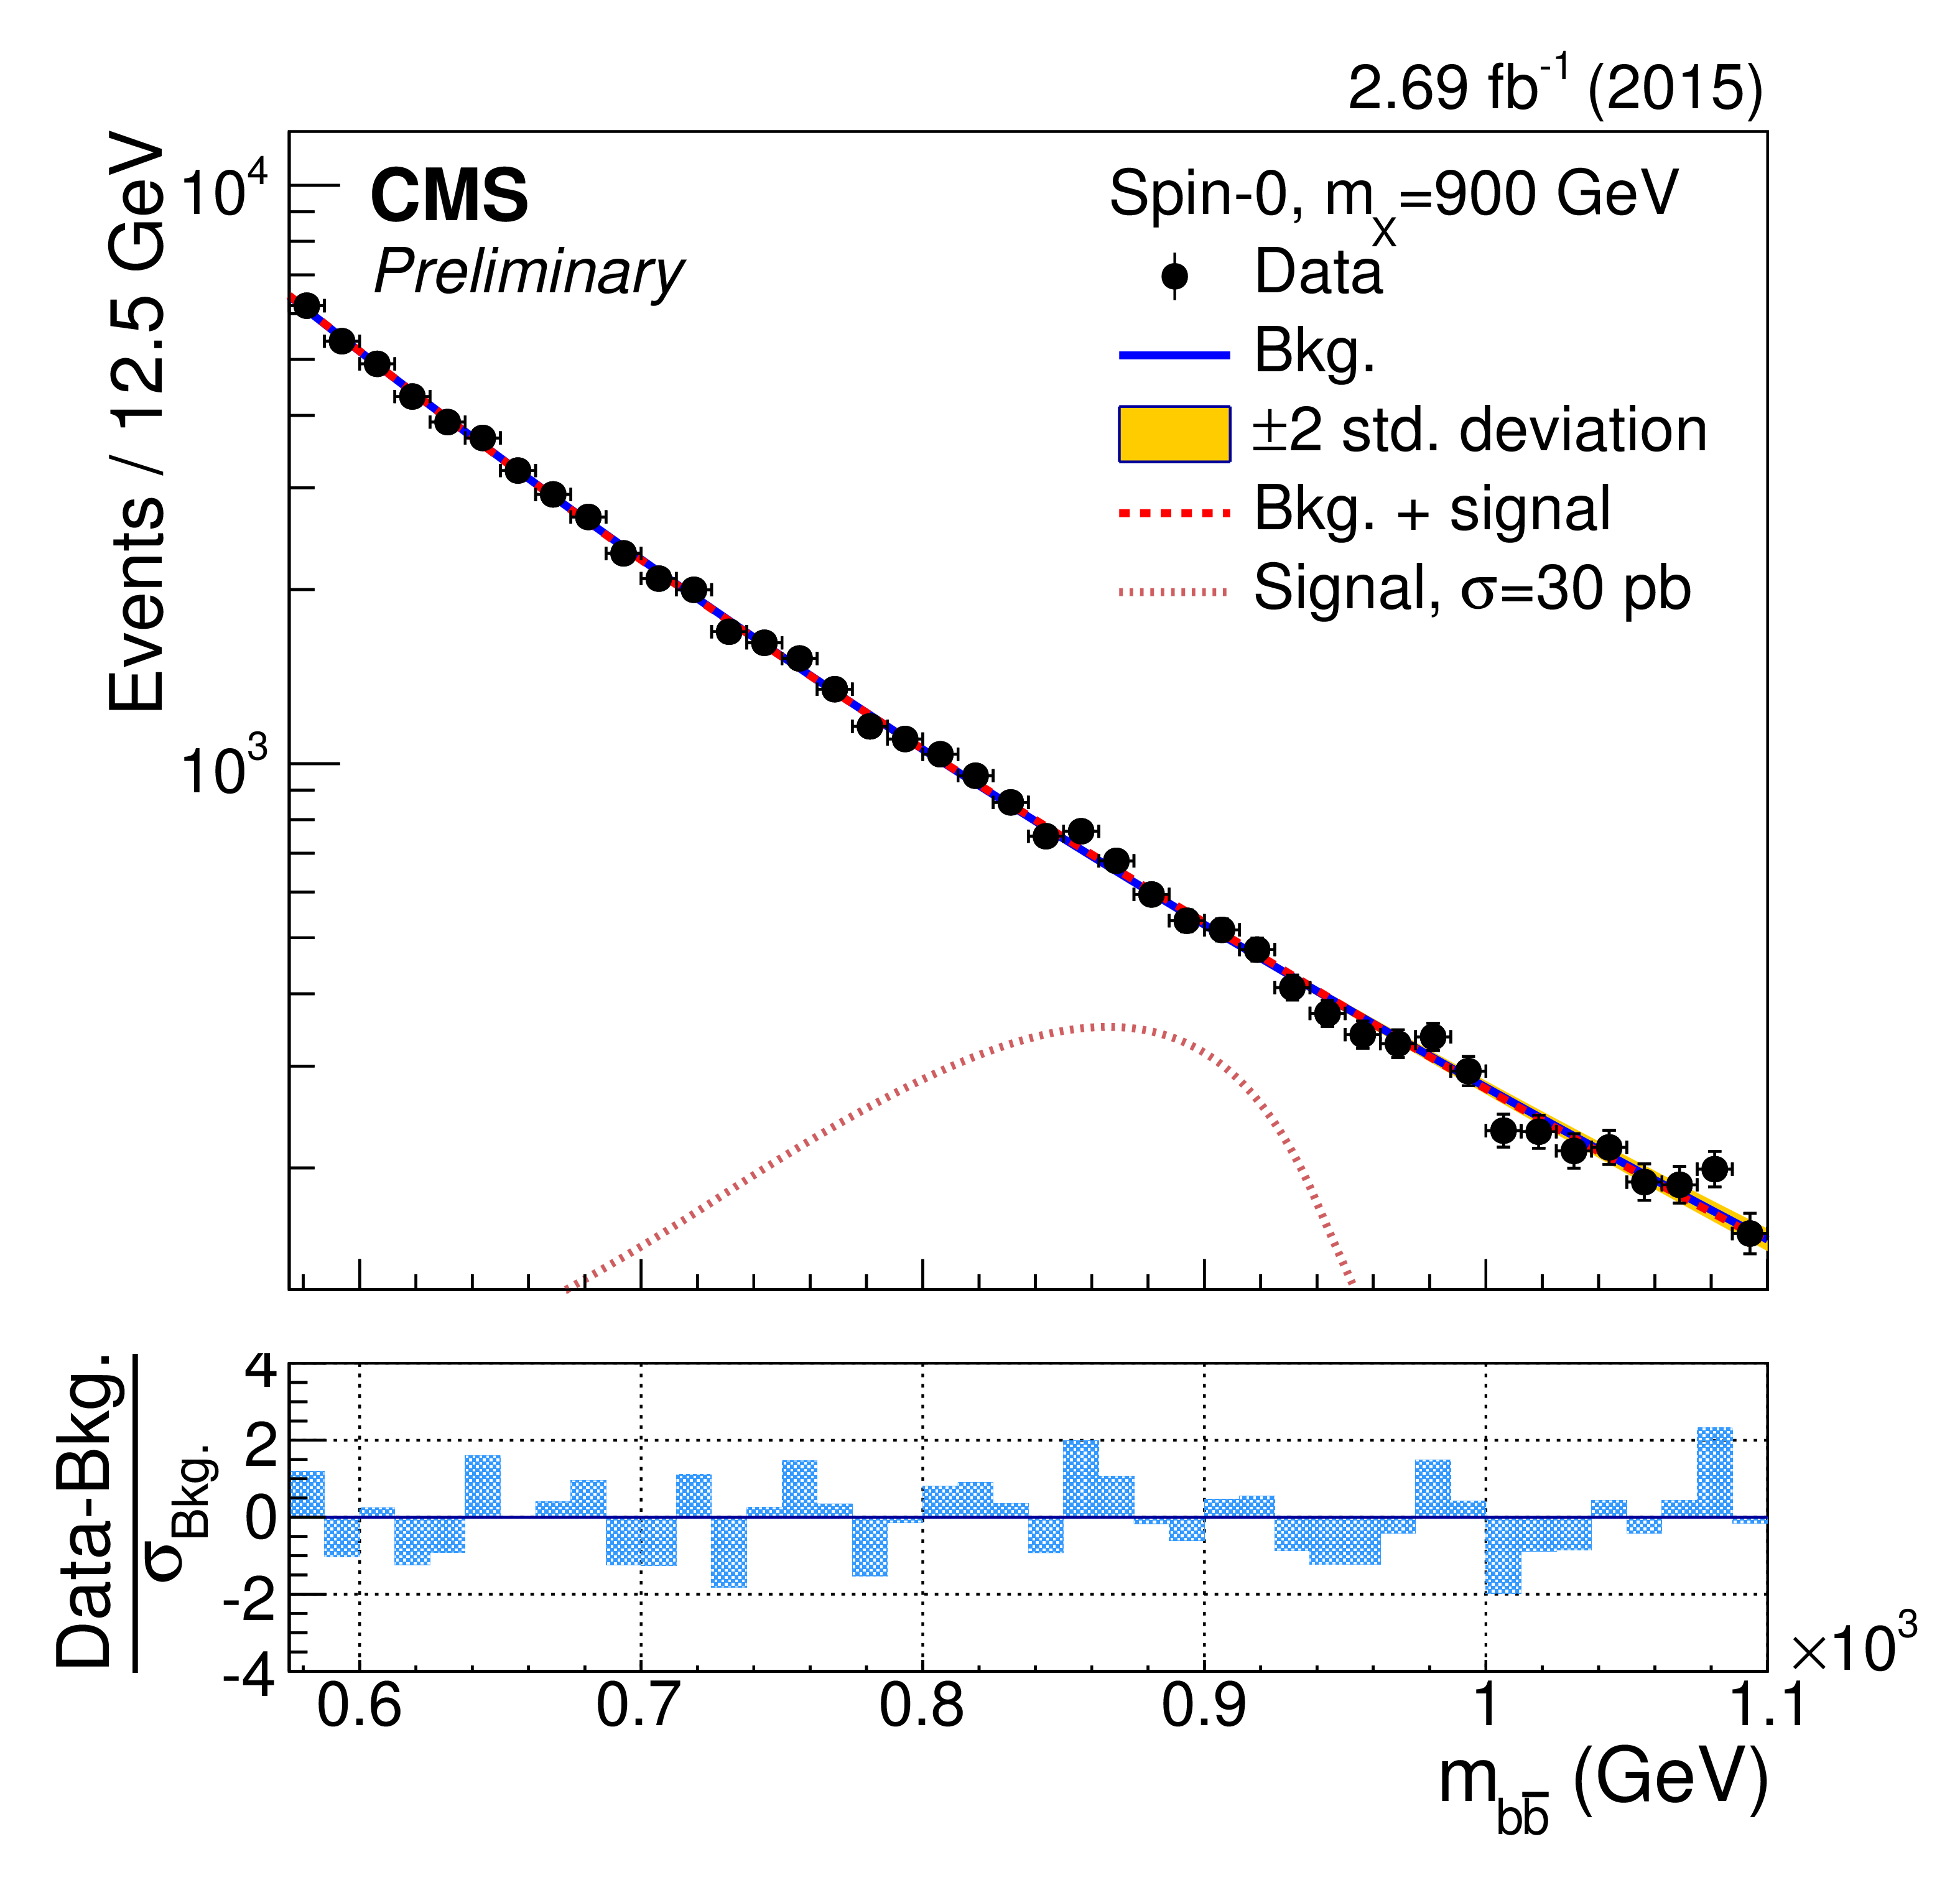
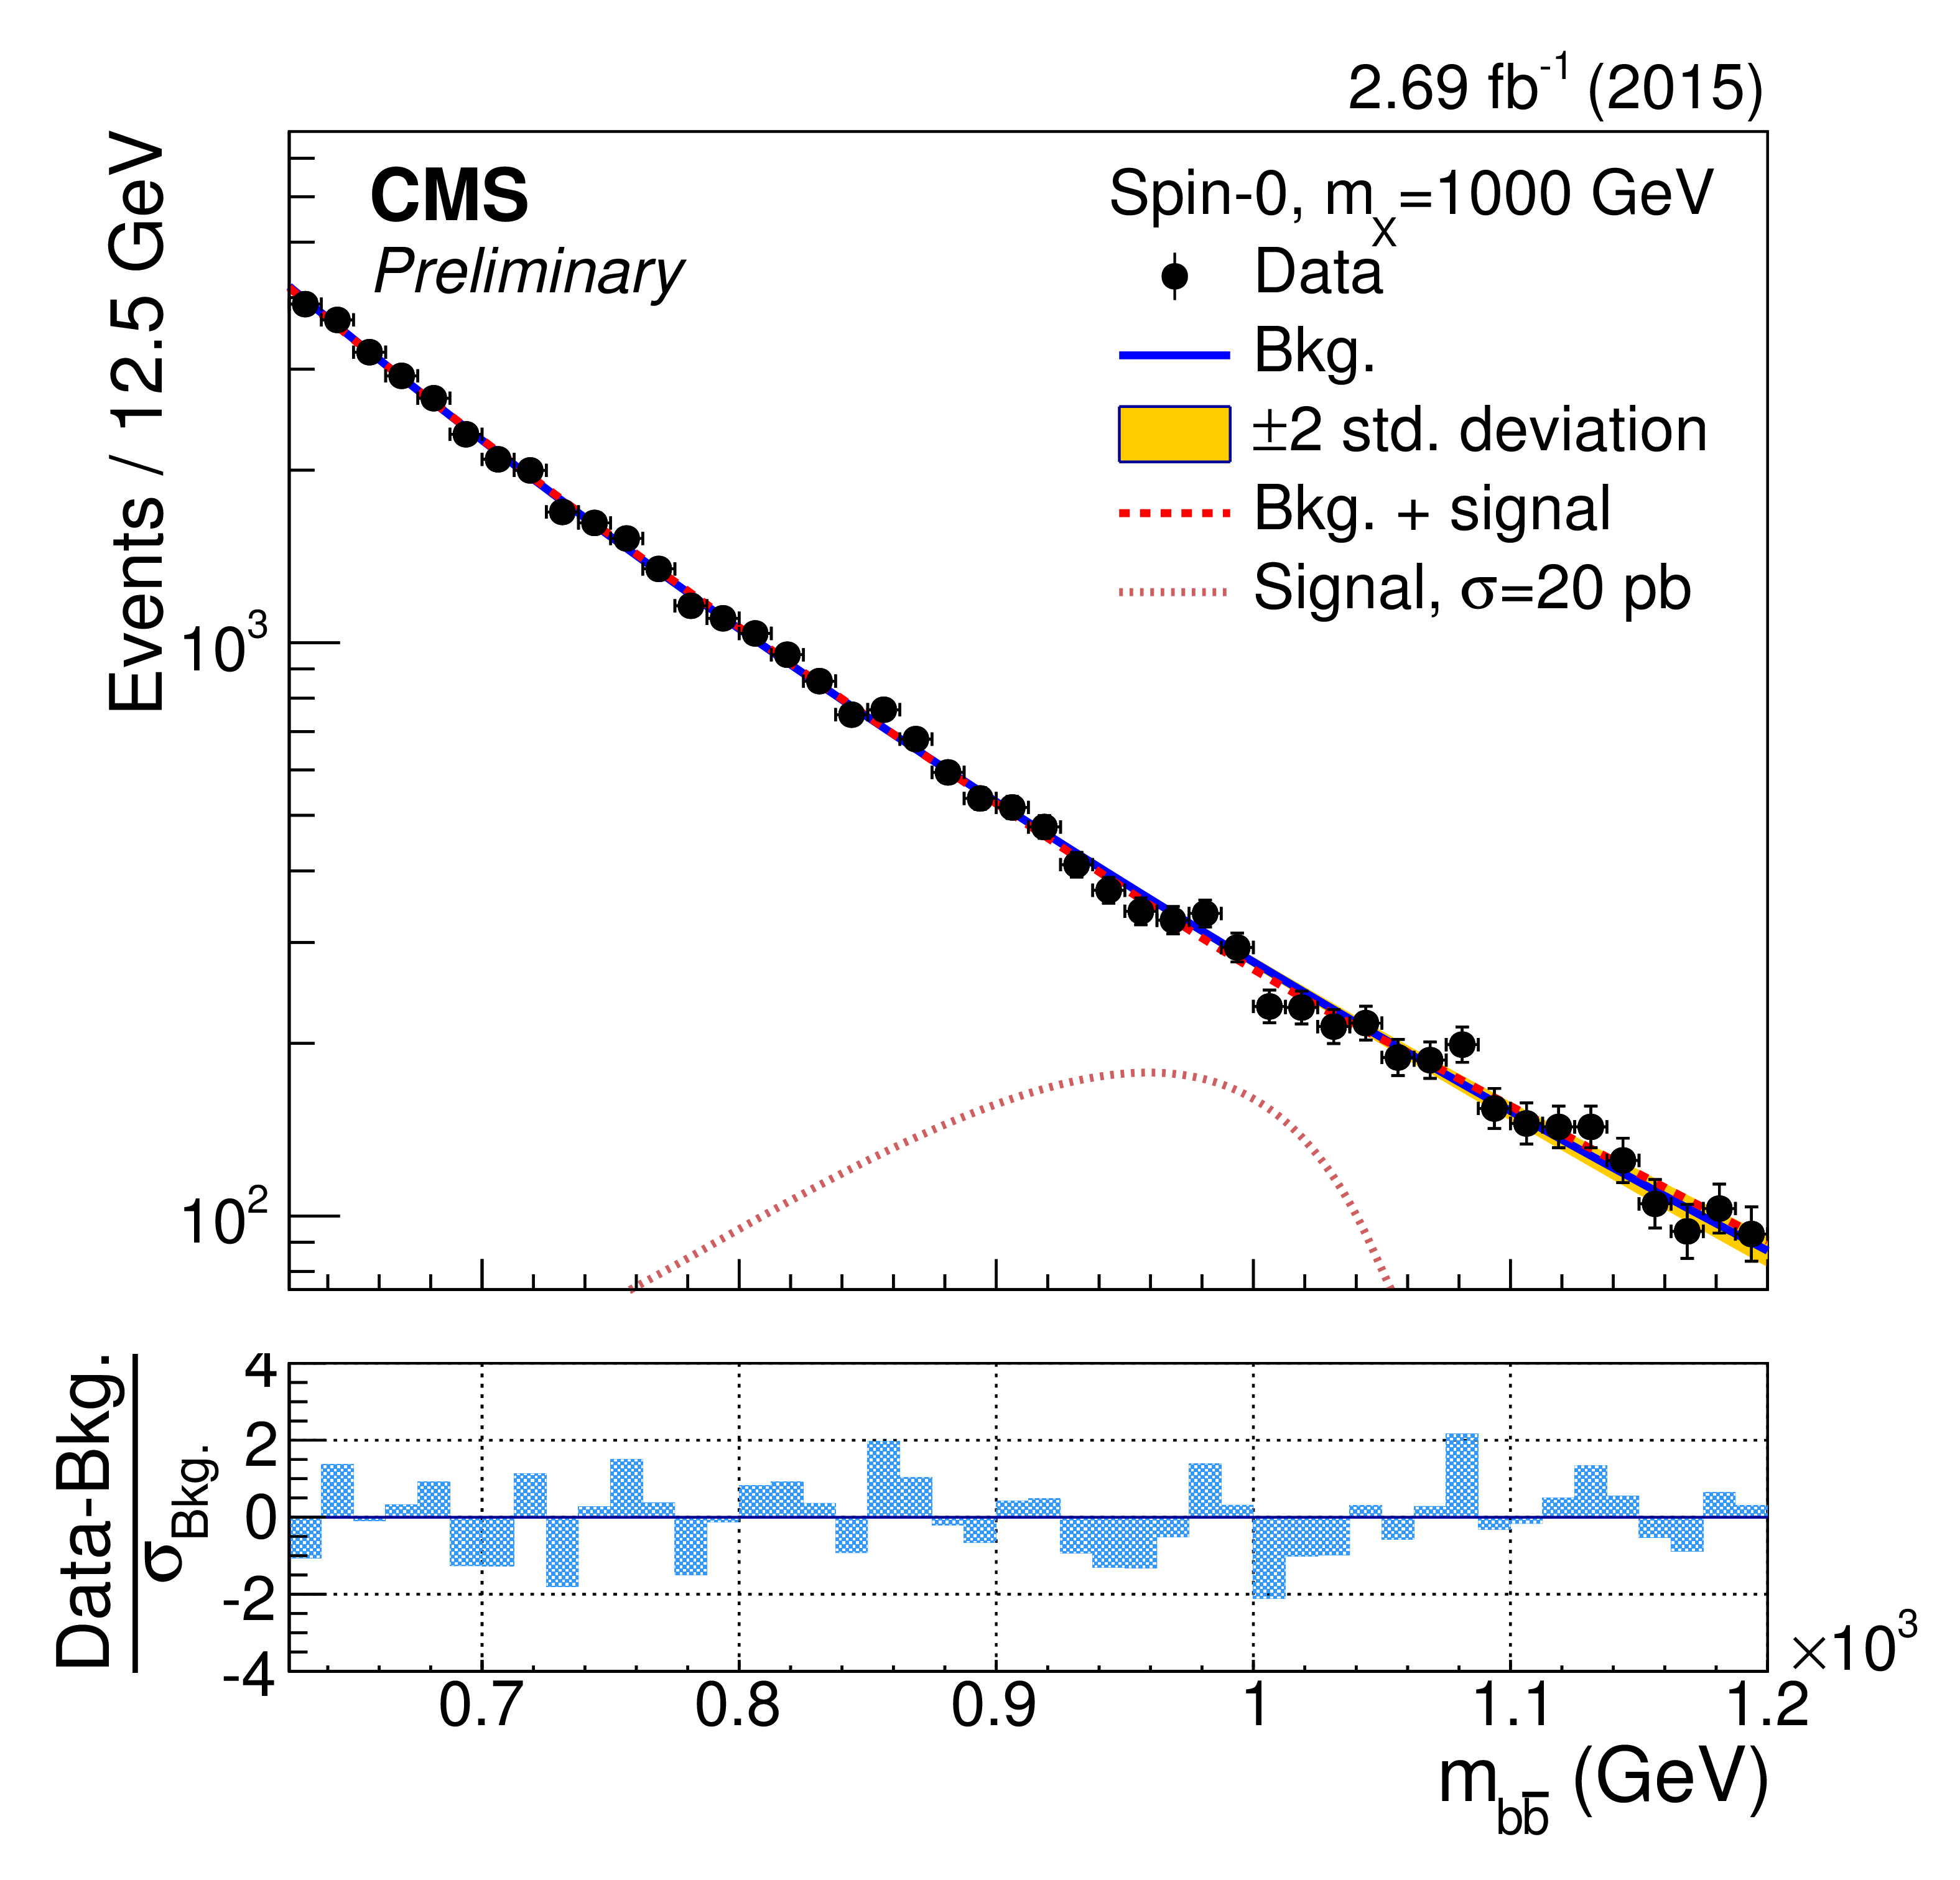
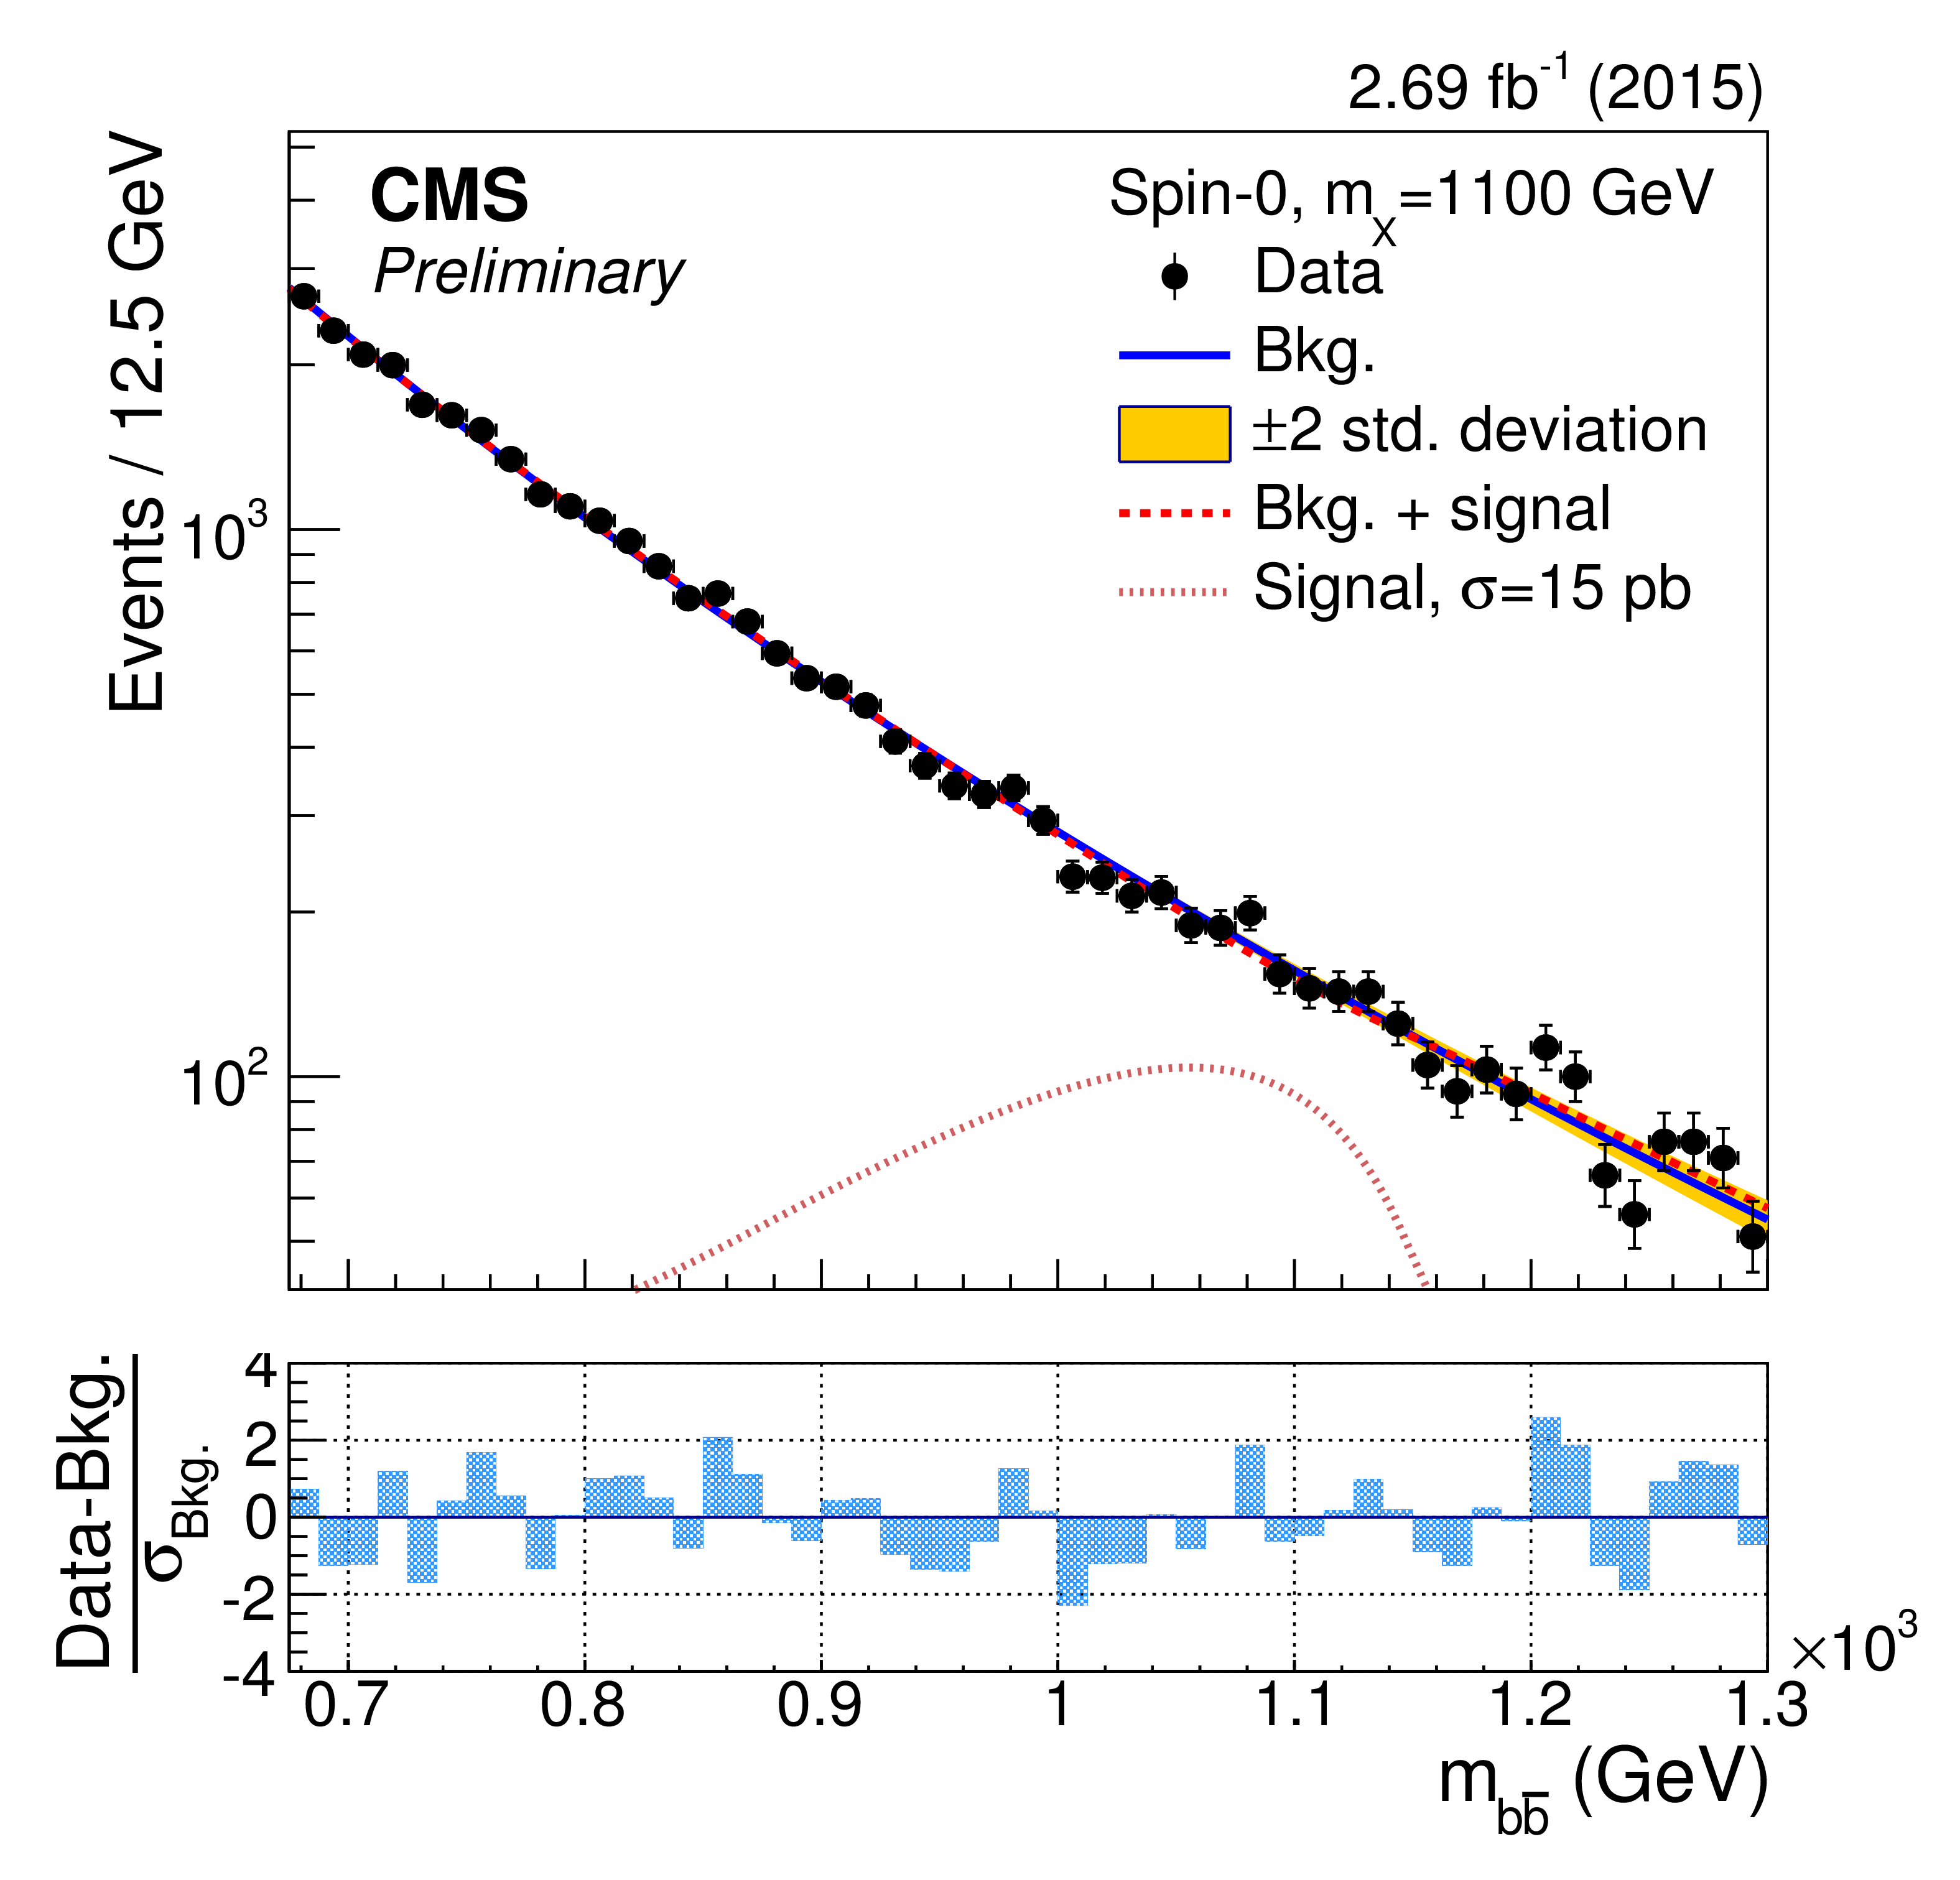
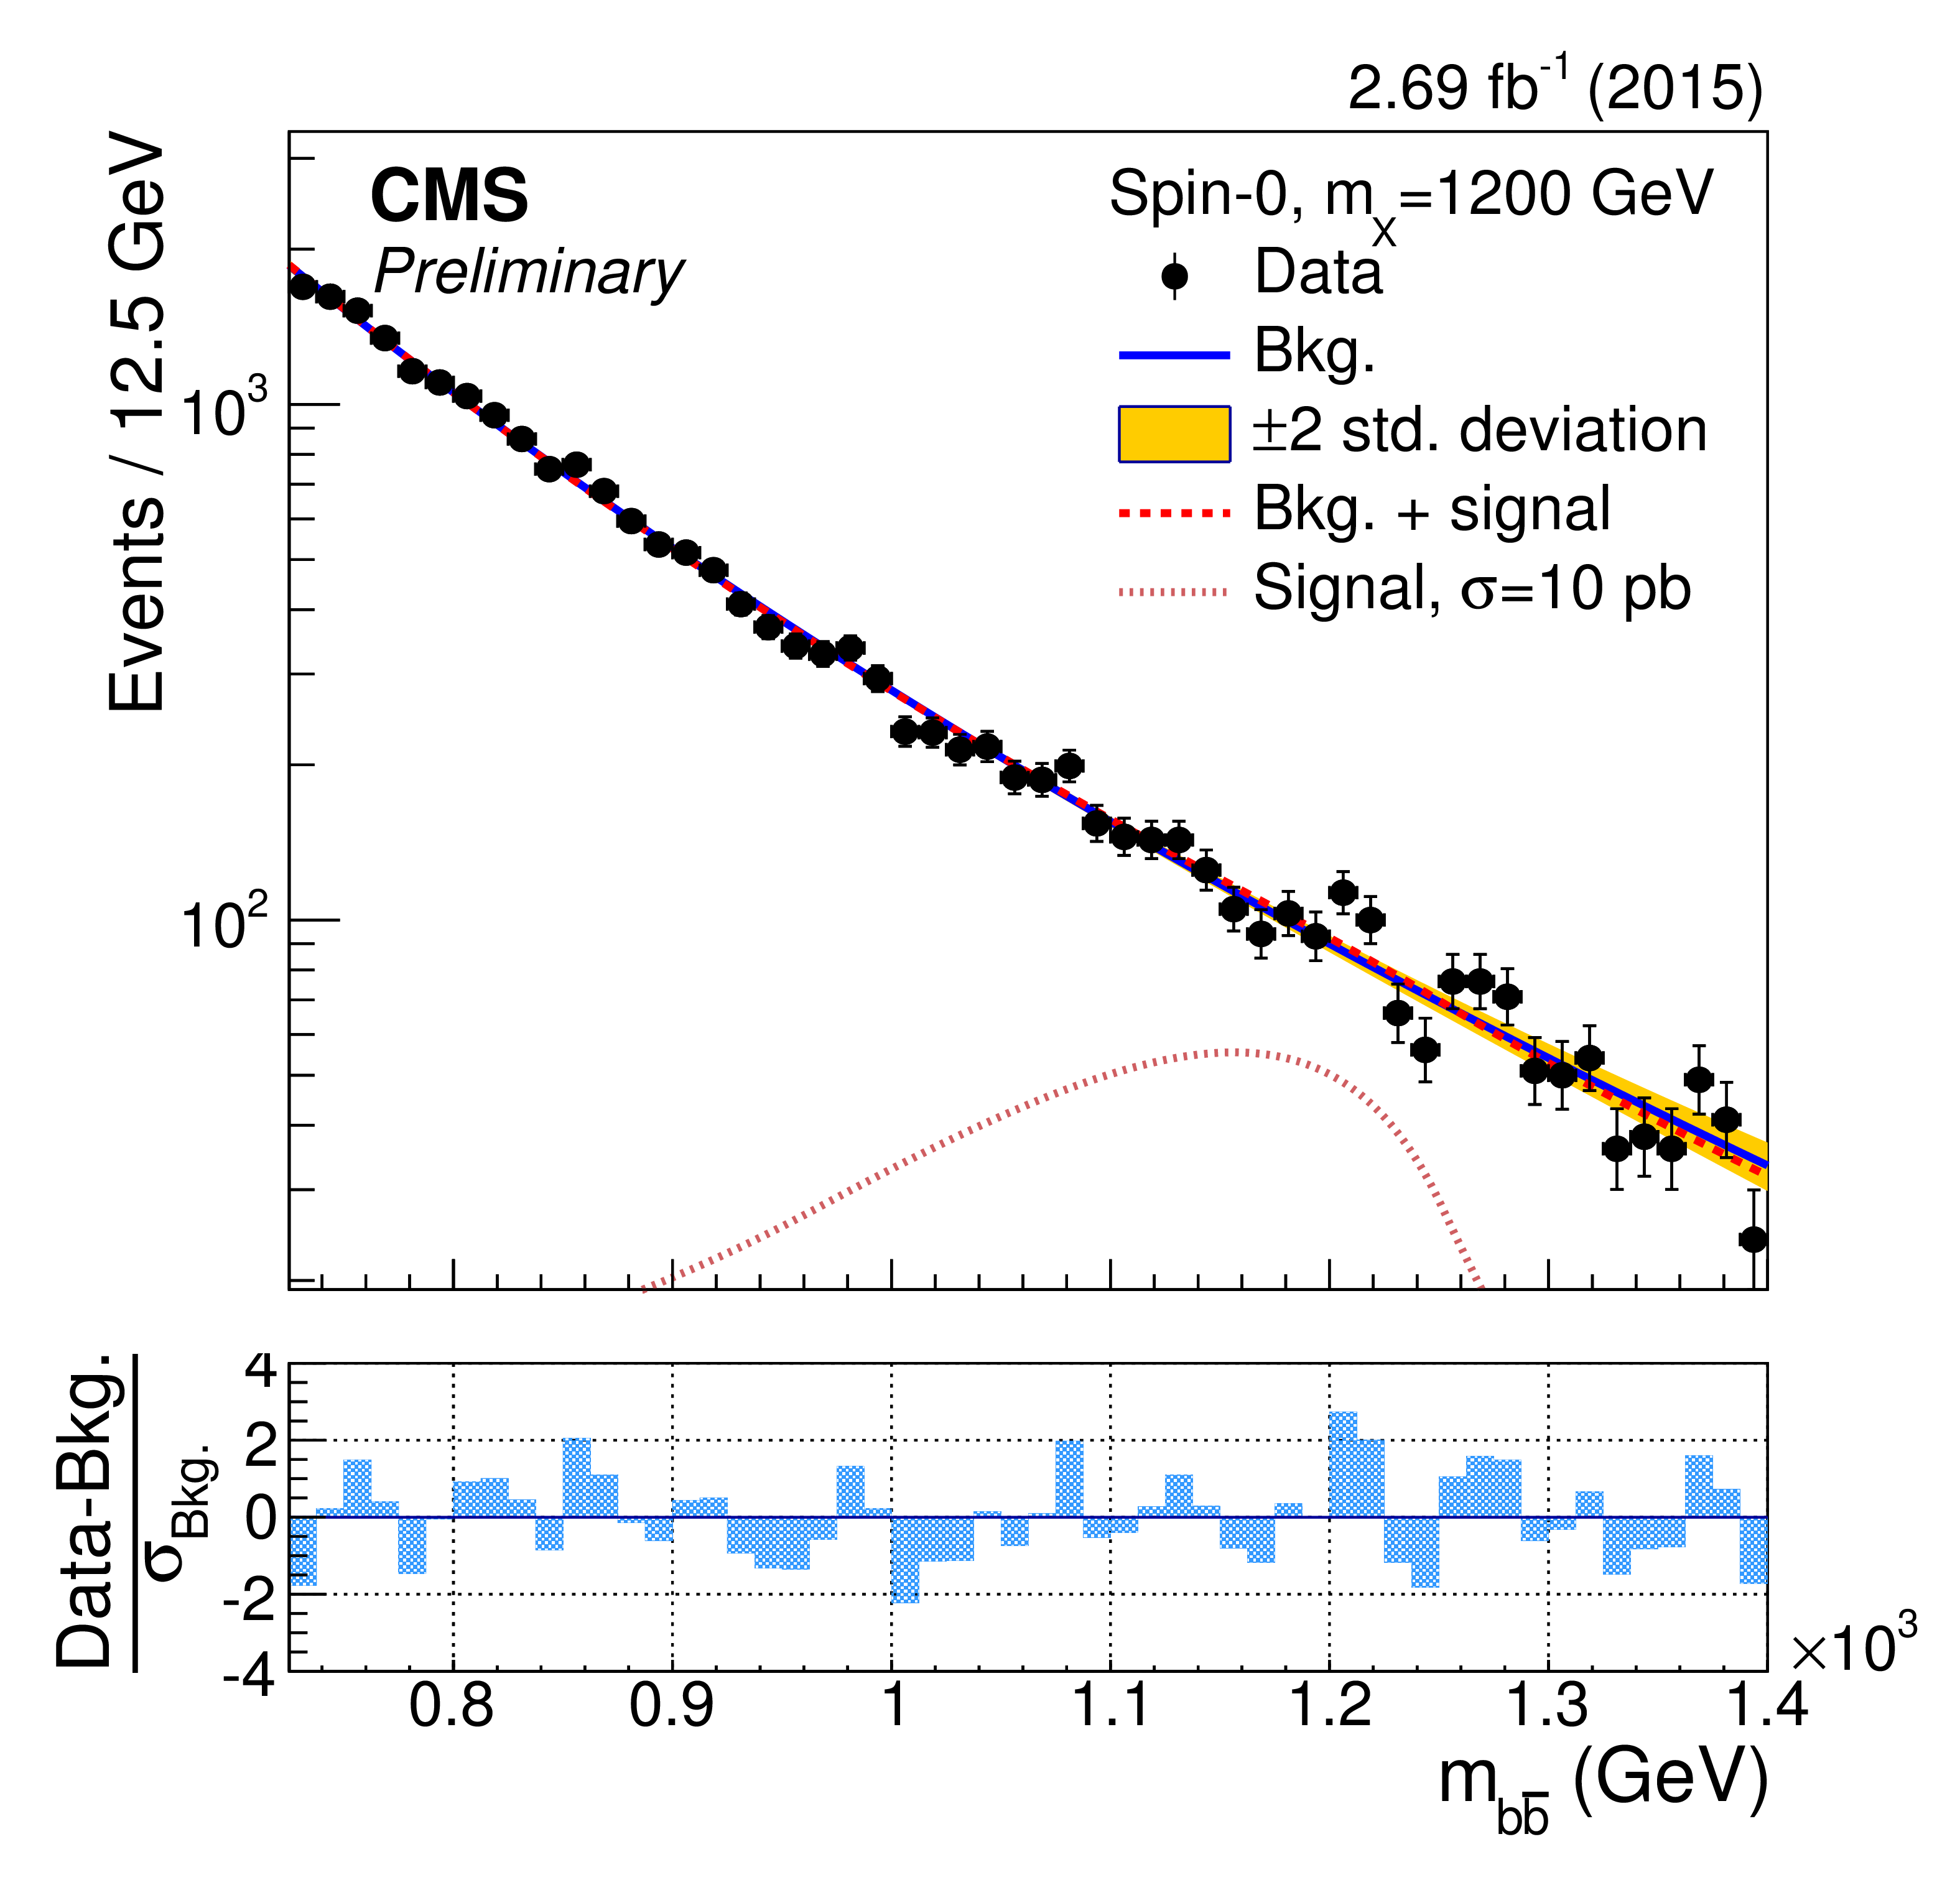
Figure 4-a:
The dijet mass ($m_{ { {\mathrm {b}} {\overline {\mathrm {b}}} } }$) distributions in the ranges used to search for a resonance with mass $m_{\rm X}=$ 850, 900, 1000, 1100, 1200 GeV. The results of the background-only fit are shown as a solid-blue line, while the signal-plus-background fit is shown as a dashed-red line. For illustrative purposes, the expected mass distribution for a spin-0 signal normalised to a large and arbitrary cross section is overlayed as a dotted light-red line. The bottom panels show the difference between the event counting and the fitted background yield in each bin, normalised to the total background uncertainty ($\sigma _{\rm Bkg.}$) in that bin. |
png pdf |
Figure 4-b:
The dijet mass ($m_{ { {\mathrm {b}} {\overline {\mathrm {b}}} } }$) distributions in the ranges used to search for a resonance with mass $m_{\rm X}=$ 850, 900, 1000, 1100, 1200 GeV. The results of the background-only fit are shown as a solid-blue line, while the signal-plus-background fit is shown as a dashed-red line. For illustrative purposes, the expected mass distribution for a spin-0 signal normalised to a large and arbitrary cross section is overlayed as a dotted light-red line. The bottom panels show the difference between the event counting and the fitted background yield in each bin, normalised to the total background uncertainty ($\sigma _{\rm Bkg.}$) in that bin. |
png pdf |
Figure 4-c:
The dijet mass ($m_{ { {\mathrm {b}} {\overline {\mathrm {b}}} } }$) distributions in the ranges used to search for a resonance with mass $m_{\rm X}=$ 850, 900, 1000, 1100, 1200 GeV. The results of the background-only fit are shown as a solid-blue line, while the signal-plus-background fit is shown as a dashed-red line. For illustrative purposes, the expected mass distribution for a spin-0 signal normalised to a large and arbitrary cross section is overlayed as a dotted light-red line. The bottom panels show the difference between the event counting and the fitted background yield in each bin, normalised to the total background uncertainty ($\sigma _{\rm Bkg.}$) in that bin. |
png pdf |
Figure 4-d:
The dijet mass ($m_{ { {\mathrm {b}} {\overline {\mathrm {b}}} } }$) distributions in the ranges used to search for a resonance with mass $m_{\rm X}=$ 850, 900, 1000, 1100, 1200 GeV. The results of the background-only fit are shown as a solid-blue line, while the signal-plus-background fit is shown as a dashed-red line. For illustrative purposes, the expected mass distribution for a spin-0 signal normalised to a large and arbitrary cross section is overlayed as a dotted light-red line. The bottom panels show the difference between the event counting and the fitted background yield in each bin, normalised to the total background uncertainty ($\sigma _{\rm Bkg.}$) in that bin. |
png pdf |
Figure 4-e:
The dijet mass ($m_{ { {\mathrm {b}} {\overline {\mathrm {b}}} } }$) distributions in the ranges used to search for a resonance with mass $m_{\rm X}=$ 850, 900, 1000, 1100, 1200 GeV. The results of the background-only fit are shown as a solid-blue line, while the signal-plus-background fit is shown as a dashed-red line. For illustrative purposes, the expected mass distribution for a spin-0 signal normalised to a large and arbitrary cross section is overlayed as a dotted light-red line. The bottom panels show the difference between the event counting and the fitted background yield in each bin, normalised to the total background uncertainty ($\sigma _{\rm Bkg.}$) in that bin. |
png pdf |
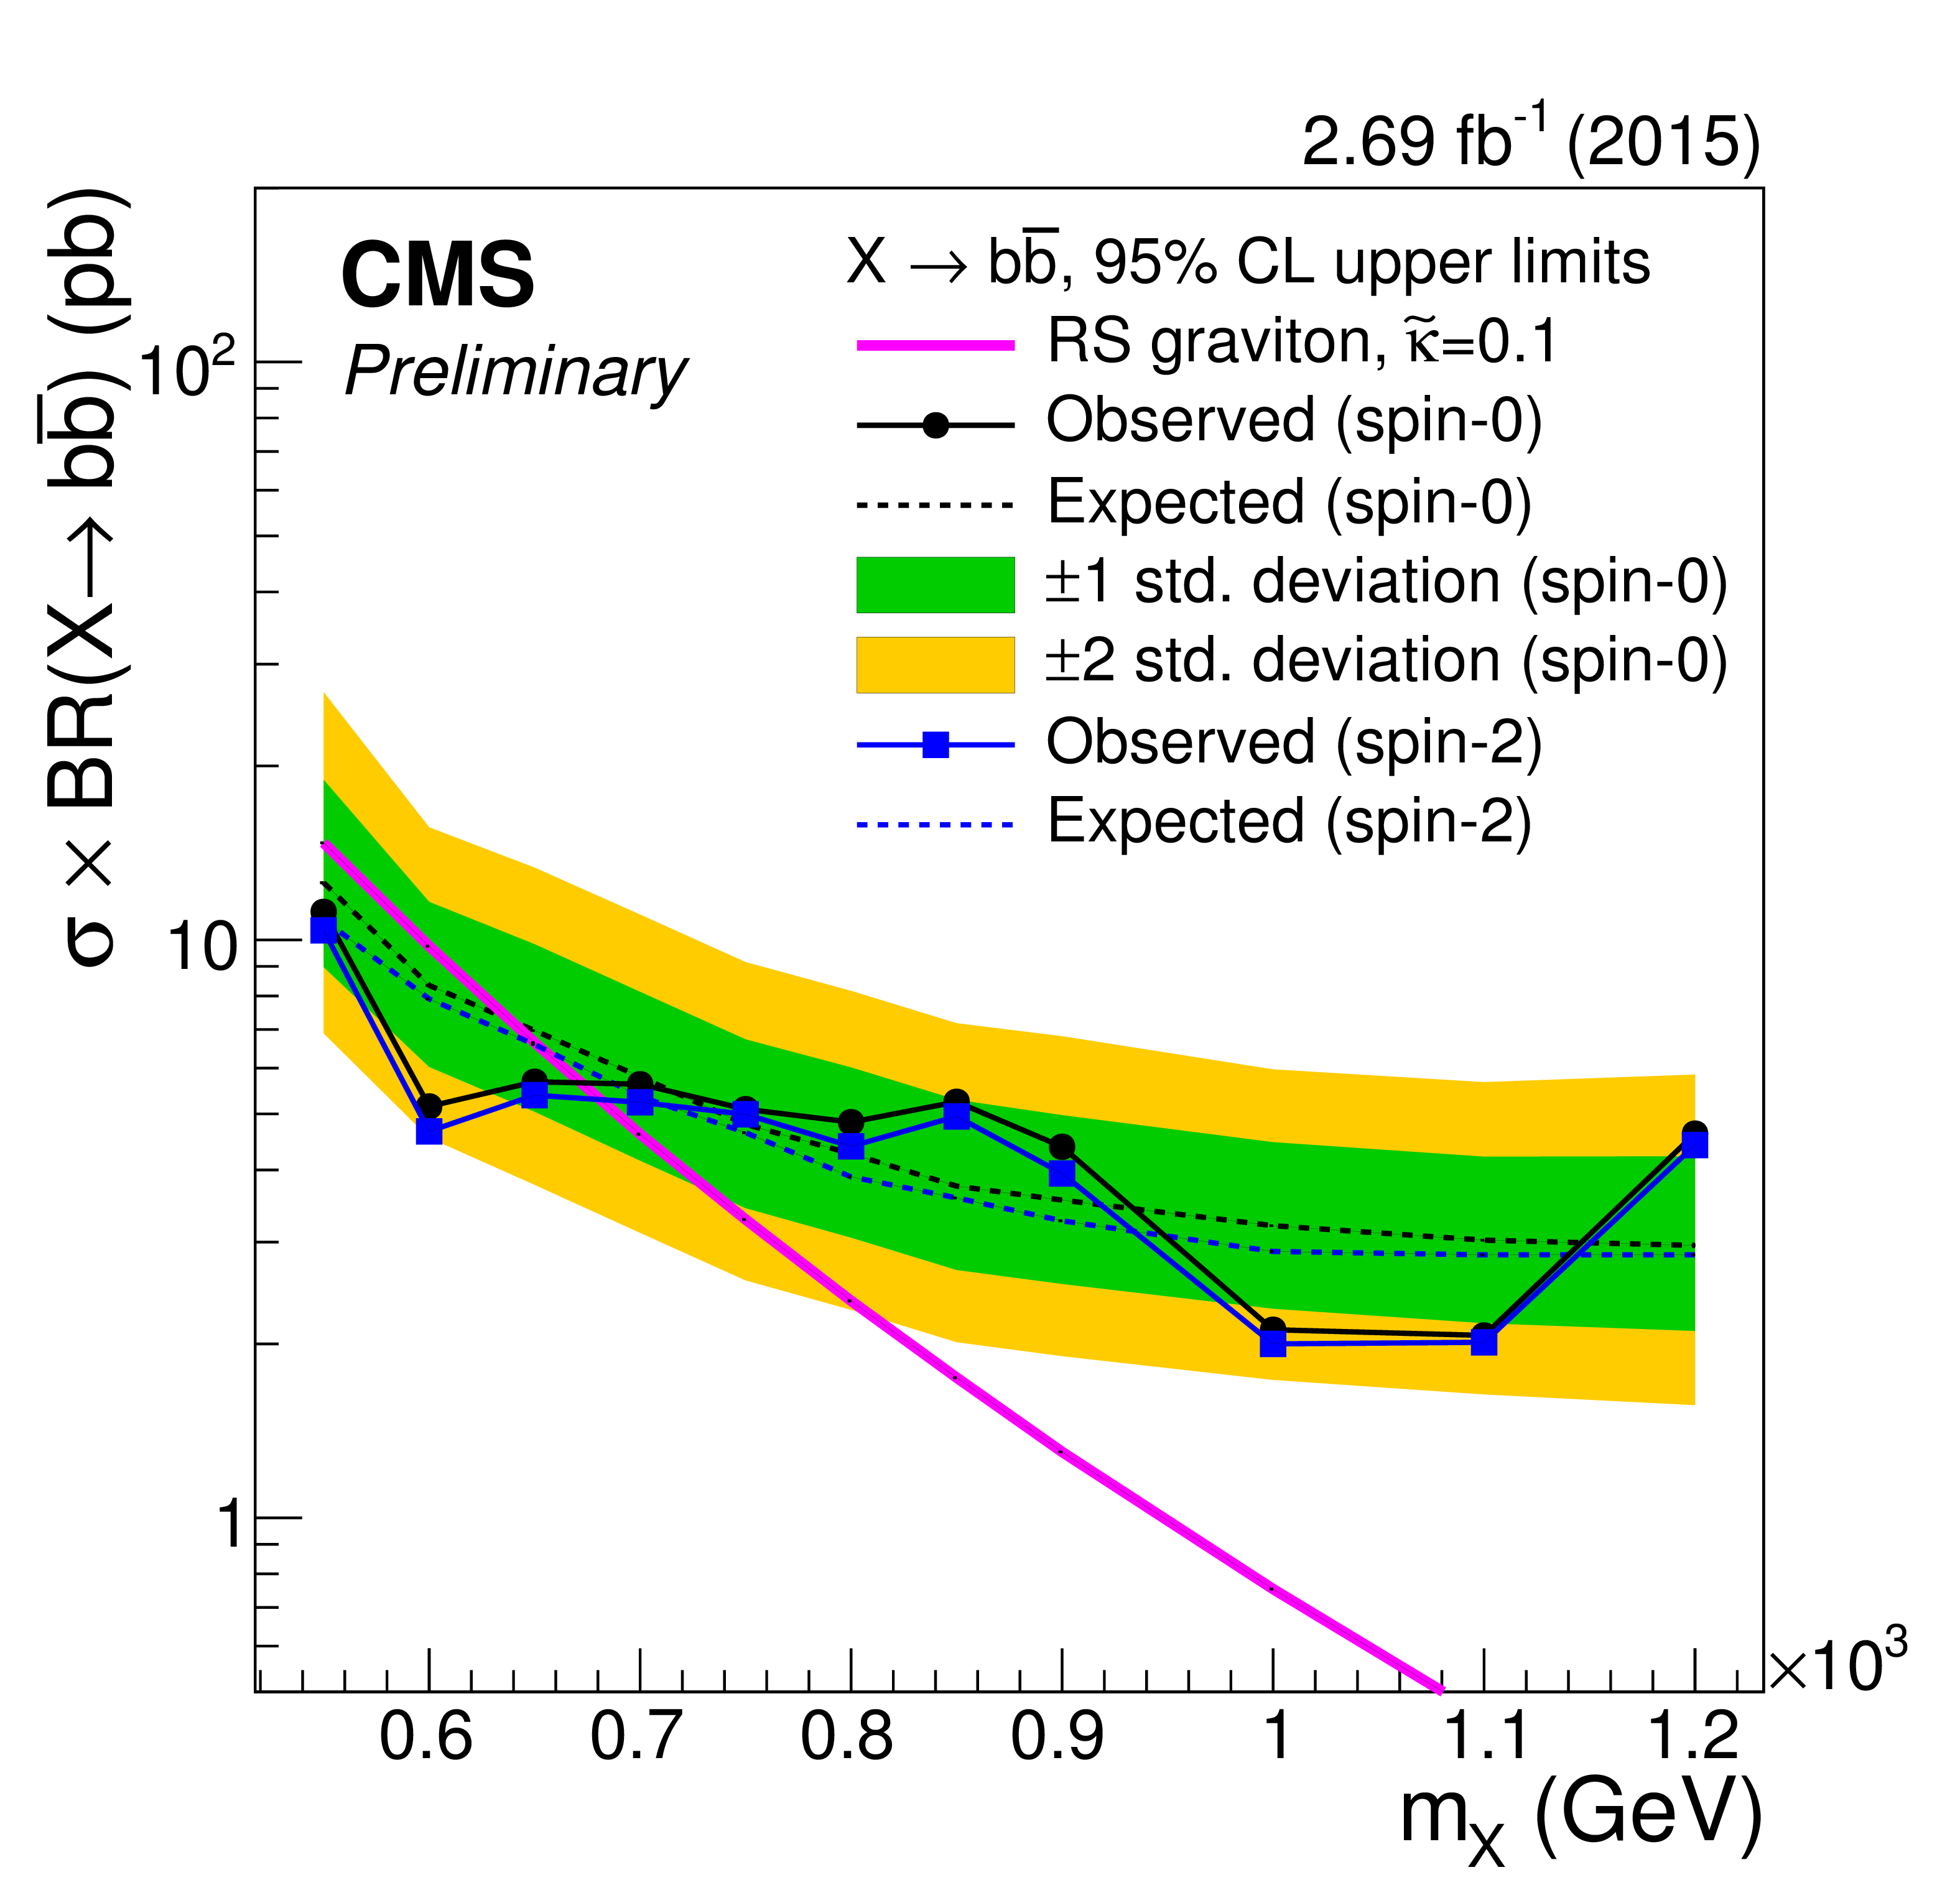
Figure 5:
The expected and observed upper limits at 95% CL on $\sigma \times \mathrm {BR}({\rm X}\to { {\mathrm {b}} {\overline {\mathrm {b}}} } )$ as a function of the resonance mass for the spin-0 (black) and spin-2 (blue) cases. The expected cross section times branching ratio for graviton production in the RS model [9] with $\tilde{\kappa }=$ 0.1 is overlayed for illustration. The one- and two-standard deviation confidence interval bands for the background-only expected limit in the spin-0 case are shown as solid coloured bands. The corresponding limits on the visible cross section $\sigma \times \mathrm {BR}({\rm X}\to { {\mathrm {b}} {\overline {\mathrm {b}}} } ) \times \mathrm {A} \times \epsilon $ can be obtained by using the acceptance-times-efficiency values reported in Fig. 5-a. |
| Tables | |
png pdf |
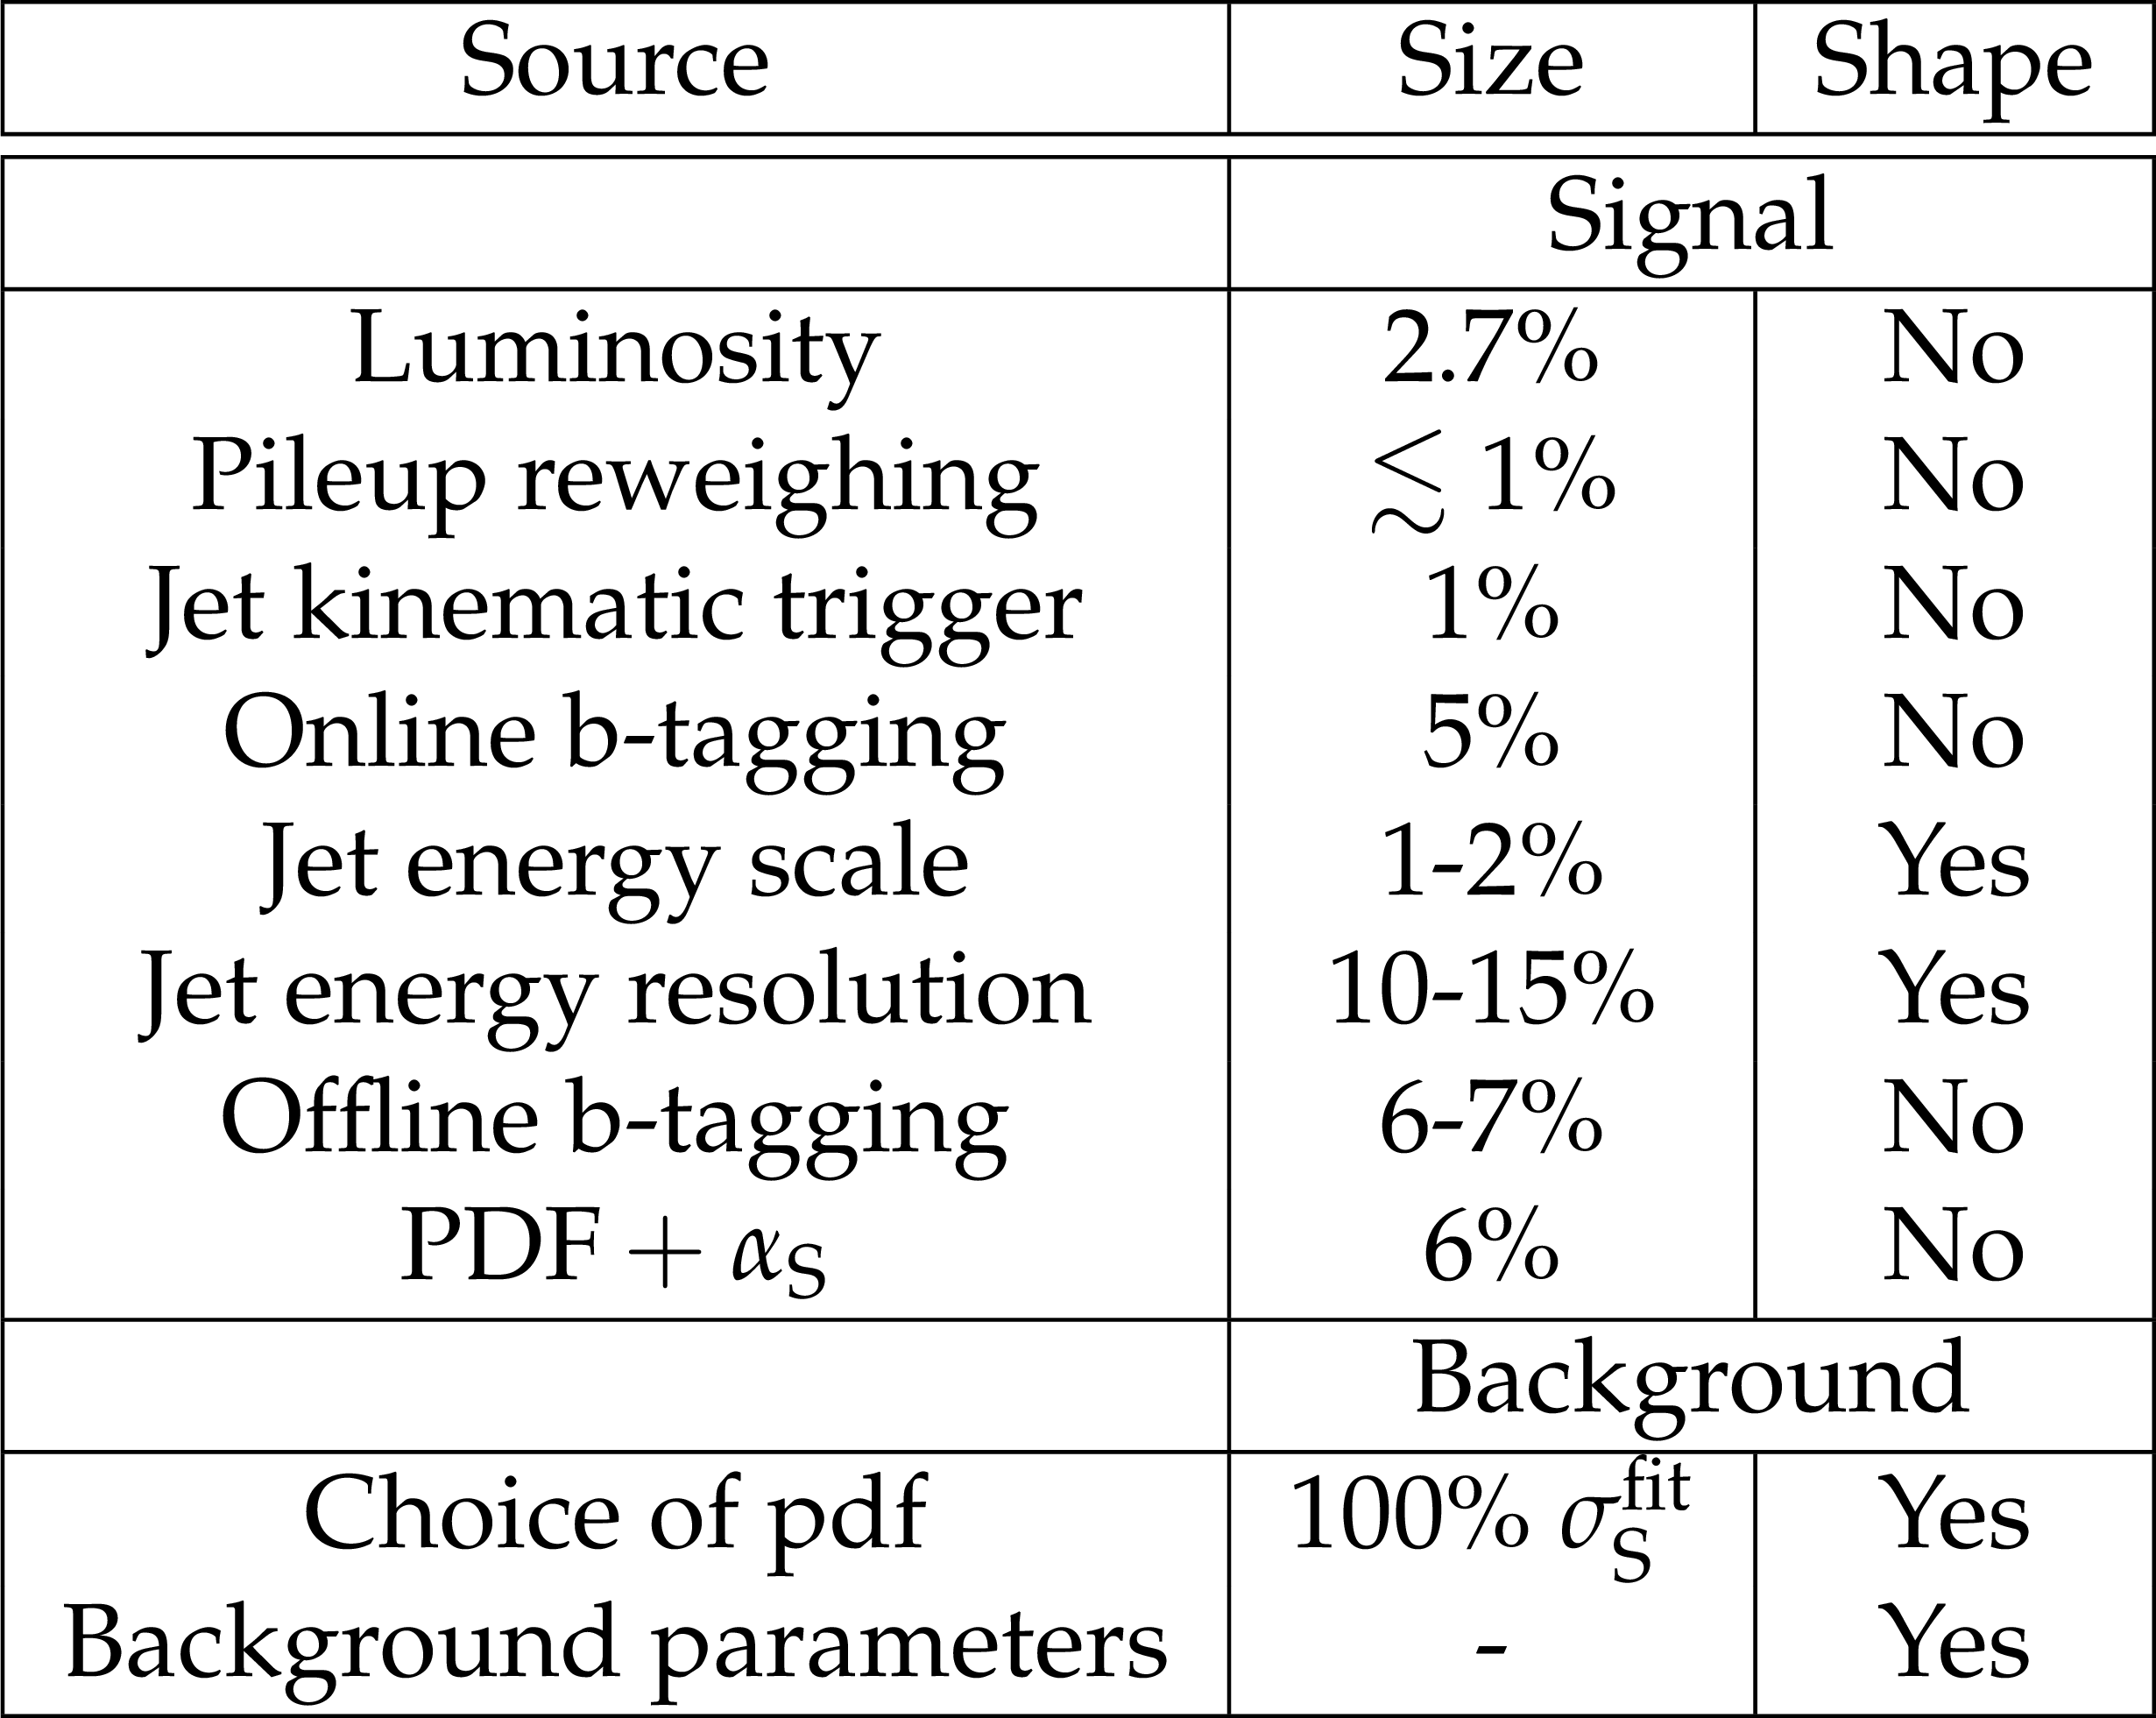
Table 1:
Summary of the systematic uncertainties affecting the signal and background modelling. The last column indicates whether a given source of systematic uncertainty affects the shape of the $m_{ { {\mathrm {b}} {\overline {\mathrm {b}}} } }$ distribution. |
| Summary |
| A search for a narrow resonance with mass ranging from 550 to 1200 GeV, and decaying to bottom quark-antiquark pairs using 2.69 fb$^{-1}$ of collision events collected at $ \sqrt{s} = $ 13 TeV in 2015 by the CMS experiment has been presented. Events are recorded by dedicated trigger paths that require the coincidence of a pair of high-$p_{\mathrm{T}}$ and b-tagged jets. The offline selection is further optimised to enrich the data sample in events compatible with a narrow resonance decaying into b jets. The signal yield is extracted by performing a fit to the dijet mass distribution, where an analytical parametrisation of the continuum background is assumed. No significant excess is observed over the background-only expectation. Results are presented in the form of 95% CL limits on $\sigma\times\mathrm{BR}({\rm X}\to \mathrm{ b \bar{b} })$ for two benchmark scenarios: a spin-0 resonance produced in gluon-gluon fusion, and a spin-2 Randall-Sundrum graviton, both with a negligible width-over-mass ratio. Upper limits ranging from 2 to 11 pb are obtained depending on the resonance mass and on its spin. This analysis extends previous results on dijet searches at $ \sqrt{s} = $ 13 TeV. |
| References | ||||
| 1 | F. Englert and R. Brout | Broken Symmetry and the Mass of Gauge Vector Mesons | PRL 13 (1964) 321--323 | |
| 2 | P. W. Higgs | Broken Symmetries and the Masses of Gauge Bosons | PRL 13 (1964) 508--509 | |
| 3 | G. S. Guralnik, C. R. Hagen, and T. W. B. Kibble | Global Conservation Laws and Massless Particless | PRL 13 (1964) 585--587 | |
| 4 | ATLAS and CMS Collaboration | Combined Measurement of the Higgs Boson Mass in $ pp $ Collisions at $ \sqrt{s}=7 $ and 8 TeV with the ATLAS and CMS Experiments | PRL 114 (2015) 191803 | 1503.07589 |
| 5 | ATLAS, CMS Collaboration | Measurements of the Higgs boson production and decay rates and constraints on its couplings from a combined ATLAS and CMS analysis of the LHC $ pp $ collision data at $ \sqrt{s}= $ 7 and 8 TeV | 1606.02266 | |
| 6 | N. Craig, J. Galloway, and S. Thomas | Searching for Signs of the Second Higgs Doublet | 1305.2424 | |
| 7 | G. Langacke | The Physics of Heavy $ Z^\prime $ Gauge Bosons | Rev. Mod. Phys 81 (2009) 1199 | 0801.1345 |
| 8 | N. Arkani-Hamed, S. Dimopoulos, and G. R. Dvali | The Hierarchy problem and new dimensions at a millimeter | PLB429 (1998) 263--272 | hep-ph/9803315 |
| 9 | L. Randall and R. Sundrum | A Large mass hierarchy from a small extra dimension | PRL 83 (1999) 3370--3373 | hep-ph/9905221 |
| 10 | H. Davoudiasl, J. L. Hewett, and T. G. Rizzo | Phenomenology of the Randall-Sundrum Gauge Hierarchy Model | PRL 84 (2000) 2080 | hep-ph/9909255 |
| 11 | CMS Collaboration | Search for narrow resonances decaying to dijets in proton-proton collisions at $ \sqrt{s} = $ 13 TeV | Phy. Rev. Lett. 116 (2016) 071801 | CMS-EXO-15-001 1512.01224 |
| 12 | ATLAS Collaboration | Search for resonances in the mass distribution of jet pairs with one or two jets identified as b-jets in proton--proton collisions at $ \sqrt{s} = $ 13 TeV with the ATLAS detector | Physics Letters B 759 (2016) 229--246 | 1603.08791 |
| 13 | ATLAS Collaboration | "Search for New Phenomena in Dijet Mass and Angular Distributions from pp Collisions at $ \sqrt{s} = $ 13 TeV with the ATLAS Detector" | Physics Letters B 754 (2016) 302--322 | 1512.01530 |
| 14 | CMS Collaboration | Search for narrow resonances in dijet final states at $ \sqrt{s} = $ 8 TeV with the novel CMS technique of data scouting | Phy. Rev. Lett. 117 (2016) 031802 | CMS-EXO-14-005 1604.08907 |
| 15 | CMS Collaboration Collaboration | Search for high-mass resonances in dijet final state with 2016 data | ||
| 16 | ATLAS Collaboration Collaboration | Search for resonances below 1.2 TeV from the mass distribution of b-jet pairs in proton-proton collisions at $ \sqrt{s} $=13$ TeV $ with the ATLAS detector | ATLAS Conference Note ATLAS-CONF-2016-031 | |
| 17 | CMS Collaboration | CMS Luminosity Measurement for the 2015 Data Taking Period | CMS-PAS-LUM-15-001 | CMS-PAS-LUM-15-001 |
| 18 | CMS Collaboration | Search for neutral MSSM Higgs bosons decaying into a pair of bottom quarks | JHEP 11 (2015) 071 | CMS-HIG-14-017 1506.08329 |
| 19 | CMS Collaboration | The CMS experiment at the CERN LHC | JINST 3 (2008) S08004 | CMS-00-001 |
| 20 | NNPDF Collaboration | Parton distributions for the LHC Run II | JHEP 04 (2015) 040 | 1410.8849 |
| 21 | T. Sjostrand, S. Mrenna, and P. Skands | A brief introduction to PYTHIA 8.1 | CPC 178 (2008) 852 | 0710.3820 |
| 22 | T. Sjostrand et al. | An Introduction to PYTHIA 8.2 | CPC 191 (2015) 159--177 | 1410.3012 |
| 23 | CMS Collaboration | Event generator tunes obtained from underlying event and multiparton scattering measurements | EPJC 76 (2015) 115 | CMS-GEN-14-001 1512.00815 |
| 24 | J. Alwall et al. | The automated computation of tree-level and next-to-leading order differential cross sections, and their matching to parton shower simulations | JHEP 07 (2014) 079 | 1405.0301 |
| 25 | P. Nason | A New method for combining NLO QCD with shower Monte Carlo algorithms | JHEP 11 (2004) 040 | hep-ph/0409146 |
| 26 | S. Frixione, P. Nason, and C. Oleari | Matching NLO QCD computations with Parton Shower simulations: the POWHEG method | JHEP 11 (2007) 070 | 0709.2092 |
| 27 | S. Alioli, P. Nason, C. Oleari, and E. Re | A general framework for implementing NLO calculations in shower Monte Carlo programs: the POWHEG BOX | JHEP 06 (2010) 043 | 1002.2581 |
| 28 | S. Alioli, P. Nason, C. Oleari, and E. Re | NLO single-top production matched with shower in POWHEG: s- and t-channel contributions | JHEP 09 (2009) 111, , [Erratum: JHEP02,011(2010)] | 0907.4076 |
| 29 | E. Re | Single-top Wt-channel production matched with parton showers using the POWHEG method | EPJC71 (2011) 1547 | 1009.2450 |
| 30 | M. Czakon, P. Fiedler, and A. Mitov | Total Top-Quark Pair-Production Cross Section at Hadron Colliders Through O($ \alpha_S^4 $) | PRL 110 (2013) 252004 | 1303.6254 |
| 31 | N. Kidonakis | Differential and total cross sections for top pair and single top production | 1205.3453 | |
| 32 | CMS Collaboration | Particle--flow event reconstruction in CMS and performance for jets, taus, and $ E_{\mathrm{T}}^{\text{miss}} $ | CDS | |
| 33 | CMS Collaboration | Commissioning of the Particle-flow Event Reconstruction with the first LHC collisions recorded in the CMS detector | CDS | |
| 34 | CMS Collaboration | Commissioning of the particle-flow reconstruction in minimum-bias and jet events from $ \mathrm{ p }\mathrm{ p } $ collisions at 7 TeV | CDS | |
| 35 | CMS Collaboration | Description and performance of track and primary-vertex reconstruction with the CMS tracker | JINST 9 (2014) P10009 | CMS-TRK-11-001 1405.6569 |
| 36 | M. Cacciari and G. P. Salam | Dispelling the $ N^{3} $ myth for the $ k_{t} $ jet-finder | PLB 641 (2006) 57 | hep-ph/0512210 |
| 37 | M. Cacciari, G. P. Salam, and G. Soyez | The anti-$ k_{t} $ jet clustering algorithm | JHEP 04 (2008) 063 | 0802.1189 |
| 38 | CMS Collaboration | Determination of Jet Energy Calibration and Transverse Momentum Resolution in CMS | JINST 6 (2011) P11002 | CMS-JME-10-011 1107.4277 |
| 39 | CMS Collaboration | Pileup jet identification | CMS-PAS-JME-13-005 | CMS-PAS-JME-13-005 |
| 40 | CMS Collaboration | Identification of b-quark jets with the CMS experiment | JINST 8 (2013) P04013 | CMS-BTV-12-001 1211.4462 |
| 41 | CMS Collaboration Collaboration | Identification of b quark jets at the CMS Experiment in the LHC Run 2 | ||
| 42 | CMS Collaboration | Search for the standard model Higgs boson produced through vector boson fusion and decaying to $\mathrm{b\bar{b}}$ with proton-proton collisions at $\sqrt{s}=$ 13 TeV | CMS-PAS-HIG-16-003 | CMS-PAS-HIG-16-003 |
| 43 | A. Bukin | Fitting function for asymmetric peaks | 0711.4449 | |
| 44 | CMS Collaboration | Search for resonant production of high-mass photon pairs in proton-proton collisions at $ \sqrt{s} = 8 $ and 13$ TeV $ | CMS-EXO-16-018 1606.04093 |
|
| 45 | ATLAS Collaboration | Search for resonances in diphoton events at $ \sqrt{s} $=13 TeV with the ATLAS detector | 1606.03833 | |
| 46 | S. S. Wilks | The large-sample distribution of the likelihood ratio for testing composite hypotheses | Ann. Math. Statist. 9 (1938) 60 | |
| 47 | T. Junk | Confidence level computation for combining searches with small statistics | Nulc. Instum. Meth. A434 (1999) 435--443 | 9902006 |
| 48 | A. L. Read | Presentation of search results: The CL(s) technique | JPG28 (2002) 2693--2704 | |
| 49 | G. Cowan, K. Cranmer, E. Gross, and O. Vitells | Asymptotic formulae for likelihood-based tests of new physics | EPJC71 (2011) 1554 | 1007.1727 |
| 50 | ATLAS and CMS Collaboration | Procedure for the LHC Higgs boson search combination in Summer 2011 | ||
|
|
Compact Muon Solenoid LHC, CERN |
|

|

|

|

|

|