

Compact Muon Solenoid
LHC, CERN
| CMS-PAS-HIG-17-008 | ||
| Search for Higgs boson pair production in the final state containing two photons and two bottom quarks in proton-proton collisions at $\sqrt{s}= $ 13 TeV | ||
| CMS Collaboration | ||
| July 2017 | ||
| Abstract: A search is presented for the production of a pair of Higgs bosons, where one decays into two photons and the other to two bottom quarks. Both resonant and nonresonant production mechanisms of the Higgs boson pair are investigated. The analysis is performed using proton-proton collision data from the LHC at $\sqrt{s} = $ 13 TeV recorded by the CMS detector in 2016, which corresponds to an integrated luminosity of 35.9 fb$^{-1}$. The observed data are in agreement with standard model predictions. Upper limits on the production cross sections of spin-0 and spin-2 particles are set at 95% confidence level, excluding a product of the production cross section and branching fraction of narrow-width particles between 0.26 and 3.67 fb for spin-0 and between 0.21 and 3.61 fb for spin-2. In addition, an upper limit on the cross section for nonresonant Higgs boson pair production is set and compared to standard model Higgs boson pair production via gluon fusion. Constraints on anomalous couplings that affect Higgs boson pair production are also determined. For the standard model hypothesis, the data exclude a product of production cross section and branching fraction larger than 1.67 fb at 95% confidence level, corresponding to 19.2 times the standard model prediction. | ||
|
Links:
CDS record (PDF) ;
inSPIRE record ;
CADI line (restricted) ;
These preliminary results are superseded in this paper, PLB 788 (2018) 7. The superseded preliminary plots can be found here. |
||
| Figures & Tables | Summary | Additional Figures | References | CMS Publications |
|---|
| Figures | |
png pdf |
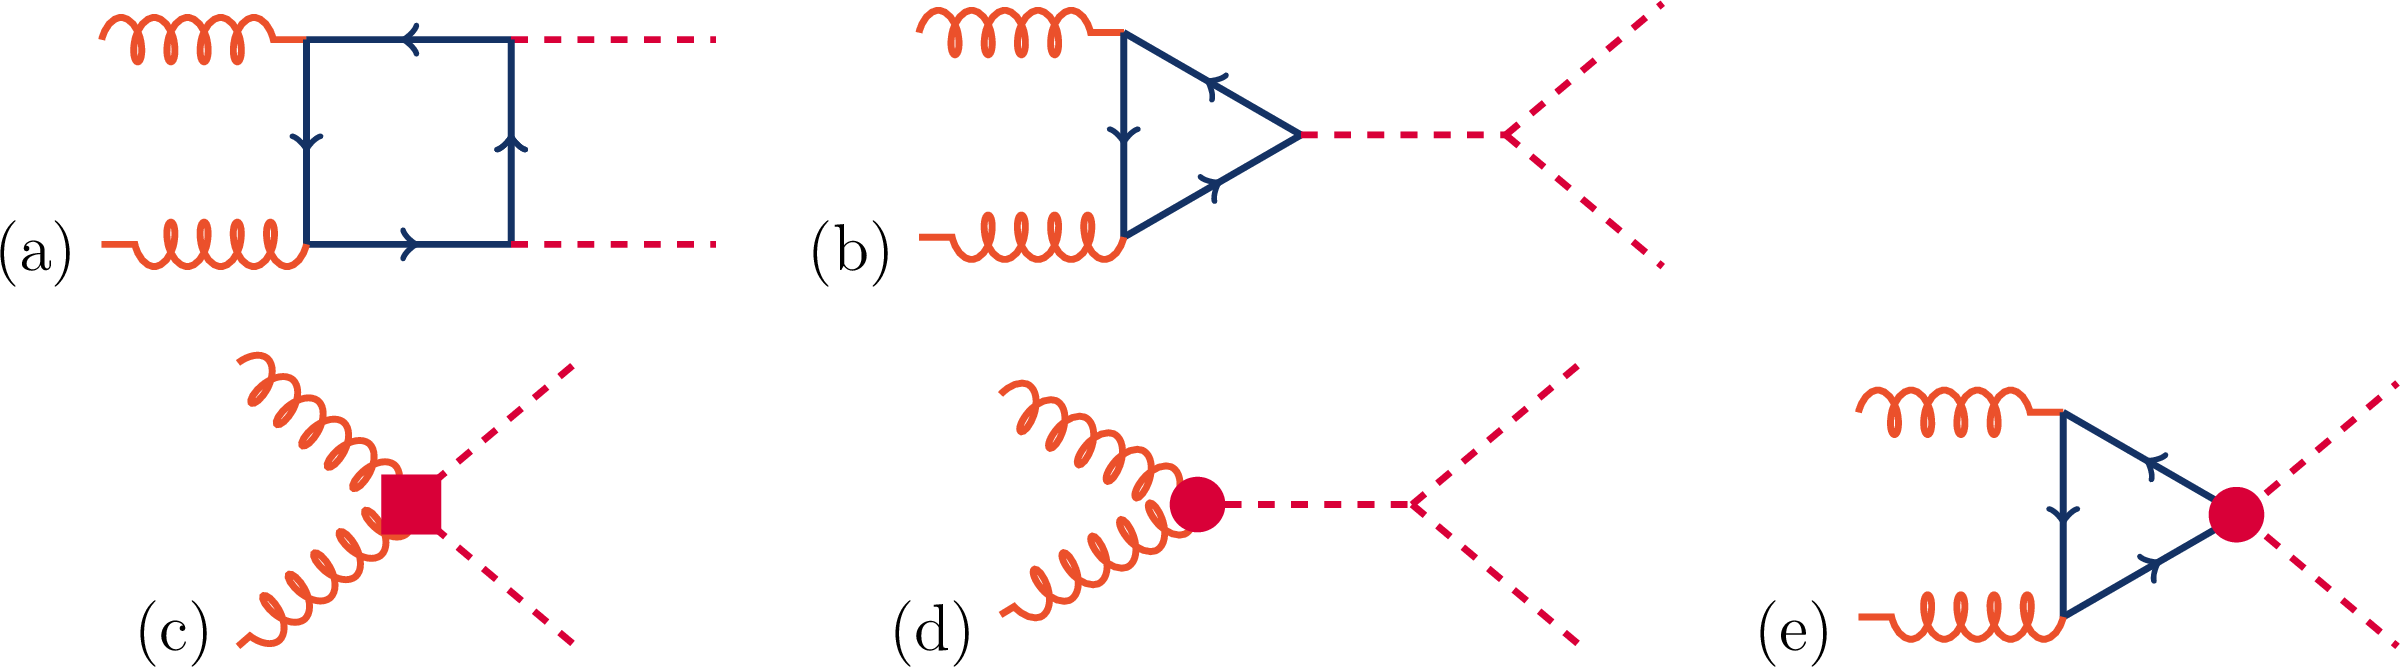
Figure 1:
Feynman diagrams that contribute to HH production by gluon-gluon fusion at leading order. Diagrams (a) and (b) correspond to SM-like processes, while diagrams (c), (d), and (e) correspond to pure BSM effects: (c) and (d) describe contact interactions between the H boson and gluons, and (e) exploits the contact interaction of two H bosons with top quarks. |

png pdf |
Figure 2:
Comparison of $ {\tilde{M}_{\mathrm {X}}} $ (red line) of $ {M(jj\gamma \gamma )}$ with $ {\tilde{M}_{\mathrm {X}}} $ (purple line) for different spin-2 resonance masses. All distributions are obtained after the full baseline selection (Table 1), and are normalized to unity. |

png pdf |
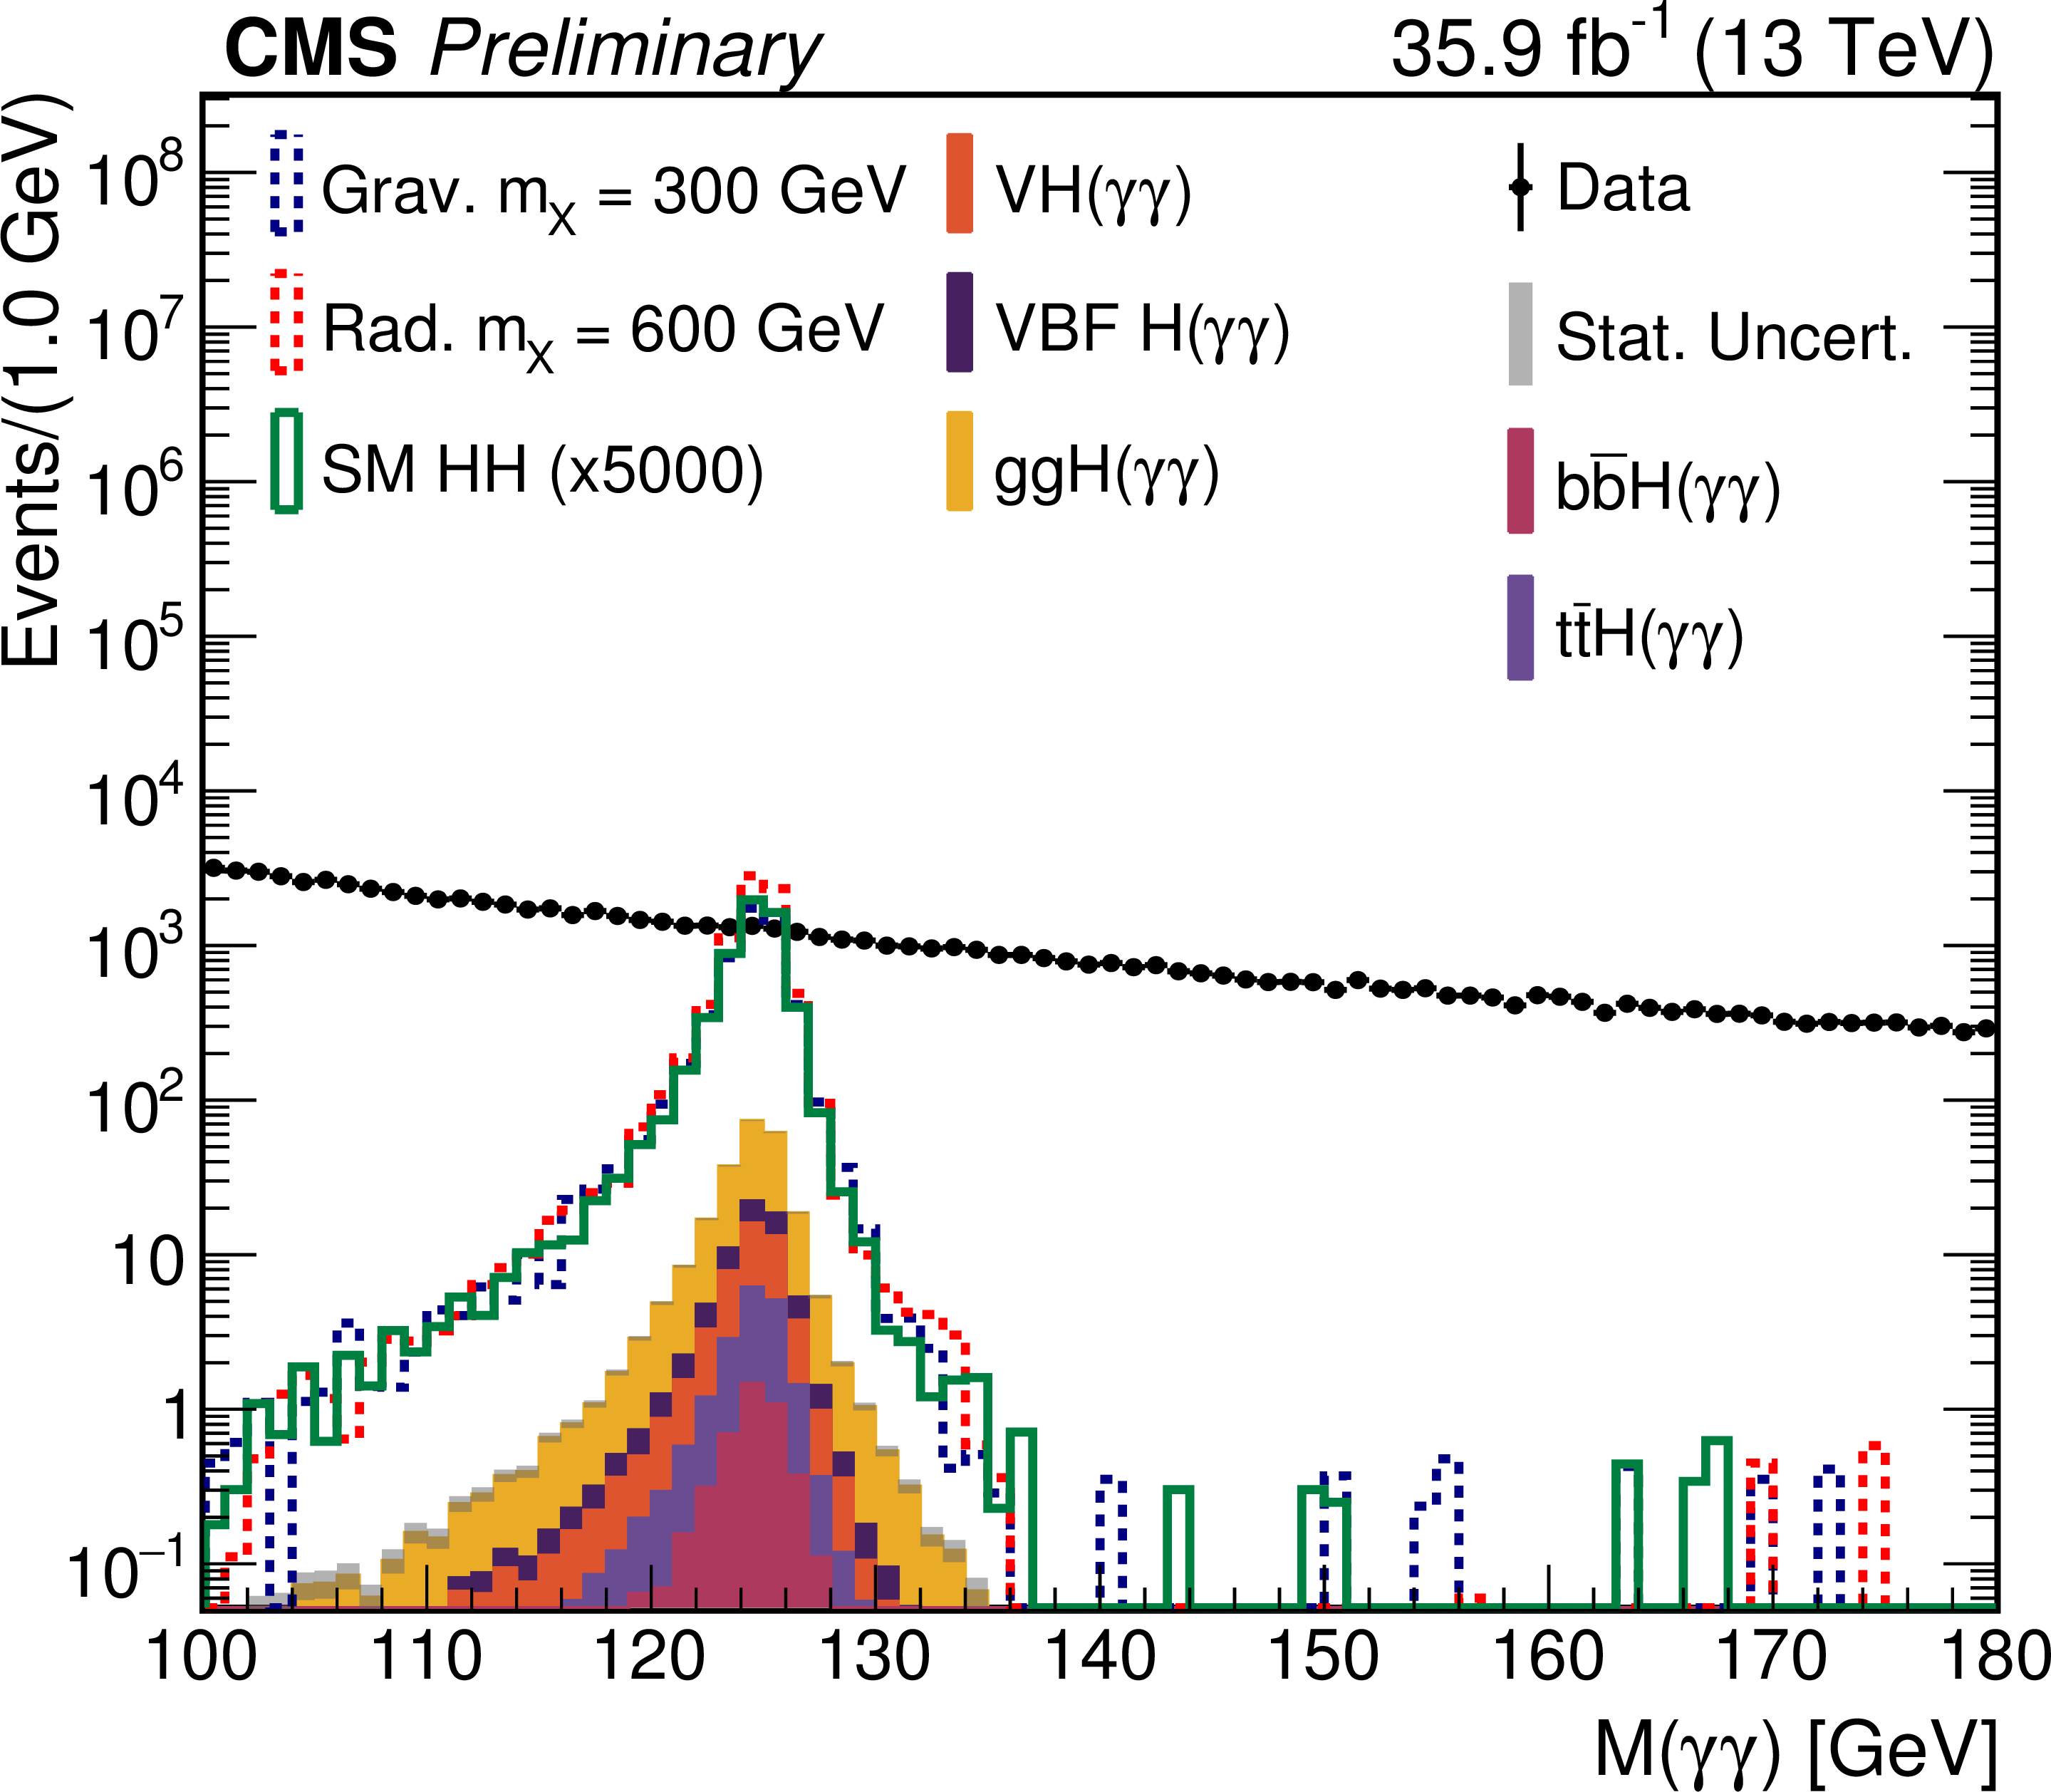
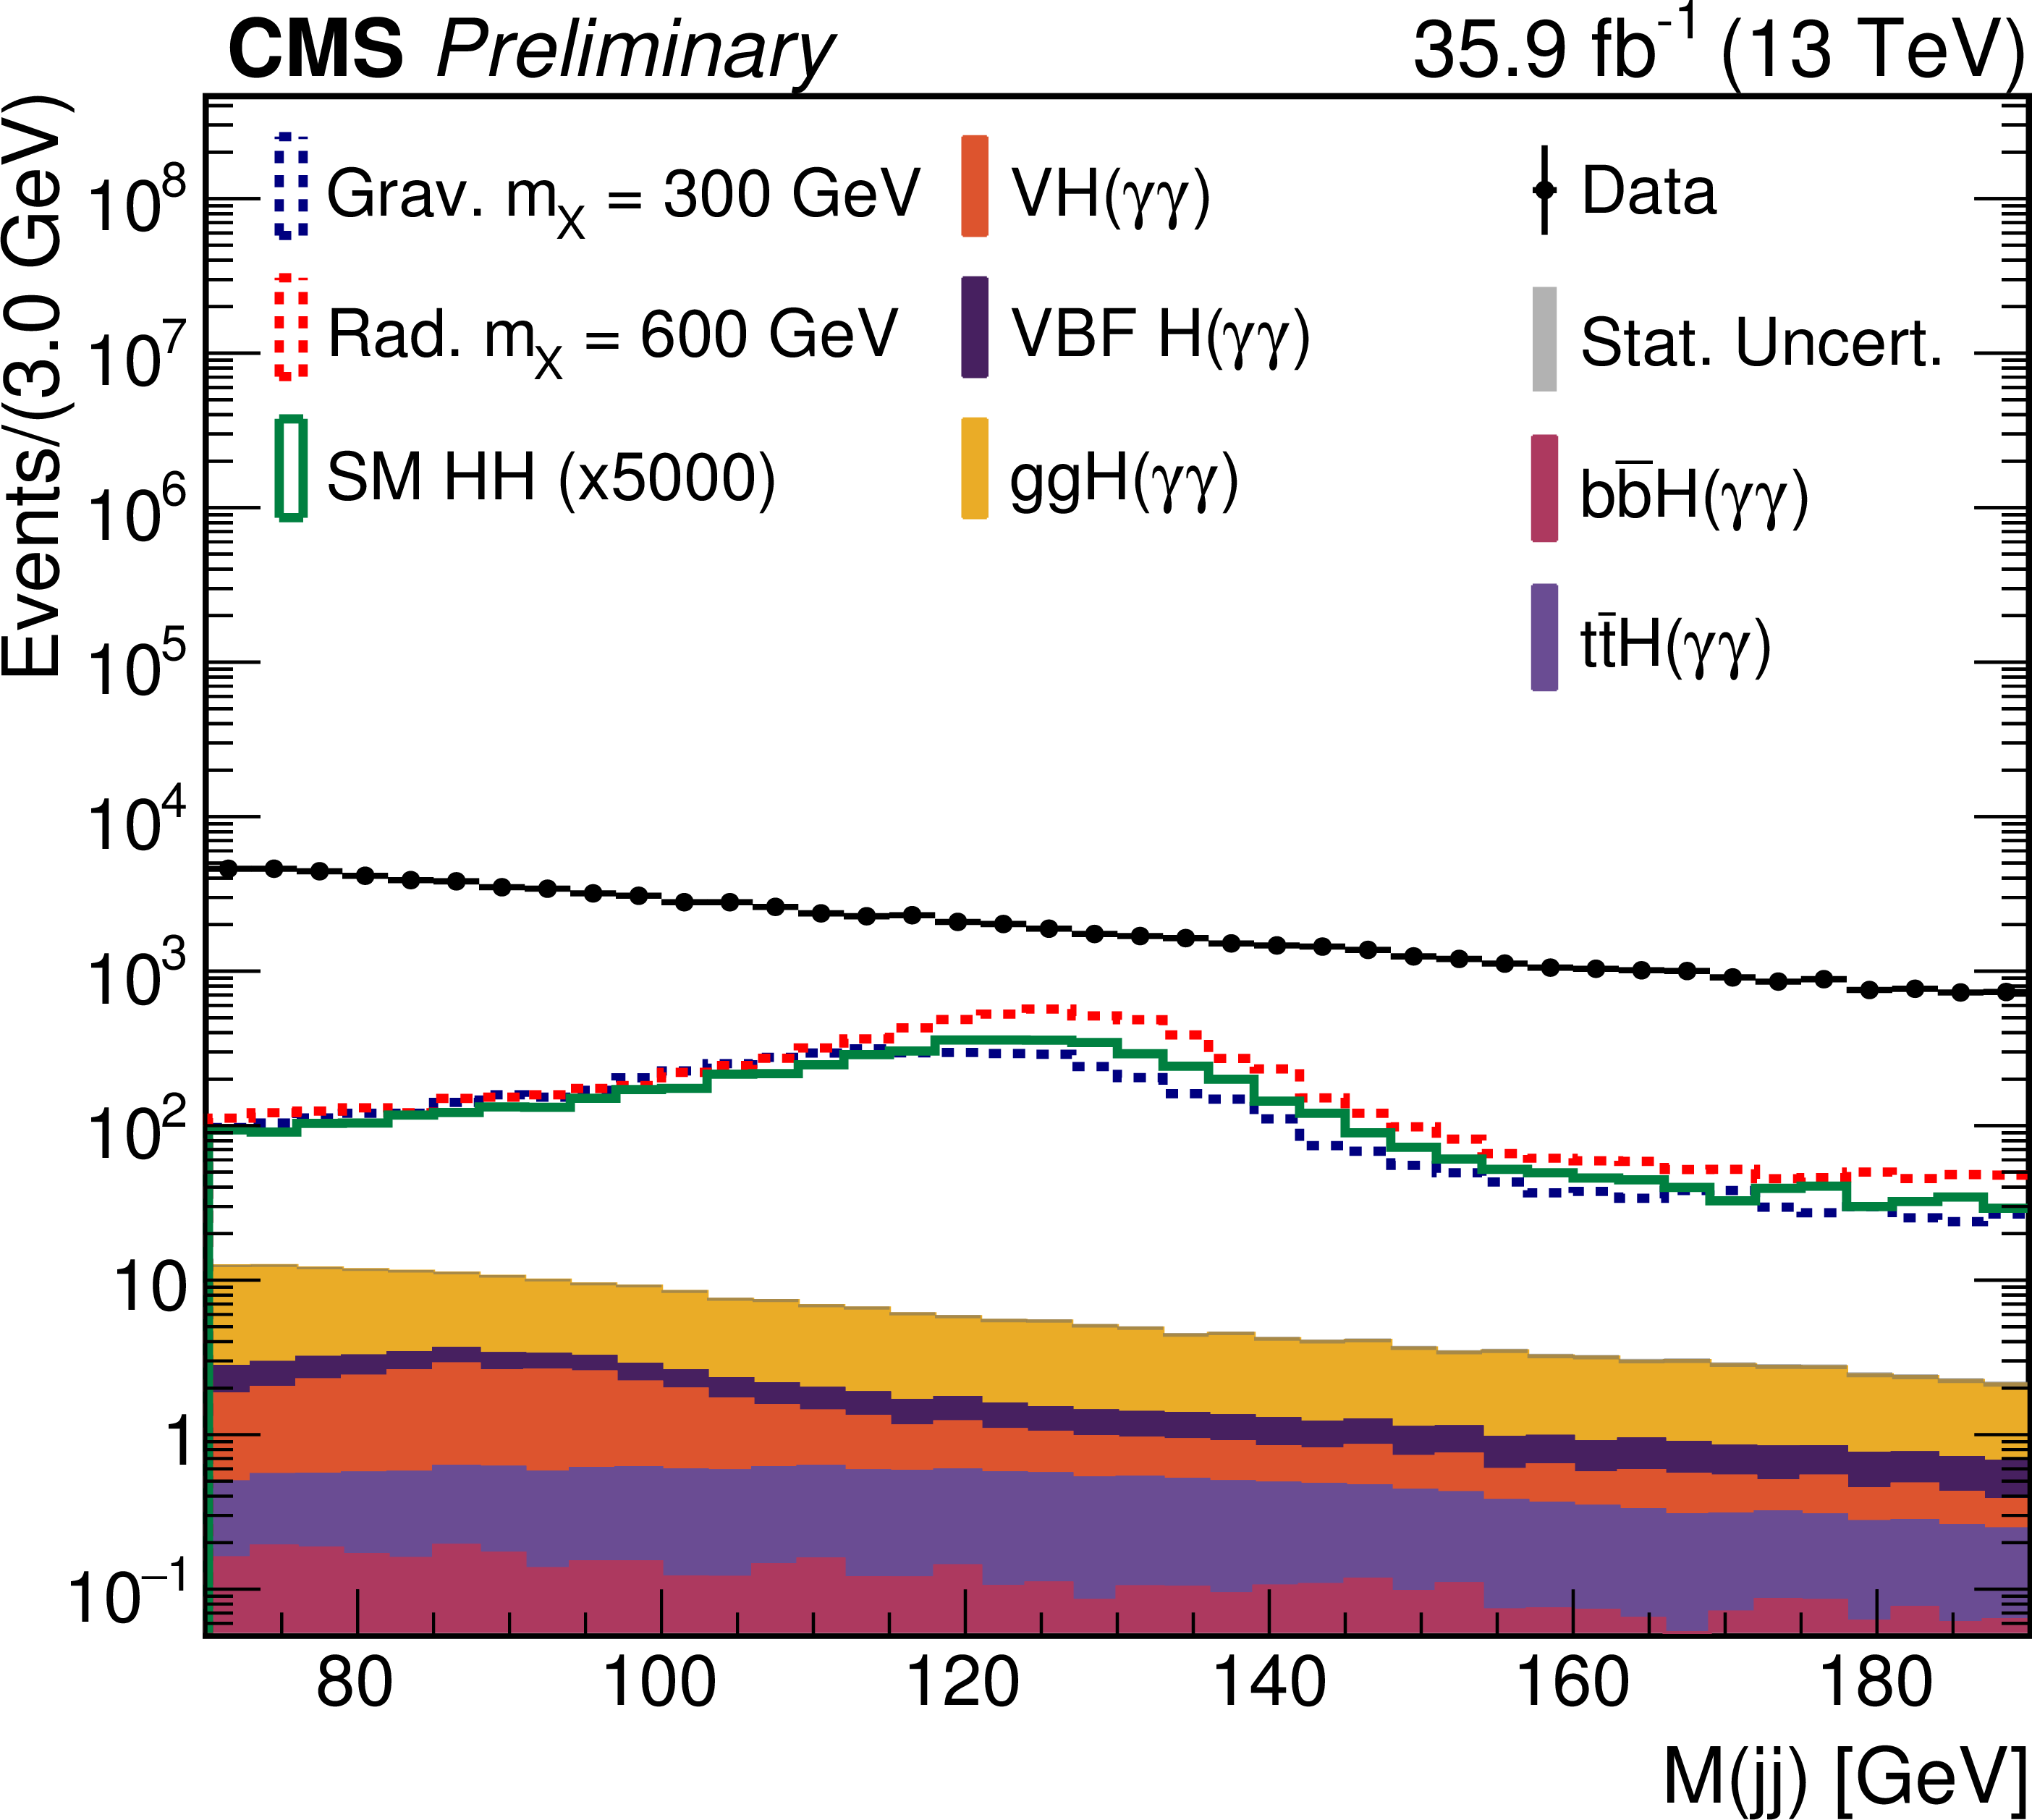
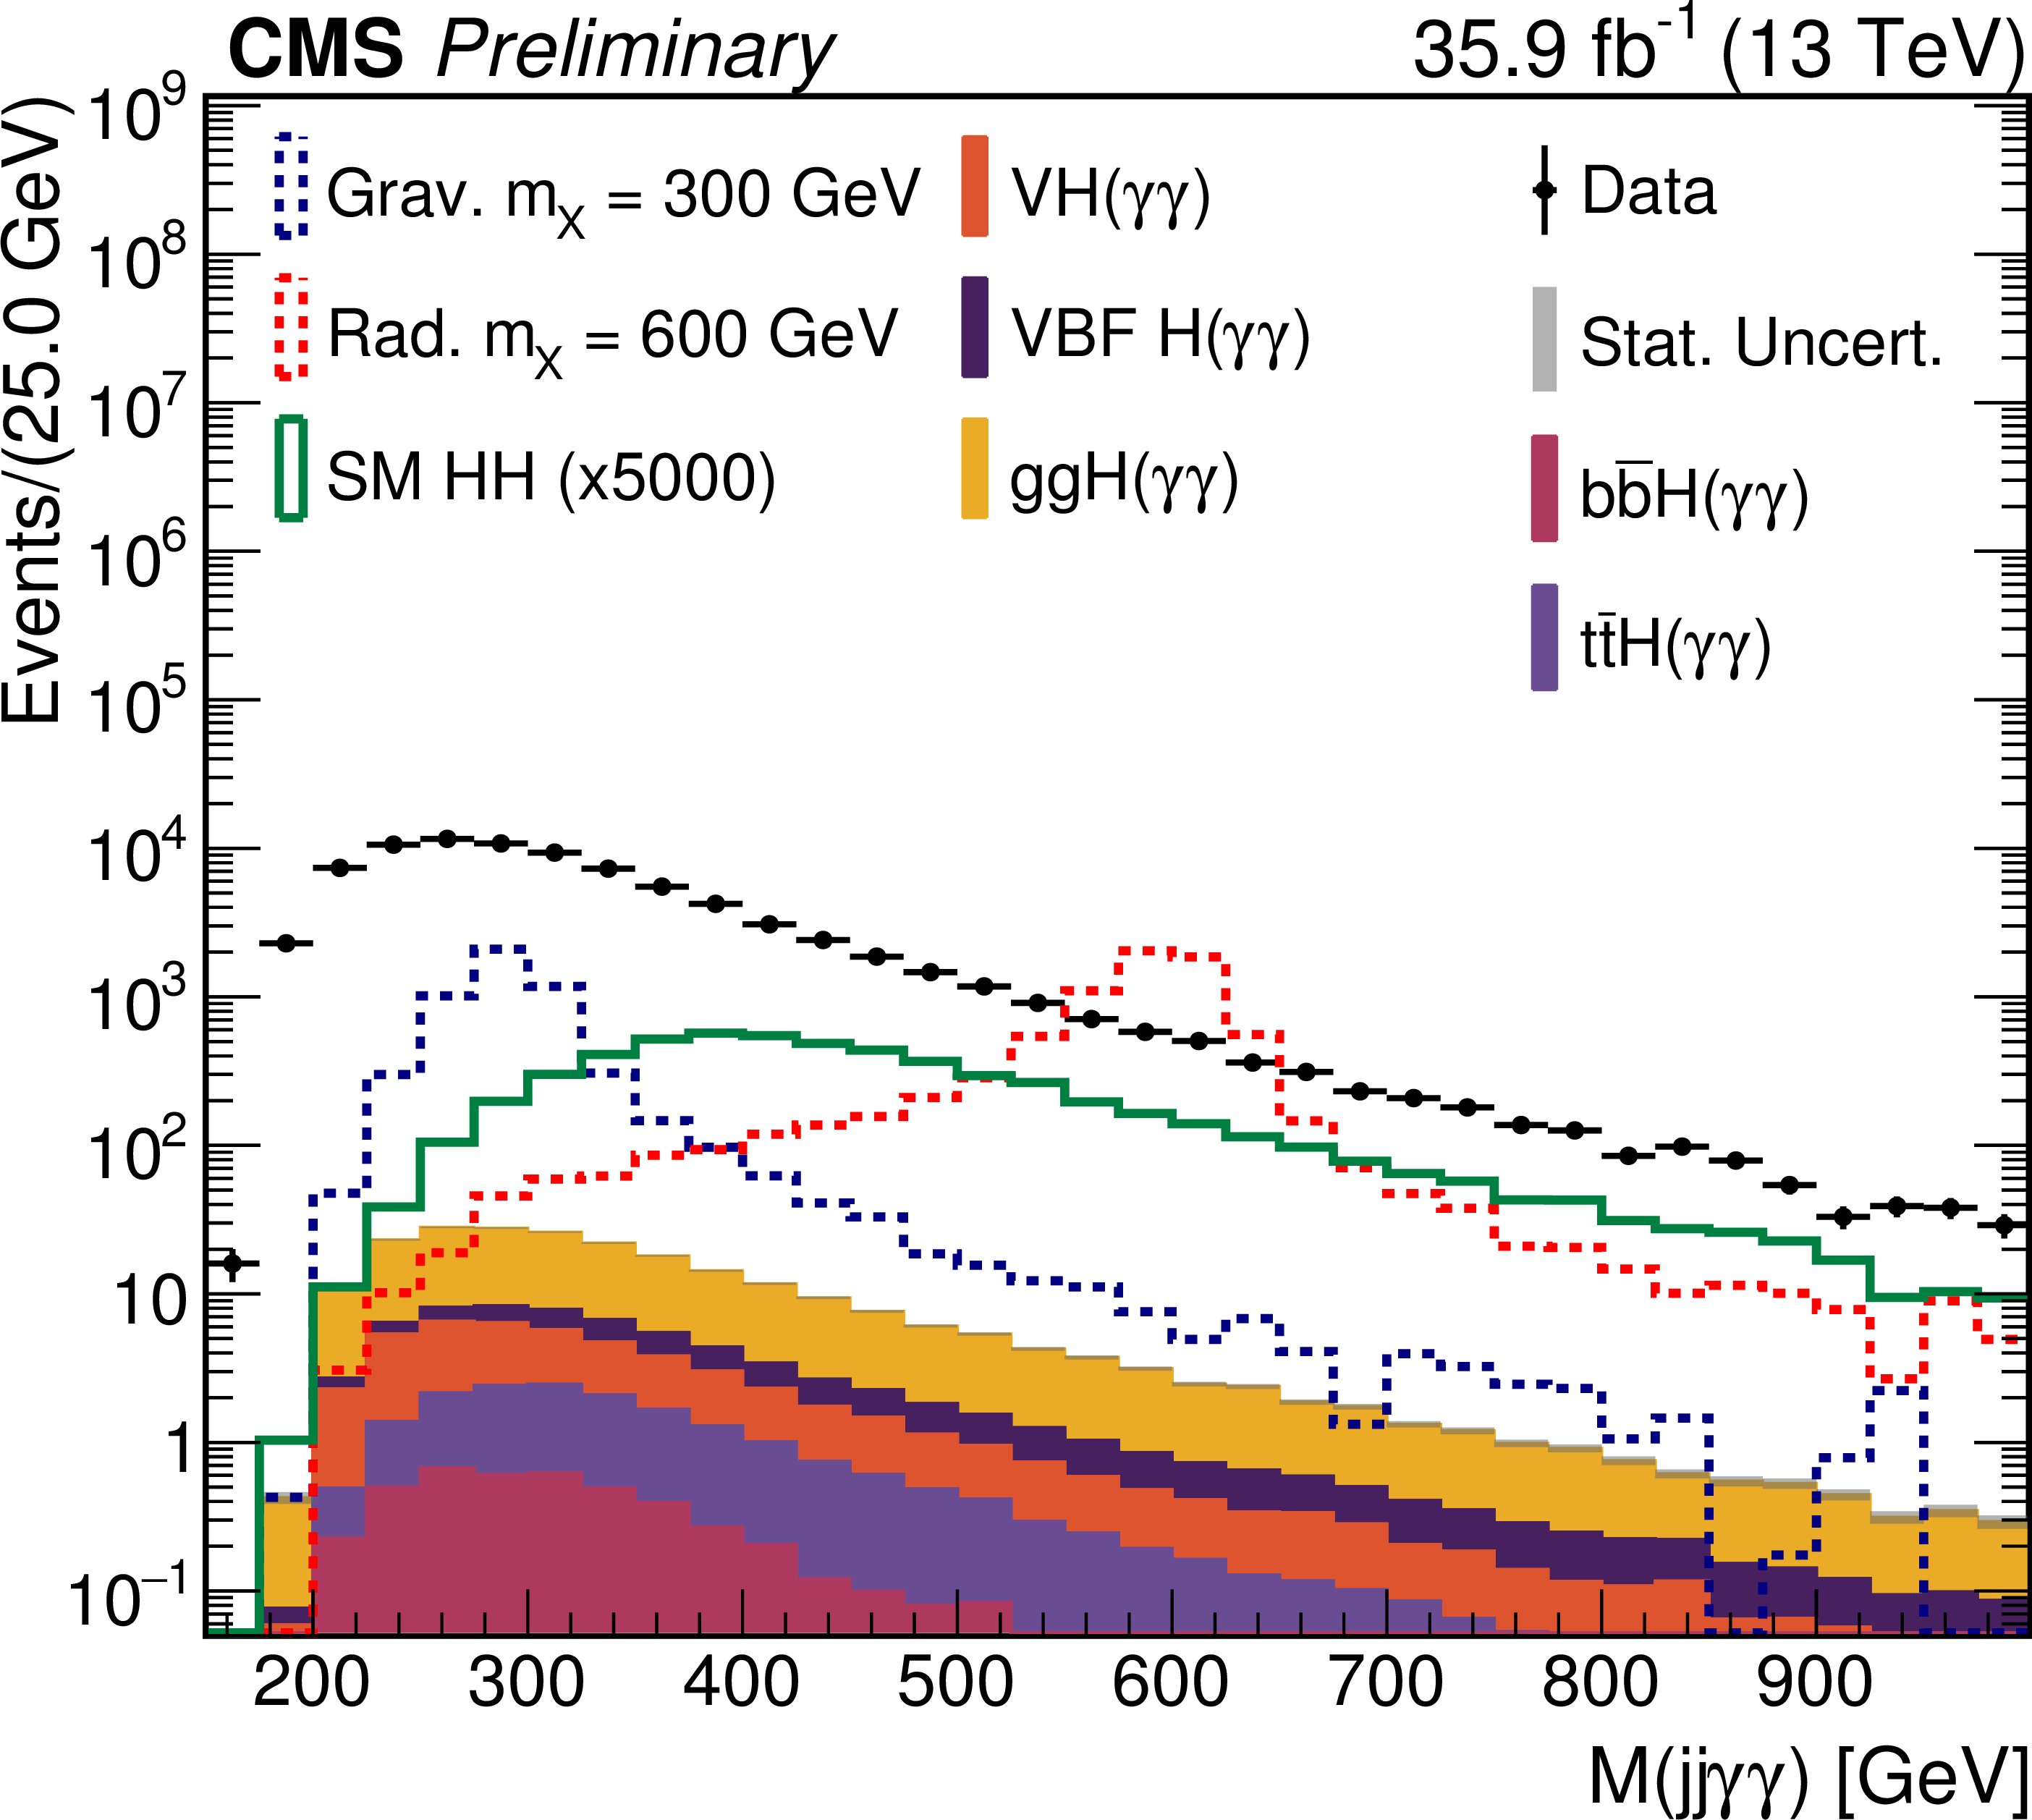
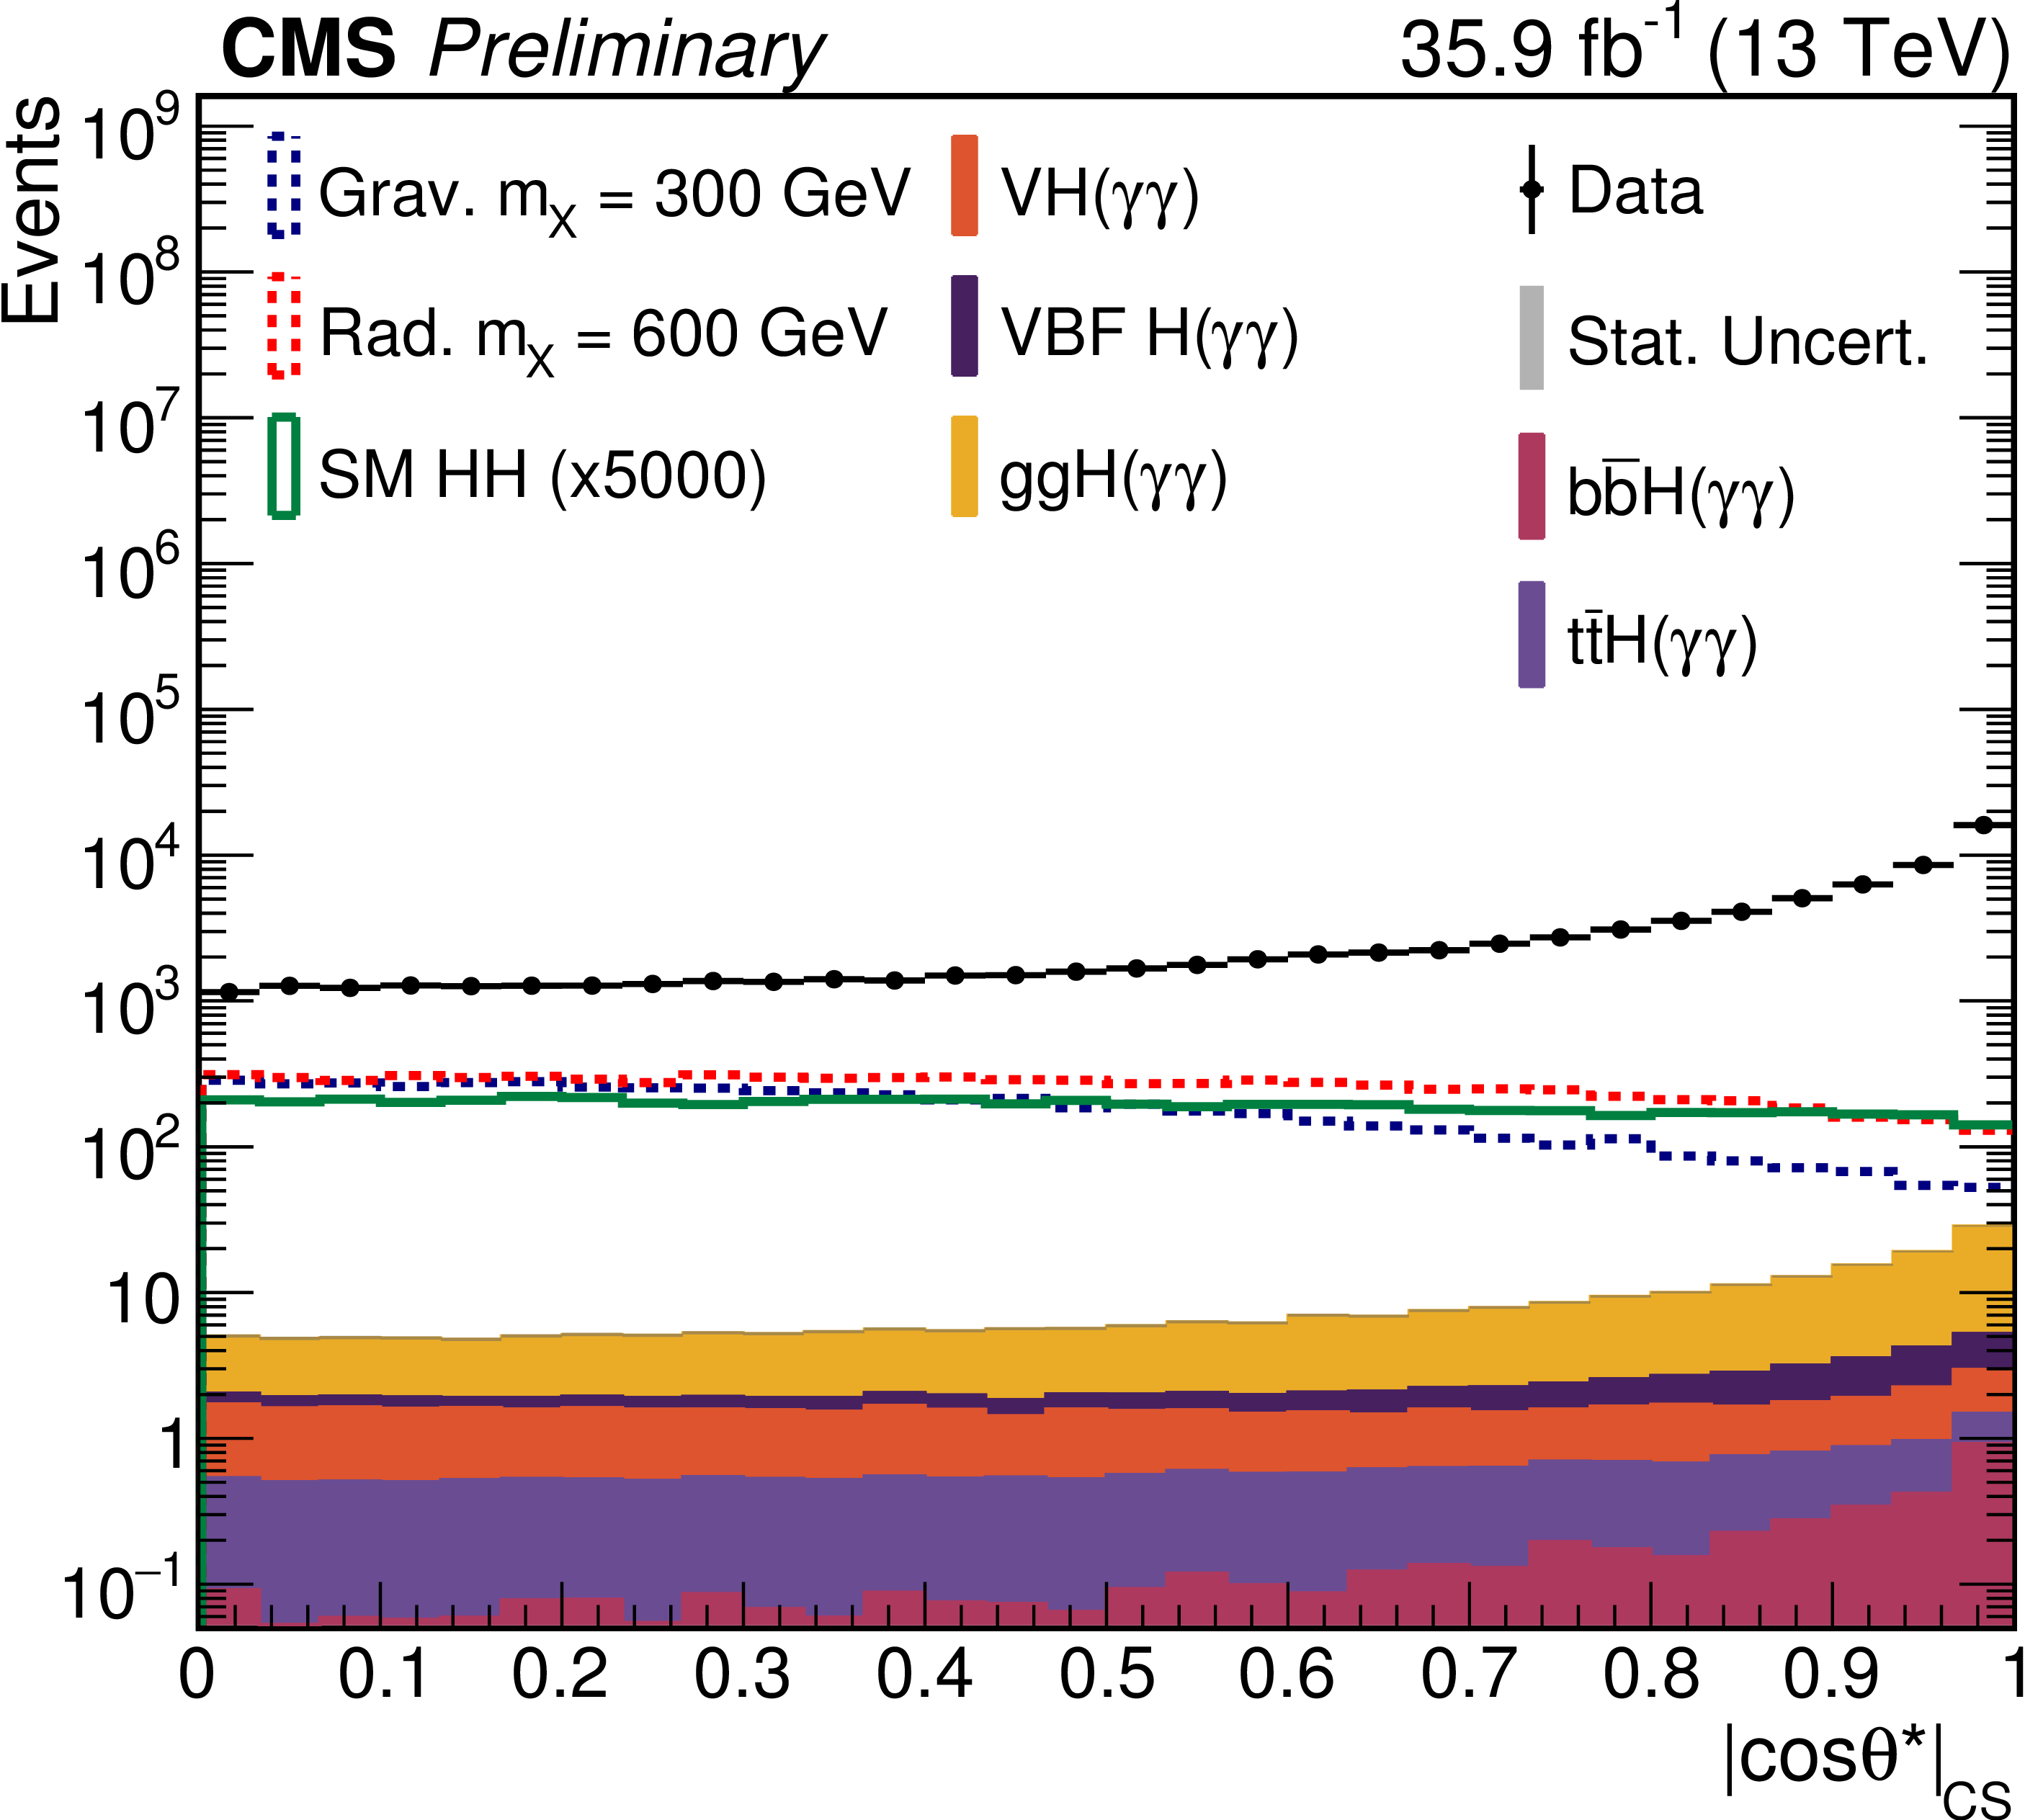
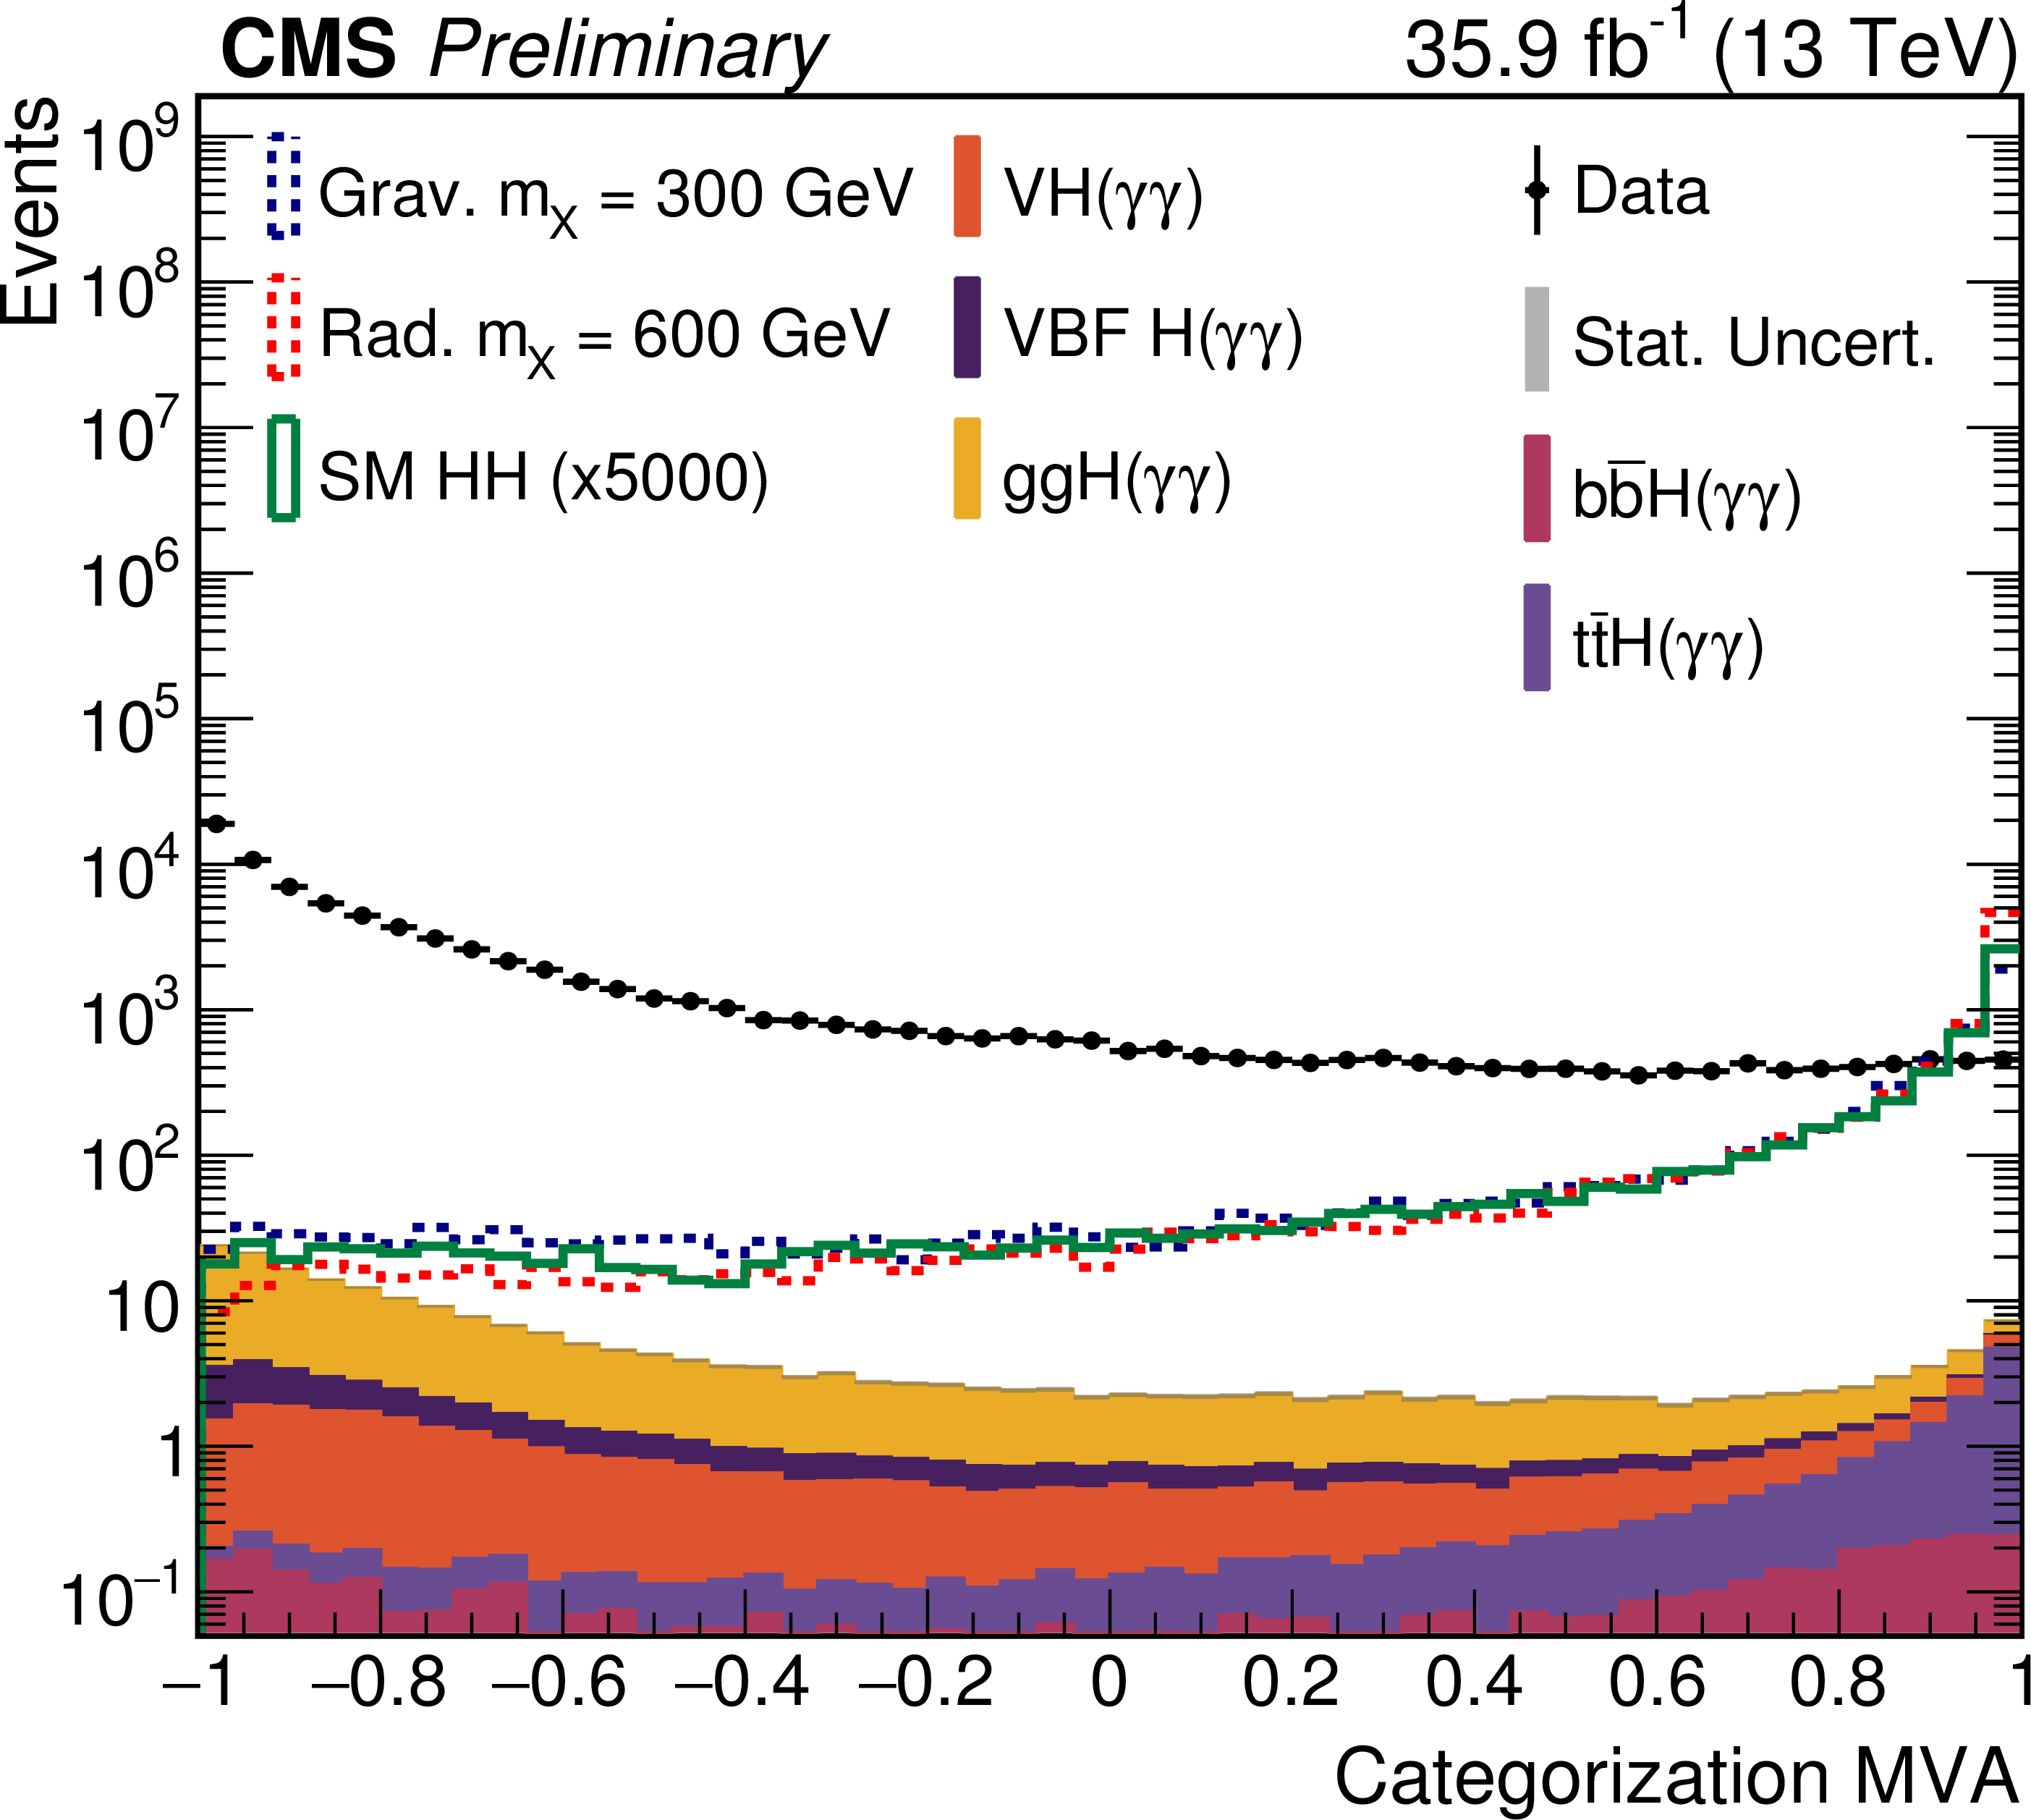
Figure 3:
Data compared to the simulated background spectra after selections on photons and jets summarised in Table 1. The diphoton (pp) and prompt-fake (pf) contributions are normalized to data. |
png pdf |
Figure 3-a:
Data compared to the simulated background spectra after selections on photons and jets summarised in Table 1. The diphoton (pp) and prompt-fake (pf) contributions are normalized to data. |
png pdf |
Figure 3-b:
Data compared to the simulated background spectra after selections on photons and jets summarised in Table 1. The diphoton (pp) and prompt-fake (pf) contributions are normalized to data. |
png pdf |
Figure 3-c:
Data compared to the simulated background spectra after selections on photons and jets summarised in Table 1. The diphoton (pp) and prompt-fake (pf) contributions are normalized to data. |

png pdf |
Figure 3-d:
Data compared to the simulated background spectra after selections on photons and jets summarised in Table 1. The diphoton (pp) and prompt-fake (pf) contributions are normalized to data. |
png pdf |
Figure 3-e:
Data compared to the simulated background spectra after selections on photons and jets summarised in Table 1. The diphoton (pp) and prompt-fake (pf) contributions are normalized to data. |

png pdf |
Figure 3-f:
Data compared to the simulated background spectra after selections on photons and jets summarised in Table 1. The diphoton (pp) and prompt-fake (pf) contributions are normalized to data. |
png pdf |
Figure 4:
BDT output (classification MVA). The background and signal normalizations follow the plots presented in Section 4.4. |
png pdf |
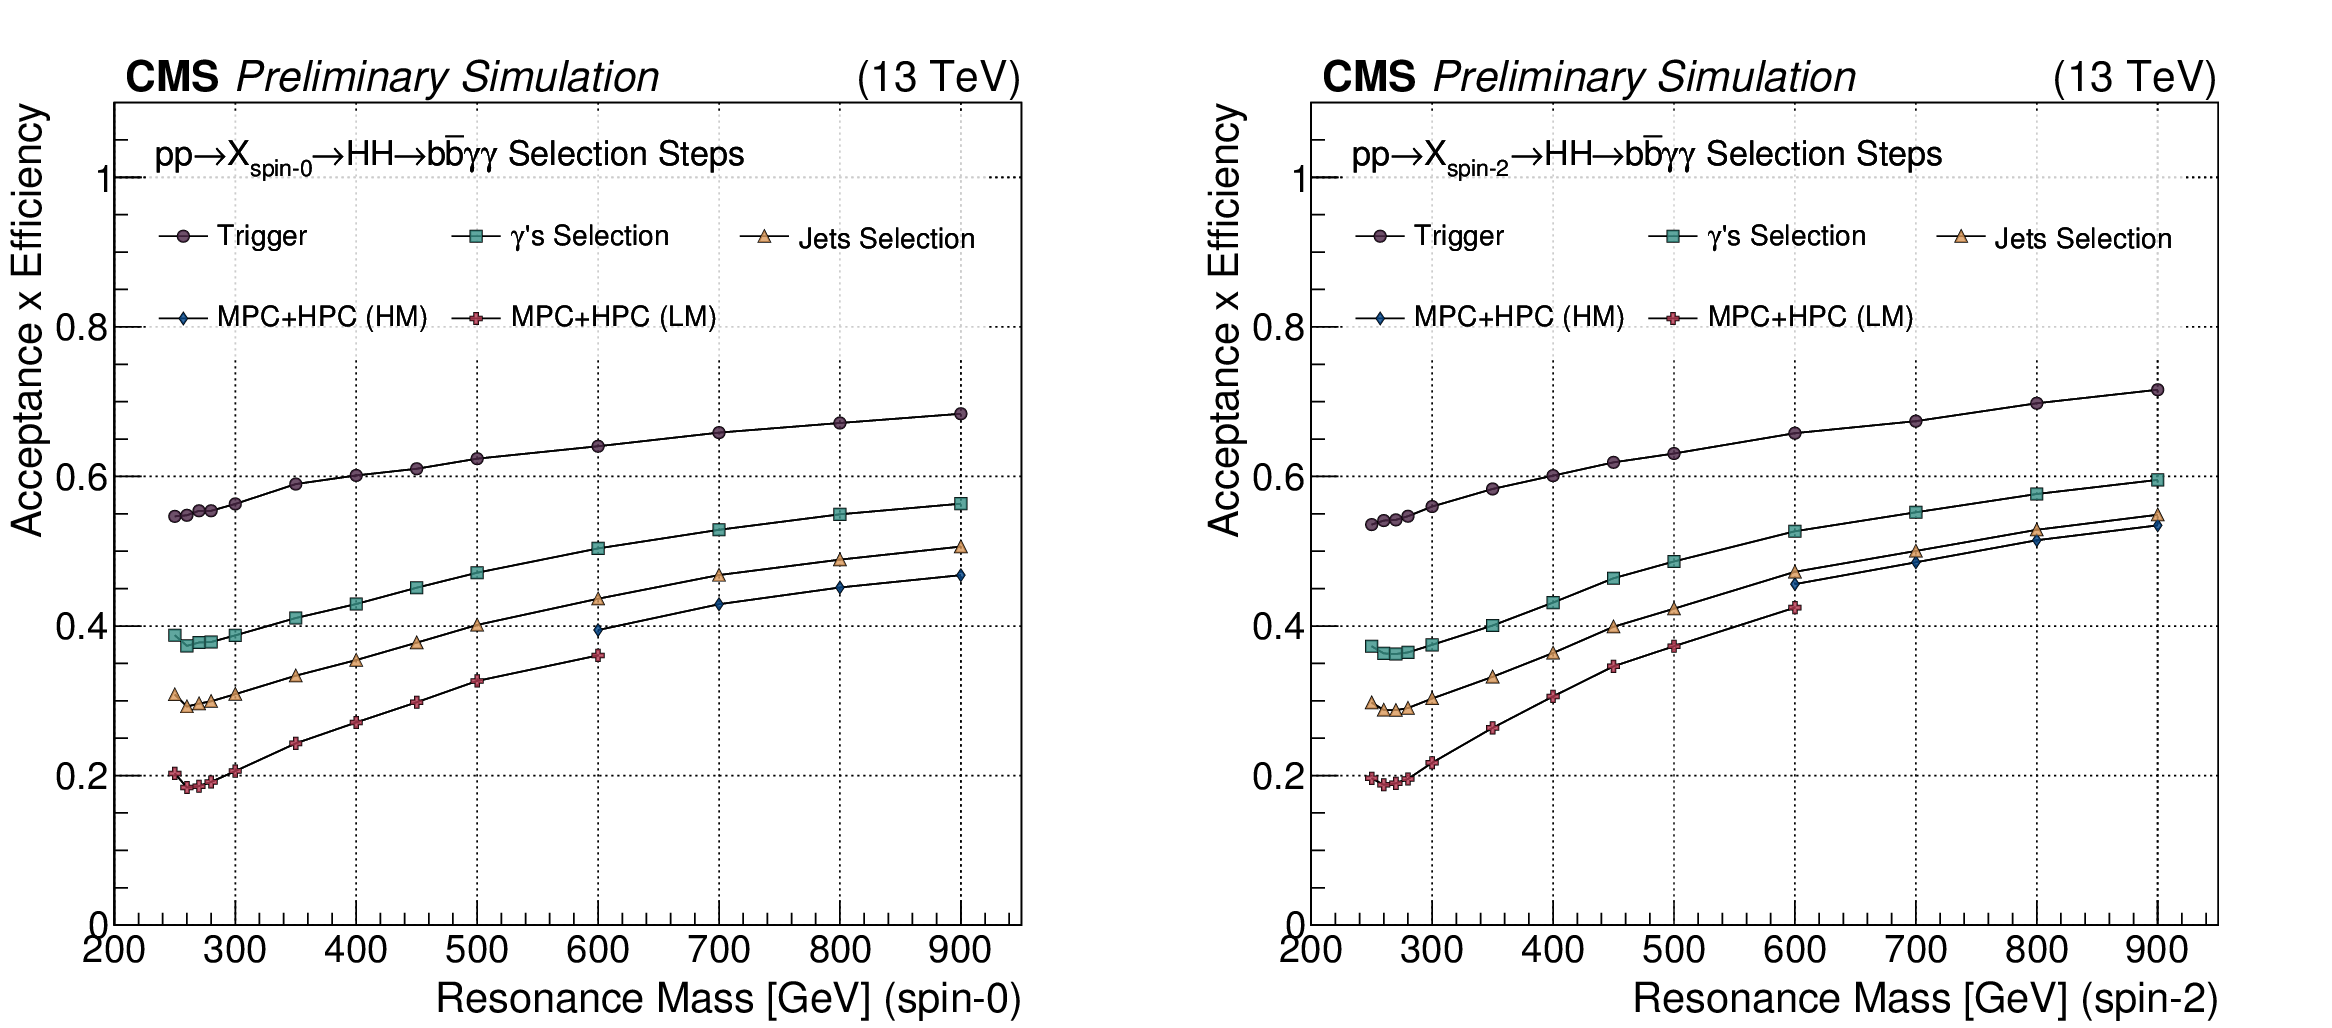
Figure 5:
Acceptance times the efficiency for different resonance hypotheses: spin-0 (left) and spin-2 (right). |
png pdf |
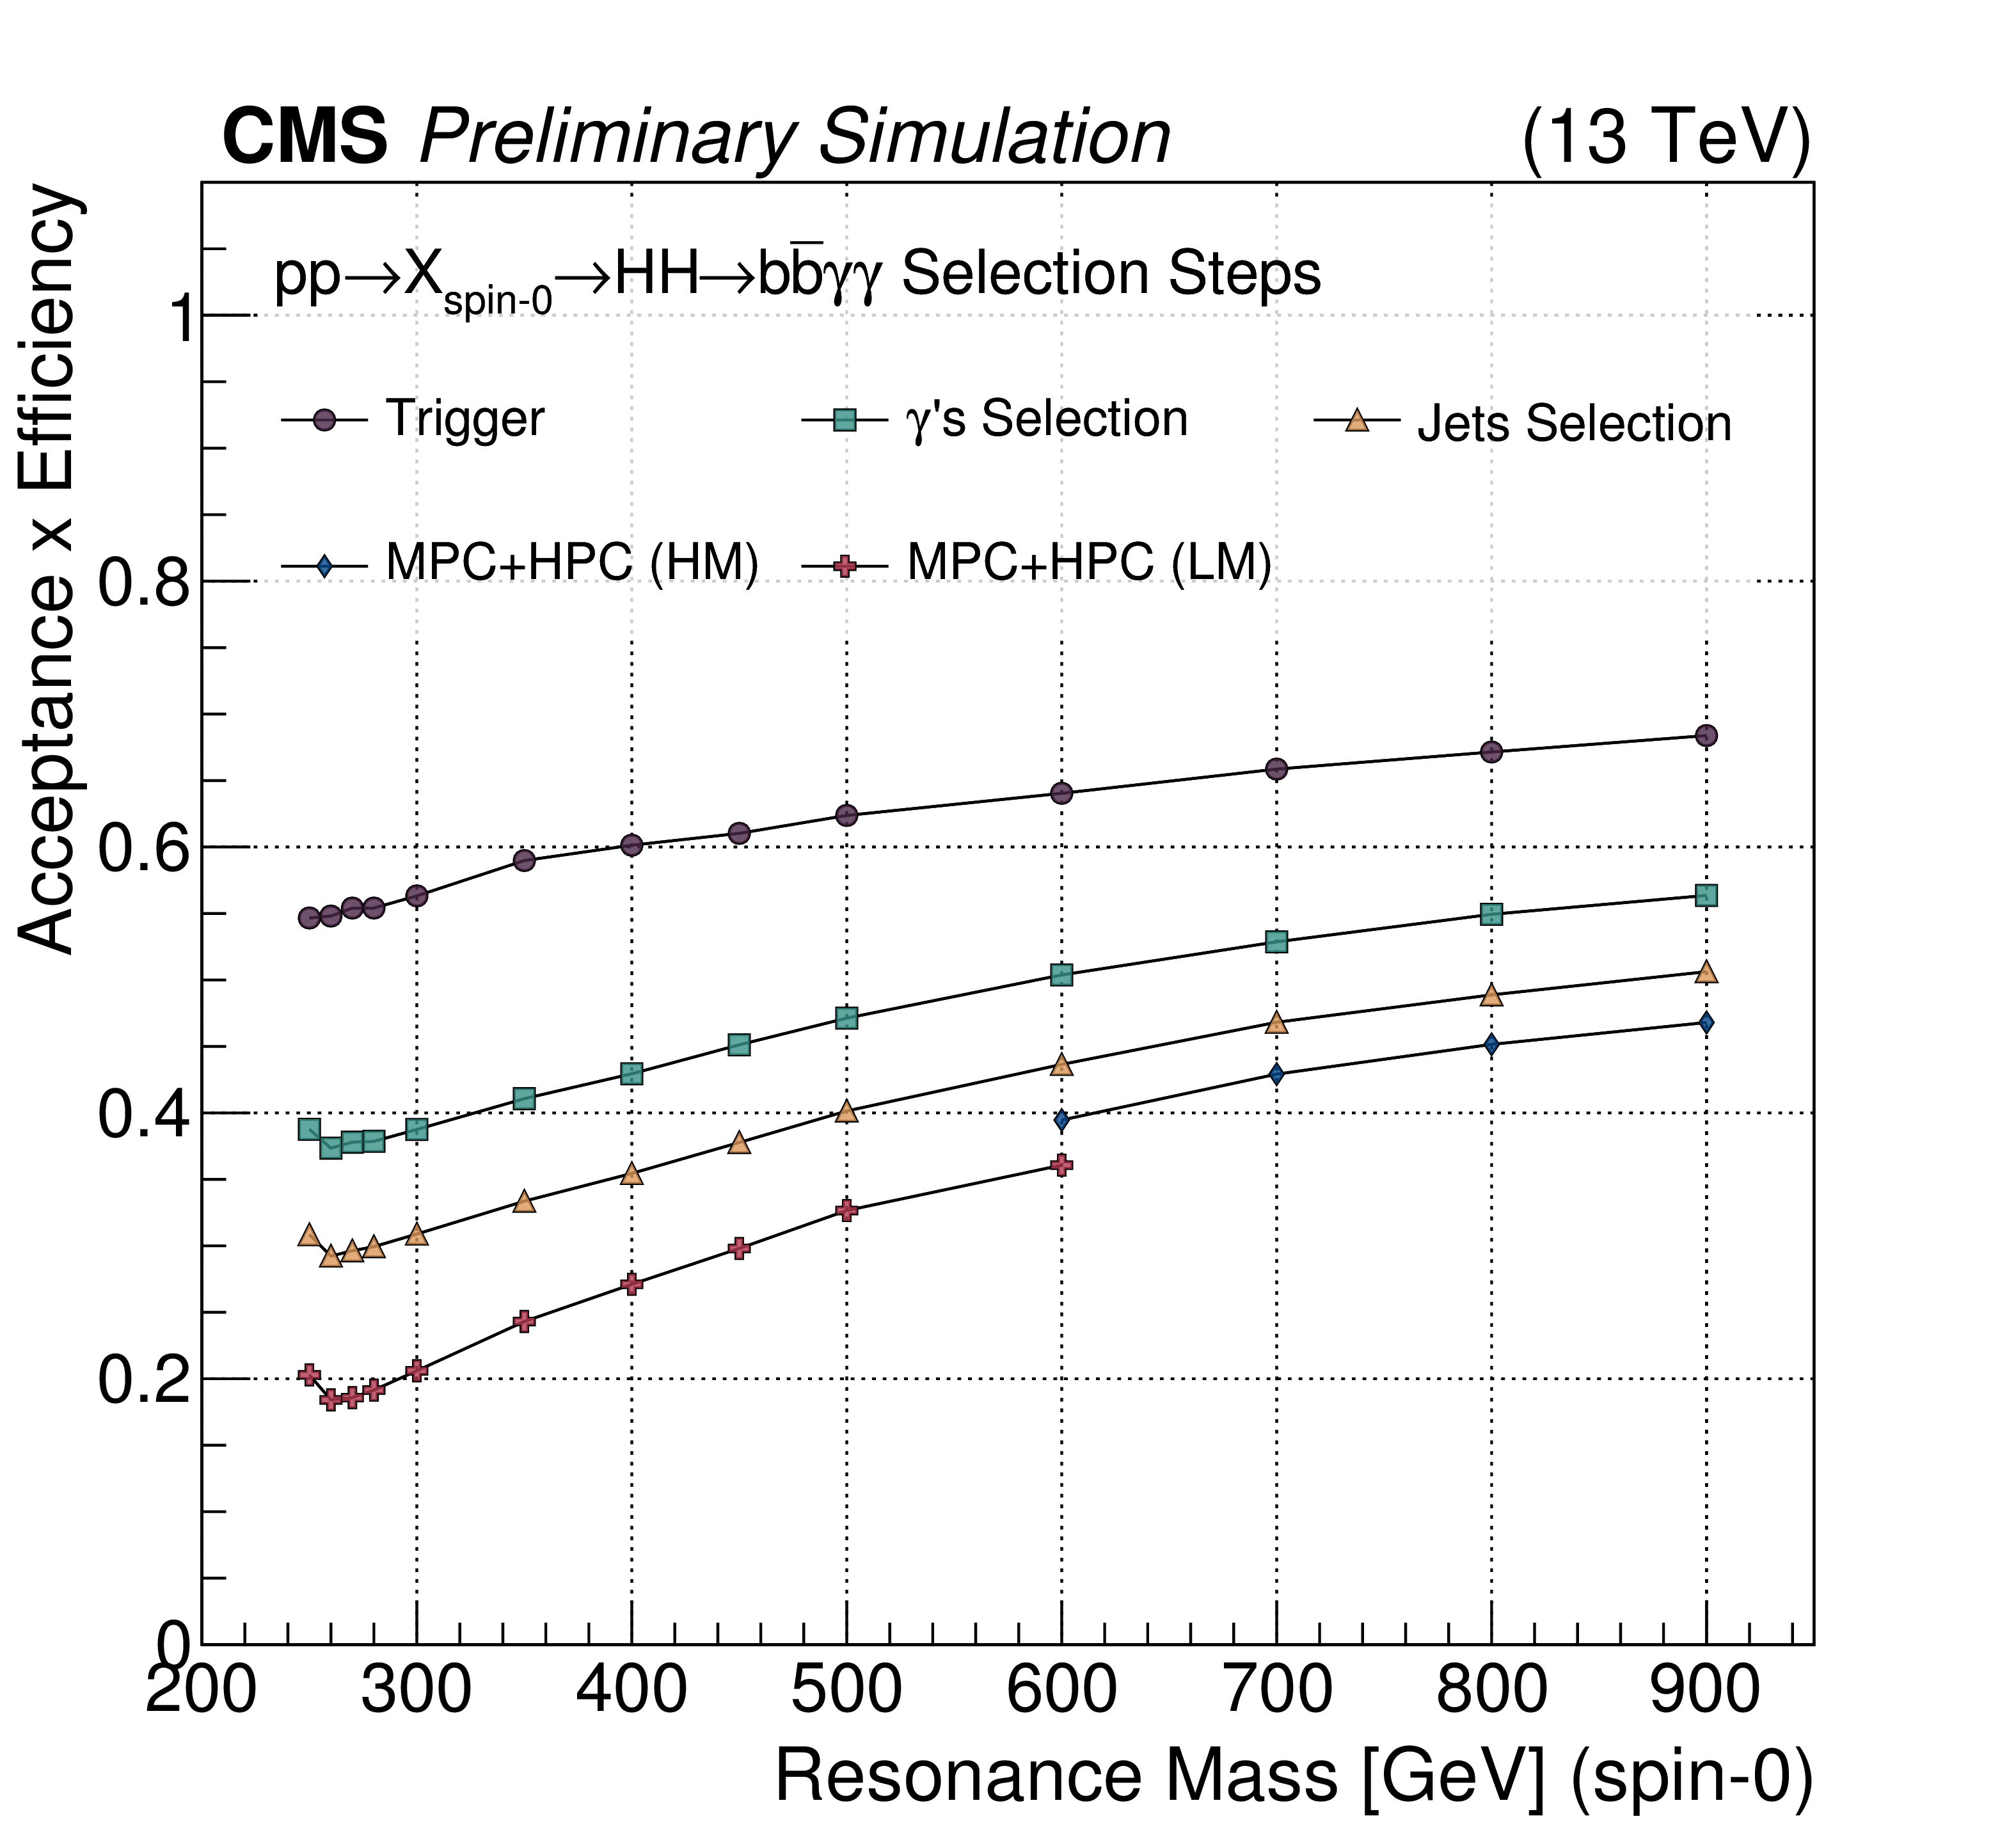
Figure 5-a:
Acceptance times the efficiency for spin-0 resonance hypothesis. |

png pdf |
Figure 5-b:
Acceptance times the efficiency for spin-2 resonance hypothesis. |

png pdf |
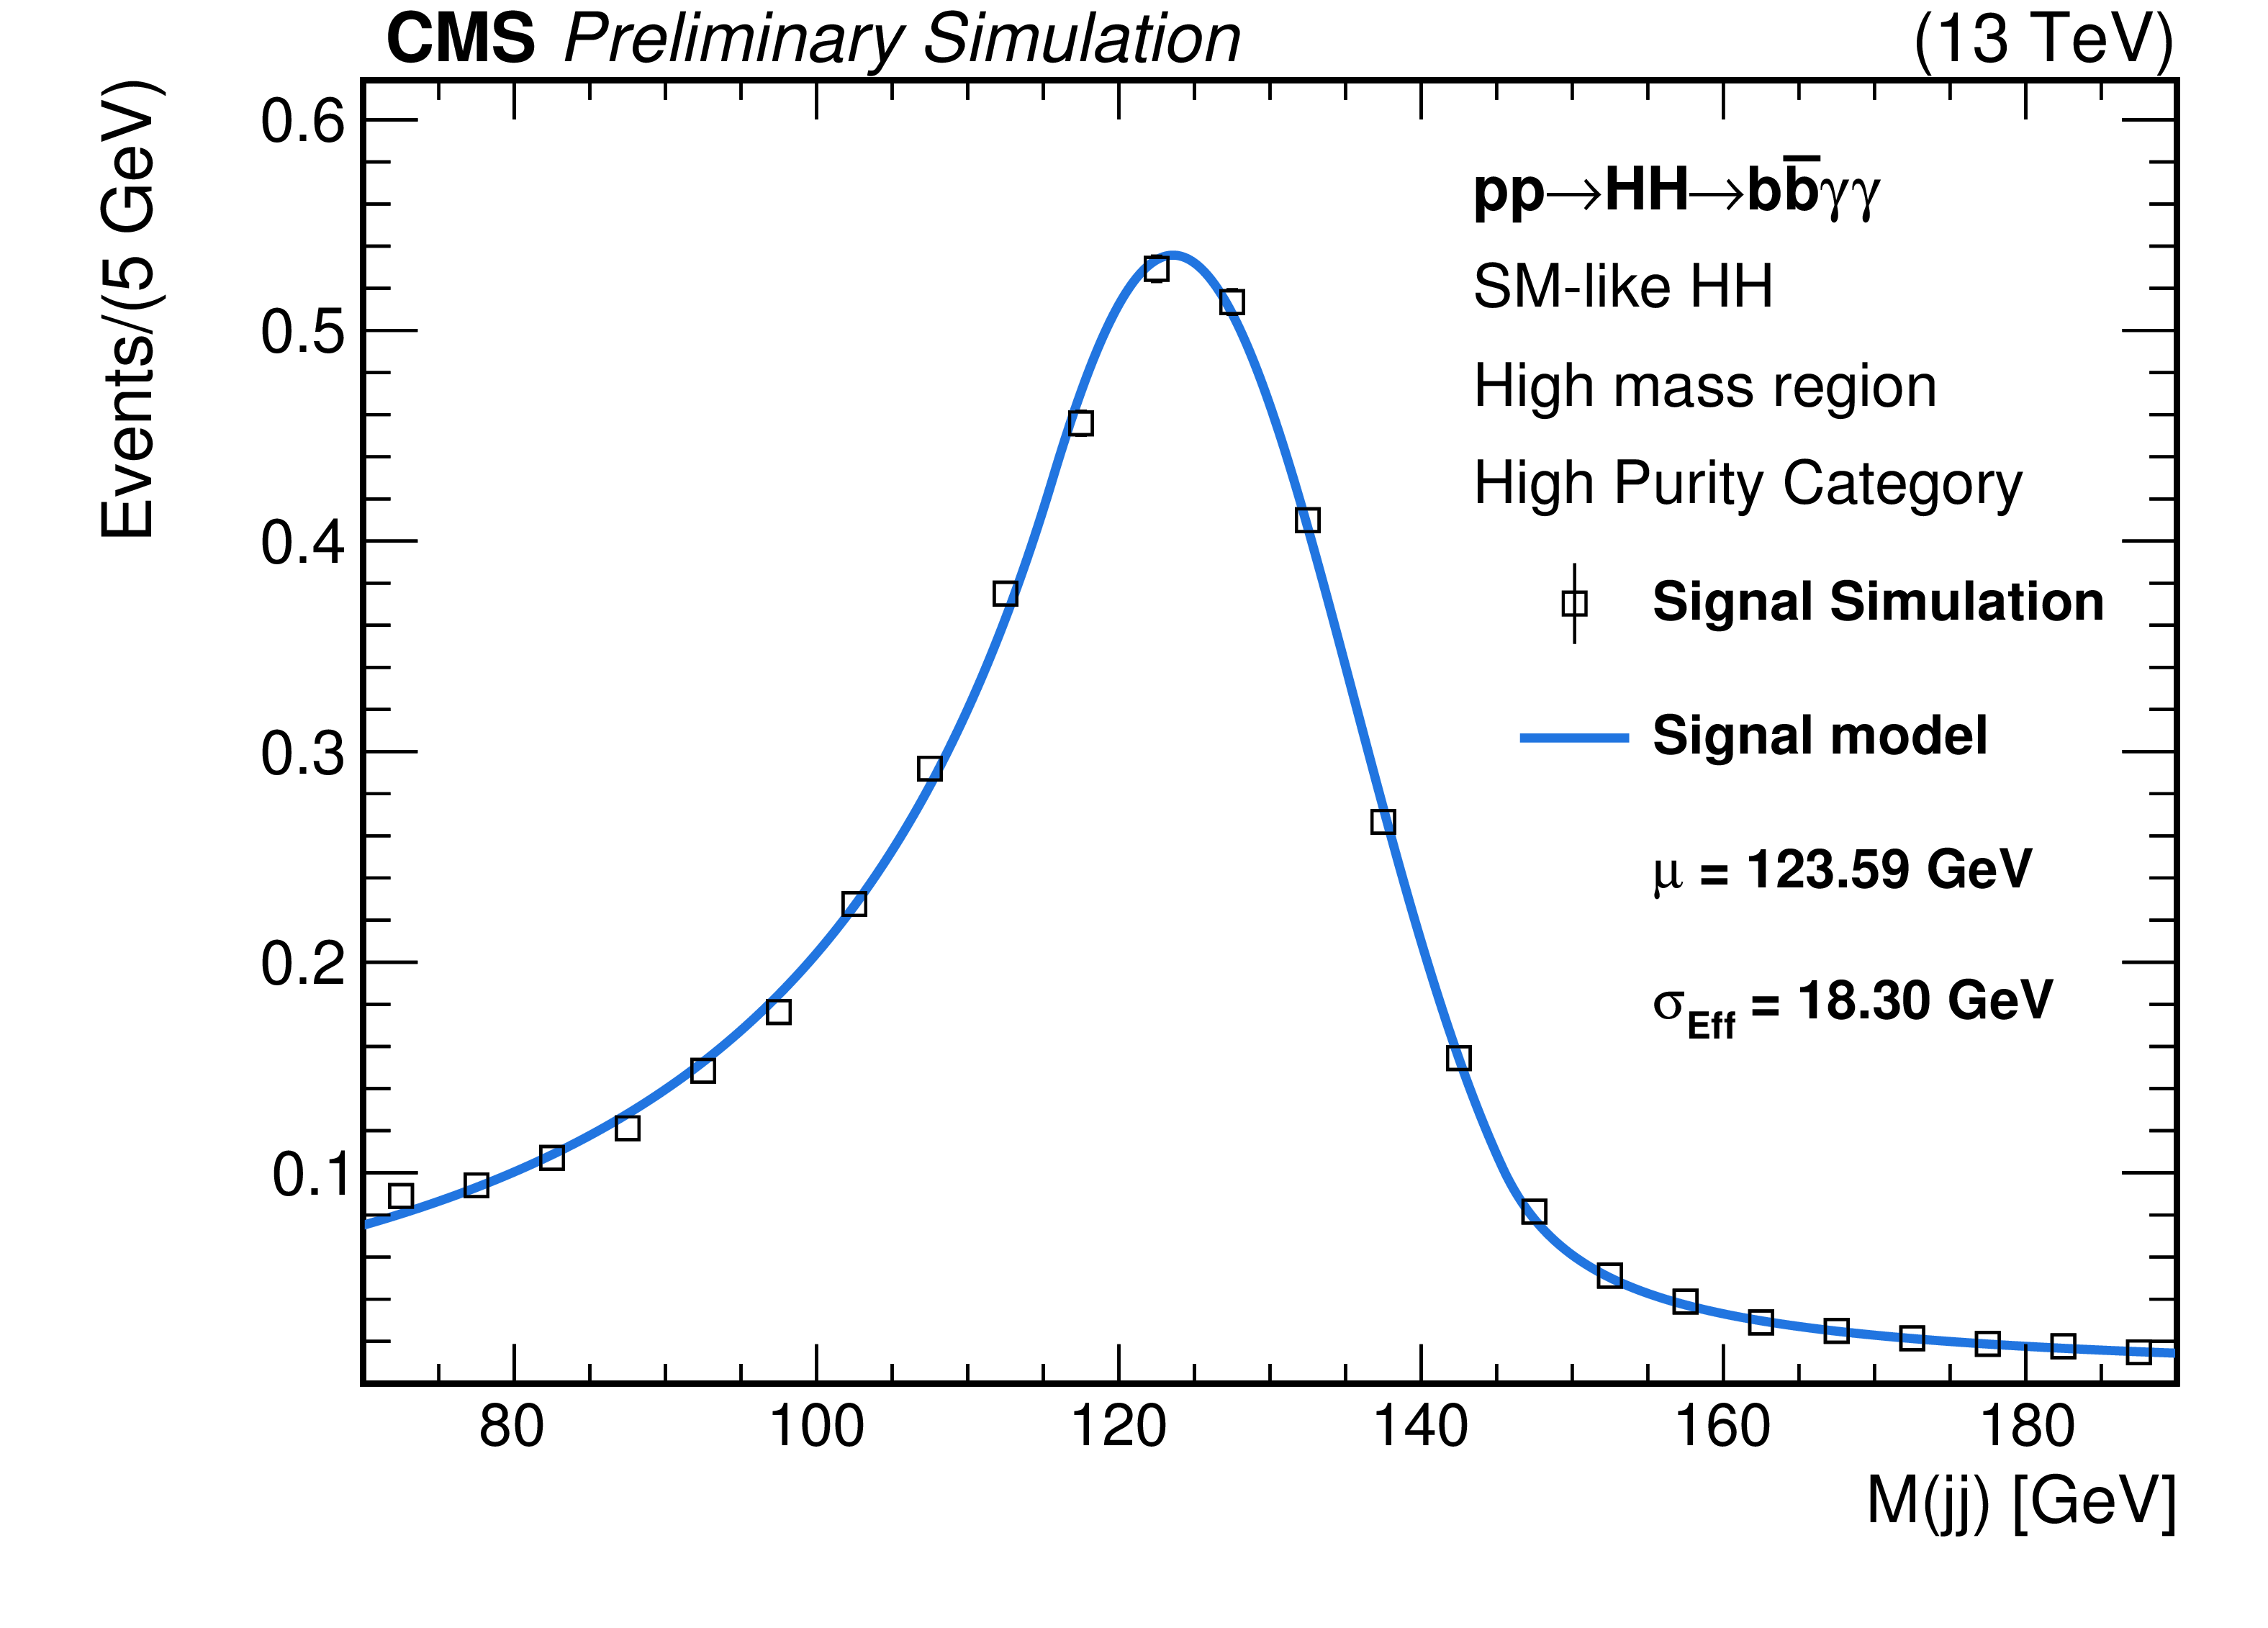
Figure 6:
Signal fits for the SM HH non-resonant sample after full analysis selection, in the high mass region. The plots on the left (right) show the distributions on the HPC (MPC). |

png pdf |
Figure 6-a:
Signal fit for the SM HH non-resonant sample after full analysis selection, in the high mass region. The plot shows the distribution on the HPC. |

png pdf |
Figure 6-b:
Signal fit for the SM HH non-resonant sample after full analysis selection, in the high mass region. The plot shows the distribution on the MPC. |
png pdf |
Figure 6-c:
Signal fits for the SM HH non-resonant sample after full analysis selection, in the high mass region. The plots on the left (right) show the distributions on the HPC (MPC). |

png pdf |
Figure 6-d:
Signal fits for the SM HH non-resonant sample after full analysis selection, in the high mass region. The plots on the left (right) show the distributions on the HPC (MPC). |

png pdf |
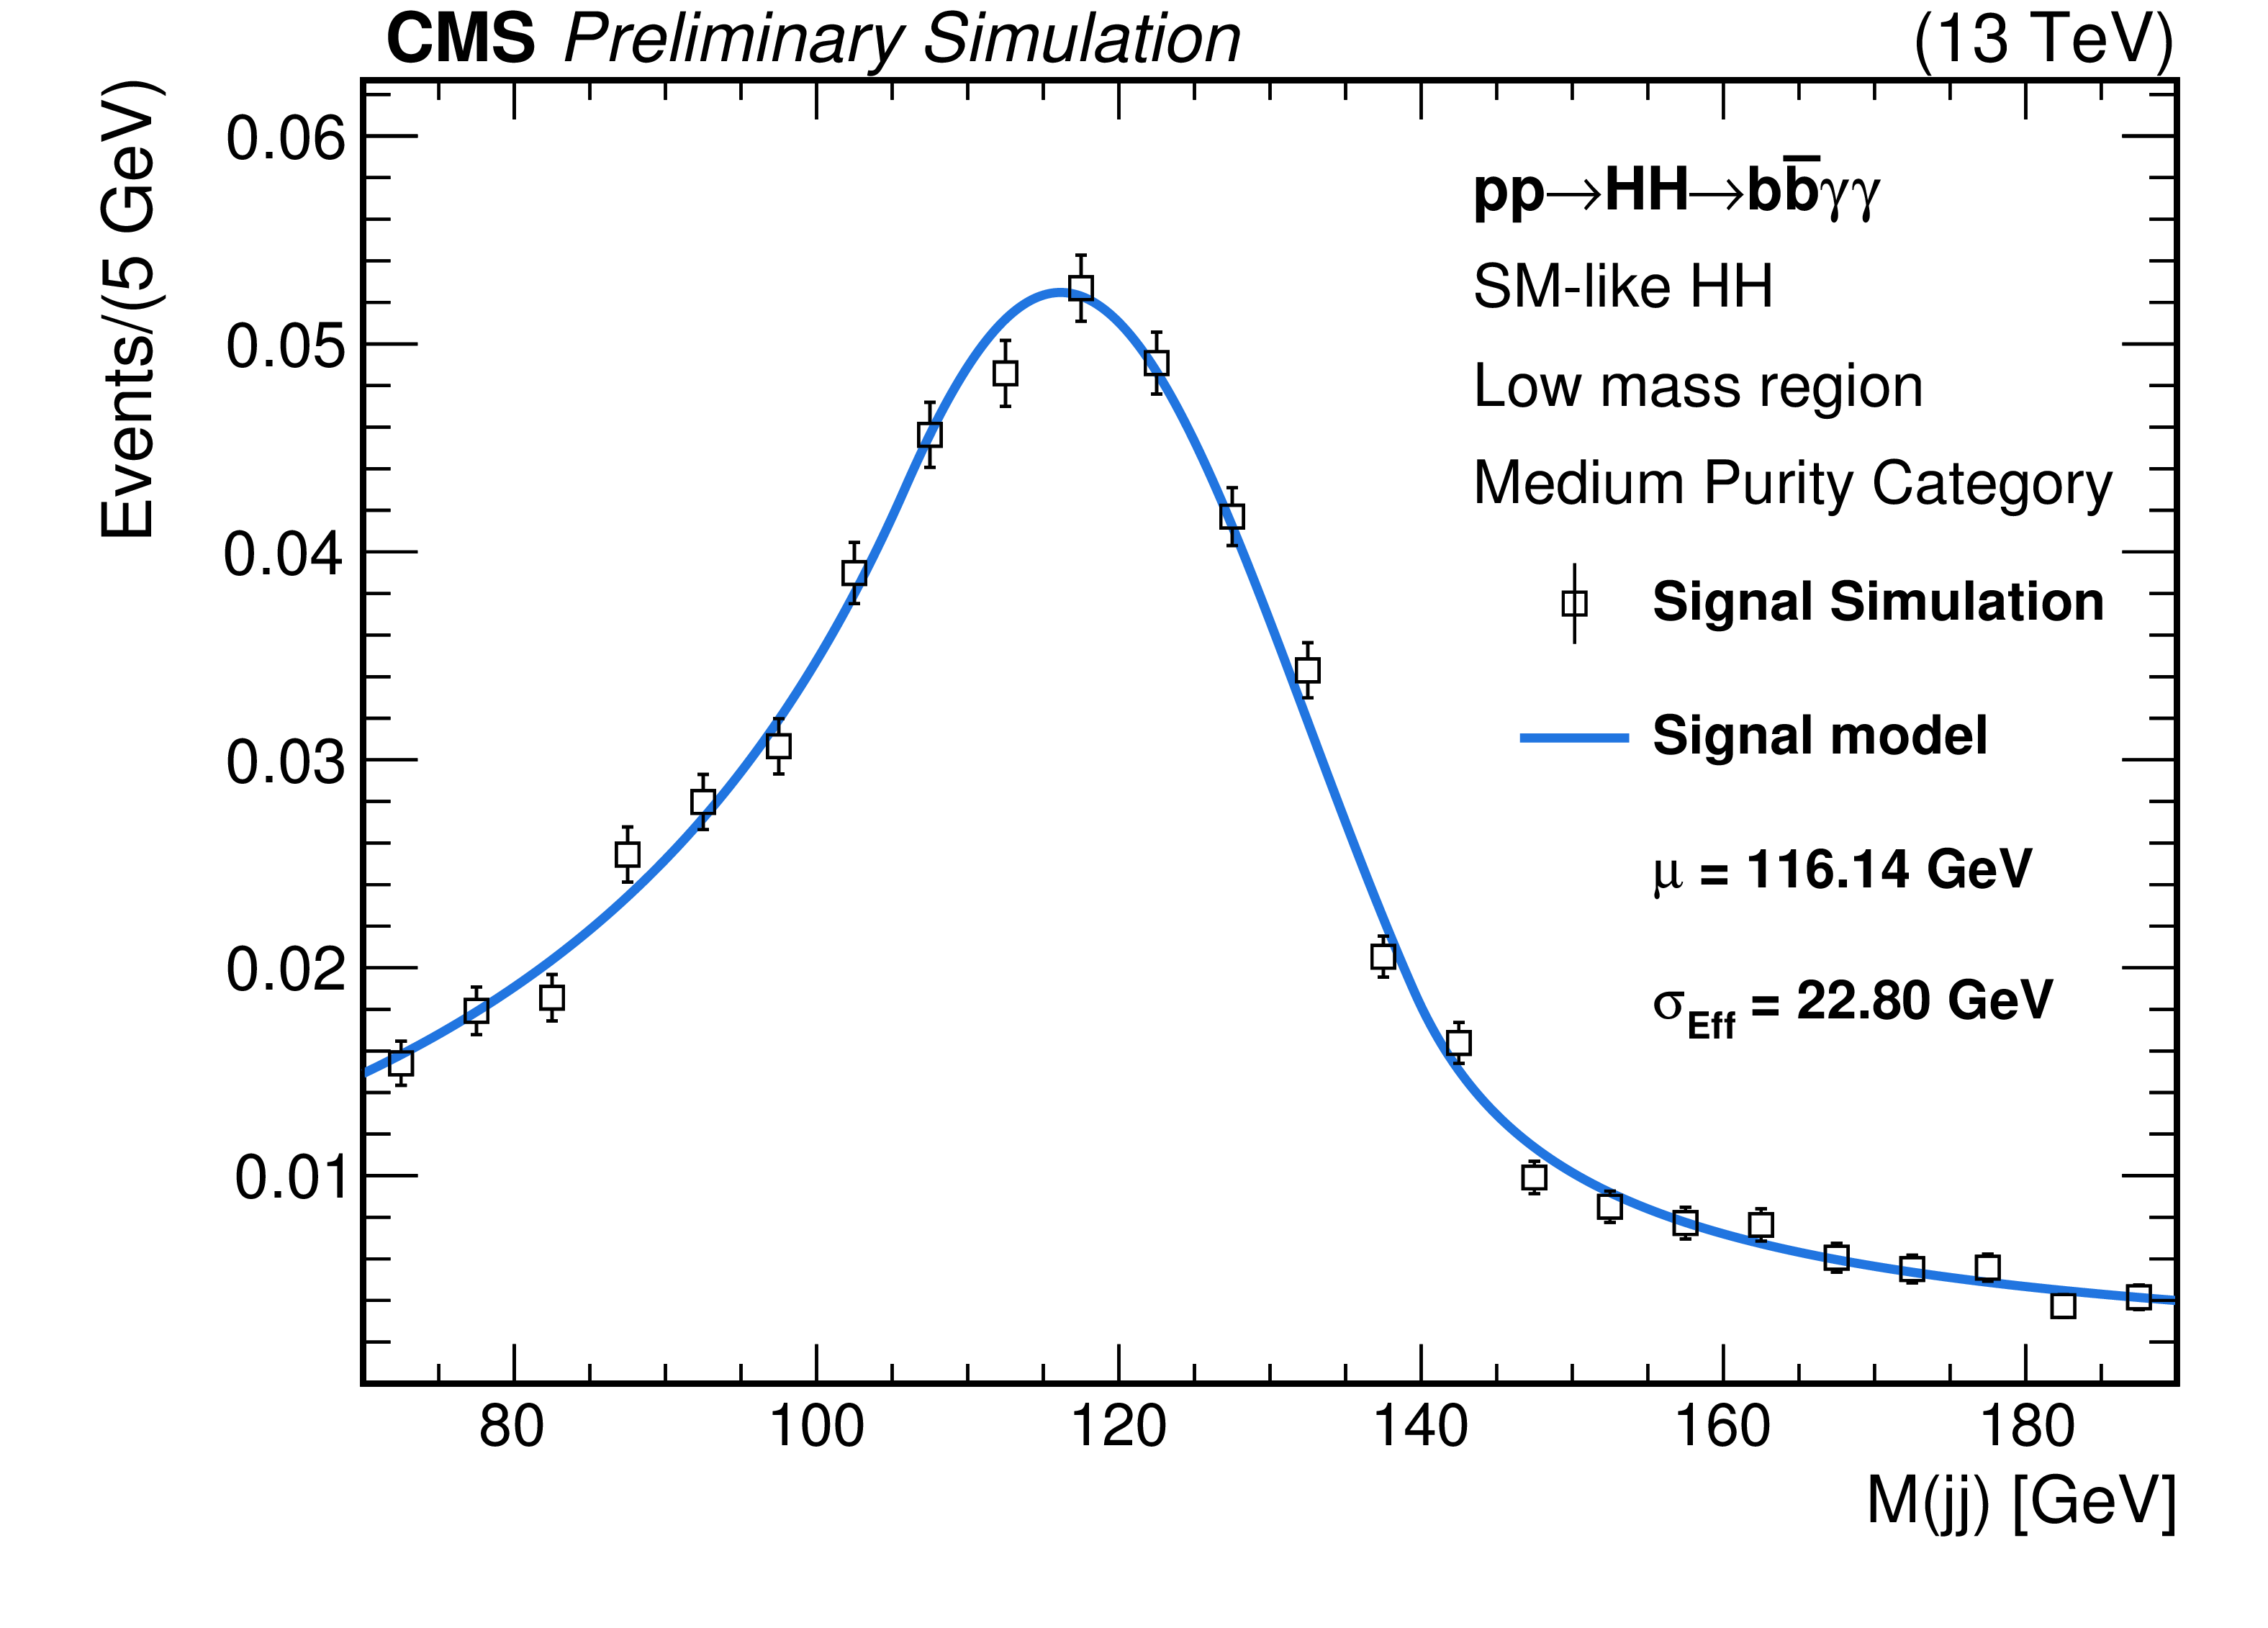
Figure 7:
Signal fits for the SM HH non-resonant sample after full analysis selection, in the low mass region. The plots on the left (right) show the distributions on the HPC (MPC). |

png pdf |
Figure 7-a:
Signal fit for the SM HH non-resonant sample after full analysis selection, in the low mass region. The plot shows the distribution on the HPC. |

png pdf |
Figure 7-b:
Signal fit for the SM HH non-resonant sample after full analysis selection, in the low mass region. The plot shows the distribution on the MPC. |

png pdf |
Figure 7-c:
Signal fits for the SM HH non-resonant sample after full analysis selection, in the low mass region. The plots on the left (right) show the distributions on the HPC (MPC). |
png pdf |
Figure 7-d:
Signal fits for the SM HH non-resonant sample after full analysis selection, in the low mass region. The plots on the left (right) show the distributions on the HPC (MPC). |

png pdf |
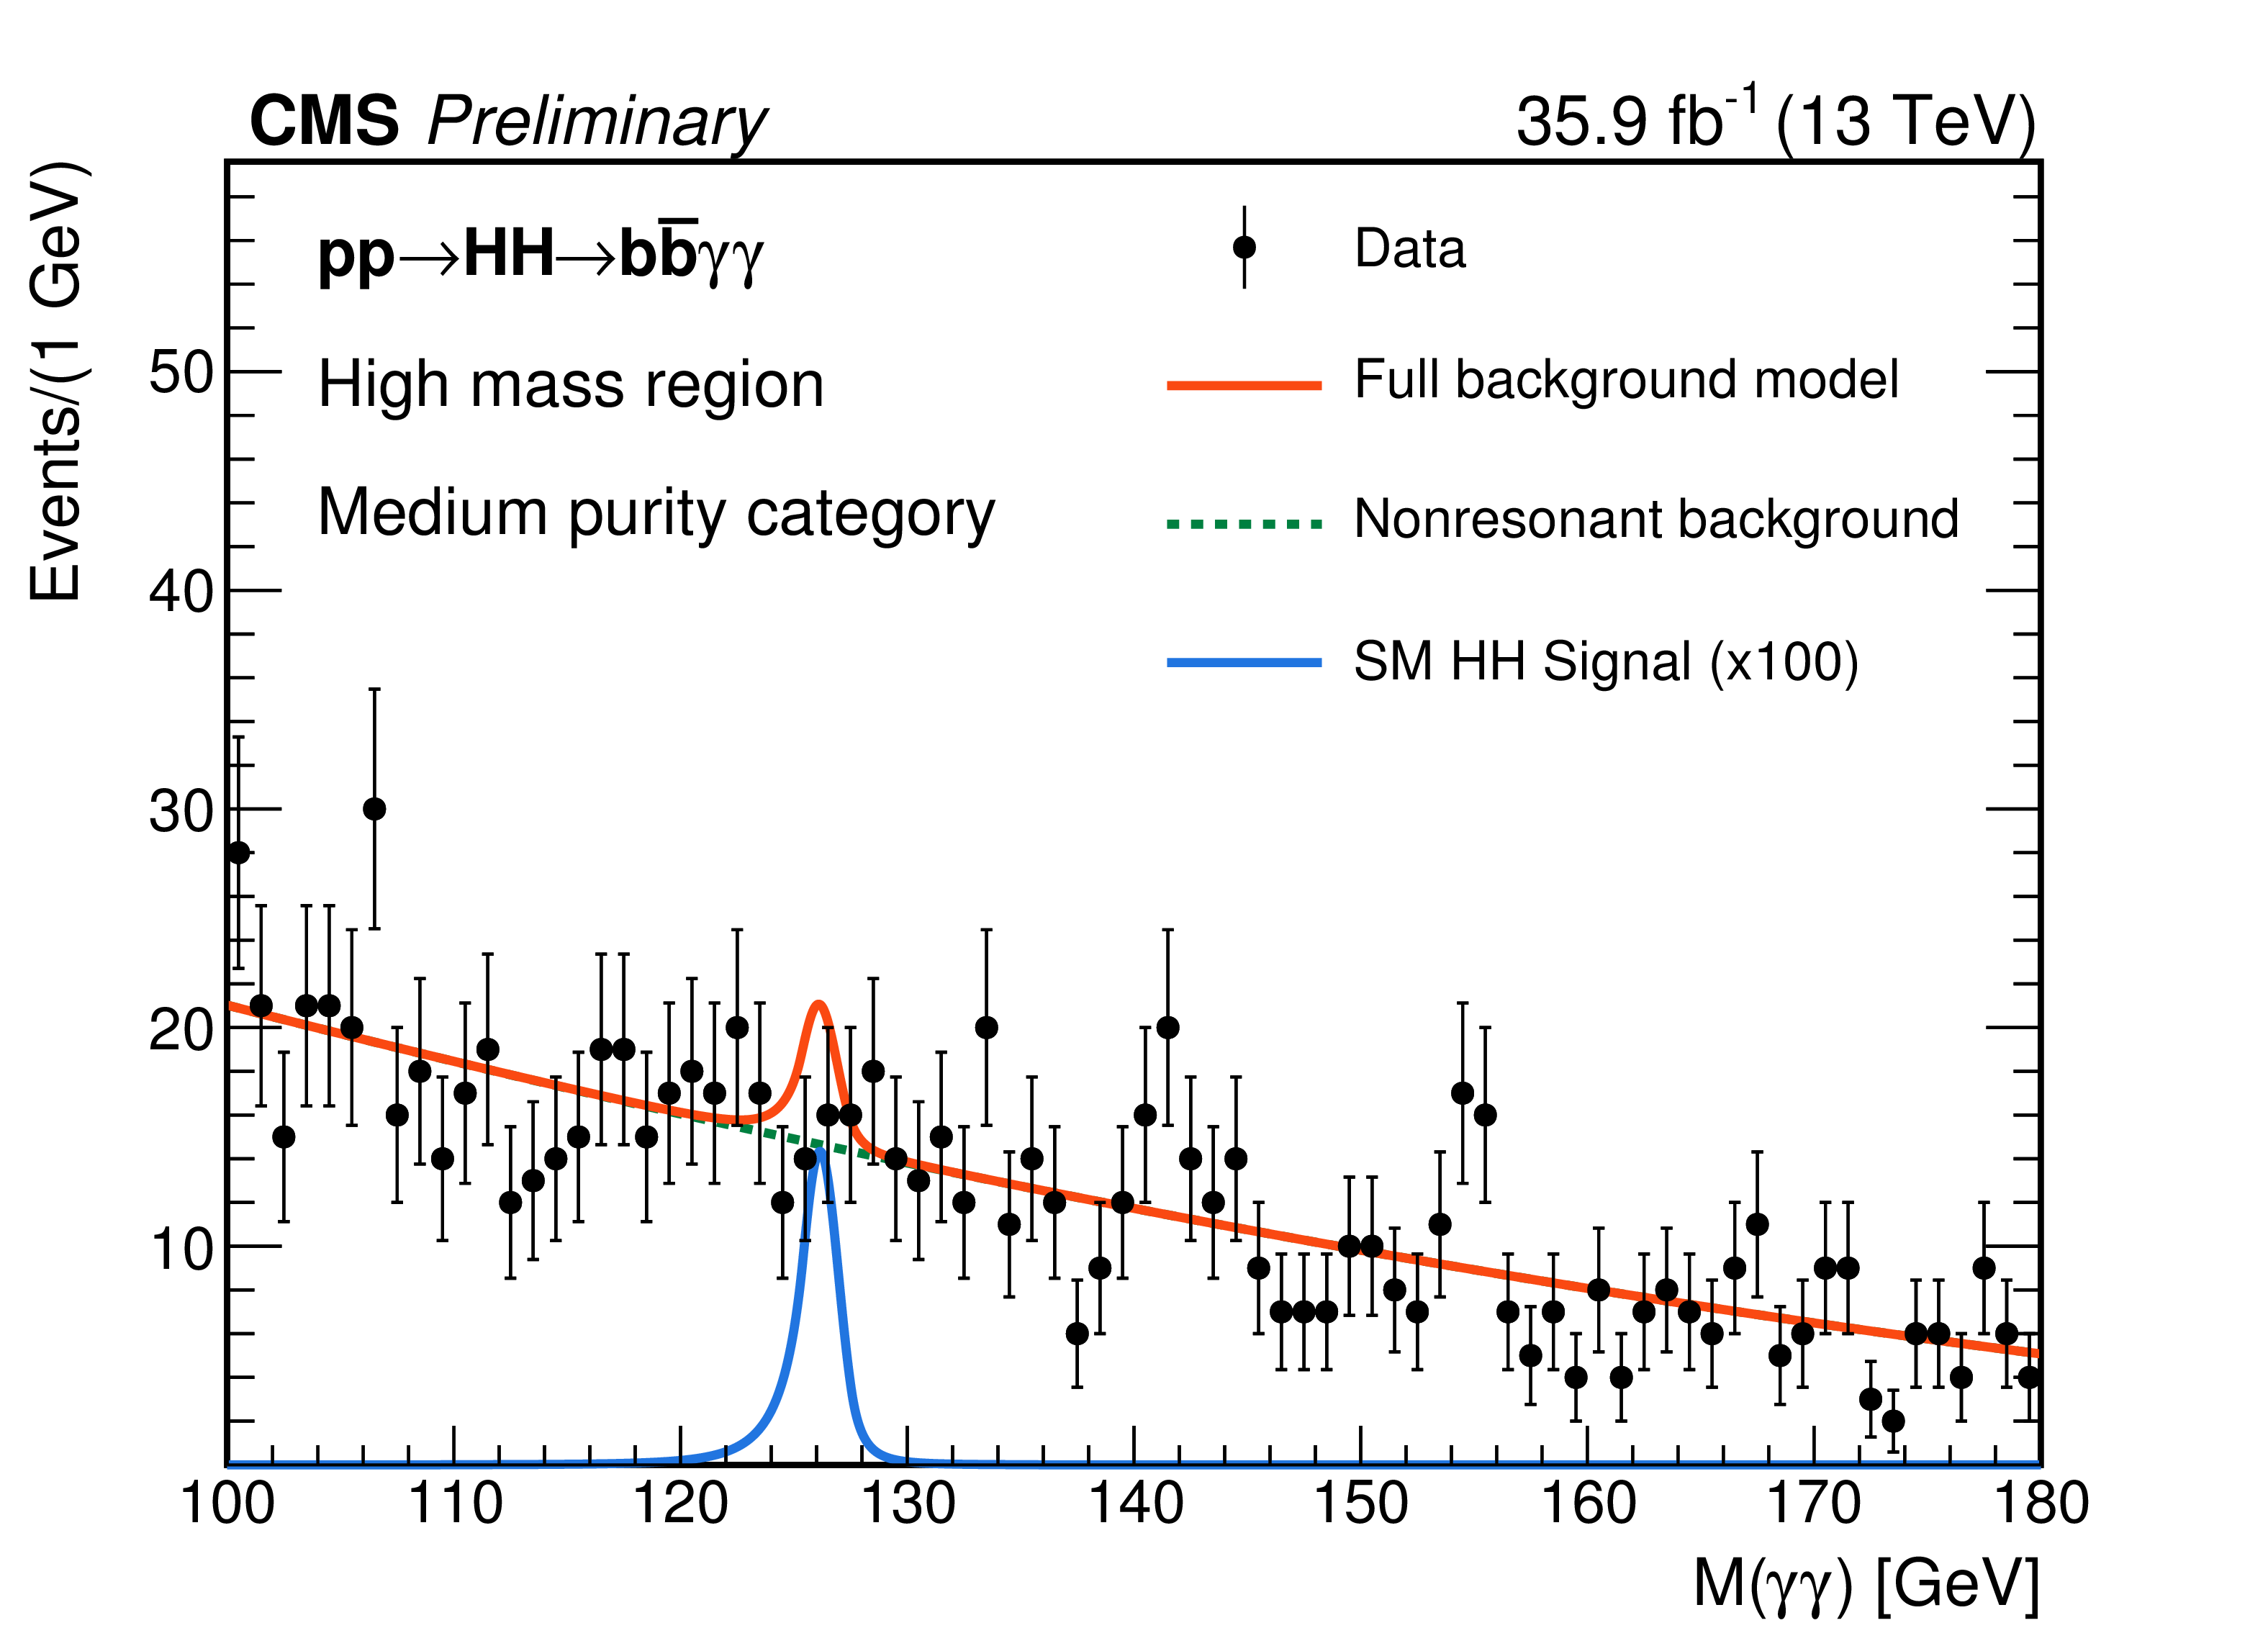
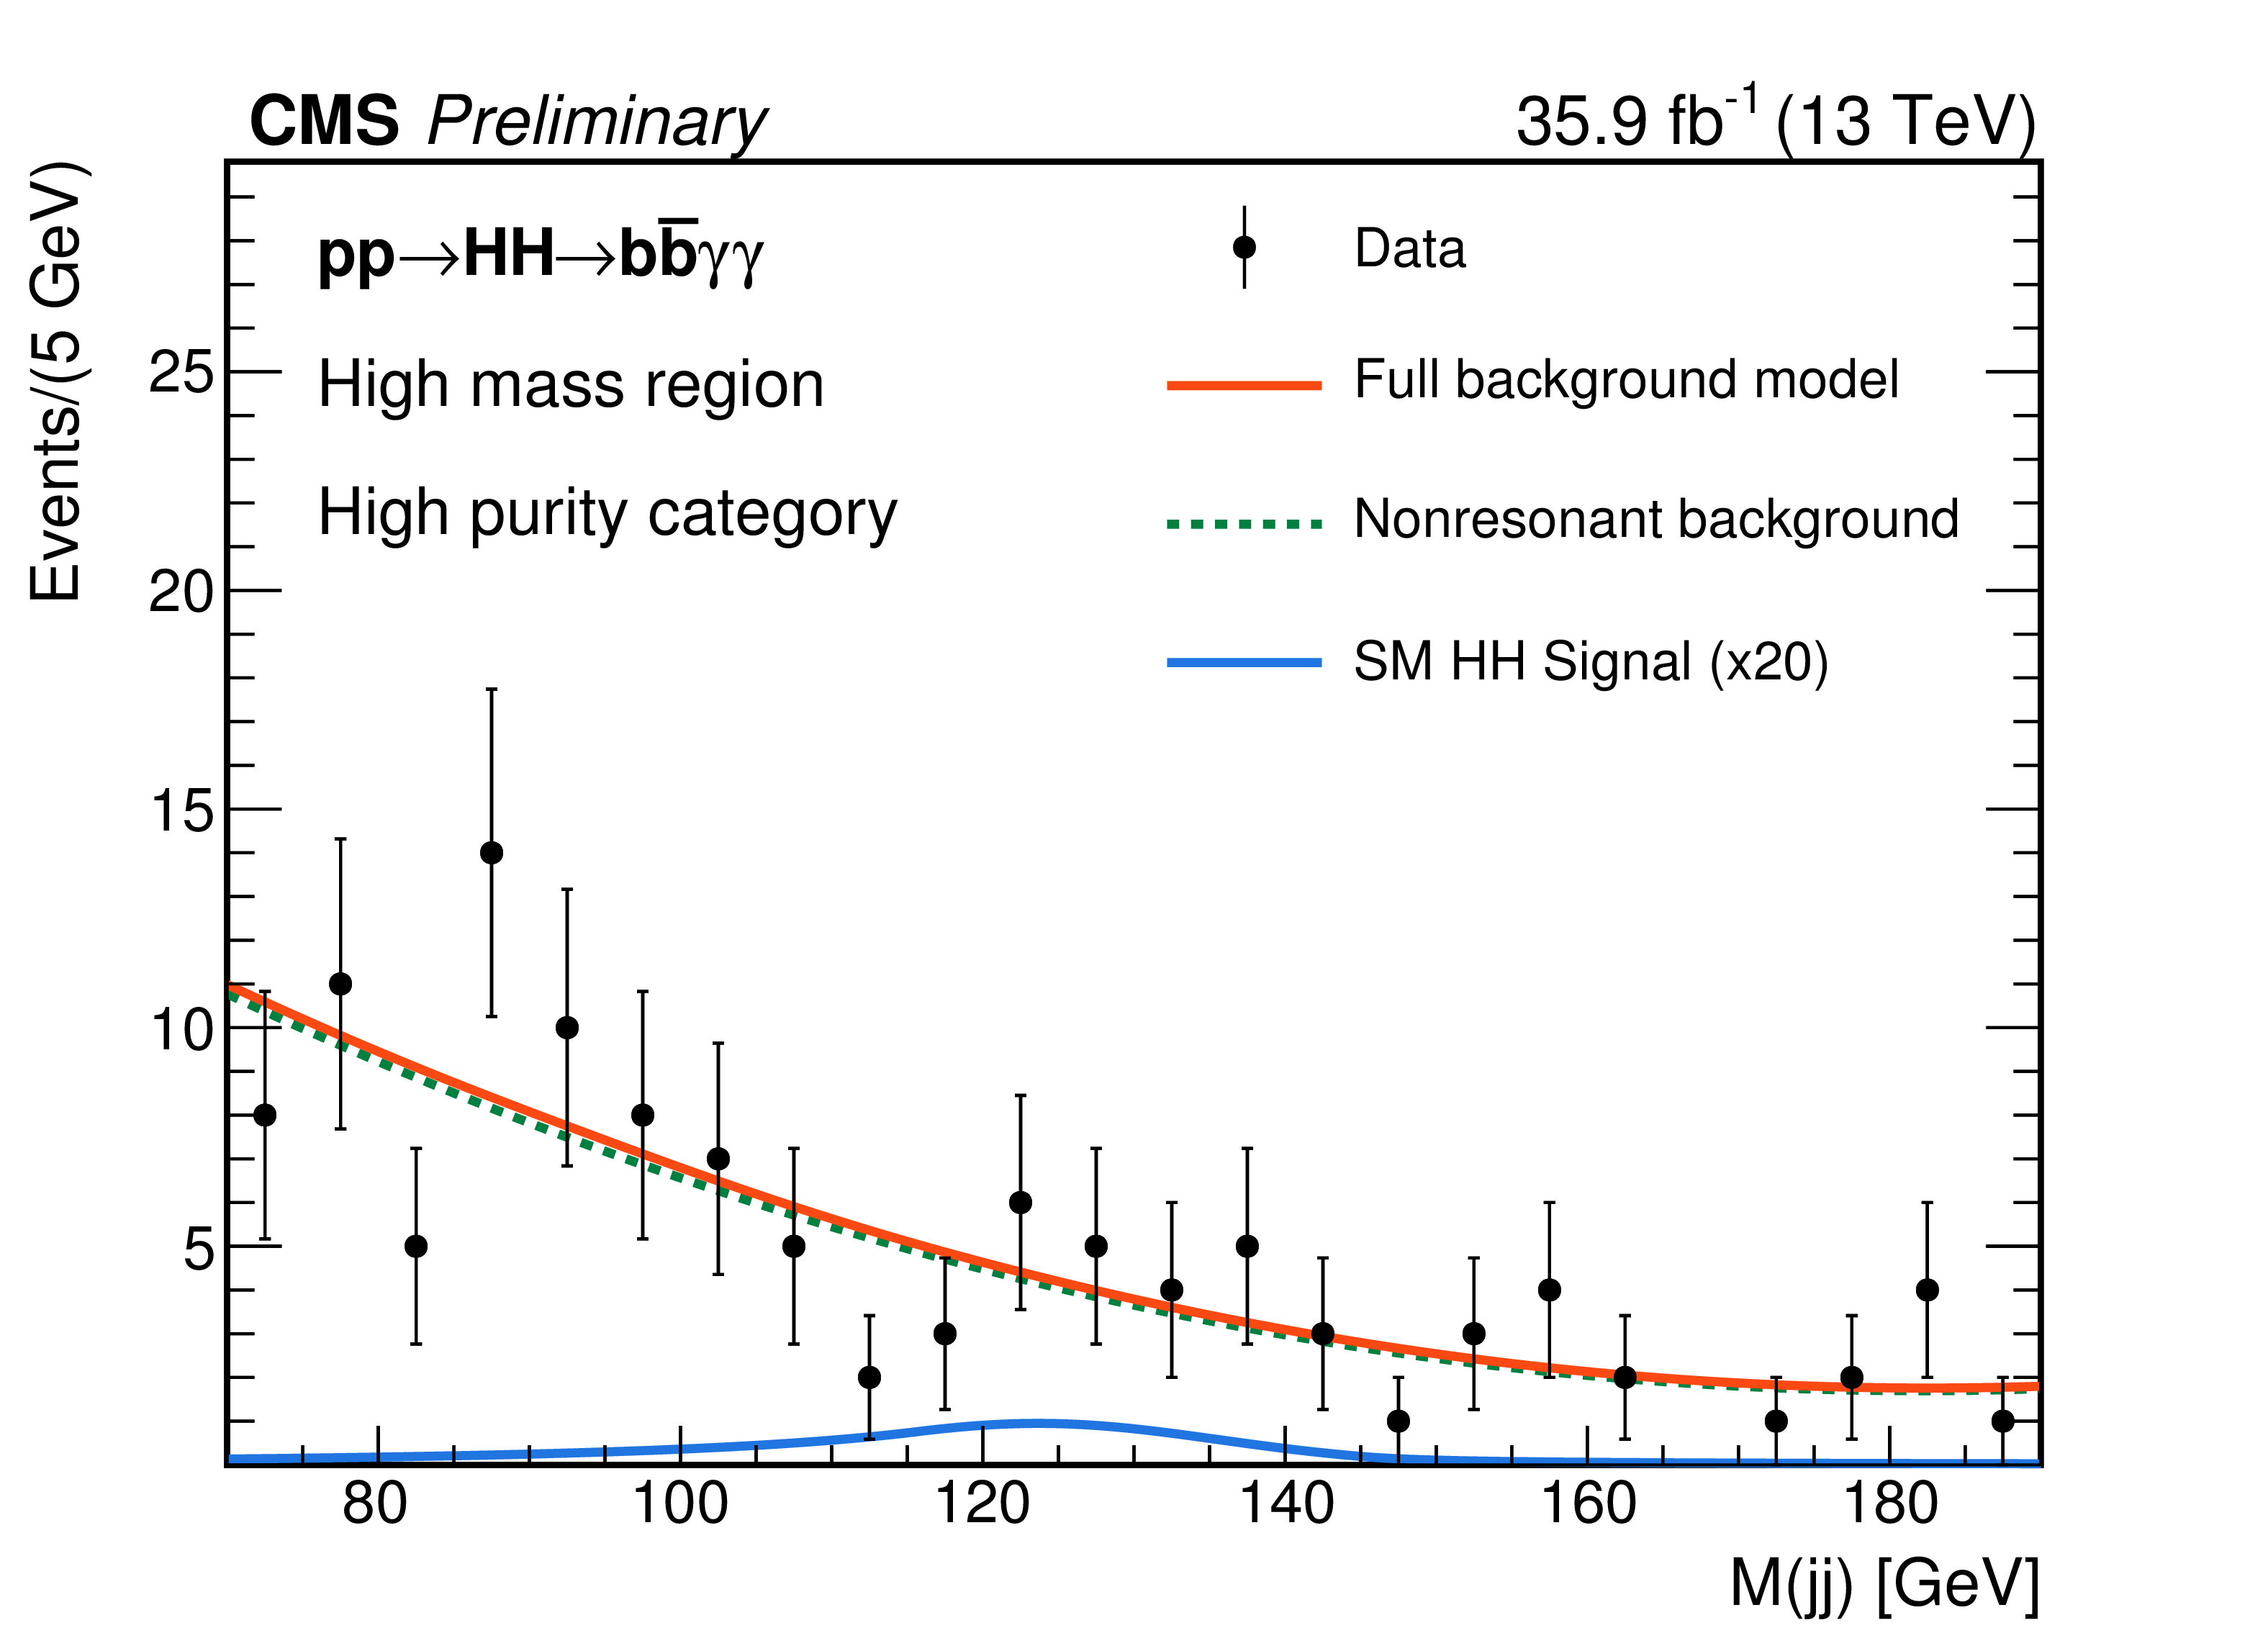
Figure 8:
Background fits for the SM HH nonresonant analysis selection, in the high mass region. The plots on the left (right) show the distributions on the HPC (MPC). |

png pdf |
Figure 8-a:
Background fit for the SM HH nonresonant analysis selection, in the high mass region (HPC). |
png pdf |
Figure 8-b:
Background fit for the SM HH nonresonant analysis selection, in the high mass region (MPC). |
png pdf |
Figure 8-c:
Background fit for the SM HH nonresonant analysis selection, in the high mass region (HPC). |

png pdf |
Figure 8-d:
Background fit for the SM HH nonresonant analysis selection, in the high mass region (MPC). |
png pdf |
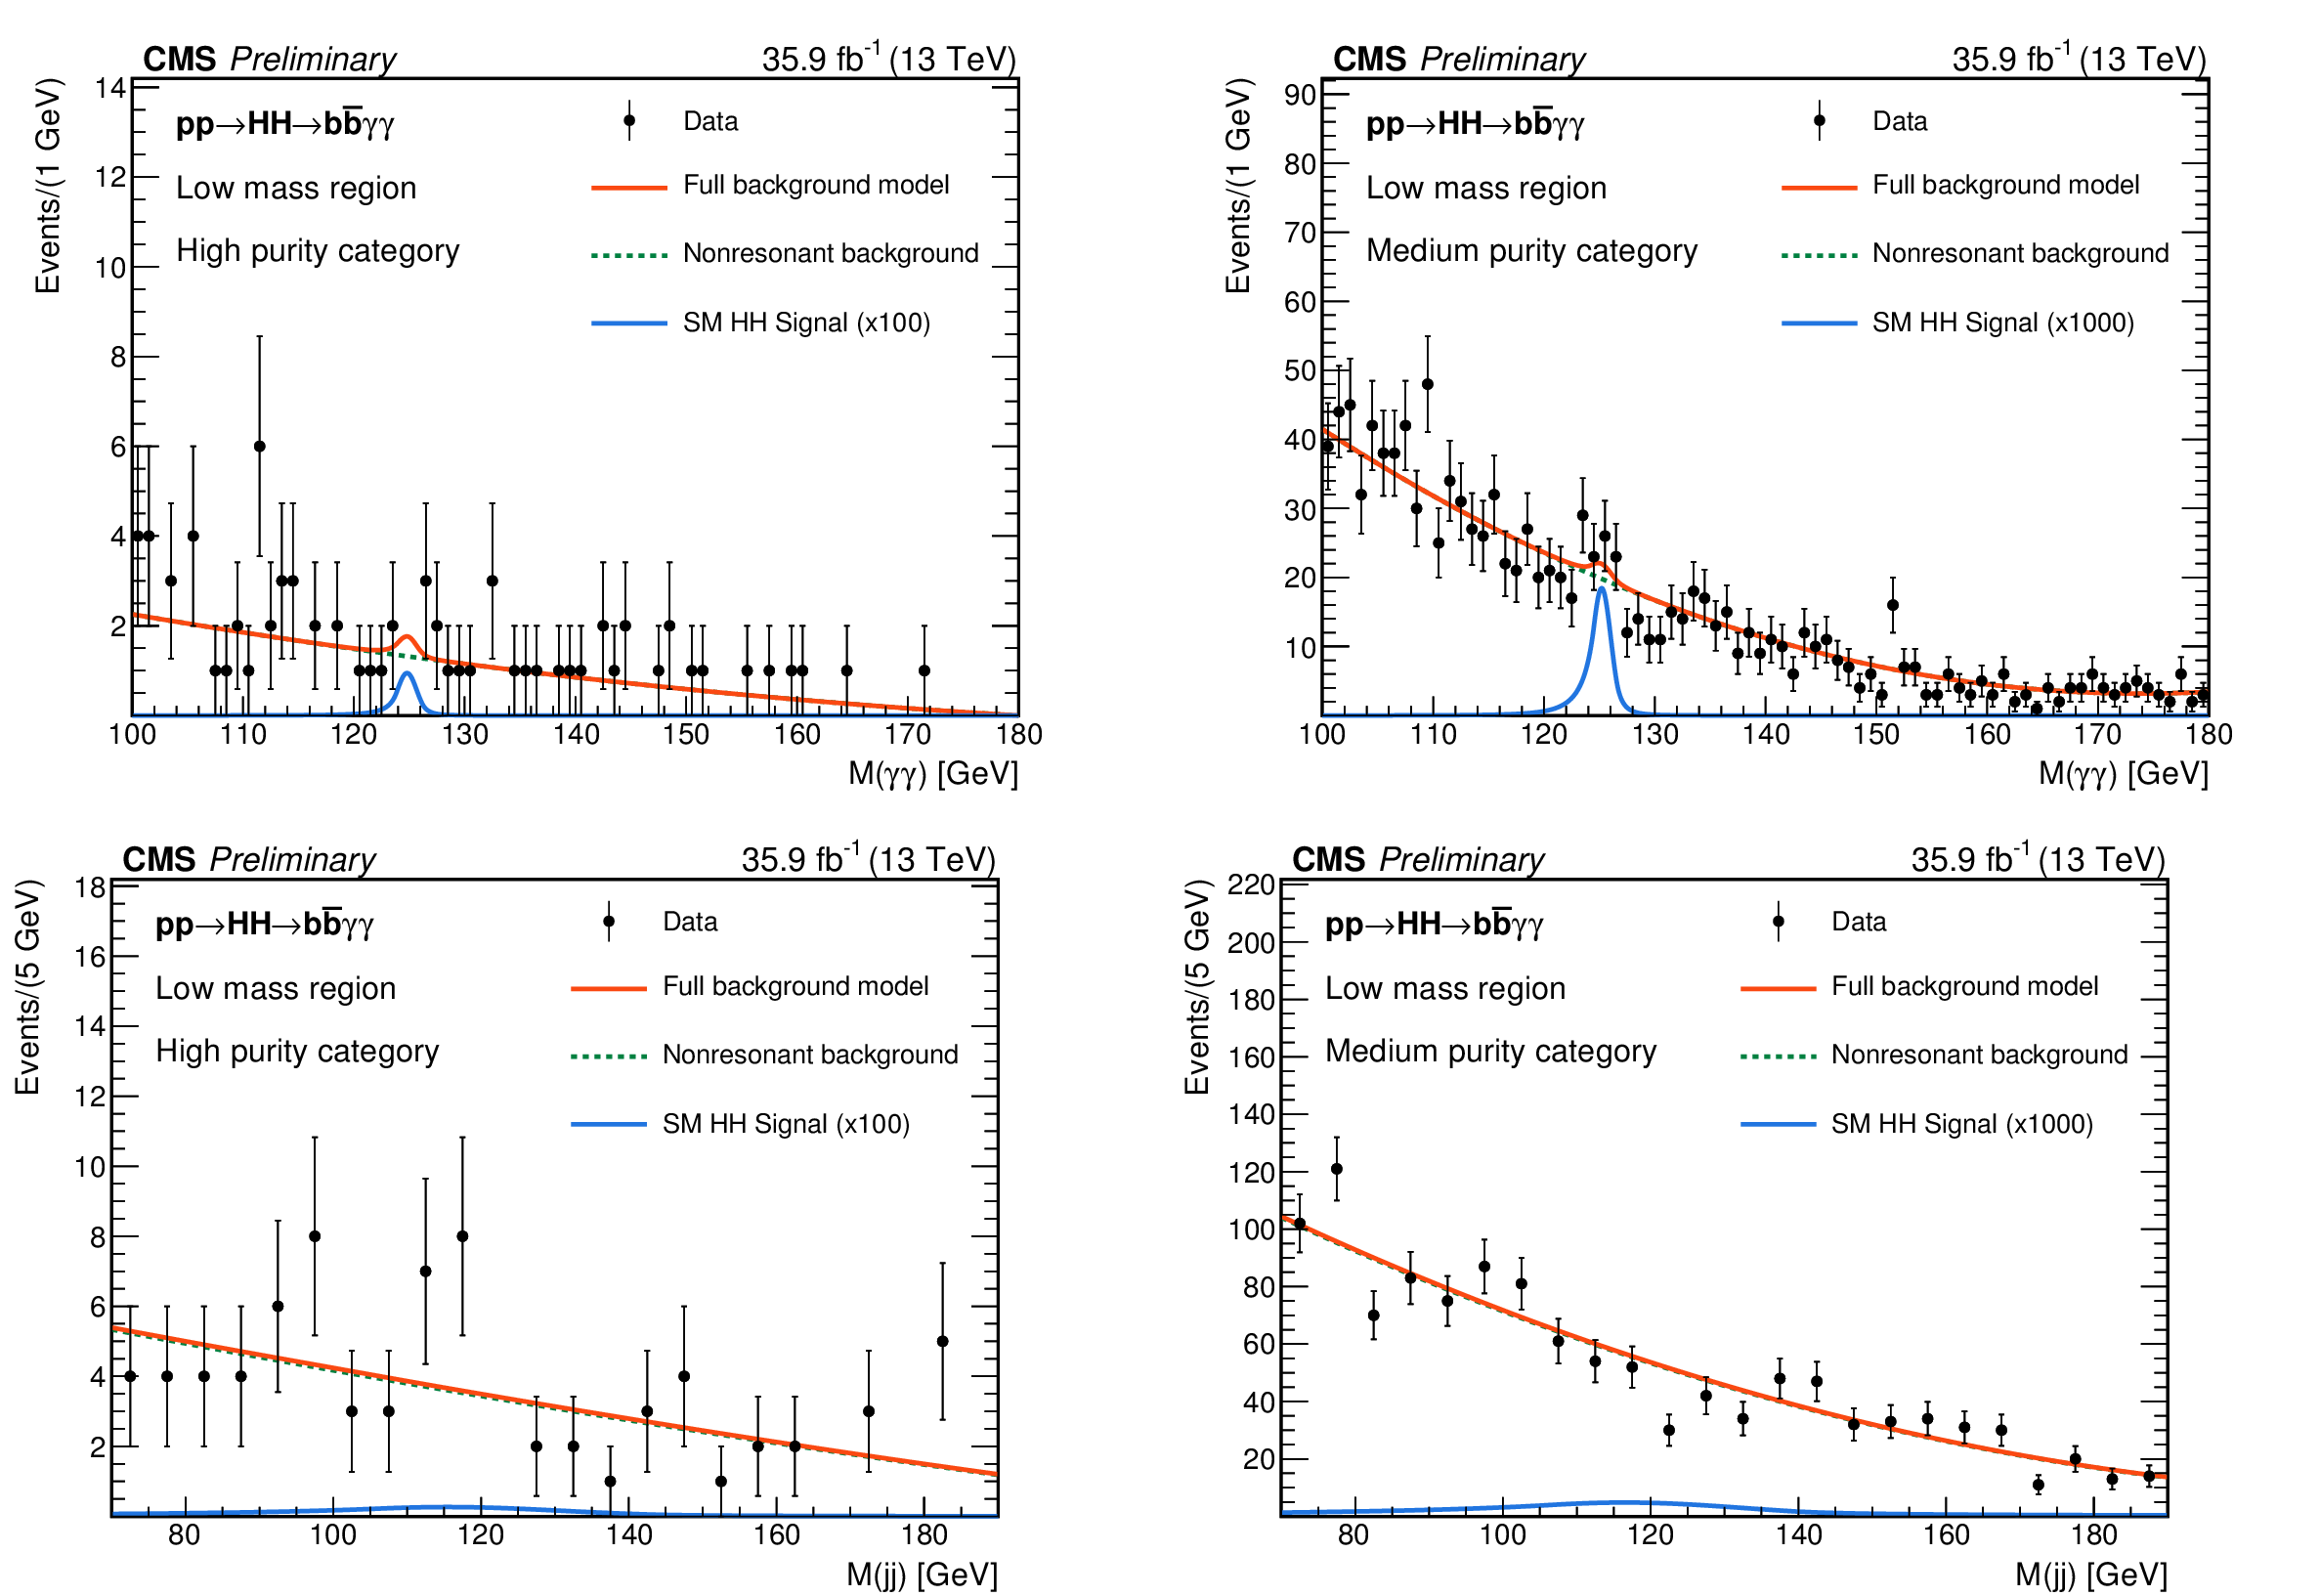
Figure 9:
Background fits for the SM HH nonresonant analysis selection, in the low mass region. The plots on the left (right) show the distributions on the HPC (MPC). |
png pdf |
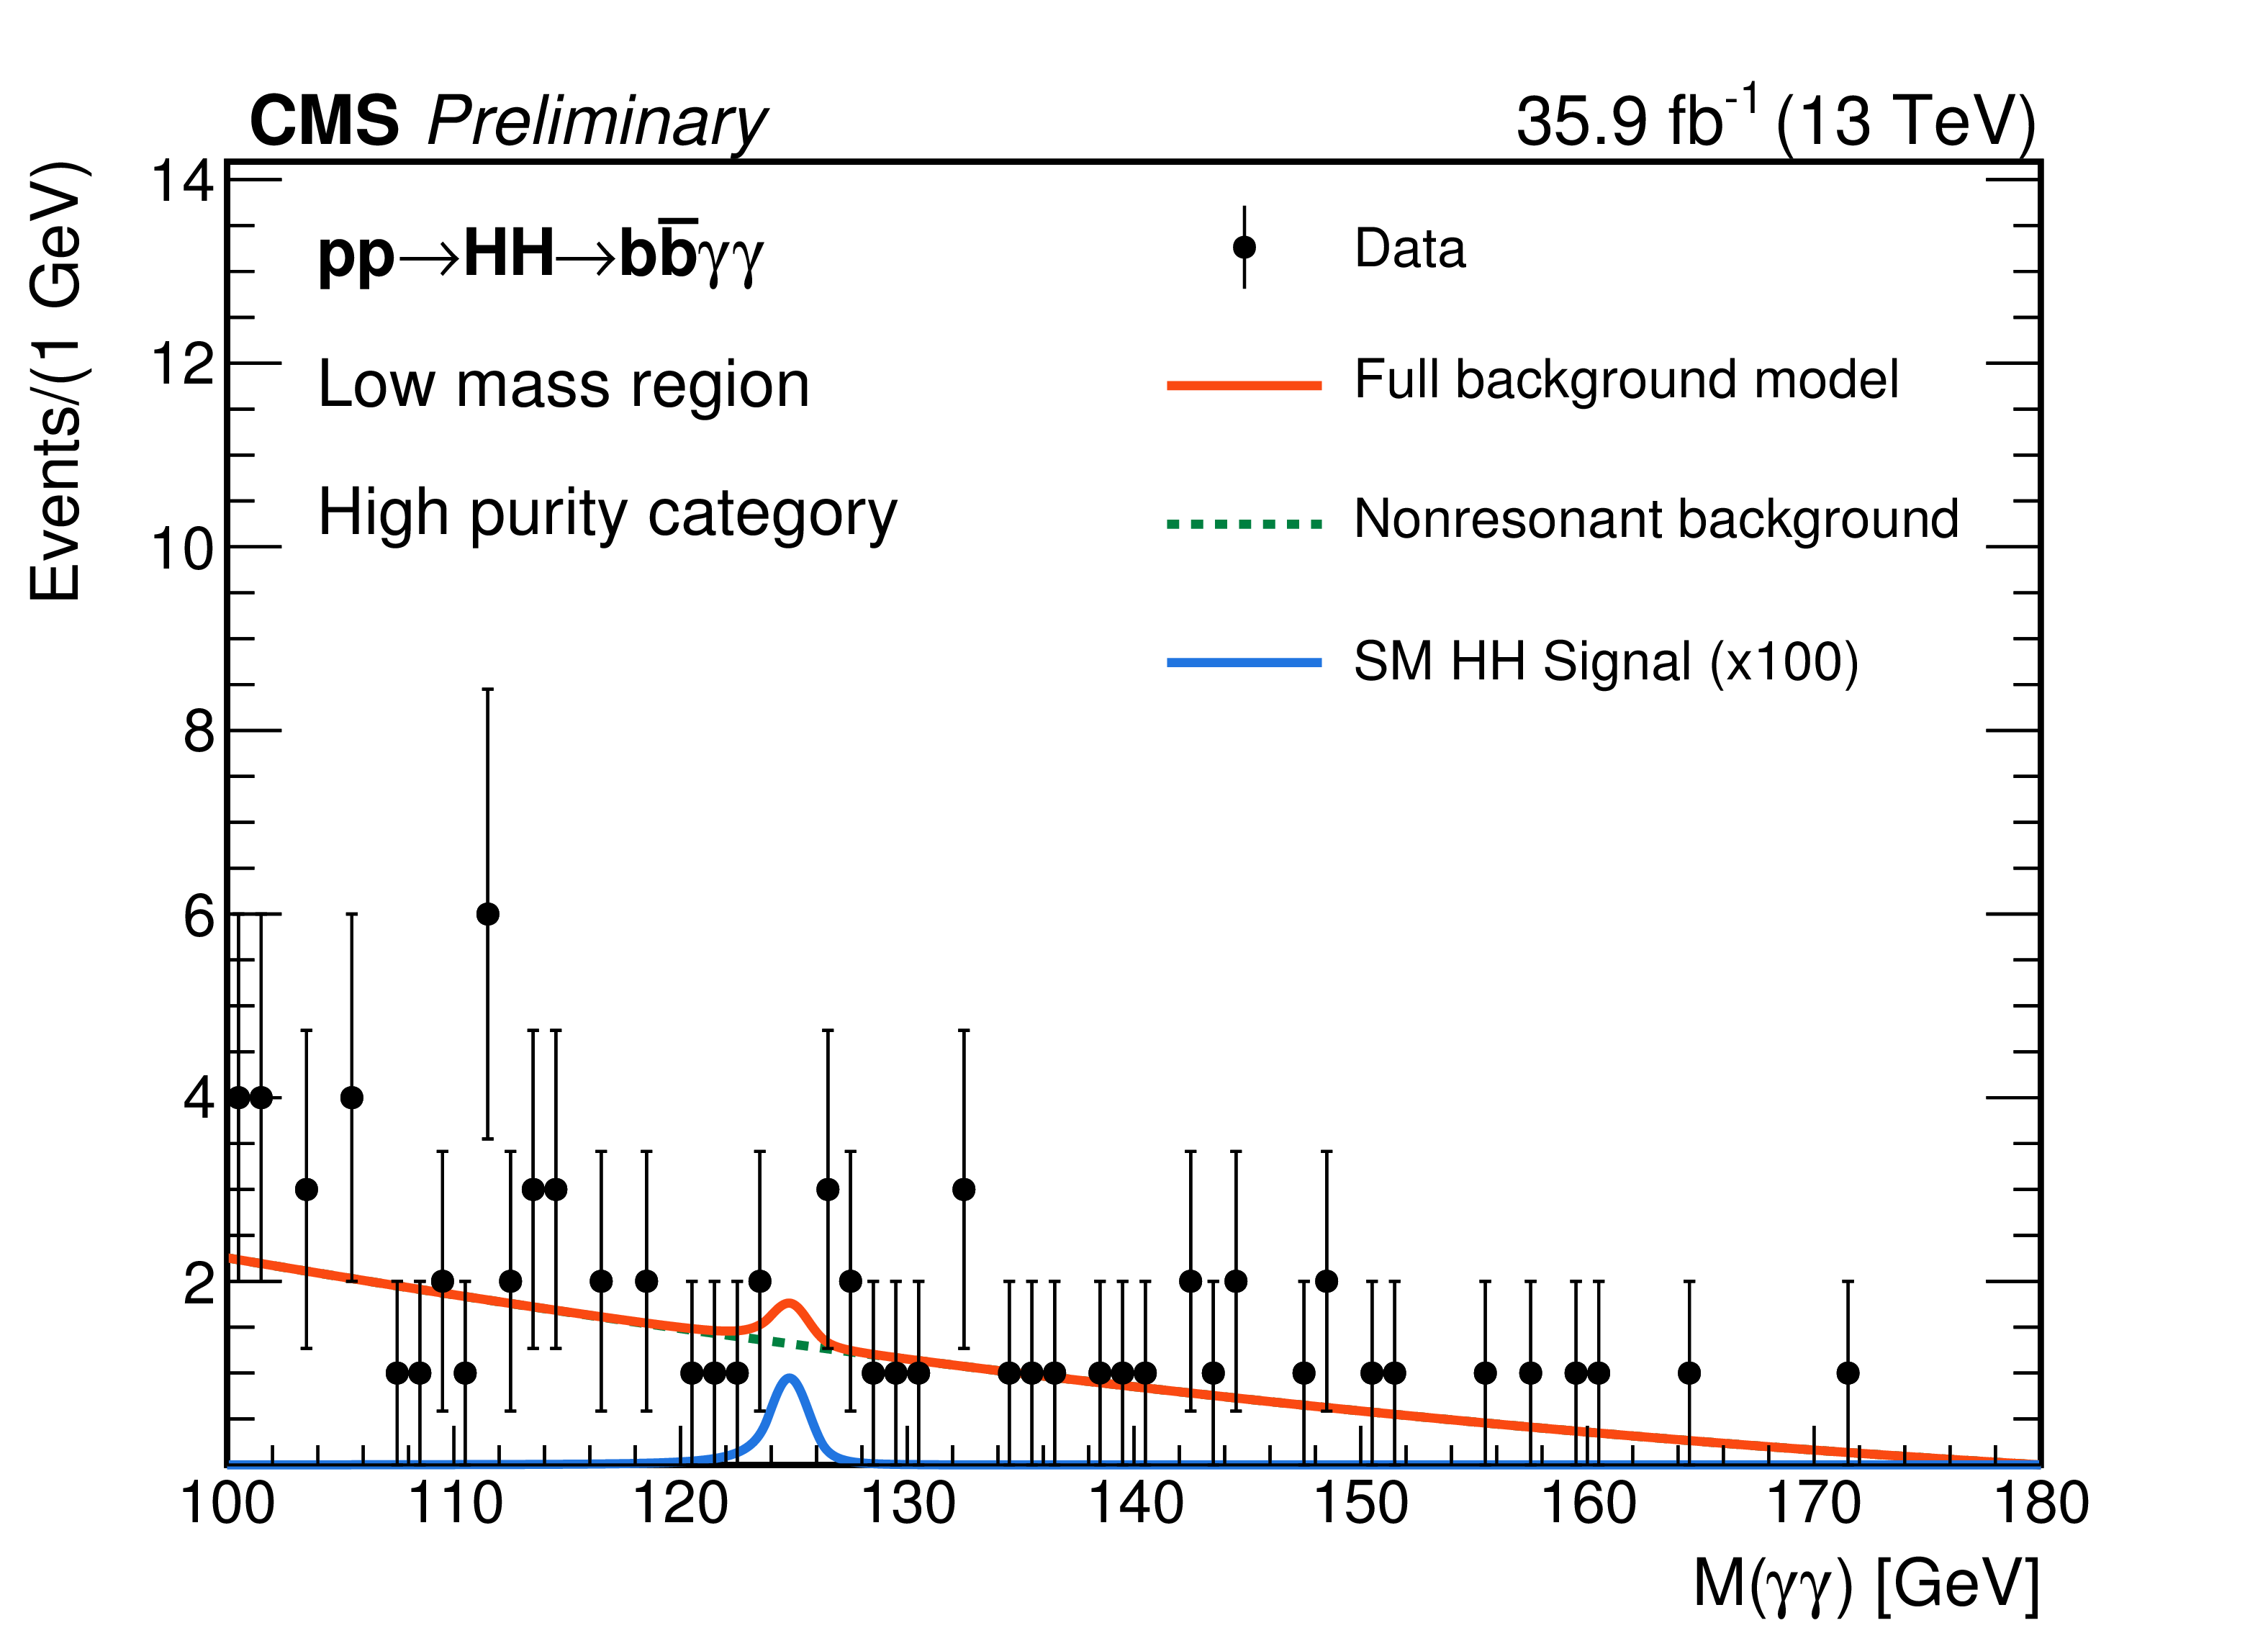
Figure 9-a:
Background fits for the SM HH nonresonant analysis selection, in the low mass region (HPC). |

png pdf |
Figure 9-b:
Background fits for the SM HH nonresonant analysis selection, in the low mass region (MPC). |

png pdf |
Figure 9-c:
Background fits for the SM HH nonresonant analysis selection, in the low mass region (HPC). |

png pdf |
Figure 9-d:
Background fits for the SM HH nonresonant analysis selection, in the low mass region (MPC). |

png pdf |
Figure 10:
Background fits for the resonant analysis selection, assuming a resonance with $m_{X} = $ 320 GeV. The plots on the left (right) show the distributions on the HPC (MPC). |

png pdf |
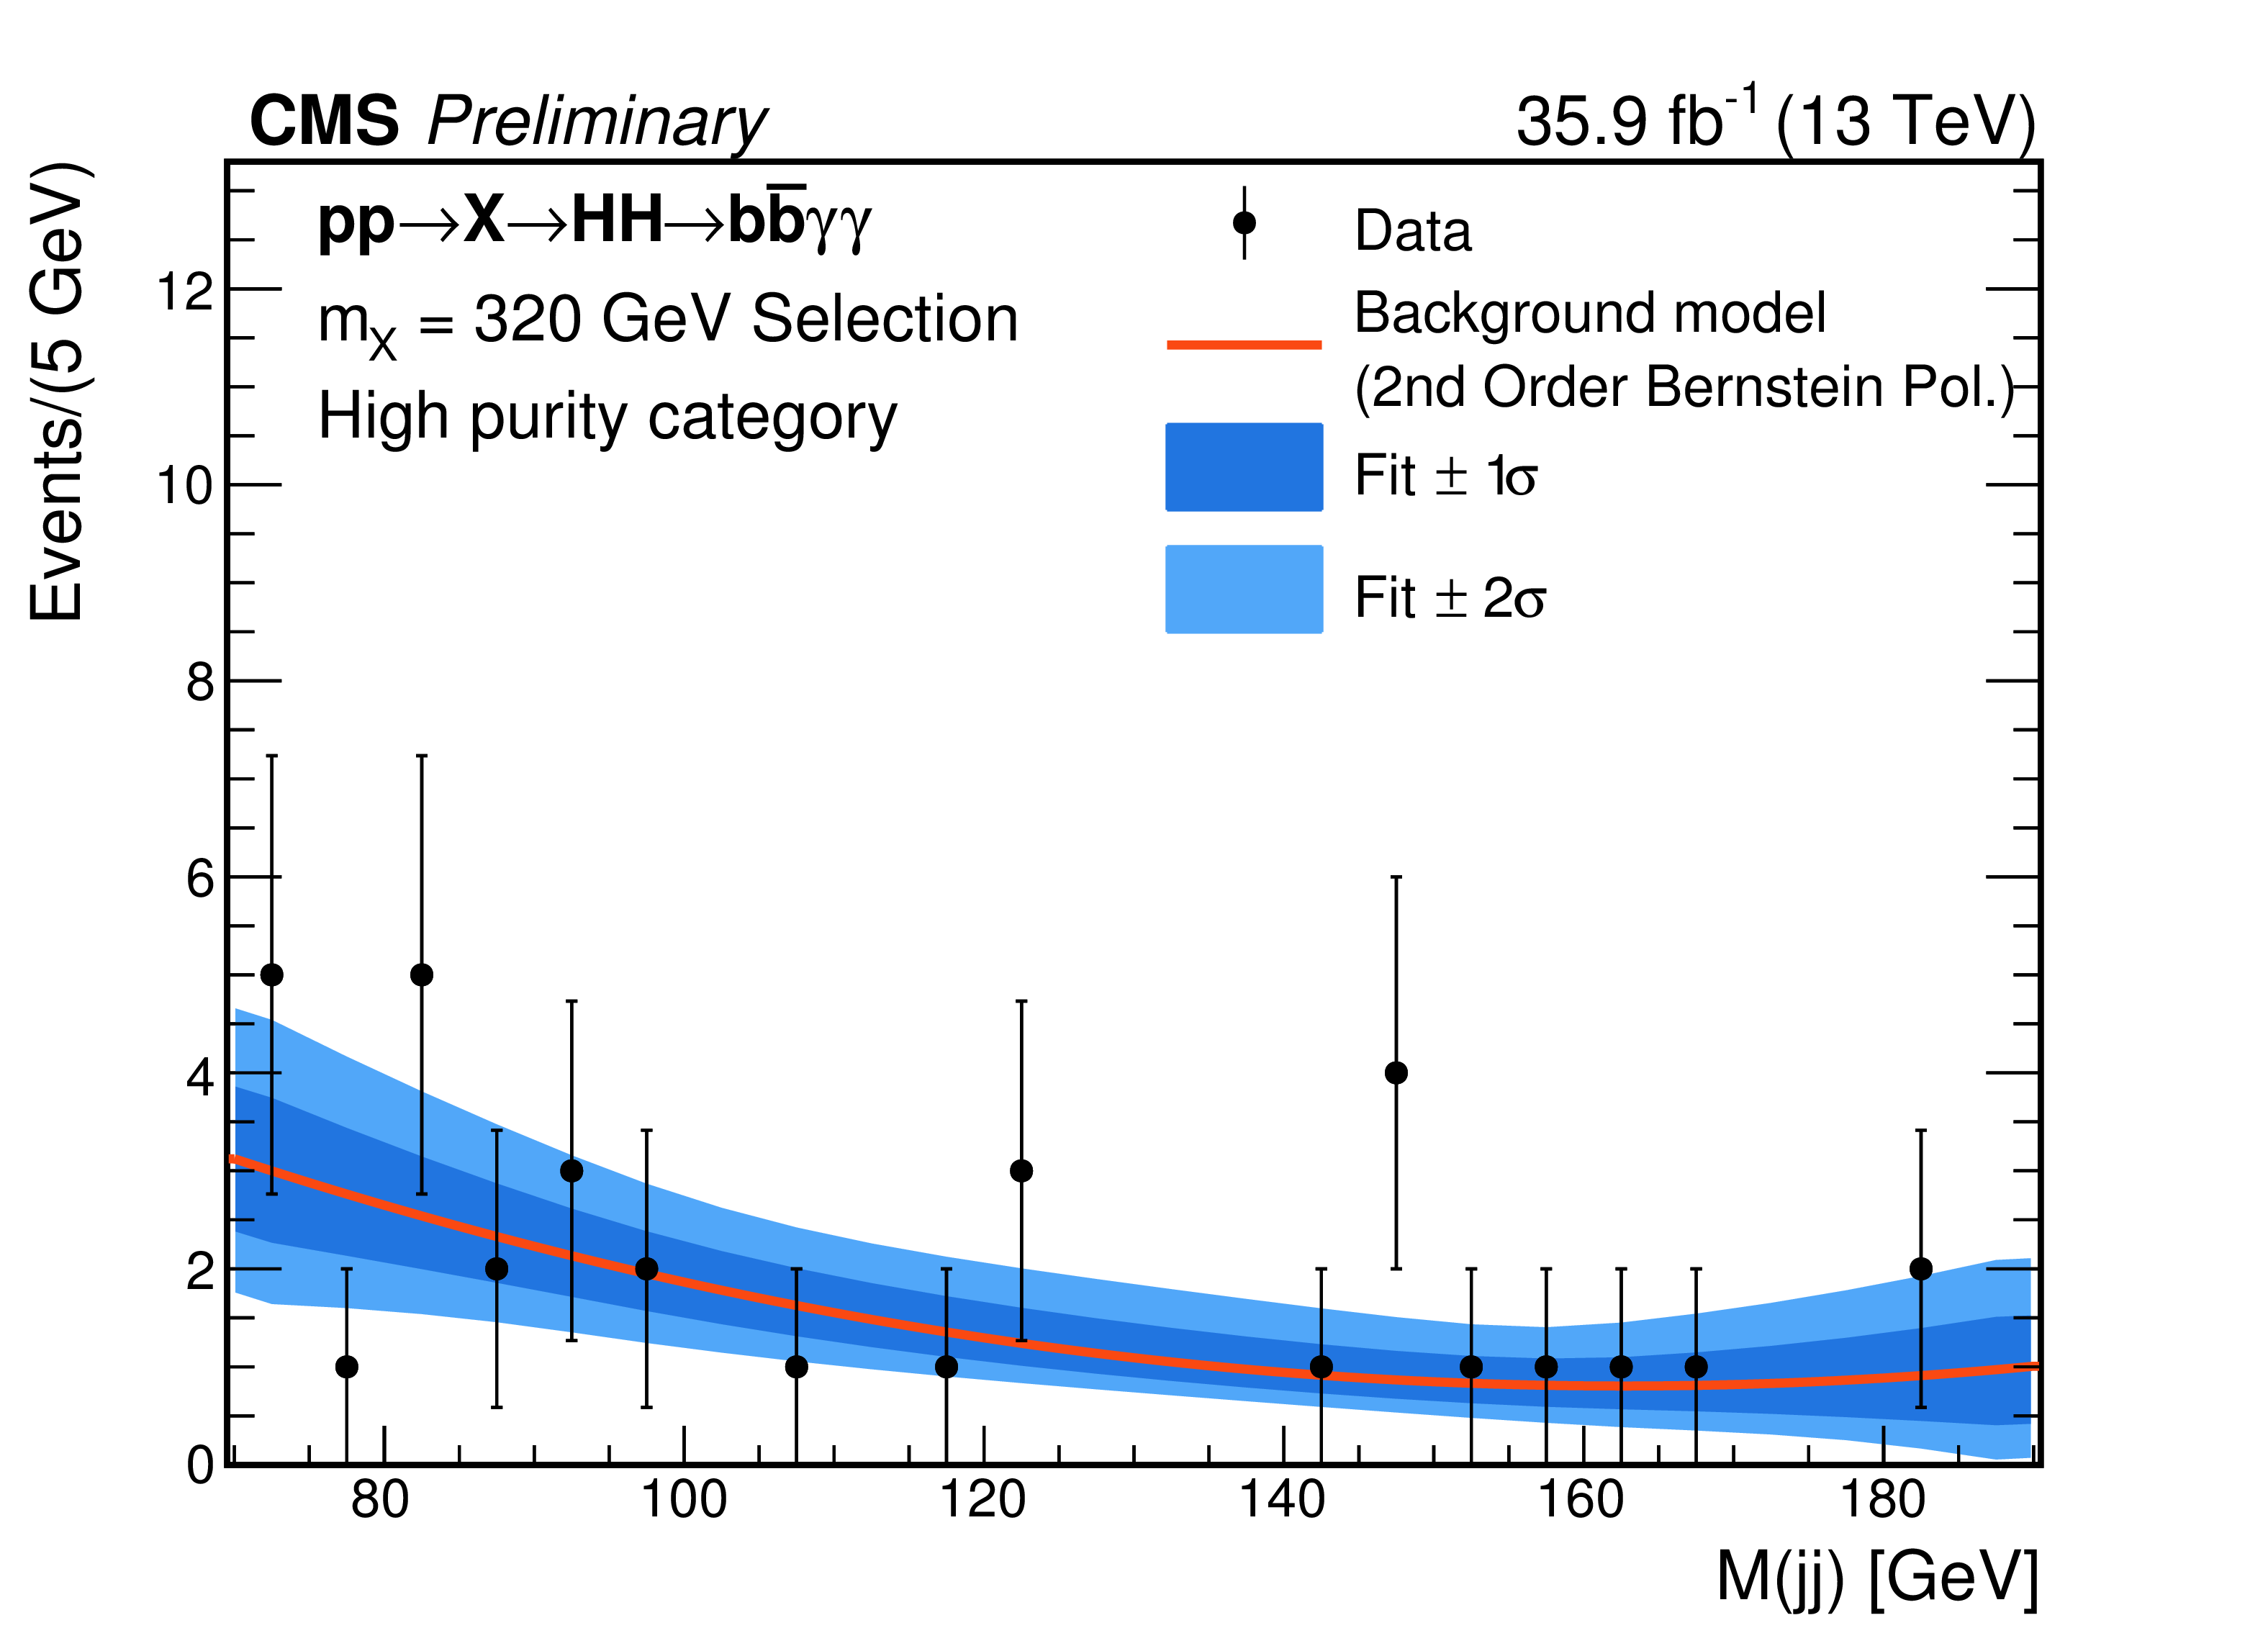
Figure 10-a:
Background fit for the resonant analysis selection, assuming a resonance with $m_{X} = $ 320 GeV (HPC). |

png pdf |
Figure 10-b:
Background fit for the resonant analysis selection, assuming a resonance with $m_{X} = $ 320 GeV (MPC). |
png pdf |
Figure 10-c:
Background fit for the resonant analysis selection, assuming a resonance with $m_{X} = $ 320 GeV (HPC). |

png pdf |
Figure 10-d:
Background fit for the resonant analysis selection, assuming a resonance with $m_{X} = $ 320 GeV (MPC). |

png pdf |
Figure 11:
Observed and expected 95% C.L. upper limits on the product of cross section and the branching fraction $\sigma (\mathrm{ p } \mathrm{ p } \to X) \times \mathcal {B}(X \to {\mathrm{ H } \mathrm{ H } } \to {\mathrm{ b \bar{b} } } \gamma \gamma )$ obtained through a combination of the two event categories. The green and yellow bands represent, respectively, the 1 and 2 standard deviation extensions beyond the expected limit. Also shown are theoretical predictions corresponding to WED models for bulk radions (left) and bulk KK-gravitons (right). The vertical dashed line in the upper plot shows the separation between the low mass and high mass regions. The limits for $ {m_{\mathrm {X}}} = $ 600 GeV are shown for both methods. |

png pdf |
Figure 11-a:
Observed and expected 95% C.L. upper limits on the product of cross section and the branching fraction $\sigma (\mathrm{ p } \mathrm{ p } \to X) \times \mathcal {B}(X \to {\mathrm{ H } \mathrm{ H } } \to {\mathrm{ b \bar{b} } } \gamma \gamma )$ obtained through a combination of the two event categories. The green and yellow bands represent, respectively, the 1 and 2 standard deviation extensions beyond the expected limit. Also shown are theoretical predictions corresponding to WED models for bulk radions. The vertical dashed line in the upper plot shows the separation between the low mass and high mass regions. The limits for $ {m_{\mathrm {X}}} = $ 600 GeV are shown for both methods. |

png pdf |
Figure 11-b:
Observed and expected 95% C.L. upper limits on the product of cross section and the branching fraction $\sigma (\mathrm{ p } \mathrm{ p } \to X) \times \mathcal {B}(X \to {\mathrm{ H } \mathrm{ H } } \to {\mathrm{ b \bar{b} } } \gamma \gamma )$ obtained through a combination of the two event categories. The green and yellow bands represent, respectively, the 1 and 2 standard deviation extensions beyond the expected limit. Also shown are theoretical predictions corresponding to WED models for bulk KK-gravitons. The vertical dashed line in the upper plot shows the separation between the low mass and high mass regions. The limits for $ {m_{\mathrm {X}}} = $ 600 GeV are shown for both methods. |

png pdf |
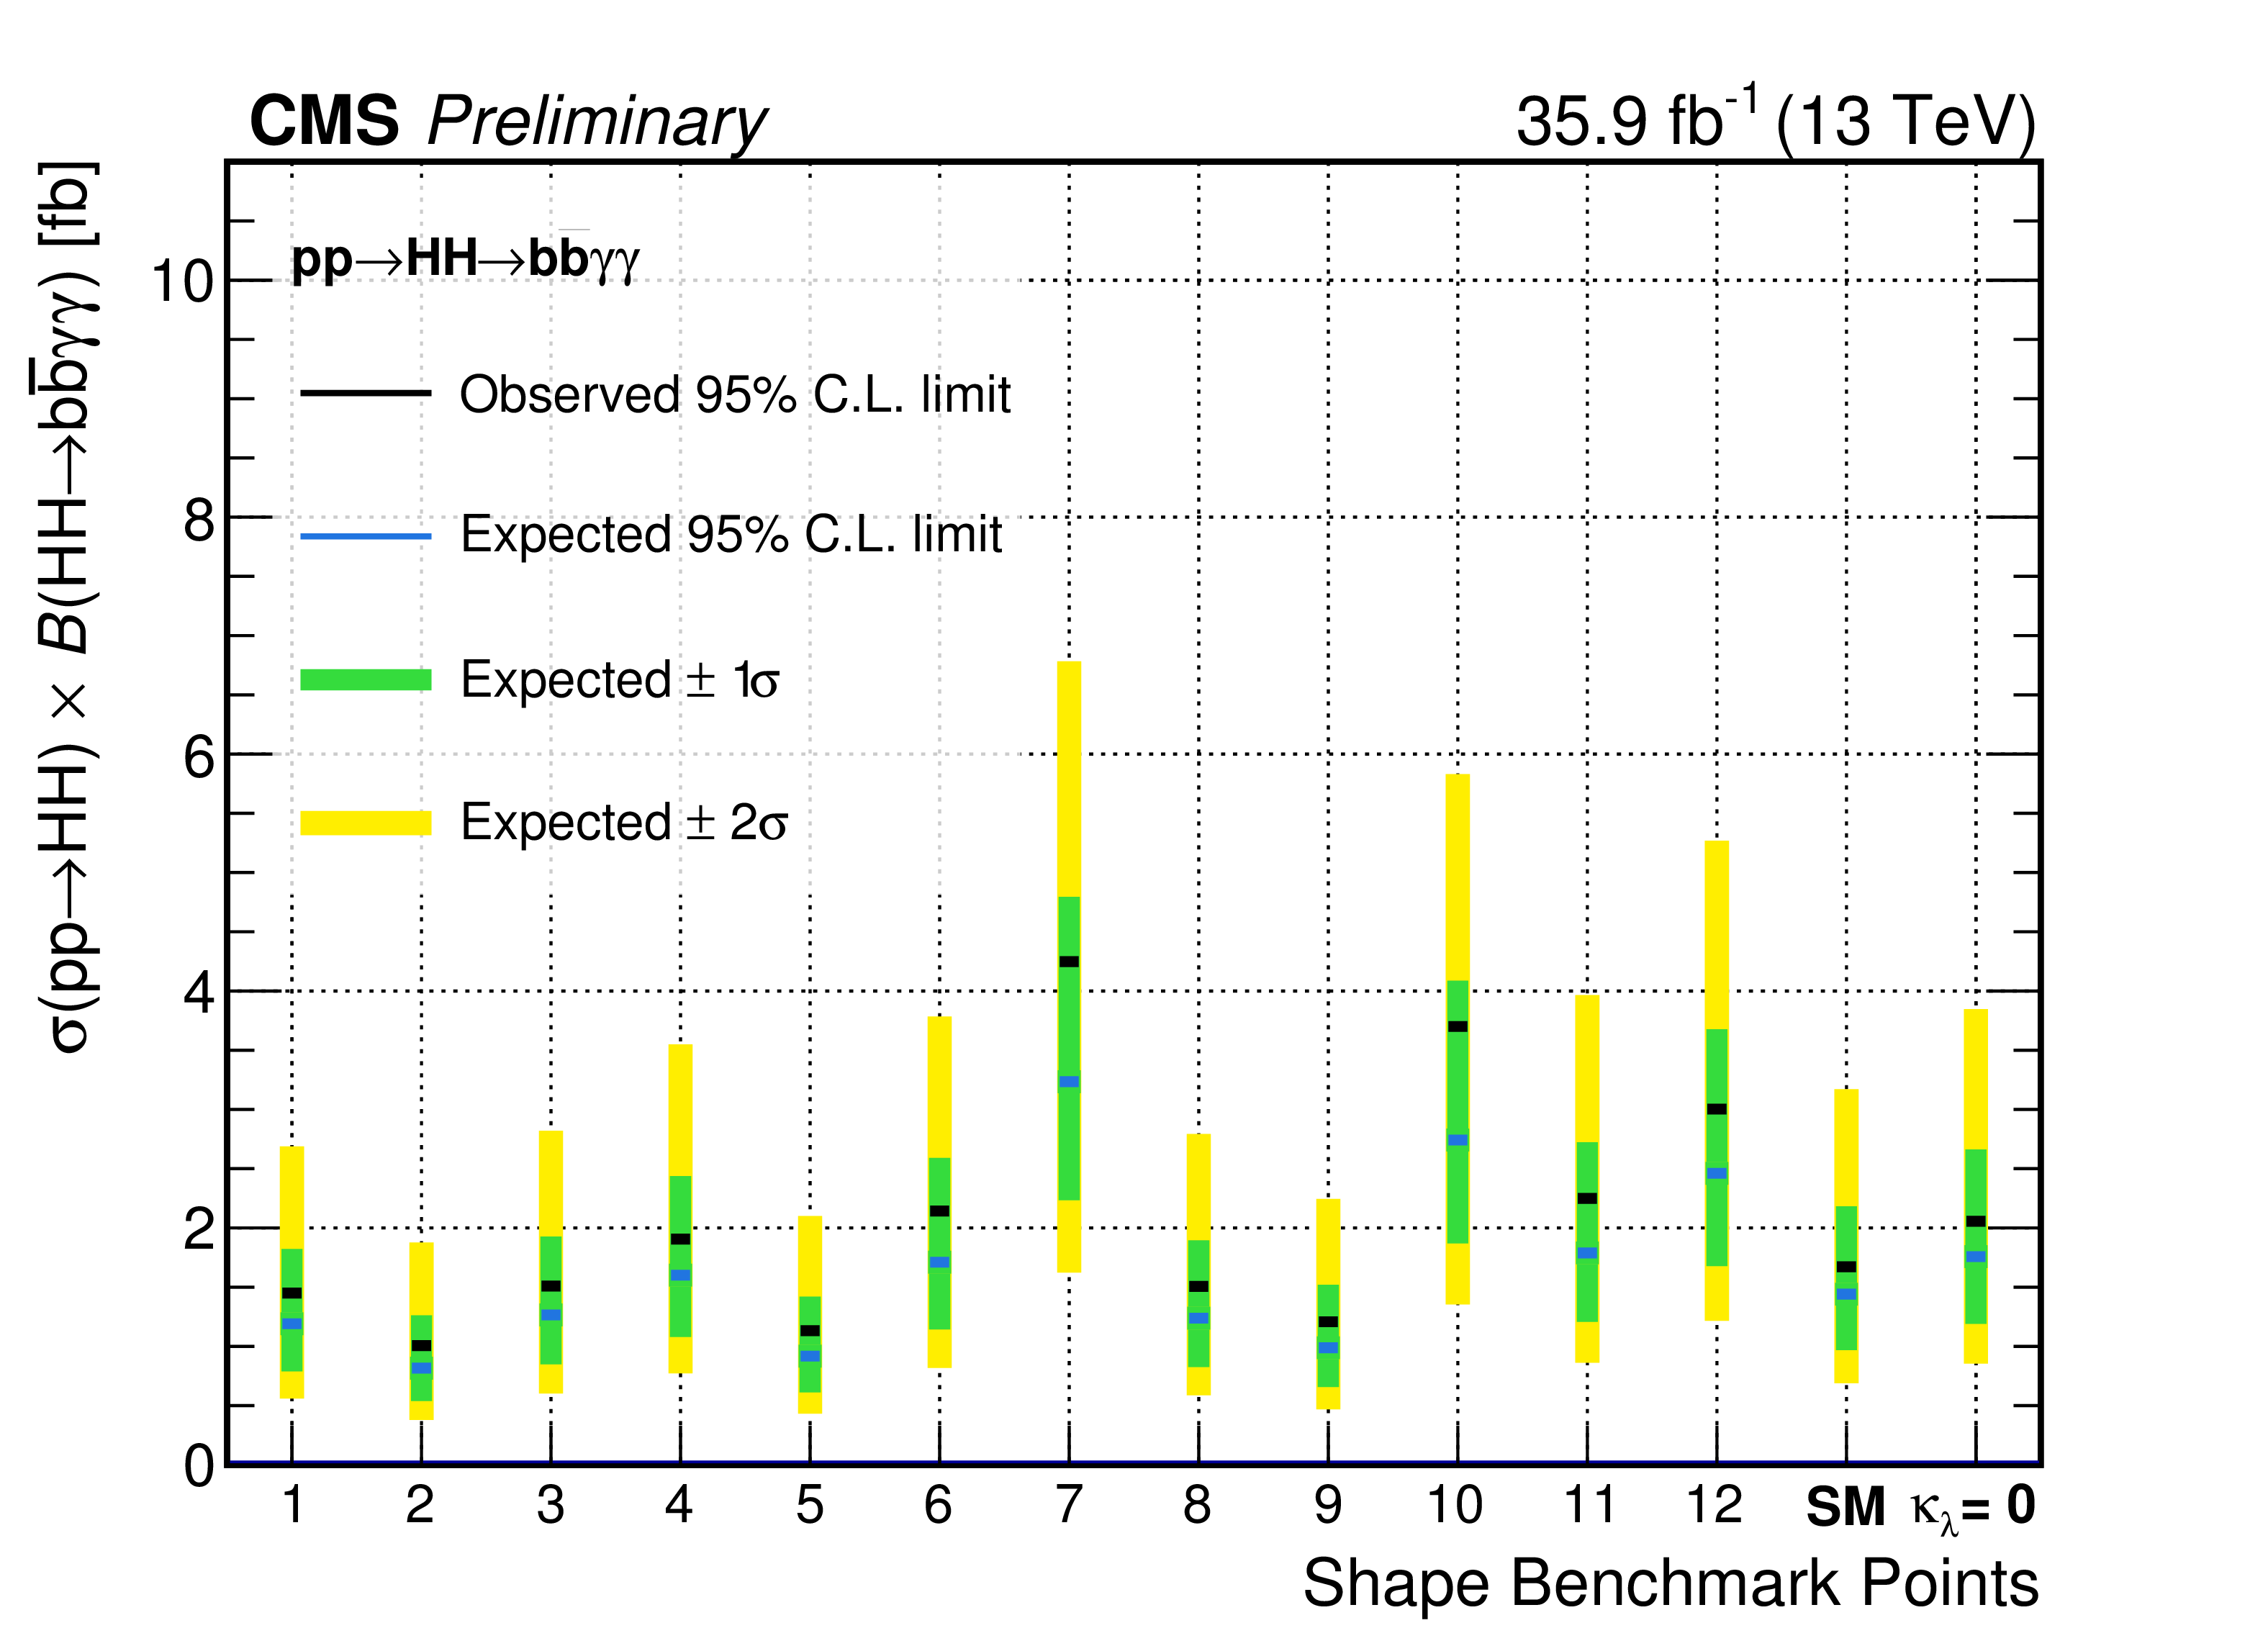
Figure 12:
Expected 95% C.L. upper limits on the product of cross section and the branching fraction $\sigma (\mathrm{ p } \mathrm{ p } \to {\mathrm{ H } \mathrm{ H } } \times \mathcal {B}( {\mathrm{ H } \mathrm{ H } } \to { {\mathrm{ b \bar{b} } } \gamma \gamma } )$ obtained through a combination of different event categories. The green and yellow bands represent, respectively, the 1 and 2 standard deviation extensions beyond the expected limit. |

png pdf |
Figure 13:
On the left, upper limits for the BSM models with varying $\kappa _\lambda $ parameter, while the others are fixed to their SM values. On the right, exclusion regions for models with varying $\kappa _\lambda $ and $\kappa _t$ parameters, while the others are fixed to their SM values. |

png pdf |
Figure 13-a:
Upper limits for the BSM models with varying $\kappa _\lambda $ parameter, while the others are fixed to their SM values. |

png pdf |
Figure 13-b :
Exclusion regions for models with varying $\kappa _\lambda $ and $\kappa _t$ parameters, while the others are fixed to their SM values. |
| Tables | |

png pdf |
Table 1:
Summary of the analysis baseline selection criteria. |

png pdf |
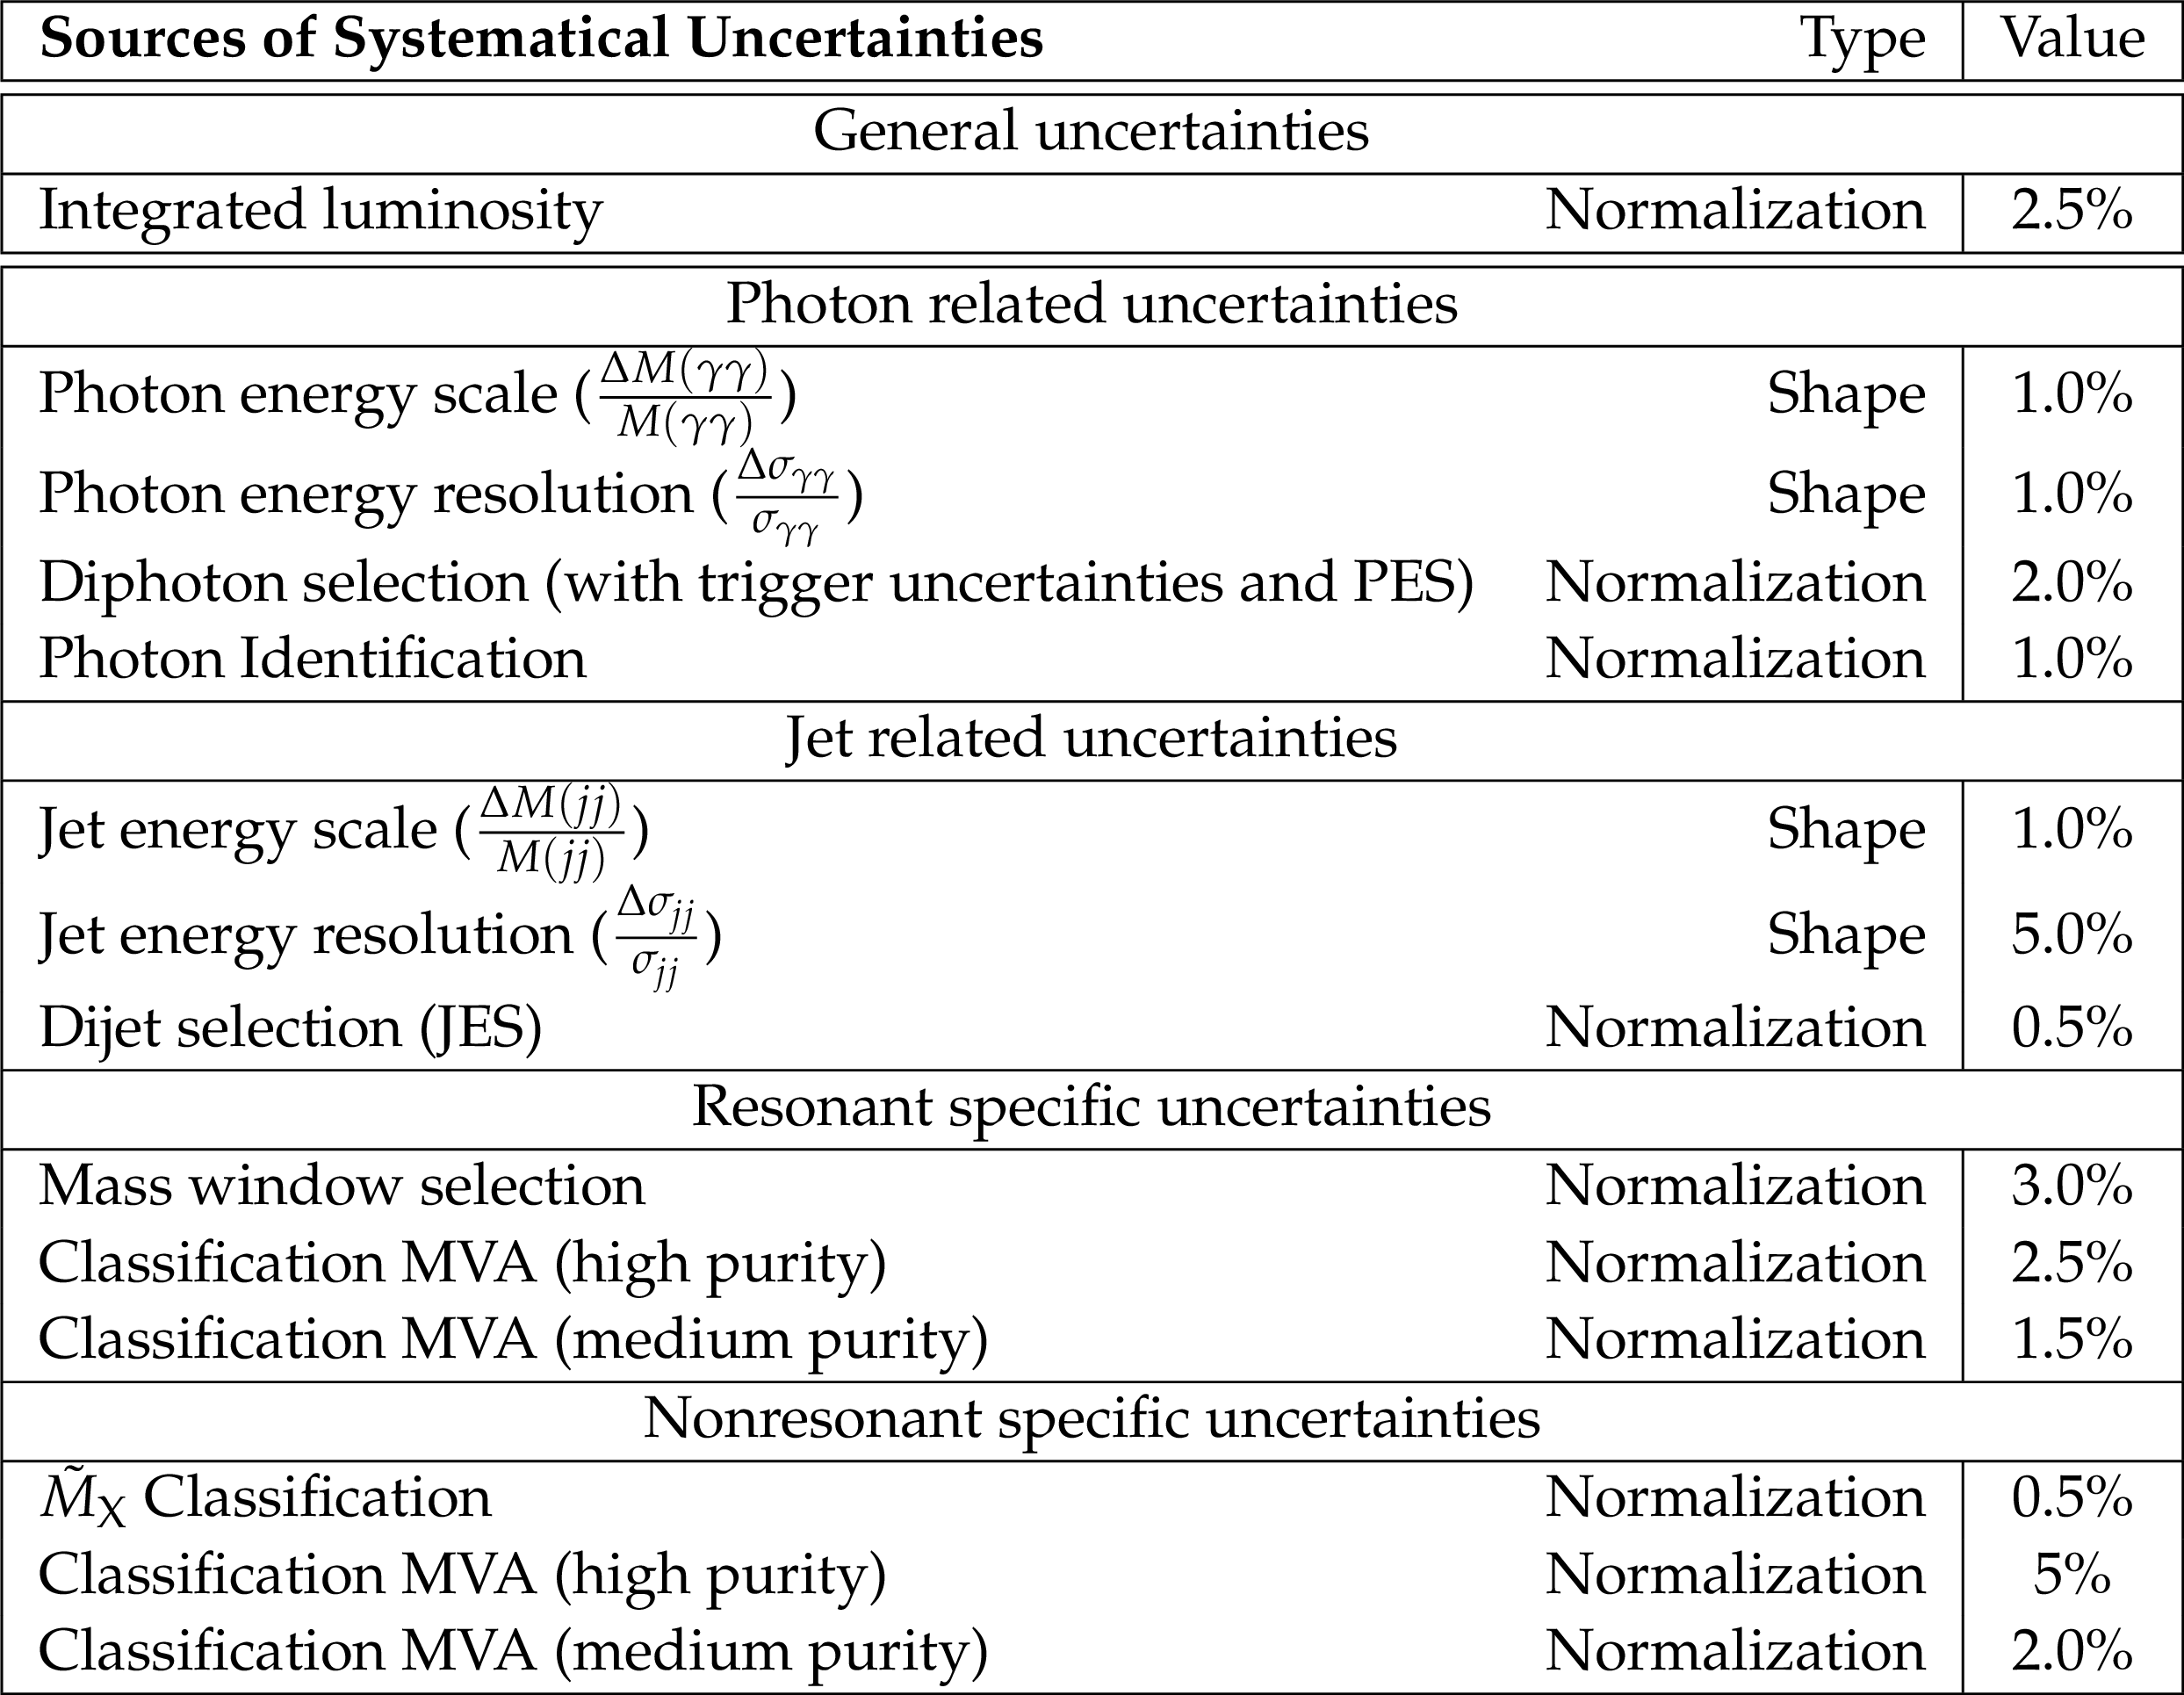
Table 2:
Summary of categorization strategies for the resonant and nonresonant analyses. |
png pdf |
Table 3:
Summary of systematic uncertainties. |
| Summary |
| A search is performed by the CMS collaboration for resonant and nonresonant production of two Higgs bosons in the decay channel ${\mathrm{ H }\mathrm{ H }} \to \mathrm{ b \bar{b} } \gamma \gamma $, based on an integrated luminosity of 35.9 fb$^{-1}$ of $\mathrm{ p }\mathrm{ p }$ collisions collected at $ \sqrt{s} = $ 13 TeV in 2016. Resonances are investigated in the mass range between 250 and 900 GeV, under spin-0 and spin-2 hypotheses. Expected and observed upper limits at a 95% CL are measured on the cross sections for the production of new particles decaying to ${\mathrm{ H }\mathrm{ H }} \to \mathrm{ b \bar{b} } \gamma\gamma$. The limits are compared to BSM predictions, based on the assumption of the existence of a warped extra dimension. No statistically significant deviations from the null hypothesis are found. The observed limits exclude the radion (spin-0) signal hypothesis, assuming $\Lambda_{R} = $ 3 TeV, for all mass points below $m_{X} = $ 550 GeV, and exclude the graviton (spin-2) hypothesis, assuming $\kappa/\text{M}_{\text{Pl}} = 1.0$, for the mass points above $m_{X} = $ 280 GeV and below 900 GeV. For nonresonant production with SM-like kinematics, a 95% CL upper limit is set on $\sigma(\mathrm{ p }\mathrm{ p }\to{\mathrm{ H }\mathrm{ H }} ) \times \mathcal{B}( {\mathrm{ H }\mathrm{ H }} \to \mathrm{ b \bar{b} } \gamma\gamma )$ at 1.67 fb. Anomalous couplings of the Higgs boson are also investigated. Exclusions are performed on the effective Higgs boson self coupling ($\kappa_{\lambda}$) for $\kappa_{\lambda} > -8.82$ and $\kappa_{\lambda} < 15.04$, assuming all other Higgs couplings to be SM-like. Additionally, exclusions are performed on the two-dimensional plane in which both $\kappa_{\lambda}$ and the Higgs-top quark Yukawa coupling vary. |
| Additional Figures | |

png pdf |
Additional Figure 1:
Expected (top) and observed (bottom) 95% C.L. upper limits on the product of cross section and the branching fraction $\sigma (\mathrm{ p } \mathrm{ p } \to \mathrm{ H } \mathrm{ H } ) \times \mathcal {B}(\mathrm{ H } \mathrm{ H } \to {\mathrm{ b \bar{b} } } \gamma \gamma )$ in the nonresonant regime, assuming variations on the Higgs self-coupling modifier parameter ($\kappa _{\lambda }$) and on the top quark Yukawa coupling modifier parameter ($\kappa _{\text {t}}$). The other effective coupling parameters are assumed to be 0. |

png pdf |
Additional Figure 1-a:
Expected 95% C.L. upper limits on the product of cross section and the branching fraction $\sigma (\mathrm{ p } \mathrm{ p } \to \mathrm{ H } \mathrm{ H } ) \times \mathcal {B}(\mathrm{ H } \mathrm{ H } \to {\mathrm{ b \bar{b} } } \gamma \gamma )$ in the nonresonant regime, assuming variations on the Higgs self-coupling modifier parameter ($\kappa _{\lambda }$) and on the top quark Yukawa coupling modifier parameter ($\kappa _{\text {t}}$). The other effective coupling parameters are assumed to be 0. |

png pdf |
Additional Figure 1-b:
Observed 95% C.L. upper limits on the product of cross section and the branching fraction $\sigma (\mathrm{ p } \mathrm{ p } \to \mathrm{ H } \mathrm{ H } ) \times \mathcal {B}(\mathrm{ H } \mathrm{ H } \to {\mathrm{ b \bar{b} } } \gamma \gamma )$ in the nonresonant regime, assuming variations on the Higgs self-coupling modifier parameter ($\kappa _{\lambda }$) and on the top quark Yukawa coupling modifier parameter ($\kappa _{\text {t}}$). The other effective coupling parameters are assumed to be 0. |
png pdf |
Additional Figure 2:
Expected and observed 95% C.L. upper limits on the product of cross section and the branching fraction $\sigma (\mathrm{ p } \mathrm{ p } \to \mathrm{ H } \mathrm{ H } ) \times \mathcal {B}(\mathrm{ H } \mathrm{ H } \to {\mathrm{ b \bar{b} } } \gamma \gamma )$ in the nonresonant regime, assuming variations on the effective coupling parameters described in Section 1. The shape benchmark points represent points of the 5-dimensional parameter space that can be used as probes to areas of the phase space with similar kinematic properties of the HH system. This choice of benchmark points has been described in [20]. Specific points of interest are the ones labeled SM, representing the SM HH production, and labeled $\kappa _{\lambda } = $ 0, representing the SM case modified with no Higgs self-coupling. |
| References | ||||
| 1 | CMS Collaboration | Observation of a new boson at a mass of 125 GeV with the CMS experiment at the LHC | CMS-HIG-12-028, CERN-PH-EP-2012-220 | CMS-HIG-12-028 1207.7235 |
| 2 | ATLAS Collaboration | Observation of a new particle in the search for the standard model Higgs boson with the ATLAS detector at the LHC | Phys.Lett. B716 (2012), no. CERN-PH-EP-2012-218, 1--29 | 1207.7214 |
| 3 | D. de Florian and J. Mazzitelli | Higgs Boson Pair Production at Next-to-Next-to-Leading Order in QCD | PRL 111 (2013) 201801 | 1309.6594 |
| 4 | J. Baglio et al. | The measurement of the Higgs self-coupling at the LHC: theoretical status | JHEP 04 (2013) 151 | 1212.5581 |
| 5 | S. Dawson, A. Ismail, and I. Low | What is in the loop? The anatomy of double Higgs production | PRD91 (2015), no. 11, 115008 | 1504.05596 |
| 6 | Z. Heng, L. Shang, Y. Zhang, and J. Zhu | Pair production of 125 GeV Higgs boson in the SM extension with color-octet scalars at the LHC | JHEP 02 (2014) 083 | 1312.4260 |
| 7 | L. Randall and R. Sundrum | A Large mass hierarchy from a small extra dimension | Phys.Rev.Lett. 83 (1999), no. MIT-CTP-2860, PUPT-1860, BUHEP-99-9, 3370--3373 | hep-ph/9905221 |
| 8 | W. D. Goldberger and M. B. Wise | Modulus stabilization with bulk fields | Phys.Rev.Lett. 83 (1999), no. CALT-68-2232, 4922--4925 | hep-ph/9907447 |
| 9 | O. DeWolfe, D. Freedman, S. Gubser, and A. Karch | Modeling the fifth-dimension with scalars and gravity | Phys.Rev. D62 (2000), no. HUTP-99-A048, MIT-CTP-2903, 046008 | hep-th/9909134 |
| 10 | C. Csaki, M. Graesser, L. Randall, and J. Terning | Cosmology of brane models with radion stabilization | Phys.Rev. D62 (2000), no. SCIPP-99-49, HUTP-A061, NSF-ITP-99-130, 045015 | hep-ph/9911406 |
| 11 | H. Davoudiasl, J. L. Hewett, and T. G. Rizzo | Phenomenology of the Randall-Sundrum Gauge Hierarchy Model | PRL 84 (2000), no. SLAC-PUB-8241 | hep-ph/9909255 |
| 12 | C. Csaki, M. L. Graesser, and G. D. Kribs | Radion dynamics and electroweak physics | Phys.Rev. D63 (2001), no. SCIPP-00-27, 065002 | hep-th/0008151 |
| 13 | K. Agashe, H. Davoudiasl, G. Perez, and A. Soni | Warped Gravitons at the LHC and Beyond | Phys.Rev. D76 (2007), no. SU-4252-843, BNL-HET-07-3, YITP-SB-07-02, 036006 | hep-ph/0701186 |
| 14 | A. L. Fitzpatrick, J. Kaplan, L. Randall, and L.-T. Wang | Searching for the Kaluza-Klein Graviton in Bulk RS Models | JHEP 0709 (2007) 013 | hep-ph/0701150 |
| 15 | G. C. Branco et al. | Theory and phenomenology of two-Higgs-doublet models | PR 516 (2012) 1--102 | 1106.0034 |
| 16 | A. Djouadi et al. | Fully covering the MSSM Higgs sector at the LHC | JHEP 06 (2015) 168 | 1502.05653 |
| 17 | R. Grober and M. Muhlleitner | Composite Higgs Boson Pair Production at the LHC | JHEP 06 (2011), no. KA-TP-37-2010, 020 | 1012.1562 |
| 18 | M. Moretti et al. | Higgs boson self-couplings at the LHC as a probe of extended Higgs sectors | JHEP 02 (2005), no. FNT-T-2004-03, SHEP-03-12, CAFPE-26-03, UG-FT-156-03, LAPTH-1028-04, BA-TH-495-04, 024 | hep-ph/0410334 |
| 19 | A. Pierce, J. Thaler, and L.-T. Wang | Disentangling dimension six operators through di-Higgs boson production | JHEP 05 (2007) 070 | hep-ph/0609049 |
| 20 | A. Carvalho Antunes De Oliveira et al. | Analytical parametrization and shape classification of anomalous HH production in EFT approach | Technical Report LHCHXSWG-2016-001, CERN, Geneva, Jul | |
| 21 | J. Grigo, K. Melnikov, and M. Steinhauser | Virtual corrections to Higgs boson pair production in the large top quark mass limit | Nucl. Phys. B888 (2014) 17--29 | 1408.2422 |
| 22 | LHC Higgs Cross Section Working Group Collaboration | Handbook of LHC Higgs Cross Sections: 4. Deciphering the Nature of the Higgs Sector | 1610.07922 | |
| 23 | G. F. Giudice, C. Grojean, A. Pomarol, and R. Rattazzi | The Strongly-Interacting Light Higgs | JHEP 06 (2007) 045 | hep-ph/0703164 |
| 24 | S. Heinemeyer et al. | Handbook of LHC Higgs cross sections: 3. Higgs properties | CERN Report CERN-2013-004 | 1307.1347 |
| 25 | CMS Collaboration | Search for two Higgs bosons in final states containing two photons and two bottom quarks in proton-proton collisions at 8 TeV | PRD94 (2016), no. 5, 052012 | CMS-HIG-13-032 1603.06896 |
| 26 | ATLAS Collaboration | Search For Higgs Boson Pair Production in the $ \gamma\gamma b\bar{b} $ Final State using $ pp $ Collision Data at $ \sqrt{s}=$ 8 TeV from the ATLAS Detector | PRL 114 (2015), no. CERN-PH-EP-2014-113, 081802 | 1406.5053 |
| 27 | ATLAS Collaboration | Search for Higgs boson pair production in the $ b\bar{b}b\bar{b} $ final state from pp collisions at $ \sqrt{s} = $ 8 TeV with the ATLAS detector | EPJC 75 (2015), no. CERN-PH-EP-2015-099, 412 | 1506.00285 |
| 28 | ATLAS Collaboration | Searches for Higgs boson pair production in the $ hh\to bb\tau\tau, \gamma\gamma WW^*, \gamma\gamma bb, bbbb $ channels with the ATLAS detector | PRD 92 (2015), no. CERN-PH-EP-2015-225, 092004 | 1509.04670 |
| 29 | CMS Collaboration | Searches for heavy Higgs bosons in two-Higgs-doublet models and for $ \mathrm{ t } \rightarrow \mathrm{c}\mathrm{h} $ decay using multilepton and diphoton final states in pp collisions at 8 TeV | PRD 90 (2014) 112013 | CMS-HIG-13-025 1410.2751 |
| 30 | CMS Collaboration | Search for resonant pair production of Higgs bosons decaying to two bottom quark-antiquark pairs in proton-proton collisions at 8 TeV | PLB 749 (2015) 560 | CMS-HIG-14-013 1503.04114 |
| 31 | CMS Collaboration | Search for heavy resonances decaying to two Higgs bosons in final states containing four b quarks | EPJC 76 (2016) 371 | CMS-EXO-12-053 1602.08762 |
| 32 | CMS Collaboration | Searches for a heavy scalar boson H decaying to a pair of 125 GeV Higgs bosons hh or for a heavy pseudoscalar boson A decaying to Zh, in the final states with $ \mathrm{h} \to \tau \tau $ | PLB 755 (2016) 217 | CMS-HIG-14-034 1510.01181 |
| 33 | CMS Collaboration | The CMS experiment at the CERN LHC | JINST 3 (2008) S08004 | CMS-00-001 |
| 34 | J. Alwall et al. | The automated computation of tree-level and next-to-leading order differential cross sections, and their matching to parton shower simulations | JHEP 07 (2014) 079 | 1405.0301 |
| 35 | A. Buckley et al. | LHAPDF6: parton density access in the LHC precision era | EPJC75 (2015), no. GLAS-PPE-2014-05, MCNET-14-29, IPPP-14-111, DCPT-14-222, 132 | 1412.7420 |
| 36 | J. Butterworth et al. | PDF4LHC recommendations for LHC Run II | 1510.03865 | |
| 37 | T. Sjostrand, S. Mrenna, and P. Z. Skands | A Brief Introduction to PYTHIA 8.1 | CPC 178 (2008), no. CERN-LCGAPP-2007-04, LU-TP-07-28, FERMILAB-PUB-07-512-CD-T, 852--867 | 0710.3820 |
| 38 | GEANT4 Collaboration | GEANT4 -- a simulation toolkit | NIMA 506 (2003), no. SLAC-PUB-9350, FERMILAB-PUB-03-339, 250 | |
| 39 | ATLAS and CMS Collaborations | Combined Measurement of the Higgs Boson Mass in $ \mathrm{ p }\mathrm{ p } $ Collisions at $ \sqrt{s}=$ 7 and 8 TeV with the ATLAS and CMS Experiments | PRL 114 (2015) 191803 | 1503.07589 |
| 40 | A. Carvalho et al. | Higgs Pair Production: Choosing Benchmarks With Cluster Analysis | JHEP 04 (2016) 126 | 1507.02245 |
| 41 | A. Carvalho et al. | Analytical parametrization and shape classification of anomalous HH production in the EFT approach | 1608.06578 | |
| 42 | B. Mellado Garcia, P. Musella, M. Grazzini, and R. Harlander | CERN Report 4: Part I Standard Model Predictions | Technical Report LHCHXSWG-DRAFT-INT-2016-008, May | |
| 43 | P. Nason | A new method for combining NLO QCD with shower Monte Carlo algorithms | JHEP 11 (2004) 040 | hep-ph/0409146 |
| 44 | S. Frixione, P. Nason, and C. Oleari | Matching NLO QCD computations with Parton Shower simulations: the POWHEG method | JHEP 11 (2007), no. BICOCCA-FT-07-9, GEF-TH-21-2007, 070 | 0709.2092 |
| 45 | S. Alioli, P. Nason, C. Oleari, and E. Re | A general framework for implementing NLO calculations in shower Monte Carlo programs: the POWHEG BOX | JHEP 06 (2010) 043 | 1002.2581 |
| 46 | CMS Collaboration | Measurements of properties of the Higgs boson in the diphoton decay channel with the full 2016 data set | CMS-PAS-HIG-16-040 | CMS-PAS-HIG-16-040 |
| 47 | CMS Collaboration | Electron and photon performance in CMS with the full 2016 data sample. | CDS | |
| 48 | CMS Collaboration | Particle-flow reconstruction and global event description with the CMS detector | Submitted to JINST | CMS-PRF-14-001 1706.04965 |
| 49 | CMS Collaboration | Identification of b quark jets at the CMS Experiment in the LHC Run 2 | CMS-PAS-BTV-15-001 | CMS-PAS-BTV-15-001 |
| 50 | CMS Collaboration | Search for the standard model Higgs boson produced through vector boson fusion and decaying to bb with proton-proton collisions at $ \sqrt{s} = $ 13 TeV | CMS-PAS-HIG-16-003 | CMS-PAS-HIG-16-003 |
| 51 | N. Kumar and S. P. Martin | LHC search for di-Higgs decays of stoponium and other scalars in events with two photons and two bottom jets | PRD90 (2014), no. 5, 055007 | 1404.0996 |
| 52 | S. Bolognesi et al. | On the spin and parity of a single-produced resonance at the LHC | PRD86 (2012) 095031 | 1208.4018 |
| 53 | A. Hoecker et al. | TMVA: Toolkit for Multivariate Data Analysis | PoS ACAT (2007) 040 | physics/0703039 |
| 54 | M. J. Oreglia | PhD thesis, Stanford University, 1980 SLAC Report SLAC-R-236 | ||
| 55 | CMS Collaboration | Observation of the diphoton decay of the Higgs boson and measurement of its properties | EPJC 74 (2014) 3076 | CMS-HIG-13-001 1407.0558 |
| 56 | CMS Collaboration | CMS Luminosity Measurements for the 2016 Data Taking Period | CMS-PAS-LUM-17-001 | CMS-PAS-LUM-17-001 |
| 57 | A. L. Read | Presentation of search results: the CL$ _s $ technique | JPG 28 (2002) 2693 | |
| 58 | T. Junk | Confidence level computation for combining searches with small statistics | NIMA 434 (1999) 435 | hep-ex/9902006 |
| 59 | K. Agashe et al. | Warped extra dimensional benchmarks for Snowmass 2013 | in Community Summer Study 2013: Snowmass on the Mississippi (CSS2013) Minneapolis 2013 | 1309.7847 |
| 60 | P. de Aquino, K. Hagiwara, Q. Li, and F. Maltoni | Simulating graviton production at hadron colliders | JHEP 06 (2011) 132 | 1101.5499 |
| 61 | A. Oliveira | Gravity particles from Warped Extra Dimensions, a review. Part I - KK Graviton | 1404.0102 | |
| 62 | U. Mahanta and A. Datta | Search prospects of light stabilized radions at Tevatron and LHC | PLB 483 (2000) 196 | hep-ph/0002183 |
| 63 | H. Davoudiasl, J. Hewett, and T. Rizzo | Experimental probes of localized gravity: On and off the wall | Phys.Rev. D63 (2001), no. SLAC-PUB-8436, 075004 | hep-ph/0006041 |
| 64 | G. F. Giudice, R. Rattazzi, and J. D. Wells | Graviscalars from higher dimensional metrics and curvature Higgs mixing | Nucl.Phys. B595 (2001) | hep-ph/0002178 |
|
|
Compact Muon Solenoid LHC, CERN |
|

|

|

|

|

|