

Compact Muon Solenoid
LHC, CERN
| CMS-PAS-HIG-23-005 | ||
| Search for rare decays of the Higgs boson into a photon and a $ \rho $, $ \phi $ or $ \mathrm{K}^{*0} $ meson | ||
| CMS Collaboration | ||
| 4 April 2024 | ||
| Abstract: Higgs boson decays into a photon and a $ \rho^0 $(770), $ \phi $, or $ \mathrm{K}^{*0} $(892) meson are searched for using proton-proton collision data collected by the CMS experiment at the LHC at $ \sqrt{s}= $ 13 TeV. Events are selected in which the mesons decay into pairs of charged pions, pairs of charged kaons, and charged kaon-pion pairs respectively. Depending on the Higgs boson production mode, different triggering and reconstruction techniques are adopted. The analysed data sets correspond to an integrated luminosity varying between 39.5 and 138 fb$ ^{-1} $, depending on the targeted final state. By combining these analysis categories, no significant excess above the background expectations is observed. Upper limits at the 95% confidence level on the Higgs boson branching fractions into $ \rho^0\gamma $, $ \phi\gamma $, and $ \mathrm{K}^{*0}\gamma $ are determined to be 3.74 $ \times$ 10$^{-4} $, 2.97 $ \times$ 10$^{-4} $, and 1.71 $ \times$ 10$^{-4} $, respectively. These results constitute the most stringent experimental limits to date. | ||
| Links: CDS record (PDF) ; CADI line (restricted) ; | ||
| Figures | |

png pdf |
Figure 1:
Feynman diagrams showing the different Higgs boson decay mechanisms into a photon and a light meson (upper: $ \phi $ meson; lower: $ \mathrm{K^{\ast}(892)}^0 $ meson). The crossed circle in the top right diagram denotes the off-shell $ \mathrm{H} \to \gamma\gamma^* $ amplitude, which in the SM arises first at one-loop order. |
png pdf |
Figure 2:
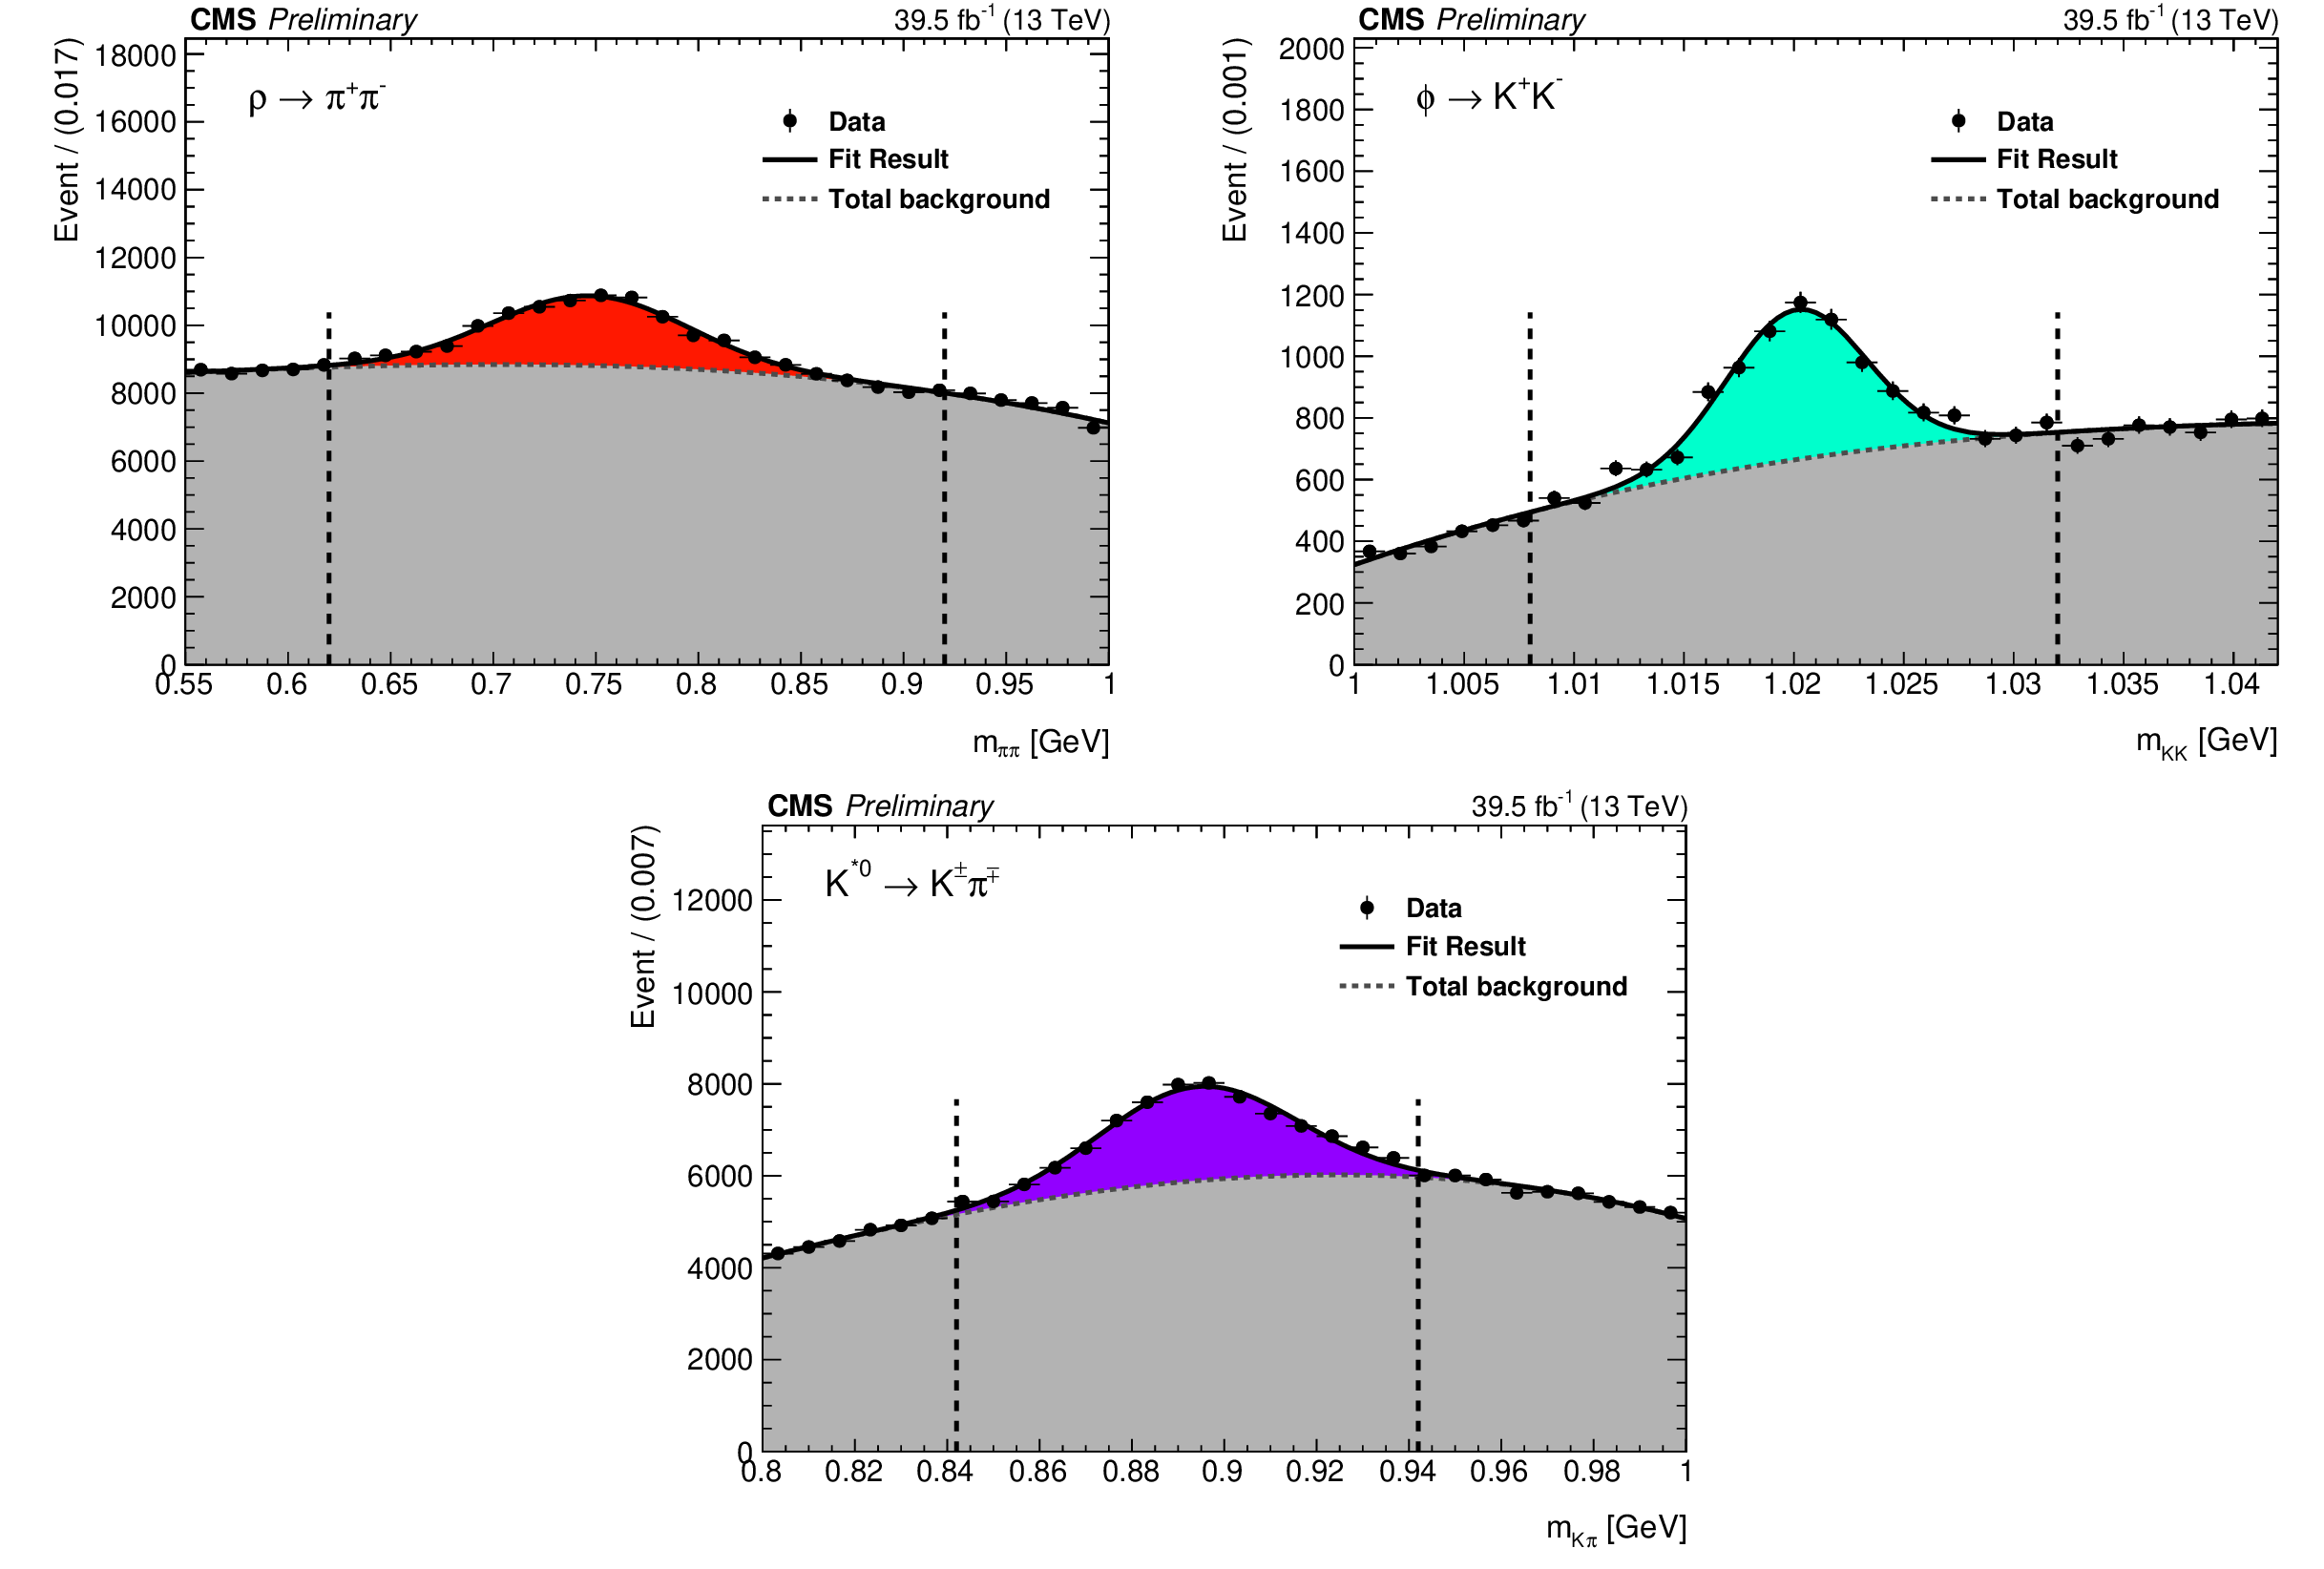
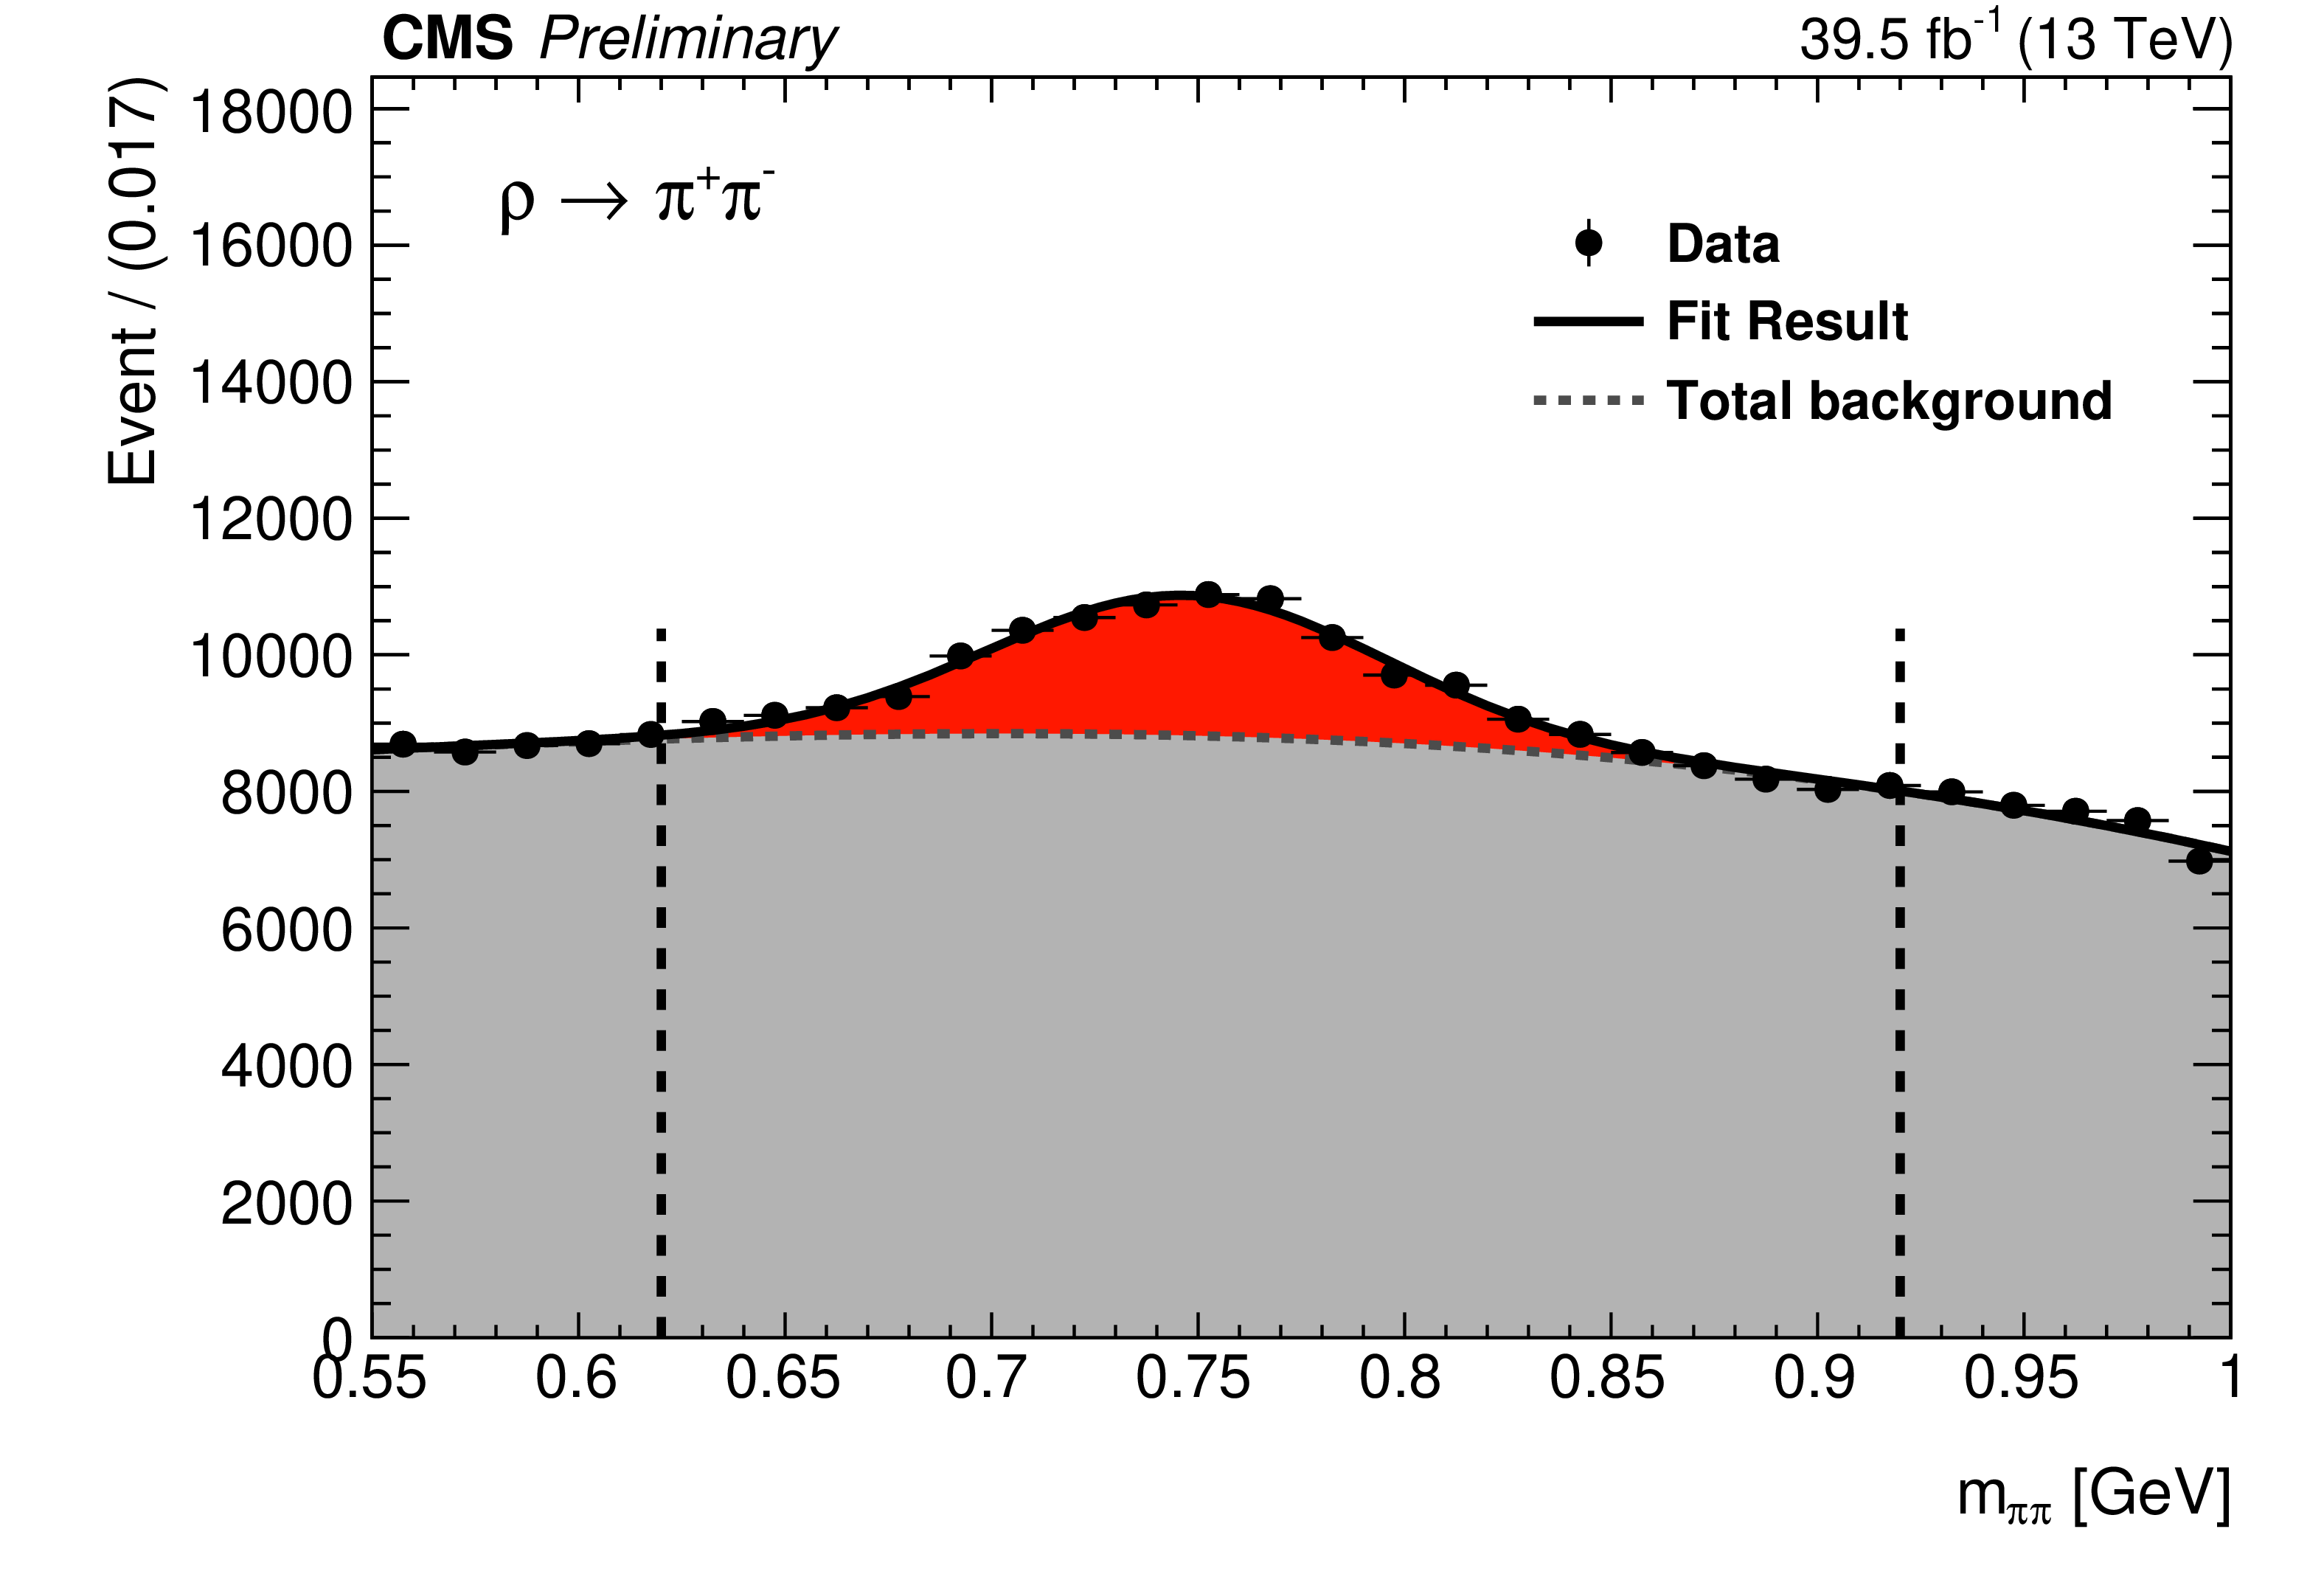
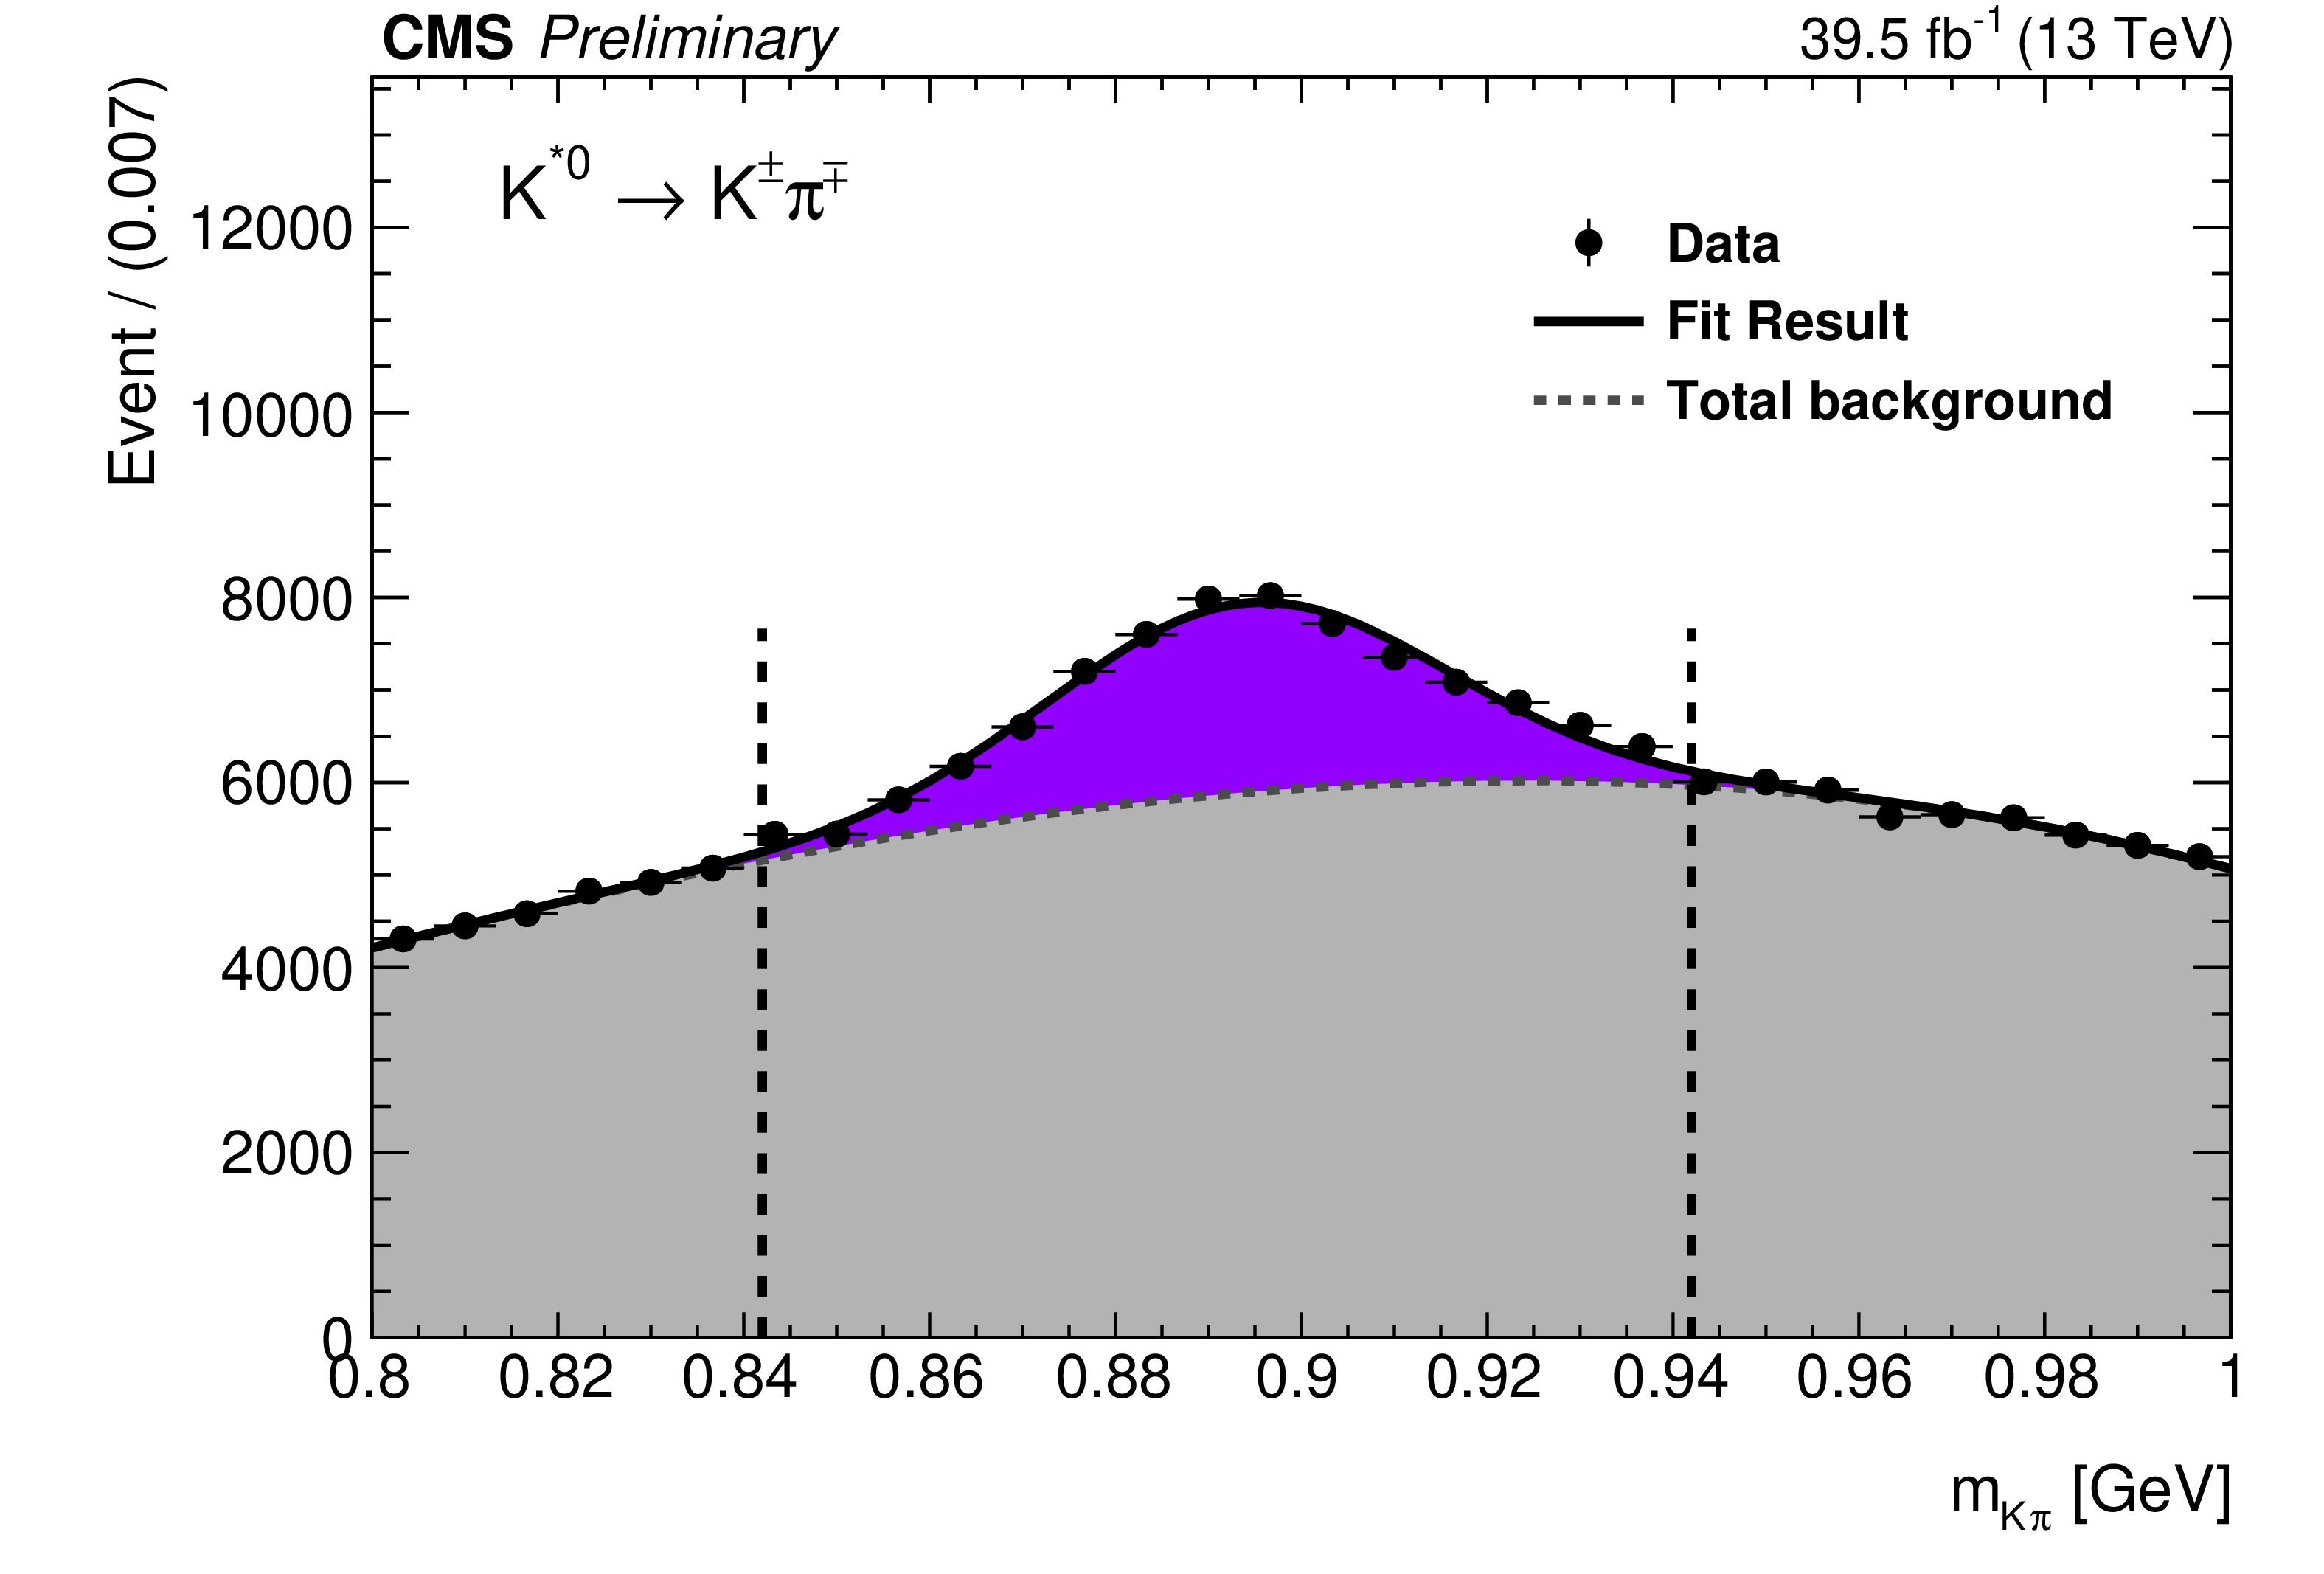
Di-track mass distribution in selected events in data, for the ggH category of the analysis, $ \rho^0\gamma $ (upper left), $ \phi\gamma $ (upper right) and $ \mathrm{K^{\ast}(892)}^0\gamma $ (lower) decays. Vertical dashed lines represent the signal mass region borders. |
png pdf |
Figure 2-a:
Di-track mass distribution in selected events in data, for the ggH category of the analysis, $ \rho^0\gamma $ (upper left), $ \phi\gamma $ (upper right) and $ \mathrm{K^{\ast}(892)}^0\gamma $ (lower) decays. Vertical dashed lines represent the signal mass region borders. |

png pdf |
Figure 2-b:
Di-track mass distribution in selected events in data, for the ggH category of the analysis, $ \rho^0\gamma $ (upper left), $ \phi\gamma $ (upper right) and $ \mathrm{K^{\ast}(892)}^0\gamma $ (lower) decays. Vertical dashed lines represent the signal mass region borders. |
png pdf |
Figure 2-c:
Di-track mass distribution in selected events in data, for the ggH category of the analysis, $ \rho^0\gamma $ (upper left), $ \phi\gamma $ (upper right) and $ \mathrm{K^{\ast}(892)}^0\gamma $ (lower) decays. Vertical dashed lines represent the signal mass region borders. |
png pdf |
Figure 3:
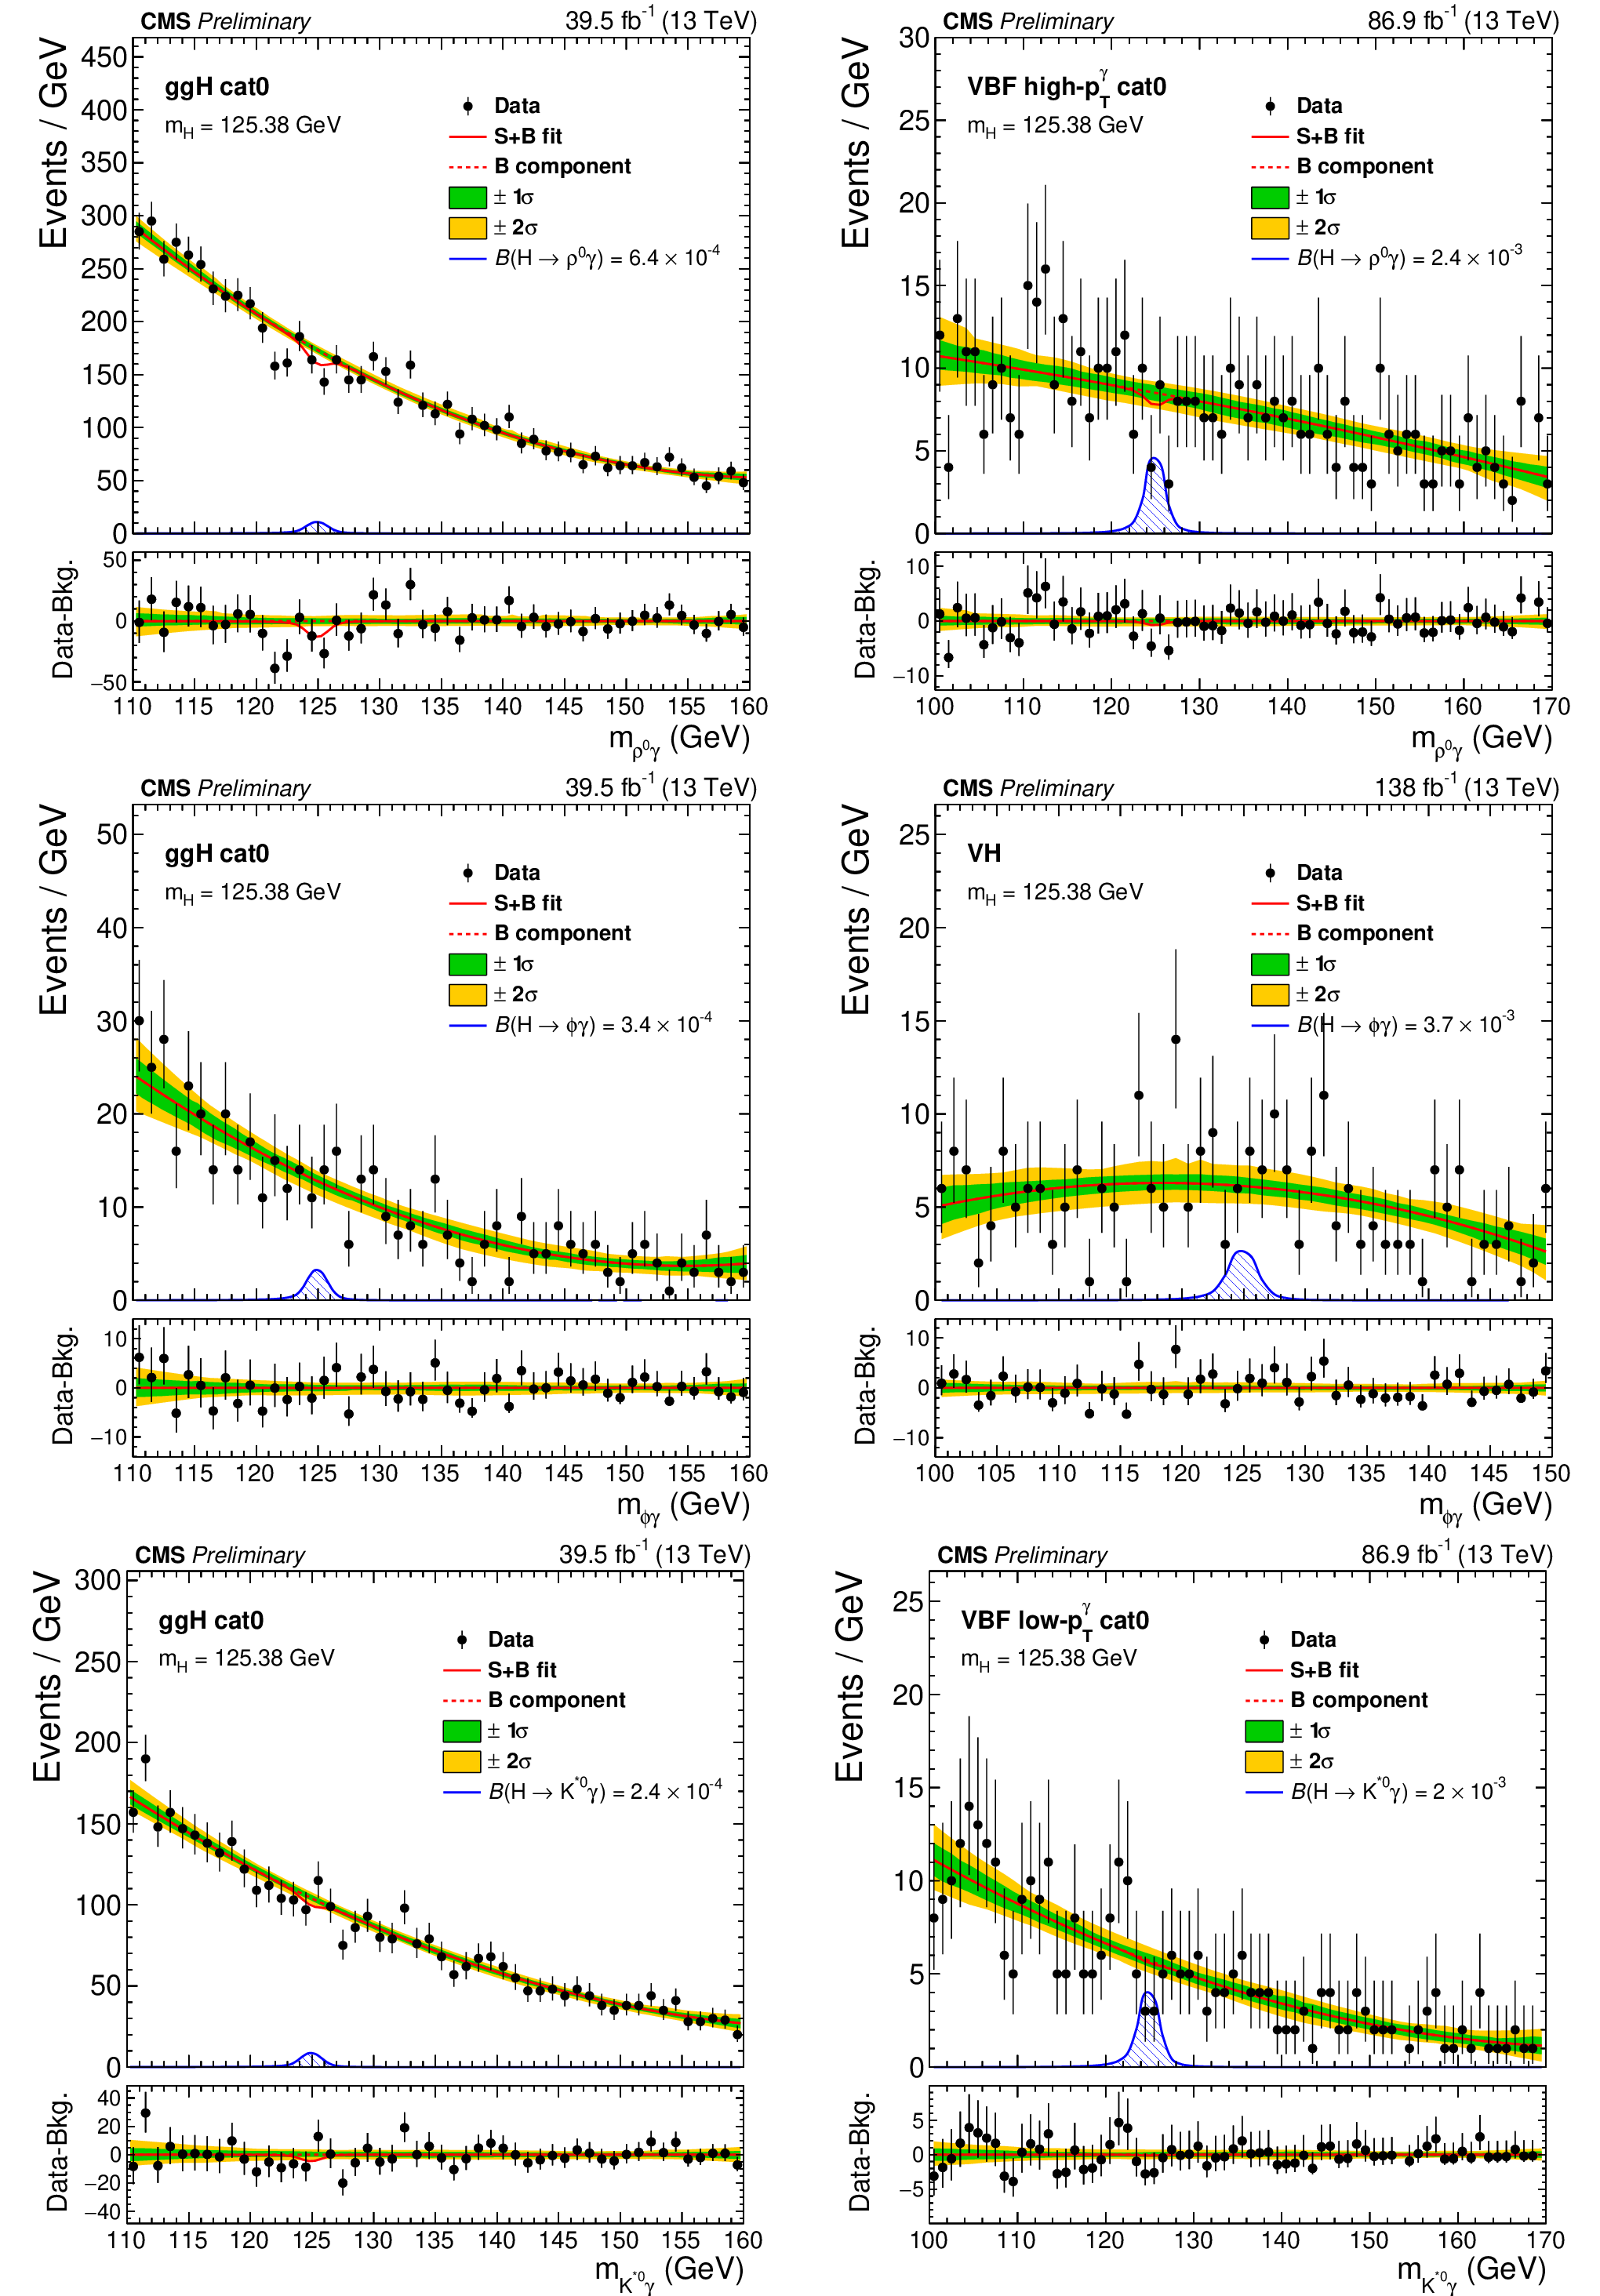
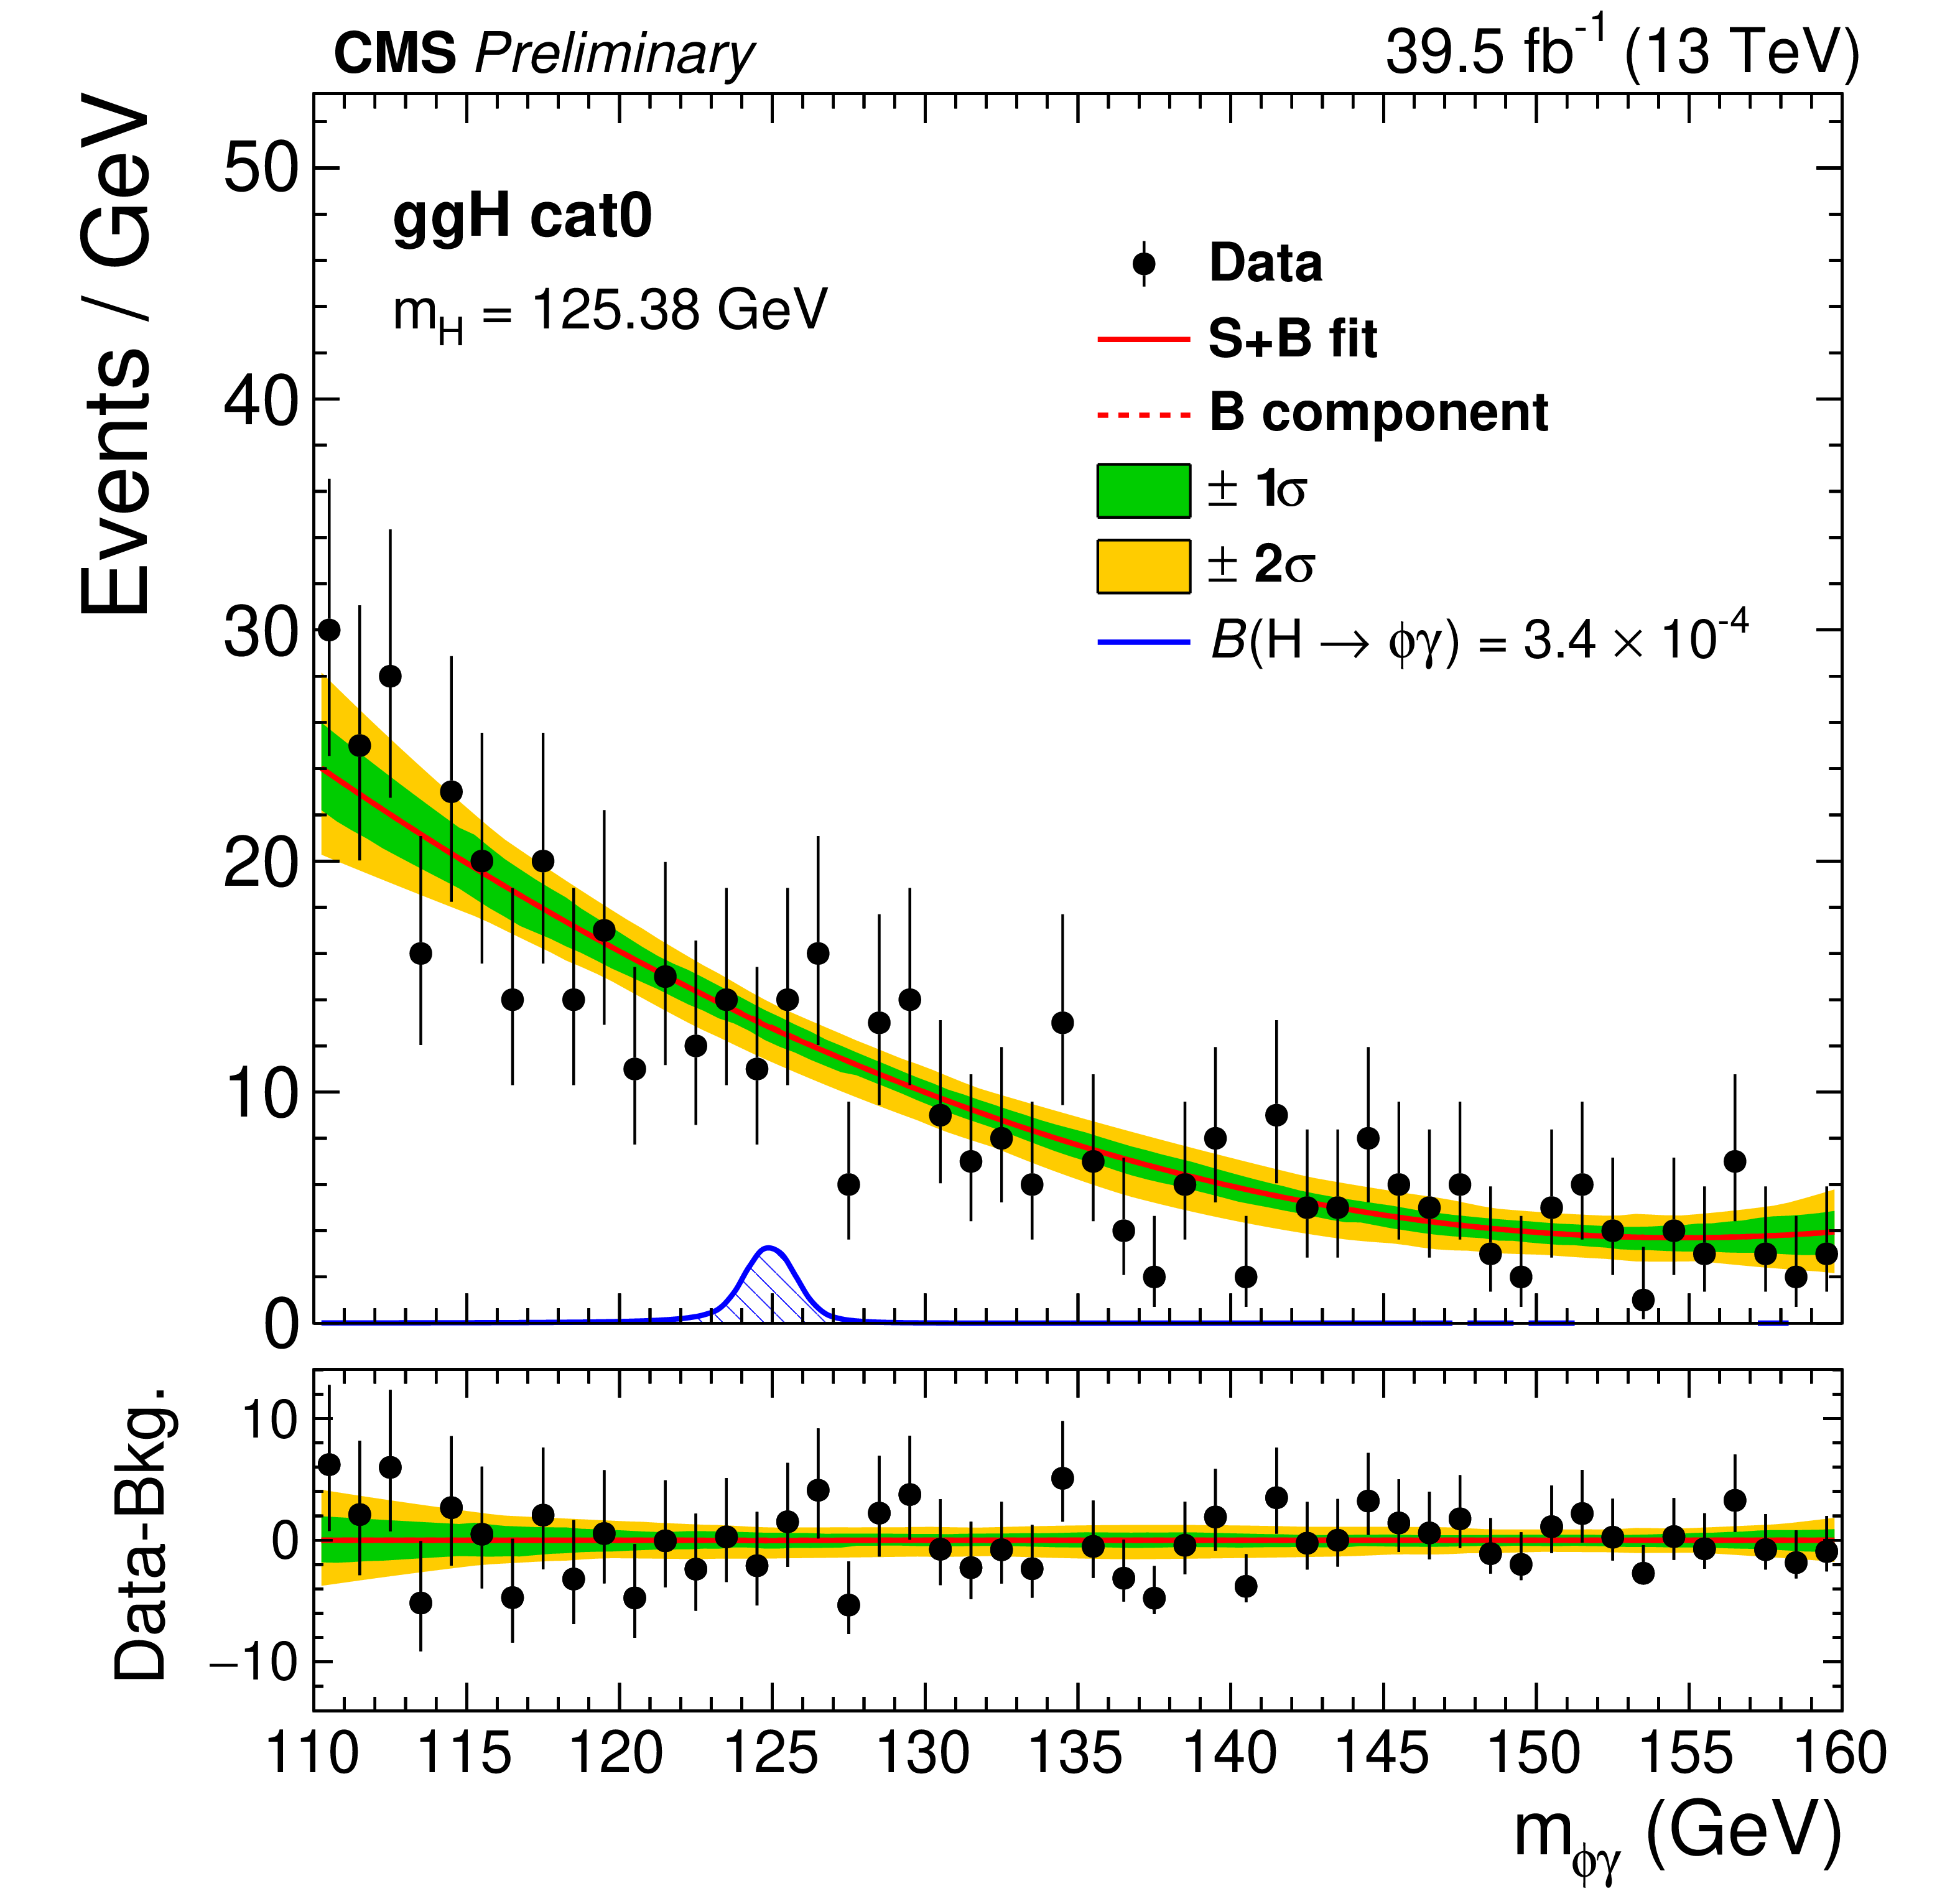
Post-fit $ m_{\mathrm{M}\gamma} $ distributions in data and the background model for ggH cat0 (upper left) and VBF high-$ p_{\mathrm{T}}^\gamma $/cat0 (upper right) of the $ \mathrm{H}\to\rho^0\gamma $ search, ggH cat0 (middle left) and the VH category (middle right) of the $ \mathrm{H}\to\phi\gamma $ search, ggH cat0 (lower left) and the VBF low-$ p_{\mathrm{T}}^\gamma $/cat0 (lower right) of the $ \mathrm{H}\to\mathrm{K^{\ast}(892)}^0\gamma $ search. The signal simulation is shown normalized at a branching fraction corresponding to the expected upper limit. Signal and background fit components, as well as 1- and 2-$ \sigma $ fit uncertainty bands are also shown. |

png pdf |
Figure 3-a:
Post-fit $ m_{\mathrm{M}\gamma} $ distributions in data and the background model for ggH cat0 (upper left) and VBF high-$ p_{\mathrm{T}}^\gamma $/cat0 (upper right) of the $ \mathrm{H}\to\rho^0\gamma $ search, ggH cat0 (middle left) and the VH category (middle right) of the $ \mathrm{H}\to\phi\gamma $ search, ggH cat0 (lower left) and the VBF low-$ p_{\mathrm{T}}^\gamma $/cat0 (lower right) of the $ \mathrm{H}\to\mathrm{K^{\ast}(892)}^0\gamma $ search. The signal simulation is shown normalized at a branching fraction corresponding to the expected upper limit. Signal and background fit components, as well as 1- and 2-$ \sigma $ fit uncertainty bands are also shown. |

png pdf |
Figure 3-b:
Post-fit $ m_{\mathrm{M}\gamma} $ distributions in data and the background model for ggH cat0 (upper left) and VBF high-$ p_{\mathrm{T}}^\gamma $/cat0 (upper right) of the $ \mathrm{H}\to\rho^0\gamma $ search, ggH cat0 (middle left) and the VH category (middle right) of the $ \mathrm{H}\to\phi\gamma $ search, ggH cat0 (lower left) and the VBF low-$ p_{\mathrm{T}}^\gamma $/cat0 (lower right) of the $ \mathrm{H}\to\mathrm{K^{\ast}(892)}^0\gamma $ search. The signal simulation is shown normalized at a branching fraction corresponding to the expected upper limit. Signal and background fit components, as well as 1- and 2-$ \sigma $ fit uncertainty bands are also shown. |
png pdf |
Figure 3-c:
Post-fit $ m_{\mathrm{M}\gamma} $ distributions in data and the background model for ggH cat0 (upper left) and VBF high-$ p_{\mathrm{T}}^\gamma $/cat0 (upper right) of the $ \mathrm{H}\to\rho^0\gamma $ search, ggH cat0 (middle left) and the VH category (middle right) of the $ \mathrm{H}\to\phi\gamma $ search, ggH cat0 (lower left) and the VBF low-$ p_{\mathrm{T}}^\gamma $/cat0 (lower right) of the $ \mathrm{H}\to\mathrm{K^{\ast}(892)}^0\gamma $ search. The signal simulation is shown normalized at a branching fraction corresponding to the expected upper limit. Signal and background fit components, as well as 1- and 2-$ \sigma $ fit uncertainty bands are also shown. |

png pdf |
Figure 3-d:
Post-fit $ m_{\mathrm{M}\gamma} $ distributions in data and the background model for ggH cat0 (upper left) and VBF high-$ p_{\mathrm{T}}^\gamma $/cat0 (upper right) of the $ \mathrm{H}\to\rho^0\gamma $ search, ggH cat0 (middle left) and the VH category (middle right) of the $ \mathrm{H}\to\phi\gamma $ search, ggH cat0 (lower left) and the VBF low-$ p_{\mathrm{T}}^\gamma $/cat0 (lower right) of the $ \mathrm{H}\to\mathrm{K^{\ast}(892)}^0\gamma $ search. The signal simulation is shown normalized at a branching fraction corresponding to the expected upper limit. Signal and background fit components, as well as 1- and 2-$ \sigma $ fit uncertainty bands are also shown. |

png pdf |
Figure 3-e:
Post-fit $ m_{\mathrm{M}\gamma} $ distributions in data and the background model for ggH cat0 (upper left) and VBF high-$ p_{\mathrm{T}}^\gamma $/cat0 (upper right) of the $ \mathrm{H}\to\rho^0\gamma $ search, ggH cat0 (middle left) and the VH category (middle right) of the $ \mathrm{H}\to\phi\gamma $ search, ggH cat0 (lower left) and the VBF low-$ p_{\mathrm{T}}^\gamma $/cat0 (lower right) of the $ \mathrm{H}\to\mathrm{K^{\ast}(892)}^0\gamma $ search. The signal simulation is shown normalized at a branching fraction corresponding to the expected upper limit. Signal and background fit components, as well as 1- and 2-$ \sigma $ fit uncertainty bands are also shown. |

png pdf |
Figure 3-f:
Post-fit $ m_{\mathrm{M}\gamma} $ distributions in data and the background model for ggH cat0 (upper left) and VBF high-$ p_{\mathrm{T}}^\gamma $/cat0 (upper right) of the $ \mathrm{H}\to\rho^0\gamma $ search, ggH cat0 (middle left) and the VH category (middle right) of the $ \mathrm{H}\to\phi\gamma $ search, ggH cat0 (lower left) and the VBF low-$ p_{\mathrm{T}}^\gamma $/cat0 (lower right) of the $ \mathrm{H}\to\mathrm{K^{\ast}(892)}^0\gamma $ search. The signal simulation is shown normalized at a branching fraction corresponding to the expected upper limit. Signal and background fit components, as well as 1- and 2-$ \sigma $ fit uncertainty bands are also shown. |

png pdf |
Figure 4:
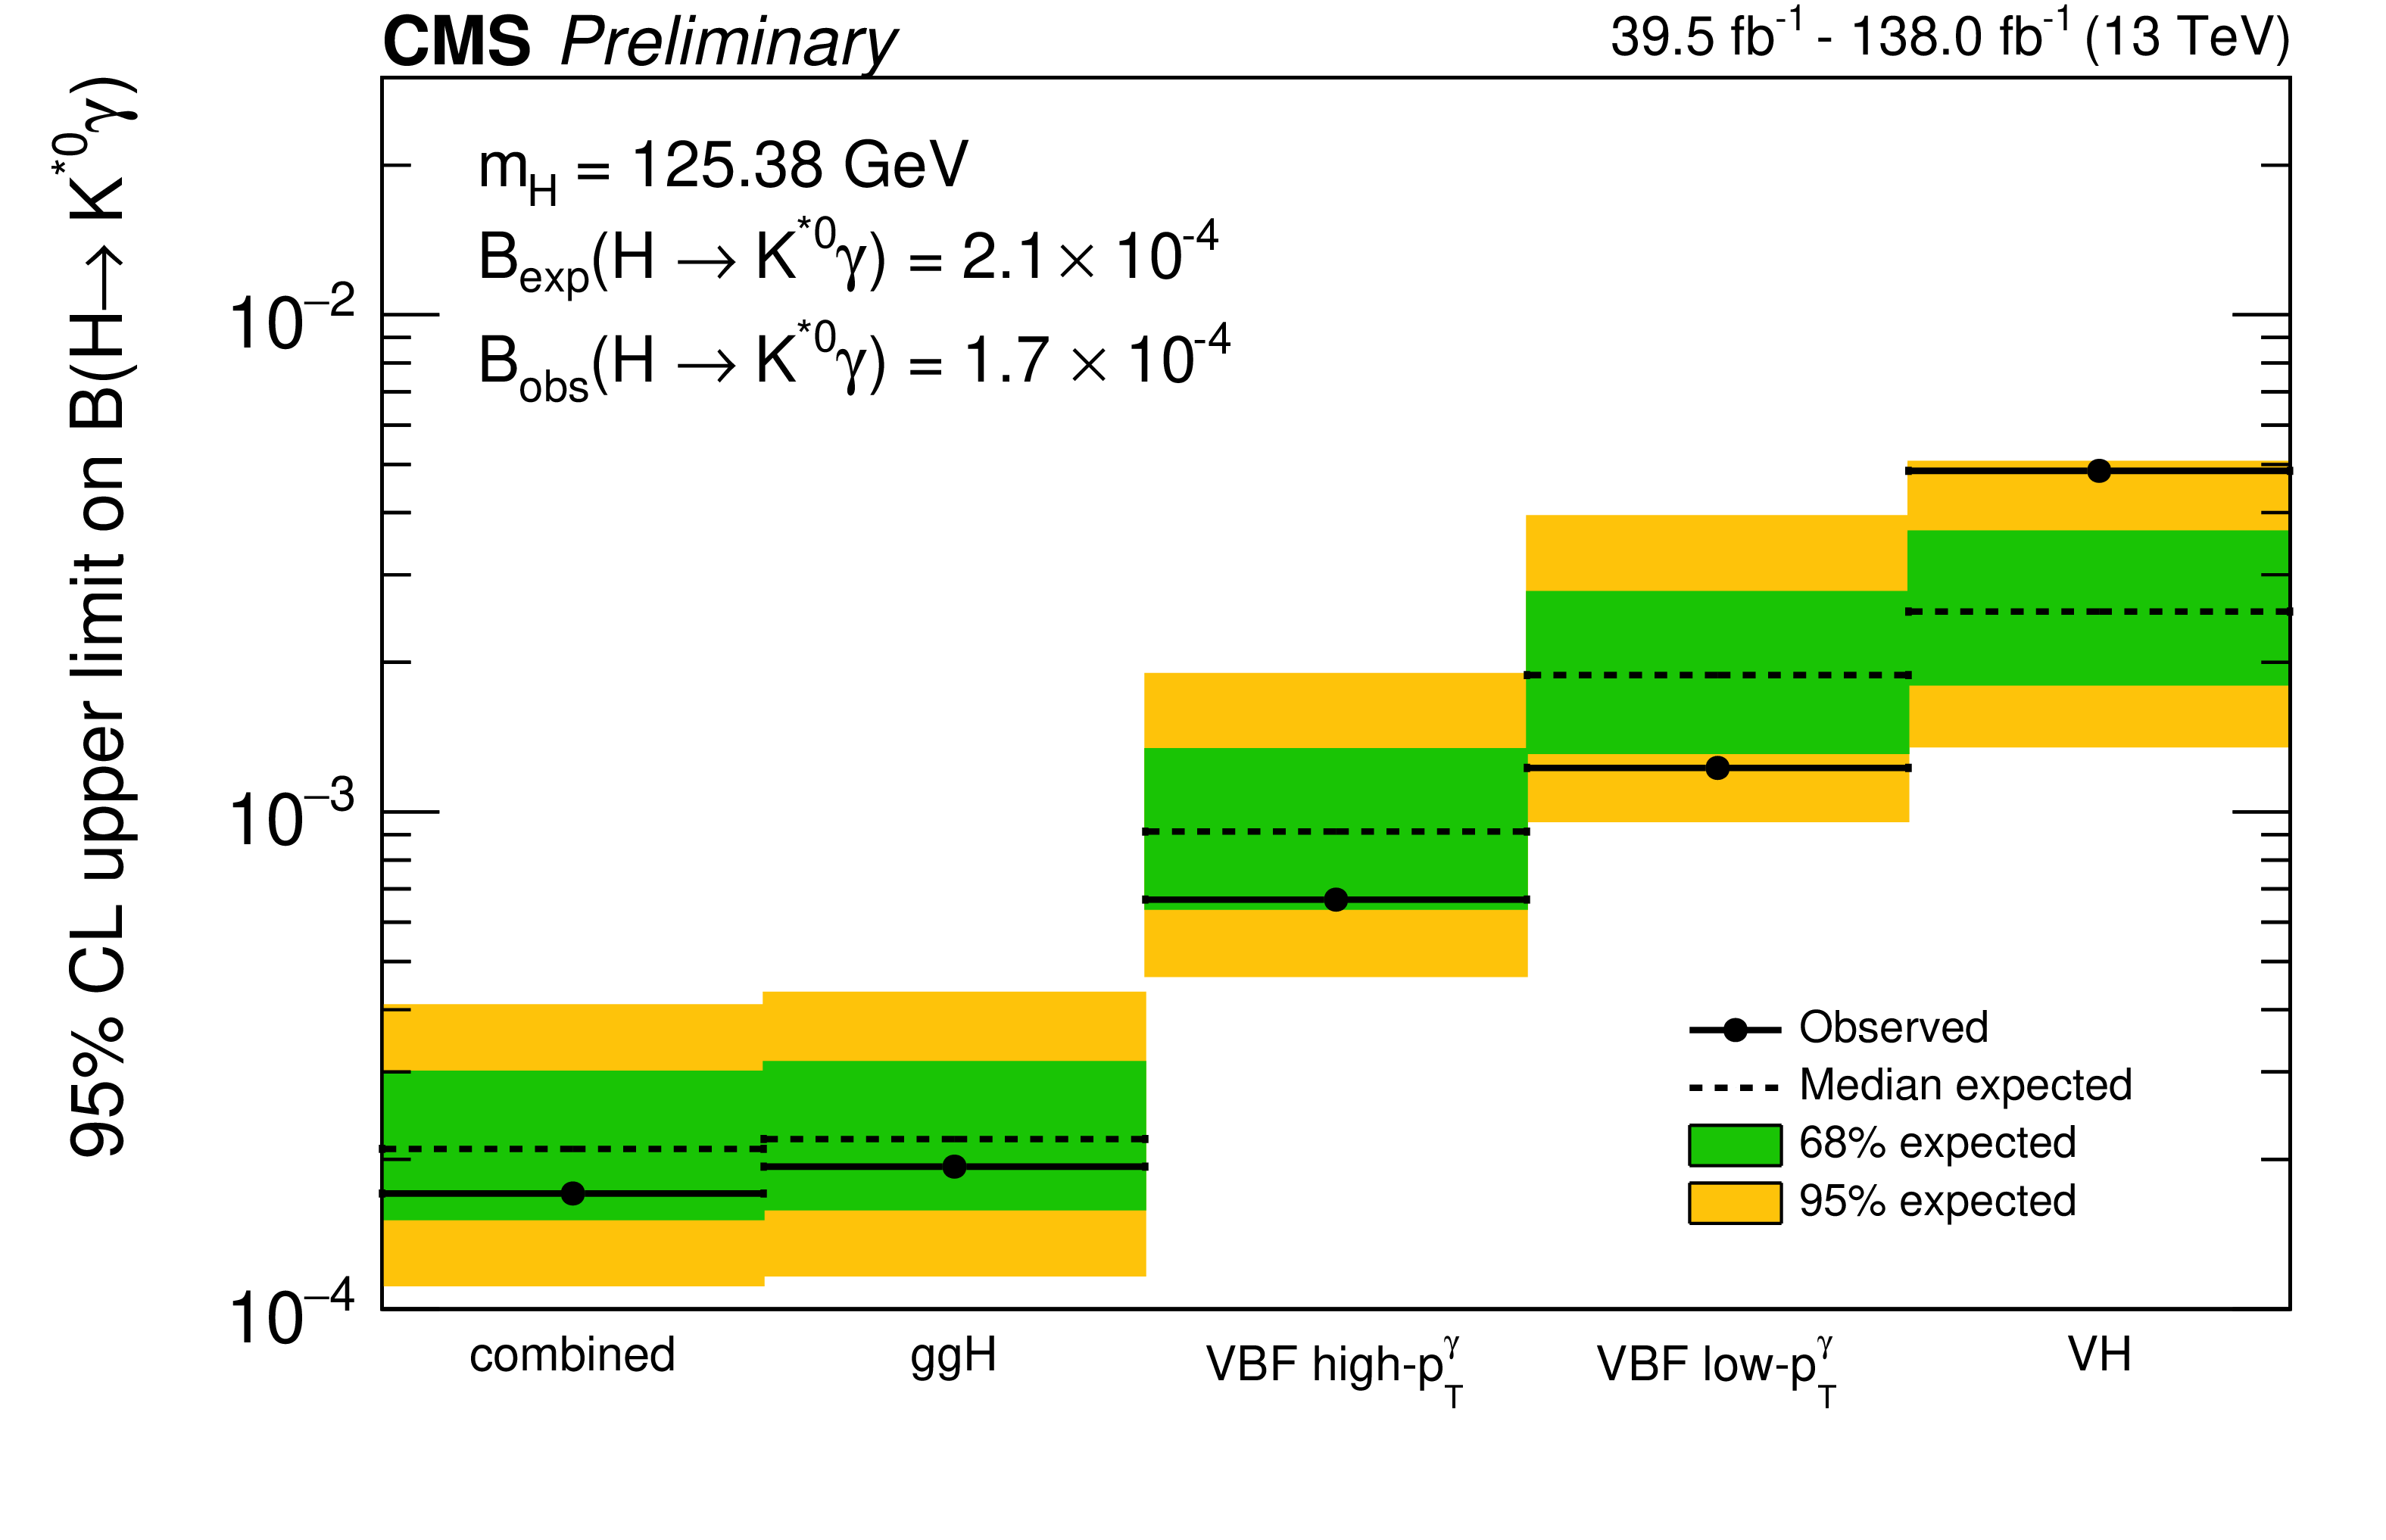
Expected and observed upper limits on $ \mathcal{B}(\mathrm{H}\to\rho^0\gamma) $ (upper left), $ \mathcal{B}(\mathrm{H}\to\phi\gamma) $ (upper right), and $ \mathcal{B}(\mathrm{H}\to\mathrm{K^{\ast}(892)}^0\gamma) $ (lower) split by analysis categories and combined. Green and yellow bands correspond to 1 and 2$ \sigma $ confidence intervals in the expected upper limits. |

png pdf |
Figure 4-a:
Expected and observed upper limits on $ \mathcal{B}(\mathrm{H}\to\rho^0\gamma) $ (upper left), $ \mathcal{B}(\mathrm{H}\to\phi\gamma) $ (upper right), and $ \mathcal{B}(\mathrm{H}\to\mathrm{K^{\ast}(892)}^0\gamma) $ (lower) split by analysis categories and combined. Green and yellow bands correspond to 1 and 2$ \sigma $ confidence intervals in the expected upper limits. |

png pdf |
Figure 4-b:
Expected and observed upper limits on $ \mathcal{B}(\mathrm{H}\to\rho^0\gamma) $ (upper left), $ \mathcal{B}(\mathrm{H}\to\phi\gamma) $ (upper right), and $ \mathcal{B}(\mathrm{H}\to\mathrm{K^{\ast}(892)}^0\gamma) $ (lower) split by analysis categories and combined. Green and yellow bands correspond to 1 and 2$ \sigma $ confidence intervals in the expected upper limits. |
png pdf |
Figure 4-c:
Expected and observed upper limits on $ \mathcal{B}(\mathrm{H}\to\rho^0\gamma) $ (upper left), $ \mathcal{B}(\mathrm{H}\to\phi\gamma) $ (upper right), and $ \mathcal{B}(\mathrm{H}\to\mathrm{K^{\ast}(892)}^0\gamma) $ (lower) split by analysis categories and combined. Green and yellow bands correspond to 1 and 2$ \sigma $ confidence intervals in the expected upper limits. |
| Tables | |
png pdf |
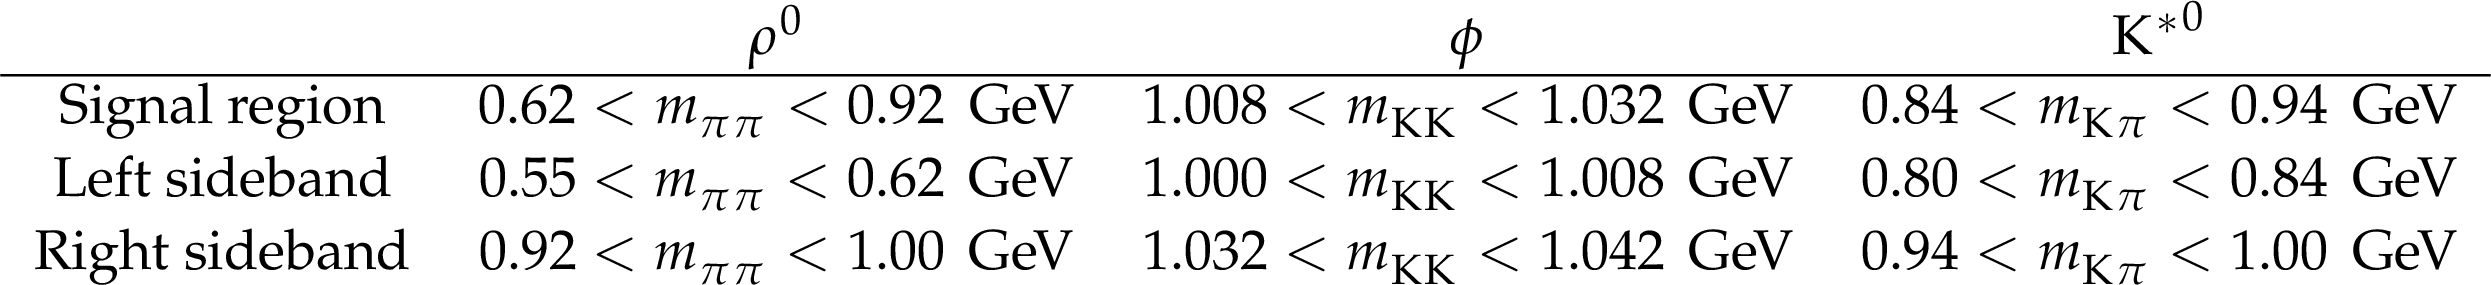
Table 1:
Invariant mass of the di-track system for signal and sideband regions. |

png pdf |
Table 2:
Summary of selections used in the analysis. |

png pdf |
Table 3:
Exclusion limits at 95% CL on the branching fractions of the H boson decays. Observed and median expected limits with the upper and lower bounds in the expected 68% CL intervals are reported. |
| Summary |
| A search was presented for Higgs boson decays into a photon and a $ \rho^0 $(770), $ \phi $(1020), or $ \mathrm{K^{\ast}}^0 $(892) meson, using proton-proton collision data collected by the CMS experiment at the LHC at $ \sqrt{s}= $ 13 TeV. Events are selected in which the mesons decay into pairs of charged pions, pairs of charged kaons, and charged kaon-pion pairs respectively. Depending on the Higgs boson production mode, different signal triggering and reconstruction techniques are adopted. The analysed data sets correspond to an integrated luminosity varying between 39.5 and 138 fb$ ^{-1} $, depending on the targeted final state. By combining all of them, no significant excess above the background expectations is observed. Upper limits at the 95% confidence level on the Higgs boson branching fractions into $ \rho^0\gamma $, $ \phi\gamma $, and $ \mathrm{K^{\ast}(892)}^0\gamma $ are determined to be 3.74 $ \times 10^{-4} $, 2.97 $ \times 10^{-4} $, and 1.71 $ \times 10^{-4} $, respectively. These results constitute the most stringent experimental limits to date on the $ \rho^0\gamma $ and $ \phi\gamma $ decay channels. |
| References | ||||
| 1 | ATLAS Collaboration | Observation of a new particle in the search for the standard model Higgs boson with the ATLAS detector at the LHC | PLB 716 (2012) 1 | 1207.7214 |
| 2 | CMS Collaboration | Observation of a new boson at a mass of 125 GeV with the CMS experiment at the LHC | PLB 716 (2012) 30 | CMS-HIG-12-028 1207.7235 |
| 3 | CMS Collaboration | Observation of a new boson with mass near 125 GeV in pp collisions at $ \sqrt{s} = $ 7 and 8 TeV | JHEP 06 (2013) 081 | CMS-HIG-12-036 1303.4571 |
| 4 | ATLAS Collaboration | Observation of Higgs boson production in association with a top quark pair at the LHC with the ATLAS detector | PLB 784 (2018) 173 | 1806.00425 |
| 5 | CMS Collaboration | Observation of $ \mathrm{t\overline{t}} $H production | PRL 120 (2018) 231801 | CMS-HIG-17-035 1804.02610 |
| 6 | ATLAS Collaboration | Measurements of Higgs boson production cross-sections in the $ H\to\tau^{+}\tau^{-} $ decay channel in pp collisions at $ \sqrt{s} = $ 13 TeV with the ATLAS detector | JHEP 08 (2022) 175 | 2201.08269 |
| 7 | CMS Collaboration | Measurement of the inclusive and differential Higgs boson production cross sections in the decay mode to a pair of $ \tau $ leptons in pp collisions at $ \sqrt{s} = $ 13 TeV | PRL 128 (2022) | CMS-HIG-20-015 2107.11486 |
| 8 | ATLAS Collaboration | Measurements of $ WH $ and $ ZH $ production in the $ H \rightarrow b\bar{b} $ decay channel in $ pp $ collisions at 13 TeV with the ATLAS detector | EPJC 81 (2021) 178 | 2007.02873 |
| 9 | CMS Collaboration | Observation of the Higgs boson decay to bottom quarks | PRL 121 (2018) 121801 | CMS-HIG-18-016 1808.08242 |
| 10 | ATLAS Collaboration | Direct constraint on the Higgs-charm coupling from a search for Higgs boson decays into charm quarks with the ATLAS detector | EPJC 82 (2022) 717 | 2201.11428 |
| 11 | CMS Collaboration | Search for higgs boson decay to a charm quark-antiquark pair in proton-proton collisions at $ \sqrt{s} = $ 13 TeV | PRL 131 (2023) | CMS-HIG-21-008 2205.05550 |
| 12 | CMS Collaboration | Search for Higgs boson decays into Z and J/$ \psi $ and for Higgs and Z boson decays into J/$ \psi $ or $ \Upsilon $ pairs in pp collisions at $ \sqrt{s} = $ 13 TeV | PLB 842 (2023) 137534 | CMS-HIG-20-008 2206.03525 |
| 13 | ATLAS Collaboration | Searches for exclusive Higgs and $ Z $ boson decays into a vector quarkonium state and a photon using 139 fb$ ^{-1} $ of ATLAS $ \sqrt{s}= $ 13 TeV proton-proton collision data | EPJC 83 (2023) | 2208.03122 |
| 14 | CMS Collaboration | Search for rare decays of Z and Higgs bosons to J$ /\psi $ and a photon in proton-proton collisions at $ \sqrt{s} = $ 13 TeV | EPJC 79 (2019) | CMS-SMP-17-012 1810.10056 |
| 15 | CMS Collaboration | Evidence for Higgs boson decay to a pair of muons | JHEP 01 (2021) 148 | CMS-HIG-19-006 2009.04363 |
| 16 | ATLAS Collaboration | A search for the dimuon decay of the Standard Model Higgs boson with the ATLAS detector | PLB 812 (2021) 135980 | 2007.07830 |
| 17 | CMS Collaboration | Search for decays of the 125 GeV Higgs boson into a Z boson and a $ \rho $ or $ \phi $ meson | JHEP 11 (2020) 039 | CMS-HIG-19-012 2007.05122 |
| 18 | ATLAS Collaboration | Erratum to: Search for exclusive Higgs and $ Z $ boson decays to $ \phi\gamma $ and $ \rho\gamma $ with the ATLAS detector | JHEP 12 (2023) 127 | 1712.02758 |
| 19 | ATLAS Collaboration | Search for exclusive Higgs and $ Z $ boson decays to $ \omega\gamma $ and Higgs boson decays to $ K^{*}\gamma $ with the ATLAS detector | PLB 847 (2023) | 2301.09938 |
| 20 | ATLAS Collaboration | Searches for exclusive Higgs boson decays into $ D^*\gamma $ and $ Z $ boson decays into $ D^0\gamma $ and $ K^0_s\gamma $ in $ pp $ collisions at $ \sqrt{s} = $ 13 TeV with the ATLAS detector | Phys. Lett. B. 847 (2024) | 2402.18731 |
| 21 | M. König and M. Neubert | Exclusive Radiative Higgs Decays as Probes of Light-Quark Yukawa Couplings | JHEP 08 (2015) 012 | 1505.03870 |
| 22 | A. L. Kagan et al. | Exclusive Window onto Higgs Yukawa Couplings | PRL 114 (2015) | 1406.1722 |
| 23 | G. Perez, Y. Soreq, E. Stamou, and K. Tobioka | Prospects for measuring the Higgs boson coupling to light quarks | PRD 93 (2016) | 1505.06689 |
| 24 | D. d'Enterria and V. D. Le | Rare and exclusive few-body decays of the Higgs, Z, W bosons, and the top quark | 2312.11211 | |
| 25 | CMS Collaboration | Description and performance of track and primary-vertex reconstruction with the CMS tracker | JINST 9 (2014) P10009 | CMS-TRK-11-001 1405.6569 |
| 26 | CMS Collaboration | Performance of the CMS muon detector and muon reconstruction with proton-proton collisions at $ \sqrt{s} = $ 13 TeV | JINST 13 (2018) P06015 | CMS-MUO-16-001 1804.04528 |
| 27 | CMS Collaboration | Performance of electron reconstruction and selection with the CMS detector in proton-proton collisions at $ \sqrt{s} = $ 8 TeV | JINST 10 (2015) P06005 | CMS-EGM-13-001 1502.02701 |
| 28 | CMS Collaboration | The CMS trigger system | JINST 12 (2017) P01020 | CMS-TRG-12-001 1609.02366 |
| 29 | CMS Collaboration | The CMS experiment at the CERN LHC | JINST 3 (2008) S08004 | |
| 30 | P. Nason | A new method for combining NLO QCD with shower Monte Carlo algorithms | JHEP 11 (2004) 040 | hep-ph/0409146 |
| 31 | S. Frixione, P. Nason, and C. Oleari | Matching NLO QCD computations with parton shower simulations: the POWHEG method | JHEP 11 (2007) 070 | 0709.2092 |
| 32 | S. Alioli, P. Nason, C. Oleari, and E. Re | NLO Higgs boson production via gluon fusion matched with shower in POWHEG | JHEP 04 (2009) 002 | 0812.0578 |
| 33 | S. Alioli, P. Nason, C. Oleari, and E. Re | A general framework for implementing NLO calculations in shower Monte Carlo programs: the POWHEG BOX | JHEP 06 (2010) 043 | 1002.2581 |
| 34 | P. Nason and C. Oleari | NLO Higgs boson production via vector-boson fusion matched with shower in POWHEG | JHEP 02 (2010) 037 | 0911.5299 |
| 35 | G. Luisoni, P. Nason, C. Oleari, and F. Tramontano | HW$ ^{\pm} $/HZ + 0 and 1 jet at NLO with the POWHEG BOX interfaced to GoSam and their merging within MiNLO | JHEP 10 (2013) 083 | 1306.2542 |
| 36 | J. Alwall et al. | The automated computation of tree-level and next-to-leading order differential cross sections, and their matching to parton shower simulations | JHEP 07 (2014) 079 | 1405.0301 |
| 37 | NNPDF Collaboration | Parton distributions from high-precision collider data | EPJC 77 (2017) 663 | 1706.00428 |
| 38 | T. Sjöstrand et al. | An introduction to PYTHIA 8.2 | Comput. Phys. Commun. 191 (2015) 159 | 1410.3012 |
| 39 | CMS Collaboration | Extraction and validation of a new set of CMS PYTHIA8 tunes from underlying-event measurements | EPJC 80 (2020) 4 | CMS-GEN-17-001 1903.12179 |
| 40 | D. J. Lange | The EvtGen particle decay simulation package | Nuclear Instruments and Methods in Physics Research Section A: Accelerators, Spectrometers. BEAUTY, Proceedings of the 7th Int. Conf. on B-Physics at Hadron Machines, 2001 link |
|
| 41 | LHC Higgs Cross Section Working Group | Handbook of LHC Higgs cross sections: 4. Deciphering the nature of the Higgs sector | CERN Report CERN-2017-002-M, 2016 link |
1610.07922 |
| 42 | Particle Data Group Collaboration | Review of Particle Physics | Prog. Theor. Exp. Phys. 2022 (2022) 083C01 | |
| 43 | GEANT4 Collaboration | GEANT 4---a simulation toolkit | NIM A 506 (2003) 250 | |
| 44 | CMS Collaboration | Particle-flow reconstruction and global event description with the CMS detector | JINST 12 (2017) P10003 | CMS-PRF-14-001 1706.04965 |
| 45 | M. Cacciari, G. P. Salam, and G. Soyez | The anti-$ k_{\mathrm{T}} $ jet clustering algorithm | JHEP 04 (2008) 063 | 0802.1189 |
| 46 | M. Cacciari, G. P. Salam, and G. Soyez | FastJet user manual | EPJC 72 (2012) 1896 | 1111.6097 |
| 47 | CMS Collaboration | Measurement of the inelastic proton-proton cross section at $ \sqrt{s}= $ 13 TeV | JHEP 07 (2018) 161 | CMS-FSQ-15-005 1802.02613 |
| 48 | CMS Collaboration | Electron and photon reconstruction and identification with the CMS experiment at the CERN LHC | JINST 16 (2021) | CMS-EGM-17-001 2012.06888 |
| 49 | CMS Collaboration | Measurements of inclusive W and Z cross sections in pp collisions at $ \sqrt{s}= $ 7 TeV | JHEP 01 (2011) 080 | CMS-EWK-10-002 1012.2466 |
| 50 | CMS Collaboration | Pileup mitigation at CMS in 13 TeV data | JINST 15 (2020) P09018 | CMS-JME-18-001 2003.00503 |
| 51 | CMS Collaboration | Jet energy scale and resolution in the CMS experiment in pp collisions at 8 TeV | JINST 12 (2017) | CMS-JME-13-004 1607.03663 |
| 52 | E. Chabanat et al. | Vertex reconstruction in CMS | NIM A 549 (2005) 188 | |
| 53 | CMS Collaboration | Performance of reconstruction and identification of $ \tau $ leptons decaying to hadrons and $ \nu_\tau $ in pp collisions at $ \sqrt{s}= $ 13 TeV | JINST 13 (2018) | CMS-TAU-16-003 1809.02816 |
| 54 | A. Hoecker et al. | TMVA - Toolkit for Multivariate Data Analysis | link | |
| 55 | T. Chen and C. Guestrin | XGBoost: A scalable tree boosting system | link | 1603.02754 |
| 56 | D. L. Rainwater, R. Szalapski, and D. Zeppenfeld | Probing color singlet exchange in $ Z $ + two jet events at the CERN LHC | PRD 54 (1996) 6680 | hep-ph/9605444 |
| 57 | T. Junk | Confidence level computation for combining searches with small statistics | NIM A 434 (1999) 435 | hep-ex/9902006 |
| 58 | A. L. Read | Presentation of search results: The CL$ _{\text{s}} $ technique | JPG 28 (2002) 2693 | |
| 59 | G. Cowan, K. Cranmer, E. Gross, and O. Vitells | Asymptotic formulae for likelihood-based tests of new physics | EPJC 71 (2011) 1554 | 1007.1727 |
| 60 | P. D. Dauncey, M. Kenzie, N. Wardle, and G. J. Davies | Handling uncertainties in background shapes: the discrete profiling method | JINST 10 (2015) P04015 | 1408.6865 |
| 61 | CMS Collaboration | Precision luminosity measurement in proton-proton collisions at $ \sqrt{s} = $ 13 TeV in 2015 and 2016 at CMS | EPJC 81 (2021) 800 | CMS-LUM-17-003 2104.01927 |
| 62 | CMS Collaboration | CMS luminosity measurement for the 2017 data-taking period at $ \sqrt{s} = $ 13 TeV | CMS Physics Analysis Summary, 2018 CMS-PAS-LUM-17-004 |
CMS-PAS-LUM-17-004 |
| 63 | CMS Collaboration | CMS luminosity measurement for the 2018 data-taking period at $ \sqrt{s} = $ 13 TeV | CMS Physics Analysis Summary, 2019 CMS-PAS-LUM-18-002 |
CMS-PAS-LUM-18-002 |
|
|
Compact Muon Solenoid LHC, CERN |
|

|

|

|

|

|