

Compact Muon Solenoid
LHC, CERN
| CMS-PAS-SUS-16-022 | ||
| Search for supersymmetry with multileptons in 13 TeV data | ||
| CMS Collaboration | ||
| August 2016 | ||
| Abstract: A search for new physics is performed using events with multileptons ($ \ge 3 $ electrons or muons) in the final state at the CMS detector. Results are based on a sample of proton-proton collisions collected in 2016 at a center-of-mass energy of 13 TeV at the LHC corresponding to an integrated luminosity of 12.9 fb$^{-1}$. A similar search has been performed with data collected in 2015. With respect to the previous search, minor updates in the object selection have been made and signal regions have been partially redefined to improve the sensitivity of the analysis with the larger integrated luminosity available. Search regions are defined by the number of b-tagged jets, missing transverse energy, hadronic transverse energy, and the invariant mass of opposite-sign, same-flavor dilepton pairs in the events. No significant excess above the standard model background expectation is observed. | ||
| Links: CDS record (PDF) ; inSPIRE record ; CADI line (restricted) ; | ||
| Figures & Tables | Summary | Additional Figures & Tables | References | CMS Publications |
|---|
| Additional information on efficiencies needed for reinterpretation of these results are available here. |
| Figures | |
png pdf |
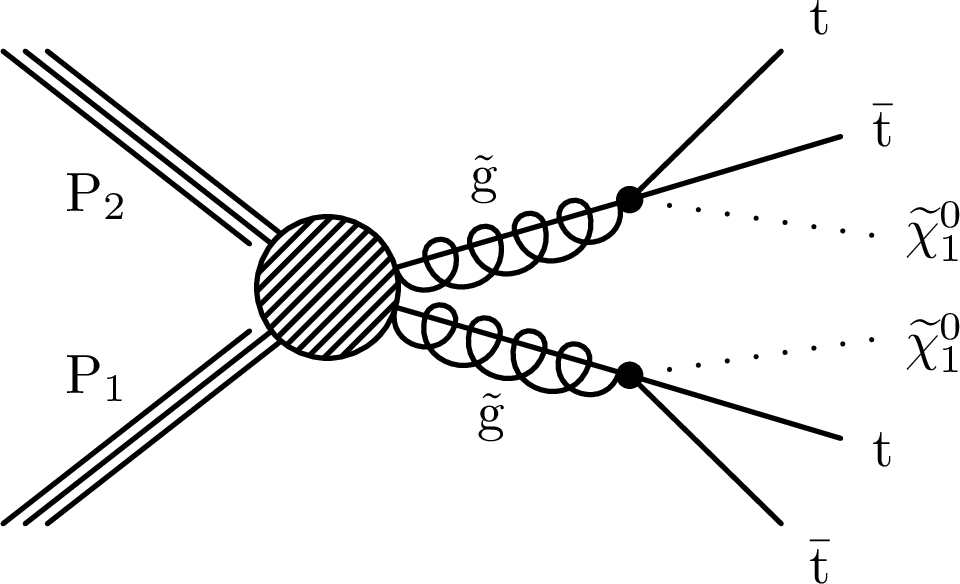
Figure 1-a:
Diagrams for gluino pair production models which can produce multilepton events: T1tttt (a) and T5qqqqVV (b). |

png pdf |
Figure 1-b:
Diagrams for gluino pair production models which can produce multilepton events: T1tttt (a) and T5qqqqVV (b). |
png pdf |
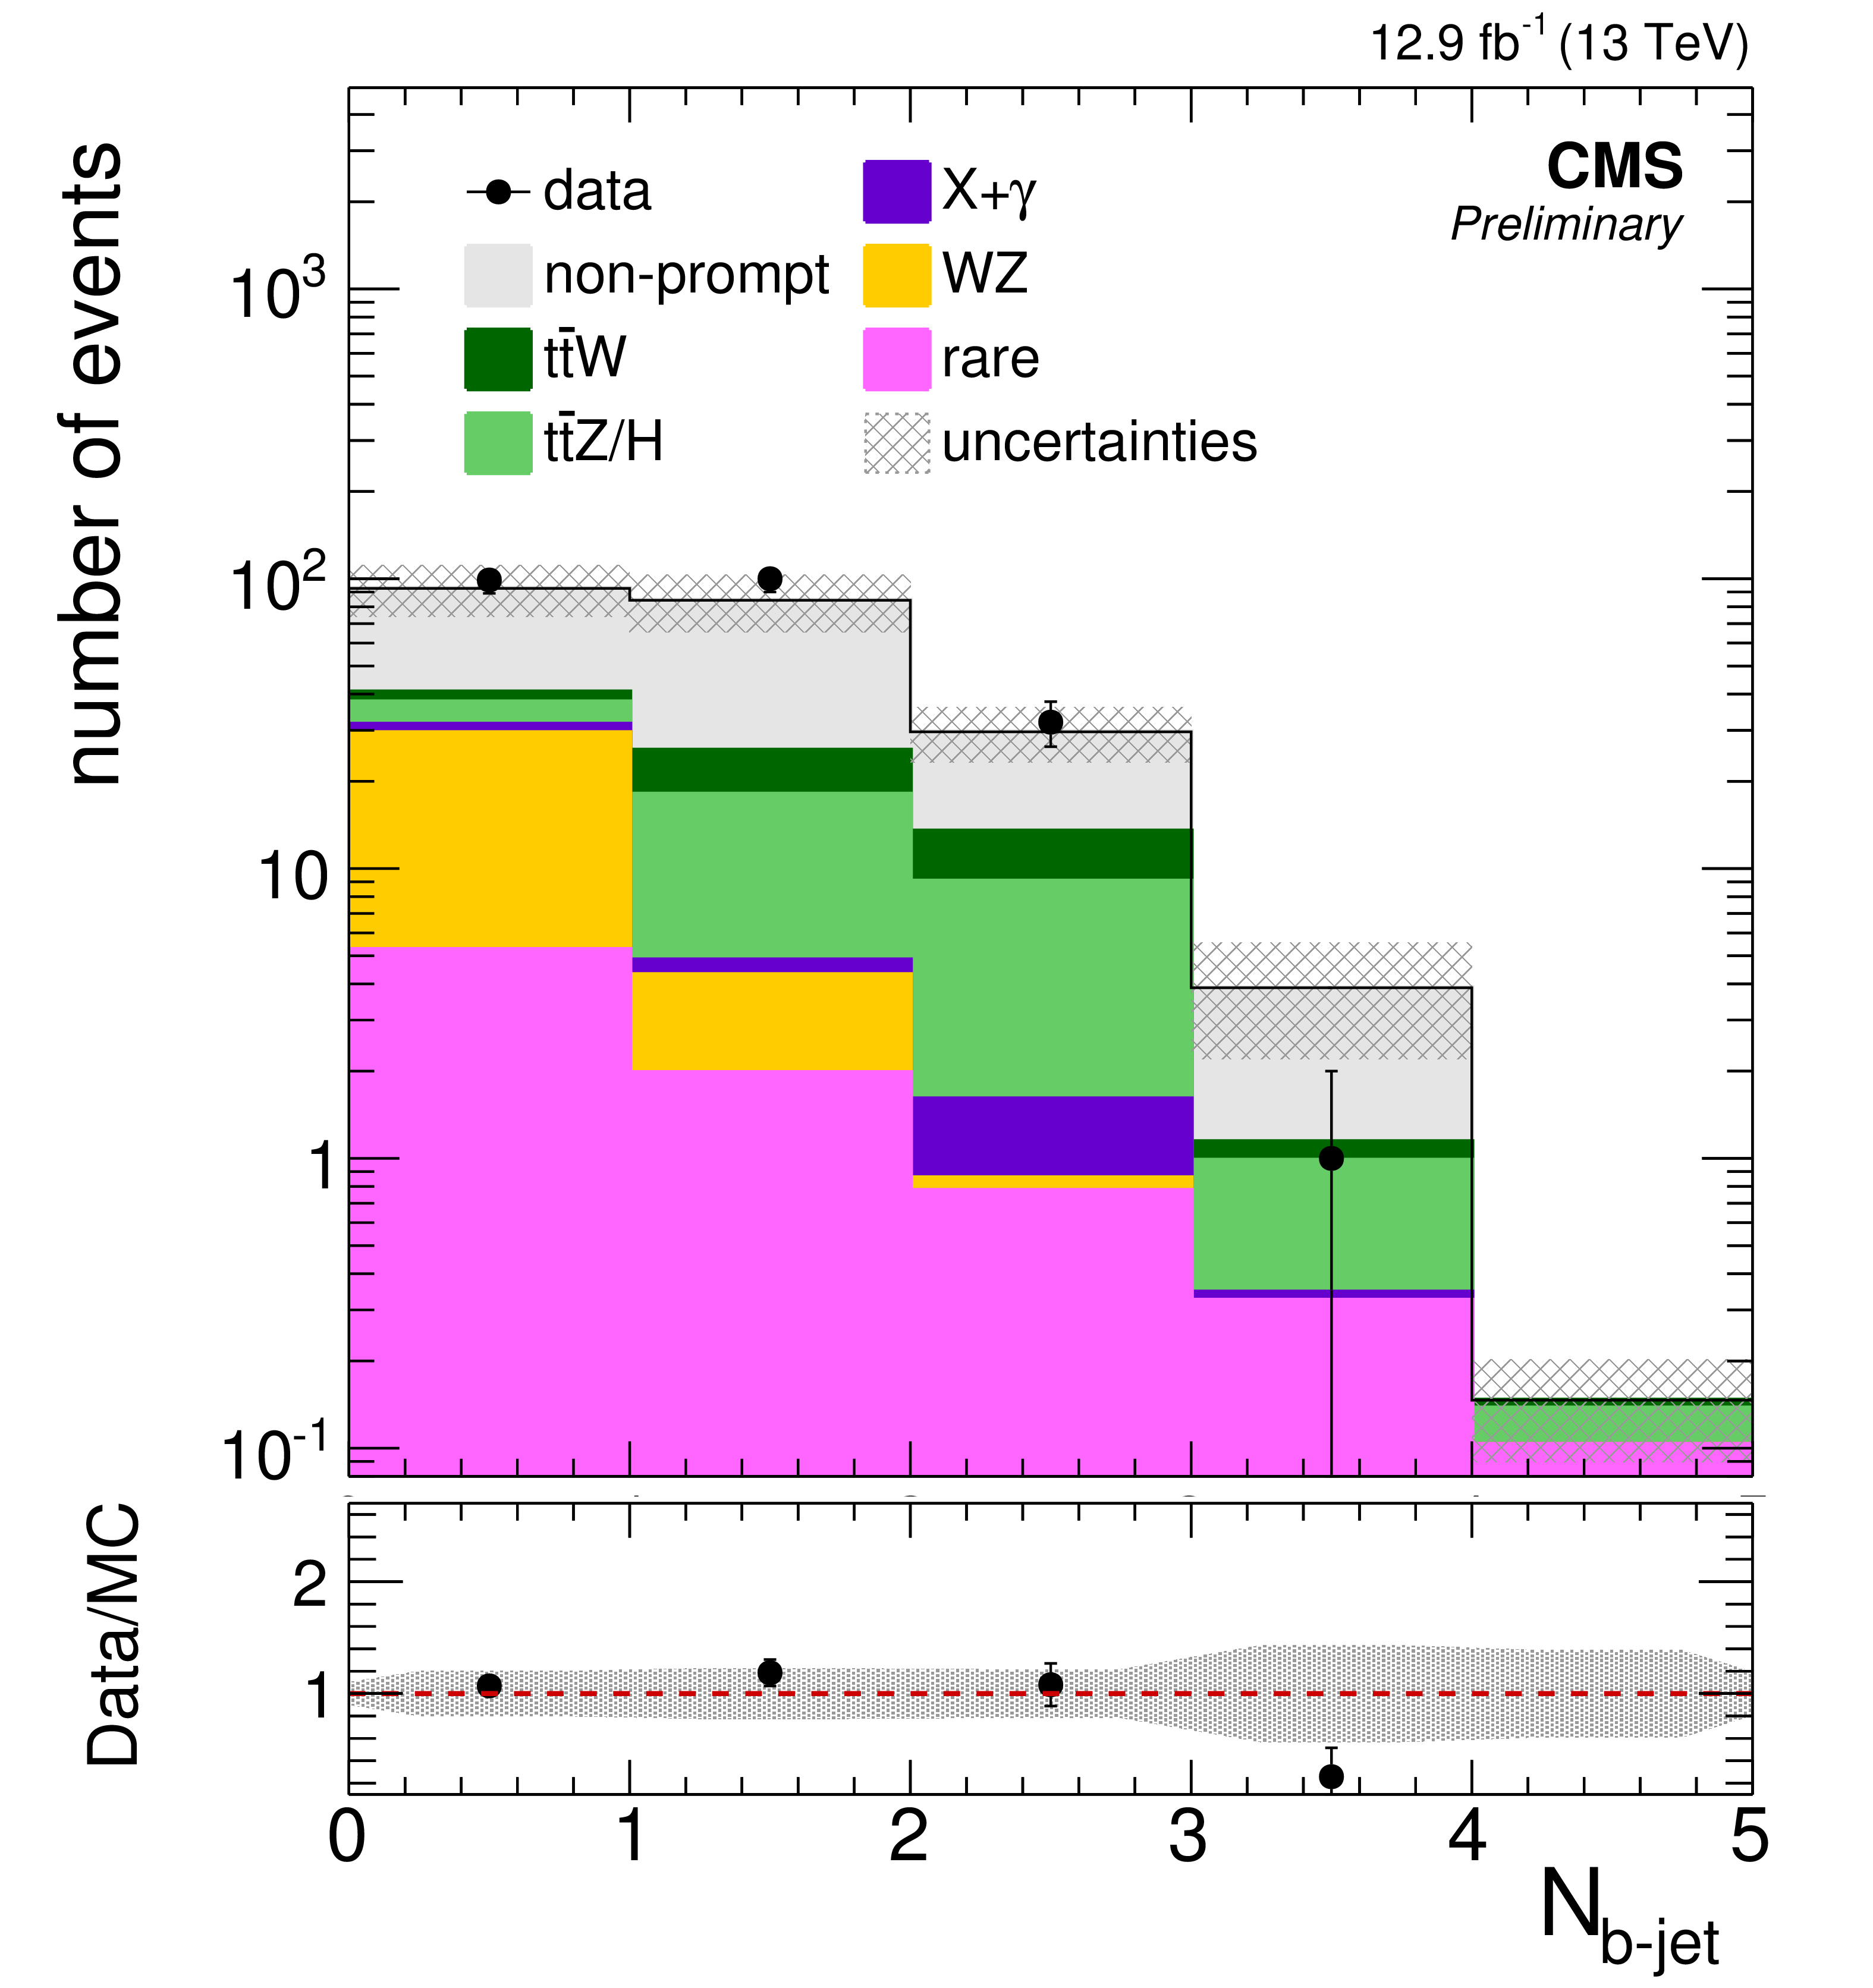
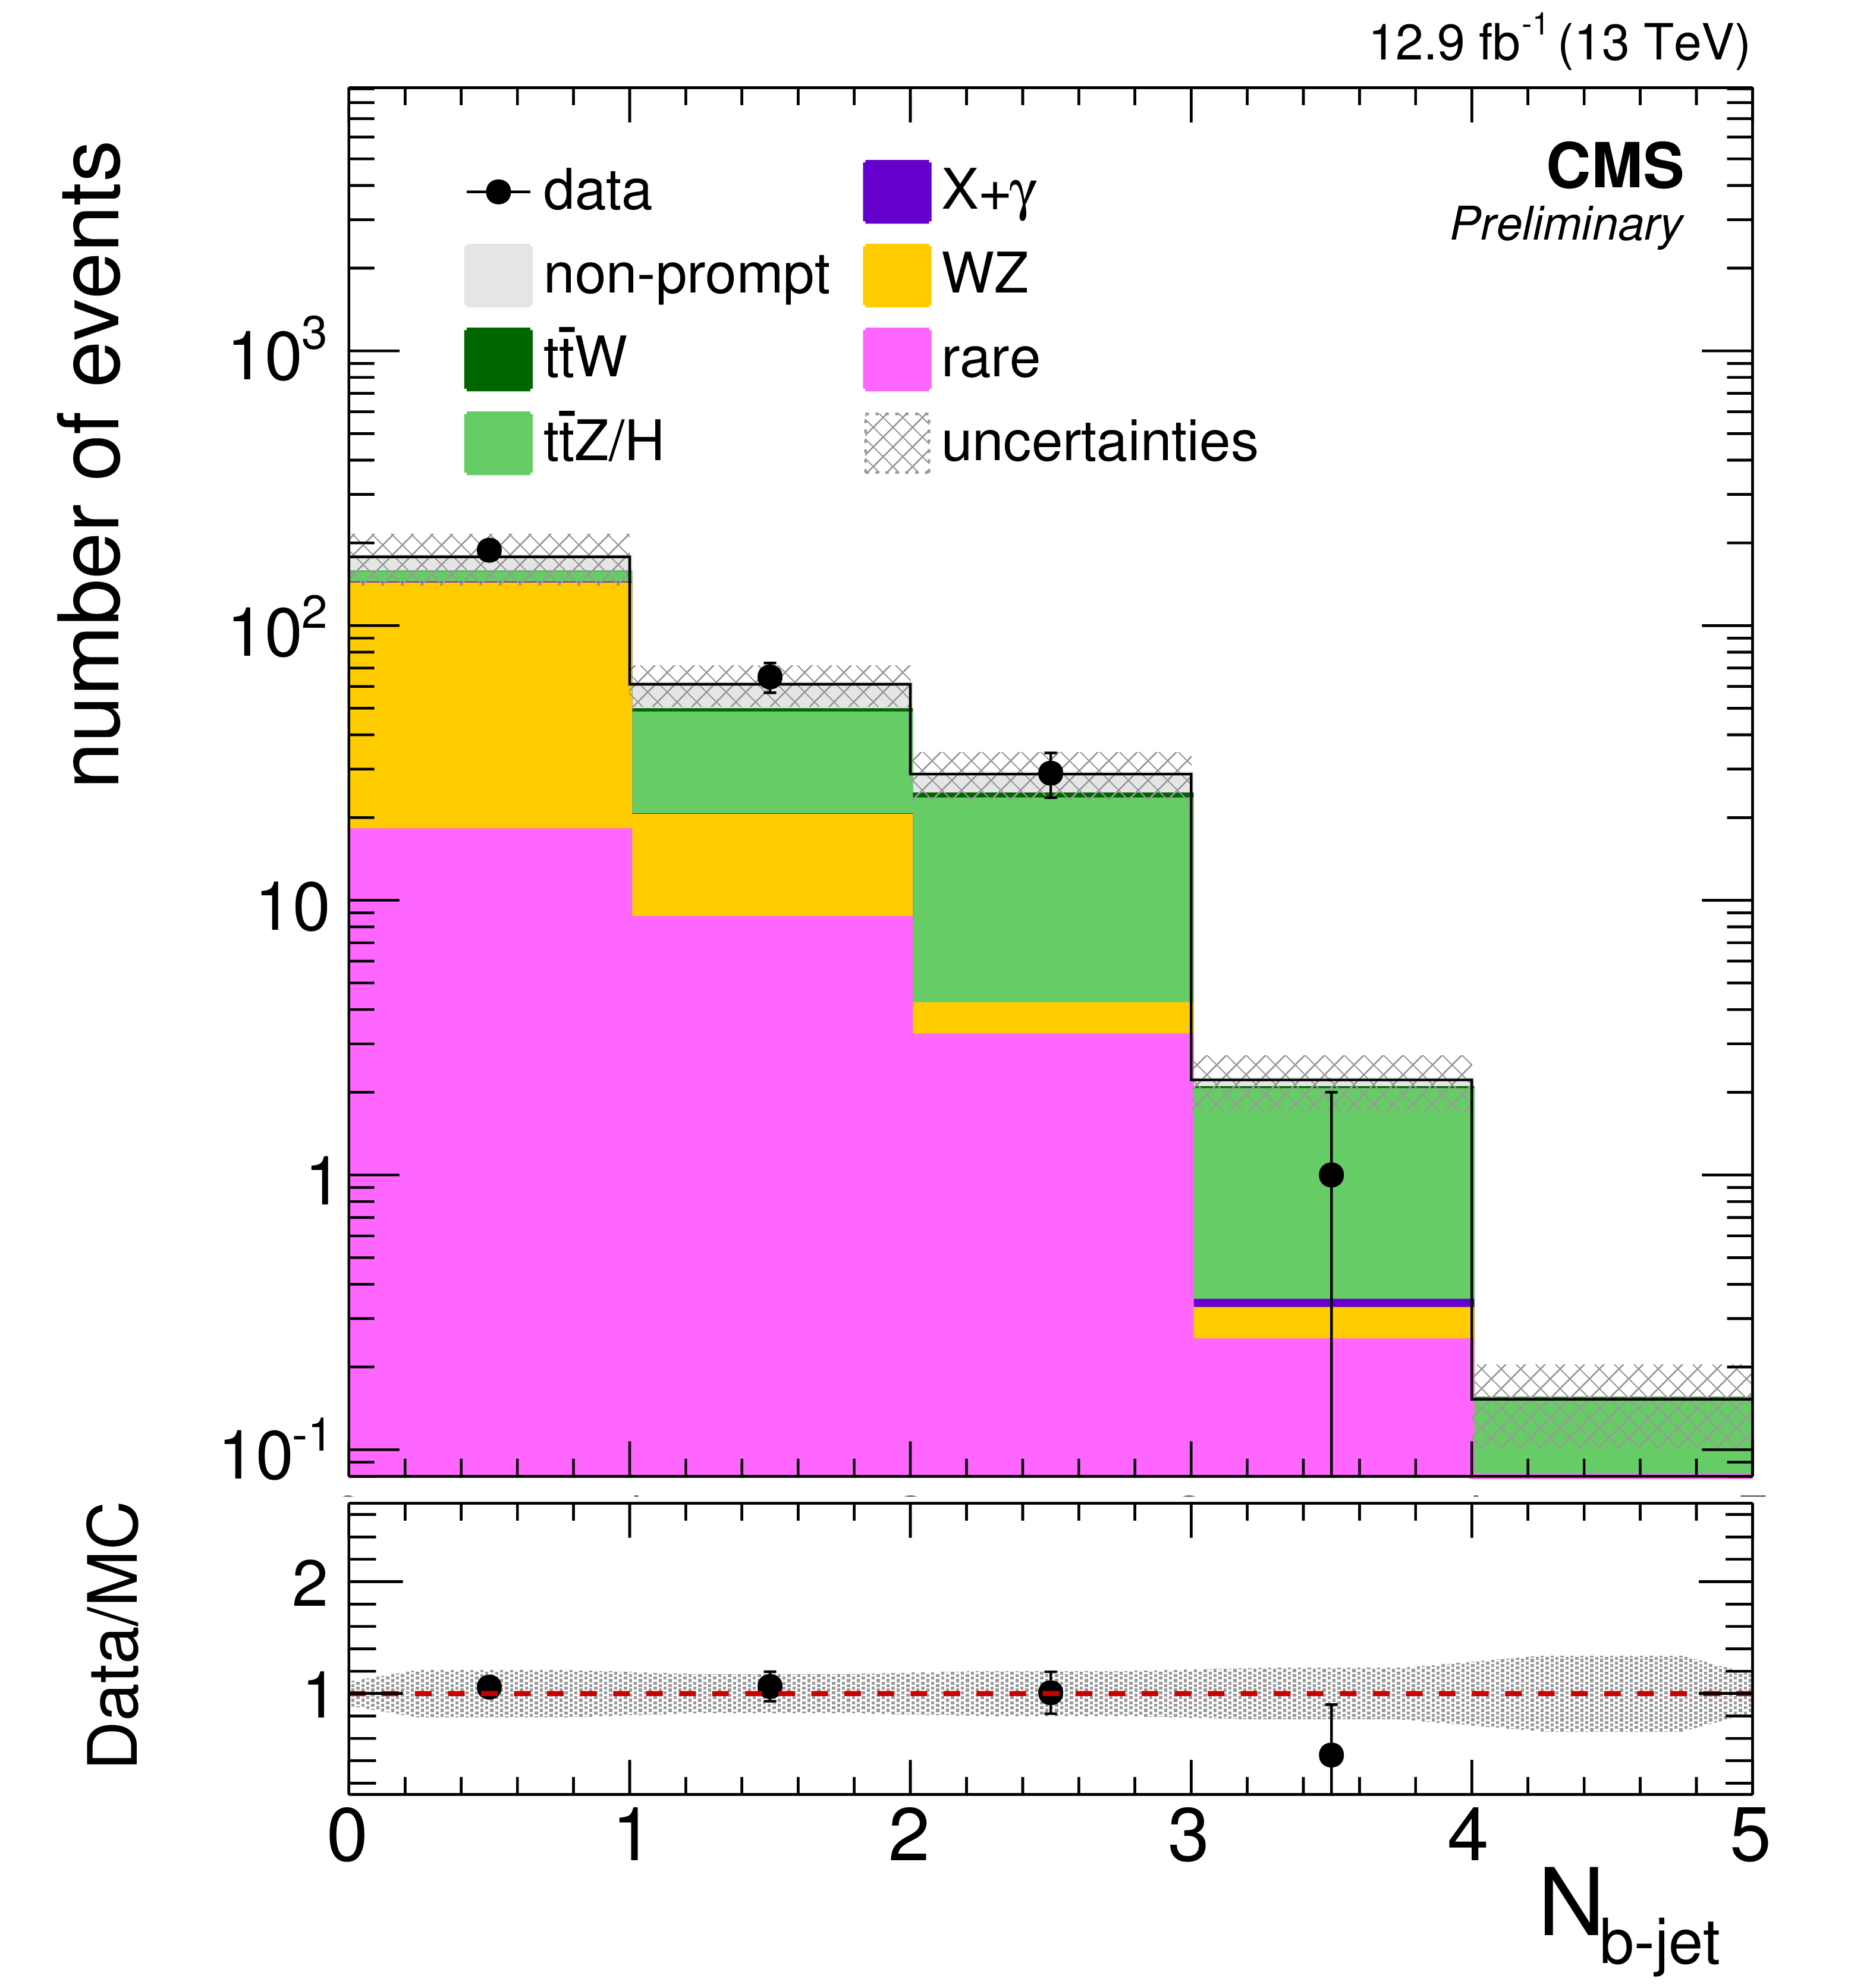
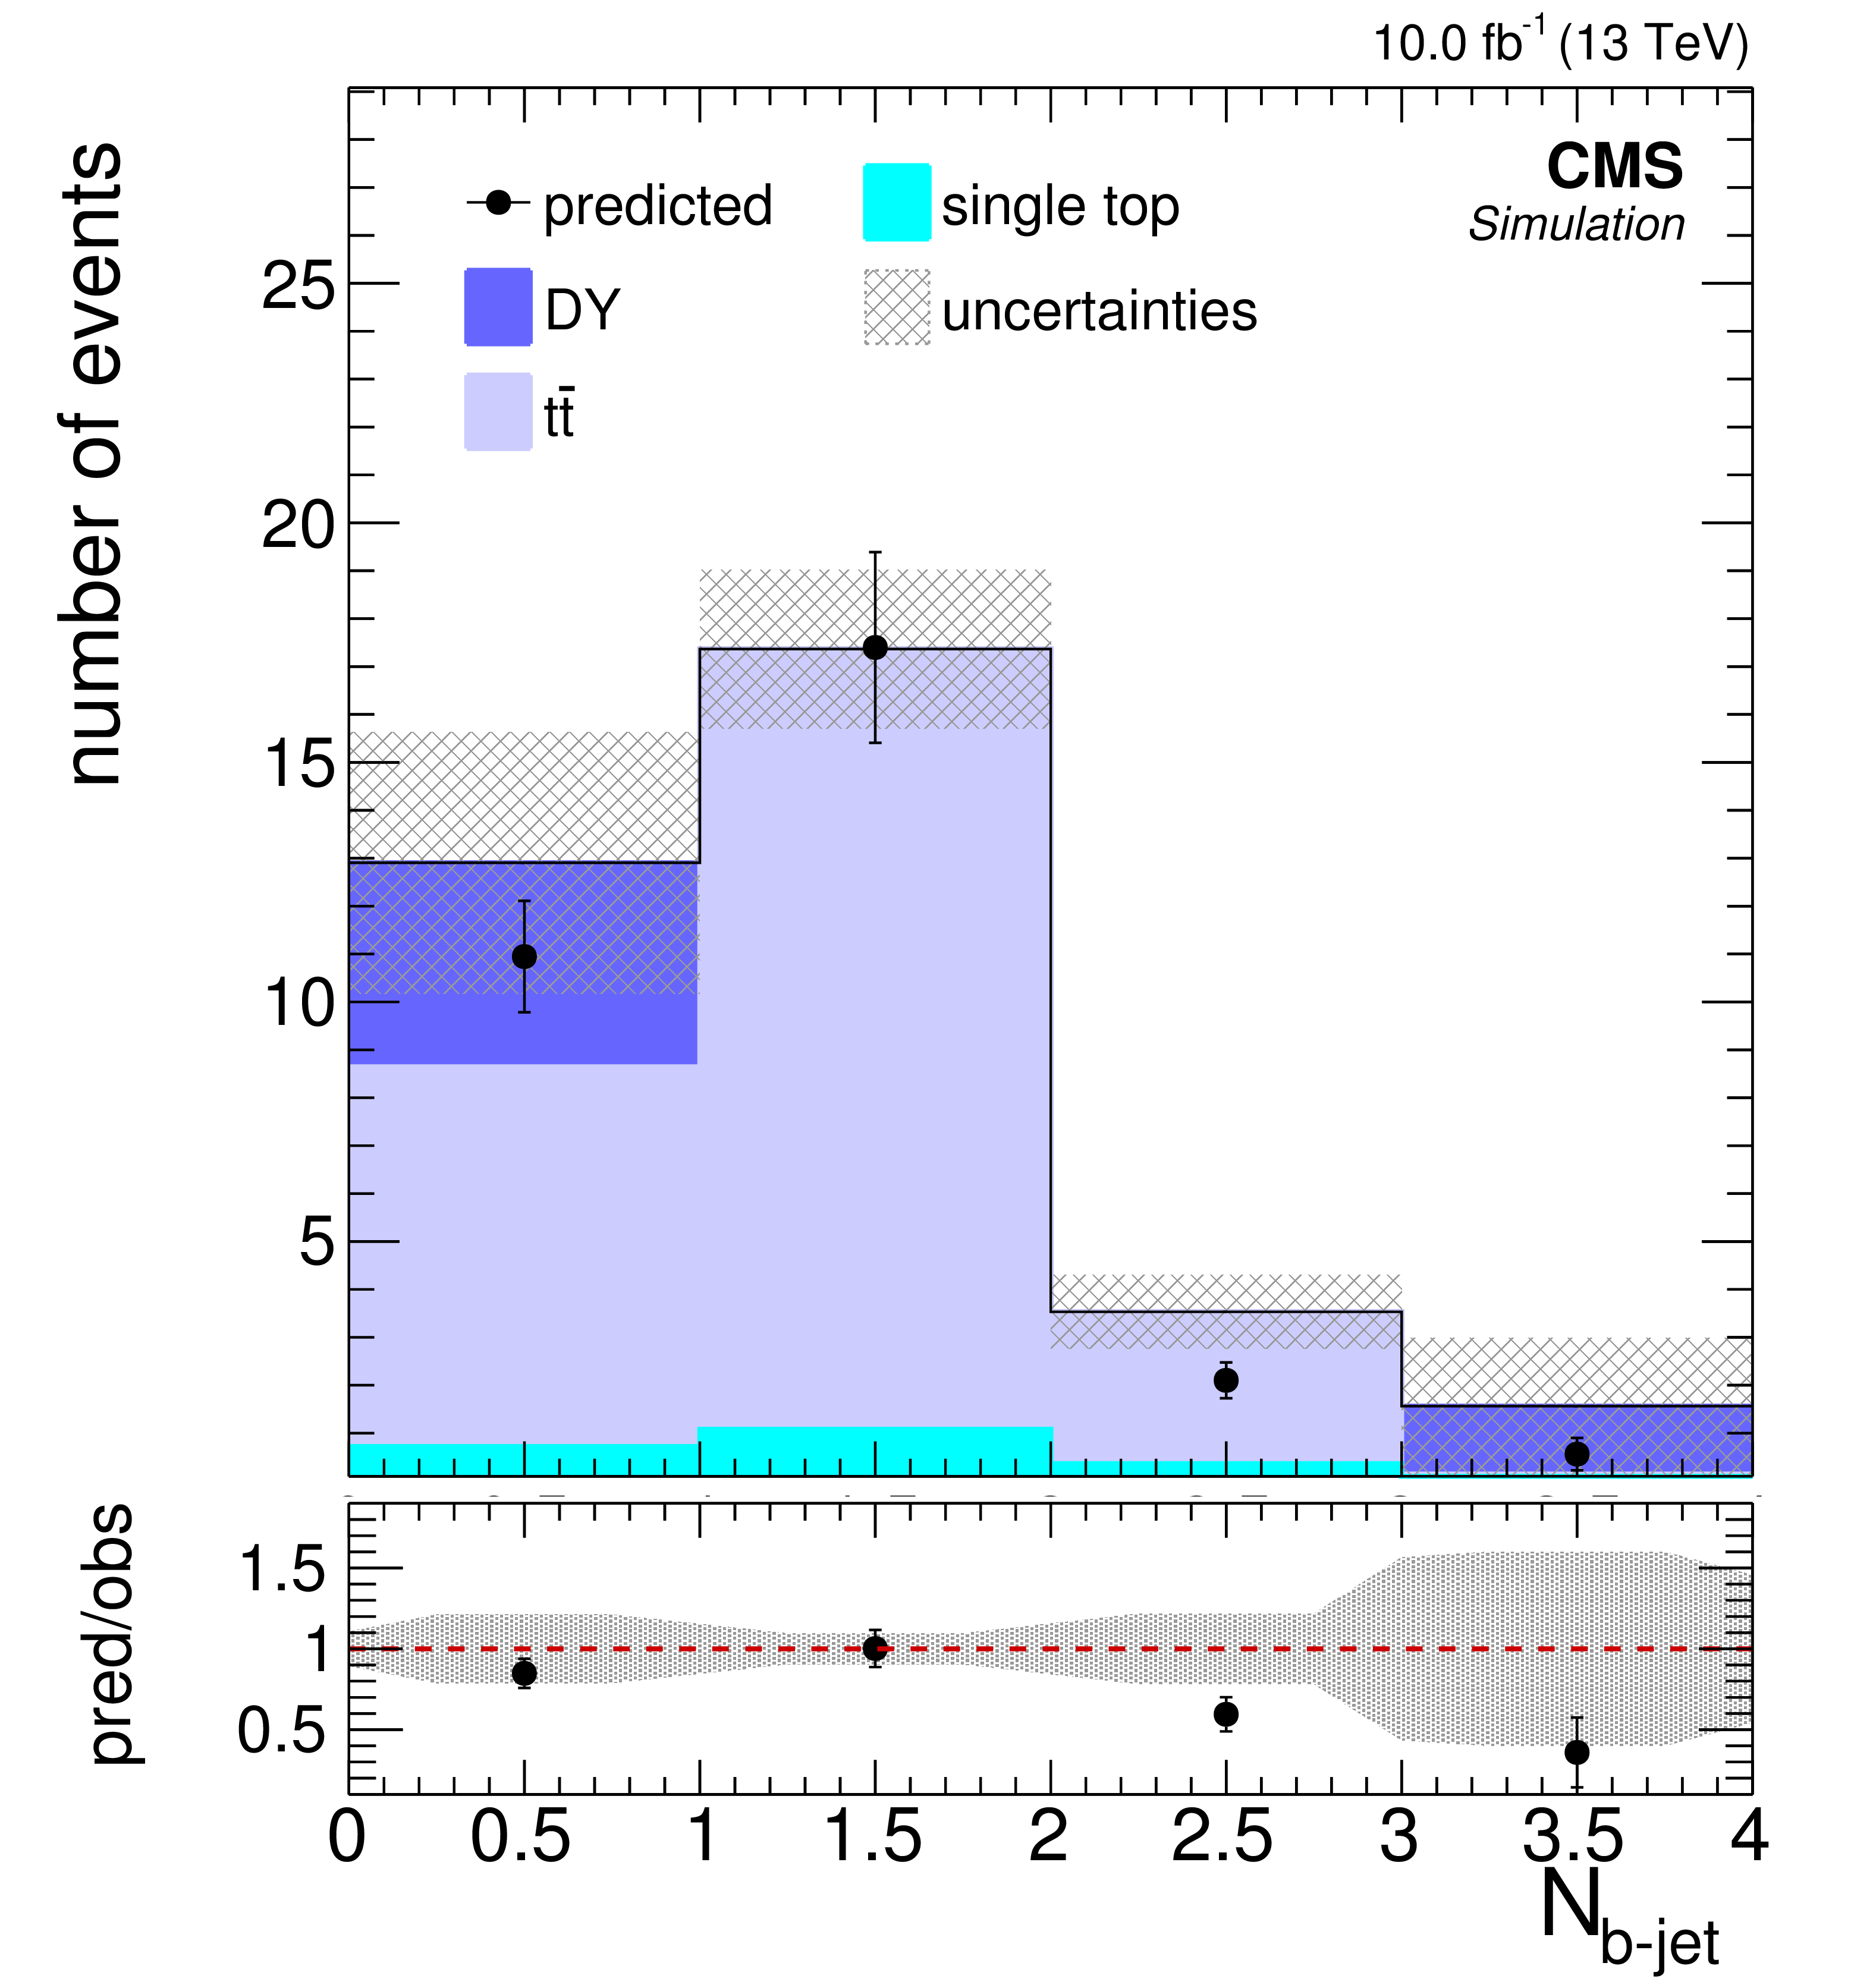
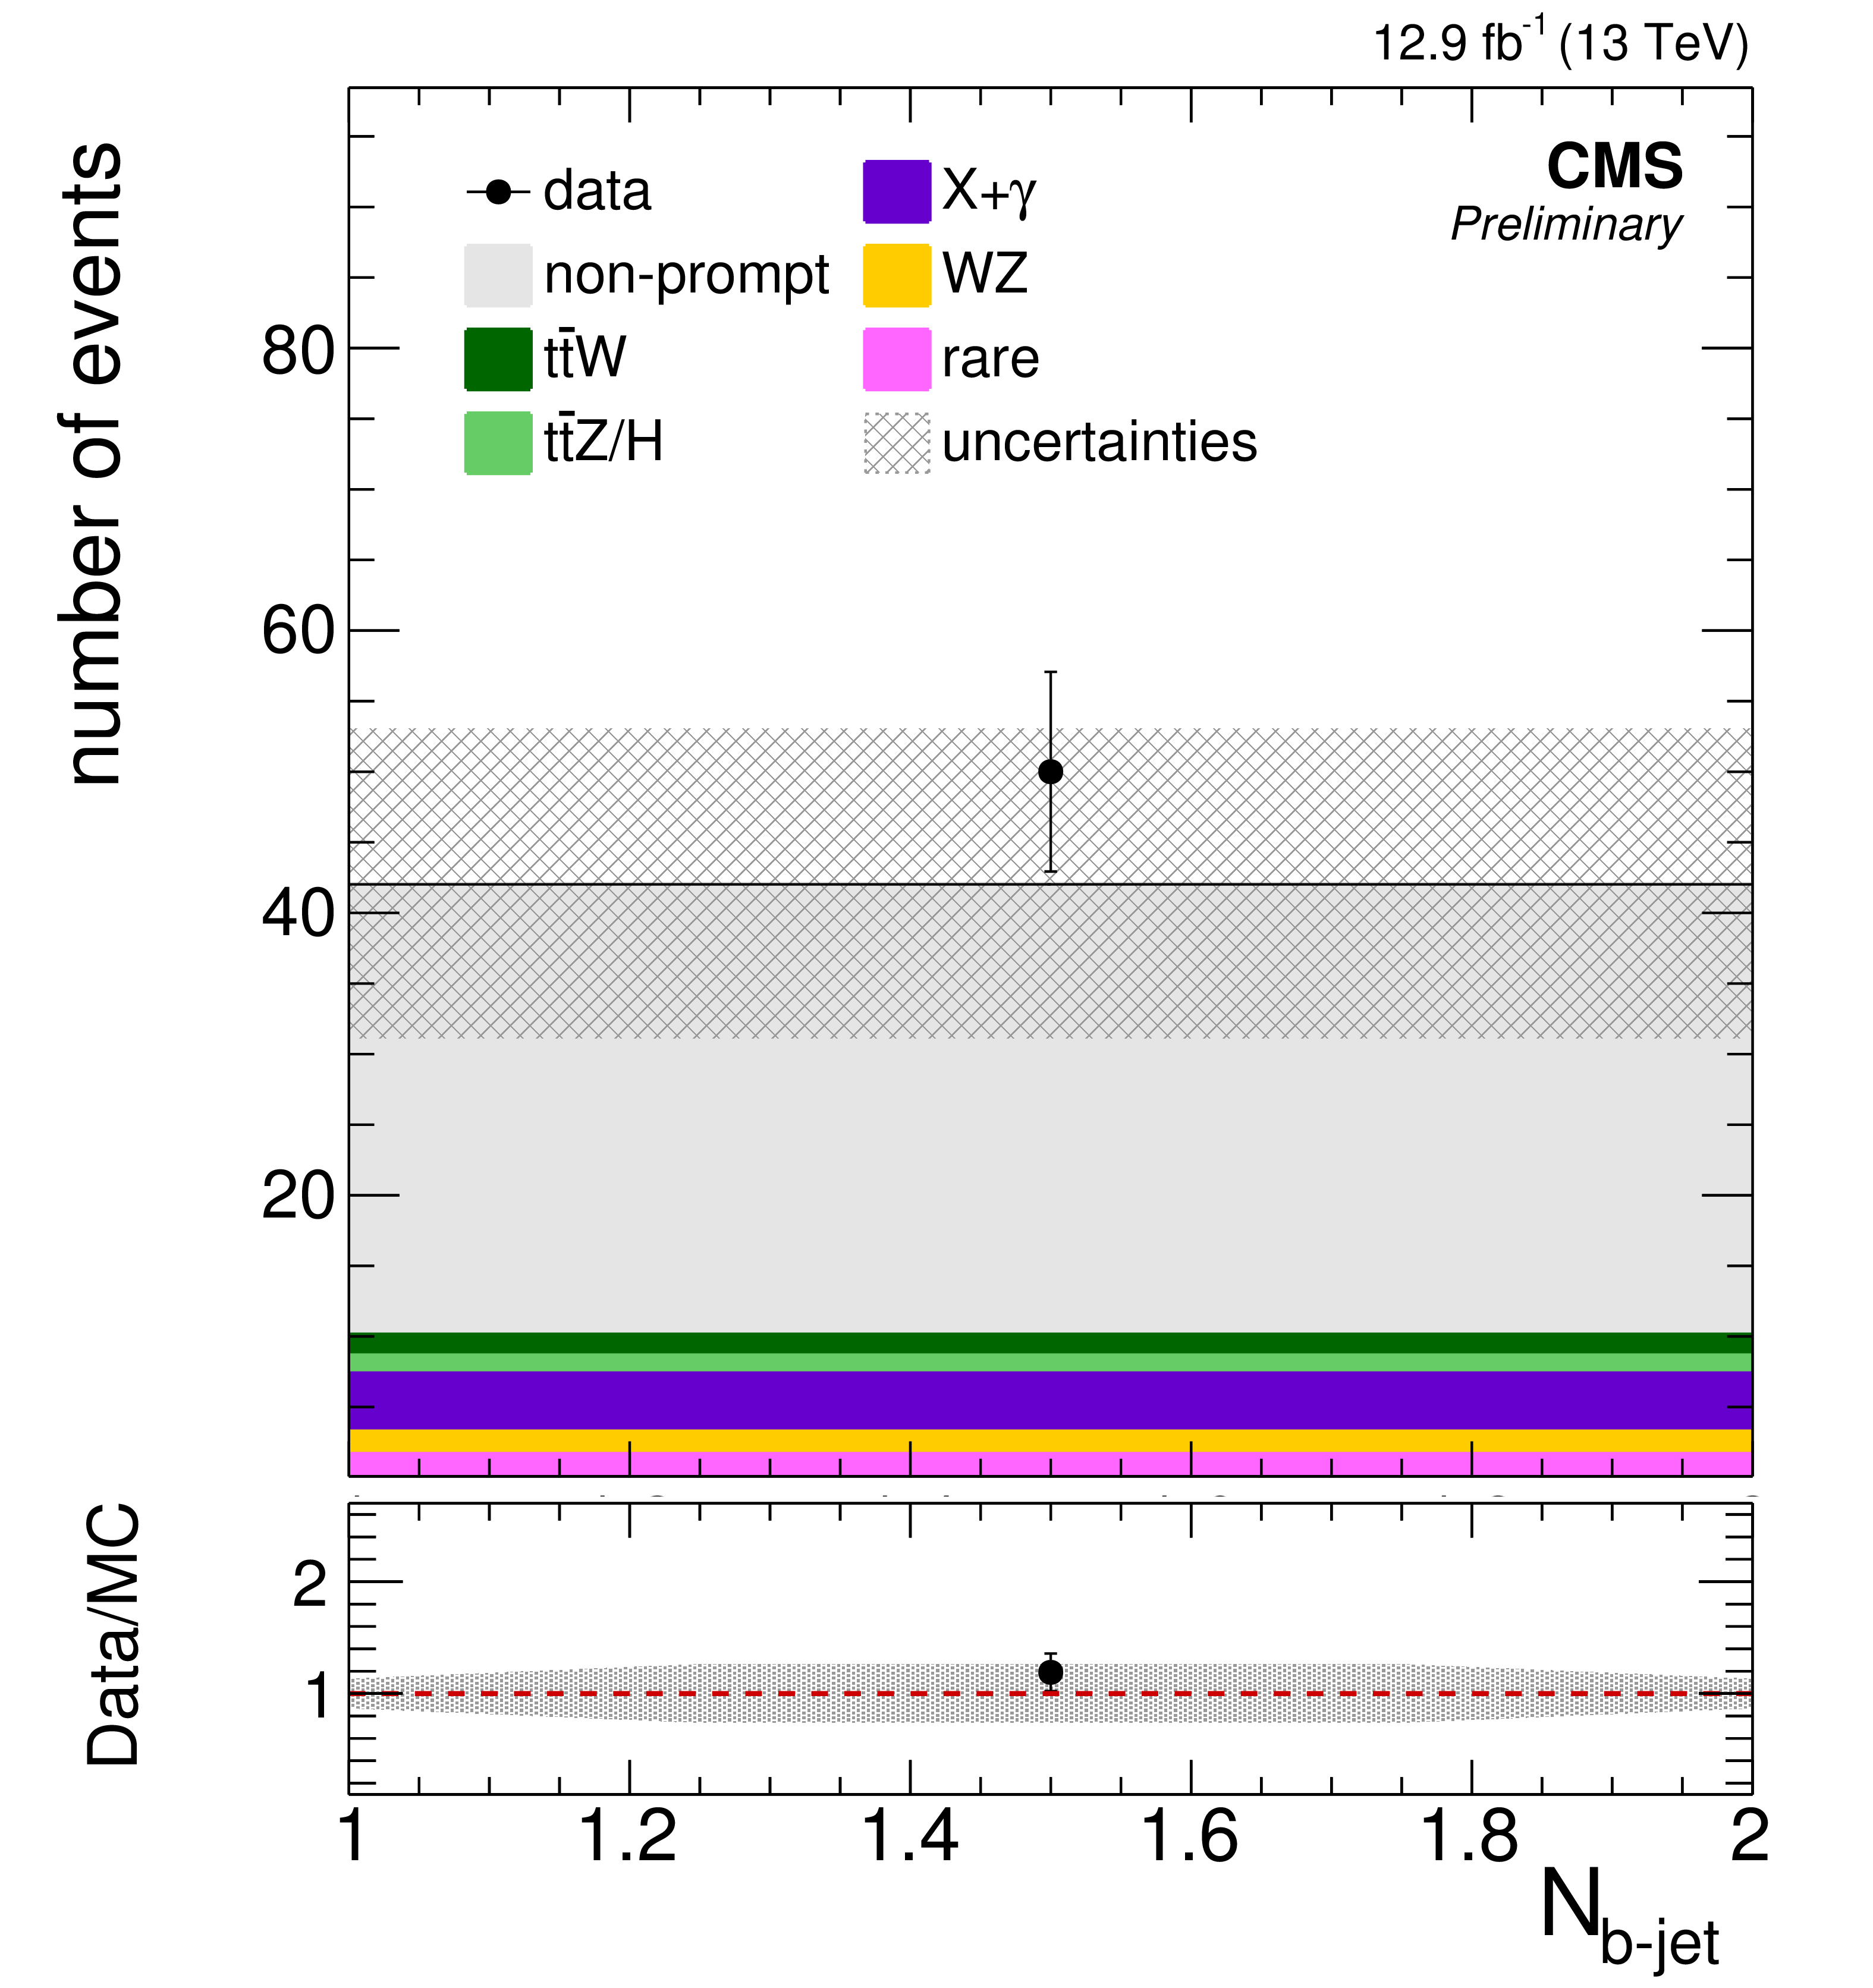
Figure 2-a:
Background prediction and observation in key observables of the off-Z baseline selection for 12.9 fb$^{-1}$ . Good agreement between data and expected background yields is observed in the event variables used for signal region categorization - the b-jet multiplicity, ${E_{\mathrm {T}}^{\text {miss}}}$ , and ${H_{\mathrm {T}}}$ . Additionally, the distributions of the lepton ${p_{\mathrm {T}}}$ spectra, the flavor composition of the leptons, and the lepton multiplicity in the event are shown. The hatched area represents the statistical and systematic uncertainties on the prediction. |
png pdf |
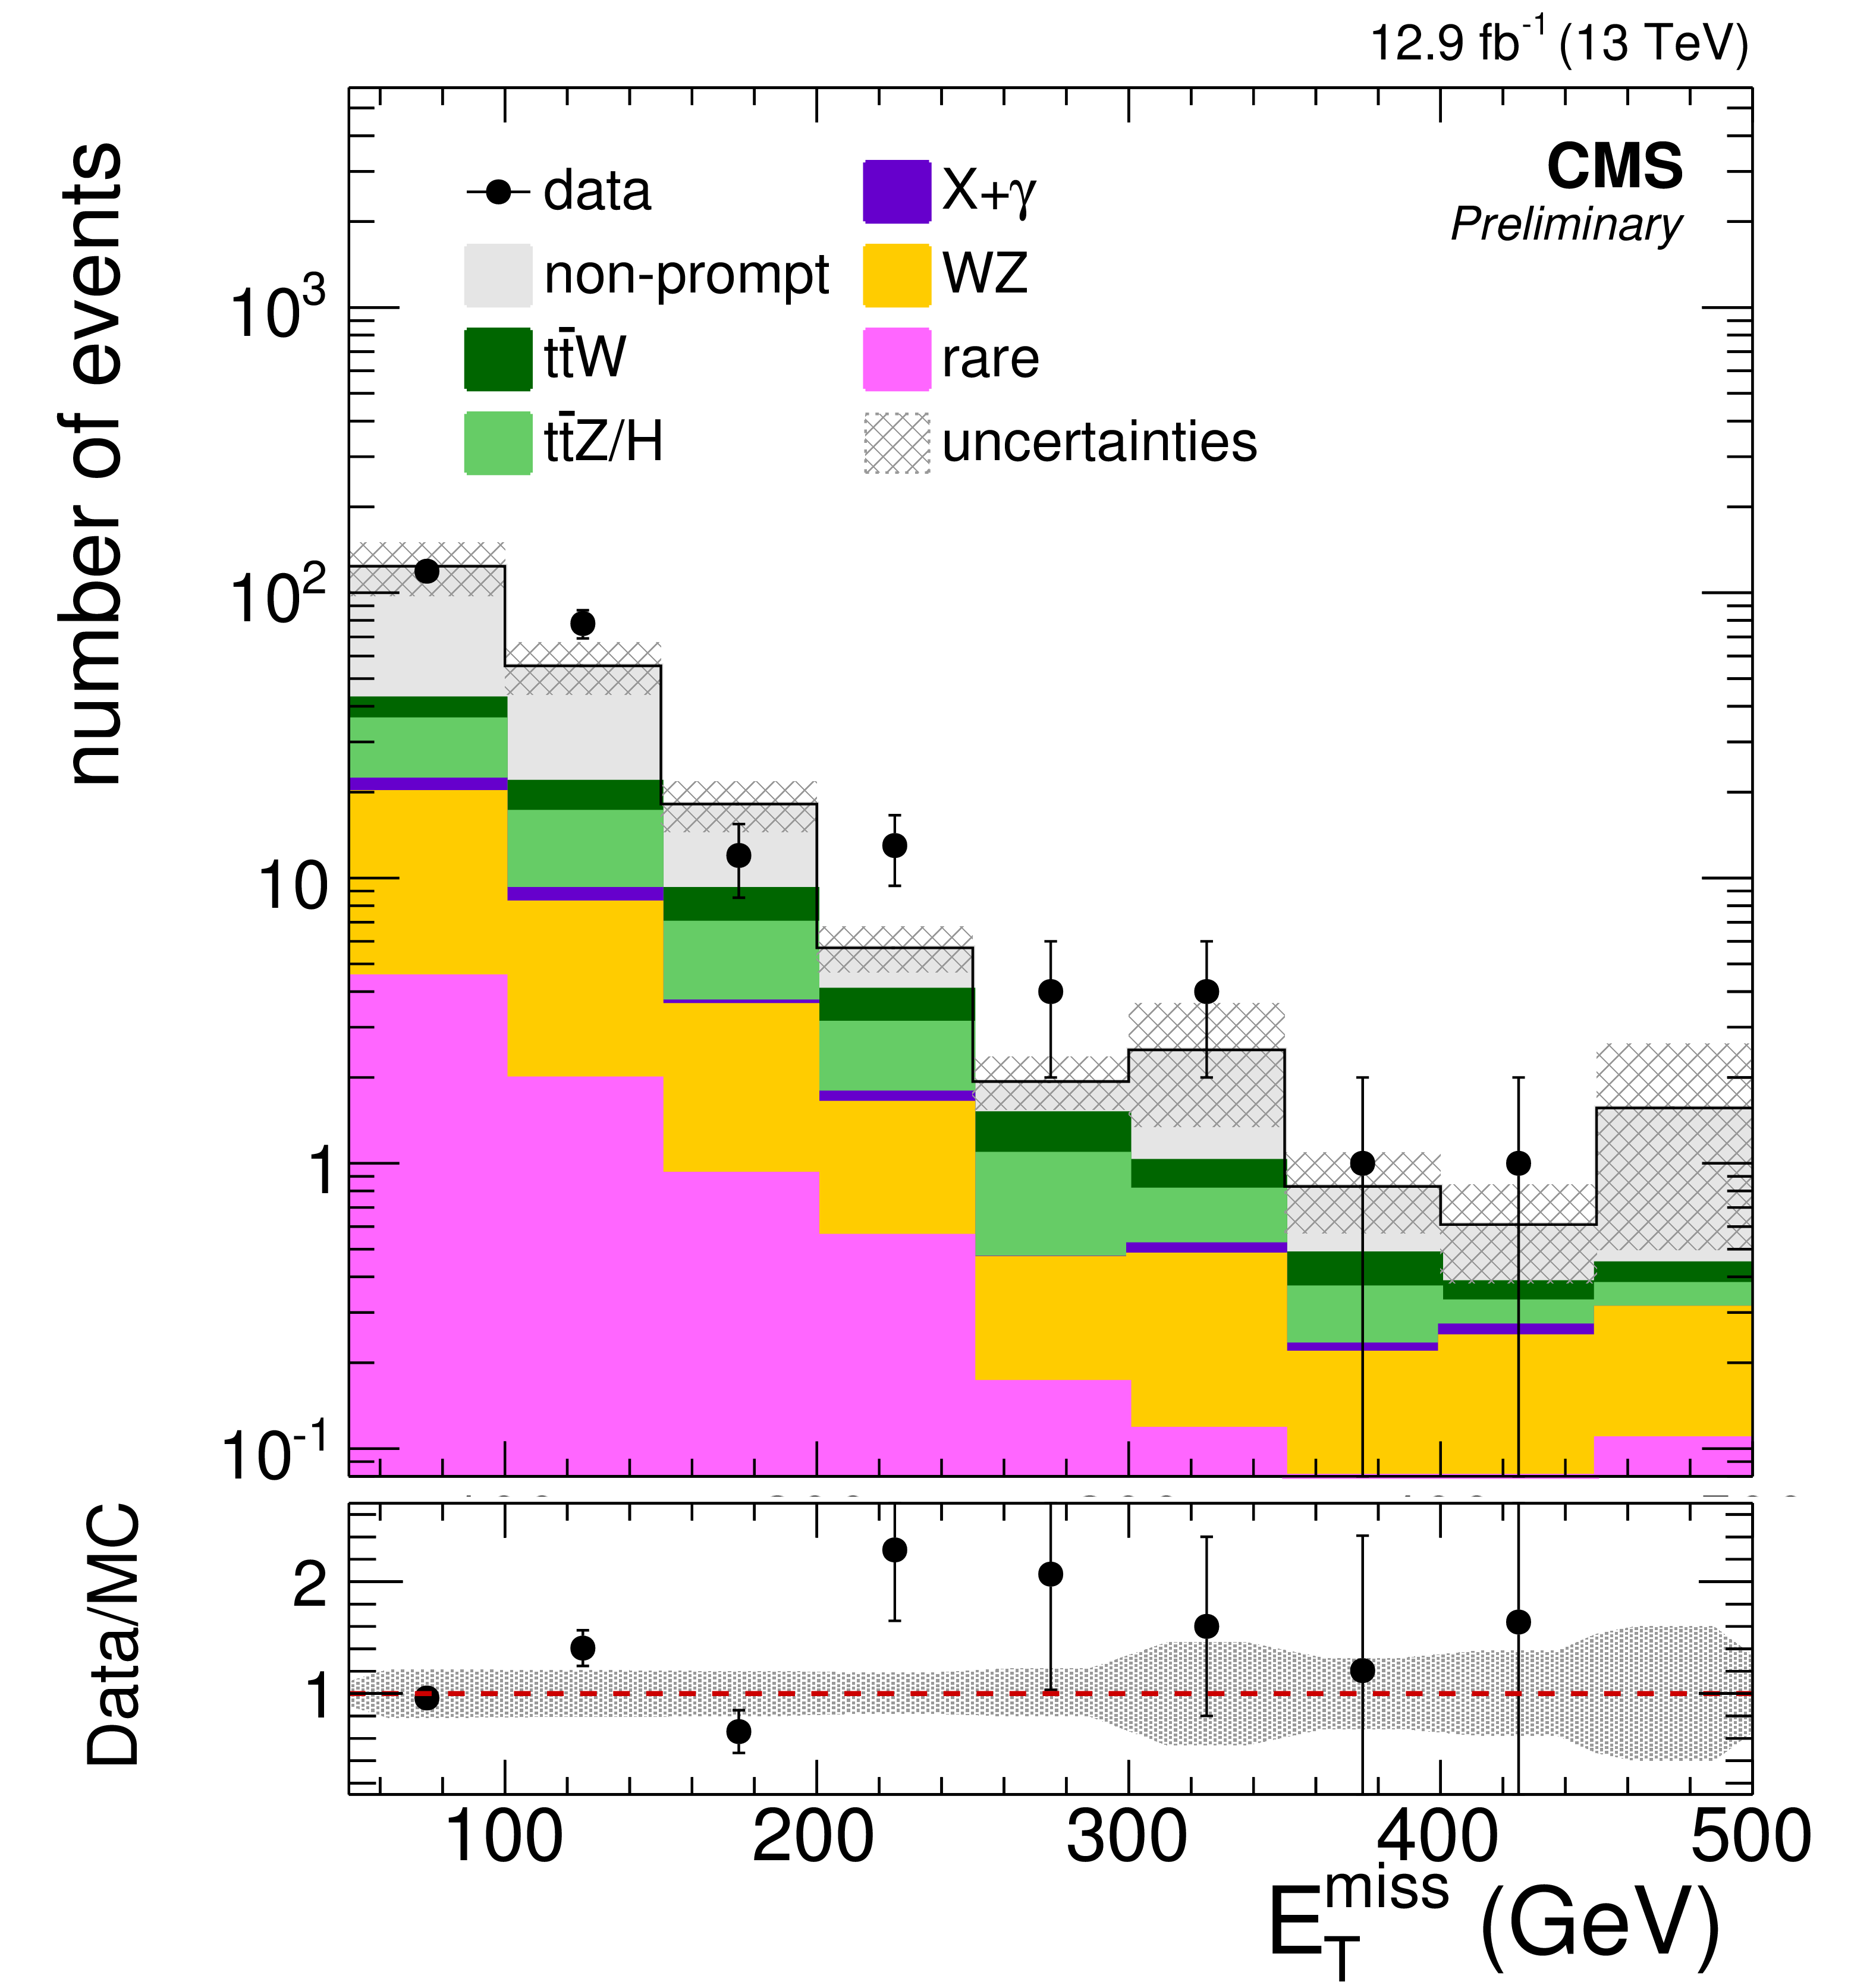
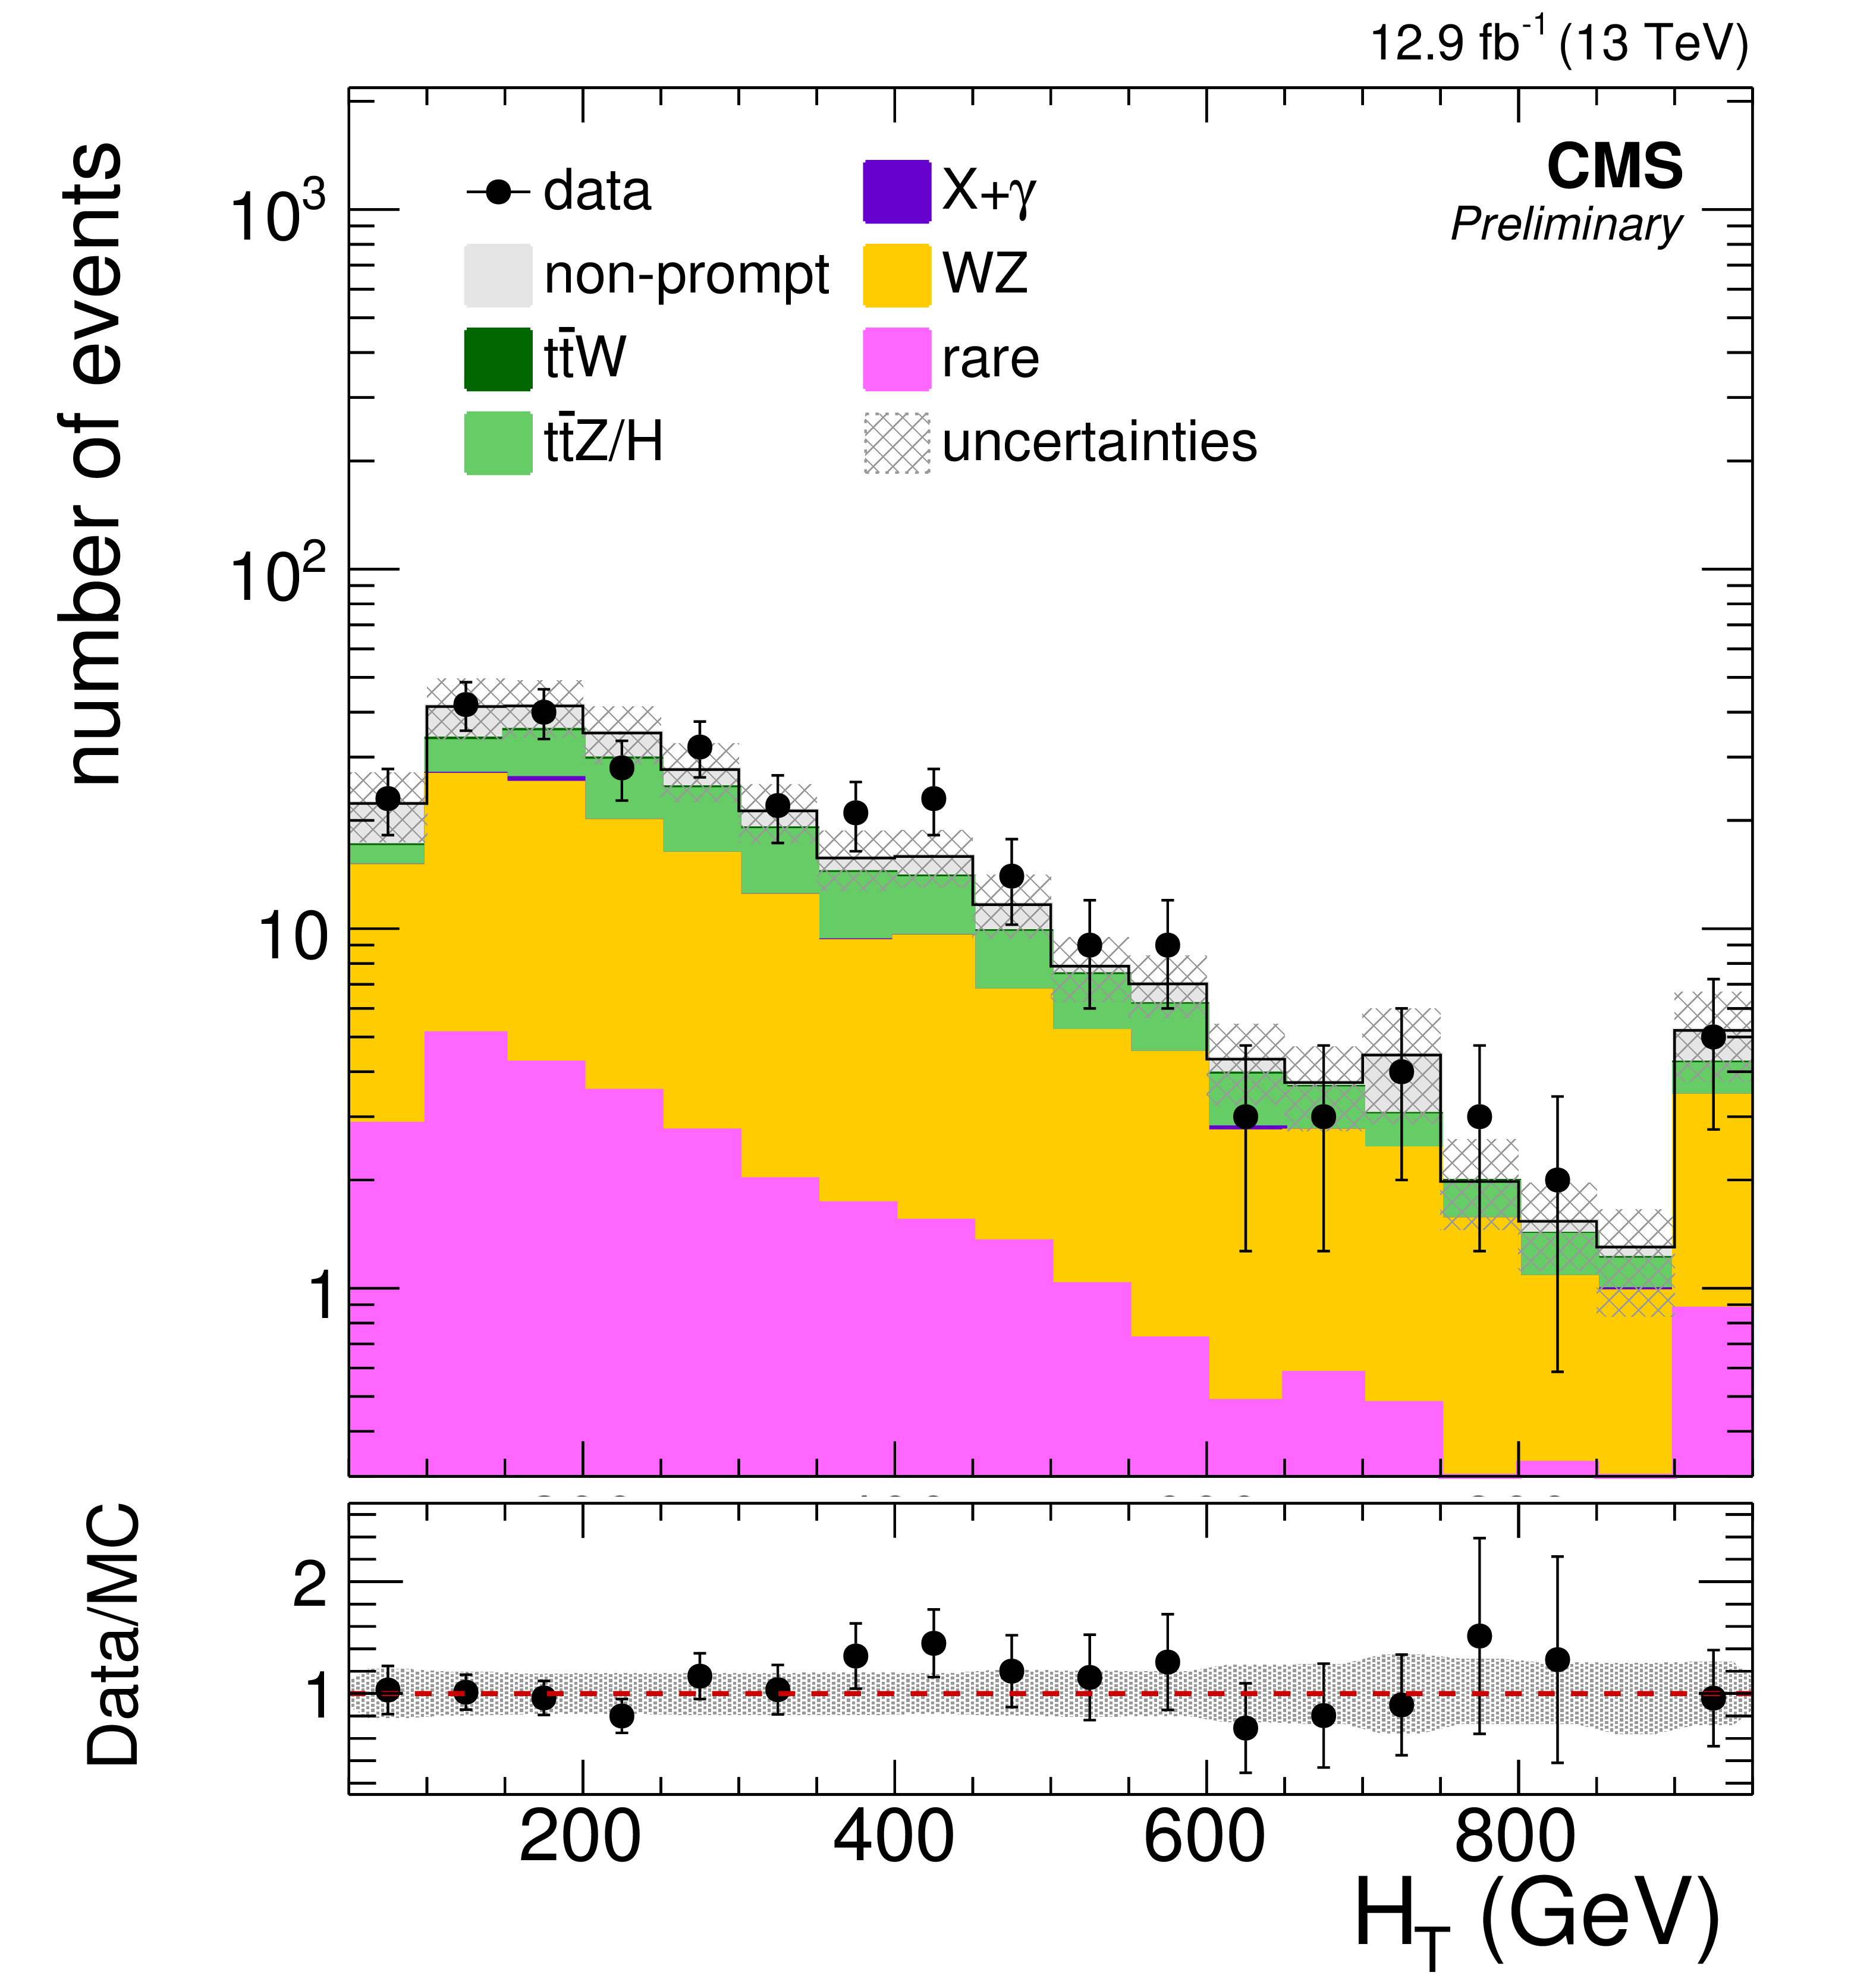
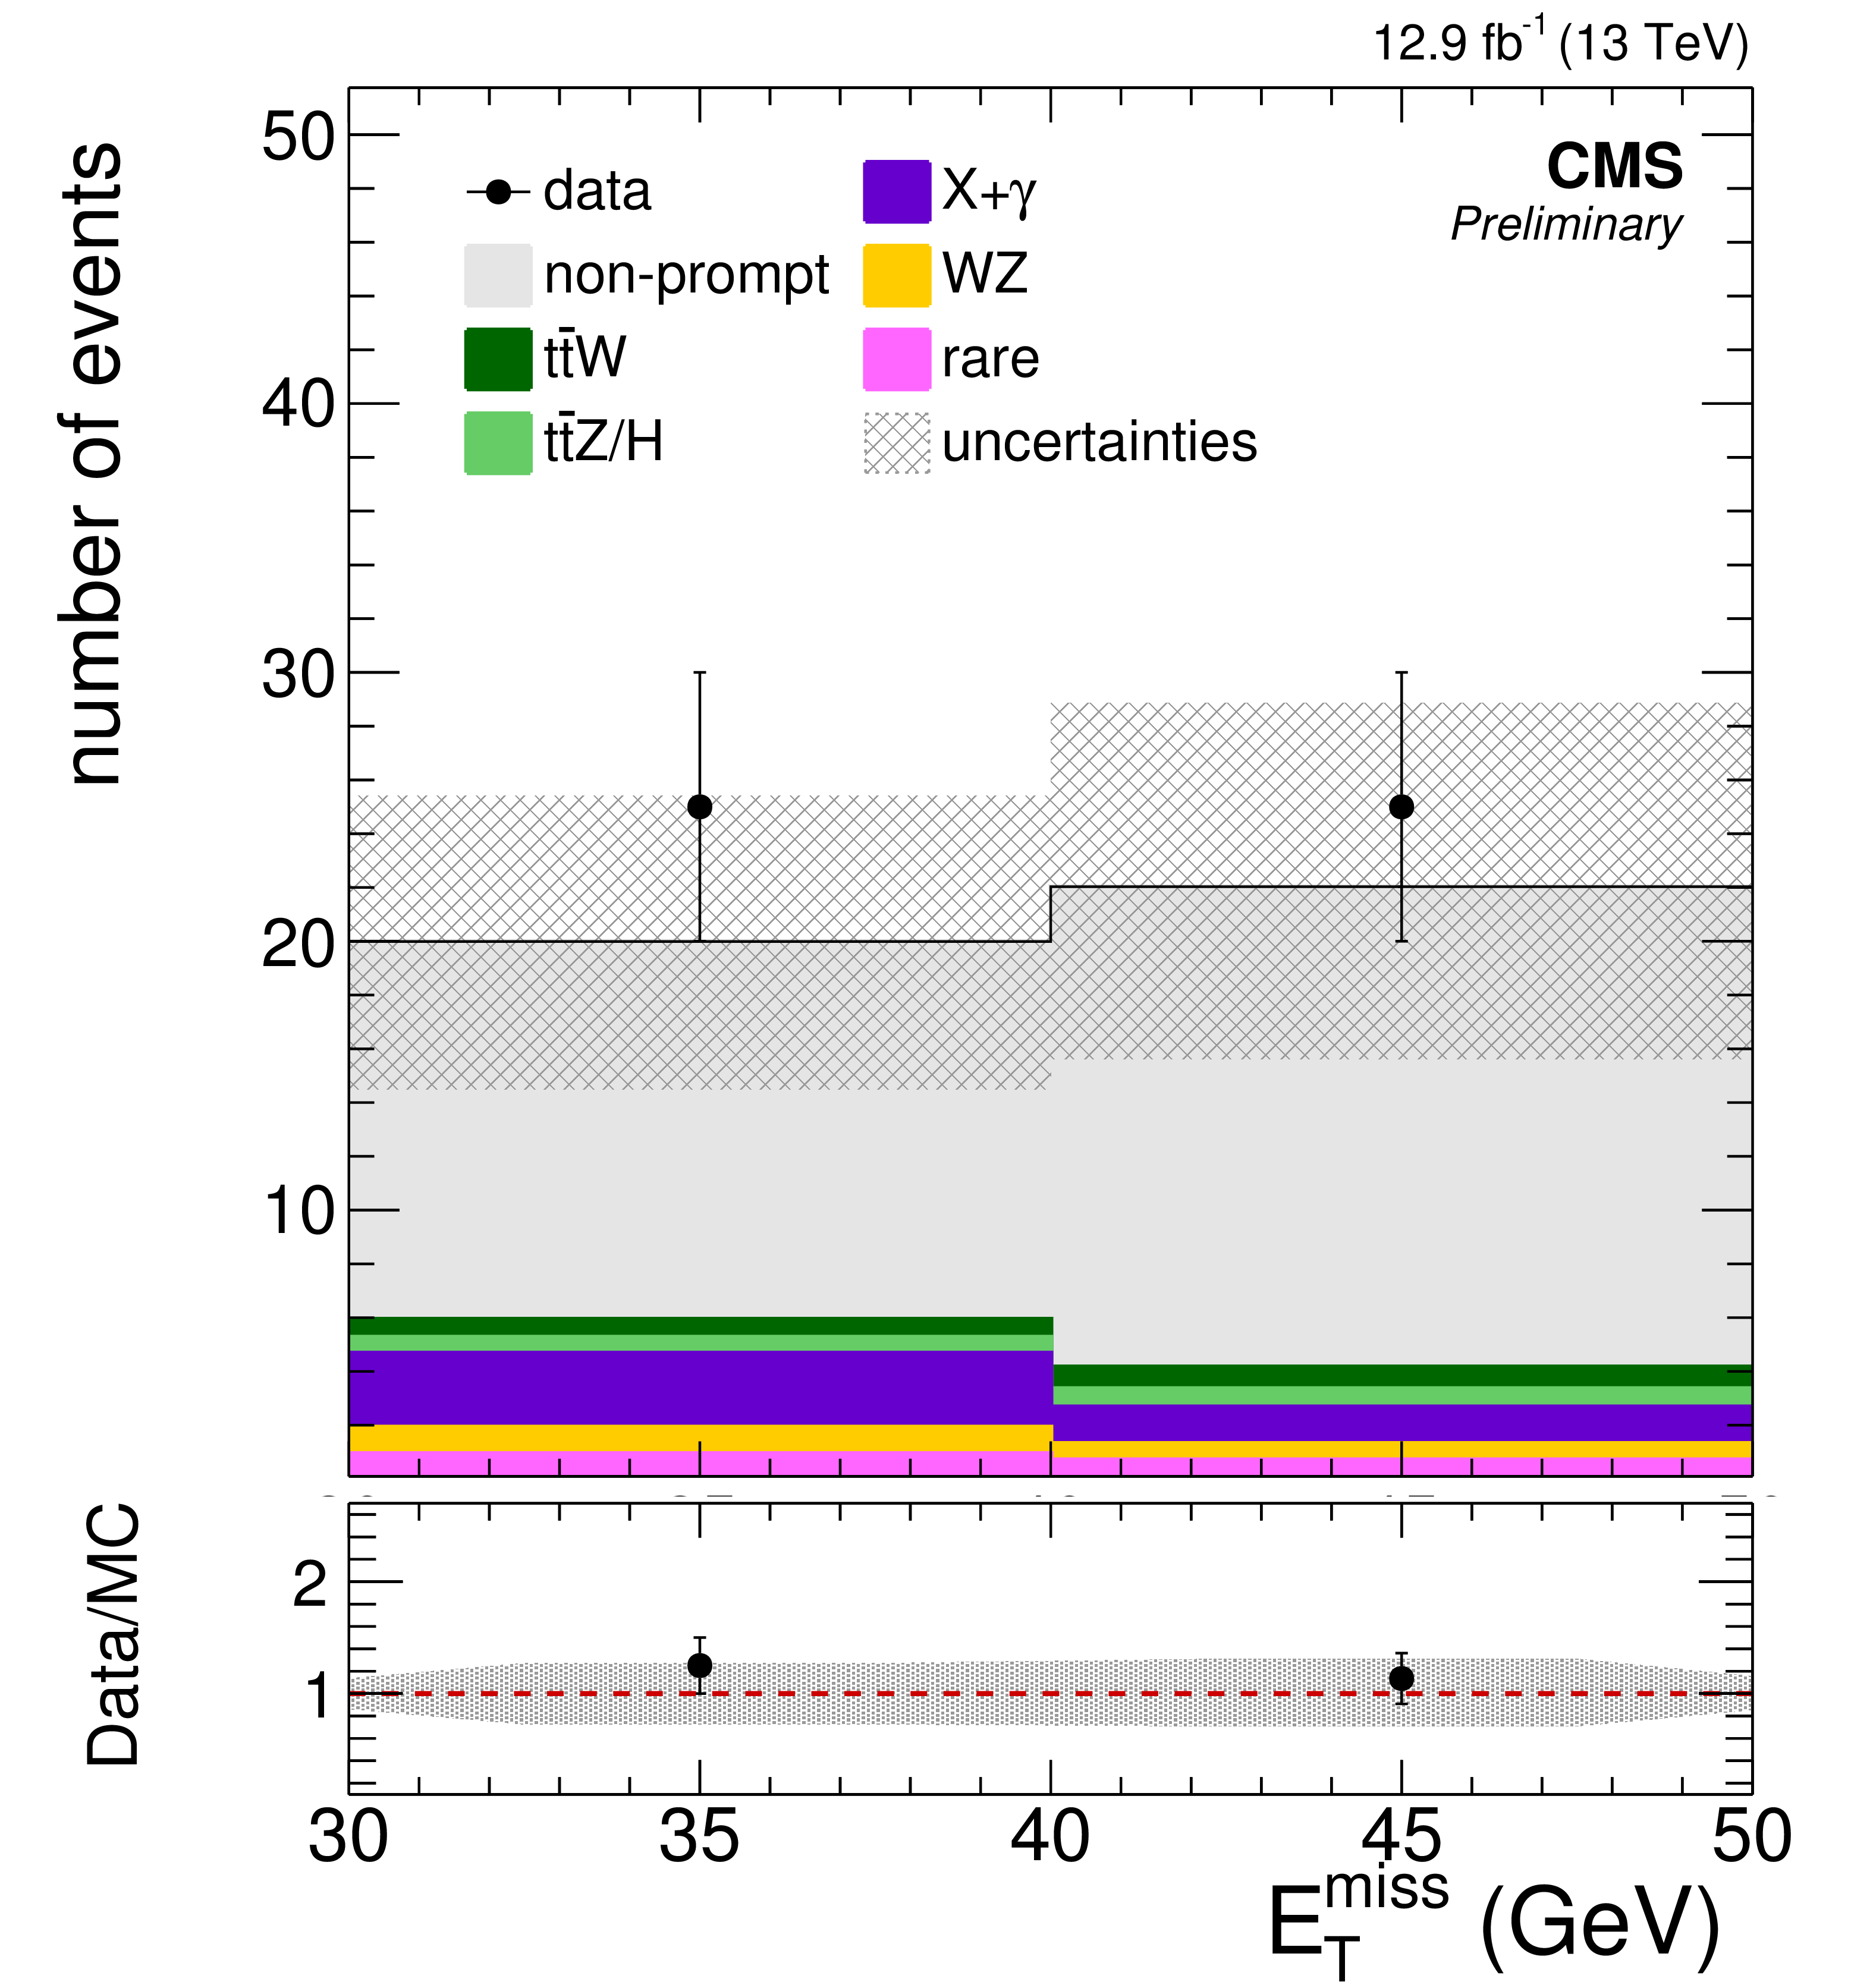
Figure 2-b:
Background prediction and observation in key observables of the off-Z baseline selection for 12.9 fb$^{-1}$ . Good agreement between data and expected background yields is observed in the event variables used for signal region categorization - the b-jet multiplicity, ${E_{\mathrm {T}}^{\text {miss}}}$ , and ${H_{\mathrm {T}}}$ . Additionally, the distributions of the lepton ${p_{\mathrm {T}}}$ spectra, the flavor composition of the leptons, and the lepton multiplicity in the event are shown. The hatched area represents the statistical and systematic uncertainties on the prediction. |

png pdf |
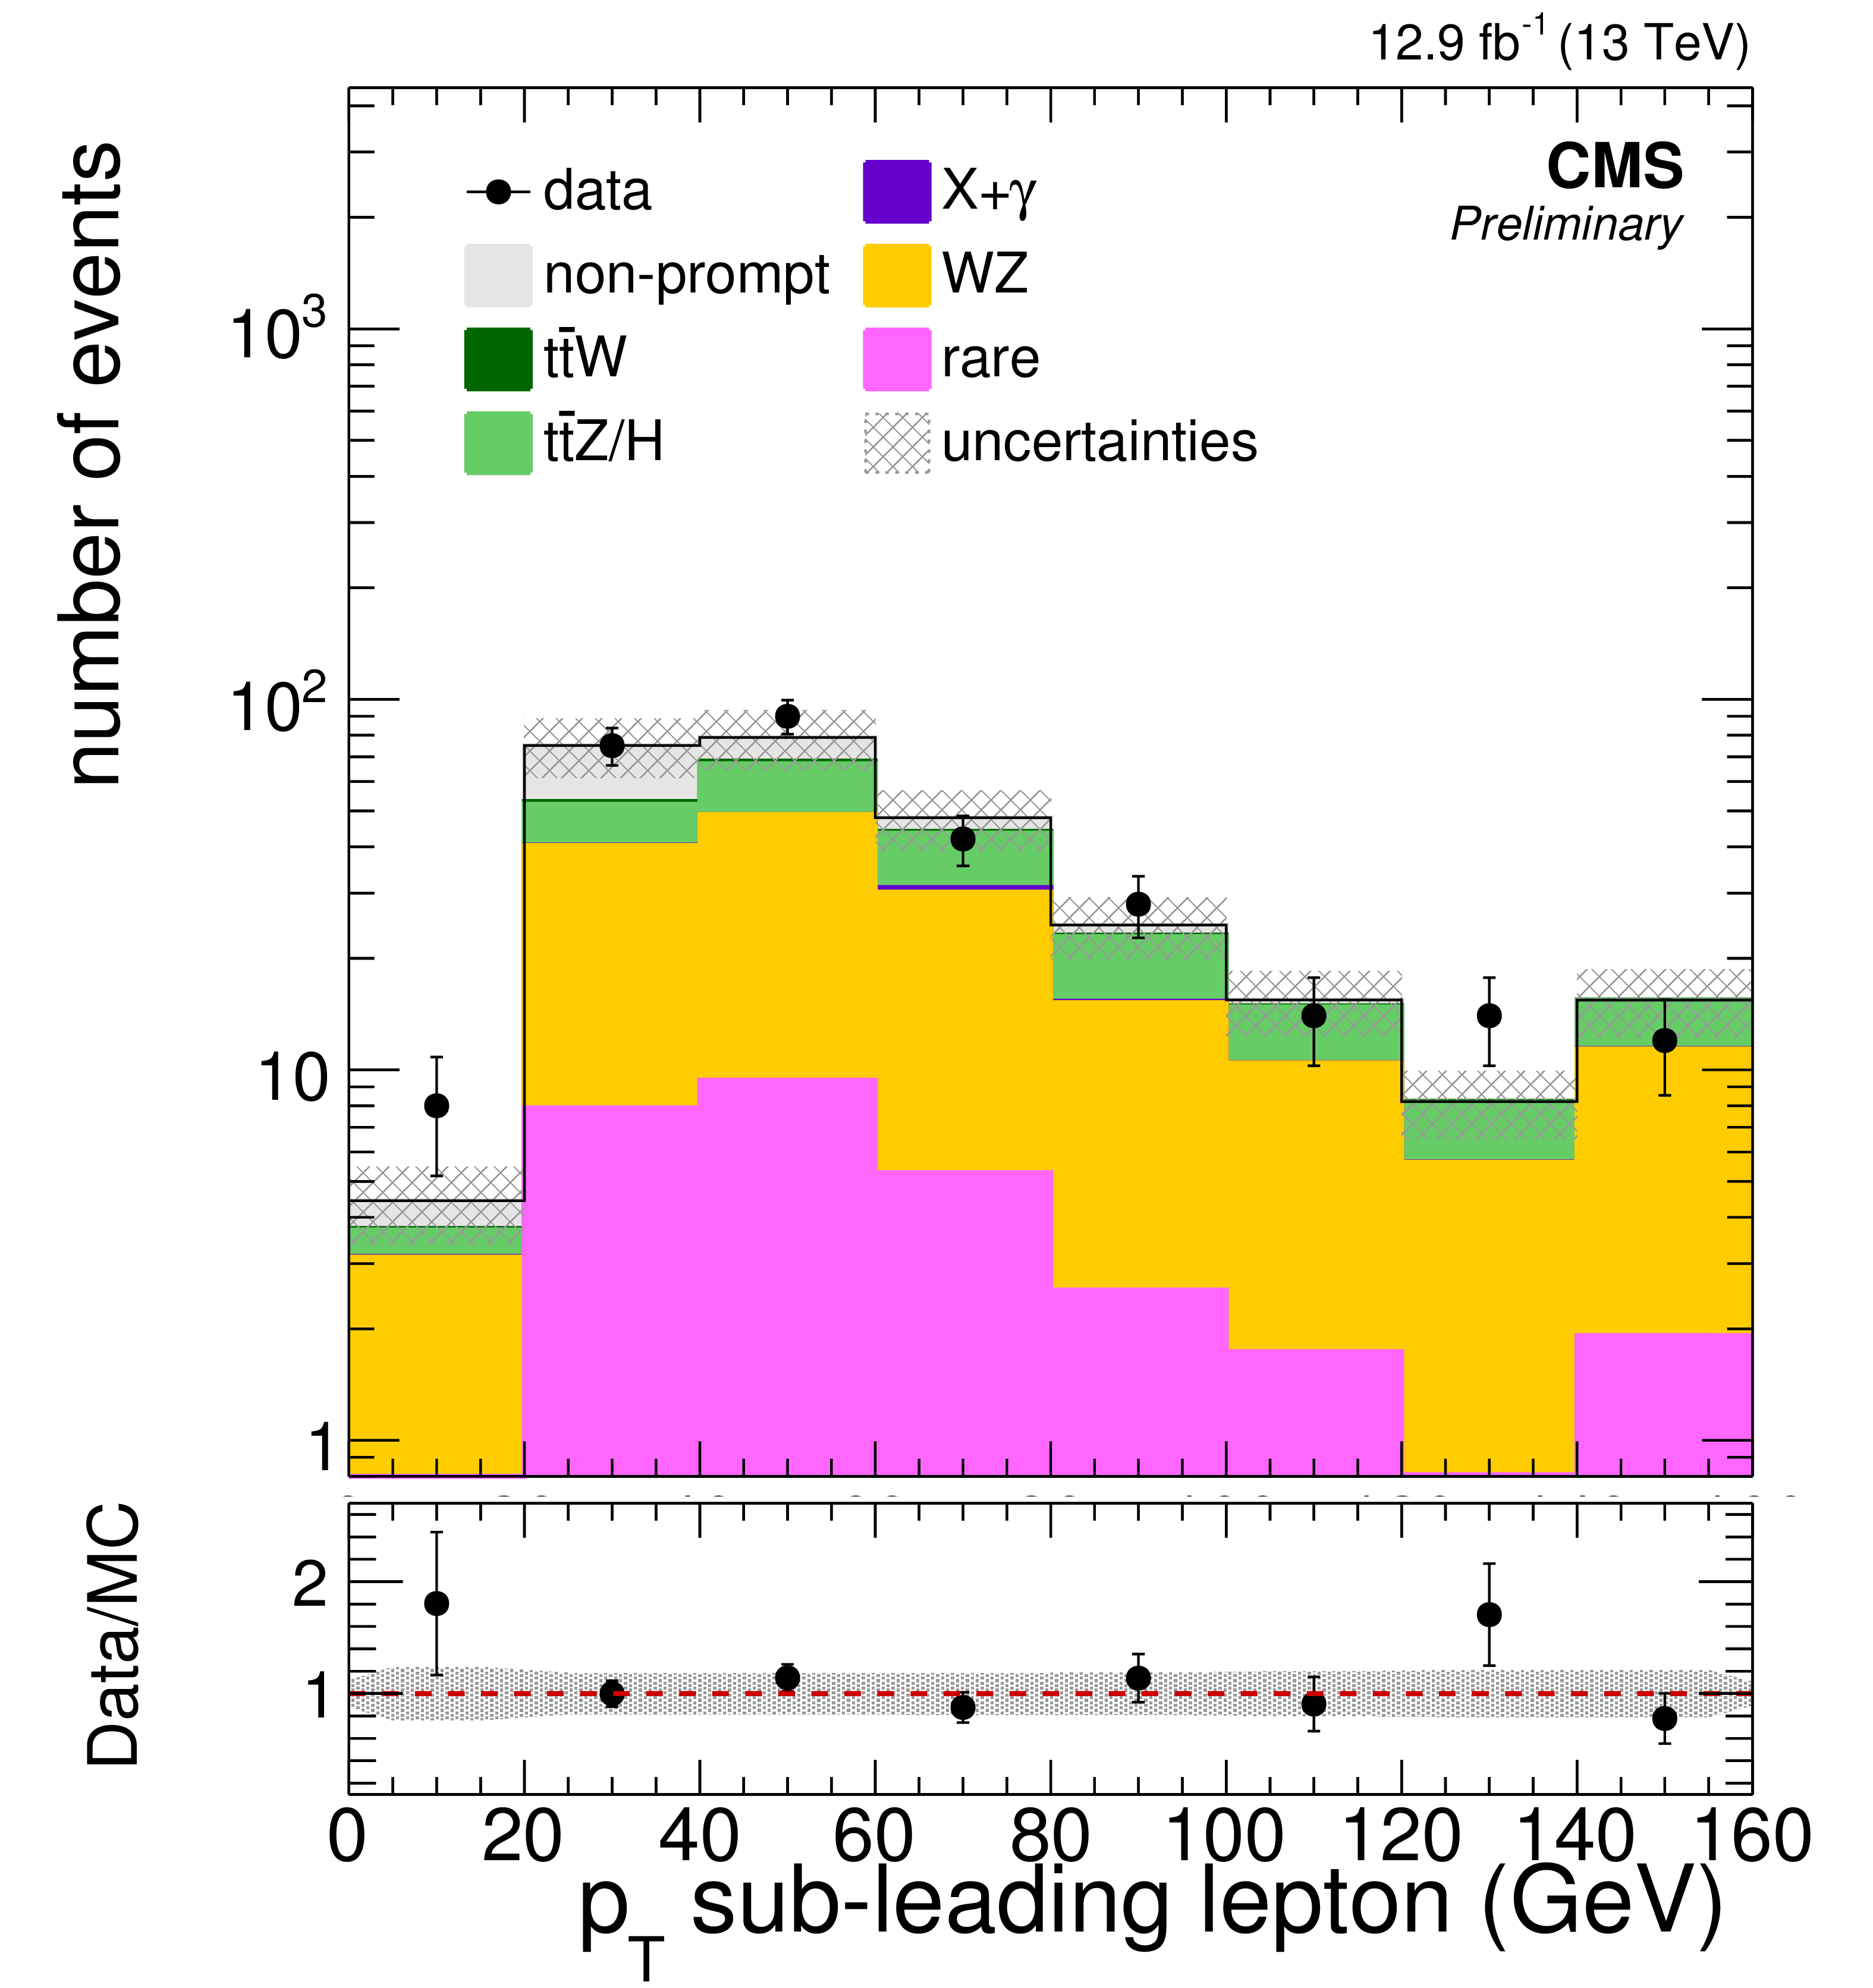
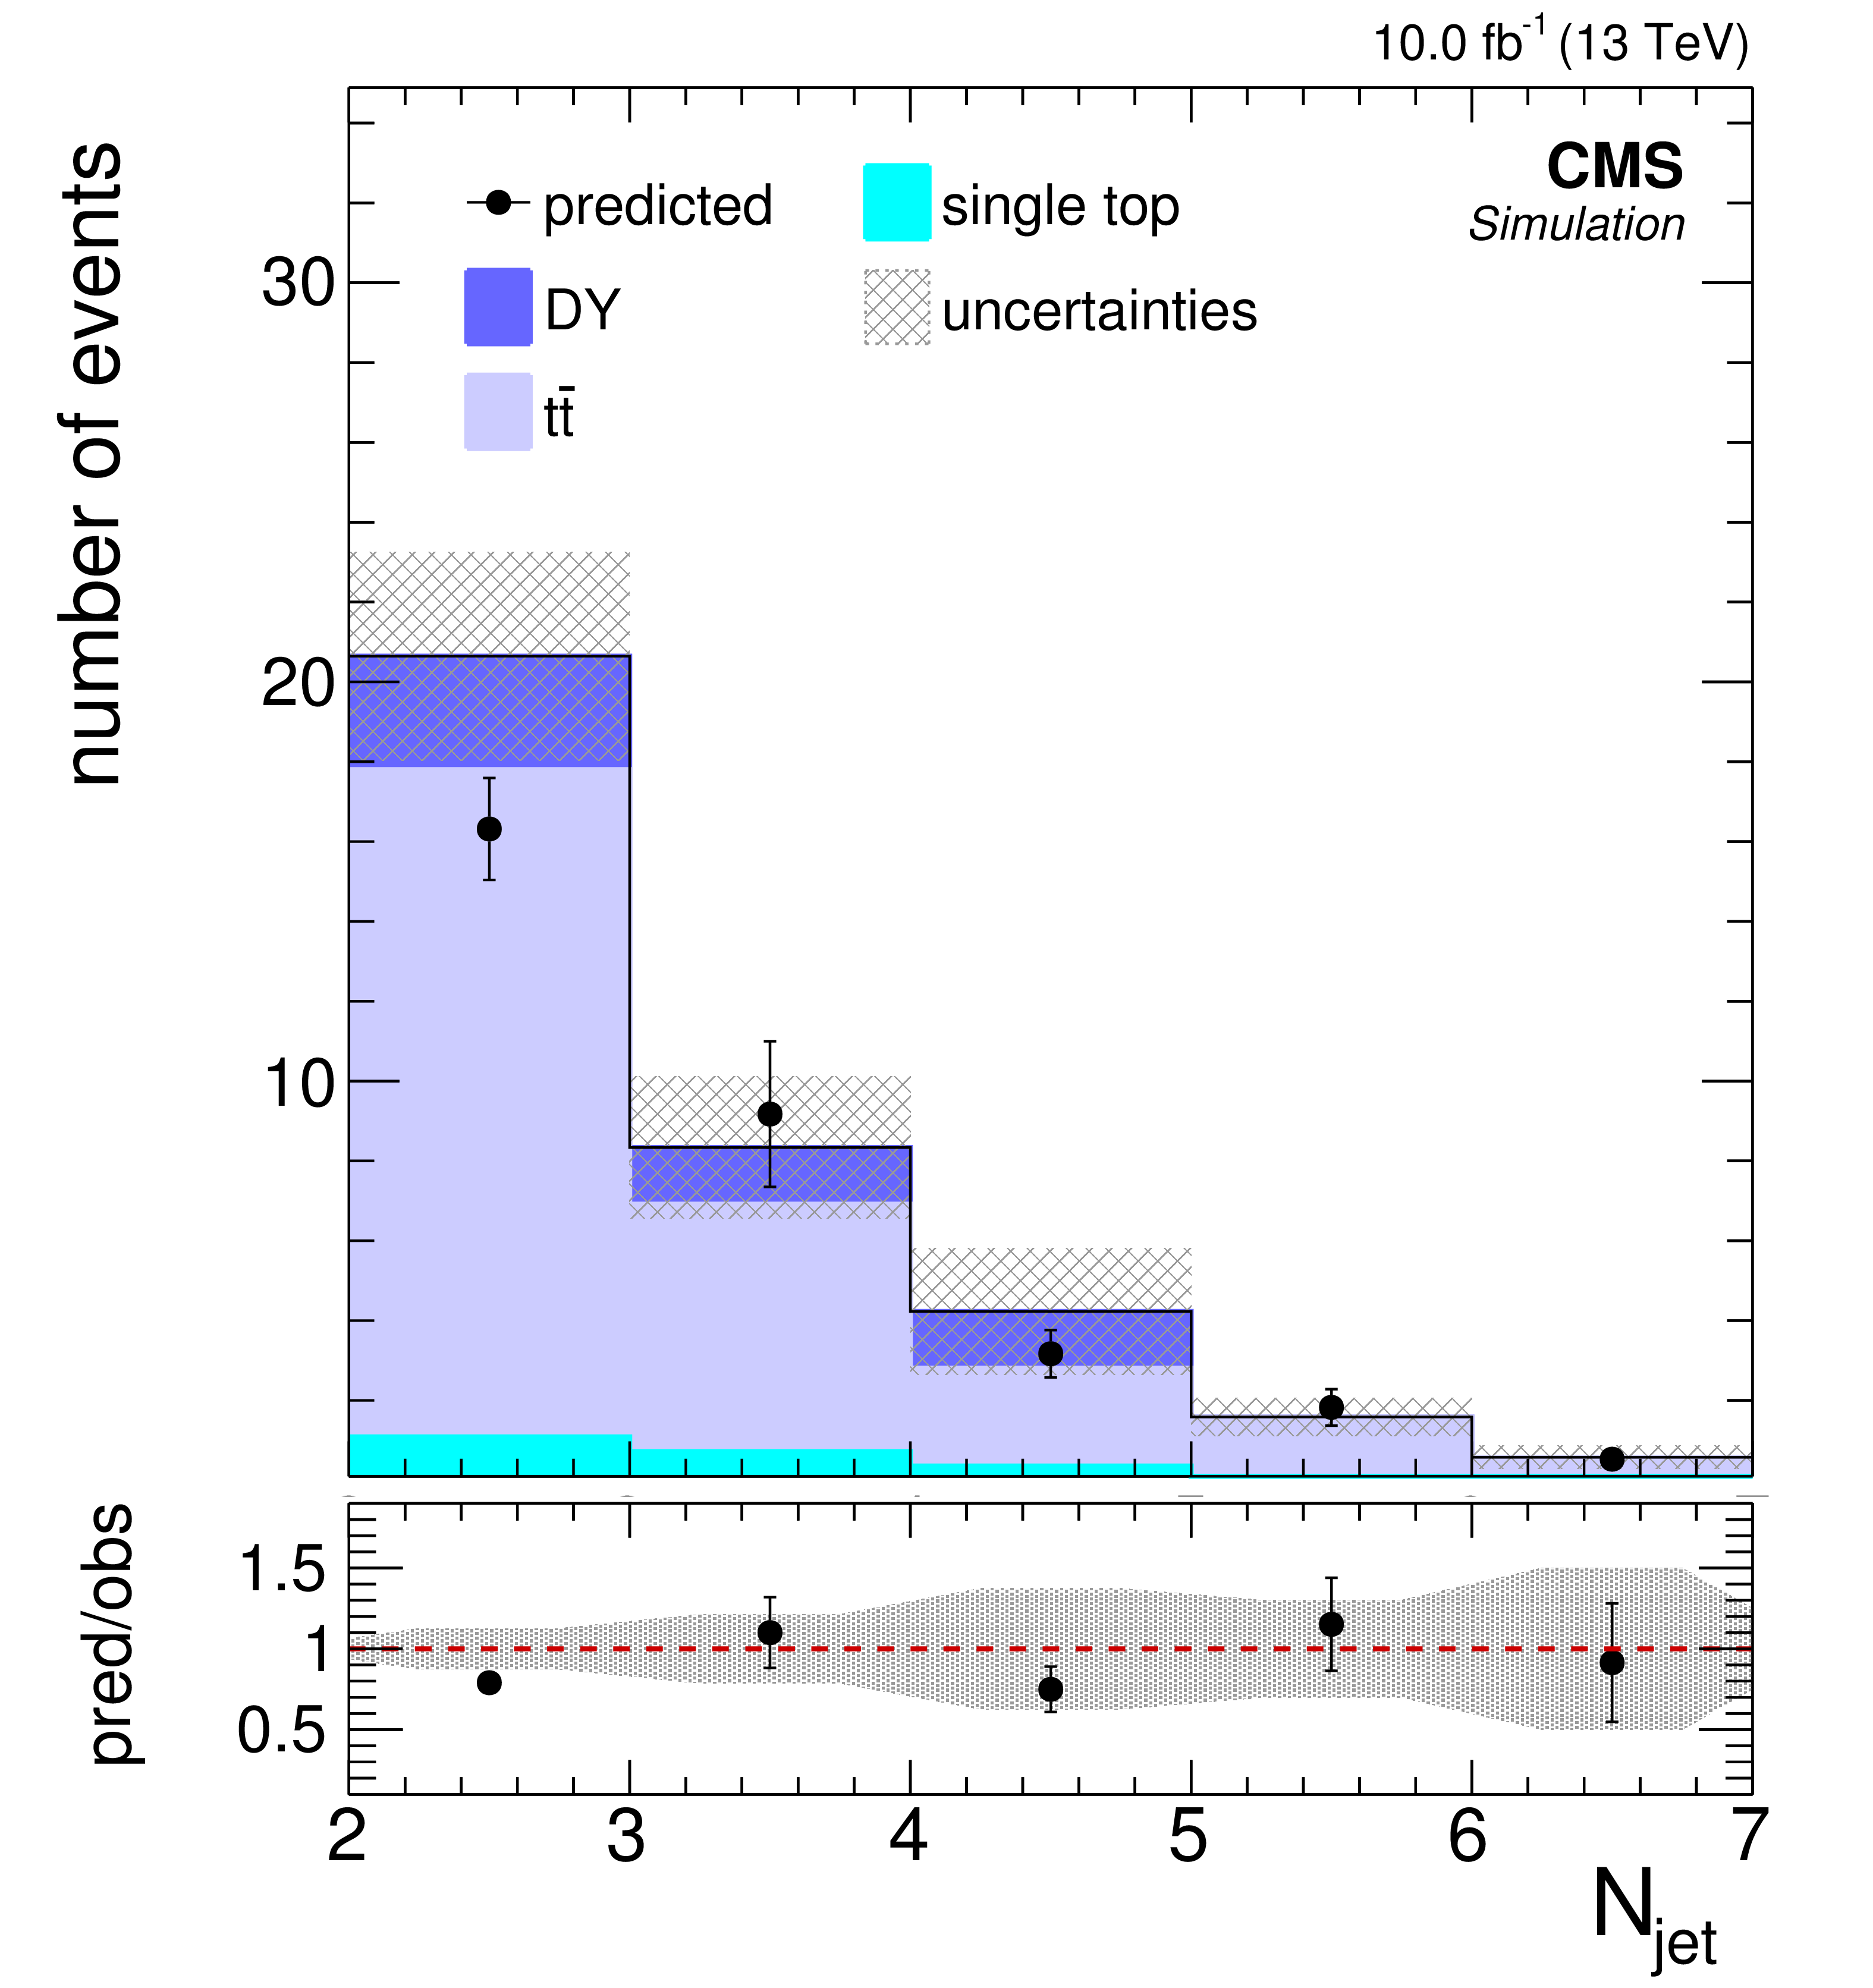
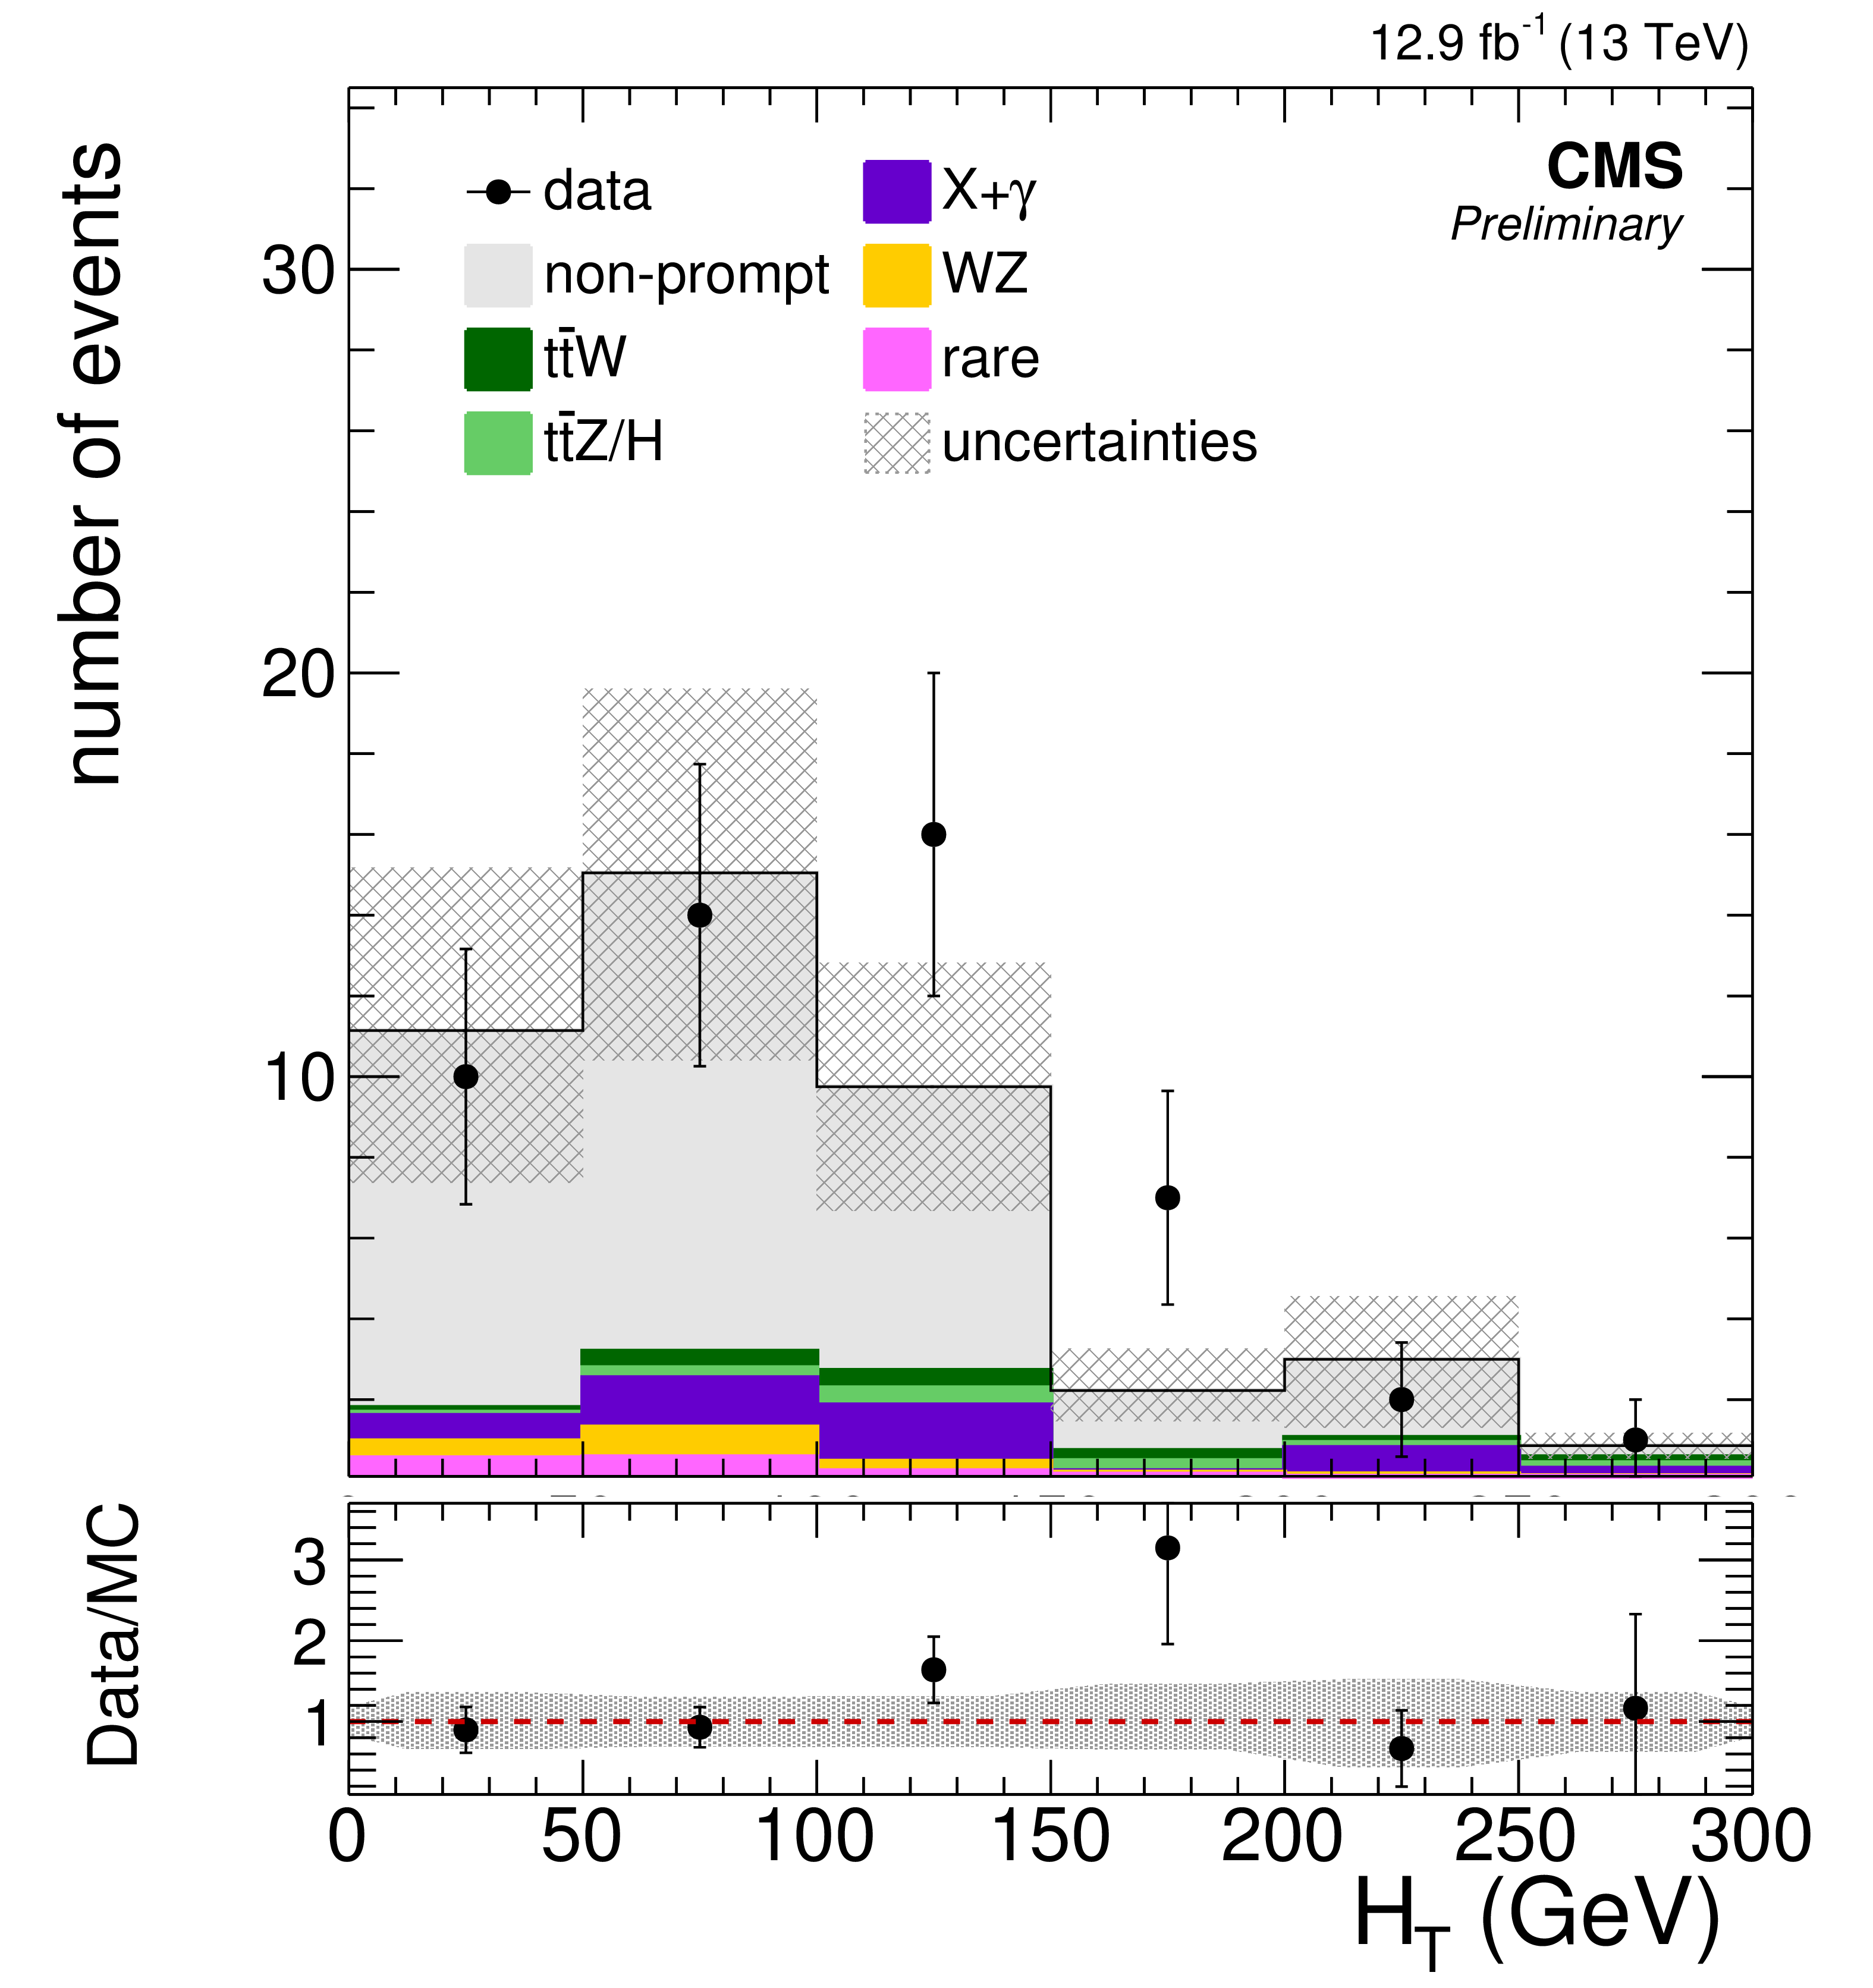
Figure 2-c:
Background prediction and observation in key observables of the off-Z baseline selection for 12.9 fb$^{-1}$ . Good agreement between data and expected background yields is observed in the event variables used for signal region categorization - the b-jet multiplicity, ${E_{\mathrm {T}}^{\text {miss}}}$ , and ${H_{\mathrm {T}}}$ . Additionally, the distributions of the lepton ${p_{\mathrm {T}}}$ spectra, the flavor composition of the leptons, and the lepton multiplicity in the event are shown. The hatched area represents the statistical and systematic uncertainties on the prediction. |
png pdf |
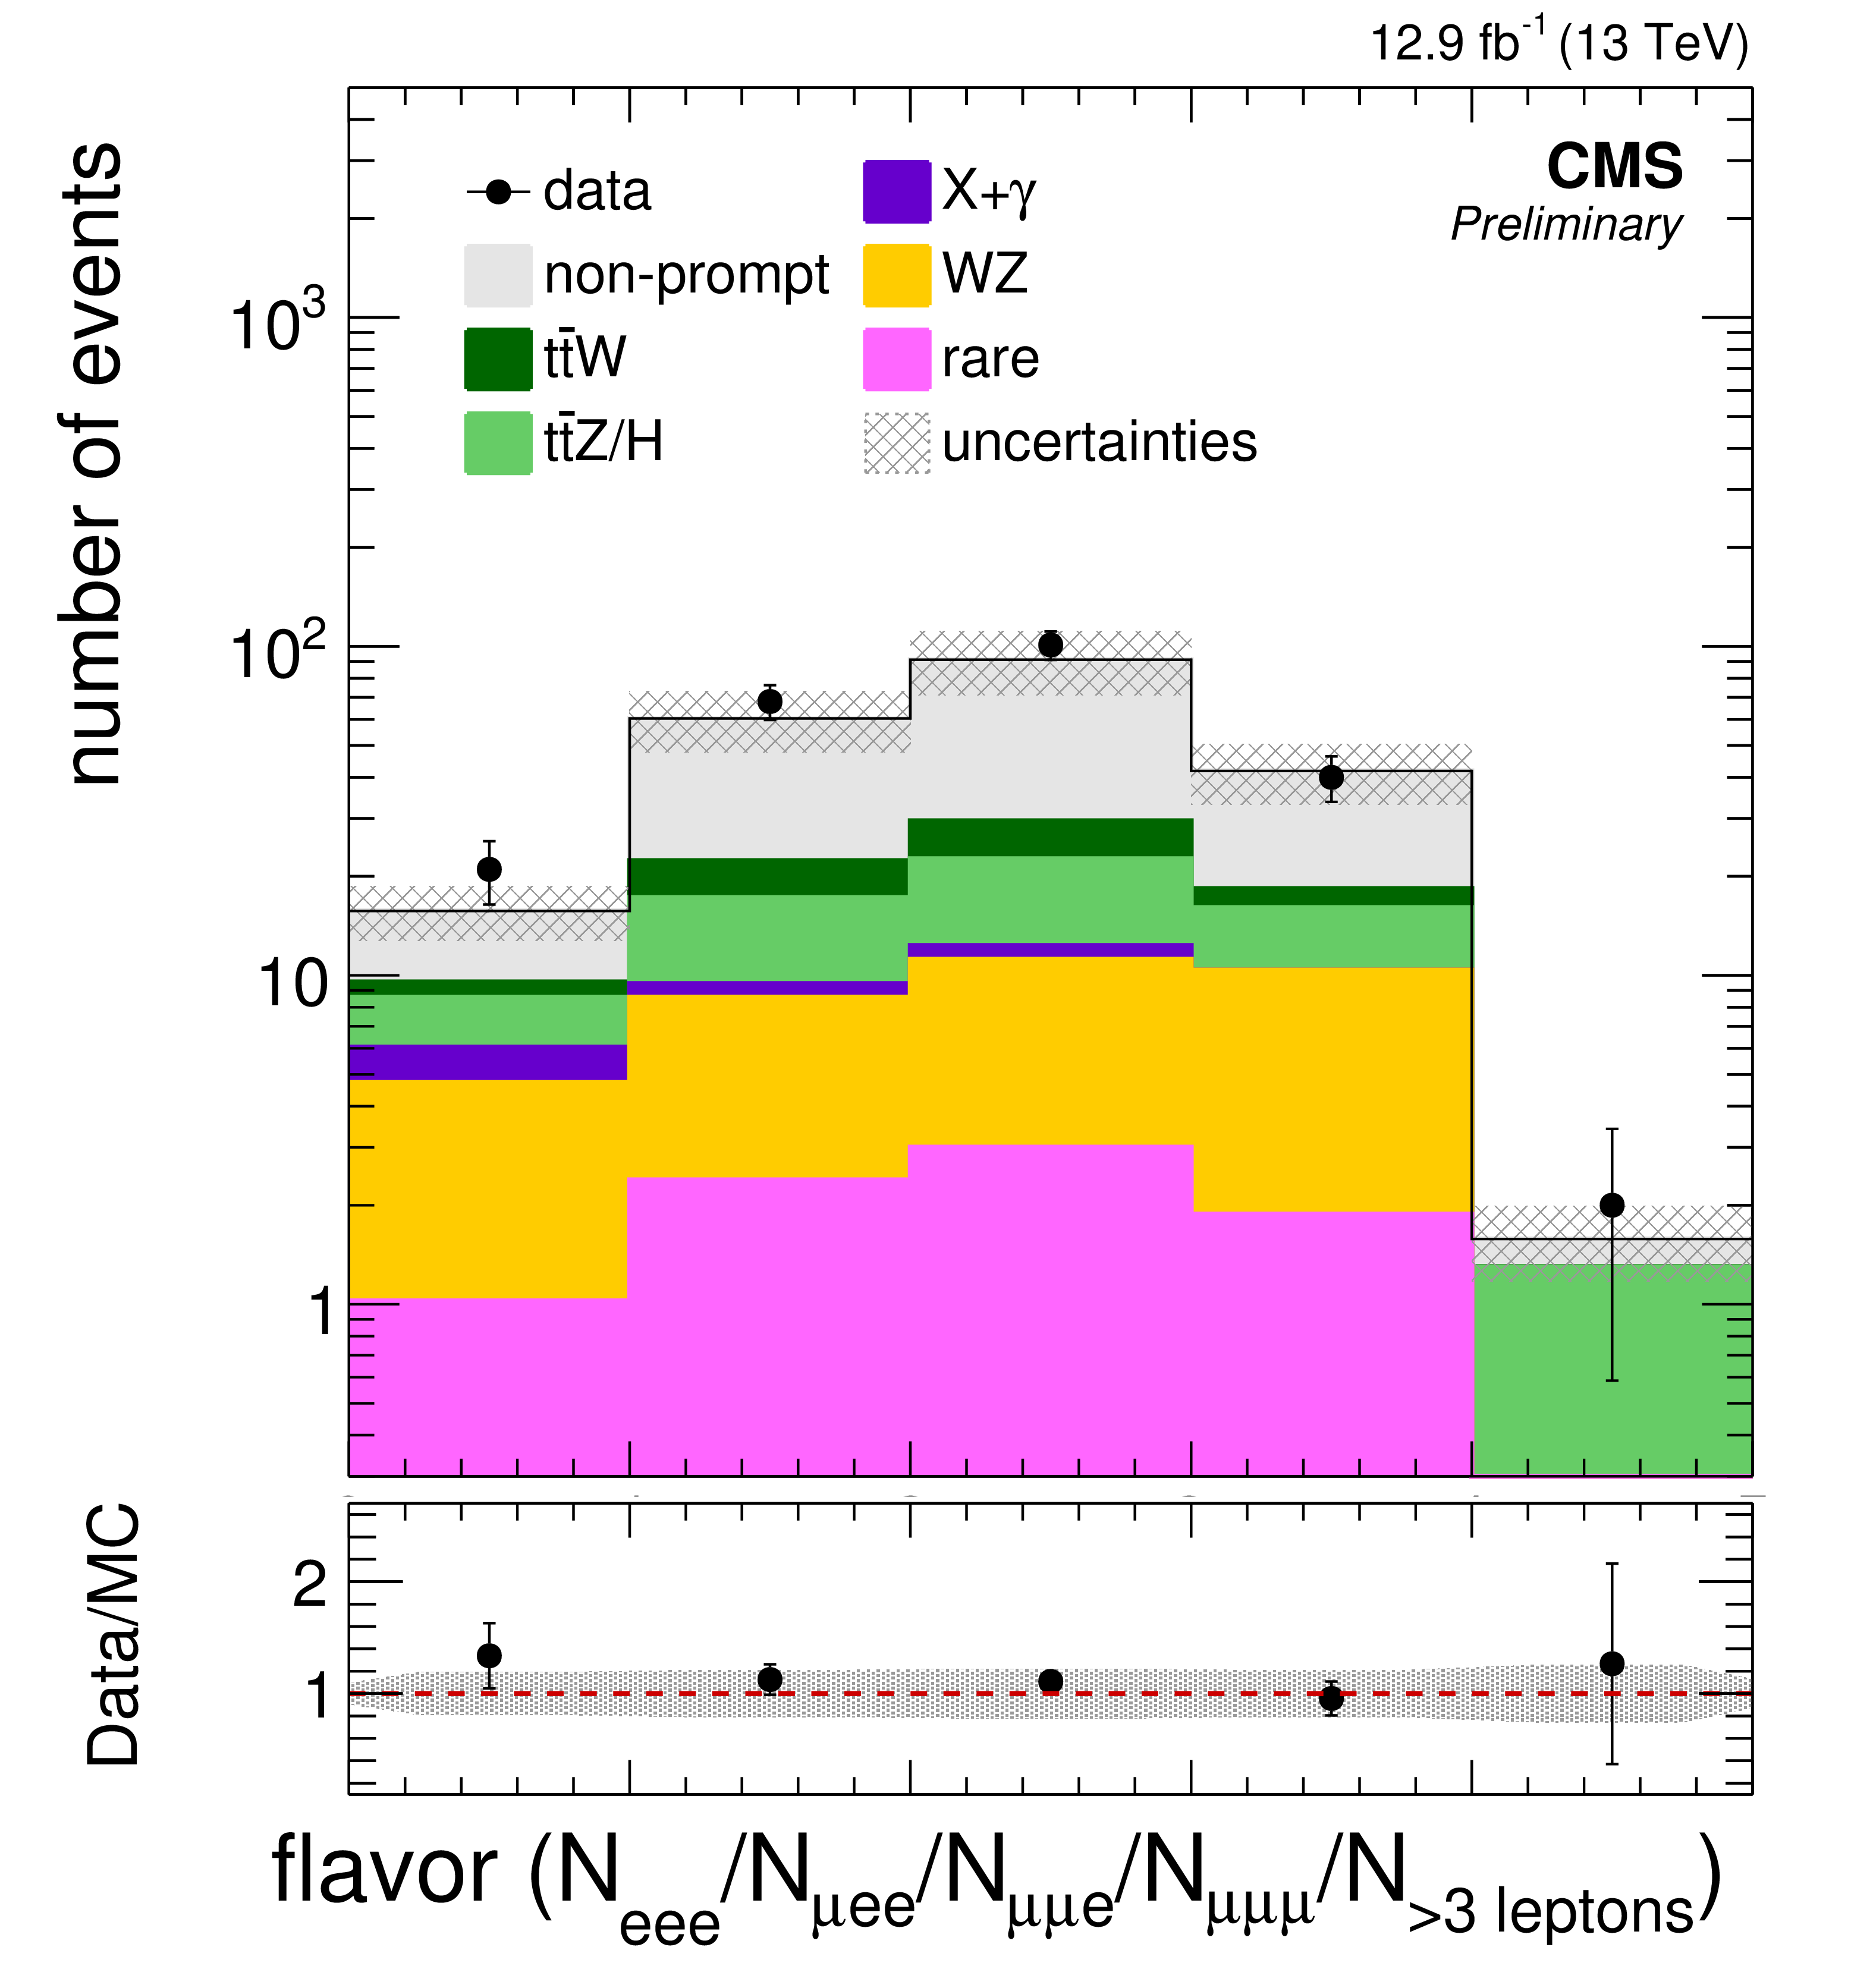
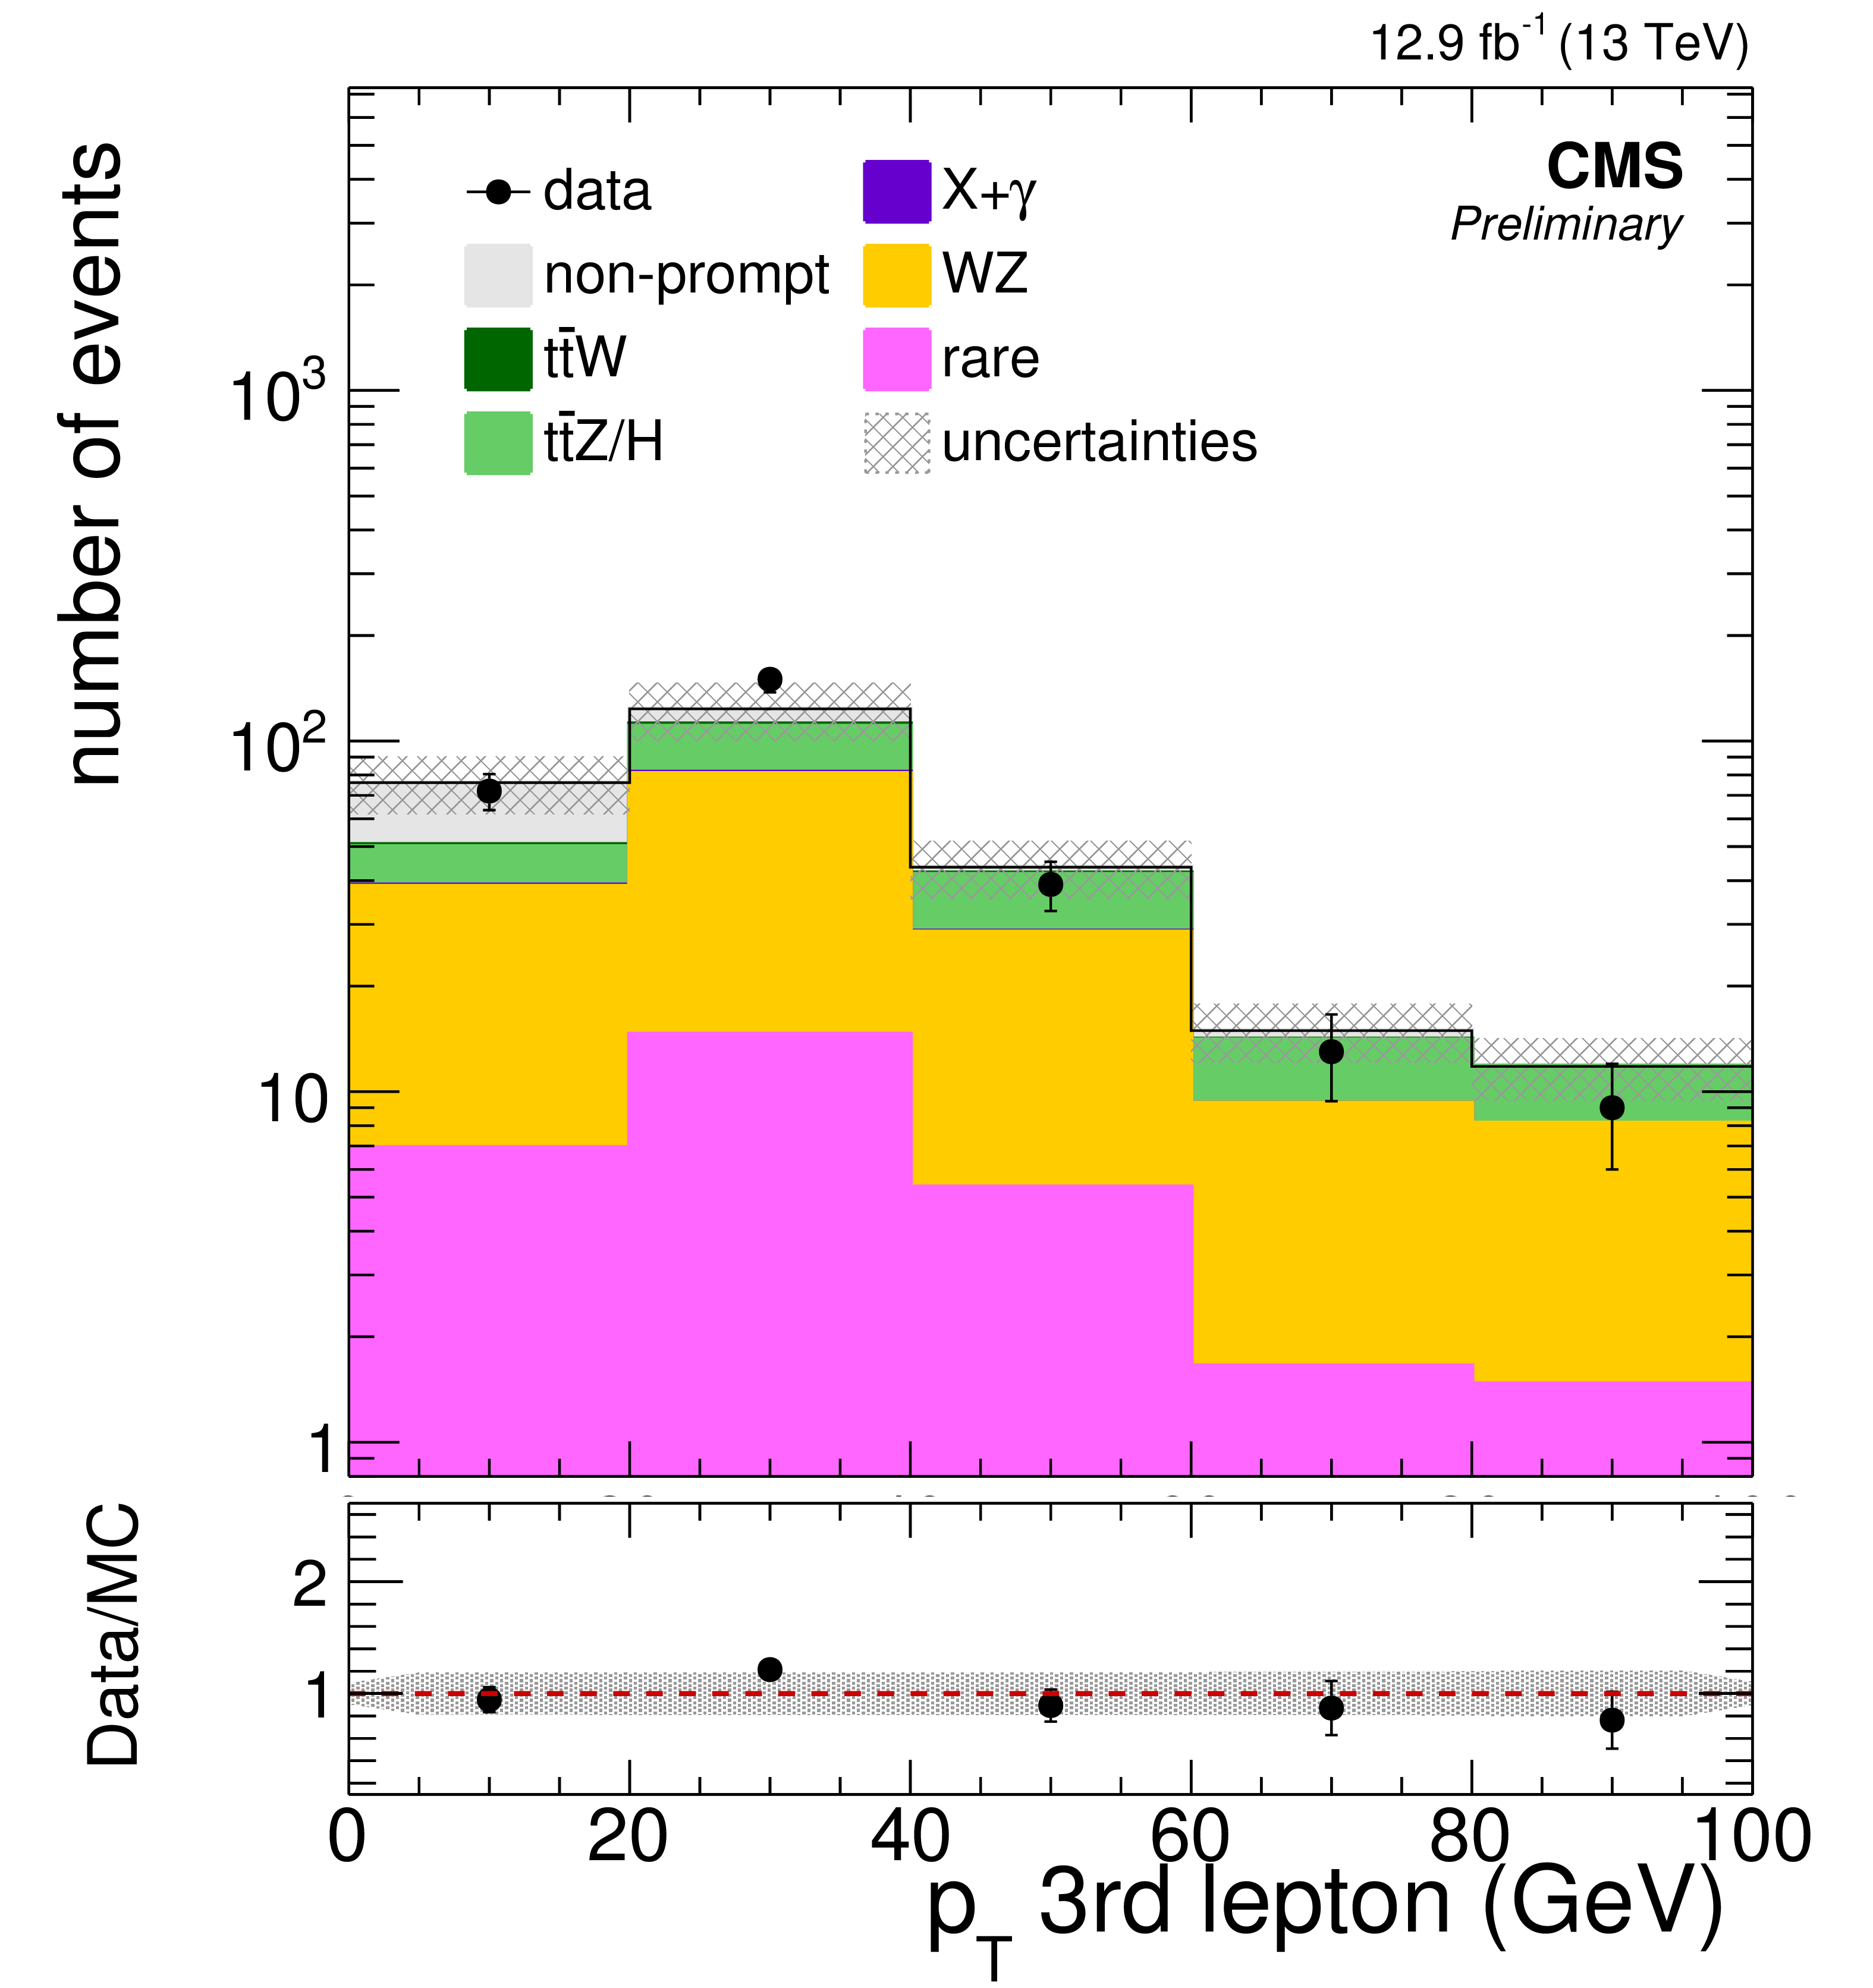
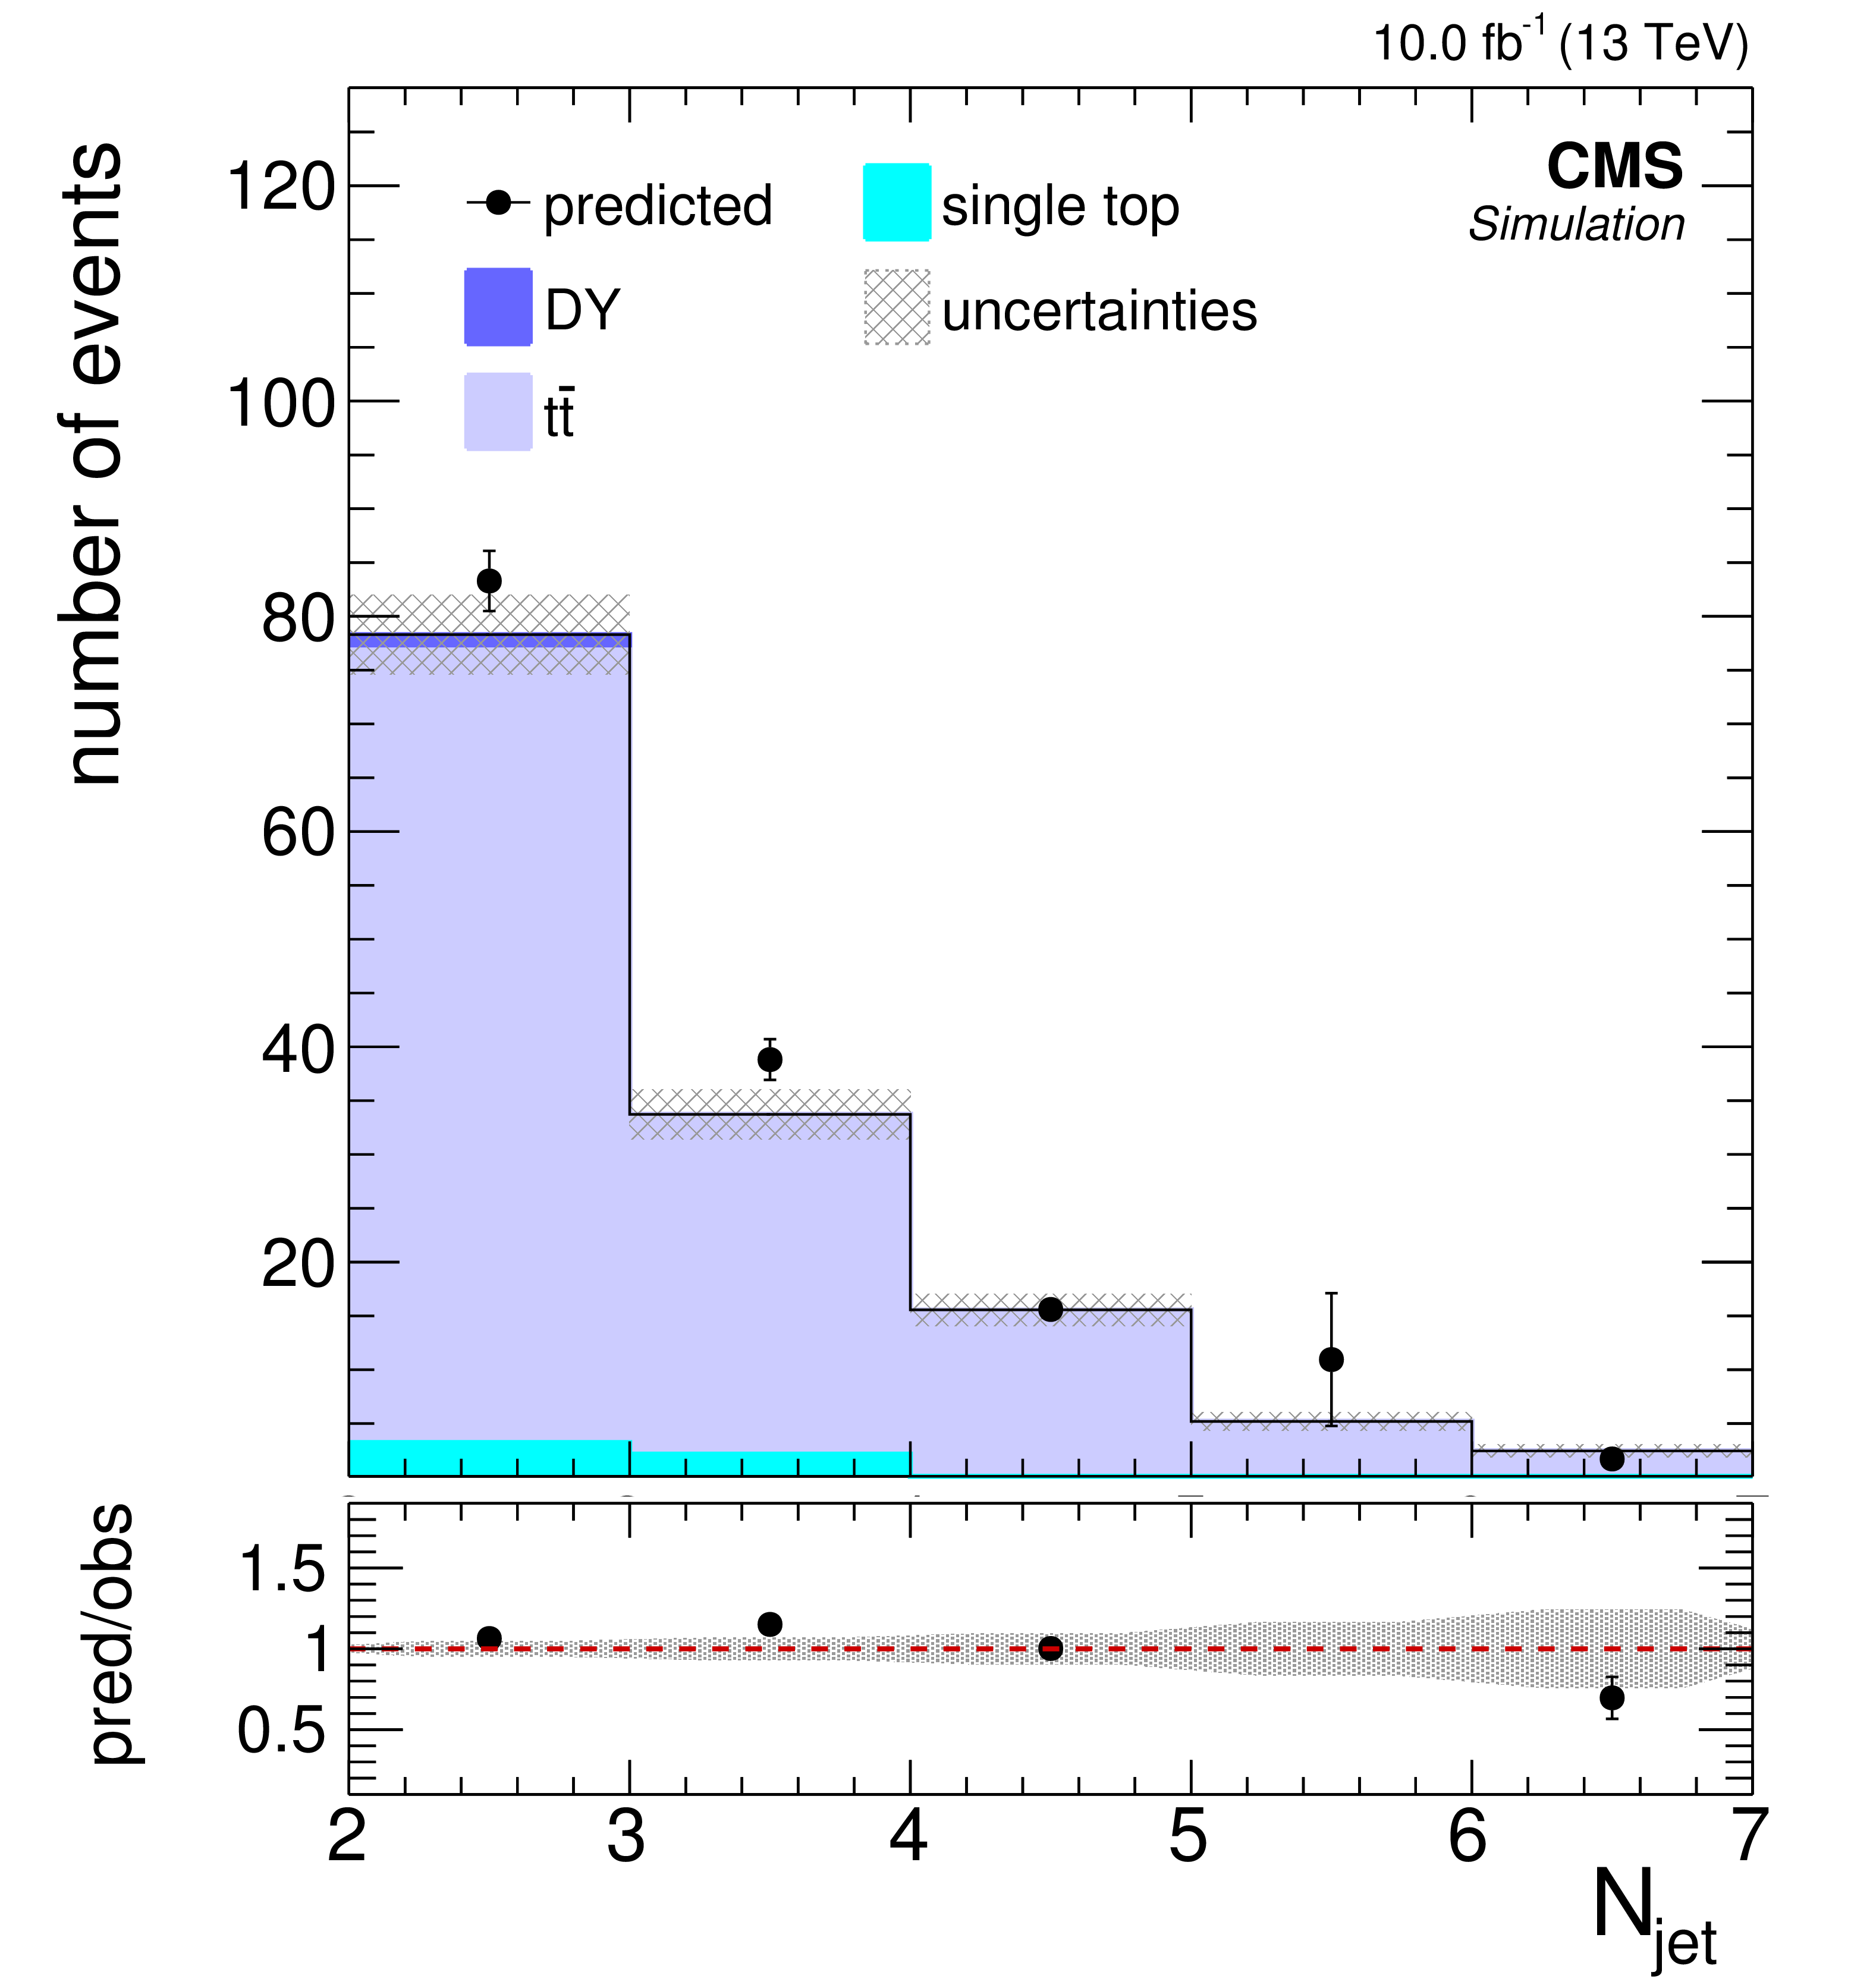
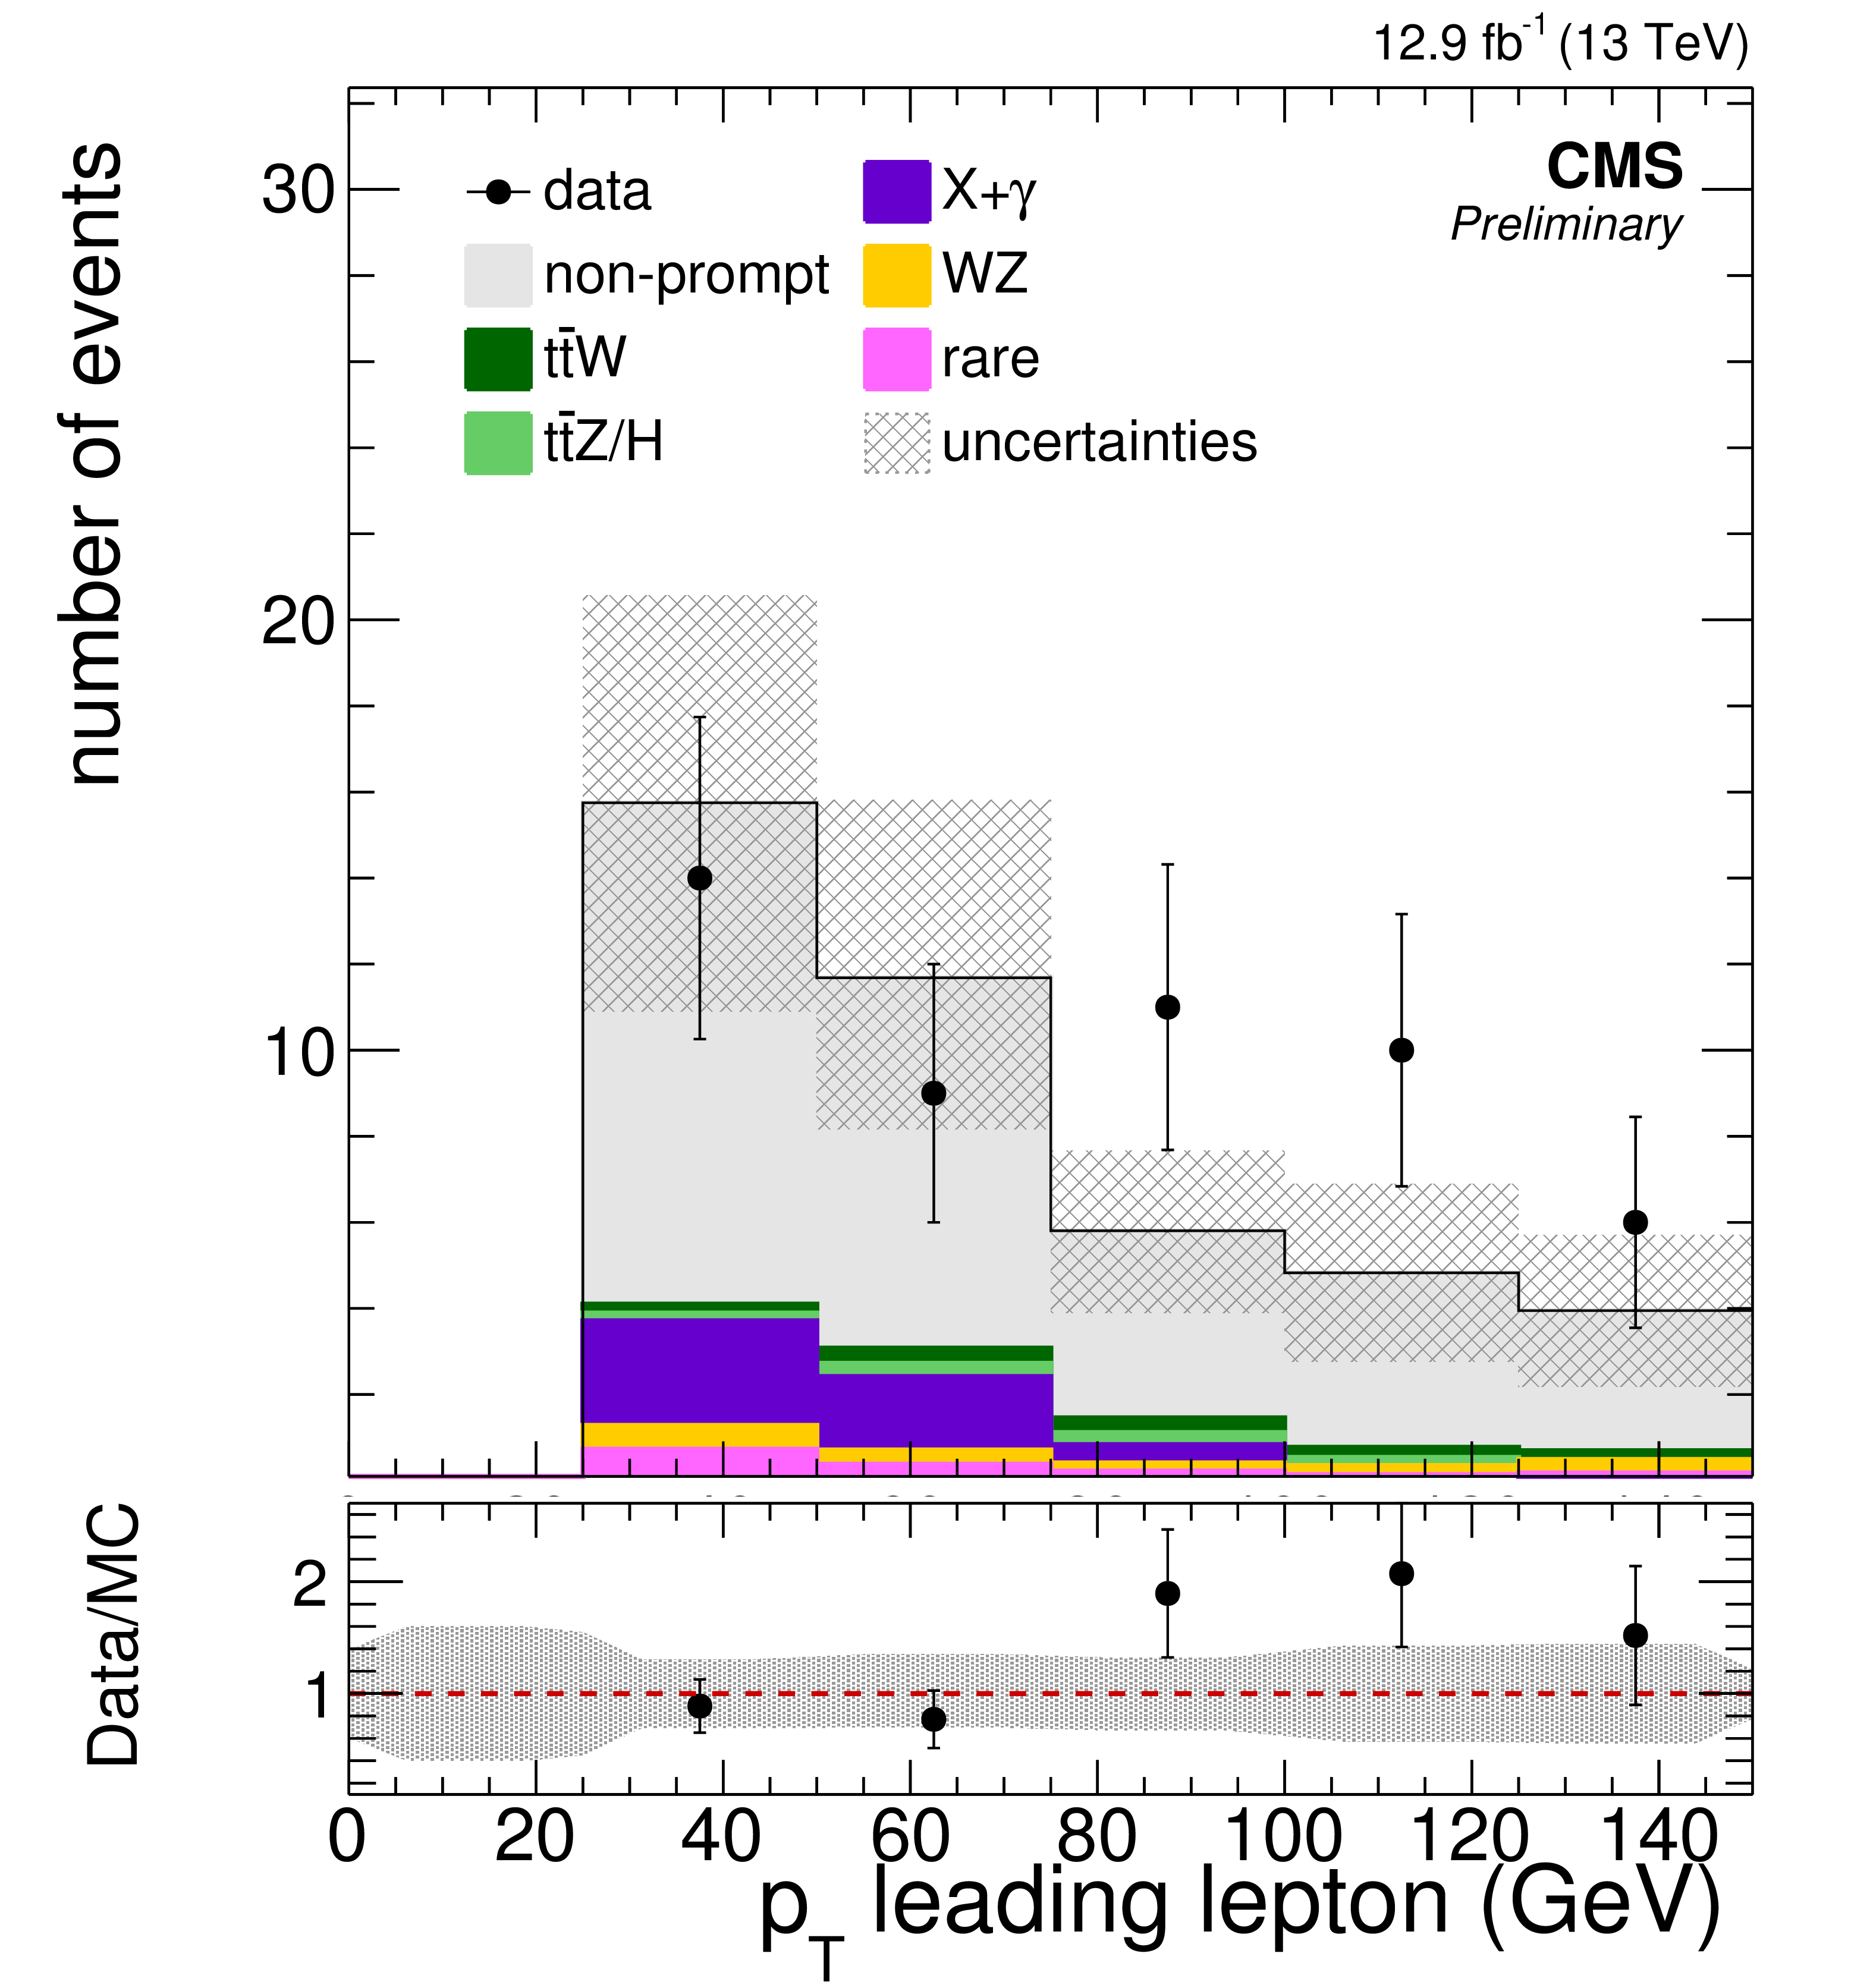
Figure 2-d:
Background prediction and observation in key observables of the off-Z baseline selection for 12.9 fb$^{-1}$ . Good agreement between data and expected background yields is observed in the event variables used for signal region categorization - the b-jet multiplicity, ${E_{\mathrm {T}}^{\text {miss}}}$ , and ${H_{\mathrm {T}}}$ . Additionally, the distributions of the lepton ${p_{\mathrm {T}}}$ spectra, the flavor composition of the leptons, and the lepton multiplicity in the event are shown. The hatched area represents the statistical and systematic uncertainties on the prediction. |
png pdf |
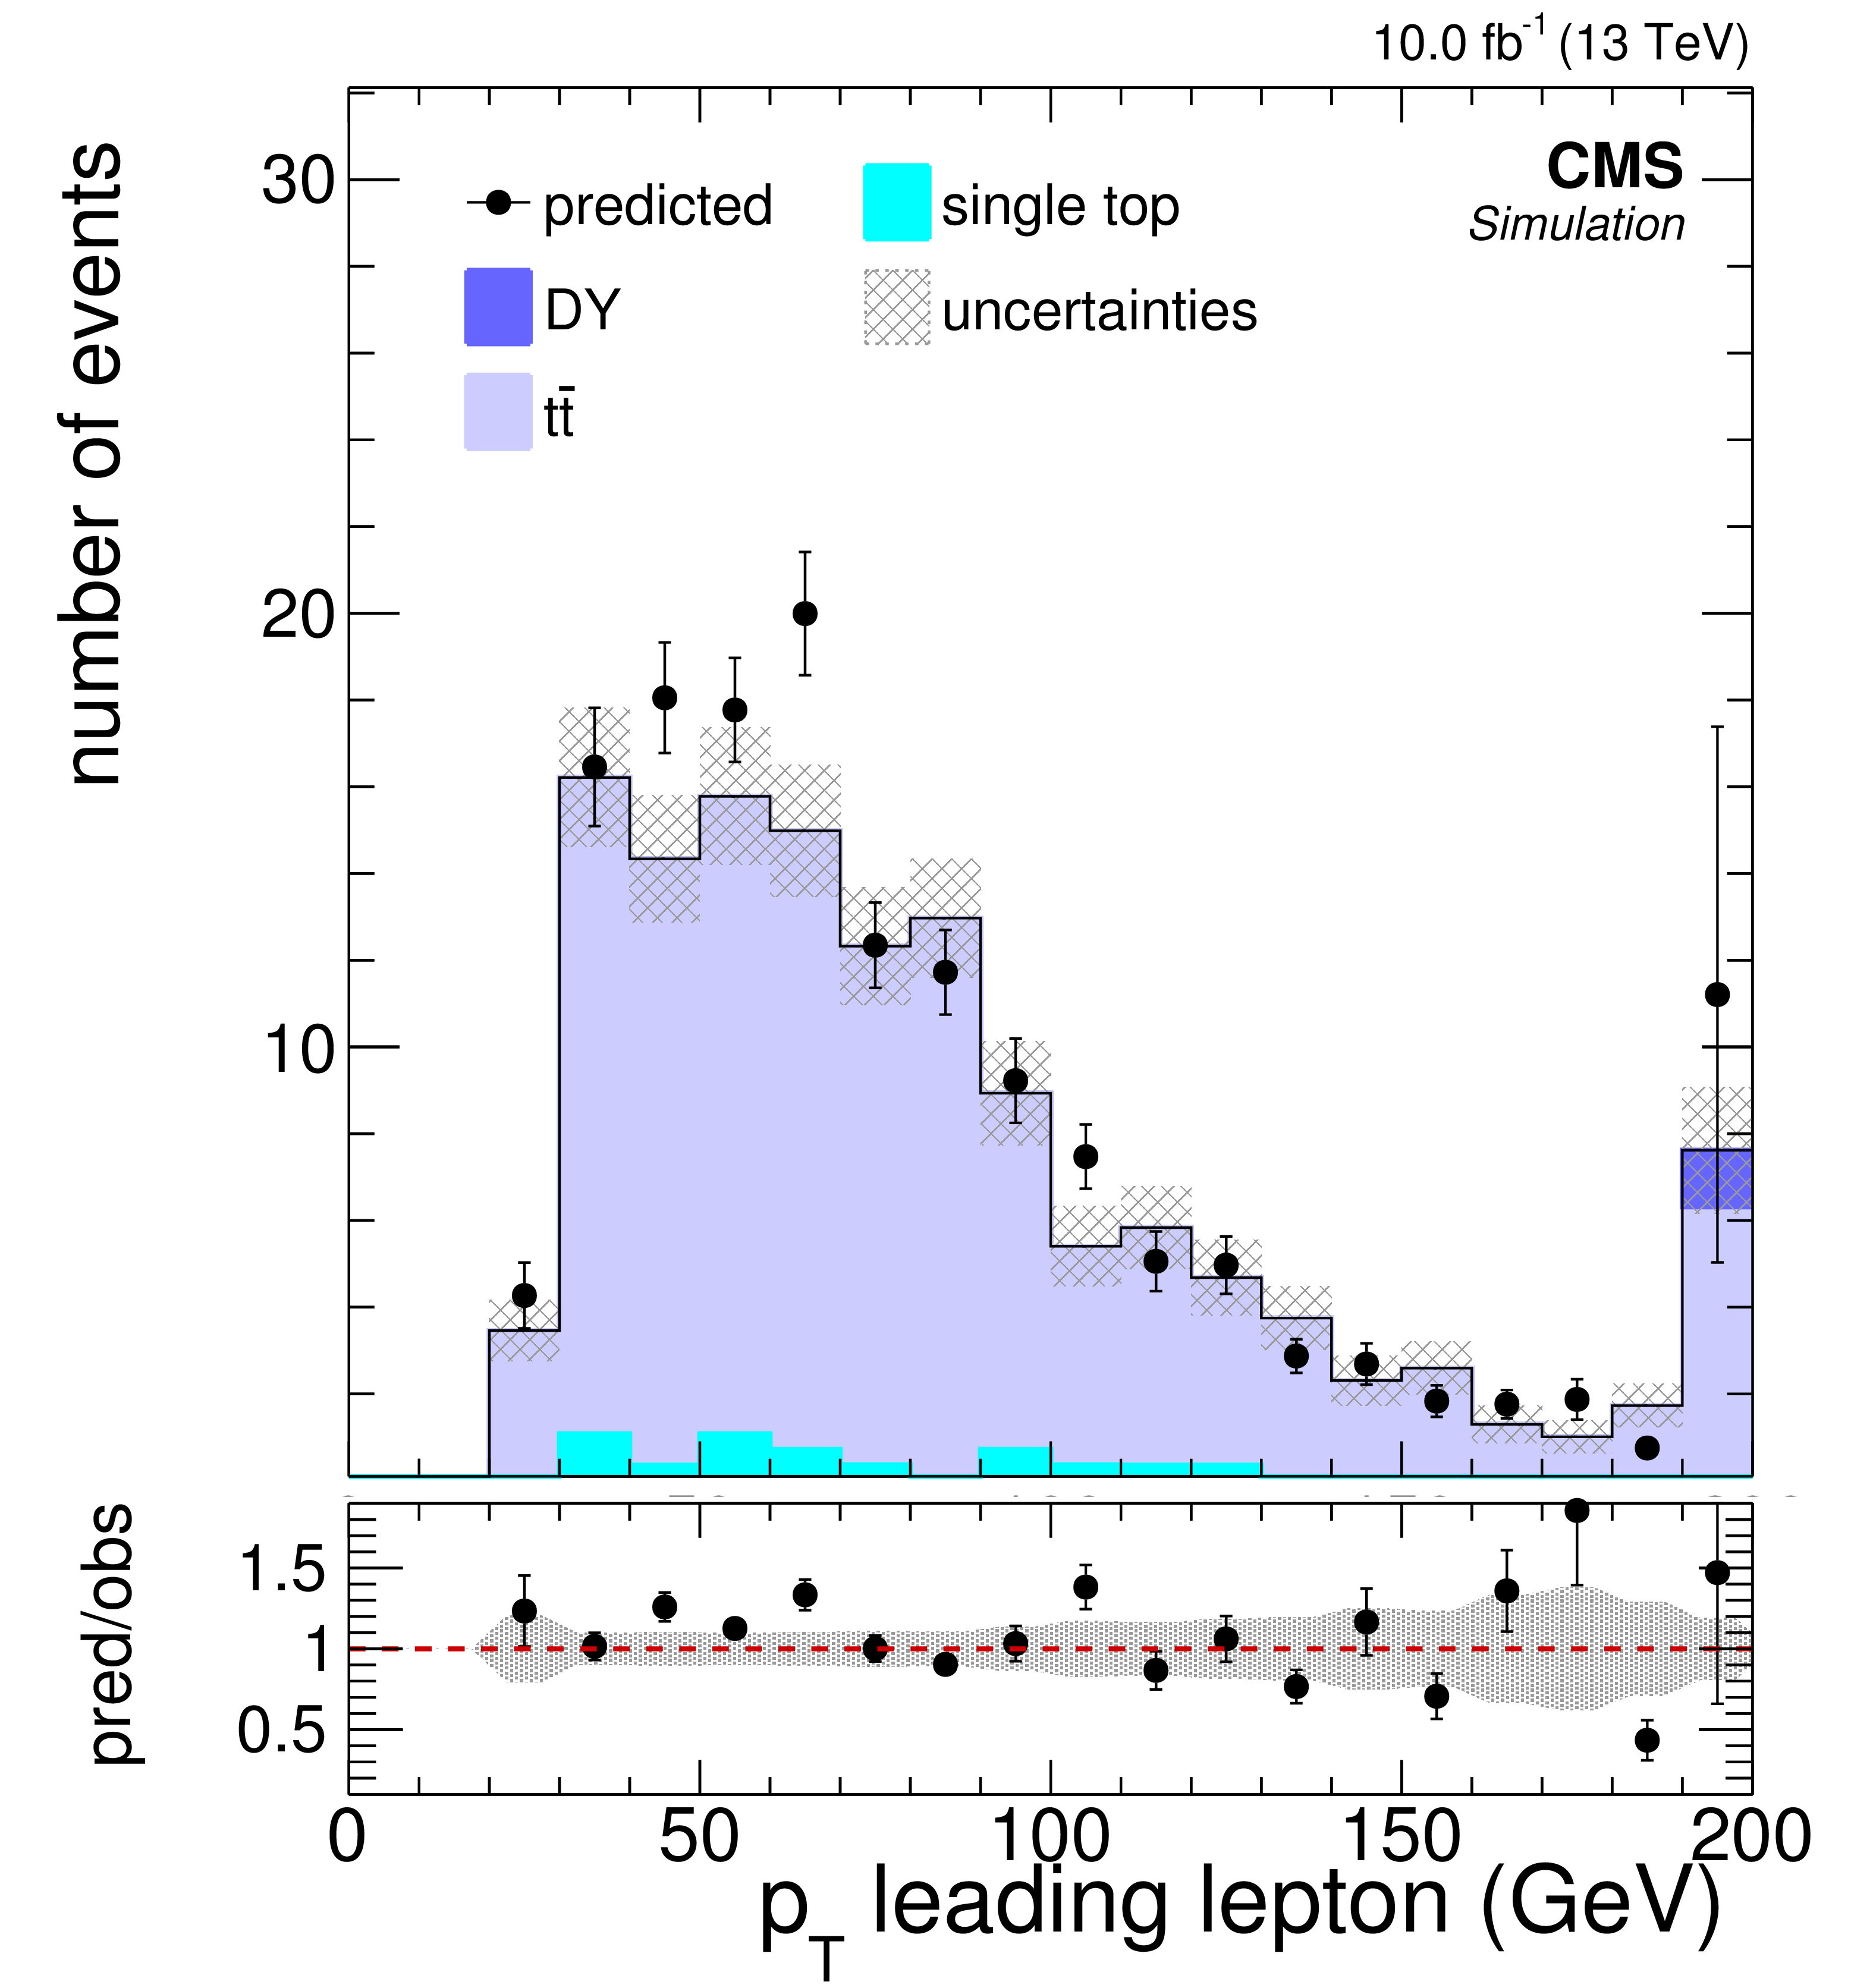
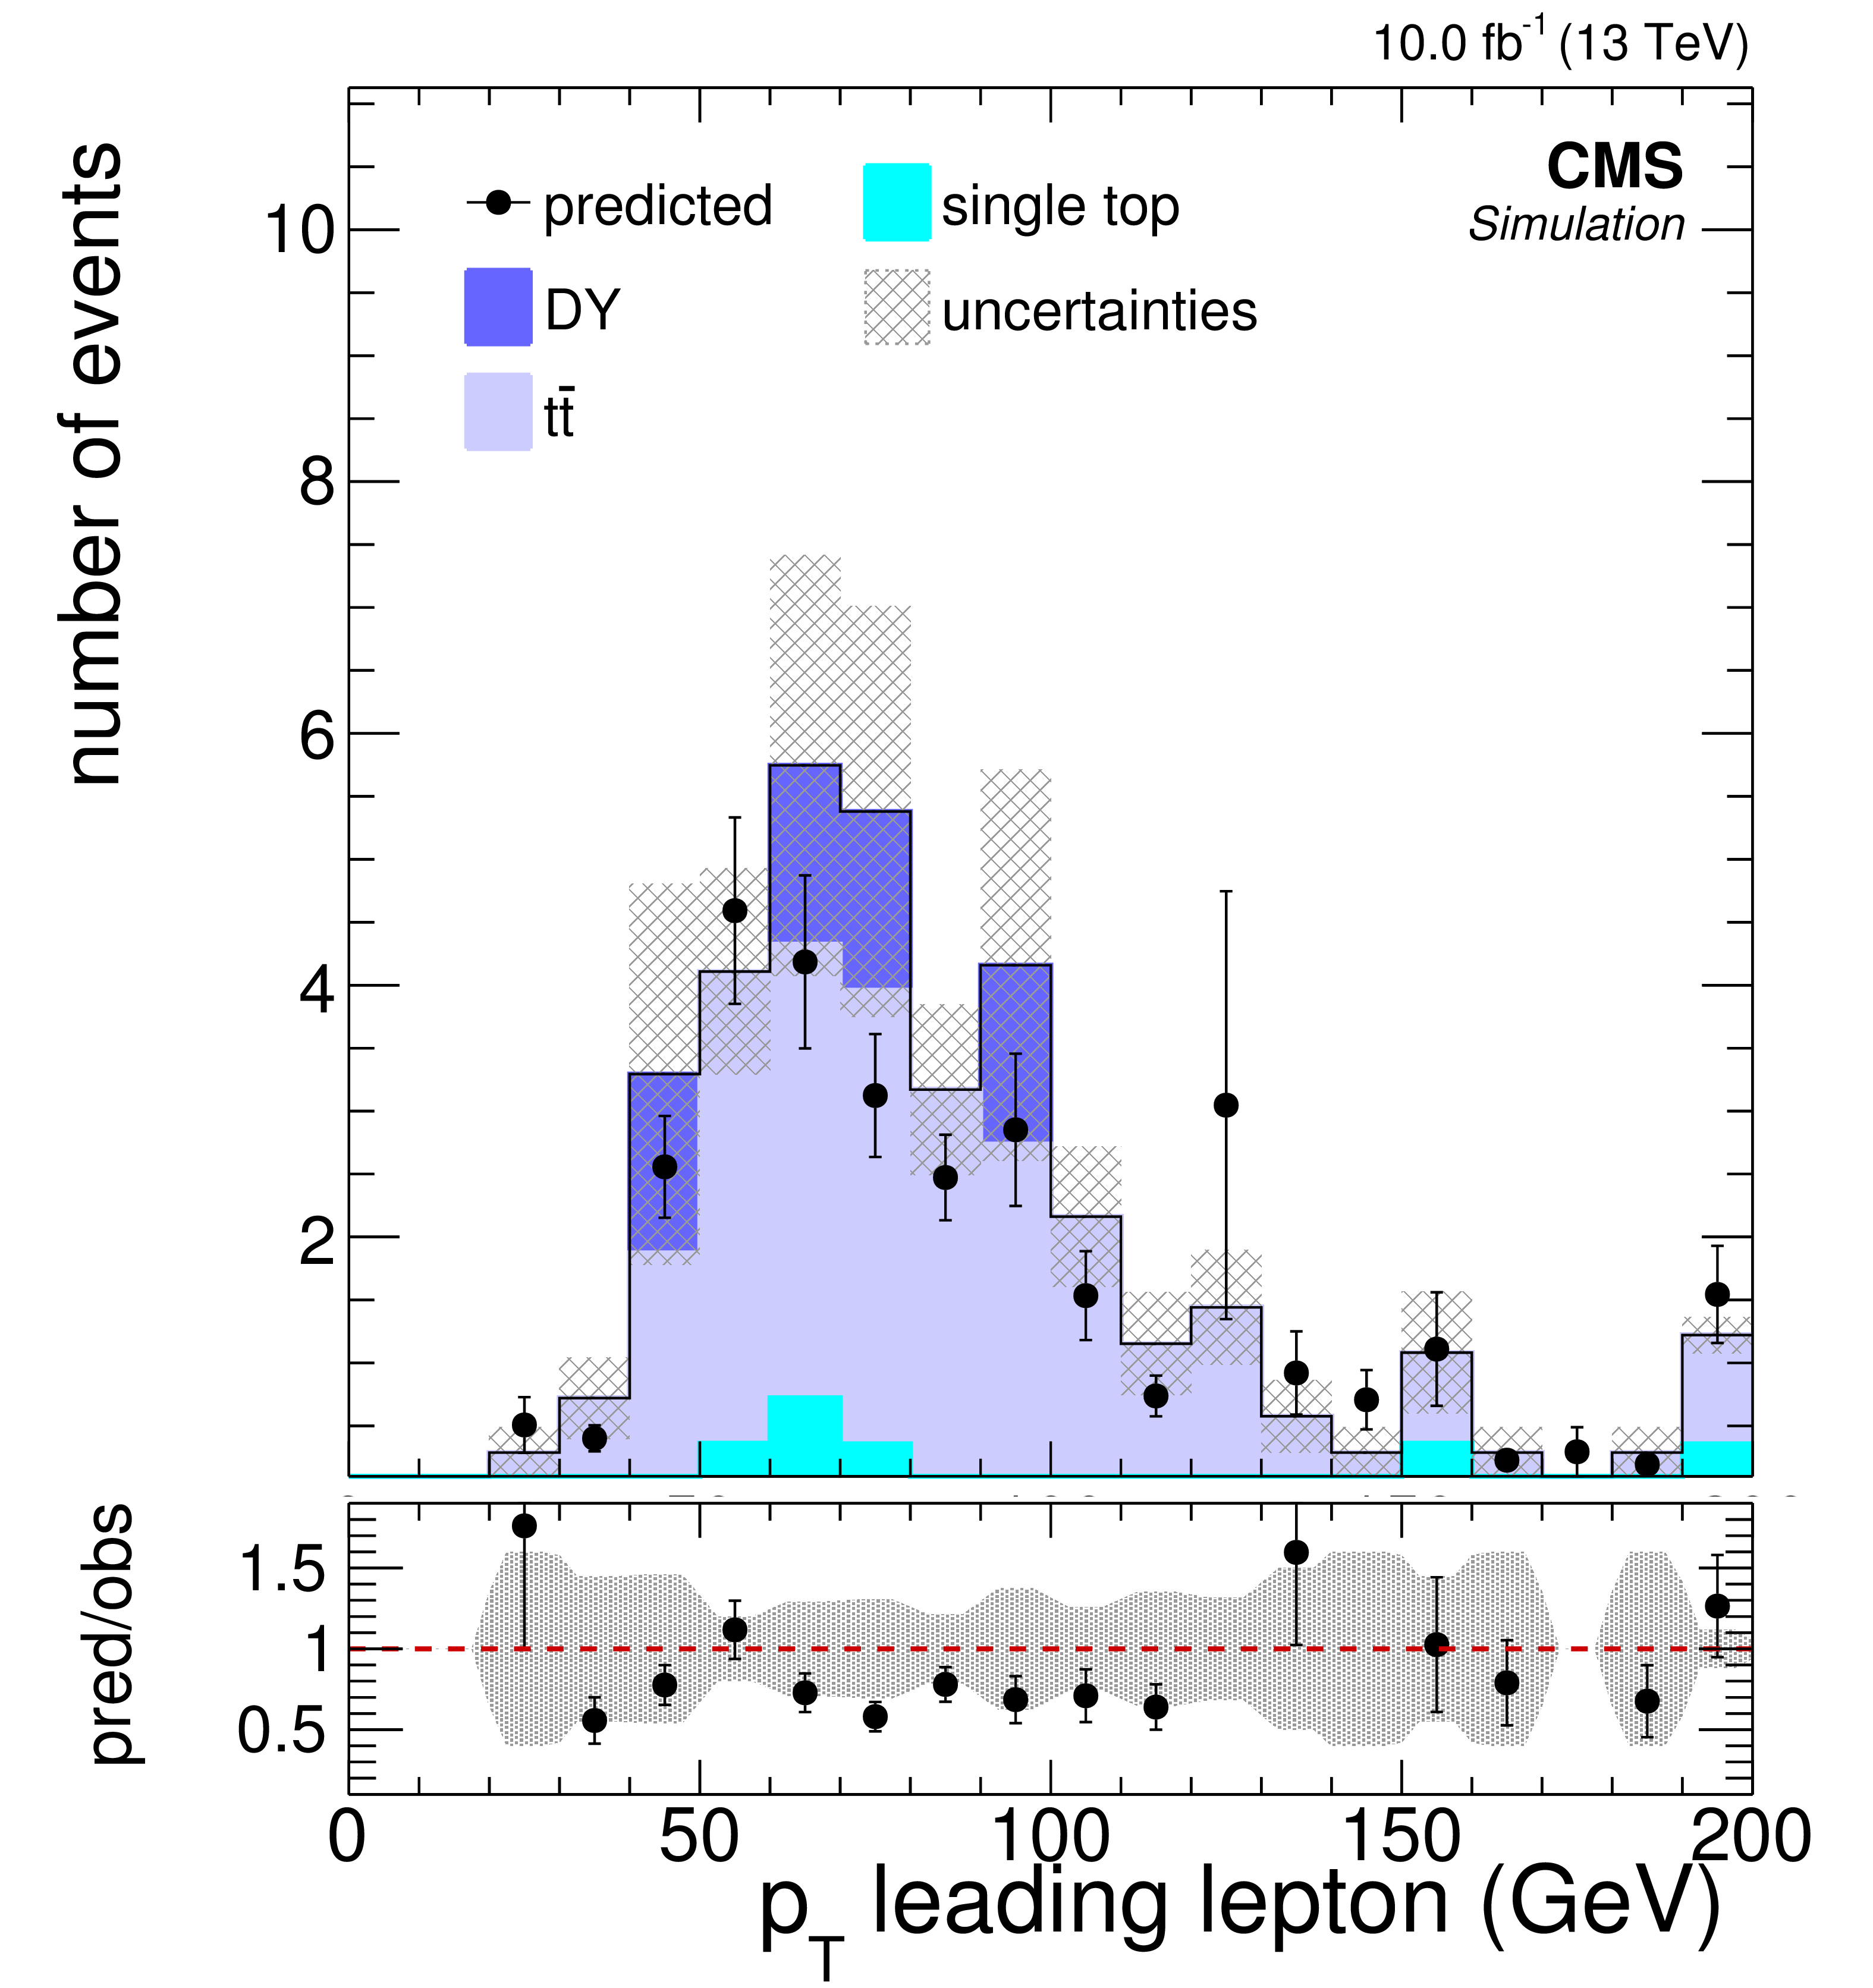
Figure 2-e:
Background prediction and observation in key observables of the off-Z baseline selection for 12.9 fb$^{-1}$ . Good agreement between data and expected background yields is observed in the event variables used for signal region categorization - the b-jet multiplicity, ${E_{\mathrm {T}}^{\text {miss}}}$ , and ${H_{\mathrm {T}}}$ . Additionally, the distributions of the lepton ${p_{\mathrm {T}}}$ spectra, the flavor composition of the leptons, and the lepton multiplicity in the event are shown. The hatched area represents the statistical and systematic uncertainties on the prediction. |
png pdf |
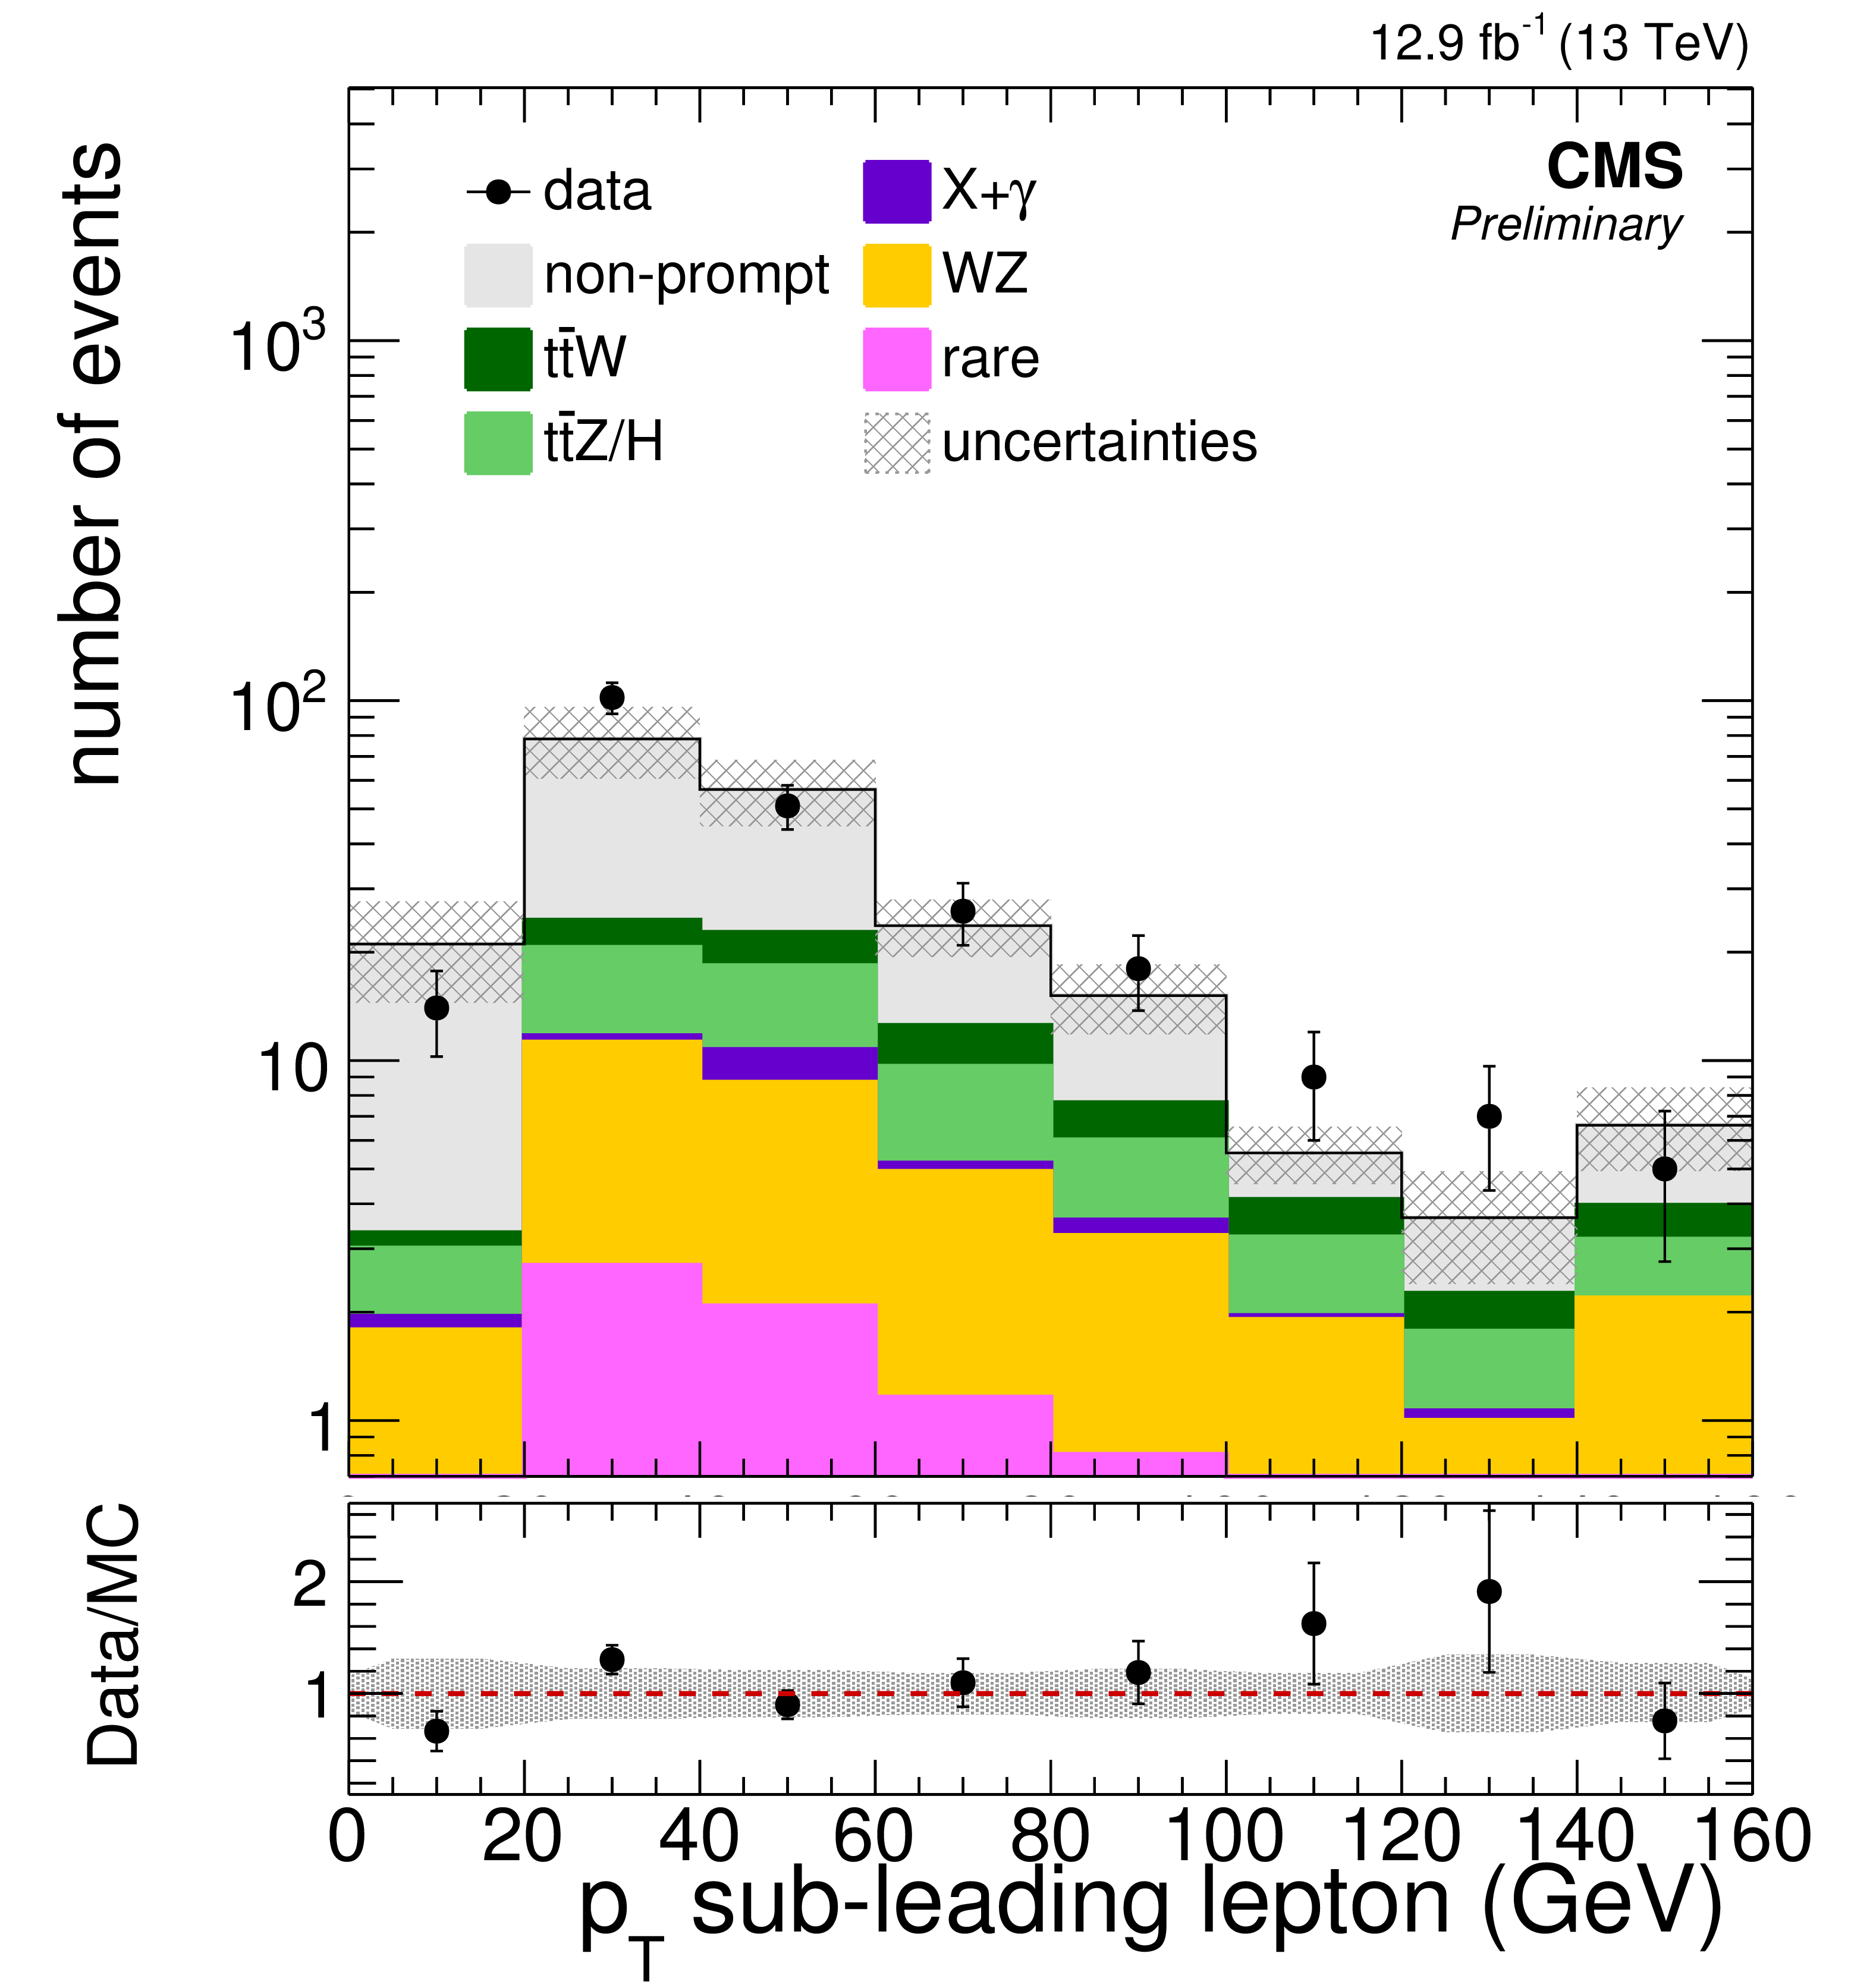
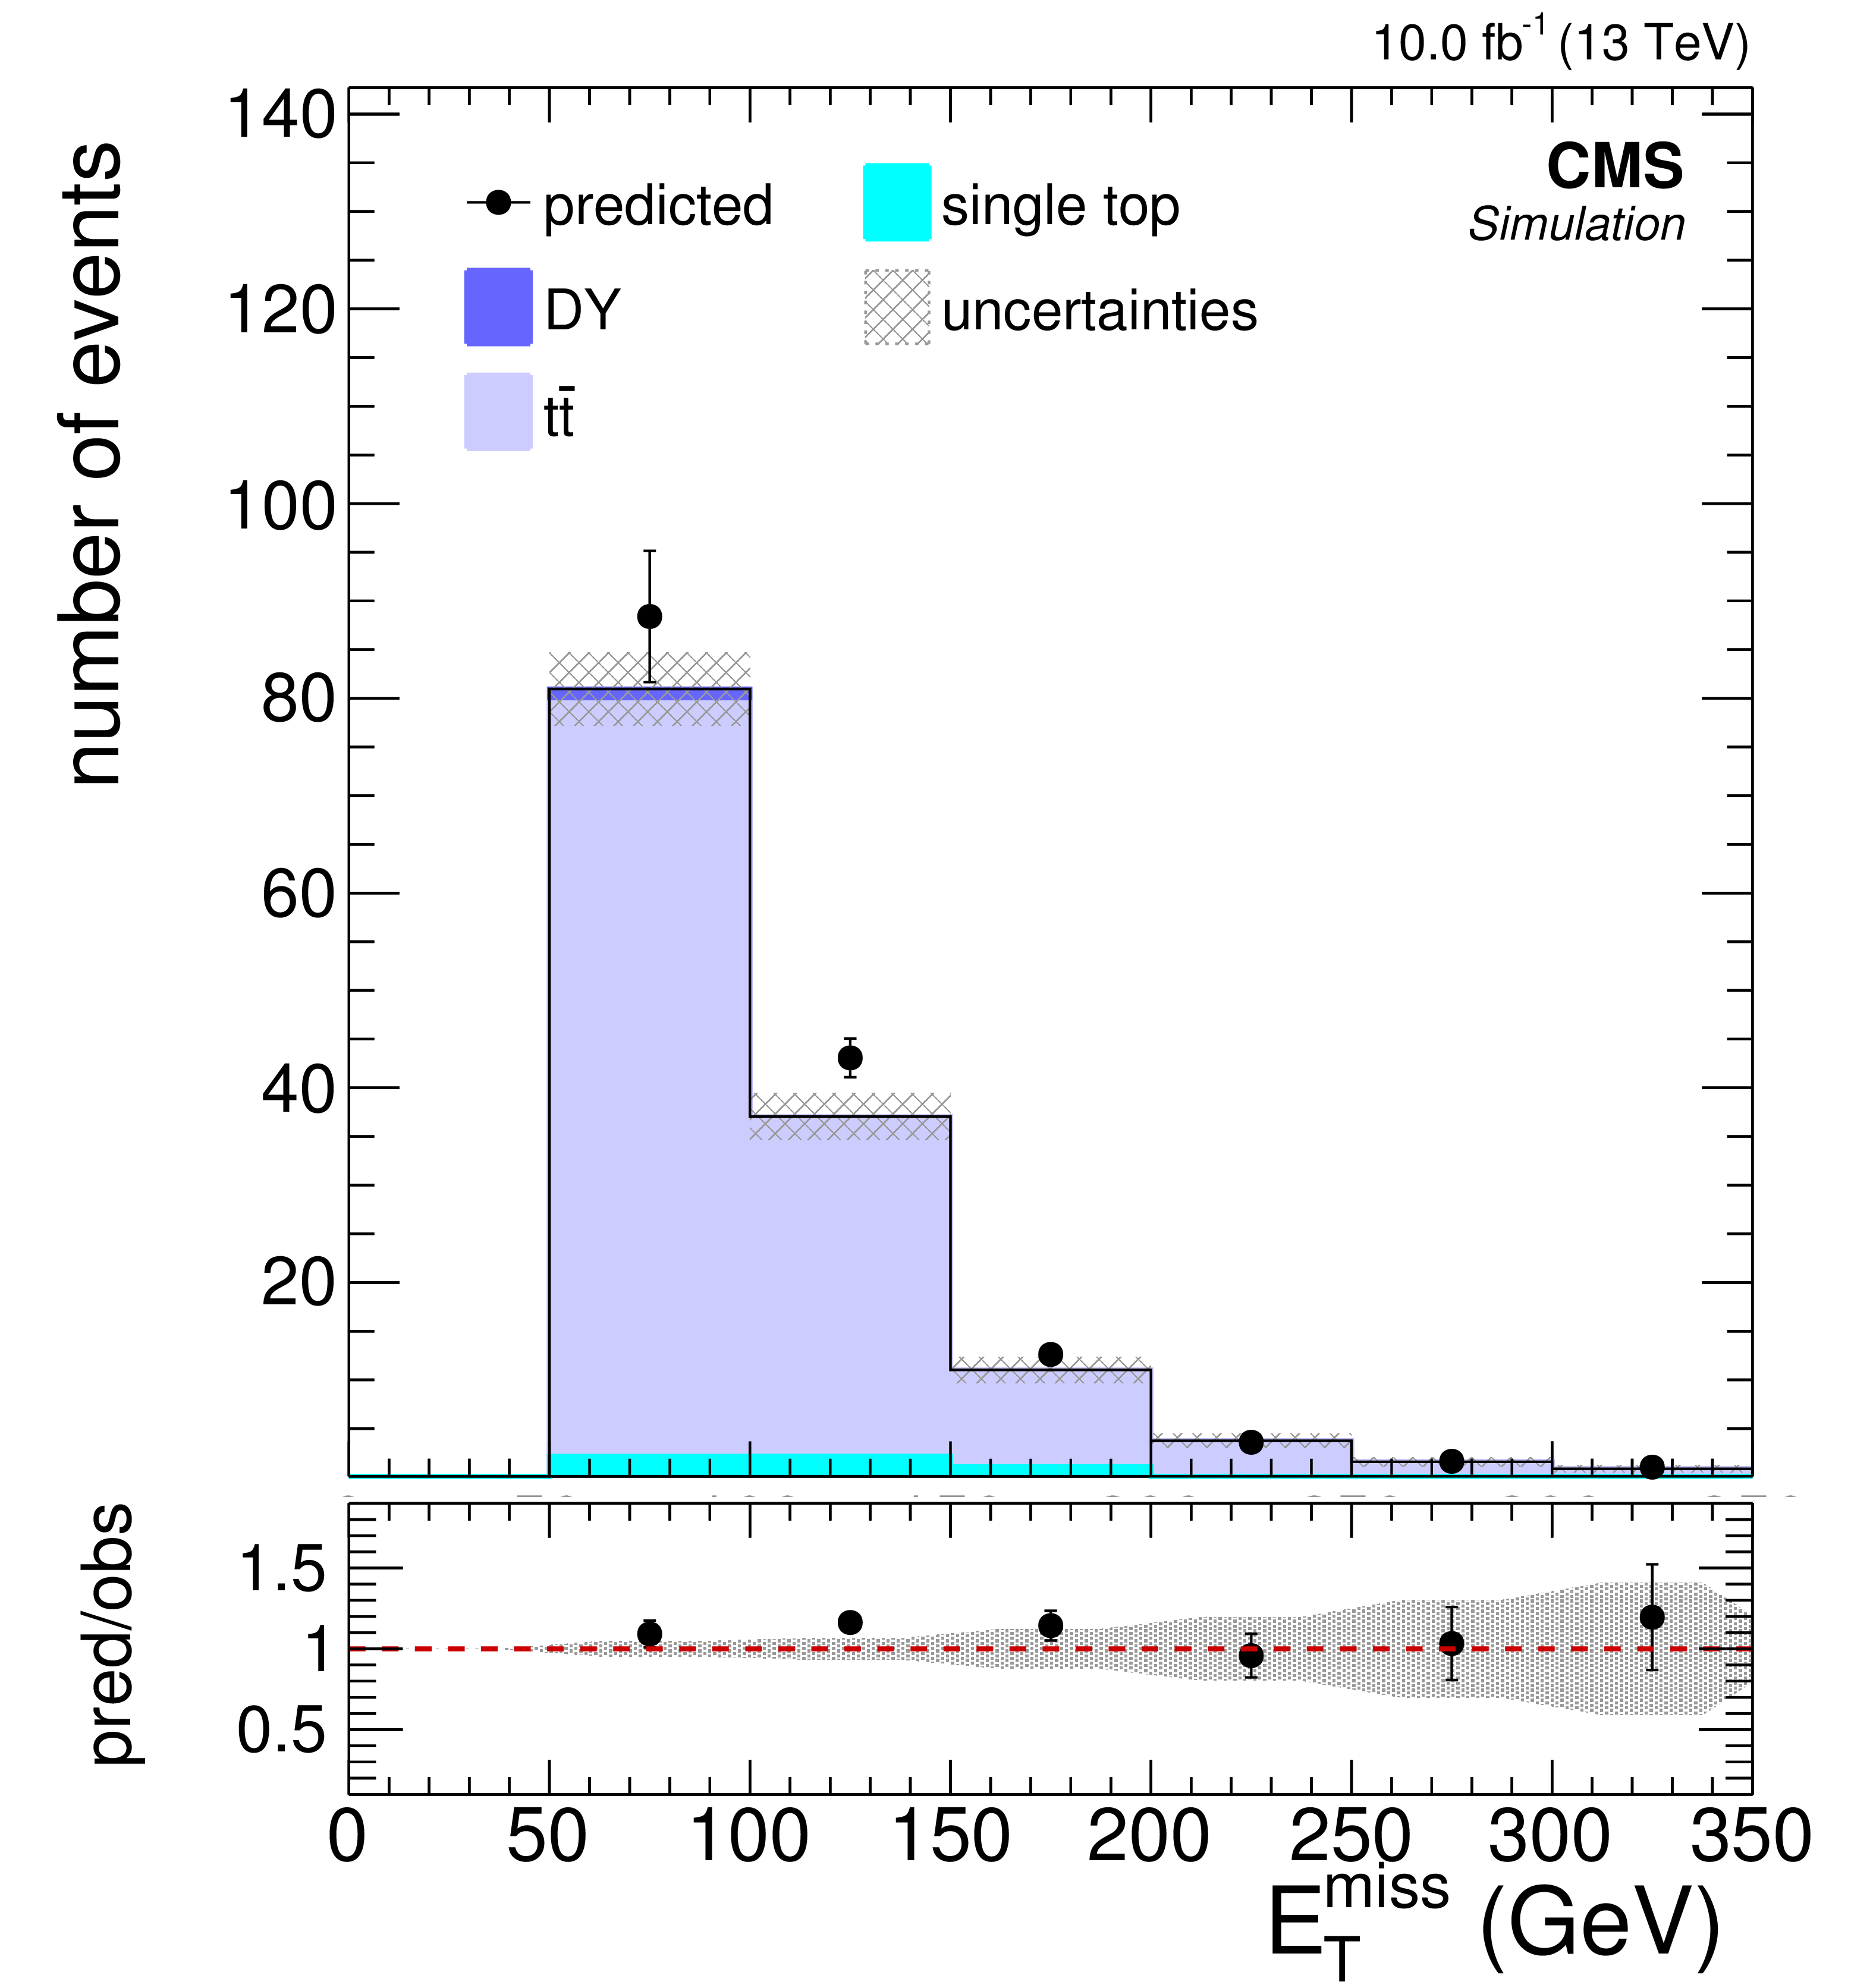
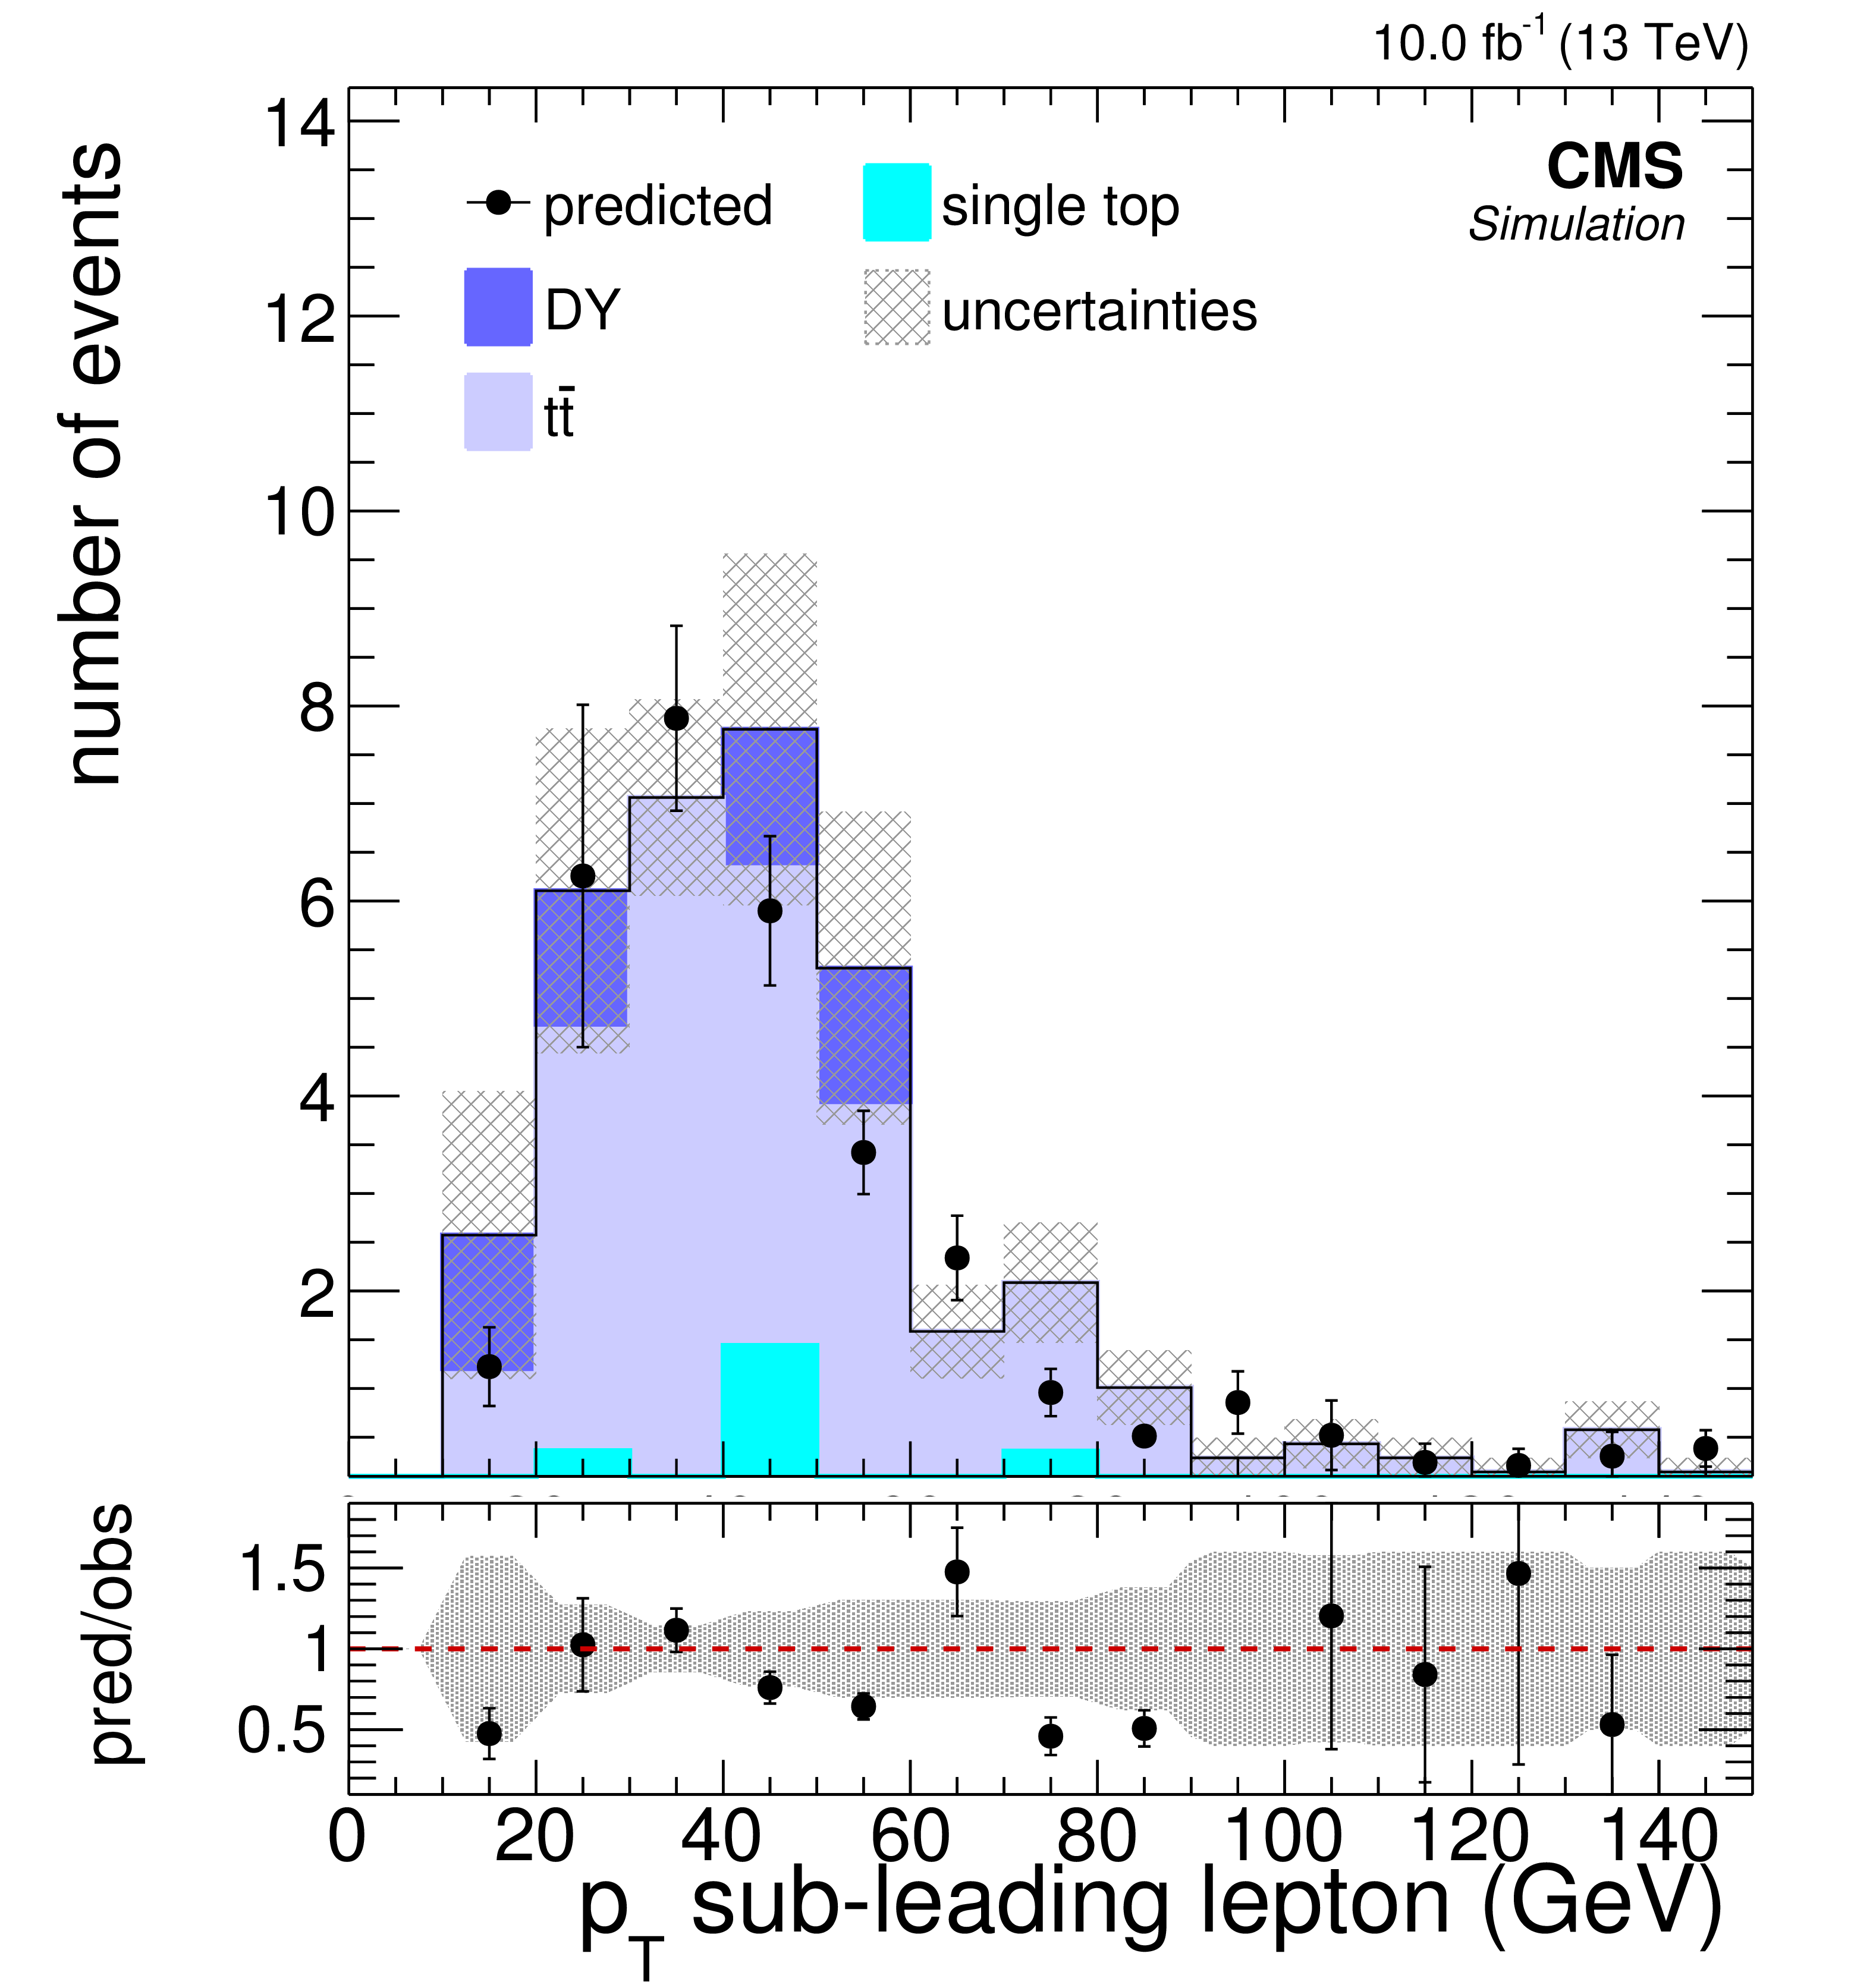
Figure 2-f:
Background prediction and observation in key observables of the off-Z baseline selection for 12.9 fb$^{-1}$ . Good agreement between data and expected background yields is observed in the event variables used for signal region categorization - the b-jet multiplicity, ${E_{\mathrm {T}}^{\text {miss}}}$ , and ${H_{\mathrm {T}}}$ . Additionally, the distributions of the lepton ${p_{\mathrm {T}}}$ spectra, the flavor composition of the leptons, and the lepton multiplicity in the event are shown. The hatched area represents the statistical and systematic uncertainties on the prediction. |
png pdf |
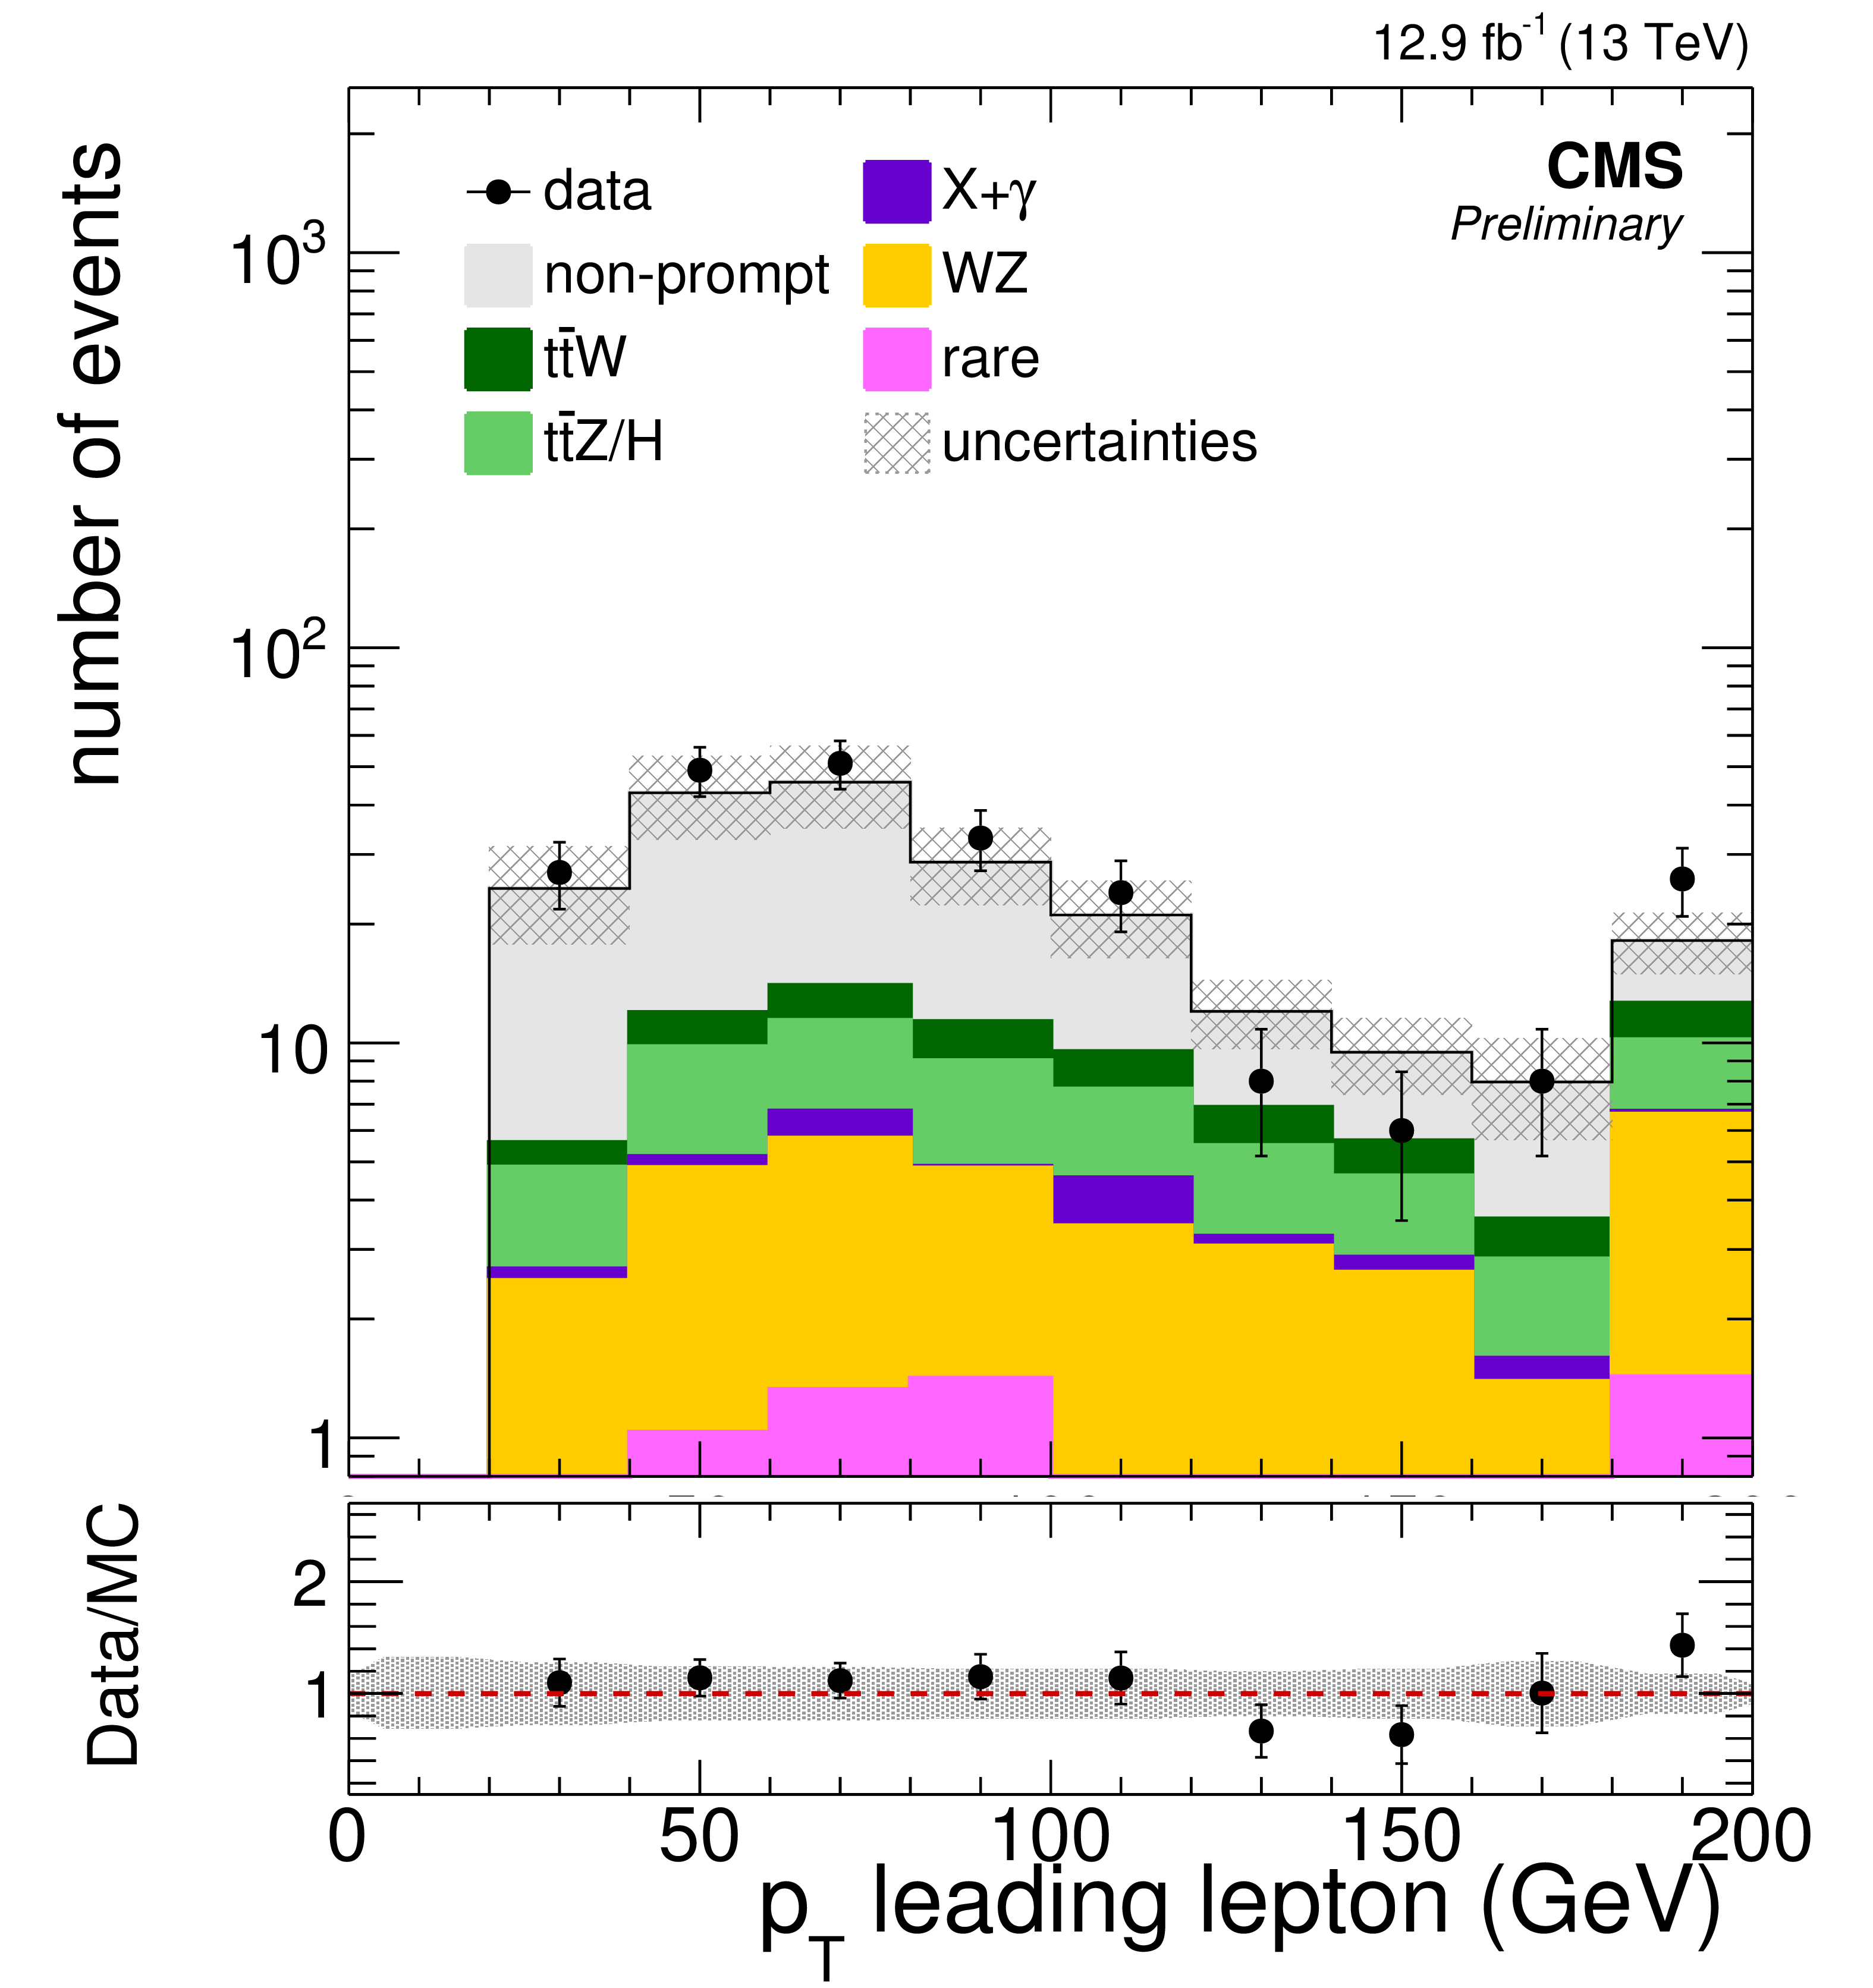
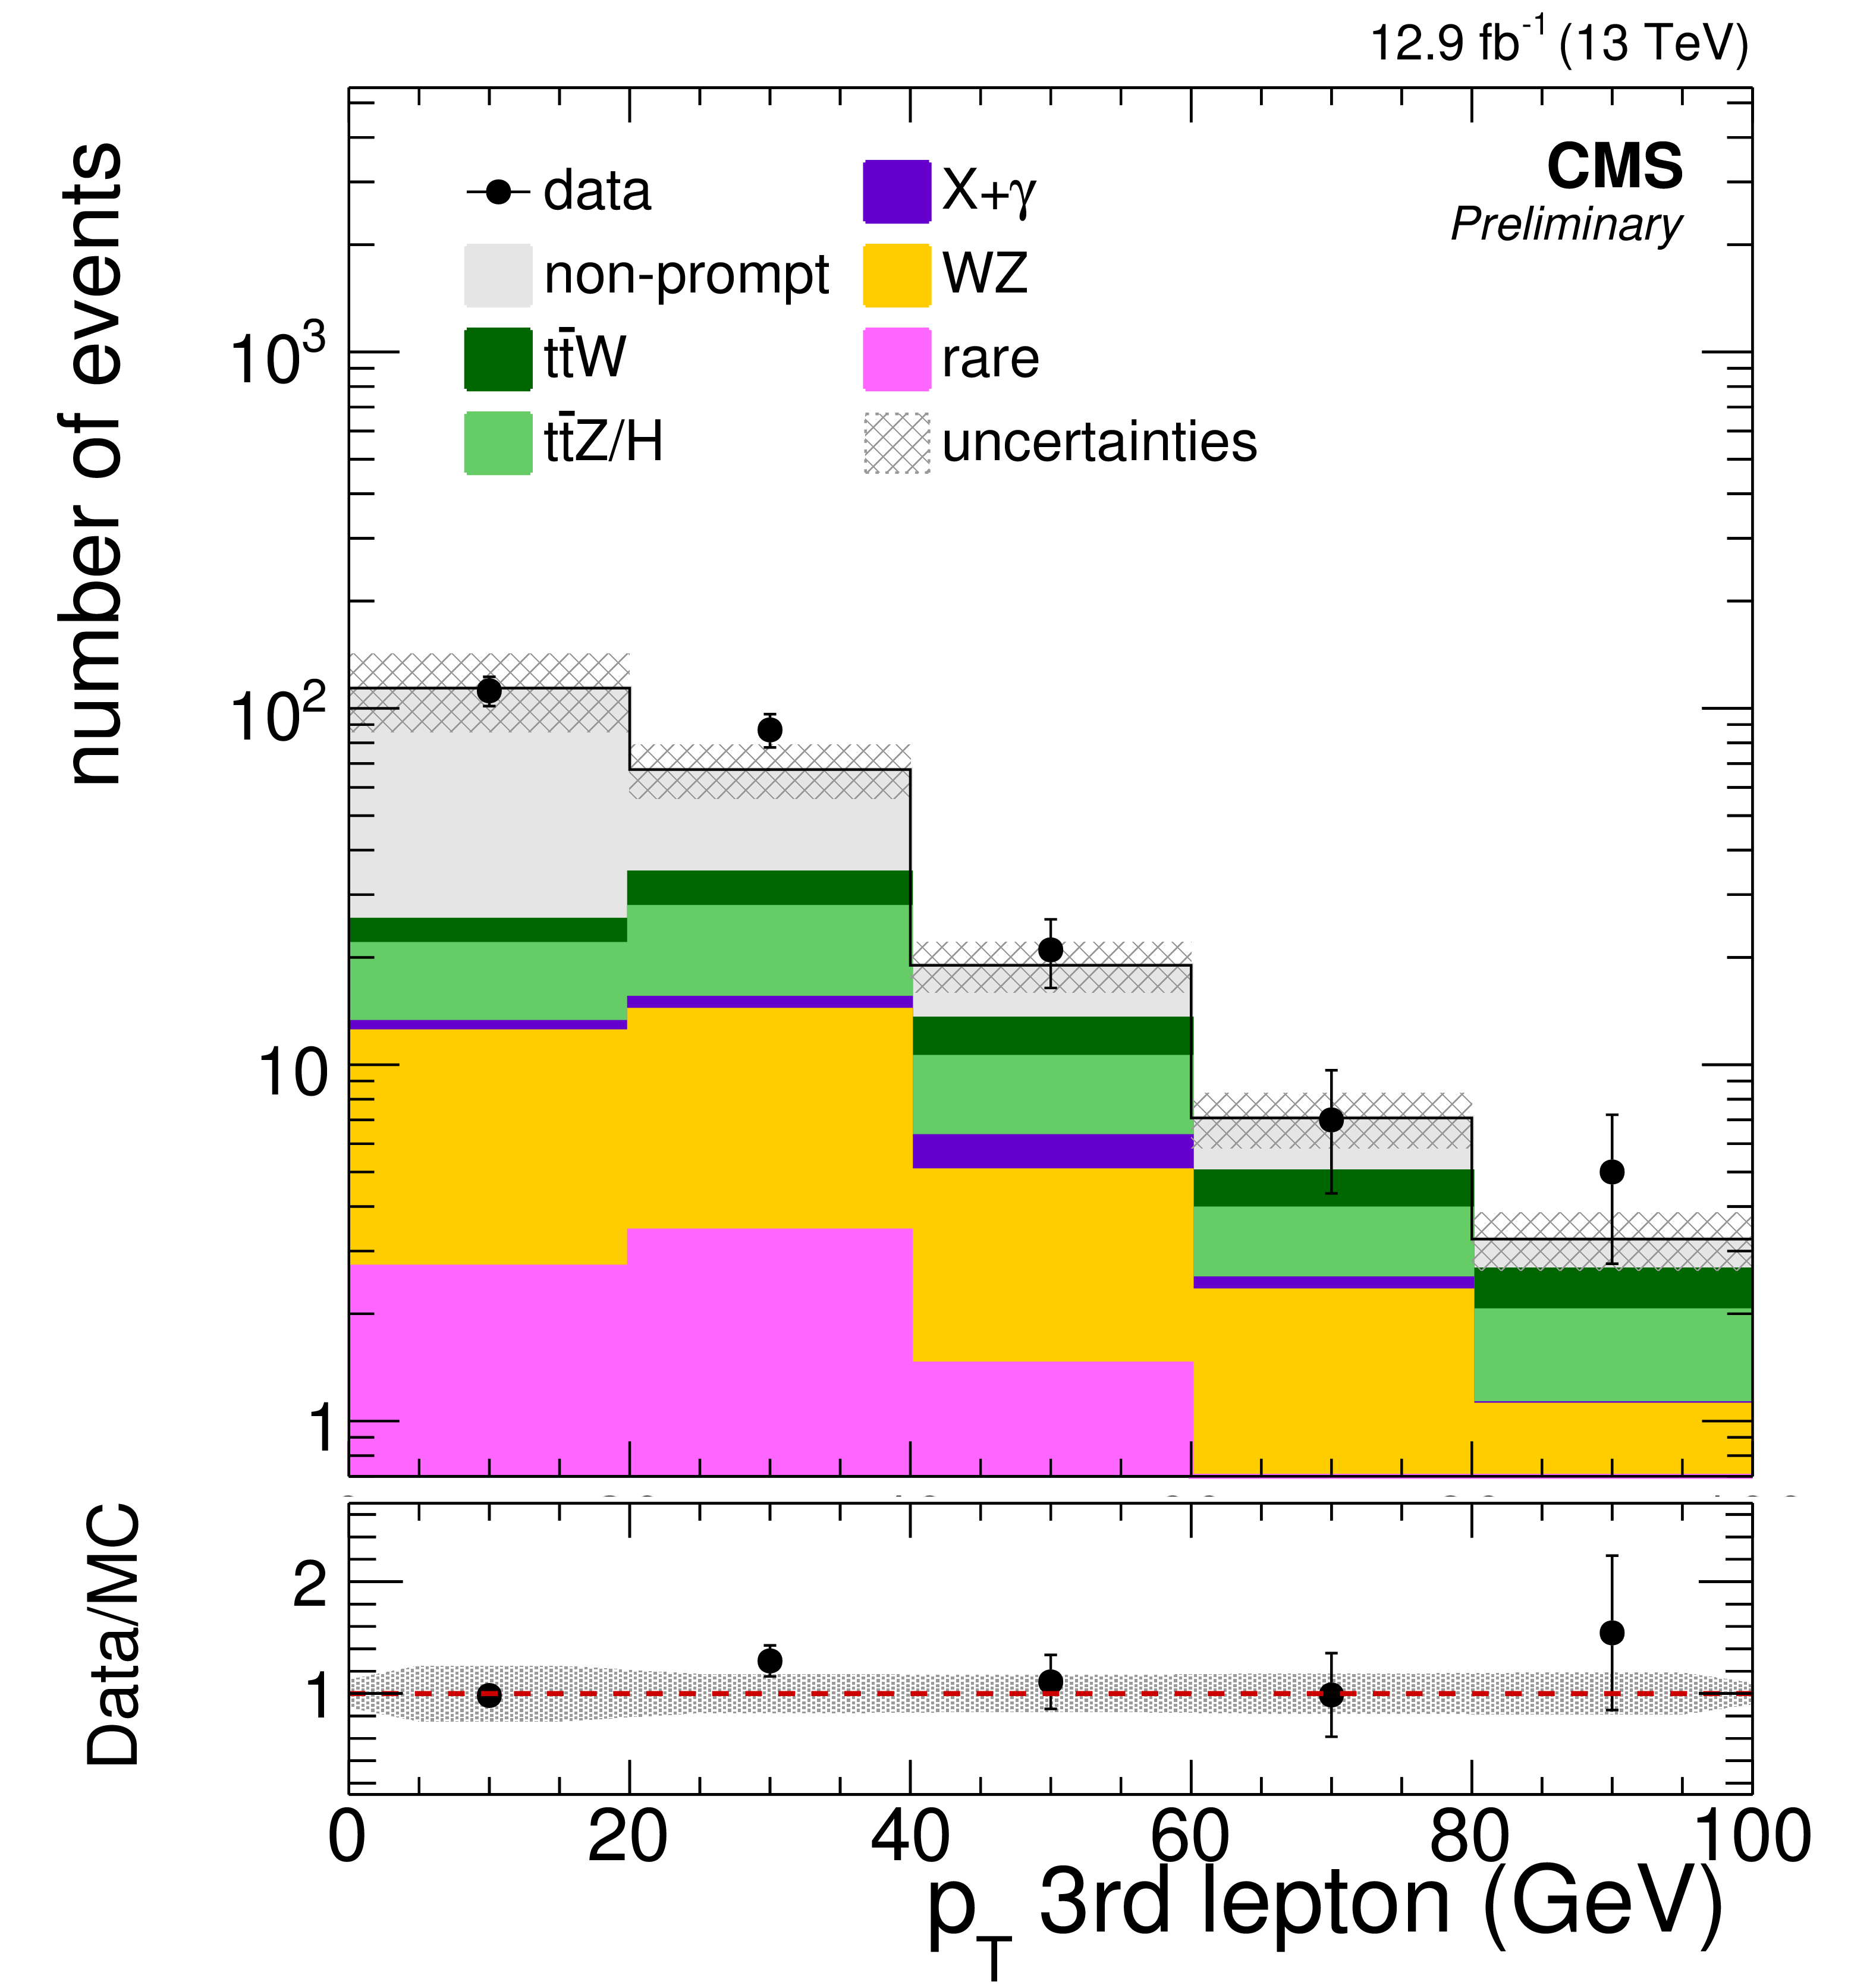
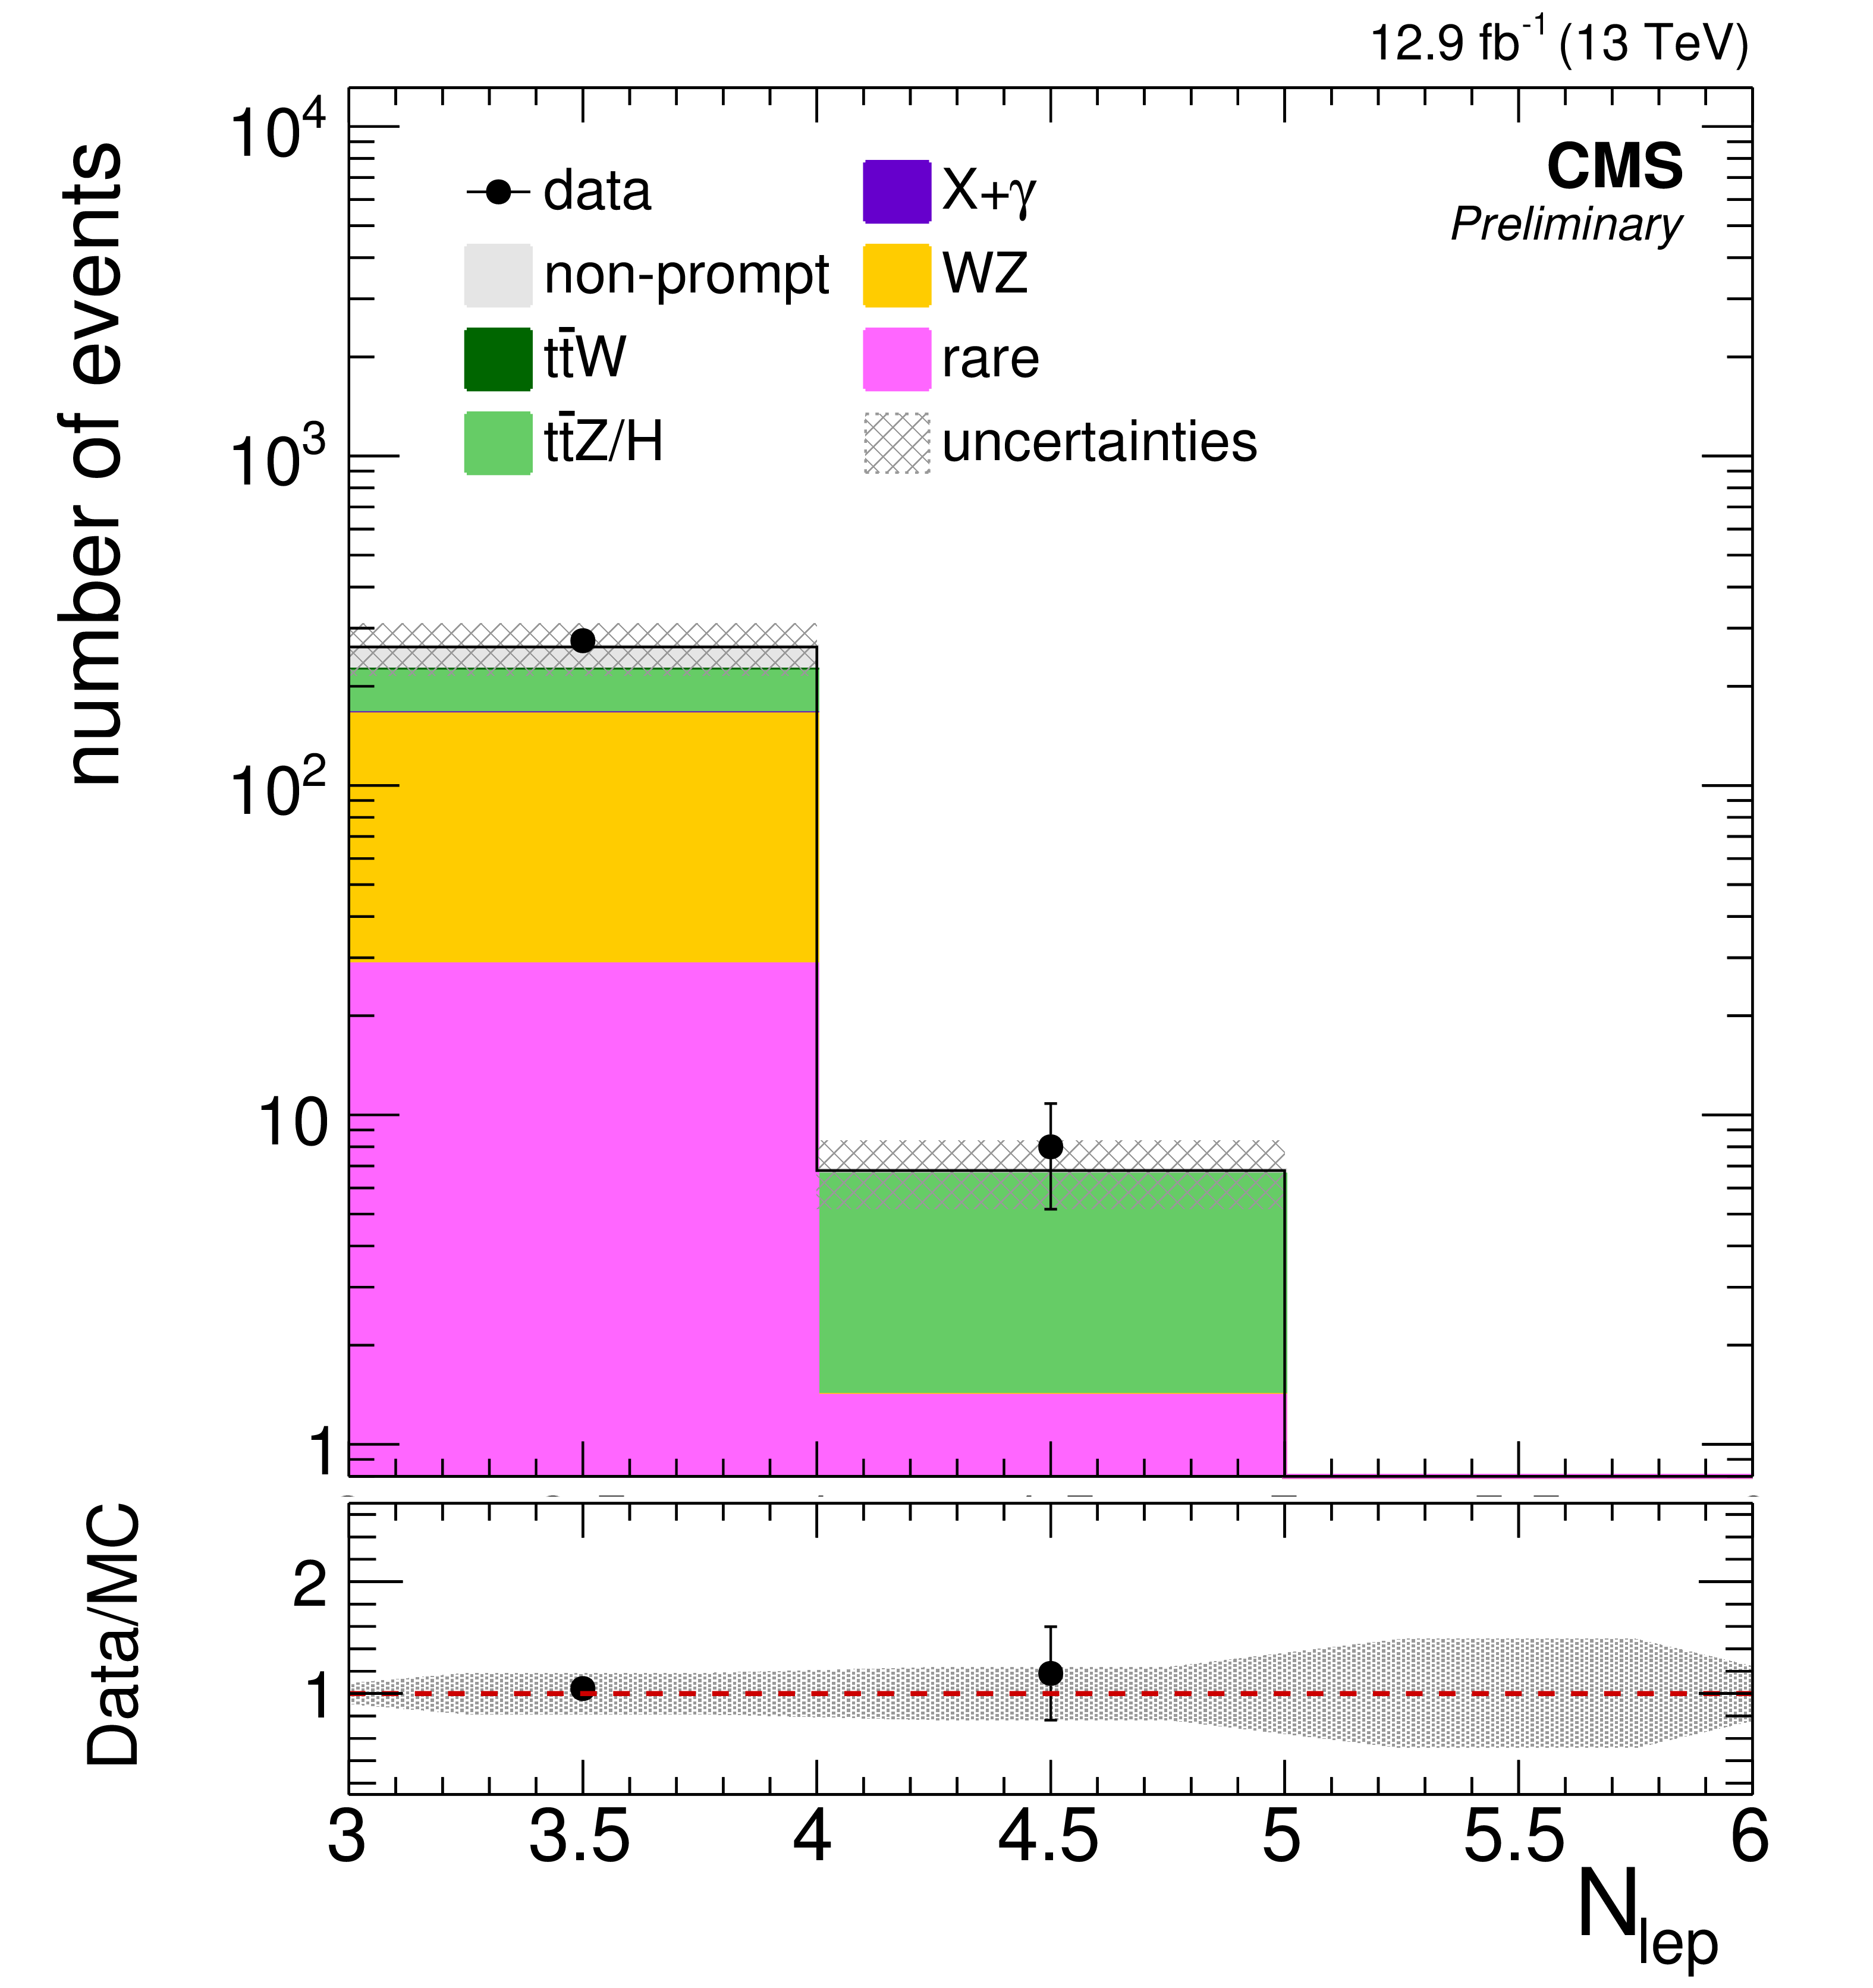
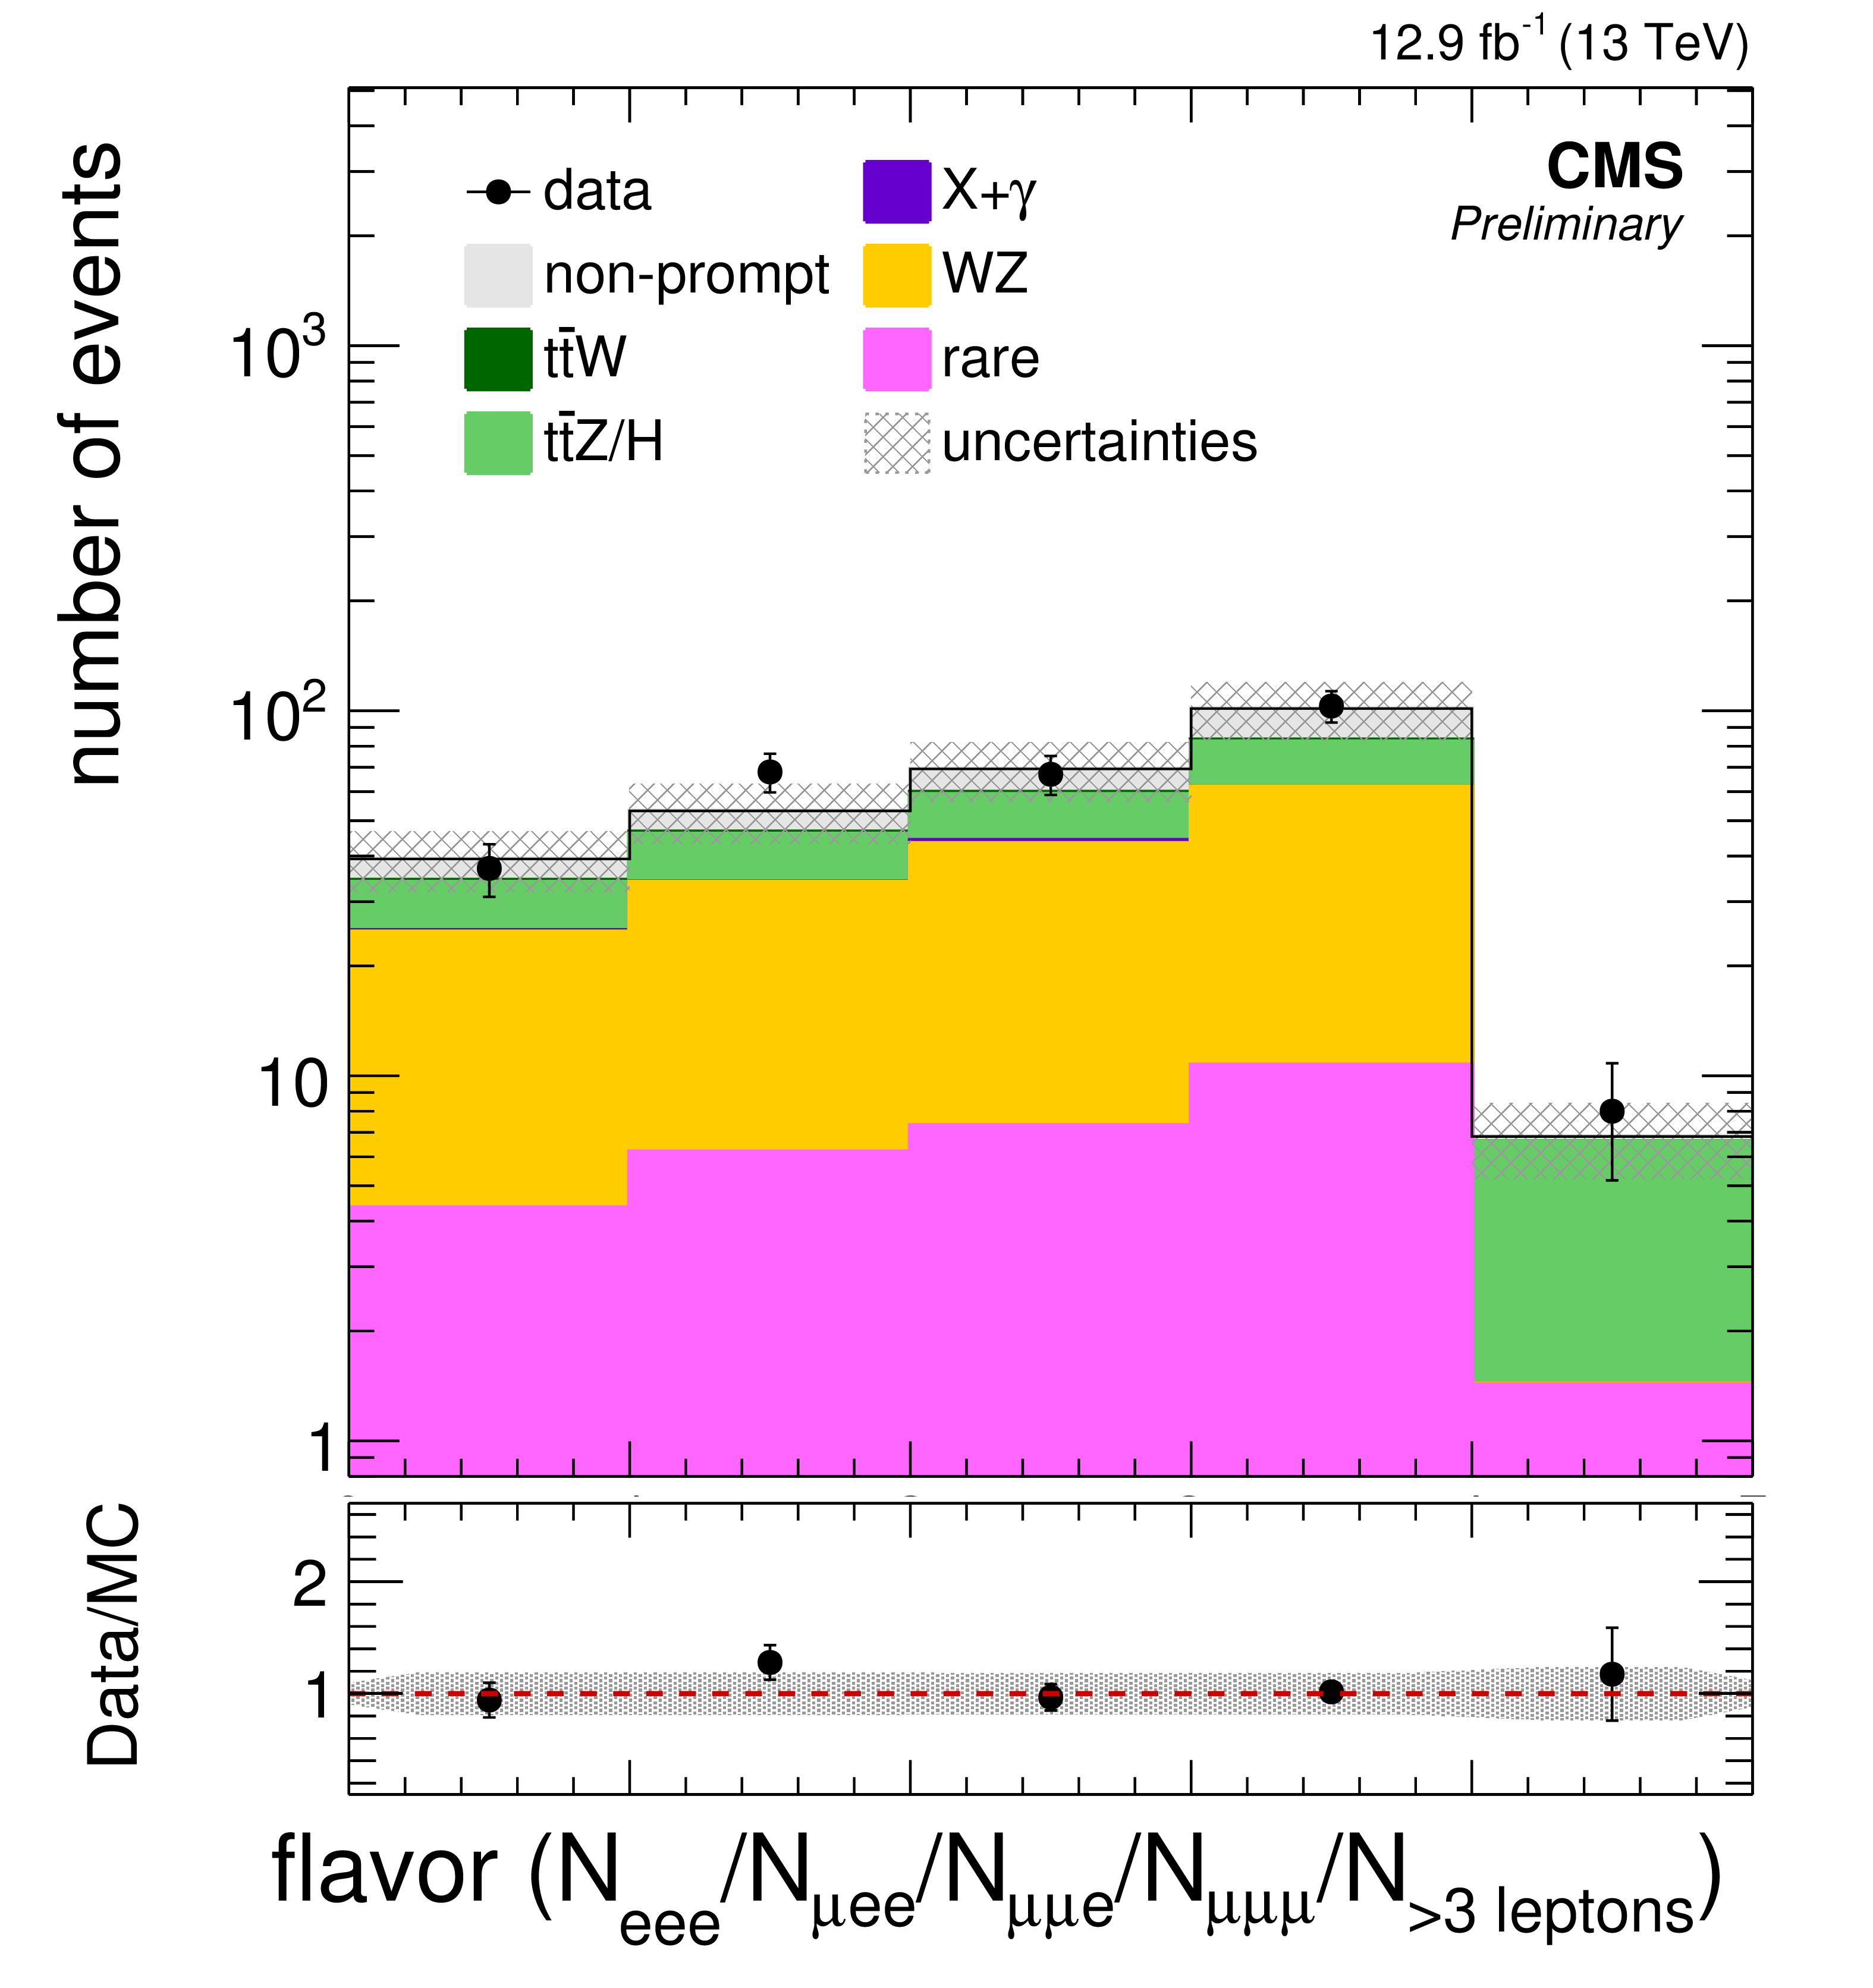
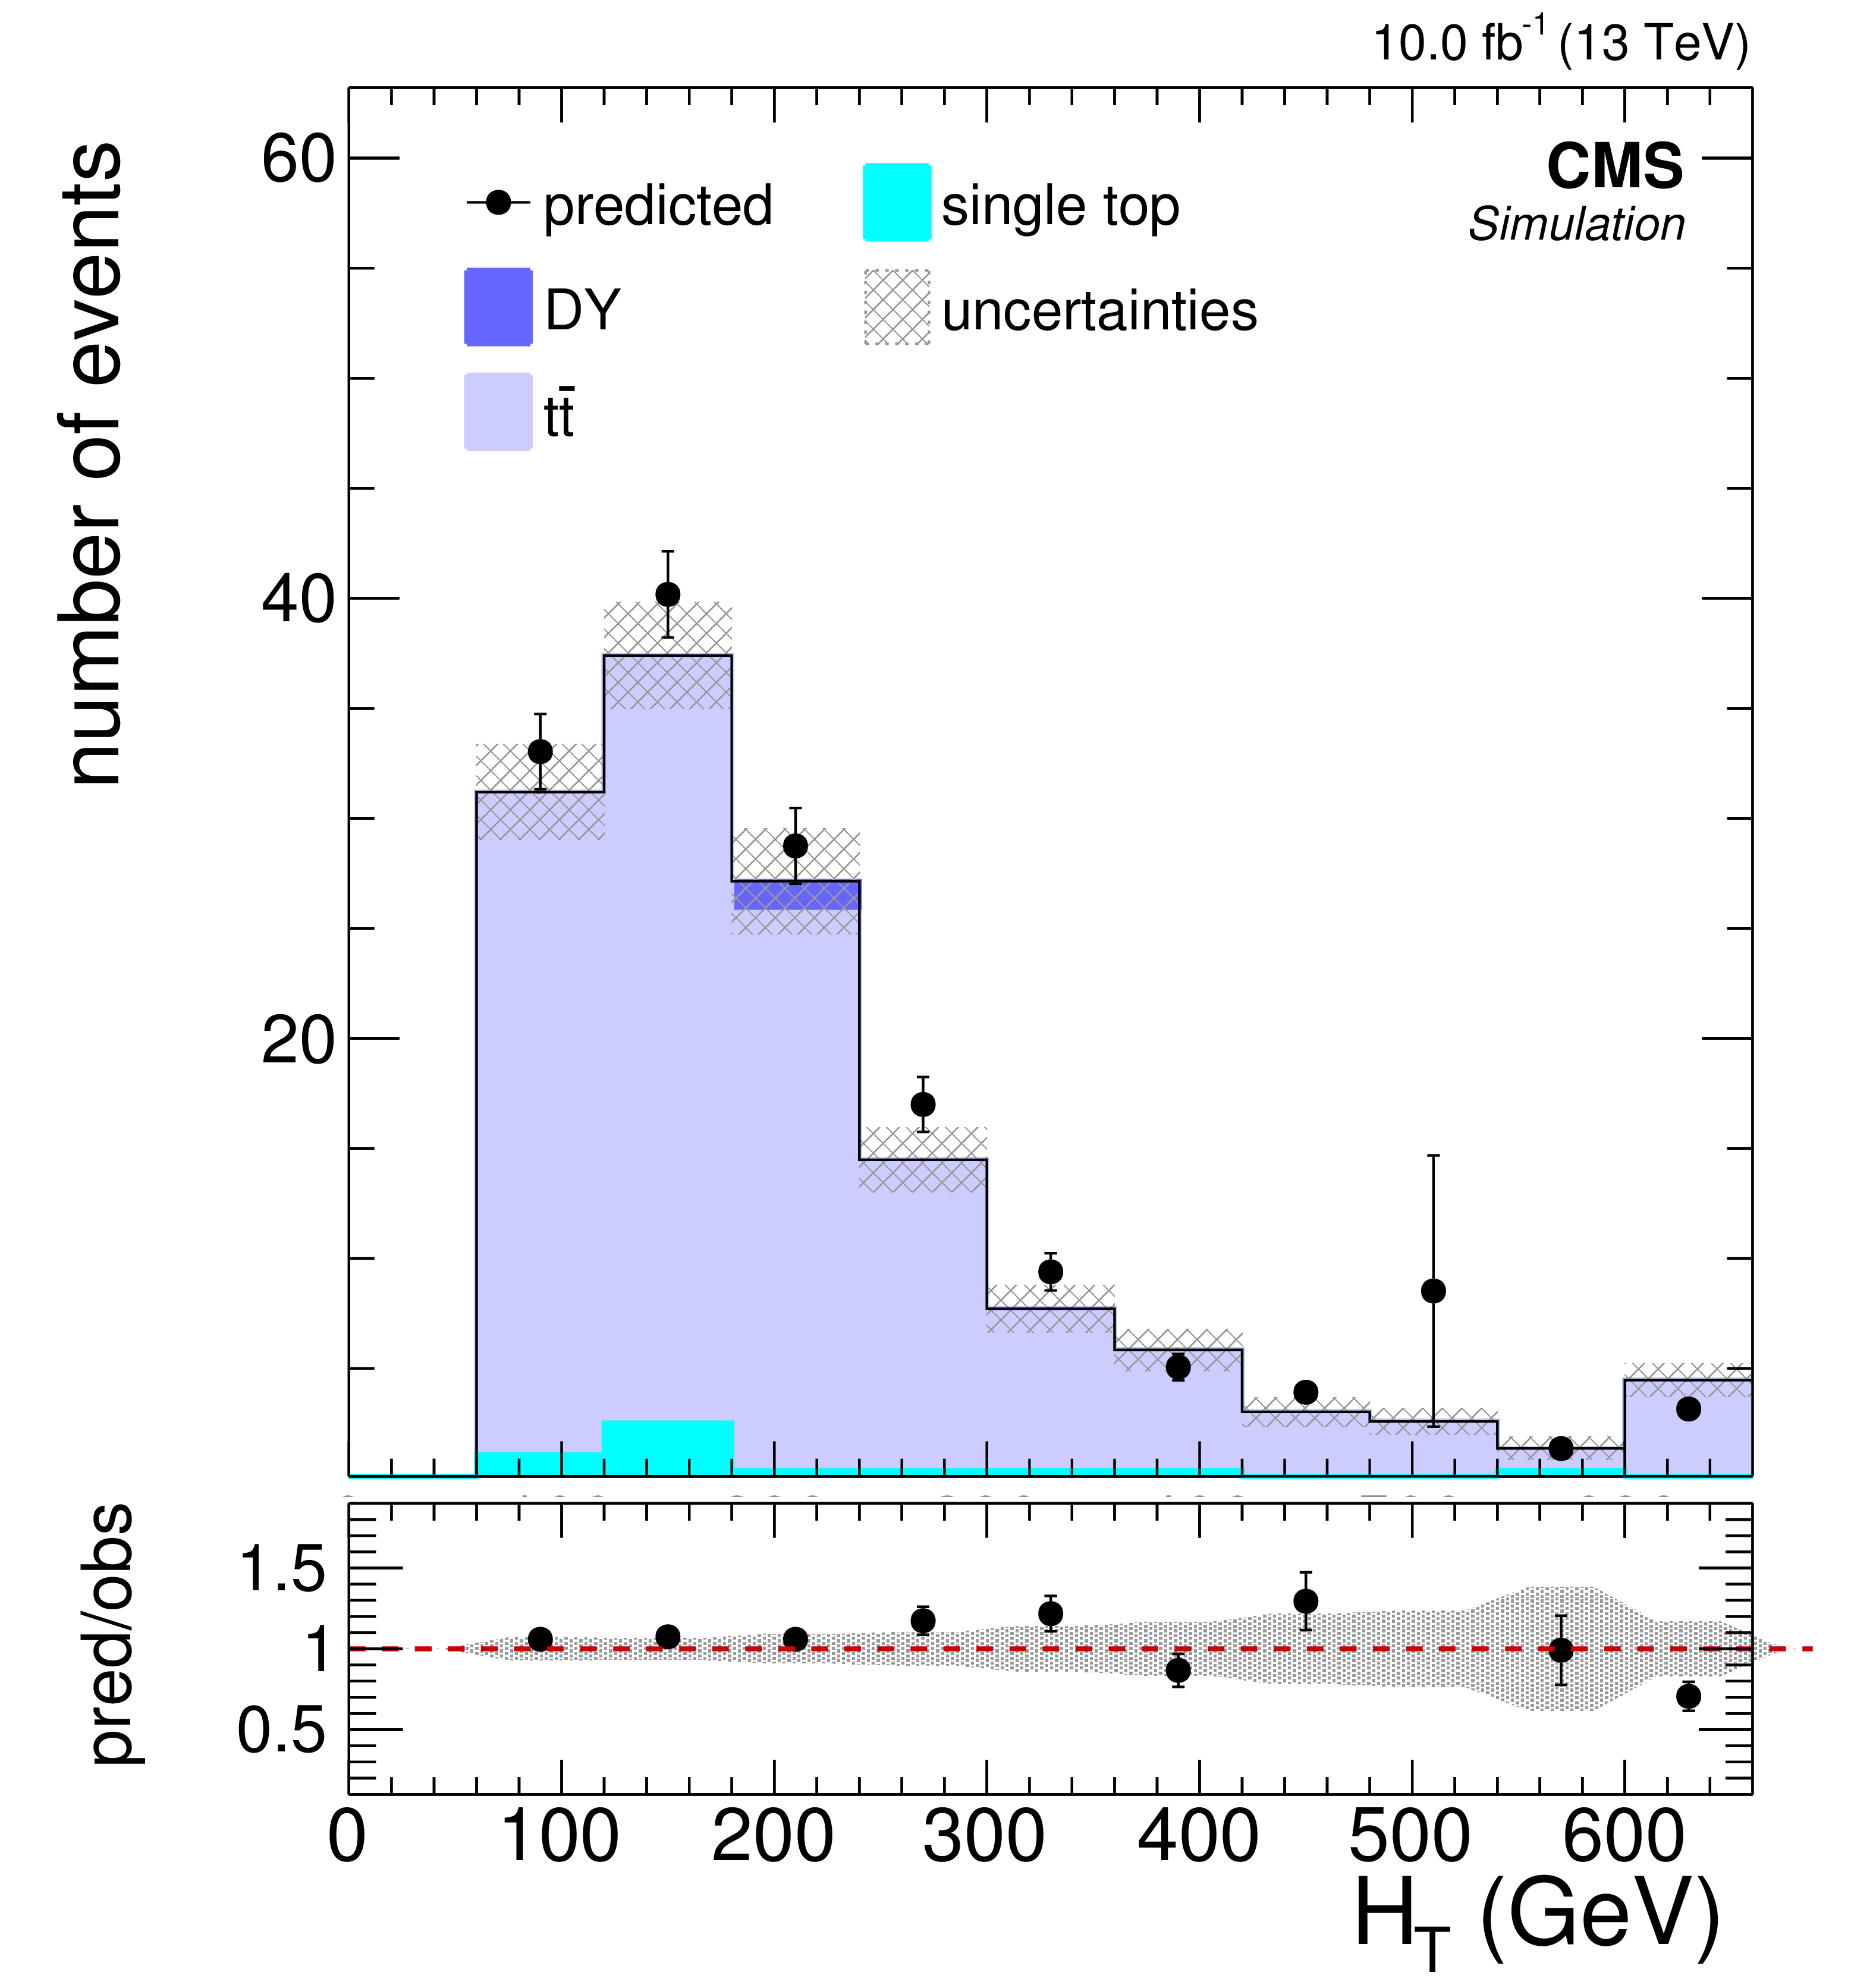
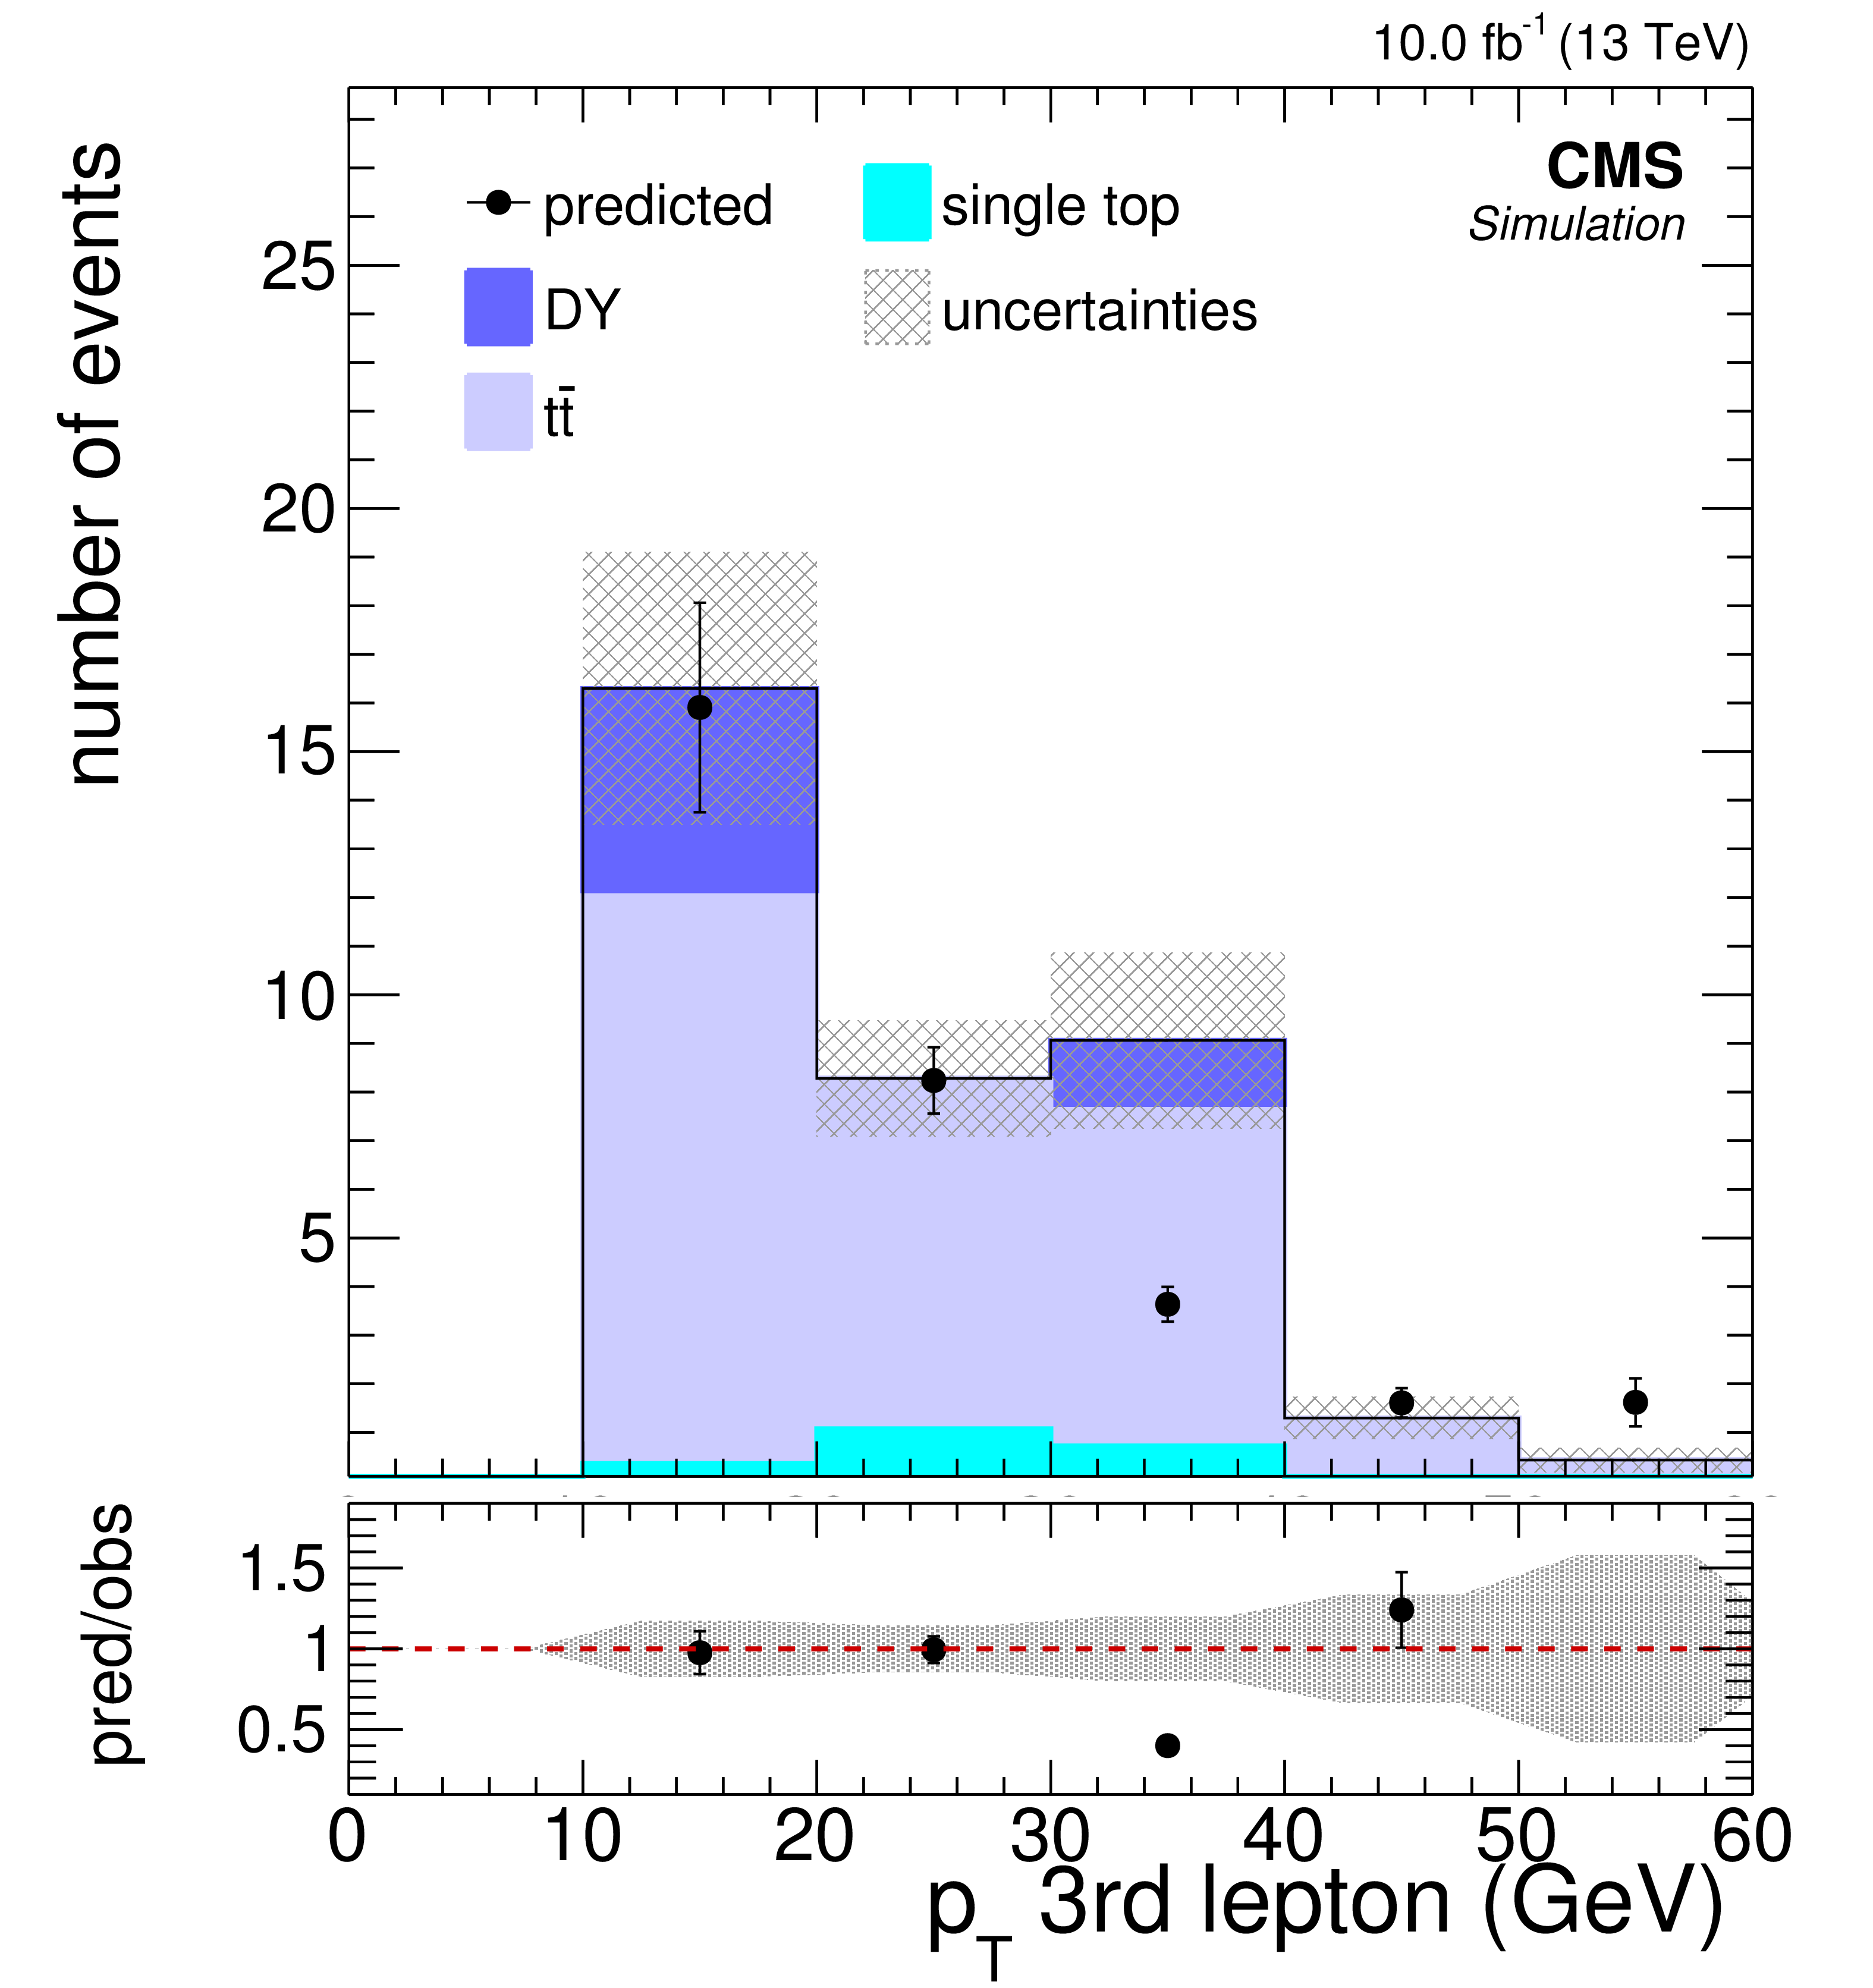
Figure 2-g:
Background prediction and observation in key observables of the off-Z baseline selection for 12.9 fb$^{-1}$ . Good agreement between data and expected background yields is observed in the event variables used for signal region categorization - the b-jet multiplicity, ${E_{\mathrm {T}}^{\text {miss}}}$ , and ${H_{\mathrm {T}}}$ . Additionally, the distributions of the lepton ${p_{\mathrm {T}}}$ spectra, the flavor composition of the leptons, and the lepton multiplicity in the event are shown. The hatched area represents the statistical and systematic uncertainties on the prediction. |
png pdf |
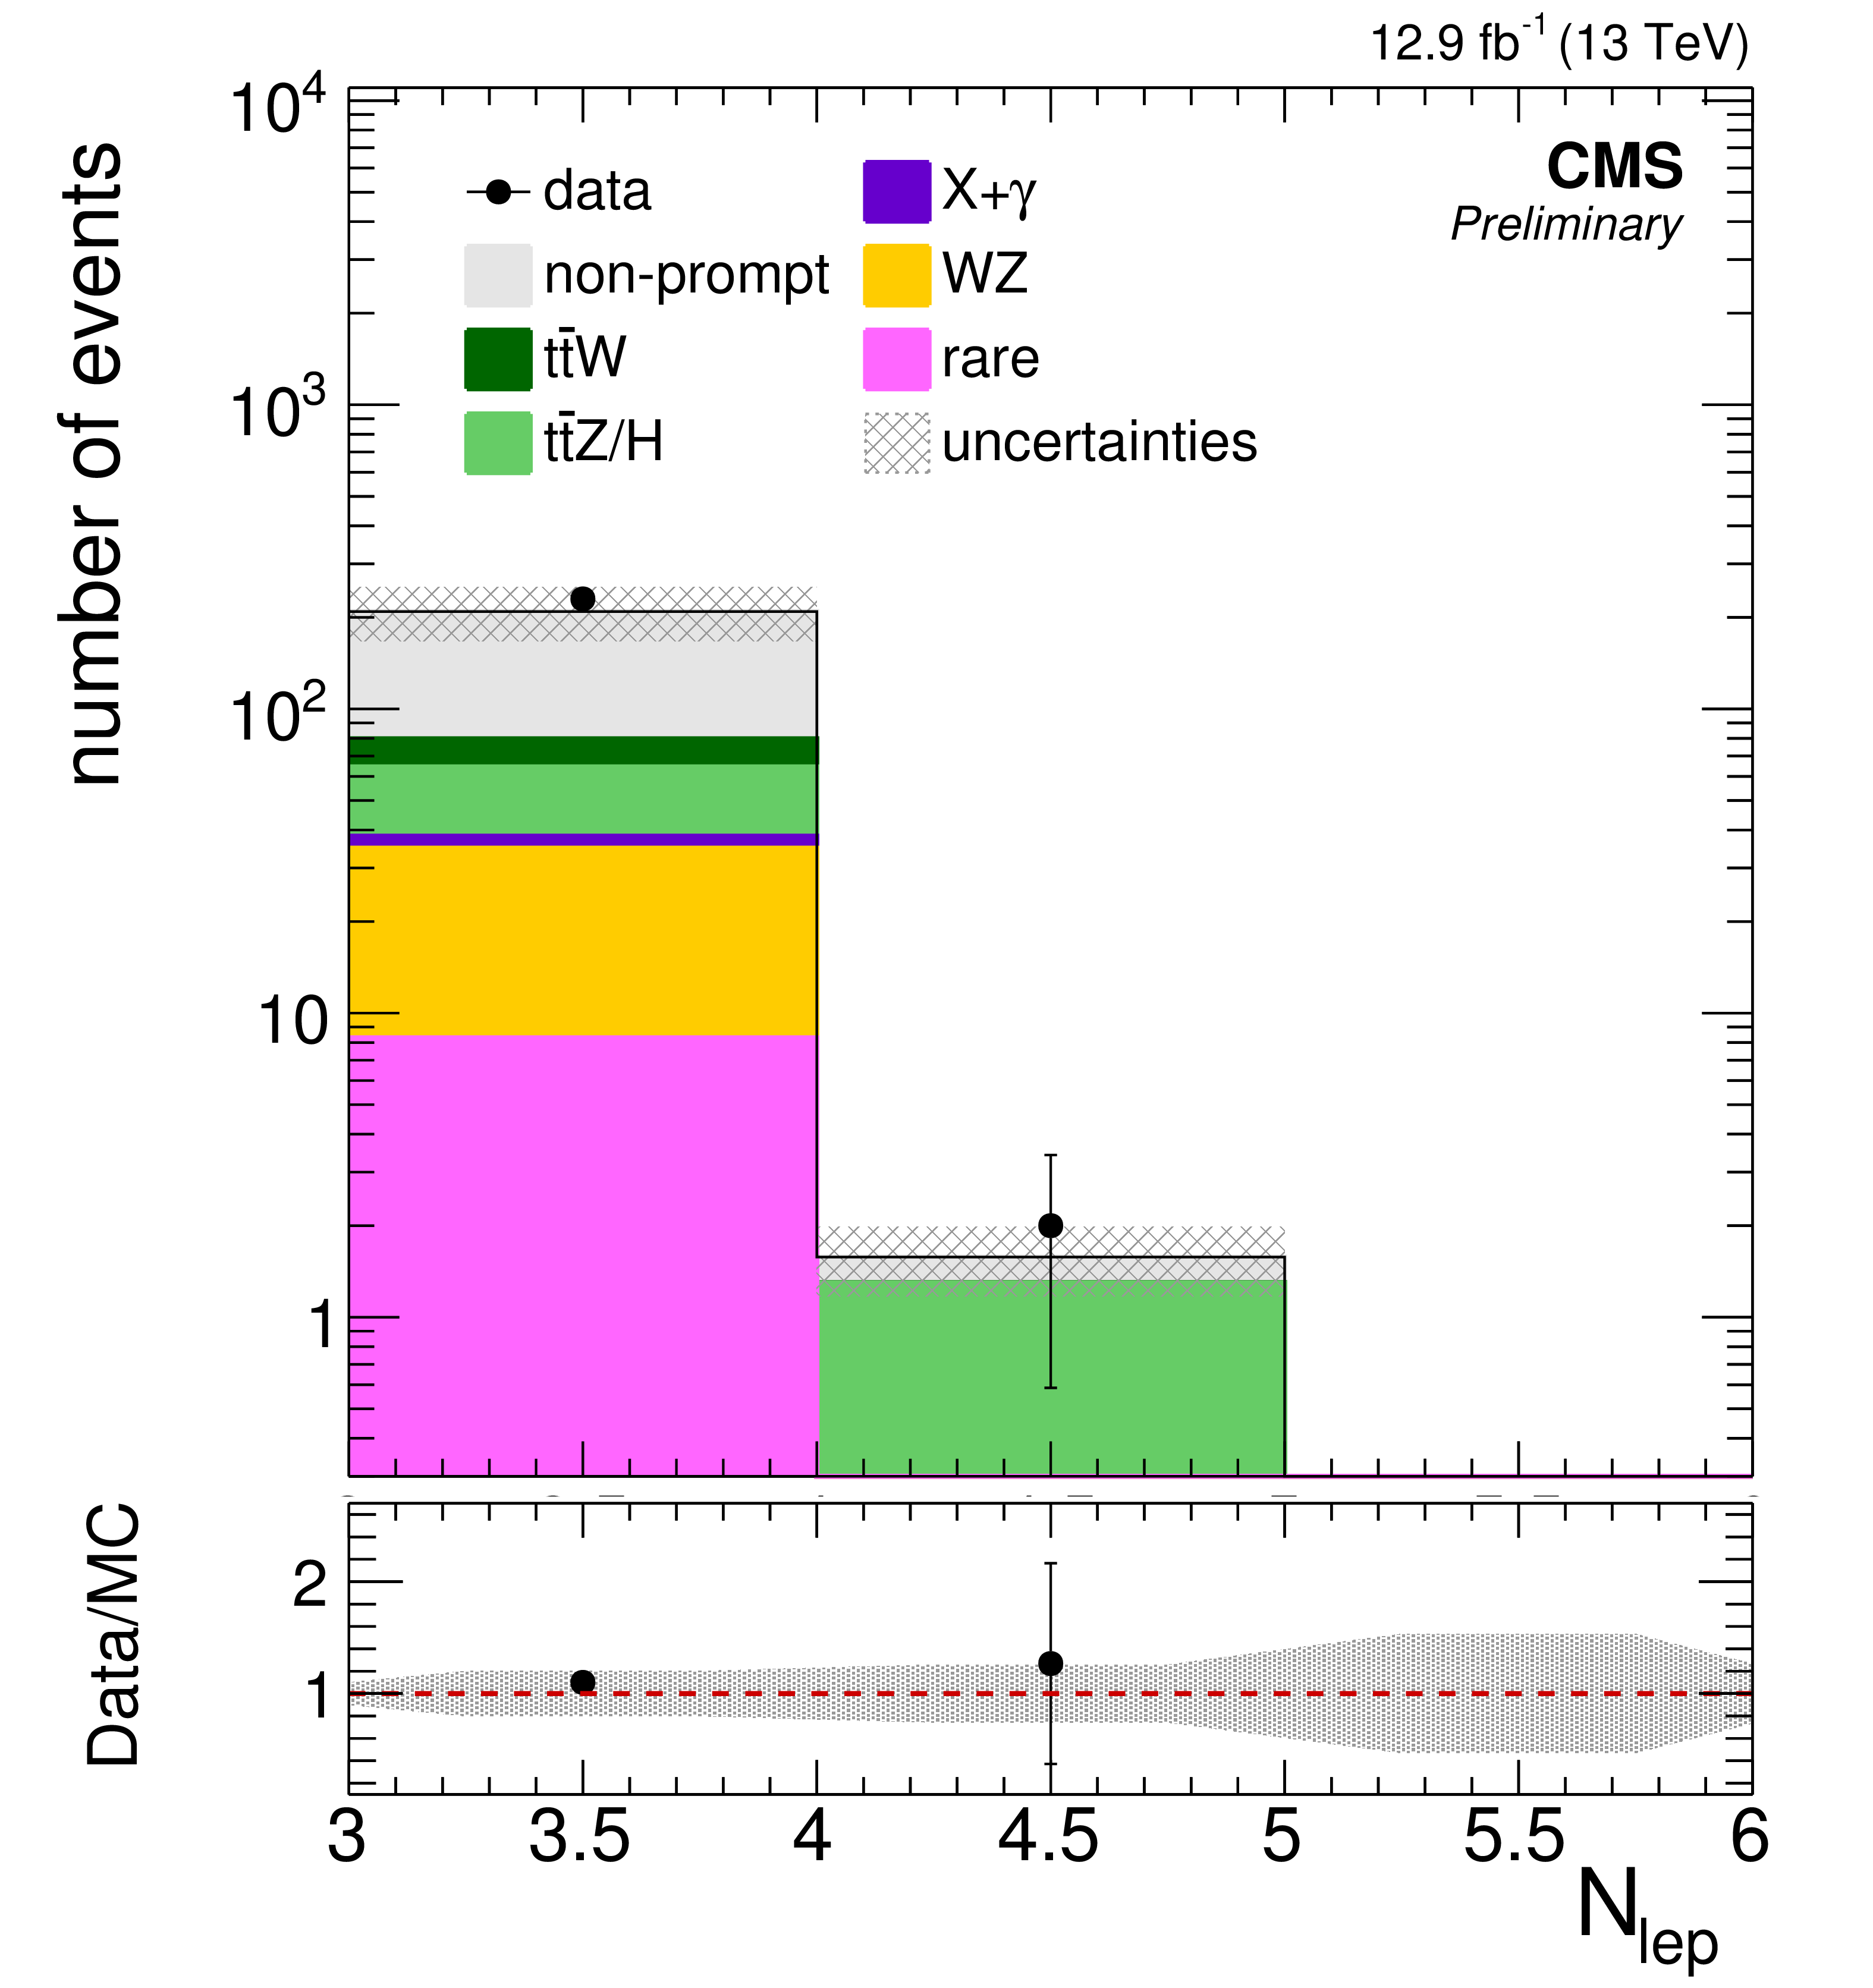
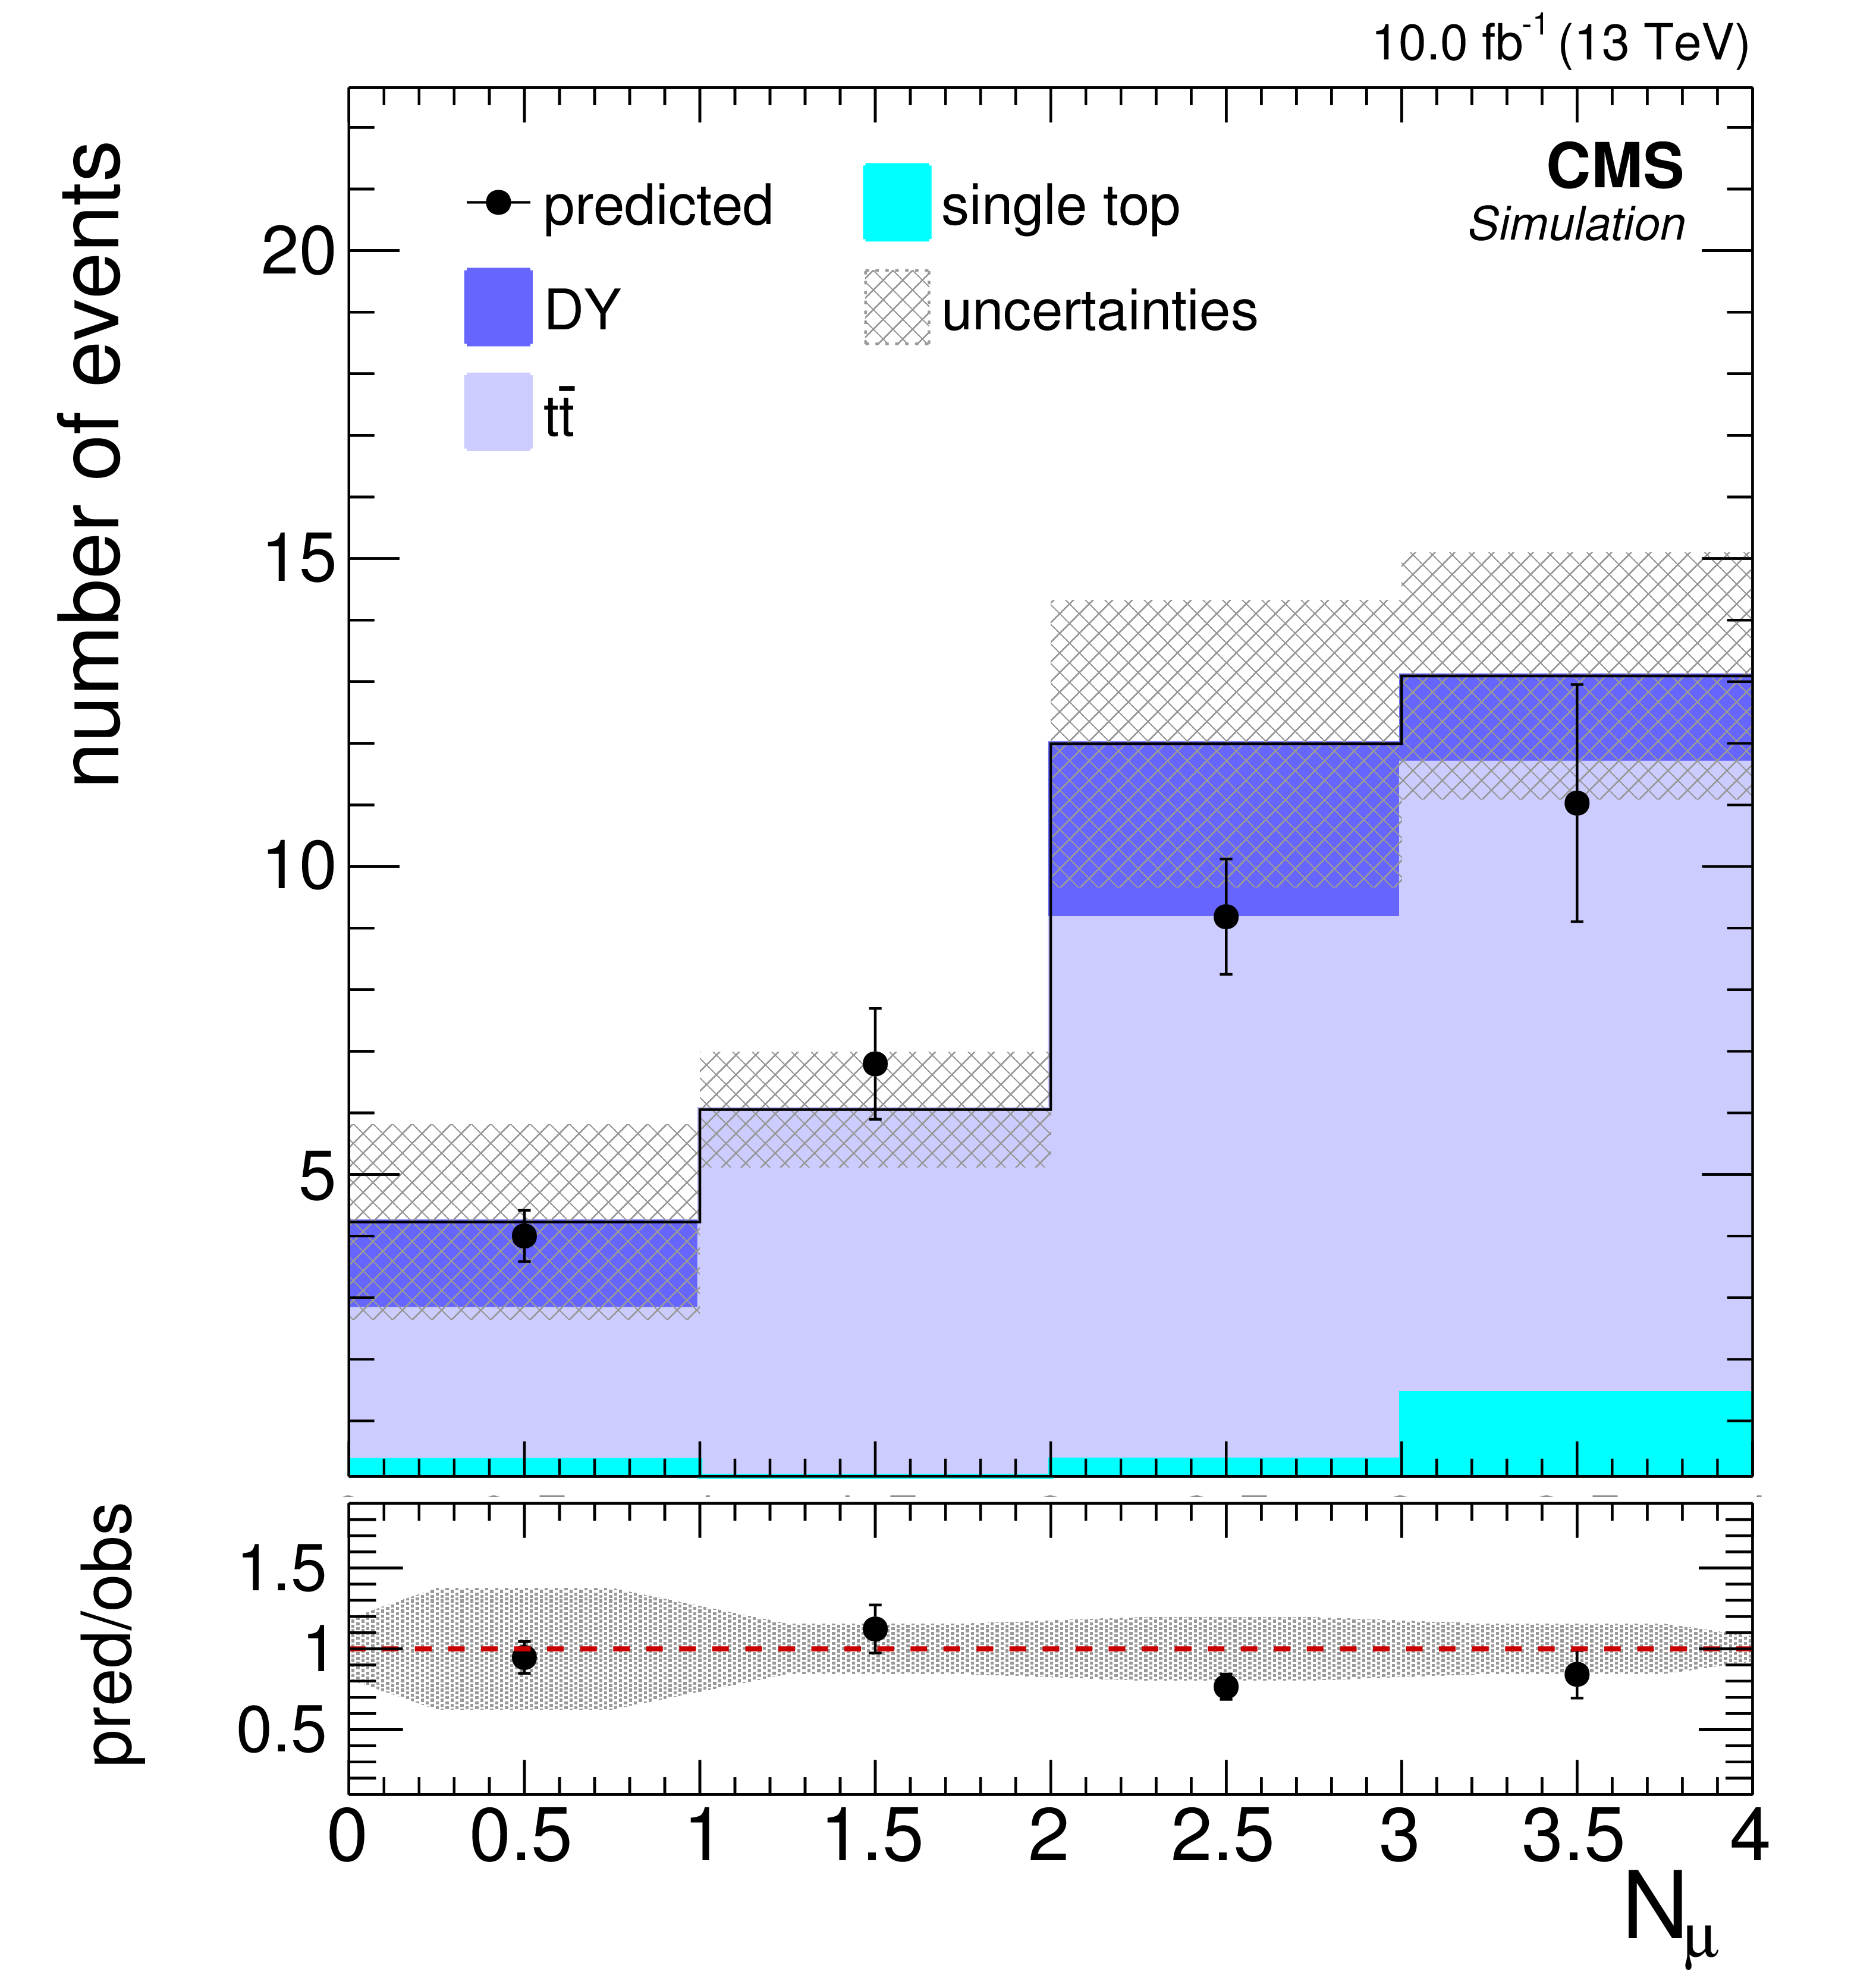
Figure 2-h:
Background prediction and observation in key observables of the off-Z baseline selection for 12.9 fb$^{-1}$ . Good agreement between data and expected background yields is observed in the event variables used for signal region categorization - the b-jet multiplicity, ${E_{\mathrm {T}}^{\text {miss}}}$ , and ${H_{\mathrm {T}}}$ . Additionally, the distributions of the lepton ${p_{\mathrm {T}}}$ spectra, the flavor composition of the leptons, and the lepton multiplicity in the event are shown. The hatched area represents the statistical and systematic uncertainties on the prediction. |
png pdf |
Figure 3-a:
Background prediction and observation in key observables of the on-Z baseline selection for 12.9 fb$^{-1}$ . Good agreement between data and expected background yields is observed in the event variables used for signal region categorization - the b-jet multiplicity, ${E_{\mathrm {T}}^{\text {miss}}}$ , and ${H_{\mathrm {T}}}$ . Additionally, the distributions of the lepton ${p_{\mathrm {T}}}$ spectra, the flavor composition of the leptons, and the lepton multiplicity in the event are shown. The hatched area represents the statistical and systematic uncertainties on the prediction. |

png pdf |
Figure 3-b:
Background prediction and observation in key observables of the on-Z baseline selection for 12.9 fb$^{-1}$ . Good agreement between data and expected background yields is observed in the event variables used for signal region categorization - the b-jet multiplicity, ${E_{\mathrm {T}}^{\text {miss}}}$ , and ${H_{\mathrm {T}}}$ . Additionally, the distributions of the lepton ${p_{\mathrm {T}}}$ spectra, the flavor composition of the leptons, and the lepton multiplicity in the event are shown. The hatched area represents the statistical and systematic uncertainties on the prediction. |
png pdf |
Figure 3-c:
Background prediction and observation in key observables of the on-Z baseline selection for 12.9 fb$^{-1}$ . Good agreement between data and expected background yields is observed in the event variables used for signal region categorization - the b-jet multiplicity, ${E_{\mathrm {T}}^{\text {miss}}}$ , and ${H_{\mathrm {T}}}$ . Additionally, the distributions of the lepton ${p_{\mathrm {T}}}$ spectra, the flavor composition of the leptons, and the lepton multiplicity in the event are shown. The hatched area represents the statistical and systematic uncertainties on the prediction. |

png pdf |
Figure 3-d:
Background prediction and observation in key observables of the on-Z baseline selection for 12.9 fb$^{-1}$ . Good agreement between data and expected background yields is observed in the event variables used for signal region categorization - the b-jet multiplicity, ${E_{\mathrm {T}}^{\text {miss}}}$ , and ${H_{\mathrm {T}}}$ . Additionally, the distributions of the lepton ${p_{\mathrm {T}}}$ spectra, the flavor composition of the leptons, and the lepton multiplicity in the event are shown. The hatched area represents the statistical and systematic uncertainties on the prediction. |
png pdf |
Figure 3-e:
Background prediction and observation in key observables of the on-Z baseline selection for 12.9 fb$^{-1}$ . Good agreement between data and expected background yields is observed in the event variables used for signal region categorization - the b-jet multiplicity, ${E_{\mathrm {T}}^{\text {miss}}}$ , and ${H_{\mathrm {T}}}$ . Additionally, the distributions of the lepton ${p_{\mathrm {T}}}$ spectra, the flavor composition of the leptons, and the lepton multiplicity in the event are shown. The hatched area represents the statistical and systematic uncertainties on the prediction. |
png pdf |
Figure 3-f:
Background prediction and observation in key observables of the on-Z baseline selection for 12.9 fb$^{-1}$ . Good agreement between data and expected background yields is observed in the event variables used for signal region categorization - the b-jet multiplicity, ${E_{\mathrm {T}}^{\text {miss}}}$ , and ${H_{\mathrm {T}}}$ . Additionally, the distributions of the lepton ${p_{\mathrm {T}}}$ spectra, the flavor composition of the leptons, and the lepton multiplicity in the event are shown. The hatched area represents the statistical and systematic uncertainties on the prediction. |
png pdf |
Figure 3-g:
Background prediction and observation in key observables of the on-Z baseline selection for 12.9 fb$^{-1}$ . Good agreement between data and expected background yields is observed in the event variables used for signal region categorization - the b-jet multiplicity, ${E_{\mathrm {T}}^{\text {miss}}}$ , and ${H_{\mathrm {T}}}$ . Additionally, the distributions of the lepton ${p_{\mathrm {T}}}$ spectra, the flavor composition of the leptons, and the lepton multiplicity in the event are shown. The hatched area represents the statistical and systematic uncertainties on the prediction. |
png pdf |
Figure 3-h:
Background prediction and observation in key observables of the on-Z baseline selection for 12.9 fb$^{-1}$ . Good agreement between data and expected background yields is observed in the event variables used for signal region categorization - the b-jet multiplicity, ${E_{\mathrm {T}}^{\text {miss}}}$ , and ${H_{\mathrm {T}}}$ . Additionally, the distributions of the lepton ${p_{\mathrm {T}}}$ spectra, the flavor composition of the leptons, and the lepton multiplicity in the event are shown. The hatched area represents the statistical and systematic uncertainties on the prediction. |
png pdf |
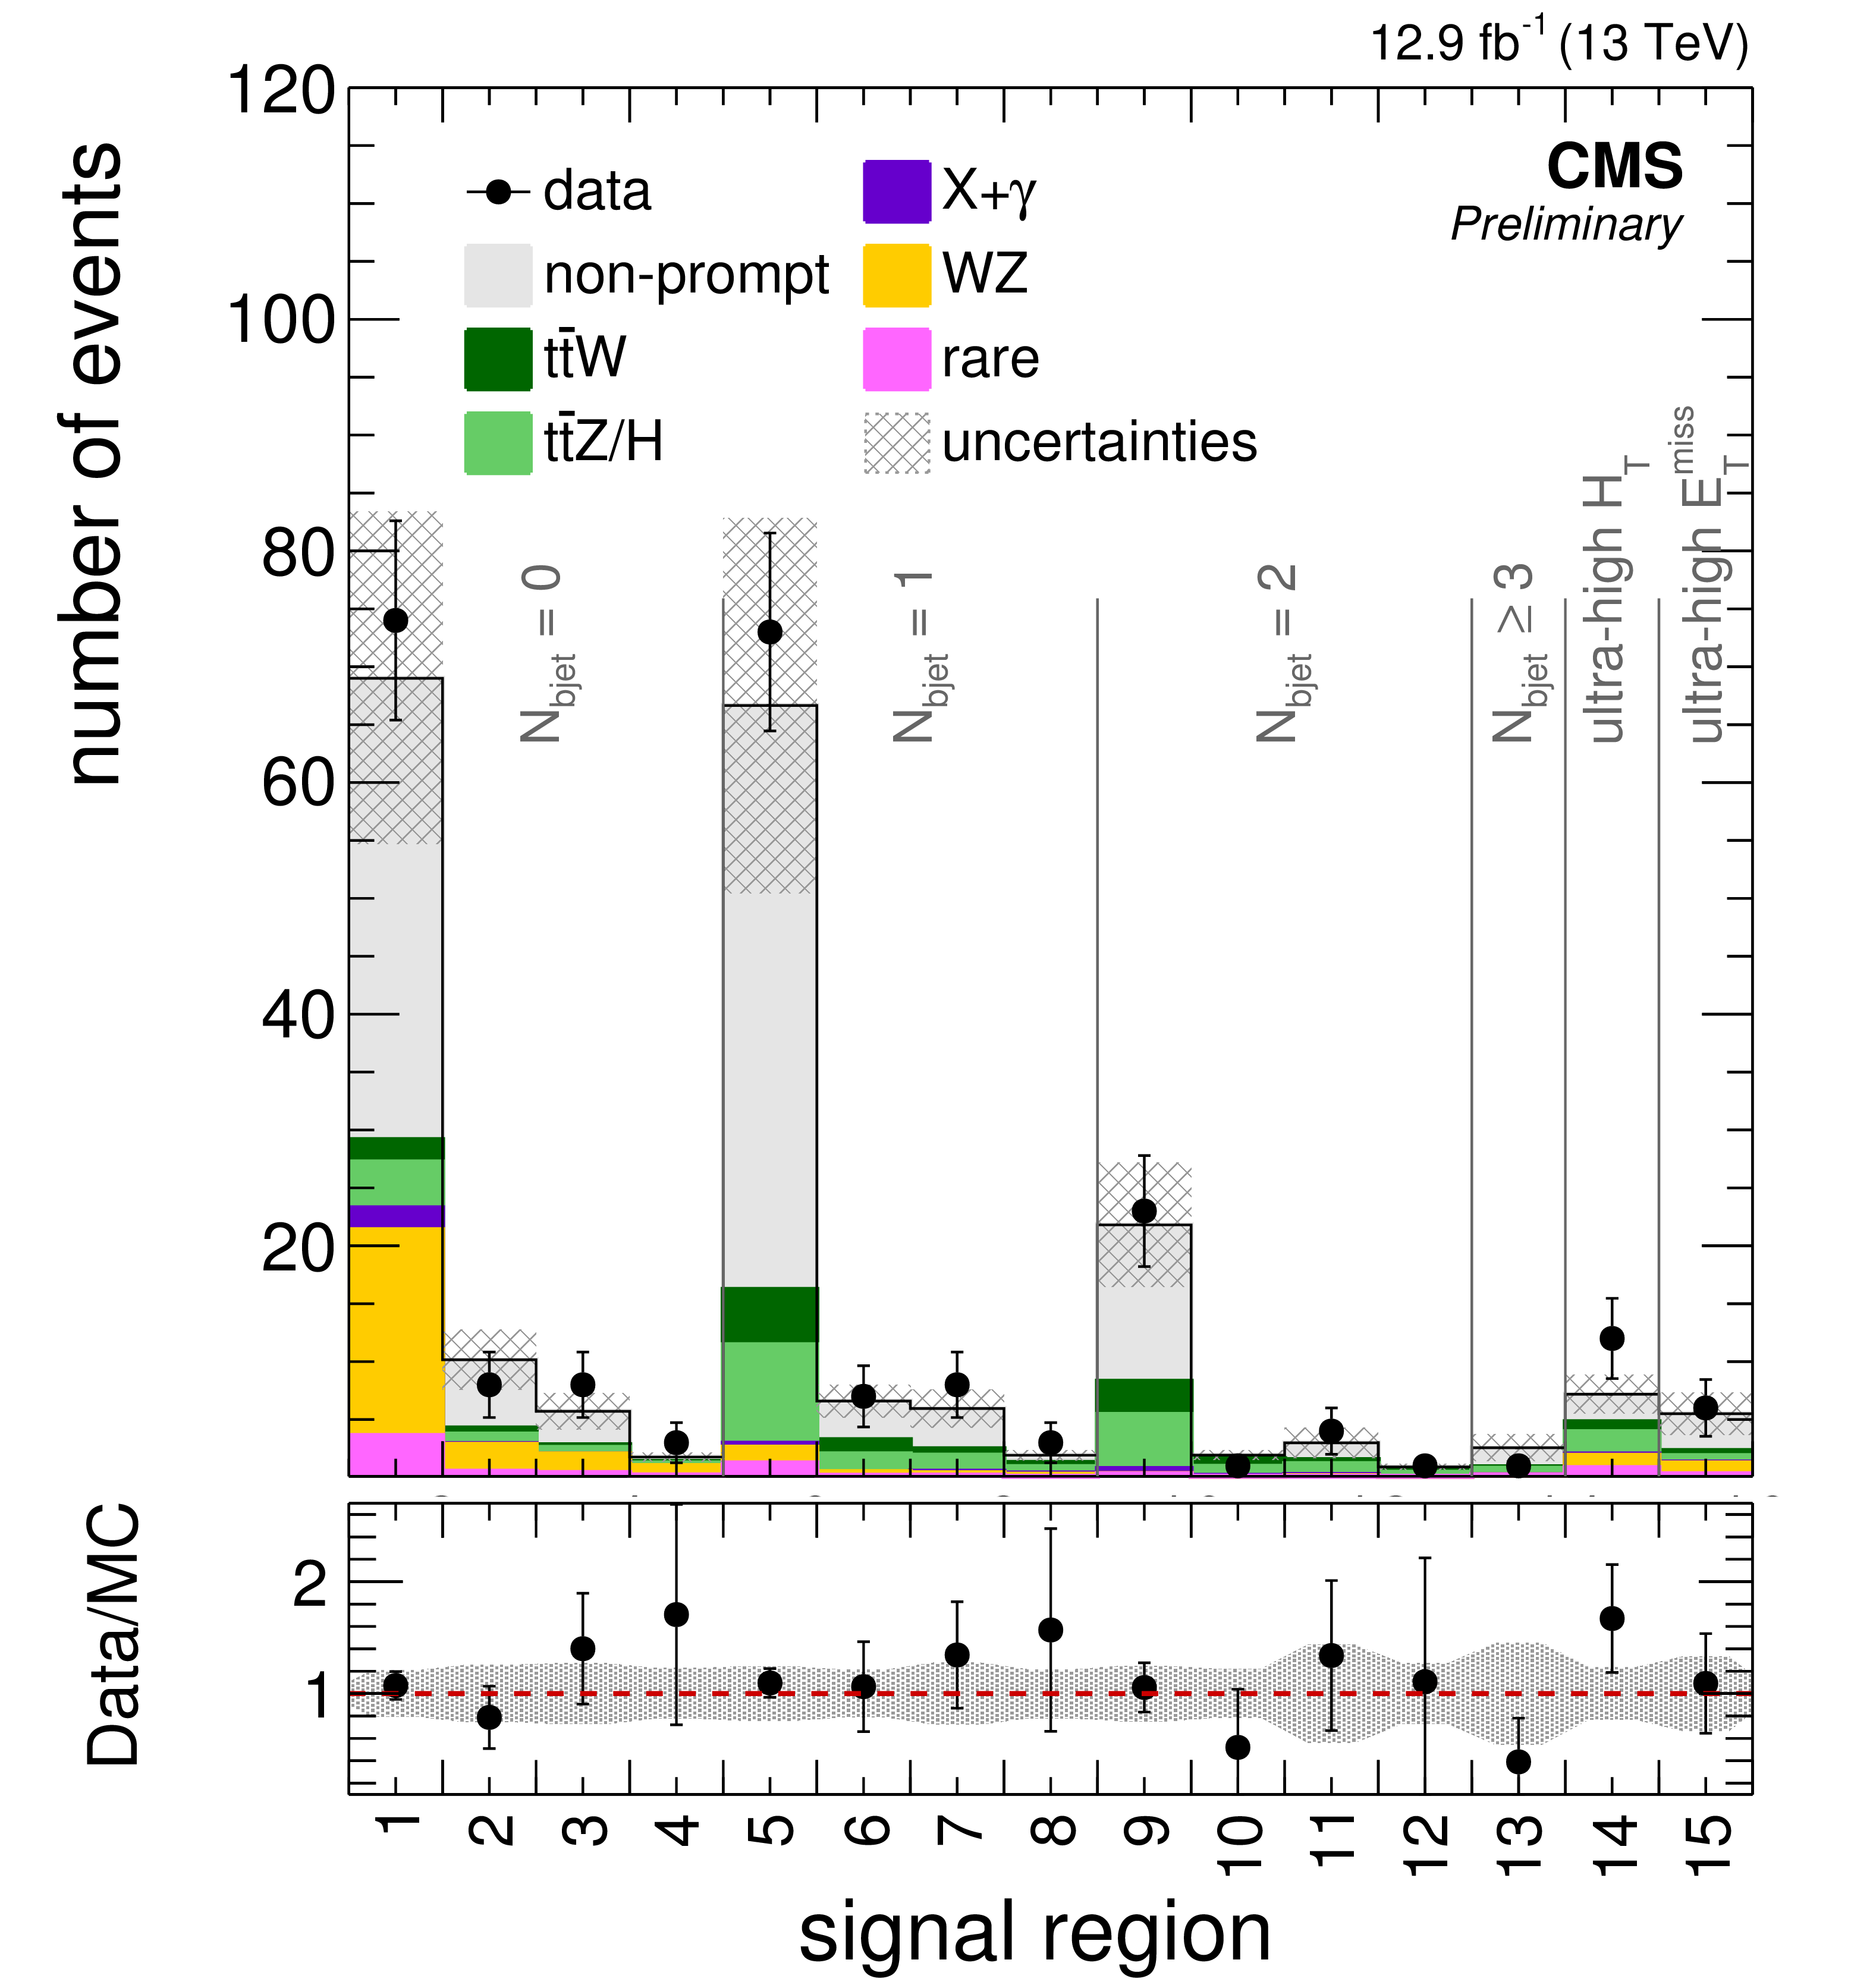
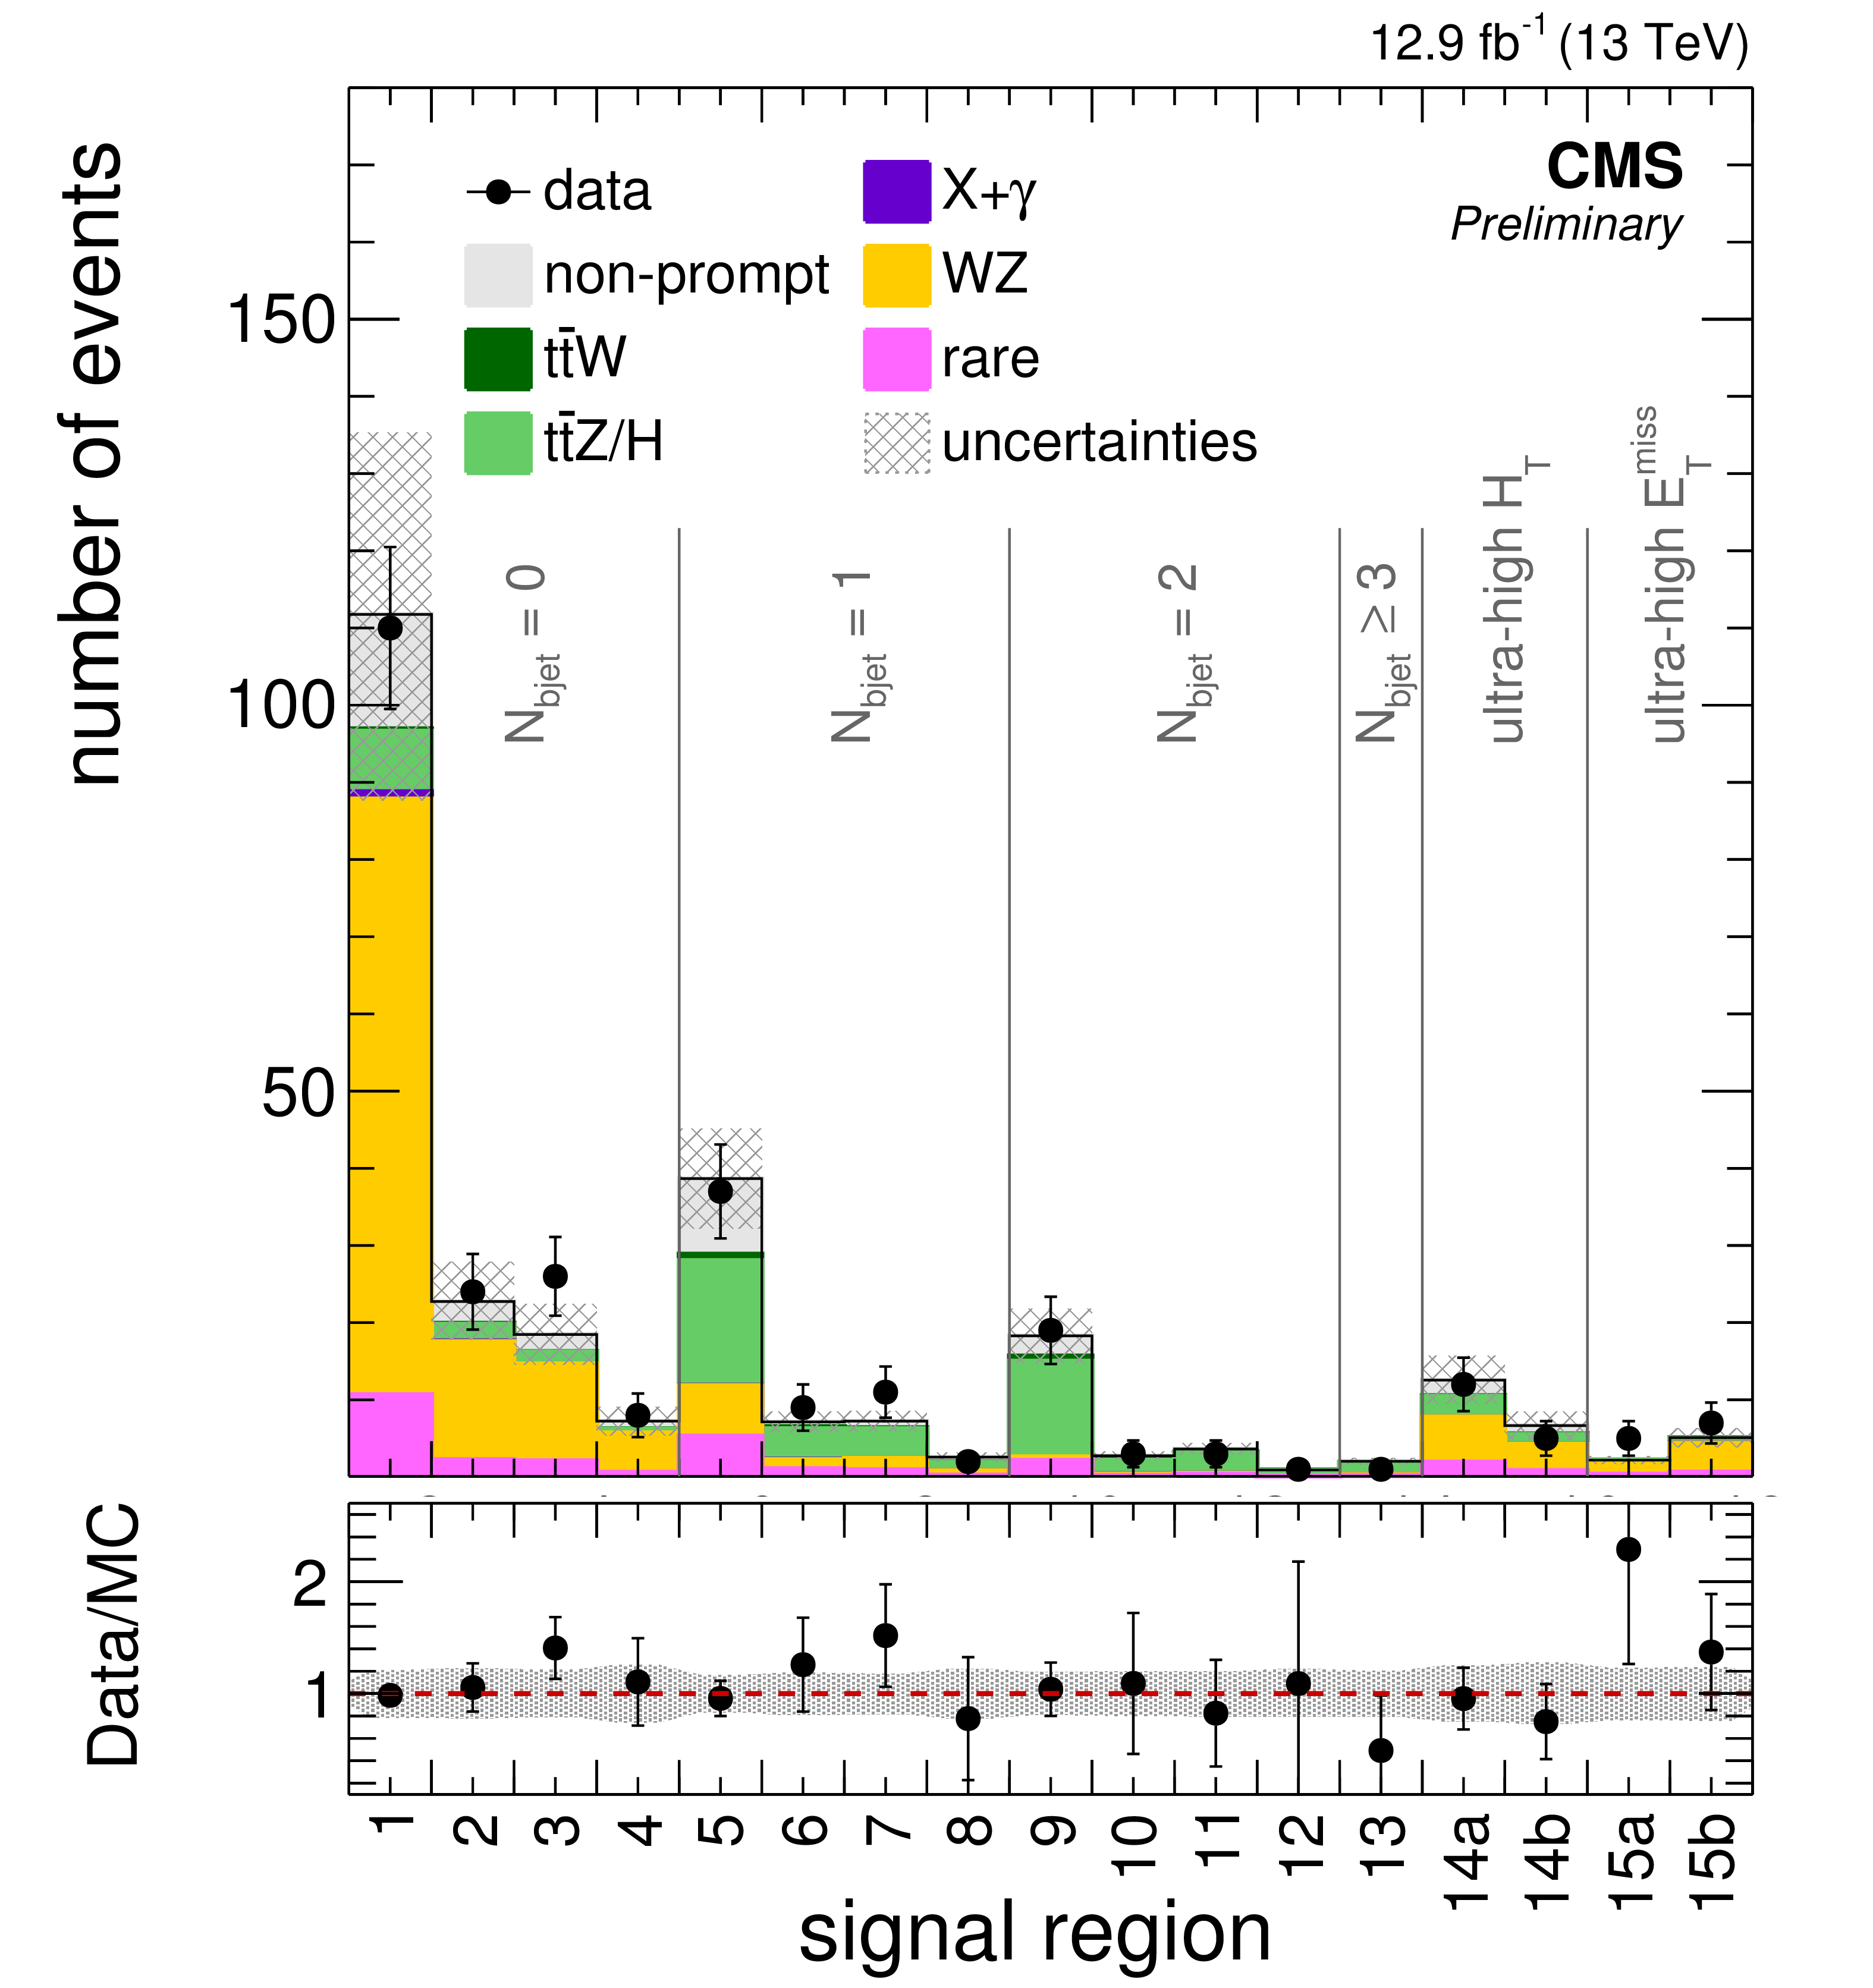
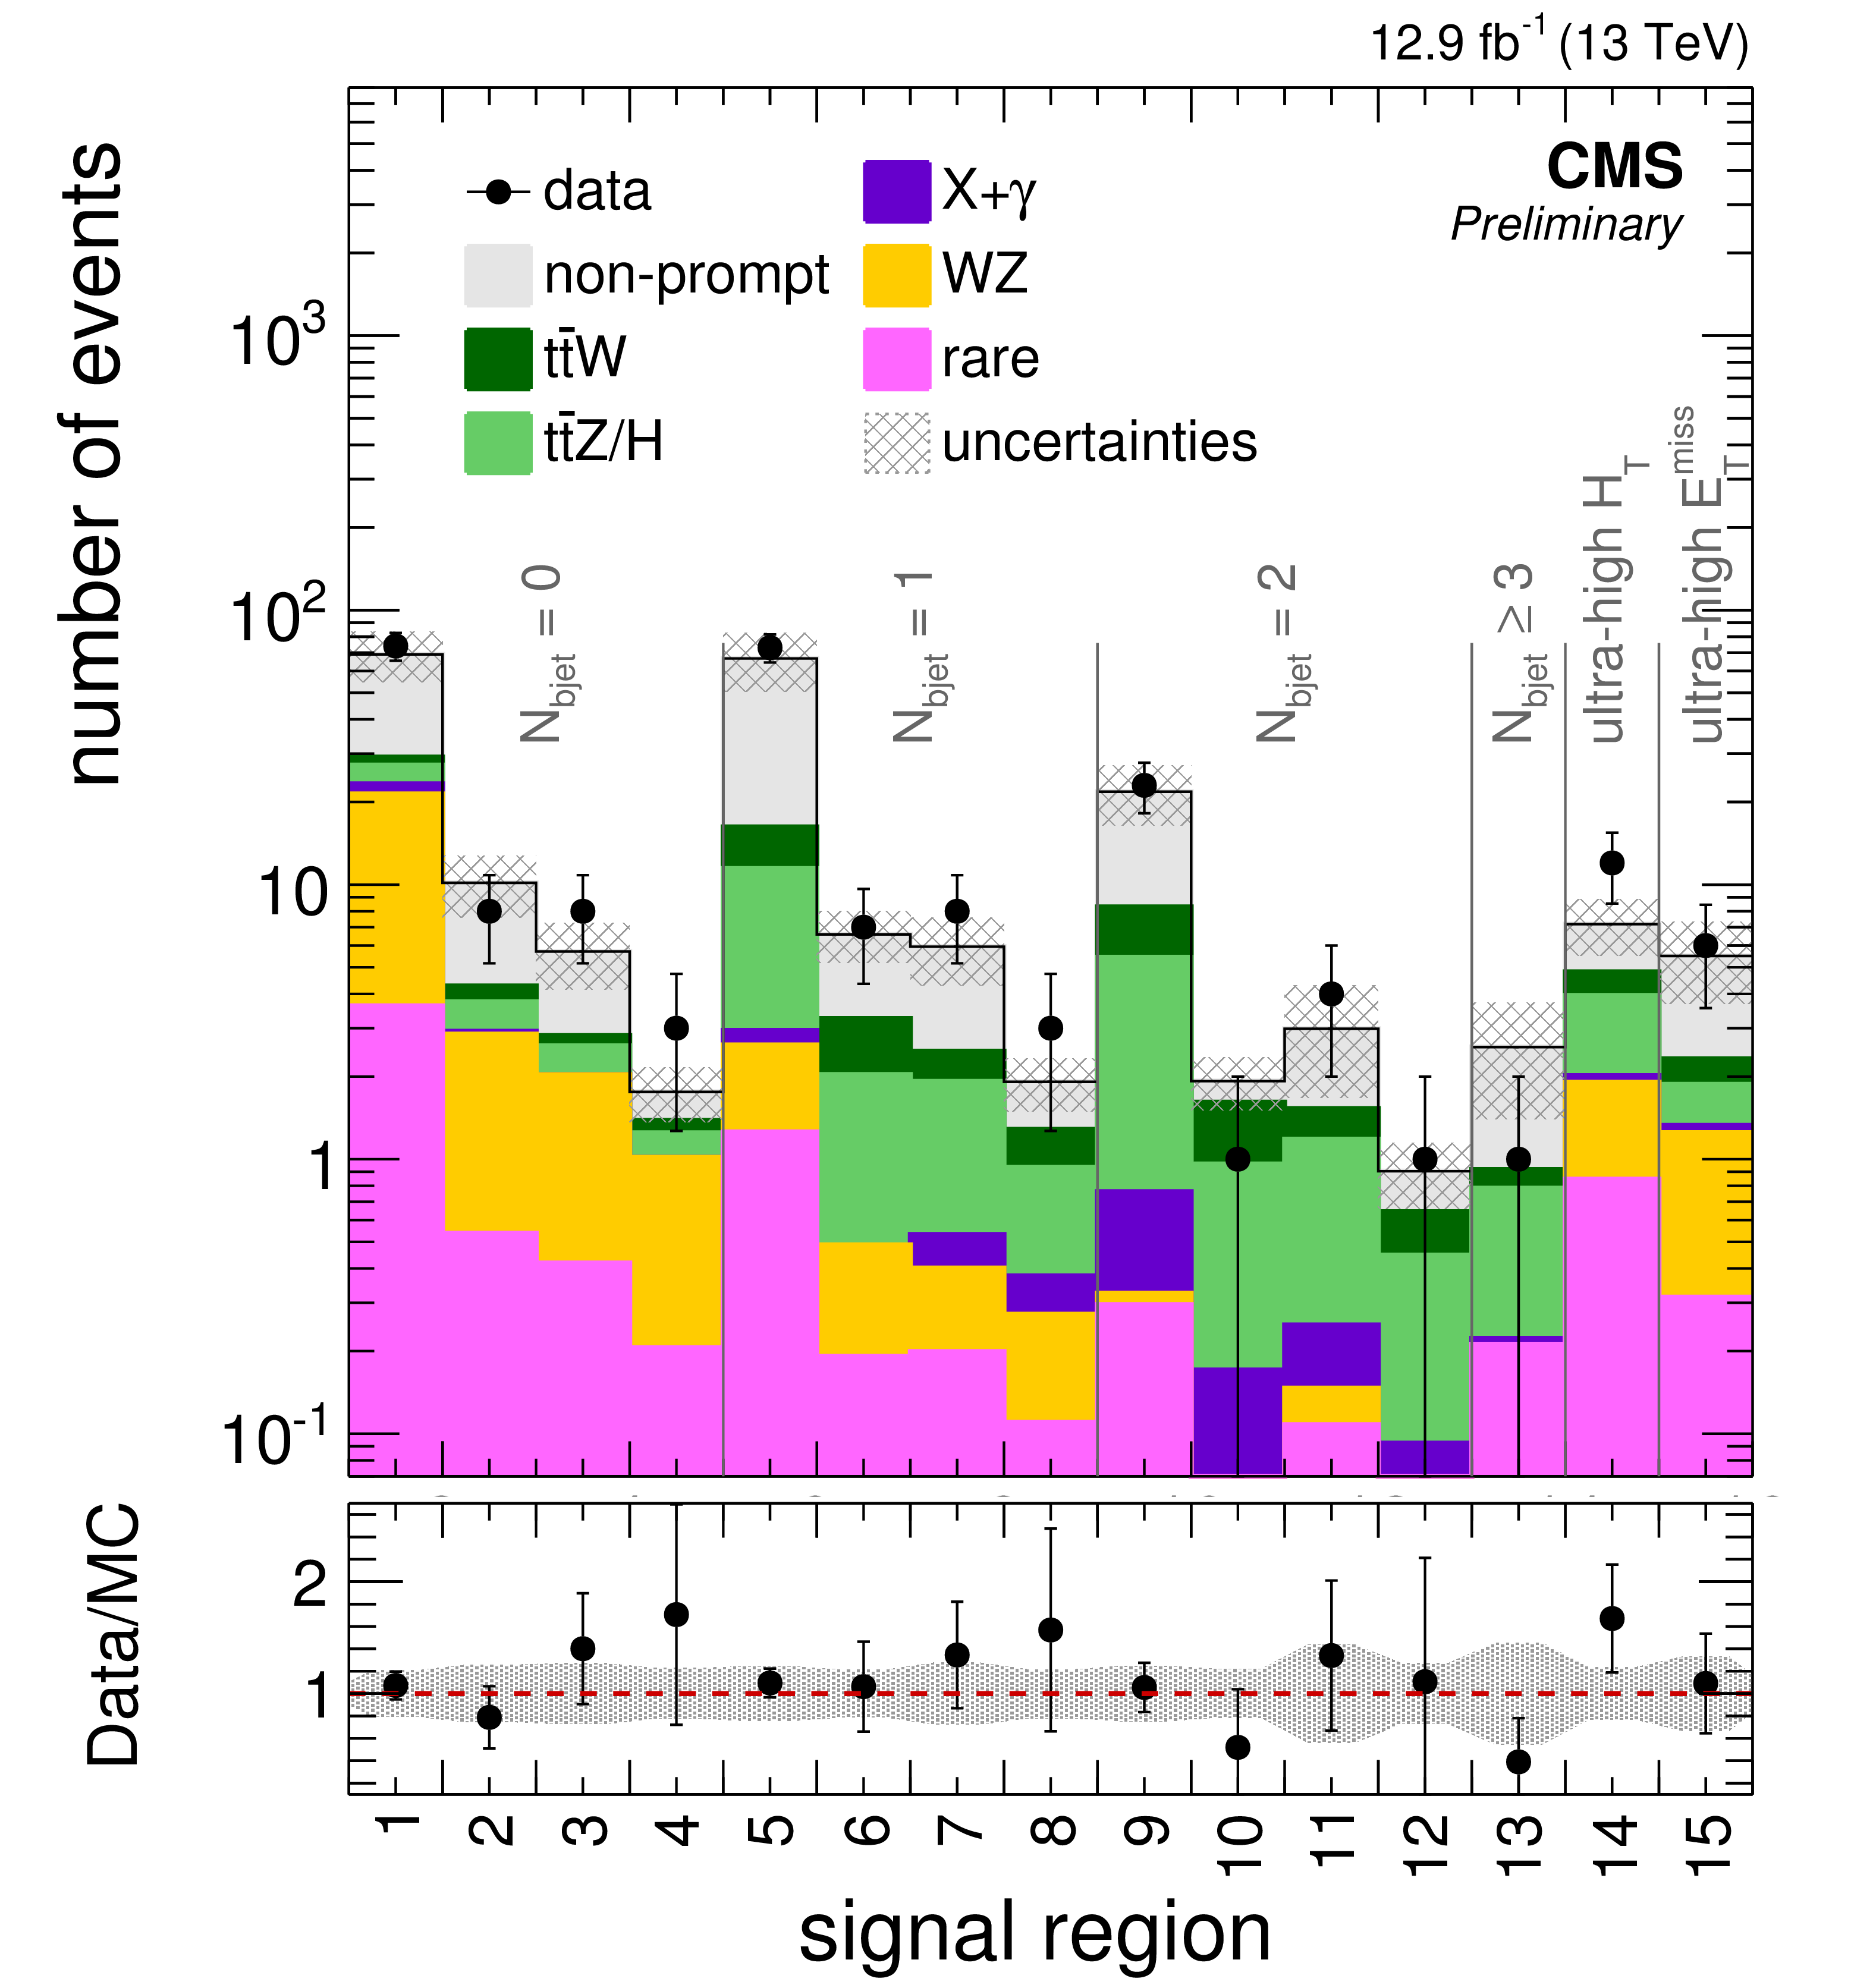
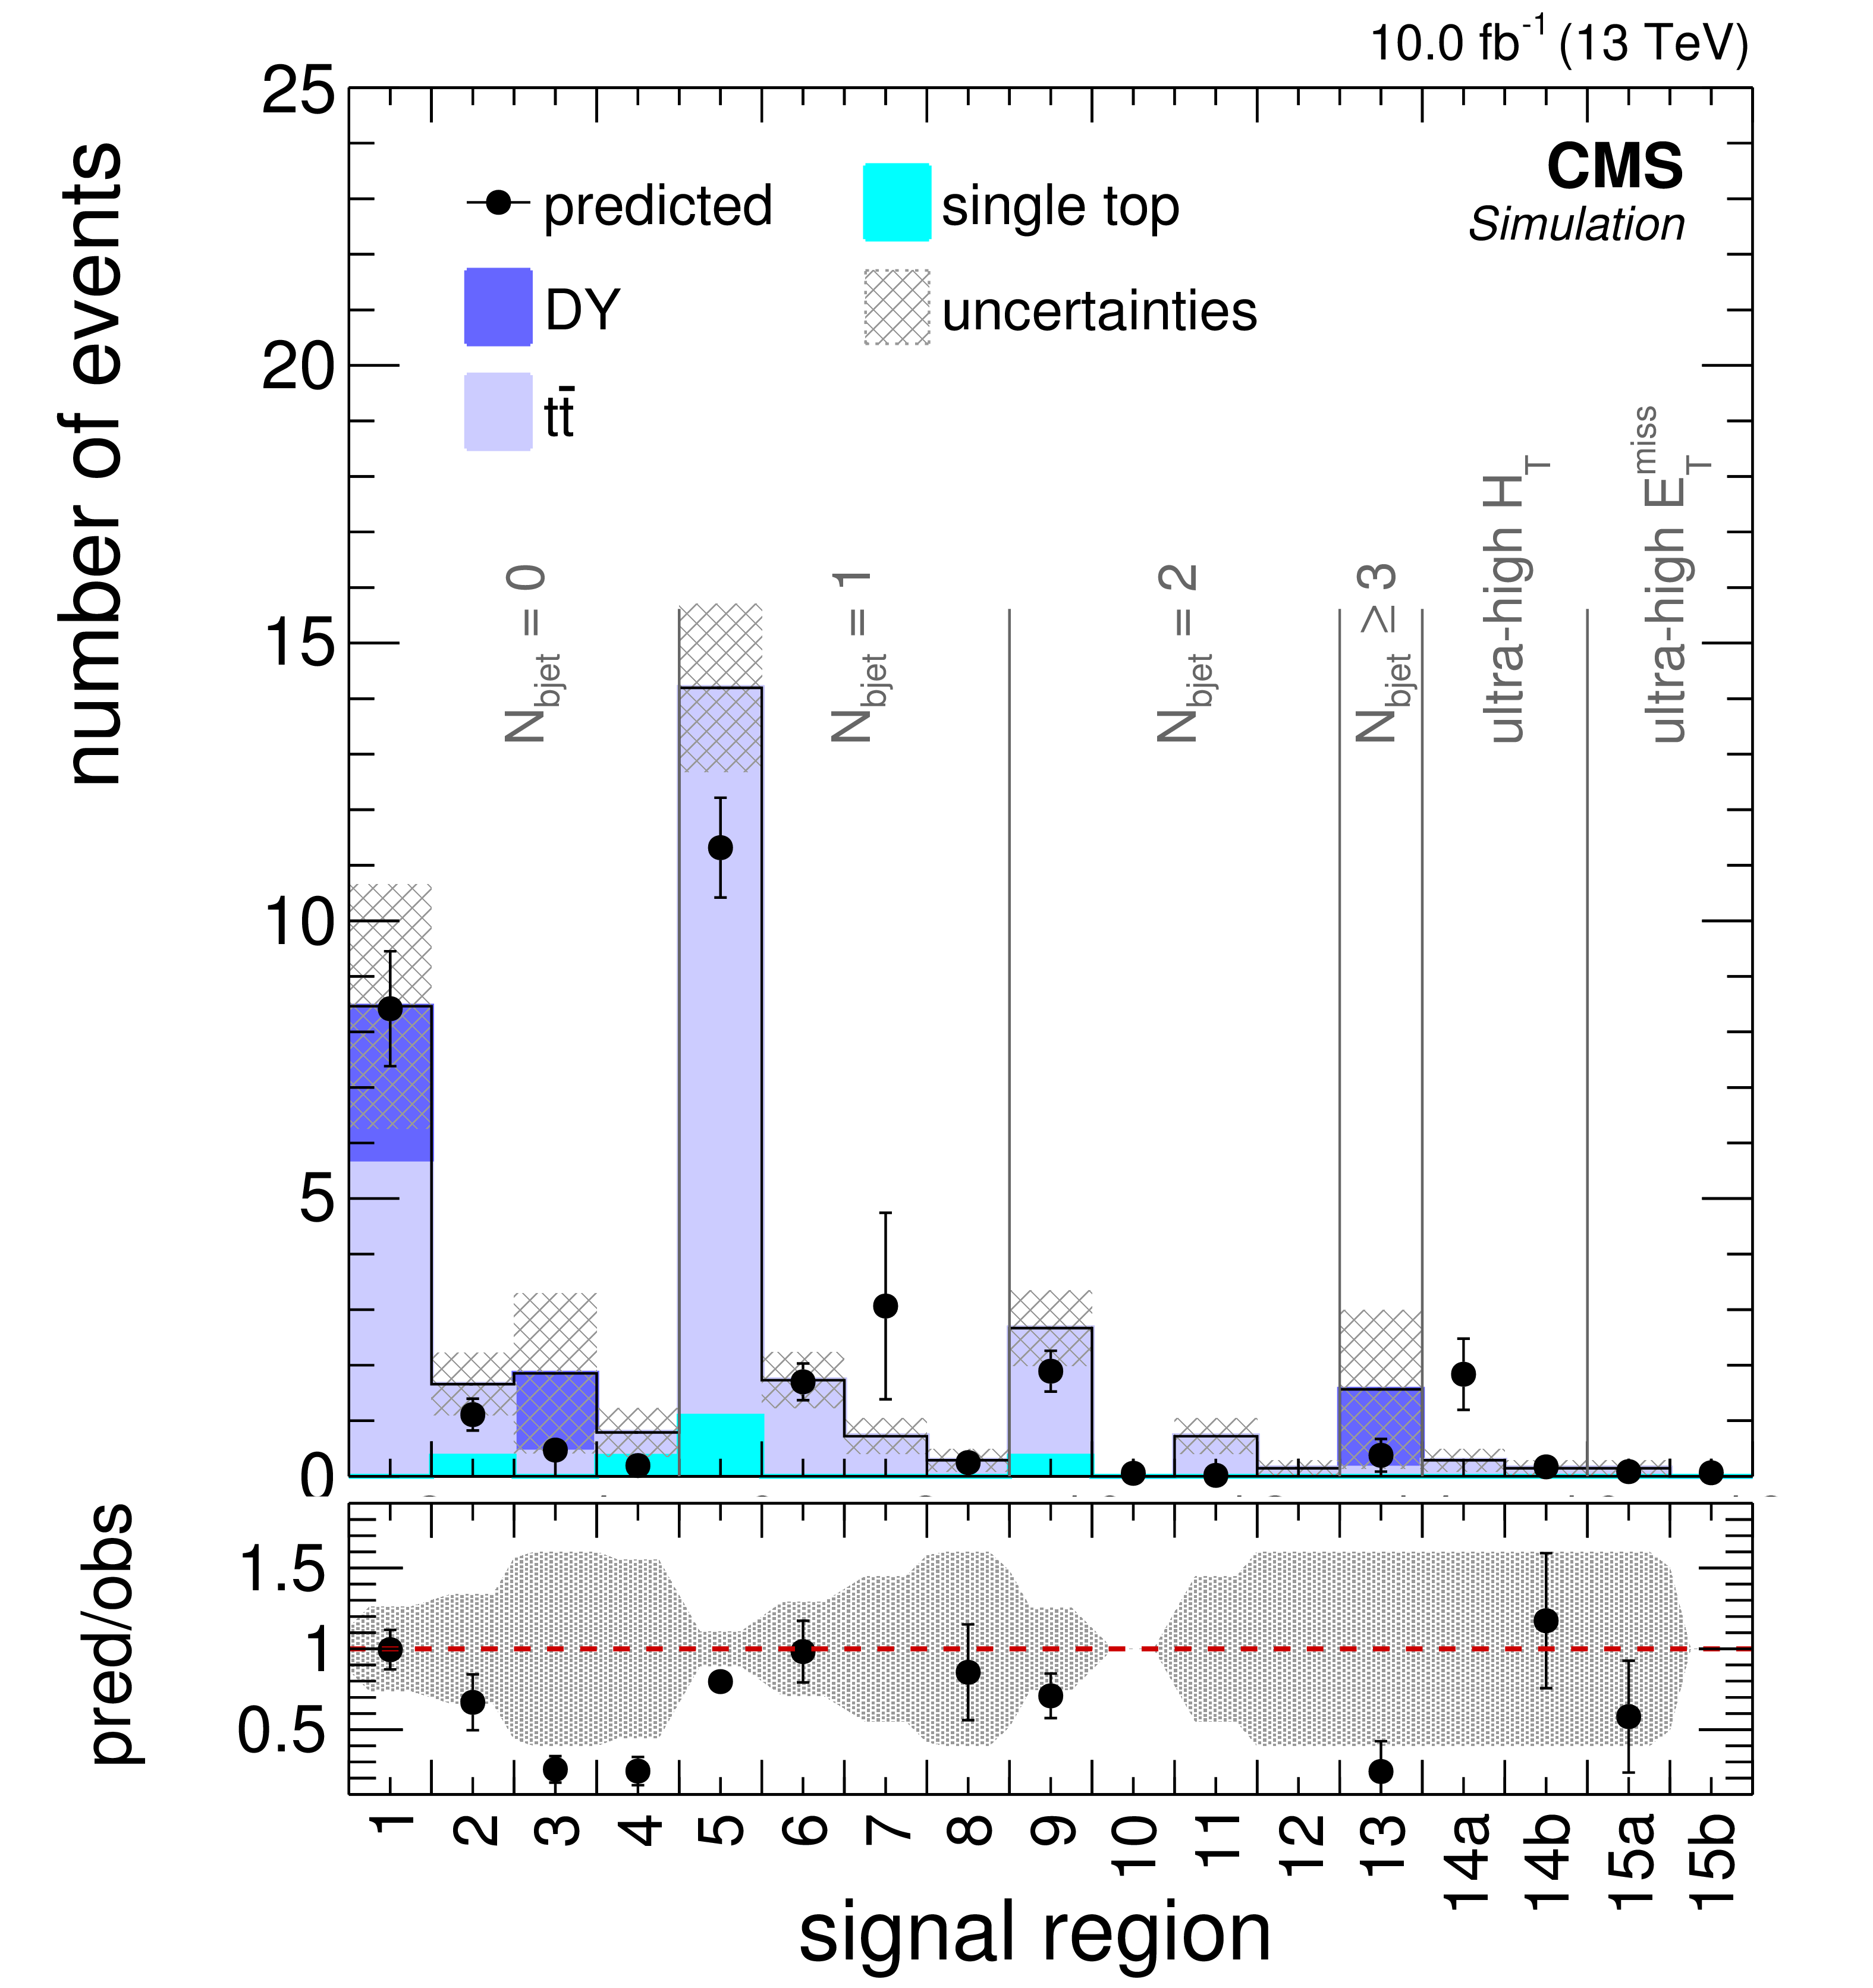
Figure 4-a:
Background prediction and observation in the 15 off-Z signal regions (a,c) and in the 17 on-Z signal regions (b,d) with linear and logarithmic y-axis. No significant deviation between data and prediction can be found in 12.9 fb$^{-1}$ of data. |
png pdf |
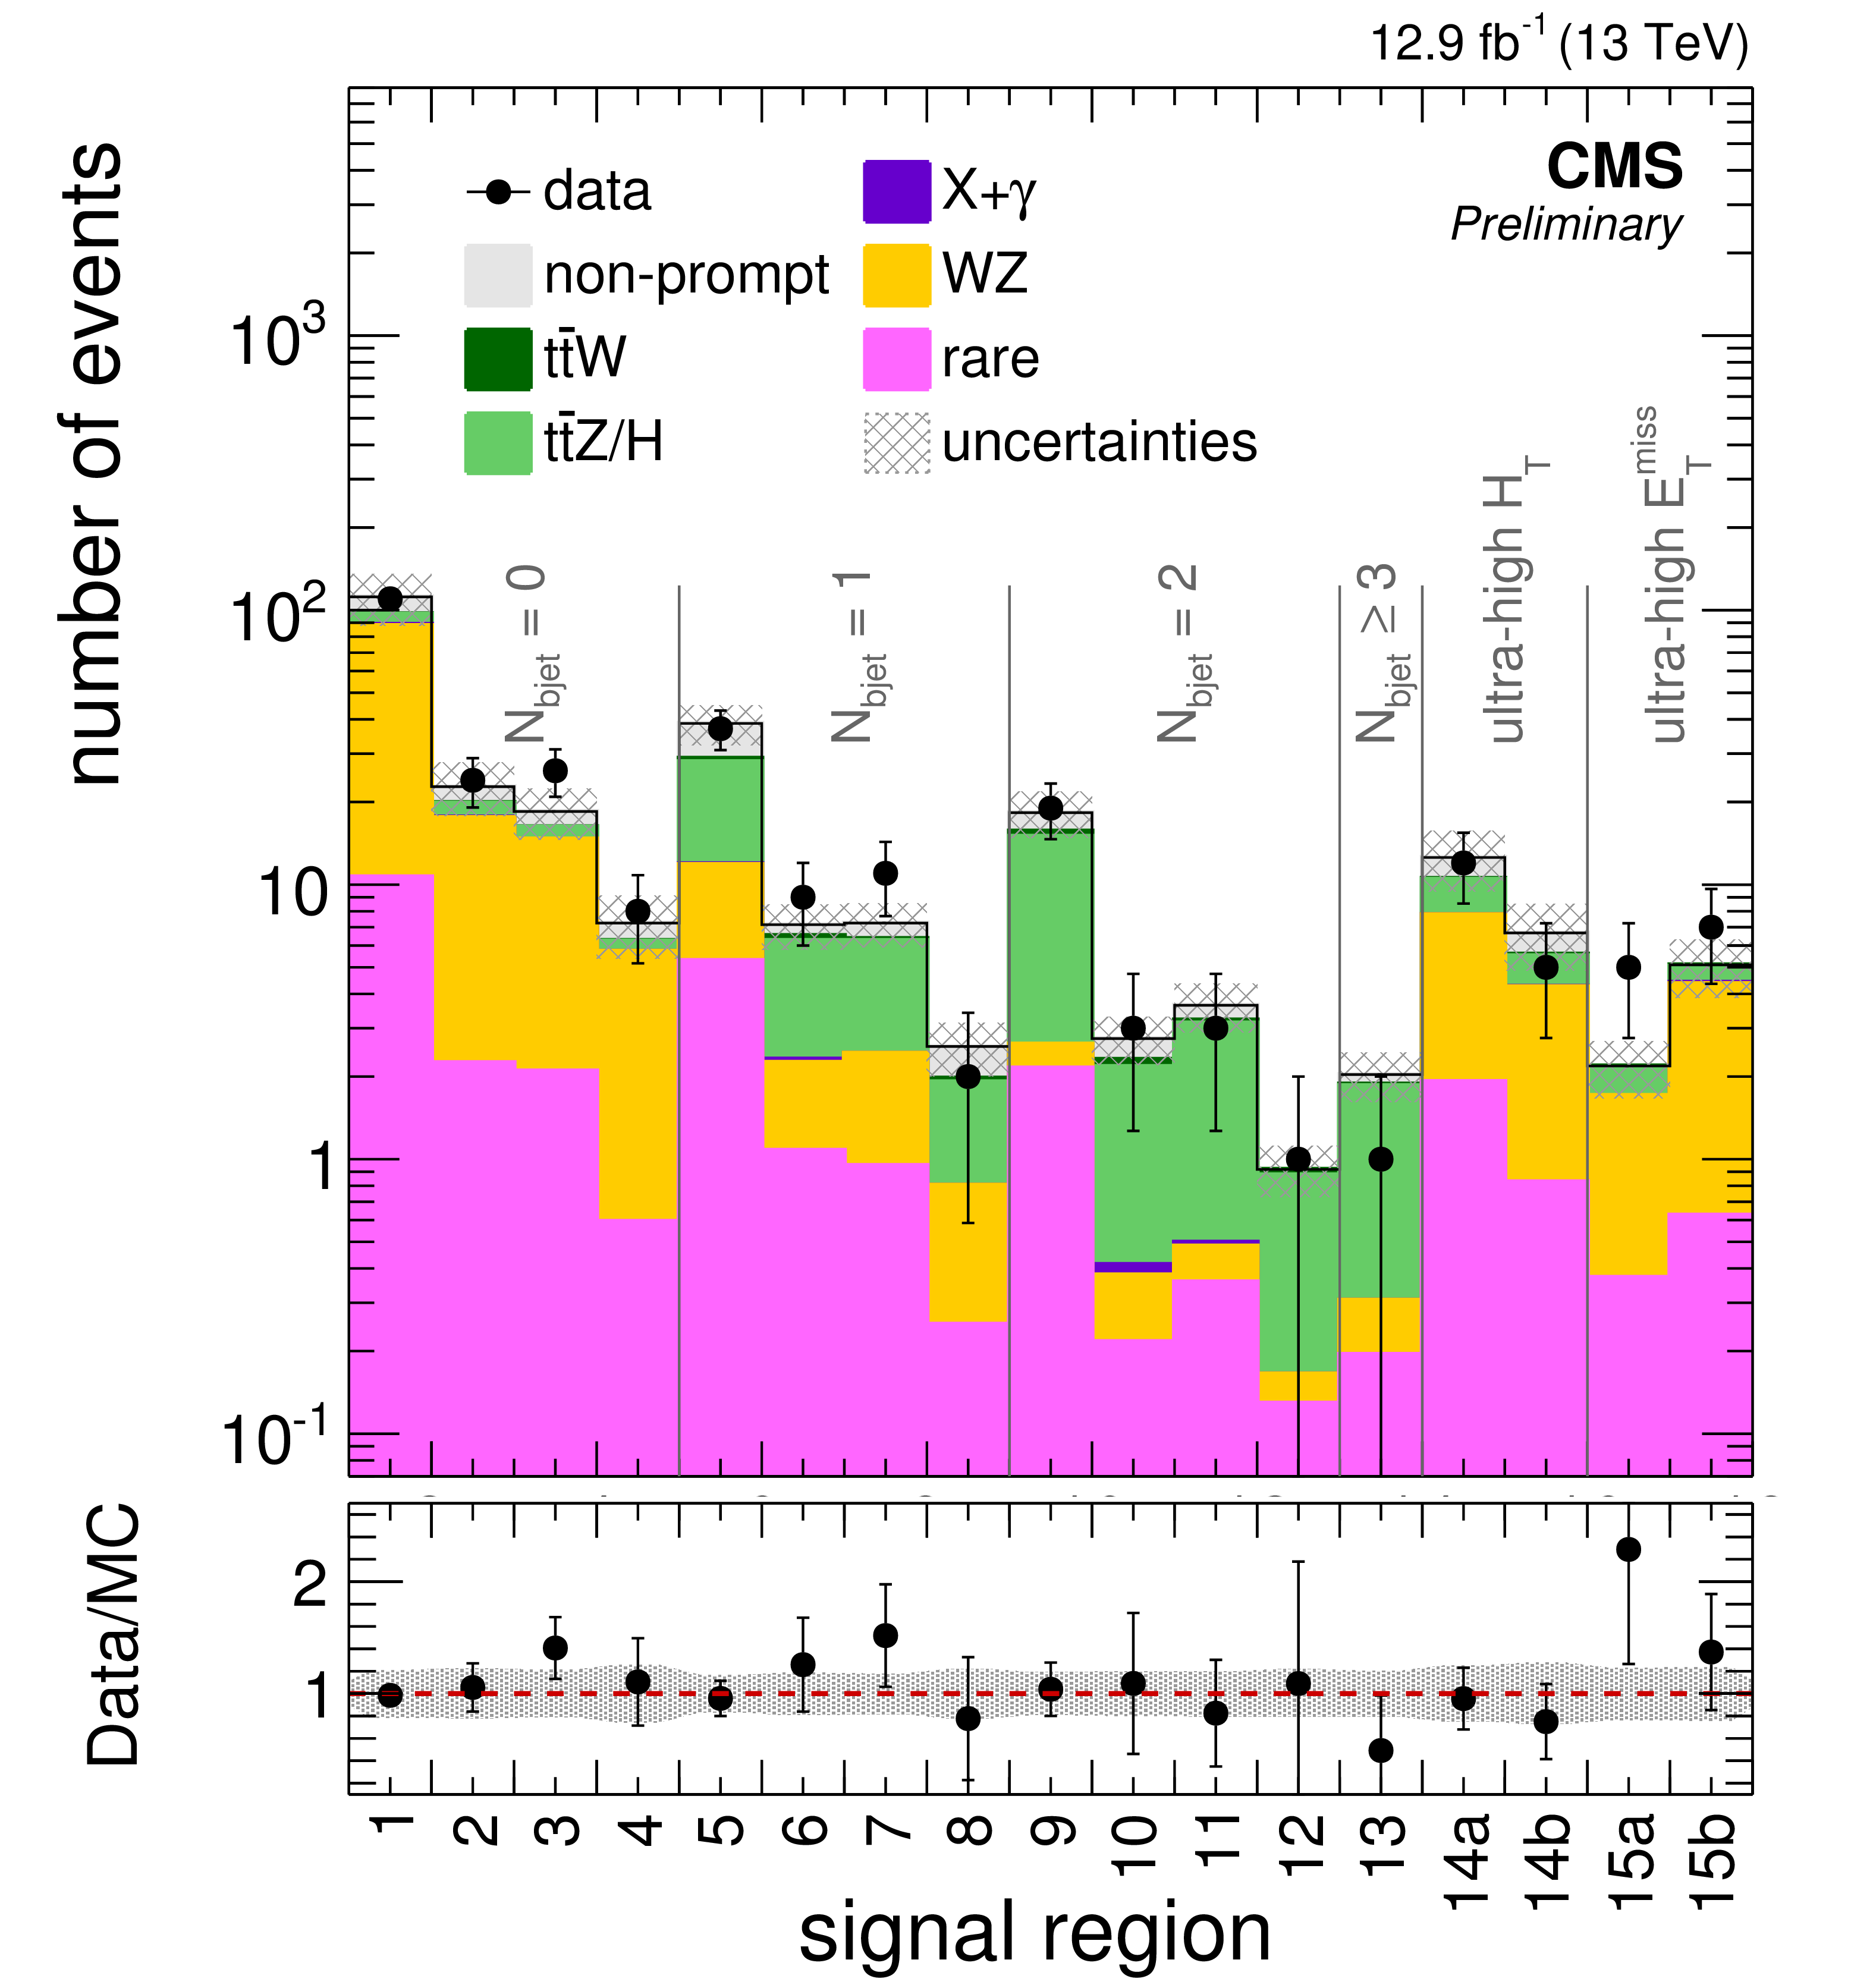
Figure 4-b:
Background prediction and observation in the 15 off-Z signal regions (a,c) and in the 17 on-Z signal regions (b,d) with linear and logarithmic y-axis. No significant deviation between data and prediction can be found in 12.9 fb$^{-1}$ of data. |
png pdf |
Figure 4-c:
Background prediction and observation in the 15 off-Z signal regions (a,c) and in the 17 on-Z signal regions (b,d) with linear and logarithmic y-axis. No significant deviation between data and prediction can be found in 12.9 fb$^{-1}$ of data. |
png pdf |
Figure 4-d:
Background prediction and observation in the 15 off-Z signal regions (a,c) and in the 17 on-Z signal regions (b,d) with linear and logarithmic y-axis. No significant deviation between data and prediction can be found in 12.9 fb$^{-1}$ of data. |
png pdf root |
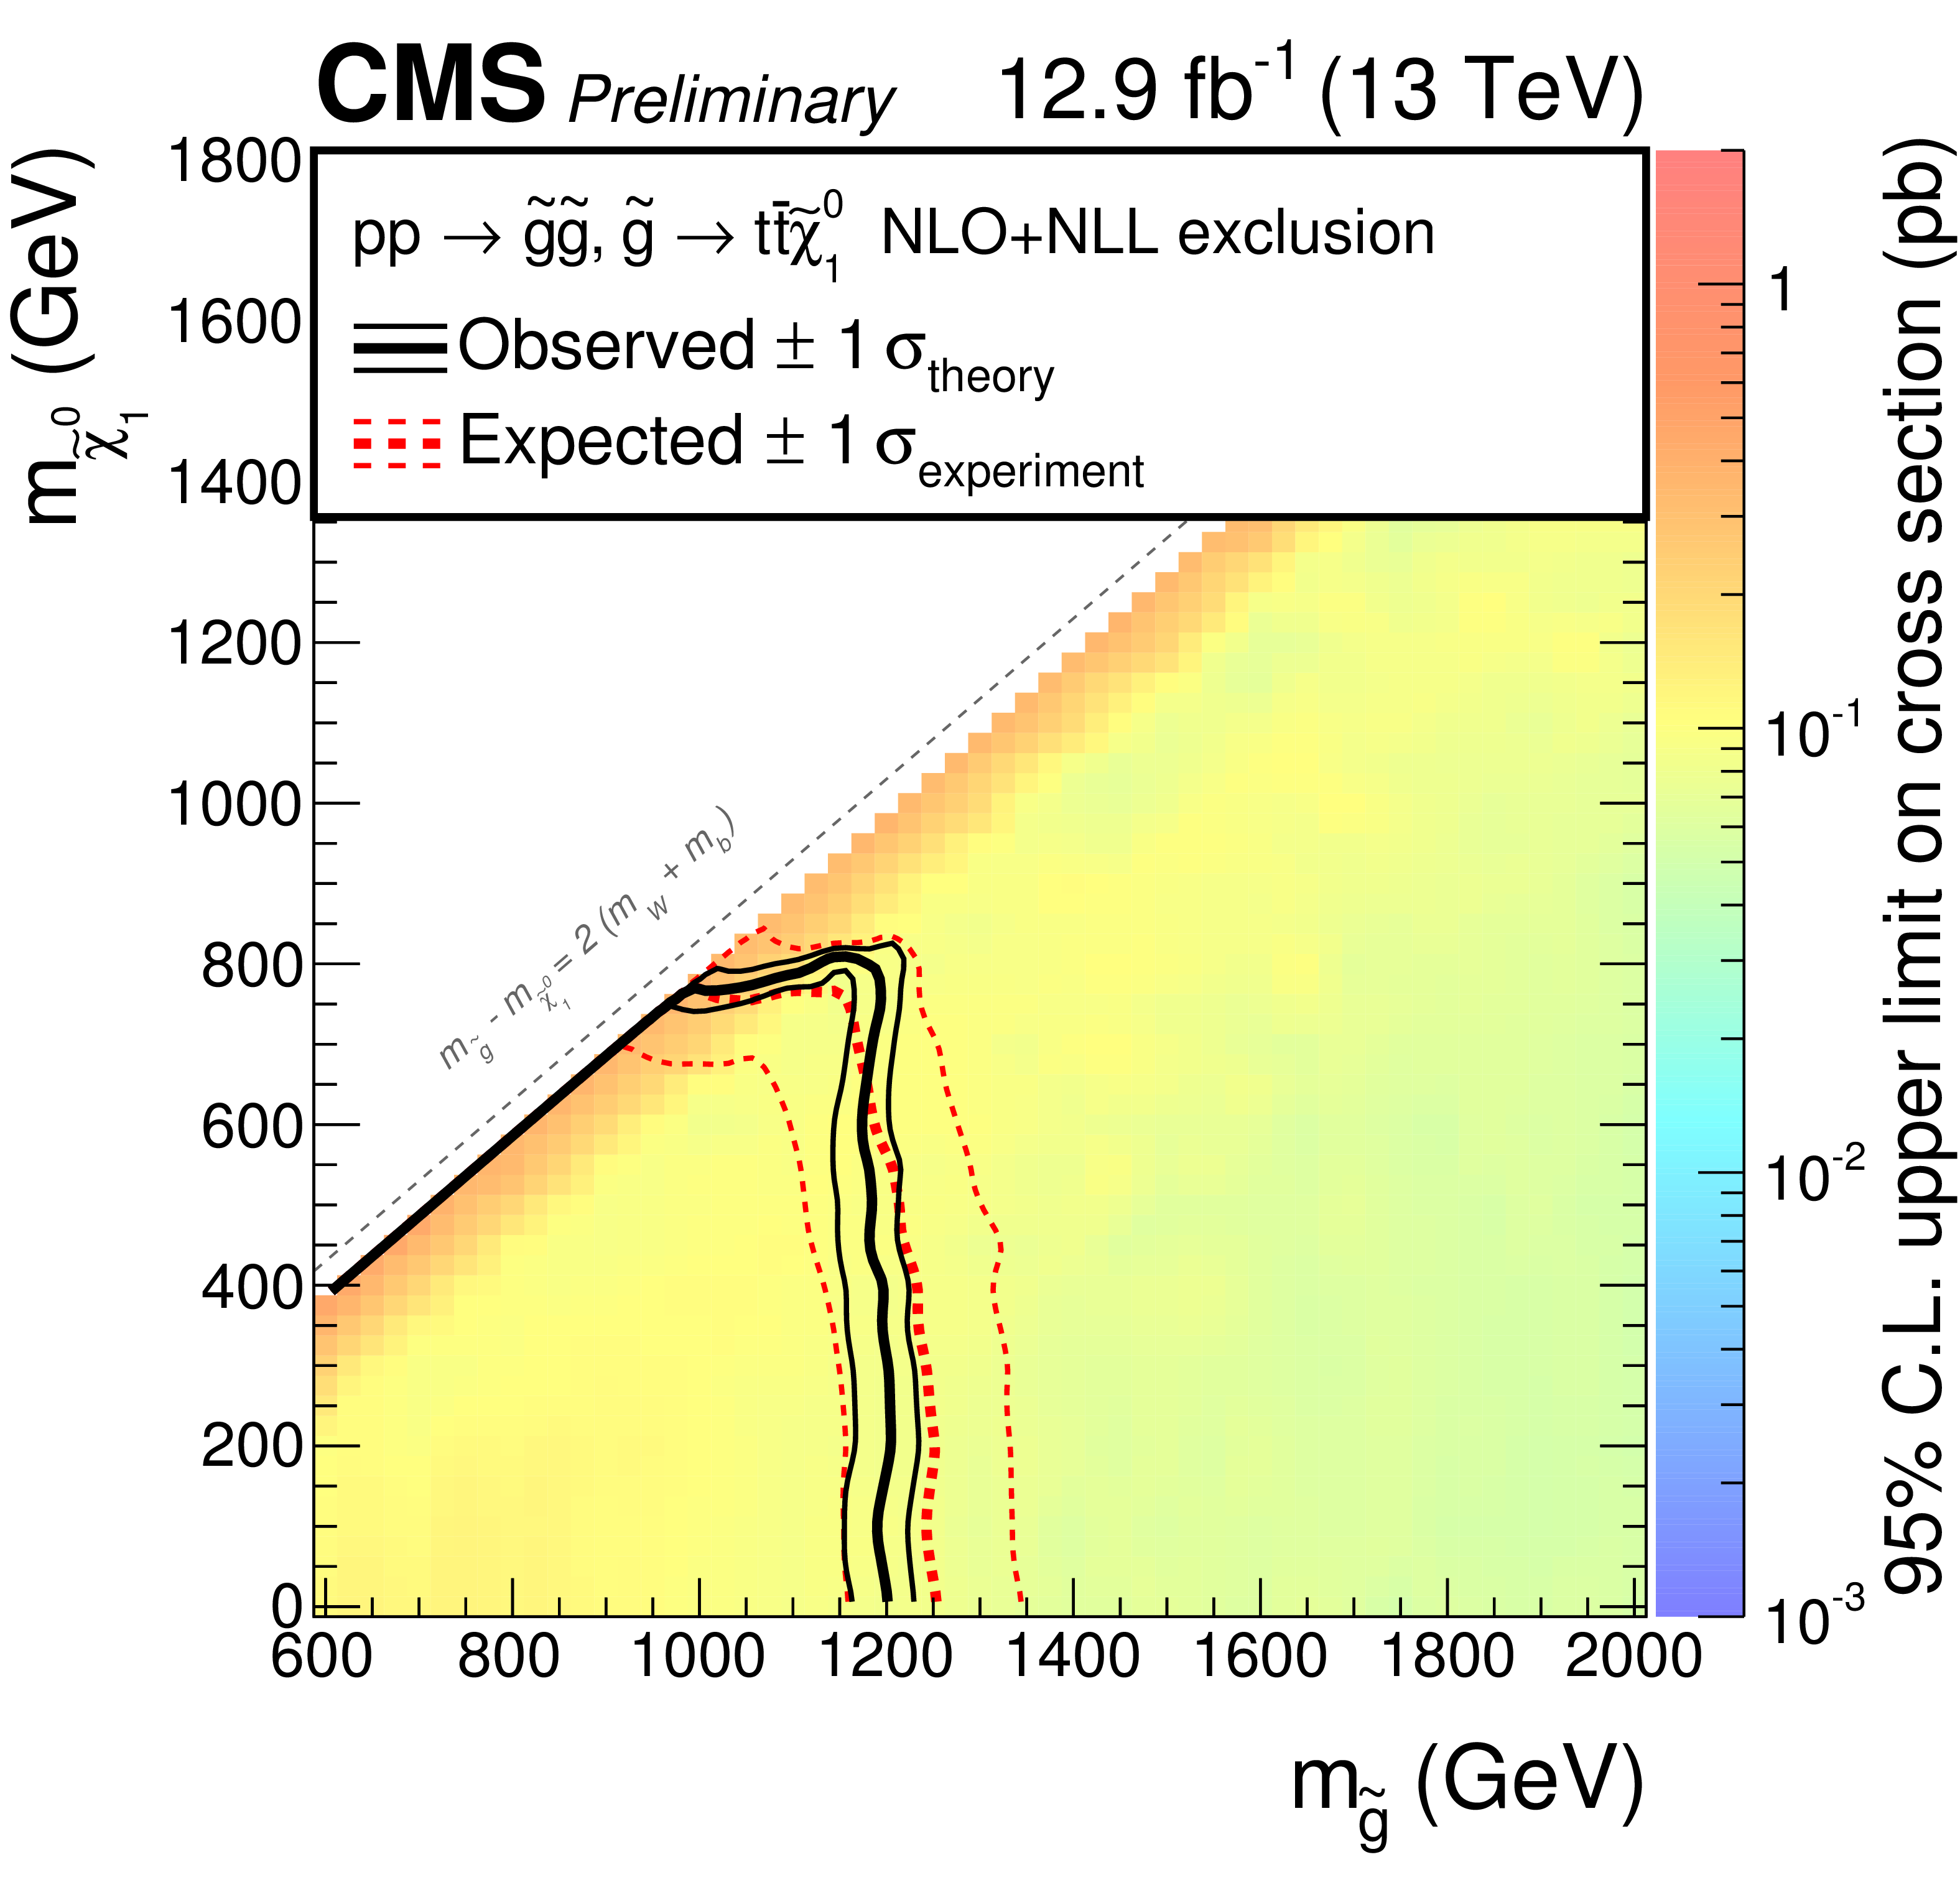
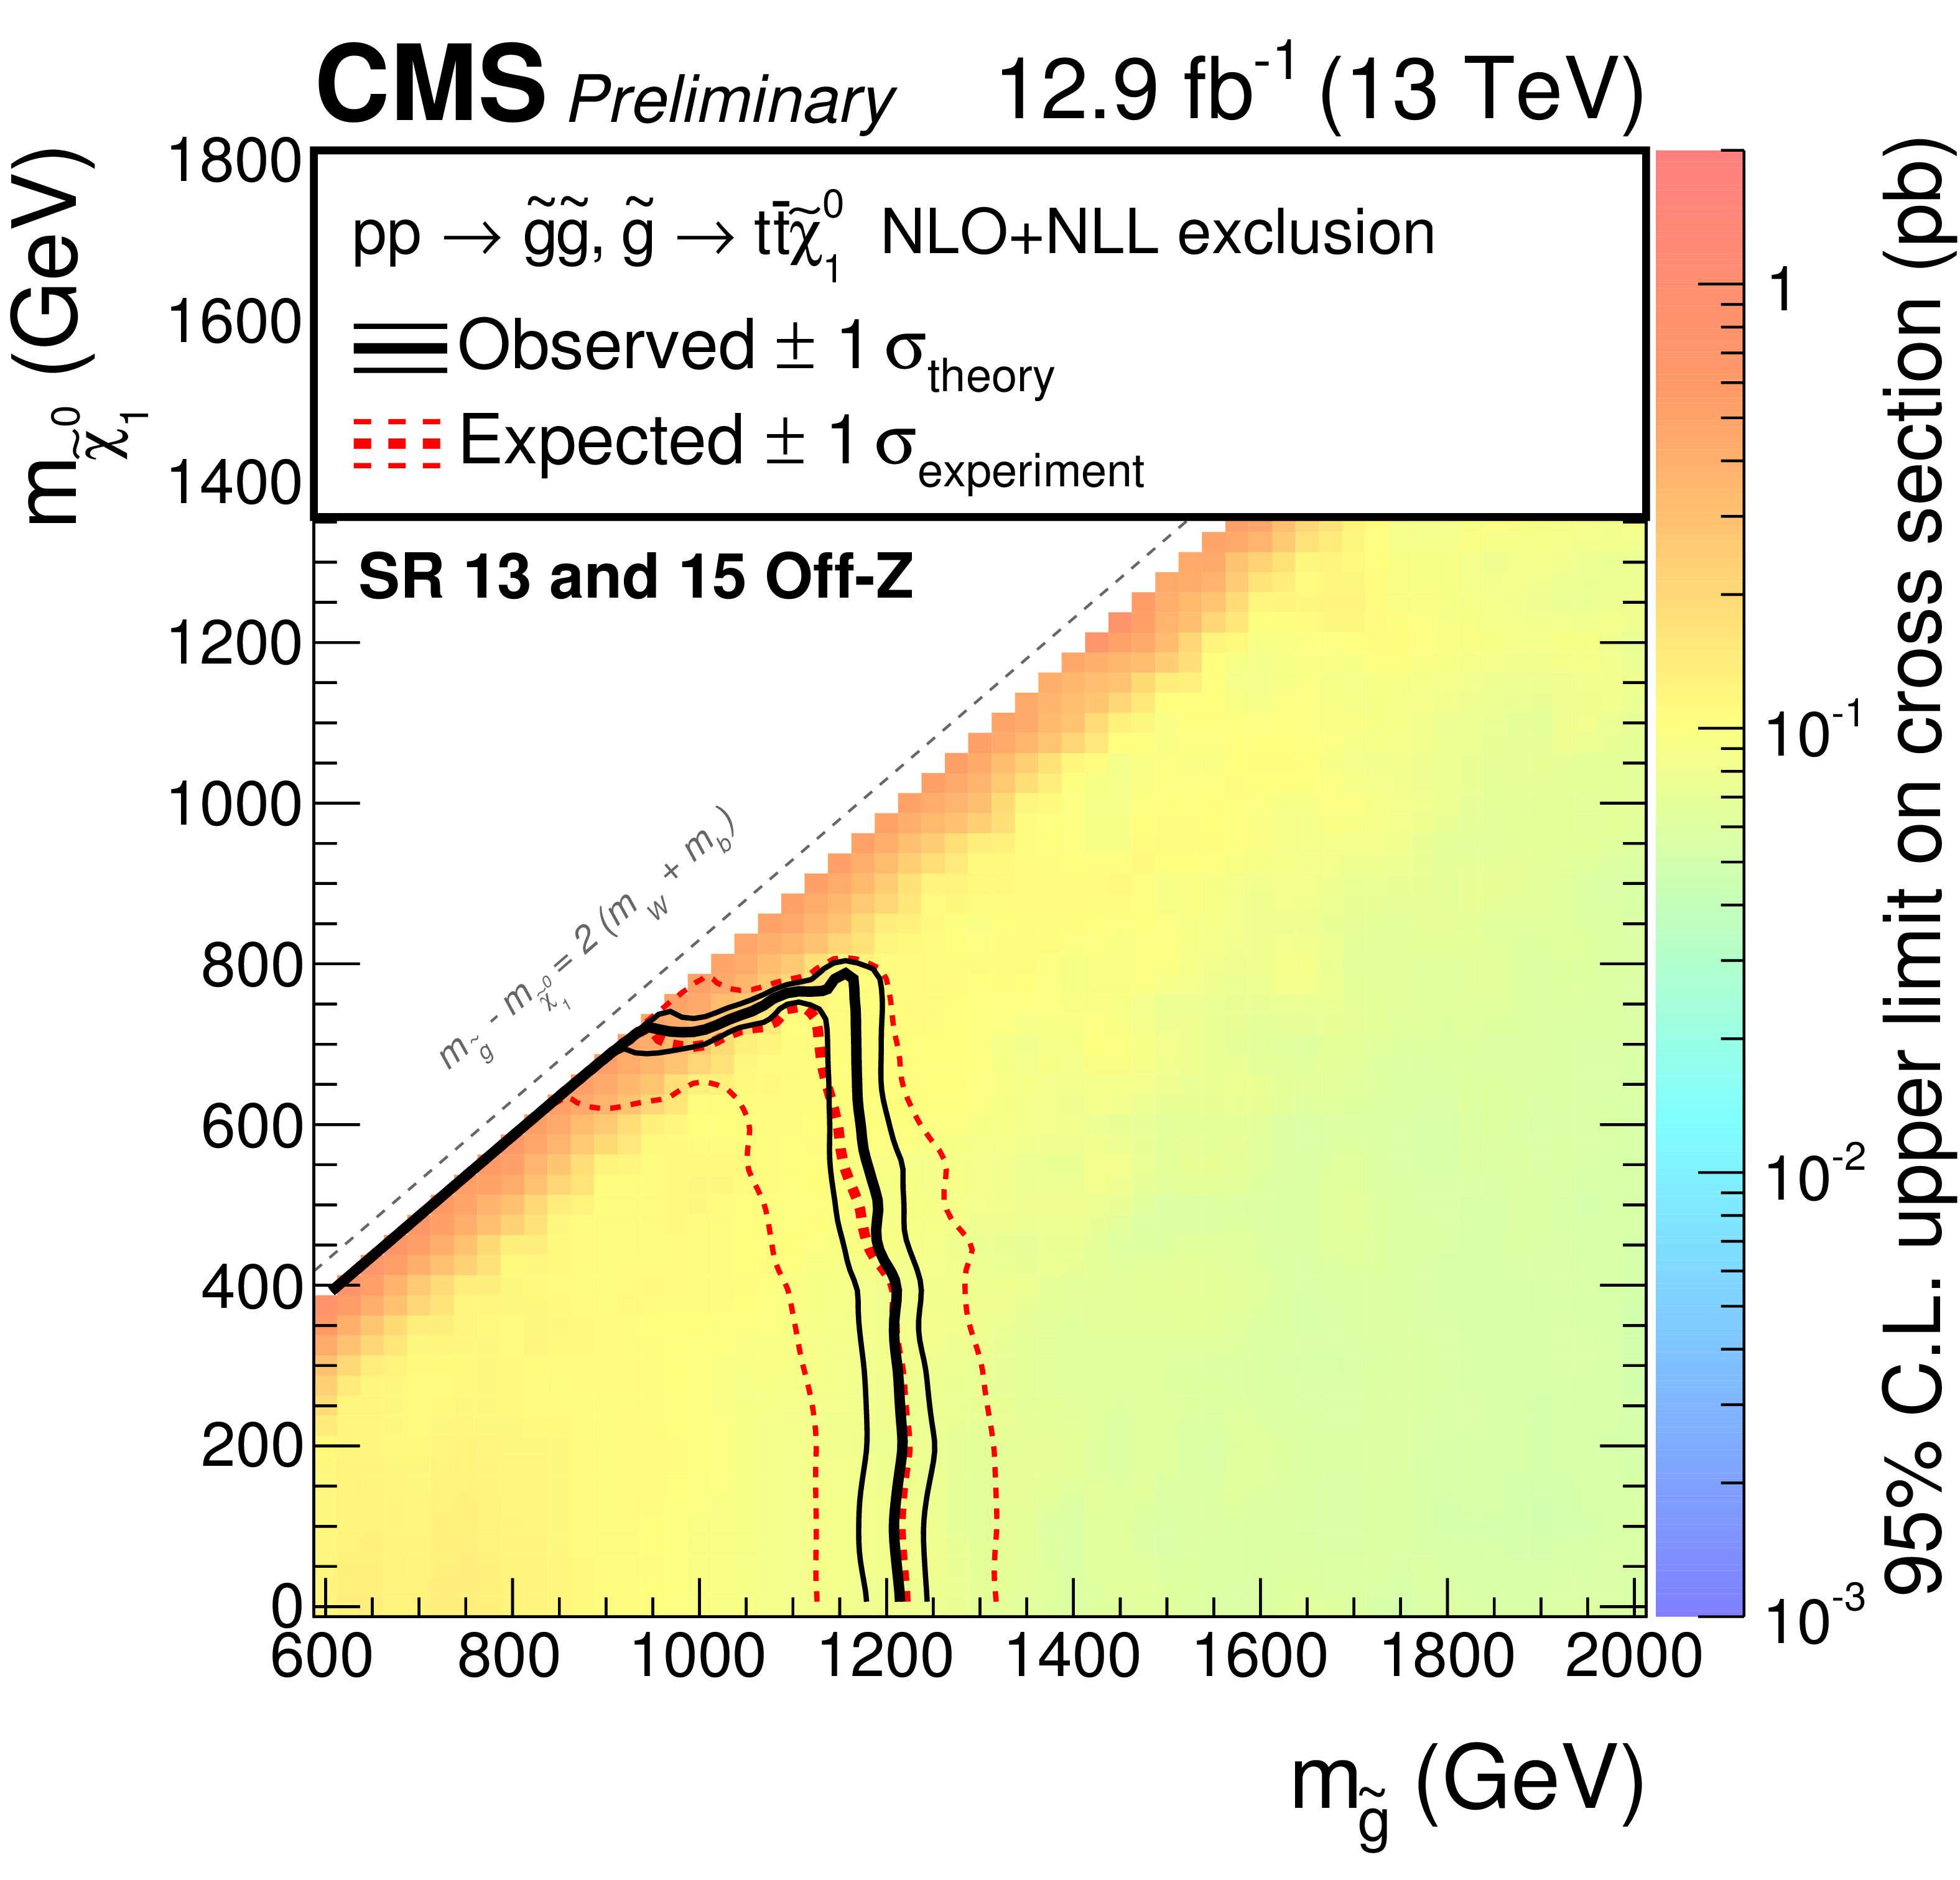
Figure 5-a:
Excluded region at 95% confidence in the $m( {\tilde{\chi}^{0}} )$ versus $m( \tilde{\mathrm{g}} )$ plane for the T1tttt (a) and for the T5qqqqWZ (b) simplified model. The color scale indicates the excluded cross section at a given point in the mass plane. The excluded regions are to the left and below the observed and expected limit curves. |
png pdf root |
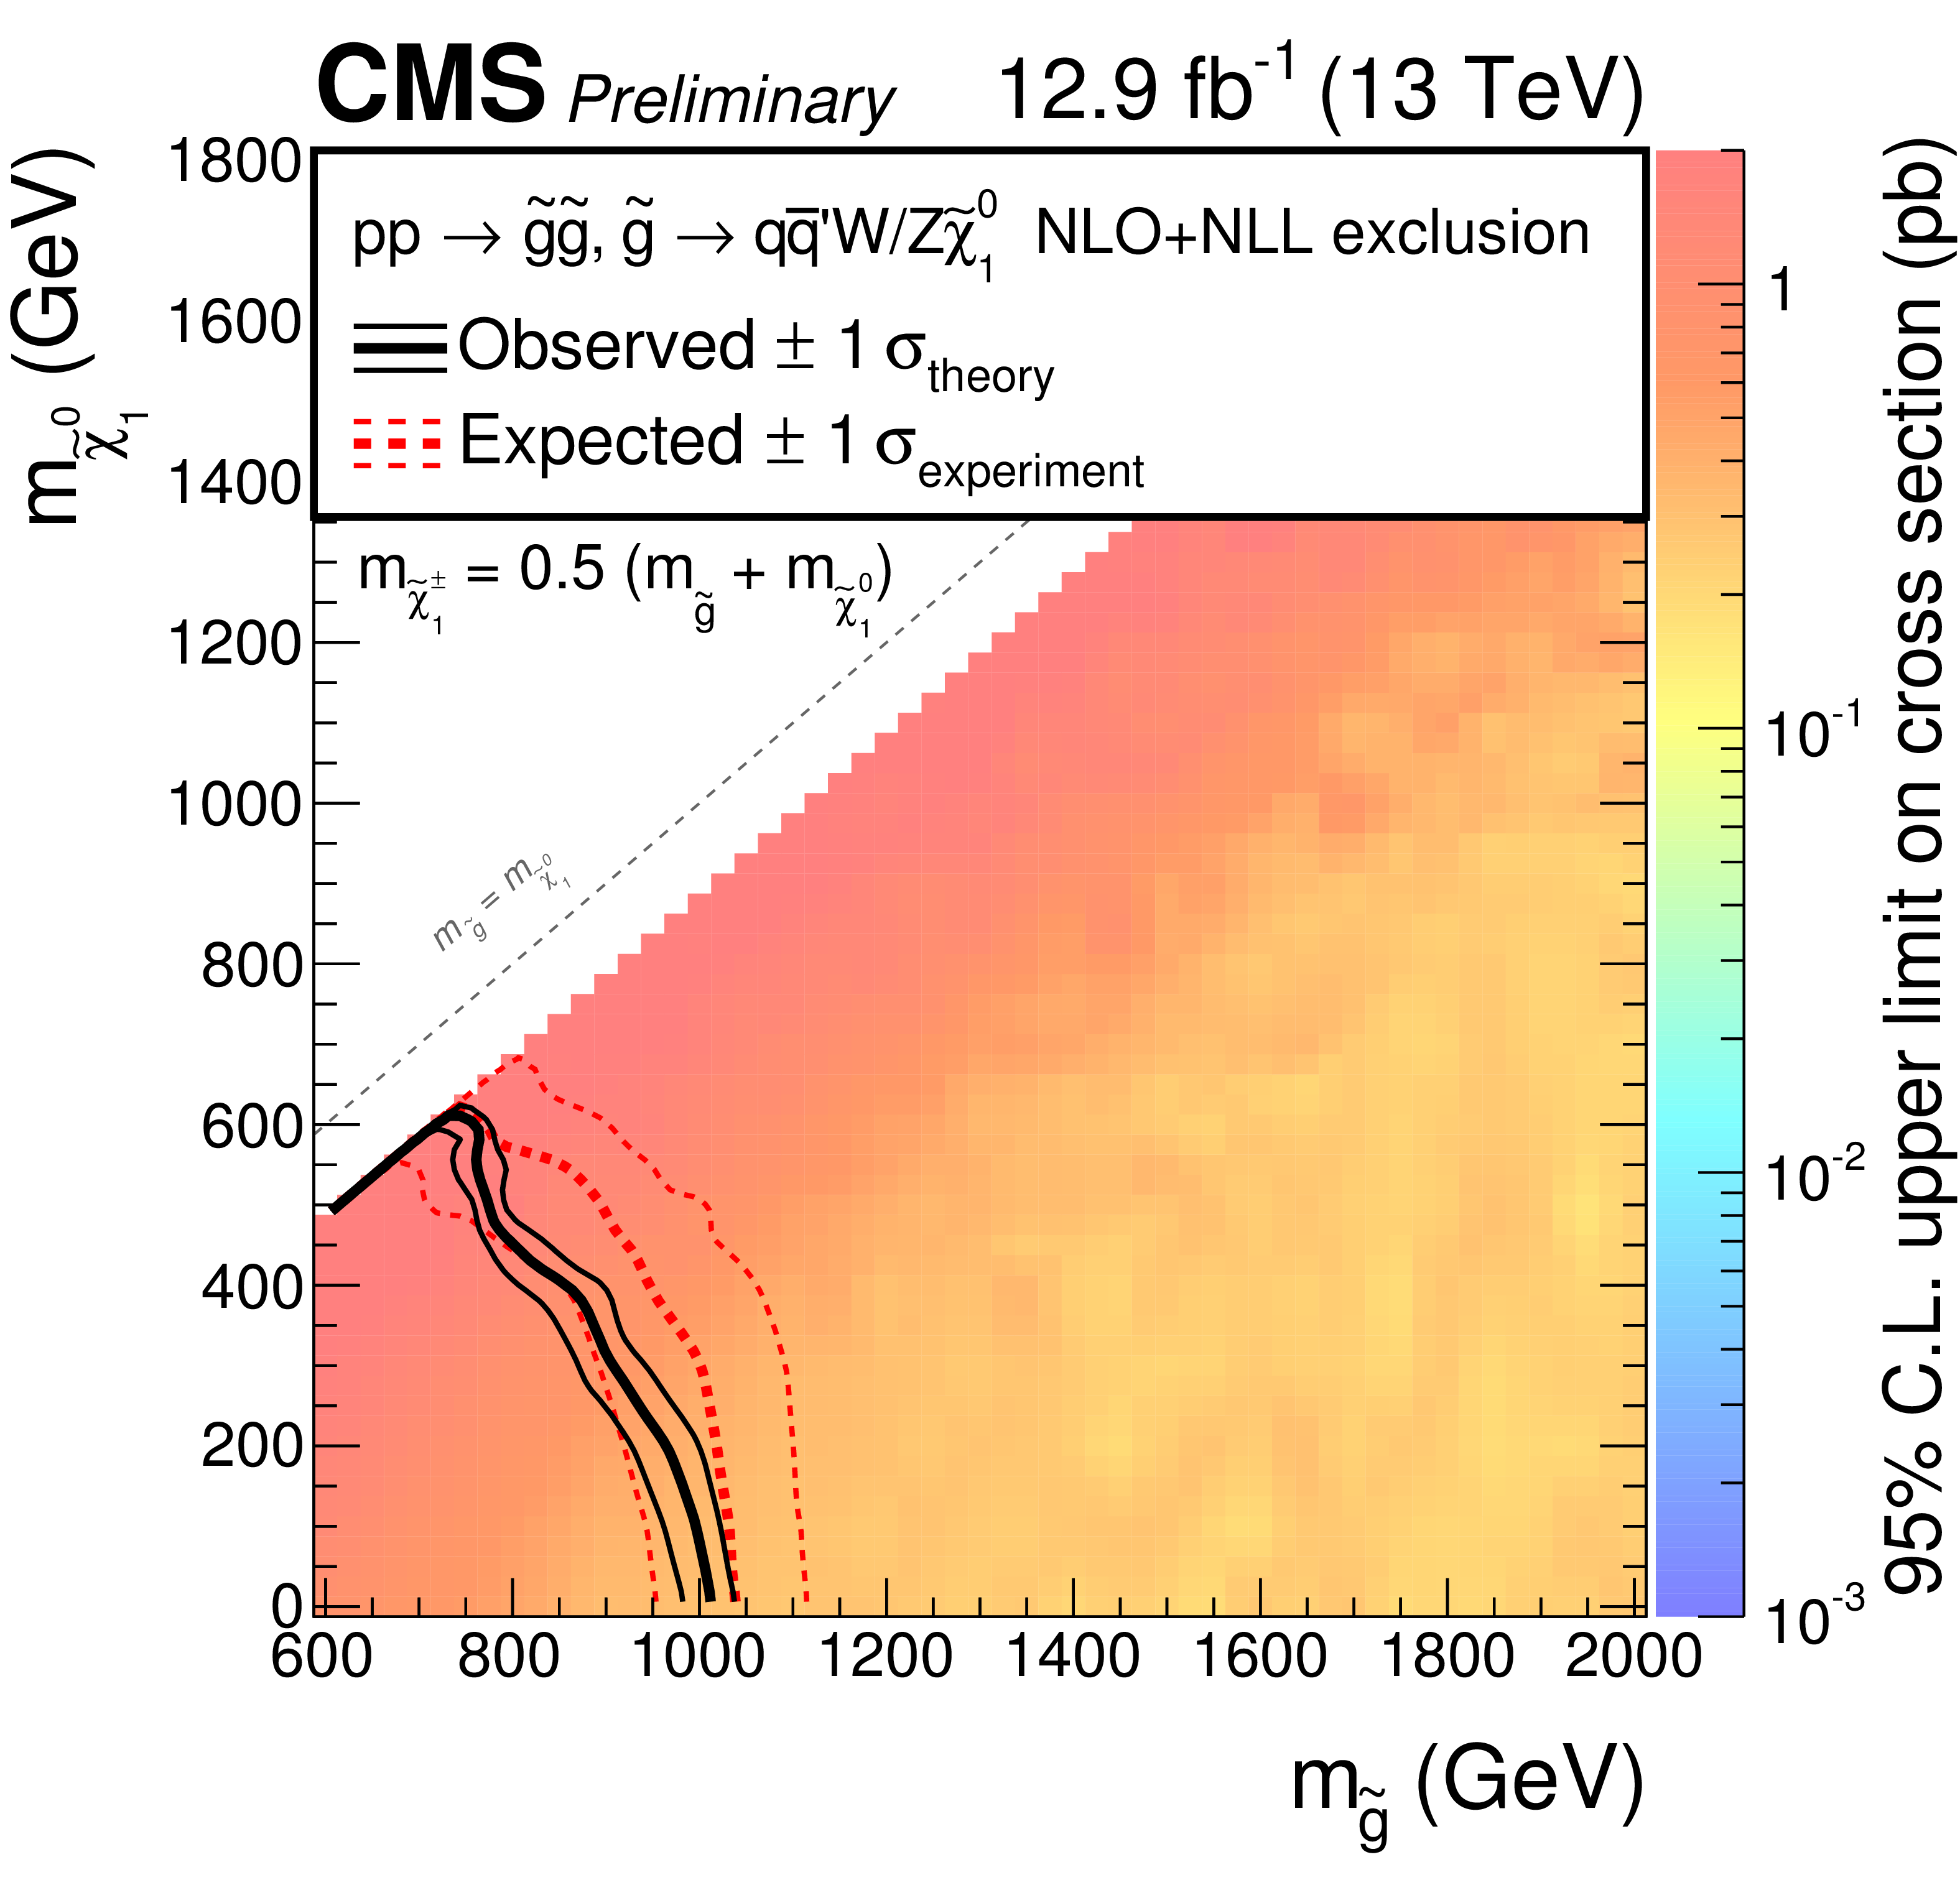
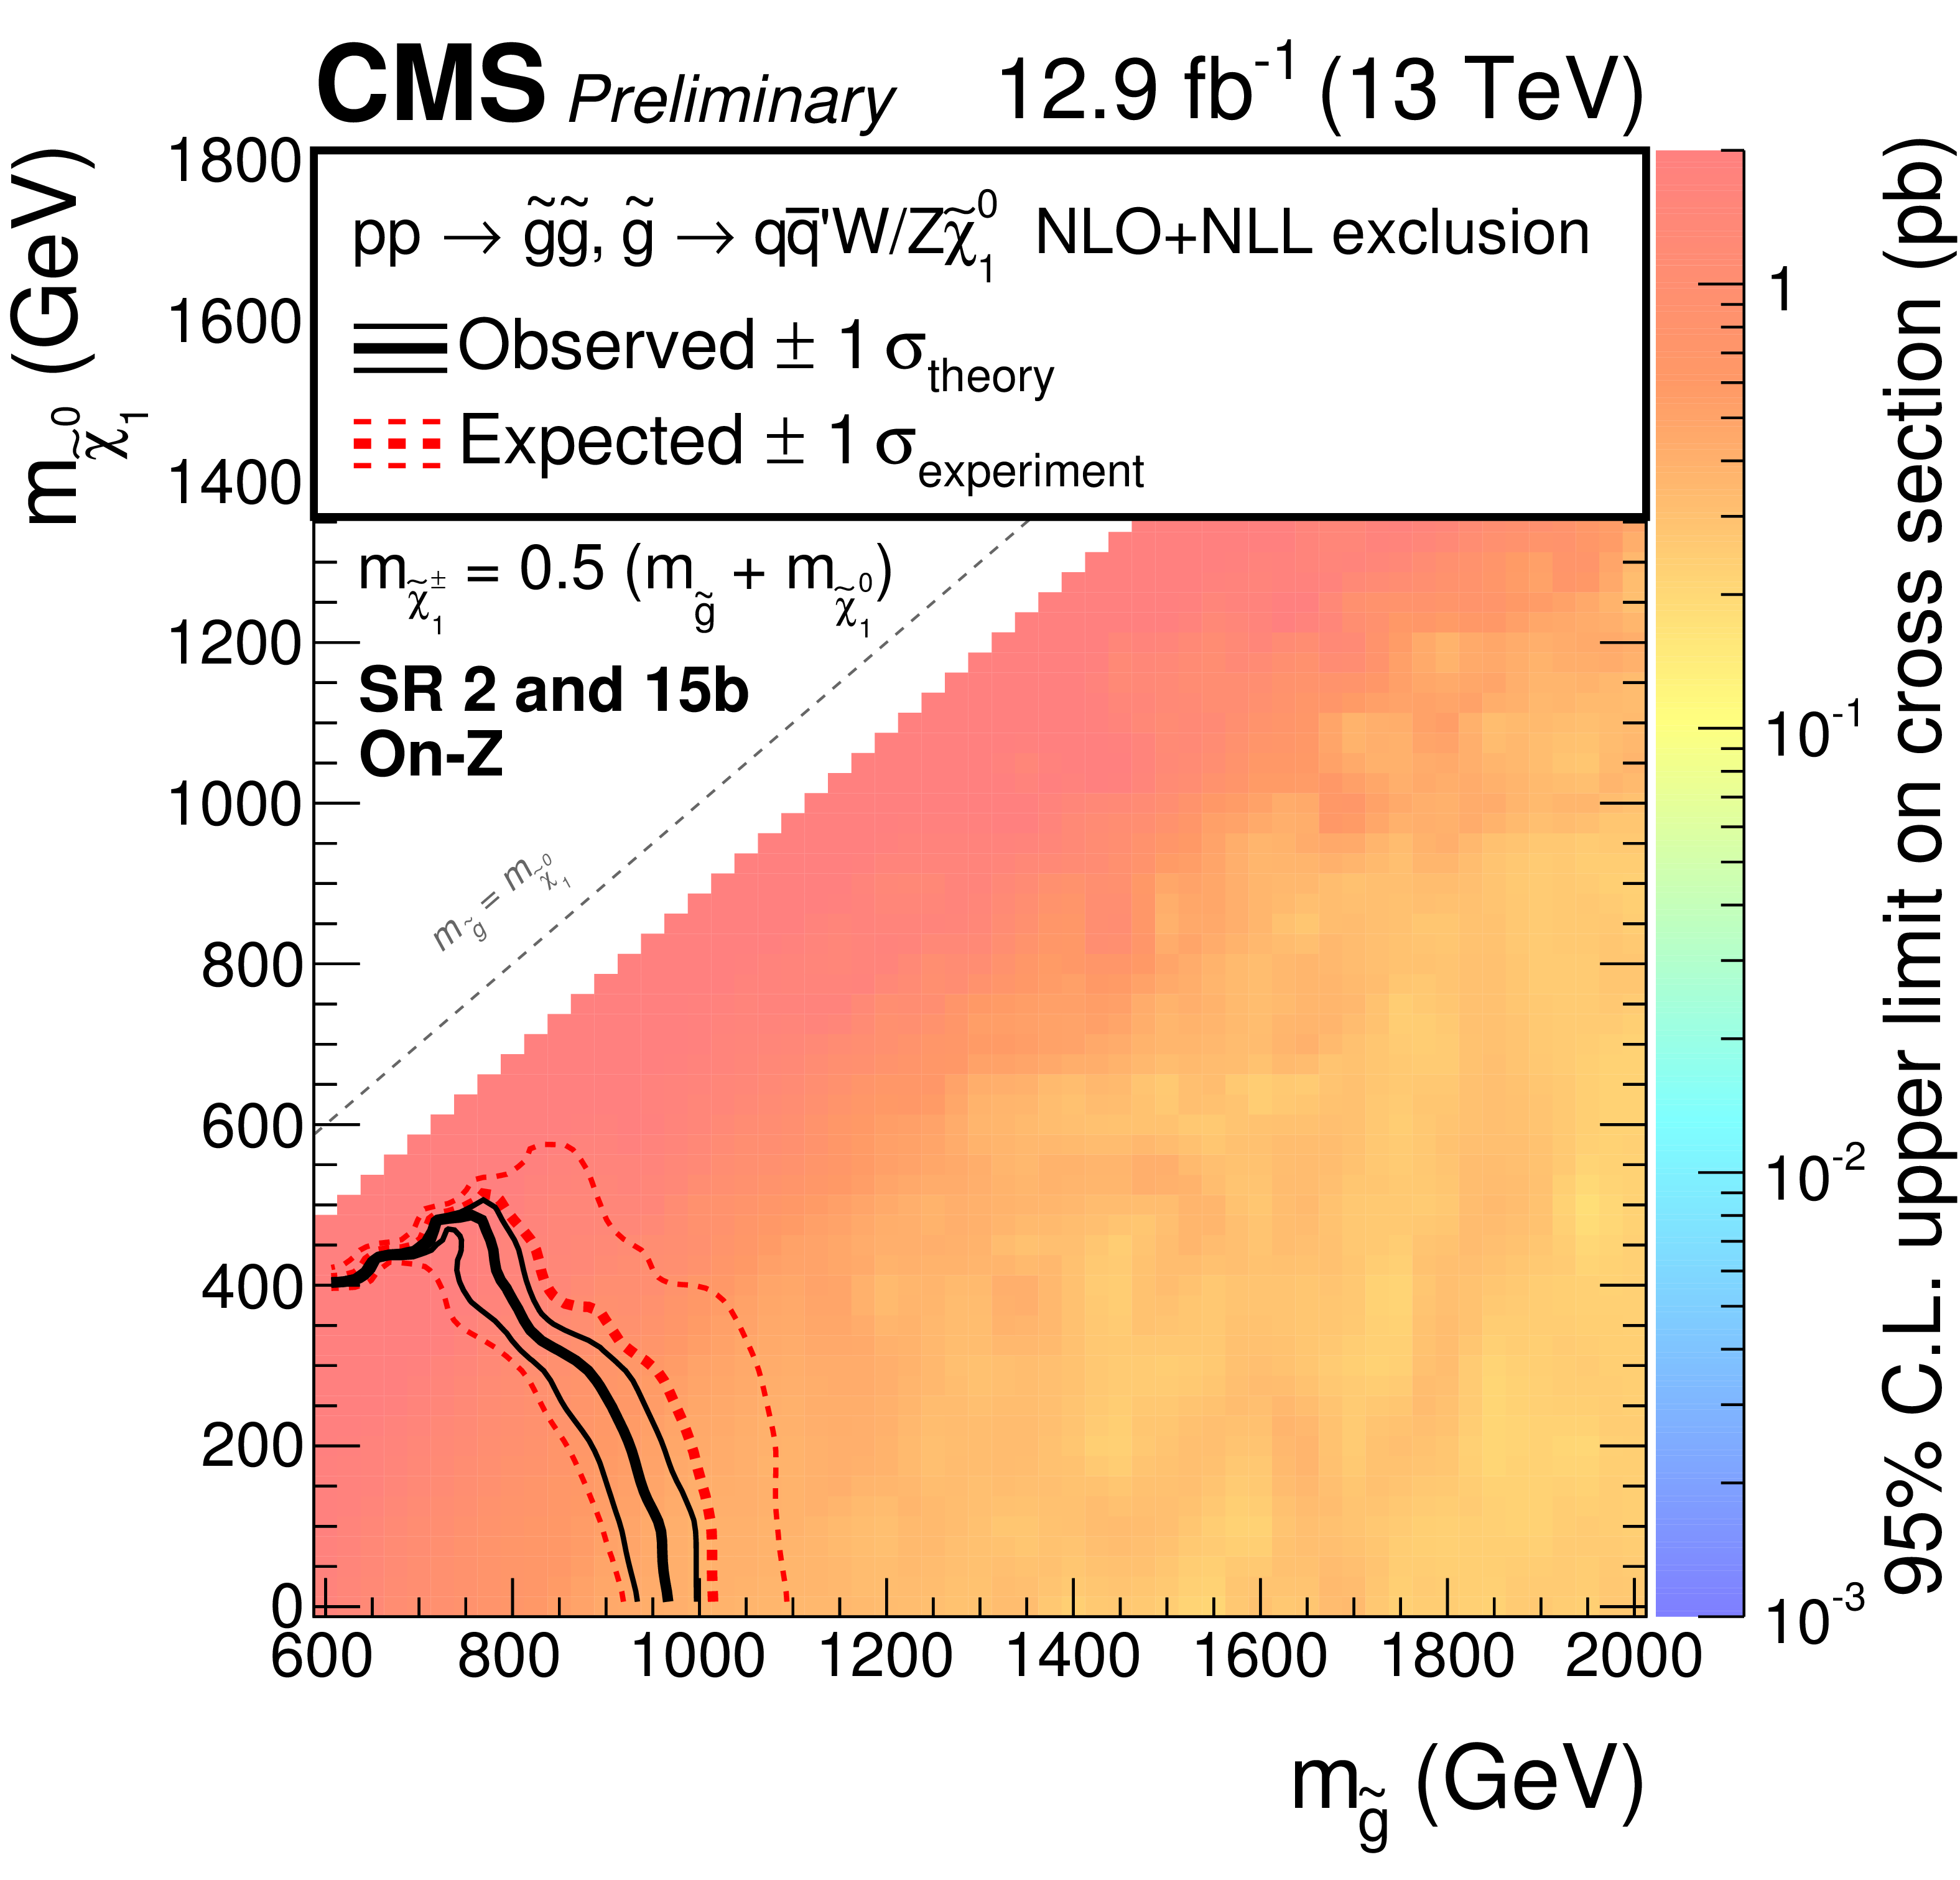
Figure 5-b:
Excluded region at 95% confidence in the $m( {\tilde{\chi}^{0}} )$ versus $m( \tilde{\mathrm{g}} )$ plane for the T1tttt (a) and for the T5qqqqWZ (b) simplified model. The color scale indicates the excluded cross section at a given point in the mass plane. The excluded regions are to the left and below the observed and expected limit curves. |
| Tables | |

png pdf |
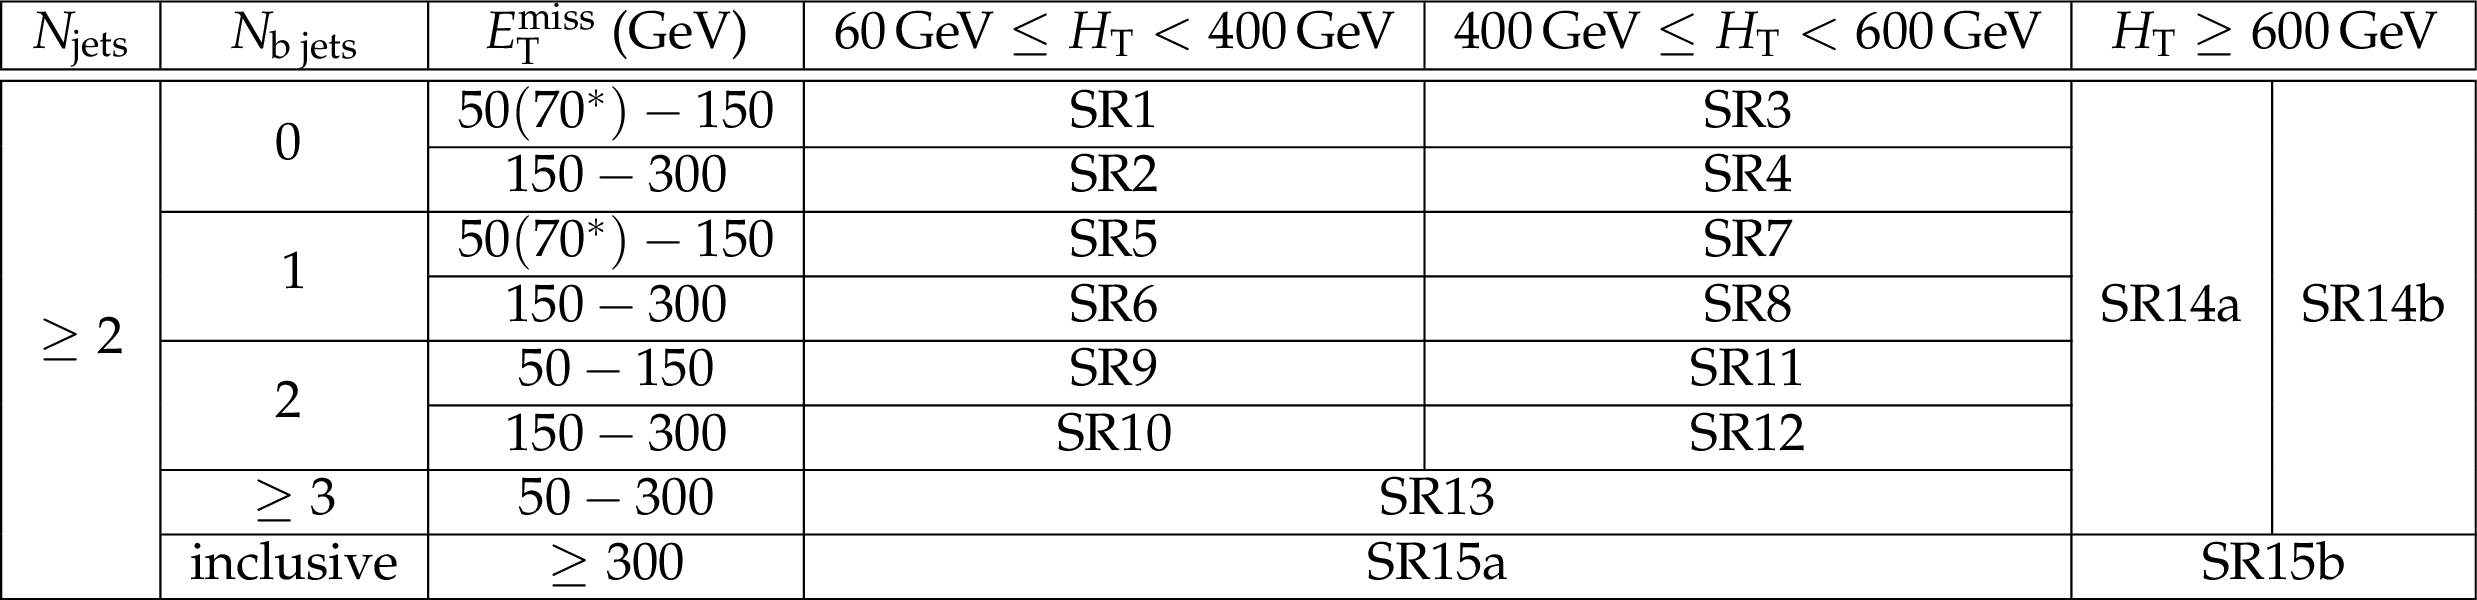
Table 1:
Multilepton off-Z signal region definition. |
png pdf |
Table 2:
Multilepton on-Z signal region definition. ${E_{\mathrm {T}}^{\text {miss}}}$ cuts labeled with * refer to the low ${H_{\mathrm {T}}}$ regions only. SR14a requires 50 GeV $ < {E_{\mathrm {T}}^{\text {miss}}} < $ 150 GeV and SR14b 150 GeV $ < {E_{\mathrm {T}}^{\text {miss}}} < $ 300 GeV. |

png pdf |
Table 3:
Systematic uncertainties and their effect on the event yields. |
png pdf |
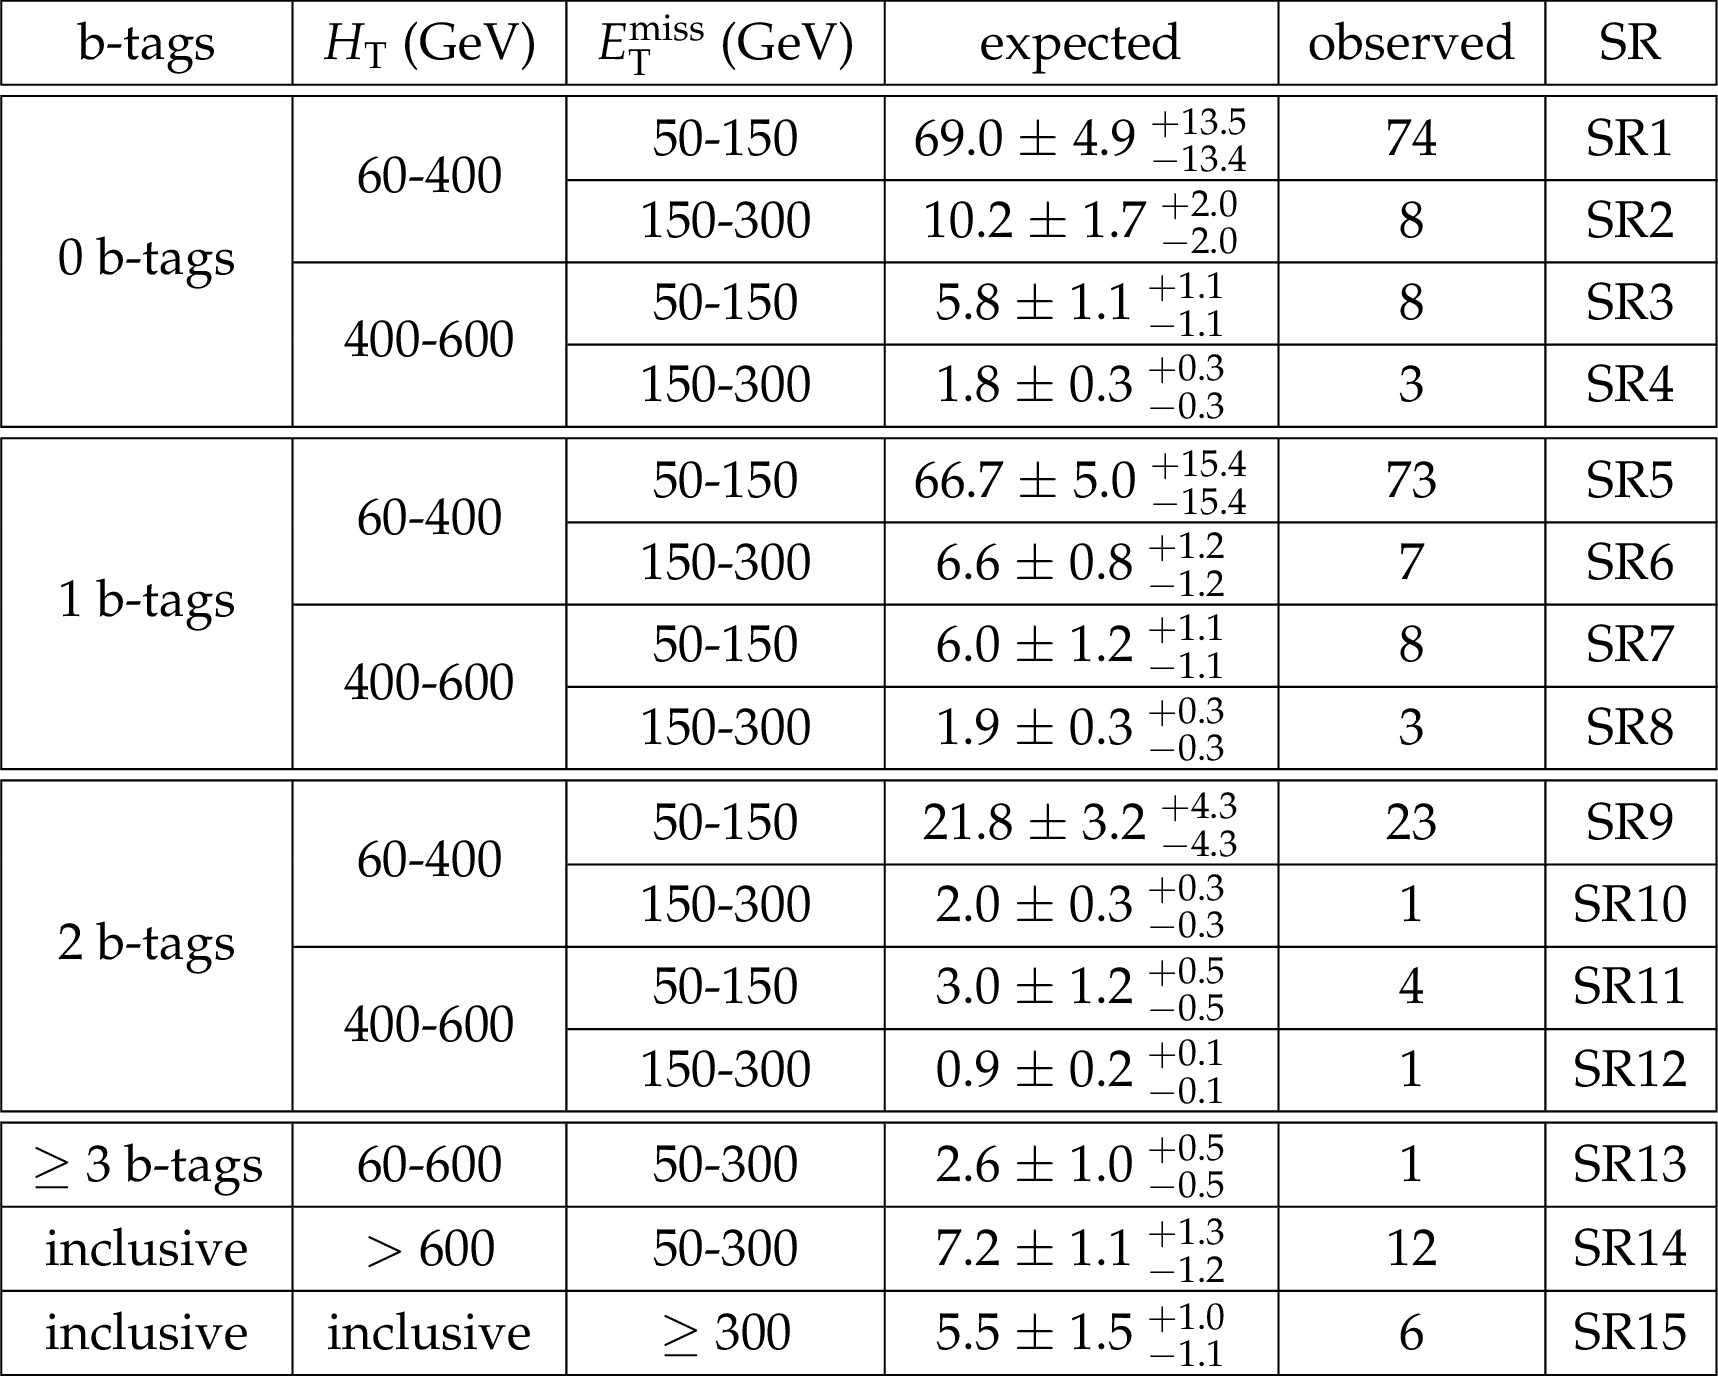
Table 4:
The total expected yields in the off-Z search regions with the 12.9 fb$^{-1}$ of data. Uncertainties are given as $\pm $ stat $\pm $ syst. |

png pdf |
Table 5:
The total expected yields in the on-Z search regions with the 12.9 fb$^{-1}$ of data. Uncertainties are given as $\pm $ stat $\pm $ syst. |
png pdf |
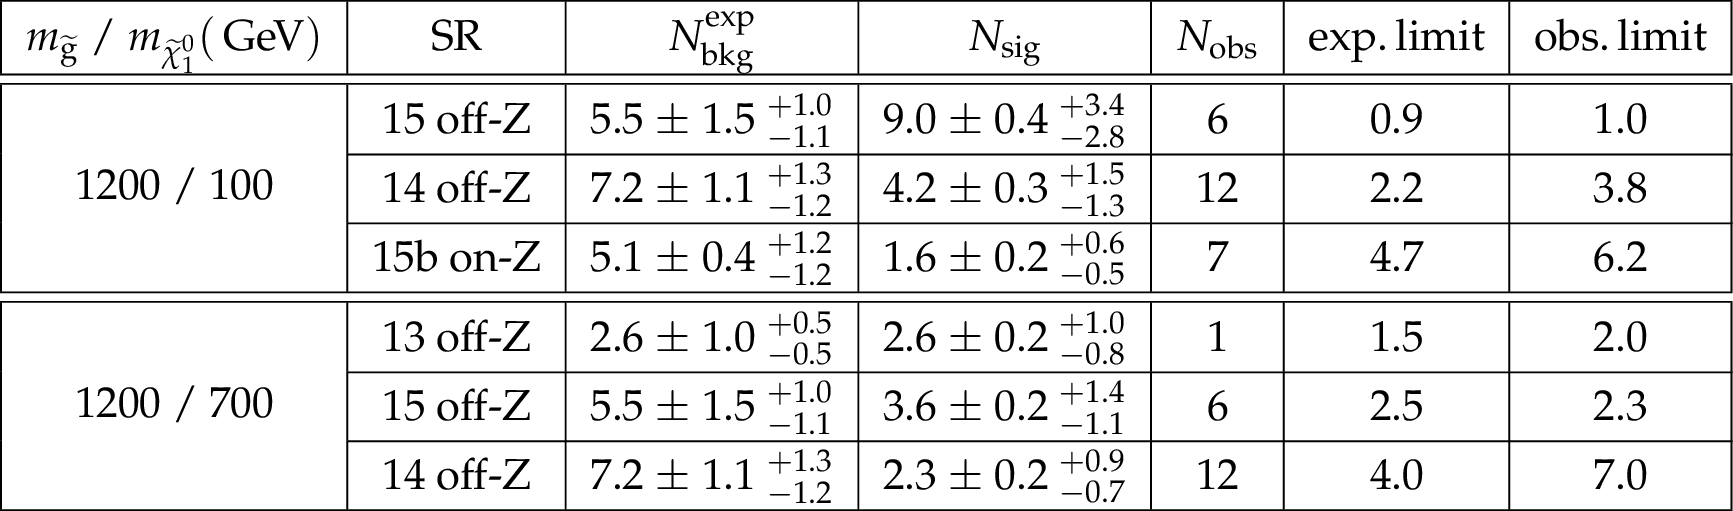
Table 6:
Most sensitive signal regions for an uncompressed ($m_{\tilde{\mathrm{g}} } =$ 1200 GeV , $m_{ {\tilde{\chi}^0_1} } =$ 100 GeV ) and a compressed ($m_{\tilde{\mathrm{g}} } =$ 1200 GeV , $m_{ {\tilde{\chi}^0_1} } =$ 700 GeV) mass scenario of the T1tttt simplified model. For the three most sensitive signal regions the number of expected background and signal events, the observed yield, and the expected and observed exclusion limit in terms of signal strength modifier are shown. |
png pdf |
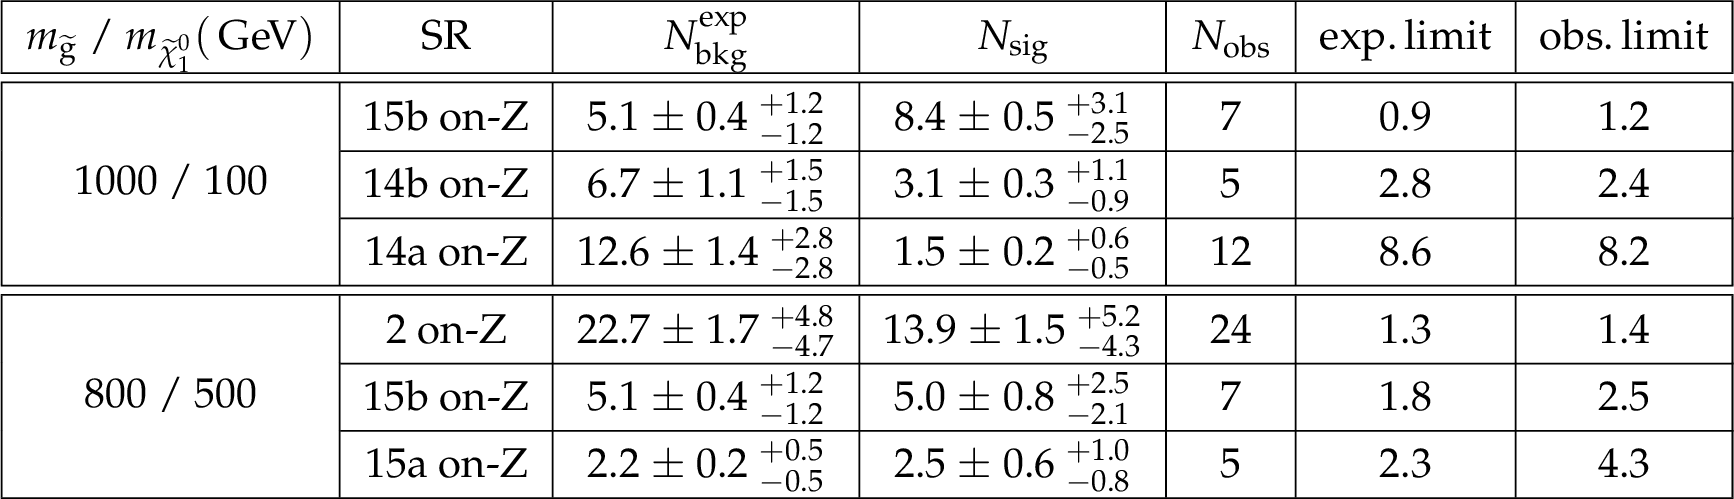
Table 7:
Most sensitive signal regions for an uncompressed ($m_{\tilde{\mathrm{g}} } =$ 1000 GeV , $m_{ {\tilde{\chi}^\pm } }= $ 550 GeV , $m_{ {\tilde{\chi}^0_1} }= $ 100 GeV ) and a compressed ($m_{\tilde{\mathrm{g}} }= $ 800 GeV , $m_{ {\tilde{\chi}^\pm } }= $ 650 GeV , $m_{ {\tilde{\chi}^0_1} }= $ 500 GeV ) mass scenario of the T5qqqqWZ simplified model. For the three most sensitive signal regions the number of expected background and signal events, the observed yield, and the expected and observed exclusion limit in terms of signal strength modifier are shown. |
| Summary |
| An analysis to search for beyond the standard model physics in final states with $\geq 3$ leptons, electrons or muons, using 12.9 fb$^{-1}$ of data collected with the CMS detector in 2016 at $ \sqrt{s} = $ 13 TeV has been presented. The analysis makes use of data-driven techniques to estimate reducible backgrounds and validates simulation for use in estimating irreducible background processes. To maximize sensitivity to a broad range of possible signal models, 32 exclusive signal regions have been investigated. No significant deviation from the expected standard model background has been observed. In the absence of any observed excesses in the data, the result has been interpreted using a simplified gluino-pair production model that features cascade decays producing four top quarks in the final state. In this model, we exclude gluinos with a mass of up to $\sim$1250 GeV in the case of a massless LSP. The maximum excluded LSP mass is $\sim$750 GeV for gluino masses up to 1150 GeV. In both masses, this represents an improvement of the order of 100 GeV with respect to the exclusion limit set in a similar search based on 2.3 fb$^{-1}$ collected with the CMS detector in 2015 [1]. For the simplified model with gluino-gluino production and light jets and each one W and Z boson in the final state, gluino masses up to $\sim$1025 GeV and neutralino masses up to $\sim$600 GeV can be excluded. The limit on gluino mass for a light neutralino extends the corresponding limit from the previous analysis by about 200 GeV, while the limit on the LSP mass improves by about 100 GeV. |
| Additional Figures | |
png pdf |
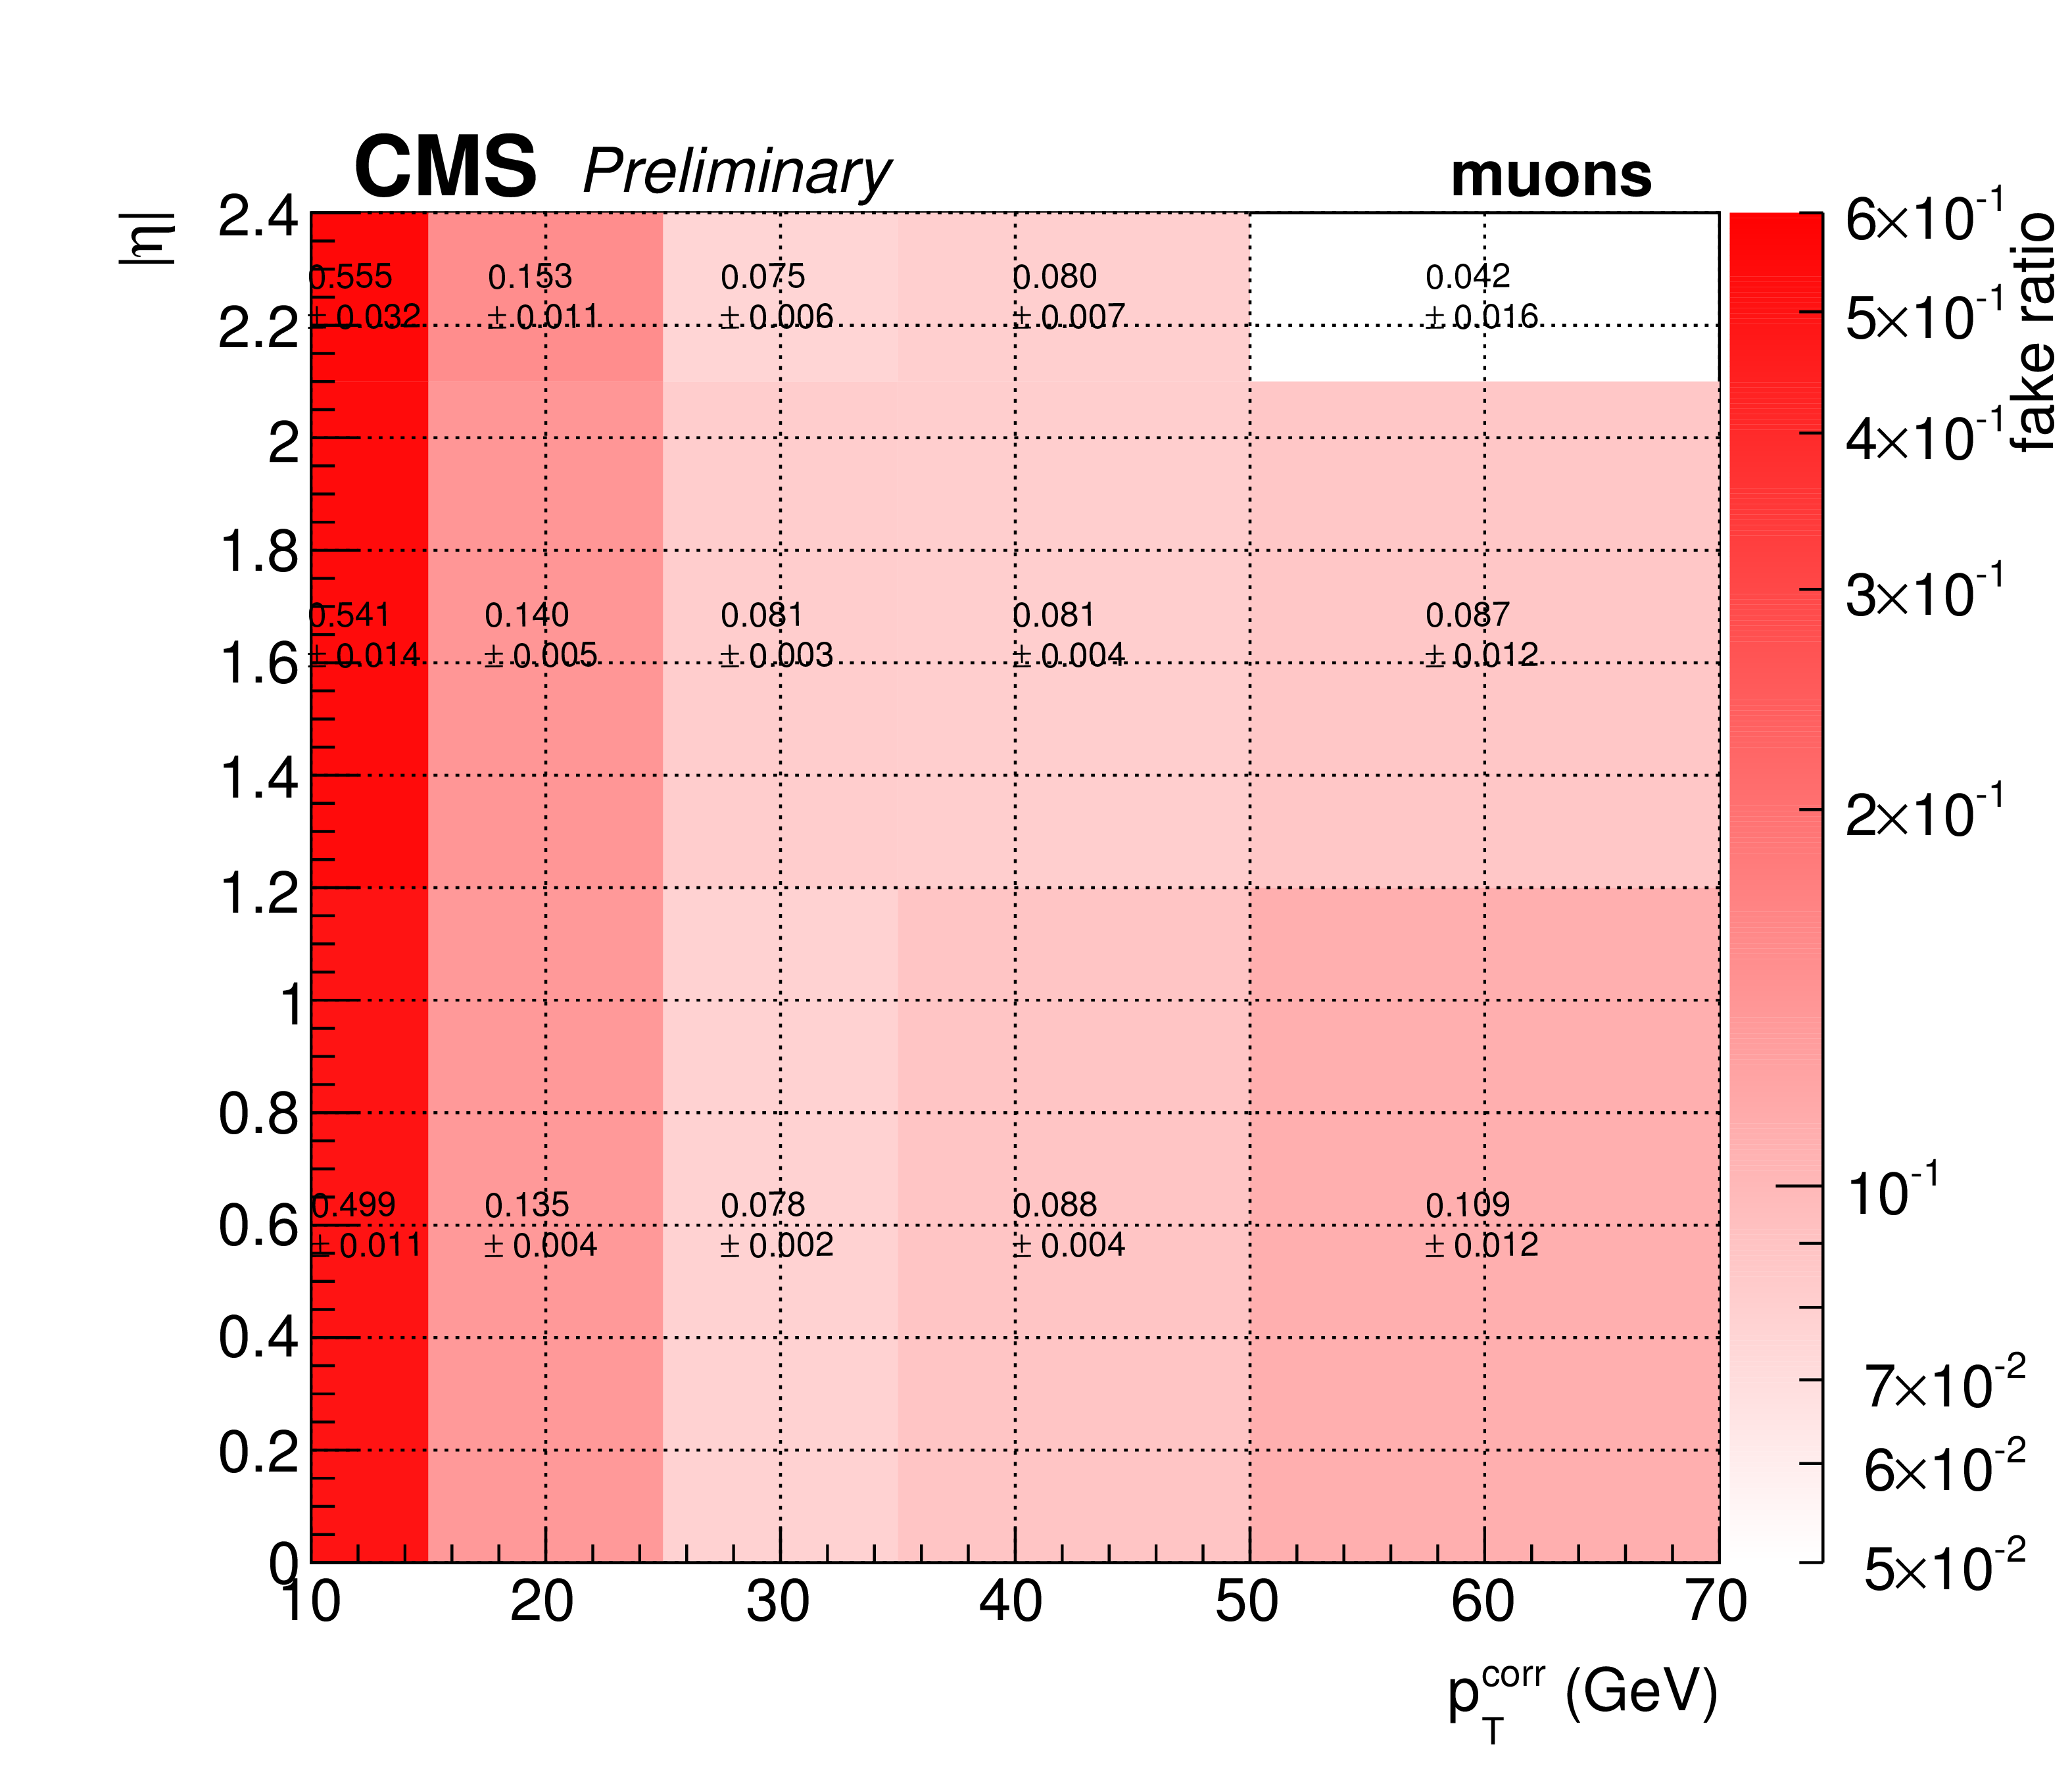
Additional Figure 1-a:
Electroweak subtracted fake rate as a function of $\eta $ and cone-corrected $ {p_{\mathrm {T}}} $ as measured with 12.9 fb$^{-1}$ of data for muons (a) and electrons (c). The projections of the fake rate on the cone $p_{T}$ axis also shows the fake rate measured in QCD Monte Carlo for muons (b) and electrons (d). Uncertainties in the maps are statistical uncertainties from the measurement. In the projections, the uncertainty band for data also contains the uncertainty on the electroweak subtraction. |
png pdf |
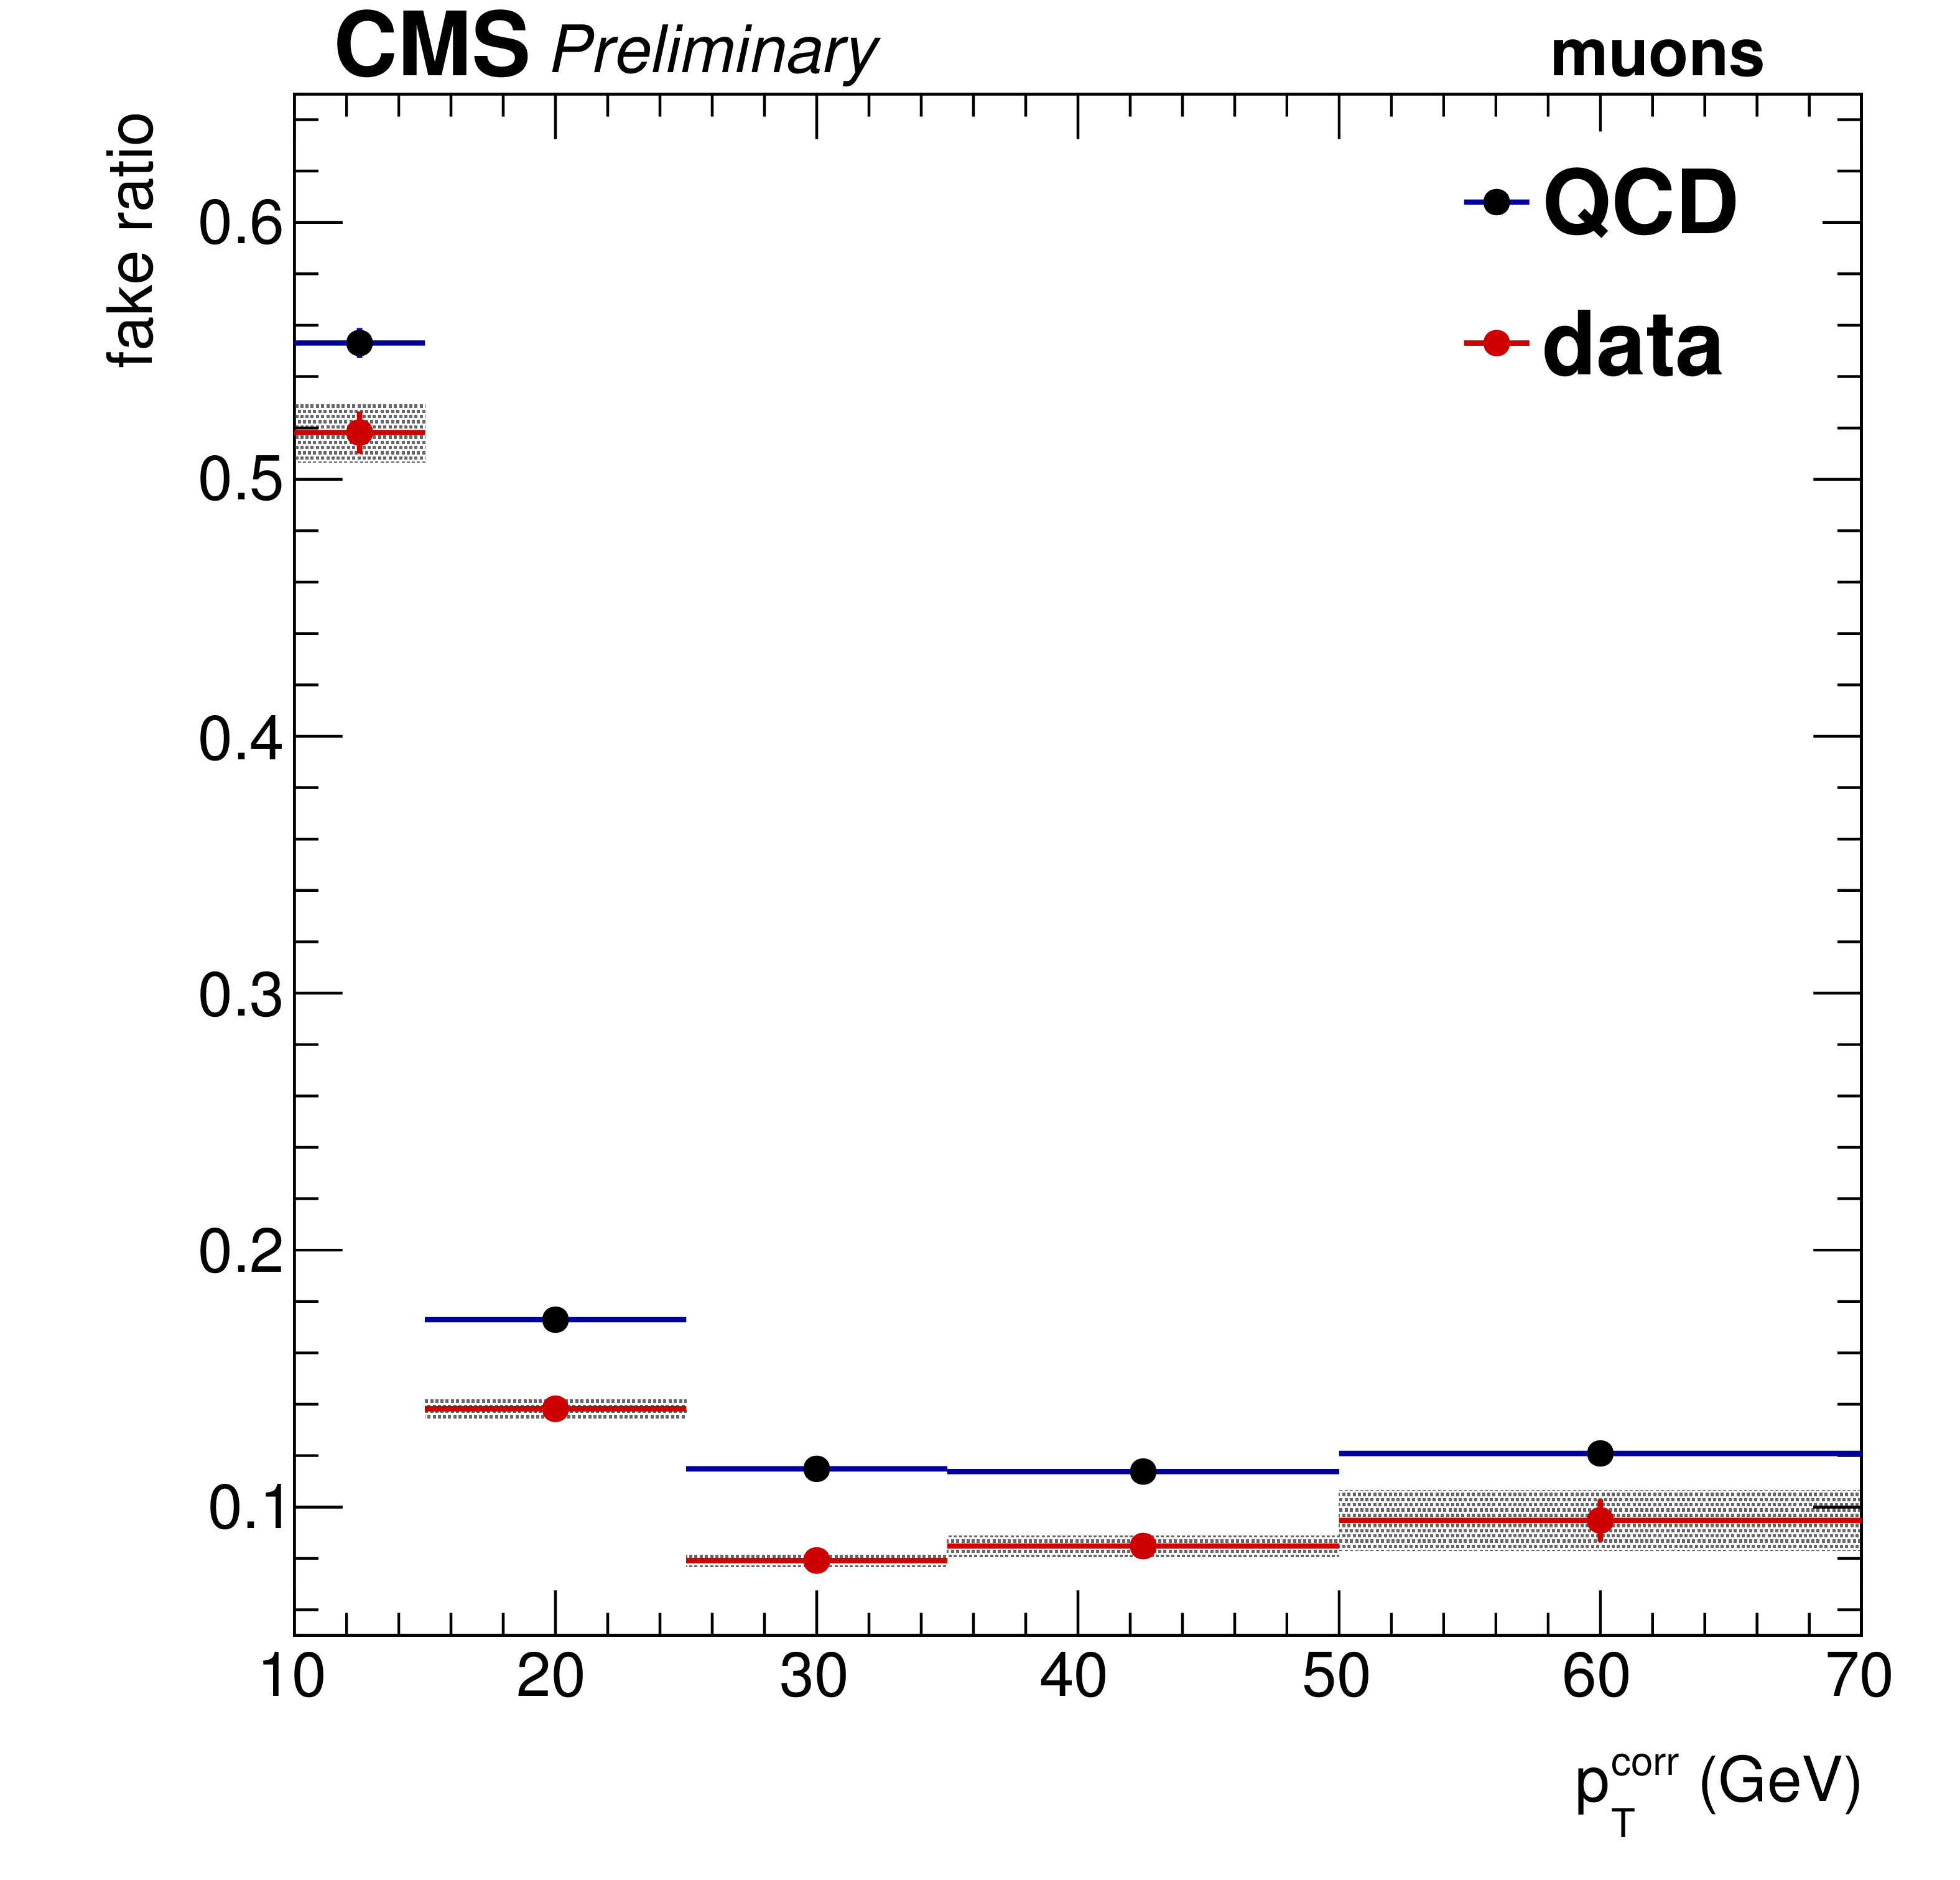
Additional Figure 1-b:
Electroweak subtracted fake rate as a function of $\eta $ and cone-corrected $ {p_{\mathrm {T}}} $ as measured with 12.9 fb$^{-1}$ of data for muons (a) and electrons (c). The projections of the fake rate on the cone $p_{T}$ axis also shows the fake rate measured in QCD Monte Carlo for muons (b) and electrons (d). Uncertainties in the maps are statistical uncertainties from the measurement. In the projections, the uncertainty band for data also contains the uncertainty on the electroweak subtraction. |
png pdf |
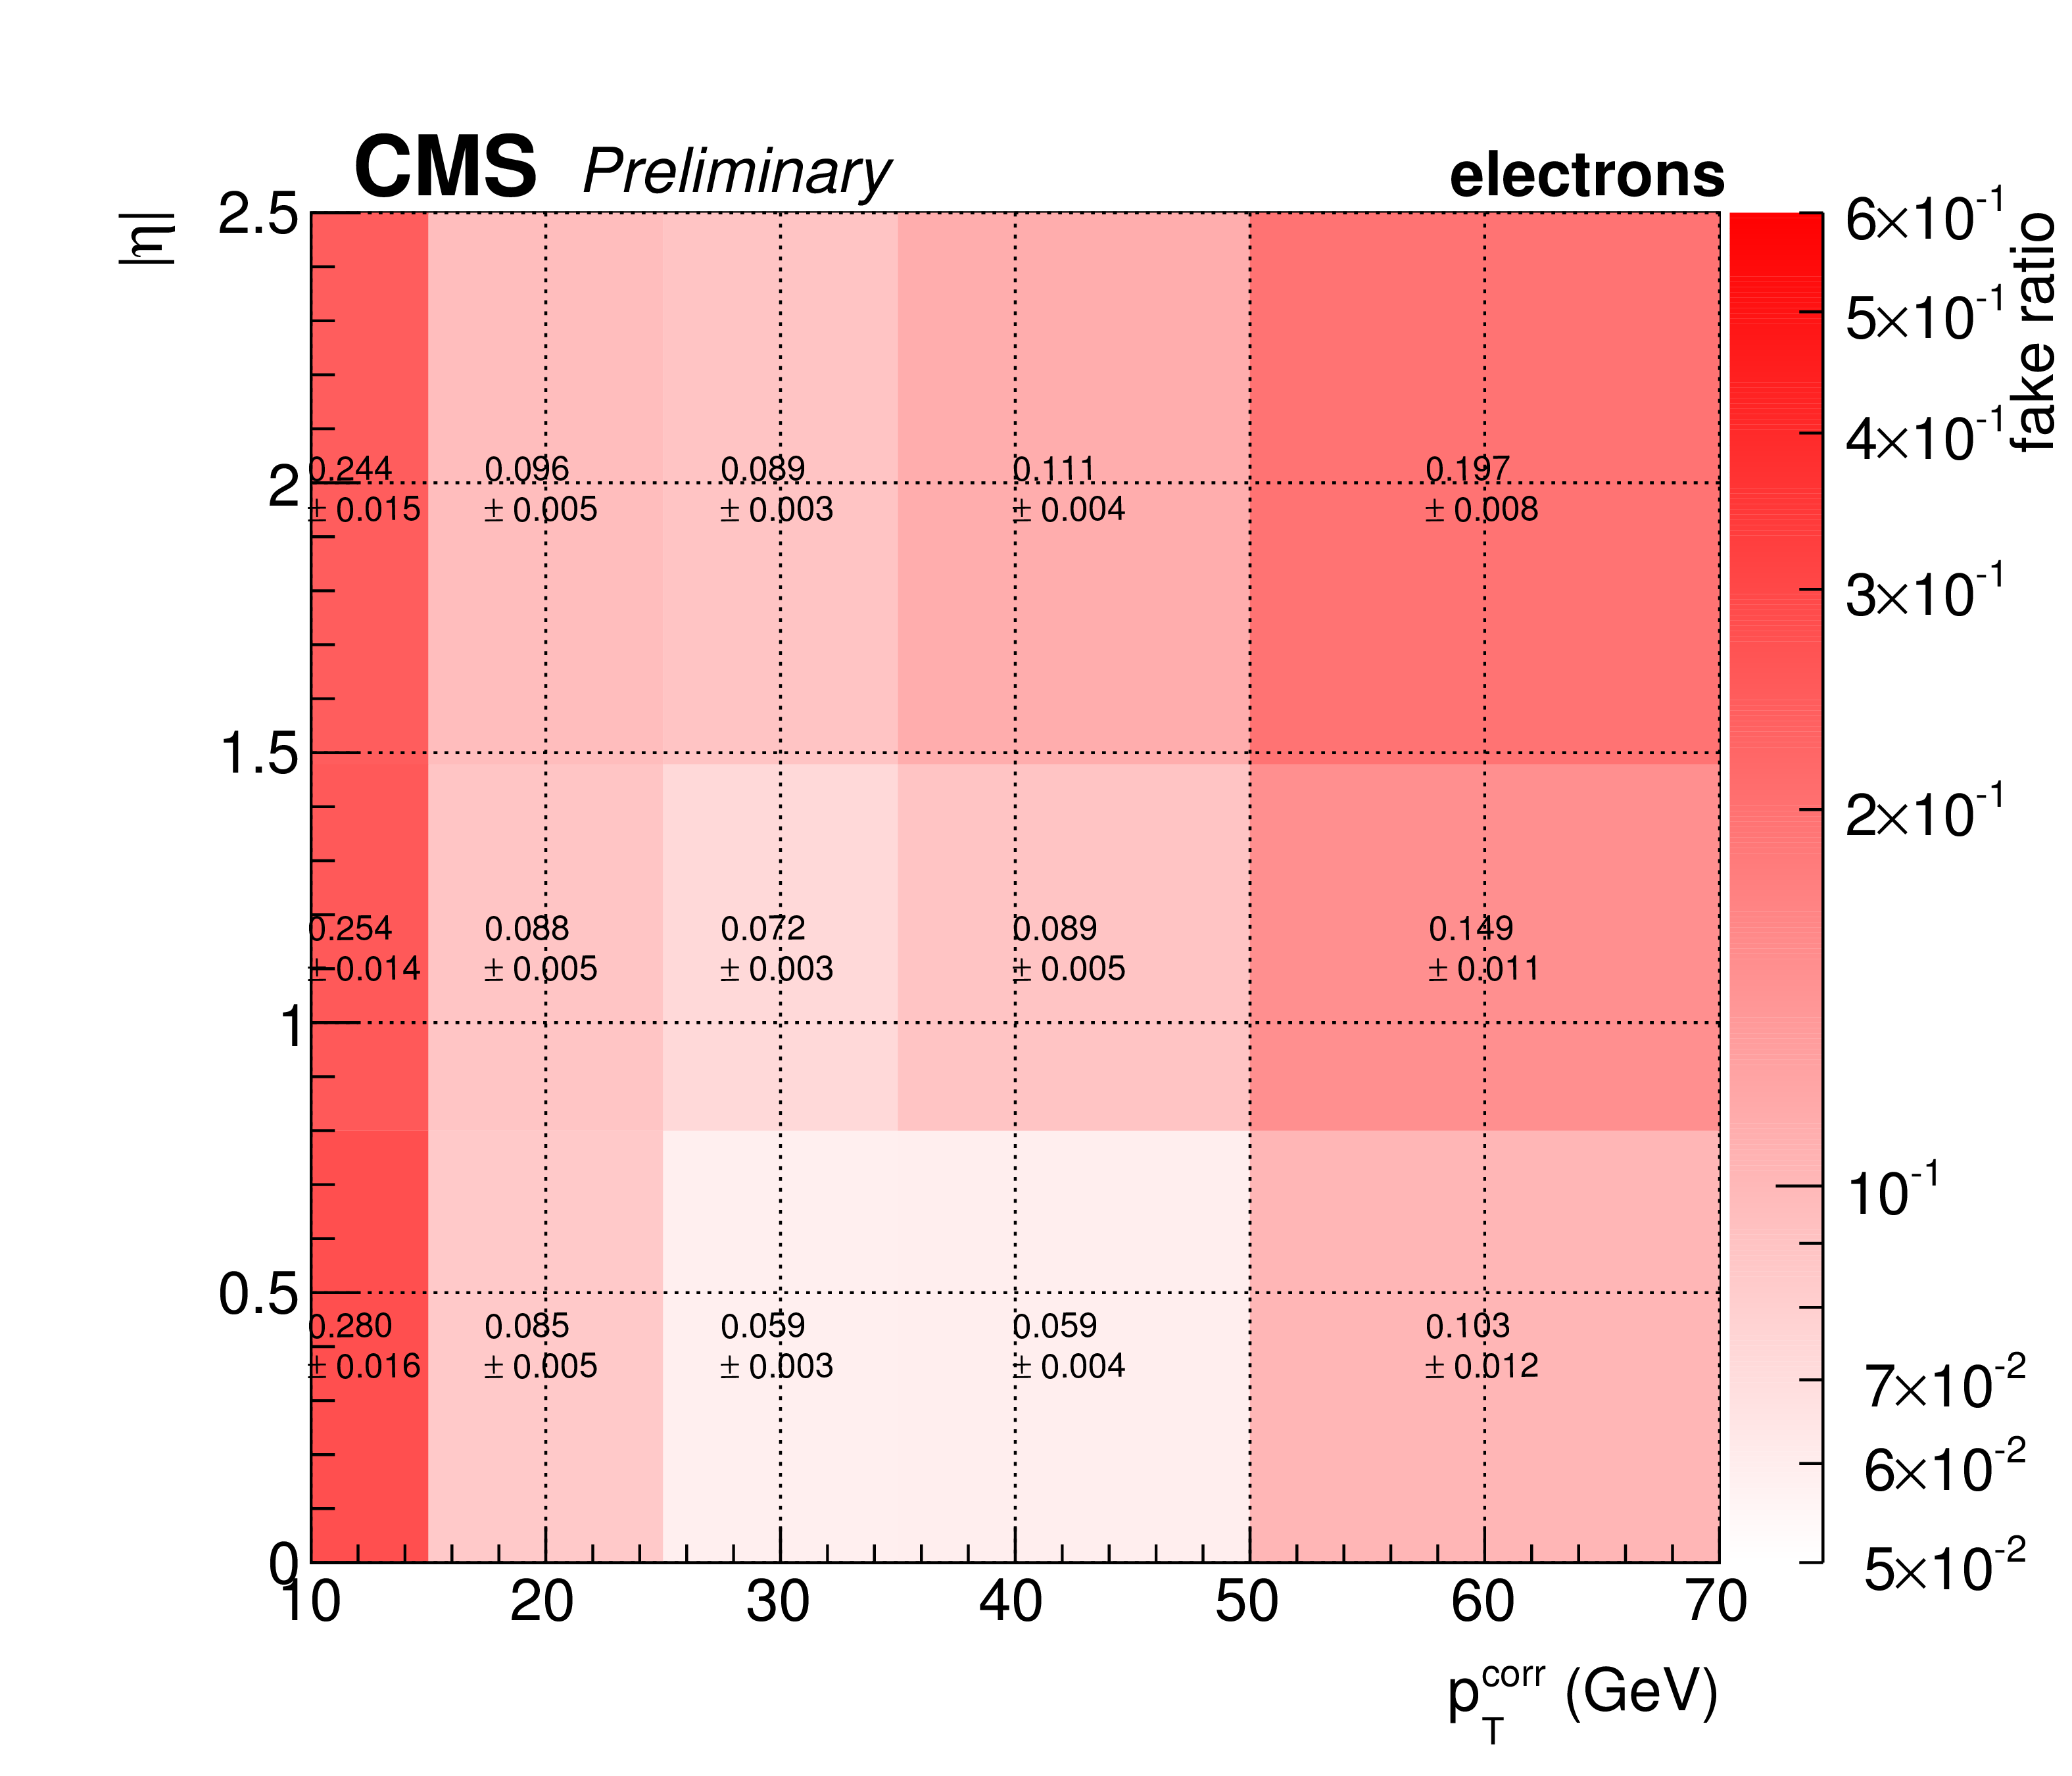
Additional Figure 1-c:
Electroweak subtracted fake rate as a function of $\eta $ and cone-corrected $ {p_{\mathrm {T}}} $ as measured with 12.9 fb$^{-1}$ of data for muons (a) and electrons (c). The projections of the fake rate on the cone $p_{T}$ axis also shows the fake rate measured in QCD Monte Carlo for muons (b) and electrons (d). Uncertainties in the maps are statistical uncertainties from the measurement. In the projections, the uncertainty band for data also contains the uncertainty on the electroweak subtraction. |
png pdf |
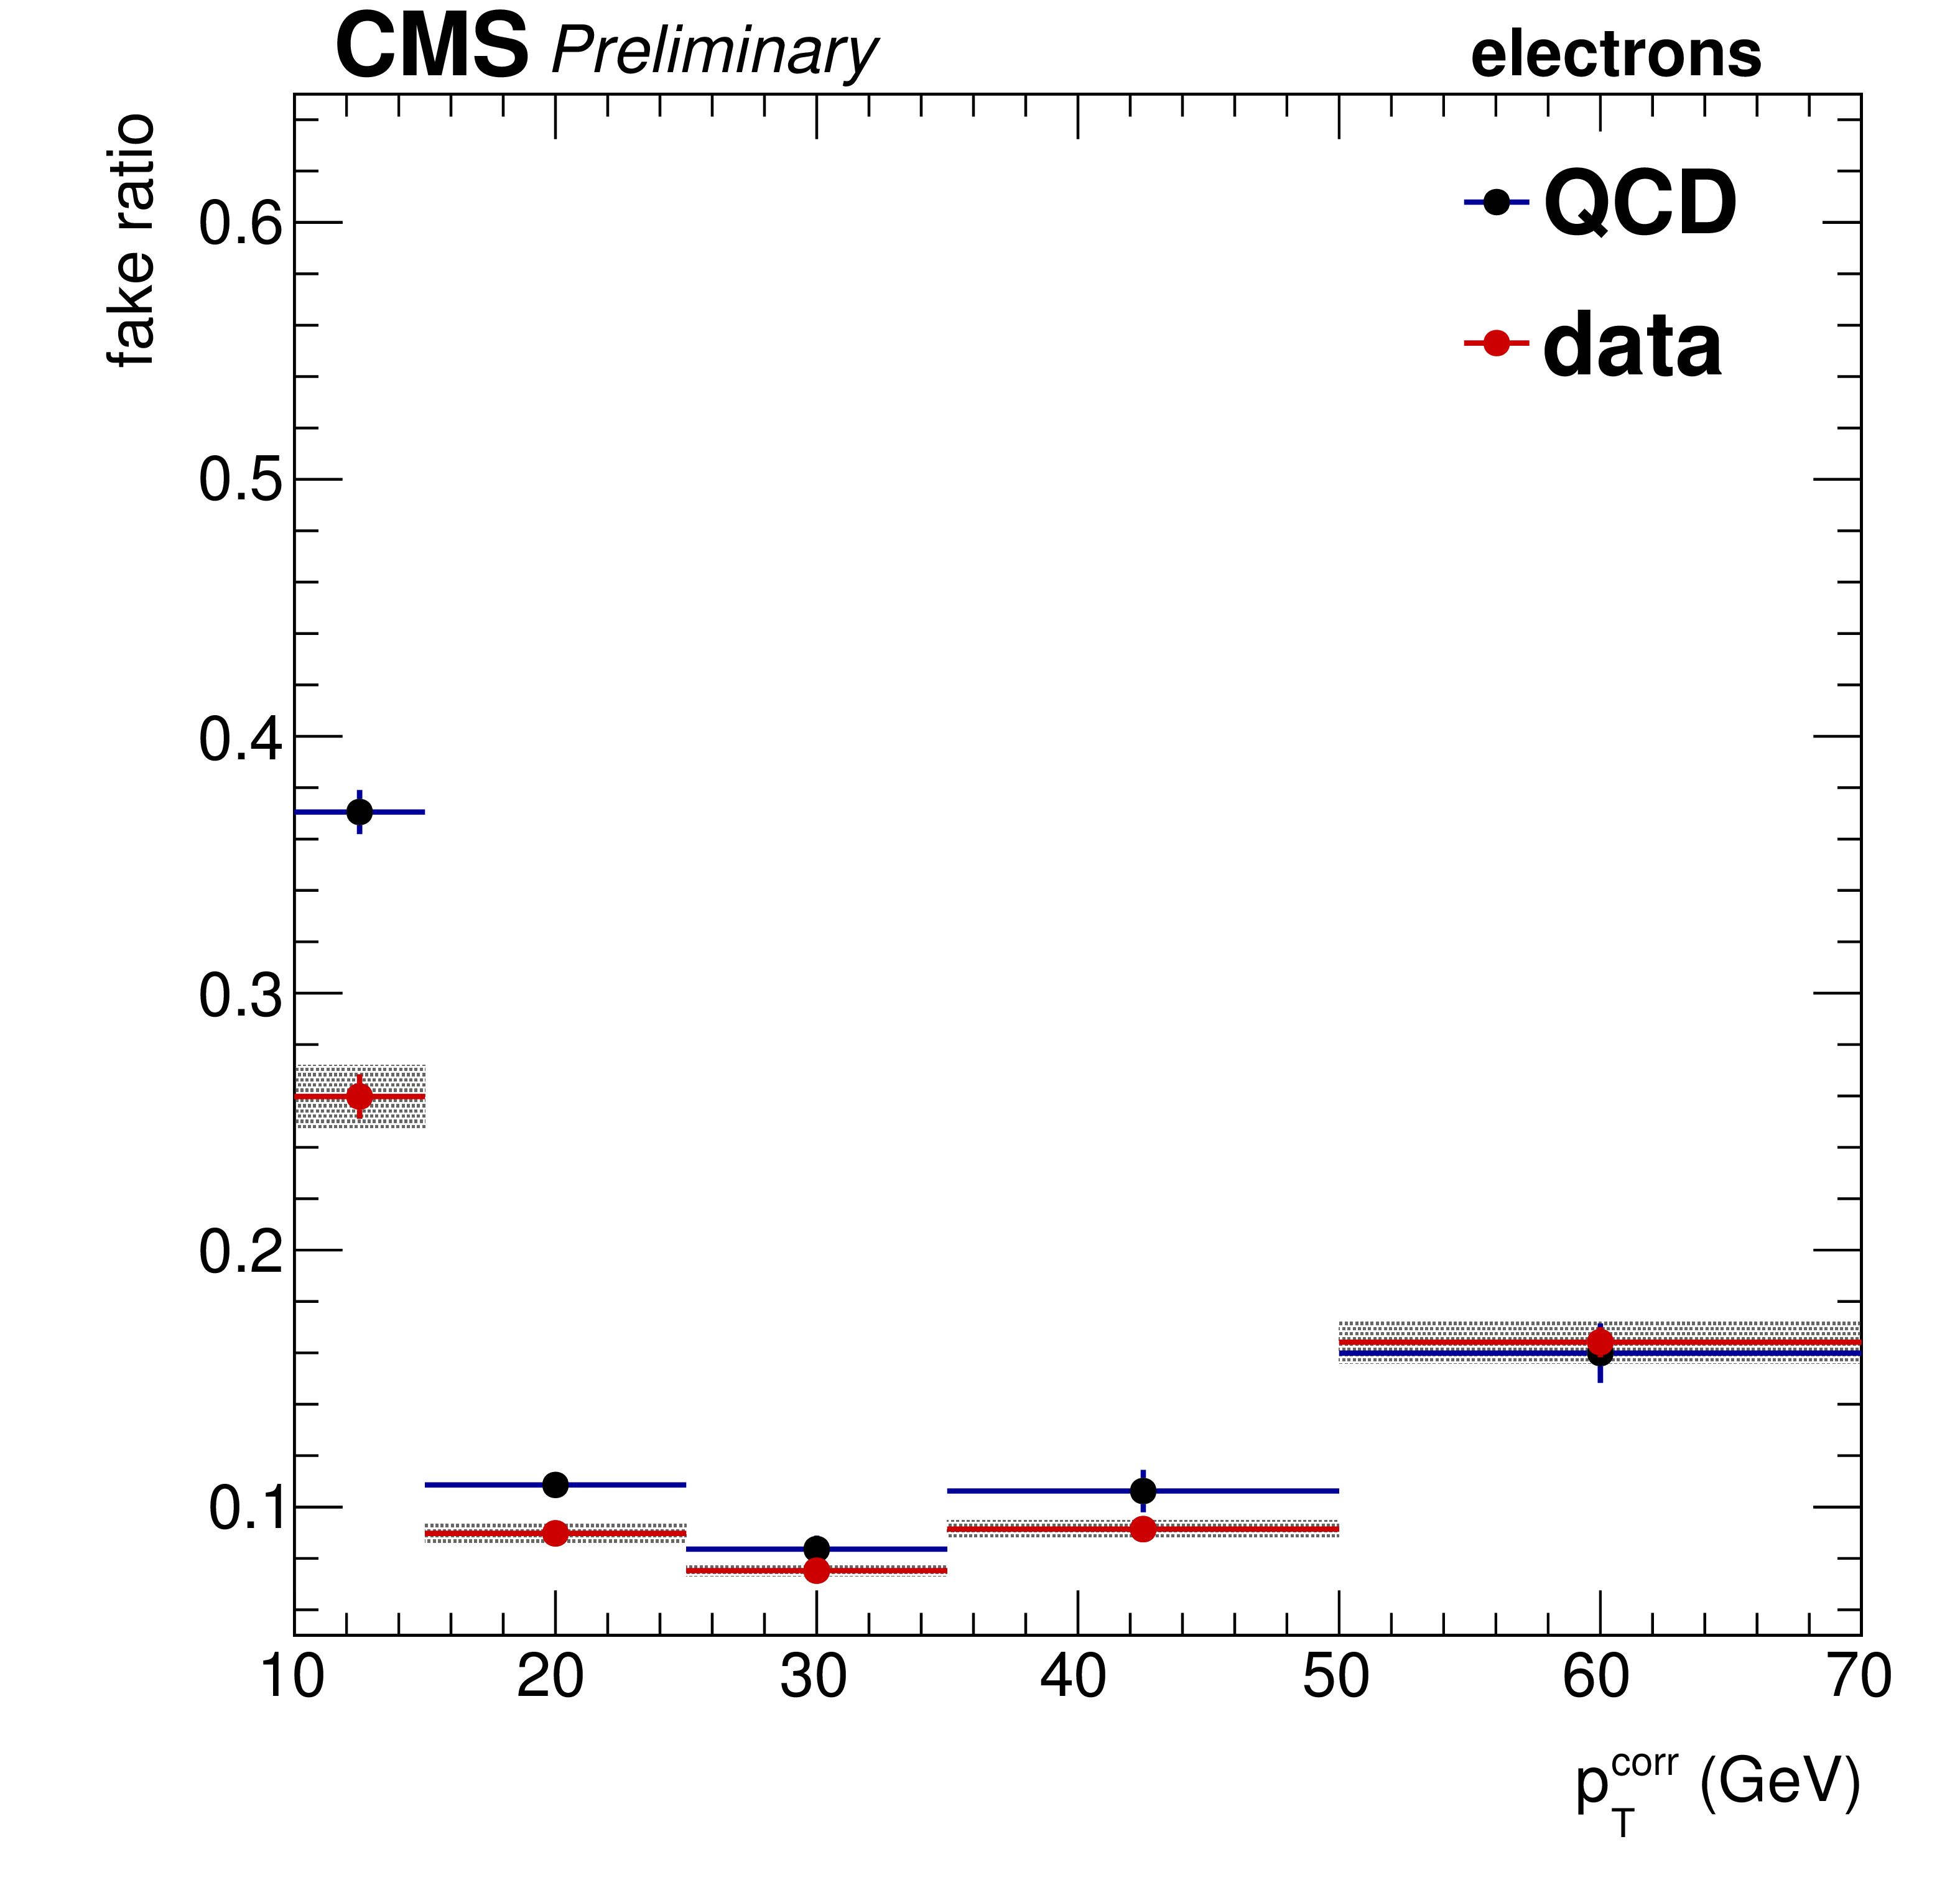
Additional Figure 1-d:
Electroweak subtracted fake rate as a function of $\eta $ and cone-corrected $ {p_{\mathrm {T}}} $ as measured with 12.9 fb$^{-1}$ of data for muons (a) and electrons (c). The projections of the fake rate on the cone $p_{T}$ axis also shows the fake rate measured in QCD Monte Carlo for muons (b) and electrons (d). Uncertainties in the maps are statistical uncertainties from the measurement. In the projections, the uncertainty band for data also contains the uncertainty on the electroweak subtraction. |
png pdf |
Additional Figure 2-a:
Fake background estimation closure with a mixture of MC samples yielding non-prompt leptons in the off-Z baseline region. Fake leptons in the off-Z baseline region originate almost exclusively from $ {\mathrm{ t } {}\mathrm{ \bar{t} } } $ with minor contributions from Drell-Yan and single top production. The fake rate has been measured in a QCD Monte Carlo sample. Yields are normalized to an integrated luminosity of 10 fb$^{-1}$. Shown are the distributions of the hadronic activity $ {H_{\mathrm {T}}} $ (a), the missing transverse energy $ {E_{\mathrm {T}}^{\text {miss}}} $ (b), the jet (c) and b-jet (d) multiplicities, and the $ {p_{\mathrm {T}}} $ distributions for the leading (e), the sub-leading (f) and the third lepton (g) for events with muons and electrons. Additionally, the flavor composition of the event (h) and the yields in the 15 signal regions (i) are shown. The solid histograms show the yield directly measured in the signal region while the point markers indicate the yield predicted by the method. |
png pdf |
Additional Figure 2-b:
Fake background estimation closure with a mixture of MC samples yielding non-prompt leptons in the off-Z baseline region. Fake leptons in the off-Z baseline region originate almost exclusively from $ {\mathrm{ t } {}\mathrm{ \bar{t} } } $ with minor contributions from Drell-Yan and single top production. The fake rate has been measured in a QCD Monte Carlo sample. Yields are normalized to an integrated luminosity of 10 fb$^{-1}$. Shown are the distributions of the hadronic activity $ {H_{\mathrm {T}}} $ (a), the missing transverse energy $ {E_{\mathrm {T}}^{\text {miss}}} $ (b), the jet (c) and b-jet (d) multiplicities, and the $ {p_{\mathrm {T}}} $ distributions for the leading (e), the sub-leading (f) and the third lepton (g) for events with muons and electrons. Additionally, the flavor composition of the event (h) and the yields in the 15 signal regions (i) are shown. The solid histograms show the yield directly measured in the signal region while the point markers indicate the yield predicted by the method. |
png pdf |
Additional Figure 2-c:
Fake background estimation closure with a mixture of MC samples yielding non-prompt leptons in the off-Z baseline region. Fake leptons in the off-Z baseline region originate almost exclusively from $ {\mathrm{ t } {}\mathrm{ \bar{t} } } $ with minor contributions from Drell-Yan and single top production. The fake rate has been measured in a QCD Monte Carlo sample. Yields are normalized to an integrated luminosity of 10 fb$^{-1}$. Shown are the distributions of the hadronic activity $ {H_{\mathrm {T}}} $ (a), the missing transverse energy $ {E_{\mathrm {T}}^{\text {miss}}} $ (b), the jet (c) and b-jet (d) multiplicities, and the $ {p_{\mathrm {T}}} $ distributions for the leading (e), the sub-leading (f) and the third lepton (g) for events with muons and electrons. Additionally, the flavor composition of the event (h) and the yields in the 15 signal regions (i) are shown. The solid histograms show the yield directly measured in the signal region while the point markers indicate the yield predicted by the method. |

png pdf |
Additional Figure 2-d:
Fake background estimation closure with a mixture of MC samples yielding non-prompt leptons in the off-Z baseline region. Fake leptons in the off-Z baseline region originate almost exclusively from $ {\mathrm{ t } {}\mathrm{ \bar{t} } } $ with minor contributions from Drell-Yan and single top production. The fake rate has been measured in a QCD Monte Carlo sample. Yields are normalized to an integrated luminosity of 10 fb$^{-1}$. Shown are the distributions of the hadronic activity $ {H_{\mathrm {T}}} $ (a), the missing transverse energy $ {E_{\mathrm {T}}^{\text {miss}}} $ (b), the jet (c) and b-jet (d) multiplicities, and the $ {p_{\mathrm {T}}} $ distributions for the leading (e), the sub-leading (f) and the third lepton (g) for events with muons and electrons. Additionally, the flavor composition of the event (h) and the yields in the 15 signal regions (i) are shown. The solid histograms show the yield directly measured in the signal region while the point markers indicate the yield predicted by the method. |
png pdf |
Additional Figure 2-e:
Fake background estimation closure with a mixture of MC samples yielding non-prompt leptons in the off-Z baseline region. Fake leptons in the off-Z baseline region originate almost exclusively from $ {\mathrm{ t } {}\mathrm{ \bar{t} } } $ with minor contributions from Drell-Yan and single top production. The fake rate has been measured in a QCD Monte Carlo sample. Yields are normalized to an integrated luminosity of 10 fb$^{-1}$. Shown are the distributions of the hadronic activity $ {H_{\mathrm {T}}} $ (a), the missing transverse energy $ {E_{\mathrm {T}}^{\text {miss}}} $ (b), the jet (c) and b-jet (d) multiplicities, and the $ {p_{\mathrm {T}}} $ distributions for the leading (e), the sub-leading (f) and the third lepton (g) for events with muons and electrons. Additionally, the flavor composition of the event (h) and the yields in the 15 signal regions (i) are shown. The solid histograms show the yield directly measured in the signal region while the point markers indicate the yield predicted by the method. |
png pdf |
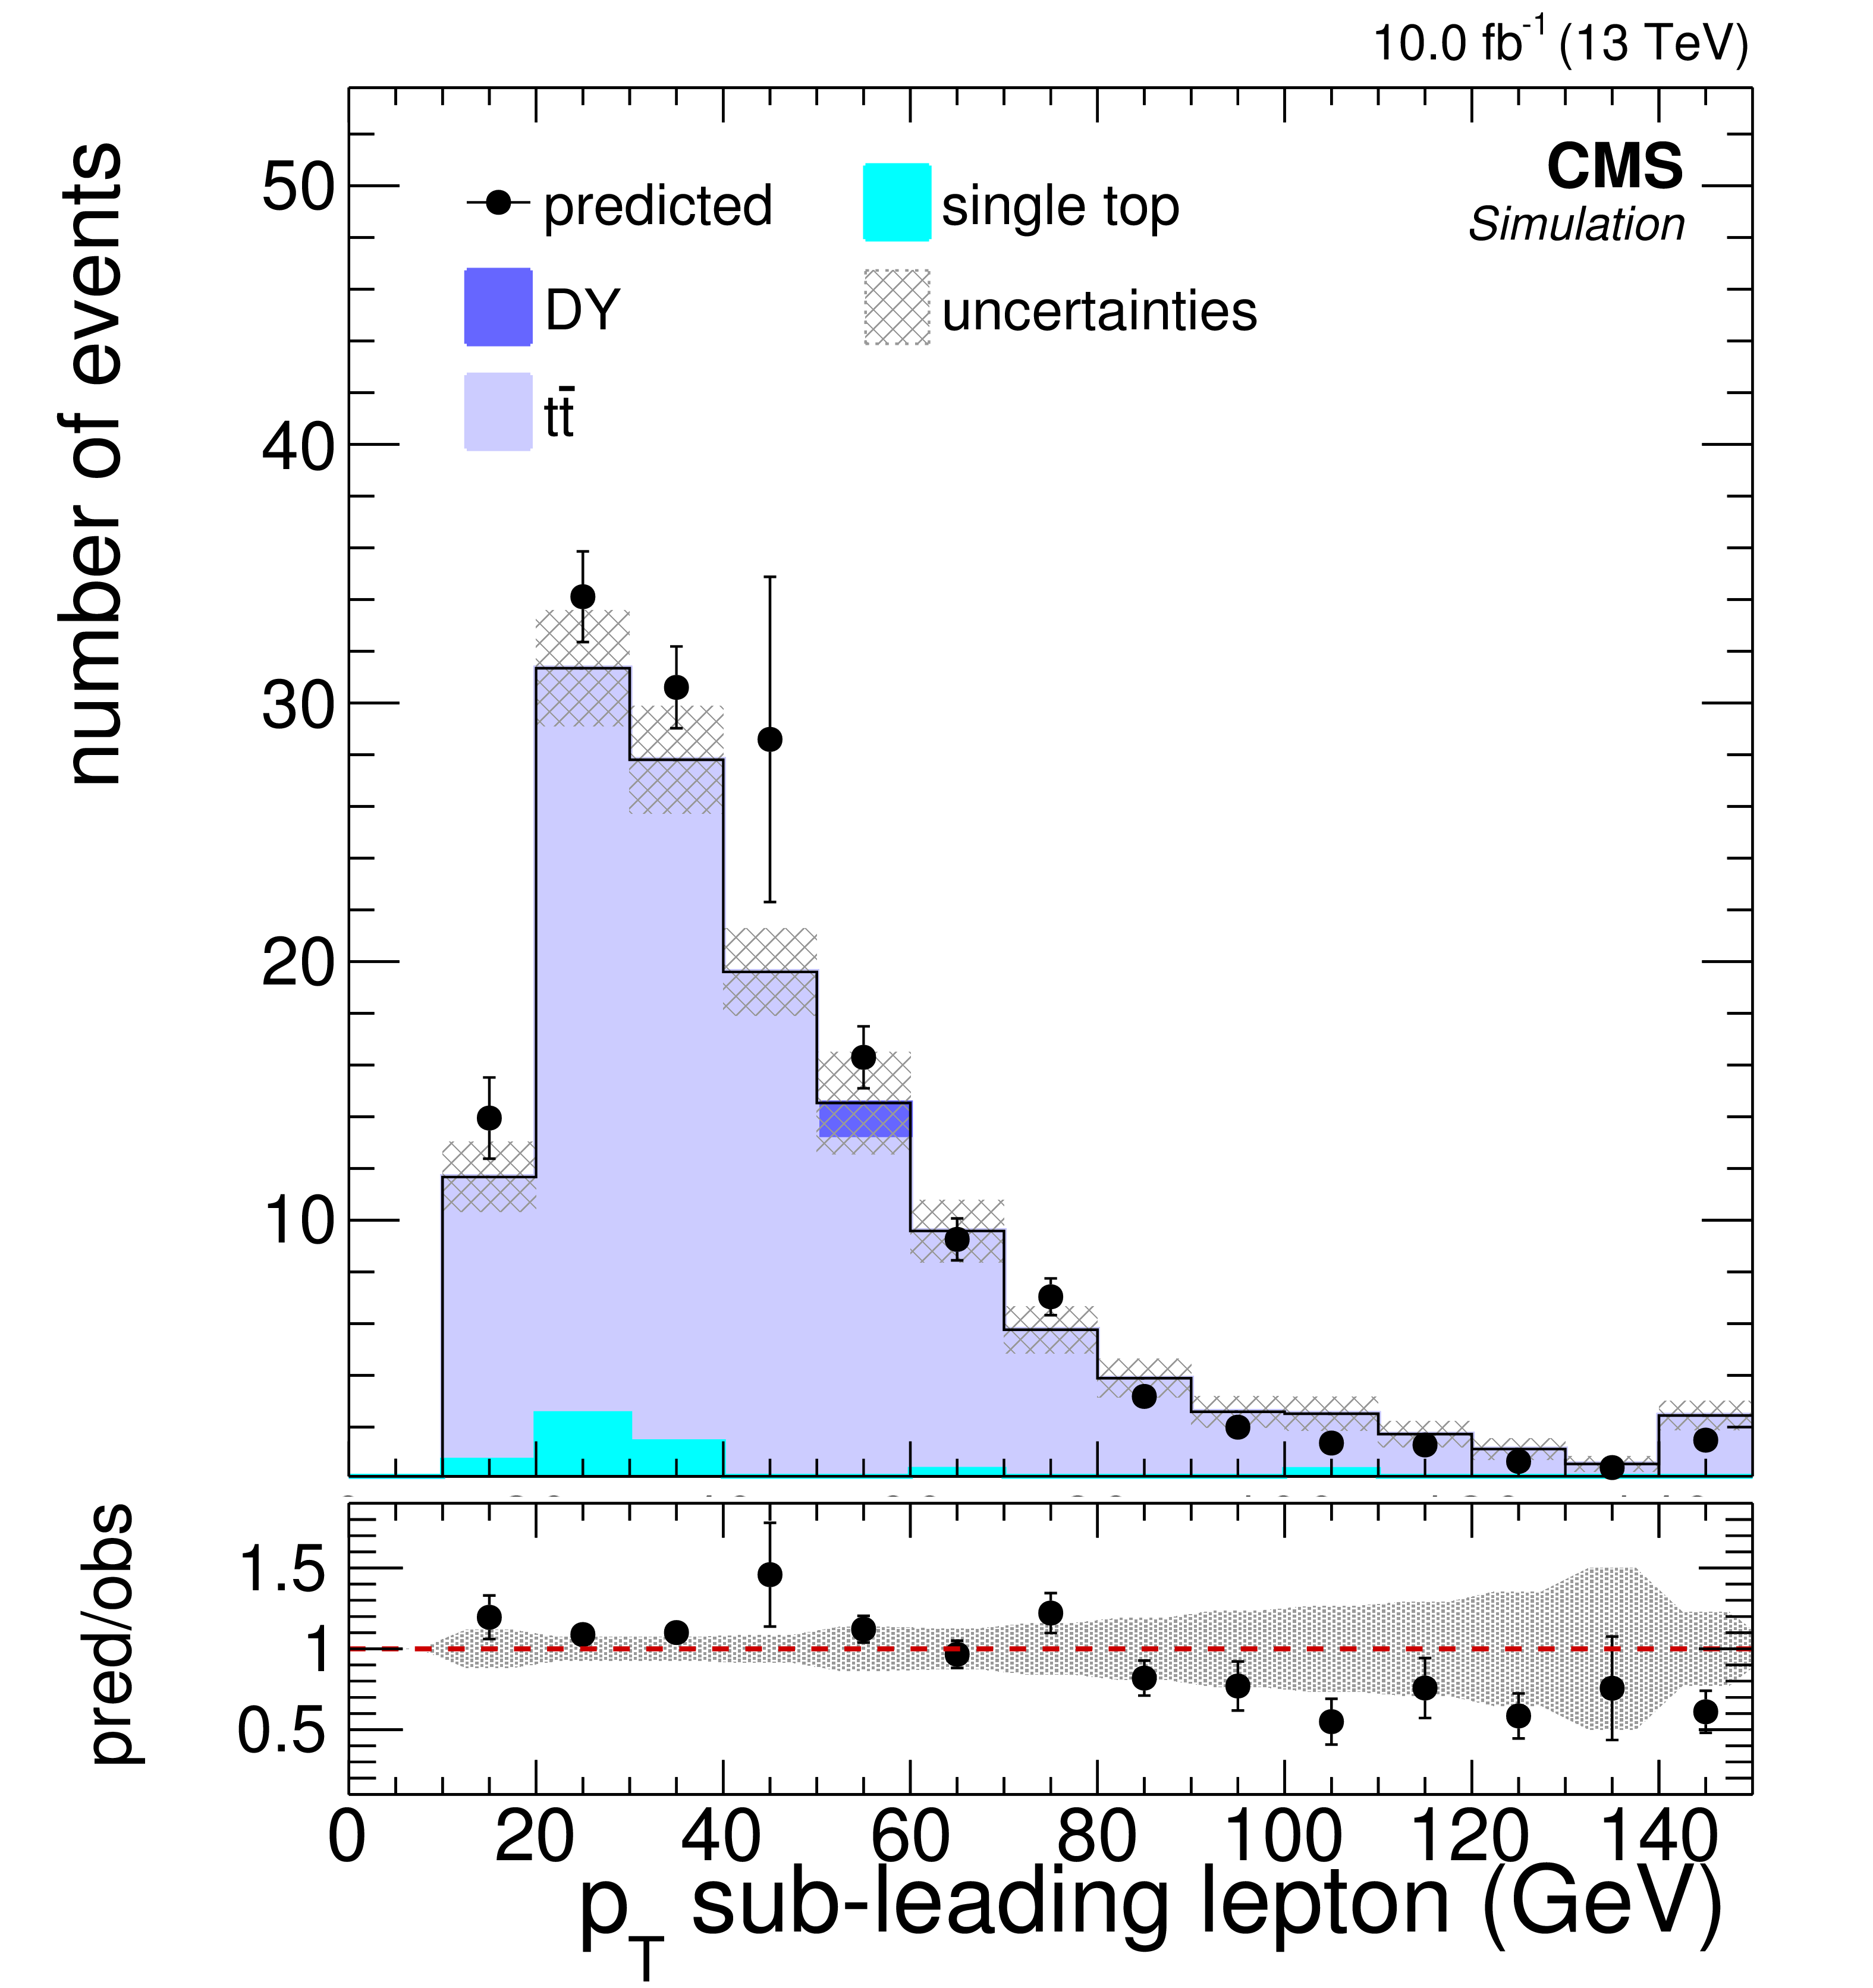
Additional Figure 2-f:
Fake background estimation closure with a mixture of MC samples yielding non-prompt leptons in the off-Z baseline region. Fake leptons in the off-Z baseline region originate almost exclusively from $ {\mathrm{ t } {}\mathrm{ \bar{t} } } $ with minor contributions from Drell-Yan and single top production. The fake rate has been measured in a QCD Monte Carlo sample. Yields are normalized to an integrated luminosity of 10 fb$^{-1}$. Shown are the distributions of the hadronic activity $ {H_{\mathrm {T}}} $ (a), the missing transverse energy $ {E_{\mathrm {T}}^{\text {miss}}} $ (b), the jet (c) and b-jet (d) multiplicities, and the $ {p_{\mathrm {T}}} $ distributions for the leading (e), the sub-leading (f) and the third lepton (g) for events with muons and electrons. Additionally, the flavor composition of the event (h) and the yields in the 15 signal regions (i) are shown. The solid histograms show the yield directly measured in the signal region while the point markers indicate the yield predicted by the method. |
png pdf |
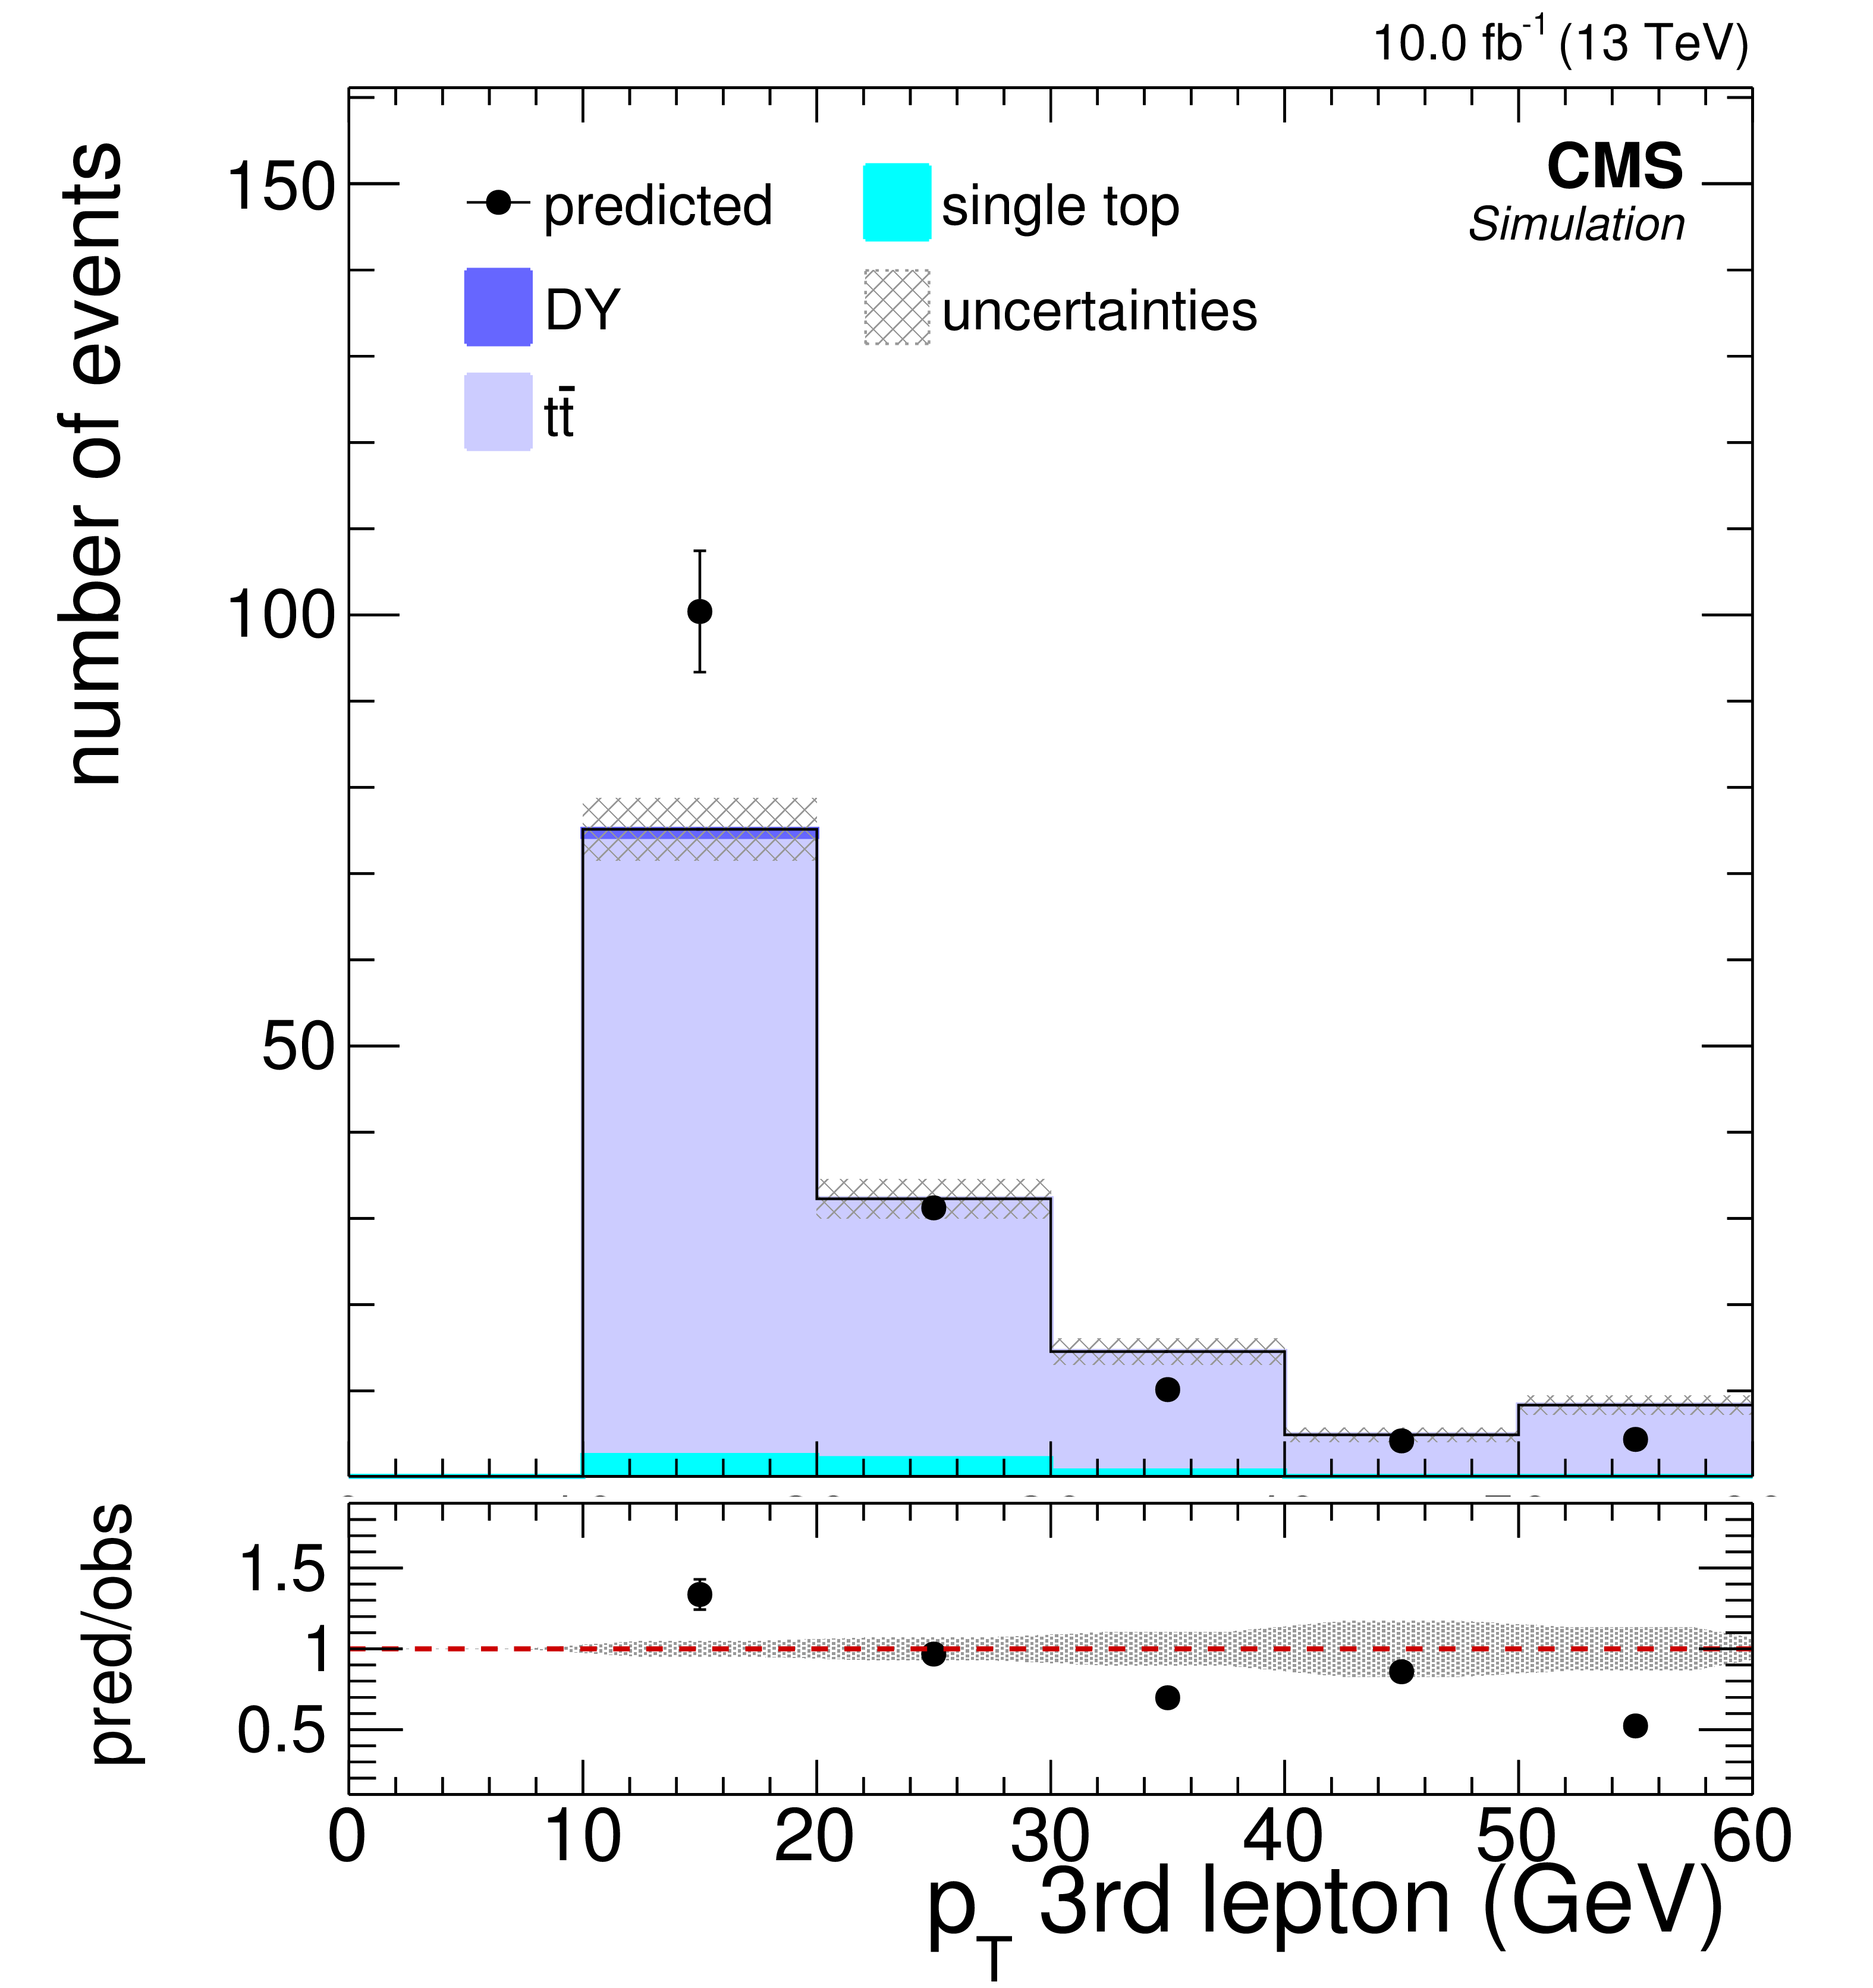
Additional Figure 2-g:
Fake background estimation closure with a mixture of MC samples yielding non-prompt leptons in the off-Z baseline region. Fake leptons in the off-Z baseline region originate almost exclusively from $ {\mathrm{ t } {}\mathrm{ \bar{t} } } $ with minor contributions from Drell-Yan and single top production. The fake rate has been measured in a QCD Monte Carlo sample. Yields are normalized to an integrated luminosity of 10 fb$^{-1}$. Shown are the distributions of the hadronic activity $ {H_{\mathrm {T}}} $ (a), the missing transverse energy $ {E_{\mathrm {T}}^{\text {miss}}} $ (b), the jet (c) and b-jet (d) multiplicities, and the $ {p_{\mathrm {T}}} $ distributions for the leading (e), the sub-leading (f) and the third lepton (g) for events with muons and electrons. Additionally, the flavor composition of the event (h) and the yields in the 15 signal regions (i) are shown. The solid histograms show the yield directly measured in the signal region while the point markers indicate the yield predicted by the method. |
png pdf |
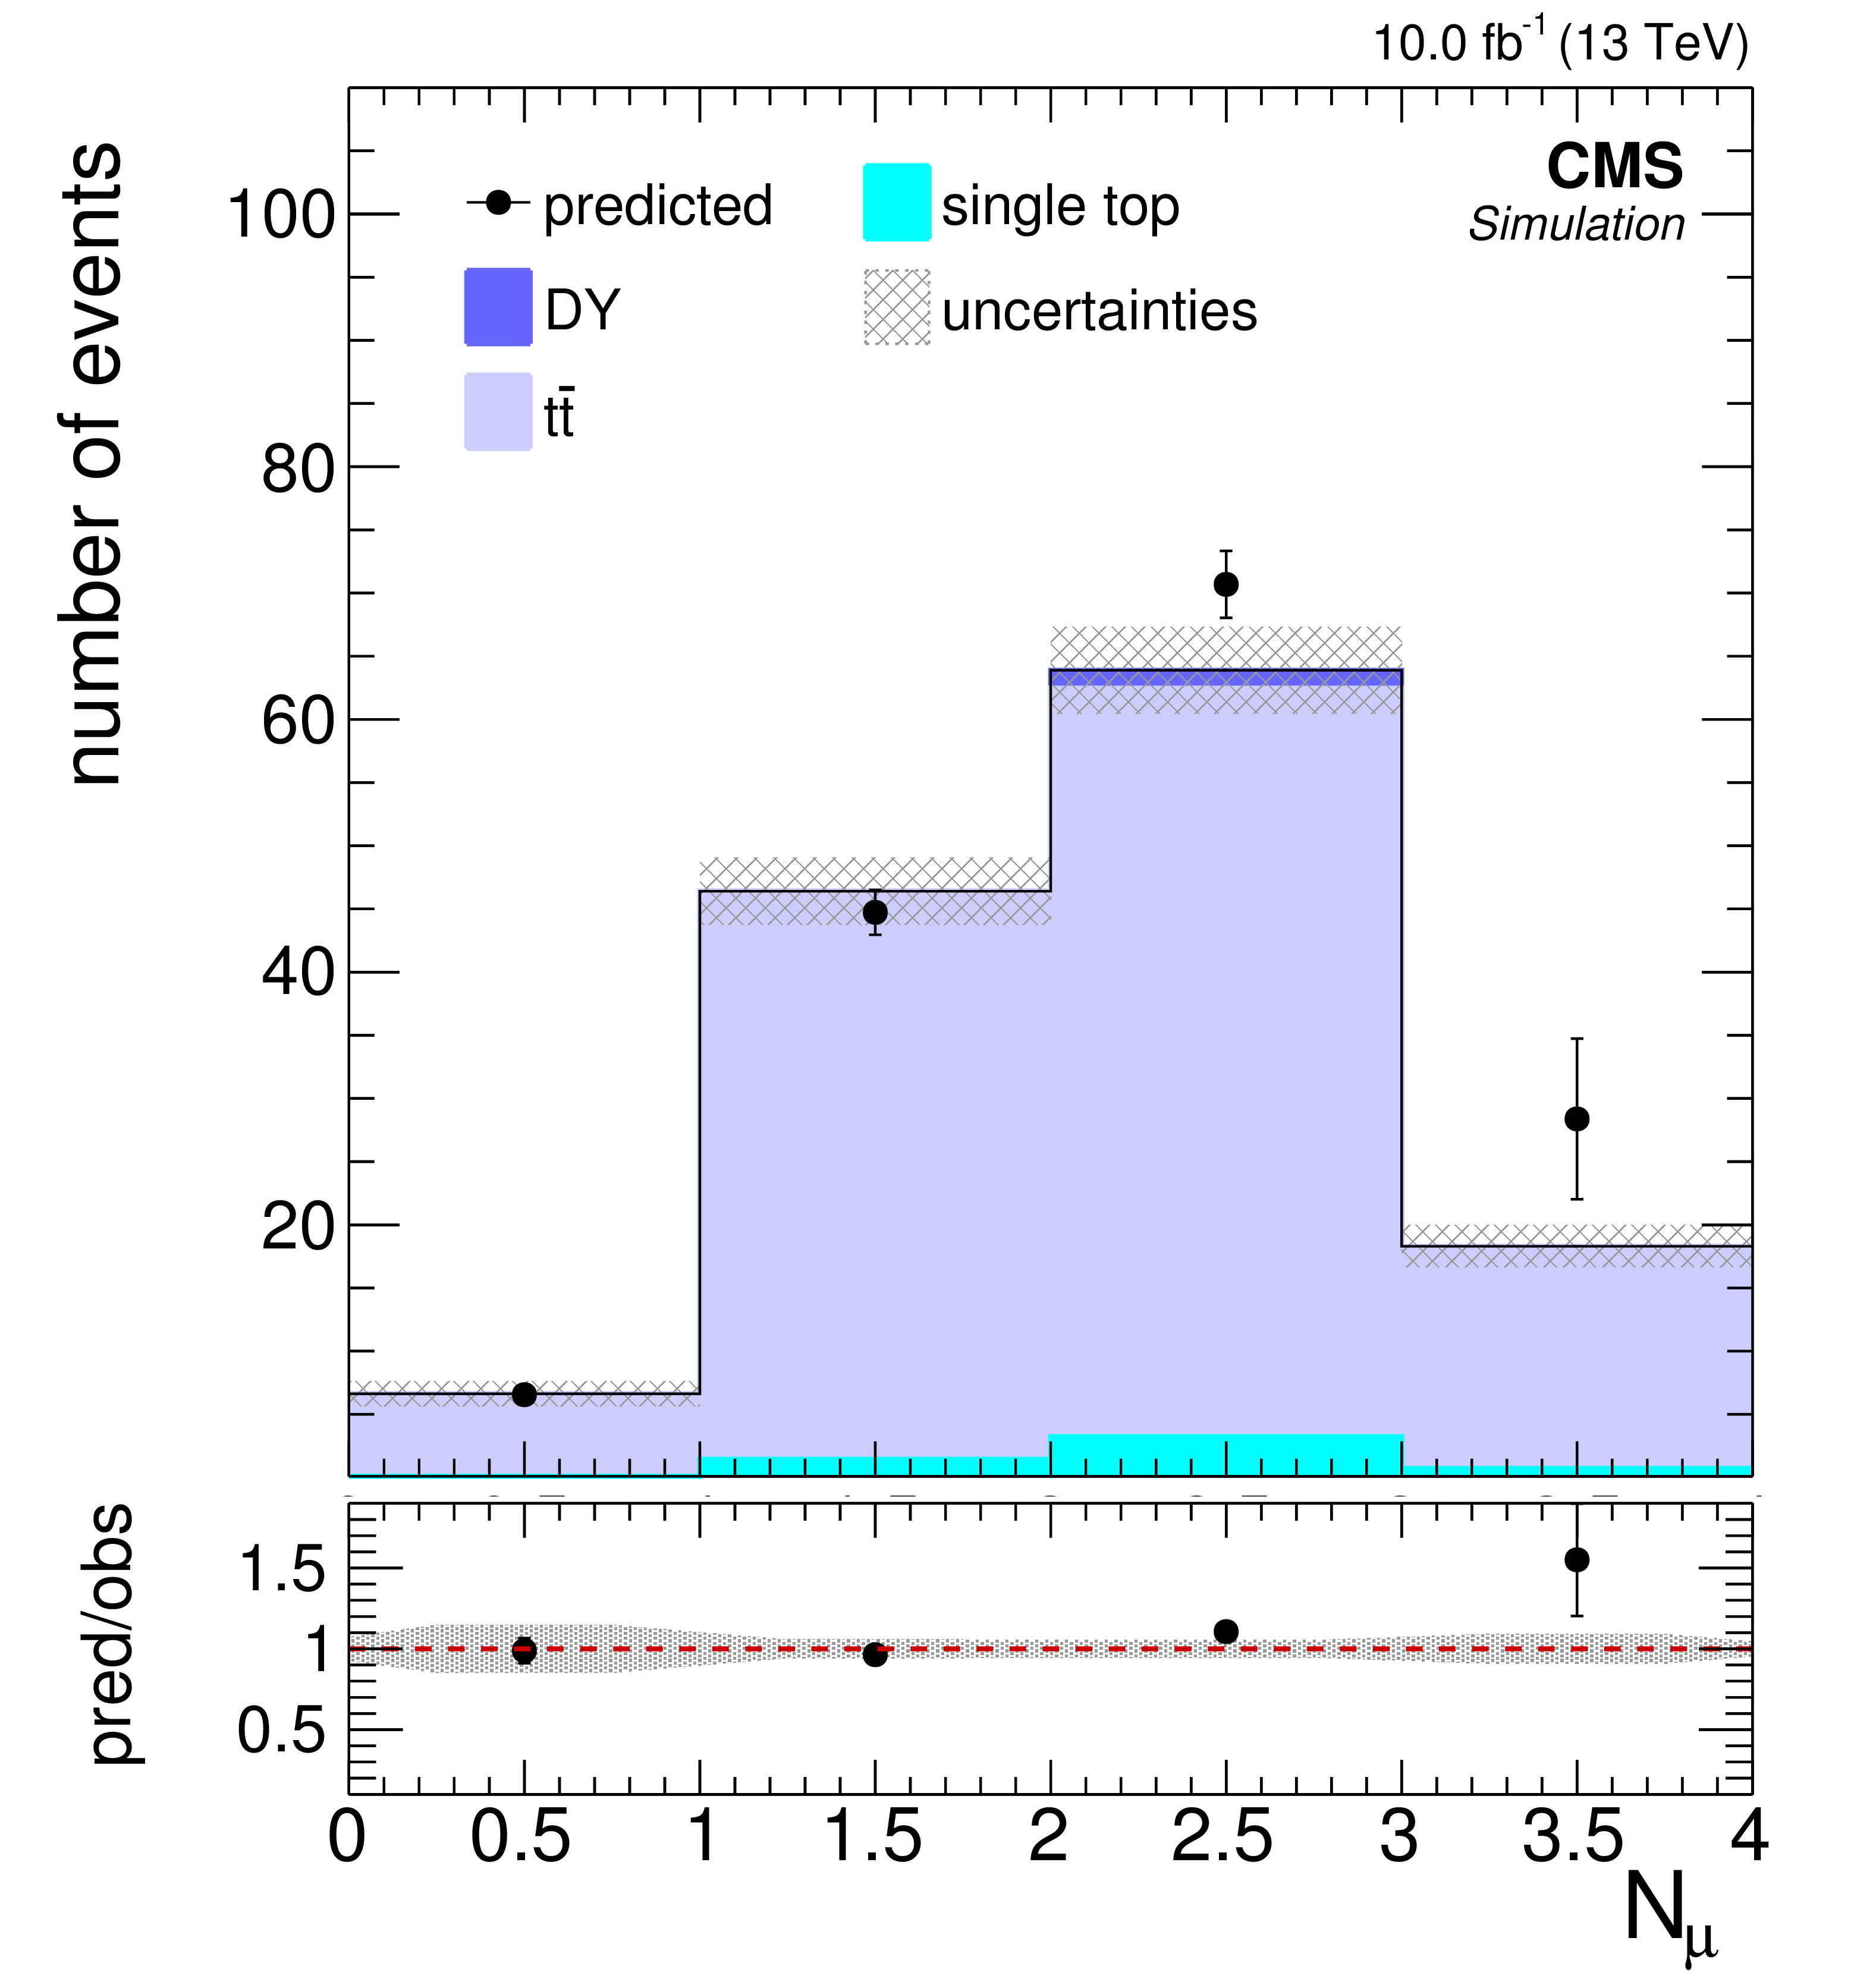
Additional Figure 2-h:
Fake background estimation closure with a mixture of MC samples yielding non-prompt leptons in the off-Z baseline region. Fake leptons in the off-Z baseline region originate almost exclusively from $ {\mathrm{ t } {}\mathrm{ \bar{t} } } $ with minor contributions from Drell-Yan and single top production. The fake rate has been measured in a QCD Monte Carlo sample. Yields are normalized to an integrated luminosity of 10 fb$^{-1}$. Shown are the distributions of the hadronic activity $ {H_{\mathrm {T}}} $ (a), the missing transverse energy $ {E_{\mathrm {T}}^{\text {miss}}} $ (b), the jet (c) and b-jet (d) multiplicities, and the $ {p_{\mathrm {T}}} $ distributions for the leading (e), the sub-leading (f) and the third lepton (g) for events with muons and electrons. Additionally, the flavor composition of the event (h) and the yields in the 15 signal regions (i) are shown. The solid histograms show the yield directly measured in the signal region while the point markers indicate the yield predicted by the method. |
png pdf |
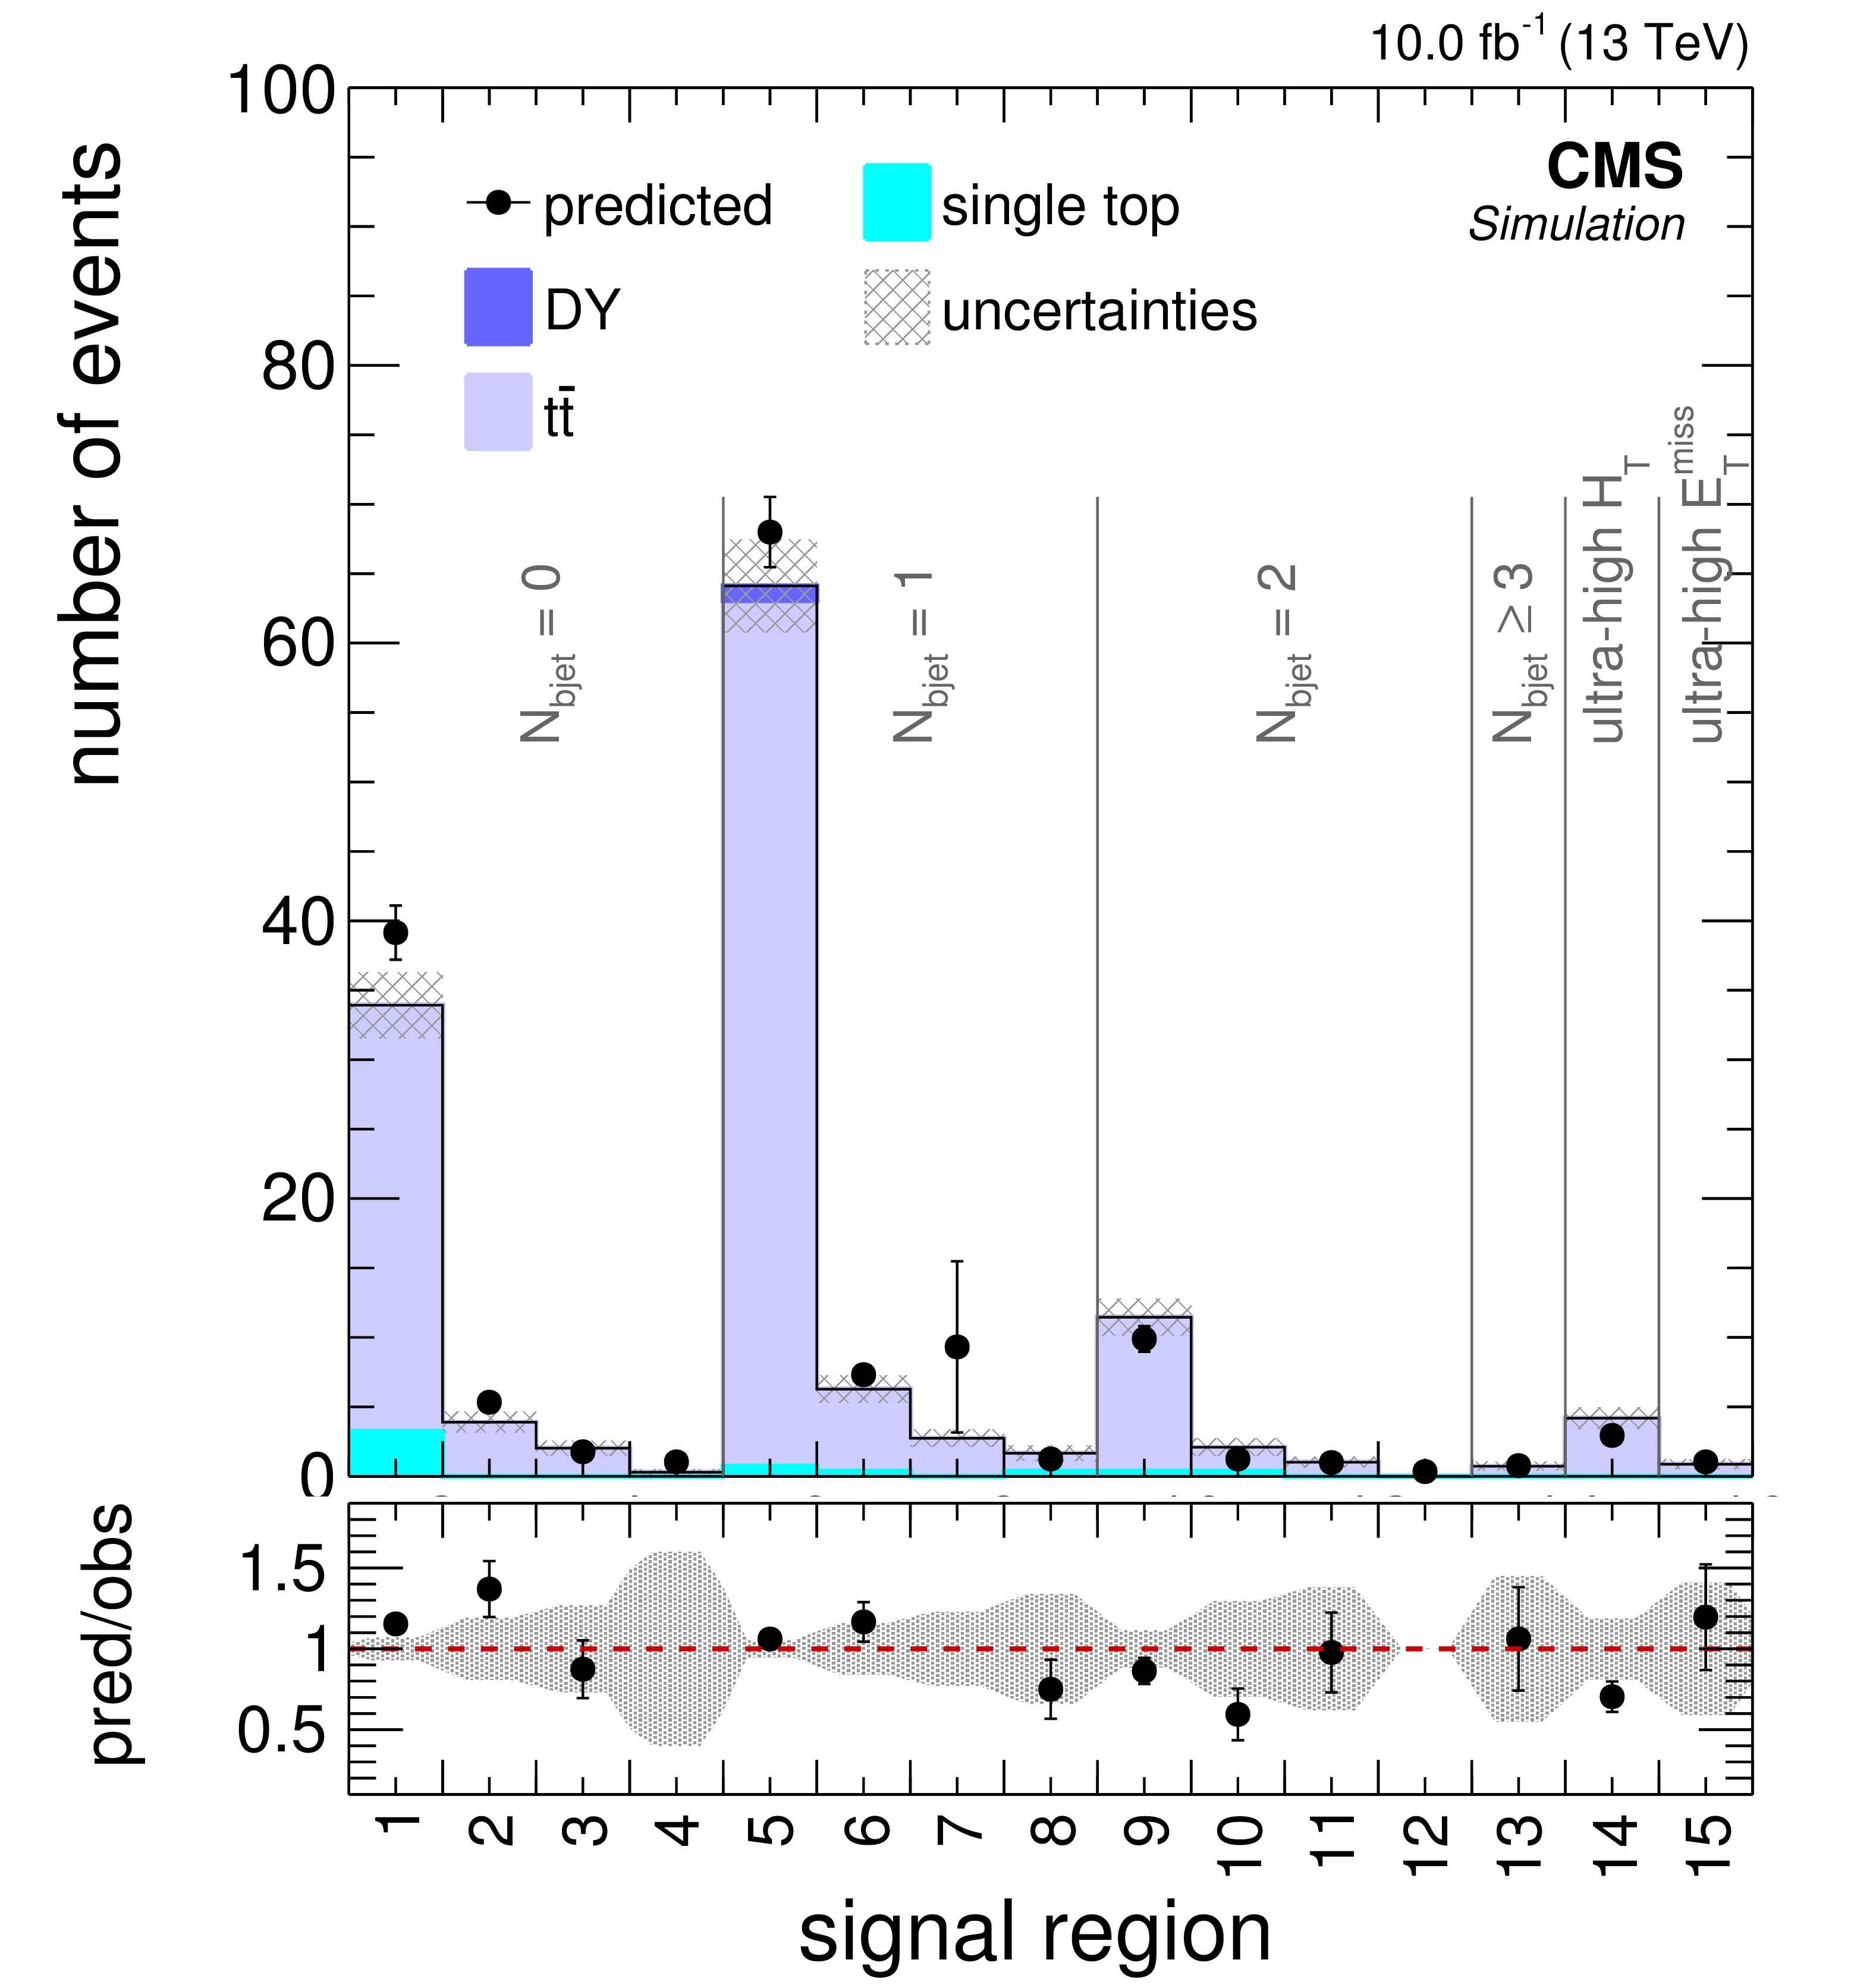
Additional Figure 2-i:
Fake background estimation closure with a mixture of MC samples yielding non-prompt leptons in the off-Z baseline region. Fake leptons in the off-Z baseline region originate almost exclusively from $ {\mathrm{ t } {}\mathrm{ \bar{t} } } $ with minor contributions from Drell-Yan and single top production. The fake rate has been measured in a QCD Monte Carlo sample. Yields are normalized to an integrated luminosity of 10 fb$^{-1}$. Shown are the distributions of the hadronic activity $ {H_{\mathrm {T}}} $ (a), the missing transverse energy $ {E_{\mathrm {T}}^{\text {miss}}} $ (b), the jet (c) and b-jet (d) multiplicities, and the $ {p_{\mathrm {T}}} $ distributions for the leading (e), the sub-leading (f) and the third lepton (g) for events with muons and electrons. Additionally, the flavor composition of the event (h) and the yields in the 15 signal regions (i) are shown. The solid histograms show the yield directly measured in the signal region while the point markers indicate the yield predicted by the method. |

png pdf |
Additional Figure 3-a:
Fake background estimation closure with a mixture of MC samples yielding non-prompt leptons in the on-Z baseline region. Fake leptons in the on-Z baseline region originate predominantly from $ {\mathrm{ t } {}\mathrm{ \bar{t} } } $ with small contributions from Drell-Yan and single top production. The fake rate has been measured in a QCD Monte Carlo sample. Yields are normalized to an integrated luminosity of 10 fb$^{-1}$. Shown are the distributions of the hadronic activity $ {H_{\mathrm {T}}} $ (a), the missing transverse energy $ {E_{\mathrm {T}}^{\text {miss}}} $ (b), the jet (c) and b-jet (d) multiplicities, and the $ {p_{\mathrm {T}}} $ distributions for the leading (e), the sub-leading (f) and the third lepton (g) for events with muons and electrons. Additionally, the flavor composition of the event (h) and the yields in the 17 signal regions (i) are shown. The solid histograms show the yield directly measured in the signal region while the point markers indicate the yield predicted by the method. |

png pdf |
Additional Figure 3-b:
Fake background estimation closure with a mixture of MC samples yielding non-prompt leptons in the on-Z baseline region. Fake leptons in the on-Z baseline region originate predominantly from $ {\mathrm{ t } {}\mathrm{ \bar{t} } } $ with small contributions from Drell-Yan and single top production. The fake rate has been measured in a QCD Monte Carlo sample. Yields are normalized to an integrated luminosity of 10 fb$^{-1}$. Shown are the distributions of the hadronic activity $ {H_{\mathrm {T}}} $ (a), the missing transverse energy $ {E_{\mathrm {T}}^{\text {miss}}} $ (b), the jet (c) and b-jet (d) multiplicities, and the $ {p_{\mathrm {T}}} $ distributions for the leading (e), the sub-leading (f) and the third lepton (g) for events with muons and electrons. Additionally, the flavor composition of the event (h) and the yields in the 17 signal regions (i) are shown. The solid histograms show the yield directly measured in the signal region while the point markers indicate the yield predicted by the method. |
png pdf |
Additional Figure 3-c:
Fake background estimation closure with a mixture of MC samples yielding non-prompt leptons in the on-Z baseline region. Fake leptons in the on-Z baseline region originate predominantly from $ {\mathrm{ t } {}\mathrm{ \bar{t} } } $ with small contributions from Drell-Yan and single top production. The fake rate has been measured in a QCD Monte Carlo sample. Yields are normalized to an integrated luminosity of 10 fb$^{-1}$. Shown are the distributions of the hadronic activity $ {H_{\mathrm {T}}} $ (a), the missing transverse energy $ {E_{\mathrm {T}}^{\text {miss}}} $ (b), the jet (c) and b-jet (d) multiplicities, and the $ {p_{\mathrm {T}}} $ distributions for the leading (e), the sub-leading (f) and the third lepton (g) for events with muons and electrons. Additionally, the flavor composition of the event (h) and the yields in the 17 signal regions (i) are shown. The solid histograms show the yield directly measured in the signal region while the point markers indicate the yield predicted by the method. |
png pdf |
Additional Figure 3-d:
Fake background estimation closure with a mixture of MC samples yielding non-prompt leptons in the on-Z baseline region. Fake leptons in the on-Z baseline region originate predominantly from $ {\mathrm{ t } {}\mathrm{ \bar{t} } } $ with small contributions from Drell-Yan and single top production. The fake rate has been measured in a QCD Monte Carlo sample. Yields are normalized to an integrated luminosity of 10 fb$^{-1}$. Shown are the distributions of the hadronic activity $ {H_{\mathrm {T}}} $ (a), the missing transverse energy $ {E_{\mathrm {T}}^{\text {miss}}} $ (b), the jet (c) and b-jet (d) multiplicities, and the $ {p_{\mathrm {T}}} $ distributions for the leading (e), the sub-leading (f) and the third lepton (g) for events with muons and electrons. Additionally, the flavor composition of the event (h) and the yields in the 17 signal regions (i) are shown. The solid histograms show the yield directly measured in the signal region while the point markers indicate the yield predicted by the method. |
png pdf |
Additional Figure 3-e:
Fake background estimation closure with a mixture of MC samples yielding non-prompt leptons in the on-Z baseline region. Fake leptons in the on-Z baseline region originate predominantly from $ {\mathrm{ t } {}\mathrm{ \bar{t} } } $ with small contributions from Drell-Yan and single top production. The fake rate has been measured in a QCD Monte Carlo sample. Yields are normalized to an integrated luminosity of 10 fb$^{-1}$. Shown are the distributions of the hadronic activity $ {H_{\mathrm {T}}} $ (a), the missing transverse energy $ {E_{\mathrm {T}}^{\text {miss}}} $ (b), the jet (c) and b-jet (d) multiplicities, and the $ {p_{\mathrm {T}}} $ distributions for the leading (e), the sub-leading (f) and the third lepton (g) for events with muons and electrons. Additionally, the flavor composition of the event (h) and the yields in the 17 signal regions (i) are shown. The solid histograms show the yield directly measured in the signal region while the point markers indicate the yield predicted by the method. |
png pdf |
Additional Figure 3-f:
Fake background estimation closure with a mixture of MC samples yielding non-prompt leptons in the on-Z baseline region. Fake leptons in the on-Z baseline region originate predominantly from $ {\mathrm{ t } {}\mathrm{ \bar{t} } } $ with small contributions from Drell-Yan and single top production. The fake rate has been measured in a QCD Monte Carlo sample. Yields are normalized to an integrated luminosity of 10 fb$^{-1}$. Shown are the distributions of the hadronic activity $ {H_{\mathrm {T}}} $ (a), the missing transverse energy $ {E_{\mathrm {T}}^{\text {miss}}} $ (b), the jet (c) and b-jet (d) multiplicities, and the $ {p_{\mathrm {T}}} $ distributions for the leading (e), the sub-leading (f) and the third lepton (g) for events with muons and electrons. Additionally, the flavor composition of the event (h) and the yields in the 17 signal regions (i) are shown. The solid histograms show the yield directly measured in the signal region while the point markers indicate the yield predicted by the method. |
png pdf |
Additional Figure 3-g:
Fake background estimation closure with a mixture of MC samples yielding non-prompt leptons in the on-Z baseline region. Fake leptons in the on-Z baseline region originate predominantly from $ {\mathrm{ t } {}\mathrm{ \bar{t} } } $ with small contributions from Drell-Yan and single top production. The fake rate has been measured in a QCD Monte Carlo sample. Yields are normalized to an integrated luminosity of 10 fb$^{-1}$. Shown are the distributions of the hadronic activity $ {H_{\mathrm {T}}} $ (a), the missing transverse energy $ {E_{\mathrm {T}}^{\text {miss}}} $ (b), the jet (c) and b-jet (d) multiplicities, and the $ {p_{\mathrm {T}}} $ distributions for the leading (e), the sub-leading (f) and the third lepton (g) for events with muons and electrons. Additionally, the flavor composition of the event (h) and the yields in the 17 signal regions (i) are shown. The solid histograms show the yield directly measured in the signal region while the point markers indicate the yield predicted by the method. |
png pdf |
Additional Figure 3-h:
Fake background estimation closure with a mixture of MC samples yielding non-prompt leptons in the on-Z baseline region. Fake leptons in the on-Z baseline region originate predominantly from $ {\mathrm{ t } {}\mathrm{ \bar{t} } } $ with small contributions from Drell-Yan and single top production. The fake rate has been measured in a QCD Monte Carlo sample. Yields are normalized to an integrated luminosity of 10 fb$^{-1}$. Shown are the distributions of the hadronic activity $ {H_{\mathrm {T}}} $ (a), the missing transverse energy $ {E_{\mathrm {T}}^{\text {miss}}} $ (b), the jet (c) and b-jet (d) multiplicities, and the $ {p_{\mathrm {T}}} $ distributions for the leading (e), the sub-leading (f) and the third lepton (g) for events with muons and electrons. Additionally, the flavor composition of the event (h) and the yields in the 17 signal regions (i) are shown. The solid histograms show the yield directly measured in the signal region while the point markers indicate the yield predicted by the method. |
png pdf |
Additional Figure 3-i:
Fake background estimation closure with a mixture of MC samples yielding non-prompt leptons in the on-Z baseline region. Fake leptons in the on-Z baseline region originate predominantly from $ {\mathrm{ t } {}\mathrm{ \bar{t} } } $ with small contributions from Drell-Yan and single top production. The fake rate has been measured in a QCD Monte Carlo sample. Yields are normalized to an integrated luminosity of 10 fb$^{-1}$. Shown are the distributions of the hadronic activity $ {H_{\mathrm {T}}} $ (a), the missing transverse energy $ {E_{\mathrm {T}}^{\text {miss}}} $ (b), the jet (c) and b-jet (d) multiplicities, and the $ {p_{\mathrm {T}}} $ distributions for the leading (e), the sub-leading (f) and the third lepton (g) for events with muons and electrons. Additionally, the flavor composition of the event (h) and the yields in the 17 signal regions (i) are shown. The solid histograms show the yield directly measured in the signal region while the point markers indicate the yield predicted by the method. |
png pdf |
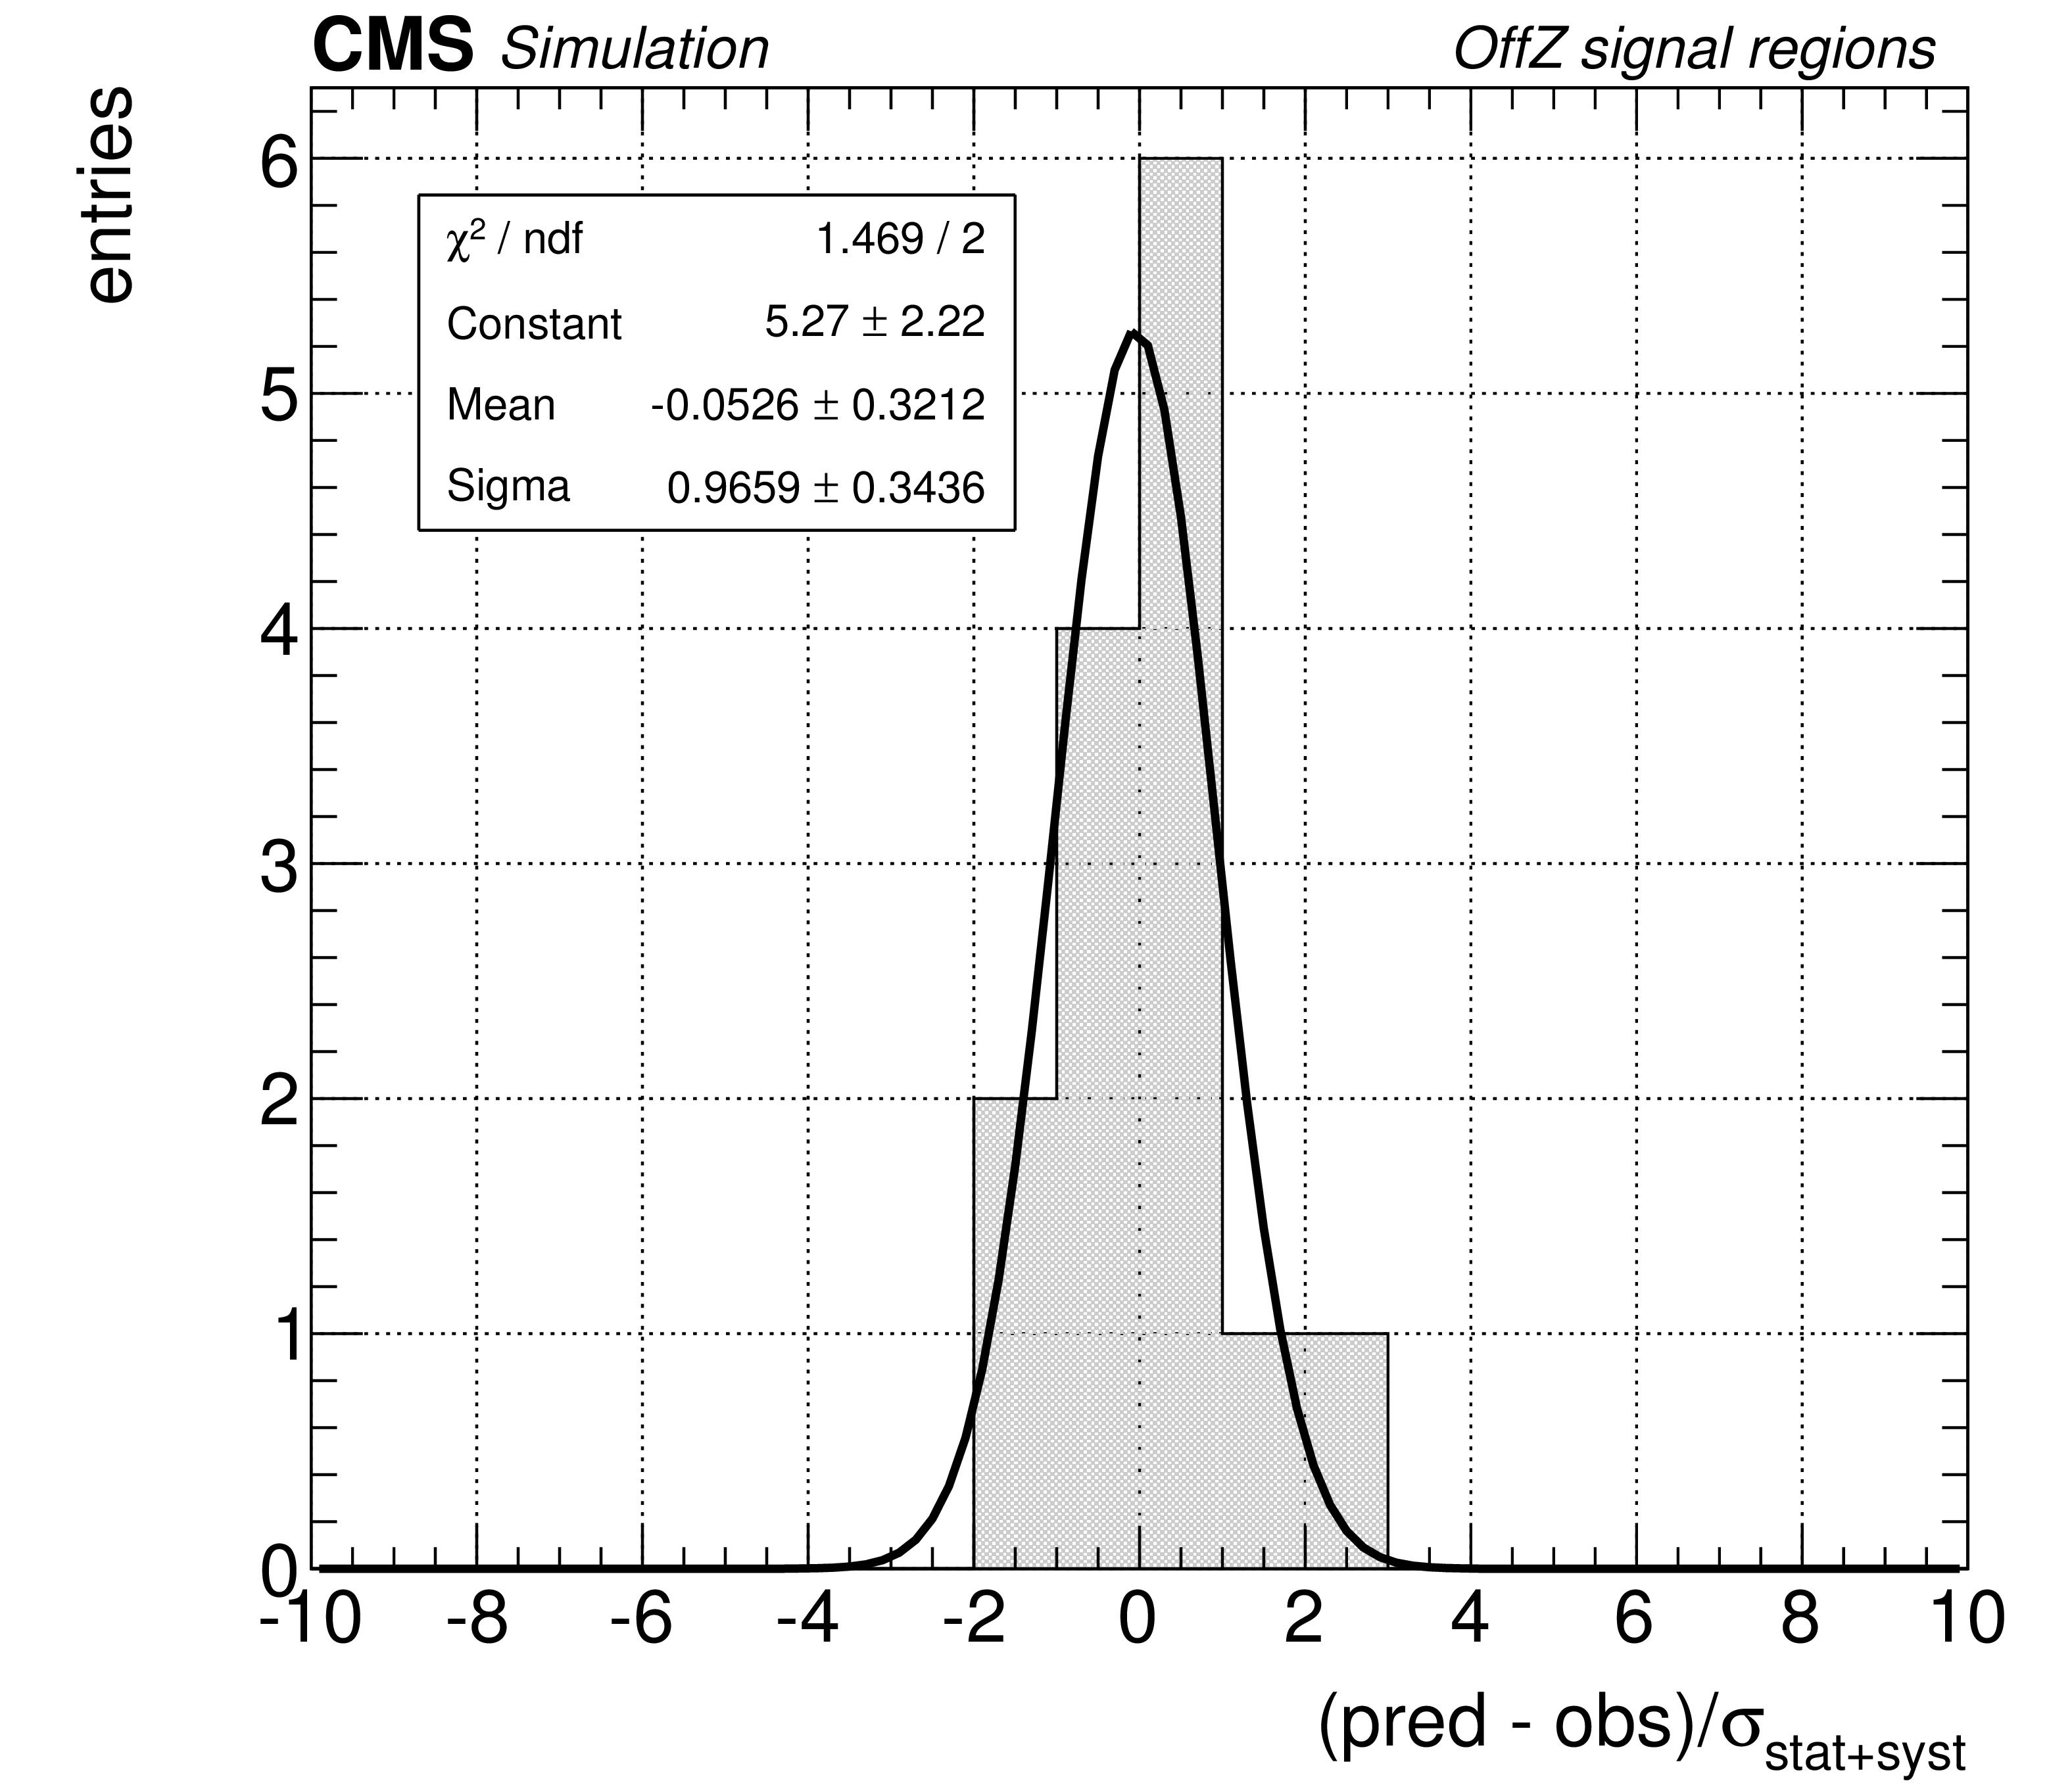
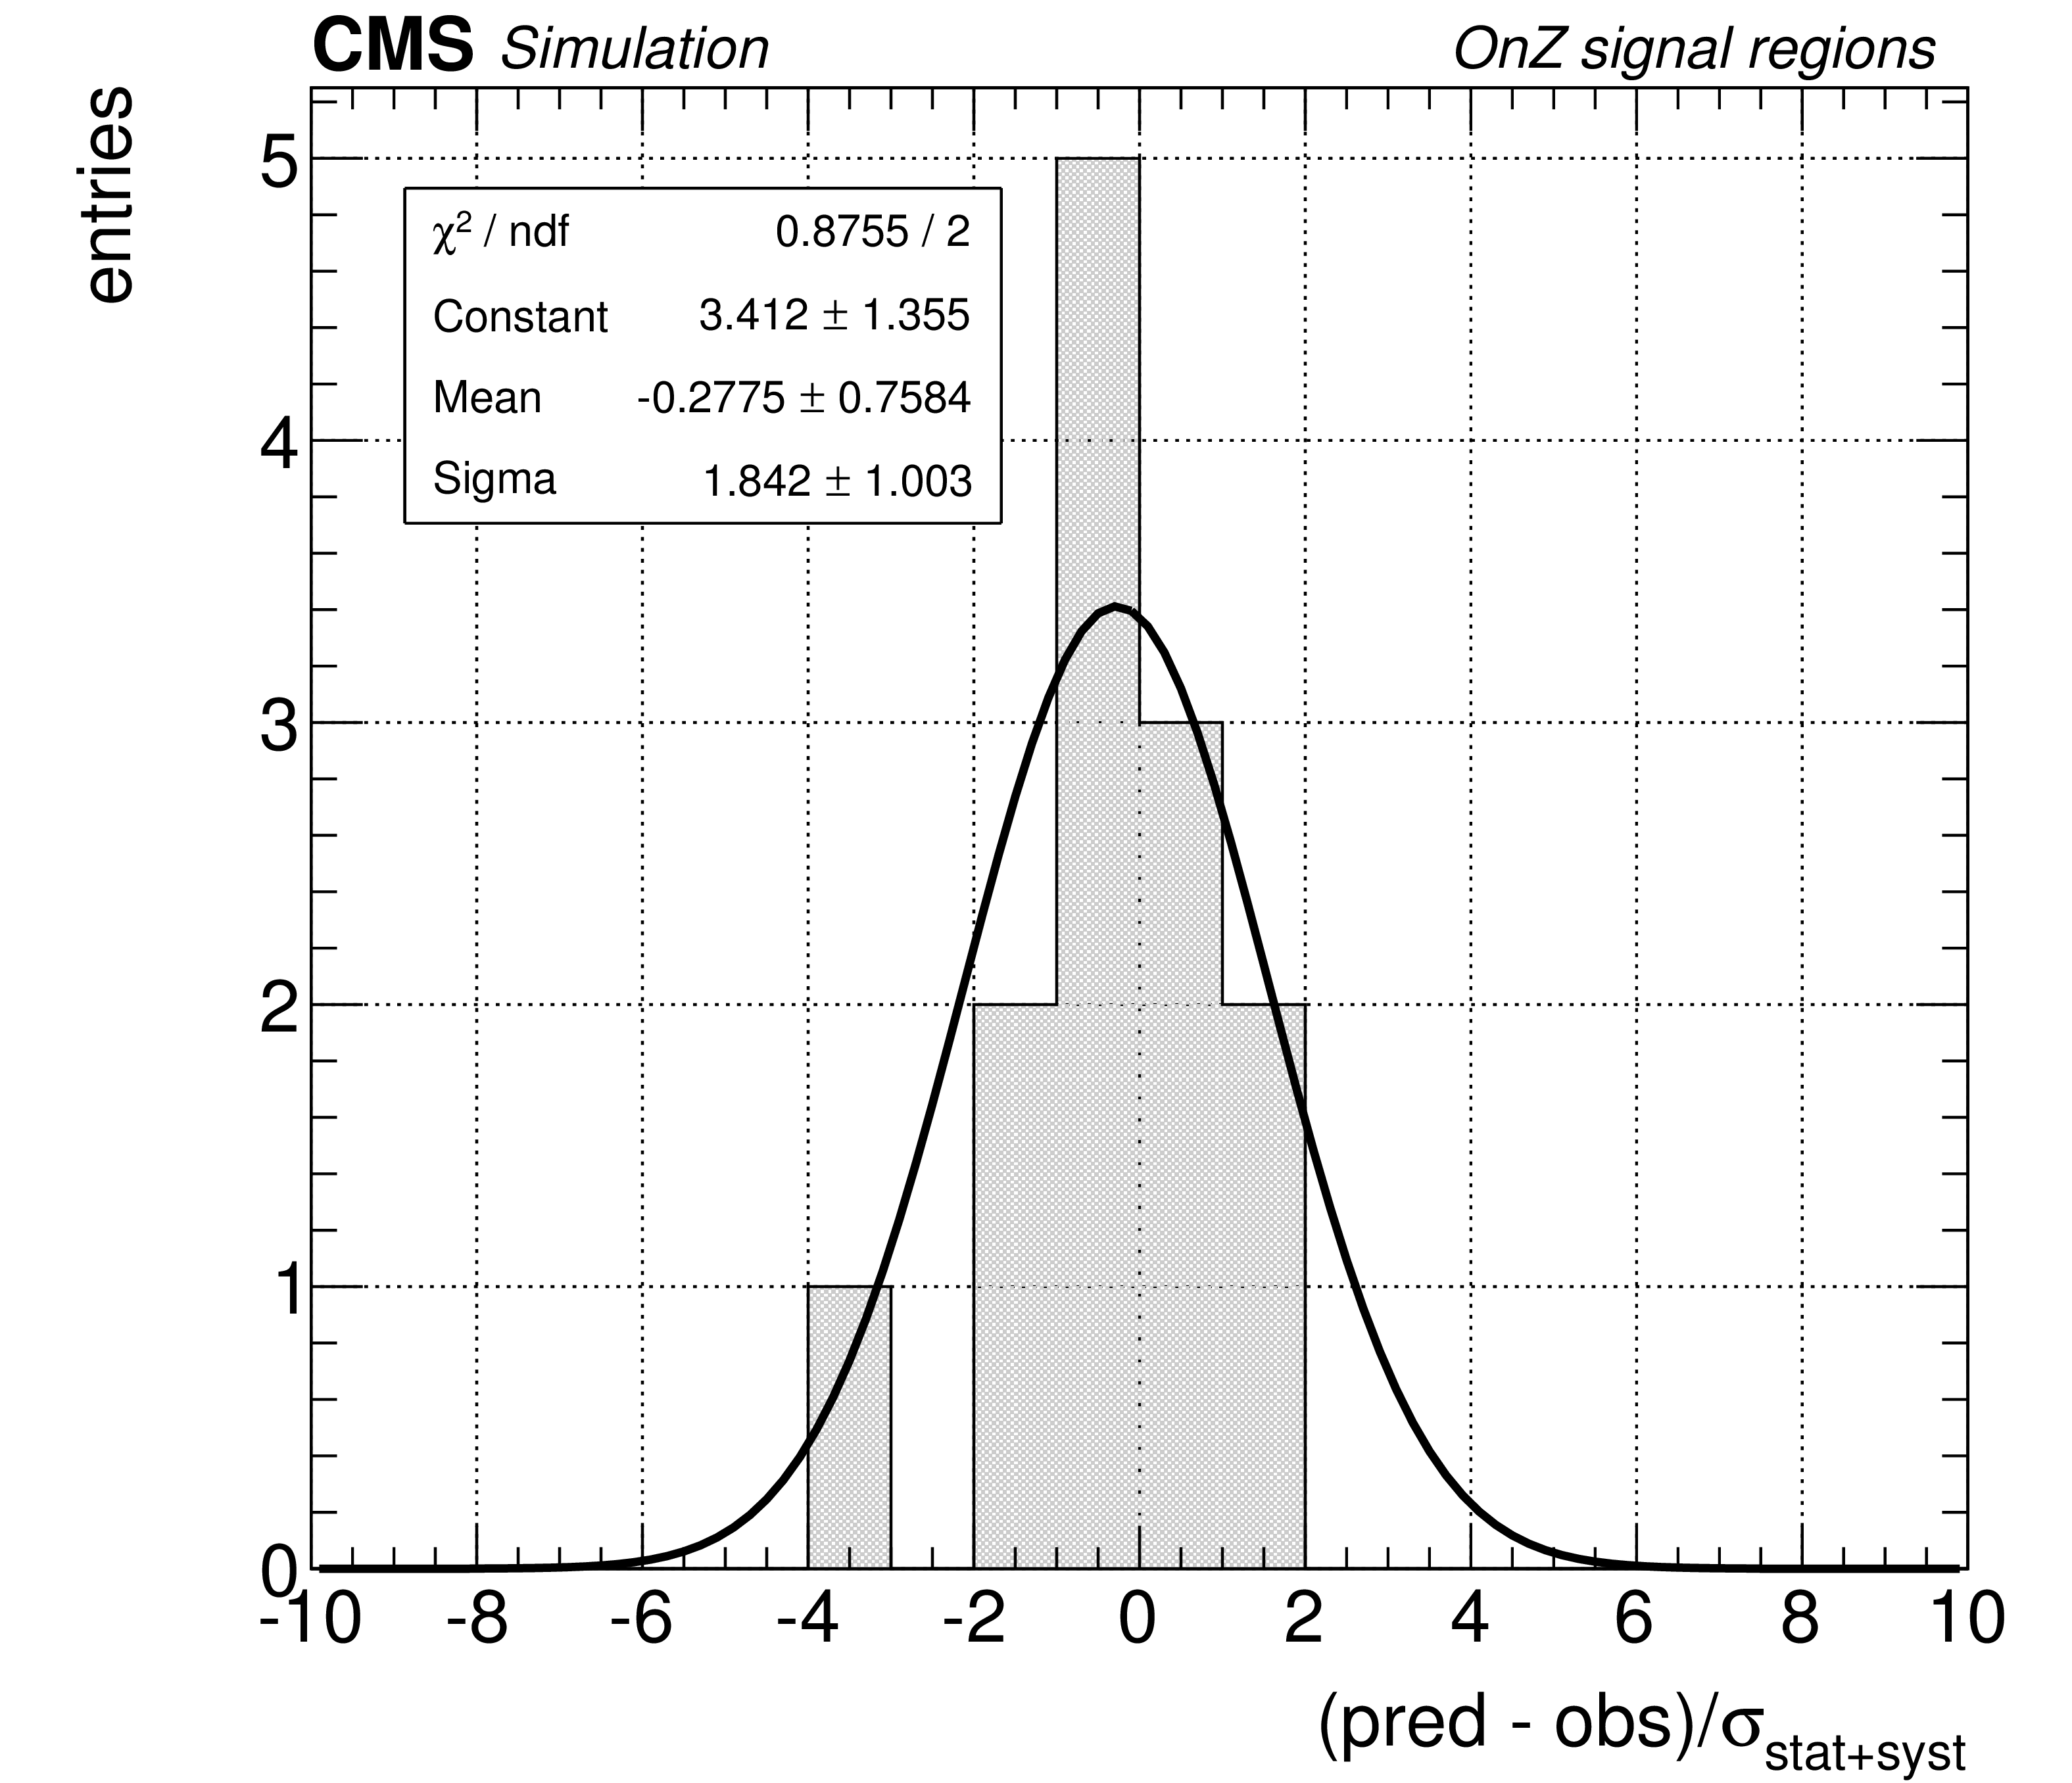
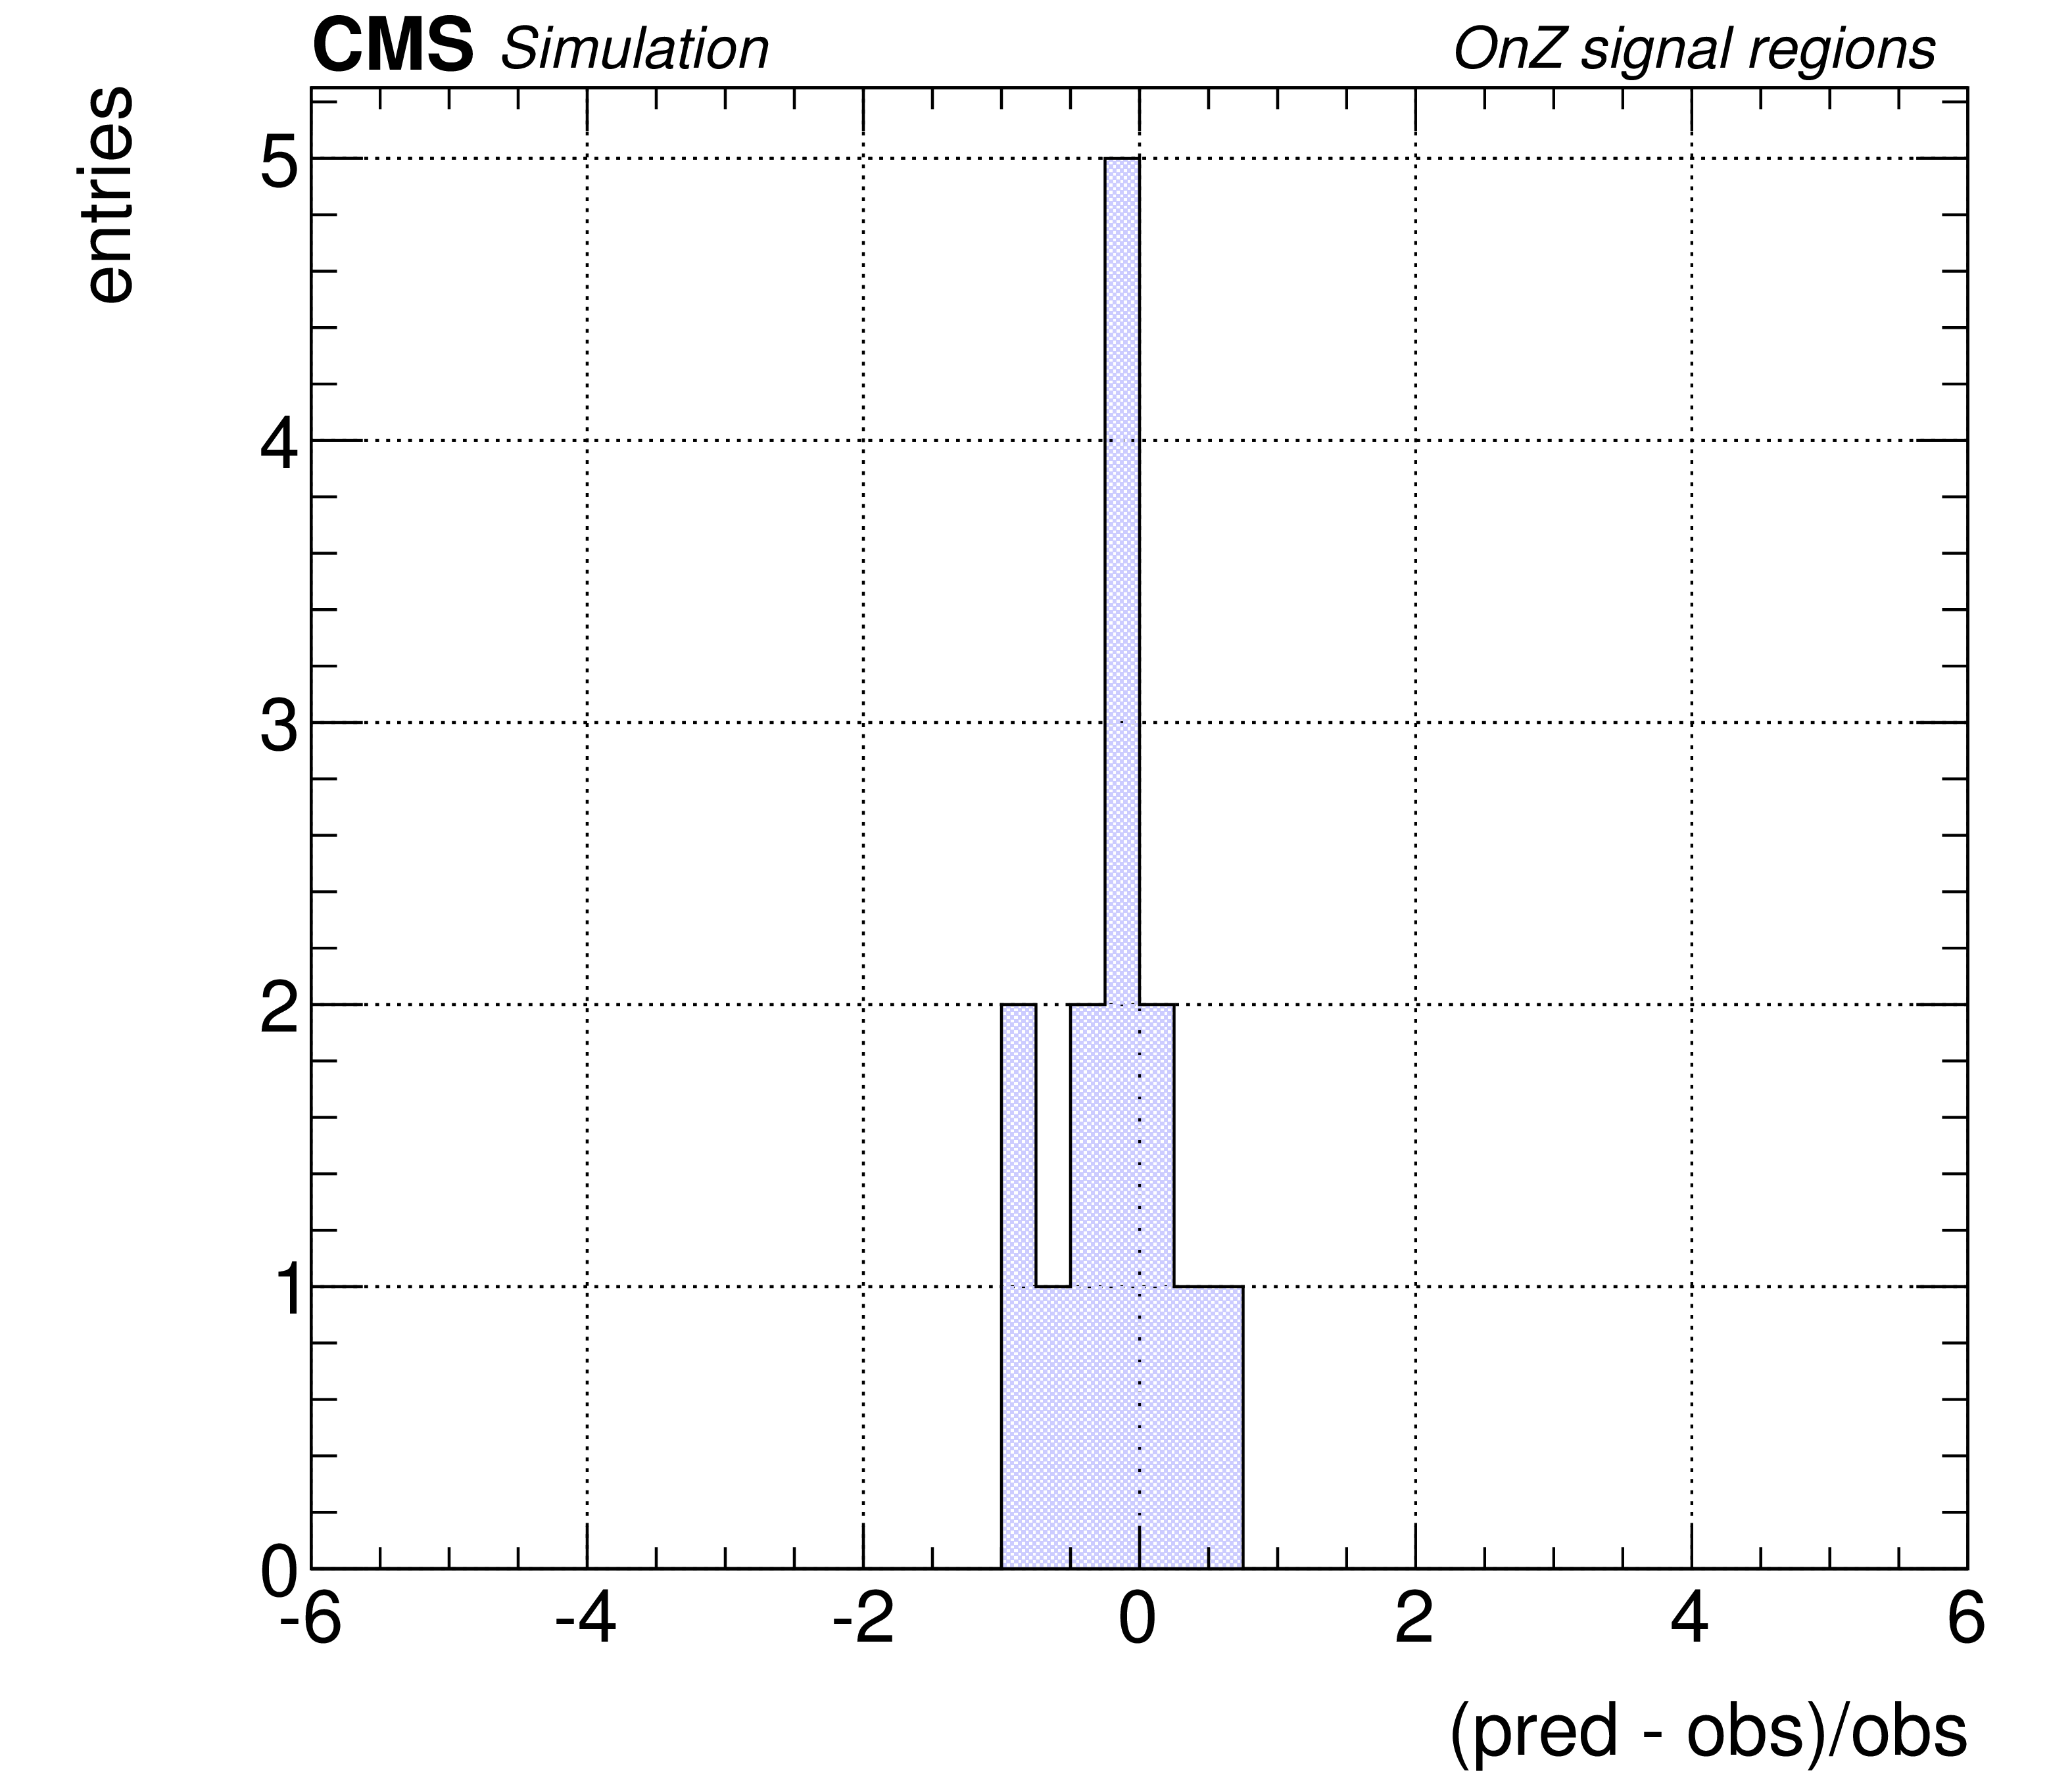
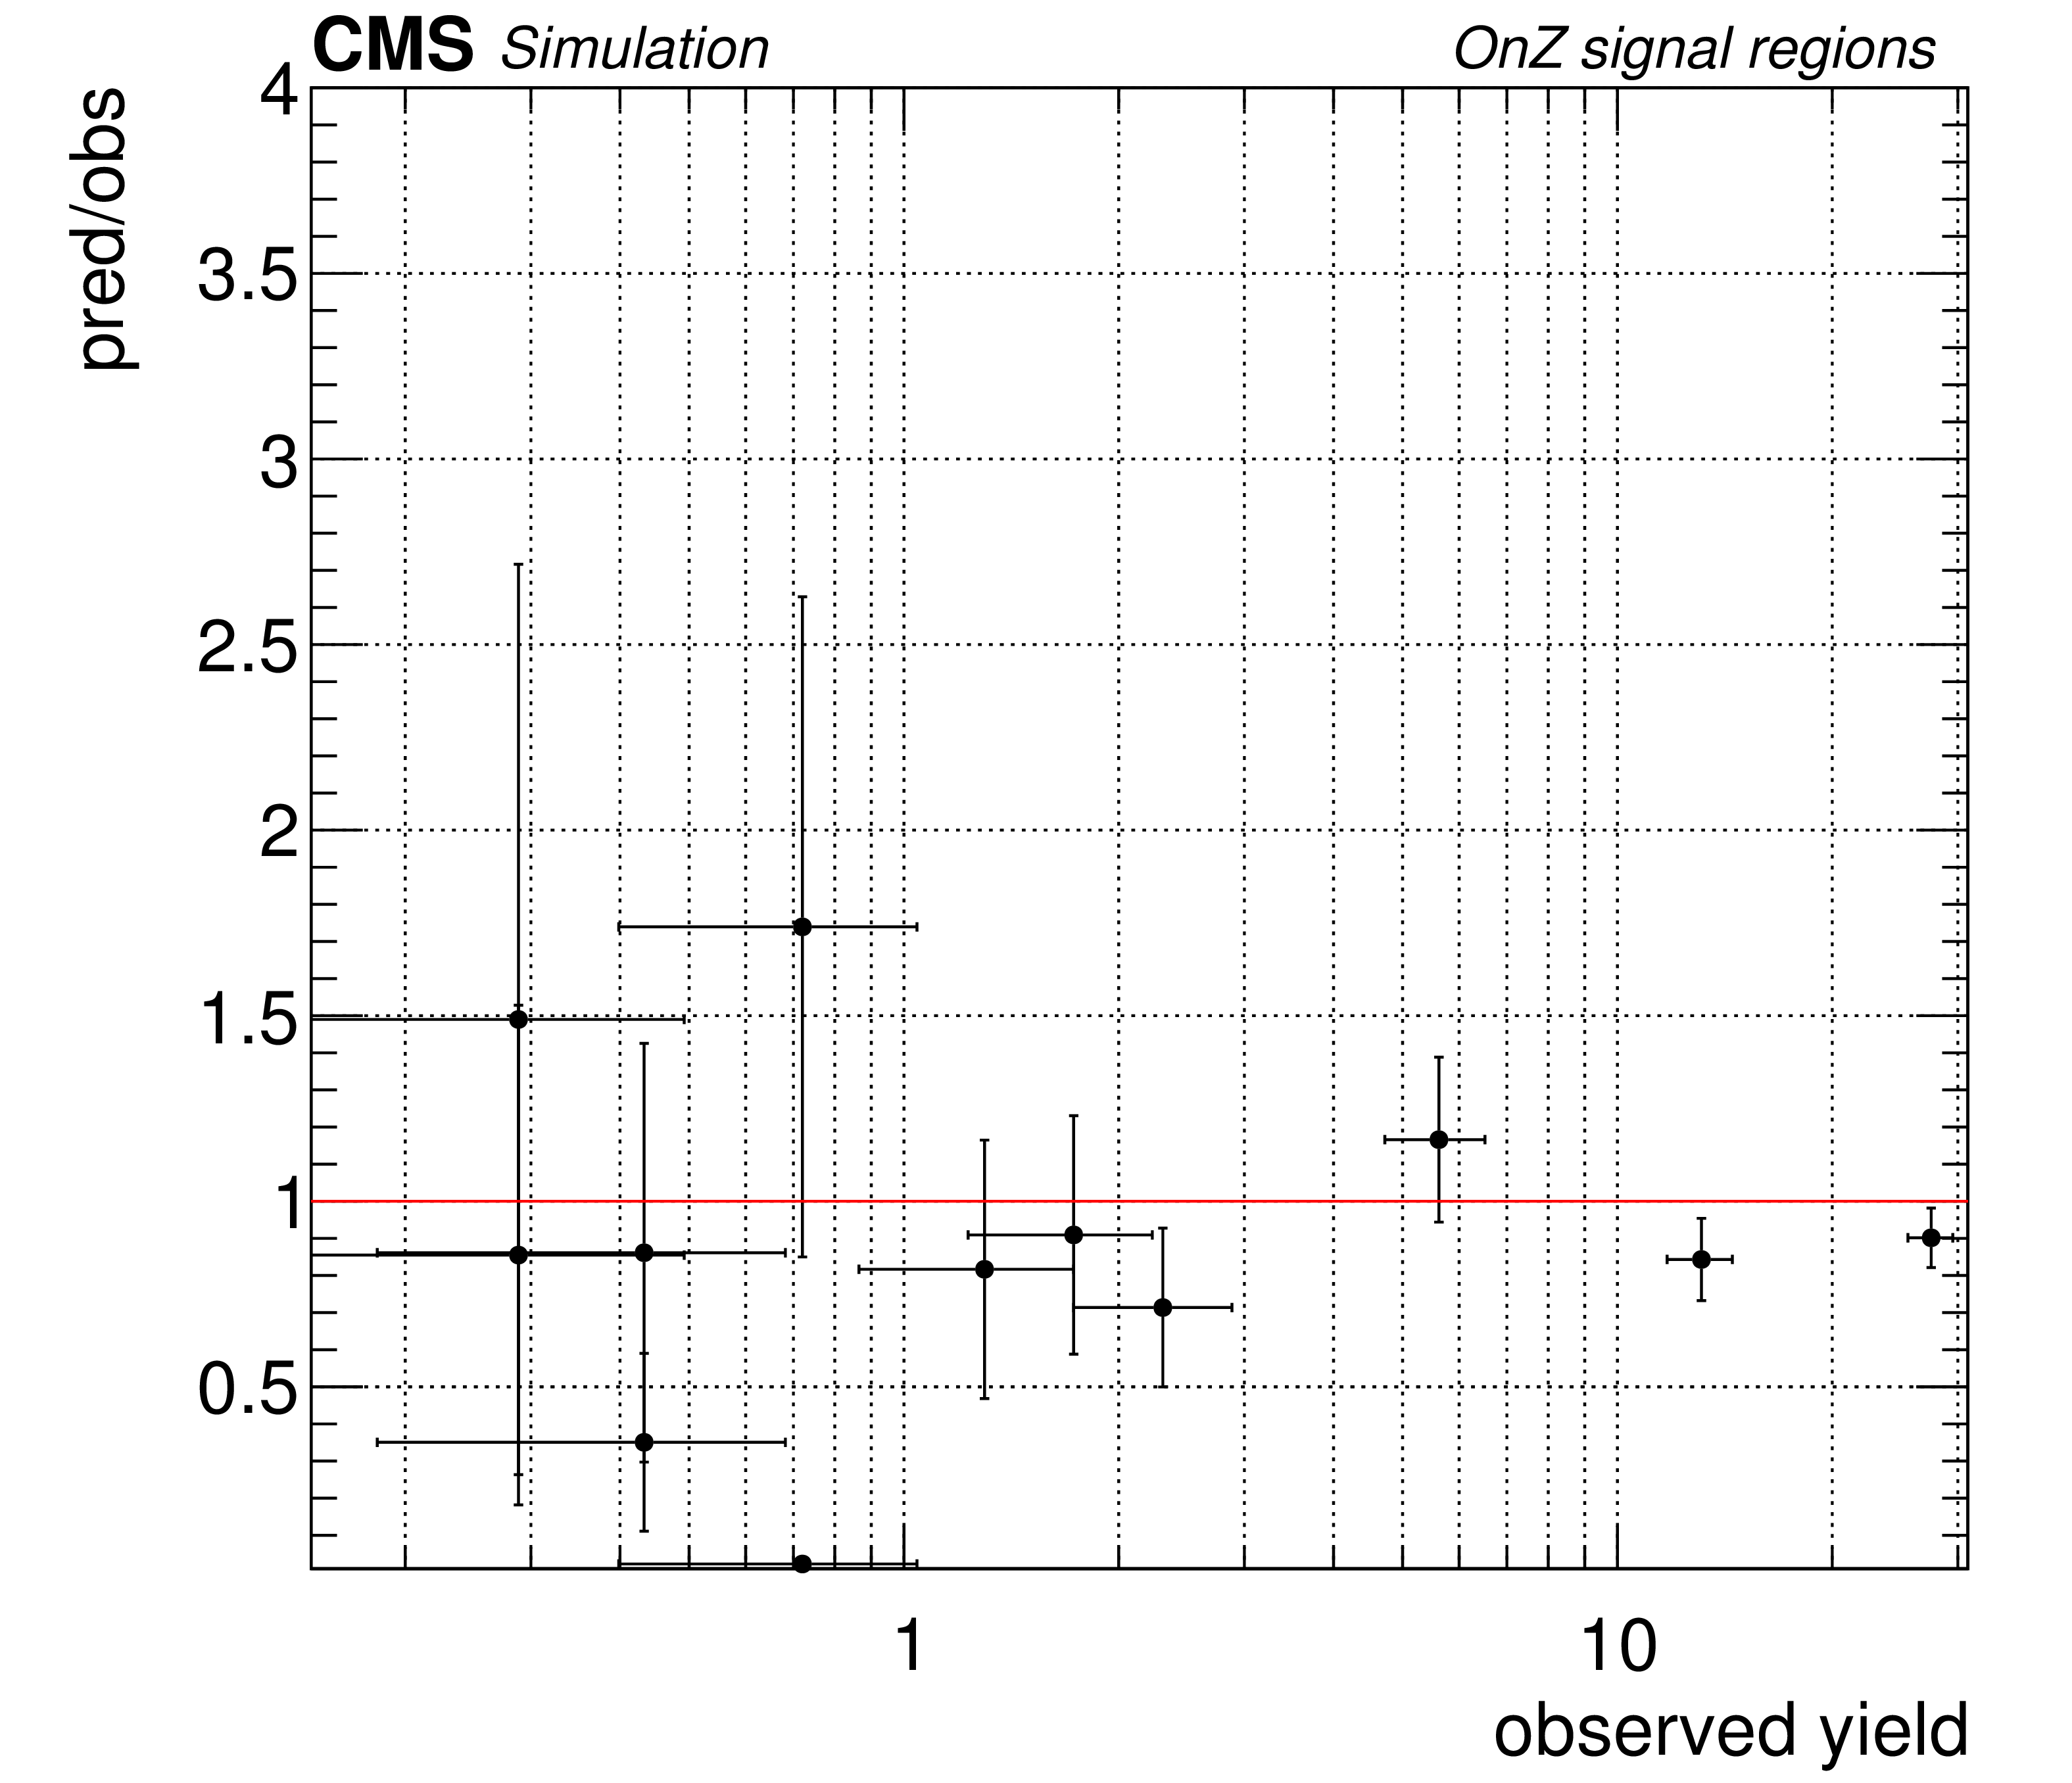
Additional Figure 4-a:
Pull distribution (a,d), systematic non-closure distribution (b,e), and closure vs yield distribution (c,f) for the closure in the 15 off-Z and the 17 on-Z signal regions. For the closure vs yield distribution also the closure for the baseline region is shown. Results obtained with a MadGraph $ {\mathrm{ t } {}\mathrm{ \bar{t} } } $ sample, yields normalized to 10 fb$^{-1}$. |

png pdf |
Additional Figure 4-b:
Pull distribution (a,d), systematic non-closure distribution (b,e), and closure vs yield distribution (c,f) for the closure in the 15 off-Z and the 17 on-Z signal regions. For the closure vs yield distribution also the closure for the baseline region is shown. Results obtained with a MadGraph $ {\mathrm{ t } {}\mathrm{ \bar{t} } } $ sample, yields normalized to 10 fb$^{-1}$. |

png pdf |
Additional Figure 4-c:
Pull distribution (a,d), systematic non-closure distribution (b,e), and closure vs yield distribution (c,f) for the closure in the 15 off-Z and the 17 on-Z signal regions. For the closure vs yield distribution also the closure for the baseline region is shown. Results obtained with a MadGraph $ {\mathrm{ t } {}\mathrm{ \bar{t} } } $ sample, yields normalized to 10 fb$^{-1}$. |
png pdf |
Additional Figure 4-d:
Pull distribution (a,d), systematic non-closure distribution (b,e), and closure vs yield distribution (c,f) for the closure in the 15 off-Z and the 17 on-Z signal regions. For the closure vs yield distribution also the closure for the baseline region is shown. Results obtained with a MadGraph $ {\mathrm{ t } {}\mathrm{ \bar{t} } } $ sample, yields normalized to 10 fb$^{-1}$. |
png pdf |
Additional Figure 4-e:
Pull distribution (a,d), systematic non-closure distribution (b,e), and closure vs yield distribution (c,f) for the closure in the 15 off-Z and the 17 on-Z signal regions. For the closure vs yield distribution also the closure for the baseline region is shown. Results obtained with a MadGraph $ {\mathrm{ t } {}\mathrm{ \bar{t} } } $ sample, yields normalized to 10 fb$^{-1}$. |
png pdf |
Additional Figure 4-f:
Pull distribution (a,d), systematic non-closure distribution (b,e), and closure vs yield distribution (c,f) for the closure in the 15 off-Z and the 17 on-Z signal regions. For the closure vs yield distribution also the closure for the baseline region is shown. Results obtained with a MadGraph $ {\mathrm{ t } {}\mathrm{ \bar{t} } } $ sample, yields normalized to 10 fb$^{-1}$. |
png pdf |
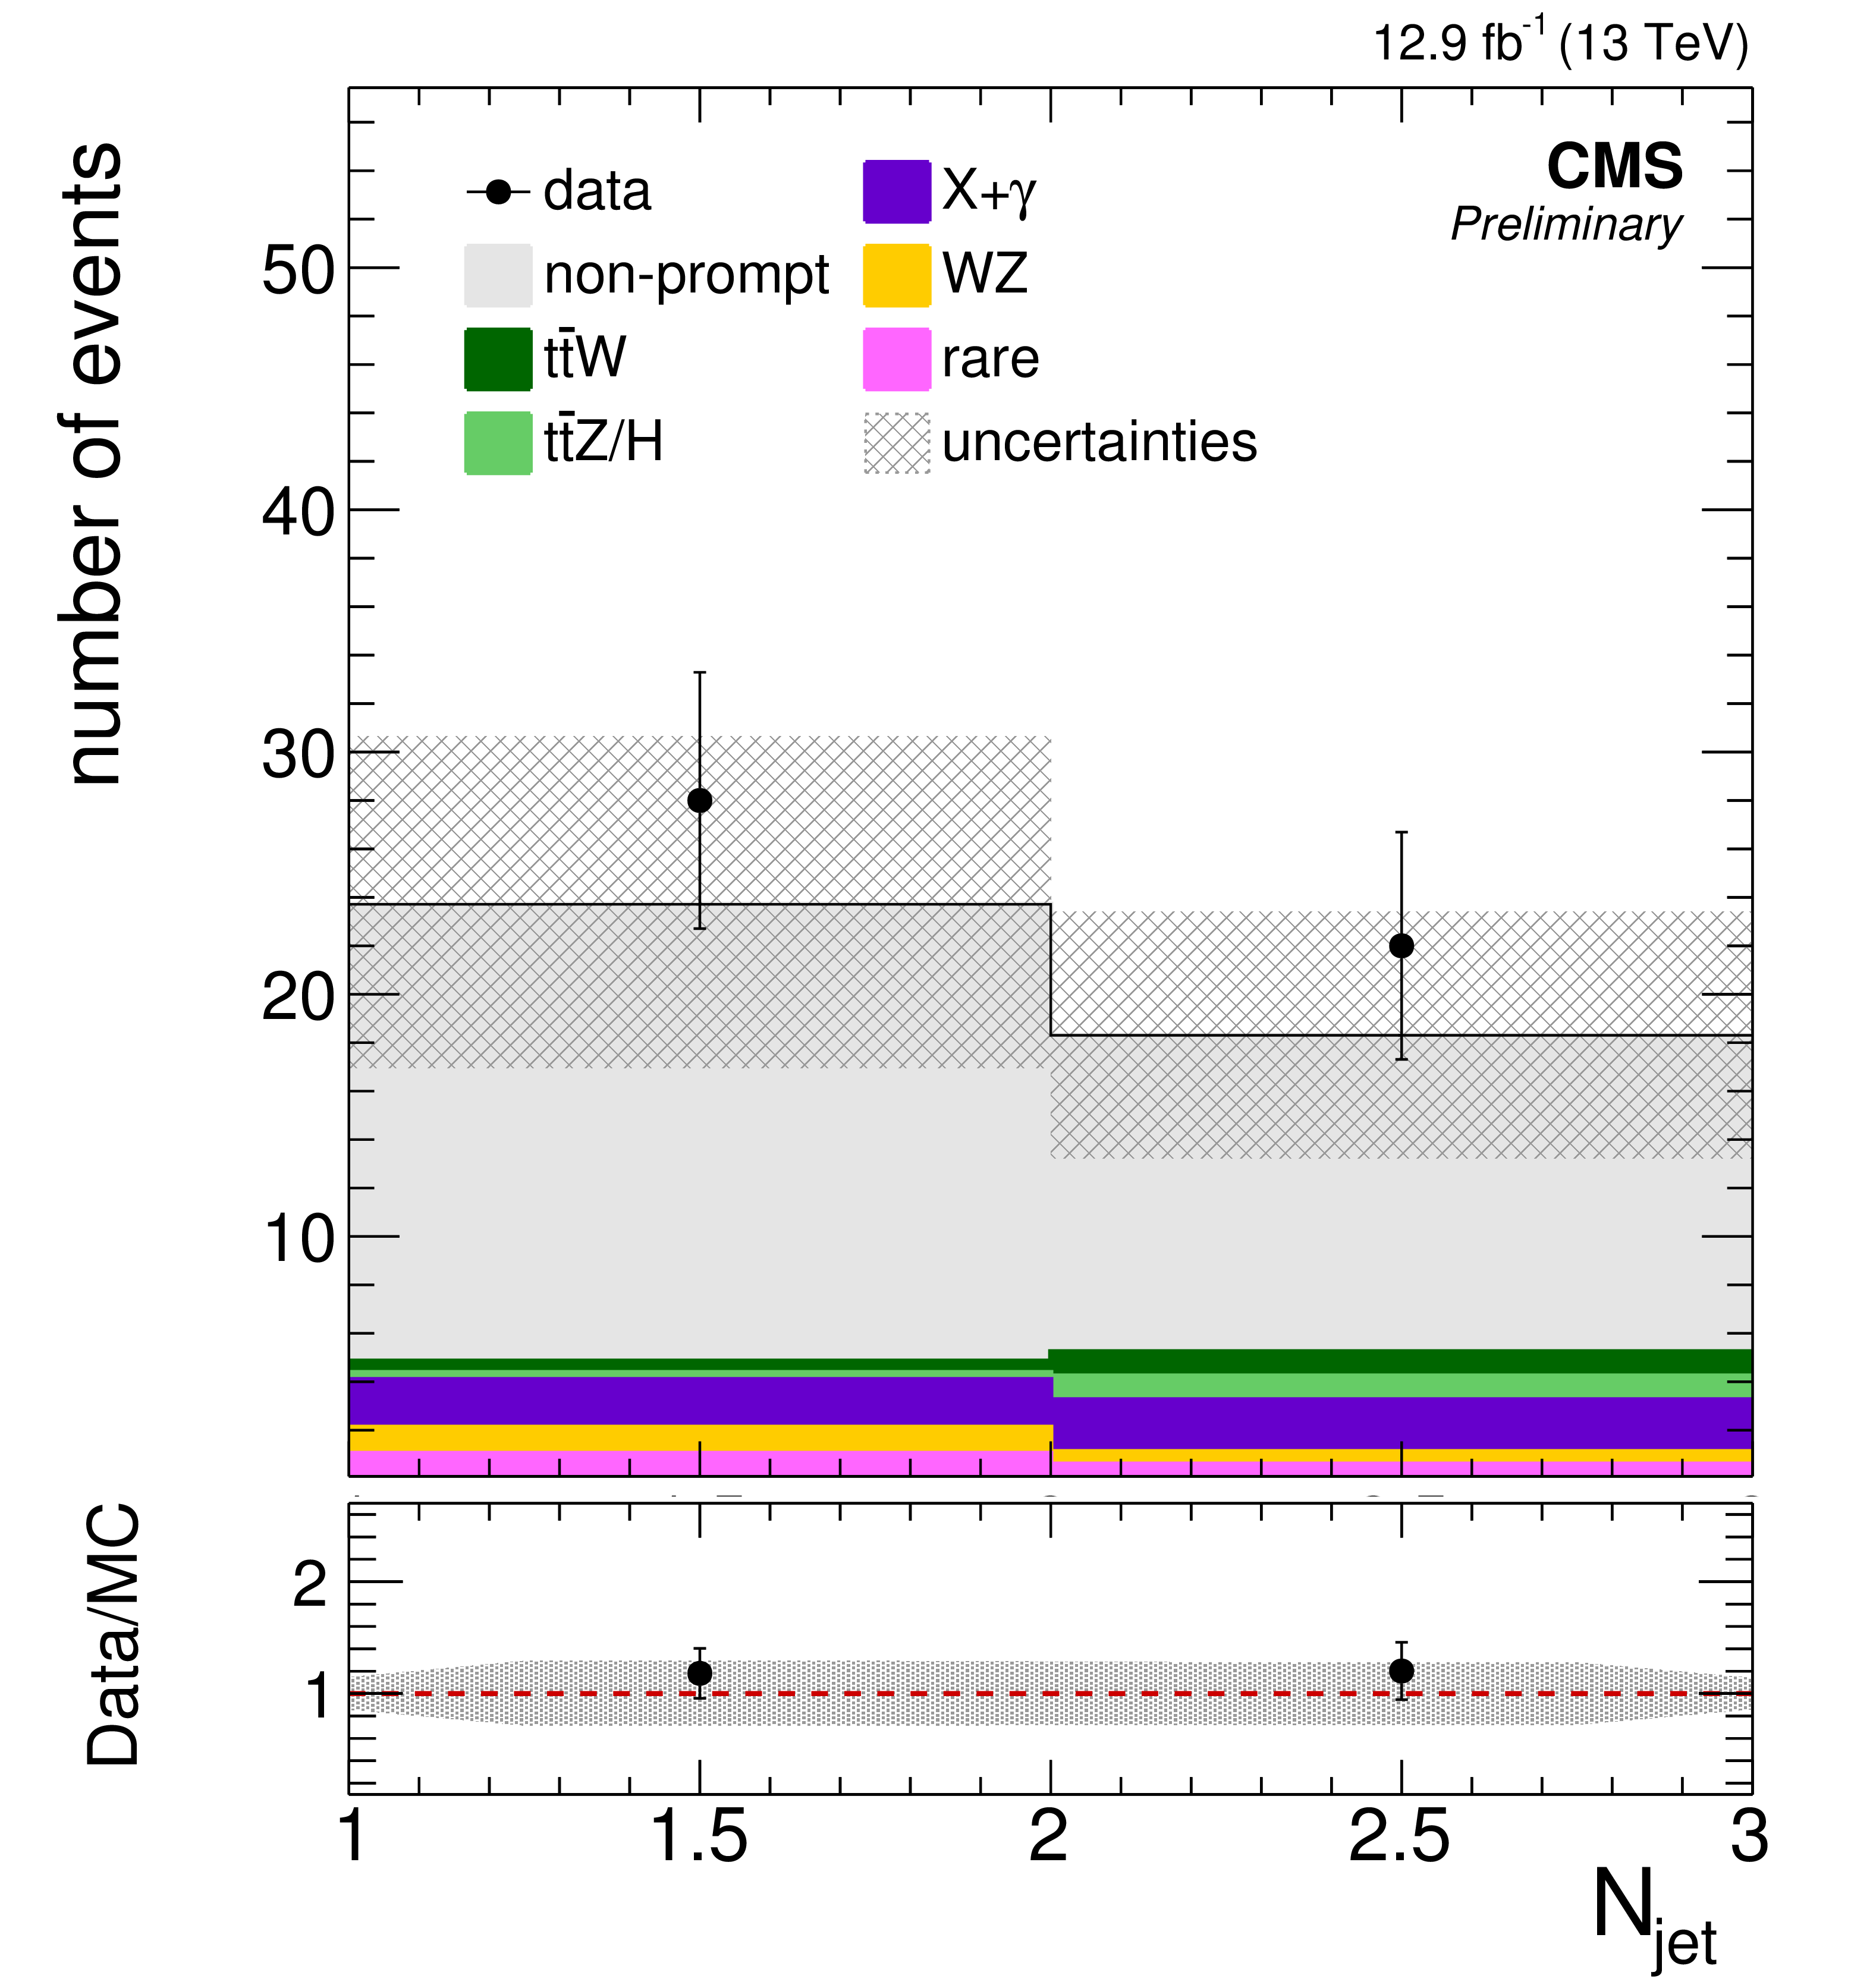
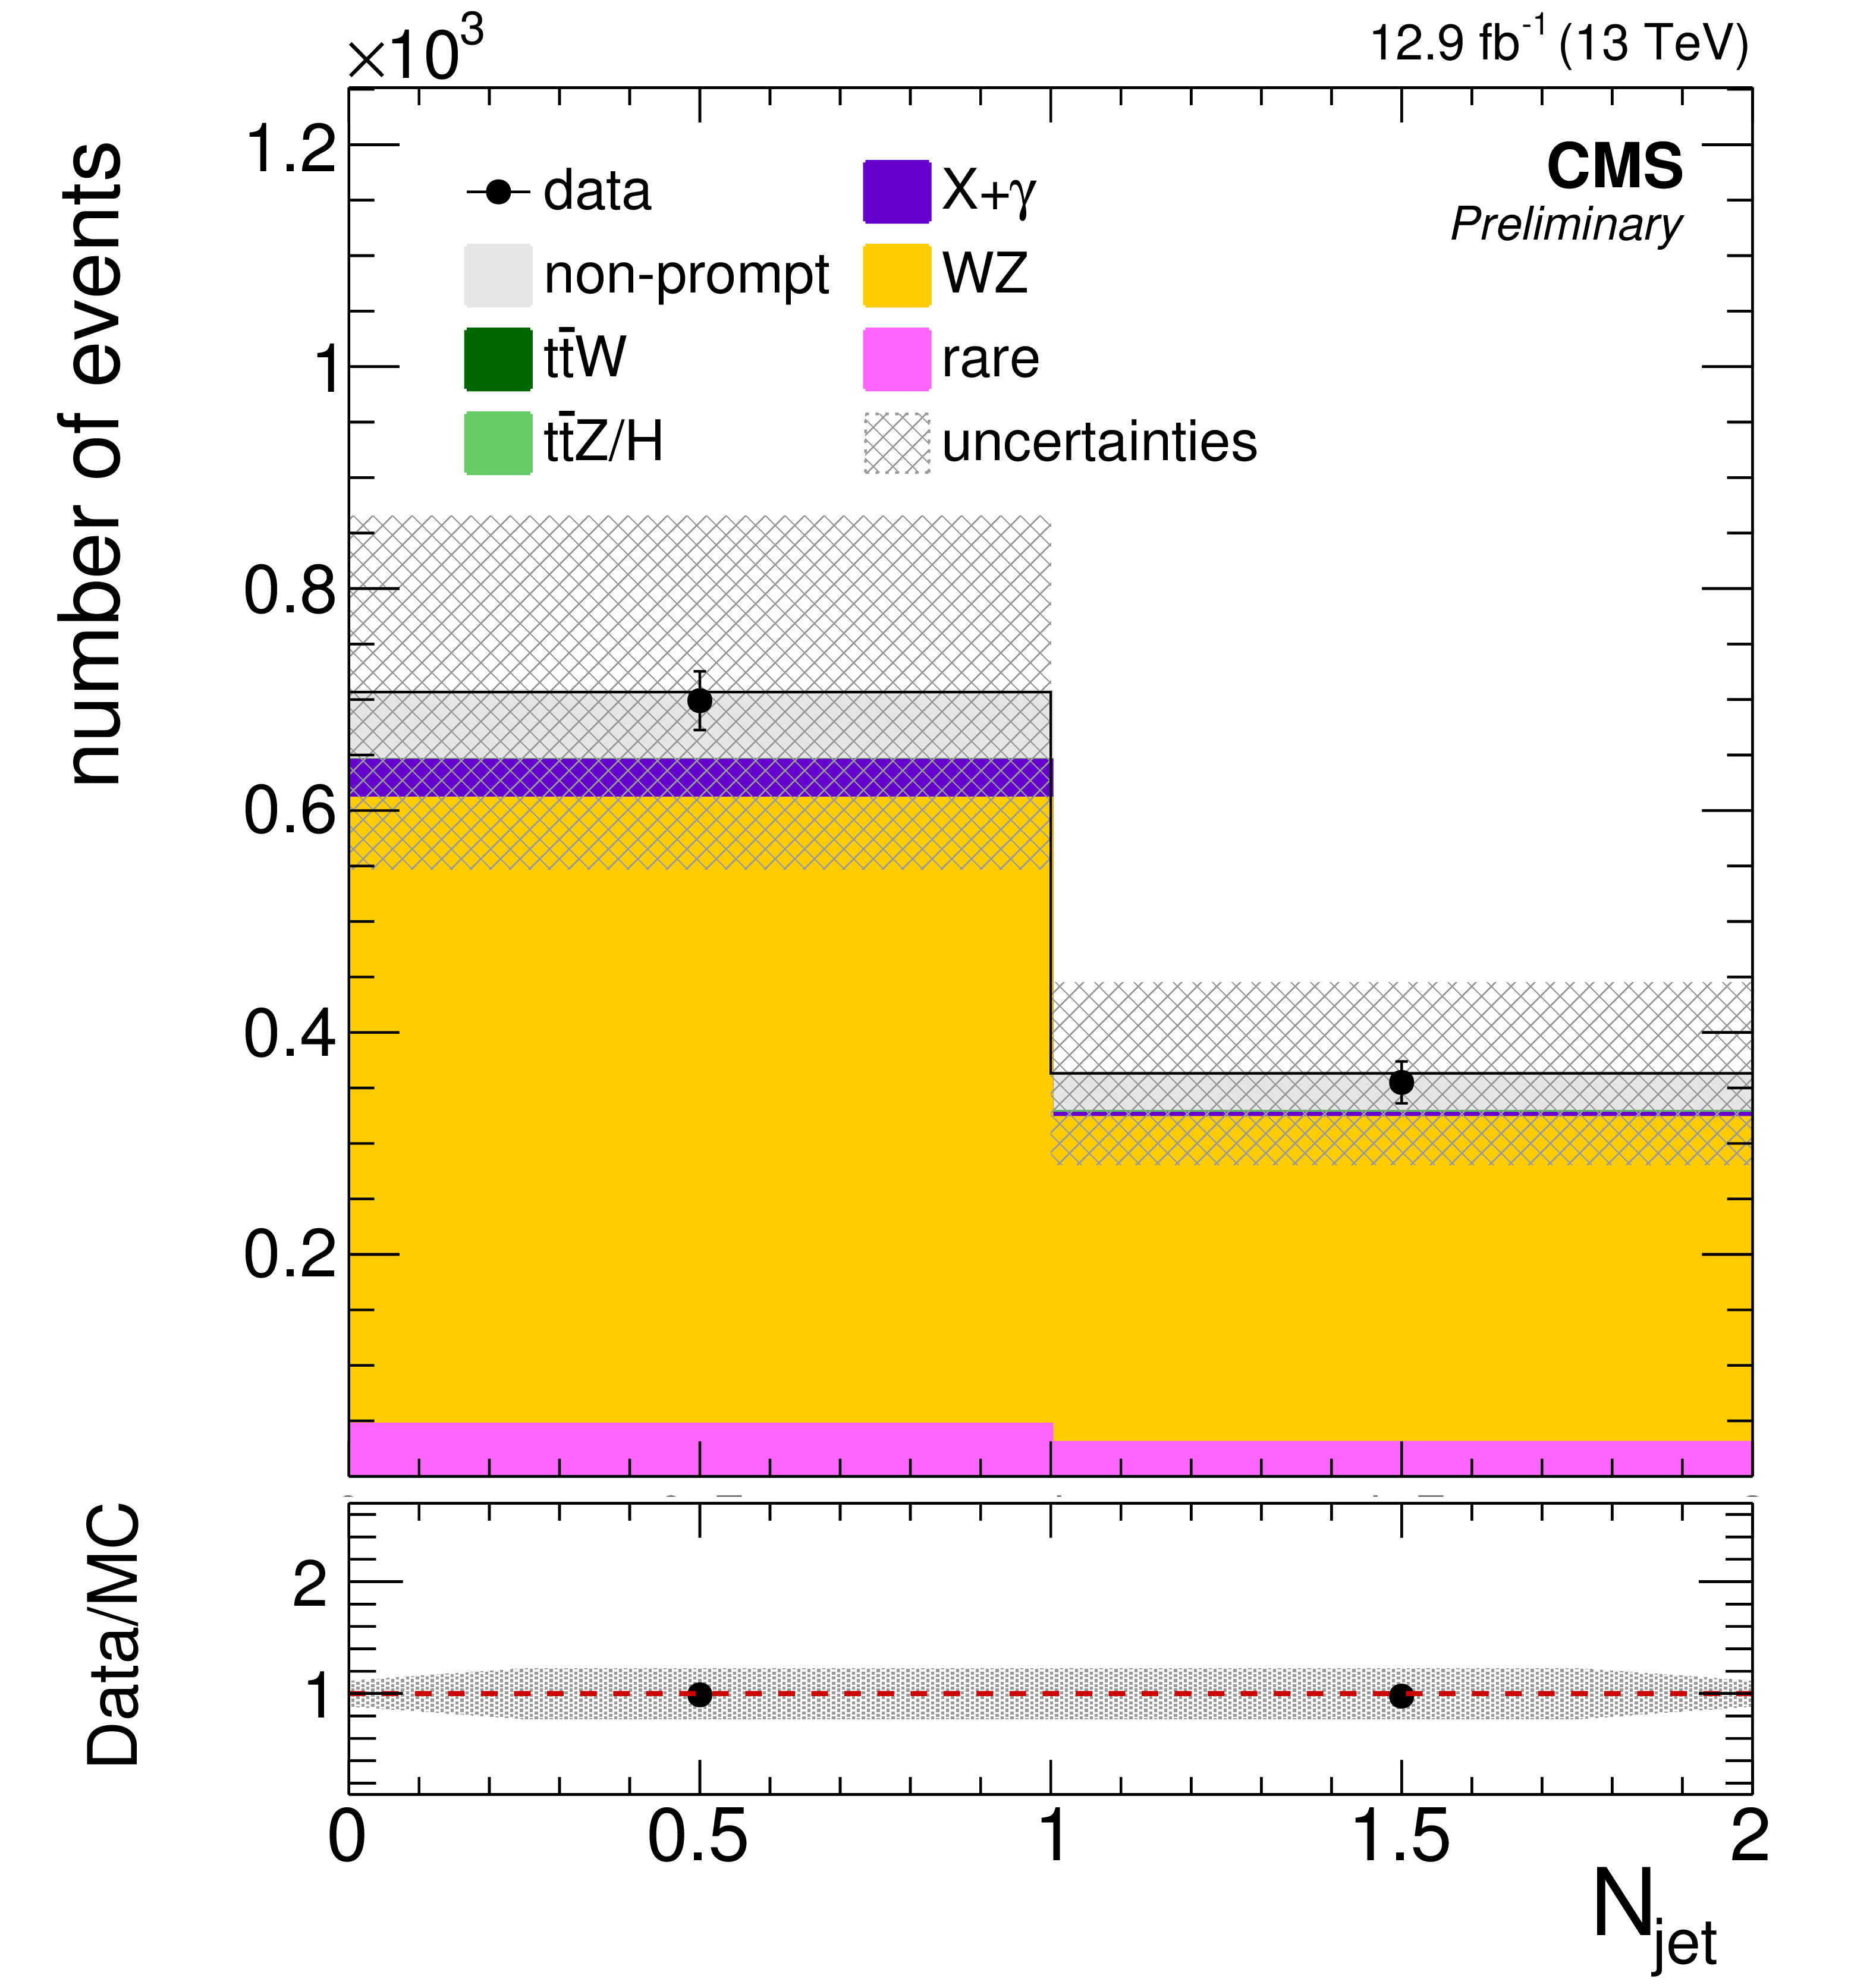
Additional Figure 5-a:
Non-prompt lepton control region. Good agreement between data and data-driven background estimation is observed in distributions showing the number of jets (a), b-tagged jets (b), $ {E_{\mathrm {T}}^{\text {miss}}} $ (c), $ {H_{\mathrm {T}}} $ (d), and the lepton $ {p_{\mathrm {T}}} $ spectra (e,f,g). |
png pdf |
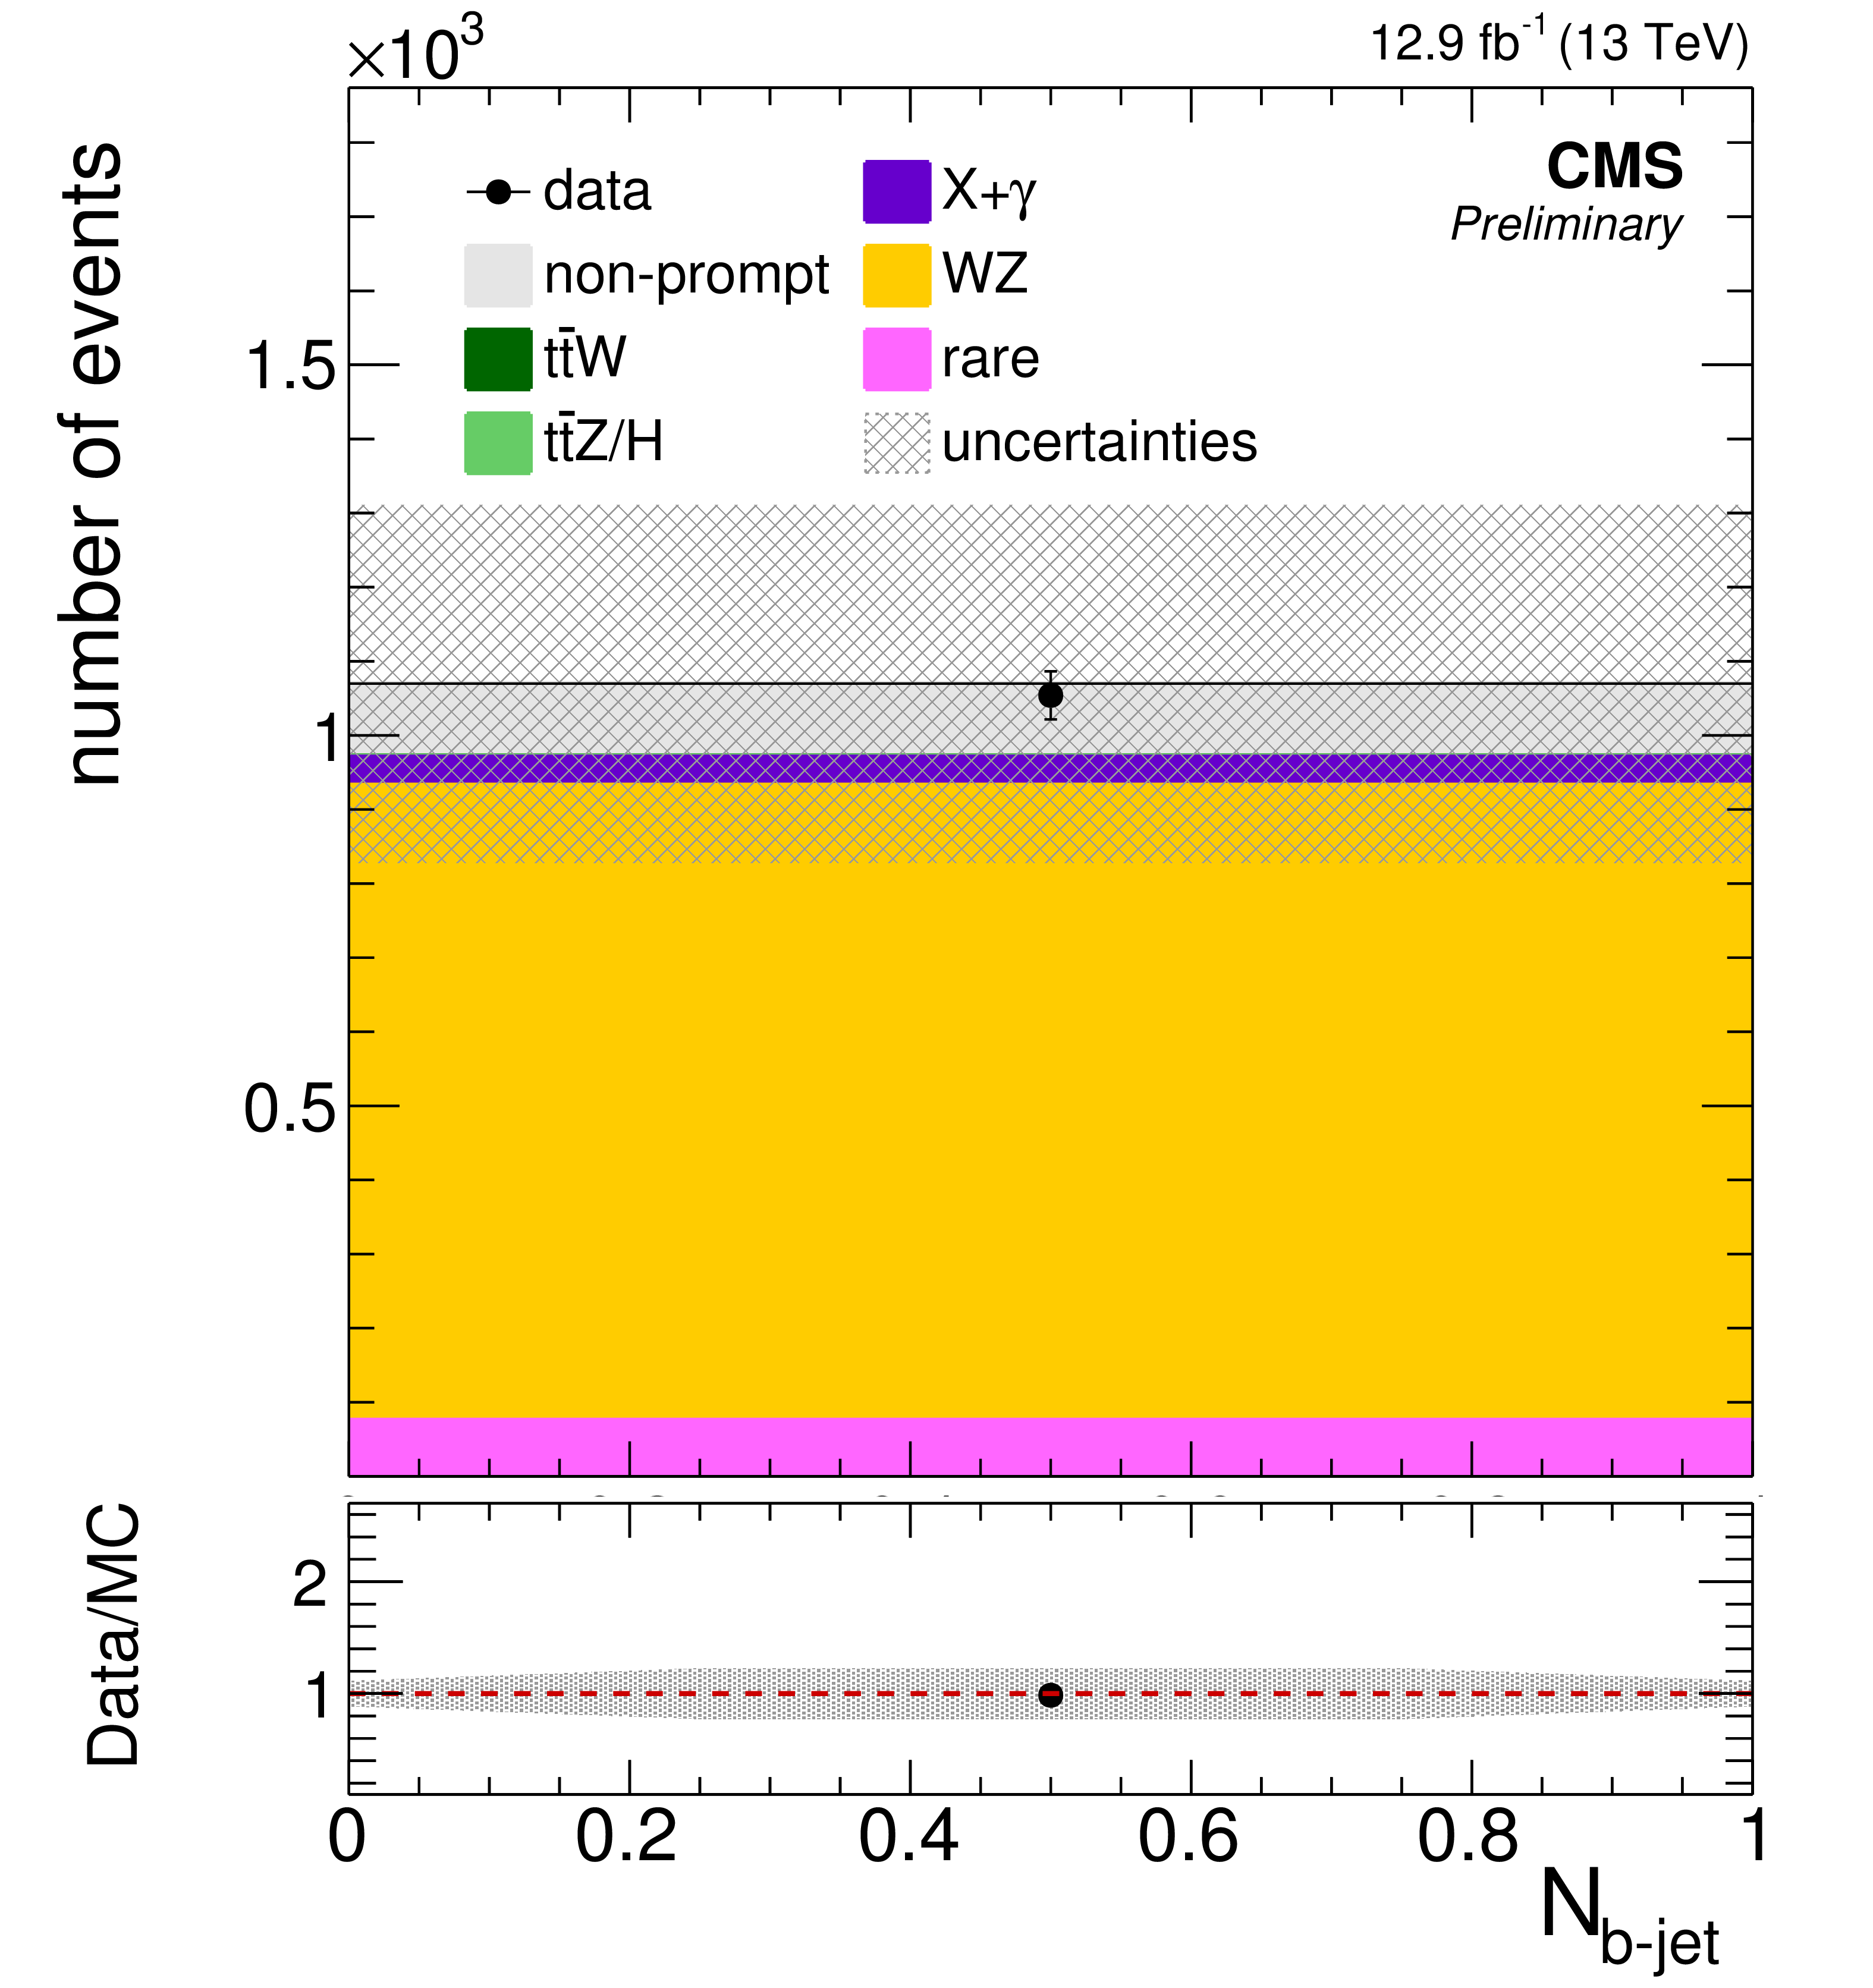
Additional Figure 5-b:
Non-prompt lepton control region. Good agreement between data and data-driven background estimation is observed in distributions showing the number of jets (a), b-tagged jets (b), $ {E_{\mathrm {T}}^{\text {miss}}} $ (c), $ {H_{\mathrm {T}}} $ (d), and the lepton $ {p_{\mathrm {T}}} $ spectra (e,f,g). |
png pdf |
Additional Figure 5-c:
Non-prompt lepton control region. Good agreement between data and data-driven background estimation is observed in distributions showing the number of jets (a), b-tagged jets (b), $ {E_{\mathrm {T}}^{\text {miss}}} $ (c), $ {H_{\mathrm {T}}} $ (d), and the lepton $ {p_{\mathrm {T}}} $ spectra (e,f,g). |
png pdf |
Additional Figure 5-d:
Non-prompt lepton control region. Good agreement between data and data-driven background estimation is observed in distributions showing the number of jets (a), b-tagged jets (b), $ {E_{\mathrm {T}}^{\text {miss}}} $ (c), $ {H_{\mathrm {T}}} $ (d), and the lepton $ {p_{\mathrm {T}}} $ spectra (e,f,g). |
png pdf |
Additional Figure 5-e:
Non-prompt lepton control region. Good agreement between data and data-driven background estimation is observed in distributions showing the number of jets (a), b-tagged jets (b), $ {E_{\mathrm {T}}^{\text {miss}}} $ (c), $ {H_{\mathrm {T}}} $ (d), and the lepton $ {p_{\mathrm {T}}} $ spectra (e,f,g). |
png pdf |
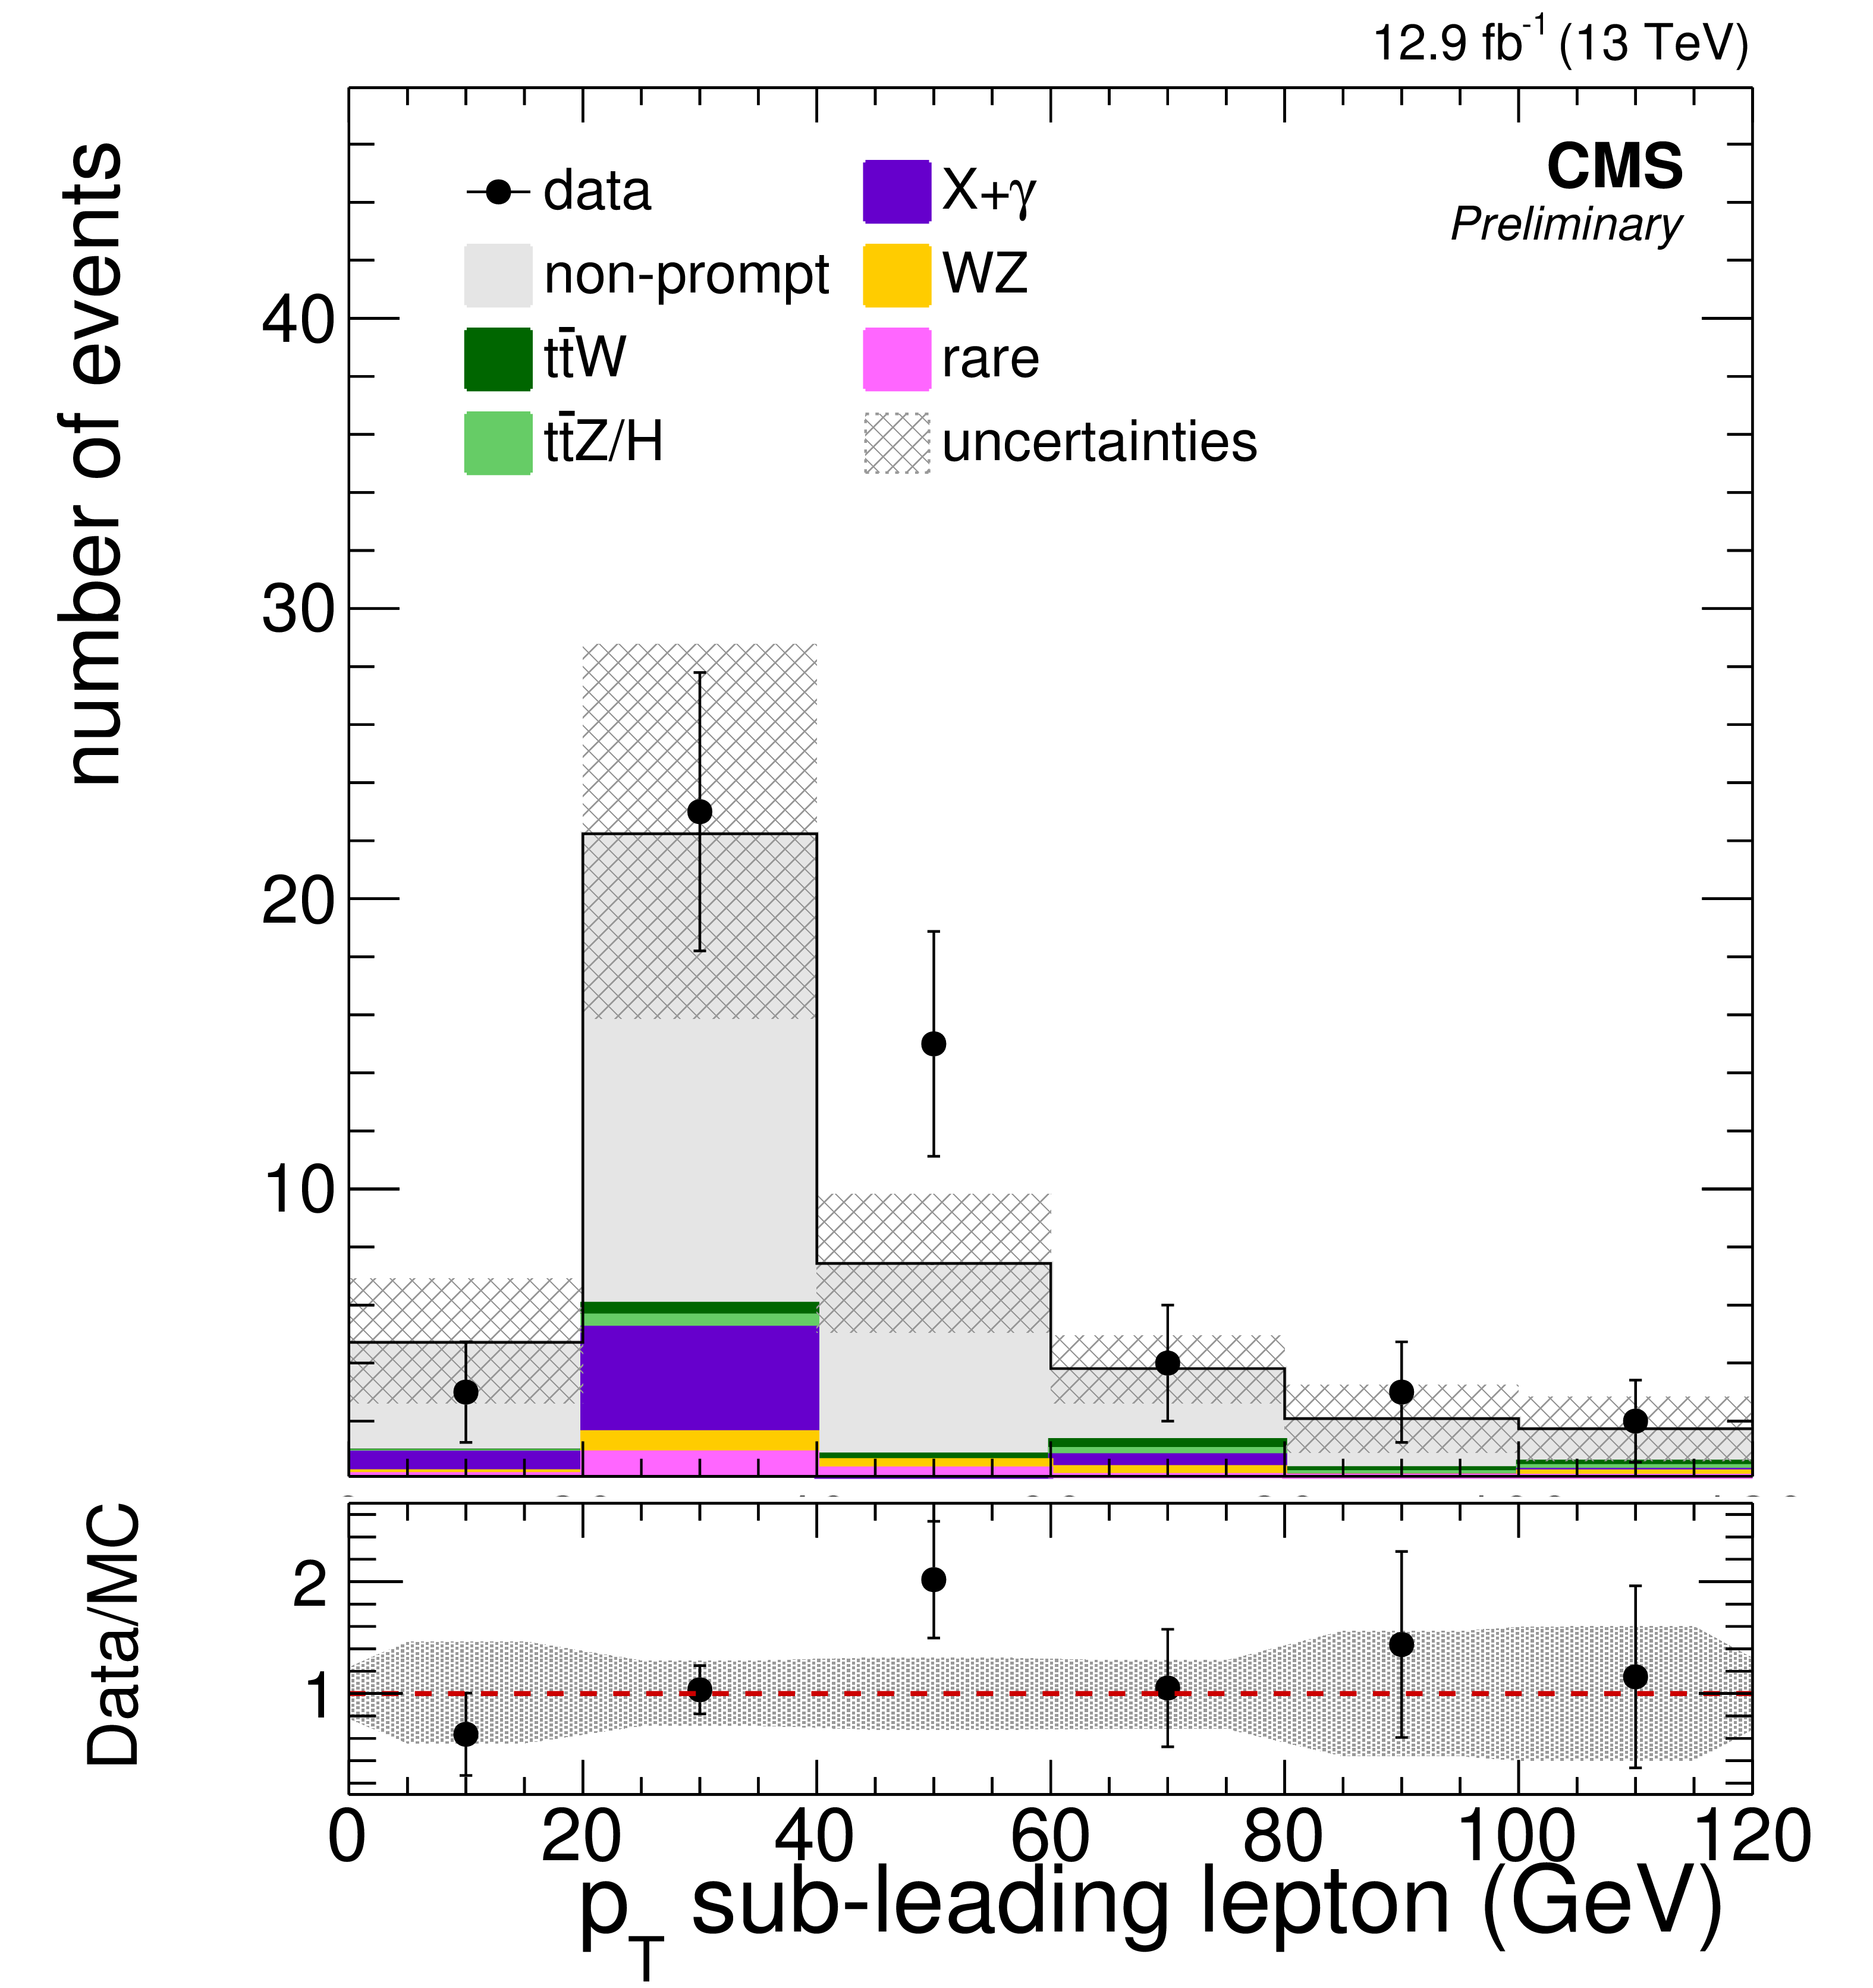
Additional Figure 5-f:
Non-prompt lepton control region. Good agreement between data and data-driven background estimation is observed in distributions showing the number of jets (a), b-tagged jets (b), $ {E_{\mathrm {T}}^{\text {miss}}} $ (c), $ {H_{\mathrm {T}}} $ (d), and the lepton $ {p_{\mathrm {T}}} $ spectra (e,f,g). |
png pdf |
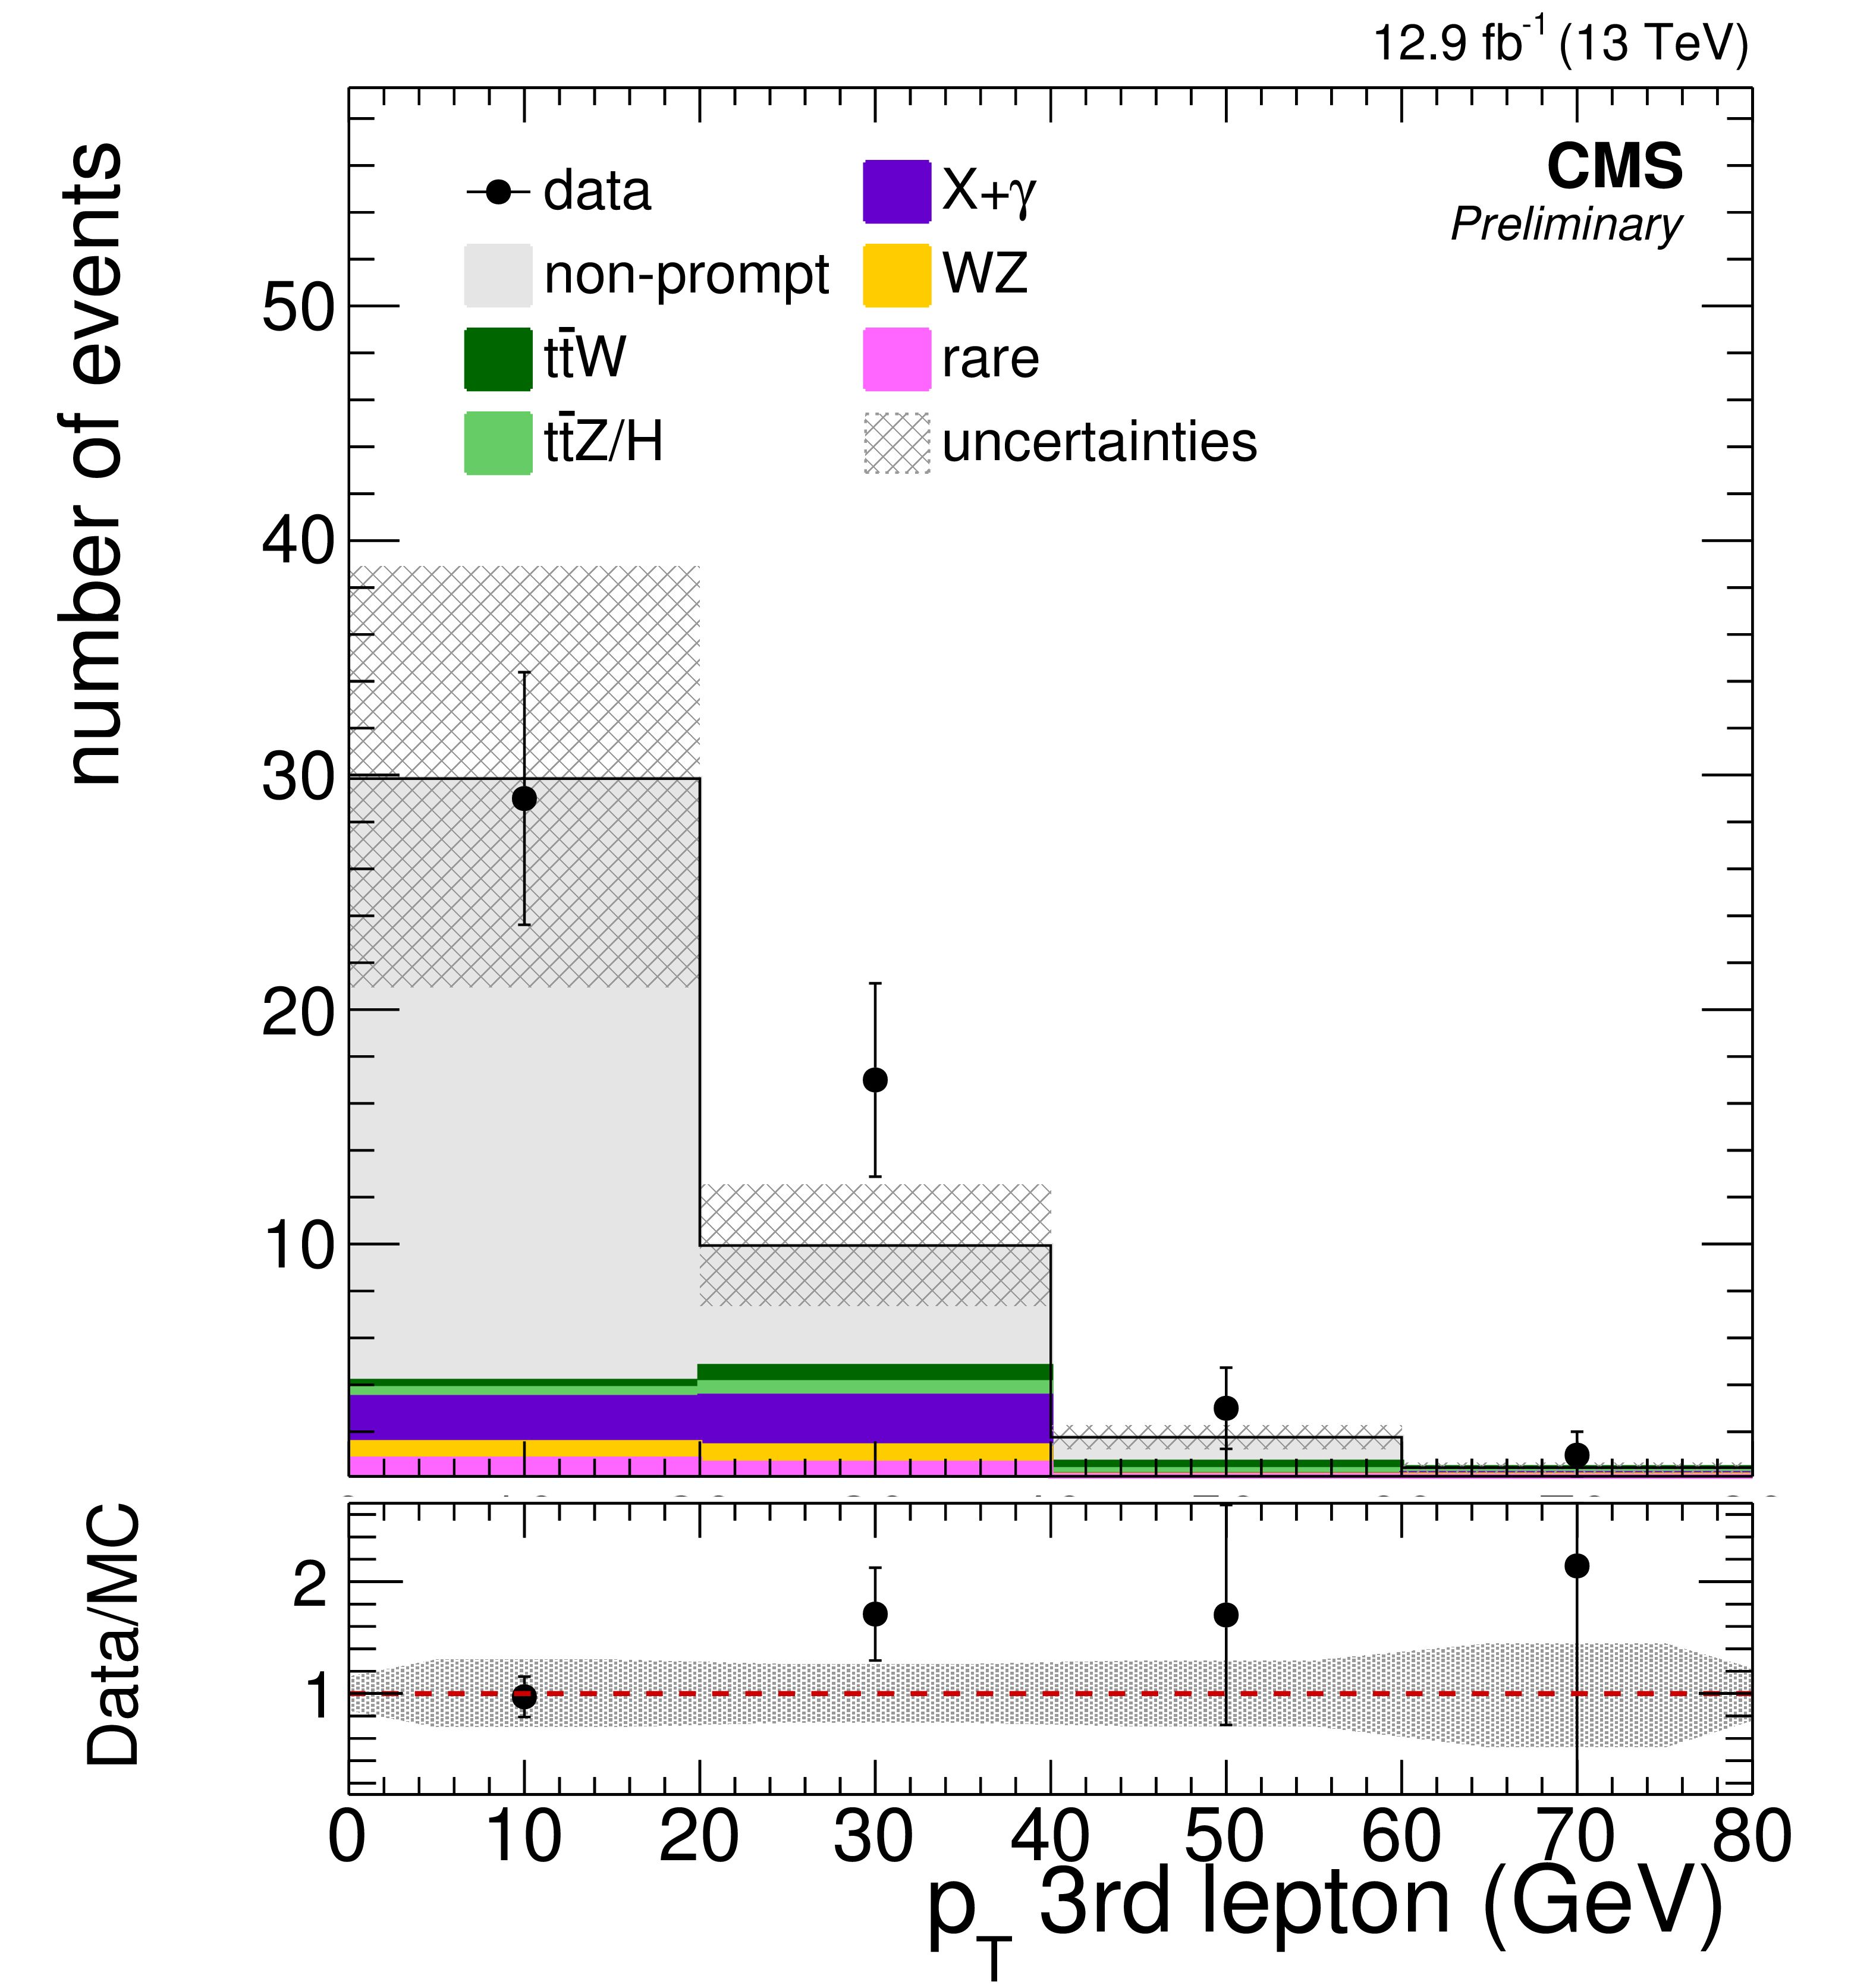
Additional Figure 5-g:
Non-prompt lepton control region. Good agreement between data and data-driven background estimation is observed in distributions showing the number of jets (a), b-tagged jets (b), $ {E_{\mathrm {T}}^{\text {miss}}} $ (c), $ {H_{\mathrm {T}}} $ (d), and the lepton $ {p_{\mathrm {T}}} $ spectra (e,f,g). |
png pdf |
Additional Figure 6-a:
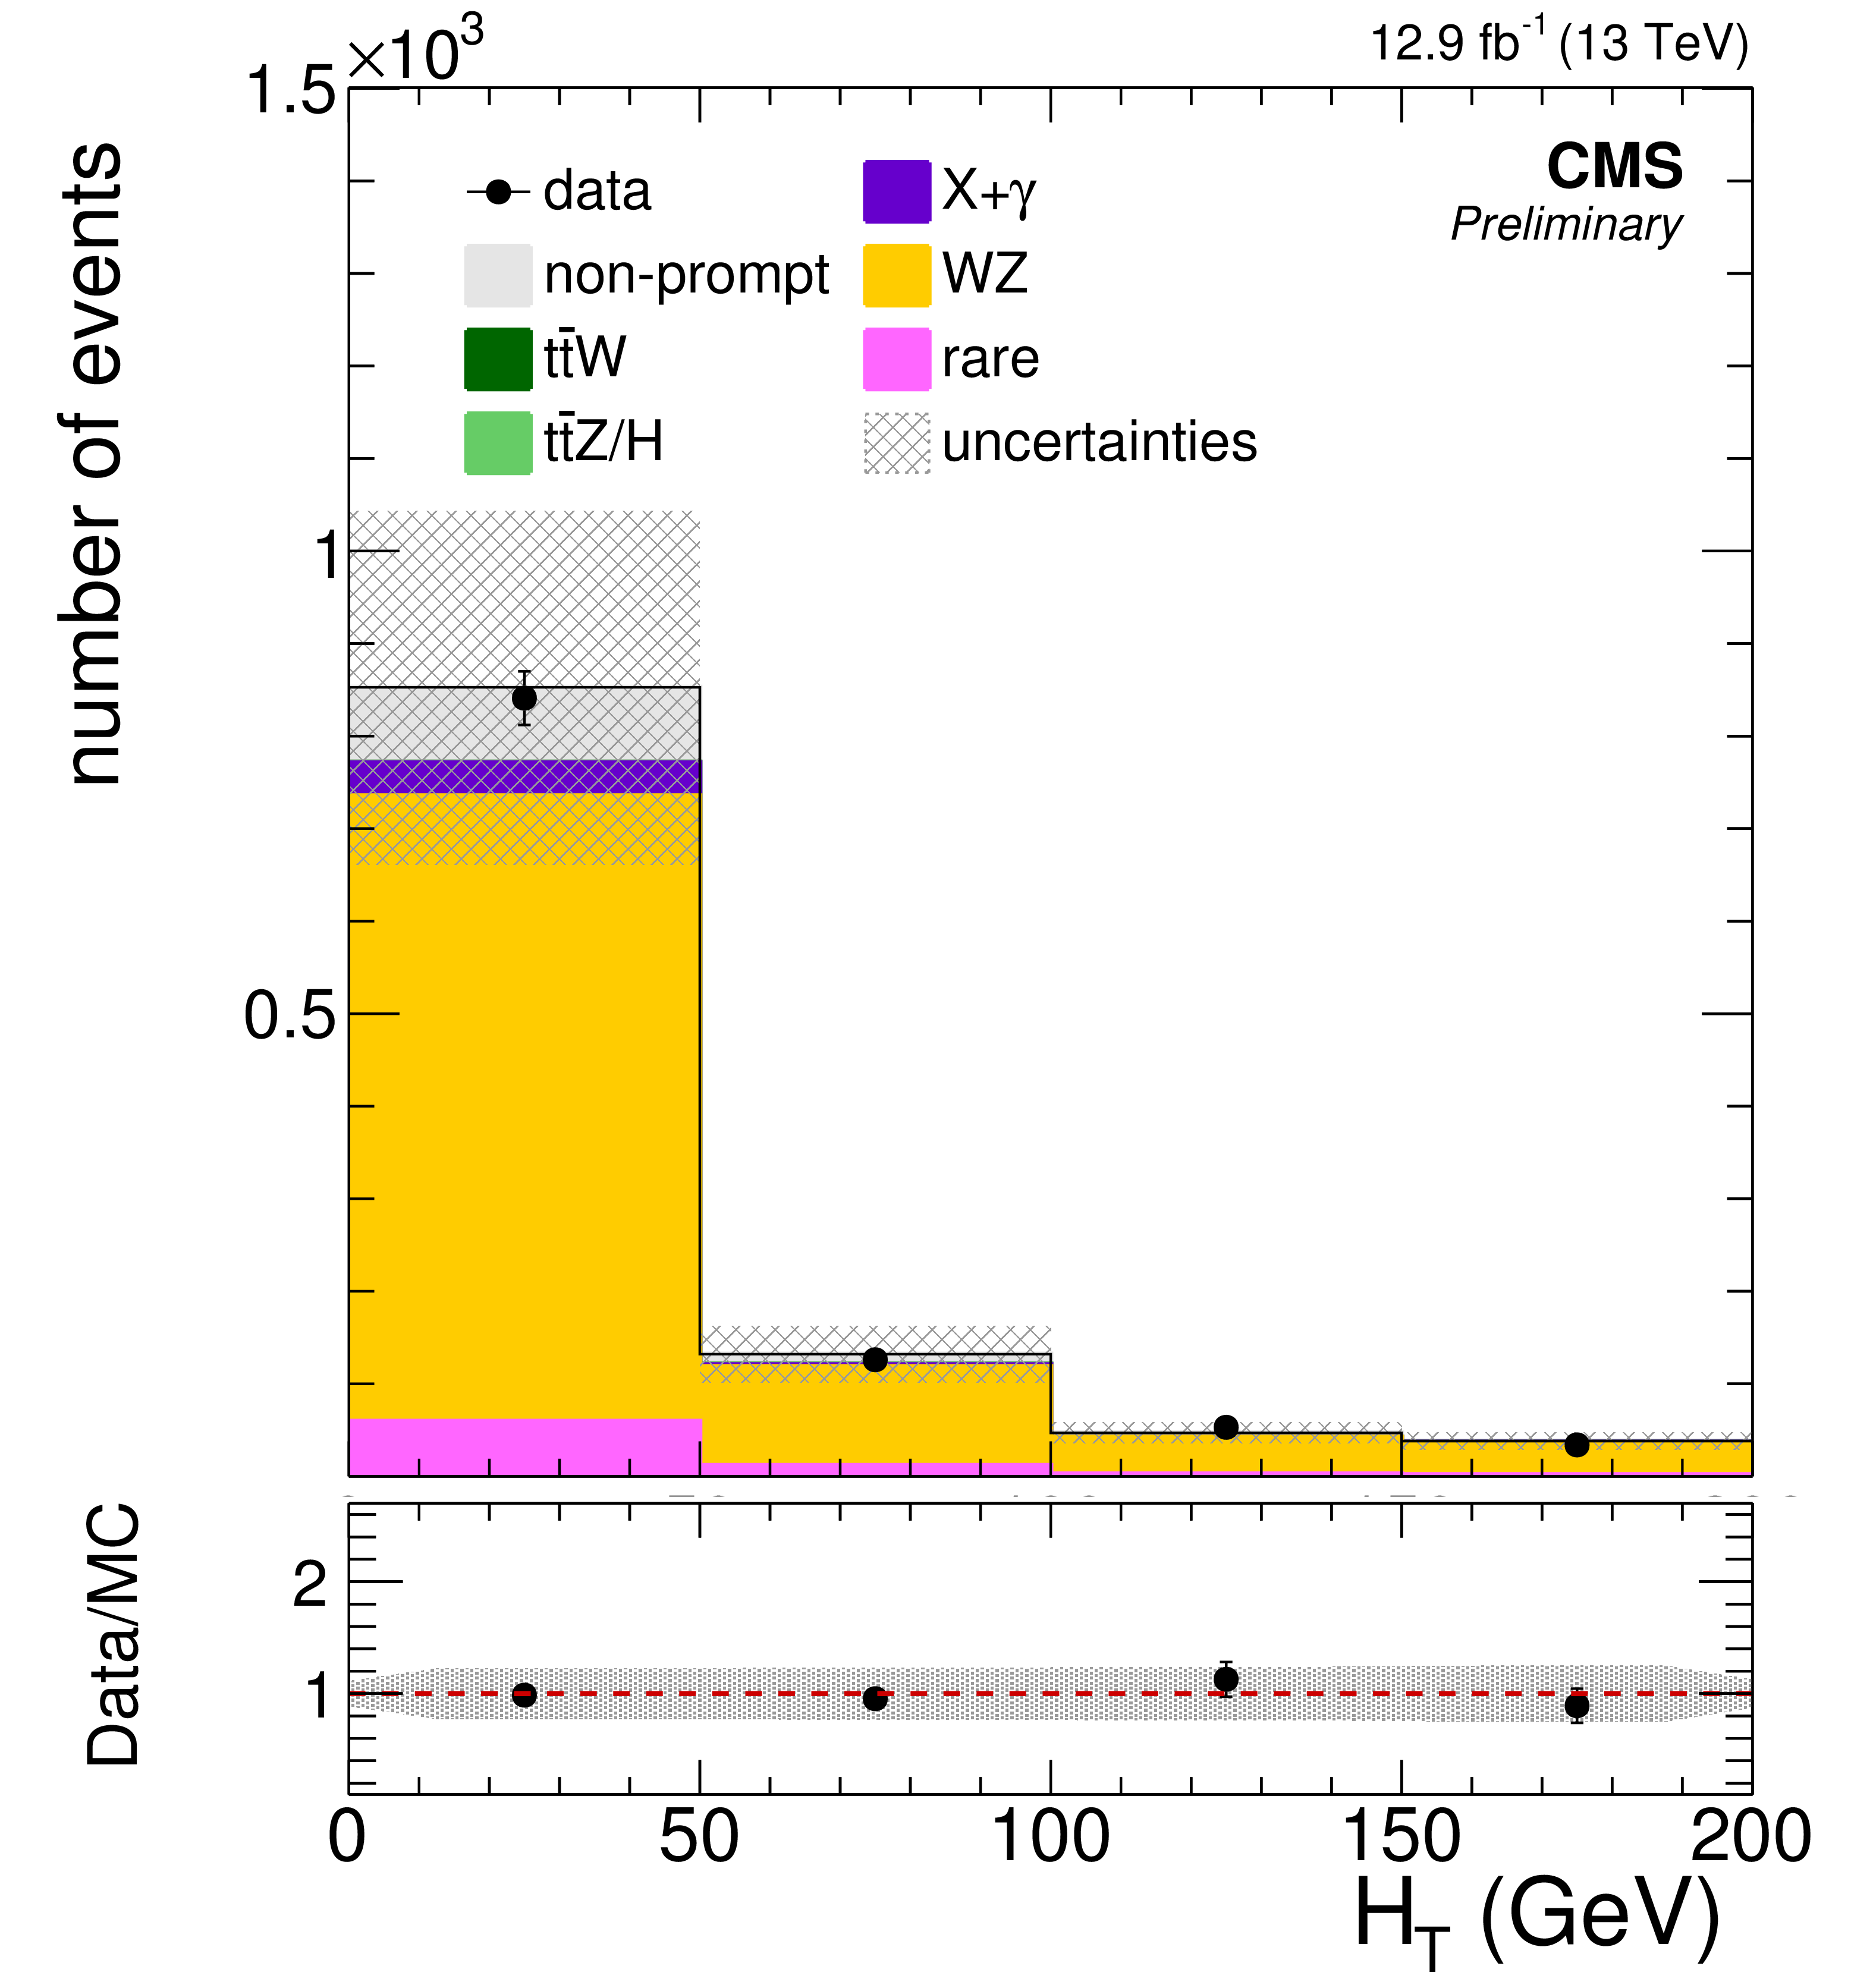
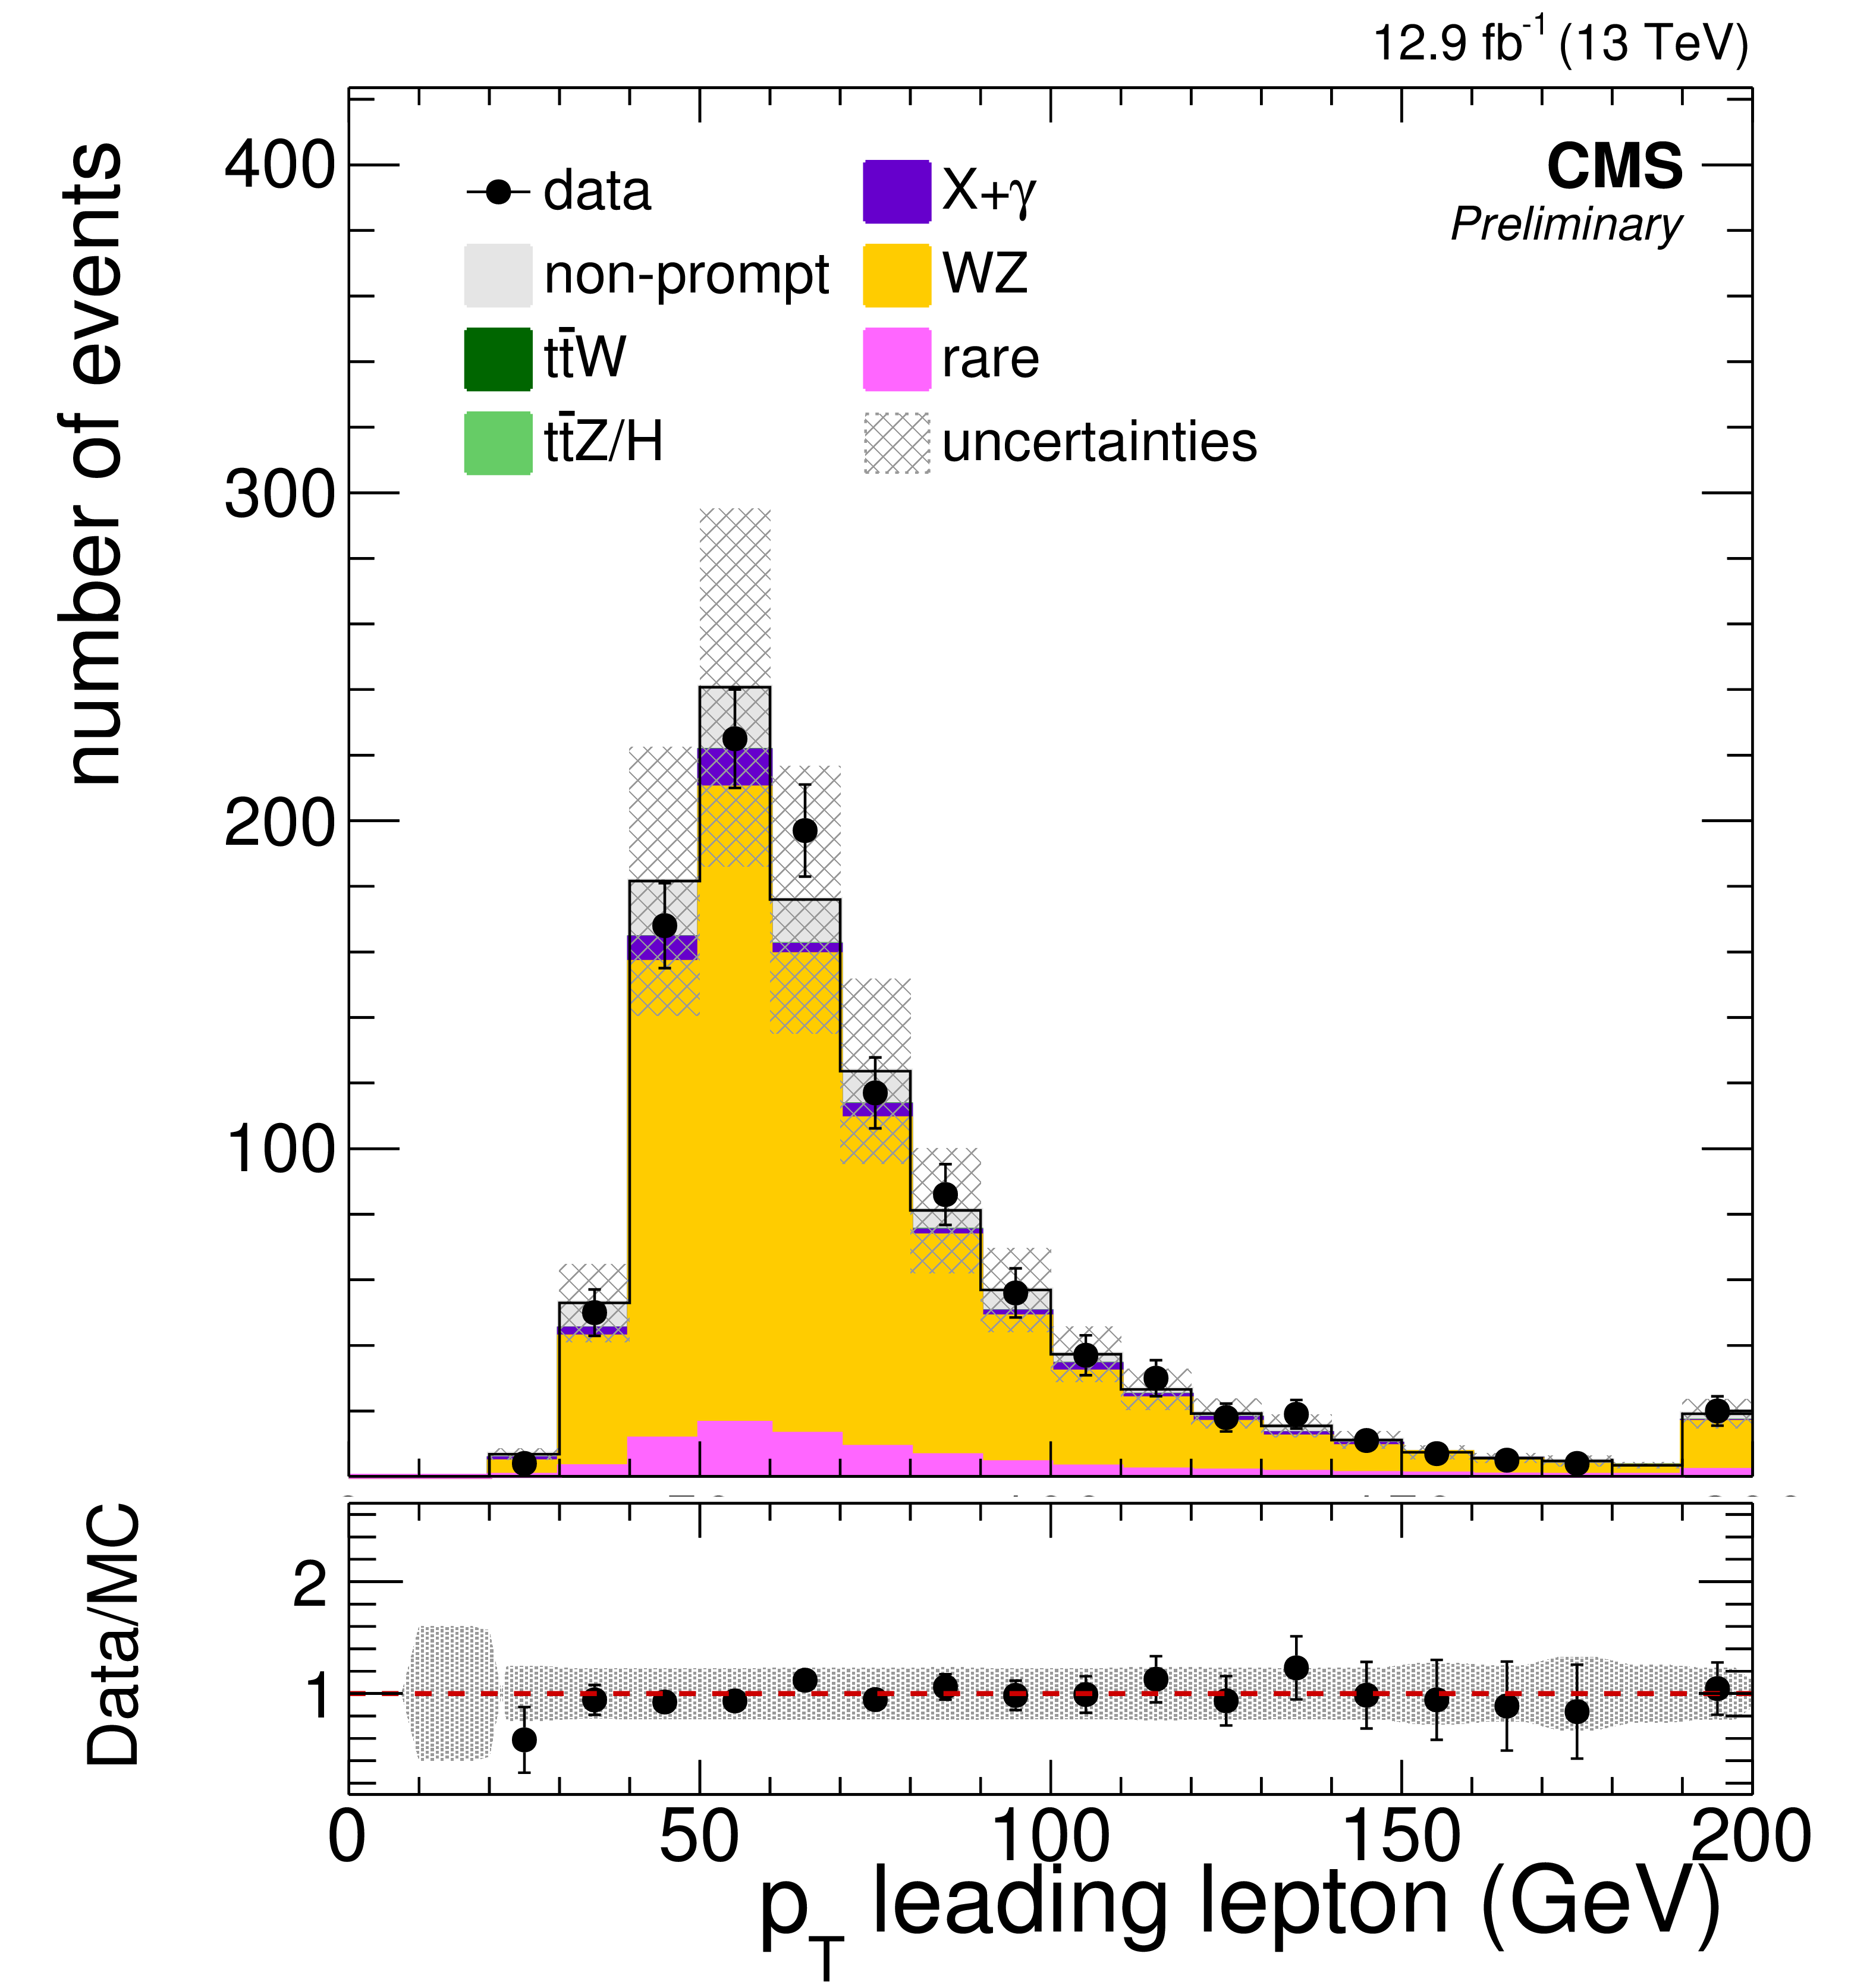
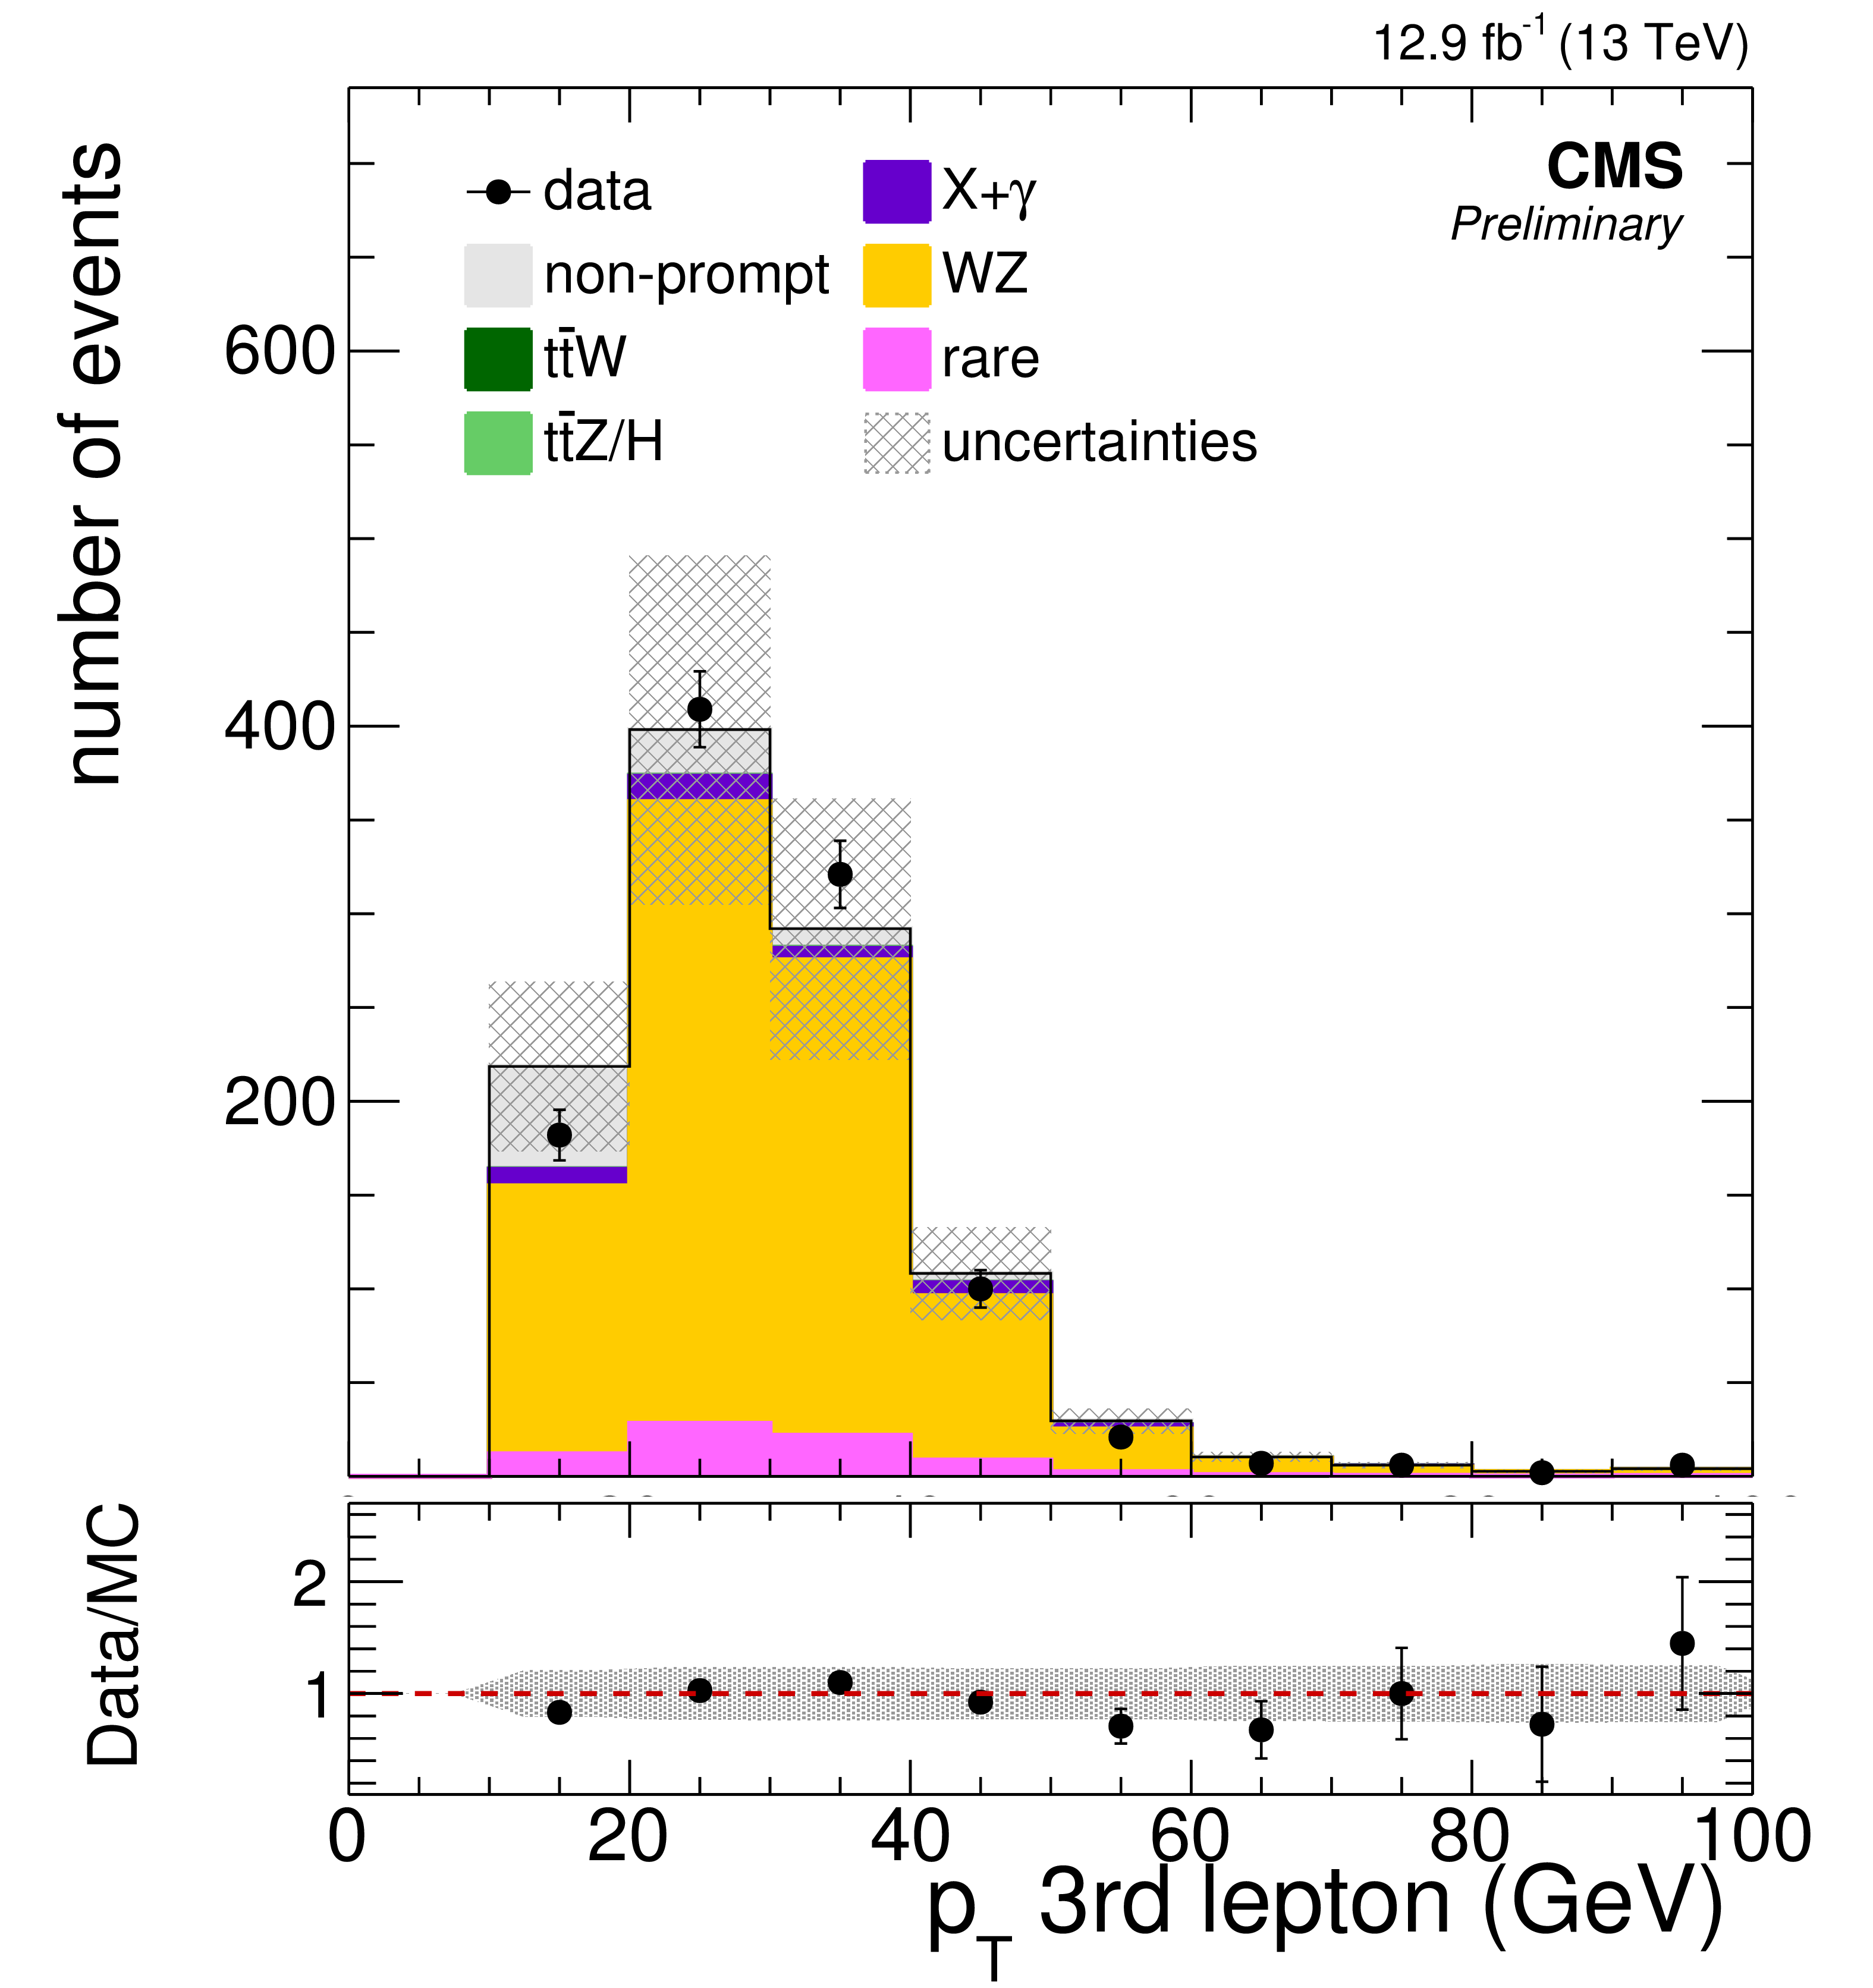
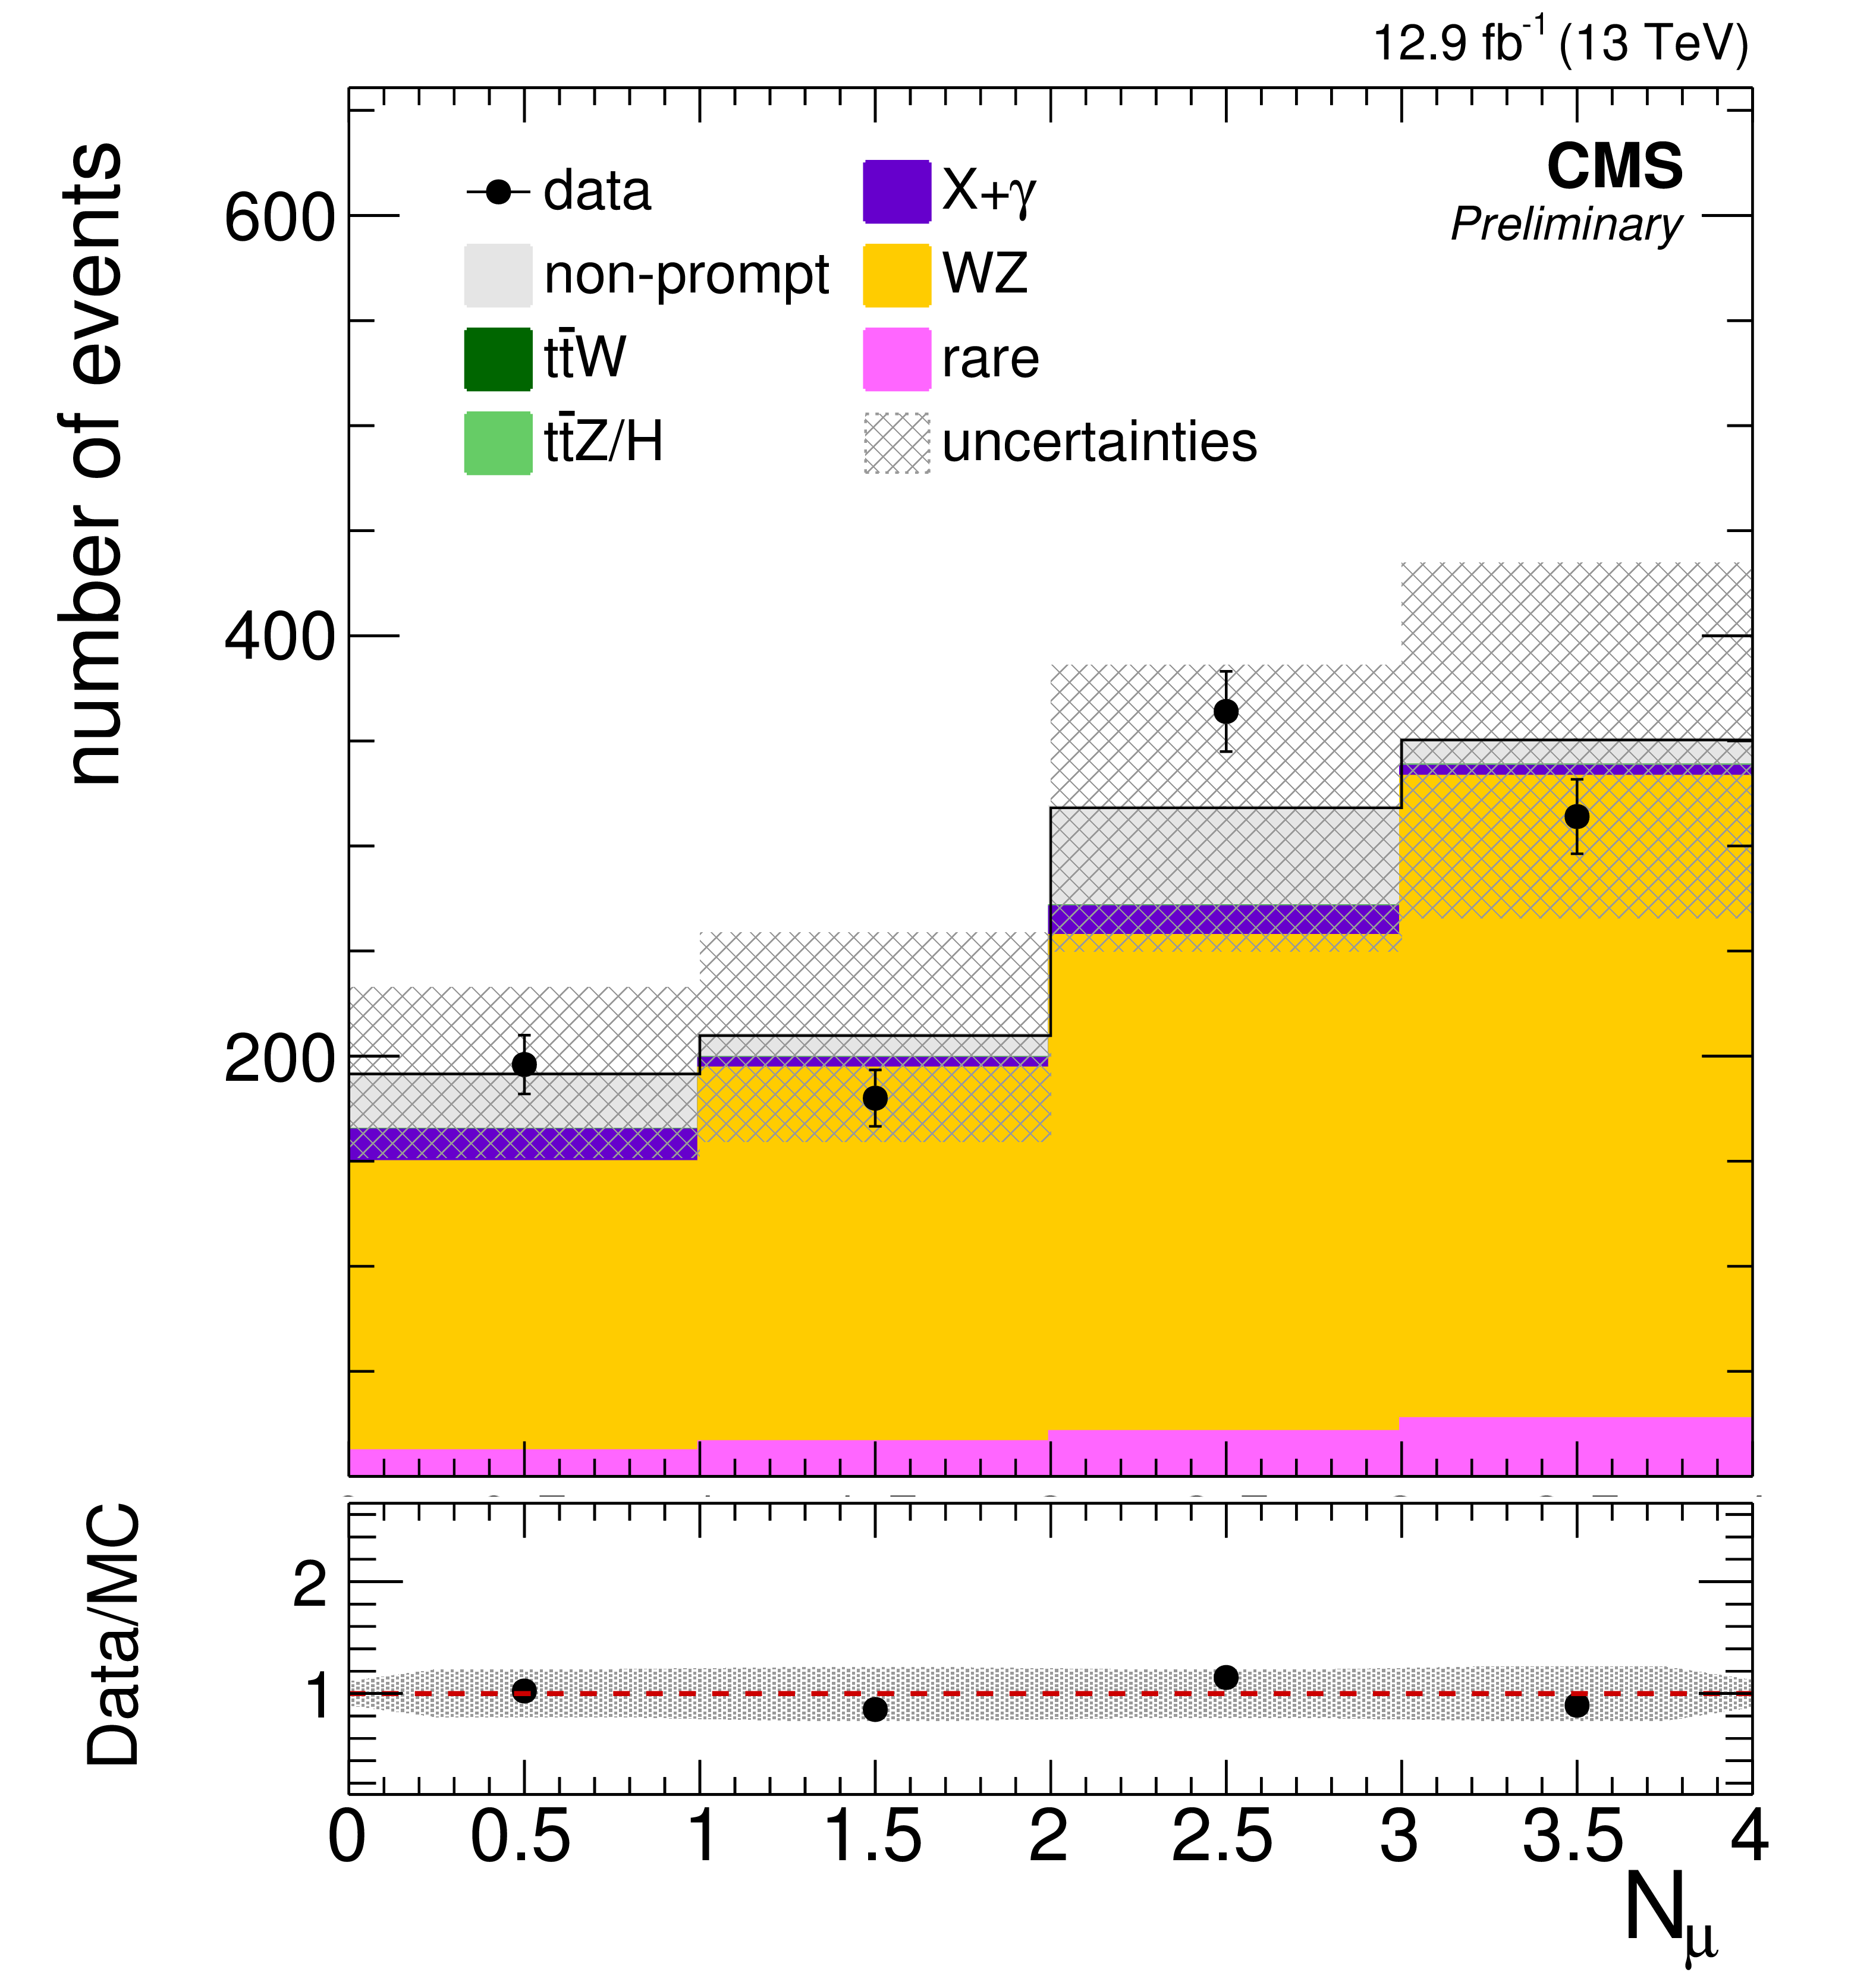
WZ control region distributions showing the number of jets (a) and b-jets (b), $ {E_{\mathrm {T}}^{\text {miss}}} $ (c), $ {H_{\mathrm {T}}} $ (d), $ {M_\text {T}} $ (e), and the lepton $ {p_{\mathrm {T}}} $ spectra (f,g,h). Additionally, the distribution of the number of muons in the event is shown (i). As the WZ control region requires exactly three leptons (electrons or muons), this number unambiguously determines the flavor composition in the event. |
png pdf |
Additional Figure 6-b:
WZ control region distributions showing the number of jets (a) and b-jets (b), $ {E_{\mathrm {T}}^{\text {miss}}} $ (c), $ {H_{\mathrm {T}}} $ (d), $ {M_\text {T}} $ (e), and the lepton $ {p_{\mathrm {T}}} $ spectra (f,g,h). Additionally, the distribution of the number of muons in the event is shown (i). As the WZ control region requires exactly three leptons (electrons or muons), this number unambiguously determines the flavor composition in the event. |

png pdf |
Additional Figure 6-c:
WZ control region distributions showing the number of jets (a) and b-jets (b), $ {E_{\mathrm {T}}^{\text {miss}}} $ (c), $ {H_{\mathrm {T}}} $ (d), $ {M_\text {T}} $ (e), and the lepton $ {p_{\mathrm {T}}} $ spectra (f,g,h). Additionally, the distribution of the number of muons in the event is shown (i). As the WZ control region requires exactly three leptons (electrons or muons), this number unambiguously determines the flavor composition in the event. |
png pdf |
Additional Figure 6-d:
WZ control region distributions showing the number of jets (a) and b-jets (b), $ {E_{\mathrm {T}}^{\text {miss}}} $ (c), $ {H_{\mathrm {T}}} $ (d), $ {M_\text {T}} $ (e), and the lepton $ {p_{\mathrm {T}}} $ spectra (f,g,h). Additionally, the distribution of the number of muons in the event is shown (i). As the WZ control region requires exactly three leptons (electrons or muons), this number unambiguously determines the flavor composition in the event. |

png pdf |
Additional Figure 6-e:
WZ control region distributions showing the number of jets (a) and b-jets (b), $ {E_{\mathrm {T}}^{\text {miss}}} $ (c), $ {H_{\mathrm {T}}} $ (d), $ {M_\text {T}} $ (e), and the lepton $ {p_{\mathrm {T}}} $ spectra (f,g,h). Additionally, the distribution of the number of muons in the event is shown (i). As the WZ control region requires exactly three leptons (electrons or muons), this number unambiguously determines the flavor composition in the event. |
png pdf |
Additional Figure 6-f:
WZ control region distributions showing the number of jets (a) and b-jets (b), $ {E_{\mathrm {T}}^{\text {miss}}} $ (c), $ {H_{\mathrm {T}}} $ (d), $ {M_\text {T}} $ (e), and the lepton $ {p_{\mathrm {T}}} $ spectra (f,g,h). Additionally, the distribution of the number of muons in the event is shown (i). As the WZ control region requires exactly three leptons (electrons or muons), this number unambiguously determines the flavor composition in the event. |

png pdf |
Additional Figure 6-g:
WZ control region distributions showing the number of jets (a) and b-jets (b), $ {E_{\mathrm {T}}^{\text {miss}}} $ (c), $ {H_{\mathrm {T}}} $ (d), $ {M_\text {T}} $ (e), and the lepton $ {p_{\mathrm {T}}} $ spectra (f,g,h). Additionally, the distribution of the number of muons in the event is shown (i). As the WZ control region requires exactly three leptons (electrons or muons), this number unambiguously determines the flavor composition in the event. |
png pdf |
Additional Figure 6-h:
WZ control region distributions showing the number of jets (a) and b-jets (b), $ {E_{\mathrm {T}}^{\text {miss}}} $ (c), $ {H_{\mathrm {T}}} $ (d), $ {M_\text {T}} $ (e), and the lepton $ {p_{\mathrm {T}}} $ spectra (f,g,h). Additionally, the distribution of the number of muons in the event is shown (i). As the WZ control region requires exactly three leptons (electrons or muons), this number unambiguously determines the flavor composition in the event. |
png pdf |
Additional Figure 6-i:
WZ control region distributions showing the number of jets (a) and b-jets (b), $ {E_{\mathrm {T}}^{\text {miss}}} $ (c), $ {H_{\mathrm {T}}} $ (d), $ {M_\text {T}} $ (e), and the lepton $ {p_{\mathrm {T}}} $ spectra (f,g,h). Additionally, the distribution of the number of muons in the event is shown (i). As the WZ control region requires exactly three leptons (electrons or muons), this number unambiguously determines the flavor composition in the event. |
png pdf root |
Additional Figure 7-a:
Excluded region at 95% confidence in the $m( \tilde{ \chi }_0 )$ versus $m( \tilde{ \mathrm{g} } )$ plane for the T1tttt (a) and T5qqqqWZ (b) simplified model using only the most sensitive signal regions. For T1tttt the limit is obtained by statistical combination of off-Z signal region 13 and 15. Almost the same sensitivity as with the combination of all 32 signal regions can be achieved. For T5qqqqWZ on-Z signal region 2 and 15b are combined. A similar sensitivity as with the combination of all signal regions can be achieved, only very close to the diagonal less mass points can be excluded. The color scale indicates the excluded cross section at a given point in the mass plane. The excluded regions are to the left and below the observed and expected limit curves. |
png pdf root |
Additional Figure 7-b:
Excluded region at 95% confidence in the $m( \tilde{ \chi }_0 )$ versus $m( \tilde{ \mathrm{g} } )$ plane for the T1tttt (a) and T5qqqqWZ (b) simplified model using only the most sensitive signal regions. For T1tttt the limit is obtained by statistical combination of off-Z signal region 13 and 15. Almost the same sensitivity as with the combination of all 32 signal regions can be achieved. For T5qqqqWZ on-Z signal region 2 and 15b are combined. A similar sensitivity as with the combination of all signal regions can be achieved, only very close to the diagonal less mass points can be excluded. The color scale indicates the excluded cross section at a given point in the mass plane. The excluded regions are to the left and below the observed and expected limit curves. |
| Additional Tables | |
png pdf |
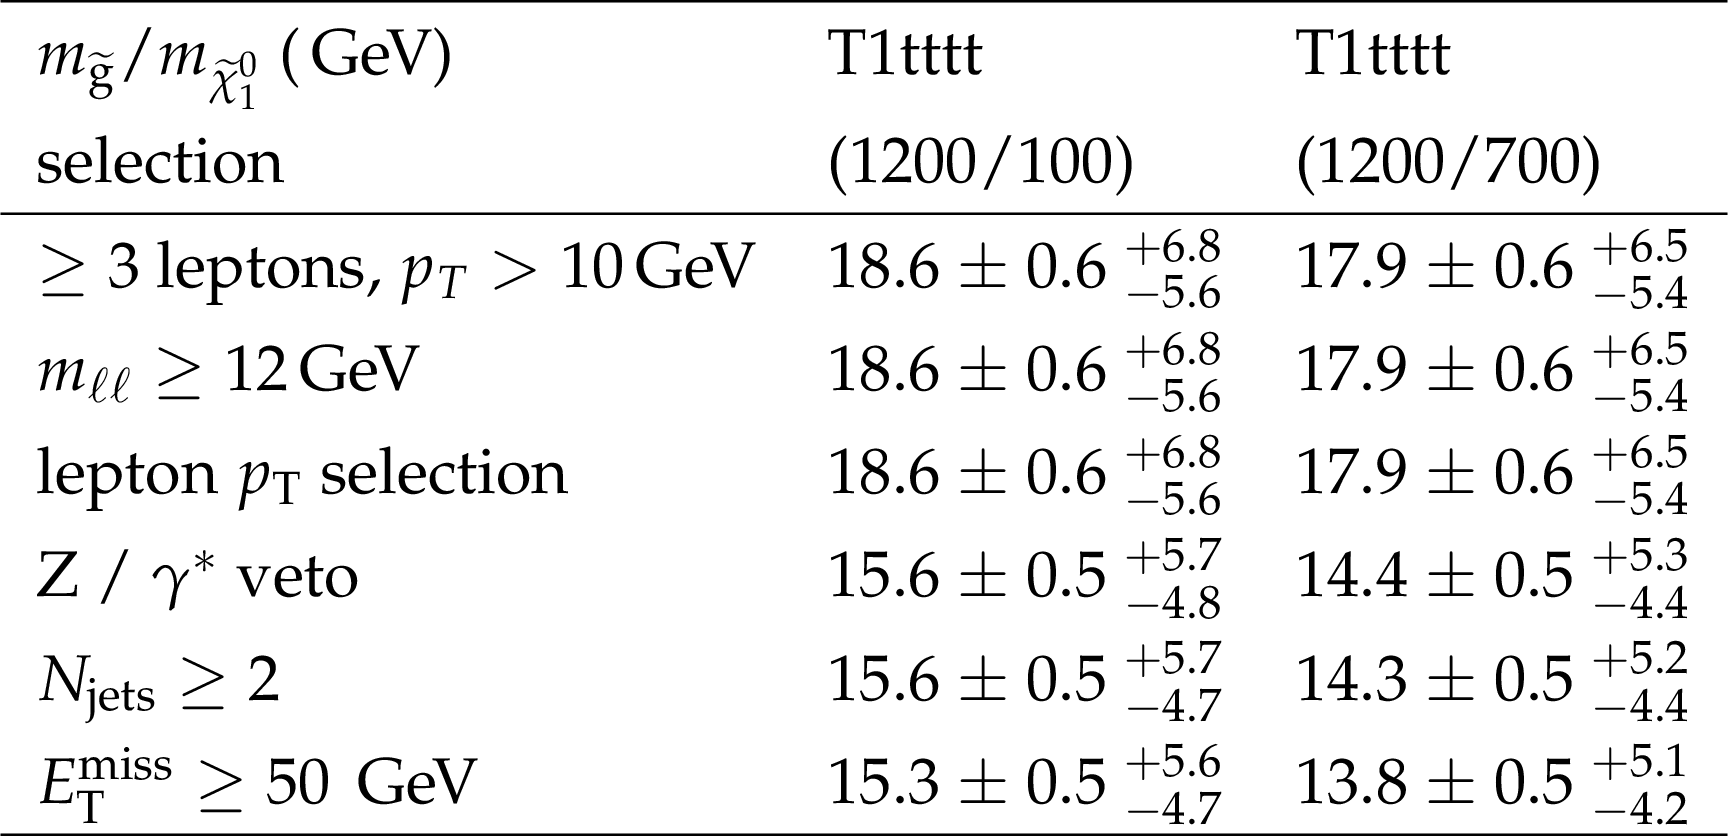
Additional Table 1:
Evolution of signal yields along the cut flow of the off-Z baseline selection for selected mass points of the T1tttt SUSY bench mark model. The yields are normalized to an integrated luminosity of $ {\mathcal {L}} = $ 12.9 fb$^{-1}$. |
png pdf |
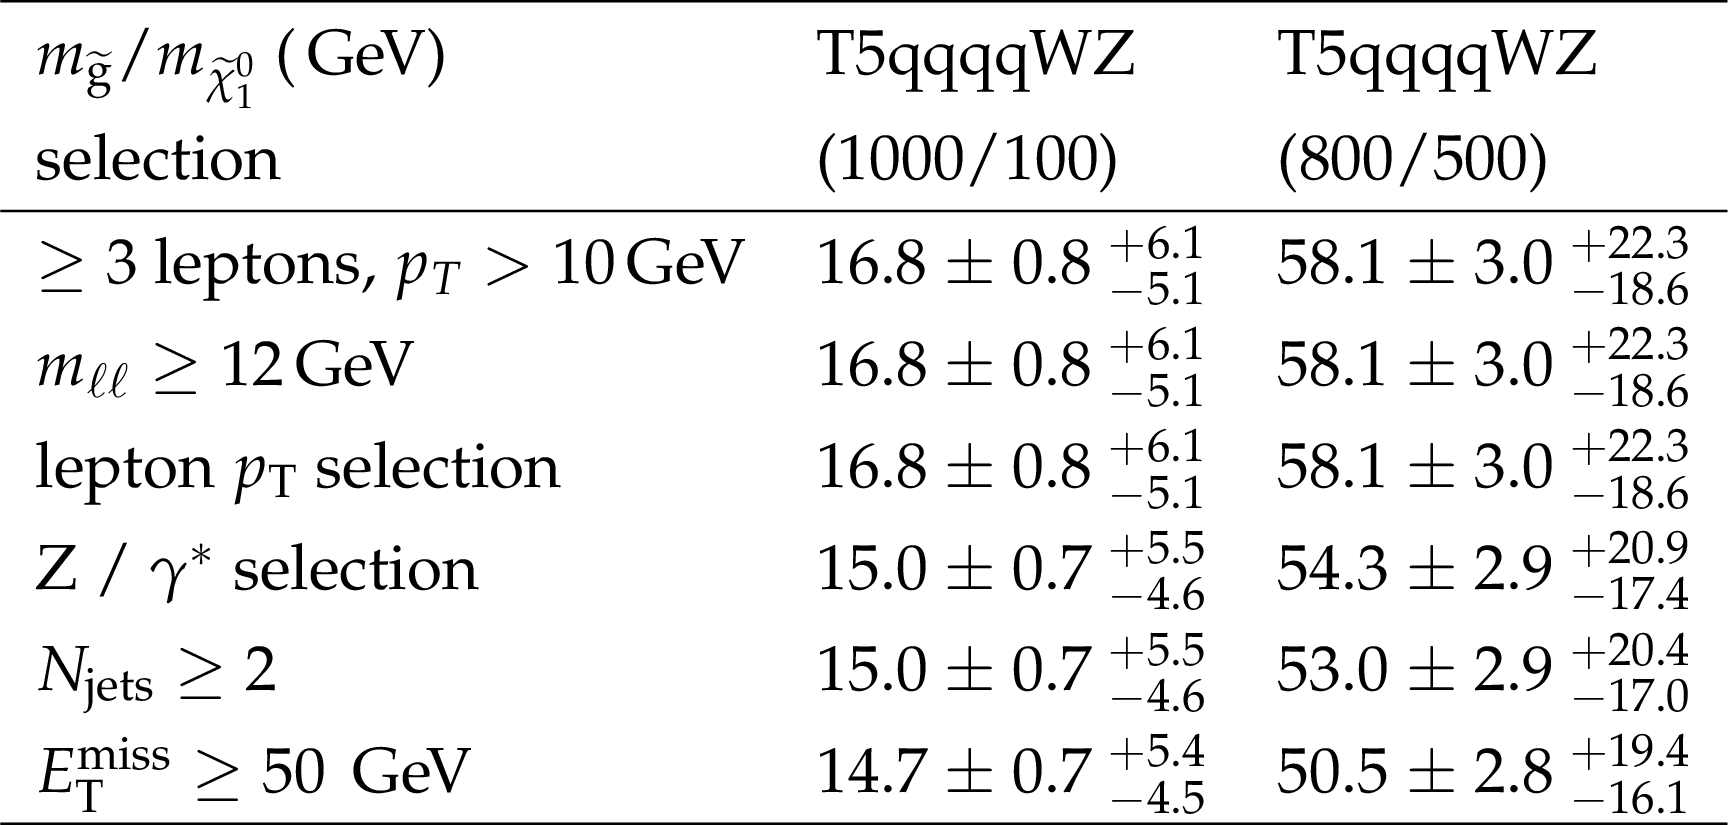
Additional Table 2:
Evolution of signal yields along the cut flow of the on-Z baseline selection for selected mass points of the T5qqqqWZ SUSY bench mark model. The yields are normalized to an integrated luminosity of $ {\mathcal {L}} = $ 12.9 fb$^{-1}$. |
png pdf |
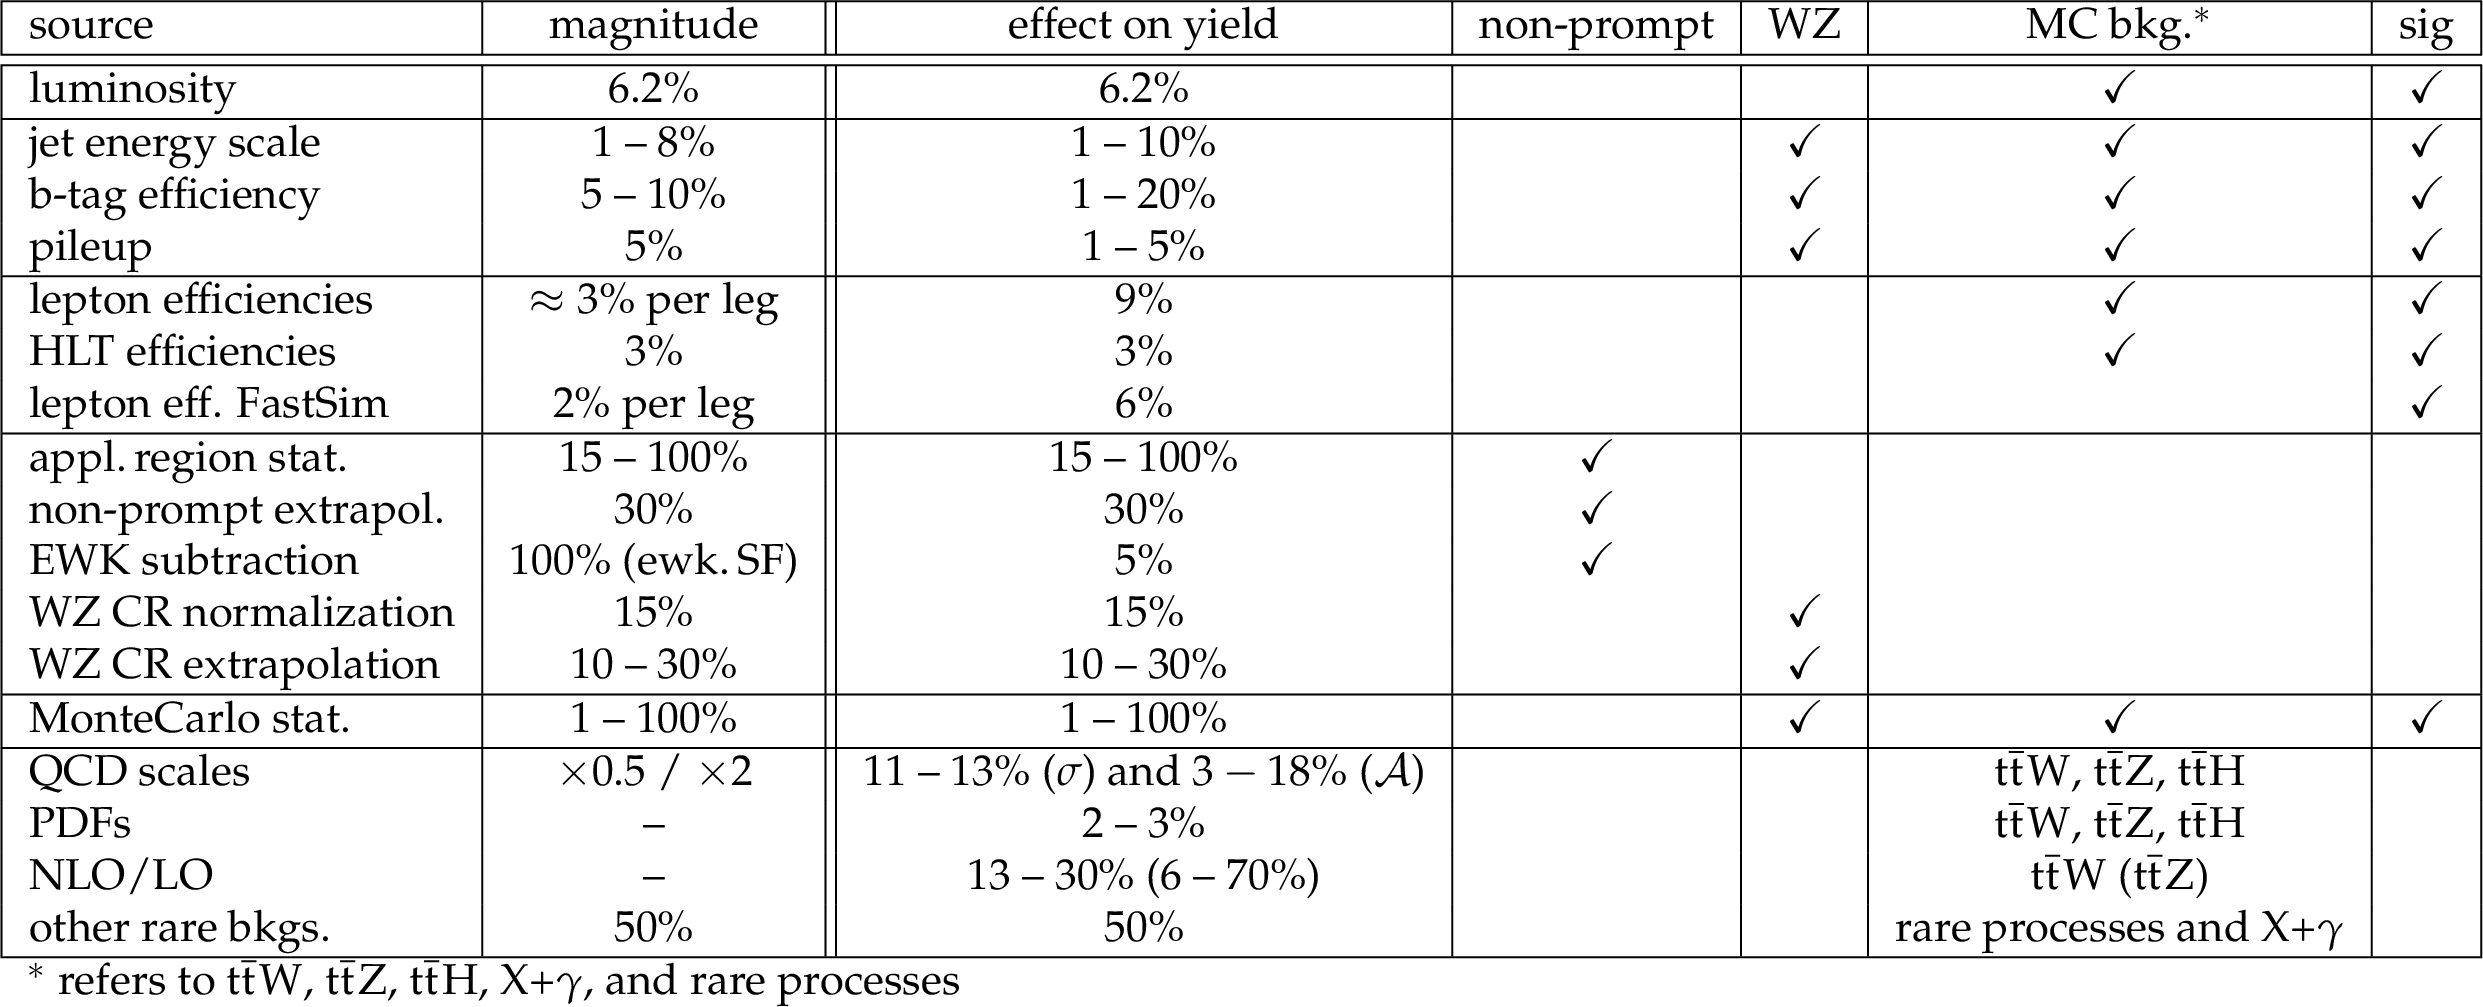
Additional Table 3:
Summary of the sources of uncertainties, their magnitude and the associated effect on the yield of selected events. The last four columns indicate which processes are affected by the respective uncertainty. Only the variation of the jet energy scale induces signal region migration of events between different $ {H_{\mathrm {T}}} $ bins. |

png pdf |
Additional Table 4:
Expected and observed yields for 12.9 fb$^{-1}$ in all 32 signal regions of the search. Statistical and systematic uncertainties are given as $\pm $stat $\pm $syst. |
| References | ||||
| 1 | CMS Collaboration | Search for SUSY with multileptons in 13 TeV data | CMS-PAS-SUS-16-003 | CMS-PAS-SUS-16-003 |
| 2 | CMS Collaboration | Search for anomalous production of events with three or more leptons in pp collisions at $ \sqrt{s} = $ 8 TeV | PRD 90 (2014) 032006 | CMS-SUS-13-002 1404.5801 |
| 3 | CMS Collaboration | Searches for supersymmetry based on events with b jets and four W bosons in pp collisions at 8 TeV | PLB 745 (2015) 5 | CMS-SUS-14-010 1412.4109 |
| 4 | ATLAS Collaboration | Search for supersymmetry at $ \sqrt{s} $=8 TeV in final states with jets and two same-sign leptons or three leptons with the ATLAS detector | JHEP 06 (2014) 035 | 1404.2500 |
| 5 | CMS Collaboration | Performance of CMS muon reconstruction in pp collision events at sqrt(s) = 7 TeV | JINST 7 (2012) P10002 | CMS-MUO-10-004 1206.4071 |
| 6 | CMS Collaboration | Performance of Electron Reconstruction and Selection with the CMS Detector in Proton-Proton Collisions at vs = 8 TeV | JINST 10 (2015) P06005 | CMS-EGM-13-001 1502.02701 |
| 7 | CMS Collaboration | Commissioning of the Particle-Flow Reconstruction in Minimum-Bias and Jet Events from $ \mathrm{ p }\mathrm{ p } $ Collisions at 7 TeV | CDS | |
| 8 | CMS Collaboration | Identification of b-quark jets with the CMS experiment | JINST 8 (2013) P04013 | CMS-BTV-12-001 1211.4462 |
| 9 | CMS Collaboration | Performance of b tagging at sqrt(s)=8 TeV in multijet, $ \mathrm{ t \bar{t} } $ and boosted topology events | CDS | |
| 10 | CMS Collaboration | Performance of the missing transverse energy reconstruction by the CMS experiment in $ \sqrt{s} $ = 8 TeV pp data | Submitted to \it JINST | CMS-JME-13-003 1411.0511 |
| 11 | J. Alwall et al. | The automated computation of tree-level and next-to-leading order differential cross sections, and their matching to parton shower simulations | JHEP 07 (2014) 079 | 1405.0301 |
| 12 | T. Melia, P. Nason, R. Rontsch, and G. Zanderighi | W+W-, WZ and ZZ production in the POWHEG BOX | JHEP 11 (2011) 078 | 1107.5051 |
| 13 | T. Sjostrand, S. Mrenna, and P. Z. Skands | A Brief Introduction to PYTHIA 8.1 | CPC 178 (2008) 852 | 0710.3820 |
| 14 | CMS Collaboration | Event generator tunes obtained from underlying event and multiparton scattering measurements | EPJC 76 (2016) 155 | CMS-GEN-14-001 1512.00815 |
| 15 | GEANT4 Collaboration | $ Geant 4--a $ simulation toolkit | NIMA 506 (2003) 250 | |
| 16 | S. Abdullin et al. | The fast simulation of the CMS detector at LHC | J. Phys. Conf. Ser. 331 (2011) 032049 | |
| 17 | W. Beenakker et al. | Production of charginos, neutralinos, and sleptons at hadron colliders | PRL 83 (1999) 3780 | hep-ph/9906298 |
| 18 | A. Kulesza and L. Motyka | Threshold resummation for squark-antisquark and gluino-pair production at the LHC | PRL 102 (2009) 111802 | 0807.2405 |
| 19 | A. Kulesza and L. Motyka | Soft gluon resummation for the production of gluino-gluino and squark-antisquark pairs at the LHC | PRD 80 (2009) 095004 | 0905.4749 |
| 20 | W. Beenakker et al. | Soft-gluon resummation for squark and gluino hadroproduction | JHEP 12 (2009) 041 | 0909.4418 |
| 21 | W. Beenakker et al. | Squark and gluino hadroproduction | Int. J. Mod. Phys. A 26 (2011) 2637 | 1105.1110 |
| 22 | J. Butterworth et al. | PDF4LHC recommendations for LHC Run II | JPG43 (2016) 023001 | 1510.03865 |
|
|
Compact Muon Solenoid LHC, CERN |
|

|

|

|

|

|