

Compact Muon Solenoid
LHC, CERN
| CMS-PAS-SUS-16-030 | ||
| Search for supersymmetry in the all-hadronic final state using top quark tagging in pp collisions at $ \sqrt{s} = $ 13 TeV | ||
| CMS Collaboration | ||
| August 2016 | ||
| Abstract: A search for supersymmetry in all-hadronic events with missing transverse momentum using top quark tagging is presented. The data were collected during 2016 in proton-proton collisions at a center-of-mass energy of 13 TeV with the CMS detector at the LHC and correspond to an integrated luminosity of 12.9 fb$^{-1}$. Search regions are defined using the properties of reconstructed jets, the presence of bottom and top quark candidates, and missing transverse momentum. No statistically significant excess of events above the expected contribution from standard model processes is observed. Exclusion limits are set on the masses of potential new particles in the context of simplified models of direct and gluino-mediated top squark production. | ||
| Links: CDS record (PDF) ; inSPIRE record ; CADI line (restricted) ; | ||
| Figures | |

png pdf |
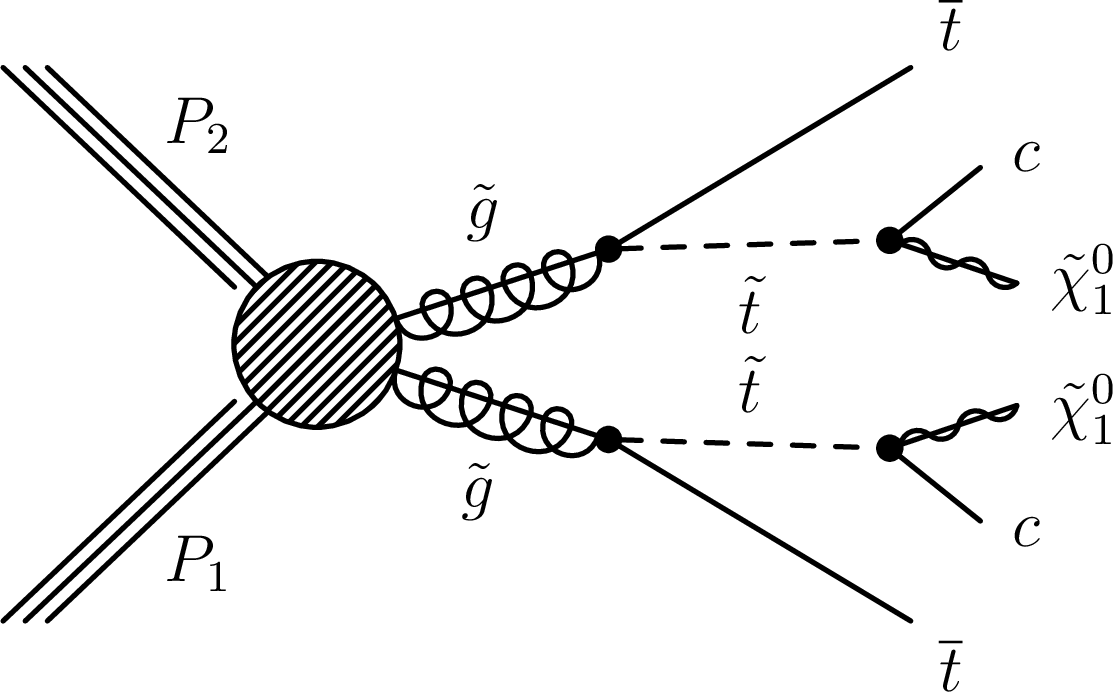
Figure 1:
The diagram representing the simplified model of direct top squark pair production considered in this study: the T2tt model with top squark decay via a top quark. |

png pdf |
Figure 2-a:
Diagrams representing the simplified models of gluino-mediated top squark production considered in this study: the T1tttt model (left) where the gluino decays to top quarks and the LSP, and the T5ttcc model (right) where the gluino decays to an on-shell top squark, which decays to a charm quark and the LSP. |
png pdf |
Figure 2-b:
Diagrams representing the simplified models of gluino-mediated top squark production considered in this study: the T1tttt model (left) where the gluino decays to top quarks and the LSP, and the T5ttcc model (right) where the gluino decays to an on-shell top squark, which decays to a charm quark and the LSP. |

png pdf |
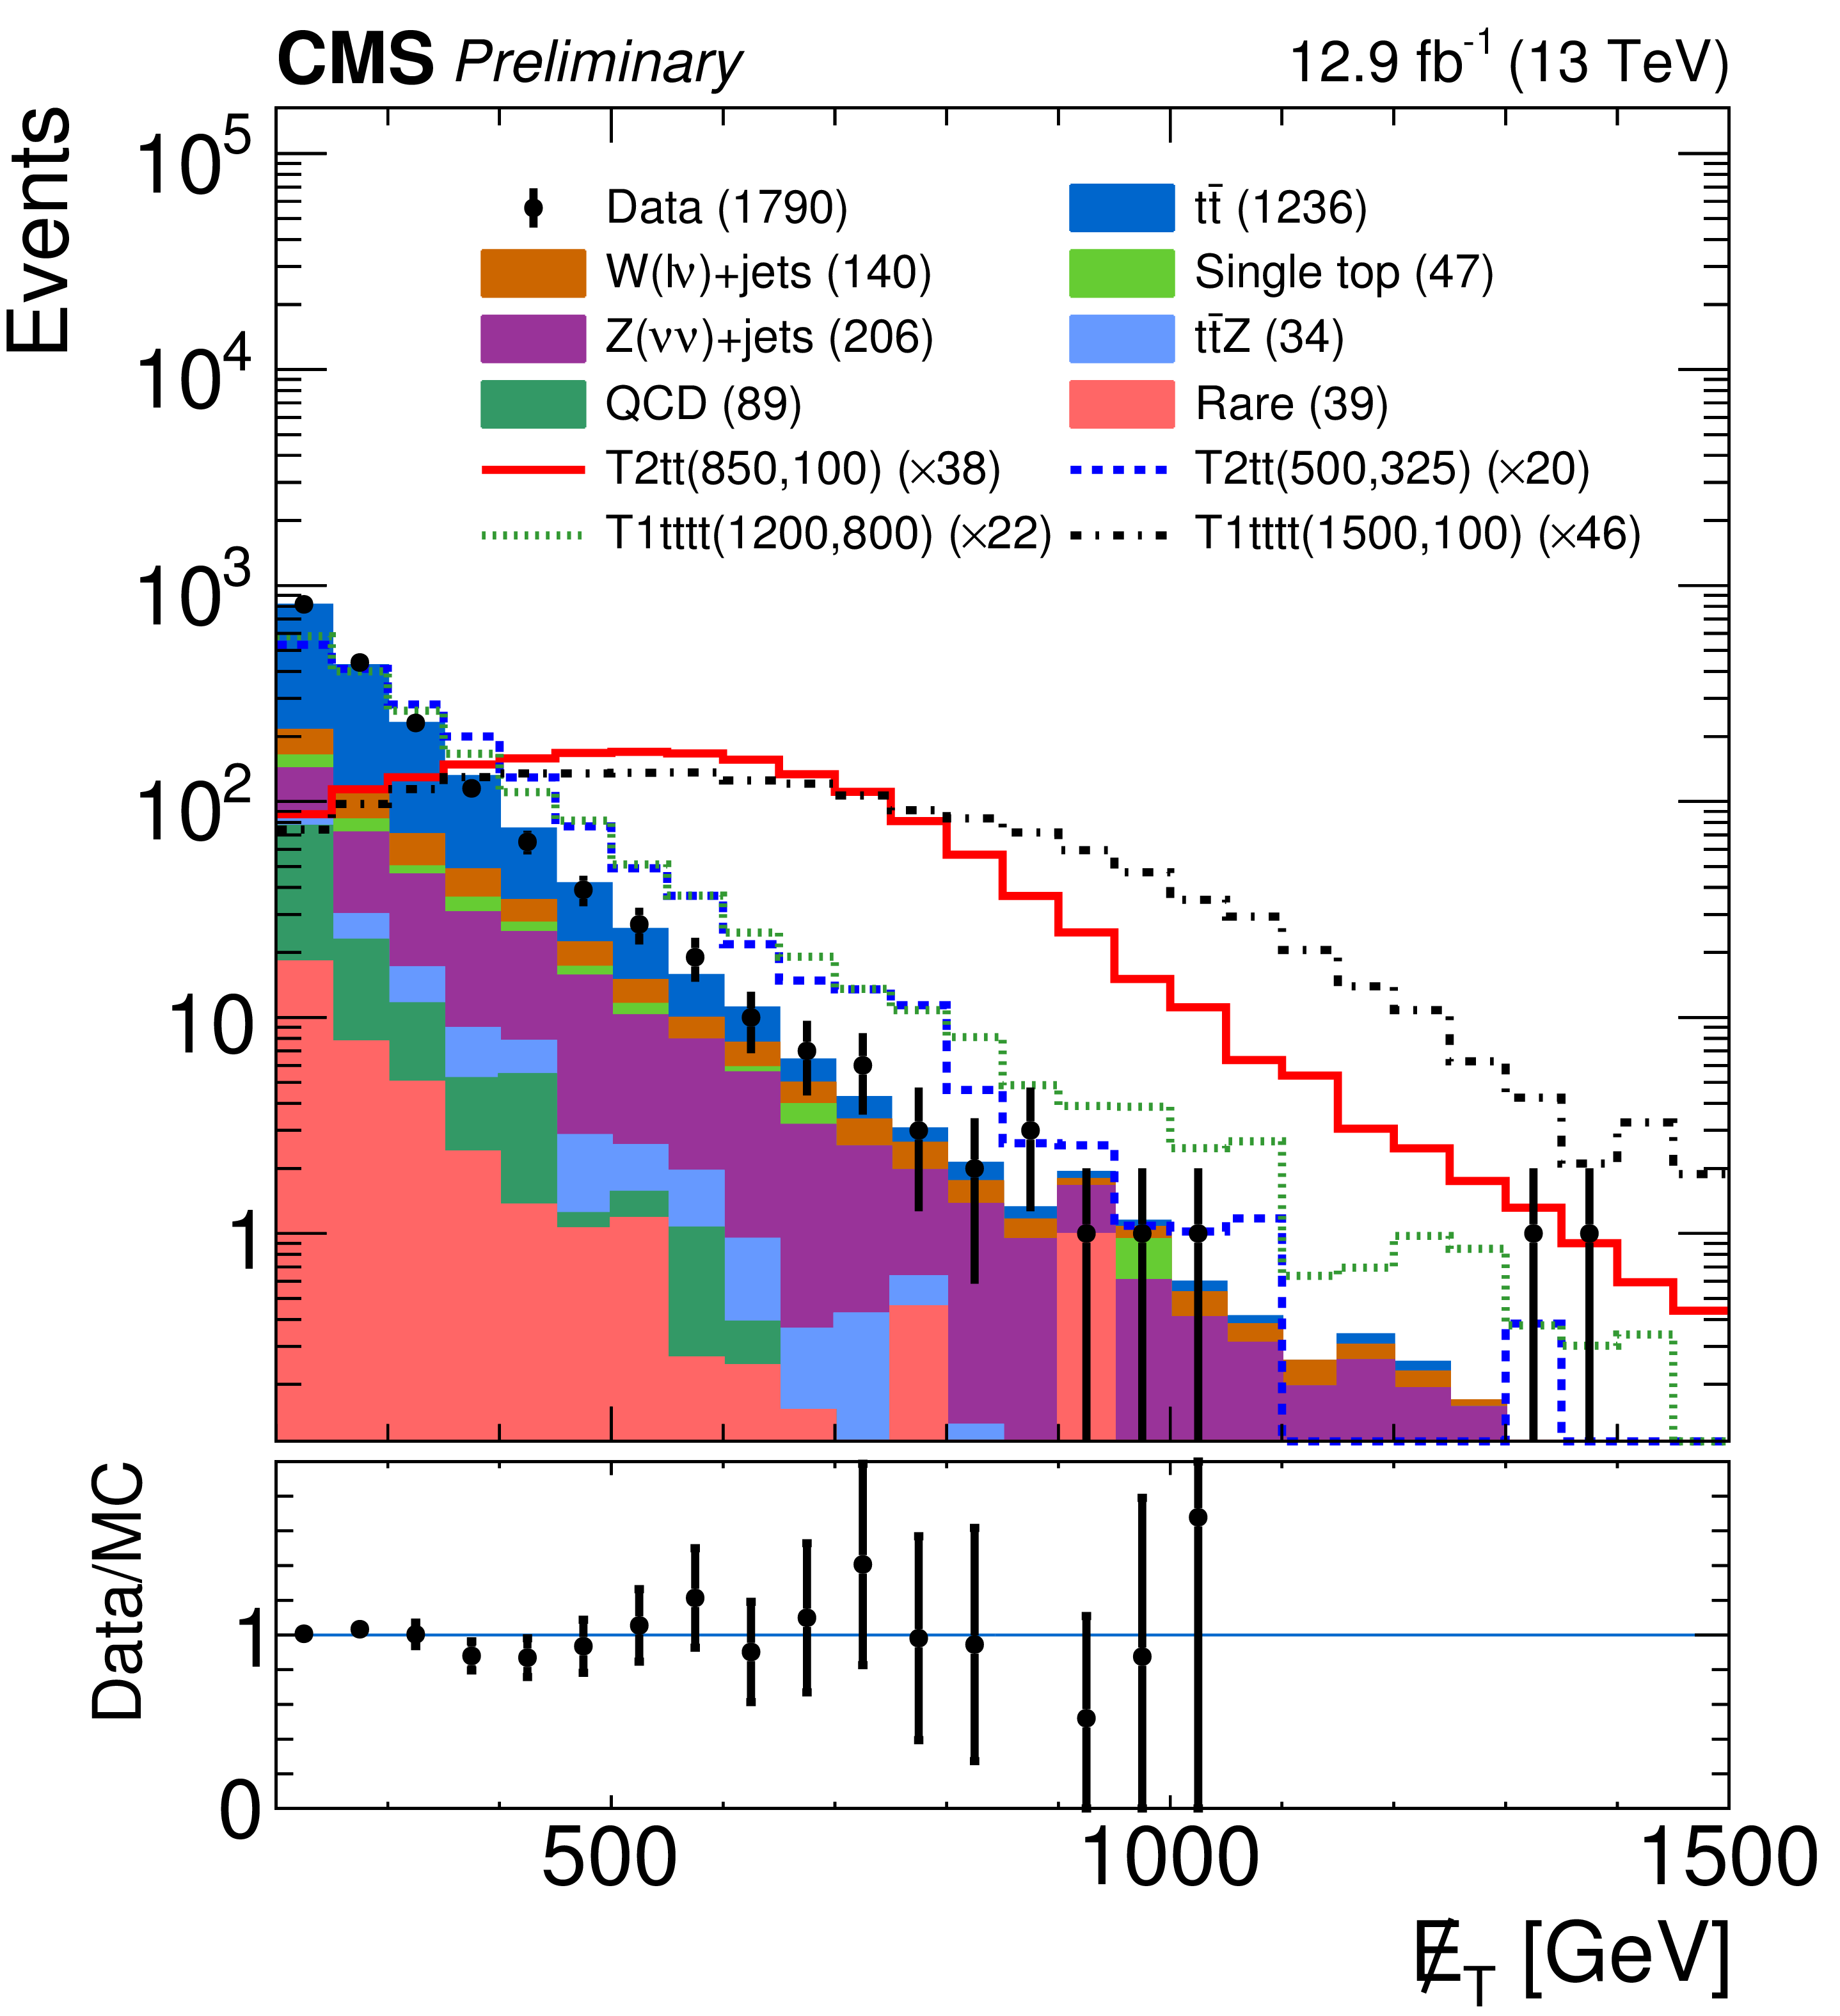
Figure 3-a:
Comparison of the simulated distributions for ${N_{ {\mathrm {t}}}} $, ${N_{ {\mathrm {b}}}} $, ${M_{\mathrm {T2}}}$ and ${E_{\mathrm {T}}}$ between SM backgrounds (filled histograms) and several example signal models (dashed lines), after the pre-selection requirements have been applied. The T2tt signal model with $m_{ {\tilde{t}} } =$ 850 GeV and $m_{ {\tilde{\chi}^{0}_{1}} } =$ 100 GeV is shown with a red solid line, the T2tt signal model with $m_{ {\tilde{t}} } = $ 500 GeV and $m_{ {\tilde{\chi}^{0}_{1}} } =$ 325 GeV with a blue dashed line, the T1tttt signal model with $m_{ \tilde{\mathrm{g}}} = $ 1200 GeV and $m_{ {\tilde{\chi}^{0}_{1}} } = $ 800 GeV with a green dotted line, and the T1tttt signal model with $m_{ \tilde{\mathrm{g}}} = $ 1500 GeV and $m_{ {\tilde{\chi}^{0}_{1}} } = $ 100 GeV with a black dashed-dotted line. The distributions for the signal models have been normalized to the same area as the total background distribution. The black points show the observed data events for each bin. The numbers associated with each MC background and data are the yield of each sample. The numbers associated with the signal points are the scale. The lower panels show the ratio between data and simulation. |

png pdf |
Figure 3-b:
Comparison of the simulated distributions for ${N_{ {\mathrm {t}}}} $, ${N_{ {\mathrm {b}}}} $, ${M_{\mathrm {T2}}}$ and ${E_{\mathrm {T}}}$ between SM backgrounds (filled histograms) and several example signal models (dashed lines), after the pre-selection requirements have been applied. The T2tt signal model with $m_{ {\tilde{t}} } =$ 850 GeV and $m_{ {\tilde{\chi}^{0}_{1}} } =$ 100 GeV is shown with a red solid line, the T2tt signal model with $m_{ {\tilde{t}} } = $ 500 GeV and $m_{ {\tilde{\chi}^{0}_{1}} } =$ 325 GeV with a blue dashed line, the T1tttt signal model with $m_{ \tilde{\mathrm{g}}} = $ 1200 GeV and $m_{ {\tilde{\chi}^{0}_{1}} } = $ 800 GeV with a green dotted line, and the T1tttt signal model with $m_{ \tilde{\mathrm{g}}} = $ 1500 GeV and $m_{ {\tilde{\chi}^{0}_{1}} } = $ 100 GeV with a black dashed-dotted line. The distributions for the signal models have been normalized to the same area as the total background distribution. The black points show the observed data events for each bin. The numbers associated with each MC background and data are the yield of each sample. The numbers associated with the signal points are the scale. The lower panels show the ratio between data and simulation. |

png pdf |
Figure 3-c:
Comparison of the simulated distributions for ${N_{ {\mathrm {t}}}} $, ${N_{ {\mathrm {b}}}} $, ${M_{\mathrm {T2}}}$ and ${E_{\mathrm {T}}}$ between SM backgrounds (filled histograms) and several example signal models (dashed lines), after the pre-selection requirements have been applied. The T2tt signal model with $m_{ {\tilde{t}} } =$ 850 GeV and $m_{ {\tilde{\chi}^{0}_{1}} } =$ 100 GeV is shown with a red solid line, the T2tt signal model with $m_{ {\tilde{t}} } = $ 500 GeV and $m_{ {\tilde{\chi}^{0}_{1}} } =$ 325 GeV with a blue dashed line, the T1tttt signal model with $m_{ \tilde{\mathrm{g}}} = $ 1200 GeV and $m_{ {\tilde{\chi}^{0}_{1}} } = $ 800 GeV with a green dotted line, and the T1tttt signal model with $m_{ \tilde{\mathrm{g}}} = $ 1500 GeV and $m_{ {\tilde{\chi}^{0}_{1}} } = $ 100 GeV with a black dashed-dotted line. The distributions for the signal models have been normalized to the same area as the total background distribution. The black points show the observed data events for each bin. The numbers associated with each MC background and data are the yield of each sample. The numbers associated with the signal points are the scale. The lower panels show the ratio between data and simulation. |
png pdf |
Figure 3-d:
Comparison of the simulated distributions for ${N_{ {\mathrm {t}}}} $, ${N_{ {\mathrm {b}}}} $, ${M_{\mathrm {T2}}}$ and ${E_{\mathrm {T}}}$ between SM backgrounds (filled histograms) and several example signal models (dashed lines), after the pre-selection requirements have been applied. The T2tt signal model with $m_{ {\tilde{t}} } =$ 850 GeV and $m_{ {\tilde{\chi}^{0}_{1}} } =$ 100 GeV is shown with a red solid line, the T2tt signal model with $m_{ {\tilde{t}} } = $ 500 GeV and $m_{ {\tilde{\chi}^{0}_{1}} } =$ 325 GeV with a blue dashed line, the T1tttt signal model with $m_{ \tilde{\mathrm{g}}} = $ 1200 GeV and $m_{ {\tilde{\chi}^{0}_{1}} } = $ 800 GeV with a green dotted line, and the T1tttt signal model with $m_{ \tilde{\mathrm{g}}} = $ 1500 GeV and $m_{ {\tilde{\chi}^{0}_{1}} } = $ 100 GeV with a black dashed-dotted line. The distributions for the signal models have been normalized to the same area as the total background distribution. The black points show the observed data events for each bin. The numbers associated with each MC background and data are the yield of each sample. The numbers associated with the signal points are the scale. The lower panels show the ratio between data and simulation. |

png pdf |
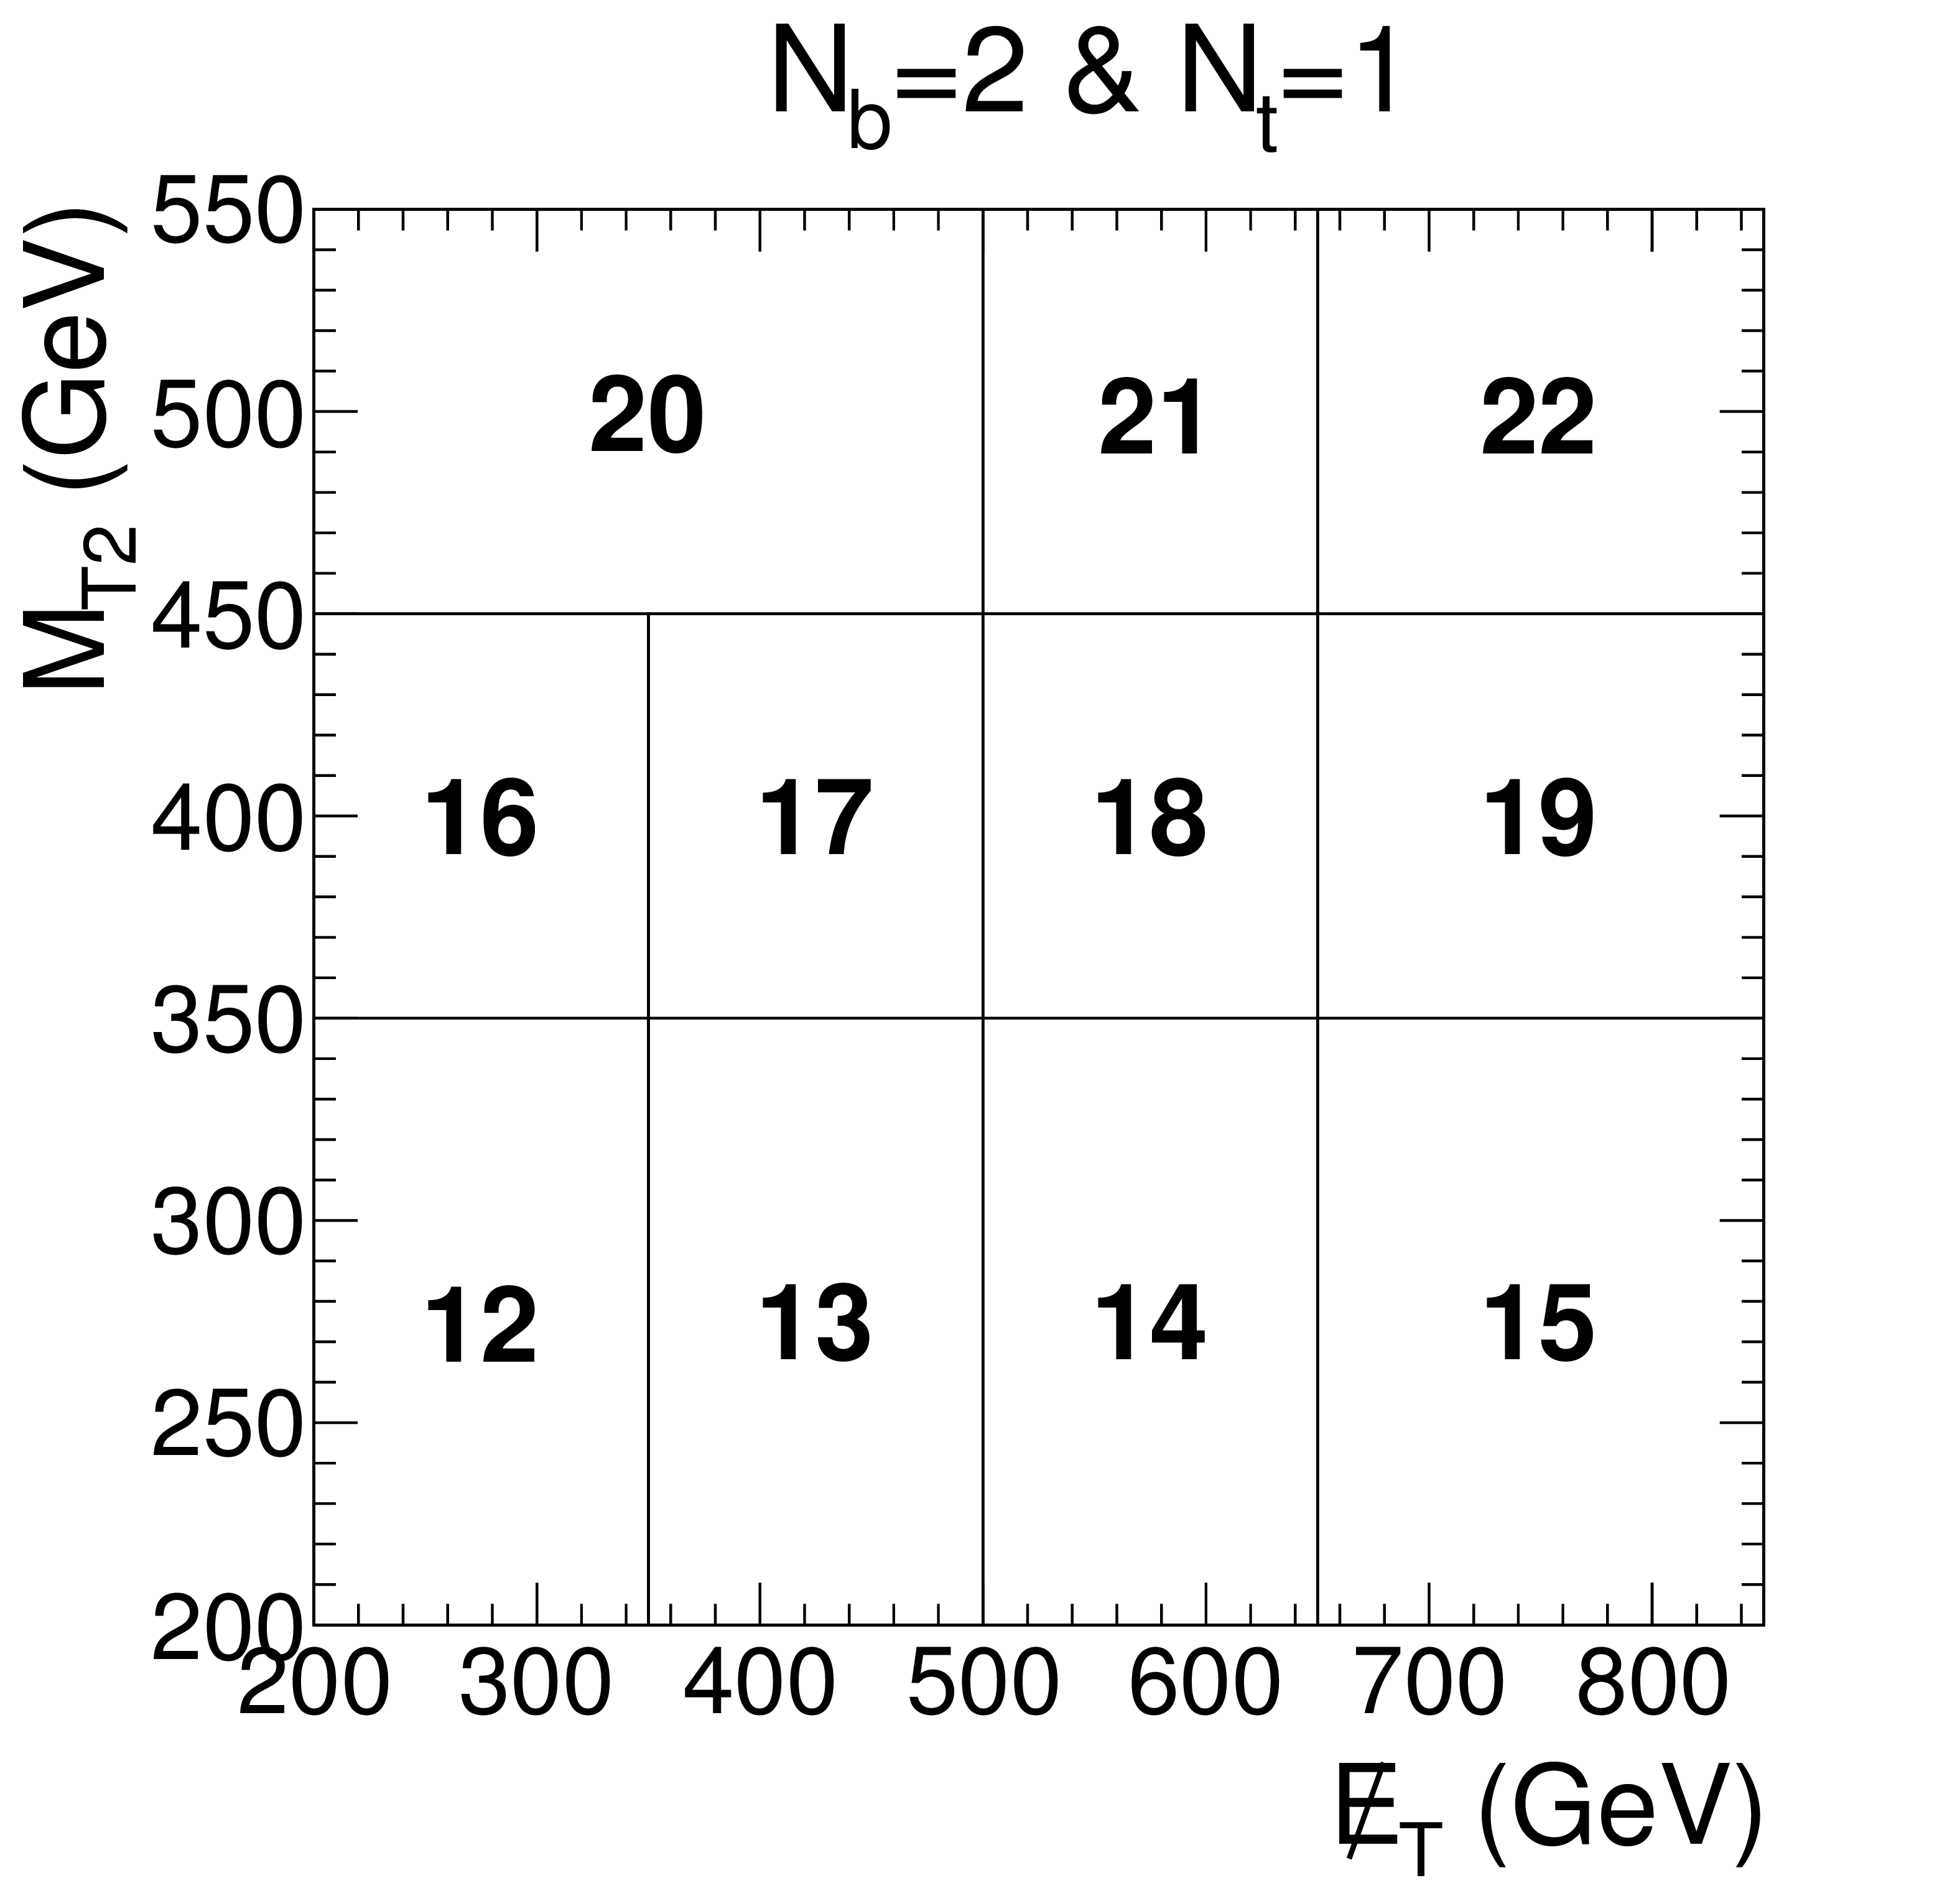
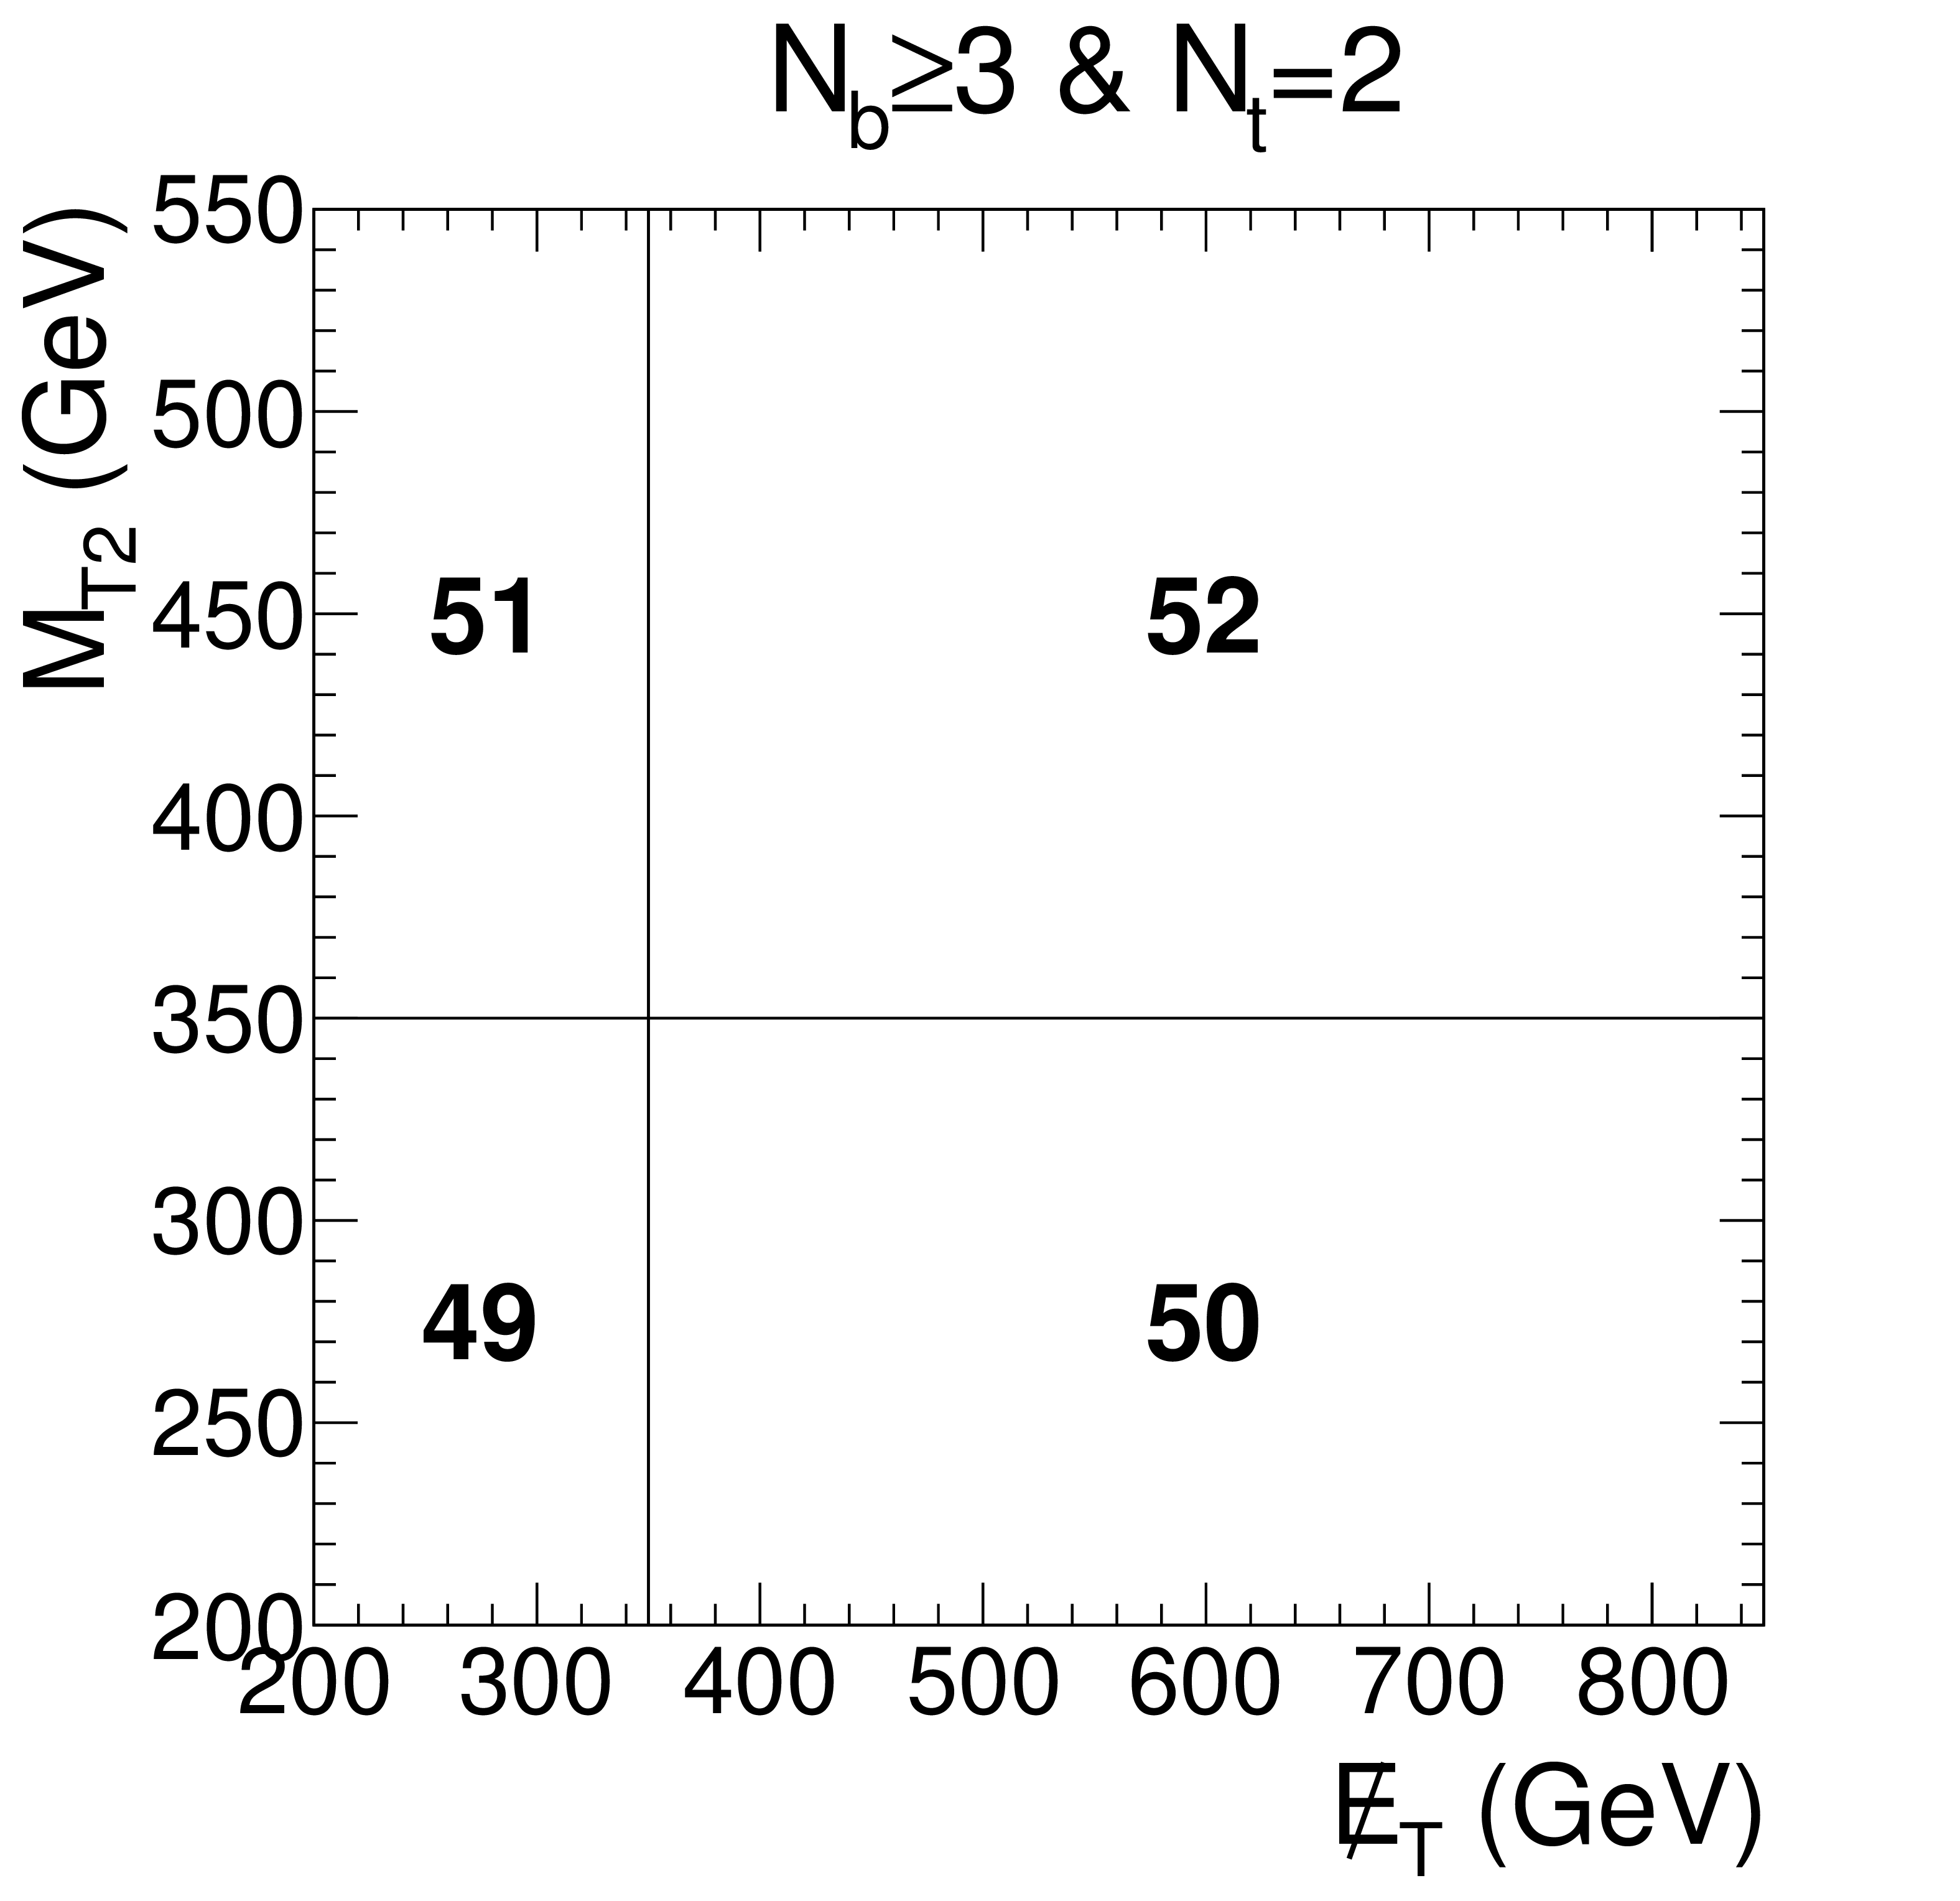
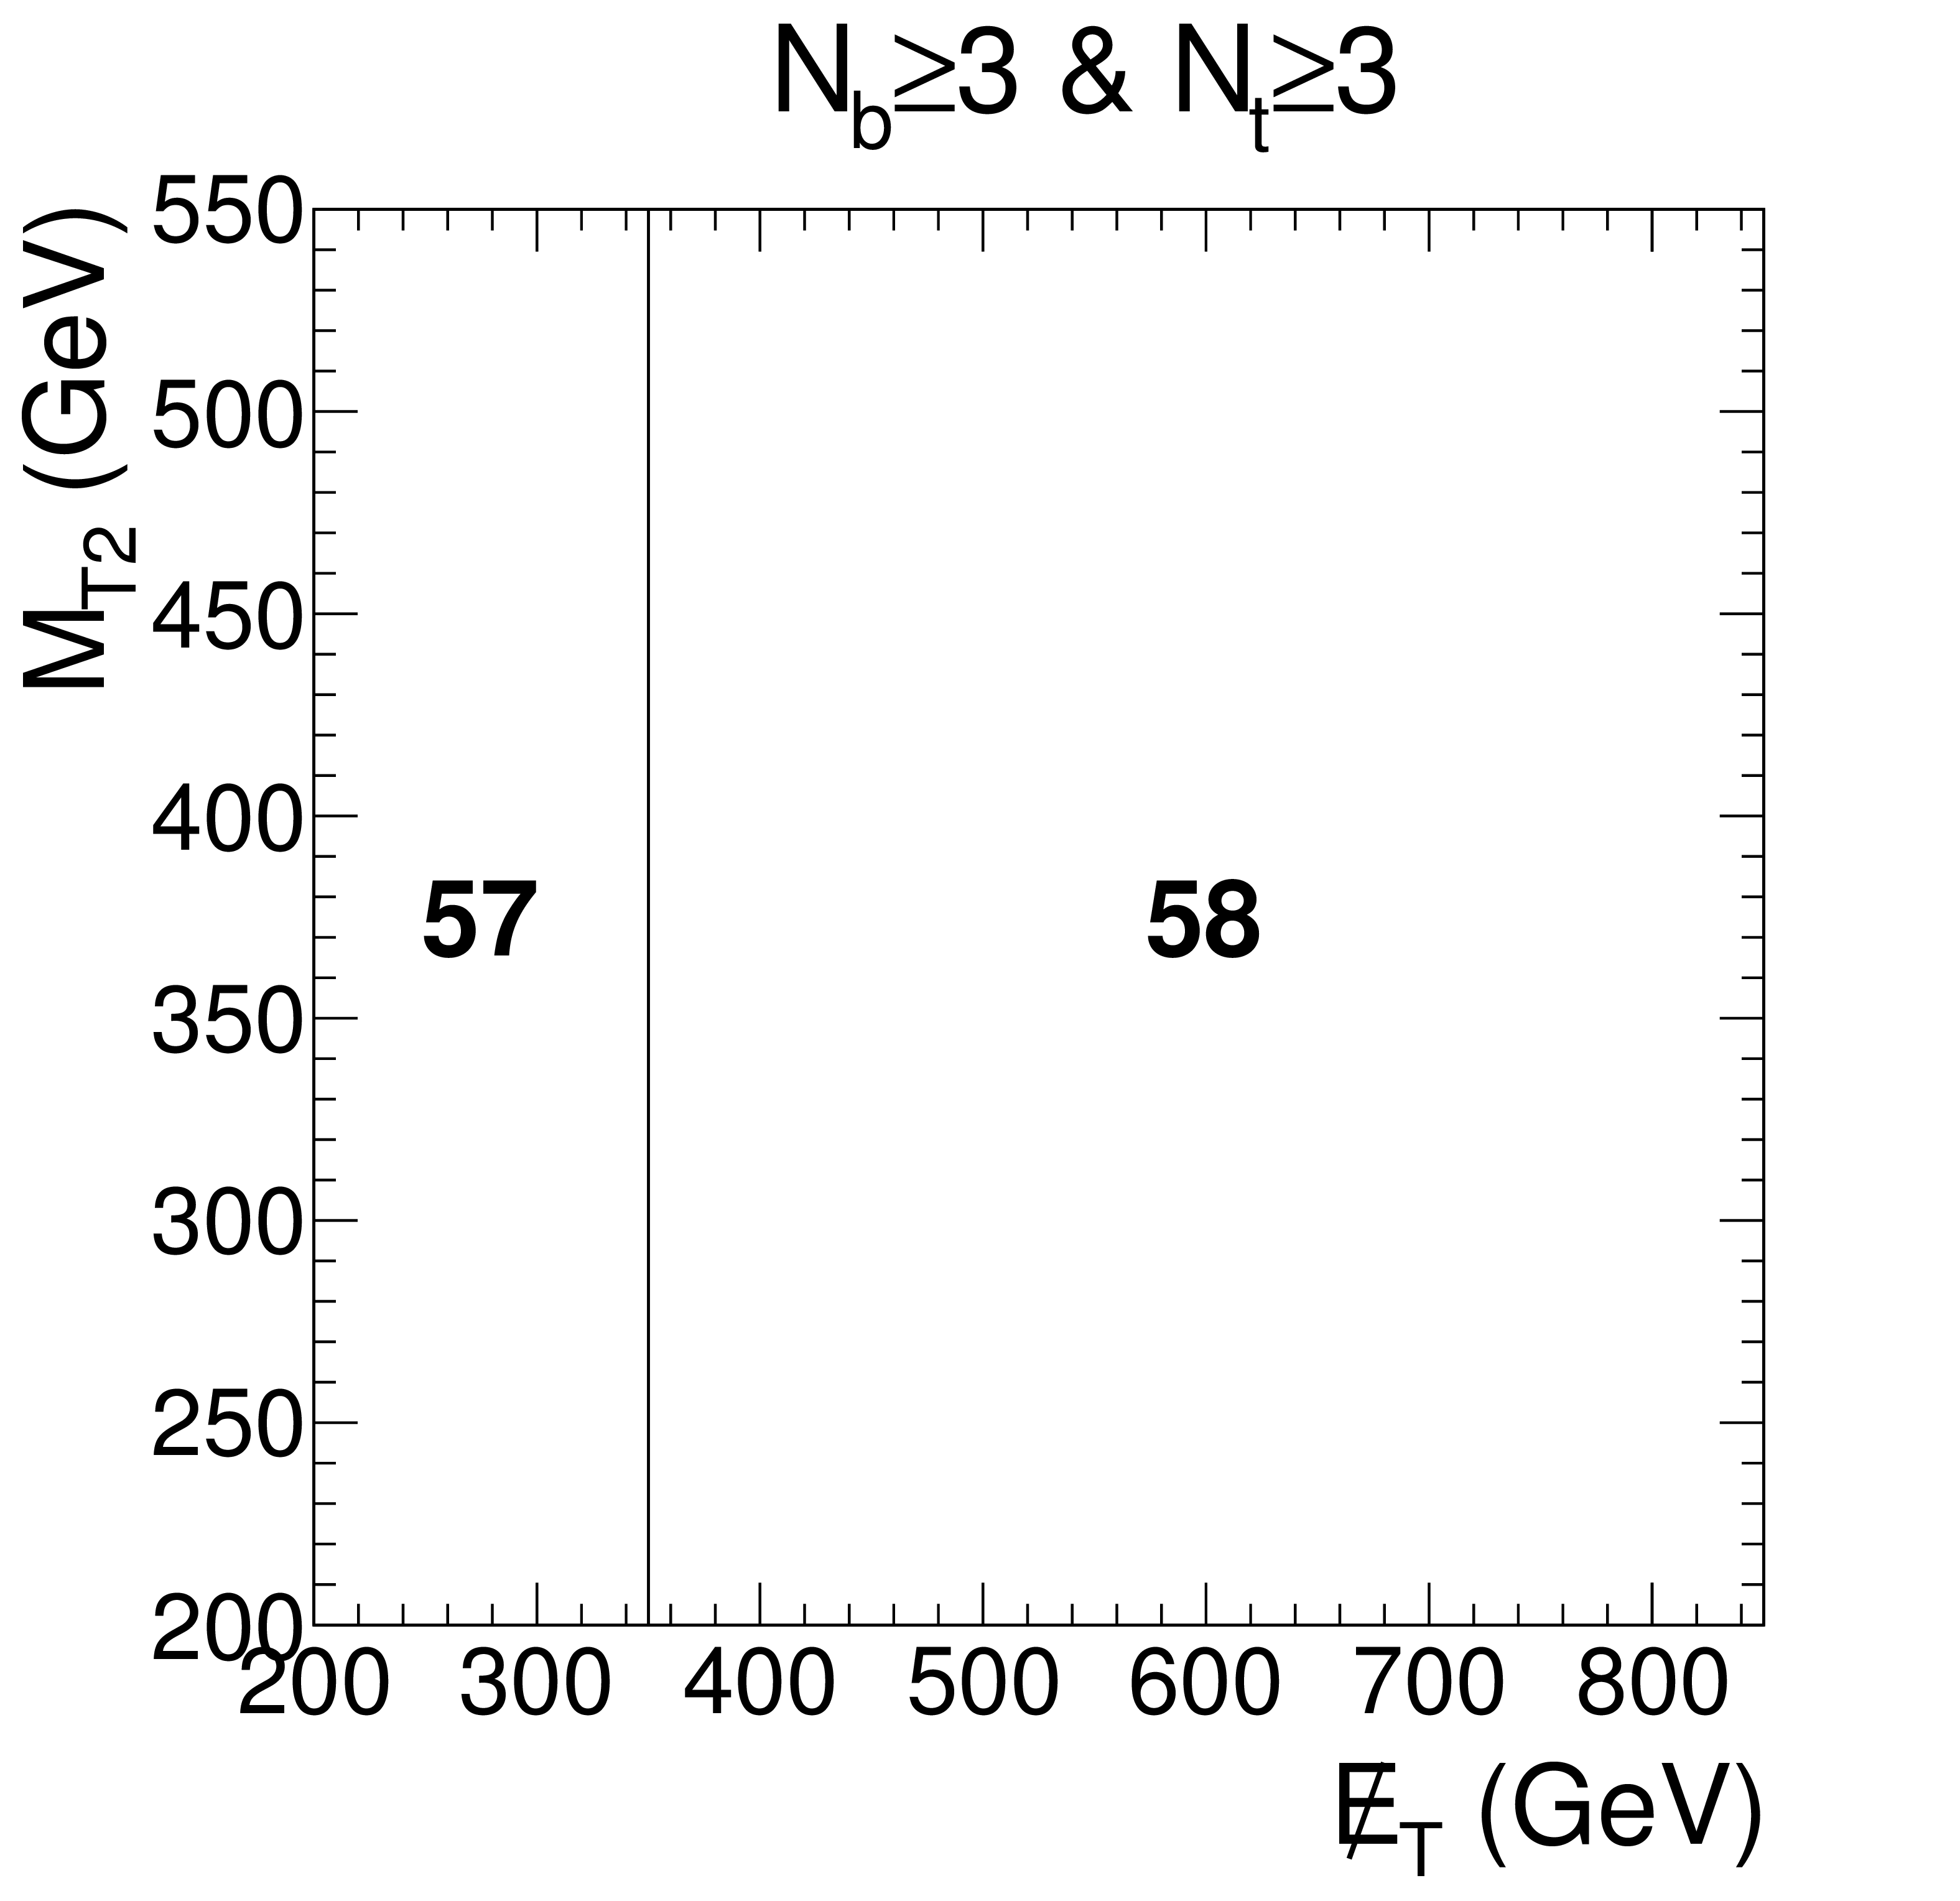
Figure 4-a:
Search bin definitions and bin numbers after pre-selection cuts defined in the text. |
png pdf |
Figure 4-b:
Search bin definitions and bin numbers after pre-selection cuts defined in the text. |

png pdf |
Figure 4-c:
Search bin definitions and bin numbers after pre-selection cuts defined in the text. |
png pdf |
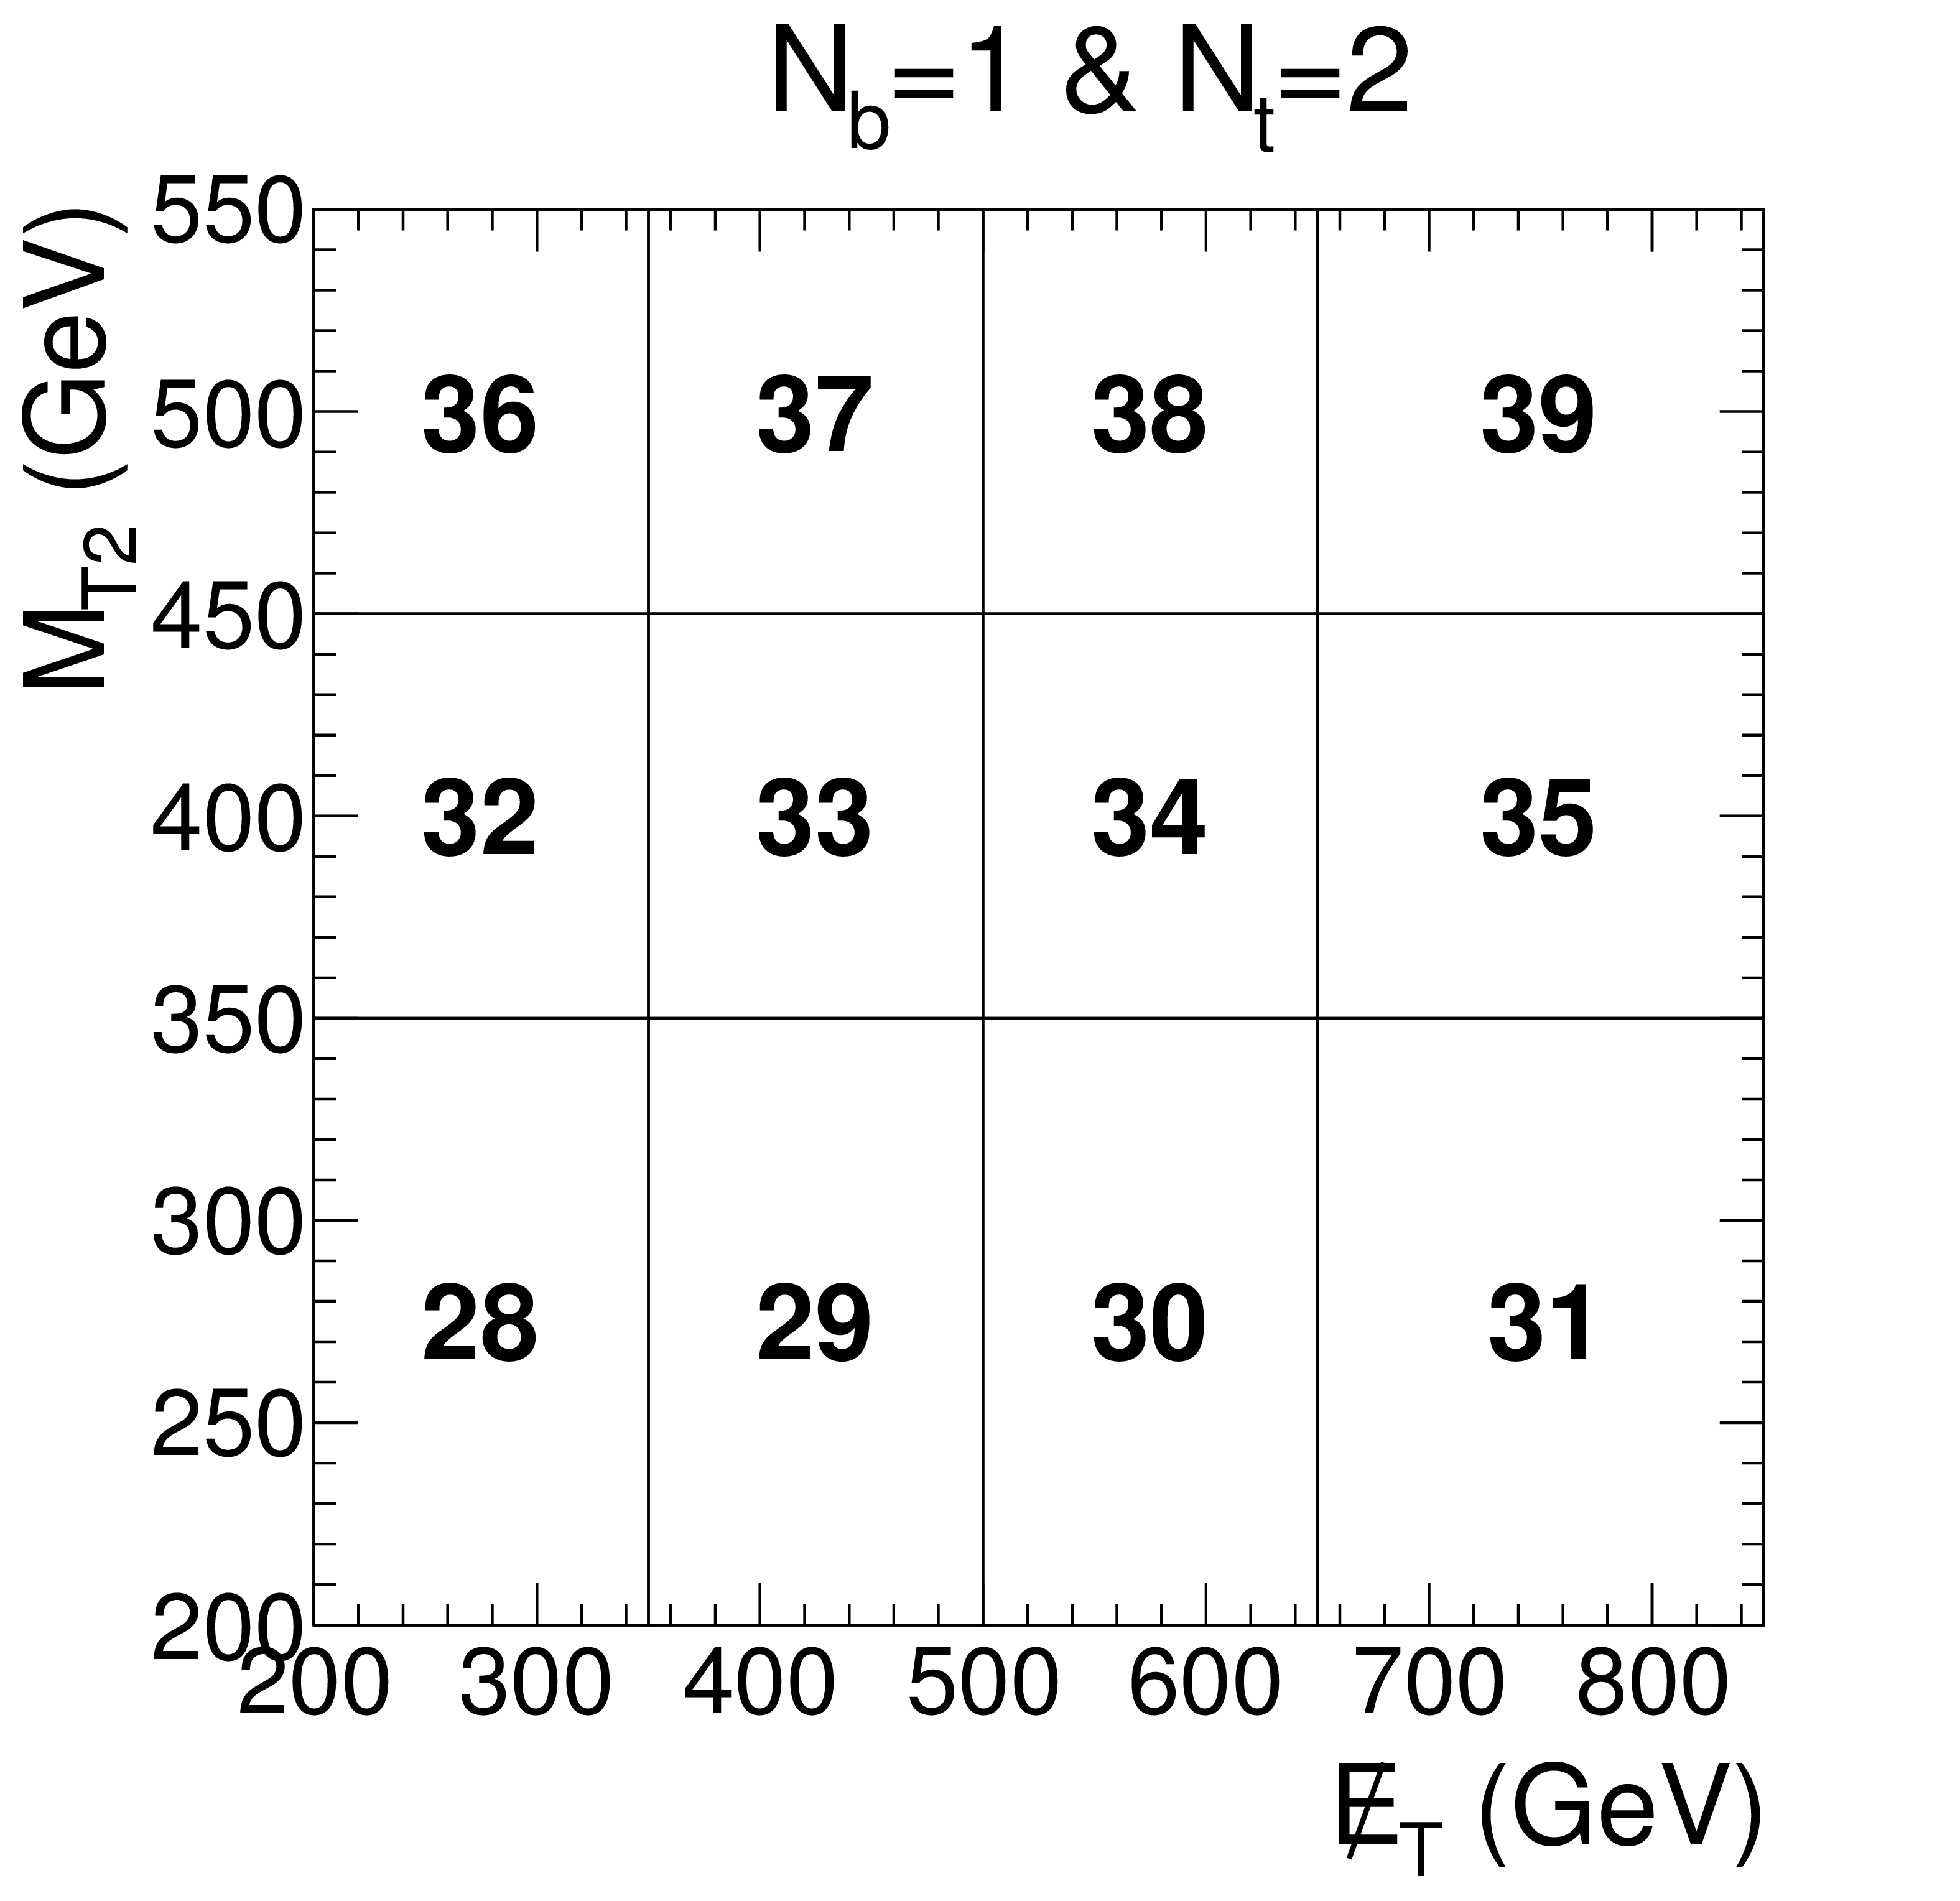
Figure 4-d:
Search bin definitions and bin numbers after pre-selection cuts defined in the text. |

png pdf |
Figure 4-e:
Search bin definitions and bin numbers after pre-selection cuts defined in the text. |
png pdf |
Figure 4-f:
Search bin definitions and bin numbers after pre-selection cuts defined in the text. |

png pdf |
Figure 4-g:
Search bin definitions and bin numbers after pre-selection cuts defined in the text. |

png pdf |
Figure 4-h:
Search bin definitions and bin numbers after pre-selection cuts defined in the text. |
png pdf |
Figure 4-i:
Search bin definitions and bin numbers after pre-selection cuts defined in the text. |
png pdf |
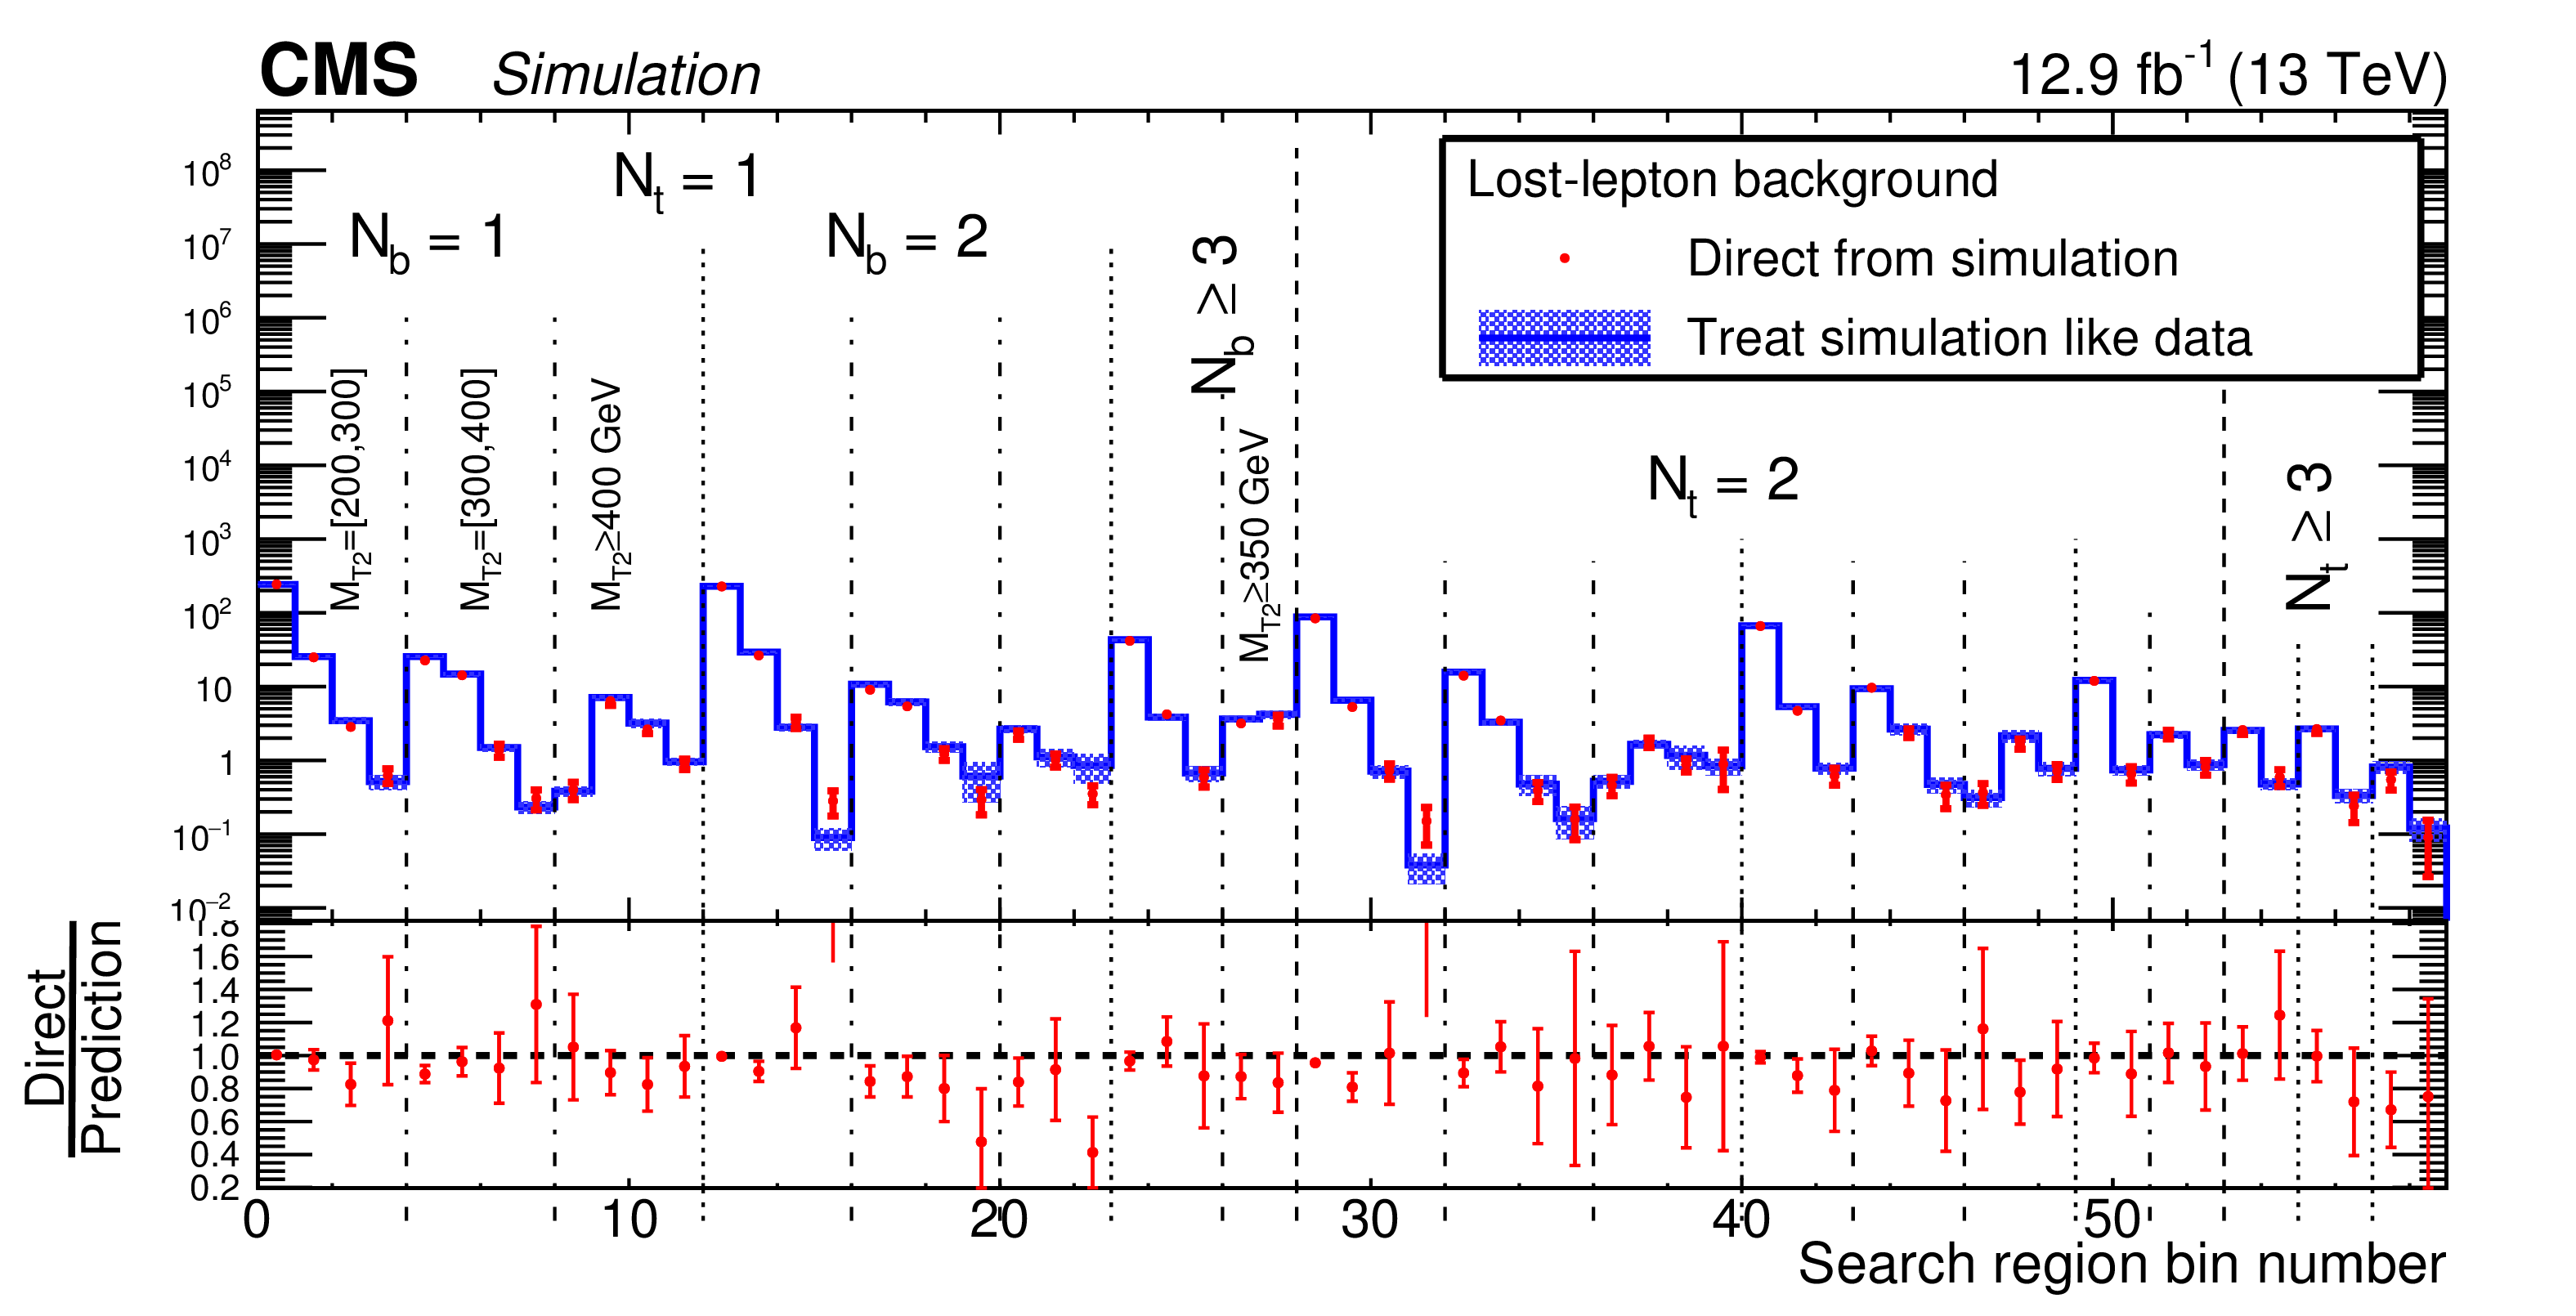
Figure 5-a:
(a) The lost-lepton background in the 59 search regions of the analysis as determined directly from ${{\rm t\bar{t}}} $, single top quark, and W+jets simulation (points) and as predicted by applying the lost-lepton background determination procedure to the simulated muon control sample (histograms). The lower panel shows the same results following division by the predicted value. Only statistical uncertainties are shown. (b) The corresponding simulated results for the background from hadronically-decaying $\tau $ leptons. For both plots, vertical lines indicate search regions with different ${N_{ {\mathrm {t}}}} $, ${N_{ {\mathrm {b}}}} $, and ${M_{\mathrm {T2}}}$ values. Within each ($ {N_{ {\mathrm {t}}}} $, ${N_{ {\mathrm {b}}}} $, ${M_{\mathrm {T2}}} $) region, the bins indicate the different ${E_{\mathrm {T}}}$ selections, as defined in Fig. 4. |
png pdf |
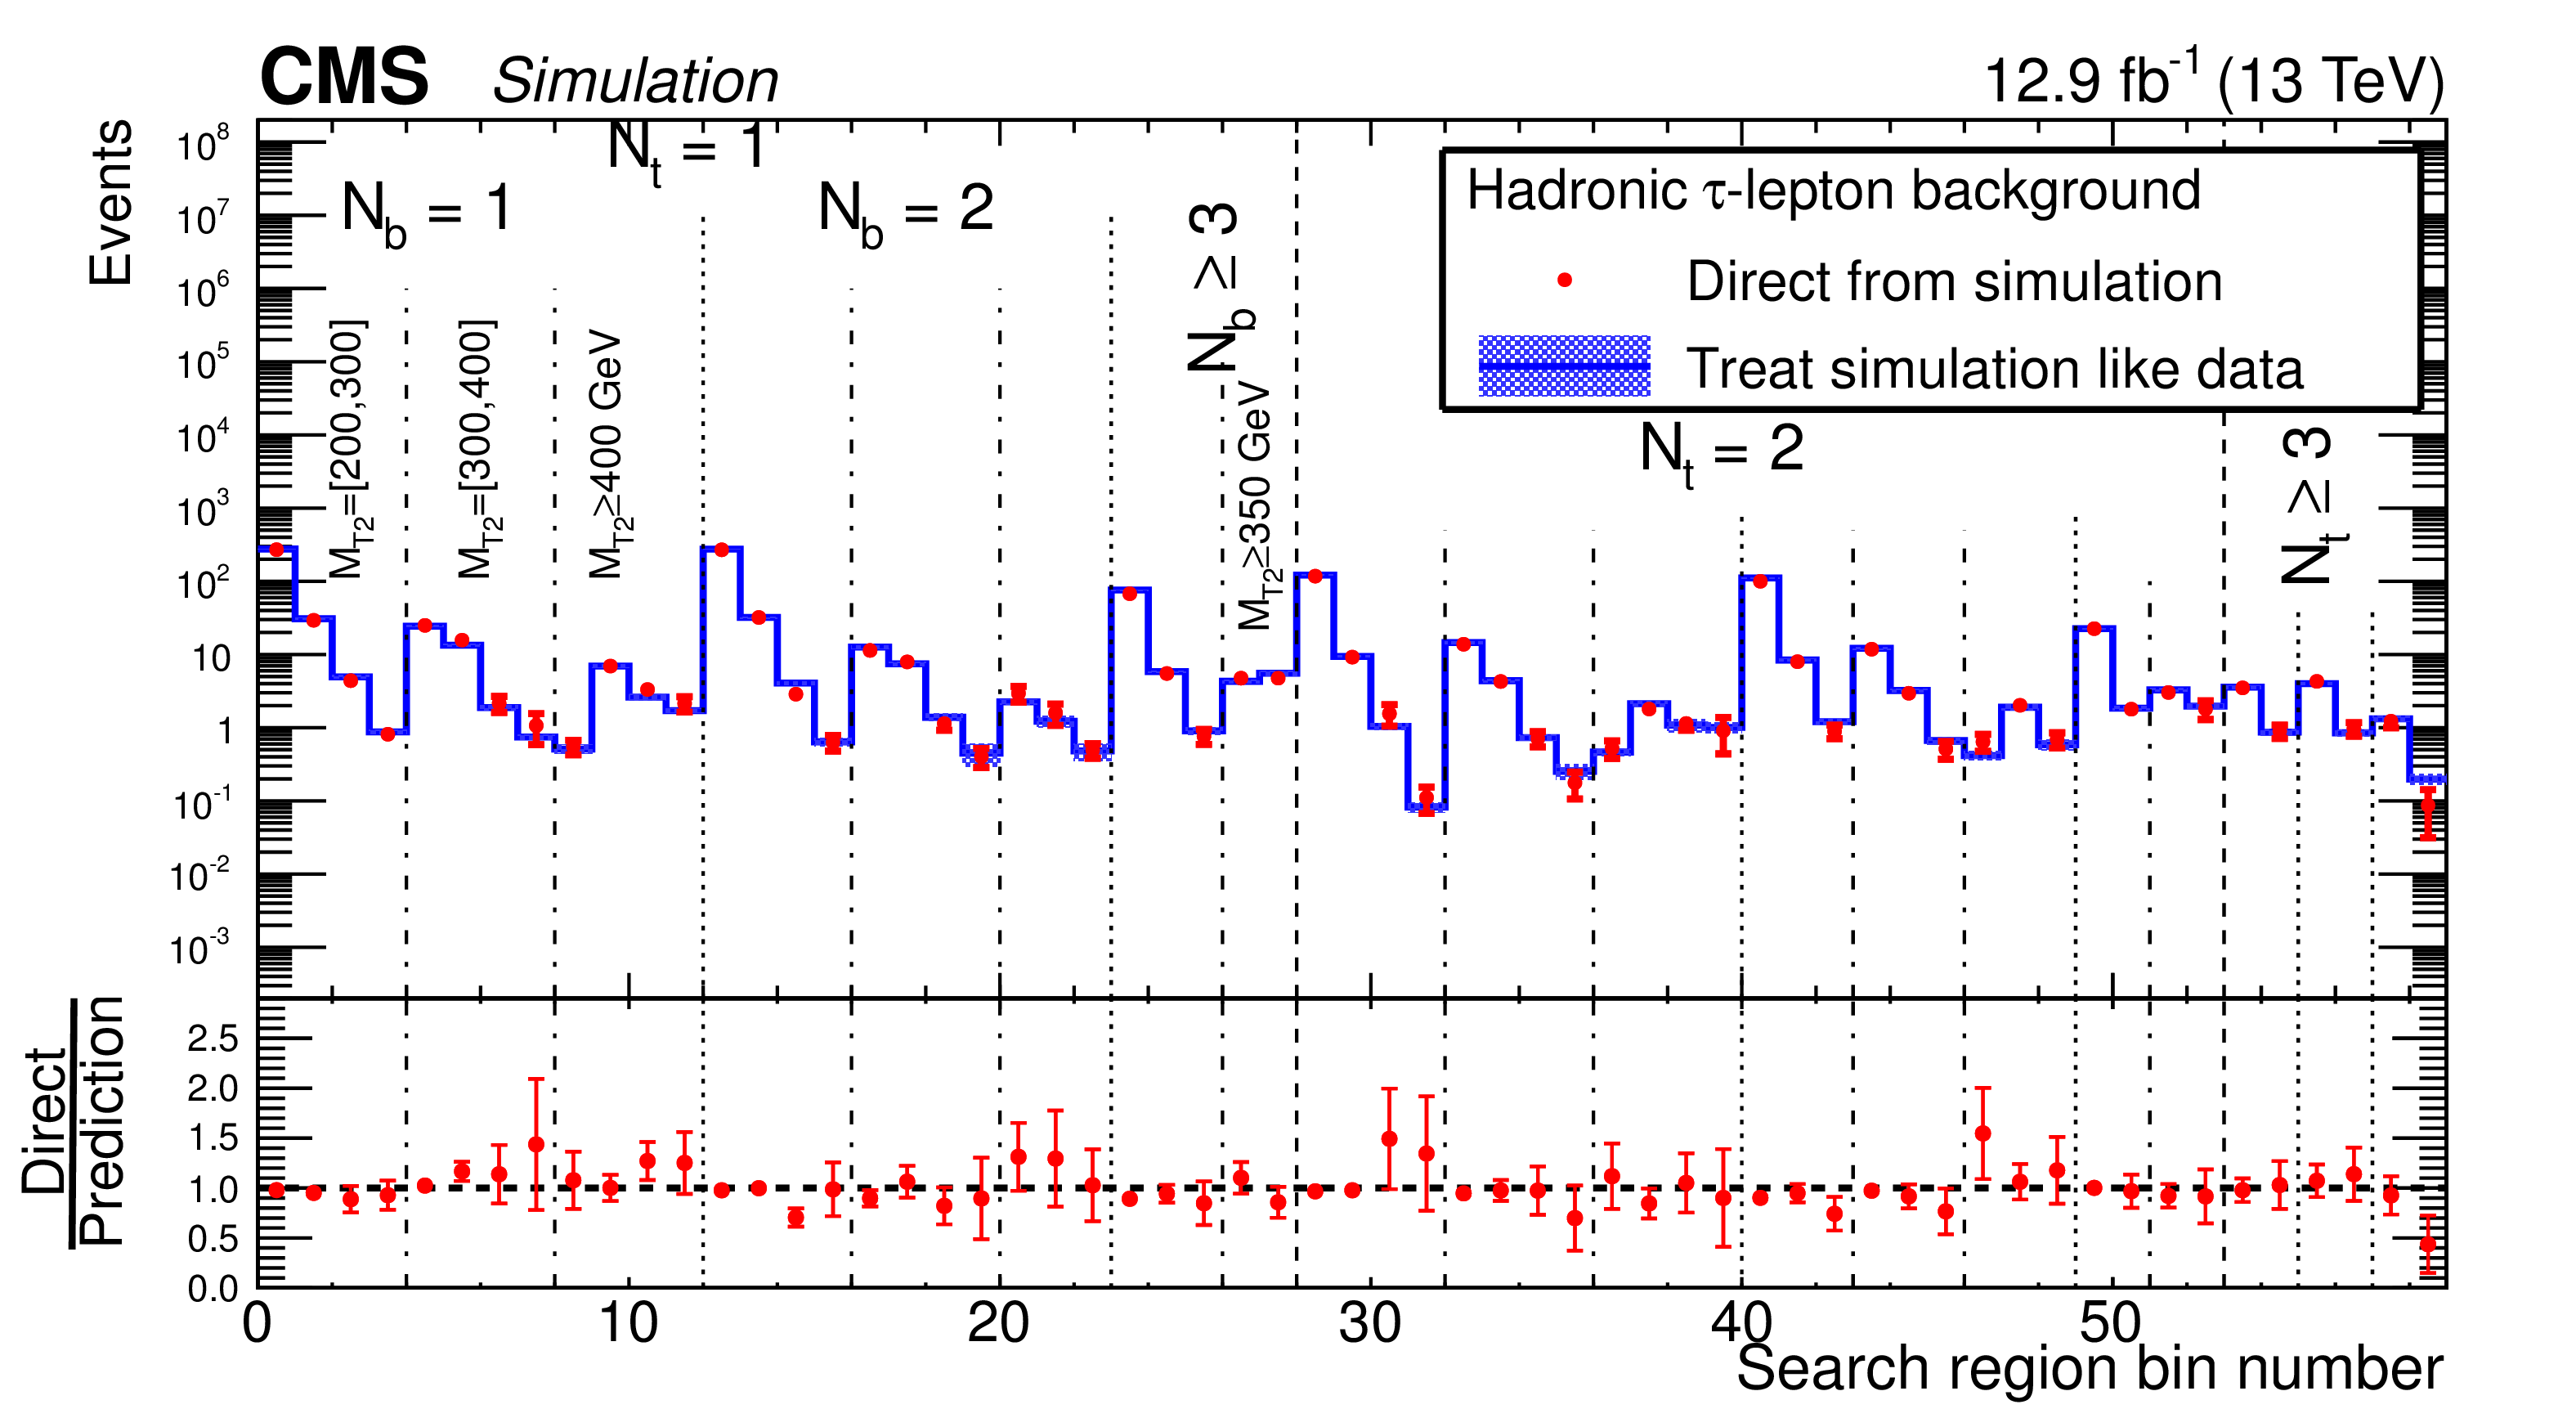
Figure 5-b:
(a) The lost-lepton background in the 59 search regions of the analysis as determined directly from ${{\rm t\bar{t}}} $, single top quark, and W+jets simulation (points) and as predicted by applying the lost-lepton background determination procedure to the simulated muon control sample (histograms). The lower panel shows the same results following division by the predicted value. Only statistical uncertainties are shown. (b) The corresponding simulated results for the background from hadronically-decaying $\tau $ leptons. For both plots, vertical lines indicate search regions with different ${N_{ {\mathrm {t}}}} $, ${N_{ {\mathrm {b}}}} $, and ${M_{\mathrm {T2}}}$ values. Within each ($ {N_{ {\mathrm {t}}}} $, ${N_{ {\mathrm {b}}}} $, ${M_{\mathrm {T2}}} $) region, the bins indicate the different ${E_{\mathrm {T}}}$ selections, as defined in Fig. 4. |

png pdf |
Figure 6-a:
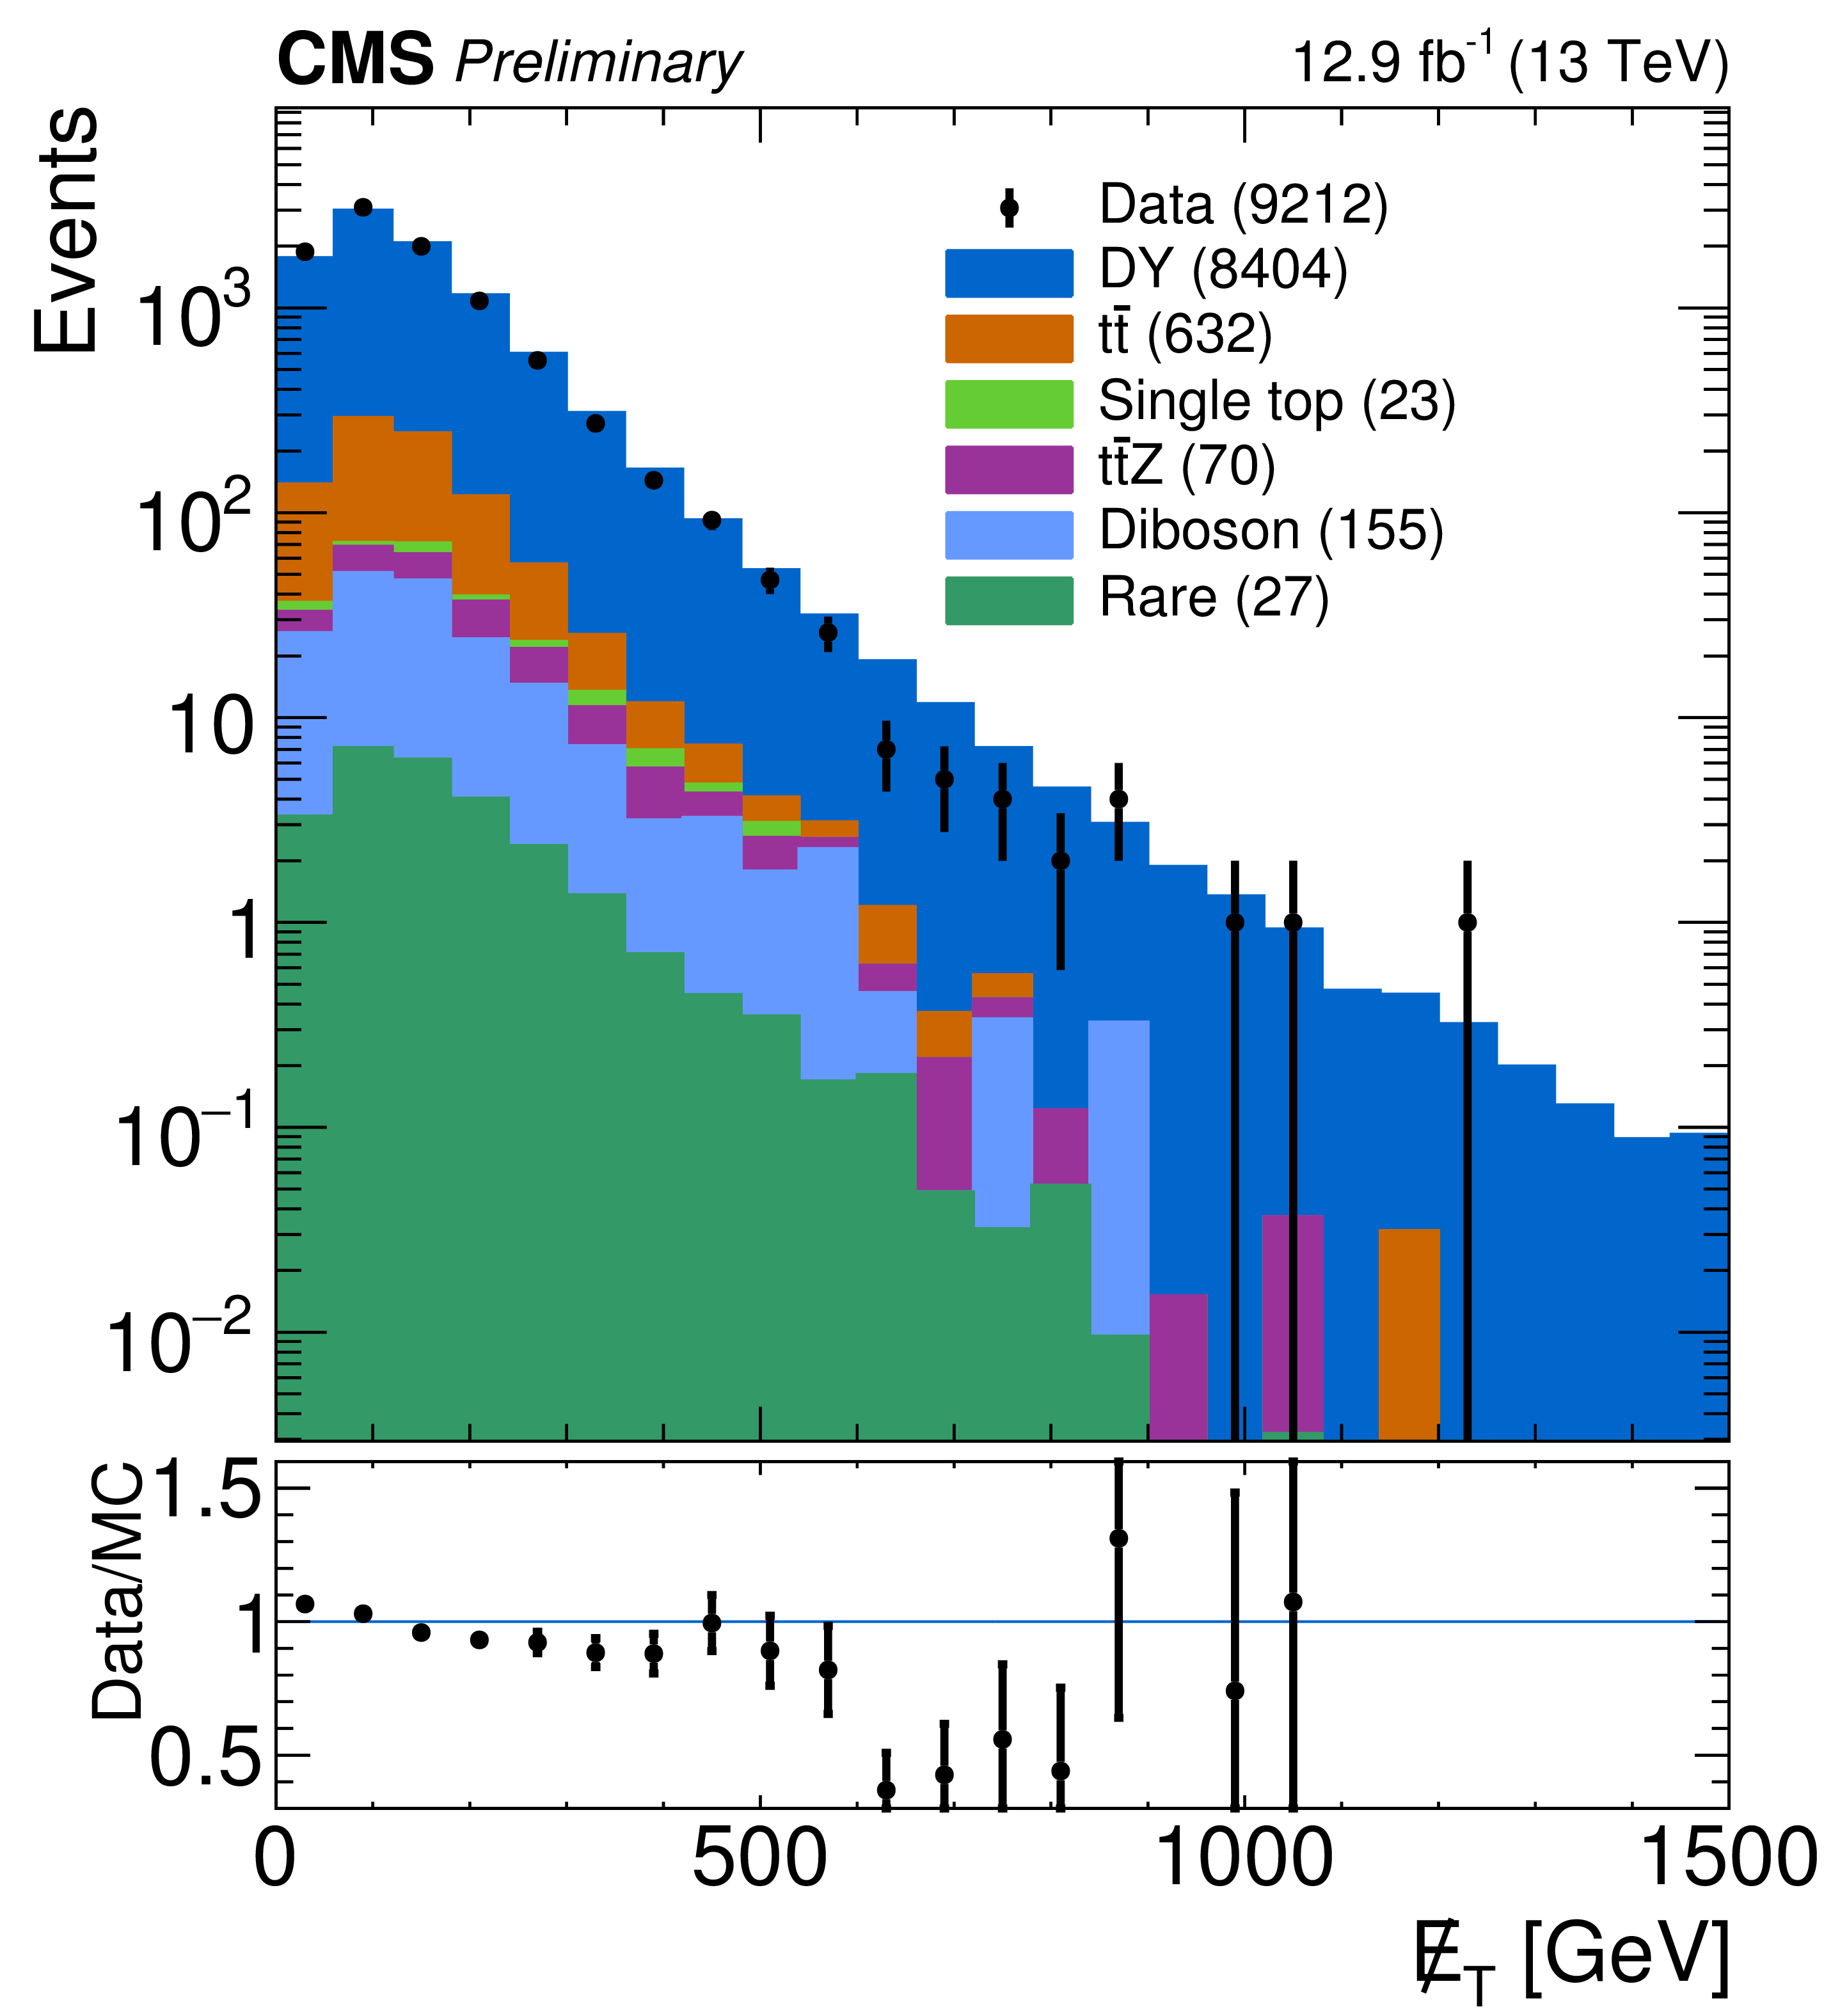
${N_{ {\mathrm {b}}}}$ (a) and ${E_{\mathrm {T}}}$ (b) distribution in data and simulation in the loose dimuon control region after applying the $S_{DY}(N_\textrm {j})$ scale factor to the simulation. The lower panels show the ratio between data and simulation. Only statistical uncertainties are shown. The values in parentheses in the legend indicate the integrated yield for each given process. |
png pdf |
Figure 6-b:
${N_{ {\mathrm {b}}}}$ (a) and ${E_{\mathrm {T}}}$ (b) distribution in data and simulation in the loose dimuon control region after applying the $S_{DY}(N_\textrm {j})$ scale factor to the simulation. The lower panels show the ratio between data and simulation. Only statistical uncertainties are shown. The values in parentheses in the legend indicate the integrated yield for each given process. |
png pdf |
Figure 7:
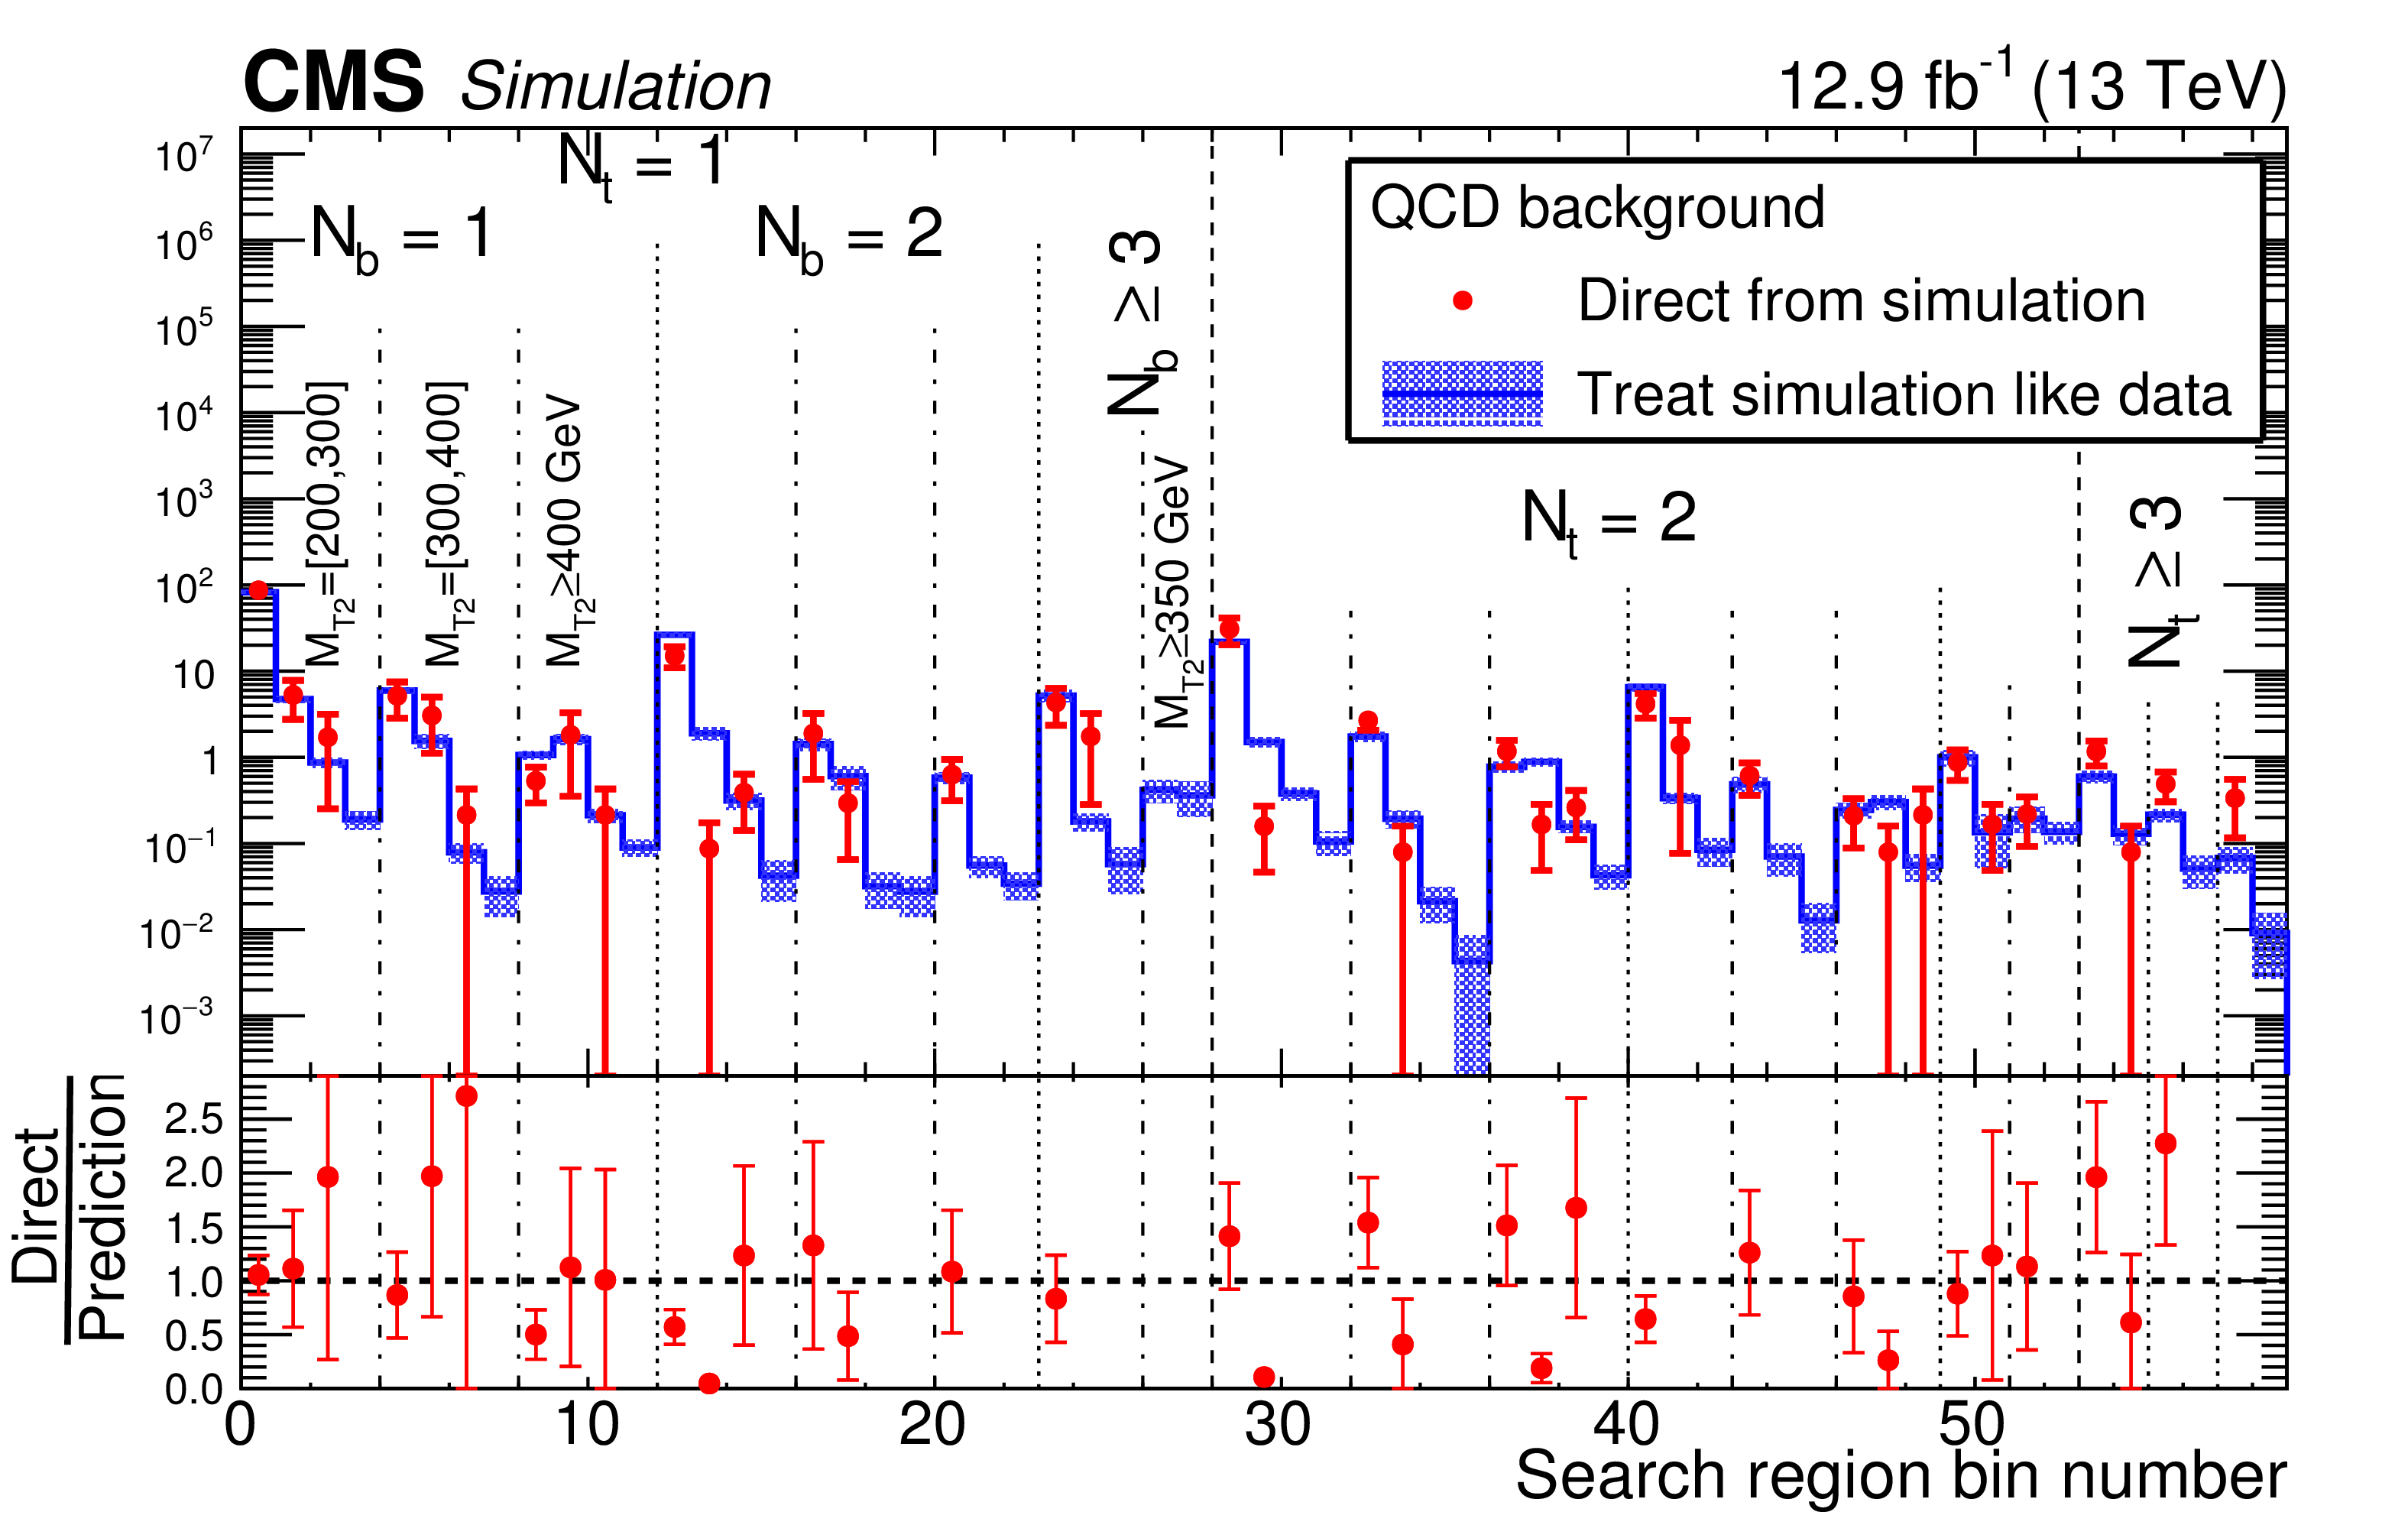
The QCD multijet background in the 59 search regions of the analysis as determined directly from QCD multijet simulation (points) and as predicted by applying the QCD multijet background determination procedure to simulated event samples in the inverted-$\Delta \phi $ control region (histograms). The lower panel shows the same results following division by the predicted value. Only statistical uncertainties are shown. The labeling of the search regions is the same as in Fig. 5. |

png pdf |
Figure 8:
Observed event yields in data (black points) and predicted SM background (filled solid area) for the 59 search bins. The lower panel shows the ratio of data over total background prediction in each search bin. Only statistical uncertainties of observed data are propagated to the ratio. The shaded bands indicate uncertainties of total predictions with dark grey for systematic uncertainty and light grey for statistical uncertainty. |
png pdf |
Figure 9:
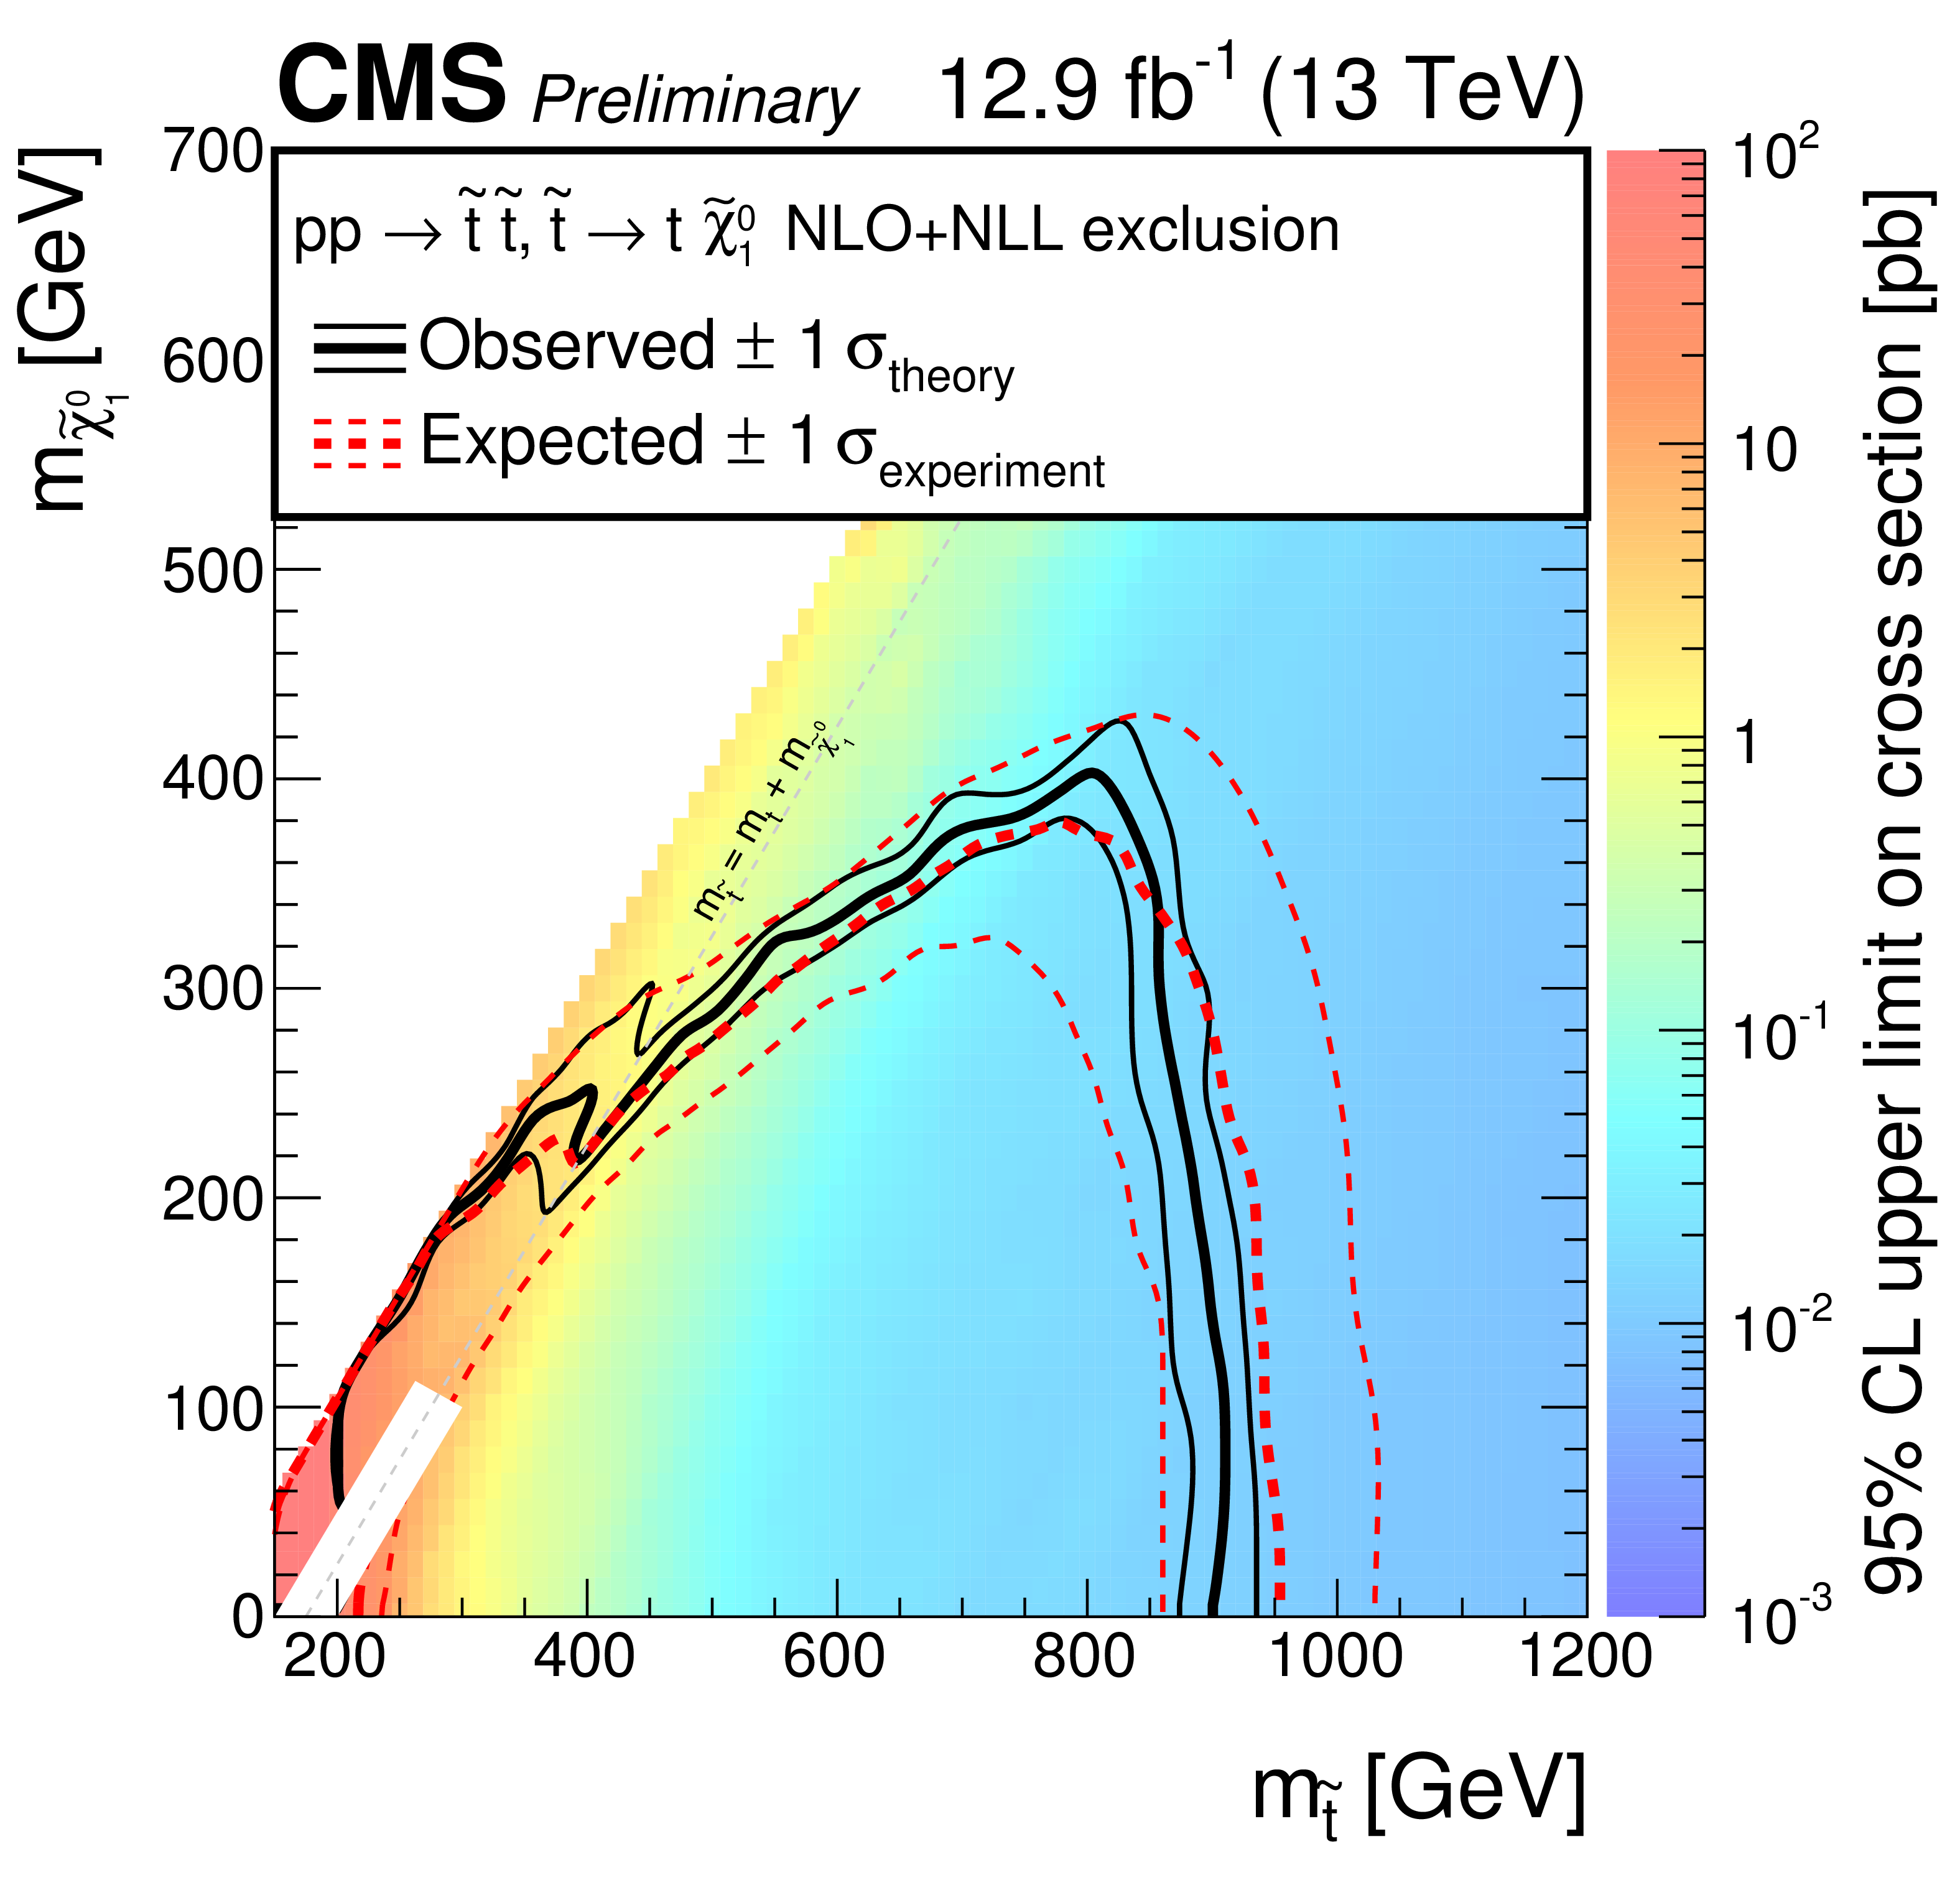
Exclusion limits at 95% CL for simplified models of top squark pair production in the T2tt scenario. The solid black curves represent the observed exclusion contours with respect to NLO+NLL cross section calculations [54] and the corresponding $\pm$1 standard deviations. The dashed red curves indicate the expected exclusion contour and the $\pm$1 standard deviations with experimental uncertainties. |
png pdf |
Figure 10:
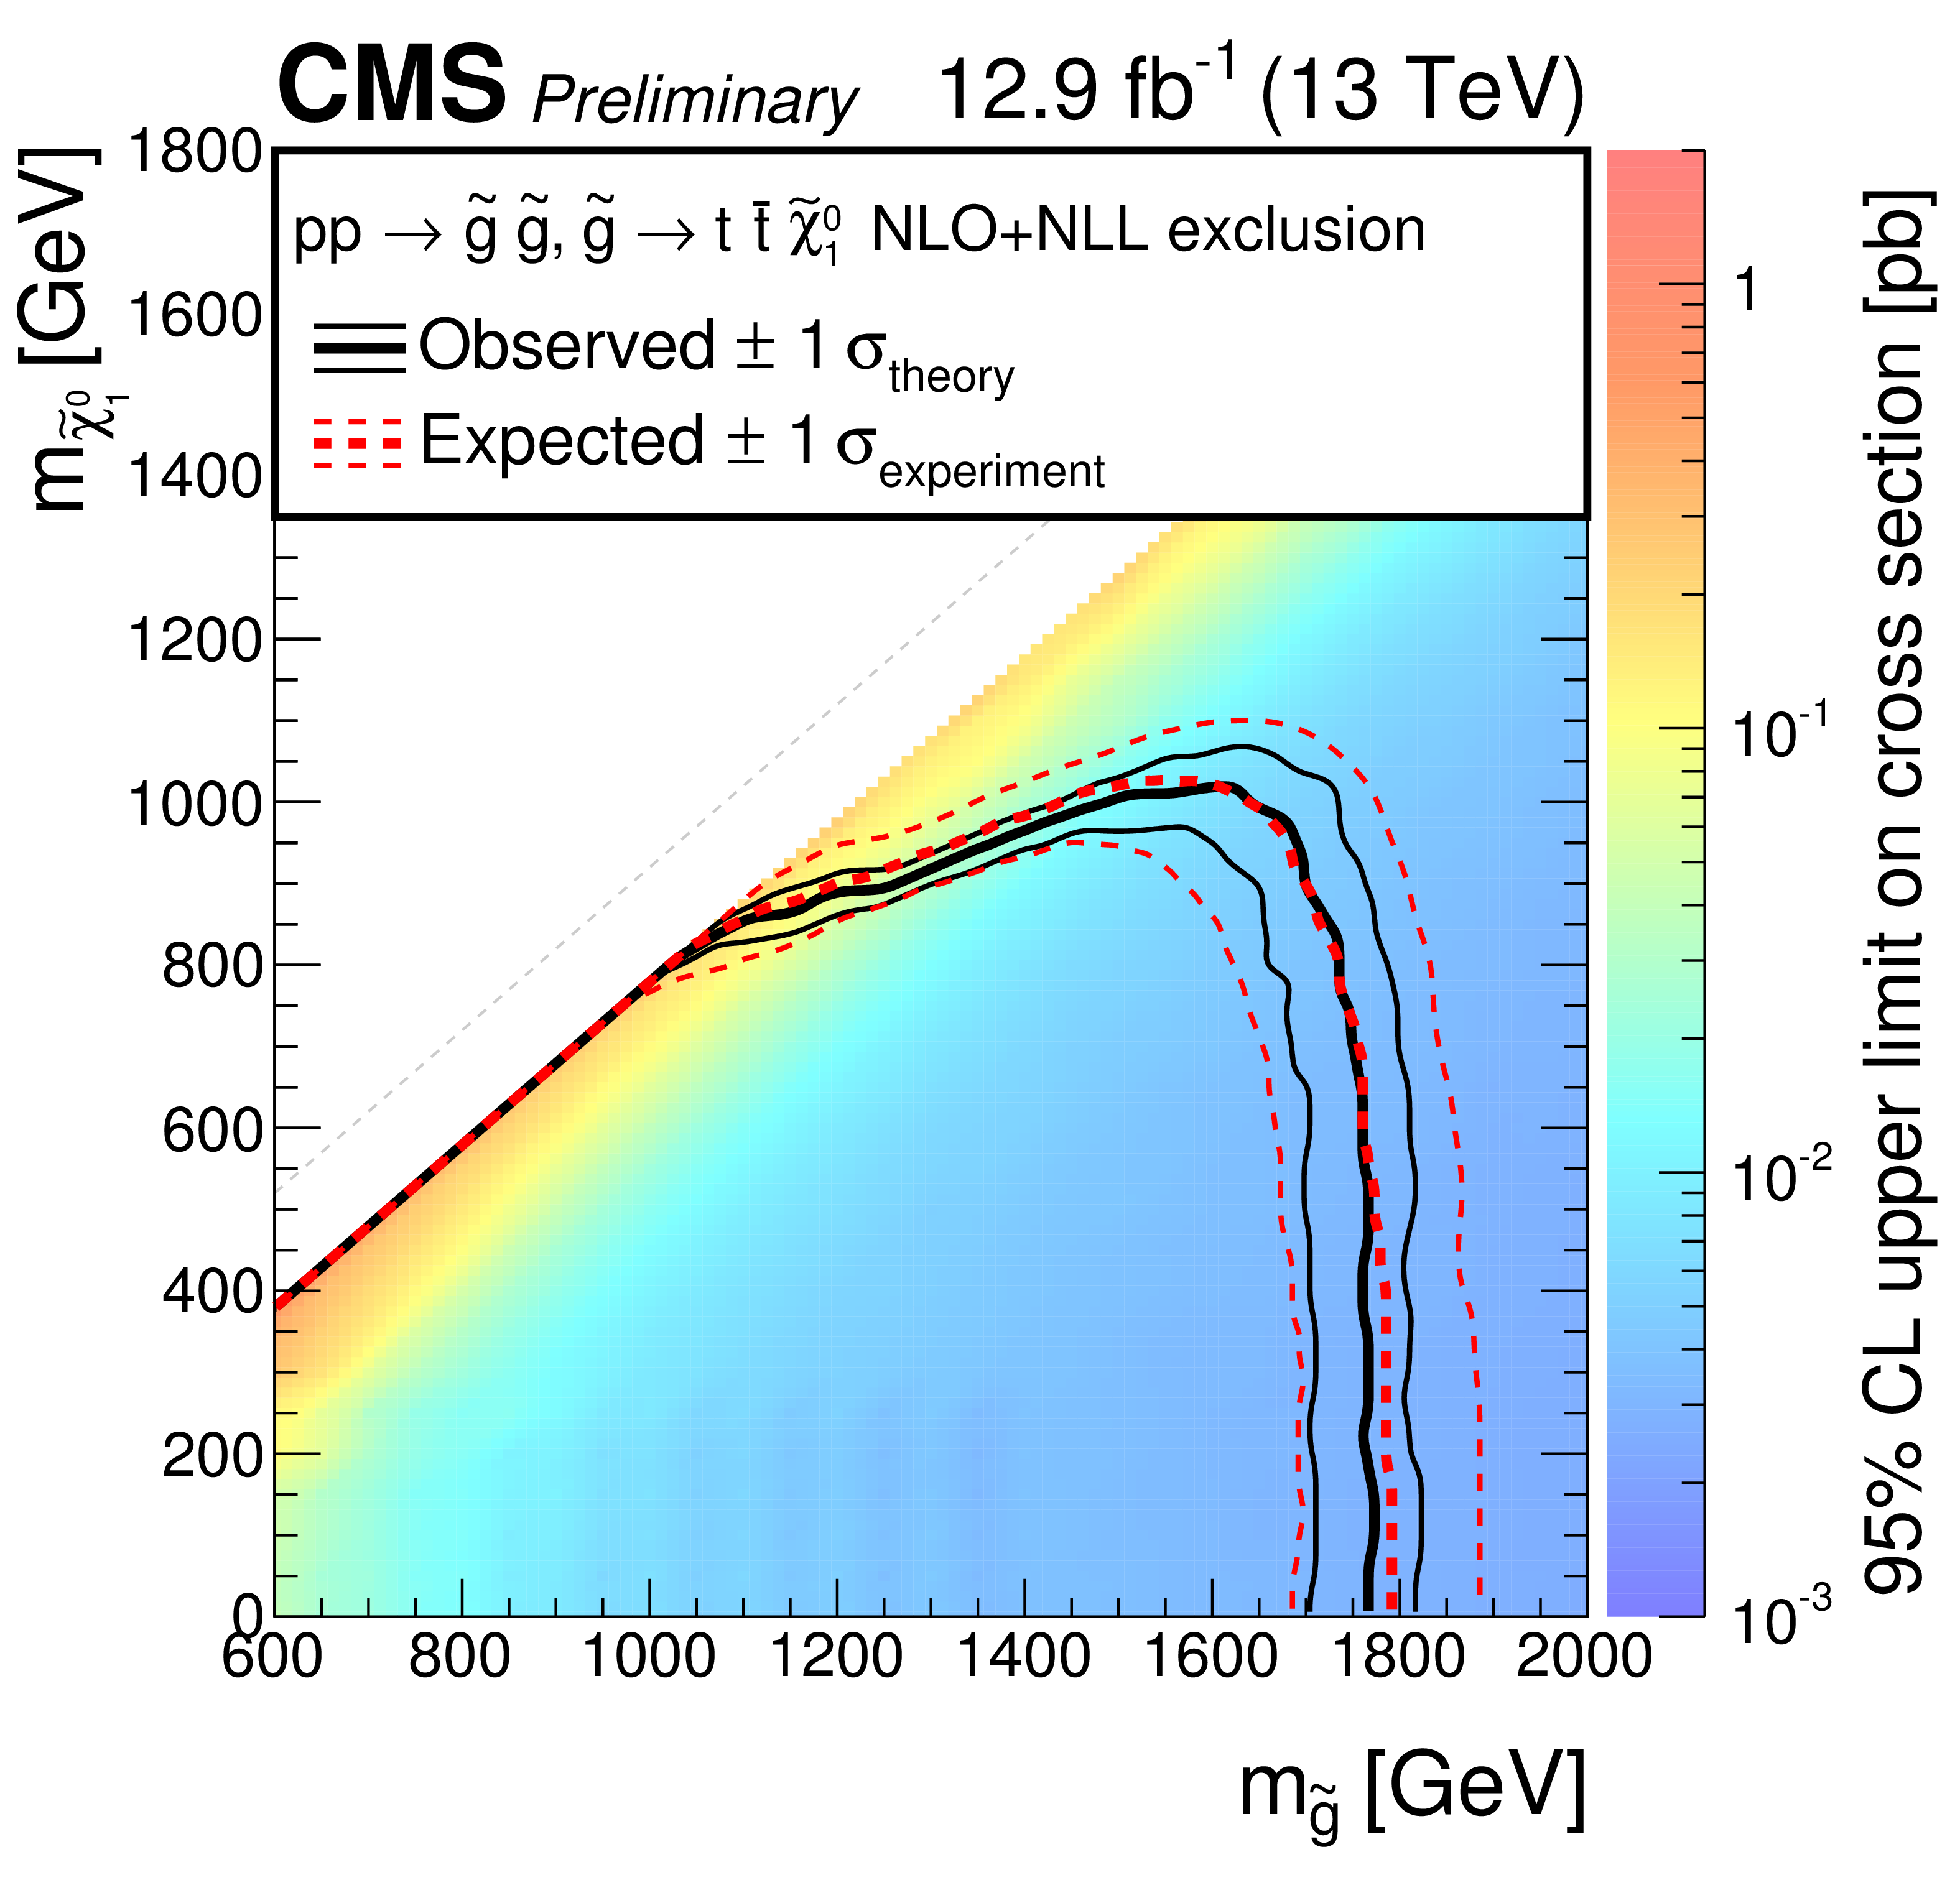
Exclusion limits at 95% CL for simplified models of top squarks produced through decays of gluino pairs in the T1tttt scenario. The solid black curves represent the observed exclusion contours with respect to NLO+NLL cross section calculations [54] and the corresponding $\pm$1 standard deviations. The dashed red curves indicate the expected exclusion contour and the $\pm$1 standard deviations with experimental uncertainties. |
png pdf |
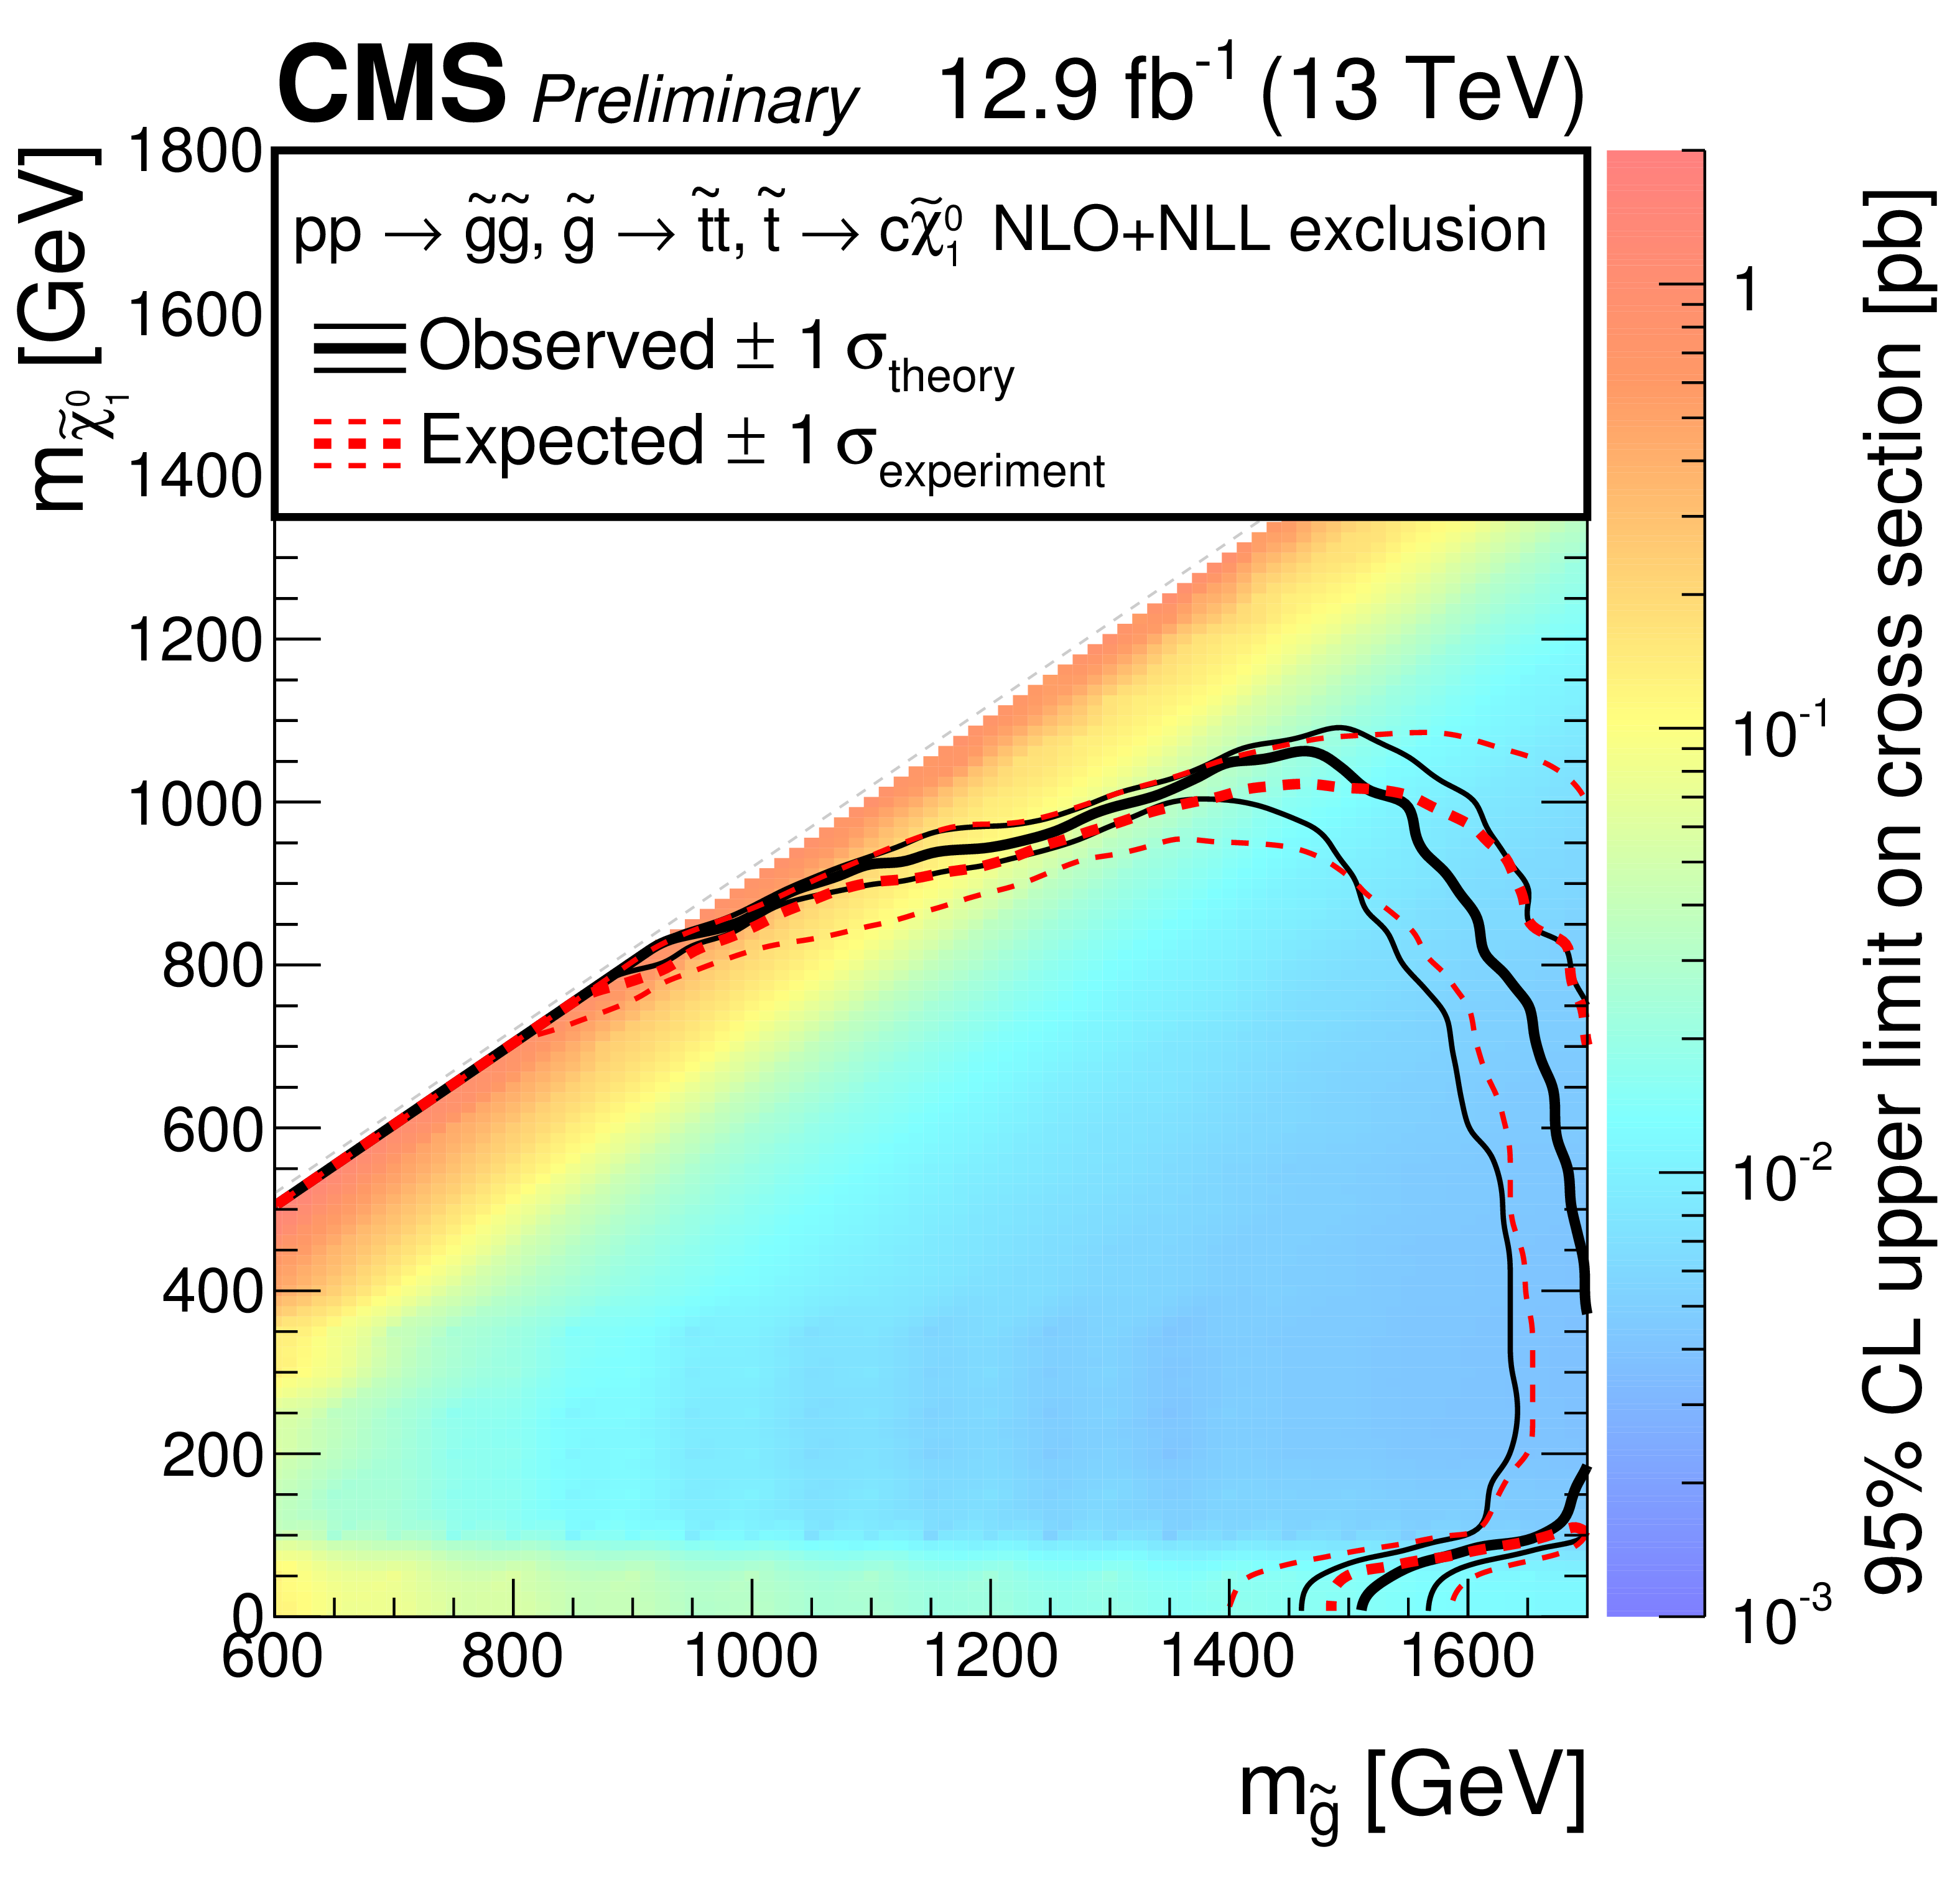
Figure 11:
Exclusion limits at 95% CL for simplified models of top squarks produced through decays of gluino pairs in the T5ttcc scenario. The solid black curves represent the observed exclusion contours with respect to NLO+NLL cross section calculations [54] and the corresponding $\pm$1 standard deviations. The dashed red curves indicate the expected exclusion contour and the $\pm$1 standard deviations with experimental uncertainties. |
| Tables | |
png pdf |
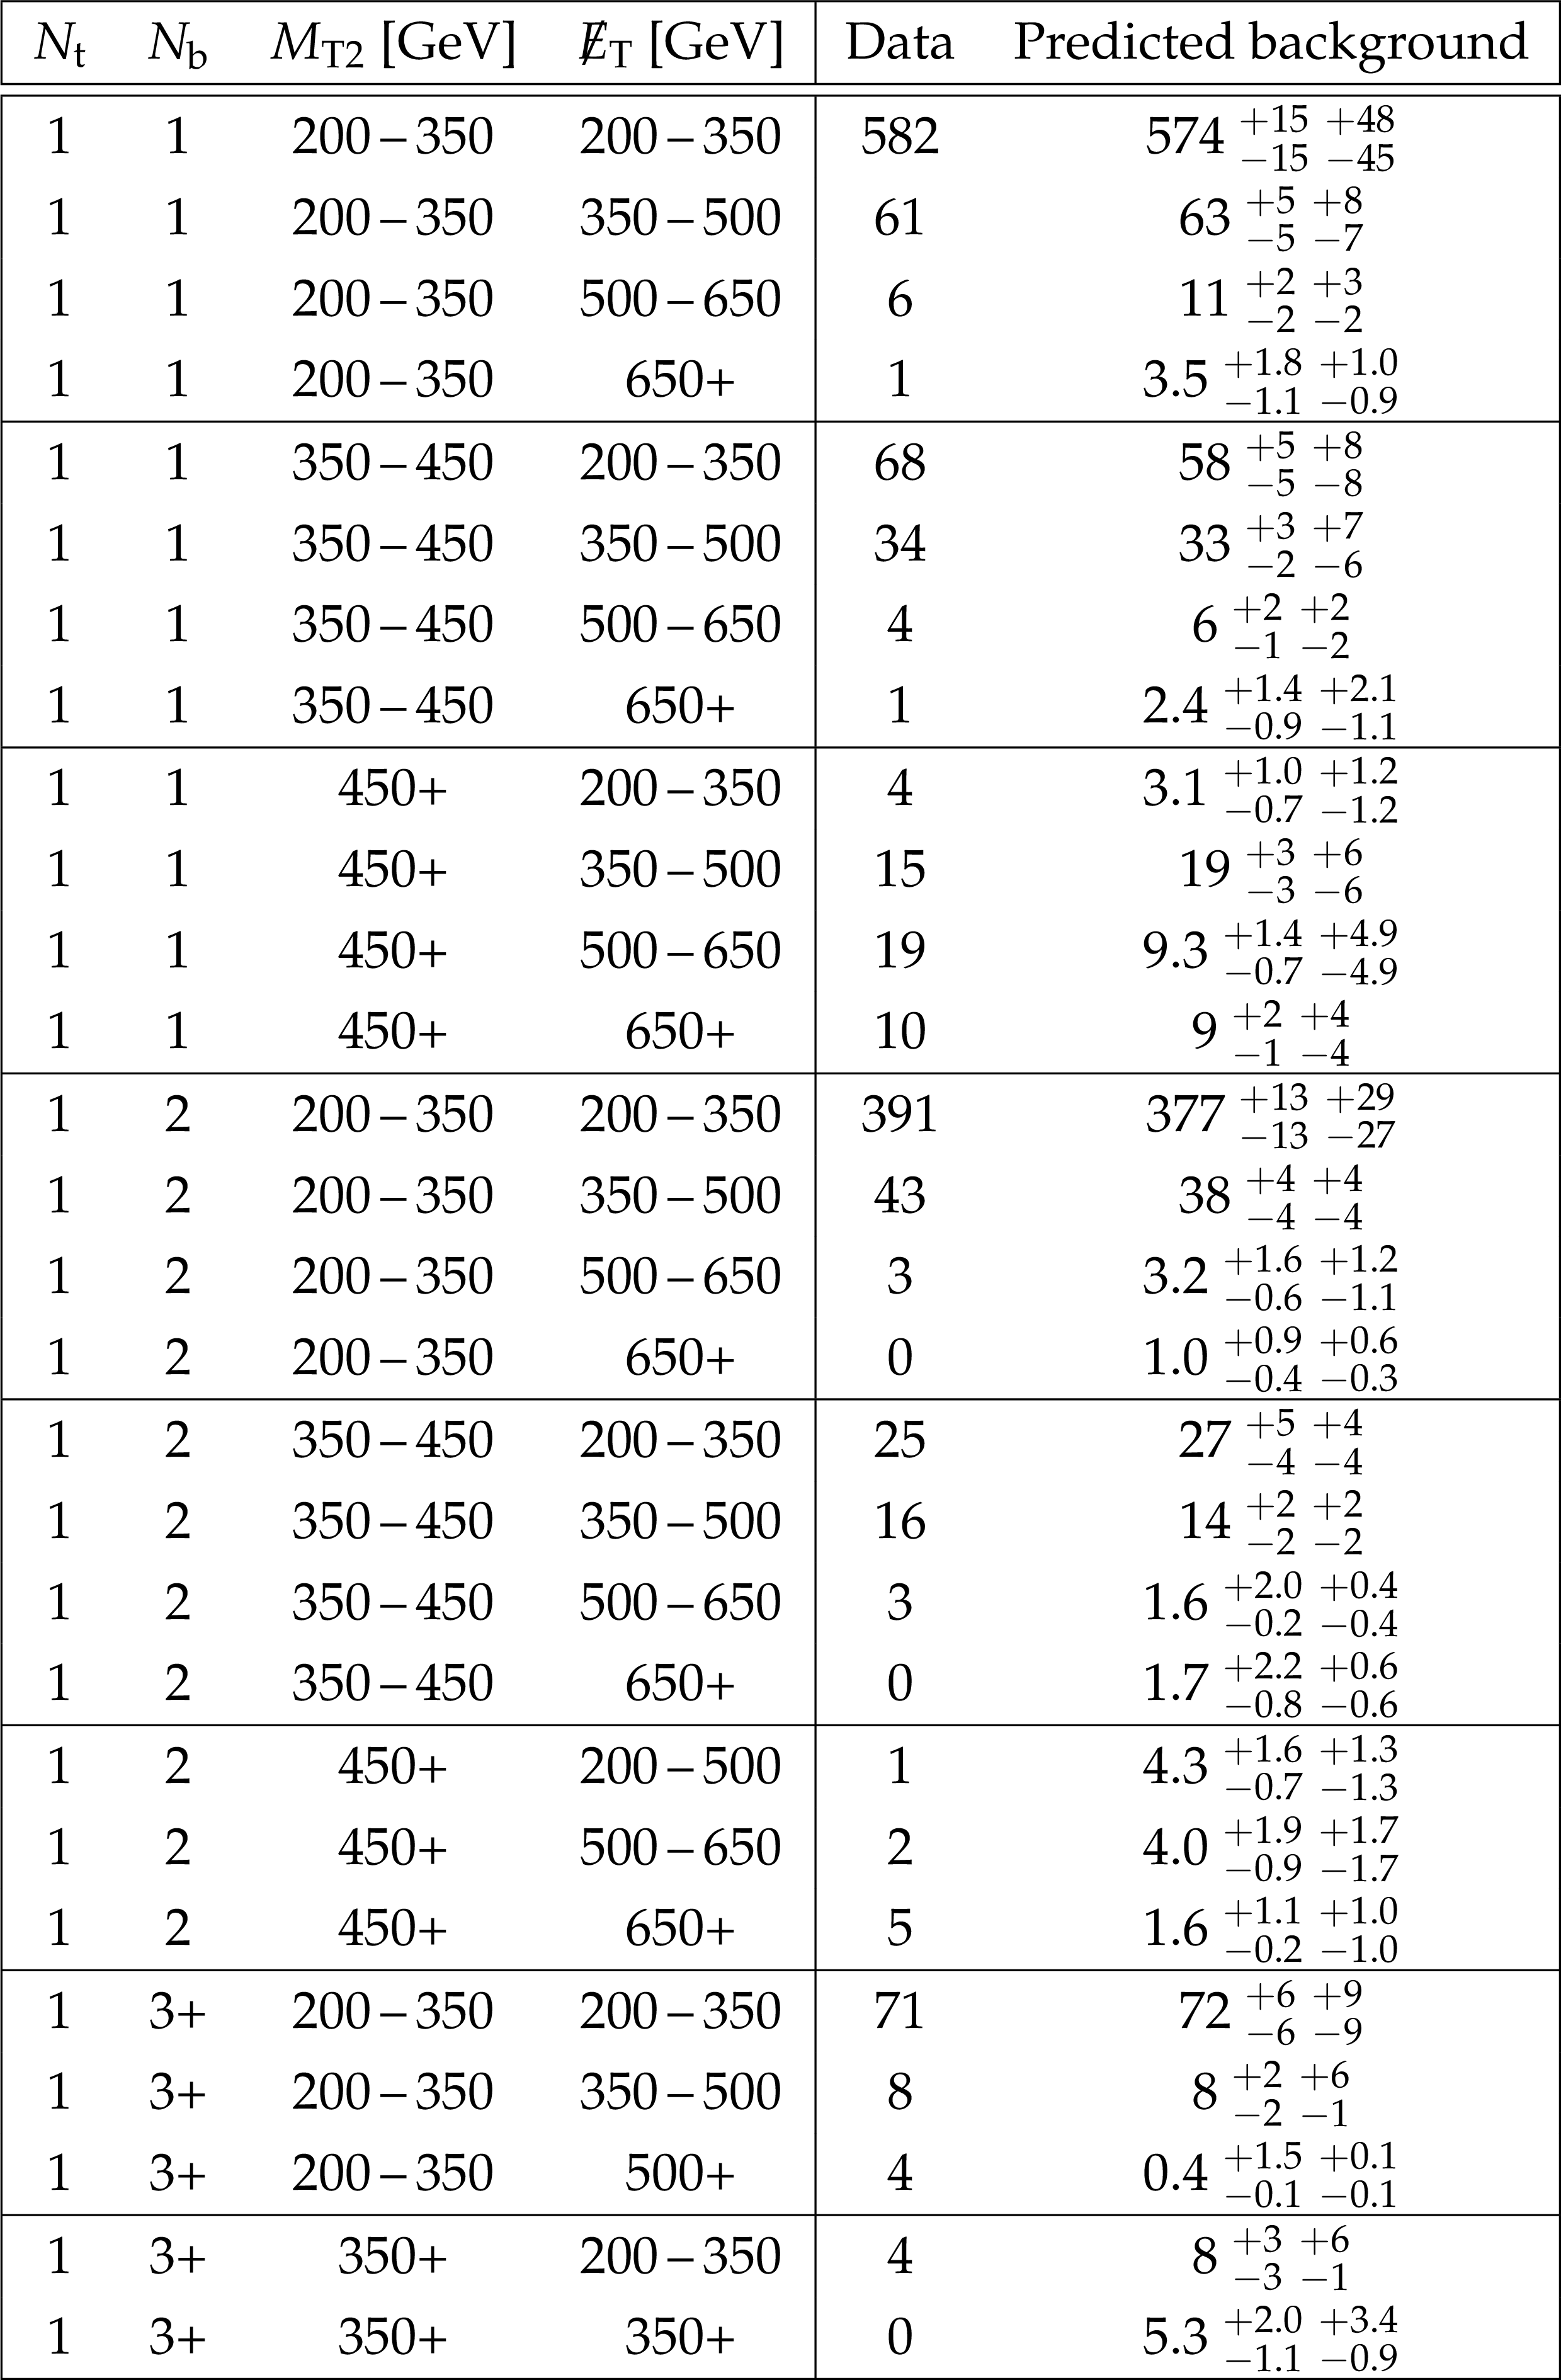
Table 1:
Observed yields from the data compared to the total background predictions for the search bins. Uncertainties are listed as $\pm $ statistical $\pm $ systematic. |
png pdf |
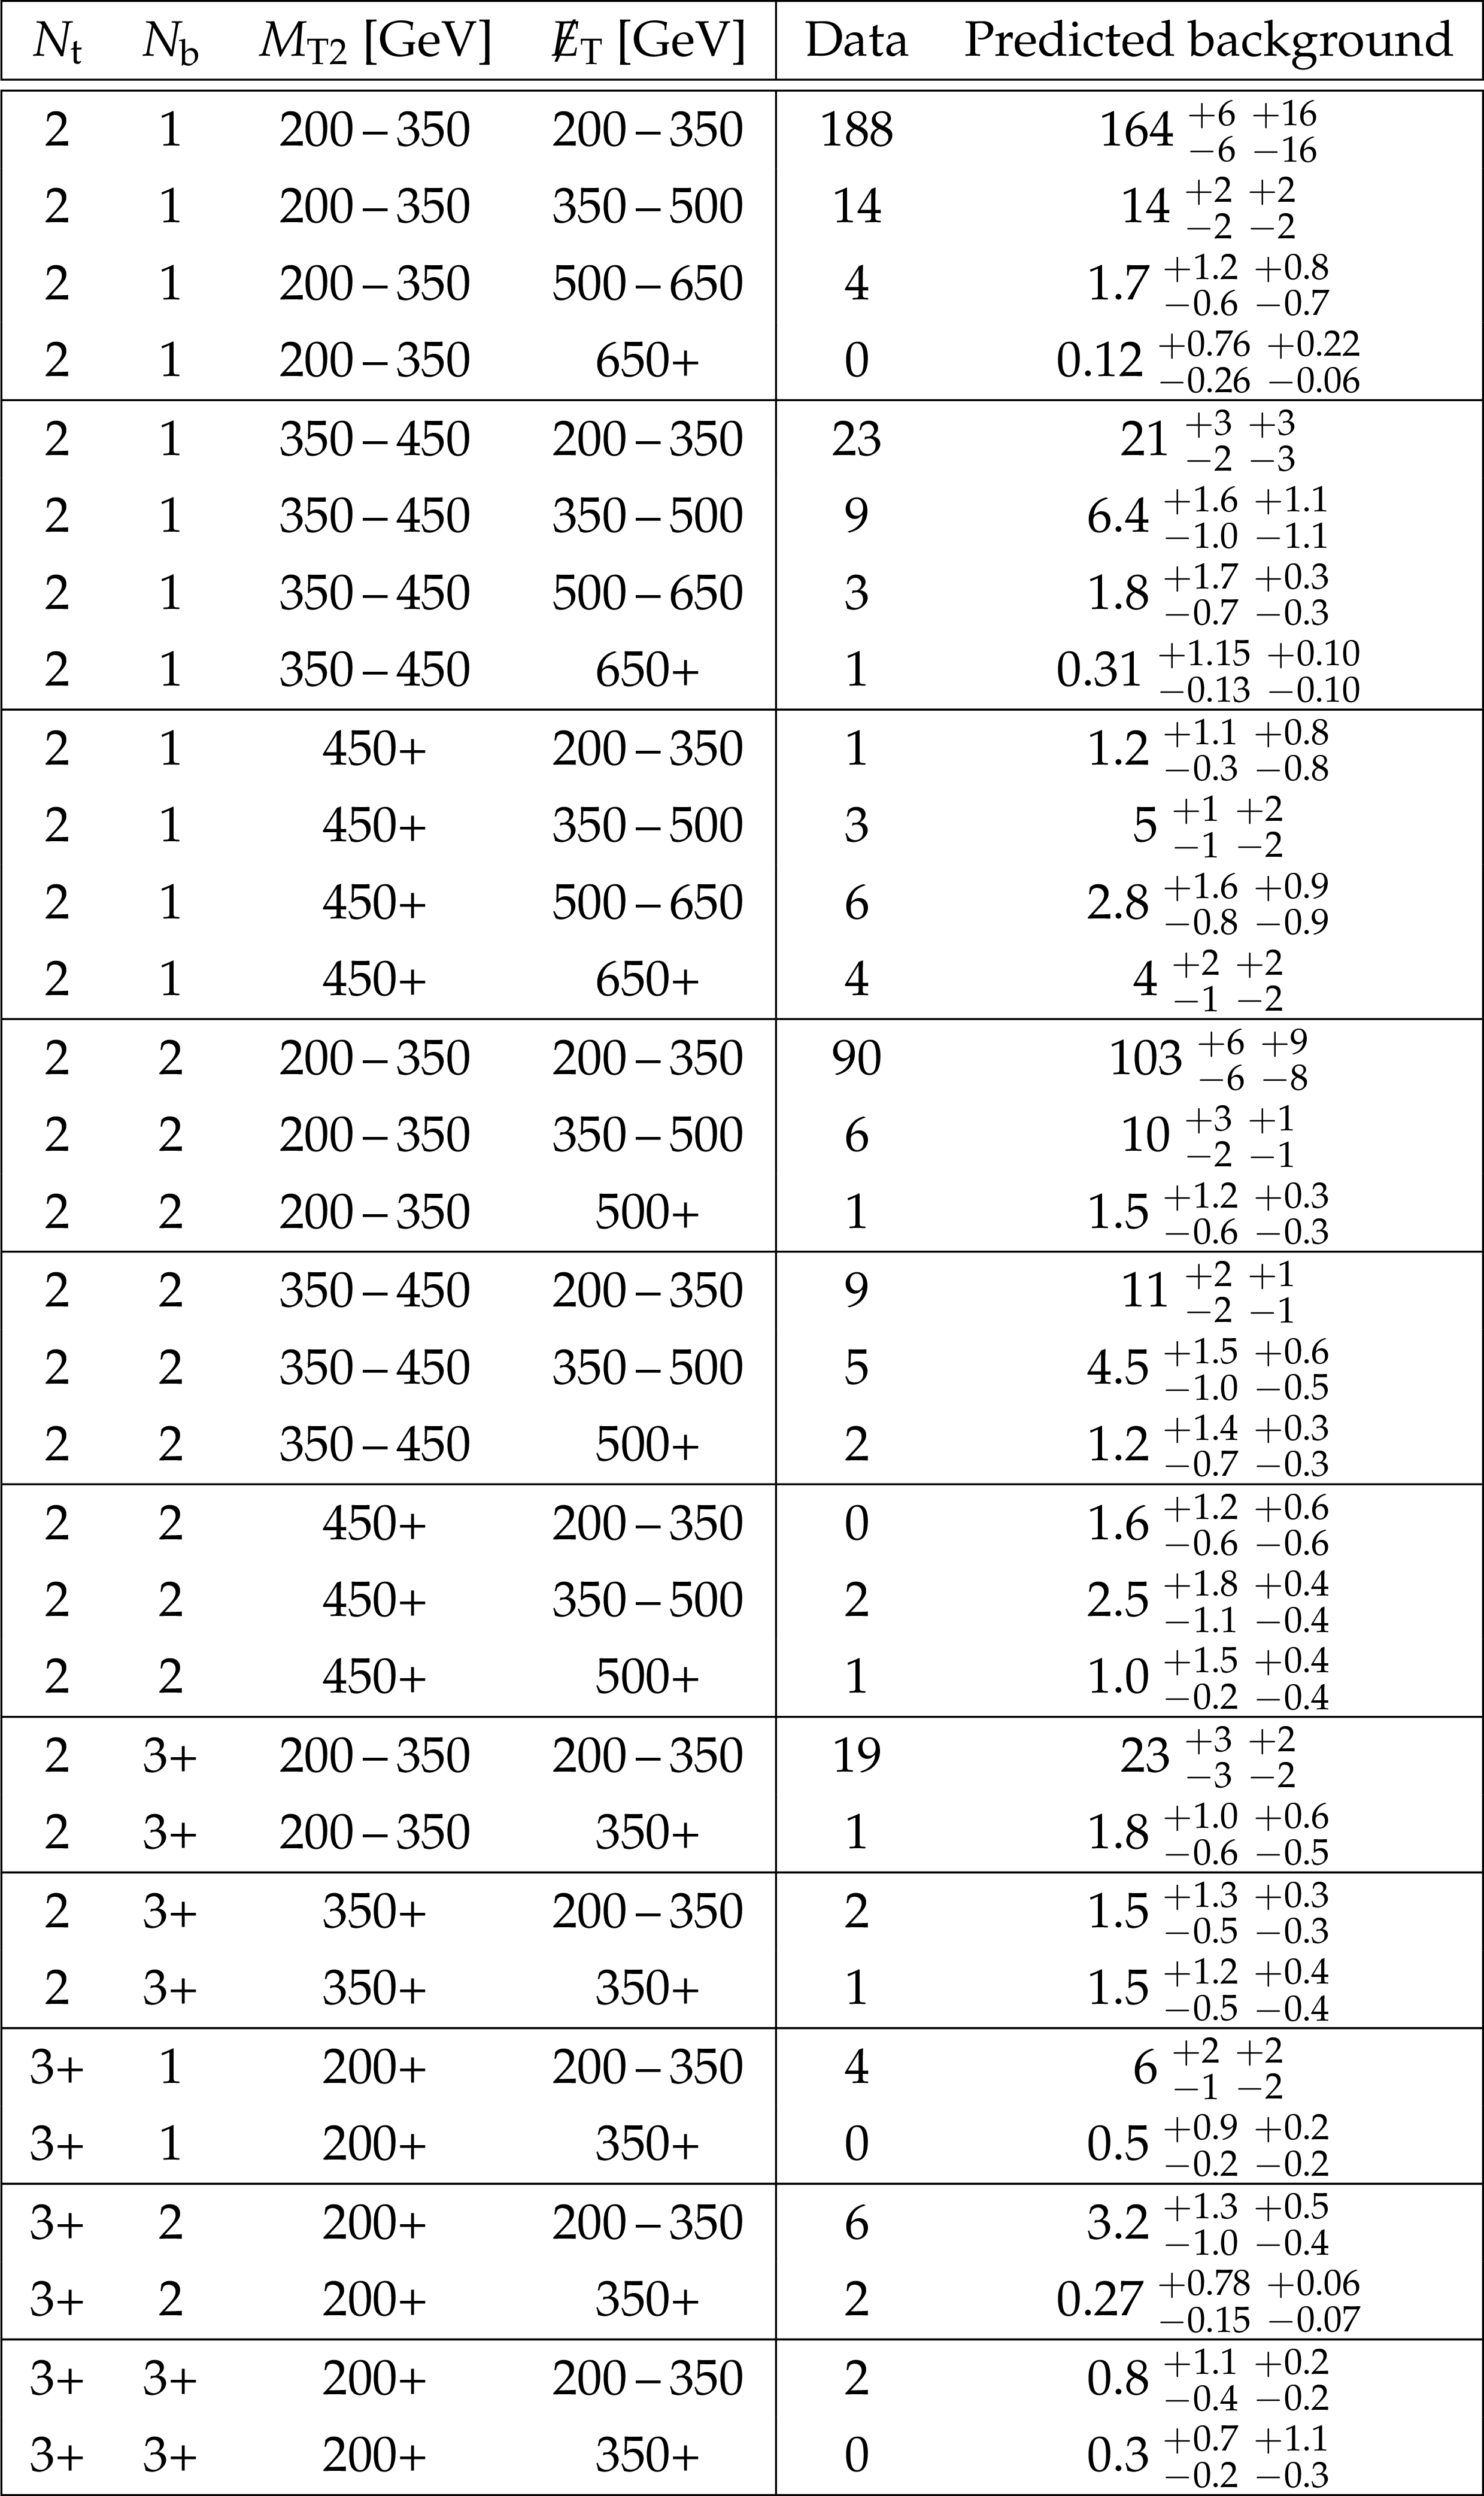
Table 2:
Continued table: observed yields from the data compared to the total background predictions for the search bins. Uncertainties are listed as $\pm $ statistical $\pm $ systematic. |

png pdf |
Table 3:
Observed number of events and background predictions in the aggregate search regions as defined in the text. A plus-sign is used as shorthand for the listed value or more. Uncertainties are listed as $\pm $ statistical $\pm $ systematic. |
| Summary |
| The results of a search for direct and gluino-mediated top squark production in final states including top-like objects have been presented. The search uses all-hadronic events with at least four jets and large $E_{\mathrm{T}}^{\text{miss}}$, selected from a data sample corresponding to an integrated luminosity of 12.9 fb$^{-1}$ collected in proton-proton collisions at a center-of-mass energy of 13 TeV with the CMS detector during 2016. A set of search regions is defined based on $E_{\mathrm{T}}^{\text{miss}}$, ${M_{\mathrm{T}}}$, the number of top-like objects, and the number of b-tagged jets. No statistically significant excess of events above the expected standard model background is observed, and exclusion limits are set at the 95% confidence level for simplified models of direct top squark pair production and gluino pair production where the gluinos decay to final states including top quarks. For simplified models of pair production of top squarks, which decay to a top quark and a neutralino, top squark masses up to 910 GeV and neutralino masses up to 400 GeV are excluded at 95% CL. For models with gluino pair production, gluino masses up to 1700 (1780) GeV and neutralino masses up to 1060 (1020) GeV are excluded for the T5ttcc (T1tttt) models. |
| References | ||||
| 1 | R. Barbieri, S. Ferrara, and C. A. Savoy | Gauge Models with Spontaneously Broken Local Supersymmetry | PLB119 (1982) 343 | |
| 2 | J. Wess and B. Zumino | Supergauge transformations in four-dimensions | Nucl. Phys. B 70 (1974) 39 | |
| 3 | Y. A. Gol'fand and E. P. Likhtman | Extension of the algebra of Poincar$ \'e $ group generators and violation of P invariance | JEPTL 13 (1971)323 | |
| 4 | D. V. Volkov and V. P. Akulov | Possible universal neutrino interaction | JEPTL 16 (1972) 438 | |
| 5 | A. H. Chamseddine, R. L. Arnowitt, and P. Nath | Locally supersymmetric grand unification | PRL 49 (1982) 970 | |
| 6 | G. L. Kane, C. F. Kolda, L. Roszkowski, and J. D. Wells | Study of constrained minimal supersymmetry | PRD 49 (1994) 6173 | hep-ph/9312272 |
| 7 | P. Fayet | Supergauge invariant extension of the Higgs mechanism and a model for the electron and its neutrino | Nucl. Phys. B 90 (1975) 104 | |
| 8 | L. J. Hall, J. D. Lykken, and S. Weinberg | Supergravity as the messenger of supersymmetry breaking | PRD 27 (1983) 2359 | |
| 9 | P. Ramond | Dual theory for free fermions | PRD 3 (1971) 2415 | |
| 10 | J. Wess and B. Zumino | Supergauge Transformations in Four-Dimensions | Nucl. Phys. B70 (1974) 39 | |
| 11 | G. R. Farrar and P. Fayet | Phenomenology of the Production, Decay, and Detection of New Hadronic States Associated with Supersymmetry | PLB76 (1978) 575 | |
| 12 | J. L. Feng | Dark Matter Candidates from Particle Physics and Methods of Detection | Ann. Rev. Astron. Astrophys. 48 (2010) 495 | 1003.0904 |
| 13 | CMS Collaboration | Observation of a new boson at a mass of 125 GeV with the CMS experiment at the LHC | PLB 716 (2012) 30 | CMS-HIG-12-028 1207.7235 |
| 14 | ATLAS Collaboration | Observation of a new particle in the search for the Standard Model Higgs boson with the ATLAS detector at the LHC | PLB 716 (2012) 1 | 1207.7214 |
| 15 | S. Dimopoulos and S. Raby | Supercolor | Nucl. Phys. B 192 (1981) 353 | |
| 16 | E. Witten | Dynamical Breaking of Supersymmetry | Nucl. Phys. B 188 (1981) 513 | |
| 17 | M. Dine, W. Fischler, and M. Srednicki | Supersymmetric Technicolor | Nucl. Phys. B 189 (1981) 575 | |
| 18 | S. Dimopoulos and H. Georgi | Softly Broken Supersymmetry and SU(5) | Nucl. Phys. B 193 (1981) 150 | |
| 19 | R. K. Kaul and P. Majumdar | Cancellation of quadratically divergent mass corrections in globally supersymmetric spontaneously broken gauge theories | Nucl. Phys. B 199 (1982) 36 | |
| 20 | S. Dimopoulos and G. Giudice | Naturalness constraints in supersymmetric theories with non-universal soft terms | PLB 357 (1995) 573 | |
| 21 | N. Sakai | Naturalness in supersymmetric GUTS | Z. Phys. C 11 (1981) 153 | |
| 22 | M. Papucci, J. T. Ruderman, and A. Weiler | Natural SUSY Endures | JHEP 09 (2012) 035 | 1110.6926 |
| 23 | C. Brust, A. Katz, S. Lawrence, and R. Sundrum | SUSY, the Third Generation and the LHC | JHEP 03 (2012) 103 | 1110.6670 |
| 24 | J. L. Feng | Naturalness and the Status of Supersymmetry | Ann. Rev. Nucl. Part. Sci. 63 (2013) 351 | 1302.6587 |
| 25 | A. Delgado et al. | The light stop window | EPJC 73 (2013) 2370 | 1212.6847 |
| 26 | L. Evans and P. Bryant (editors) | LHC Machine | JINST 3 (2008) S08001 | |
| 27 | ATLAS Collaboration | Search for top squarks in final states with one isolated lepton, jets, and missing transverse momentum in $ \sqrt{s}=13 $ TeV $ pp $ collisions with the ATLAS detector | 1606.03903 | |
| 28 | CMS Collaboration | Search for direct production of top squark pairs decaying to all-hadronic final states in pp collisions at sqrt(s) = 13 TeV | CMS-PAS-SUS-16-007 | CMS-PAS-SUS-16-007 |
| 29 | CMS Collaboration | Search for direct top squark pair production in the single lepton final state at $ \sqrt{s}=13 \mathrm{TeV} $ | CMS-PAS-SUS-16-002 | CMS-PAS-SUS-16-002 |
| 30 | ATLAS Collaboration | Search for pair production of gluinos decaying via stop and sbottom in events with $ b $-jets and large missing transverse momentum in $ pp $ collisions at $ \sqrt{s} = 13 $ TeV with the ATLAS detector | 1605.09318 | |
| 31 | CMS Collaboration | Search for supersymmetry in the multijet and missing transverse momentum final state in pp collisions at 13 TeV | PLB 758 (2016) 152 | CMS-SUS-15-002 1602.06581 |
| 32 | CMS Collaboration | Search for new physics with the MT2 variable in all-jets final states produced in pp collisions at sqrt(s) = 13 TeV | Submitted to JHEP | CMS-SUS-15-003 1603.04053 |
| 33 | C. Lester and D. Summers | Measuring masses of semiinvisibly decaying particles pair produced at hadron colliders | Phys.Lett. B463 (1999) 99--103 | hep-ph/9906349 |
| 34 | A. Barr, C. Lester, and P. Stephens | m(T2): The Truth behind the glamour | J.Phys. G29 (2003) 2343--2363 | hep-ph/0304226 |
| 35 | CMS Collaboration | The CMS experiment at the CERN LHC | JINST 3 (2008) S08004 | CMS-00-001 |
| 36 | CMS Collaboration | Particle--Flow Event Reconstruction in CMS and Performance for Jets, Taus, and $ E_{\mathrm{T}}^{\text{miss}} $ | CDS | |
| 37 | M. Cacciari, G. P. Salam, and G. Soyez | The anti-$ k_t $ jet clustering algorithm | JHEP 0804:063 (2008) | 0802.1189 |
| 38 | M. Cacciari and G. P. Salam | Pileup subtraction using jet areas | PLB 659 (2007) 119 | 0707.1378 |
| 39 | M. Cacciari, G. P. Salam, and G. Soyez | FastJet user manual | EPJC 72 (2012) 1896 | 1111.6097 |
| 40 | CMS Collaboration | Determination of Jet Energy Calibration and Transverse Momentum Resolution in CMS | JINST 6 (2011) P11002 | CMS-JME-10-011 1107.4277 |
| 41 | CMS Collaboration | Jet Performance in pp Collisions at 7 TeV | CDS | |
| 42 | CMS Collaboration | Identification of b quark jets at the CMS Experiment in the LHC Run 2 | CMS-PAS-BTV-15-001 | CMS-PAS-BTV-15-001 |
| 43 | J. Alwall et al. | MadGraph5: going beyond | JHEP 06 (2011) 128 | 1106.0522 |
| 44 | NNPDF Collaboration | Parton distributions for the LHC Run II | JHEP 04 (2015) 040 | 1410.8849 |
| 45 | P. Nason | A New method for combining NLO QCD with shower Monte Carlo algorithms | JHEP 11 (2004) 040 | hep-ph/0409146 |
| 46 | S. Frixione, P. Nason, and C. Oleari | Matching NLO QCD computations with Parton Shower simulations: the POWHEG method | JHEP 11 (2007) 070 | 0709.2092 |
| 47 | S. Alioli, P. Nason, C. Oleari, and E. Re | A general framework for implementing NLO calculations in shower Monte Carlo programs: the POWHEG BOX | JHEP 06 (2010) 043 | 1002.2581 |
| 48 | E. Re | Single-top Wt-channel production matched with parton showers using the POWHEG method | EPJC71 (2011) 1547 | 1009.2450 |
| 49 | J. Alwall et al. | The automated computation of tree-level and next-to-leading order differential cross sections, and their matching to parton shower simulations | JHEP 07 (2014) 079 | 1405.0301 |
| 50 | T. Sjostrand, S. Mrenna, and P. Z. Skands | A Brief Introduction to PYTHIA 8.1 | CPC 178 (2008) 852--867 | 0710.3820 |
| 51 | CMS Collaboration | Event generator tunes obtained from underlying event and multiparton scattering measurements | EPJC76 (2016), no. 3, 155 | CMS-GEN-14-001 1512.00815 |
| 52 | GEANT4 Collaboration | GEANT4---a simulation toolkit | NIMA 506 (2003) 250 | |
| 53 | S. Abdullin et al. | The fast simulation of the CMS detector at LHC | J. Phys. Conf. Ser. 331 (2011) 032049 | |
| 54 | C. Borschensky et al. | Squark and gluino production cross sections in pp collisions at $ \sqrt{s} $ = 13, 14, 33 and 100 TeV | EPJC74 (2014), no. 12 | 1407.5066 |
| 55 | M. Czakon and A. Mitov | Top++: A Program for the Calculation of the Top-Pair Cross-Section at Hadron Colliders | CPC 185 (2014) 2930 | 1112.5675 |
| 56 | P. Kant et al. | HatHor for single top-quark production: Updated predictions and uncertainty estimates for single top-quark production in hadronic collisions | CPC 191 (2015) 74--89 | 1406.4403 |
| 57 | M. Aliev et al. | HATHOR: HAdronic Top and Heavy quarks crOss section calculatoR | CPC 182 (2011) 1034--1046 | 1007.1327 |
| 58 | T. Gehrmann et al. | $ W^+W^- $ Production at Hadron Colliders in Next to Next to Leading Order QCD | PRL 113 (2014), no. 21, 212001 | 1408.5243 |
| 59 | J. M. Campbell and R. K. Ellis | An Update on vector boson pair production at hadron colliders | PRD60 (1999) 113006 | hep-ph/9905386 |
| 60 | J. M. Campbell, R. K. Ellis, and C. Williams | Vector boson pair production at the LHC | JHEP 07 (2011) 018 | 1105.0020 |
| 61 | Y. Li and F. Petriello | Combining QCD and electroweak corrections to dilepton production in FEWZ | PRD86 (2012) 094034 | 1208.5967 |
| 62 | CMS Collaboration | Identification of b quark jets at the CMS Experiment in the LHC Run 2 | CMS-PAS-BTV-15-001 | CMS-PAS-BTV-15-001 |
| 63 | J. Alwall, P. Schuster, and N. Toro | Simplified Models for a First Characterization of New Physics at the LHC | PRD79 (2009) 075020 | 0810.3921 |
| 64 | J. Alwall, M.-P. Le, M. Lisanti, and J. G. Wacker | Model-Independent Jets plus Missing Energy Searches | PRD79 (2009) 015005 | 0809.3264 |
| 65 | LHC New Physics Working Group Collaboration | Simplified Models for LHC New Physics Searches | JPG39 (2012) 105005 | 1105.2838 |
| 66 | D. Alves, E. Izaguirre, and J. G. Wacker | Where the sidewalk ends: jets and missing energy search strategies for the 7$ TeV $ LHC | JHEP 10 (2011) 012 | 1102.5338 |
| 67 | CMS Collaboration | Interpretation of searches for supersymmetry with simplified models | PRD 88 (2013) 052017 | CMS-SUS-11-016 1301.2175 |
| 68 | D. E. Kaplan, K. Rehermann, M. D. Schwartz, and B. Tweedie | Top Tagging: A Method for Identifying Boosted Hadronically Decaying Top Quarks | PRL 101 (2008) 142001 | 0806.0848 |
| 69 | T. Plehn, M. Spannowsky, M. Takeuchi, and D. Zerwas | Stop Reconstruction with Tagged Tops | JHEP 1010 (2010) 078 | 1006.2833 |
| 70 | D. E. Kaplan, K. Rehermann, and D. Stolarski | Searching for Direct Stop Production in Hadronic Top Data at the LHC | JHEP 1207 (2012) 119 | 1205.5816 |
| 71 | ATLAS and CMS Collaborations | Procedure for the LHC Higgs boson search combination in summer 2011 | Technical Report ATL-PHYS-PUB-2011-011, CMS NOTE-2011/005, CERN, Geneva, Aug | |
|
|
Compact Muon Solenoid LHC, CERN |
|

|

|

|

|

|