

Compact Muon Solenoid
LHC, CERN
| CMS-PAS-TOP-17-007 | ||
| Measurement of the top quark mass with lepton+jets final states in pp collisions at $\sqrt{s}= $ 13 TeV | ||
| CMS Collaboration | ||
| September 2017 | ||
| Abstract: The mass of the top quark is measured using a sample of $\rm{t}\bar{\rm t}$ candidate events with one lepton, muon or electron, and at least four jets in the final state, collected by the CMS detector in pp collisions at $\sqrt{s}= $ 13 TeV at the CERN LHC. The candidate events are selected from data corresponding to an integrated luminosity of 35.9 fb$^{-1}$. For each event the mass is reconstructed from a kinematic fit of the decay products to a $\rm{t}\bar{\rm t}$ hypothesis. The top quark mass is determined simultaneously with an overall jet energy scale factor (JSF), constrained by the mass of the W boson in $\rm{q}\bar{\rm q}$ decays. The measurement is calibrated on samples simulated at next-to-leading order matched to parton shower. The top quark mass is found to be 172.25 $\pm$ 0.08 (stat+JSF) $\pm$ 0.62 (syst) GeV. The dependence of this result on event kinematical properties is studied and compared to predictions of different models of $\rm{t}\bar{\rm t}$ production. | ||
|
Links:
CDS record (PDF) ;
inSPIRE record ;
CADI line (restricted) ;
These preliminary results are superseded in this paper, EPJC 78 (2018) 891. The superseded preliminary plots can be found here. |
||
| Figures & Tables | Summary | Additional Figures & Tables | References | CMS Publications |
|---|
| Figures | |
png pdf |
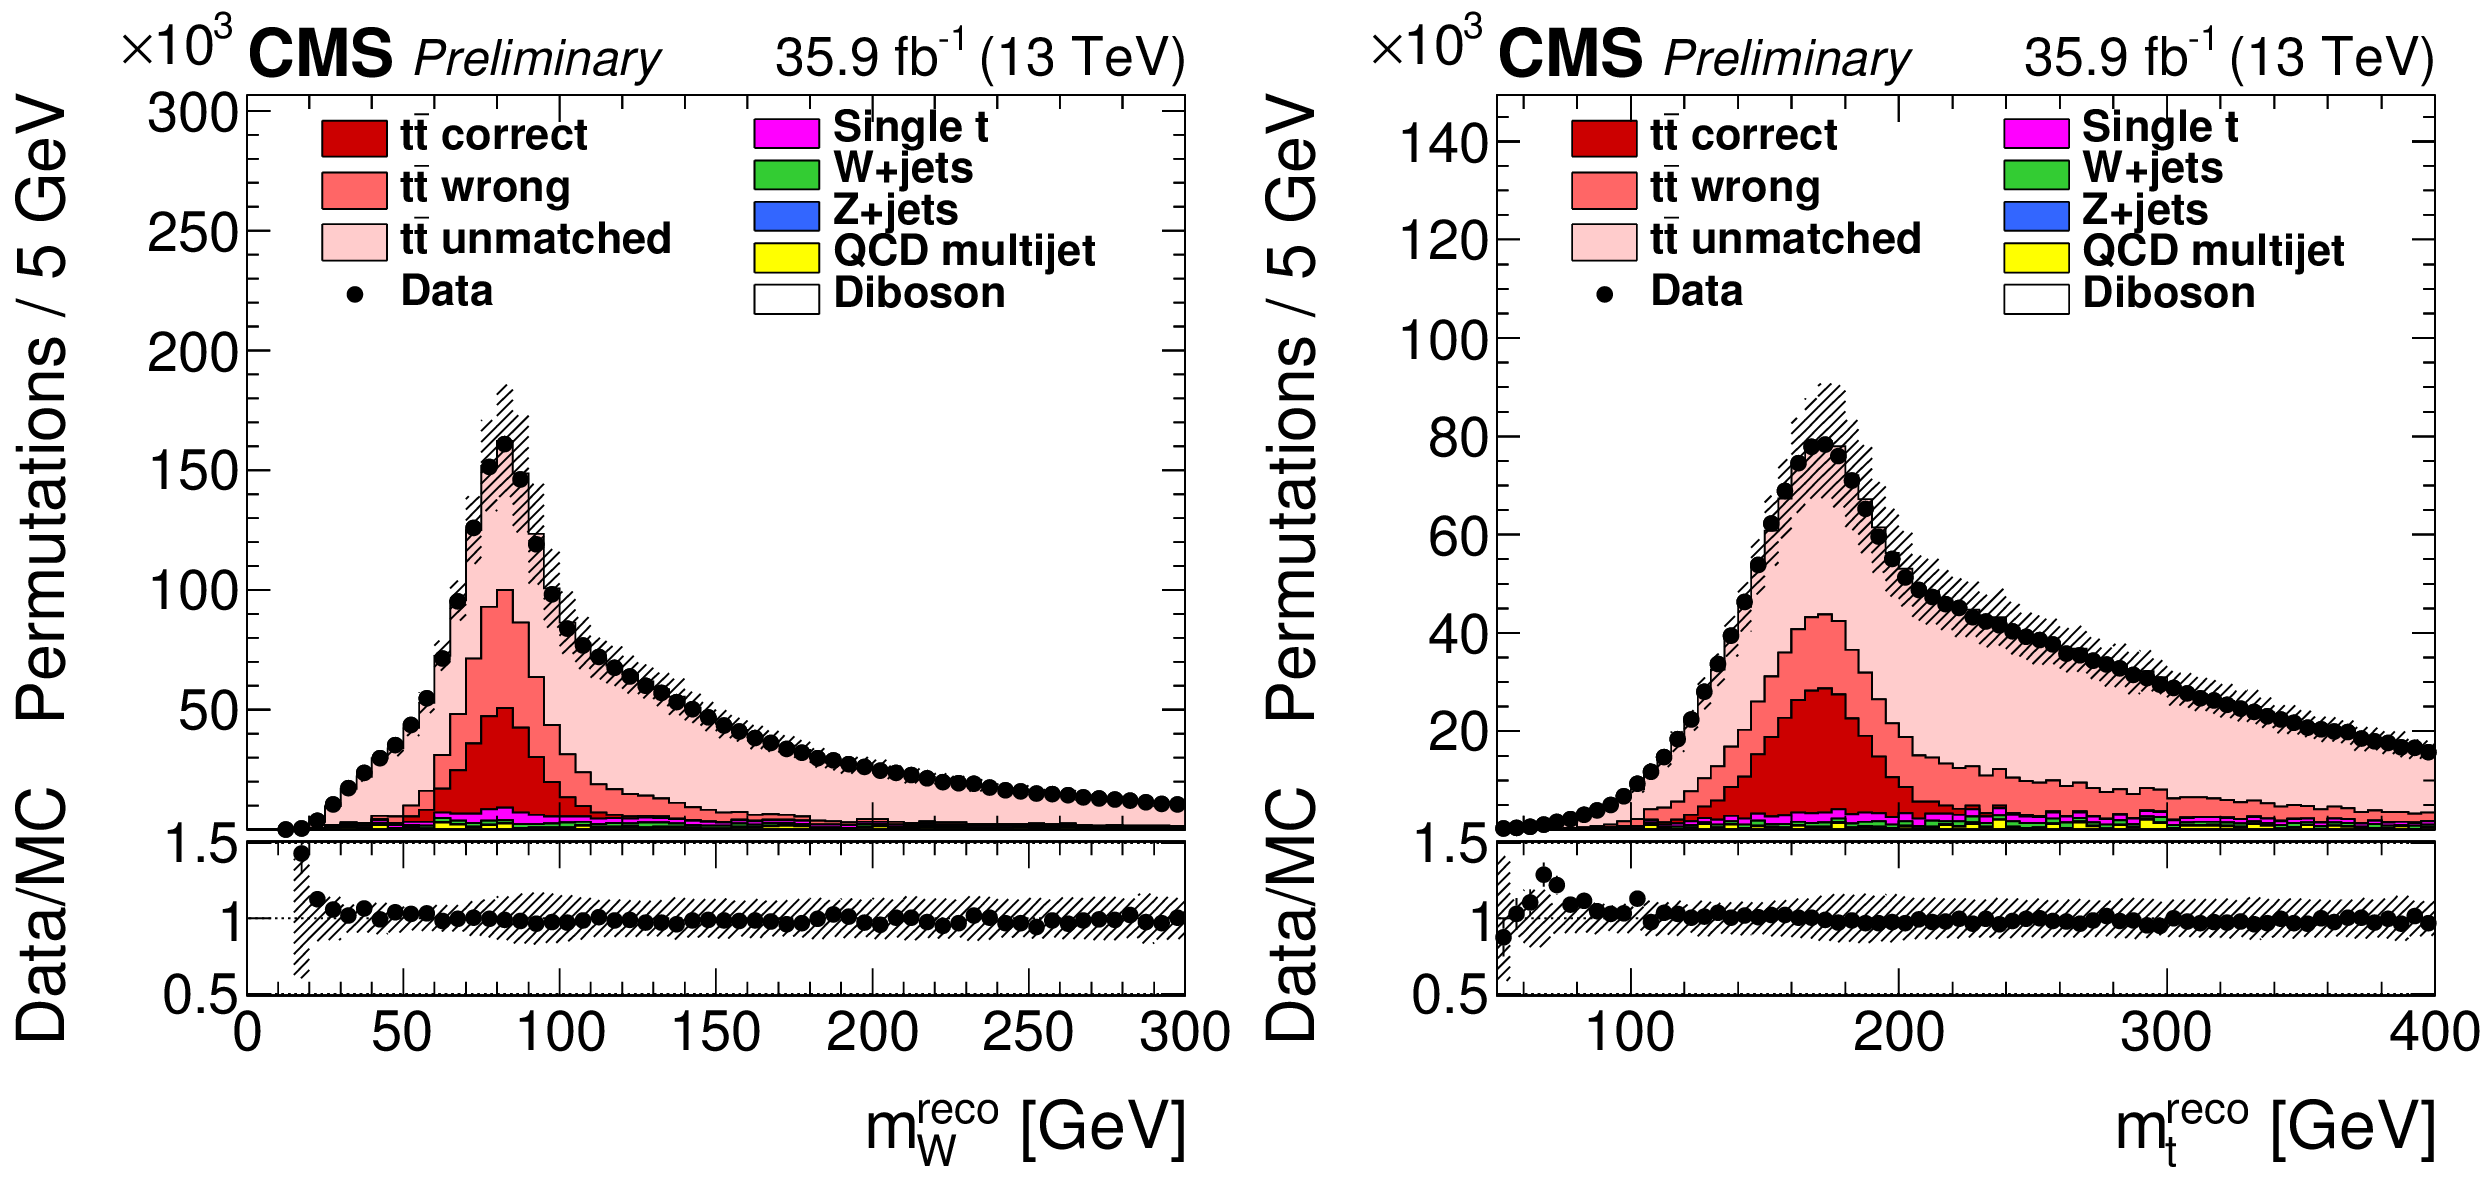
Figure 1:
(left) Invariant mass $m_\mathrm{W} ^\text {reco}$ of the two untagged jets and (right) the invariant mass $ {m_{\mathrm{t}}} ^\text {reco}$ of the two untagged jets and one of the b-tagged jets after the b tagging requirement. The vertical bars show the statistical uncertainty and the hatched bands show the statistical and systematic uncertainties considered in Sec. xxxxx added in quadrature. The lower portion of each panel show the ratio of the yields between the collision data and the simulation. The simulations are normalized to the luminosity. |

png pdf |
Figure 1-a:
(left) Invariant mass $m_\mathrm{W} ^\text {reco}$ of the two untagged jets and (right) the invariant mass $ {m_{\mathrm{t}}} ^\text {reco}$ of the two untagged jets and one of the b-tagged jets after the b tagging requirement. The vertical bars show the statistical uncertainty and the hatched bands show the statistical and systematic uncertainties considered in Sec. xxxxx added in quadrature. The lower portion of each panel show the ratio of the yields between the collision data and the simulation. The simulations are normalized to the luminosity. |

png pdf |
Figure 1-b:
(left) Invariant mass $m_\mathrm{W} ^\text {reco}$ of the two untagged jets and (right) the invariant mass $ {m_{\mathrm{t}}} ^\text {reco}$ of the two untagged jets and one of the b-tagged jets after the b tagging requirement. The vertical bars show the statistical uncertainty and the hatched bands show the statistical and systematic uncertainties considered in Sec. xxxxx added in quadrature. The lower portion of each panel show the ratio of the yields between the collision data and the simulation. The simulations are normalized to the luminosity. |
png pdf |
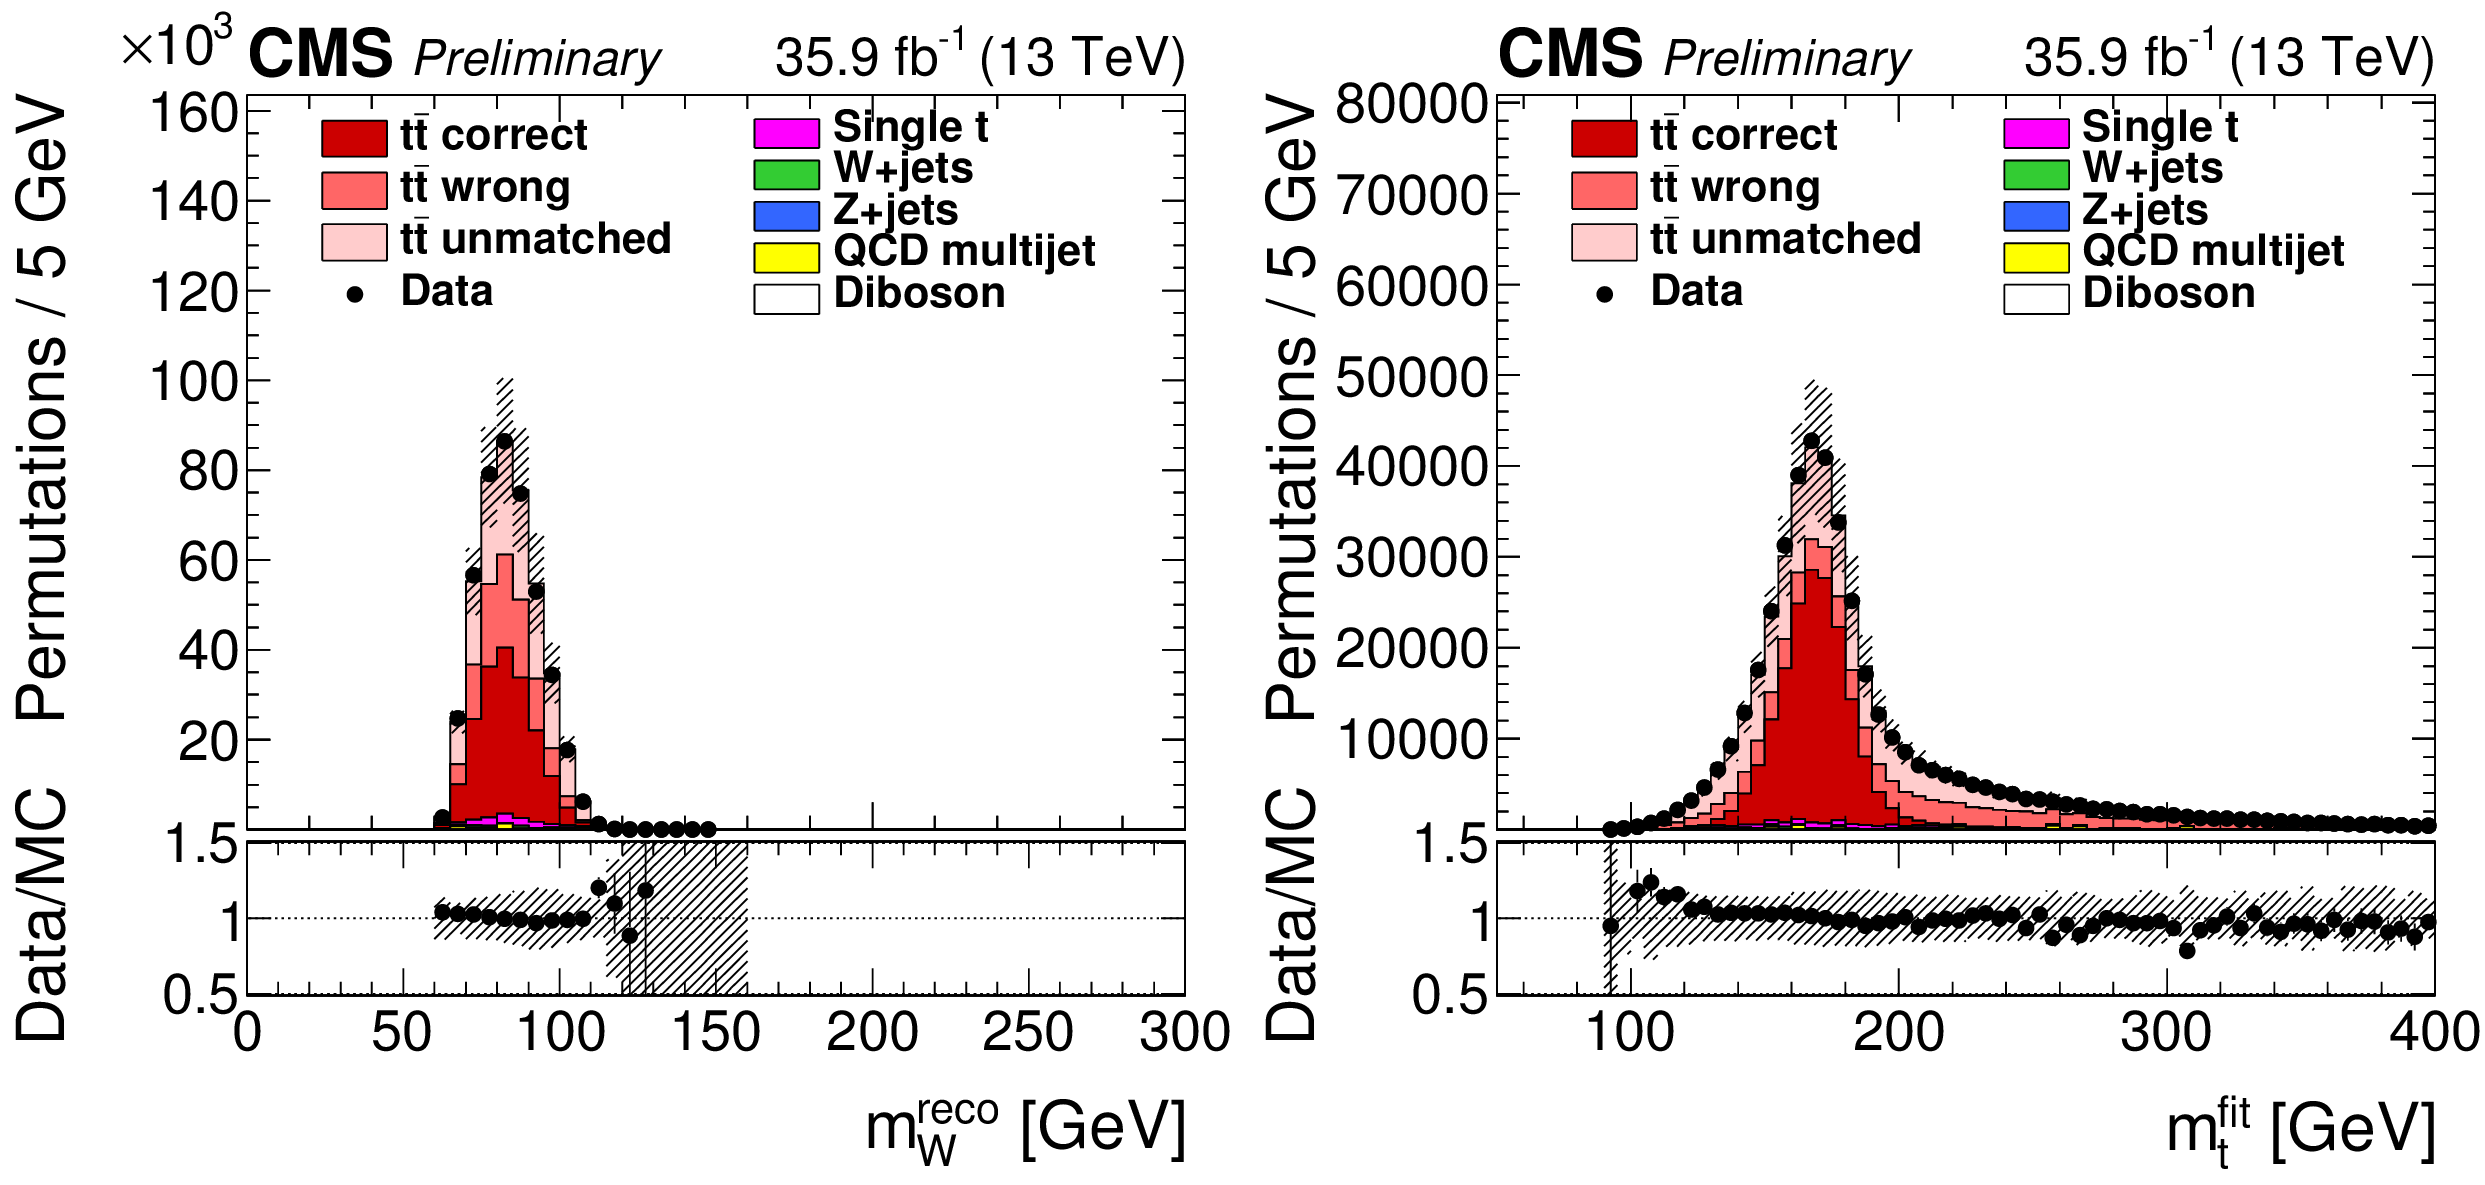
Figure 2:
(left) The reconstructed W boson masses $m_\mathrm{W} ^\text {reco}$ and (right) the fitted top quark masses $ {m_{\mathrm{t}}} ^\text {fit}$ after the goodness-of-fit selection and the weighting by $P_\mathrm {gof}$. The vertical bars show the statistical uncertainty and the hatched bands show the statistical and systematic uncertainties added in quadrature. The lower portion of each panel shown the ratio of the yields between the collision data and the simulation. |
png pdf |
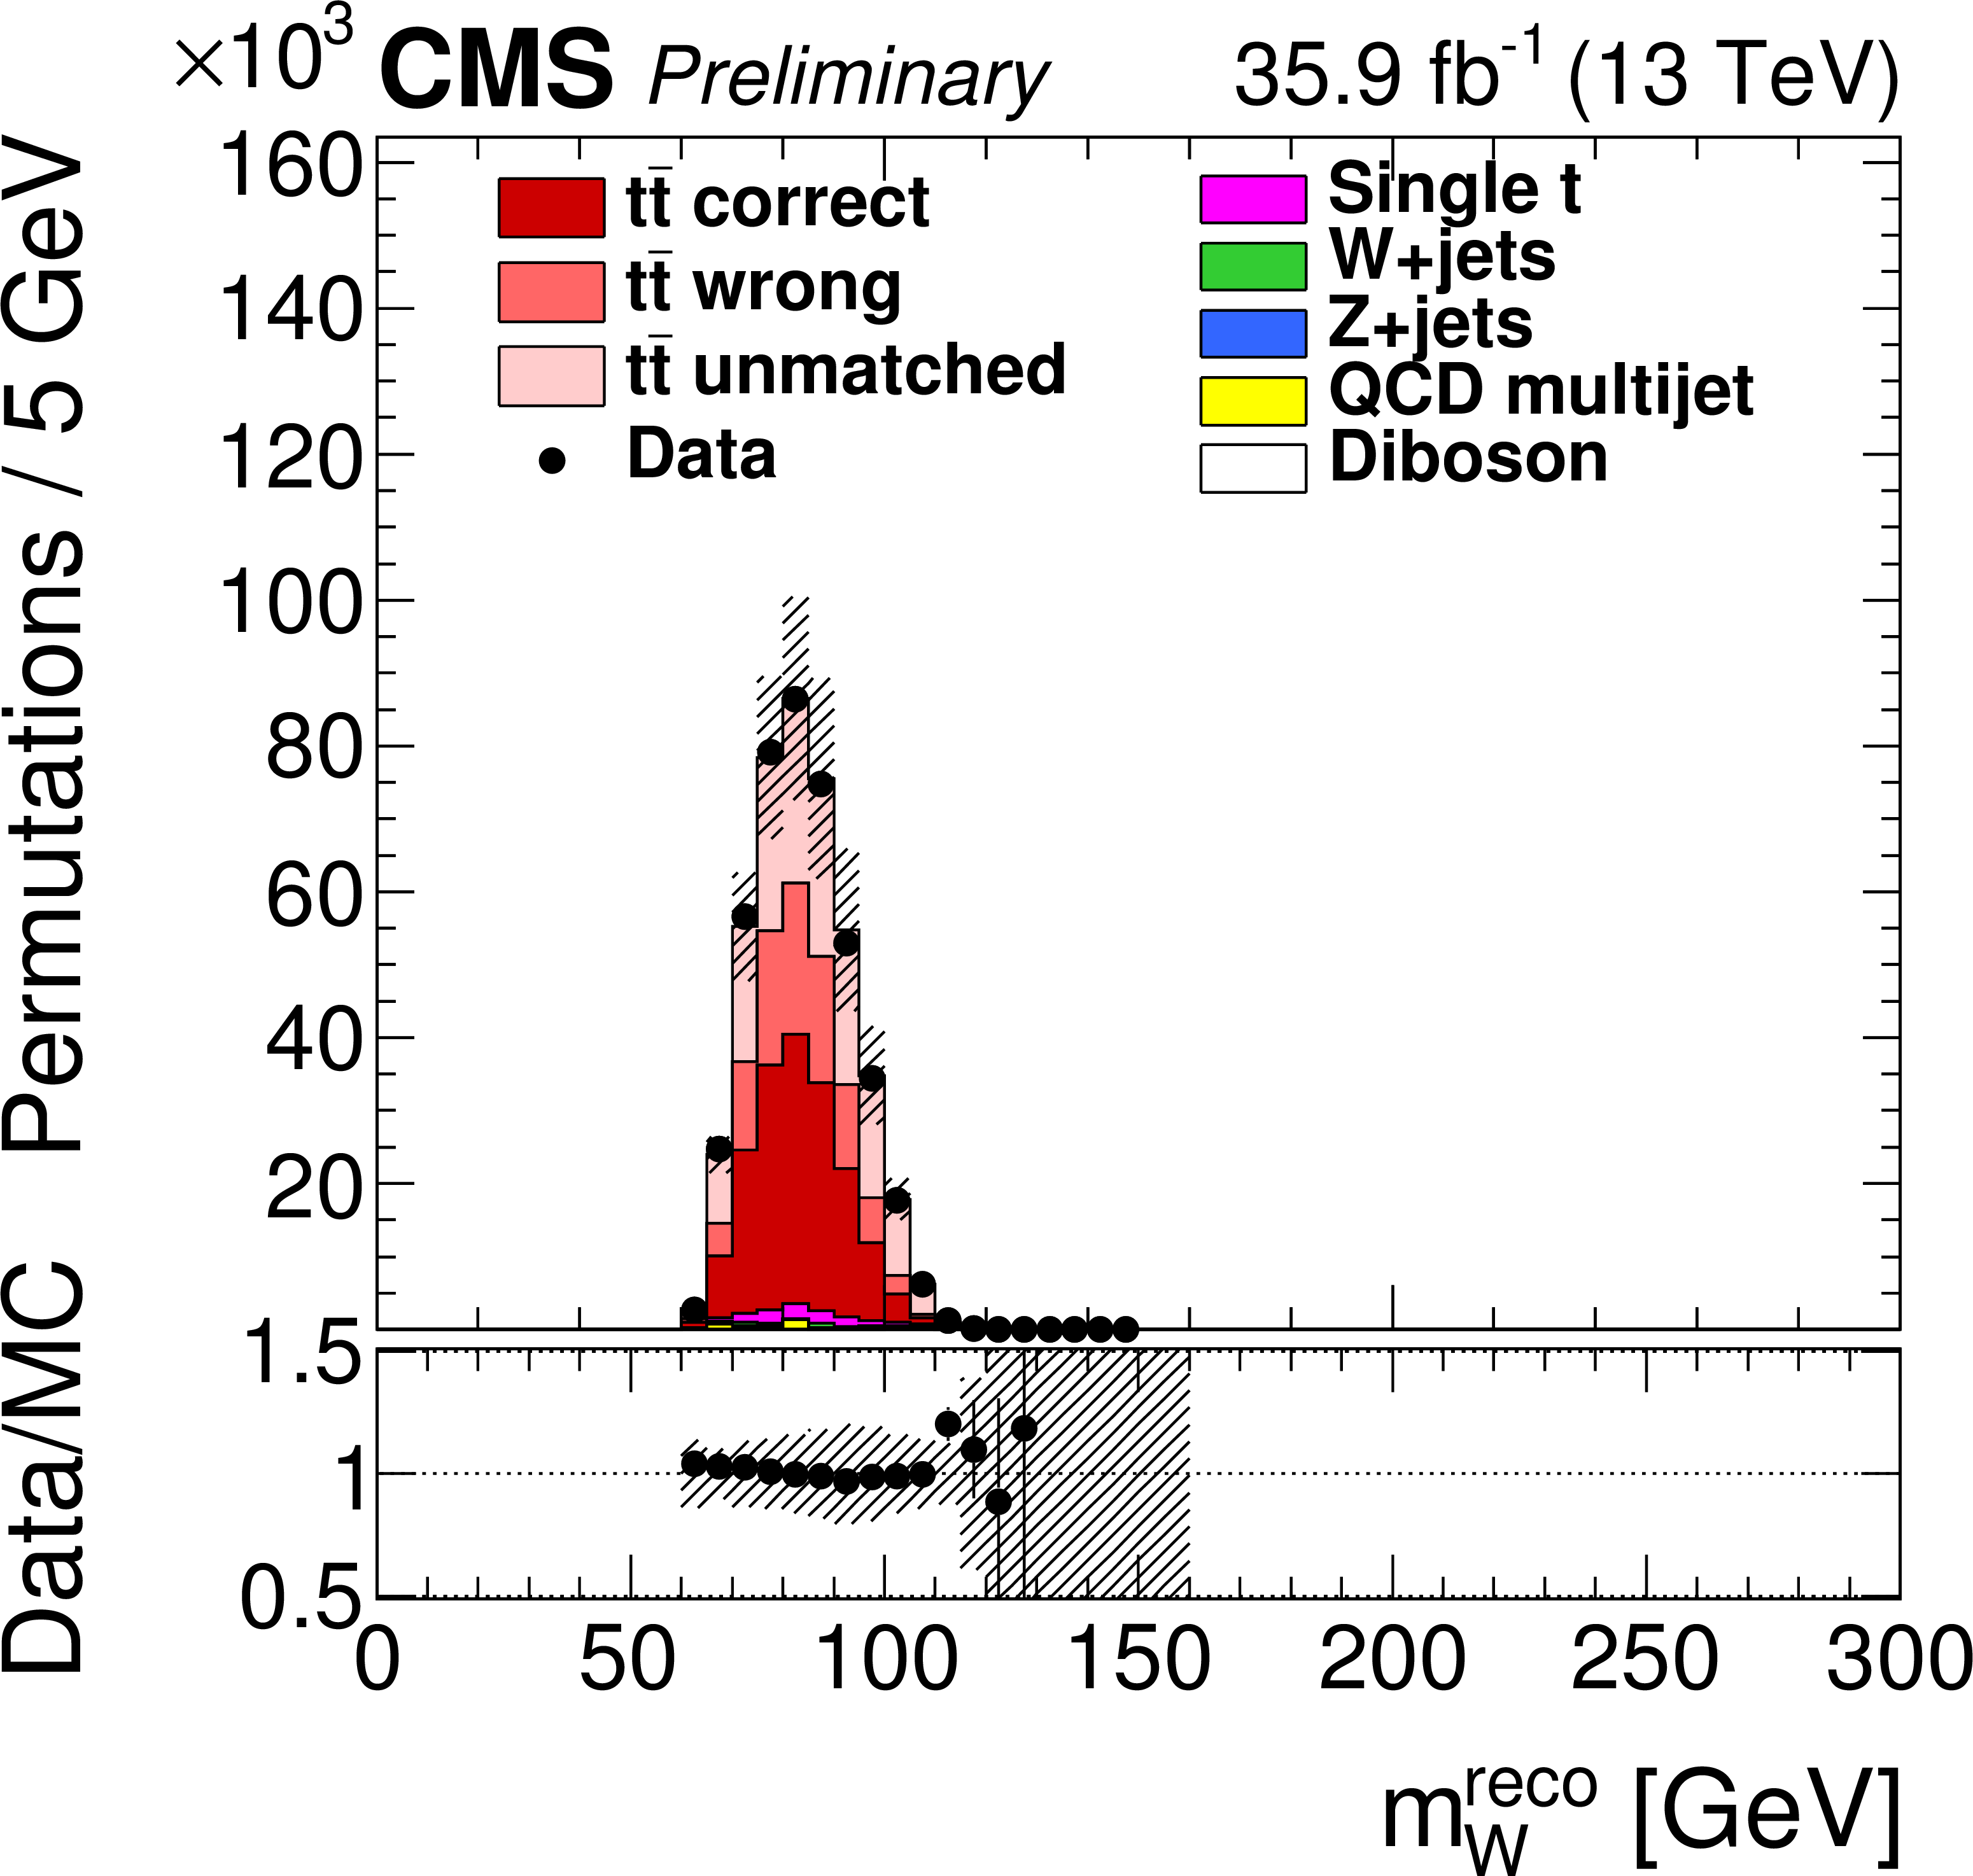
Figure 2-a:
(left) The reconstructed W boson masses $m_\mathrm{W} ^\text {reco}$ and (right) the fitted top quark masses $ {m_{\mathrm{t}}} ^\text {fit}$ after the goodness-of-fit selection and the weighting by $P_\mathrm {gof}$. The vertical bars show the statistical uncertainty and the hatched bands show the statistical and systematic uncertainties added in quadrature. The lower portion of each panel shown the ratio of the yields between the collision data and the simulation. |
png pdf |
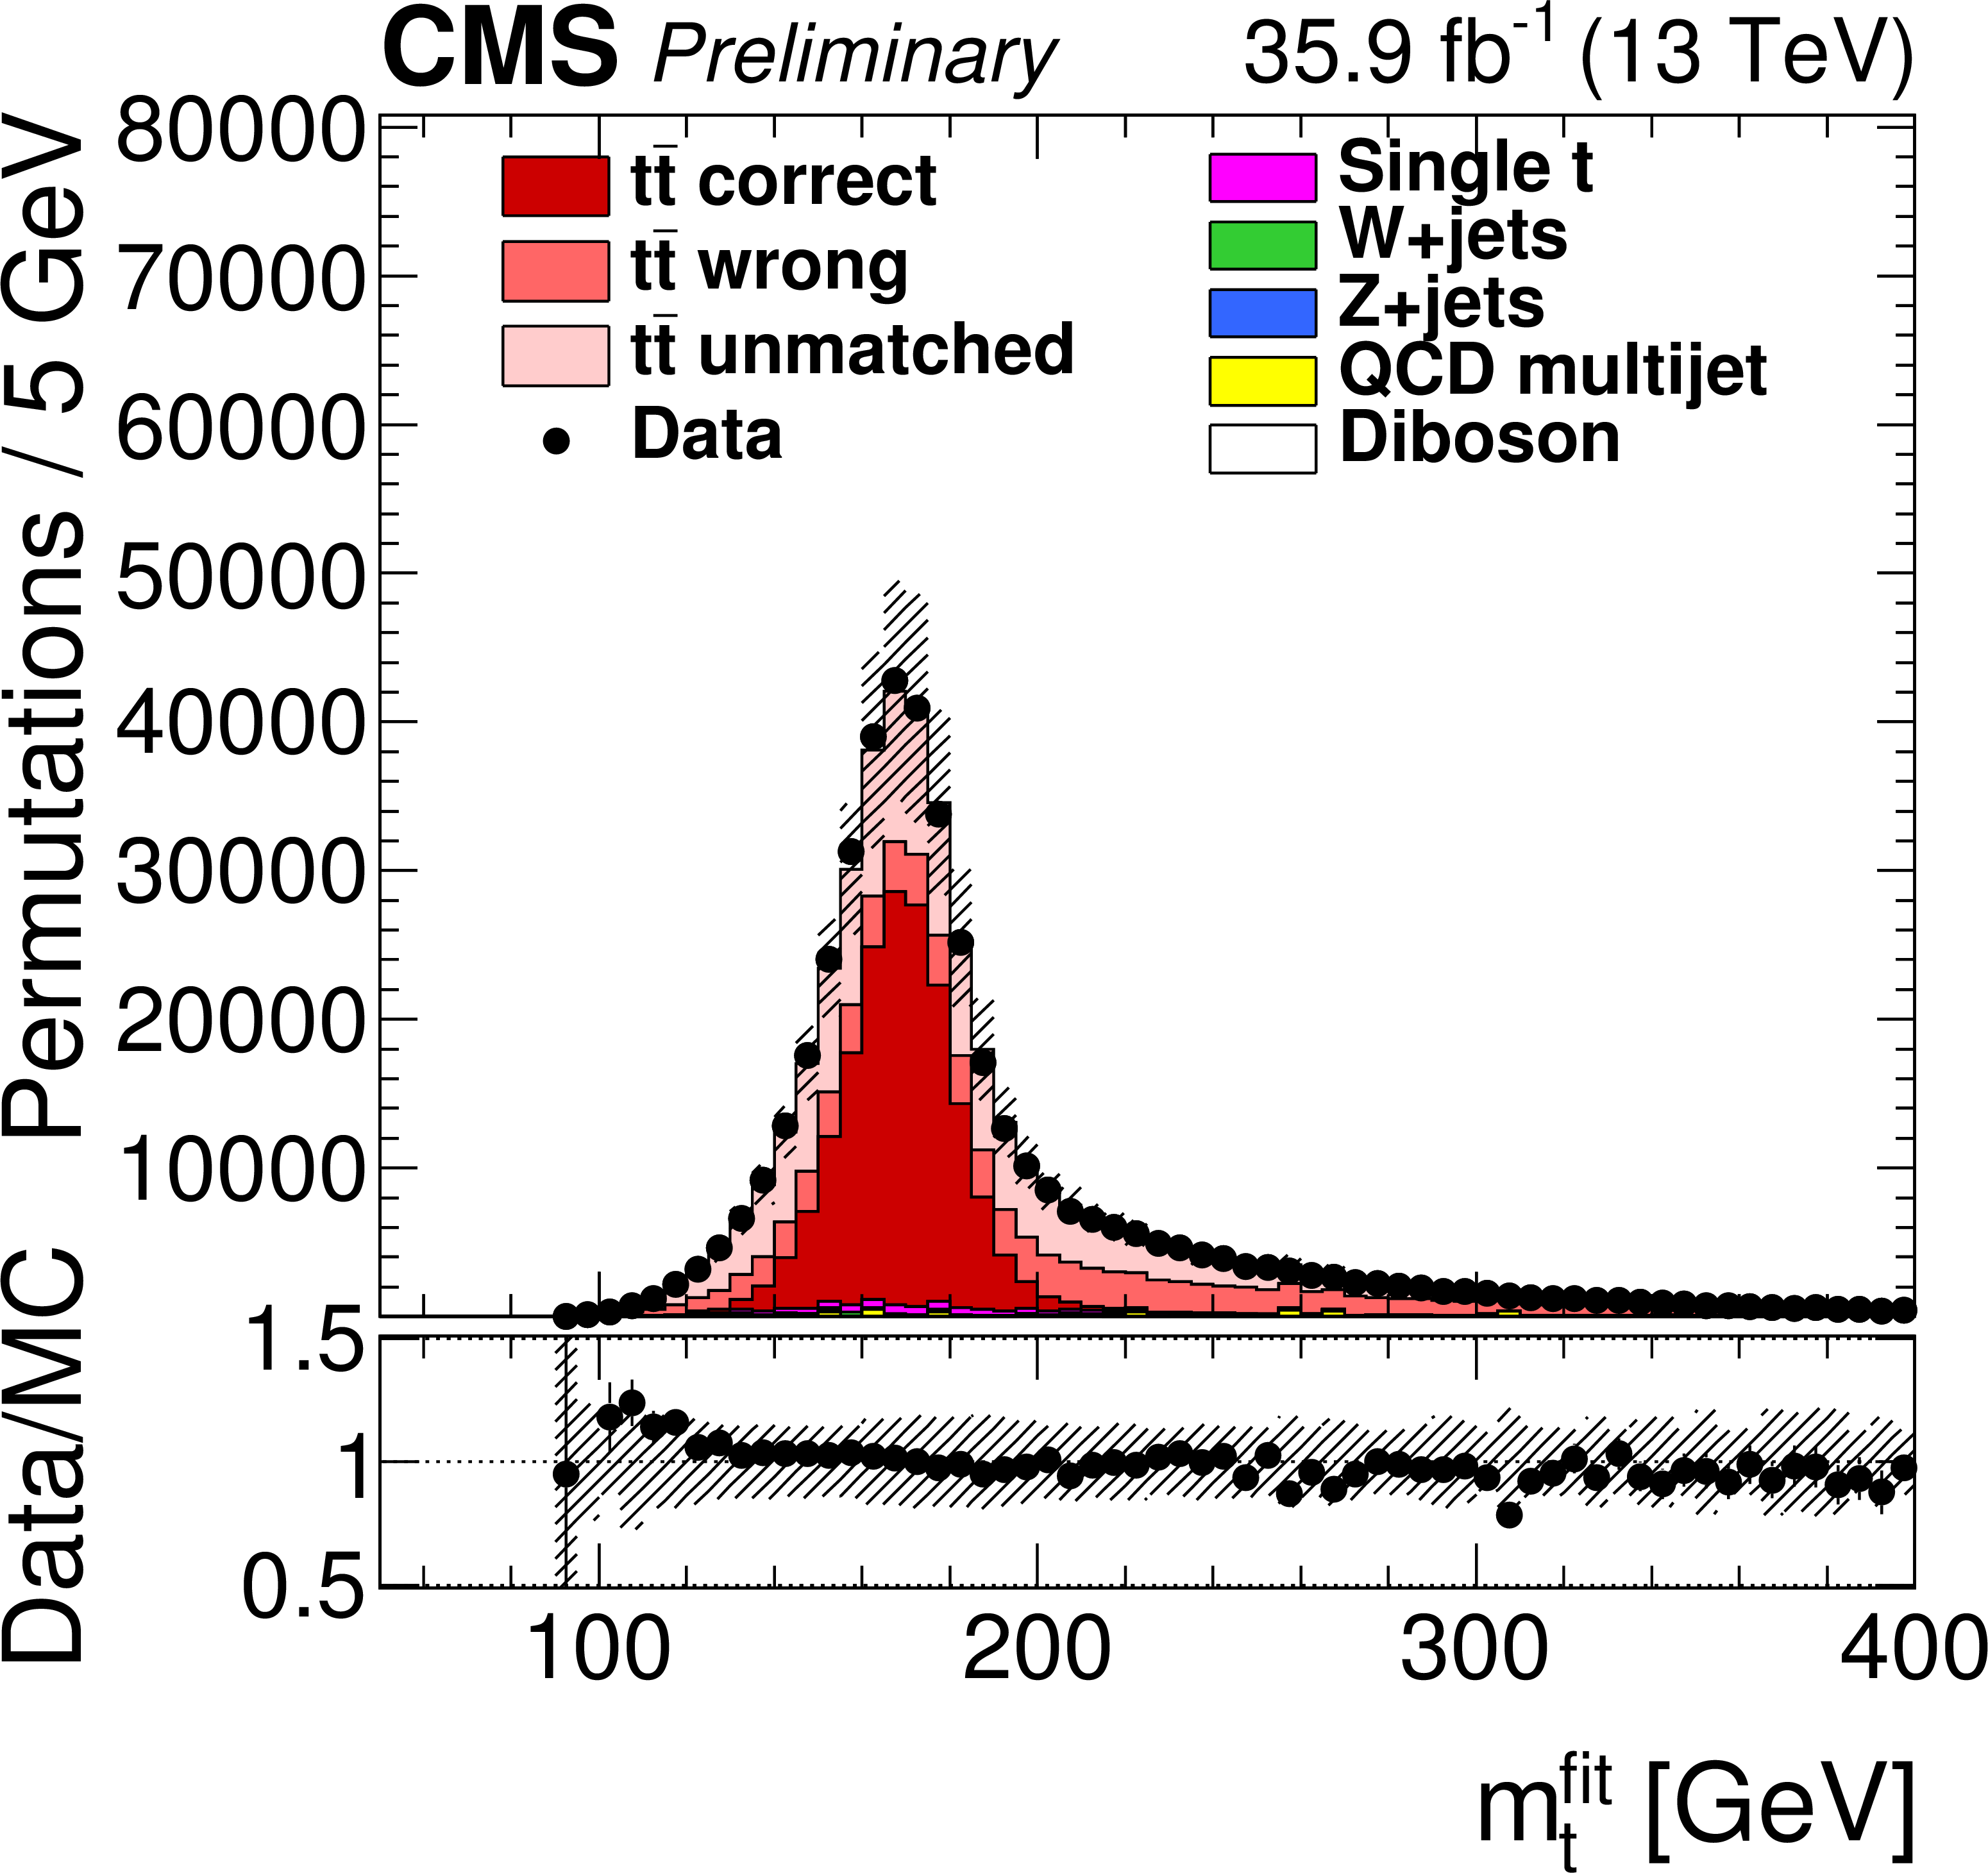
Figure 2-b:
(left) The reconstructed W boson masses $m_\mathrm{W} ^\text {reco}$ and (right) the fitted top quark masses $ {m_{\mathrm{t}}} ^\text {fit}$ after the goodness-of-fit selection and the weighting by $P_\mathrm {gof}$. The vertical bars show the statistical uncertainty and the hatched bands show the statistical and systematic uncertainties added in quadrature. The lower portion of each panel shown the ratio of the yields between the collision data and the simulation. |

png pdf |
Figure 3:
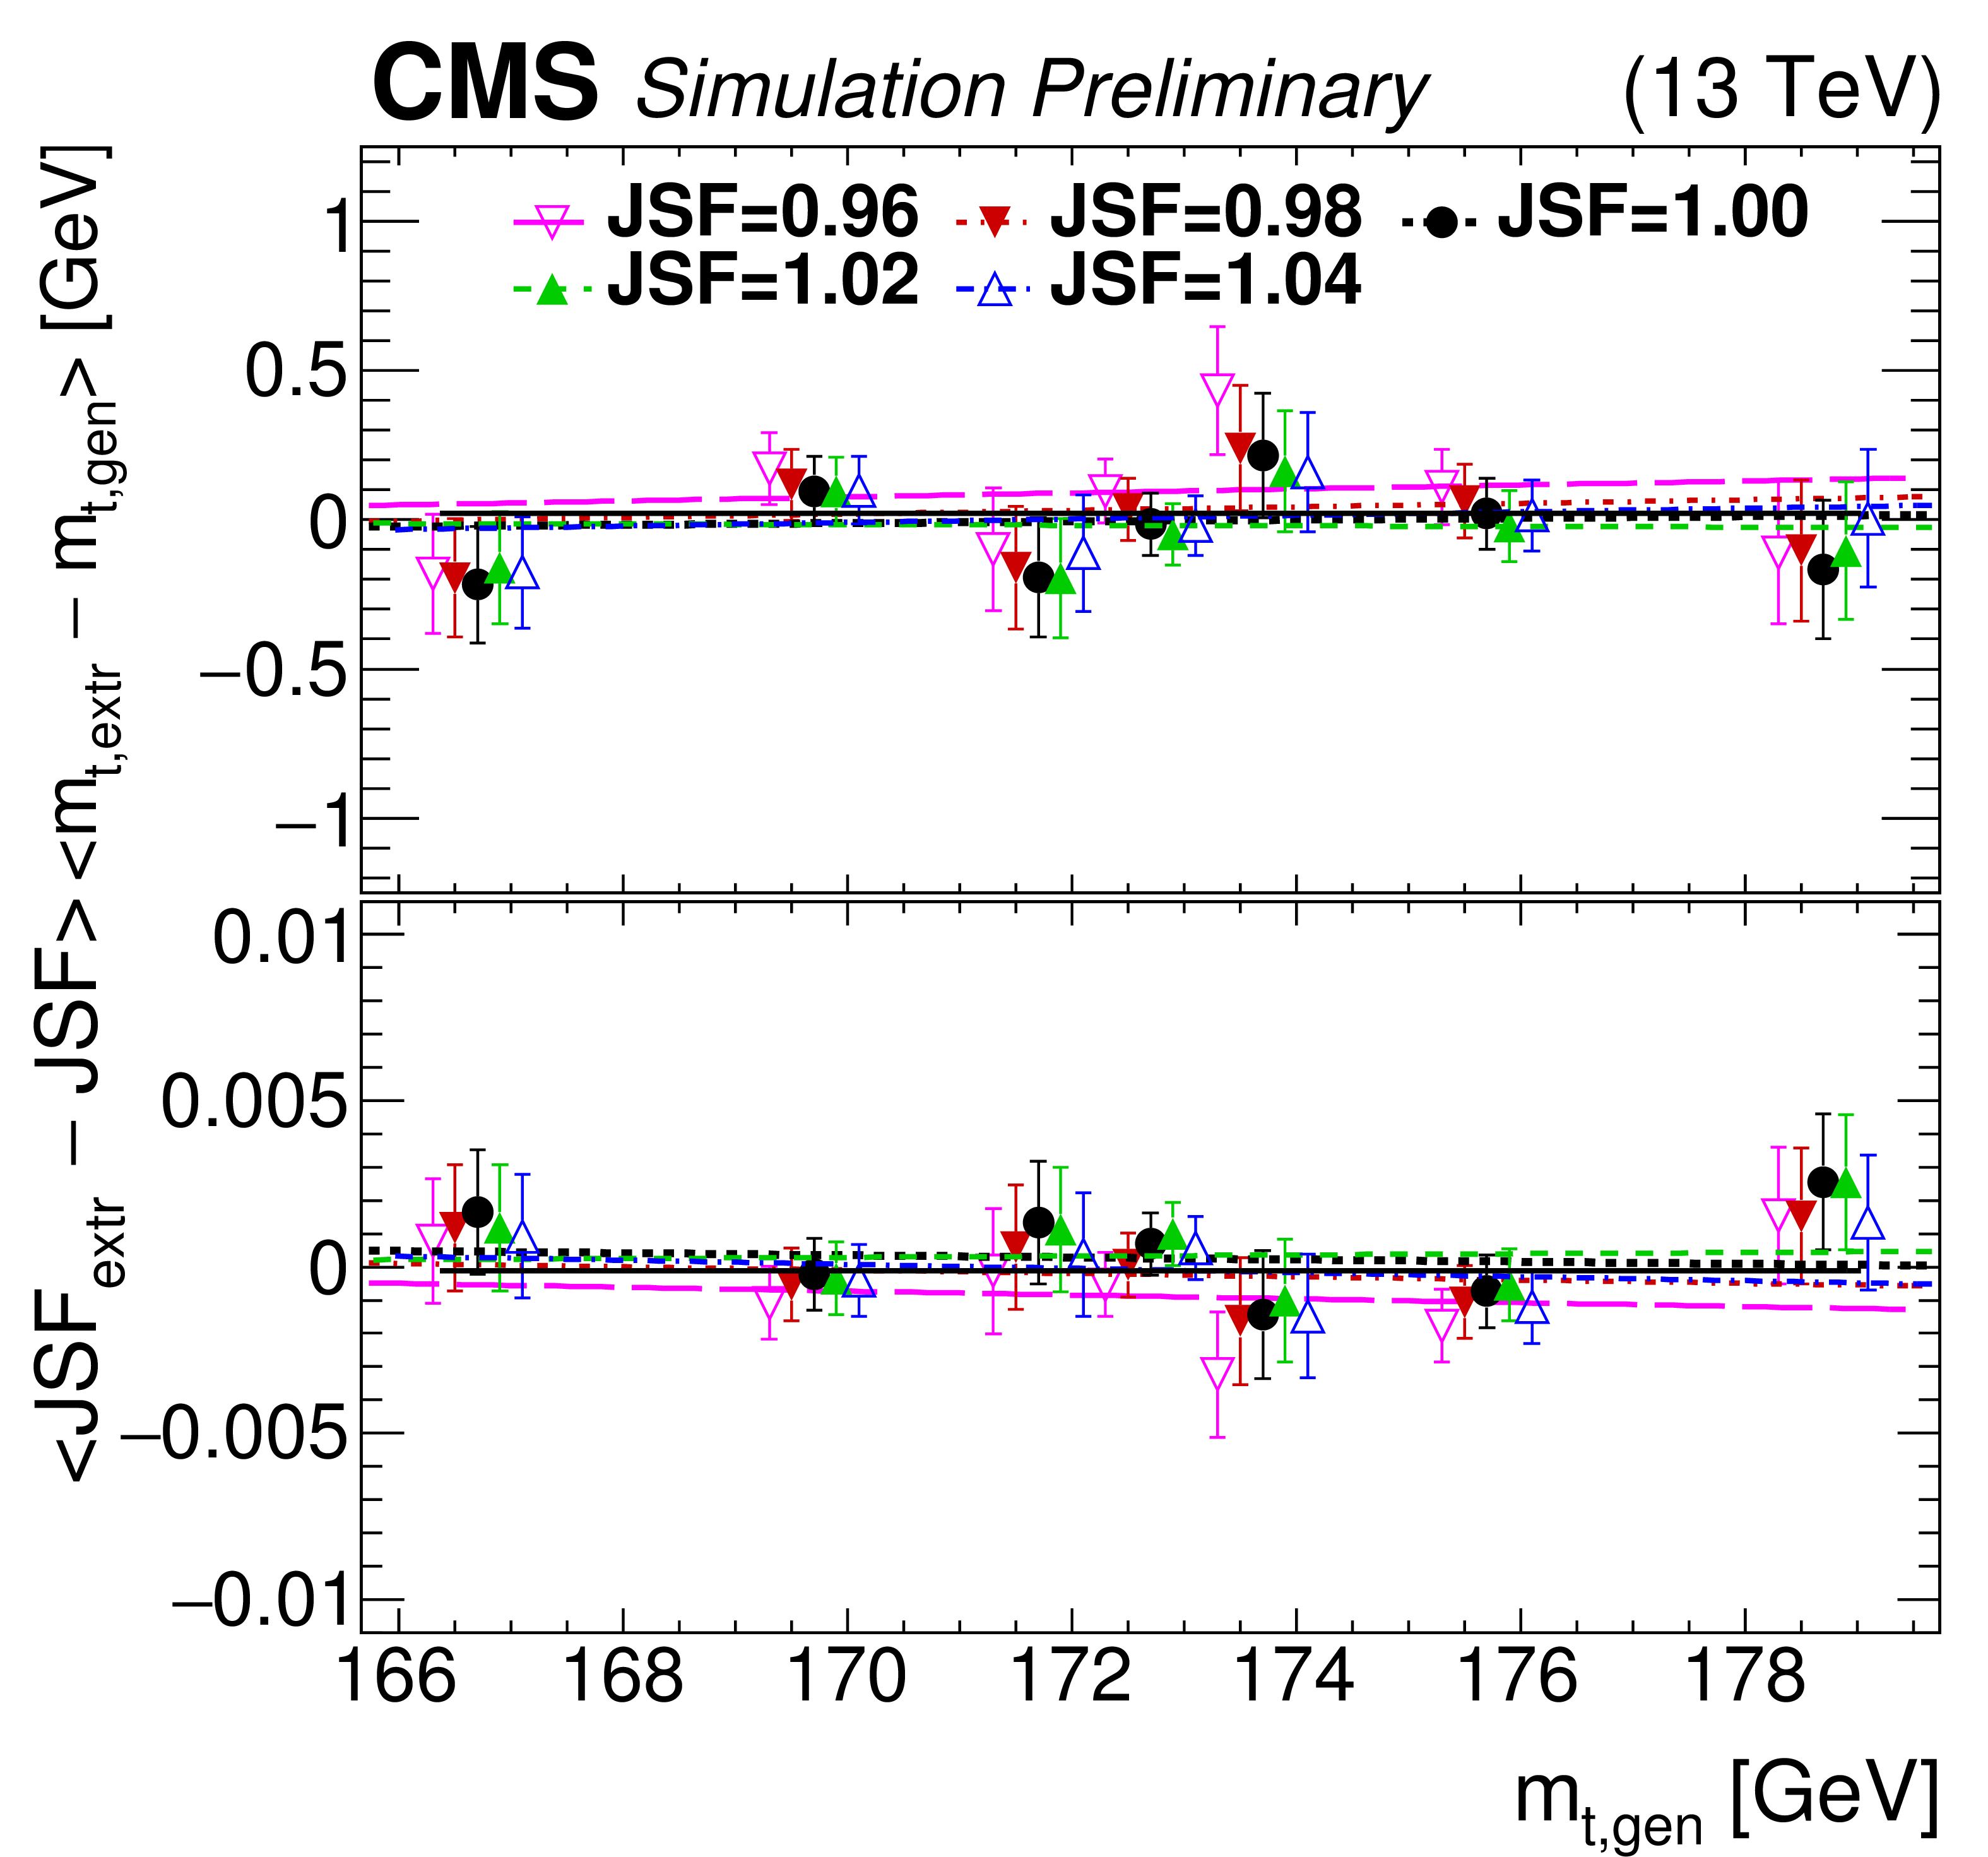
Mean difference between the calibrated and generated values of $ {m_{\mathrm{t}}} $ and JSF as a function of different generated $m_{\mathrm{t},\text {gen}}$ and five values of JSF for the muon channel (left) and the electron channel (right). The colored dashed lines correspond to straight line fits, the black solid line corresponds to a constant fit to all calibration points. The error bars indicate the statistical uncertainty on the mean difference. |

png pdf |
Figure 3-a:
Mean difference between the calibrated and generated values of $ {m_{\mathrm{t}}} $ and JSF as a function of different generated $m_{\mathrm{t},\text {gen}}$ and five values of JSF for the muon channel (left) and the electron channel (right). The colored dashed lines correspond to straight line fits, the black solid line corresponds to a constant fit to all calibration points. The error bars indicate the statistical uncertainty on the mean difference. |
png pdf |
Figure 3-b:
Mean difference between the calibrated and generated values of $ {m_{\mathrm{t}}} $ and JSF as a function of different generated $m_{\mathrm{t},\text {gen}}$ and five values of JSF for the muon channel (left) and the electron channel (right). The colored dashed lines correspond to straight line fits, the black solid line corresponds to a constant fit to all calibration points. The error bars indicate the statistical uncertainty on the mean difference. |

png pdf |
Figure 4:
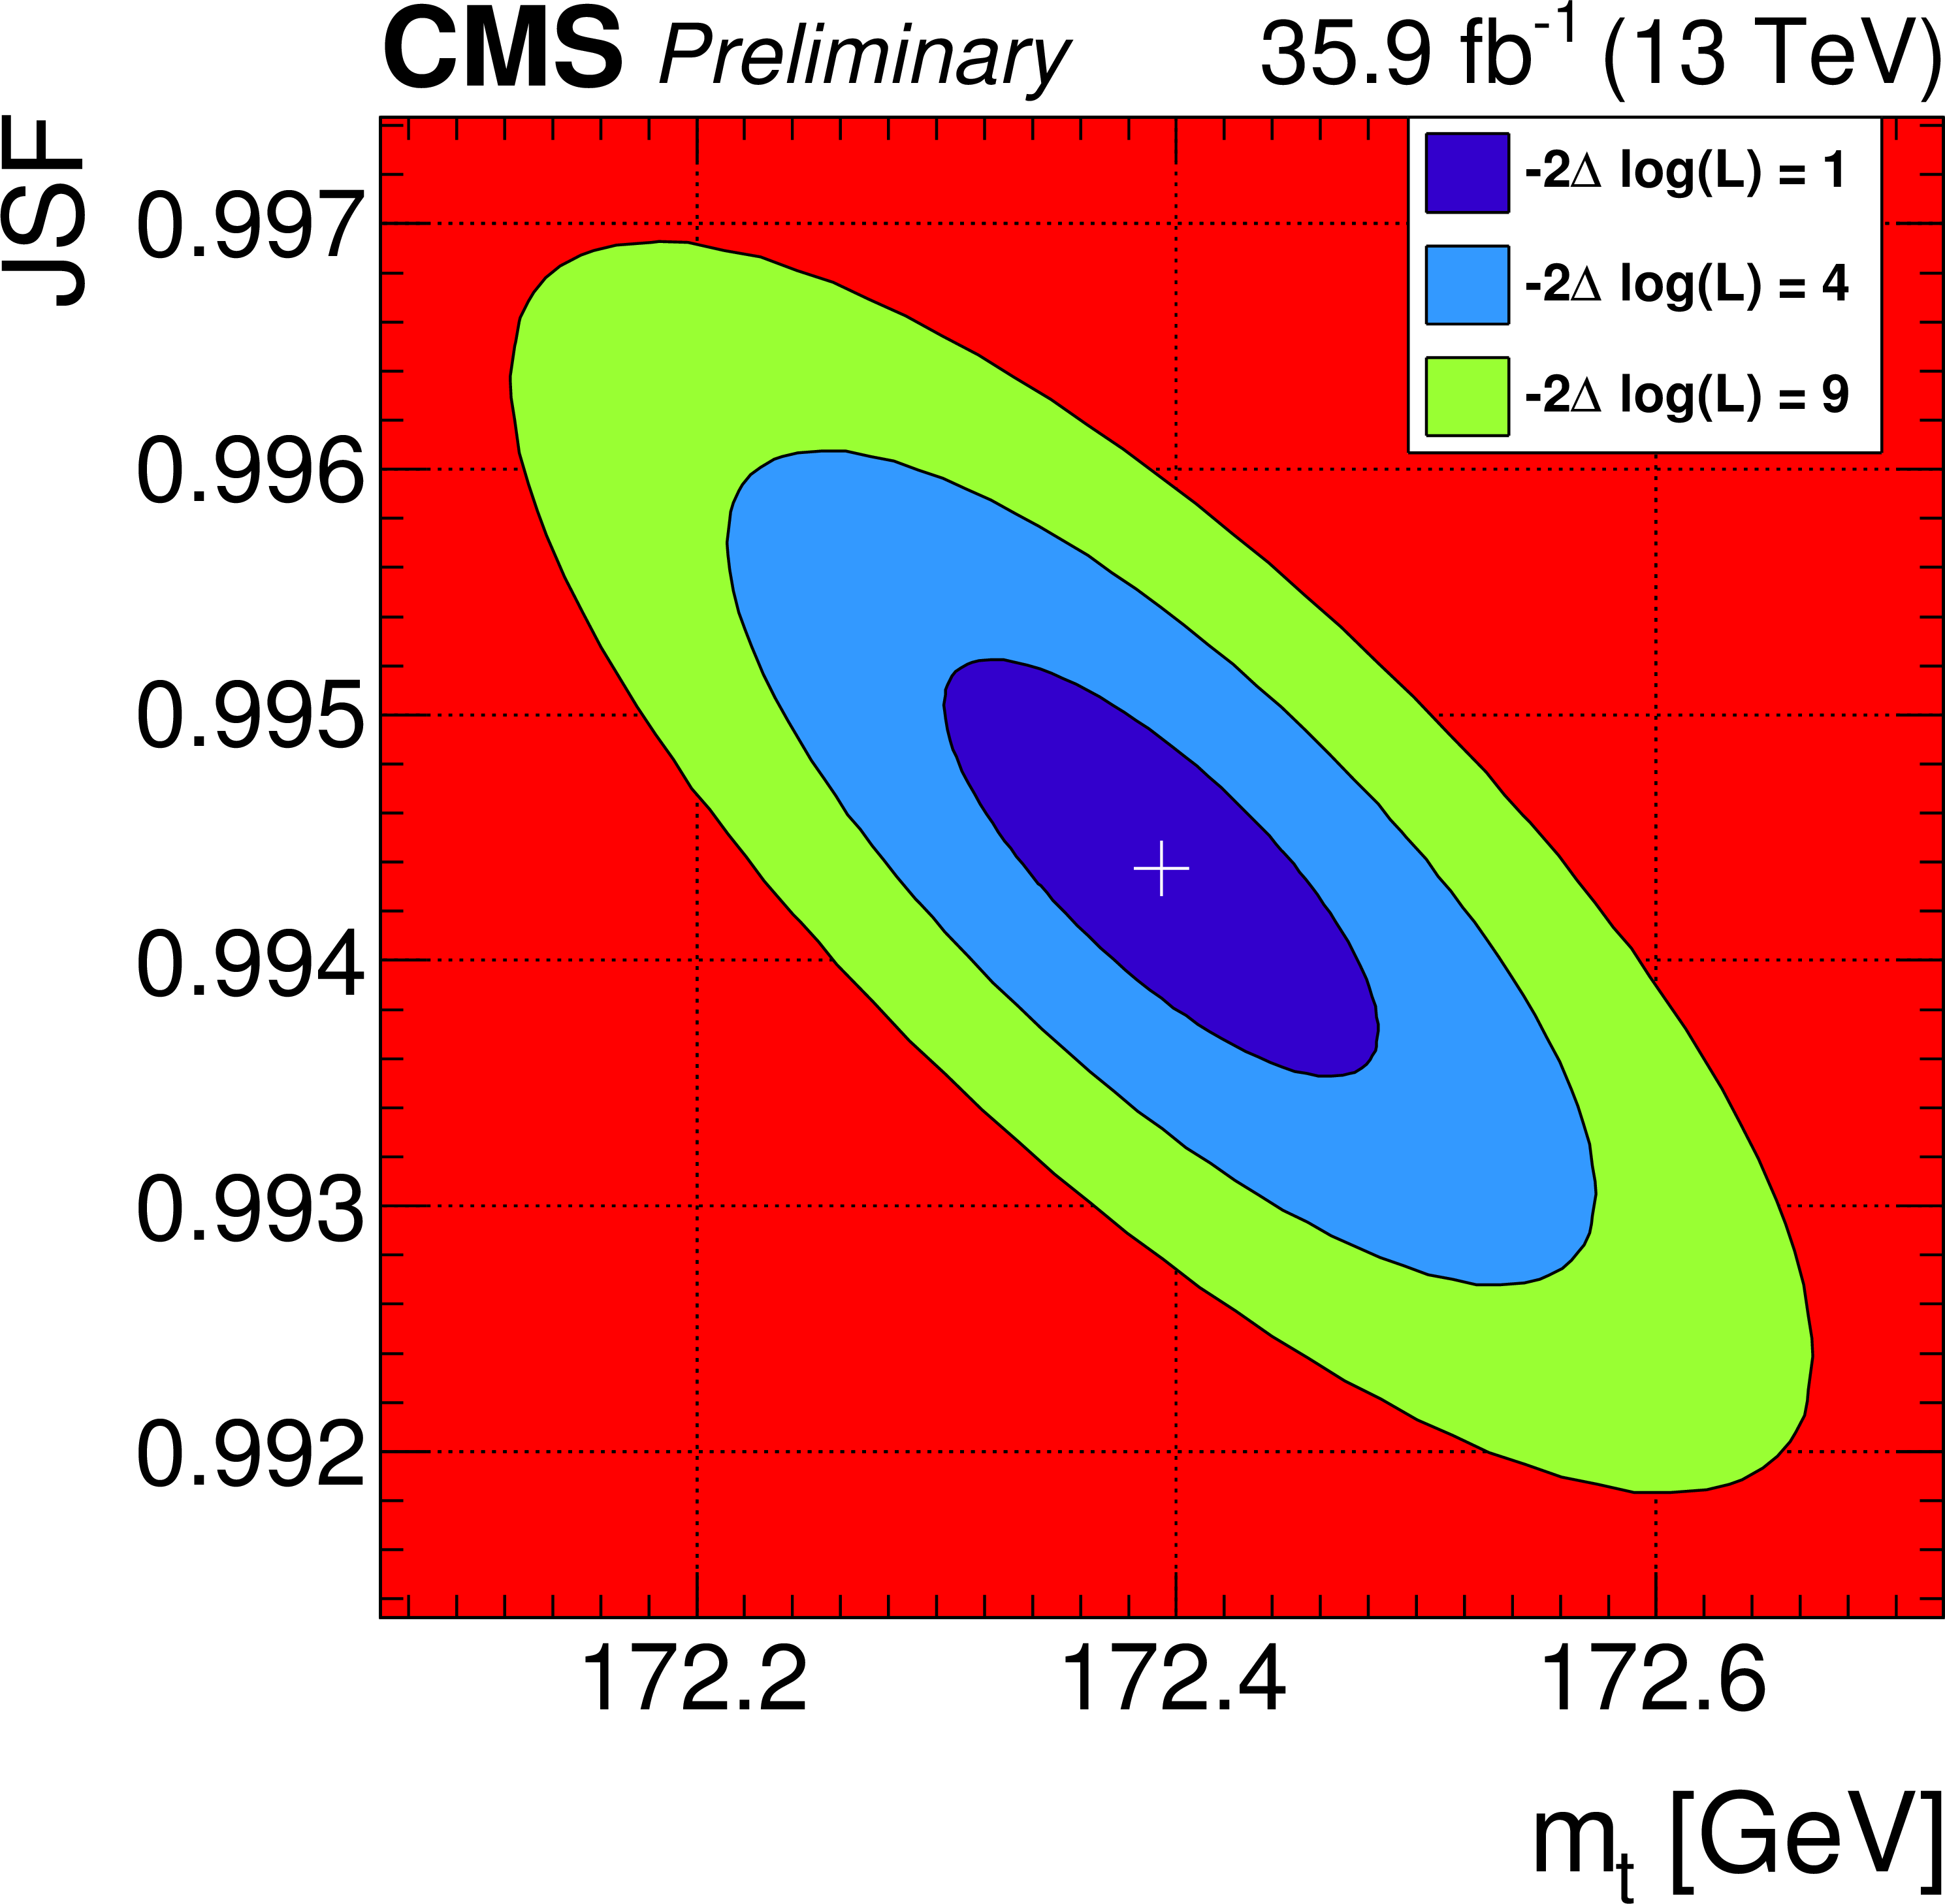
The likelihood ($-2 \Delta \log (\mathcal {L})$) for the 2D fit (left) and the hybrid fit (right) measured for the lepton+jets final state. The ellipses correspond to contours of $-2 \Delta \log (\mathcal {L}) = $ 1 (4, 9) allowing the construction one (two, three) $\sigma $ statistical intervals of $ {m_{\mathrm{t}}} $. |
png pdf |
Figure 4-a:
The likelihood ($-2 \Delta \log (\mathcal {L})$) for the 2D fit (left) and the hybrid fit (right) measured for the lepton+jets final state. The ellipses correspond to contours of $-2 \Delta \log (\mathcal {L}) = $ 1 (4, 9) allowing the construction one (two, three) $\sigma $ statistical intervals of $ {m_{\mathrm{t}}} $. |

png pdf |
Figure 4-b:
The likelihood ($-2 \Delta \log (\mathcal {L})$) for the 2D fit (left) and the hybrid fit (right) measured for the lepton+jets final state. The ellipses correspond to contours of $-2 \Delta \log (\mathcal {L}) = $ 1 (4, 9) allowing the construction one (two, three) $\sigma $ statistical intervals of $ {m_{\mathrm{t}}} $. |

png pdf |
Figure 5:
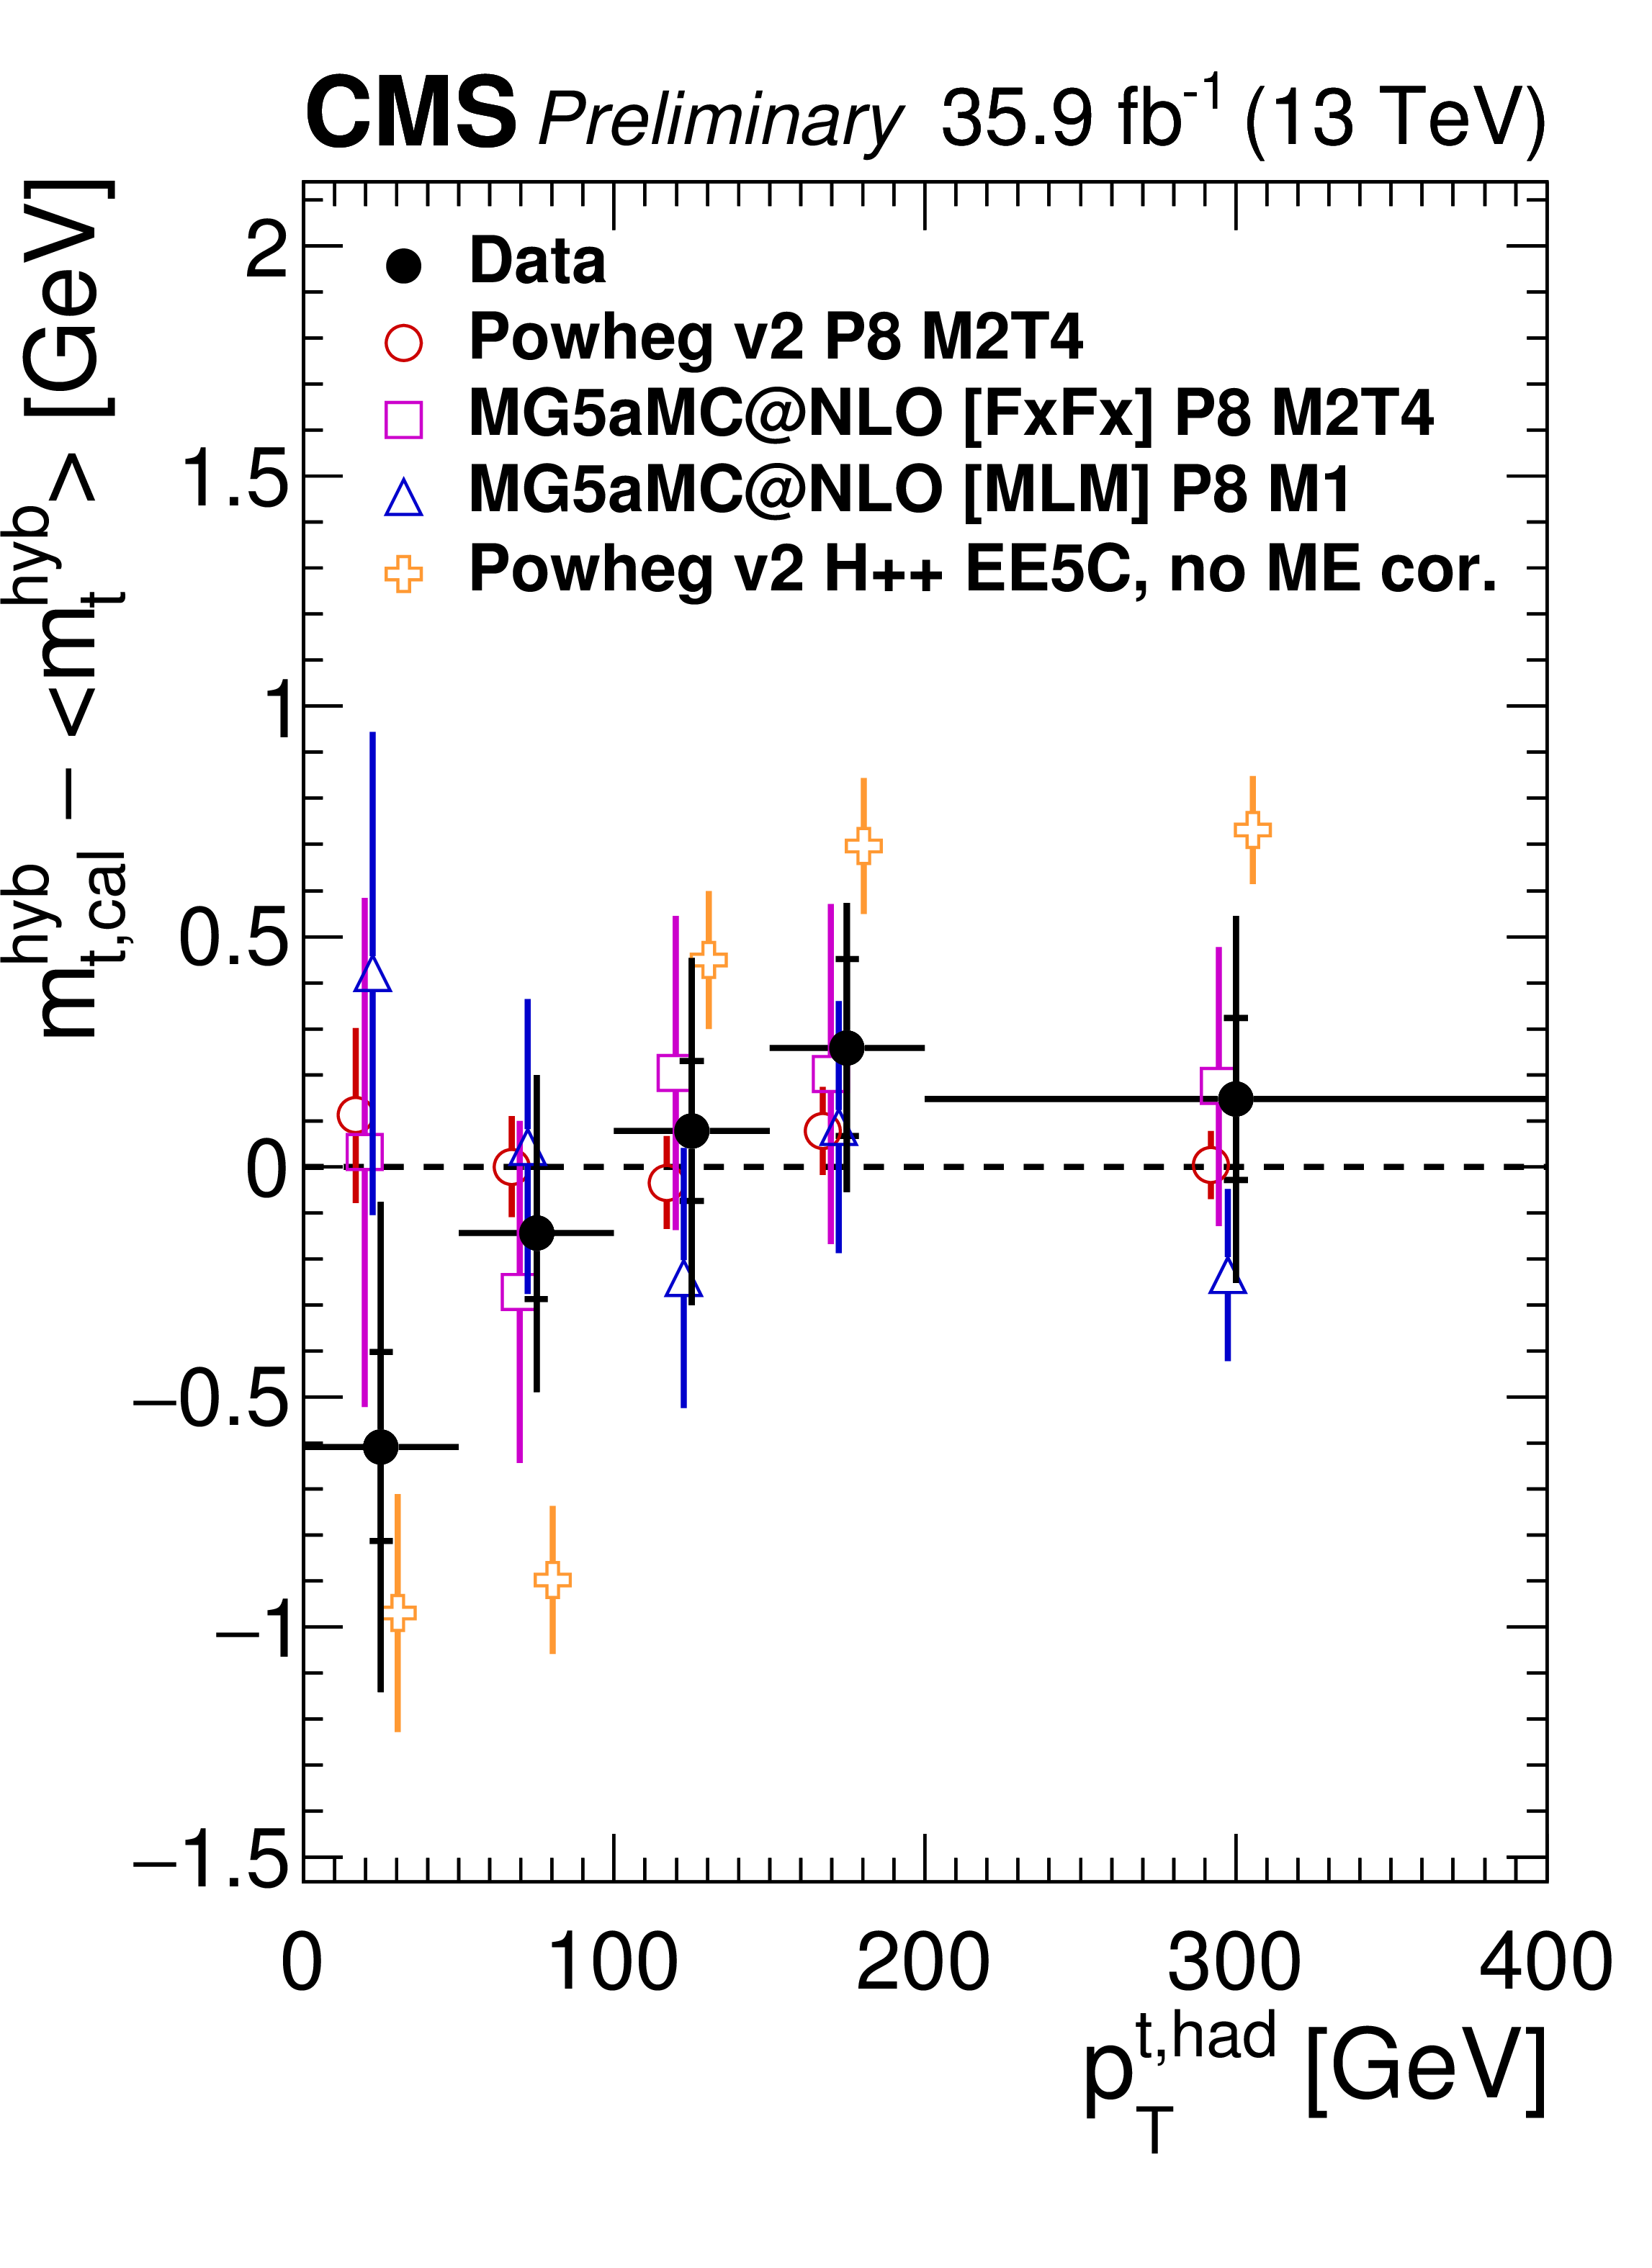
Measurements of $ {m_{\mathrm{t}}} $ as a function of the transverse momentum of the hadronically decaying top quark ($ {p_{\mathrm {T}}} ^{\rm {t,had}}$), the invariant mass of the $ {\mathrm{t} {}\mathrm{\bar{t}}} $ system ($m_{{\mathrm{t} {}\mathrm{\bar{t}}}}$), the transverse momentum of the $ {\mathrm{t} {}\mathrm{\bar{t}}} $ system ($ {p_{\mathrm {T}}} ^{{\mathrm{t} {}\mathrm{\bar{t}}}}$), and the number of jets with $ {p_{\mathrm {T}}} > $ 30 GeV compared to different generator choices. The filled circles represent the data, and the other symbols are for the simulations. For reasons of clarity the horizontal error bars are shown only for the data points and each of the simulations is shown as a single offset point with a vertical error bar representing its statistical uncertainty. The statistical uncertainty of the data is displayed by the inner error bars. For the outer error bars, the systematic uncertainties are added in quadrature. |
png pdf |
Figure 5-a:
Measurements of $ {m_{\mathrm{t}}} $ as a function of the transverse momentum of the hadronically decaying top quark ($ {p_{\mathrm {T}}} ^{\rm {t,had}}$), the invariant mass of the $ {\mathrm{t} {}\mathrm{\bar{t}}} $ system ($m_{{\mathrm{t} {}\mathrm{\bar{t}}}}$), the transverse momentum of the $ {\mathrm{t} {}\mathrm{\bar{t}}} $ system ($ {p_{\mathrm {T}}} ^{{\mathrm{t} {}\mathrm{\bar{t}}}}$), and the number of jets with $ {p_{\mathrm {T}}} > $ 30 GeV compared to different generator choices. The filled circles represent the data, and the other symbols are for the simulations. For reasons of clarity the horizontal error bars are shown only for the data points and each of the simulations is shown as a single offset point with a vertical error bar representing its statistical uncertainty. The statistical uncertainty of the data is displayed by the inner error bars. For the outer error bars, the systematic uncertainties are added in quadrature. |

png pdf |
Figure 5-b:
Measurements of $ {m_{\mathrm{t}}} $ as a function of the transverse momentum of the hadronically decaying top quark ($ {p_{\mathrm {T}}} ^{\rm {t,had}}$), the invariant mass of the $ {\mathrm{t} {}\mathrm{\bar{t}}} $ system ($m_{{\mathrm{t} {}\mathrm{\bar{t}}}}$), the transverse momentum of the $ {\mathrm{t} {}\mathrm{\bar{t}}} $ system ($ {p_{\mathrm {T}}} ^{{\mathrm{t} {}\mathrm{\bar{t}}}}$), and the number of jets with $ {p_{\mathrm {T}}} > $ 30 GeV compared to different generator choices. The filled circles represent the data, and the other symbols are for the simulations. For reasons of clarity the horizontal error bars are shown only for the data points and each of the simulations is shown as a single offset point with a vertical error bar representing its statistical uncertainty. The statistical uncertainty of the data is displayed by the inner error bars. For the outer error bars, the systematic uncertainties are added in quadrature. |

png pdf |
Figure 5-c:
Measurements of $ {m_{\mathrm{t}}} $ as a function of the transverse momentum of the hadronically decaying top quark ($ {p_{\mathrm {T}}} ^{\rm {t,had}}$), the invariant mass of the $ {\mathrm{t} {}\mathrm{\bar{t}}} $ system ($m_{{\mathrm{t} {}\mathrm{\bar{t}}}}$), the transverse momentum of the $ {\mathrm{t} {}\mathrm{\bar{t}}} $ system ($ {p_{\mathrm {T}}} ^{{\mathrm{t} {}\mathrm{\bar{t}}}}$), and the number of jets with $ {p_{\mathrm {T}}} > $ 30 GeV compared to different generator choices. The filled circles represent the data, and the other symbols are for the simulations. For reasons of clarity the horizontal error bars are shown only for the data points and each of the simulations is shown as a single offset point with a vertical error bar representing its statistical uncertainty. The statistical uncertainty of the data is displayed by the inner error bars. For the outer error bars, the systematic uncertainties are added in quadrature. |

png pdf |
Figure 5-d:
Measurements of $ {m_{\mathrm{t}}} $ as a function of the transverse momentum of the hadronically decaying top quark ($ {p_{\mathrm {T}}} ^{\rm {t,had}}$), the invariant mass of the $ {\mathrm{t} {}\mathrm{\bar{t}}} $ system ($m_{{\mathrm{t} {}\mathrm{\bar{t}}}}$), the transverse momentum of the $ {\mathrm{t} {}\mathrm{\bar{t}}} $ system ($ {p_{\mathrm {T}}} ^{{\mathrm{t} {}\mathrm{\bar{t}}}}$), and the number of jets with $ {p_{\mathrm {T}}} > $ 30 GeV compared to different generator choices. The filled circles represent the data, and the other symbols are for the simulations. For reasons of clarity the horizontal error bars are shown only for the data points and each of the simulations is shown as a single offset point with a vertical error bar representing its statistical uncertainty. The statistical uncertainty of the data is displayed by the inner error bars. For the outer error bars, the systematic uncertainties are added in quadrature. |

png pdf |
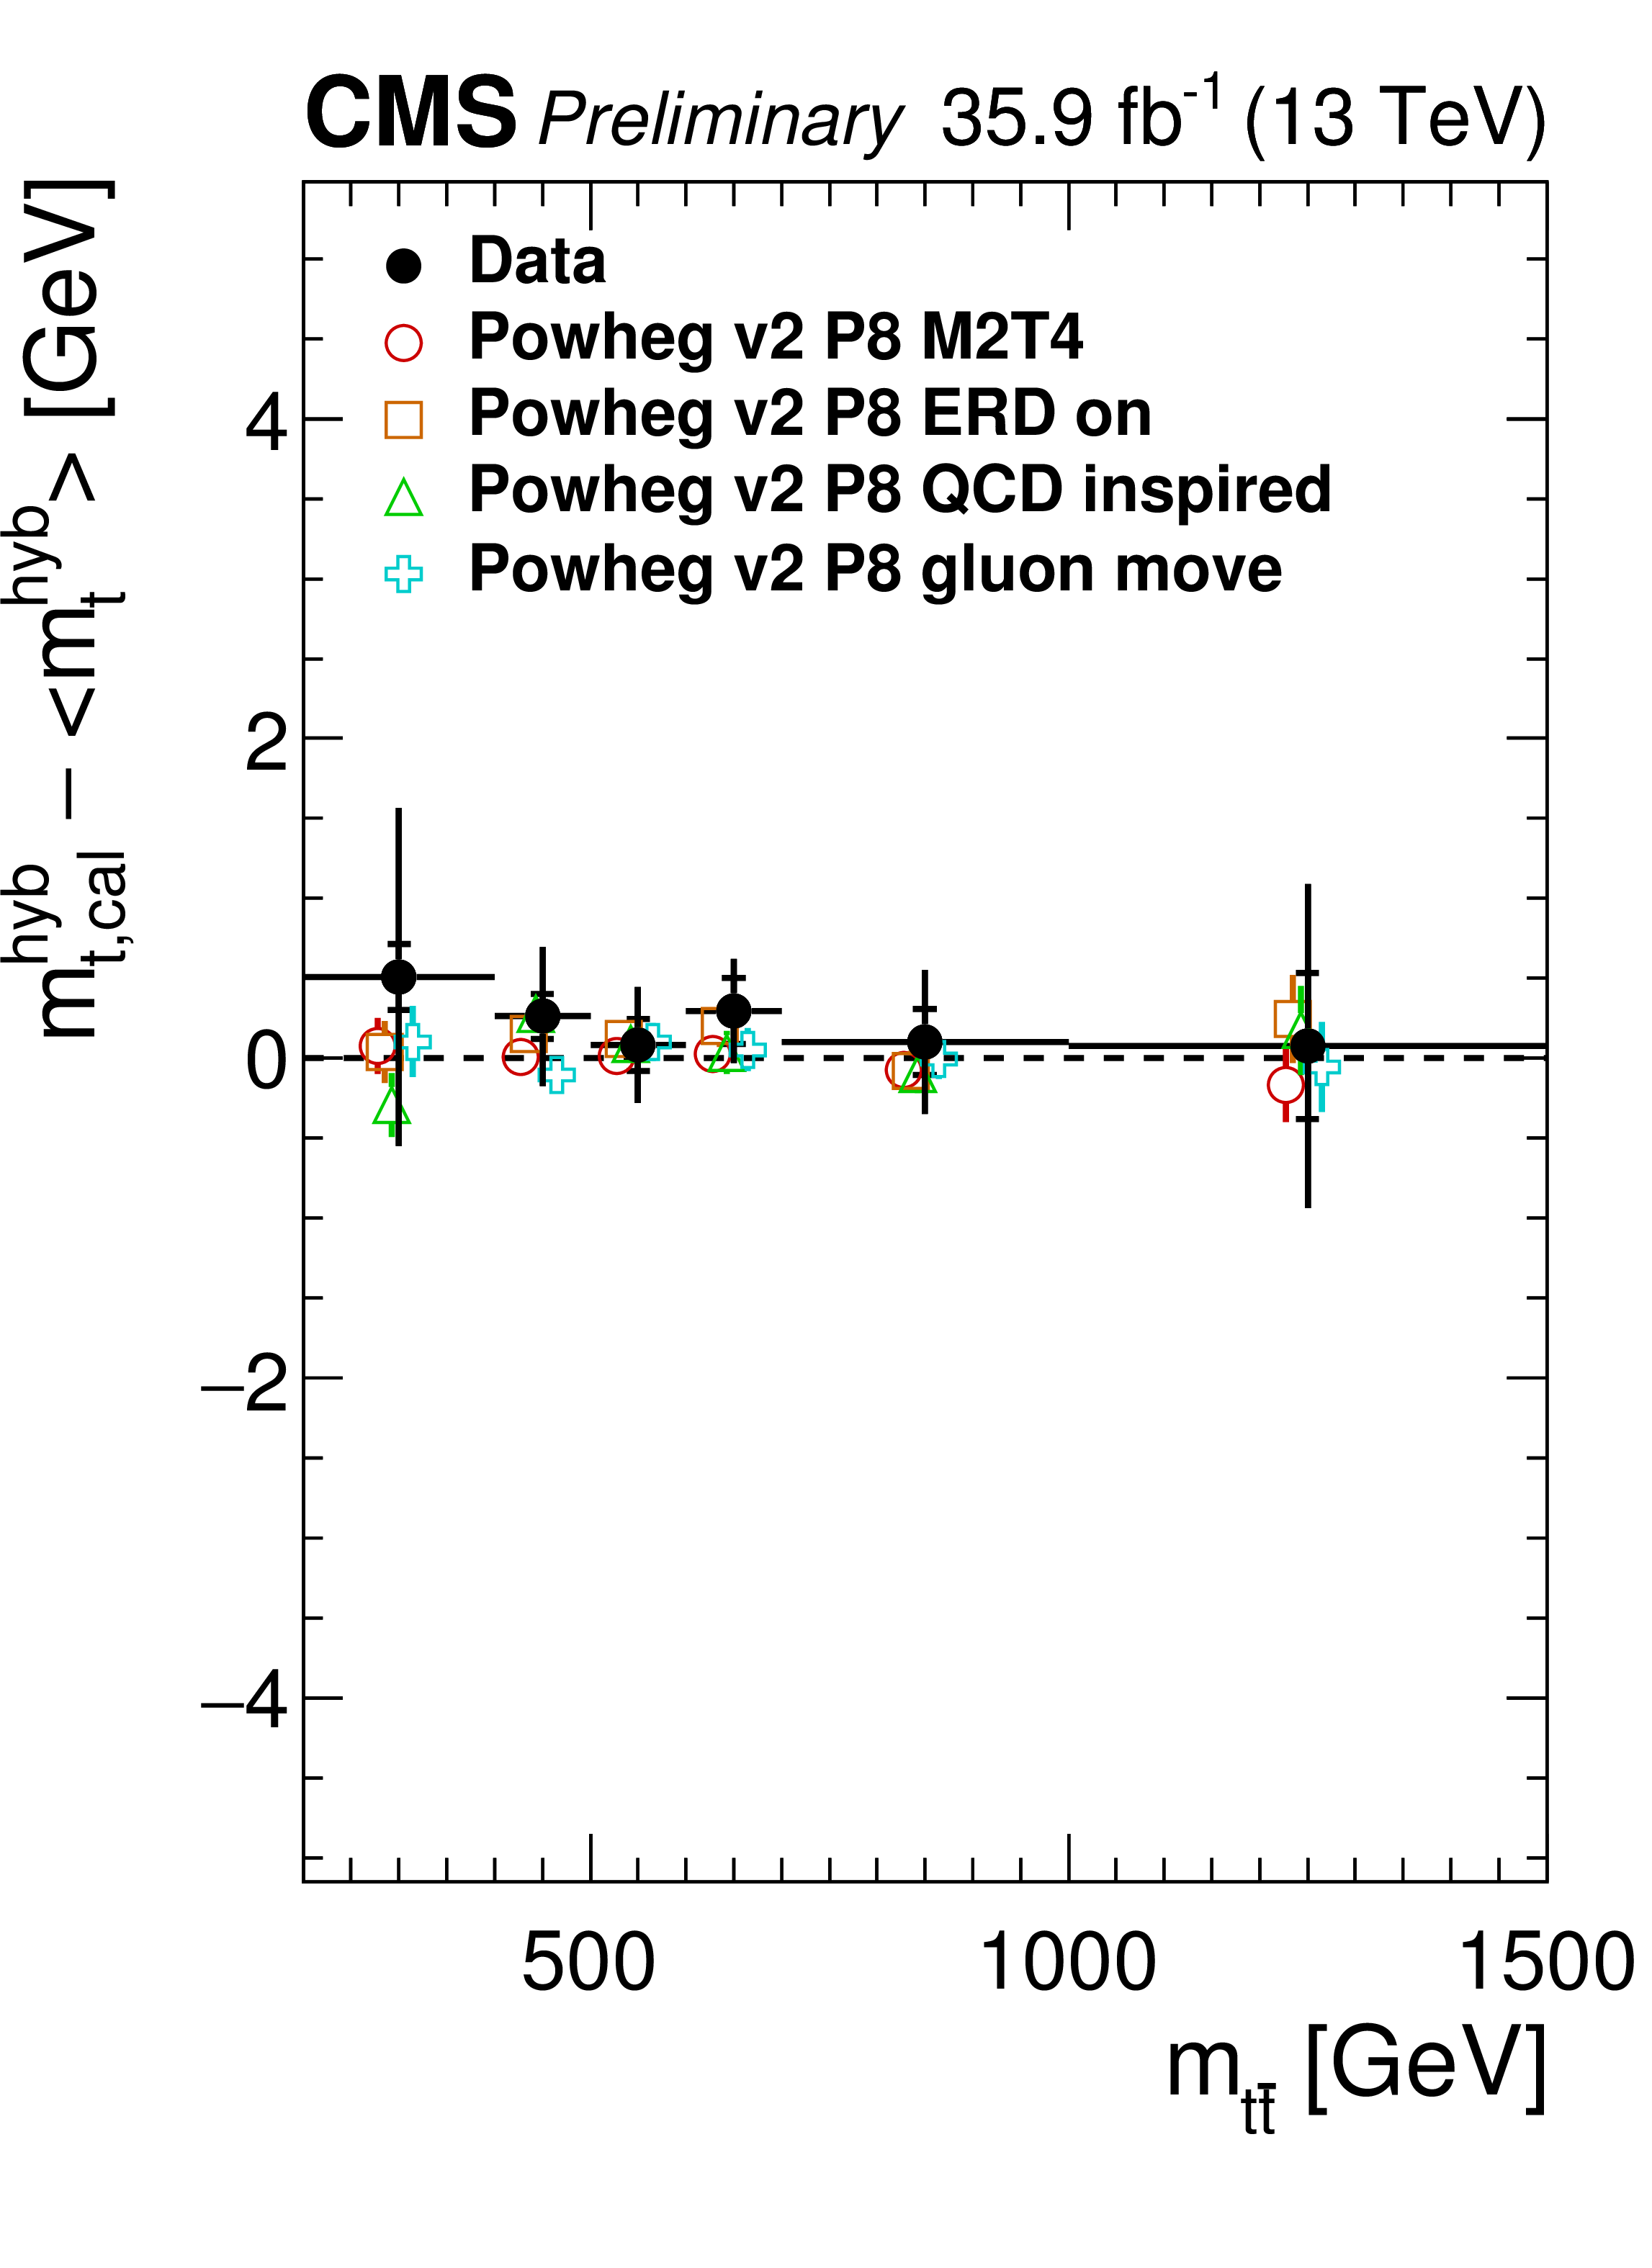
Figure 6:
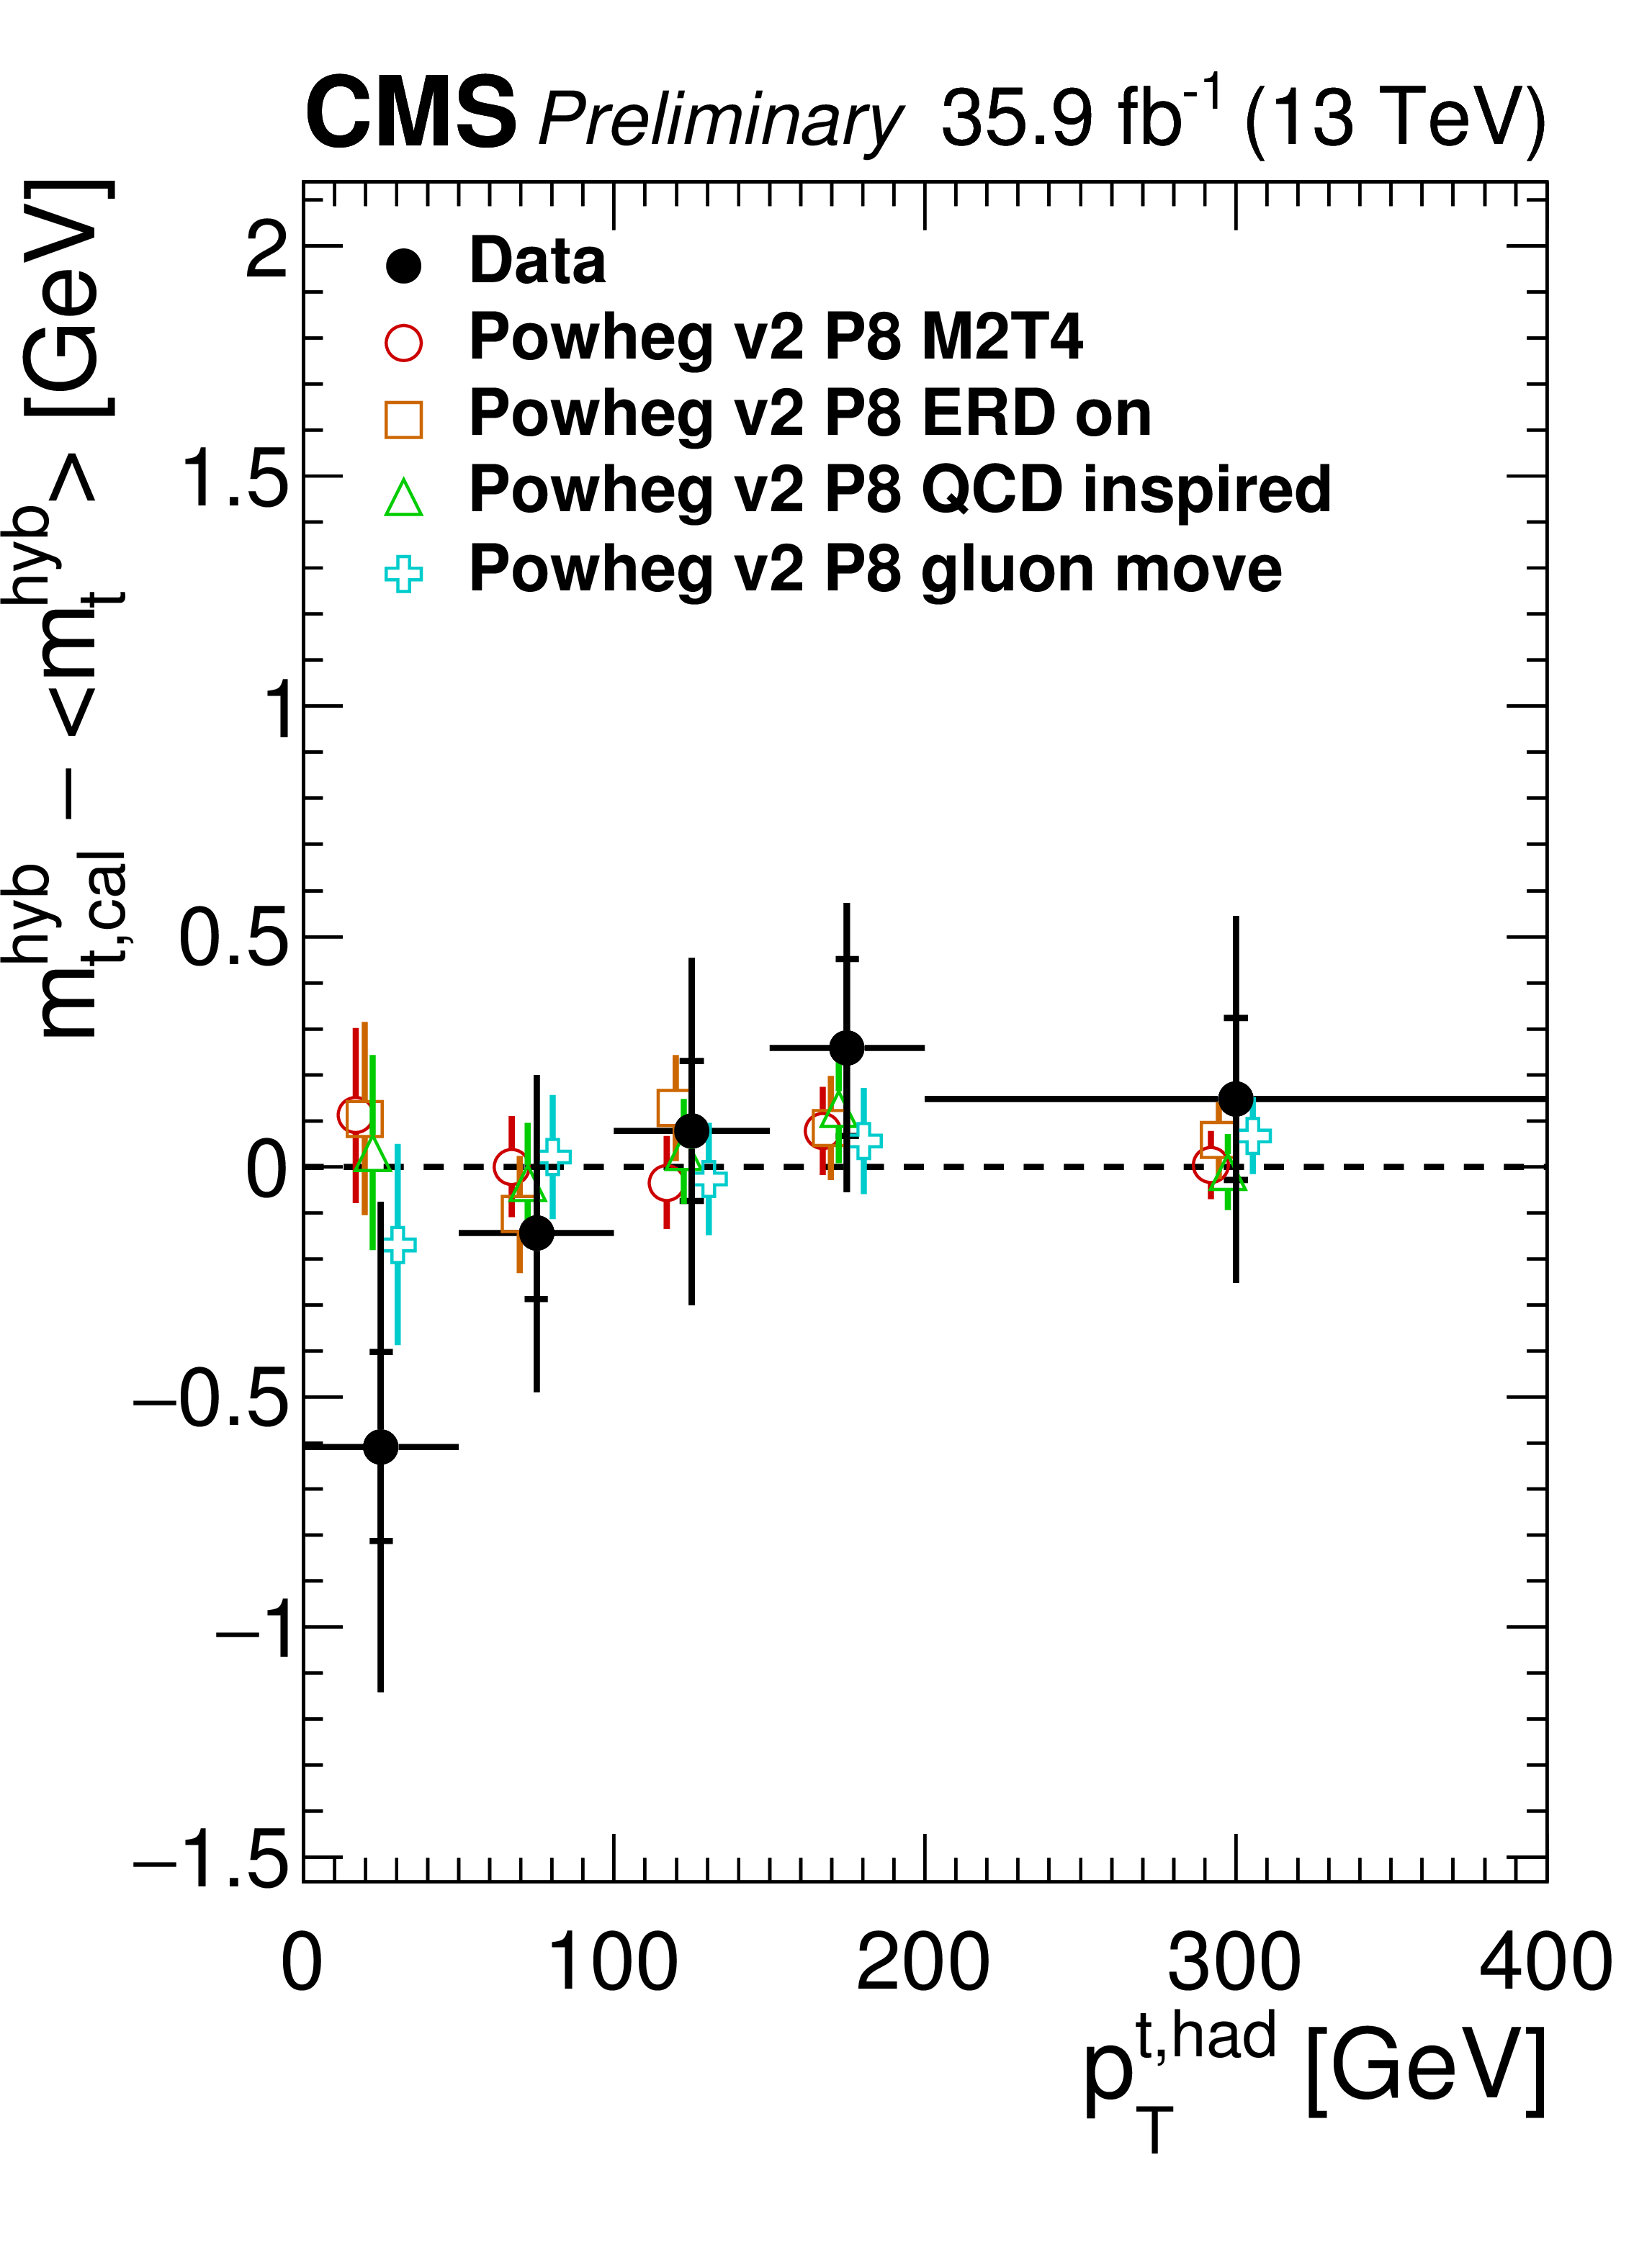
Measurements of $ {m_{\mathrm{t}}} $ as a function of the transverse momentum of the hadronically decaying top quark ($ {p_{\mathrm {T}}} ^{\rm {t,had}}$), the invariant mass of the $ {\mathrm{t} {}\mathrm{\bar{t}}} $ system ($m_{{\mathrm{t} {}\mathrm{\bar{t}}}}$), the transverse momentum of the $ {\mathrm{t} {}\mathrm{\bar{t}}} $ system ($ {p_{\mathrm {T}}} ^{{\mathrm{t} {}\mathrm{\bar{t}}}}$), and the number of jets with $ {p_{\mathrm {T}}} > $ 30 GeV compared to alternative models of color reconnections. The filled circles represent the data, and the other symbols are for the simulations. For reasons of clarity the horizontal error bars are shown only for the data points and each of the simulations is shown as a single offset point with a vertical error bar representing its statistical uncertainty. The statistical uncertainty of the data is displayed by the inner error bars. For the outer error bars, the systematic uncertainties are added in quadrature. |
png pdf |
Figure 6-a:
Measurements of $ {m_{\mathrm{t}}} $ as a function of the transverse momentum of the hadronically decaying top quark ($ {p_{\mathrm {T}}} ^{\rm {t,had}}$), the invariant mass of the $ {\mathrm{t} {}\mathrm{\bar{t}}} $ system ($m_{{\mathrm{t} {}\mathrm{\bar{t}}}}$), the transverse momentum of the $ {\mathrm{t} {}\mathrm{\bar{t}}} $ system ($ {p_{\mathrm {T}}} ^{{\mathrm{t} {}\mathrm{\bar{t}}}}$), and the number of jets with $ {p_{\mathrm {T}}} > $ 30 GeV compared to alternative models of color reconnections. The filled circles represent the data, and the other symbols are for the simulations. For reasons of clarity the horizontal error bars are shown only for the data points and each of the simulations is shown as a single offset point with a vertical error bar representing its statistical uncertainty. The statistical uncertainty of the data is displayed by the inner error bars. For the outer error bars, the systematic uncertainties are added in quadrature. |
png pdf |
Figure 6-b:
Measurements of $ {m_{\mathrm{t}}} $ as a function of the transverse momentum of the hadronically decaying top quark ($ {p_{\mathrm {T}}} ^{\rm {t,had}}$), the invariant mass of the $ {\mathrm{t} {}\mathrm{\bar{t}}} $ system ($m_{{\mathrm{t} {}\mathrm{\bar{t}}}}$), the transverse momentum of the $ {\mathrm{t} {}\mathrm{\bar{t}}} $ system ($ {p_{\mathrm {T}}} ^{{\mathrm{t} {}\mathrm{\bar{t}}}}$), and the number of jets with $ {p_{\mathrm {T}}} > $ 30 GeV compared to alternative models of color reconnections. The filled circles represent the data, and the other symbols are for the simulations. For reasons of clarity the horizontal error bars are shown only for the data points and each of the simulations is shown as a single offset point with a vertical error bar representing its statistical uncertainty. The statistical uncertainty of the data is displayed by the inner error bars. For the outer error bars, the systematic uncertainties are added in quadrature. |

png pdf |
Figure 6-c:
Measurements of $ {m_{\mathrm{t}}} $ as a function of the transverse momentum of the hadronically decaying top quark ($ {p_{\mathrm {T}}} ^{\rm {t,had}}$), the invariant mass of the $ {\mathrm{t} {}\mathrm{\bar{t}}} $ system ($m_{{\mathrm{t} {}\mathrm{\bar{t}}}}$), the transverse momentum of the $ {\mathrm{t} {}\mathrm{\bar{t}}} $ system ($ {p_{\mathrm {T}}} ^{{\mathrm{t} {}\mathrm{\bar{t}}}}$), and the number of jets with $ {p_{\mathrm {T}}} > $ 30 GeV compared to alternative models of color reconnections. The filled circles represent the data, and the other symbols are for the simulations. For reasons of clarity the horizontal error bars are shown only for the data points and each of the simulations is shown as a single offset point with a vertical error bar representing its statistical uncertainty. The statistical uncertainty of the data is displayed by the inner error bars. For the outer error bars, the systematic uncertainties are added in quadrature. |

png pdf |
Figure 6-d:
Measurements of $ {m_{\mathrm{t}}} $ as a function of the transverse momentum of the hadronically decaying top quark ($ {p_{\mathrm {T}}} ^{\rm {t,had}}$), the invariant mass of the $ {\mathrm{t} {}\mathrm{\bar{t}}} $ system ($m_{{\mathrm{t} {}\mathrm{\bar{t}}}}$), the transverse momentum of the $ {\mathrm{t} {}\mathrm{\bar{t}}} $ system ($ {p_{\mathrm {T}}} ^{{\mathrm{t} {}\mathrm{\bar{t}}}}$), and the number of jets with $ {p_{\mathrm {T}}} > $ 30 GeV compared to alternative models of color reconnections. The filled circles represent the data, and the other symbols are for the simulations. For reasons of clarity the horizontal error bars are shown only for the data points and each of the simulations is shown as a single offset point with a vertical error bar representing its statistical uncertainty. The statistical uncertainty of the data is displayed by the inner error bars. For the outer error bars, the systematic uncertainties are added in quadrature. |
png pdf |
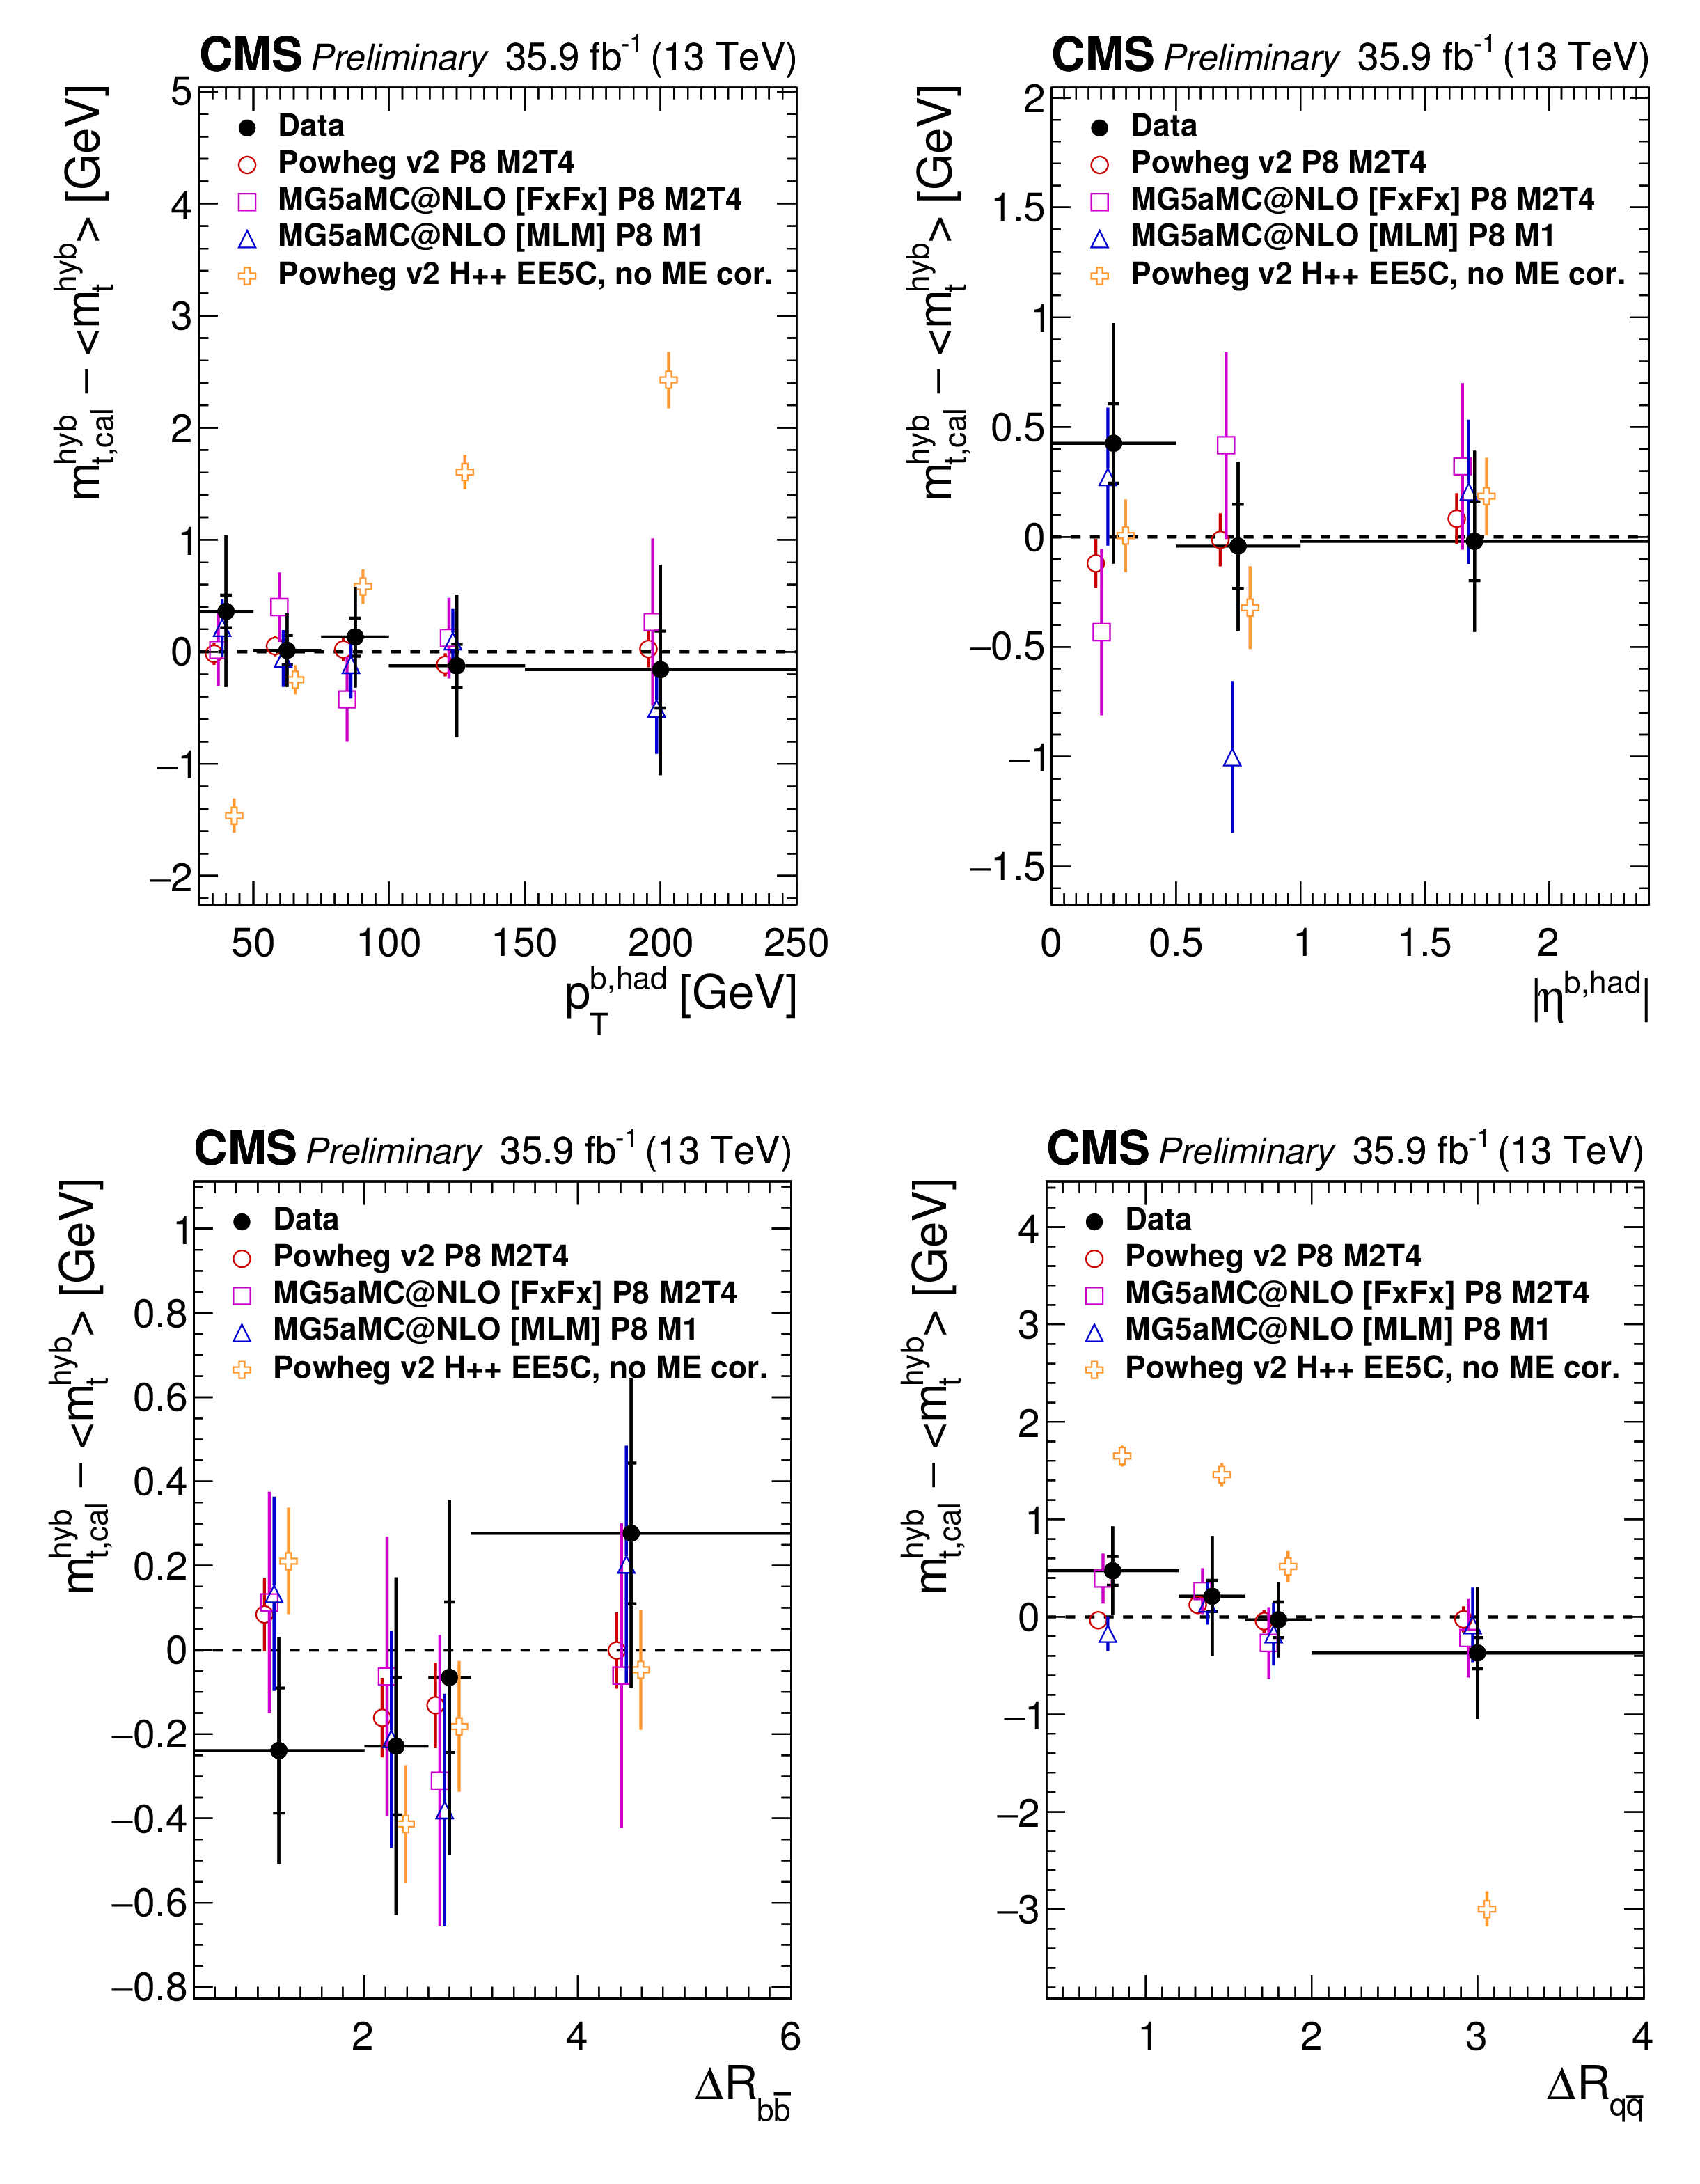
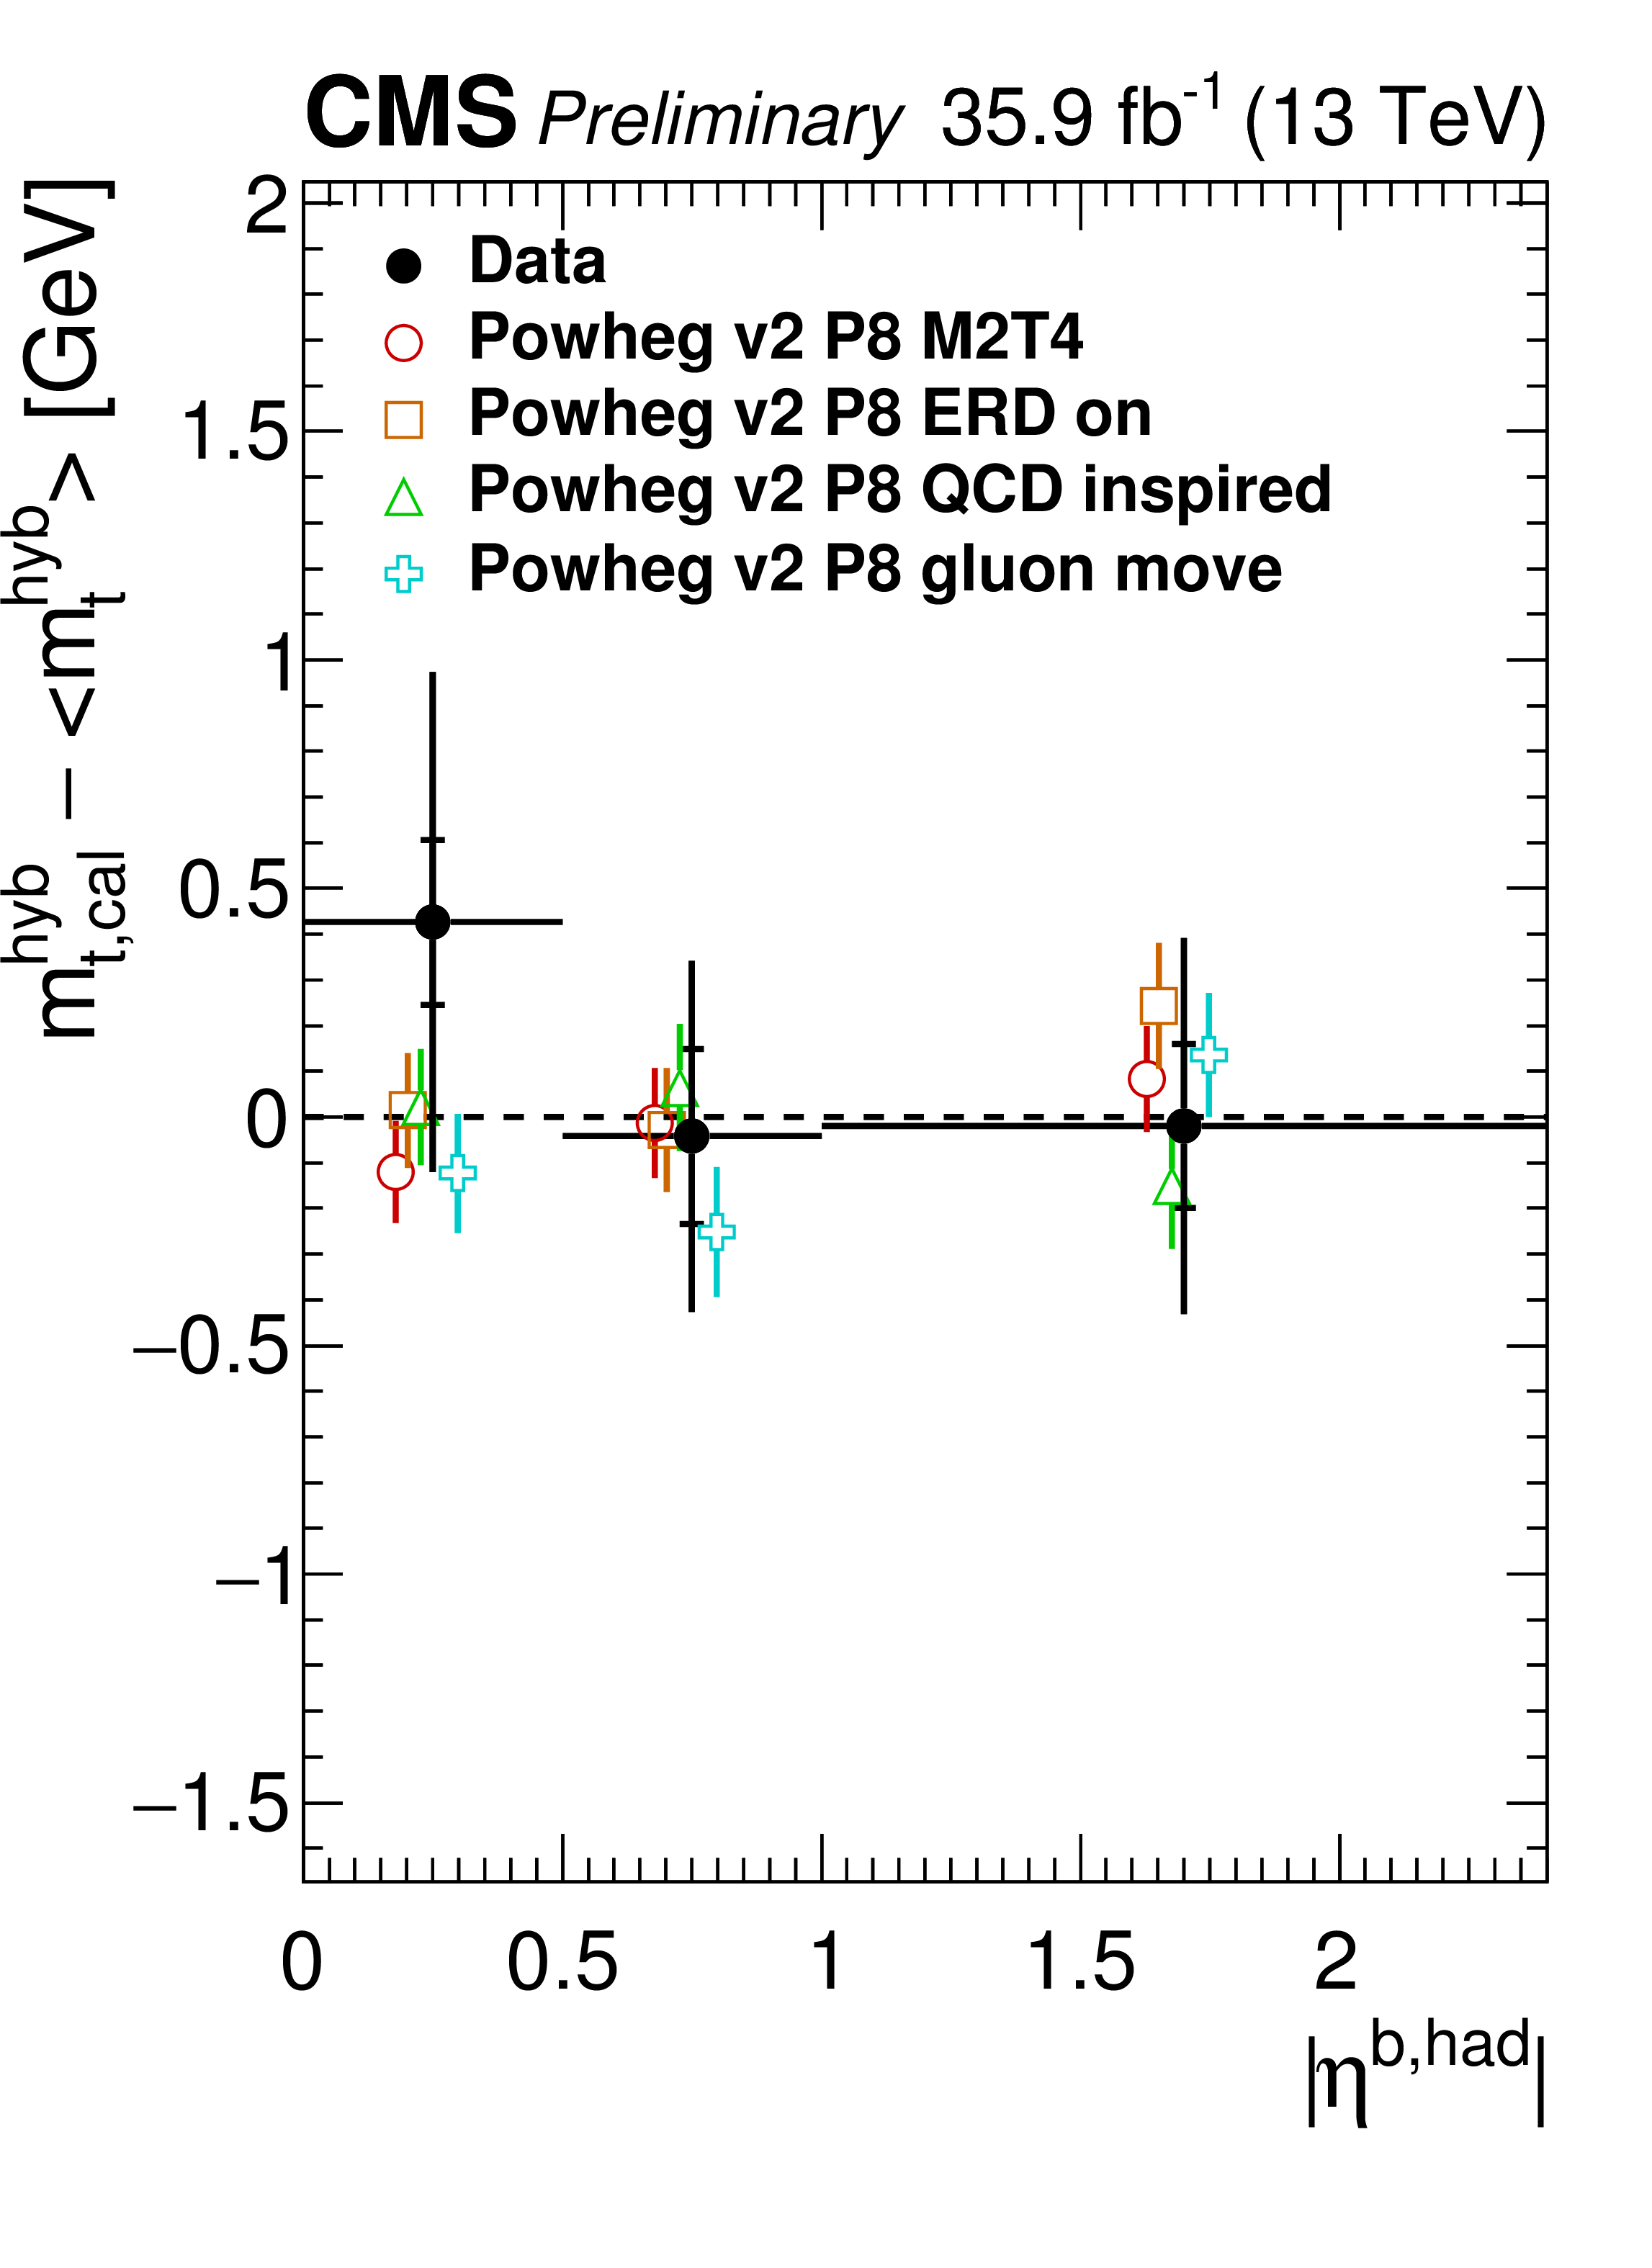
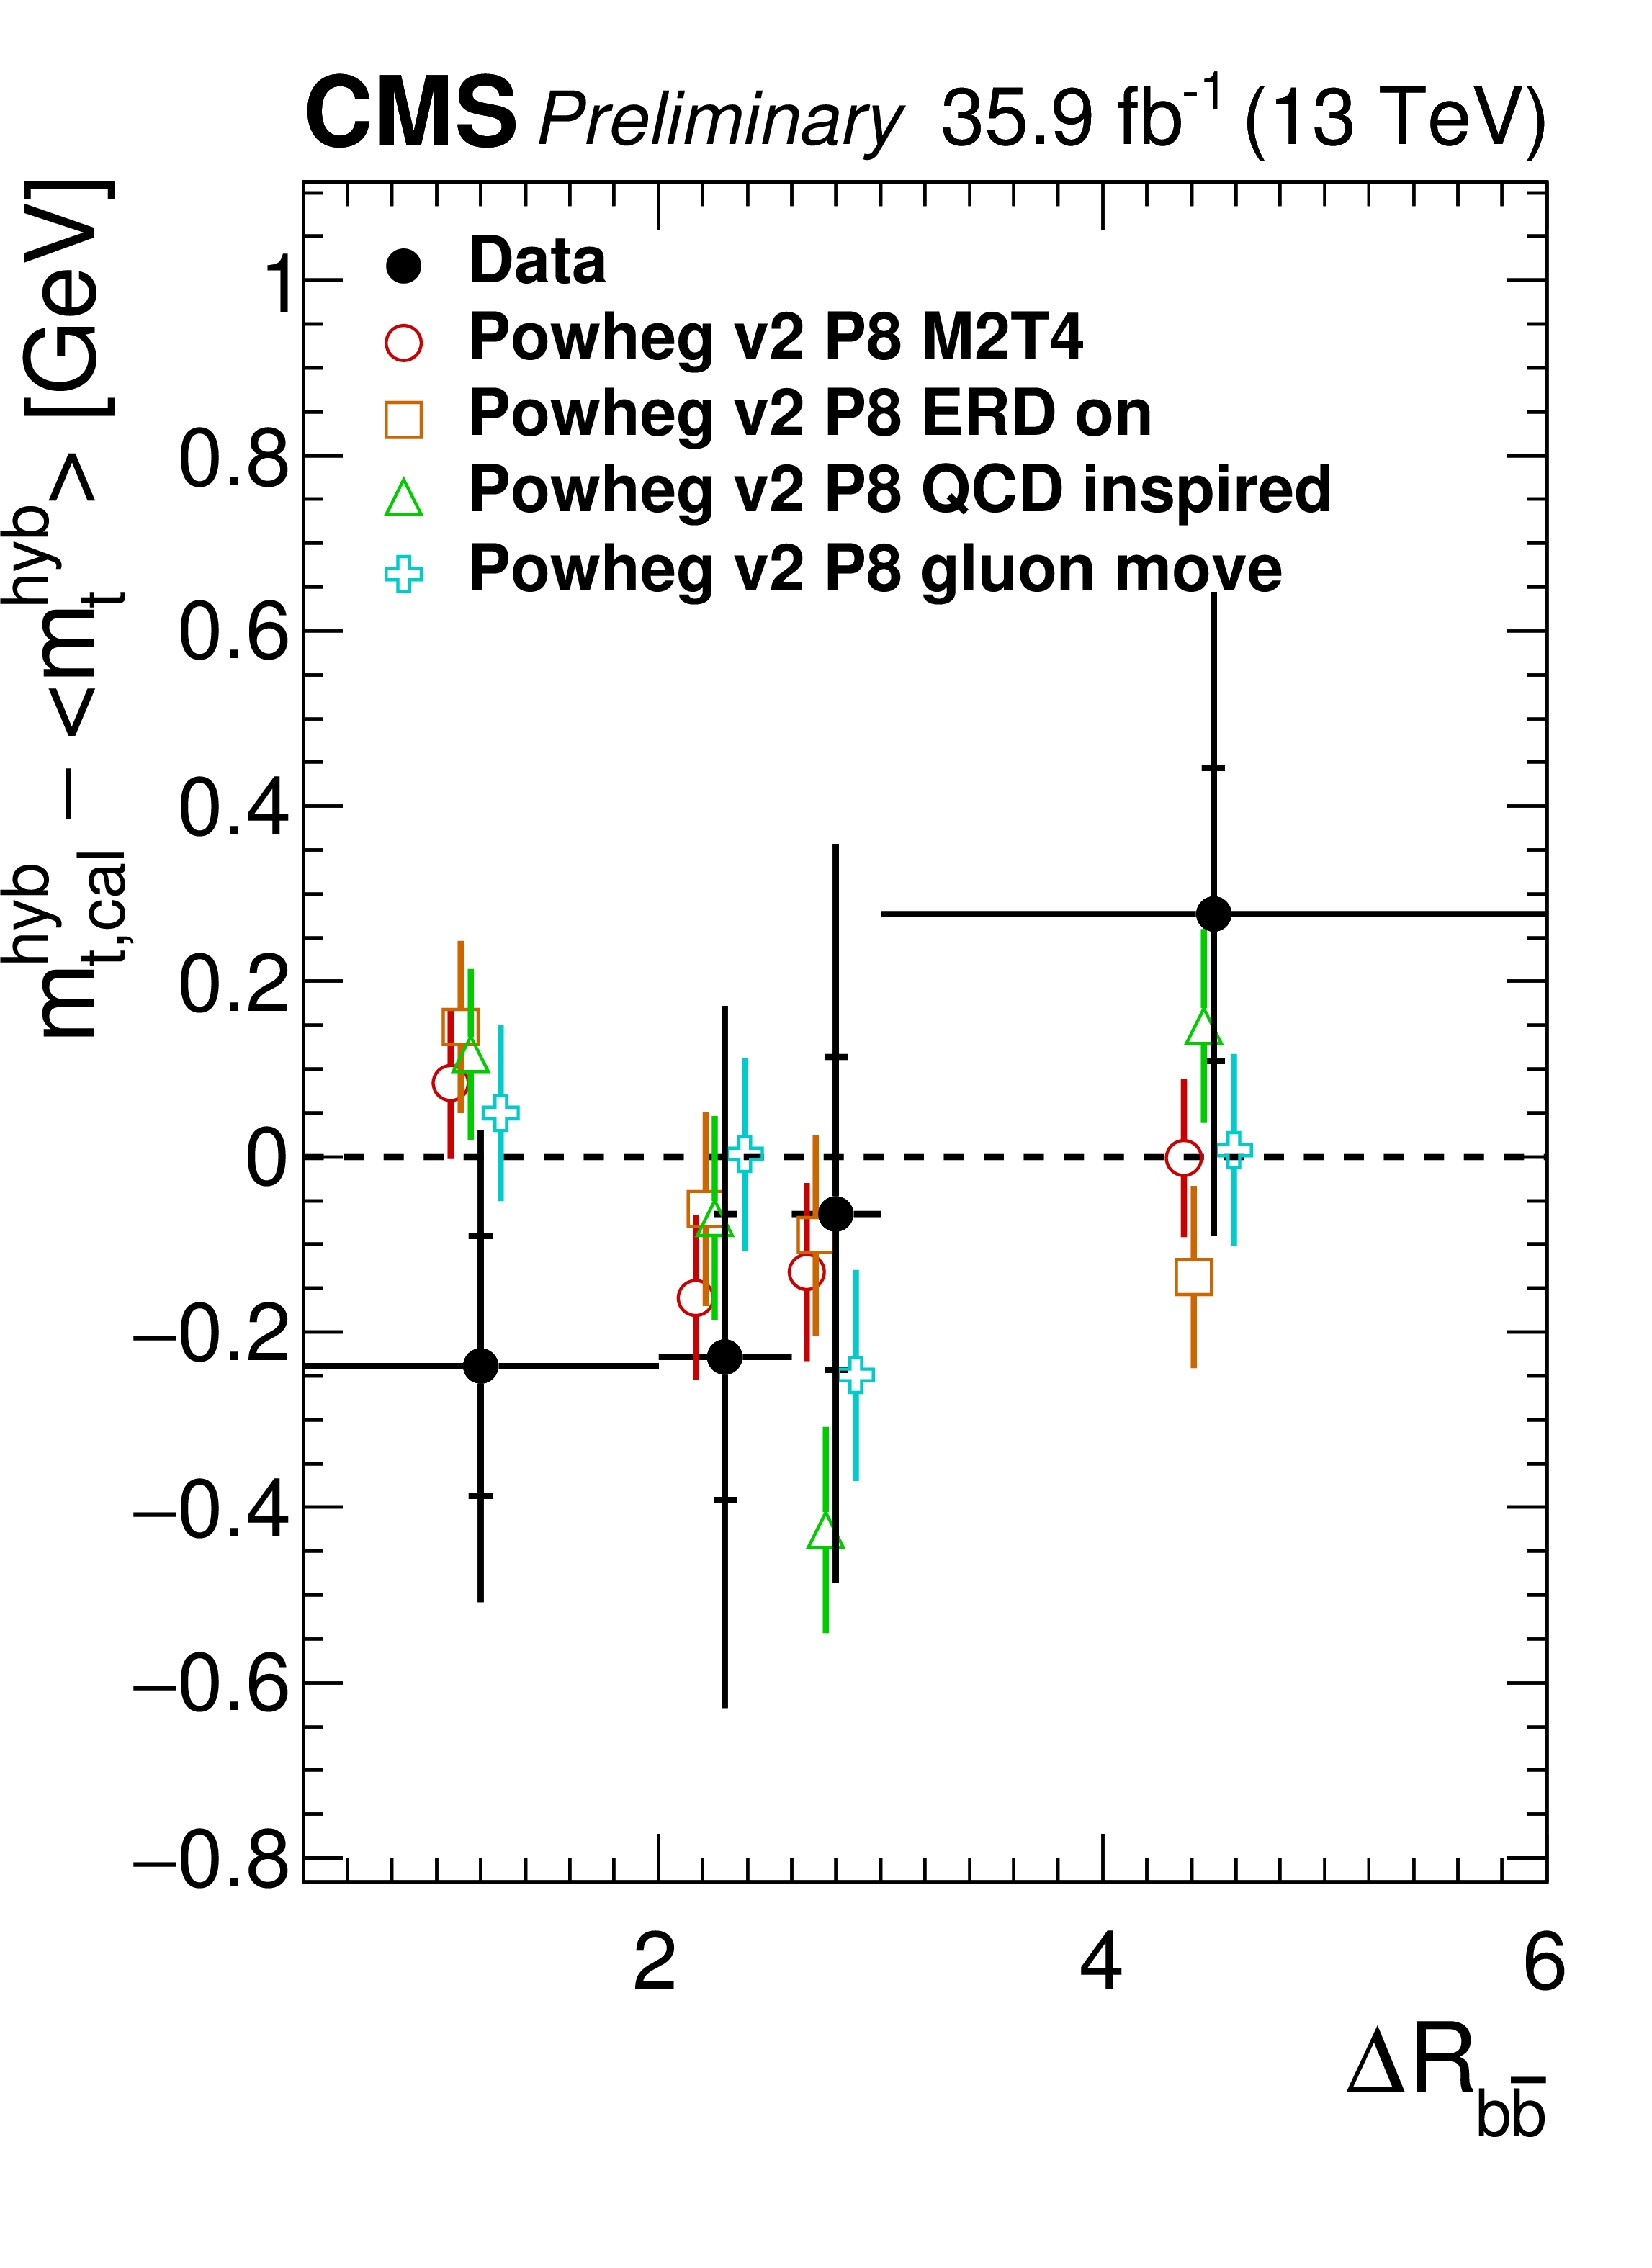
Figure 7:
Measurements of $ {m_{\mathrm{t}}} $ as a function of the $ {p_{\mathrm {T}}} $ of the b jet assigned to the hadronic decay branch ($ {p_{\mathrm {T}}} ^{\rm {b,had}}$), the pseudorapidity of the b jet assigned to the hadronic decay branch ($\left |\eta ^{\rm b,had}\right |$), the $\Delta R$ between the b jets ($\Delta R_{{\mathrm{b} \mathrm{\bar{b}}}}$), and the $\Delta R$ between the light quark jets ($\Delta R_{{\mathrm{q} \mathrm{\bar{q}}}}$) compared to different generator choices. The filled circles represent the data, and the other symbols are for the simulations. For reasons of clarity the horizontal error bars are shown only for the data points and each of the simulations is shown as a single offset point with a vertical error bar representing its statistical uncertainty. The statistical uncertainty of the data is displayed by the inner error bars. For the outer error bars, the systematic uncertainties are added in quadrature. |
png pdf |
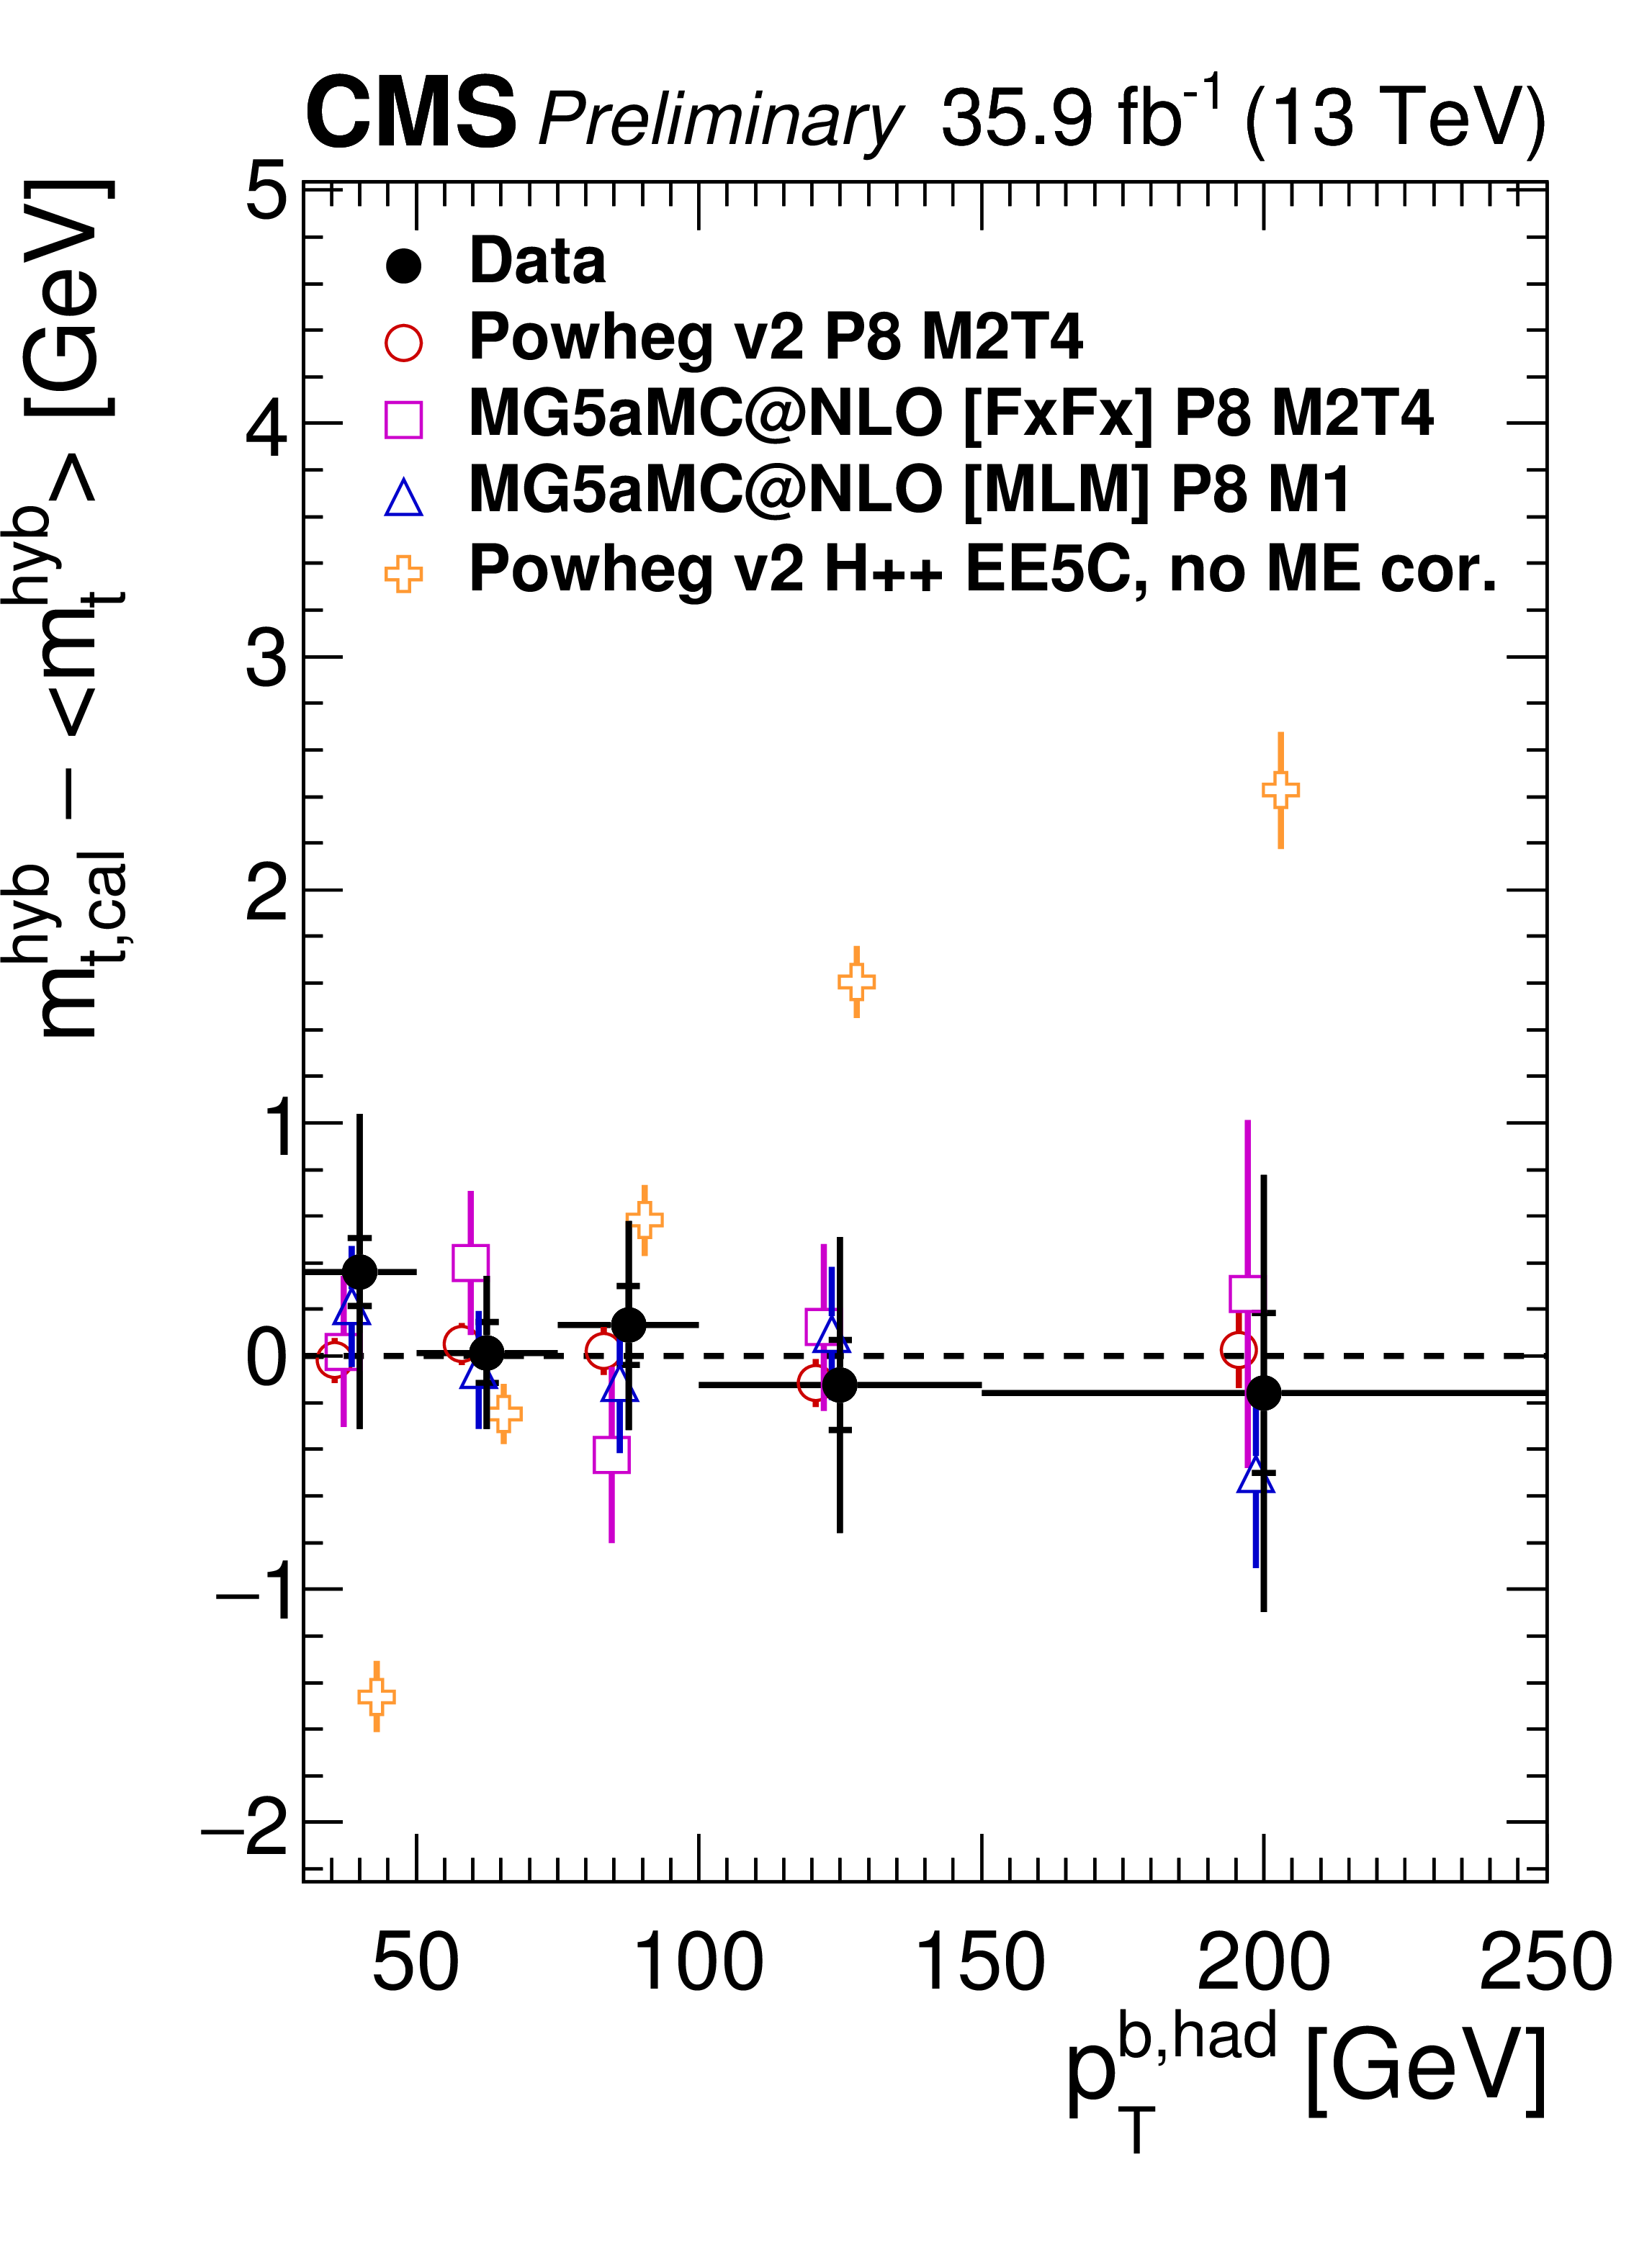
Figure 7-a:
Measurements of $ {m_{\mathrm{t}}} $ as a function of the $ {p_{\mathrm {T}}} $ of the b jet assigned to the hadronic decay branch ($ {p_{\mathrm {T}}} ^{\rm {b,had}}$), the pseudorapidity of the b jet assigned to the hadronic decay branch ($\left |\eta ^{\rm b,had}\right |$), the $\Delta R$ between the b jets ($\Delta R_{{\mathrm{b} \mathrm{\bar{b}}}}$), and the $\Delta R$ between the light quark jets ($\Delta R_{{\mathrm{q} \mathrm{\bar{q}}}}$) compared to different generator choices. The filled circles represent the data, and the other symbols are for the simulations. For reasons of clarity the horizontal error bars are shown only for the data points and each of the simulations is shown as a single offset point with a vertical error bar representing its statistical uncertainty. The statistical uncertainty of the data is displayed by the inner error bars. For the outer error bars, the systematic uncertainties are added in quadrature. |

png pdf |
Figure 7-b:
Measurements of $ {m_{\mathrm{t}}} $ as a function of the $ {p_{\mathrm {T}}} $ of the b jet assigned to the hadronic decay branch ($ {p_{\mathrm {T}}} ^{\rm {b,had}}$), the pseudorapidity of the b jet assigned to the hadronic decay branch ($\left |\eta ^{\rm b,had}\right |$), the $\Delta R$ between the b jets ($\Delta R_{{\mathrm{b} \mathrm{\bar{b}}}}$), and the $\Delta R$ between the light quark jets ($\Delta R_{{\mathrm{q} \mathrm{\bar{q}}}}$) compared to different generator choices. The filled circles represent the data, and the other symbols are for the simulations. For reasons of clarity the horizontal error bars are shown only for the data points and each of the simulations is shown as a single offset point with a vertical error bar representing its statistical uncertainty. The statistical uncertainty of the data is displayed by the inner error bars. For the outer error bars, the systematic uncertainties are added in quadrature. |

png pdf |
Figure 7-c:
Measurements of $ {m_{\mathrm{t}}} $ as a function of the $ {p_{\mathrm {T}}} $ of the b jet assigned to the hadronic decay branch ($ {p_{\mathrm {T}}} ^{\rm {b,had}}$), the pseudorapidity of the b jet assigned to the hadronic decay branch ($\left |\eta ^{\rm b,had}\right |$), the $\Delta R$ between the b jets ($\Delta R_{{\mathrm{b} \mathrm{\bar{b}}}}$), and the $\Delta R$ between the light quark jets ($\Delta R_{{\mathrm{q} \mathrm{\bar{q}}}}$) compared to different generator choices. The filled circles represent the data, and the other symbols are for the simulations. For reasons of clarity the horizontal error bars are shown only for the data points and each of the simulations is shown as a single offset point with a vertical error bar representing its statistical uncertainty. The statistical uncertainty of the data is displayed by the inner error bars. For the outer error bars, the systematic uncertainties are added in quadrature. |
png pdf |
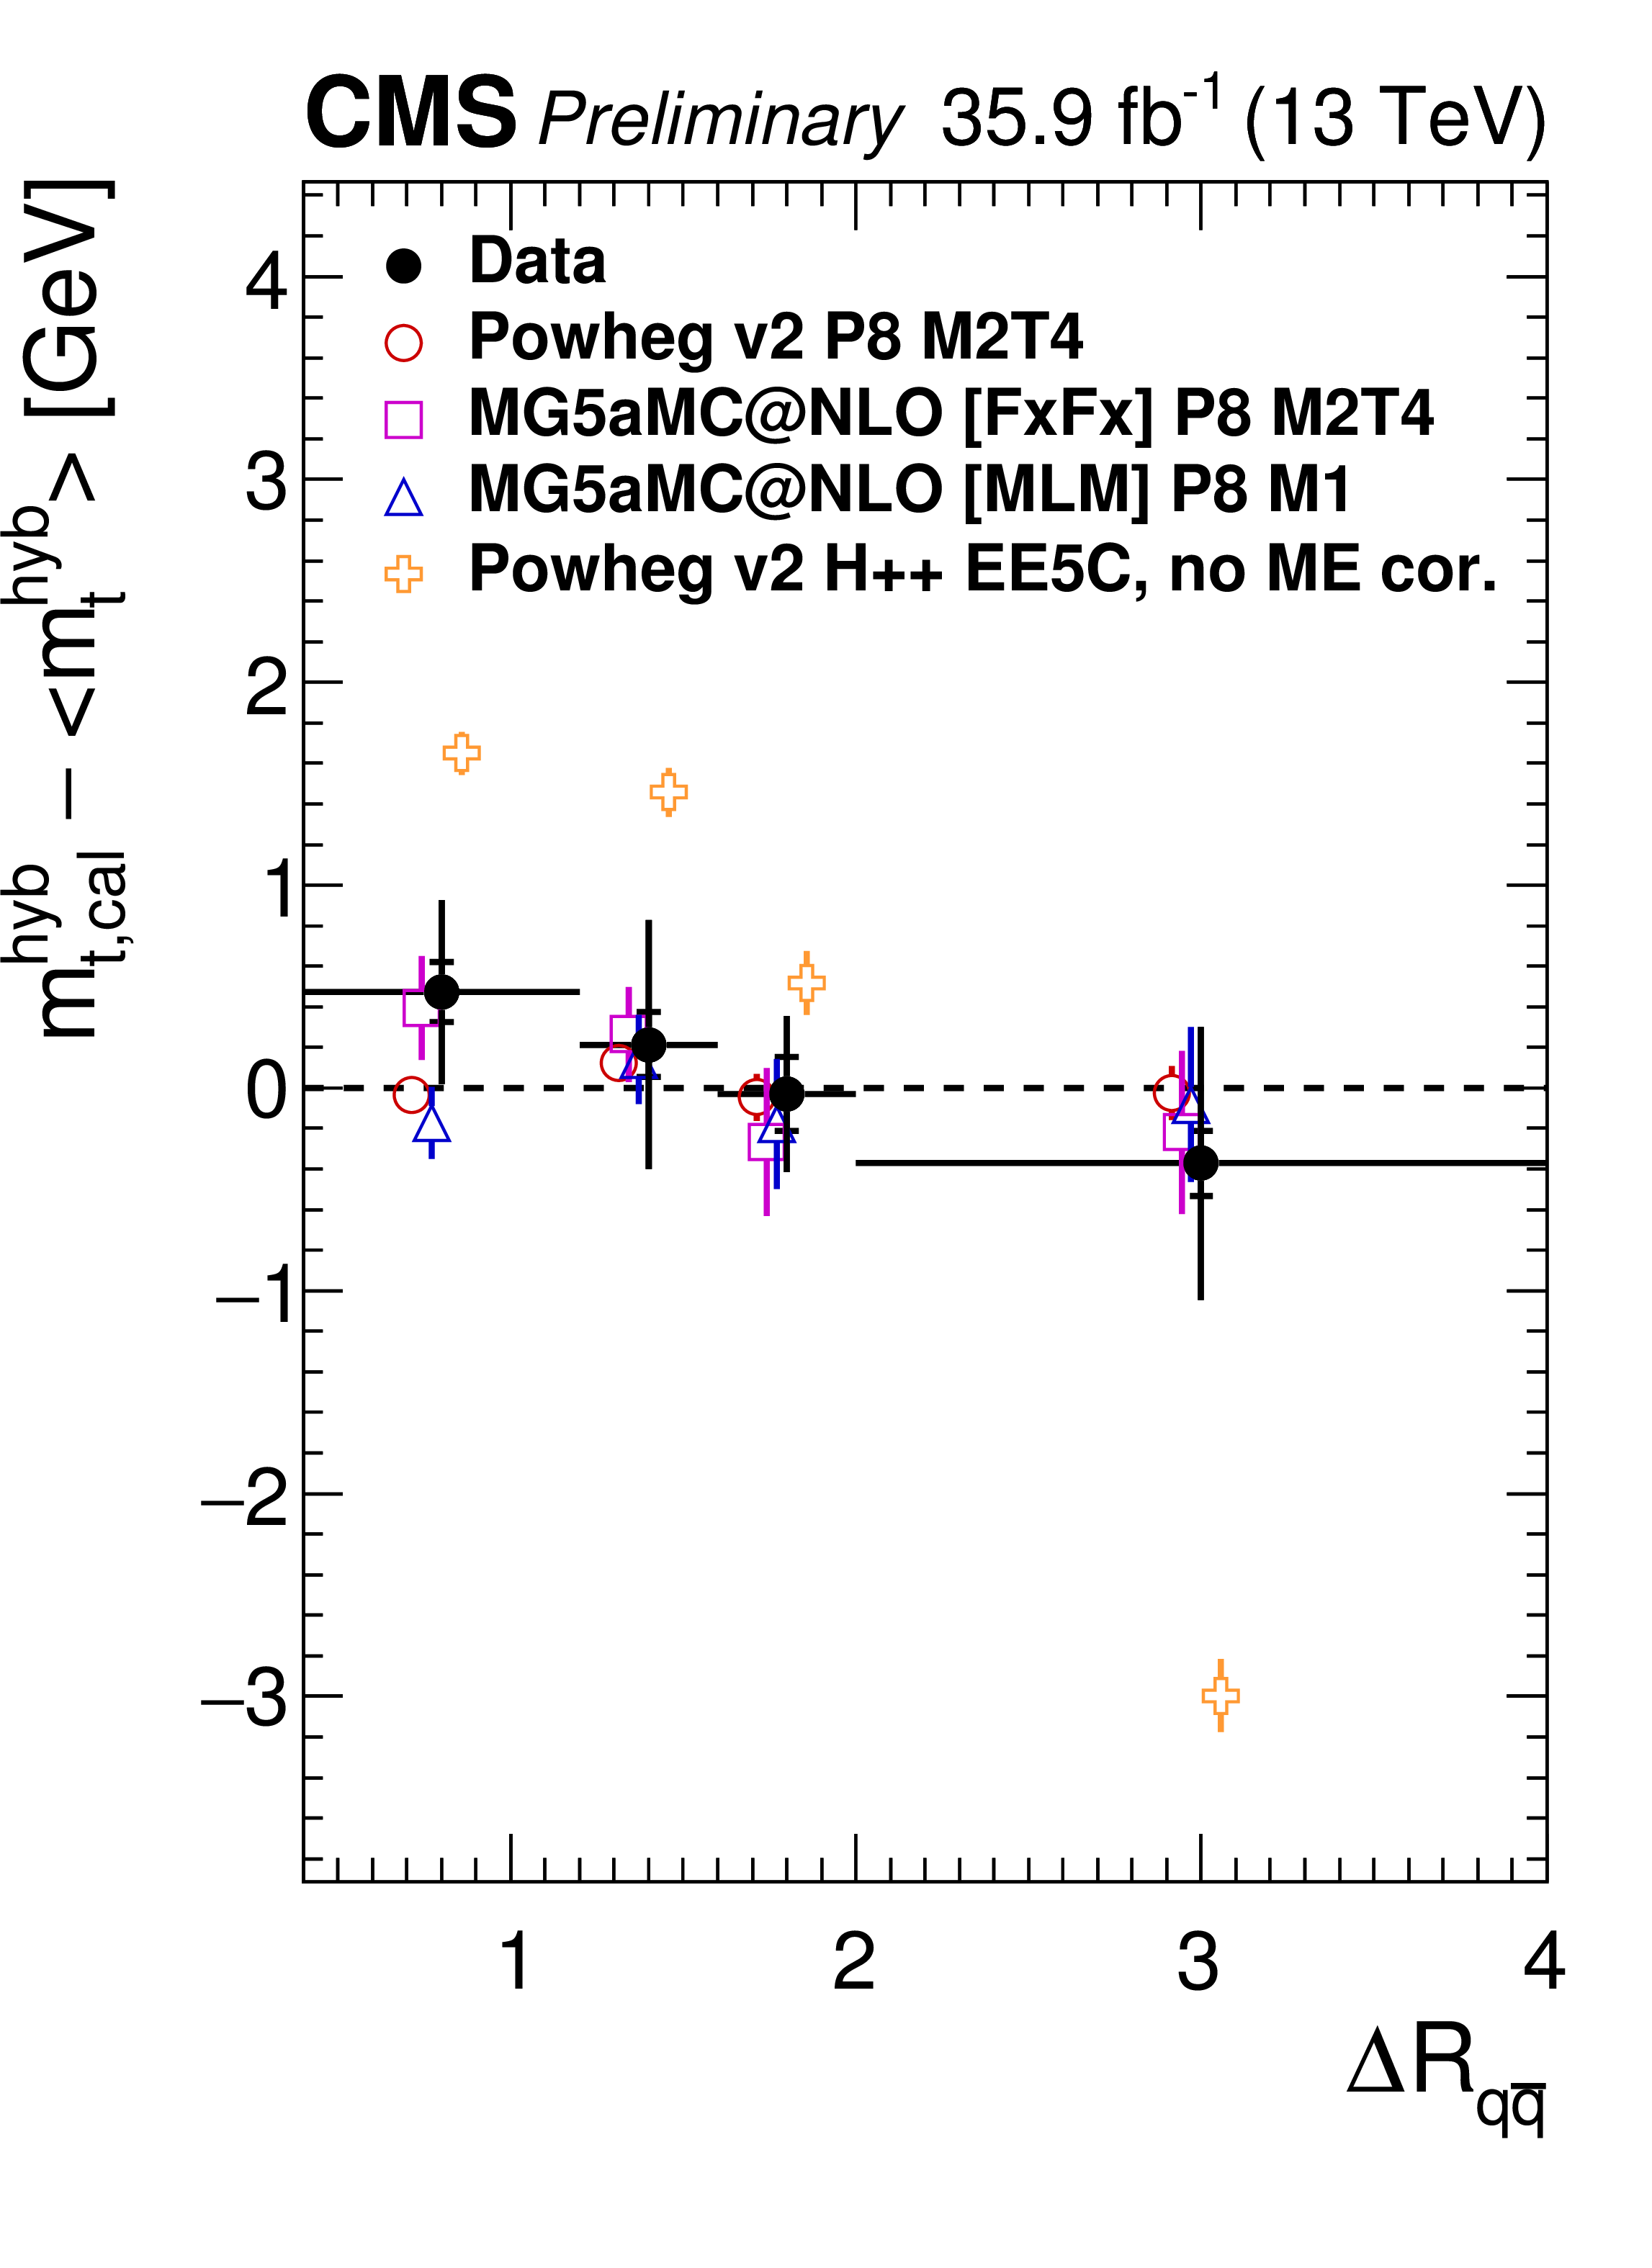
Figure 7-d:
Measurements of $ {m_{\mathrm{t}}} $ as a function of the $ {p_{\mathrm {T}}} $ of the b jet assigned to the hadronic decay branch ($ {p_{\mathrm {T}}} ^{\rm {b,had}}$), the pseudorapidity of the b jet assigned to the hadronic decay branch ($\left |\eta ^{\rm b,had}\right |$), the $\Delta R$ between the b jets ($\Delta R_{{\mathrm{b} \mathrm{\bar{b}}}}$), and the $\Delta R$ between the light quark jets ($\Delta R_{{\mathrm{q} \mathrm{\bar{q}}}}$) compared to different generator choices. The filled circles represent the data, and the other symbols are for the simulations. For reasons of clarity the horizontal error bars are shown only for the data points and each of the simulations is shown as a single offset point with a vertical error bar representing its statistical uncertainty. The statistical uncertainty of the data is displayed by the inner error bars. For the outer error bars, the systematic uncertainties are added in quadrature. |

png pdf |
Figure 8:
Measurements of $ {m_{\mathrm{t}}} $ as a function of the $ {p_{\mathrm {T}}} $ of the b jet assigned to the hadronic decay branch ($ {p_{\mathrm {T}}} ^{\rm {b,had}}$), the pseudorapidity of the b jet assigned to the hadronic decay branch ($\left |\eta ^{\rm b,had}\right |$), the $\Delta R$ between the b jets ($\Delta R_{{\mathrm{b} \mathrm{\bar{b}}}}$), and the $\Delta R$ between the light quark jets ($\Delta R_{{\mathrm{q} \mathrm{\bar{q}}}}$) compared to alternative models of color reconnections. The filled circles represent the data, and the other symbols are for the simulations. For reasons of clarity the horizontal error bars are shown only for the data points and each of the simulations is shown as a single offset point with a vertical error bar representing its statistical uncertainty. The statistical uncertainty of the data is displayed by the inner error bars. For the outer error bars, the systematic uncertainties are added in quadrature. |

png pdf |
Figure 8-a:
Measurements of $ {m_{\mathrm{t}}} $ as a function of the $ {p_{\mathrm {T}}} $ of the b jet assigned to the hadronic decay branch ($ {p_{\mathrm {T}}} ^{\rm {b,had}}$), the pseudorapidity of the b jet assigned to the hadronic decay branch ($\left |\eta ^{\rm b,had}\right |$), the $\Delta R$ between the b jets ($\Delta R_{{\mathrm{b} \mathrm{\bar{b}}}}$), and the $\Delta R$ between the light quark jets ($\Delta R_{{\mathrm{q} \mathrm{\bar{q}}}}$) compared to alternative models of color reconnections. The filled circles represent the data, and the other symbols are for the simulations. For reasons of clarity the horizontal error bars are shown only for the data points and each of the simulations is shown as a single offset point with a vertical error bar representing its statistical uncertainty. The statistical uncertainty of the data is displayed by the inner error bars. For the outer error bars, the systematic uncertainties are added in quadrature. |
png pdf |
Figure 8-b:
Measurements of $ {m_{\mathrm{t}}} $ as a function of the $ {p_{\mathrm {T}}} $ of the b jet assigned to the hadronic decay branch ($ {p_{\mathrm {T}}} ^{\rm {b,had}}$), the pseudorapidity of the b jet assigned to the hadronic decay branch ($\left |\eta ^{\rm b,had}\right |$), the $\Delta R$ between the b jets ($\Delta R_{{\mathrm{b} \mathrm{\bar{b}}}}$), and the $\Delta R$ between the light quark jets ($\Delta R_{{\mathrm{q} \mathrm{\bar{q}}}}$) compared to alternative models of color reconnections. The filled circles represent the data, and the other symbols are for the simulations. For reasons of clarity the horizontal error bars are shown only for the data points and each of the simulations is shown as a single offset point with a vertical error bar representing its statistical uncertainty. The statistical uncertainty of the data is displayed by the inner error bars. For the outer error bars, the systematic uncertainties are added in quadrature. |
png pdf |
Figure 8-c:
Measurements of $ {m_{\mathrm{t}}} $ as a function of the $ {p_{\mathrm {T}}} $ of the b jet assigned to the hadronic decay branch ($ {p_{\mathrm {T}}} ^{\rm {b,had}}$), the pseudorapidity of the b jet assigned to the hadronic decay branch ($\left |\eta ^{\rm b,had}\right |$), the $\Delta R$ between the b jets ($\Delta R_{{\mathrm{b} \mathrm{\bar{b}}}}$), and the $\Delta R$ between the light quark jets ($\Delta R_{{\mathrm{q} \mathrm{\bar{q}}}}$) compared to alternative models of color reconnections. The filled circles represent the data, and the other symbols are for the simulations. For reasons of clarity the horizontal error bars are shown only for the data points and each of the simulations is shown as a single offset point with a vertical error bar representing its statistical uncertainty. The statistical uncertainty of the data is displayed by the inner error bars. For the outer error bars, the systematic uncertainties are added in quadrature. |

png pdf |
Figure 8-d:
Measurements of $ {m_{\mathrm{t}}} $ as a function of the $ {p_{\mathrm {T}}} $ of the b jet assigned to the hadronic decay branch ($ {p_{\mathrm {T}}} ^{\rm {b,had}}$), the pseudorapidity of the b jet assigned to the hadronic decay branch ($\left |\eta ^{\rm b,had}\right |$), the $\Delta R$ between the b jets ($\Delta R_{{\mathrm{b} \mathrm{\bar{b}}}}$), and the $\Delta R$ between the light quark jets ($\Delta R_{{\mathrm{q} \mathrm{\bar{q}}}}$) compared to alternative models of color reconnections. The filled circles represent the data, and the other symbols are for the simulations. For reasons of clarity the horizontal error bars are shown only for the data points and each of the simulations is shown as a single offset point with a vertical error bar representing its statistical uncertainty. The statistical uncertainty of the data is displayed by the inner error bars. For the outer error bars, the systematic uncertainties are added in quadrature. |
| Tables | |

png pdf |
Table 1:
List of systematic uncertainties for the fit to the combined data set. |

png pdf |
Table 2:
Observed shifts with respect to the default simulation for different models of color reconnection. |

png pdf |
Table 3:
Observed shifts with respect to the default simulation for different generator setups. |
| Summary |
| The mass of the top quark has been measured with high precision by CMS in Run 1 of the CERN LHC. The most precise of these measurements is repeated using the 2016 data of Run 2 and POWHEG v2 interfaced to PYTHIA{}8 with the CUETP8M2T4 tune for the simulation. Candidate events are selected from $\sqrt{s}= $ 13 TeV data corresponding to an integrated luminosity of 35.9 fb$^{-1}$ requiring one lepton, muon or electron, and at least four jets with two b tags in the final state. The top quark mass is measured to be 172.25 $\pm$ 0.08 (stat+JSF) $\pm$ 0.62 (syst) GeV from the 161496 selected events. This result is consistent with the CMS measurements of Run 1 and no impact from the new reference generator or the change in the center-of-mass energy is observed. The top quark mass has also been studied as a function of the event kinematical properties. No indications of a kinematical bias in the measurements are observed. |
| Additional Figures | |

png pdf |
Additional Figure 1:
CMS data [CMS-PAS-FSQ-15-007] at $\sqrt {s} = $ 13 TeV for particle densities of charged particles with $ {p_{\mathrm {T}}} > $ 0.5 GeV and $|\eta | < $ 0.8 in the transMIN region as defined by the leading charged particle, as a function of the transverse momentum of the leading charged-particle $p_{\textrm {T}}^{\textrm {max}}$. The data are compared to predictions of PYTHIA v8.226 Tune CUETP8M2T4, and of PYTHIA v8.226 with the two tunes using the QCD-inspired and gluon-move color reconnection models, respectively. The ratios of MC predictions to data are given below each panel. |

png pdf |
Additional Figure 2:
CMS data [Phys. Lett. B 751 (2015)] at $\sqrt {s} = $ 13 TeV for the charged-particle pseudorapidity distribution, $\mathrm{d}N_{\textrm {ch}}/\mathrm{d}\eta $, in inelastic proton-proton collisions. The data are compared to predictions of PYTHIA v8.226 Tune CUETP8M2T4, and of PYTHIA v8.226 with the two tunes using the QCD-inspired and gluon-move color reconnection models, respectively. The ratios of MC predictions to data are given below each panel. |
| Additional Tables | |
png pdf |
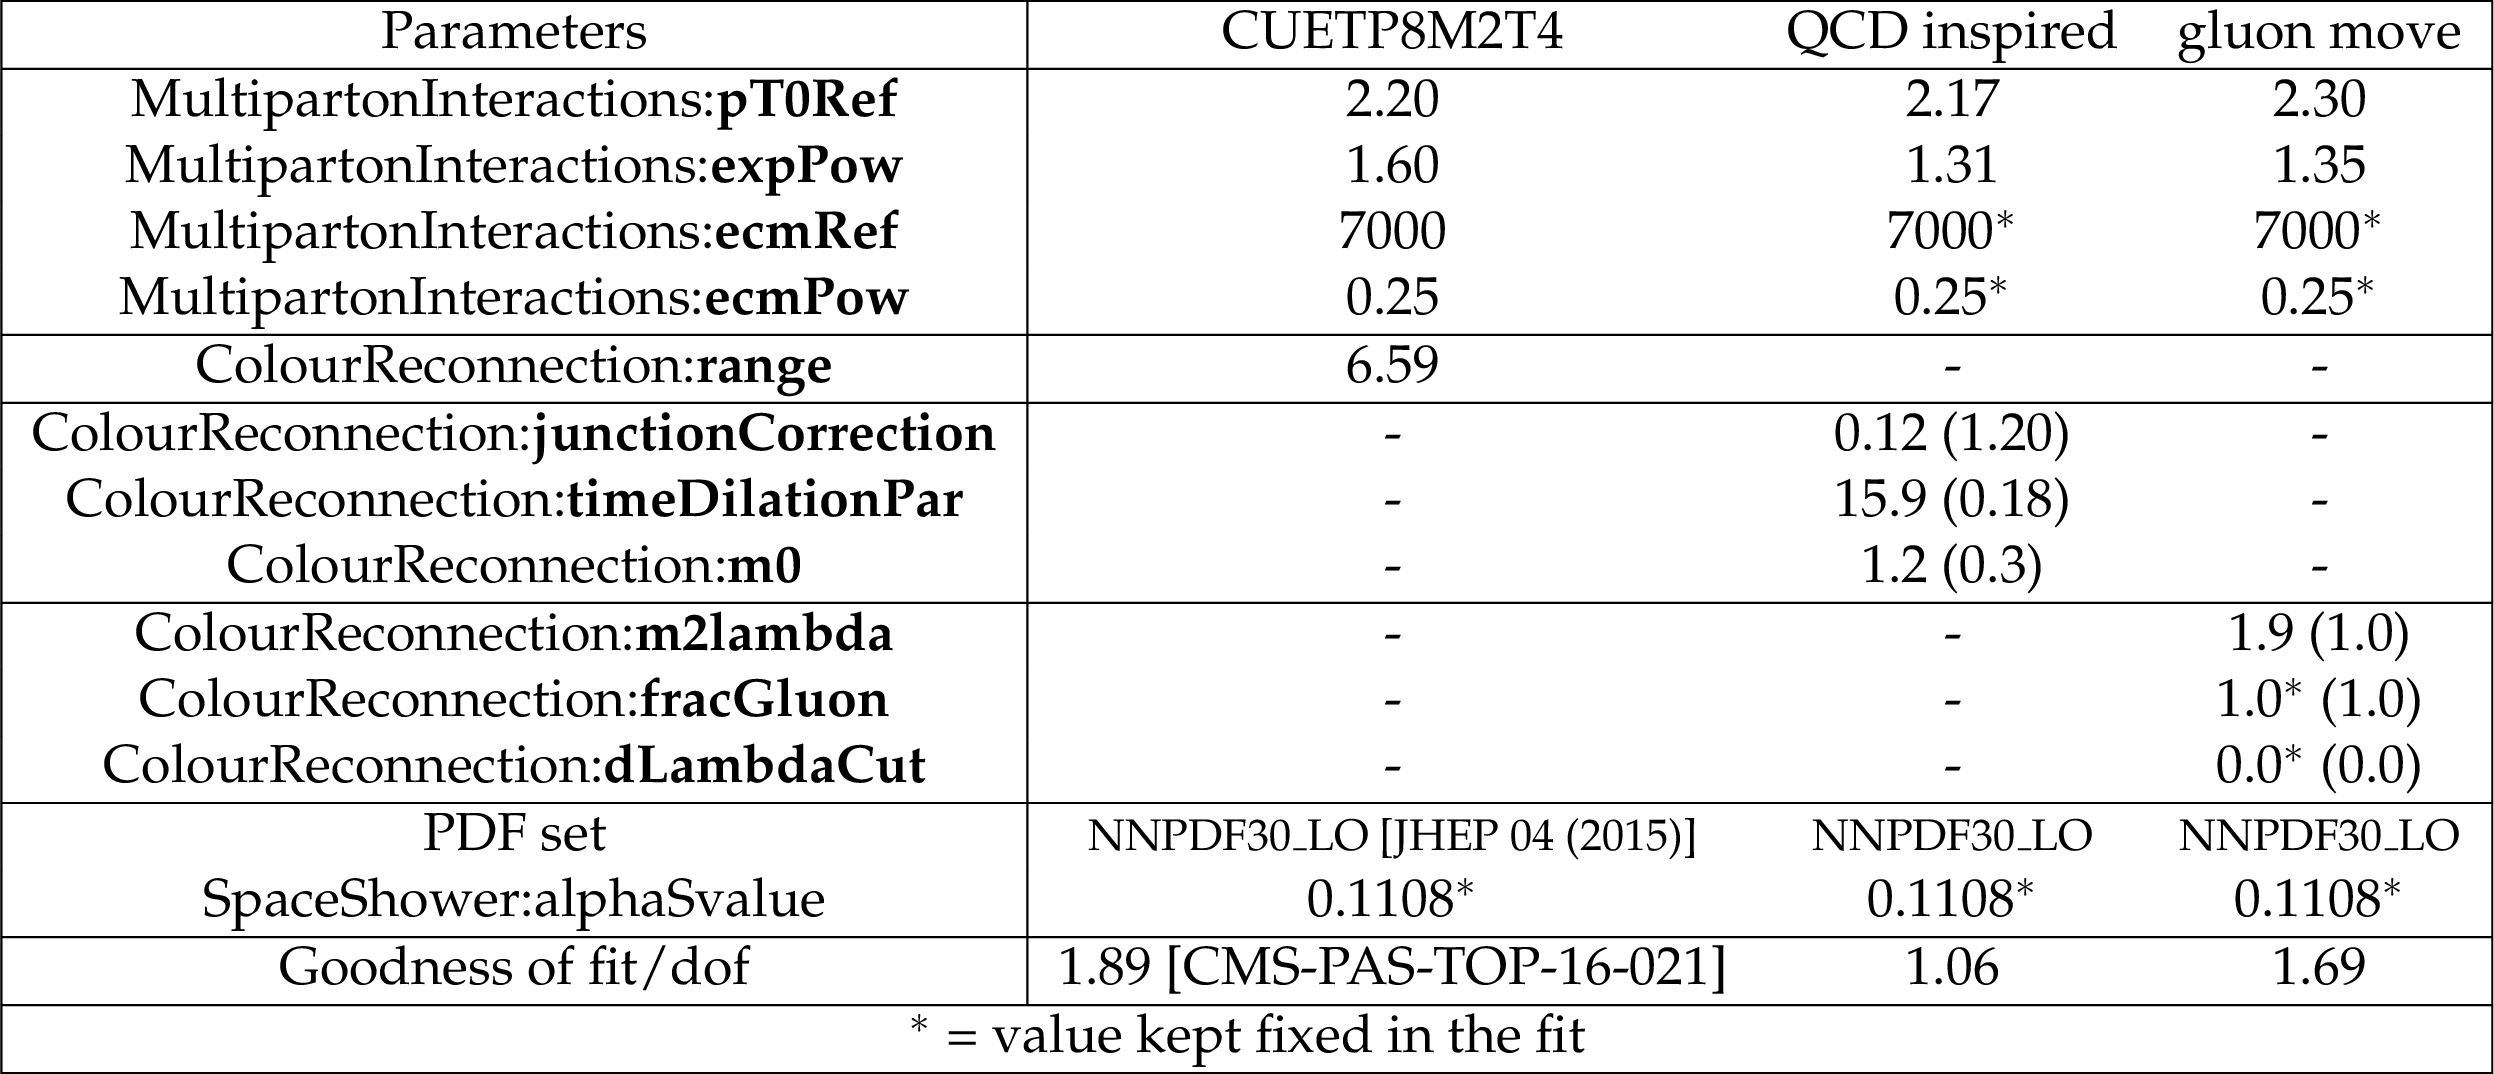
Additional Table 1:
The parameters obtained in the fits of the tunes of the PYTHIA v8.226 [Comput. Phys. Commun. 191 (2015)] event generator, based on the QCD-inspired [JHEP 08 (2015) 003] and the gluon-move [Eur. Phys. J. C 75 (2015)] color reconnection models, compared to the ones of the tune CUETP8M2T4 [CMS-PAS-TOP-16-021], using the MPI-based [Phys. Rev. D 36 (1987)] color reconnection model. The fits are performed by using both the Professor 1.4.0 software [Eur. Phys. J. C 65 (2010)] and RIVET 2.4.0 [Comput. Phys. Commun. 184 (2013)]. The observables used for extracting the tunes are the charged particle multiplicity and average ${p_{\mathrm {T}}}$ sum as a function of the leading charged-particle transverse momentum, $p_T^\textrm {max}$, measured by CMS at $\sqrt {s} = $ 13 TeV in transMIN and transMAX [CMS-PAS-FSQ-15-007], and the charged particle multiplcity as a function of pseudorapidity $\eta $, measured by CMS at $\sqrt {s} = $ 13 TeV [Phys. Lett. B 751 (2015)]. Likewise for the CUETP8M2T4 tune [CMS-PAS-TOP-16-021], the region between 0.5 $ < p_T^\textrm {max} < $ 3 GeV is excluded from the fit, since it is affected by possible contributions of diffractive processes, whose free parameters are not considered in the tuning procedure. Parameters marked with $^*$ are the ones which were kept fixed in the fit. For the QCD-inspired and gluon-move color reconnection models, the default values implemented in PYTHIA v8.226 are indicated in parentheses, where applicable. The goodness of fit divided by the number of degrees of freedom is also shown. |
| References | ||||
| 1 | C. Patrignani et al. | Review of Particle Physics | CPC 40 (2016) 100001 | |
| 2 | CDF and \DZERO Collaborations | Combination of CDF and D0 results on the mass of the top quark using up $ 9.7\:{\rm fb}^{-1} $ at the Tevatron | 1608.01881 | |
| 3 | ATLAS Collaboration | Measurement of the top quark mass in the $ t\bar{t}\to $ dilepton channel from $ \sqrt{s}= $ 8 TeV ATLAS data | PLB 761 (2016) 350--371 | 1606.02179 |
| 4 | CMS Collaboration | Measurement of the top quark mass using proton-proton data at $ {\sqrt{s}} = $ 7 and 8 TeV | PRD 93 (2016) 072004 | CMS-TOP-14-022 1509.04044 |
| 5 | S. Moch et al. | High precision fundamental constants at the TeV scale | DESY-14-081, MITP-14-036 | 1405.4781 |
| 6 | P. Marquard, A. V. Smirnov, V. A. Smirnov, and M. Steinhauser | Quark Mass Relations to Four-Loop Order in Perturbative QCD | PRL 114 (2015) 142002 | 1502.01030 |
| 7 | G. Corcella | Interpretation of the top-quark mass measurements: a theory overview | in Proceedings, 8th International Workshop on Top Quark Physics (TOP2015): Ischia, Italy, September 14-18, 2015, volume TOP2015, p. 037 2016 | 1511.08429 |
| 8 | M. Beneke, P. Marquard, P. Nason, and M. Steinhauser | On the ultimate uncertainty of the top quark pole mass | DESY-16-082, TTP16-016, TUM-HEP-1044-16 | 1605.03609 |
| 9 | M. Butenschoen et al. | Top Quark Mass Calibration for Monte Carlo Event Generators | PRL 117 (2016), no. 23, 232001 | 1608.01318 |
| 10 | CMS Collaboration | The cms experiment at the cern lhc | JINST 3 (2008) S08004 | CMS-00-001 |
| 11 | CMS Collaboration | CMS Luminosity Measurements for the 2016 Data Taking Period | CMS-PAS-LUM-17-001 | CMS-PAS-LUM-17-001 |
| 12 | P. Nason | A new method for combining NLO QCD with shower Monte Carlo algorithms | JHEP 11 (2004) 040 | hep-ph/0409146 |
| 13 | S. Frixione, P. Nason, and C. Oleari | Matching NLO QCD computations with parton shower simulations: the $ POWHEG $ method | JHEP 11 (2007) 070 | 0709.2092 |
| 14 | S. Alioli, P. Nason, C. Oleari, and E. Re | A general framework for implementing NLO calculations in shower Monte Carlo programs: the $ POWHEG $ BOX | JHEP 06 (2010) 043 | 1002.2581 |
| 15 | J. M. Campbell, R. K. Ellis, P. Nason, and E. Re | Top-pair production and decay at NLO matched with parton showers | JHEP 04 (2015) 114 | 1412.1828 |
| 16 | T. Sjostrand, S. Mrenna, and P. Z. Skands | $ PYTHIA $ 6.4 physics and manual | JHEP 05 (2006) 026 | hep-ph/0603175 |
| 17 | T. Sjostrand, S. Mrenna, and P. Z. Skands | A Brief Introduction to PYTHIA 8.1 | CPC 178 (2008) 852--867 | 0710.3820 |
| 18 | P. Skands, S. Carrazza, and J. Rojo | Tuning PYTHIA 8.1: the Monash 2013 Tune | EPJC 74 (2014) 3024 | 1404.5630 |
| 19 | J. Alwall et al. | The automated computation of tree-level and next-to-leading order differential cross sections, and their matching to parton shower simulations | JHEP 07 (2014) 079 | 1405.0301 |
| 20 | R. Frederix and S. Frixione | Merging meets matching in MC@NLO | JHEP 12 (2012) 061 | 1209.6215 |
| 21 | J. Alwall et al. | Comparative study of various algorithms for the merging of parton showers and matrix elements in hadronic collisions | EPJC 53 (2008) 473 | 0706.2569 |
| 22 | T. Melia, P. Nason, R. Rontsch, and G. Zanderighi | W+W-, WZ and ZZ production in the POWHEG BOX | JHEP 11 (2011) 078 | 1107.5051 |
| 23 | E. Re | Single-top Wt-channel production matched with parton showers using the $ POWHEG $ method | EPJC 71 (2011) 1547 | 1009.2450 |
| 24 | S. Alioli, P. Nason, C. Oleari, and E. Re | NLO single-top production matched with shower in $ POWHEG: s $- and $ t $-channel contributions | JHEP 09 (2009) 111 | 0907.4076 |
| 25 | S. Frixione, E. Laenen, P. Motylinski, and B. R. Webber | Angular correlations of lepton pairs from vector boson and top quark decays in Monte Carlo simulations | JHEP 04 (2007) 081 | hep-ph/0702198 |
| 26 | P. Artoisenet, R. Frederix, O. Mattelaer, and R. Rietkerk | Automatic spin-entangled decays of heavy resonances in Monte Carlo simulations | JHEP 03 (2013) 015 | 1212.3460 |
| 27 | NNPDF Collaboration | Parton distributions for the LHC Run II | JHEP 04 (2015) 040 | 1410.8849 |
| 28 | M. Czakon and A. Mitov | Top++: A Program for the Calculation of the Top-Pair Cross-Section at Hadron Colliders | CPC 185 (2014) 2930 | 1112.5675 |
| 29 | Y. Li and F. Petriello | Combining QCD and electroweak corrections to dilepton production in FEWZ | PRD 86 (2012) 094034 | 1208.5967 |
| 30 | P. Kant et al. | HatHor for single top-quark production: Updated predictions and uncertainty estimates for single top-quark production in hadronic collisions | CPC 191 (2015) 74 | 1406.4403 |
| 31 | N. Kidonakis | NNLL threshold resummation for top-pair and single-top production | Phys. Part. Nucl. 45 (2014) 714 | 1210.7813 |
| 32 | GEANT4 Collaboration | $ GEANT4 $ -- a simulation toolkit | NIMA 506 (2003) 250 | |
| 33 | J. Allison et al. | Geant4 developments and applications | IEEE Trans. Nucl. Sci. 53 (2006) 270 | |
| 34 | CMS Collaboration | Particle-flow reconstruction and global event description with the CMS detector | Submitted to JINST | CMS-PRF-14-001 1706.04965 |
| 35 | M. Cacciari and G. P. Salam | Dispelling the $ N^{3} $ myth for the $ k_{\rm t} $ jet-finder | PLB 641 (2006) 57 | hep-ph/0512210 |
| 36 | M. Cacciari, G. P. Salam, and G. Soyez | The anti-$ k_{\rm t} $ jet clustering algorithm | JHEP 04 (2008) 063 | 0802.1189 |
| 37 | M. Cacciari, G. P. Salam, and G. Soyez | FastJet user manual | EPJC 72 (2012) 1896 | 1111.6097 |
| 38 | CMS Collaboration | Jet energy scale and resolution in the CMS experiment in pp collisions at 8 TeV | JINST 12 (2017) P02014 | CMS-JME-13-004 1607.03663 |
| 39 | CMS Collaboration | Identification of b-quark jets with the cms experiment | JINST 8 (2013) P04013 | CMS-BTV-12-001 1211.4462 |
| 40 | CMS Collaboration | Identification of b quark jets at the CMS experiment in the LHC Run 2 | CMS-PAS-BTV-15-001 | CMS-PAS-BTV-15-001 |
| 41 | \DZERO Collaboration | Direct measurement of the top quark mass at $ \DZERO $ | PRD 58 (1998) 052001 | hep-ex/9801025 |
| 42 | DELPHI Collaboration | Measurement of the mass and width of the W boson in $ {\rm e}^{+}{\rm e}^{-} $ collisions at $ \sqrt{s} = $ 161 -- 209 GeV | EPJC 55 (2008) 1 | 0803.2534 |
| 43 | CMS Collaboration | Measurement of the top-quark mass in $ t\bar{t} $ events with lepton+jets final states in $ pp $ collisions at $ \sqrt{s}= $ 7 TeV | JHEP 12 (2012) 105 | CMS-TOP-11-015 1209.2319 |
| 44 | S. Argyropoulos and T. Sjostrand | Effects of color reconnection on $ t\bar{t} $ final states at the LHC | JHEP 11 (2014) 043 | 1407.6653 |
| 45 | J. R. Christiansen and P. Z. Skands | String Formation Beyond Leading Colour | JHEP 08 (2015) 003 | 1505.01681 |
| 46 | ATLAS and CMS Collaborations | Jet energy scale uncertainty correlations between ATLAS and CMS at 8 TeV | ATL-PHYS-PUB-2015-049, CMS-PAS-JME-15-001 | |
| 47 | M. Bahr et al. | Herwig++ physics and manual | EPJC 58 (2008) 639 | 0803.0883 |
| 48 | ALEPH Collaboration | Study of the fragmentation of b quarks into B mesons at the Z peak | PLB 512 (2001) 30--48 | hep-ex/0106051 |
| 49 | DELPHI Collaboration | A study of the b-quark fragmentation function with the DELPHI detector at LEP I and an averaged distribution obtained at the Z Pole | EPJC 71 (2011) 1557 | 1102.4748 |
| 50 | CMS Collaboration | Investigations of the impact of the parton shower tuning in Pythia 8 in the modelling of $ \mathrm{t\overline{t}} $ at $ \sqrt{s}= $ 8 and 13 TeV | CMS-PAS-TOP-16-021 | CMS-PAS-TOP-16-021 |
| 51 | M. Czakon, D. Heymes, and A. Mitov | High-precision differential predictions for top-quark pairs at the LHC | PRL 116 (2016) 082003 | 1511.00549 |
| 52 | CMS Collaboration | Measurement of differential cross sections for top quark pair production using the lepton+jets final state in proton-proton collisions at 13 TeV | PRD 95 (2017), no. 9, 092001 | CMS-TOP-16-008 1610.04191 |
| 53 | CMS Collaboration | Measurement of normalized differential t-tbar cross sections in the dilepton channel from pp collisions at sqrt(s) = 13 TeV | Submitted to JHEP | CMS-TOP-16-007 1708.07638 |
| 54 | M. H. Seymour and A. Siodmok | Constraining MPI models using $ \sigma_{eff} $ and recent Tevatron and LHC Underlying Event data | JHEP 10 (2013) 113 | 1307.5015 |
|
|
Compact Muon Solenoid LHC, CERN |
|

|

|

|

|

|