

Compact Muon Solenoid
LHC, CERN
| CMS-B2G-15-008 ; CERN-EP-2016-279 | ||
| Search for single production of a heavy vector-like T quark decaying to a Higgs boson and a top quark with a lepton and jets in the final state | ||
| CMS Collaboration | ||
| 3 December 2016 | ||
| Phys. Lett. B 771 (2017) 80 | ||
| Abstract: A search for single production of vector-like top quark partners (T) decaying into a Higgs boson and a top quark is performed using data from pp collisions at a centre-of-mass energy of 13 TeV collected by the CMS experiment at the CERN LHC, corresponding to an integrated luminosity of 2.3 fb$^{-1}$. The top quark decay includes an electron or a muon while the Higgs boson decays into a pair of b quarks. No significant excess over standard model backgrounds is observed. Exclusion limits on the product of the production cross section and the branching fraction are derived in the T quark mass range 700 to 1800 GeV. For a mass of 1000 GeV, values of the product of the production cross section and the branching fraction greater than 0.8 and 0.7 pb are excluded at 95% confidence level, assuming left- and right-handed coupling of the T quark to standard model particles, respectively. This is the first analysis setting exclusion limits on the cross section of singly produced vector-like T quarks at a centre-of-mass energy of 13 TeV. | ||
| Links: e-print arXiv:1612.00999 [hep-ex] (PDF) ; CDS record ; inSPIRE record ; CADI line (restricted) ; | ||
| Figures | |

png pdf |
Figure 1:
Production and decay mechanisms of a vector-like T quark, as targeted in this analysis. |
png pdf |
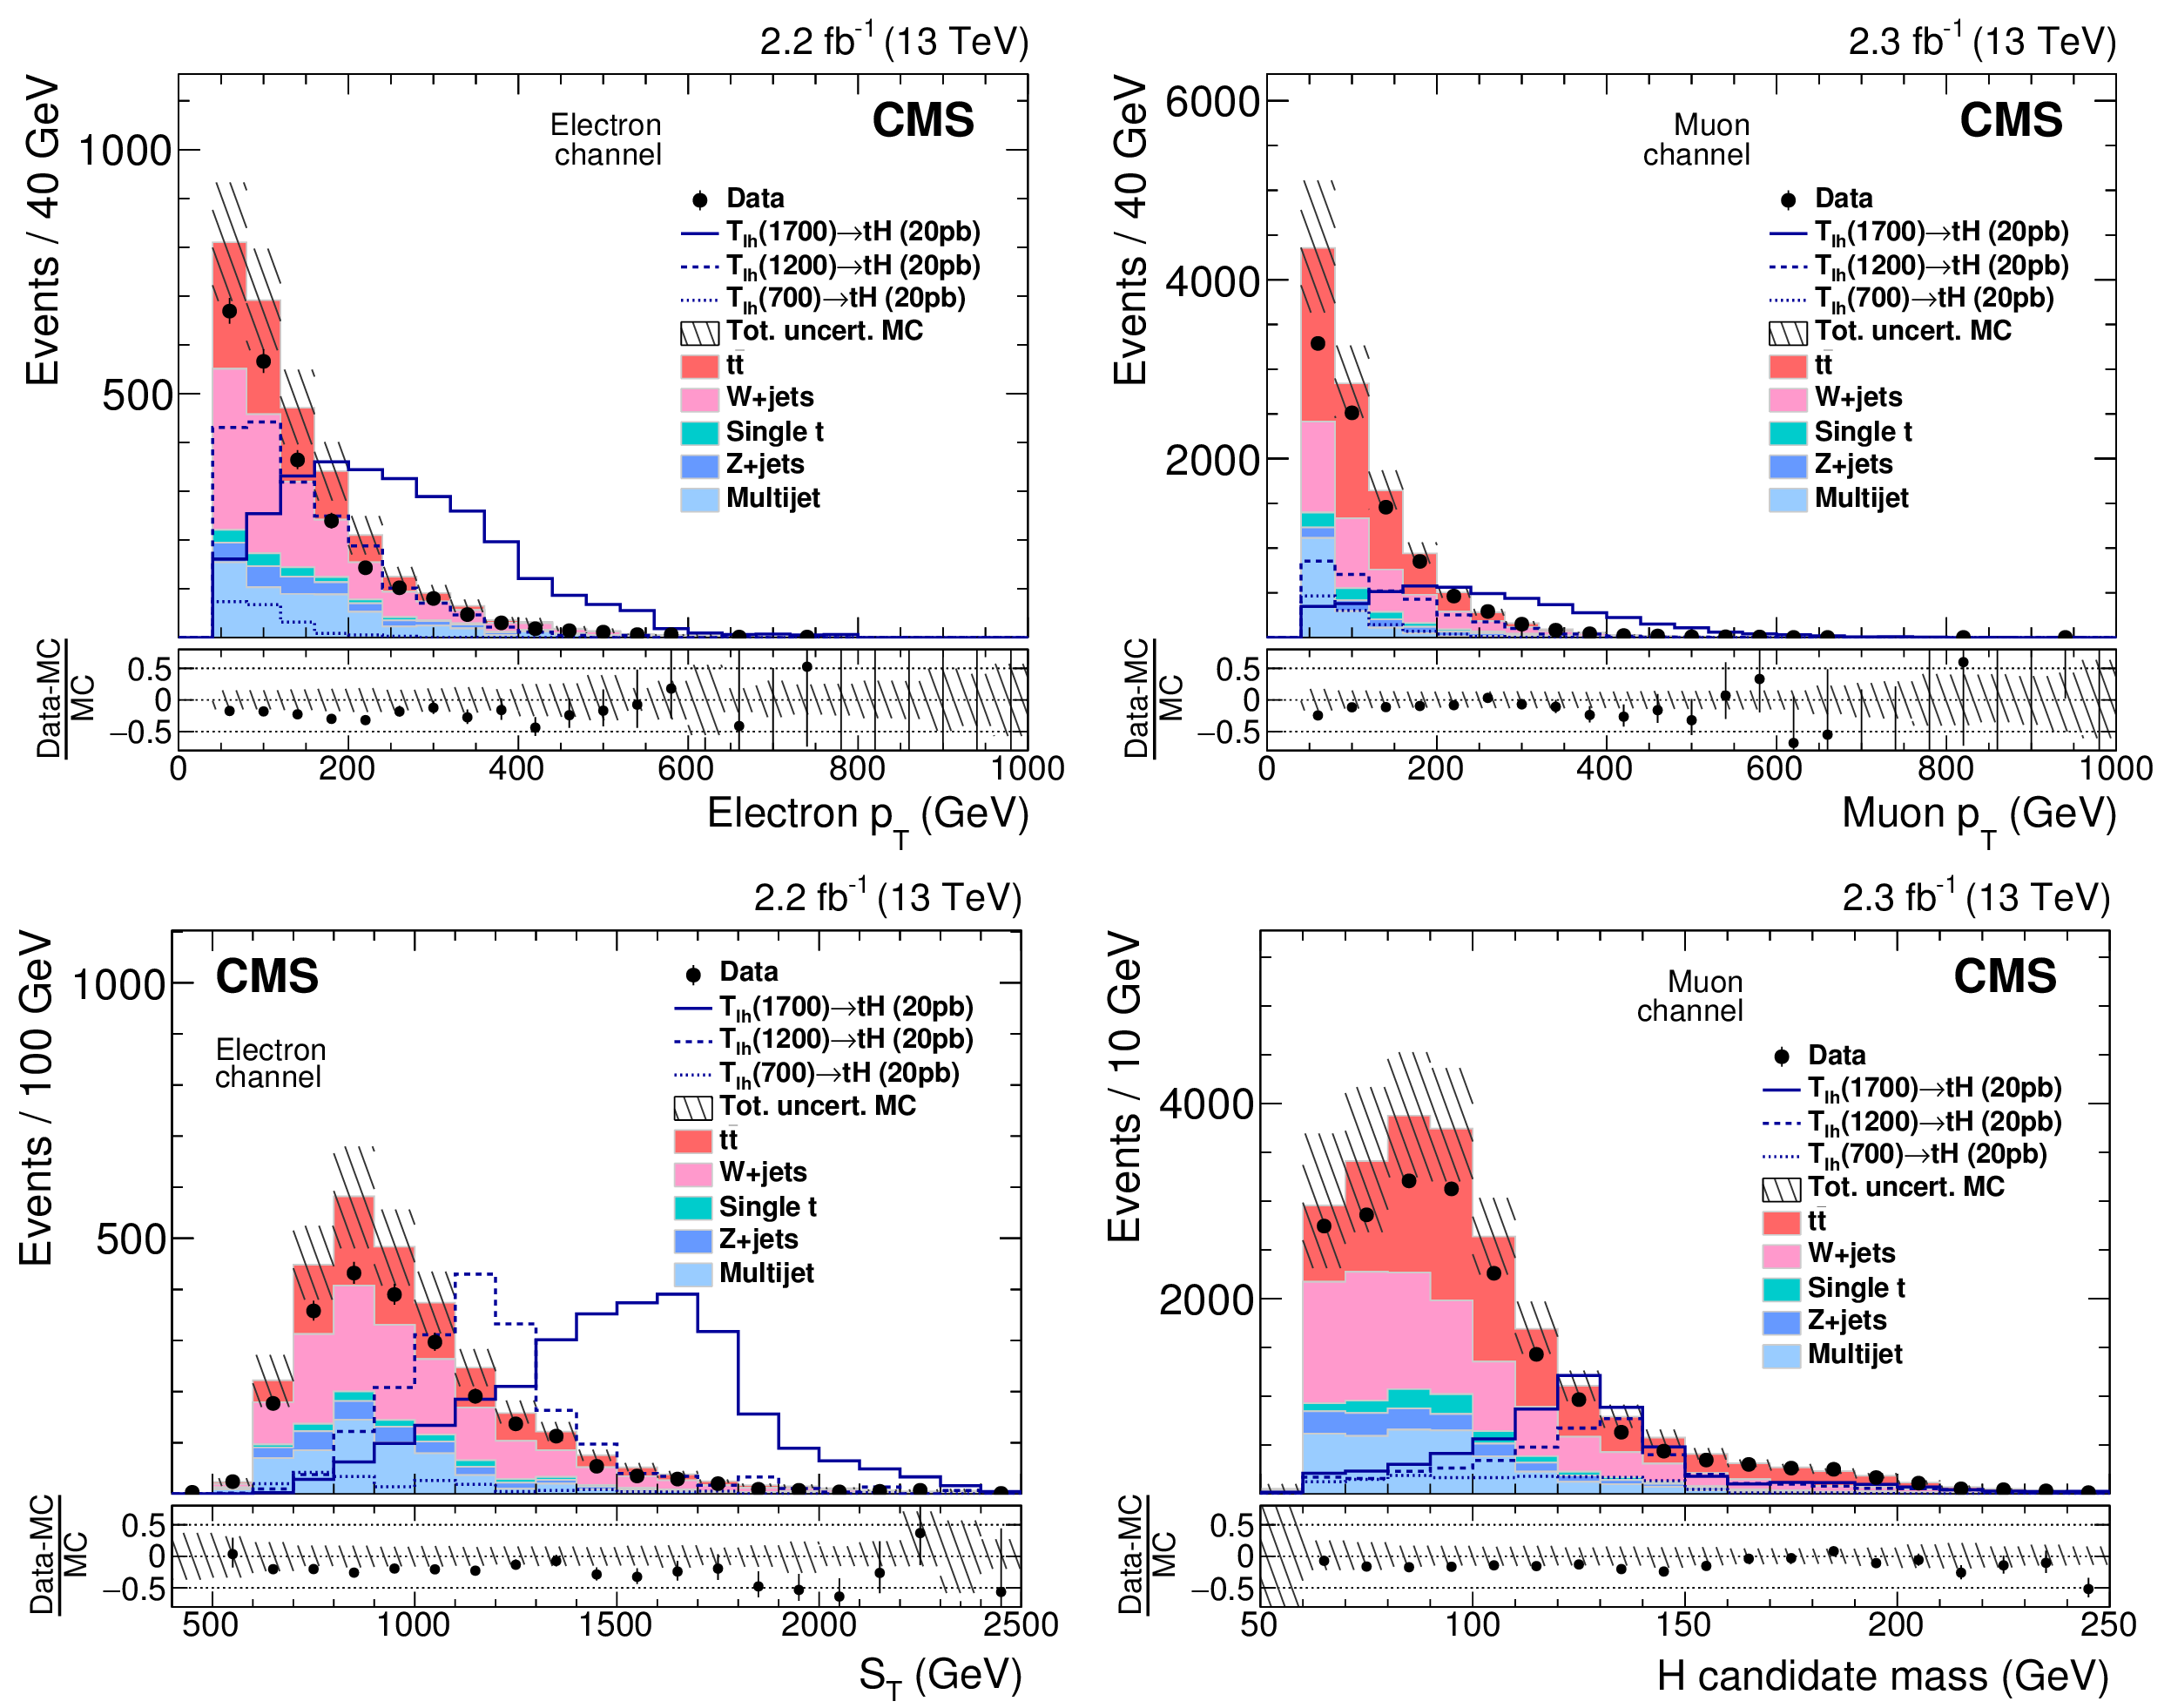
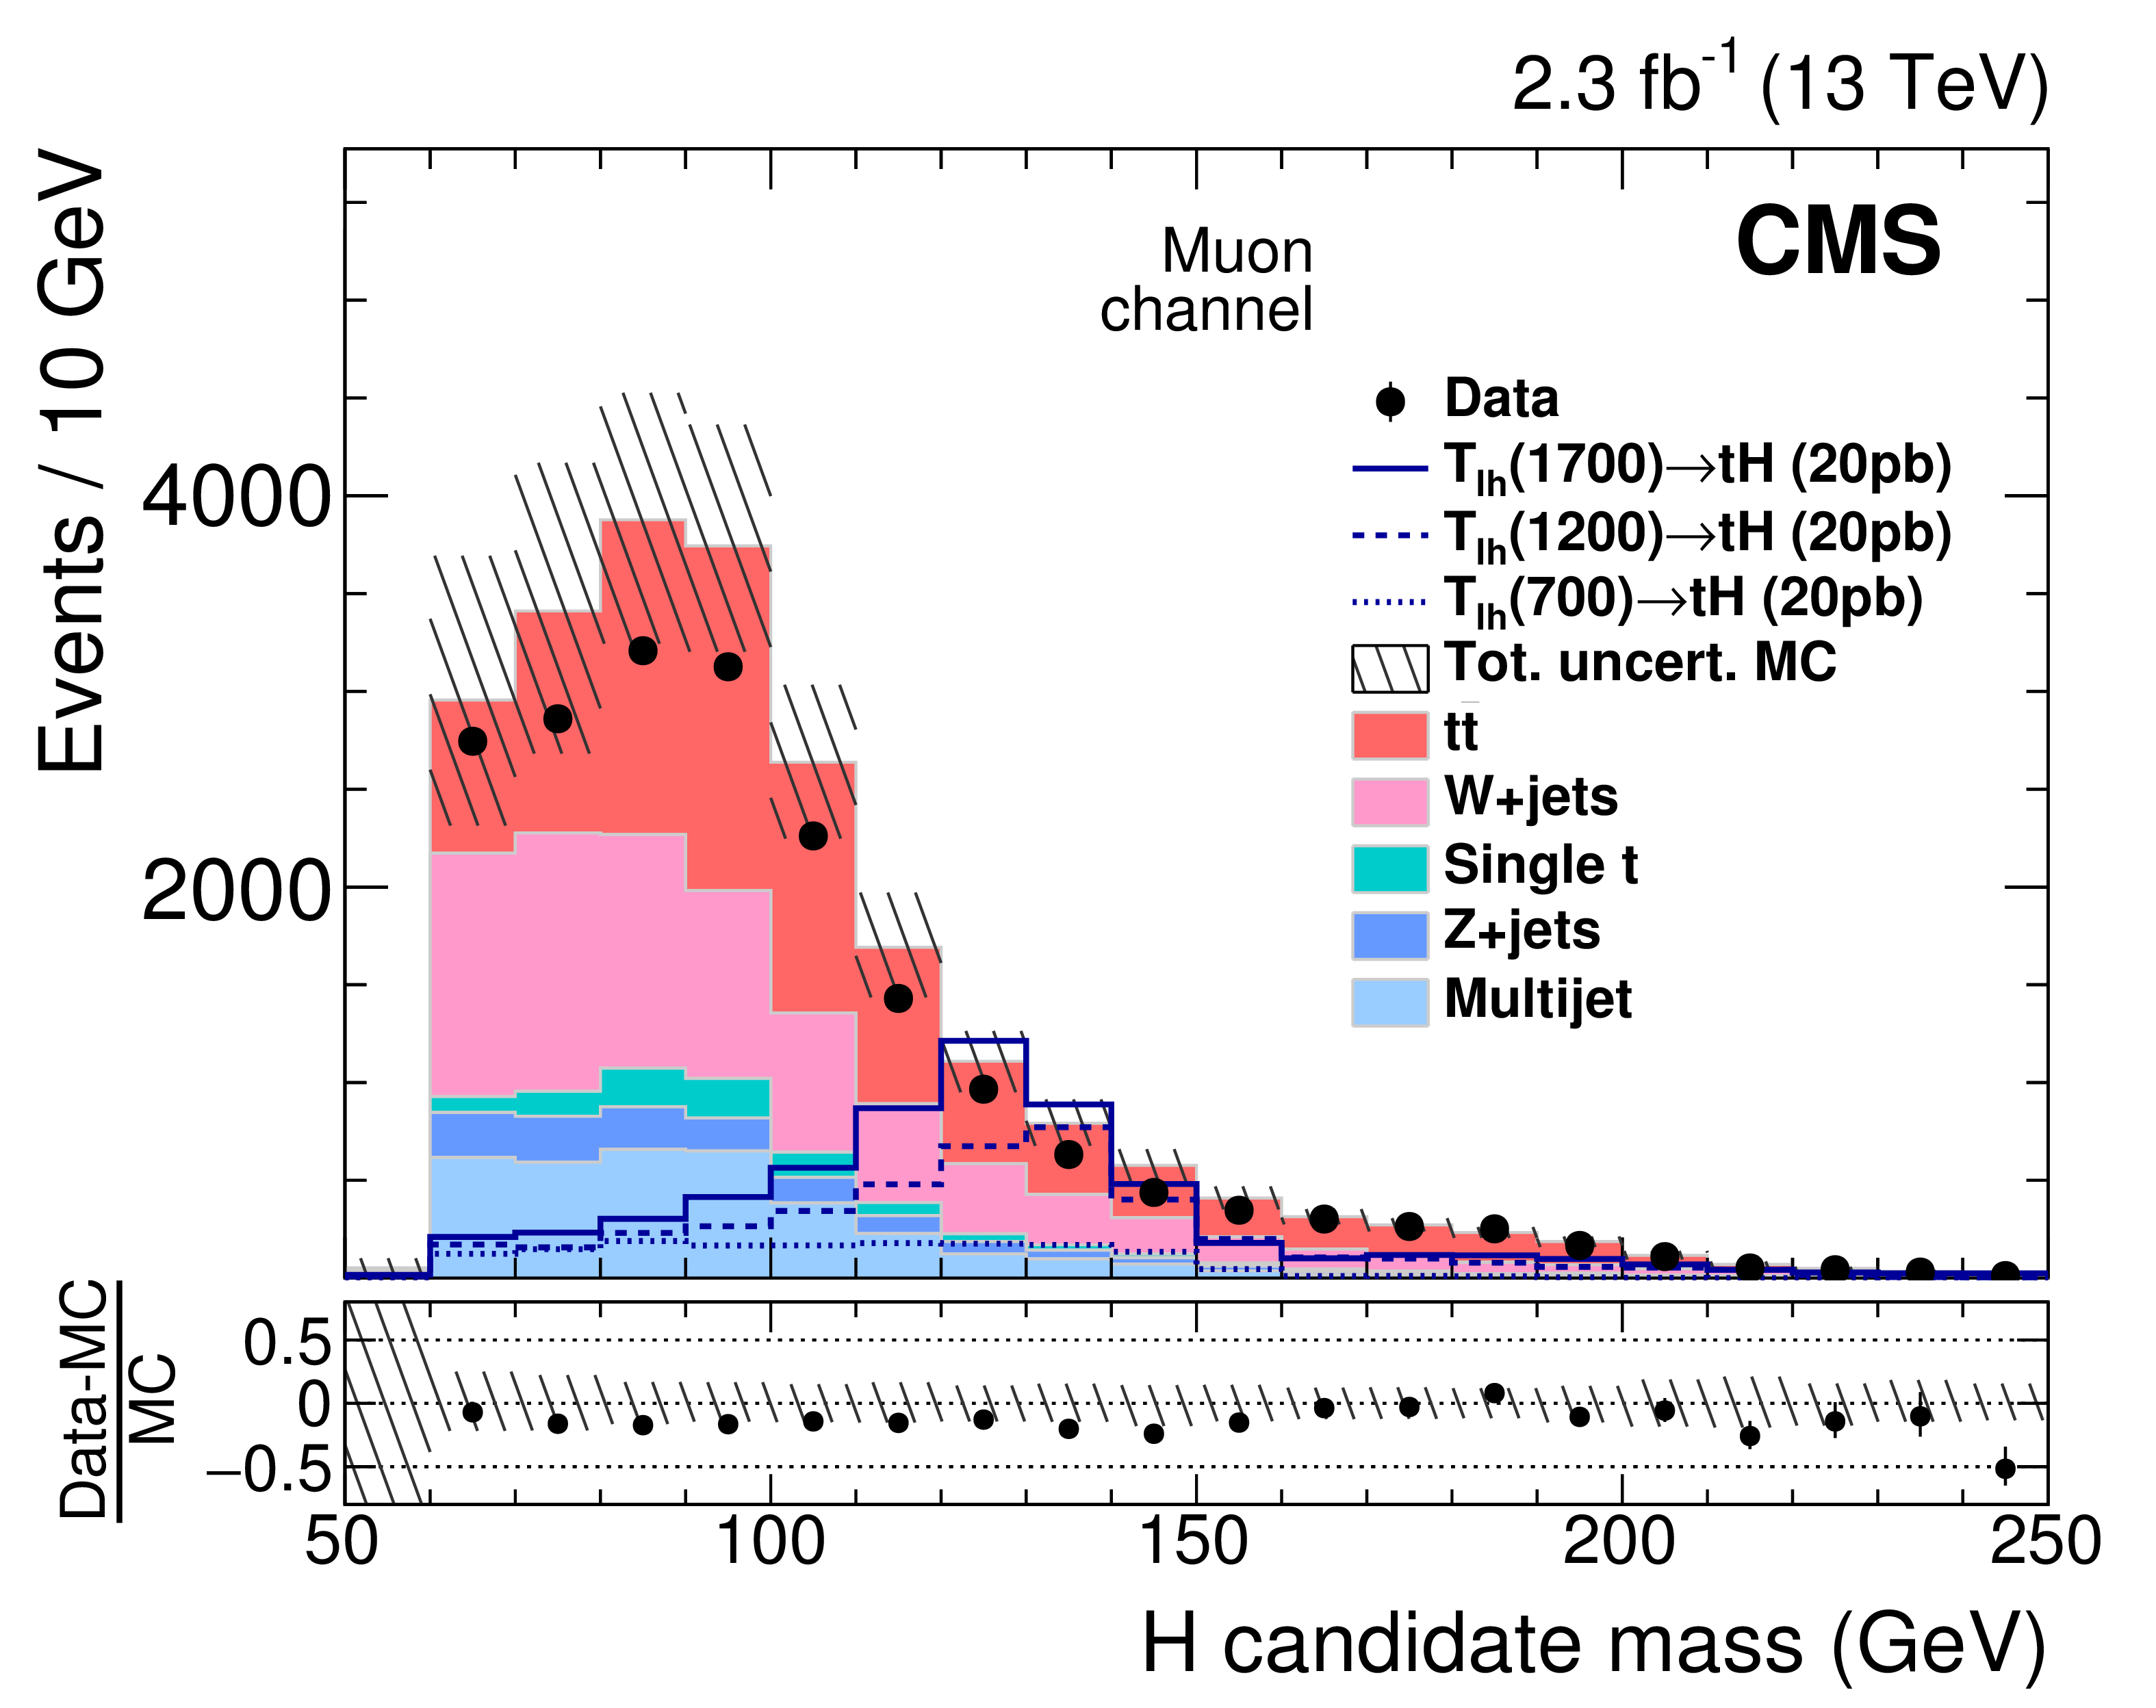
Figure 2:
Distributions of kinematic variables after baseline selection. Electron and muon $ {p_{\mathrm {T}}} $ distributions are depicted in the upper-left and upper-right panels. The lower-left panel shows $S_\mathrm {T}$ in the electron channel while the soft-drop mass of the Higgs boson candidate in the muon channel is depicted in the lower right. The different background contributions are shown using full histograms while the open histograms are signal yields and the data are shown as solid circles. The hatched bands represent the statistical and systematic uncertainties of the simulated event samples. The systematic uncertainties include those discussed in Section 6, except the forward jet uncertainty. Signal cross sections are enhanced by a factor of 20. |
png pdf |
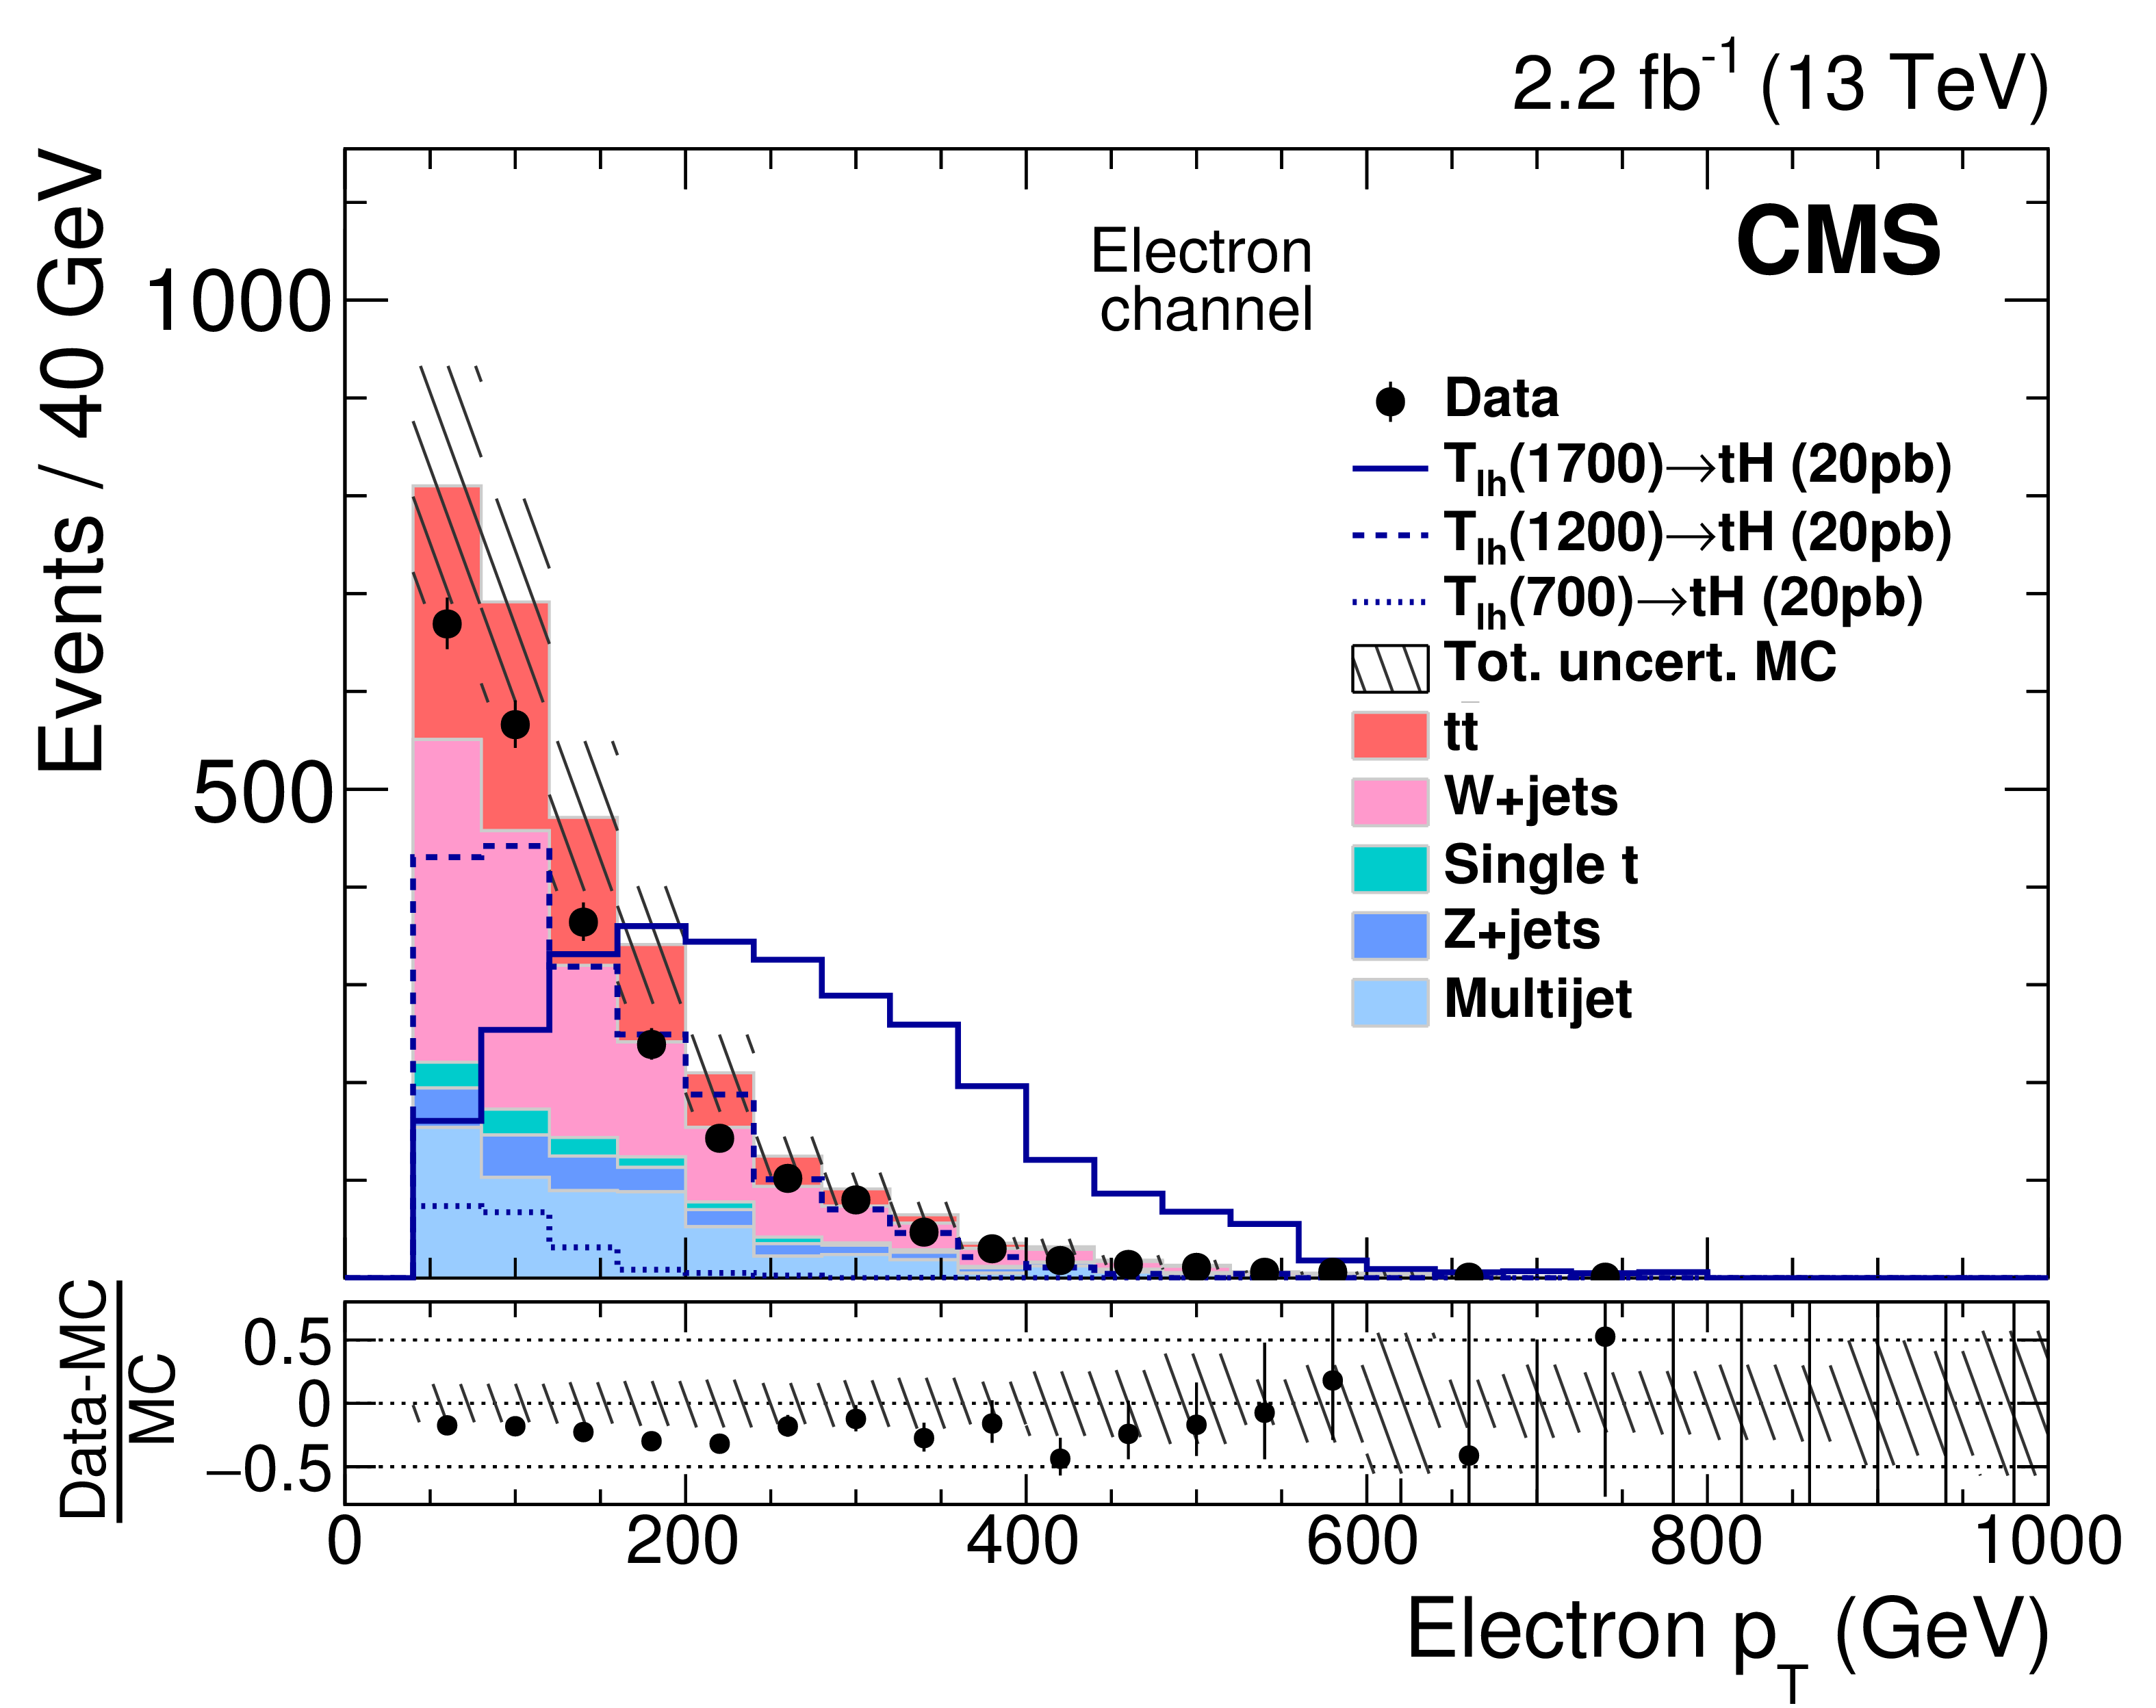
Figure 2-a:
Distribution of the electron $ {p_{\mathrm {T}}} $ after baseline selection. The background contributions are shown using full histograms while the open histograms are signal yields and the data are shown as solid circles. The hatched bands represent the statistical and systematic uncertainties of the simulated event samples. The systematic uncertainties include those discussed in Section 6, except the forward jet uncertainty. Signal cross sections are enhanced by a factor of 20. |
png pdf |
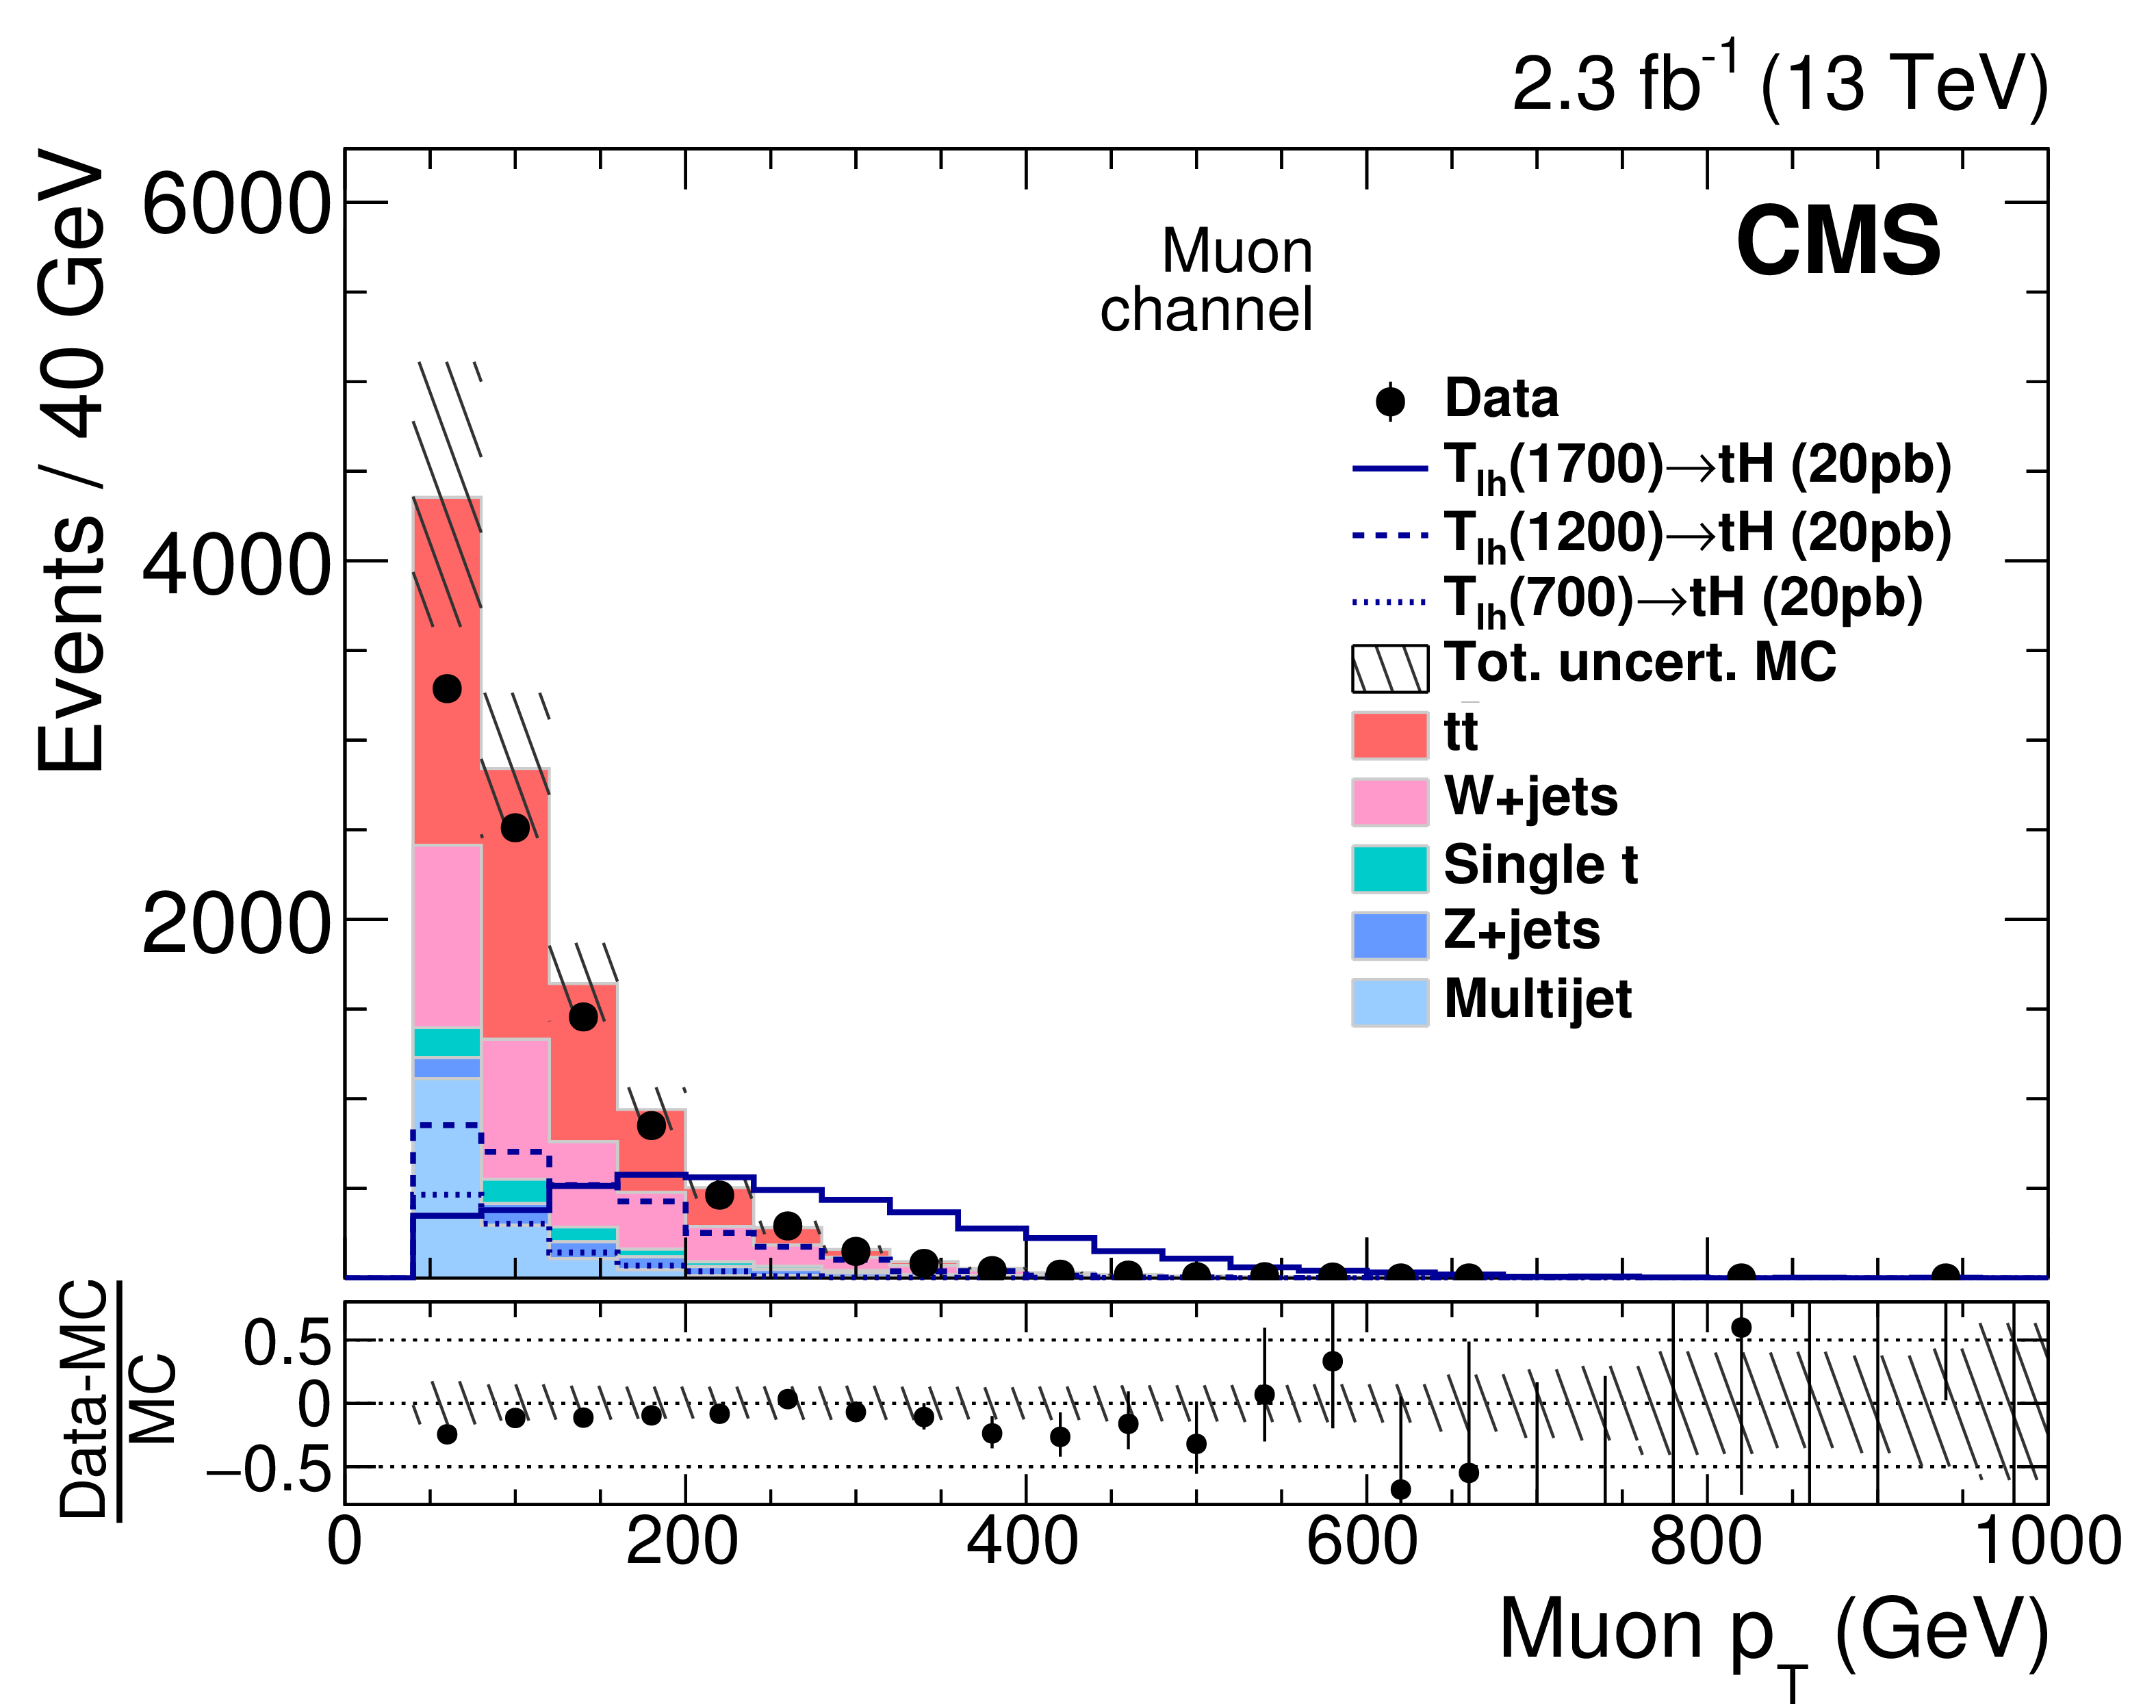
Figure 2-b:
Distribution of the muon $ {p_{\mathrm {T}}} $ after baseline selection. The background contributions are shown using full histograms while the open histograms are signal yields and the data are shown as solid circles. The hatched bands represent the statistical and systematic uncertainties of the simulated event samples. The systematic uncertainties include those discussed in Section 6, except the forward jet uncertainty. Signal cross sections are enhanced by a factor of 20. |
png pdf |
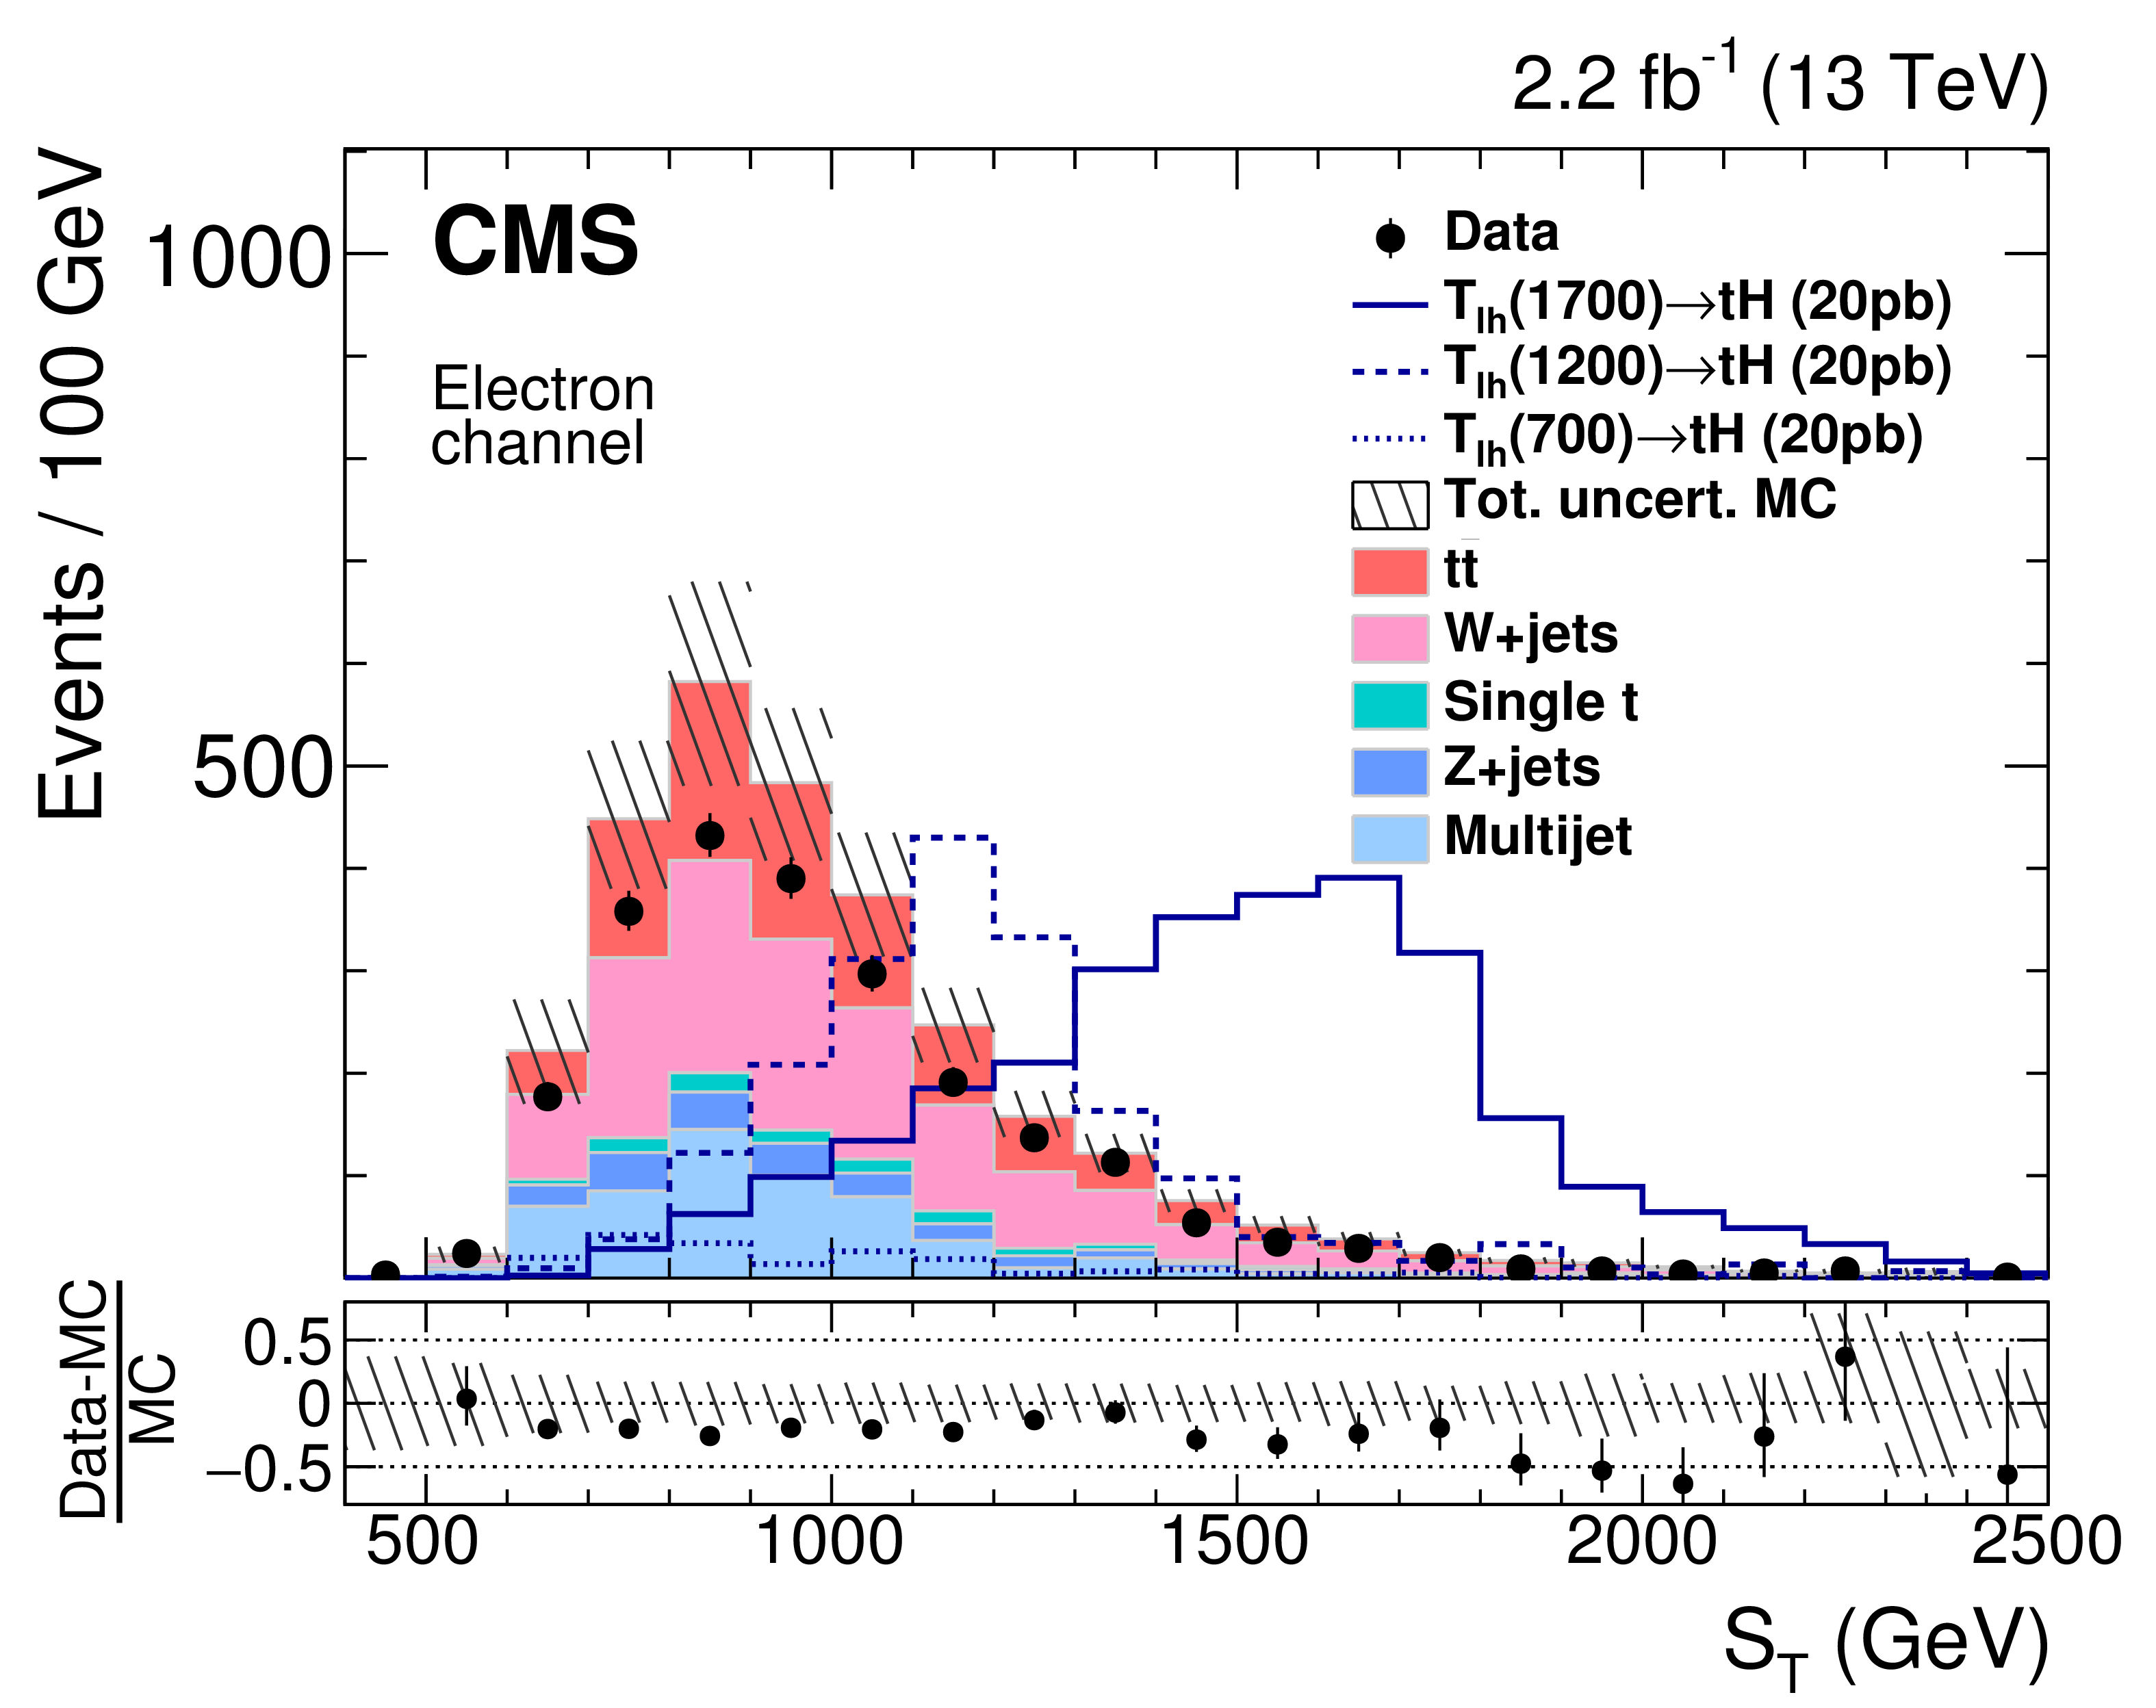
Figure 2-c:
Distribution of $S_\mathrm {T}$ in the electron channel after baseline selection. The background contributions are shown using full histograms while the open histograms are signal yields and the data are shown as solid circles. The hatched bands represent the statistical and systematic uncertainties of the simulated event samples. The systematic uncertainties include those discussed in Section 6, except the forward jet uncertainty. Signal cross sections are enhanced by a factor of 20. |
png pdf |
Figure 2-d:
Distribution of the soft-drop mass of the Higgs boson candidate in the muon channel after baseline selection. The background contributions are shown using full histograms while the open histograms are signal yields and the data are shown as solid circles. The hatched bands represent the statistical and systematic uncertainties of the simulated event samples. The systematic uncertainties include those discussed in Section 6, except the forward jet uncertainty. Signal cross sections are enhanced by a factor of 20. |
png pdf |
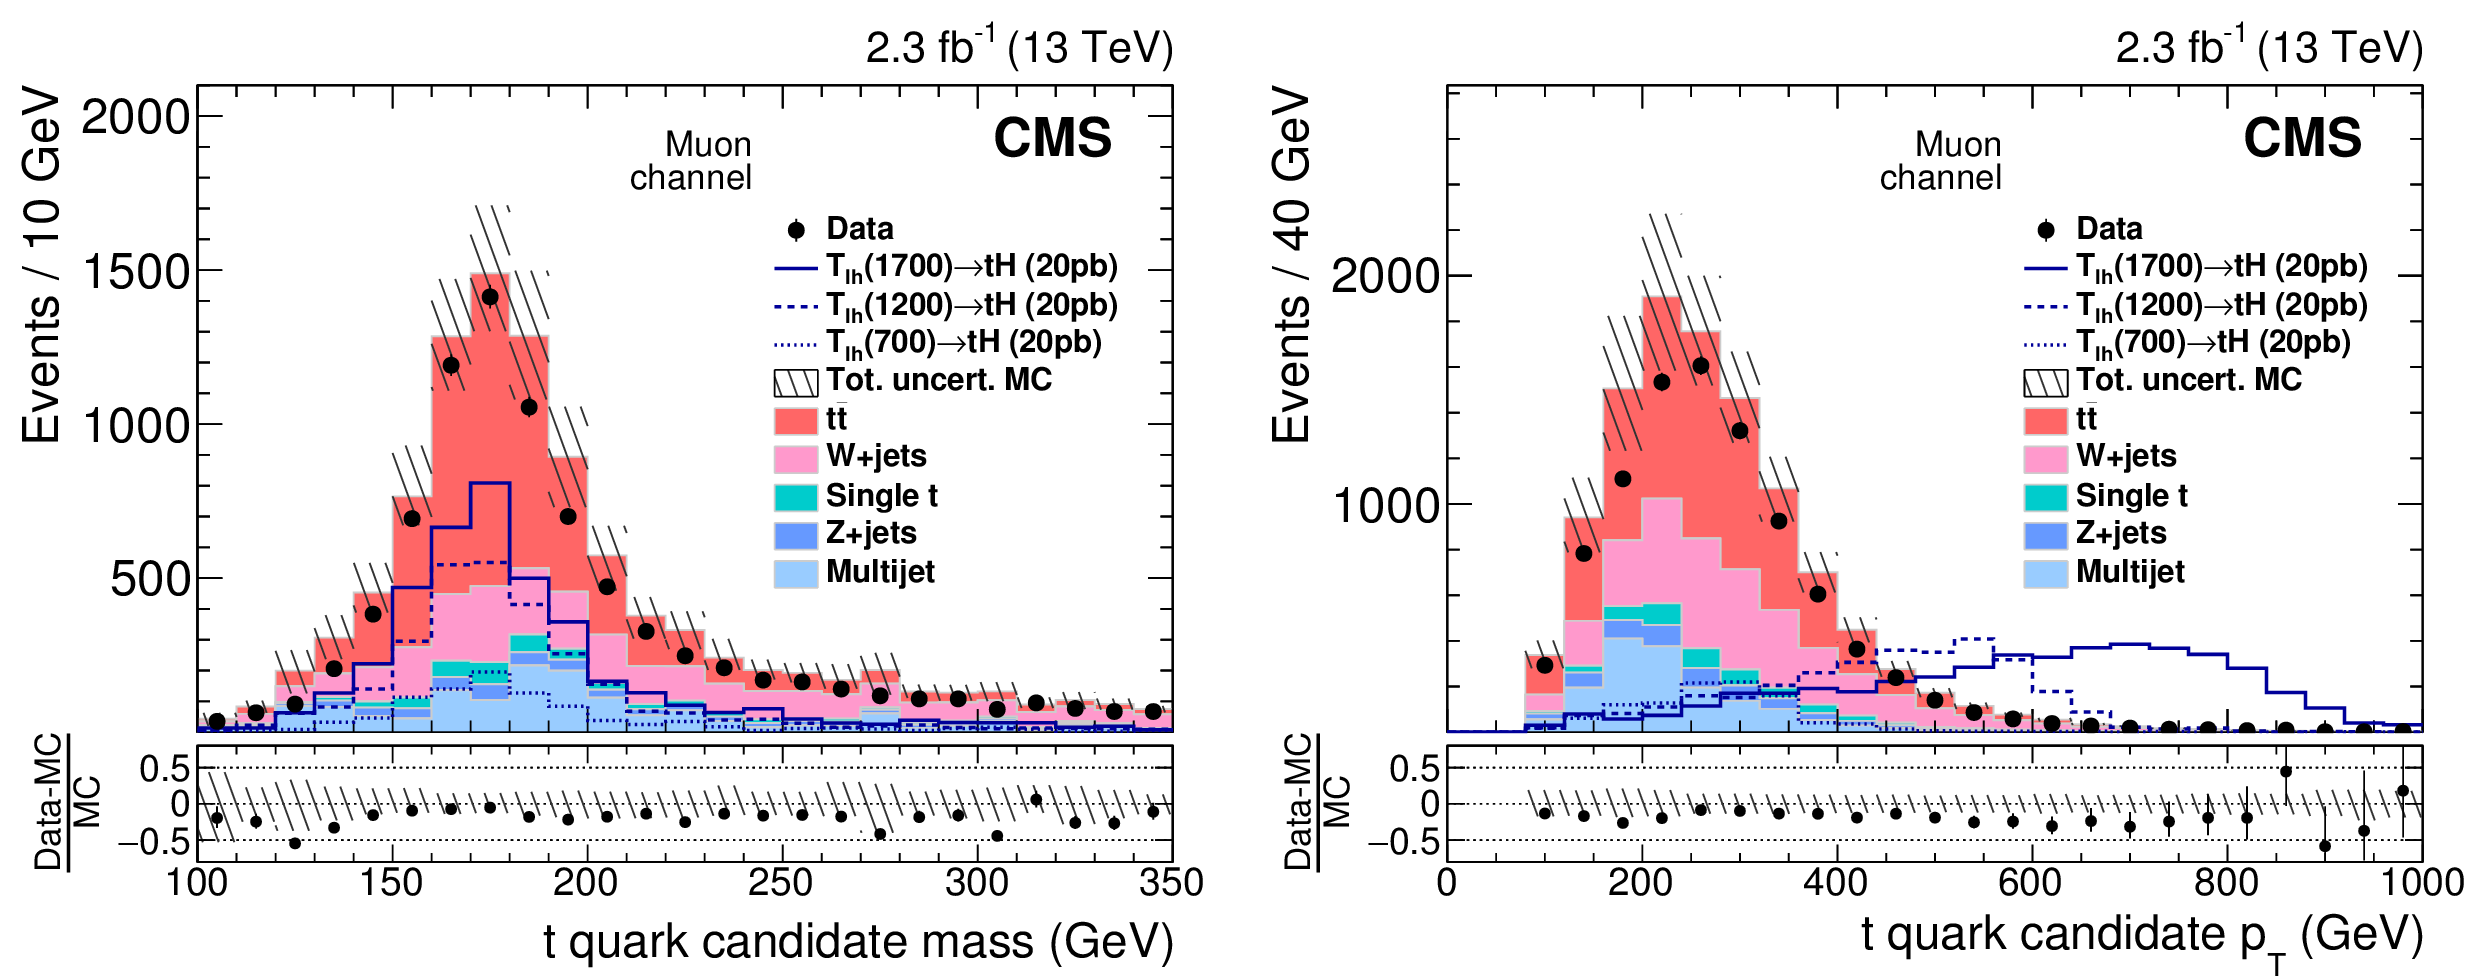
Figure 3:
Mass (left) and $ {p_{\mathrm {T}}} $ (right) distributions of the reconstructed top quark candidate in the muon channel after the baseline selection. The different background contributions are shown using full histograms while the open histograms are signal yields and the data are shown as solid circles. The hatched bands represent the statistical and systematic uncertainties of the simulated event samples. The systematic uncertainties include those discussed in Section 6, except the forward jet uncertainty. Signal cross sections are enhanced by a factor of 20. |

png pdf |
Figure 3-a:
Mass distribution of the reconstructed top quark candidate in the muon channel after the baseline selection. The different background contributions are shown using full histograms while the open histograms is signal yield and the data are shown as solid circles. The hatched bands represent the statistical and systematic uncertainties of the simulated event samples. The systematic uncertainties include those discussed in Section 6, except the forward jet uncertainty. Signal cross sections are enhanced by a factor of 20. |
png pdf |
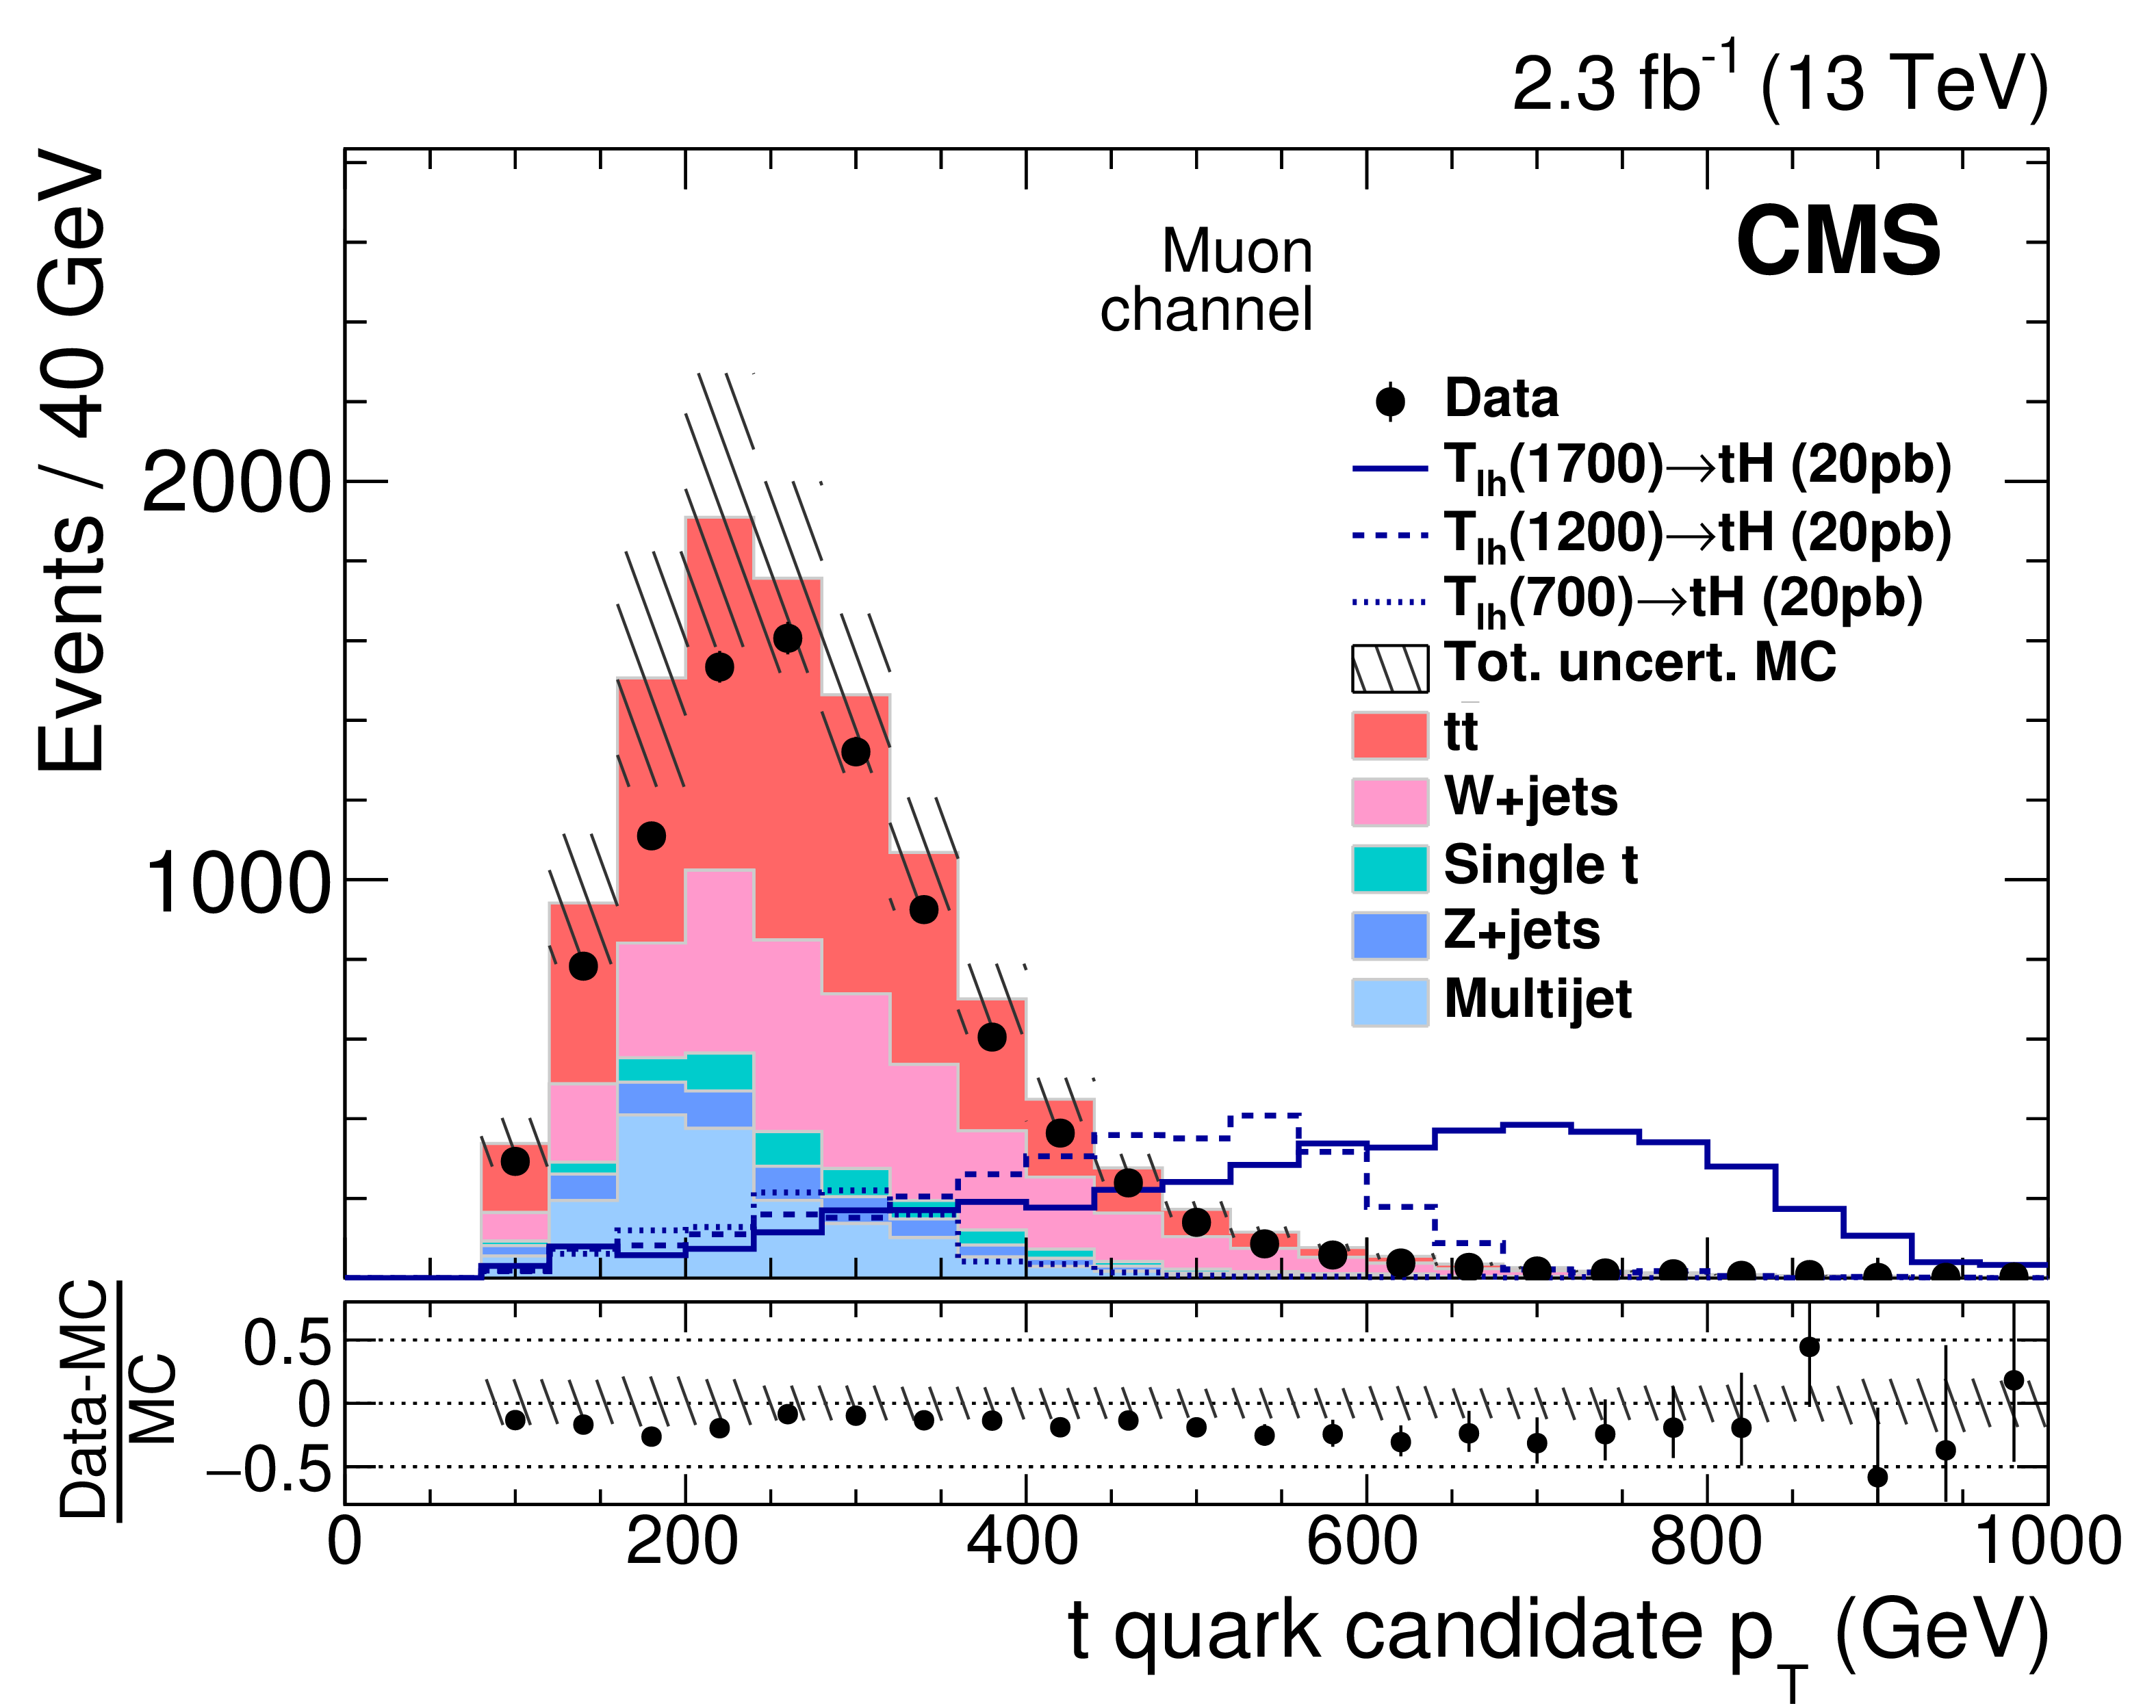
Figure 3-b:
$ {p_{\mathrm {T}}} $ distribution of the reconstructed top quark candidate in the muon channel after the baseline selection. The different background contributions are shown using full histograms while the open histograms is signal yield and the data are shown as solid circles. The hatched bands represent the statistical and systematic uncertainties of the simulated event samples. The systematic uncertainties include those discussed in Section 6, except the forward jet uncertainty. Signal cross sections are enhanced by a factor of 20. |
png pdf |
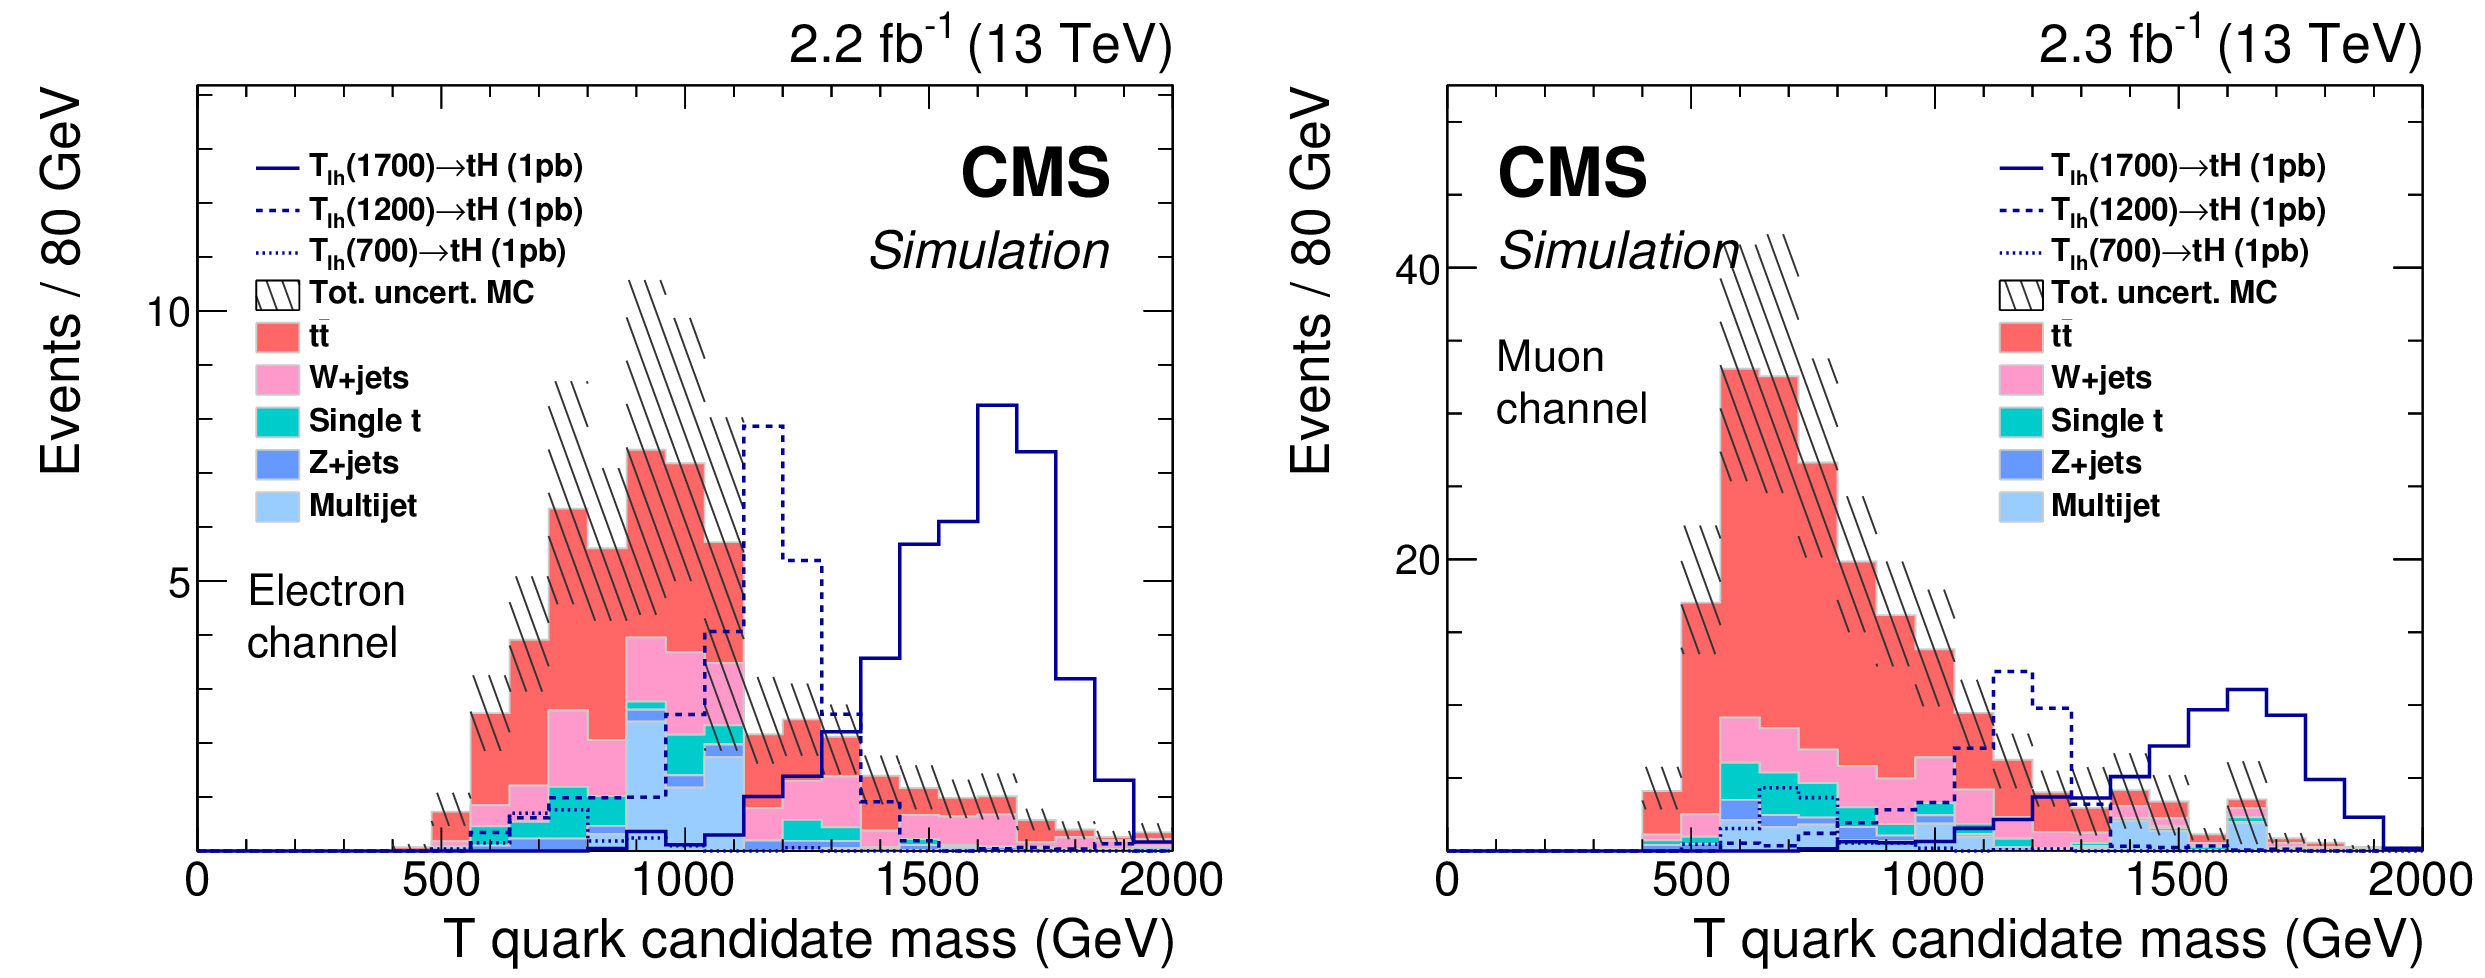
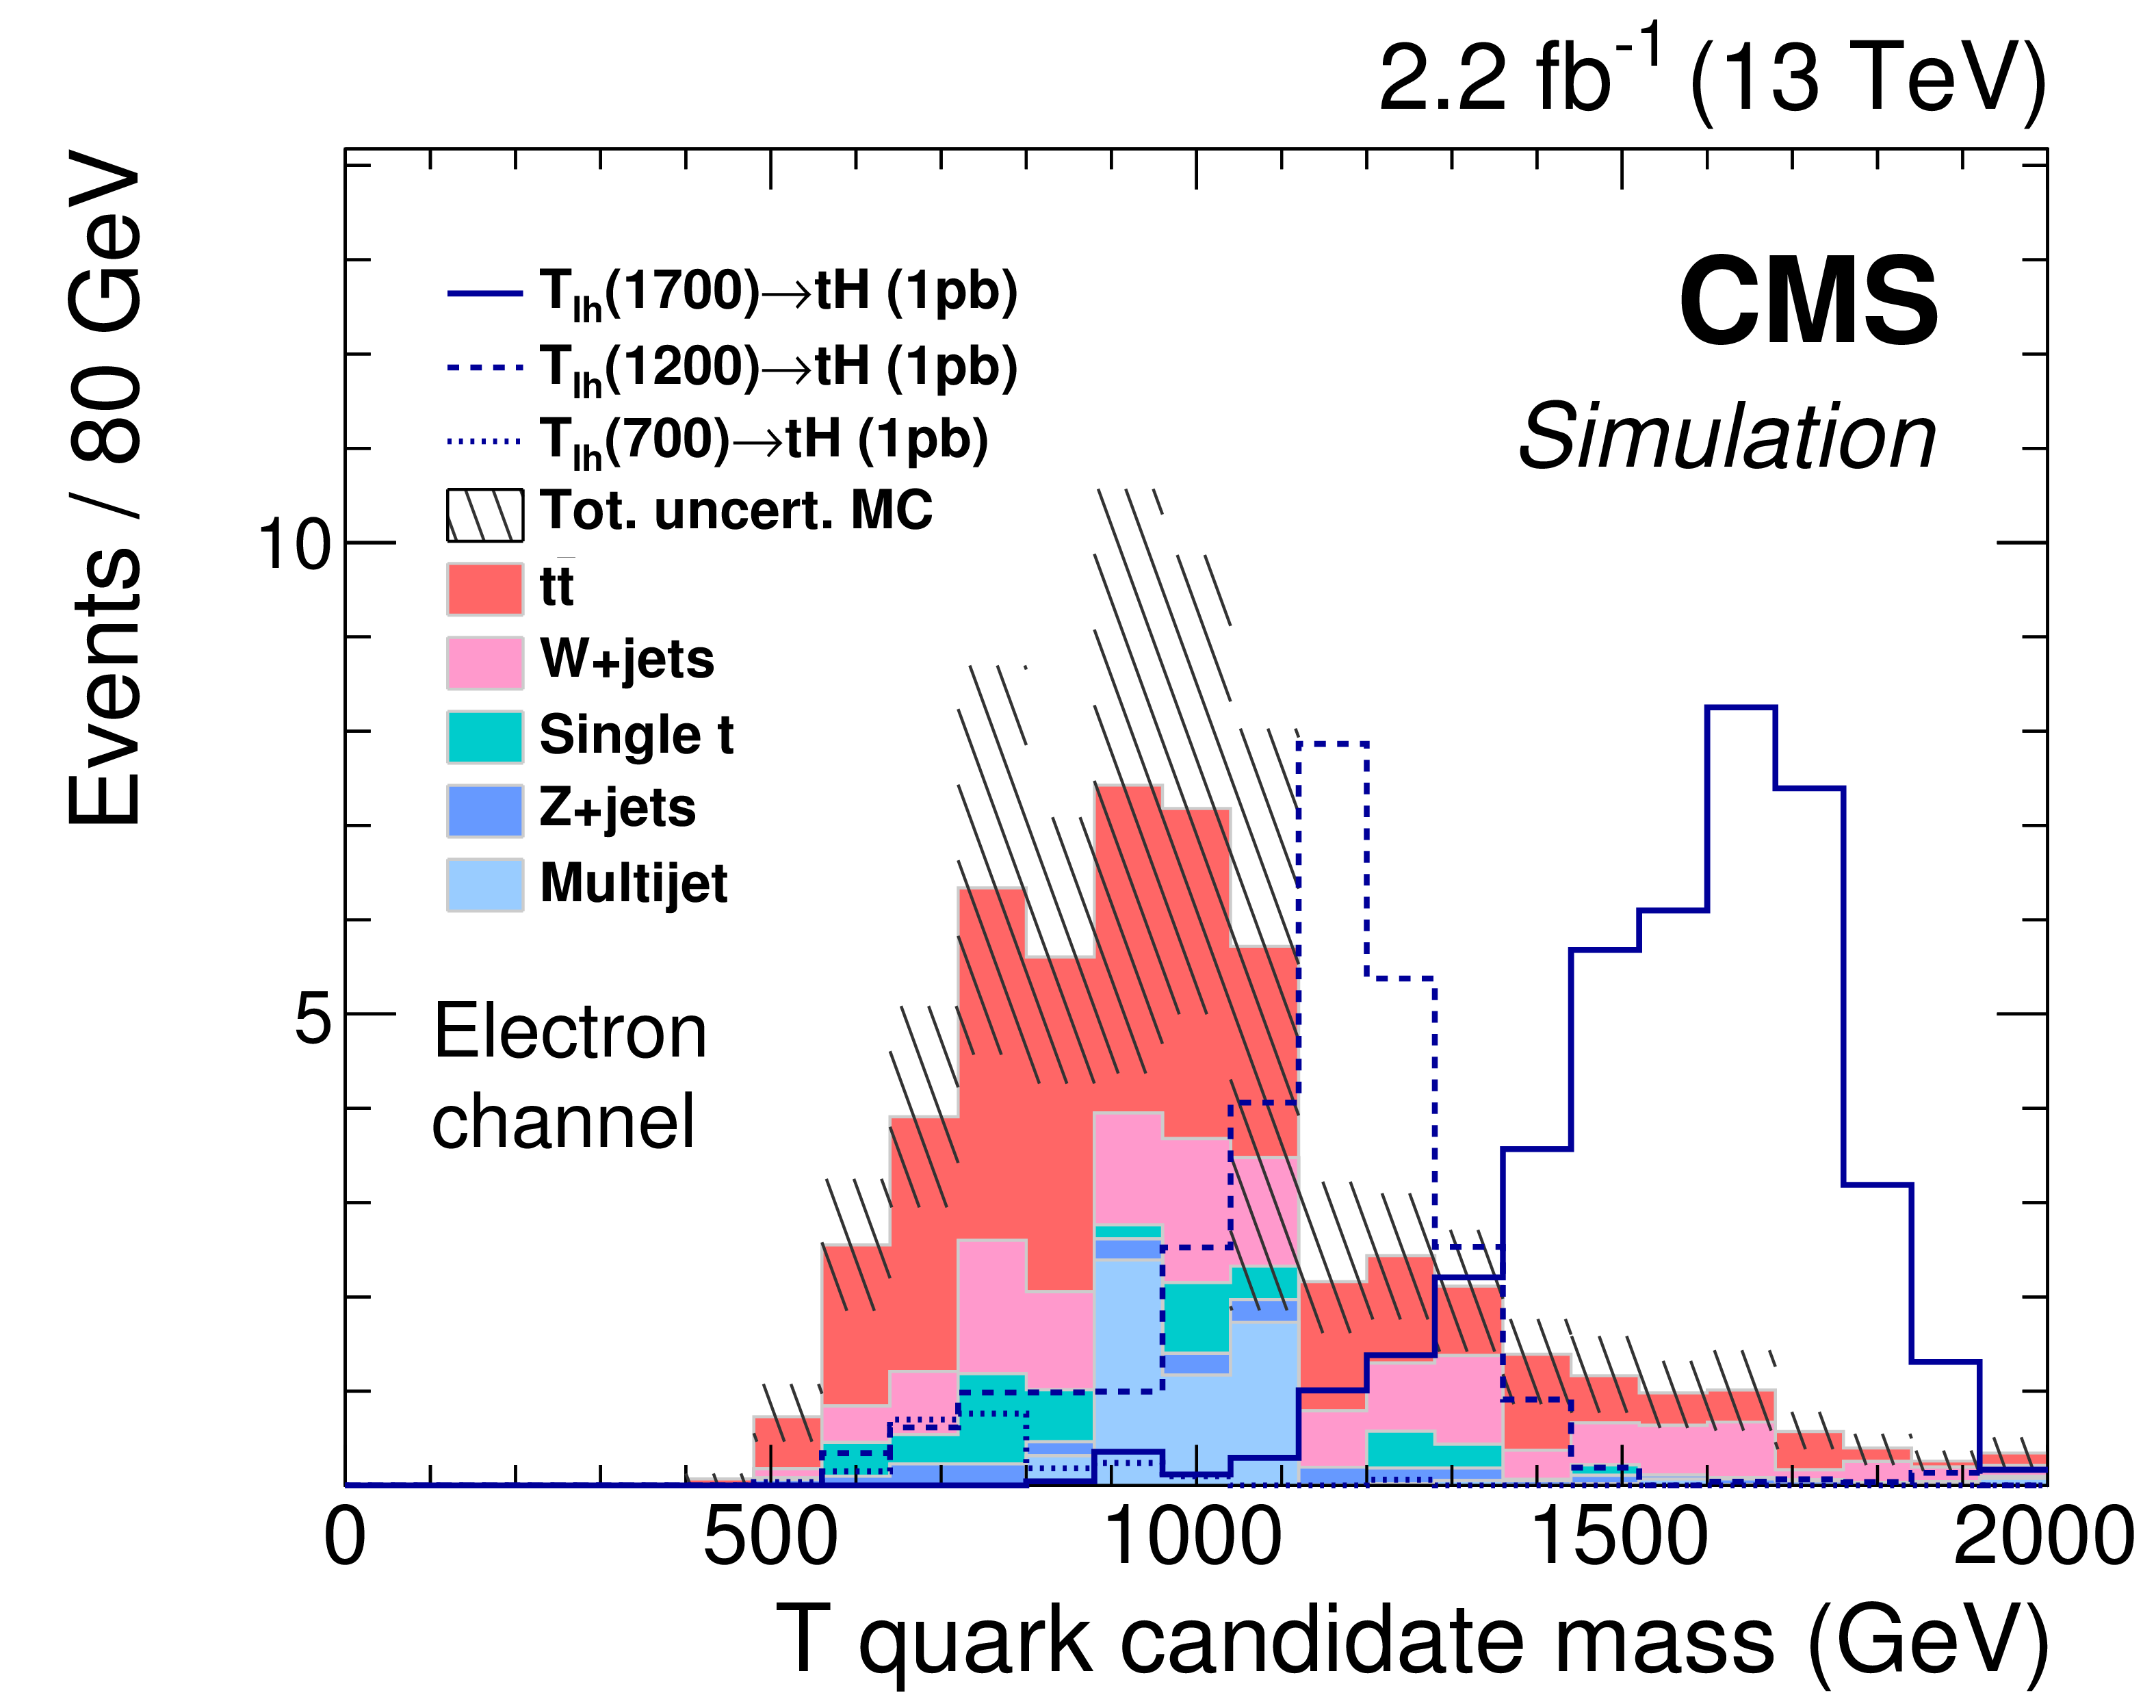
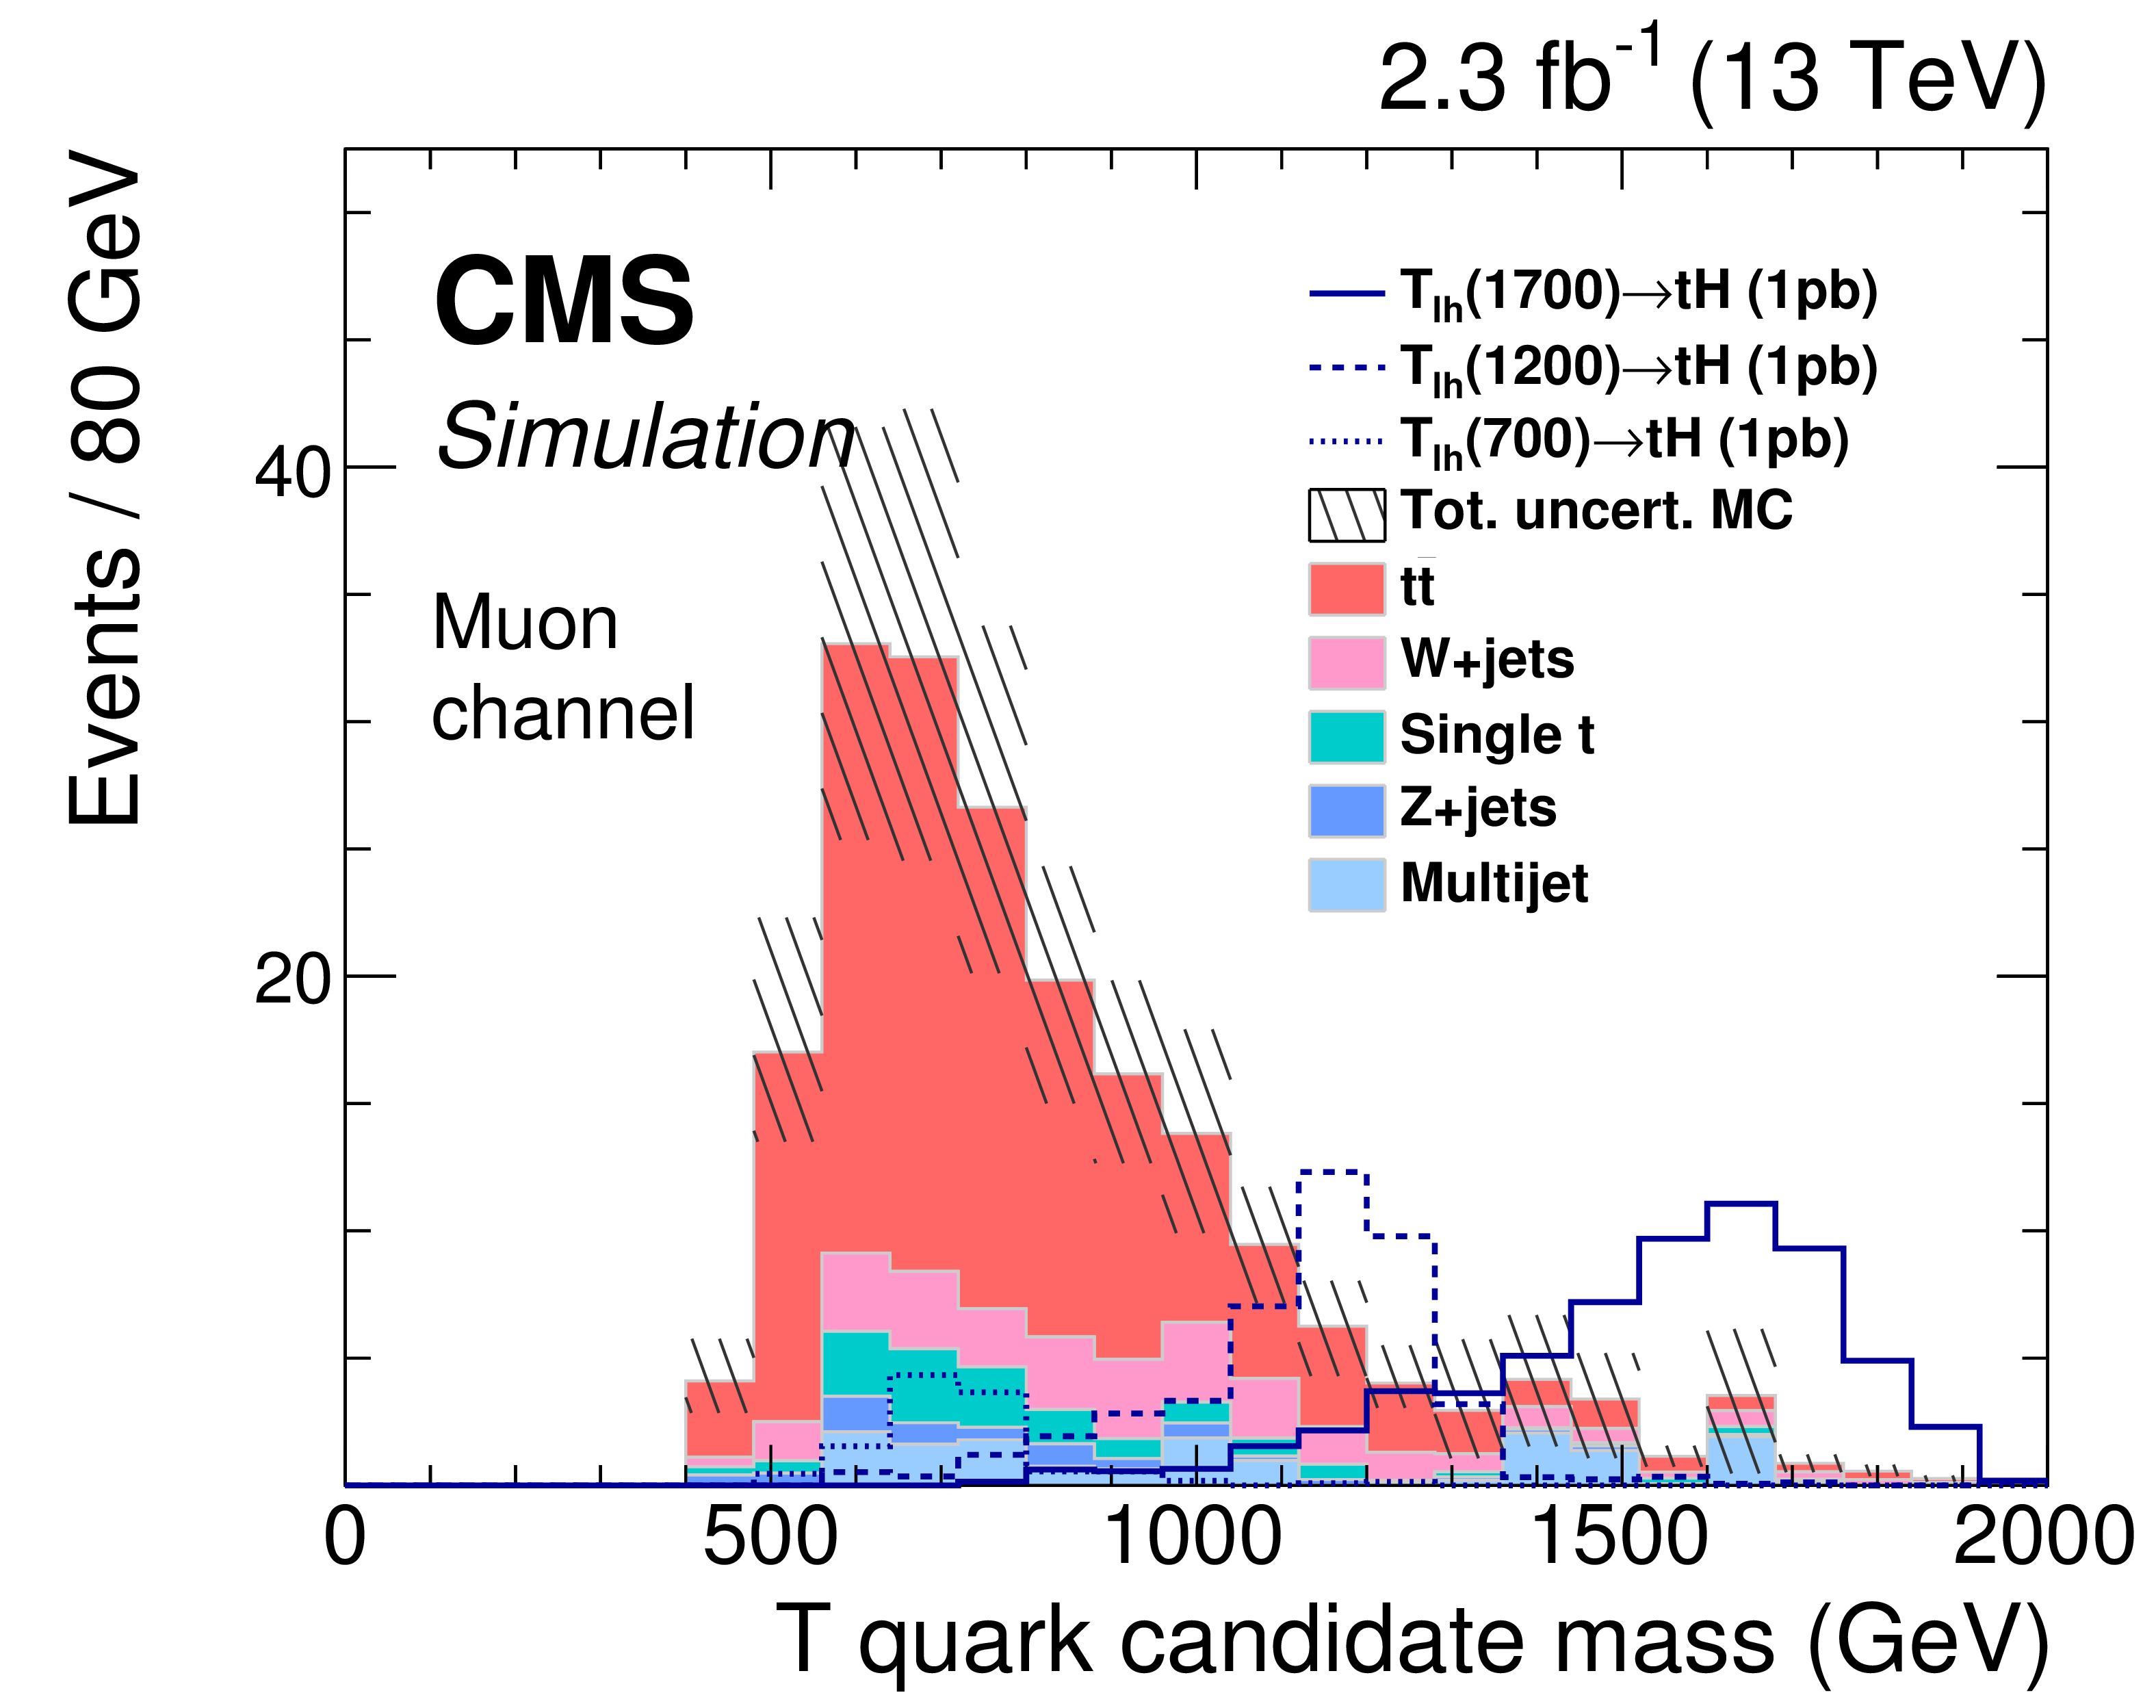
Figure 4:
Vector-like T quark candidate mass in the signal region for the electron (left) and muon (right) channels. The different background contributions are shown using full histograms while the open histograms are signal yields and the data are shown as solid circles. The hatched bands represent the statistical and systematic uncertainties of the simulated event samples. The systematic uncertainties include those discussed in Section 6. |
png pdf |
Figure 4-a:
Vector-like T quark candidate mass in the signal region for the electron channel. The different background contributions are shown using full histograms while the open histograms are signal yields and the data are shown as solid circles. The hatched bands represent the statistical and systematic uncertainties of the simulated event samples. The systematic uncertainties include those discussed in Section 6. |
png pdf |
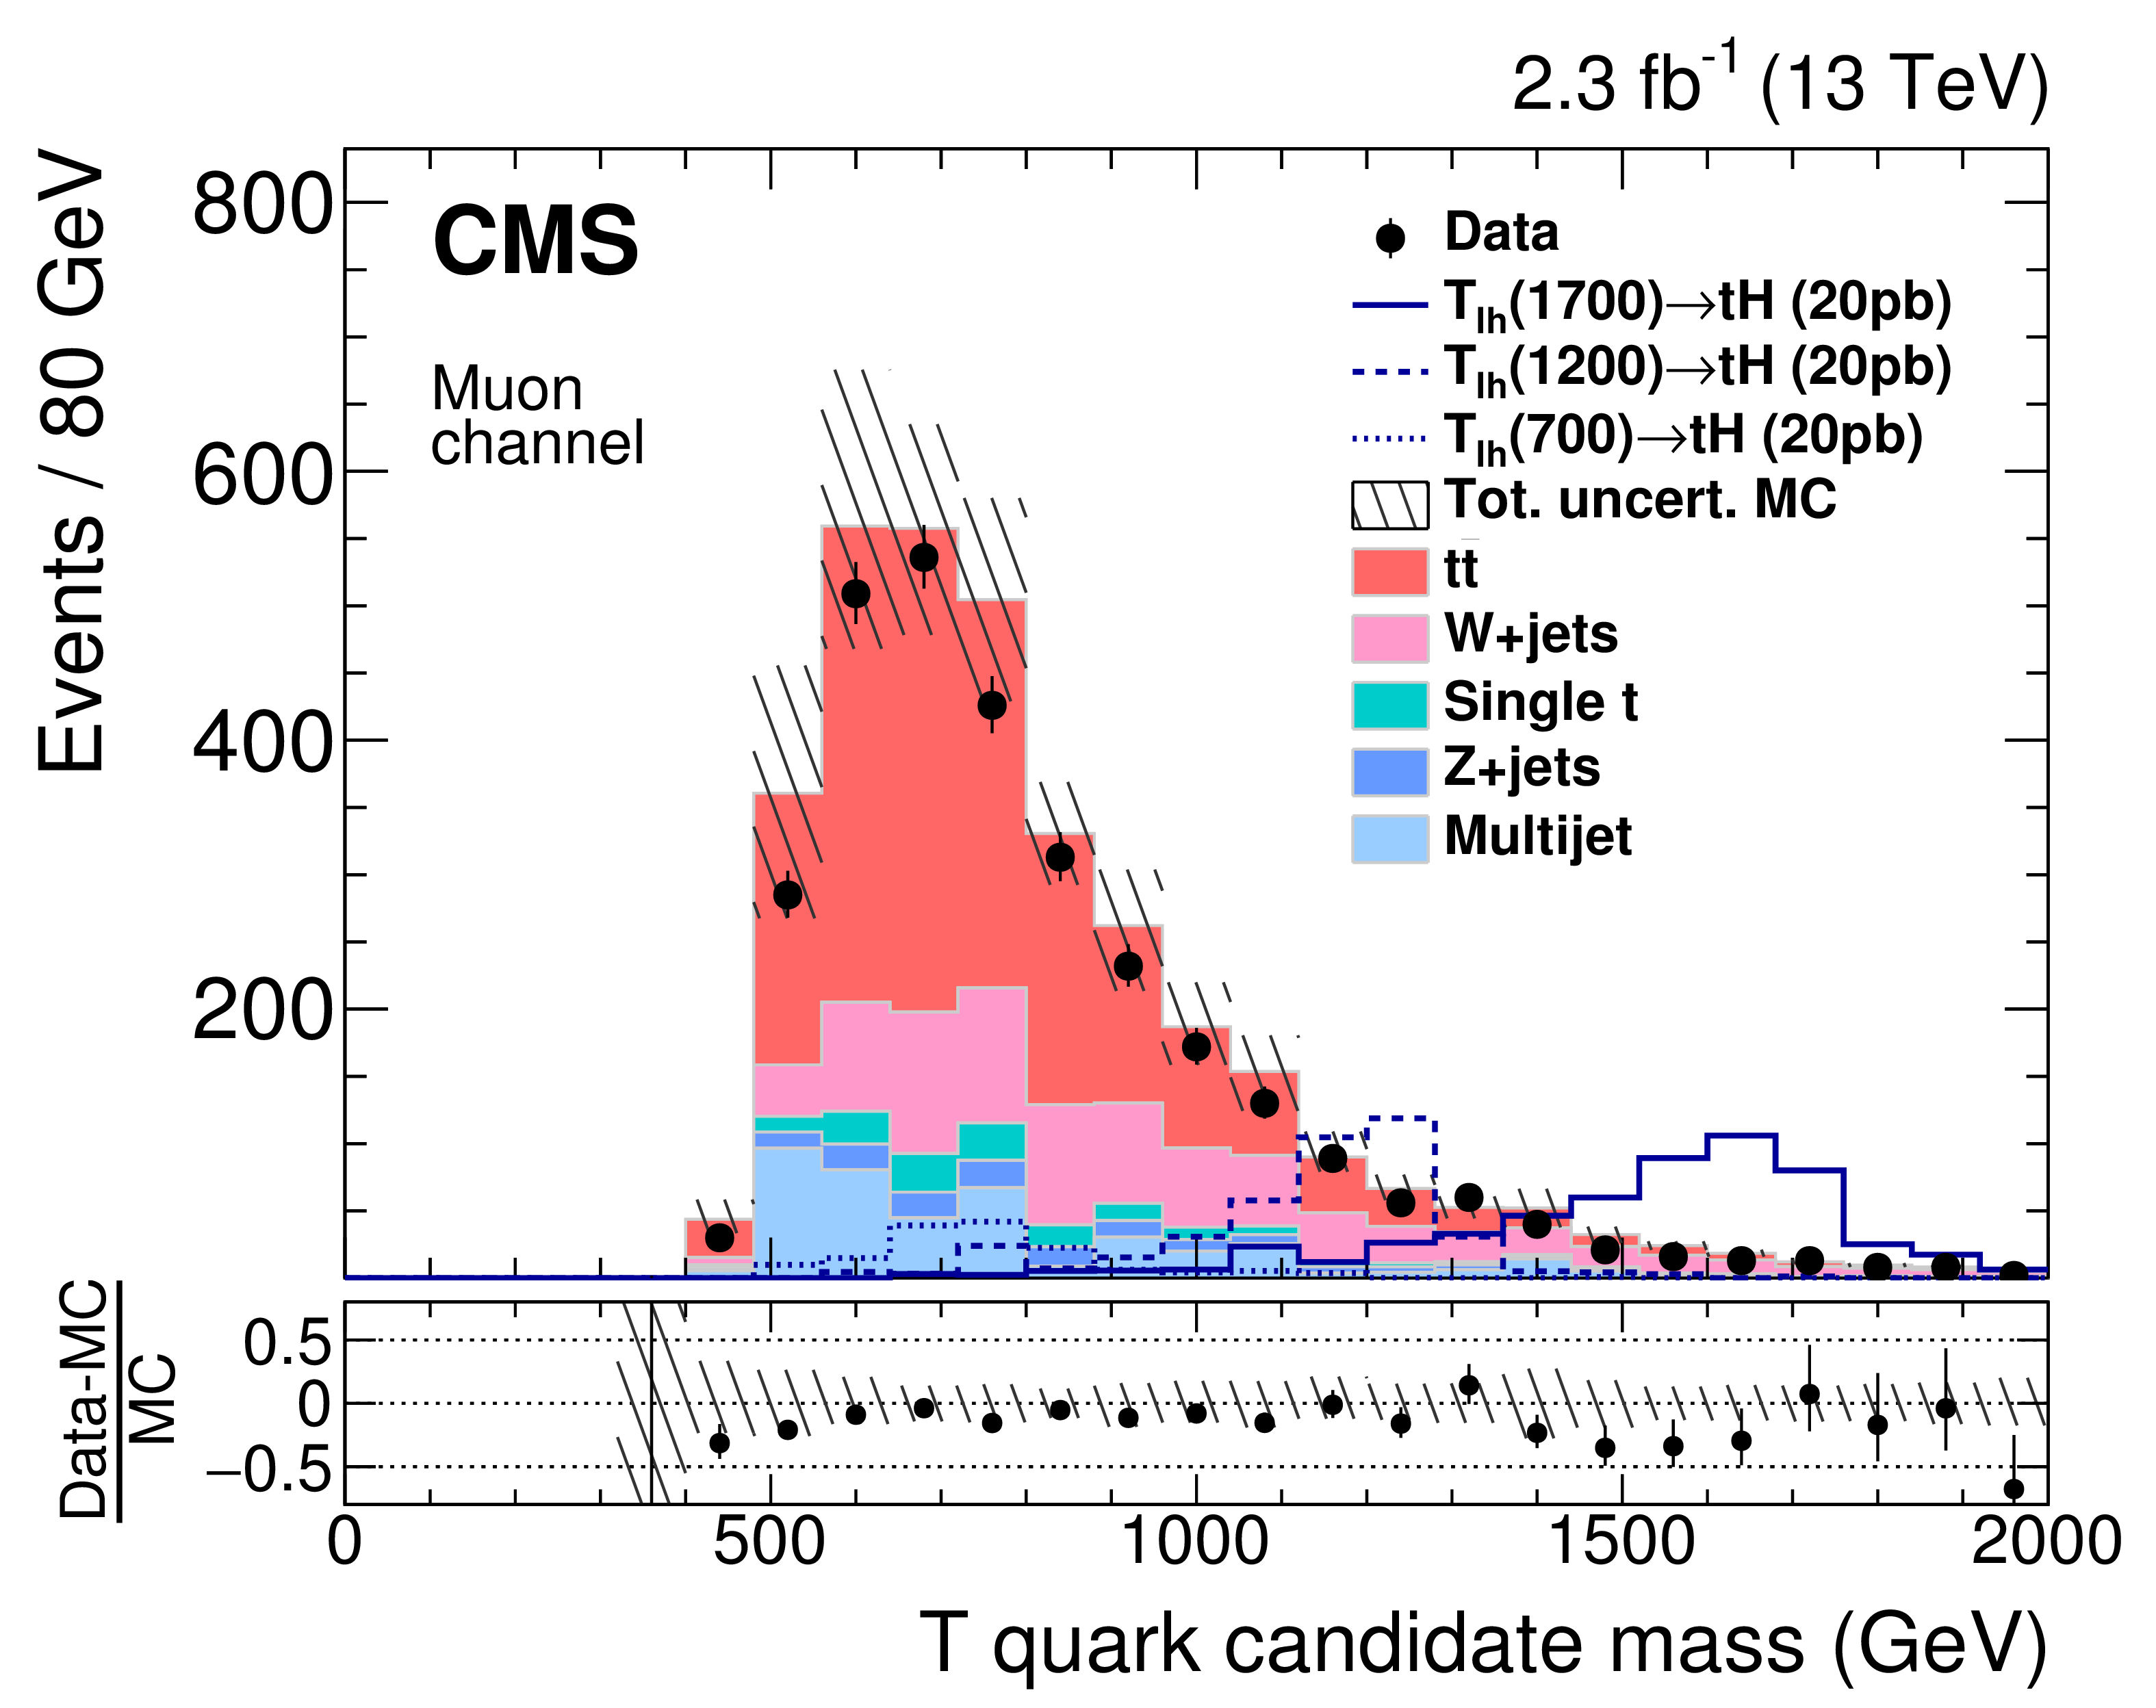
Figure 4-b:
Vector-like T quark candidate mass in the signal region for the muon channel. The different background contributions are shown using full histograms while the open histograms are signal yields and the data are shown as solid circles. The hatched bands represent the statistical and systematic uncertainties of the simulated event samples. The systematic uncertainties include those discussed in Section 6. |
png pdf |
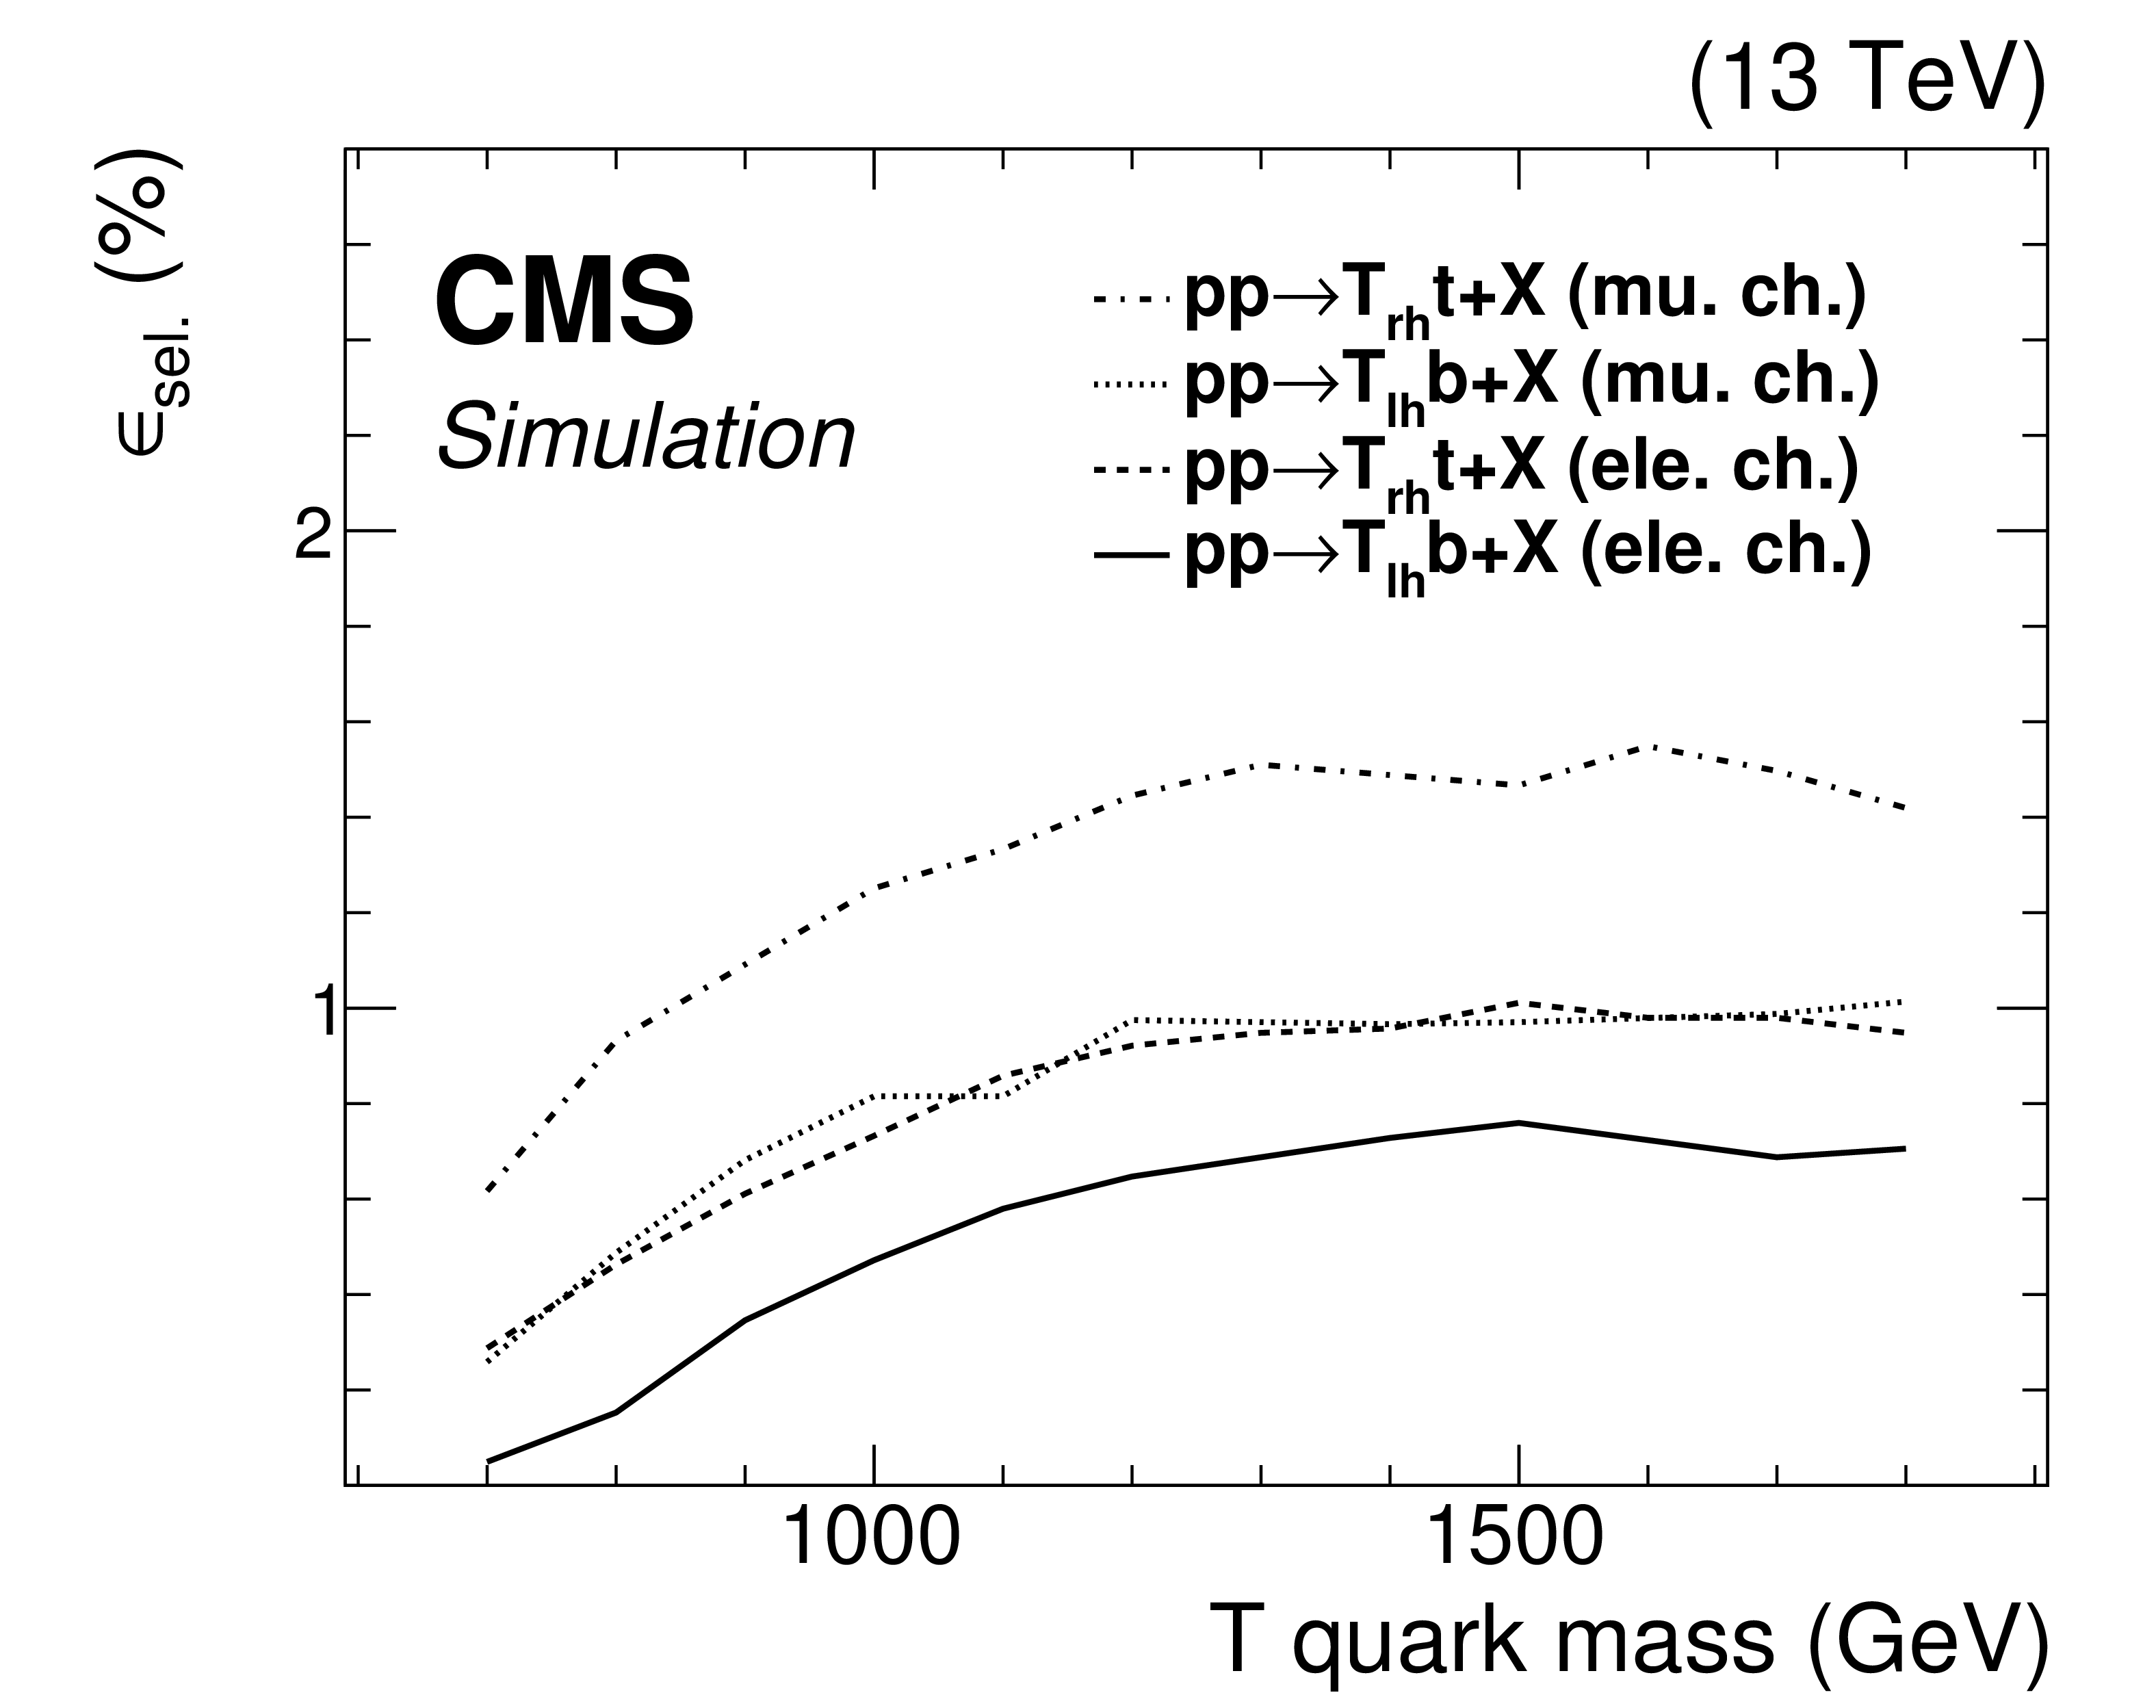
Figure 5:
Selection efficiency $\epsilon _\text {sel}$ for the signal, i.e. the product of the branching fractions for the top quark decaying to final states including a lepton, and the Higgs boson decaying to bottom quarks, amounting to approximately 8%, is included in the signal selection efficiency. Left-handed (denoted by lh) and right-handed (denoted by rh) couplings of the T quark to SM particles in associated production with bottom and top quarks, respectively, are shown separately. |

png pdf |
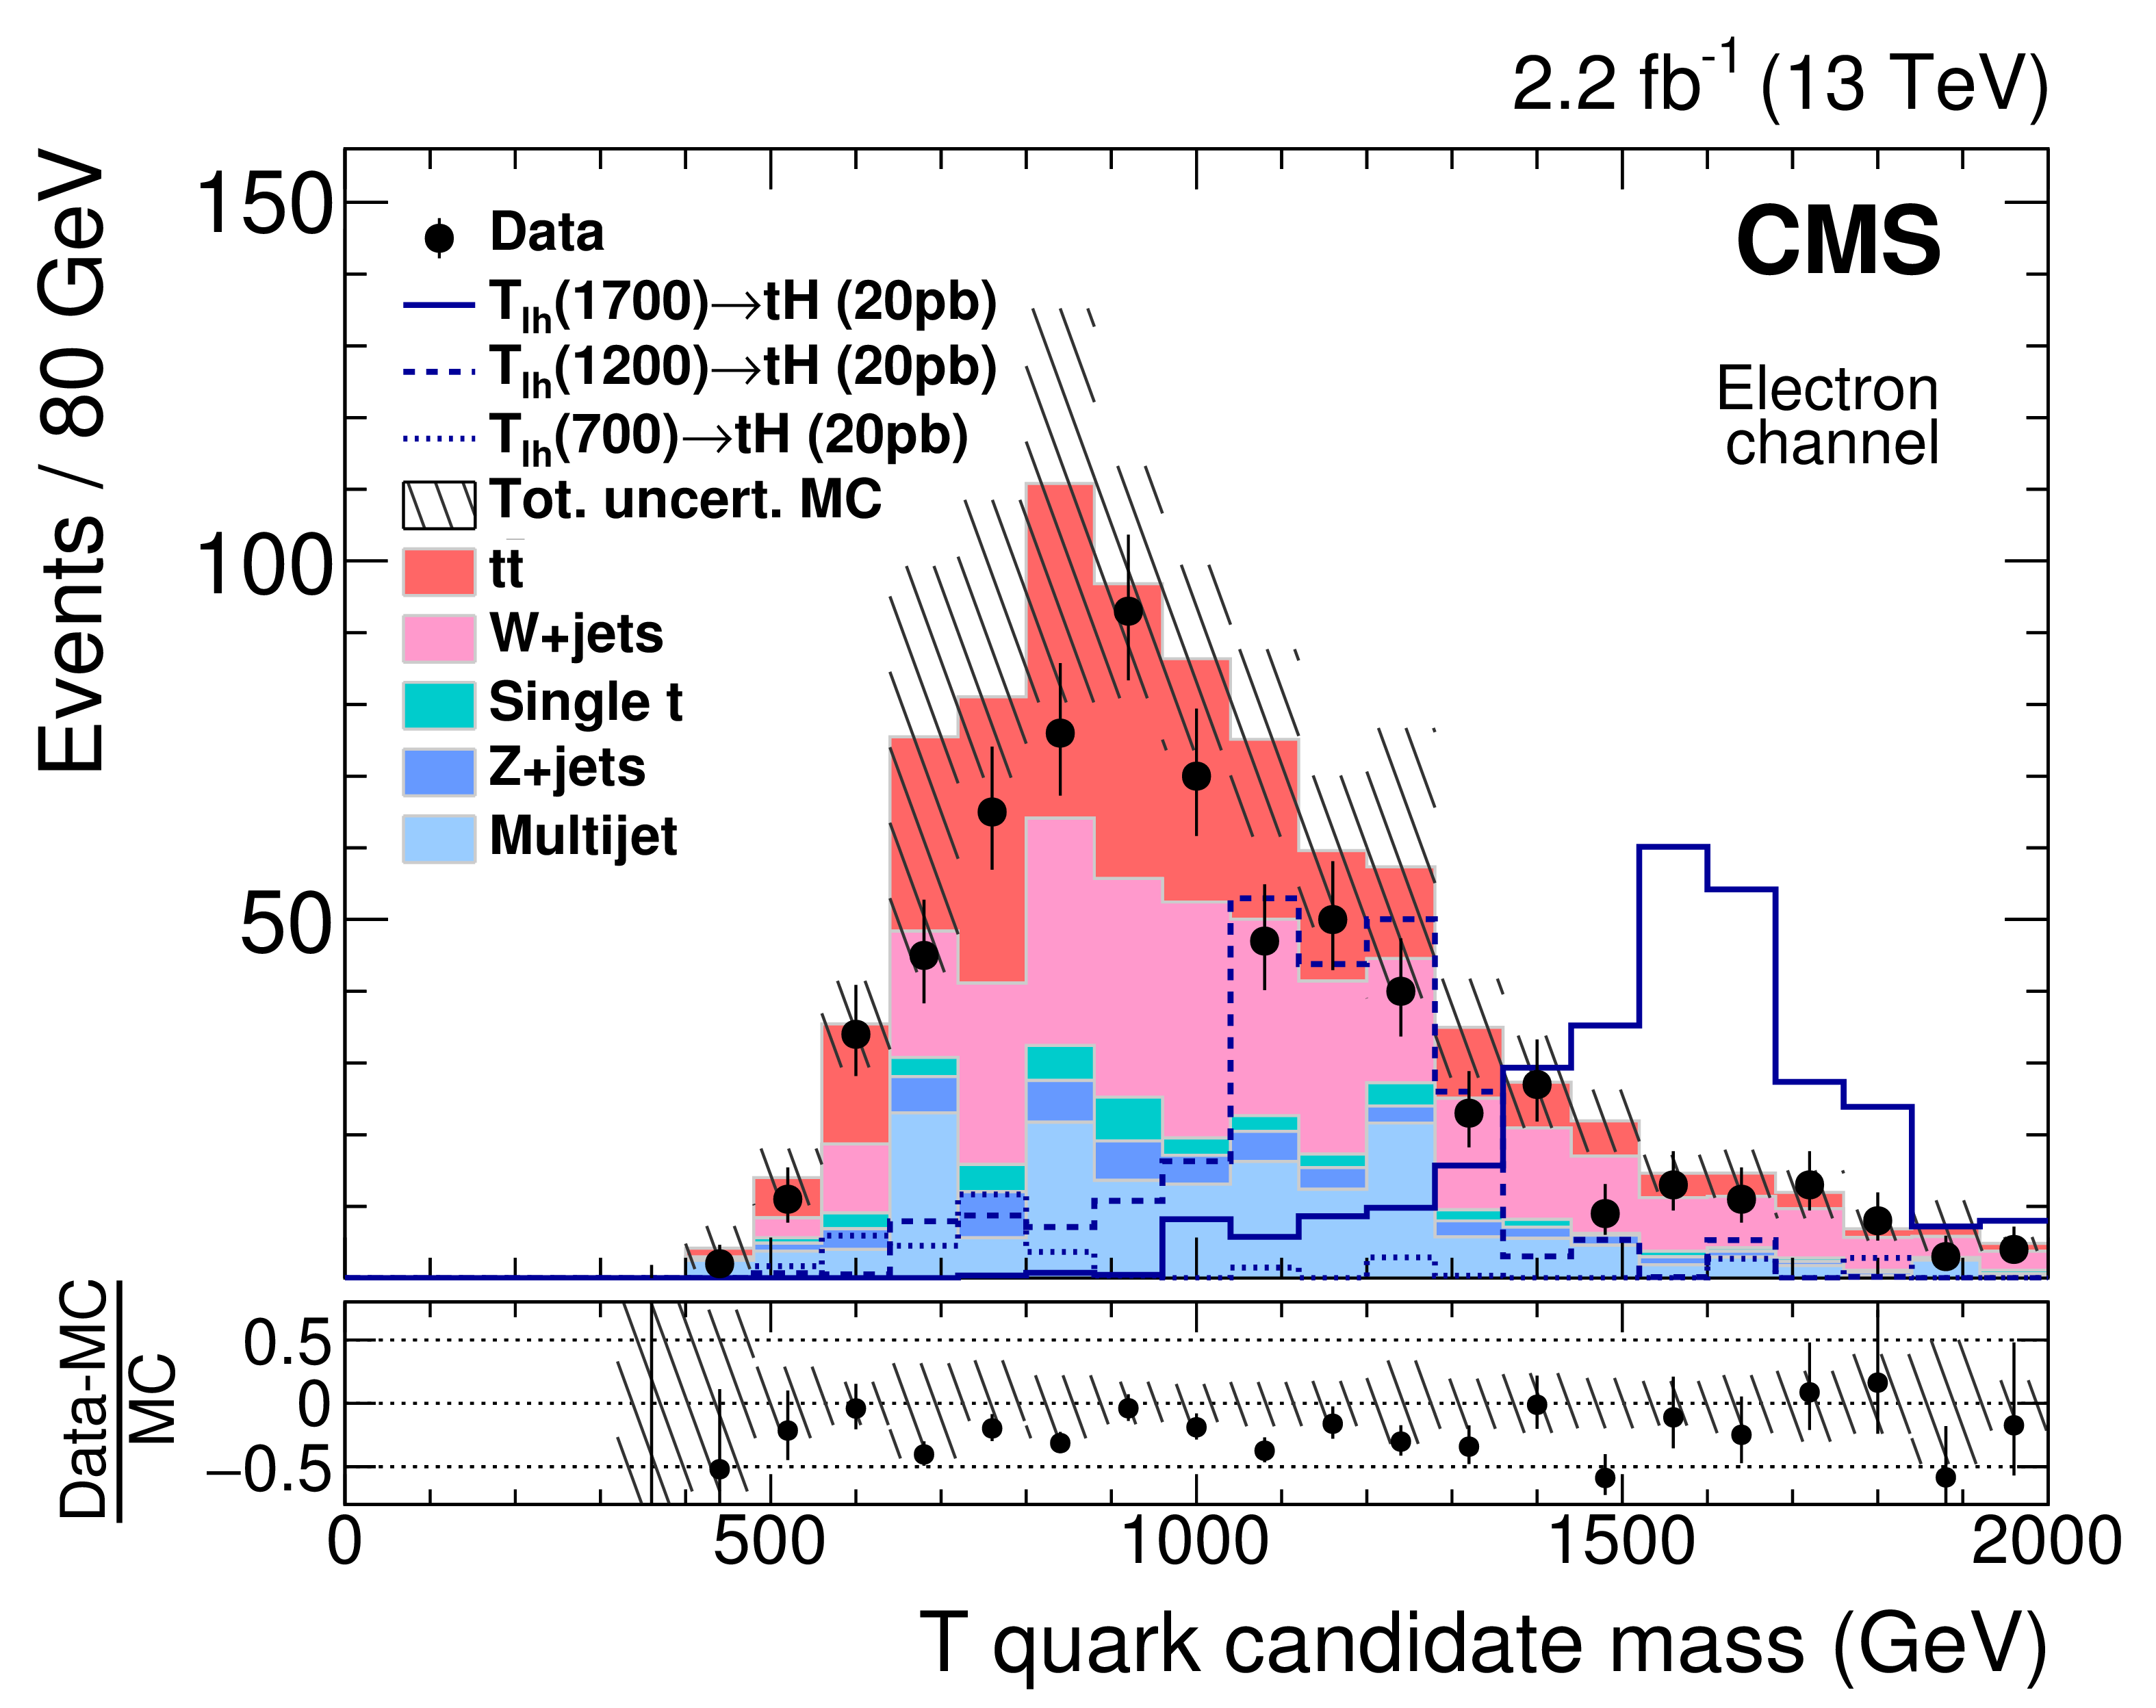
Figure 6:
Vector-like T quark candidate mass in the control region for the electron (left ) and muon (right ) channels. Signal samples are normalized to 20 pb, which is a factor of 20 larger than what is used in Figure 4. The shape of the data distribution provides the background estimate. The different background contributions are shown using full histograms while the open histogram are signal yields and the data are shown as solid circles. The hatched bands represent the statistical and systematic uncertainties of the simulated event samples. The systematic uncertainties include those discussed in Section 6, except the forward jet uncertainty. |
png pdf |
Figure 6-a:
Vector-like T quark candidate mass in the control region for the electron channel. The signal sample is normalized to 20 pb, which is a factor of 20 larger than what is used in Figure 4. The shape of the data distribution provides the background estimate. The different background contributions are shown using full histograms while the open histograms are signal yields and the data are shown as solid circles. The hatched bands represent the statistical and systematic uncertainties of the simulated event samples. The systematic uncertainties include those discussed in Section 6, except the forward jet uncertainty. |
png pdf |
Figure 6-b:
Vector-like T quark candidate mass in the control region for the muon channel. The signal sample is normalized to 20 pb, which is a factor of 20 larger than what is used in Figure 4. The shape of the data distribution provides the background estimate. The different background contributions are shown using full histograms while the open histograms are signal yields and the data are shown as solid circles. The hatched bands represent the statistical and systematic uncertainties of the simulated event samples. The systematic uncertainties include those discussed in Section 6, except the forward jet uncertainty. |
png pdf |
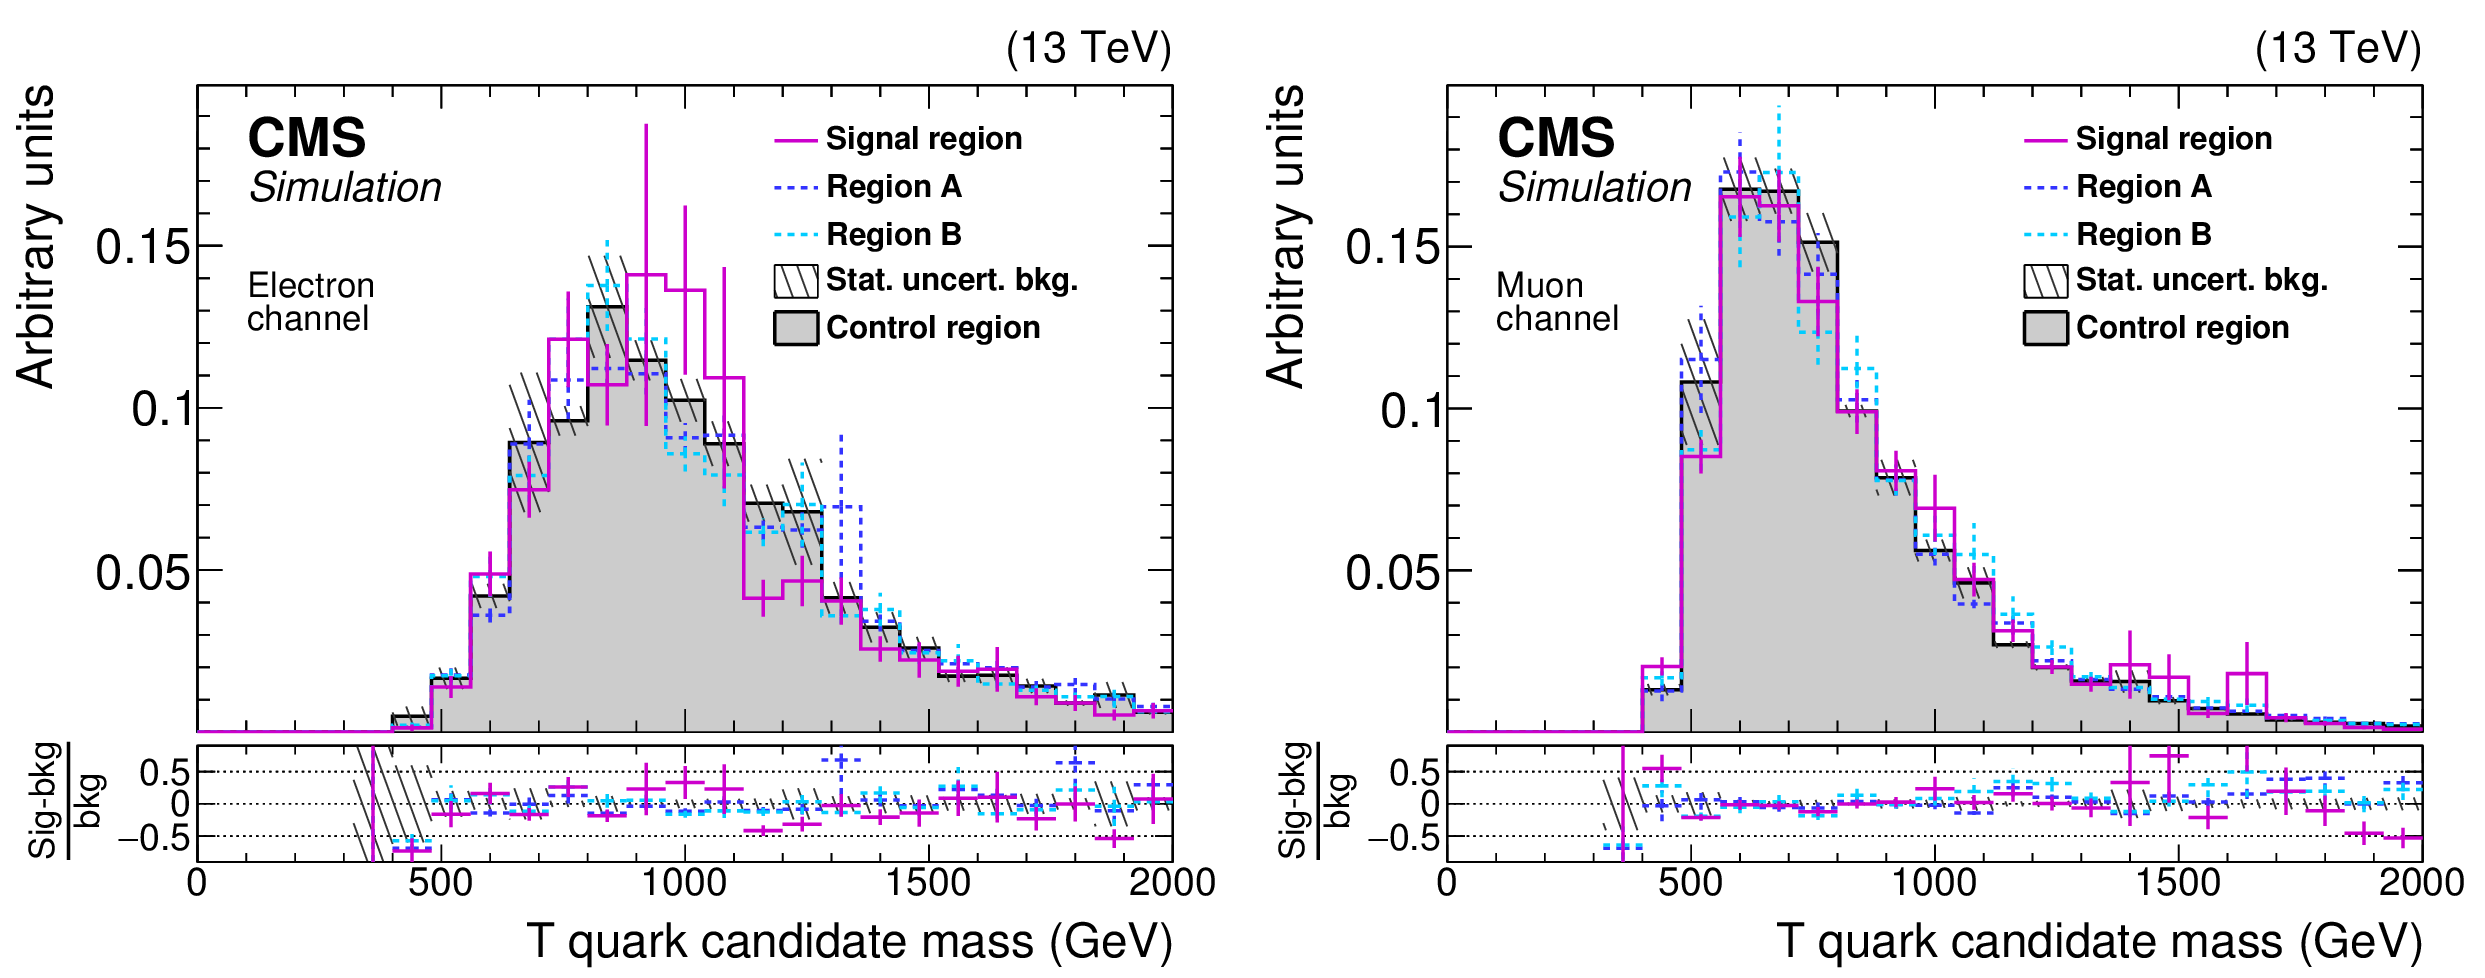
Figure 7:
Shape comparison of the T quark candidate mass distributions in the signal (open histogram) and control (shaded histogram) regions for the electron (left ) and muon (right ) channels. The distributions show the sum of all simulated backgrounds, with the statistical uncertainties indicated as the error bars (signal region) or the hatched band (control region). |
png pdf |
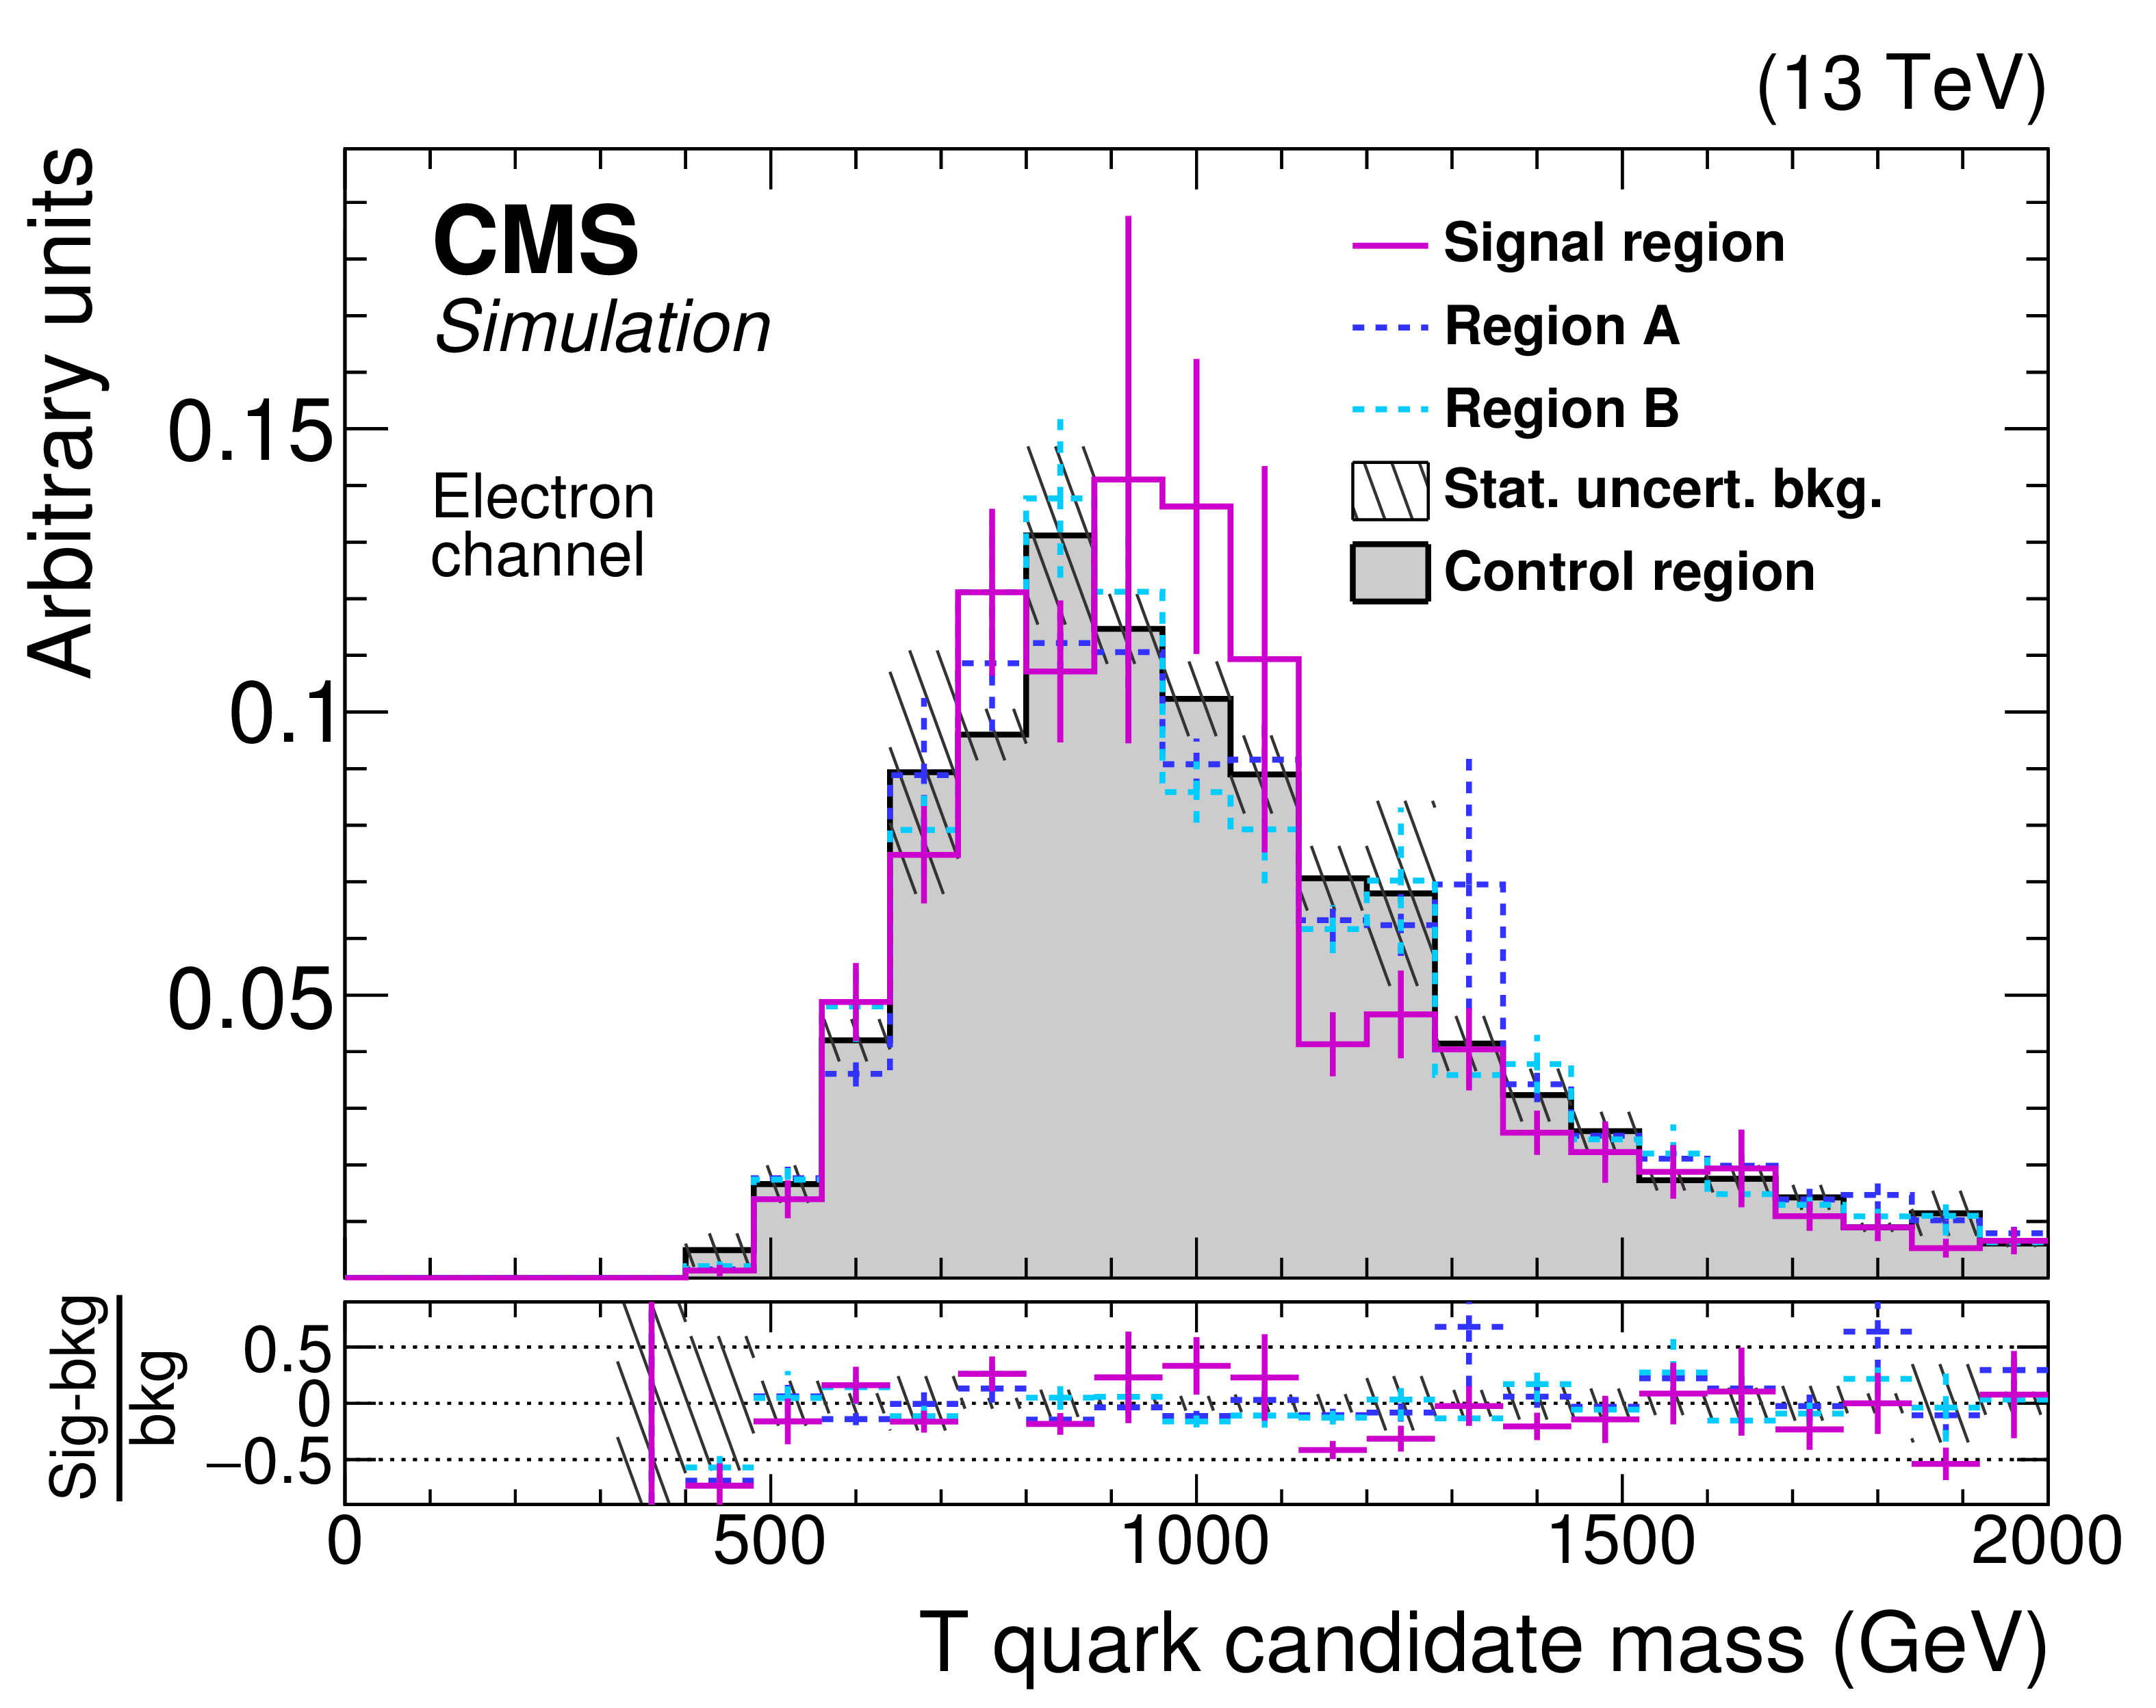
Figure 7-a:
Shape comparison of the T quark candidate mass distributions in the signal (open histogram) and control (shaded histogram) regions for the electron channel. The distribution shows the sum of all simulated backgrounds, with the statistical uncertainties indicated as the error bars (signal region) or the hatched band (control region). |

png pdf |
Figure 7-b:
Shape comparison of the T quark candidate mass distributions in the signal (open histogram) and control (shaded histogram) regions for the muon channel. The distribution shows the sum of all simulated backgrounds, with the statistical uncertainties indicated as the error bars (signal region) or the hatched band (control region). |
png pdf |
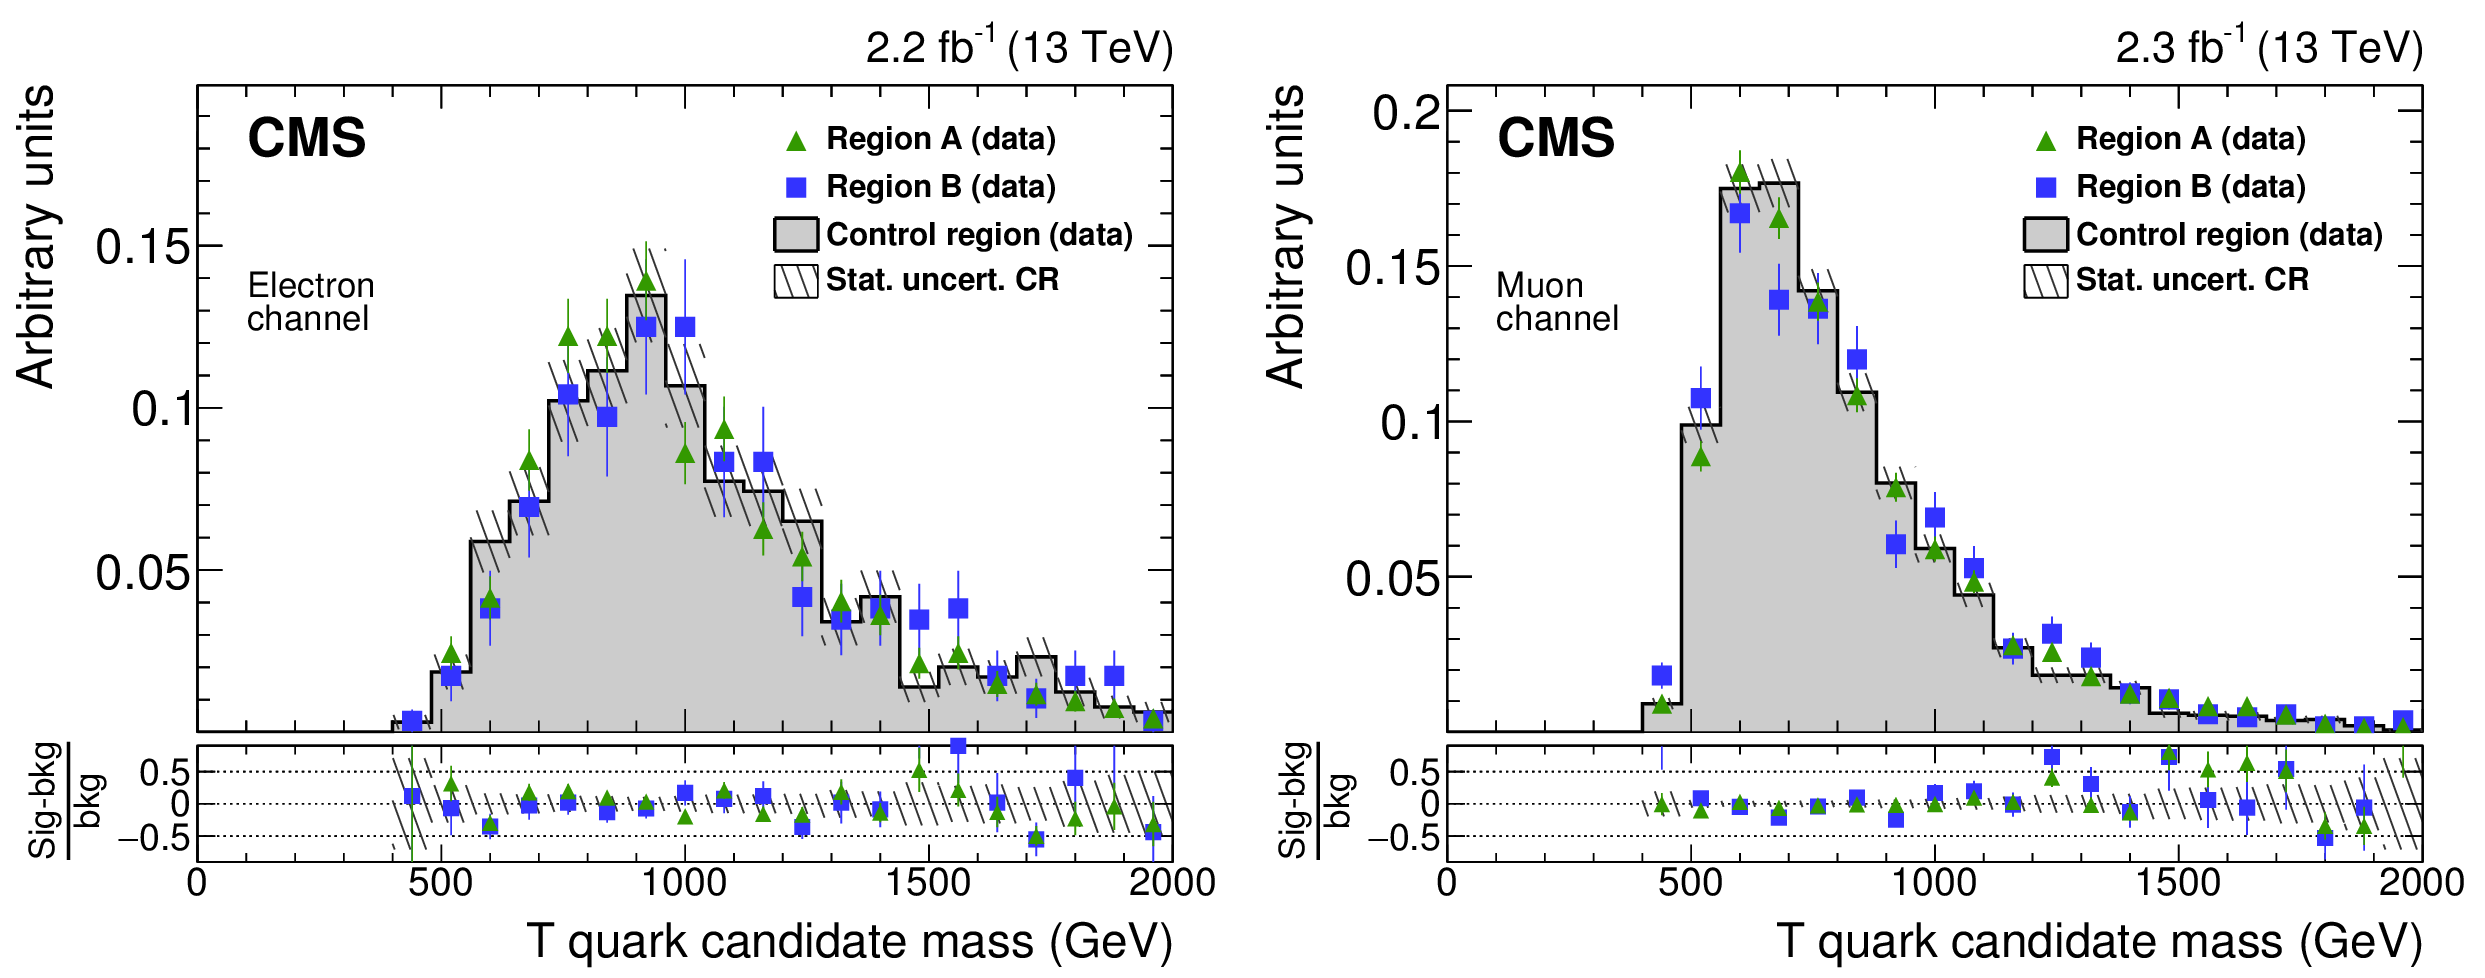
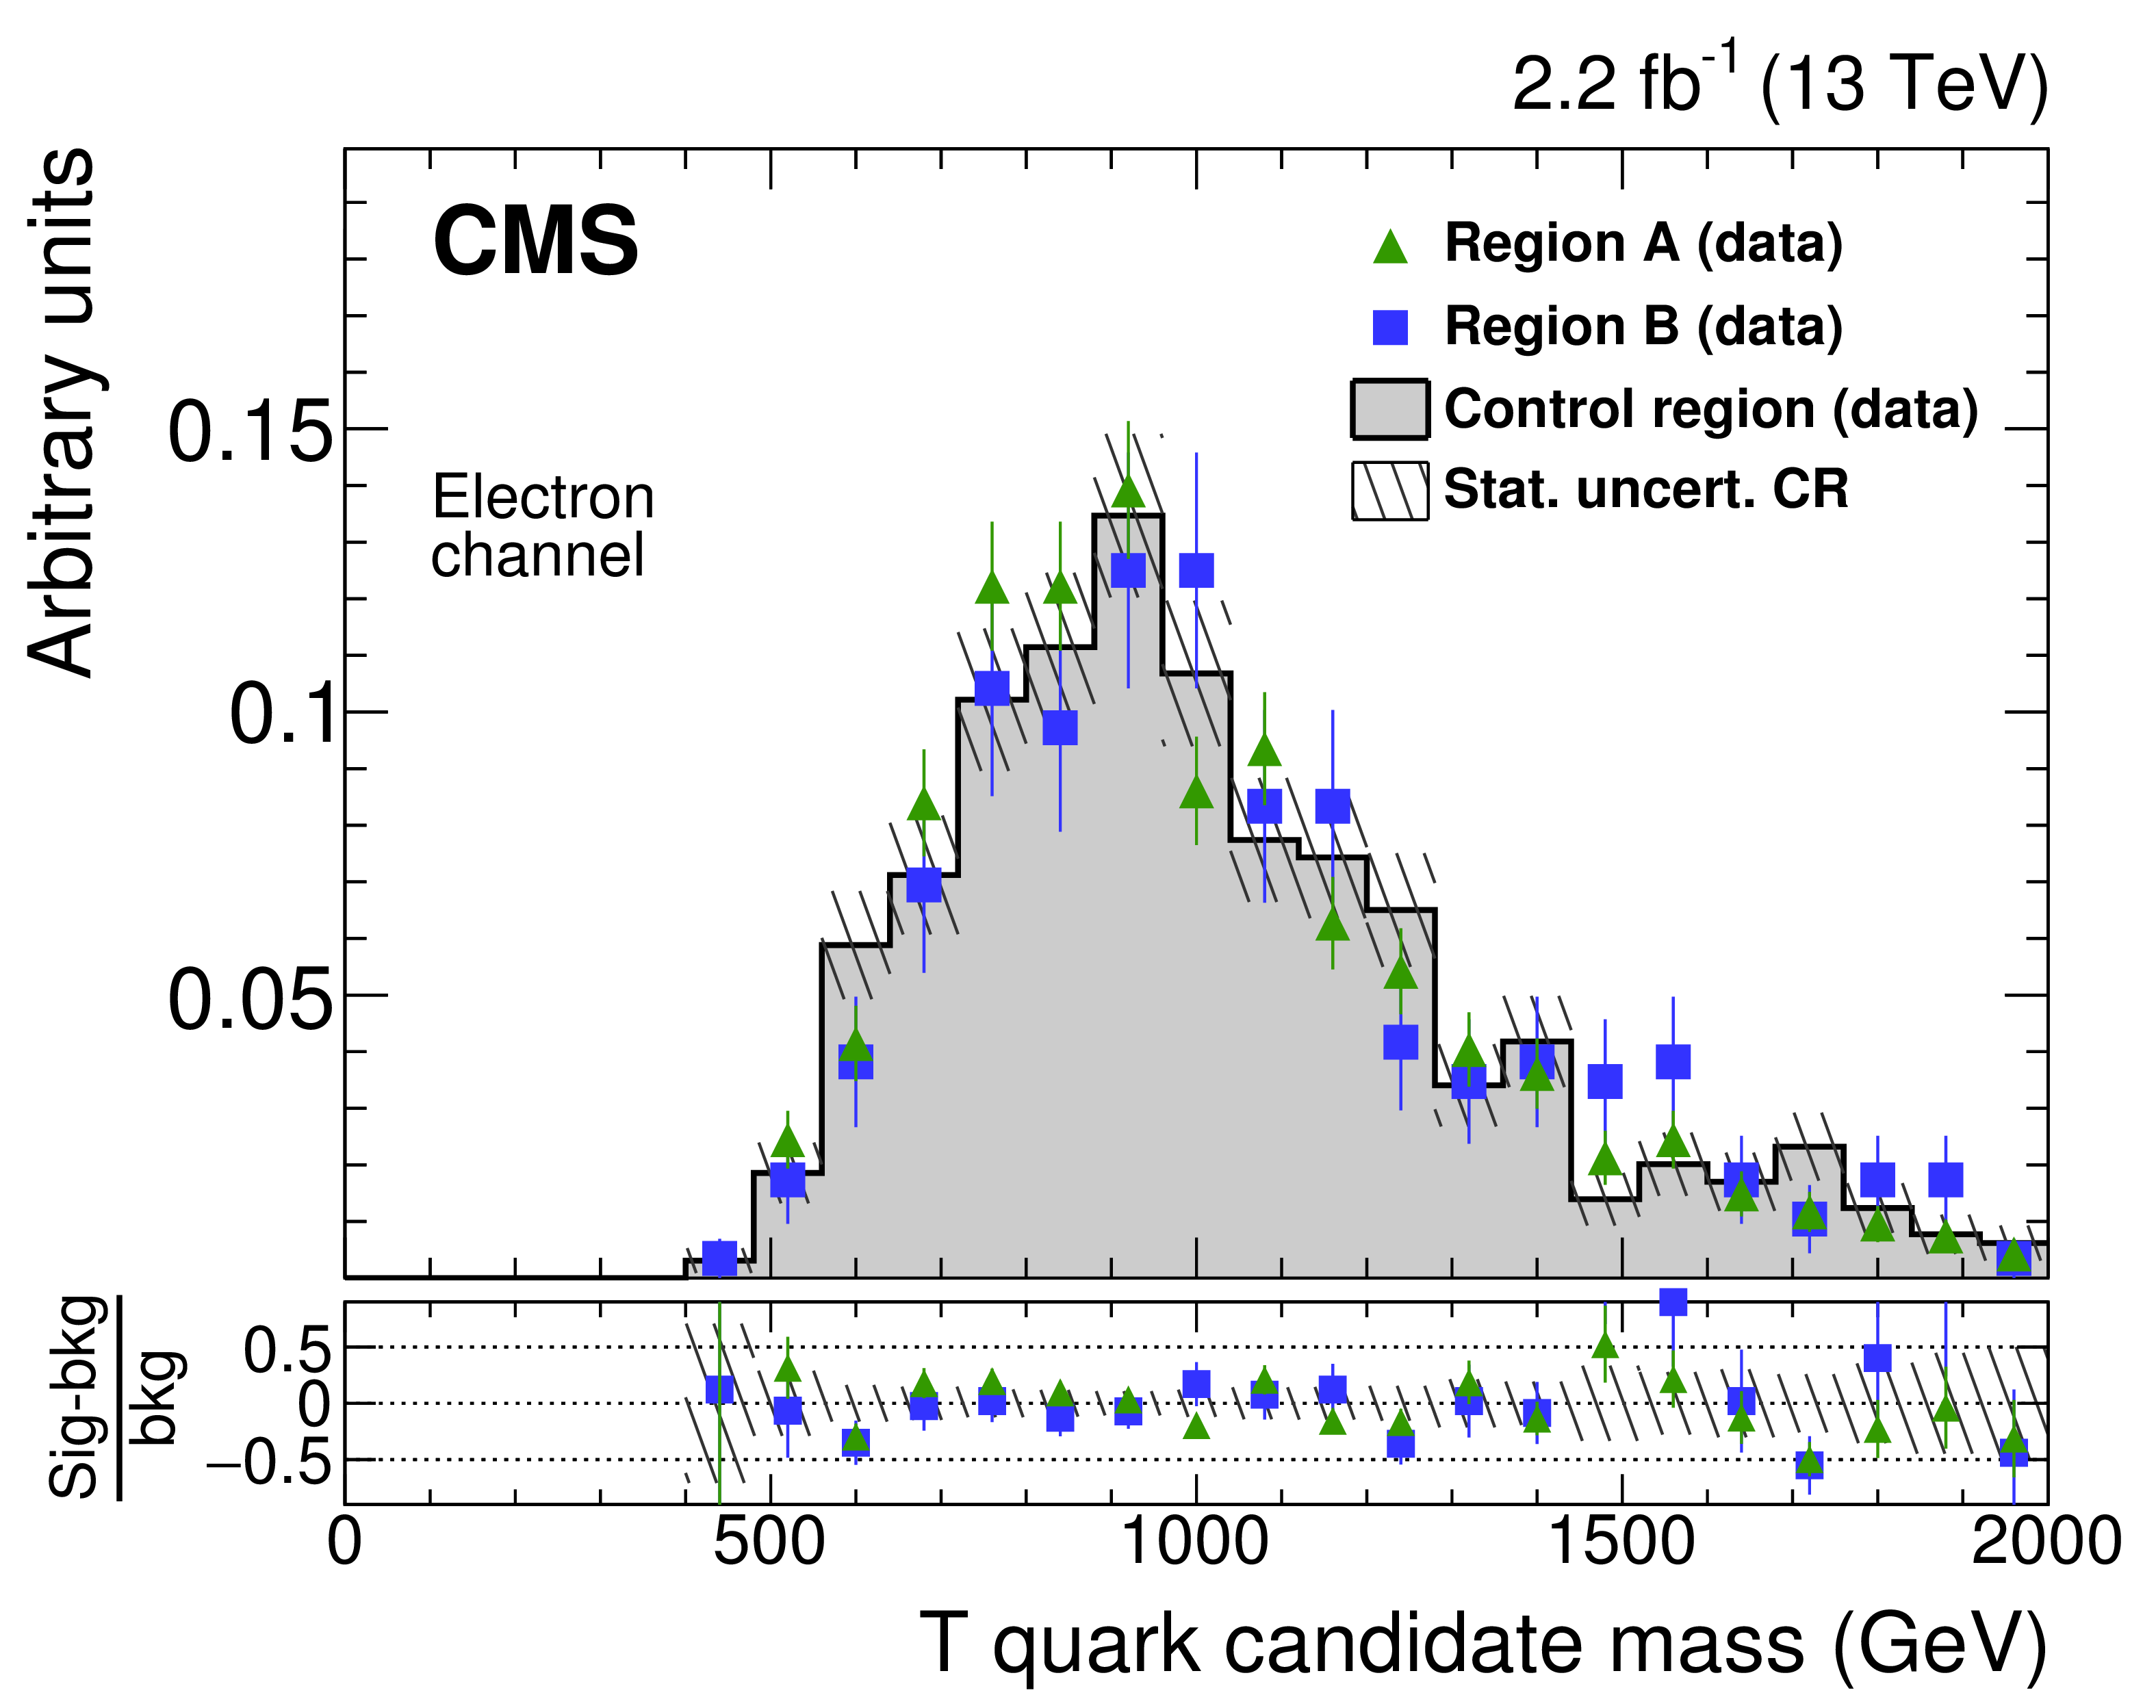
Figure 8:
Shape comparison of the ${\mathrm {T}}$ quark candidate mass distributions in the control region (shaded histogram) regions and the validation regions A (green) and B (blue) for the electron (left) and muon (right) channels in data. |
png pdf |
Figure 8-a:
Shape comparison of the ${\mathrm {T}}$ quark candidate mass distributions in the control region (shaded histogram) regions and the validation regions A (green) and B (blue) for the electron channel in data. |

png pdf |
Figure 8-b:
Shape comparison of the ${\mathrm {T}}$ quark candidate mass distributions in the control region (shaded histogram) regions and the validation regions A (green) and B (blue) for the muon channel in data. |
png pdf |
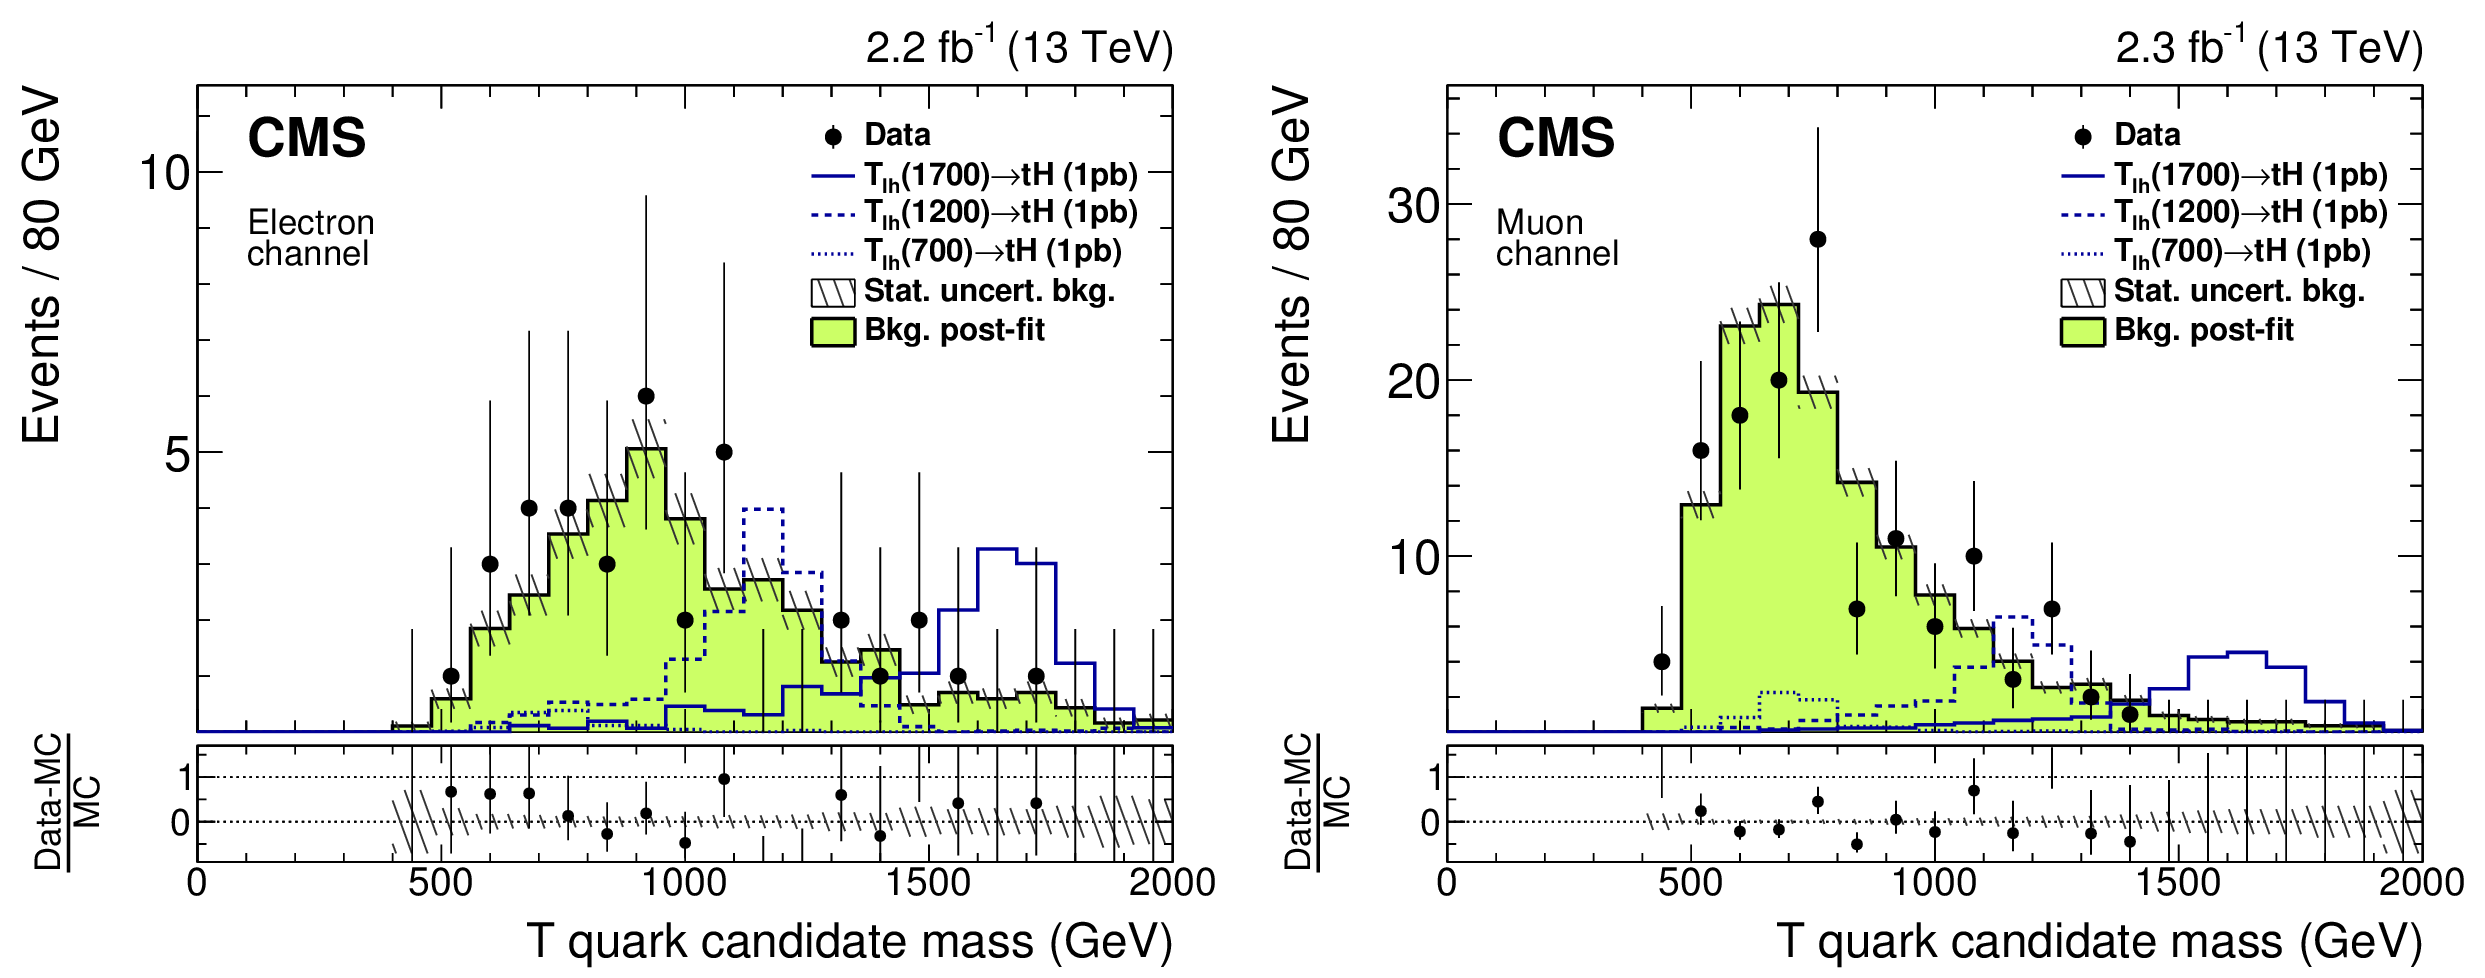
Figure 9:
Final background, data, and expected signal distributions in $ {M_\mathrm {T}} $ in the signal region for the electron (left) and muon (right) channels. The normalisation of the background estimate is taken from the fit, its uncertainty is 12%. The hatched uncertainty band shows the statistical uncertainty in the background prediction, which is used as the shape uncertainty in the fit, as detailed in Section 6. |
png pdf |
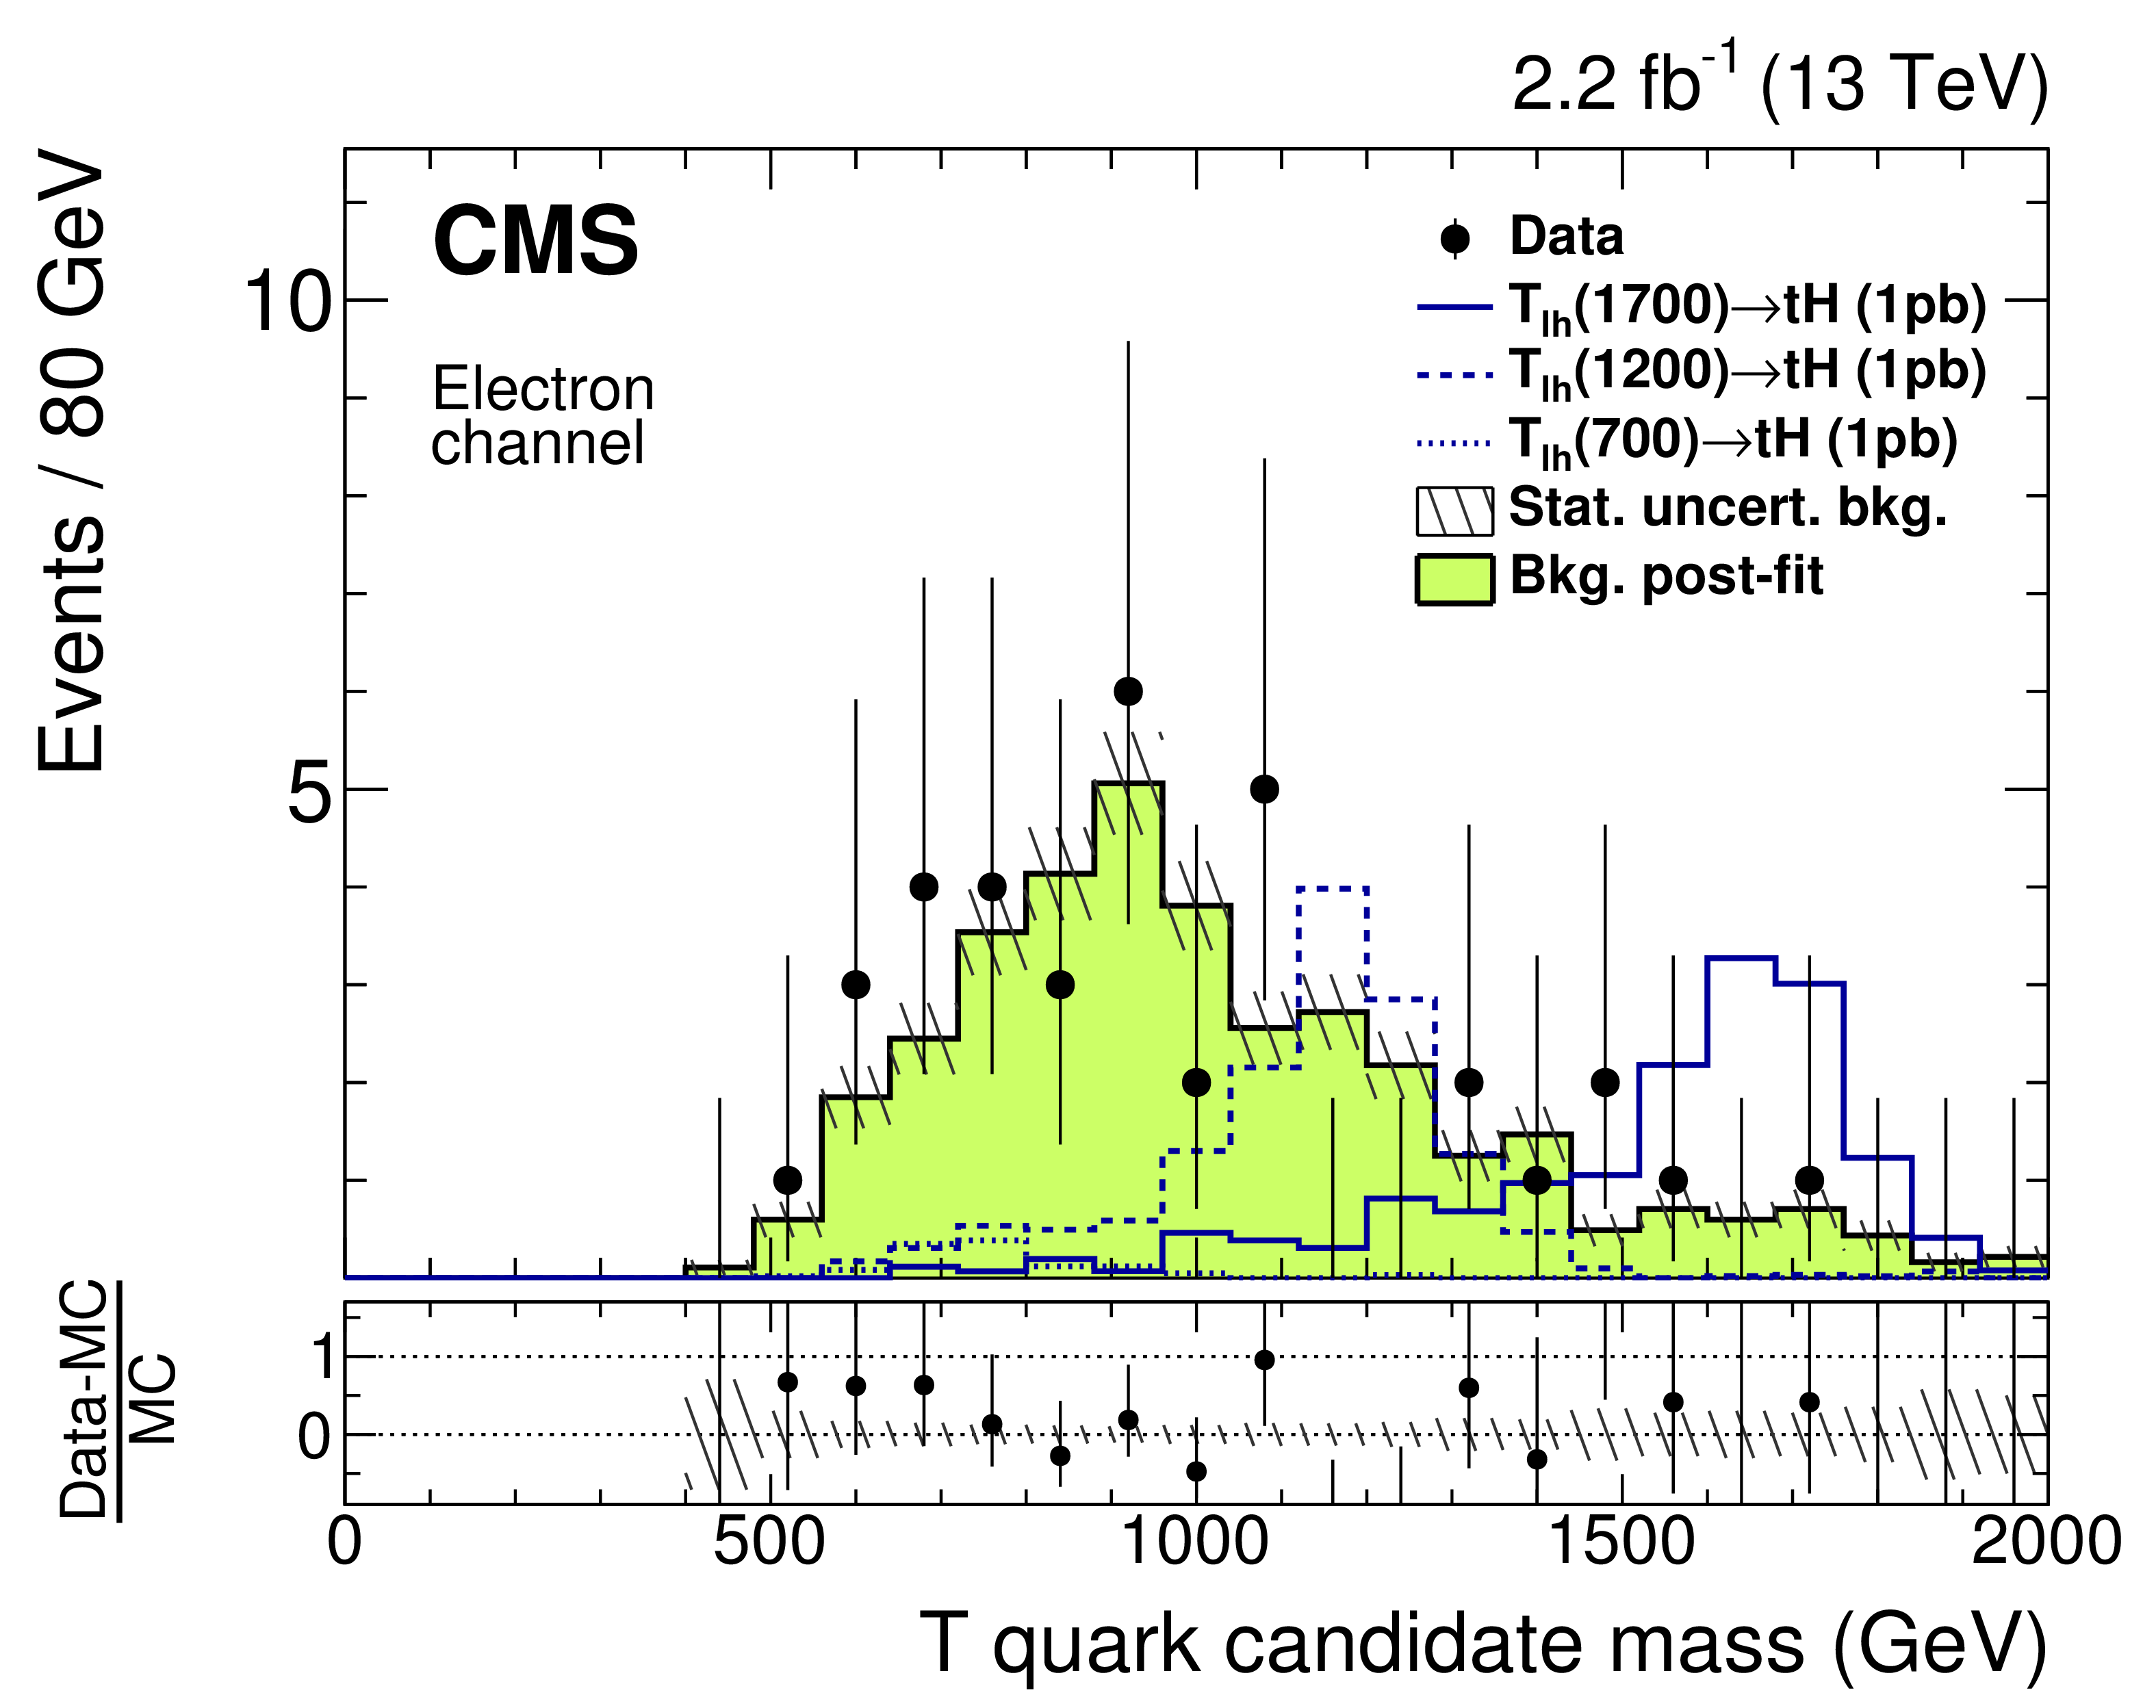
Figure 9-a:
Final background, data, and expected signal distributions in $ {M_\mathrm {T}} $ in the signal region for the electron channel. The normalisation of the background estimate is taken from the fit, its uncertainty is 12%. The hatched uncertainty band shows the statistical uncertainty in the background prediction, which is used as the shape uncertainty in the fit, as detailed in Section 6. |
png pdf |
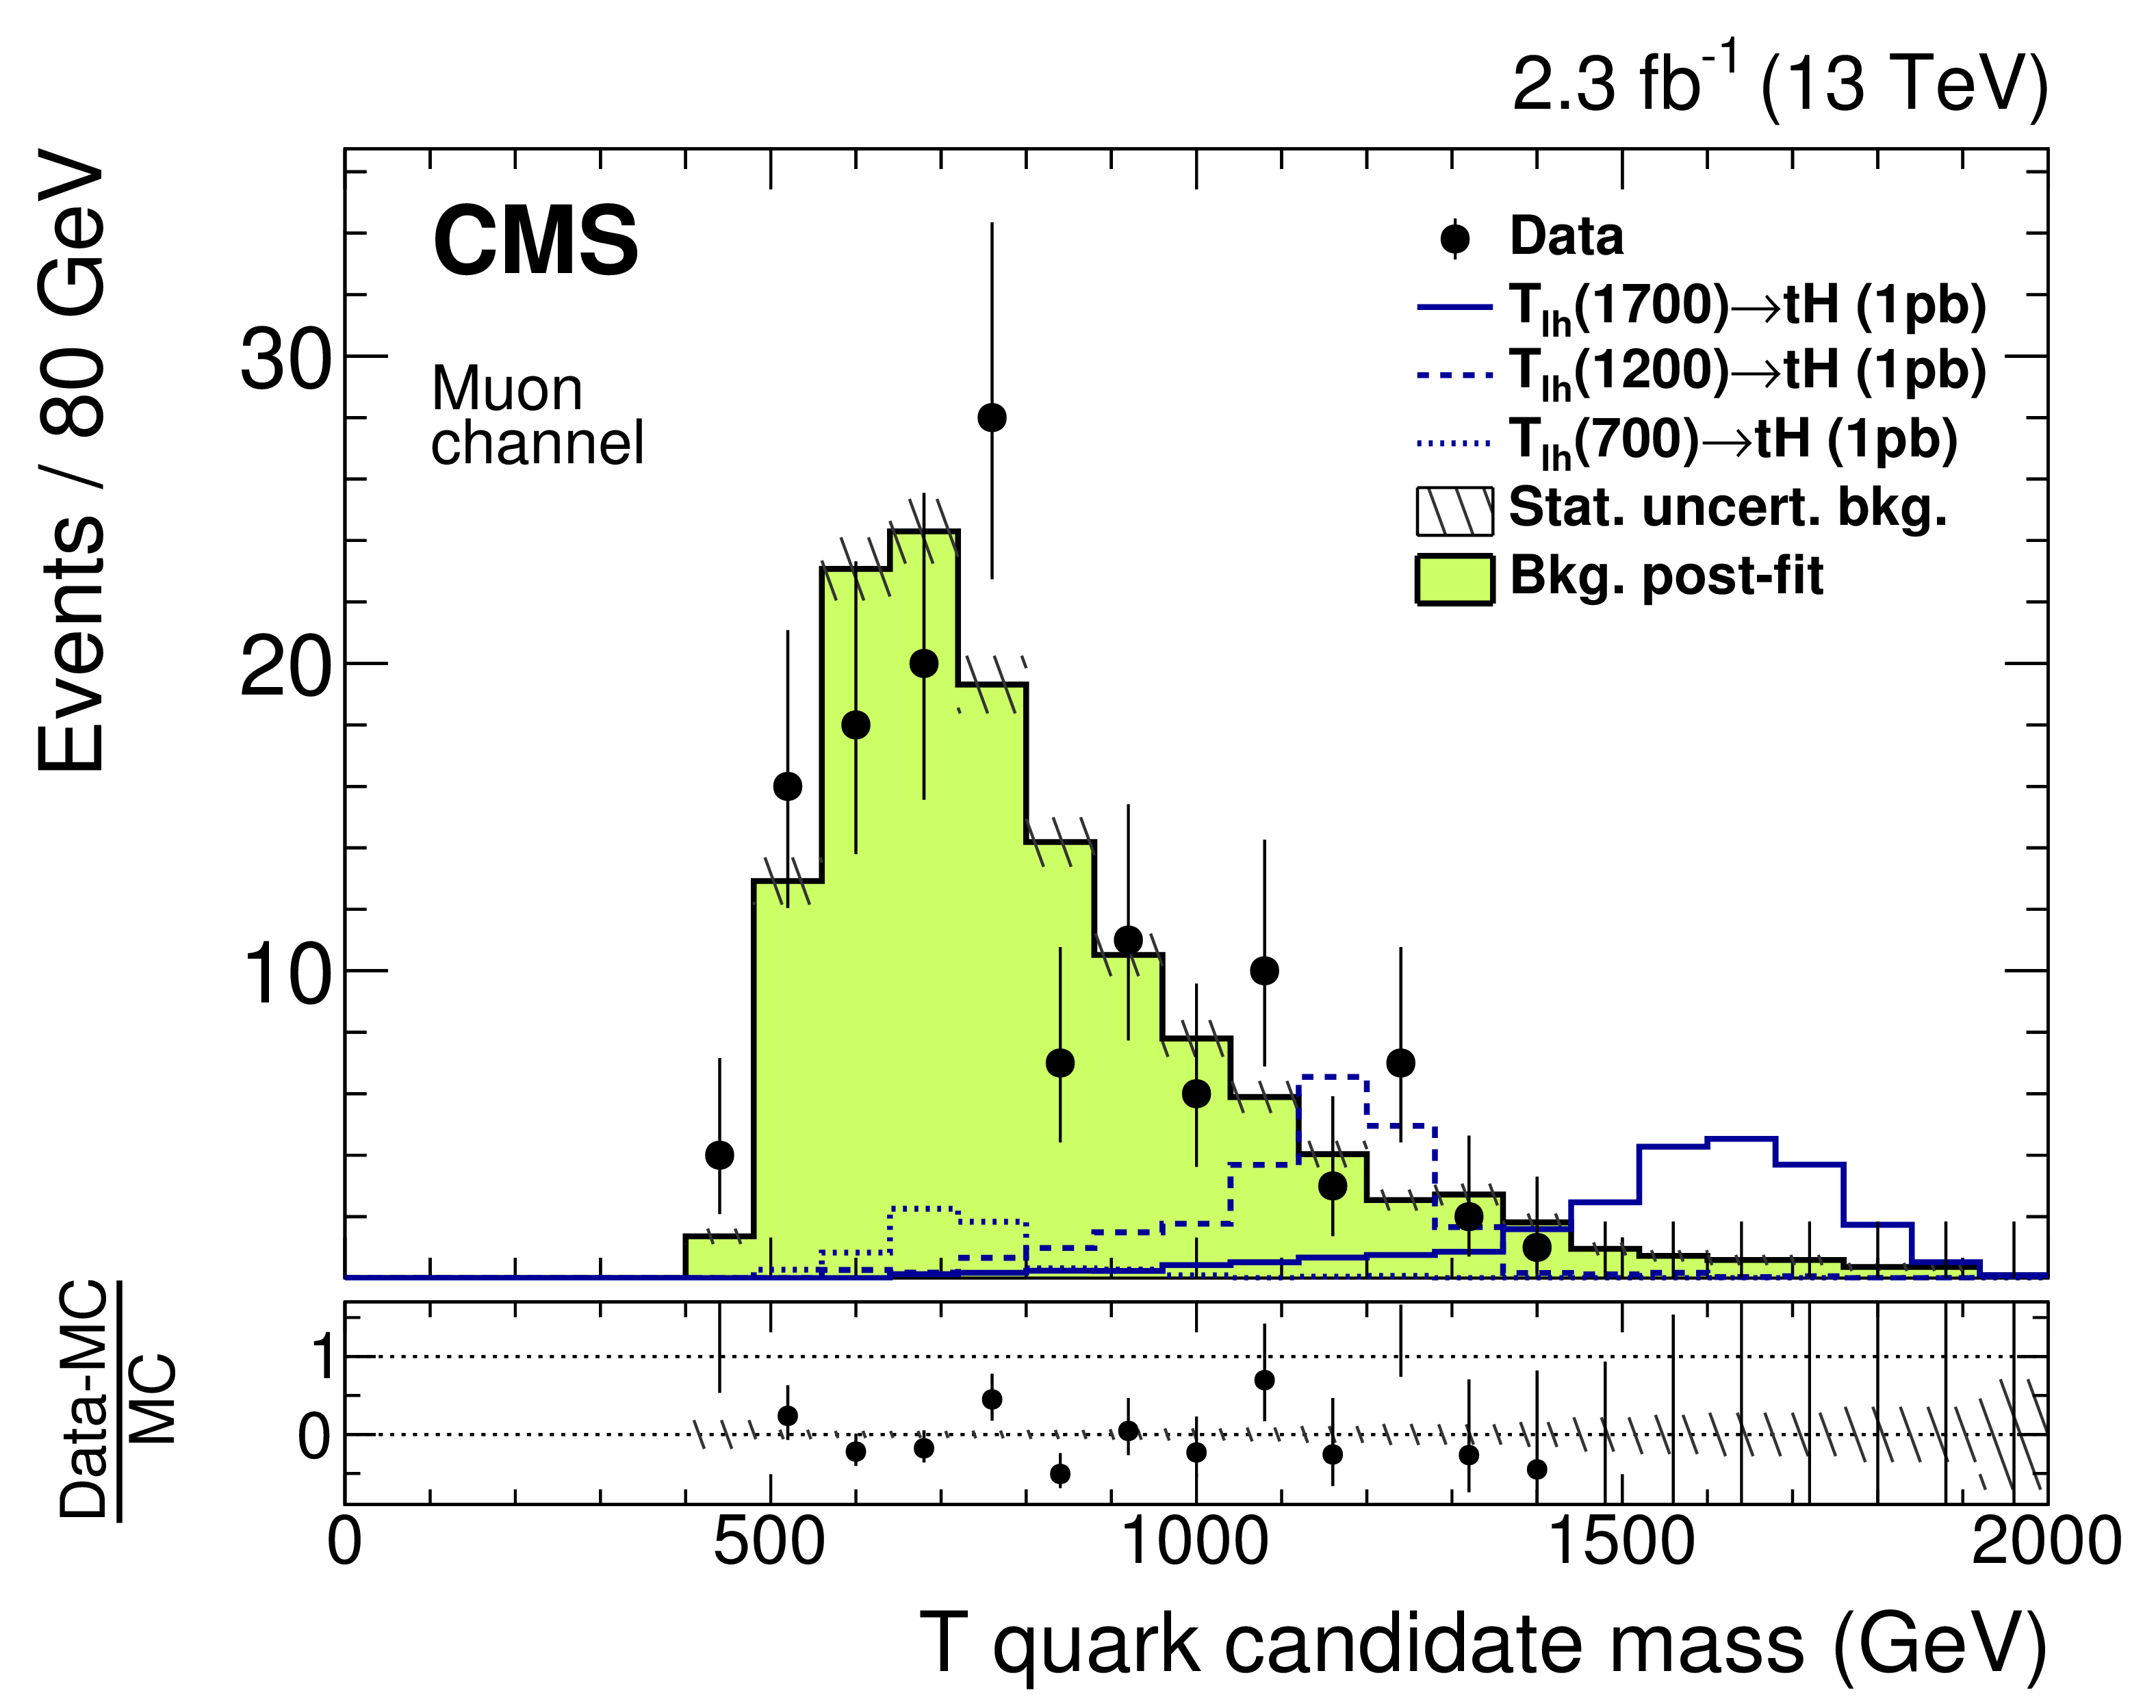
Figure 9-b:
Final background, data, and expected signal distributions in $ {M_\mathrm {T}} $ in the signal region for the muon channel. The normalisation of the background estimate is taken from the fit, its uncertainty is 12%. The hatched uncertainty band shows the statistical uncertainty in the background prediction, which is used as the shape uncertainty in the fit, as detailed in Section 6. |
png pdf |
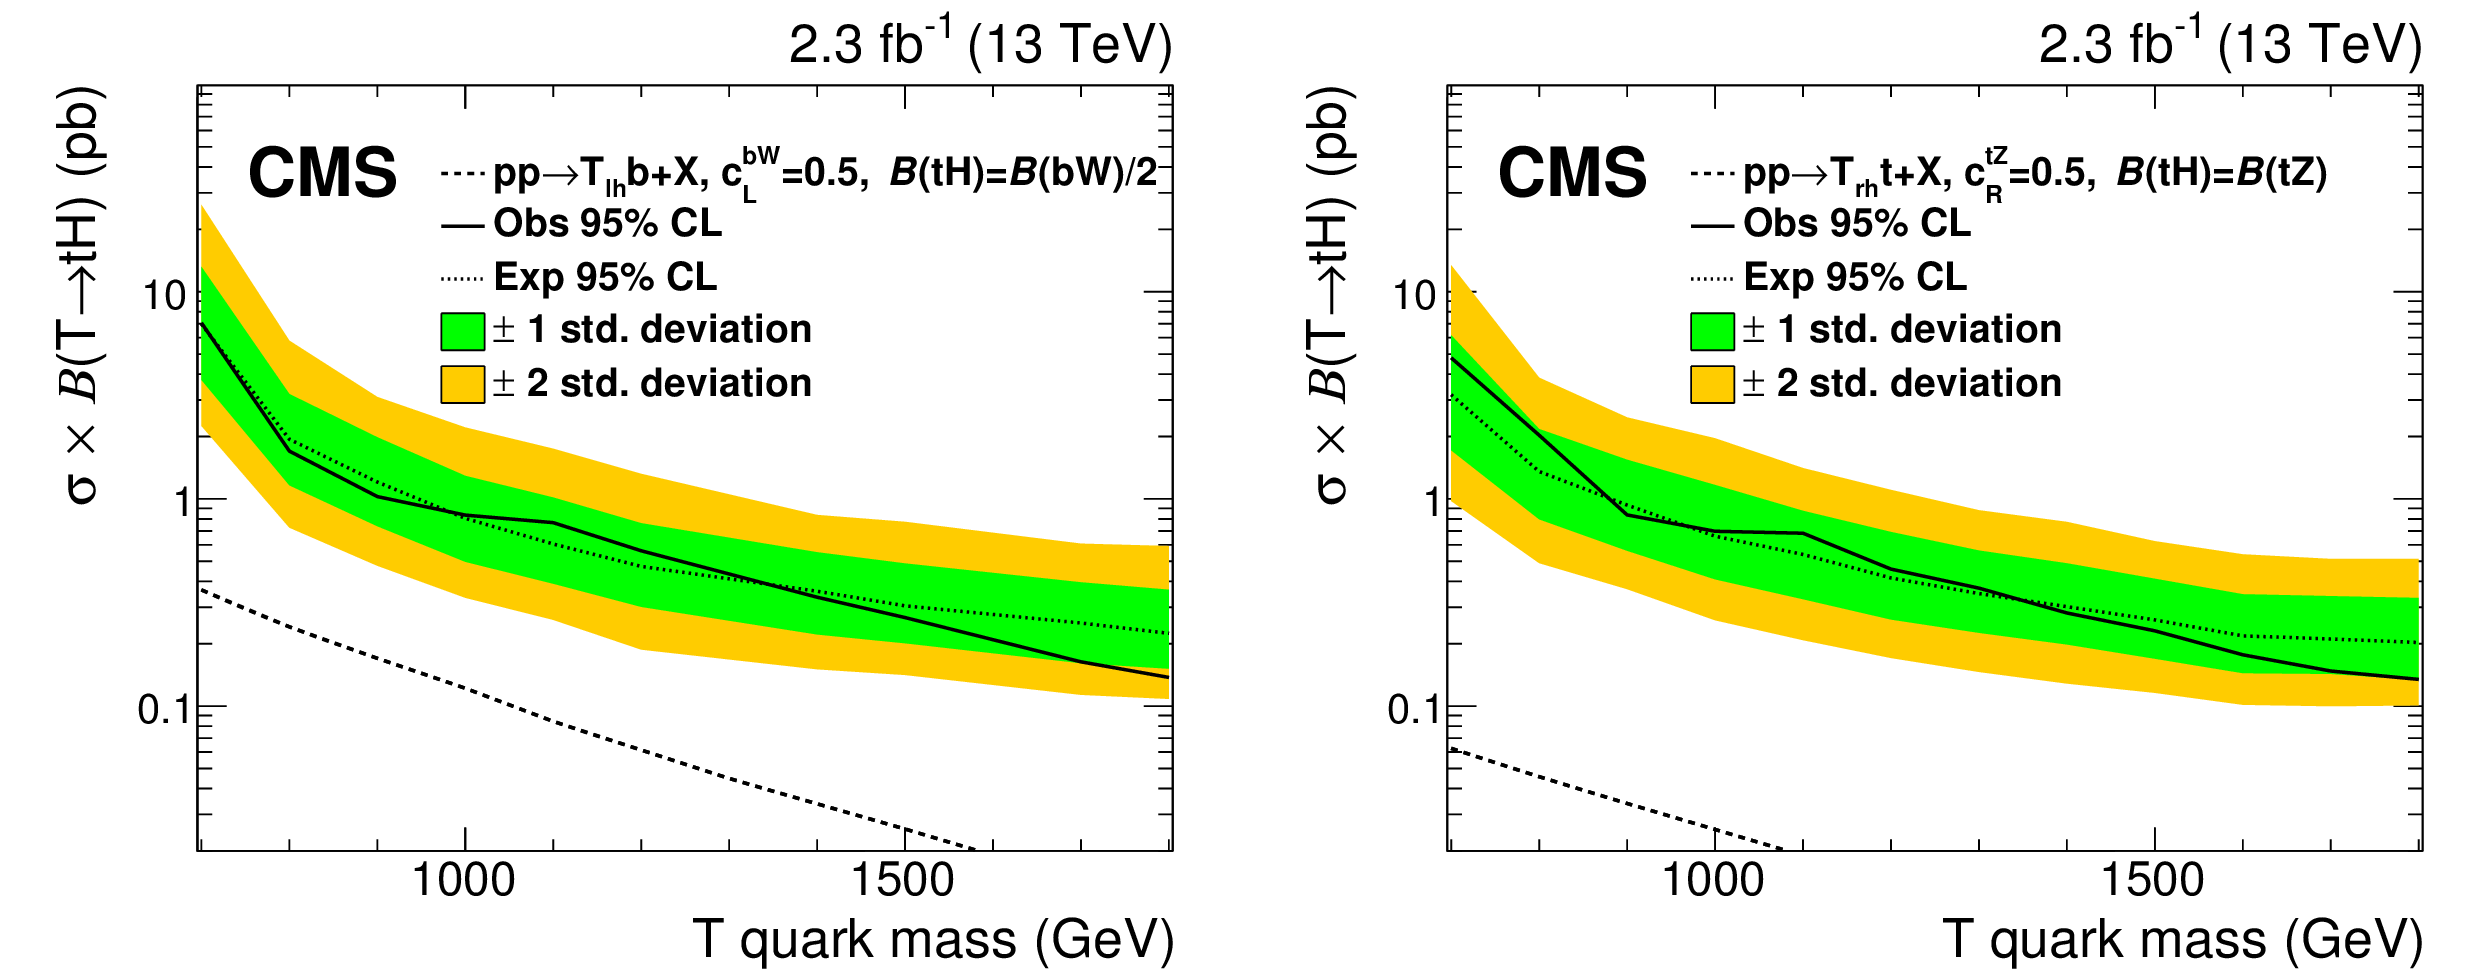
Figure 10:
Exclusion limits on the product of the cross section and the branching fraction of single T quark production and $ {\mathrm {T}} \to \mathrm{ t } \mathrm{ H } $ decay. A simultaneous fit is made to the electron and muon channels. Left- (right-) handed T quark production in association with a bottom (top) quark is shown in the left- (right-) diagram. |

png pdf |
Figure 10-a:
Exclusion limits on the product of the cross section and the branching fraction of single T quark production and $ {\mathrm {T}} \to \mathrm{ t } \mathrm{ H } $ decay. A simultaneous fit is made to the electron and muon channels. The left-handed T quark production in association with a bottom quark is shown. |
png pdf |
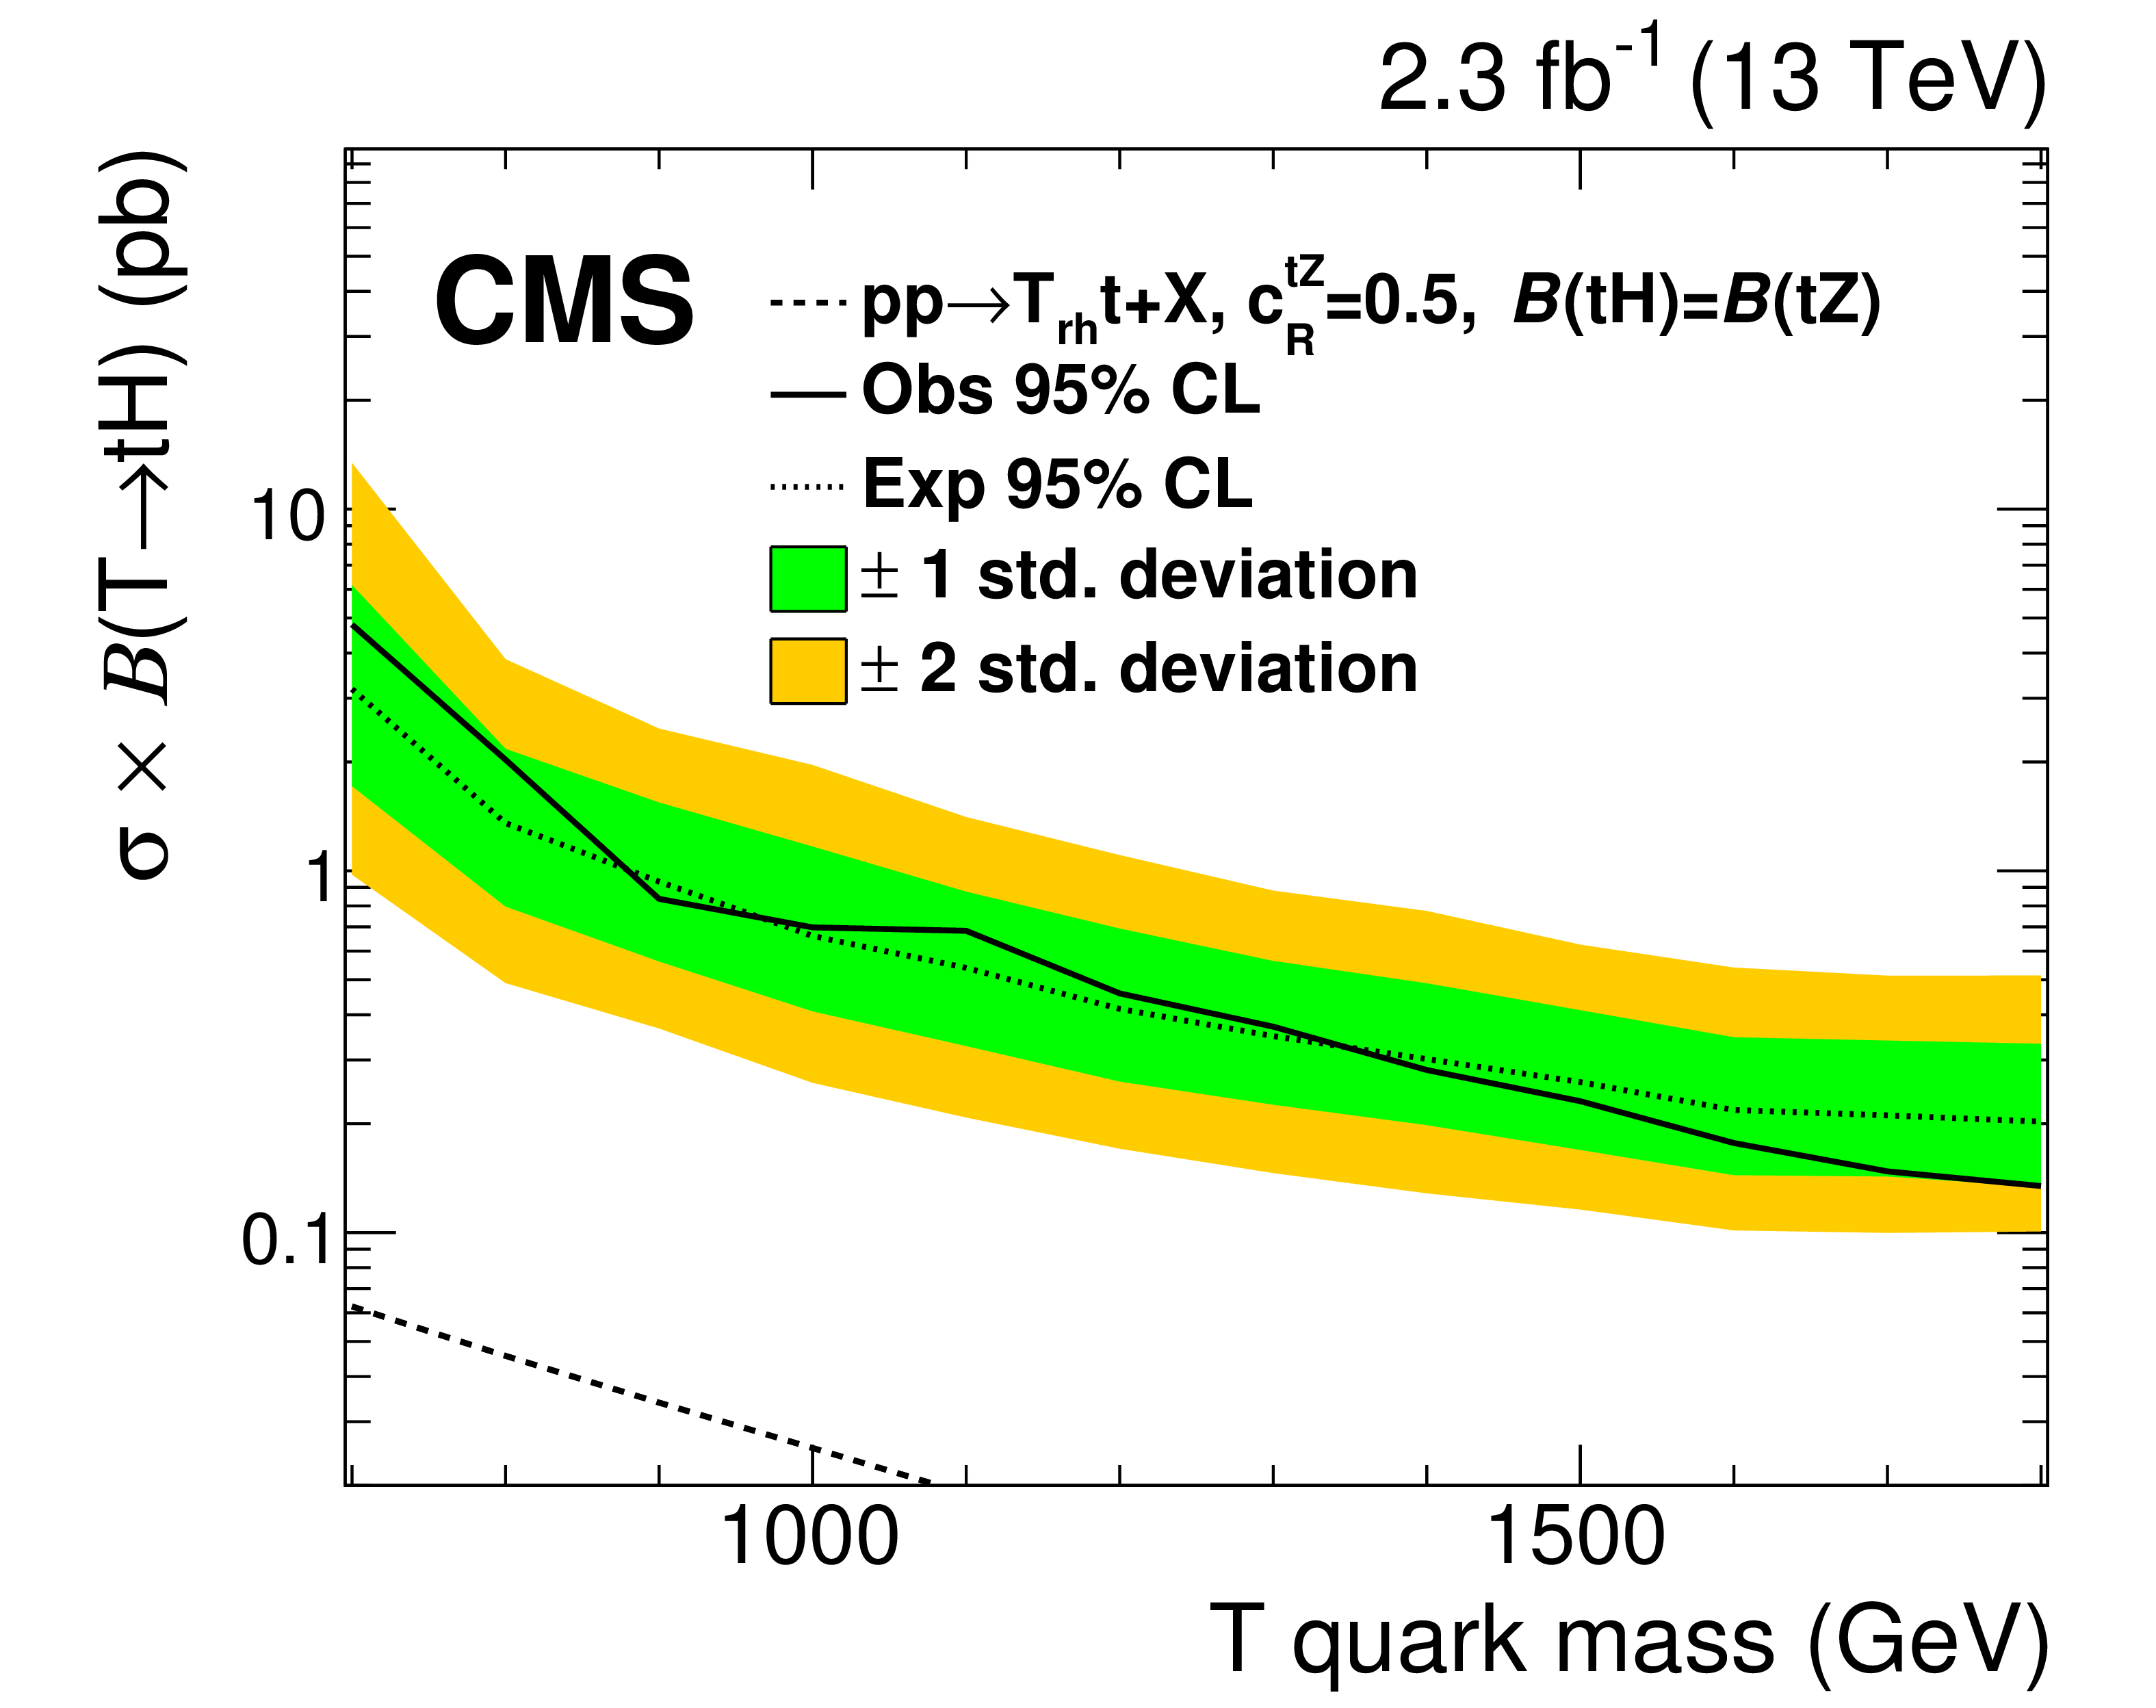
Figure 10-b:
Exclusion limits on the product of the cross section and the branching fraction of single T quark production and $ {\mathrm {T}} \to \mathrm{ t } \mathrm{ H } $ decay. A simultaneous fit is made to the electron and muon channels. The right-handed T quark production in association with a top quark is shown. |
| Tables | |

png pdf |
Table 1:
Event selection criteria: required number of b-tagged subjets for the Higgs boson candidate, and number of forward jets. |
png pdf |
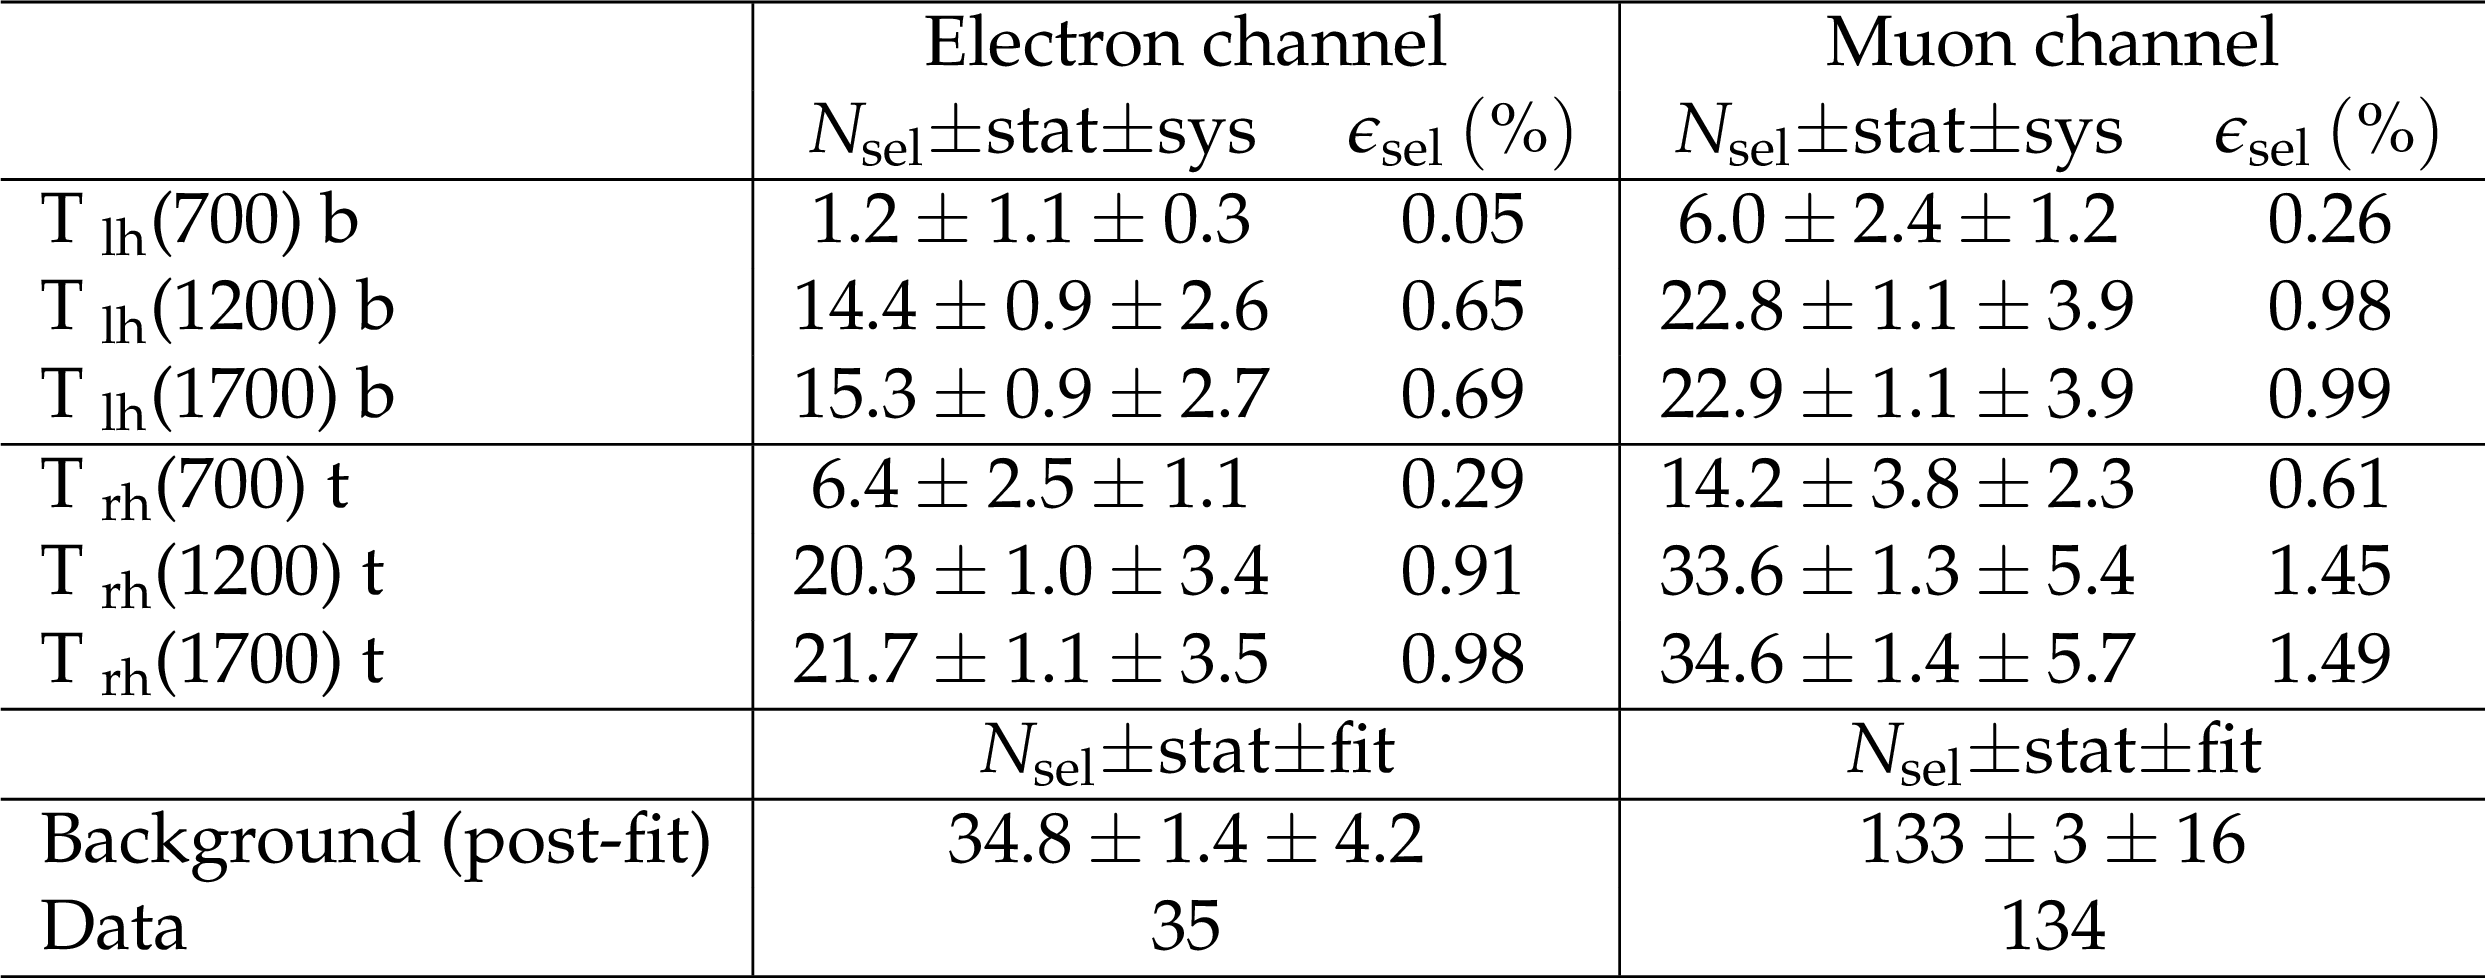
Table 2:
Number of selected events $N_\text {sel}$ and selection efficiency $\epsilon _\text {sel}$ for the signal region including both statistical (stat) and systematic (sys) uncertainties. For the background, the post-fit value (as described in Sections {background} and \ref {sec_limits}) is quoted. The left- (right-) handed T quark production in association with a bottom (top) quark is denoted by a subscript lh (rh) and following b (t). All signal samples are normalised to a cross section of 1 pb, i.e. the product of the branching fractions for the top quark decaying to final states including a lepton, and the Higgs boson decaying to bottom quarks, amounting to approximately 8%, is included in the signal selection efficiency. |
png pdf |
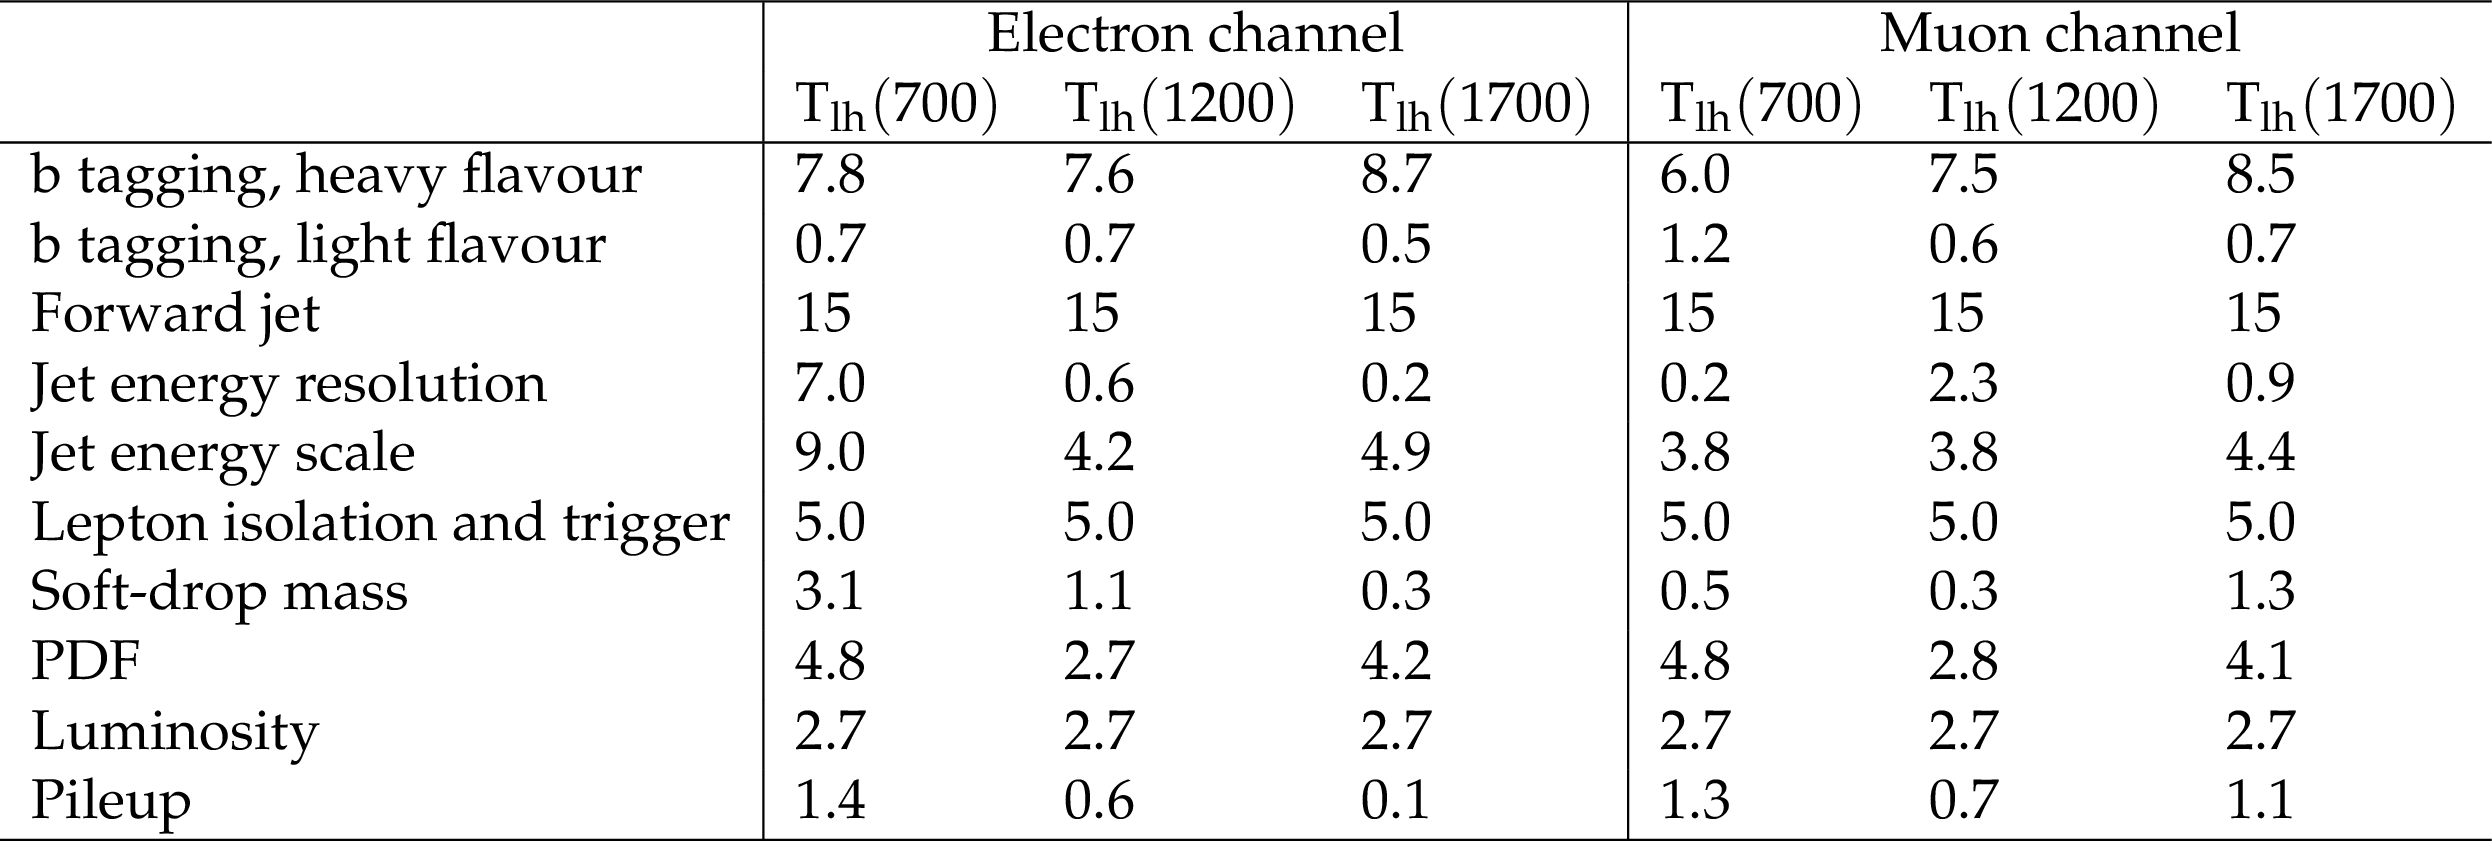
Table 3:
Impacts of the largest systematic uncertainties in the signal event yields. The signal samples for $ {\mathrm {T}} _\mathrm {lh}\mathrm{ b } $ production are shown. The uncertainties in the forward jet, and lepton isolation and trigger are rate uncertainties, all other uncertainties are evaluated bin-by-bin. All values are reported as percentage of the signal event yield. |
| Summary |
| A search for a singly produced vector-like T quark decaying to a top quark and a Higgs boson has been presented, where the top quark decay includes an electron or a muon and the Higgs boson decays into a pair of b quarks. For every event, the four-momentum of the vector-like T quark candidate is reconstructed and its mass is evaluated. No excess over the estimated backgrounds is observed. Upper limits are placed on the product of the cross section and the branching fraction for vector-like T quarks to third-generation standard model quarks in the mass range of 700 to 1800 GeV, at 95% confidence level. This is the first analysis setting exclusion limits on the cross section of singly produced vector-like T quarks at a centre-of-mass energy of 13 TeV. |
| References | ||||
| 1 | N. Arkani-Hamed, A. G. Cohen, and H. Georgi | Electroweak symmetry breaking from dimensional deconstruction | PLB 513 (2001) 232 | hep-ph/0105239 |
| 2 | M. Schmaltz and D. Tucker-Smith | Little Higgs review | Ann. Rev. Nucl. Part. Sci. 55 (2005) 229 | hep-ph/0502182 |
| 3 | M. Perelstein, M. E. Peskin, and A. Pierce | Top quarks and electroweak symmetry breaking in little Higgs models | PRD 69 (2004) 075002 | hep-ph/0310039 |
| 4 | I. Antoniadis, K. Benakli, and M. Quiros | Finite Higgs mass without supersymmetry | New J. Phys. 3 (2001) 20 | hep-th/0108005 |
| 5 | Y. Hosotani, S. Noda, and K. Takenaga | Dynamical gauge-Higgs unification in the electroweak theory | PLB 607 (2005) 276 | hep-ph/0410193 |
| 6 | M. J. Dugan, H. Georgi, and D. B. Kaplan | Anatomy of a composite Higgs model | Nucl. Phys. B 254 (1985) 299 | |
| 7 | D. B. Kaplan | Flavor at SSC energies: A new mechanism for dynamically generated fermion masses | Nucl. Phys. B 365 (1991) 259 | |
| 8 | K. Agashe, R. Contino, and A. Pomarol | The minimal composite Higgs model | Nucl. Phys. B 719 (2005) 165 | hep-ph/0412089 |
| 9 | R. Contino, L. Da Rold, and A. Pomarol | Light custodians in natural composite Higgs models | PRD 75 (2007) 055014 | hep-ph/0612048 |
| 10 | A. De Simone, O. Matsedonskyi, R. Rattazzi, and A. Wulzer | A first top partner hunter's guide | JHEP 04 (2013) 1 | 1211.5663 |
| 11 | ATLAS Collaboration | Observation of a new particle in the search for the Standard Model Higgs boson with the ATLAS detector at the LHC | PLB 716 (2012) 1 | 1207.7214 |
| 12 | CMS Collaboration | Observation of a new boson at a mass of 125 GeV with the CMS experiment at the LHC | PLB 716 (2012) 30 | CMS-HIG-12-028 1207.7235 |
| 13 | CMS Collaboration | Observation of a new boson with mass near 125 GeV in pp collisions at $ \sqrt{s} $ = 7 and 8 TeV | JHEP 06 (2013) 081 | CMS-HIG-12-036 1303.4571 |
| 14 | O. Eberhardt et al. | Joint analysis of Higgs boson decays and electroweak precision observables in the standard model with a sequential fourth generation | PRD 86 (2012) 013011 | 1204.3872 |
| 15 | J. A. Aguilar-Saavedra, R. Benbrik, S. Heinemeyer, and M. Perez-Victoria | Handbook of vector-like quarks: mixing and single production | PRD 88 (2013) 094010 | 1306.0572 |
| 16 | ATLAS Collaboration | Search for pair and single production of new heavy quarks that decay to a Z boson and a third-generation quark in pp collisions at $ \sqrt{s}=8 $ TeV with the ATLAS detector | JHEP 11 (2014) 104 | 1409.5500 |
| 17 | ATLAS Collaboration | Analysis of events with b-jets and a pair of leptons of the same charge in pp collisions at $ \sqrt{s}=8 $ TeV with the ATLAS detector | JHEP 10 (2015) 150 | 1504.04605 |
| 18 | ATLAS Collaboration | Search for production of vector-like quark pairs and of four top quarks in the lepton-plus-jets final state in pp collisions at $ \sqrt{s}=8 $ TeV with the ATLAS detector | JHEP 08 (2015) 105 | 1505.04306 |
| 19 | ATLAS Collaboration | Search for single production of vector-like quarks decaying into $ Wb $ in $ pp $ collisions at $ \sqrt{s} = 8 $ TeV with the ATLAS detector | EPJC 76 (2016), no. 8, 442 | 1602.05606 |
| 20 | CMS Collaboration | Search for vector-like charge 2/3 T quarks in proton-proton collisions at $ \sqrt{s} $ = 8 TeV | PRD 93 (2016) 012003 | CMS-B2G-13-005 1509.04177 |
| 21 | CMS Collaboration | Search for vector-like T quarks decaying to top quarks and Higgs bosons in the all-hadronic channel using jet substructure | JHEP 06 (2015) 080 | CMS-B2G-14-002 1503.01952 |
| 22 | CMS Collaboration | The CMS experiment at the CERN LHC | JINST 3 (2008) S08004 | CMS-00-001 |
| 23 | CMS Collaboration | Particle-flow event reconstruction in CMS and performance for jets, taus, and $ E_{\mathrm{T}}^{\text{miss}} $ | CDS | |
| 24 | CMS Collaboration | Commissioning of the particle-flow event with the first LHC collisions recorded in the CMS detector | CDS | |
| 25 | CMS Collaboration | Performance of electron reconstruction and selection with the CMS detector in proton-proton collisions at $ \sqrt{s} = 8 $$ TeV $ | JINST 10 (2015) P06005 | CMS-EGM-13-001 1502.02701 |
| 26 | CMS Collaboration | Performance of CMS muon reconstruction in pp collision events at $ \sqrt{s} = 7 $$ TeV $ | JINST 7 (2012) P10002 | CMS-MUO-10-004 1206.4071 |
| 27 | M. Cacciari, G. P. Salam, and G. Soyez | The anti-$ k_t $ jet clustering algorithm | JHEP 04 (2008) 063 | 0802.1189 |
| 28 | M. Cacciari, G. P. Salam, and G. Soyez | FastJet user manual | EPJC 72 (2012) 1896 | 1111.6097 |
| 29 | M. Cacciari, G. P. Salam, and G. Soyez | The catchment area of jets | JHEP 04 (2008) 005 | 0802.1188 |
| 30 | CMS Collaboration | Determination of jet energy calibration and transverse momentum resolution in CMS | JINST 6 (2011) P11002 | CMS-JME-10-011 1107.4277 |
| 31 | CMS Collaboration | Identification of b-quark jets with the CMS experiment | JINST 8 (2013) P04013 | CMS-BTV-12-001 1211.4462 |
| 32 | J. Alwall et al. | The automated computation of tree-level and next-to-leading order differential cross sections, and their matching to parton shower simulations | JHEP 07 (2014) 079 | 1405.0301 |
| 33 | O. Matsedonskyi, G. Panico, and A. Wulzer | On the interpretation of top partners searches | JHEP 12 (2014) 097 | 1409.0100 |
| 34 | P. Nason | A new method for combining NLO QCD with shower Monte Carlo algorithms | JHEP 11 (2004) 040 | hep-ph/0409146 |
| 35 | S. Frixione, P. Nason, and C. Oleari | Matching NLO QCD computations with parton shower simulations: the POWHEG method | JHEP 11 (2007) 070 | 0709.2092 |
| 36 | S. Alioli, P. Nason, C. Oleari, and E. Re | A general framework for implementing NLO calculations in shower Monte Carlo programs: the POWHEG BOX | JHEP 06 (2010) 043 | 1002.2581 |
| 37 | S. Frixione, P. Nason, and G. Ridolfi | A positive-weight next-to-leading-order Monte Carlo for heavy flavour hadroproduction | JHEP 09 (2007) 126 | 0707.3088 |
| 38 | M. L. Mangano, M. Moretti, F. Piccinini, and M. Treccani | Matching matrix elements and shower evolution for top-pair production in hadronic collisions | JHEP 01 (2007) 013 | hep-ph/0611129 |
| 39 | T. Sjostrand, S. Mrenna, and P. Skands | PYTHIA 6.4 physics and manual | JHEP 05 (2006) 026 | hep-ph/0603175 |
| 40 | T. Sjostrand et al. | An Introduction to PYTHIA 8.2 | CPC 191 (2015) 159 | 1410.3012 |
| 41 | CMS Collaboration | Event generator tunes obtained from underlying event and multiparton scattering measurements | EPJC 76 (2016) 1 | |
| 42 | NNPDF Collaboration | Parton distributions for the LHC Run II | JHEP 04 (2015) 040 | 1410.8849 |
| 43 | GEANT4 Collaboration | GEANT4---a simulation toolkit | NIMA 506 (2003) 250 | |
| 44 | J. Allison et al. | GEANT4 developments and applications | IEEE Trans. Nucl. Sci. 53 (2006) 270 | |
| 45 | CMS Collaboration | Description and performance of track and primary-vertex reconstruction with the CMS tracker | JINST 9 (2014) P10009 | CMS-TRK-11-001 1405.6569 |
| 46 | W. Waltenberger, R. Fruwirth, and P. Vanlaer | Adaptive Vertex Fitting | JPG 34 (2007) N343 | |
| 47 | M. Dasgupta, A. Fregoso, S. Marzani, and G. P. Salam | Towards an understanding of jet substructure | JHEP 09 (2013) 029 | 1307.0007 |
| 48 | A. J. Larkoski, S. Marzani, G. Soyez, and J. Thaler | Soft drop | JHEP 05 (2014) 146 | 1402.2657 |
| 49 | Particle Data Group Collaboration | Review of Particle Physics | CPC 38 (2014) 090001 | |
| 50 | N. D. Gagunashvili | Pearson's Chi-Square Test Modifications for Comparison of Unweighted and Weighted Histograms and Two Weighted Histograms | in XI International Workshop on Advanced Computing and Analysis Techniques in Physics Research SISSA, 2007 PoS(ACAT)060 | physics/0605123 |
| 51 | ATLAS Collaboration | Measurement of the Inelastic Proton-Proton Cross Section at $ \sqrt{s} = 13 $ TeV with the ATLAS Detector at the LHC | PRL (2016), no. 117, 182002 | 1606.02625 |
| 52 | CMS Collaboration | CMS Luminosity Measurement for the 2015 Data Taking Period | CMS-PAS-LUM-15-001 | CMS-PAS-LUM-15-001 |
| 53 | J. Butterworth et al. | PDF4LHC recommendations for LHC Run II | JPG 43 (2016) 023001 | 1510.03865 |
| 54 | T. Muller, J. Ott, and J. Wagner-Kuhr | theta -- a framework for template-based modeling and inference | 2010 | |
| 55 | A. O'Hagan and J. J. Forster | Arnold, London | ||
| 56 | R. J. Barlow and C. Beeston | Fitting using finite Monte Carlo samples | CPC 77 (1993) 219 | |
| 57 | J. Campbell, R. K. Ellis, and F. Tramontano | Single top-quark production and decay at next-to-leading order | PRD 70 (2004) 094012 | hep-ph/0408180 |
|
|
Compact Muon Solenoid LHC, CERN |
|

|

|

|

|

|