

Compact Muon Solenoid
LHC, CERN
| CMS-BPH-15-002 ; CERN-EP-2017-331 | ||
| Measurement of the $ \Lambda_{\mathrm{b}} $ polarization and angular parameters in $ \Lambda_{\mathrm{b}} \to \mathrm{J}/\psi \Lambda $ decays from pp collisions at $\sqrt{s}= $ 7 and 8 TeV | ||
| CMS Collaboration | ||
| 13 February 2018 | ||
| Phys. Rev. D 97 (2018) 072010 | ||
| Abstract: An analysis of the decay $ \Lambda_{\mathrm{b}} \to \mathrm{J}/\psi ( \to \mu^{+} \mu^{-}) \Lambda (\to \mathrm{p} \pi^{-}) $ is performed to measure the $ \Lambda_{\mathrm{b}} $ polarization and three angular parameters in data from pp collisions at $\sqrt{s} = $ 7 and 8 TeV, collected by the CMS experiment at the LHC. The $ \Lambda_{\mathrm{b}} $ polarization is measured to be 0.00 $\pm$ 0.06 (stat) $\pm$ 0.06 (syst) and the parity-violating asymmetry parameter is determined to be 0.14 $\pm$ 0.14 (stat) $\pm$ 0.10 (syst). The measurements are compared to various theoretical predictions, including those from perturbative quantum chromodynamics. | ||
| Links: e-print arXiv:1802.04867 [hep-ex] (PDF) ; CDS record ; inSPIRE record ; HepData record ; CADI line (restricted) ; | ||
| Figures | |
png pdf |
Figure 1:
Definition of the angles used to describe the ${{\Lambda_{\mathrm{b}}}} \to { \mathrm{J} / \psi } { \Lambda }$ decay into the ${{{\mu ^+}} {{\mu ^-}}} {{\mathrm {p}} {\pi ^-}}$ final state as explained in the text. |
png pdf |
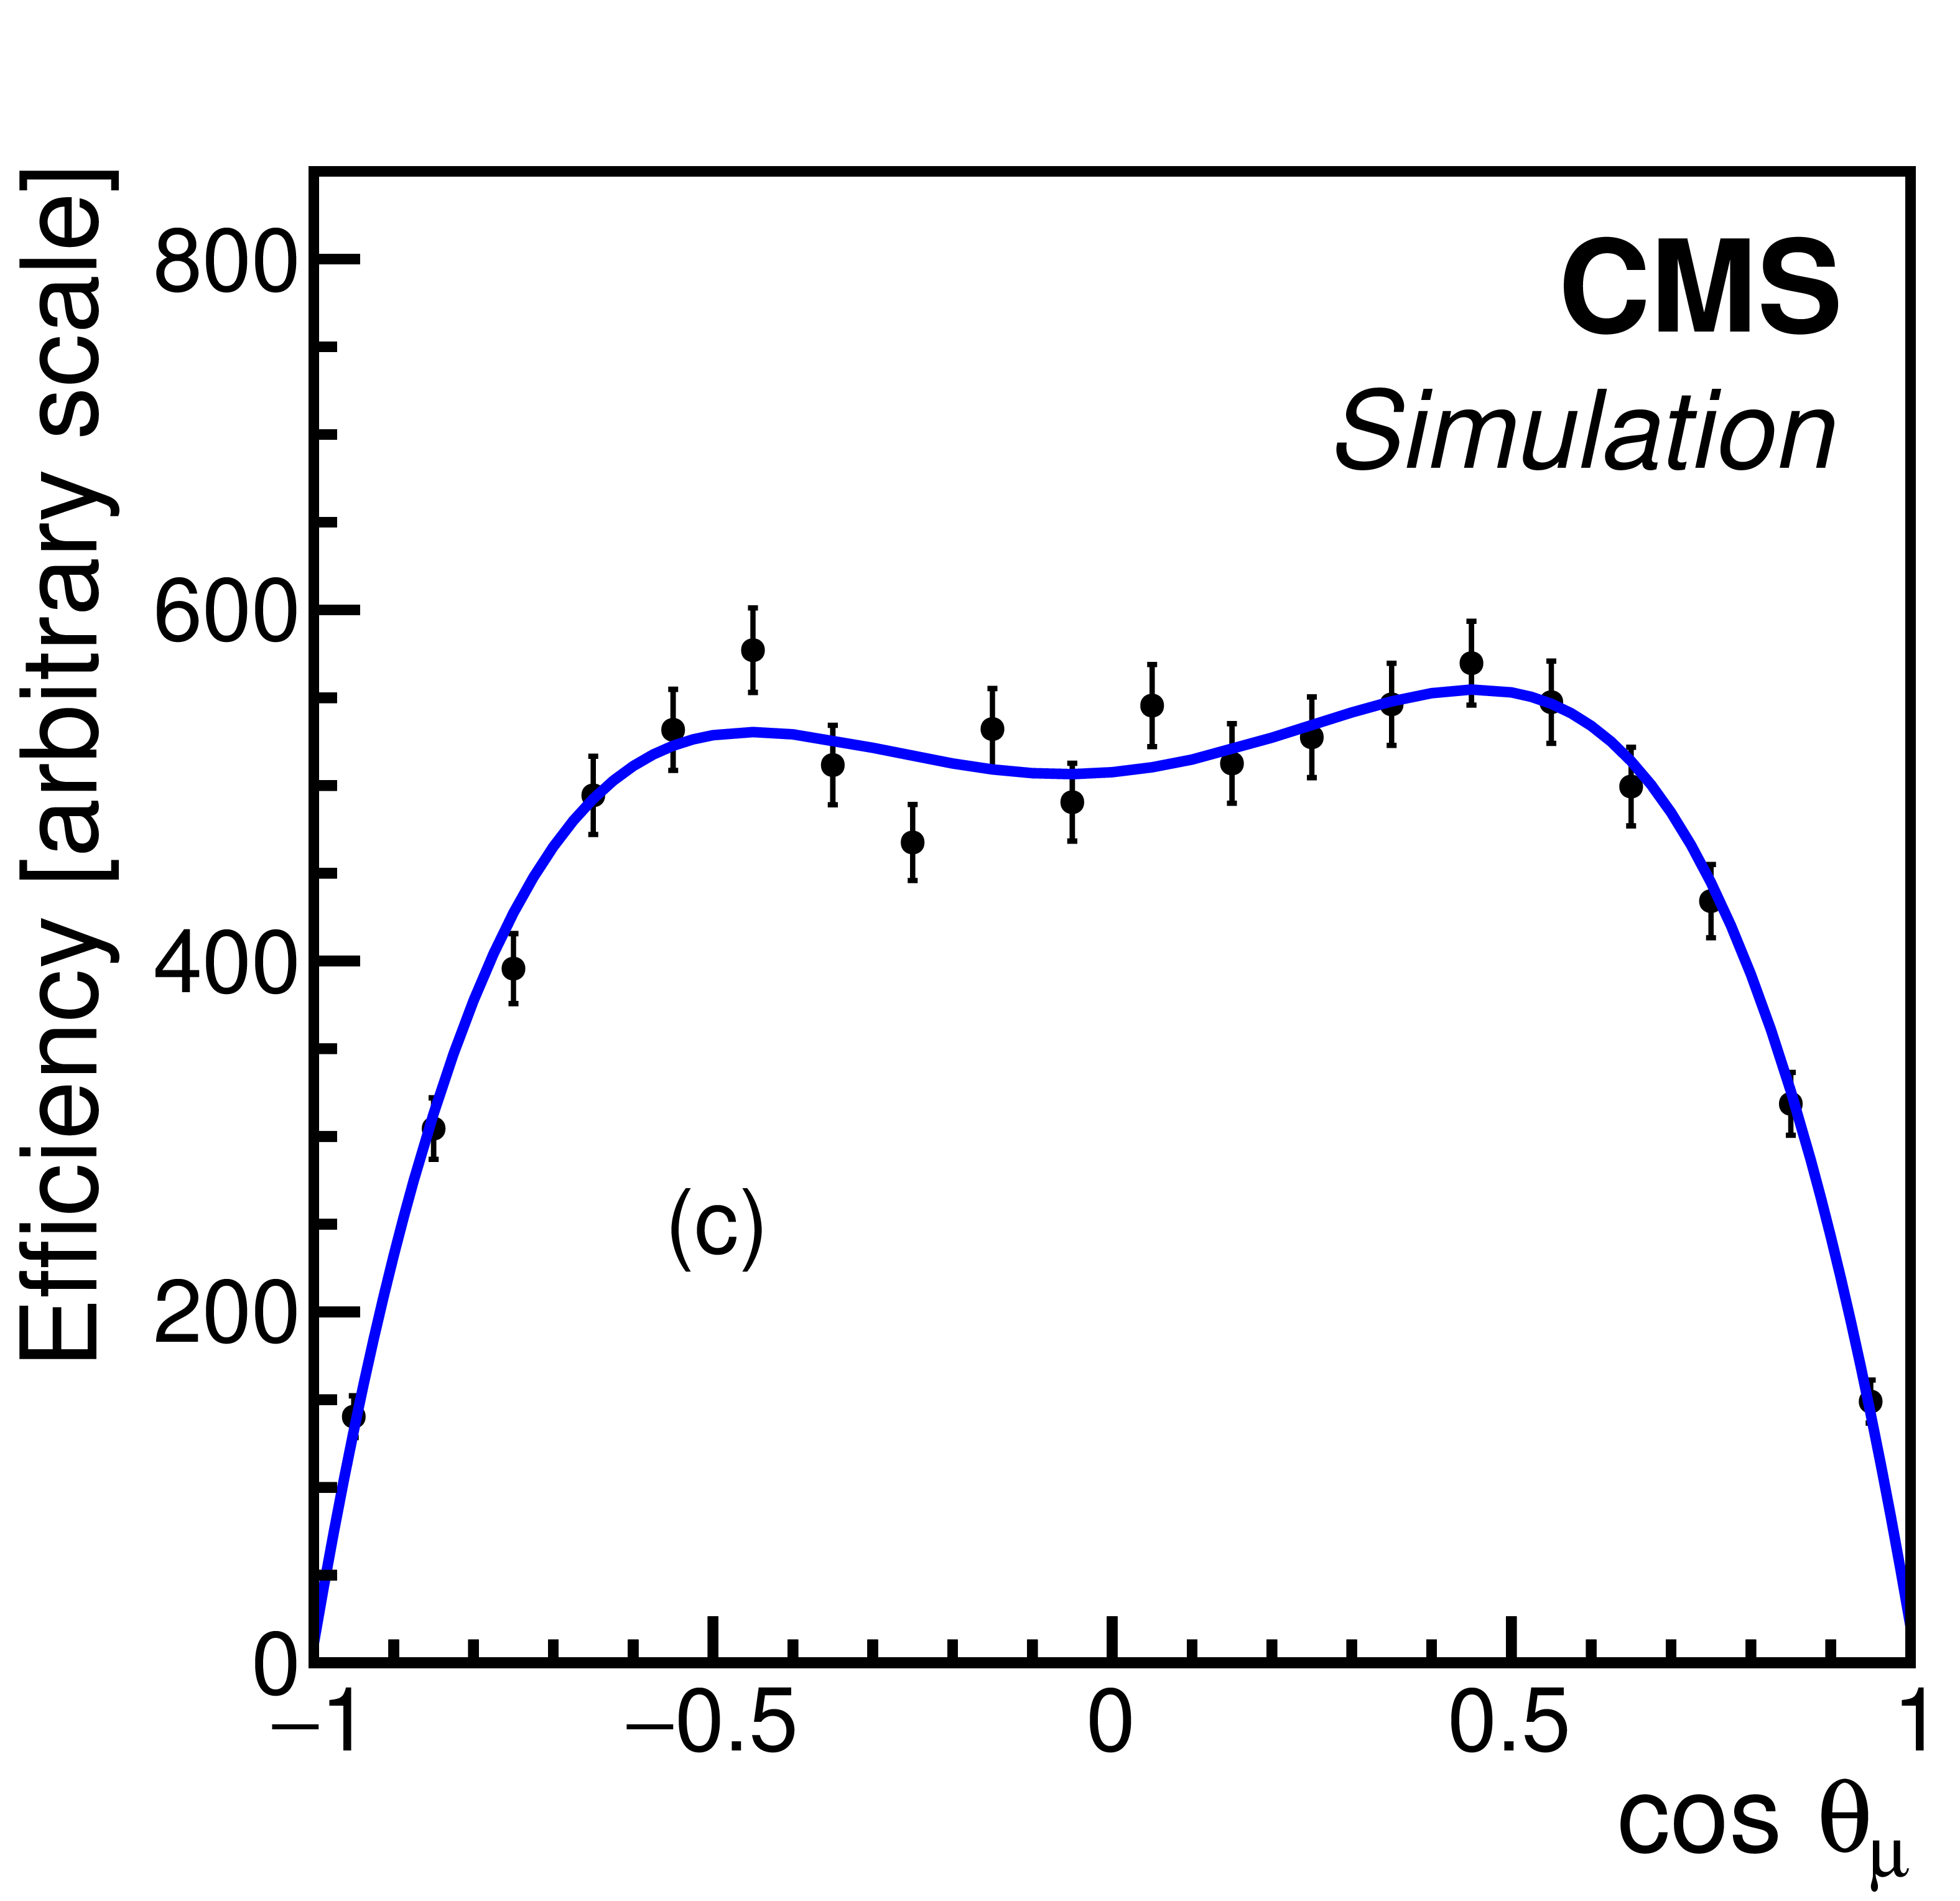
Figure 2:
The efficiencies as a function of (a) $\cos {\theta _{ \Lambda }} $, (b) $\cos {\theta _{{\mathrm {p}}}} $, and (c) $\cos {\theta _{{{\mu}}}} $ obtained from simulated $ {{\Lambda_{\mathrm{b}}}} \to { \mathrm{J} / \psi } { \Lambda } $ decays at $\sqrt {s}= $ 8 TeV. The vertical bars on the points are the statistical uncertainties in the simulated data, and the lines show the projections of a 3D fit to the distributions using Chebyshev polynomials. The scales of the vertical axes are arbitrary. |
png pdf |
Figure 2-a:
The efficiency as a function of $\cos {\theta _{ \Lambda }} $ obtained from simulated $ {{\Lambda_{\mathrm{b}}}} \to { \mathrm{J} / \psi } { \Lambda } $ decays at $\sqrt {s}= $ 8 TeV. The vertical bars on the points are the statistical uncertainties in the simulated data, and the lines show the projections of a 3D fit to the distributions using Chebyshev polynomials. The scale of the vertical axis is arbitrary. |
png pdf |
Figure 2-b:
The efficiency as a function of $\cos {\theta _{{\mathrm {p}}}} $ obtained from simulated $ {{\Lambda_{\mathrm{b}}}} \to { \mathrm{J} / \psi } { \Lambda } $ decays at $\sqrt {s}= $ 8 TeV. The vertical bars on the points are the statistical uncertainties in the simulated data, and the lines show the projections of a 3D fit to the distributions using Chebyshev polynomials. The scale of the vertical axis is arbitrary. |
png pdf |
Figure 2-c:
The efficiency as a function of $\cos {\theta _{{{\mu}}}} $ obtained from simulated $ {{\Lambda_{\mathrm{b}}}} \to { \mathrm{J} / \psi } { \Lambda } $ decays at $\sqrt {s}= $ 8 TeV. The vertical bars on the points are the statistical uncertainties in the simulated data, and the lines show the projections of a 3D fit to the distributions using Chebyshev polynomials. The scale of the vertical axis is arbitrary. |

png pdf |
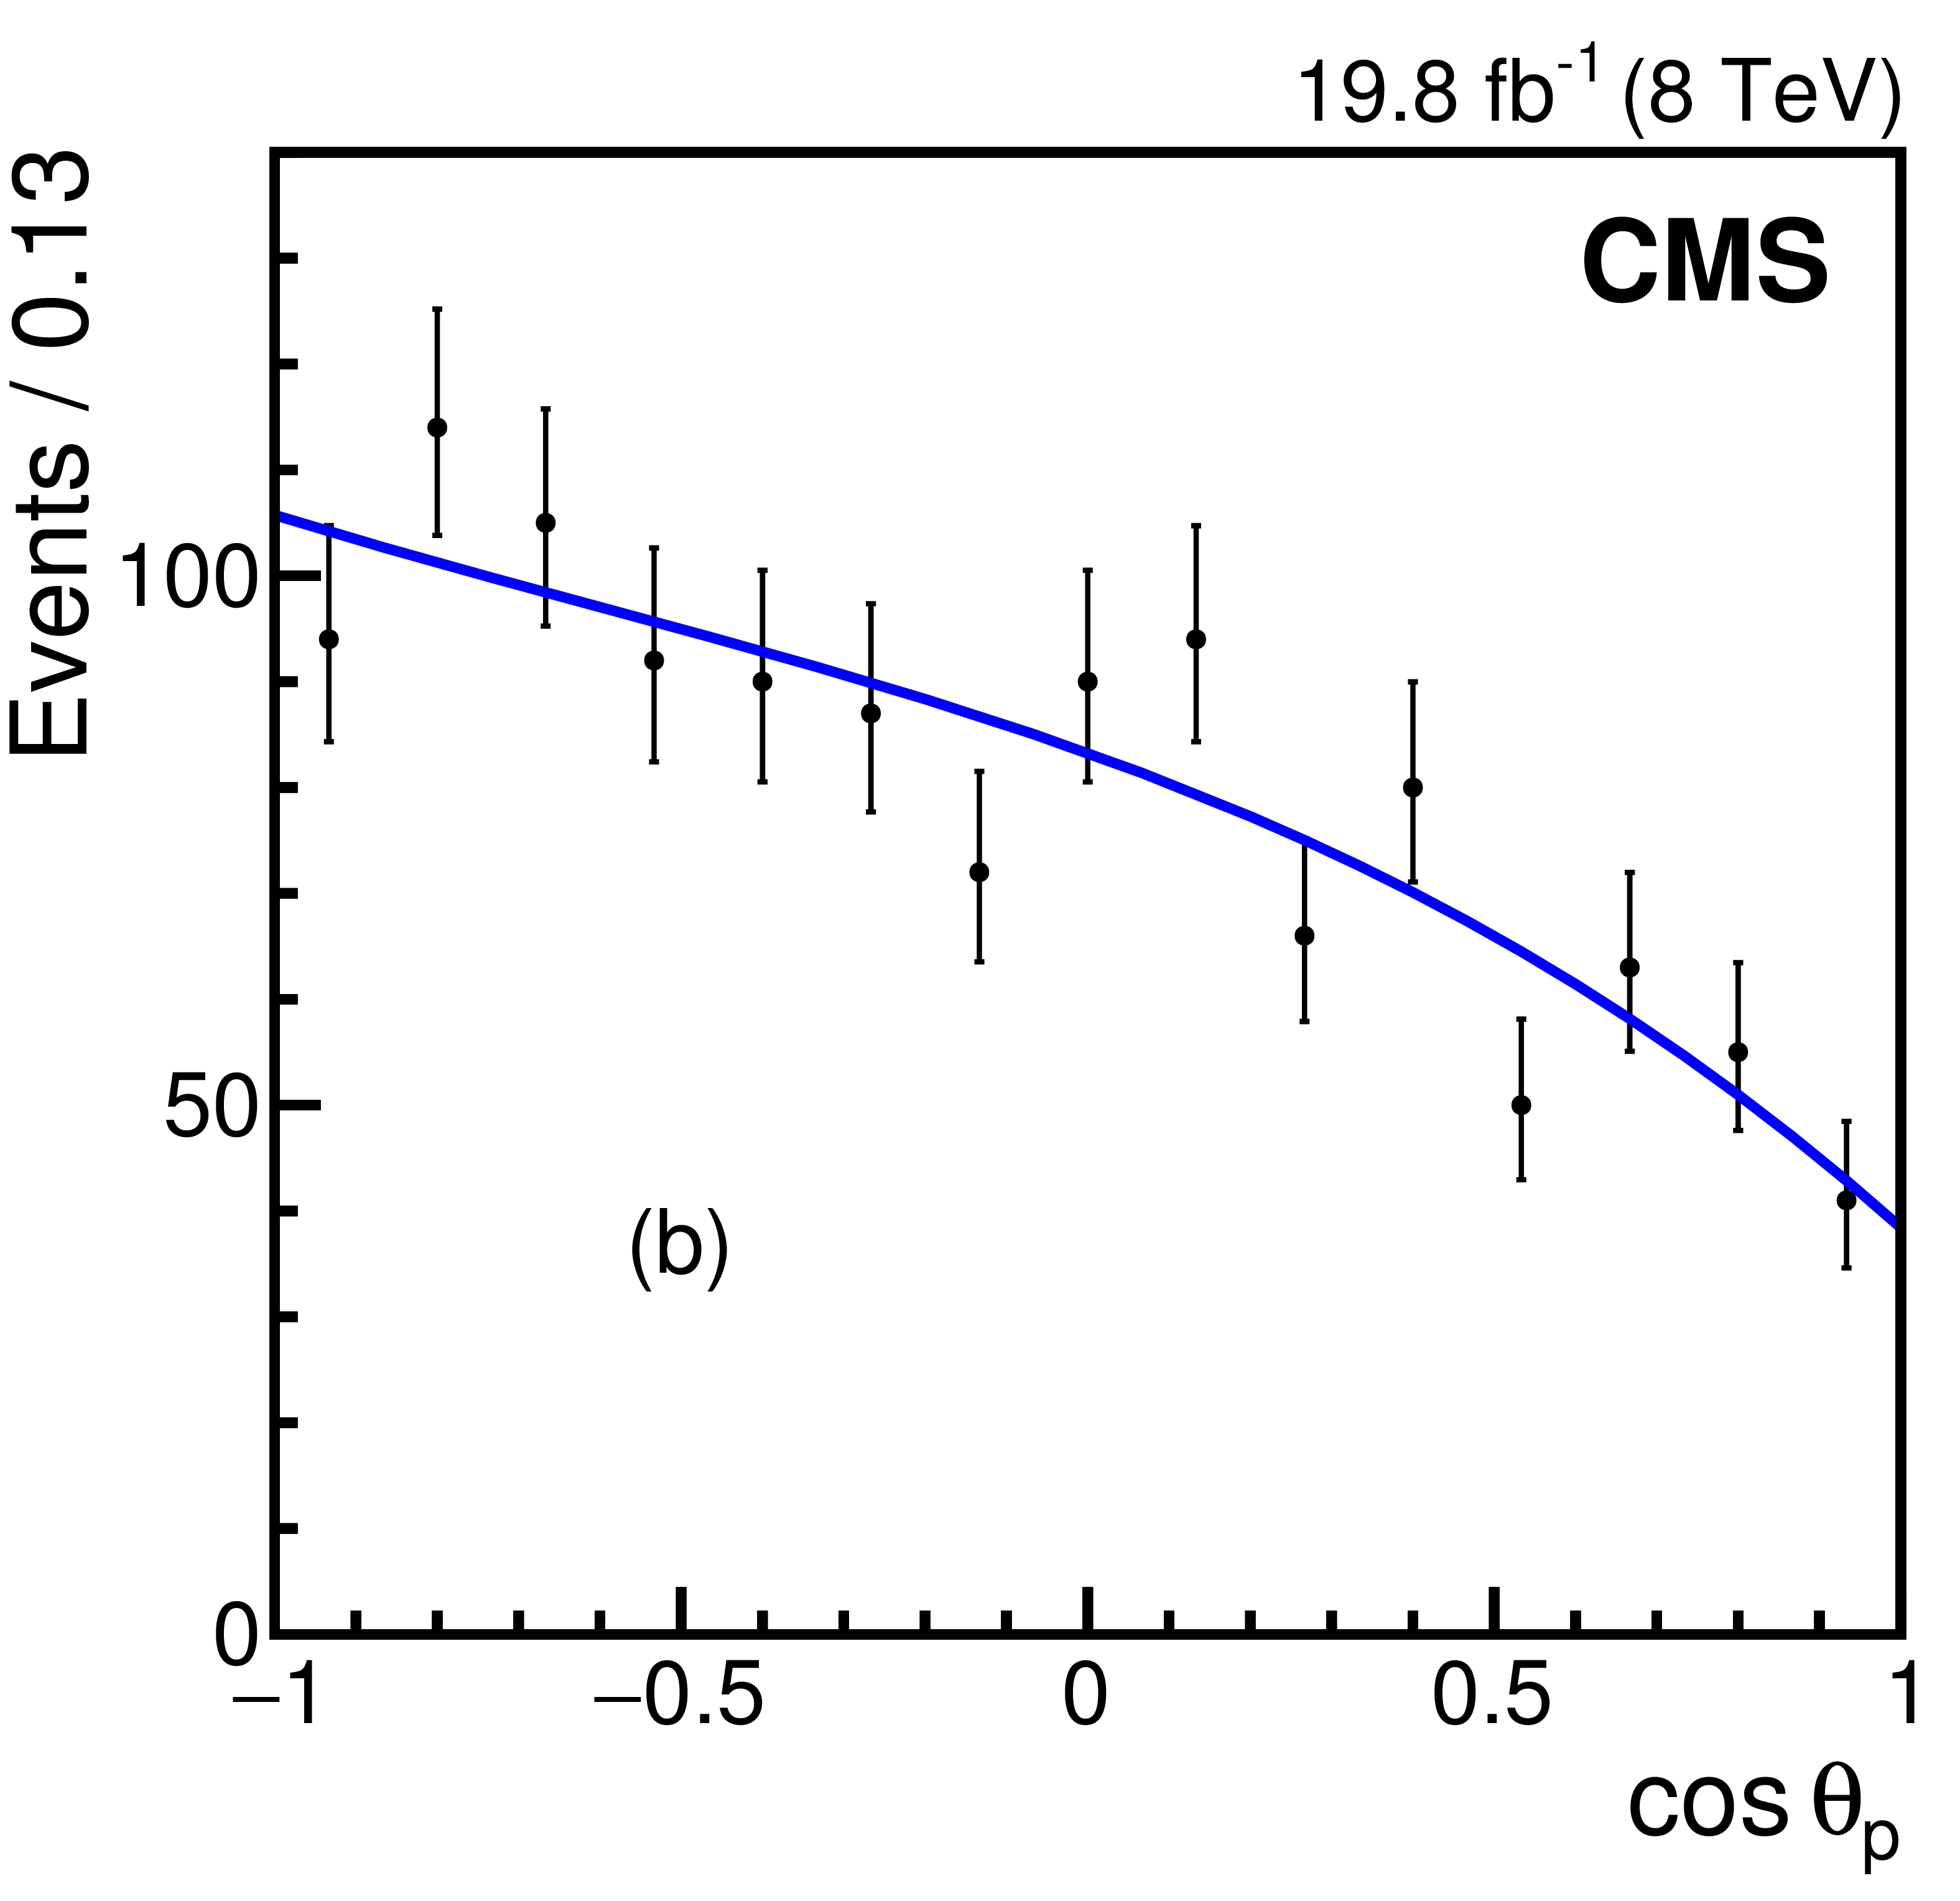
Figure 3:
The background angular distributions of (a) $\cos {\theta _{ \Lambda }} $, (b) $\cos {\theta _{{\mathrm {p}}}} $, and (c) $\cos {\theta _{{{\mu}}}} $ are shown, as obtained from the sidebands in the $ { \mathrm{J} / \psi } { \Lambda }$ invariant mass distribution at $\sqrt {s}= $ 8 TeV. The vertical bars on the points represent the statistical uncertainties, and the solid lines are the results of the fits to data as described in the text. |

png pdf |
Figure 3-a:
The background angular distribution of $\cos {\theta _{ \Lambda }} $ is shown, as obtained from the sidebands in the $ { \mathrm{J} / \psi } { \Lambda }$ invariant mass distribution at $\sqrt {s}= $ 8 TeV. The vertical bars on the points represent the statistical uncertainties, and the solid lines are the results of the fits to data as described in the text. |
png pdf |
Figure 3-b:
The background angular distribution of $\cos {\theta _{{\mathrm {p}}}} $ is shown, as obtained from the sidebands in the $ { \mathrm{J} / \psi } { \Lambda }$ invariant mass distribution at $\sqrt {s}= $ 8 TeV. The vertical bars on the points represent the statistical uncertainties, and the solid lines are the results of the fits to data as described in the text. |

png pdf |
Figure 3-c:
The background angular distribution of $\cos {\theta _{{{\mu}}}} $ is shown, as obtained from the sidebands in the $ { \mathrm{J} / \psi } { \Lambda }$ invariant mass distribution at $\sqrt {s}= $ 8 TeV. The vertical bars on the points represent the statistical uncertainties, and the solid lines are the results of the fits to data as described in the text. |
png pdf |
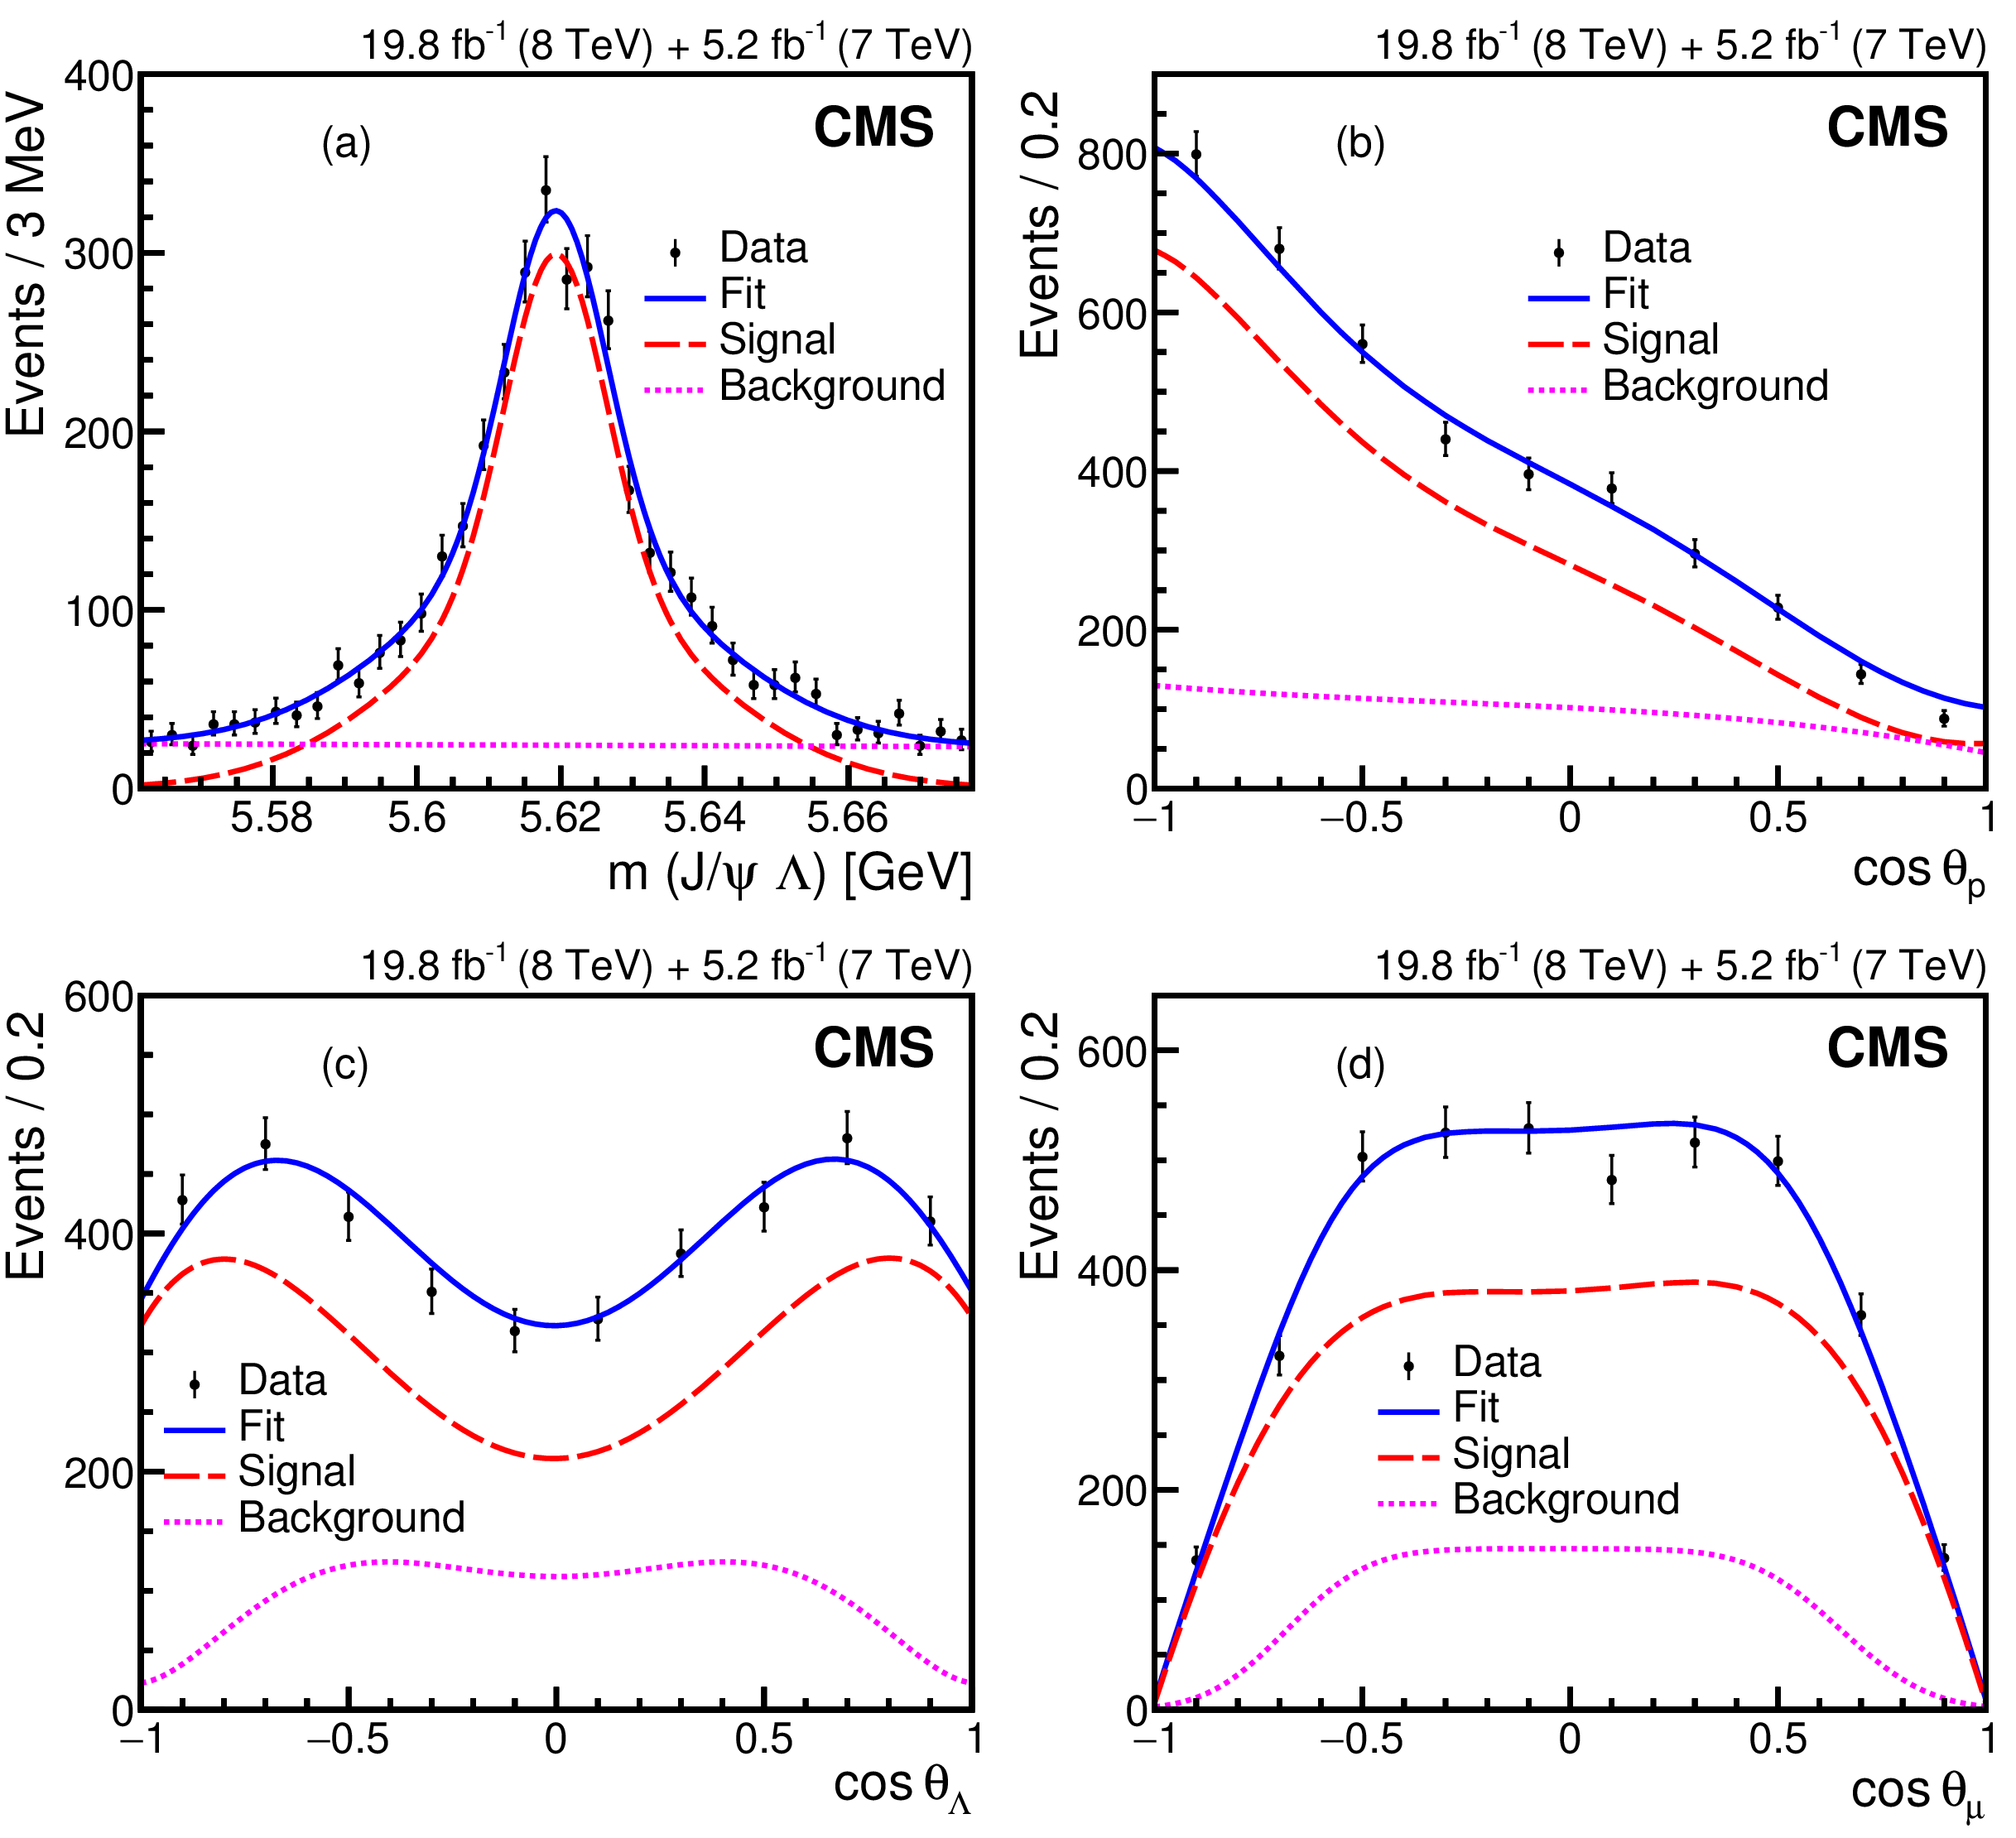
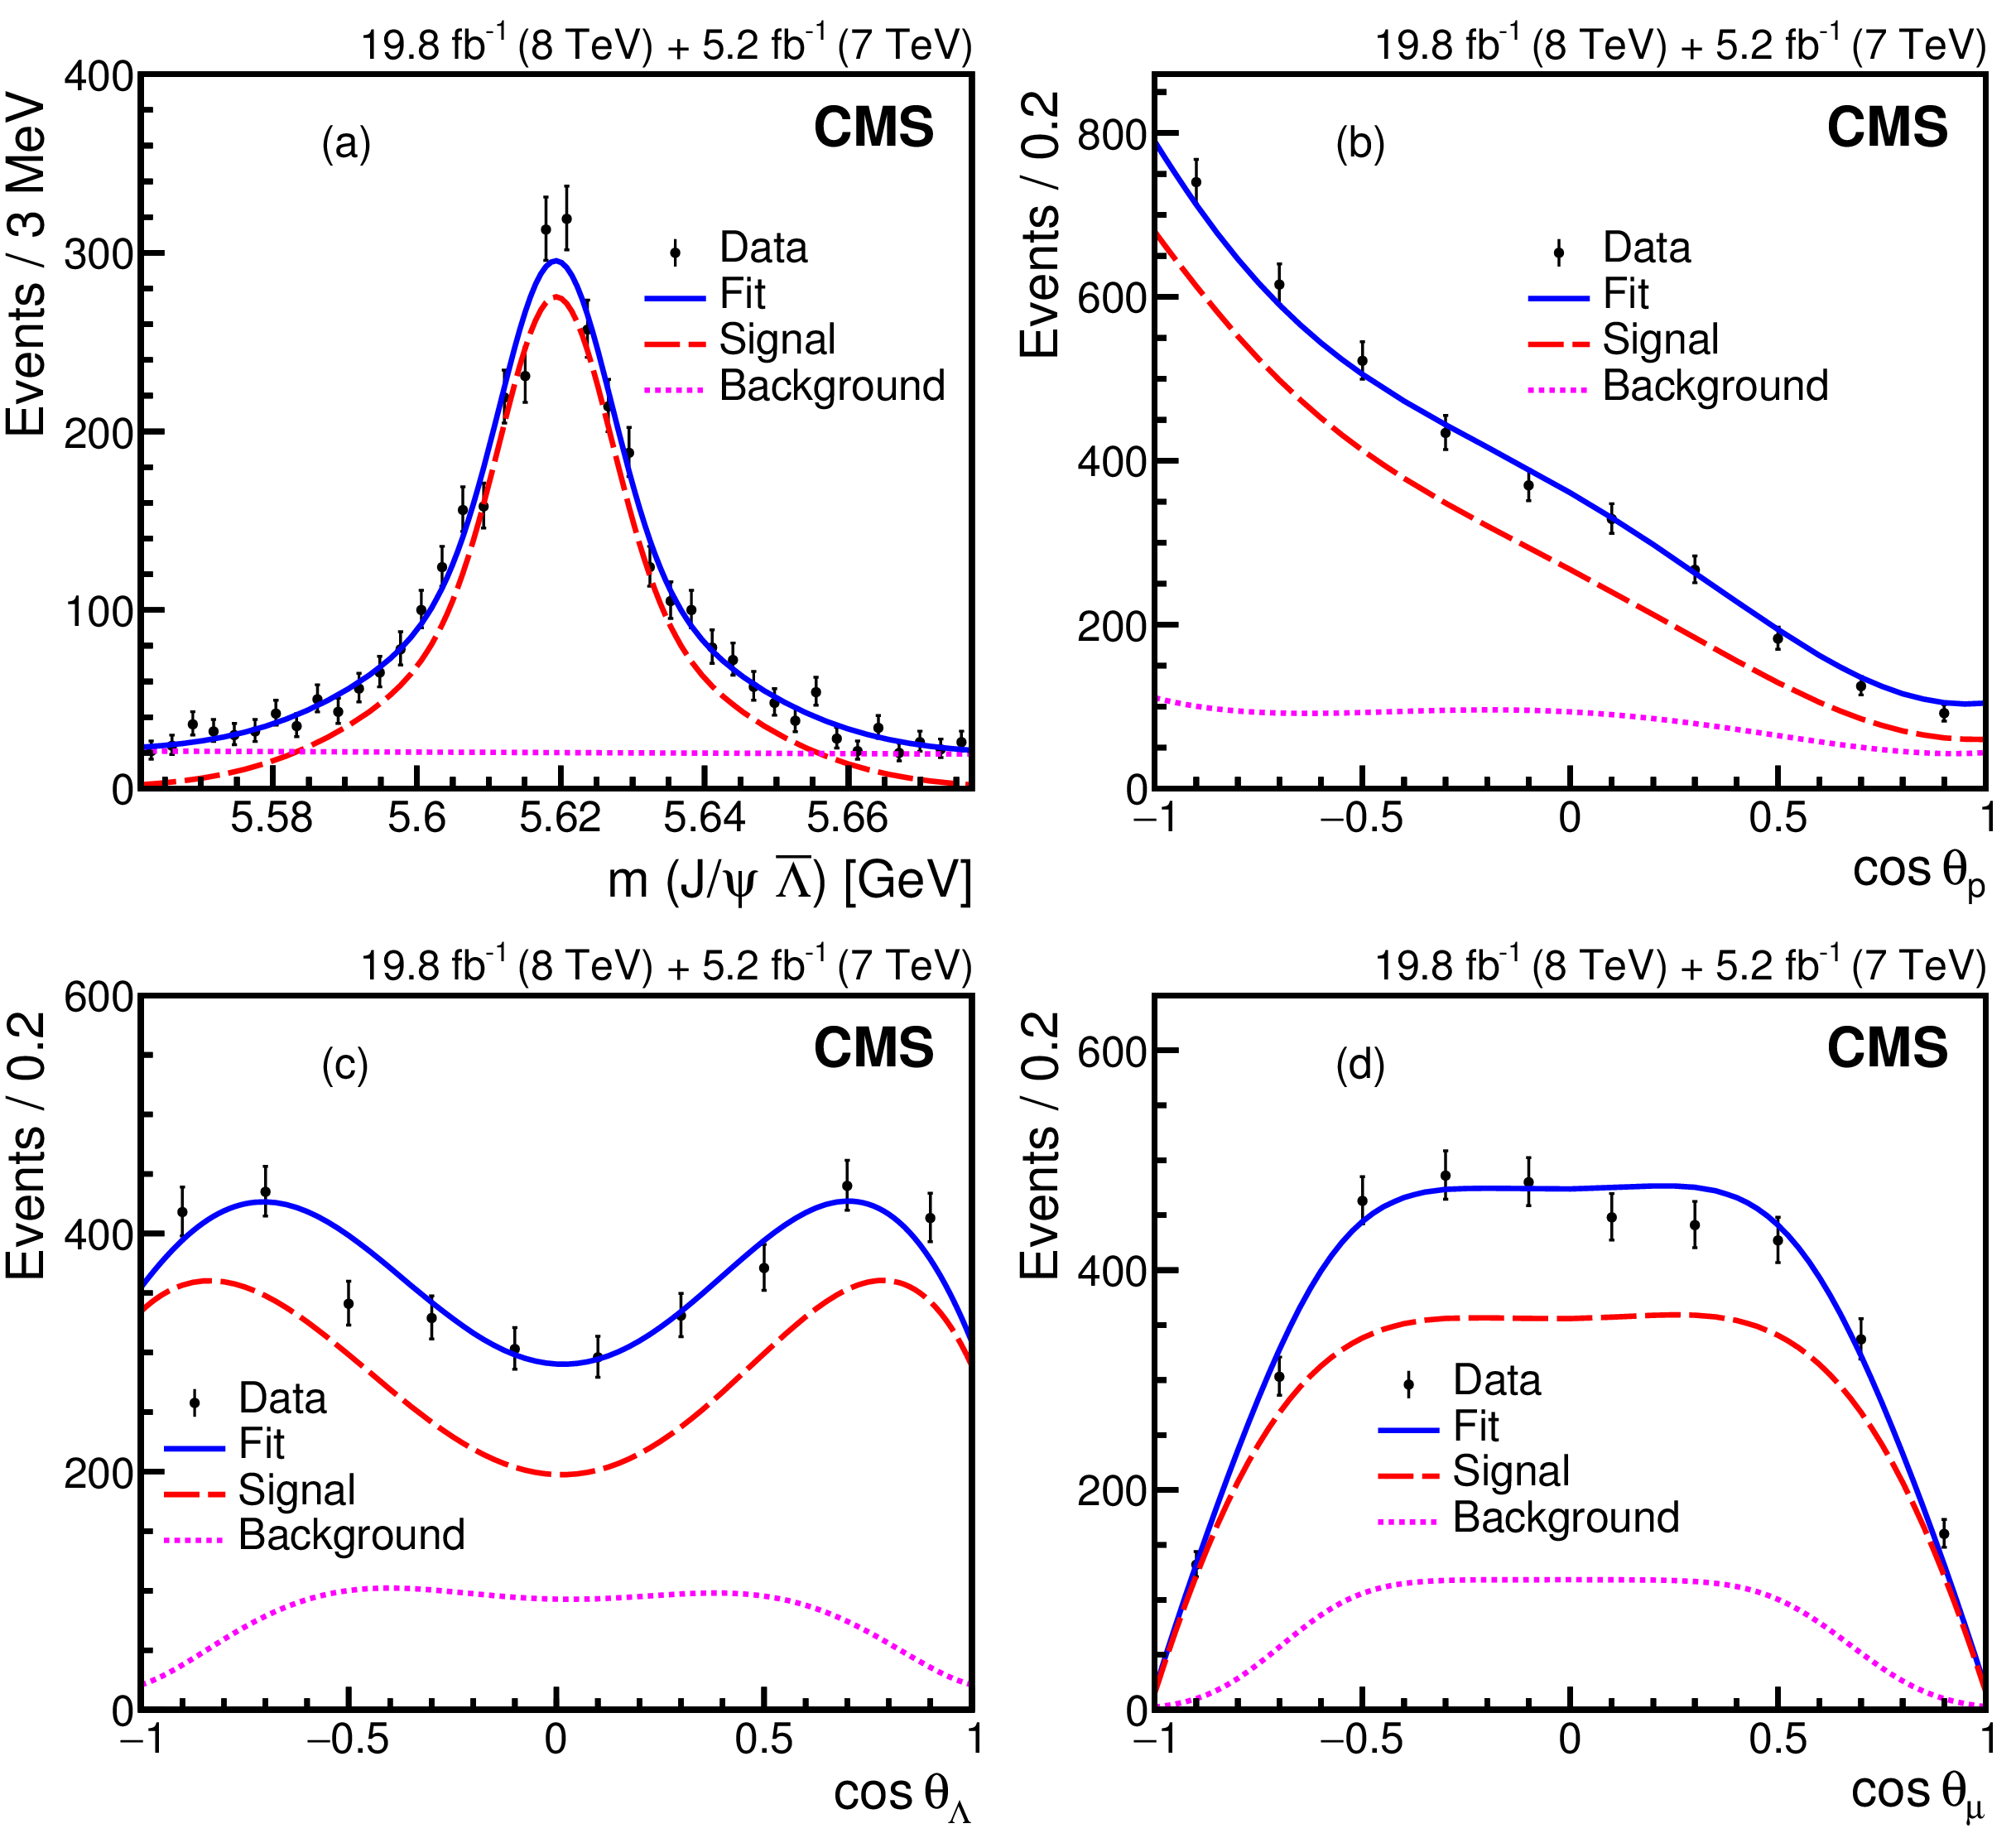
Figure 4:
Distributions in (a) $ {m_{{ \mathrm{J} / \psi } { \Lambda }}} $, (b) $\cos {\theta _{{\mathrm {p}}}} $, (c) $\cos {\theta _{ \Lambda }} $, and (d) $\cos {\theta _{{{\mu}}}} $ for ${\Lambda_{\mathrm{b}}}$ candidates in the combined $\sqrt {s}= $ 7 and 8 TeV data. The vertical bars on the points are the statistical uncertainties in the data, the solid line shows the result of the fit, and the dashed and dotted lines represent, respectively, the signal and background contributions from the fit. |
png pdf |
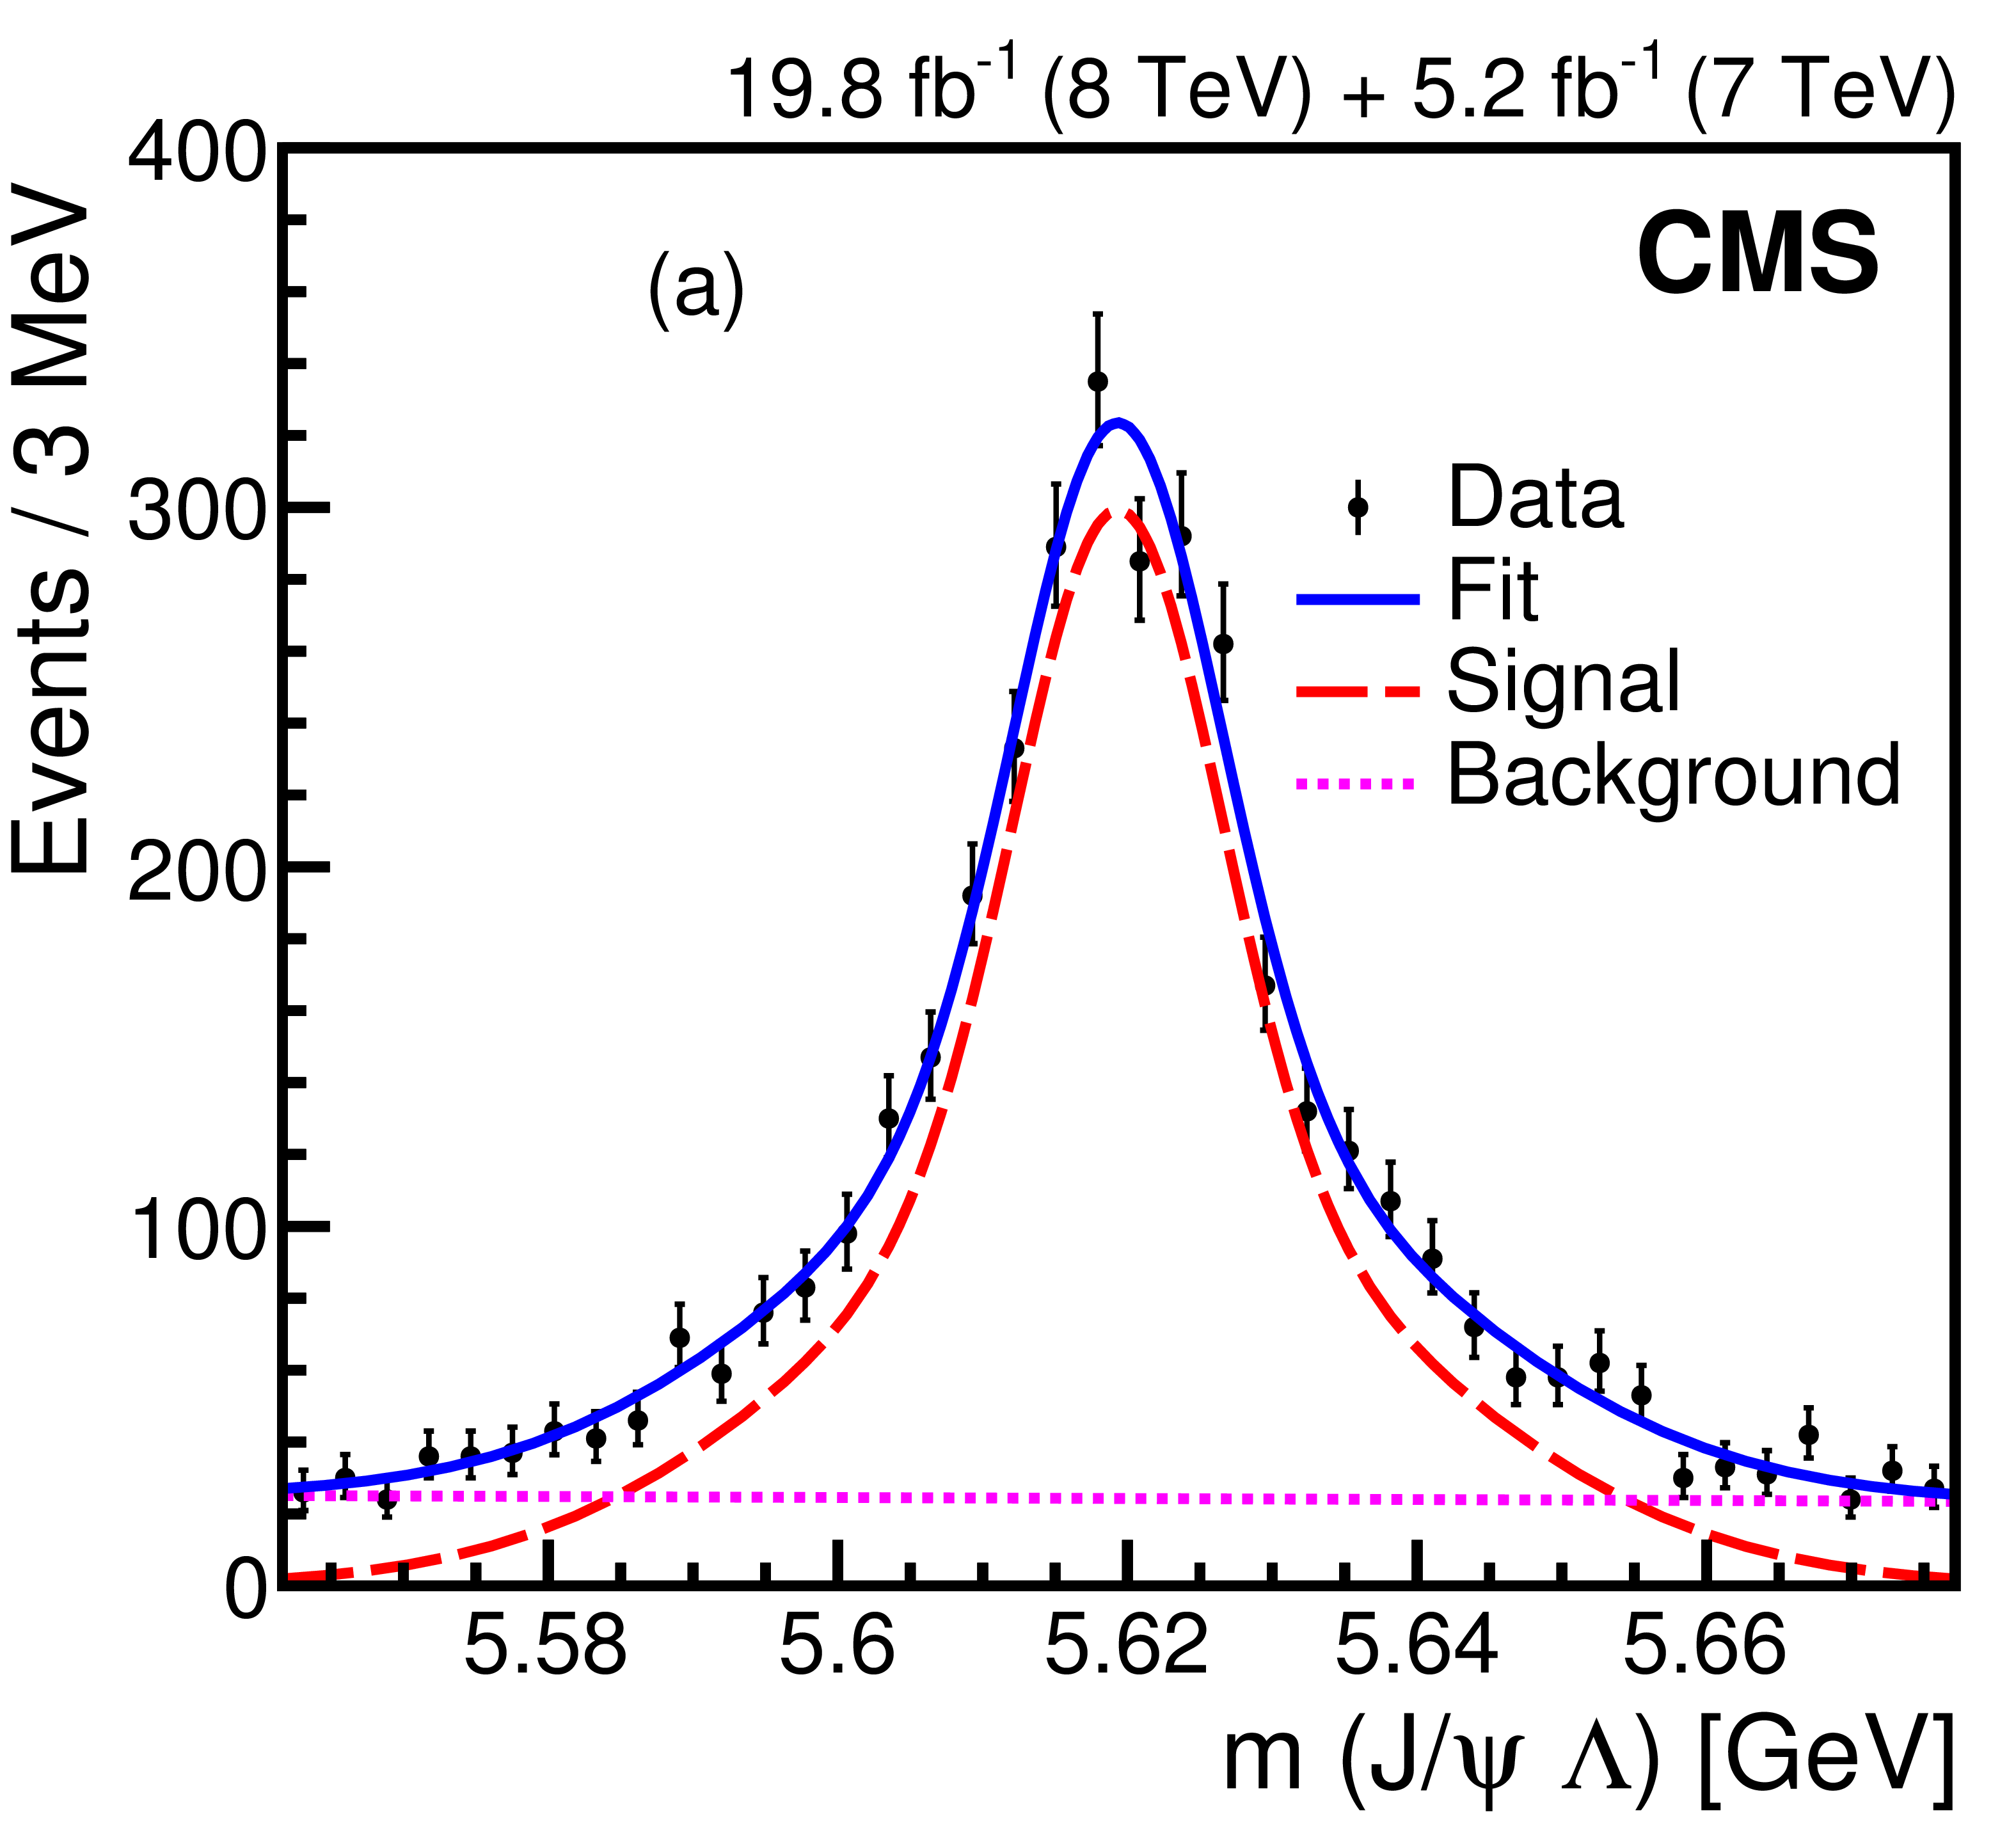
Figure 4-a:
Distribution in $ {m_{{ \mathrm{J} / \psi } { \Lambda }}} $ for ${\Lambda_{\mathrm{b}}}$ candidates in the combined $\sqrt {s}= $ 7 and 8 TeV data. The vertical bars on the points are the statistical uncertainties in the data, the solid line shows the result of the fit, and the dashed and dotted lines represent, respectively, the signal and background contributions from the fit. |

png pdf |
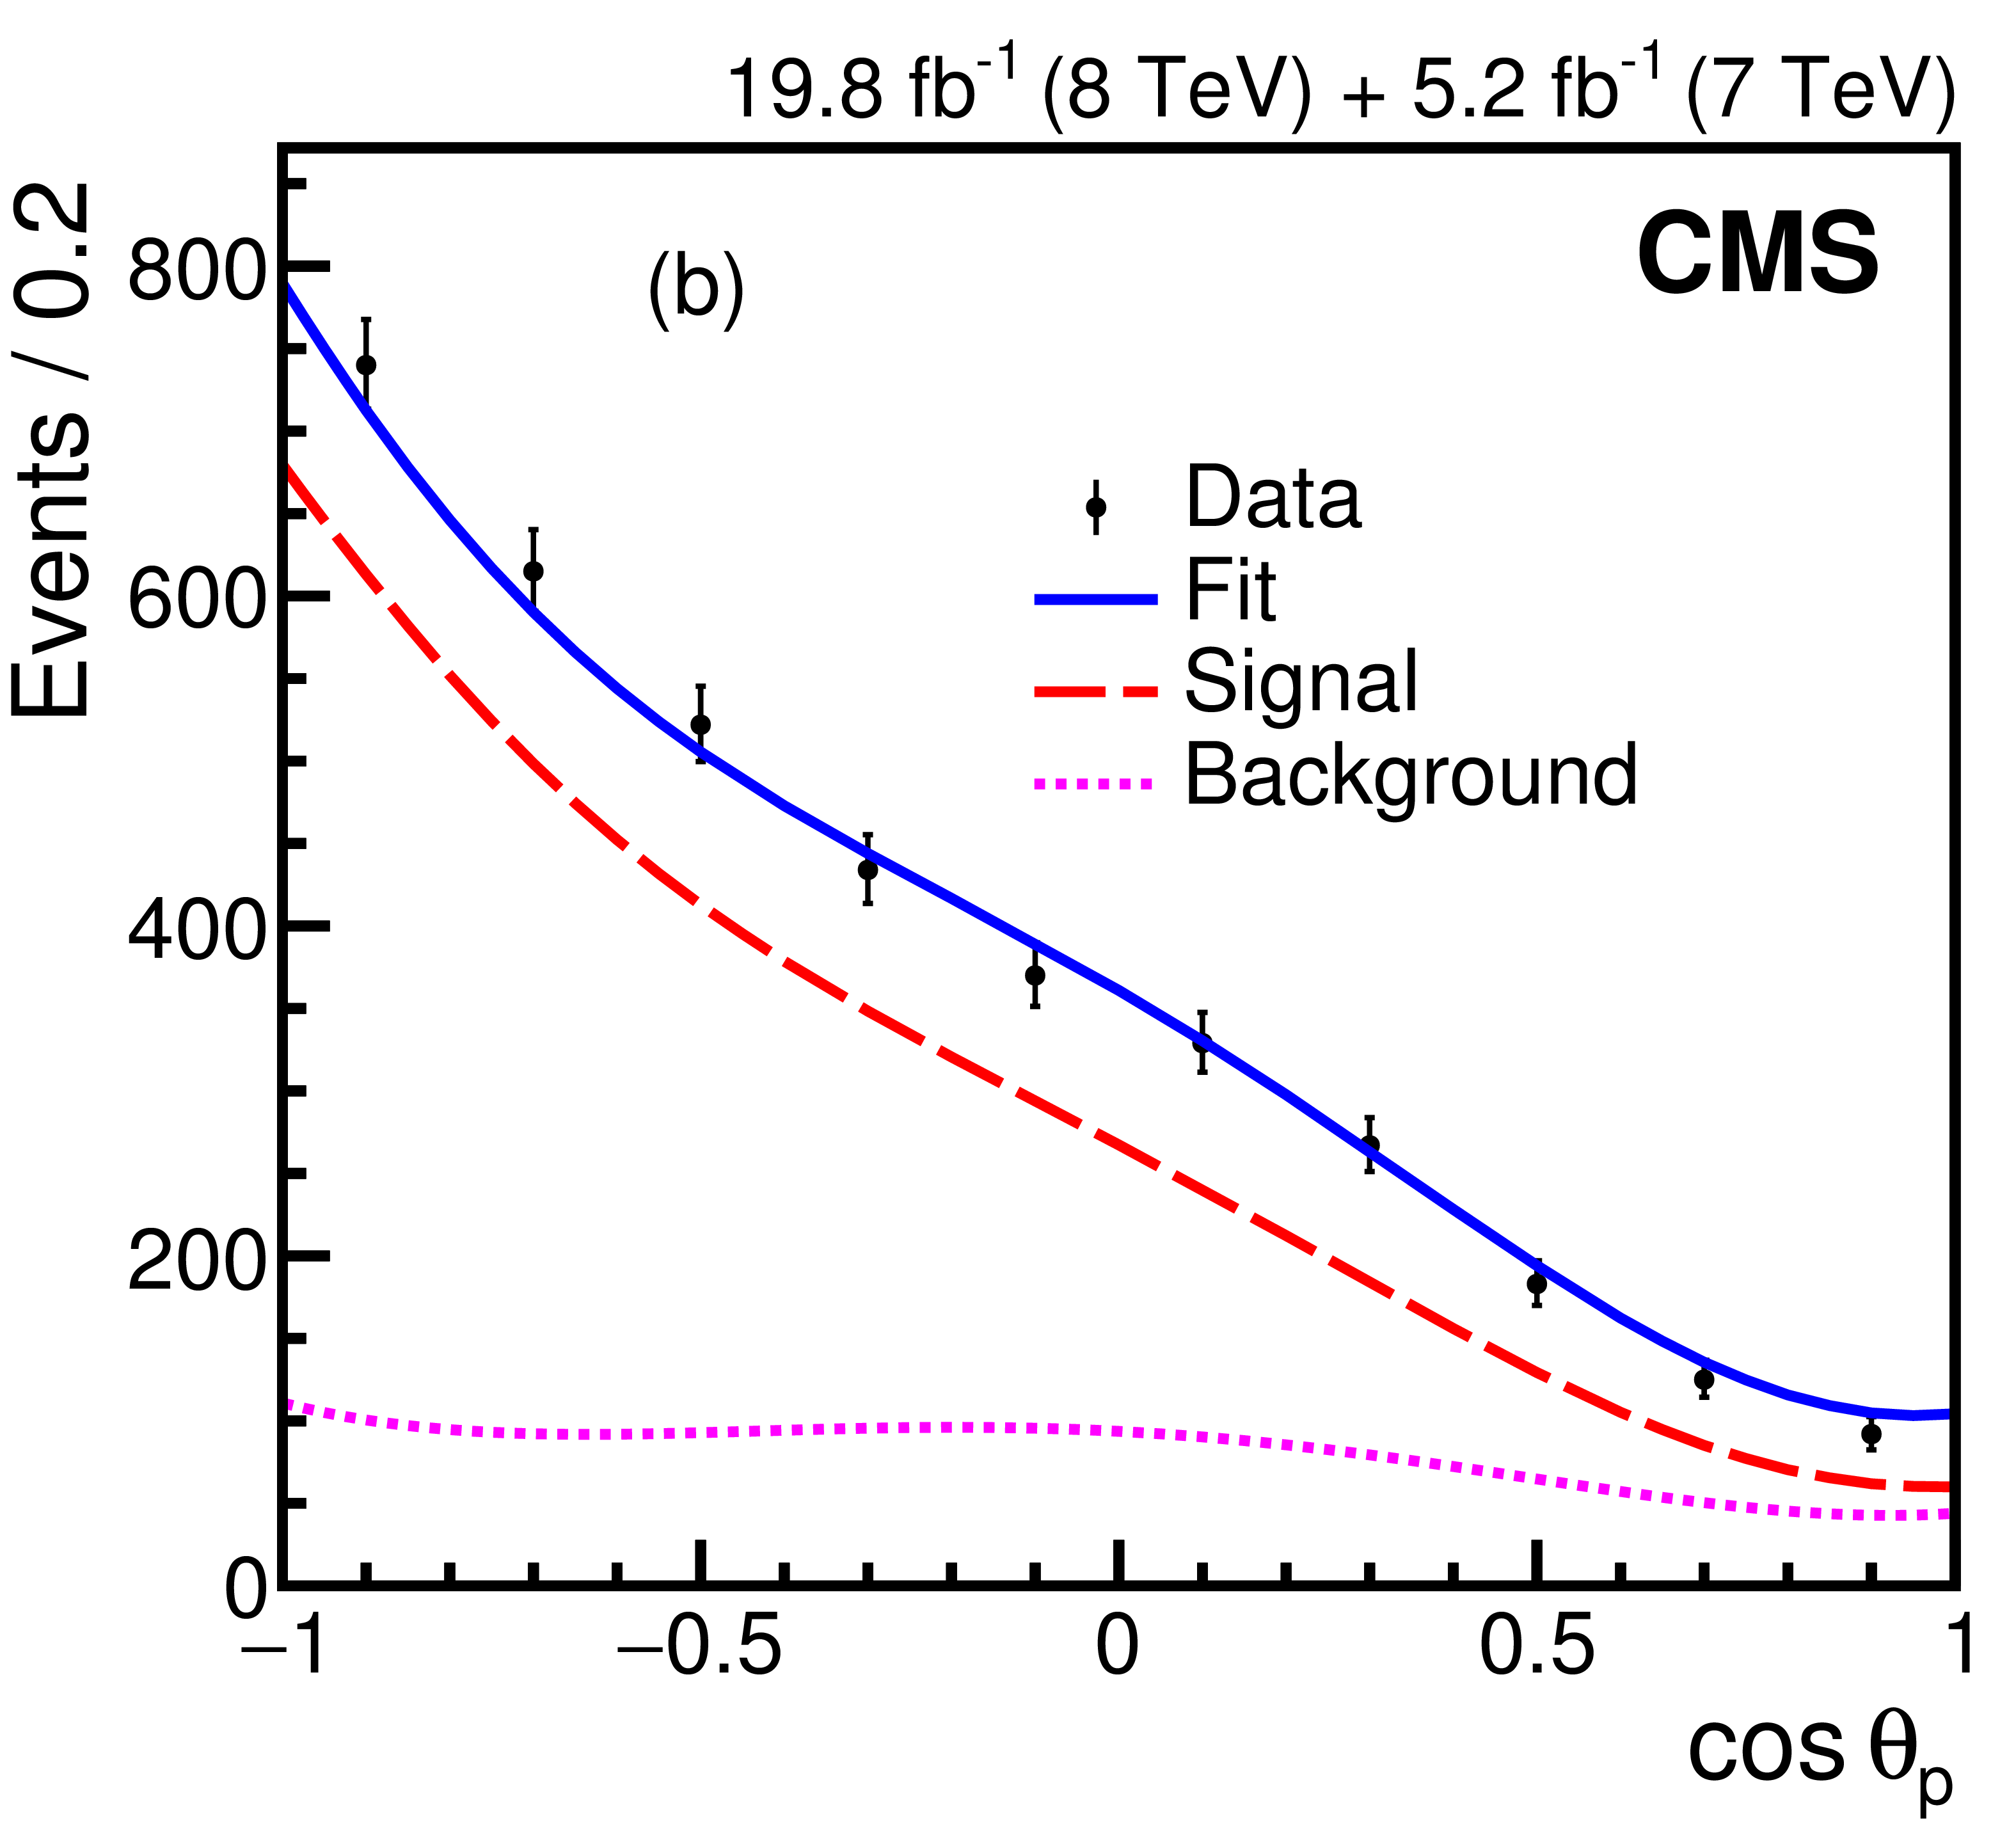
Figure 4-b:
Distribution in $\cos {\theta _{{\mathrm {p}}}} $ candidates in the combined $\sqrt {s}= $ 7 and 8 TeV data. The vertical bars on the points are the statistical uncertainties in the data, the solid line shows the result of the fit, and the dashed and dotted lines represent, respectively, the signal and background contributions from the fit. |

png pdf |
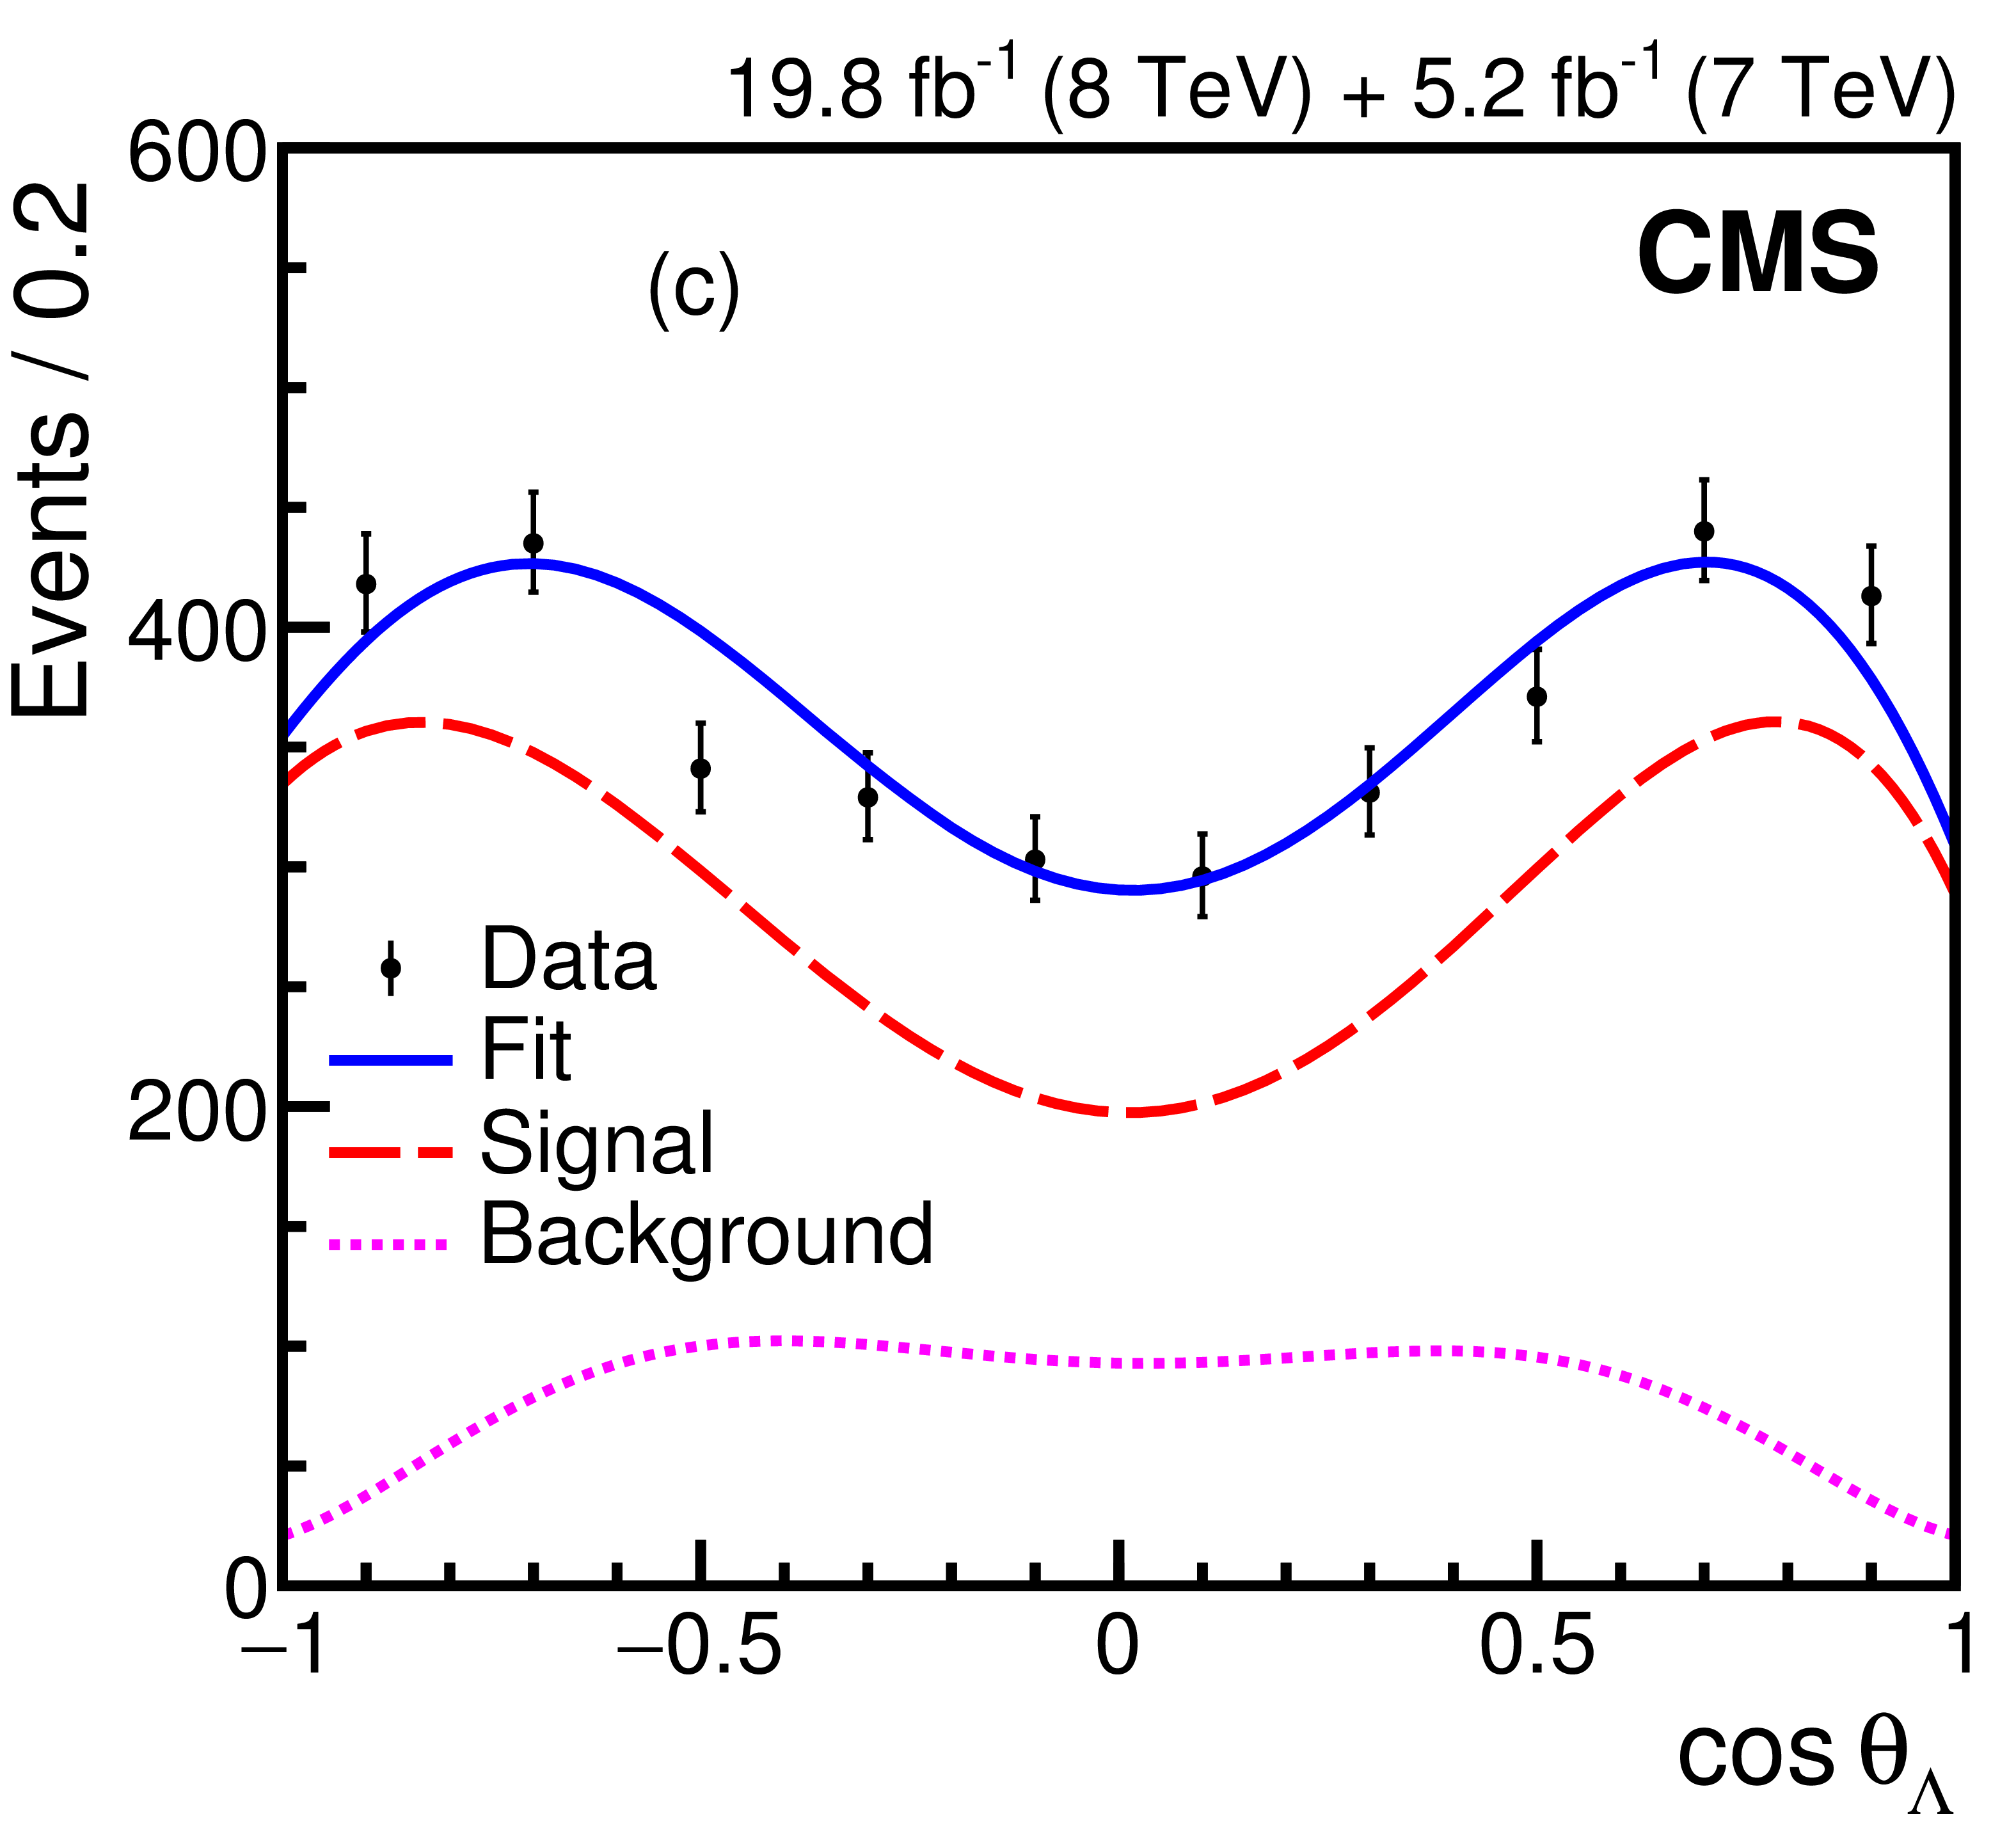
Figure 4-c:
Distribution in $\cos {\theta _{ \Lambda }} $ for ${\Lambda_{\mathrm{b}}}$ candidates in the combined $\sqrt {s}= $ 7 and 8 TeV data. The vertical bars on the points are the statistical uncertainties in the data, the solid line shows the result of the fit, and the dashed and dotted lines represent, respectively, the signal and background contributions from the fit. |

png pdf |
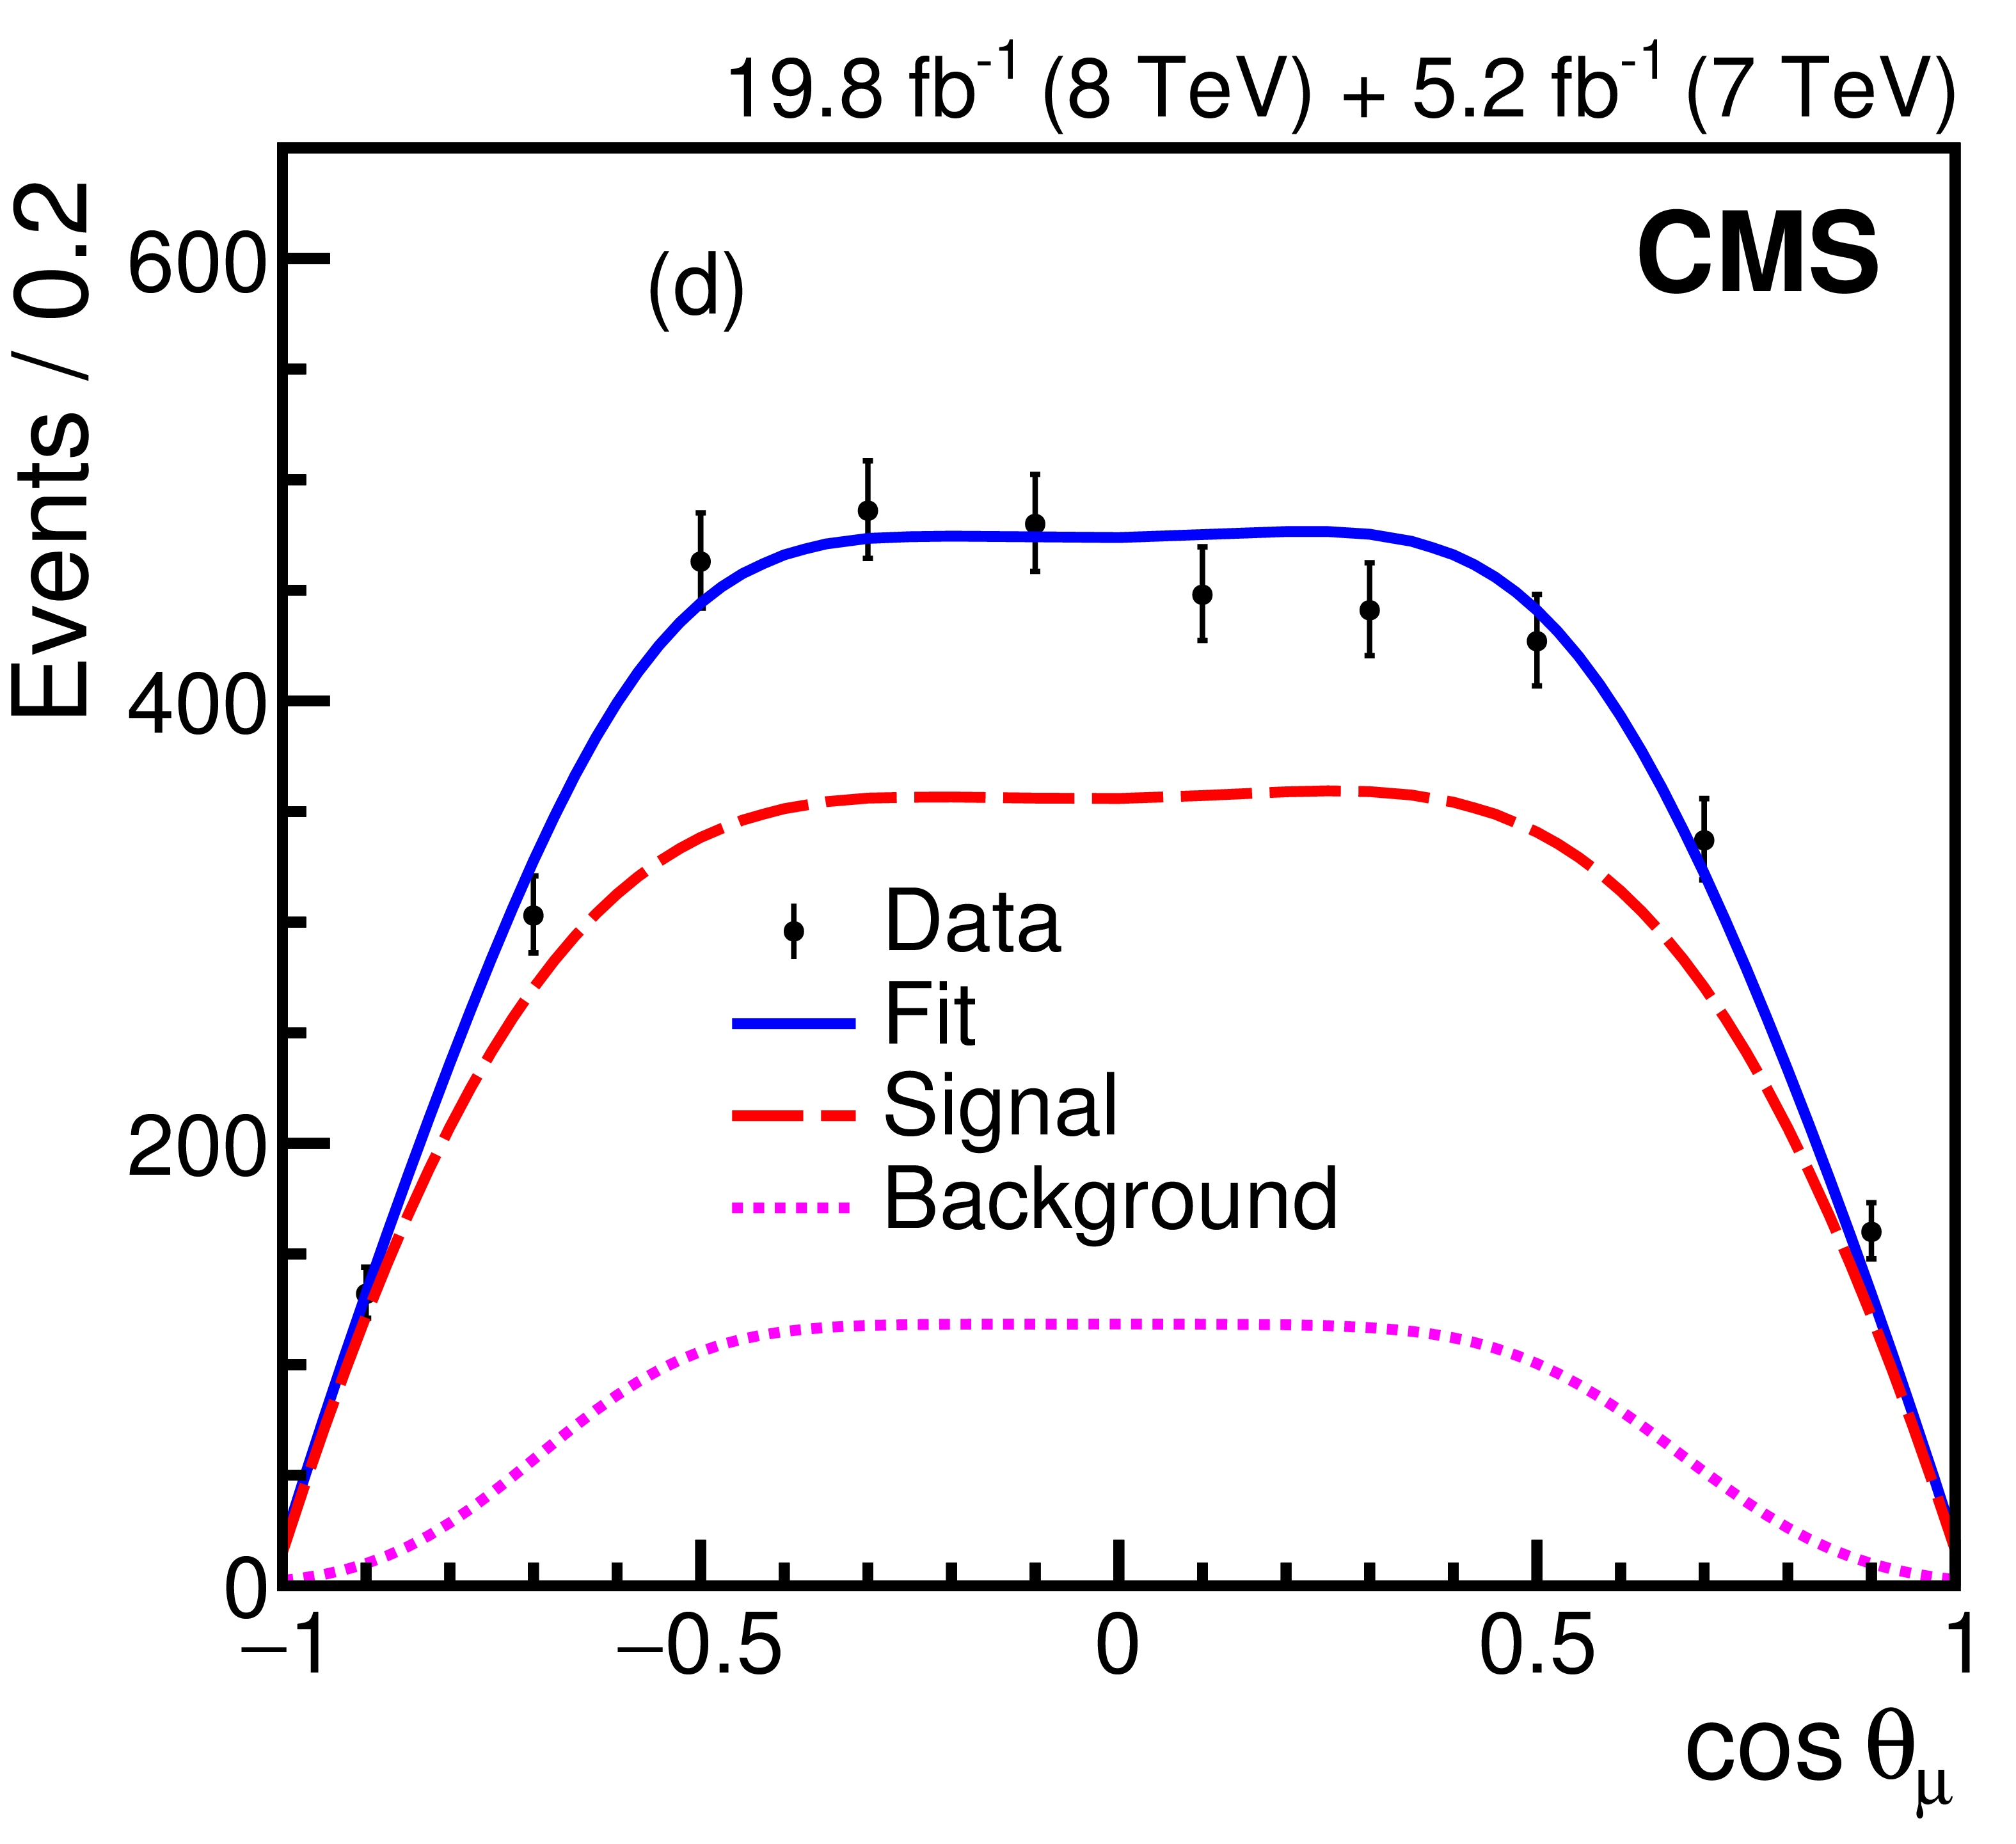
Figure 4-d:
Distribution in $\cos {\theta _{{{\mu}}}} $ for ${\Lambda_{\mathrm{b}}}$ candidates in the combined $\sqrt {s}= $ 7 and 8 TeV data. The vertical bars on the points are the statistical uncertainties in the data, the solid line shows the result of the fit, and the dashed and dotted lines represent, respectively, the signal and background contributions from the fit. |
png pdf |
Figure 5:
Distributions in (a) $ {m_{{ \mathrm{J} / \psi } {{\overline { \Lambda }}}}} $, (b) $\cos {\theta _{{\mathrm {p}}}} $, (c) $\cos {\theta _{ \Lambda }} $, and (d) $\cos {\theta _{{{\mu}}}} $ for ${{{\overline { \Lambda }}_{\mathrm {b}}}}$ candidates in the combined $\sqrt {s}= $ 7 and 8 TeV data. The vertical bars on the points are the statistical uncertainties in the data, the solid line shows the result of the fit, and the dashed and dotted lines represent, respectively, the signal and background contributions from the fit. |

png pdf |
Figure 5-a:
Distribution in $ {m_{{ \mathrm{J} / \psi } {{\overline { \Lambda }}}}} $ for ${{{\overline { \Lambda }}_{\mathrm {b}}}}$ candidates in the combined $\sqrt {s}= $ 7 and 8 TeV data. The vertical bars on the points are the statistical uncertainties in the data, the solid line shows the result of the fit, and the dashed and dotted lines represent, respectively, the signal and background contributions from the fit. |
png pdf |
Figure 5-b:
Distribution in $\cos {\theta _{{\mathrm {p}}}} $ for ${{{\overline { \Lambda }}_{\mathrm {b}}}}$ candidates in the combined $\sqrt {s}= $ 7 and 8 TeV data. The vertical bars on the points are the statistical uncertainties in the data, the solid line shows the result of the fit, and the dashed and dotted lines represent, respectively, the signal and background contributions from the fit. |
png pdf |
Figure 5-c:
Distribution in $\cos {\theta _{{\mathrm {p}}}} $ for ${{{\overline { \Lambda }}_{\mathrm {b}}}}$ candidates in the combined $\sqrt {s}= $ 7 and 8 TeV data. The vertical bars on the points are the statistical uncertainties in the data, the solid line shows the result of the fit, and the dashed and dotted lines represent, respectively, the signal and background contributions from the fit. |
png pdf |
Figure 5-d:
Distribution in $\cos {\theta _{{{\mu}}}} $ for ${{{\overline { \Lambda }}_{\mathrm {b}}}}$ candidates in the combined $\sqrt {s}= $ 7 and 8 TeV data. The vertical bars on the points are the statistical uncertainties in the data, the solid line shows the result of the fit, and the dashed and dotted lines represent, respectively, the signal and background contributions from the fit. |
| Tables | |
png pdf |
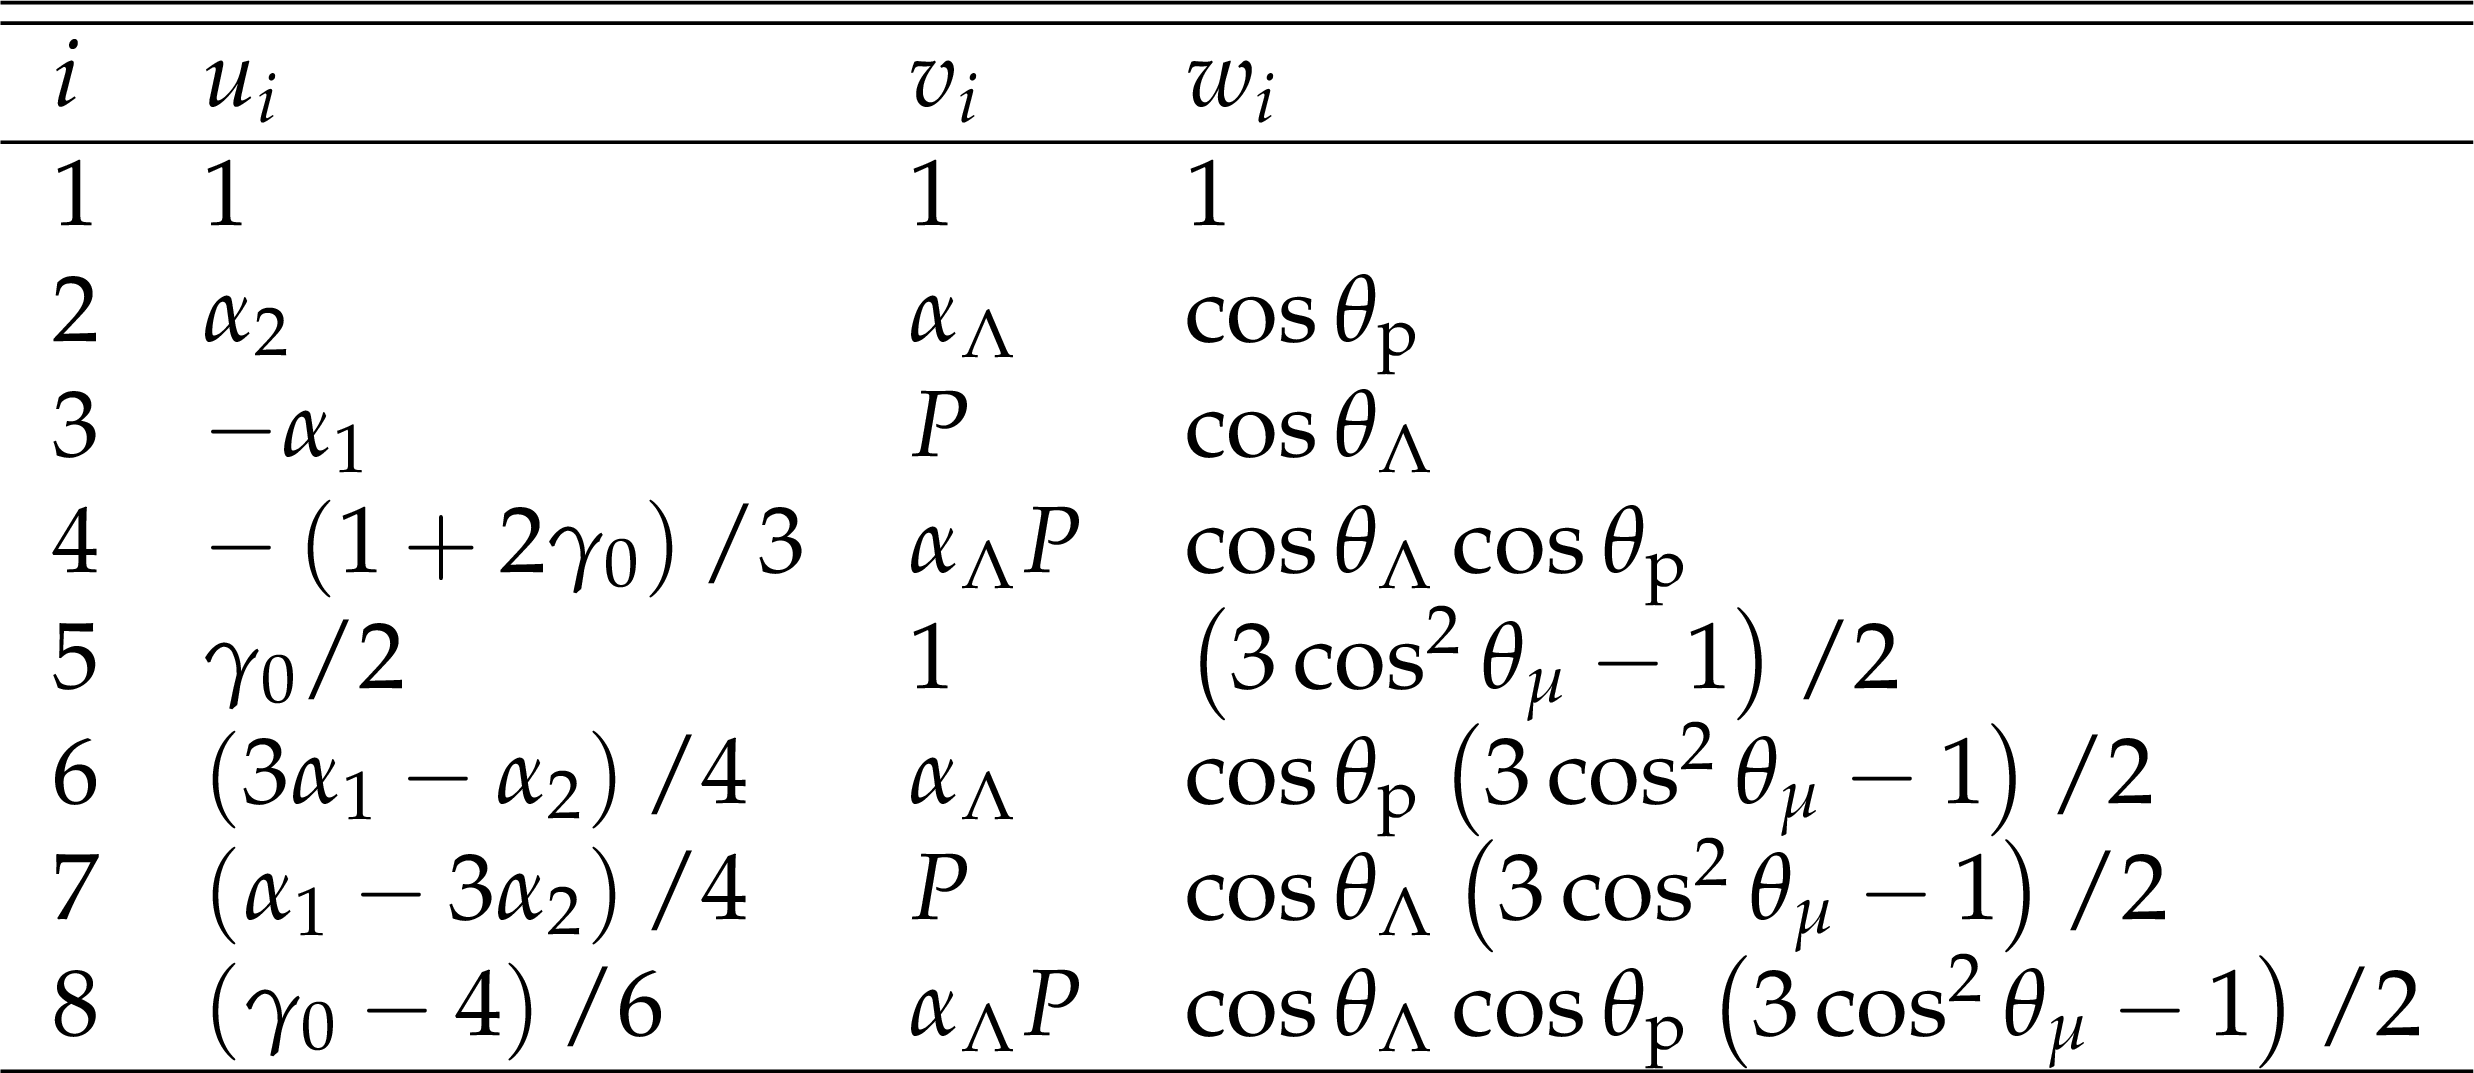
Table 1:
Functions used in Eq. (3) to describe the angular distribution in the decay ${{\Lambda_{\mathrm{b}}}} \to { \mathrm{J} / \psi } { \Lambda }$, with ${{ \mathrm{J} / \psi } \to {{{\mu ^+}} {{\mu ^-}}}}$ and $ { \Lambda }\to {{\mathrm {p}} {\pi ^-}} $. |
png pdf |
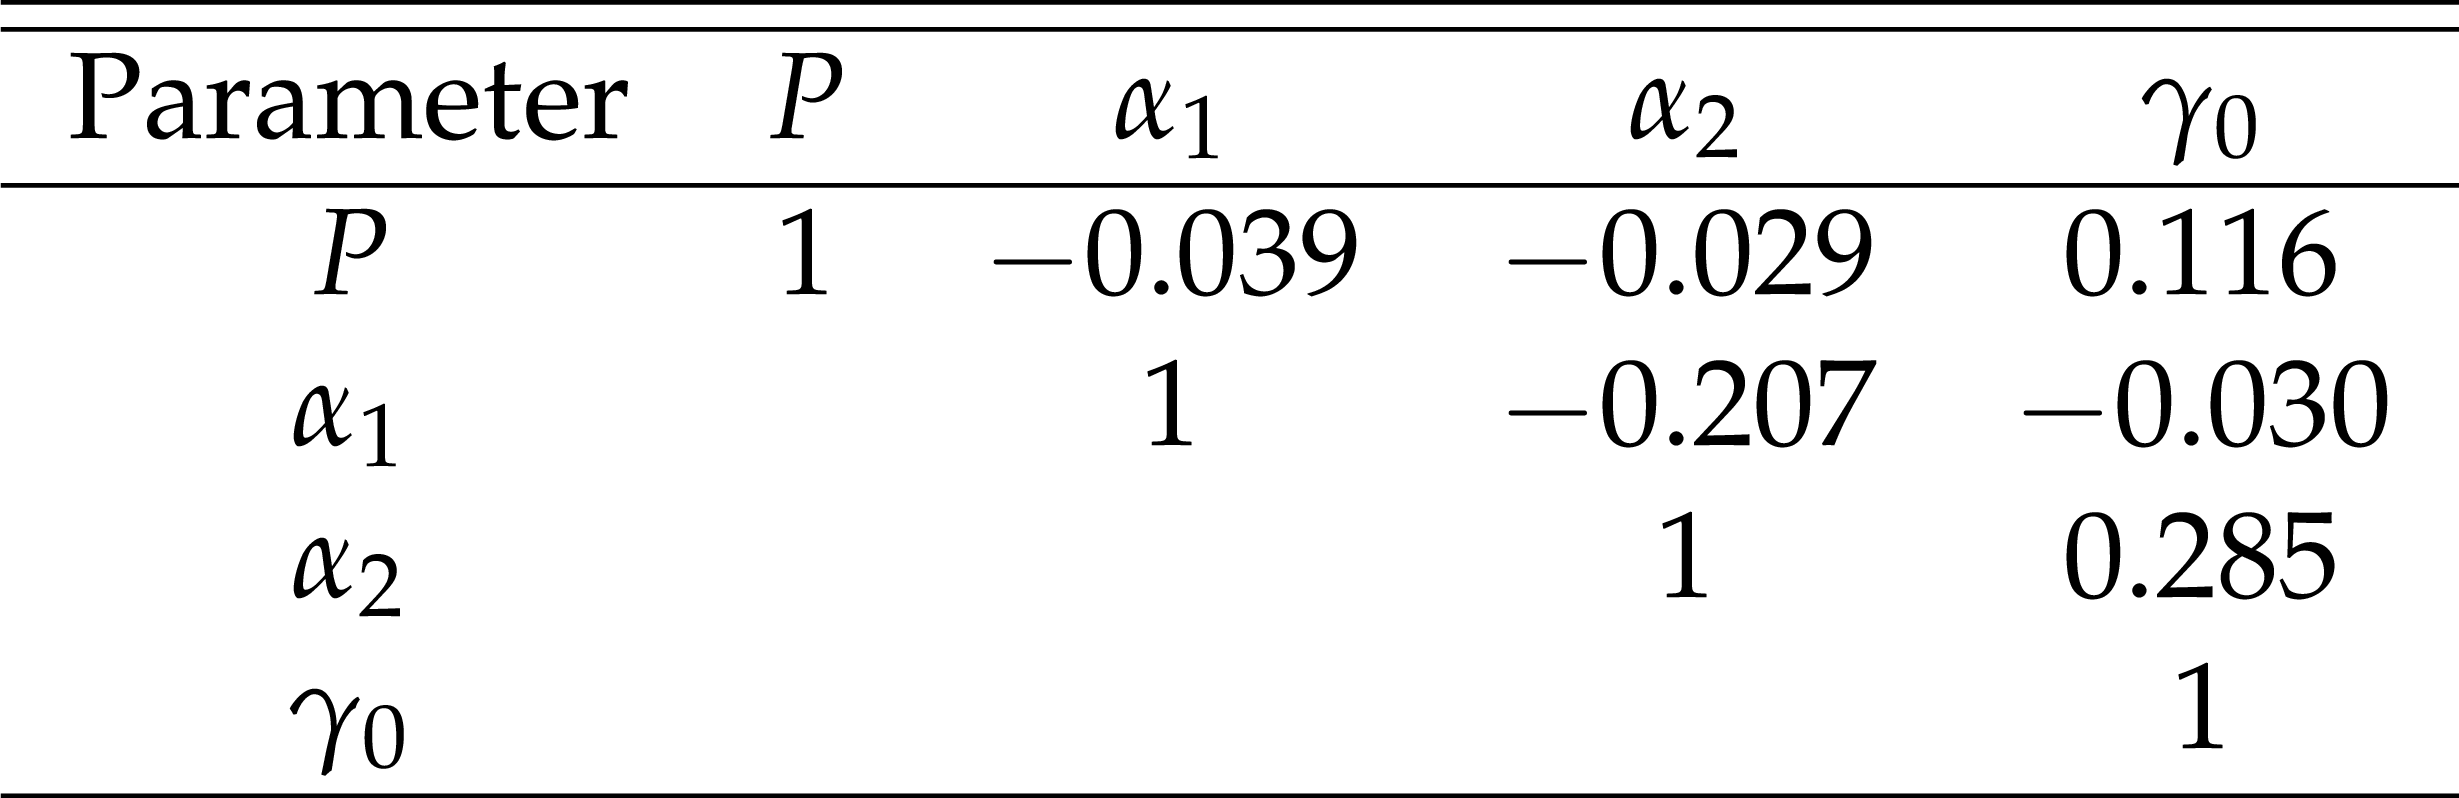
Table 2:
Correlation matrix for the fitted parameters. |
png pdf |
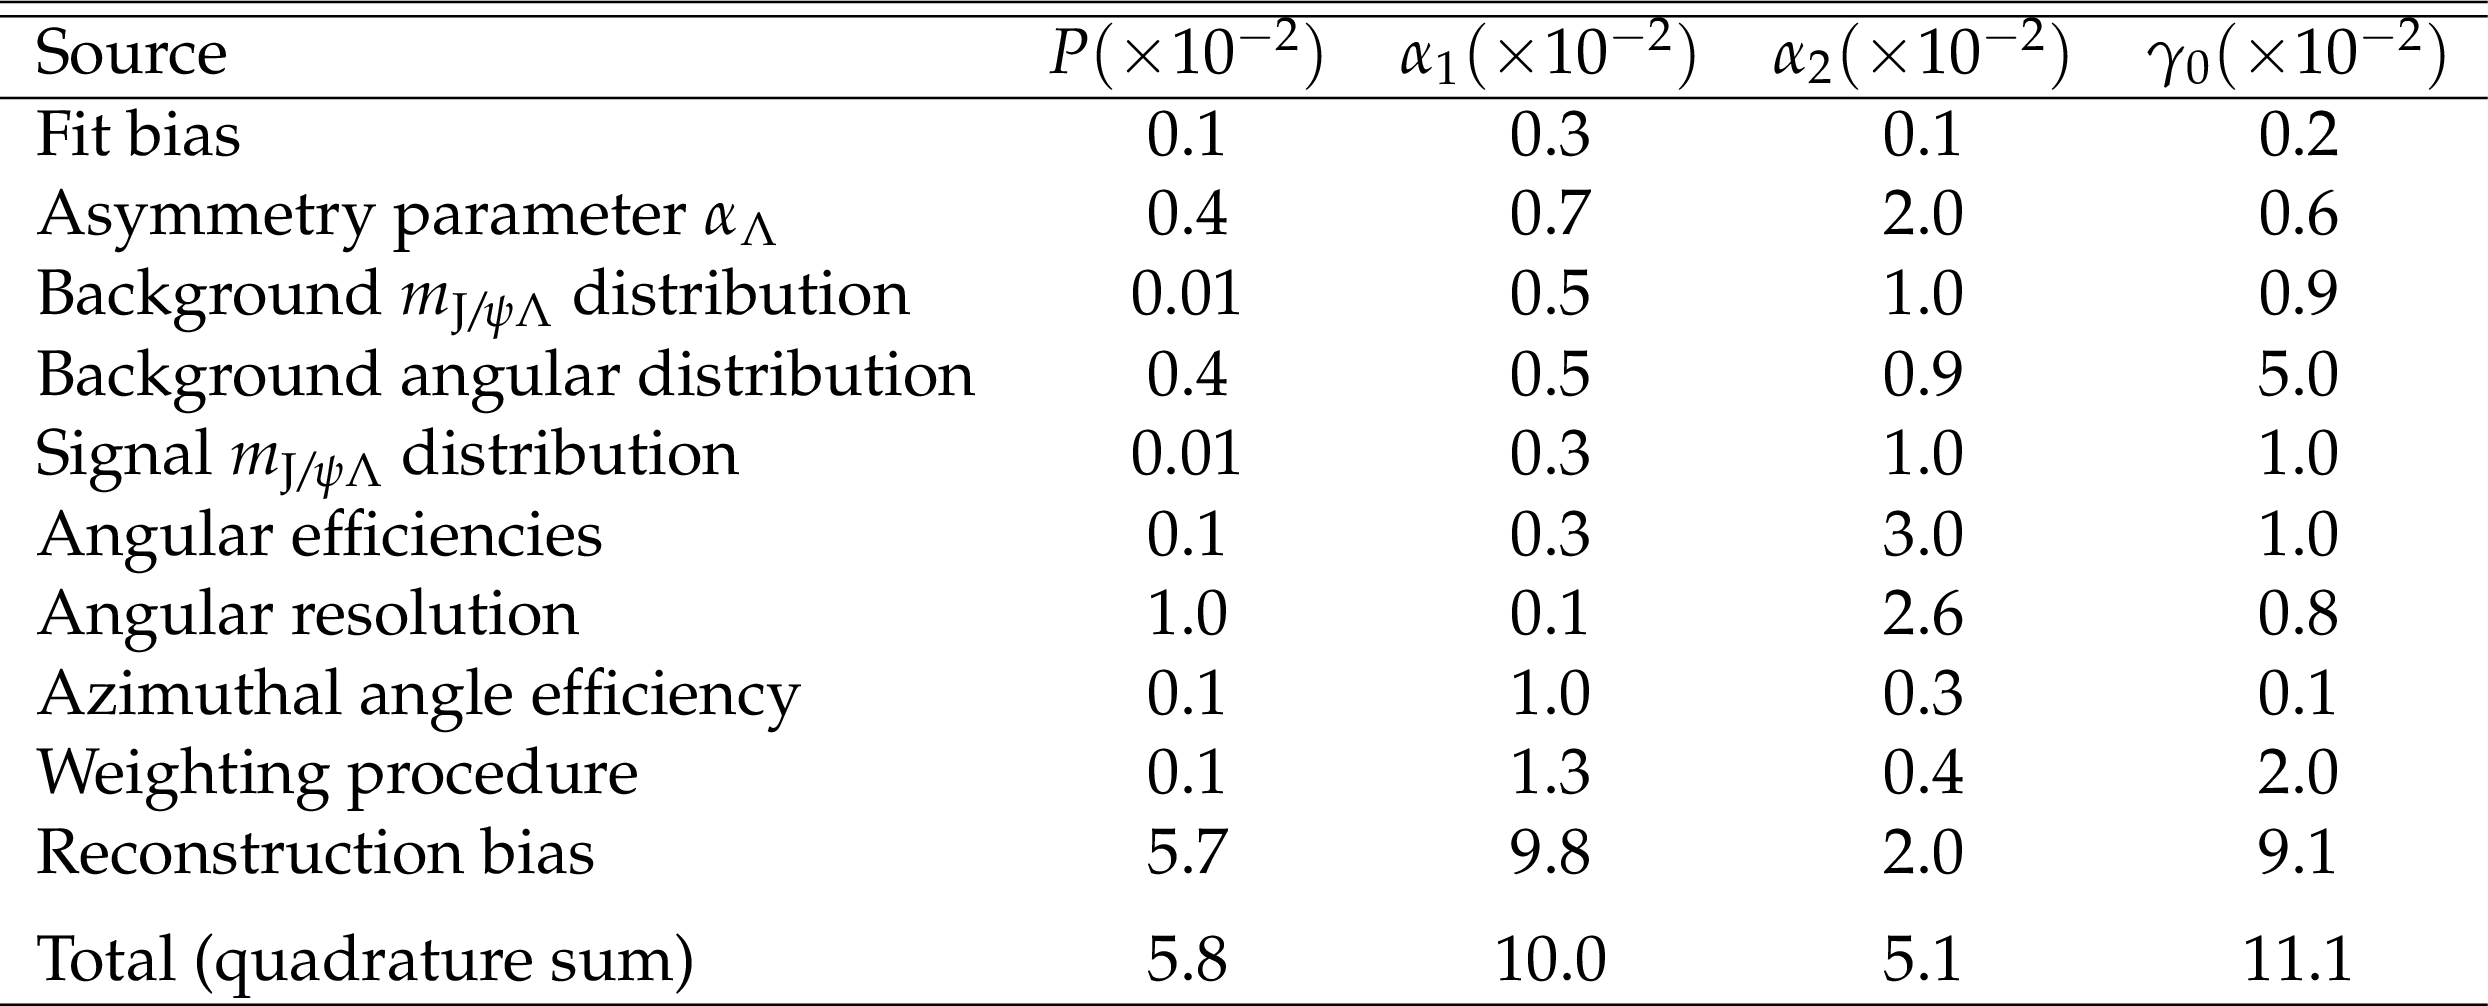
Table 3:
The sources and values of the systematic uncertainties in each parameter and the total uncertainty. Each value in the table should be multiplied by $10^{-2}$ to obtain the corresponding systematic uncertainty. |
| Summary |
|
Based on an angular analysis of about 6000 $ \Lambda_{\mathrm{b}} \to \mathrm{J}/\psi ( \to \mu^{+} \mu^{-}) \Lambda (\to \mathrm{p} \pi^{-}) $ events collected by the CMS experiment at $\sqrt{s}= $ 7 and 8 TeV, a measurement of the $ \Lambda_{\mathrm{b}} $ polarization $P$, the parity-violating asymmetry parameter in the $ \Lambda_{\mathrm{b}} $ decay $\alpha_1$, the $ \Lambda $ longitudinal polarization $\alpha_2$, and the parameter $\gamma_0$ has been performed. The obtained values are |
| References | ||||
| 1 | A. F. Falk and M. E. Peskin | Production, decay, and polarization of excited heavy hadrons | PRD 49 (1994) 3320 | hep-ph/9308241 |
| 2 | B. Mele and G. Altarelli | Lepton spectra as a measure of b quark polarization at LEP | PLB 299 (1993) 345 | |
| 3 | ALEPH Collaboration | Measurement of $ \Lambda_{\mathrm{b}} $ polarization in Z decays | PLB 365 (1996) 437 | |
| 4 | Z. J. Ajaltouni, E. Conte, and O. Leitner | An angular distribution analysis of $ \Lambda_{\mathrm{b}} $ decays | NP A 755 (2005) 435 | hep-ph/0412131 |
| 5 | G. Hiller, M. Knecht, F. Legger, and T. Schietinger | Photon polarization from helicity suppression in radiative decays of polarized $ \Lambda_{\mathrm{b}} $ to spin--3/2 baryons | PLB 649 (2007) 152 | hep-ph/0702191 |
| 6 | Z. J. Ajaltouni, E. Conte, and O. Leitner | $ \Lambda_{\mathrm{b}} $ decays into $ \Lambda$-vector | PLB 614 (2005) 165 | hep-ph/0412116 |
| 7 | P. Bialas, J. G. Korner, M. Kramer, and K. Zalewski | Joint angular decay distributions in exclusive weak decays of heavy mesons and baryons | Z. Phys. C 57 (1993) 115 | |
| 8 | M. Kramer and H. Simma | Angular correlations in $ \Lambda_{\mathrm{b}} \to\Lambda+\text{V} $: polarization measurements, HQET and CP violation | NPPS 50 (1996) 125 | |
| 9 | T. Gutsche et al. | Polarization effects in the cascade decay $ \Lambda_{\mathrm{b}} \to \Lambda(\to \mathrm{p} \pi) + \mathrm{J}/\psi (\ell^{+}\ell^{-}) $ in the covariant confined quark model | PRD 88 (2013) 114018 | 1309.7879 |
| 10 | C.-H. Chou, H.-H. Shih, S.-C. Lee, and H.-n. Li | $ \Lambda_{\mathrm{b}} \to \Lambda \mathrm{J}/\psi $ decay in perturbative QCD | PRD 65 (2002) 074030 | hep-ph/0112145 |
| 11 | LHCb Collaboration | Measurements of the $ \Lambda_{\mathrm{b}} \to \mathrm{J}/\psi \Lambda $ decay amplitudes and the $ \Lambda_{\mathrm{b}} $ polarisation in $ {\mathrm{p}}{\mathrm{p}} $ collisions at $ \sqrt{s} = $ 7 TeV | PLB 724 (2013) 27 | 1302.5578 |
| 12 | ATLAS Collaboration | Measurement of the parity-violating asymmetry parameter $ {{\alpha}}_{\text{b}} $ and the helicity amplitudes for the decay $ \Lambda_{\mathrm{b}} \to\mathrm{J}/\psi \Lambda $ with the ATLAS detector | PRD 89 (2014) 092009 | 1404.1071 |
| 13 | CDF Collaboration | Observation of the heavy baryons $ \Sigma_{\mathrm{b}} $ and $ \Sigma_{\mathrm{b}}^{*} $ | PRL 99 (2007) 202001 | 0706.3868 |
| 14 | CDF Collaboration | Measurement of the masses and widths of the bottom baryons $ \Sigma_{\mathrm{b}}^{\pm} $ and $ \Sigma_{\mathrm{b}}^{* \pm} $ | PRD 85 (2012) 092011 | 1112.2808 |
| 15 | LHCb Collaboration | Observation of excited $ \Lambda_{\mathrm{b}} $ baryons | PRL 109 (2012) 172003 | 1205.3452 |
| 16 | CMS Collaboration | The CMS experiment at the CERN LHC | JINST 3 (2008) S08004 | CMS-00-001 |
| 17 | Particle Data Group, C. Patrignani et al. | Review of particle physics | CPC 40 (2016) 100001 | |
| 18 | CMS Collaboration | Description and performance of track and primary-vertex reconstruction with the CMS tracker | JINST 9 (2014) P10009 | CMS-TRK-11-001 1405.6569 |
| 19 | CMS Collaboration | Performance of CMS muon reconstruction in $ {\mathrm{p}}{\mathrm{p}} $ collision events at $ \sqrt{s} = $ 7 TeV | JINST 7 (2012) P10002 | CMS-MUO-10-004 1206.4071 |
| 20 | CMS Collaboration | Particle-flow reconstruction and global event description with the CMS detector | JINST 12 (2017) P10003 | CMS-PRF-14-001 1706.04965 |
| 21 | CMS Collaboration | The CMS trigger system | JINST 12 (2017) P01020 | CMS-TRG-12-001 1609.02366 |
| 22 | T. Sjostrand, S. Mrenna and P. Z. Skands | PYTHIA 6.4 physics and manual | JHEP 05 (2006) 026 | hep-ph/0603175 |
| 23 | D. J. Lange | The EVTGEN particle decay simulation package | NIMA 462 (2001) 152 | |
| 24 | GEANT4 Collaboration | GEANT4---a simulation toolkit | NIMA 506 (2003) 250 | |
| 25 | CMS Collaboration | Strange particle production in pp collisions at $ \sqrt{s}= $ 0.9 and 7 TeV | JHEP 05 (2011) 064 | CMS-QCD-10-007 1102.4282 |
| 26 | W. Verkerke and D. P. Kirkby | The RooFit toolkit for data modeling | in Statistical problems in particle physics, astrophysics and Cosmology (PHYSTAT 05): Proceedings, Oxford, UK, September 12-15, 2005, volume 0303241, p. MOLT007 2003 | physics/0306116 |
| 27 | H.-Y. Cheng | Nonleptonic weak decays of bottom baryons | PRD 56 (1997) 2799 | hep-ph/9612223 |
| 28 | Fayyazuddin and Riazuddin | Two-body nonleptonic $ \Lambda_{\mathrm{b}} $ decays in the quark model with factorization ansatz | PRD 58 (1998) 014016 | hep-ph/9802326 |
| 29 | R. Mohanta et al. | Hadronic weak decays of $ \Lambda_{\mathrm{b}} $ baryon in the covariant oscillator quark model | Prog. Theor. Phys. 101 (1999) 959 | hep-ph/9904324 |
| 30 | Z.-T. Wei, H.-W. Ke, and X.-Q. Li | Evaluating decay rates and asymmetries of $ \Lambda_{\mathrm{b}} $ into light baryons in LFQM | PRD 80 (2009) 094016 | 0909.0100 |
|
|
Compact Muon Solenoid LHC, CERN |
|

|

|

|

|

|