

Compact Muon Solenoid
LHC, CERN
| CMS-BPH-15-008 ; CERN-EP-2017-240 | ||
| Measurement of angular parameters from the decay $\mathrm{B}^0 \to \mathrm{K}^{*0} \mu^+ \mu^-$ in proton-proton collisions at $\sqrt{s} = $ 8 TeV | ||
| CMS Collaboration | ||
| 8 October 2017 | ||
| Phys. Lett. B 781 (2018) 517 | ||
| Abstract: Angular distributions of the decay $\mathrm{B}^0 \to \mathrm{K}^{*0} \mu^ +\mu^-$ are studied using a sample of proton-proton collisions at $\sqrt{s} = $ 8 TeV collected with the CMS detector at the LHC, corresponding to an integrated luminosity of 20.5 fb$^{-1}$. An angular analysis is performed to determine the $P_1$ and $P_5'$ parameters, where the $P_5'$ parameter is of particular interest because of recent measurements that indicate a potential discrepancy with the standard model predictions. Based on a sample of 1397 signal events, the $P_1$ and $P_5'$ parameters are determined as a function of the dimuon invariant mass squared. The measurements are in agreement with predictions based on the standard model. | ||
| Links: e-print arXiv:1710.02846 [hep-ex] (PDF) ; CDS record ; inSPIRE record ; CADI line (restricted) ; | ||
| Figures & Tables | Summary | Additional Figures | References | CMS Publications |
|---|
| Figures | |
png pdf |
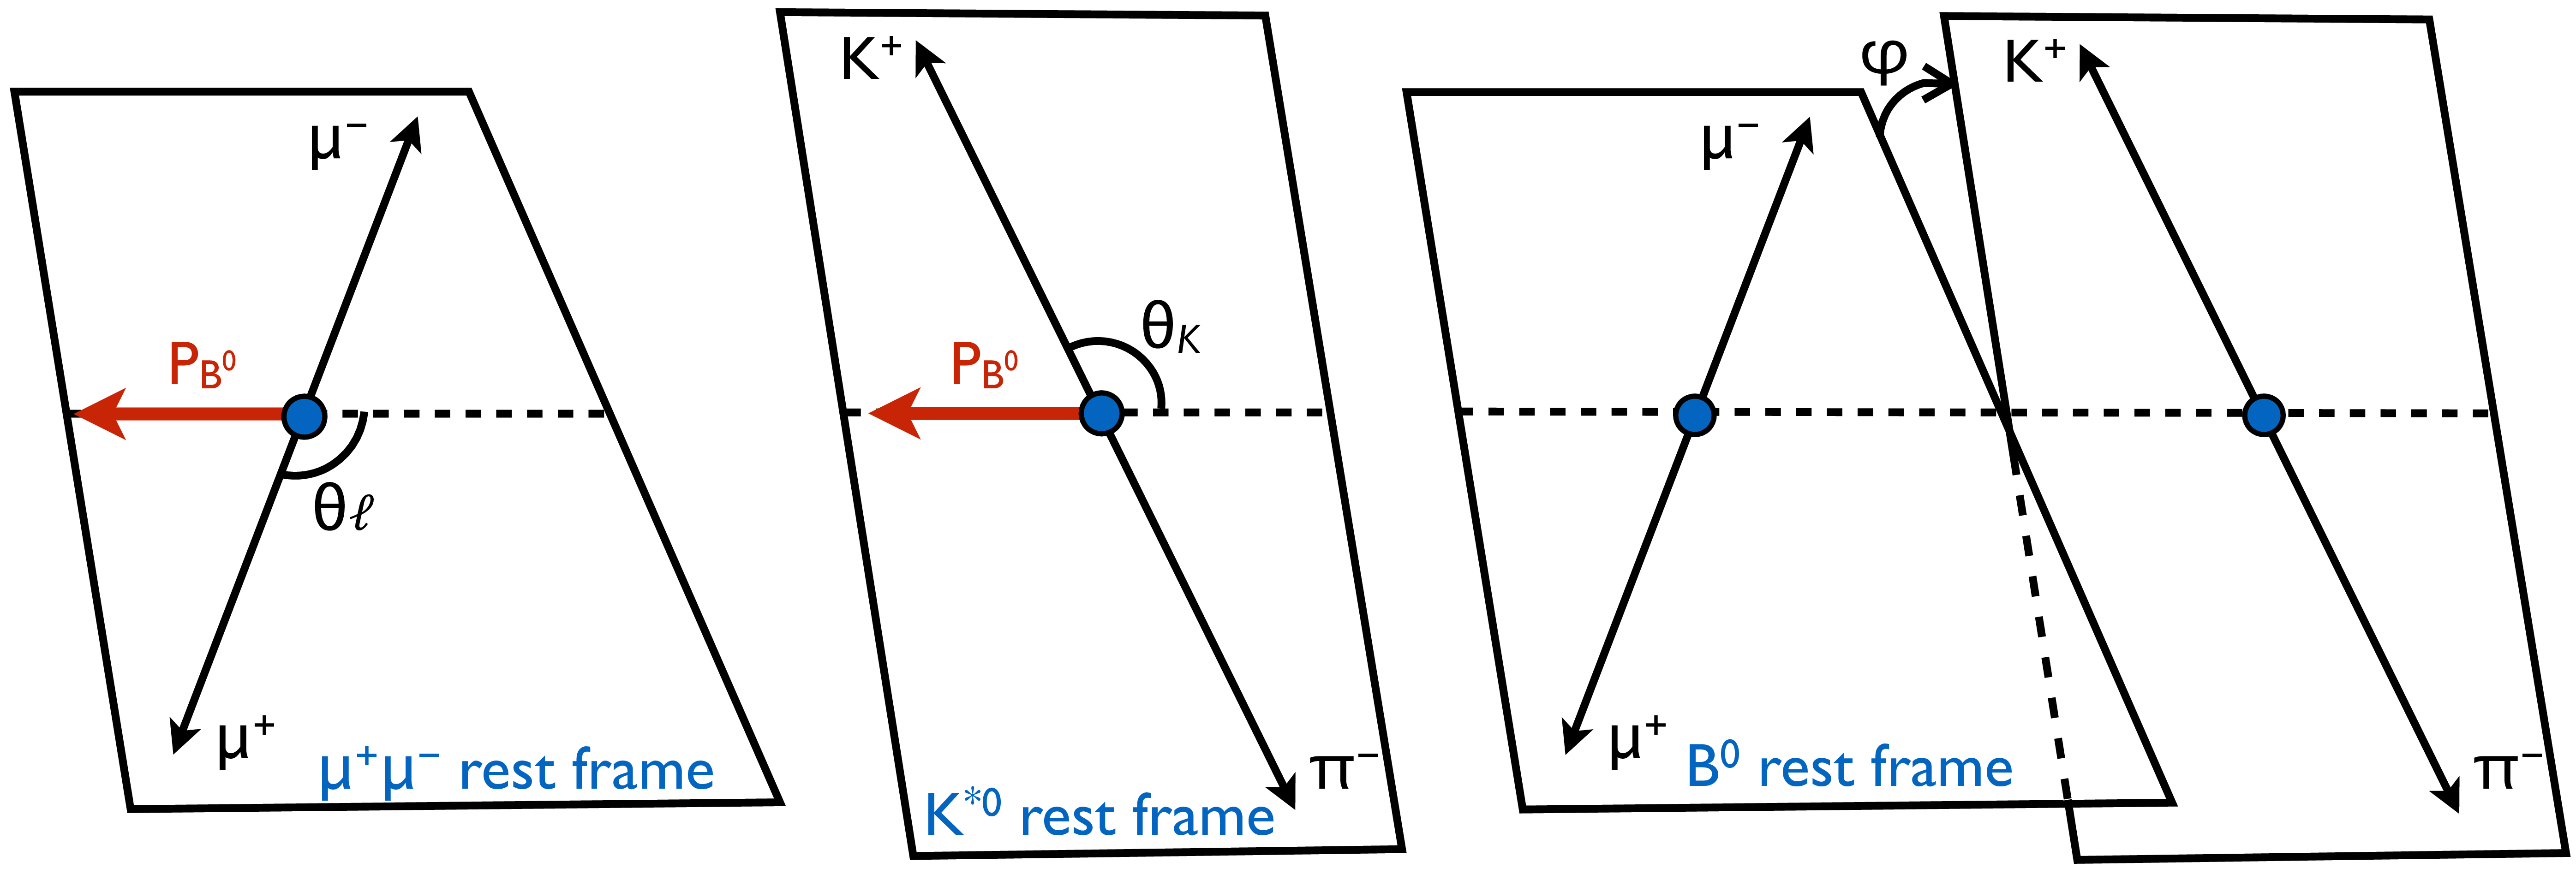
Figure 1:
Illustration of the angular variables $\theta _{\ell}$ (left), $\theta _{\mathrm{K}}$ (middle), and $\varphi $ (right) for the decay ${\mathrm{B}^{0} \to {\mathrm {K}^{* 0}} (\mathrm{K^{+}} \pi^{-}) \mu^{+} \mu^{-}}$. |
png pdf |
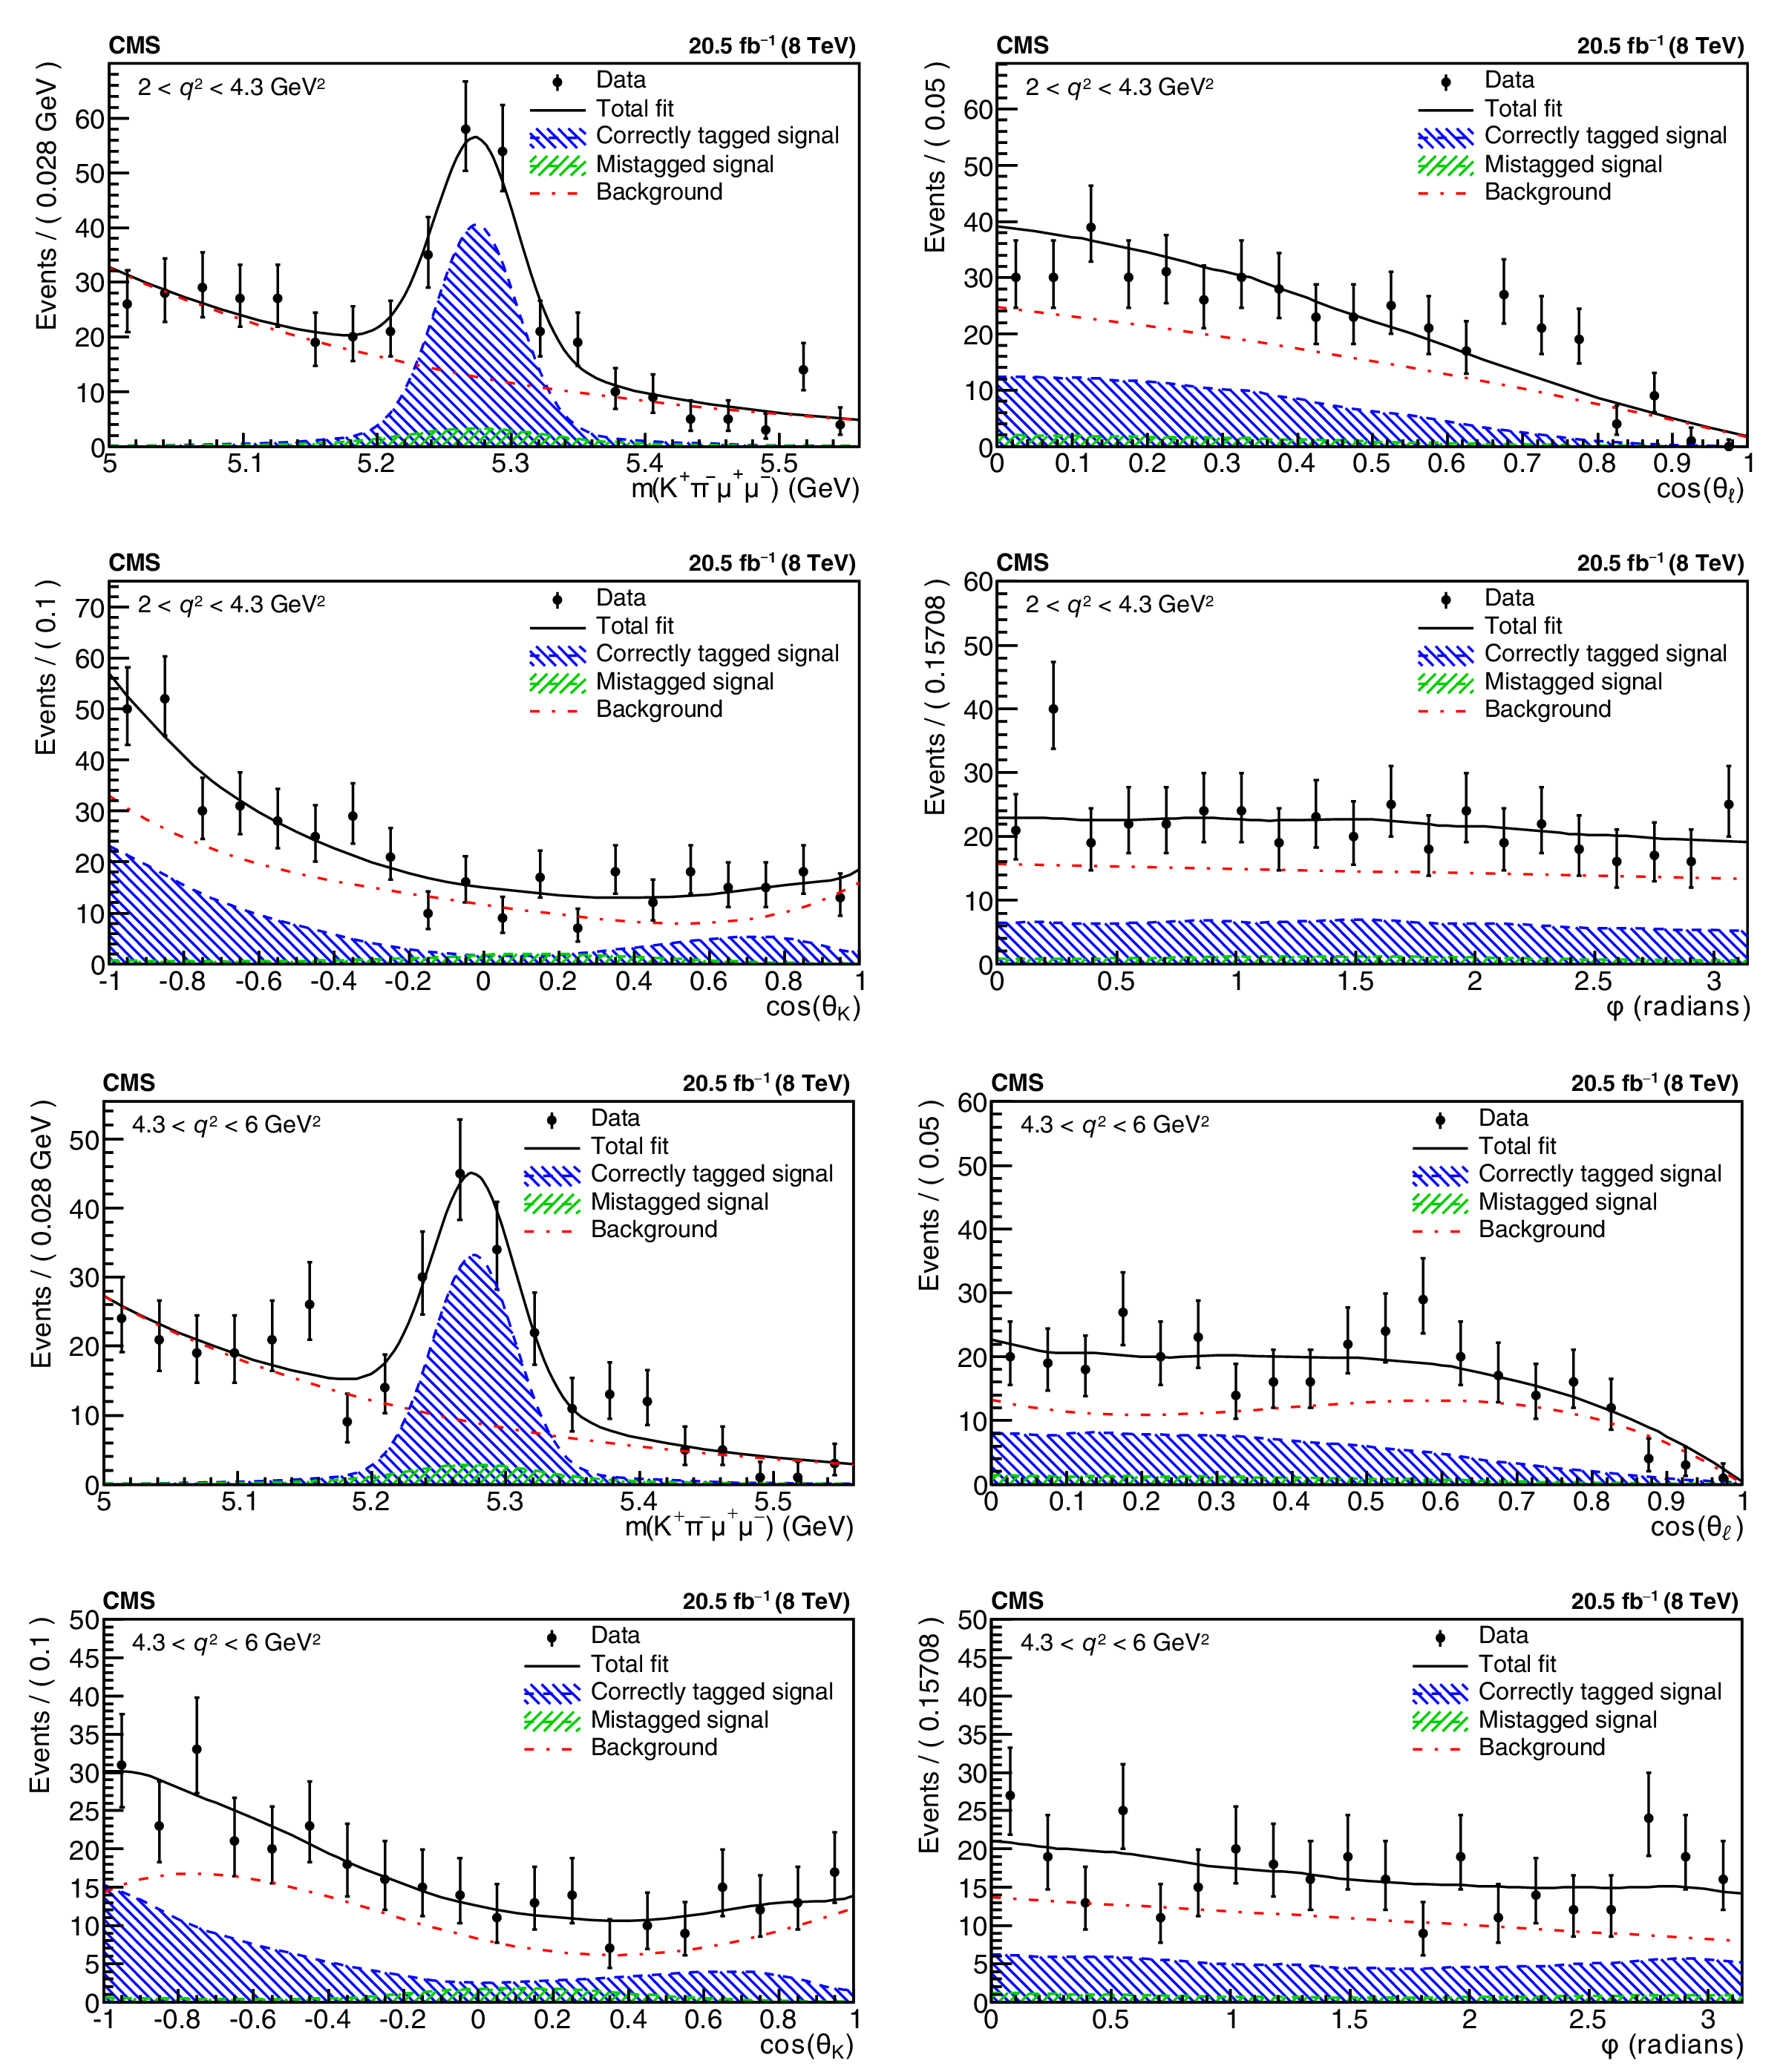
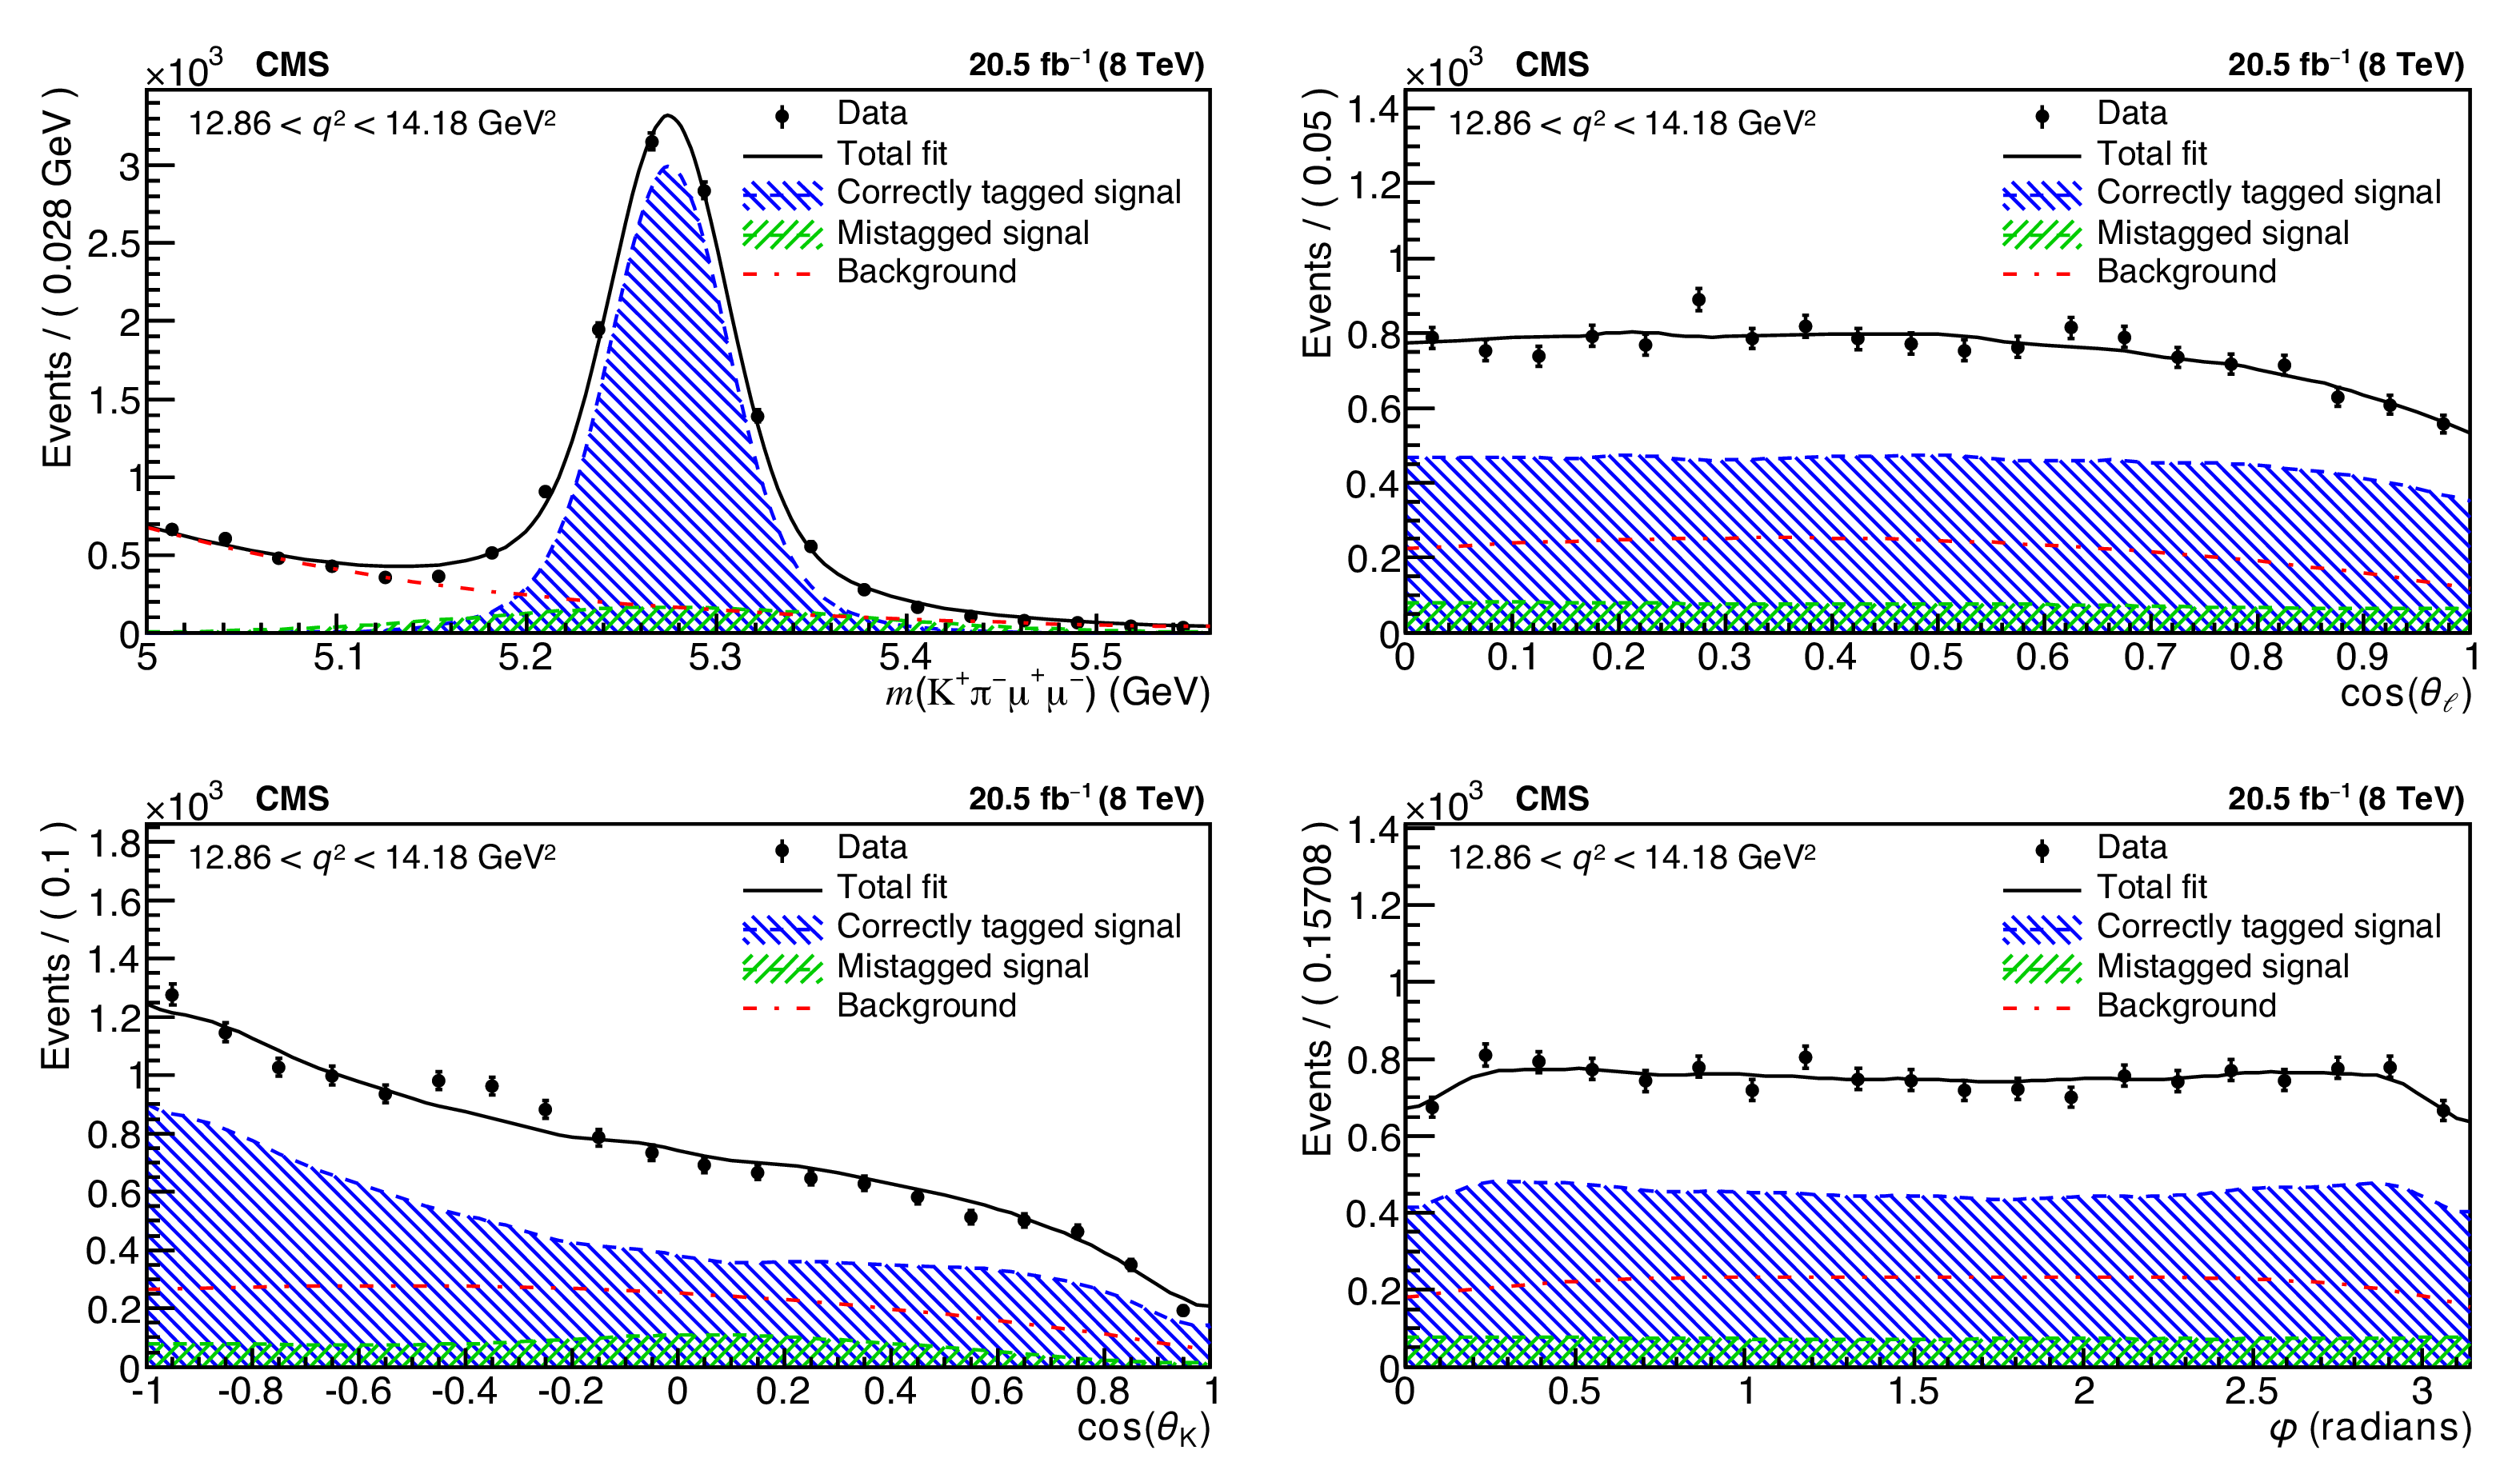
Figure 2:
Invariant mass and angular distributions of $\mathrm{K^{+}} \pi^{-} \mu^{+} \mu^{-} $ events for (upper two rows) 2 $ < q^2 < 4.3 GeV ^2$ and (lower two rows) 4.3 $ < q^2 < $ 6 GeV$^2$. The projection of the results from the total fit, as well as for correctly tagged signal events, mistagged signal events, and background events, are also shown. The vertical bars indicate the statistical uncertainties. |
png pdf |
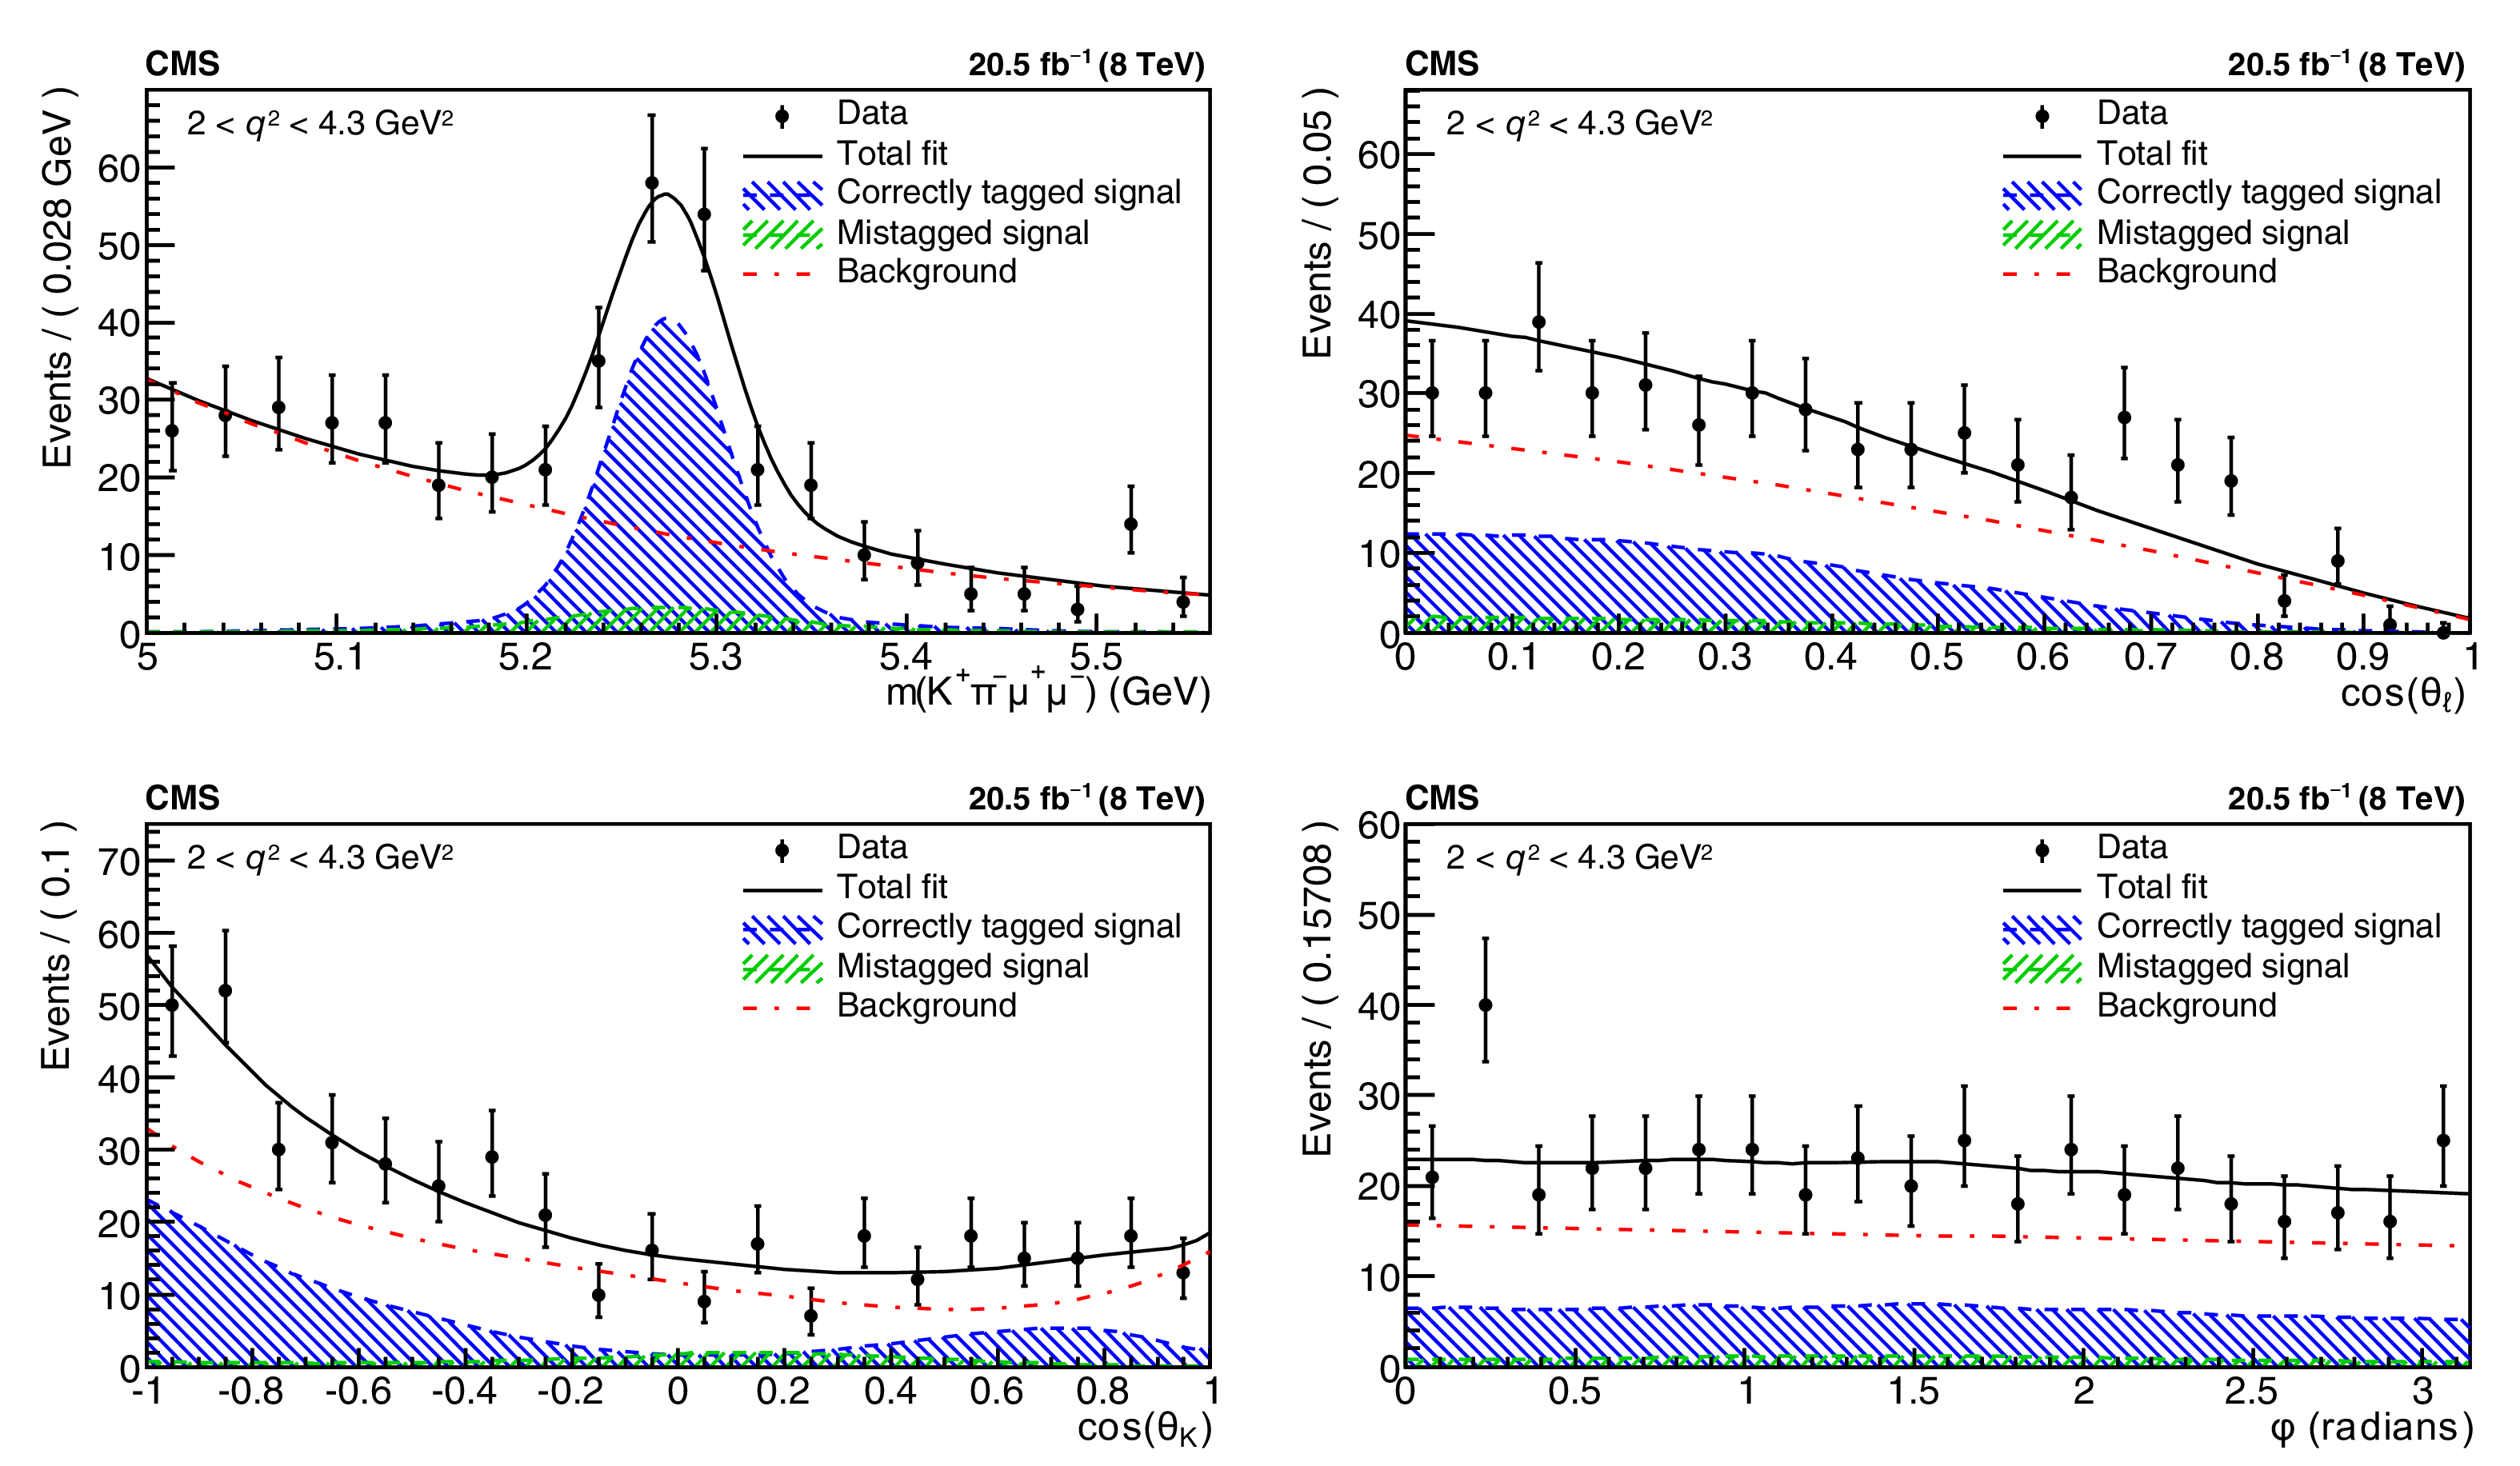
Figure 2-a:
Invariant mass and angular distributions of $\mathrm{K^{+}} \pi^{-} \mu^{+} \mu^{-} $ events for 2 $ < q^2 < 4.3 GeV ^2$. The projection of the results from the total fit, as well as for correctly tagged signal events, mistagged signal events, and background events, are also shown. The vertical bars indicate the statistical uncertainties. |
png pdf |
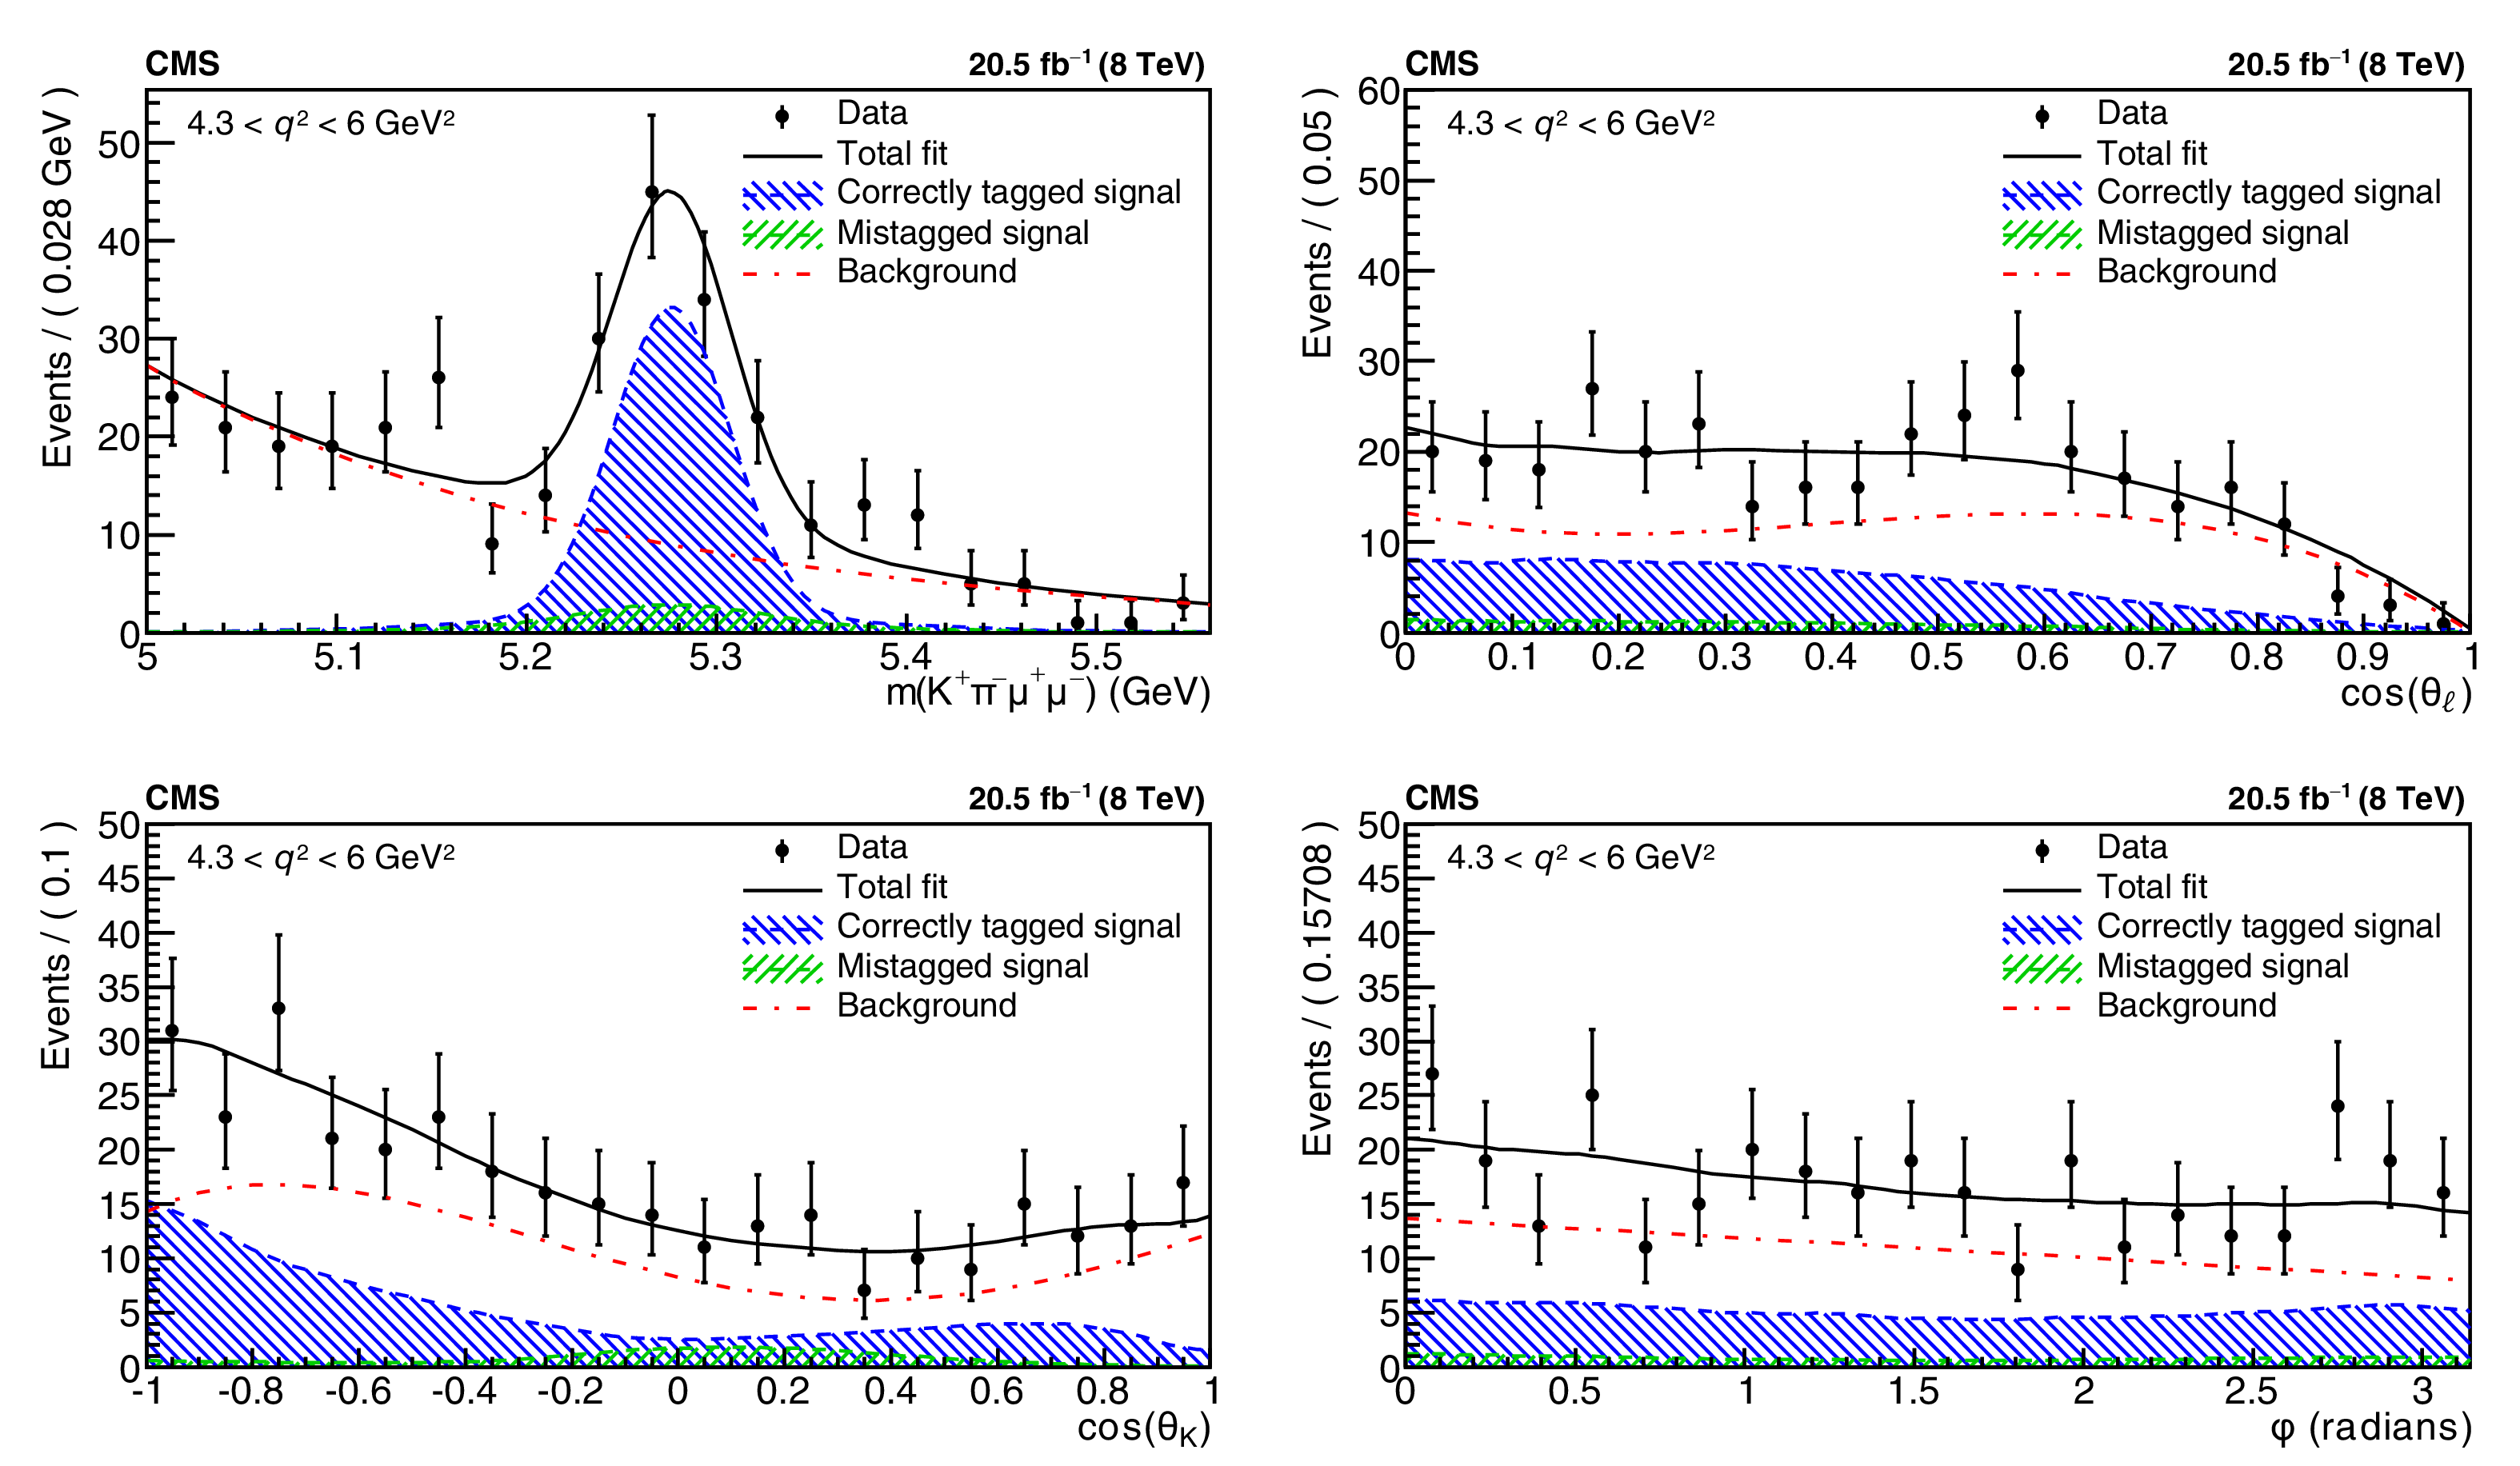
Figure 2-b:
Invariant mass and angular distributions of $\mathrm{K^{+}} \pi^{-} \mu^{+} \mu^{-} $ events for 4.3 $ < q^2 < $ 6 GeV$^2$. The projection of the results from the total fit, as well as for correctly tagged signal events, mistagged signal events, and background events, are also shown. The vertical bars indicate the statistical uncertainties. |
png pdf |
Figure 3:
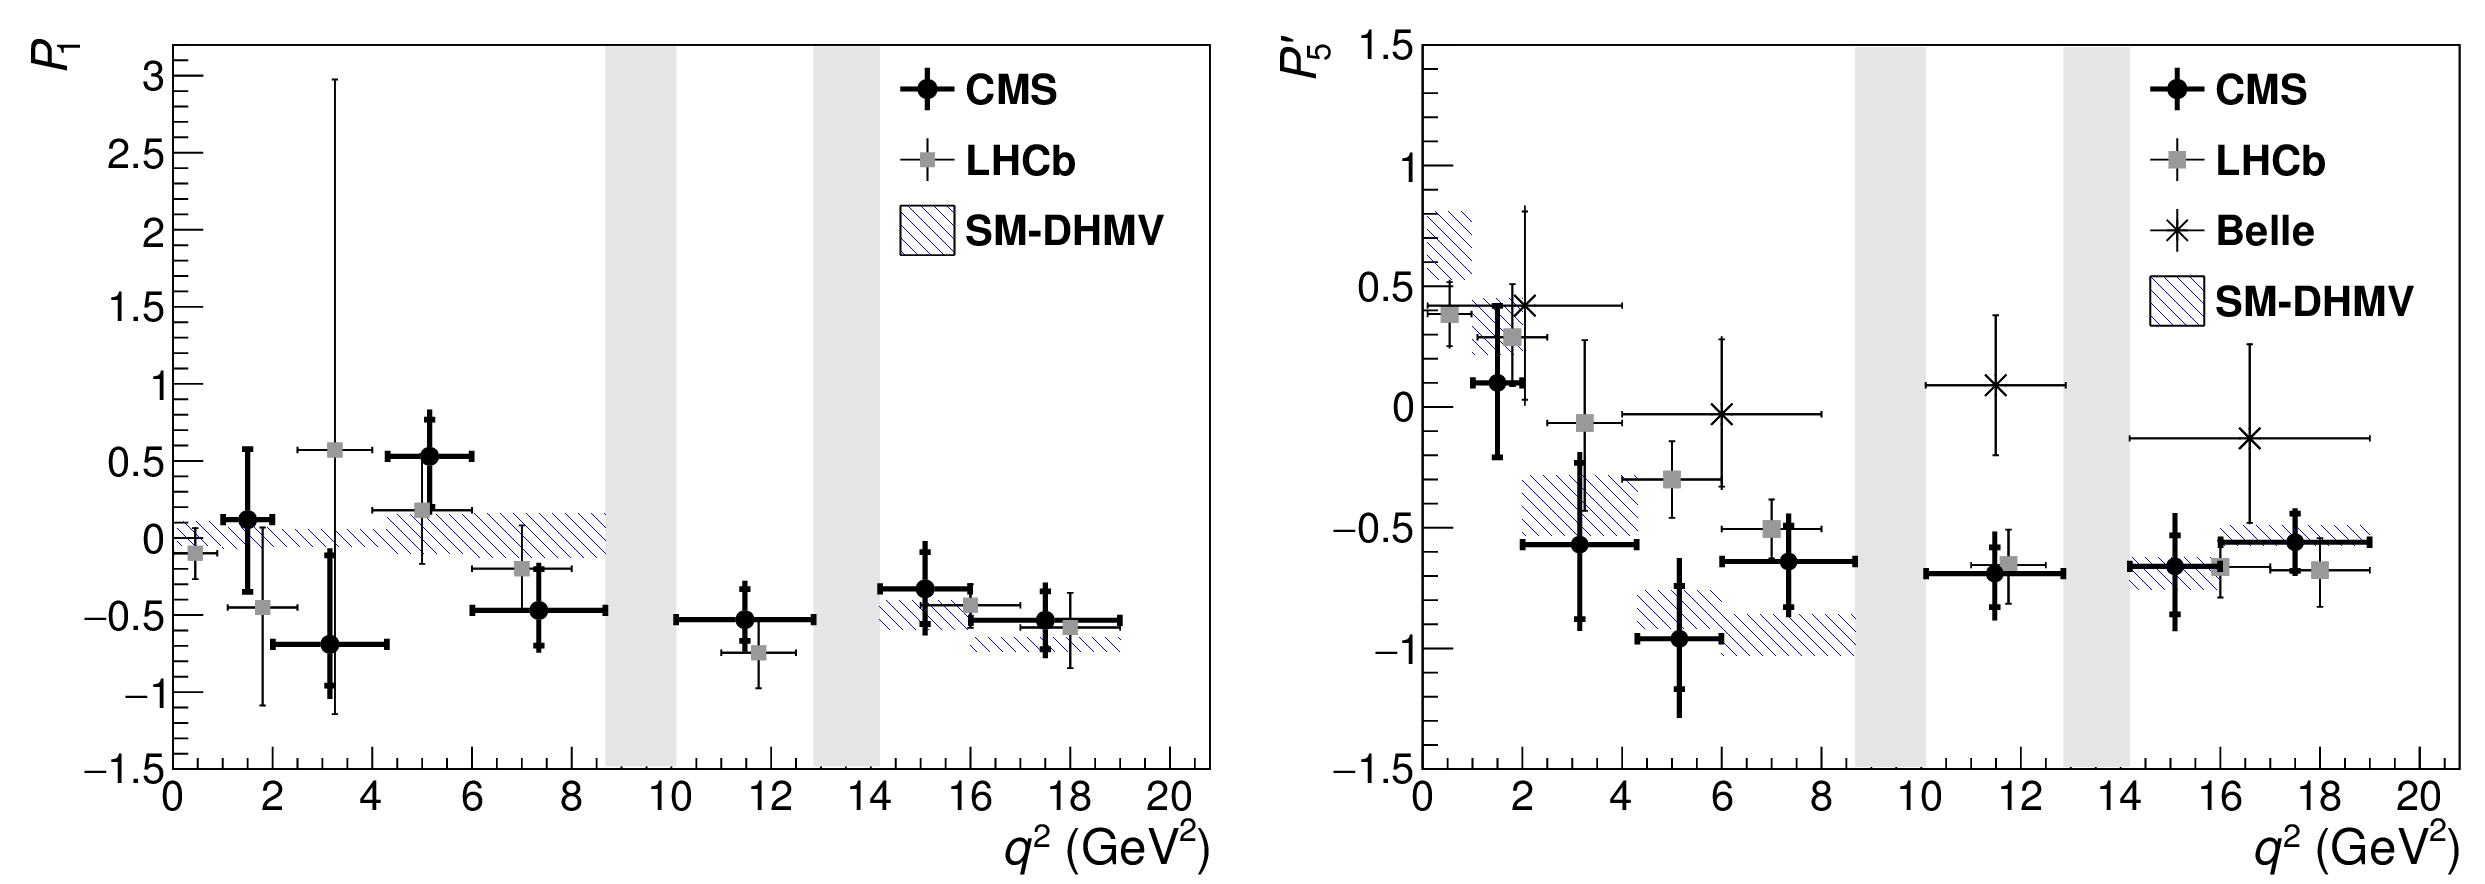
CMS measurements of the $P_1$ and $P_5'$ angular parameters versus $q^2$ for ${\mathrm{B}^{0} \to {\mathrm {K}^{* 0}} \mu^{+} \mu^{-}}$ decays, in comparison to results from the LHCb [33] and Belle [34] Collaborations. The statistical uncertainties are shown by the inner vertical bars, while the outer vertical bars give the total uncertainties. The horizontal bars show the bin widths. The vertical shaded regions correspond to the $\mathrm{J}/\psi $ and $\psi '$ resonances. The hatched region shows the predictions from two SM calculations described in the text, averaged over each $q^2$ bin. |
png pdf |
Figure 3-a:
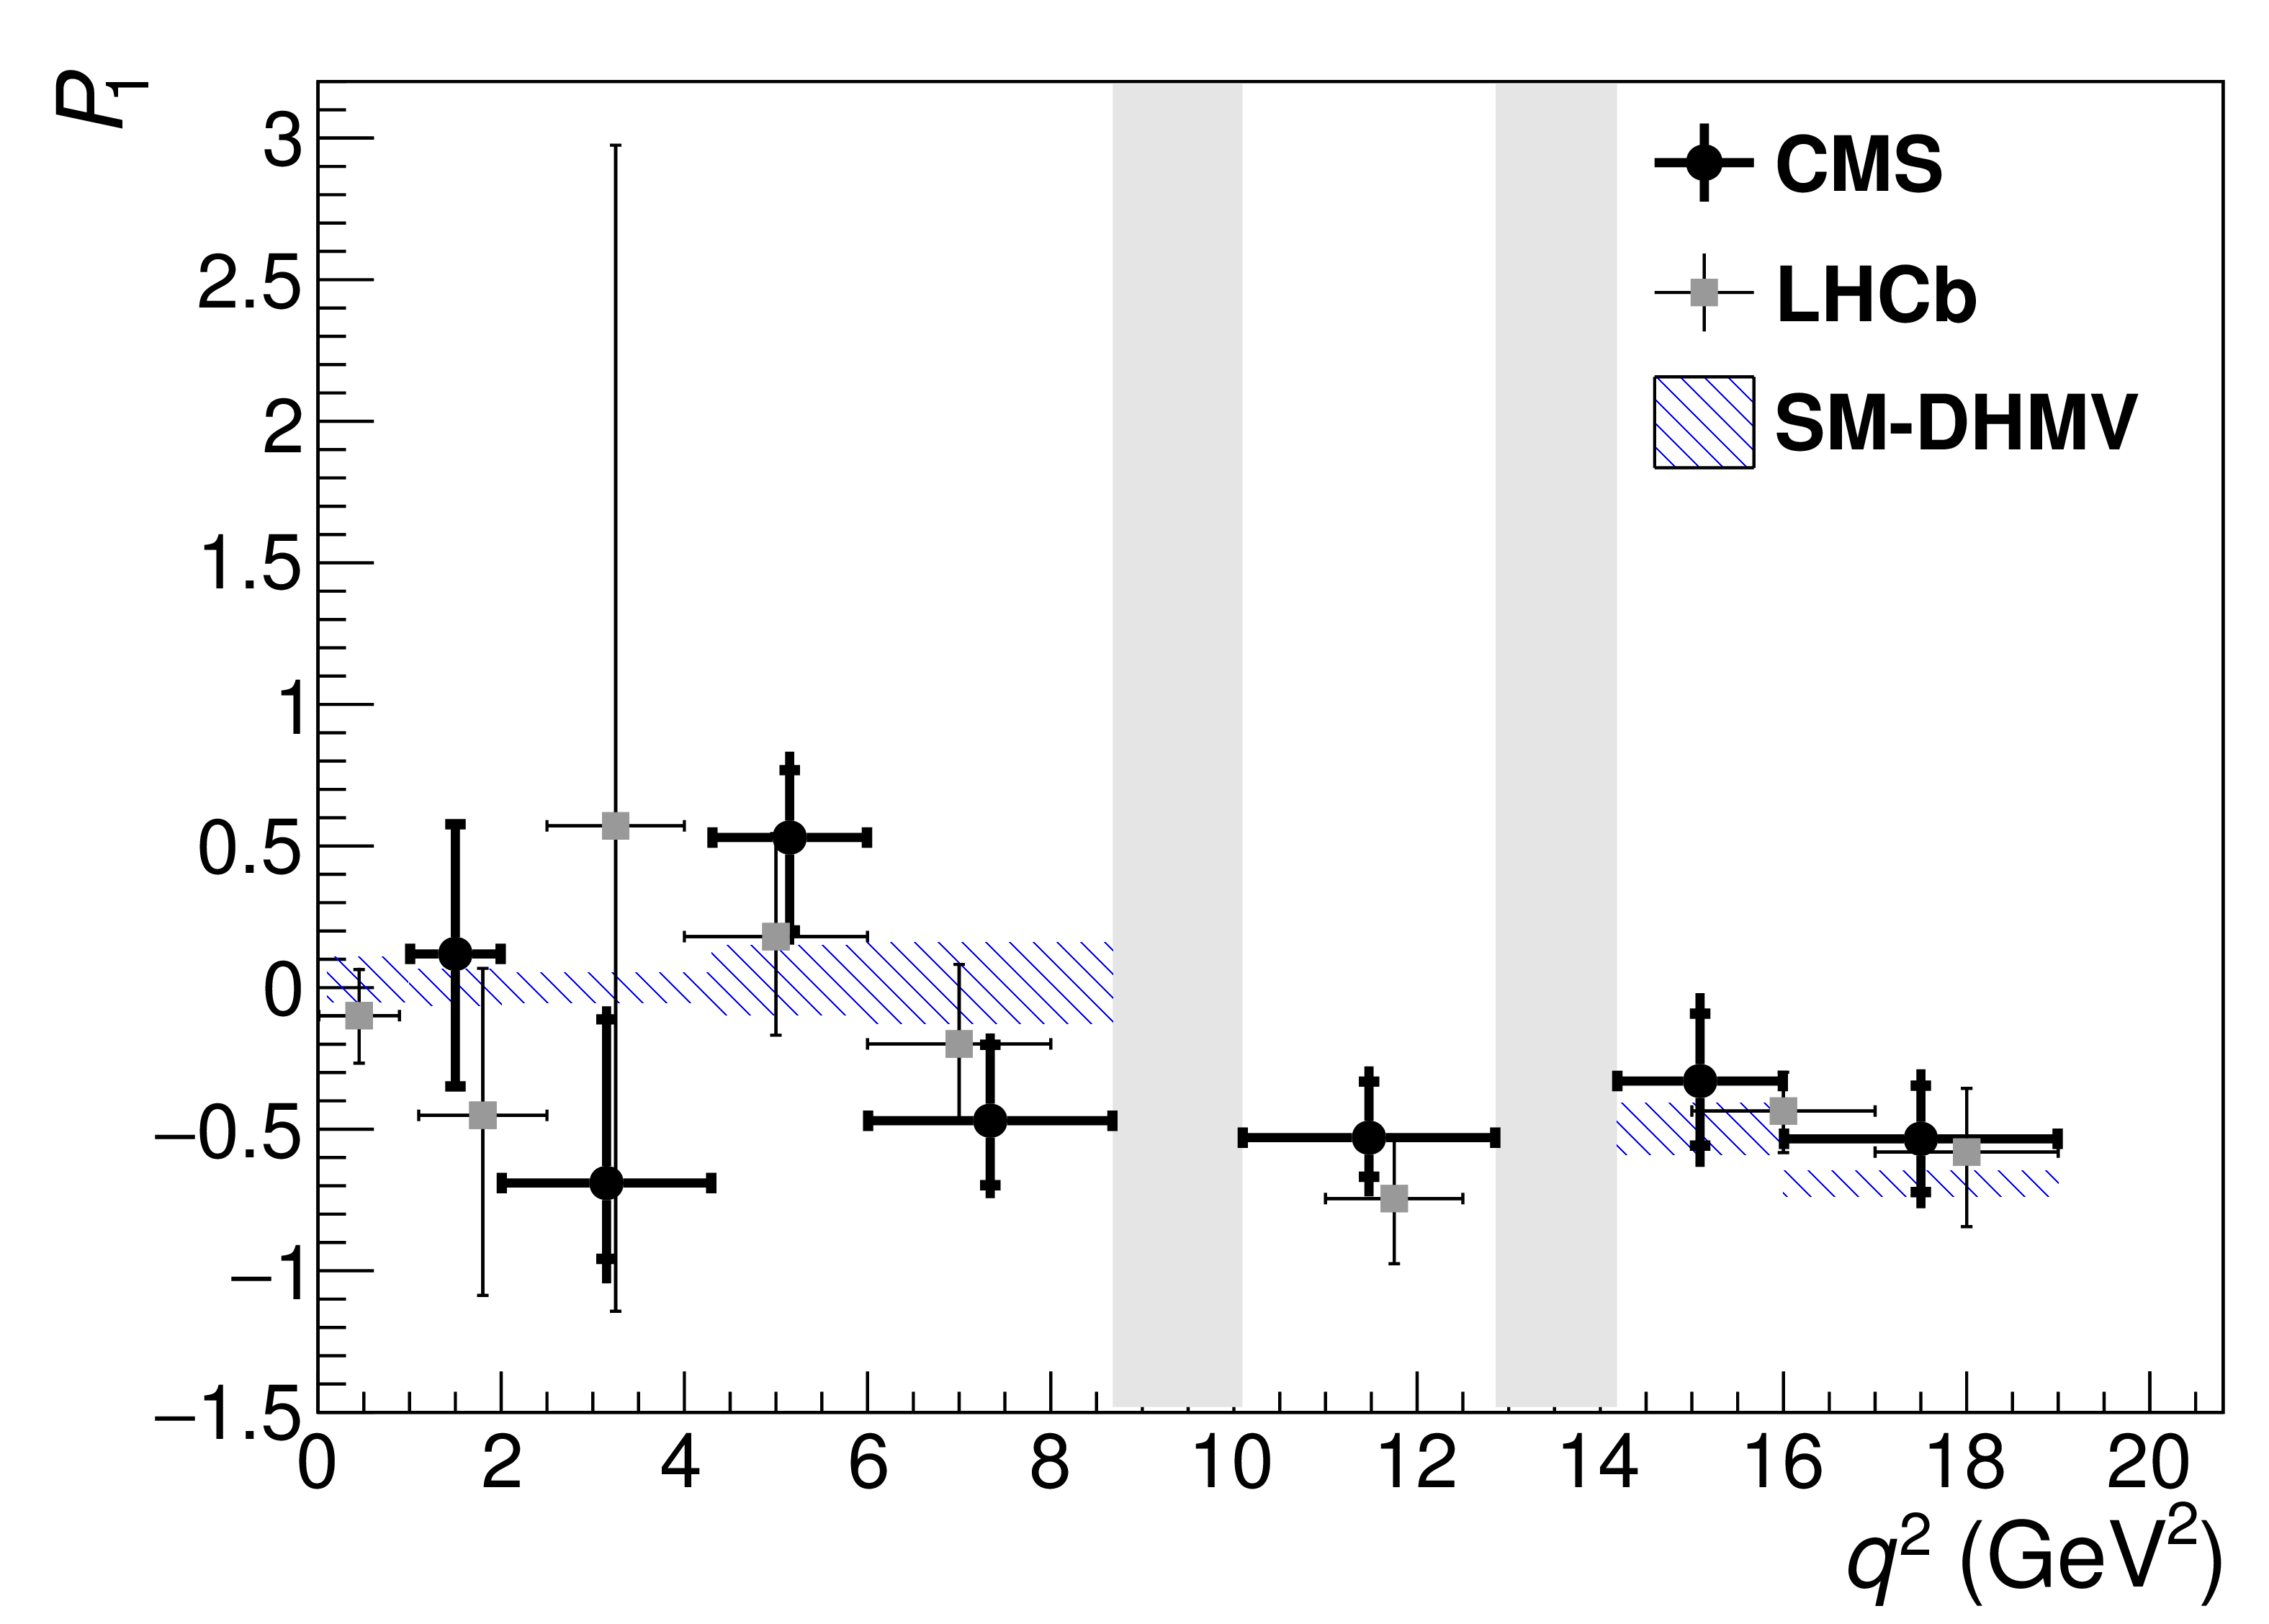
CMS measurements of the $P_1$ angular parameter versus $q^2$ for ${\mathrm{B}^{0} \to {\mathrm {K}^{* 0}} \mu^{+} \mu^{-}}$ decays, in comparison to results from the LHCb [33] and Belle [34] Collaborations. The statistical uncertainties are shown by the inner vertical bars, while the outer vertical bars give the total uncertainties. The horizontal bars show the bin widths. The vertical shaded regions correspond to the $\mathrm{J}/\psi $ and $\psi '$ resonances. The hatched region shows the predictions from two SM calculations described in the text, averaged over each $q^2$ bin. |
png pdf |
Figure 3-b:
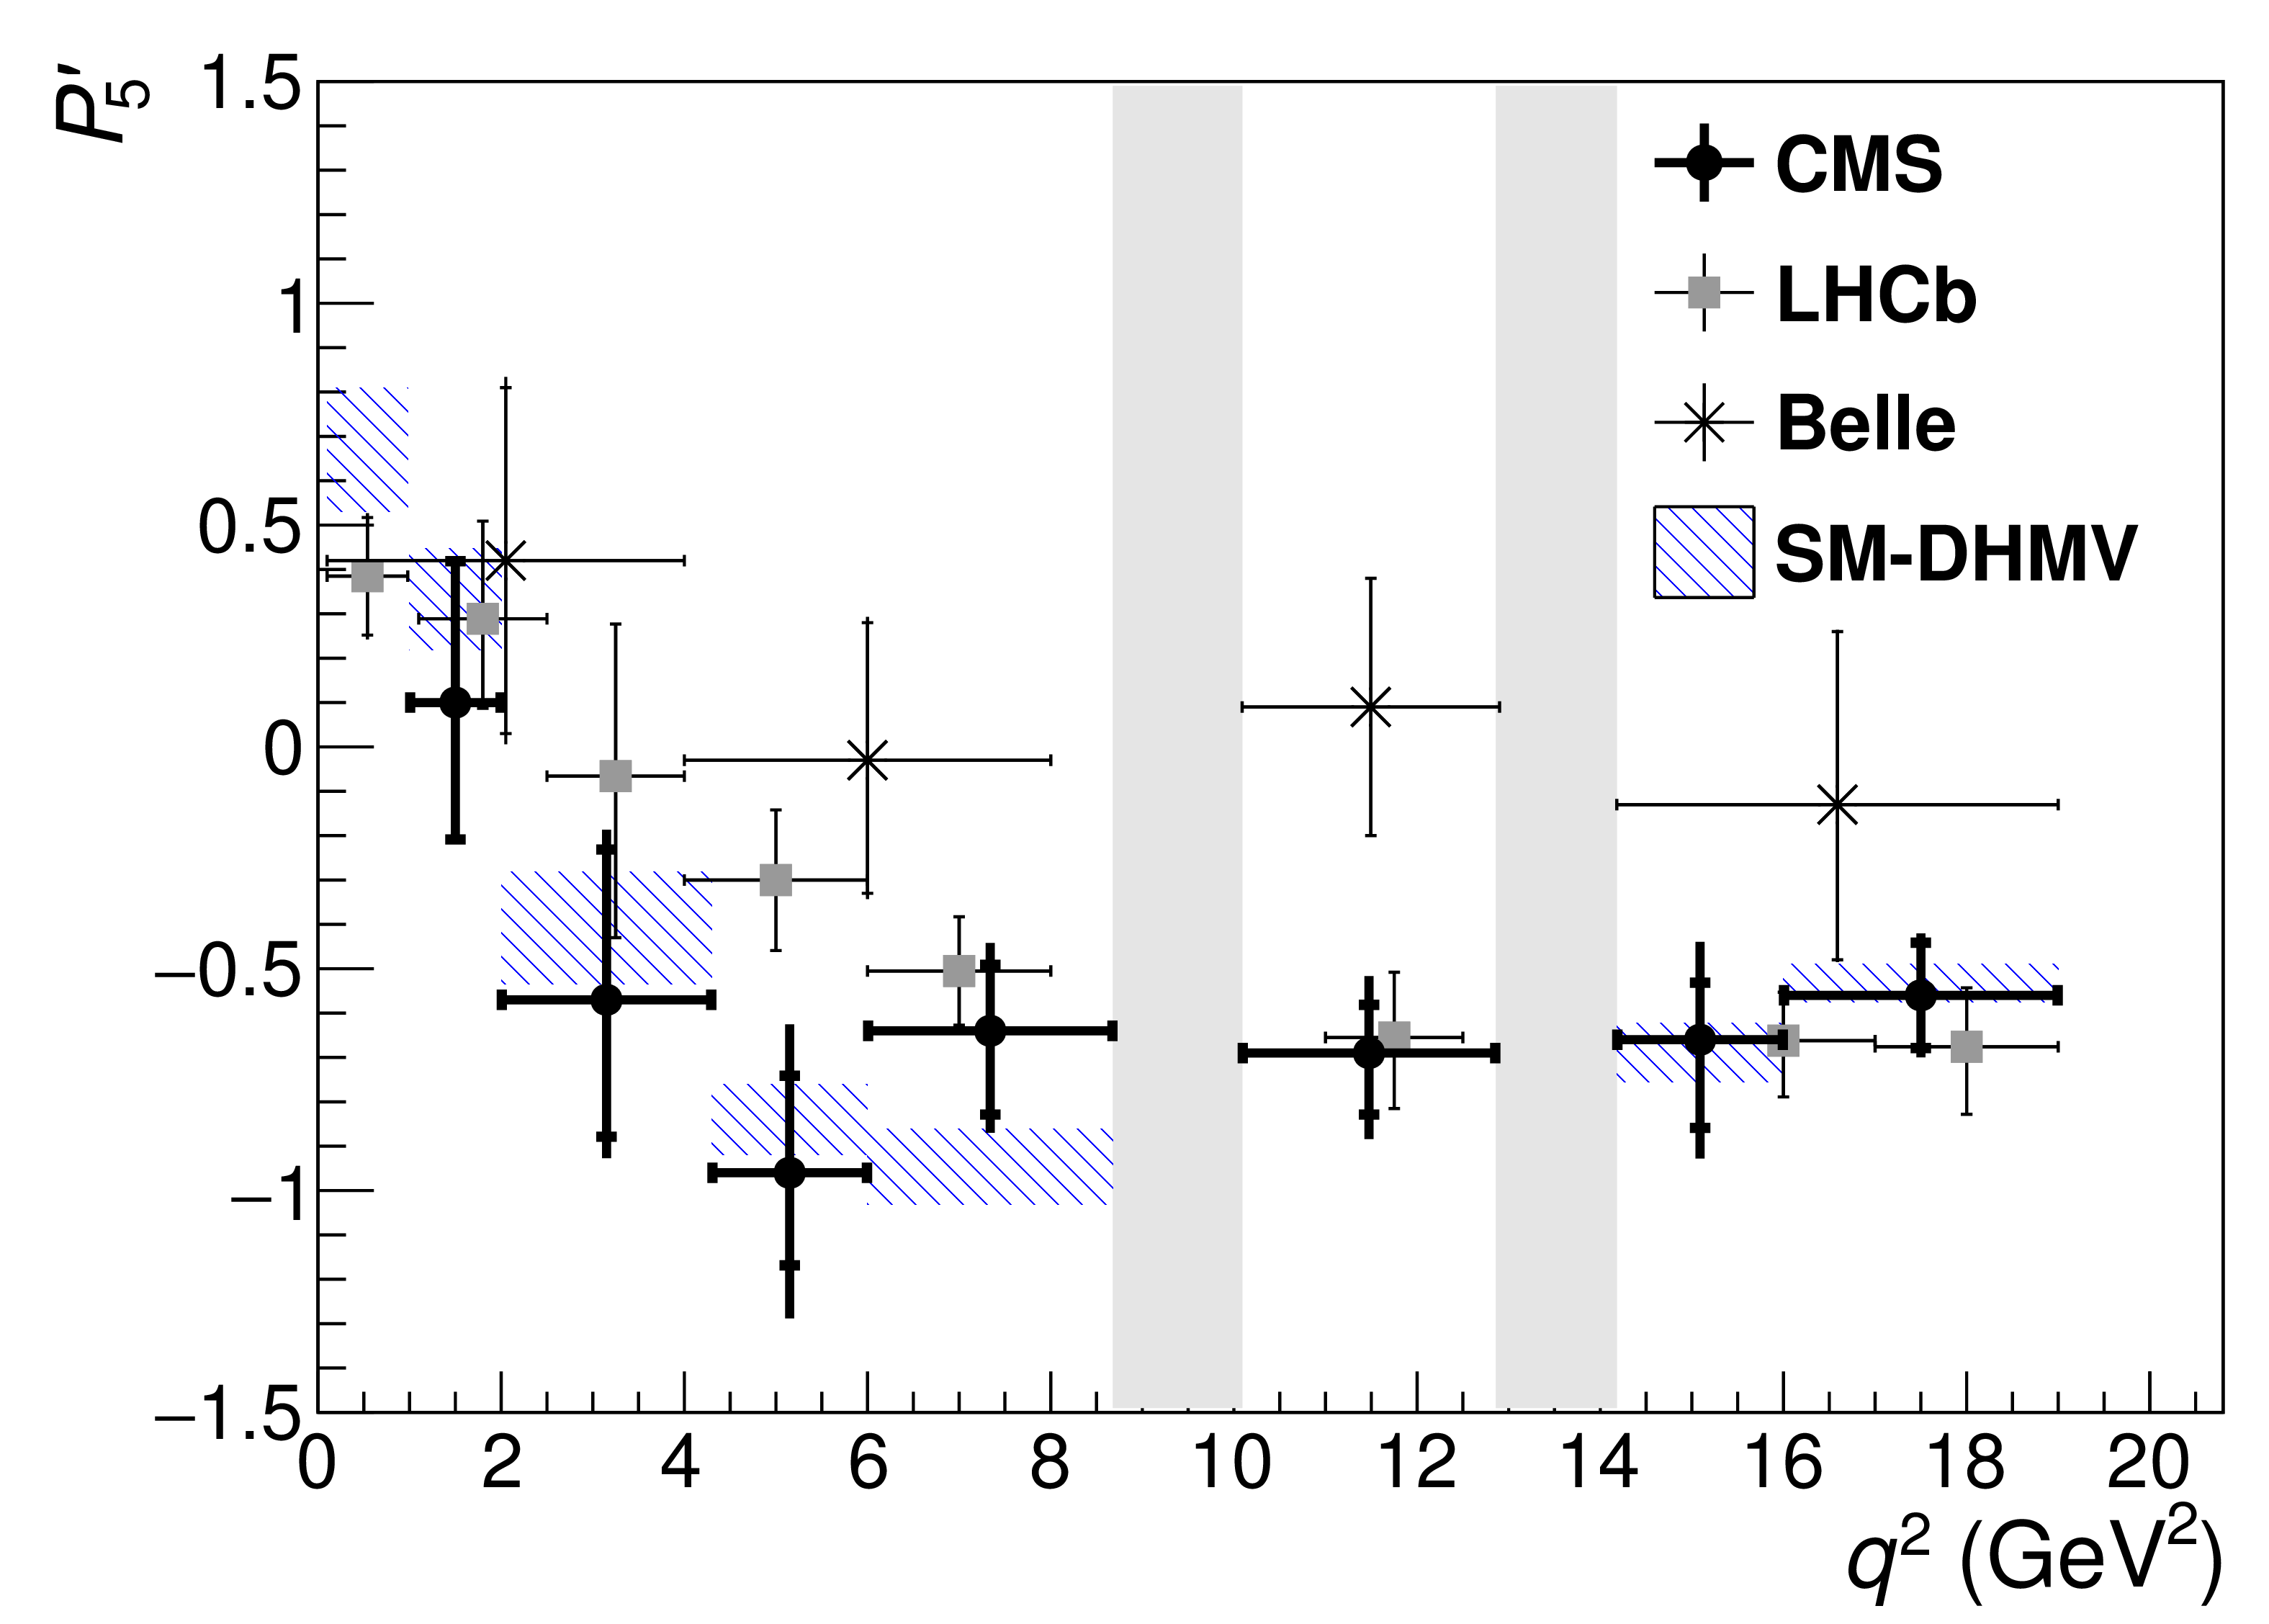
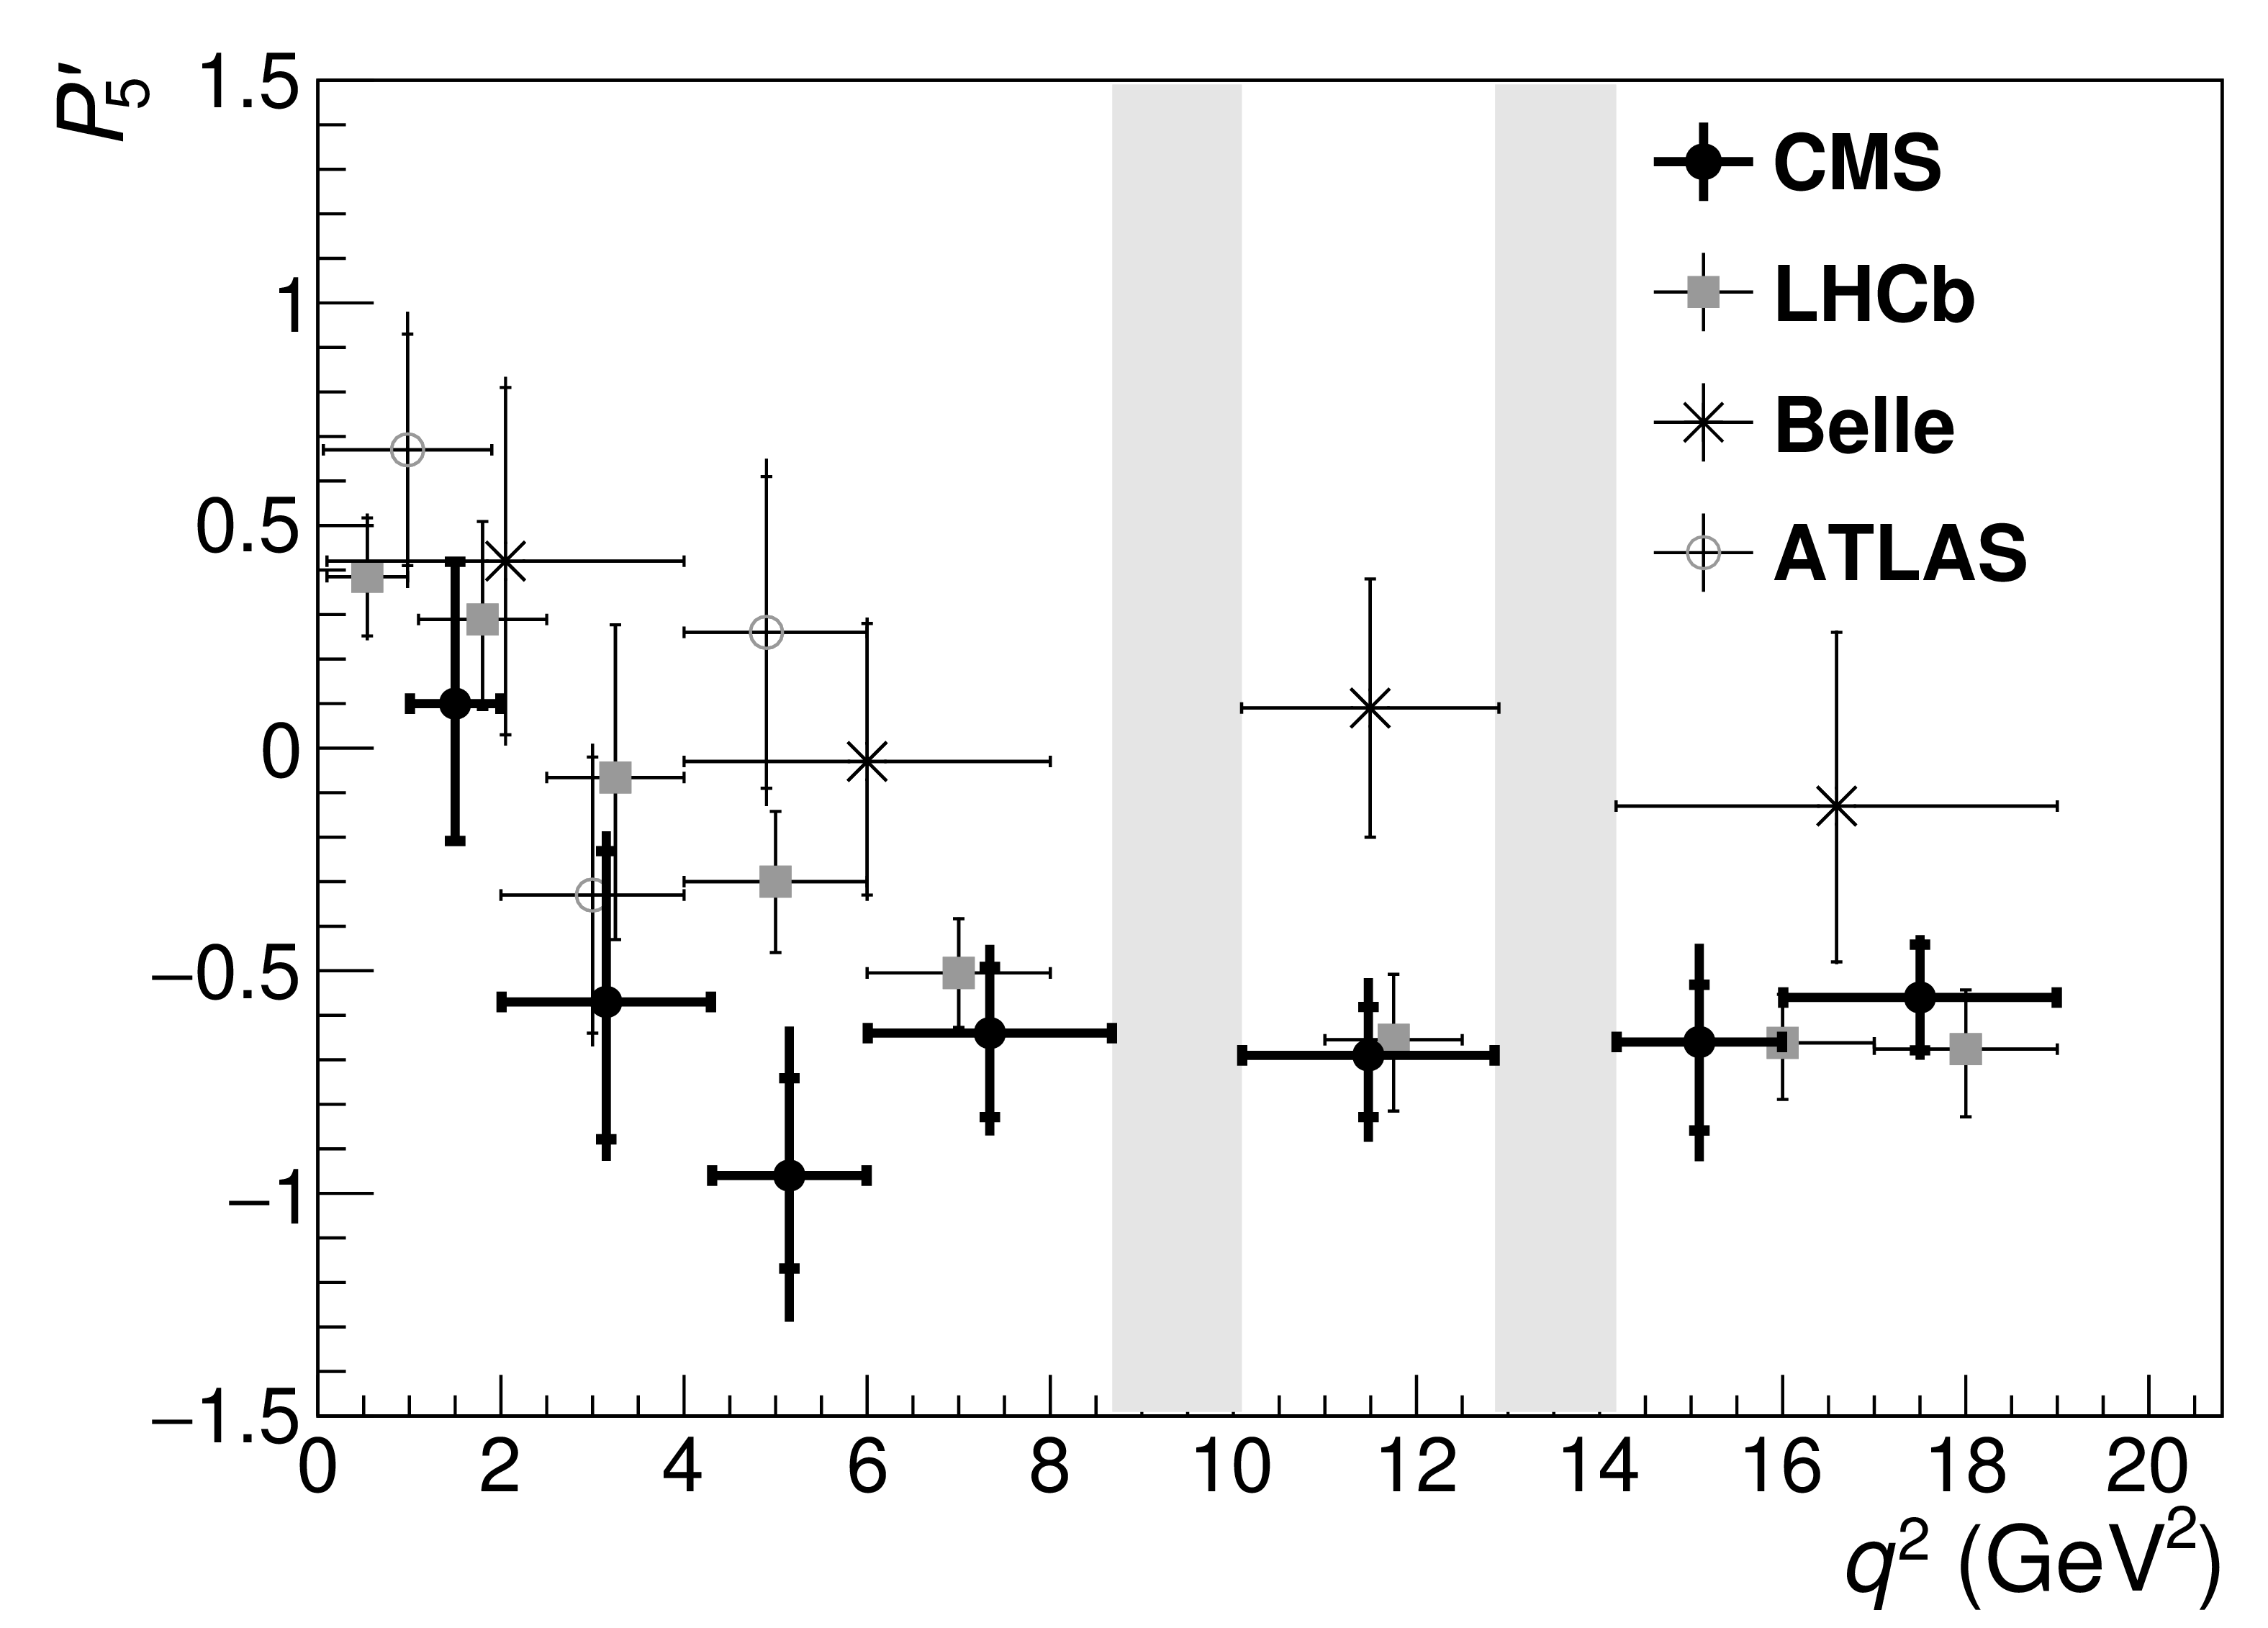
CMS measurements of the $P_5'$ angular parameter versus $q^2$ for ${\mathrm{B}^{0} \to {\mathrm {K}^{* 0}} \mu^{+} \mu^{-}}$ decays, in comparison to results from the LHCb [33] and Belle [34] Collaborations. The statistical uncertainties are shown by the inner vertical bars, while the outer vertical bars give the total uncertainties. The horizontal bars show the bin widths. The vertical shaded regions correspond to the $\mathrm{J}/\psi $ and $\psi '$ resonances. The hatched region shows the predictions from two SM calculations described in the text, averaged over each $q^2$ bin. |
| Tables | |
png pdf |
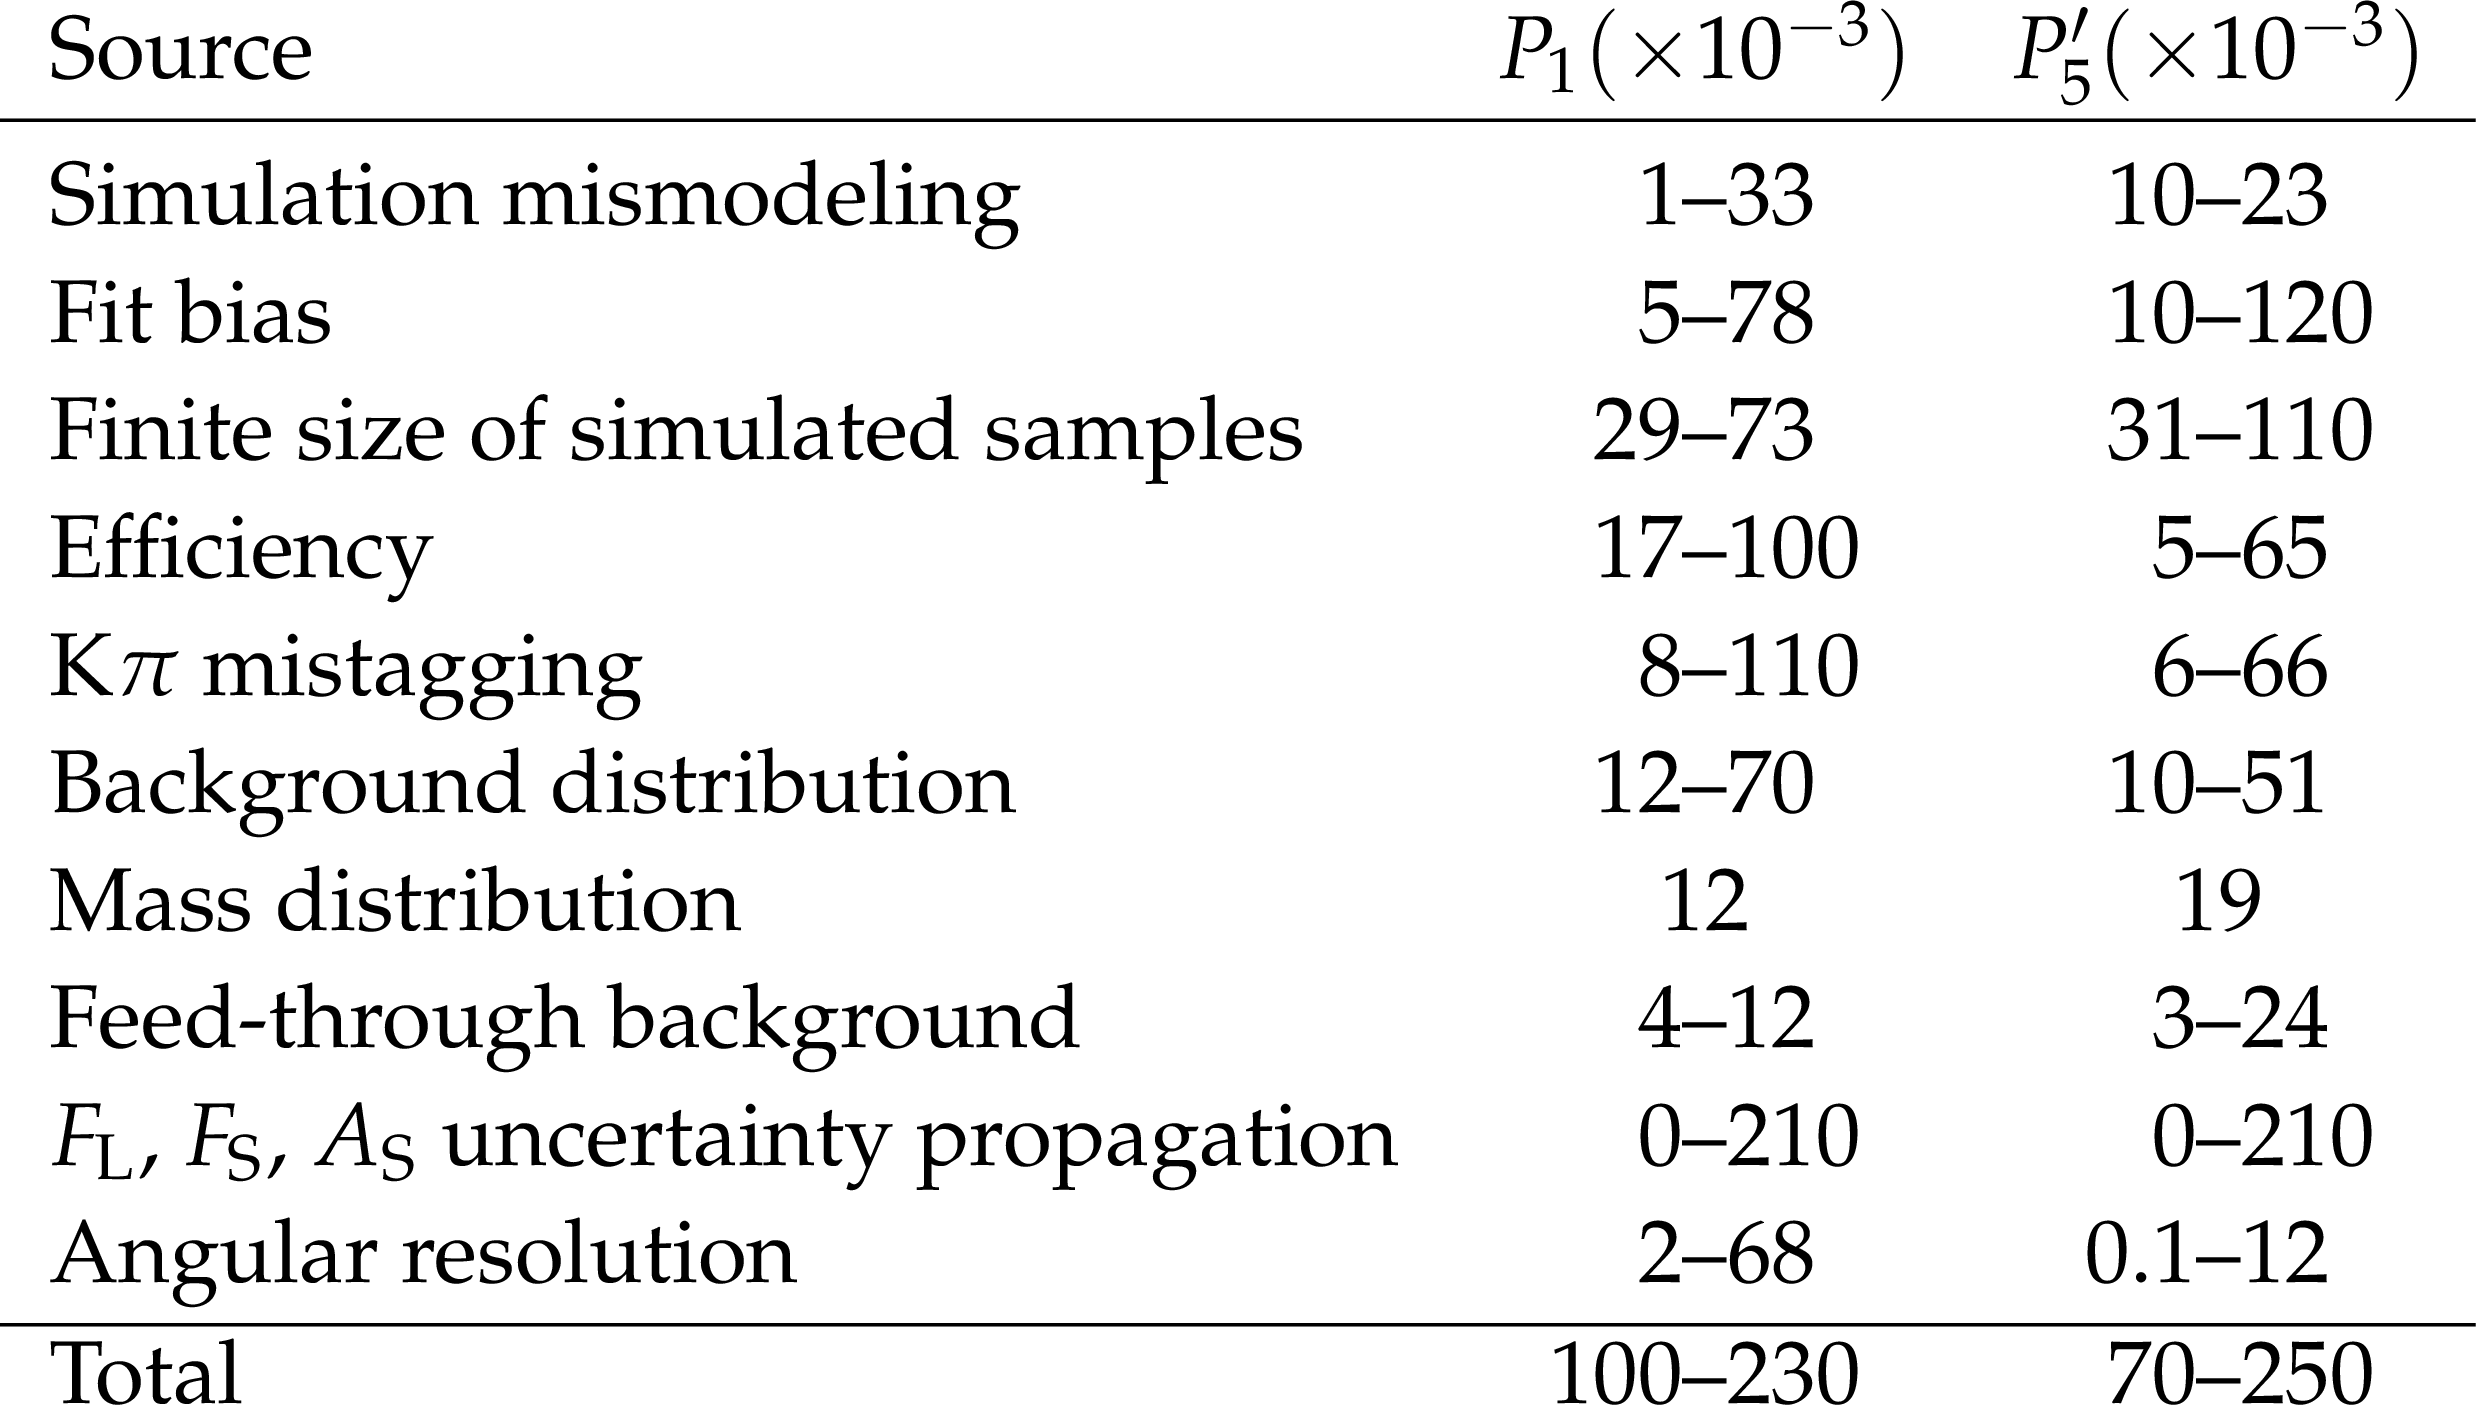
Table 1:
Systematic uncertainties in $P_1$ and $P_5'$. For each source, the range indicates the variation over the bins in $q^2$. |
png pdf |
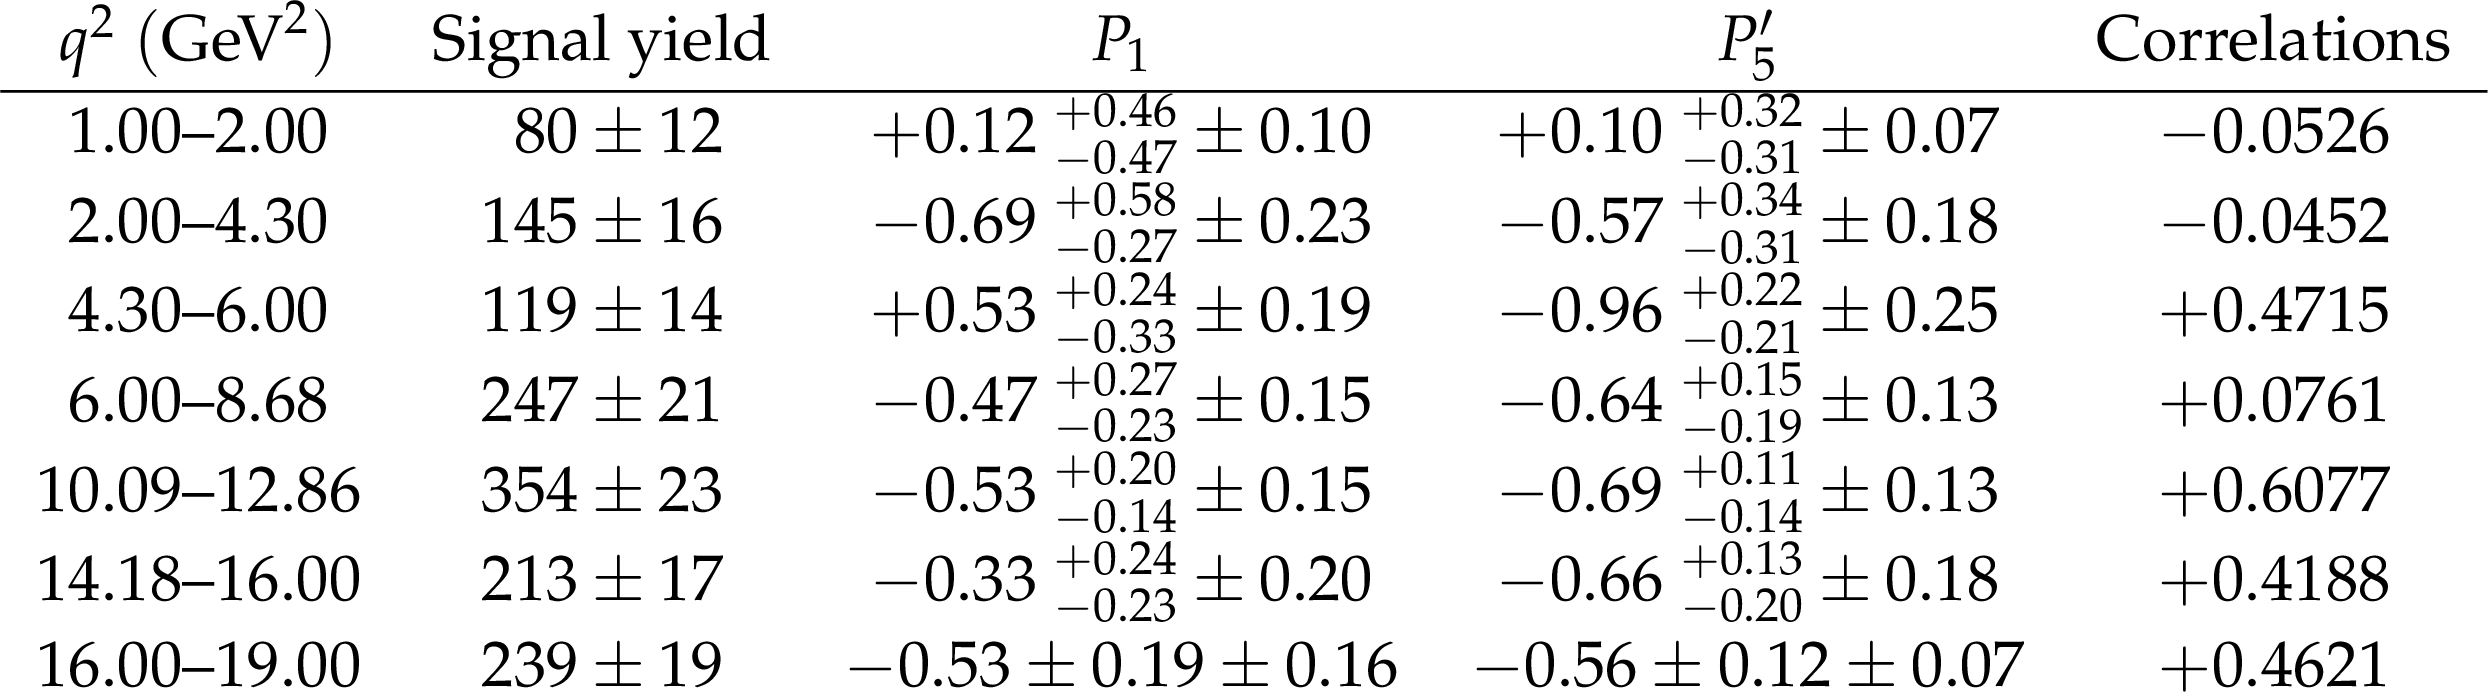
Table 2:
The measured signal yields, which include both correctly tagged and mistagged events, the $P_1$ and $P_5'$ values, and the correlation coefficients, in bins of $q^2$, for ${\mathrm{B}^{0} \to {\mathrm {K}^{* 0}} \mu^{+} \mu^{-}} $ decays. The first uncertainty is statistical and the second is systematic. The bin ranges are selected to allow comparison with previous measurements. |
| Summary |
| Using proton-proton collision data recorded at $\sqrt{s} = $ 8 TeV with the CMS detector at the LHC, corresponding to an integrated luminosity of 20.5 fb$^{-1}$, an angular analysis has been performed for the decay ${\mathrm{B}^{0}\to{\mathrm{K}^{*0}} \mu^{+} \mu^{-}} $. The signal sample consists of 1397 selected events. For each of seven bins between 1 to 19 GeV$^2$ in the dimuon invariant mass squared $q^2$, unbinned maximum-likelihood fits are performed on the distributions of the $\mathrm{K^{+}}\pi^{-}\mu^{+}\mu^{-}$ invariant mass and three angular variables to obtain values of the $P_1$ and $P_5'$ parameters. The results are among the most precise to date for these parameters and are consistent with predictions based on the standard model. |
| Additional Figures | |
png pdf |
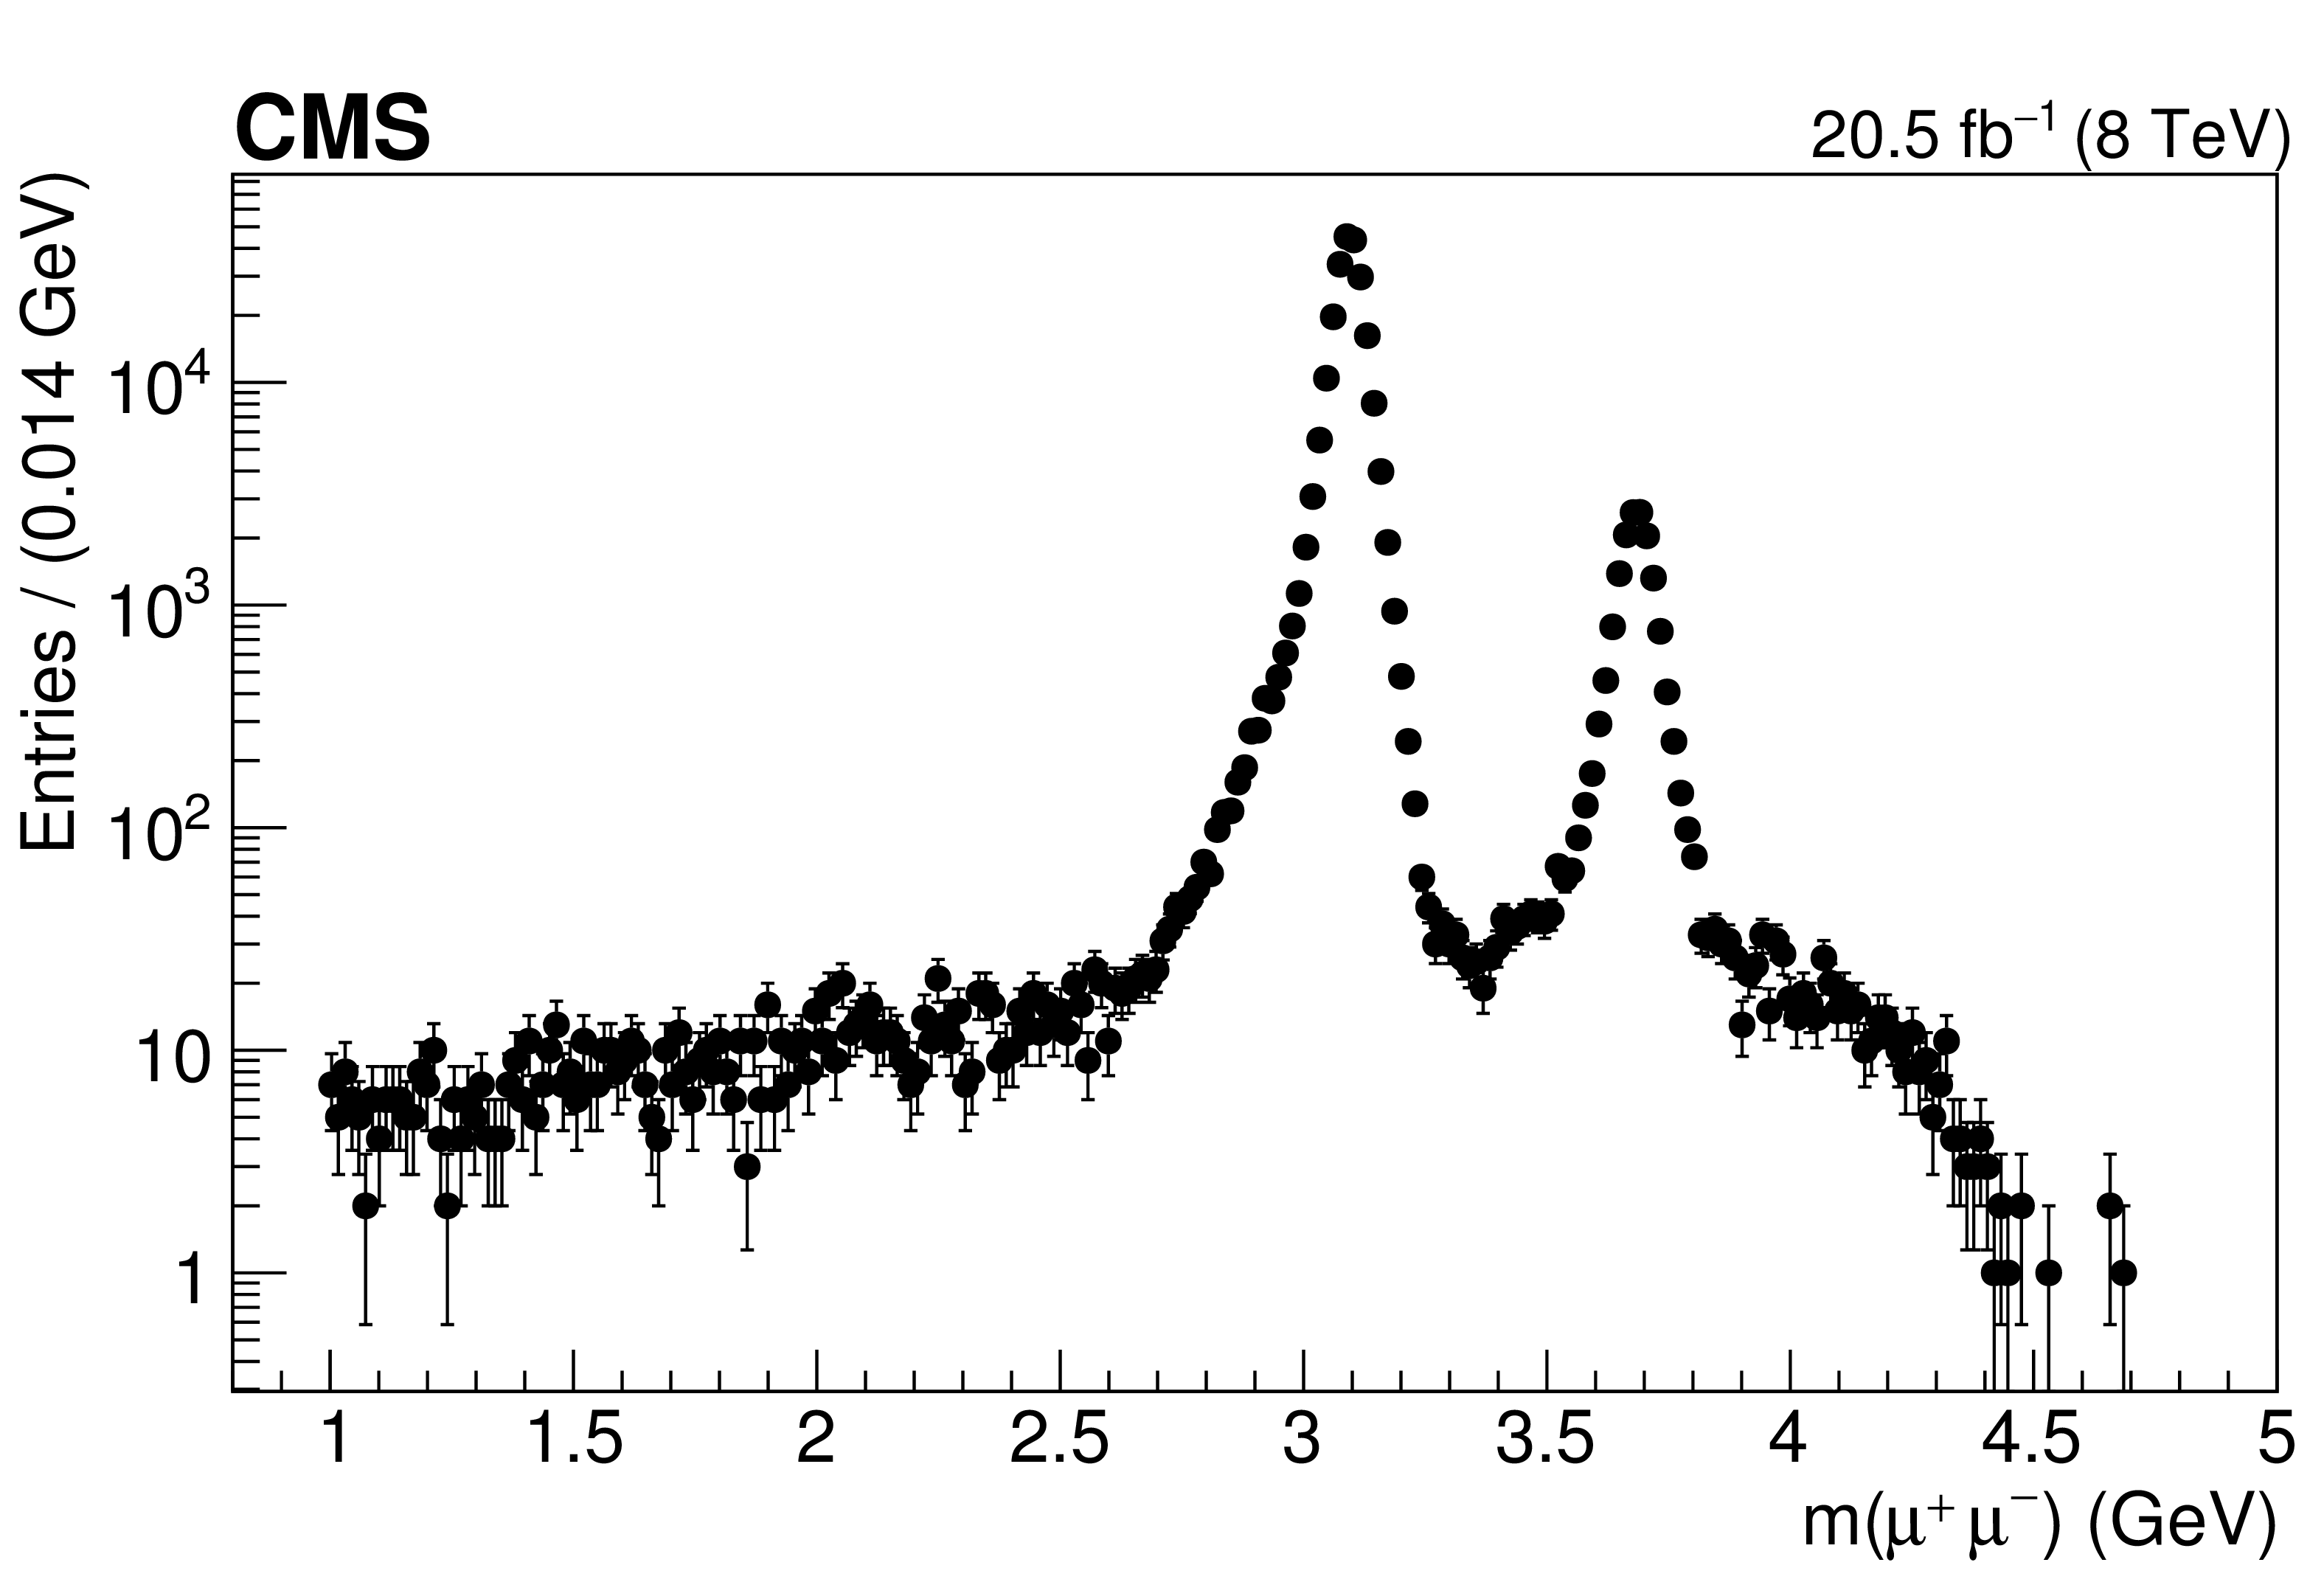
Additional Figure 1:
Spectrum of the di-muon invariant mass. The two peaks correspond to the $\mathrm{J}/\psi$ and $\psi '$ resonances used as control samples. |
png pdf |
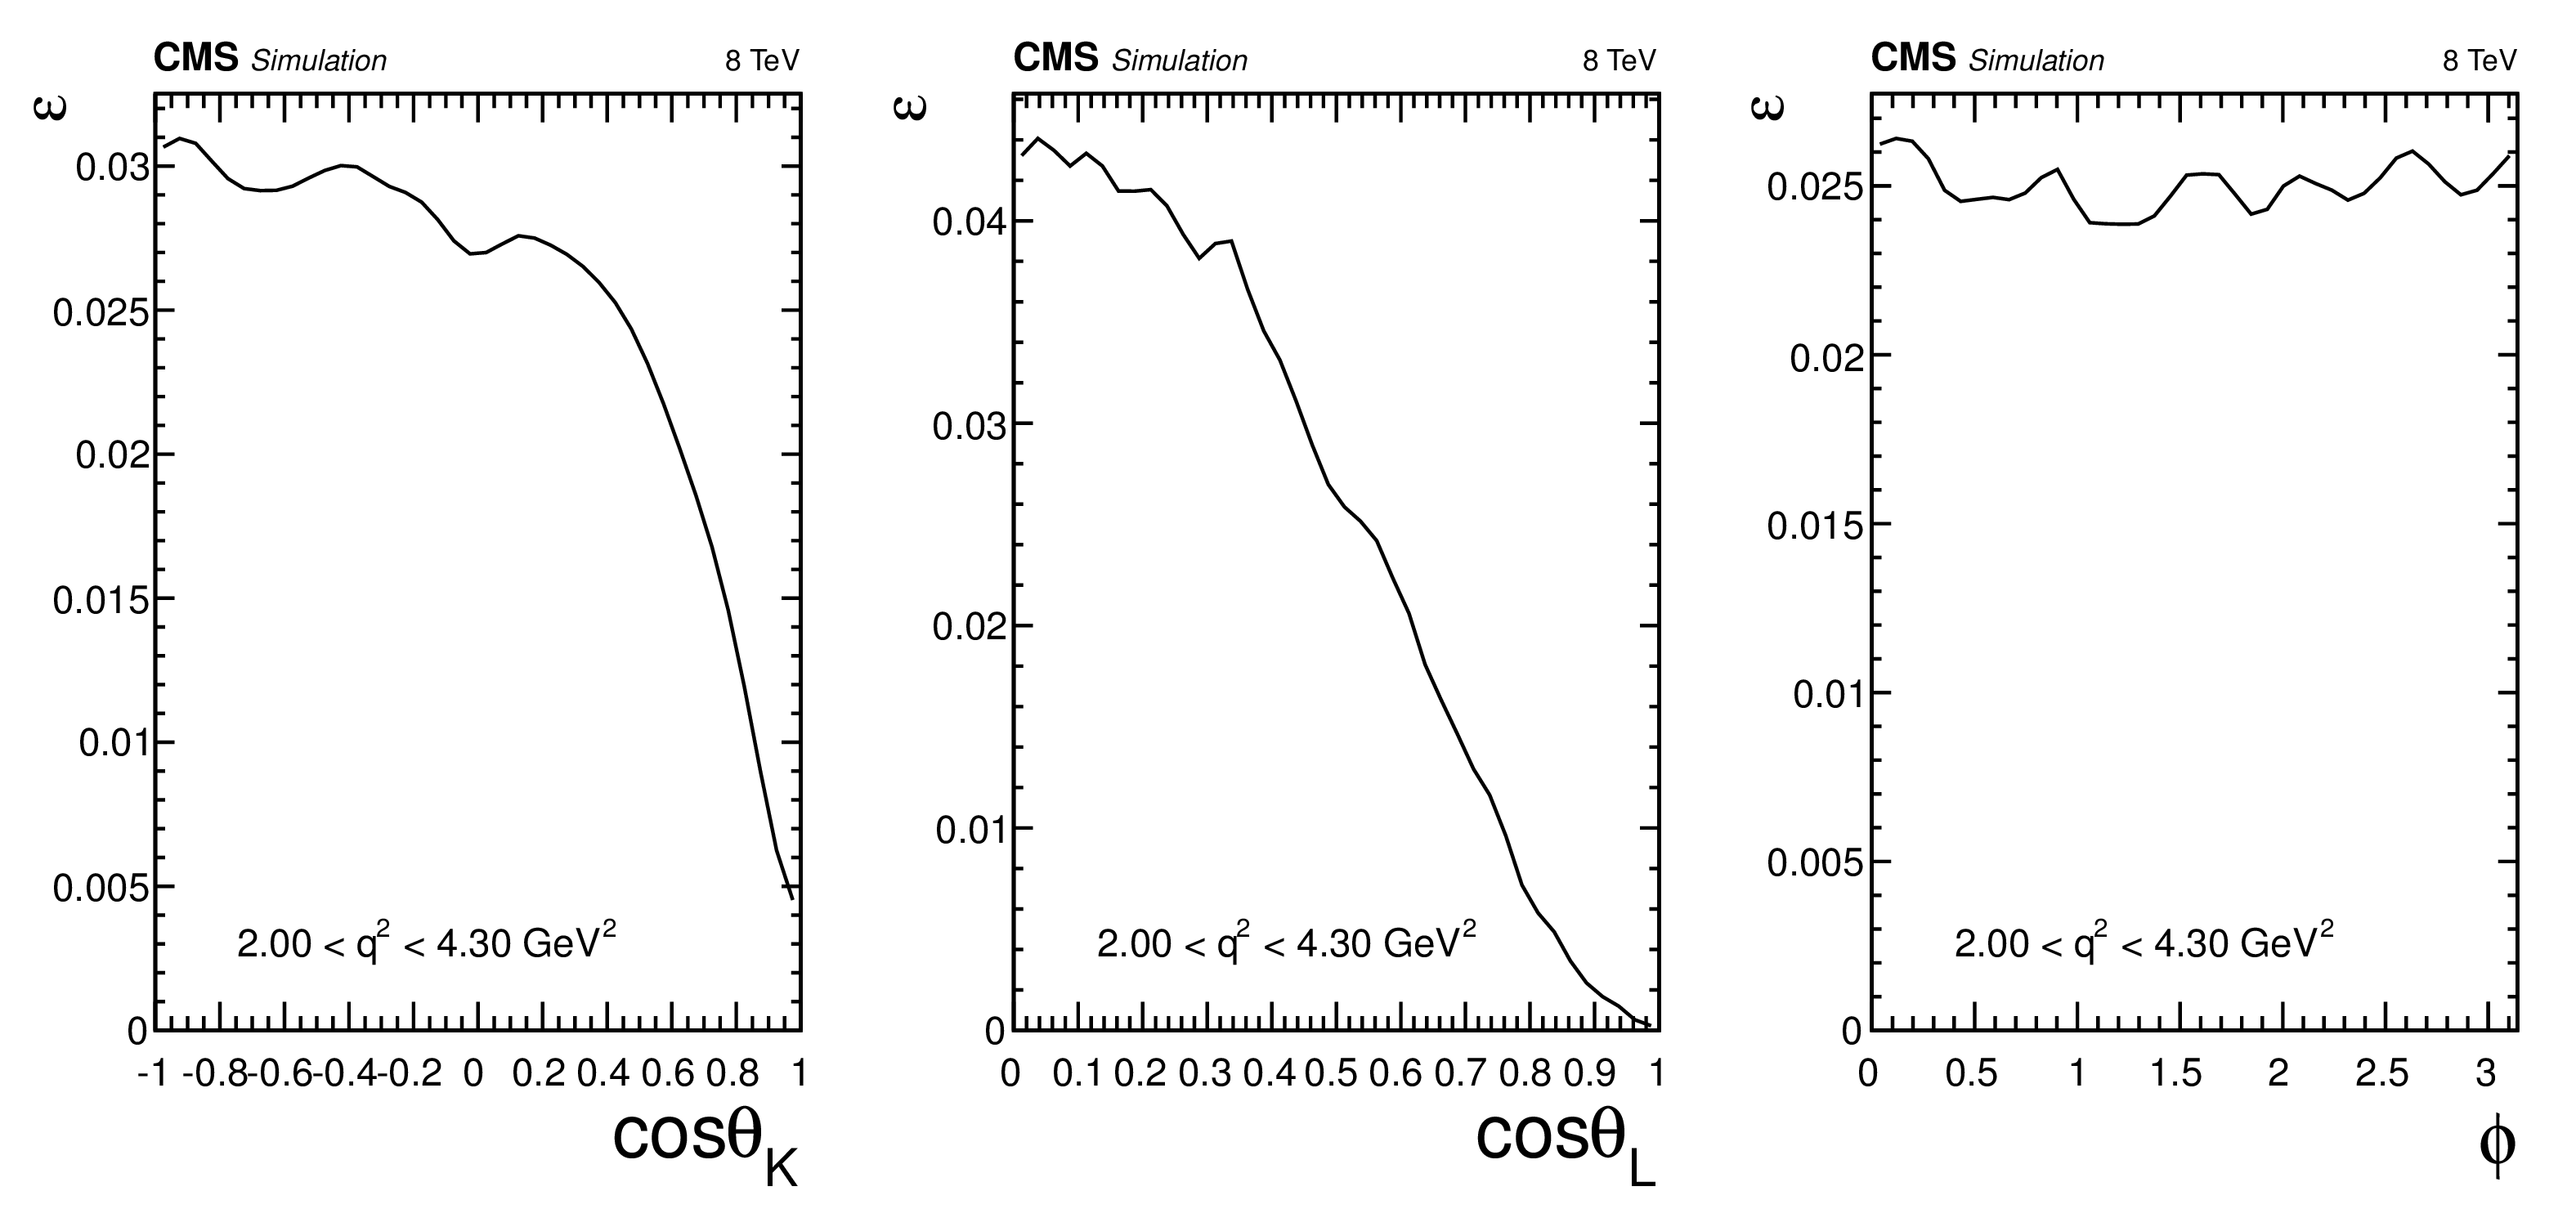
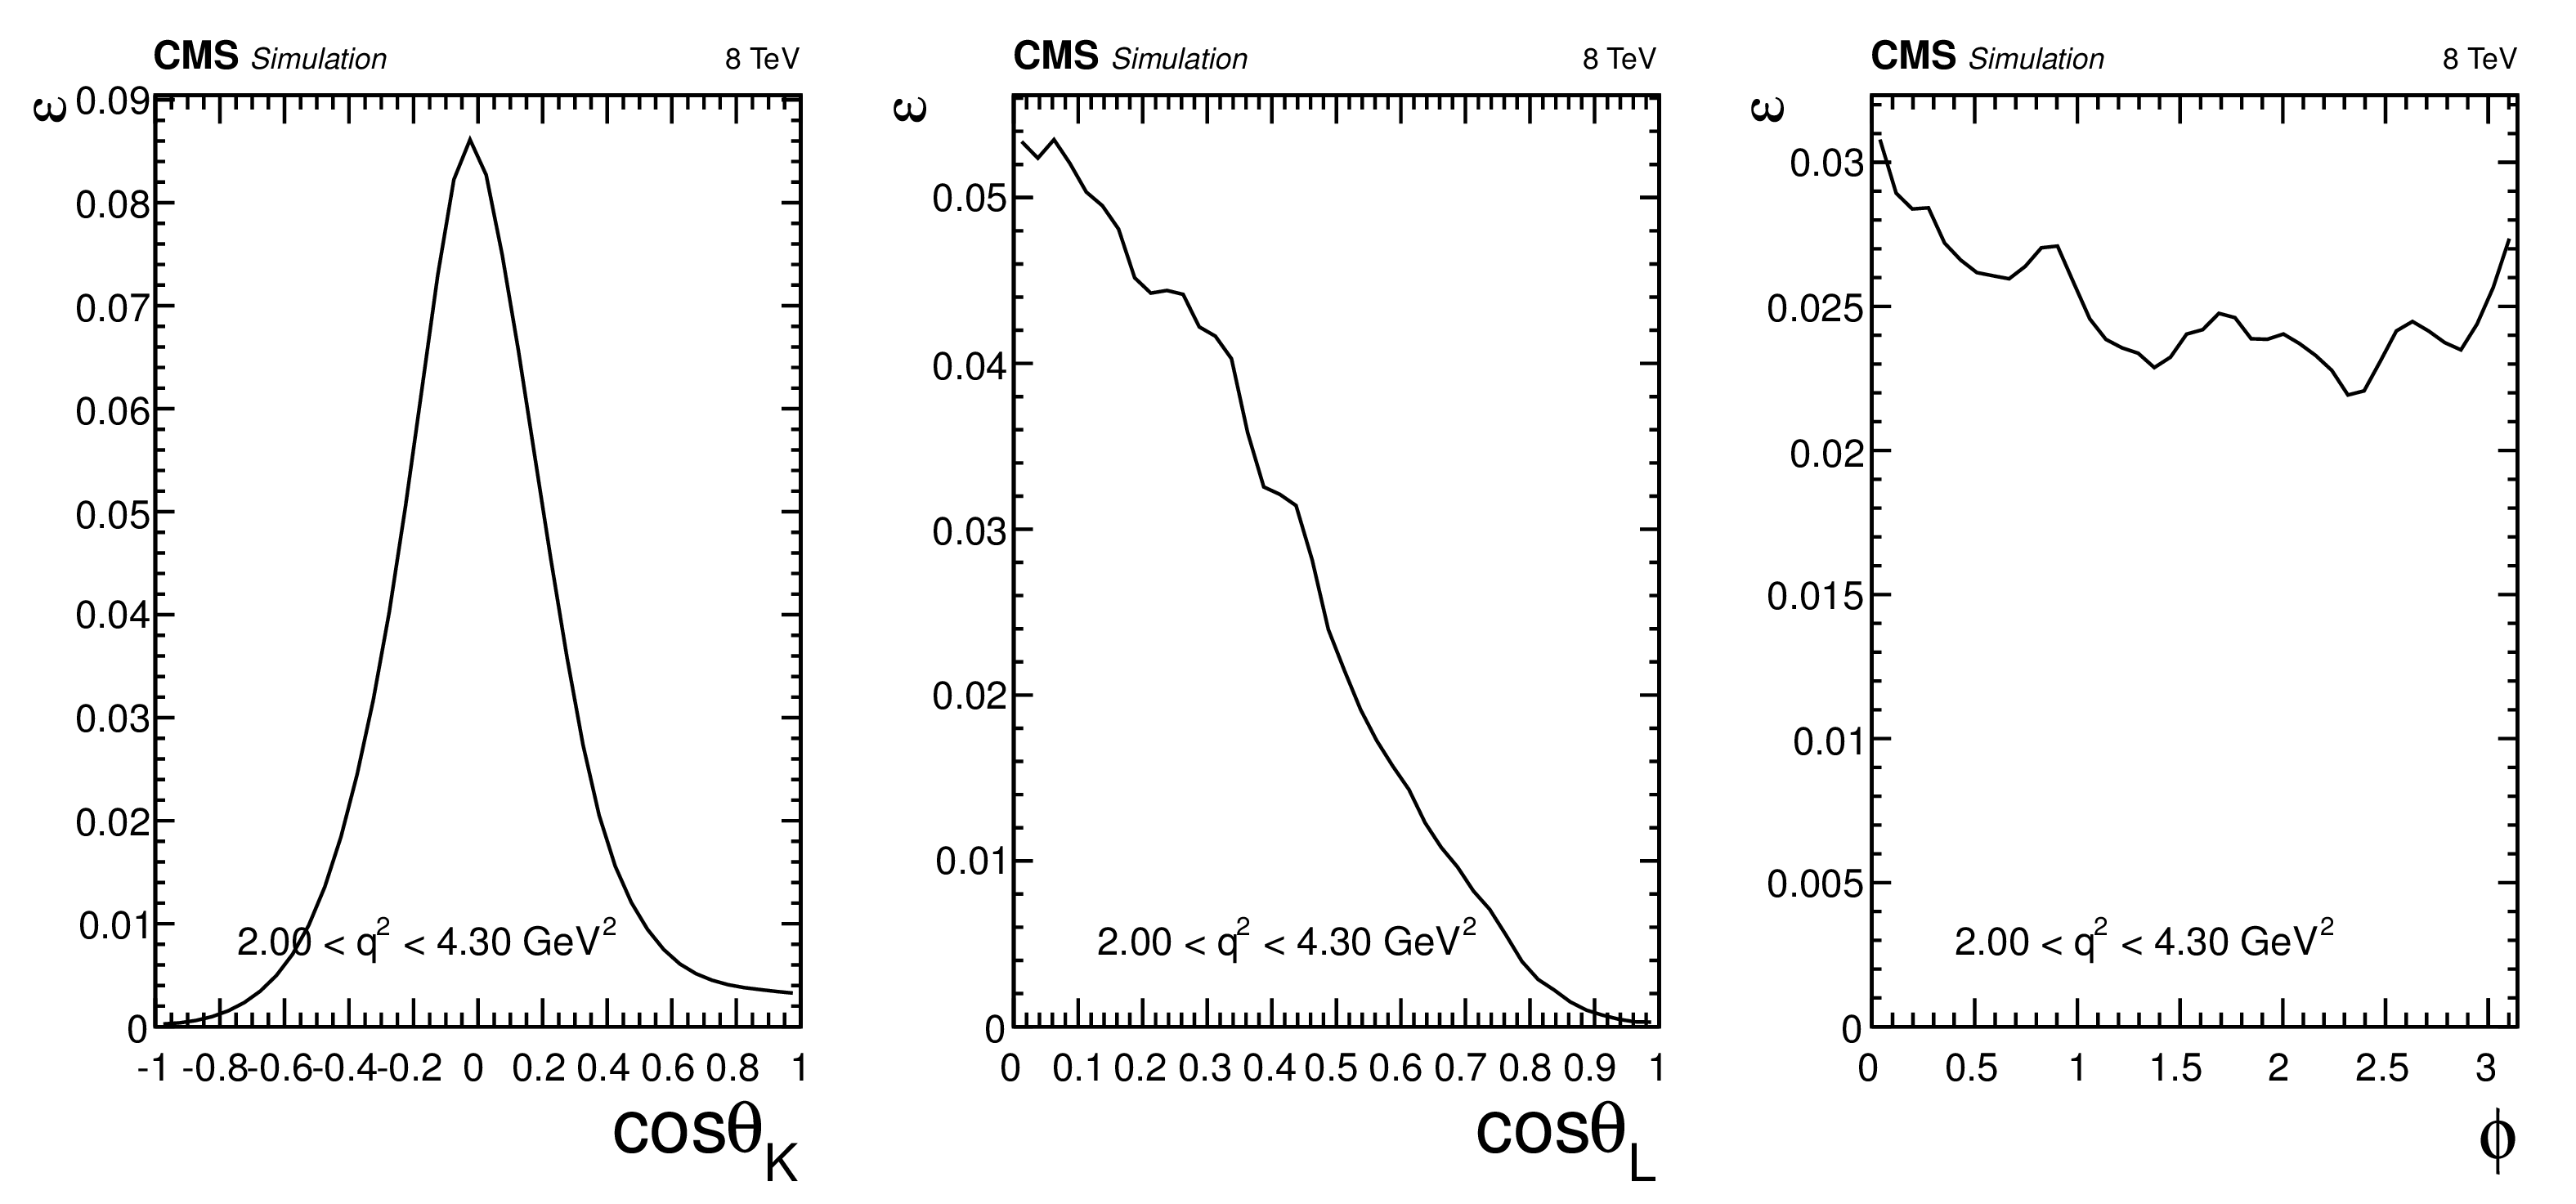
Additional Figure 2:
Projection of the efficiency computed on simulated events along the three angular variables $\cos\theta _K$, $|\cos\theta _L|$, $\phi $ for the second bin 2.00 $ < q^2 < $ 4.30 GeV$^{2}$ for correctly tagged events. |
png pdf |
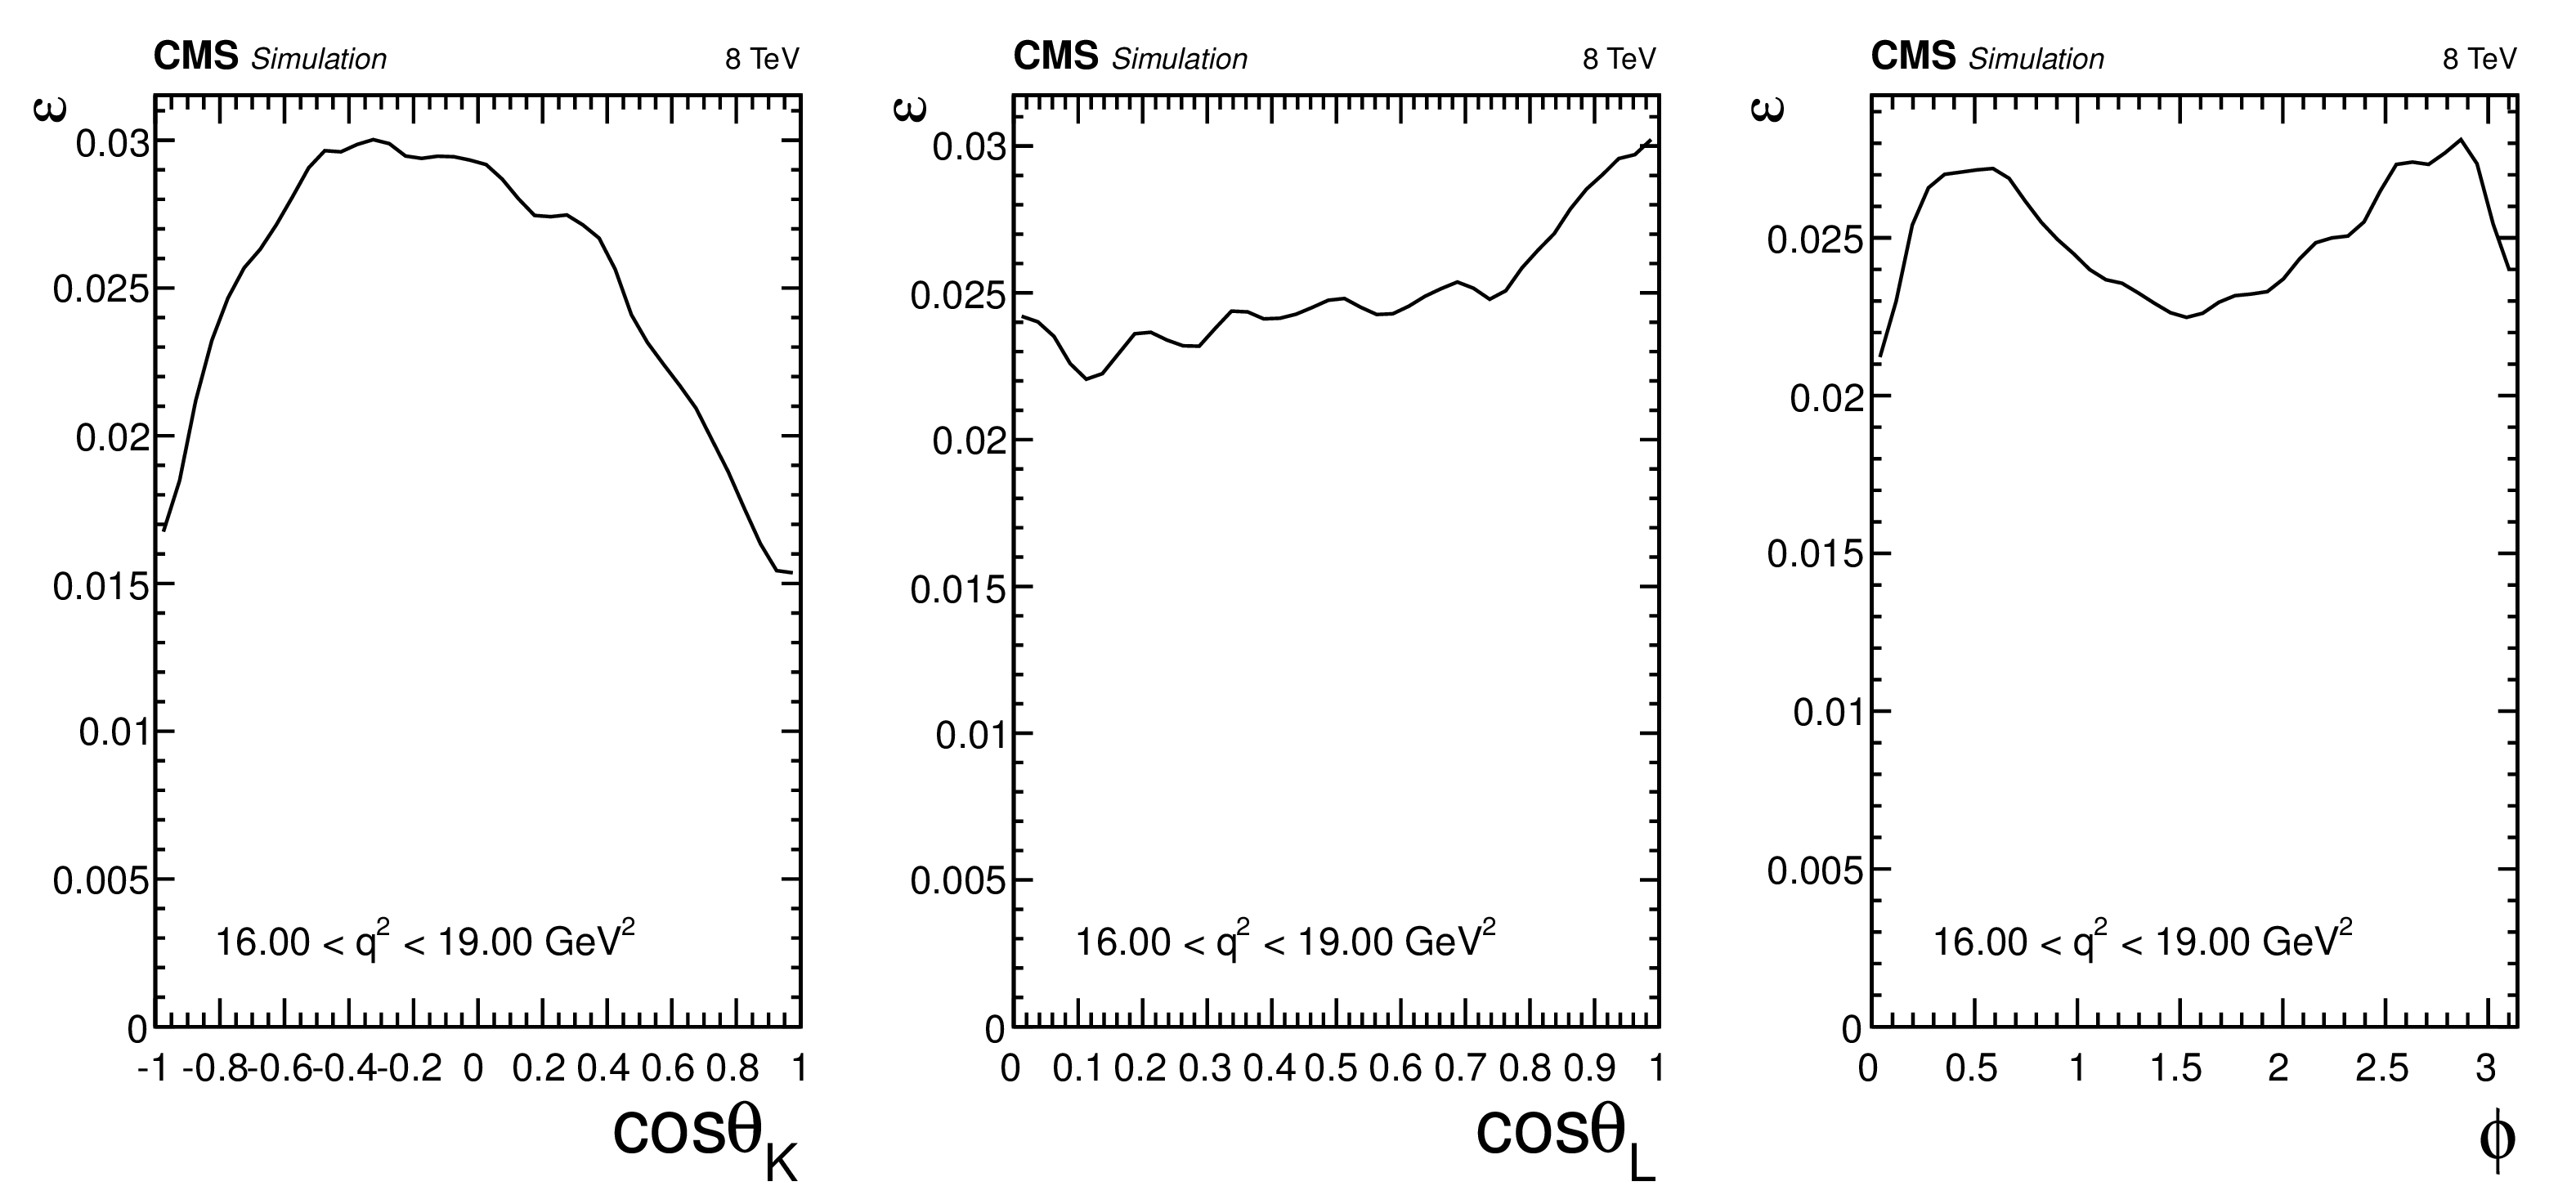
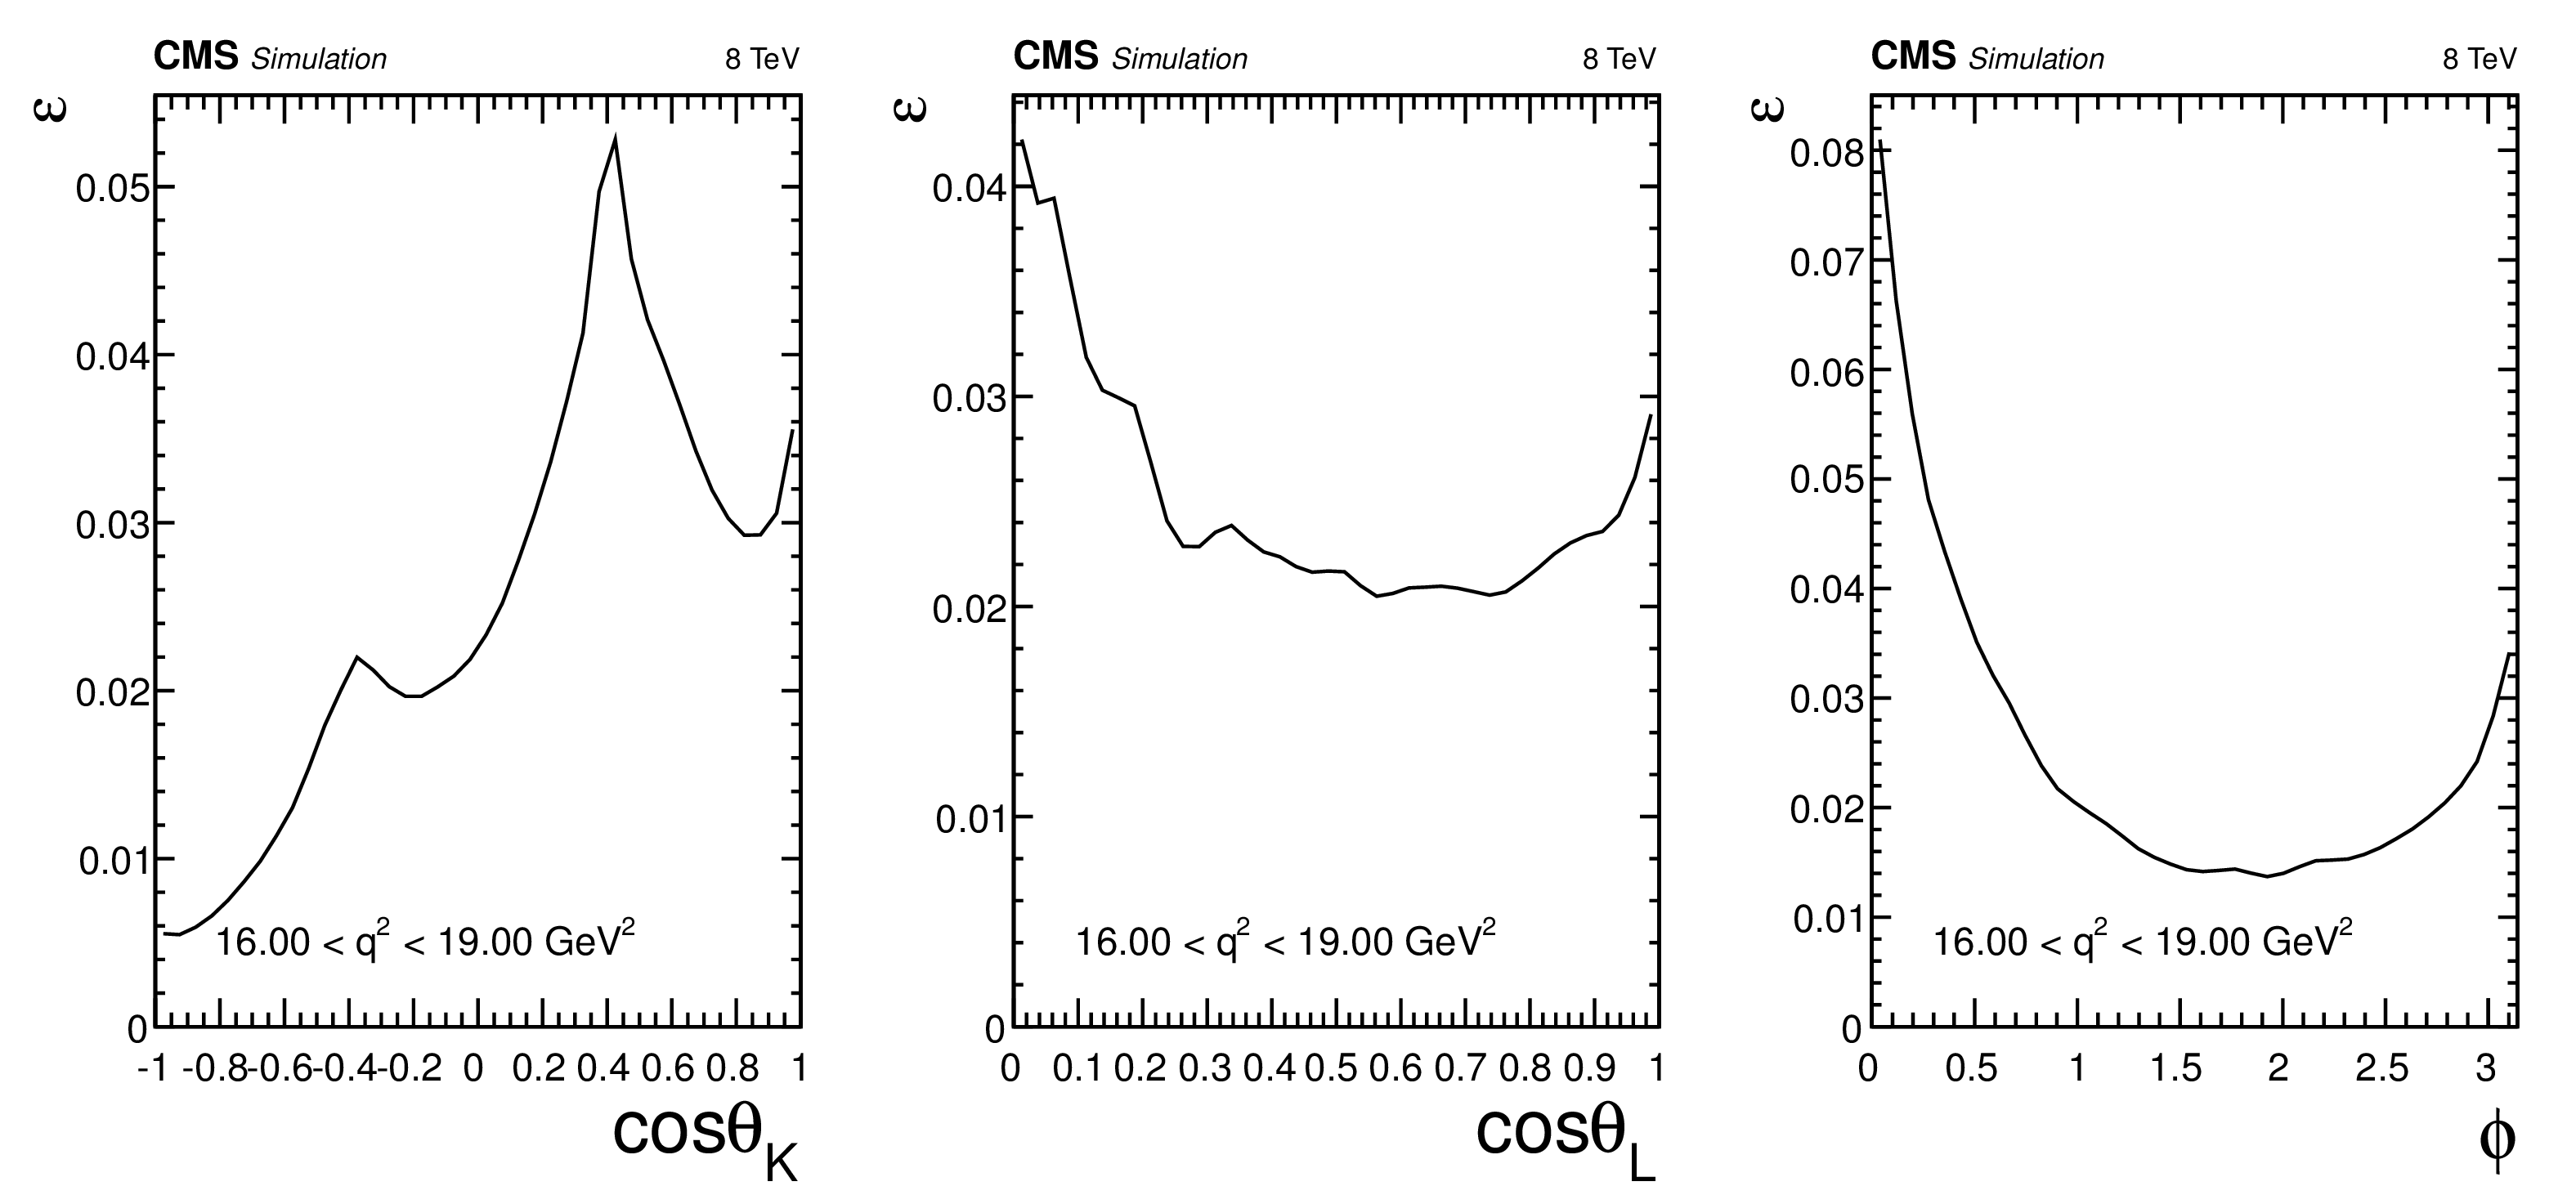
Additional Figure 3:
Projection of the efficiency computed on simulated events along the three angular variables $\cos\theta _K$, $|\cos\theta _L|$, $\phi $ for the seventh bin 16.00 $ < q^2 < $ 19.00 GeV$^{2}$ for correctly tagged events. |
png pdf |
Additional Figure 4:
Projection of the efficiency computed on simulated events along the three angular variables $\cos\theta _K$, $|\cos\theta _L|$, $\phi $ for the second bin 2.00 $ < q^2 < $ 4.30 GeV$^{2}$ for wrongly tagged events. |
png pdf |
Additional Figure 5:
Projection of the efficiency computed on simulated events along the three angular variables $\cos\theta _K$, $|\cos\theta _L|$, $\phi $ for the seventh bin 16.00 $ < q^2 < $ 19.00 GeV$^{2}$ for wrongly tagged events. |

png pdf |
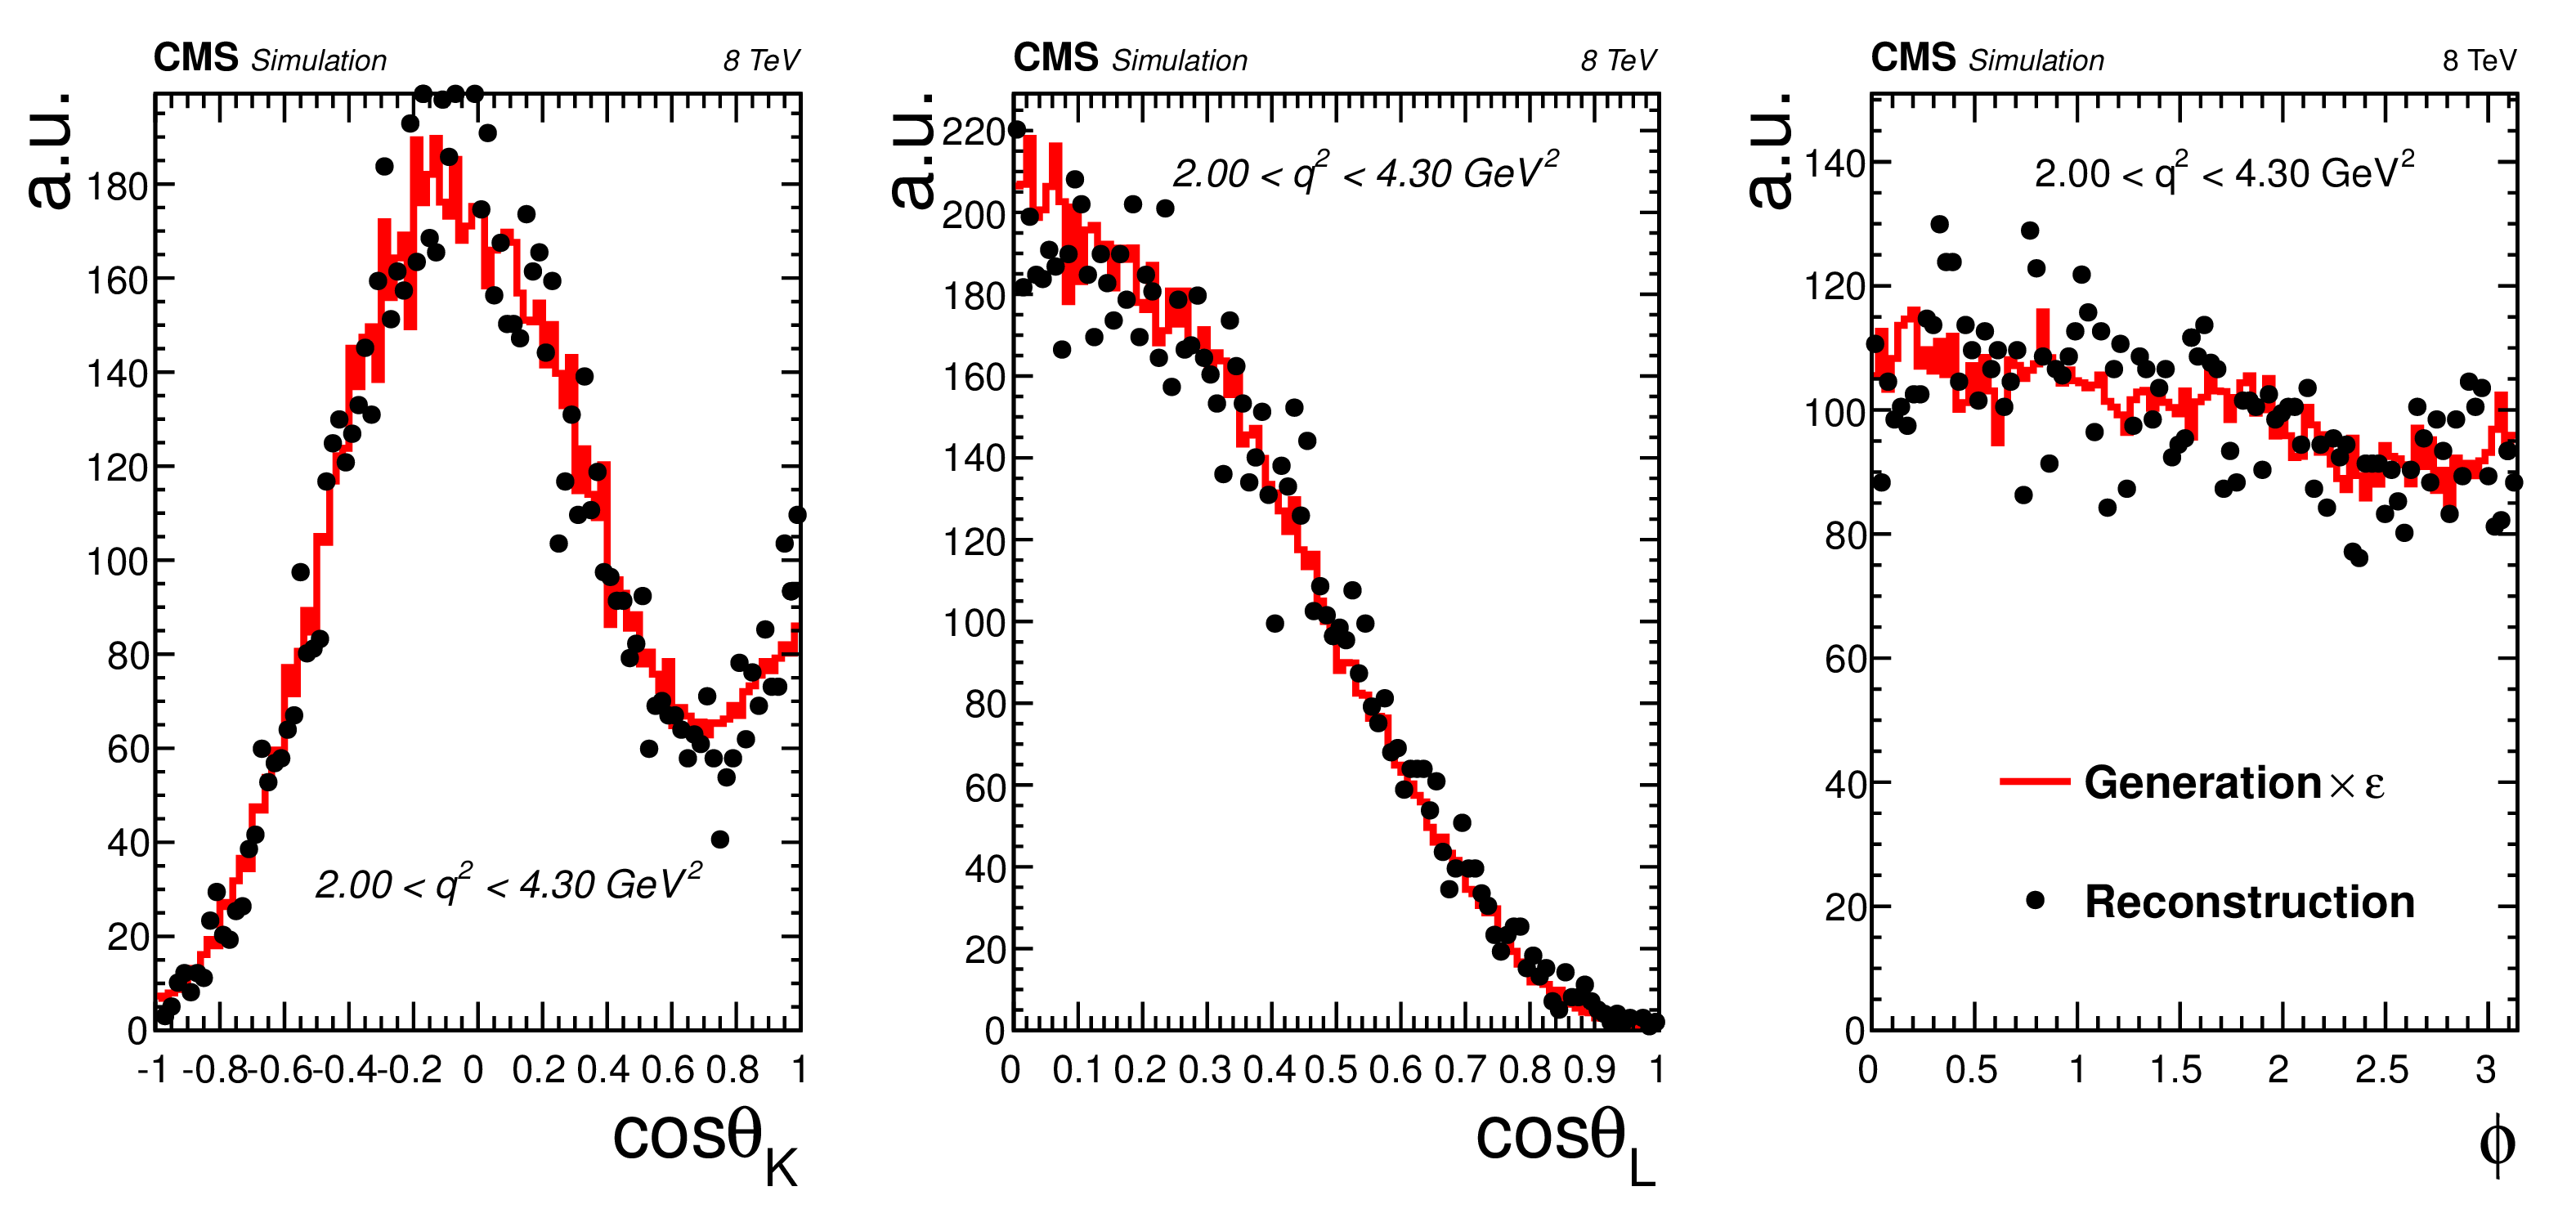
Additional Figure 6:
Closure test of efficiency using simulated events for correctly tagged events. Half of the simulated events are used to compute the efficiency, and the other half is used for the test. The black dots are the reconstructed simulated events, the red dots are instead the distributions of the events at generator level, multiplied by the efficiency. |
png pdf |
Additional Figure 7:
Closure test of efficiency using simulated events for wrongly tagged events. Half of the simulated events are used to compute the efficiency, and the other half is used for the test. The black dots are the reconstructed simulated events, the red dots are instead the distributions of the events at generator level, multiplied by the efficiency. |

png pdf |
Additional Figure 8:
Closure test of the fit results of $P_5'$ for each $q^2$ bin on simulated data. The results of the fit on reconstructed events (black dots) are compared with the fit on the generated events (red dots). The vertical shaded regions correspond to the $\mathrm{J}/\psi$ and $\psi '$ resonances. |

png pdf |
Additional Figure 9:
Closure test of the fit results of $P_1$ for each $q^2$ bin on simulated data. The results of the fit on reconstructed events (black dots) are compared with the fit on the generated events (red dots). The vertical shaded regions correspond to the $\mathrm{J}/\psi$ and $\psi '$ resonances. |

png pdf |
Additional Figure 10:
Distribution of $\mathcal {L}$ computed on data for the second bin 2.00 $ < q^2 < $ 4.30 GeV$^{2}$, in the $P_1, P'_5$ plane. The colored regions correspond to $\Delta \log {L} < $ 0.5 (yellow), 0.5 $ < \Delta \log {L} < $ 2.0 (green), $\Delta \log {L} > $ 2.0 (purple), respectively. The magenta line represents the physical boundary, the physically allowed region being above that line. Superimposed is a bivariate Gaussian fit (dot-dashed line), and the position of the maxima of the profiled $\mathcal {L}$ along $P_1$, with $P'_5$ fixed, (blue crosses) and along $P'_5$, with $P_1$ fixed, (red crosses). |

png pdf |
Additional Figure 11:
Distribution of $\mathcal {L}$ computed on data for the third bin 4.30 $ < q^2 < $ 6.00 GeV$^{2}$, in the $P_1, P'_5$ plane. The colored regions correspond to $\Delta \log {L} < $ 0.5 (yellow), 0.5 $ < \Delta \log {L} < $ 2.0 (green), $\Delta \log {L} > $ 2.0 (purple), respectively. The magenta line represents the physical boundary, the physically allowed region being above that line. Superimposed is a bivariate Gaussian fit (dot-dashed line), and the position of the maxima of the profiled $\mathcal {L}$ along $P_1$, with $P'_5$ fixed, (blue crosses) and along $P'_5$, with $P_1$ fixed, (red crosses). |

png pdf |
Additional Figure 12:
$ {\mathrm {K^+}} {\pi ^-} {{\mu ^+}} {{\mu ^-}}$ invariant mass and angular distributions of the control channel $\mathrm{J}/\psi$ on data. Overlaid on each plot is the projection of the results for the total fit, as well as for the three components: correctly tagged signal, mistagged signal, and background. The vertical bars indicate the statistical uncertainties. |
png pdf |
Additional Figure 13:
$ {\mathrm {K^+}} {\pi ^-} {{\mu ^+}} {{\mu ^-}}$ invariant mass and angular distributions of the control channel $\psi '$ on data. Overlaid on each plot is the projection of the results for the total fit, as well as for the three components: correctly tagged signal, mistagged signal, and background. The vertical bars indicate the statistical uncertainties. |
png pdf |
Additional Figure 14:
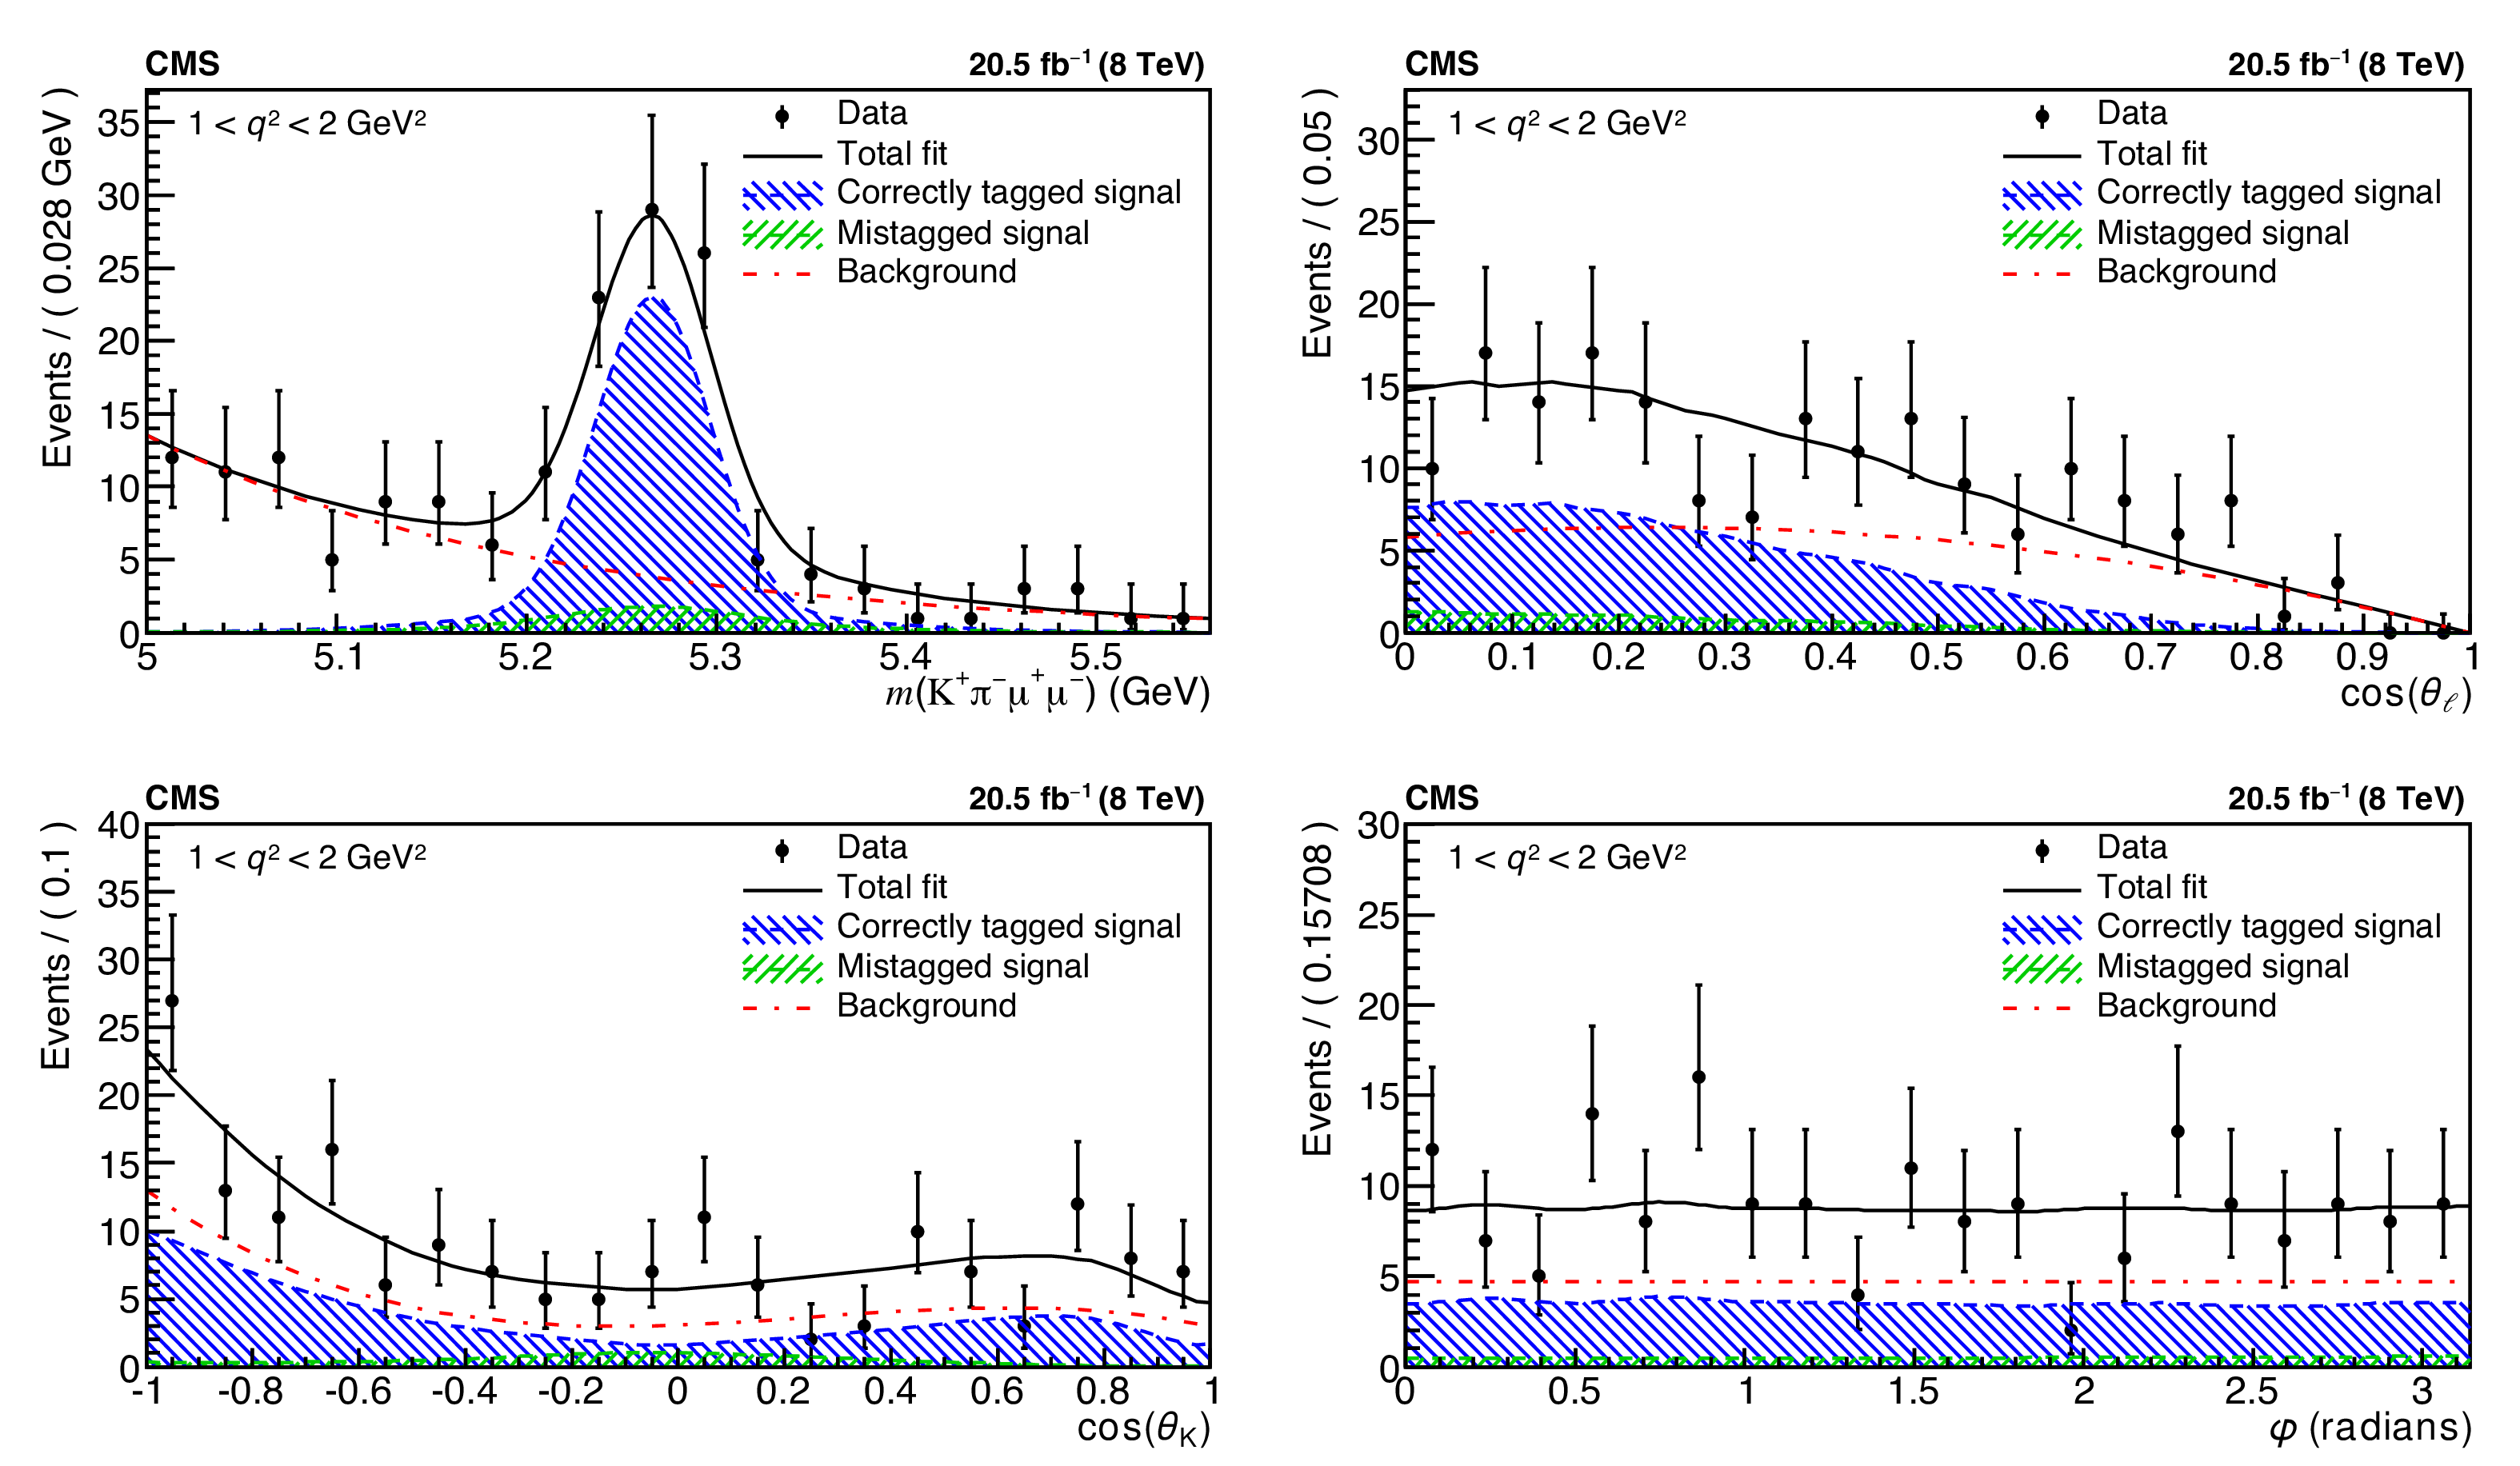
$ {\mathrm {K^+}} {\pi ^-} {{\mu ^+}} {{\mu ^-}}$ invariant mass and angular distributions for the first $q^2$ bin 1.00 $ < q^2 < $ 2.00 GeV$^{2}$. Overlaid on each plot is the projection of the results for the total fit, as well as for the three components: correctly tagged signal, mistagged signal, and background. The vertical bars indicate the statistical uncertainties. |
png pdf |
Additional Figure 15:
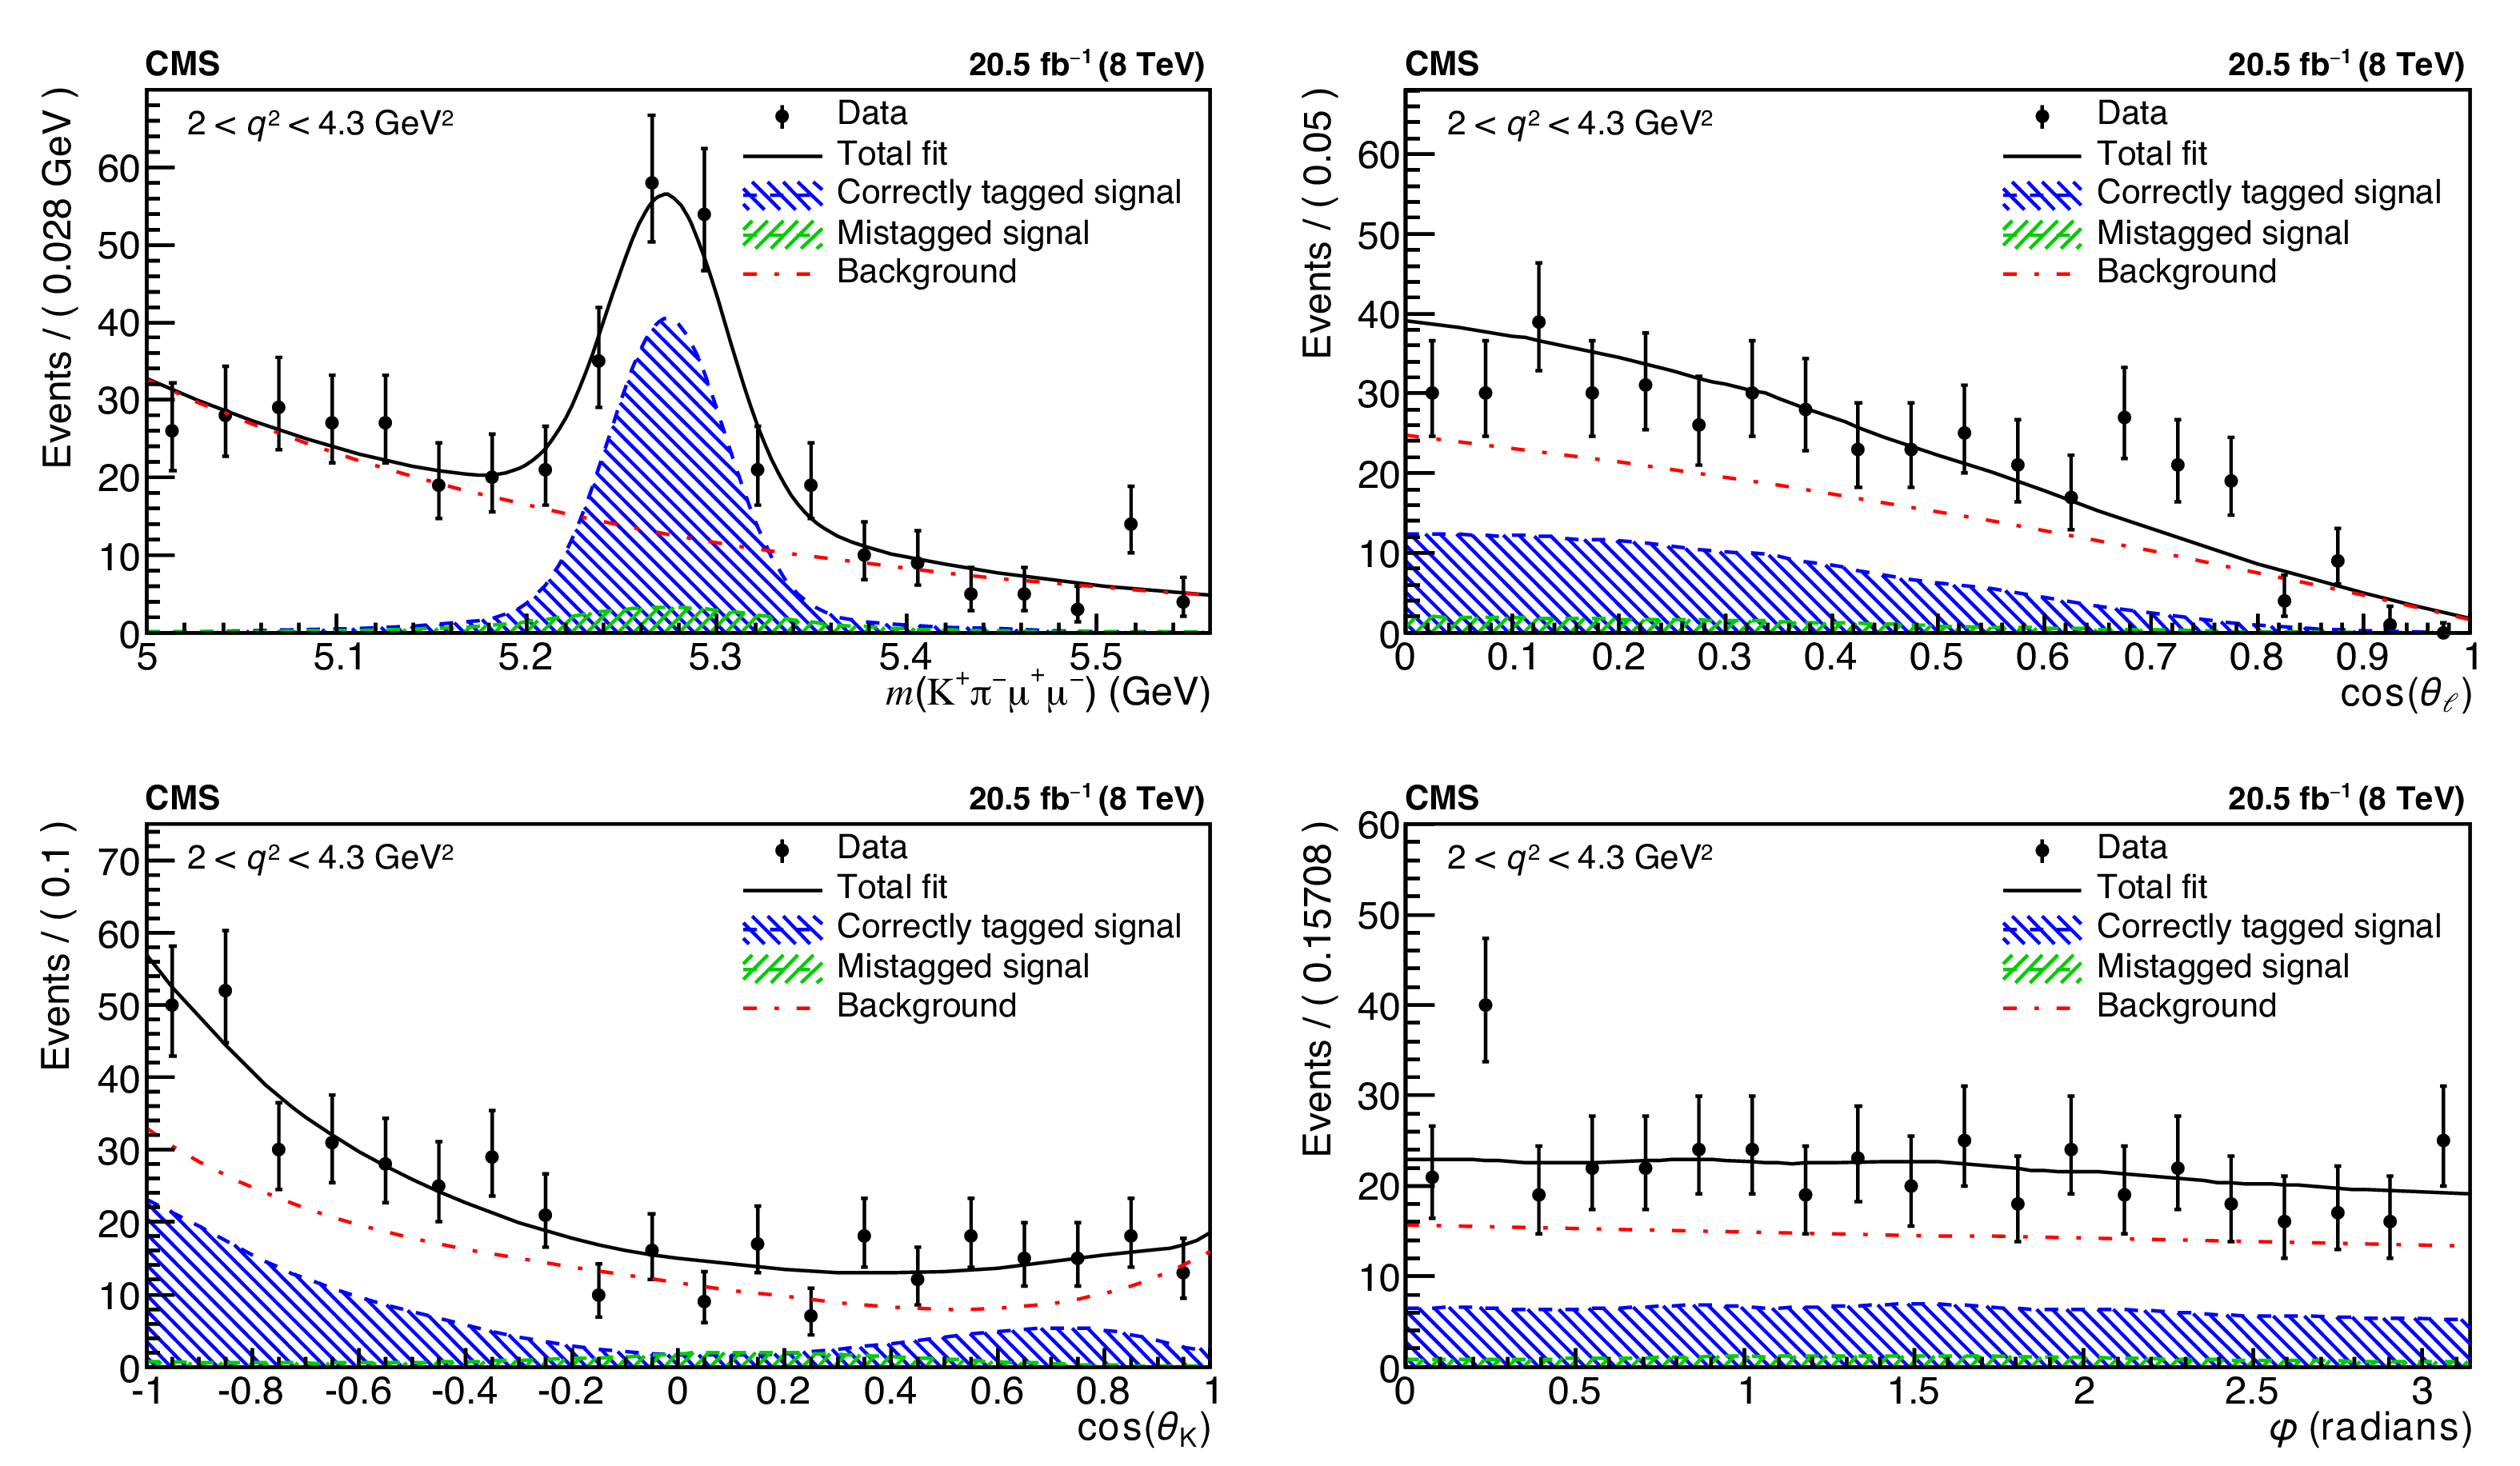
$ {\mathrm {K^+}} {\pi ^-} {{\mu ^+}} {{\mu ^-}}$ invariant mass and angular distributions for the second $q^2$ bin 2.00 $ < q^2 < $ 4.30 GeV$^{2}$. Overlaid on each plot is the projection of the results for the total fit, as well as for the three components: correctly tagged signal, mistagged signal, and background. The vertical bars indicate the statistical uncertainties. |

png pdf |
Additional Figure 16:
$ {\mathrm {K^+}} {\pi ^-} {{\mu ^+}} {{\mu ^-}}$ invariant mass and angular distributions for the third $q^2$ bin 4.30 $ < q^2 < $ 6.00 GeV$^{2}$. Overlaid on each plot is the projection of the results for the total fit, as well as for the three components: correctly tagged signal, mistagged signal, and background. The vertical bars indicate the statistical uncertainties. |
png pdf |
Additional Figure 17:
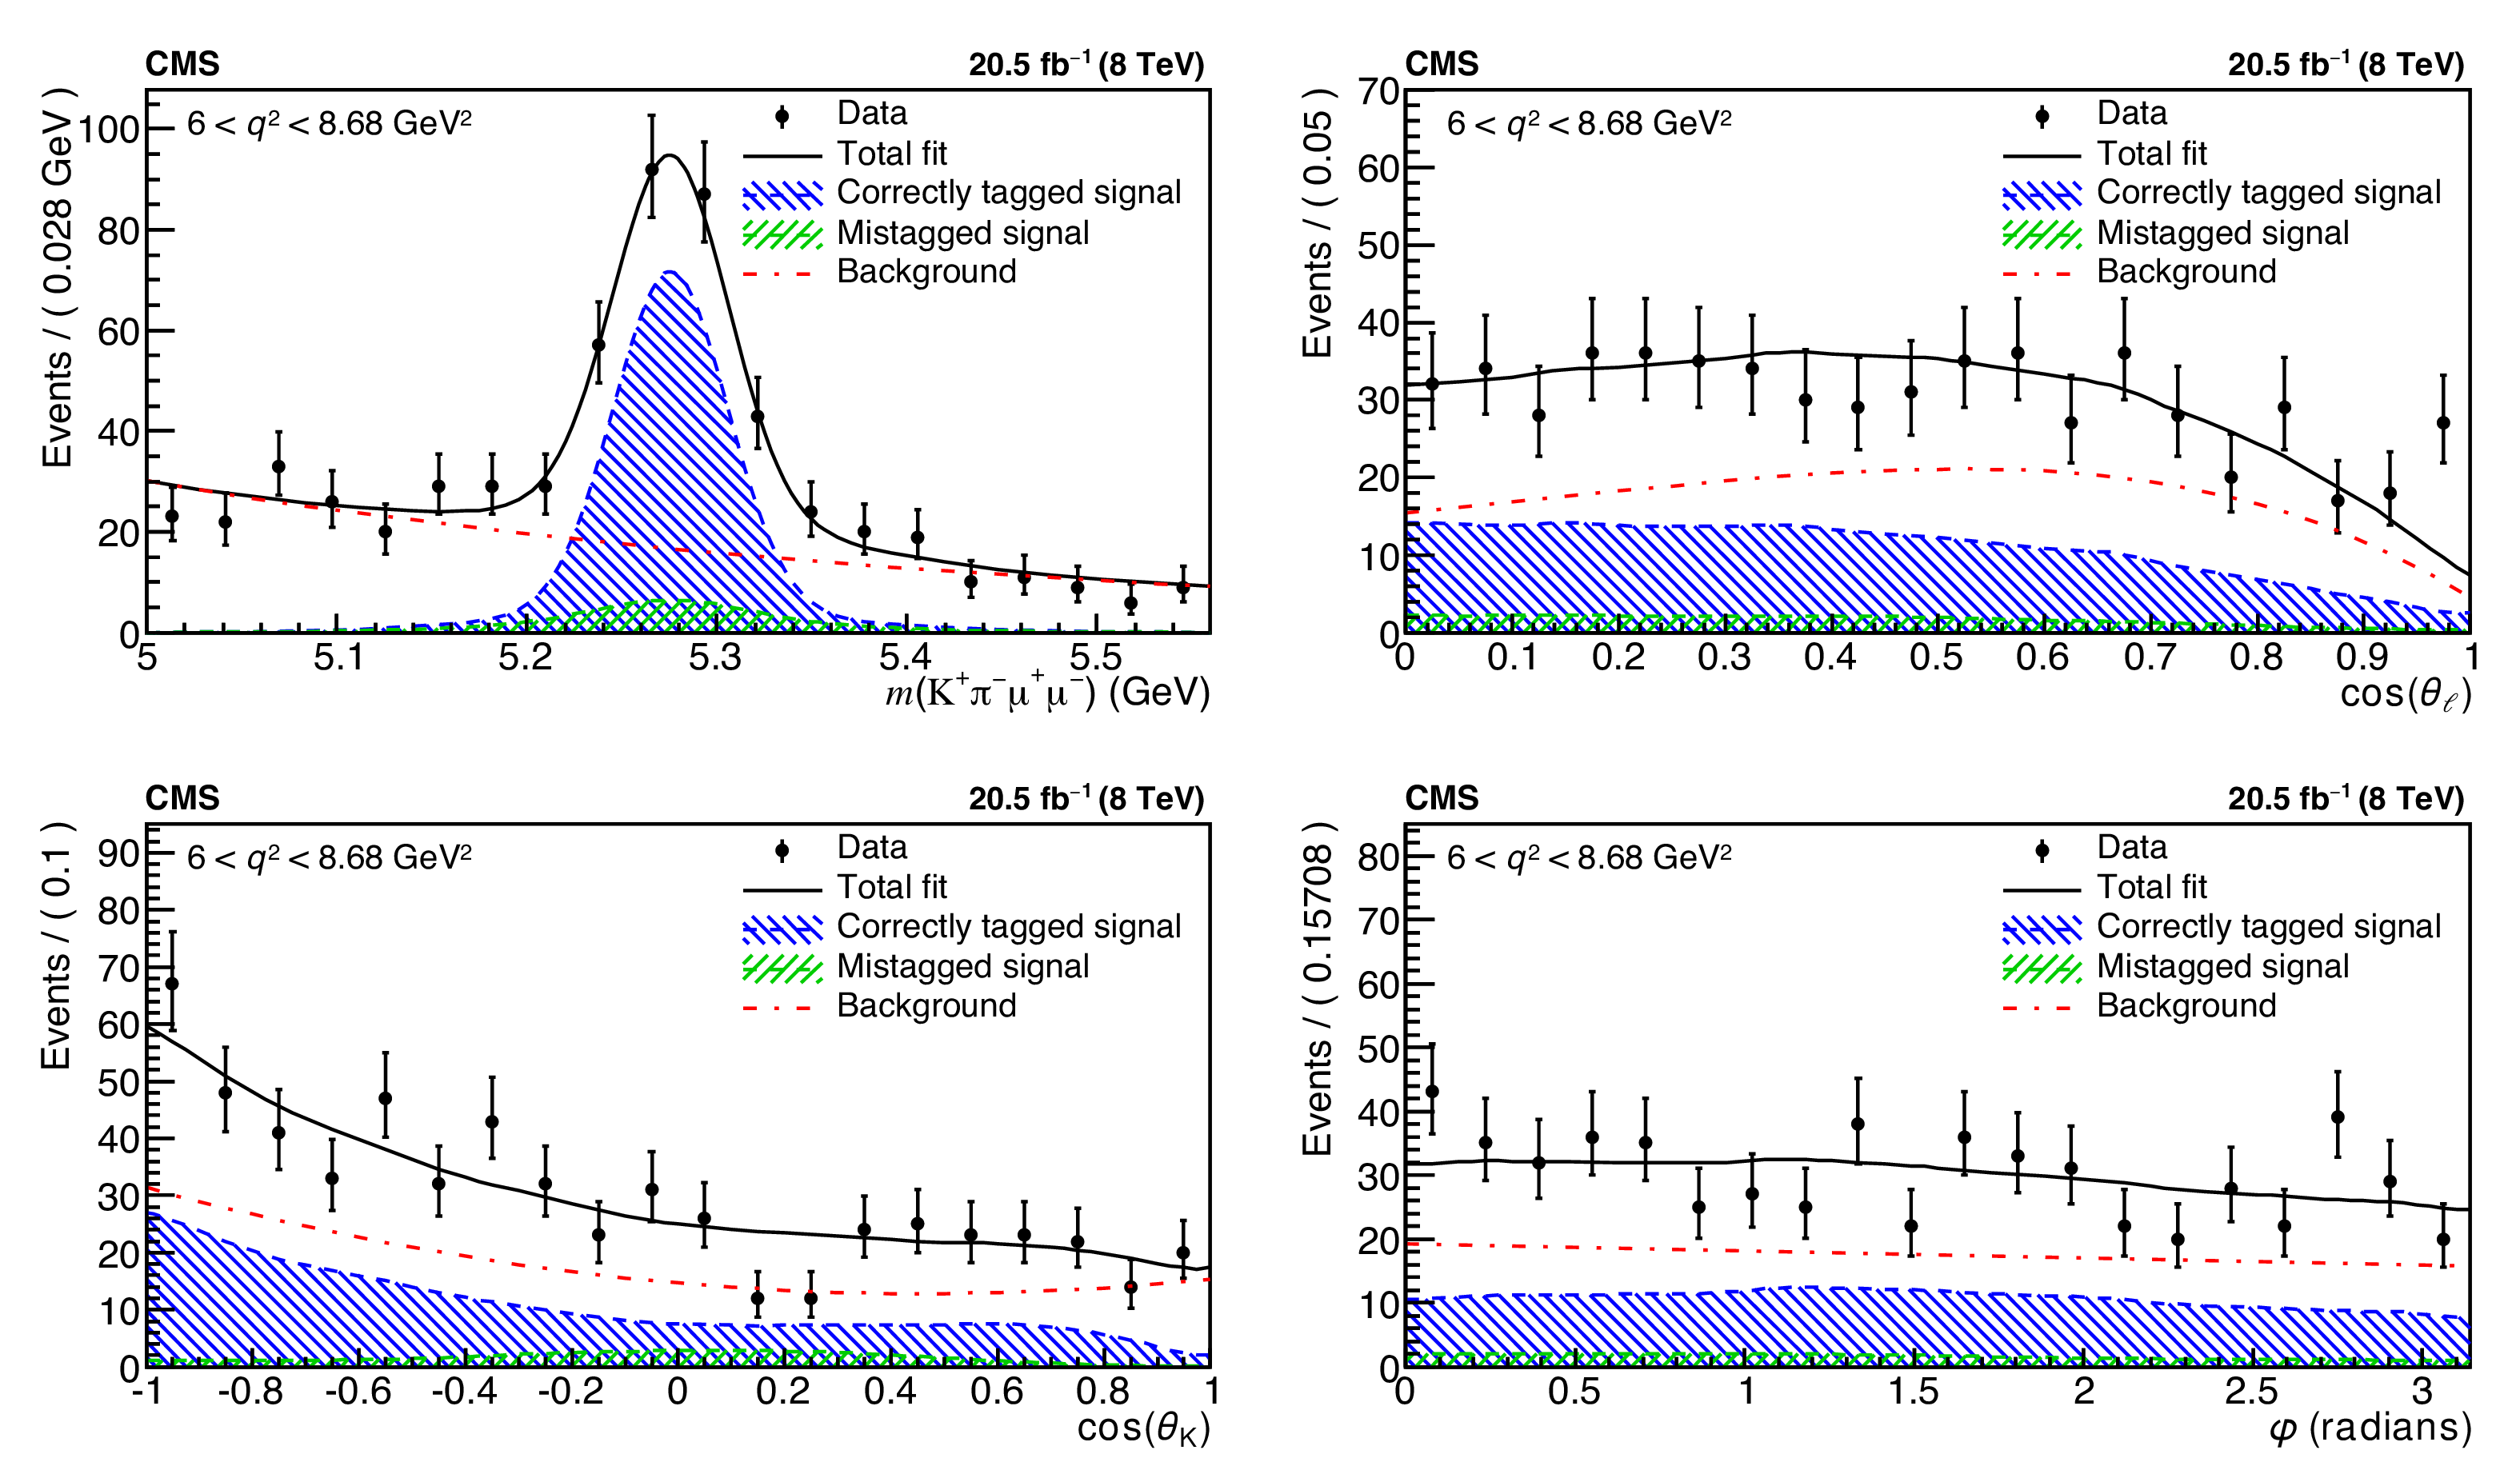
$ {\mathrm {K^+}} {\pi ^-} {{\mu ^+}} {{\mu ^-}}$ invariant mass and angular distributions for the fourth $q^2$ bin 6.00 $ < q^2 < $ 8.68 GeV$^{2}$. Overlaid on each plot is the projection of the results for the total fit, as well as for the three components: correctly tagged signal, mistagged signal, and background. The vertical bars indicate the statistical uncertainties. |
png pdf |
Additional Figure 18:
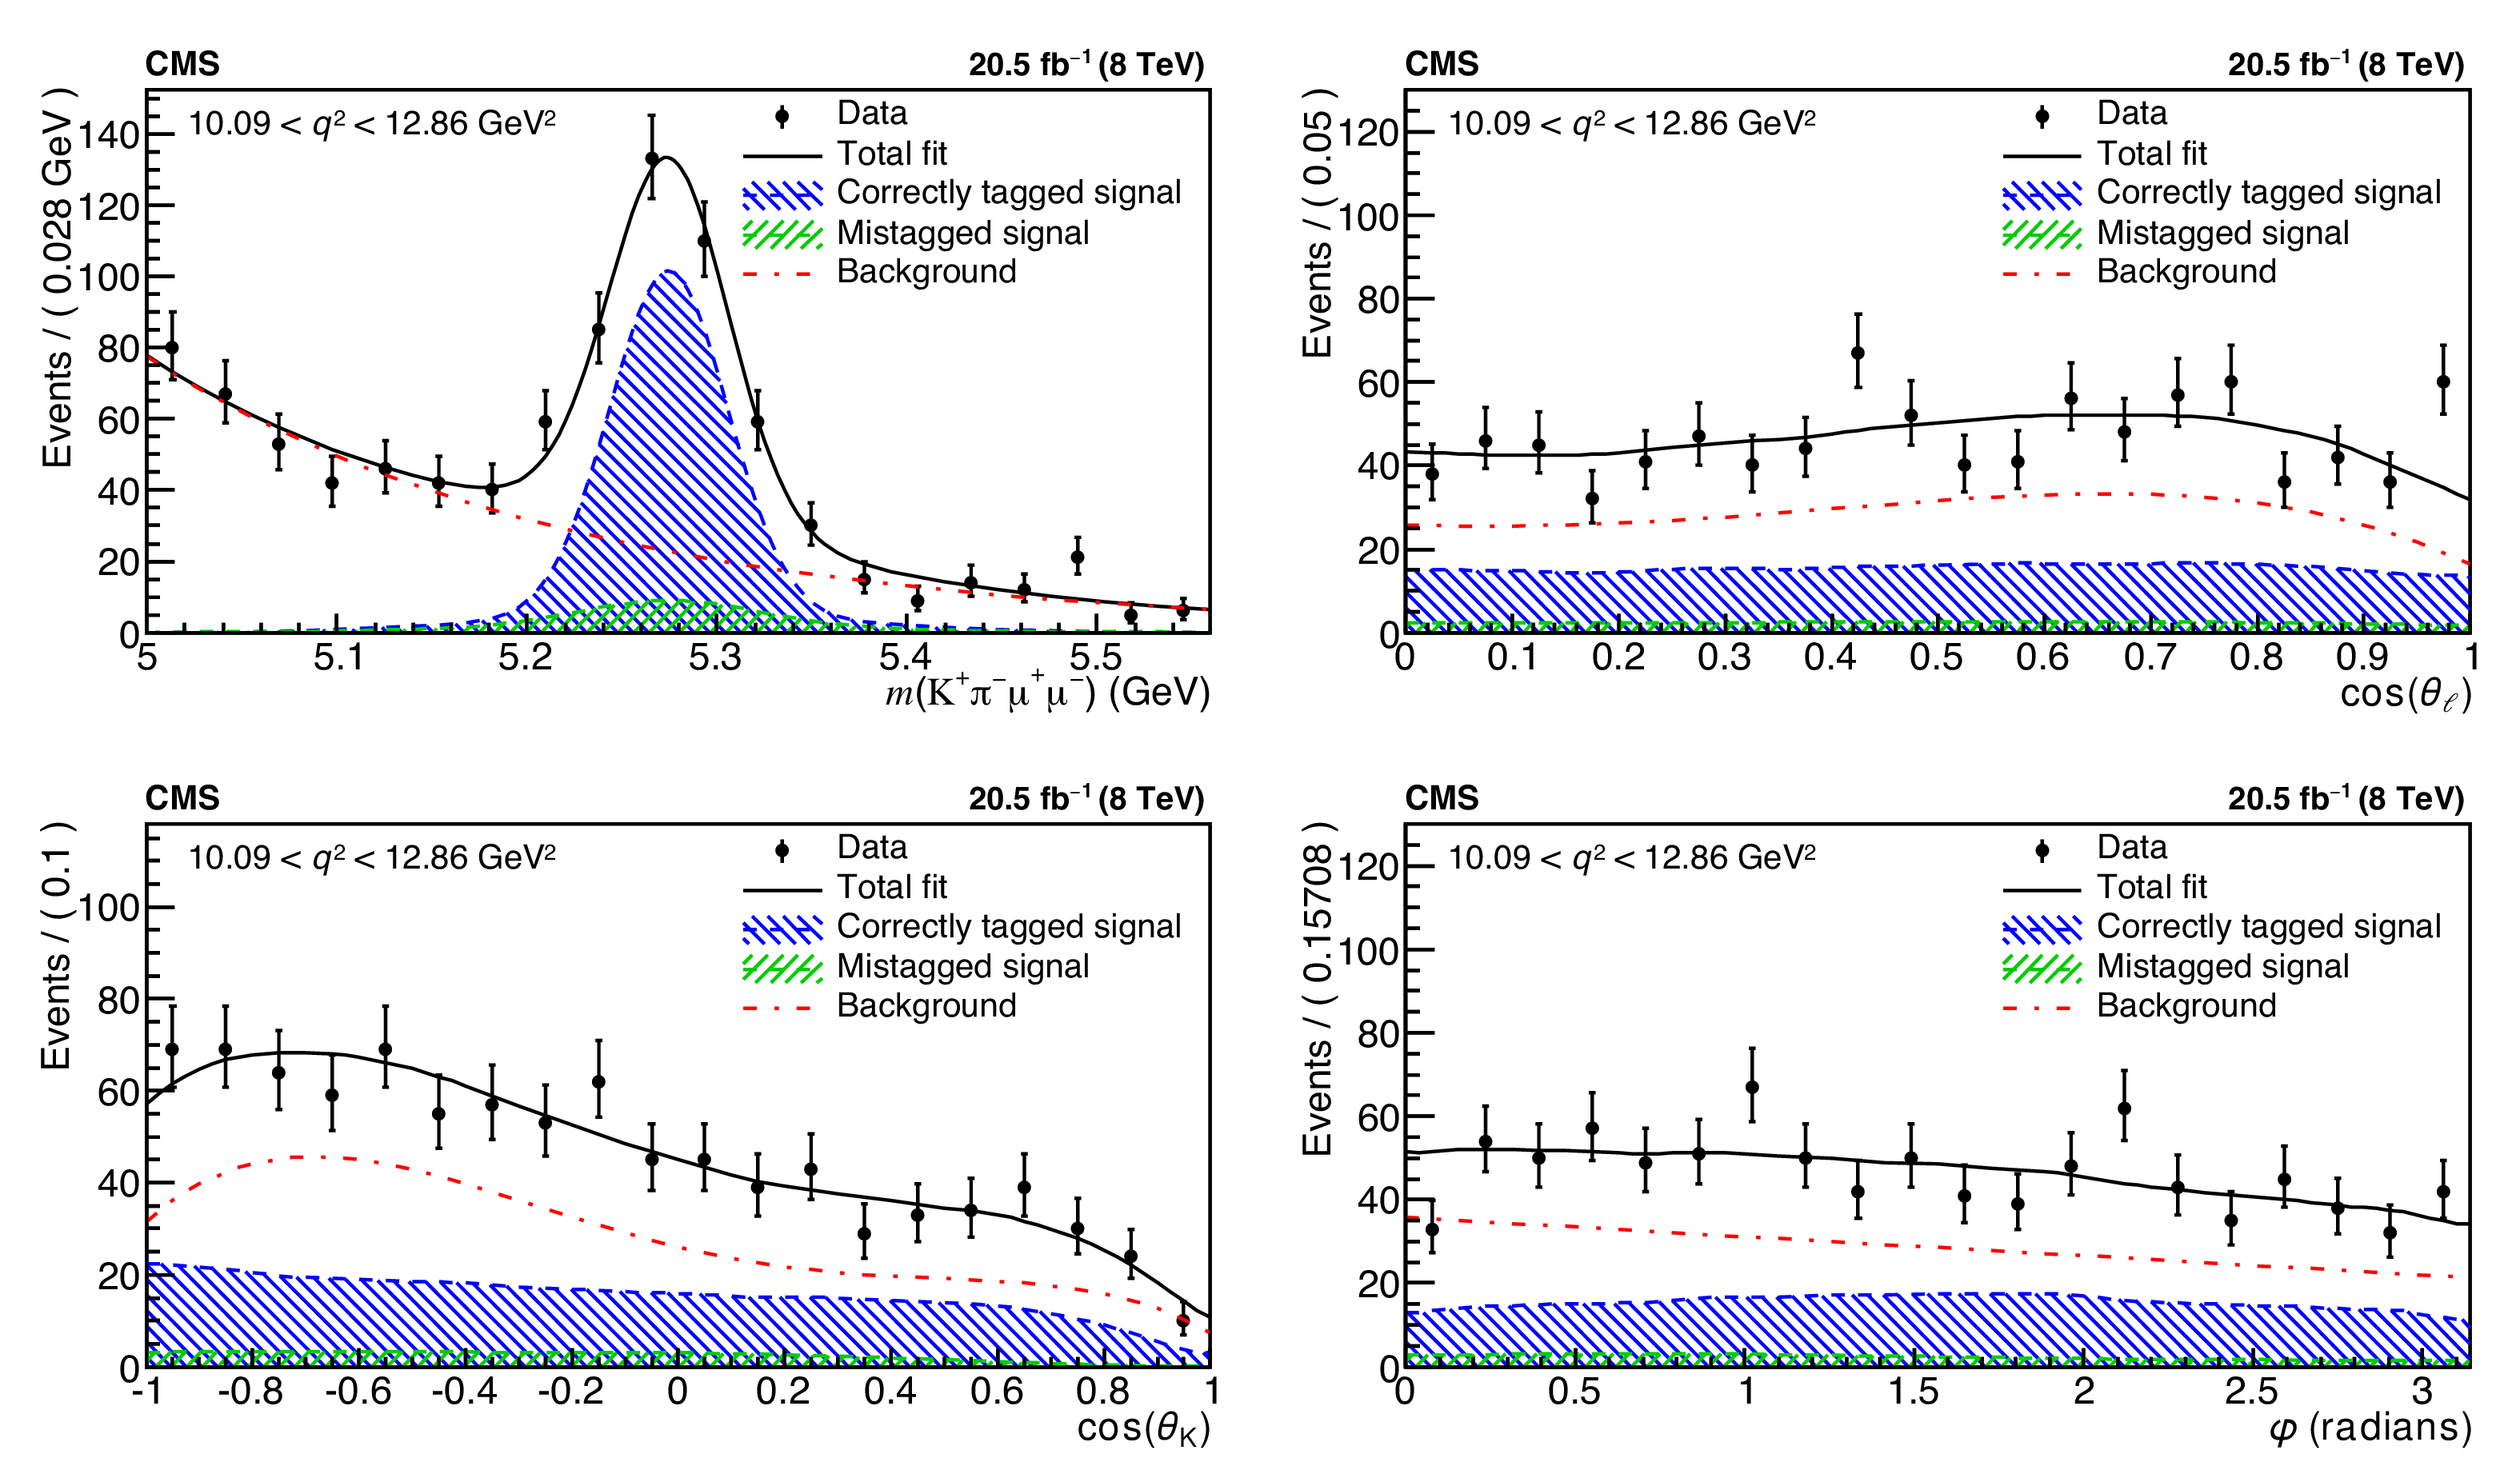
$ {\mathrm {K^+}} {\pi ^-} {{\mu ^+}} {{\mu ^-}}$ invariant mass and angular distributions for the fifth $q^2$ bin 10.09 $ < q^2 < $ 12.86 GeV$^{2}$. Overlaid on each plot is the projection of the results for the total fit, as well as for the three components: correctly tagged signal, mistagged signal, and background. The vertical bars indicate the statistical uncertainties. |
png pdf |
Additional Figure 19:
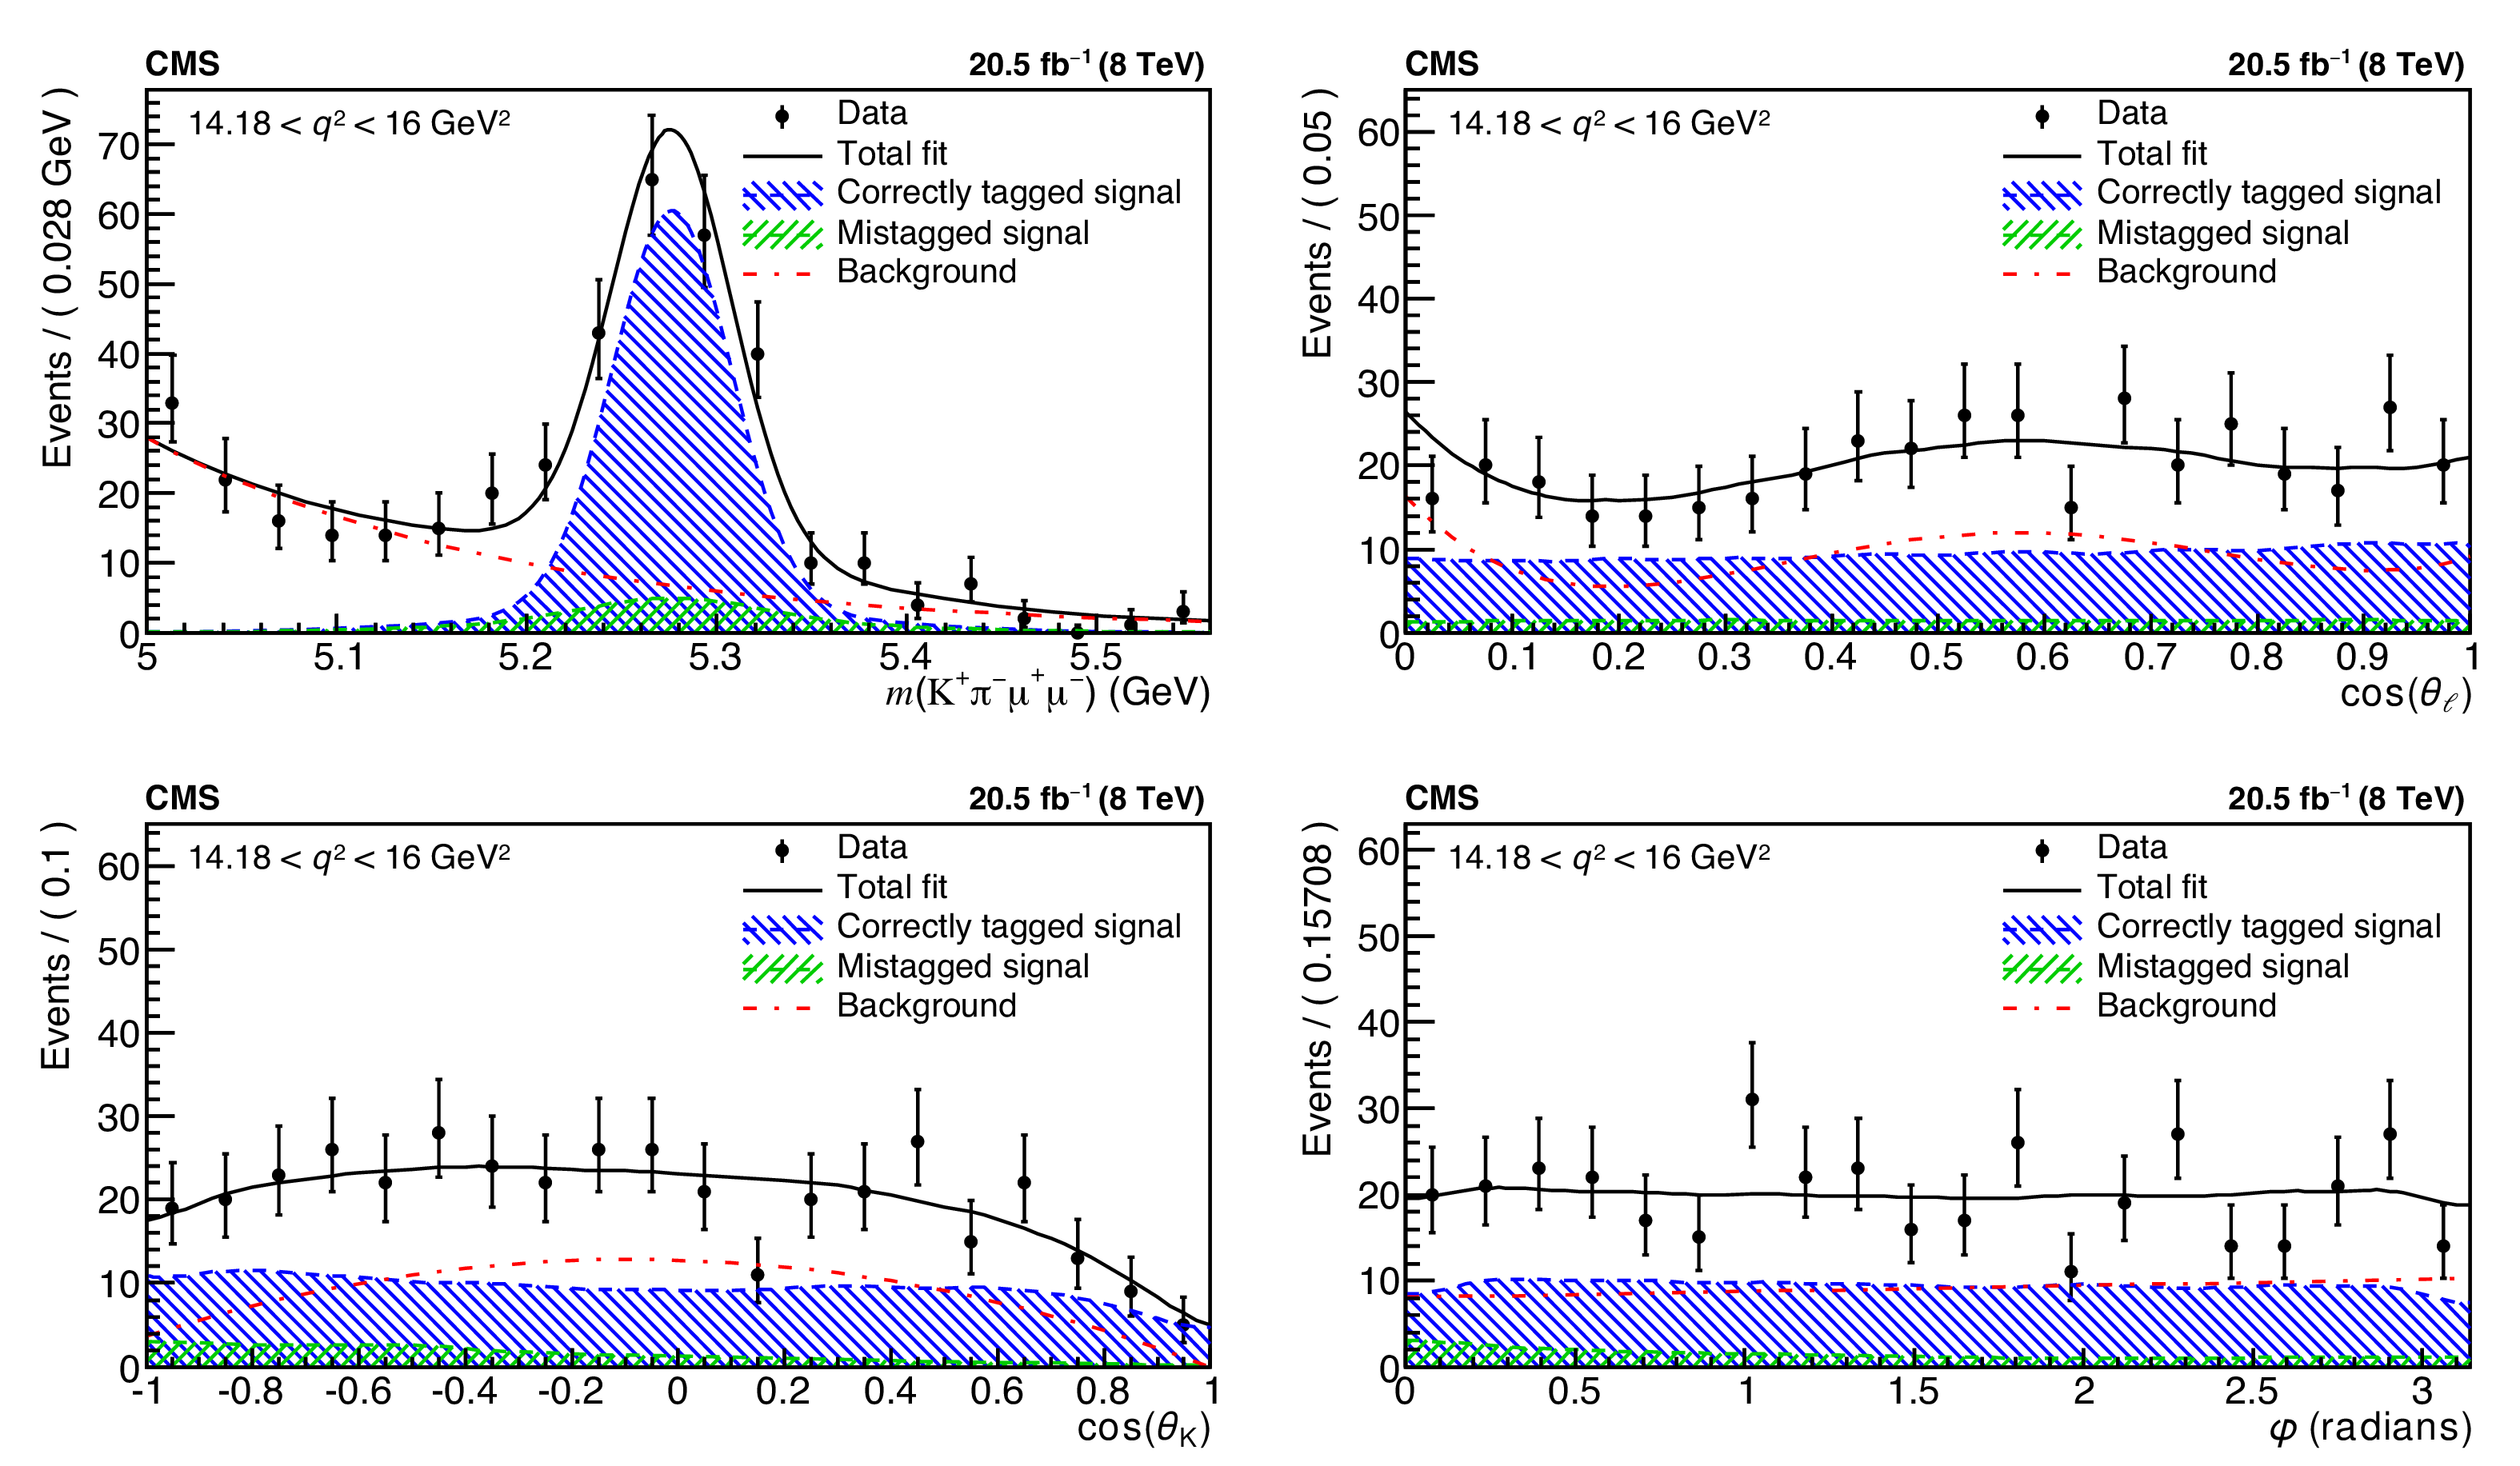
$ {\mathrm {K^+}} {\pi ^-} {{\mu ^+}} {{\mu ^-}}$ invariant mass and angular distributions for the sixth $q^2$ bin 14.18 $ < q^2 < $ 16.00 GeV$^{2}$. Overlaid on each plot is the projection of the results for the total fit, as well as for the three components: correctly tagged signal, mistagged signal, and background. The vertical bars indicate the statistical uncertainties. |
png pdf |
Additional Figure 20:
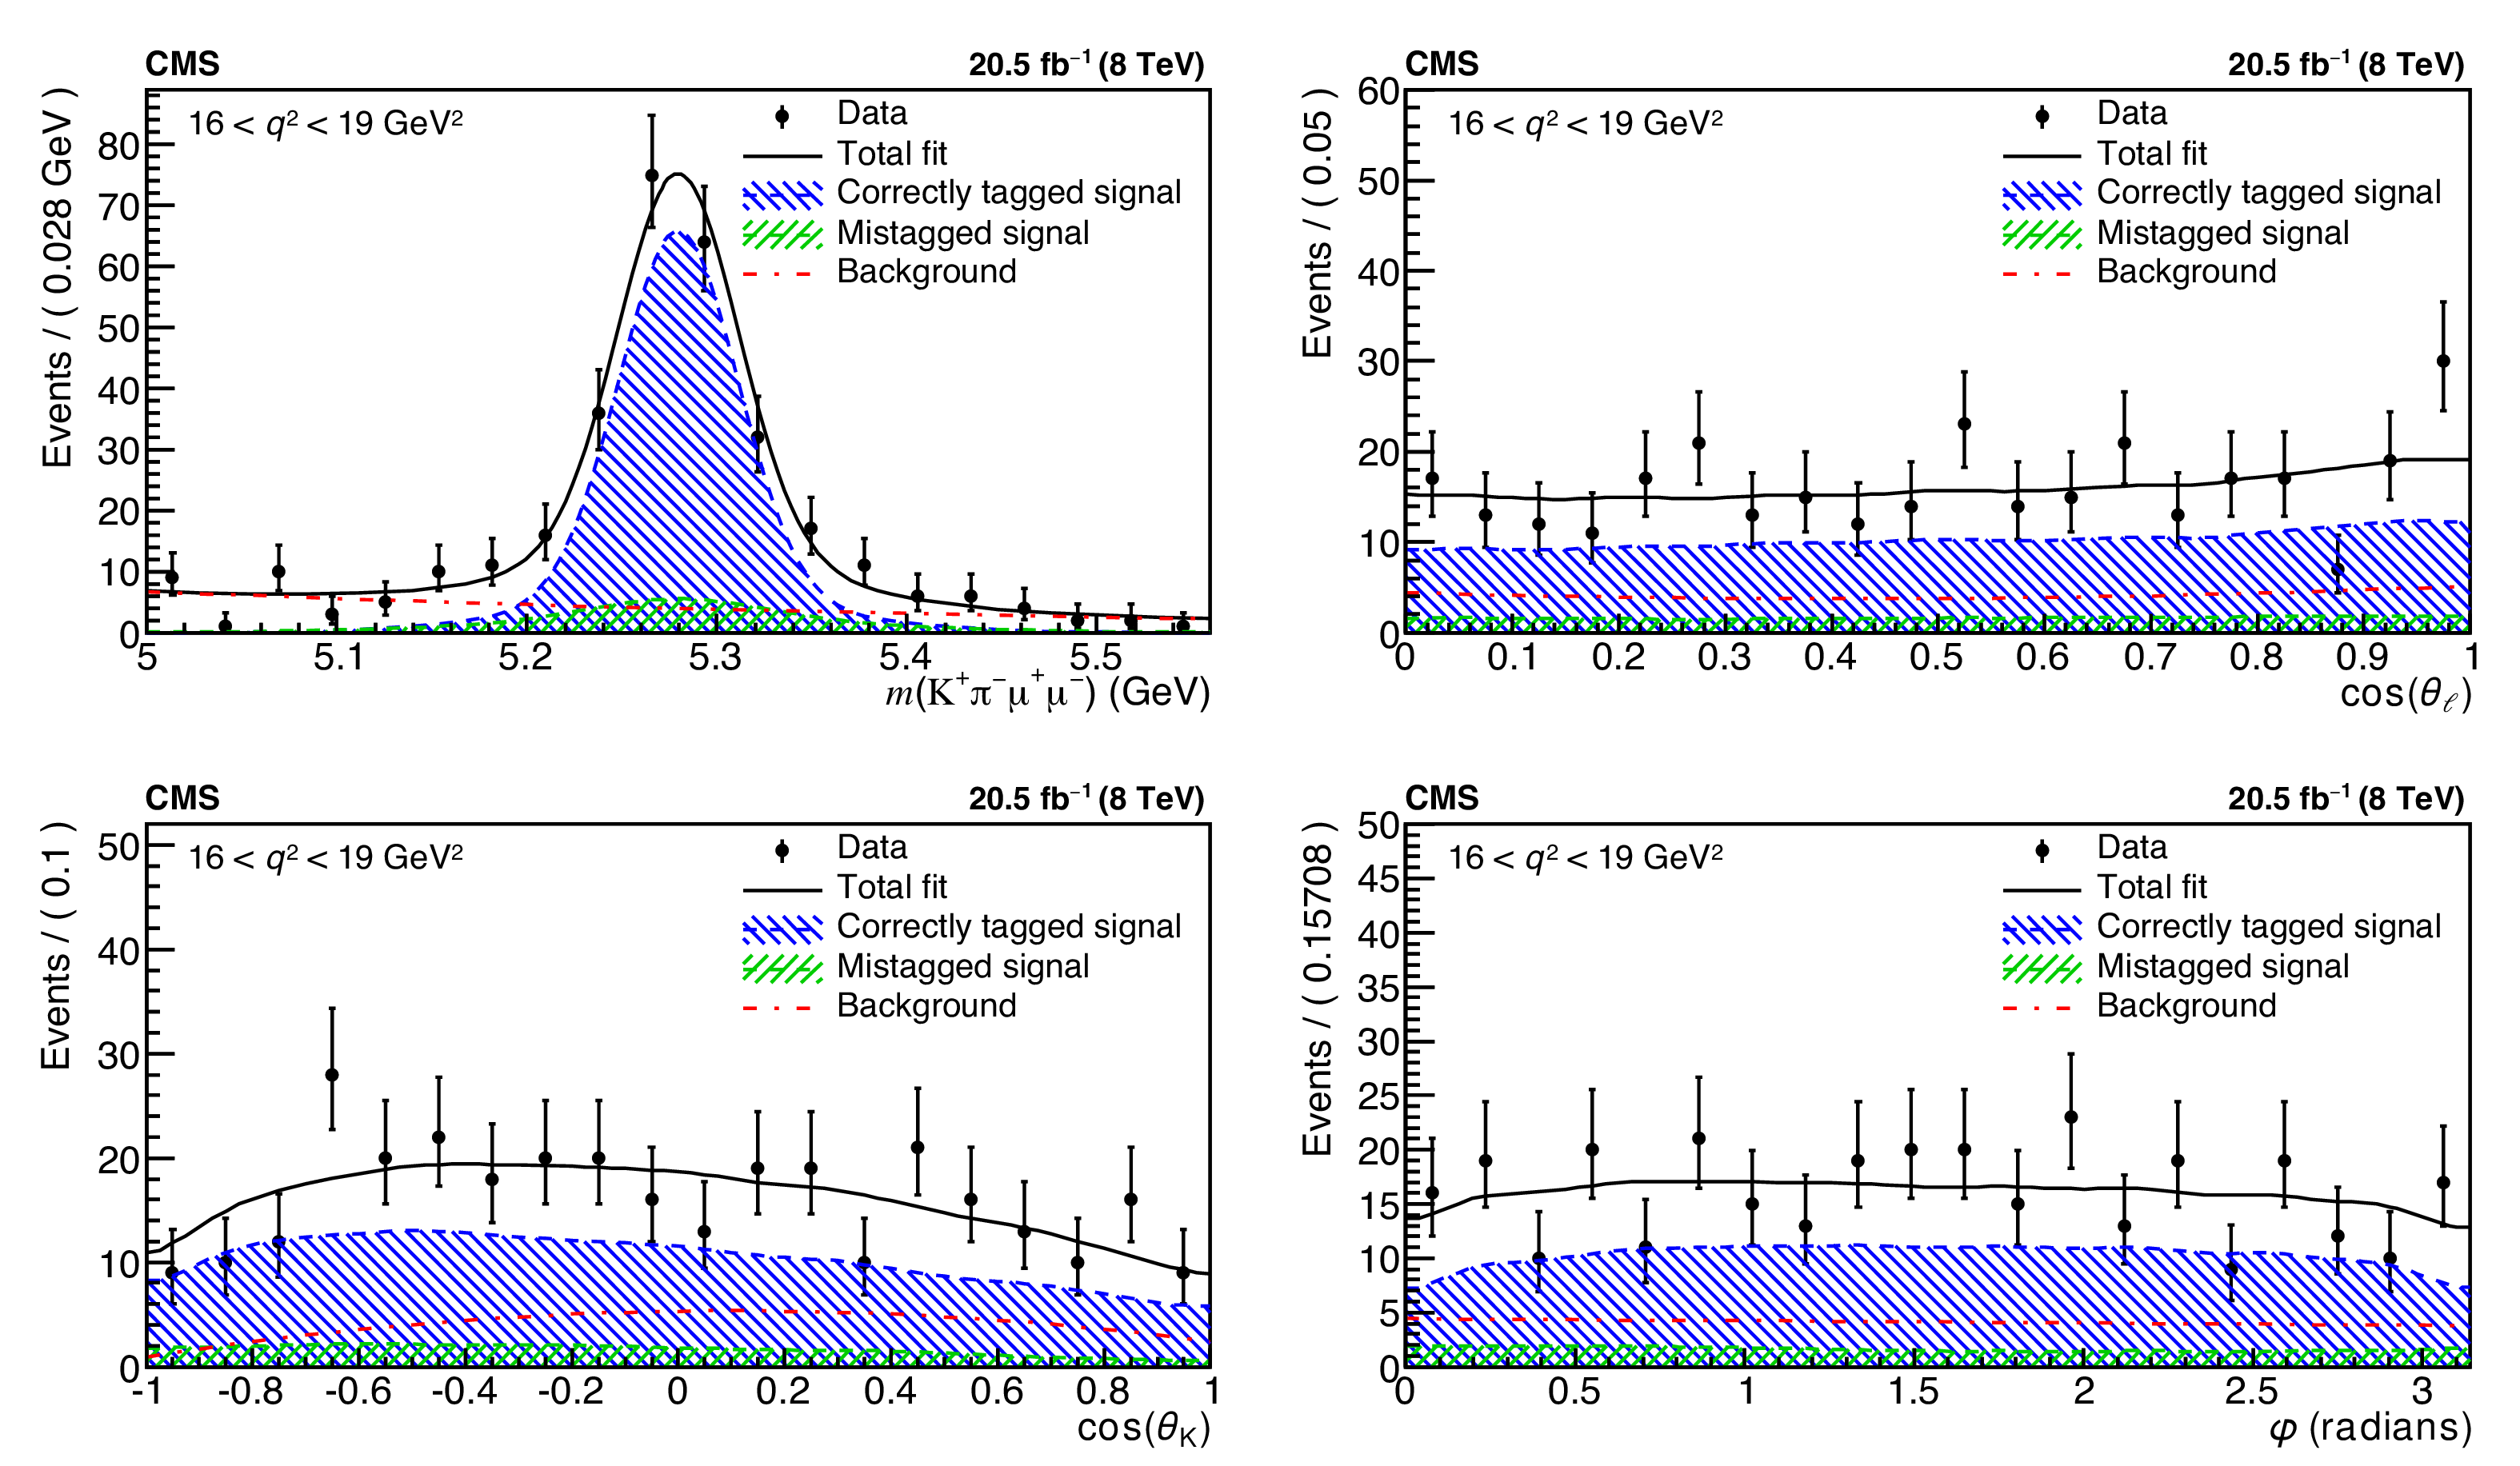
$ {\mathrm {K^+}} {\pi ^-} {{\mu ^+}} {{\mu ^-}}$ invariant mass and angular distributions for the seventh $q^2$ bin 16.00 $ < q^2 < $ 19.00 GeV$^{2}$. Overlaid on each plot is the projection of the results for the total fit, as well as for the three components: correctly tagged signal, mistagged signal, and background. The vertical bars indicate the statistical uncertainties. |
png pdf |
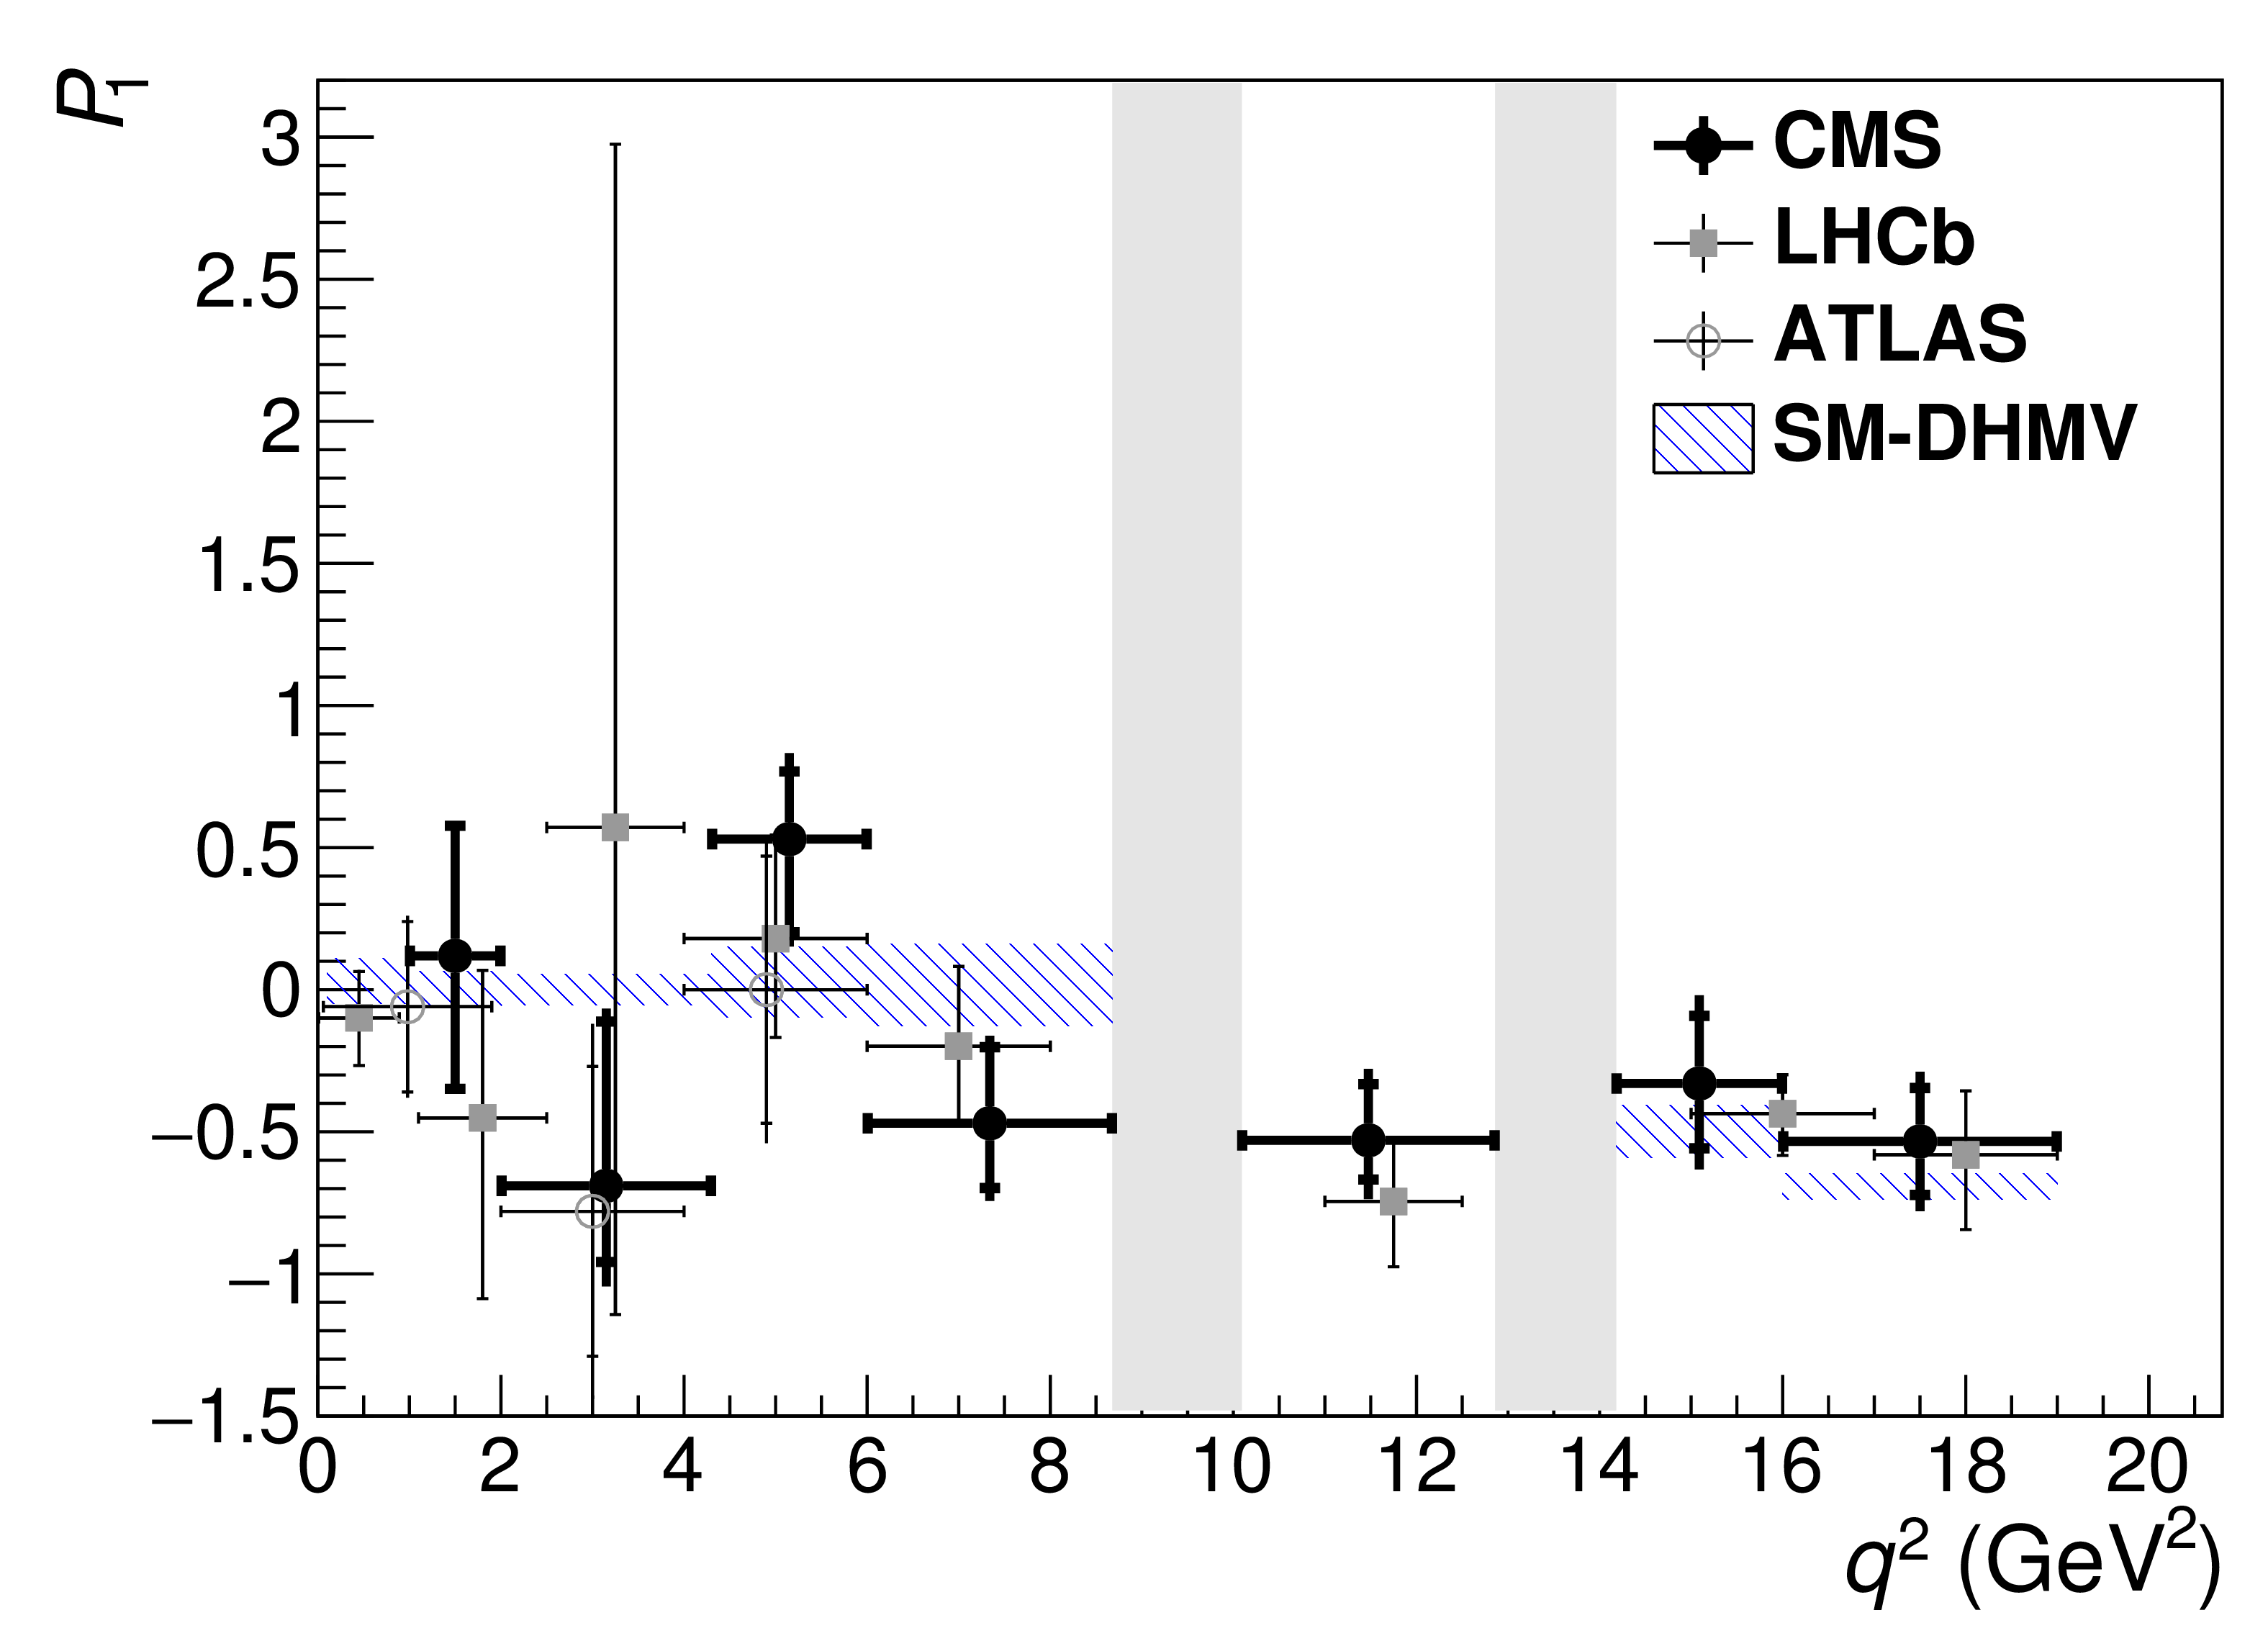
Additional Figure 21:
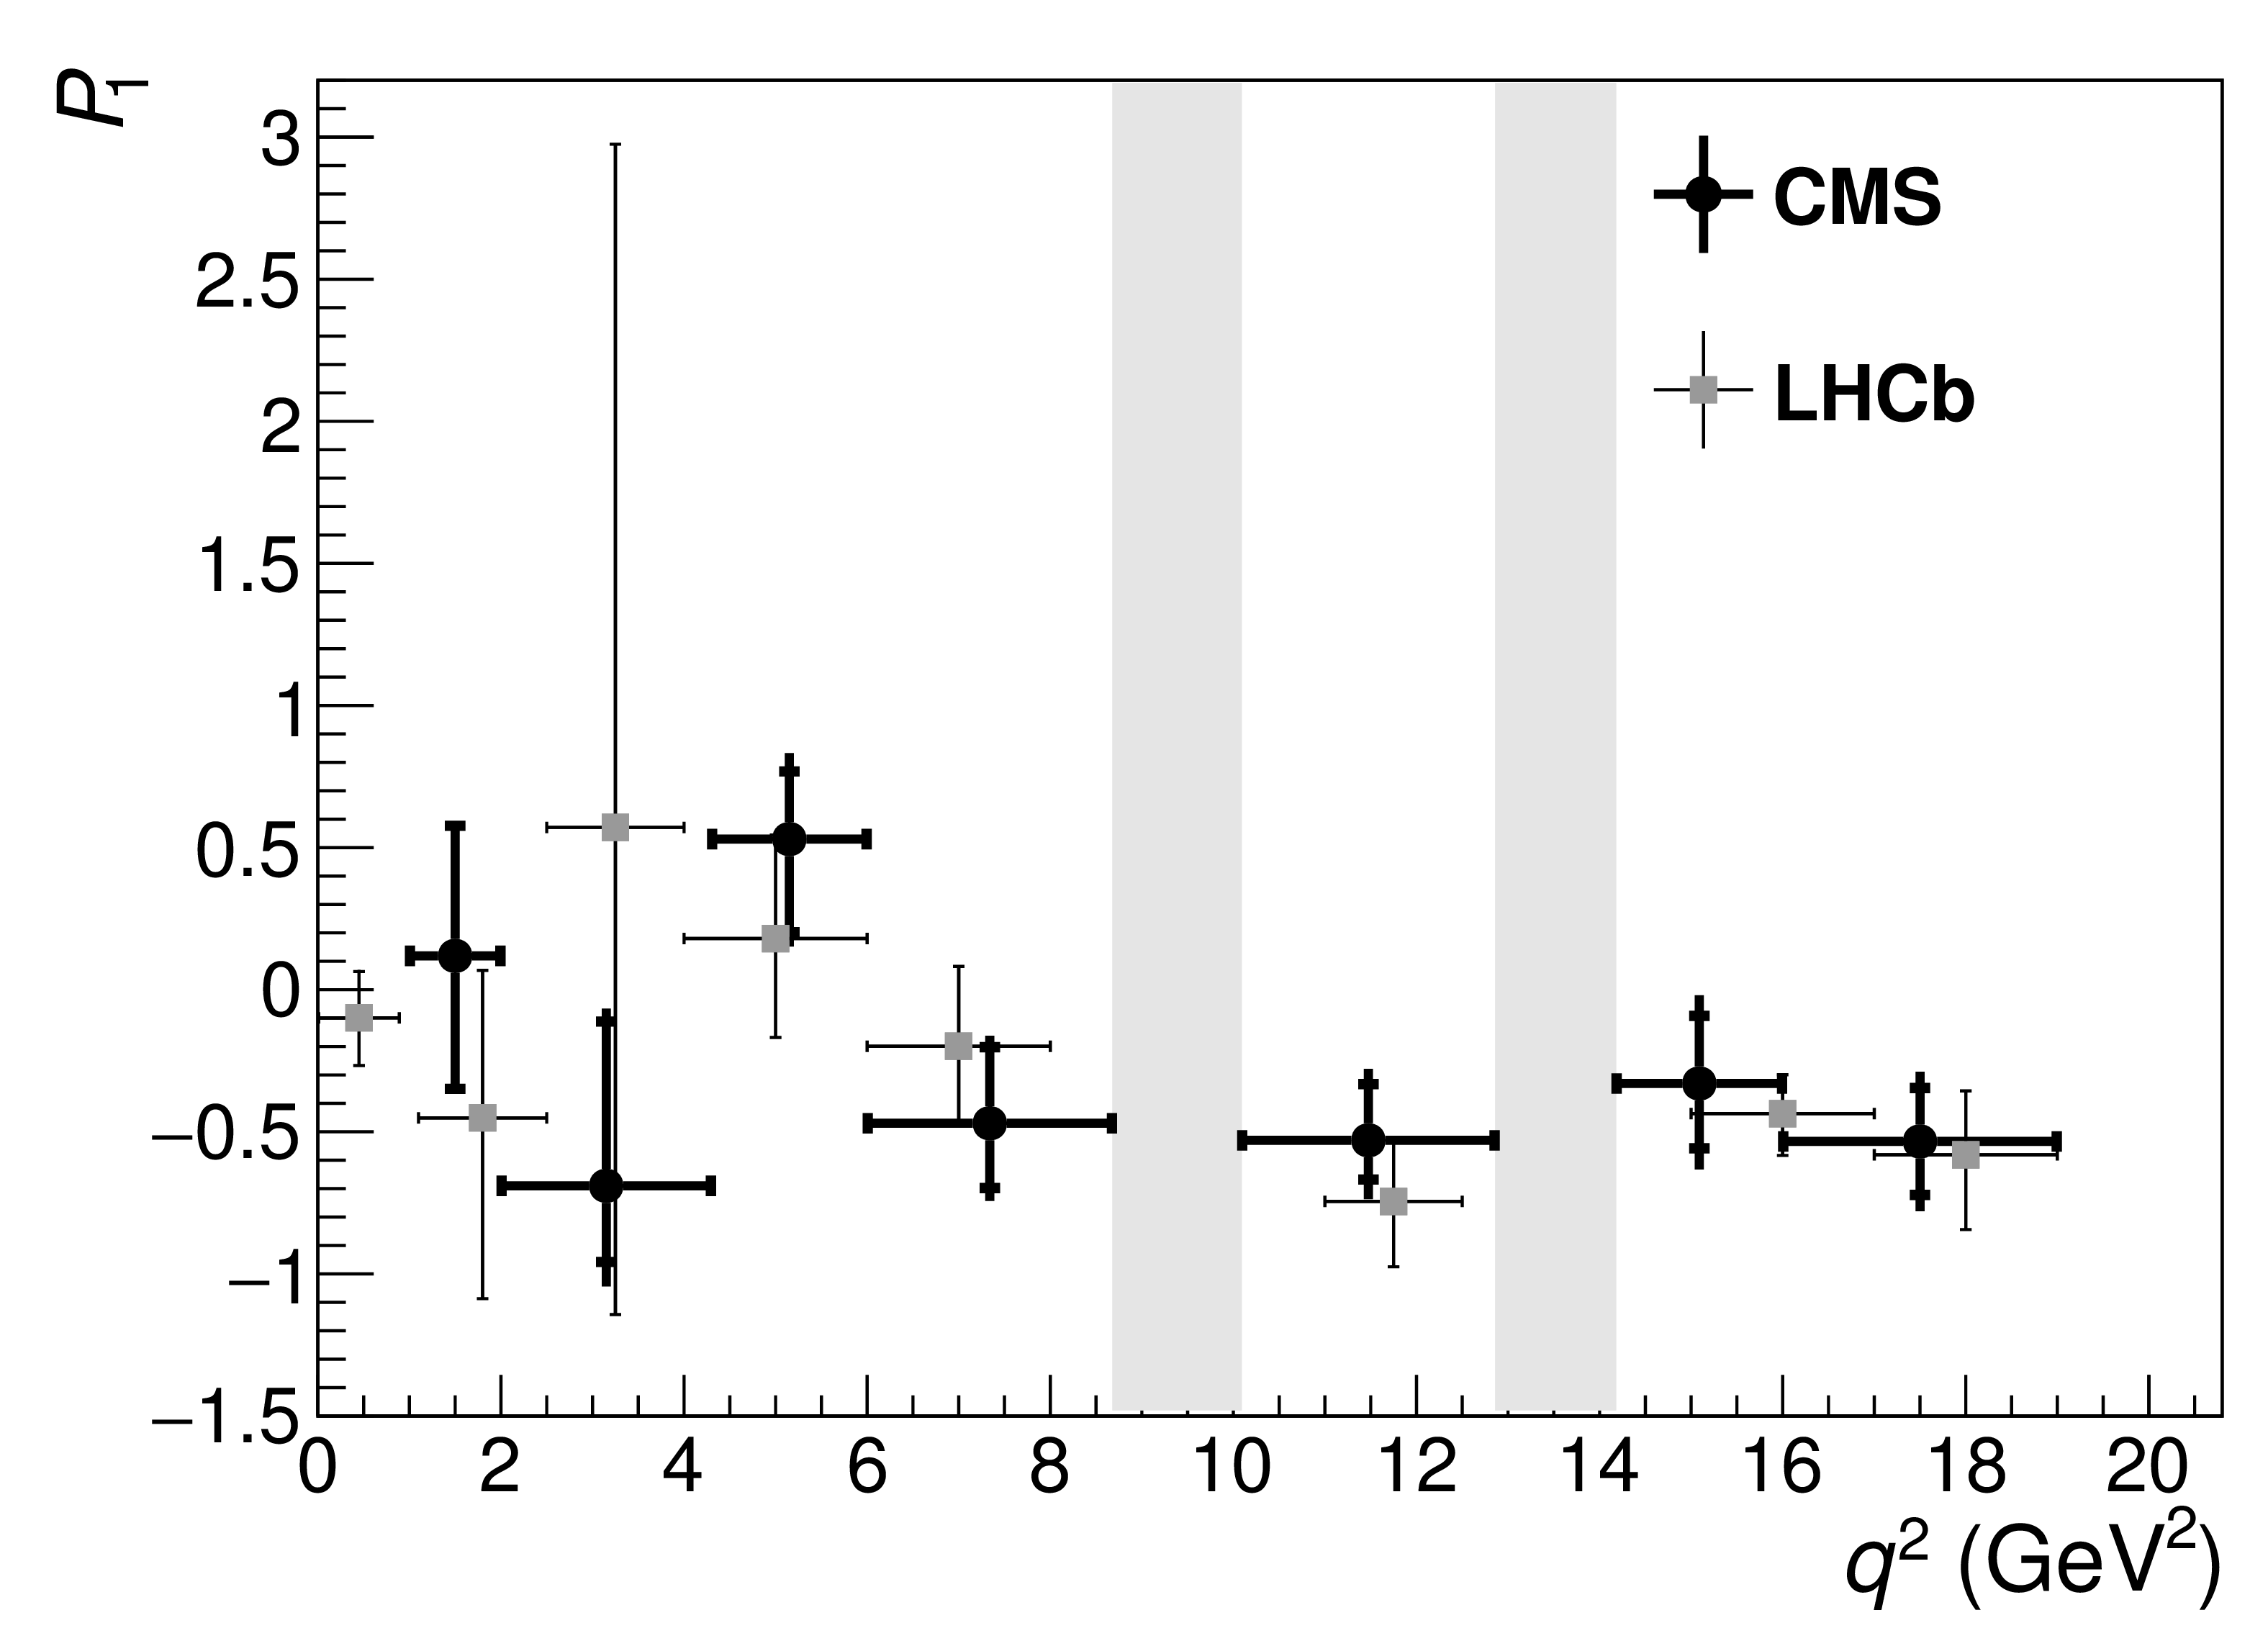
Measured values of $P_1$ versus $q^2$ for $ {{{\mathrm {B}^0}}\to {\mathrm {K}^{\ast 0}} {{\mu ^+}} {{\mu ^-}}} $ from CMS, compared with LHCb [1] results. The statistical uncertainty is shown by the inner vertical bars, while the outer vertical bars give the total uncertainty. The horizontal bars show the bin widths. The vertical shaded regions correspond to the $\mathrm{J}/\psi$ and $\psi '$ resonances. |
png pdf |
Additional Figure 22:
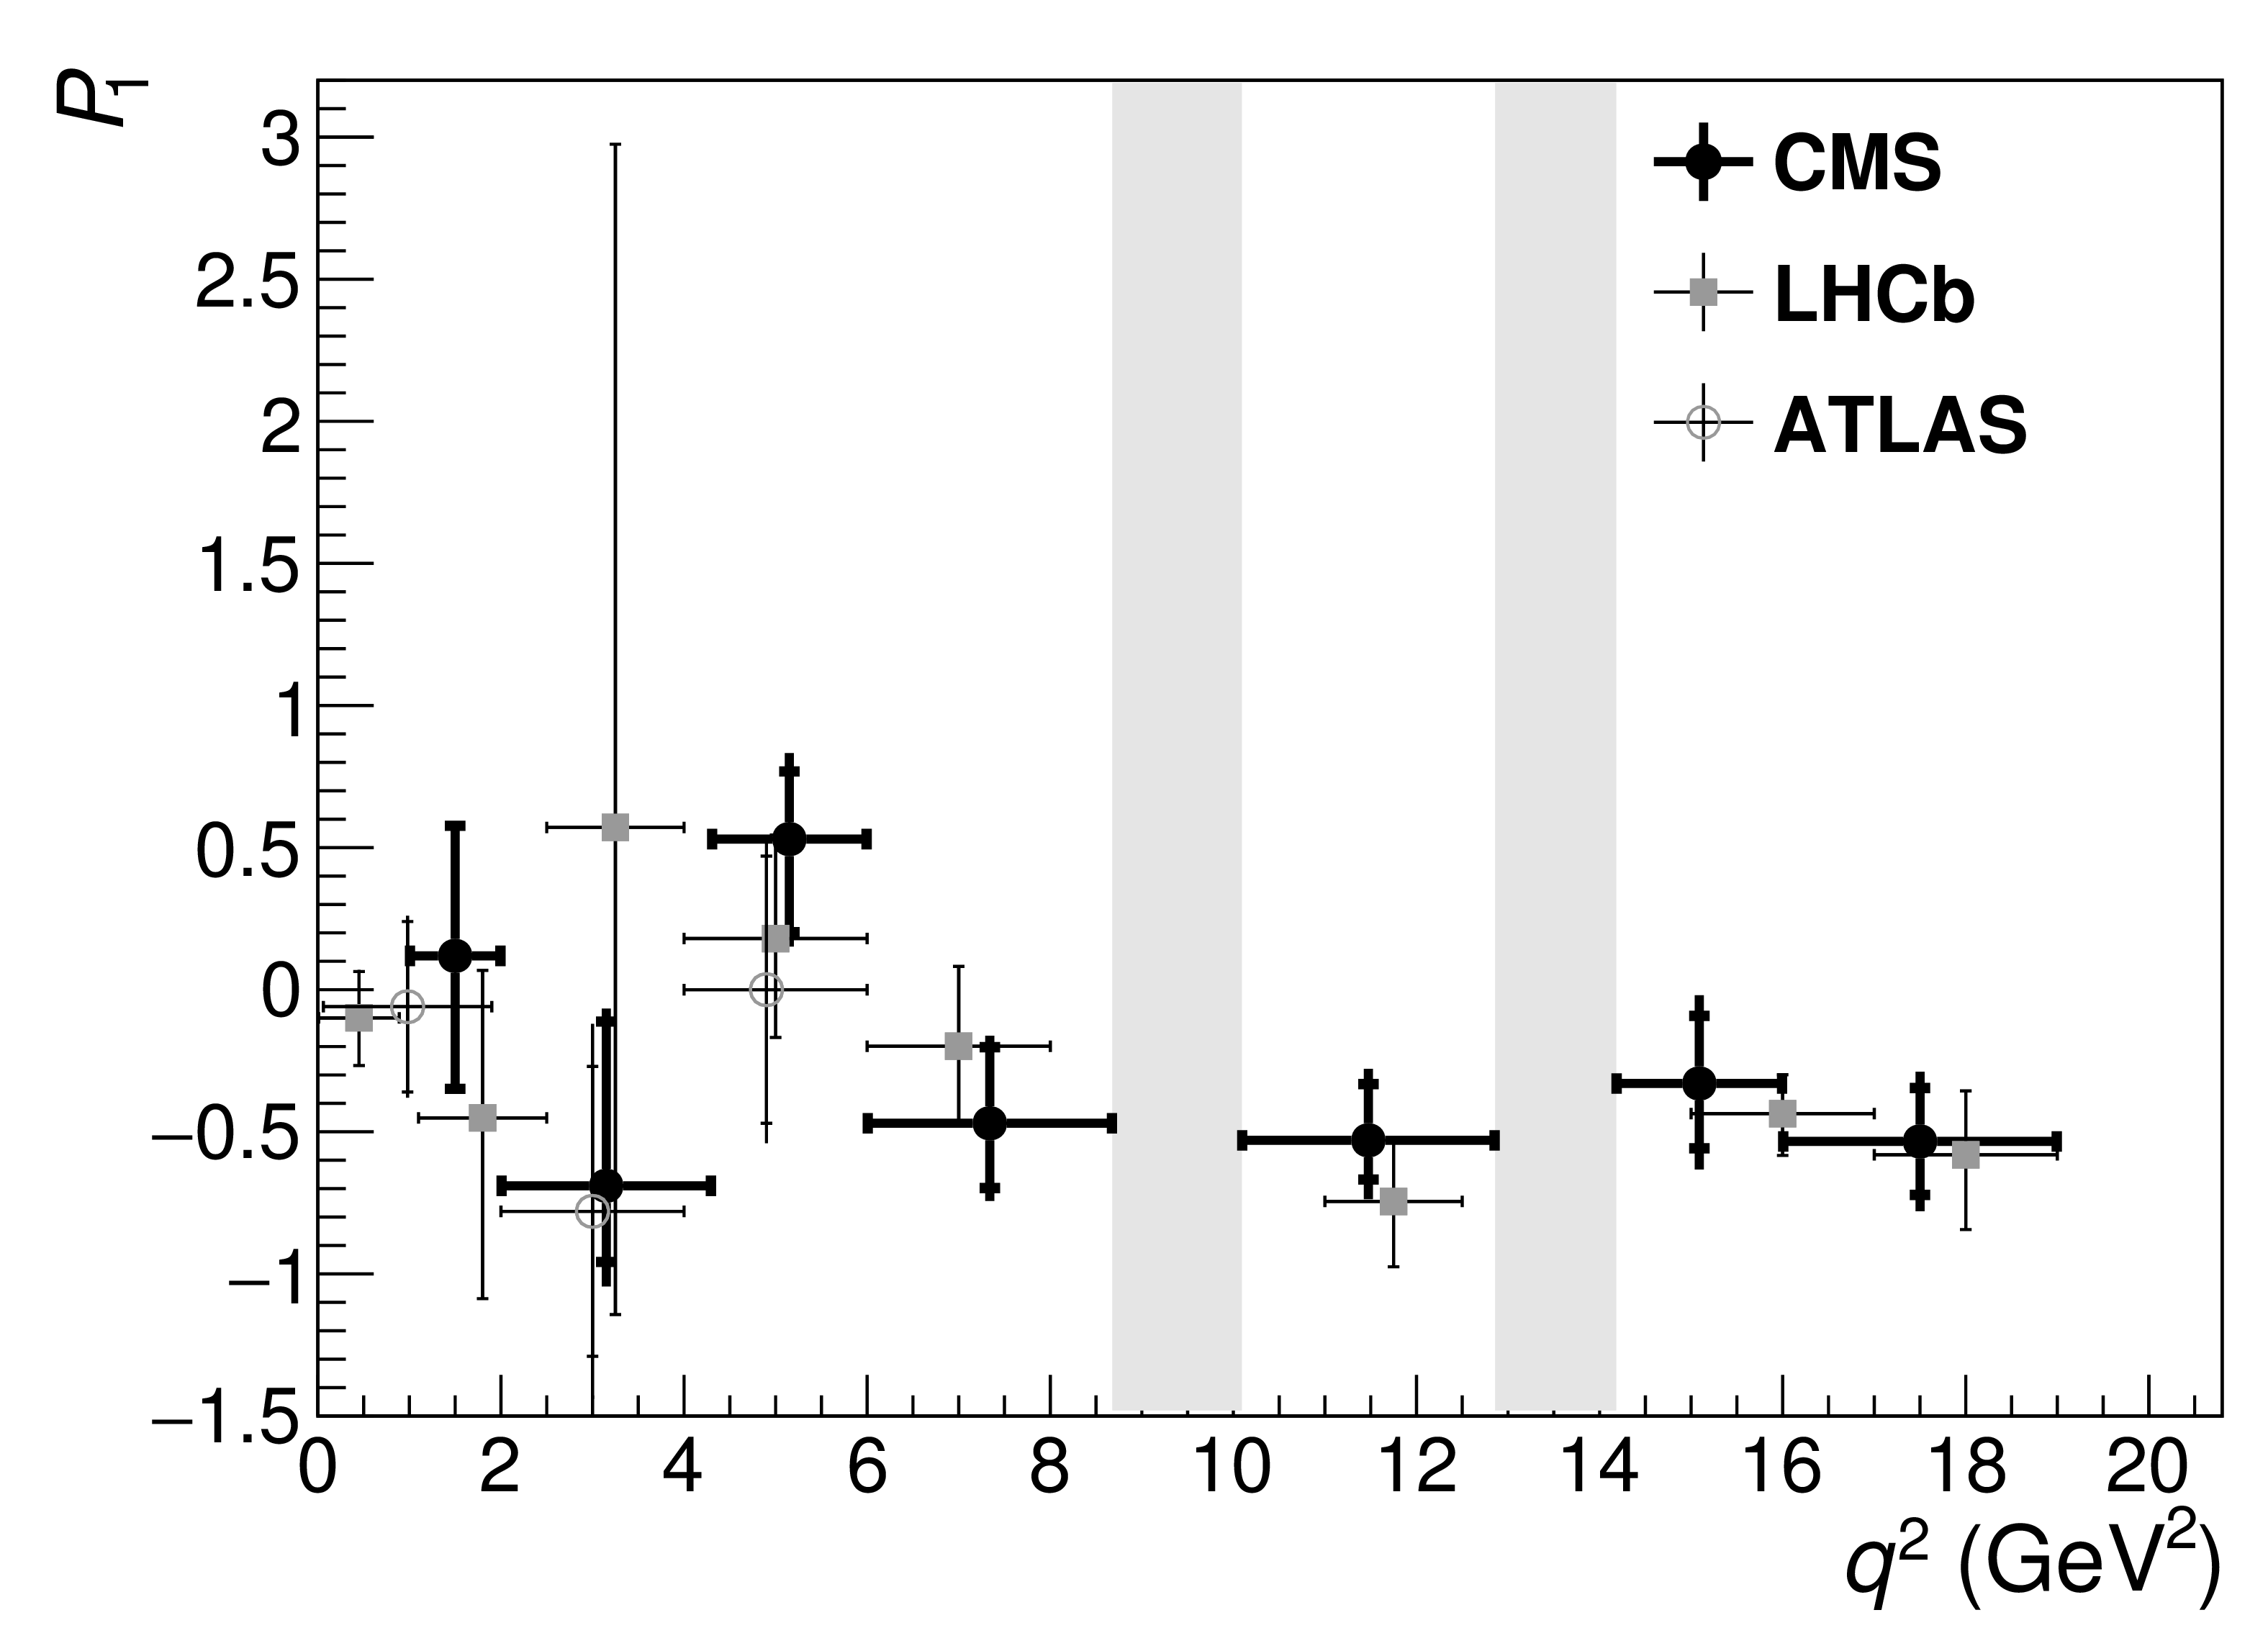
Measured values of $P_1$ versus $q^2$ for $ {{{\mathrm {B}^0}}\to {\mathrm {K}^{\ast 0}} {{\mu ^+}} {{\mu ^-}}} $ from CMS, compared with LHCb [1], and ATLAS [2] results. The statistical uncertainty is shown by the inner vertical bars, while the outer vertical bars give the total uncertainty. The horizontal bars show the bin widths. The vertical shaded regions correspond to the $\mathrm{J}/\psi$ and $\psi '$ resonances. |
png pdf |
Additional Figure 23:
Measured values of $P_1$ versus $q^2$ for $ {{{\mathrm {B}^0}}\to {\mathrm {K}^{\ast 0}} {{\mu ^+}} {{\mu ^-}}} $ from CMS, compared with LHCb [1], and ATLAS [2] results. The statistical uncertainty is shown by the inner vertical bars, while the outer vertical bars give the total uncertainty. The horizontal bars show the bin widths. The vertical shaded regions correspond to the $\mathrm{J}/\psi$ and $\psi '$ resonances. The blue hatched regions show a SM prediction (SM-DHMV) averaged over each $q^2$ bin to provide a direct comparison to the data. The SM-DHMV result is derived from Refs. [3,4]. Reliable theoretical predictions are not available near the $\mathrm{J}/\psi$ and $\psi '$ resonances. |
png pdf |
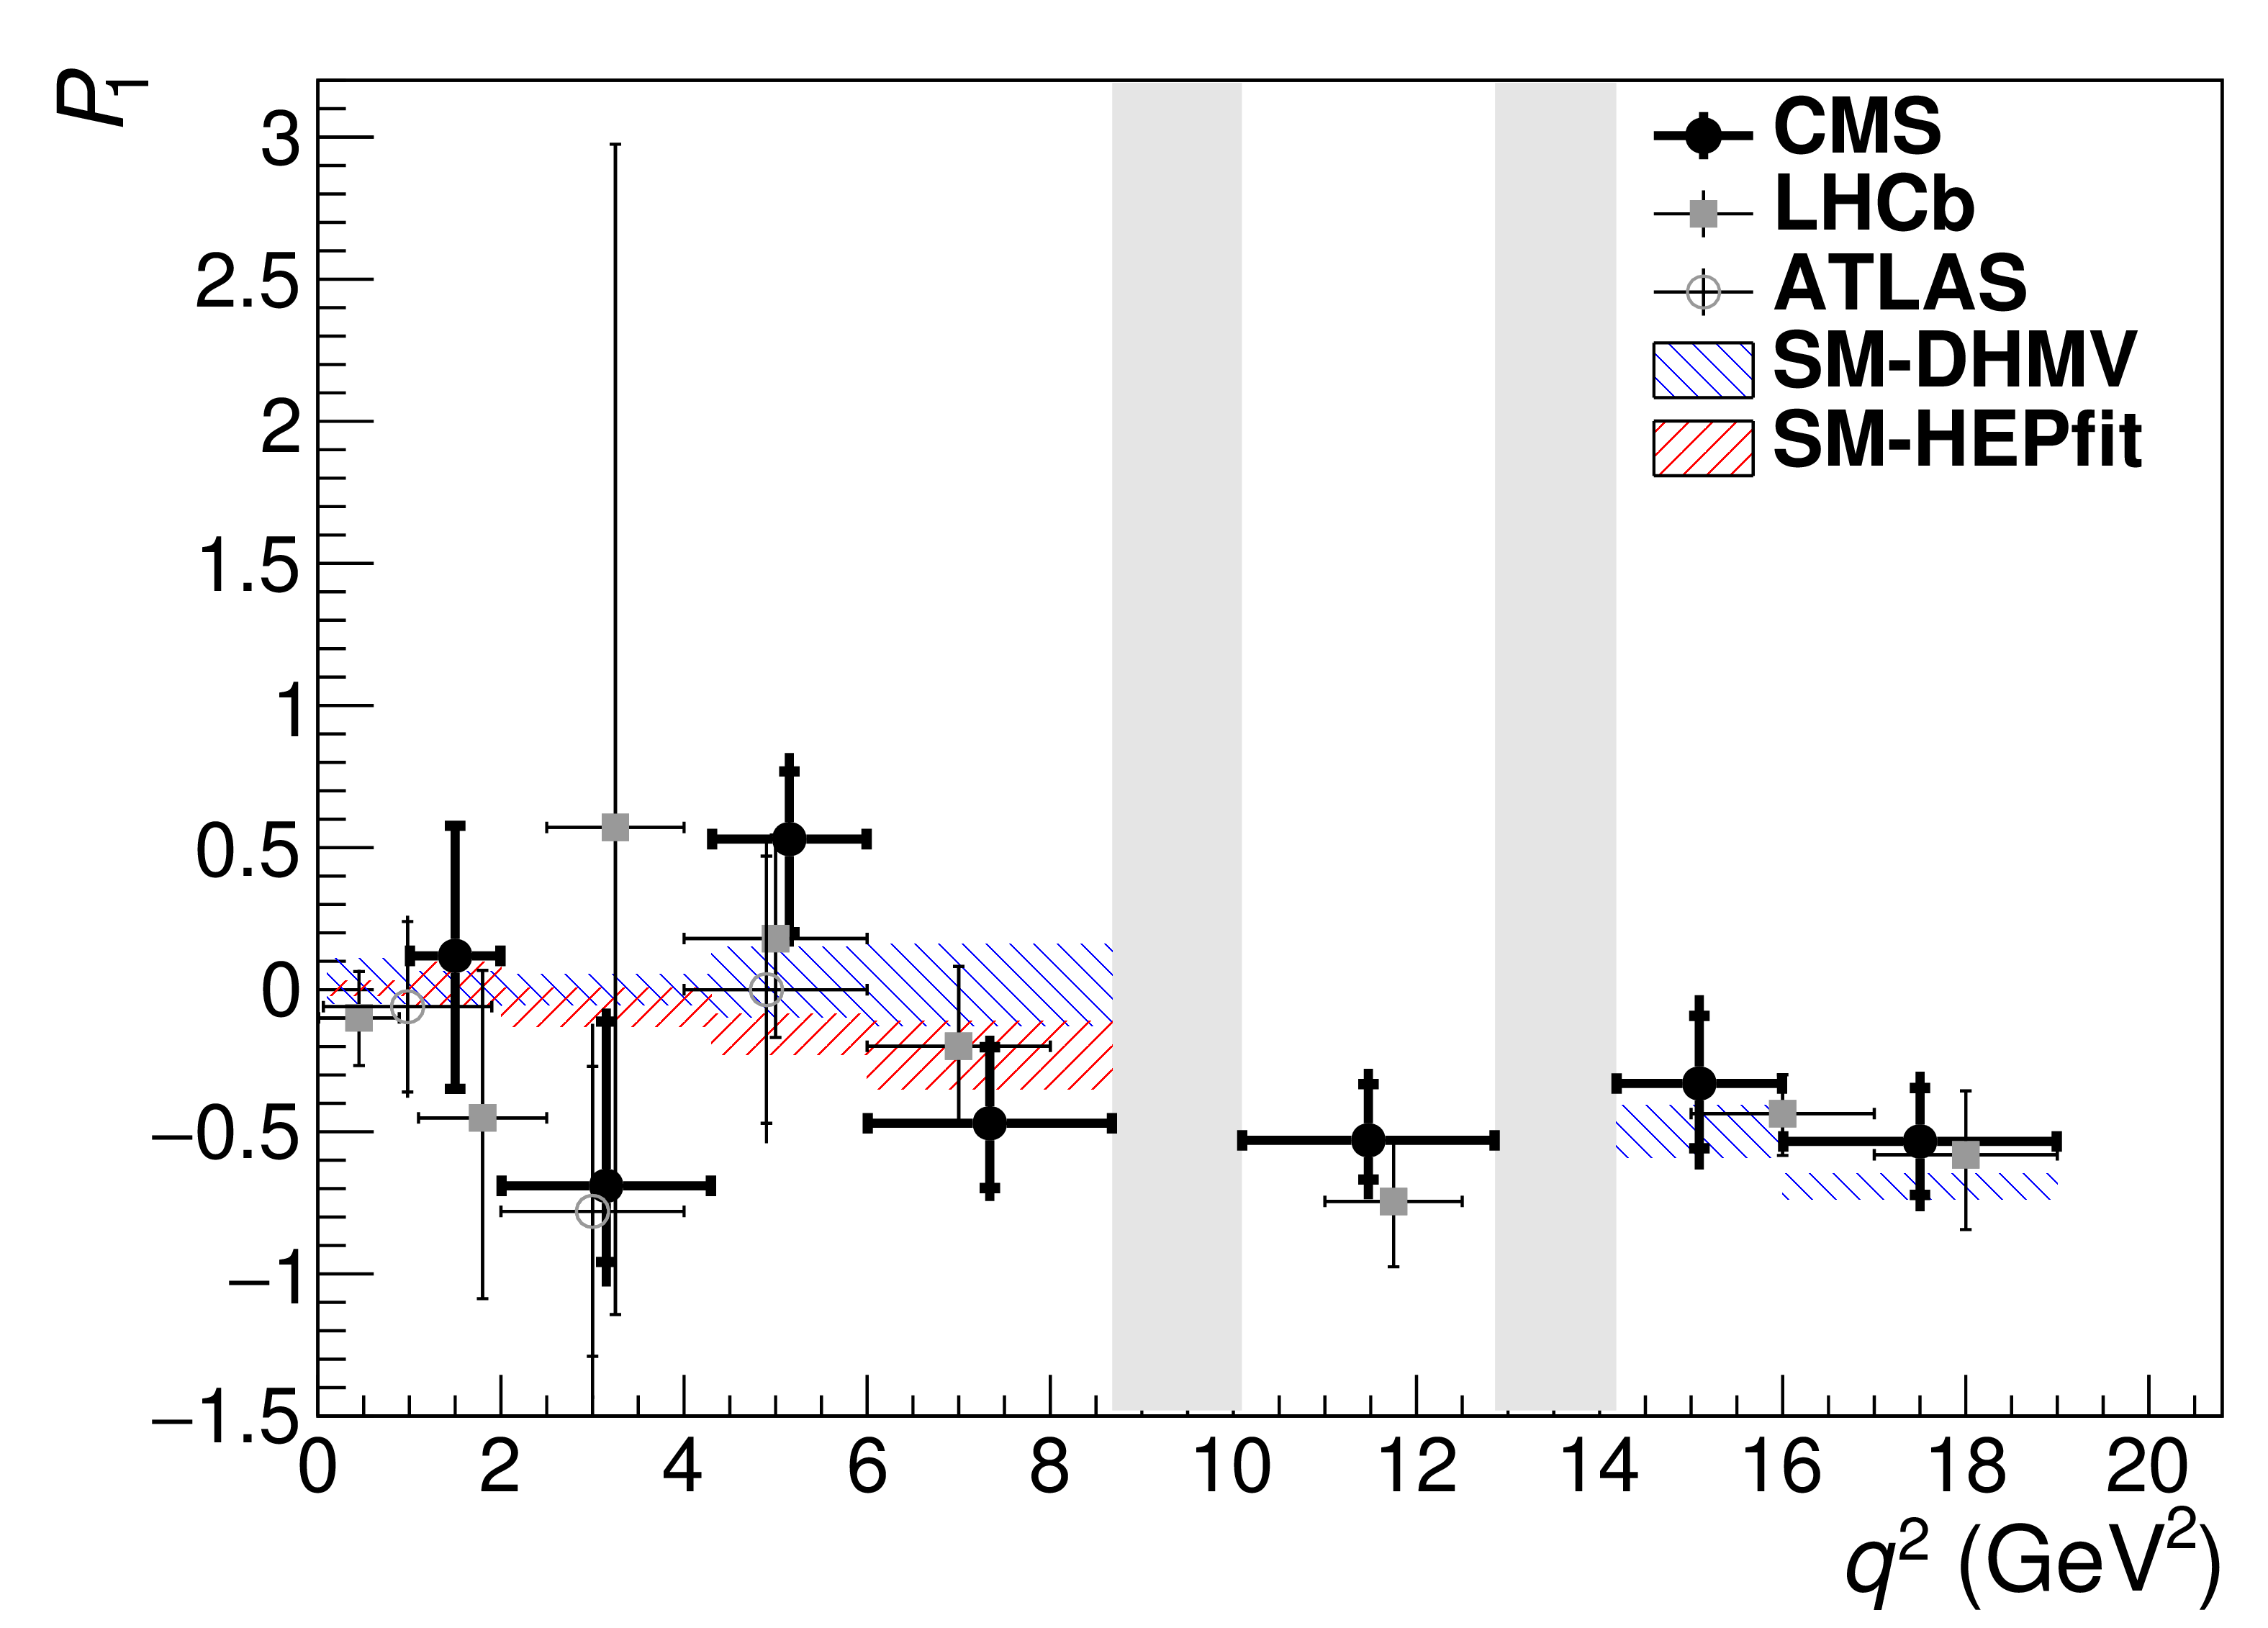
Additional Figure 24:
Measured values of $P_1$ versus $q^2$ for $ {{{\mathrm {B}^0}}\to {\mathrm {K}^{\ast 0}} {{\mu ^+}} {{\mu ^-}}} $ from CMS, compared with LHCb [1], and ATLAS [2] results. The statistical uncertainty is shown by the inner vertical bars, while the outer vertical bars give the total uncertainty. The horizontal bars show the bin widths. The vertical shaded regions correspond to the $\mathrm{J}/\psi$ and $\psi '$ resonances. The red and blue hatched regions show two SM predictions averaged over each $q^2$ bin to provide a direct comparison to the data. The SM-DHMV result is derived from Refs. [3,4], while the SM-HEPfit result from Refs. [5,6]. Reliable theoretical predictions are not available near the $\mathrm{J}/\psi$ and $\psi '$ resonances. |
png pdf |
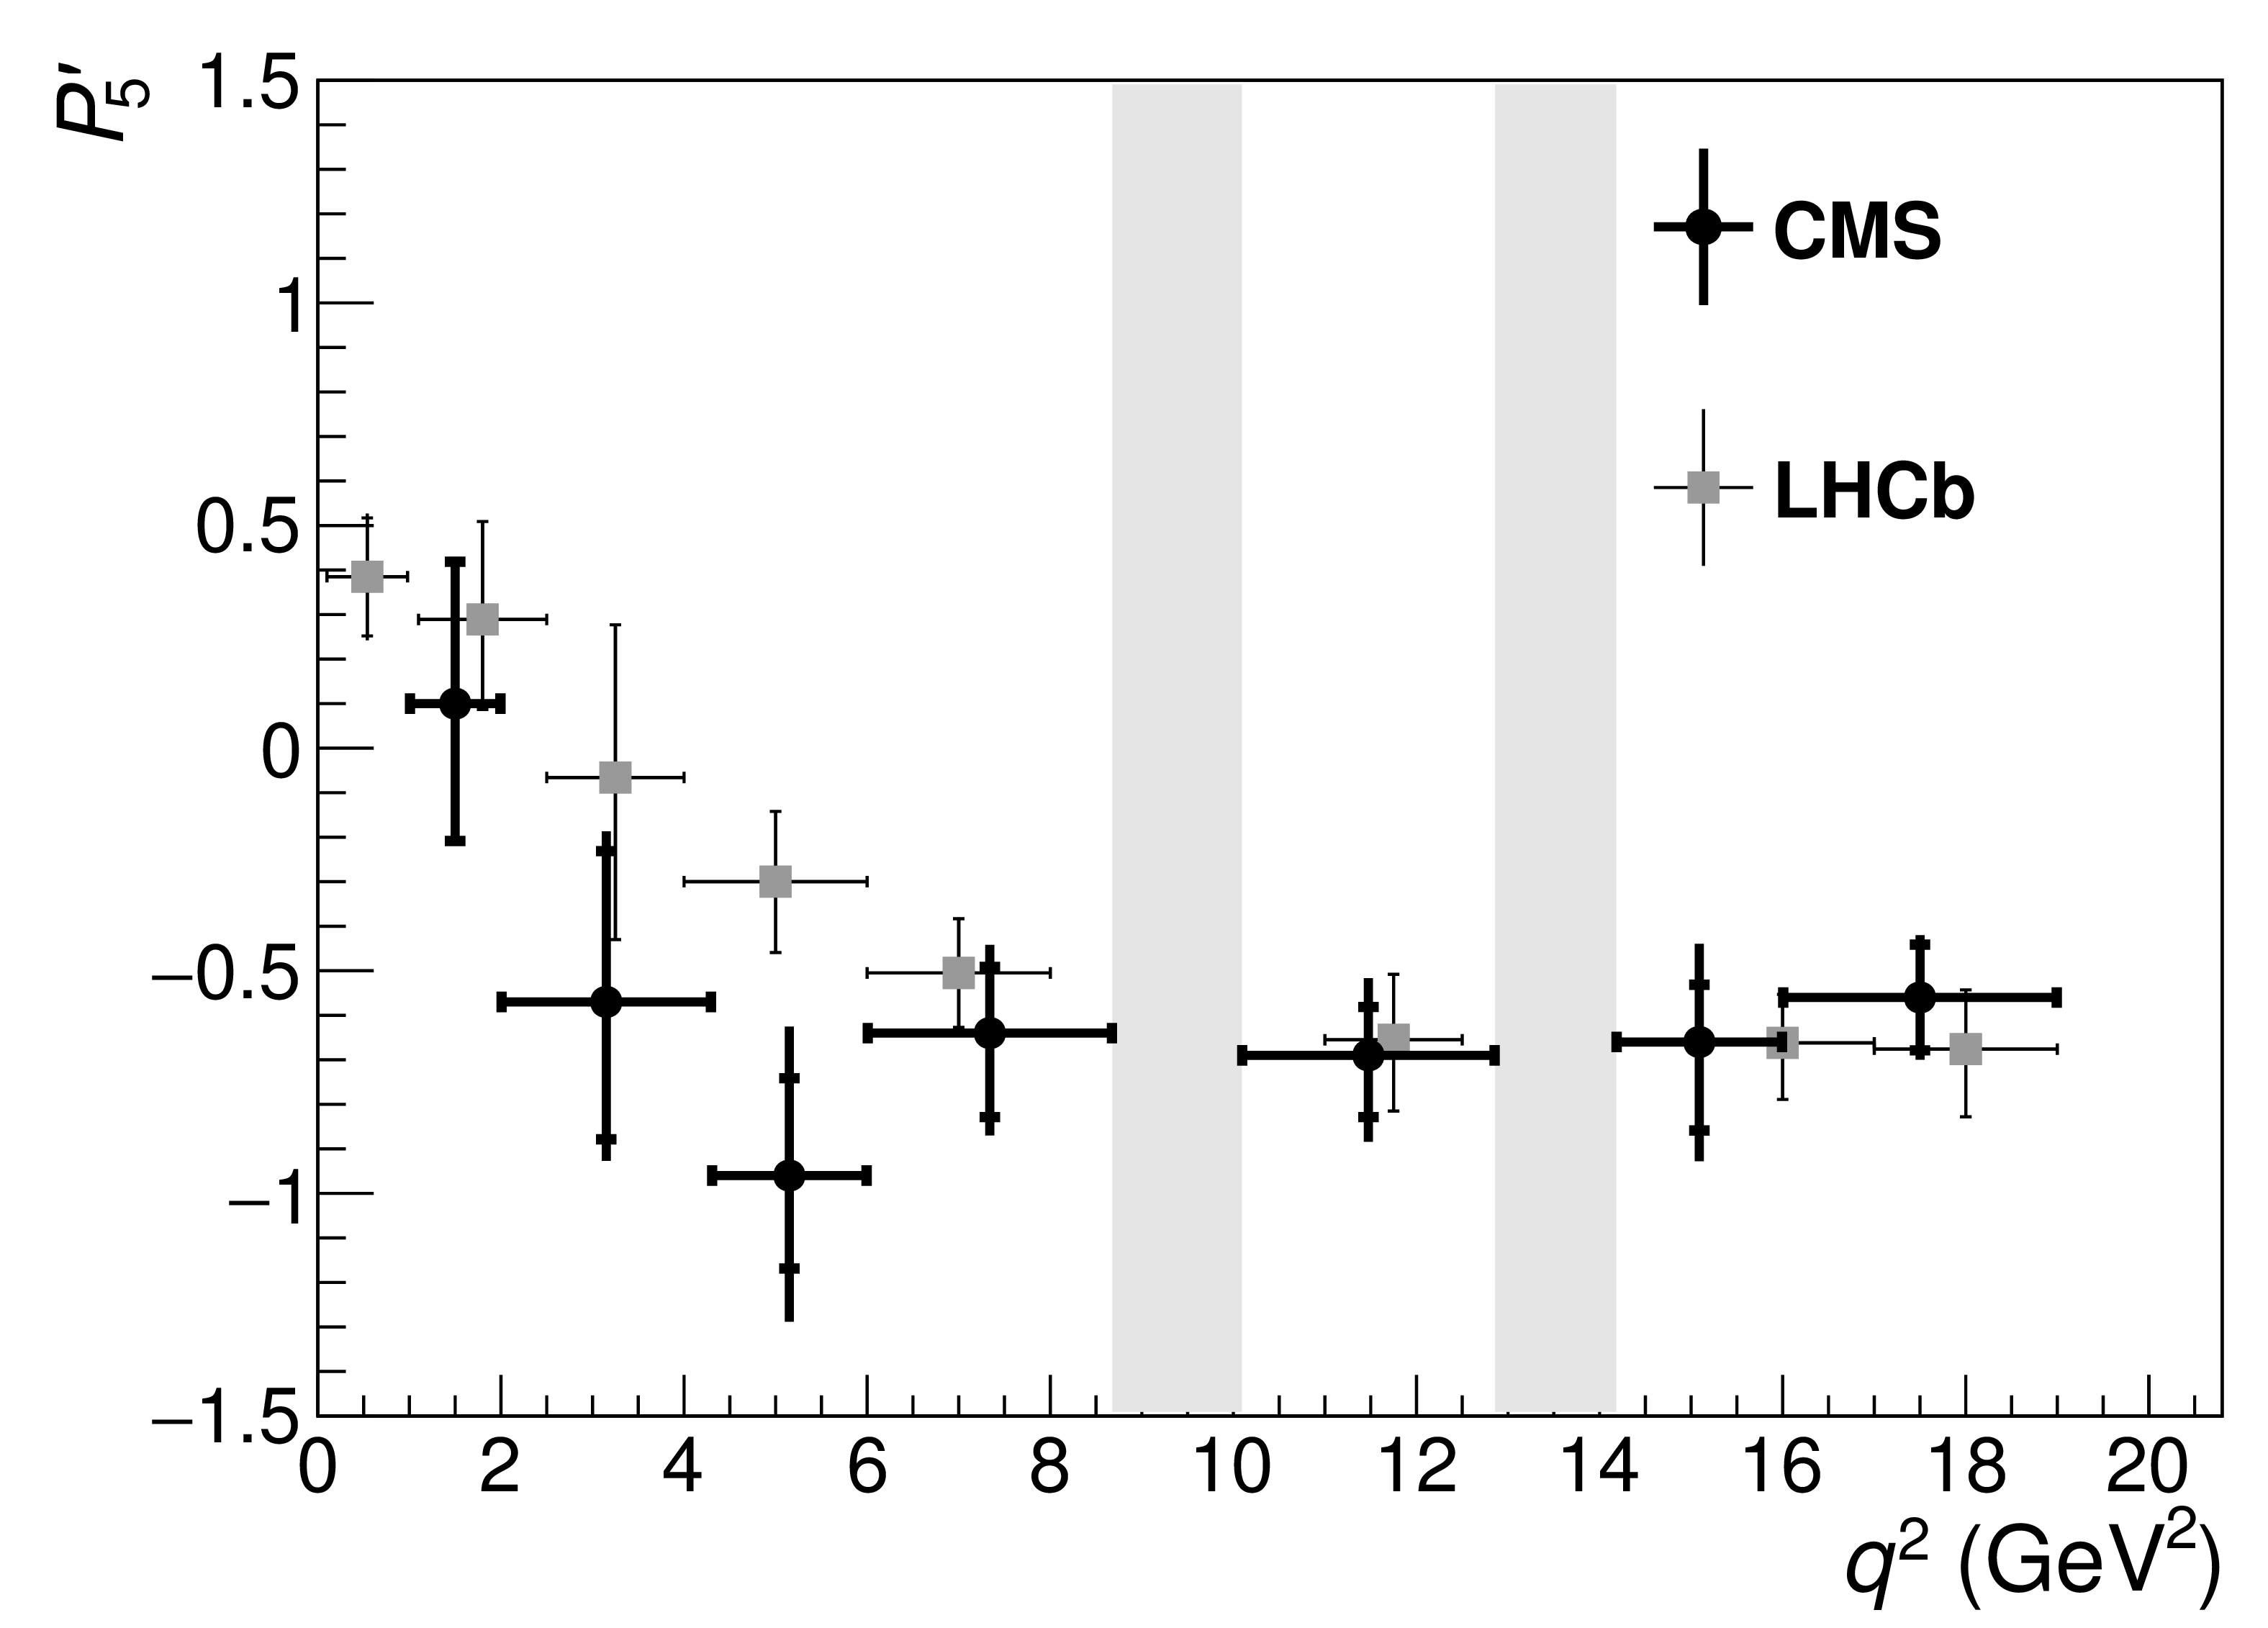
Additional Figure 25:
Measured values of $P'_5$ versus $q^2$ for $ {{{\mathrm {B}^0}}\to {\mathrm {K}^{\ast 0}} {{\mu ^+}} {{\mu ^-}}} $ from CMS, compared with LHCb [1] results. The statistical uncertainty is shown by the inner vertical bars, while the outer vertical bars give the total uncertainty. The horizontal bars show the bin widths. The vertical shaded regions correspond to the $\mathrm{J}/\psi$ and $\psi '$ resonances. |
png pdf |
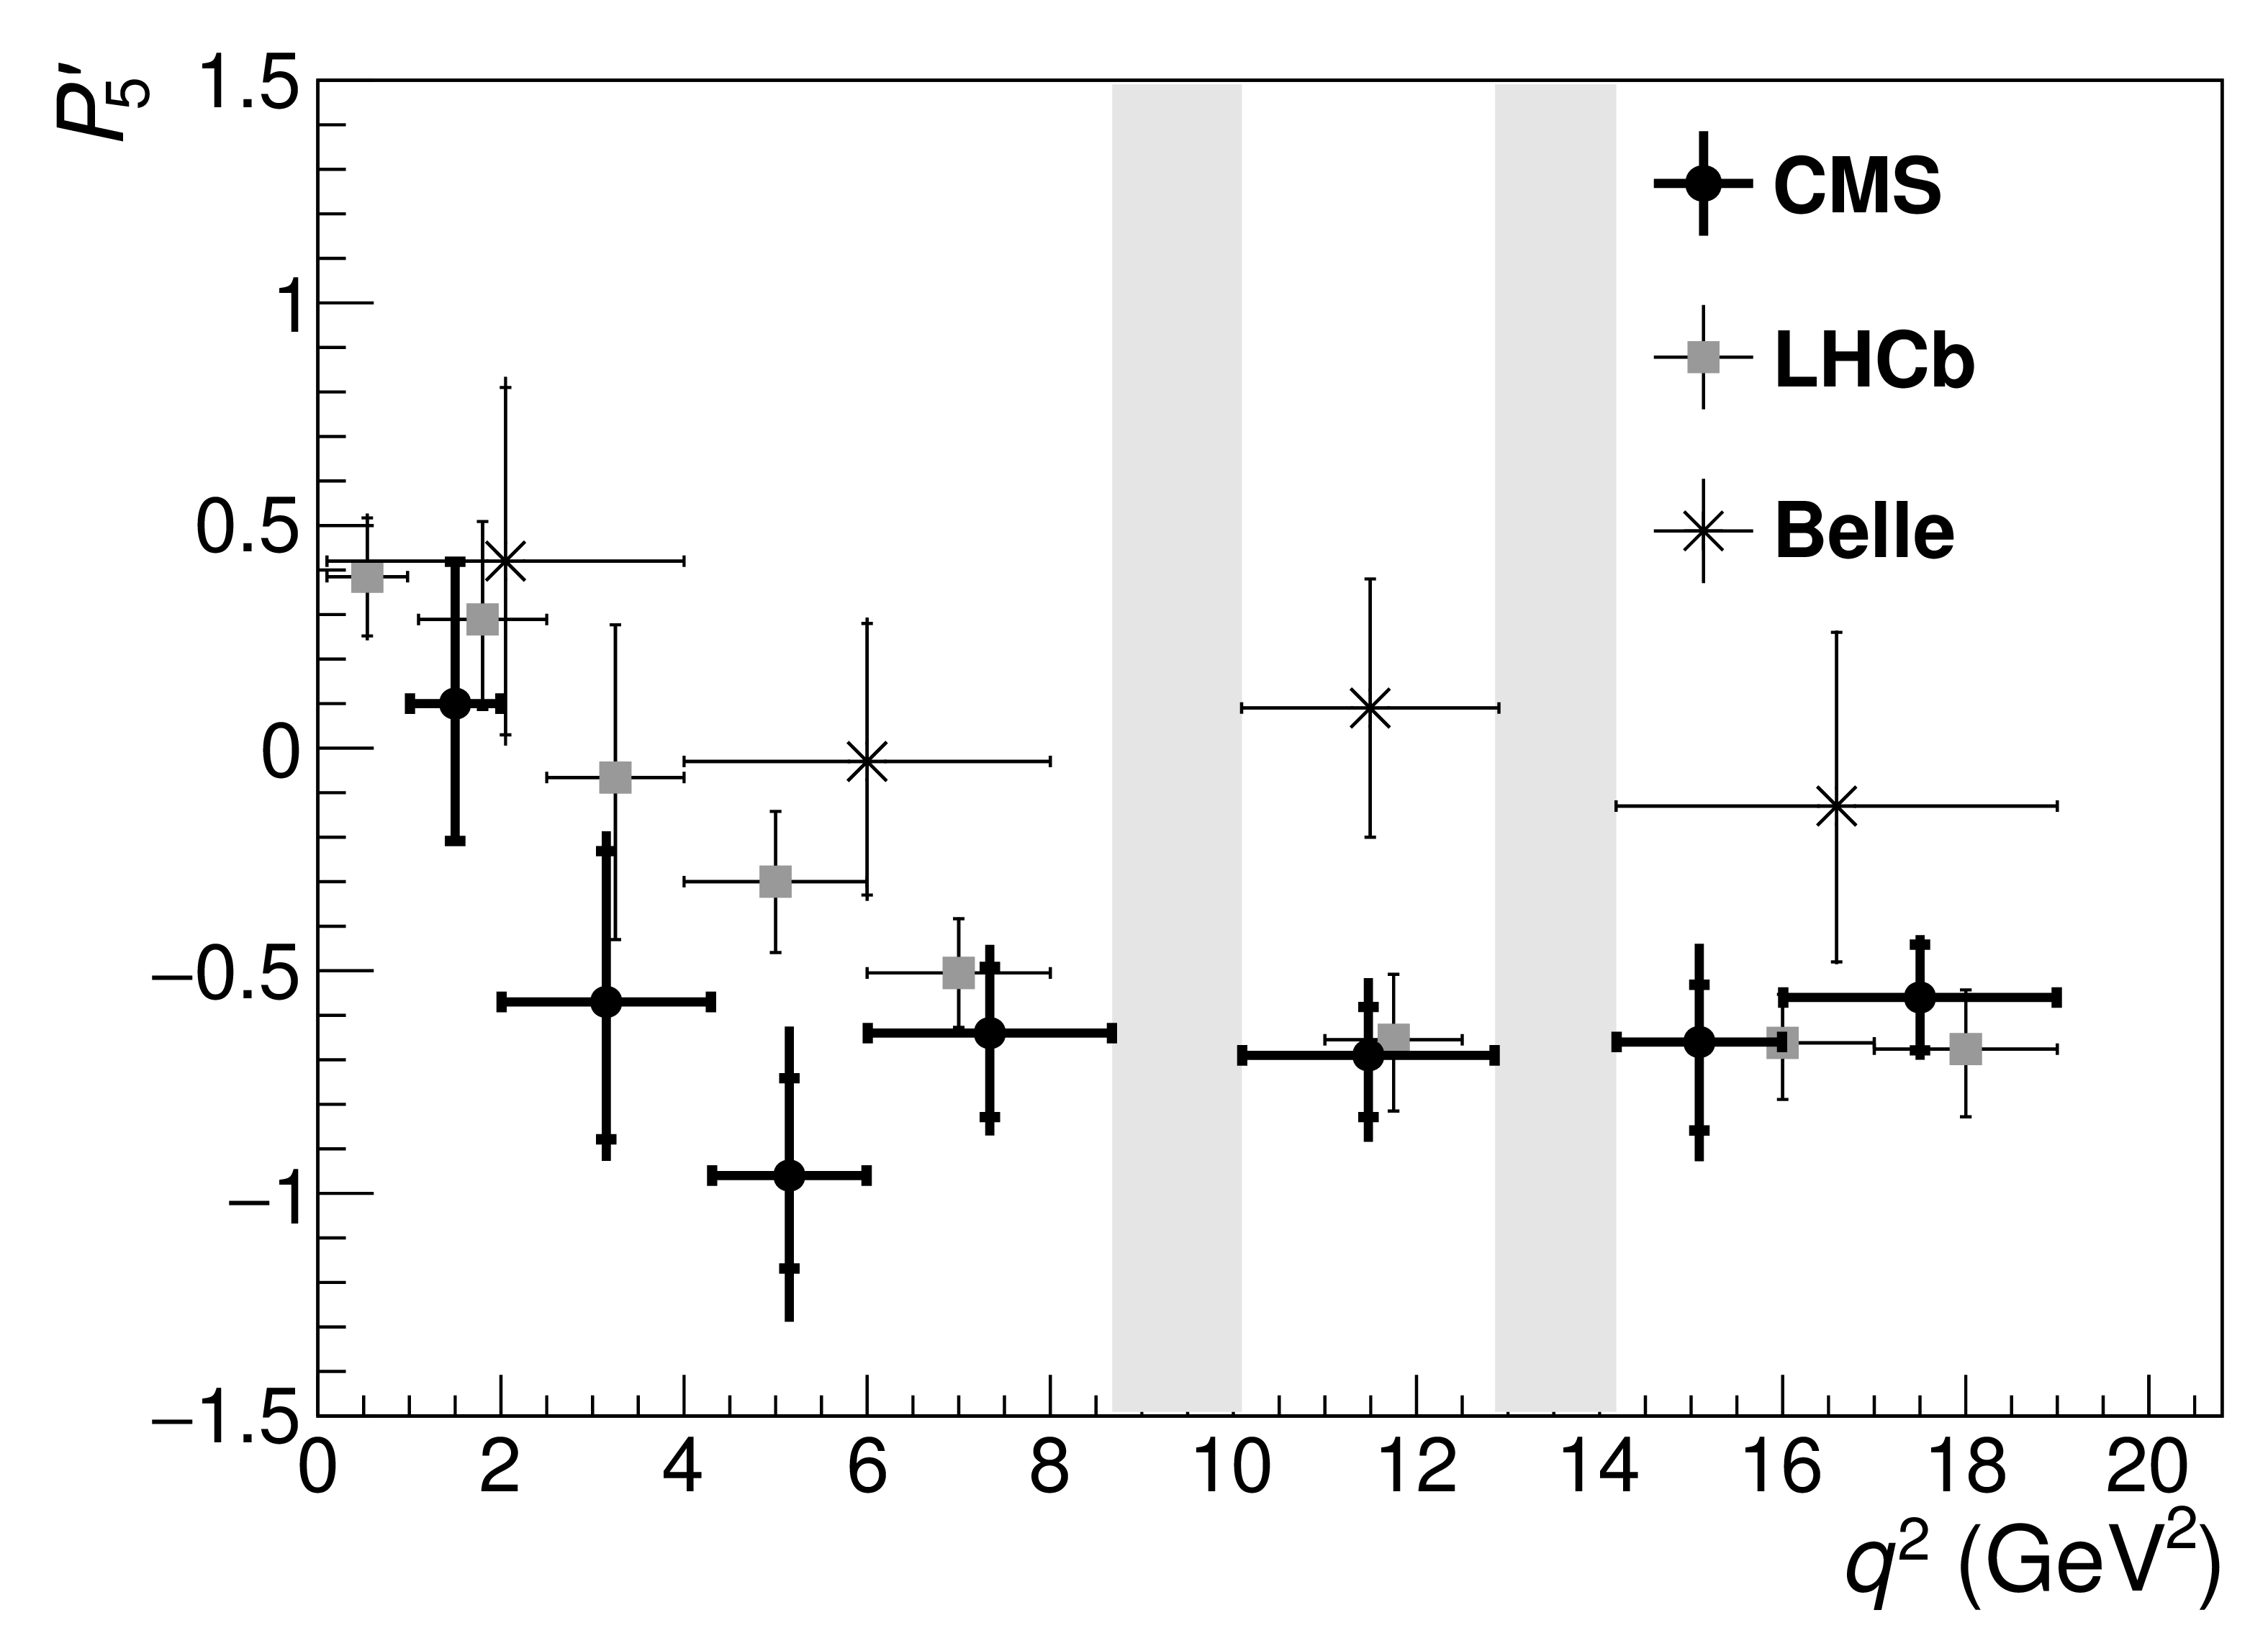
Additional Figure 26:
Measured values of $P'_5$ versus $q^2$ for $ {{{\mathrm {B}^0}}\to {\mathrm {K}^{\ast 0}} {{\mu ^+}} {{\mu ^-}}} $ from CMS, compared with LHCb [1], and Belle [7] results. The statistical uncertainty is shown by the inner vertical bars, while the outer vertical bars give the total uncertainty. The horizontal bars show the bin widths. The vertical shaded regions correspond to the $\mathrm{J}/\psi$ and $\psi '$ resonances. |
png pdf |
Additional Figure 27:
Measured values of $P'_5$ versus $q^2$ for $ {{{\mathrm {B}^0}}\to {\mathrm {K}^{\ast 0}} {{\mu ^+}} {{\mu ^-}}} $ from CMS, compared with LHCb [1], Belle [7], and ATLAS [2] results. The statistical uncertainty is shown by the inner vertical bars, while the outer vertical bars give the total uncertainty. The horizontal bars show the bin widths. The vertical shaded regions correspond to the $\mathrm{J}/\psi$ and $\psi '$ resonances. |

png pdf |
Additional Figure 28:
Measured values of $P'_5$ versus $q^2$ for $ {{{\mathrm {B}^0}}\to {\mathrm {K}^{\ast 0}} {{\mu ^+}} {{\mu ^-}}} $ from CMS, compared with LHCb [1], Belle [7], and ATLAS [2] results. The statistical uncertainty is shown by the inner vertical bars, while the outer vertical bars give the total uncertainty. The horizontal bars show the bin widths. The vertical shaded regions correspond to the $\mathrm{J}/\psi$ and $\psi '$ resonances. The blue hatched regions show a SM prediction (SM-DHMV) averaged over each $q^2$ bin to provide a direct comparison to the data. The SM-DHMV result is derived from Refs. [3,4]. Reliable theoretical predictions are not available near the $\mathrm{J}/\psi$ and $\psi '$ resonances. |
png pdf |
Additional Figure 29:
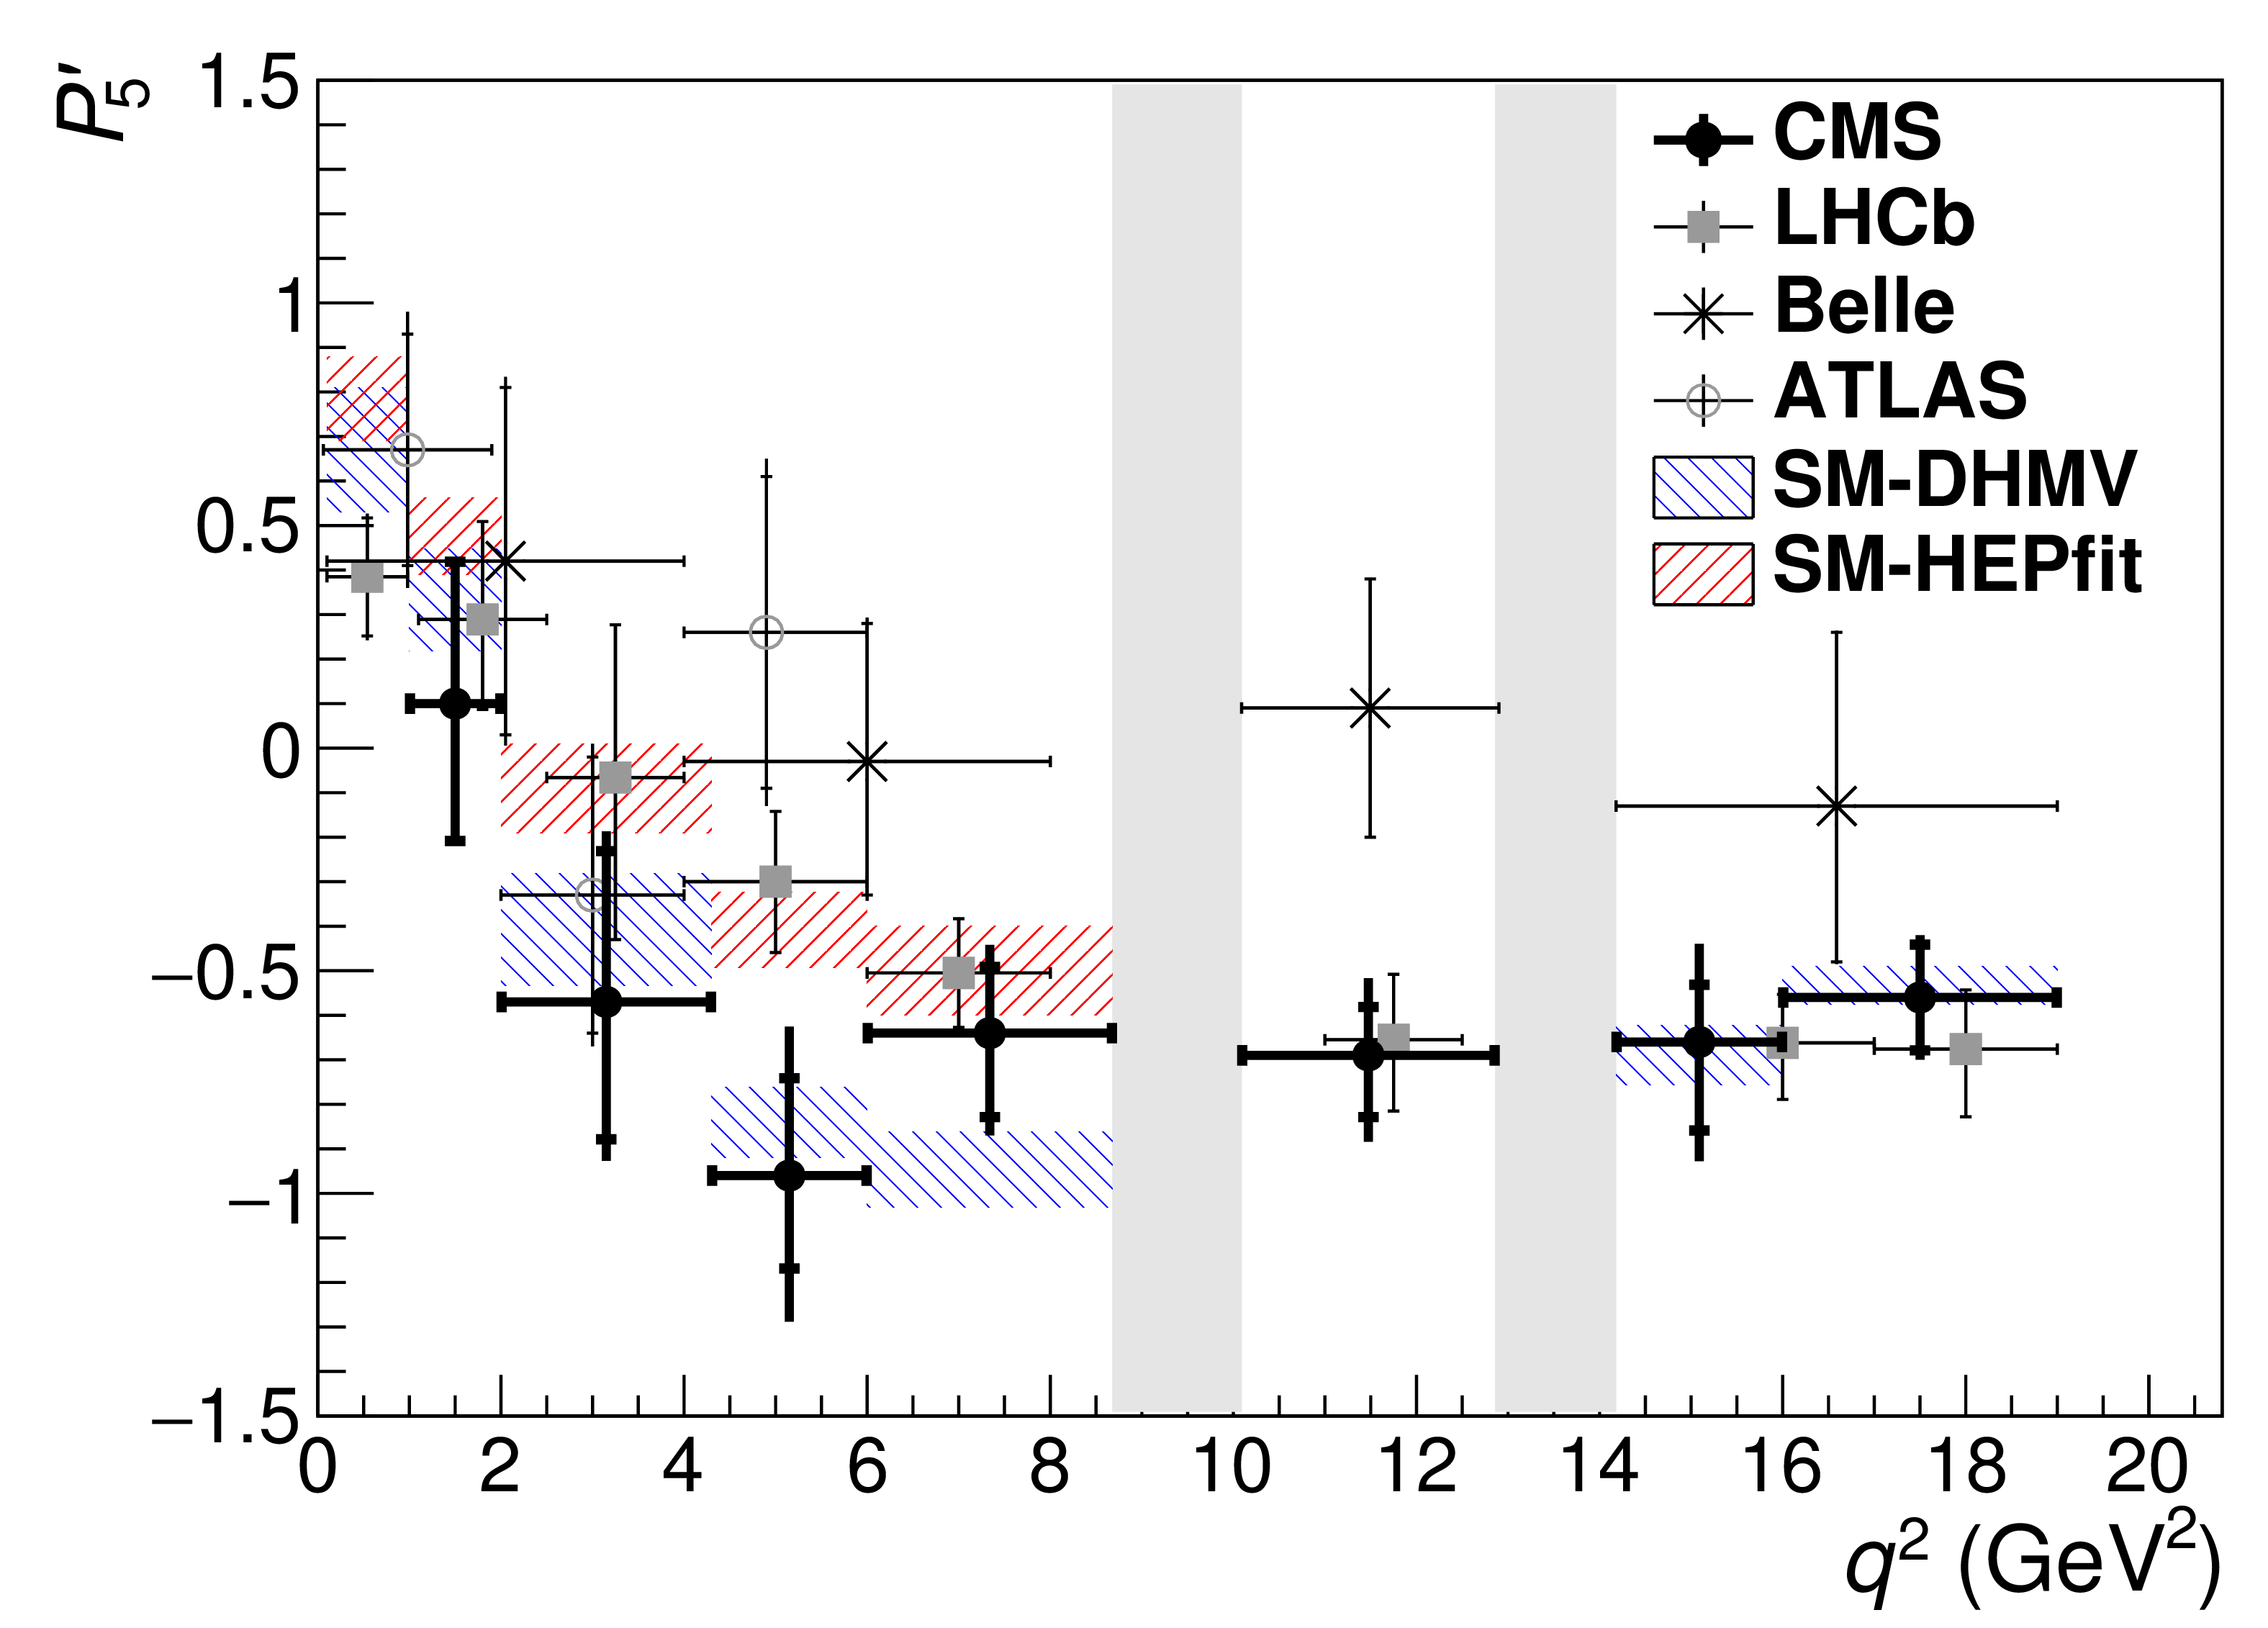
Measured values of $P'_5$ versus $q^2$ for $ {{{\mathrm {B}^0}}\to {\mathrm {K}^{\ast 0}} {{\mu ^+}} {{\mu ^-}}} $ from CMS, compared with LHCb [1], Belle [7], and ATLAS [2] results. The statistical uncertainty is shown by the inner vertical bars, while the outer vertical bars give the total uncertainty. The horizontal bars show the bin widths. The vertical shaded regions correspond to the $\mathrm{J}/\psi$ and $\psi '$ resonances. The red and blue hatched regions show two SM predictions averaged over each $q^2$ bin to provide a direct comparison to the data. The SM-DHMV result is derived from Refs. [3,4], while the SM-HEPfit result from Refs. [5,6]. Reliable theoretical predictions are not available near the $\mathrm{J}/\psi$ and $\psi '$ resonances. |
| References | ||||
| 1 | W. Altmannshofer et al. | Symmetries and asymmetries of $ B \to K^{*} \mu^{+} \mu^{-} $ decays in the Standard Model and beyond | JHEP 01 (2009) 019 | 0811.1214 |
| 2 | J. Matias, F. Mescia, M. Ramon, and J. Virto | Complete anatomy of $ \overline{B}_d \to \overline{K}^{* 0} (\to K \pi) \ell^+ \ell^- $ and its angular distribution | JHEP 04 (2012) 104 | 1202.4266 |
| 3 | S. Descotes-Genon, J. Matias, and J. Virto | Global analysis of $ b \to s \ell \ell $ anomalies | JHEP 06 (2016) 092 | 1510.04239 |
| 4 | D. Melikhov, N. Nikitin, and S. Simula | Probing right-handed currents in $ B \to K^* \ell^+ \ell^- $ transitions | PLB 442 (1998) 381 | hep-ph/9807464 |
| 5 | A. Ali, P. Ball, L. T. Handoko, and G. Hiller | A comparative study of the decays $ B \to (K, K^*) \ell^+ \ell^- $ in the standard model and supersymmetric theories | PRD 61 (2000) 074024 | hep-ph/9910221 |
| 6 | Q.-S. Yan, C.-S. Huang, W. Liao, and S.-H. Zhu | Exclusive semileptonic rare decays $ B \to (K, K^*) \ell^+ \ell^- $ in supersymmetric theories | PRD 62 (2000) 094023 | hep-ph/0004262 |
| 7 | G. Buchalla, G. Hiller, and G. Isidori | Phenomenology of nonstandard $ Z $ couplings in exclusive semileptonic $ b \to s $ transitions | PRD 63 (2000) 014015 | hep-ph/0006136 |
| 8 | T. Feldmann and J. Matias | Forward-backward and isospin asymmetry for $ B \to K^* \ell^+ \ell^- $ decay in the standard model and in supersymmetry | JHEP 01 (2003) 074 | hep-ph/0212158 |
| 9 | G. Hiller and F. Kruger | More model-independent analysis of $ b \to s $ processes | PRD 69 (2004) 074020 | hep-ph/0310219 |
| 10 | F. Kruger and J. Matias | Probing new physics via the transverse amplitudes of $ B^0 \to K^{*0}(\to K^-\pi^+)\ell^+\ell^- $ at large recoil | PRD 71 (2005) 094009 | hep-ph/0502060 |
| 11 | W.-S. Hou, A. Hovhannisyan, and N. Mahajan | $ B \to K^* \ell^+ \ell^- $ forward-backward asymmetry and new physics | PRD 77 (2008) 014016 | hep-ph/0701046 |
| 12 | U. Egede et al. | New observables in the decay mode $ \overline{B}_d \to \overline{K}^{*0} \ell^+ \ell^- $ | JHEP 11 (2008) 032 | 0807.2589 |
| 13 | T. Hurth, G. Isidori, J. F. Kamenik, and F. Mescia | Constraints on new physics in MFV models: A model-independent analysis of $ \Delta F = $ 1 processes | NPB 808 (2009) 326 | 0807.5039 |
| 14 | A. K. Alok et al. | New-physics contributions to the forward-backward asymmetry in $ B\to K^*\mu^+\mu^- $ | JHEP 02 (2010) 053 | 0912.1382 |
| 15 | A. K. Alok et al. | New physics in $ b \to s \mu^+ \mu^- $: CP-conserving observables | JHEP 11 (2011) 121 | 1008.2367 |
| 16 | Q. Chang, X.-Q. Li, and Y.-D. Yang | $ B \to K^* \ell^+ \ell^- $, $ K \ell^+ \ell^- $ decays in a family non-universal $ Z^{\prime} $ model | JHEP 04 (2010) 052 | 1002.2758 |
| 17 | S. Descotes-Genon, D. Ghosh, J. Matias, and M. Ramon | Exploring new physics in the C$ _7 $-C$ _{7'} $ plane | JHEP 06 (2011) 099 | 1104.3342 |
| 18 | S. Descotes-Genon, J. Matias, M. Ramon, and J. Virto | Implications from clean observables for the binned analysis of $ B \to K^*\mu^+\mu^- $ at large recoil | JHEP 01 (2013) 048 | 1207.2753 |
| 19 | C. Bobeth, G. Hiller, and D. van Dyk | The benefits of $ \overline{B} \to \overline{K}^* \ell^+ \ell^- $ decays at low recoil | JHEP 07 (2010) 098 | 1006.5013 |
| 20 | C. Bobeth, G. Hiller, D. van Dyk, and C. Wacker | The decay $ \overline{B} \to \overline{K} \ell^+ \ell^- $ at low hadronic recoil and model-independent $ \Delta B = $ 1 constraints | JHEP 01 (2012) 107 | 1111.2558 |
| 21 | C. Bobeth, G. Hiller, and D. van Dyk | General analysis of $ \overline{B} \to \overline{K}{}^{(*)} \ell^+ \ell^- $ decays at low recoil | PRD 87 (2012) 034016 | 1212.2321 |
| 22 | A. Ali, G. Kramer, and G. Zhu | $ B\to K^*\ell^+\ell^- $ decay in soft-collinear effective theory | EPJC 47 (2006) 625 | hep-ph/0601034 |
| 23 | W. Altmannshofer, P. Paradisi, and D. M. Straub | Model-independent constraints on new physics in $ b \to s $ transitions | JHEP 04 (2012) 008 | 1111.1257 |
| 24 | S. Jager and J. Martin Camalich | On $ B \to V \ell \ell $ at small dilepton invariant mass, power corrections, and new physics | JHEP 05 (2013) 043 | 1212.2263 |
| 25 | S. Descotes-Genon, T. Hurth, J. Matias, and J. Virto | Optimizing the basis of $ B \to {K}^{*}\ell^+ \ell^- $ observables in the full kinematic range | JHEP 05 (2013) 137 | 1303.5794 |
| 26 | BaBar Collaboration | Angular distributions in the decay $ B \to K^* \ell^+ \ell^- $ | PRD 79 (2009) 031102 | 0804.4412 |
| 27 | Belle Collaboration | Measurement of the differential branching fraction and forward-backward asymmetry for $ B \to K^{(*)} \ell^+ \ell^- $ | PRL 103 (2009) 171801 | 0904.0770 |
| 28 | CDF Collaboration | Measurements of the angular distributions in the decays $ B \to K^{(*)} \mu^+ \mu^- $ at CDF | PRL 108 (2012) 081807 | 1108.0695 |
| 29 | LHCb Collaboration | Differential branching fraction and angular analysis of the decay $ B^{0} \to K^{*0} \mu^{+}\mu^{-} $ | JHEP 08 (2013) 131 | 1304.6325 |
| 30 | CMS Collaboration | Angular analysis and branching fraction measurement of the decay $ \mathrm{B}^0 \to \mathrm{K}^{*0} \mu^+\mu^- $ | PLB 727 (2013) 77 | CMS-BPH-11-009 1308.3409 |
| 31 | CMS Collaboration | Angular analysis of the decay $ \mathrm{B}^0 \to \mathrm{K}^{*0} \mu^+\mu^- $ from pp collisions at $ \sqrt{s} = $ 8 TeV | PLB 753 (2016) 424 | CMS-BPH-13-010 1507.08126 |
| 32 | LHCb Collaboration | Measurement of form-factor-independent observables in the decay $ {B}^{0}{\rightarrow}{K}^{*0}{\mu}^{+}{\mu}^{-} $ | PRL 111 (2013) 191801 | 1308.1707 |
| 33 | LHCb Collaboration | Angular analysis of the $ B^0 \to K^* \mu^+ \mu^- $ decay using 3$ fb$^{-1} of integrated luminosity | JHEP 02 (2016) 104 | 1512.04442 |
| 34 | Belle Collaboration | Lepton-flavor-dependent angular analysis of $ B \to K^* \ell^+\ell^- $ | PRL 118 (2017) 111801 | 1612.05014 |
| 35 | CMS Collaboration | CMS luminosity based on pixel cluster counting --- Summer 2013 update | CMS-PAS-LUM-13-001 | CMS-PAS-LUM-13-001 |
| 36 | CMS Collaboration | The CMS experiment at the CERN LHC | JINST 3 (2008) S08004 | CMS-00-001 |
| 37 | CMS Collaboration | Description and performance of track and primary-vertex reconstruction with the CMS tracker | JINST 9 (2014) P10009 | CMS-TRK-11-001 1405.6569 |
| 38 | CMS Collaboration | Performance of CMS muon reconstruction in pp collision events at $ \sqrt{s} = $ 7 TeV | JINST 7 (2012) P10002 | CMS-MUO-10-004 1206.4071 |
| 39 | CMS Collaboration | The CMS trigger system | JINST 12 (2017) P01020 | CMS-TRG-12-001 1609.02366 |
| 40 | Particle Data Group, C. Patrignani et al. | The Review of Particle Physics | CPC 40 (2016) 100001 | |
| 41 | T. Sjostrand, S. Mrenna, and P. Skands | PYTHIA 6.4 physics and manual | JHEP 05 (2006) 026 | hep-ph/0603175 |
| 42 | D. J. Lange | The EvtGen particle decay simulation package | NIMA 462 (2001) 152 | |
| 43 | E. Barberio, and Z. Was | Photos---a universal Monte Carlo for QED radiative corrections in Z and W decays | EPJC 45 (2006) 97 | hep-ph/0506026 |
| 44 | GEANT4 Collaboration | GEANT4---a simulation toolkit | NIMA 506 (2003) 250 | |
| 45 | D. Be\vcirevi\'c and A. Tayduganov | Impact of $ B\to K^{*0} \ell^+\ell^- $ on the new physics search in $ B\to K^* \ell^+\ell^- $ decay | NPB 868 (2013) 368 | 1207.4004 |
| 46 | J. Matias | On the S-wave pollution of $ B \to K^* \ell^+\ell^- $ observables | PRD 86 (2012) 094024 | 1209.1525 |
| 47 | T. Blake, U. Egede, and A. Shires | The effect of S-wave interference on the $ B^0 \rightarrow K^{*0} \ell^+ \ell^- $ angular observables | JHEP 03 (2013) 027 | 1210.5279 |
| 48 | D. W. Scott | Multivariate density estimation: theory, practice, and visualization | Wiley series in probability and mathematical statistics: Applied probability and statistics section, Wiley-Interscience, 1992 ISBN 0-471-54770-0 | |
| 49 | K. S. Cranmer | Kernel estimation in high-energy physics | CPC 136 (2001) 198 | hep-ex/0011057 |
| 50 | F. James and M. Roos | Minuit---a system for function minimization and analysis of the parameter errors and correlations | CPC 10 (1975) 343 | |
| 51 | G. J. Feldman and R. D. Cousins | Unified approach to the classical statistical analysis of small signals | PRD 57 (1998) 3873 | physics/9711021 |
| 52 | P. Ball and R. Zwicky | $ B_{d,s} \to \rho,\:\omega,\:K^*,\:\phi $ decay form factors from light-cone sum rules reexamined | PRD 71 (2005) 014029 | hep-ph/0412079 |
| 53 | A. Bharucha, D. M. Straub, and R. Zwicky | $ b \to v \ell^+ \ell^- $ in the standard model from light-cone sum rules | JHEP 08 (2016) 098 | 1503.05534 |
| 54 | R. R. Horgan, Z. Liu, S. Meinel, and M. Wingate | Lattice QCD calculation of form factors describing the rare decays $ B \to K^* \ell^+ \ell^- $ and $ B_s \to \phi \ell^+ \ell^- $ | PRD 89 (2014) 094501 | 1310.3722 |
| 55 | A. Khodjamirian, T. Mannel, A. A. Pivovarov, and Y.-M. Wang | Charm-loop effect in $ {B \rightarrow K^{(*)} \ell^+ \ell^-} $ and $ b \rightarrow {K}^* \gamma $ | JHEP 09 (2010) 089 | 1006.4945 |
| 56 | M. Ciuchini et al. | $ B \to K^* \ell^+\ell^- $ decays at large recoil in the Standard Model: a theoretical reappraisal | JHEP 06 (2016) 116 | 1512.07157 |
|
|
Compact Muon Solenoid LHC, CERN |
|

|

|

|

|

|