

Compact Muon Solenoid
LHC, CERN
| CMS-BPH-16-002 ; CERN-EP-2017-287 | ||
| Search for the X(5568) state decaying into $\mathrm{B}^{0}_{\mathrm{s}}\pi^{\pm}$ in proton-proton collisions at $\sqrt{s} = $ 8 TeV | ||
| CMS Collaboration | ||
| 17 December 2017 | ||
| Phys. Rev. Lett. 120 (2018) 202005 | ||
| Abstract: A search for resonance-like structures in the $\mathrm{B}^{0}_{\mathrm{s}}\pi^{\pm}$ invariant mass spectrum is performed using proton-proton collision data collected by the CMS experiment at the LHC at $\sqrt{s} = $ 8 TeV, corresponding to an integrated luminosity of 19.7 fb$^{-1}$. The $\mathrm{B}^{0}_{\mathrm{s}}$ mesons are reconstructed in the decay chain $\mathrm{B}^{0}_{\mathrm{s}} \rightarrow \mathrm{J}/\psi\,\phi$, with $\mathrm{J}/\psi \rightarrow \mu^+\mu^-$ and $\phi\rightarrow\mathrm{K^{+}}\mathrm{K^{-}}$. The $\mathrm{B}^{0}_{\mathrm{s}}\pi^{\pm}$ invariant mass distribution shows no statistically significant peaks for different selection requirements on the reconstructed $\mathrm{B}^{0}_{\mathrm{s}}$ and $\pi^{\pm}$ candidates. Upper limits are set on the relative production rates of the X(5568) and $\mathrm{B}^{0}_{\mathrm{s}}$ states times the branching fraction of the decay $\mathrm{X}(5568)^{\pm} \rightarrow \mathrm{B}^{0}_{\mathrm{s}} \pi^{\pm} $. In addition, upper limits are obtained as a function of the mass and the natural width of possible exotic states decaying into $\mathrm{B}^{0}_{\mathrm{s}}\pi^{\pm}$. | ||
| Links: e-print arXiv:1712.06144 [hep-ex] (PDF) ; CDS record ; inSPIRE record ; HepData record ; CADI line (restricted) ; | ||
| Figures | |
png pdf |
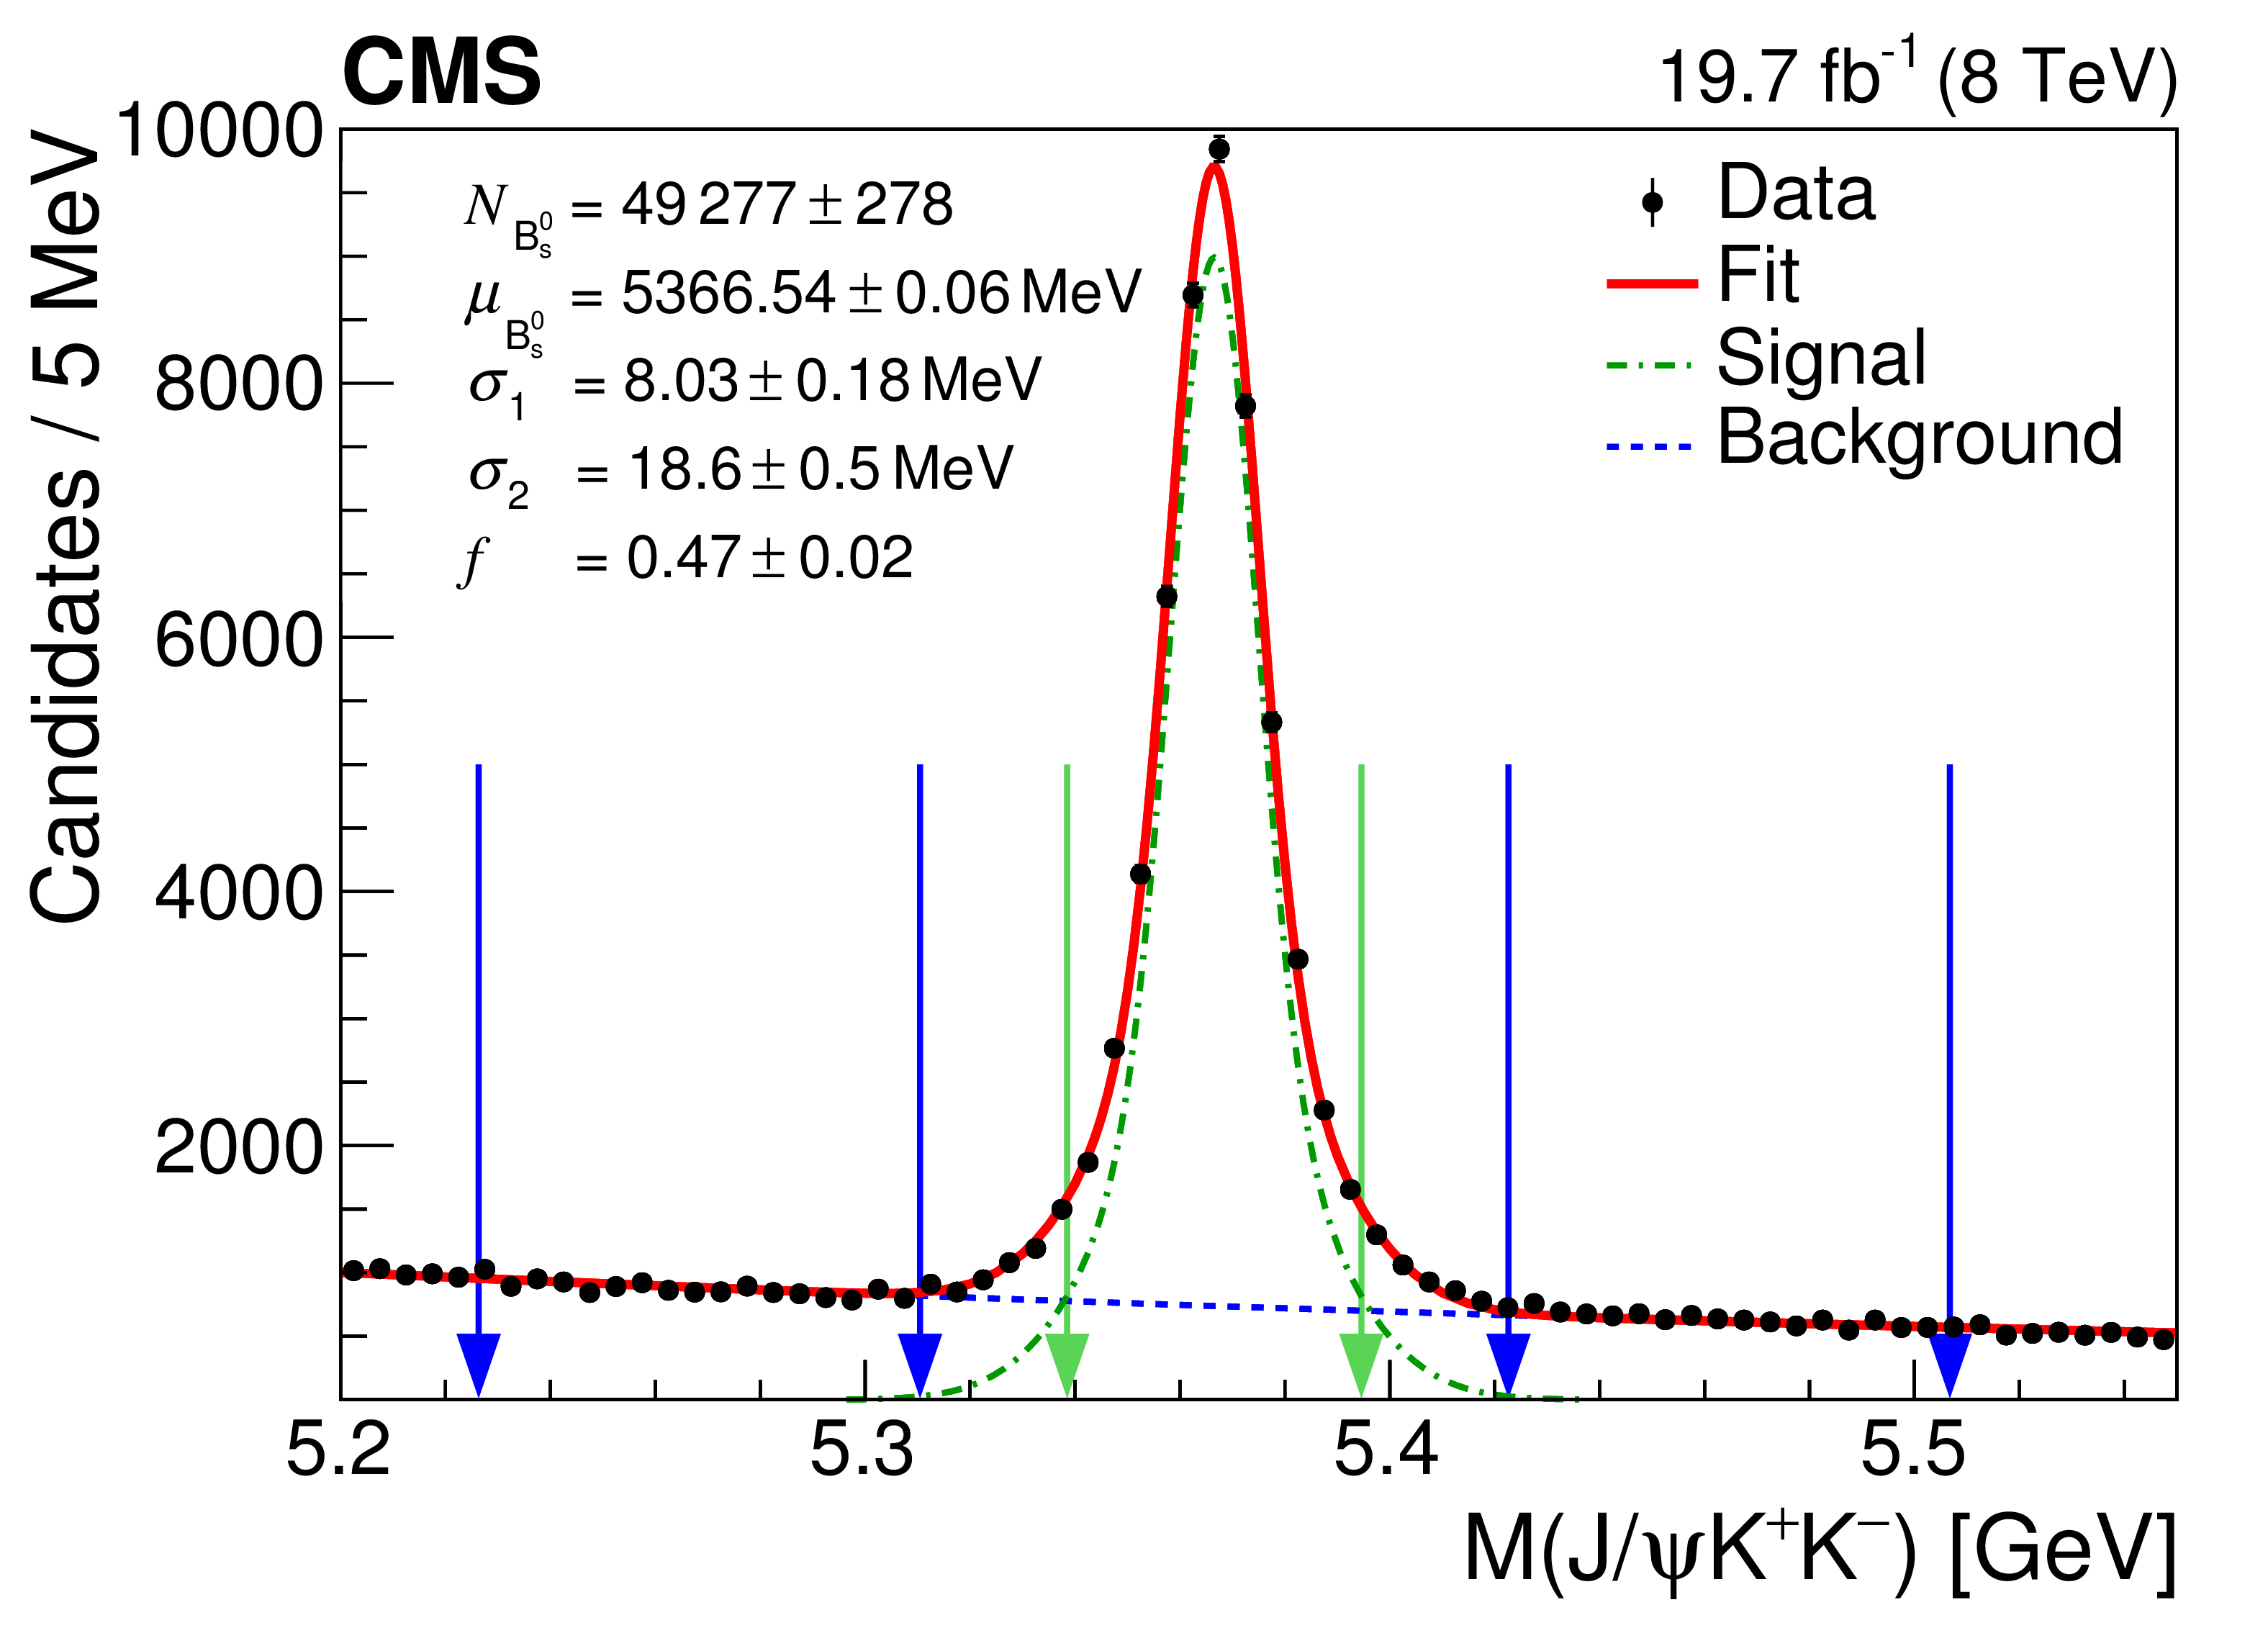
Figure 1:
Invariant mass distribution of the $ {\mathrm {B}^0_\mathrm {s}} $ candidates with the fit result superimposed. The outermost pairs of dark vertical arrows define the lower and upper $ {\mathrm {B}^0_\mathrm {s}} $ sidebands, while the innermost light vertical arrows delimit the signal region. |
png pdf |
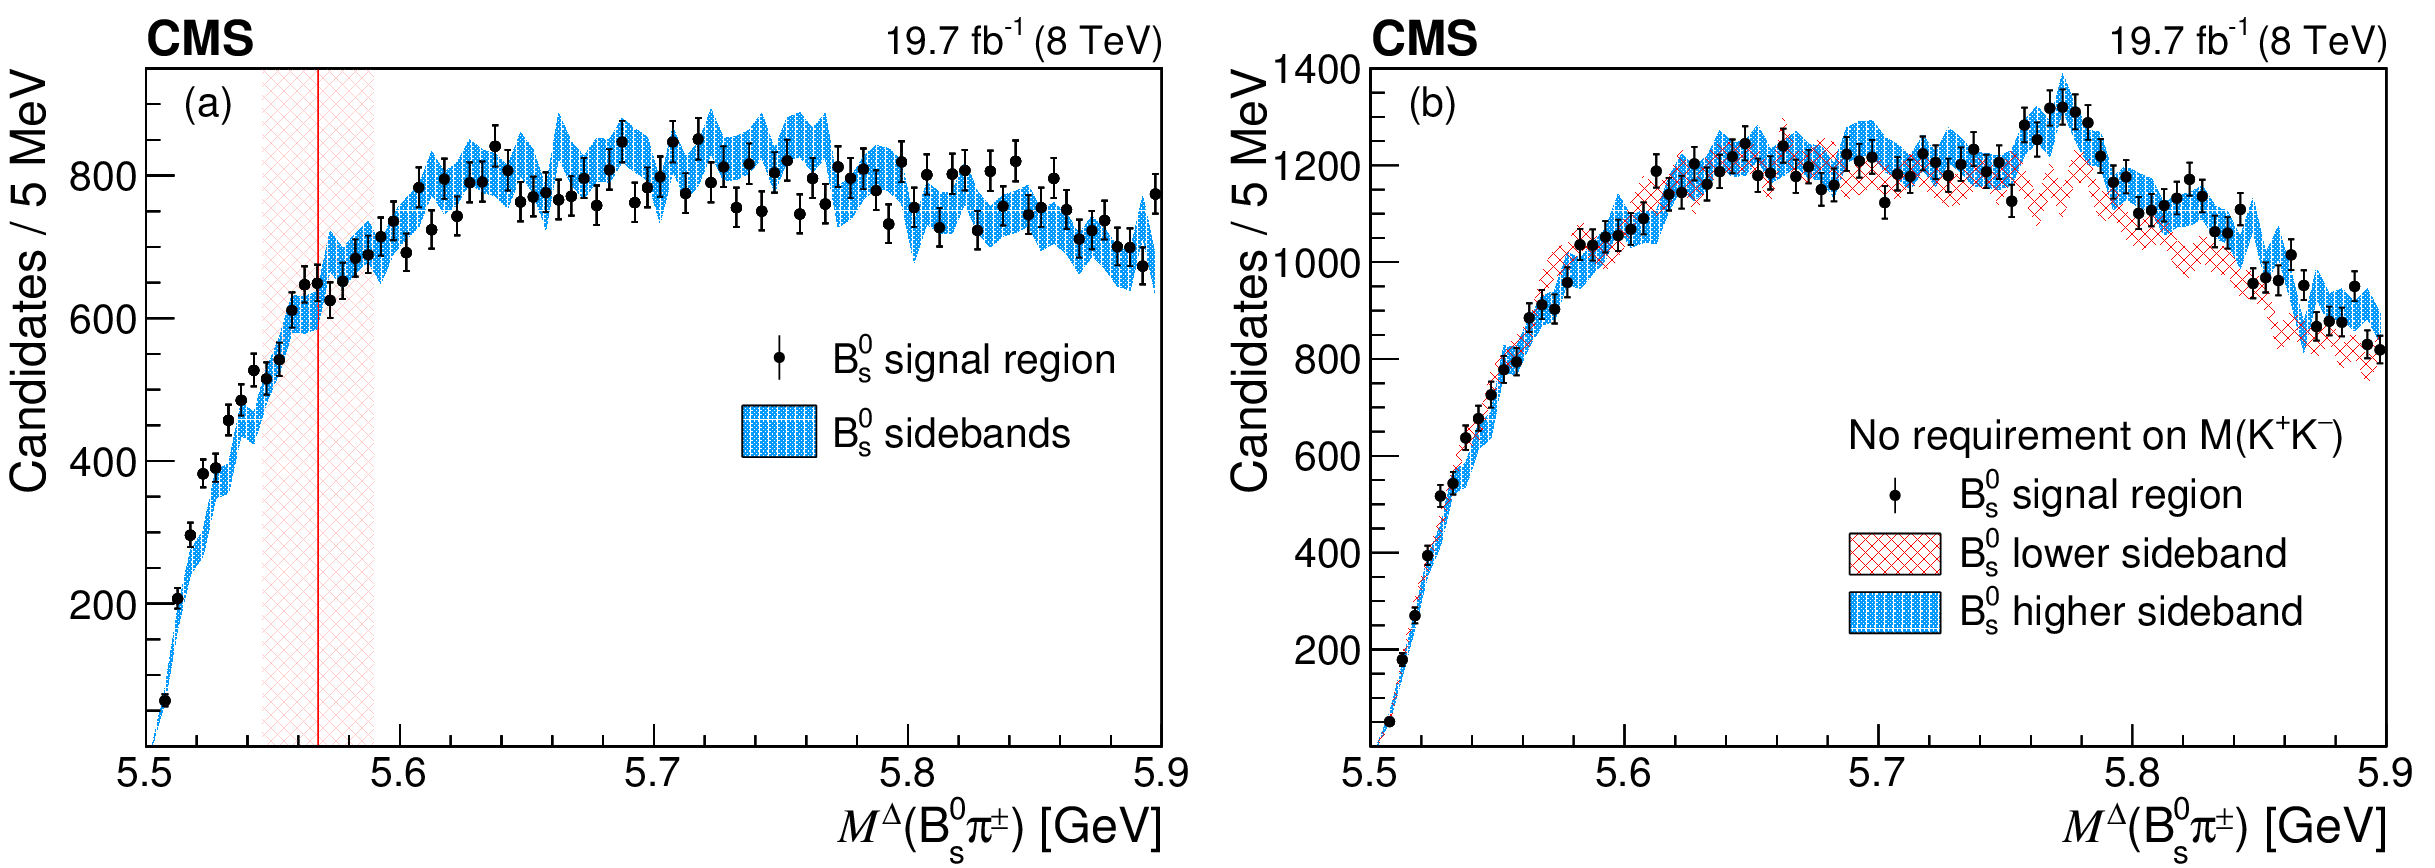
Figure 2:
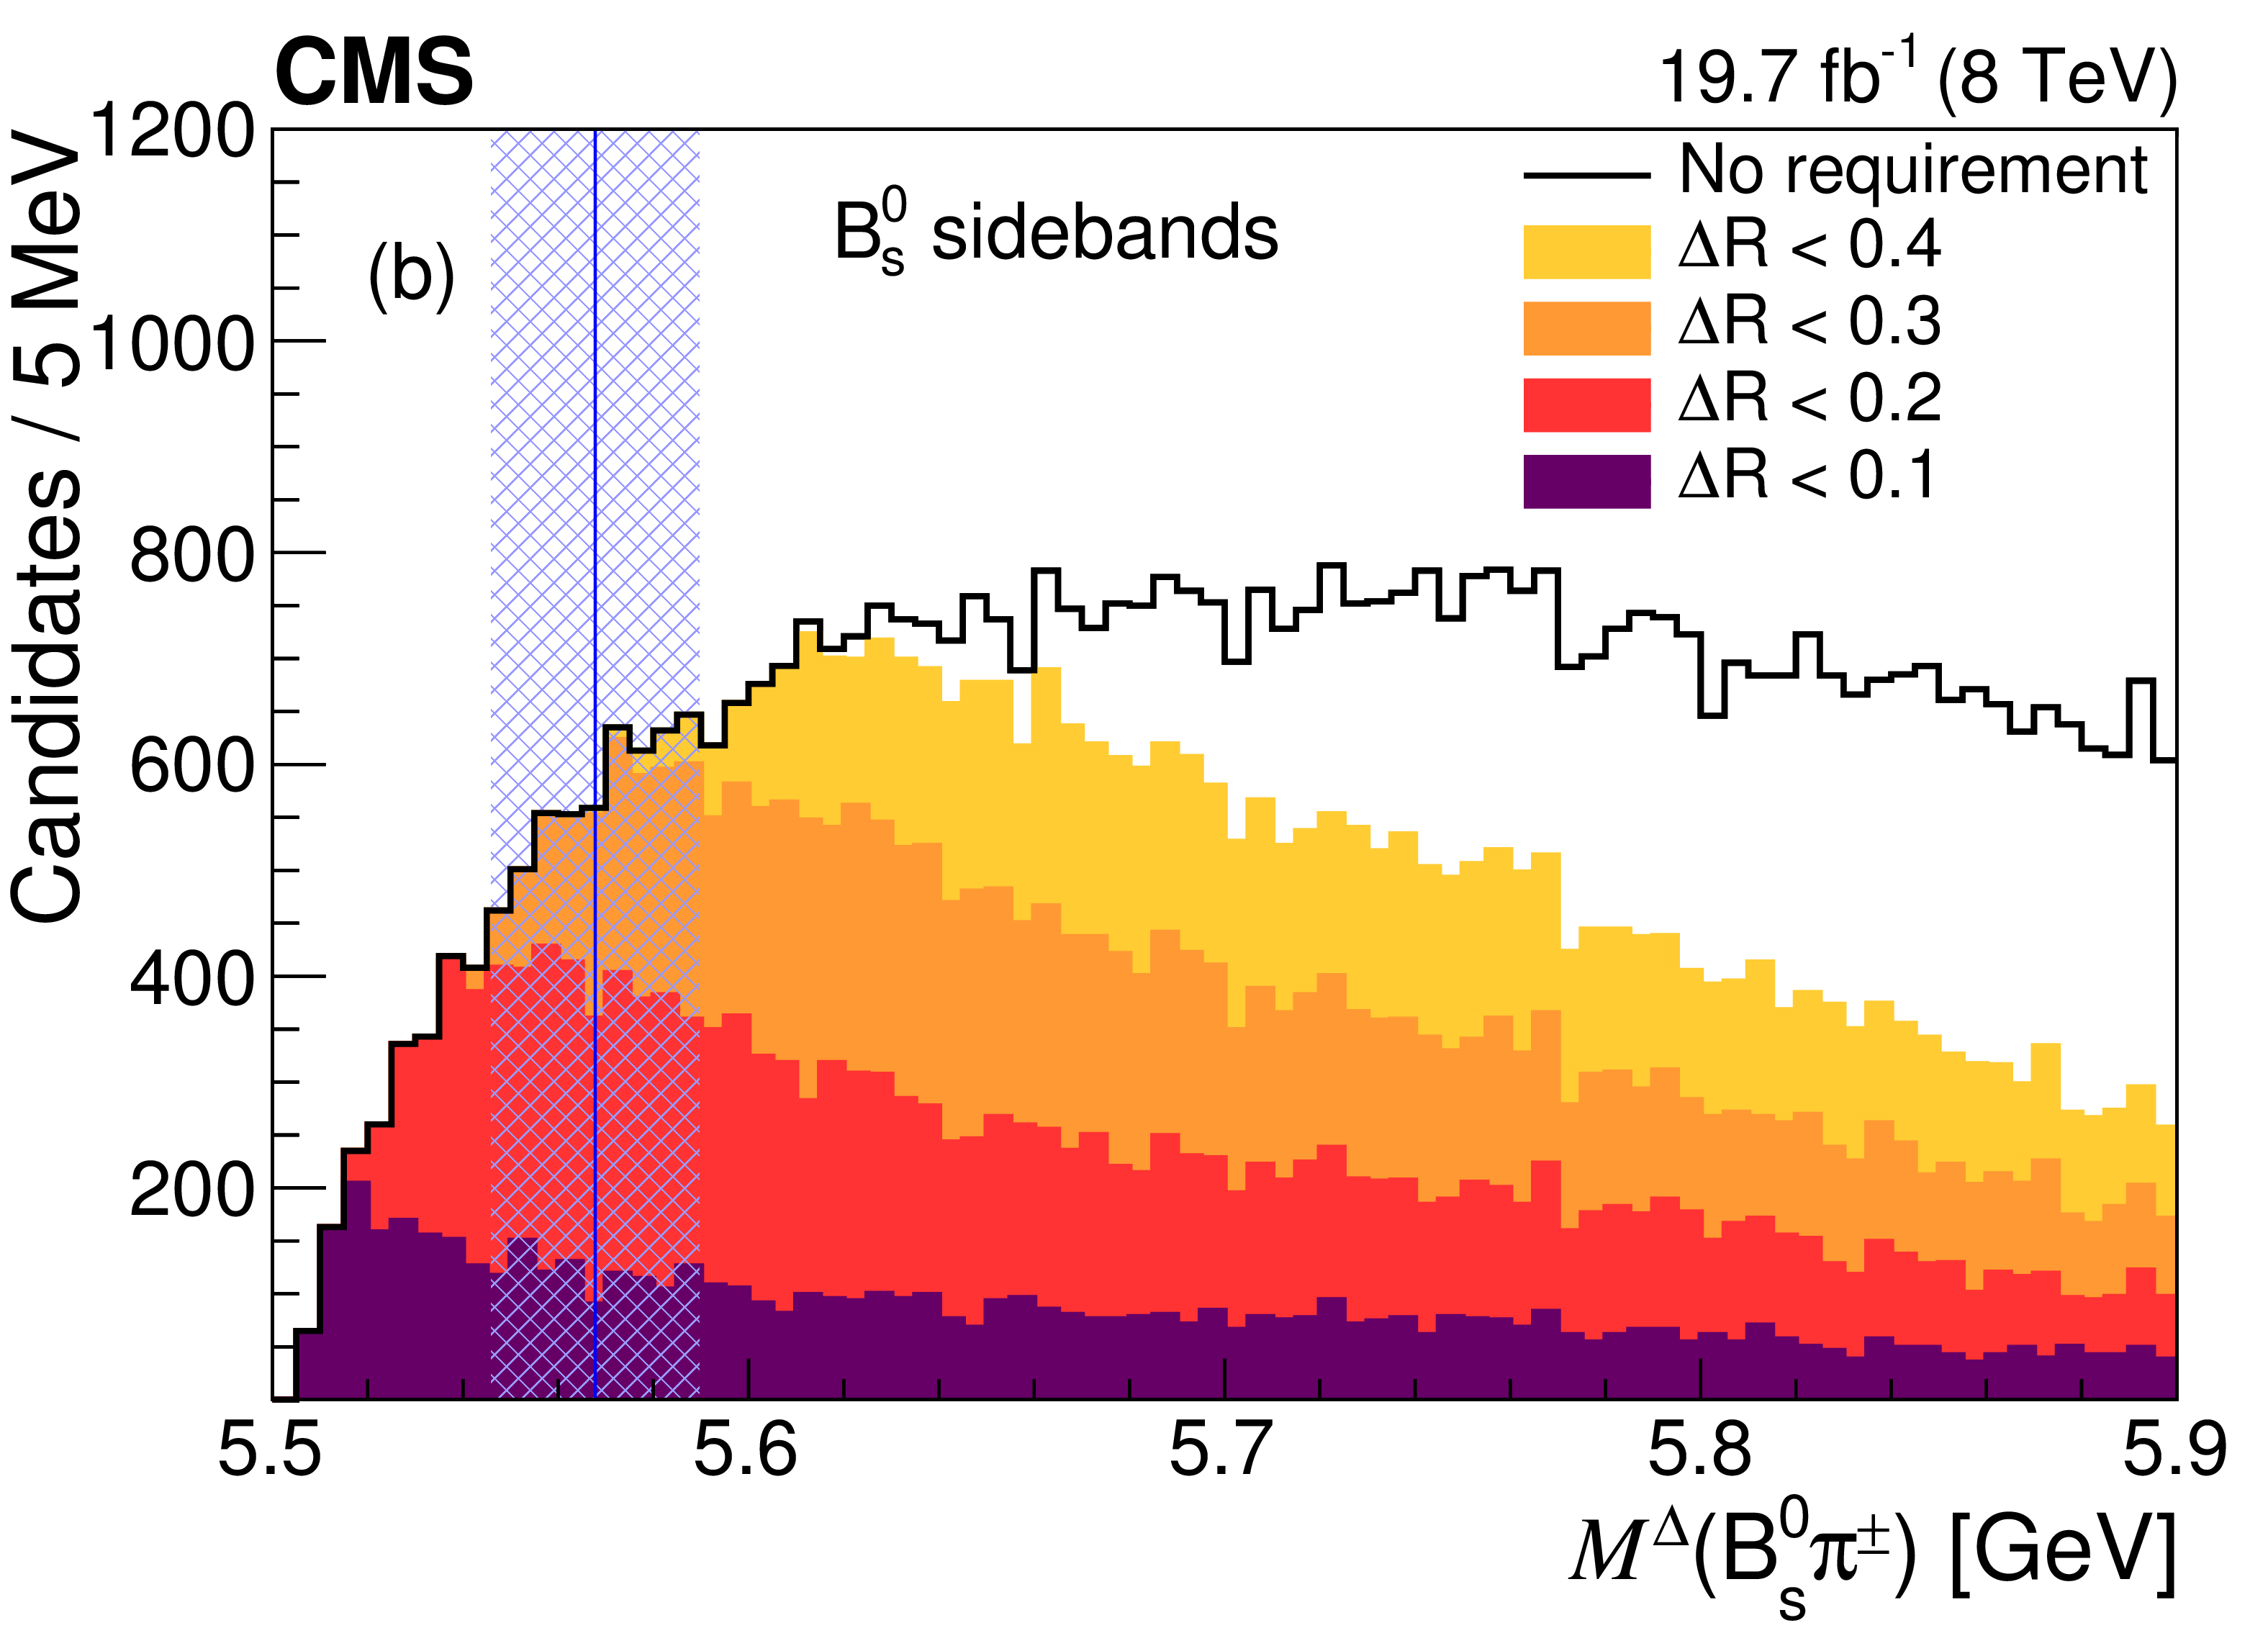
(a) The $M^{\Delta}({\mathrm {B}^0_\mathrm {s}} {\pi ^\mathrm {{\pm}}})$ distribution for events in the $ {\mathrm {B}^0_\mathrm {s}} $ signal (points) and sideband regions (bands). The latter is normalized to the former. The vertical band indicates the region $m_{{\mathrm {X}}}\pm \Gamma _{{\mathrm {X}}}$. (b) The $M^{\Delta}({\mathrm {B}^0_\mathrm {s}} {\pi ^\mathrm {{\pm}}})$ distribution for events in the $ {\mathrm {B}^0_\mathrm {s}} $ signal (points) and lower and higher sideband regions (bands), when the requirement on $ M({\mathrm {K^+}} {\mathrm {K^-}}) $ is removed (see text for additional requirements). The three distributions are normalized from the mass threshold up to 5.74 GeV. The excess observed for events in the $ {\mathrm {B}^0_\mathrm {s}} $ signal and higher sideband regions is due to $ {{\mathrm {B}}}^{(*)}_{1,2}{}^+\to {\mathrm {B}^{*0}} {\pi ^+}$ decays. |
png pdf |
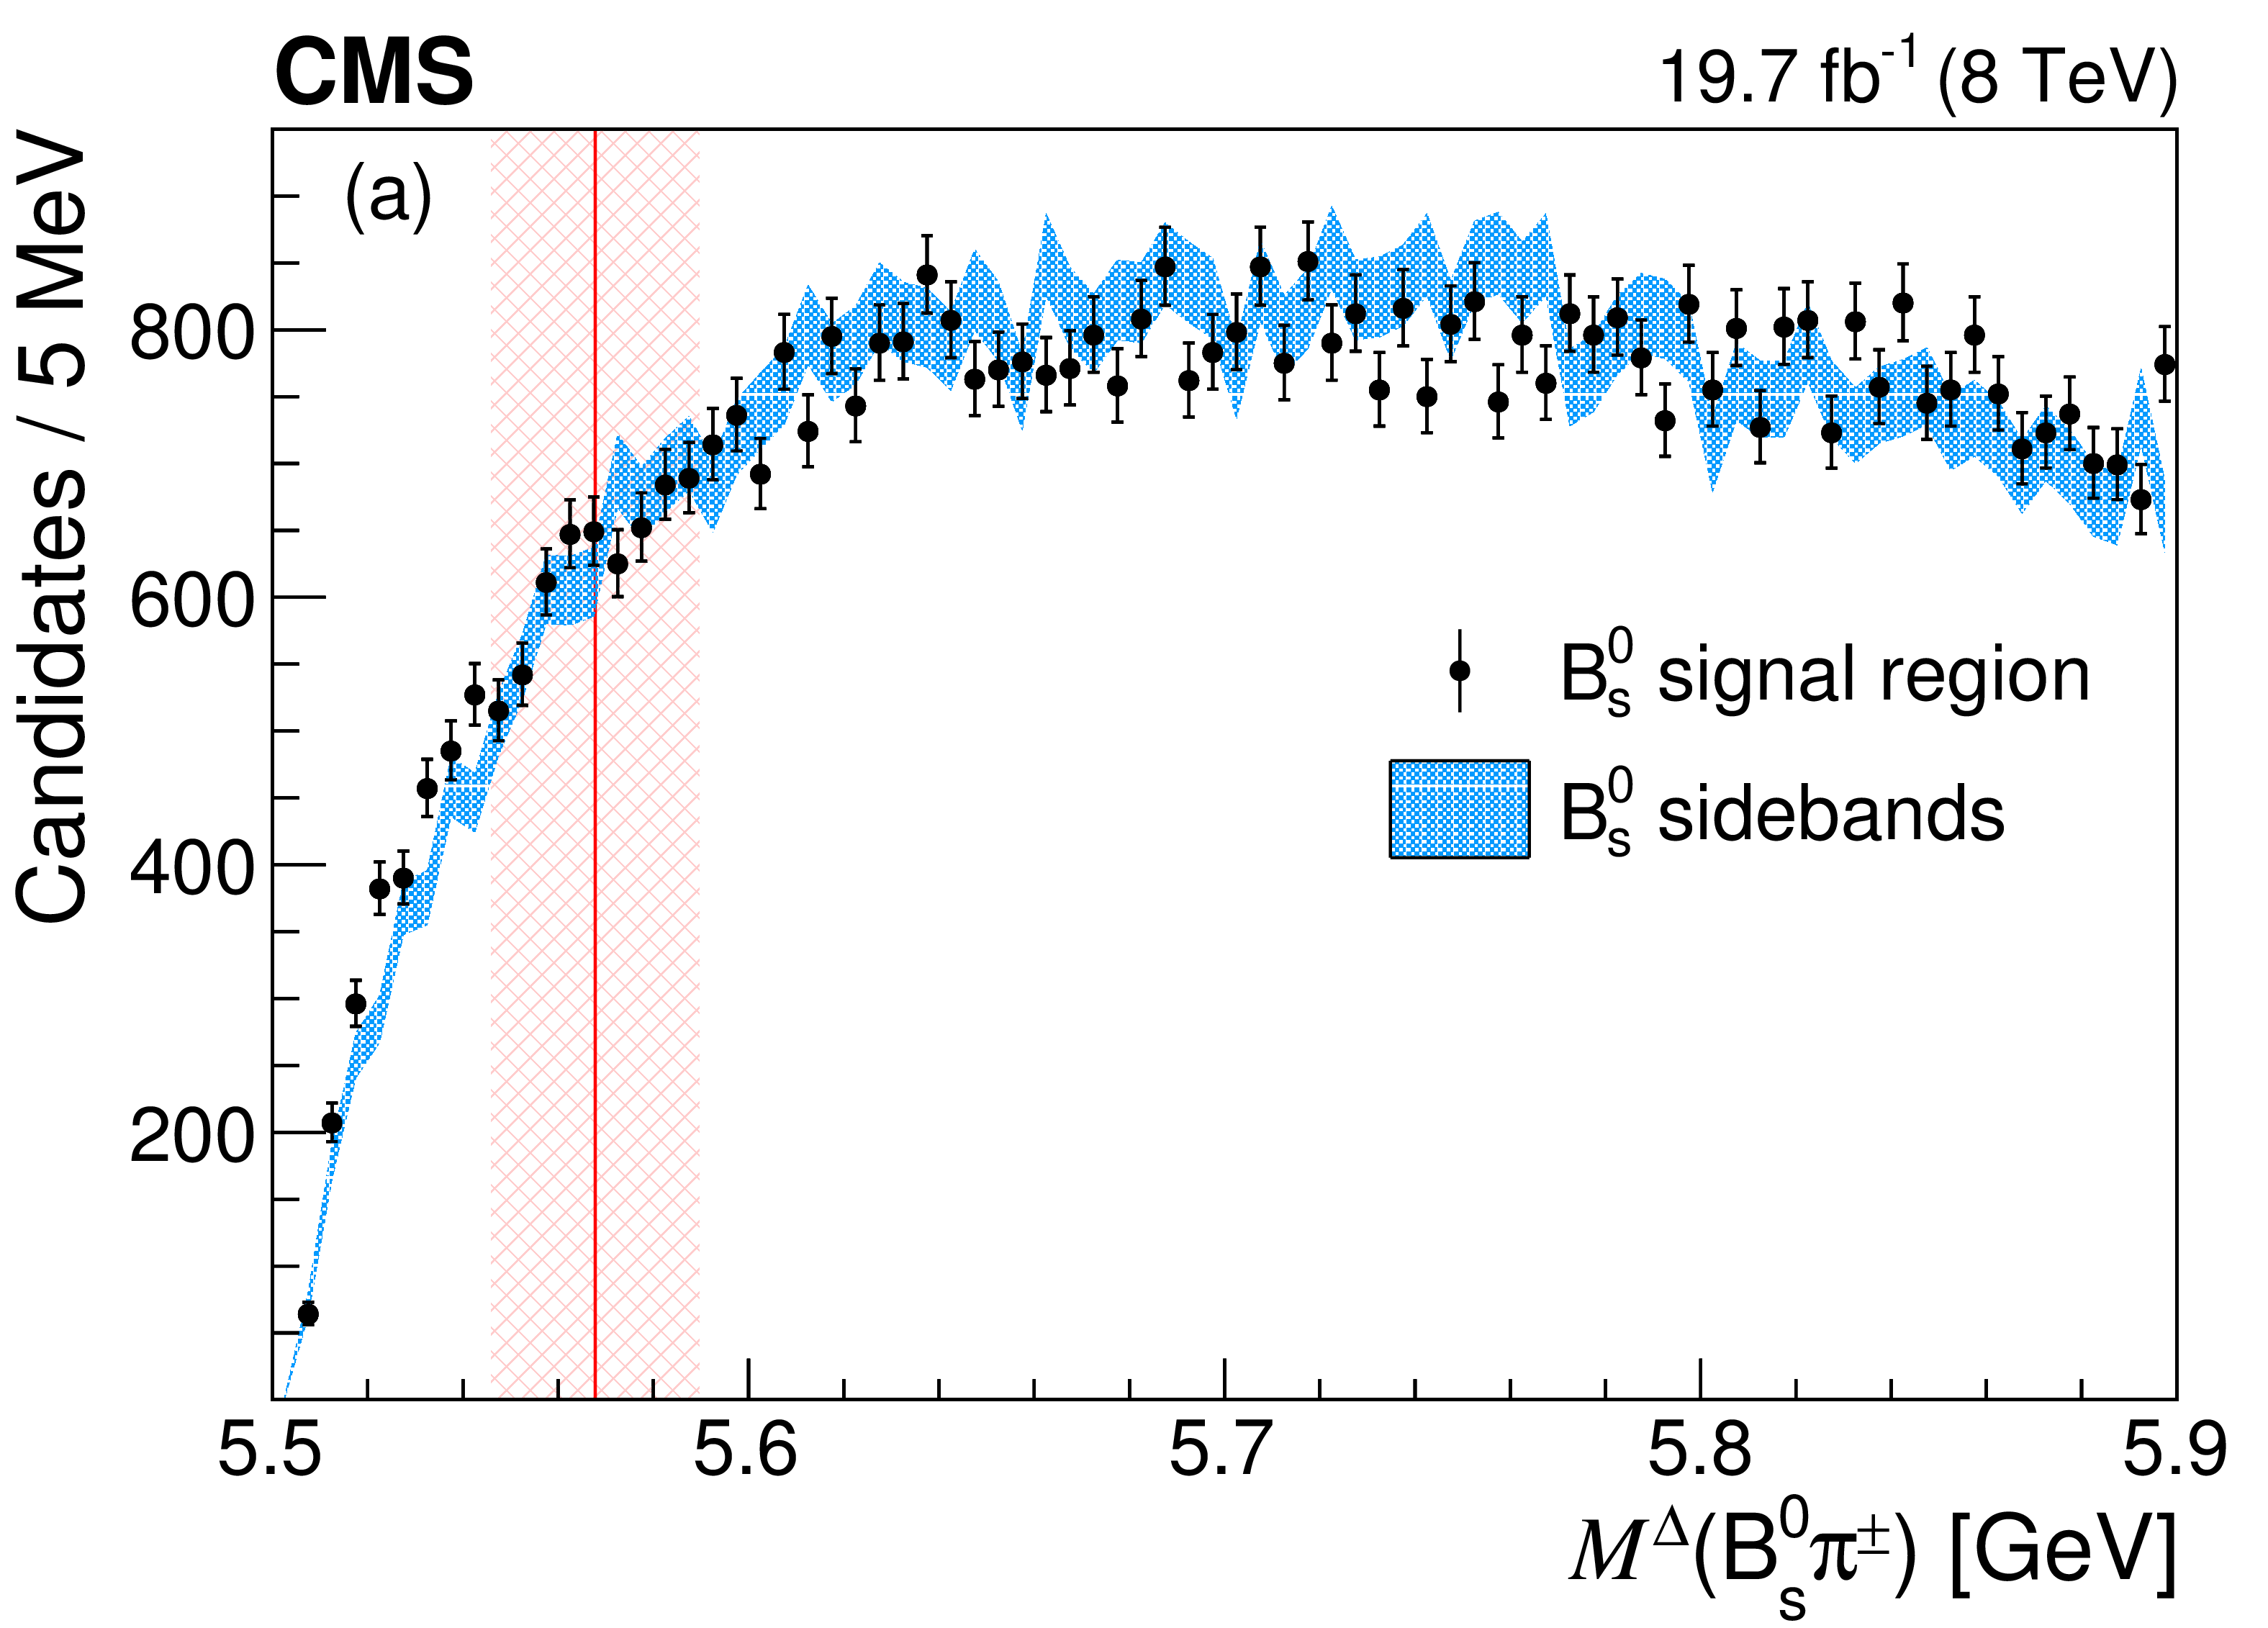
Figure 2-a:
The $M^{\Delta}({\mathrm {B}^0_\mathrm {s}} {\pi ^\mathrm {{\pm}}})$ distribution for events in the $ {\mathrm {B}^0_\mathrm {s}} $ signal (points) and sideband regions (bands). The latter is normalized to the former. The vertical band indicates the region $m_{{\mathrm {X}}}\pm \Gamma _{{\mathrm {X}}}$. |
png pdf |
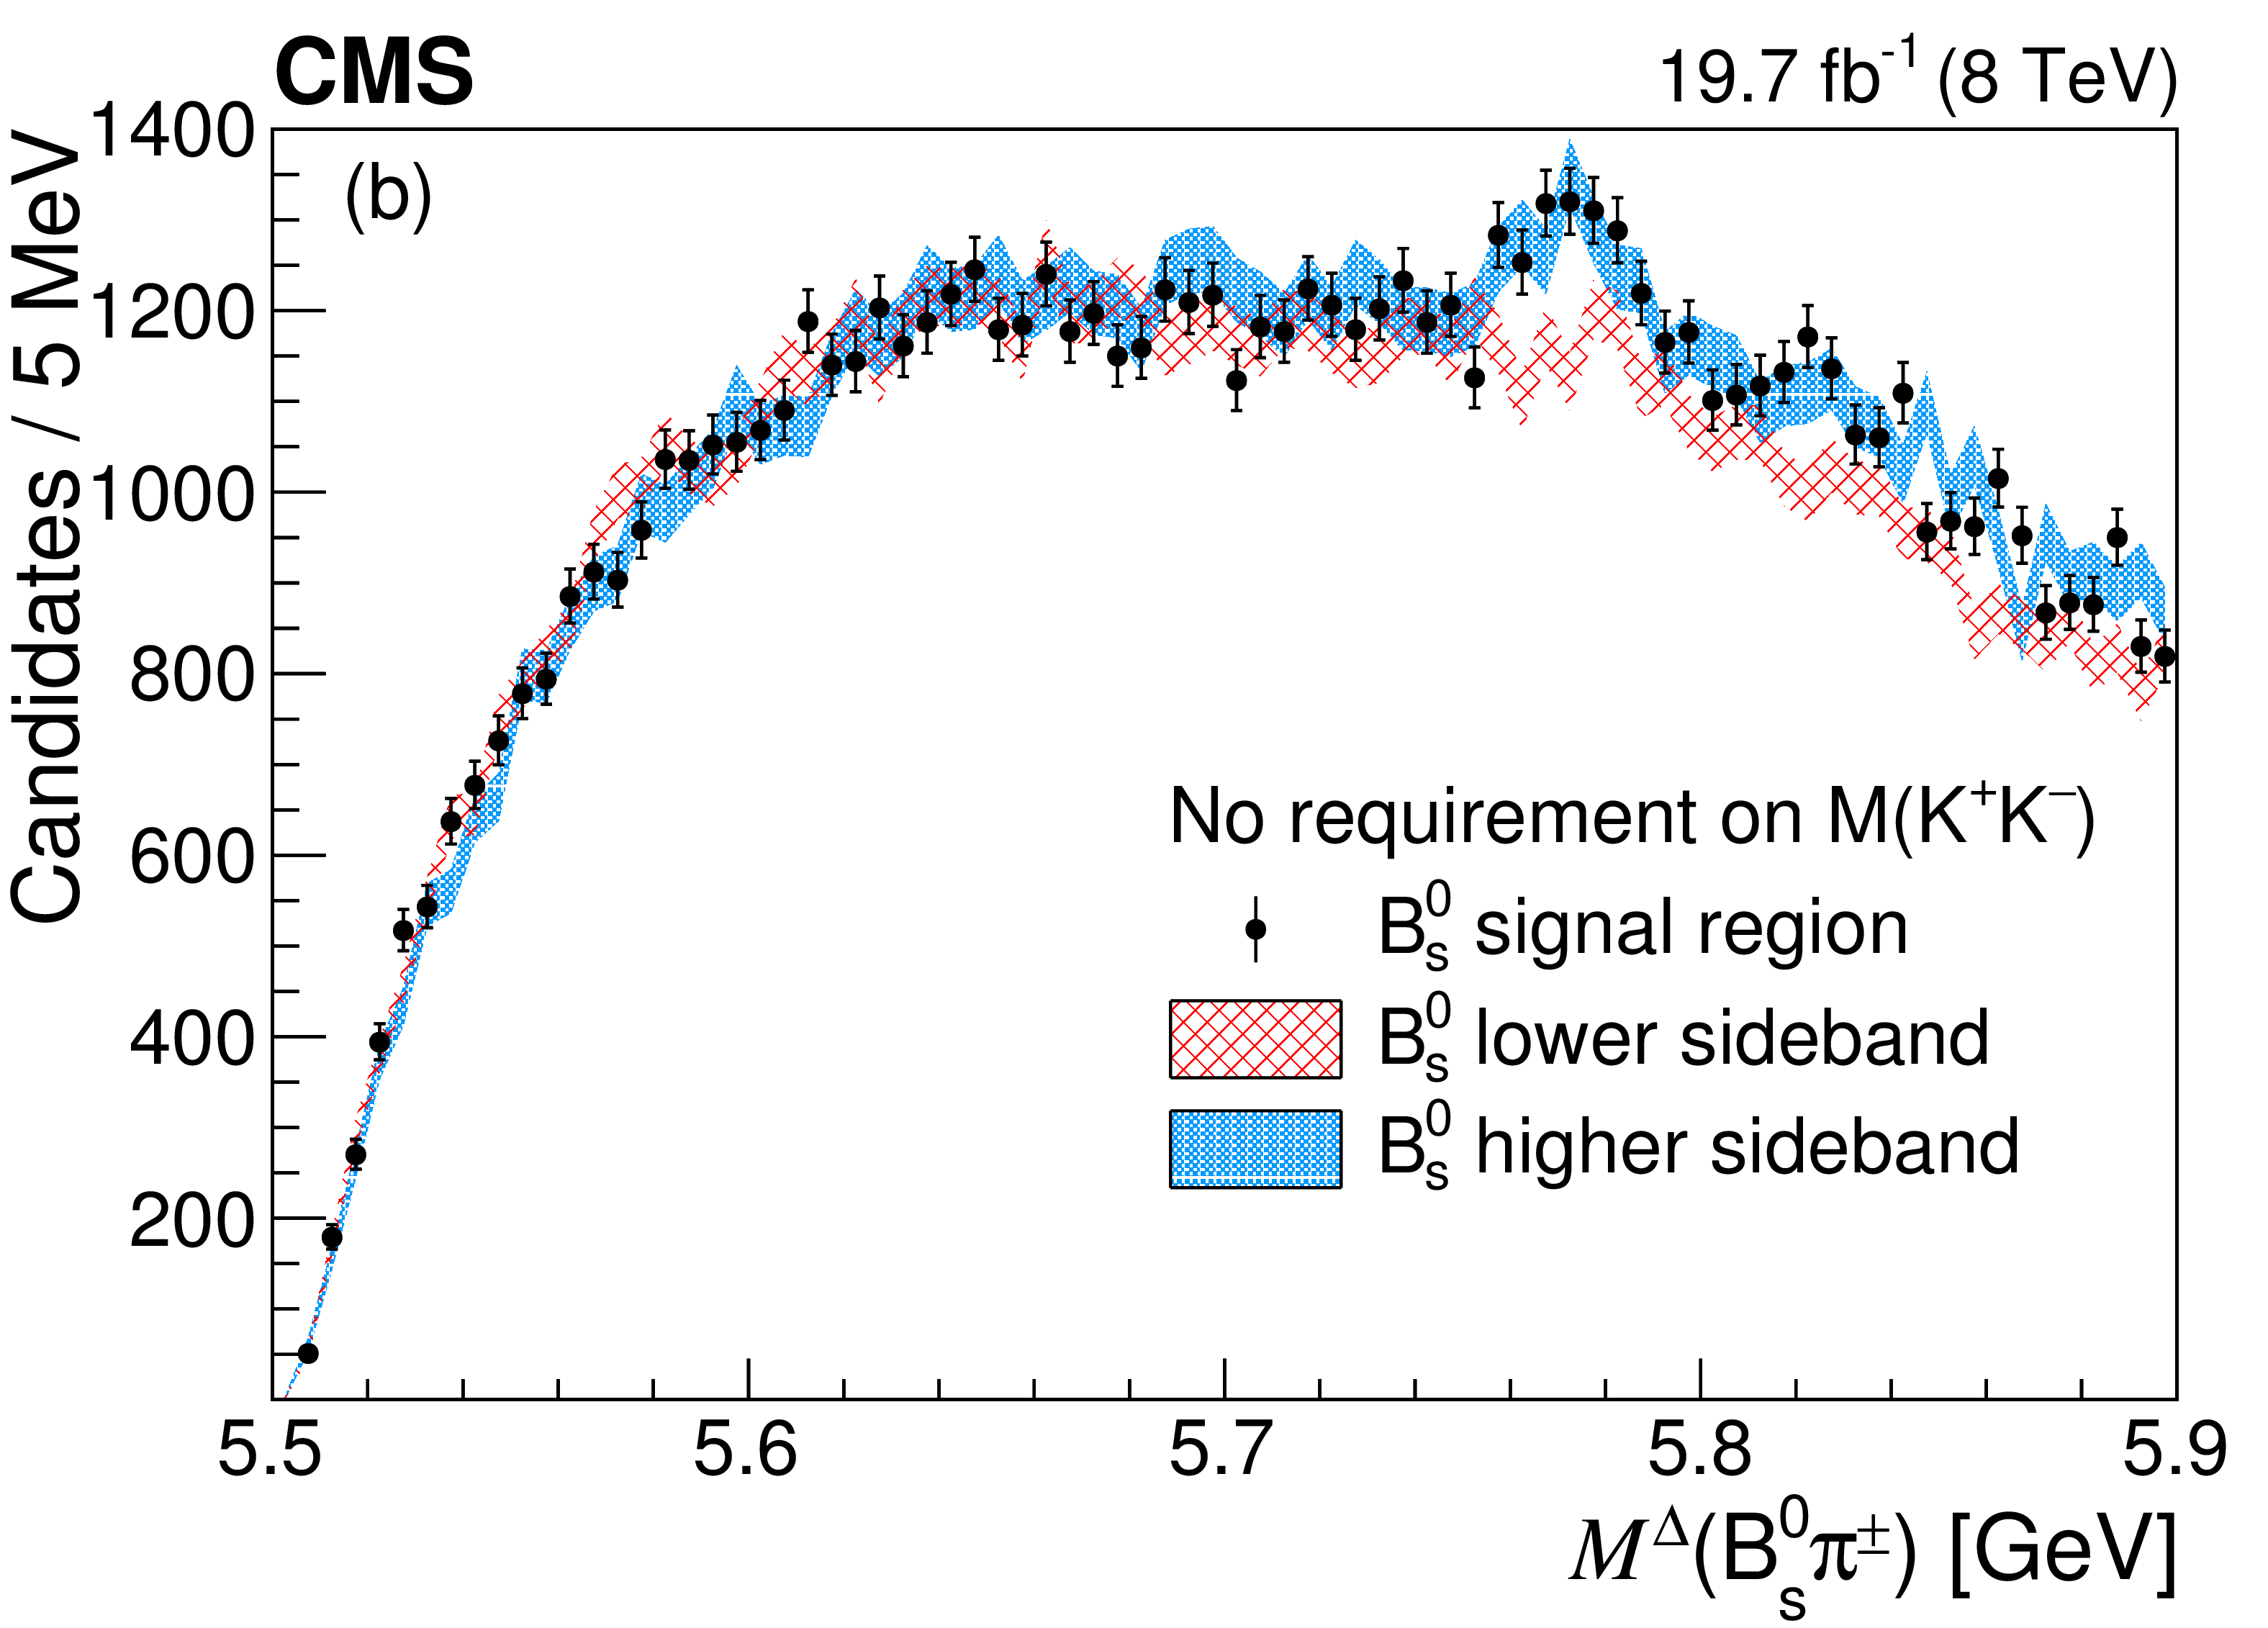
Figure 2-b:
The $M^{\Delta}({\mathrm {B}^0_\mathrm {s}} {\pi ^\mathrm {{\pm}}})$ distribution for events in the $ {\mathrm {B}^0_\mathrm {s}} $ signal (points) and lower and higher sideband regions (bands), when the requirement on $ M({\mathrm {K^+}} {\mathrm {K^-}}) $ is removed (see text for additional requirements). The three distributions are normalized from the mass threshold up to 5.74 GeV. The excess observed for events in the $ {\mathrm {B}^0_\mathrm {s}} $ signal and higher sideband regions is due to $ {{\mathrm {B}}}^{(*)}_{1,2}{}^+\to {\mathrm {B}^{*0}} {\pi ^+}$ decays. |

png pdf |
Figure 3:
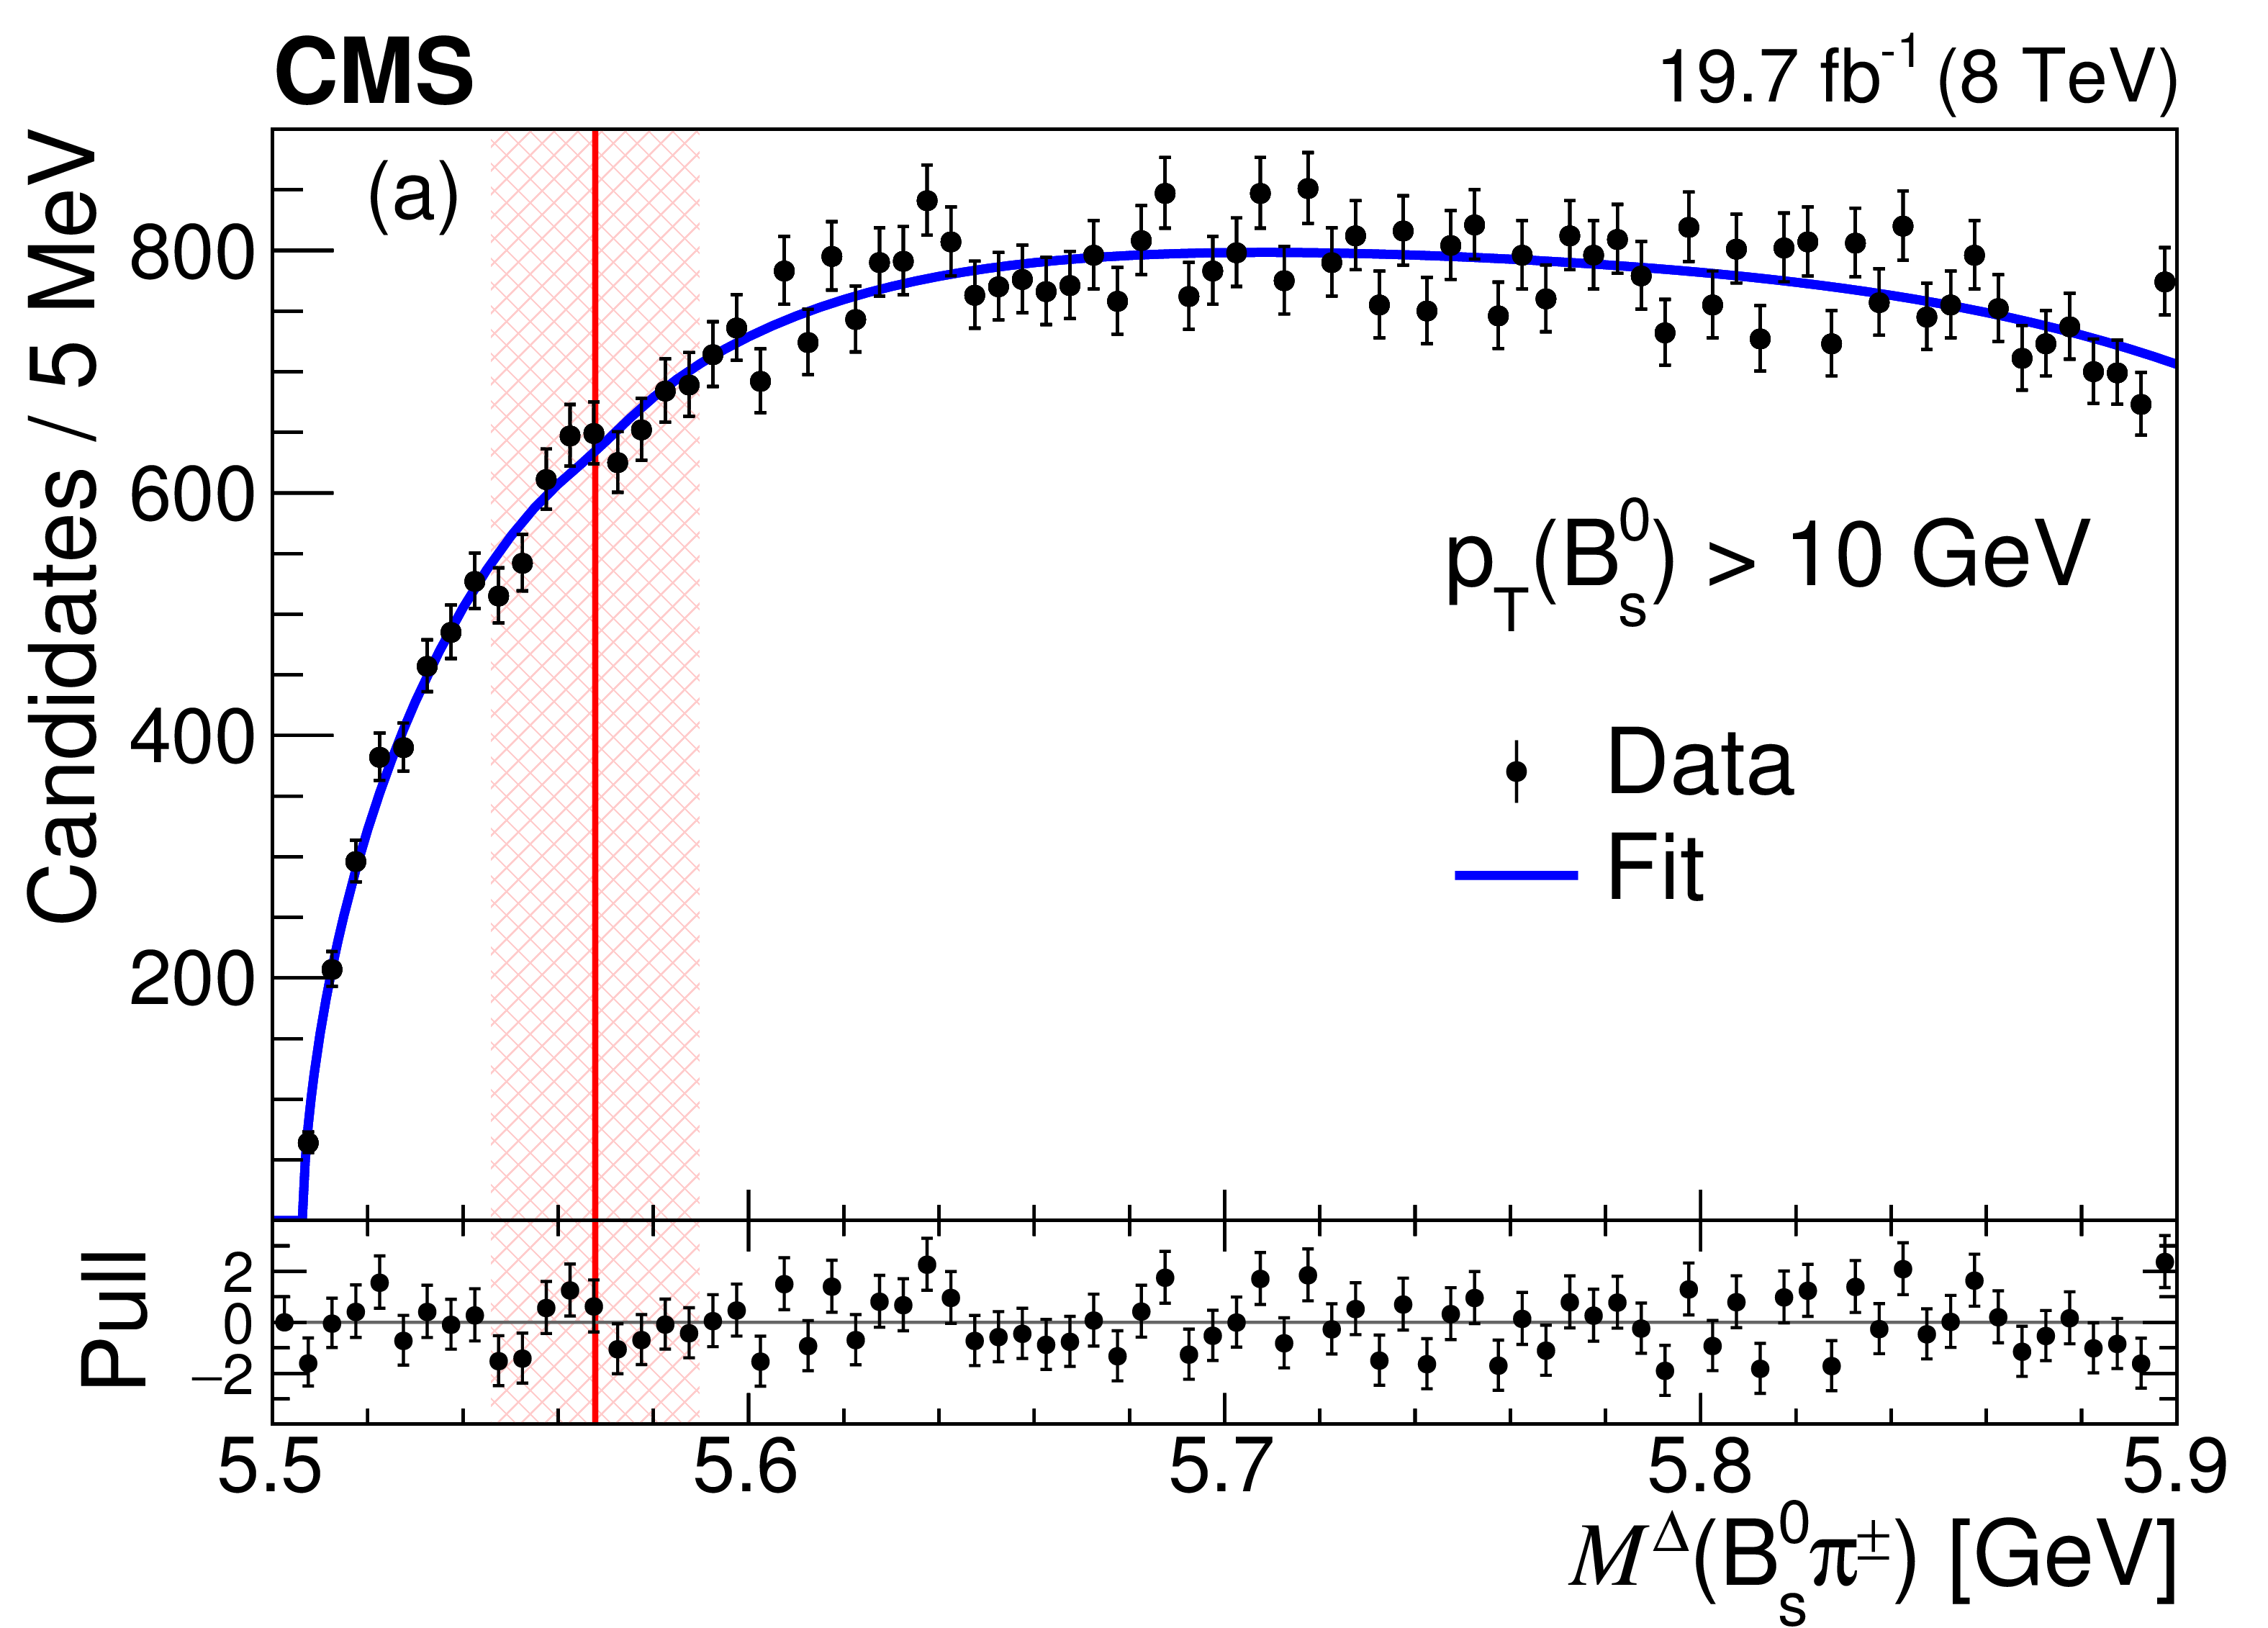
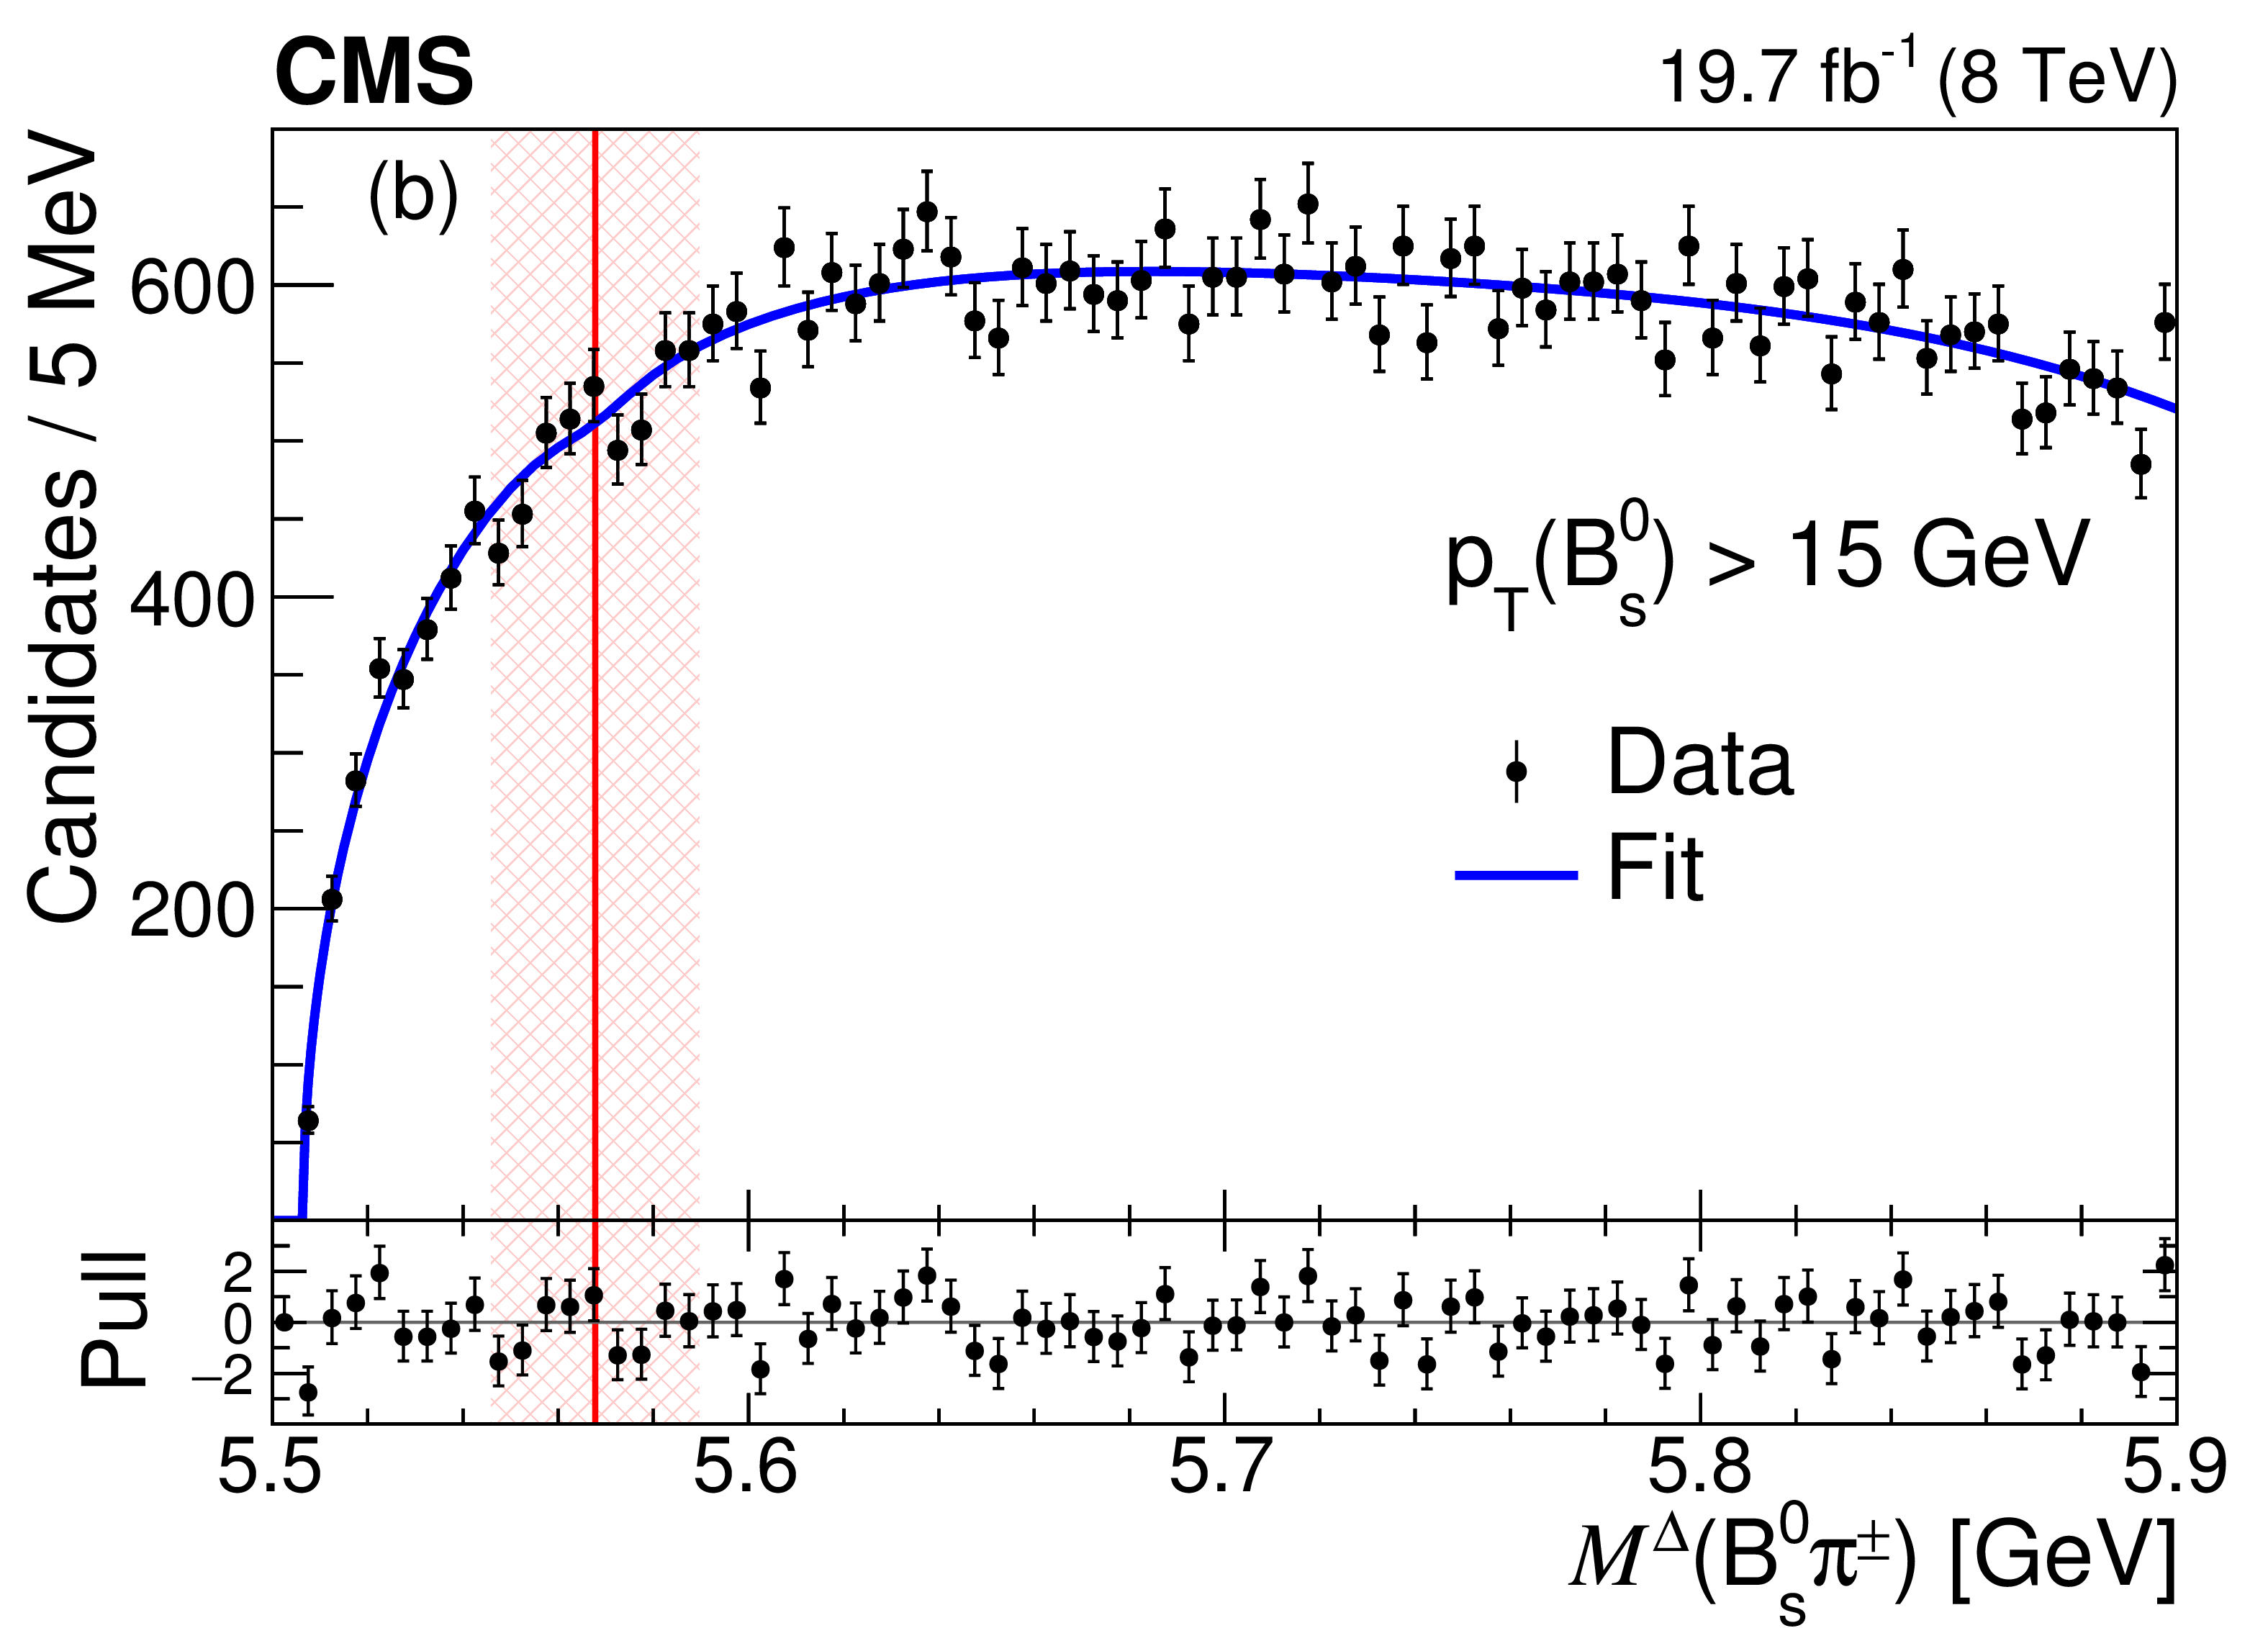
The $M^{\Delta}({\mathrm {B}^0_\mathrm {s}} {\pi ^\mathrm {{\pm}}})$ distribution for events in the $ {\mathrm {B}^0_\mathrm {s}} $ signal region with the result of the fit superimposed for the baseline selection with $ {p_{\mathrm {T}}} ({\mathrm {B}^0_\mathrm {s}}) > $ 10 GeV (a) and $ {p_{\mathrm {T}}} ({\mathrm {B}^0_\mathrm {s}}) > $ 15 GeV (b). The vertical band indicates the region $m_{{\mathrm {X}}}\pm \Gamma _{{\mathrm {X}}}$. The lower panels display the pull (difference between the data and the fit result, divided by the statistical uncertainty in the data). |
png pdf |
Figure 3-a:
The $M^{\Delta}({\mathrm {B}^0_\mathrm {s}} {\pi ^\mathrm {{\pm}}})$ distribution for events in the $ {\mathrm {B}^0_\mathrm {s}} $ signal region with the result of the fit superimposed for the baseline selection with $ {p_{\mathrm {T}}} ({\mathrm {B}^0_\mathrm {s}}) > $ 10 GeV. The vertical band indicates the region $m_{{\mathrm {X}}}\pm \Gamma _{{\mathrm {X}}}$. The lower panels display the pull (difference between the data and the fit result, divided by the statistical uncertainty in the data). |
png pdf |
Figure 3-b:
The $M^{\Delta}({\mathrm {B}^0_\mathrm {s}} {\pi ^\mathrm {{\pm}}})$ distribution for events in the $ {\mathrm {B}^0_\mathrm {s}} $ signal region with the result of the fit superimposed for the baseline selection with $ {p_{\mathrm {T}}} ({\mathrm {B}^0_\mathrm {s}}) > $ 15 GeV. The vertical band indicates the region $m_{{\mathrm {X}}}\pm \Gamma _{{\mathrm {X}}}$. The lower panels display the pull (difference between the data and the fit result, divided by the statistical uncertainty in the data). |
png pdf |
Figure 4:
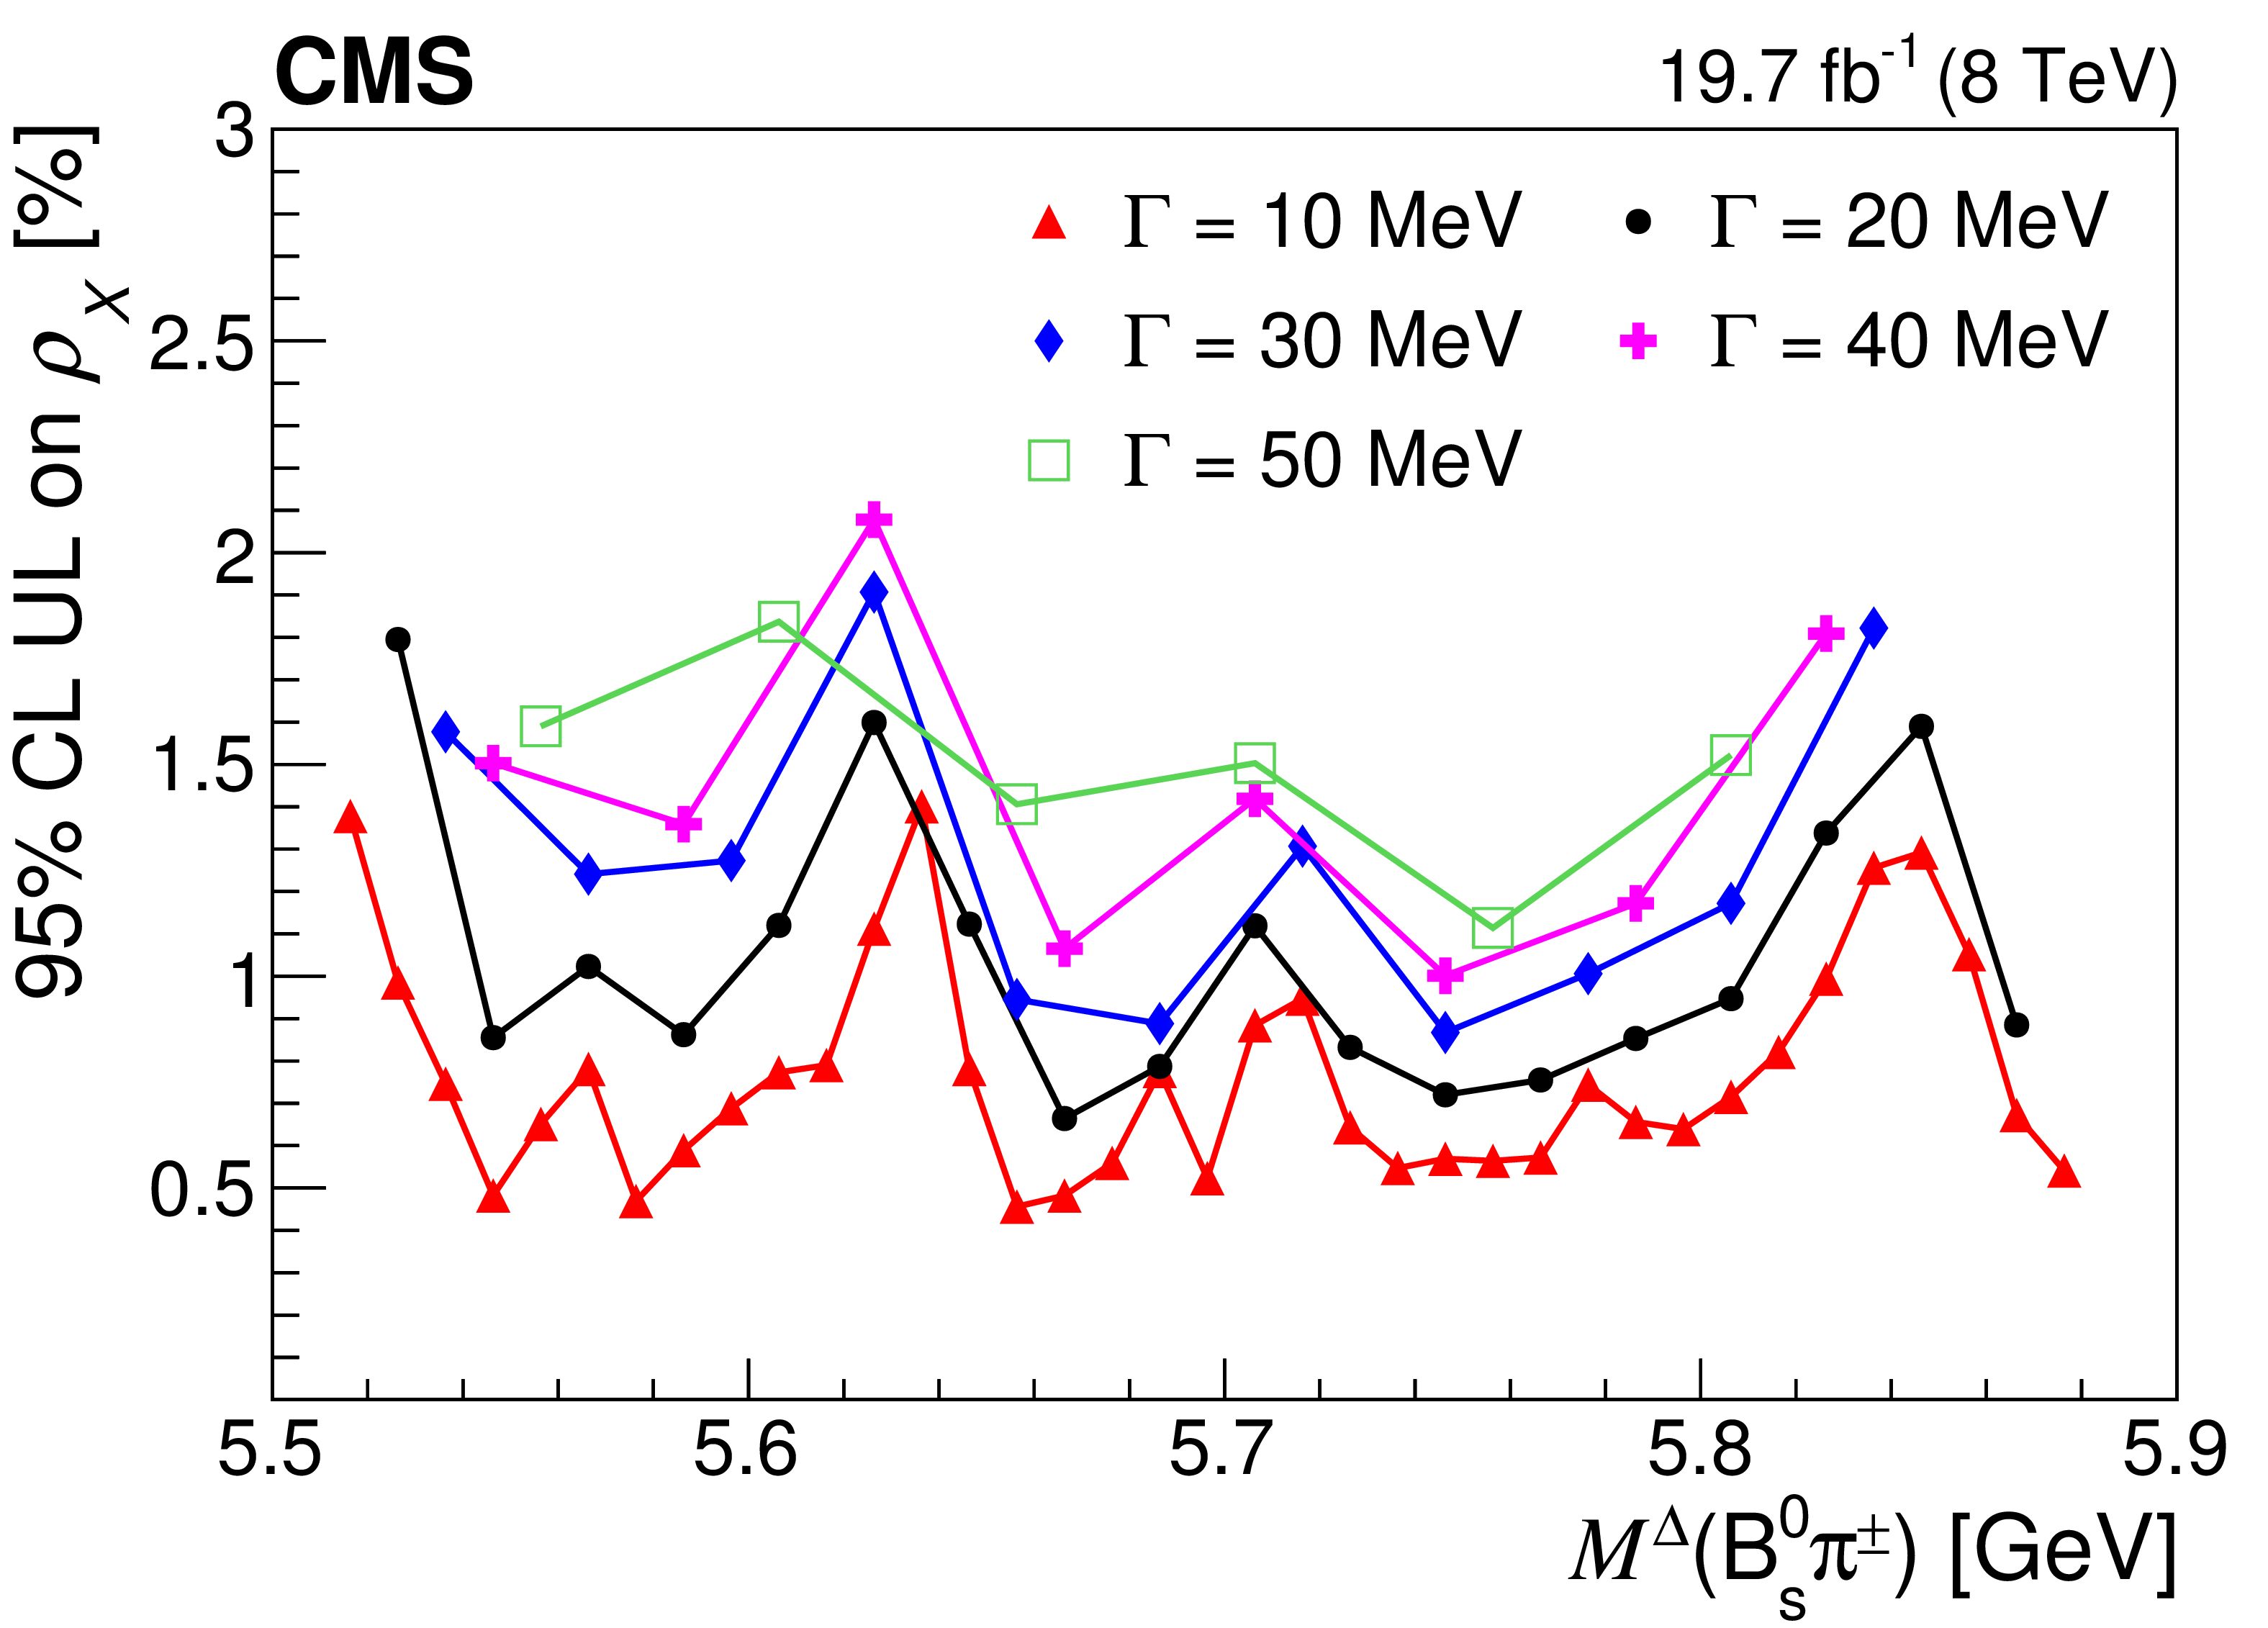
The 95% CL upper limit (UL) on $\rho _{{\mathrm {X}}}$, Eq.(1), as a function of the mass of a possible exotic state decaying into $ {\mathrm {B}^0_\mathrm {s}} {\pi ^\mathrm {{\pm}}}$ for five different values of the natural width of the state. |
png pdf |
Figure 5:
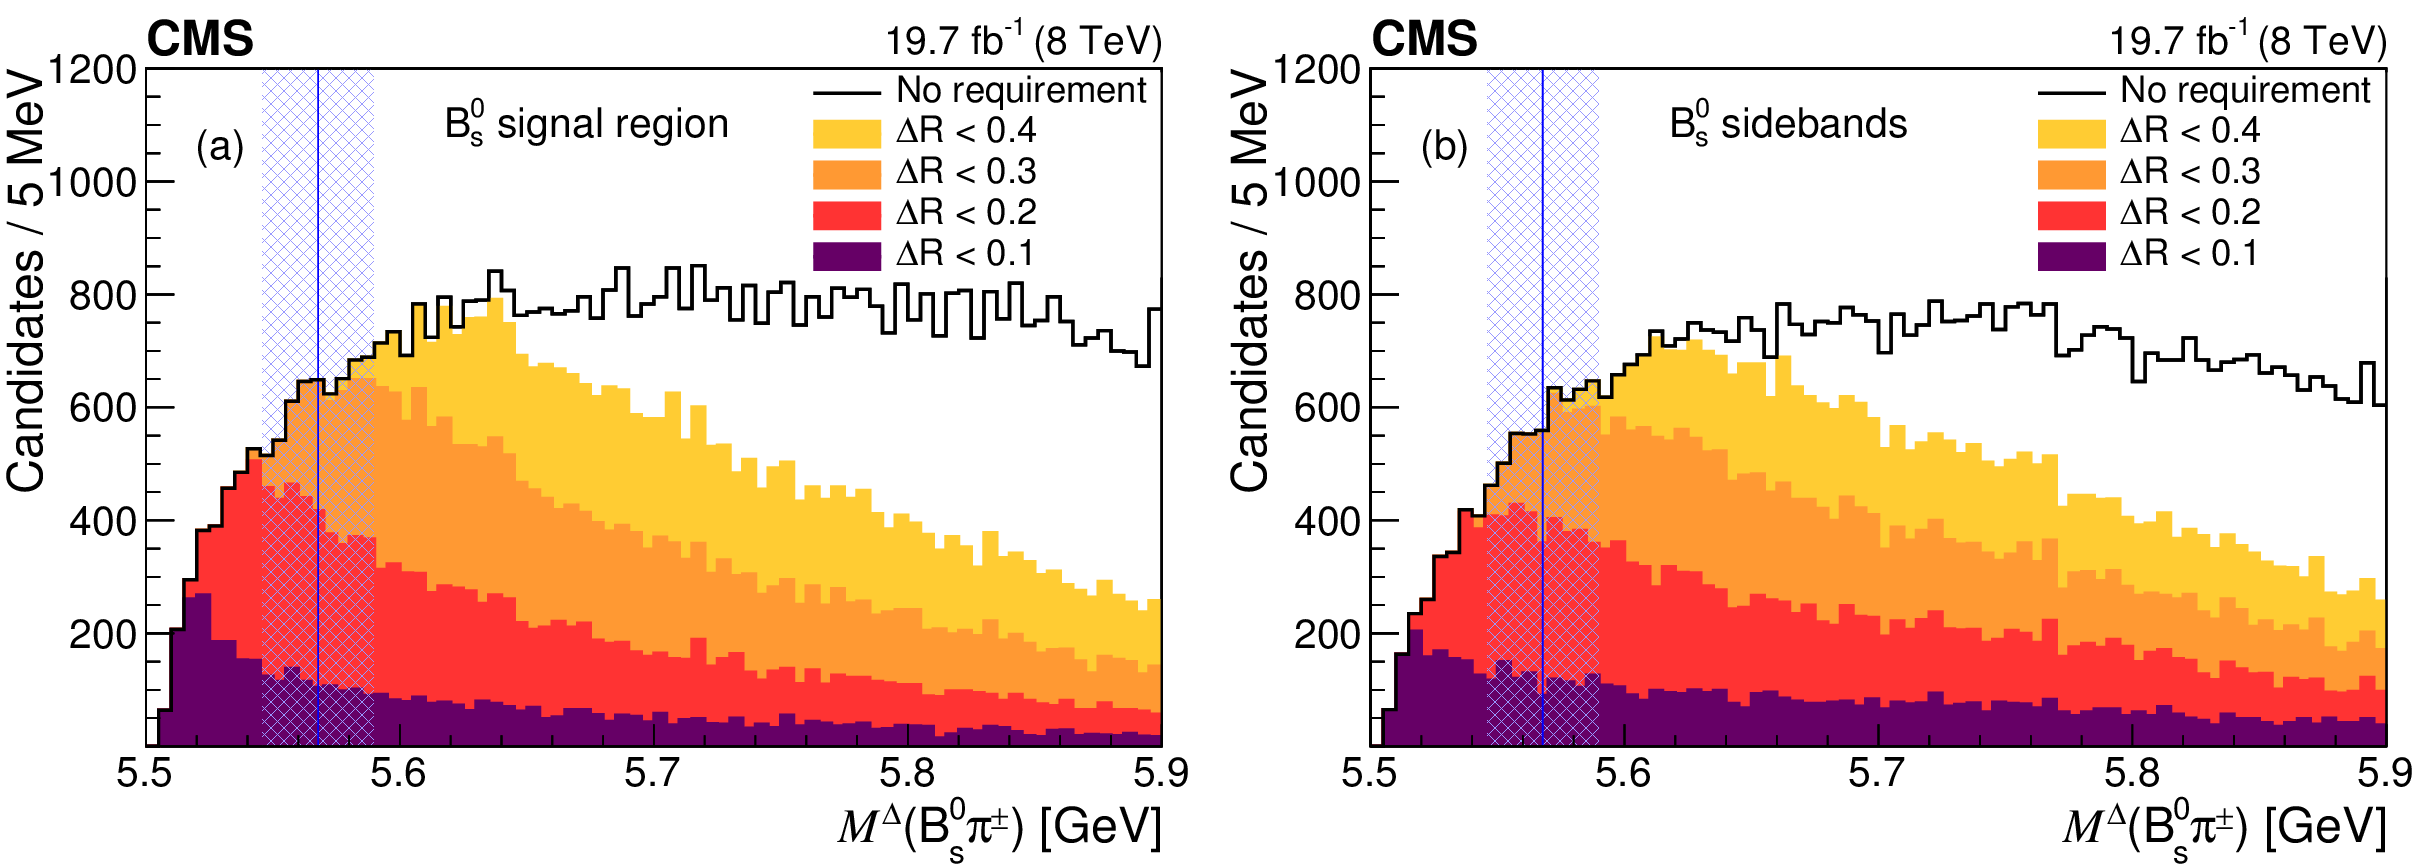
The $M^{\Delta}({\mathrm {B}^0_\mathrm {s}} {\pi ^\mathrm {{\pm}}})$ distributions for events in the $ {\mathrm {B}^0_\mathrm {s}} $ (a) signal and (b) sideband regions for different $\Delta R$ requirements. The uncertainties are not shown for the sake of clarity. The vertical band indicates the region $m_{{\mathrm {X}}}\pm \Gamma _{{\mathrm {X}}}$. |

png pdf |
Figure 5-a:
The $M^{\Delta}({\mathrm {B}^0_\mathrm {s}} {\pi ^\mathrm {{\pm}}})$ distributions for events in the $ {\mathrm {B}^0_\mathrm {s}} $ signal region for different $\Delta R$ requirements. The uncertainties are not shown for the sake of clarity. The vertical band indicates the region $m_{{\mathrm {X}}}\pm \Gamma _{{\mathrm {X}}}$. |
png pdf |
Figure 5-b:
The $M^{\Delta}({\mathrm {B}^0_\mathrm {s}} {\pi ^\mathrm {{\pm}}})$ distributions for events in the $ {\mathrm {B}^0_\mathrm {s}} $ sideband region for different $\Delta R$ requirements. The uncertainties are not shown for the sake of clarity. The vertical band indicates the region $m_{{\mathrm {X}}}\pm \Gamma _{{\mathrm {X}}}$. |
| Summary |
|
In summary, a search for the X(5568) state is performed by the CMS Collaboration using pp collision data collected at $\sqrt{s} = $ 8 TeV and corresponding to an integrated luminosity of 19.7 fb$^{-1}$. With about 50 000 $\mathrm{B}^{0}_{\mathrm{s}}$ signal candidates, no significant structure in the $\mathrm{B}^{0}_{\mathrm{s}}\pi^{\pm}$ invariant mass spectrum is found around the mass reported by the D0 Collaboration (nor for masses up to 5.9 GeV). The absence of a peak is supported by direct comparison with the events in the $\mathrm{B}^{0}_{\mathrm{s}}$ sidebands, and by fits to the $\mathrm{B}^{0}_{\mathrm{s}}\pi^{\pm}$ invariant mass distribution with a resonant component included, using different kinematic selection requirements, as well as variants of the background modeling, fit regions, and quality criteria. Upper limits on the relative production rates of the X(5568) and $\mathrm{B}^{0}_{\mathrm{s}}$ states, multiplied by the unknown branching fraction of the $\mathrm{X}(5568)^{\pm}\to\mathrm{B}^{0}_{\mathrm{s}}\pi^{\pm}$ decay, are computed to be: $\rho_{\mathrm{X}} < $ 1.0% at 95% CL for $ p_{\mathrm{T}}(\mathrm{B}^{0}_{\mathrm{s}})> $ 15 GeV. The upper limits on $\rho_{\mathrm{X}}$ presented in this Letter are a factor of two more stringent than the previous best limits, and do not confirm the existence of the X(5568) state. Additionally, upper limits are set for different values of mass and natural width of a hypothetical exotic resonance decaying into $\mathrm{B}^{0}_{\mathrm{s}}\pi^{\pm}$. |
| References | ||||
| 1 | D0 Collaboration | Evidence for a $ \mathrm{B}^0_{\mathrm{s}} \pi^{\pm} $ state | PRL 117 (2016) 022003 | 1602.07588 |
| 2 | T. J. Burns and E. S. Swanson | Interpreting the X(5568) | PLB 760 (2016) 627 | 1603.04366 |
| 3 | F.-K. Guo, U.-G. Meissner, and B.-S. Zou | How the X(5568) challenges our understanding of QCD | Commun. Theor. Phys. 65 (2016) 593 | 1603.06316 |
| 4 | LHCb Collaboration | Search for structure in the $ \mathrm{B}^0_{\mathrm{s}}\pi^{\pm} $ invariant mass spectrum | PRL 117 (2016) 152003 | 1608.00435 |
| 5 | Particle Data Group, C. Patrignani et al. | Review of particle physics | CPC 40 (2016) 100001 | |
| 6 | CMS Collaboration | Description and performance of track and primary-vertex reconstruction with the CMS tracker | JINST 9 (2014) P10009 | CMS-TRK-11-001 1405.6569 |
| 7 | CMS Collaboration | Performance of CMS muon reconstruction in pp collision events at $ \sqrt{s} = $ 7 TeV | JINST 7 (2012) P10002 | CMS-MUO-10-004 1206.4071 |
| 8 | CMS Collaboration | The CMS experiment at the CERN LHC | JINST 3 (2008) S08004 | CMS-00-001 |
| 9 | CMS Collaboration | The CMS trigger system | JINST 12 (2017) P01020 | CMS-TRG-12-001 1609.02366 |
| 10 | CMS Collaboration | Measurement of the CP-violating weak phase $ \phi_s $ and the decay width difference $ \Delta \Gamma_s $ using the $ \mathrm{B}^0_{\mathrm{s}} \to \mathrm{J}/\psi \phi(1020) $ decay channel in pp collisions at $ \sqrt{s} = $ 8 TeV | PLB 757 (2016) 97 | CMS-BPH-13-012 1507.07527 |
| 11 | T. Sjostrand, S. Mrenna, and P. Skands | PYTHIA 6.4 physics and manual | JHEP 05 (2006) 026 | hep-ph/0603175 |
| 12 | D. J. Lange | The EvtGen particle decay simulation package | NIMA 462 (2001) 152 | |
| 13 | E. Barberio, B. van Eijk, and Z. Was | PHOTOS---a universal Monte Carlo for QED radiative corrections in decays | CPC 66 (1991) 115 | |
| 14 | E. Barberio and Z. Was | PHOTOS---a universal Monte Carlo for QED radiative corrections: version 2.0 | CPC 79 (1994) 291 | |
| 15 | GEANT4 Collaboration | GEANT4---a simulation toolkit | NIMA 506 (2003) 250 | |
| 16 | A. L. Read | Presentation of search results: the $ \mathrm{CL}_{S} $ technique | JPG 28 (2002) 2693 | |
| 17 | T. Junk | Confidence level computation for combining searches with small statistics | NIMA 434 (1999) 435 | hep-ex/9902006 |
| 18 | ATLAS and CMS Collaborations | Procedure for the LHC Higgs boson search combination in Summer 2011 | ATL-PHYS-PUB-2011-11, CMS NOTE-2011/005 | |
| 19 | A. Esposito, A. Pilloni, and A. D. Polosa | Hybridized tetraquarks | PLB 758 (2016) 292 | 1603.07667 |
| 20 | A. Ali, L. Maiani, A. D. Polosa, and V. Riquer | $ \mathrm{B}_{\mathrm{c}}^{\pm} $ decays into tetraquarks | PRD 94 (2016) 034036 | 1604.01731 |
|
|
Compact Muon Solenoid LHC, CERN |
|

|

|

|

|

|