

Compact Muon Solenoid
LHC, CERN
| CMS-EXO-16-021 ; CERN-EP-2016-230 | ||
| Search for high-mass Z$\gamma$ resonances in $\mathrm{ e }^+\mathrm{ e }^-\gamma$ and $\mu^+\mu^-\gamma$ final states in proton-proton collisions at $\sqrt{s}= $ 8 and 13 TeV | ||
| CMS Collaboration | ||
| 10 October 2016 | ||
| JHEP 01 (2017) 076 | ||
| Abstract: This paper describes the search for a high-mass narrow-width scalar particle decaying into a Z boson and a photon. The analysis is performed using proton-proton collision data recorded with the CMS detector at the LHC at center-of-mass energies of 8 and 13 TeV, corresponding to integrated luminosities of 19.7 and 2.7 fb$^{-1}$, respectively. The Z bosons are reconstructed from opposite-sign electron or muon pairs. No statistically significant deviation from the standard model predictions has been found in the 200-2000 GeV mass range. Upper limits at 95% confidence level have been derived on the product of the scalar particle production cross section and the branching fraction of the Z decaying into electrons or muons, which range from 280 to 20 fb for resonance masses between 200 and 2000 GeV. | ||
| Links: e-print arXiv:1610.02960 [hep-ex] (PDF) ; CDS record ; inSPIRE record ; CADI line (restricted) ; | ||
| Figures | |
png pdf |
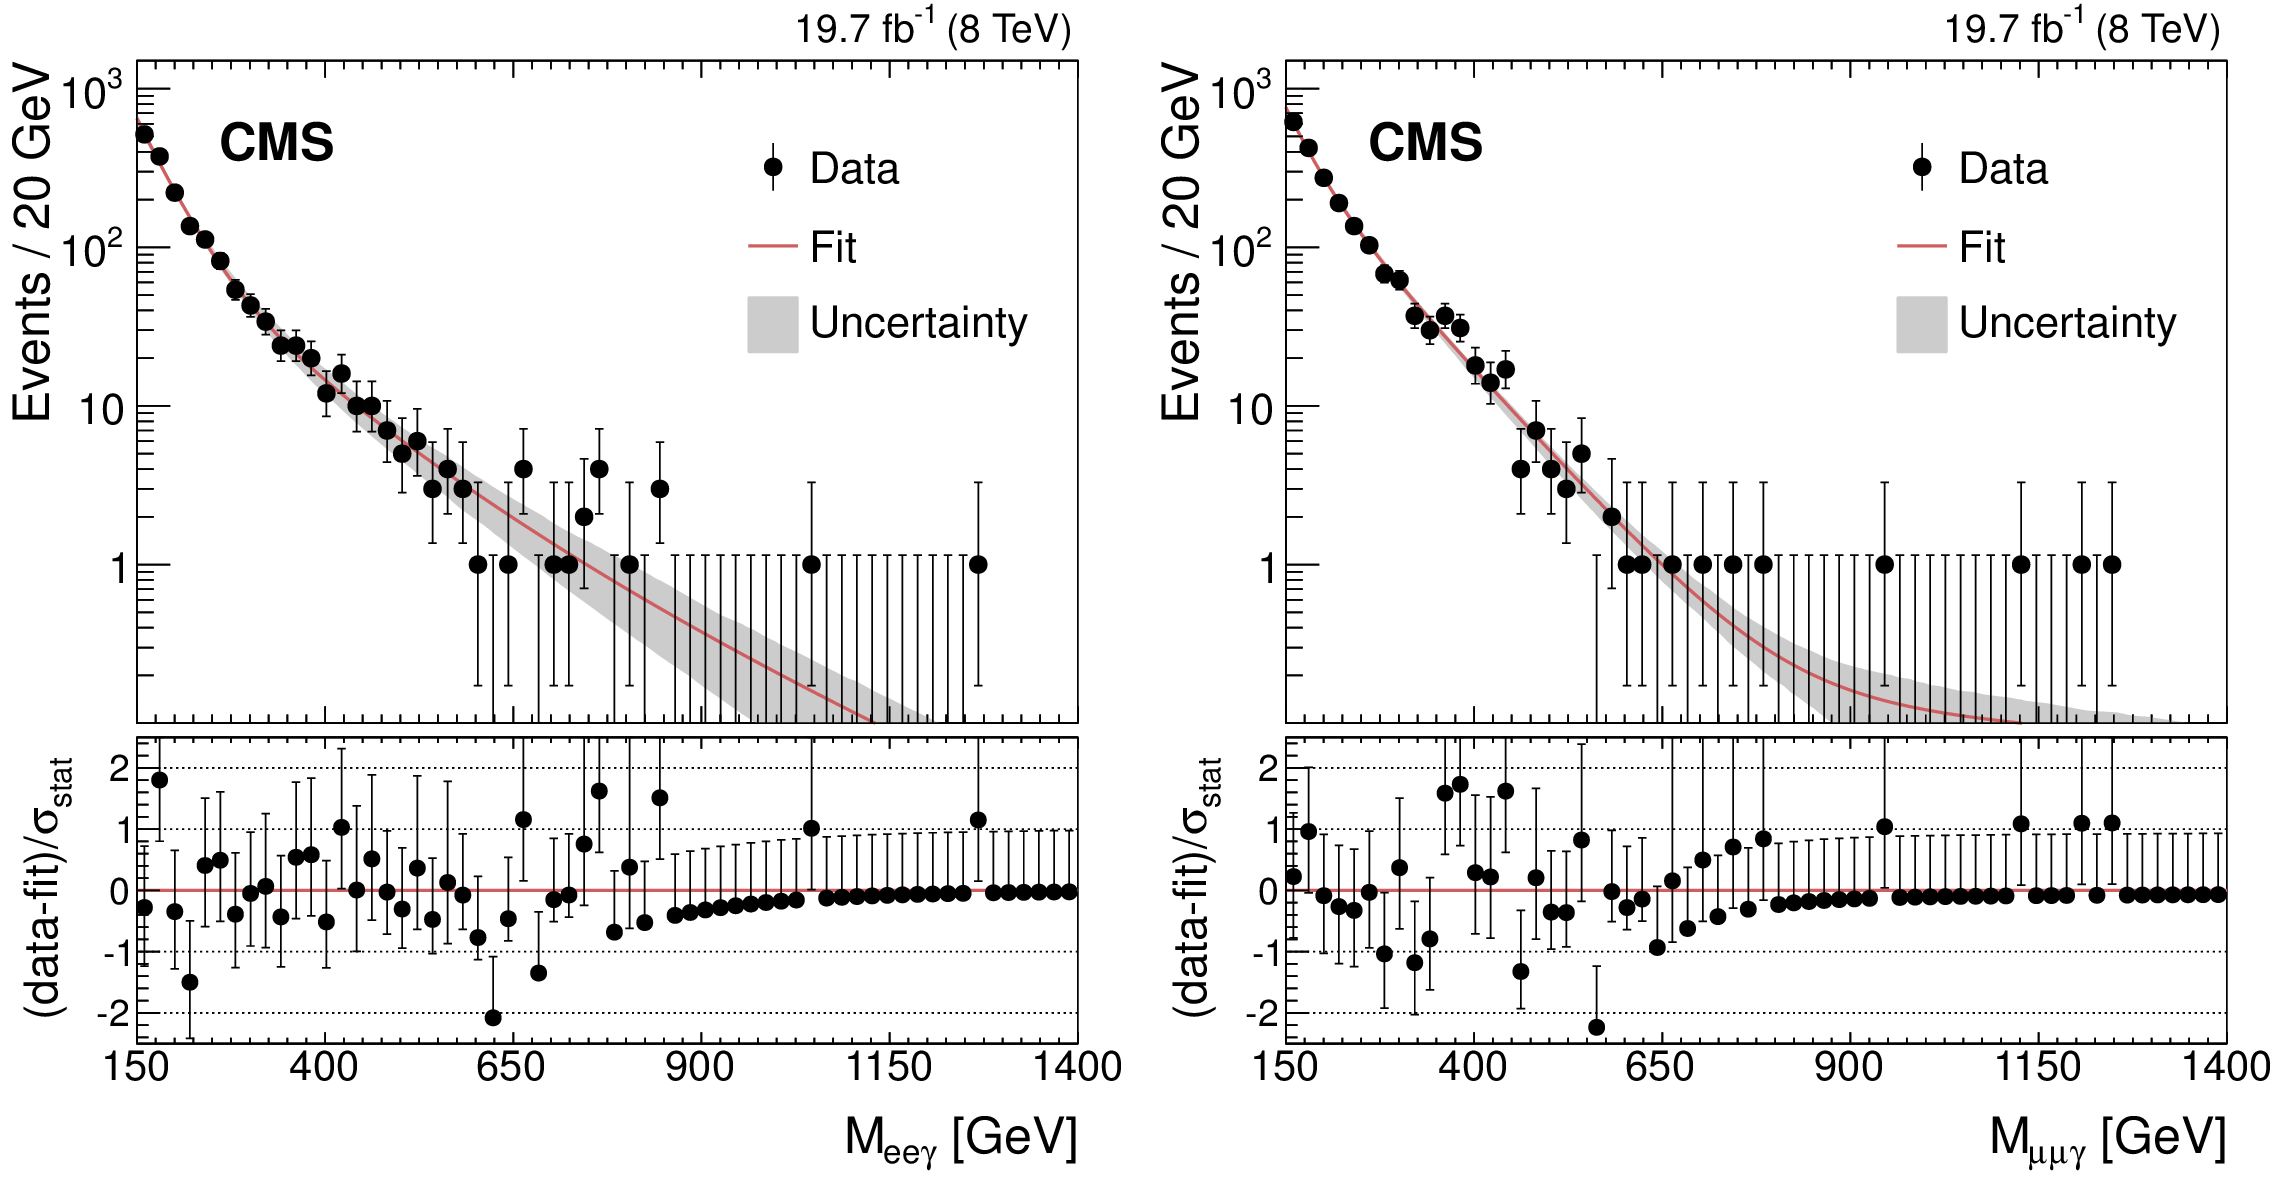
Figure 1:
Observed $ {{M}_{\ell \ell \gamma }} $ invariant mass spectra in the 8 TeV data, for the $ {\mathrm{ e } ^+\mathrm{ e } ^-\gamma } $(left) and the $ {\mu ^+\mu ^-\gamma } $ (right) channels. The fitted function is represented by a line, with the 68% uncertainty band as grey shading. The lower panels show the difference between the data and the fit, divided by the uncertainty $\sigma _\text {stat}$, that includes the statistical uncertainty in both the data and the fit. For bins with a low number of data entries, the error bars correspond to the Garwood confidence intervals. |
png pdf |
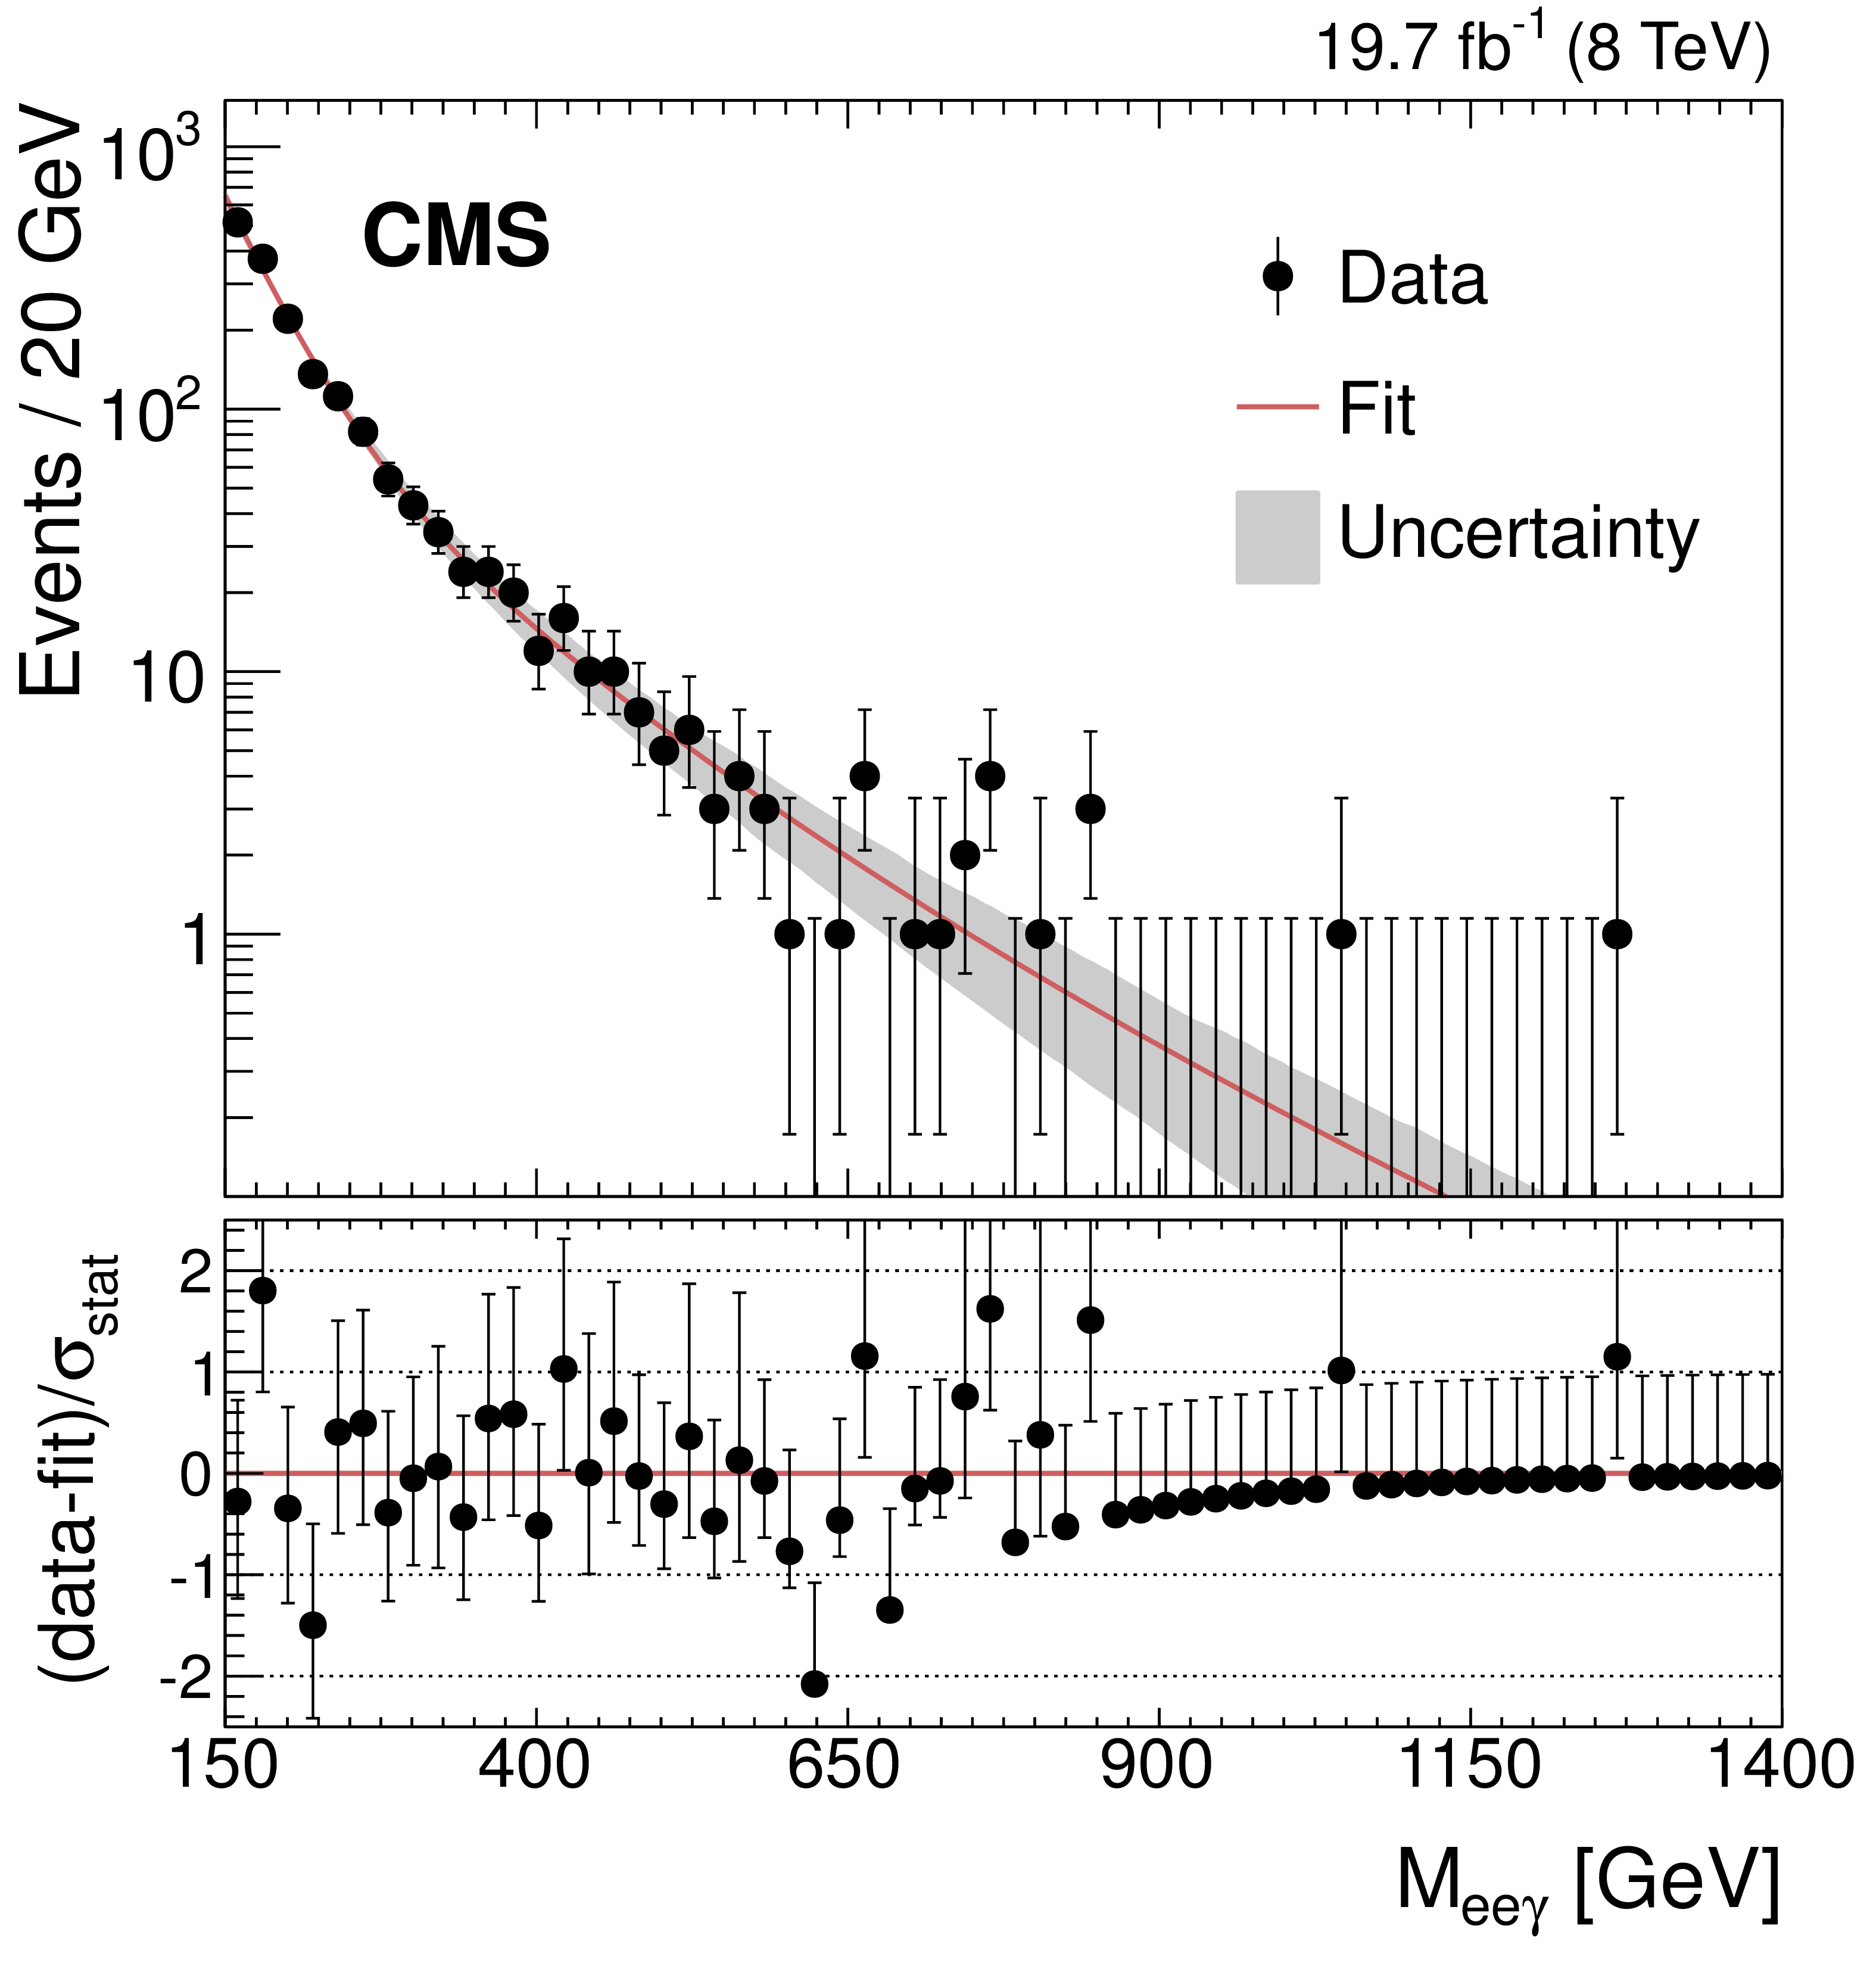
Figure 1-a:
Observed $ {{M}_{\mathrm{ e } ^+\mathrm{ e } ^- \gamma }} $ invariant mass spectrum in the 8 TeV data. The fitted function is represented by a line, with the 68% uncertainty band as grey shading. The lower panels show the difference between the data and the fit, divided by the uncertainty $\sigma _\text {stat}$, that includes the statistical uncertainty in both the data and the fit. For bins with a low number of data entries, the error bars correspond to the Garwood confidence intervals. |
png pdf |
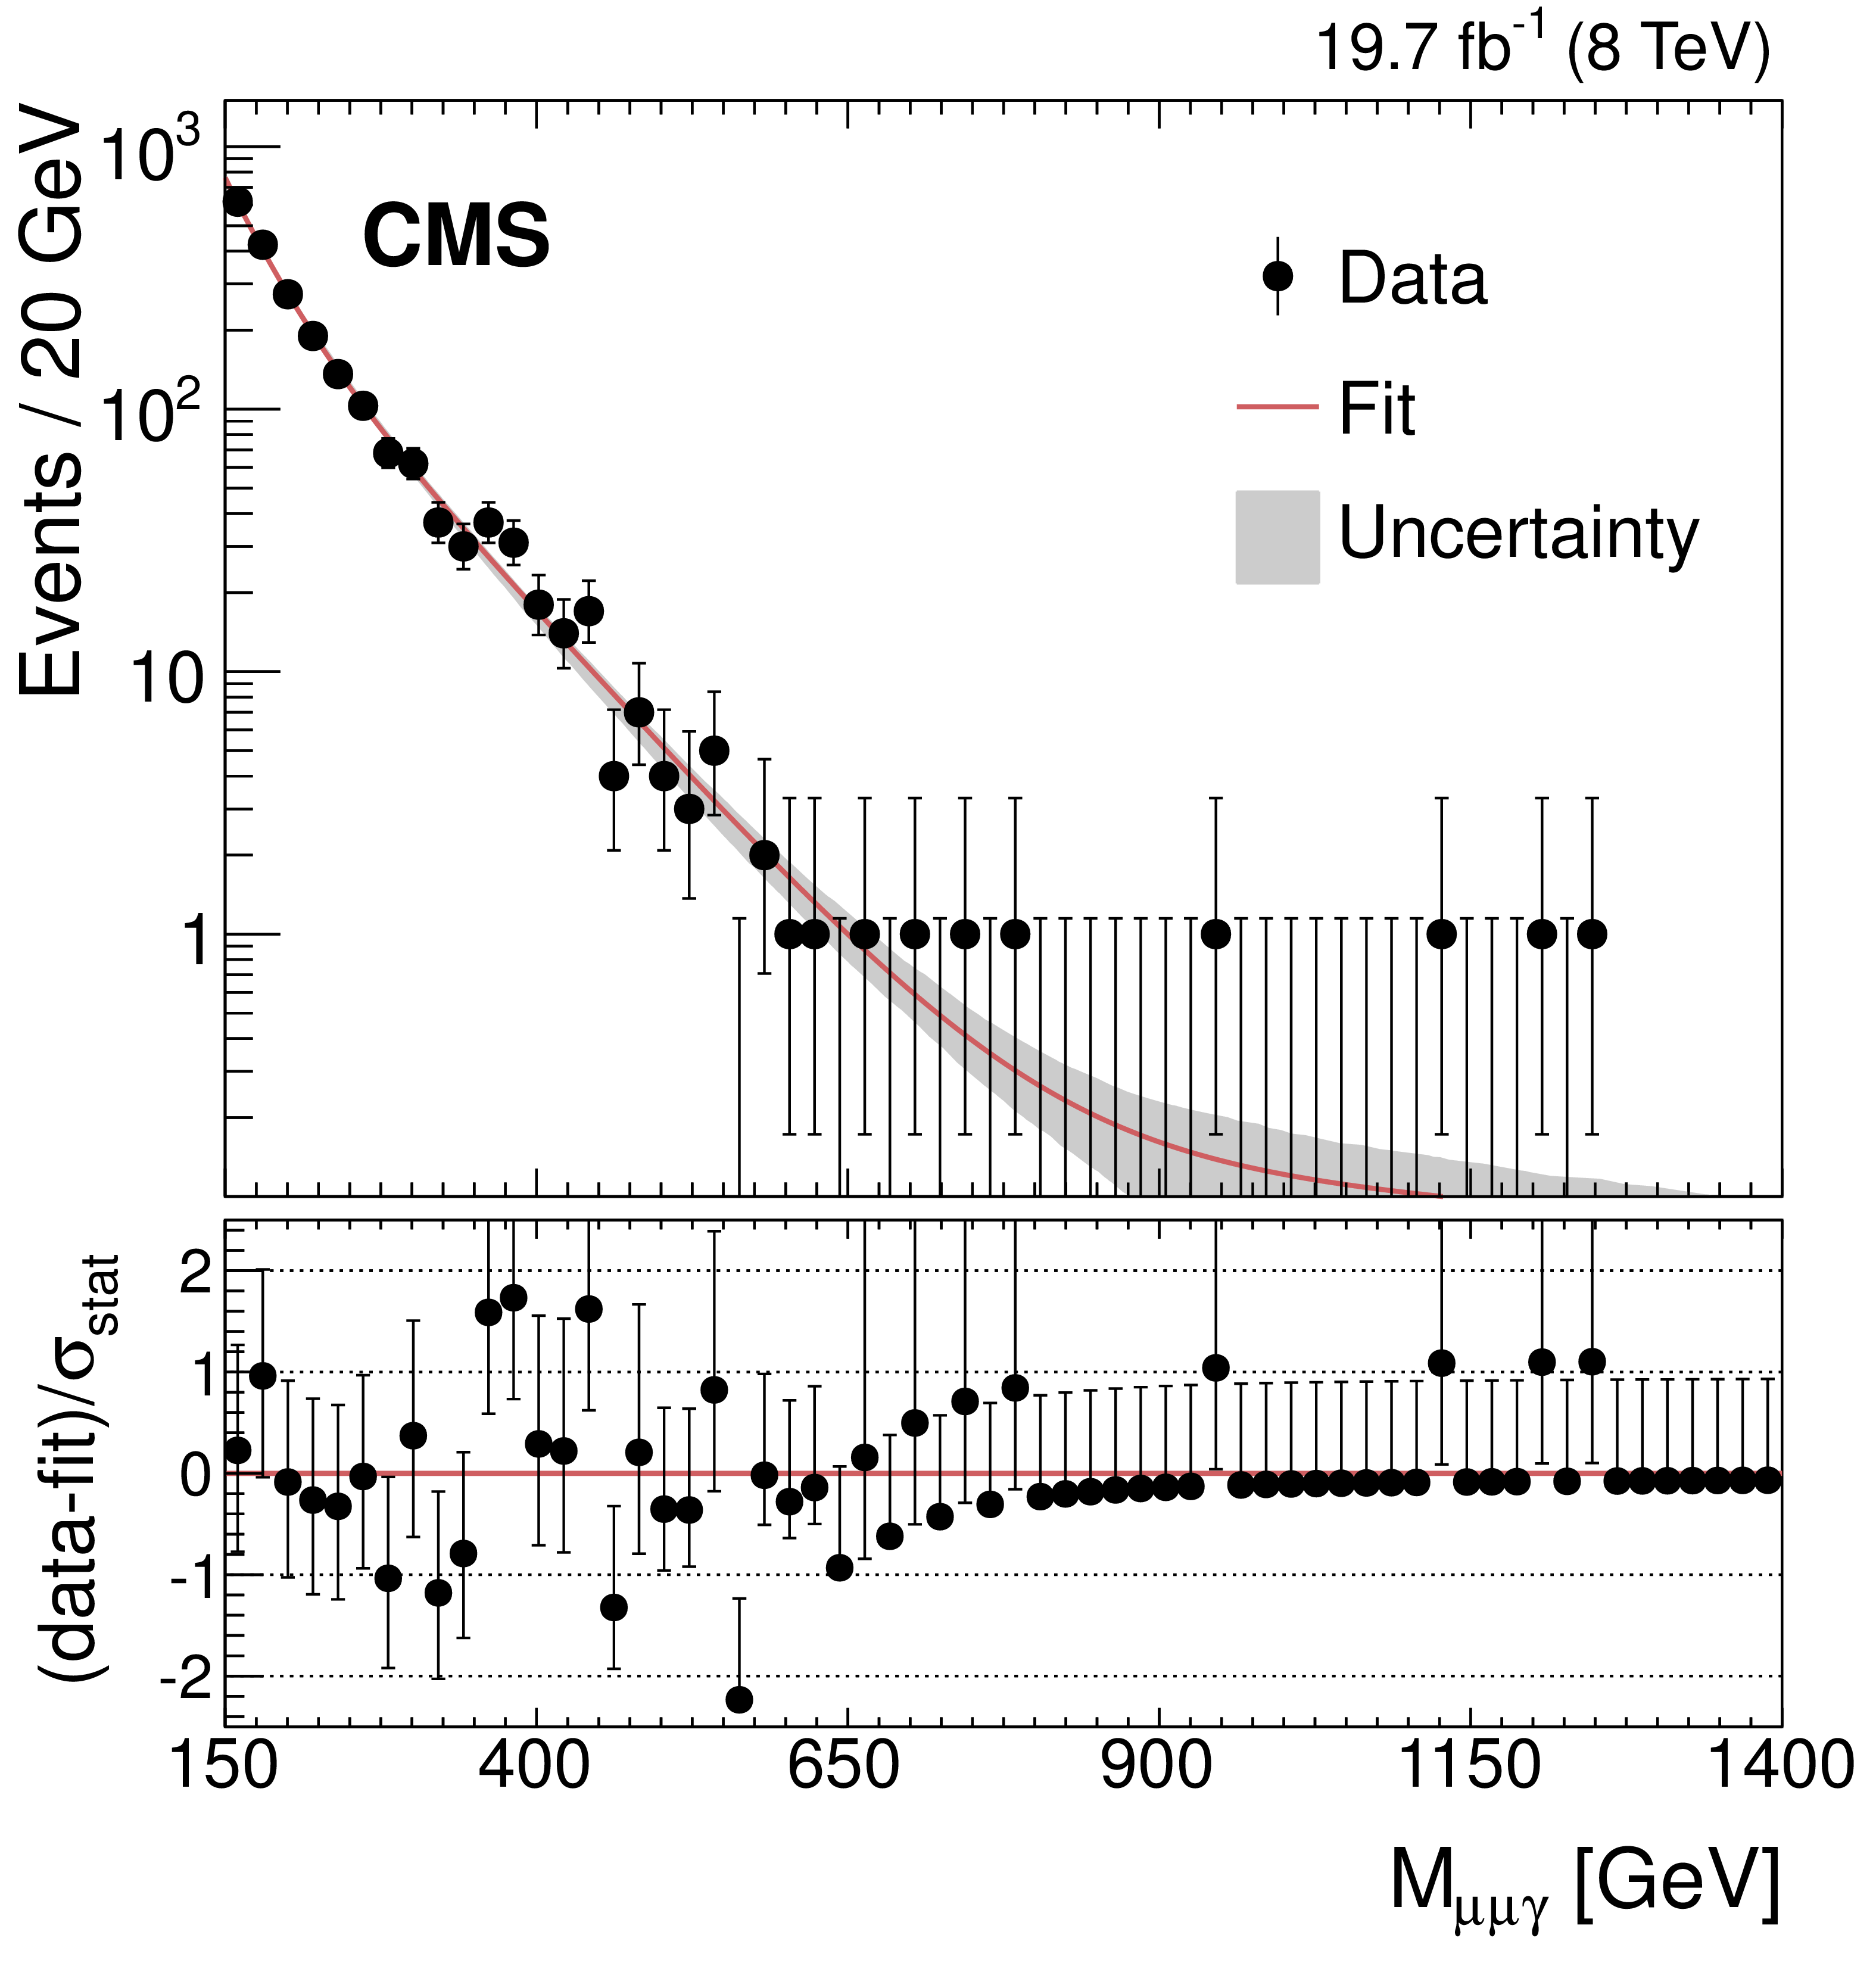
Figure 1-b:
Observed $ {{M}_{\mu ^+\mu ^-\gamma }} $ invariant mass spectrum in the 8 TeV data. The fitted function is represented by a line, with the 68% uncertainty band as grey shading. The lower panels show the difference between the data and the fit, divided by the uncertainty $\sigma _\text {stat}$, that includes the statistical uncertainty in both the data and the fit. For bins with a low number of data entries, the error bars correspond to the Garwood confidence intervals. |
png pdf |
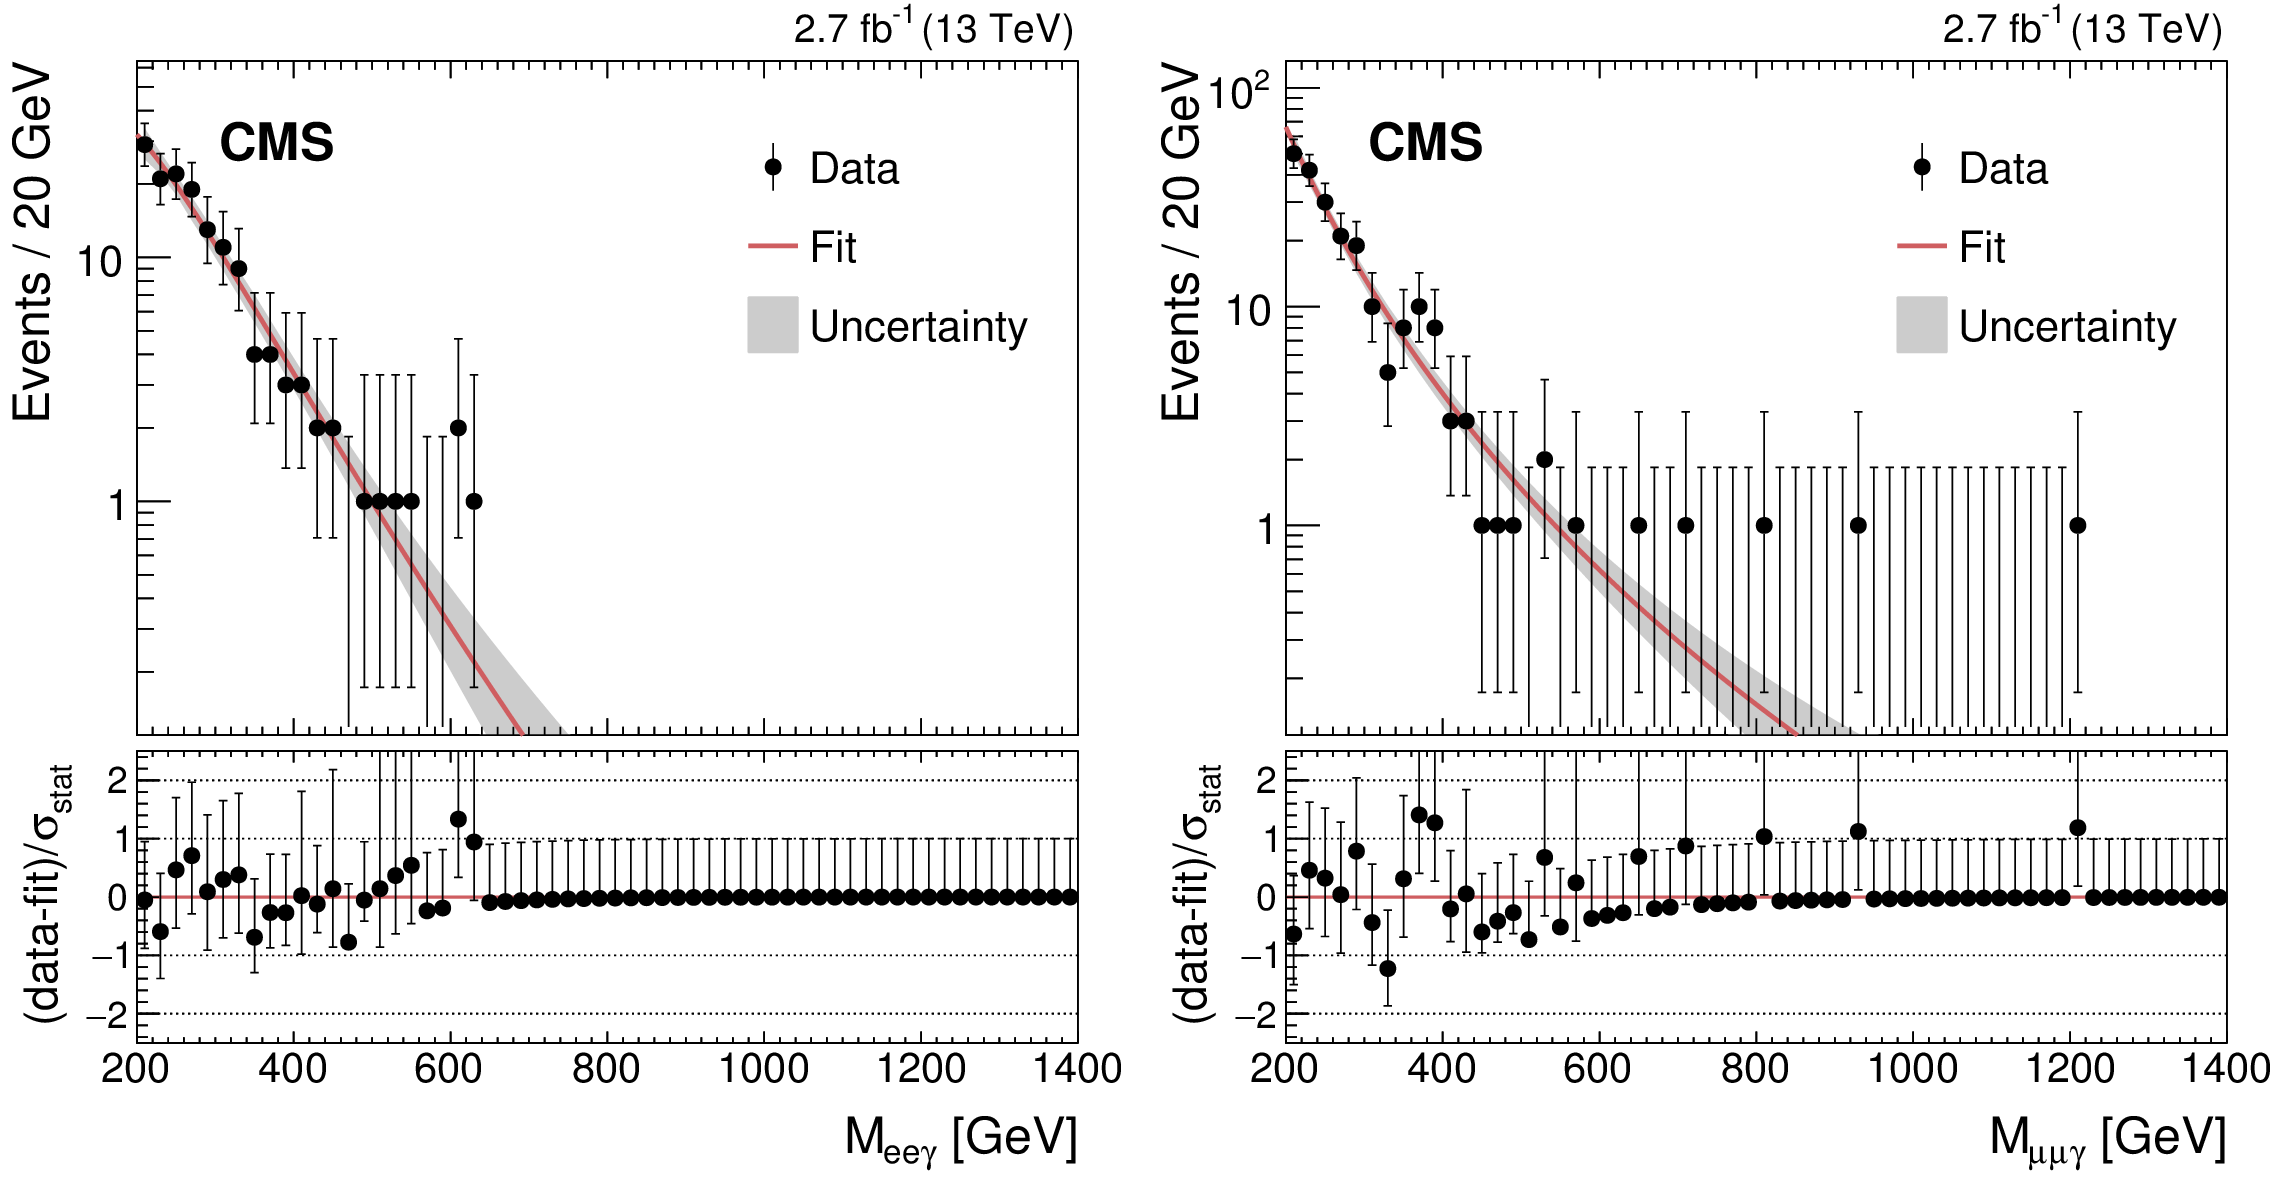
Figure 2:
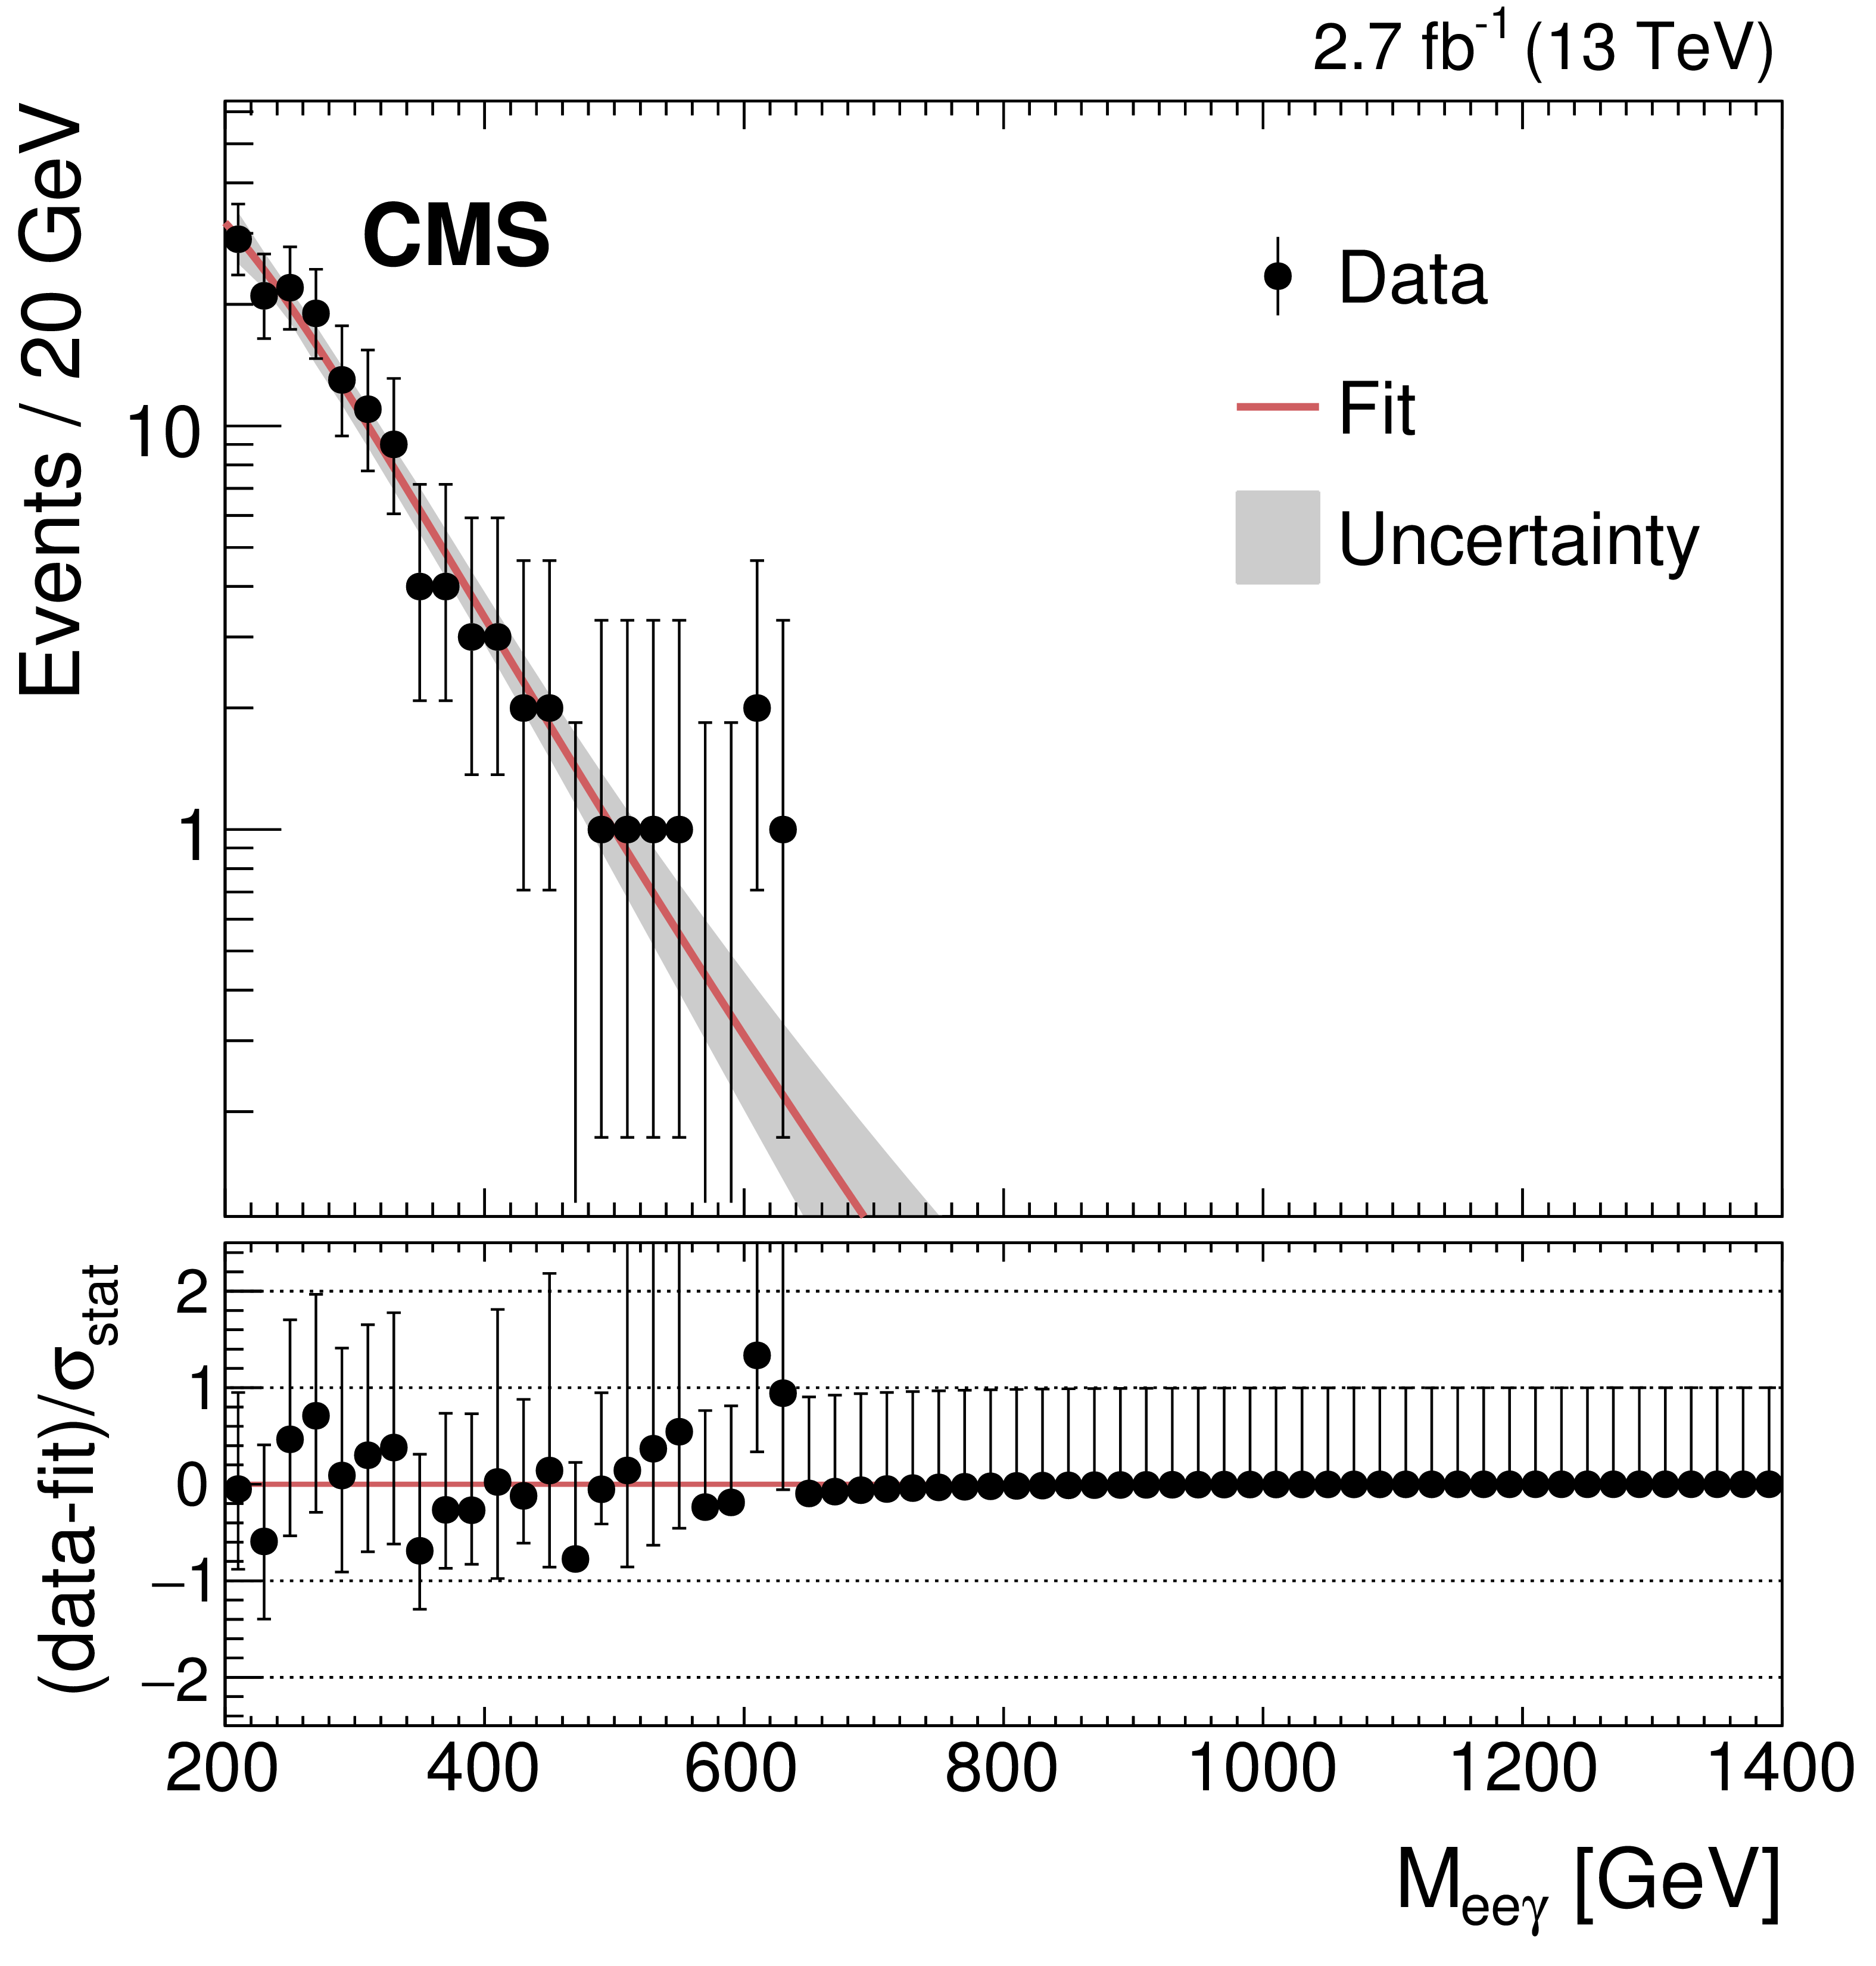
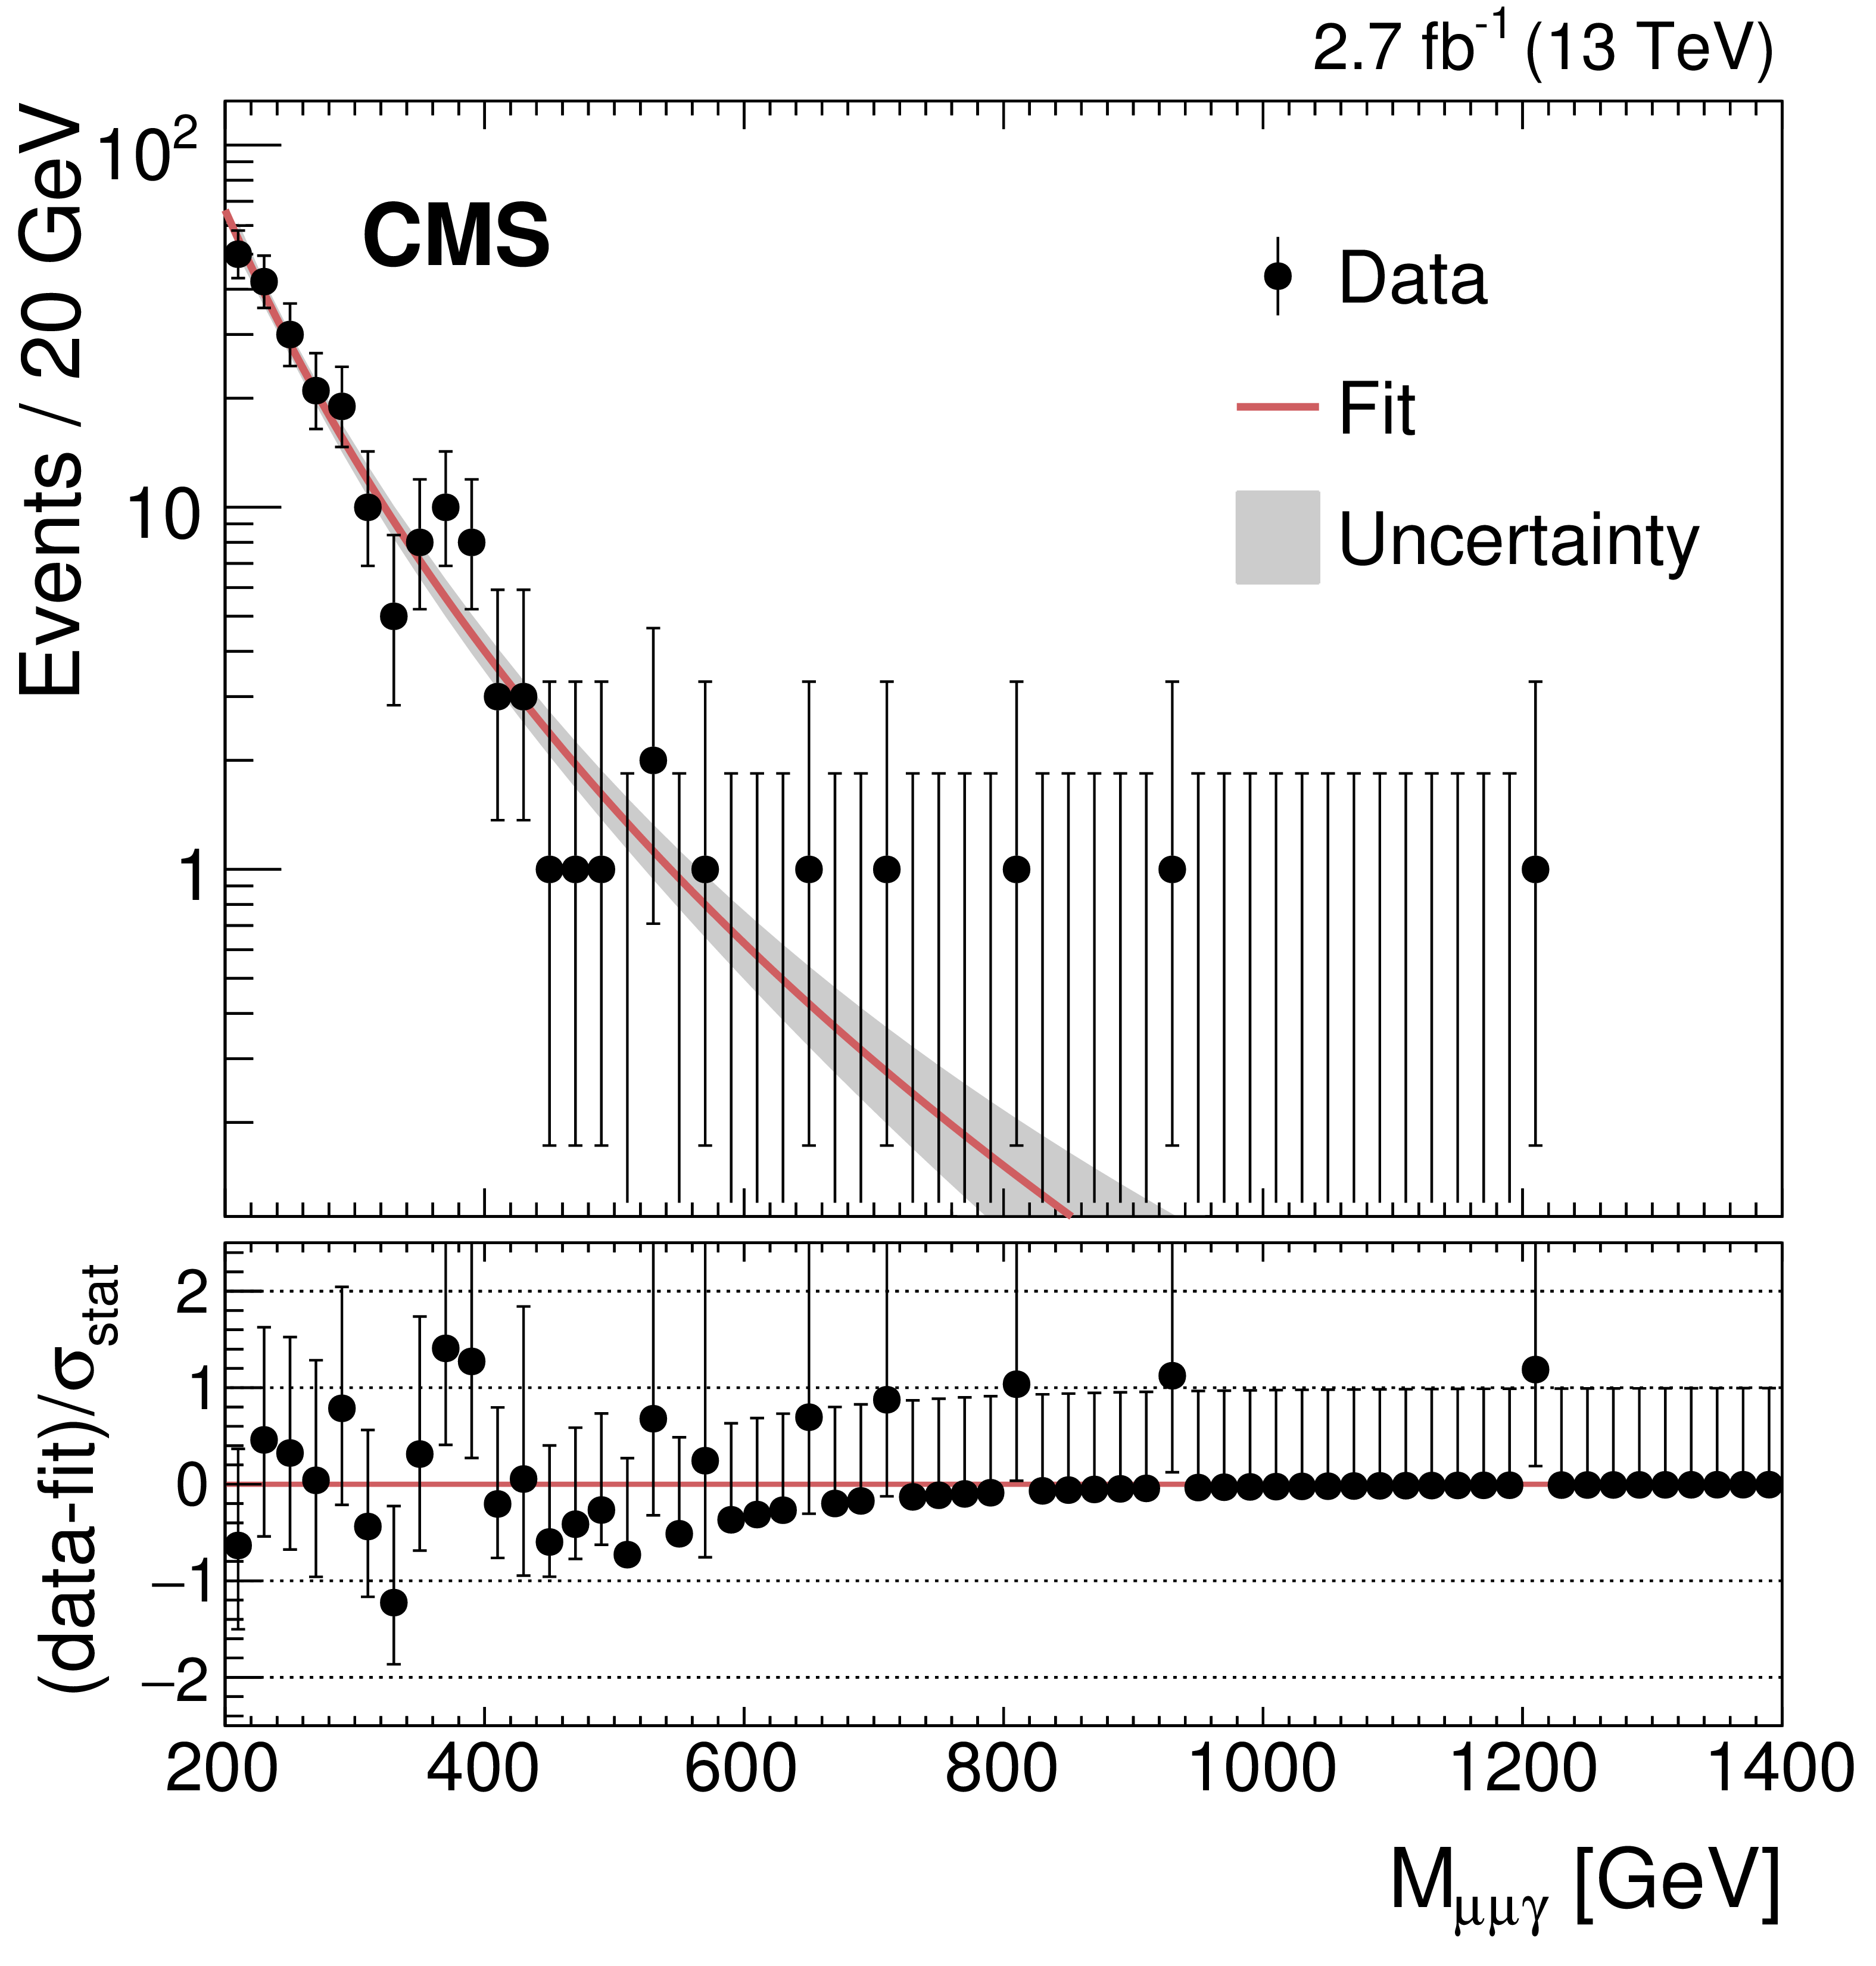
Observed $ {{M}_{\ell \ell \gamma }} $ invariant mass spectra in the 13 TeV data, for the $ {\mathrm{ e } ^+\mathrm{ e } ^-\gamma } $(left) and the $ {\mu ^+\mu ^-\gamma } $ (right) channels. The fitted function is represented by a line, with the 68% uncertainty band as gray shading. The lower panels show the difference between the data and the fit, divided by the uncertainty $\sigma _\text {stat}$, which includes the statistical uncertainty in both the data and the fit. For bins with a low number of data entries, the error bars correspond to the Garwood confidence intervals. |
png pdf |
Figure 2-a:
Observed $ {{M}_{\mathrm{ e } ^+\mathrm{ e } ^- \gamma }} $ invariant mass spectrum in the 13 TeV data. The fitted function is represented by a line, with the 68% uncertainty band as gray shading. The lower panels show the difference between the data and the fit, divided by the uncertainty $\sigma _\text {stat}$, which includes the statistical uncertainty in both the data and the fit. For bins with a low number of data entries, the error bars correspond to the Garwood confidence intervals. |
png pdf |
Figure 2-b:
Observed $ {{M}_{\mu ^+\mu ^-\gamma }} $ invariant mass spectrum in the 13 TeV data. The fitted function is represented by a line, with the 68% uncertainty band as gray shading. The lower panels show the difference between the data and the fit, divided by the uncertainty $\sigma _\text {stat}$, which includes the statistical uncertainty in both the data and the fit. For bins with a low number of data entries, the error bars correspond to the Garwood confidence intervals. |

png pdf |
Figure 3:
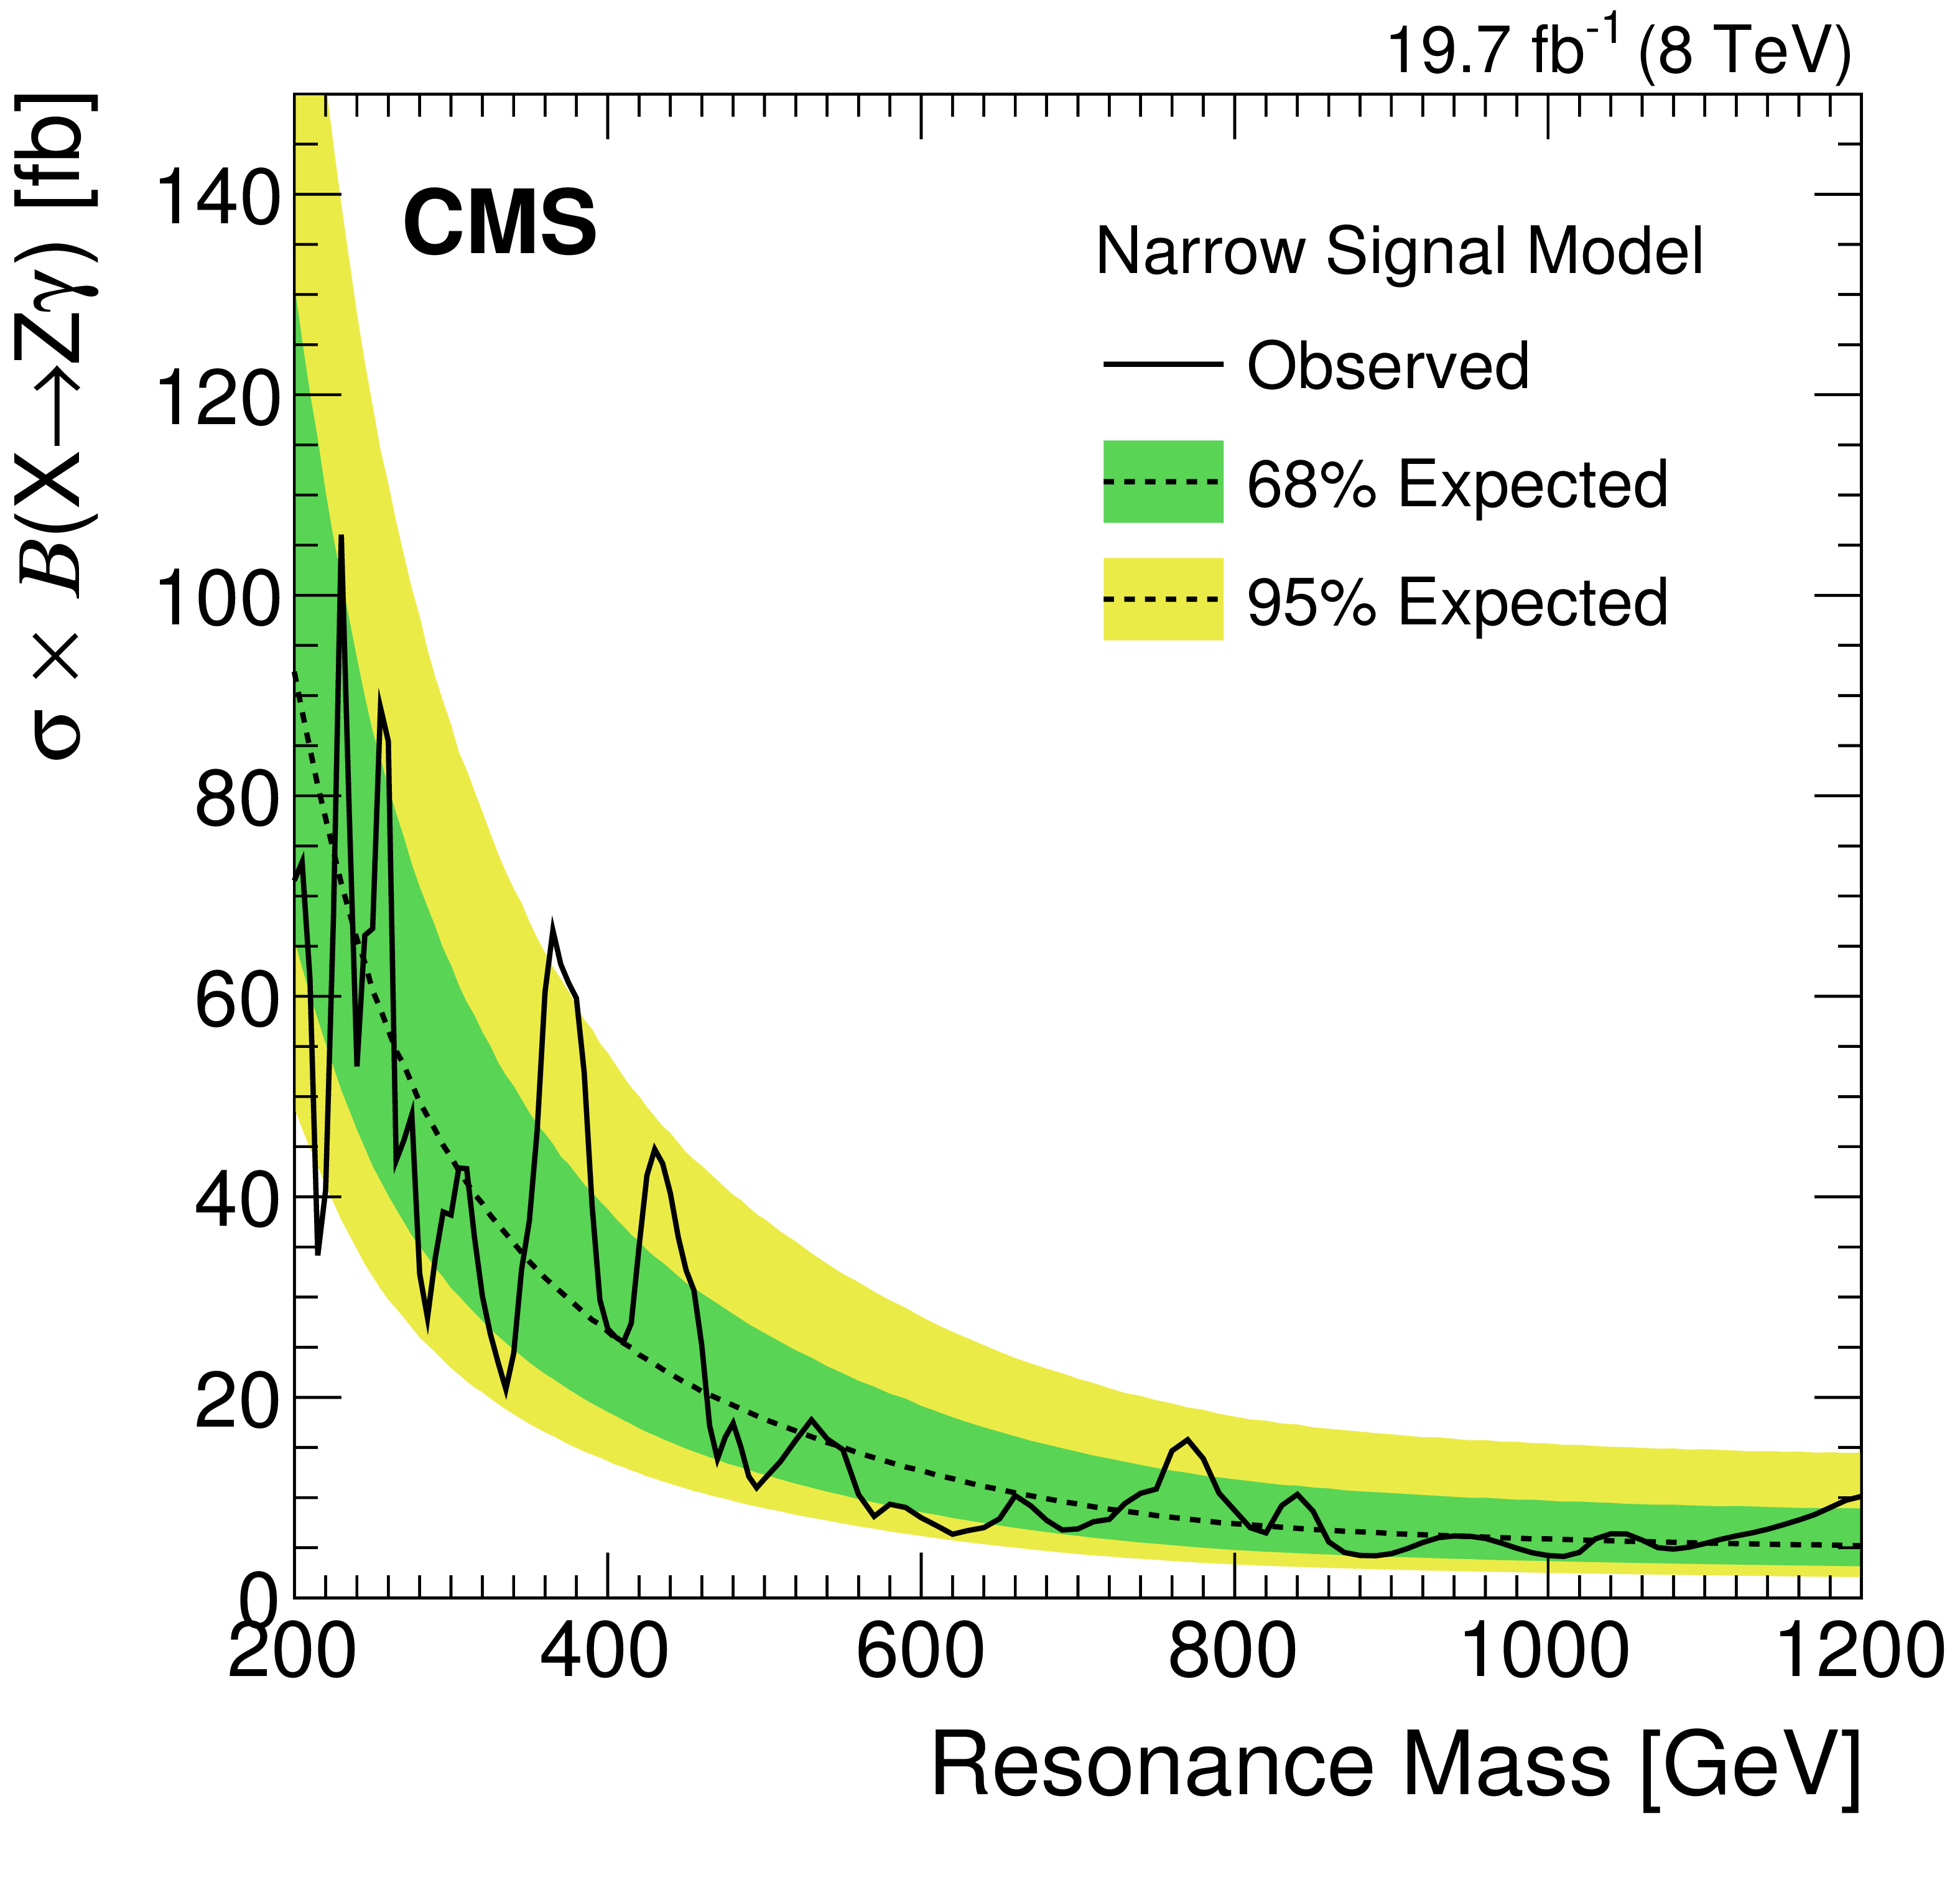
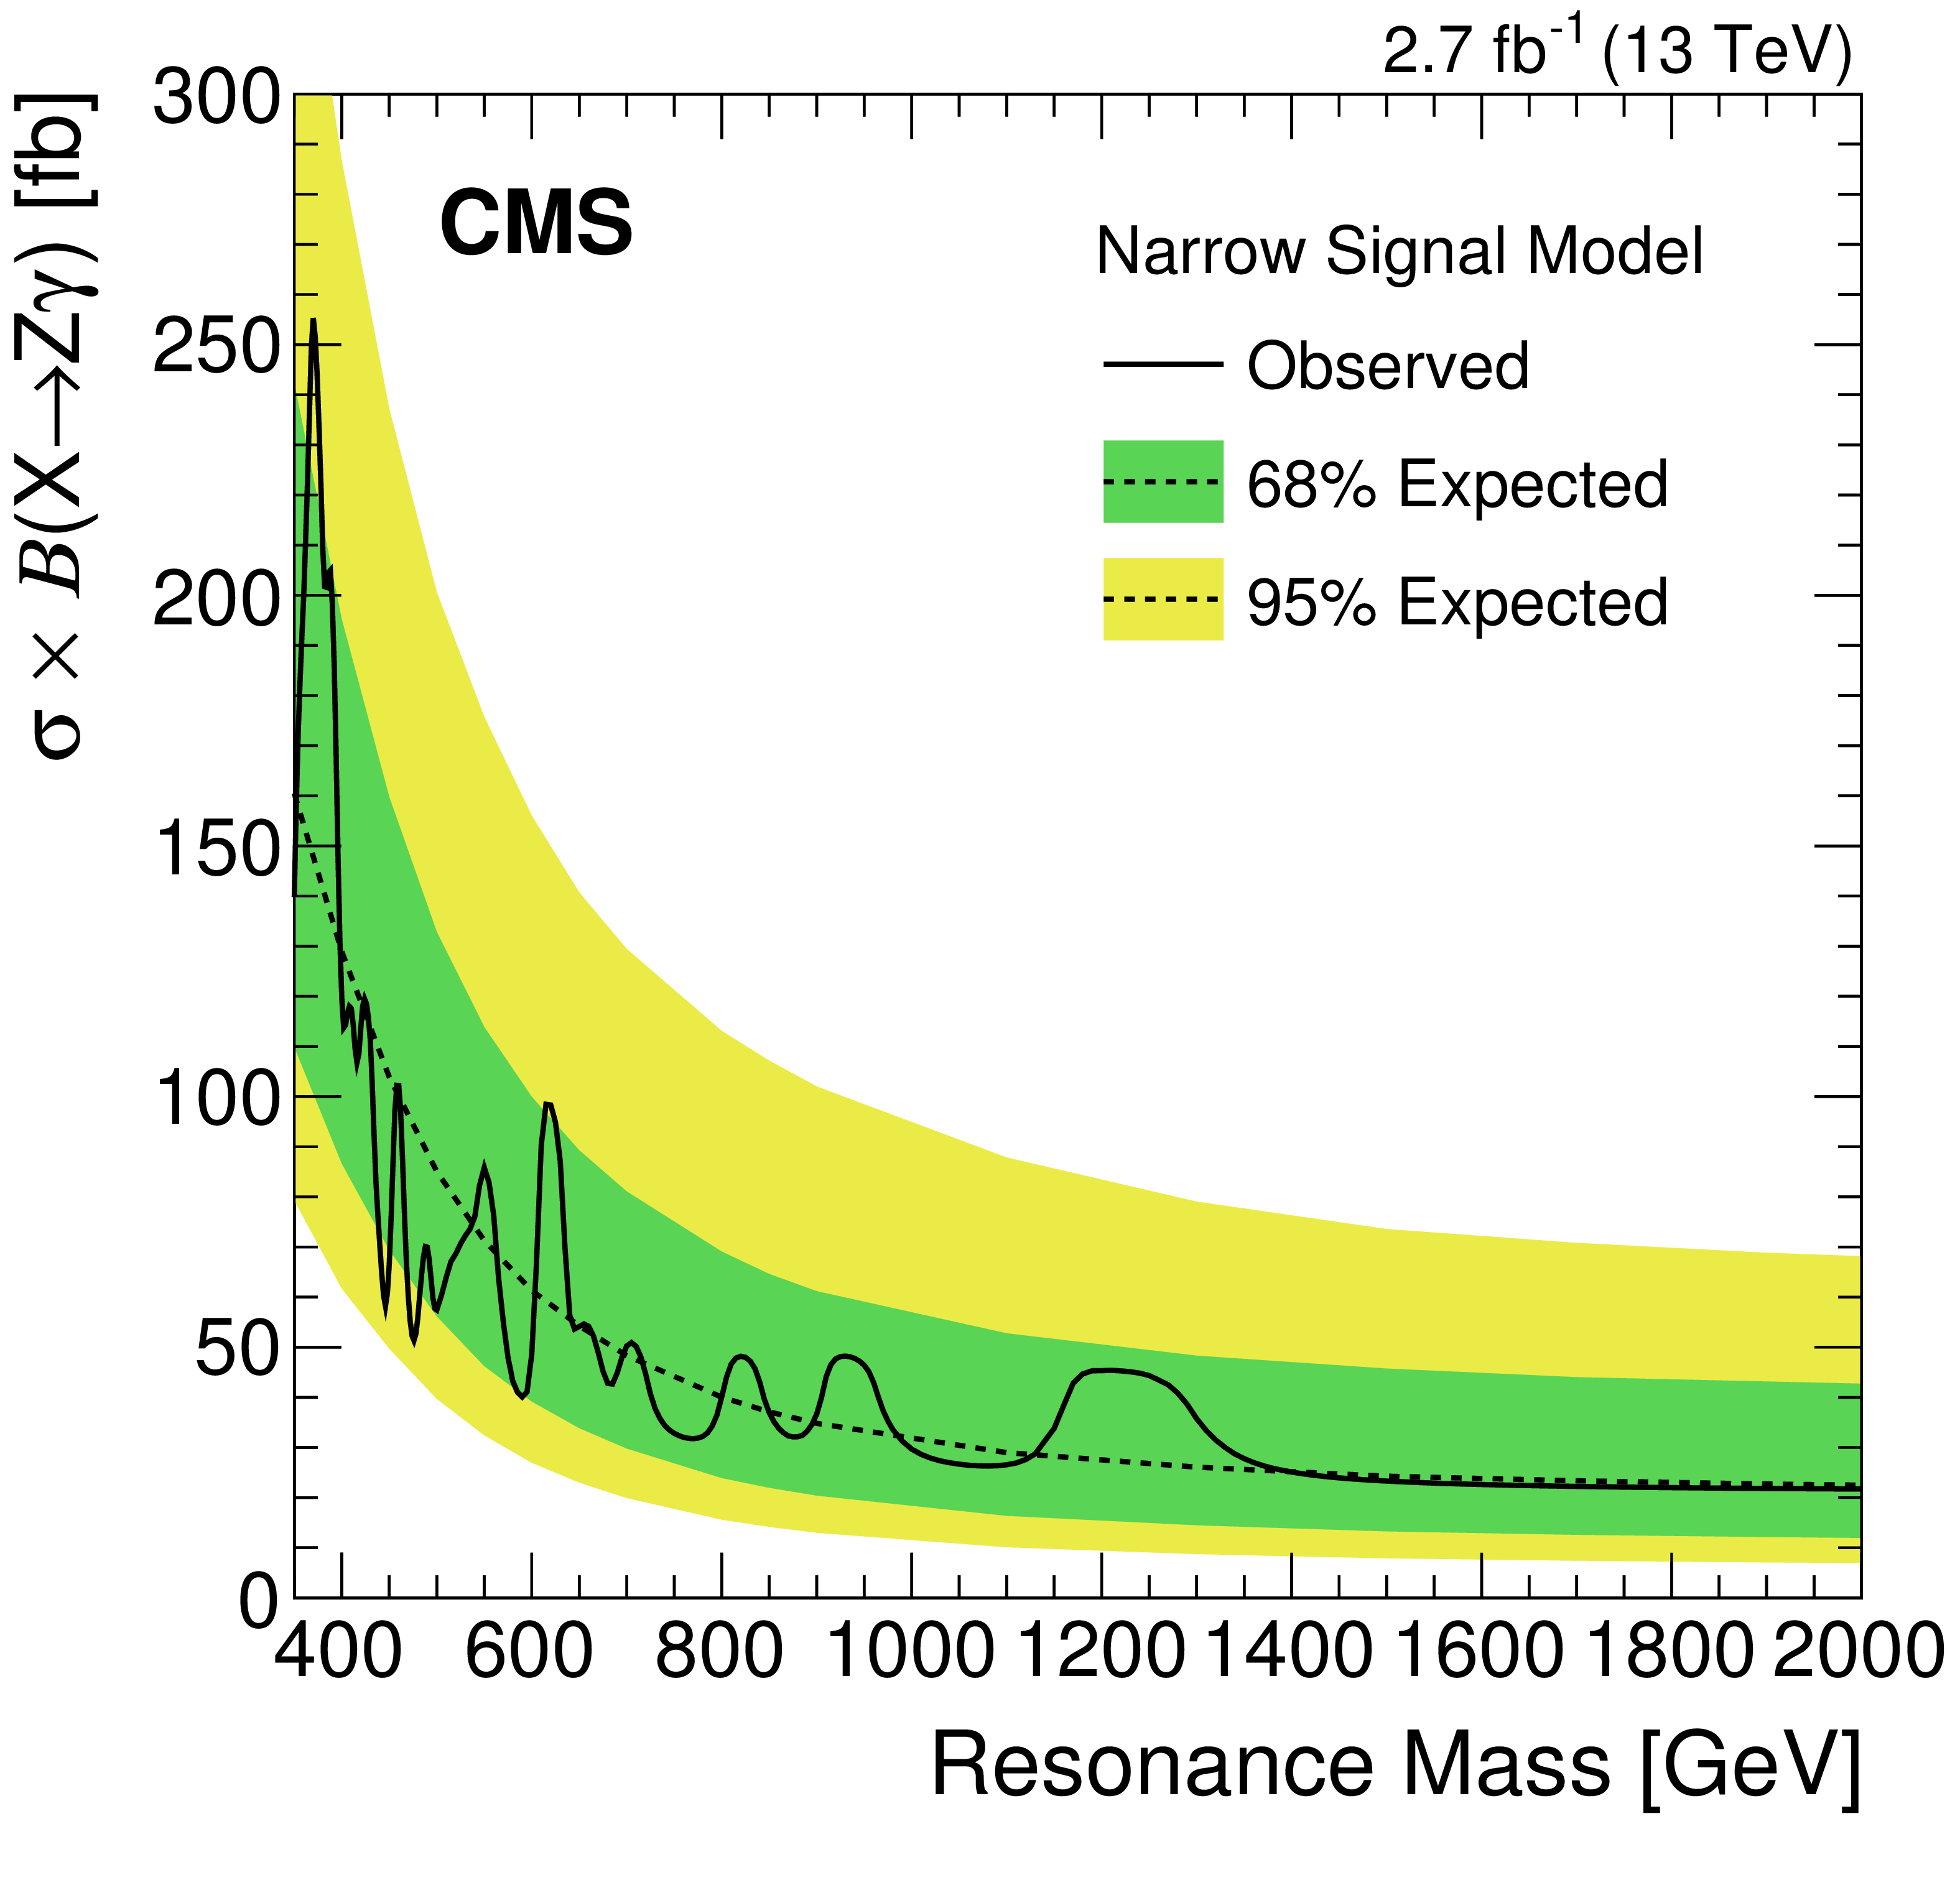
Expected and observed upper limits, at 95% CL, on the cross section times branching fraction for ${\mathrm{X} }\to {\mathrm{ Z } } \gamma $ obtained with the searches performed at 8 TeV (left) and at 13 TeV (right). |
png pdf |
Figure 3-a:
Expected and observed upper limits, at 95% CL, on the cross section times branching fraction for ${\mathrm{X} }\to {\mathrm{ Z } } \gamma $ obtained with the searches performed at 8 TeV. |
png pdf |
Figure 3-b:
Expected and observed upper limits, at 95% CL, on the cross section times branching fraction for ${\mathrm{X} }\to {\mathrm{ Z } } \gamma $ obtained with the searches performed at 13 TeV. |
png pdf |
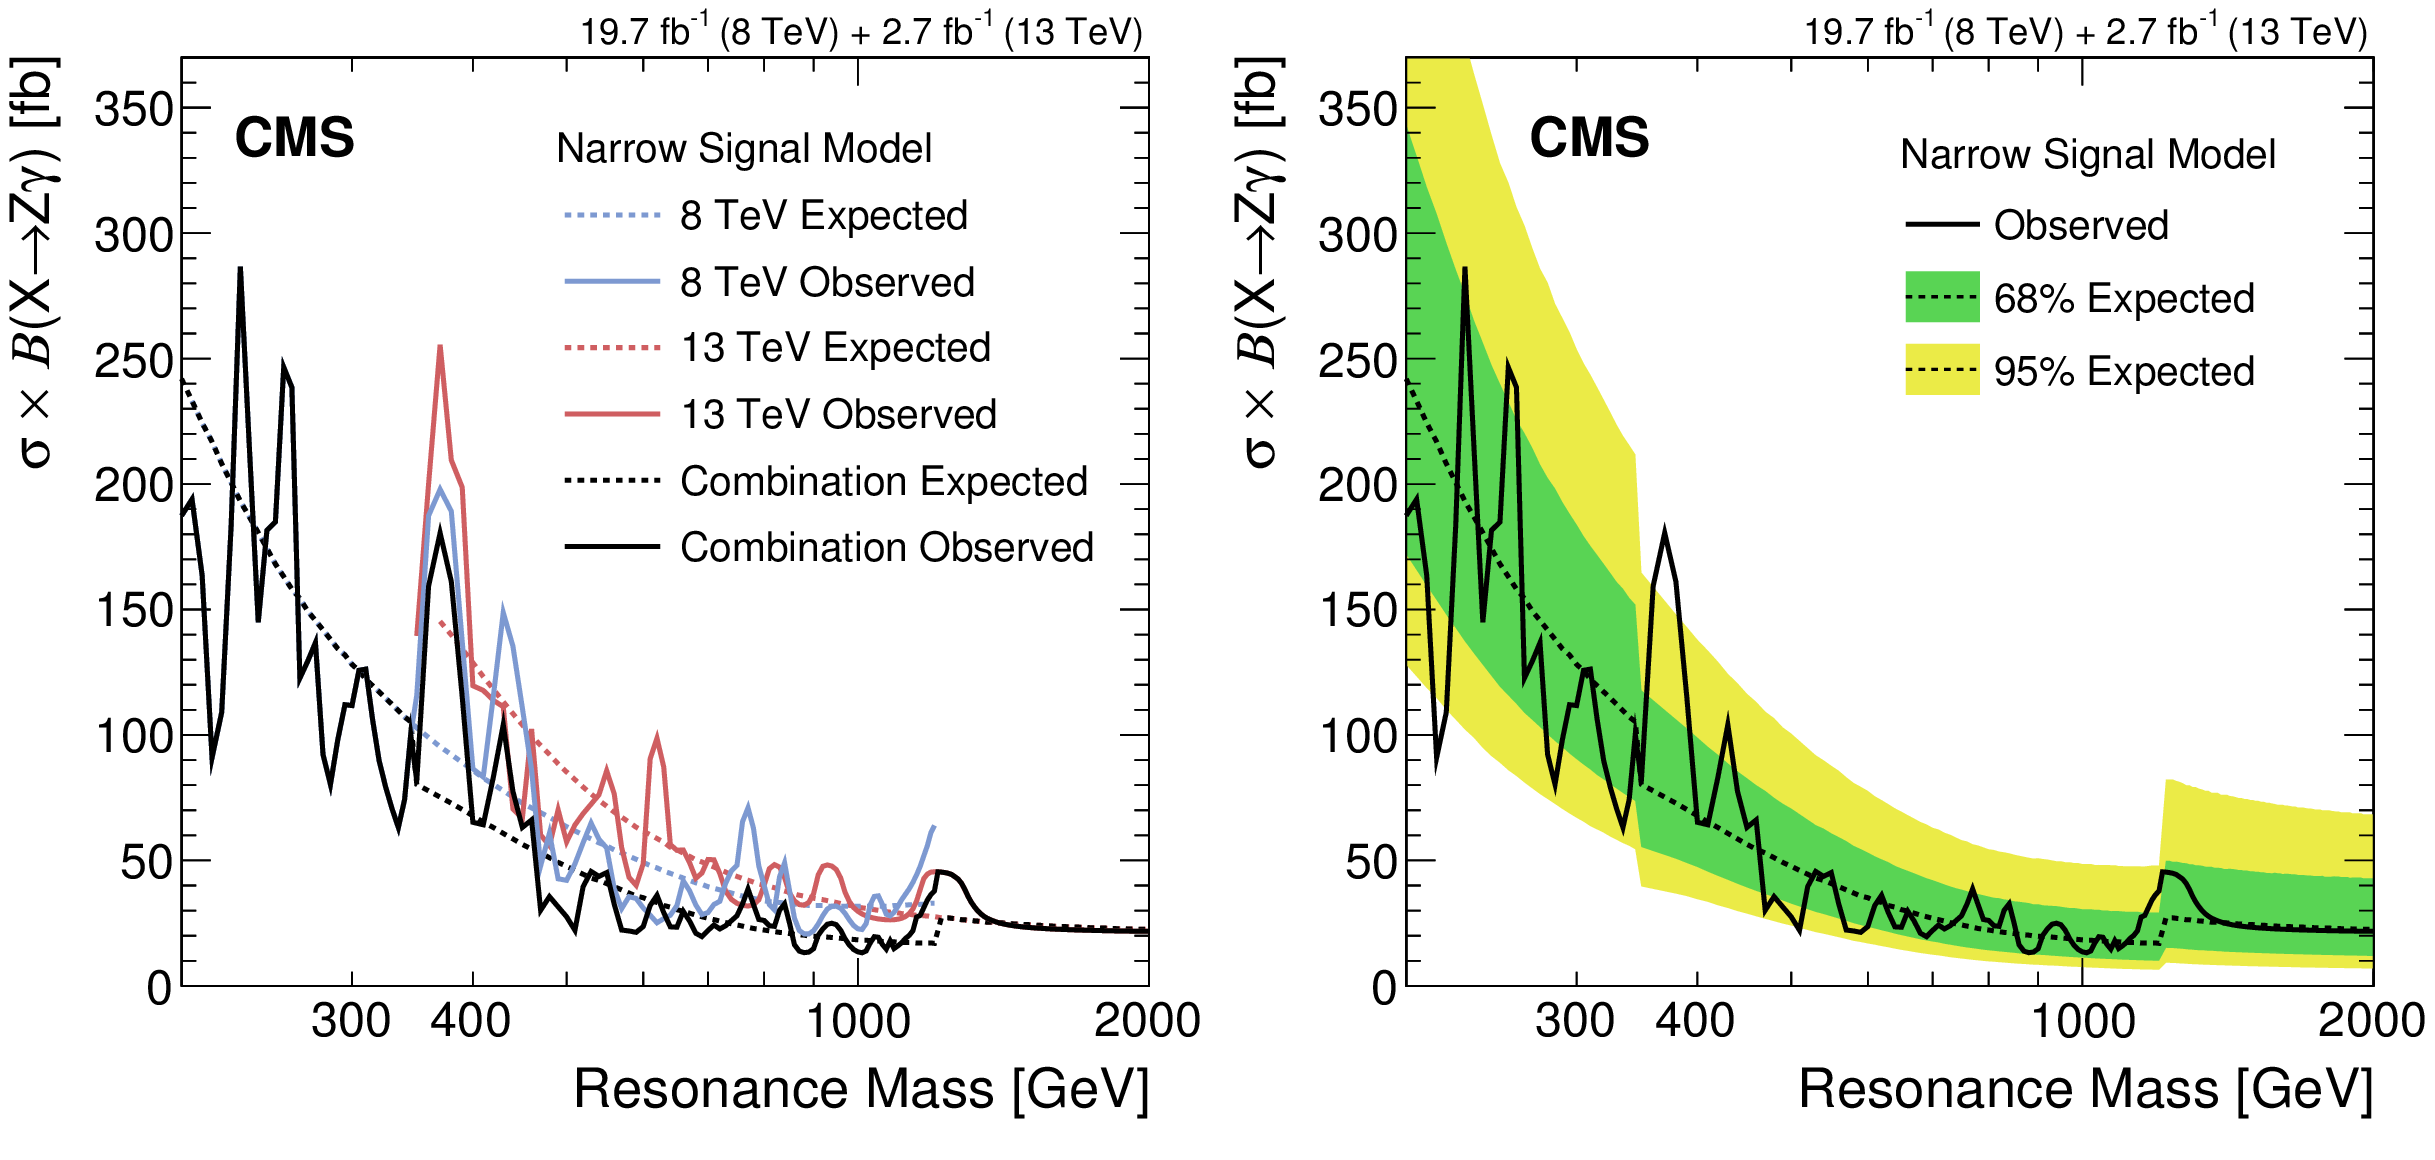
Figure 4:
Left: expected and observed upper limits, at 95% CL, on the 13 TeV cross section $\sigma _{13 TeV }({\mathrm{X} } \to {\mathrm{ Z } } \gamma )$ for the scaled 8 TeV (blue, lighter) and 13 TeV (red, darker) searches, together with their combination(black). Expected limits are shown with dashed lines, observed ones with solid lines. Right: 95% CL upper limit for the combination of 8 TeV and 13 TeV data. The solid(dashed) line represents the observed(expected) limit, whereas the inner green(outer yellow) bands represent the 68%(95%) uncertainty bands. |
png pdf |
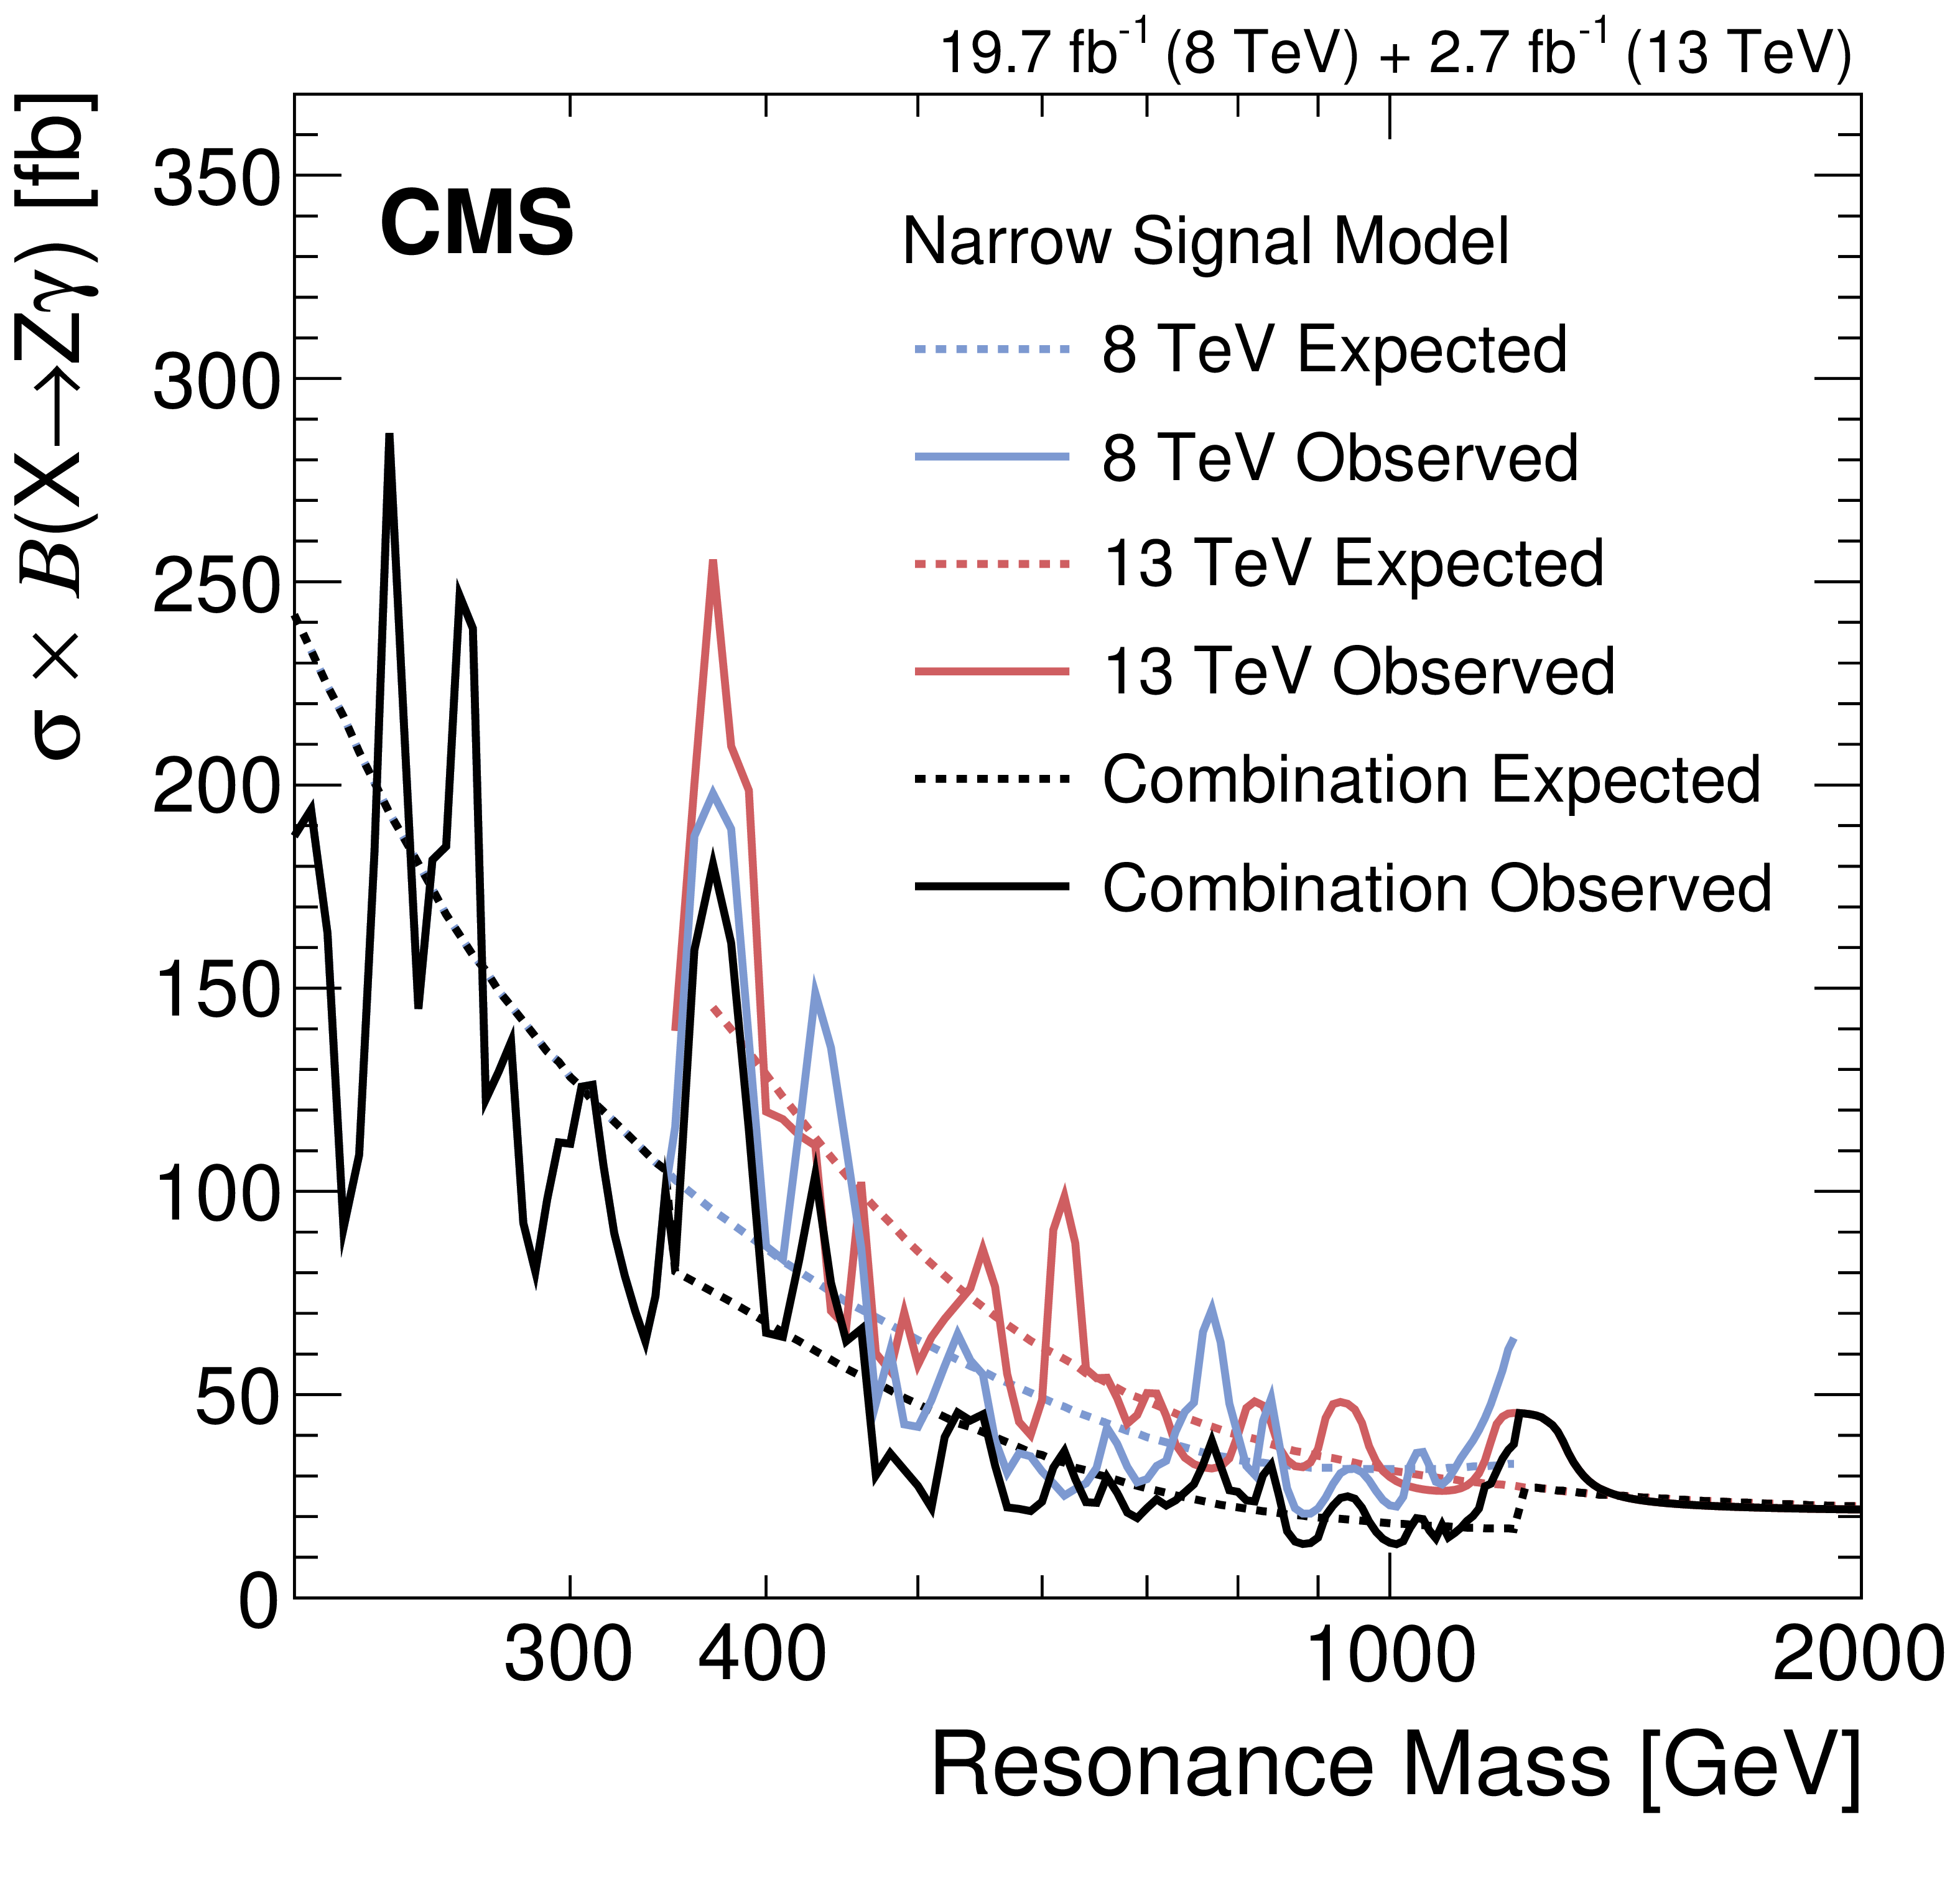
Figure 4-a:
Expected and observed upper limits, at 95% CL, on the 13 TeV cross section $\sigma _{13 TeV }({\mathrm{X} } \to {\mathrm{ Z } } \gamma )$ for the scaled 8 TeV (blue, lighter) and 13 TeV (red, darker) searches, together with their combination(black). Expected limits are shown with dashed lines, observed ones with solid lines. |
png pdf |
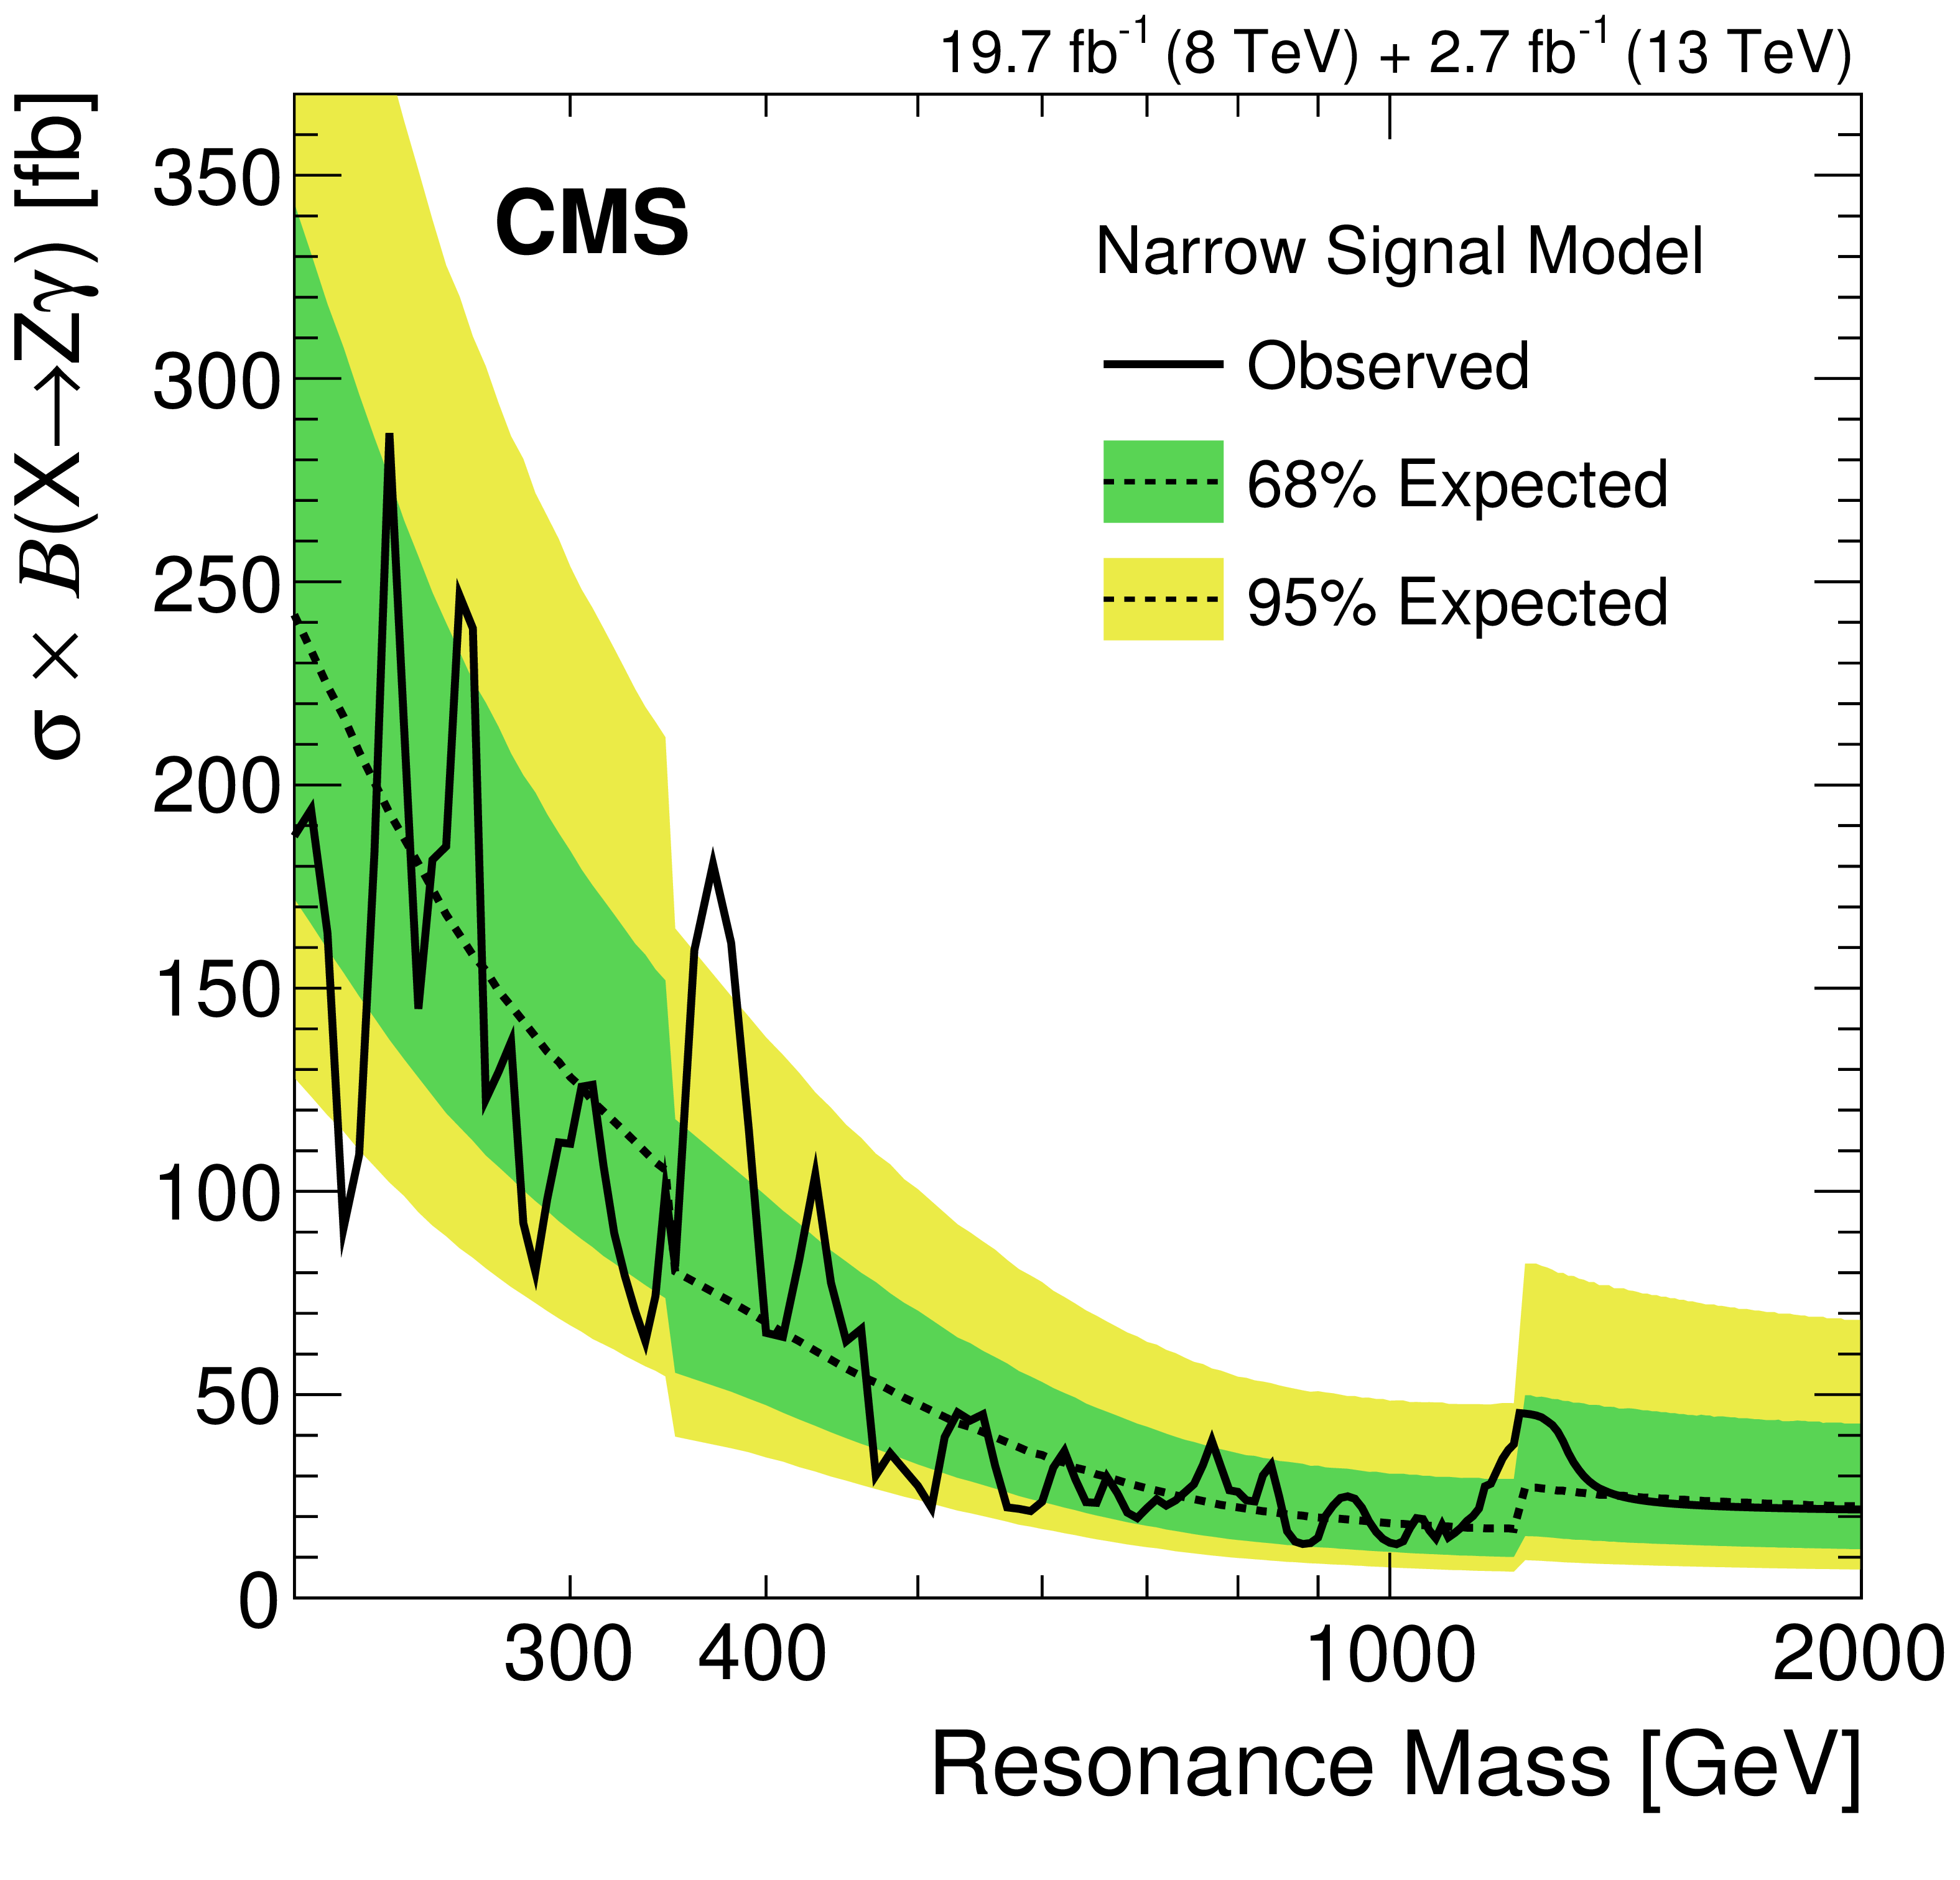
Figure 4-b:
95% CL upper limit for the combination of 8 TeV and 13 TeV data. The solid(dashed) line represents the observed(expected) limit, whereas the inner green(outer yellow) bands represent the 68%(95%) uncertainty bands. |
png pdf |
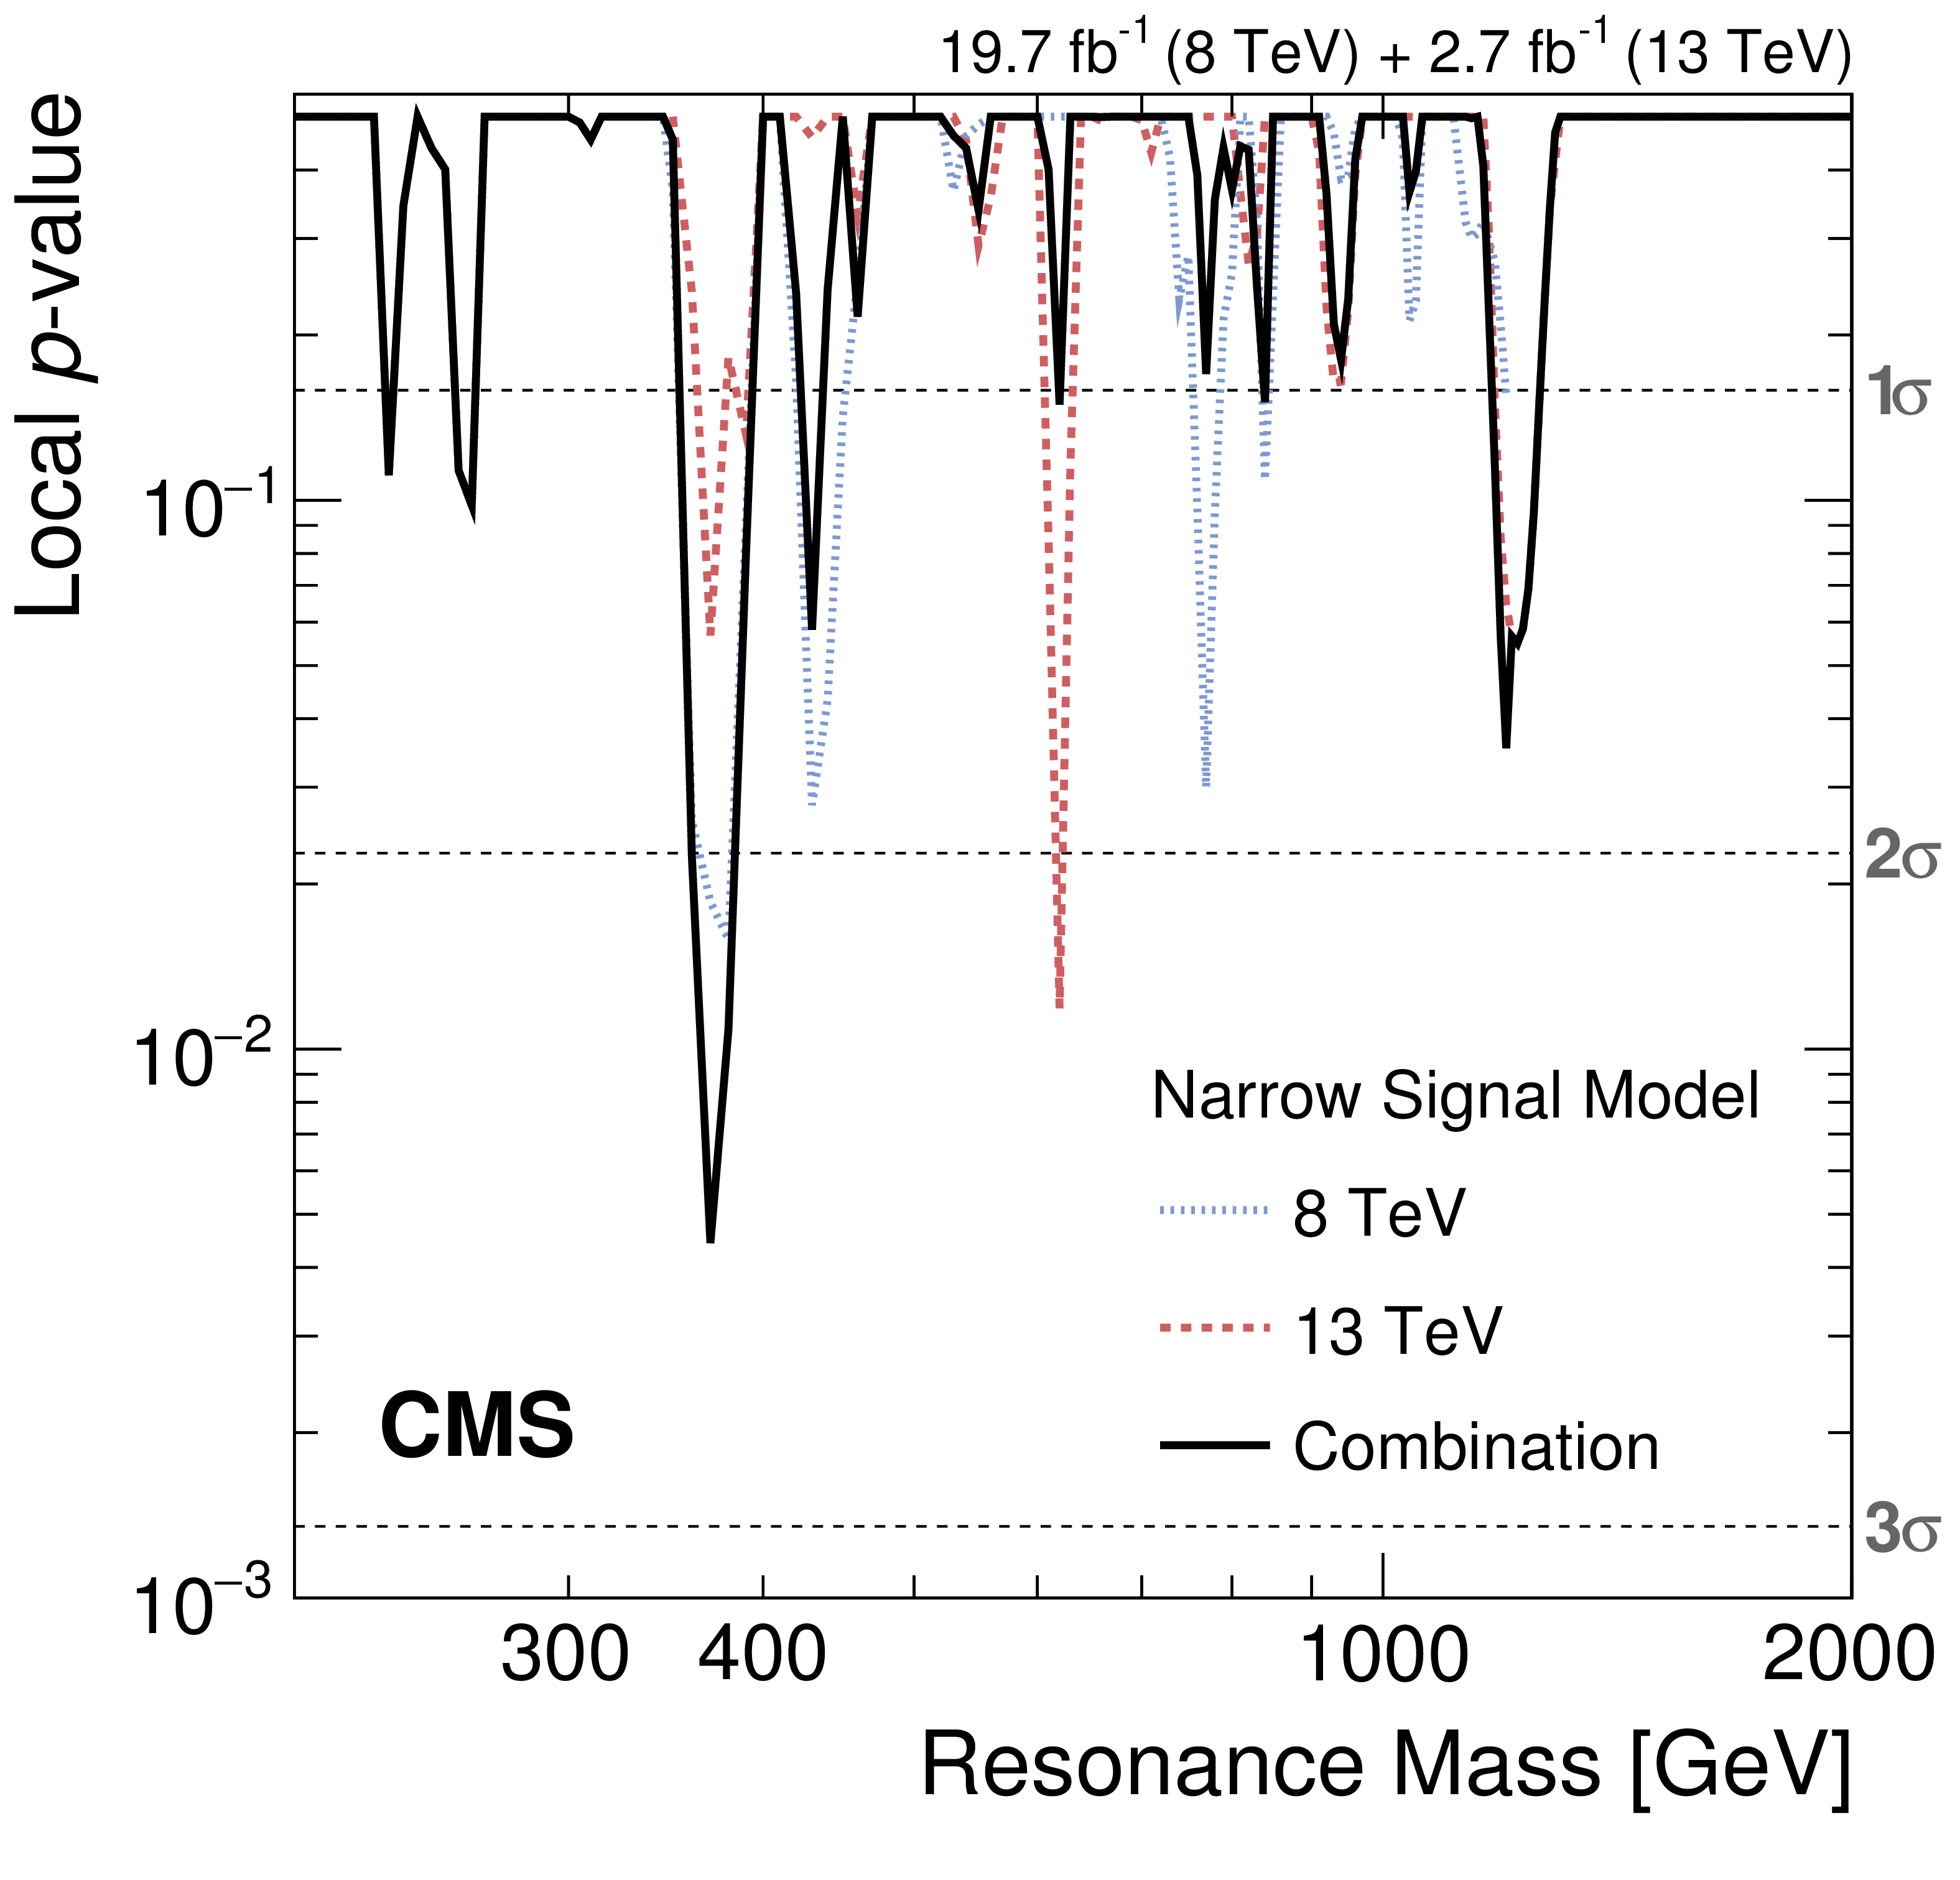
Figure 5:
Observed background-only local $p$-values for the scaled 8 TeV search(blue, dotted), the 13 TeV search (red, dashed), and the combination (black, solid). |
| Tables | |

png pdf |
Table 1:
Summary of considered systematic uncertainties in signal. |
| Summary |
| A search for heavy resonances decaying to Z$\gamma$, with further decay $\mathrm{ Z }\to \ell^+\ell^-$, with $\ell = \mathrm{ e }$ or $\mu$, has been presented. The search makes use of proton-proton data collected by the CMS detector at the LHC, corresponding to integrated luminosities of 19.7 and 2.7 fb at 8 and 13 TeV, respectively. The background is measured directly from data and localized excesses are looked for. No significant deviation with respect to the standard model expectation is found. Upper limits at 95% confidence level are set on the production cross section of narrow resonances, ranging from 280 to 20 fb for resonance masses from 200 to 2000 GeV. |
| Additional Tables | |
png pdf |
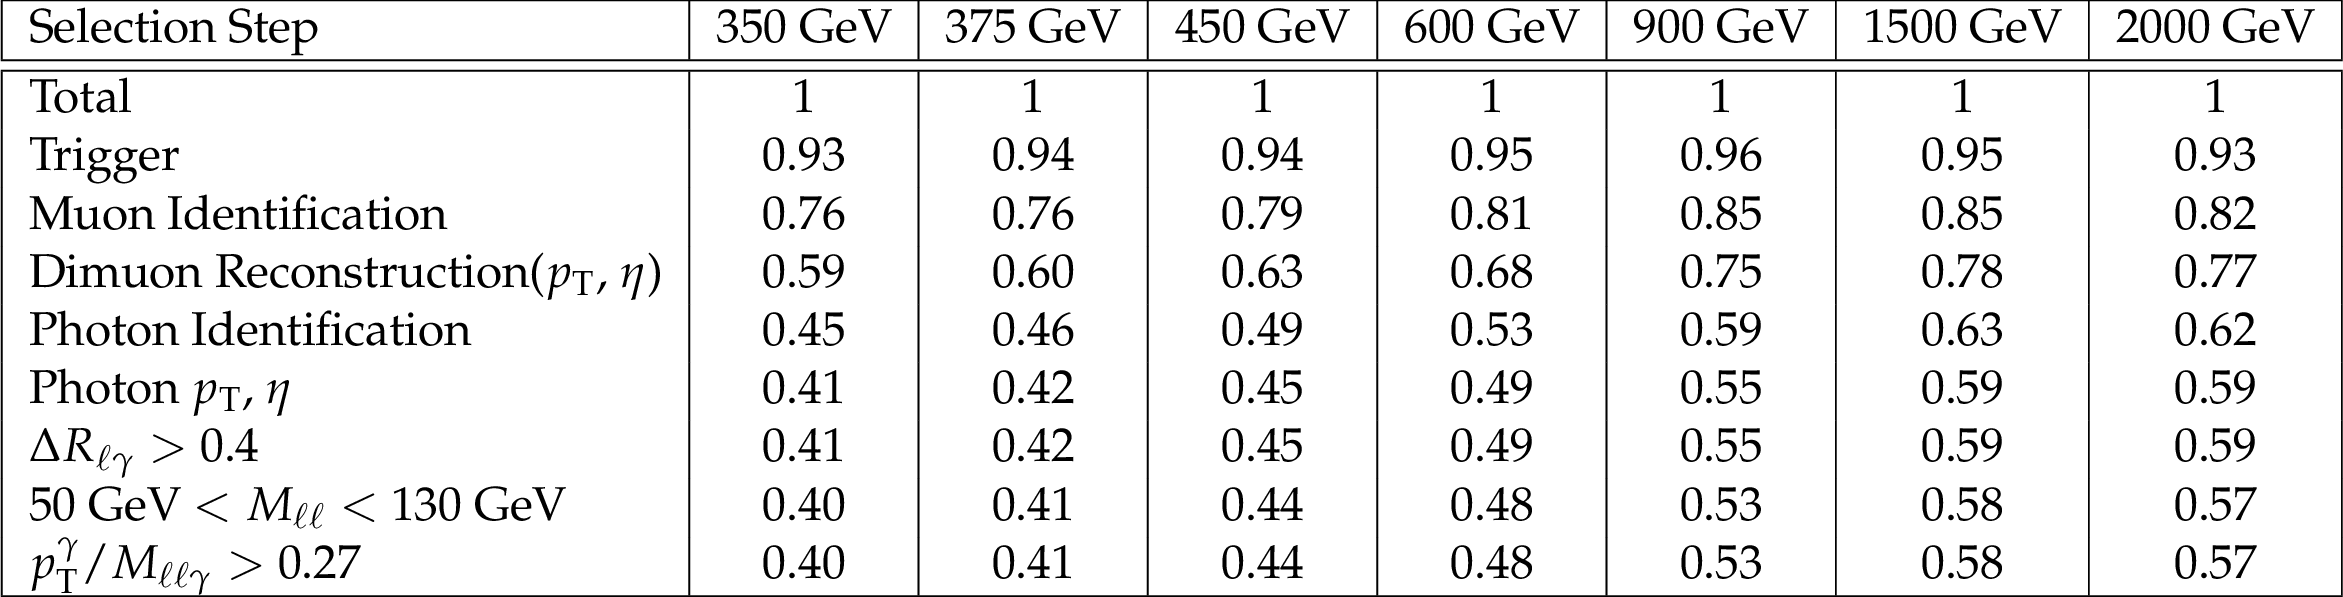
Additional Table 1:
The signal efficiency of the selection used in 13 TeV data for the $ {\mu ^+\mu ^-\gamma} $ channel. The efficiency is measured by counting the number of the simulated events passing the selection requirements sequentially, in order from top to bottom. The following is the selection requirement at each step; Total: no selection requirements (base). Trigger: to fire at least one of the muon trigger paths. Muon identification: to have muons passing the muon identification criteria. Dimuon Reconstruction: to have two muons in $|\eta | < $ 2.4, the leading muon with $ {p_{\mathrm {T}}} > $ 25 GeV and the second-leading muon with $ {p_{\mathrm {T}}} > $ 20 GeV. Photon Identification: to have a photon passing the photon identification criteria. Photon $ {p_{\mathrm {T}}} $, $\eta $: to have a photon with $ {p_{\mathrm {T}}} > $ 40 GeV and $|\eta | < $ 2.5. $\Delta {R}_{\ell \gamma} > $ 0.4: $\Delta {R}$ between the photon and each of the two muons must be larger than 0.4. 50 GeV $ < {M}_{\ell \ell} < $ 130 GeV: the invariant mass of the dimuon system must be in the range from 50 GeV to 130 GeV. $ {p_{\mathrm {T}}} ^{\gamma} / {{M}_{\ell \ell \gamma}} > $ 0.27: The portion of the $ {p_{\mathrm {T}}} $ of the photon to the invariant mass of the dimuon and the photon must be larger than 0.27. |
png pdf |
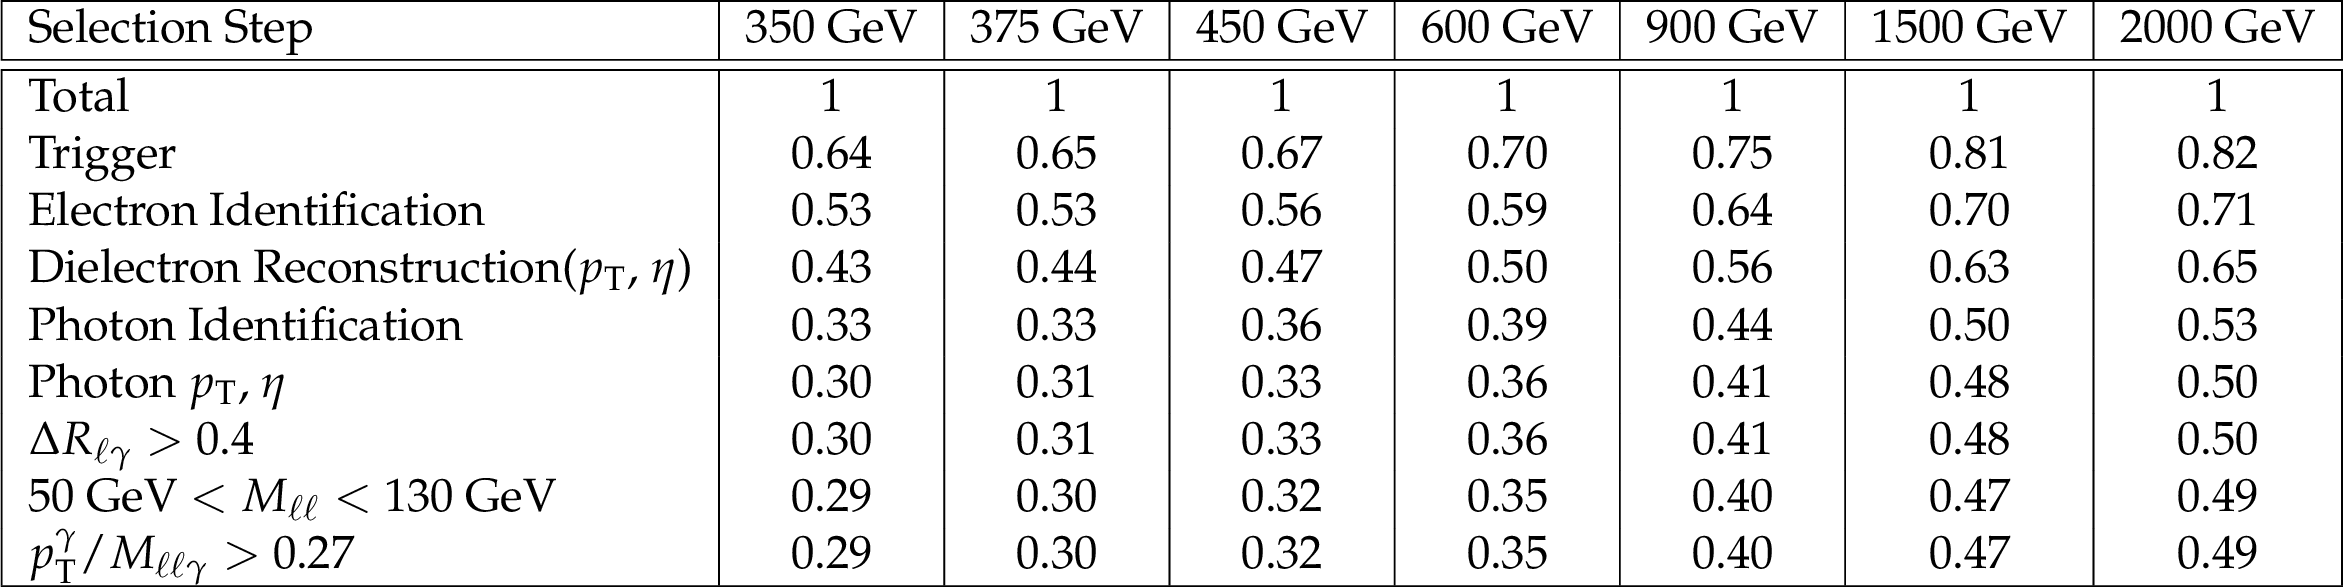
Additional Table 2:
The signal efficiency of the selection used in 13 TeV data for the $ {\mathrm{e} ^+\mathrm{e} ^-\gamma} $ channel. The efficiency is measured by counting the number of the simulated events passing the selection requirements sequentially, in order from top to bottom. The following is the selection requirement at each step; Total: no selection requirements (base). Trigger: to fire at least one of the electron trigger paths. Electron identification: to have electrons passing the electron identification criteria. Dielectron Reconstruction: to have two electrons in $|\eta | < $ 2.5, the leading electron with $ {p_{\mathrm {T}}} > $ 25 GeV and the second-leading electron with $ {p_{\mathrm {T}}} > $ 20 GeV. Photon Identification: to have a photon passing the photon identification criteria. Photon $ {p_{\mathrm {T}}} $, $\eta $: to have a photon with $ {p_{\mathrm {T}}} > $ 40 GeV and $|\eta | < $ 2.5. $\Delta {R}_{\ell \gamma} > $ 0.4: $\Delta {R}$ between the photon and each of the two electrons must be larger than 0.4. 50 GeV $ < {M}_{\ell \ell} < $ 130 GeV: the invariant mass of the dielectron system must be in the range from 50 GeV to 130 GeV. $ {p_{\mathrm {T}}} ^{\gamma} / {{M}_{\ell \ell \gamma}} > $ 0.27: The portion of the $ {p_{\mathrm {T}}} $ of the photon to the invariant mass of the dielectron and the photon must be larger than 0.27. |
| An example python configuration to generate signal events of the resoance mass 750 GeV is provided at this link. The python parameters are given as processParameters in the configuration file. |
| References | ||||
| 1 | ATLAS Collaboration | Observation of a new particle in the search for the standard model higgs boson with the atlas detector at the lhc | PLB 716 (2012) 1 | 1207.7214 |
| 2 | CMS Collaboration | Observation of a new boson at a mass of 125 gev with the cms experiment at the lhc | PLB 716 (2012) 30 | CMS-HIG-12-028 1207.7235 |
| 3 | CMS Collaboration | Observation of a new boson at a mass of 125 GeV with the CMS experiment at the LHC | JHEP 06 (2013) 081 | CMS-HIG-12-028 1207.7235 |
| 4 | CMS Collaboration | Precise determination of the mass of the Higgs boson and tests of compatibility of its couplings with the standard model predictions using proton collisions at 7 and 8 TeV | EPJC 75 (2014) 212 | CMS-HIG-14-009 1412.8662 |
| 5 | G. Altarelli | Status of the standard model and beyond | NIMA 518 (2004) 1 | hep-ph/0306055 |
| 6 | CMS Collaboration | Search for a higgs boson decaying into a Z and a photon in pp collisions at $ \sqrt{s} = $ 7 and 8 TeV | PLB 726 (2013) 587 | CMS-HIG-13-006 1307.5515 |
| 7 | ATLAS Collaboration | Search for Higgs boson decays to a photon and a Z boson in pp collisions at $ \sqrt{s} = $ 7 ~and 8 TeV with the ATLAS detector | PLB 732 (2014) 8 | 1402.3051 |
| 8 | ATLAS Collaboration | Search for resonances in diphoton events at $ \sqrt{s}= $ 13 ~TeV with the ATLAS detector | JHEP 09 (2016) 1 | 1606.03833 |
| 9 | CMS Collaboration | Search for resonant production of high-mass photon pairs in proton-proton collisions at $ \sqrt{s}= $ 8 and 13 tev | PRL 117 (2016) 051802 | CMS-EXO-16-018 1606.04093 |
| 10 | CMS Collaboration | Search for high-mass diphoton resonances in proton-proton collisions at 13~TeV and combination with 8~TeV search | Submitted to \it PLB | CMS-EXO-16-027 1609.02507 |
| 11 | D. Buttazzo, A. Greljo, and D. Marzocca | Knocking on new physics' door with a scalar resonance | EPJC 76 (2016) 116 | 1512.04929 |
| 12 | ATLAS Collaboration | Search for new resonances in $ W\gamma $ and $ Z\gamma $ final states in pp collisions at $ \sqrt s= $ 8 TeV with the ATLAS detector | PLB 738 (2014) 428 | 1407.8150 |
| 13 | ATLAS Collaboration | Search for heavy resonances decaying to a $ Z $ boson and a photon in $ pp $ collisions at $ \sqrt{s}= $ 13 ~TeV with the ATLAS detector | Submitted to \it JHEP | 1607.06363 |
| 14 | CMS Collaboration | The cms experiment at the cern lhc | JINST 3 (2008) S08004 | CMS-00-001 |
| 15 | CMS Collaboration | Performance of photon reconstruction and identification with the CMS detector in proton-proton collisions at $ \sqrt{s} = $ 8 TeV | JINST 10 (2015) P08010 | CMS-EGM-14-001 1502.02702 |
| 16 | CMS Collaboration | Performance of electron reconstruction and selection with the CMS detector in proton-proton collisions at $ \sqrt{s}= $ 8 TeV | JINST 10 (2015) P06005 | CMS-EGM-13-001 1502.02701 |
| 17 | CMS Collaboration | Performance of CMS muon reconstruction in pp collision events at $ \sqrt{s}= $ 7 TeV | JINST 7 (2012) P10002 | CMS-MUO-10-004 1206.4071 |
| 18 | V. Veszpremi | Operation and performance of the CMS tracker | in Proceedings, 13th Topical Seminar on Innovative Particle and Radiation Detectors (IPRD13) 2014 JINST 9 (2014) C03005 | 1402.0675 |
| 19 | CMS Collaboration | Particle-Flow Event Reconstruction in CMS and Performance for Jets, Taus, and MET | CDS | |
| 20 | CMS Collaboration | Commissioning of the Particle-flow Event Reconstruction with the first LHC collisions recorded in the CMS detector | CDS | |
| 21 | M. Cacciari and G. P. Salam | Pileup subtraction using jet areas | PLB 659 (2008) 119 | 0707.1378 |
| 22 | CMS Collaboration | Measurement of the inclusive W and Z production cross sections in pp collisions at $ \sqrt{s} = $ 7 TeV with the cms experiment | JHEP 10 (2011) 132 | CMS-EWK-10-005 1107.4789 |
| 23 | T. Sjostrand, S. Mrenna, and P. Z. Skands | A Brief Introduction to PYTHIA 8.1 | CPC 178 (2008) 852 | 0710.3820 |
| 24 | NNPDF Collaboration | Parton distributions with LHC data | NPB 867 (2013) 244 | 1207.1303 |
| 25 | R. Field | Min-Bias and the Underlying Event at the LHC | in Soft side of the LHC. Proceedings, 51st Cracow School of Theoretical Physics, Zakopane, Poland, June 11-19, 2011, p. 2631 2011 Acta Phys. Polon. B 42 (2011) 2631 | 1110.5530 |
| 26 | CMS Collaboration | Event generator tunes obtained from underlying event and multiparton scattering measurements | EPJC 76 (2016) 155 | CMS-GEN-14-001 1512.00815 |
| 27 | M. J. Oreglia | PhD thesis, Stanford University, 1980 SLAC Report SLAC-R-236, see Appendix D | ||
| 28 | CMS Collaboration | CMS Luminosity Based on Pixel Cluster Counting - Summer 2013 Update | CMS-PAS-LUM-13-001 | CMS-PAS-LUM-13-001 |
| 29 | CMS Collaboration | CMS Luminosity Measurement for the 2015 Data Taking Period | CDS | |
| 30 | J. Butterworth et al. | Pdf4lhc recommendations for lhc run ii | JPG 43 (2016) 023001 | 1510.03865 |
| 31 | A. L. Read | Presentation of search results: the $ CL_s $ technique | JPG 28 (2002) 2693 | |
| 32 | T. Junk | Confidence level computation for combining searches with small statistics | NIMA 434 (1999) 435 | hep-ex/9902006 |
| 33 | G. Cowan, K. Cranmer, E. Gross, and O. Vitells | Asymptotic formulae for likelihood-based tests of new physics | EPJC 71 (2011) 1554 | 1007.1727 |
| 34 | E. Gross and O. Vitells | Trial factors for the look elsewhere effect in high energy physics | EPJC 70 (2010) 525 | 1005.1891 |
|
|
Compact Muon Solenoid LHC, CERN |
|

|

|

|

|

|