

Compact Muon Solenoid
LHC, CERN
| CMS-FSQ-12-001 ; CERN-EP-2017-141 | ||
| Study of dijet events with a large rapidity gap between the two leading jets in pp collisions at $\sqrt{s}= $ 7 TeV | ||
| CMS Collaboration | ||
| 2 October 2017 | ||
| Eur. Phys. J. C 78 (2018) 242 [Erratum] | ||
|
Abstract:
Events with no charged particles produced between the two leading jets are studied in proton-proton collisions at $\sqrt{s}= $ 7 TeV. The jets were required to have transverse momentum ${p_{\mathrm{T}}}^{\text{jet}} > $ 40 GeV and pseudorapidity 1.5 $ < |{\eta^{\text{jet}}}| < $ 4.7, and to have values of $\eta^{\text{jet}}$ with opposite signs. The data used for this study were collected with the CMS detector during low-luminosity running at the LHC, and correspond to an integrated luminosity of 8 pb$^{-1}$. Events with no charged particles with ${p_{\mathrm{T}}} > $ 0.2 GeV in the interval $-1 < \eta < 1$ between the jets are observed in excess of calculations that assume no color-singlet exchange. The fraction of events with such a rapidity gap, amounting to 0.5-1% of the selected dijet sample, is measured as a function of the ${p_{\mathrm{T}}}$ of the second-leading jet and of the rapidity separation between the jets. The data are compared to previous measurements at Tevatron, and to perturbative quantum chromodynamics calculations based on the Balitsky-Fadin-Kuraev-Lipatov evolution equations, including different modelings of the non-perturbative gap survival probability. We dedicate this paper to the memory of our colleague and friend Sasha Proskuryakov, who started this analysis but passed away before it was completed. His contribution to the study of diffractive processes at CMS is invaluable. | ||
| Links: e-print arXiv:1710.02586 [hep-ex] (PDF) ; CDS record ; inSPIRE record ; HepData record ; CADI line (restricted) ; | ||
| Figures | |
png pdf |
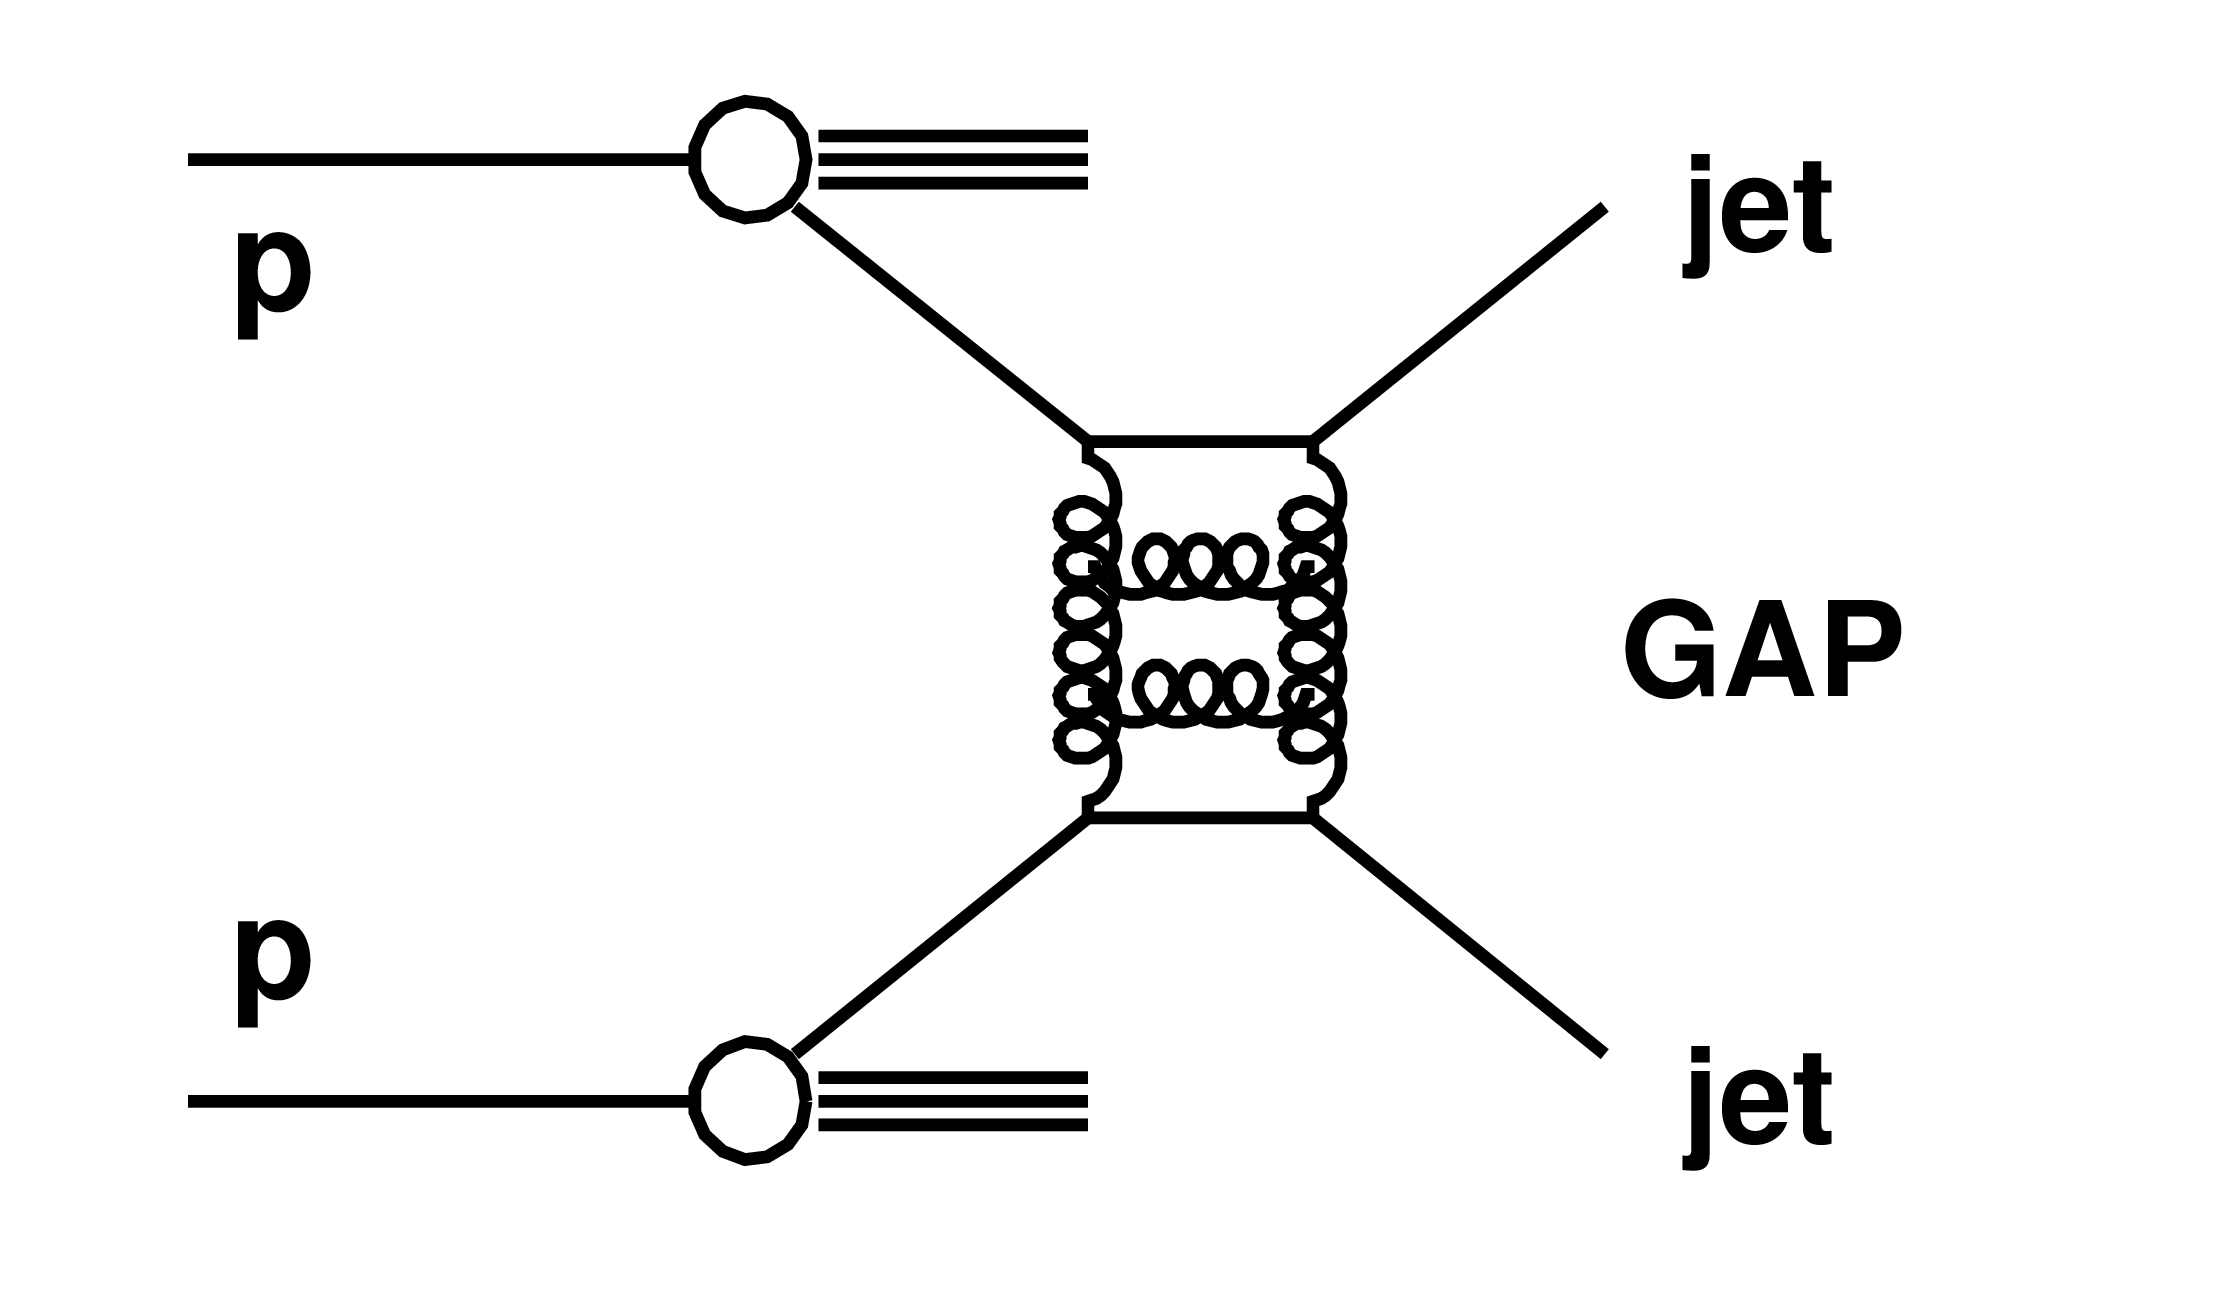
Figure 1:
Schematic diagram of a dijet event with a rapidity gap between the jets (jet-gap-jet event). The gap is defined as the absence of charged particle tracks above a certain $ {p_{\mathrm {T}}} $ threshold. |
png pdf |
Figure 2:
Schematic picture of a jet-gap-jet event in the $\varphi $ vs. $\eta $ plane. The circles indicate the two jets reconstructed on each side of the detector, while the dots represent the remaining hadronic activity in the event. The shaded area corresponds to the region of the potential rapidity gap, in which the charged-particle multiplicity is measured (the so-called gap region). |
png pdf |
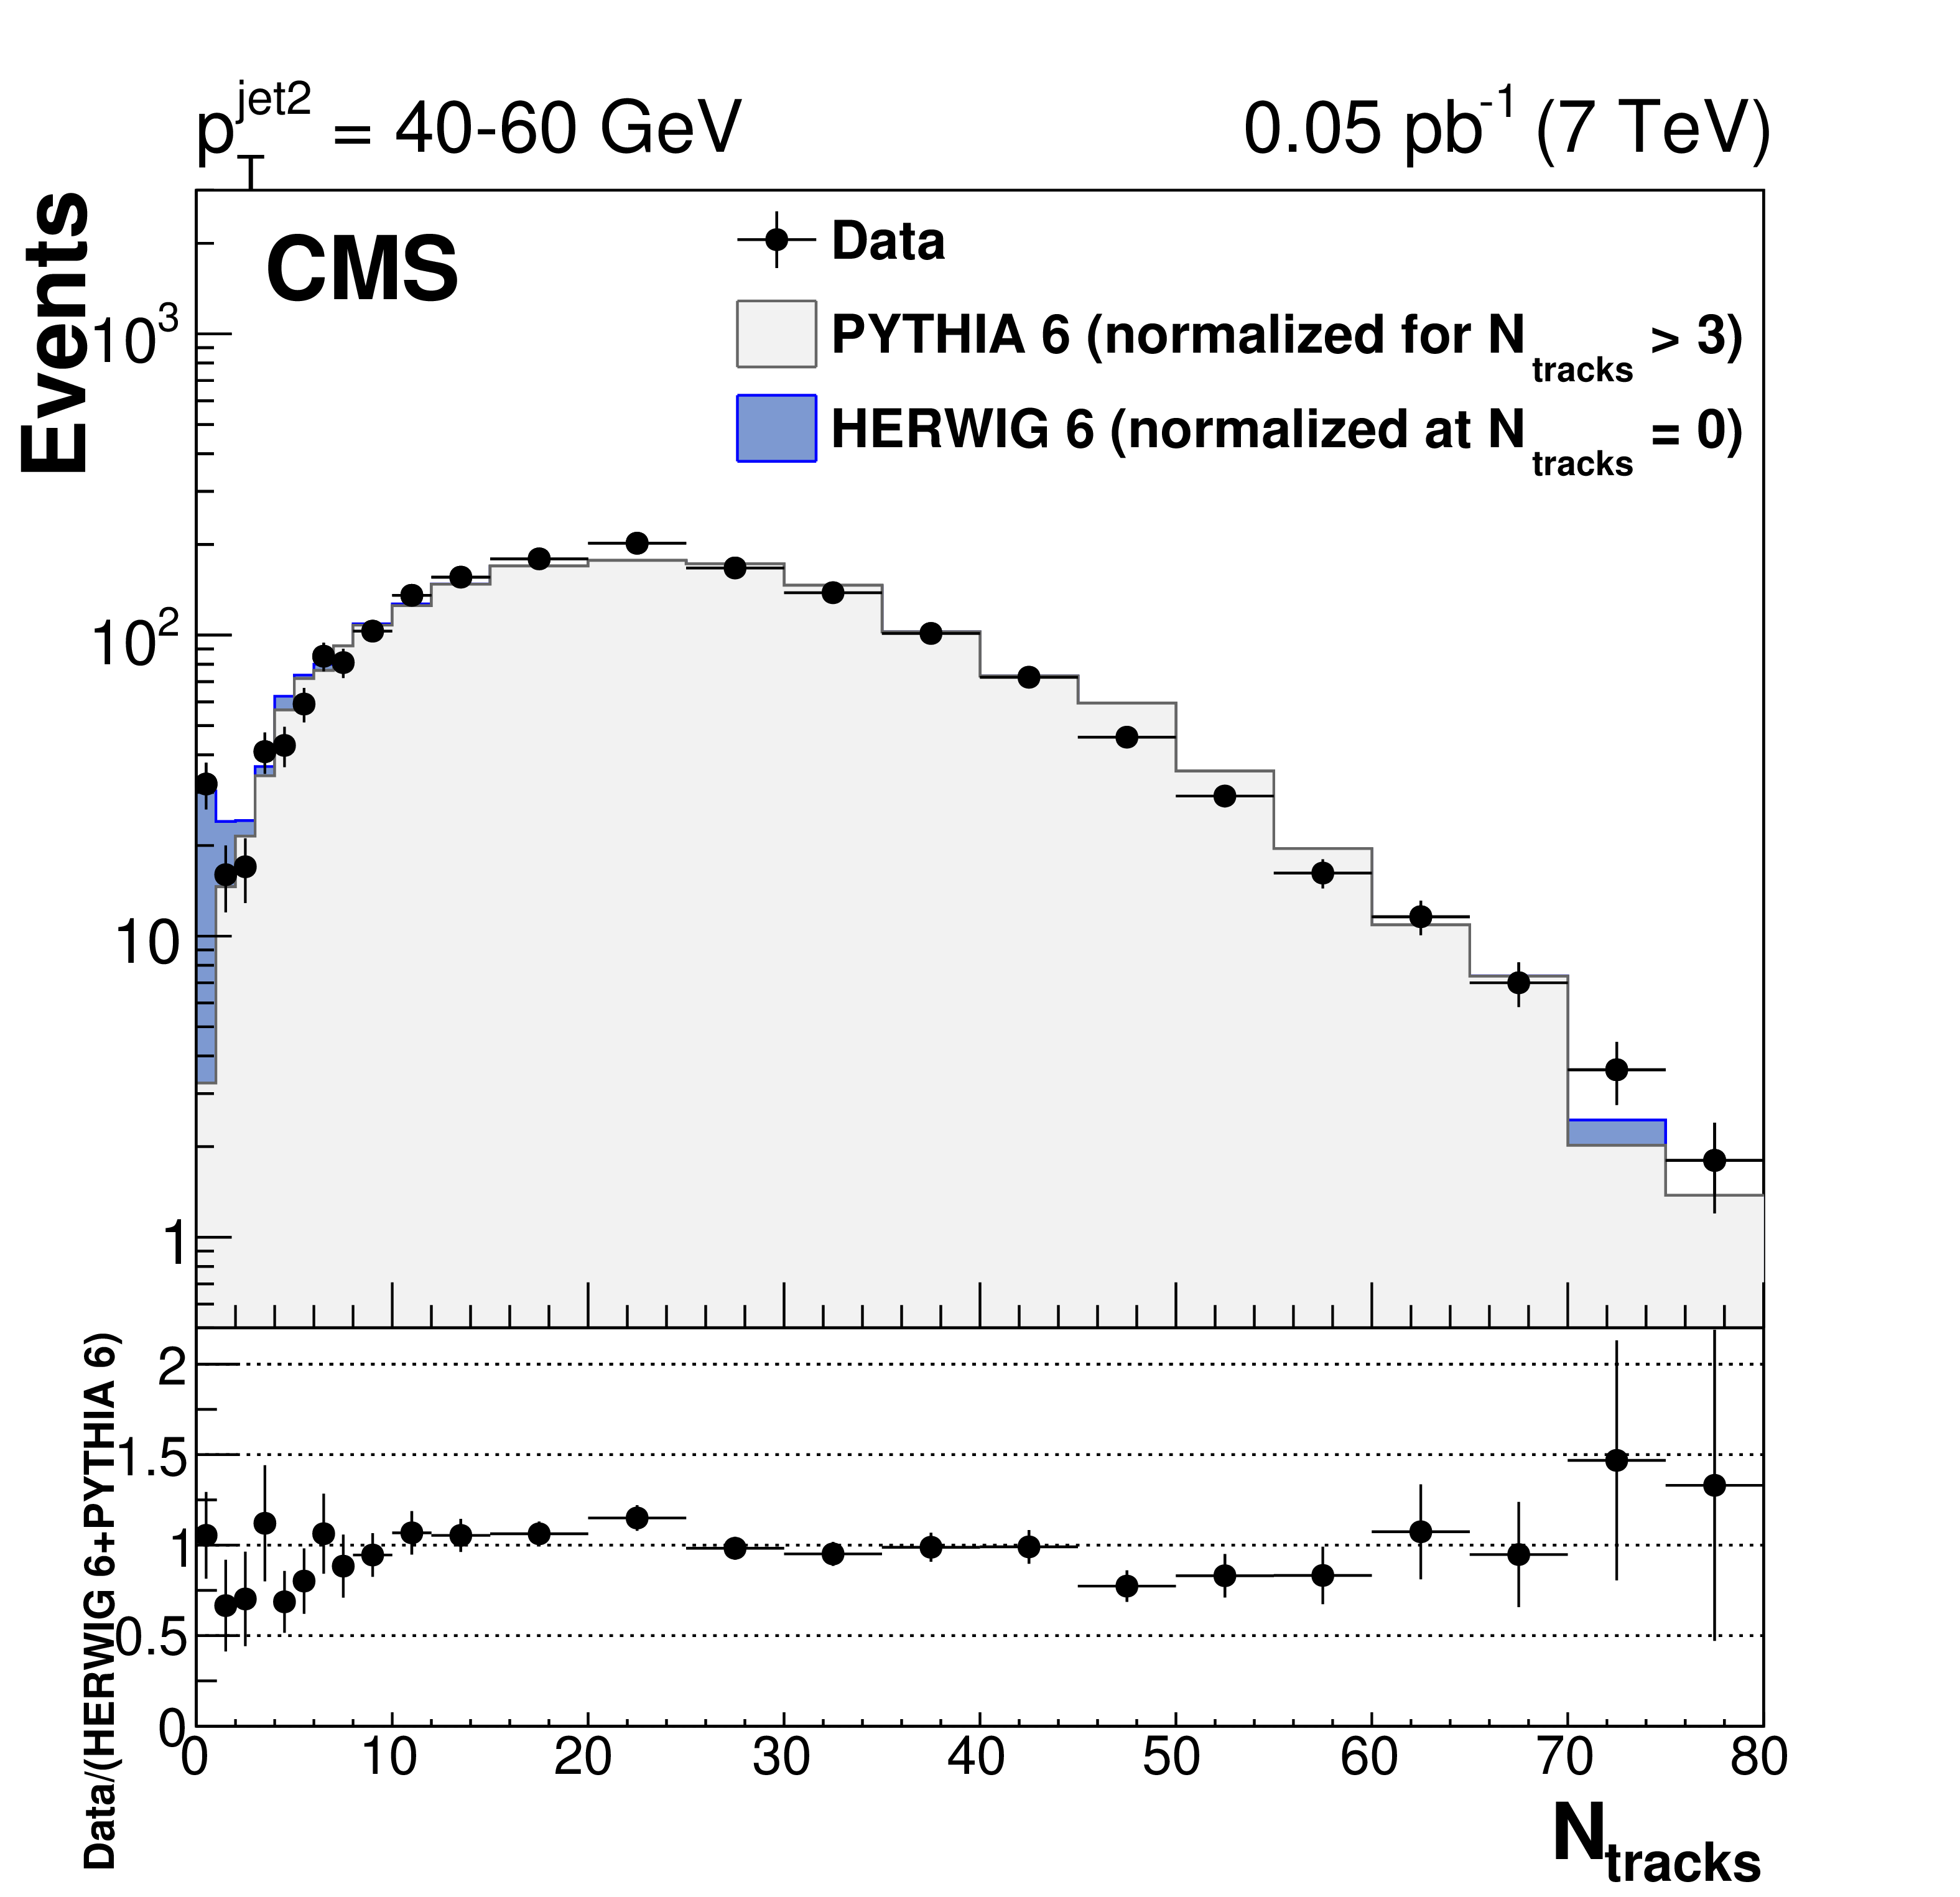
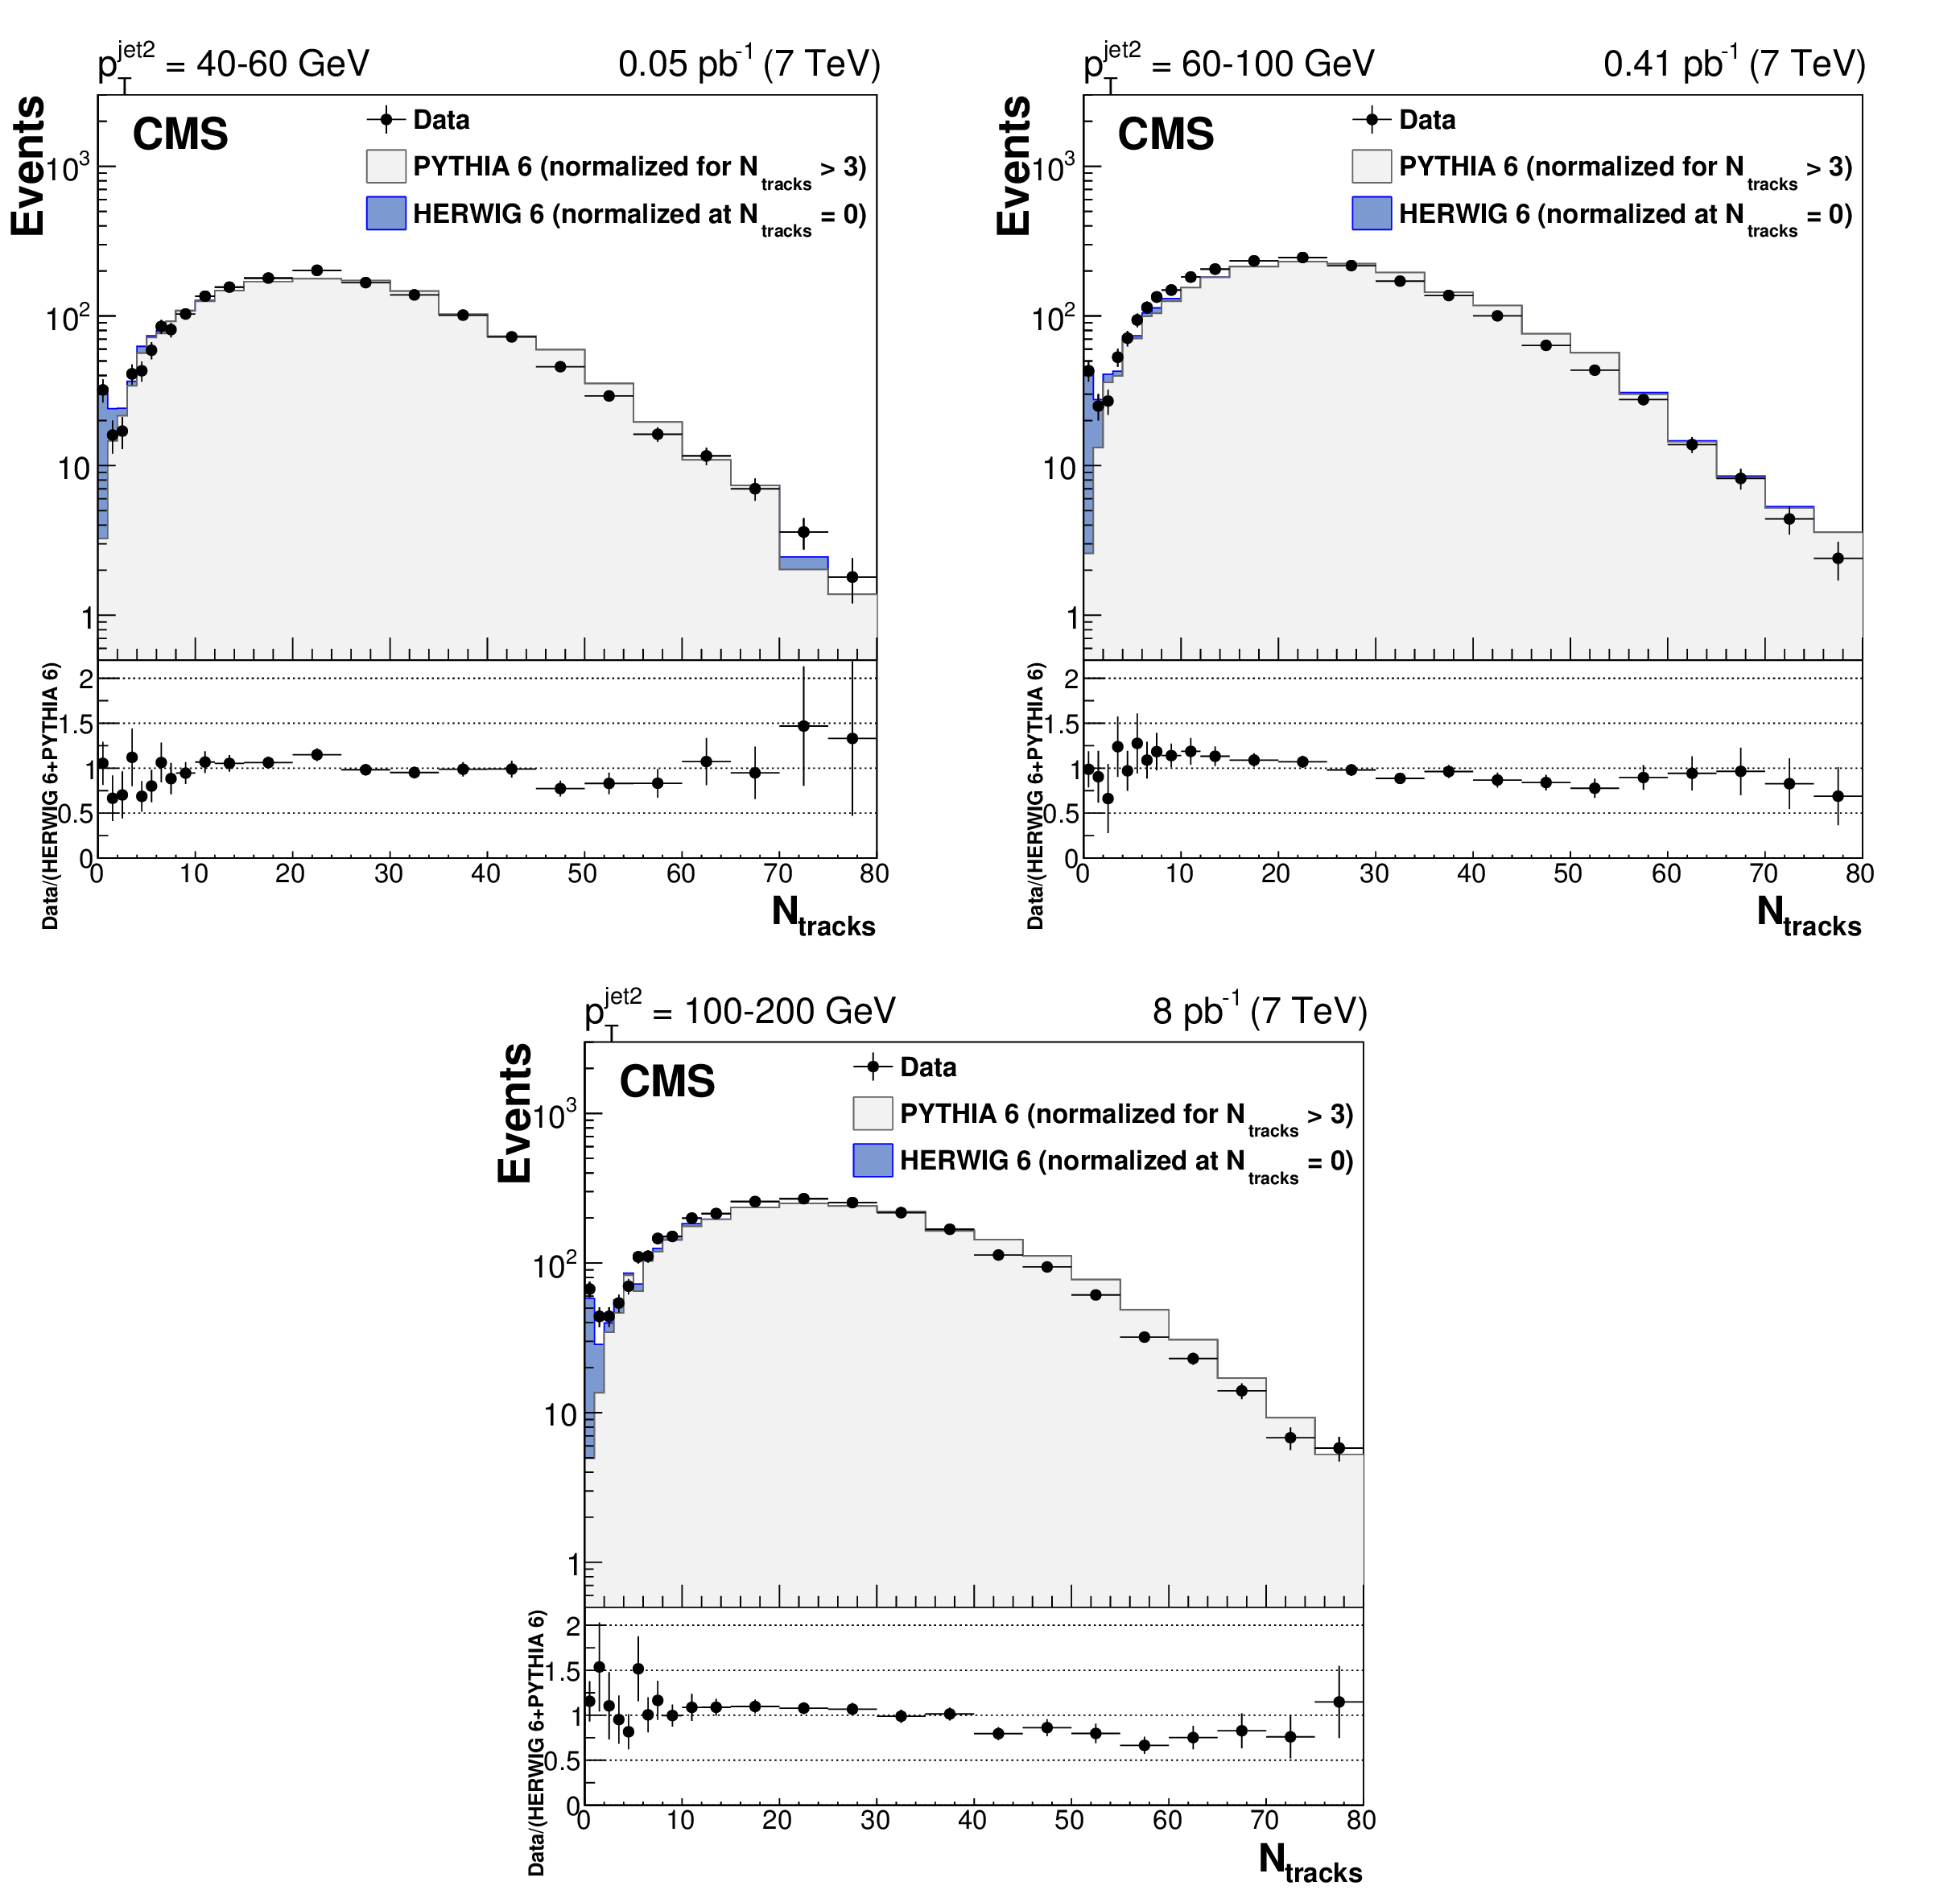
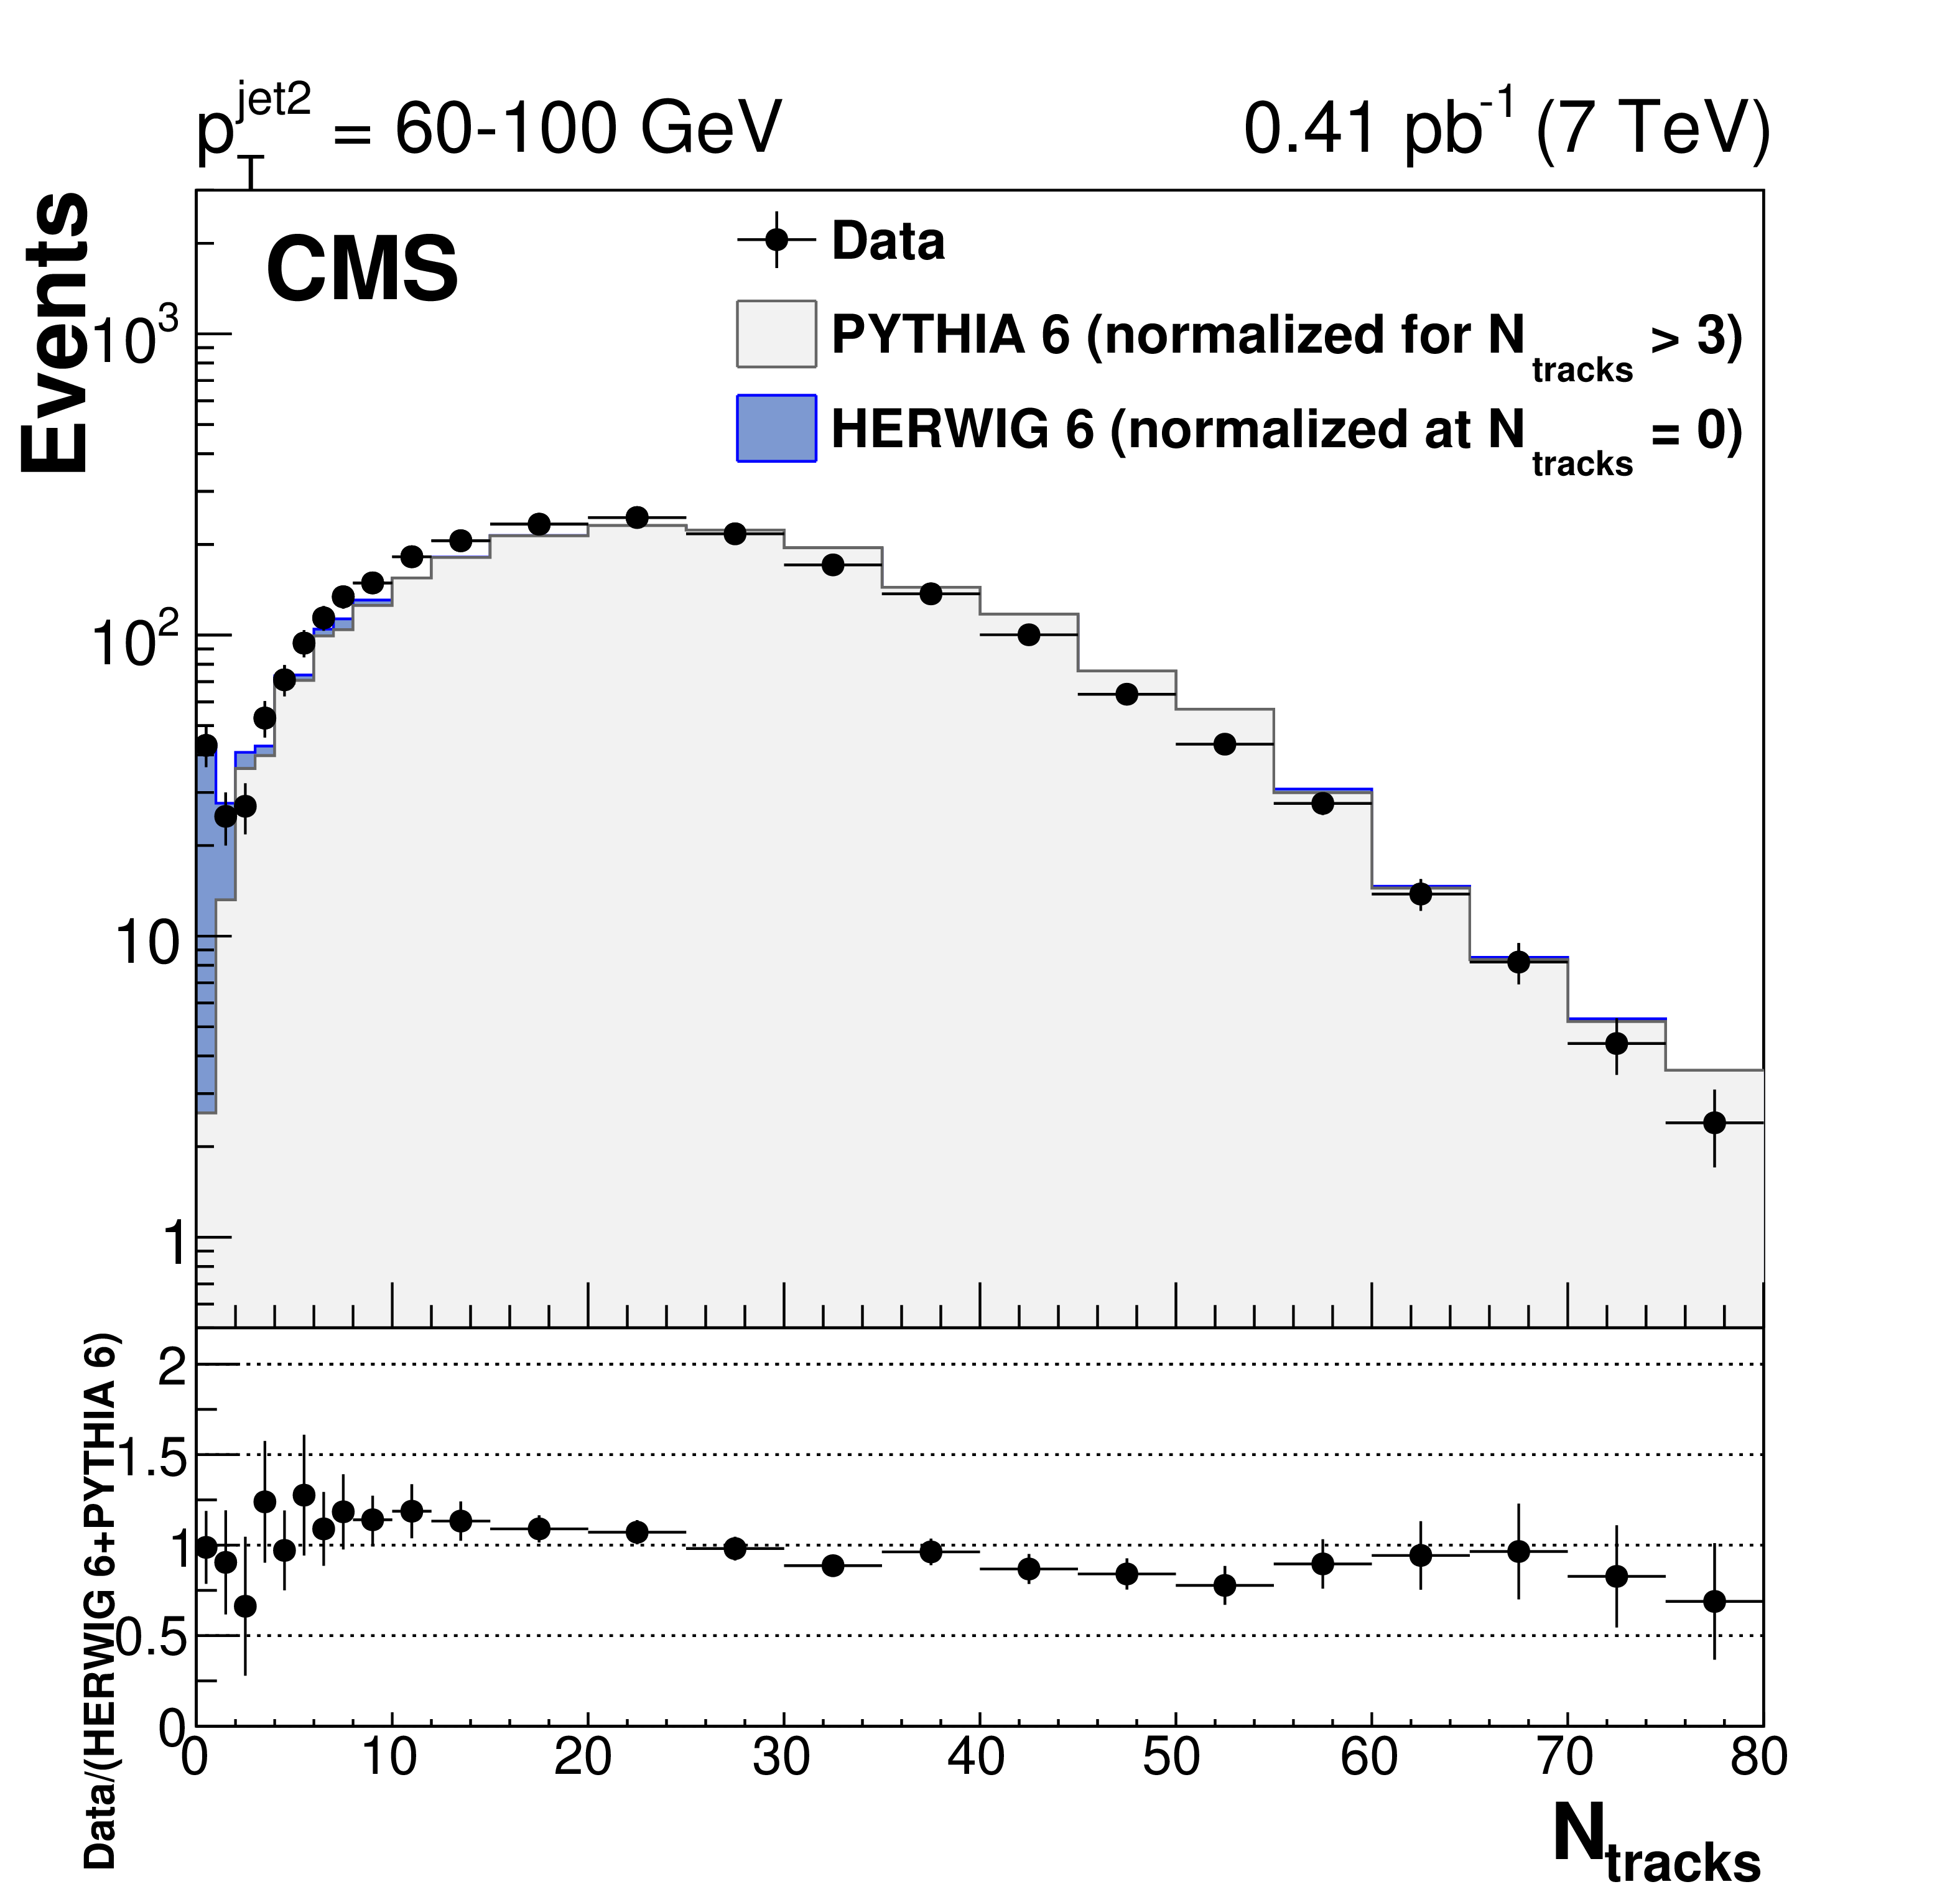
Figure 3:
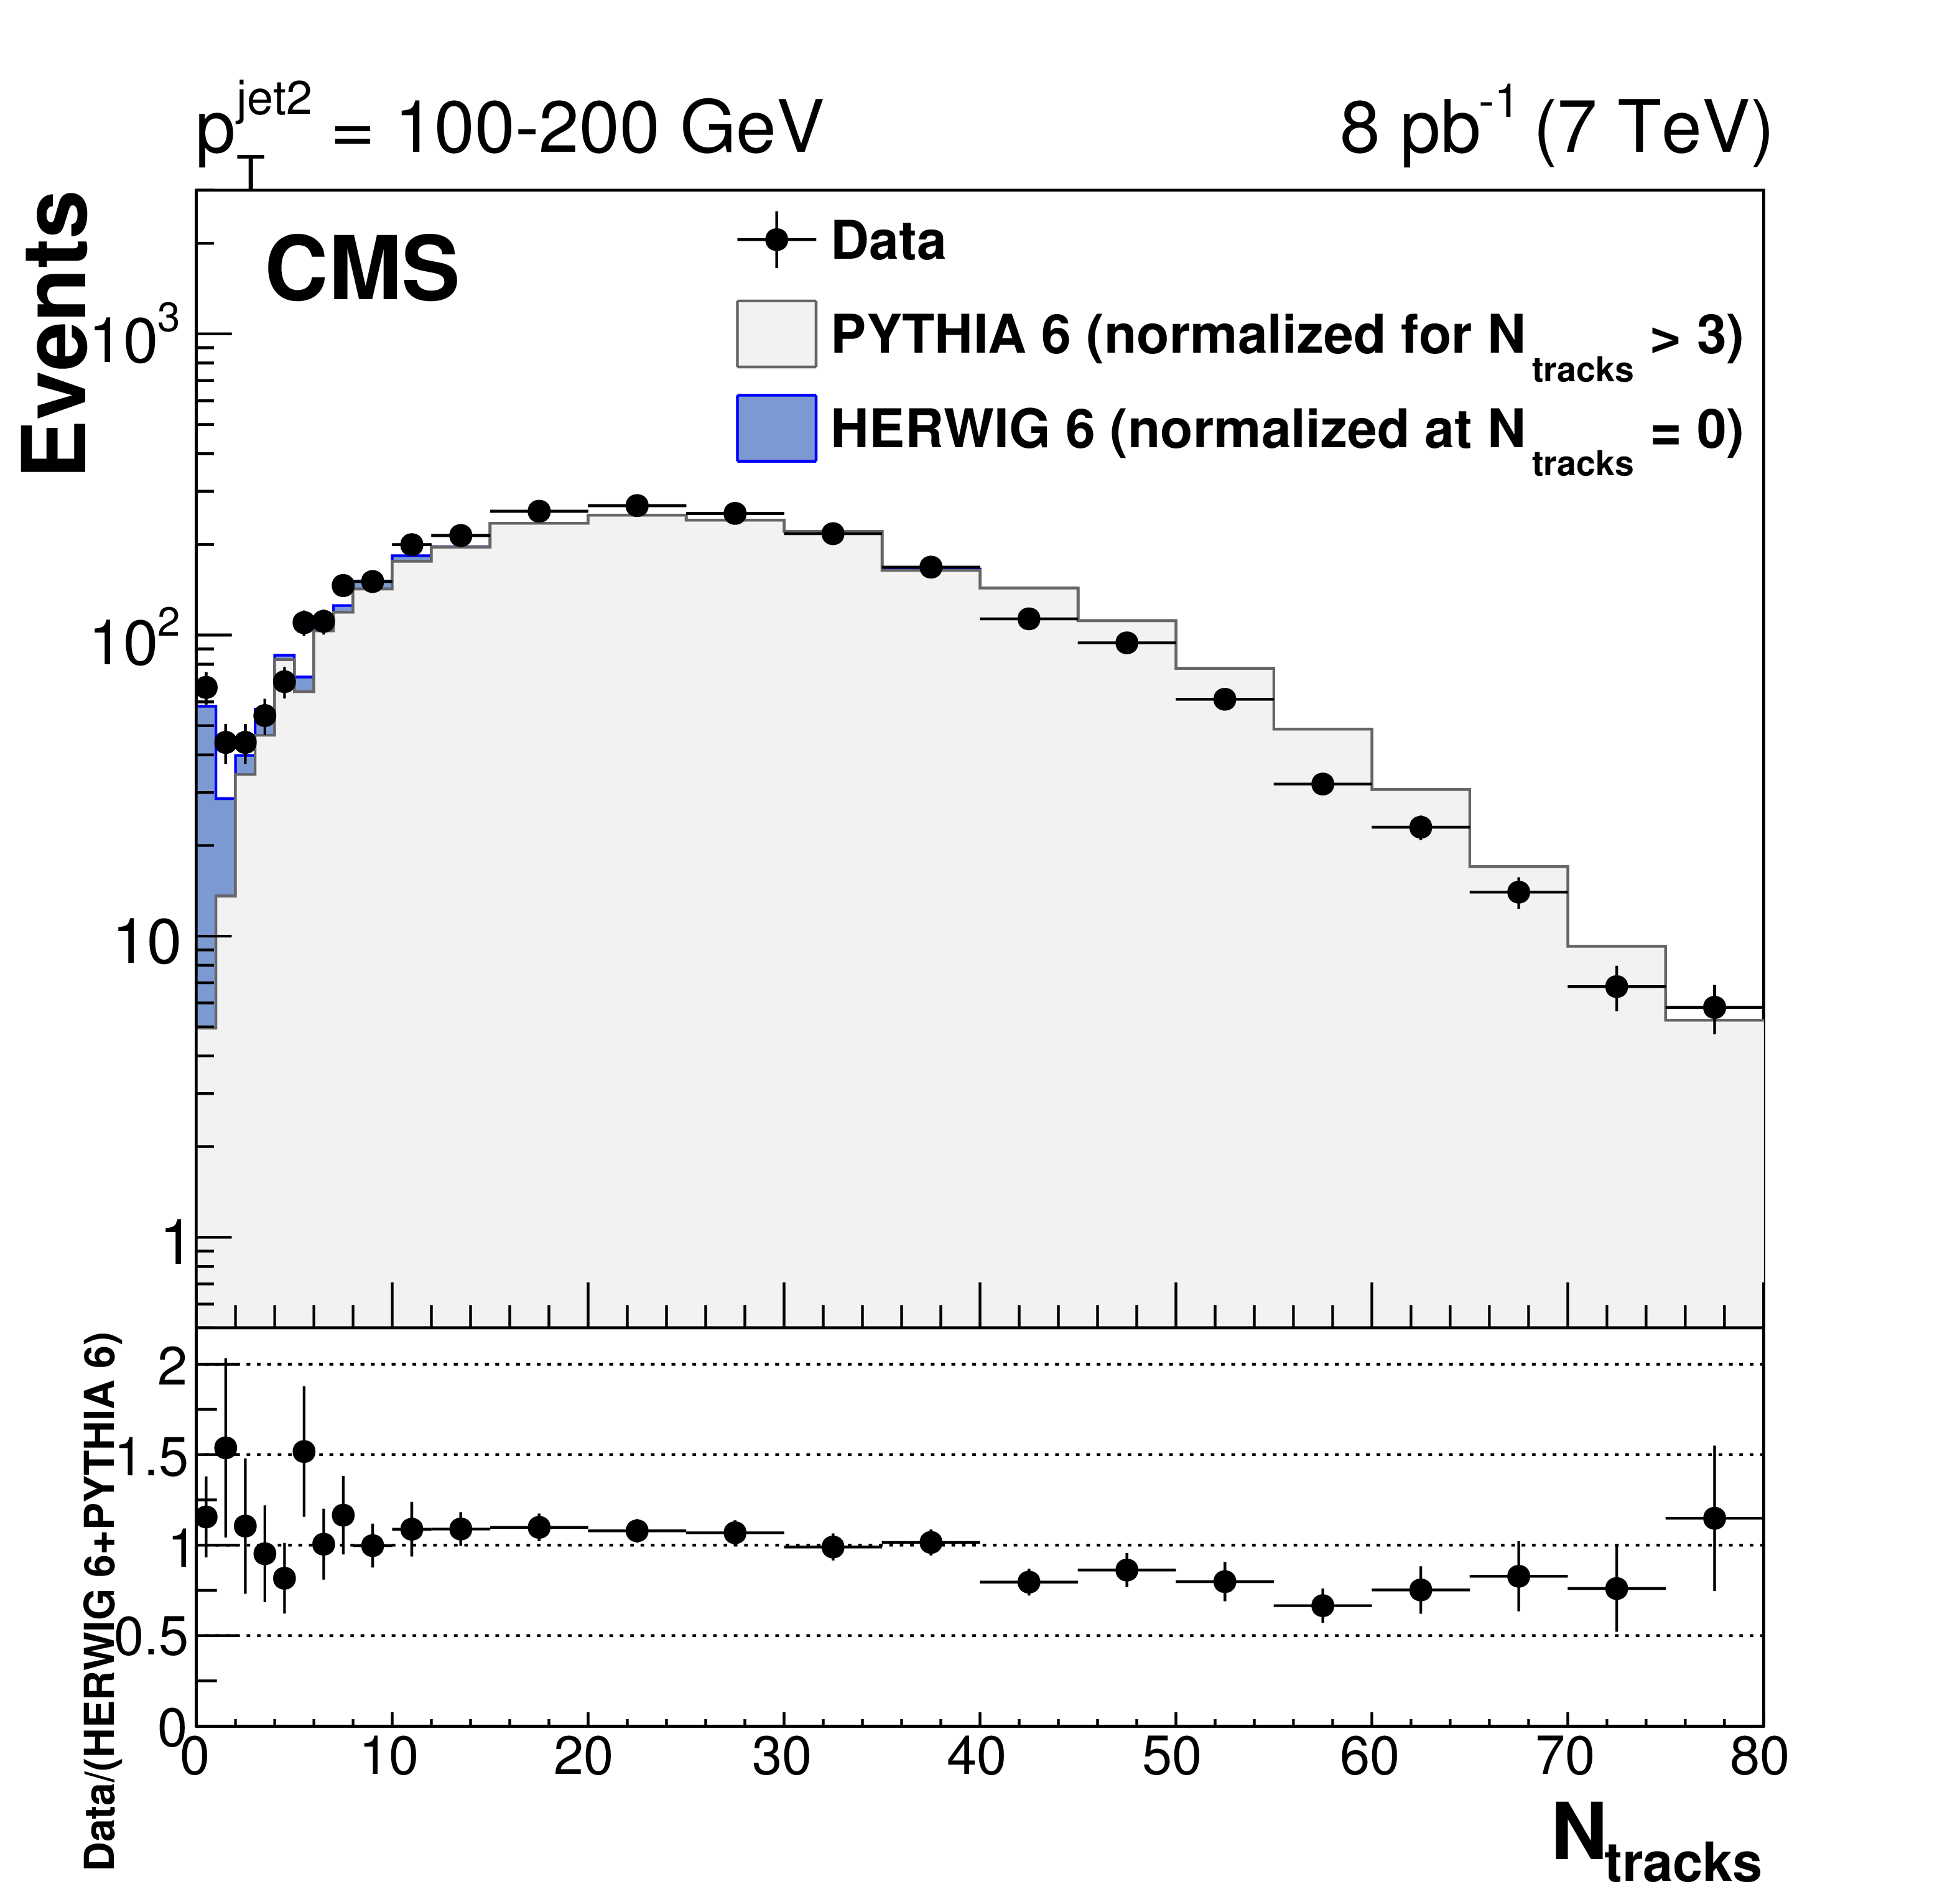
Distribution, uncorrected for detector effects, of the number of central tracks between the two leading jets in events with $ {p_{\mathrm {T}}} ^\text {jet2} = $ 40-60 (top left), 60-100 (top right), and 100-200 (bottom) GeV, compared to predictions of PYTHIA 6 (inclusive dijets) and HERWIG 6 (CSE jet-gap-jet events). The PYTHIA 6 and HERWIG 6 samples are normalized to the number of events measured for $N_\text {tracks} > $ 3 and $N_\text {tracks}= $ 0, respectively. Beneath each plot the ratio of the data yield to the sum of the normalized HERWIG 6 and PYTHIA 6 predictions is shown. The vertical error bars indicate the statistical uncertainty. |
png pdf |
Figure 3-a:
Distribution, uncorrected for detector effects, of the number of central tracks between the two leading jets in events with $ {p_{\mathrm {T}}} ^\text {jet2} = $ 40-60 (top left), 60-100 (top right), and 100-200 (bottom) GeV, compared to predictions of PYTHIA 6 (inclusive dijets) and HERWIG 6 (CSE jet-gap-jet events). The PYTHIA 6 and HERWIG 6 samples are normalized to the number of events measured for $N_\text {tracks} > $ 3 and $N_\text {tracks}= $ 0, respectively. Beneath each plot the ratio of the data yield to the sum of the normalized HERWIG 6 and PYTHIA 6 predictions is shown. The vertical error bars indicate the statistical uncertainty. |
png pdf |
Figure 3-b:
Distribution, uncorrected for detector effects, of the number of central tracks between the two leading jets in events with $ {p_{\mathrm {T}}} ^\text {jet2} = $ 40-60 (top left), 60-100 (top right), and 100-200 (bottom) GeV, compared to predictions of PYTHIA 6 (inclusive dijets) and HERWIG 6 (CSE jet-gap-jet events). The PYTHIA 6 and HERWIG 6 samples are normalized to the number of events measured for $N_\text {tracks} > $ 3 and $N_\text {tracks}= $ 0, respectively. Beneath each plot the ratio of the data yield to the sum of the normalized HERWIG 6 and PYTHIA 6 predictions is shown. The vertical error bars indicate the statistical uncertainty. |
png pdf |
Figure 4:
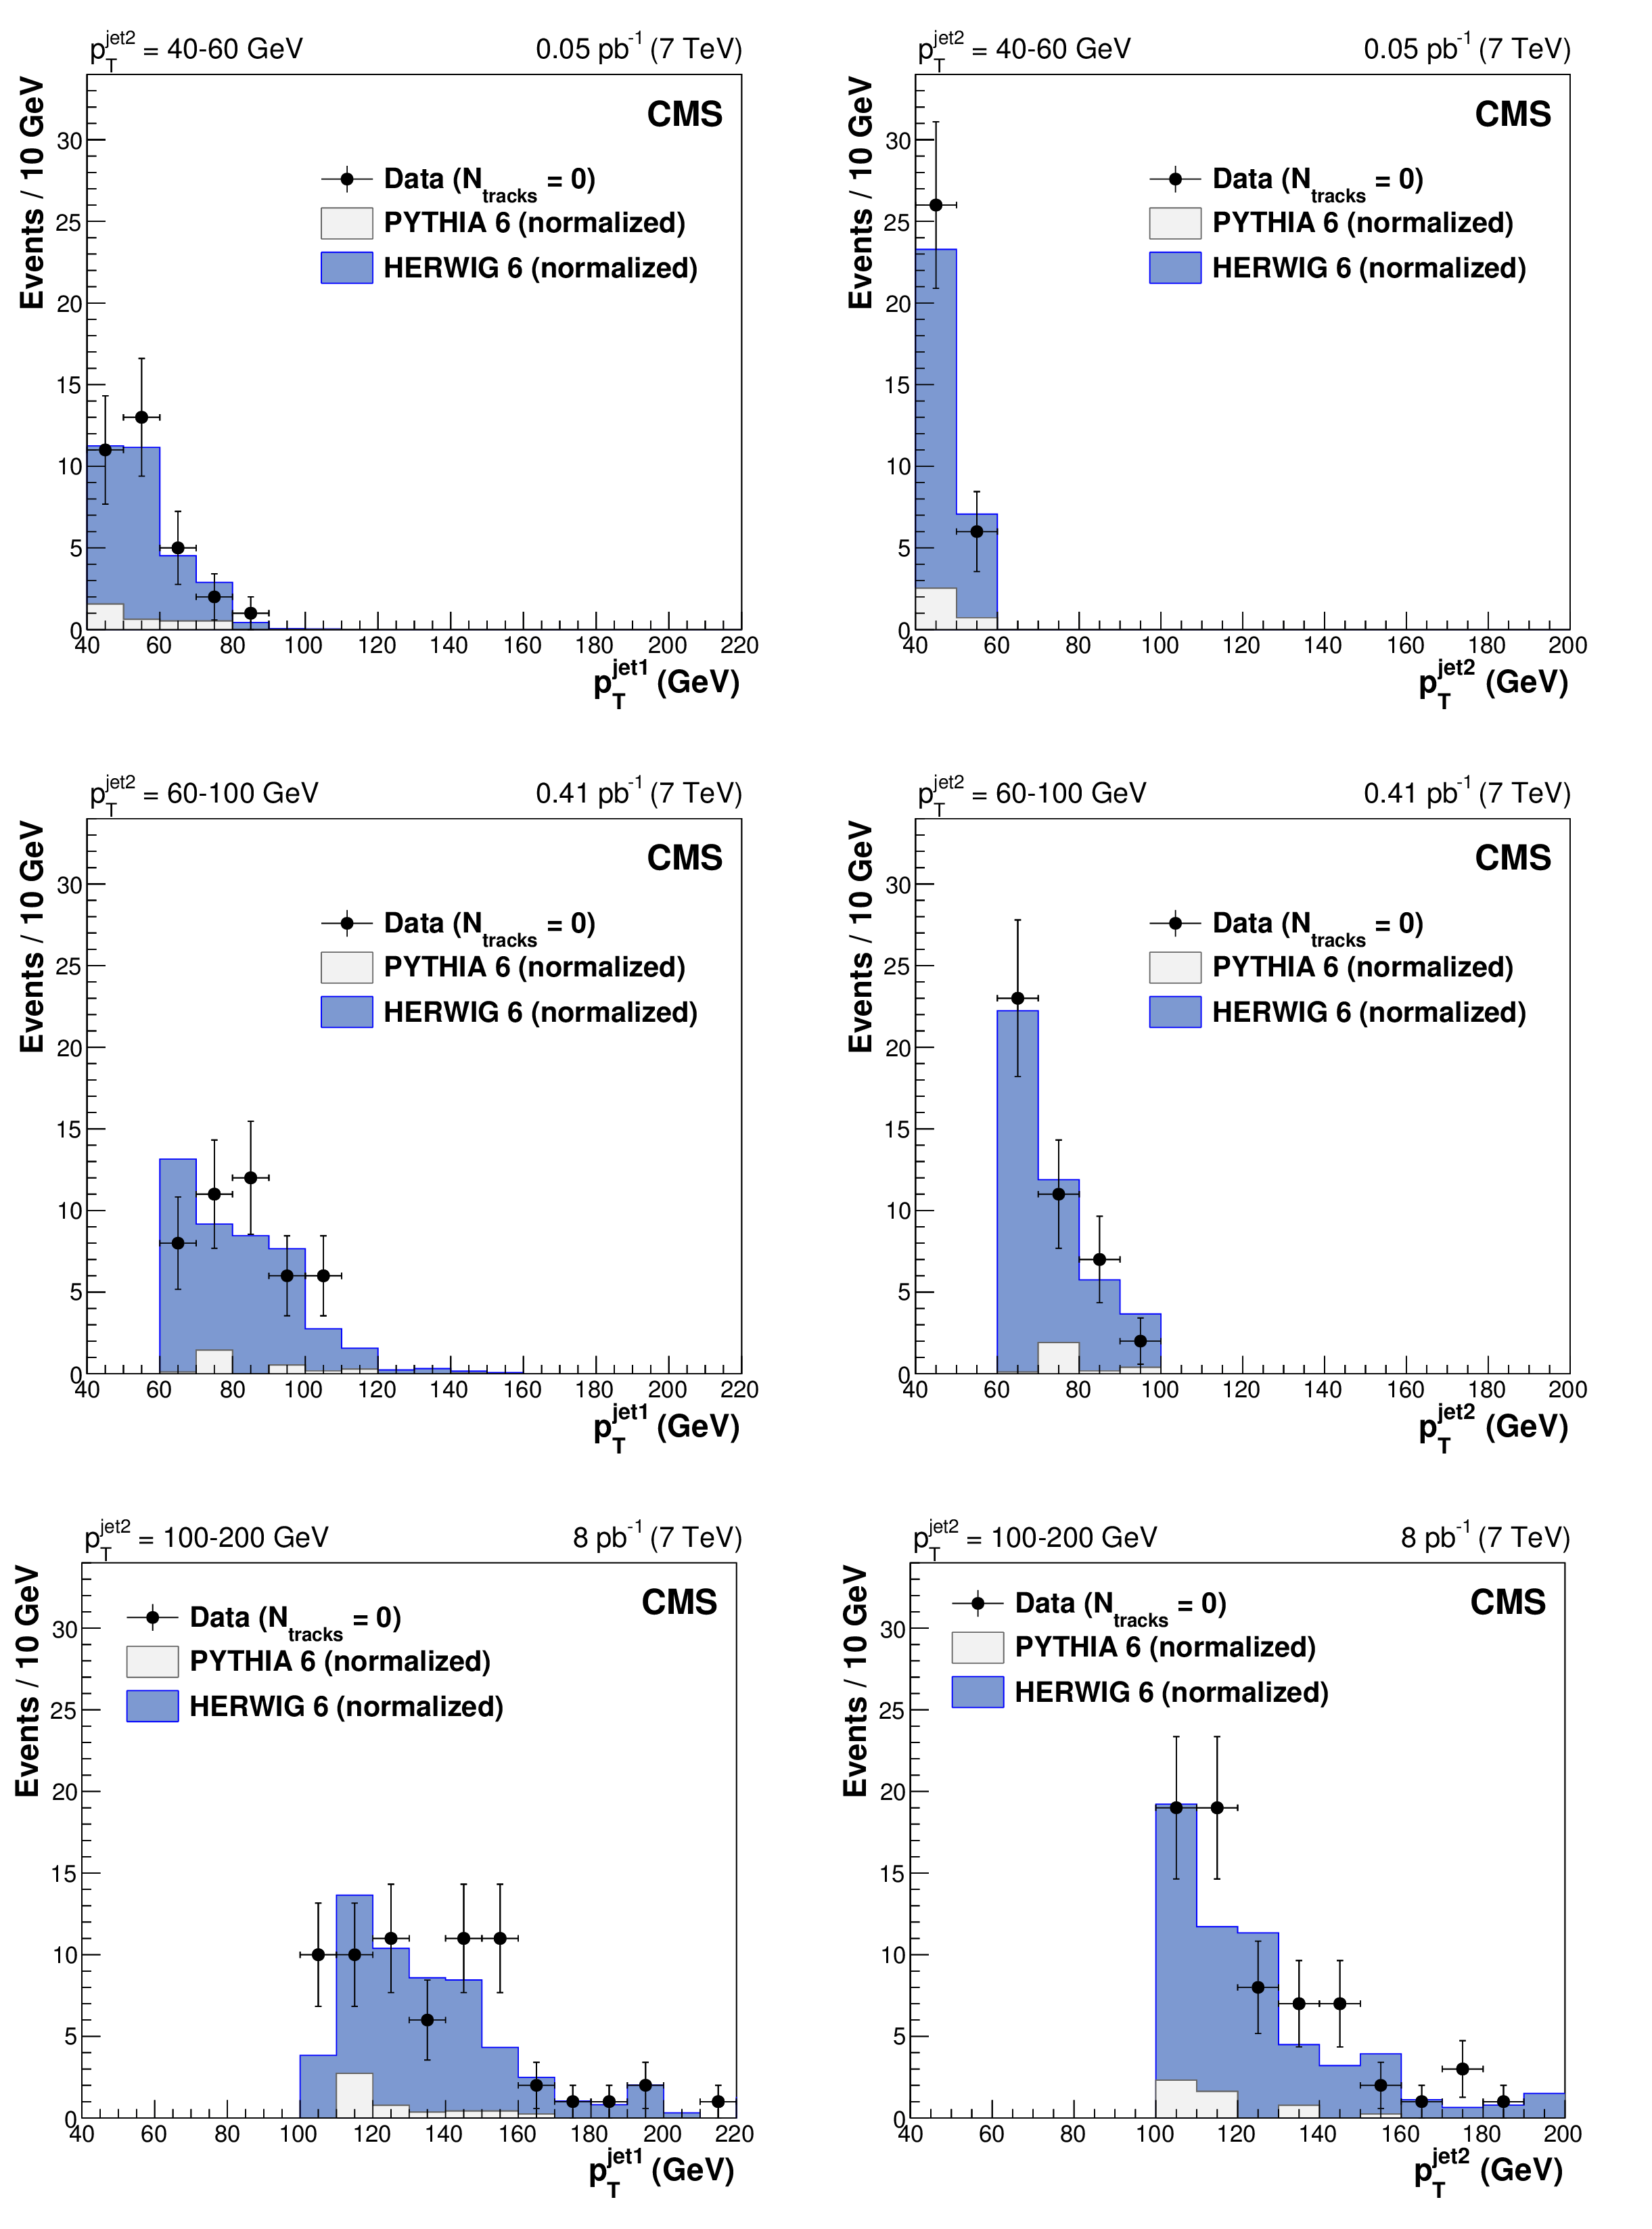
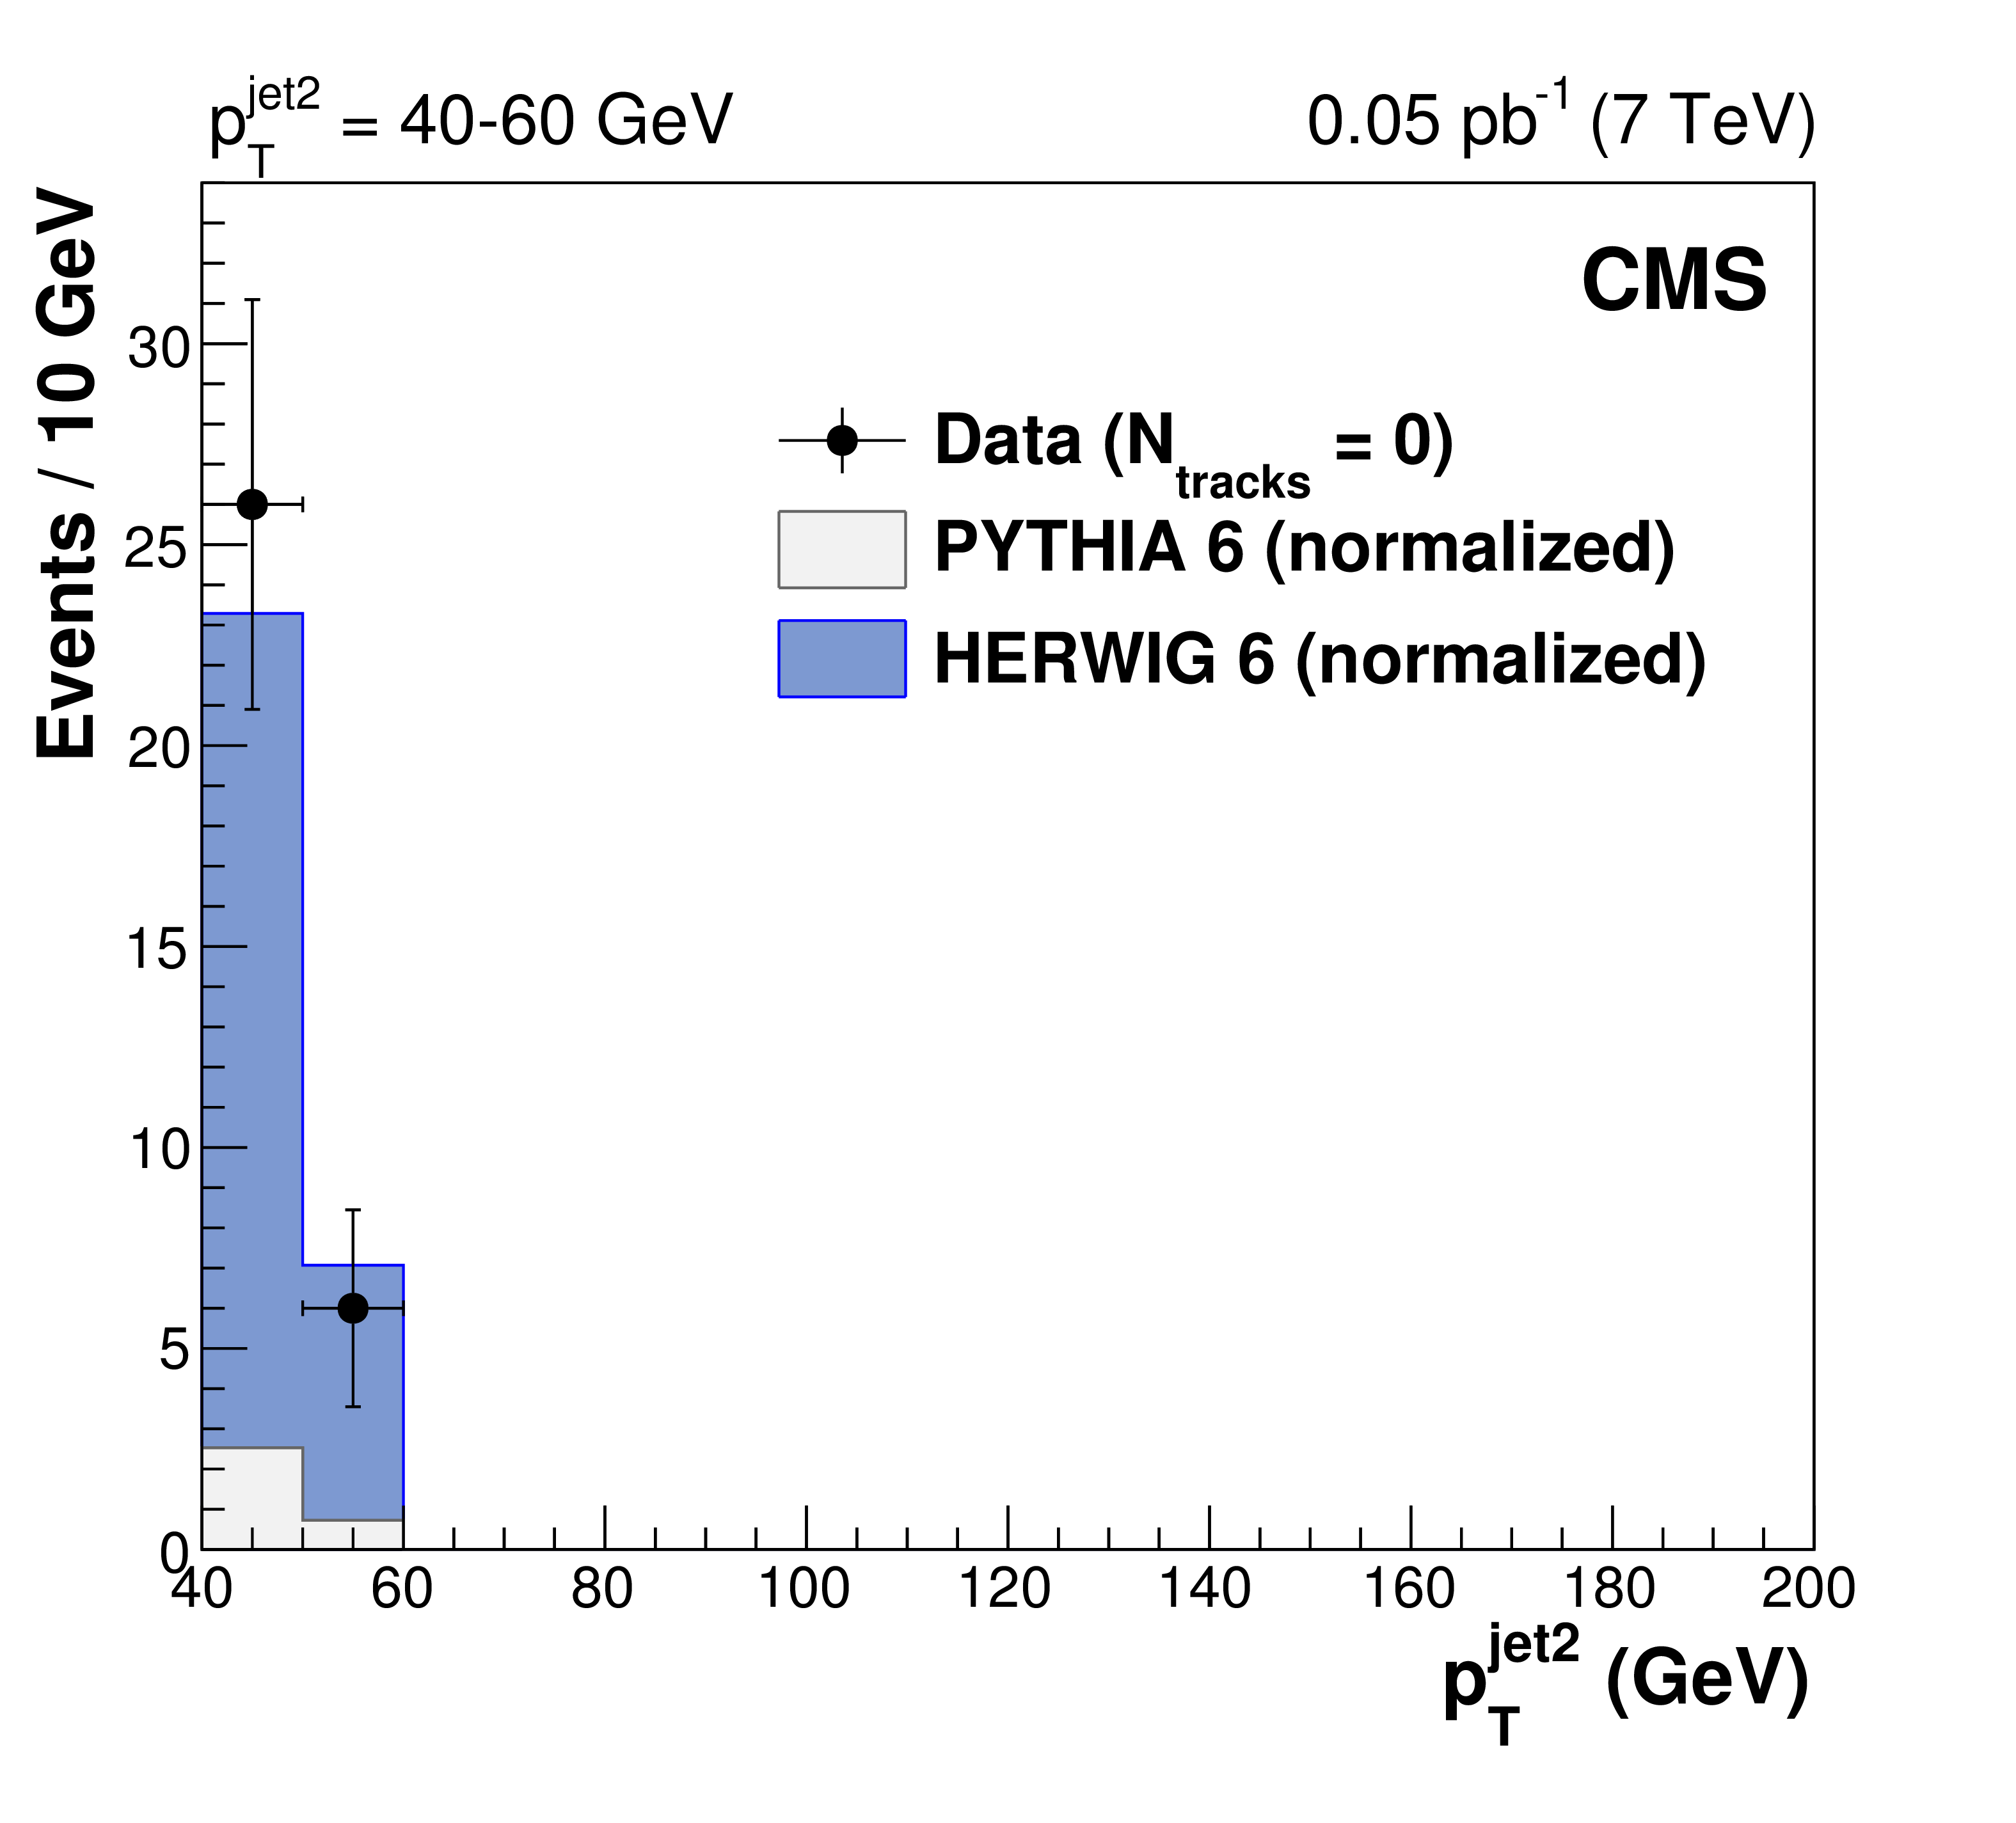
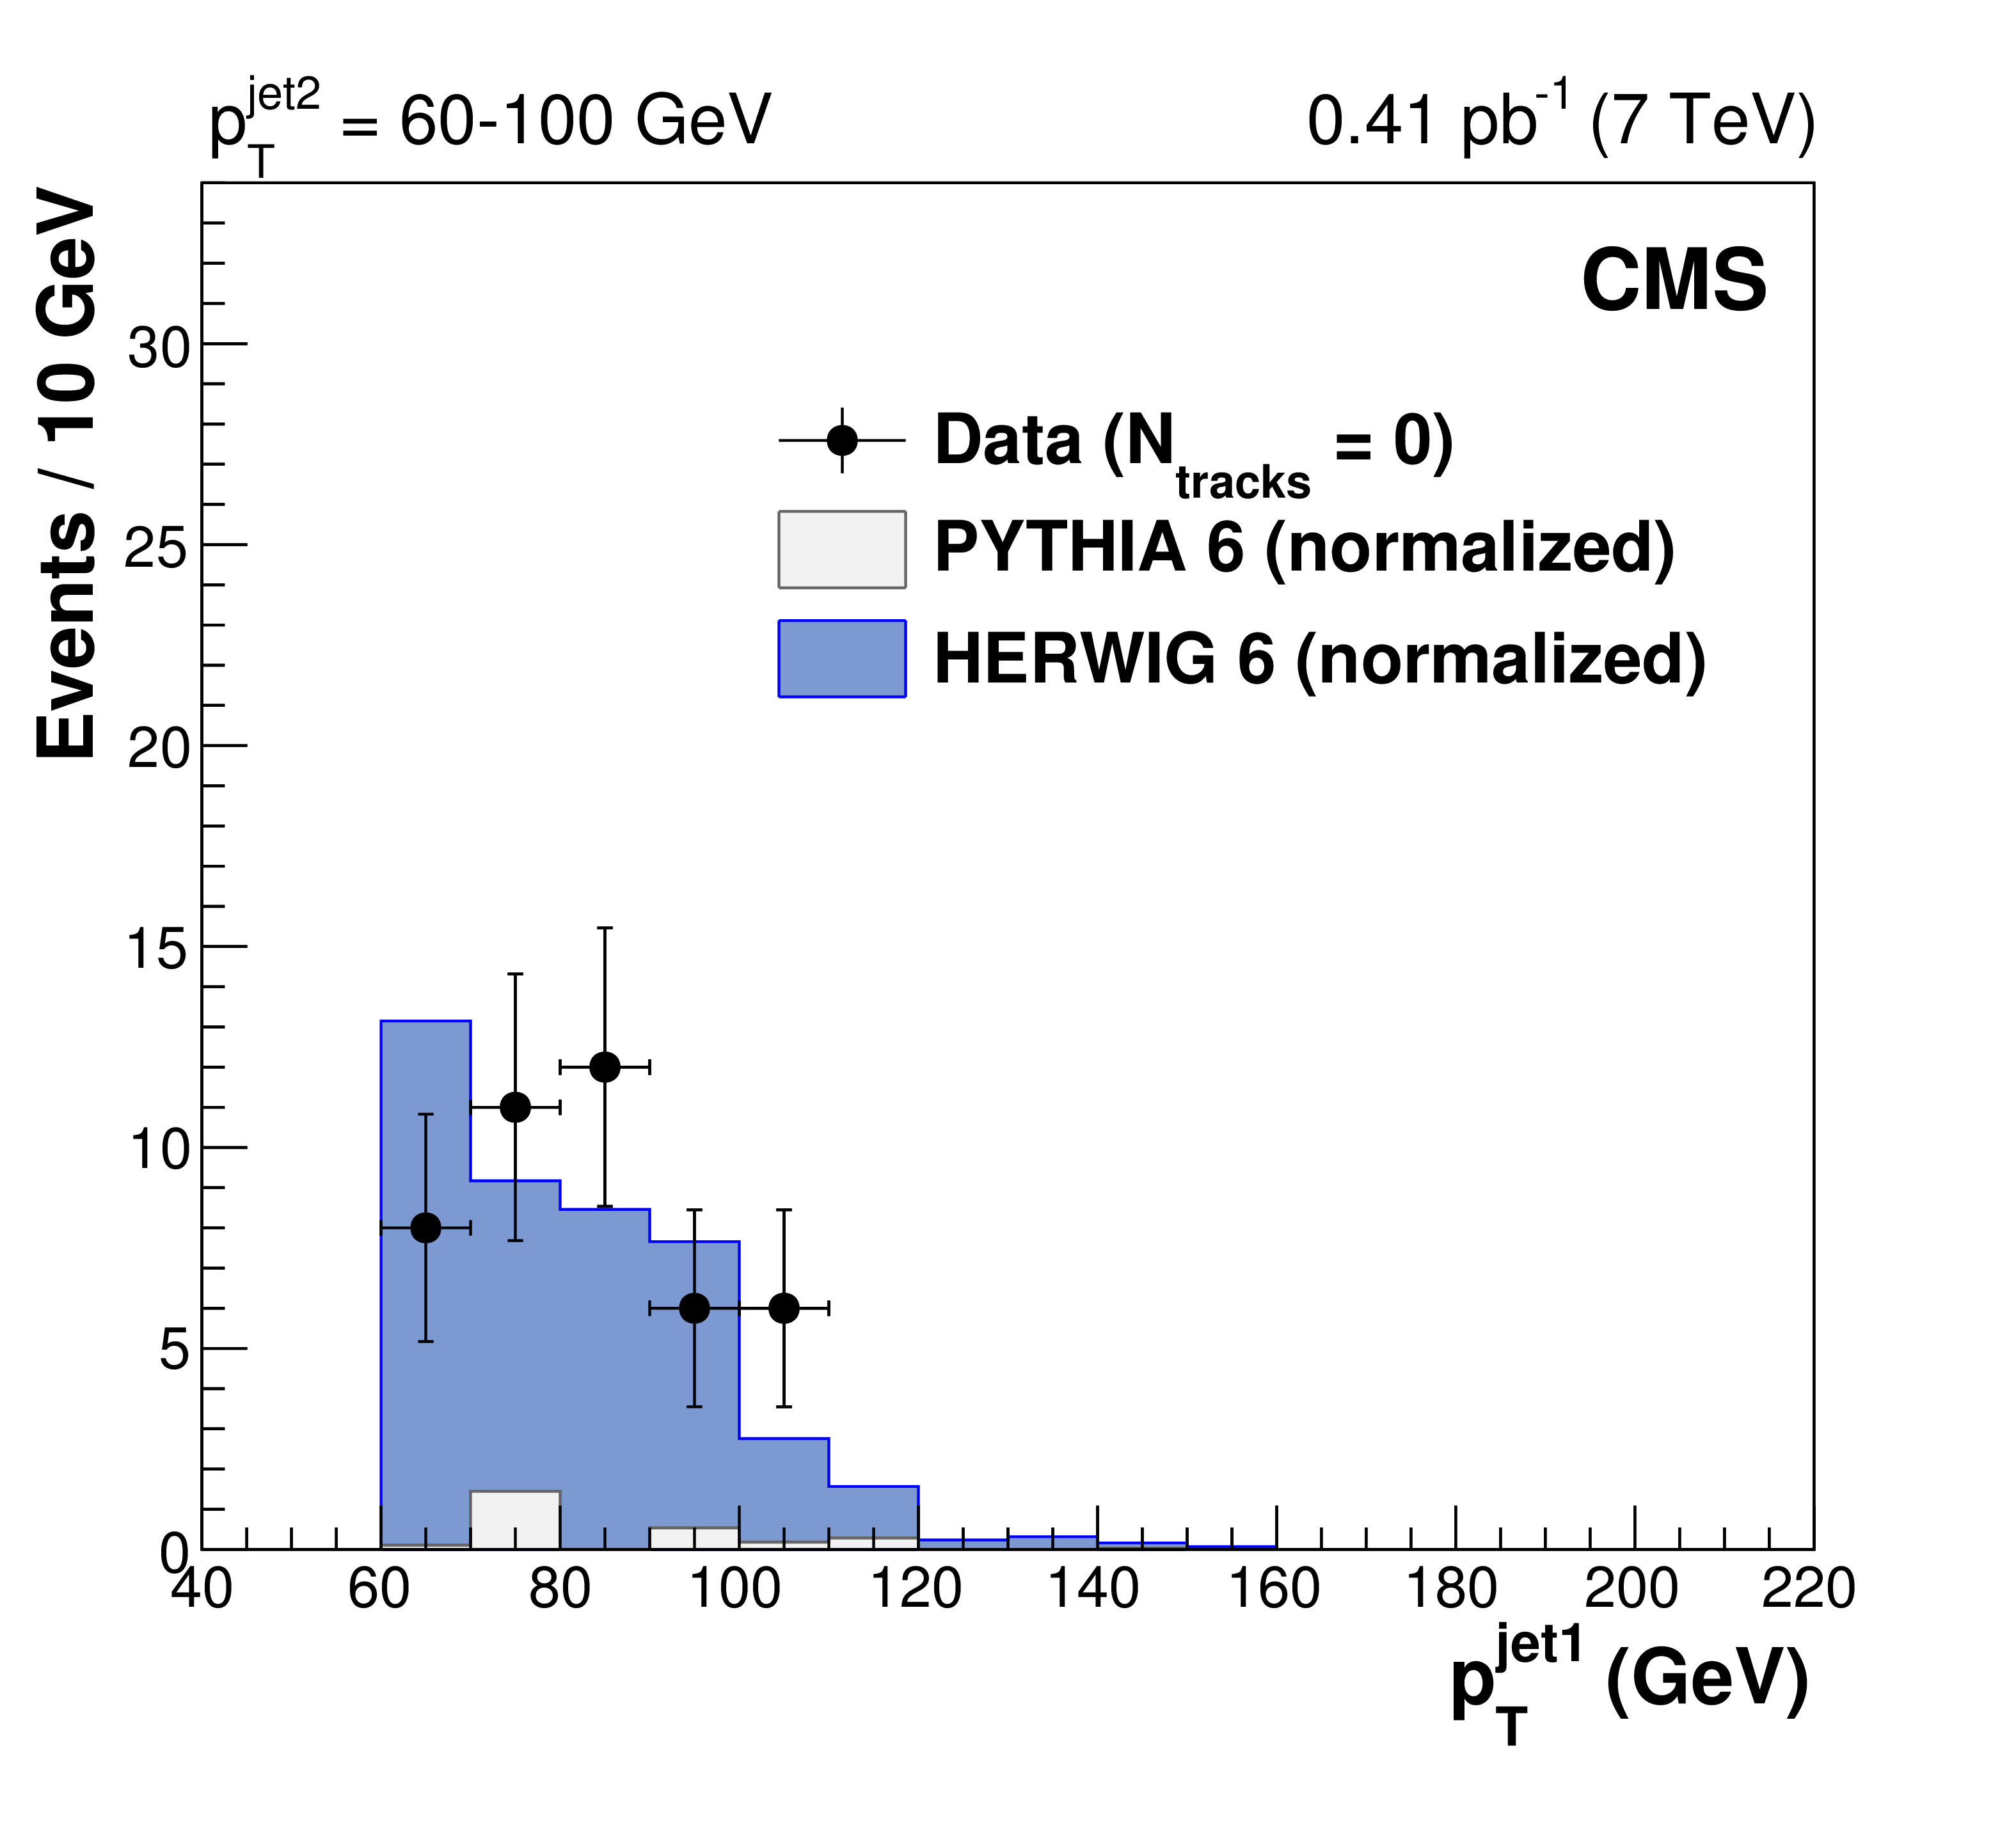
Transverse momentum distributions, uncorrected for detector effects, of the leading jet (left) and the second-leading jet (right) in three dijet samples with $ {p_{\mathrm {T}}} ^\text {jet2} = $ 40-60, 60-100, and 100-200 GeV (from top to bottom) after all selections, for events with no tracks reconstructed in the gap region $ {< \eta >} < $ 1, compared to predictions of PYTHIA 6 (inclusive dijets) and HERWIG 6 (CSE jet-gap-jet events), normalized as in Fig. xxxxx. The error bars indicate the statistical uncertainty. |

png pdf |
Figure 4-a:
Transverse momentum distributions, uncorrected for detector effects, of the leading jet (left) and the second-leading jet (right) in three dijet samples with $ {p_{\mathrm {T}}} ^\text {jet2} = $ 40-60, 60-100, and 100-200 GeV (from top to bottom) after all selections, for events with no tracks reconstructed in the gap region $ {< \eta >} < $ 1, compared to predictions of PYTHIA 6 (inclusive dijets) and HERWIG 6 (CSE jet-gap-jet events), normalized as in Fig. xxxxx. The error bars indicate the statistical uncertainty. |
png pdf |
Figure 4-b:
Transverse momentum distributions, uncorrected for detector effects, of the leading jet (left) and the second-leading jet (right) in three dijet samples with $ {p_{\mathrm {T}}} ^\text {jet2} = $ 40-60, 60-100, and 100-200 GeV (from top to bottom) after all selections, for events with no tracks reconstructed in the gap region $ {< \eta >} < $ 1, compared to predictions of PYTHIA 6 (inclusive dijets) and HERWIG 6 (CSE jet-gap-jet events), normalized as in Fig. xxxxx. The error bars indicate the statistical uncertainty. |
png pdf |
Figure 4-c:
Transverse momentum distributions, uncorrected for detector effects, of the leading jet (left) and the second-leading jet (right) in three dijet samples with $ {p_{\mathrm {T}}} ^\text {jet2} = $ 40-60, 60-100, and 100-200 GeV (from top to bottom) after all selections, for events with no tracks reconstructed in the gap region $ {< \eta >} < $ 1, compared to predictions of PYTHIA 6 (inclusive dijets) and HERWIG 6 (CSE jet-gap-jet events), normalized as in Fig. xxxxx. The error bars indicate the statistical uncertainty. |

png pdf |
Figure 4-d:
Transverse momentum distributions, uncorrected for detector effects, of the leading jet (left) and the second-leading jet (right) in three dijet samples with $ {p_{\mathrm {T}}} ^\text {jet2} = $ 40-60, 60-100, and 100-200 GeV (from top to bottom) after all selections, for events with no tracks reconstructed in the gap region $ {< \eta >} < $ 1, compared to predictions of PYTHIA 6 (inclusive dijets) and HERWIG 6 (CSE jet-gap-jet events), normalized as in Fig. xxxxx. The error bars indicate the statistical uncertainty. |

png pdf |
Figure 4-e:
Transverse momentum distributions, uncorrected for detector effects, of the leading jet (left) and the second-leading jet (right) in three dijet samples with $ {p_{\mathrm {T}}} ^\text {jet2} = $ 40-60, 60-100, and 100-200 GeV (from top to bottom) after all selections, for events with no tracks reconstructed in the gap region $ {< \eta >} < $ 1, compared to predictions of PYTHIA 6 (inclusive dijets) and HERWIG 6 (CSE jet-gap-jet events), normalized as in Fig. xxxxx. The error bars indicate the statistical uncertainty. |

png pdf |
Figure 4-f:
Transverse momentum distributions, uncorrected for detector effects, of the leading jet (left) and the second-leading jet (right) in three dijet samples with $ {p_{\mathrm {T}}} ^\text {jet2} = $ 40-60, 60-100, and 100-200 GeV (from top to bottom) after all selections, for events with no tracks reconstructed in the gap region $ {< \eta >} < $ 1, compared to predictions of PYTHIA 6 (inclusive dijets) and HERWIG 6 (CSE jet-gap-jet events), normalized as in Fig. xxxxx. The error bars indicate the statistical uncertainty. |
png pdf |
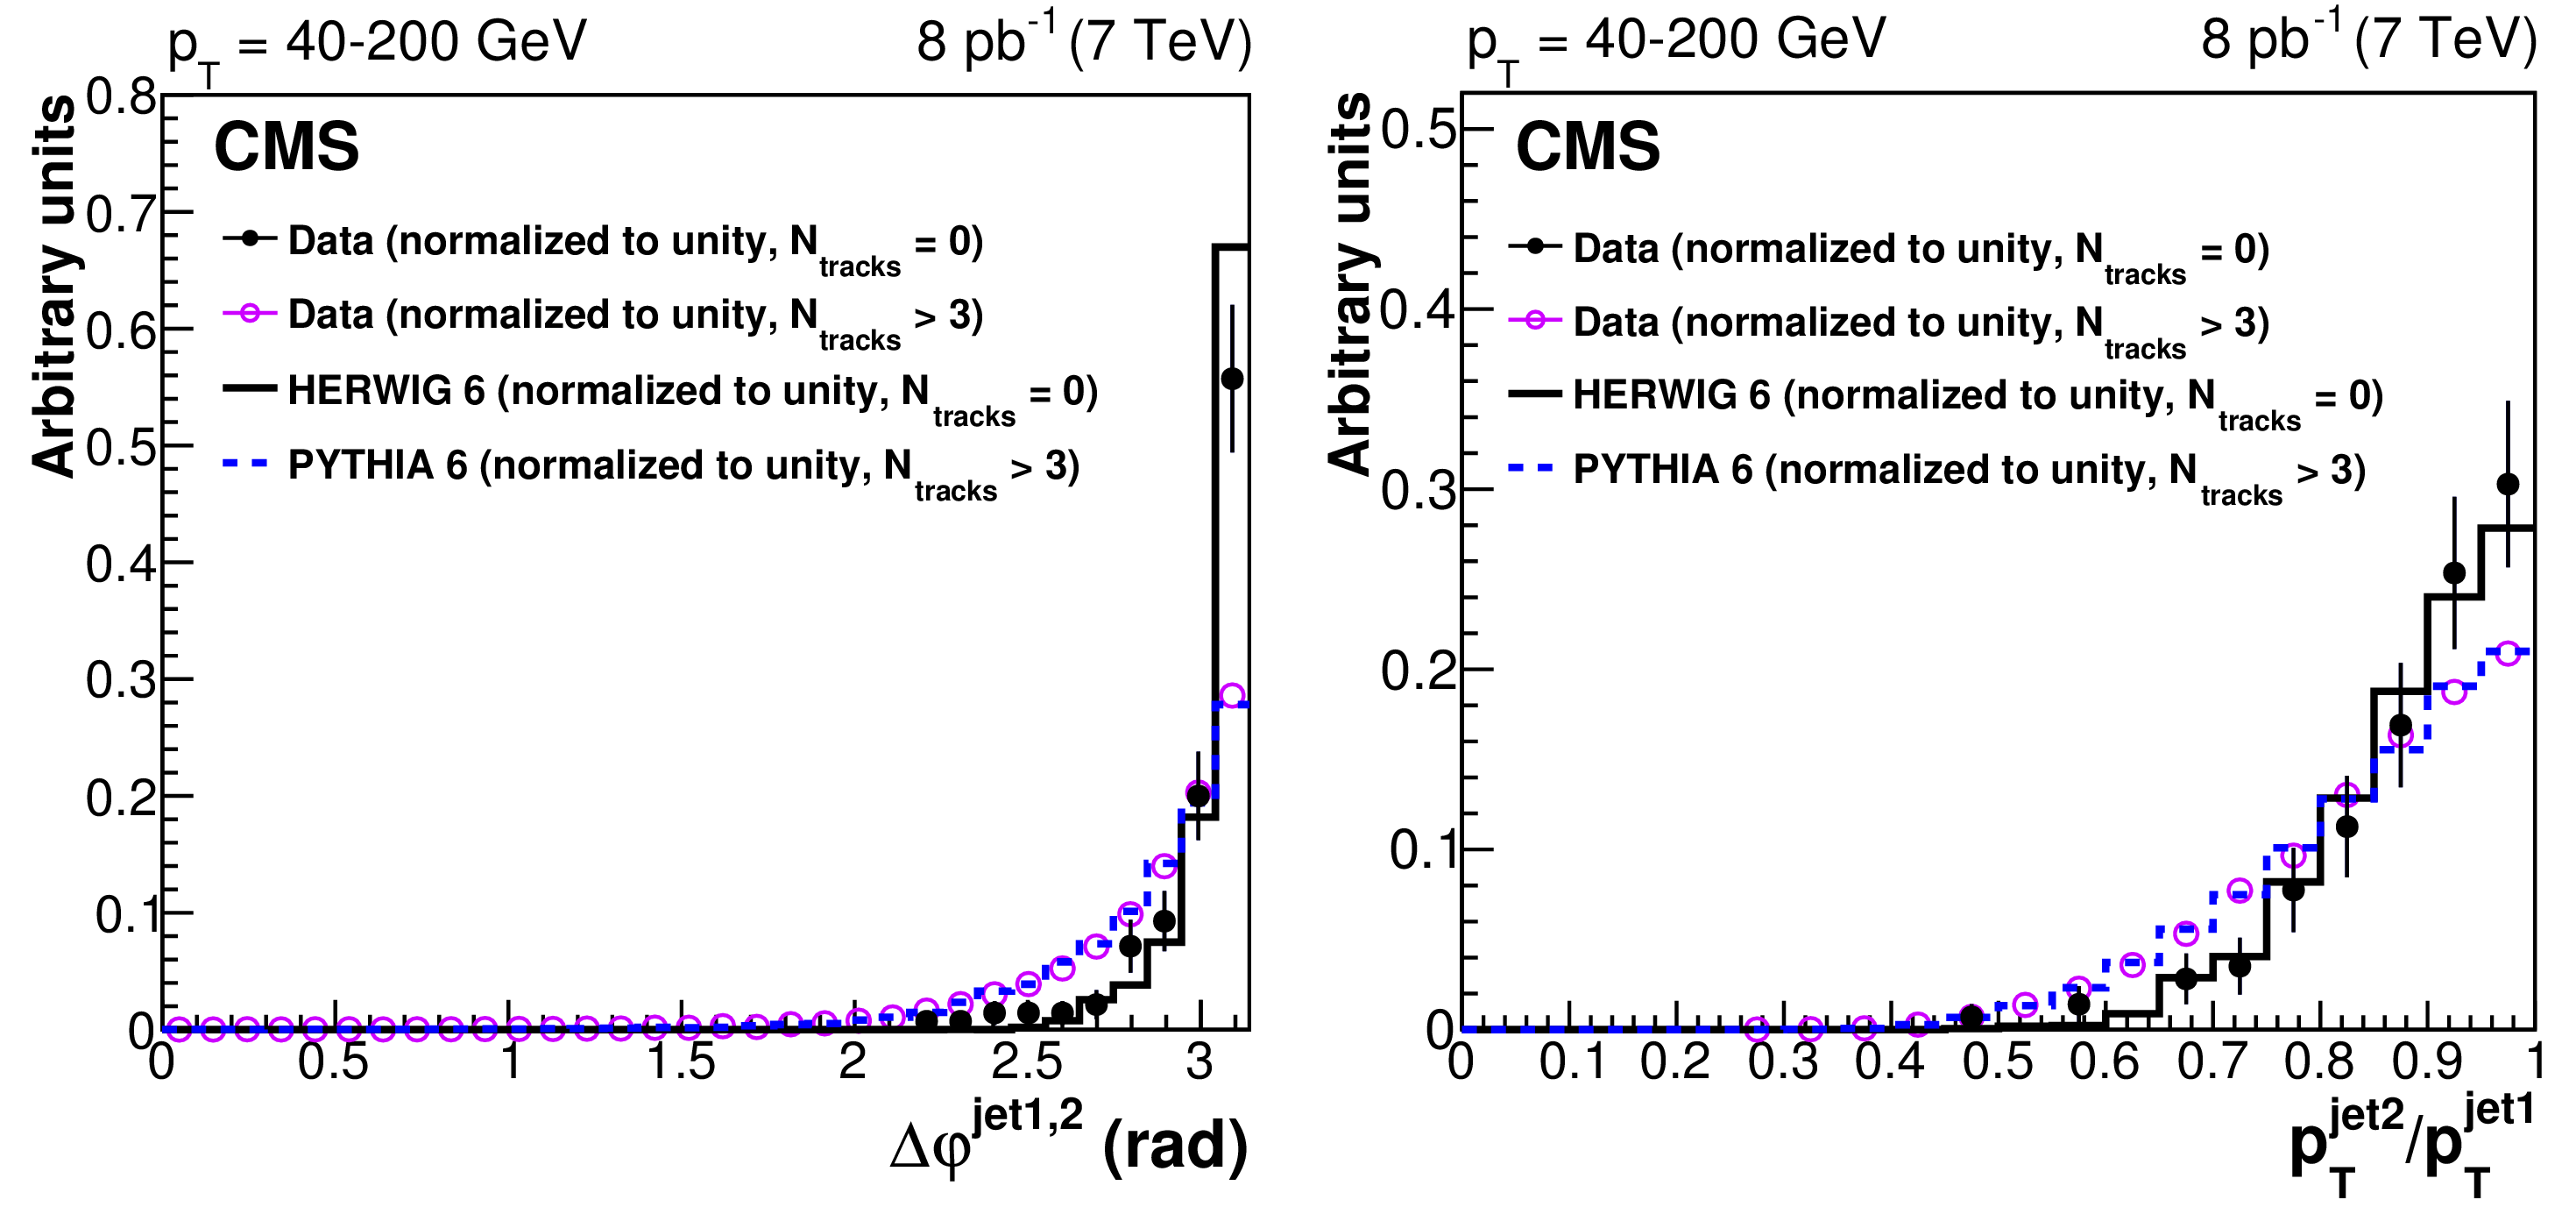
Figure 5:
Distributions, uncorrected for detector effects, of the azimuthal angle $\Delta \varphi ^\mathrm {jet1,2}$ between the two leading jets (left) and the ratio $ {p_{\mathrm {T}}} ^\text {jet2}/ {p_{\mathrm {T}}} ^\mathrm {jet1}$ of the second-leading jet $ {p_{\mathrm {T}}} $ to the leading jet $ {p_{\mathrm {T}}} $ (right) for events after all selections, with no tracks ($N_\text {tracks} = $ 0, full circles) or more than three tracks ($N_\text {tracks} > $ 3, open circles) reconstructed in the $ {< \eta >} < 1$ region, compared with the MC predictions. The distributions are summed over the three $p^\text {jet2}_\mathrm {T}$ bins used in the analysis and normalized to unity for shape comparison. |
png pdf |
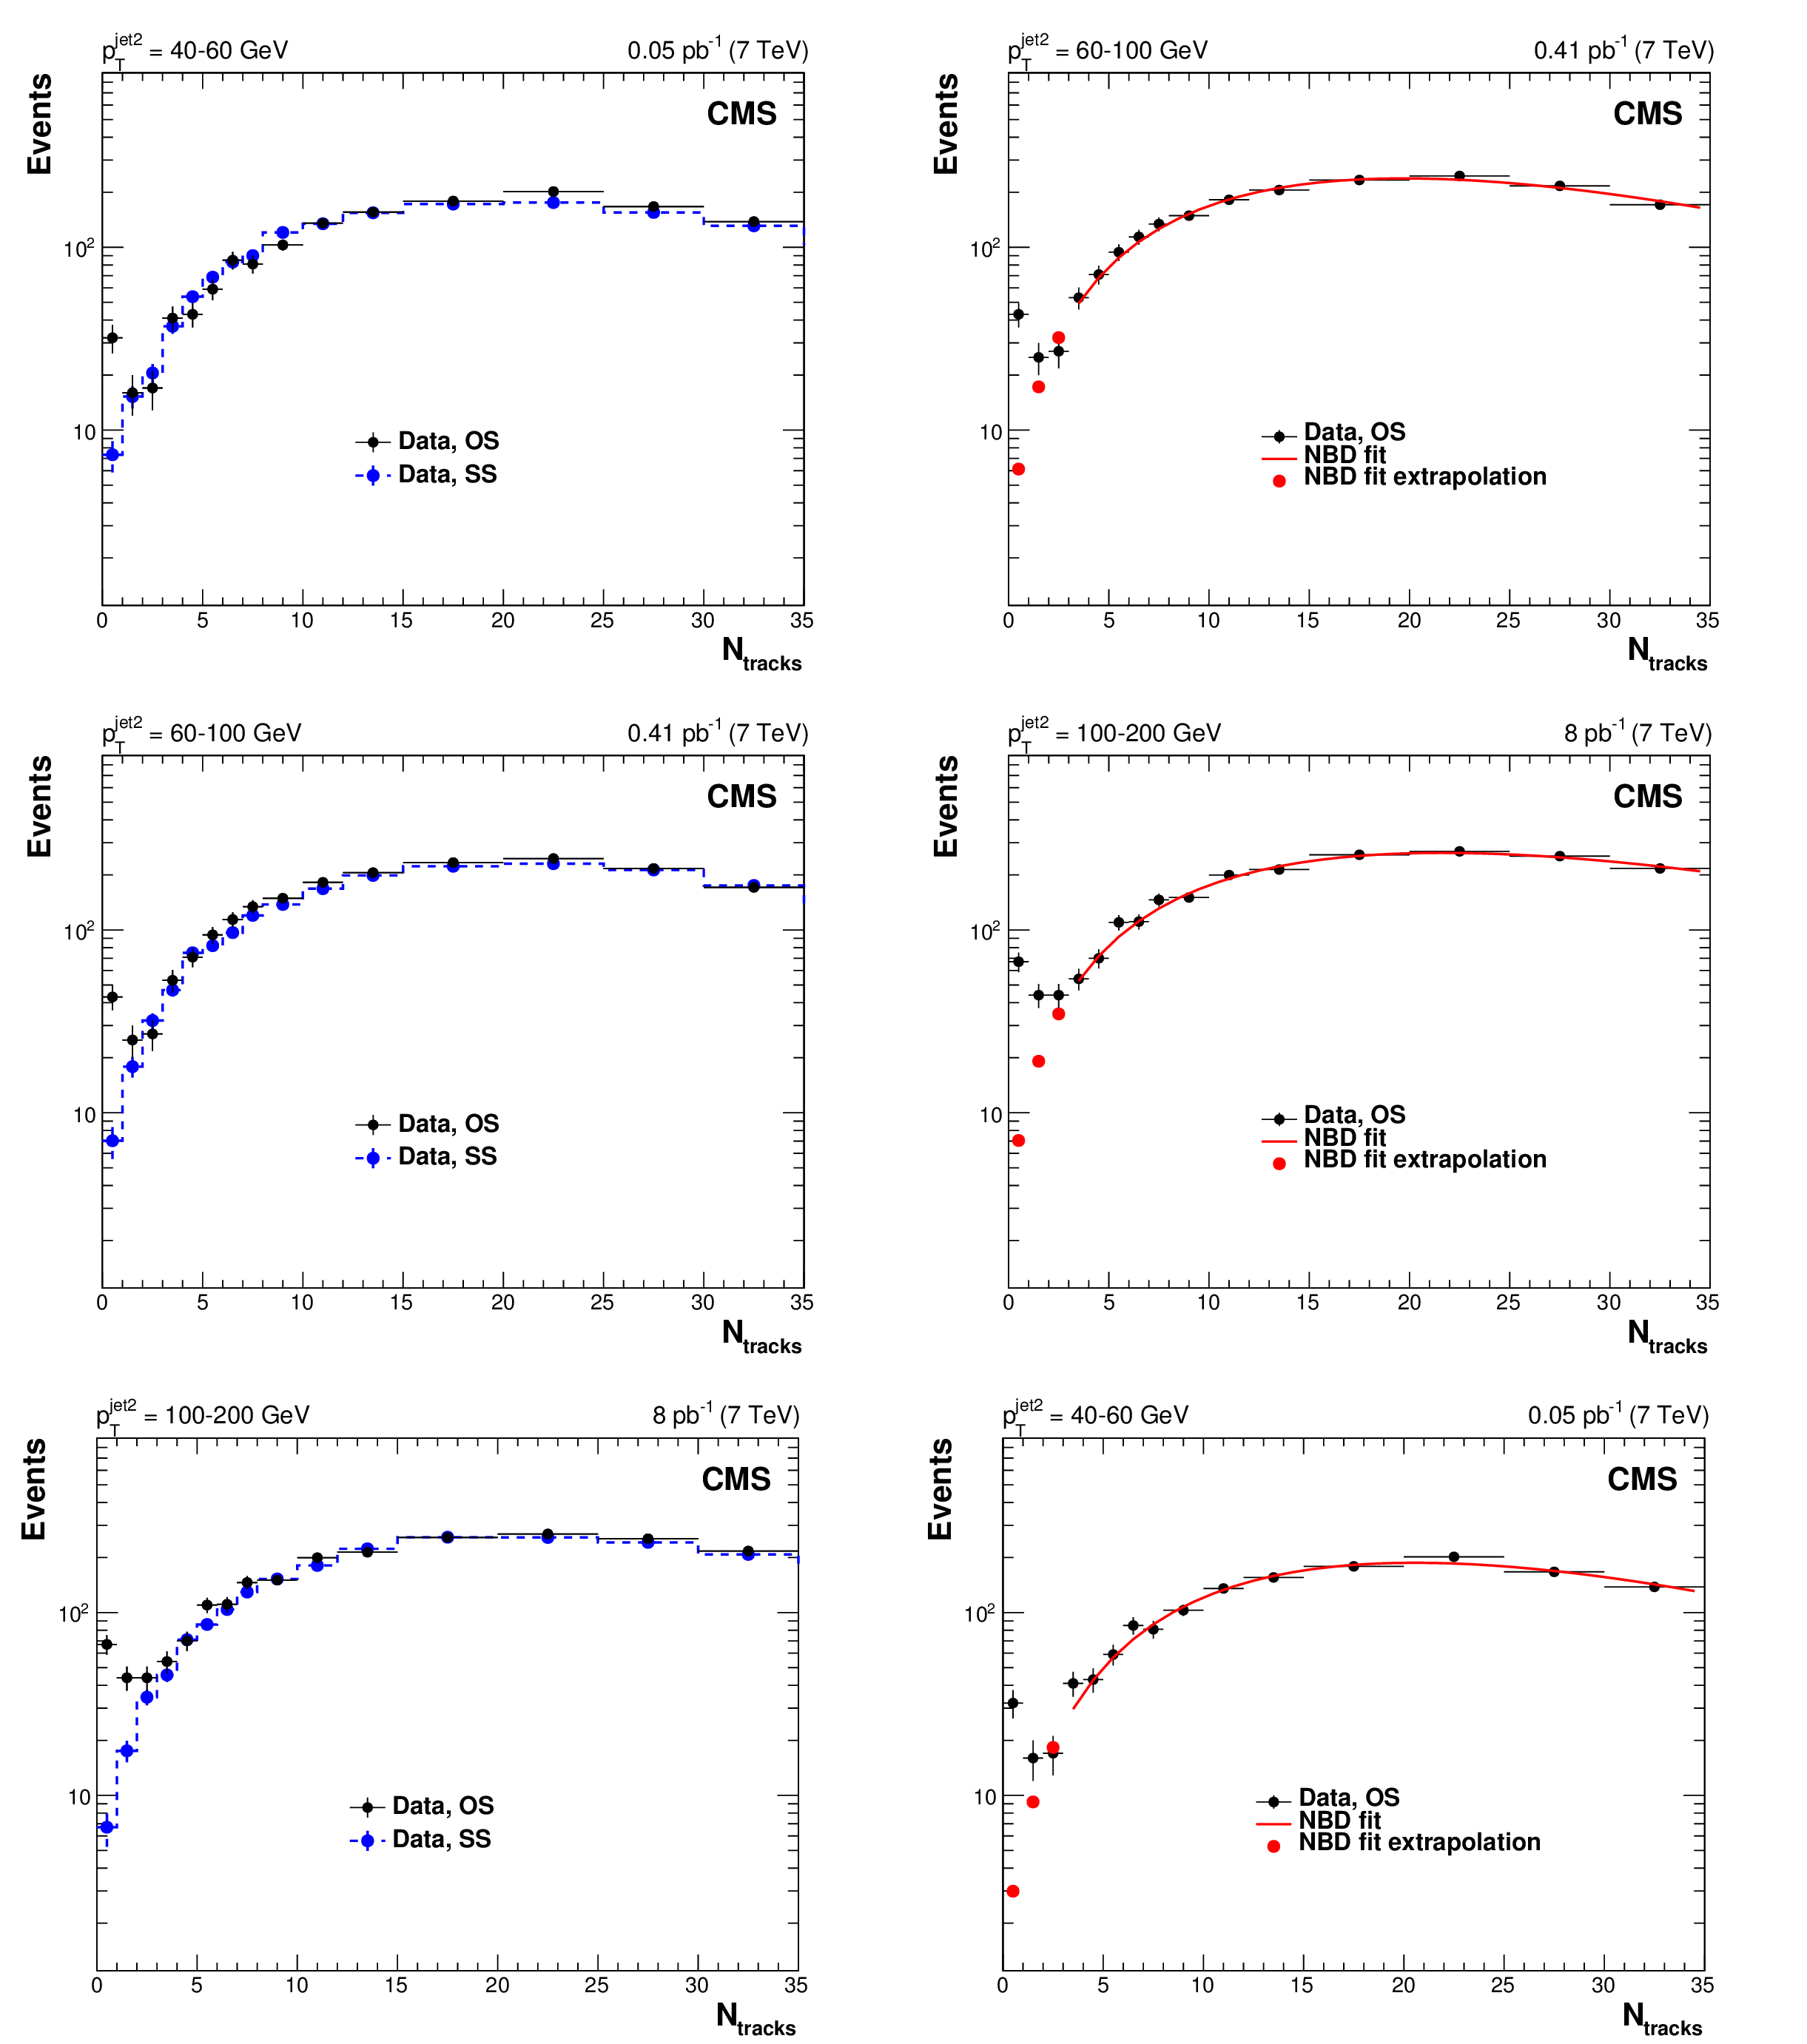
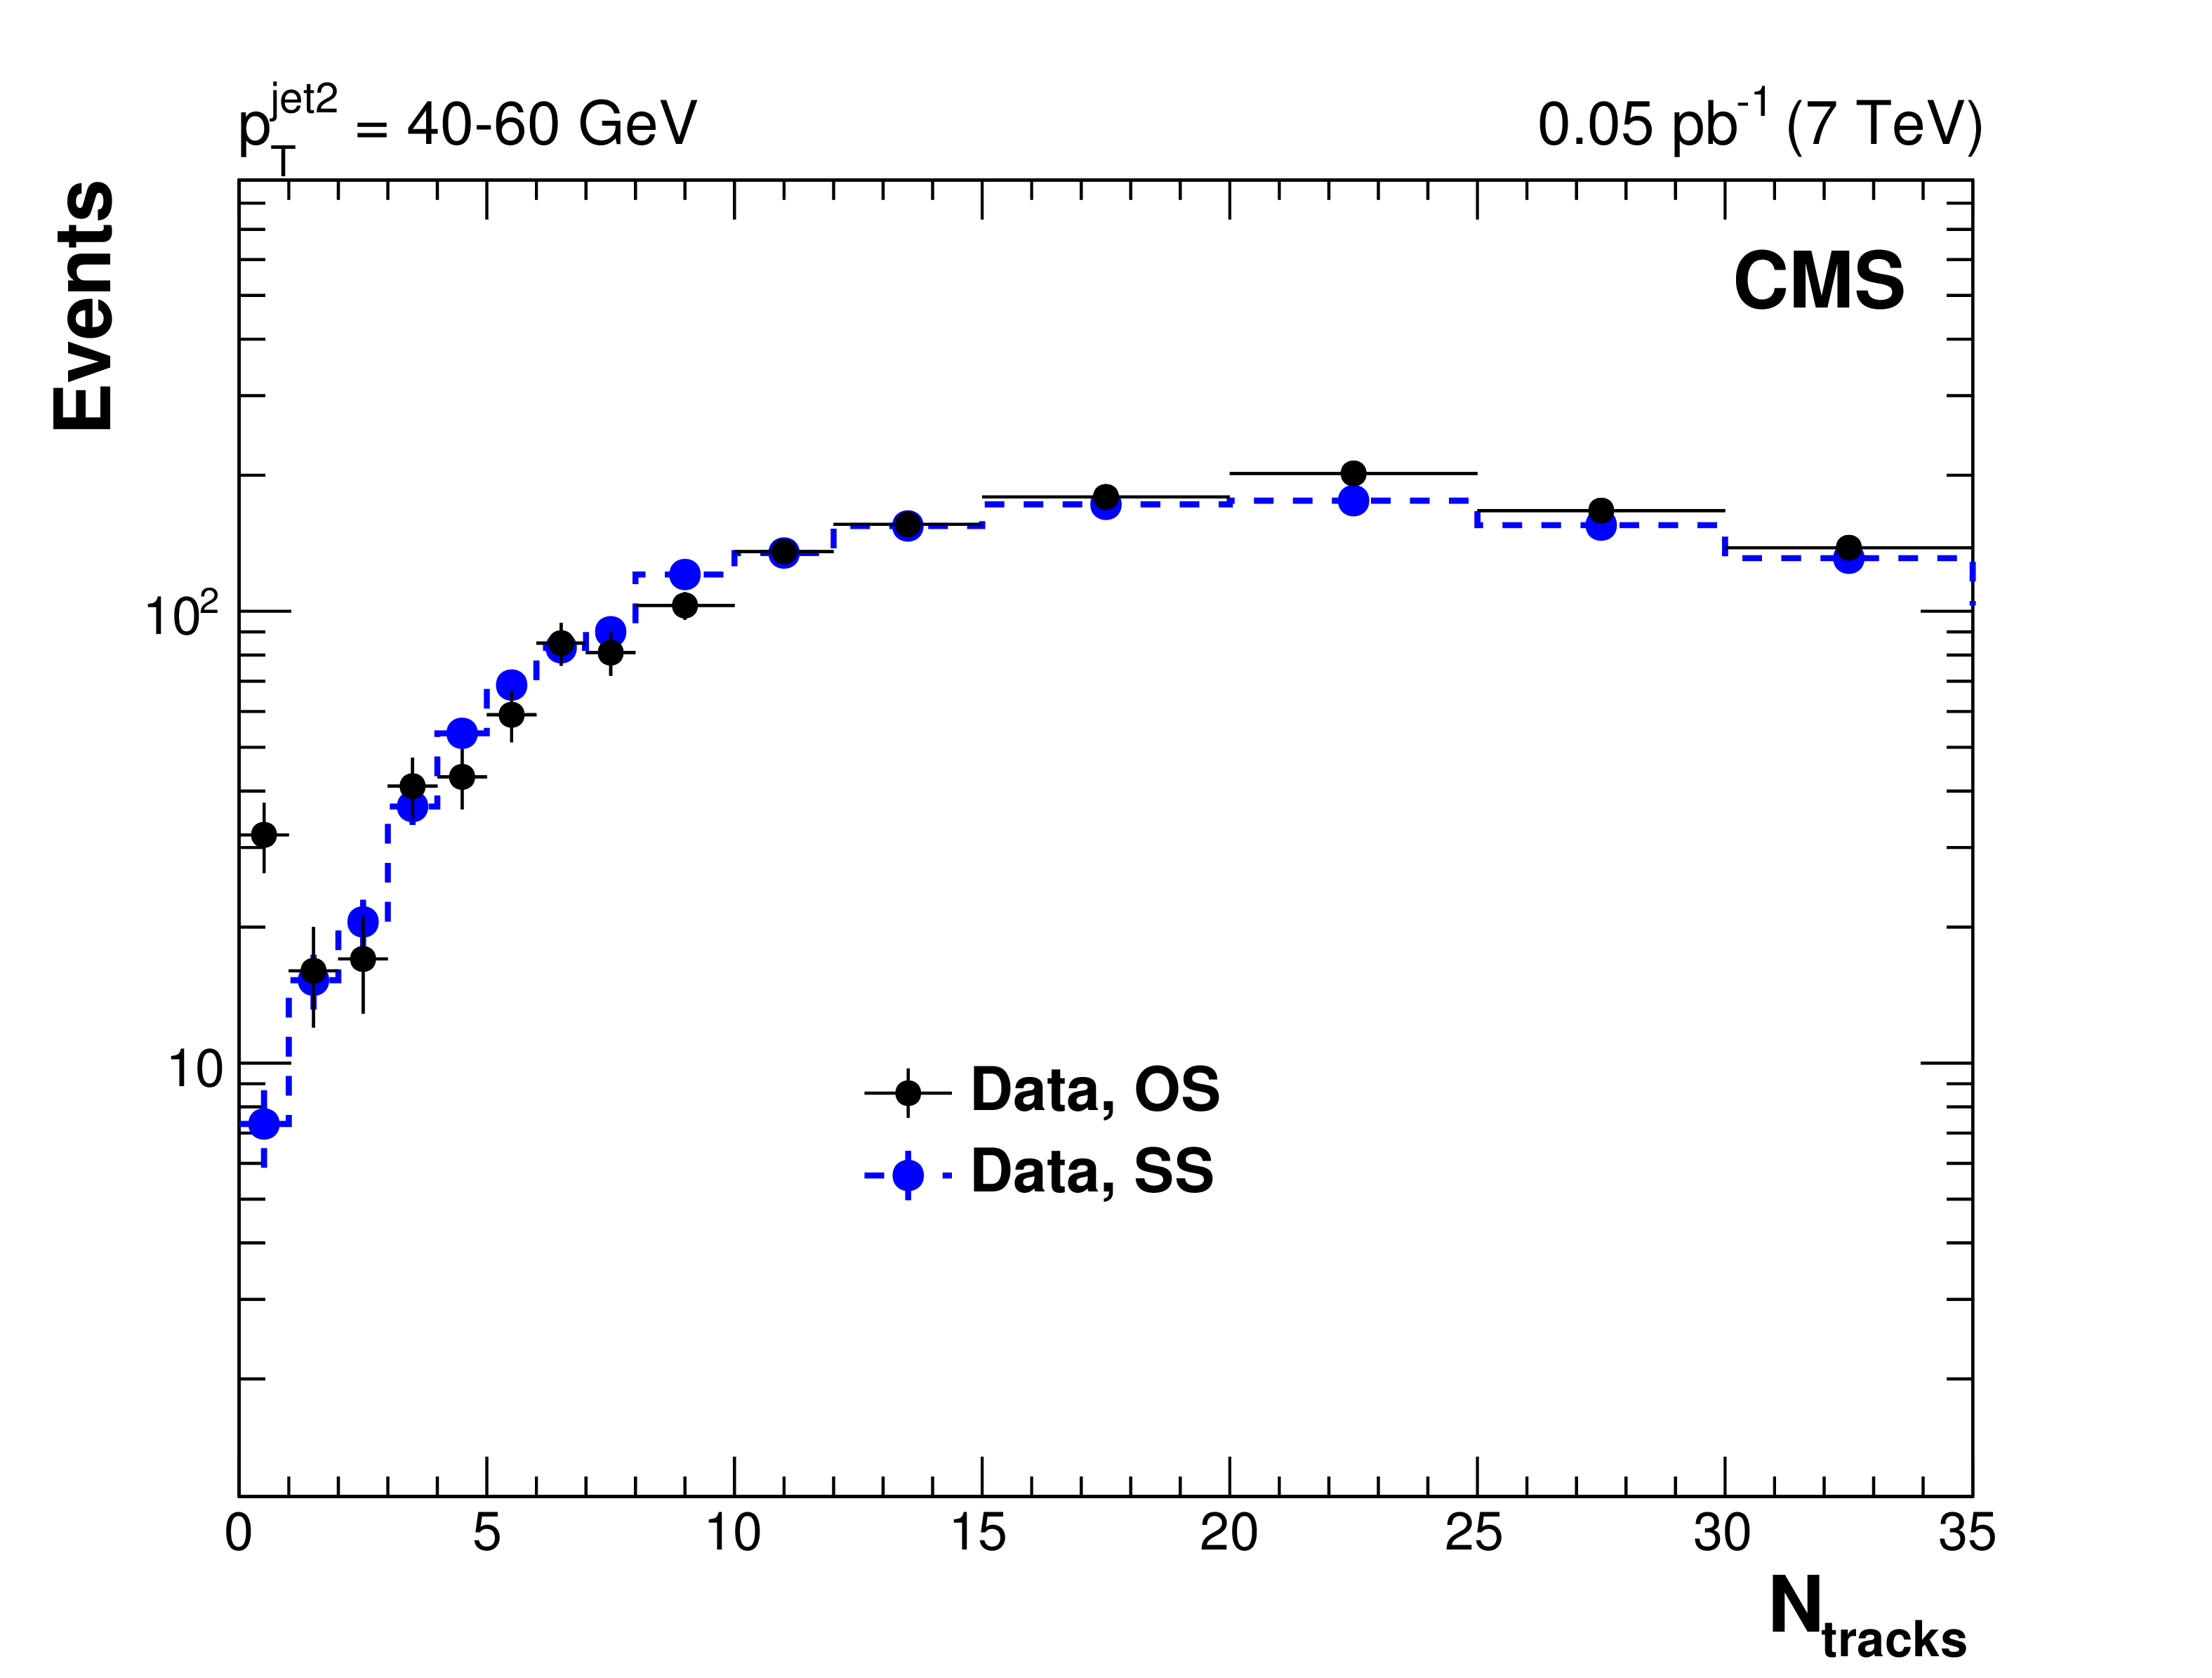
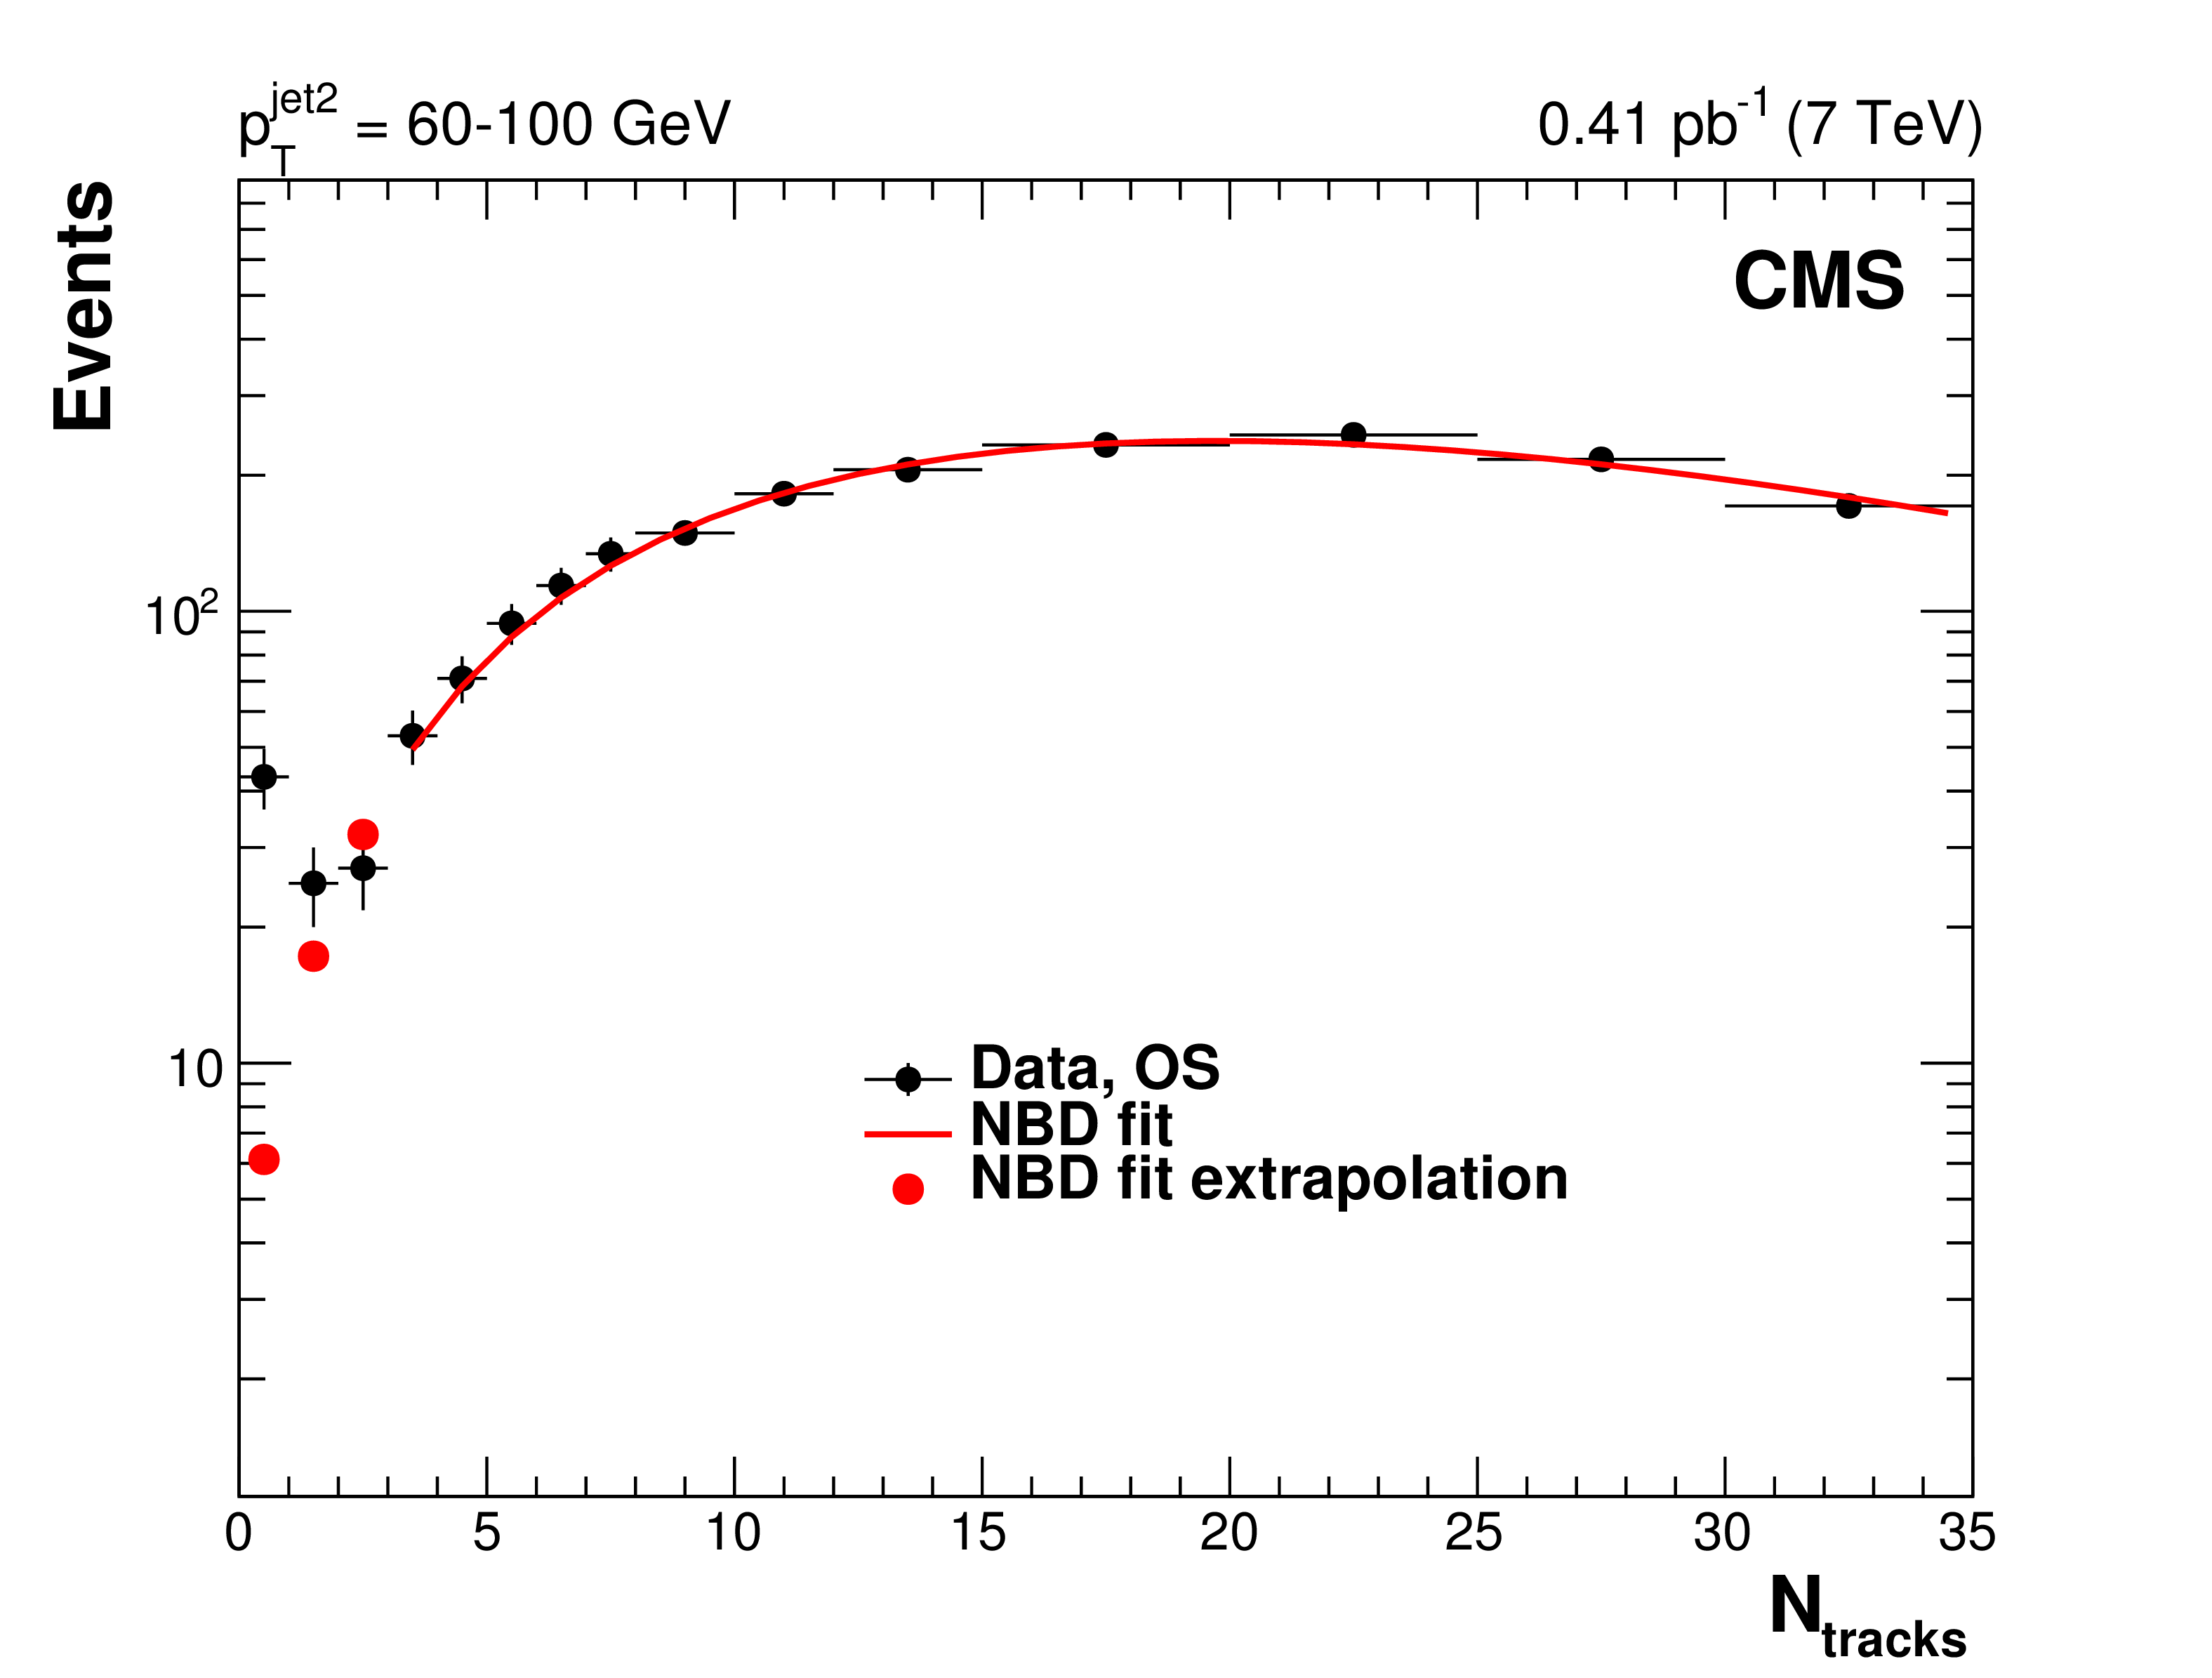
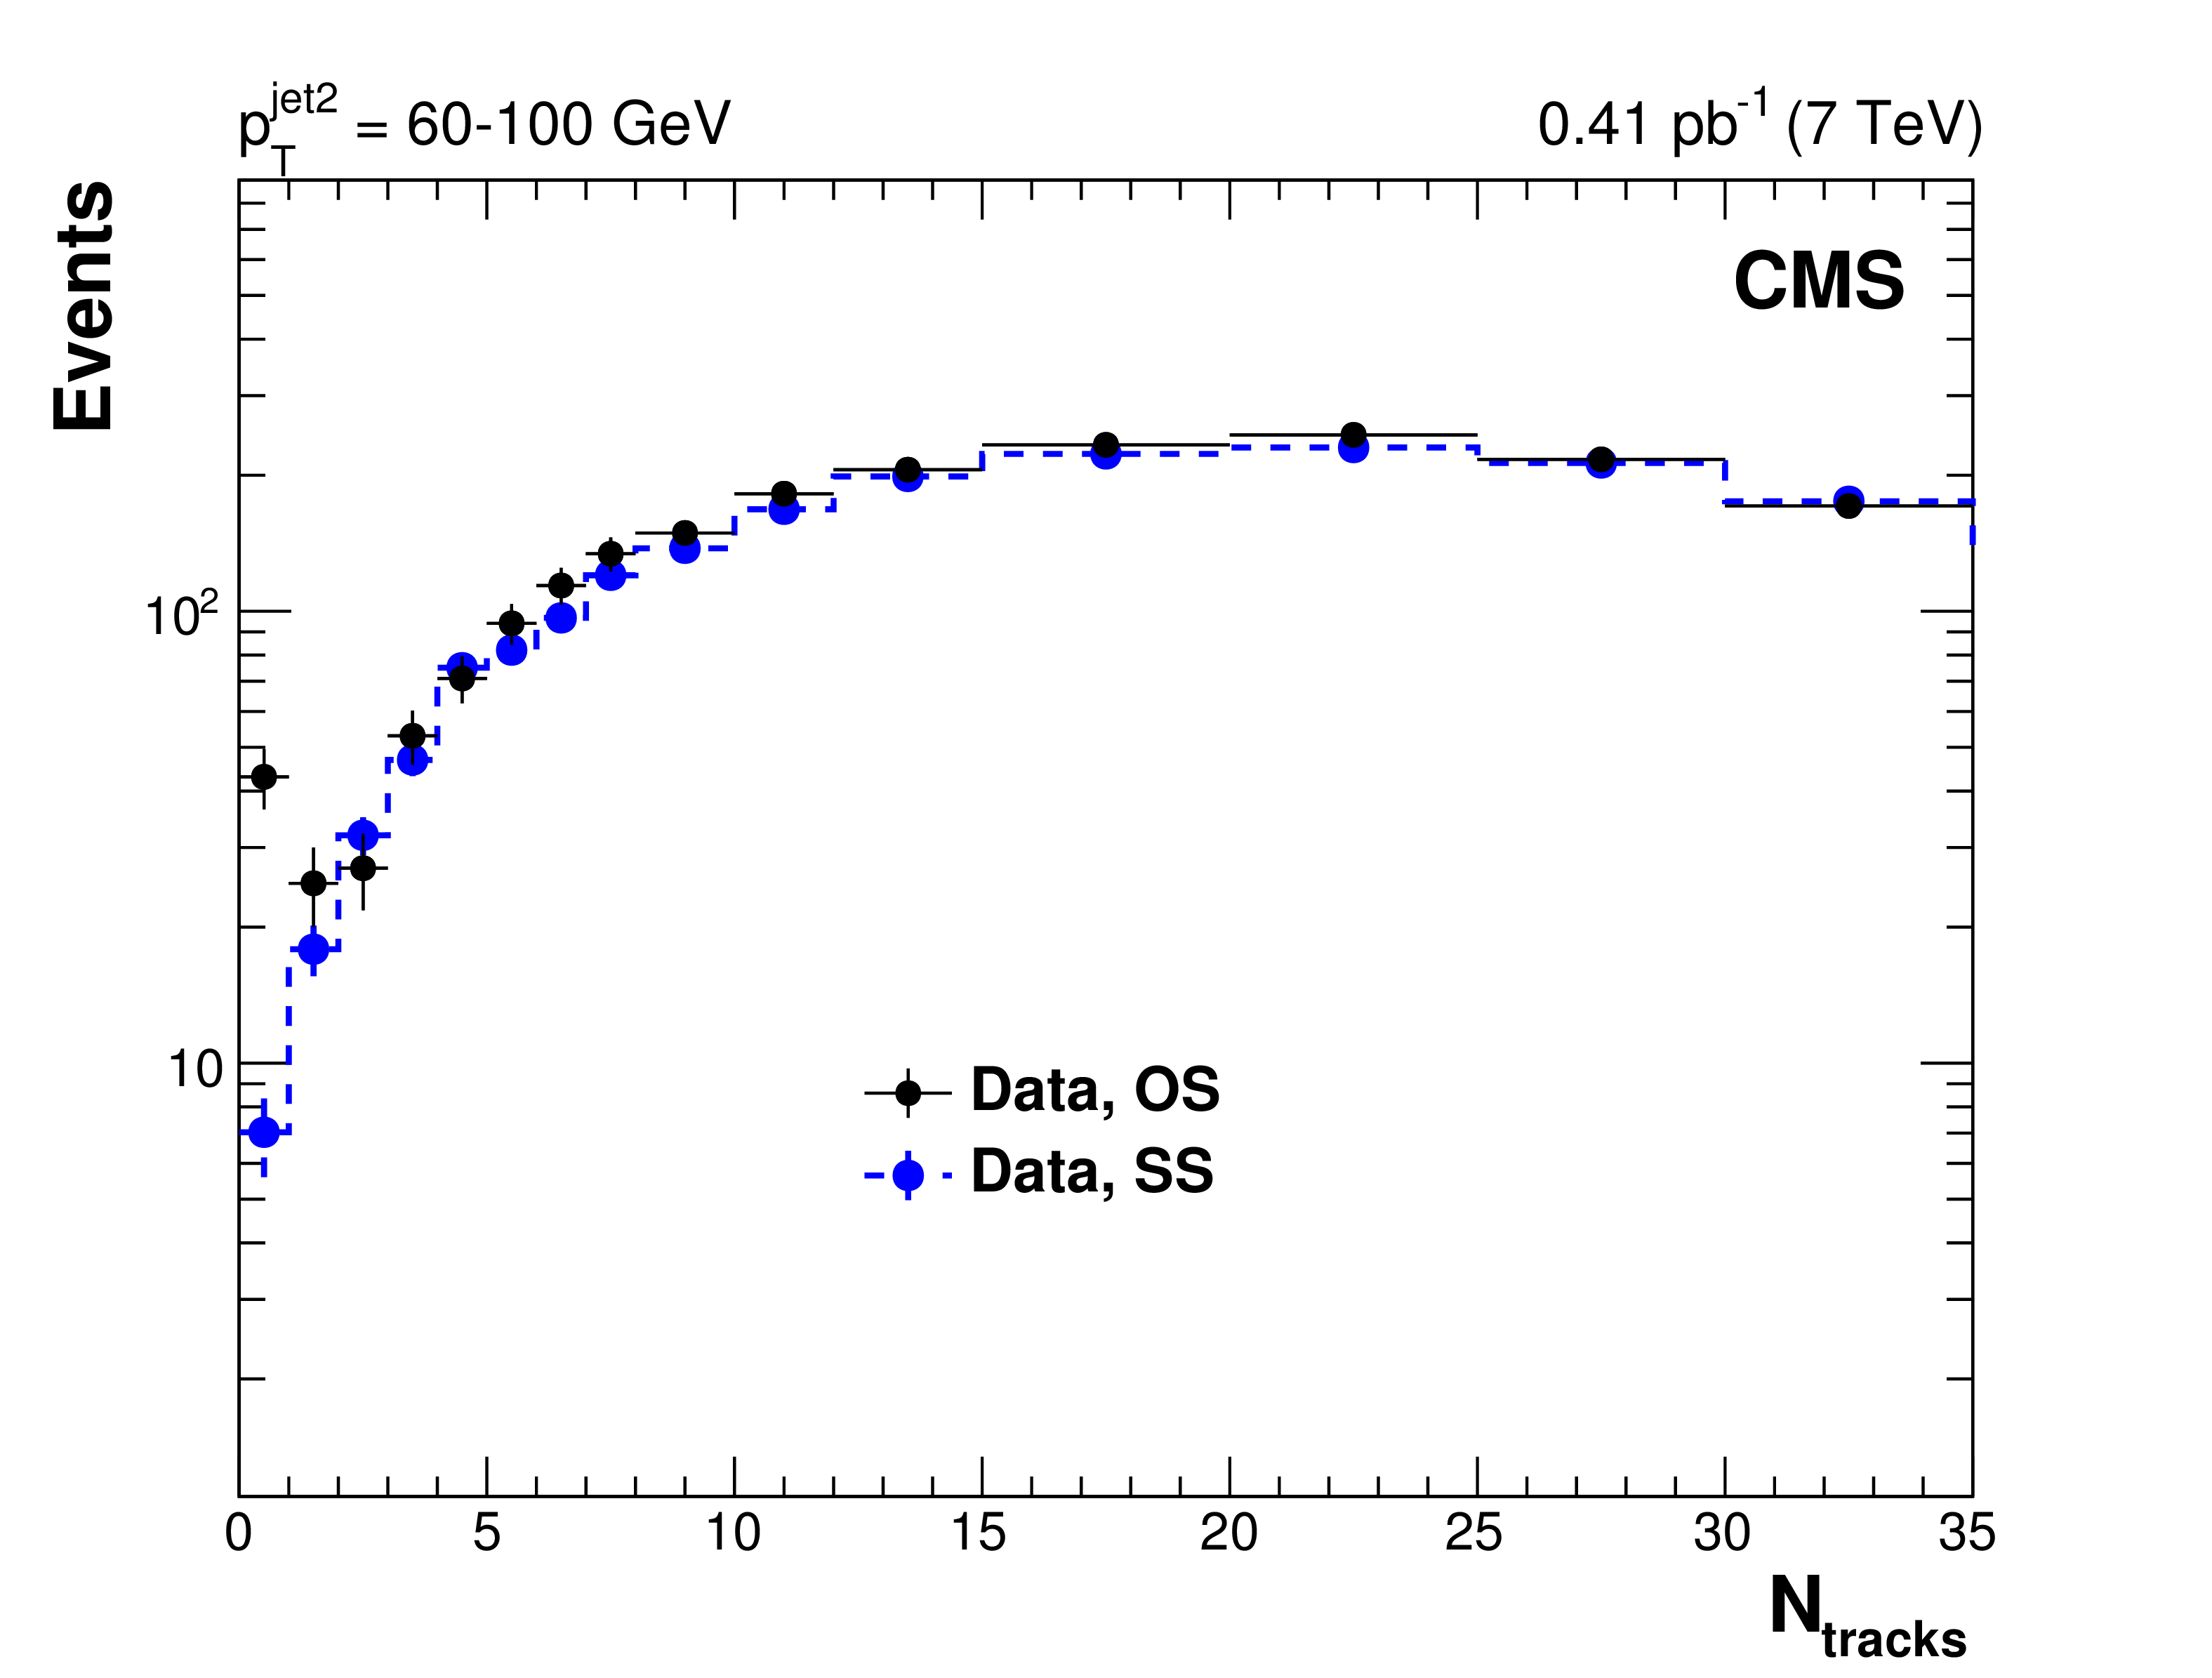
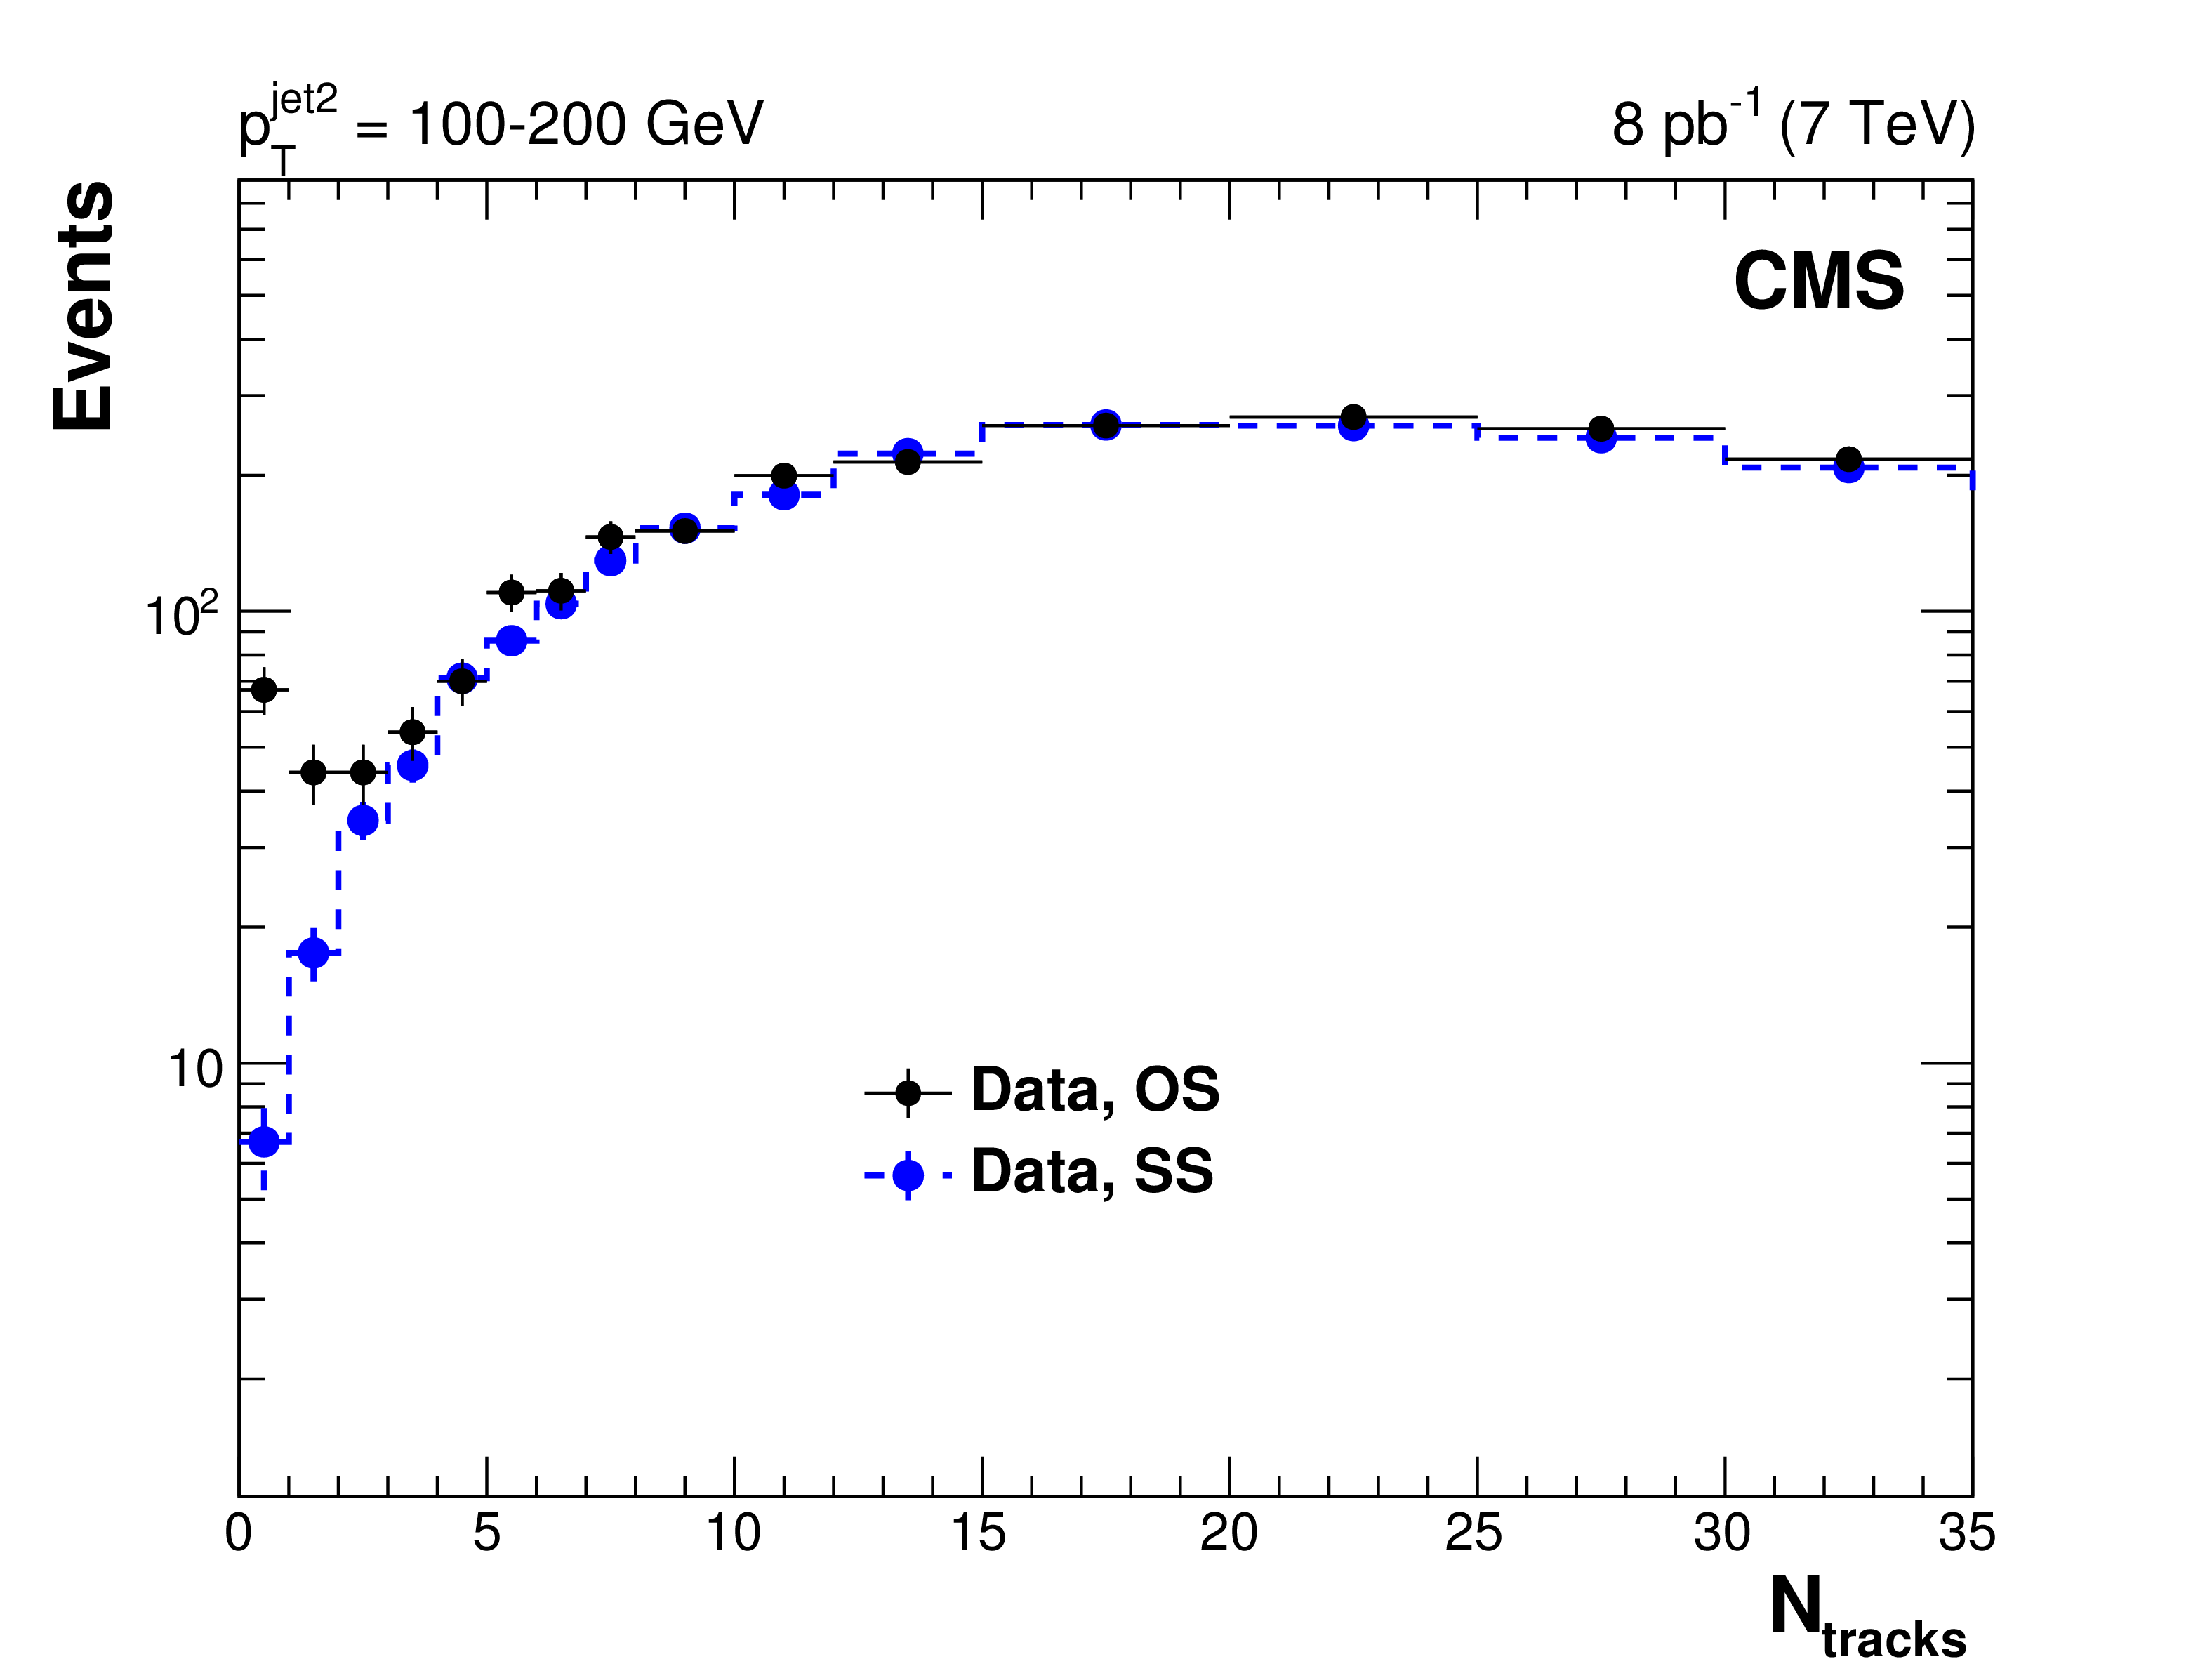
Figure 6:
Distribution, uncorrected for detector effects, of the number of central tracks in opposite-side (OS) dijet events (black circles) with $ {p_{\mathrm {T}}} ^\text {jet2} = $ 40-60 (top), 60-100 (middle), and 100-200 GeV (bottom), plotted (left) together with the $N_\text {tracks}$ distribution of same-side (SS) dijet events (blue circles), and fitted to a NBD function (right). |
png pdf |
Figure 6-a:
Distribution, uncorrected for detector effects, of the number of central tracks in opposite-side (OS) dijet events (black circles) with $ {p_{\mathrm {T}}} ^\text {jet2} = $ 40-60 (top), 60-100 (middle), and 100-200 GeV (bottom), plotted (left) together with the $N_\text {tracks}$ distribution of same-side (SS) dijet events (blue circles), and fitted to a NBD function (right). |
png pdf |
Figure 6-b:
Distribution, uncorrected for detector effects, of the number of central tracks in opposite-side (OS) dijet events (black circles) with $ {p_{\mathrm {T}}} ^\text {jet2} = $ 40-60 (top), 60-100 (middle), and 100-200 GeV (bottom), plotted (left) together with the $N_\text {tracks}$ distribution of same-side (SS) dijet events (blue circles), and fitted to a NBD function (right). |
png pdf |
Figure 6-c:
Distribution, uncorrected for detector effects, of the number of central tracks in opposite-side (OS) dijet events (black circles) with $ {p_{\mathrm {T}}} ^\text {jet2} = $ 40-60 (top), 60-100 (middle), and 100-200 GeV (bottom), plotted (left) together with the $N_\text {tracks}$ distribution of same-side (SS) dijet events (blue circles), and fitted to a NBD function (right). |

png pdf |
Figure 6-d:
Distribution, uncorrected for detector effects, of the number of central tracks in opposite-side (OS) dijet events (black circles) with $ {p_{\mathrm {T}}} ^\text {jet2} = $ 40-60 (top), 60-100 (middle), and 100-200 GeV (bottom), plotted (left) together with the $N_\text {tracks}$ distribution of same-side (SS) dijet events (blue circles), and fitted to a NBD function (right). |
png pdf |
Figure 6-e:
Distribution, uncorrected for detector effects, of the number of central tracks in opposite-side (OS) dijet events (black circles) with $ {p_{\mathrm {T}}} ^\text {jet2} = $ 40-60 (top), 60-100 (middle), and 100-200 GeV (bottom), plotted (left) together with the $N_\text {tracks}$ distribution of same-side (SS) dijet events (blue circles), and fitted to a NBD function (right). |

png pdf |
Figure 6-f:
Distribution, uncorrected for detector effects, of the number of central tracks in opposite-side (OS) dijet events (black circles) with $ {p_{\mathrm {T}}} ^\text {jet2} = $ 40-60 (top), 60-100 (middle), and 100-200 GeV (bottom), plotted (left) together with the $N_\text {tracks}$ distribution of same-side (SS) dijet events (blue circles), and fitted to a NBD function (right). |
png pdf |
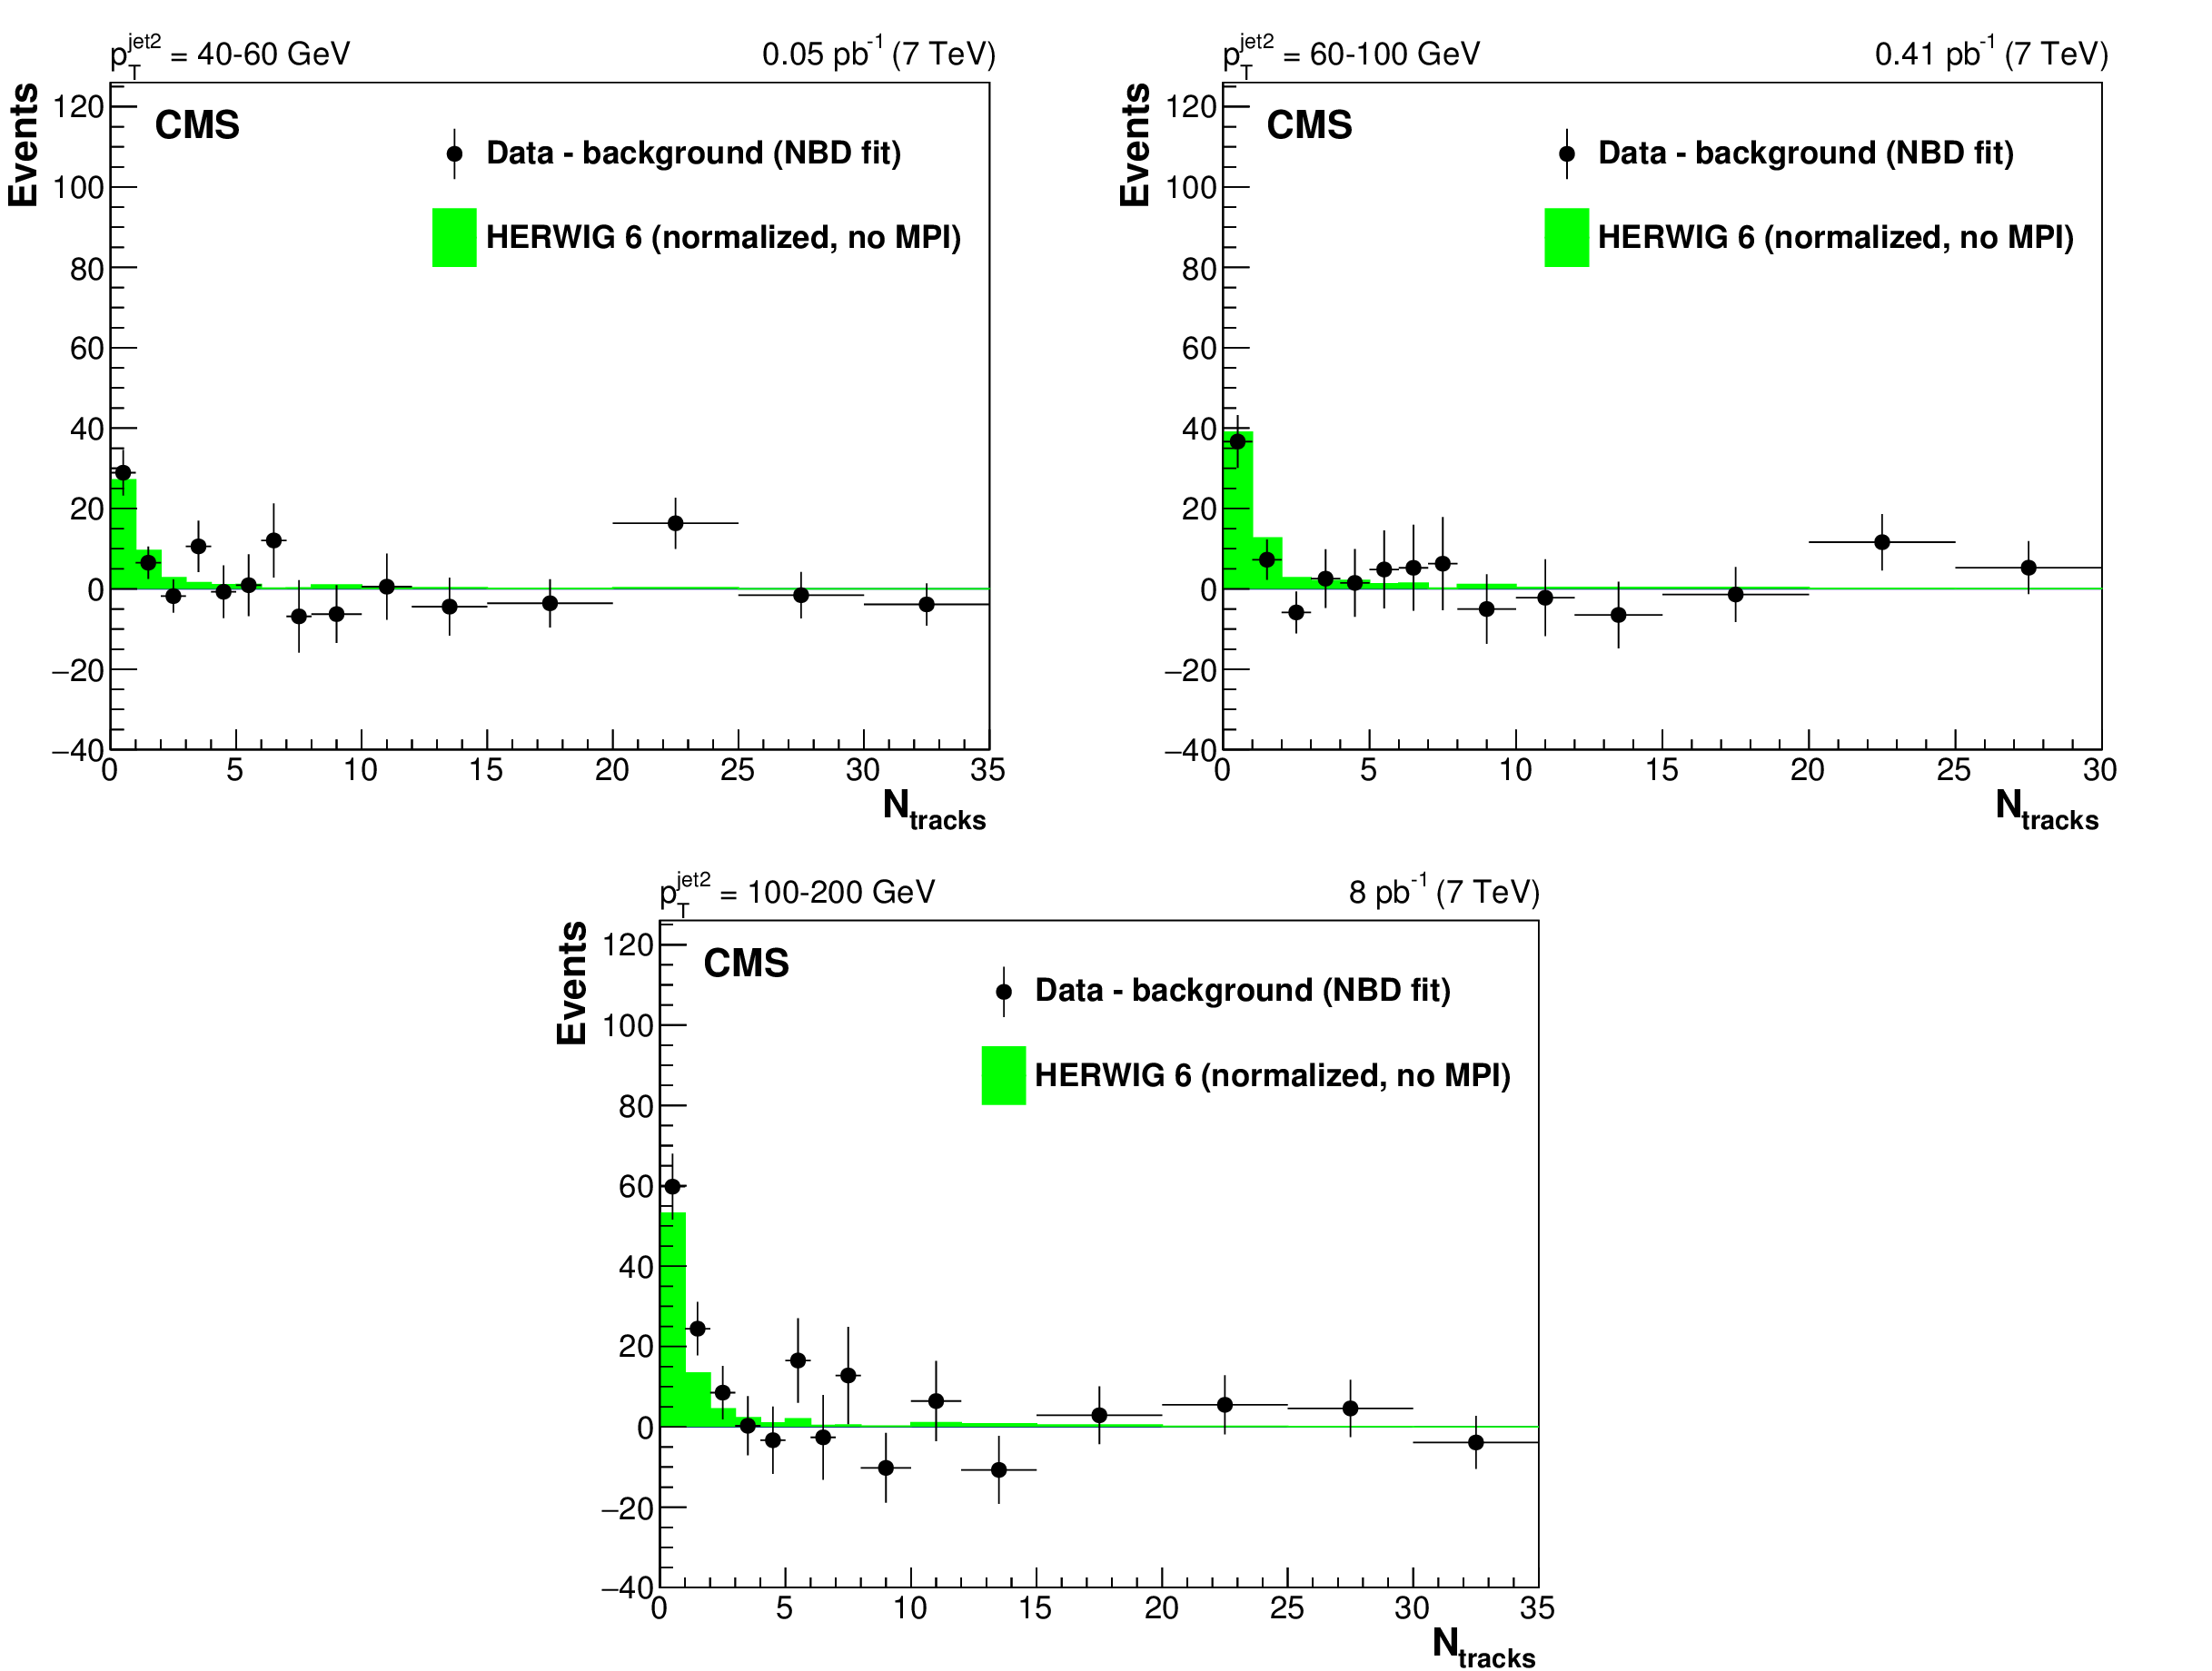
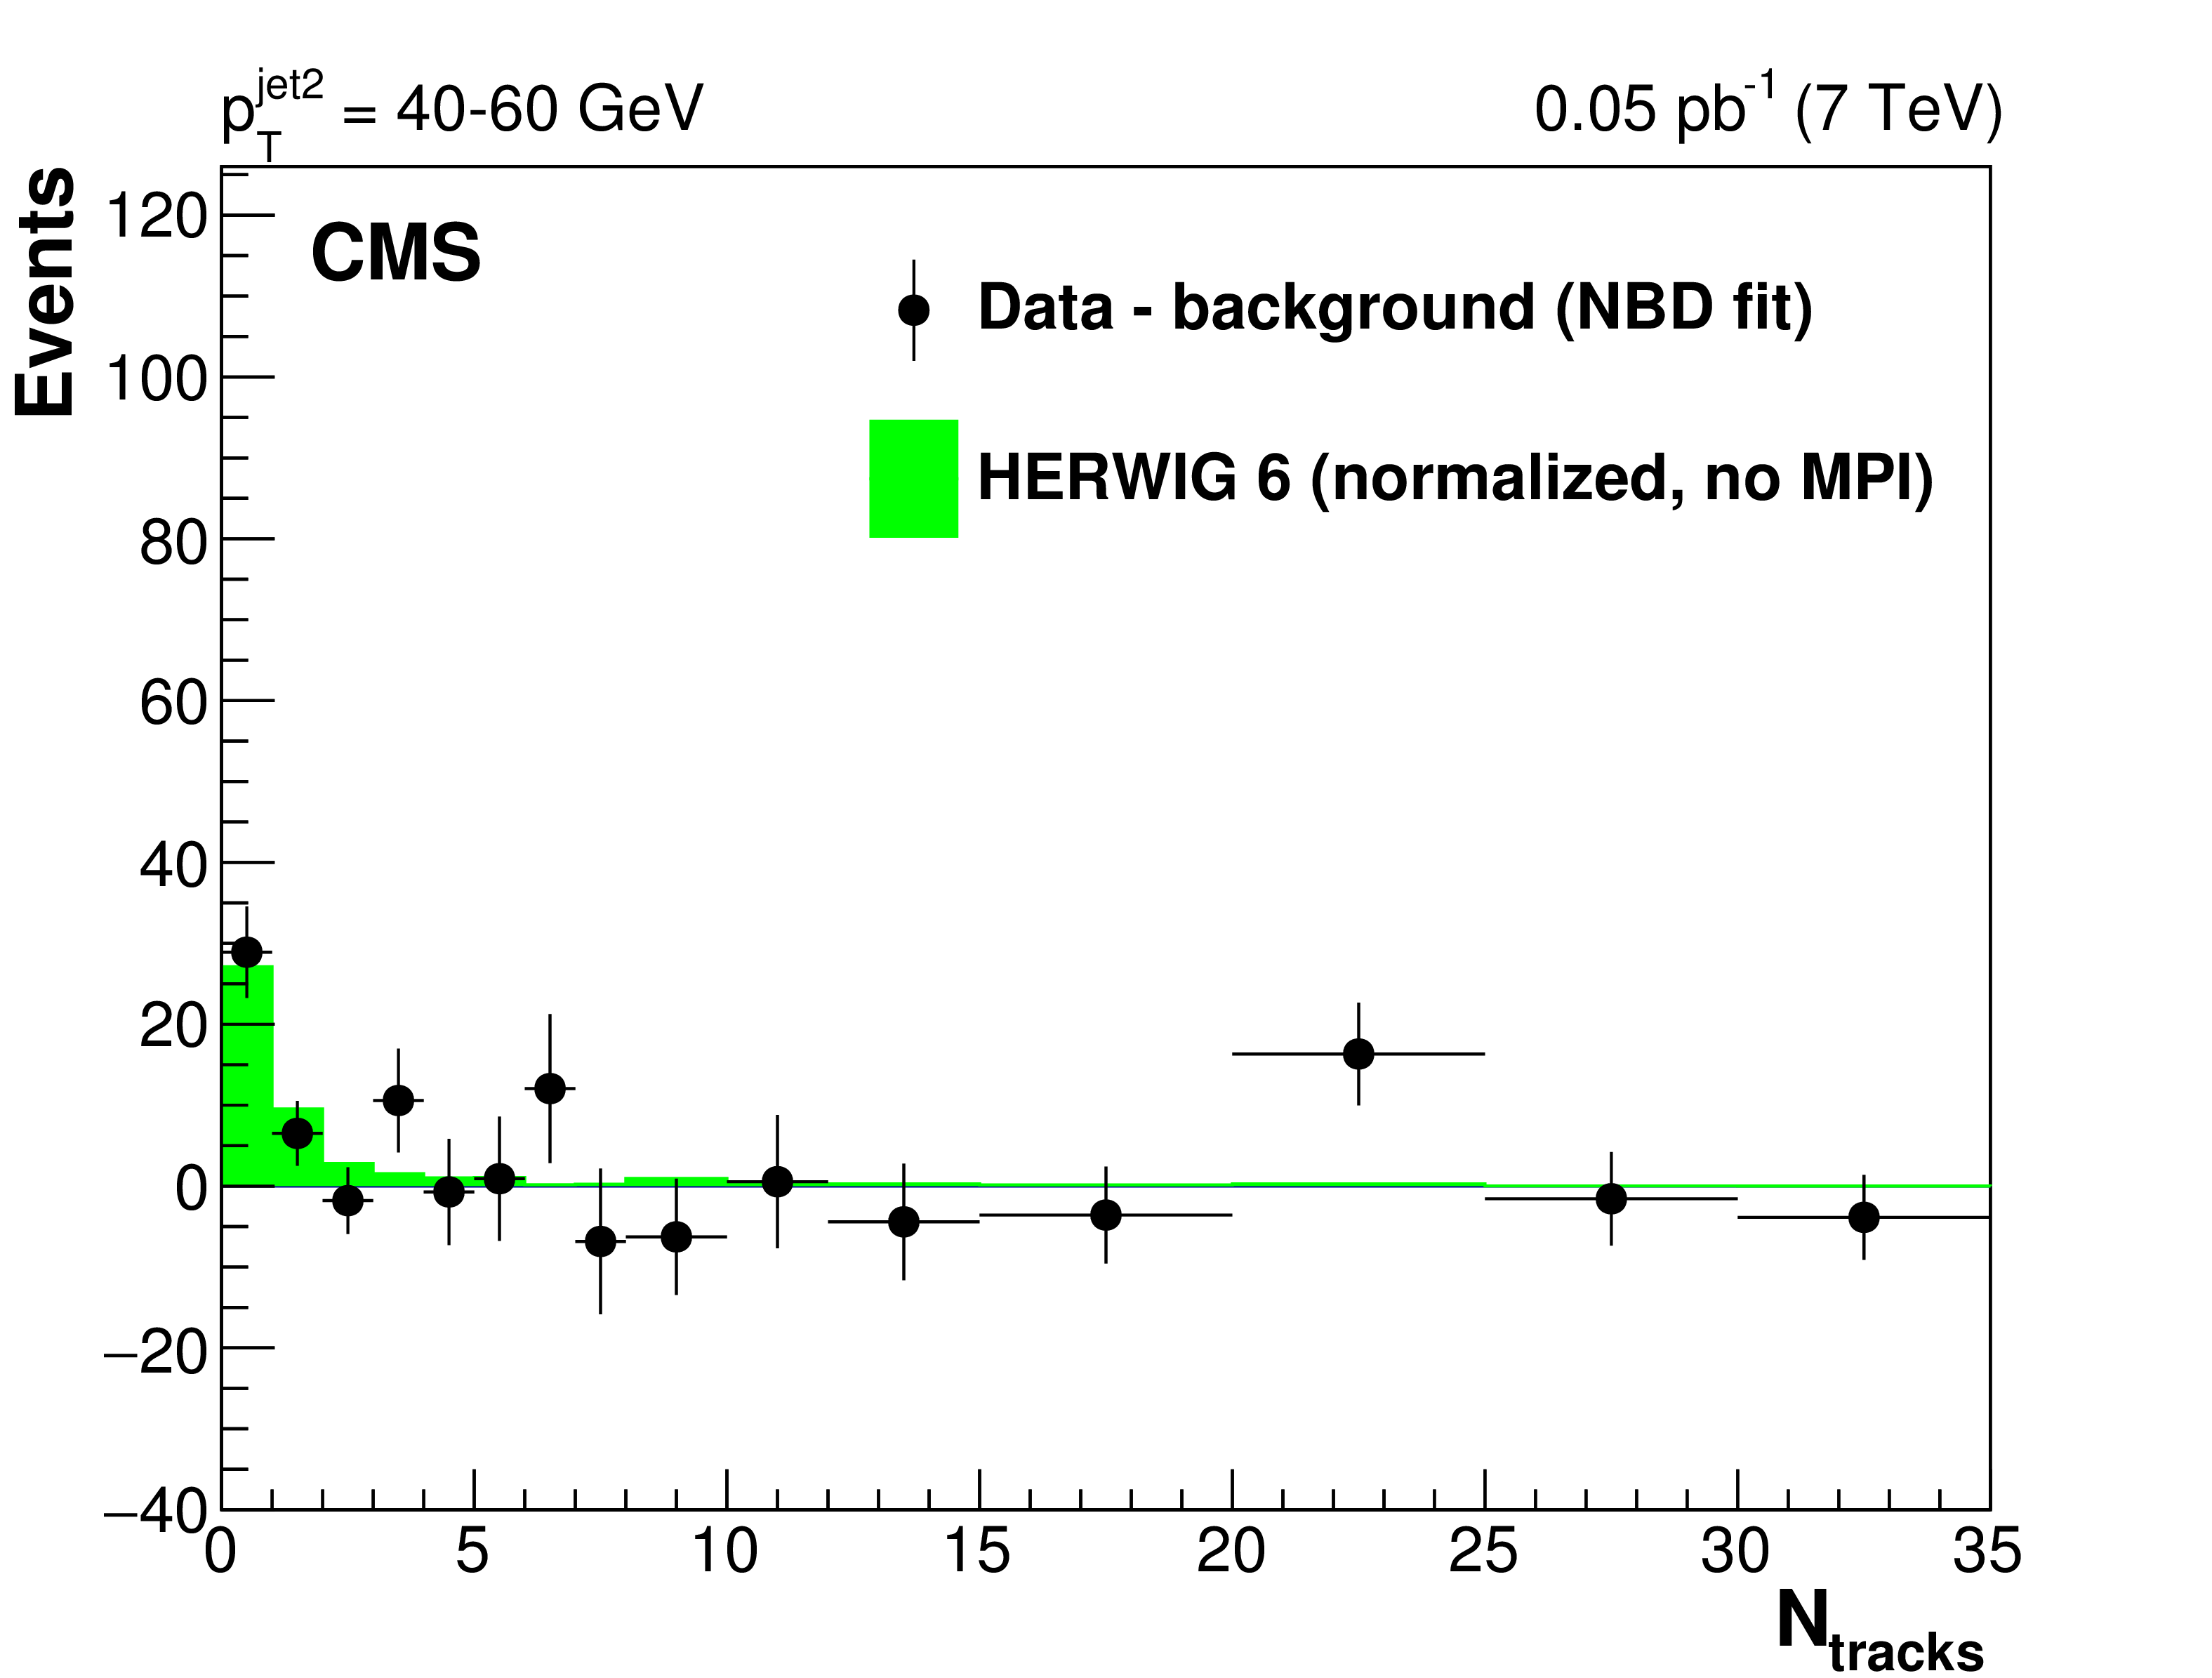
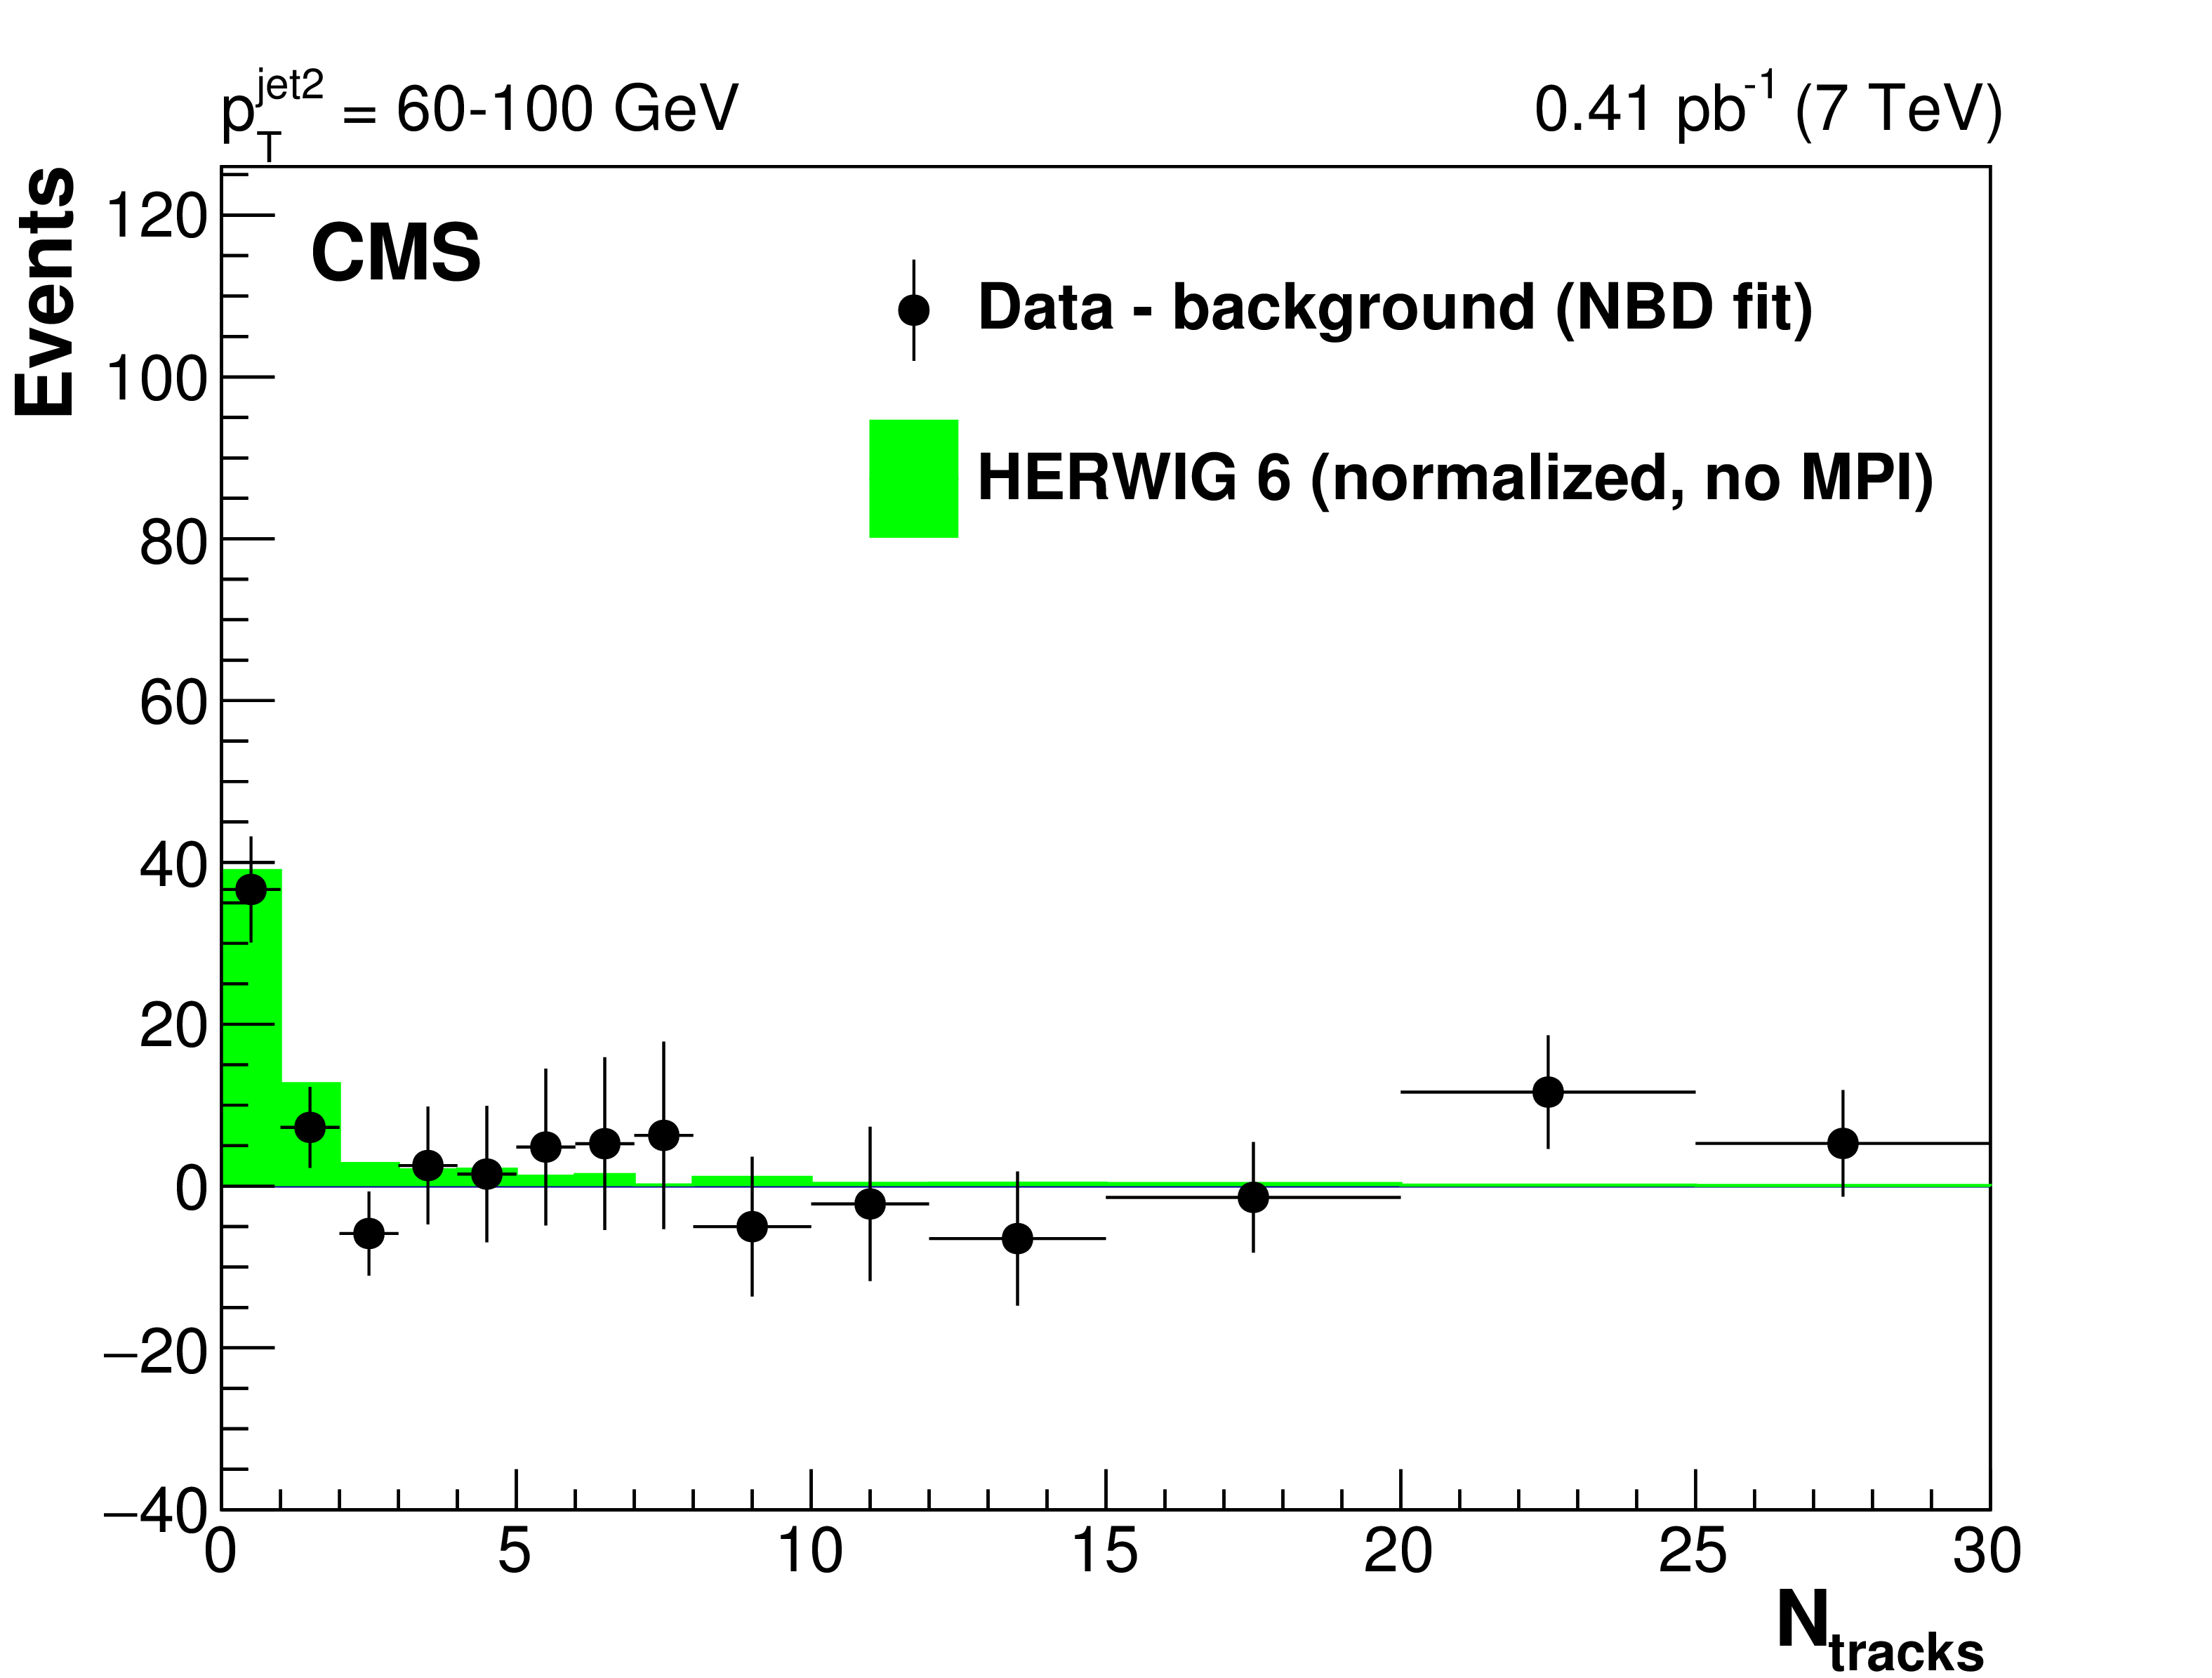
Figure 7:
Background-subtracted central track multiplicity distributions, uncorrected for detector effects, in the three bins of $ {p_{\mathrm {T}}} ^\text {jet2}$, compared to the HERWIG 6 predictions without underlying event simulation ("no MPI"), normalized as in Fig. xxxxx. The background is estimated from the NBD fit to the data in the 3 $ \le N_\text {tracks} \le $ 35 range, extrapolated to the lowest multiplicity bins. |
png pdf |
Figure 7-a:
Background-subtracted central track multiplicity distributions, uncorrected for detector effects, in the three bins of $ {p_{\mathrm {T}}} ^\text {jet2}$, compared to the HERWIG 6 predictions without underlying event simulation ("no MPI"), normalized as in Fig. xxxxx. The background is estimated from the NBD fit to the data in the 3 $ \le N_\text {tracks} \le $ 35 range, extrapolated to the lowest multiplicity bins. |
png pdf |
Figure 7-b:
Background-subtracted central track multiplicity distributions, uncorrected for detector effects, in the three bins of $ {p_{\mathrm {T}}} ^\text {jet2}$, compared to the HERWIG 6 predictions without underlying event simulation ("no MPI"), normalized as in Fig. xxxxx. The background is estimated from the NBD fit to the data in the 3 $ \le N_\text {tracks} \le $ 35 range, extrapolated to the lowest multiplicity bins. |

png pdf |
Figure 7-c:
Background-subtracted central track multiplicity distributions, uncorrected for detector effects, in the three bins of $ {p_{\mathrm {T}}} ^\text {jet2}$, compared to the HERWIG 6 predictions without underlying event simulation ("no MPI"), normalized as in Fig. xxxxx. The background is estimated from the NBD fit to the data in the 3 $ \le N_\text {tracks} \le $ 35 range, extrapolated to the lowest multiplicity bins. |
png pdf |
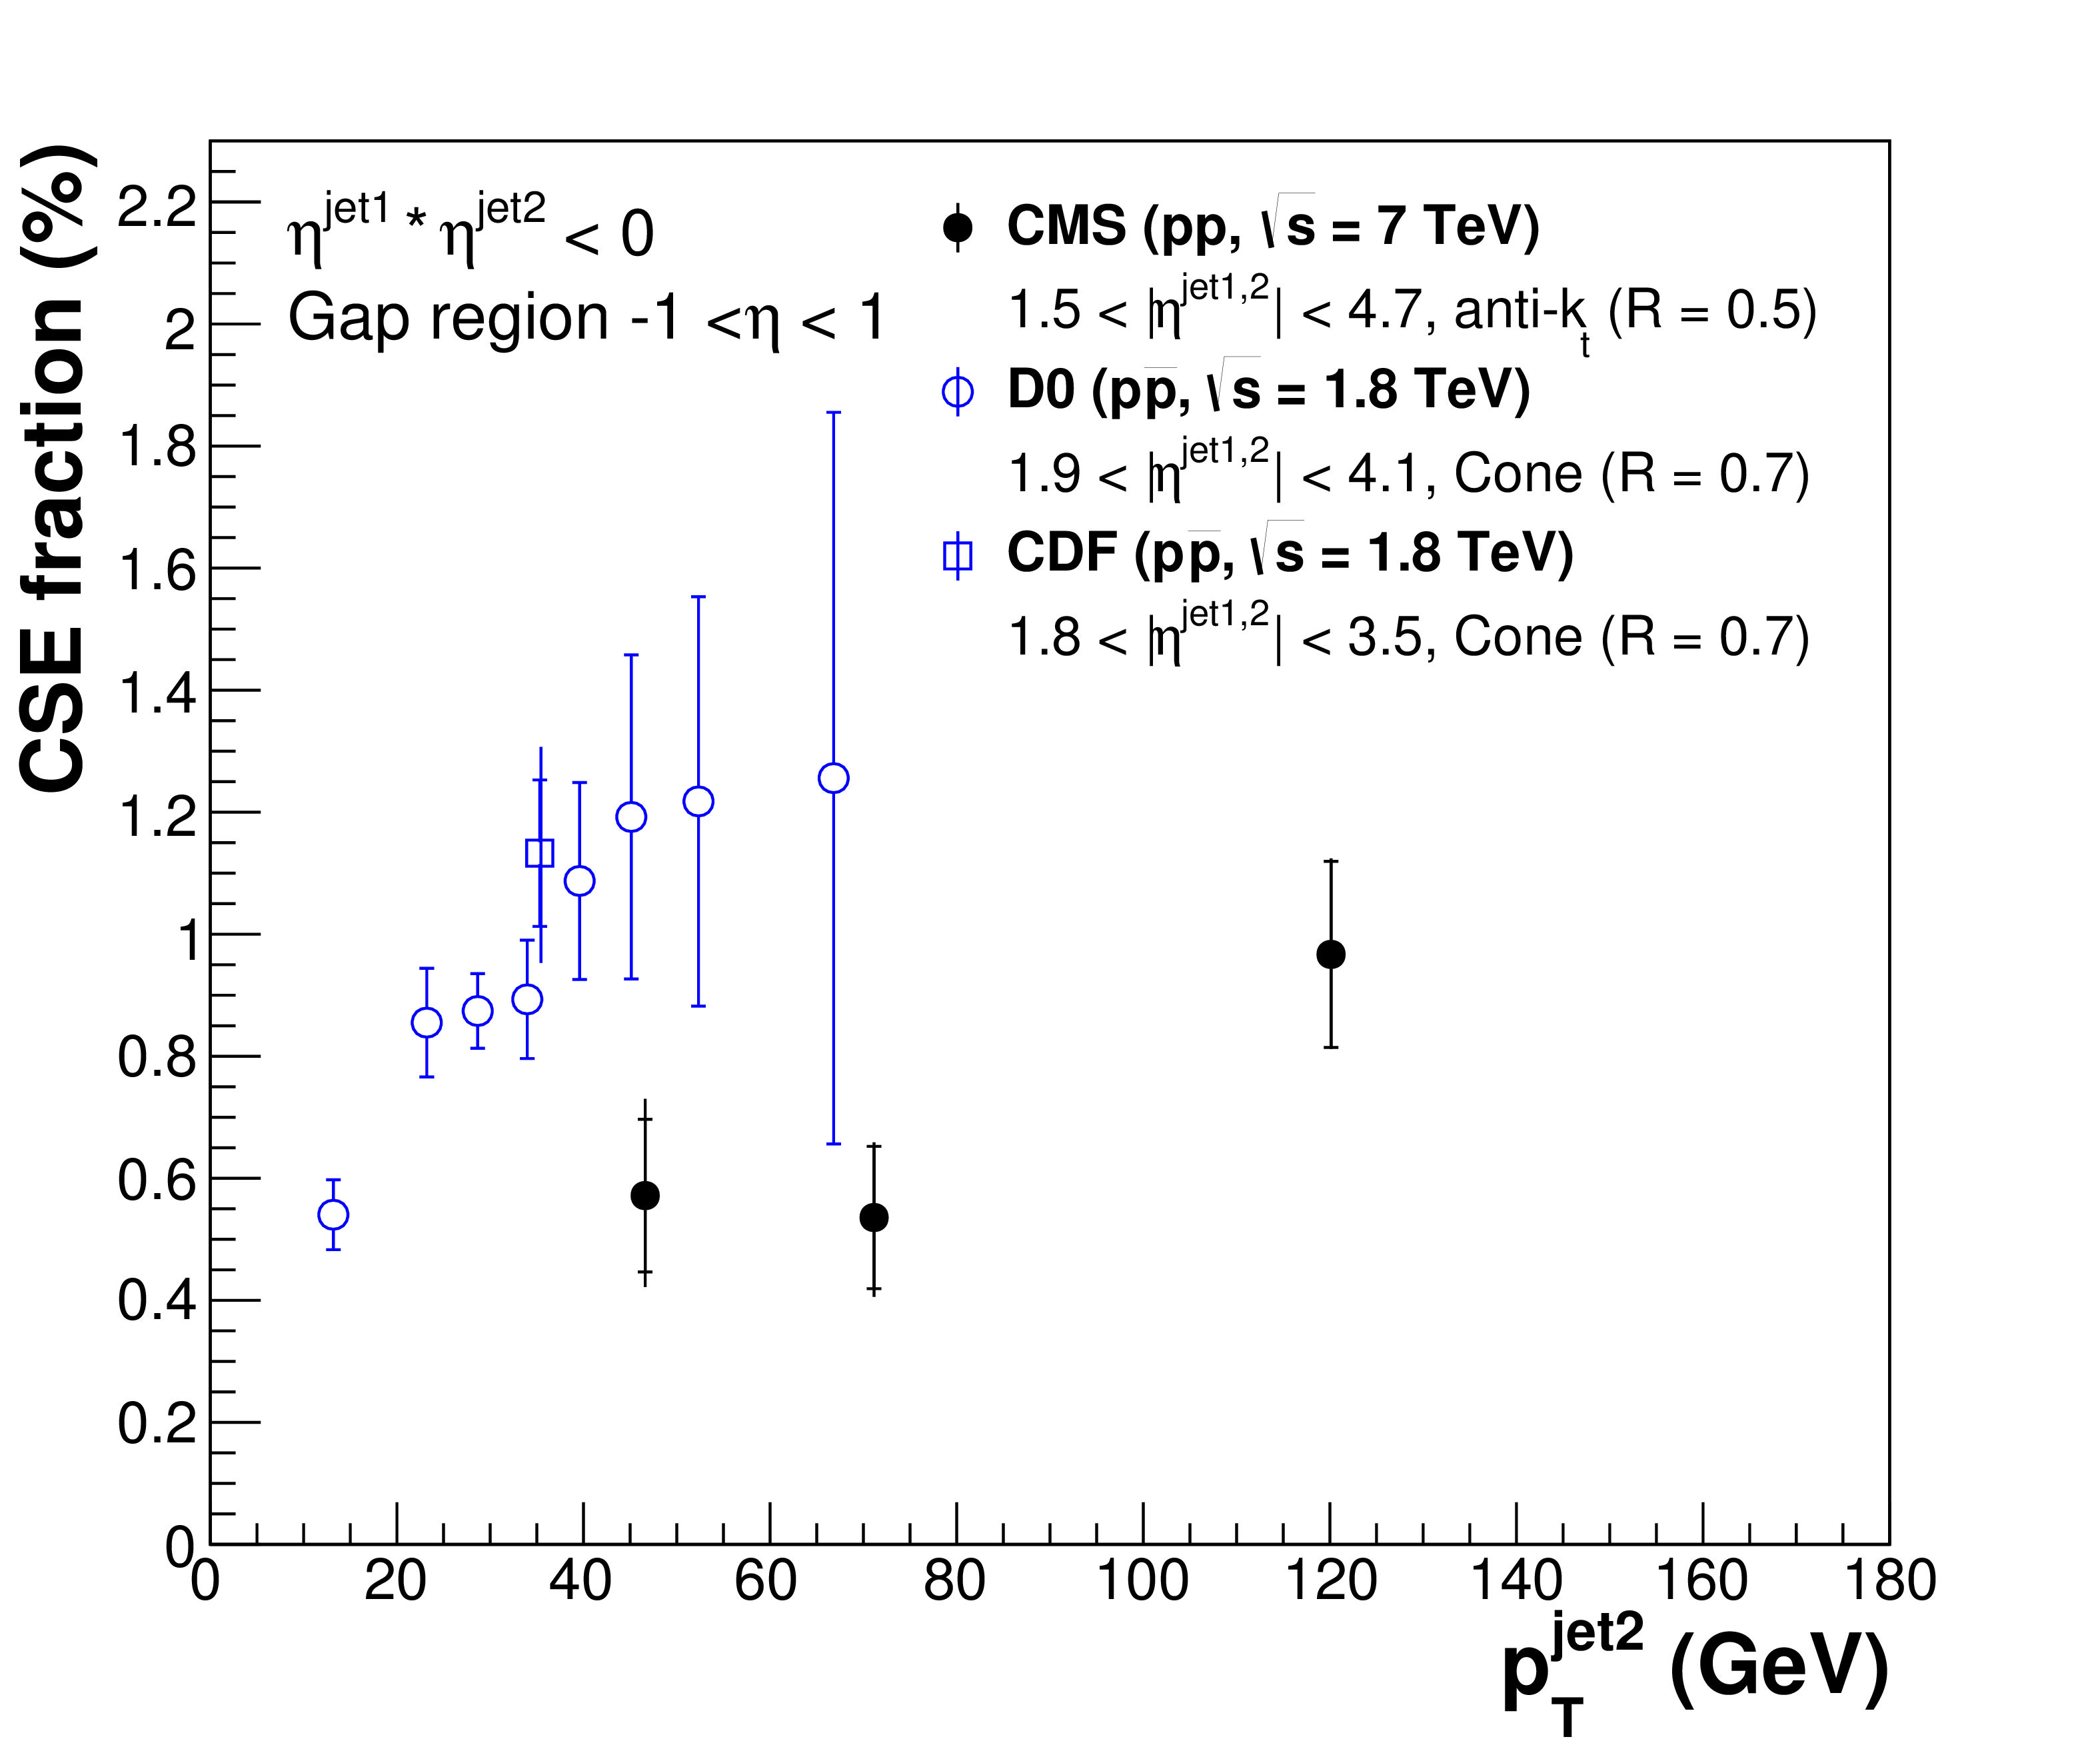
Figure 8:
Fraction of dijet events with a central gap ($f_\mathrm {CSE}$) as a function of $ {p_{\mathrm {T}}} ^\text {jet2}$ at $\sqrt {s}=7$ TeV, compared to similar D0 [27] and CDF [29] results at $\sqrt {s}= $ 1.8 TeV. The details of the jet selections are given in the legend. The results are plotted at the mean value of $ {p_{\mathrm {T}}} ^\text {jet2}$ in the bin. The inner and outer error bars represent the statistical, and the statistical and systematic uncertainties added in quadrature, respectively. |
png pdf |
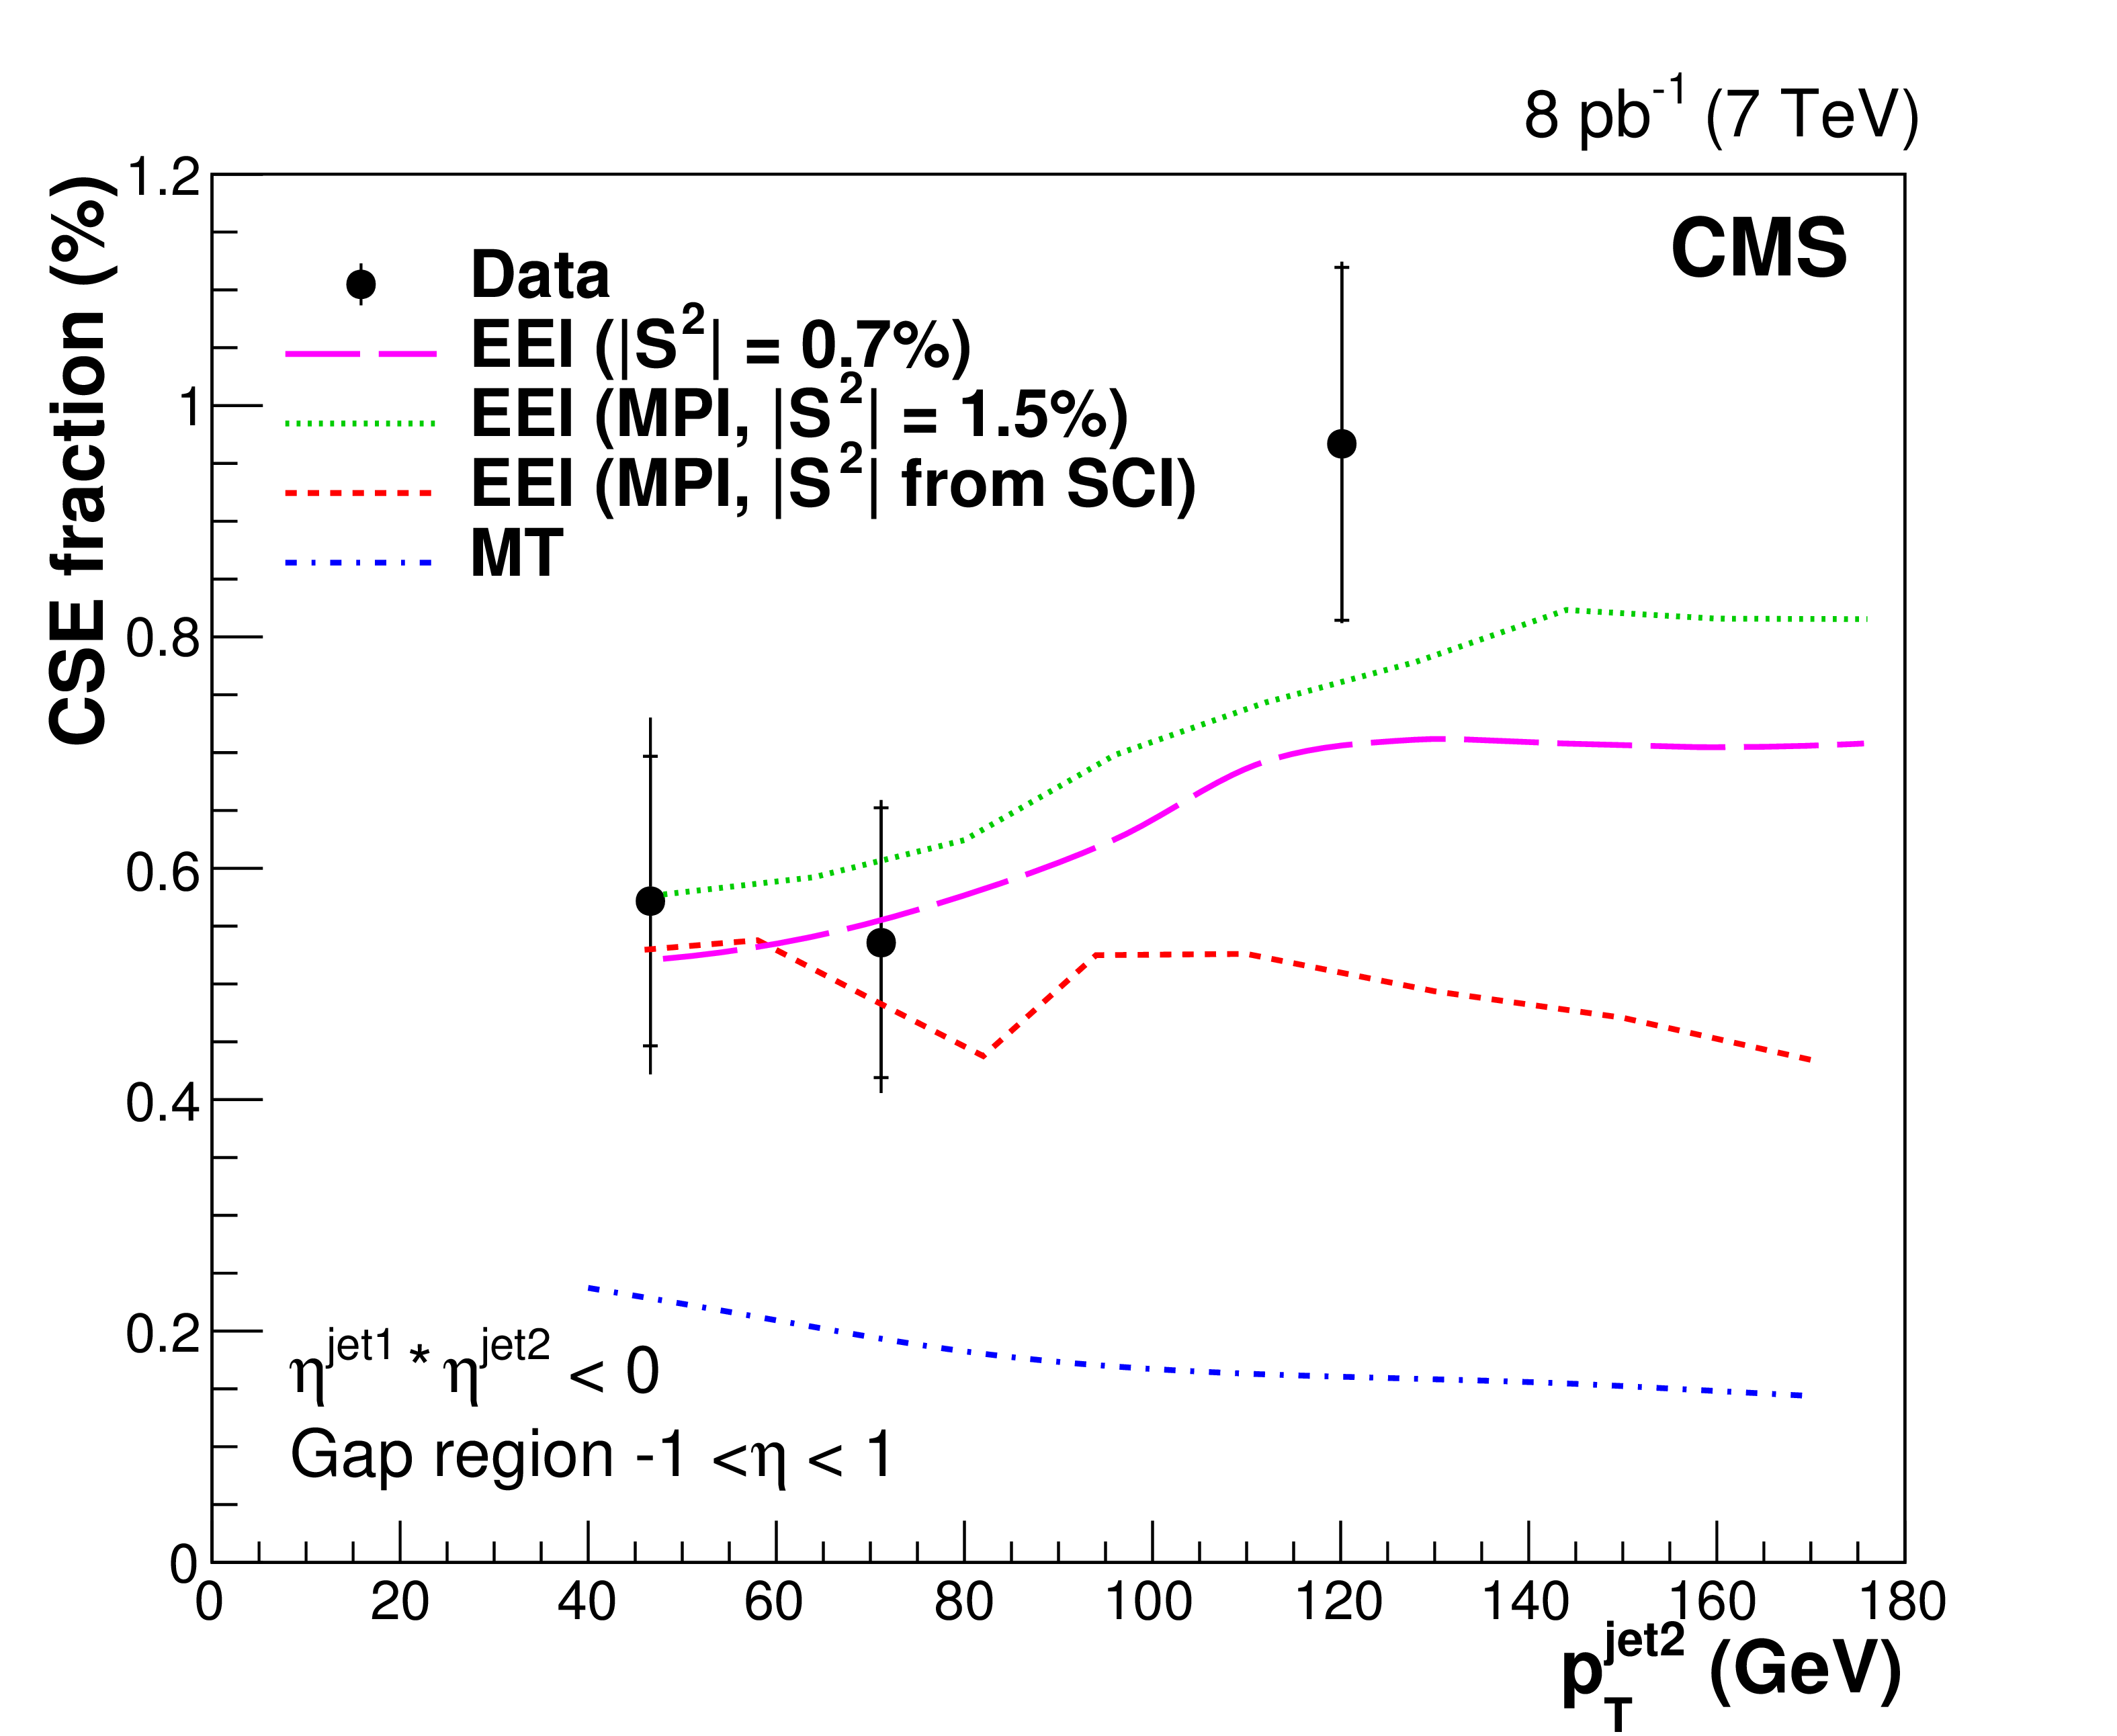
Figure 9:
Fraction of dijet events with a central gap ($f_\mathrm {CSE}$) as a function of $ {p_{\mathrm {T}}} ^\text {jet2}$ at $\sqrt {s}= $ 7 TeV, compared to the predictions of the Mueller and Tang (MT) model [21], and of the Ekstedt, Enberg, and Ingelman (EEI) model [22,23] with three different treatments of the gap survival probability factor $ {< S >}^2$, as described in the text. The results are plotted at the mean value of $ {p_{\mathrm {T}}} ^\text {jet2}$ in the bin. The inner and outer error bars represent the statistical, and the statistical and systematic uncertainties added in quadrature, respectively. |
png pdf |
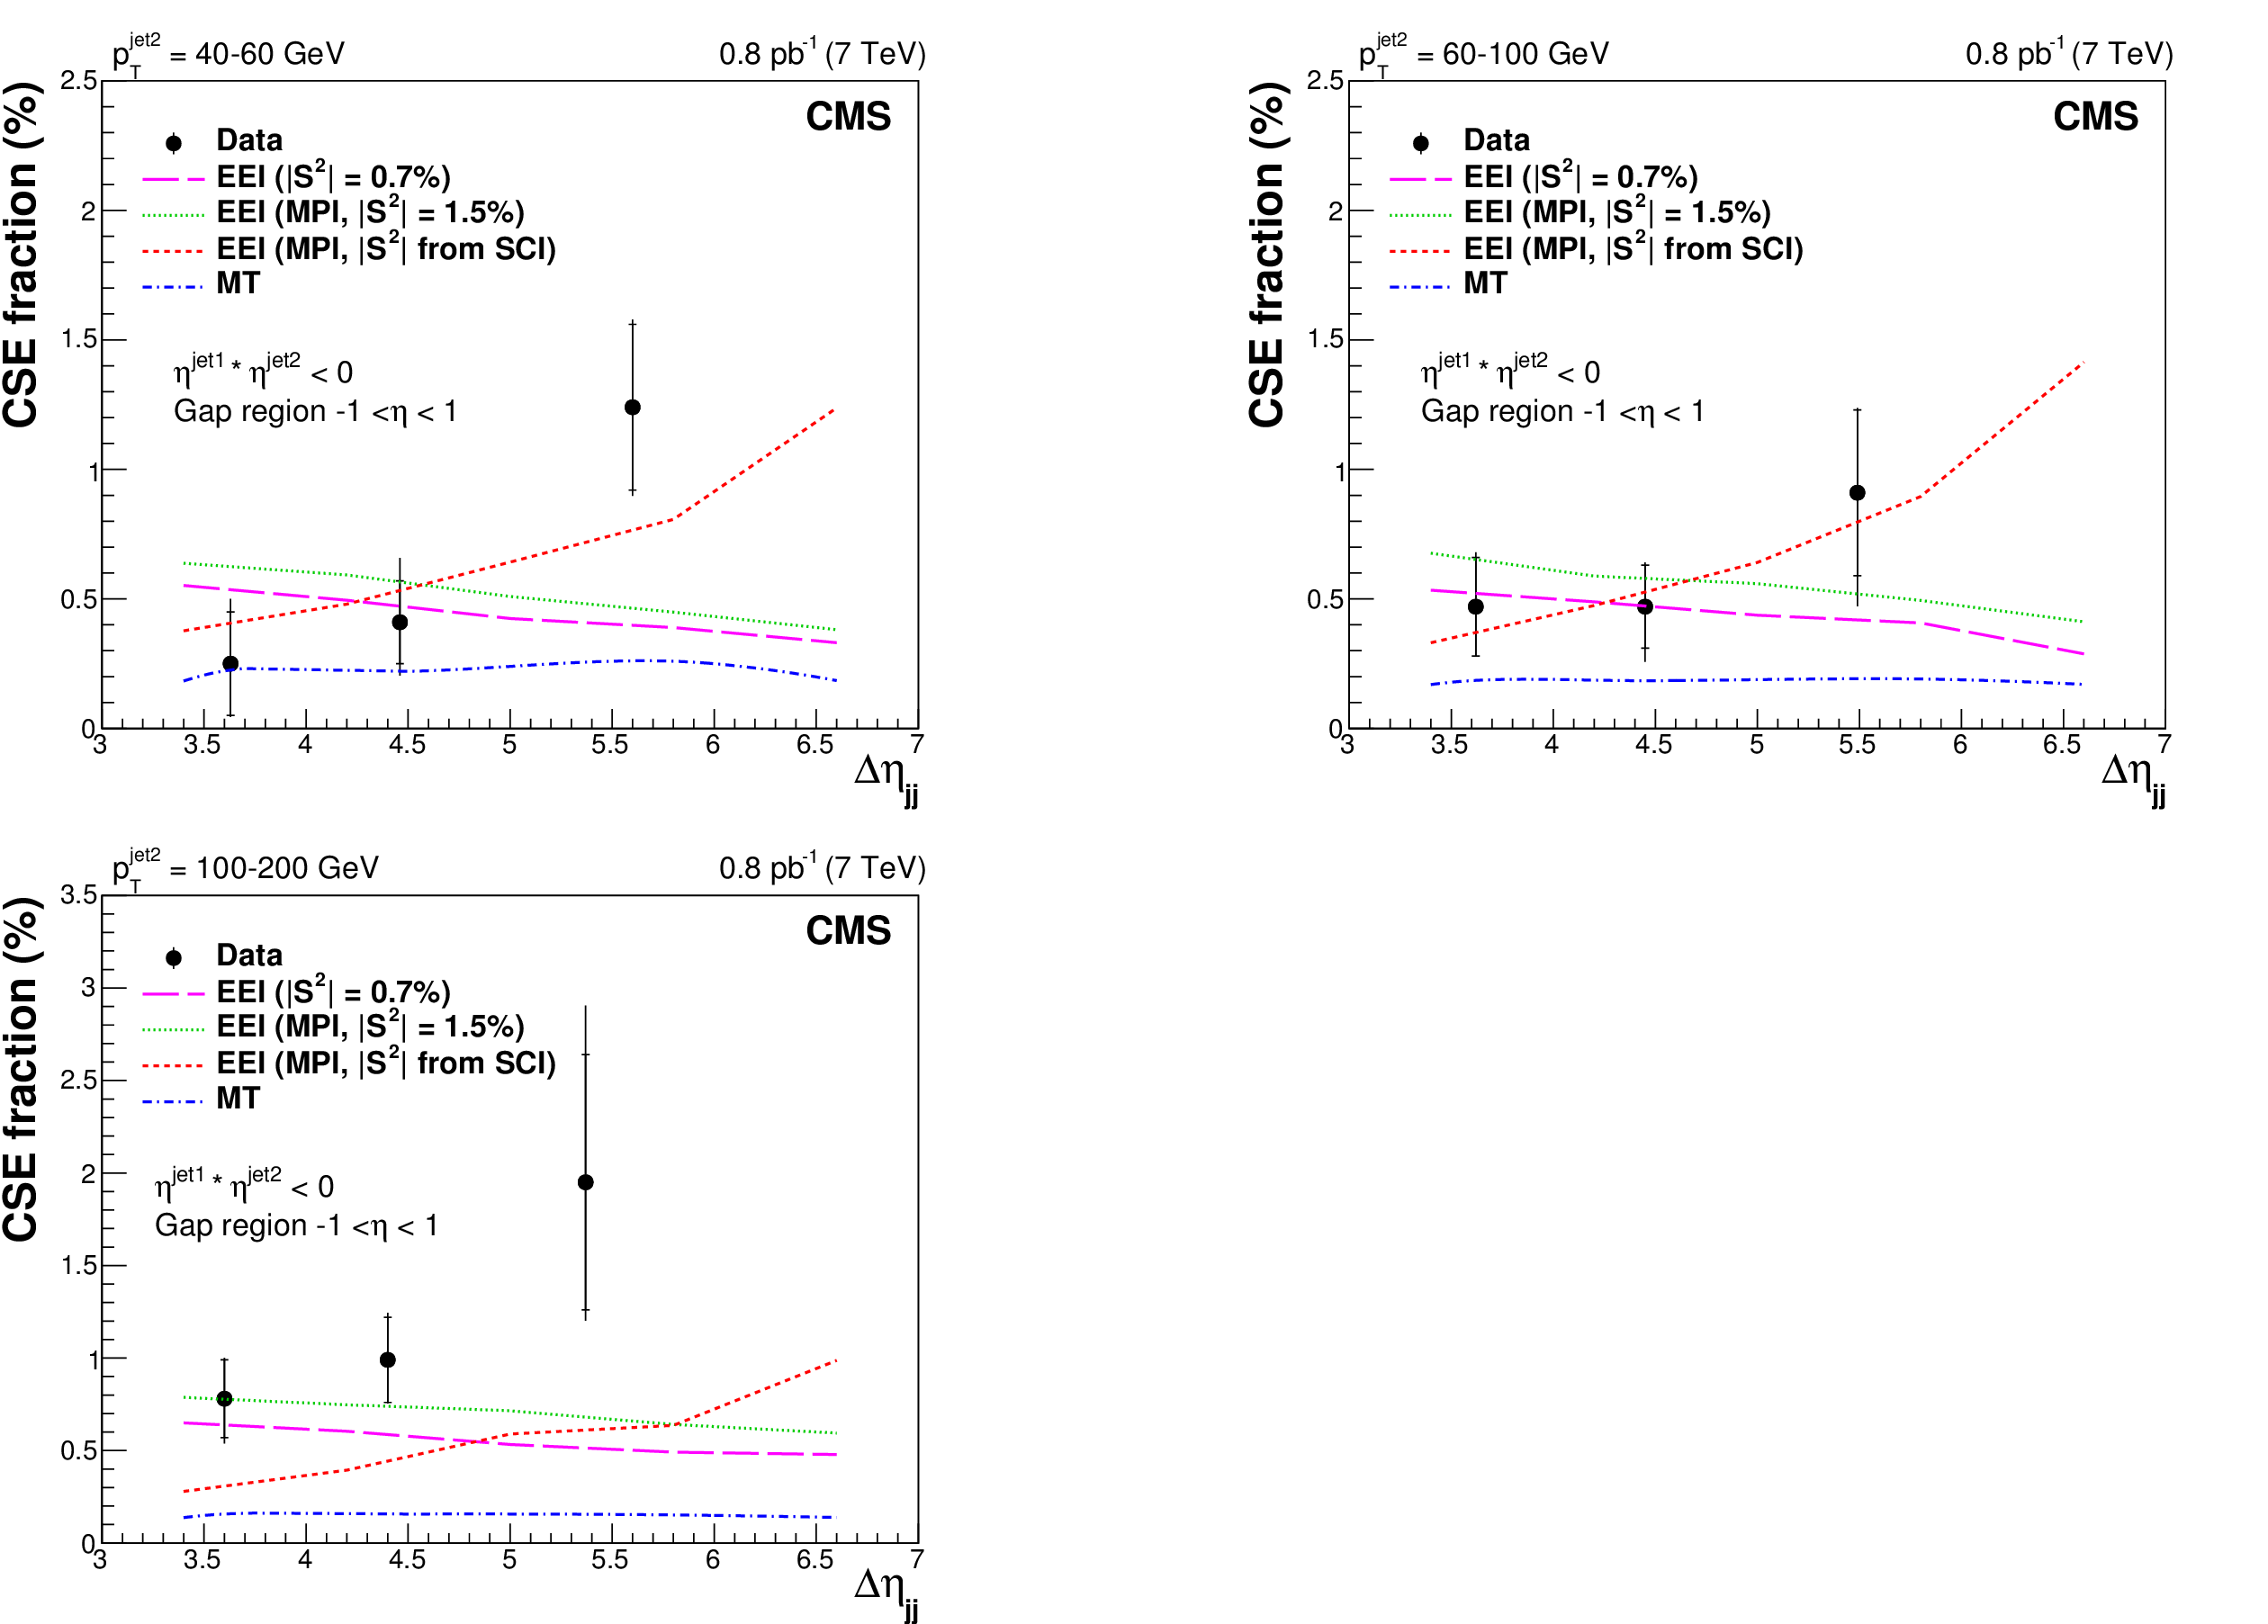
Figure 10:
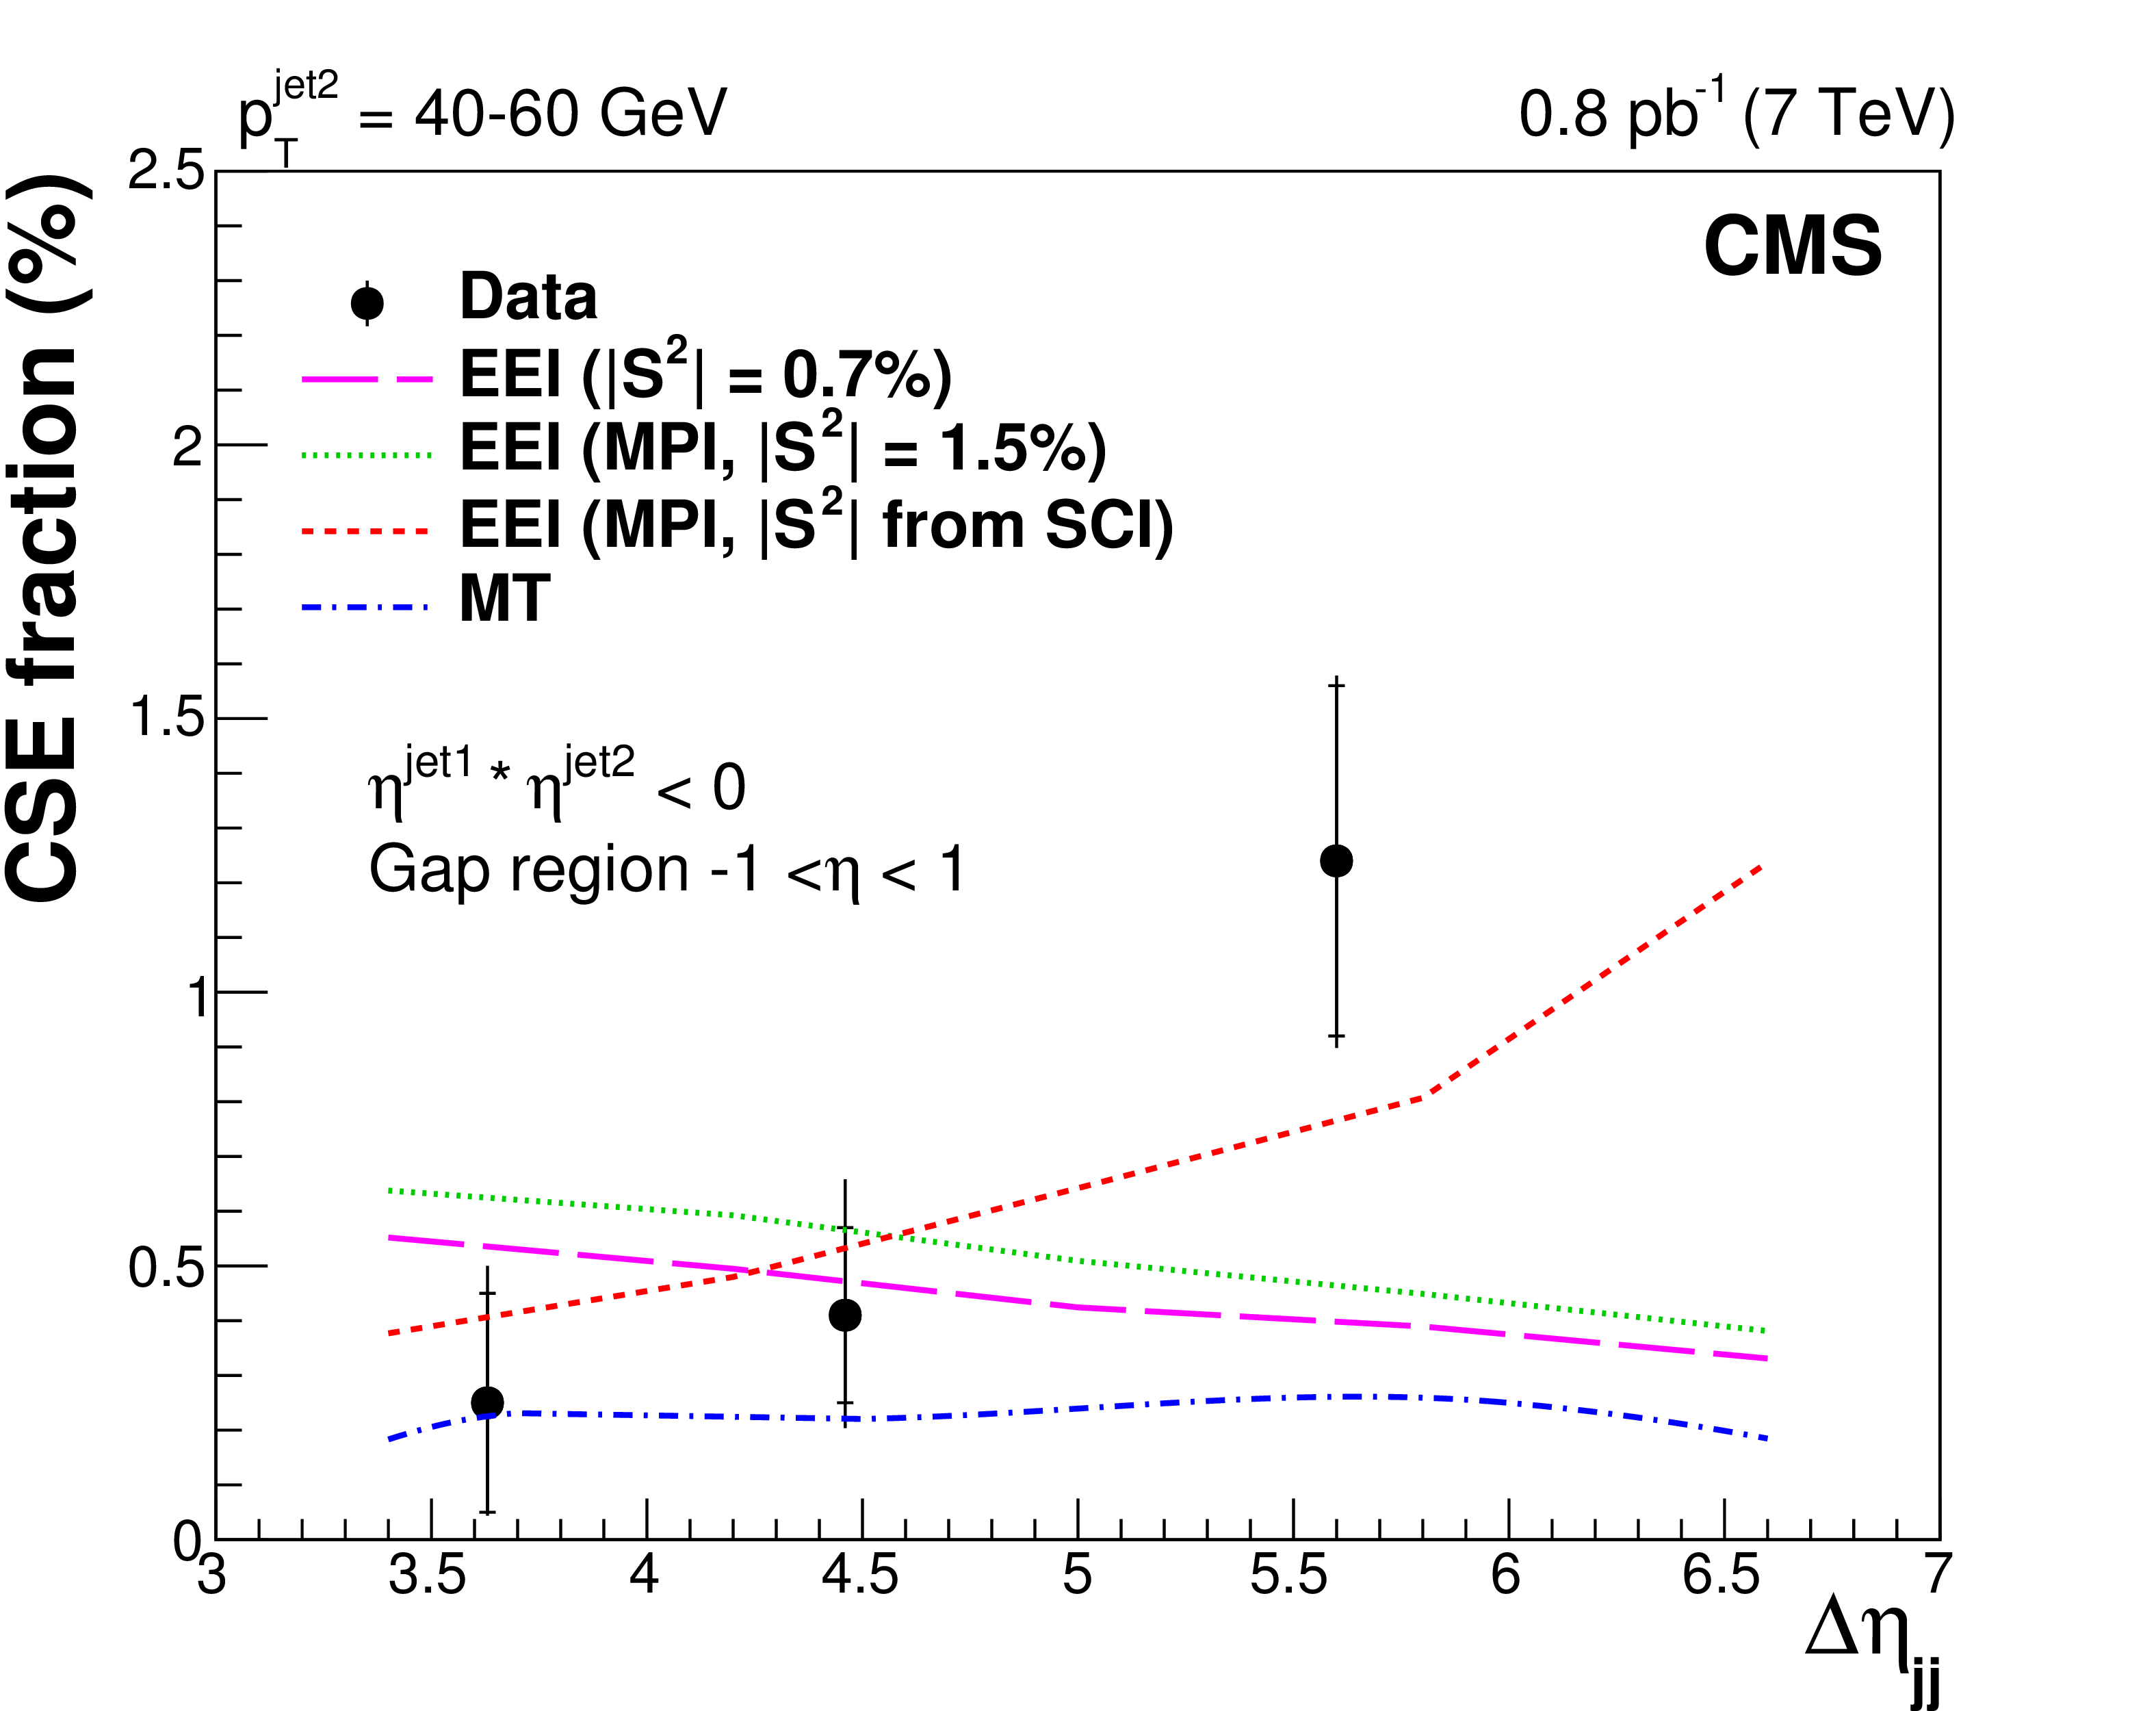
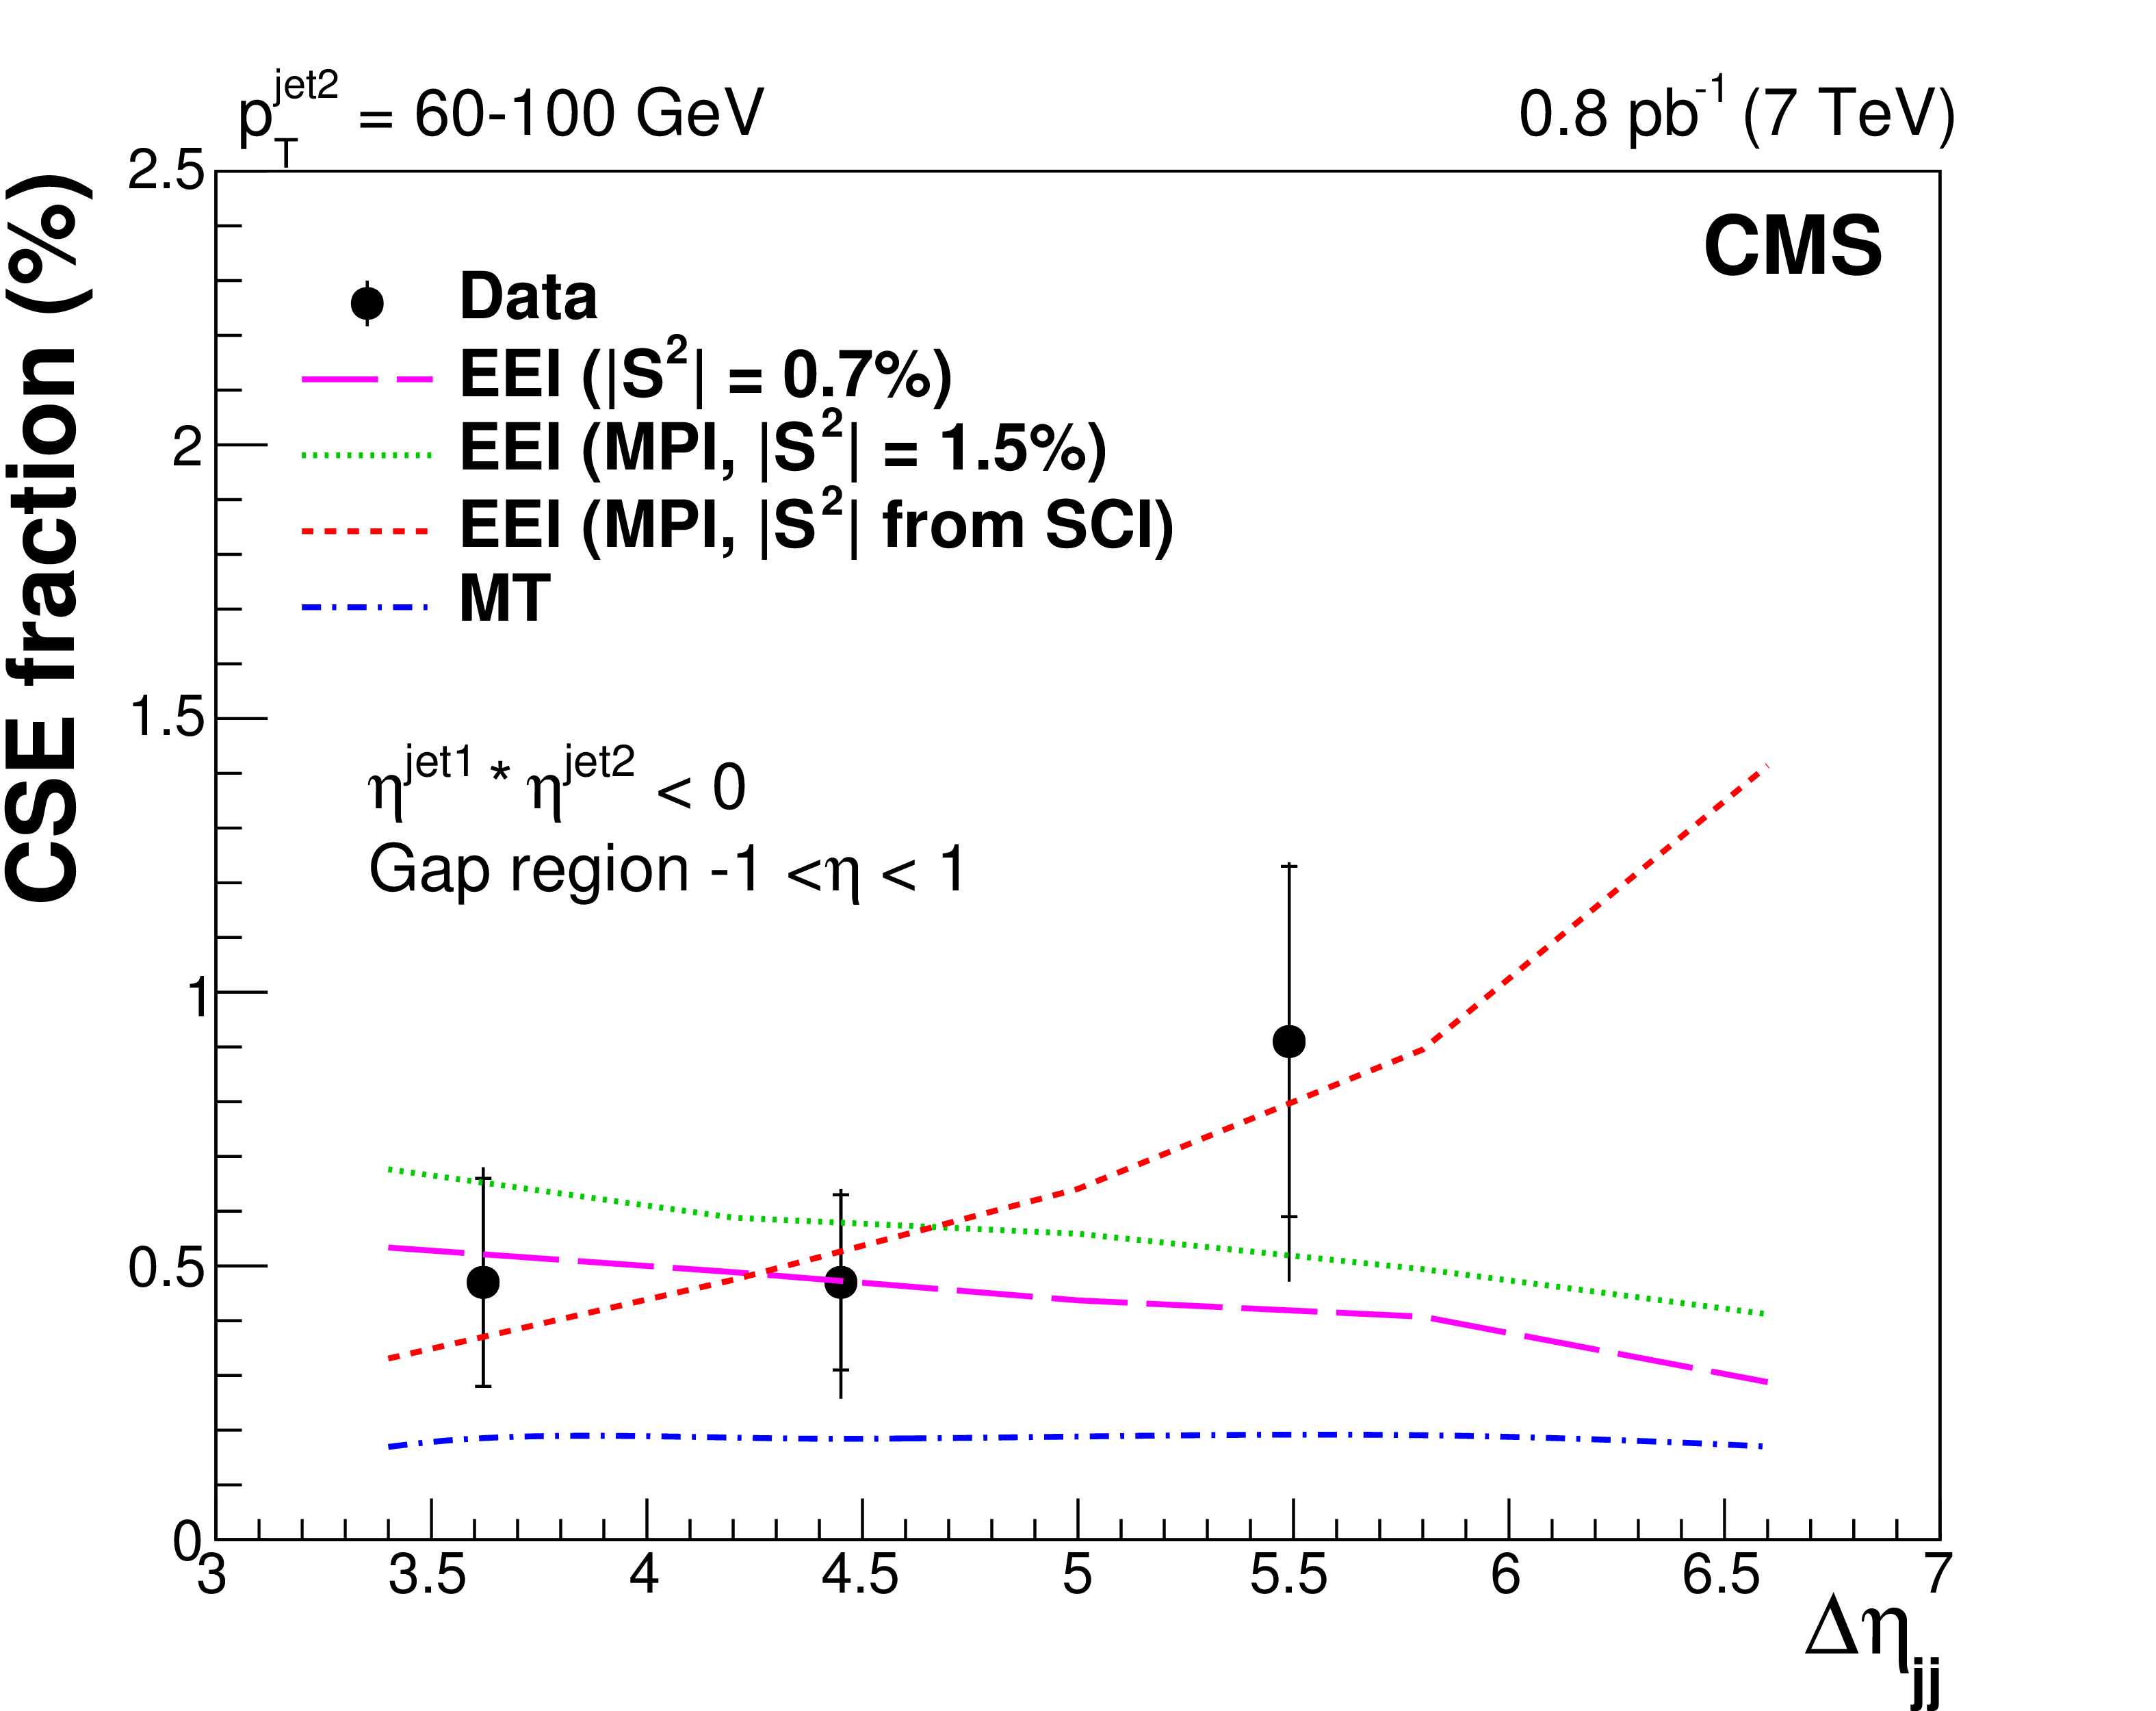
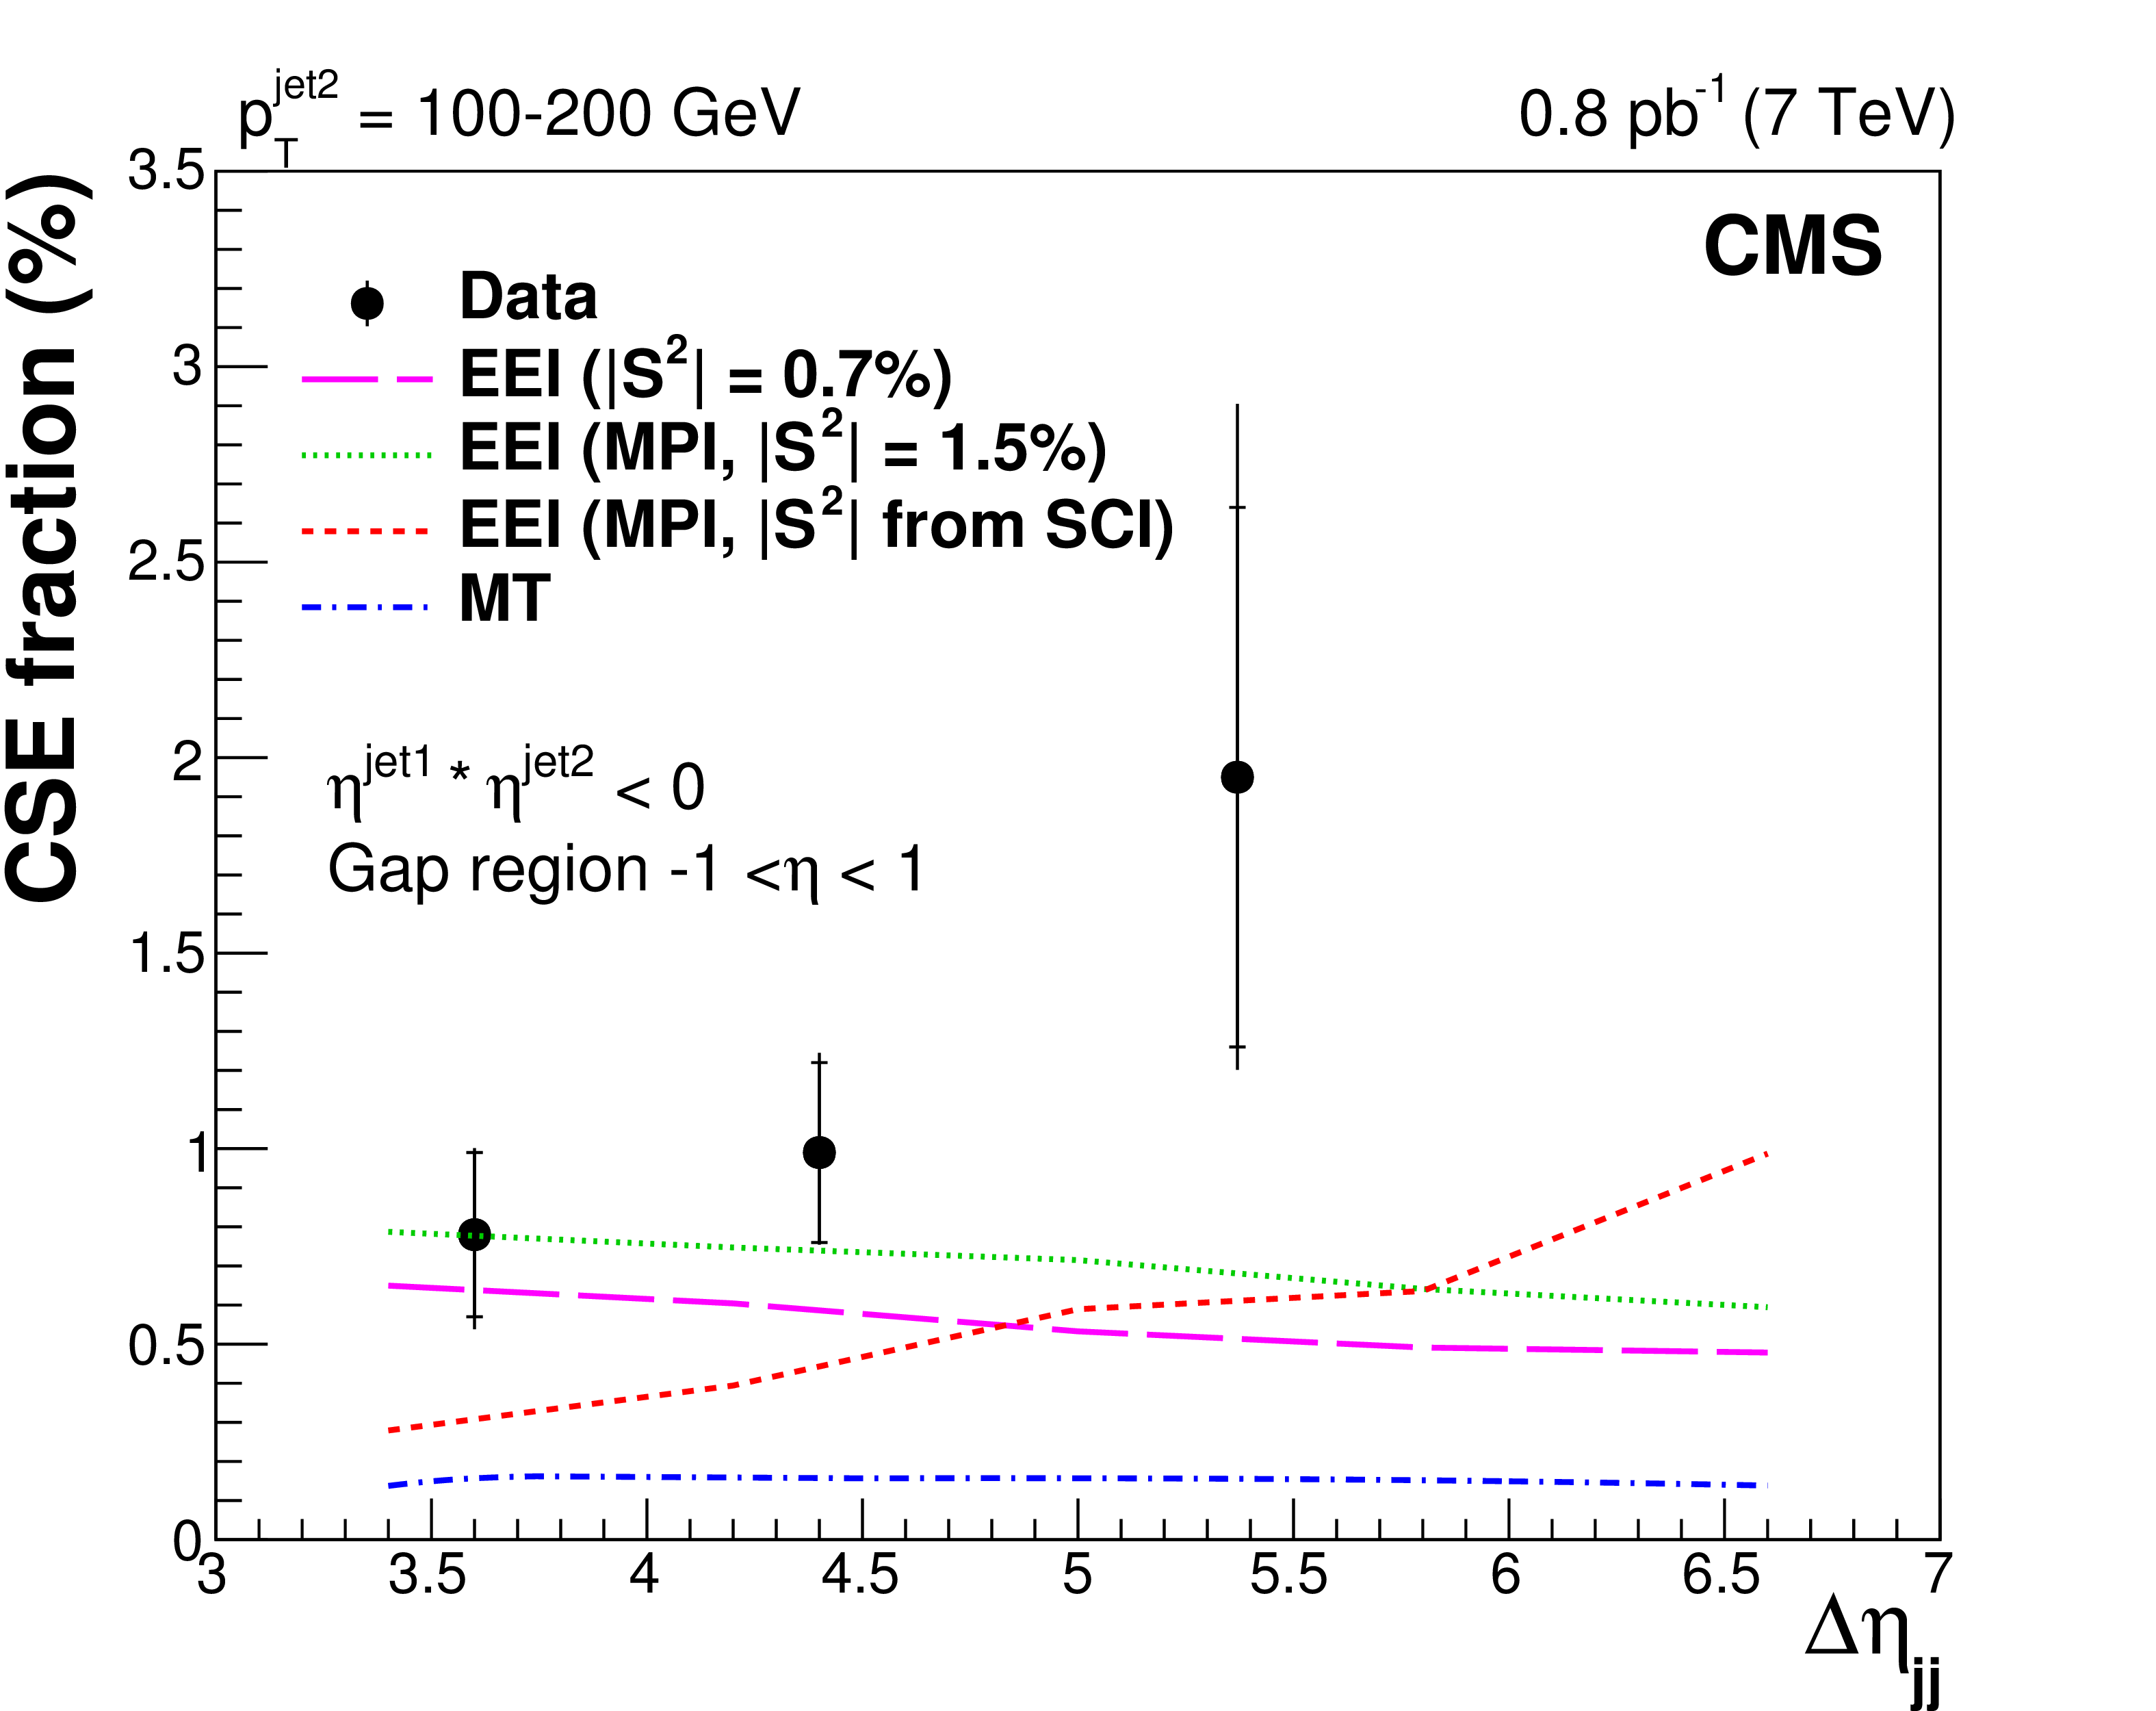
Fraction of dijet events with a central gap ($f_\mathrm {CSE}$) as a function of $\Delta \eta _\mathrm {jj}$ at $\sqrt {s}= $ 7 TeV in three different $ {p_{\mathrm {T}}} ^\text {jet2}$ ranges, compared to the predictions of the Mueller and Tang (MT) model [21], and of the Ekstedt, Enberg, and Ingelman (EEI) model [22,23] with three different treatments of the gap survival probability factor $ {< S >}^2$, as described in the text. The results are plotted at the mean value of $\Delta \eta _\mathrm {jj}$ in the bin. Inner and outer error bars correspond to the statistical, and the statistical and systematic uncertainties added in quadrature, respectively. |
png pdf |
Figure 10-a:
Fraction of dijet events with a central gap ($f_\mathrm {CSE}$) as a function of $\Delta \eta _\mathrm {jj}$ at $\sqrt {s}= $ 7 TeV in three different $ {p_{\mathrm {T}}} ^\text {jet2}$ ranges, compared to the predictions of the Mueller and Tang (MT) model [21], and of the Ekstedt, Enberg, and Ingelman (EEI) model [22,23] with three different treatments of the gap survival probability factor $ {< S >}^2$, as described in the text. The results are plotted at the mean value of $\Delta \eta _\mathrm {jj}$ in the bin. Inner and outer error bars correspond to the statistical, and the statistical and systematic uncertainties added in quadrature, respectively. |
png pdf |
Figure 10-b:
Fraction of dijet events with a central gap ($f_\mathrm {CSE}$) as a function of $\Delta \eta _\mathrm {jj}$ at $\sqrt {s}= $ 7 TeV in three different $ {p_{\mathrm {T}}} ^\text {jet2}$ ranges, compared to the predictions of the Mueller and Tang (MT) model [21], and of the Ekstedt, Enberg, and Ingelman (EEI) model [22,23] with three different treatments of the gap survival probability factor $ {< S >}^2$, as described in the text. The results are plotted at the mean value of $\Delta \eta _\mathrm {jj}$ in the bin. Inner and outer error bars correspond to the statistical, and the statistical and systematic uncertainties added in quadrature, respectively. |
png pdf |
Figure 10-c:
Fraction of dijet events with a central gap ($f_\mathrm {CSE}$) as a function of $\Delta \eta _\mathrm {jj}$ at $\sqrt {s}= $ 7 TeV in three different $ {p_{\mathrm {T}}} ^\text {jet2}$ ranges, compared to the predictions of the Mueller and Tang (MT) model [21], and of the Ekstedt, Enberg, and Ingelman (EEI) model [22,23] with three different treatments of the gap survival probability factor $ {< S >}^2$, as described in the text. The results are plotted at the mean value of $\Delta \eta _\mathrm {jj}$ in the bin. Inner and outer error bars correspond to the statistical, and the statistical and systematic uncertainties added in quadrature, respectively. |
| Tables | |
png pdf |
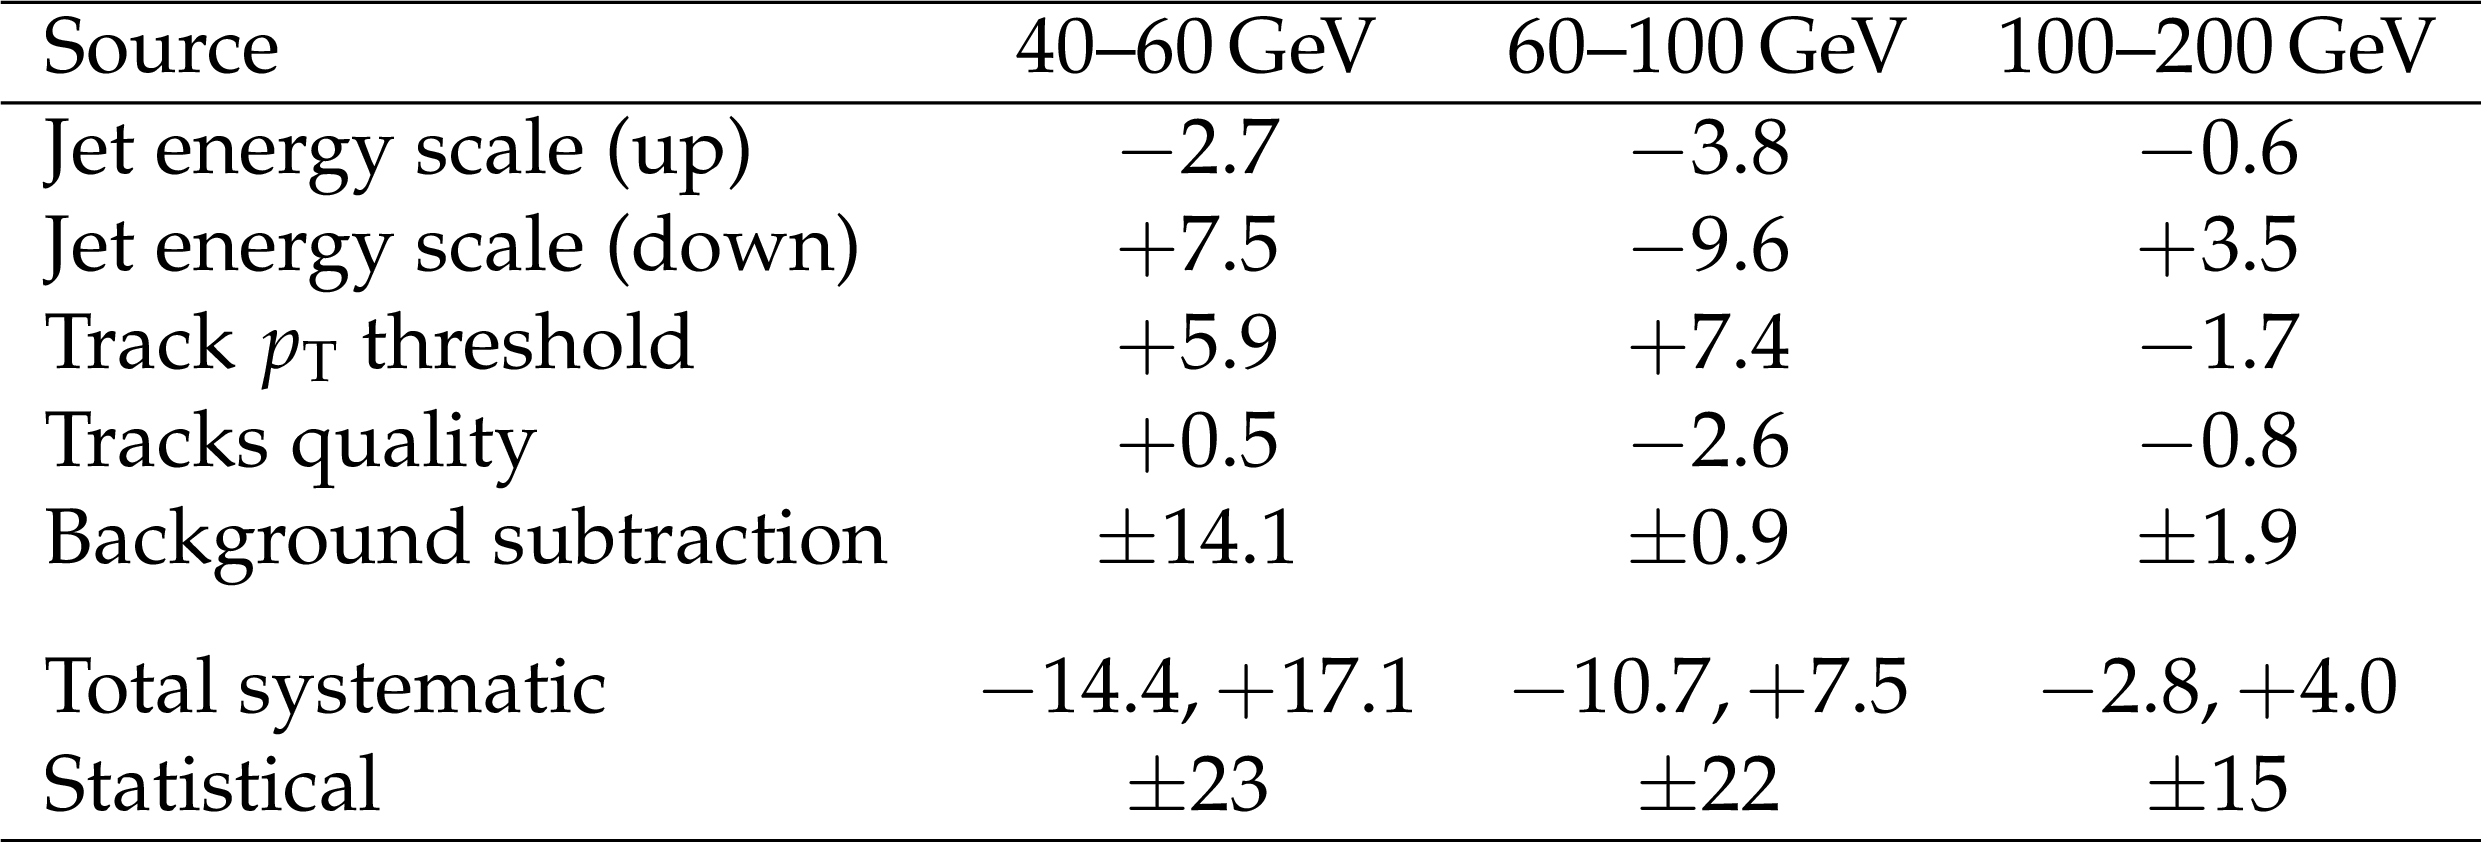
Table 1:
Percent systematic (individual, and total) and statistical uncertainties in the measurement of the CSE fraction in the three bins of $ {p_{\mathrm {T}}} ^\text {jet2}$. |
png pdf |
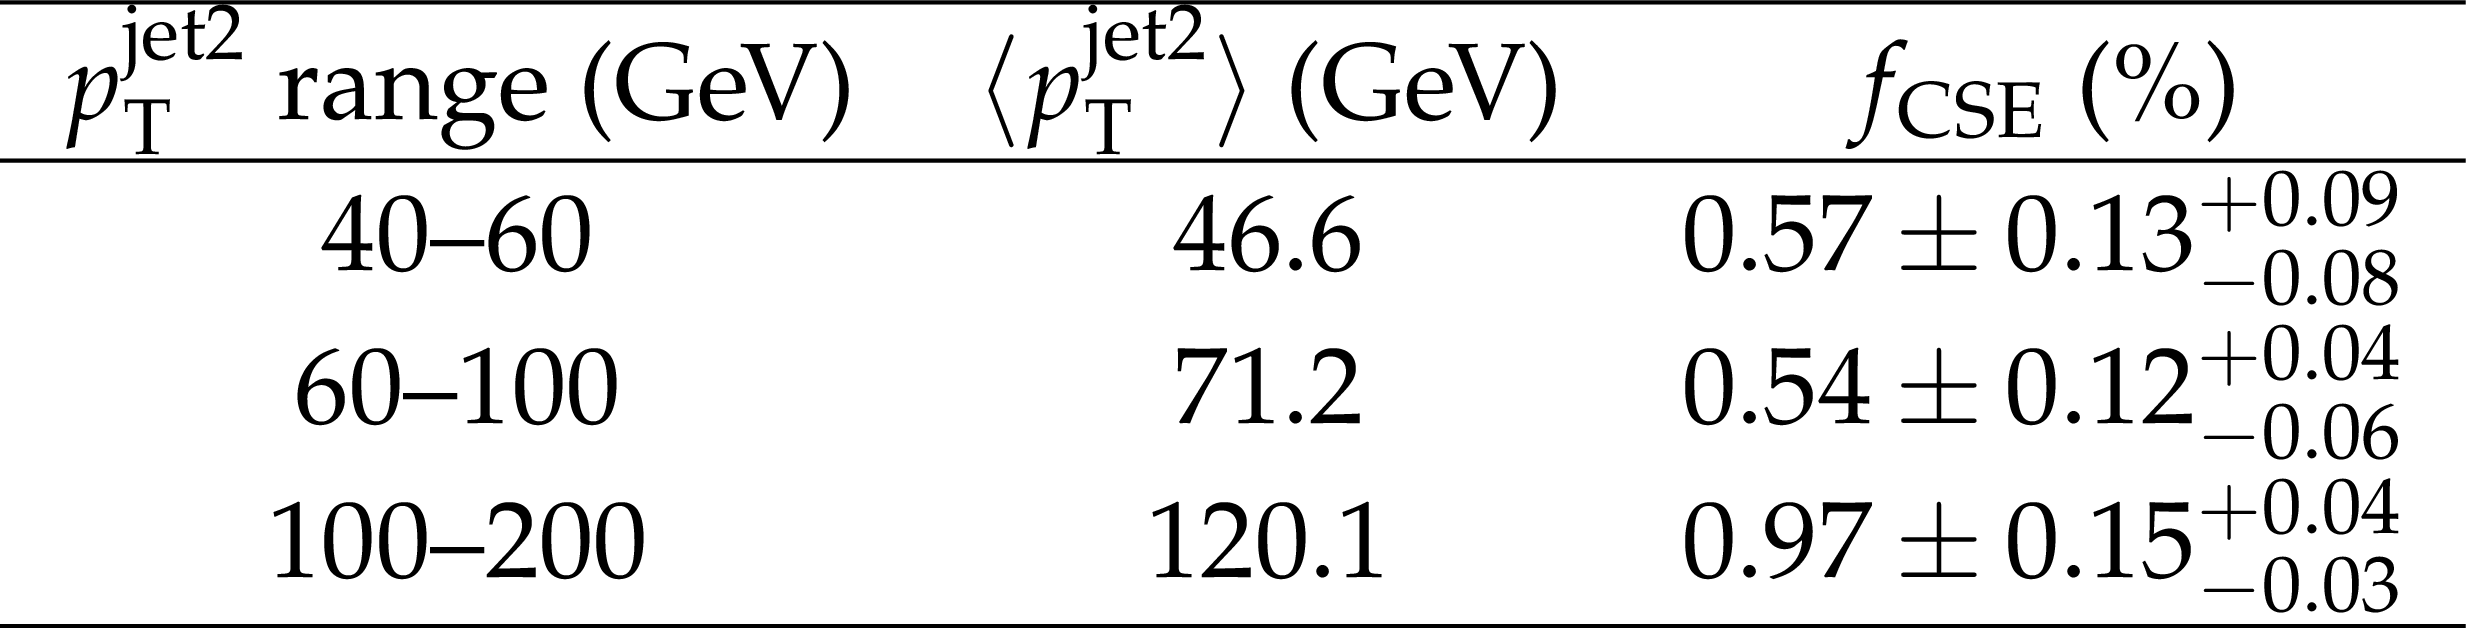
Table 2:
Measured values of $f_\mathrm {CSE}$ as a function of $ {p_{\mathrm {T}}} ^\text {jet2}$. The first and second (asymmetric) uncertainties correspond to the statistical and systematic components, respectively. The mean values of $ {p_{\mathrm {T}}} ^\text {jet2}$ in the bin are also given. |
png pdf |
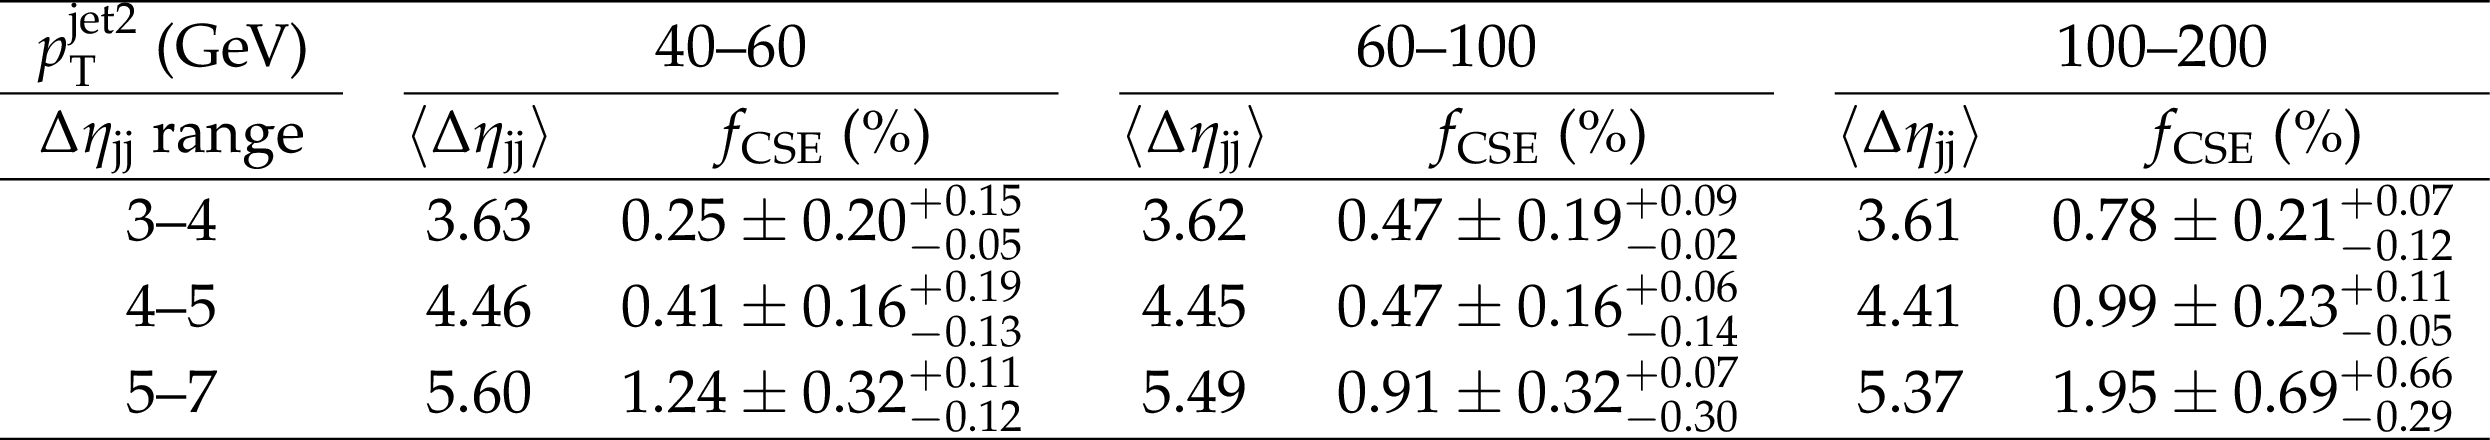
Table 3:
Measured values of the fraction of dijet events with a central gap ($f_\mathrm {CSE}$) as a function of the pseudorapidity separation between the jets ($\Delta \eta _\mathrm {jj}$) in bins of $ {p_{\mathrm {T}}} ^\text {jet2}$. The columns in the table correspond to $ {p_{\mathrm {T}}} ^\text {jet2}$ bins and the rows to $\Delta \eta _\mathrm {jj}$ bins. The first and second (asymmetric) errors correspond to the statistical and systematic uncertainties, respectively. The mean values of $\Delta \eta _\mathrm {jj}$ in the bin are also given. |
| Summary |
|
Events with a large rapidity gap between the two leading jets have been measured for the first time at the LHC, for jets with transverse momentum ${p_{\mathrm{T}}}^{\text{jet}} > $ 40 GeV and pseudorapidity 1.5 $ < |{\eta^{\text{jet}}}| < $ 4.7, reconstructed in opposite ends of the detector. The number of dijet events with no particles with ${p_{\mathrm{T}}} > $ 0.2 GeV in the region $|{\eta}| < $ 1 is severely underestimated by PYTHIA6 (tune Z2*). HERWIG6 predictions, which include a contribution from color singlet exchange (CSE), based on the leading logarithmic Balitsky-Fadin-Kuraev-Lipatov (BFKL) evolution equations, are needed to reproduce the type of dijet topologies selected in our analysis. The fraction of selected dijet events with such a rapidity gap has been measured as a function of the second-leading jet transverse momentum (${p_{\mathrm{T}}}^\text{jet2}$) and as a function of the size of the pseudorapidity interval between the jets, $\Delta\eta_\mathrm{jj}$. The $f_\mathrm{CSE}$ fraction rises with ${p_{\mathrm{T}}}^\text{jet2}$ (from 0.6 to 1%) and with $\Delta\eta_\mathrm{jj}$ (from 0.3 to 1.2% for 40 $ < {p_{\mathrm{T}}}^\text{jet2} < $ 60 GeV, from 0.5 to 0.9% for 60 $ < {p_{\mathrm{T}}}^\text{jet2} < $ 100 GeV, and from 0.8 to 2% for 100 $ < {p_{\mathrm{T}}}^\text{jet2} < $ 200 GeV). The measured CSE fractions have been compared to the results of the D0 and CDF experiments at a center-of-mass energy of 1.8 TeV. A factor of two decrease of the CSE fraction measured at $\sqrt{s} = $ 7 TeV with respect to those at lower collision energies is observed. Such a behavior is consistent with the decrease seen in the Tevatron data when $\sqrt{s}$ rises from 0.63 to 1.8 TeV, and with theoretical expectations for the $\sqrt{s}$ dependence of the rapidity gap survival probability. The data are also compared to theoretical perturbative quantum chromodynamics calculations based on the BFKL evolution equations complemented with different estimates of the non-perturbative gap survival probability. The next-to-leading-logarithmic BFKL calculations of Ekstedt, Enberg and Ingelman, with three different implementations of the soft rescattering processes, describe many features of the data, but none of the implementations is able to simultaneously describe all the features of the measurement. |
| References | ||||
| 1 | CMS Collaboration | Dijet azimuthal decorrelations in $ pp $ collisions at $ \sqrt{s} = $ 7 ~TeV | PRL 106 (2011) 122003 | CMS-QCD-10-026 1101.5029 |
| 2 | CMS Collaboration | Measurement of the differential dijet production cross section in proton-proton collisions at $ \sqrt{s}= $ 7 TeV | PLB 700 (2011) 187 | CMS-QCD-10-025 1104.1693 |
| 3 | CMS Collaboration | Measurement of the inclusive production cross sections for forward jets and for dijet events with one forward and one central jet in pp collisions at $ \sqrt{s}= $ 7 TeV | JHEP 06 (2012) 036 | CMS-FWD-11-002 1202.0704 |
| 4 | CMS Collaboration | Ratios of dijet production cross sections as a function of the absolute difference in rapidity between jets in proton-proton collisions at $ \sqrt{s}= $ 7 TeV | EPJC 72 (2012) 2216 | CMS-FWD-10-014 1204.0696 |
| 5 | CMS Collaboration | Measurement of dijet azimuthal decorrelation in pp collisions at $ \sqrt{s}= $ 8 TeV | EPJC 76 (2016) 536 | CMS-SMP-14-015 1602.04384 |
| 6 | CMS Collaboration | Measurement of the triple-differential dijet cross section in proton-proton collisions at $ \sqrt{s} = $ 8 TeV and constraints on parton distribution functions | Submitted to EPJC | CMS-SMP-16-011 1705.02628 |
| 7 | ATLAS Collaboration | Measurement of inclusive jet and dijet cross sections in proton-proton collisions at 7 TeV centre-of-mass energy with the ATLAS detector | EPJC 71 (2011) 1512 | 1009.5908 |
| 8 | ATLAS Collaboration | Measurement of dijet production with a veto on additional central jet activity in pp collisions at $ \sqrt{s}= $ 7 TeV using the ATLAS detector | JHEP 09 (2011) 053 | 1107.1641 |
| 9 | ATLAS Collaboration | Measurement of inclusive jet and dijet production in pp collisions at $ \sqrt{s}= $ 7 TeV using the ATLAS detector | PRD 86 (2012) 014022 | 1112.6297 |
| 10 | ATLAS Collaboration | Measurement of dijet cross sections in pp collisions at 7 TeV centre-of-mass energy using the ATLAS detector | JHEP 05 (2014) 059 | 1312.3524 |
| 11 | ATLAS Collaboration | Measurements of jet vetoes and azimuthal decorrelations in dijet events produced in pp collisions at $ \sqrt{s}= $ 7 TeV using the ATLAS detector | EPJC 74 (2014) 3117 | 1407.5756 |
| 12 | ATLAS Collaboration | Dijet production in $ \sqrt{s}= $ 7 TeV pp collisions with large rapidity gaps at the ATLAS experiment | PLB 754 (2016) | 1511.00502 |
| 13 | V. N. Gribov and L. N. Lipatov | Deep inelastic ep scattering in perturbation theory | Sov. J. NP 15 (1972) 438 | |
| 14 | G. Altarelli and G. Parisi | Asymptotic freedom in parton language | NPB 126 (1977) 298 | |
| 15 | Y. L. Dokshitzer | Calculation of the structure functions for deep inelastic scattering and e+ e- annihilation by perturbation theory in quantum chromodynamics | Sov. Phys. JETP 46 (1977)641 | |
| 16 | E. E. Kuraev, L. N. Lipatov, and V. S. Fadin | The Pomeranchuk singularity in nonabelian gauge theories | Sov. Phys. JETP 45 (1977) 199 | |
| 17 | Y. Y. Balitsky and L. N. Lipatov | The Pomeranchuk singularity in quantum chromodynamics | Sov. J. NP 28 (1978) 822 | |
| 18 | L. N. Lipatov | The bare pomeron in quantum chromodynamics | Sov. Phys. JETP 63 (1986) 904 | |
| 19 | J. D. Bjorken | Rapidity gaps and jets as a new physics signature in very high-energy hadron hadron collisions | PRD 47 (1993) 101 | |
| 20 | V. Barone and E. Predazzi | High-energy particle diffraction | Texts and monographs in physics. Springer, Berlin | |
| 21 | A. H. Mueller and W.-K. Tang | High-energy parton-parton elastic scattering in QCD | PLB 284 (1992) 123 | |
| 22 | R. Enberg, G. Ingelman, and L. Motyka | Hard color singlet exchange and gaps between jets at the Tevatron | PLB 524 (2002) 273 | hep-ph/0111090 |
| 23 | A. Ekstedt, R. Enberg, and G. Ingelman | Hard color singlet BFKL exchange and gaps between jets at the LHC | 2017 | 1703.10919 |
| 24 | O. Kepka, C. Marquet, and C. Royon | Gaps between jets in hadronic collisions | PRD 83 (2011) 034036 | 1012.3849 |
| 25 | D0 Collaboration | Rapidity gaps between jets in p$ \bar{\mathrm{p}} $ collisions at $ \sqrt{s} = $ 1.8 TeV | PRL 72 (1994) 2332 | |
| 26 | D0 Collaboration | Jet production via strongly-interacting color-singlet exchange in p$ \bar{\mathrm{p}} $ collisions | PRL 76 (1996) 734 | hep-ex/9509013 |
| 27 | D0 Collaboration | Probing hard color-singlet exchange in p$ \bar{\mathrm{p}} $ collisions at $ \sqrt{s} = $ 630 GeV and 1800 GeV | PLB 440 (1998) 189 | hep-ex/9809016 |
| 28 | CDF Collaboration | Observation of rapidity gaps in $ \bar{\mathrm{p}} $p collisions at 1.8 TeV | PRL 74 (1995) 855 | |
| 29 | CDF Collaboration | Dijet production by color-singlet exchange at the Fermilab Tevatron | PRL 80 (1998) 1156 | |
| 30 | CDF Collaboration | Events with a rapidity gap between jets in $ \bar{\mathrm{p}} $p collisions at $ \sqrt{s} = $ 630 GeV | PRL 81 (1998) 5278 | |
| 31 | ZEUS Collaboration | Rapidity gaps between jets in photoproduction at HERA | PLB 369 (1996) 55 | hep-ex/9510012 |
| 32 | H1 Collaboration | Energy flow and rapidity gaps between jets in photoproduction at HERA | EPJC 24 (2002) 517 | hep-ex/0203011 |
| 33 | CMS Collaboration | Description and performance of track and primary-vertex reconstruction with the CMS tracker | JINST 9 (2014) P10009 | CMS-TRK-11-001 1405.6569 |
| 34 | CMS Collaboration | The CMS experiment at the CERN LHC | JINST 3 (2008) S08004 | CMS-00-001 |
| 35 | CMS Collaboration | The CMS trigger system | JINST 12 (2017) P01020 | CMS-TRG-12-001 1609.02366 |
| 36 | M. Cacciari, G. P. Salam, and G. Soyez | The anti-$ k_t $ jet clustering algorithm | JHEP 04 (2008) 063 | 0802.1189 |
| 37 | M. Cacciari, G. P. Salam, and G. Soyez | FastJet user manual | EPJC 72 (2012) 1896 | 1111.6097 |
| 38 | CMS Collaboration | Particle-flow reconstruction and global event description with the CMS detector | Submitted to JINST; in proof | CMS-PRF-14-001 1706.04965 |
| 39 | CMS Collaboration | Jet performance in pp collisions at 7 TeV | CMS-PAS-JME-10-003 | |
| 40 | CMS Collaboration | Determination of the jet energy scale in CMS with pp collisions at $ \sqrt{s}= $ 7 TeV | CMS-PAS-JME-10-010 | |
| 41 | T. Sjostrand, S. Mrenna, and P. Skands | PYTHIA 6.4 physics and manual | JHEP 05 (2006) 026 | hep-ph/0603175 |
| 42 | B. Andersson, G. Gustafson, G. Ingelman, and T. Sjostrand | Parton fragmentation and string dynamics | PR 97 (1983) 31 | |
| 43 | CMS Collaboration | Study of the underlying event at forward rapidity in pp collisions at $ \sqrt{s} = $ 0.9, 2.76, and 7 TeV | JHEP 04 (2013) 072 | CMS-FWD-11-003 1302.2394 |
| 44 | G. Corcella et al. | HERWIG 6: an event generator for hadron emission reactions with interfering gluons (including supersymmetric processes) | JHEP 01 (2001) 010 | hep-ph/0011363 |
| 45 | J. M. Butterworth, J. R. Forshaw, and M. H. Seymour | Multiparton interactions in photoproduction at HERA | Z. Phys. C 72 (1996) 637 | hep-ph/9601371 |
| 46 | J. Pumplin et al. | New generation of parton distributions with uncertainties from global QCD analysis | JHEP 07 (2002) 012 | hep-ph/0201195 |
| 47 | GEANT4 Collaboration | GEANT4---a simulation toolkit | NIMA 506 (2003) 250 | |
| 48 | CMS Collaboration | Determination of jet energy calibration and transverse momentum resolution in CMS | JINST 6 (2011) P11002 | CMS-JME-10-011 1107.4277 |
| 49 | CMS Collaboration | Transverse-momentum and pseudorapidity distributions of charged hadrons in pp collisions at $ \sqrt{s} $~=~0.9 and 2.36~TeV | JHEP. 02 (2010) 041 | CMS-QCD-09-010 1002.0621 |
| 50 | UA5 Collaboration | Multiplicity distributions in different pseudorapidity intervals s at a CMS energy of 540 GeV | PLB 160 (1985) 193 | |
| 51 | UA5 Collaboration | Charged particle multiplicity distributions at 200 GeV and 900 GeV c.m. energy | Z. Phys. C 43 (1989) 357 | |
| 52 | ALICE Collaboration | Charged-particle multiplicity measurement in proton-proton collisions at $ \sqrt{s}= $ 7 TeV with ALICE at LHC | EPJC 68 (2010) 345 | 1004.3514 |
| 53 | E. Gotsman, E. Levin, and U. Maor | Energy dependence of the survival probability of large rapidity gaps | PLB 438 (1998) 229 | hep-ph/9804404 |
| 54 | V. A. Khoze, A. D. Martin, and M. G. Ryskin | Diffraction at the LHC | EPJC 73 (2013) 2503 | 1306.2149 |
| 55 | E. Gotsman, E. Levin, and U. Maor | CGC/saturation approach for soft interactions at high energy: survival probability of central exclusive production | EPJC 76 (2016) 177 | 1510.07249 |
|
|
Compact Muon Solenoid LHC, CERN |
|

|

|

|

|

|