

Compact Muon Solenoid
LHC, CERN
| CMS-SMP-14-012 ; CERN-EP-2016-152 | ||
| Measurement of the transverse momentum spectra of weak vector bosons produced in proton-proton collisions at $ \sqrt{s} = $ 8 TeV | ||
| CMS Collaboration | ||
| 19 June 2016 | ||
| JHEP 02 (2017) 096 | ||
| Abstract: The transverse momentum spectra of weak vector bosons are measured in the CMS experiment at the LHC. The measurement uses a sample of proton-proton collisions at $ \sqrt{s} = $ 8 TeV, collected during a special low-luminosity running that corresponds to an integrated luminosity of 18.4 $\pm$ 0.5 pb$^{-1}$. The production of W bosons is studied in both electron and muon decay modes, while the production of Z bosons is studied using only the dimuon decay channel. The ratios of $\mathrm{ W }^{-}$ to $\mathrm{ W }^{+}$ and Z to W differential cross sections are also measured. The measured differential cross sections and ratios are compared with theoretical predictions up to next-to-next leading order in QCD. | ||
| Links: e-print arXiv:1606.05864 [hep-ex] (PDF) ; CDS record ; inSPIRE record ; HepData record ; CADI line (restricted) ; | ||
| Figures & Tables | Summary | Additional Figures & Tables | References | CMS Publications |
|---|
| Figures | |
png pdf |
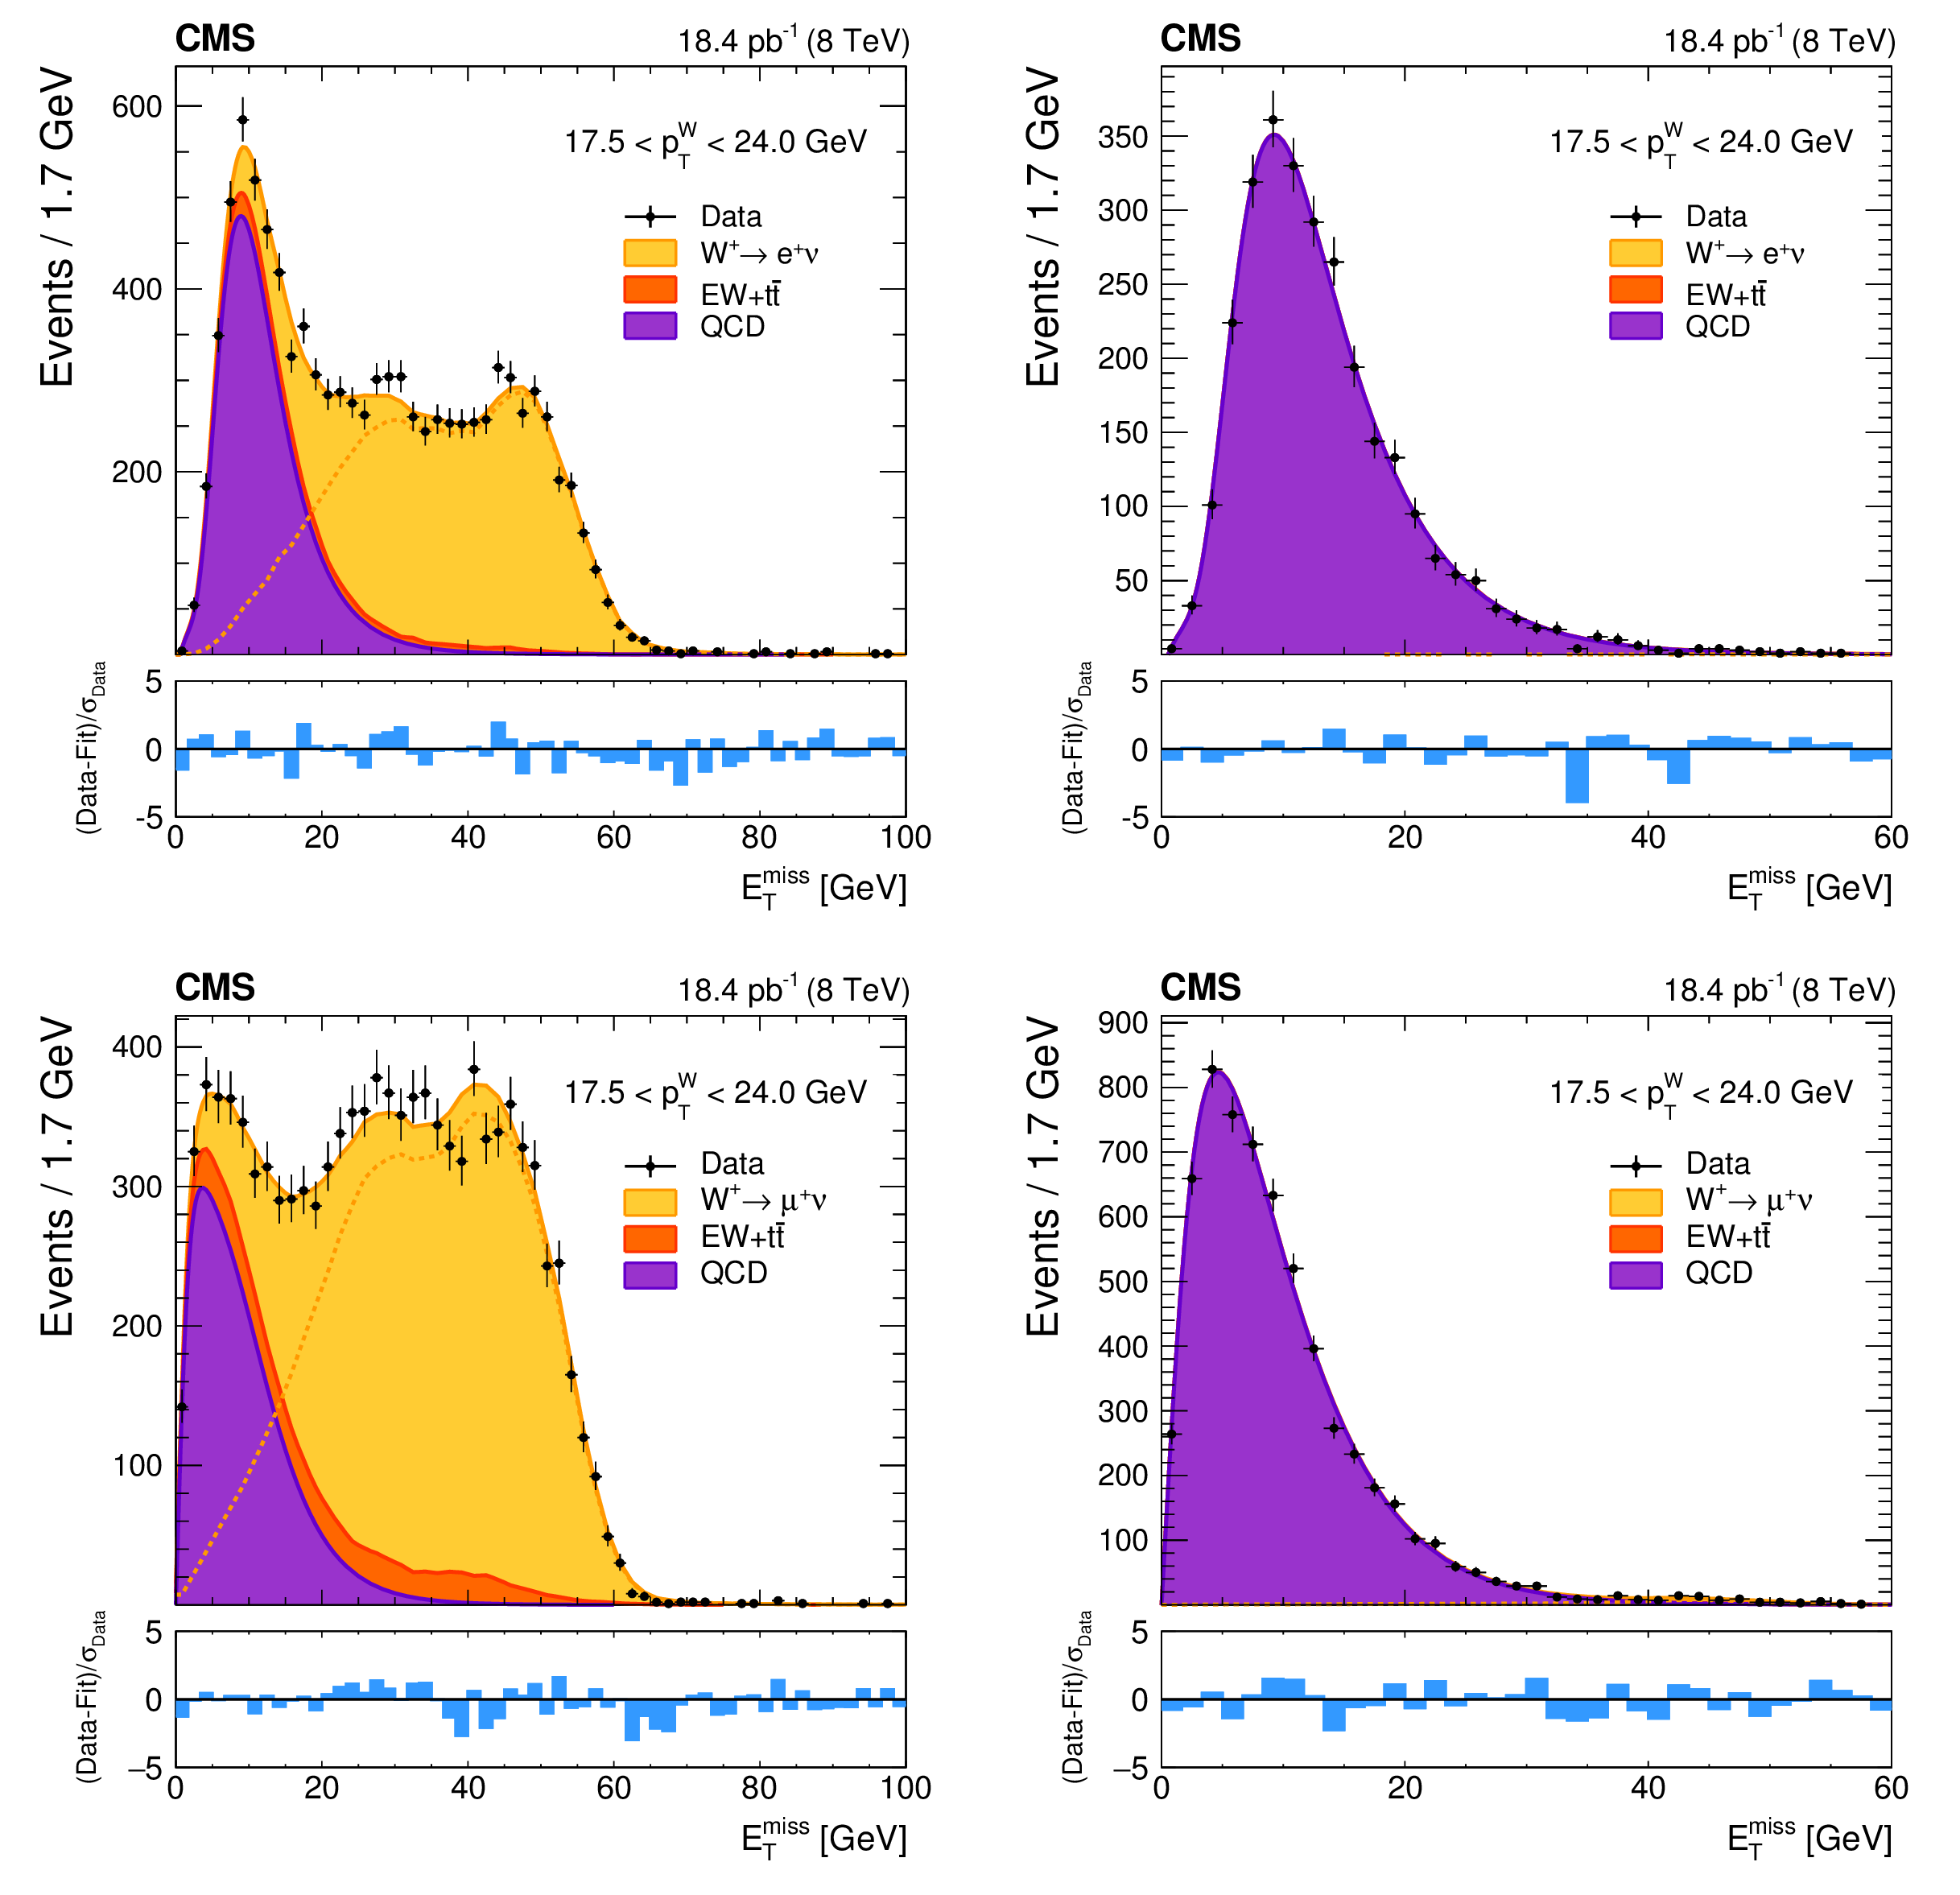
Figure 1:
The ${E_{\mathrm {T}}^{\text {miss}}}$ distributions for the selected ${ {{ {\mathrm{ W } }^+}} {\rightarrow }\mathrm{ e } ^+\nu }$ (a,b) and ${ {{ {\mathrm{ W } }^+}} {\rightarrow }\mu ^+\nu }$ (c,d) candidates for 17.5 $ < { {p_{\mathrm {T}}} ^{\mathrm {W}}}< $ 24 GeV (a,c) and the corresponding QCD multijet-enriched control sample (b,d). Solid lines represent the results of the fit. The dotted lines represent the signal shape after background subtraction. The bottom panels show the difference between data and fitted results divided by the statistical uncertainty in data, $\sigma _{\rm Data}$. |

png pdf |
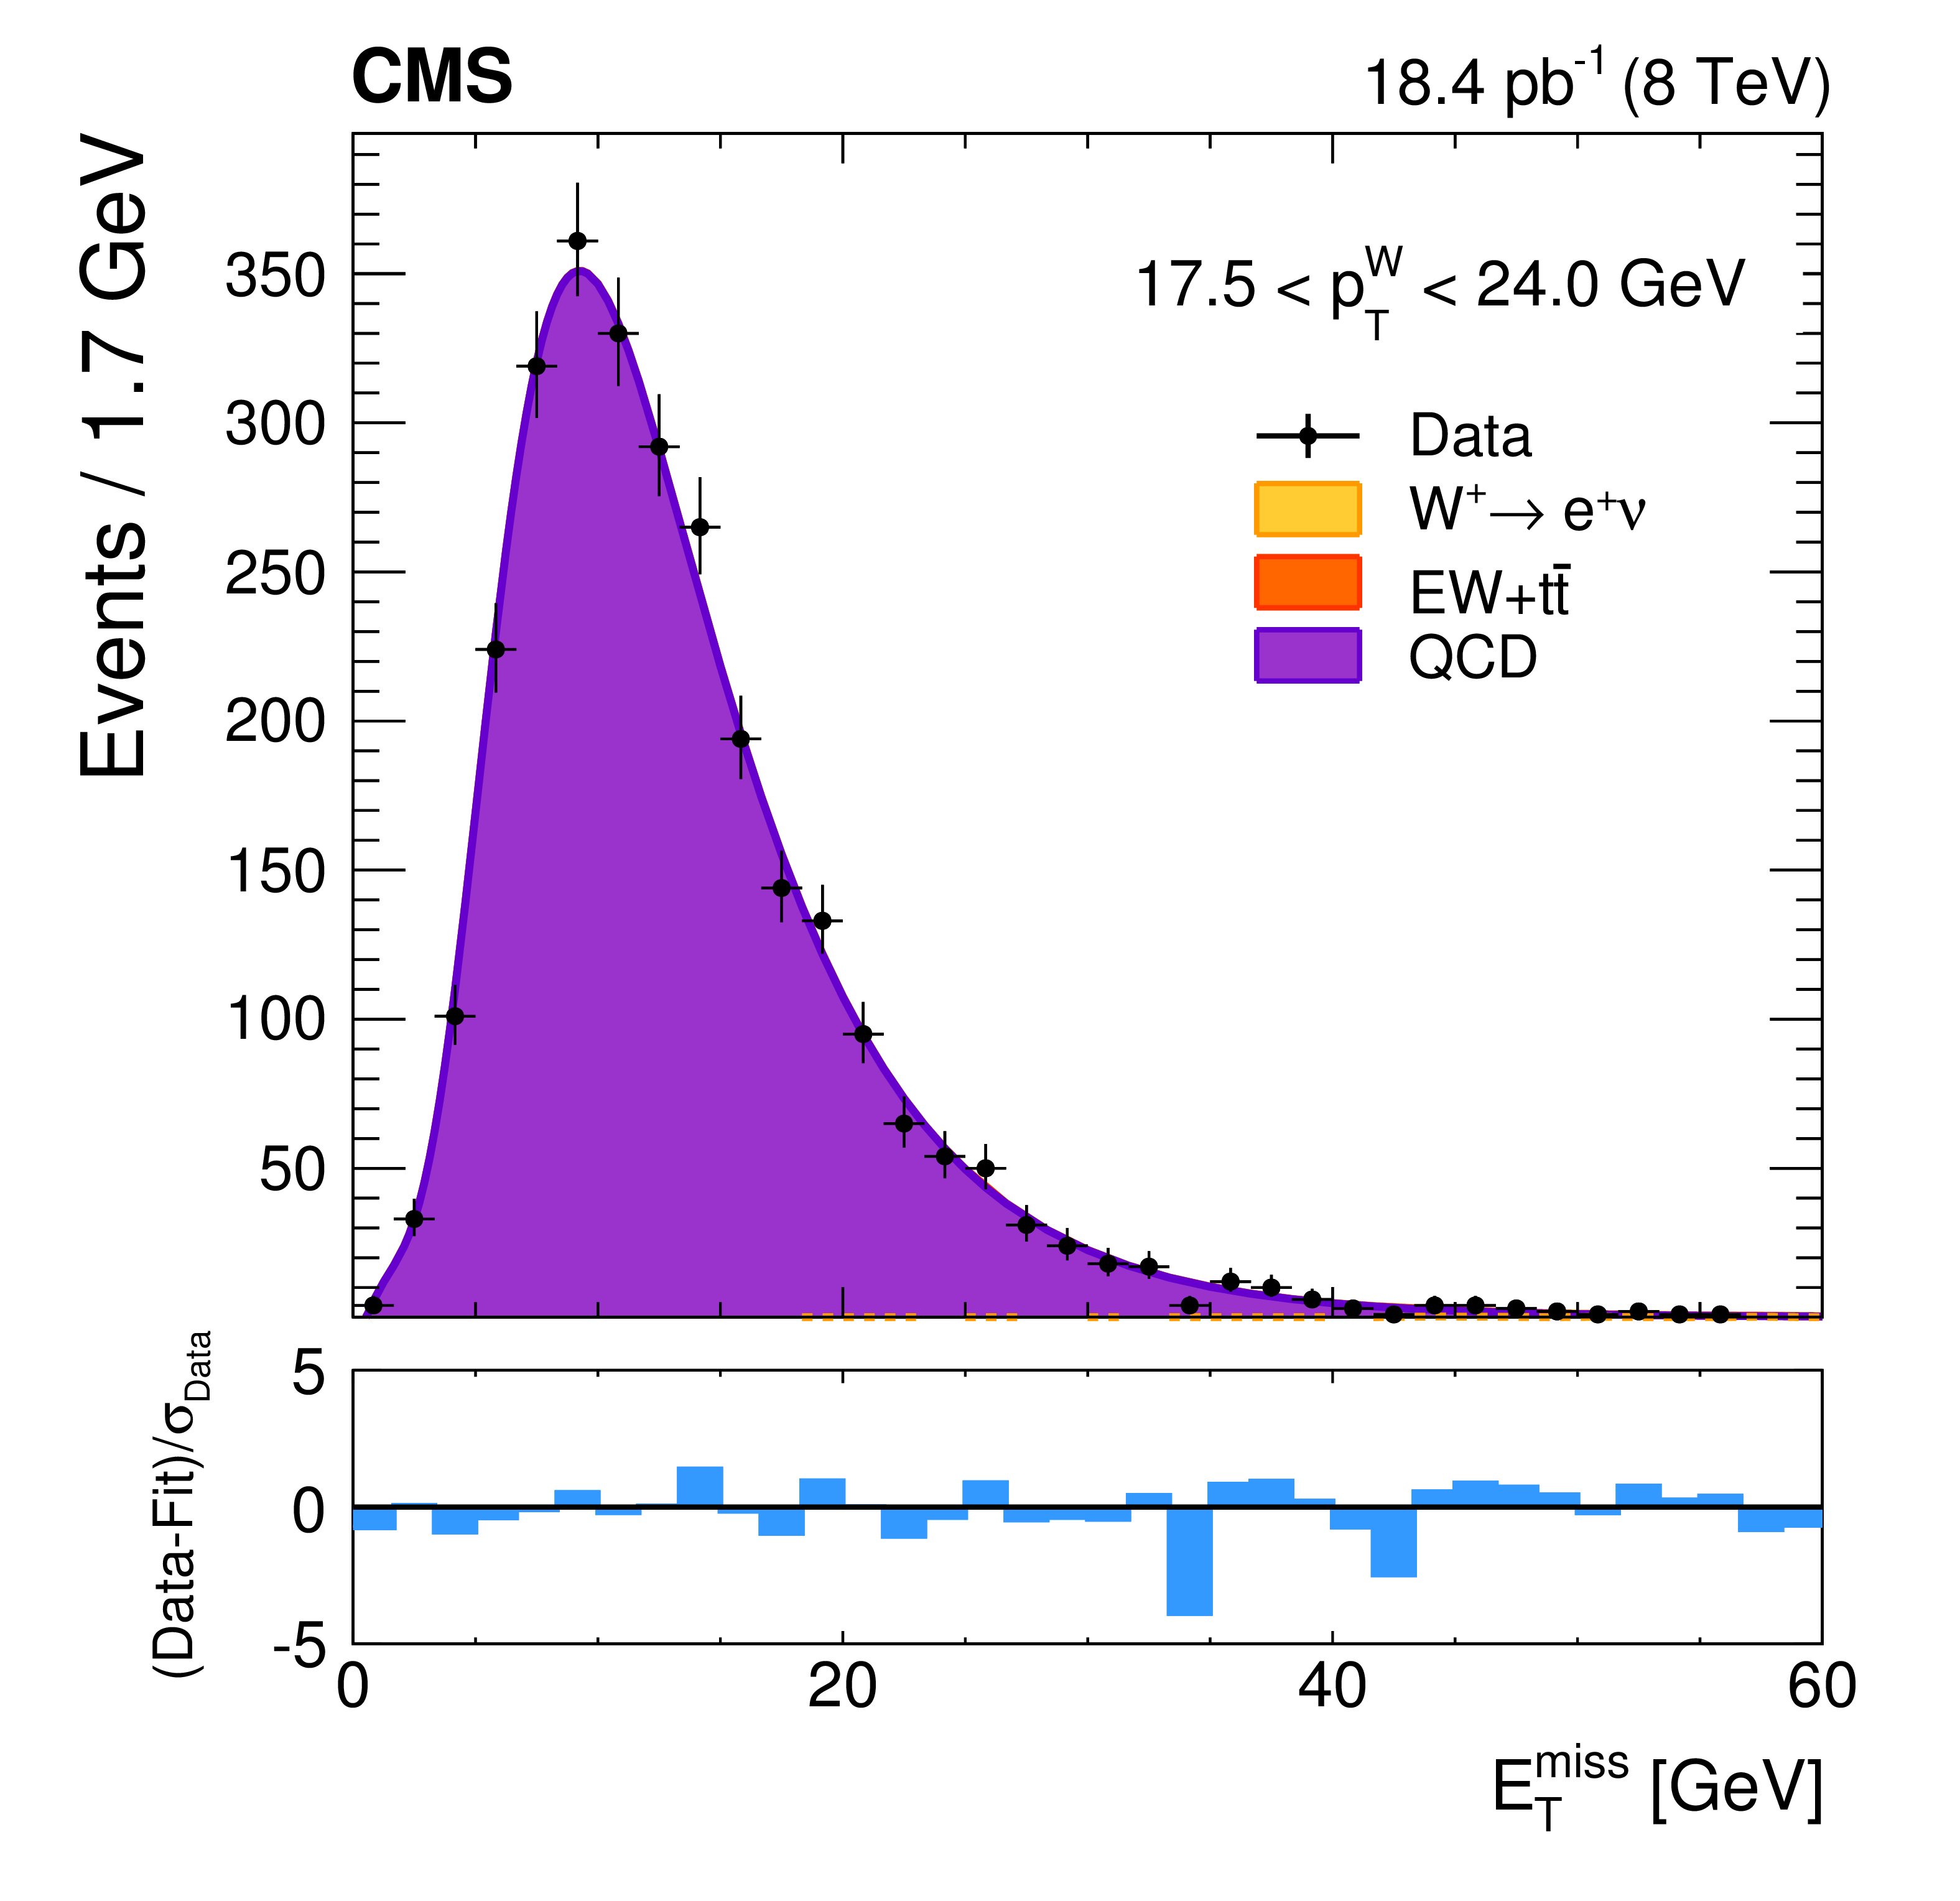
Figure 1-a:
The ${E_{\mathrm {T}}^{\text {miss}}}$ distributions for the selected ${ {{ {\mathrm{ W } }^+}} {\rightarrow }\mathrm{ e } ^+\nu }$ candidates for 17.5 $ < { {p_{\mathrm {T}}} ^{\mathrm {W}}}< $ 24 GeV. Solid lines represent the results of the fit. The dotted lines represent the signal shape after background subtraction. The bottom panel shows the difference between data and fitted results divided by the statistical uncertainty in data, $\sigma _{\rm Data}$. |
png pdf |
Figure 1-b:
The ${E_{\mathrm {T}}^{\text {miss}}}$ distributions for the selected ${ {{ {\mathrm{ W } }^+}} {\rightarrow }\mathrm{ e } ^+\nu }$ candidates for the corresponding QCD multijet-enriched control sample. Solid lines represent the results of the fit. The dotted lines represent the signal shape after background subtraction. The bottom panel shows the difference between data and fitted results divided by the statistical uncertainty in data, $\sigma _{\rm Data}$. |
png pdf |
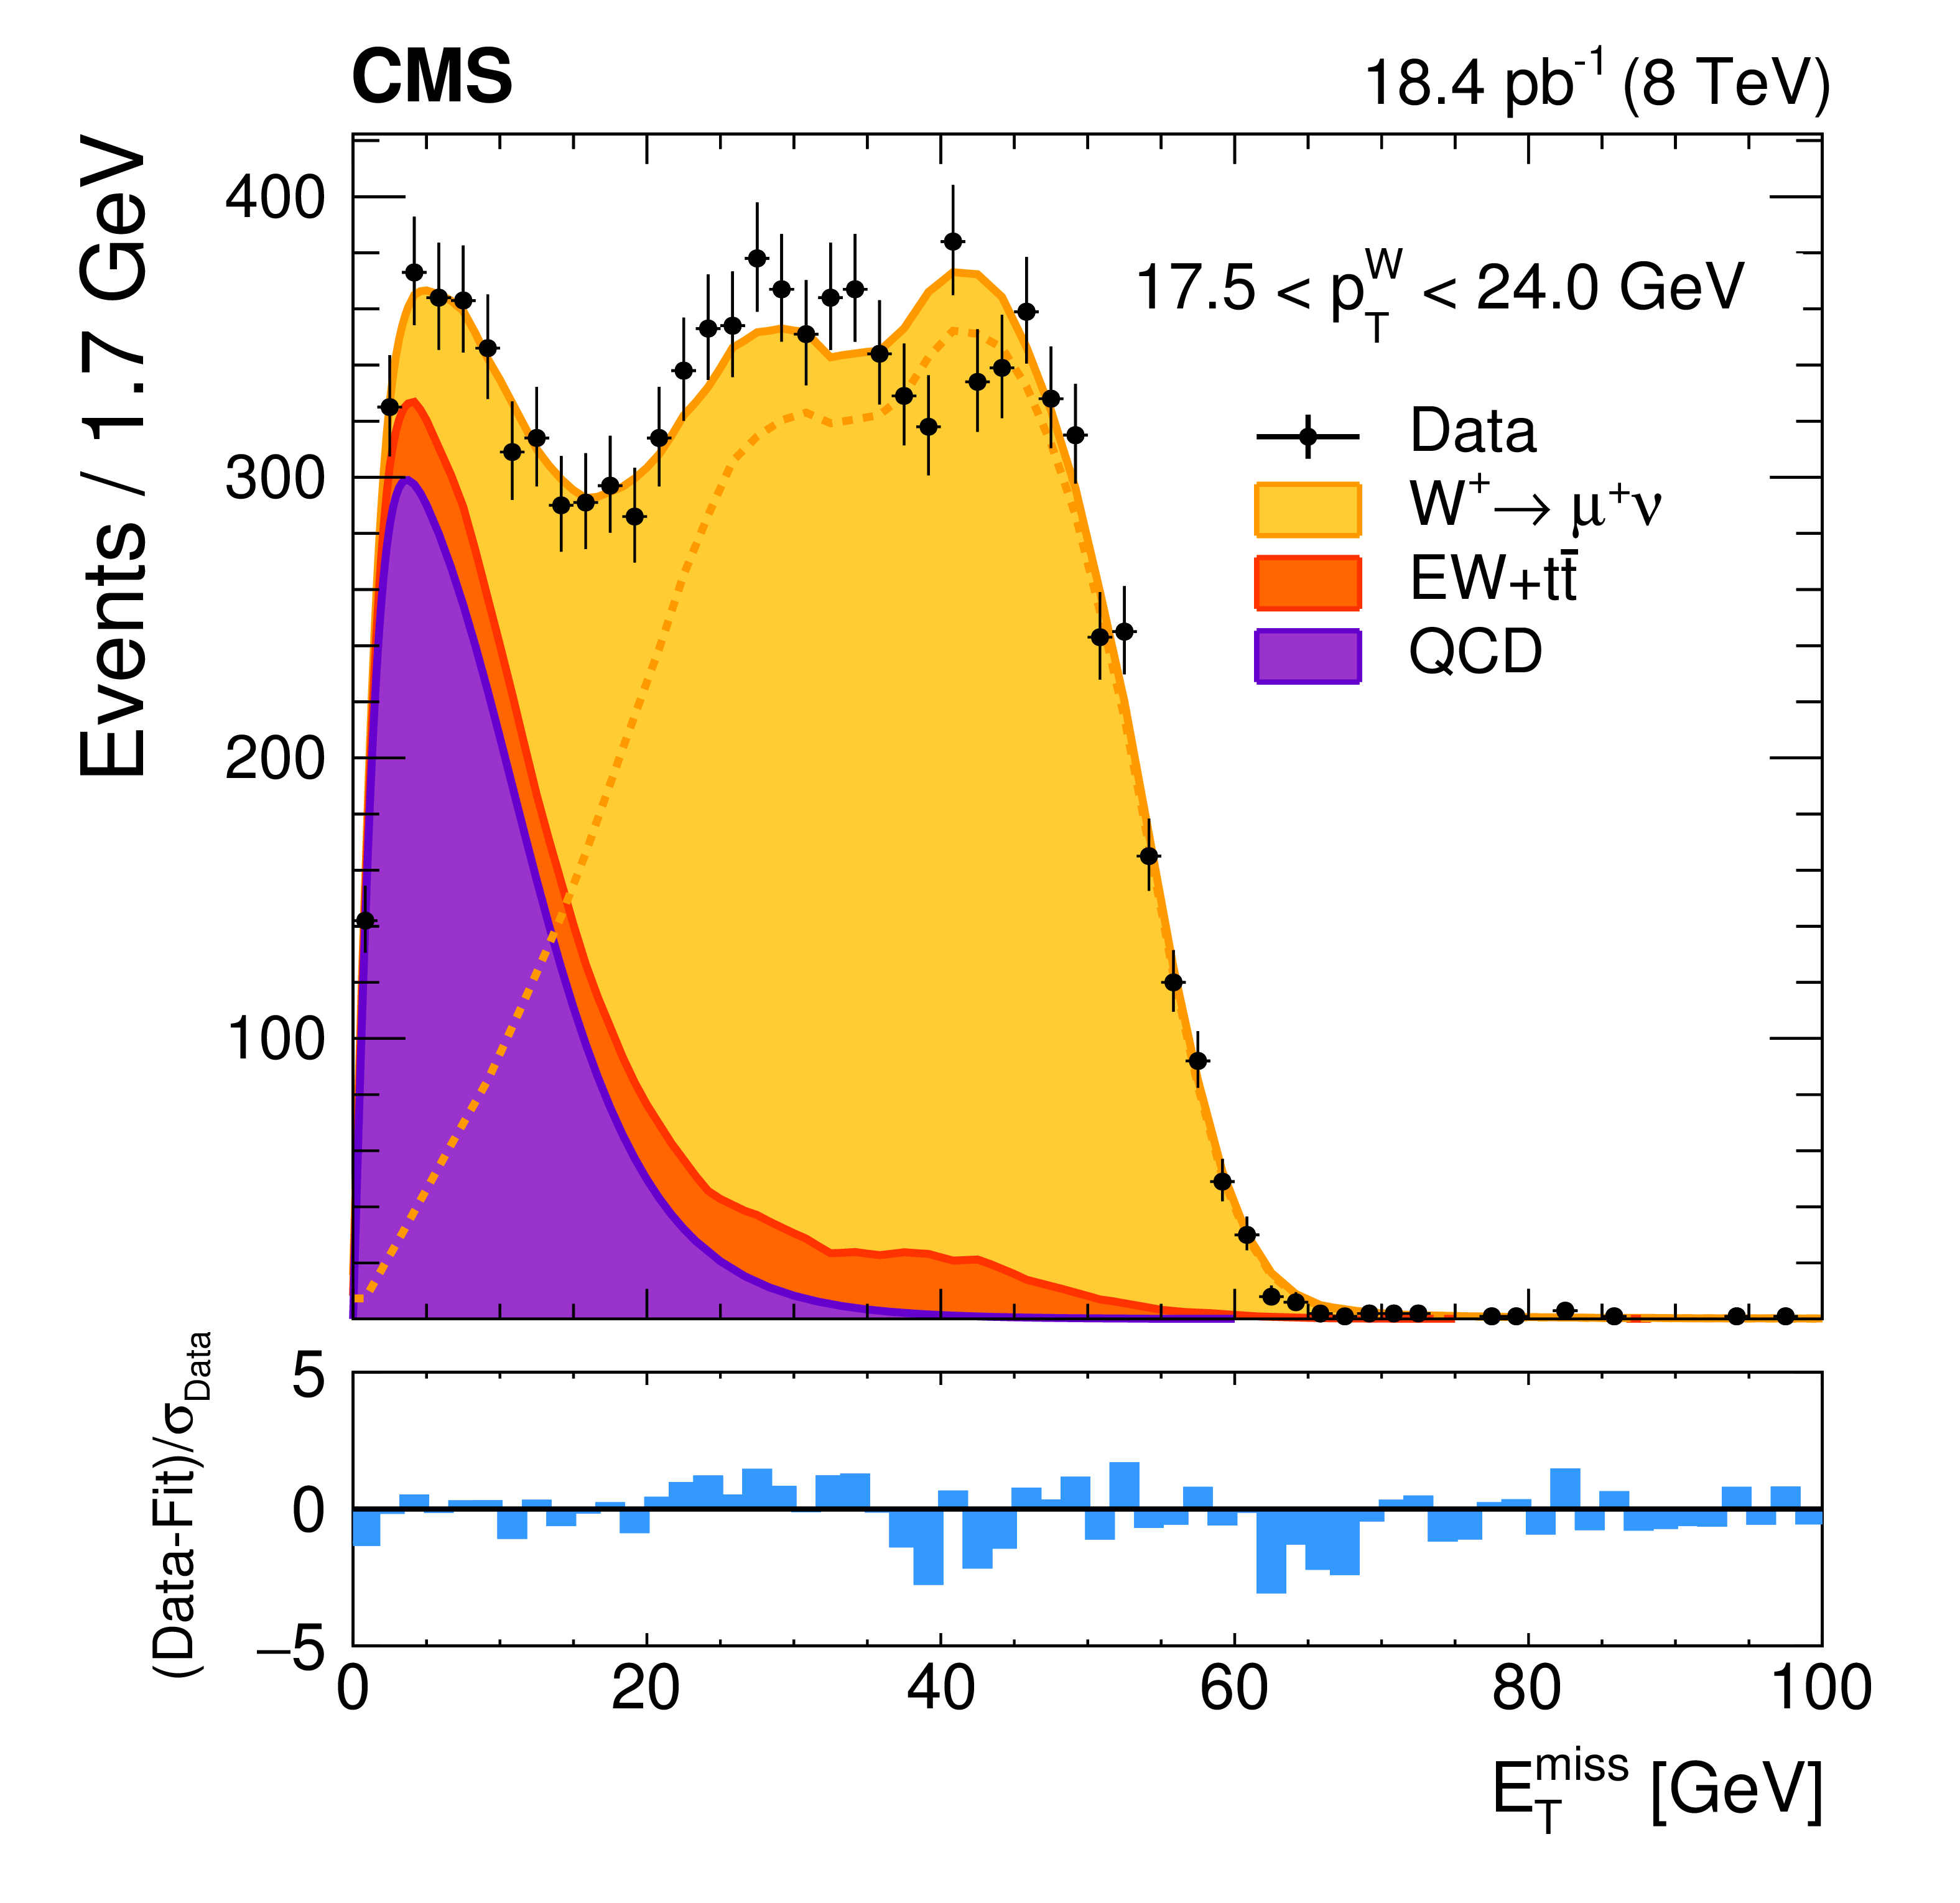
Figure 1-c:
The ${E_{\mathrm {T}}^{\text {miss}}}$ distributions for the selected ${ {{ {\mathrm{ W } }^+}} {\rightarrow }\mu ^+\nu }$ candidates for 17.5 $ < { {p_{\mathrm {T}}} ^{\mathrm {W}}}< $ 24 GeV. Solid lines represent the results of the fit. The dotted lines represent the signal shape after background subtraction. The bottom panel shows the difference between data and fitted results divided by the statistical uncertainty in data, $\sigma _{\rm Data}$. |
png pdf |
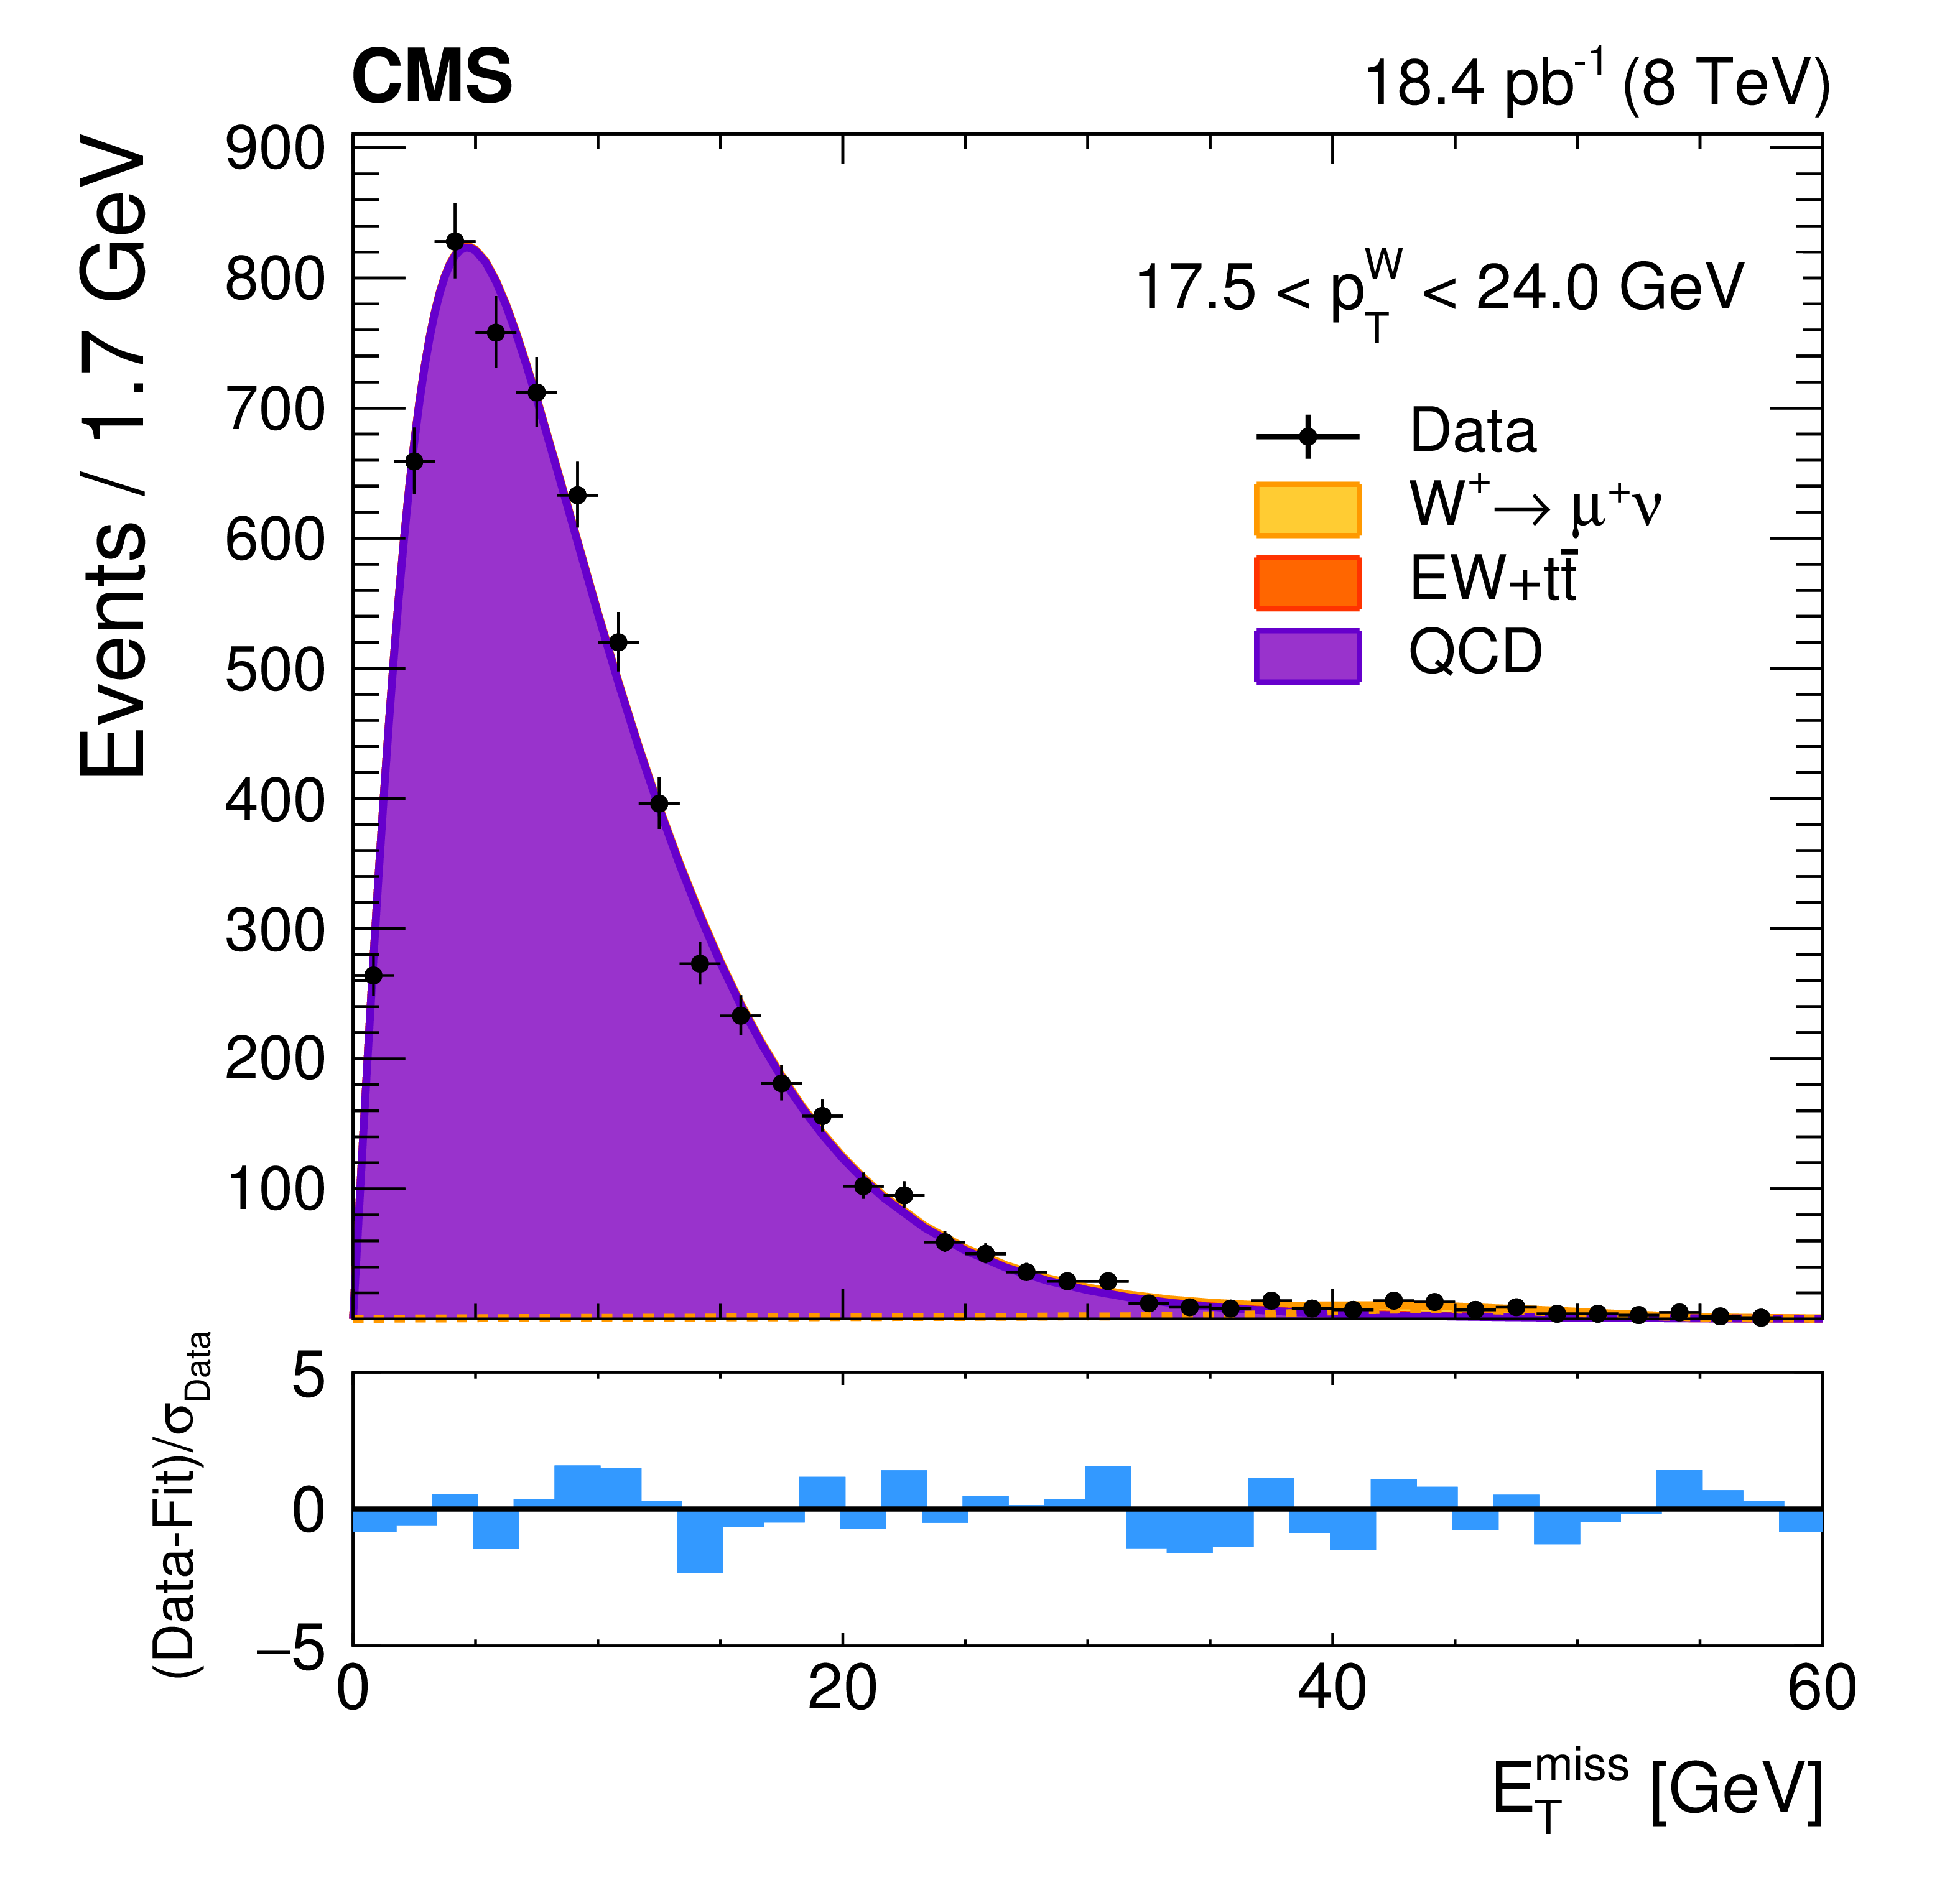
Figure 1-d:
The ${E_{\mathrm {T}}^{\text {miss}}}$ distributions for the selected ${ {{ {\mathrm{ W } }^+}} {\rightarrow }\mu ^+\nu }$ candidates for the corresponding QCD multijet-enriched control sample. Solid lines represent the results of the fit. The dotted lines represent the signal shape after background subtraction. The bottom panel shows the difference between data and fitted results divided by the statistical uncertainty in data, $\sigma _{\rm Data}$. |
png pdf |
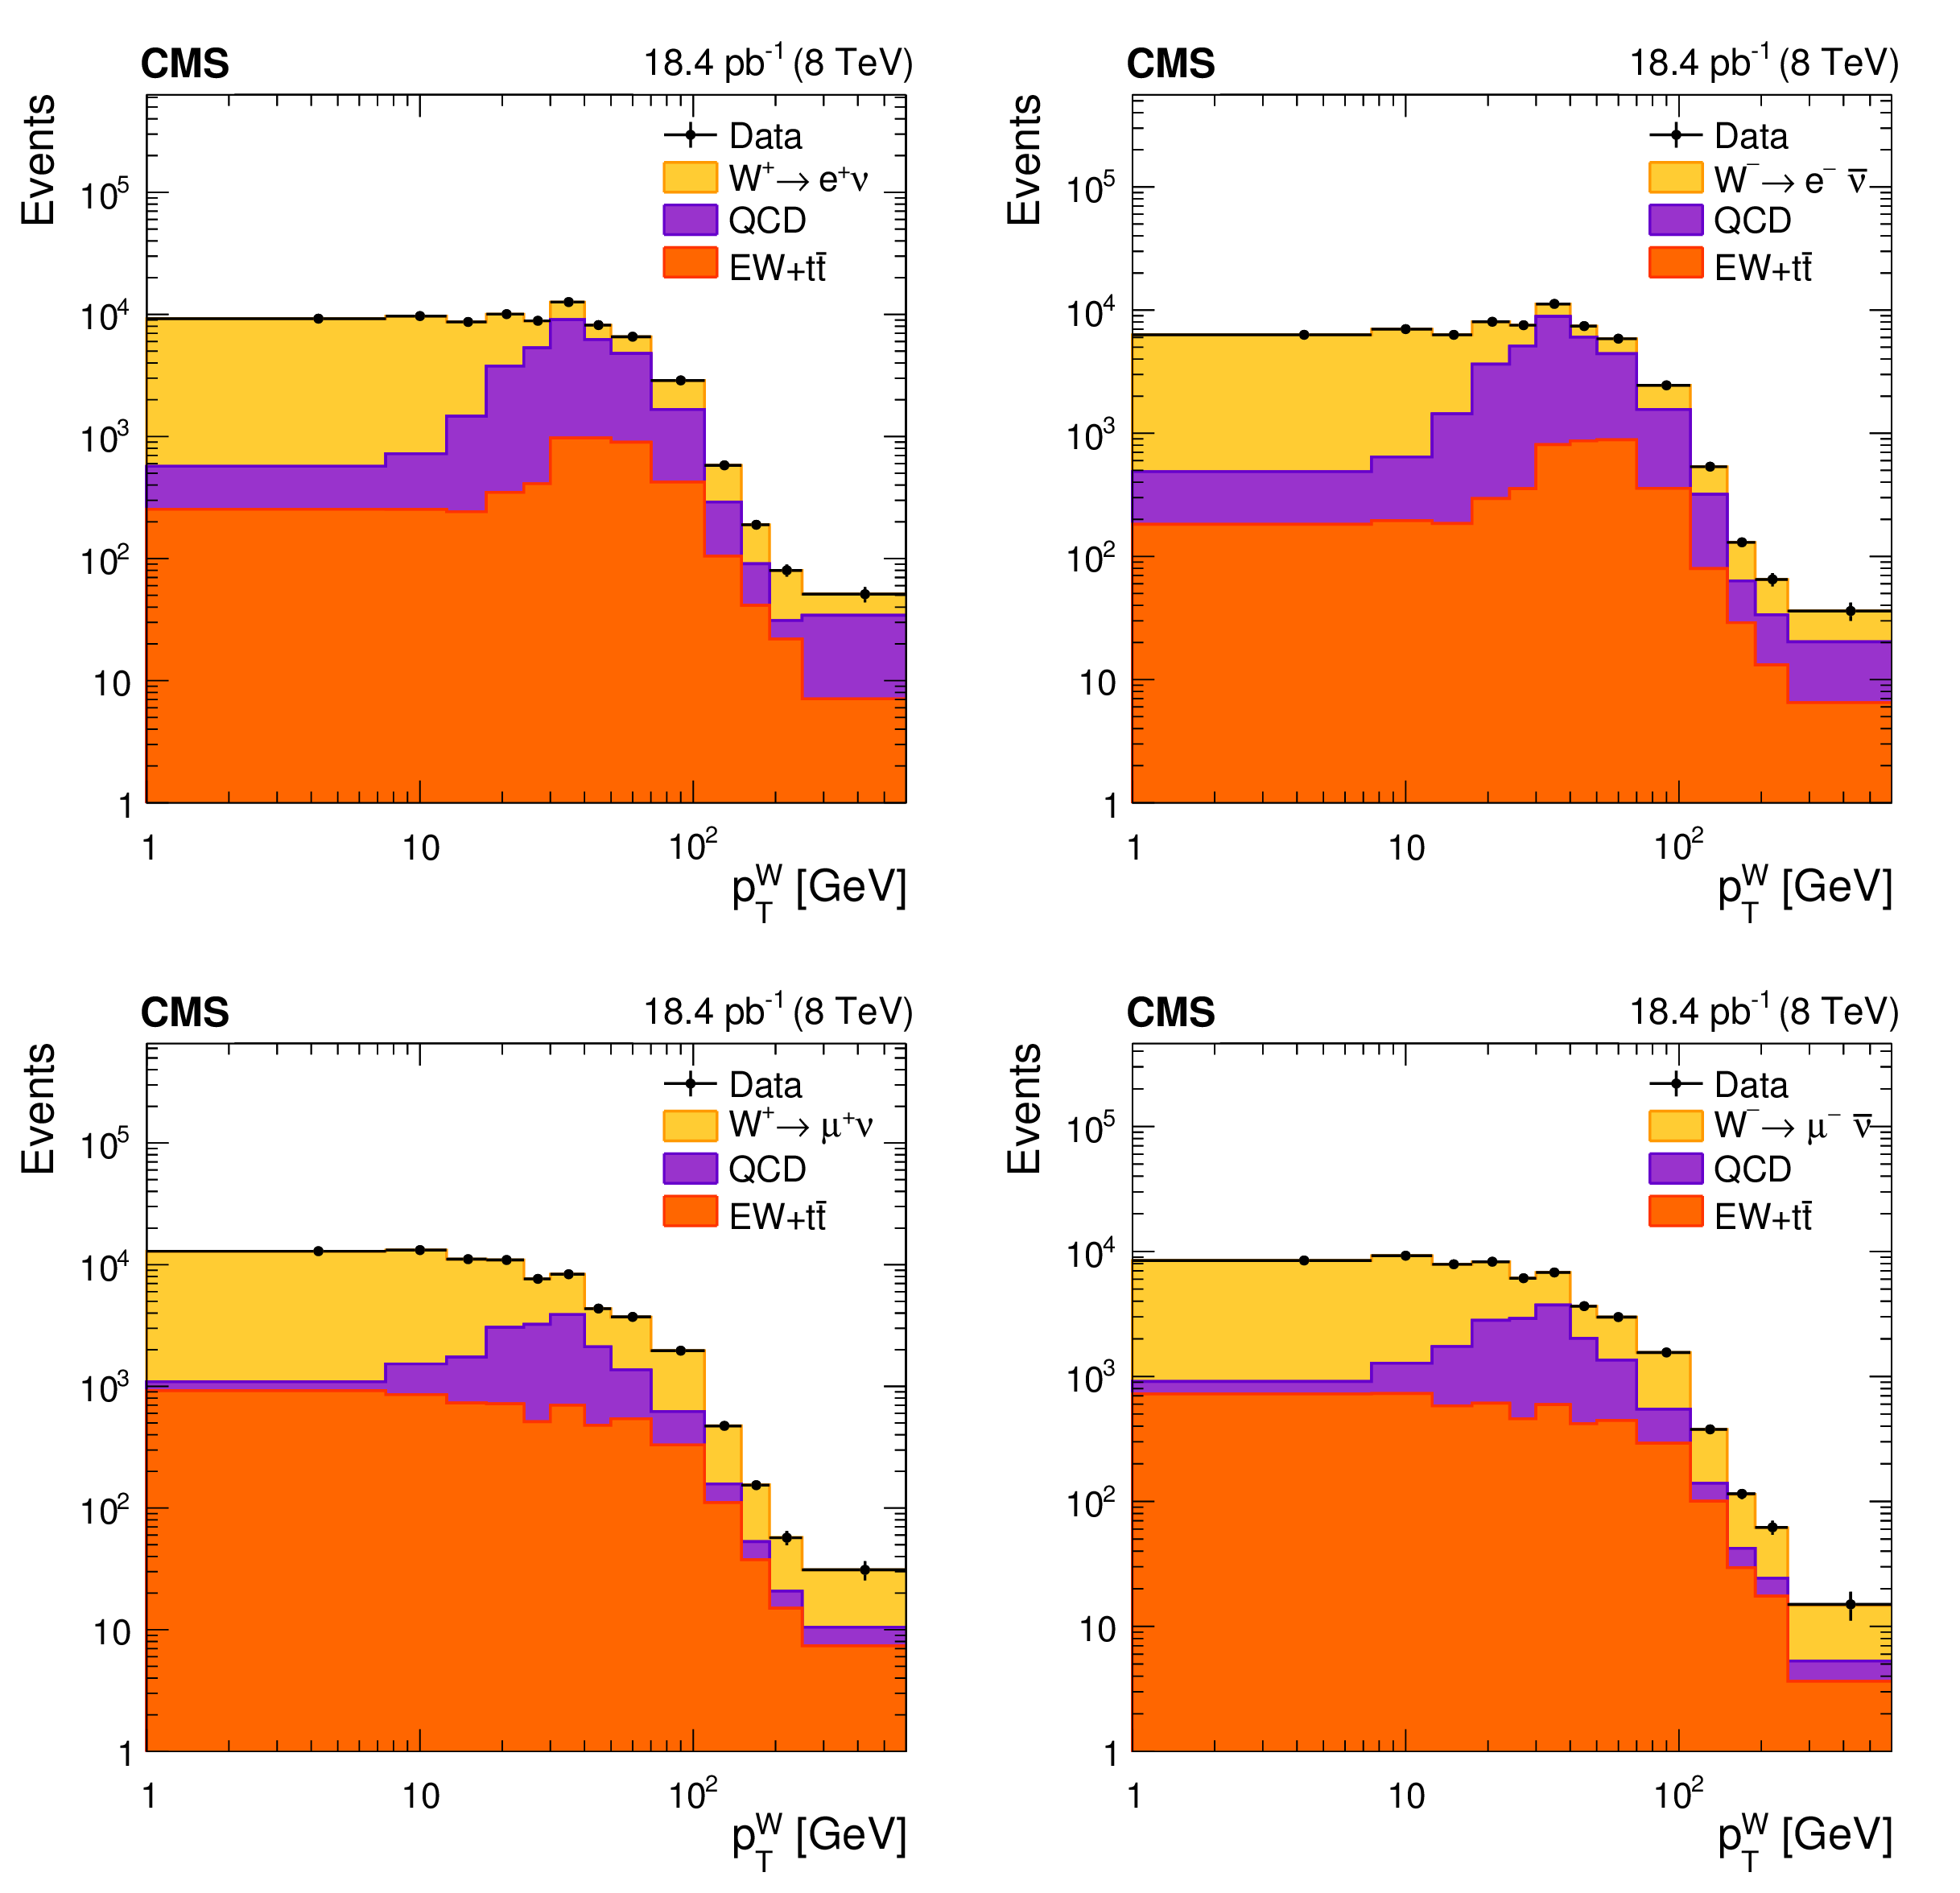
Figure 2:
Signal and background yields after fitting the data for ${ {{ {\mathrm{ W } }^+}} {\rightarrow }\mathrm{ e } ^+\nu }$ (a), ${ {{ {\mathrm{ W } }^-}} {\rightarrow }\mathrm{ e } ^-\bar{\nu} }$ (b), ${ {{ {\mathrm{ W } }^+}} {\rightarrow }\mu ^+\nu }$ (c), and ${ {{ {\mathrm{ W } }^-}} {\rightarrow }\mu ^-\bar{\nu} }$ (d) as a function of the W boson ${p_{\mathrm {T}}}$. The points are data yields with statistical uncertainties. The stacked histogram shows the signal and background components estimated from a fit to the ${E_{\mathrm {T}}^{\text {miss}}}$ or ${{M}_{\mathrm {T}}}$ distribution at each W boson ${p_{\mathrm {T}}}$ bin. |
png pdf |
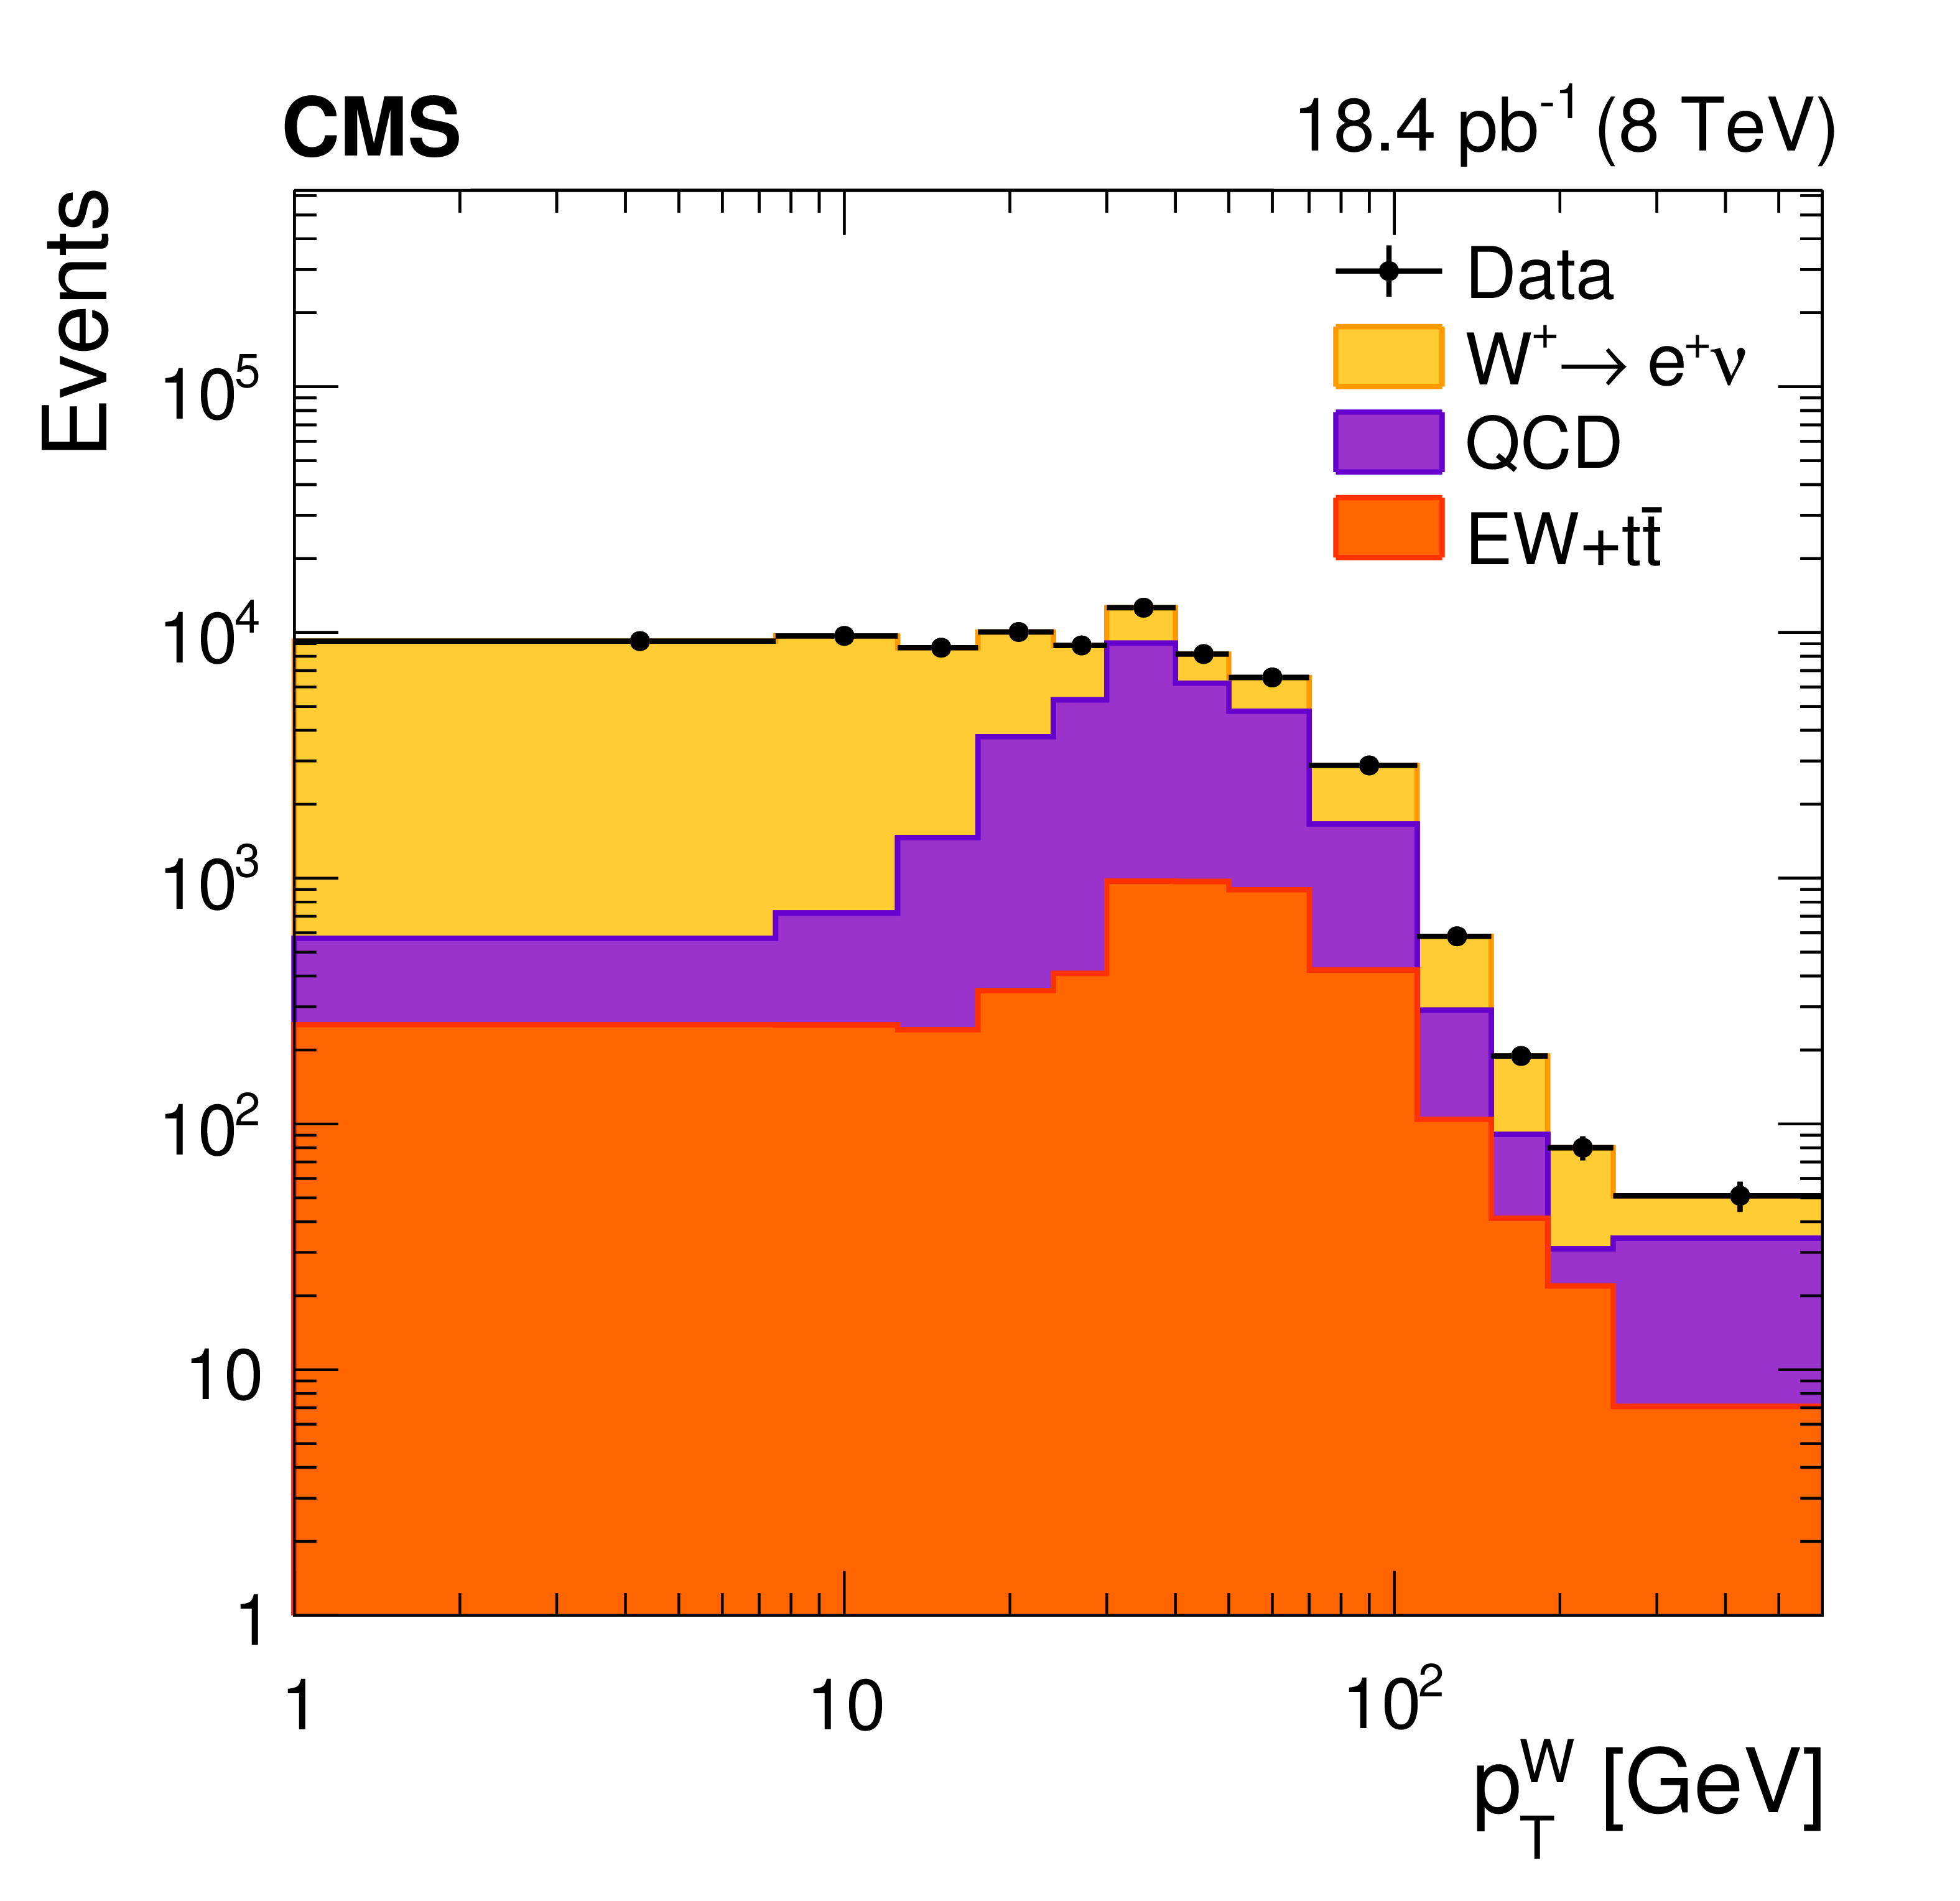
Figure 2-a:
Signal and background yields after fitting the data for ${ {{ {\mathrm{ W } }^+}} {\rightarrow }\mathrm{ e } ^+\nu }$ as a function of the W boson ${p_{\mathrm {T}}}$. The points are data yields with statistical uncertainties. The stacked histogram shows the signal and background components estimated from a fit to the ${E_{\mathrm {T}}^{\text {miss}}}$ or ${{M}_{\mathrm {T}}}$ distribution at each W boson ${p_{\mathrm {T}}}$ bin. |

png pdf |
Figure 2-b:
Signal and background yields after fitting the data for ${ {{ {\mathrm{ W } }^-}} {\rightarrow }\mathrm{ e } ^-\bar{\nu} }$ as a function of the W boson ${p_{\mathrm {T}}}$. The points are data yields with statistical uncertainties. The stacked histogram shows the signal and background components estimated from a fit to the ${E_{\mathrm {T}}^{\text {miss}}}$ or ${{M}_{\mathrm {T}}}$ distribution at each W boson ${p_{\mathrm {T}}}$ bin. |
png pdf |
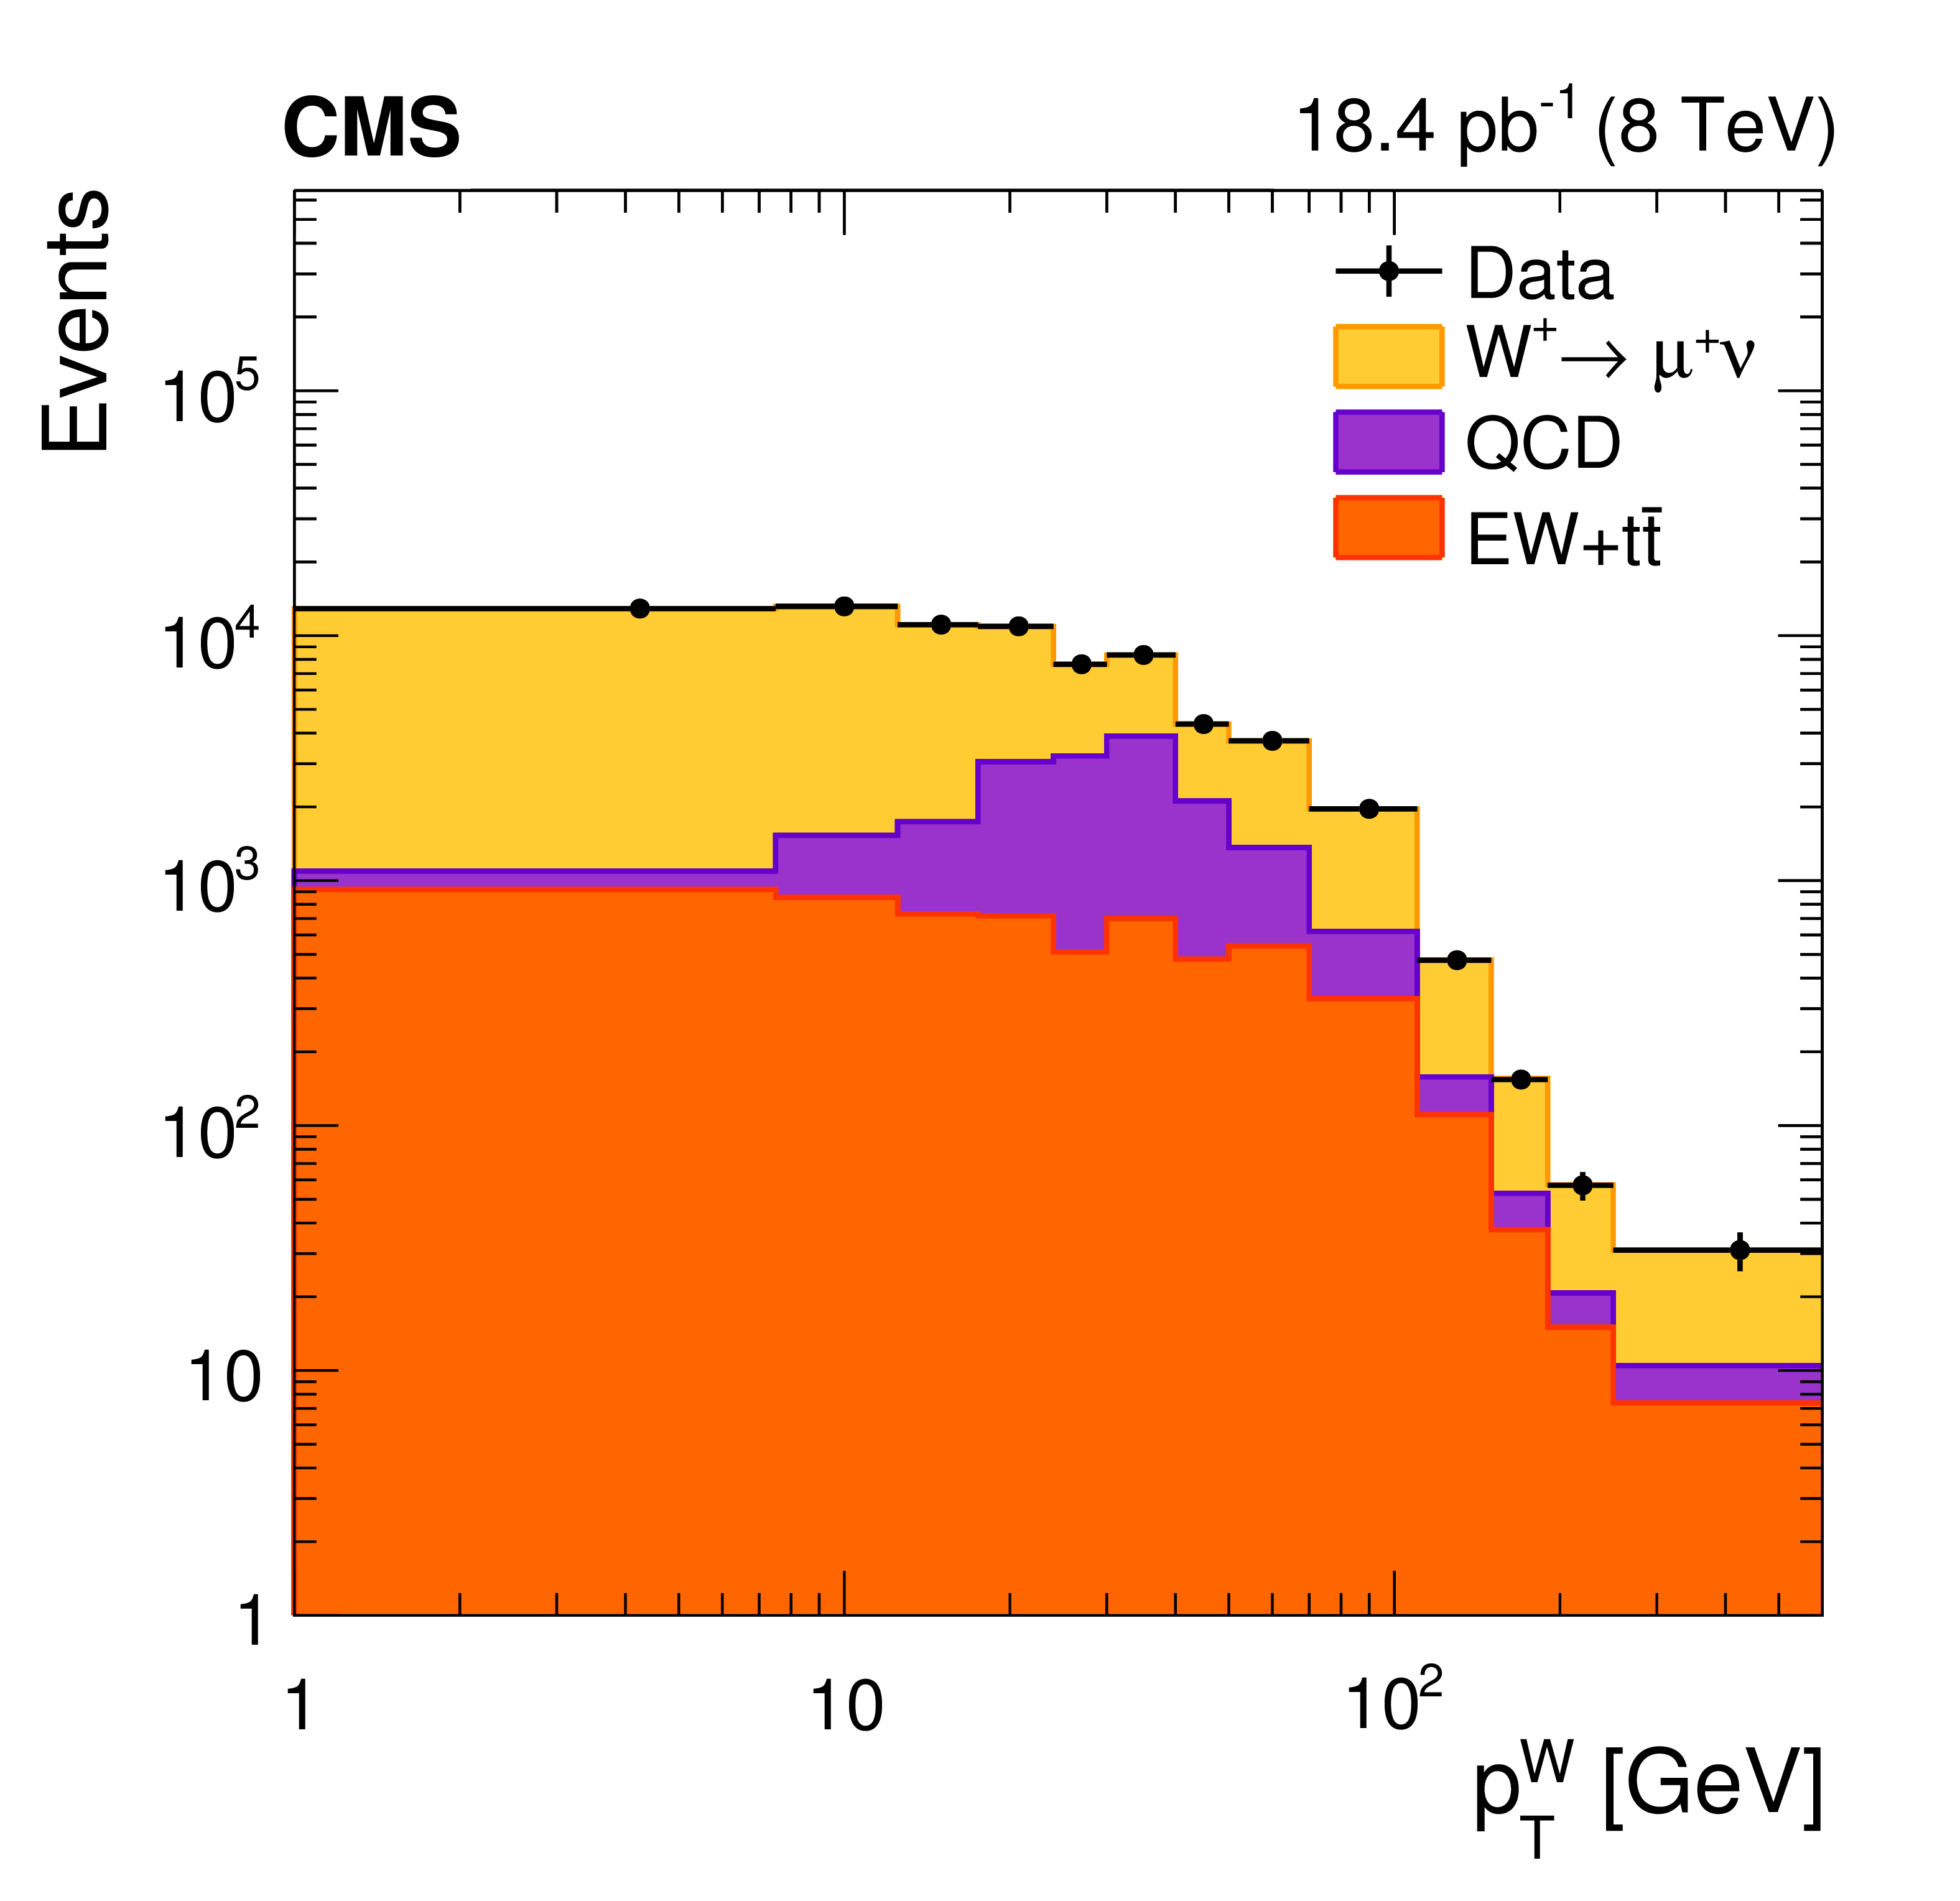
Figure 2-c:
Signal and background yields after fitting the data for ${ {{ {\mathrm{ W } }^+}} {\rightarrow }\mu ^+\nu }$ as a function of the W boson ${p_{\mathrm {T}}}$. The points are data yields with statistical uncertainties. The stacked histogram shows the signal and background components estimated from a fit to the ${E_{\mathrm {T}}^{\text {miss}}}$ or ${{M}_{\mathrm {T}}}$ distribution at each W boson ${p_{\mathrm {T}}}$ bin. |
png pdf |
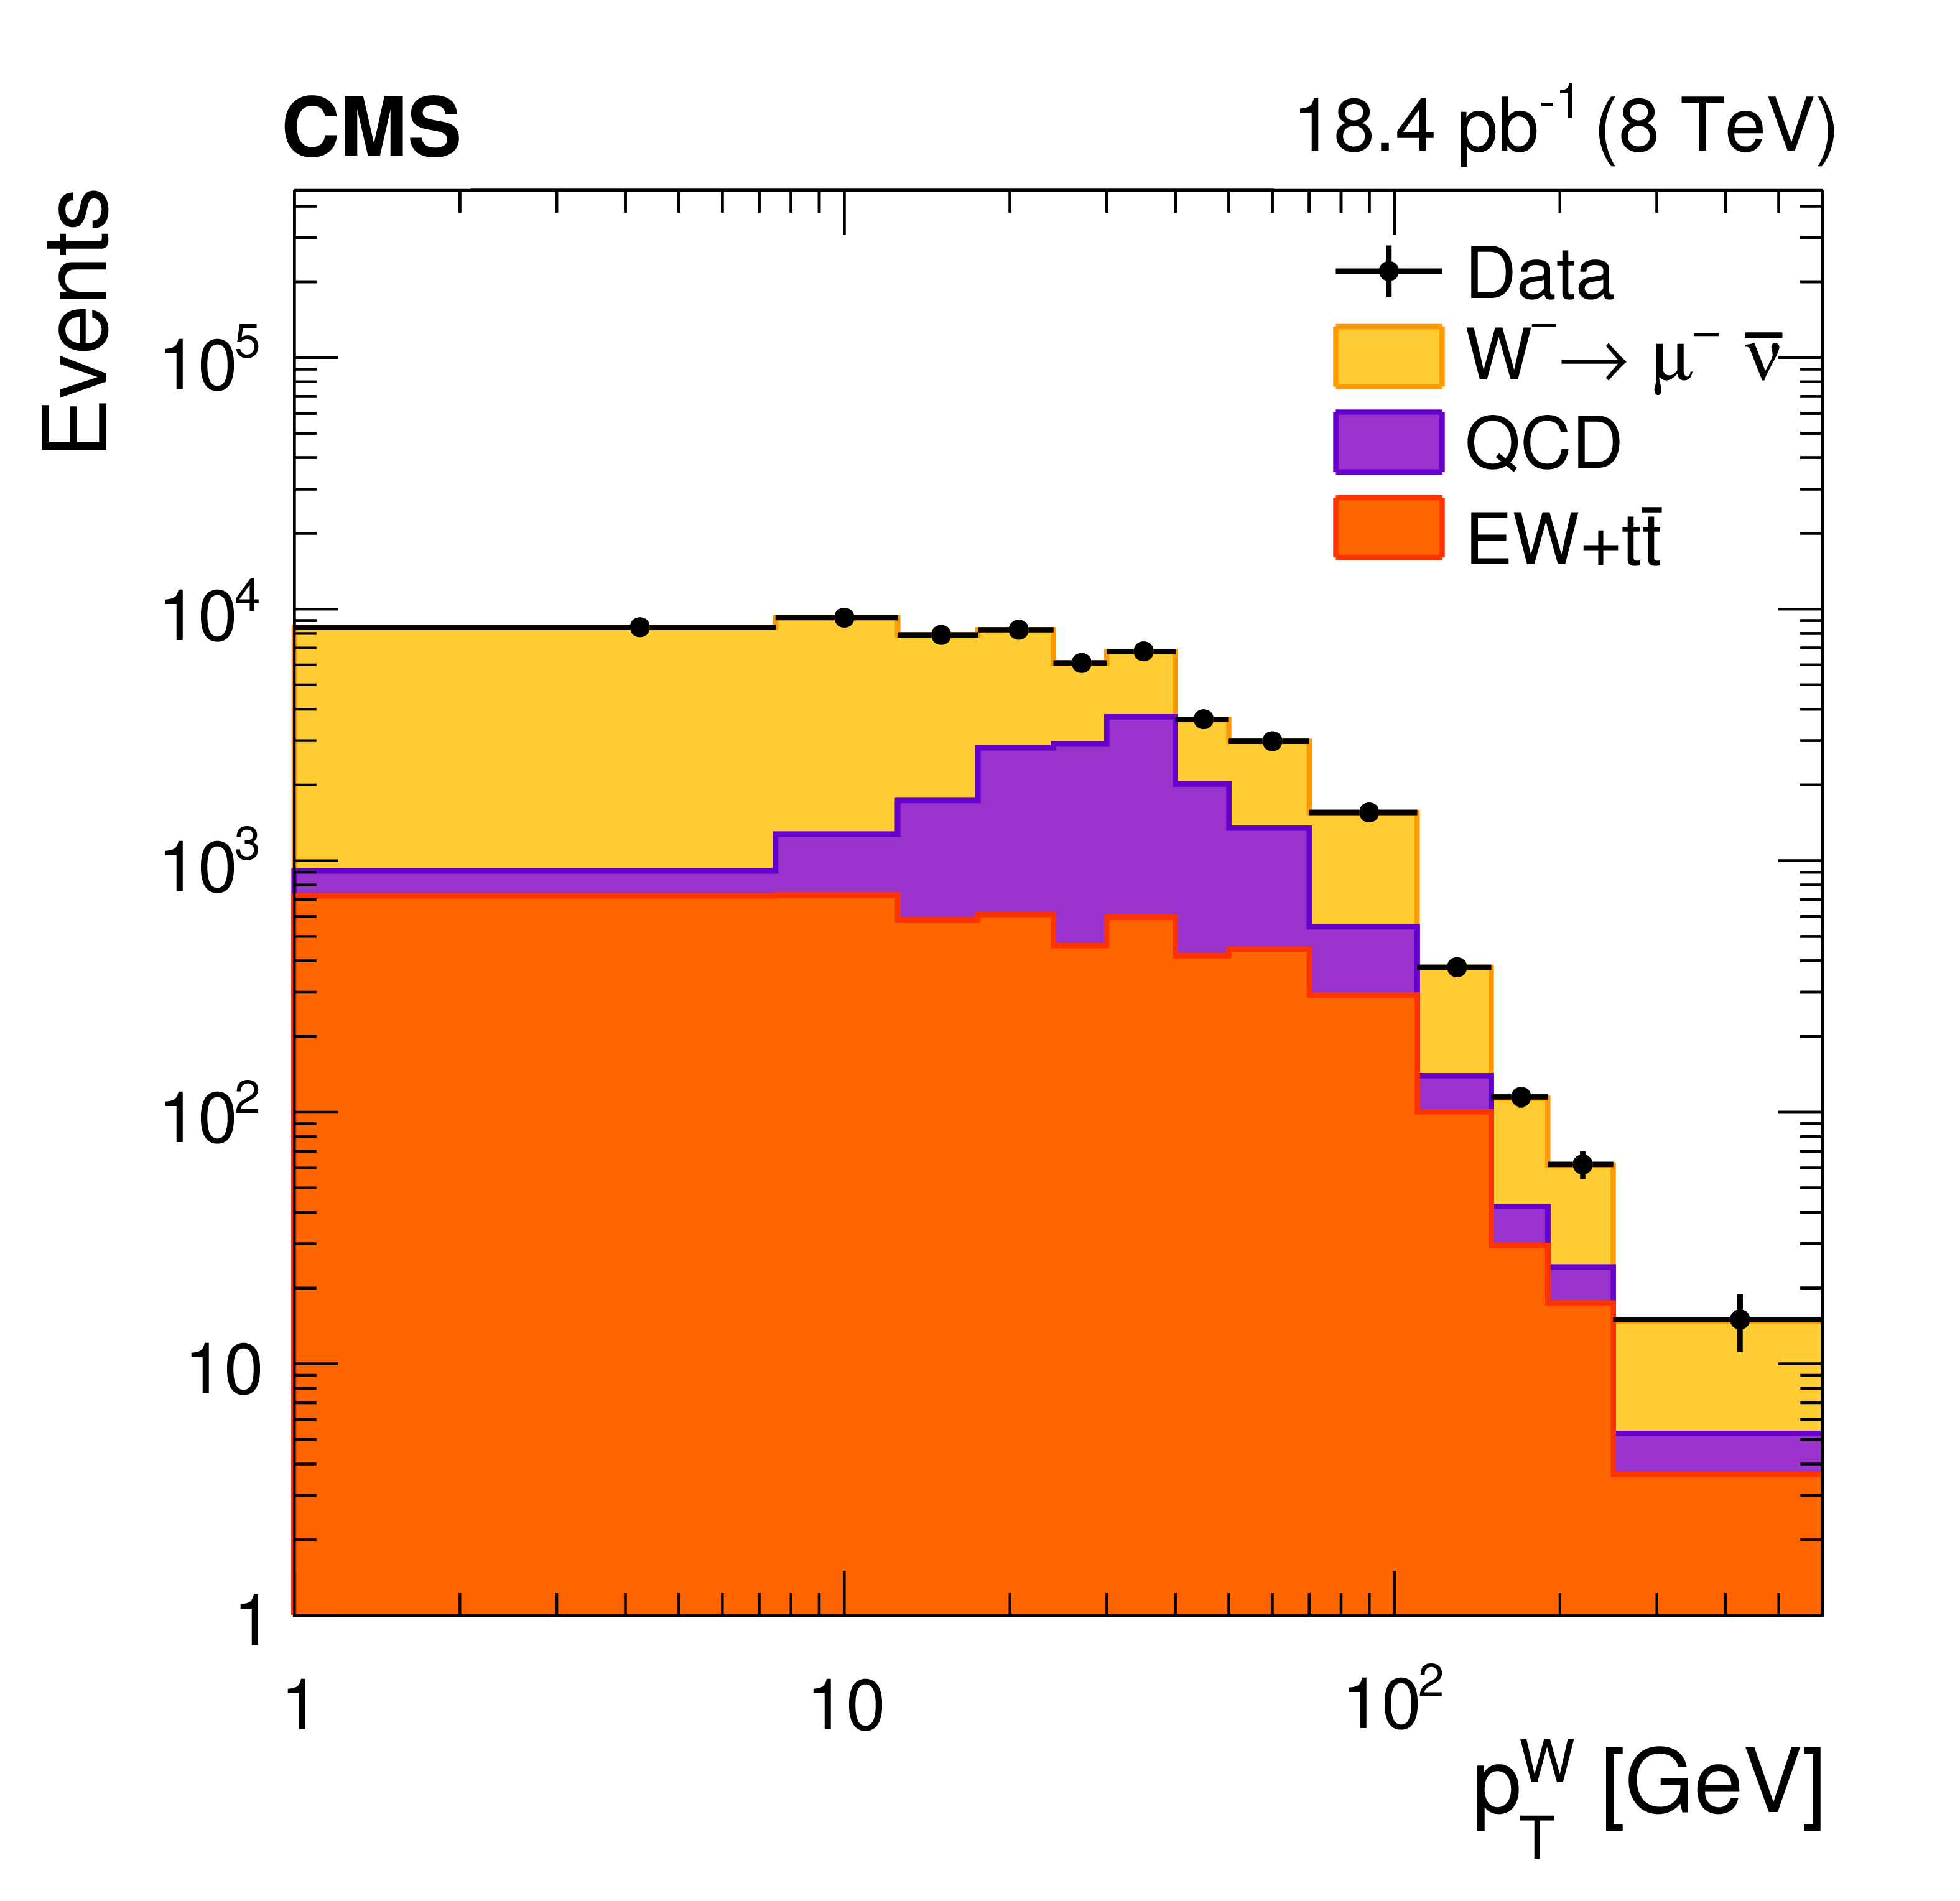
Figure 2-d:
Signal and background yields after fitting the data for ${ {{ {\mathrm{ W } }^-}} {\rightarrow }\mu ^-\bar{\nu} }$ as a function of the W boson ${p_{\mathrm {T}}}$. The points are data yields with statistical uncertainties. The stacked histogram shows the signal and background components estimated from a fit to the ${E_{\mathrm {T}}^{\text {miss}}}$ or ${{M}_{\mathrm {T}}}$ distribution at each W boson ${p_{\mathrm {T}}}$ bin. |

png pdf |
Figure 3:
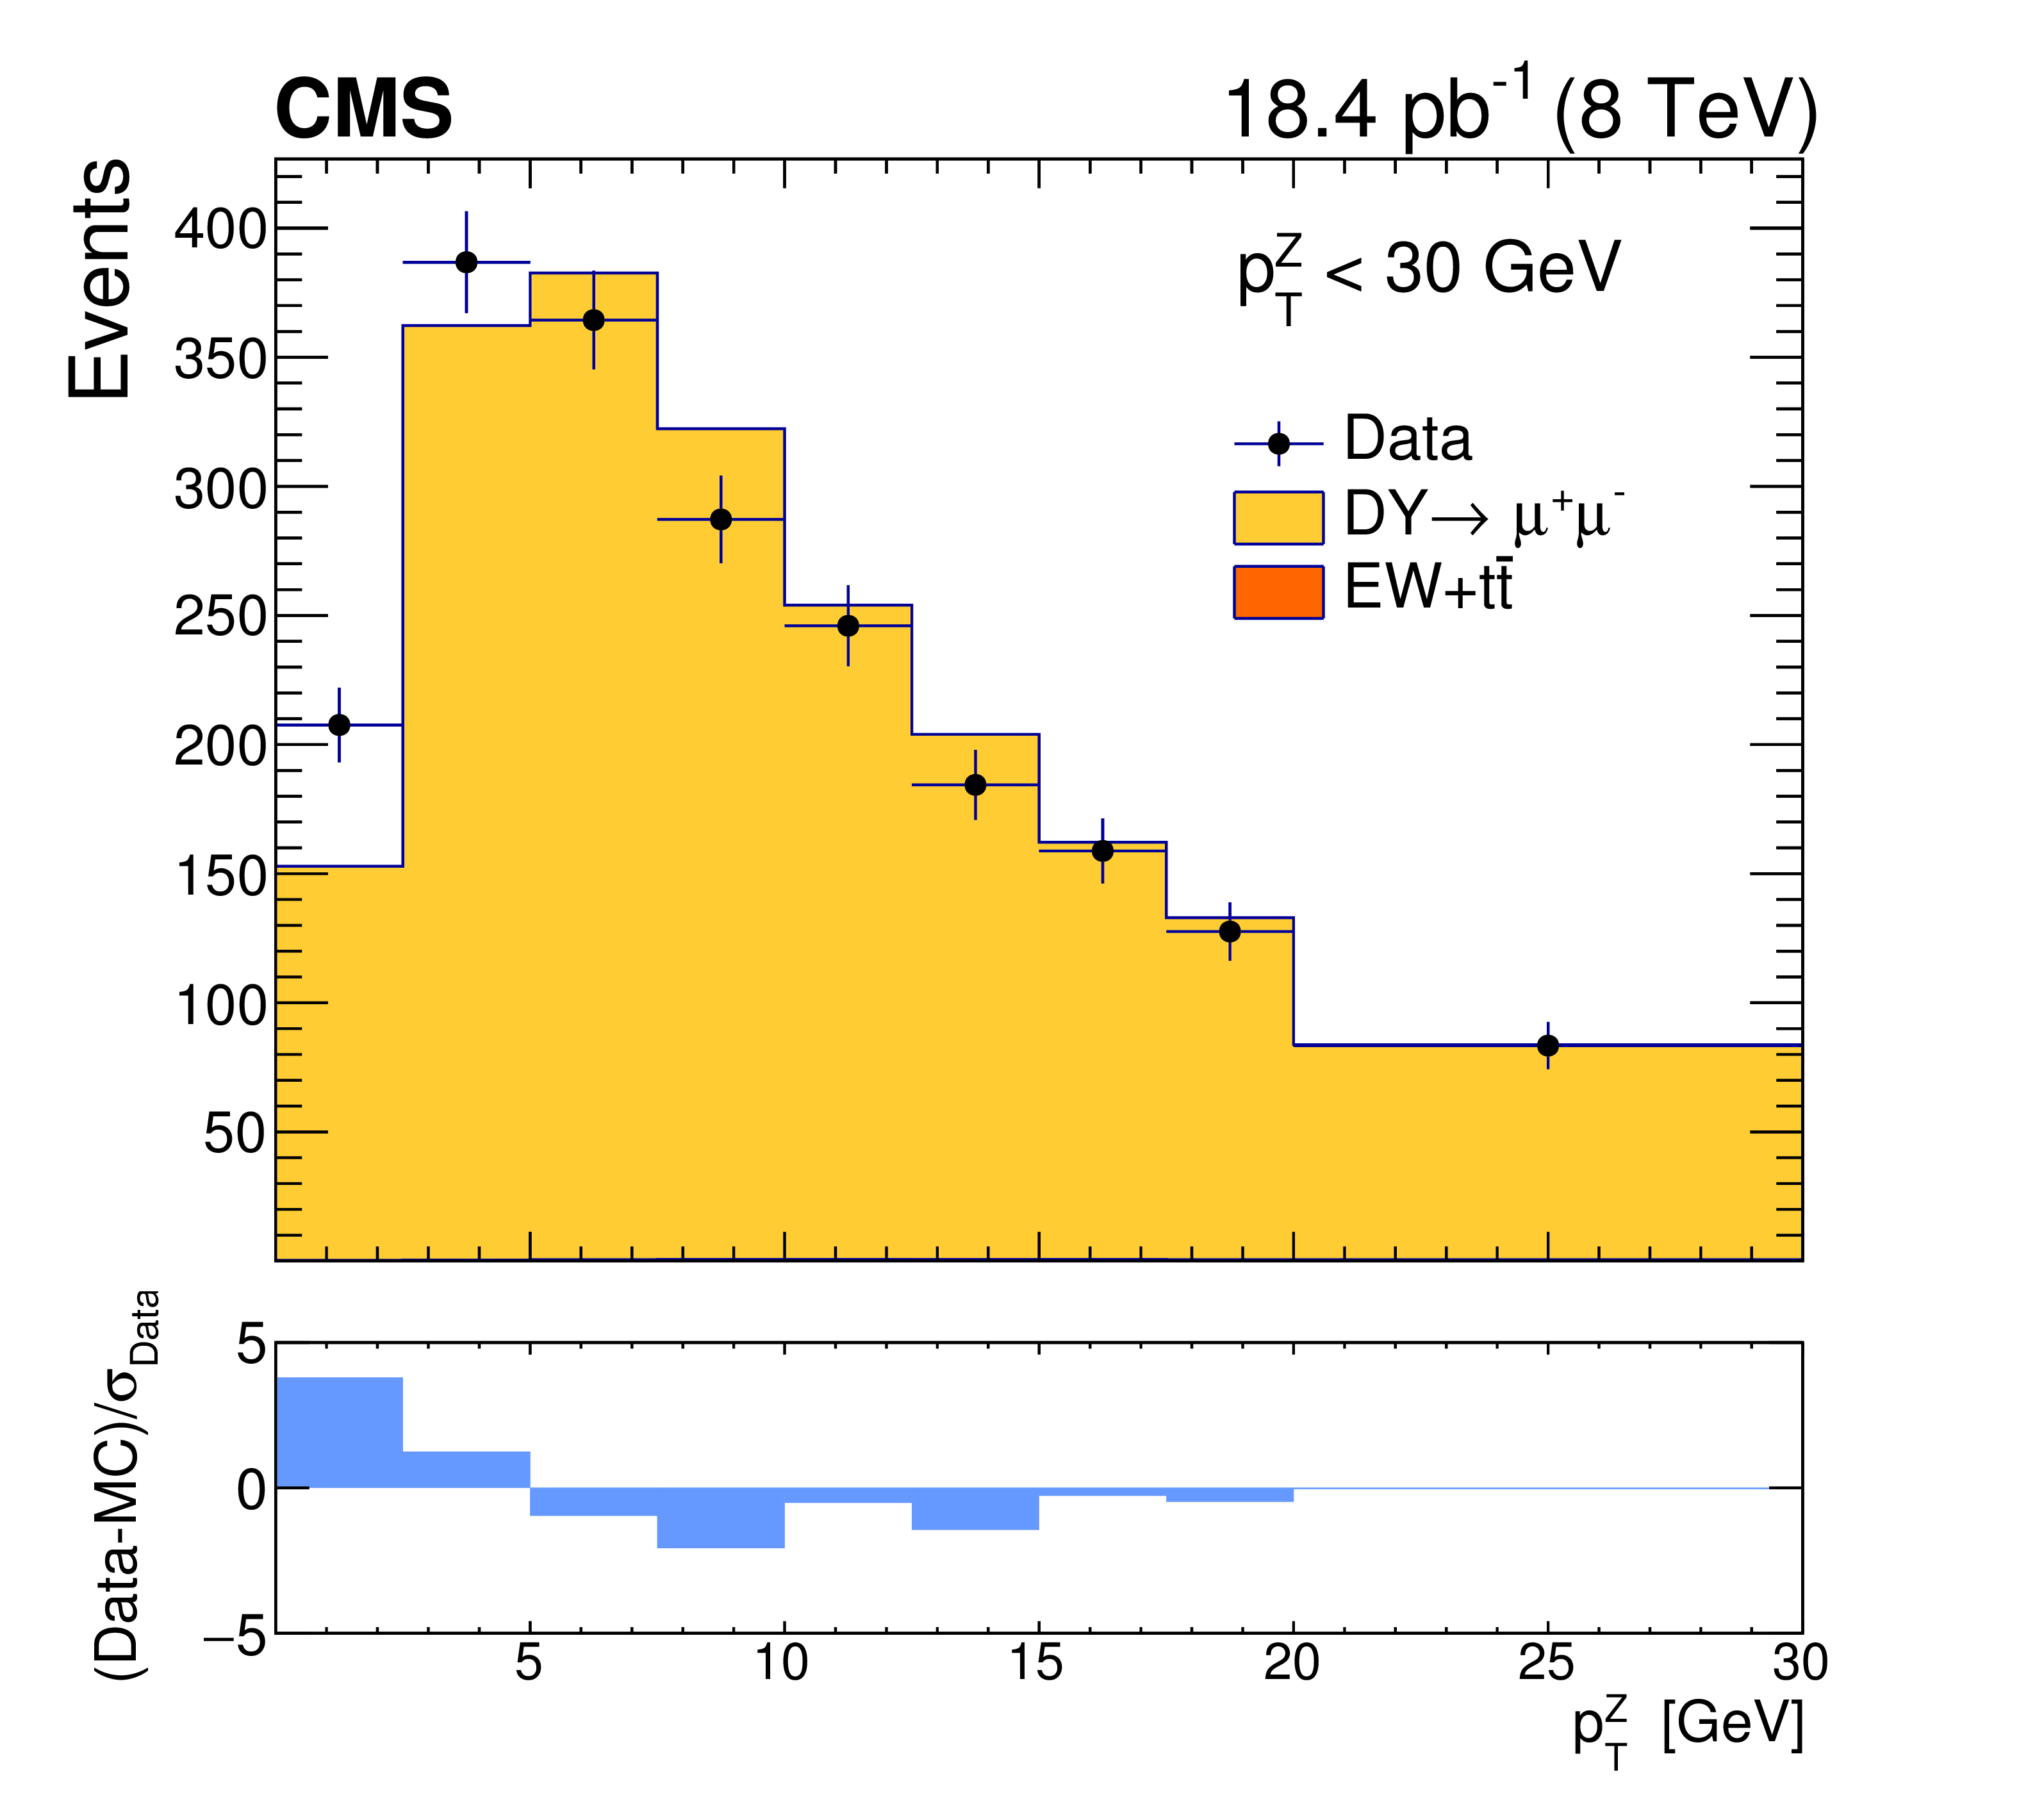
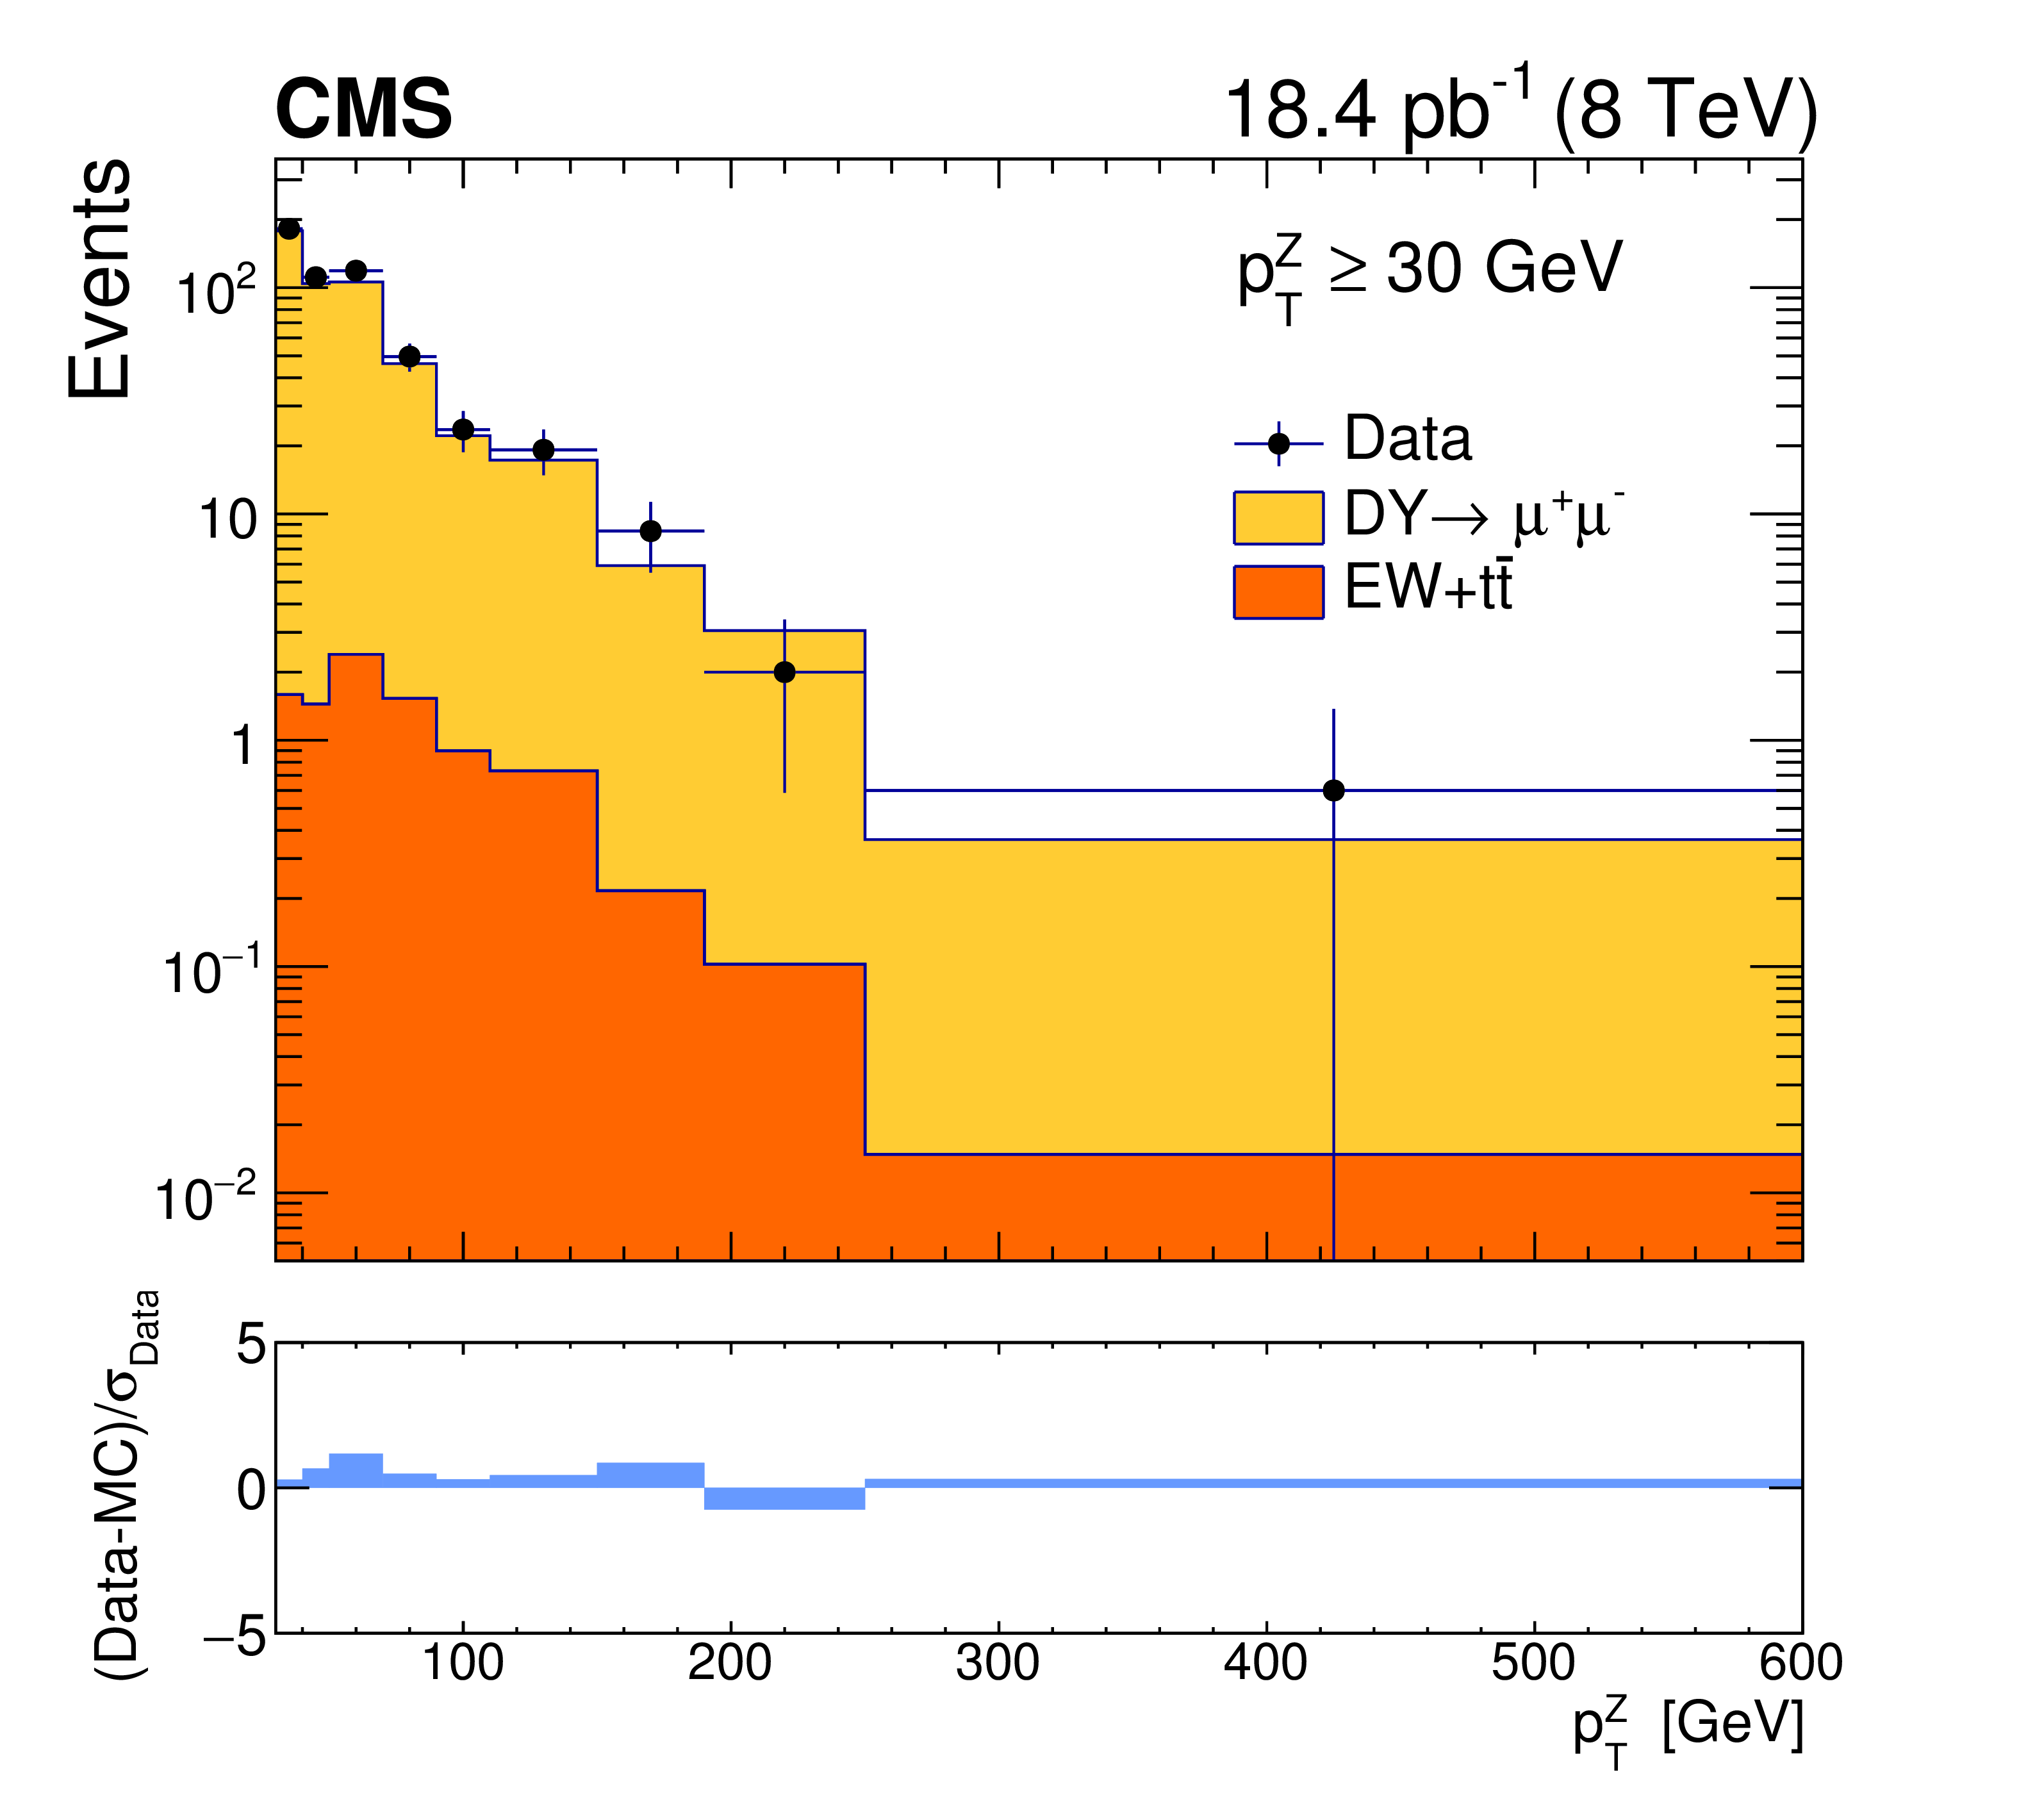
Data and simulated events for both DY processes and various backgrounds after event reconstruction. a (b): events for low (high) $ { {p_{\mathrm {T}}} ^{\mathrm {Z}} }$, $ { {p_{\mathrm {T}}} ^{\mathrm {Z}}} <$ 30 ($\ge$ 30) GeV. The lower panels show the difference between the data and the simulation predictions divided by the statistical uncertainty in data, $\sigma _{\rm Data}$. |
png pdf |
Figure 3-a:
Data and simulated events for both DY processes and various backgrounds after event reconstruction: events for low $ { {p_{\mathrm {T}}} ^{\mathrm {Z}} }$, $ { {p_{\mathrm {T}}} ^{\mathrm {Z}}} <$ 30 GeV. The lower panel shows the difference between the data and the simulation predictions divided by the statistical uncertainty in data, $\sigma _{\rm Data}$. |
png pdf |
Figure 3-b:
Data and simulated events for both DY processes and various backgrounds after event reconstruction: events for high $ { {p_{\mathrm {T}}} ^{\mathrm {Z}} }$, $ { {p_{\mathrm {T}}} ^{\mathrm {Z}}} \ge$ 30 GeV. The lower panel shows the difference between the data and the simulation predictions divided by the statistical uncertainty in data, $\sigma _{\rm Data}$. |
png pdf |
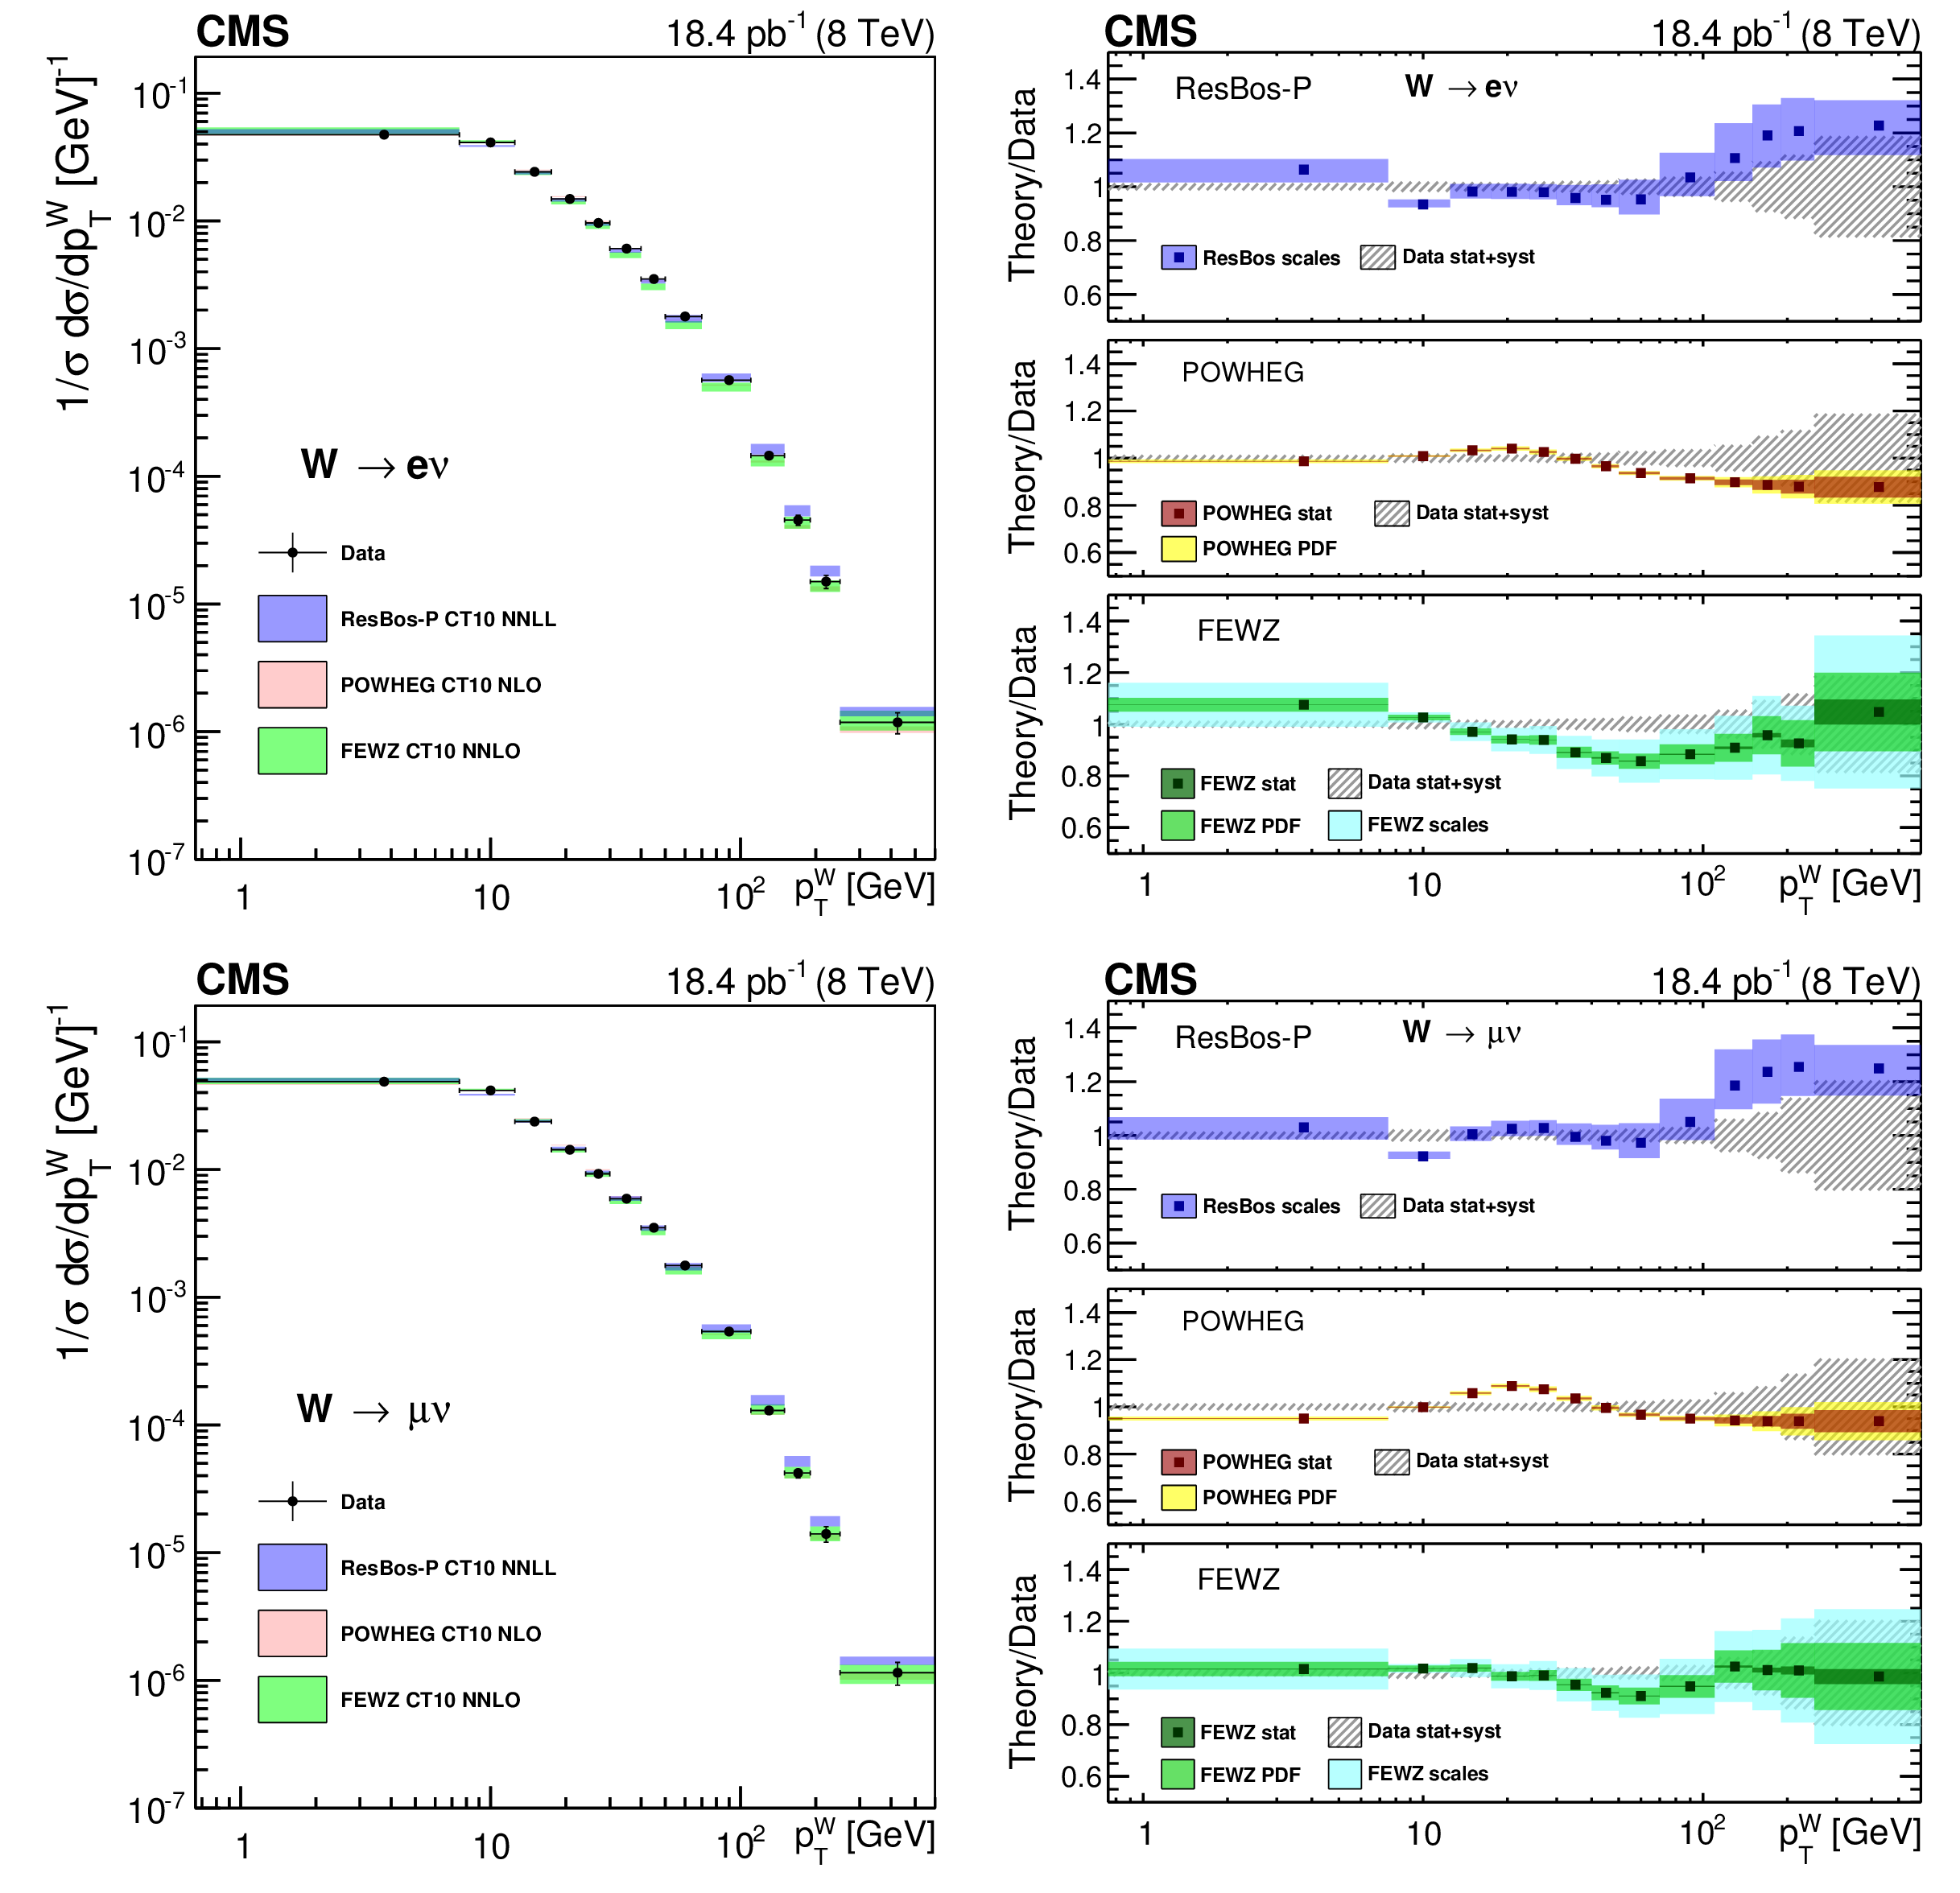
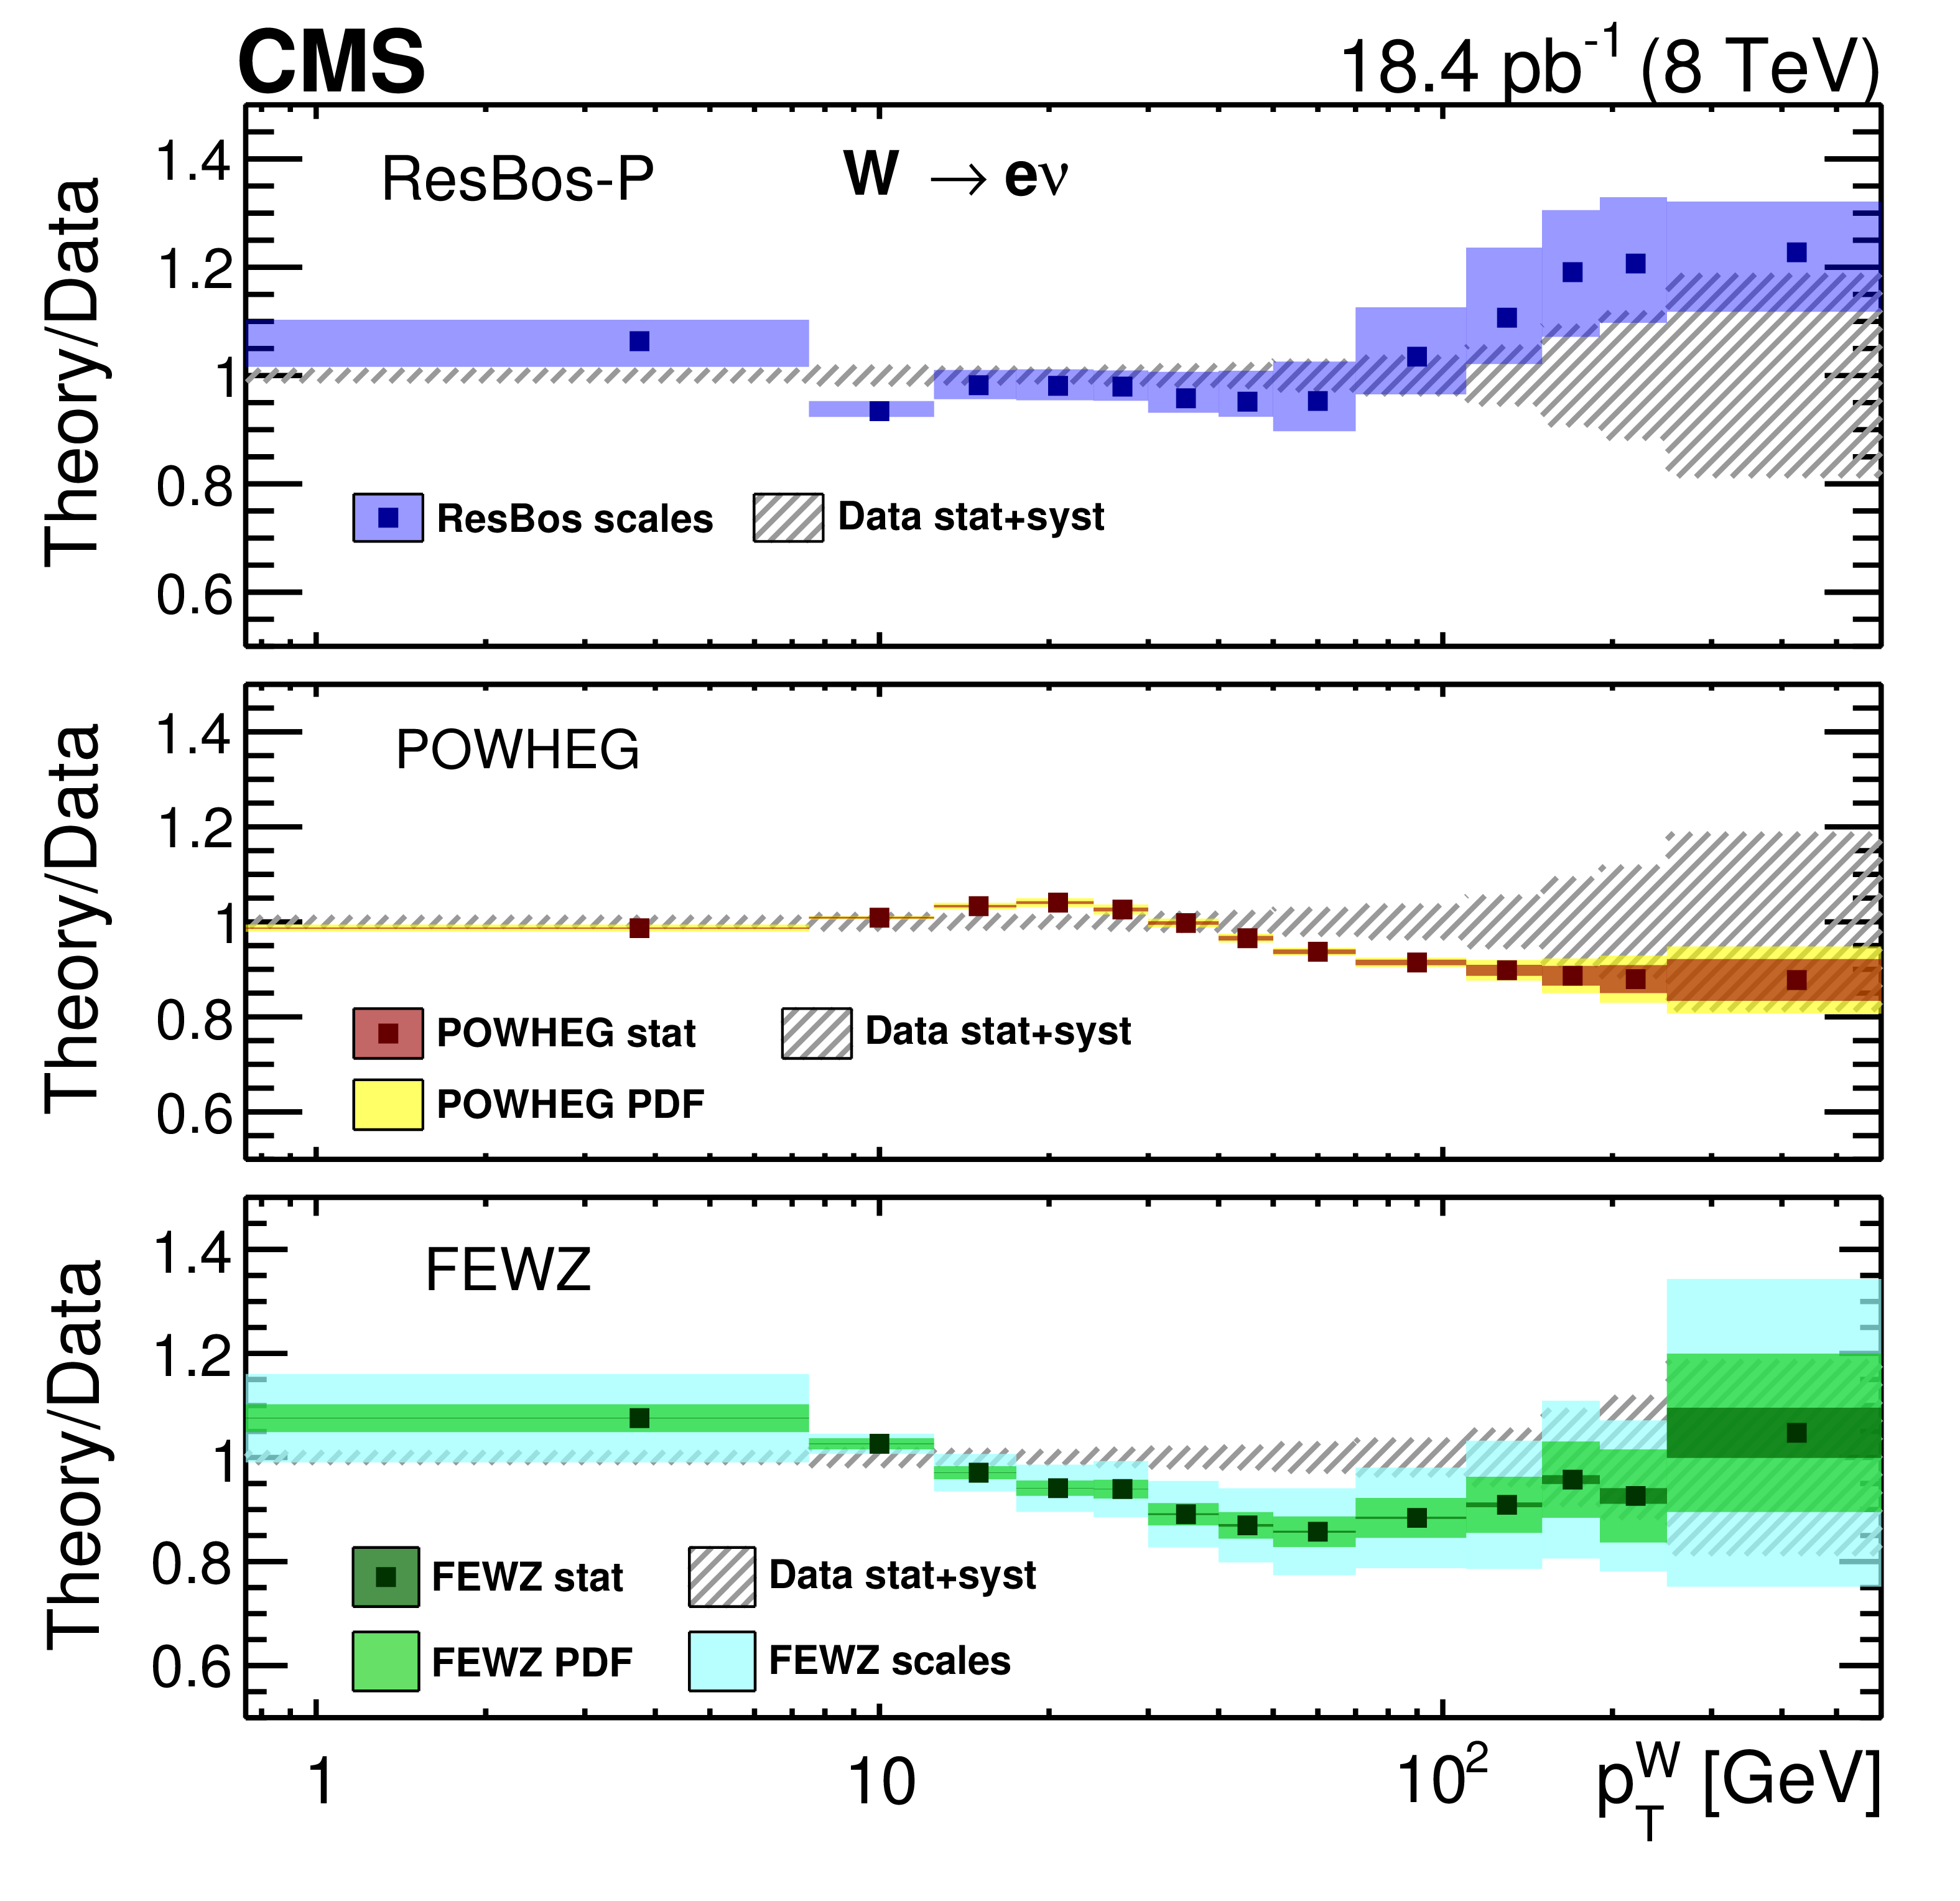
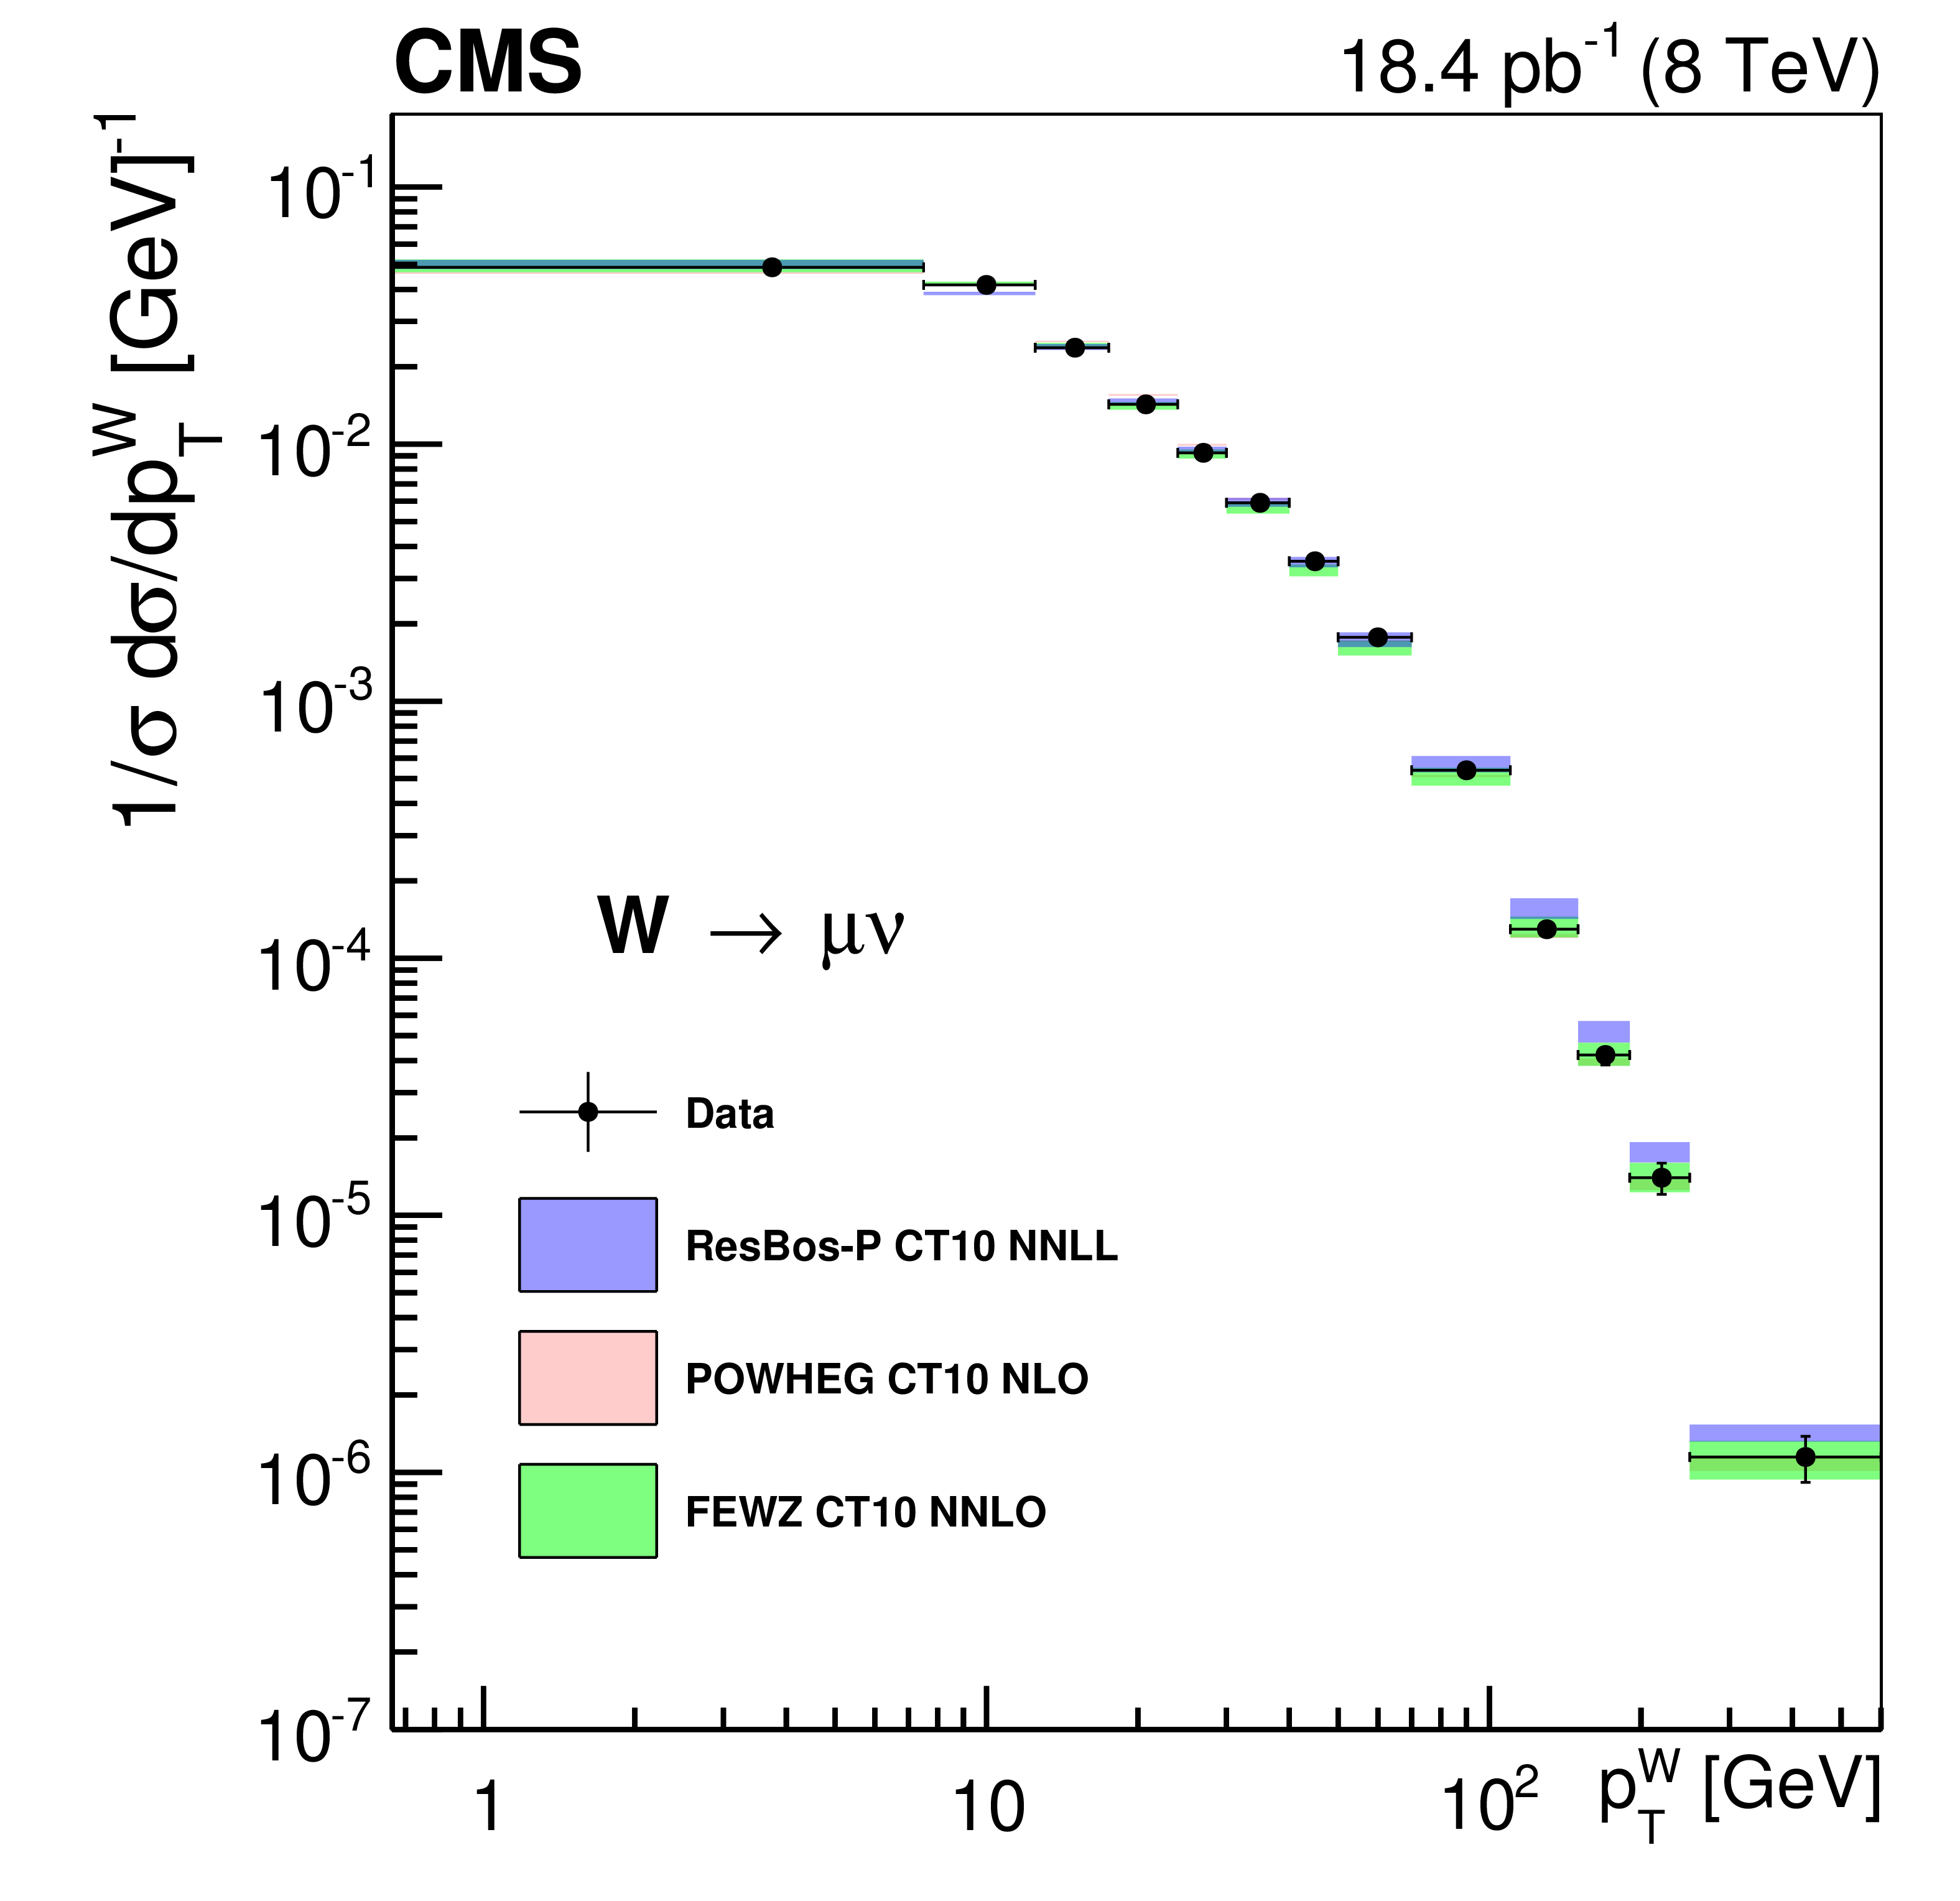
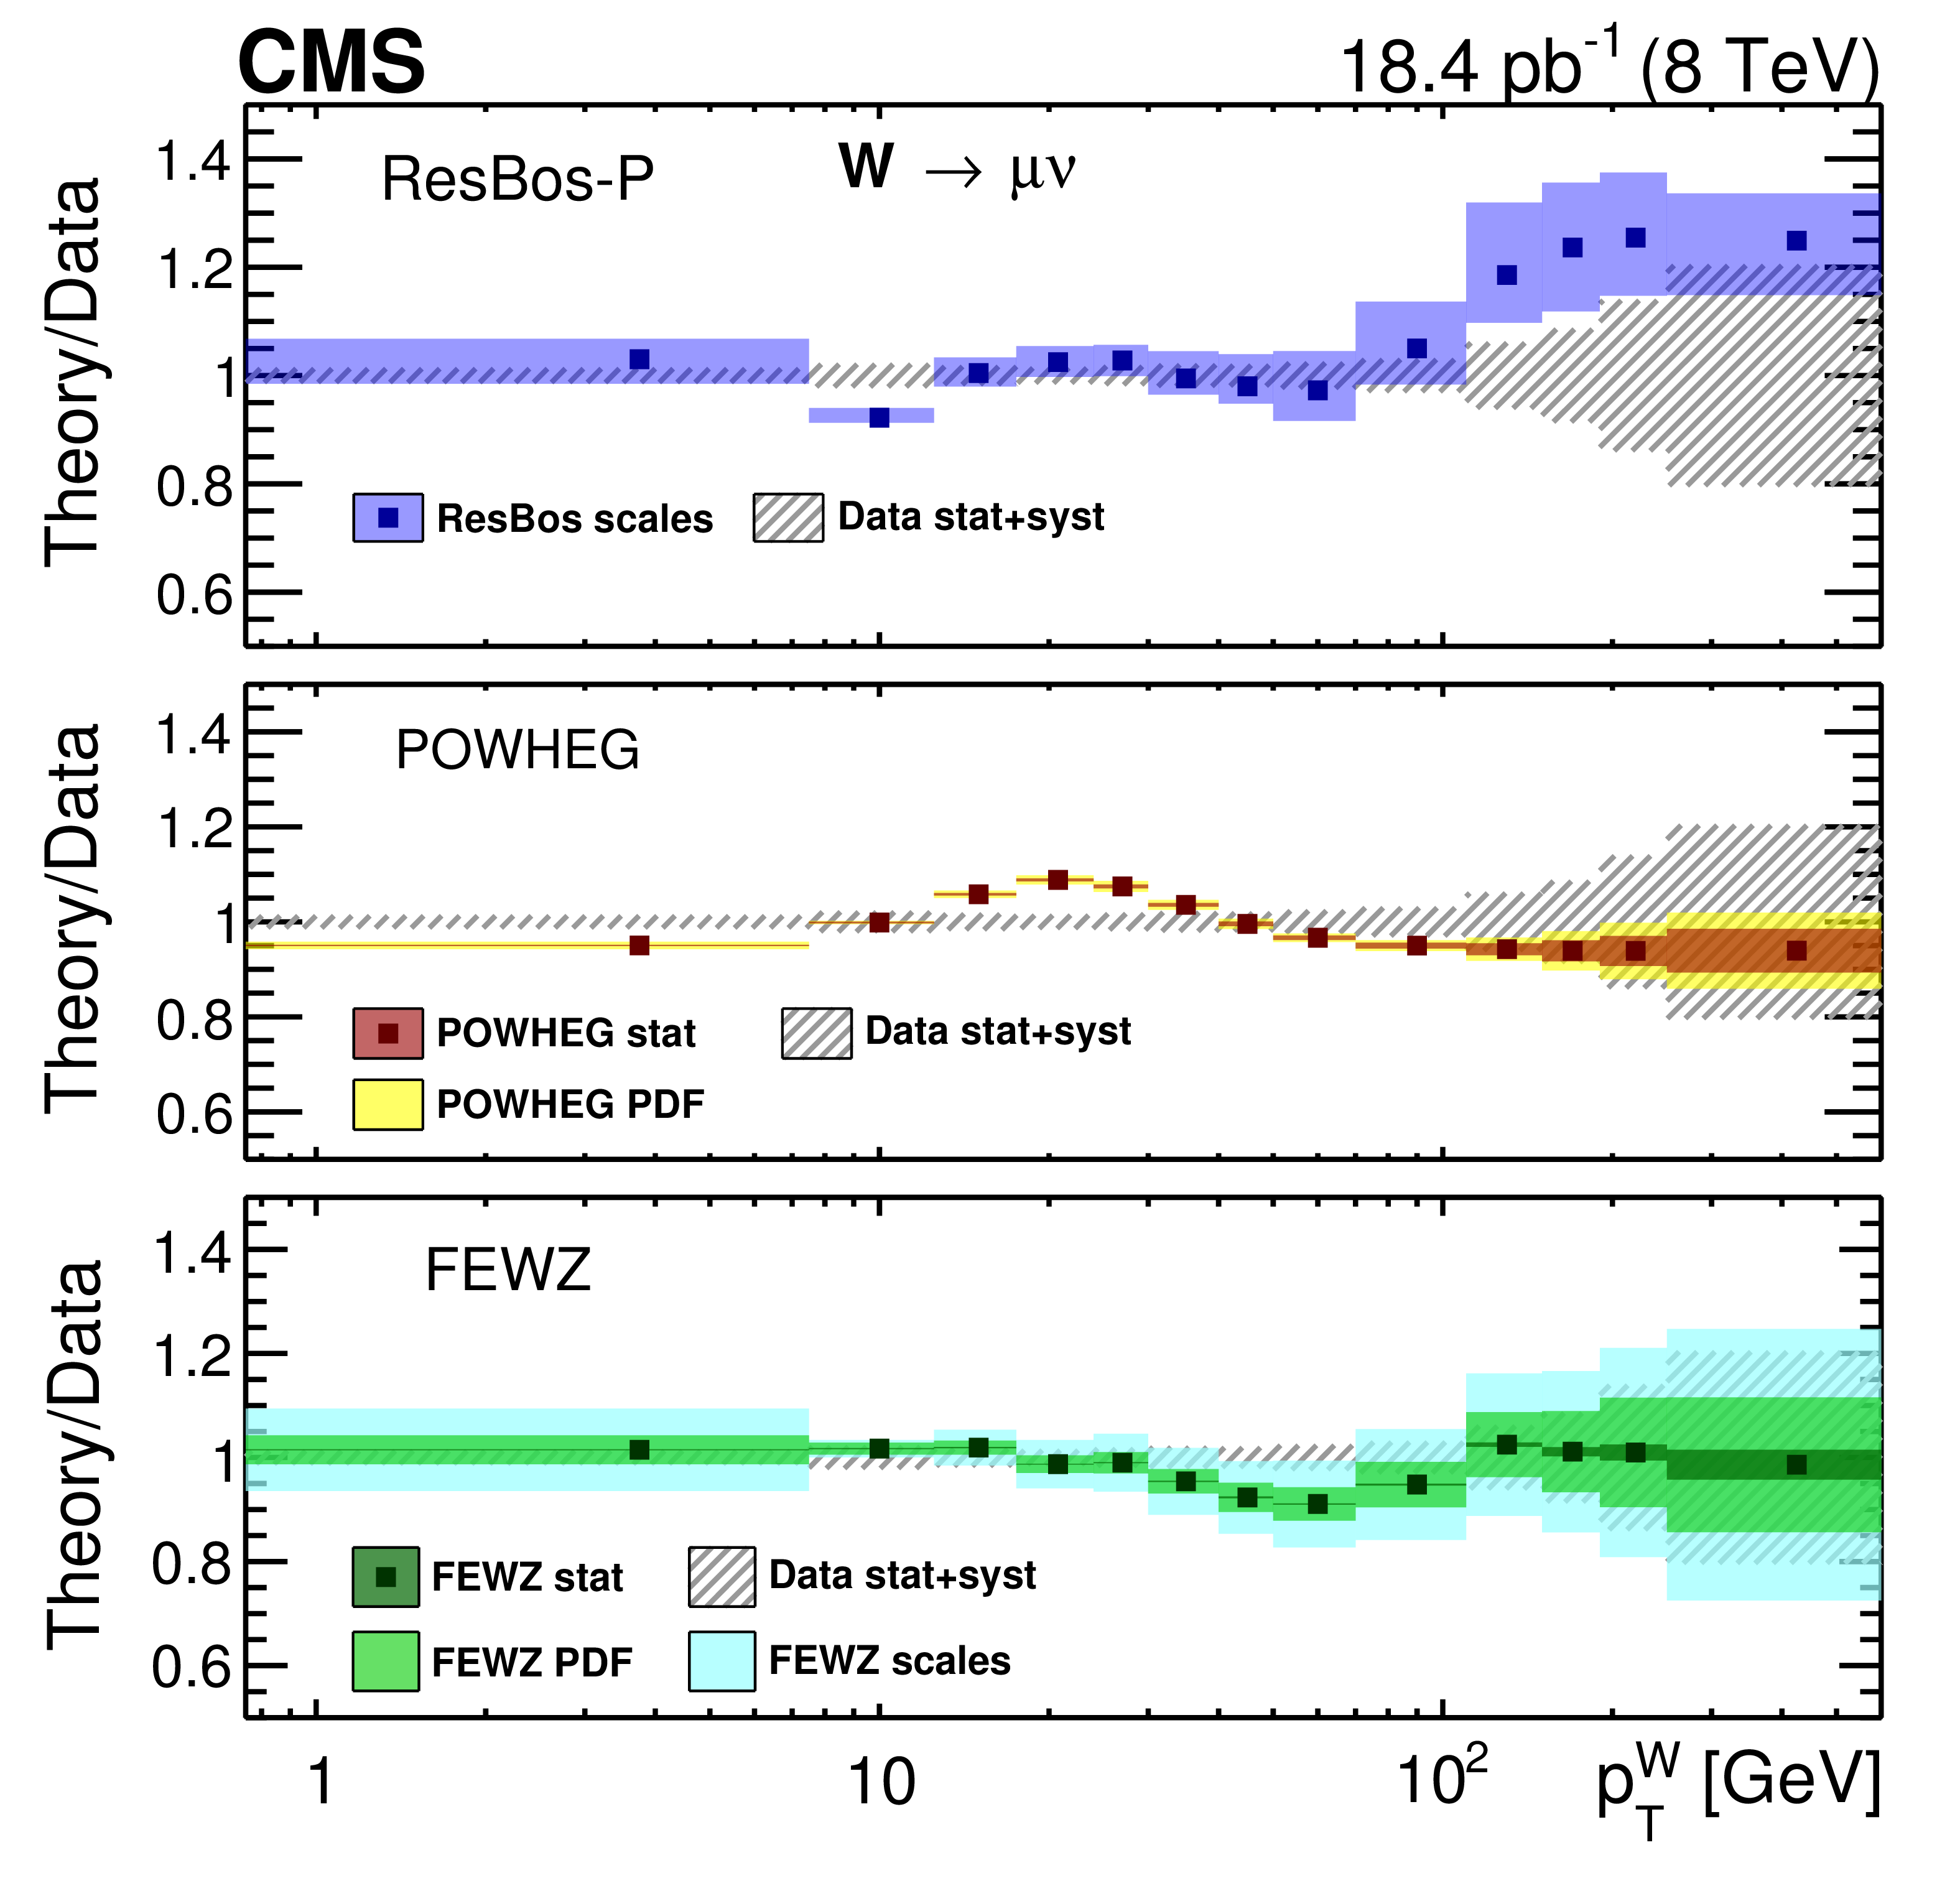
Figure 4:
Normalized differential cross sections for charge independent W boson production at the lepton pre-FSR level as a function of $ { {p_{\mathrm {T}}} ^{\mathrm {W}}}$ for electron (a,b) and muon (c,d) decay channels. The b,d panels show the ratios of theory predictions to the data. The bands include (i) the statistical uncertainties, uncertainties from scales, and PDF uncertainties for FEWZ; (ii) the statistical uncertainties and PDF uncertainties for POWHEG; (iii) the uncertainty from scales for ResBos-P; and (iv) the sum of the statistical and systematic uncertainties in quadrature for data. |
png pdf |
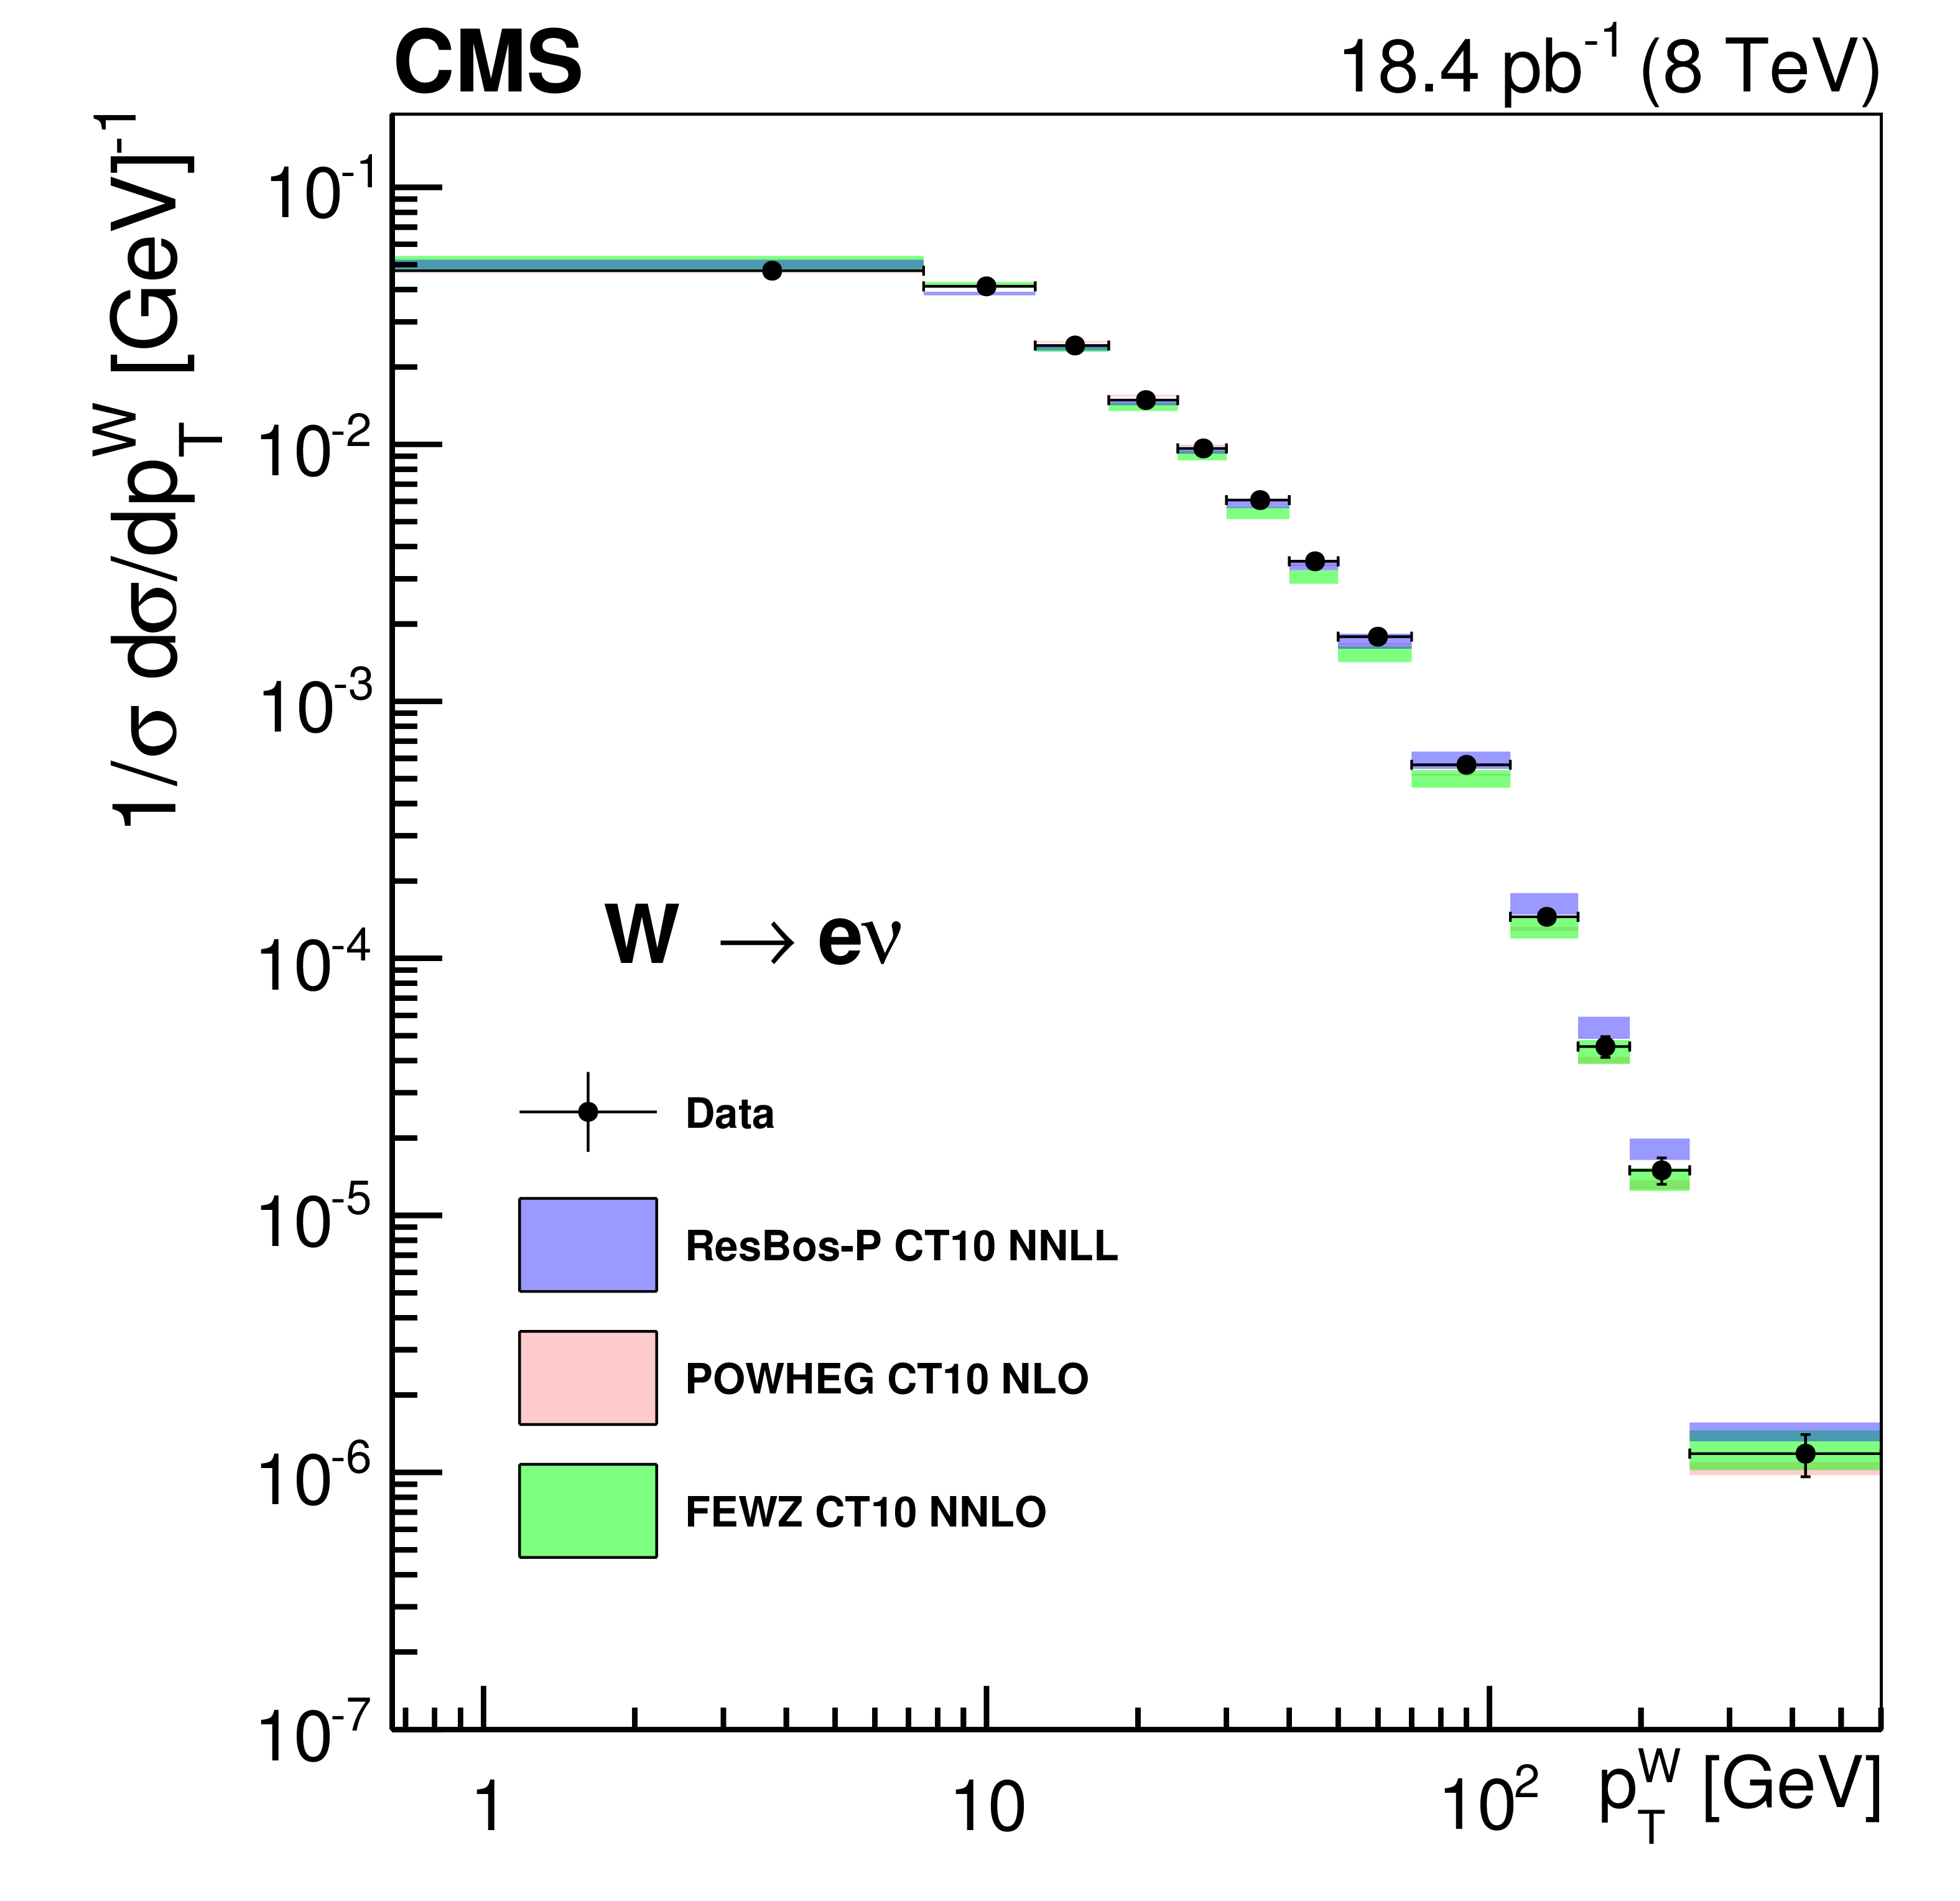
Figure 4-a:
Normalized differential cross sections for charge independent W boson production at the lepton pre-FSR level as a function of $ { {p_{\mathrm {T}}} ^{\mathrm {W}}}$ for the electron decay channel. |
png pdf |
Figure 4-b:
Normalized differential cross sections for charge independent W boson production at the lepton pre-FSR level as a function of $ { {p_{\mathrm {T}}} ^{\mathrm {W}}}$ for the electron decay channel. The panel shows the ratios of theory predictions to the data. The bands include (i) the statistical uncertainties, uncertainties from scales, and PDF uncertainties for FEWZ; (ii) the statistical uncertainties and PDF uncertainties for POWHEG; (iii) the uncertainty from scales for ResBos-P; and (iv) the sum of the statistical and systematic uncertainties in quadrature for data. |
png pdf |
Figure 4-c:
Normalized differential cross sections for charge independent W boson production at the lepton pre-FSR level as a function of $ { {p_{\mathrm {T}}} ^{\mathrm {W}}}$ for the muon decay channel. |
png pdf |
Figure 4-d:
Normalized differential cross sections for charge independent W boson production at the lepton pre-FSR level as a function of $ { {p_{\mathrm {T}}} ^{\mathrm {W}}}$ for the muon decay channel. The panel shows the ratios of theory predictions to the data. The bands include (i) the statistical uncertainties, uncertainties from scales, and PDF uncertainties for FEWZ; (ii) the statistical uncertainties and PDF uncertainties for POWHEG; (iii) the uncertainty from scales for ResBos-P; and (iv) the sum of the statistical and systematic uncertainties in quadrature for data. |
png pdf |
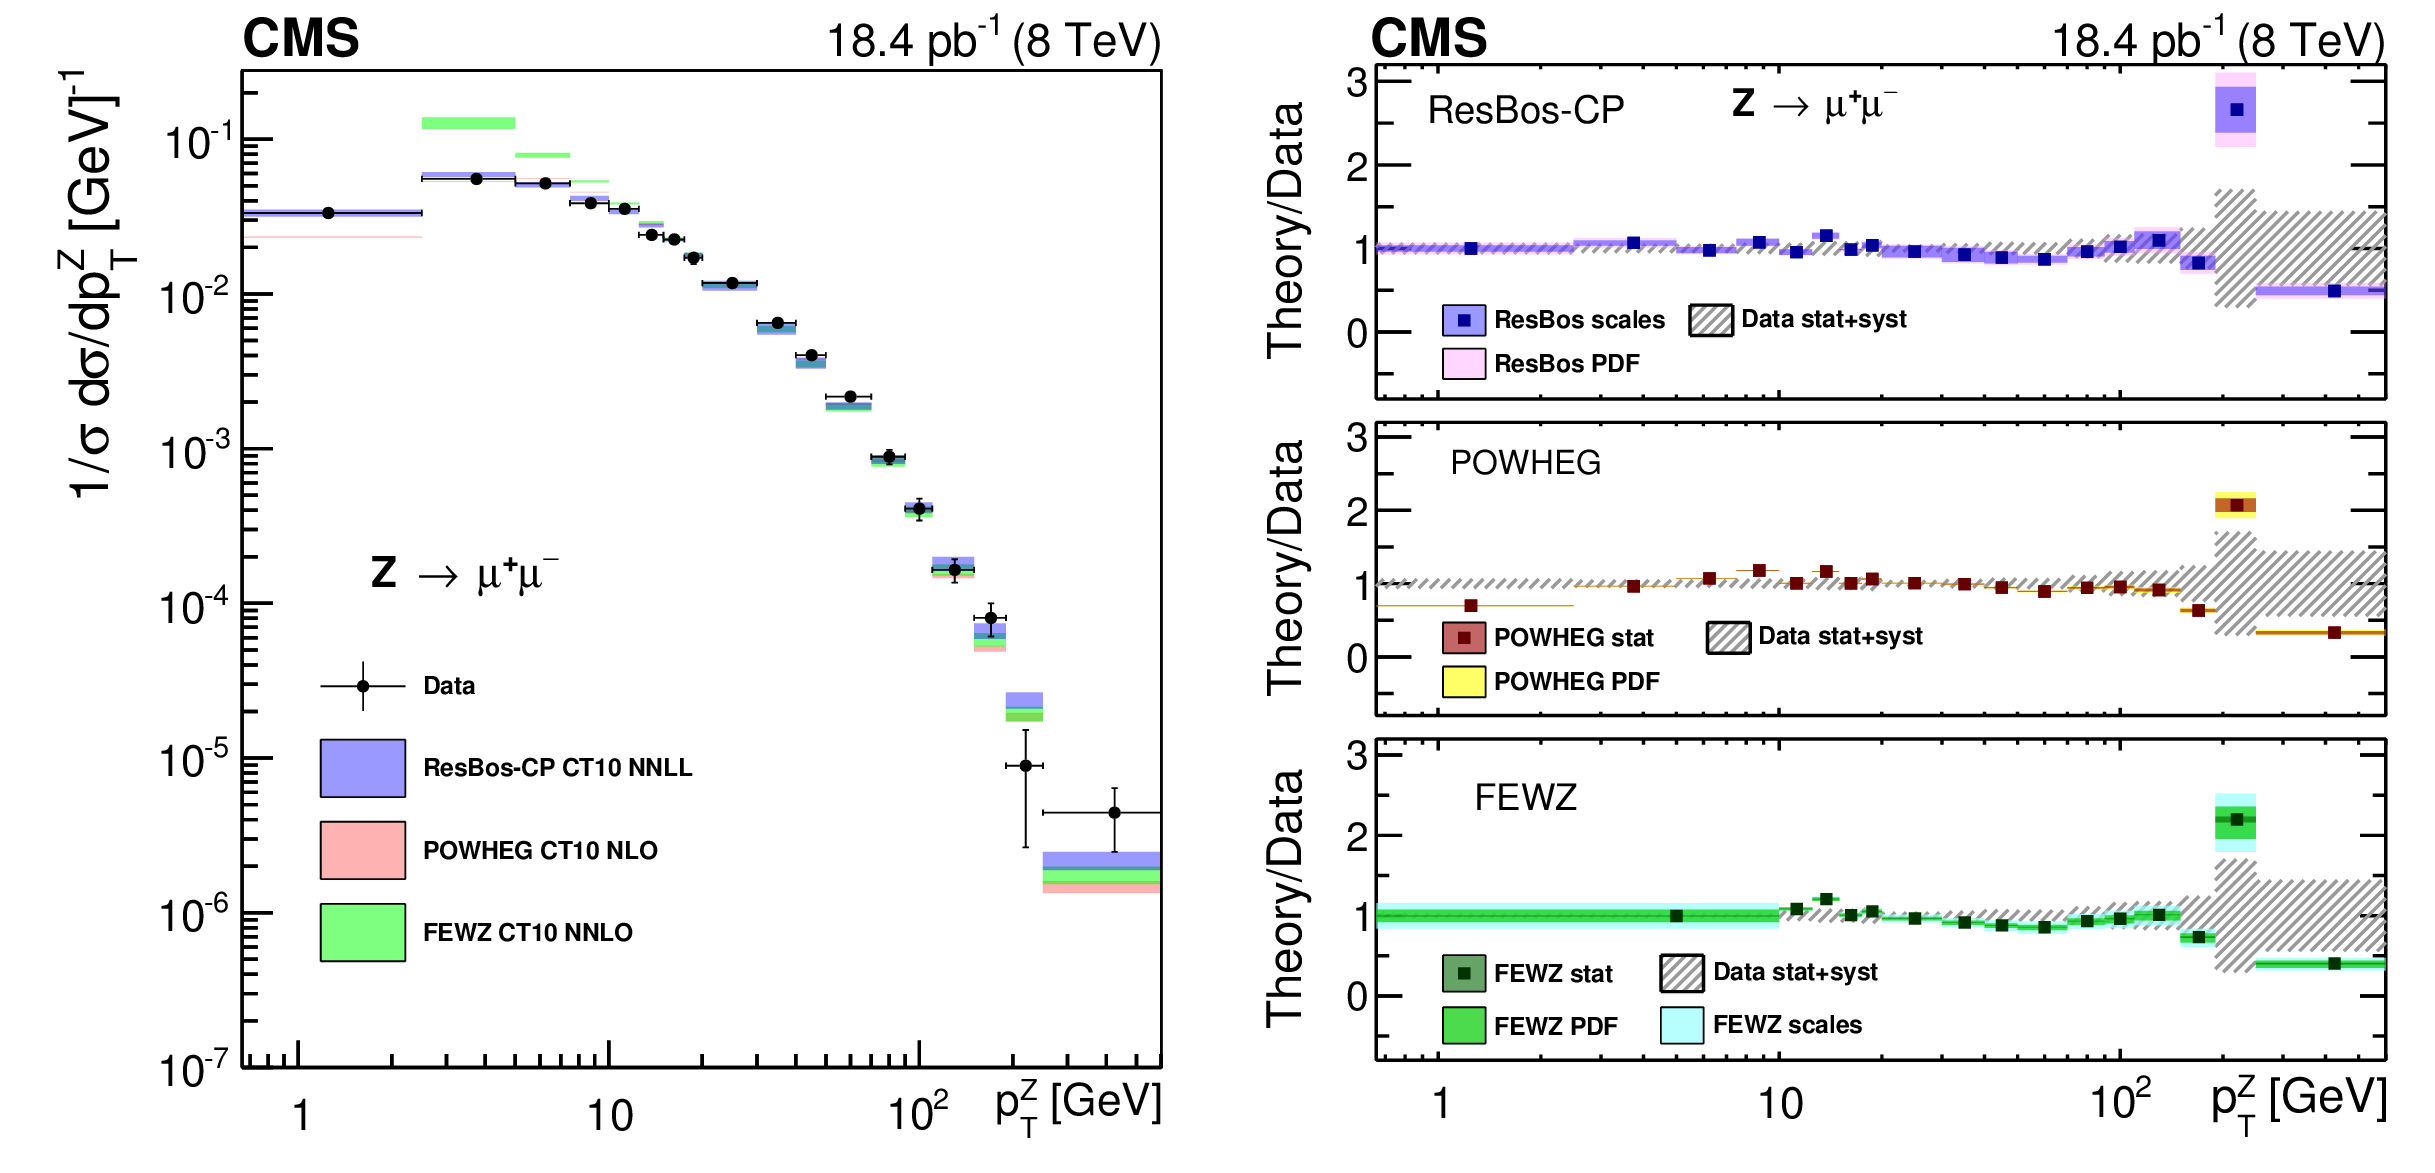
Figure 5:
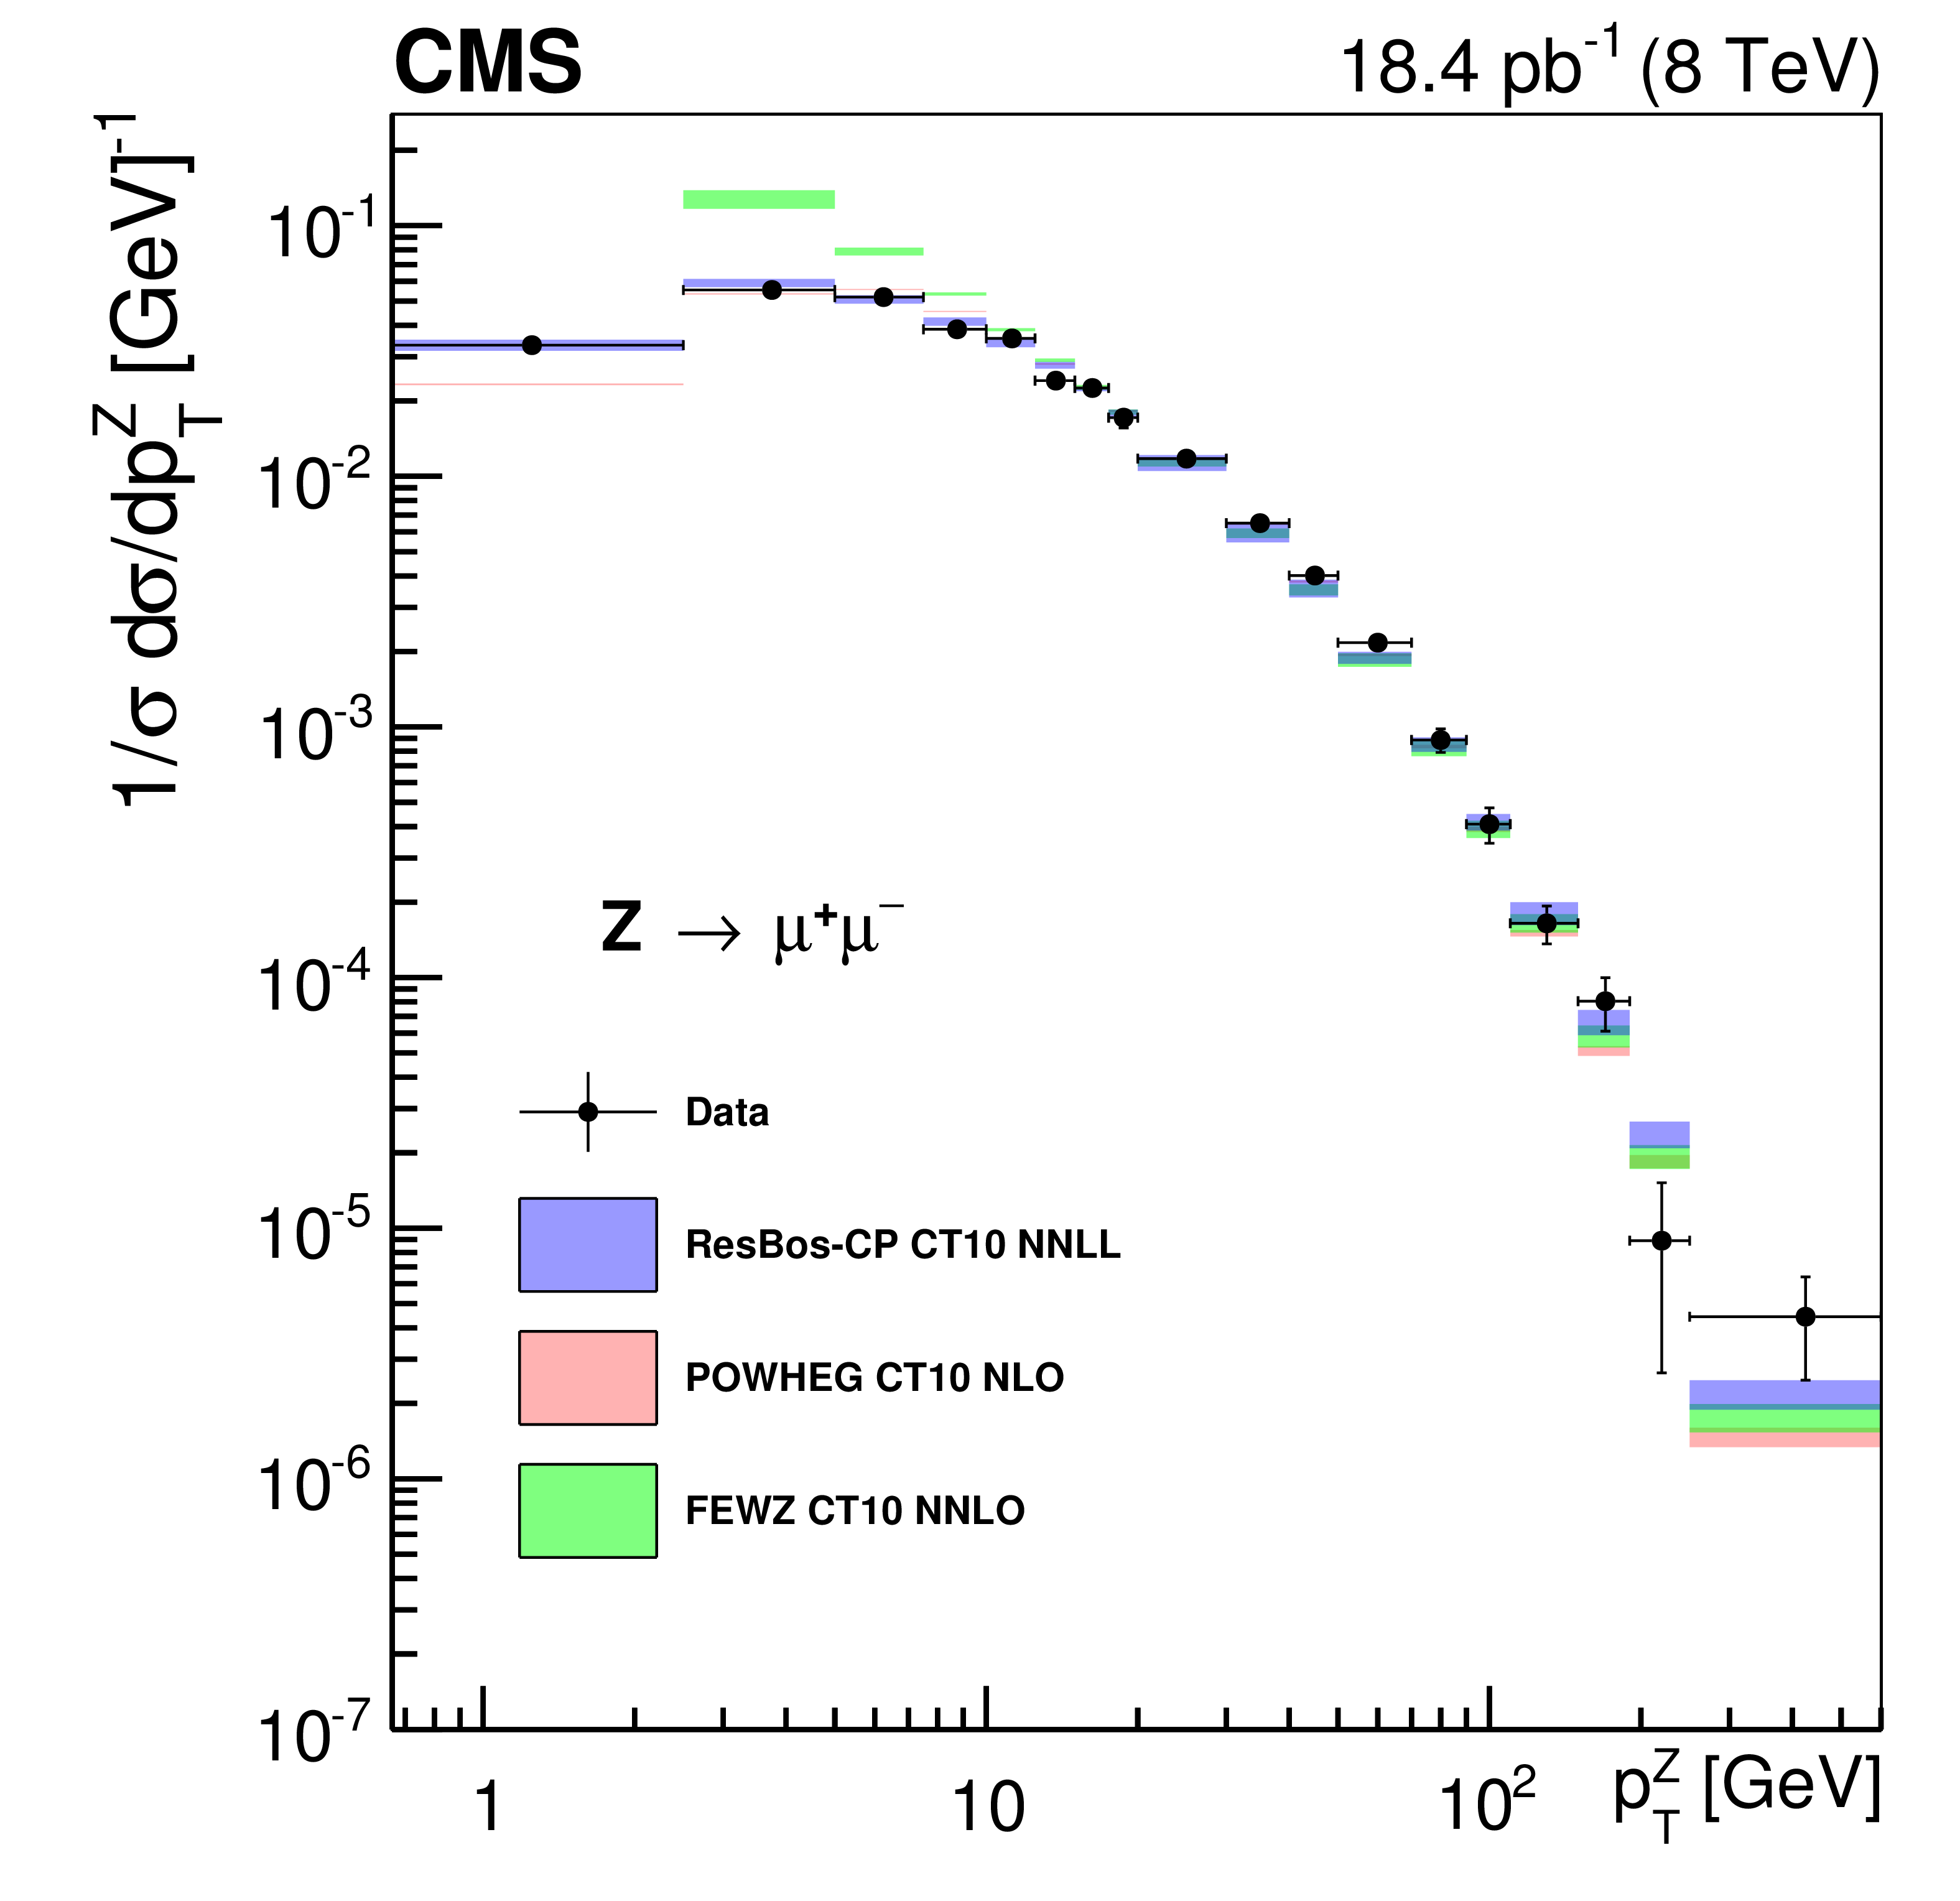
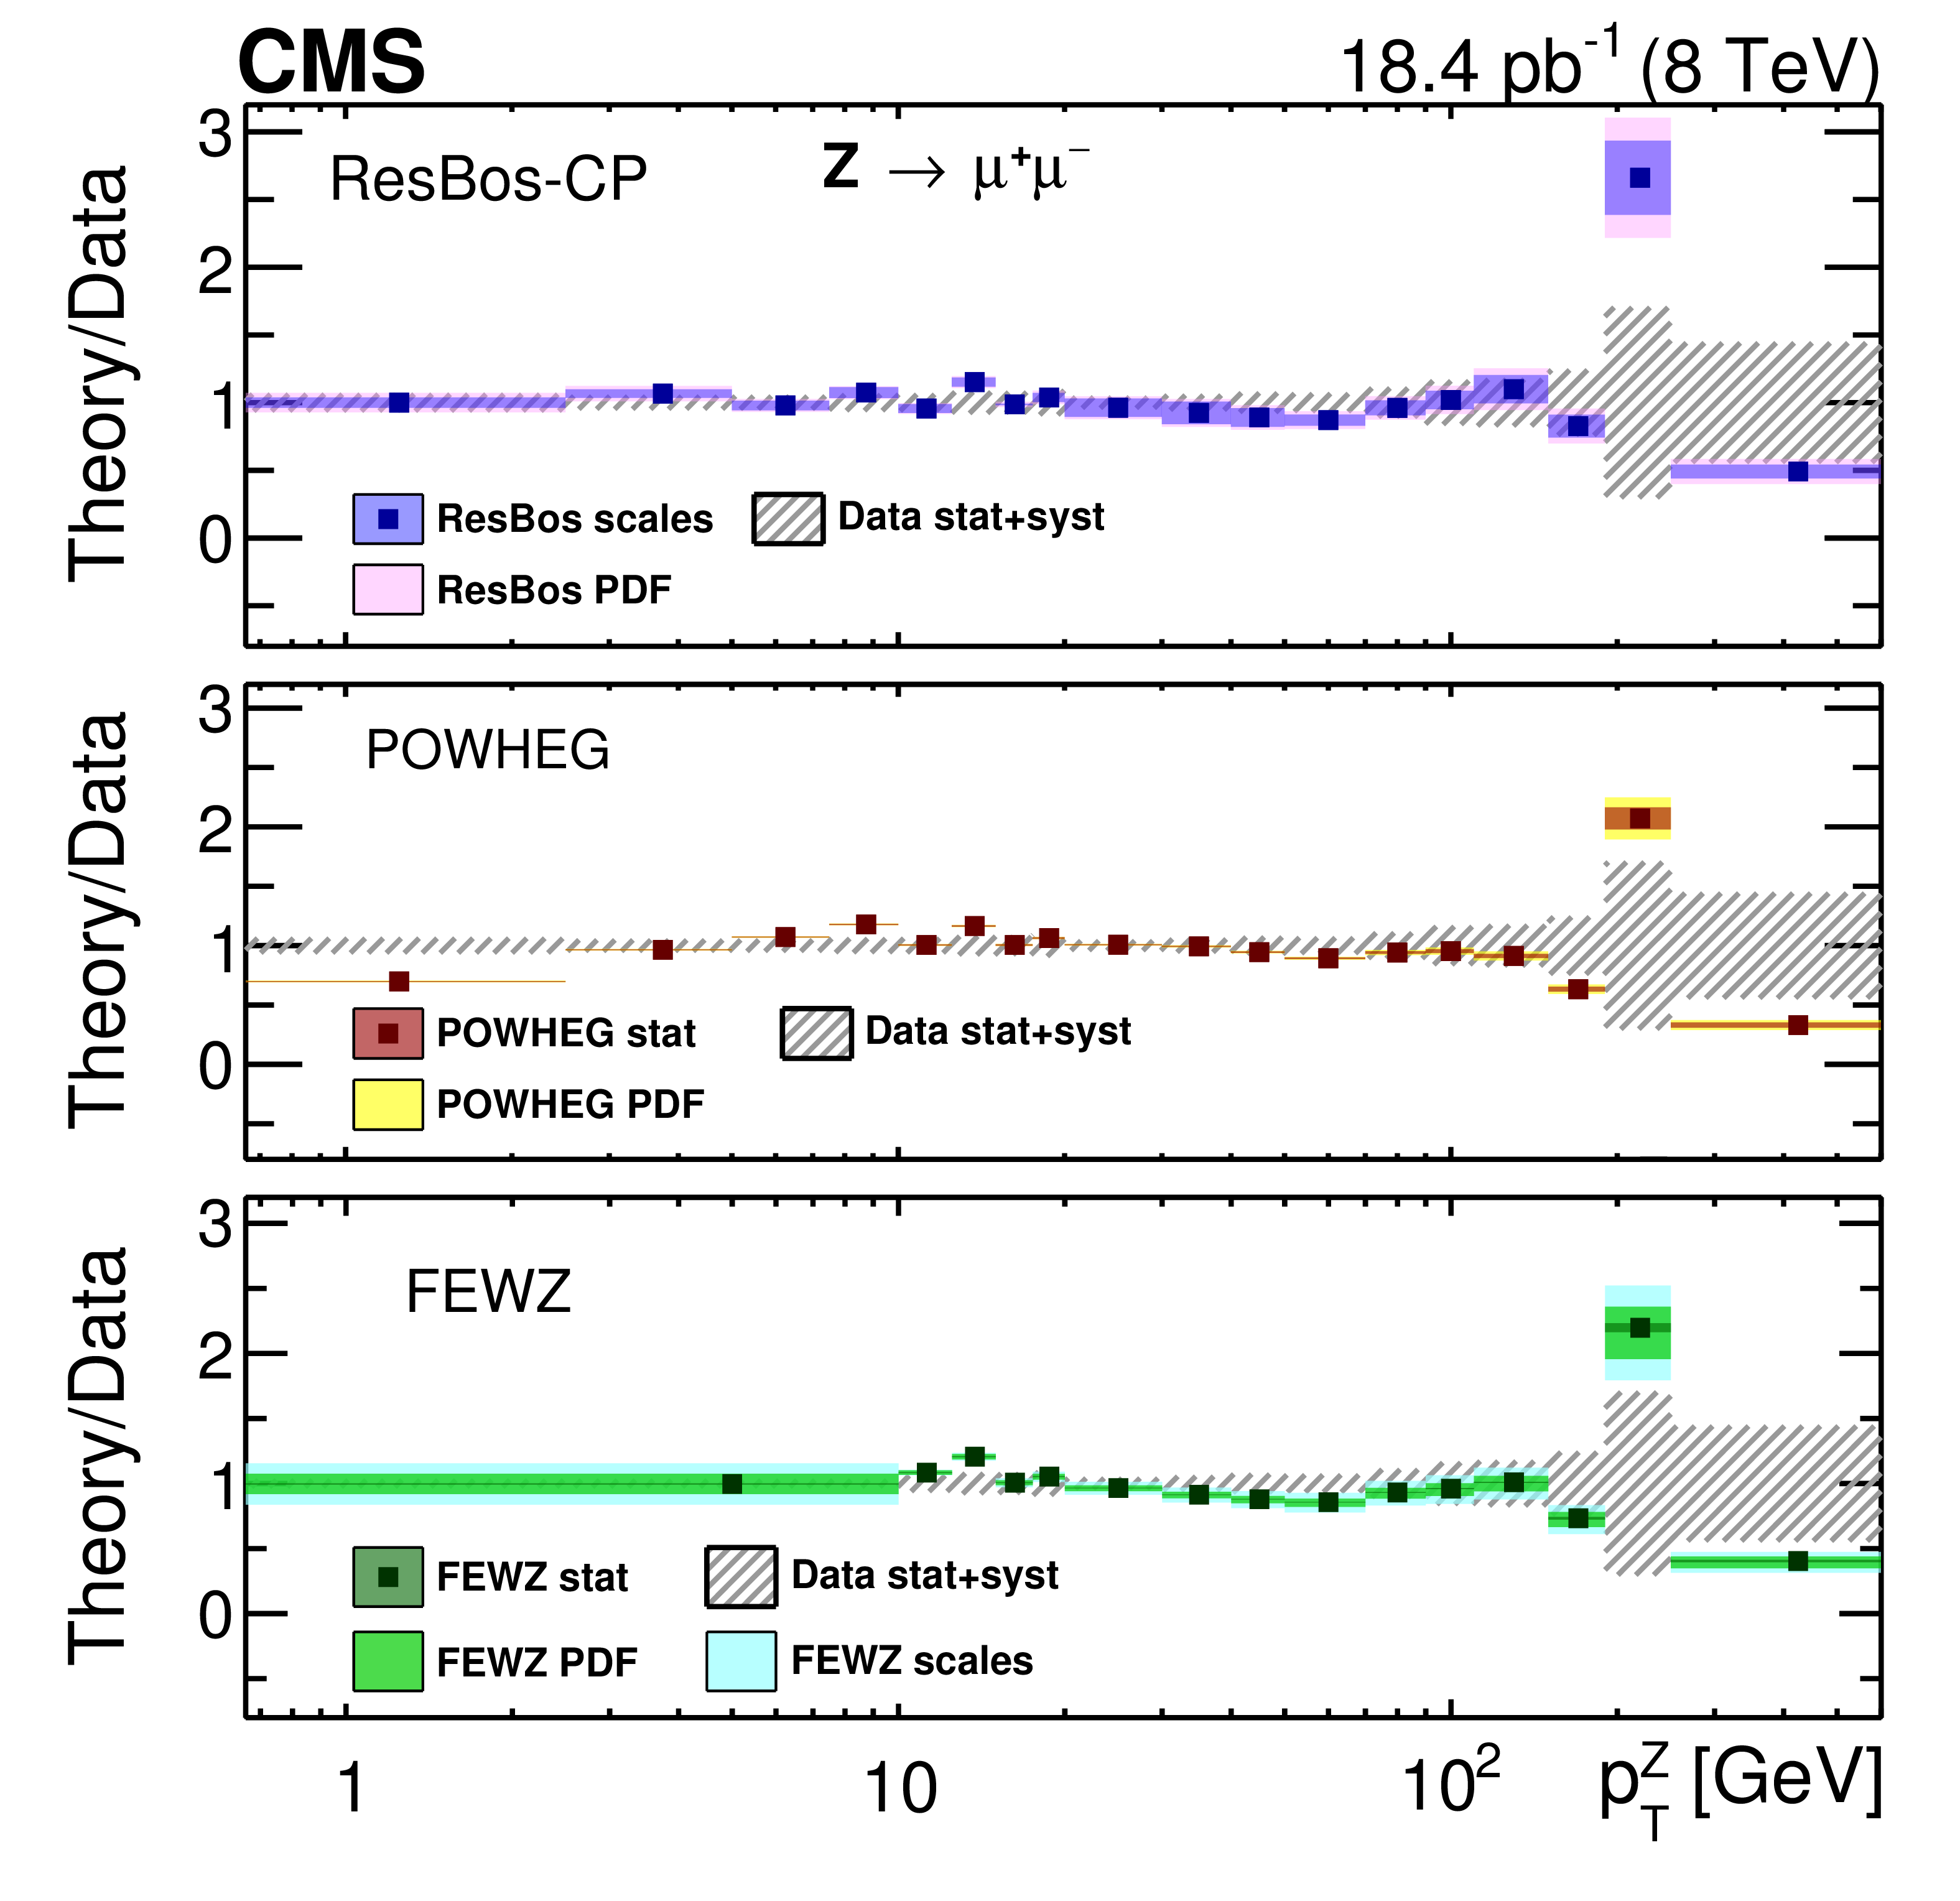
Comparison of the normalized dimuon differential transverse momentum distribution from data (solid symbols) with different theoretical predictions. The right panels show the ratios of theory predictions to the data. The ResBos-CP version with scale and PDF variation is used for comparison. |
png pdf |
Figure 5-a:
Comparison of the normalized dimuon differential transverse momentum distribution from data (solid symbols) with different theoretical predictions. The panel shows the ratios of theory predictions to the data. The ResBos-CP version with scale and PDF variation is used for comparison. |
png pdf |
Figure 5-b:
Comparison of the normalized dimuon differential transverse momentum distribution from data (solid symbols) with different theoretical predictions. The right panels show the ratios of theory predictions to the data. The ResBos-CP version with scale and PDF variation is used for comparison. |
png pdf |
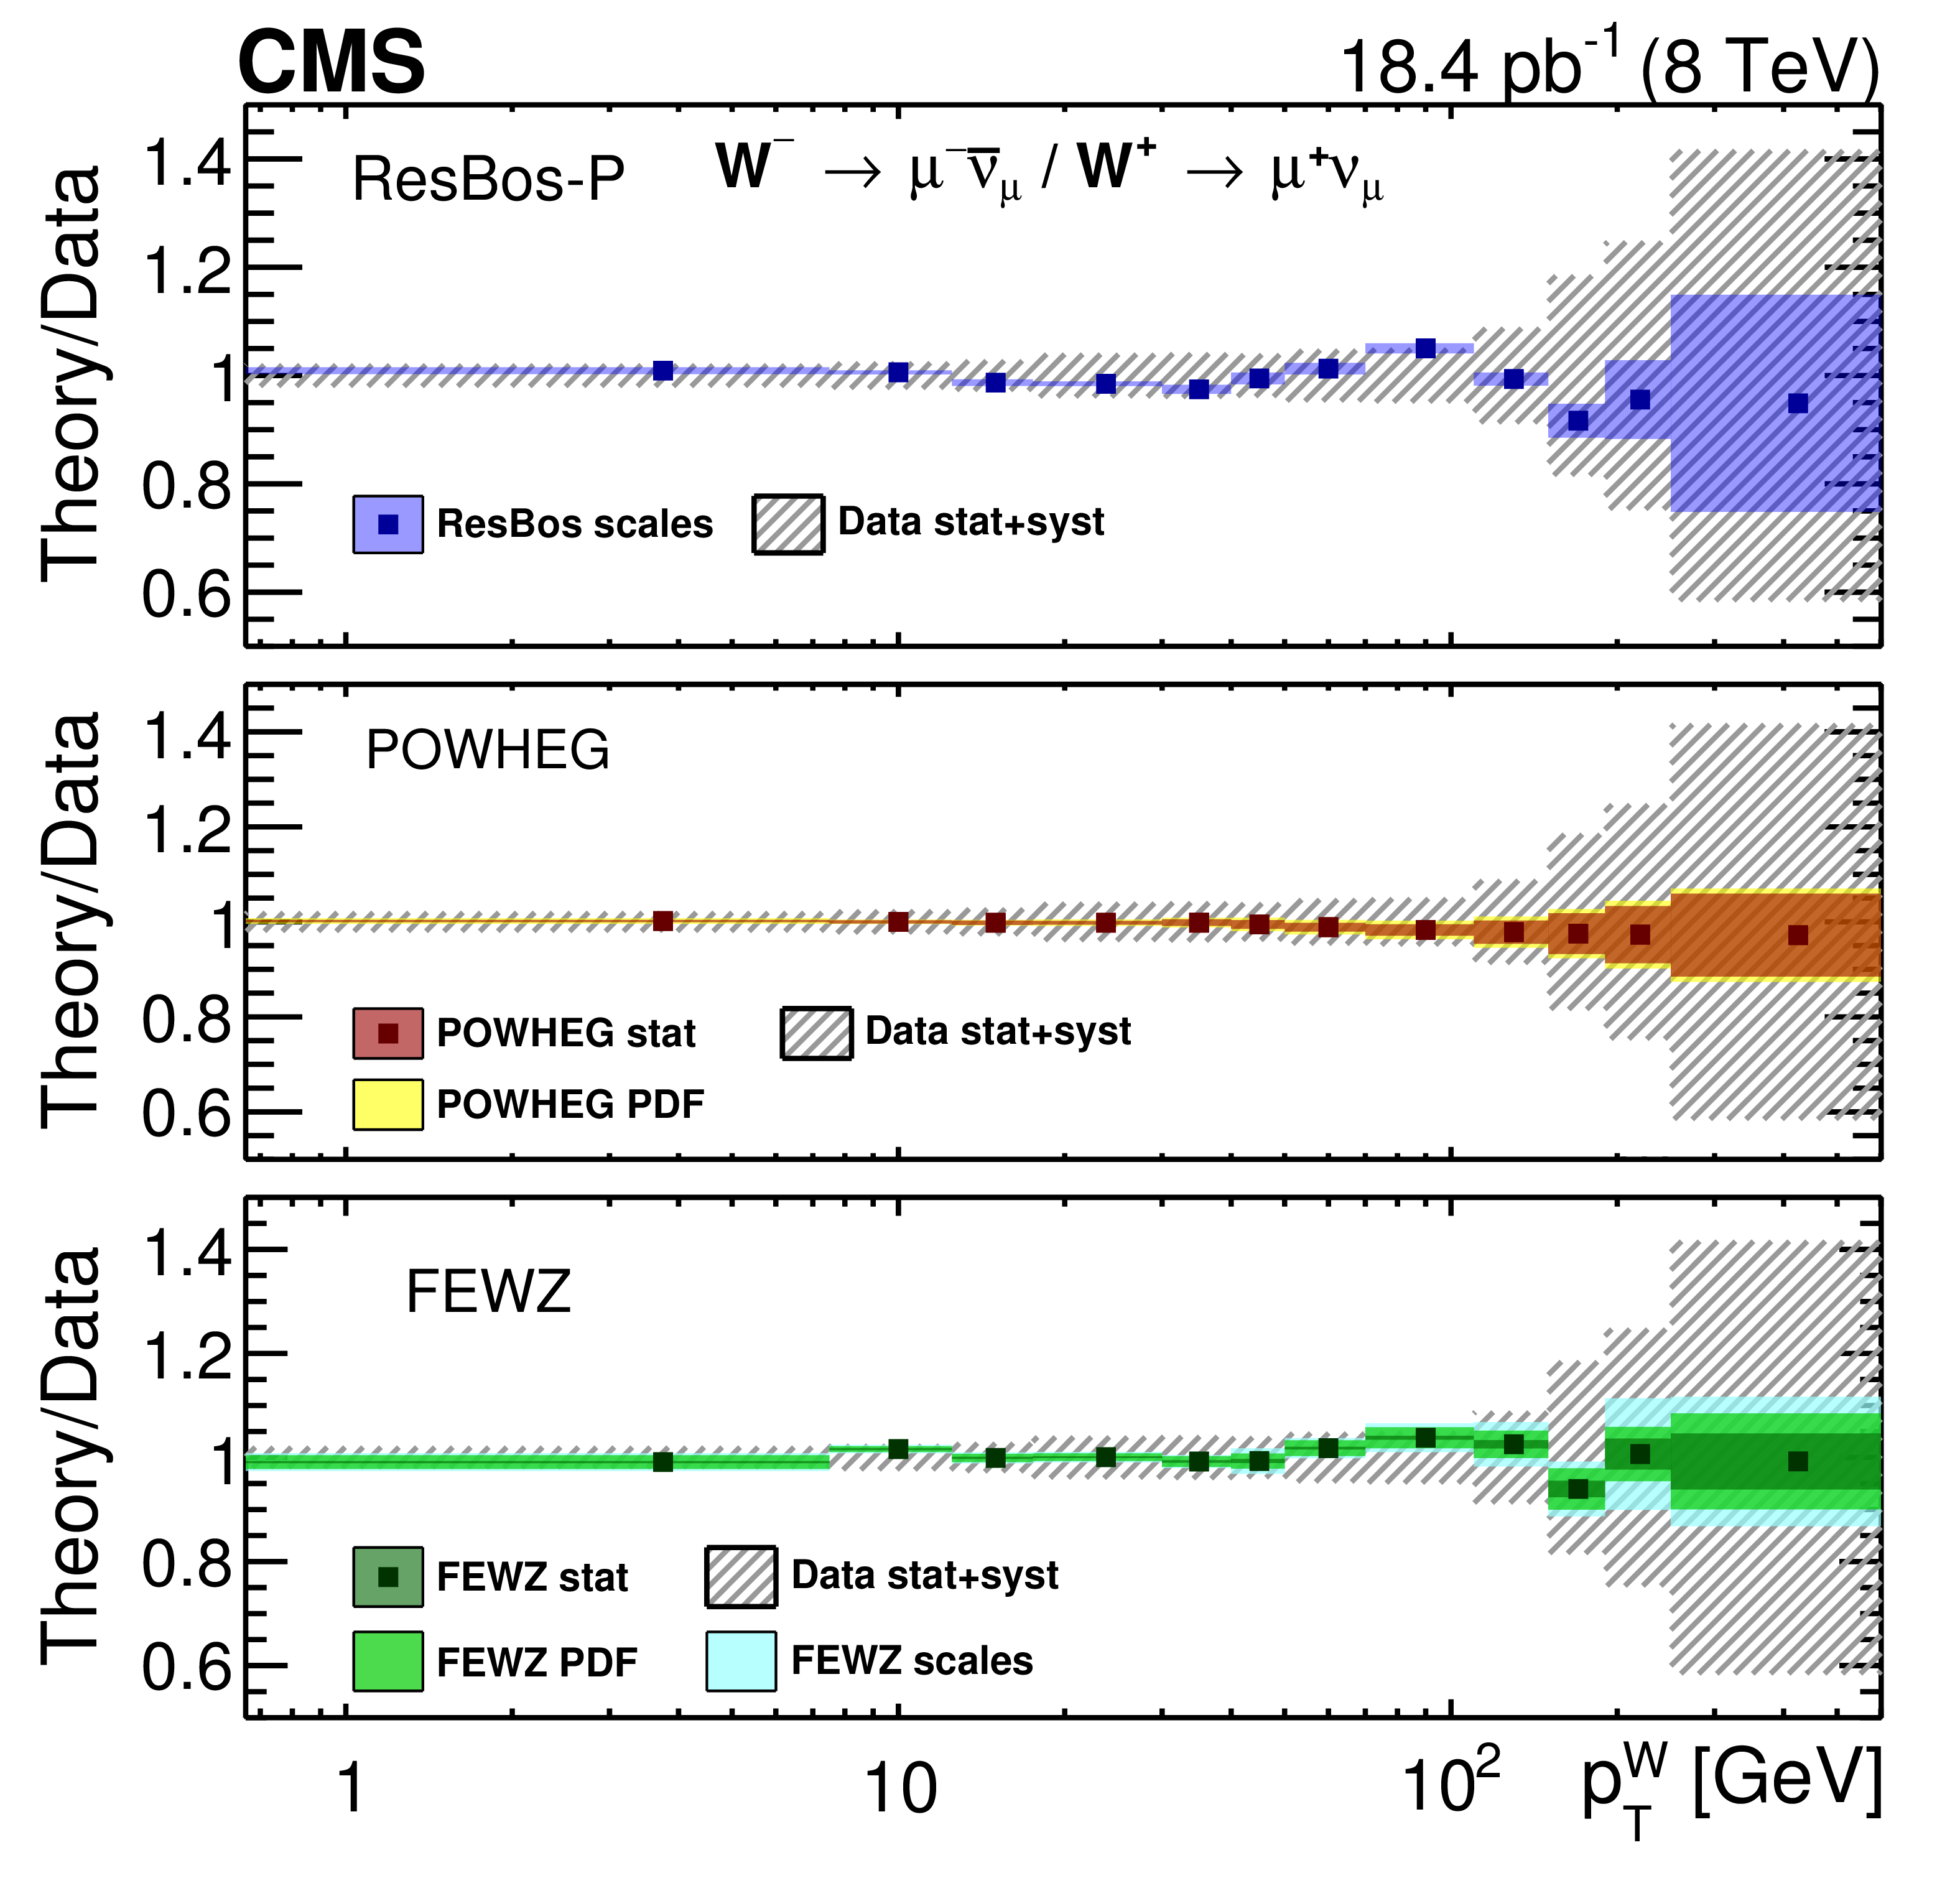
Figure 6:
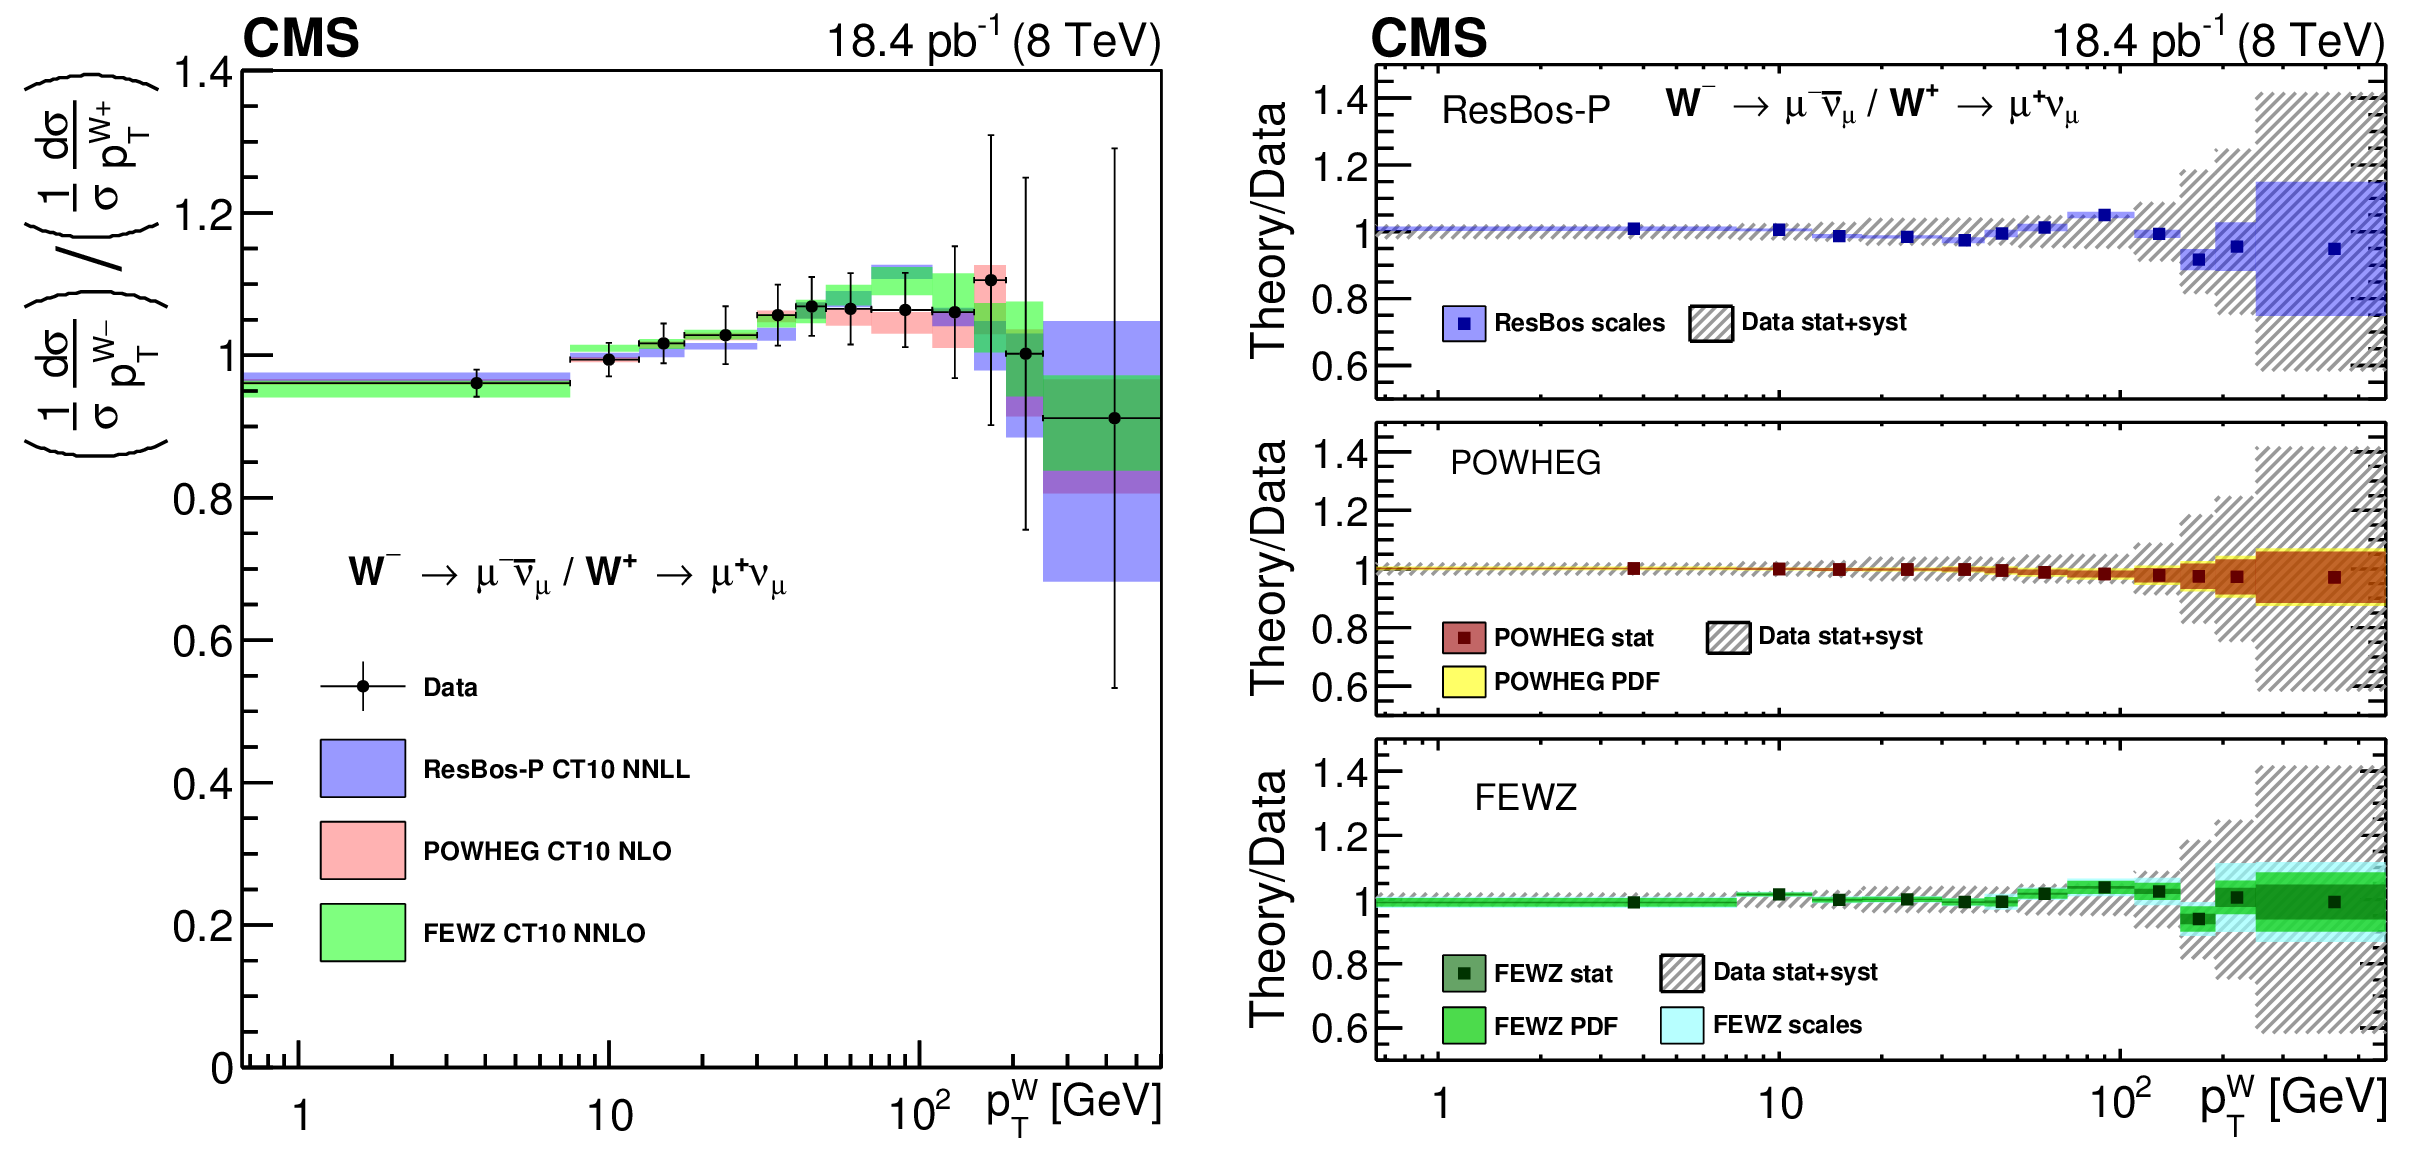
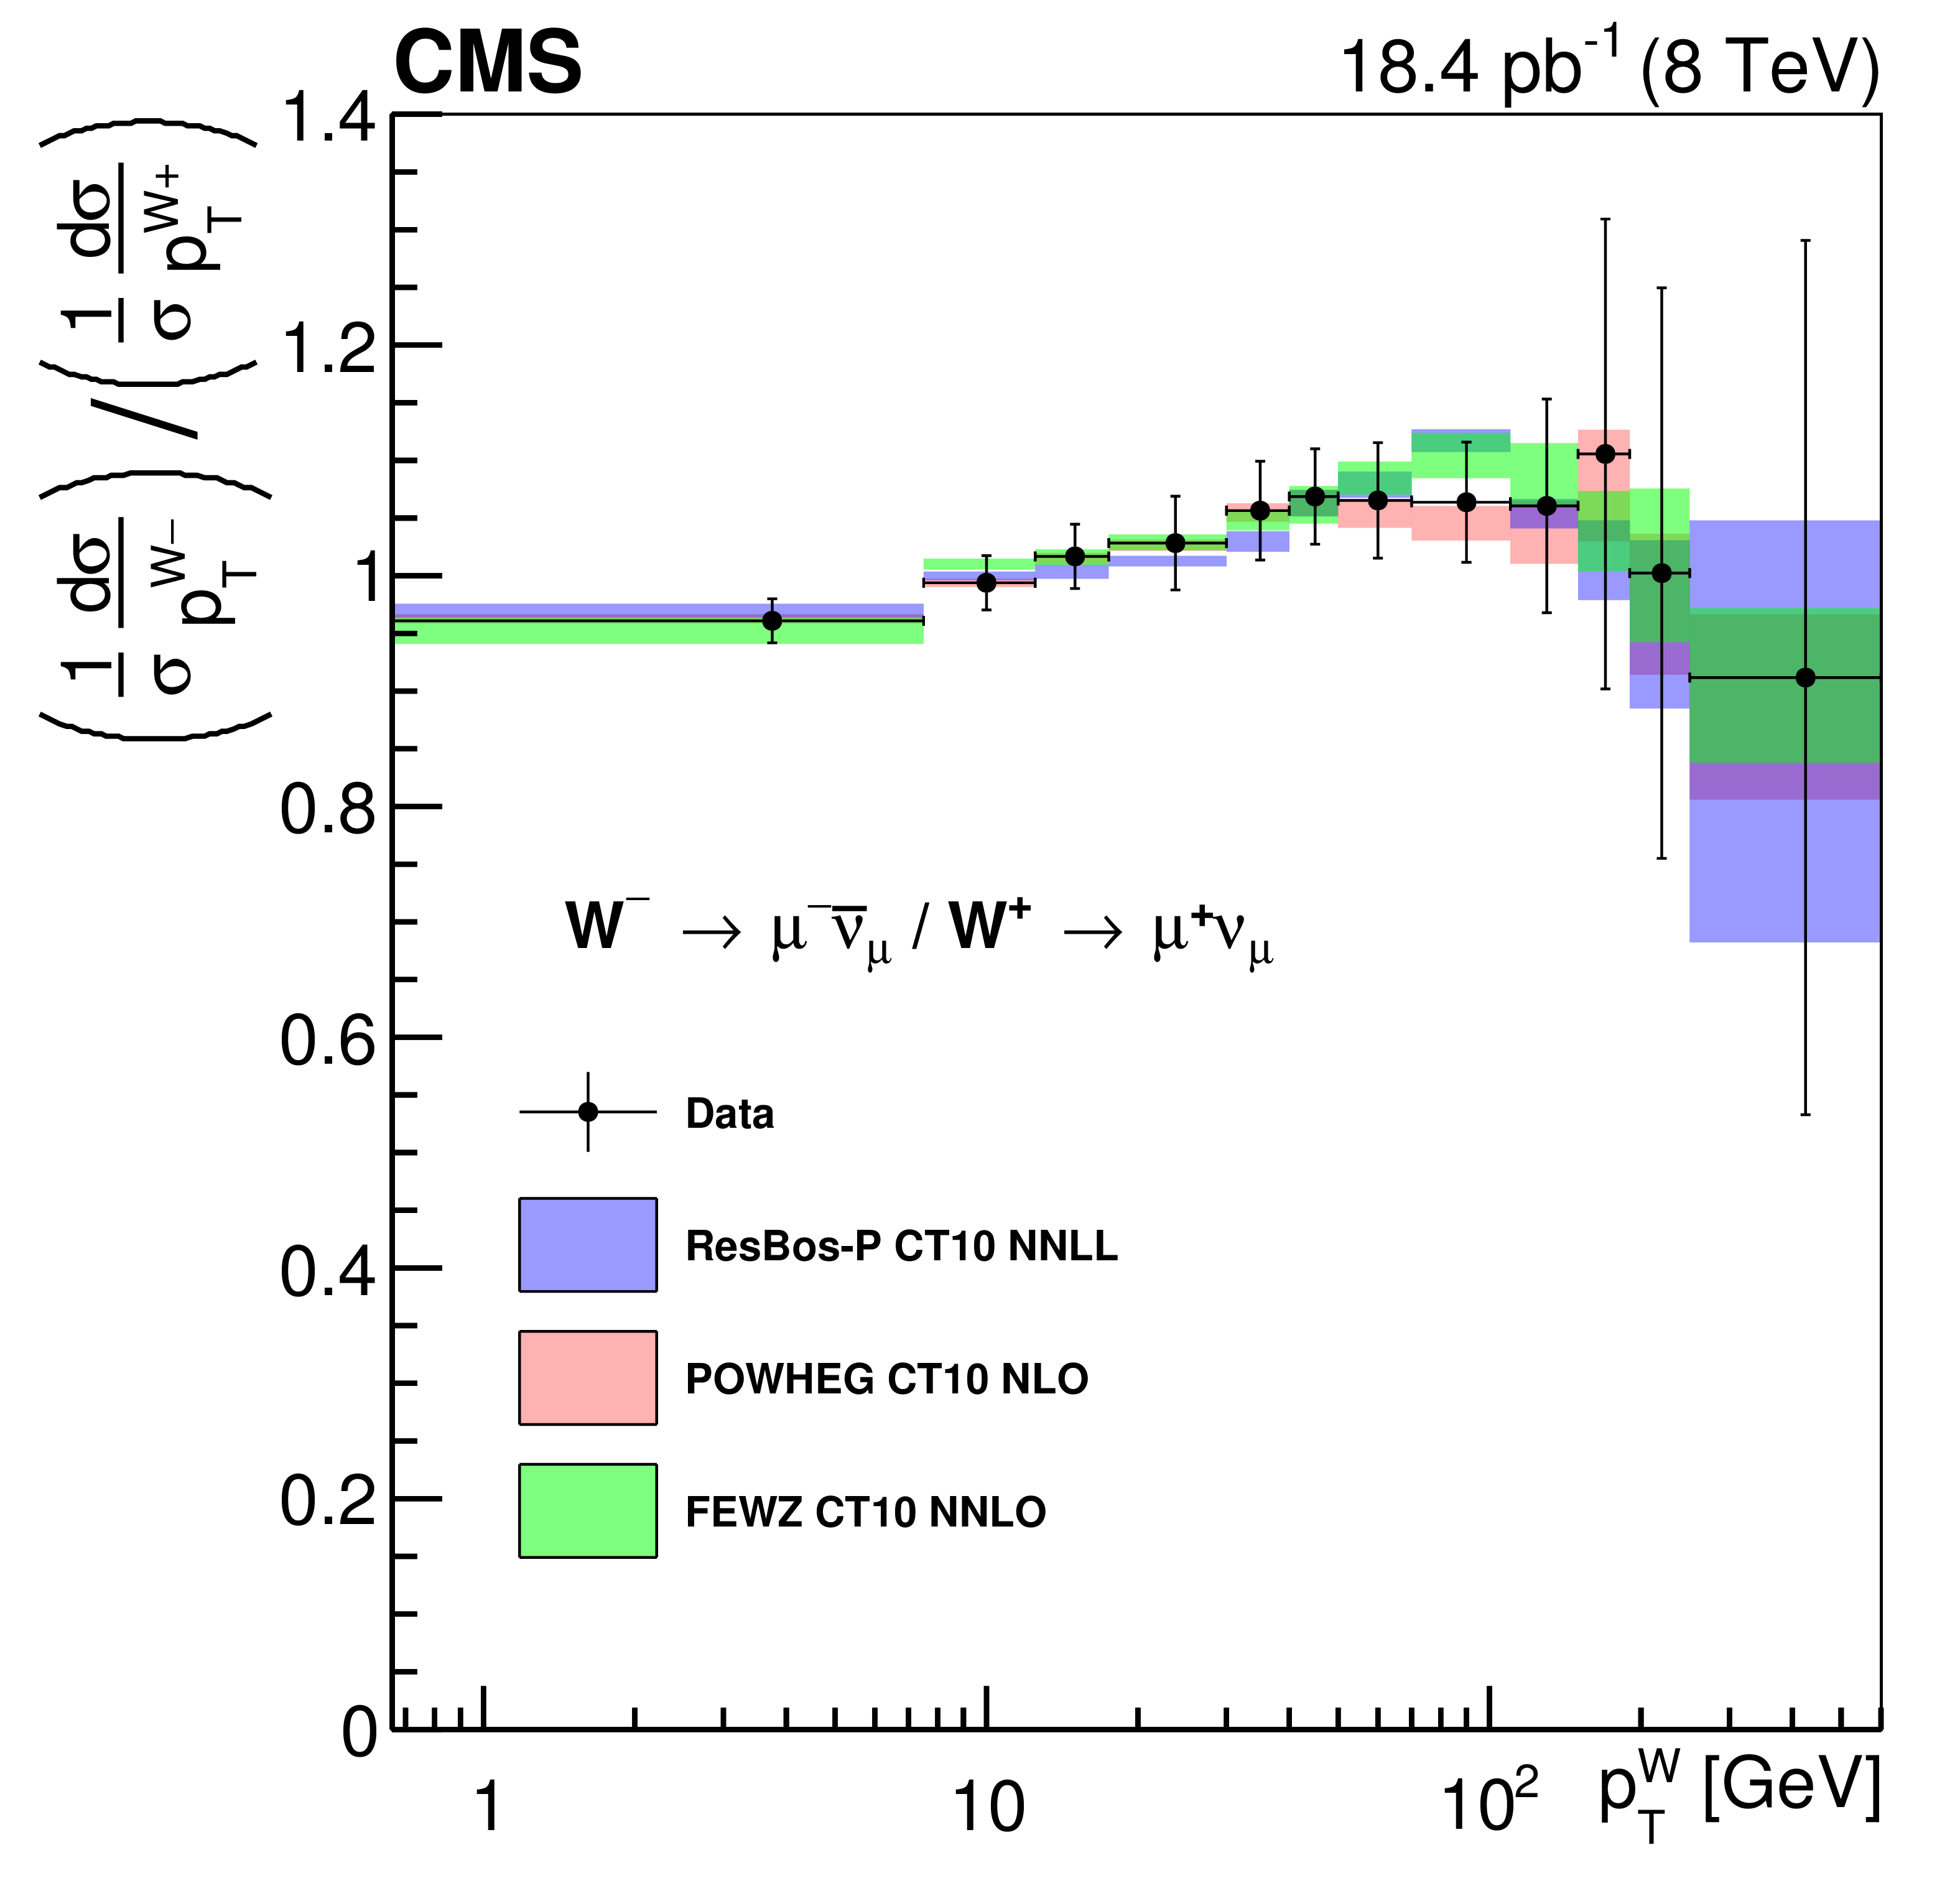
The normalized $ {p_{\mathrm {T}}} $ differential cross section ratio of $\mathrm{ W }^- $ to $\mathrm{ W }^+ $ for muon channel compared with theoretical predictions. Data points include the sum of the statistical and systematic uncertainties in quadrature. More details are given in the Fig. 4 caption. |
png pdf |
Figure 6-a:
The normalized $ {p_{\mathrm {T}}} $ differential cross section ratio of $\mathrm{ W }^- $ to $\mathrm{ W }^+ $ for muon channel compared with theoretical predictions. Data points include the sum of the statistical and systematic uncertainties in quadrature. More details are given in the Fig. 4 caption. |
png pdf |
Figure 6-b:
The normalized $ {p_{\mathrm {T}}} $ differential cross section ratio of $\mathrm{ W }^- $ to $\mathrm{ W }^+ $ for muon channel compared with theoretical predictions. Data points include the sum of the statistical and systematic uncertainties in quadrature. More details are given in the Fig. 4 caption. |
png pdf |
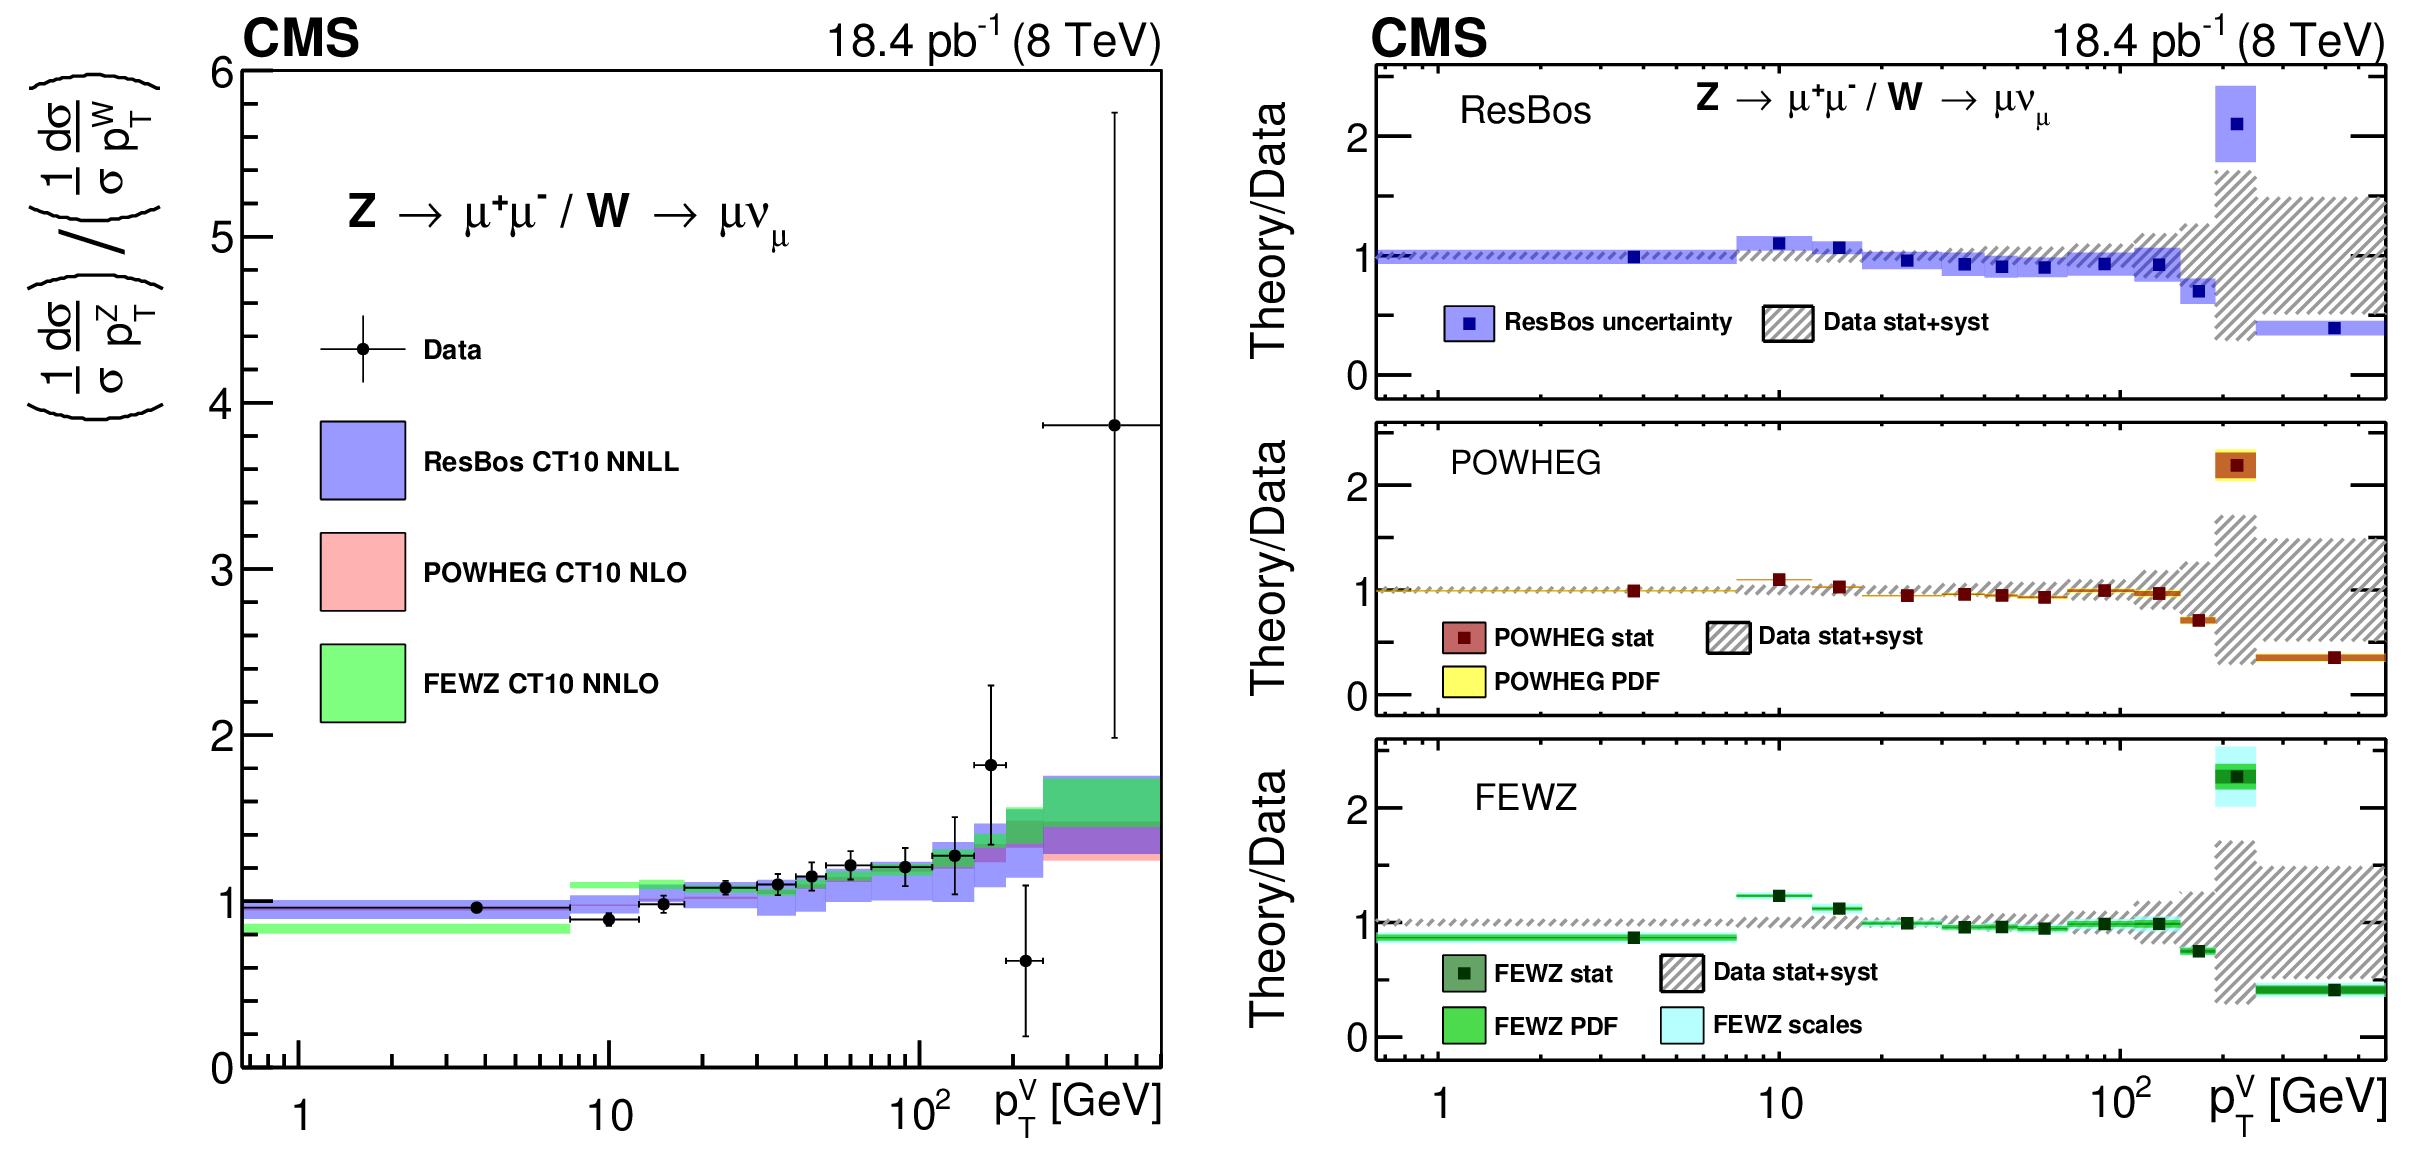
Figure 7:
The normalized $ {p_{\mathrm {T}}} $ differential cross section ratio of $\mathrm{ Z } $ to W for muon channel compared with theoretical predictions. The right panels show the ratios of theory predictions to the data. The larger than expected uncertainties for ResBos arise from the different strategies in terms of the scale and PDF variations between ResBos-P and ResBos-CP version. More details are given in the Fig. 4 and 5 caption. |
png pdf |
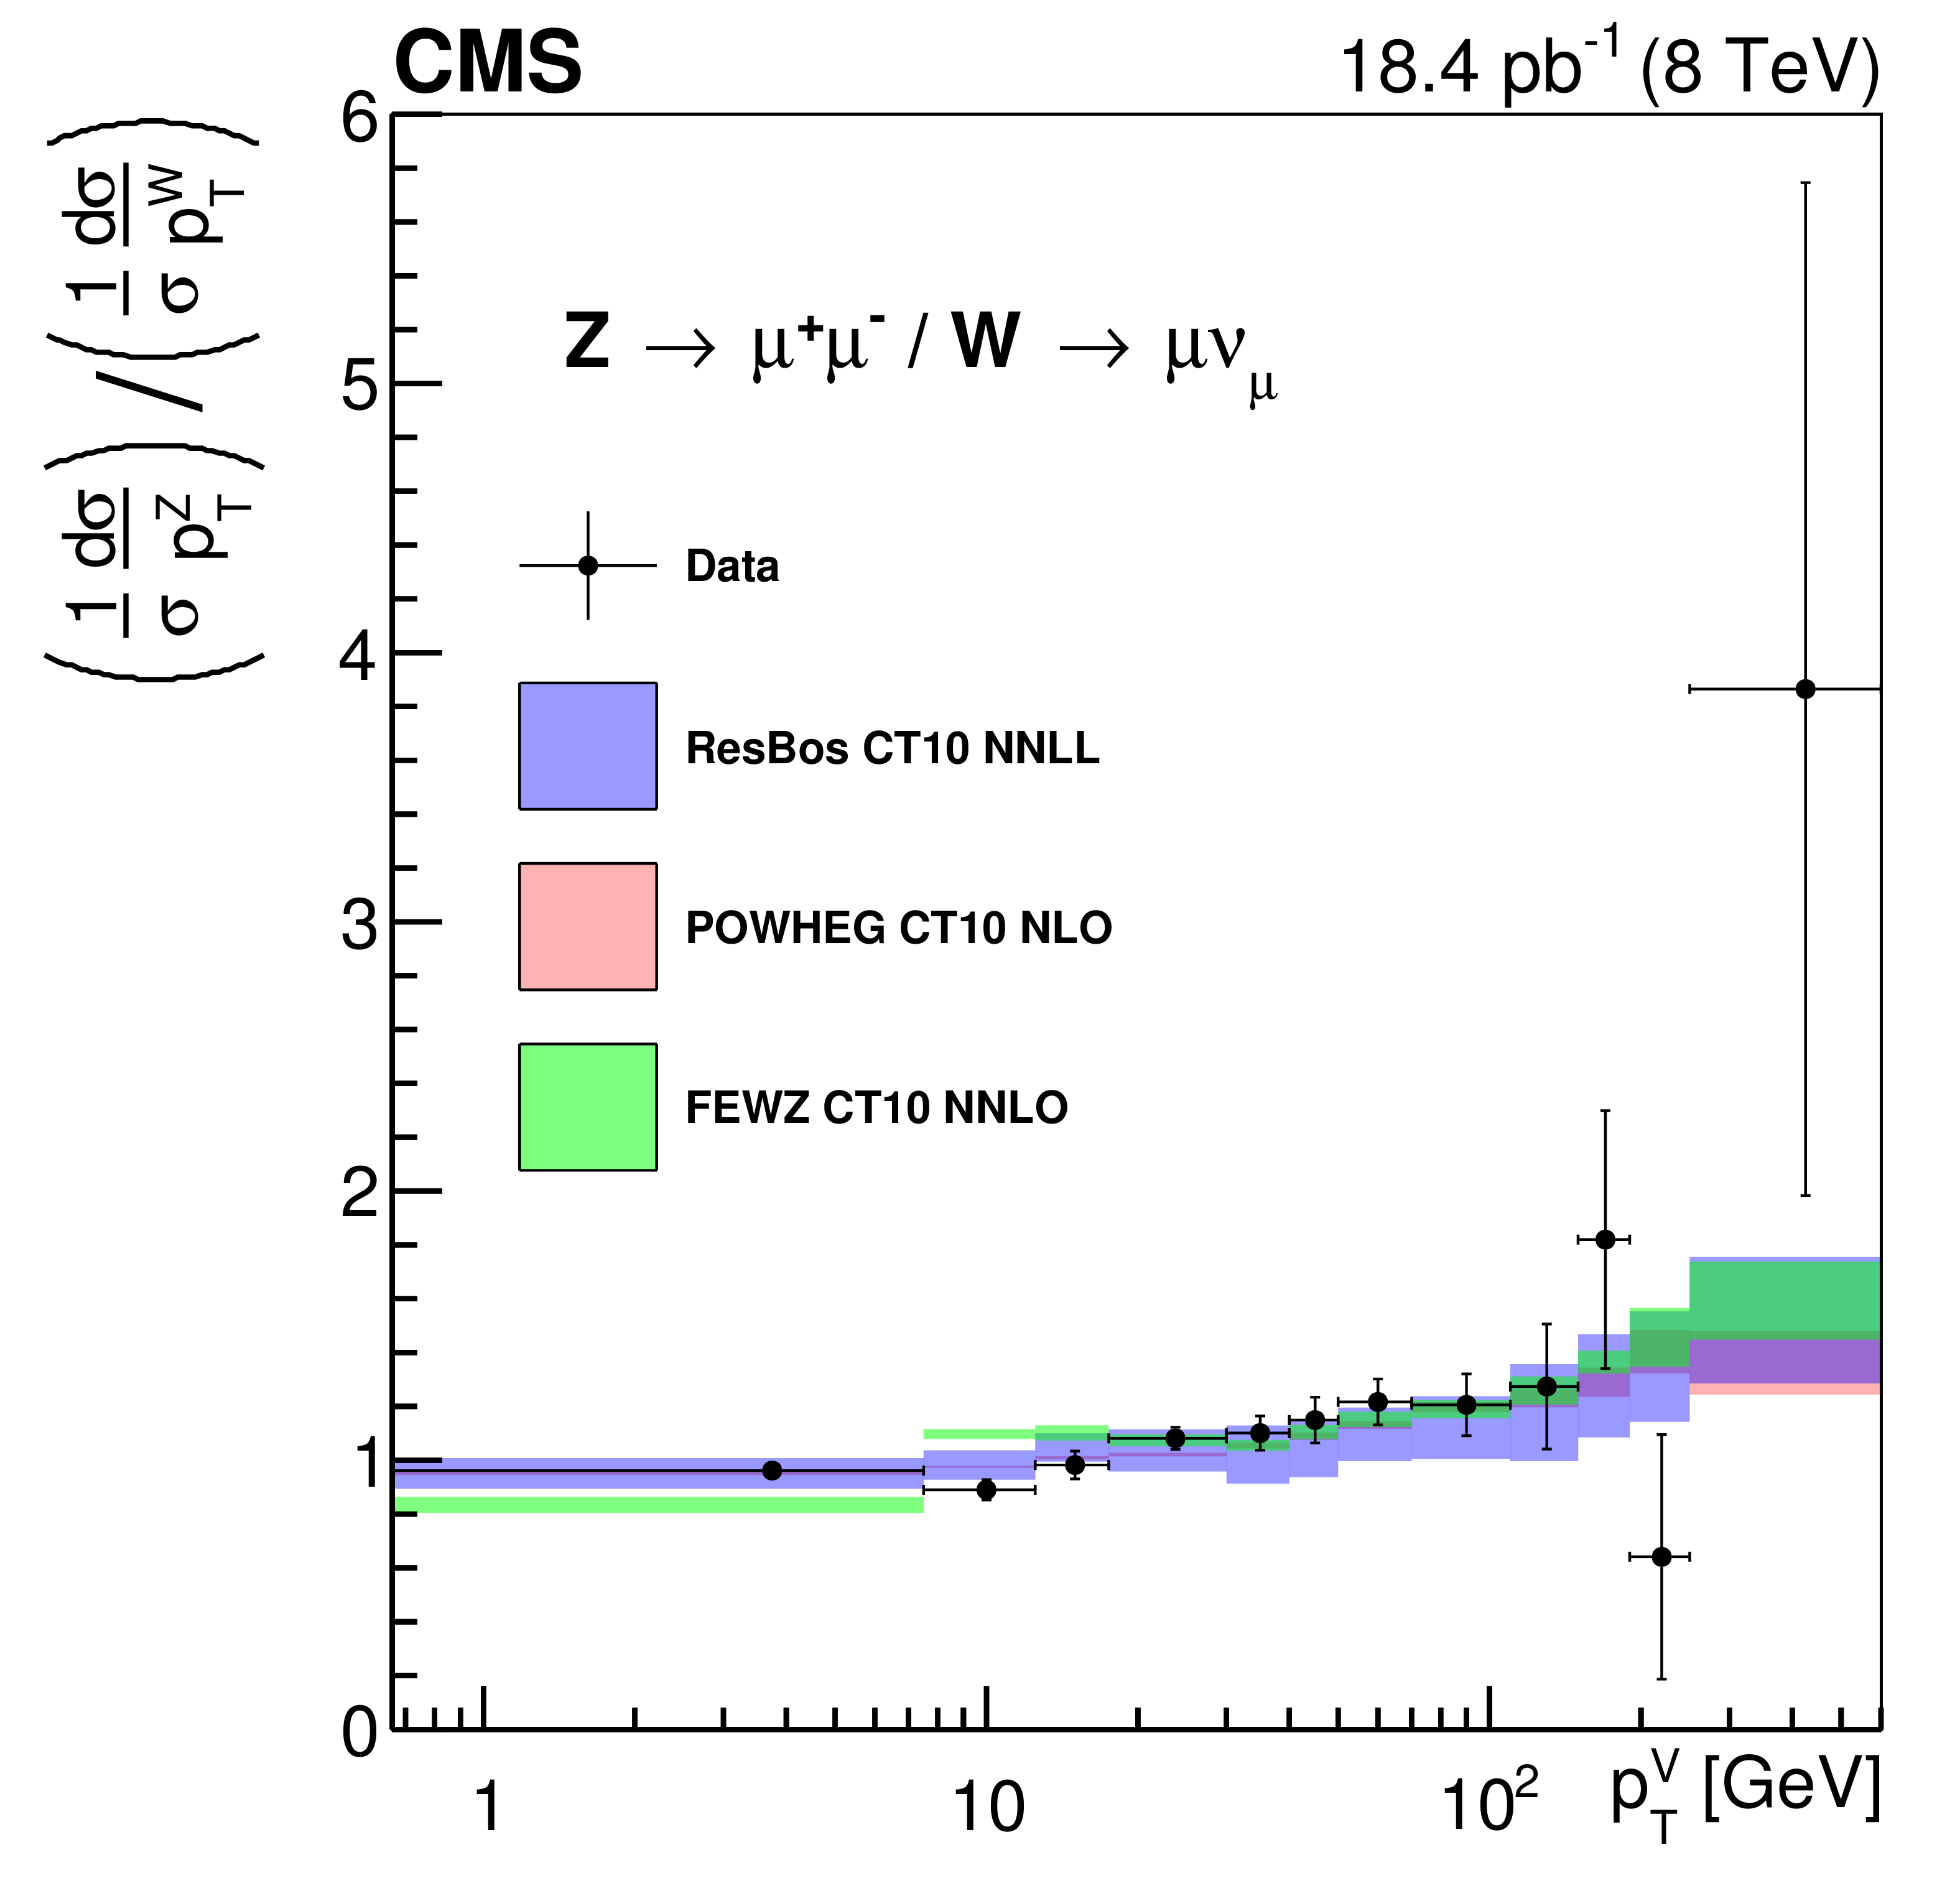
Figure 7-a:
The normalized $ {p_{\mathrm {T}}} $ differential cross section ratio of $\mathrm{ Z } $ to W for muon channel compared with theoretical predictions. |
png pdf |
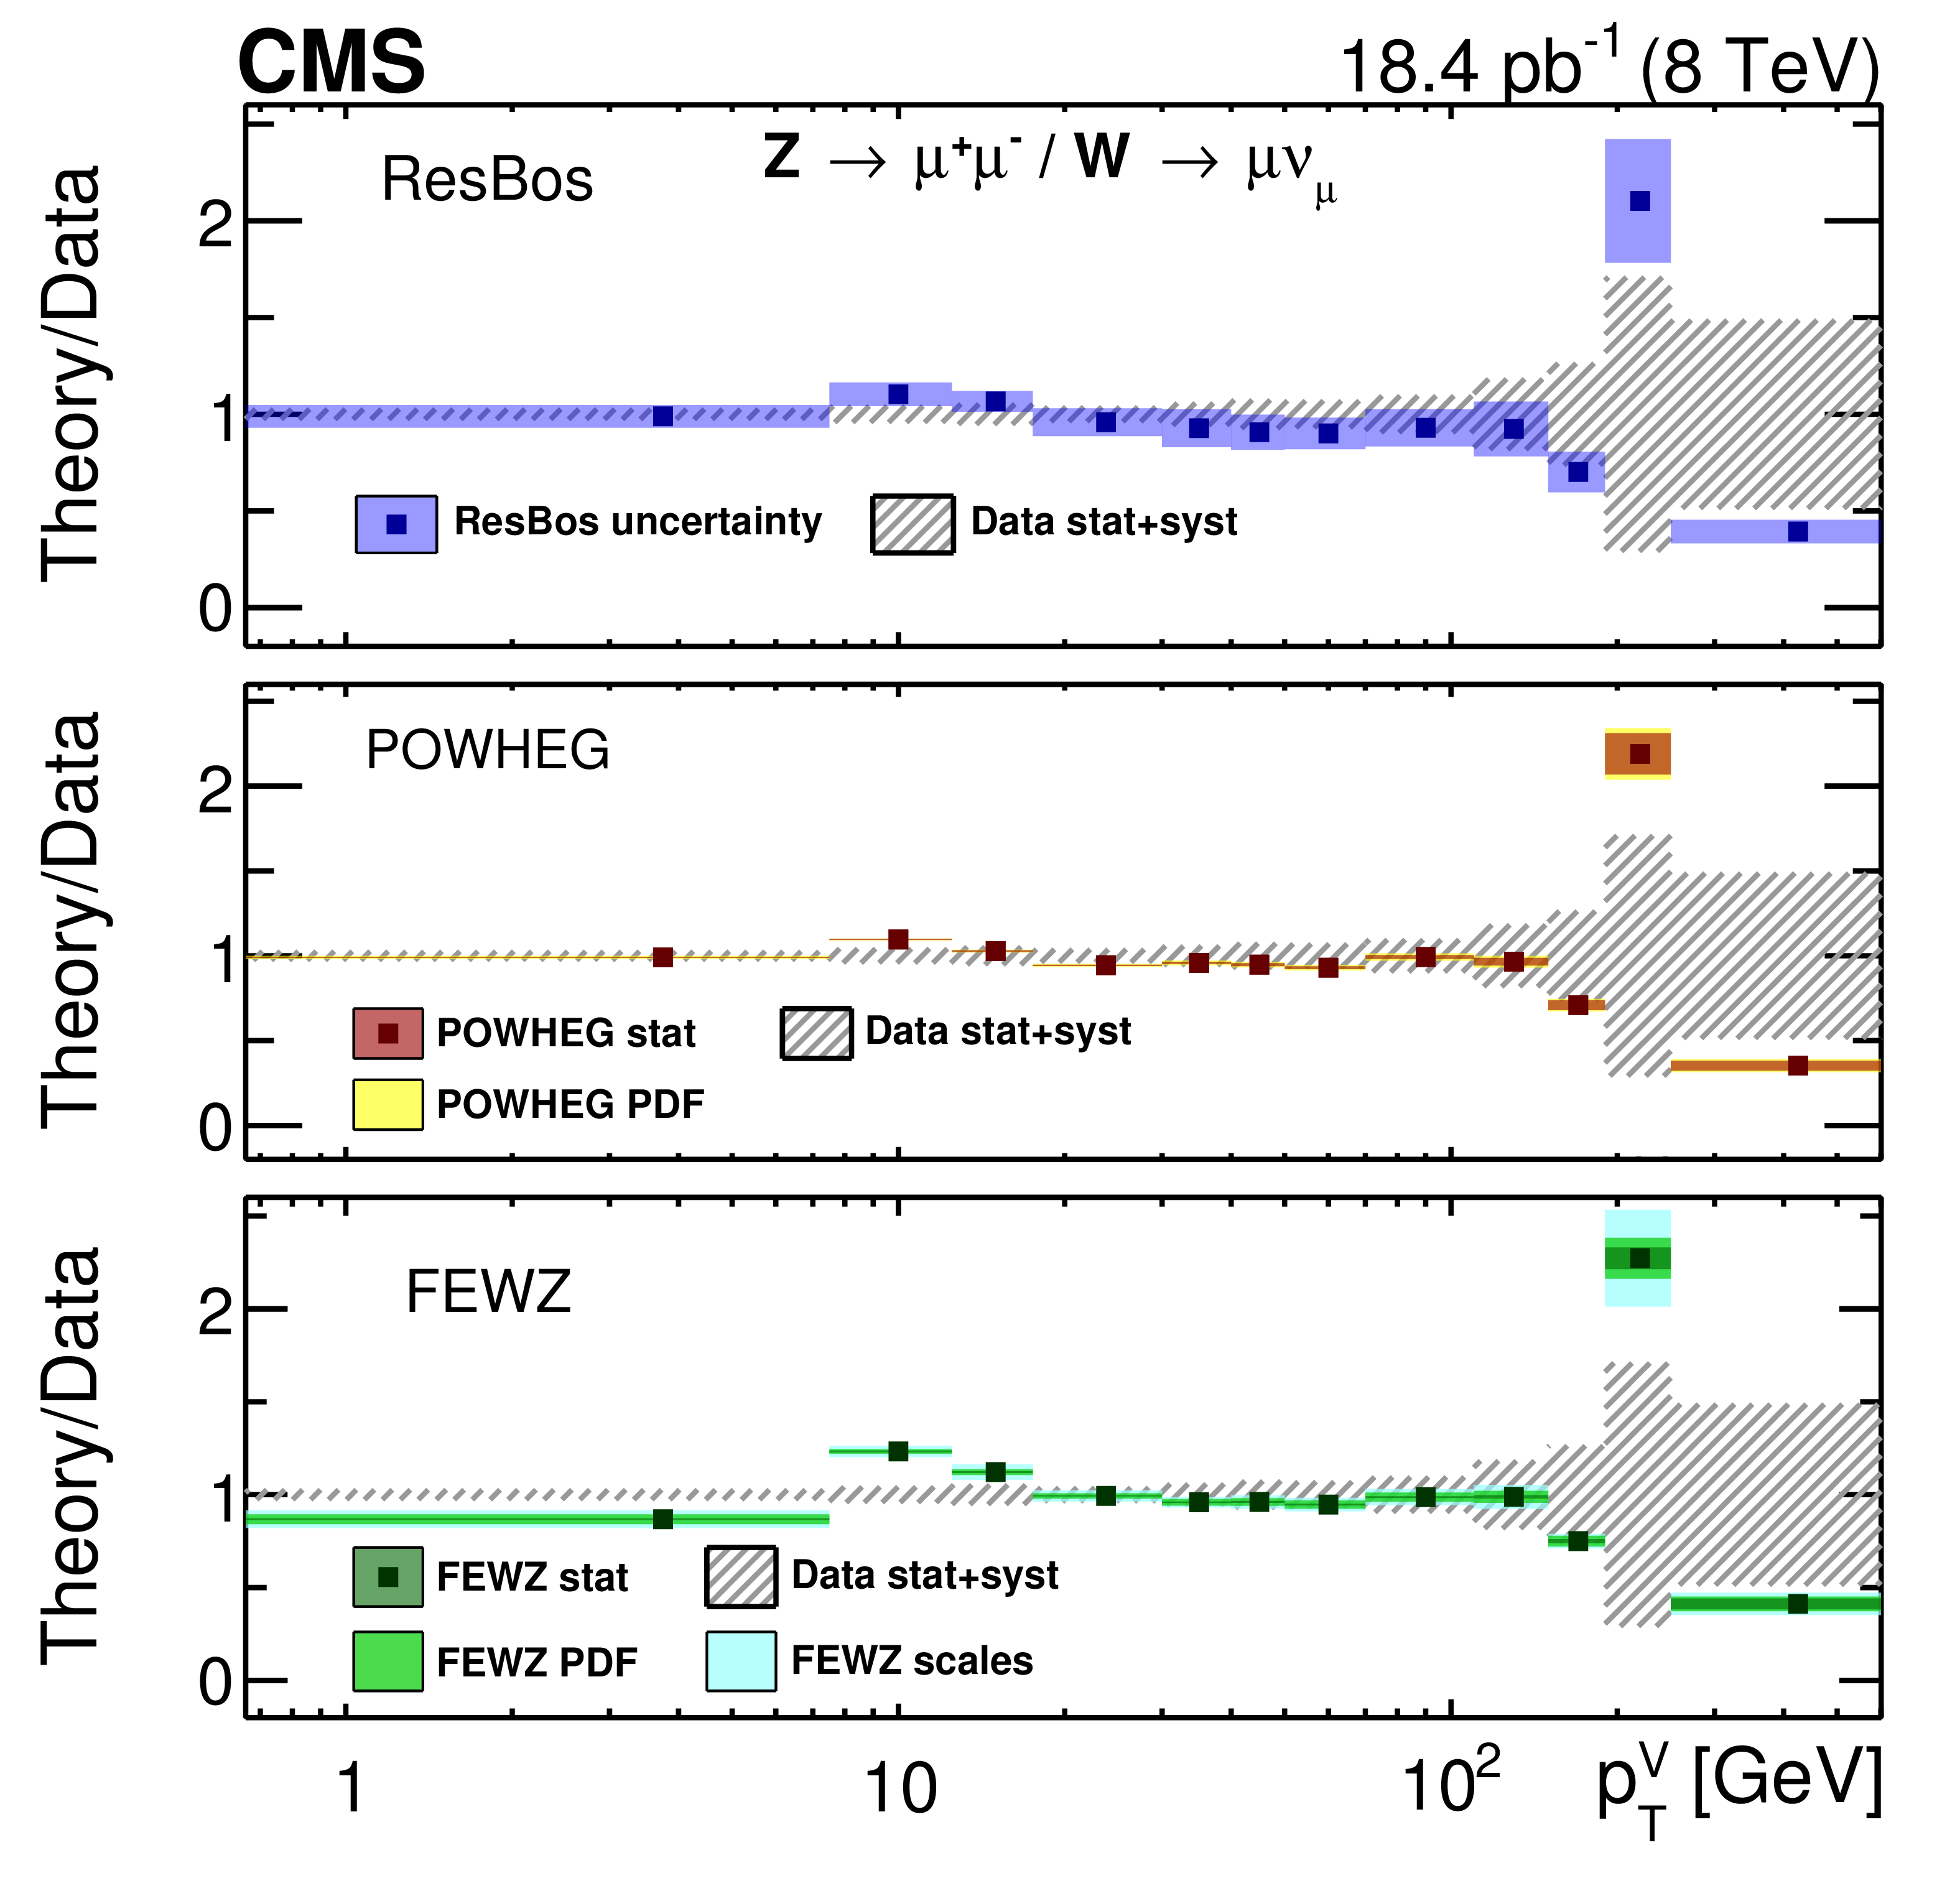
Figure 7-b:
The normalized $ {p_{\mathrm {T}}} $ differential cross section ratio of $\mathrm{ Z } $ to W for muon channel compared with theoretical predictions. The panel shows the ratios of theory predictions to the data. The larger than expected uncertainties for ResBos arise from the different strategies in terms of the scale and PDF variations between ResBos-P and ResBos-CP version. More details are given in the Fig. 4 and 5 caption. |
png pdf |
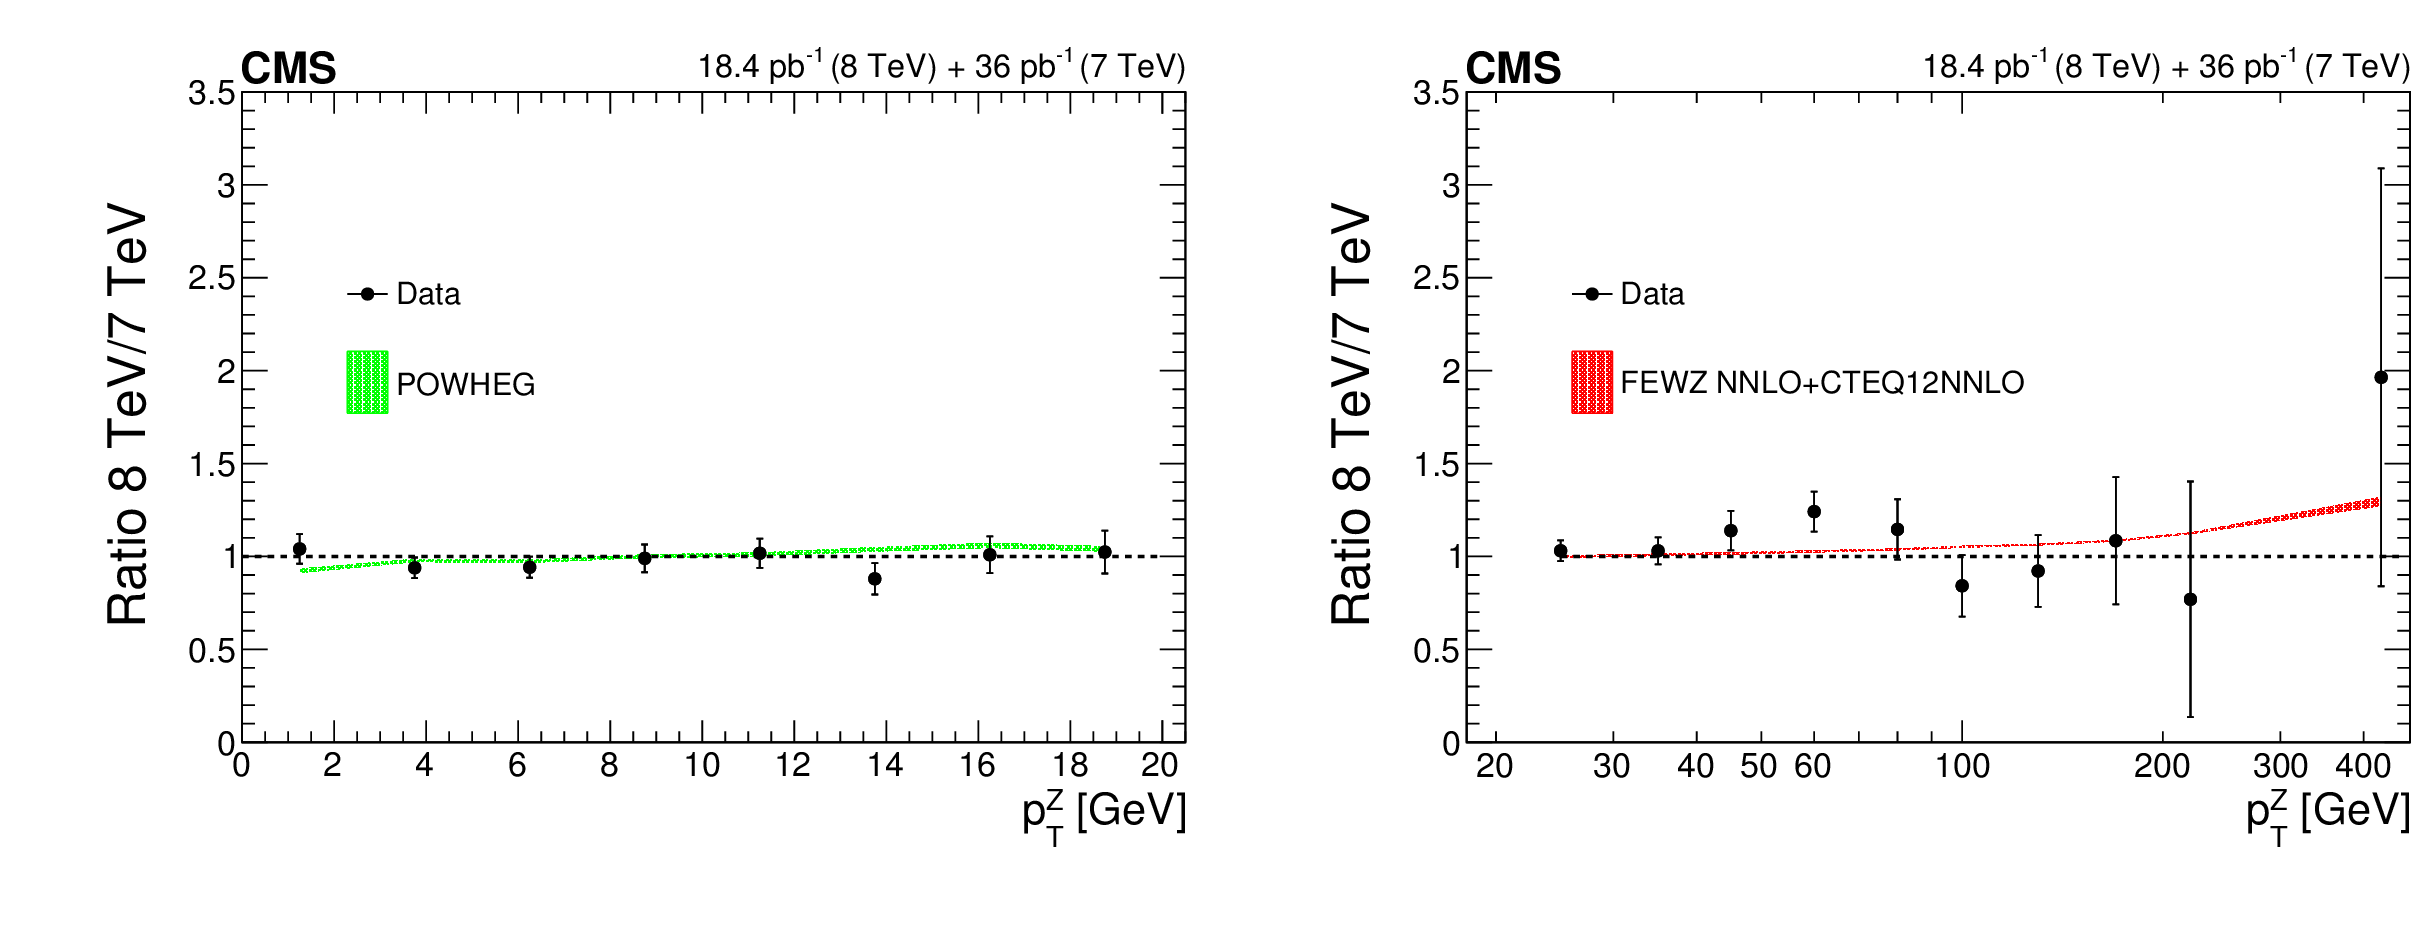
Figure 8:
Comparison of the shapes of the differential $ { {p_{\mathrm {T}}} ^{\mathrm {Z}}}$ distributions in the muon channel at centre-of-mass energies of 7 and 8 TeV compared with the predictions from POWHEG for $ { {p_{\mathrm {T}}} ^{\mathrm {Z}}}< $ 20 GeV and FEWZ for $ { {p_{\mathrm {T}}} ^{\mathrm {Z}}}> $ 20 GeV. |
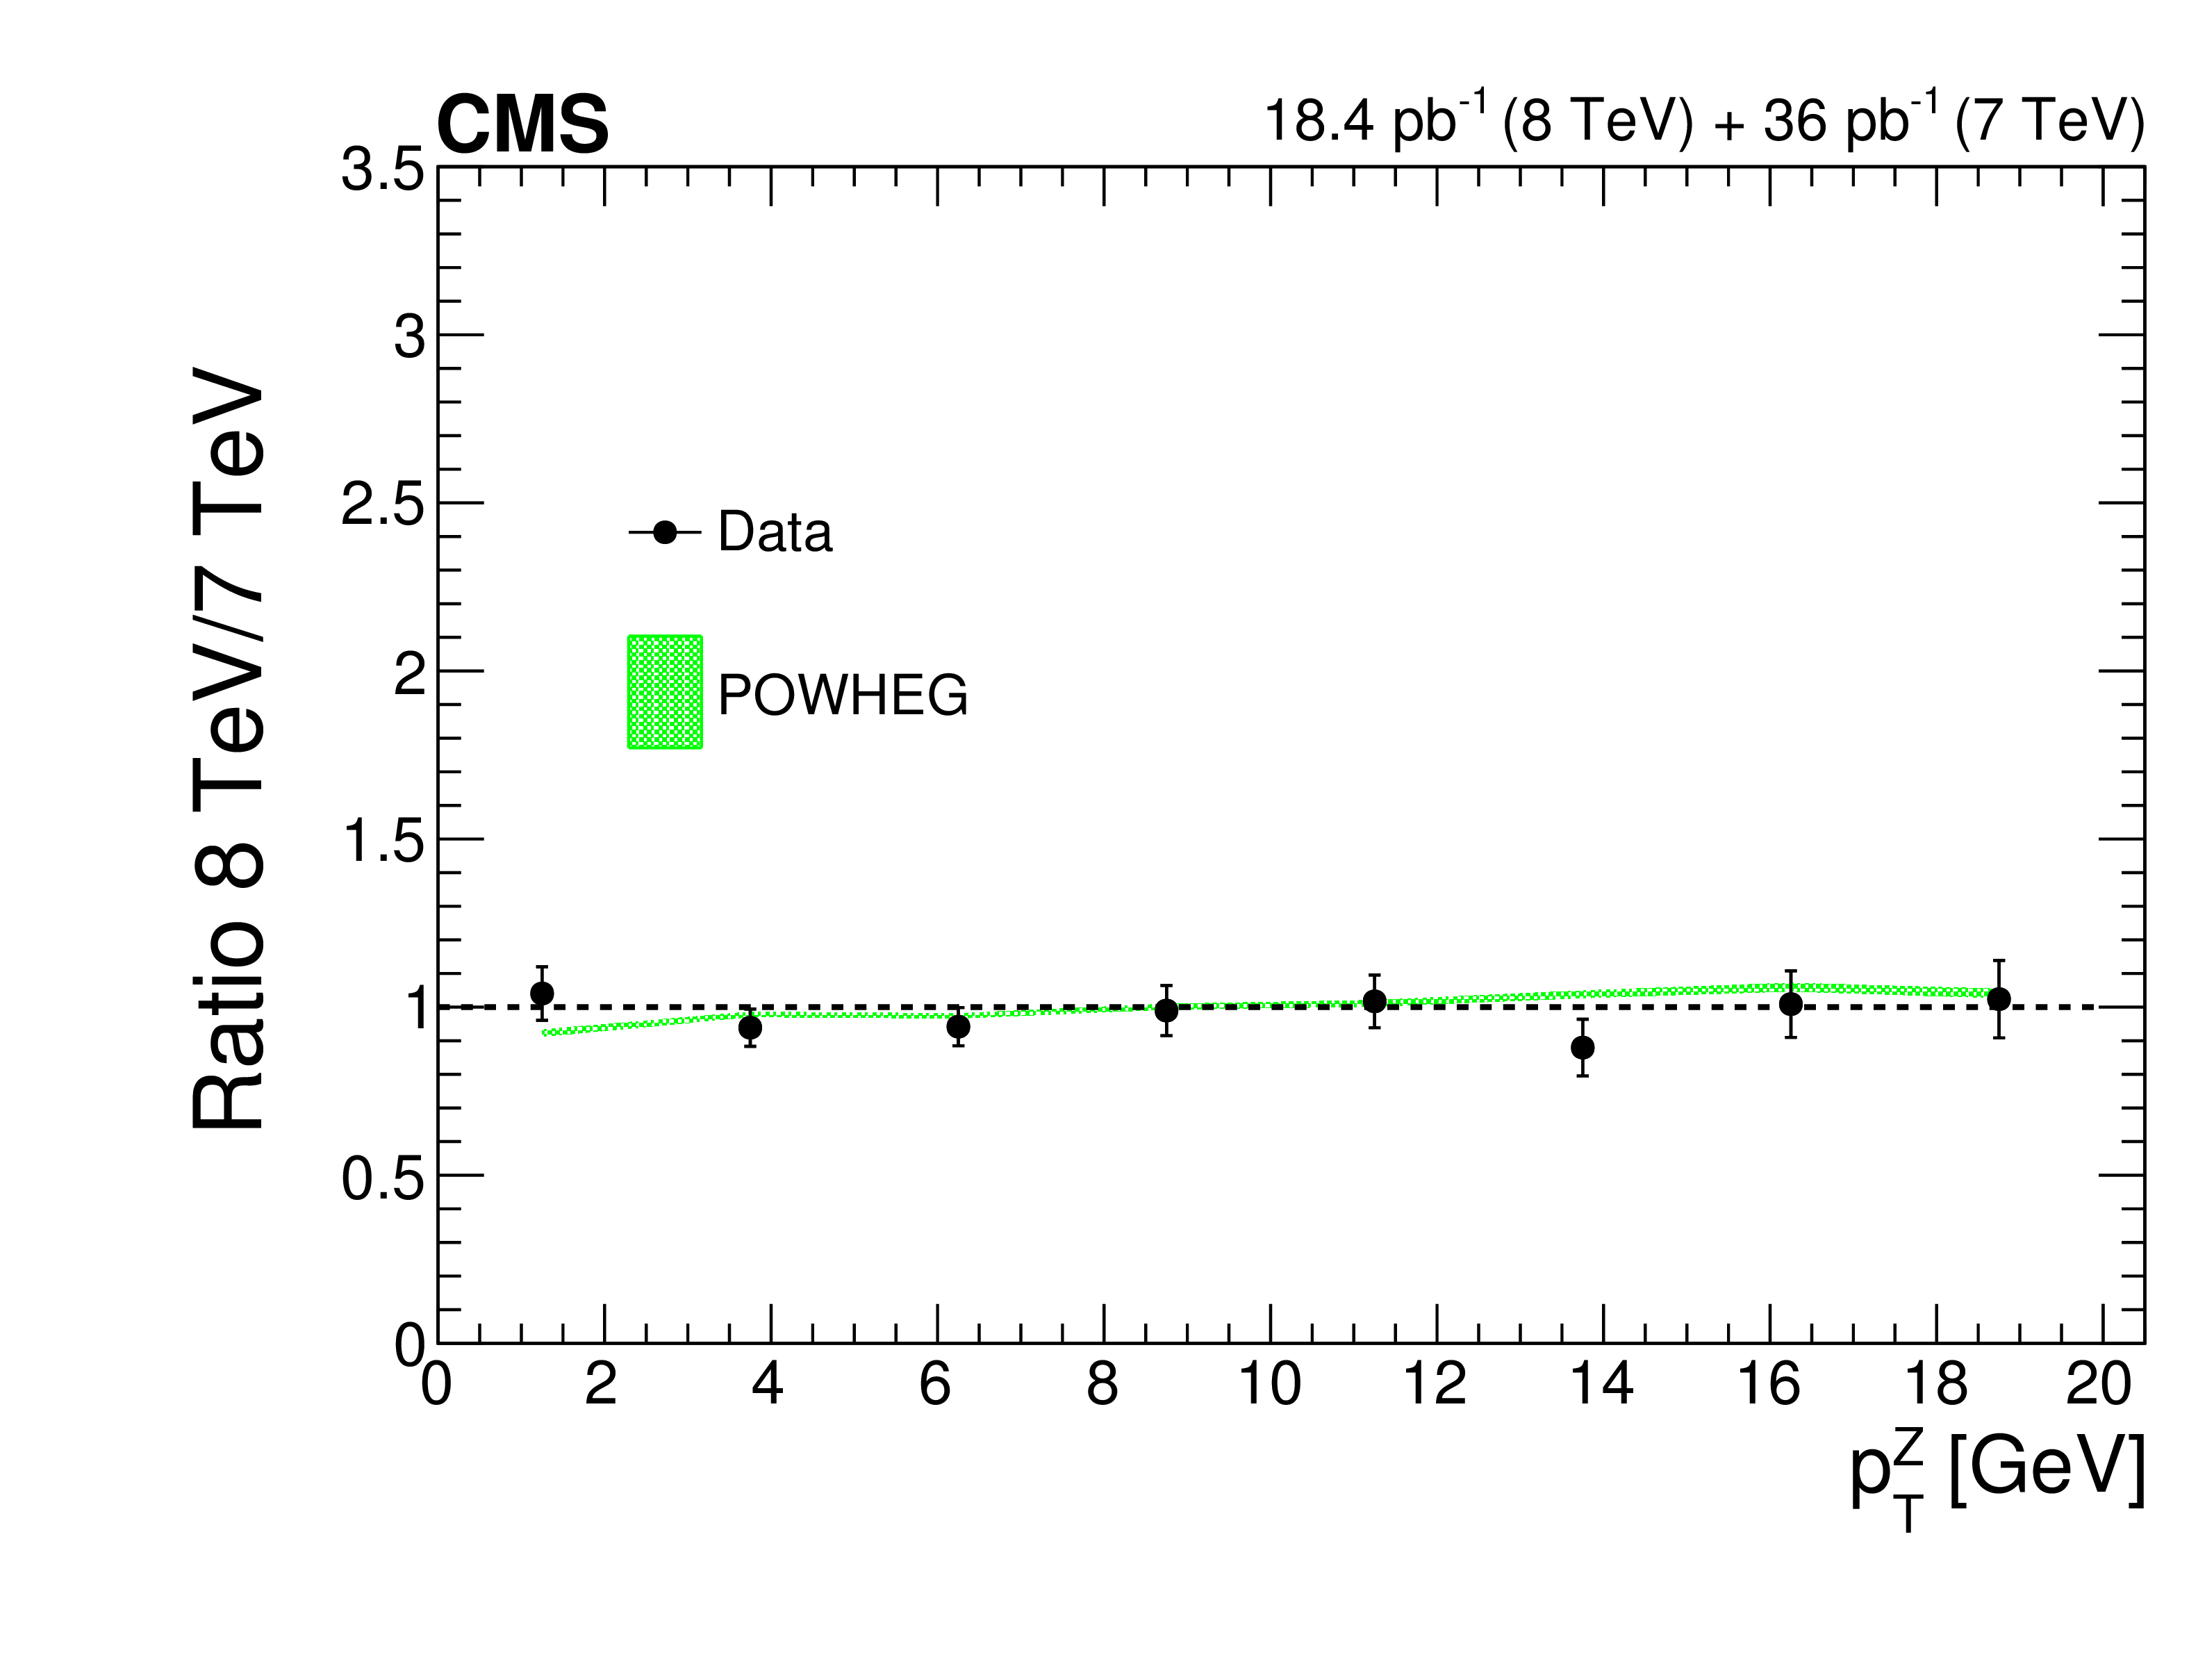
png pdf |
Figure 8-a:
Comparison of the shapes of the differential $ { {p_{\mathrm {T}}} ^{\mathrm {Z}}}$ distributions in the muon channel at centre-of-mass energies of 7 and 8 TeV compared with the predictions from POWHEG for $ { {p_{\mathrm {T}}} ^{\mathrm {Z}}}< $ 20 GeV. |
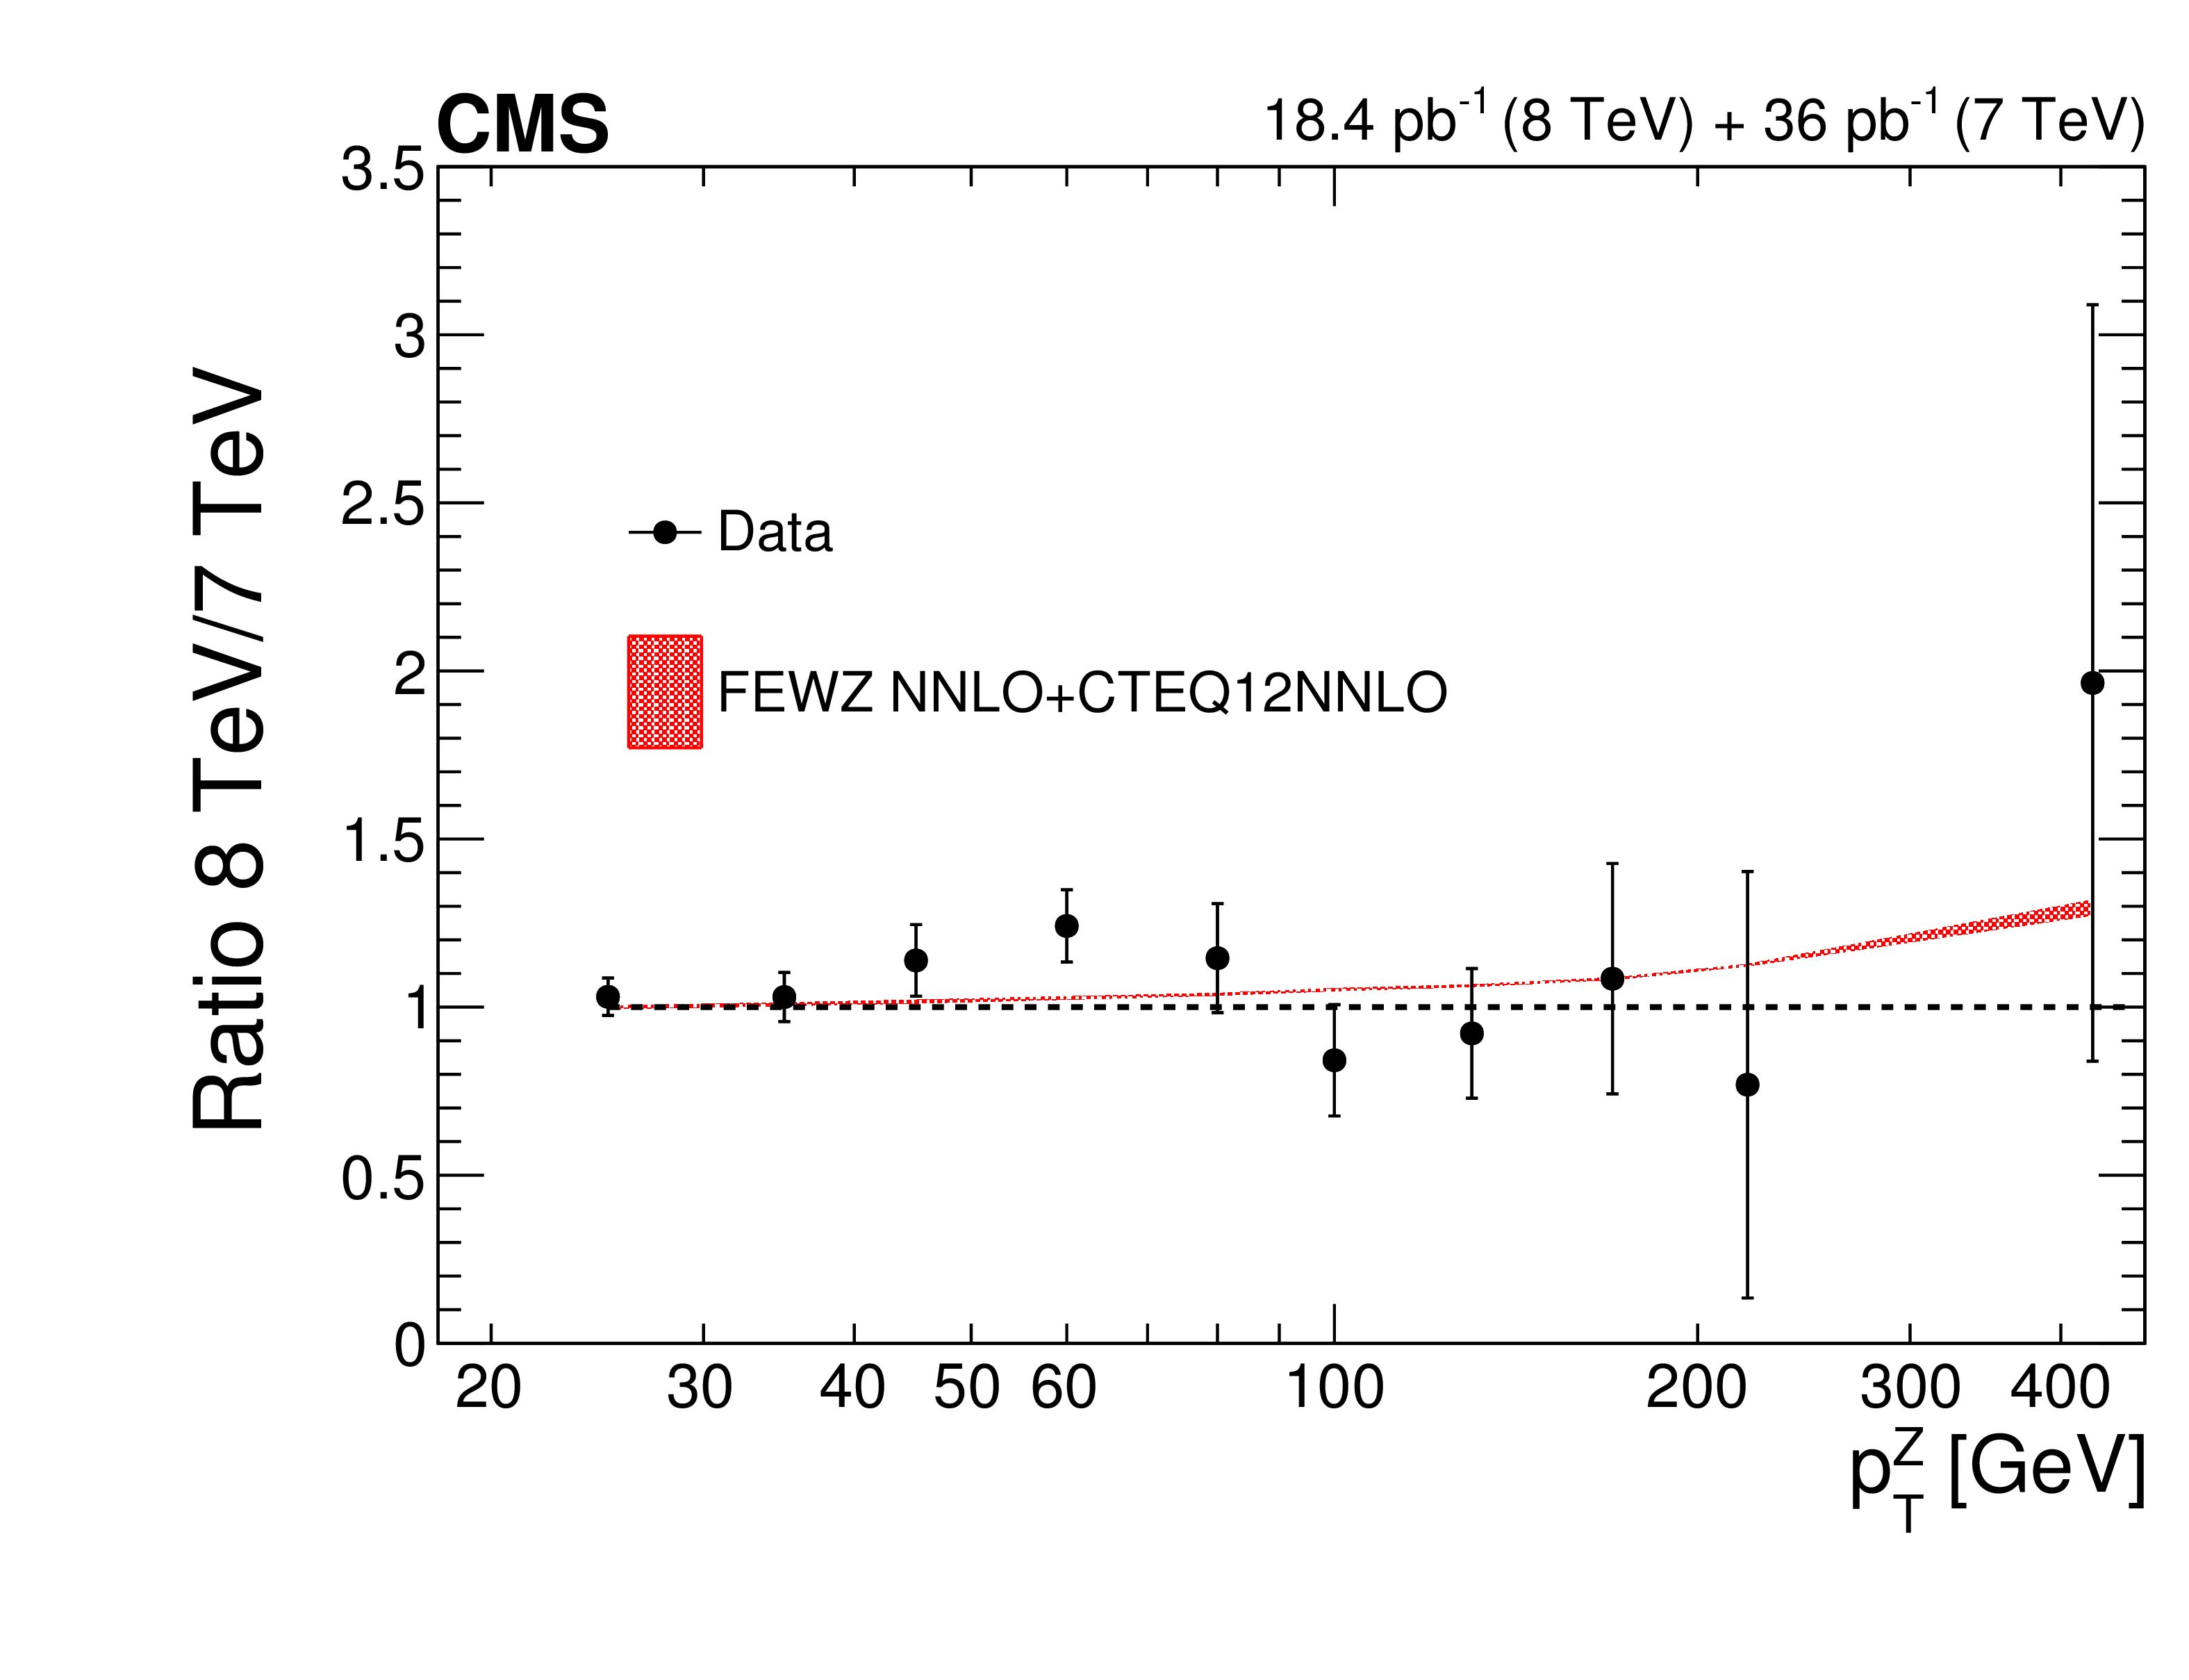
png pdf |
Figure 8-b:
Comparison of the shapes of the differential $ { {p_{\mathrm {T}}} ^{\mathrm {Z}}}$ distributions in the muon channel at centre-of-mass energies of 7 and 8 TeV compared with the predictions from FEWZ for $ { {p_{\mathrm {T}}} ^{\mathrm {Z}}}> $ 20 GeV. |
| Tables | |
png pdf |
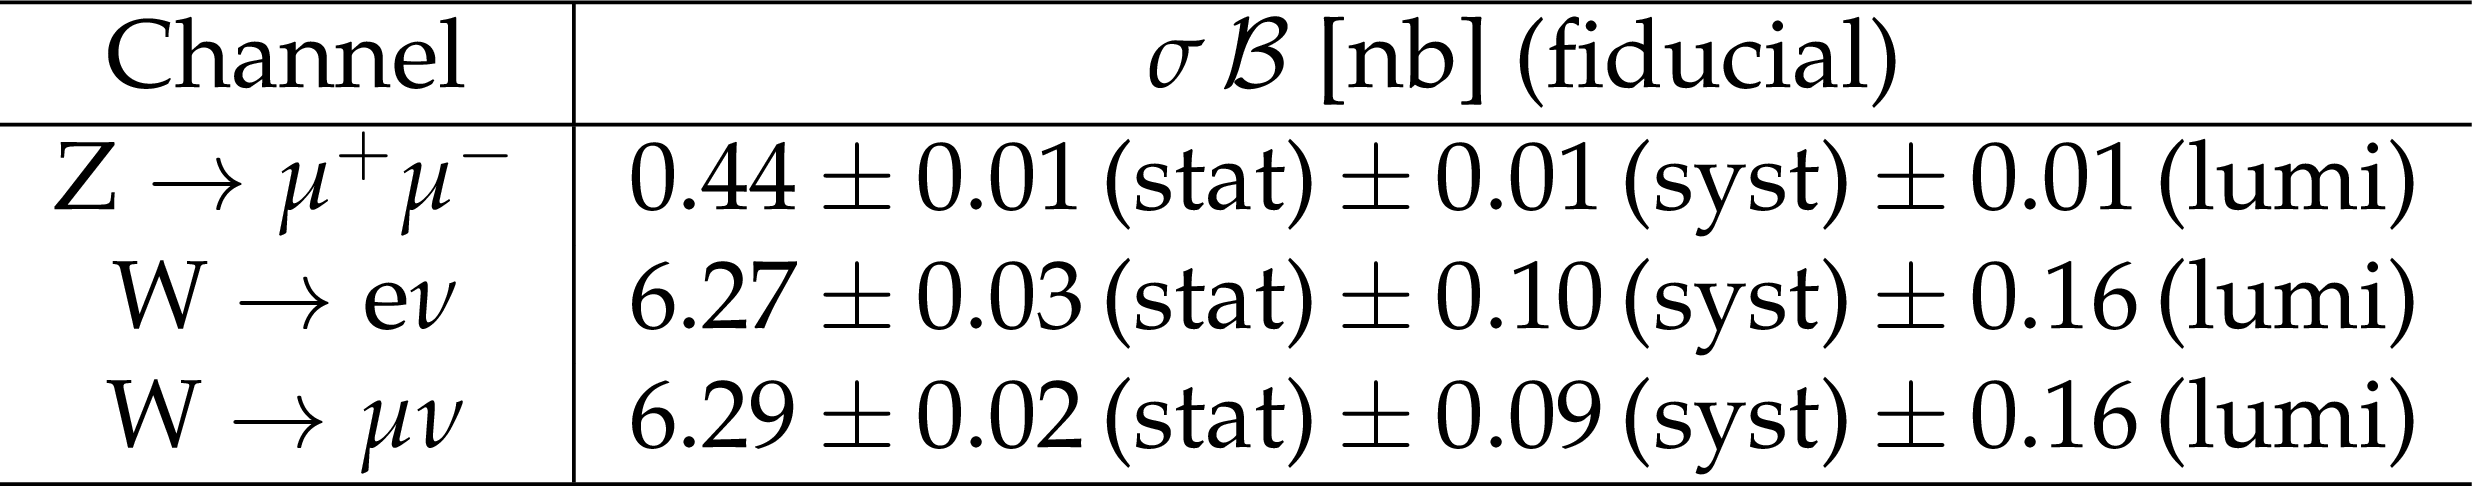
Table 1:
The fiducial cross sections at pre-FSR level calculated as the sum of differential cross sections. The fiducial volumes are defined in the text. |
png pdf |
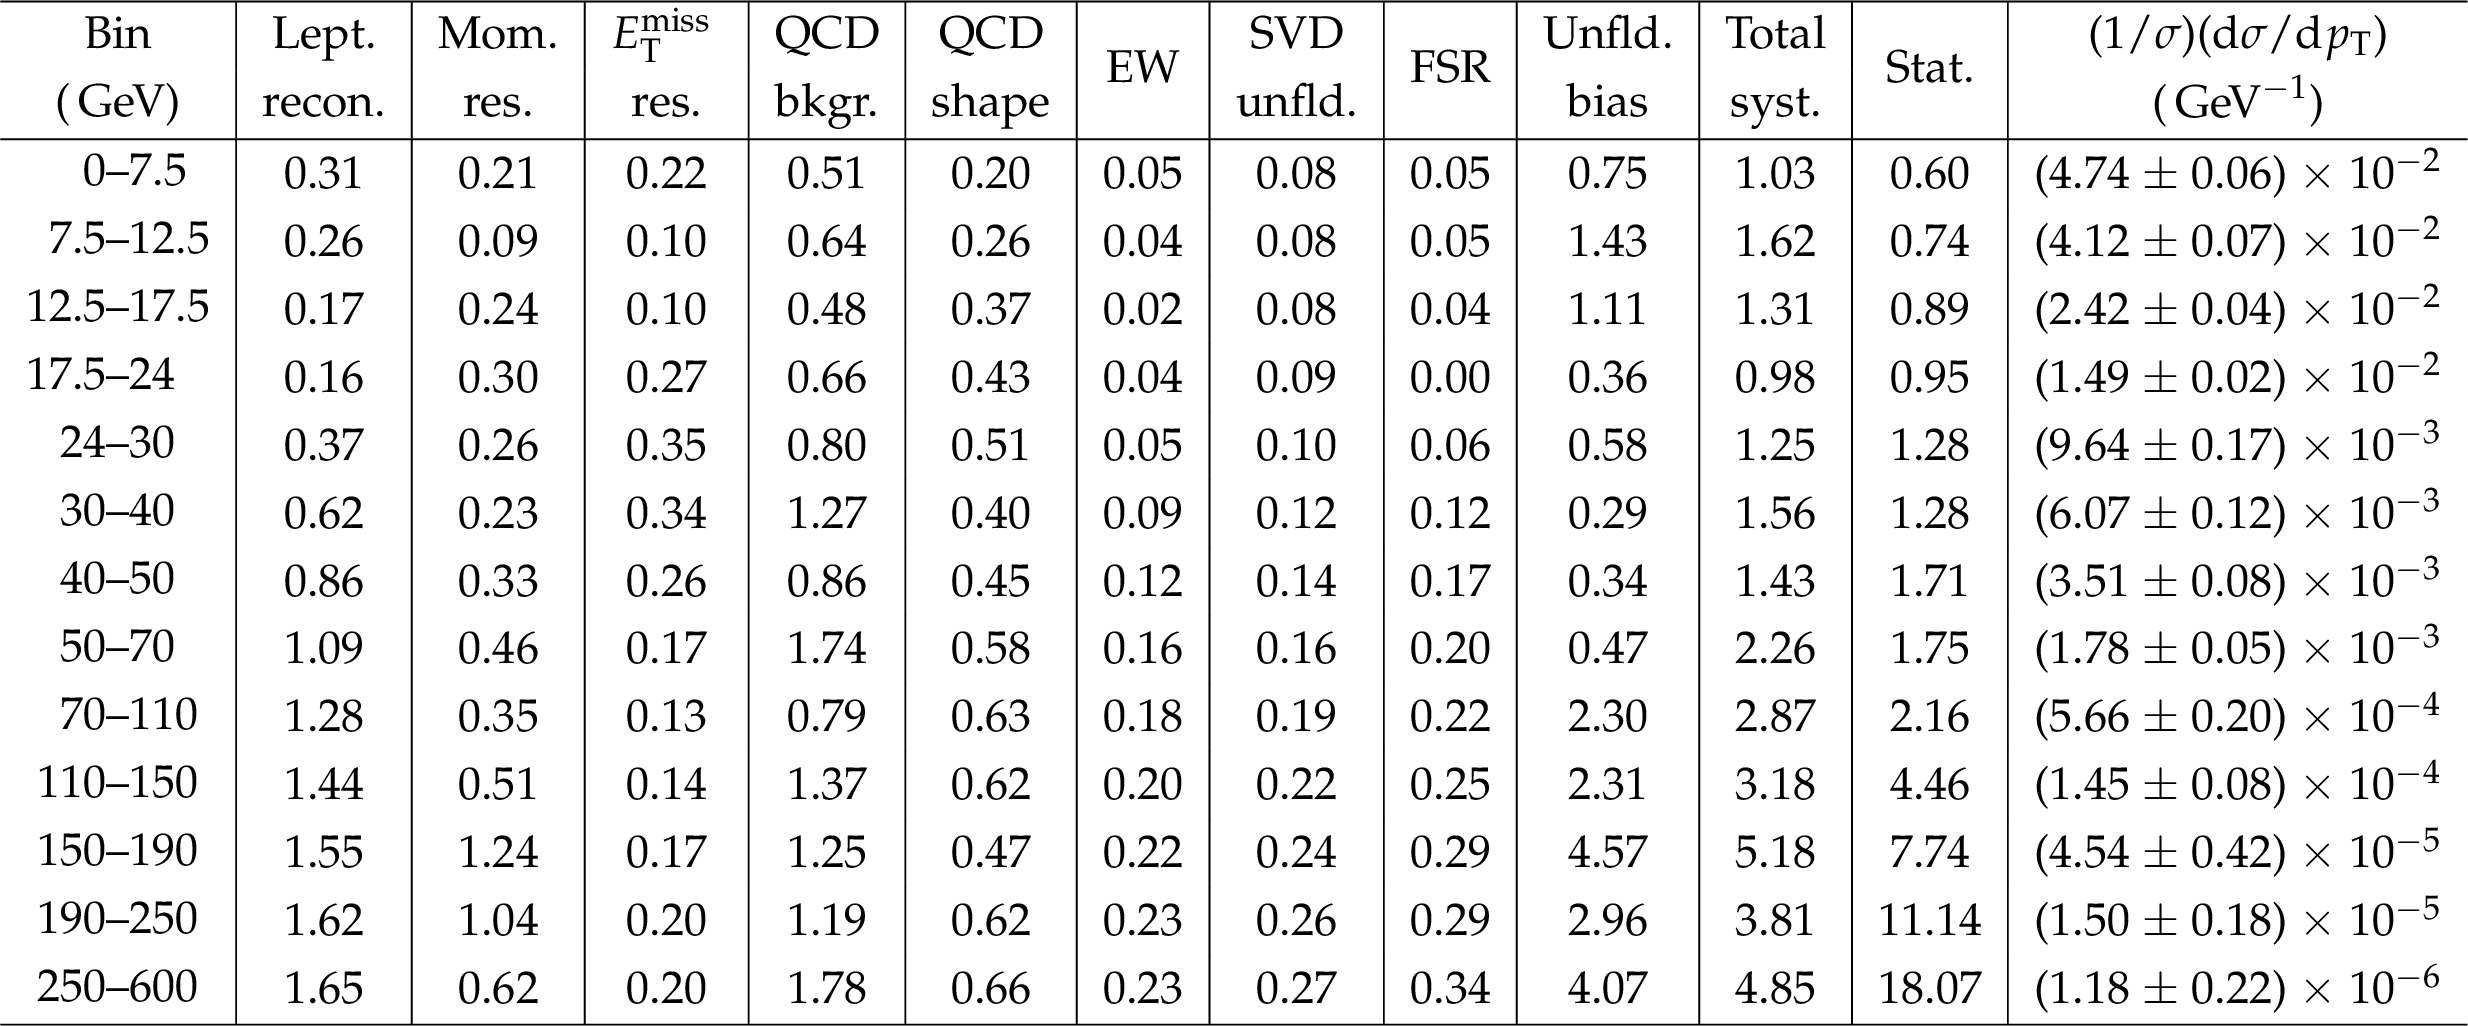
Table 2:
The W boson normalized differential cross sections for the electron channel in bins of $ { {p_{\mathrm {T}}} ^{\mathrm {W}}}$, (1/$\sigma $)(d$\sigma $/d$ {p_{\mathrm {T}}} $) ($\mathrm{ W } \rightarrow \mathrm{ e } \nu $), and systematic uncertainties from various sources in units of %, where $\sigma $ is the sum of the cross sections for the $ { {p_{\mathrm {T}}} ^{\mathrm {W}}}$ bins. (1/$\sigma $)(d$\sigma $/d$ {p_{\mathrm {T}}} $) is shown with total uncertainty, i.e. the sum of statistical and systematic uncertainties in quadrature. |
png pdf |
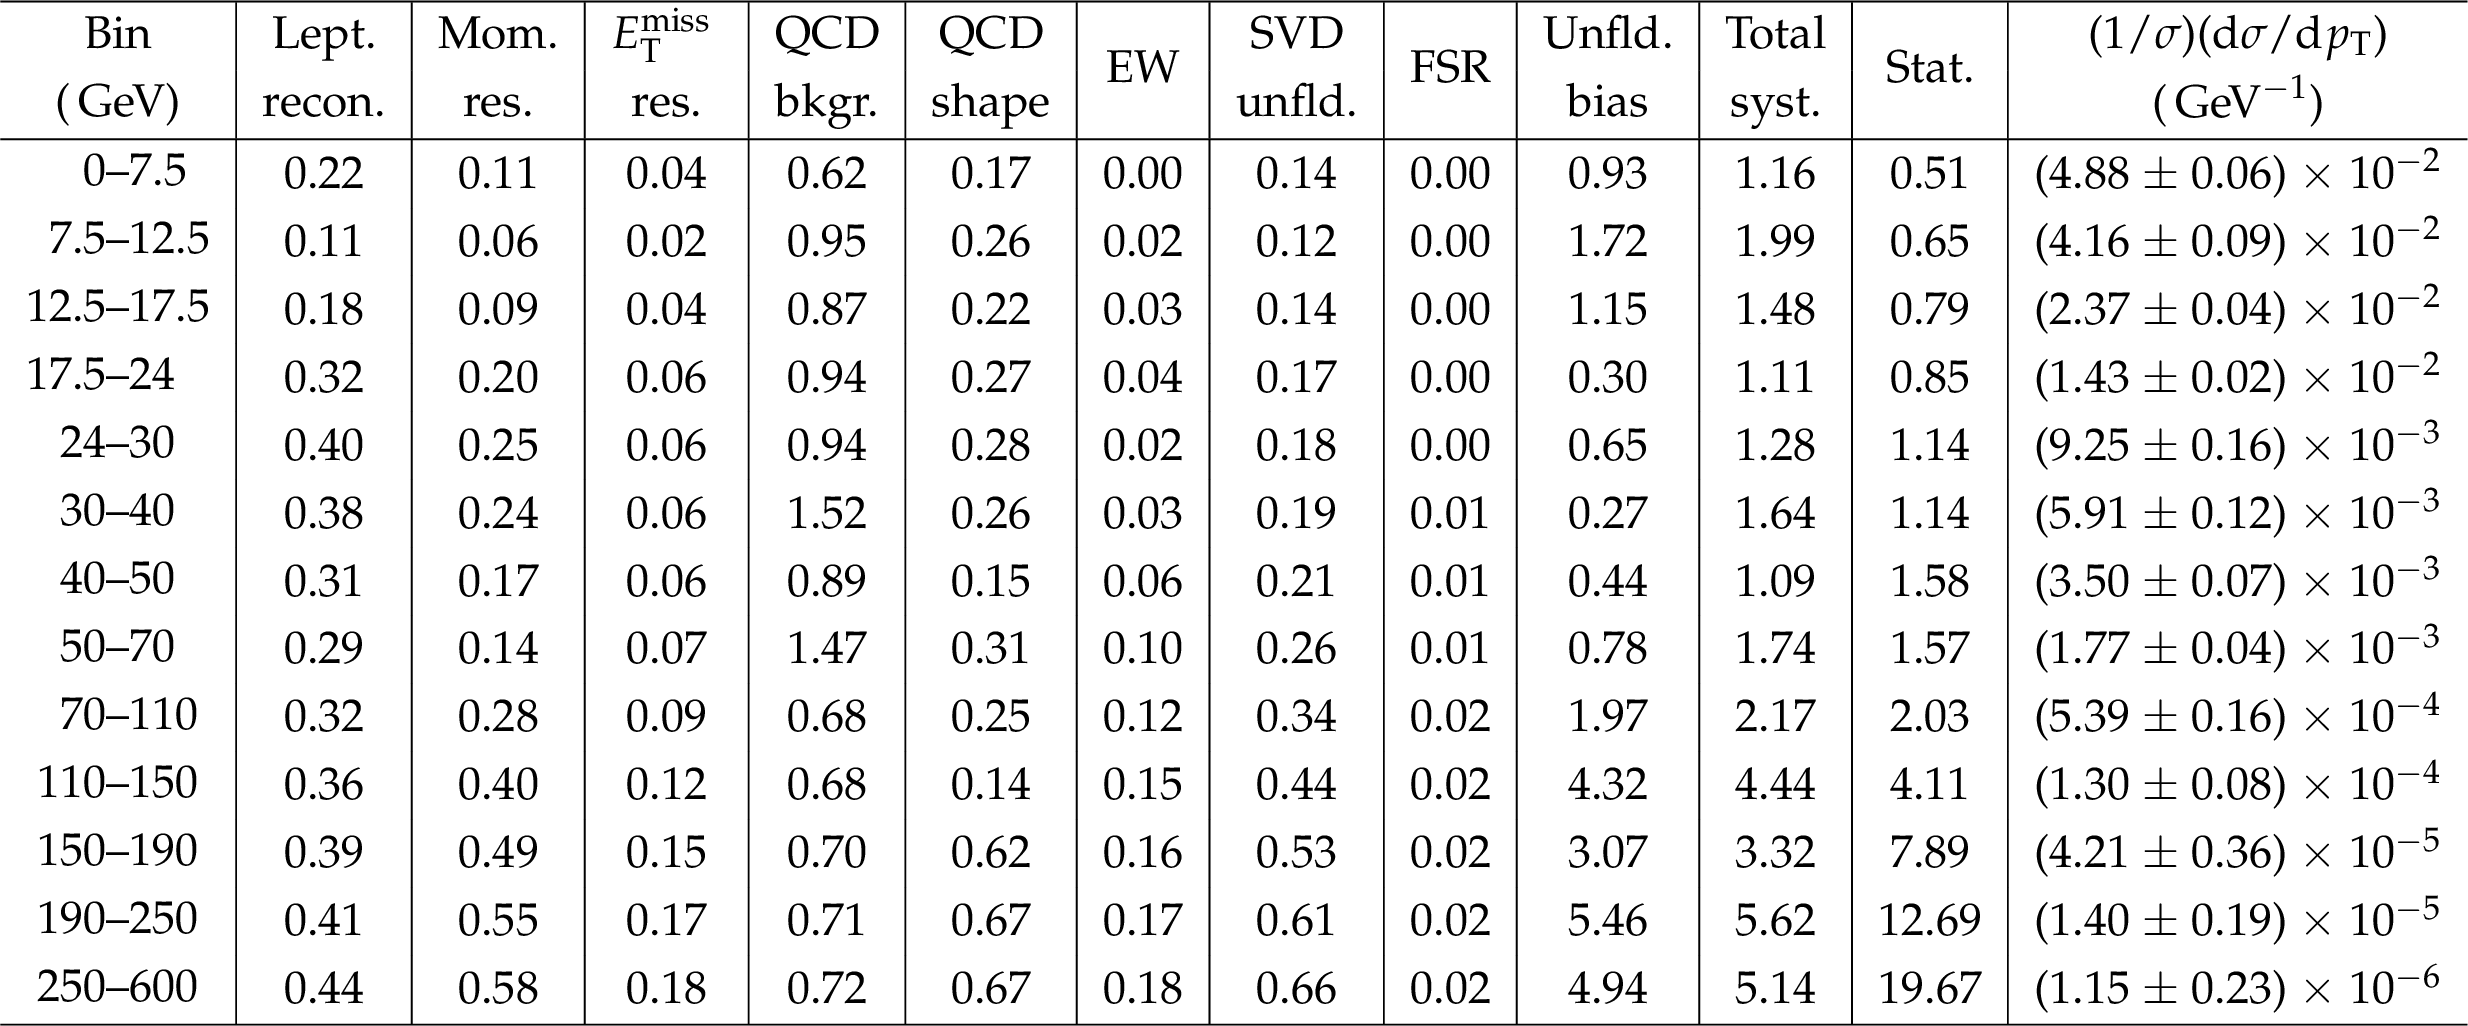
Table 3:
The W boson normalized differential cross sections for the muon channel in bins of $ { {p_{\mathrm {T}}} ^{\mathrm {W}}}$, (1/$\sigma $)(d$\sigma $/d$ {p_{\mathrm {T}}} $) ($\mathrm{ W } \rightarrow \mu \nu $), and systematic uncertainties from various sources in units of%. Other details are the same as in Table 1. |
png pdf |
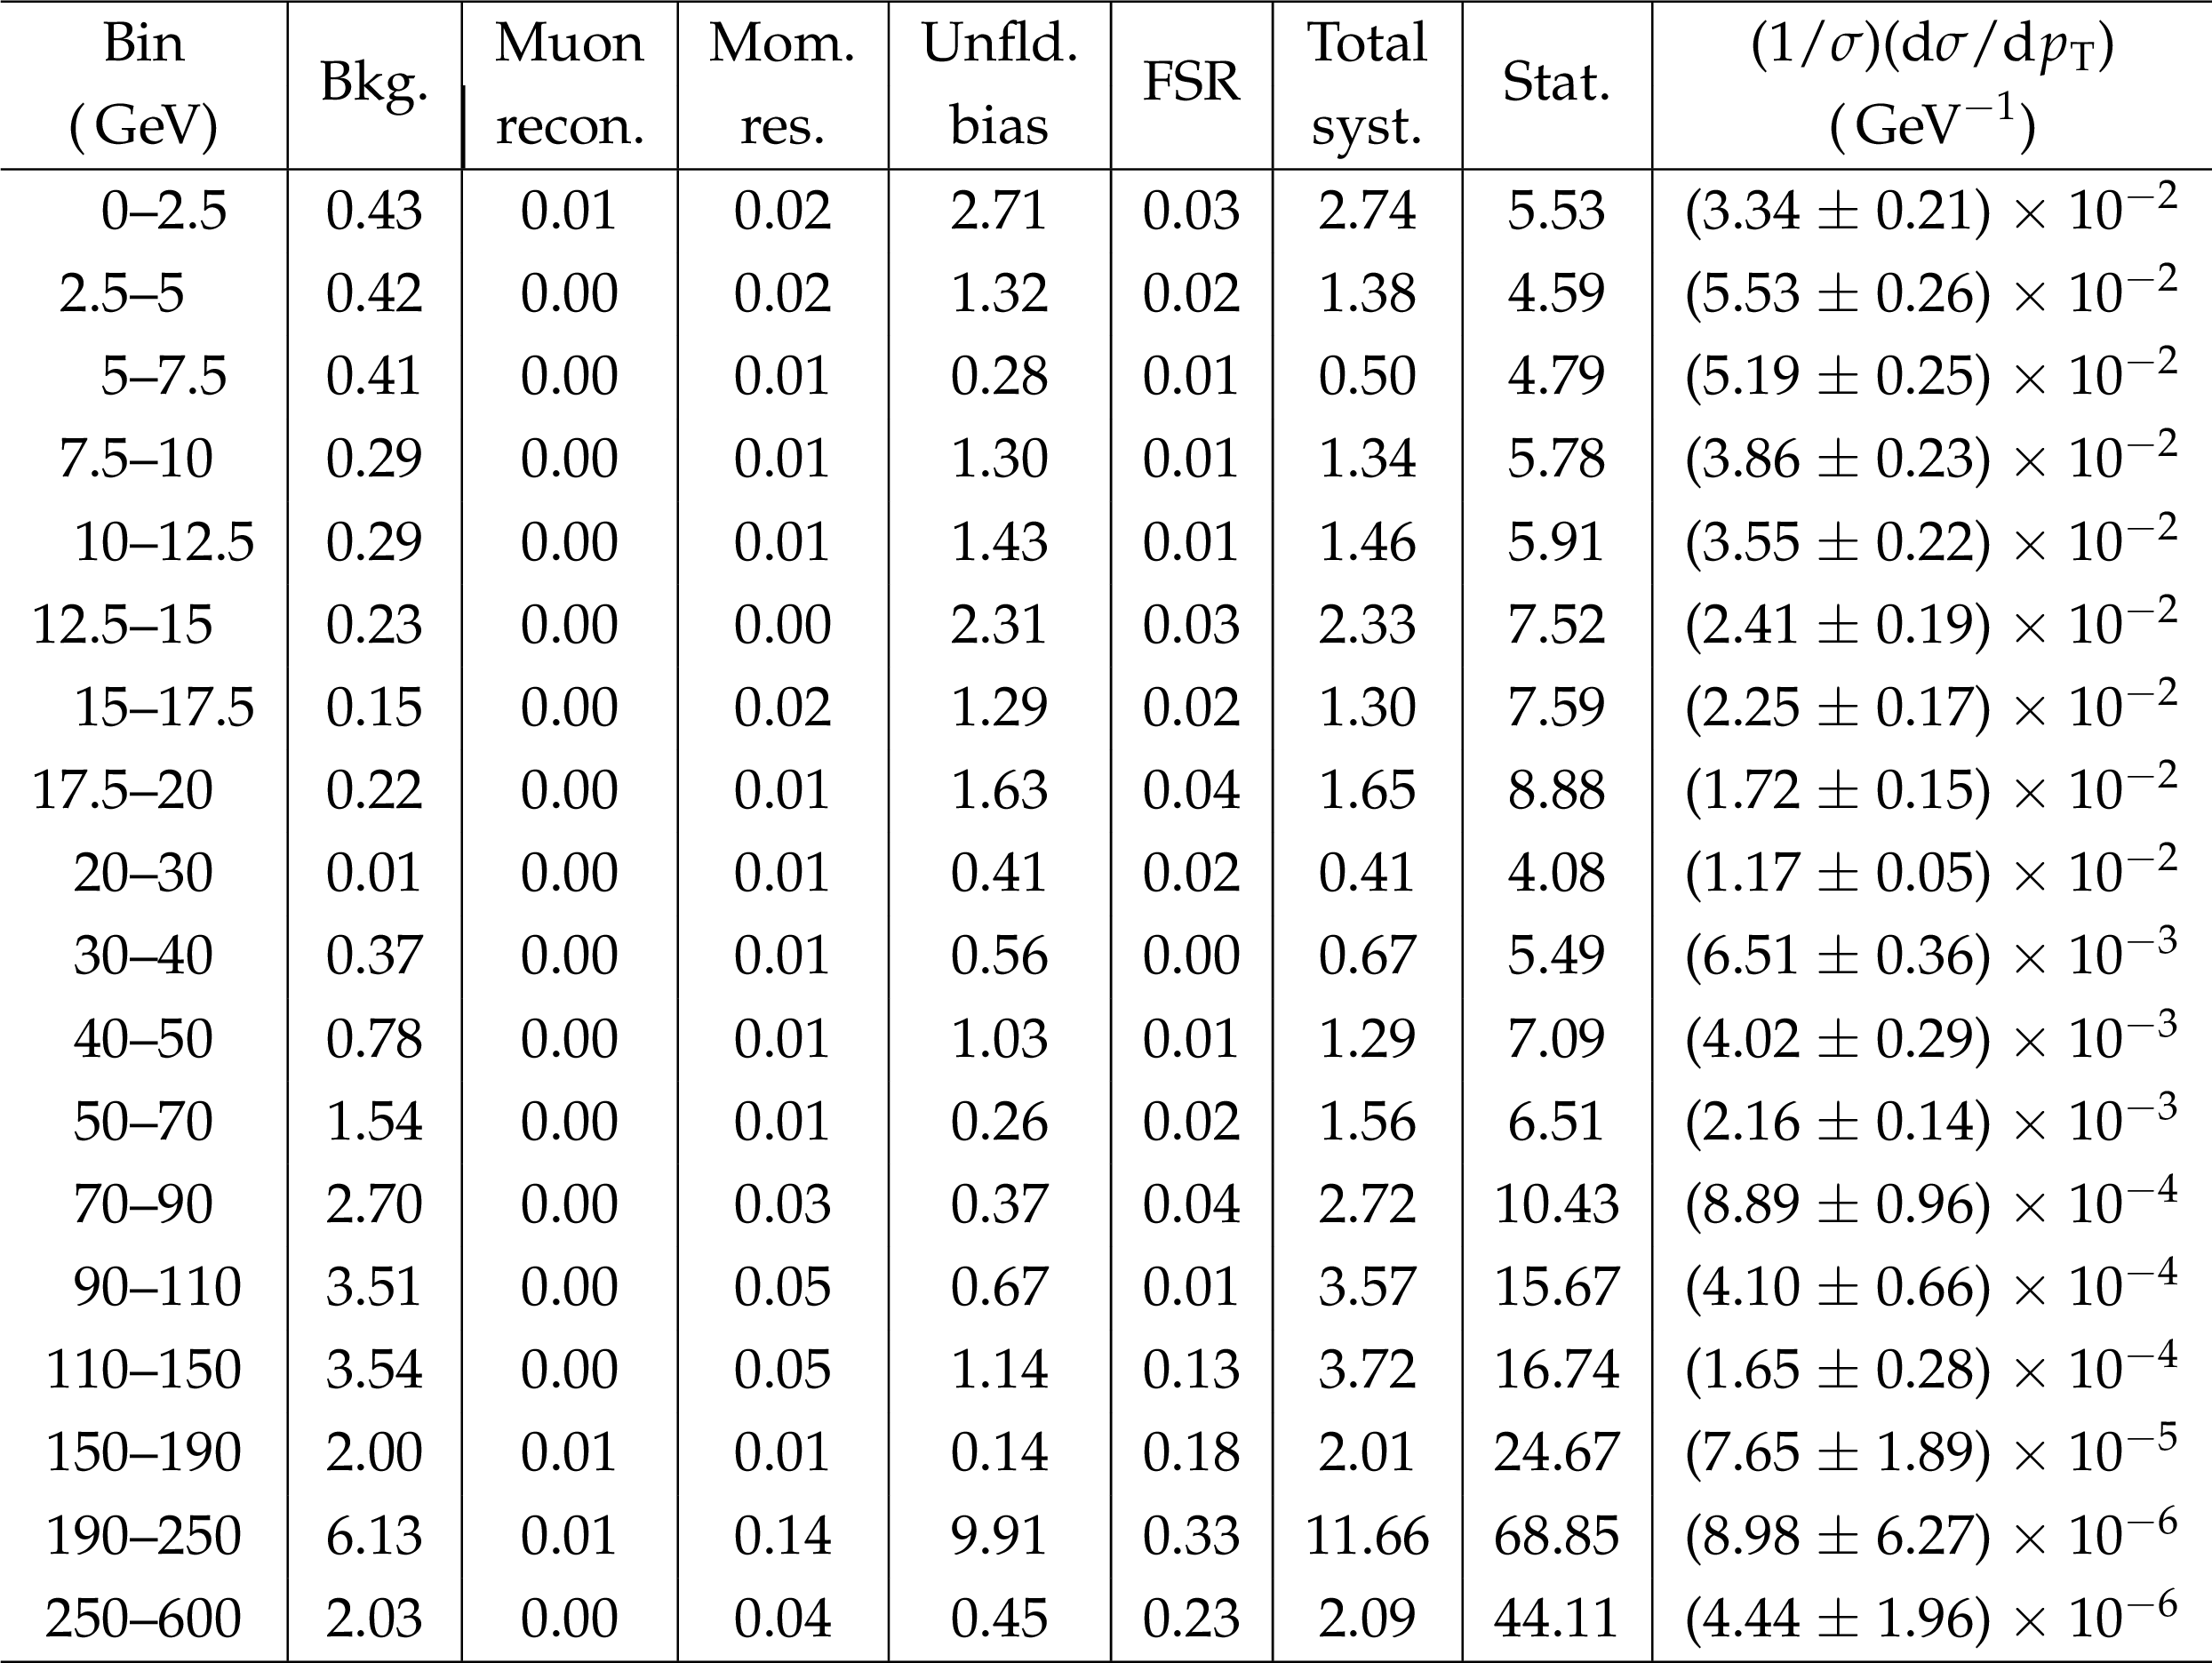
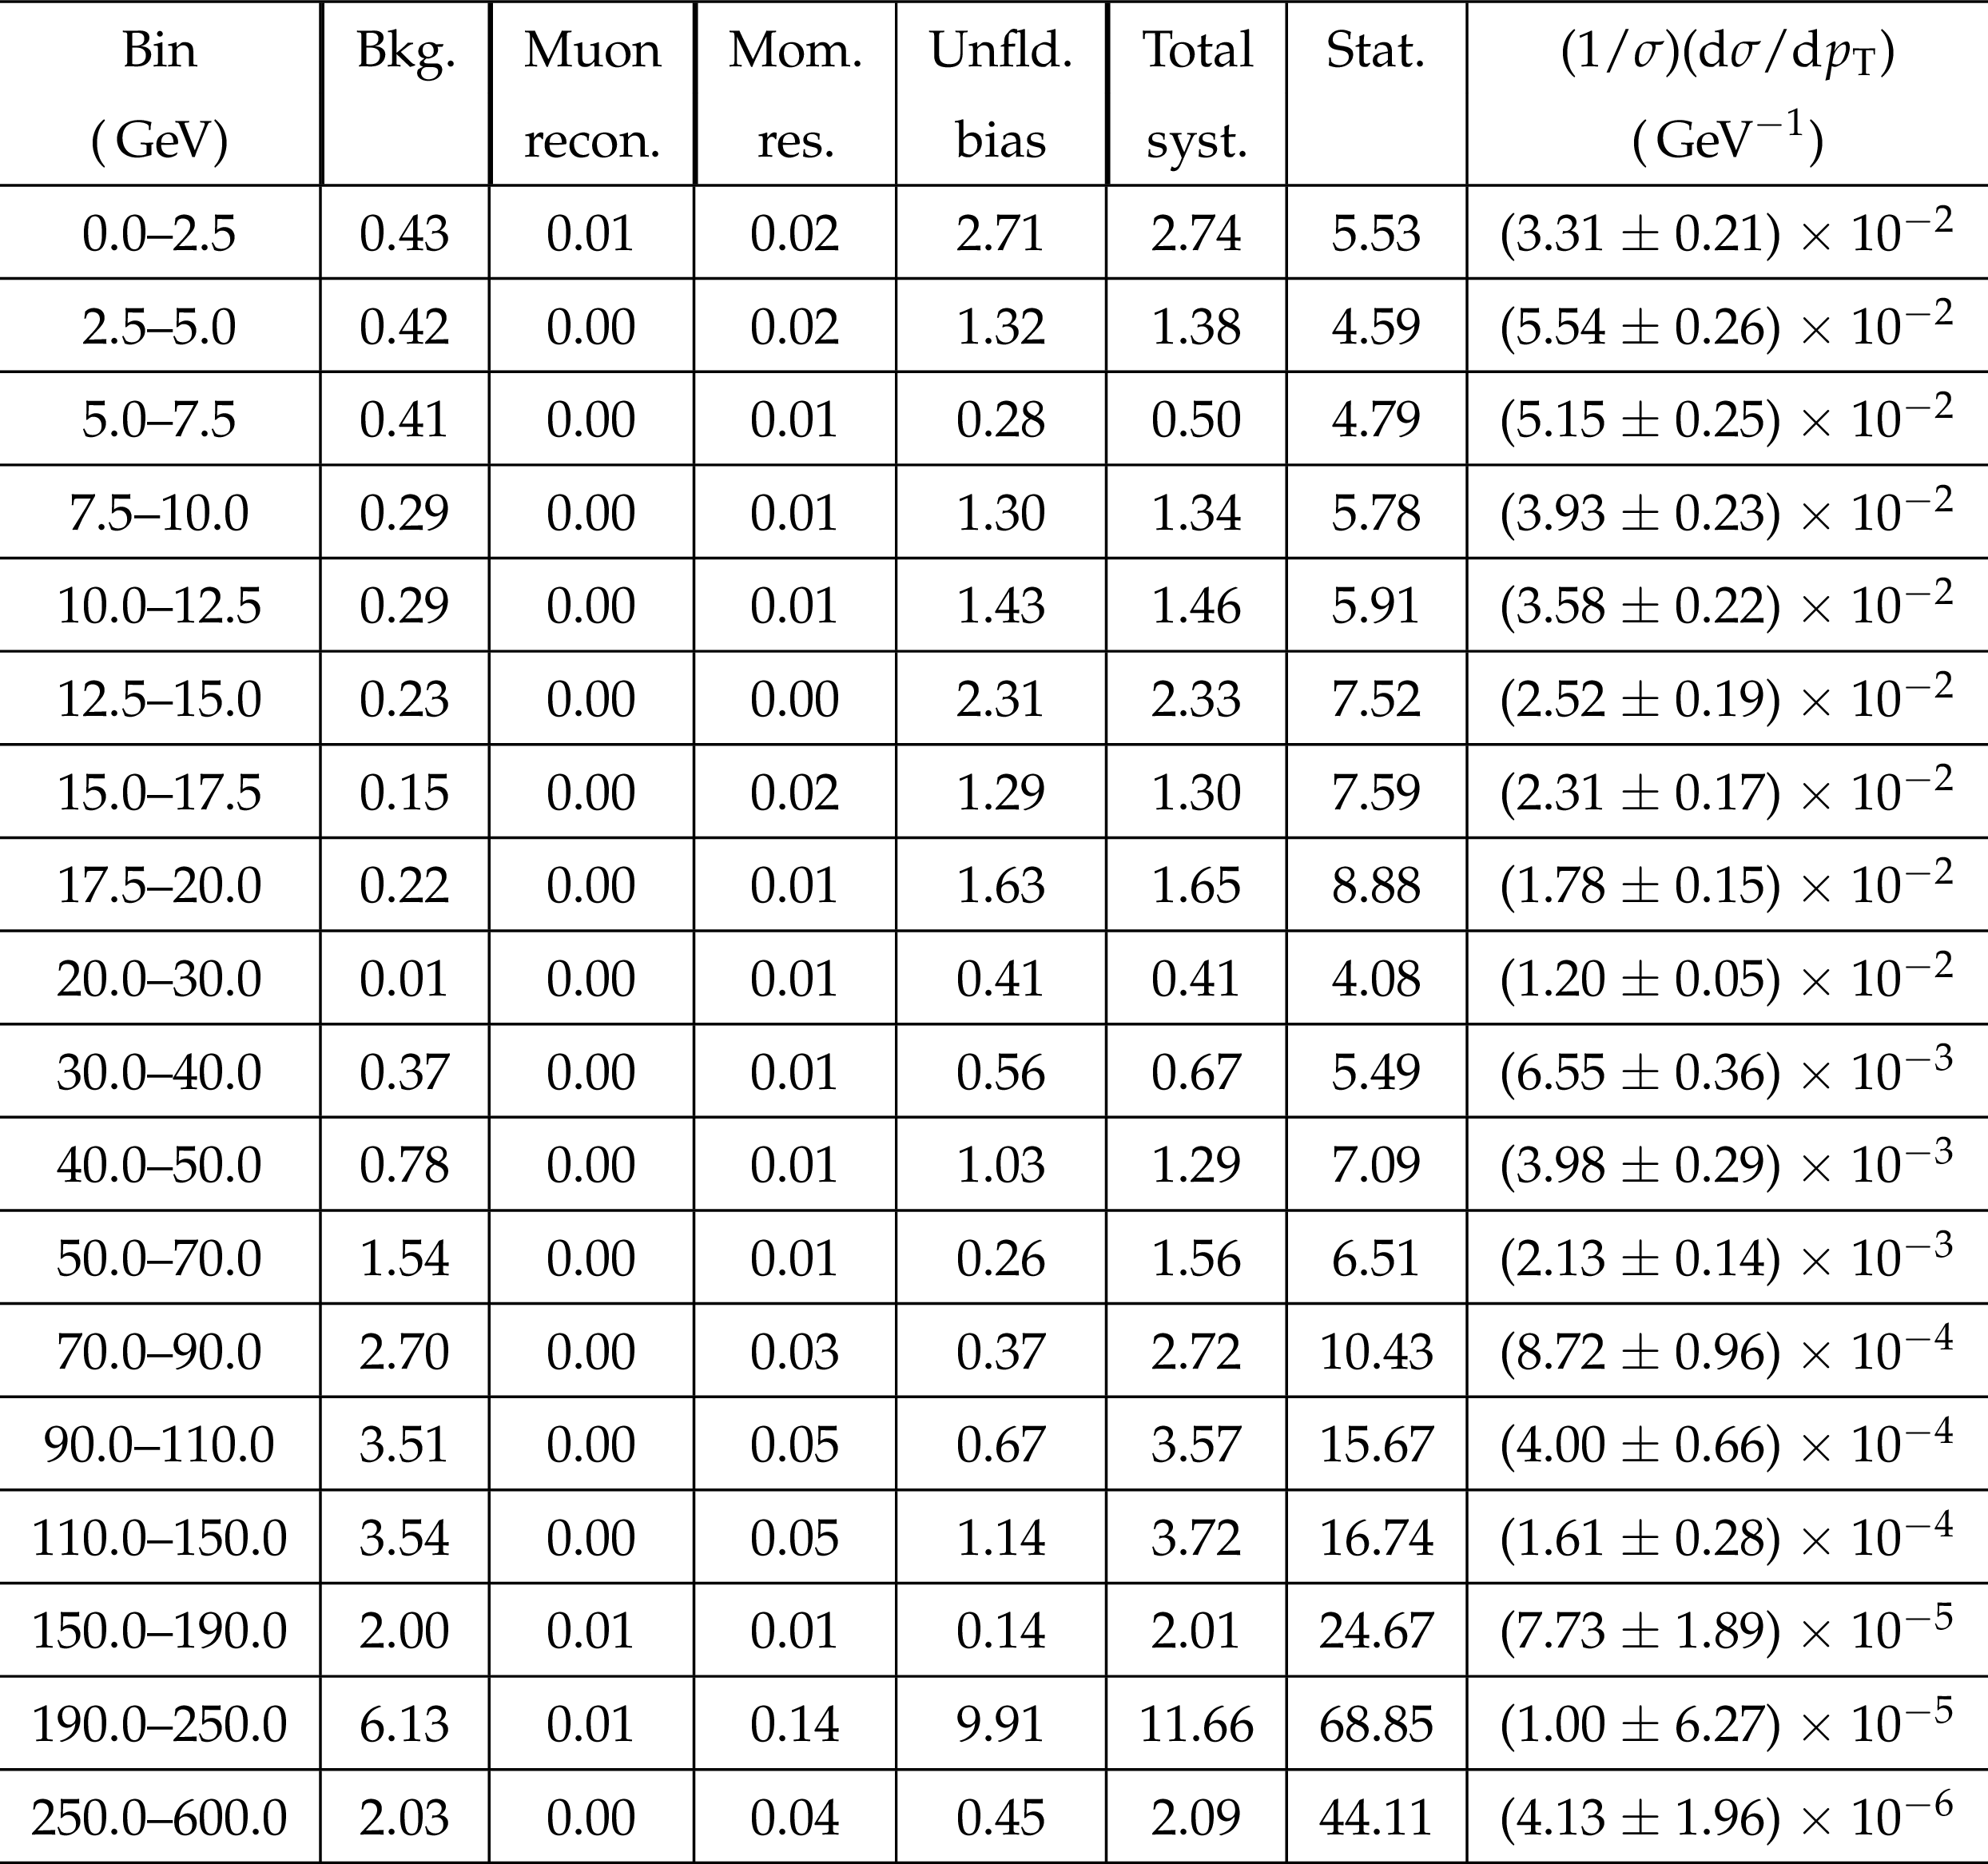
Table 4:
The $\mathrm{ Z } $ boson normalized differential cross sections for the muon channel in bins of $ { {p_{\mathrm {T}}} ^{\mathrm {Z}}}$, (1/$\sigma $)(d$\sigma $/d$ {p_{\mathrm {T}}} $) ($\mathrm{ Z } \rightarrow \mu ^+ \mu ^-$), and systematic uncertainties from various sources in units of%. Other details are the same as in Table 1. |
png pdf |
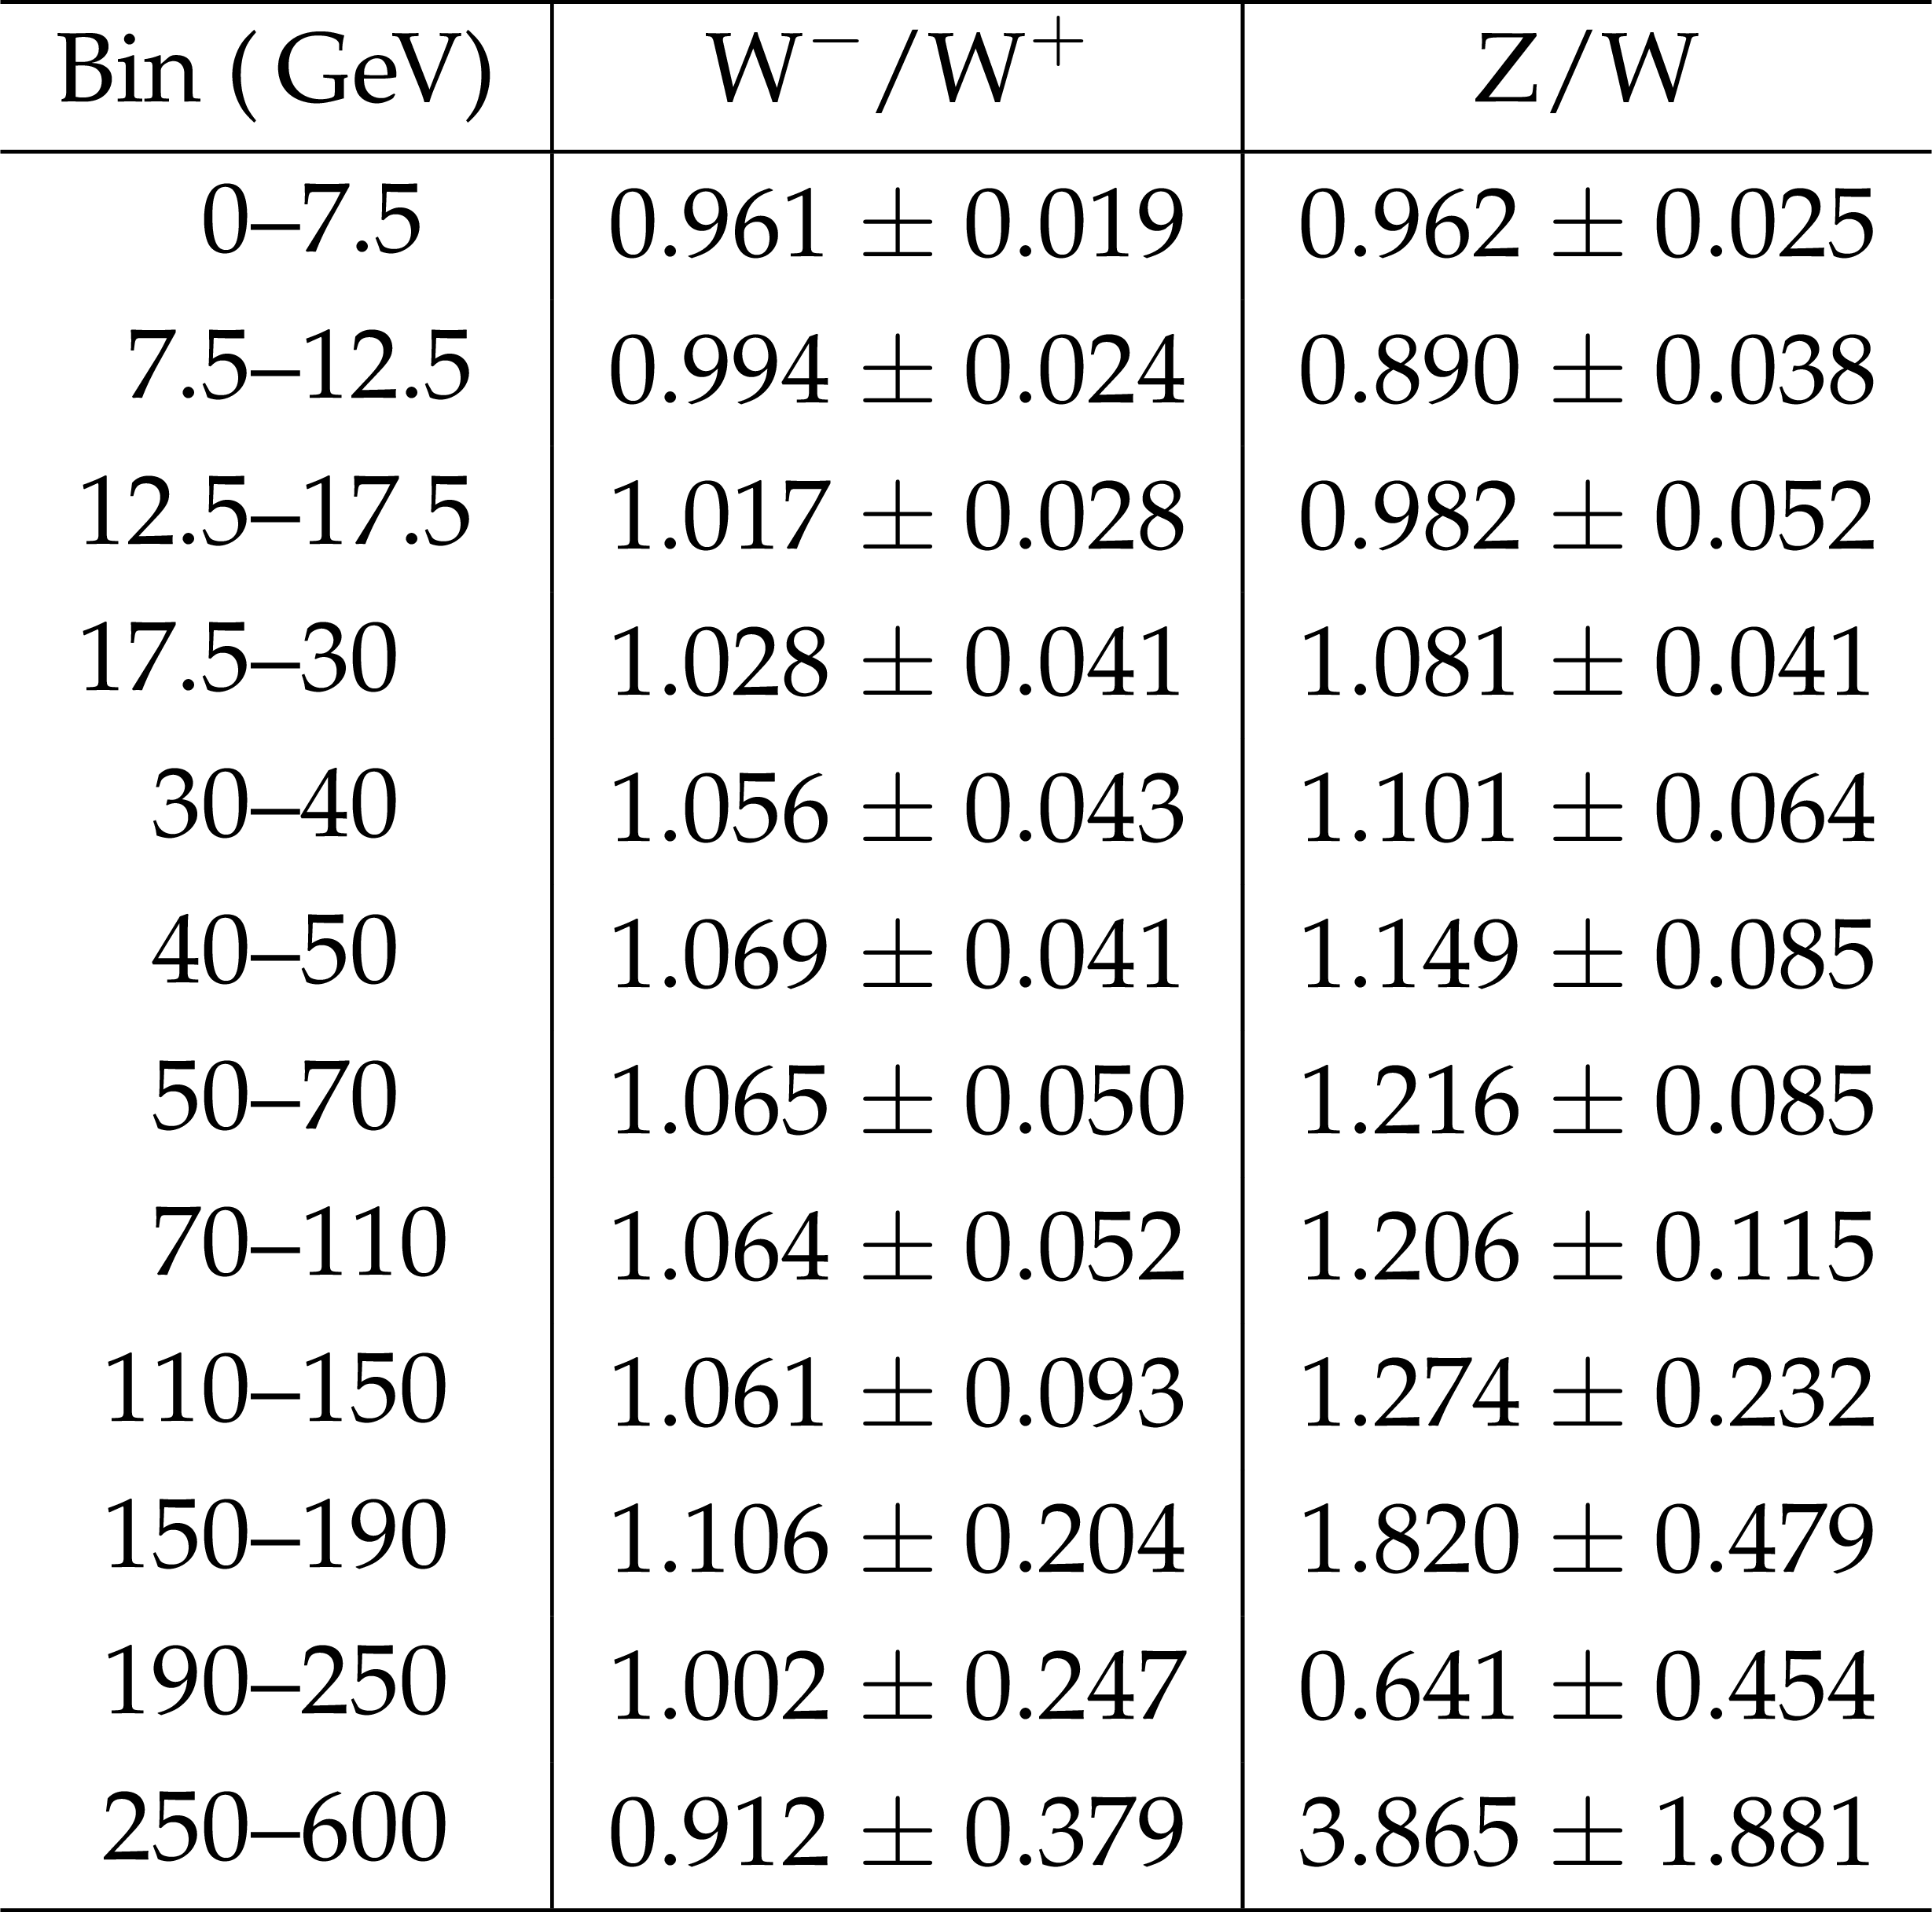
Table 5:
Estimated ratios of pre-FSR level normalized differential cross sections within the muon fiducial volume. The uncertainty is the sum of statistical and systematic uncertainties in quadrature. |
| Summary |
|
The production cross sections of the weak vector bosons, W and Z, as a function of transverse momentum, are measured by the CMS experiment using a sample of proton-proton collisions during a special low luminosity running of the LHC at $ \sqrt{s} = $ 8 TeV that corresponds to an integrated luminosity of 18.4 pb$^{-1}$. The production of W bosons is analyzed in both electron and muon decay modes, while the production of Z bosons is analyzed using only the dimuon decay channel. The measured normalized cross sections are compared to various theoretical predictions. All the predictions provide reasonable descriptions of the data, but POWHEG at NLO overestimates the yield by up to 12% around $p_{\mathrm{T}}^{\mathrm{W}} =$ 25 GeV. POWHEG shows 27% lower expectation in the $p_{\mathrm{T}}^{\mathrm{Z}}$ range 0-2.5 GeV and 18% excess for the $p_{\mathrm{T}}^{\mathrm{Z}}$ interval 7.5-10 GeV. FEWZ at NNLO shows 10% discrepancy around $p_{\mathrm{T}}^{\mathrm{W}} =$ 60 GeV and divergent behavior in the low $p_{\mathrm{T}}^{\mathrm{Z}}$ region where bin widths are finer than those of the W boson study. ResBos-P systematically overestimates the cross section by approximately 20% above $p_{\mathrm{T}}^{\mathrm{W}} =$ 110 GeV, but the CP version demonstrates good agreement with data in the accessible region of $p_{\mathrm{T}}^{\mathrm{Z}}$. The ratios of $\mathrm{ W }^-$ to $\mathrm{ W }^+$, Z to W boson differential cross sections, as well as the ratio of Z boson production cross sections at centre-of-mass energies 7 to 8 TeV are calculated to allow for more precise comparisons with data. Overall, the different theoretical models describe the ratios well. |
| Additional Figures | |
png pdf |
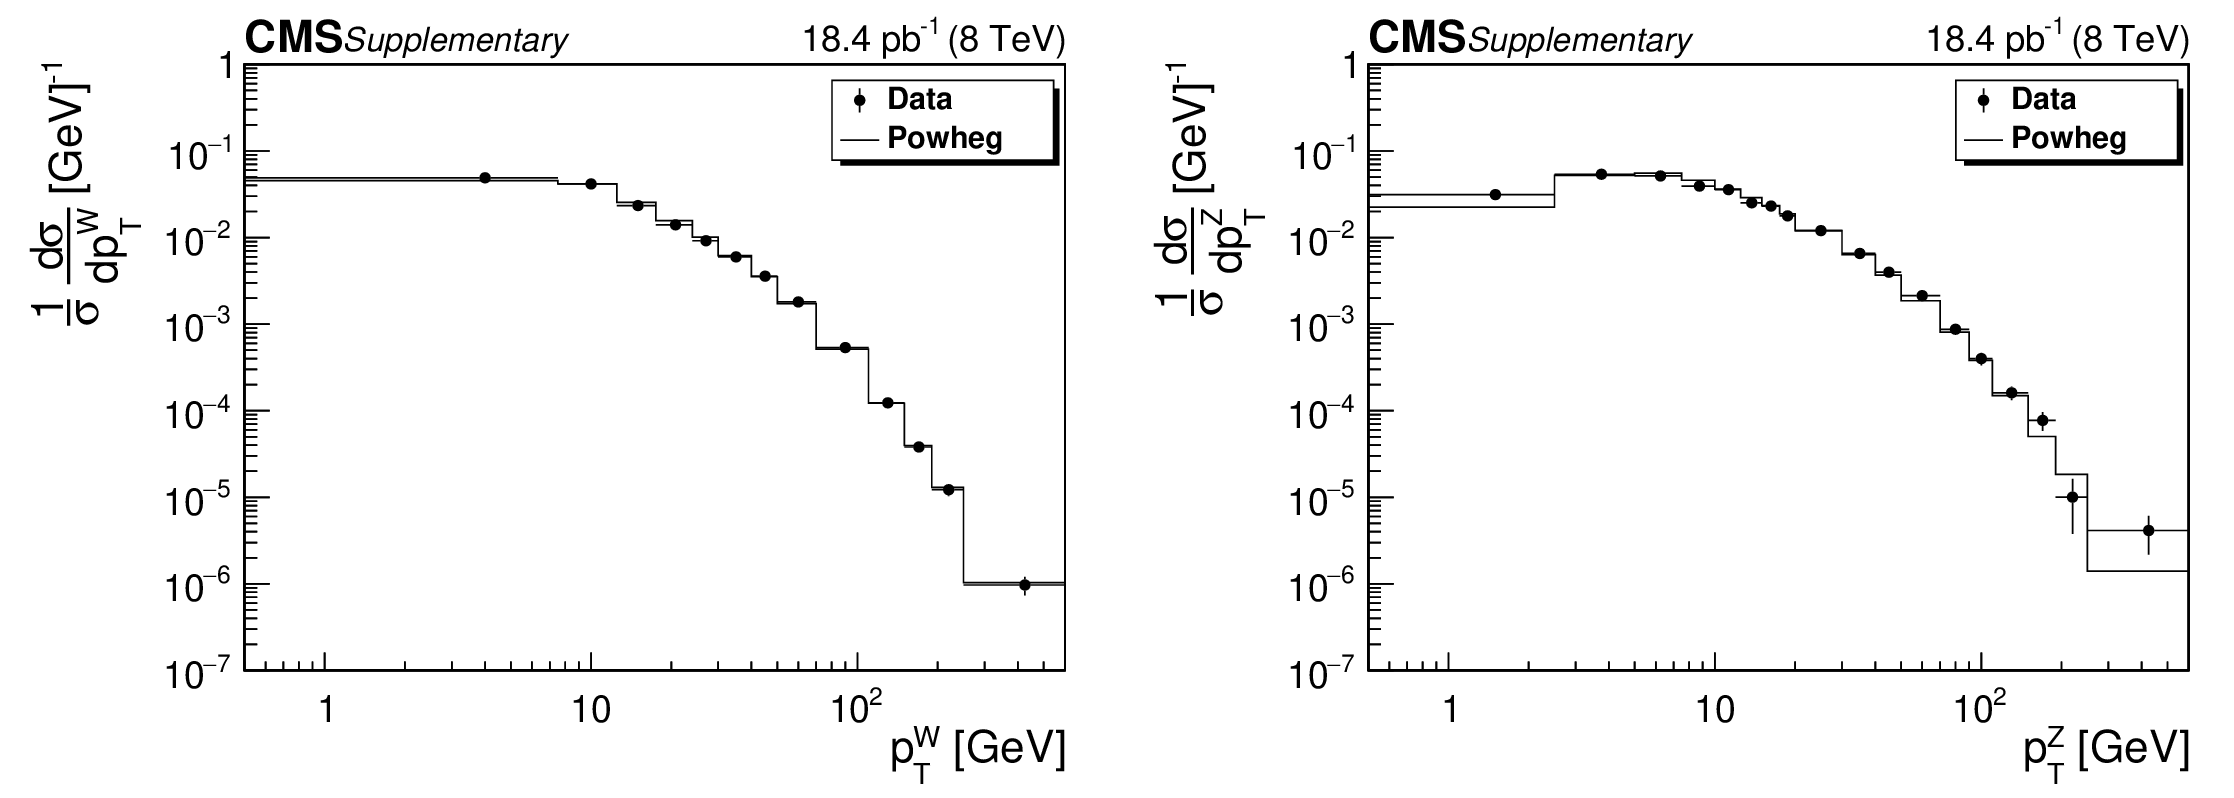
Additional Figure 1:
The unfolding from selected event to post-FSR level distribution for data (circles) and Powheg theory (line) for ${{{\mathrm {W}}} {\rightarrow} {\mu \nu}}$ channel(left), ${{{\mathrm {Z}}} {\rightarrow} {{\mu}^+{\mu}^-}}$ channel (right). SVD technique is used to unfold the measured events to post-FSR level to compensate the detector effect. The lepton from bosons is dressed with DR=0 (bare lepton) in this level. The POWHEG baseline MC describes the response matrix which formulates the relation between selected event and post-FSR event. |
png pdf |
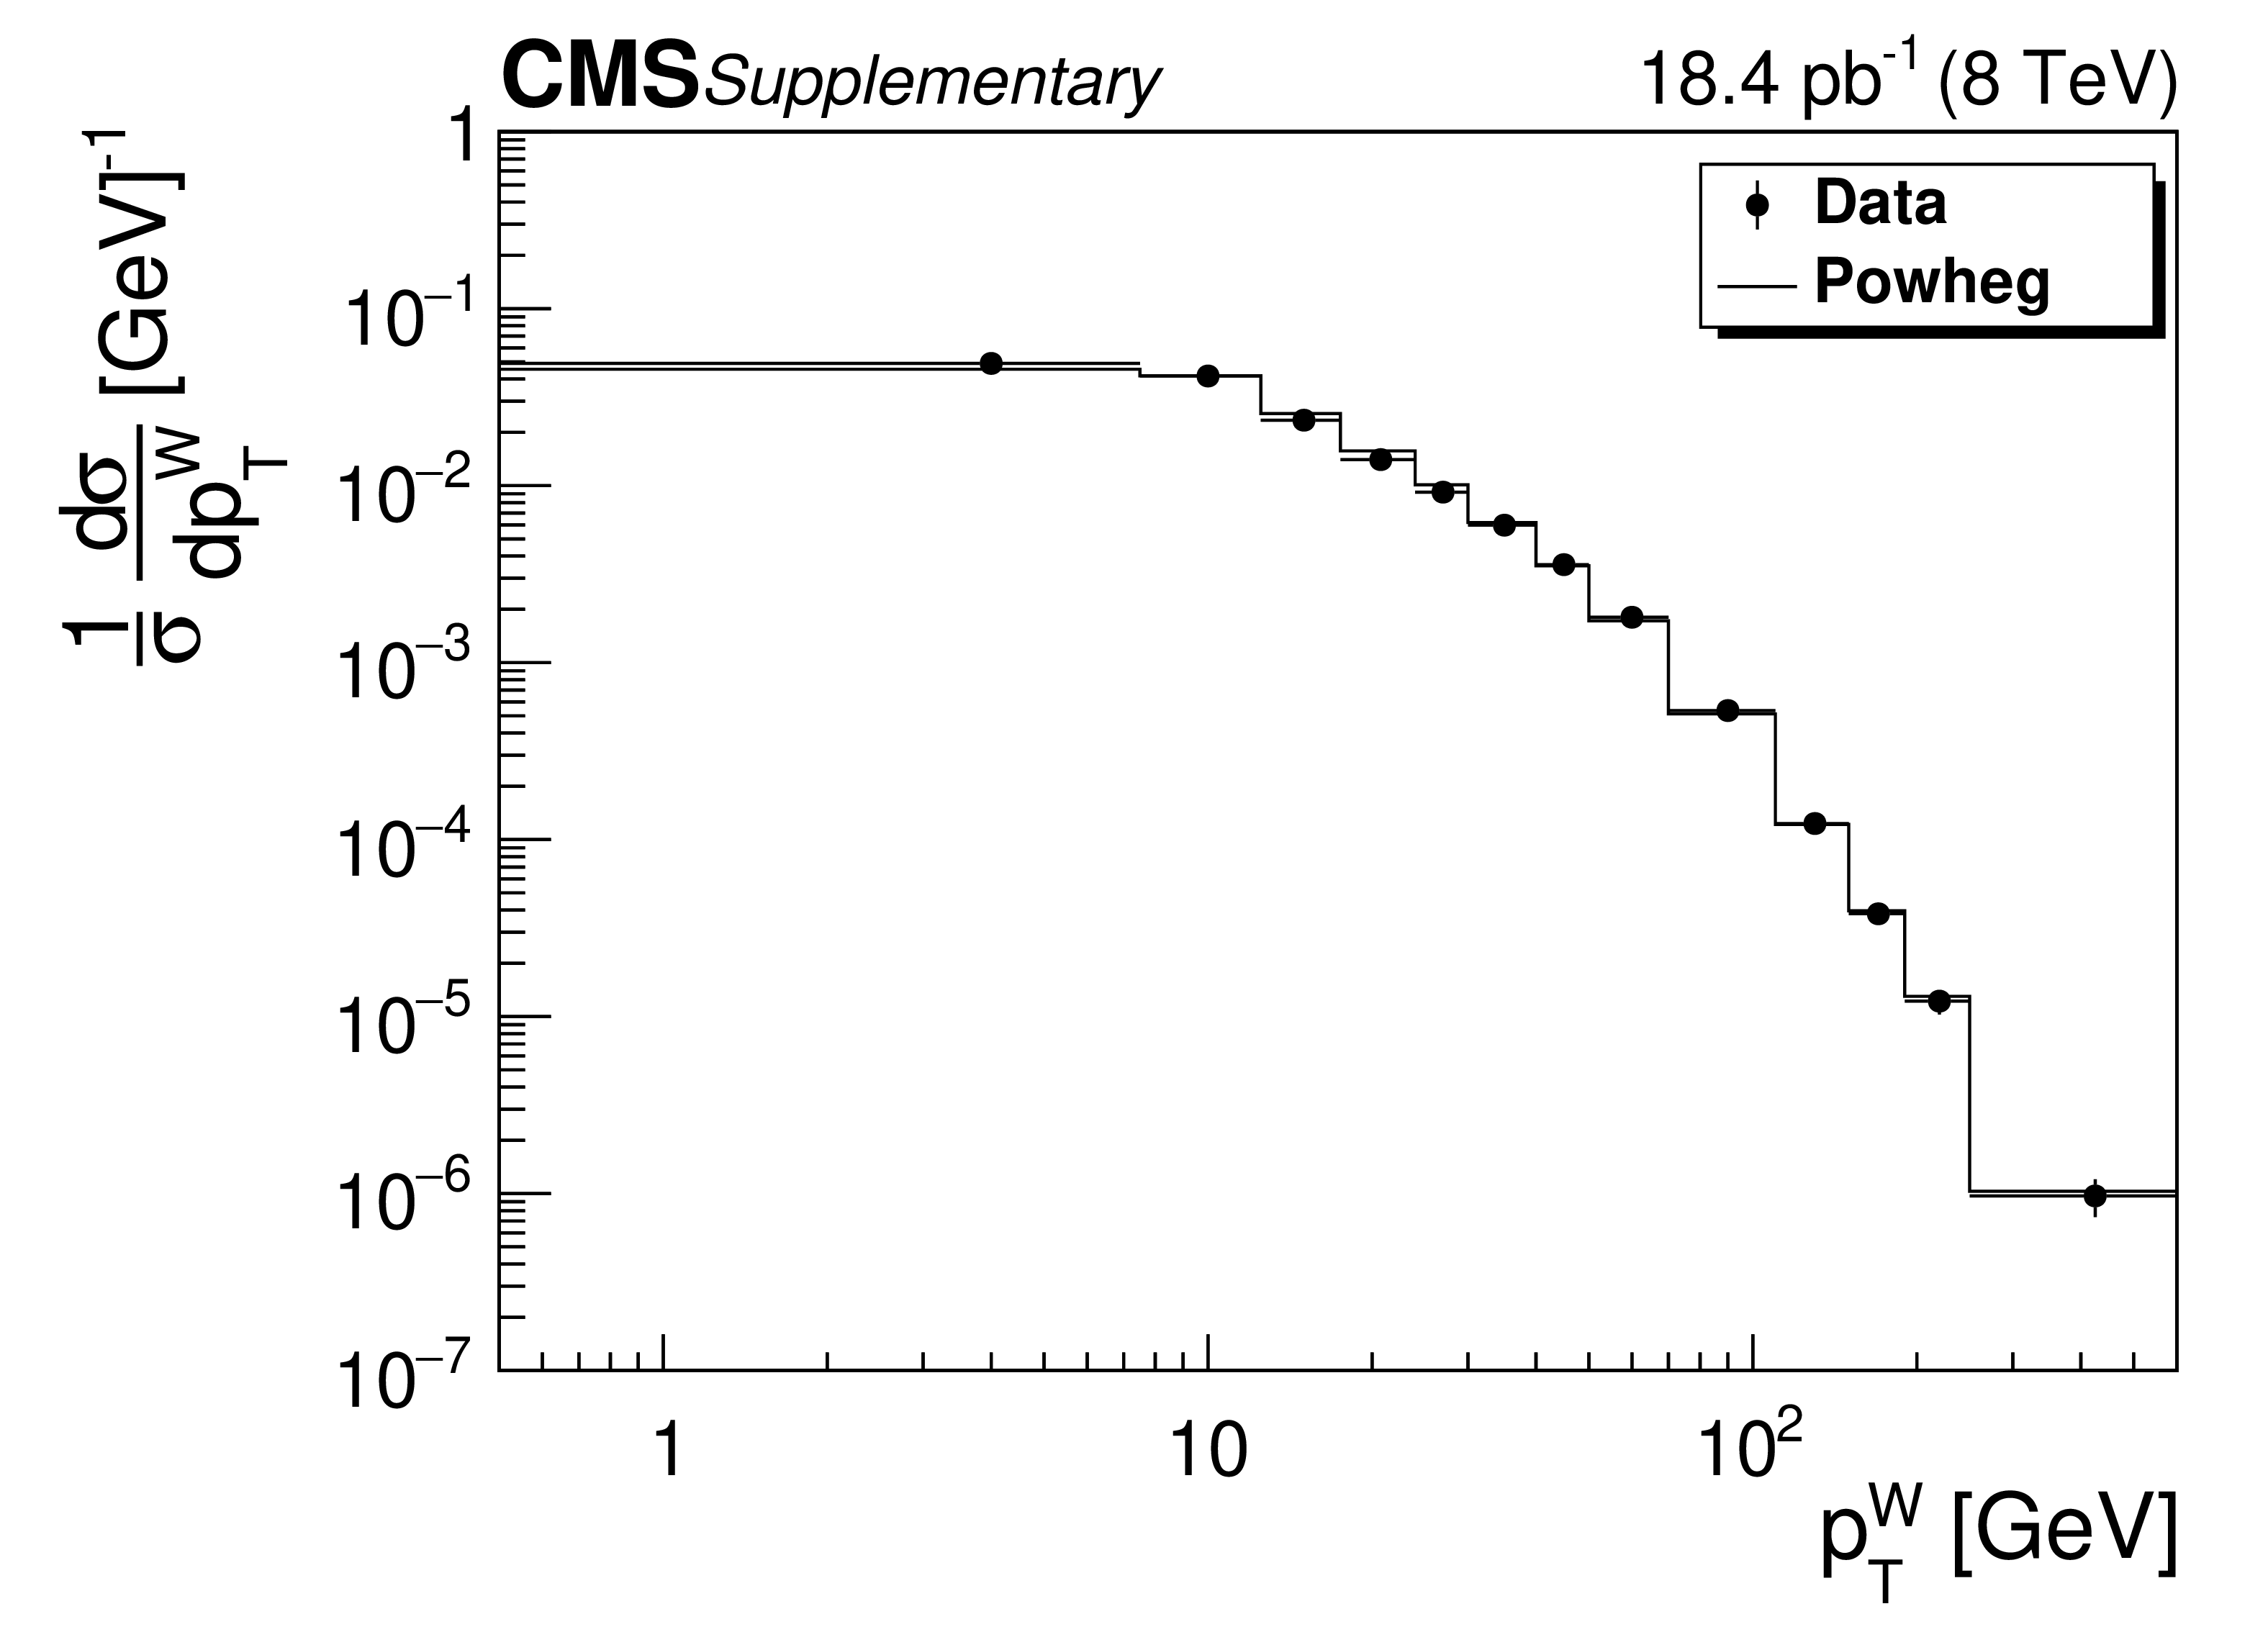
Additional Figure 1-a:
The unfolding from selected event to post-FSR level distribution for data (circles) and Powheg theory (line) for the ${{{\mathrm {W}}} {\rightarrow} {\mu \nu}}$ channel. SVD technique is used to unfold the measured events to post-FSR level to compensate the detector effect. The lepton from bosons is dressed with DR=0 (bare lepton) in this level. The POWHEG baseline MC describes the response matrix which formulates the relation between selected event and post-FSR event. |
png pdf |
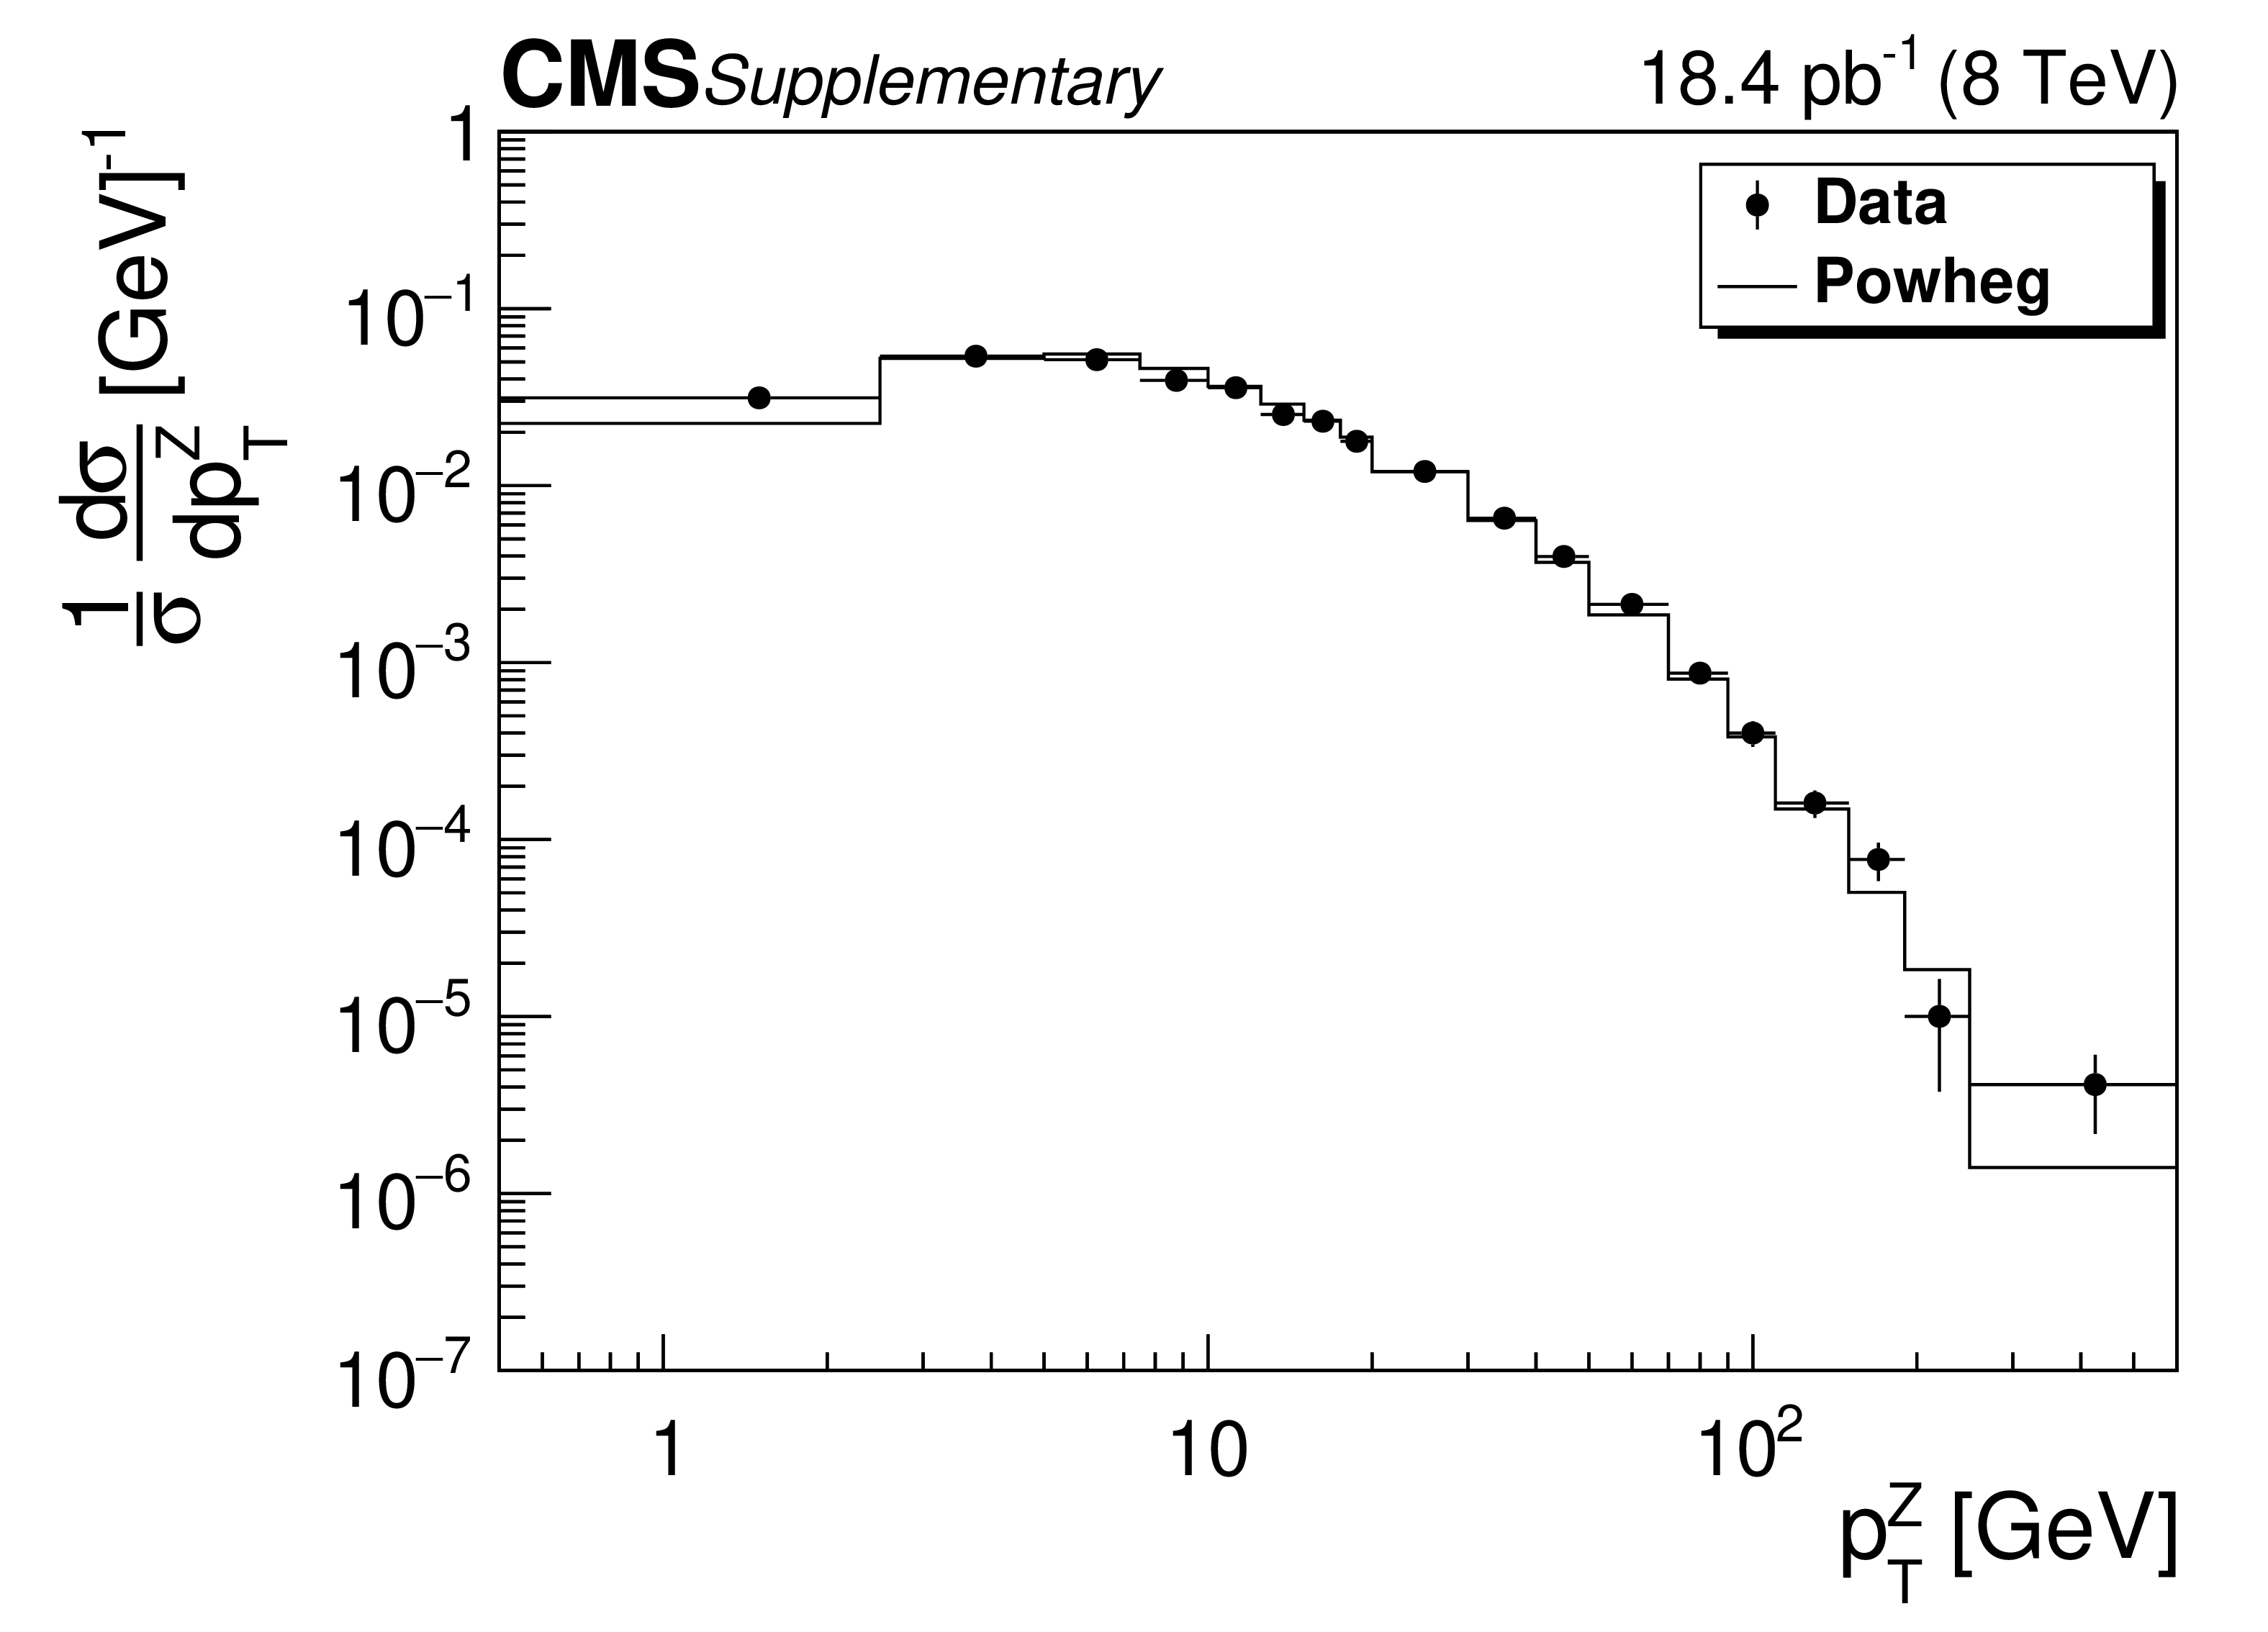
Additional Figure 1-b:
The unfolding from selected event to post-FSR level distribution for data (circles) and Powheg theory (line) for the ${{{\mathrm {Z}}} {\rightarrow} {{\mu}^+{\mu}^-}}$ channel. SVD technique is used to unfold the measured events to post-FSR level to compensate the detector effect. The lepton from bosons is dressed with DR=0 (bare lepton) in this level. The POWHEG baseline MC describes the response matrix which formulates the relation between selected event and post-FSR event. |
| Additional Tables | |
png pdf |
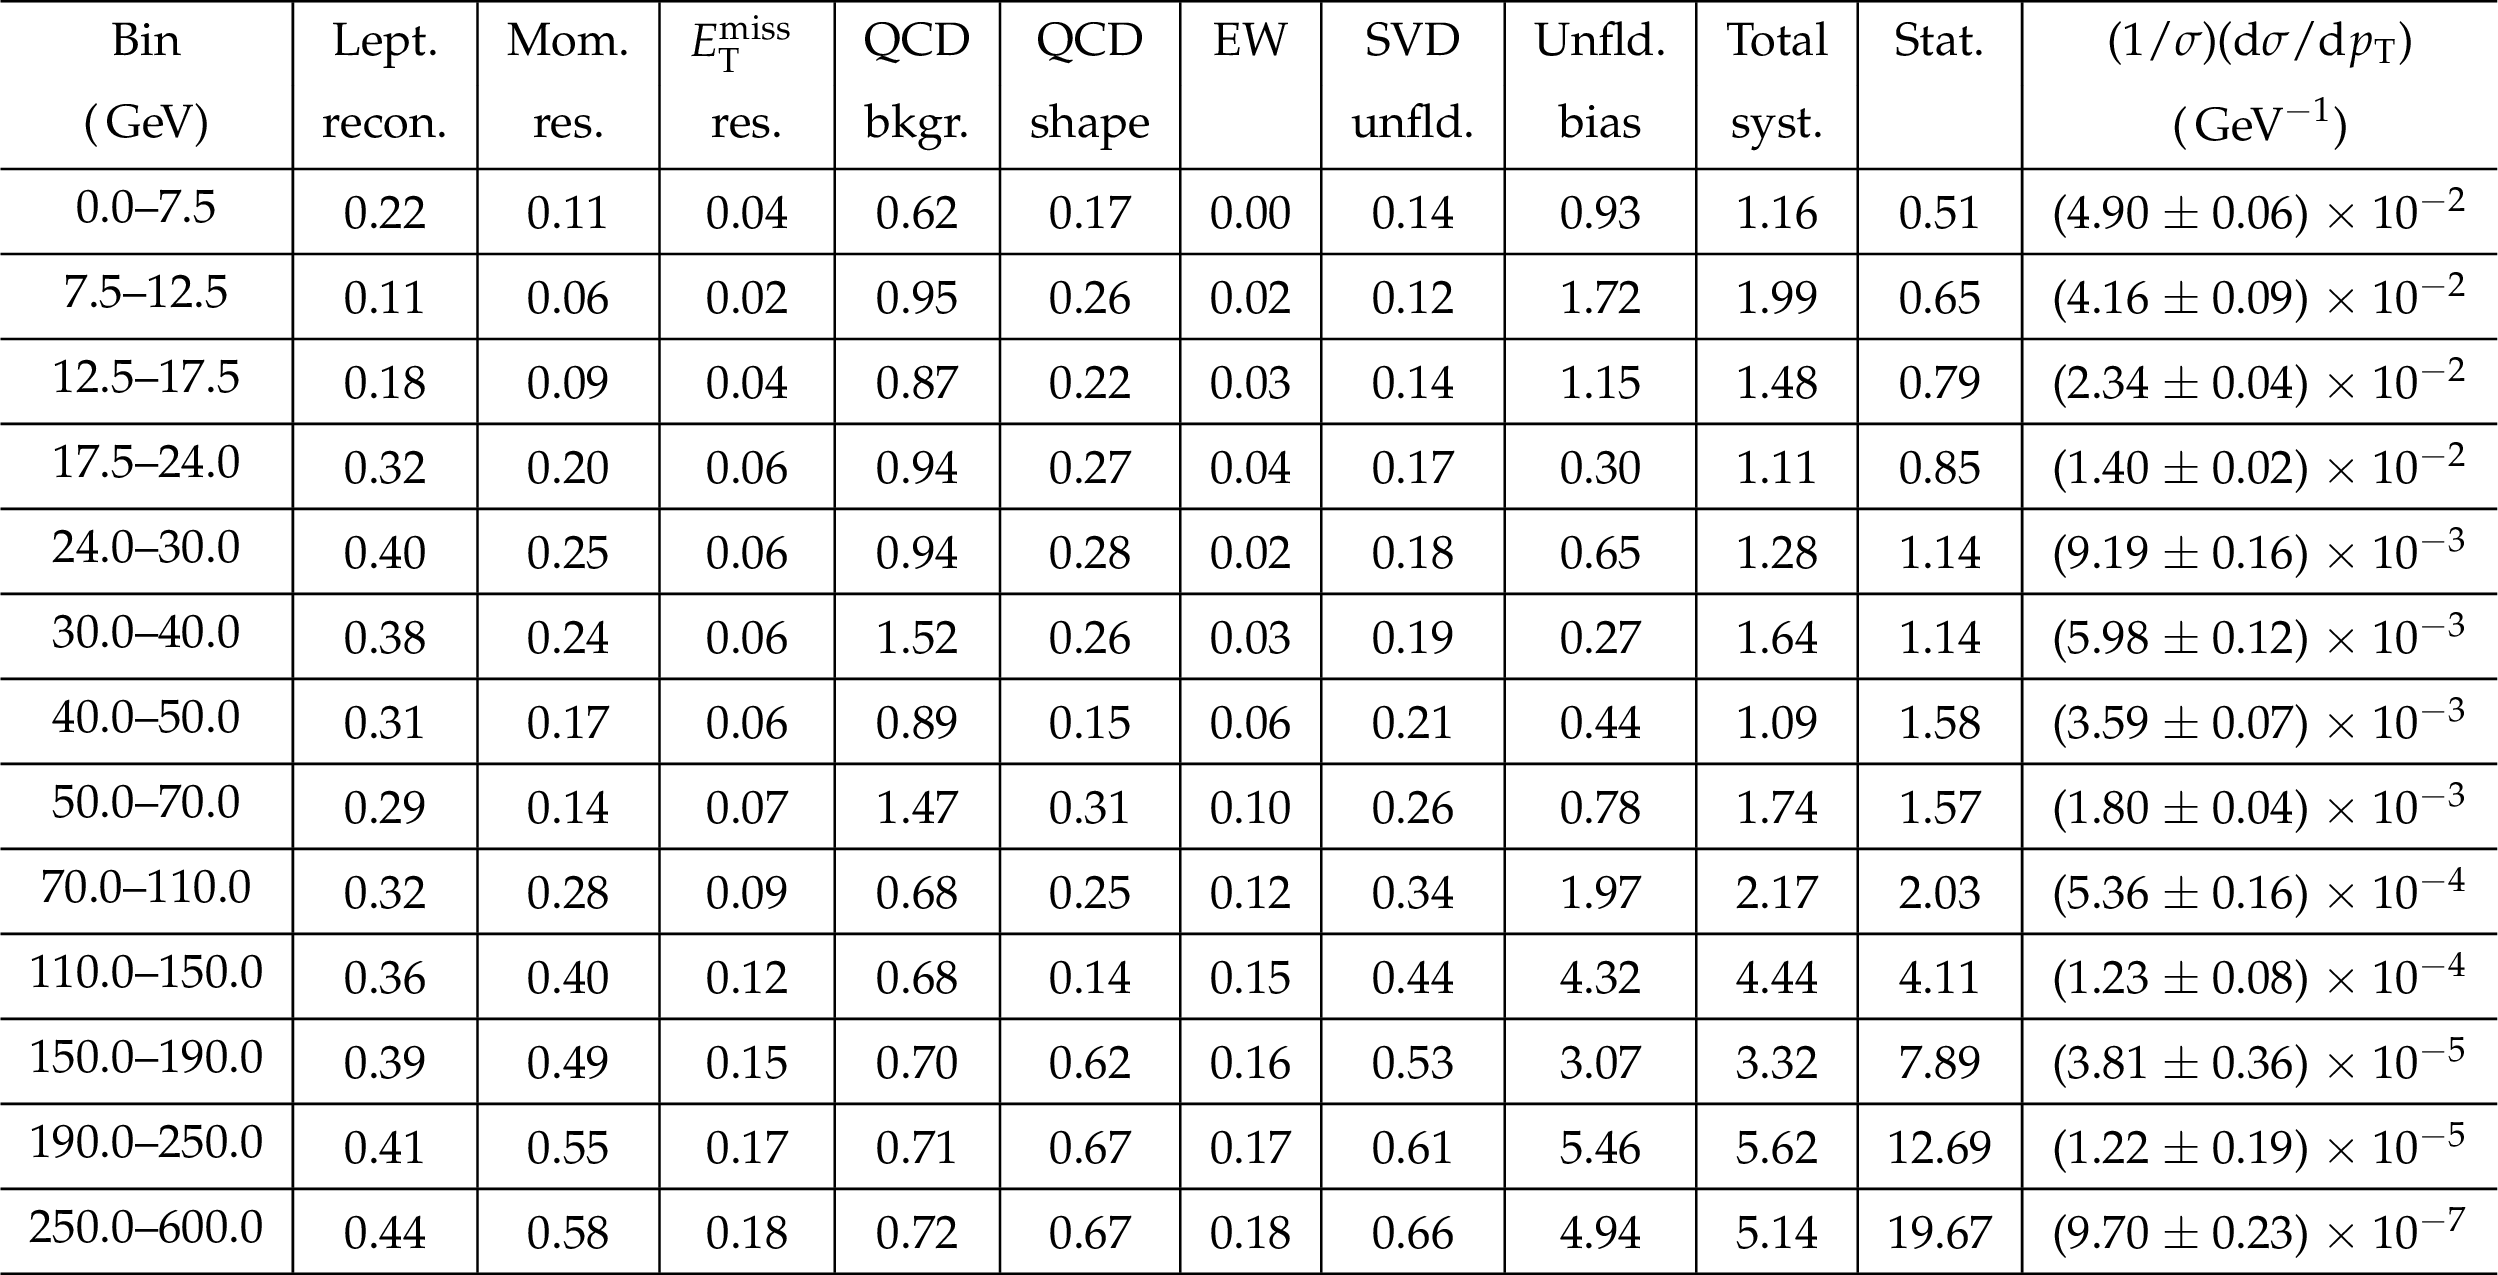
Additional Table 1:
The post-FSR level W boson normalized differential cross sections for the muon channel in bins of $ {p_{\mathrm {T}}} ^{\mathrm{W}}$, $(1/\sigma )(\mathrm{d}\sigma /\mathrm{d} {p_{\mathrm {T}}}) ({\mathrm{W} \rightarrow \mu \nu })$, and systematic uncertainties from various sources in units of %. where $\sigma $ is the sum of the cross sections for the $ {p_{\mathrm {T}}} ^{\mathrm{W}}$ bins. $(1/\sigma )(\mathrm{d}\sigma /\mathrm{d} {p_{\mathrm {T}}})$ is shown with total uncertainty, i.e. the sum of statistical and systematic uncertainties in quadrature. SVD technique is used to unfold the measured events to post-FSR level to compensate the detector effect. The lepton from bosons is dressed with DR=0 (bare lepton) in this level. |
png pdf |
Additional Table 2:
The post-FSR level Z boson normalized differential cross sections for the $\mathrm{Z} \rightarrow \mu ^+ \mu ^-$ channel in bins of $ {p_{\mathrm {T}}} ^{\mathrm{Z}}$, $(1/\sigma )(\mathrm{d}\sigma /\mathrm{d} {p_{\mathrm {T}}}) ({\mathrm{Z} \rightarrow \mu ^+ \mu ^-})$, and systematic uncertainties from various sources in units of %. Other details are the same as in Additional Table 1. |
| References | ||||
| 1 | C. Balazs and C.-P. Yuan | Soft gluon effects on lepton pairs at hadron colliders | PRD 56 (1997) 5558 | hep-ph/9704258 |
| 2 | K. Melnikov and F. Petriello | Electroweak gauge boson production at hadron colliders through $ \mathcal{O}(\alpha_s^{2} $) | PRD 74 (2006) 114017 | hep-ph/0609070 |
| 3 | CMS Collaboration | Measurement of inclusive W and Z boson production cross sections in pp collisions at $ \sqrt{s} = $ 8 TeV | PRL 112 (2014) 191802 | CMS-SMP-12-011 1402.0923 |
| 4 | CMS Collaboration | Measurement of the Z boson differential cross section in transverse momentum and rapidity in proton-proton collisions at 8 TeV | PLB 749 (2015) 187 | CMS-SMP-13-013 1504.03511 |
| 5 | CDF Collaboration | Measurement of the $ W $-boson $ p_{\mathrm{T}} $ distribution in$ \mathrm{ \bar{p} p } $ collisions at $ \sqrt{s} = $ 1.8 TeV | PRL 66 (1991) 2951 | |
| 6 | D0 Collaboration | Measurement of the shape of the transverse momentum distribution of $ W $ bosons produced in $ \mathrm{ \bar{p} p } $ collisions at $ \sqrt{s} = $ 1.8 TeV | PRL 80 (1998) 5498 | hep-ex/9803003 |
| 7 | CDF Collaboration | Measurements of inclusive $ W $ and $ Z $ cross sections in $ \mathrm{ \bar{p} p } $ collisions at $ \sqrt{s} = $ 1.96 TeV | JPG 34 (2007) 2457 | hep-ex/0508029 |
| 8 | D0 Collaboration | Measurement of differential $ Z/\gamma^* + $ jet $ + $ x cross sections in $ \mathrm{ \bar{p} p } $ collisions at $ \sqrt{s} = $ 1.96 TeV | PLB 669 (2008) 278 | 0808.1296 |
| 9 | D0 Collaboration | Measurement of the shape of the boson-transverse momentum distribution in $ { \bar{p} p } \to Z/\gamma^* + { e^+e^-} + X $ events produced at $ \sqrt{s} = $ 1.96 TeV | PRL 100 (2008) 102002 | 0712.0803 |
| 10 | D0 Collaboration | Measurement of the normalized $ Z/\gamma^*\to\mu^+\mu^- $ transverse momentum distribution in $ \mathrm{ \bar{p} p } $ collisions at $ \sqrt{s} = $ 1.96 TeV | PLB 693 (2010) 522 | 1006.0618 |
| 11 | D0 Collaboration | Precise study of the $ Z/\gamma^* $ boson transverse momentum distribution in $ \mathrm{ \bar{p} p } $ collisions using a novel technique | PRL 106 (2011) 122001 | 1010.0262 |
| 12 | ATLAS Collaboration | Measurement of the inclusive $ W^{\pm} $ and $ \mathrm{ Z }/\gamma^* $ cross sections in the $ e $ and $ \mu $ decay channels in $ {\mathrm{ p }\mathrm{ p }} $ collisions at $ \sqrt{s} = $ 7 TeV with the atlas detector | PRD 85 (2012) 072004 | 1109.5141 |
| 13 | CMS Collaboration | Measurement of the inclusive $ W $ and $ Z $ production cross sections in $ pp $ collisions at $ \sqrt{s} = $ 7 TeV with the CMS experiment | JHEP 10 (2011) 132 | CMS-EWK-10-005 1107.4789 |
| 14 | CMS Collaboration | Measurement of the differential and double-differential drell--yan cross sections in proton-proton collisions at $ \sqrt{s} = $ 7 TeV | JHEP 12 (2013) 030 | CMS-SMP-13-003 1310.7291 |
| 15 | CMS Collaboration | Measurements of differential and double-differential drell--yan cross sections in proton-proton collisions at $ \sqrt{s} = $ 8 TeV | EPJC 75 (2015) 147 | CMS-SMP-14-003 1412.1115 |
| 16 | ATLAS Collaboration | Measurement of the transverse momentum distribution of $ \mathrm{ Z }/\gamma^* $ bosons in proton-proton collisions at $ \sqrt{s} = $ 7 TeV with ATLAS detector | PLB 705 (2011) 415 | 1107.2381 |
| 17 | ATLAS Collaboration | Measurement of the $ \mathrm{ Z }/\gamma^* $ bosons transverse momentum distribution in pp collisions at $ \sqrt{s} = $ 7 TeV with ATLAS detector | JHEP 09 (2014) 145 | 1406.3660 |
| 18 | CMS Collaboration | Measurement of the rapidity and transverse momentum distributions of Z bosons in pp collisions at $ \sqrt{s} = $ 7 TeV | PRD 85 (2012) 032002 | CMS-EWK-10-010 1110.4973 |
| 19 | ATLAS Collaboration | Measurement of the transverse momentum distribution of $ W $ bosons in $ pp $ collisions at $ \sqrt{s} = $ 7 TeV with the atlas detector | PRD 85 (2012) 012005 | 1108.6308 |
| 20 | LHCb Collaboration | Inclusive W and Z production in the forward region at $ \sqrt{s} = $ 7 TeV | JHEP 06 (2012) 058 | 1204.1620 |
| 21 | LHCb Collaboration | Measurement of the cross-section for $ \mathrm{ Z }\rightarrow \rm{e^+e^-} $ production in pp collisions at $ \sqrt{s} = $ 7 TeV | JHEP 02 (2013) 106 | 1212.4620 |
| 22 | LHCb Collaboration | A study of the Z production cross-section in pp collisions at $ \sqrt{s} = $ 7 TeV using tau final states | JHEP 01 (2013) 111 | 1210.6289 |
| 23 | LHCb Collaboration | Measurement of the forward Z boson production cross-section in pp collisions at $ \sqrt{s} = $ 7 TeV | JHEP 08 (2015) 039 | 1505.07024 |
| 24 | LHCb Collaboration | Measurement of the forward W boson cross-section in pp collisions at $ \sqrt{s} = $ 7 TeV | JHEP 12 (2014) 079 | 1408.4354 |
| 25 | LHCb Collaboration | Measurement of forward W and Z boson production in pp collisions at $ \sqrt{s} = $ 8 TeV | JHEP 01 (2016) 155 | 1511.08039 |
| 26 | C. Anastasiou, L. Dixon, and F. Petriello | High-precision QCD at hadron colliders: Electroweak gauge boson rapidity distributions at next-to-next-to-leading order | PRD 69 (2004) 094008 | hep-ph/0312266 |
| 27 | R. Gavin, Y. Li, F. Petriello, and S. Quackenbush | FEWZ 2.0: A code for hadronic $ Z $ production at next-to-next-to-leading order | CPC 182 (2011) 2388 | 1011.3540 |
| 28 | R. Gavin, Y. Li, F. Petriello, and S. Quackenbush | $ W $ physics at the LHC with FEWZ 2.1 | CPC 184 (2013) 209 | 1201.5896 |
| 29 | Y. Li and F. Petriello | Combining QCD and electroweak corrections to dilepton production in the framework of the FEWZ simulation code | PRD 86 (2012) 094034 | 1208.5967 |
| 30 | G. A. Ladinsky and C.-P. Yuan | Nonperturbative regime in QCD resummation for gauge boson production at hadron colliders | PRD 50 (1994) R4239 | hep-ph/9311341 |
| 31 | F. Landry, R. Brock, P. M. Nadolsky, and C.-P. Yuan | Fermilab tevatron run-1 $ Z $ boson data and the collins-soper-sterman resummation formalism | PRD 67 (2003) 073016 | hep-ph/0212159 |
| 32 | M. Guzzi, P. M. Nadolsky, and B. Wang | Nonperturbative contributions to a resummed leptonic angular distribution in inclusive neutral vector boson production | PRD 90 (2014) 014030 | 1309.1393 |
| 33 | S. Frixione, P. Nason, and C. Oleari | Matching NLO QCD computations with parton shower simulations: the POWHEG method | JHEP 11 (2007) 070 | 0709.2092 |
| 34 | P. Nason | A new method for combining NLO QCD with shower monte carlo algorithms | JHEP 11 (2004) 040 | hep-ph/0409146 |
| 35 | S. Alioli, P. Nason, C. Oleari, and E. Re | NLO vector-boson production matched with shower in POWHEG | JHEP 07 (2008) 060 | 0805.4802 |
| 36 | S. Alioli, P. Nason, C. Oleari, and E. Re | A general framework for implementing NLO calculations in shower Monte Carlo programs: the POWHEG box | JHEP 06 (2010) 043 | 1002.2581 |
| 37 | T. Sjostrand, S. Mrenna, and P. Skands | PYTHIA 6.4 physics and manual | JHEP 05 (2006) 026 | hep-ph/0603175 |
| 38 | CMS Collaboration | The CMS experiment at the CERN LHC | JINST 3 (2008) S08004 | CMS-00-001 |
| 39 | H.-L. Lai et al. | New parton distributions for collider physics | PRD 82 (2010) 074024 | 1007.2241 |
| 40 | J. Alwall et al. | MADGRAPH 5: Going beyond | JHEP 06 (2011) 128 | 1106.0522 |
| 41 | R. Field | Early LHC underlying event data --- Findings and surprises | 1010.3558 | |
| 42 | J. Pumplin et al. | New generation of parton distributions with uncertainties from global QCD analysis | JHEP 07 (2002) 012 | hep-ph/0201195 |
| 43 | F. Maltoni and T. Stelzer | Madevent: automatic event generation with MADGRAPH | JHEP 02 (2003) 027 | hep-ph/0208156 |
| 44 | GEANT4 Collaboration | GEANT4 --- a simulation toolkit | NIMA 506 (2003) 250 | |
| 45 | CMS Collaboration | Particle--flow event reconstruction in CMS and performance for jets, taus, and $ E_{\mathrm{T}}^{\text{miss}} $ | CMS-PAS-PFT-09-001 | |
| 46 | CMS Collaboration | Commissioning of the particle--flow event reconstruction with the first LHC collisions recorded in the CMS detector | CMS-PAS-PFT-10-001 | |
| 47 | W. Adam, R. Fruhwirth, A. Strandlie, and T. Todorov | Reconstruction of electrons with the gaussian-sum filter in the CMS tracker at the LHC | JPG 31 (2005) N9 | physics/0306087 |
| 48 | CMS Collaboration | Performance of electron reconstruction and selection with the CMS detector in proton-proton collisions at $ \sqrt{s} = $ 8 TeV | JINST 10 (2015) P06005 | CMS-EGM-13-001 1502.02701 |
| 49 | CMS Collaboration | Performance of photon reconstruction and identification with the CMS detector in proton-proton collisions at $ \sqrt{s} = $ 8 TeV | JINST 10 (2015) P08010 | CMS-EGM-14-001 1502.02702 |
| 50 | CMS Collaboration | Performance of CMS muon reconstruction in pp collision events at $ \sqrt{s} = $ 7 TeV | JINST 7 (2012) P10002 | |
| 51 | M. Cacciari and G. P. Salam | Pileup subtraction using jet areas | PLB 659 (2008) 119 | 0707.1378 |
| 52 | CMS Collaboration | Missing transverse energy performance of the CMS detector | JINST 6 (2011) 09001 | CMS-JME-10-009 1106.5048 |
| 53 | CMS Collaboration | Measurement of inclusive $ W $ and $ Z $ cross sections in $ pp $ collisions at $ \sqrt{s} = $ 7 TeV | JHEP 01 (2011) 080 | CMS-EWK-10-002 1012.2466 |
| 54 | A. Hoecker and V. Kartvelishvili | Svd approach to data unfolding | NIMA 372 (1996) 469 | hep-ph/9509307 |
| 55 | V. Blobel | An unfolding method for high-energy physics experiments | hep-ex/0208022 | |
| 56 | G. Nanava and Z. W\cas | How to use sanc to improve the photos monte carlo simulation of bremsstrahlung in leptonic w boson decays | Acta Phys. Polon. B 34 (2003) 4561 | hep-ph/0303260 |
| 57 | H. Burkhardt and B. Pietrzyk | Update of the hadronic contribution to the QED vacuum polarization | PLB 513 (2001) 46 | |
| 58 | J. C. Collins and D. E. Soper | Back-to-back jets in QCD | NPB 193 (1981) 381 | |
| 59 | J. C. Collins, D. E. Soper, and G. F. Sterman | Transverse momentum distribution in drell--yan pair and $ W $ and $ Z $ boson production | NPB 250 (1985) 199 | |
| 60 | D. Bourilkov, R. C. Group, and M. R. Whalley | LHAPDF: PDF use from the Tevatron to the LHC | hep-ph/0605240 | |
|
|
Compact Muon Solenoid LHC, CERN |
|

|

|

|

|

|