

Compact Muon Solenoid
LHC, CERN
| CMS-SMP-18-005 ; CERN-EP-2019-226 | ||
| Determination of the strong coupling constant ${\alpha_S}(m_{\mathrm{Z}})$ from measurements of inclusive $\mathrm{W}^{\pm}$ and $Z$ boson production cross sections in proton-proton collisions at $\sqrt{s} = $ 7 and 8 TeV | ||
| CMS Collaboration | ||
| 9 December 2019 | ||
| JHEP 06 (2020) 018 | ||
| Abstract: Twelve measurements of inclusive cross sections of $\mathrm{W^{\pm}} $ and $\mathrm{Z}$ boson production, performed in proton-proton collisions at centre-of-mass energies of 7 and 8 TeV, are compared with perturbative quantum chromodynamics calculations at next-to-next-to-leading order (NNLO) accuracy obtained with the CT14, HERAPDF2.0, MMHT14, and NNPDF3.0 parton distribution functions (PDFs). Data and theory agree well for all PDF sets, taking into account the experimental and theoretical uncertainties. A novel procedure is employed to extract the strong coupling constant at the $\mathrm{Z}$ pole mass from a detailed comparison of all the experimental fiducial cross sections to the corresponding NNLO theoretical predictions, yielding ${\alpha_S}(m_{\mathrm{Z}}) = $ 0.1163$^{+0.0024}_{-0.0031}$ (CT14), 0.1072$^{+0.0043}_{-0.0040}$ (HERAPDF2.0), 0.1186 $\pm$ 0.0025 (MMHT14), and 0.1147 $\pm$ 0.0023 (NNPDF3.0). Using the results obtained with the CT14 and MMHT14 PDFs, which yield the most robust and stable $\alpha_{S}(m_{\mathrm{Z}})$ extractions, a value $\alpha_{S}(m_{\mathrm{Z}}) = $ 0.1175$^{+0.0025}_{-0.0028}$ is determined. | ||
| Links: e-print arXiv:1912.04387 [hep-ex] (PDF) ; CDS record ; inSPIRE record ; CADI line (restricted) ; | ||
| Figures | |
png pdf |
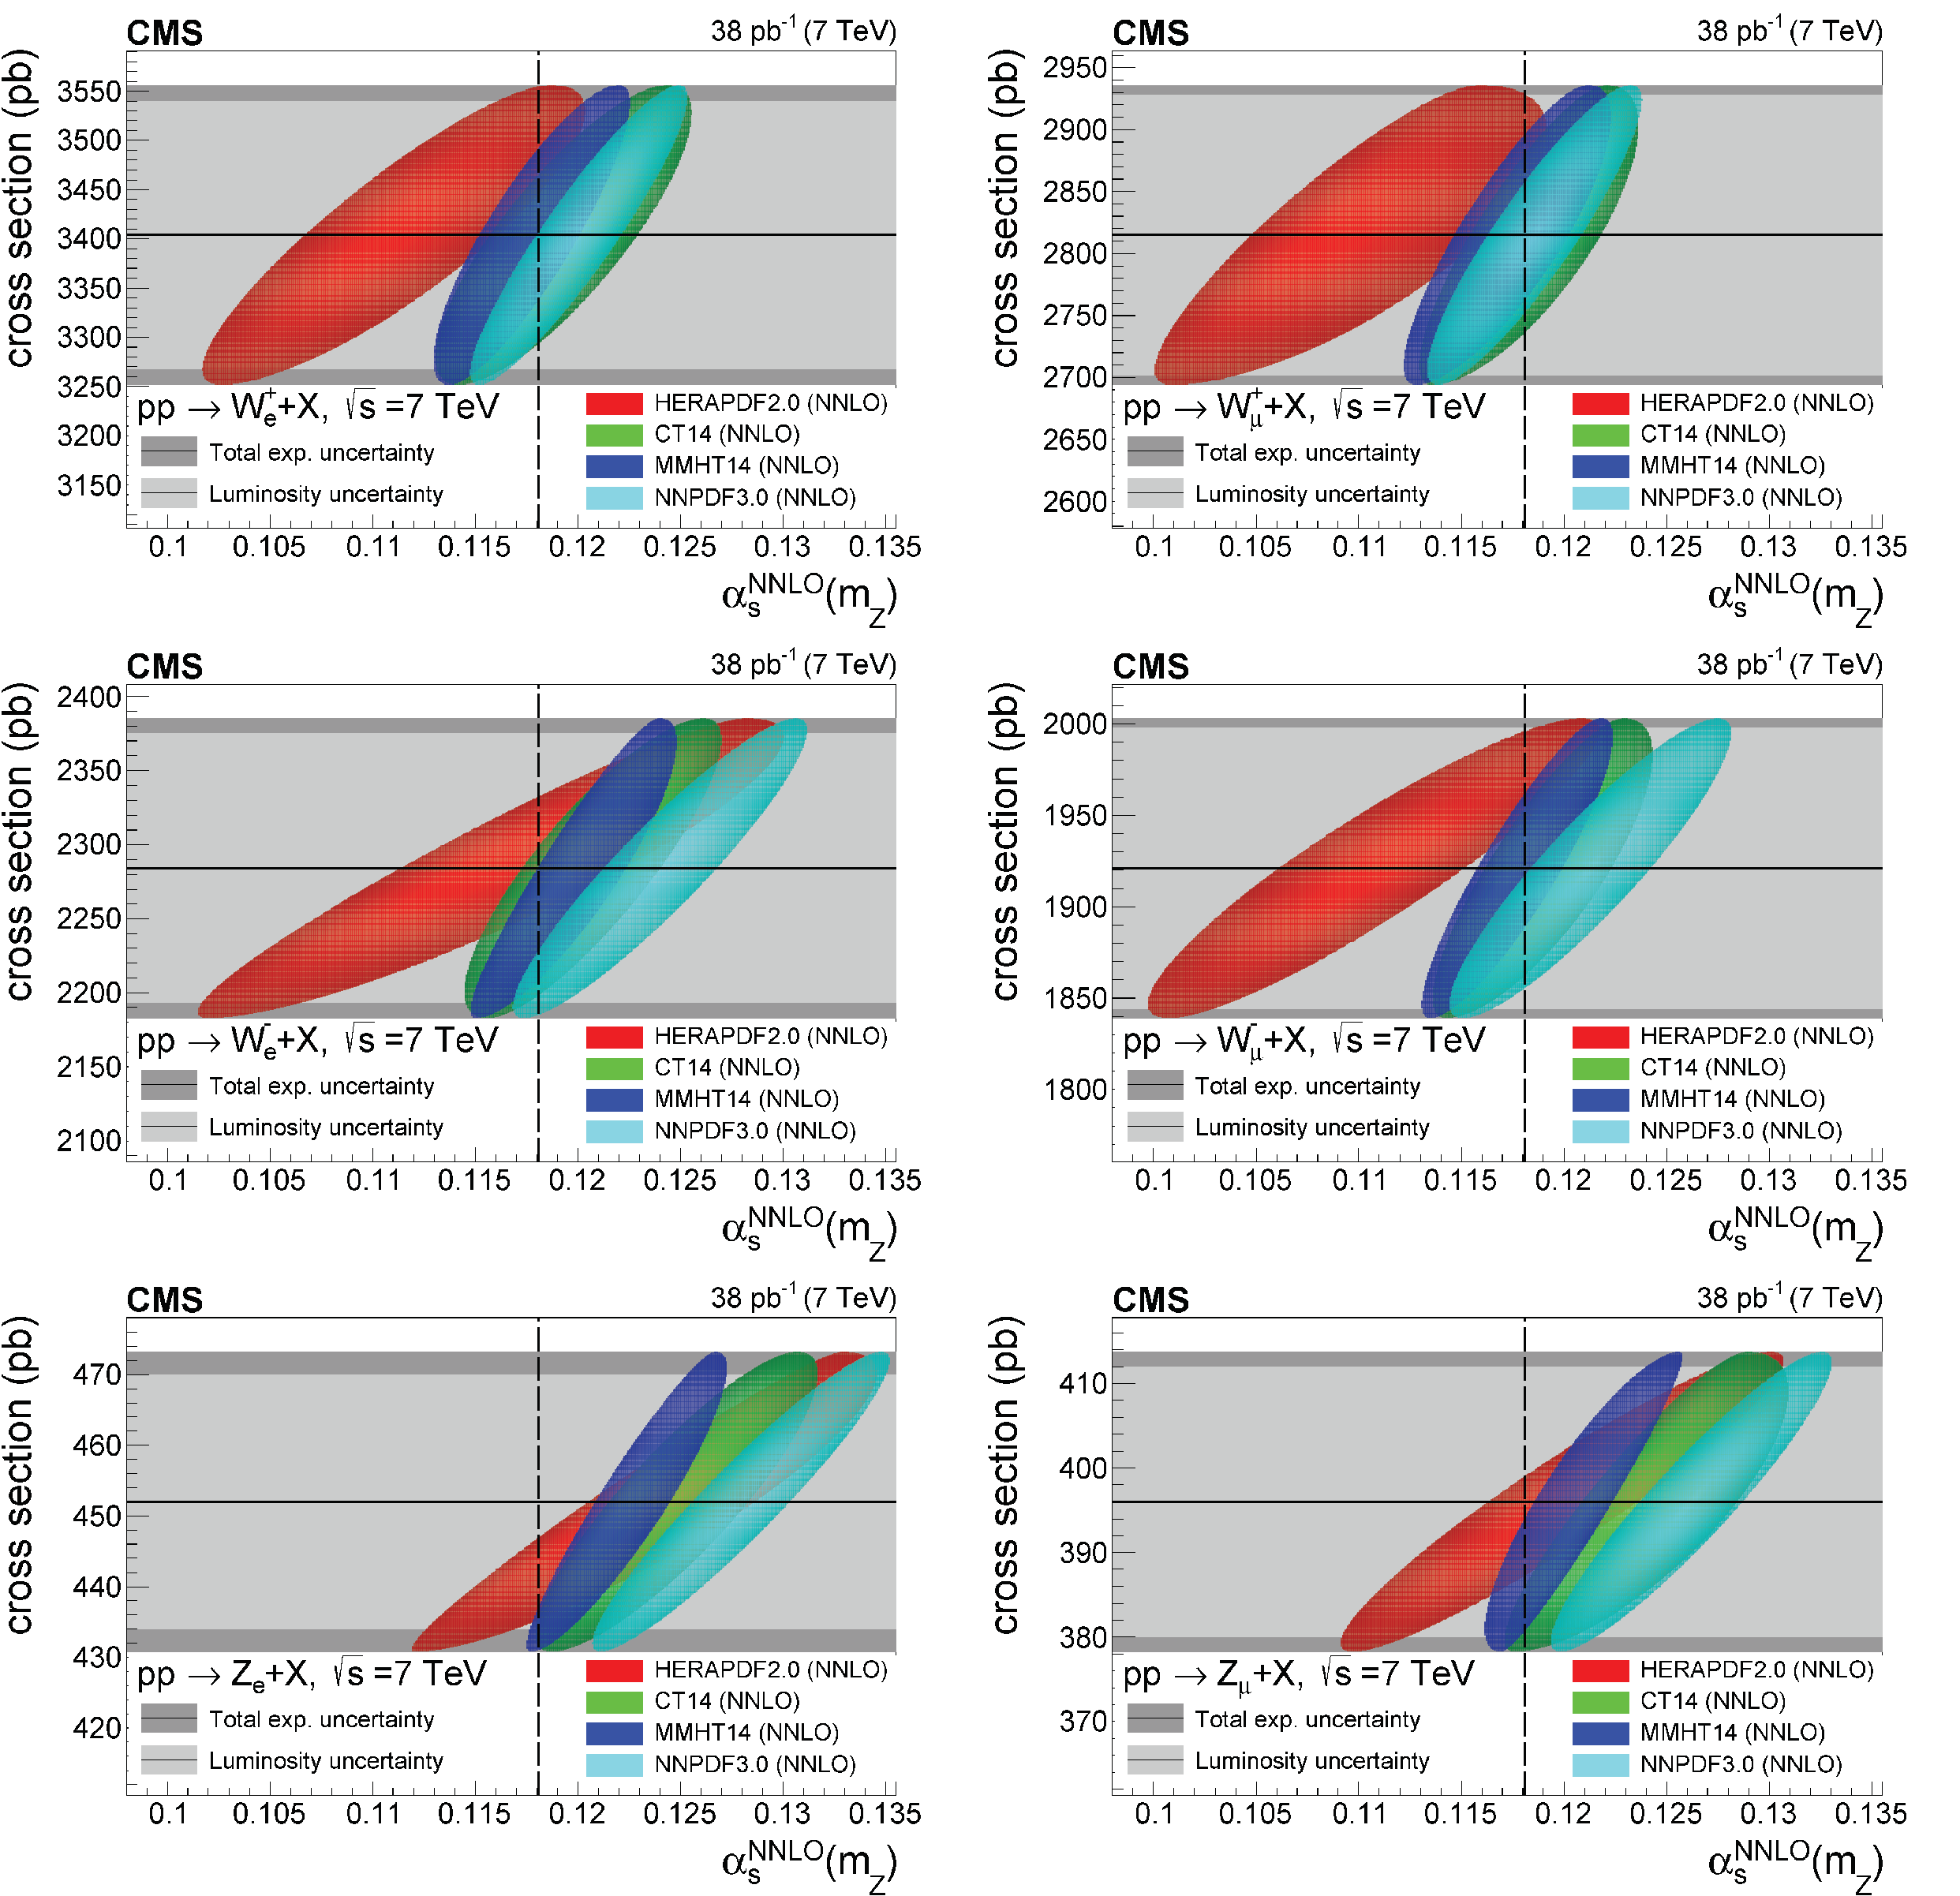
Figure 1:
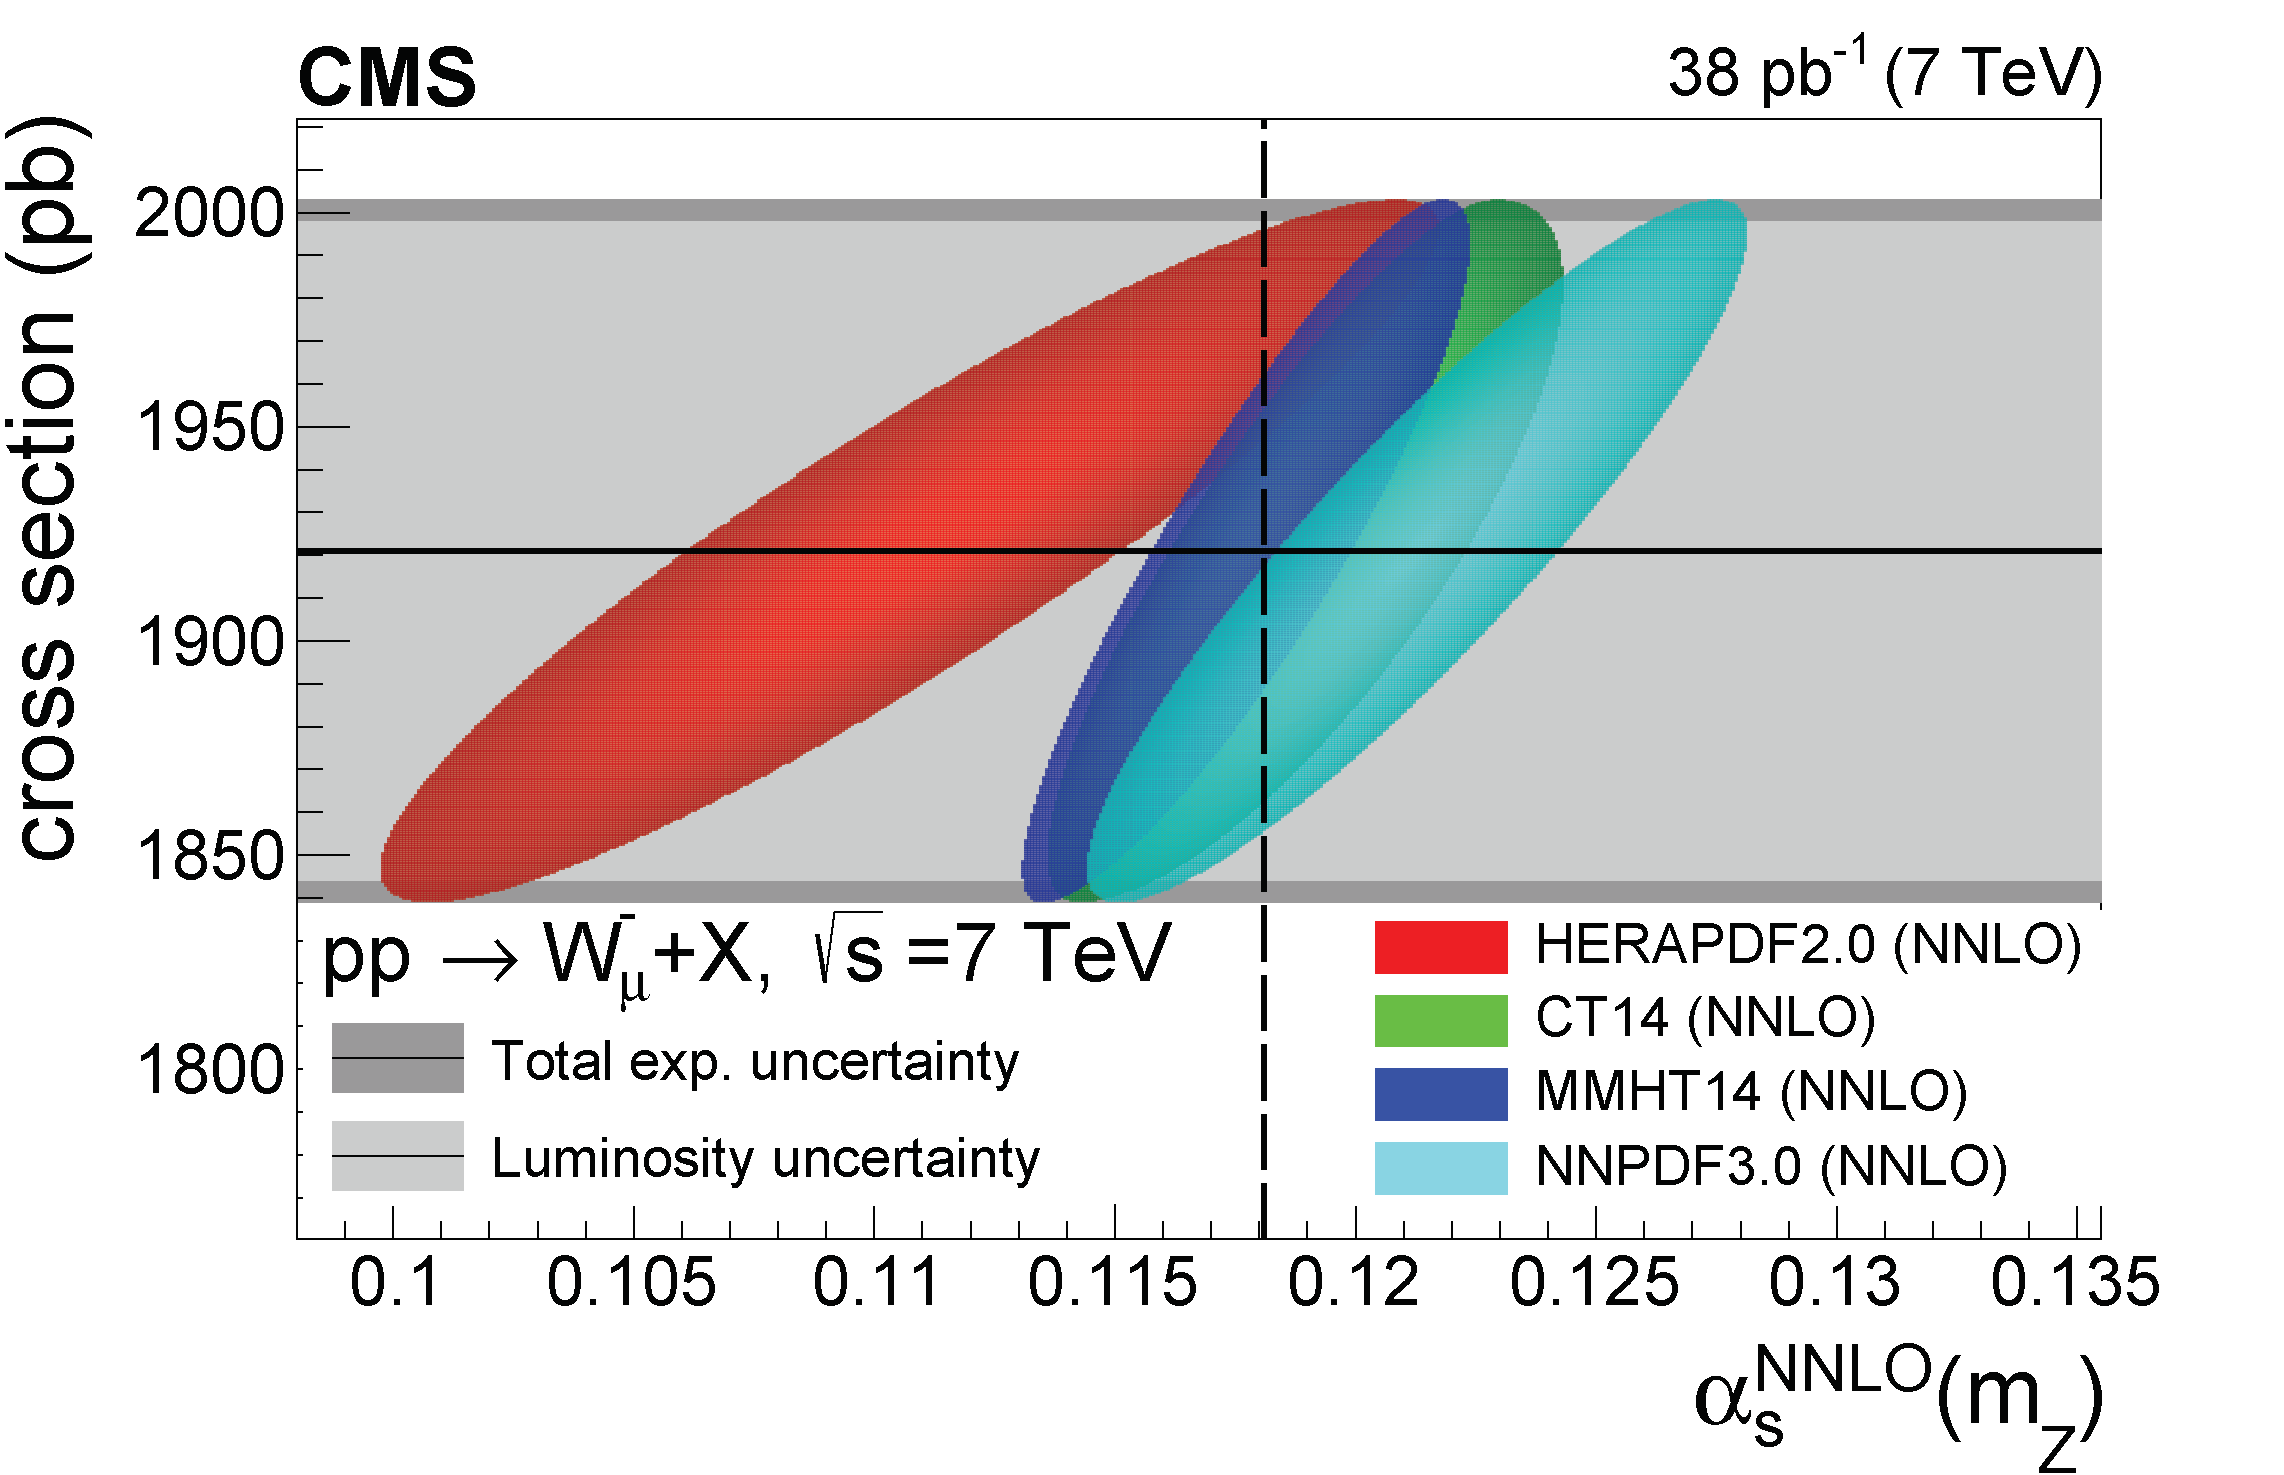
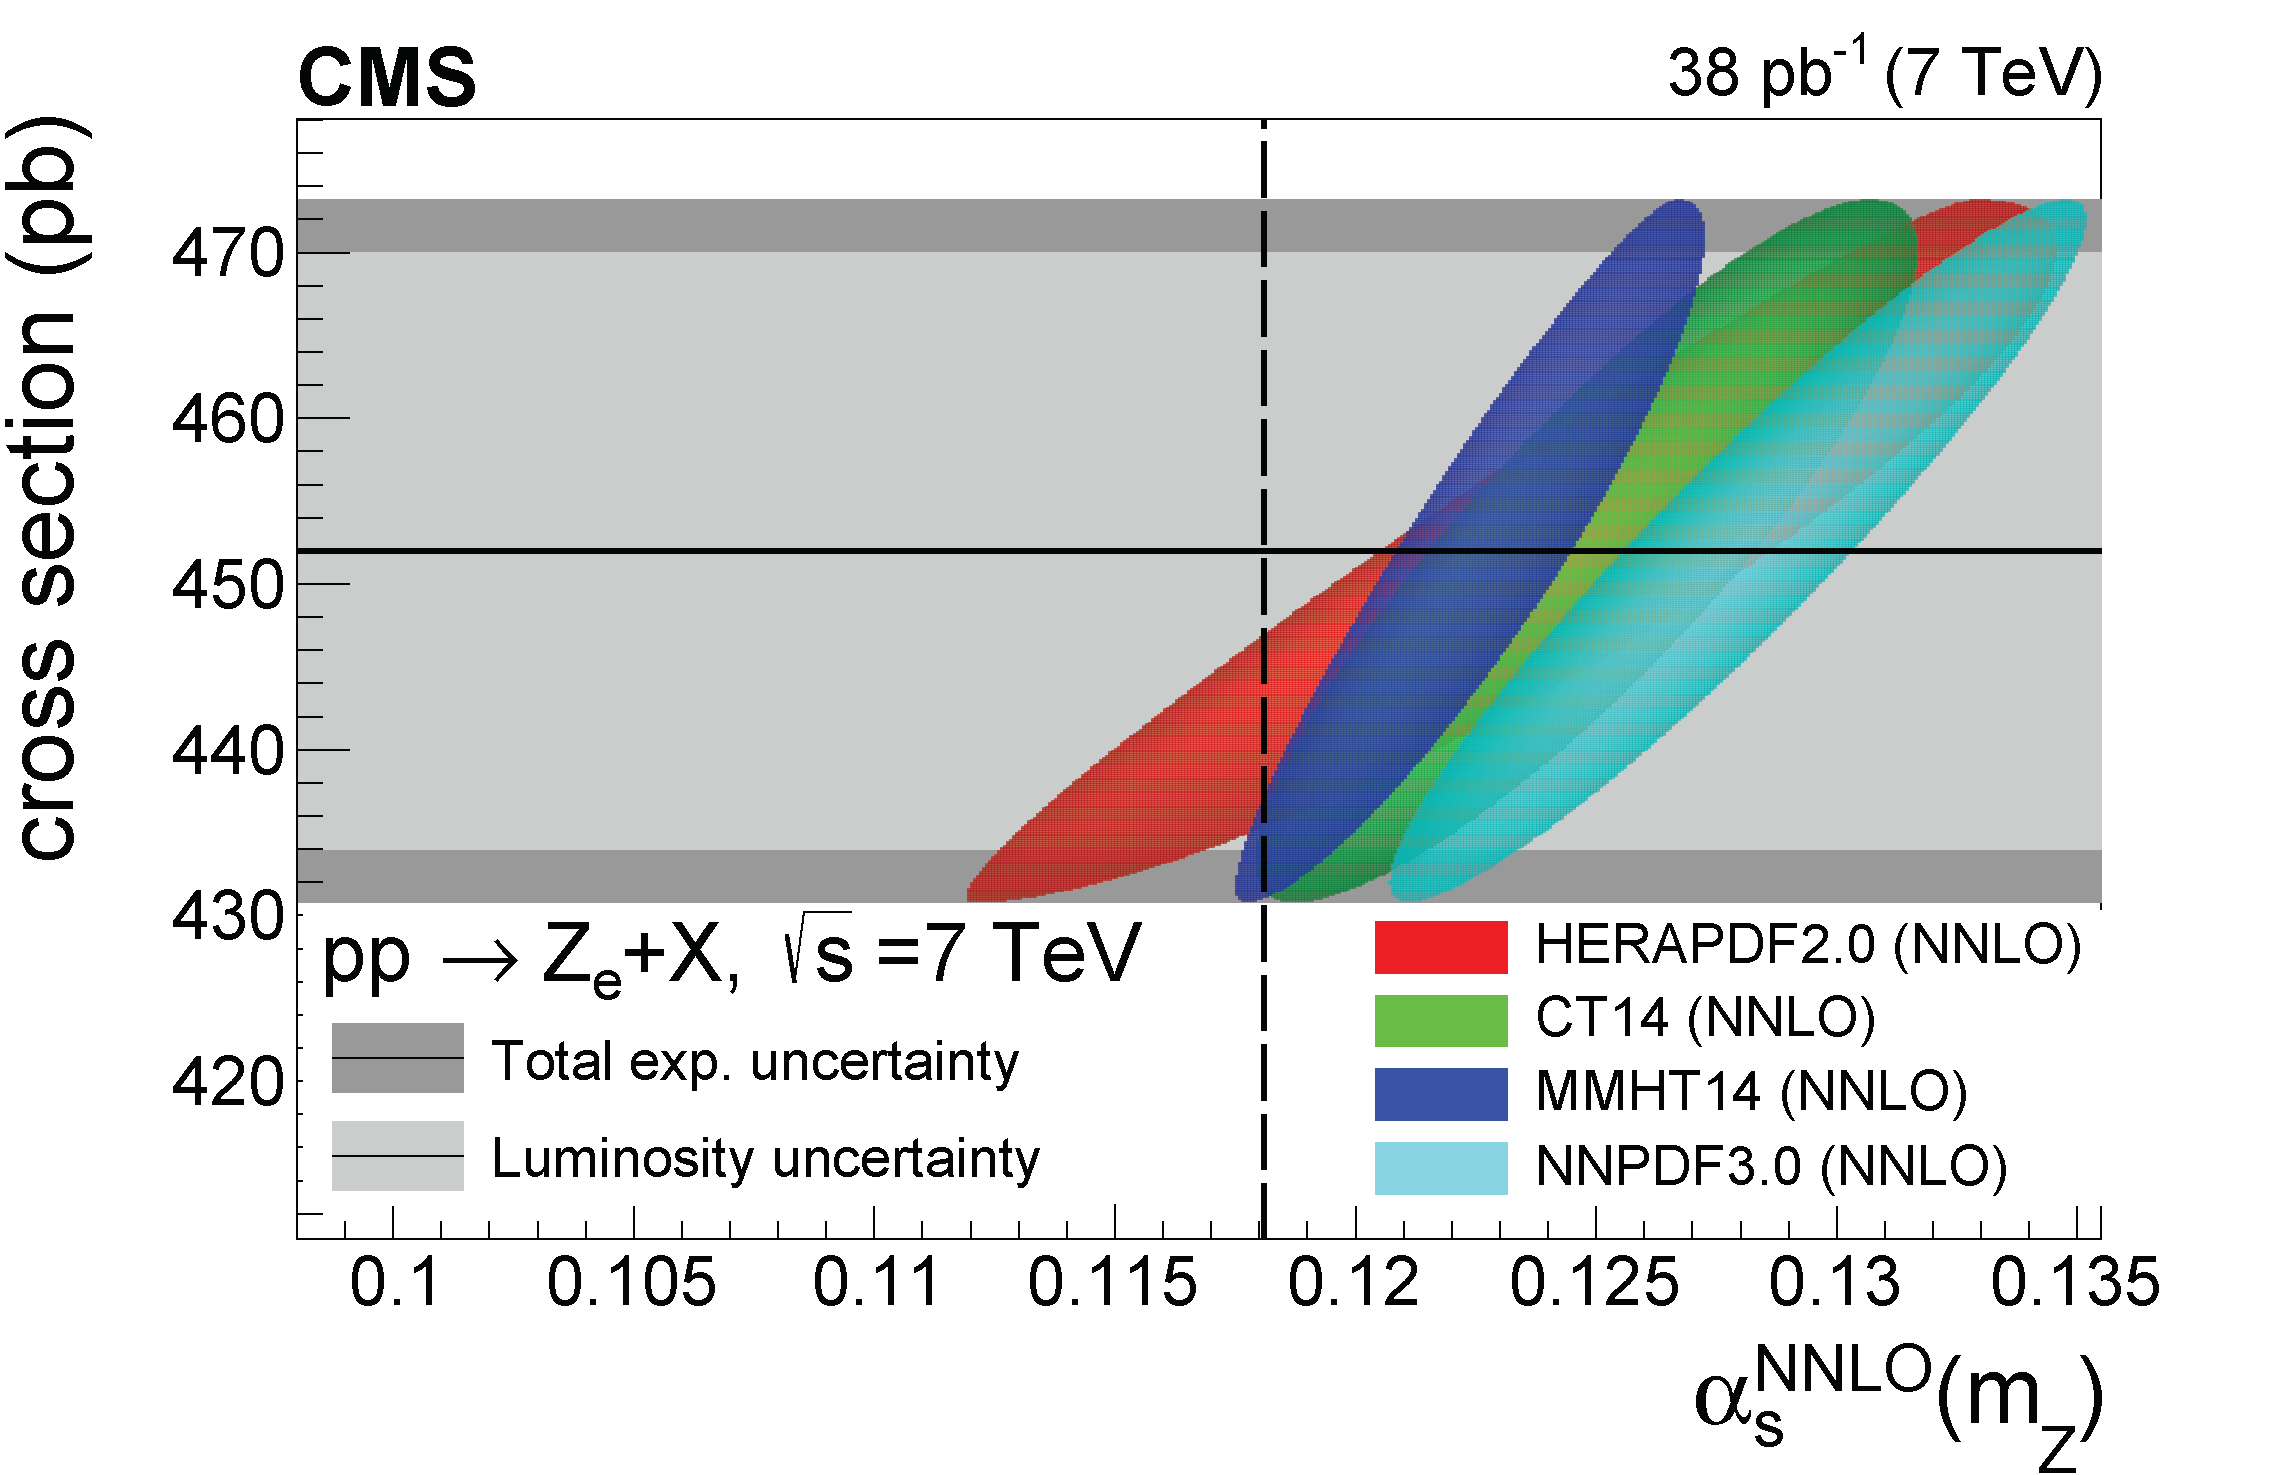
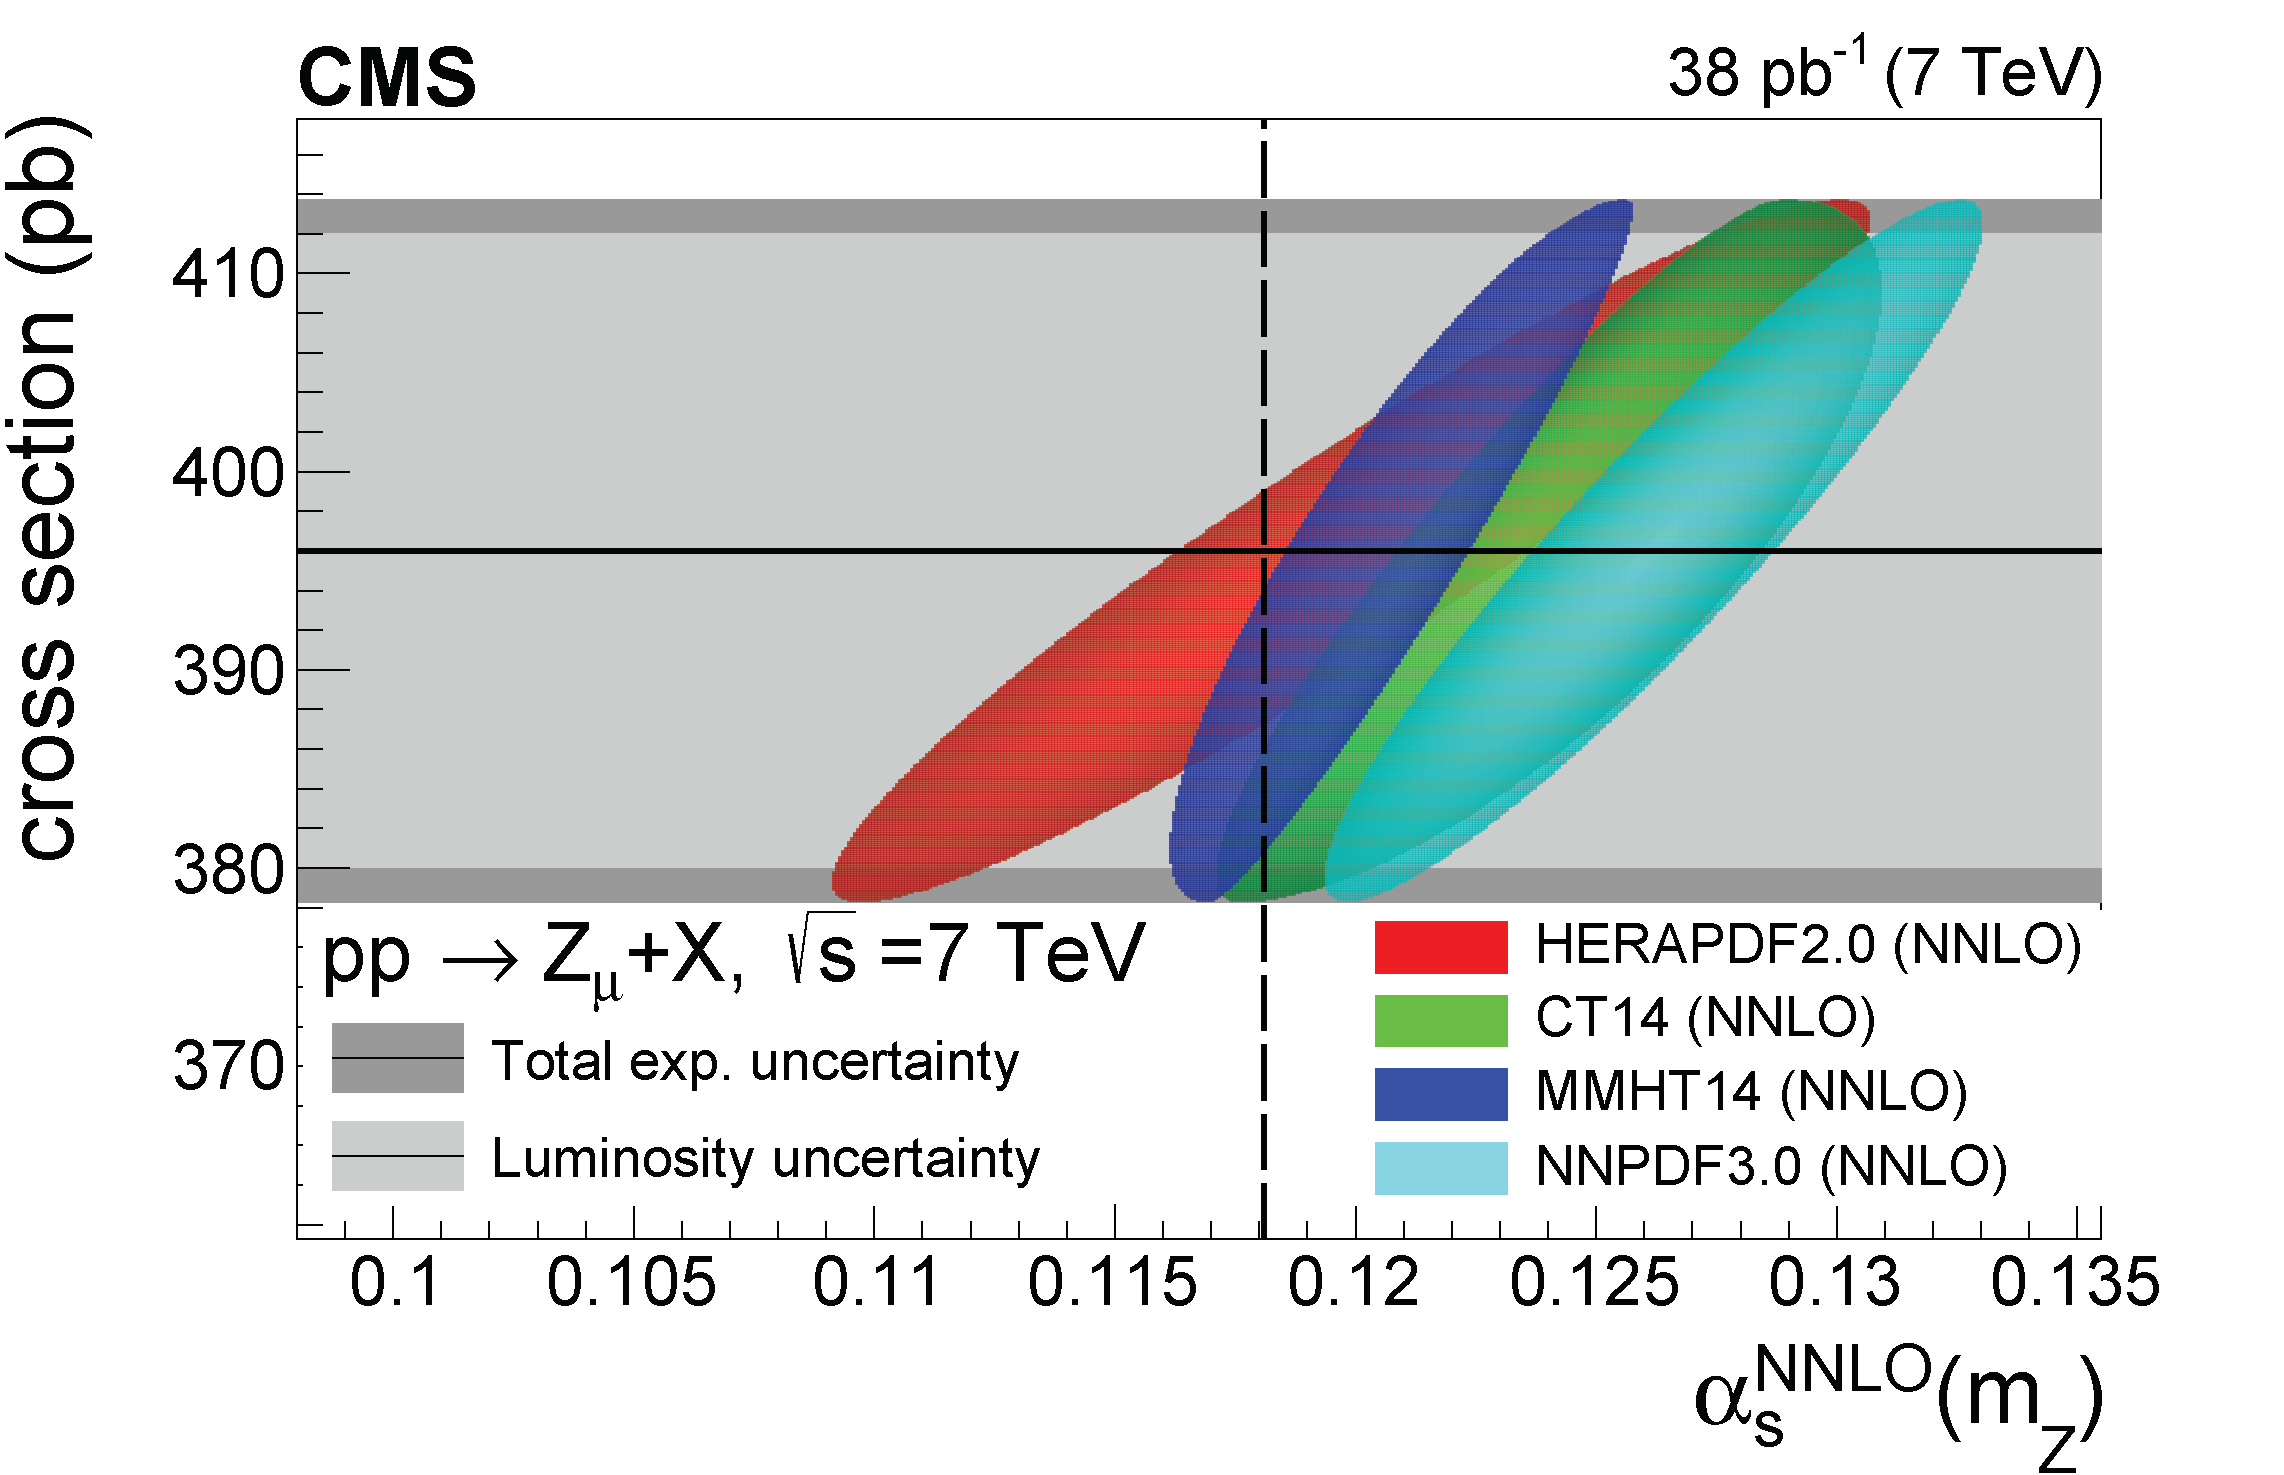
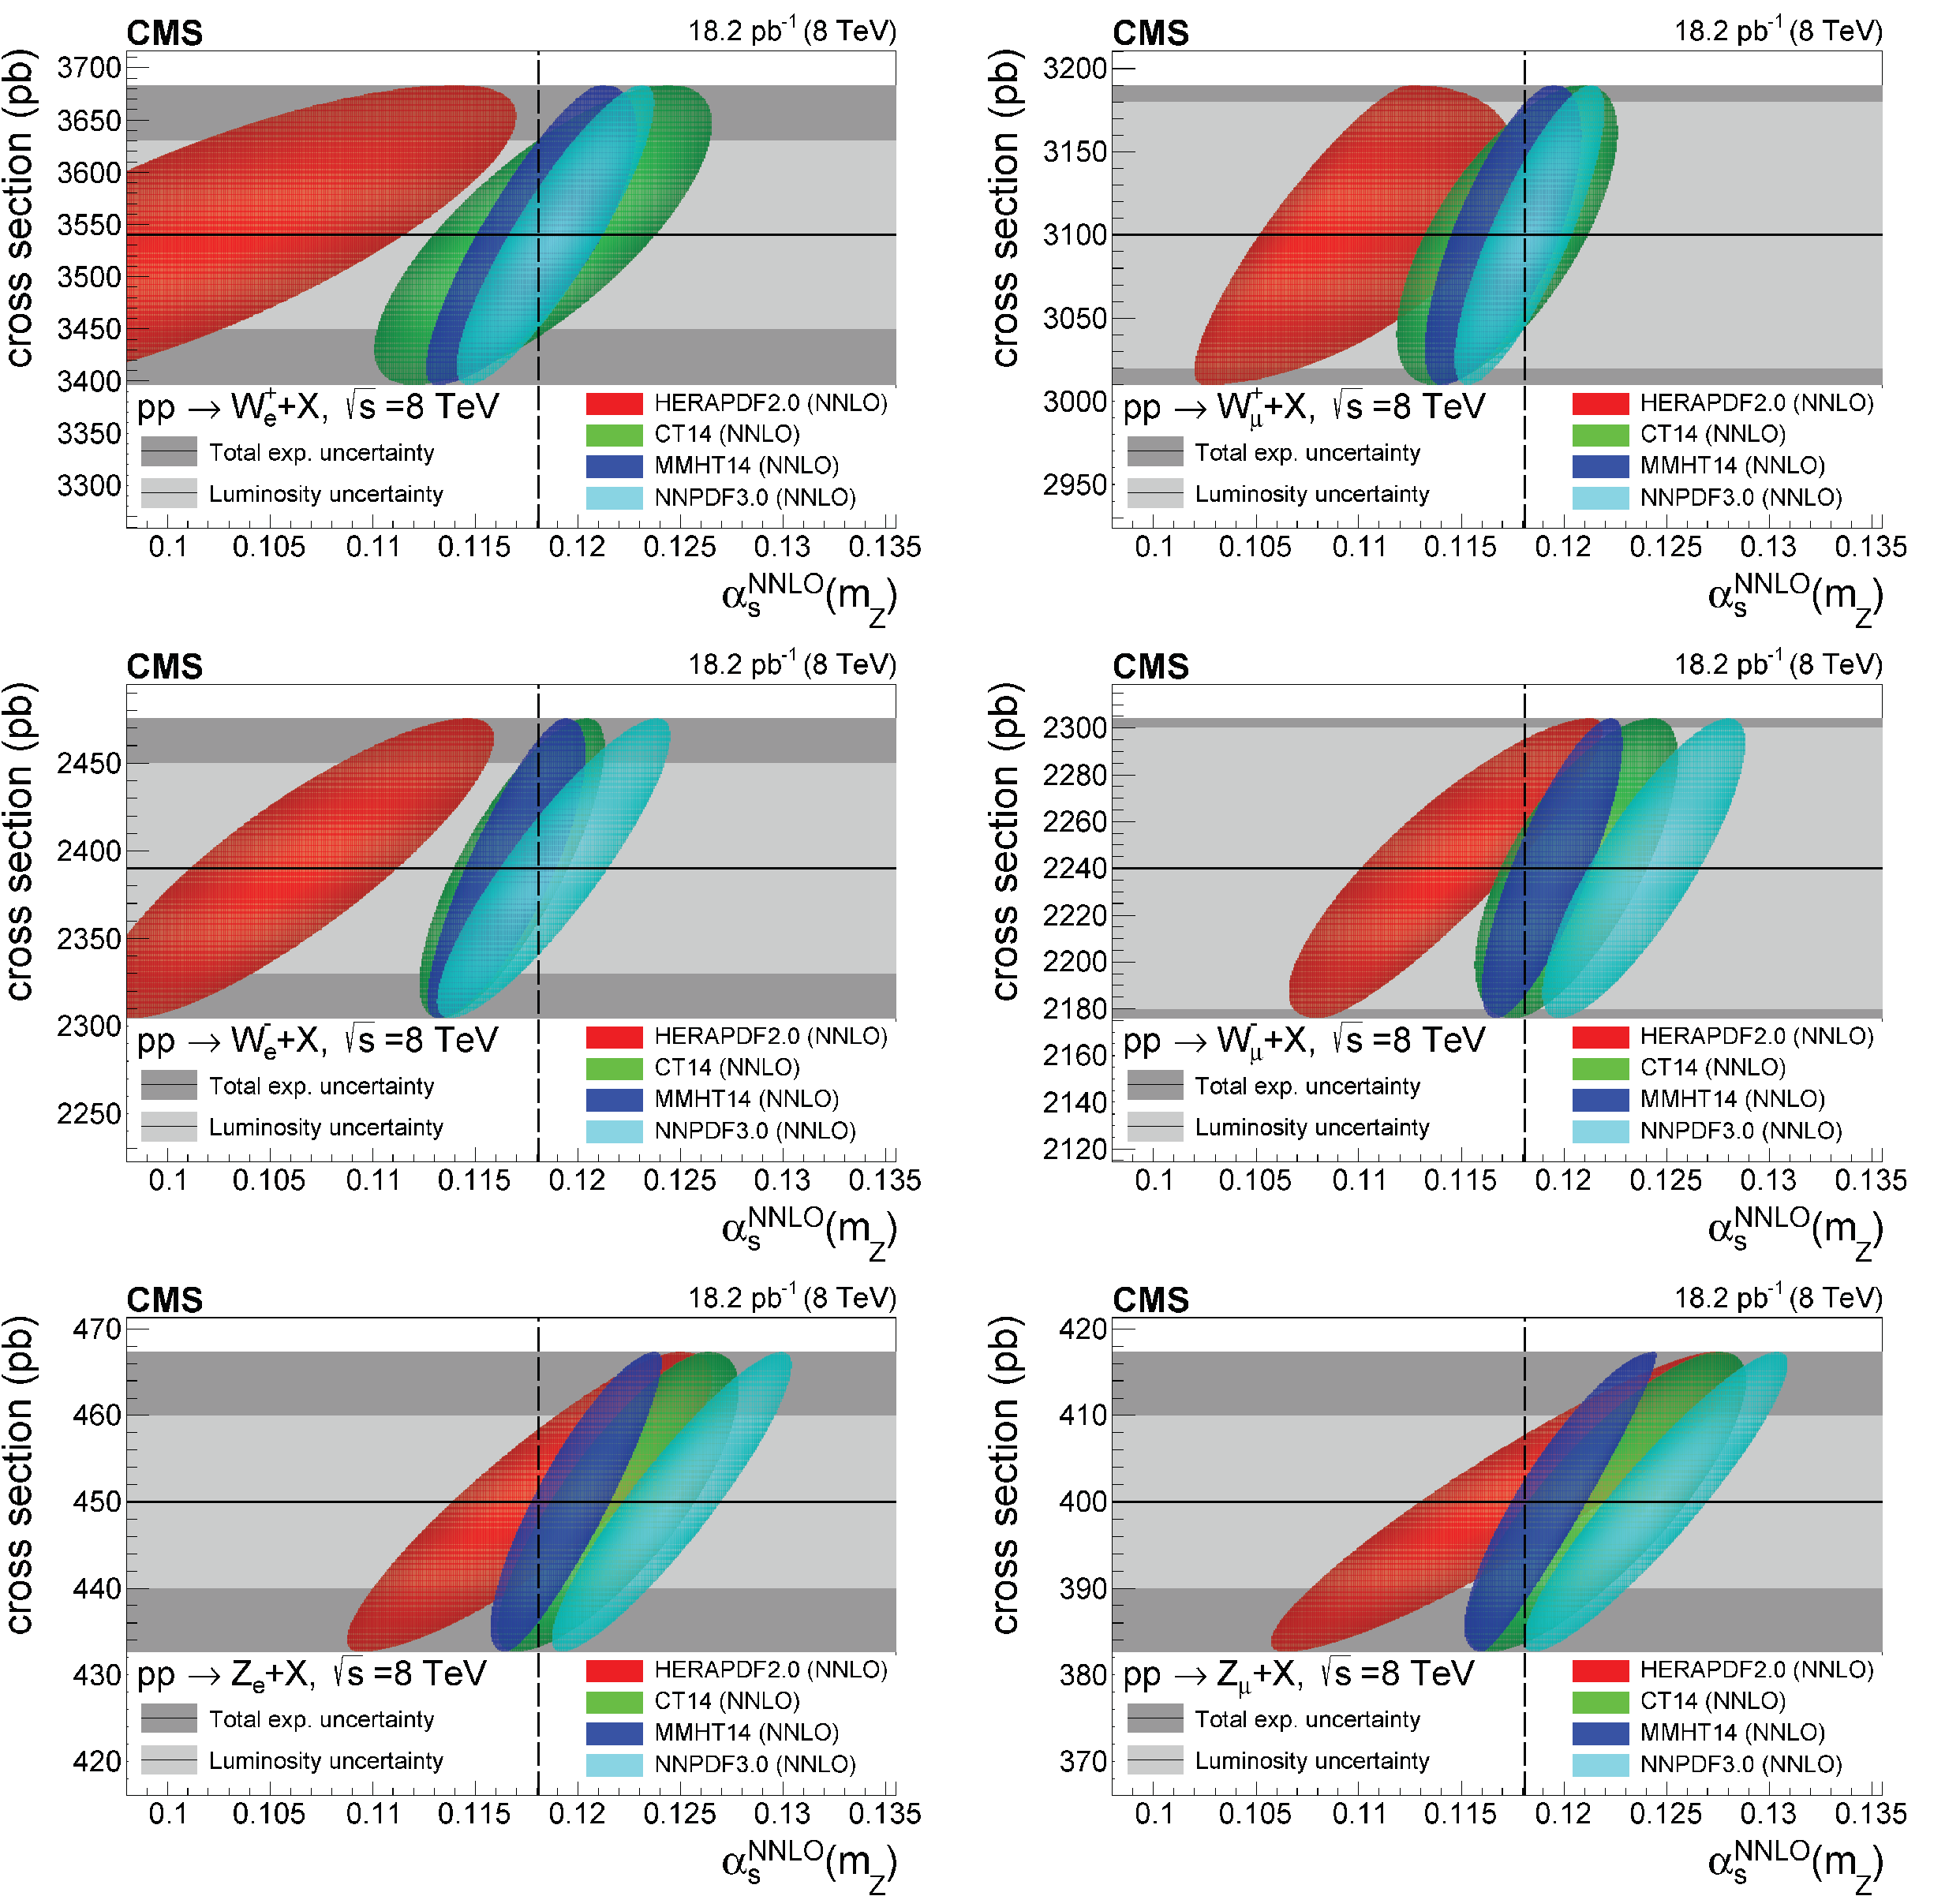
Experimental fiducial cross section for the production of $\mathrm{W} ^{+}_{\mathrm{e}}$ (upper left) and $\mathrm{W} ^{+}_{\mu}$ (upper right), $\mathrm{W} ^{-}_{\mathrm{e}}$ (middle left) and $\mathrm{W} ^{-}_{\mu}$ (middle right), and $\mathrm{Z} _{\mathrm{e}}$ (lower left) and $\mathrm{Z} _{\mu}$ (lower right) in pp collisions at $ {\sqrt {s}} = $ 7 TeV compared to the corresponding joint probability density functions (elliptical contours, see text) obtained with four different PDFs as a function of $ {\alpha _S} (m_{\mathrm{Z}})$ and $\sigma $. The experimental measurements are plotted as a horizontal black line with the inner grey band indicating the integrated luminosity uncertainty, and the outer darker band showing all experimental uncertainties added in quadrature. The filled ellipses are obtained from the product of the probability distributions of the experimental and theoretical results for each PDF, and represent the two-dimensional one standard deviation. The points where the filled ellipses cross the vertical dashed line at $ {\alpha _S} (m_{\mathrm{Z}}) = $ 0.118 indicate the most likely cross section interval that would be obtained using the baseline QCD coupling constant value of all PDF sets. |
png |
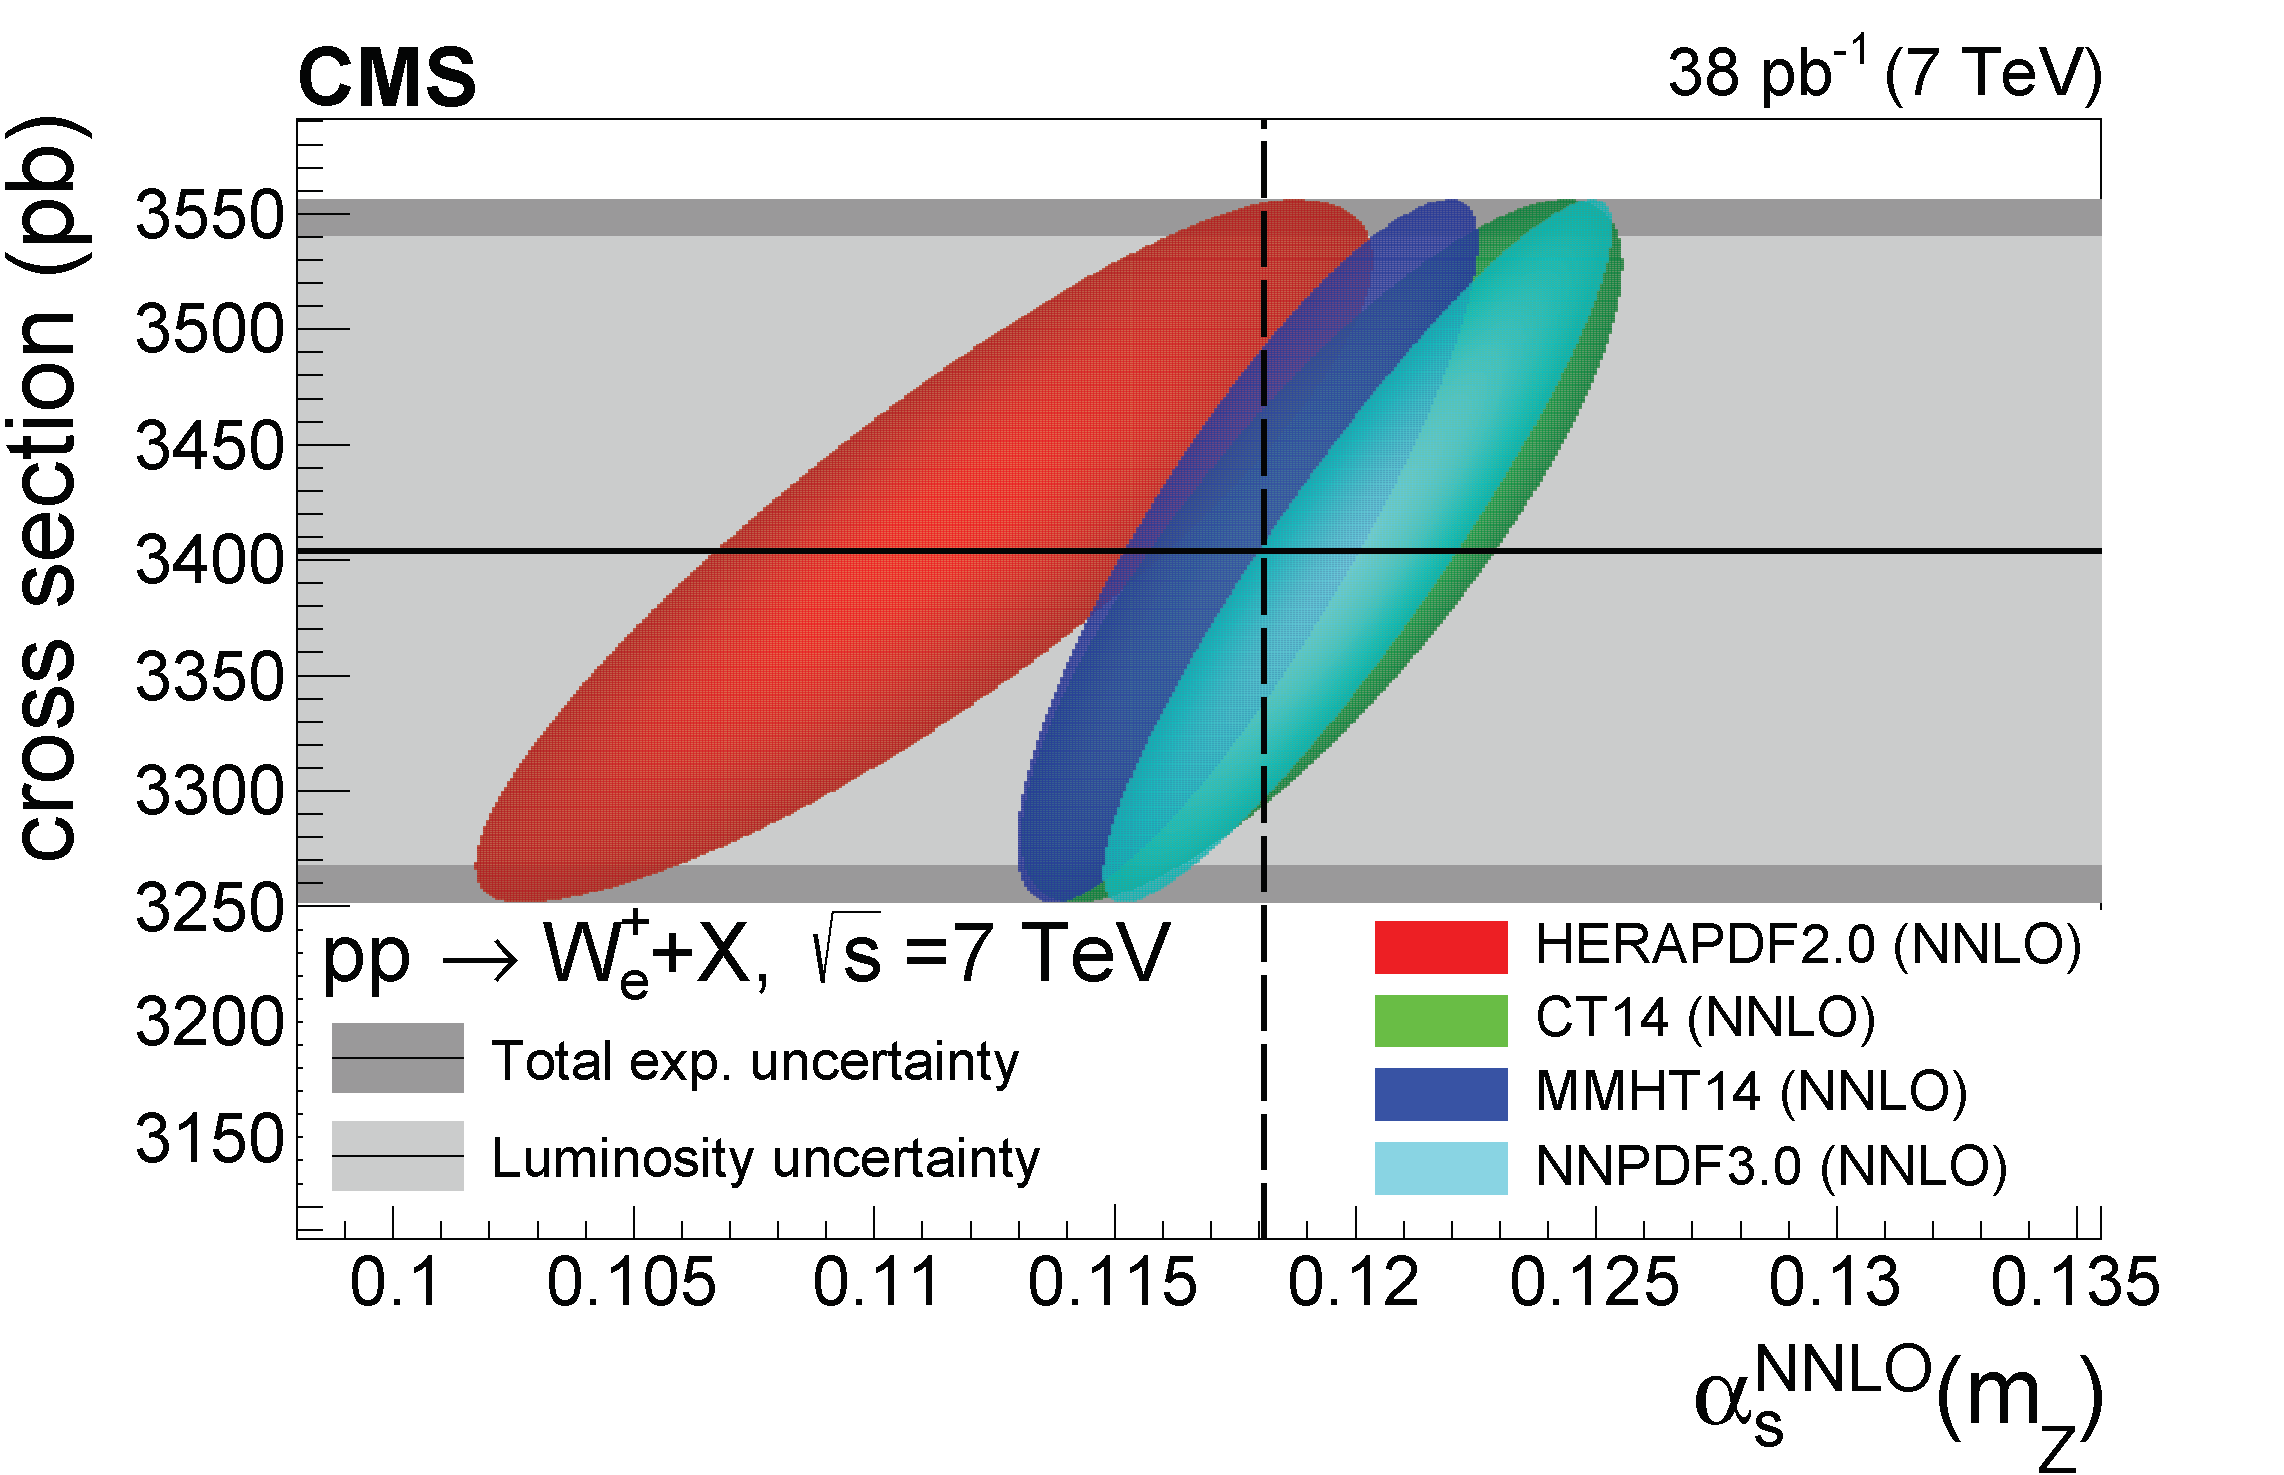
Figure 1-a:
Experimental fiducial cross section for the production of $\mathrm{W} ^{+}_{\mathrm{e}}$ in pp collisions at $ {\sqrt {s}} = $ 7 TeV compared to the corresponding joint probability density functions (elliptical contours, see text) obtained with four different PDFs as a function of $ {\alpha _S} (m_{\mathrm{Z}})$ and $\sigma $. The experimental measurements are plotted as a horizontal black line with the inner grey band indicating the integrated luminosity uncertainty, and the outer darker band showing all experimental uncertainties added in quadrature. The filled ellipses are obtained from the product of the probability distributions of the experimental and theoretical results for each PDF, and represent the two-dimensional one standard deviation. The points where the filled ellipses cross the vertical dashed line at $ {\alpha _S} (m_{\mathrm{Z}}) = $ 0.118 indicate the most likely cross section interval that would be obtained using the baseline QCD coupling constant value of all PDF sets. |
png |
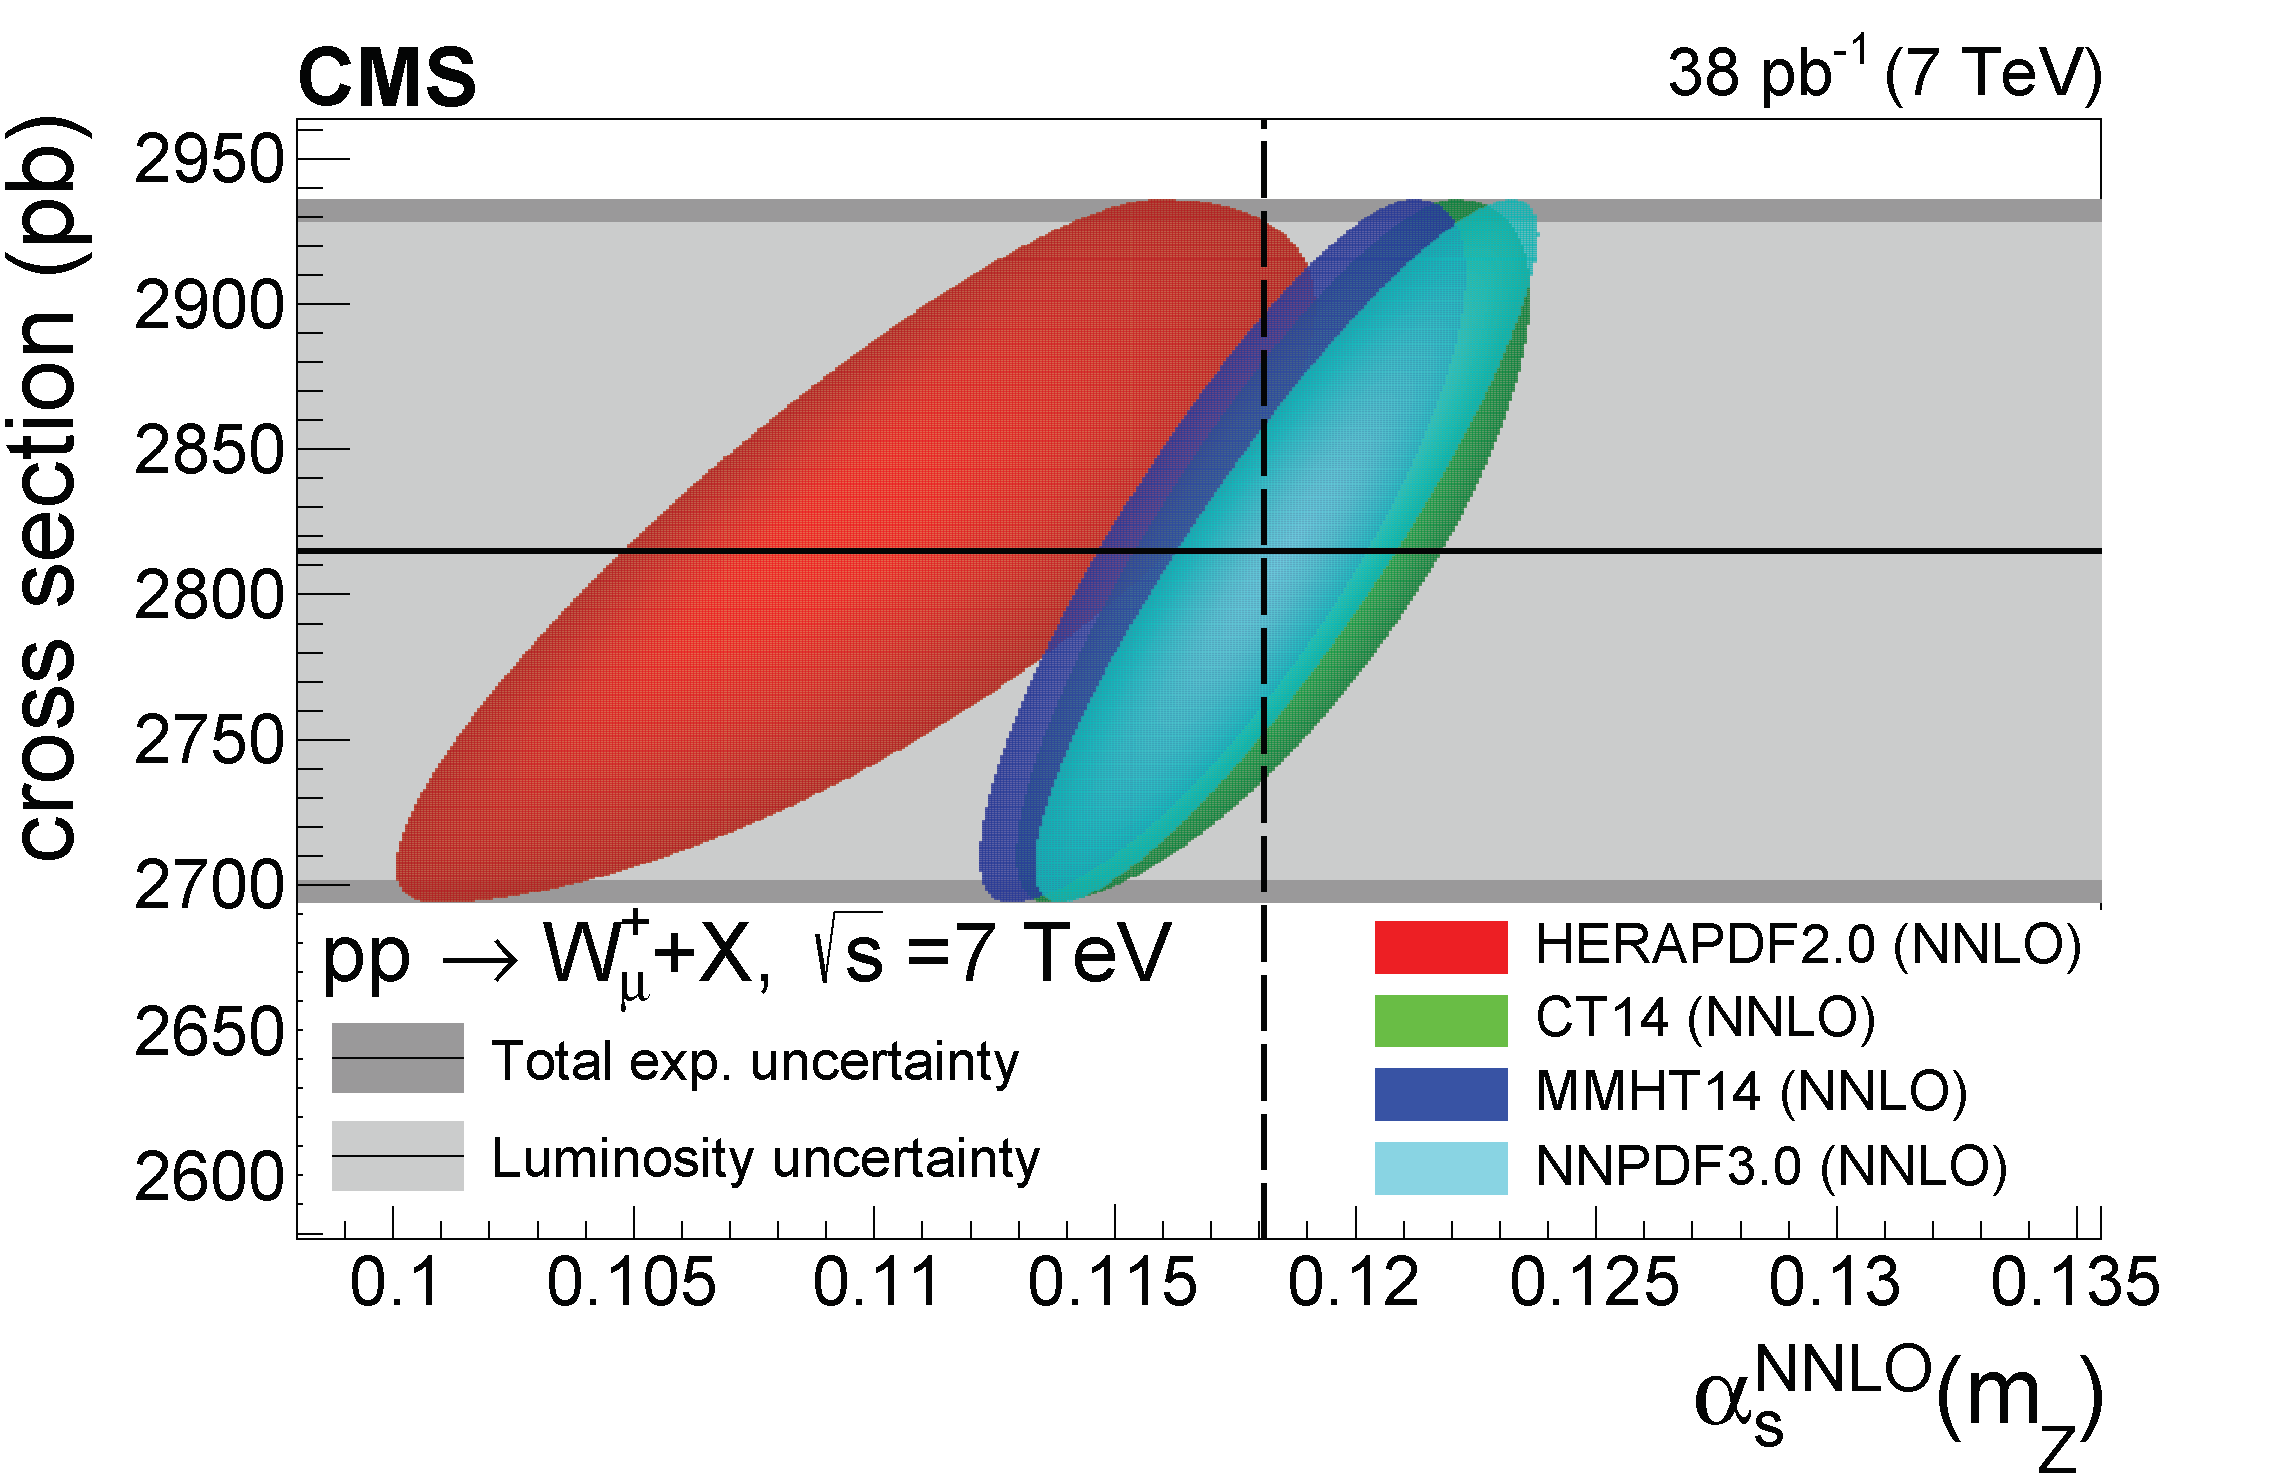
Figure 1-b:
Experimental fiducial cross section for the production of $\mathrm{W} ^{+}_{\mu}$ in pp collisions at $ {\sqrt {s}} = $ 7 TeV compared to the corresponding joint probability density functions (elliptical contours, see text) obtained with four different PDFs as a function of $ {\alpha _S} (m_{\mathrm{Z}})$ and $\sigma $. The experimental measurements are plotted as a horizontal black line with the inner grey band indicating the integrated luminosity uncertainty, and the outer darker band showing all experimental uncertainties added in quadrature. The filled ellipses are obtained from the product of the probability distributions of the experimental and theoretical results for each PDF, and represent the two-dimensional one standard deviation. The points where the filled ellipses cross the vertical dashed line at $ {\alpha _S} (m_{\mathrm{Z}}) = $ 0.118 indicate the most likely cross section interval that would be obtained using the baseline QCD coupling constant value of all PDF sets. |
png |
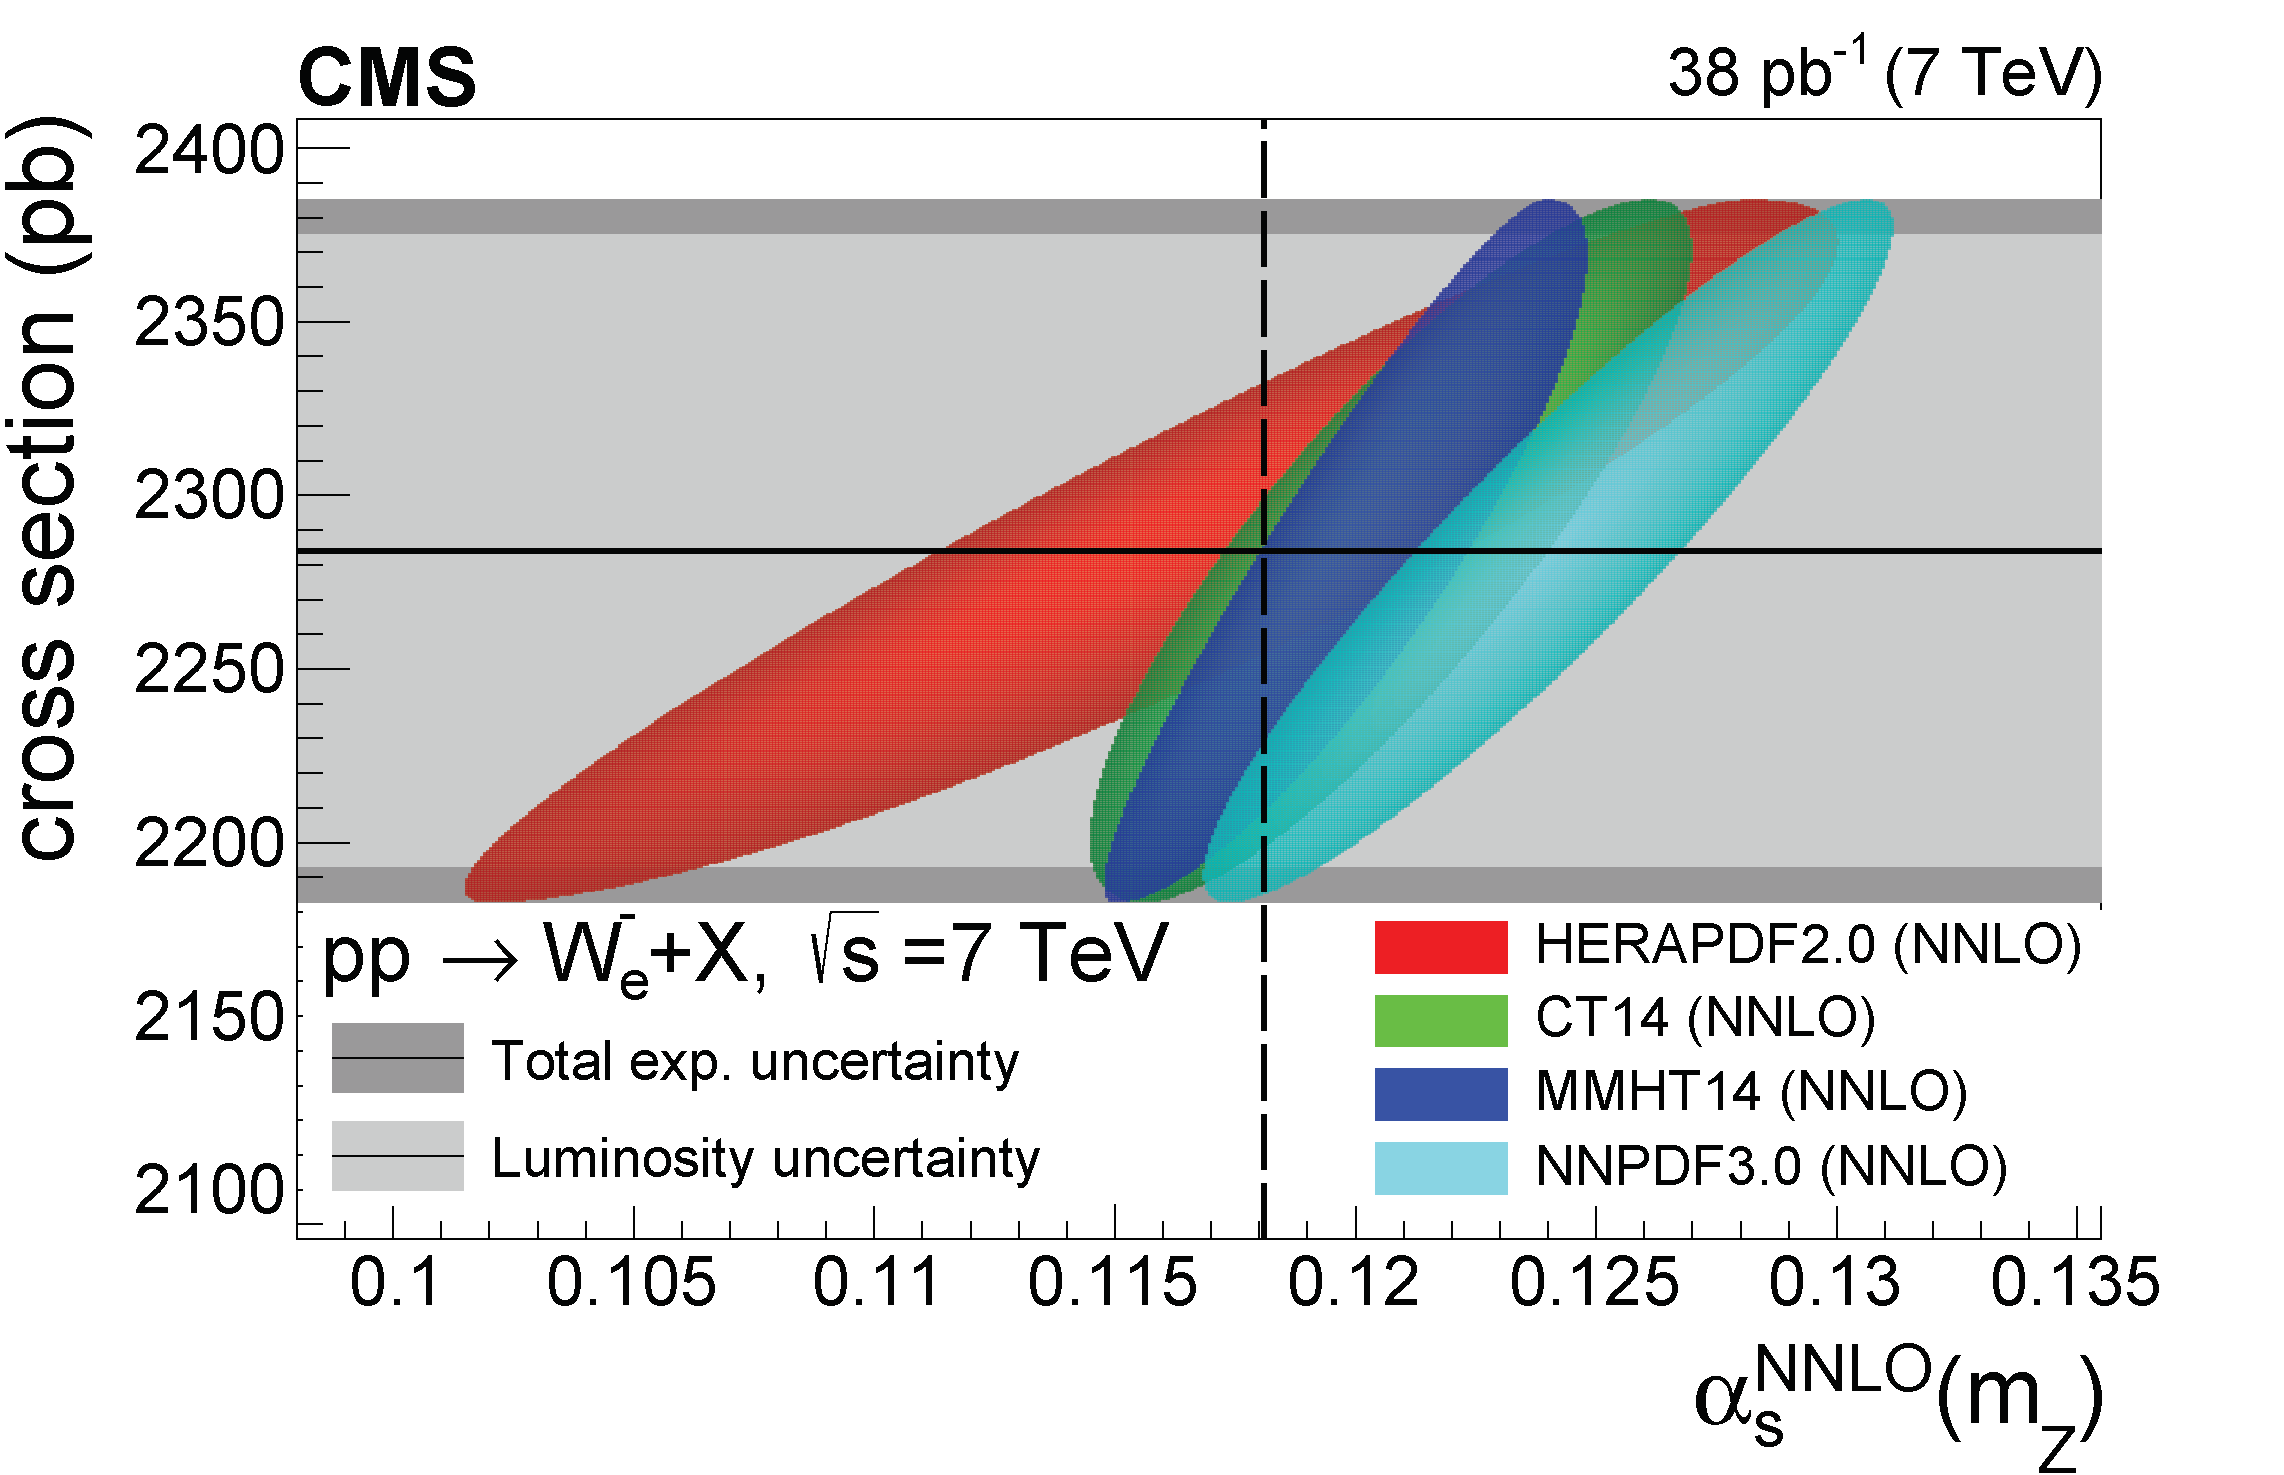
Figure 1-c:
Experimental fiducial cross section for the production of $\mathrm{W} ^{-}_{\mathrm{e}}$ in pp collisions at $ {\sqrt {s}} = $ 7 TeV compared to the corresponding joint probability density functions (elliptical contours, see text) obtained with four different PDFs as a function of $ {\alpha _S} (m_{\mathrm{Z}})$ and $\sigma $. The experimental measurements are plotted as a horizontal black line with the inner grey band indicating the integrated luminosity uncertainty, and the outer darker band showing all experimental uncertainties added in quadrature. The filled ellipses are obtained from the product of the probability distributions of the experimental and theoretical results for each PDF, and represent the two-dimensional one standard deviation. The points where the filled ellipses cross the vertical dashed line at $ {\alpha _S} (m_{\mathrm{Z}}) = $ 0.118 indicate the most likely cross section interval that would be obtained using the baseline QCD coupling constant value of all PDF sets. |
png |
Figure 1-d:
Experimental fiducial cross section for the production of $\mathrm{W} ^{-}_{\mu}$ in pp collisions at $ {\sqrt {s}} = $ 7 TeV compared to the corresponding joint probability density functions (elliptical contours, see text) obtained with four different PDFs as a function of $ {\alpha _S} (m_{\mathrm{Z}})$ and $\sigma $. The experimental measurements are plotted as a horizontal black line with the inner grey band indicating the integrated luminosity uncertainty, and the outer darker band showing all experimental uncertainties added in quadrature. The filled ellipses are obtained from the product of the probability distributions of the experimental and theoretical results for each PDF, and represent the two-dimensional one standard deviation. The points where the filled ellipses cross the vertical dashed line at $ {\alpha _S} (m_{\mathrm{Z}}) = $ 0.118 indicate the most likely cross section interval that would be obtained using the baseline QCD coupling constant value of all PDF sets. |
png |
Figure 1-e:
Experimental fiducial cross section for the production of $\mathrm{Z} _{\mathrm{e}}$ in pp collisions at $ {\sqrt {s}} = $ 7 TeV compared to the corresponding joint probability density functions (elliptical contours, see text) obtained with four different PDFs as a function of $ {\alpha _S} (m_{\mathrm{Z}})$ and $\sigma $. The experimental measurements are plotted as a horizontal black line with the inner grey band indicating the integrated luminosity uncertainty, and the outer darker band showing all experimental uncertainties added in quadrature. The filled ellipses are obtained from the product of the probability distributions of the experimental and theoretical results for each PDF, and represent the two-dimensional one standard deviation. The points where the filled ellipses cross the vertical dashed line at $ {\alpha _S} (m_{\mathrm{Z}}) = $ 0.118 indicate the most likely cross section interval that would be obtained using the baseline QCD coupling constant value of all PDF sets. |
png |
Figure 1-f:
Experimental fiducial cross section for the production of $\mathrm{Z} _{\mu}$ in pp collisions at $ {\sqrt {s}} = $ 7 TeV compared to the corresponding joint probability density functions (elliptical contours, see text) obtained with four different PDFs as a function of $ {\alpha _S} (m_{\mathrm{Z}})$ and $\sigma $. The experimental measurements are plotted as a horizontal black line with the inner grey band indicating the integrated luminosity uncertainty, and the outer darker band showing all experimental uncertainties added in quadrature. The filled ellipses are obtained from the product of the probability distributions of the experimental and theoretical results for each PDF, and represent the two-dimensional one standard deviation. The points where the filled ellipses cross the vertical dashed line at $ {\alpha _S} (m_{\mathrm{Z}}) = $ 0.118 indicate the most likely cross section interval that would be obtained using the baseline QCD coupling constant value of all PDF sets. |
png pdf |
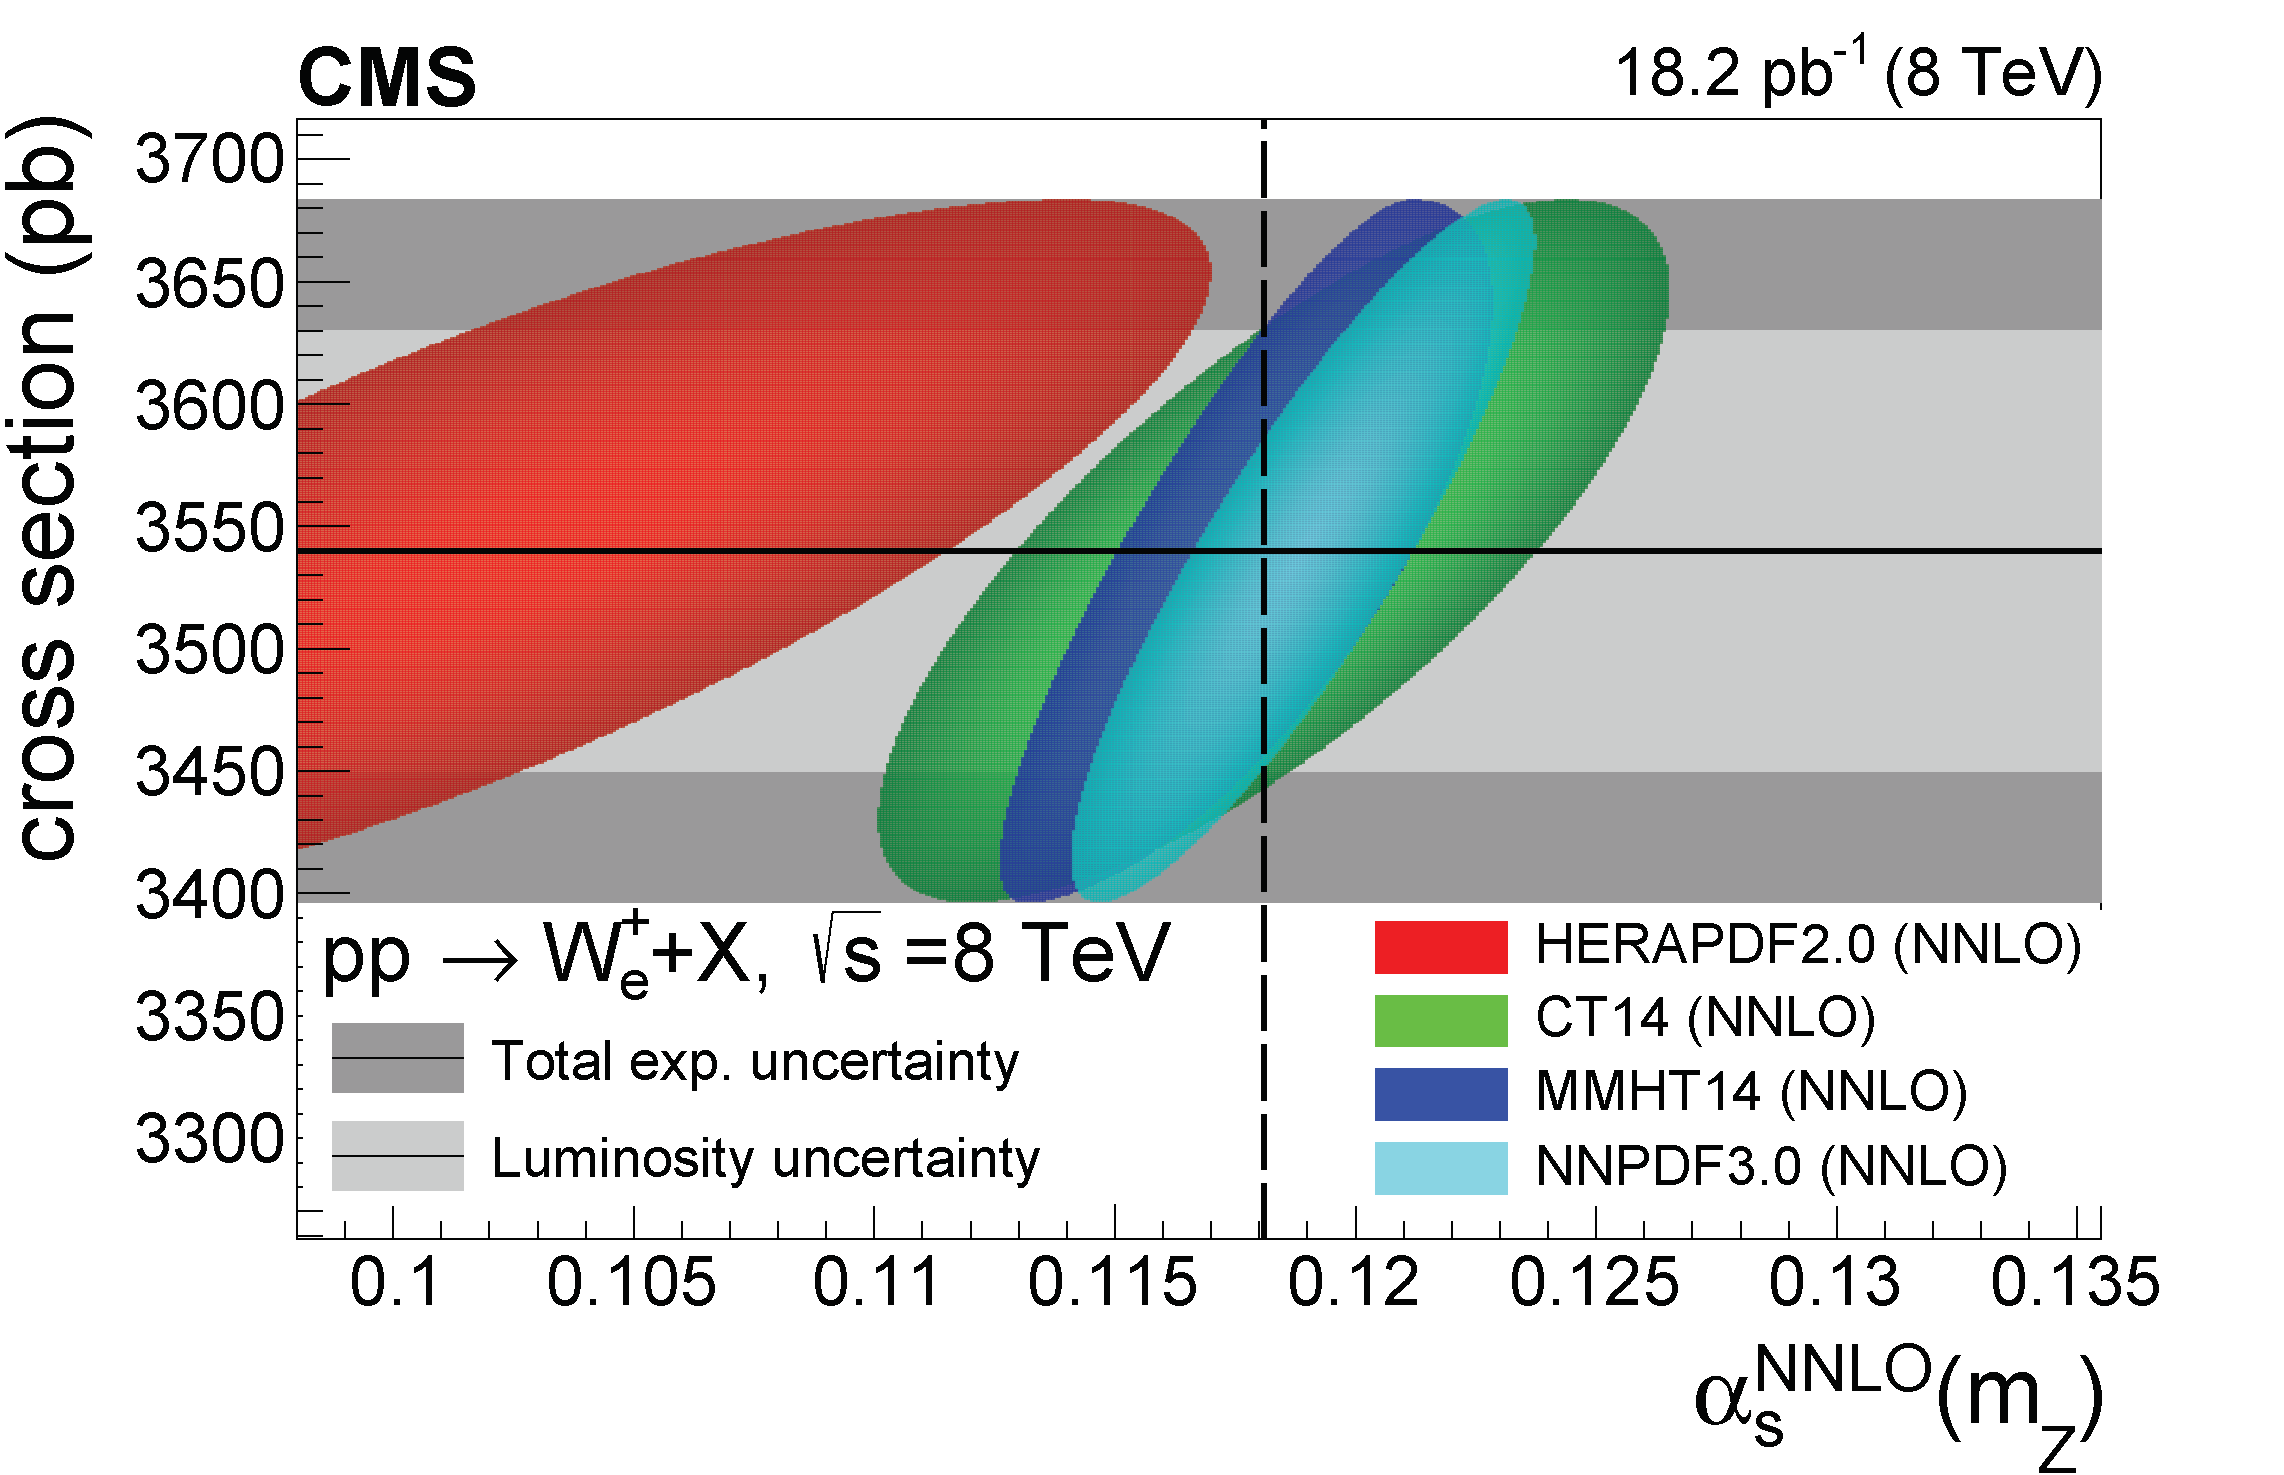
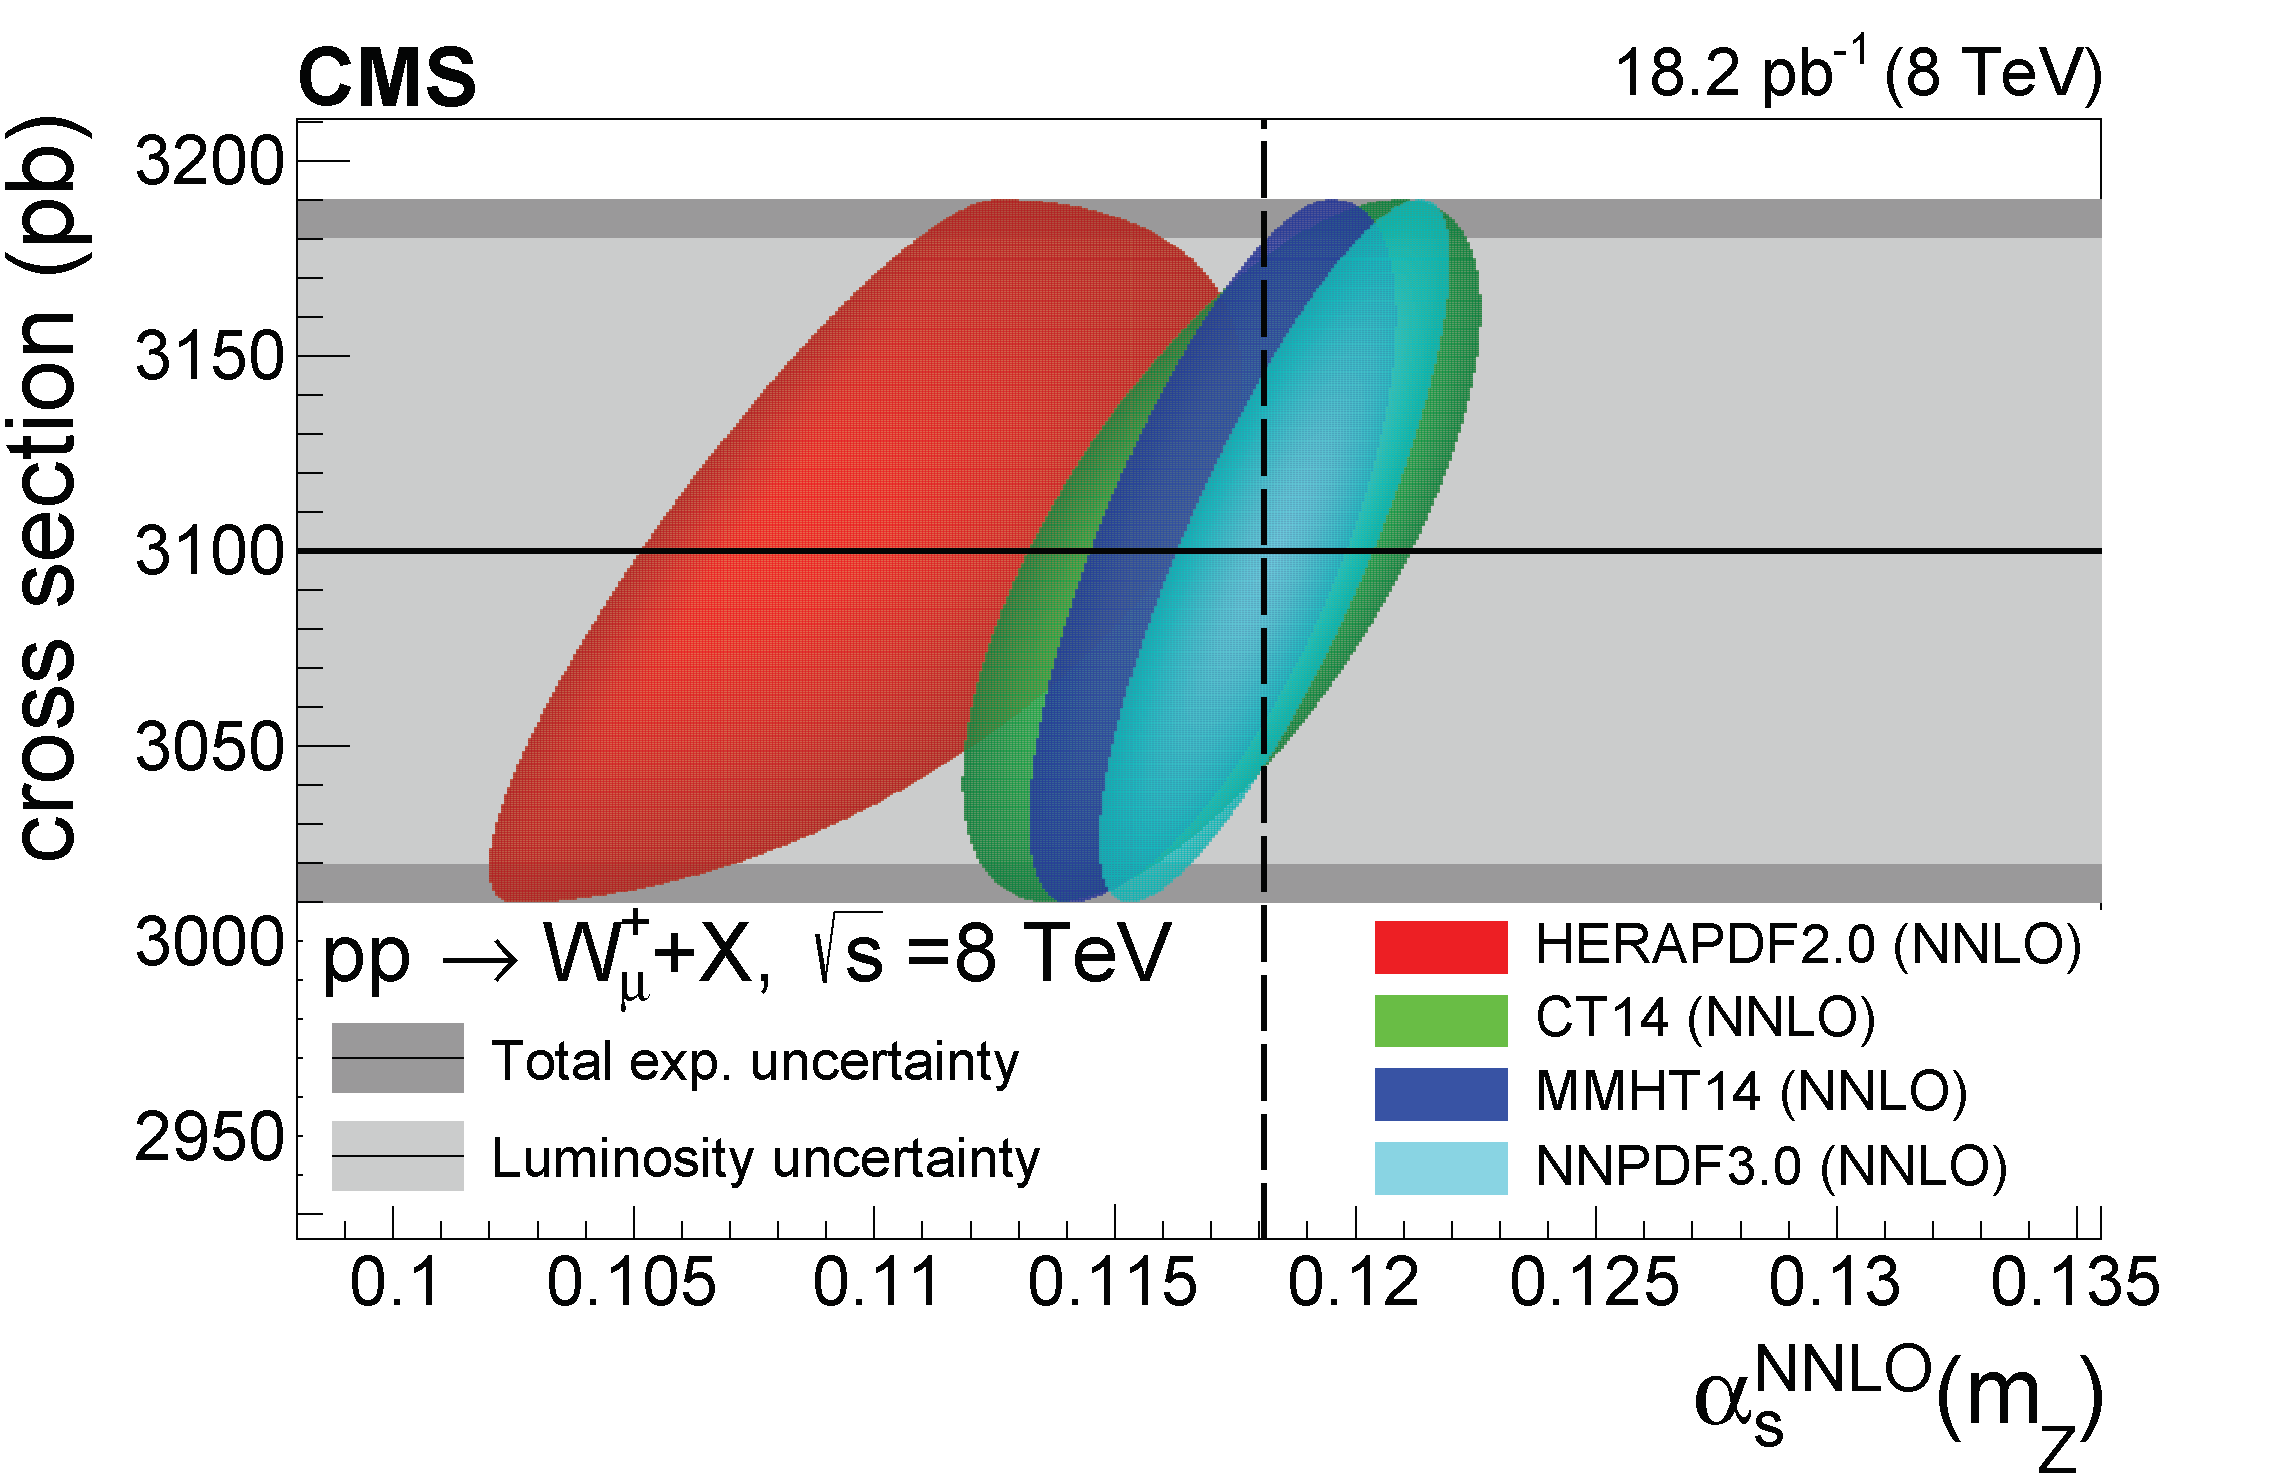
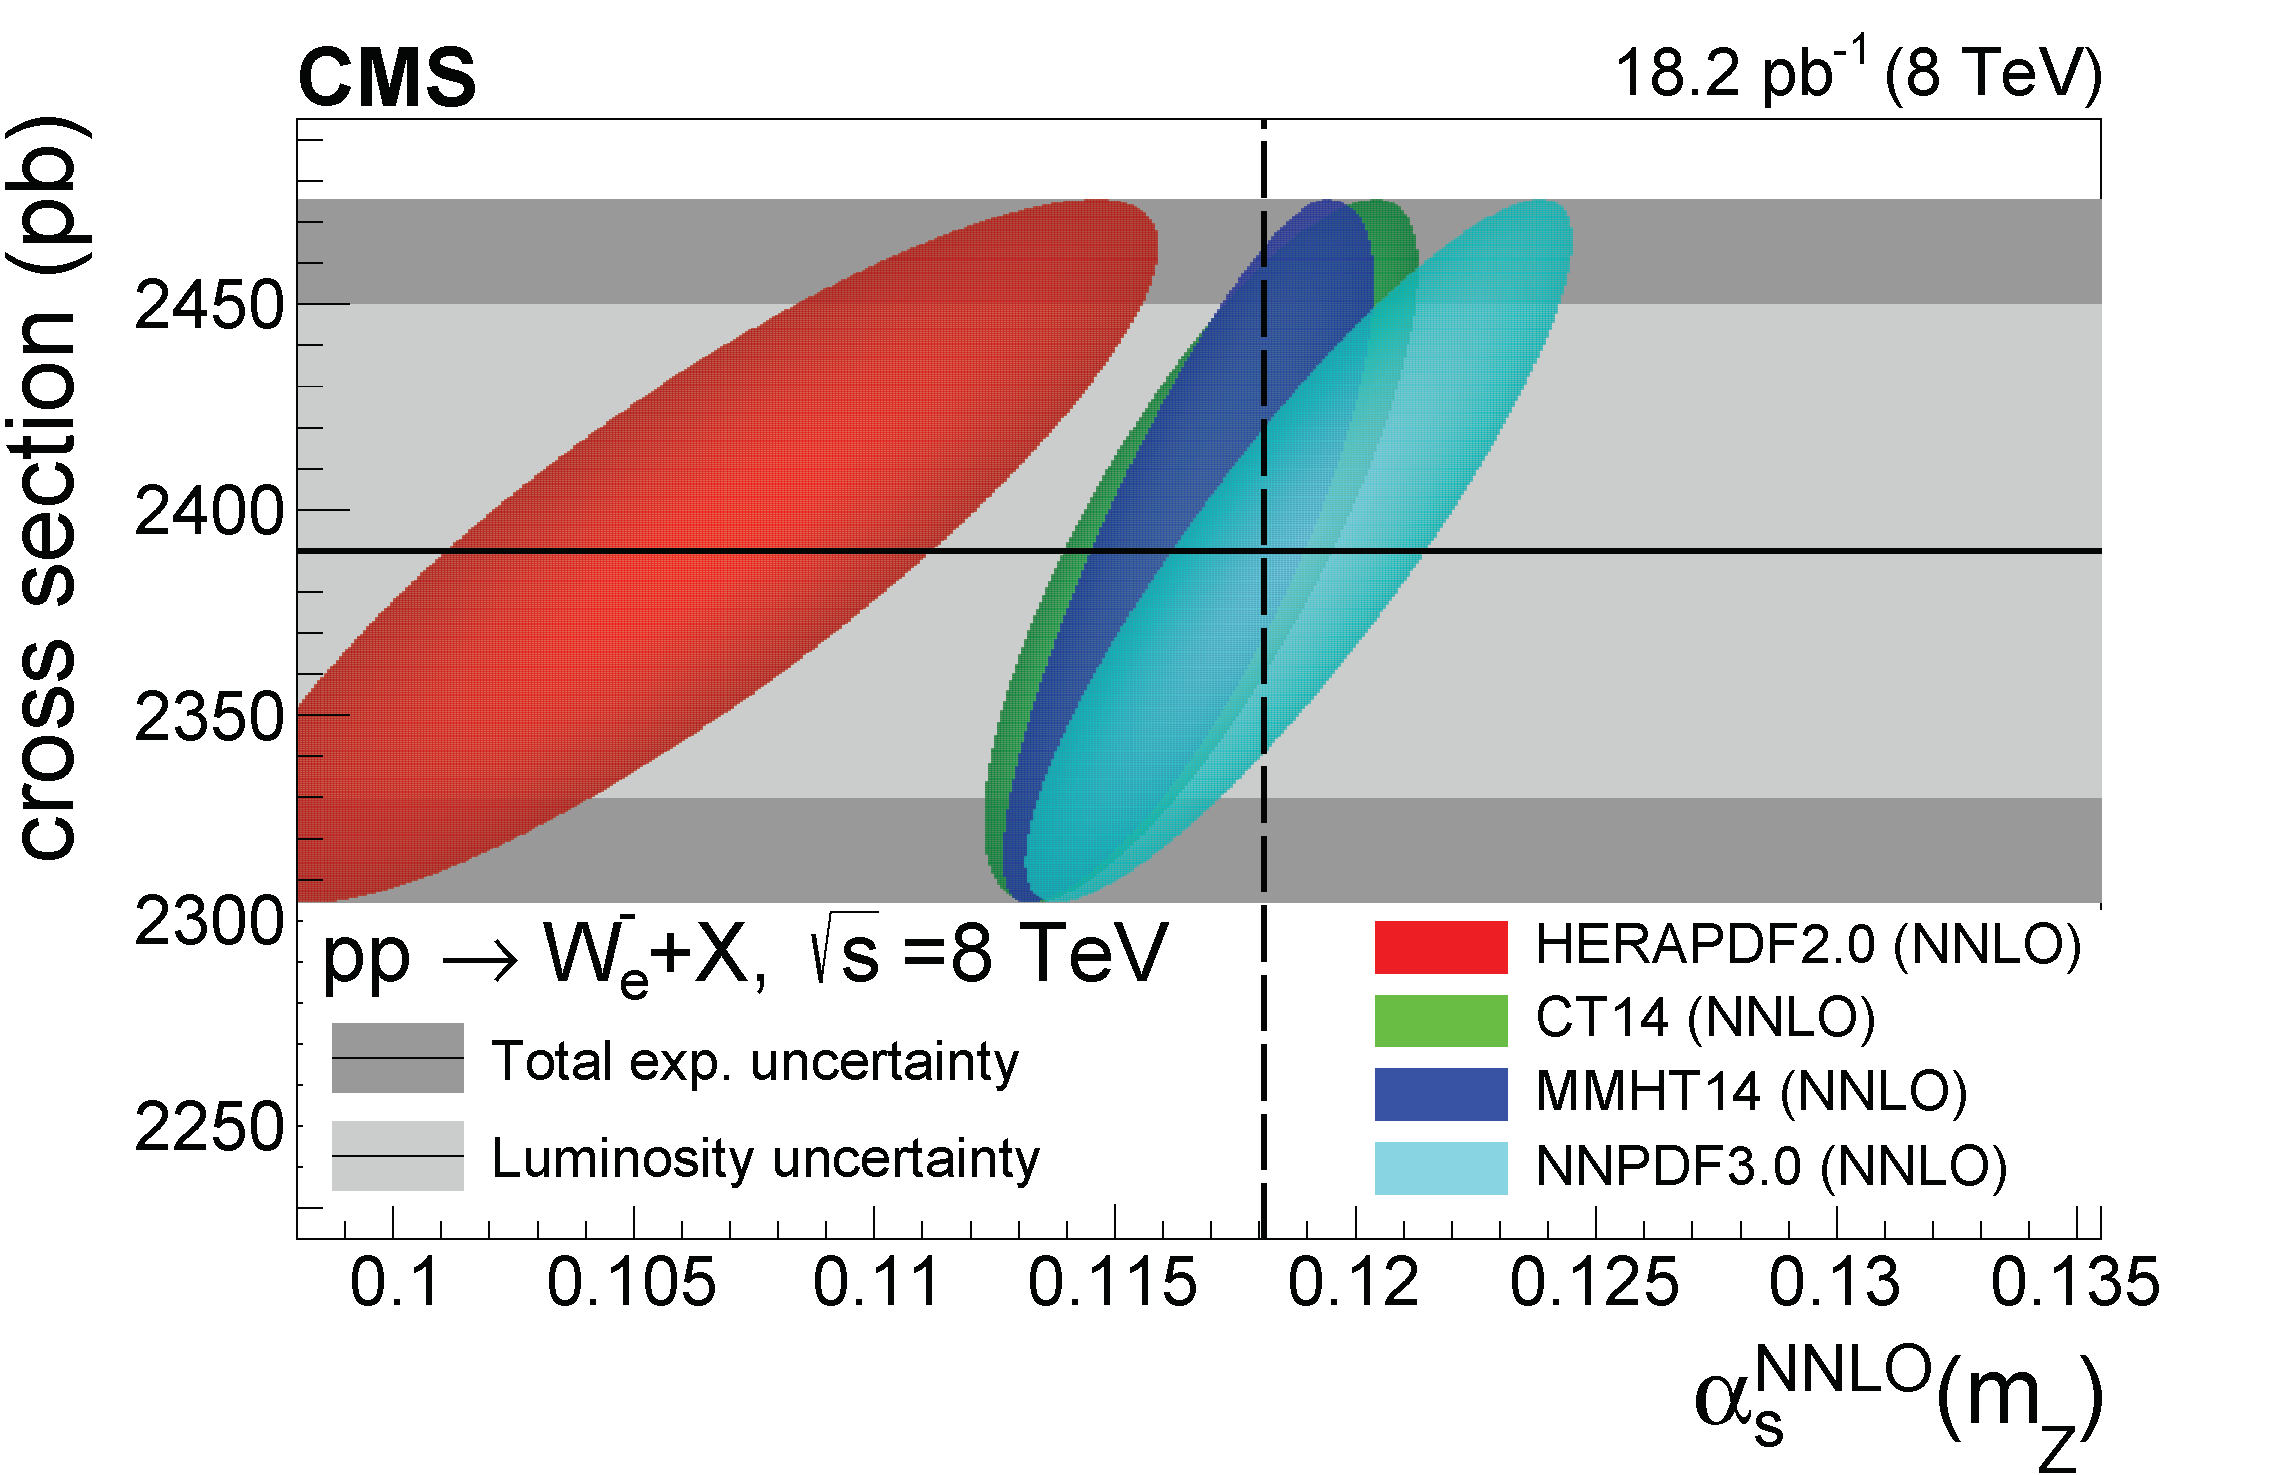
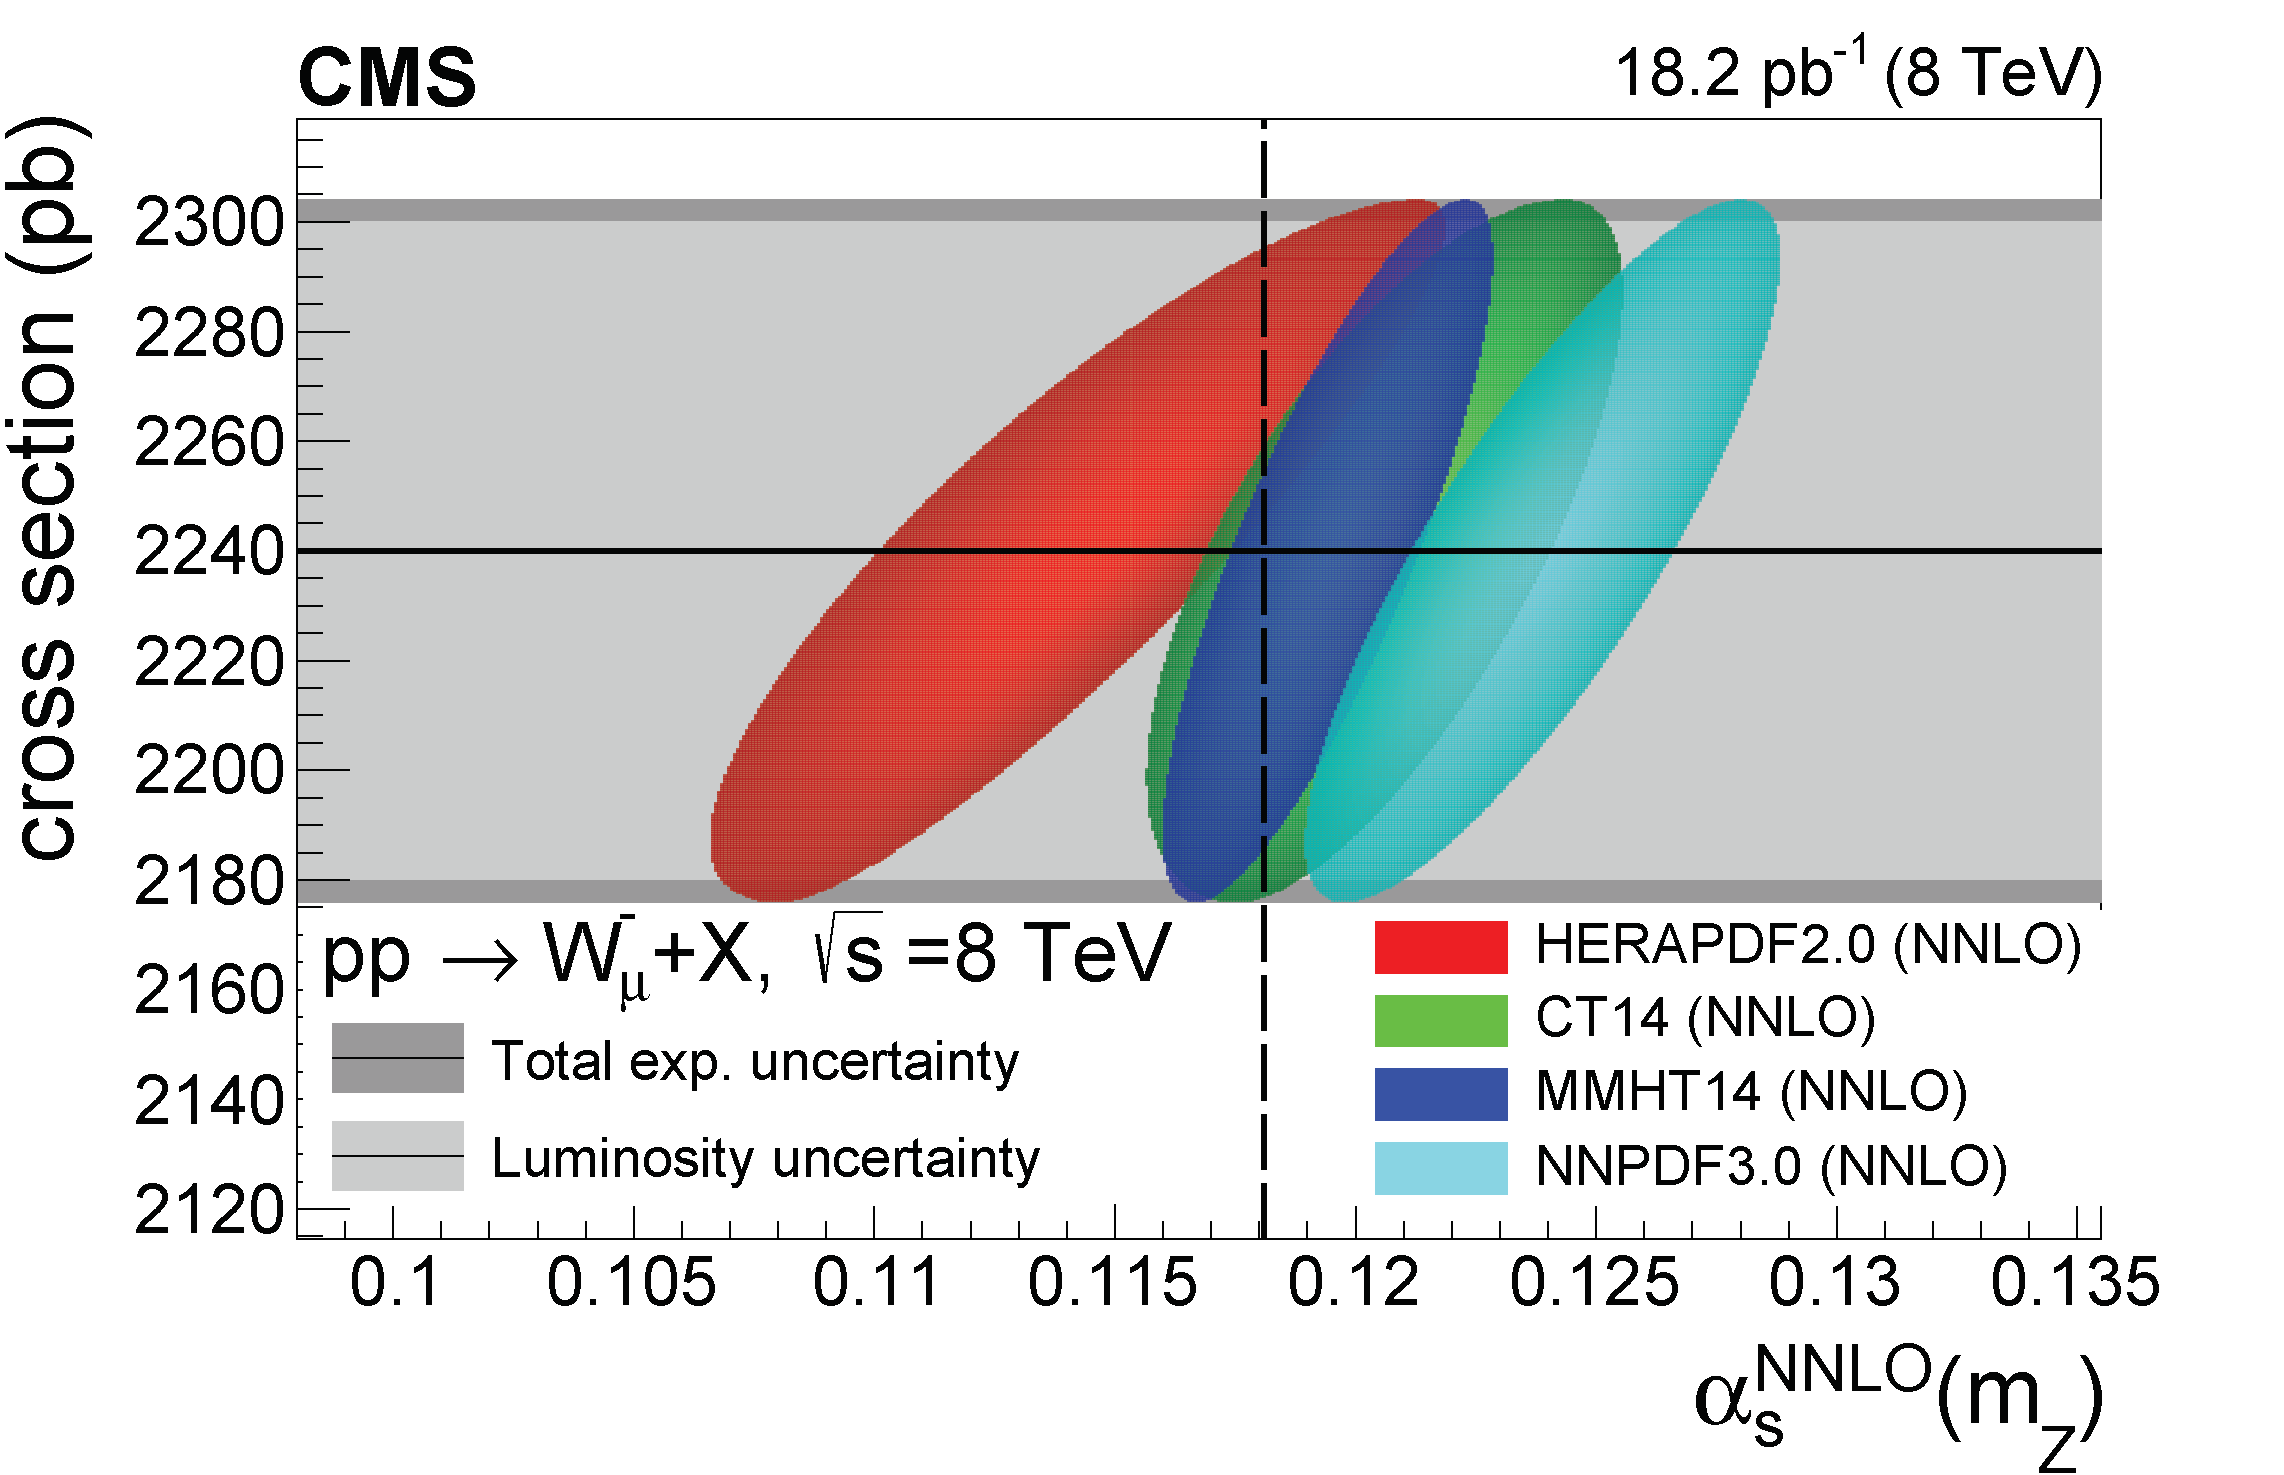
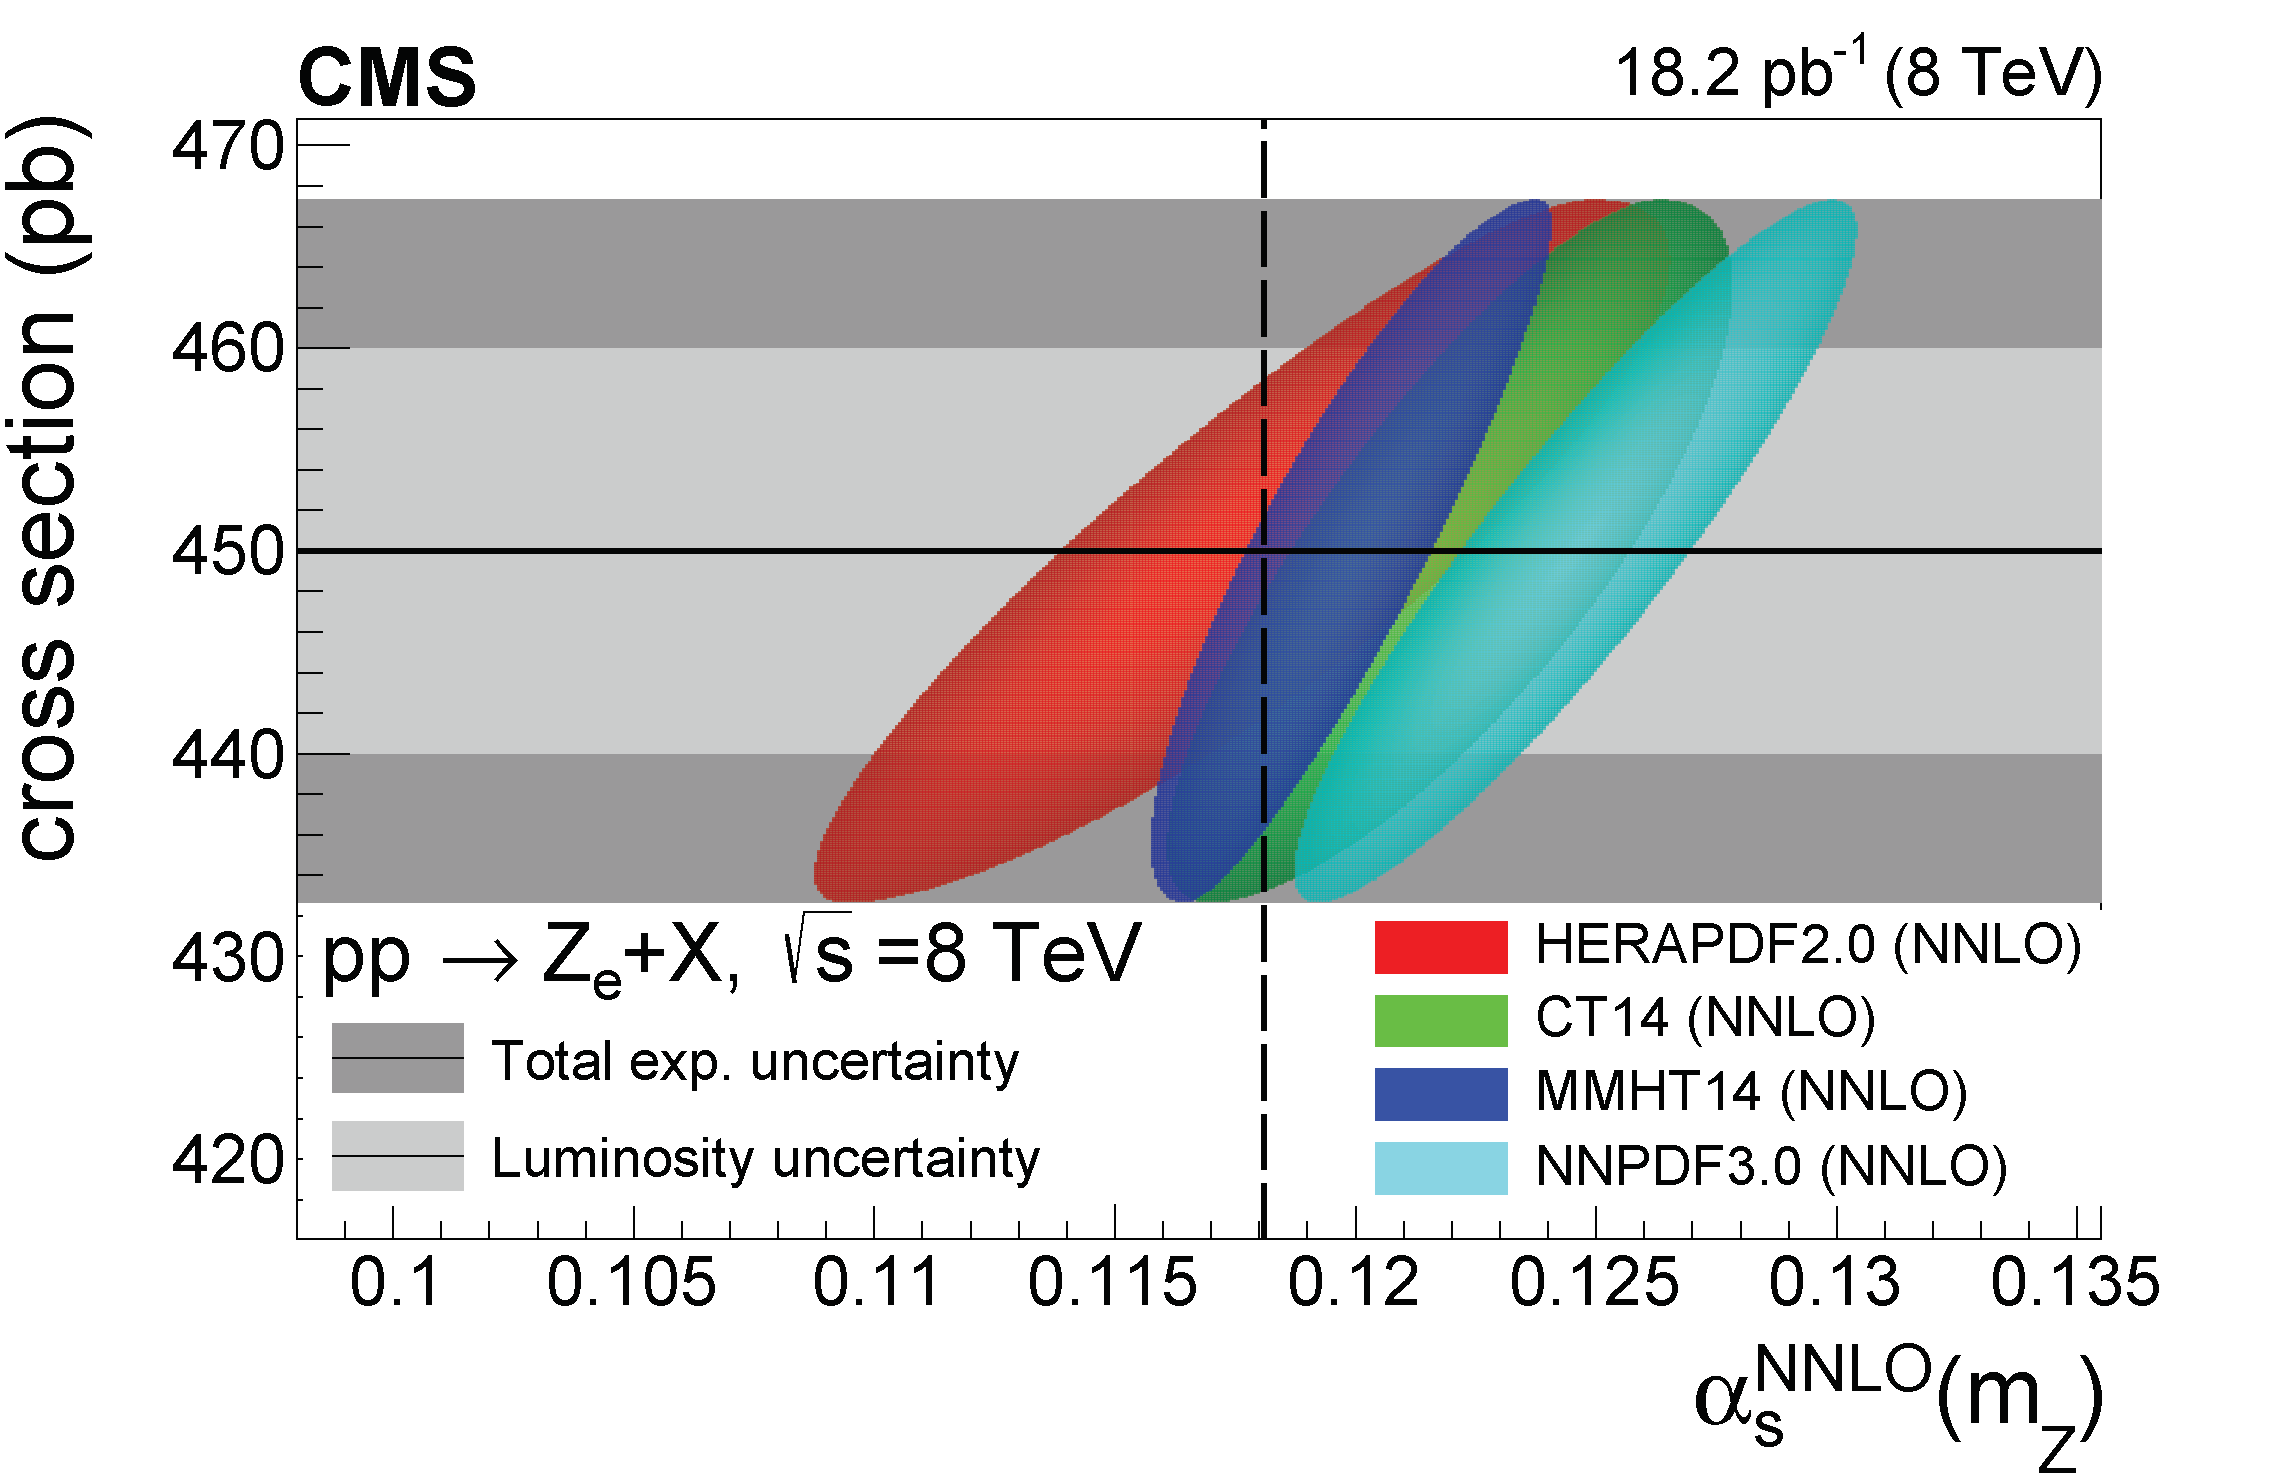
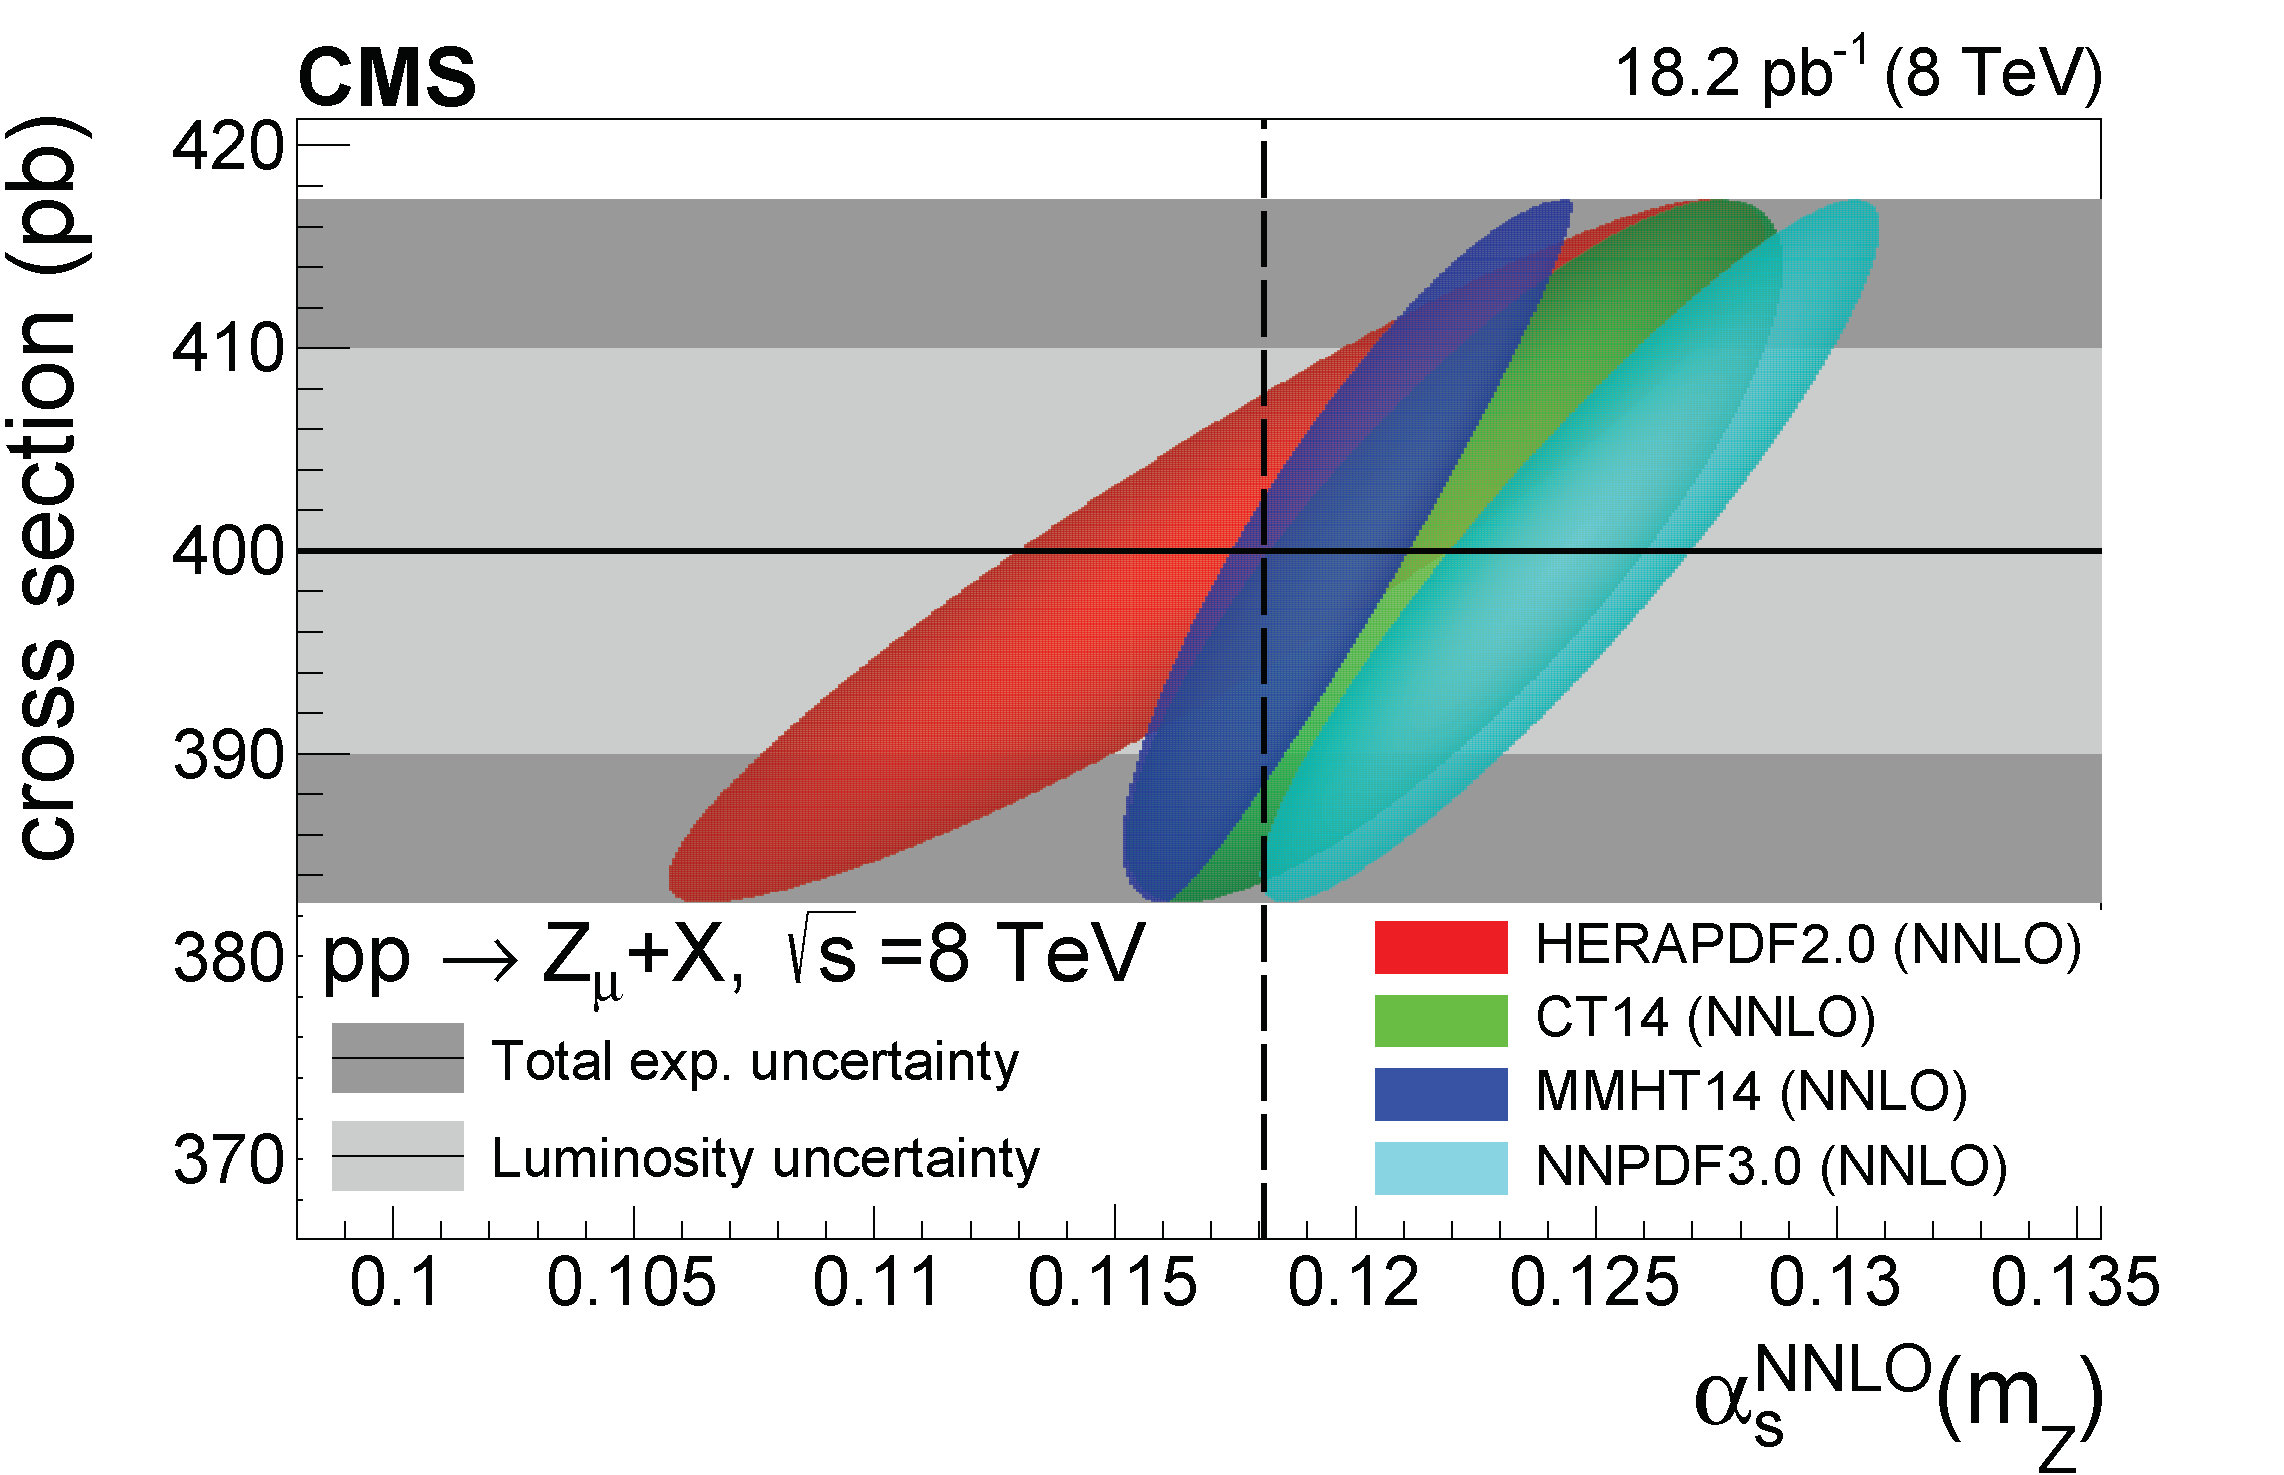
Figure 2:
Same as Fig. 1 for the production of $\mathrm{W} ^{+}_{\mathrm{e}}$ (upper left) and $\mathrm{W} ^{+}_{\mu}$ (upper right), $\mathrm{W} ^{-}_{\mathrm{e}}$ (middle left) and $\mathrm{W} ^{-}_{\mu}$ (middle right), and $\mathrm{Z} _{\mathrm{e}}$ (lower left) and $\mathrm{Z} _{\mu}$ (lower right) in pp collisions at $ {\sqrt {s}} = $ 8 TeV. |
png |
Figure 2-a:
Same as Fig. 1 for the production of $\mathrm{W} ^{+}_{\mathrm{e}}$ in pp collisions at $ {\sqrt {s}} = $ 8 TeV. |
png |
Figure 2-b:
Same as Fig. 1 for the production of $\mathrm{W} ^{+}_{\mu}$ in pp collisions at $ {\sqrt {s}} = $ 8 TeV. |
png |
Figure 2-c:
Same as Fig. 1 for the production of $\mathrm{W} ^{-}_{\mathrm{e}}$ in pp collisions at $ {\sqrt {s}} = $ 8 TeV. |
png |
Figure 2-d:
Same as Fig. 1 for the production of $\mathrm{W} ^{-}_{\mu}$ in pp collisions at $ {\sqrt {s}} = $ 8 TeV. |
png |
Figure 2-e:
Same as Fig. 1 for the production of $\mathrm{Z} _{\mathrm{e}}$ in pp collisions at $ {\sqrt {s}} = $ 8 TeV. |
png |
Figure 2-f:
Same as Fig. 1 for the production of $\mathrm{Z} _{\mu}$ in pp collisions at $ {\sqrt {s}} = $ 8 TeV. |
png pdf |
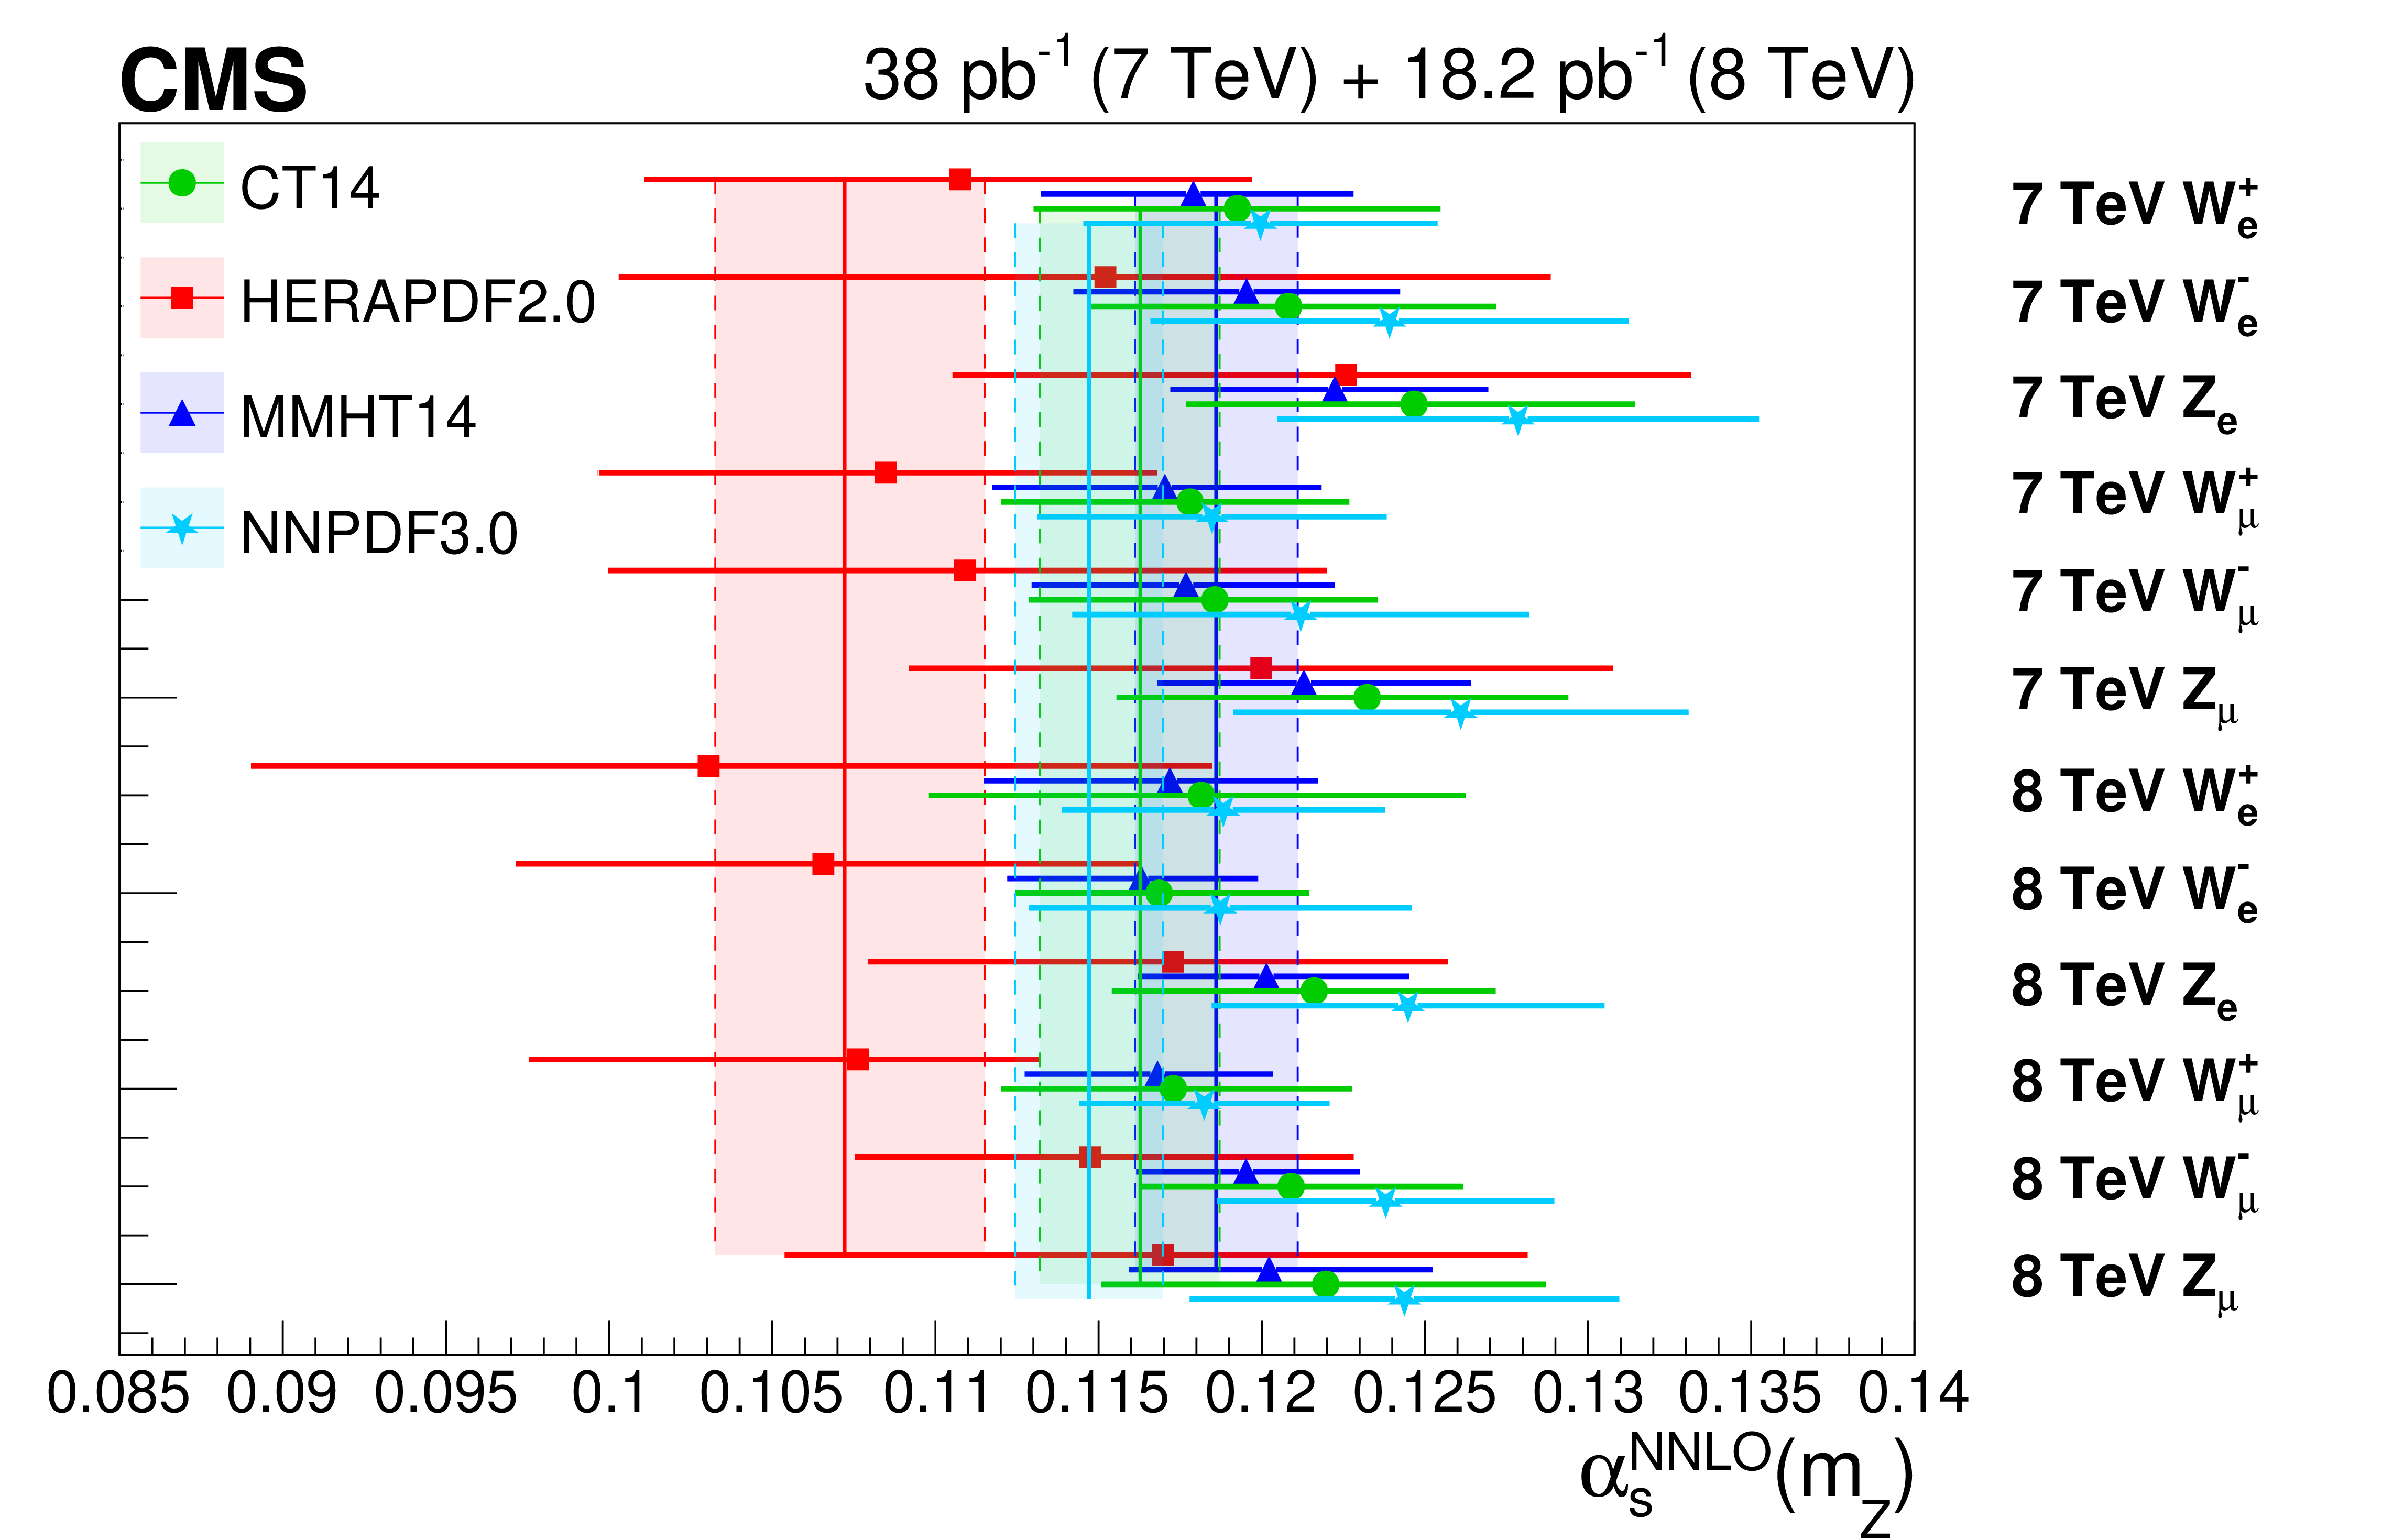
Figure 3:
Individual $ {\alpha _S} (m_{\mathrm{Z}})$ values extracted from each measured $\mathrm{W^{\pm}}$ and $\mathrm{Z}$ boson production cross section (bars), and final $ {\alpha _S} (m_{\mathrm{Z}})$ values obtained combining the twelve individual determinations (vertical coloured areas), for each PDF set. |
png pdf |
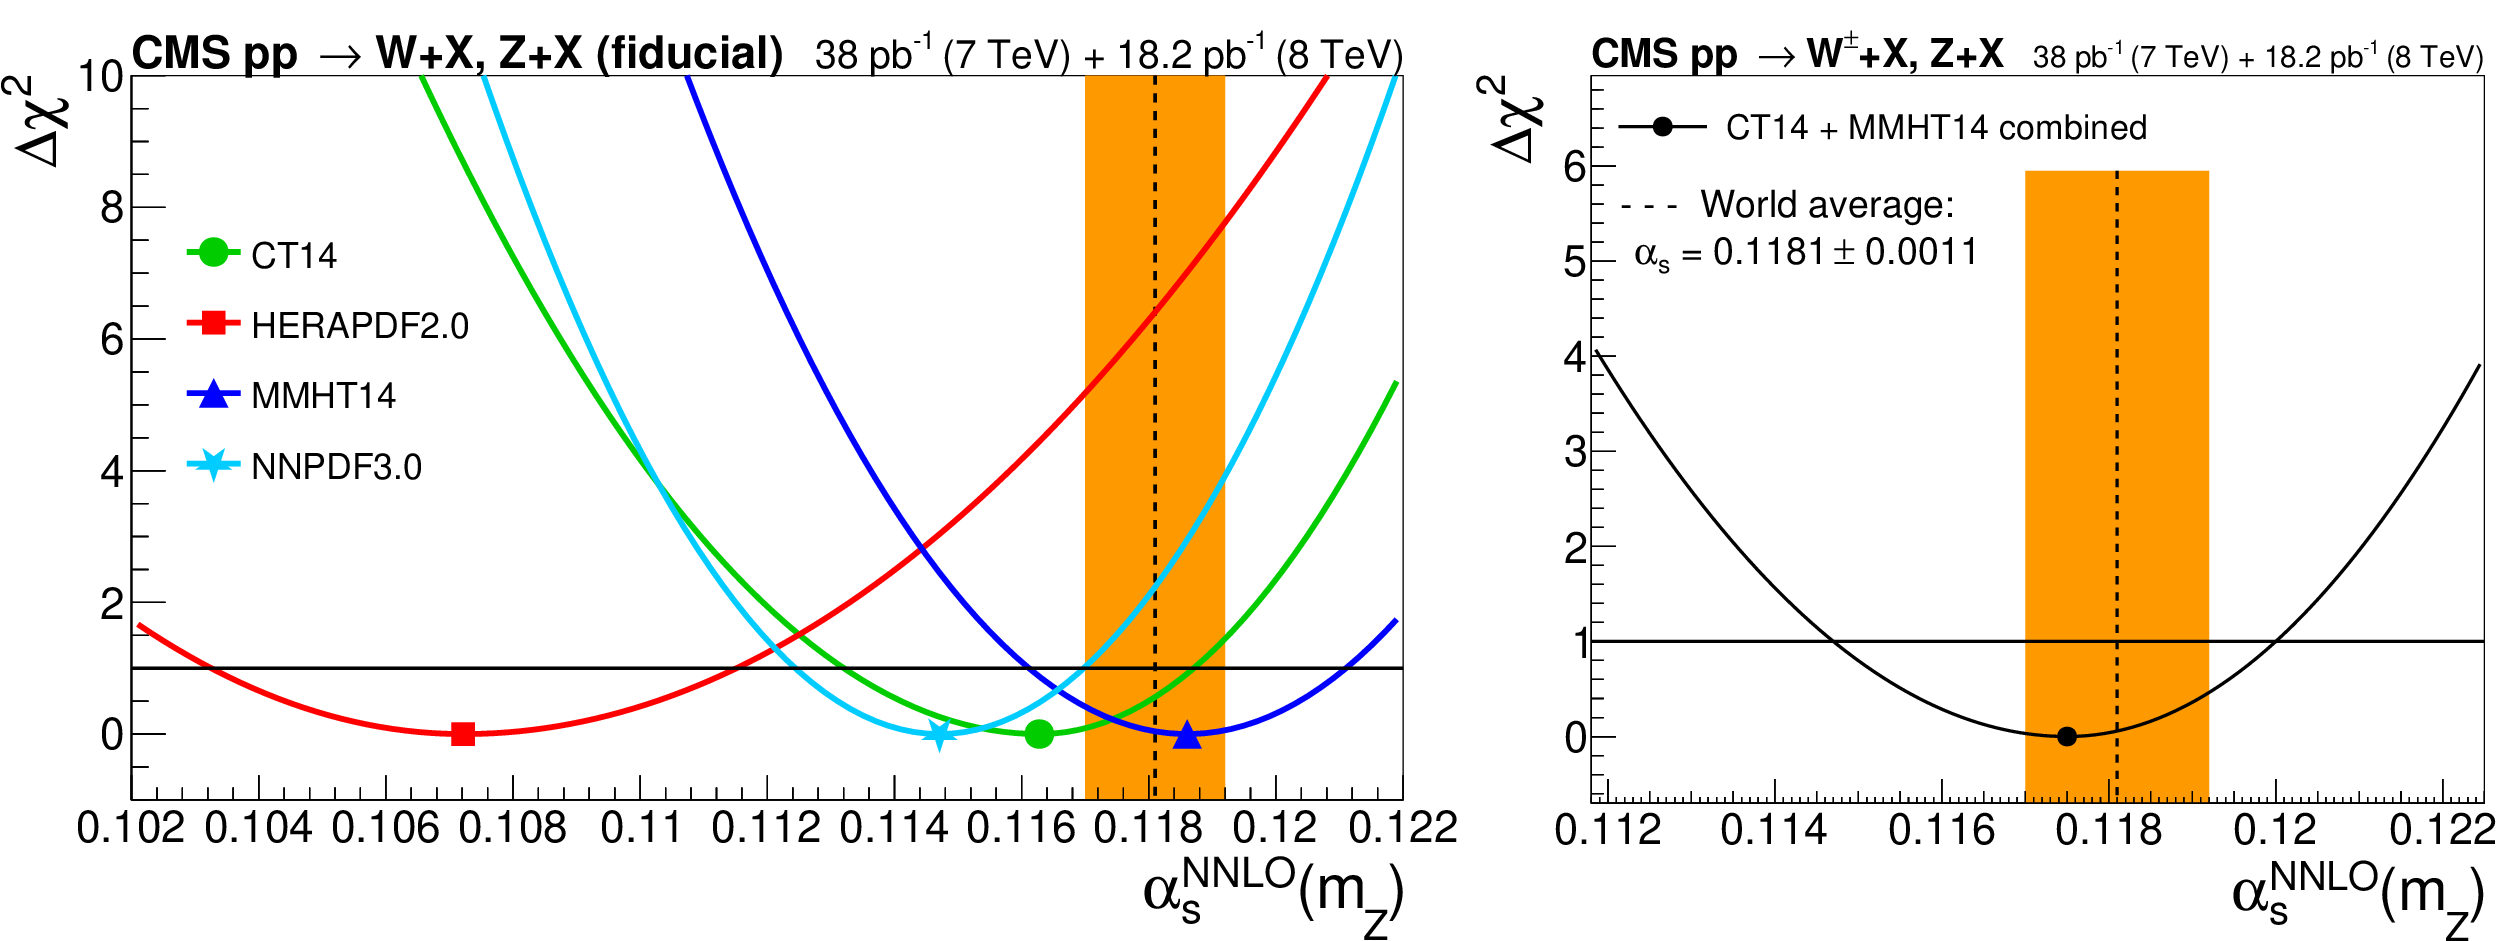
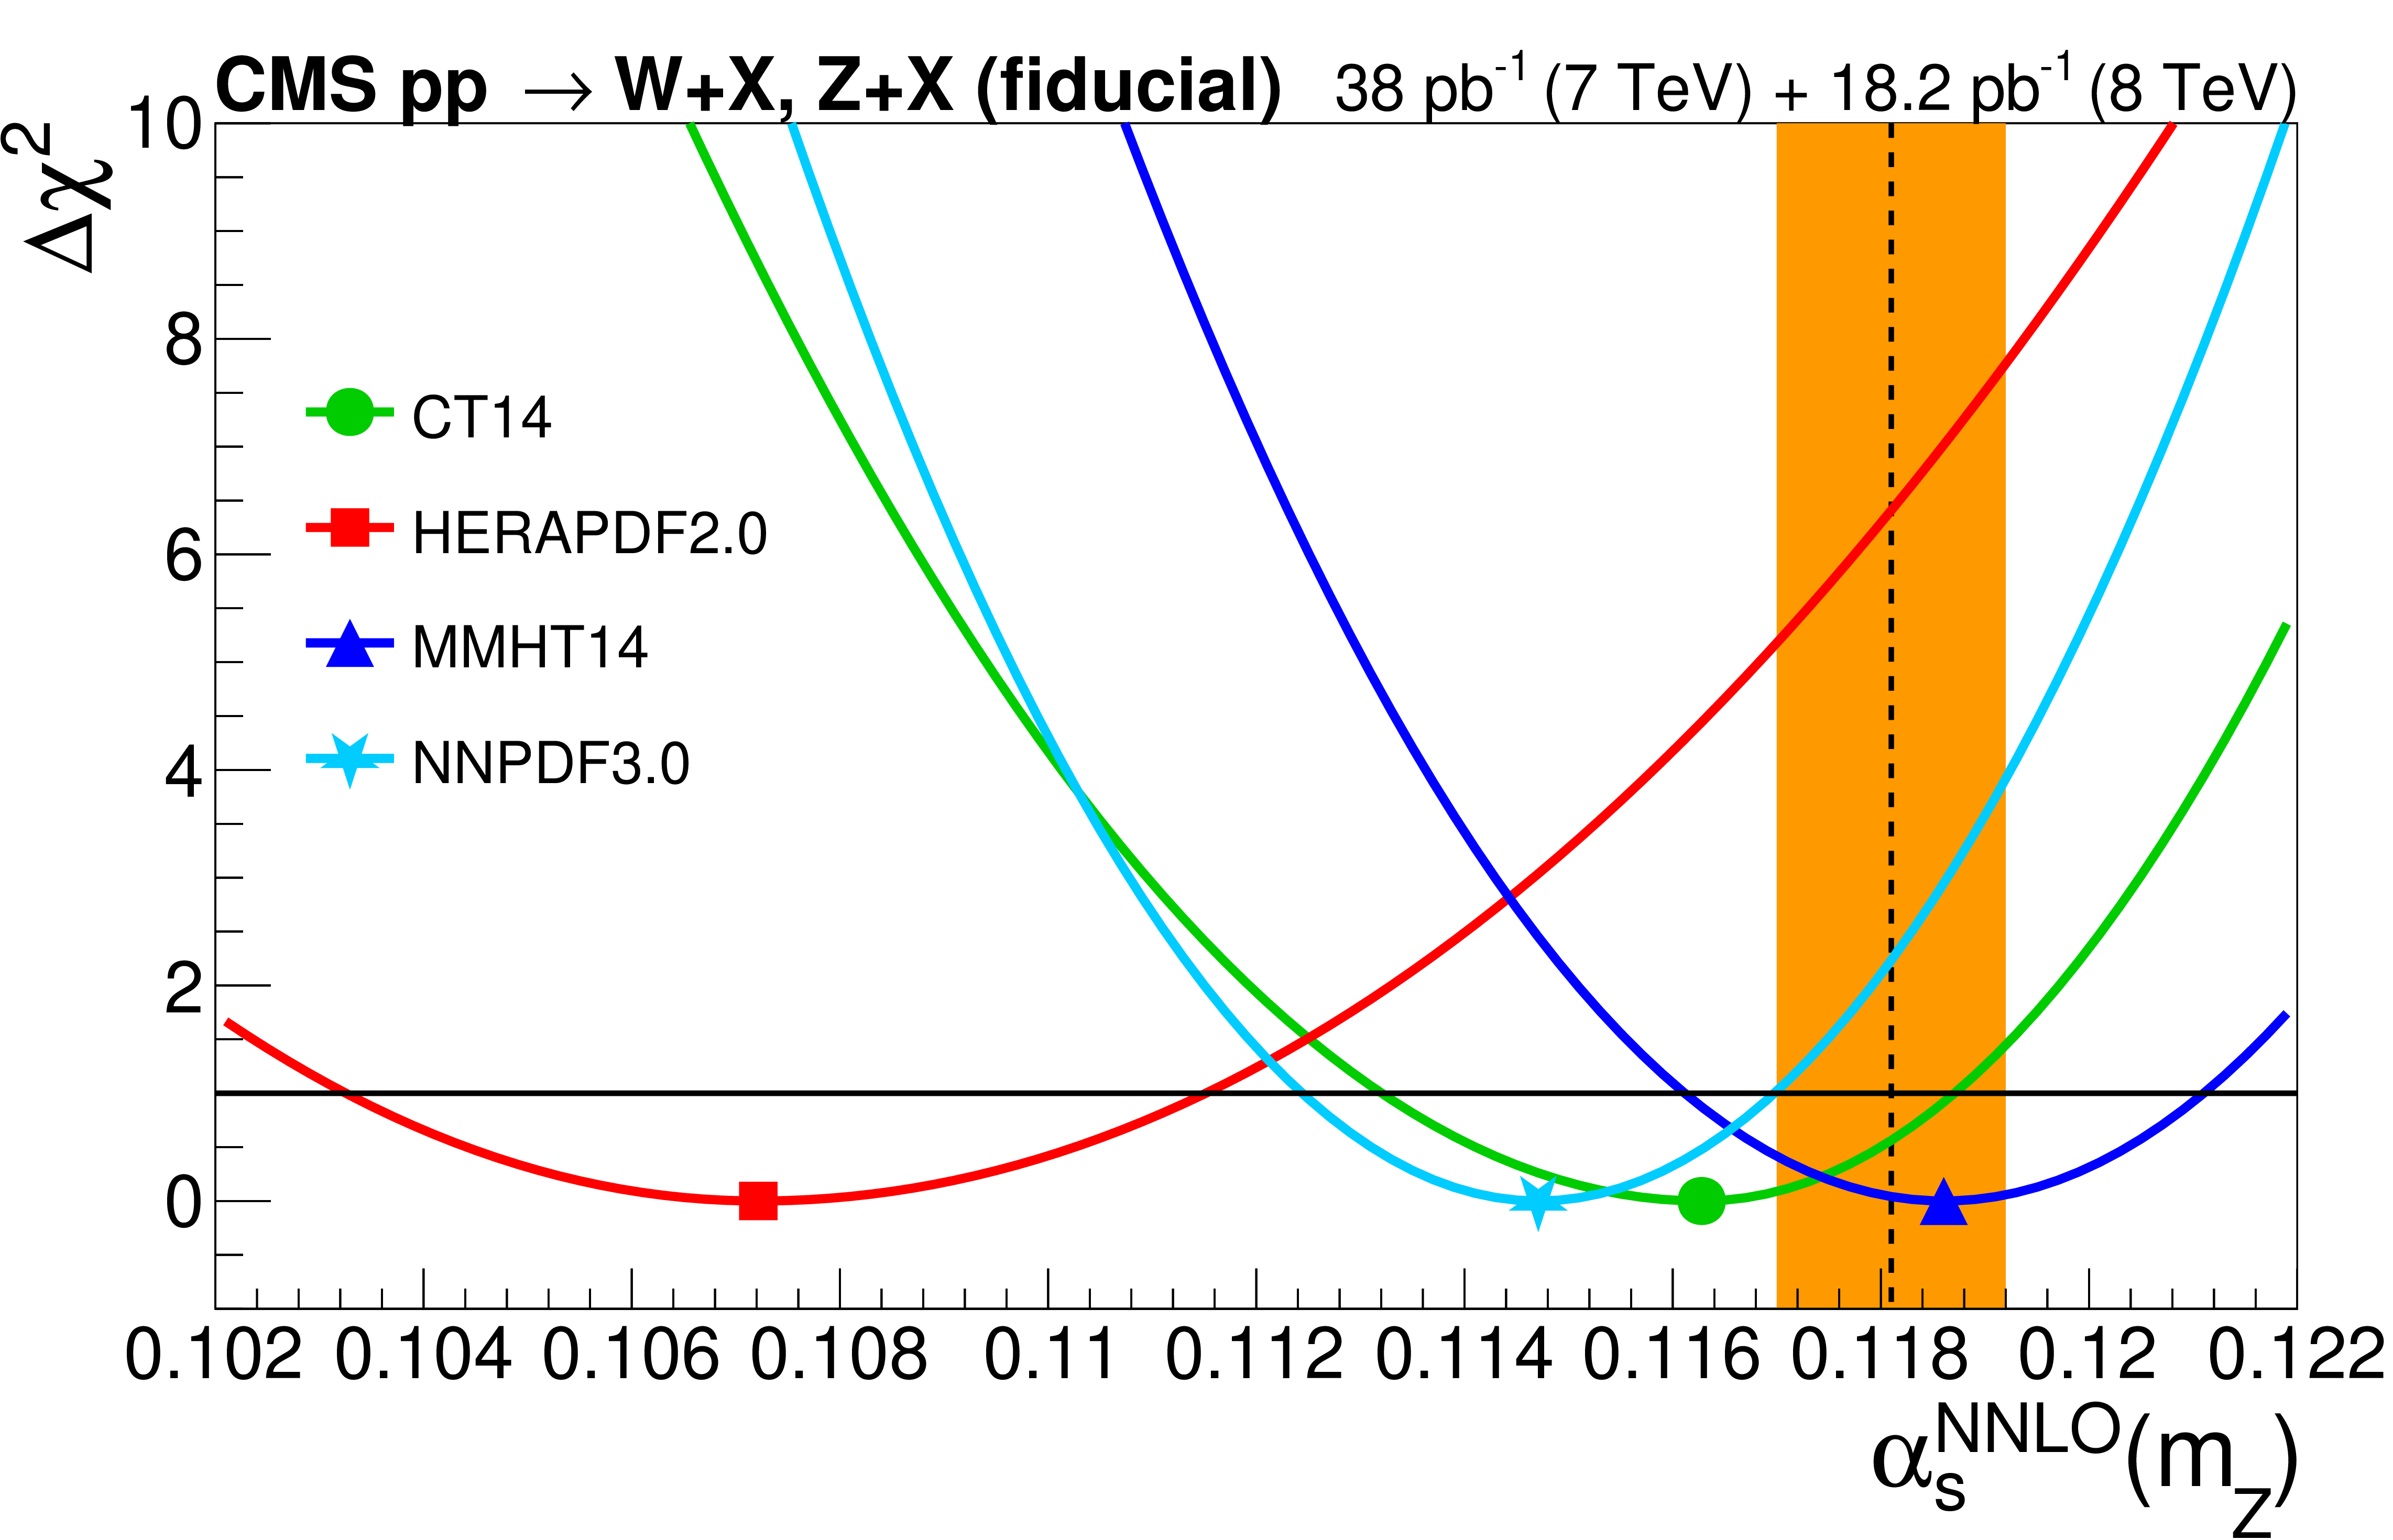
Figure 4:
Final $ {\alpha _S} (m_{\mathrm{Z}})$ values extracted for the CT14, HERAPDF2.0, MMHT14, and NNPDF3.0 PDF sets (left), and combined $ {\alpha _S} (m_{\mathrm{Z}})$ extraction from the CT14 and MMHT14 PDFs (right), compared to the current world average (vertical orange band). The asymmetric parabolas are constructed to have a minimum at the combined value and are fitted to go through $\Delta \chi ^2=$ 1 (horizontal black lines) at the one std. deviation uncertainties quoted in Table 8. |
png pdf |
Figure 4-a:
Final $ {\alpha _S} (m_{\mathrm{Z}})$ values extracted for the CT14, HERAPDF2.0, MMHT14, and NNPDF3.0 PDF sets, compared to the current world average (vertical orange band). The asymmetric parabolas are constructed to have a minimum at the combined value and are fitted to go through $\Delta \chi ^2=$ 1 (horizontal black lines) at the one std. deviation uncertainties quoted in Table 8. |

png pdf |
Figure 4-b:
Combined $ {\alpha _S} (m_{\mathrm{Z}})$ extraction from the CT14 and MMHT14 PDFs, compared to the current world average (vertical orange band). The asymmetric parabolas are constructed to have a minimum at the combined value and are fitted to go through $\Delta \chi ^2=$ 1 (horizontal black lines) at the one std. deviation uncertainties quoted in Table 8. |
| Tables | |
png pdf |
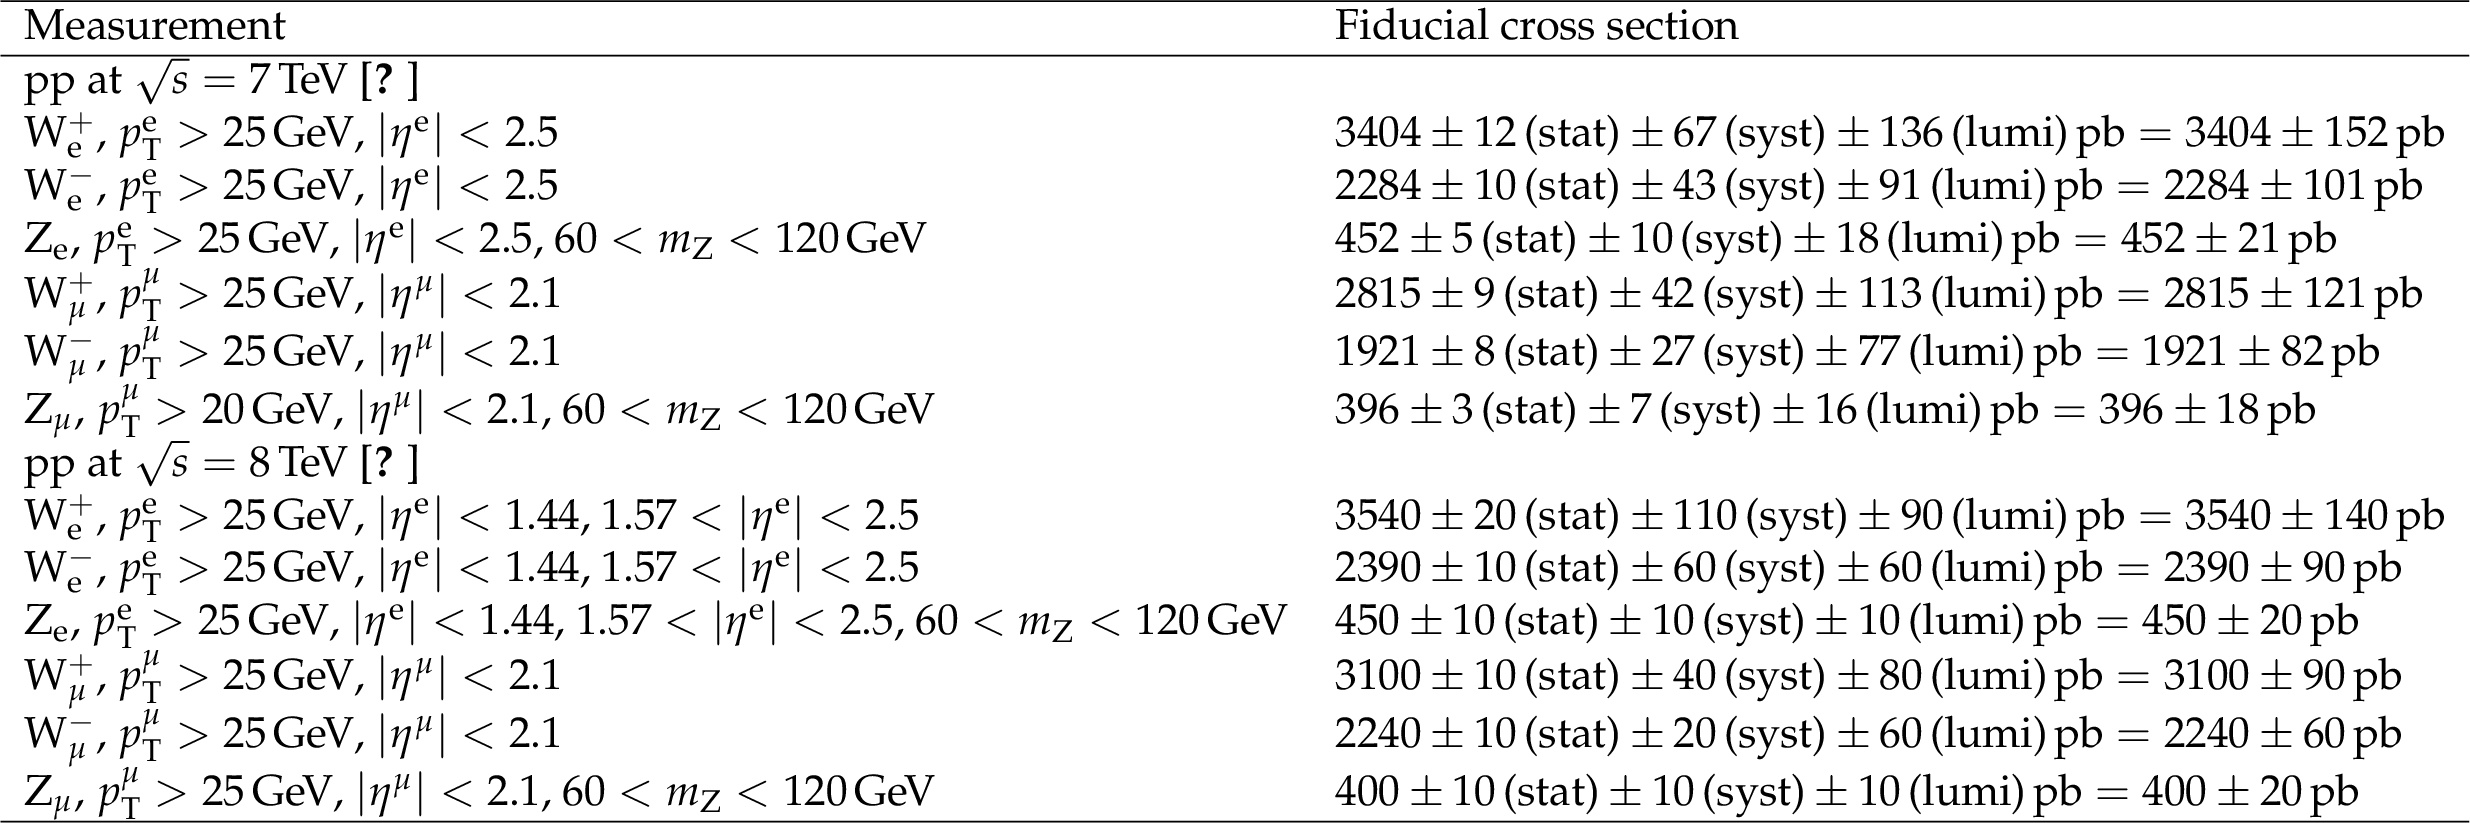
Table 1:
Summary of the twelve $\mathrm{W^{\pm}}$ and $\mathrm{Z}$ boson production cross sections, along with their individual (and total, added in quadrature) uncertainties, measured with the indicated fiducial selection criteria on the transverse momentum ($ {p_{\mathrm {T}}} ^\ell $) and pseudorapidity ($\eta ^\ell $), in the electron ($\mathrm{W^{\pm}} _{\mathrm{e}}$, $\mathrm{Z} _{\mathrm{e}}$) and muon ($\mathrm{W^{\pm}} _{\mu}$, $\mathrm{Z} _{\mu}$) final states, in pp collisions at $ {\sqrt {s}}= $ 7 and 8 TeV [13,14]. |
png pdf |
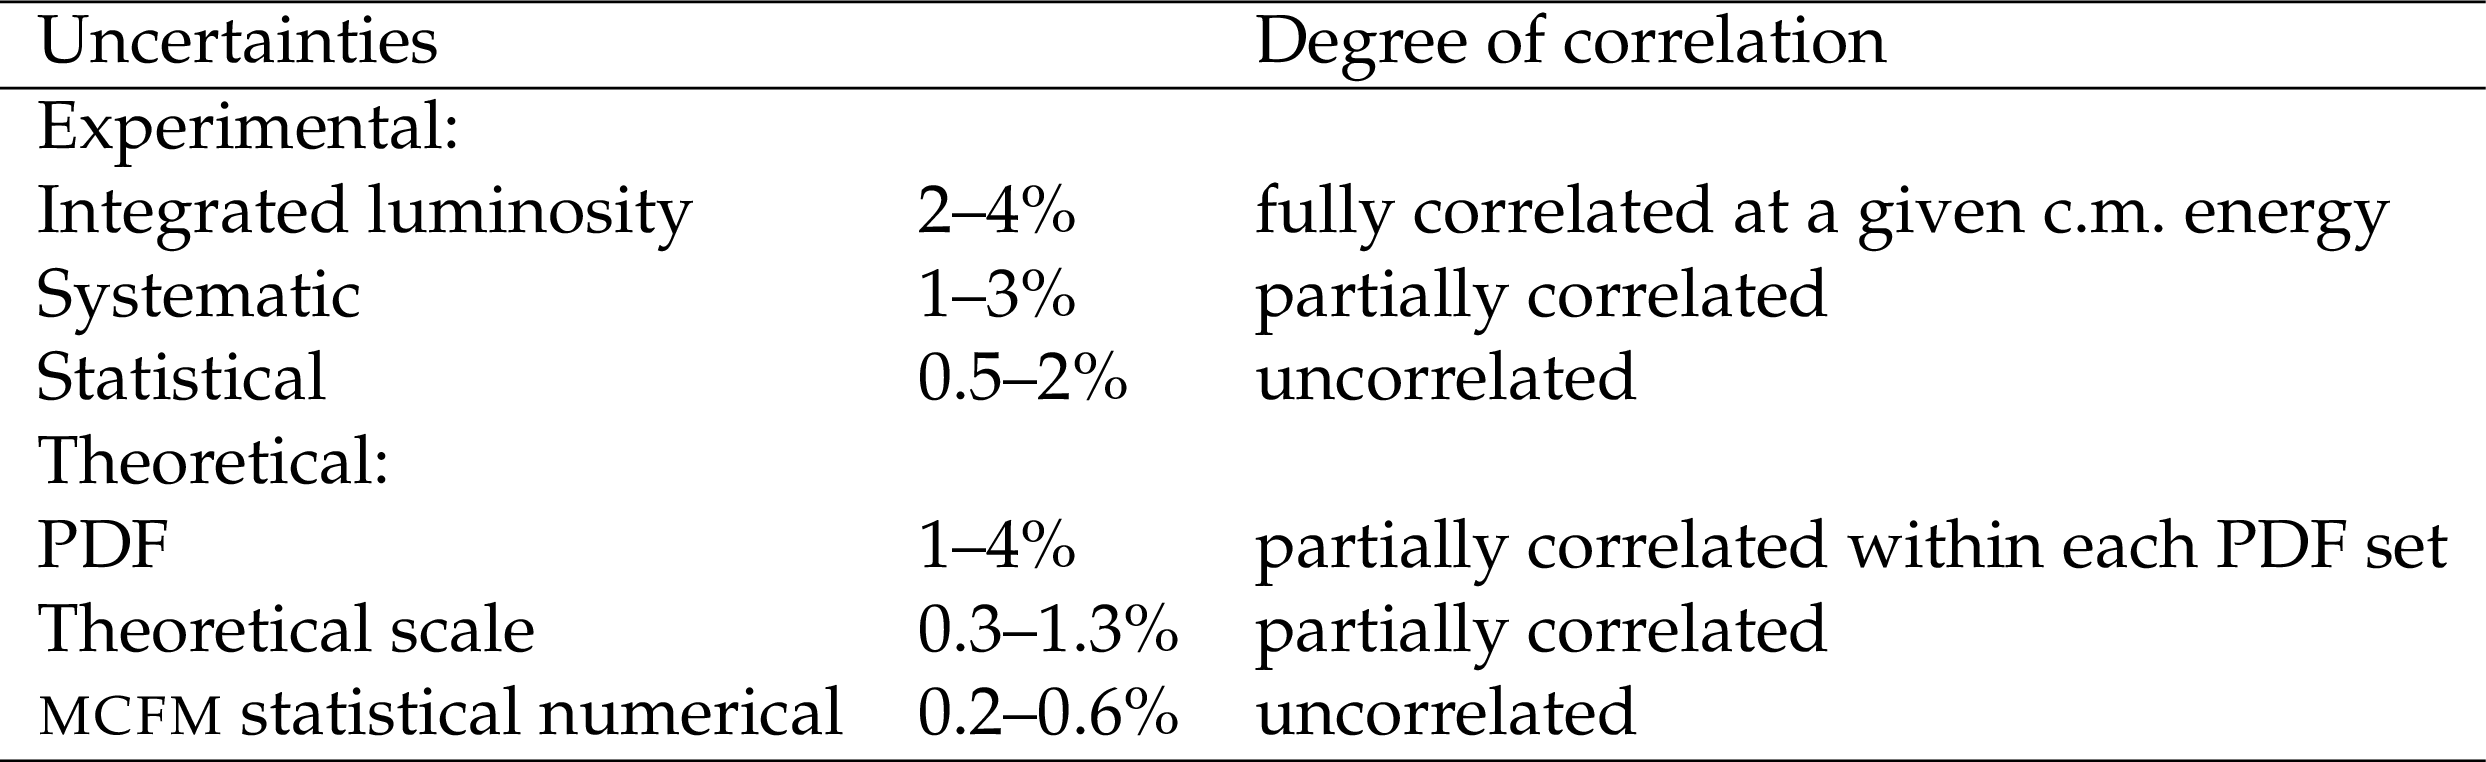
Table 2:
Summary of the typical experimental and theoretical uncertainties in the $\mathrm{W^{\pm}}$ and $\mathrm{Z}$ boson production cross sections, and their degree of correlation (details are provided in Section 5.3). |
png pdf |
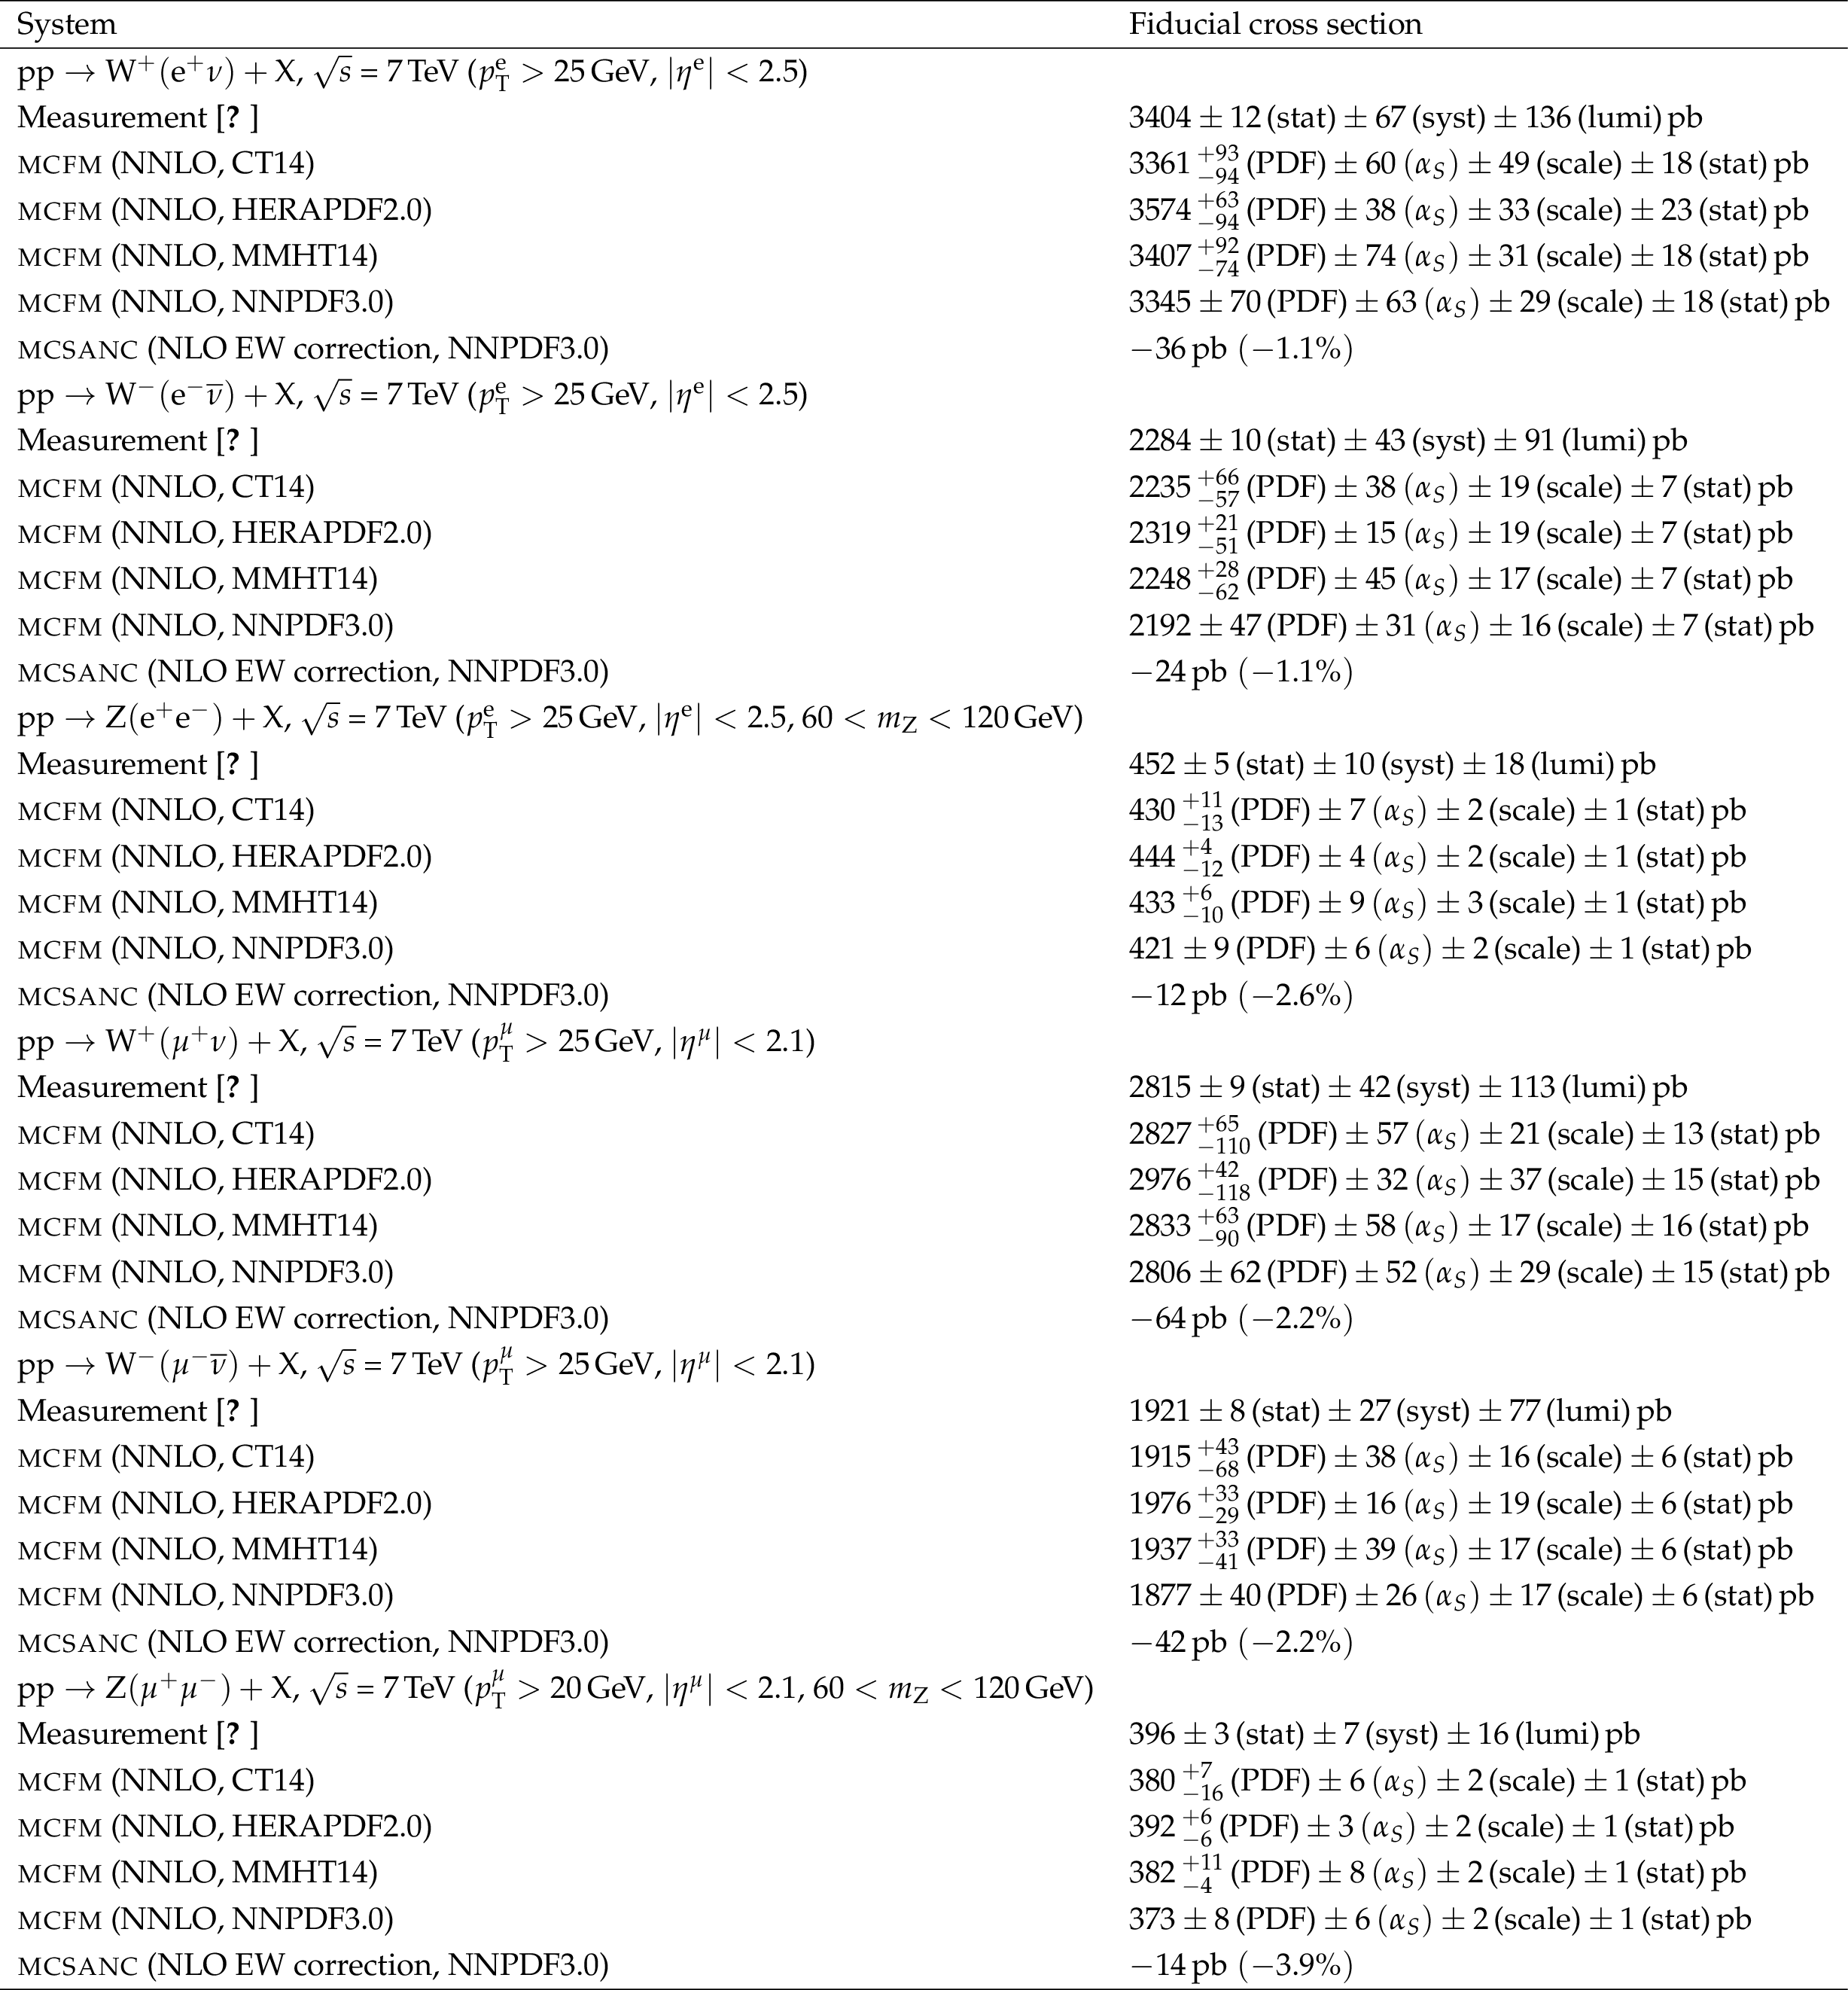
Table 3:
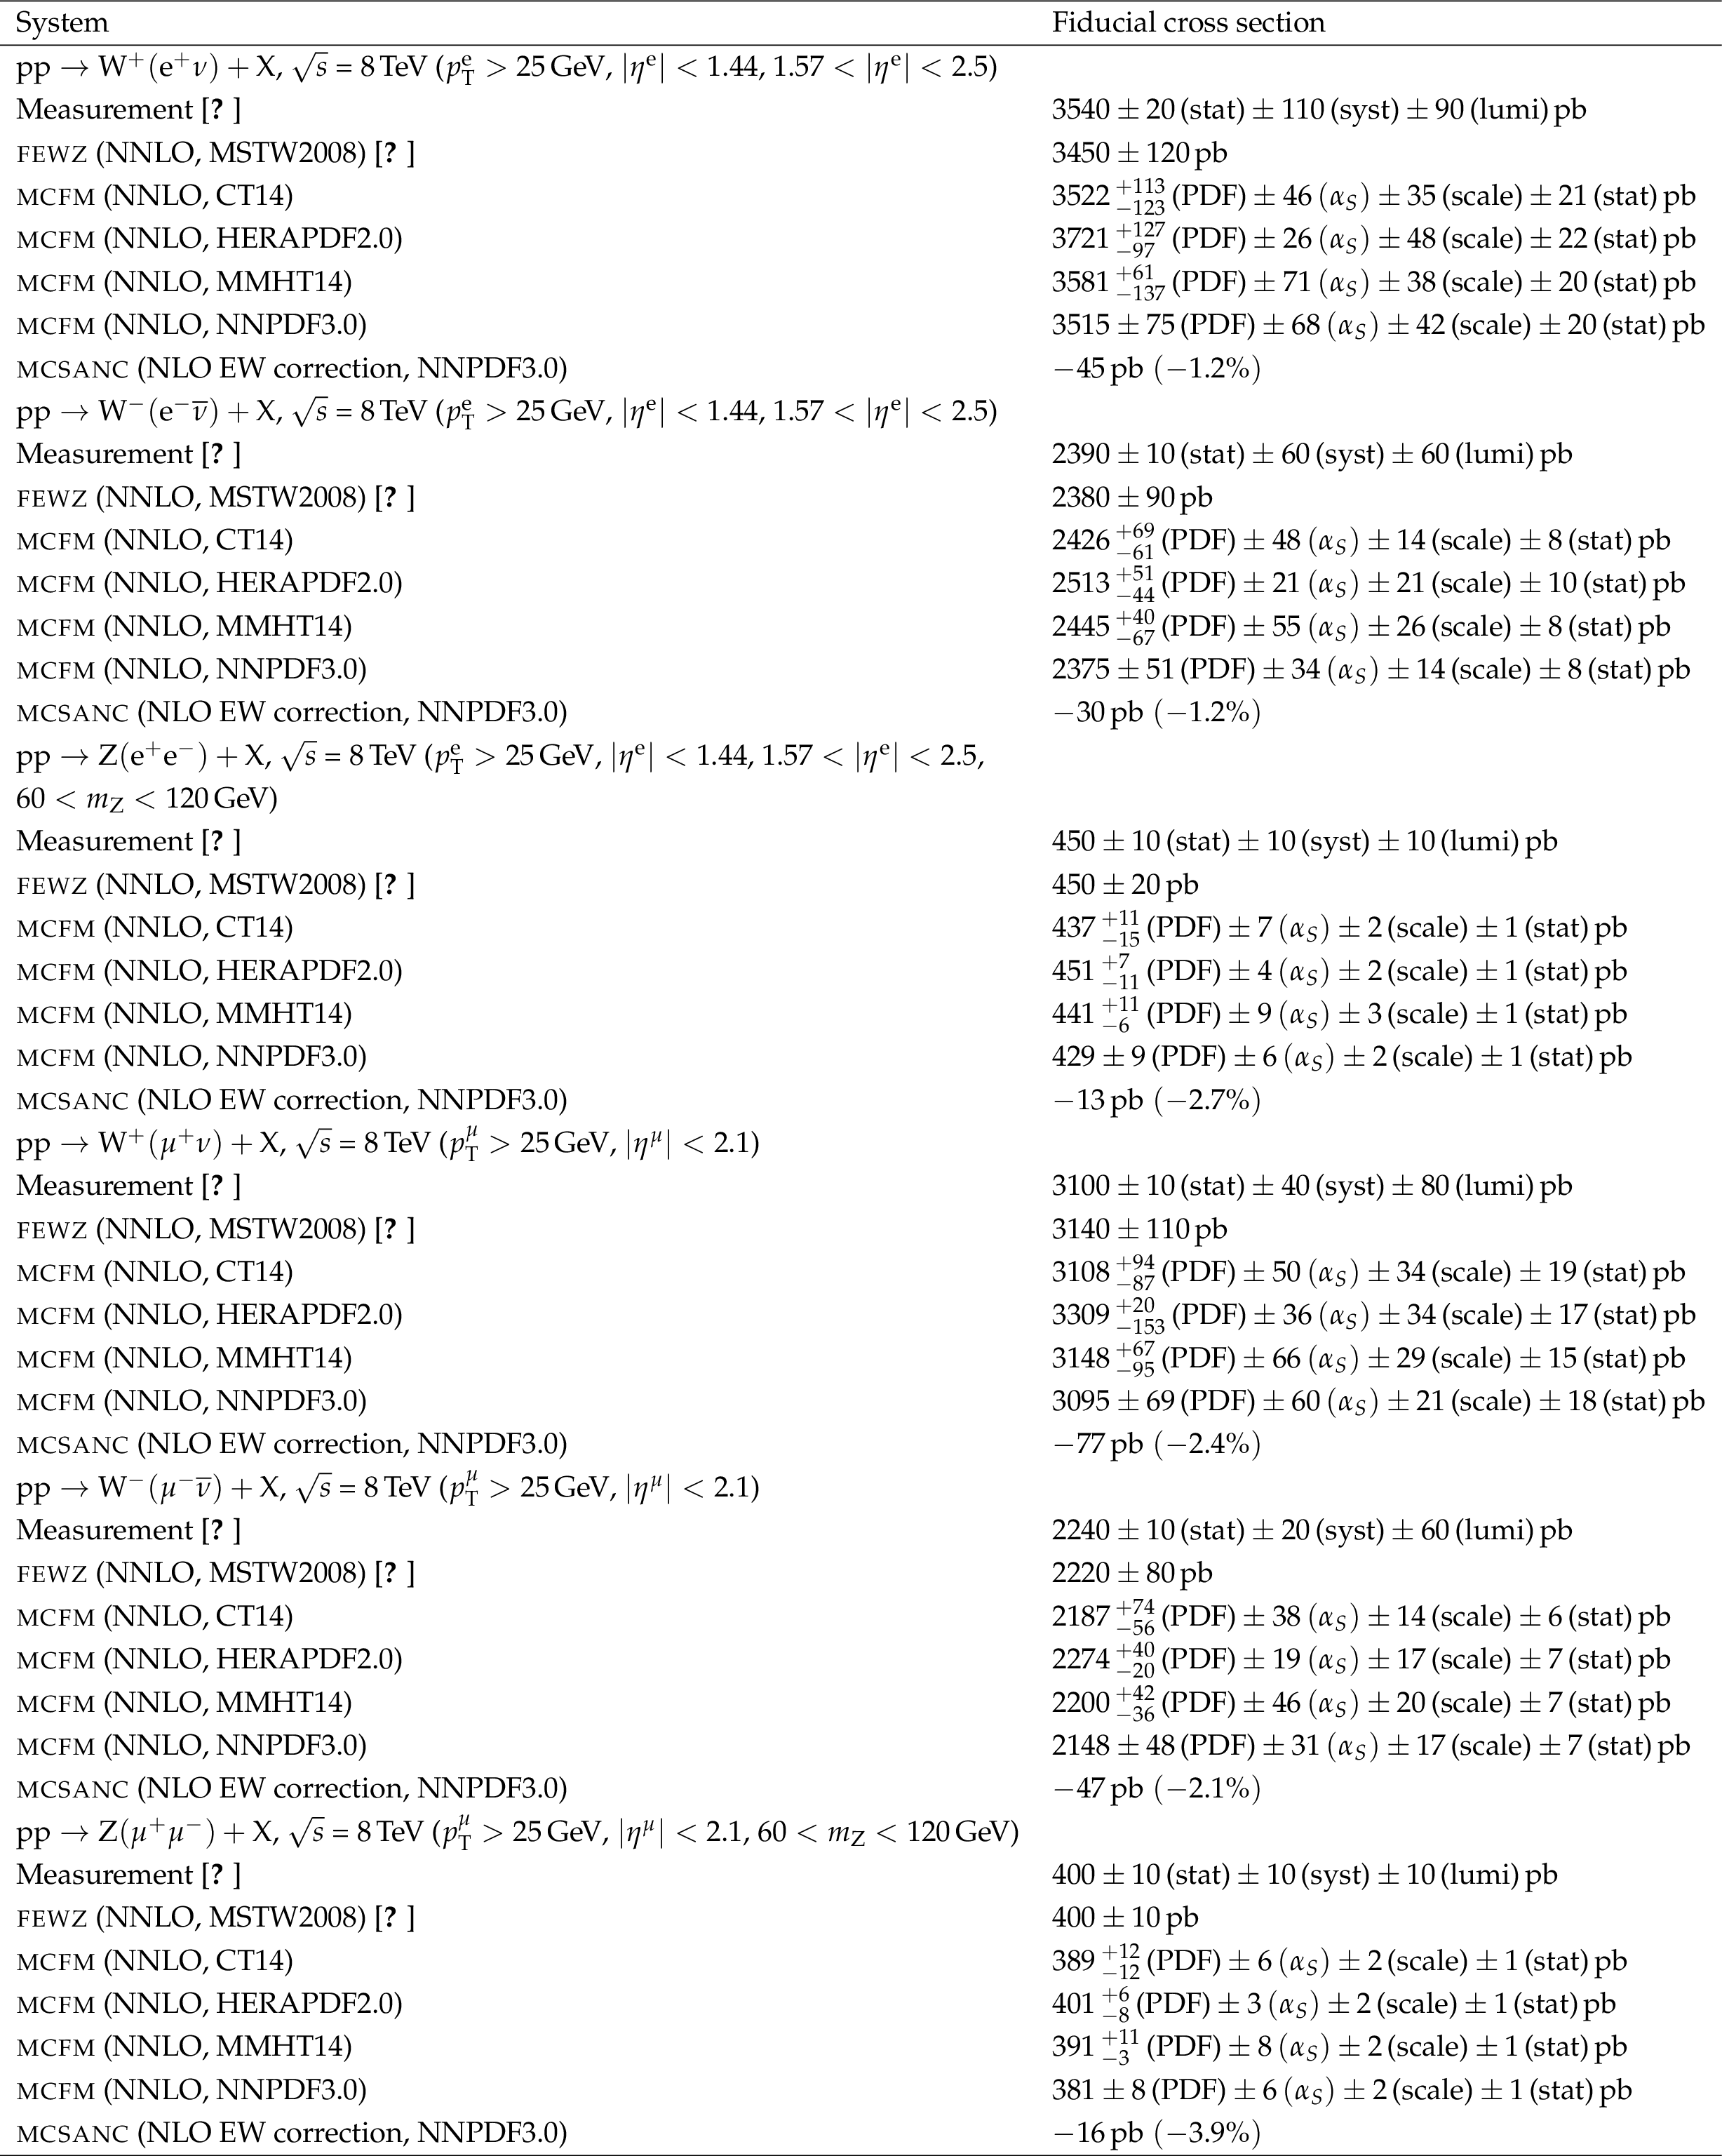
Experimental and theoretical fiducial cross sections for $\mathrm{W^{\pm}}$ and $\mathrm{Z}$ production in pp collisions at $ {\sqrt {s}} = $ 7 TeV, with the uncertainty sources listed in Table 2. The NNLO pQCD results are obtained with MCFM for $ {\alpha _S} (m_{\mathrm{Z}}) = $ 0.118 using the CT14, HERAPDF2.0, MMHT14, and NNPDF3.0 PDF sets. (The quoted $ {\alpha _S} $ uncertainties are derived from the cross section changes when $ {\alpha _S} (m_{\mathrm{Z}})$ is modified by $ \pm$ 0.002). The NLO EW corrections are computed with MCSANC. |
png pdf |
Table 4:
Experimental and theoretical fiducial cross sections for $\mathrm{W^{\pm}}$ and $\mathrm{Z}$ production in pp collisions at $ {\sqrt {s}} = $ 8 TeV, with the uncertainty sources listed in Table 2. The NNLO pQCD results are obtained with MCFM for $ {\alpha _S} (m_{\mathrm{Z}}) = $ 0.118 using the CT14, HERAPDF2.0, MMHT14, and NNPDF3.0 PDF sets, as well as with {fewz} using the MSTW2008 PDF. (The quoted $ {\alpha _S} $ uncertainties are derived from the cross section changes when $ {\alpha _S} (m_{\mathrm{Z}})$ is modified by $ \pm $ 0.002). The NLO EW corrections are computed with MCSANC. |

png pdf |
Table 5:
Overall goodness-of-fit per number of degrees of freedom, $\chi ^2$/ndf, among the twelve experimental measurements of $\mathrm{W^{\pm}}$ and $\mathrm{Z}$ boson production cross sections and the corresponding theoretical calculations obtained with the four different PDF sets for their default $ {\alpha _S} (m_{\mathrm{Z}})=$ 0.118 value. The first (second) row is obtained symmetrising the PDF uncertainties of the cross sections obtained with the CT14, HERAPDF2.0, and MMHT14 sets to the largest (smallest) of their respective values. |

png pdf |
Table 6:
Extracted $ {\alpha _S} (m_{\mathrm{Z}})$ values from the different data-theory $\mathrm{W^{\pm}}$ and $\mathrm{Z}$ boson production cross section comparisons for each PDF set, with associated uncertainties from different experimental (statistical, integrated luminosity, and systematic) and theoretical (PDF, scale, and numerical) sources. |
png pdf |
Table 7:
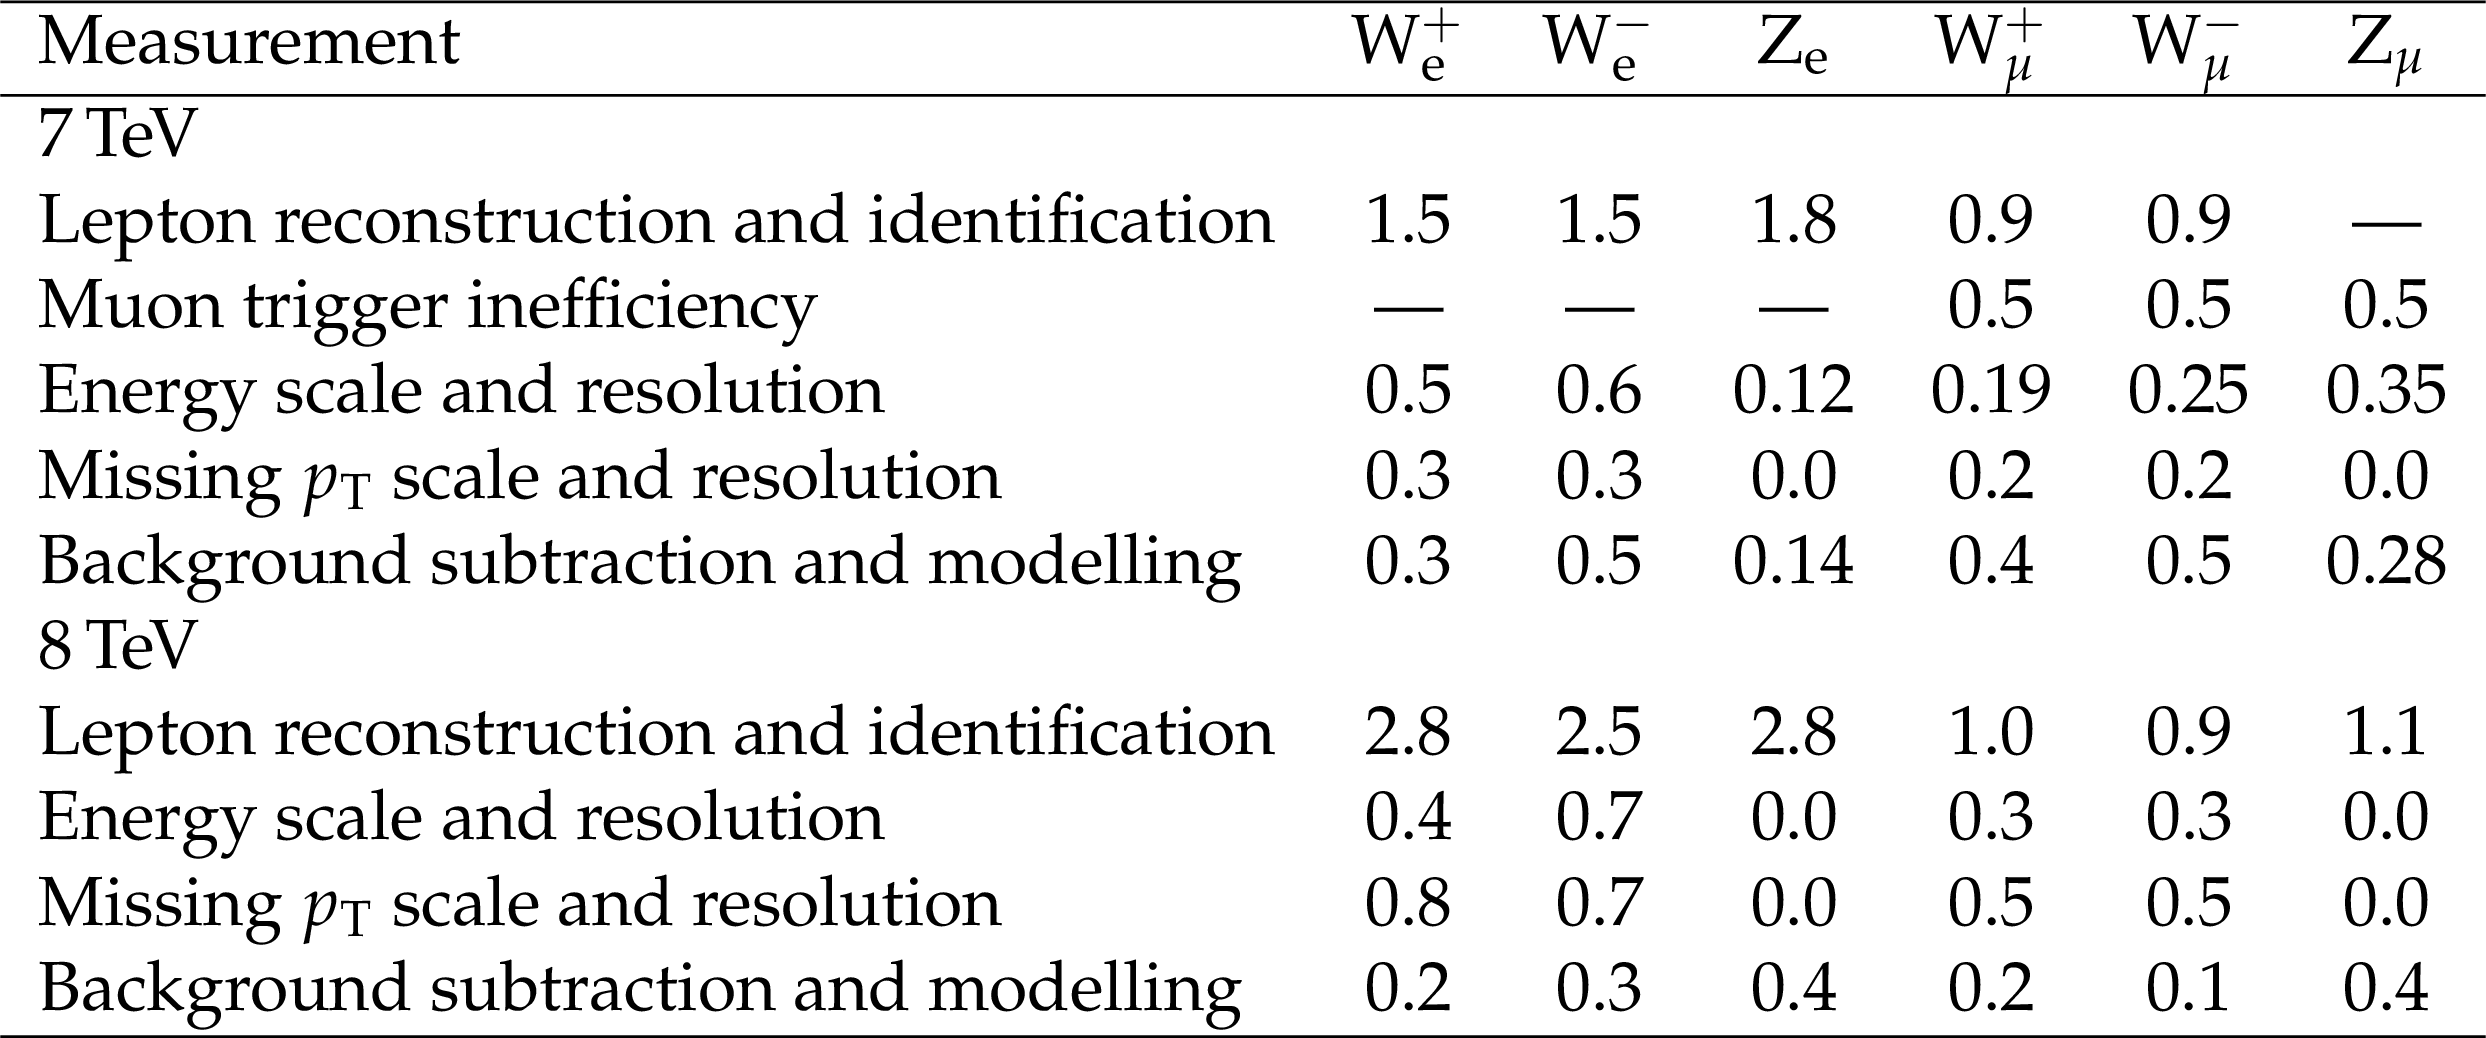
Breakdown of the experimental systematic uncertainties (in percent) for each of the $\mathrm{W^{\pm}}$ and $\mathrm{Z}$ boson production cross section measurements at 7 and 8 TeV [13,14]. |
png pdf |
Table 8:
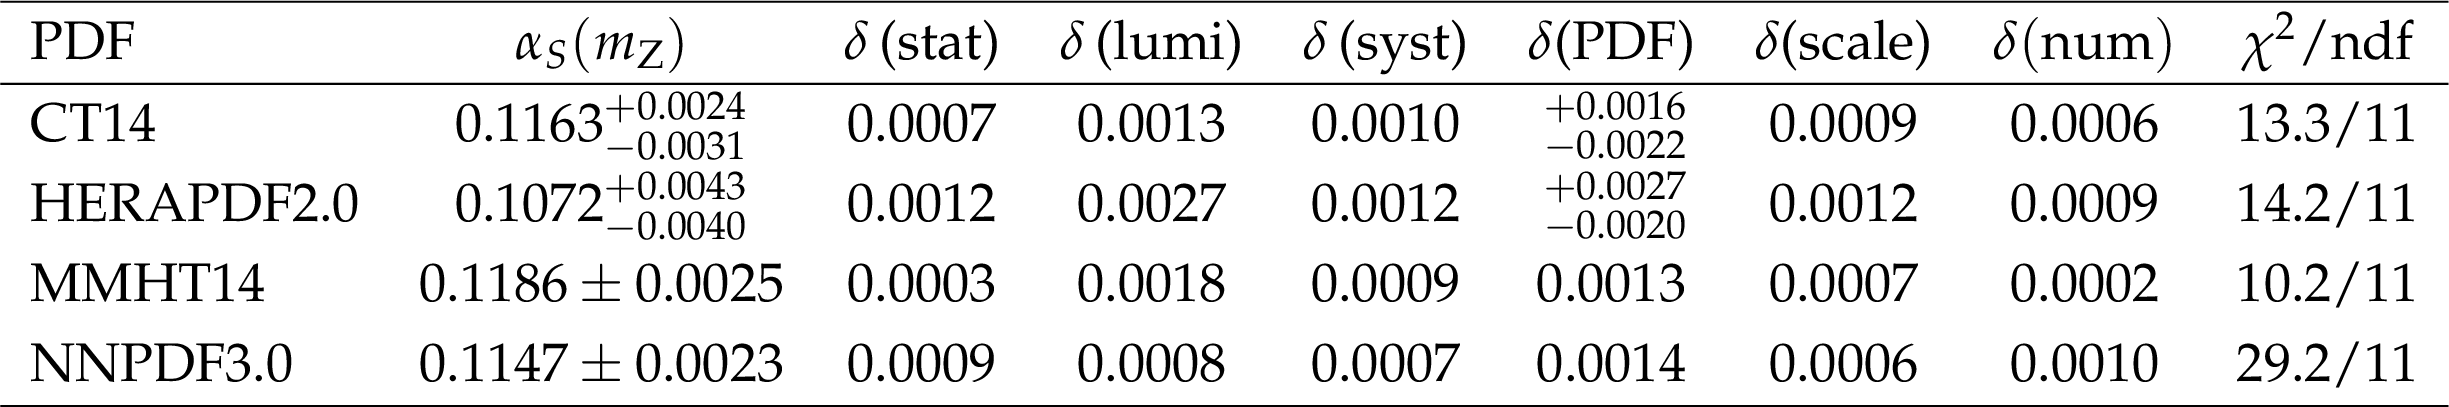
Strong coupling constant $ {\alpha _S} (m_{\mathrm{Z}})$ values extracted per PDF set by combining all the individual results obtained for each $\mathrm{W^{\pm}}$ and $\mathrm{Z}$ boson production cross section measurements, listed along with their total and individual uncertainties. The last column tabulates the goodness-of-fit per degree of freedom $\chi ^2$/ndf of the final single combined result compared to the twelve individual $ {\alpha _S} (m_{\mathrm{Z}})$ extractions. |

png pdf |
Table 9:
Sensitivity of the final $ {\alpha _S} (m_{\mathrm{Z}})$ extractions per PDF set to various data, uncertainties, and correlation assumptions. Top rows: Extractions of $ {\alpha _S} (m_{\mathrm{Z}})$ using only the 7 and 8 TeV measurements separately. Bottom rows: Extractions of $ {\alpha _S} (m_{\mathrm{Z}})$ when symmetrising the asymmetric PDF uncertainties by taking the maximum of the negative and positive values (left), and when adding a 1% uncorrelated uncertainty to all cross sections (right). |
png pdf |
Table 10:
Experimental systematic uncertainties: Lepton reconstruction and identification correlation matrix. |
png pdf |
Table 11:
Experimental systematic uncertainties: Muon trigger inefficiency correlation matrix [38]. |

png pdf |
Table 12:
Experimental systematic uncertainties: Energy and momentum scale and resolution correlation matrix. |
png pdf |
Table 13:
Experimental systematic uncertainties: Missing $ {p_{\mathrm {T}}} $ scale and resolution correlation matrix. |
png pdf |
Table 14:
Experimental systematic uncertainties: Background subtraction and modelling correlation matrix. |

png pdf |
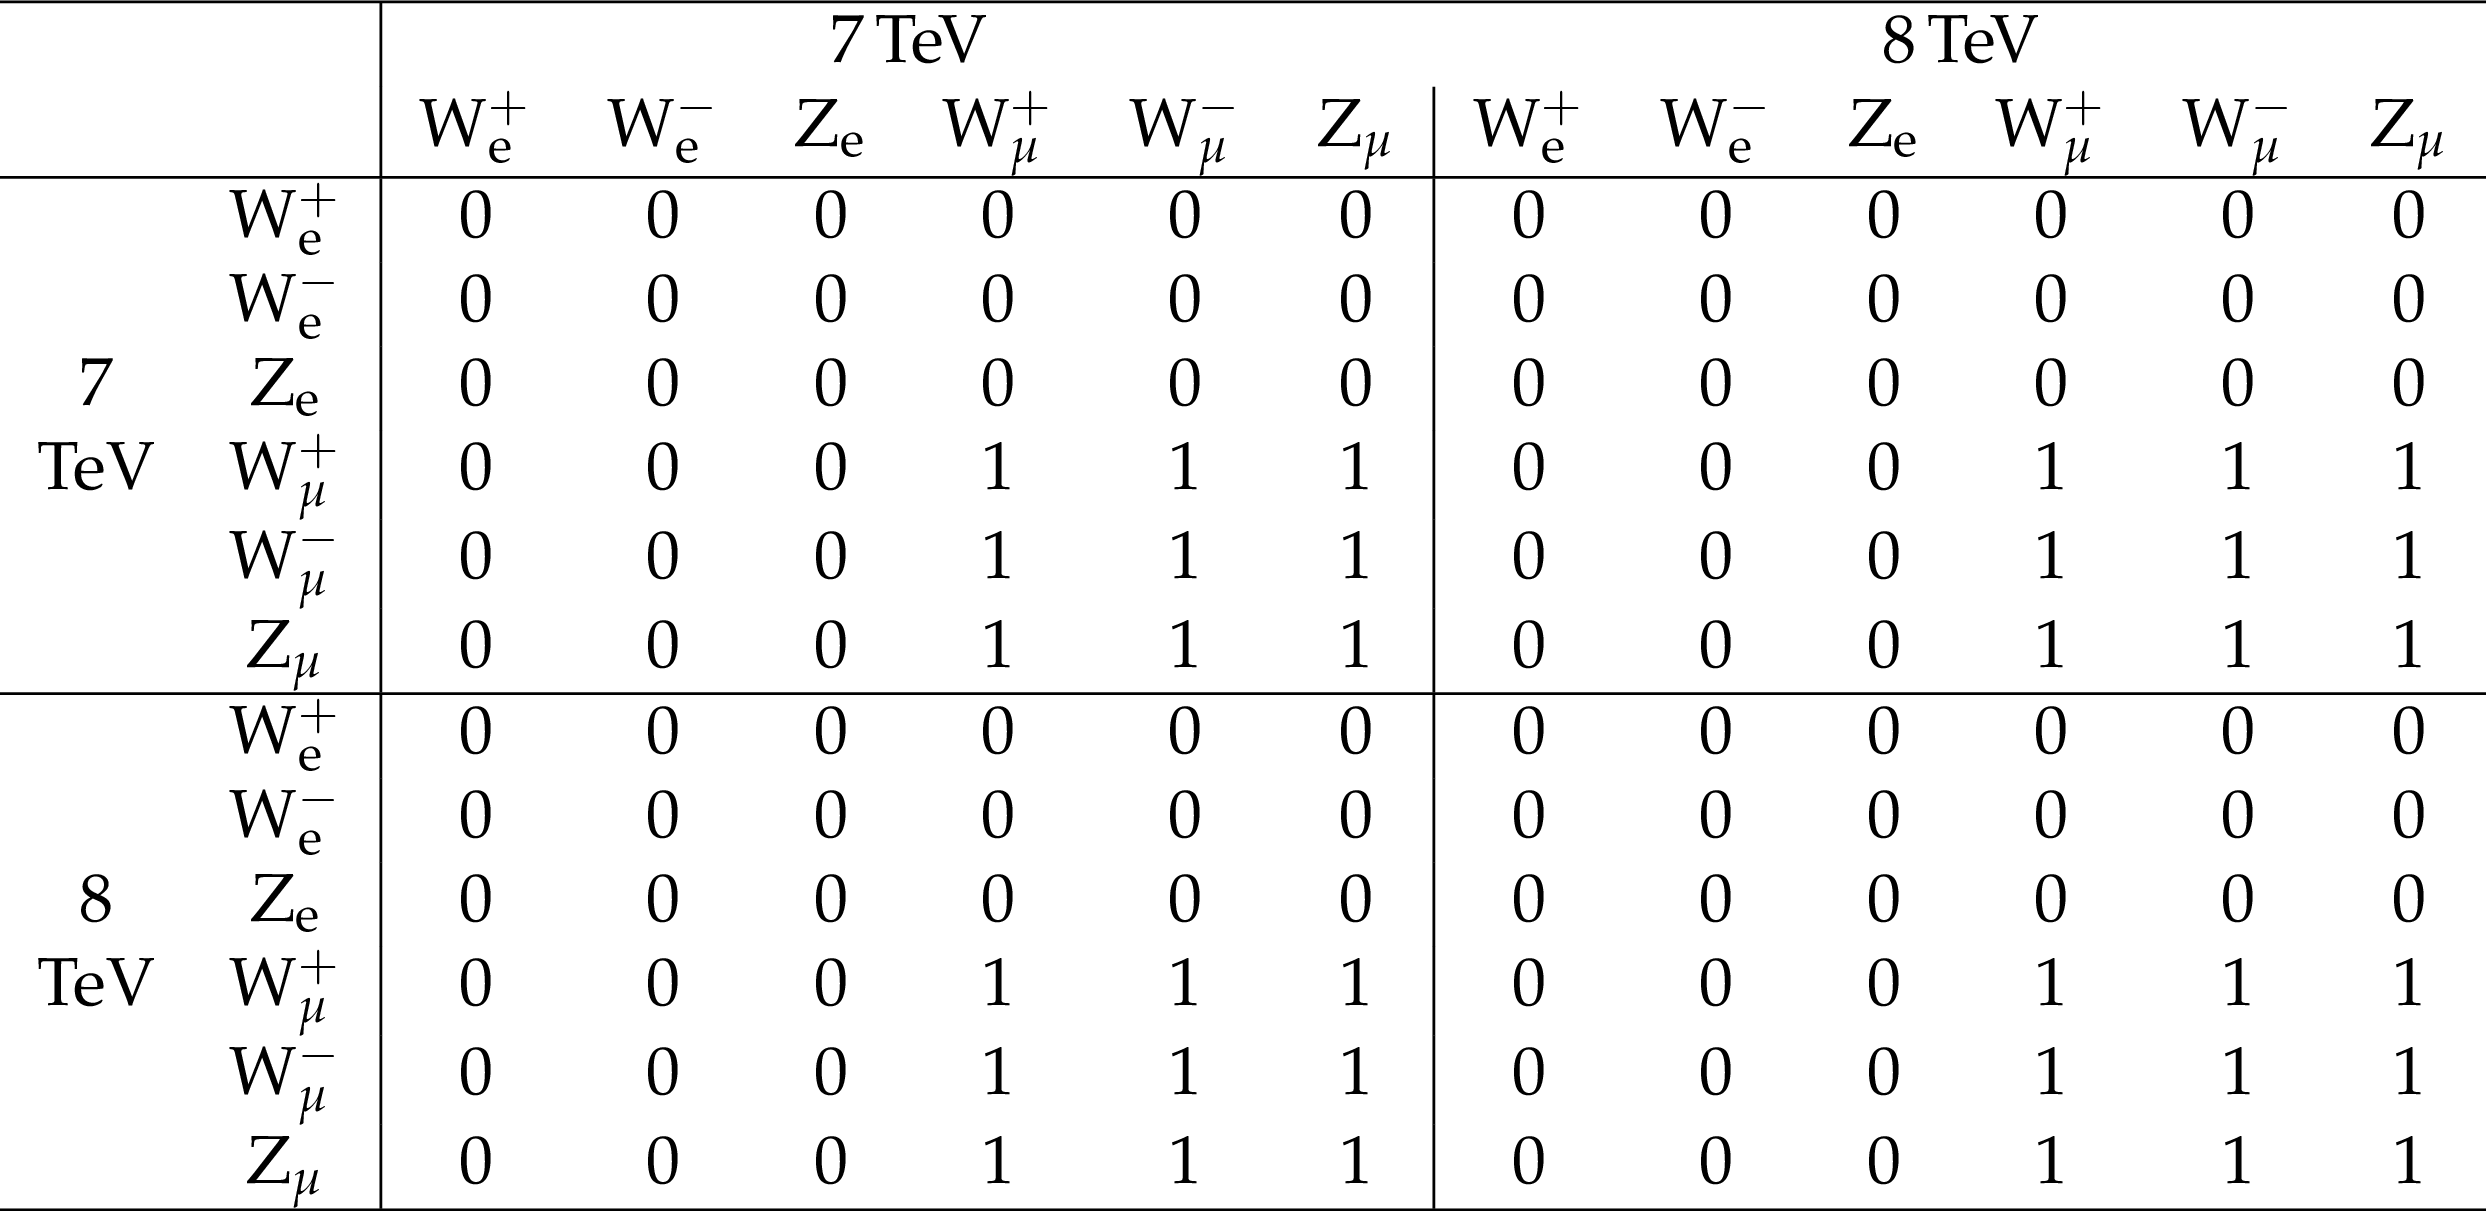
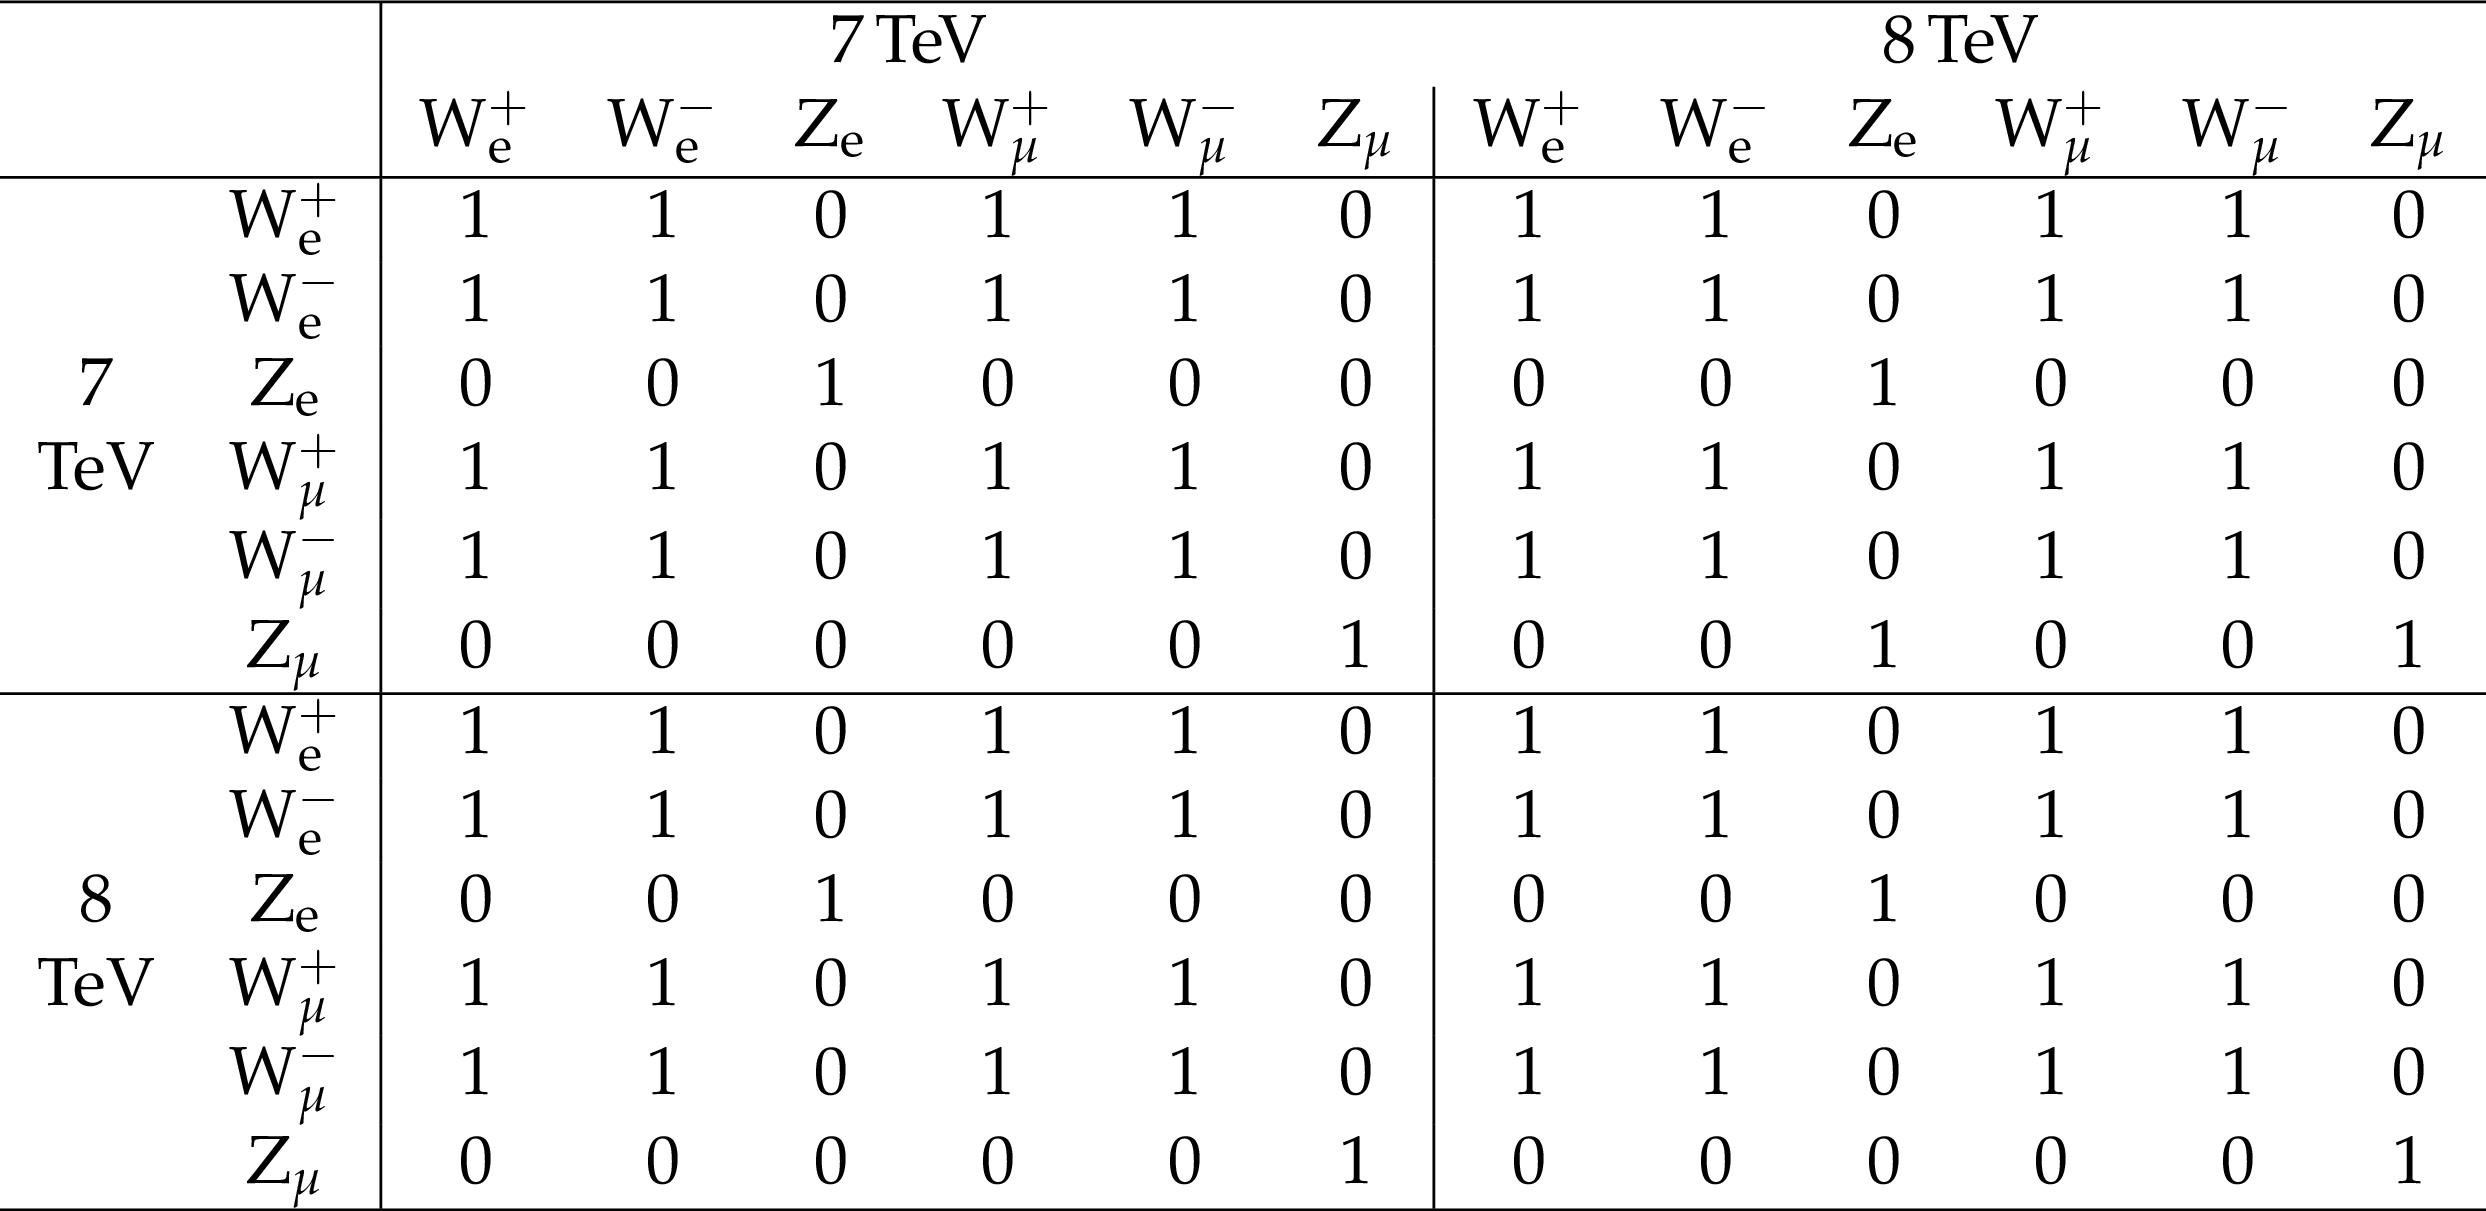
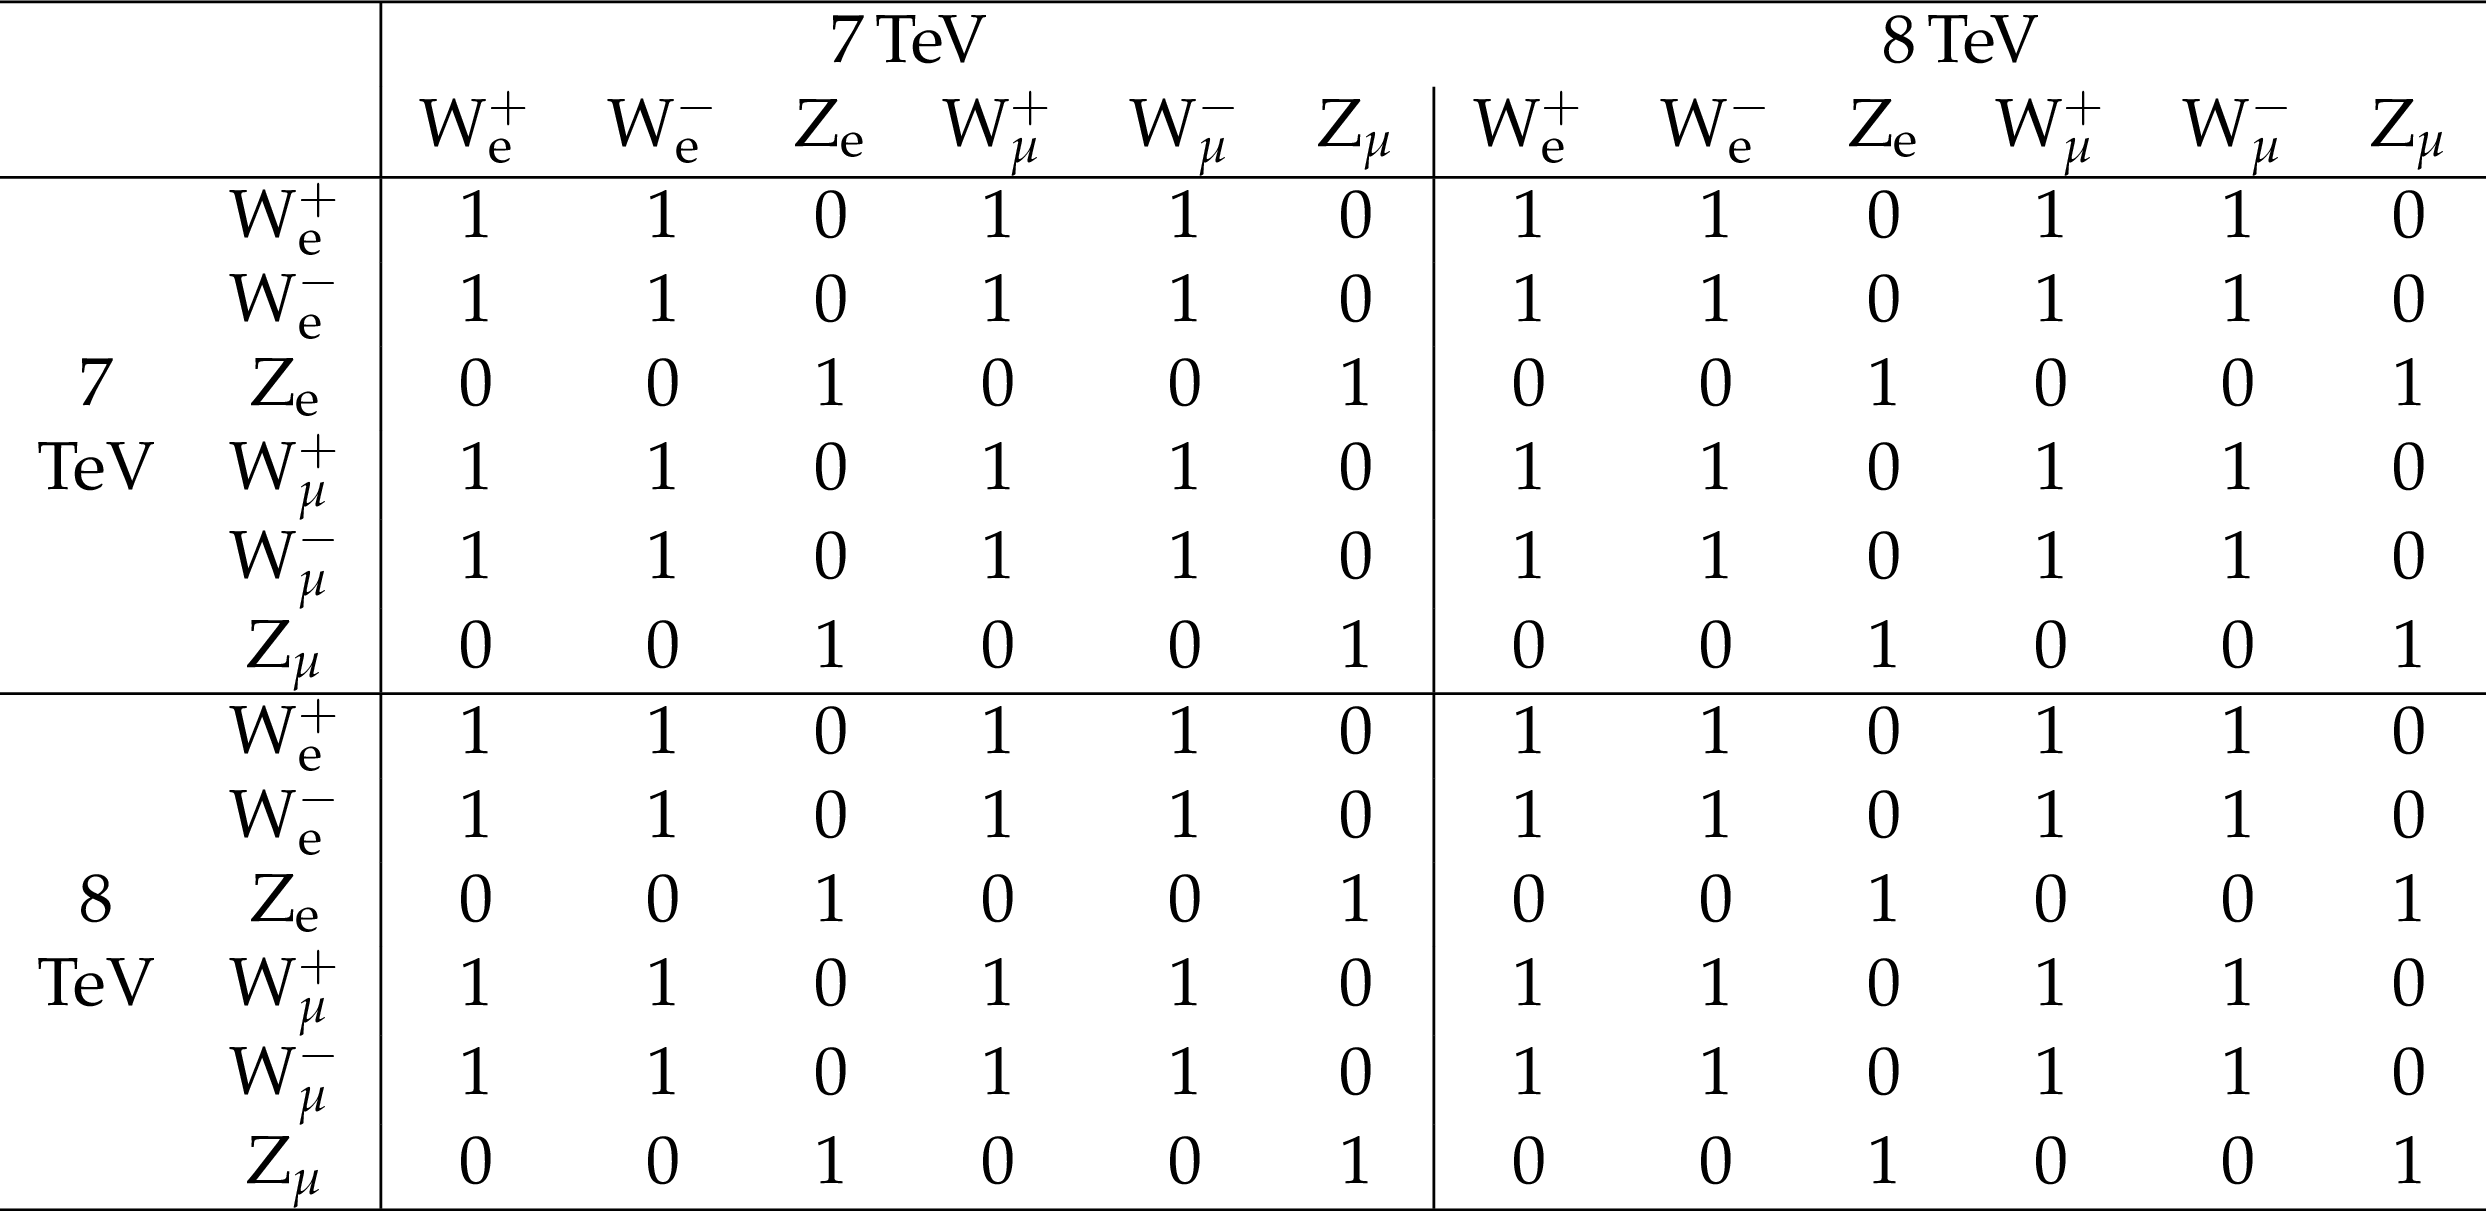
Table 15:
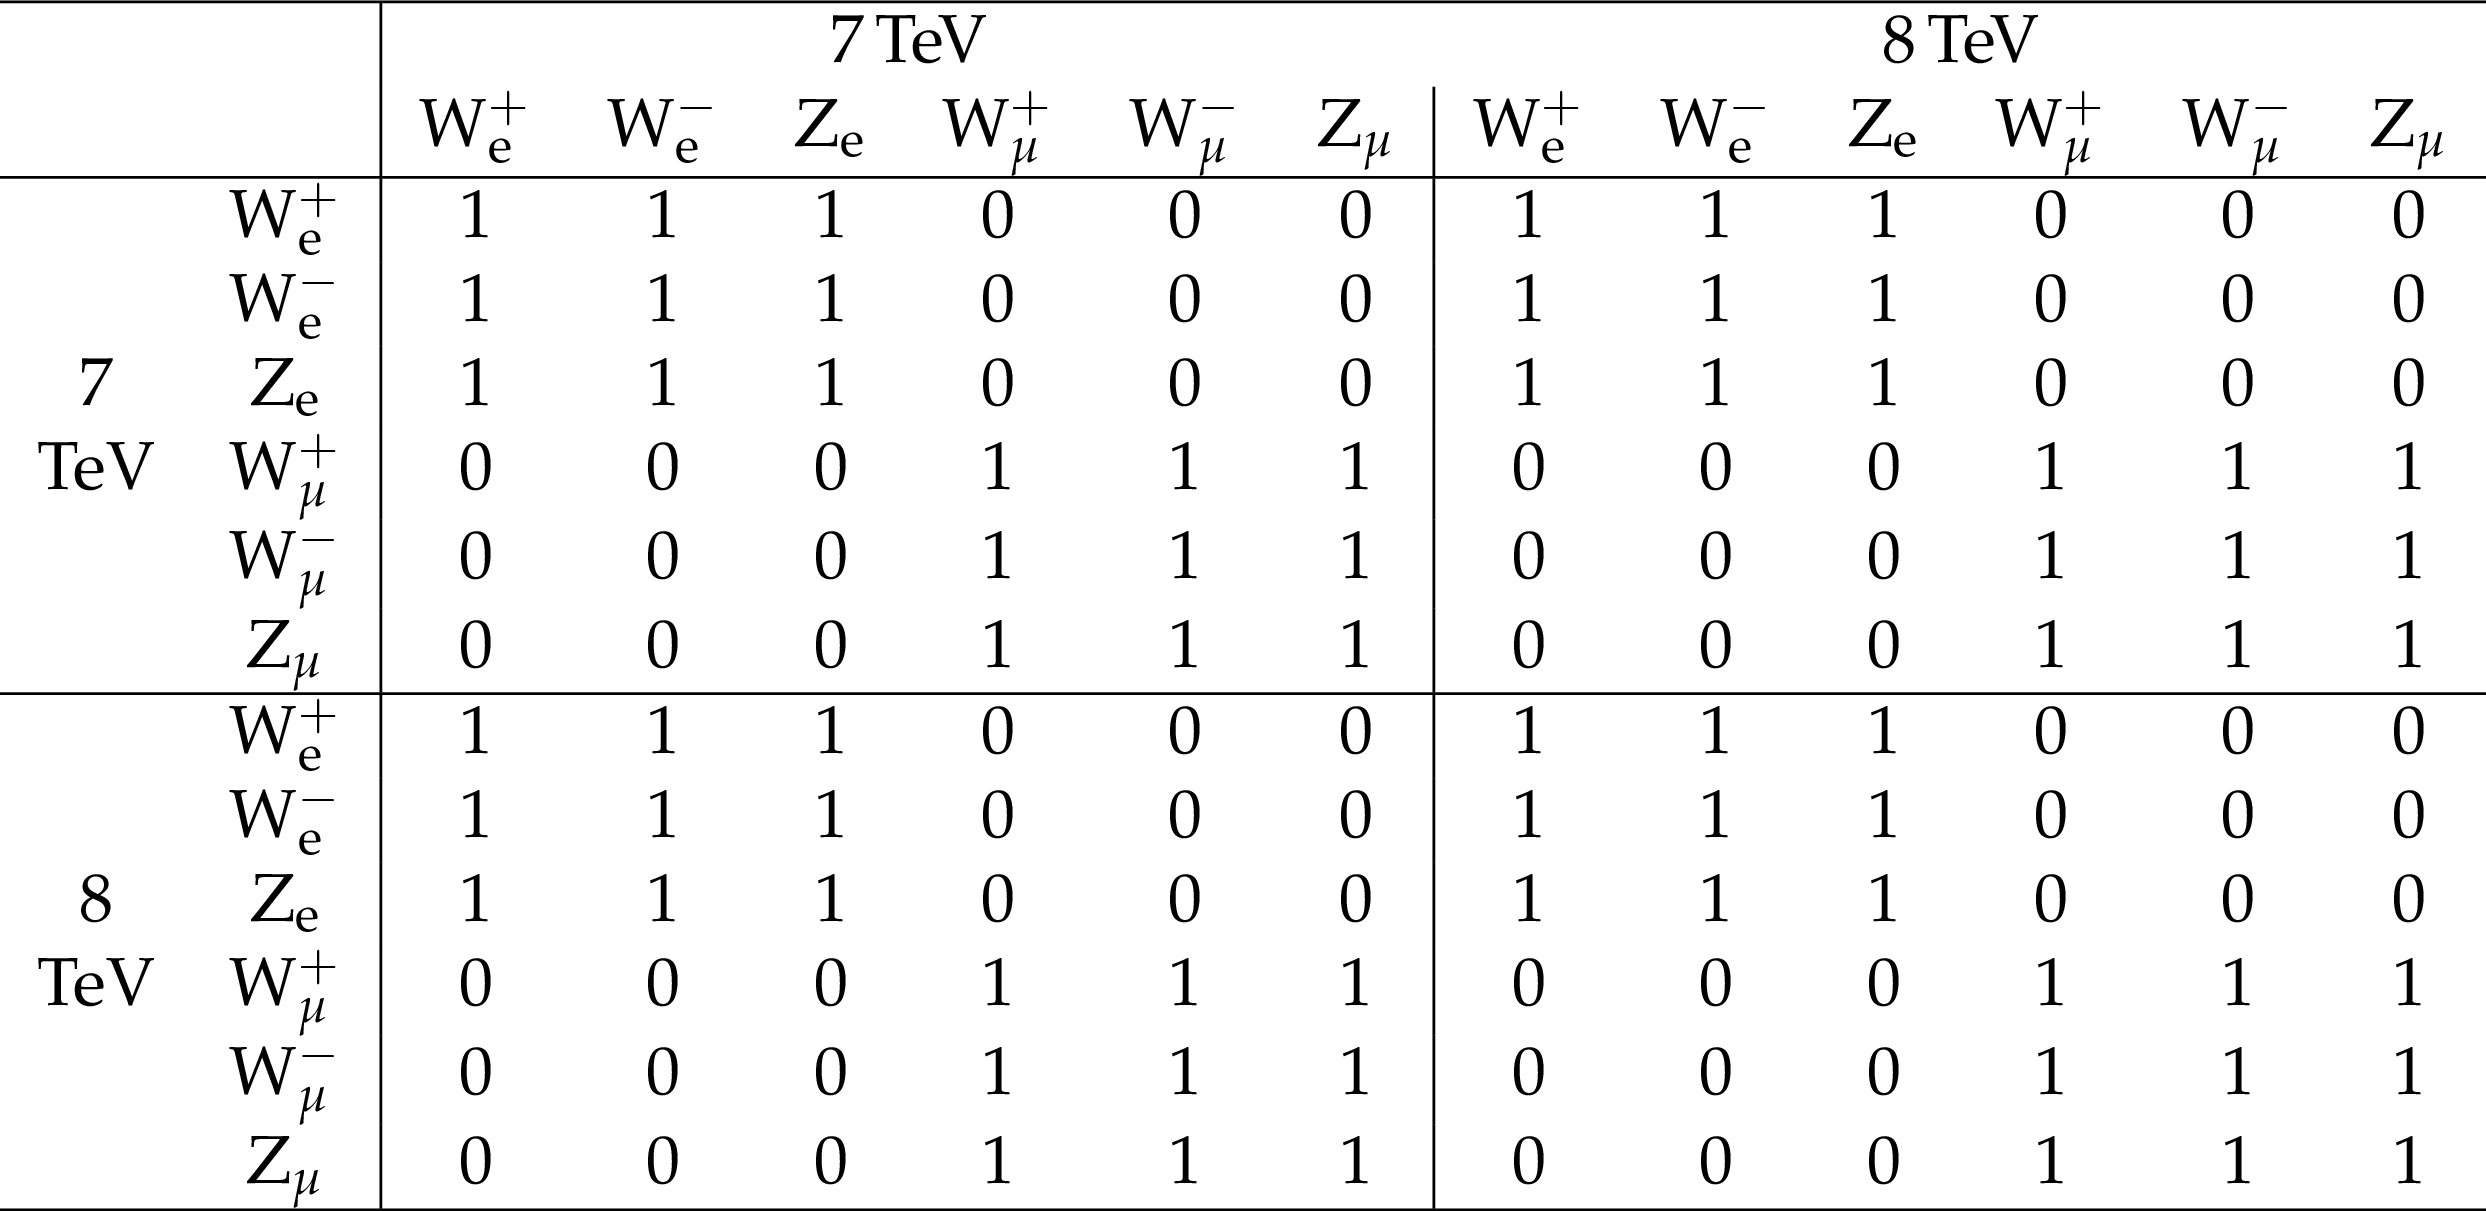
Total experimental systematic uncertainties correlations among $ {\alpha _S} (m_{\mathrm{Z}})$ values extracted from all individual measurements at 7 and 8 TeV [13,14] of the $\mathrm{W^{\pm}}$ and $\mathrm{Z}$ boson production cross sections. |
png pdf |
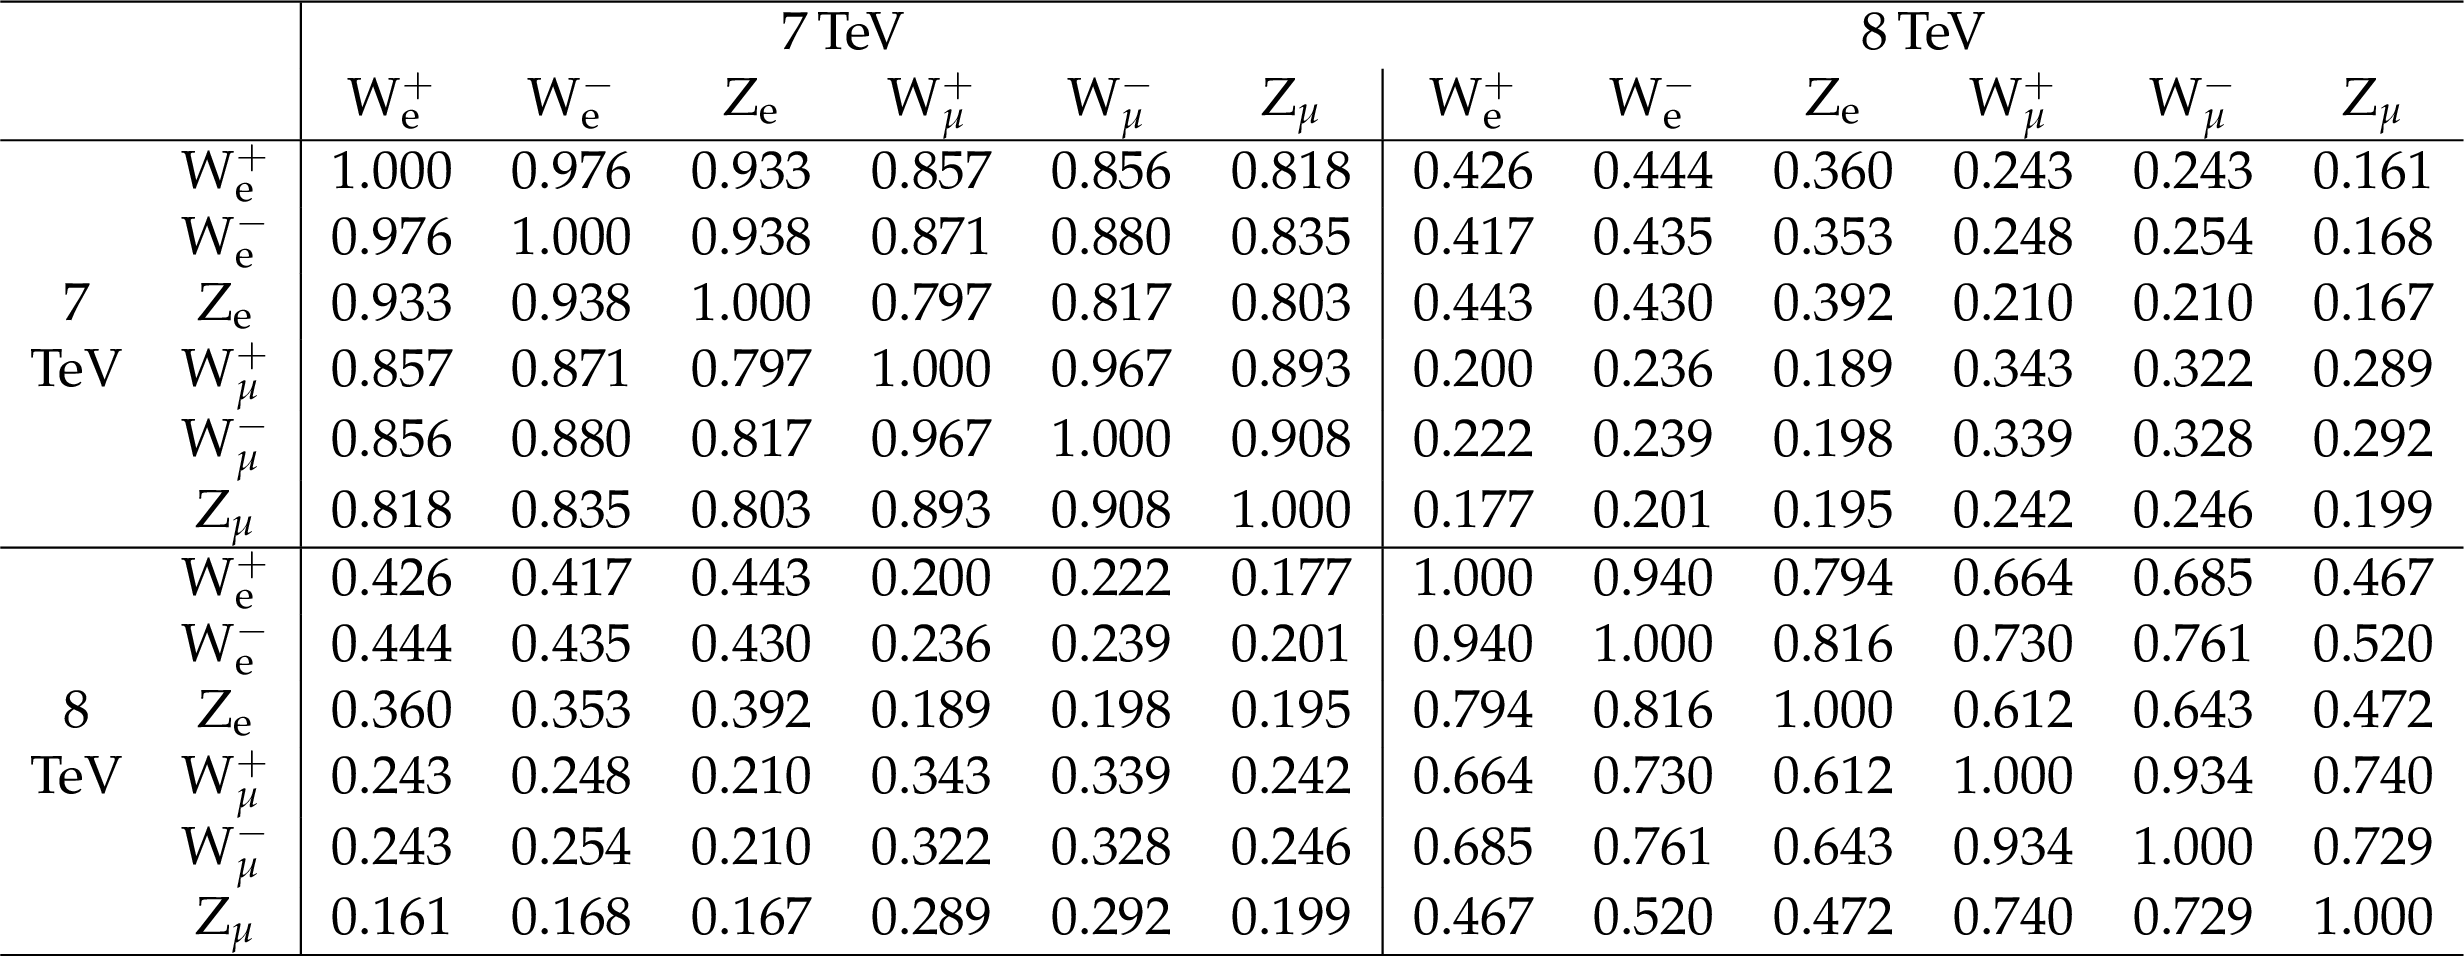
Table 16:
Total experimental and theoretical correlations between all the $ {\alpha _S} (m_{\mathrm{Z}})$ values extracted from all measurements at 7 and 8 TeV [13,14] of $\mathrm{W^{\pm}}$ and $\mathrm{Z}$ boson production cross sections, obtained using the NNPDF3.0 PDF set. |
| Summary |
| We have used twelve measurements of the inclusive fiducial $\mathrm{W^{\pm}}$ and $\mathrm{Z}$ production cross sections in proton-proton collisions (pp) at ${\sqrt{s}} = $ 7 and 8 TeV, carried out in the electron and muon decay channels by the CMS experiment, to extract the value of the strong coupling constant at the $\mathrm{Z}$ pole mass, ${\alpha_S}(m_{\mathrm{Z}})$. The procedure is based on a detailed comparison of the measured electroweak boson cross sections to theoretical calculations computed at next-to-next-to-leading-order accuracy with the CT14, HERAPDF2.0, MMHT14, and NNPDF3.0 parton distribution function (PDF) sets. The overall data-theory agreement is good within the experimental and theoretical uncertainties. A $\chi^2$-minimisation procedure has been employed to combine all twelve individual ${\alpha_S}$ extractions per PDF set, properly taking into account all individual sources of experimental and theoretical uncertainties, and their correlations. The following combined values are extracted for the four different PDFs: ${\alpha_S}(m_{\mathrm{Z}}) = $ 0.1163$^{+0.0024}_{-0.0031}$ (CT14), 0.1072$^{+0.0043}_{-0.0040}$ (HERAPDF2.0), 0.1186 $\pm$ 0.0025 (MMHT14), and 0.1147 $\pm$ 0.0023 (NNPDF3.0). The largest propagated uncertainties are associated with the experimental integrated luminosity and theoretical intra-PDF uncertainties. Among the four extractions, the cross section calculated with the CT14 and MMHT14 sets appear as the most sensitive to the underlying ${\alpha_S}$ value and, at the same time, the derived ${\alpha_S}(m_{\mathrm{Z}})$ values are the most robust and stable with respect to variations in the data and theoretical cross sections, their uncertainties, and correlations. The result derived combining the CT14 and MMHT14 extractions, ${\alpha_S}(m_{\mathrm{Z}}) = $ 0.1175$^{+0.0025}_{-0.0028}$, has a $\approx$2.3% uncertainty that is comparable to that previously obtained in a similar analysis of the inclusive $\mathrm{t\bar{t}}$ cross sections in pp collisions at the LHC. This extracted value is fully compatible with the current ${\alpha_S}(m_{\mathrm{Z}})$ world average. |
| References | ||||
| 1 | Particle Data Group Collaboration | Review of particle physics | CPC 40 (2016) 100001 | |
| 2 | LHC Higgs Cross Section Working Group, S. Dittmaier et al. | Handbook of LHC Higgs cross sections: 2. differential distributions | CERN-2012-002 | 1201.3084 |
| 3 | A. H. Hoang et al. | The MSR mass and the $ \mathcal{O}\left({\Lambda}_{\mathrm{QCD}}\right) $ renormalon sum rule | JHEP 04 (2018) 003 | 1704.01580 |
| 4 | TLEP Design Study Collaboration | First look at the physics case of TLEP | JHEP 01 (2014) 164 | 1308.6176 |
| 5 | D. Buttazzo et al. | Investigating the near-criticality of the Higgs boson | JHEP 12 (2013) 089 | 1307.3536 |
| 6 | D. Bourilkov | Strong coupling running, gauge coupling unification and the scale of new physics | JHEP 11 (2015) 117 | 1508.04176 |
| 7 | F. Sannino | $ \alpha_{S} $ at LHC: Challenging asymptotic freedom | in Proceedings: High-precision $\alpha_S$ measurements from LHC to FCC-ee, p. 11 2015 | 1511.09022 |
| 8 | CMS Collaboration | Determination of the top-quark pole mass and strong coupling constant from the $ \mathrm{t\bar{t}} $ production cross section in pp collisions at $ \sqrt{s} = $ 7 TeV | PLB 728 (2014) 496 | CMS-TOP-12-022 1307.1907 |
| 9 | T. Klijnsma, S. Bethke, G. Dissertori, and G. P. Salam | Determination of the strong coupling constant $ \alpha_{S}(m_{Z}) $ from measurements of the total cross section for top-antitop quark production | EPJC 77 (2017) 778 | 1708.07495 |
| 10 | CMS Collaboration | Measurement of the $ \mathrm{t}\overline{\mathrm{t}} $ production cross section, the top quark mass, and the strong coupling constant using dilepton events in pp collisions at $ \sqrt{s} = $ 13 TeV | EPJC 79 (2019) 368 | CMS-TOP-17-001 1812.10505 |
| 11 | D. d'Enterria and P. Z. Skands, eds. | High-precision $\alpha_S$ measurements from LHC to FCC-ee | CERN, Geneva, Switzerland, (2015) | 1512.05194 |
| 12 | D. d'Enterria, S. Kluth et al., eds. | Workshop on precision measurements of the QCD coupling | ECT*, Villazano, Trento, Italy, (February, 2019) | 1907.01435 |
| 13 | CMS Collaboration | Measurement of the inclusive W and Z production cross sections in pp collisions at $ \sqrt{s}= $ 7 TeV | JHEP 10 (2011) 132 | CMS-EWK-10-005 1107.4789 |
| 14 | CMS Collaboration | Measurement of inclusive W and Z boson production cross sections in pp collisions at $ \sqrt{s} = $ 8 TeV | PRL 112 (2014) 191802 | CMS-SMP-12-011 1402.0923 |
| 15 | R. Hamberg, W. L. van Neerven, and T. Matsuura | A complete calculation of the order $ \alpha_{S}^{2} $ correction to the Drell--Yan $ k $ factor | NPB 359 (1991) 343, .[Erratum: \DOI10.1016/S0550-3213(02)00814-3] | |
| 16 | R. Boughezal et al. | Color singlet production at NNLO in MCFM | EPJC 77 (2017) 7 | 1605.08011 |
| 17 | S. G. Bondarenko and A. A. Sapronov | NLO EW and QCD proton-proton cross section calculations with MCSANC-v1.01 | CPC 184 (2013) 2343 | 1301.3687 |
| 18 | C. Anastasiou, L. J. Dixon, K. Melnikov, and F. Petriello | High precision QCD at hadron colliders: Electroweak gauge boson rapidity distributions at NNLO | PRD 69 (2004) 094008 | hep-ph/0312266 |
| 19 | A. Poldaru, D. d'Enterria, and X. Weichen | $ \alpha_{S} $ extraction from inclusive W$ ^\pm $ and Z cross sections in proton-proton collisions at the LHC | in Proceedings $\alpha_S$(2019): Workshop on precision measurements of the QCD coupling, p. 013 ECT*, Villazano, Trento, Italy, February, 2019 [PoS(ALPHAS2019)013] | |
| 20 | CMS Collaboration | The CMS experiment at the CERN LHC | JINST 3 (2008) S08004 | CMS-00-001 |
| 21 | J. C. Collins, D. E. Soper, and G. F. Sterman | Factorization of hard processes in QCD | Adv. Ser. Direct. High Energy Phys. 5 (1989) 1 | hep-ph/0409313 |
| 22 | A. Buckley et al. | LHAPDF6: parton density access in the LHC precision era | EPJC 75 (2015) 132 | 1412.7420 |
| 23 | S. Dulat et al. | New parton distribution functions from a global analysis of quantum chromodynamics | PRD 93 (2016) 033006 | 1506.07443 |
| 24 | ZEUS and H1 Collaboration | HERA inclusive neutral and charged current cross sections and a new PDF fit, HERAPDF 2.0 | Acta Phys. Polon. Supp. 8 (2015) 957 | 1511.05402 |
| 25 | L. A. Harland-Lang, A. D. Martin, P. Motylinski, and R. S. Thorne | Parton distributions in the LHC era: MMHT 2014 PDFs | EPJC 75 (2015) 204 | 1412.3989 |
| 26 | NNPDF Collaboration | Parton distributions for the LHC Run II | JHEP 04 (2015) 040 | 1410.8849 |
| 27 | S. Alioli et al. | Precision studies of observables in pp$ \to $W$ \to \ell\nu_l $ and pp$ \to \gamma, $Z$ \to \ell^+\ell^- $ processes at the LHC | EPJC 77 (2017) 280 | 1606.02330 |
| 28 | NNPDF Collaboration | Illuminating the photon content of the proton within a global PDF analysis | SciPost Phys. 5 (2018) 008 | 1712.07053 |
| 29 | D. de Florian, M. Der, and I. Fabre | QCD$ \oplus $QED NNLO corrections to Drell--Yan production | PRD 98 (2018) 094008 | 1805.12214 |
| 30 | Y. Li and F. Petriello | Combining QCD and electroweak corrections to dilepton production in FEWZ | PRD 86 (2012) 094034 | 1208.5967 |
| 31 | A. D. Martin, W. J. Stirling, R. S. Thorne, and G. Watt | Parton distributions for the LHC | EPJC 63 (2009) 189 | 0901.0002 |
| 32 | J. Kieseler | A method and tool for combining differential or inclusive measurements obtained with simultaneously constrained uncertainties | EPJC 77 (2017) 792 | 1706.01681 |
| 33 | R. Nisius | On the combination of correlated estimates of a physics observable | EPJC 74 (2014) 3004 | 1402.4016 |
| 34 | S. Carrazza, A. Ferrara, D. Palazzo, and J. Rojo | APFEL Web | JPG 42 (2015) 057001 | 1410.5456 |
| 35 | NNPDF Collaboration | Parton distributions from high-precision collider data | EPJC 77 (2017) 663 | 1706.00428 |
| 36 | J. Butterworth et al. | PDF4LHC recommendations for LHC Run II | JPG 43 (2016) 023001 | 1510.03865 |
| 37 | J. Haller et al. | Update of the global electroweak fit and constraints on two-Higgs-doublet models | EPJC 78 (2018) 675 | 1803.01853 |
| 38 | CMS Collaboration | The CMS trigger system | JINST 12 (2017) P01020 | CMS-TRG-12-001 1609.02366 |
|
|
Compact Muon Solenoid LHC, CERN |
|

|

|

|

|

|