

Compact Muon Solenoid
LHC, CERN
| CMS-TOP-13-008 ; CERN-EP-2016-118 | ||
| Measurement of the W boson helicity fractions in the decays of top quark pairs to lepton+jets final states produced in pp collisions at $ \sqrt{s} = $ 8 TeV | ||
| CMS Collaboration | ||
| 29 May 2016 | ||
| Phys. Lett. B 762 (2016) 512 | ||
| Abstract: The W boson helicity fractions from top quark decays in $\mathrm{ t \bar{t} }$ events are measured using data from proton-proton collisions at a centre-of-mass energy of 8 TeV. The data were collected in 2012 with the CMS detector at the LHC, corresponding to an integrated luminosity of 19.8 fb$^{-1}$. Events are reconstructed with either one muon or one electron, along with four jets in the final state, with two of the jets being identified as originating from b quarks. The measured helicity fractions from both channels are combined, yielding $F_{\rm 0}= 0.681 \pm 0.012 $ (stat) $\pm 0.023 $ (syst), $F_{\rm L}= 0.323 \pm 0.008 $ (stat) $\pm 0.014 $ (syst), and $F_{\rm R}= -0.004 \pm 0.005 $ (stat) $\pm 0.014 $ (syst) for the longitudinal, left-, and right-handed components of the helicity, respectively. These measurements of the W boson helicity fractions are the most accurate to date and they agree with the predictions from the standard model. | ||
| Links: e-print arXiv:1605.09047 [hep-ex] (PDF) ; CDS record ; inSPIRE record ; HepData record ; CADI line (restricted) ; | ||
| Figures | |
png pdf |
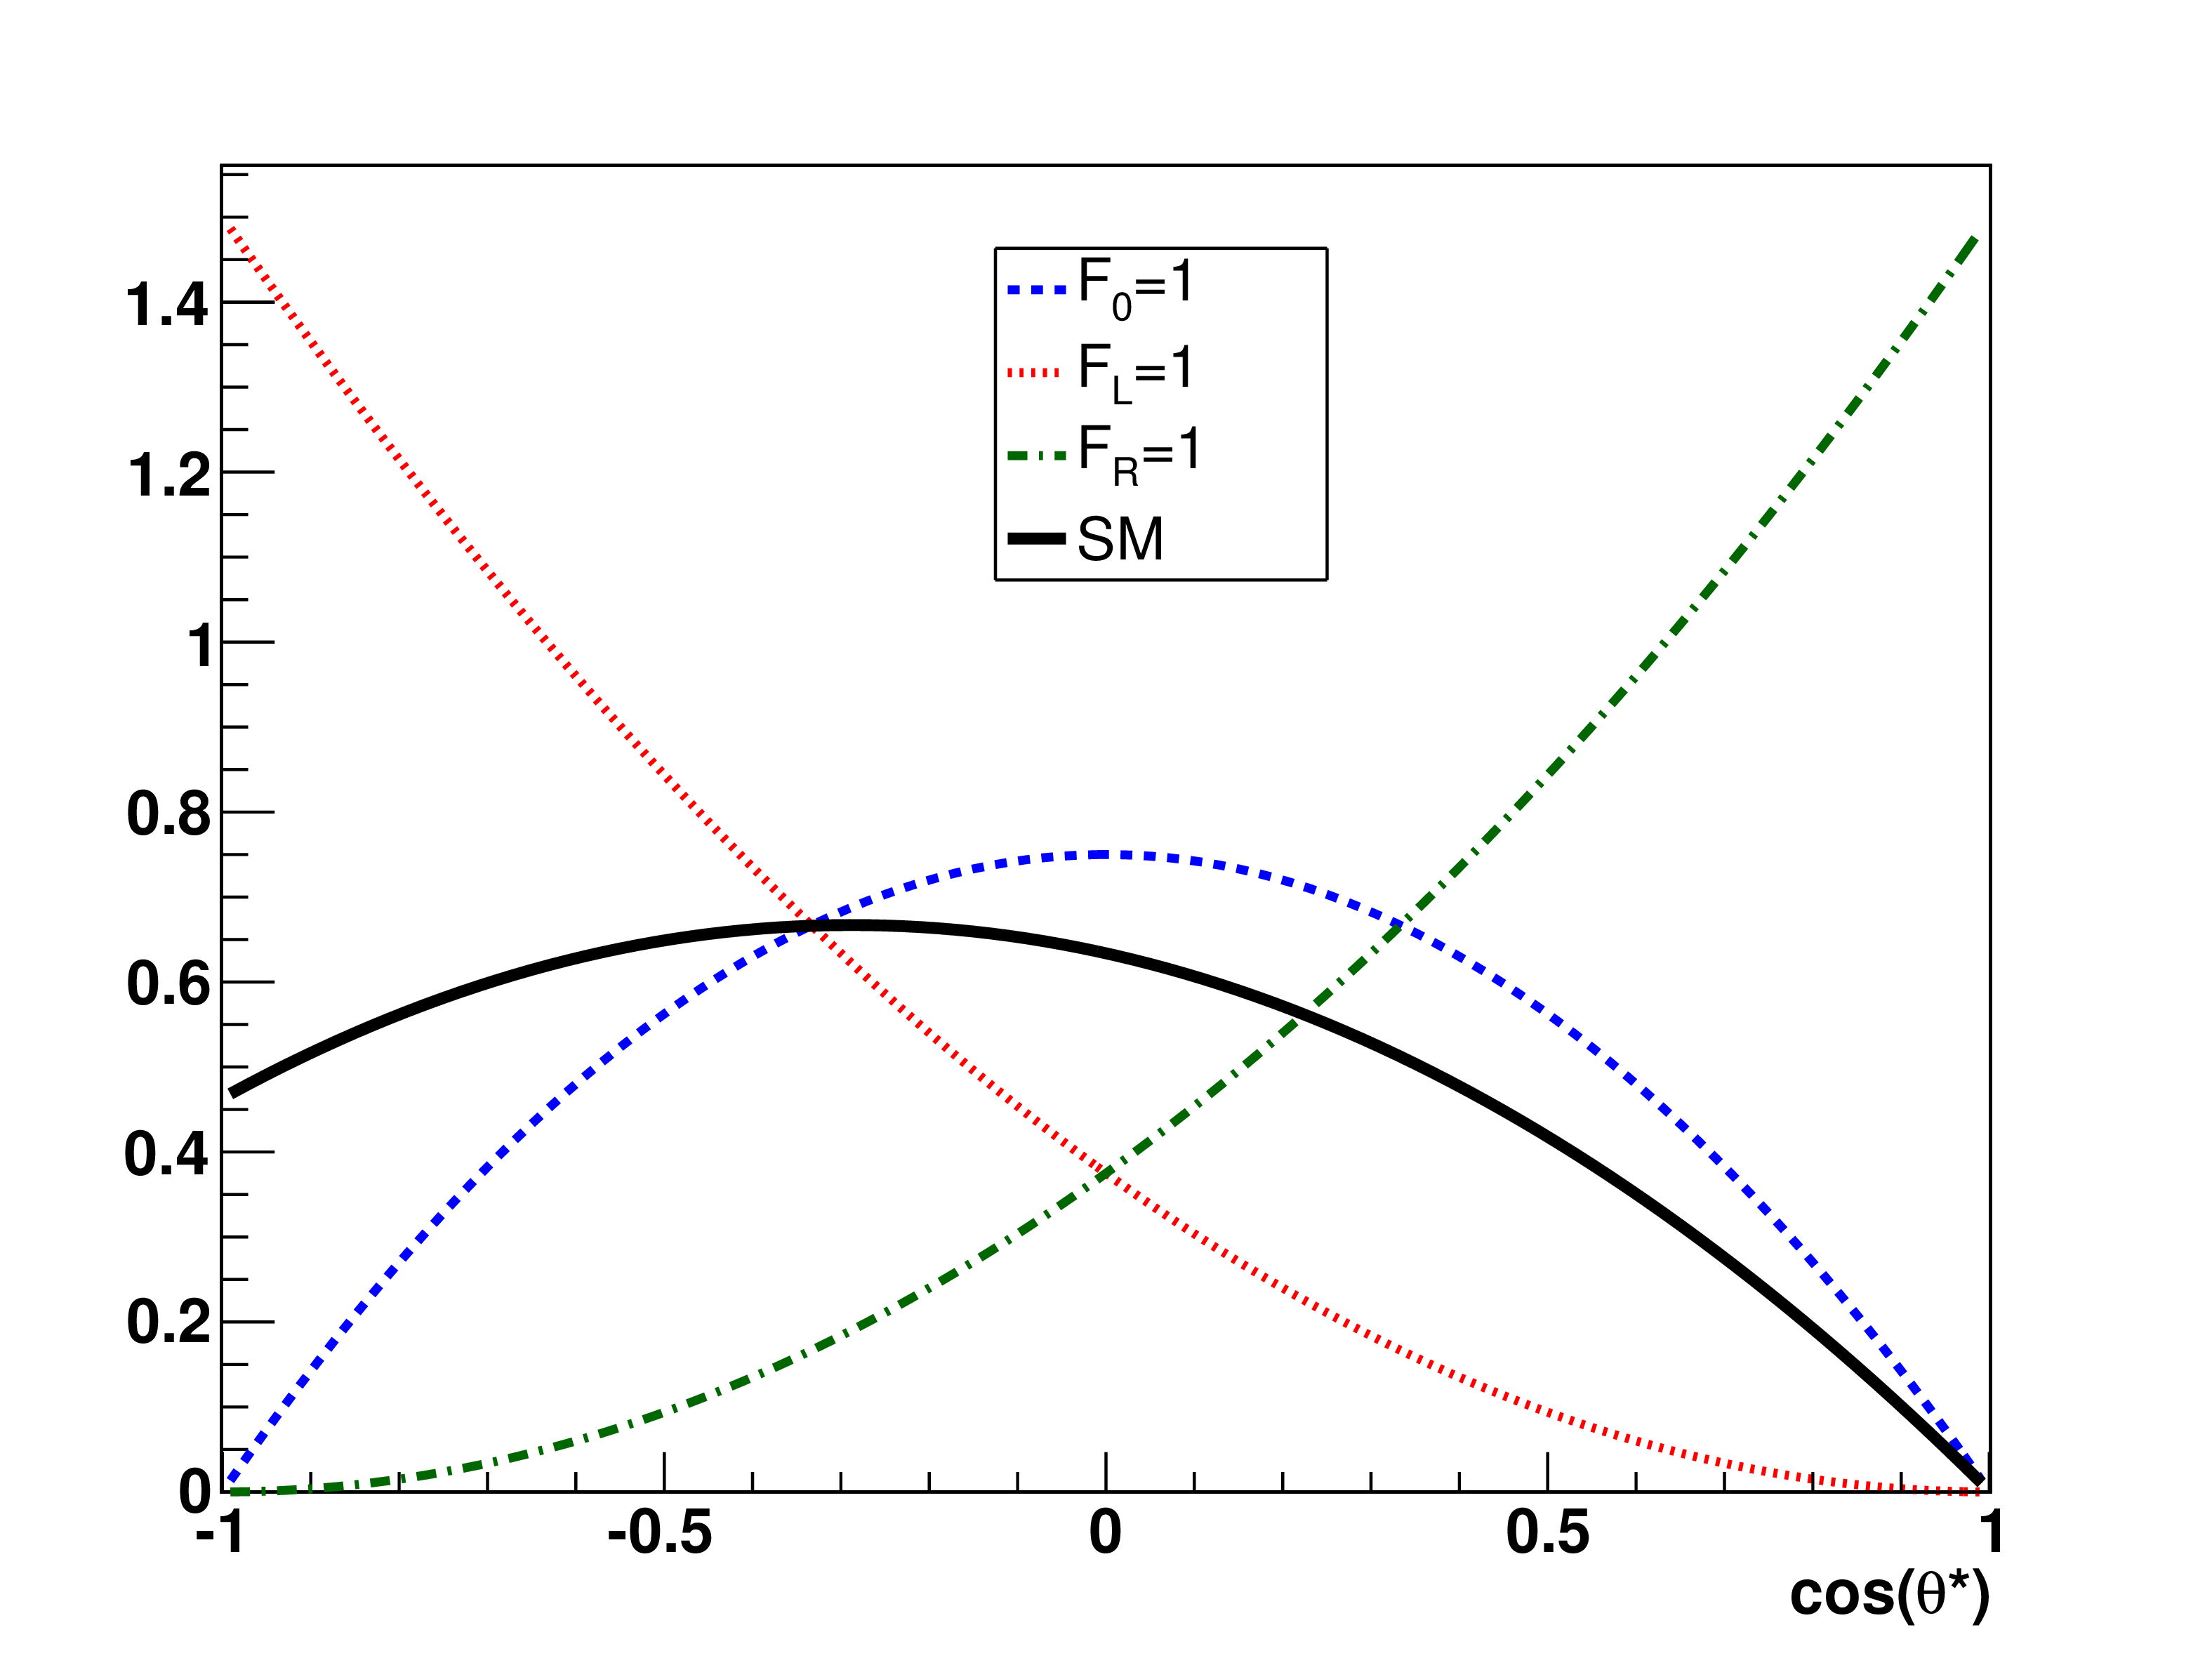
Figure 1:
Predicted cos$\theta ^*$ distributions for the different helicity fractions. The distributions for the fractions $F_\mathrm {0},\ F_\mathrm {L}$, and $F_\mathrm {R}$ are shown as dashed, dotted, and dash-dotted lines, respectively, and the sum of the three contributions according to the SM predictions is displayed as a solid line. |

png pdf |
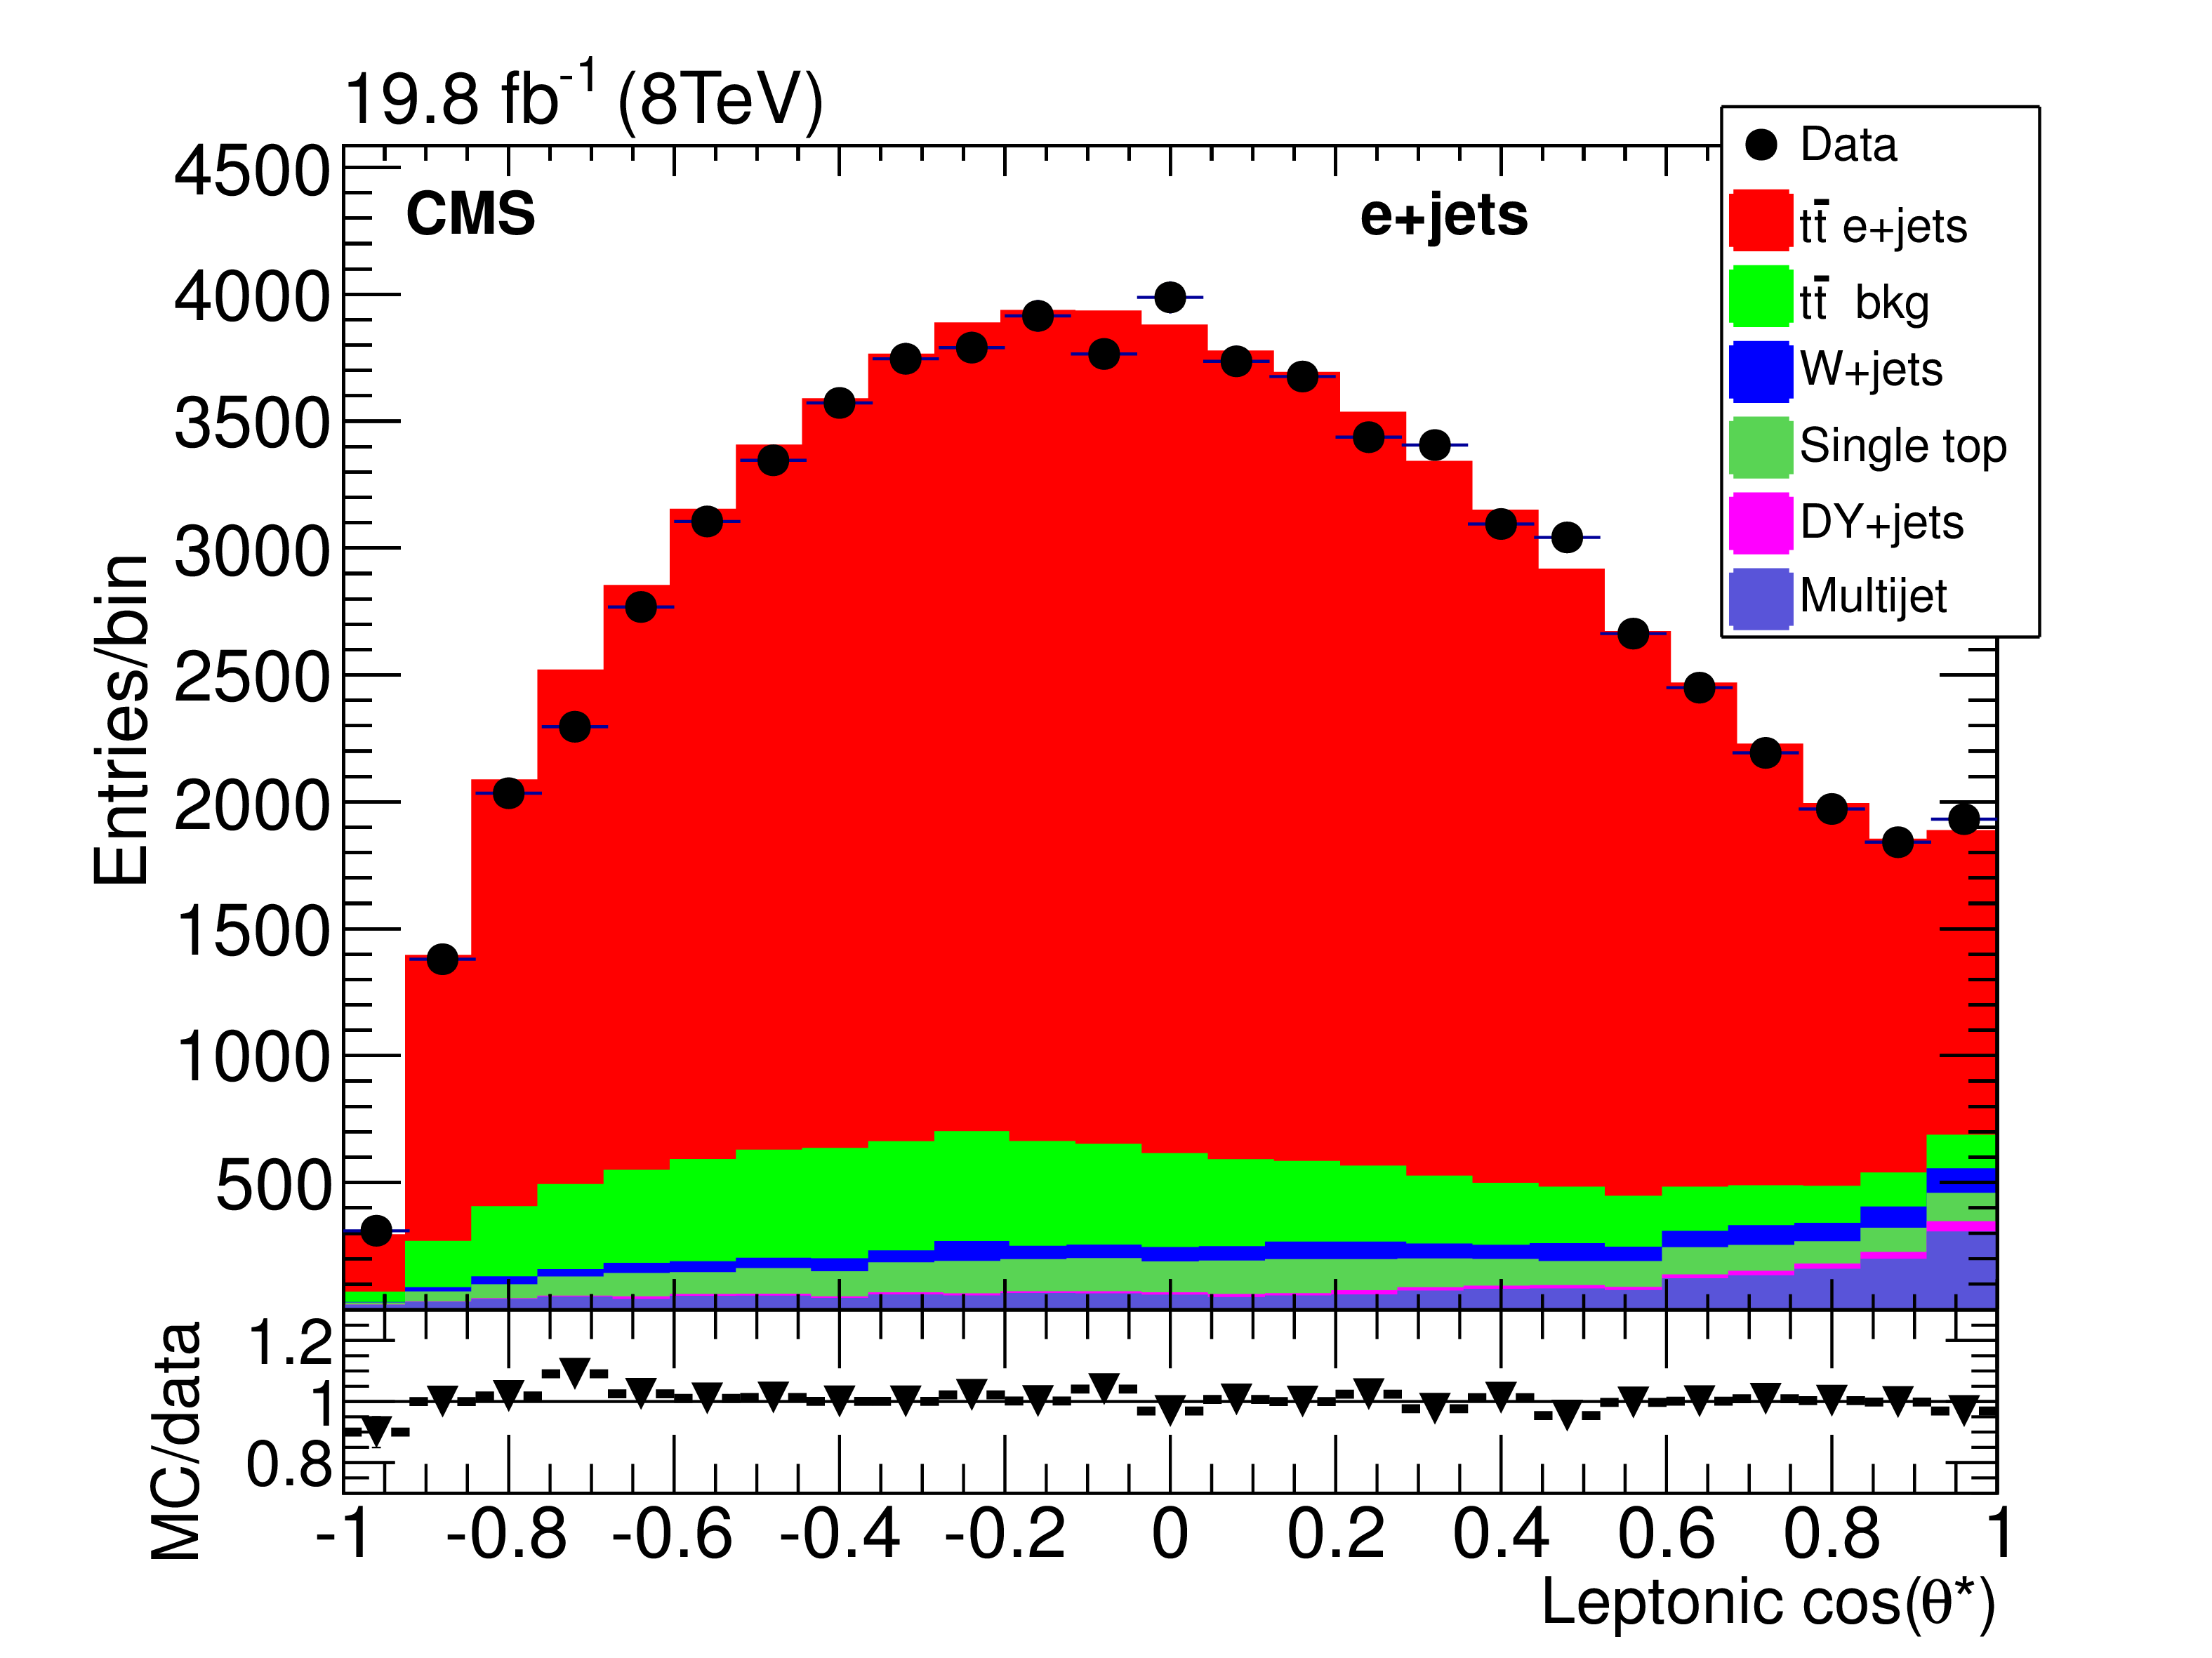
Figure 2:
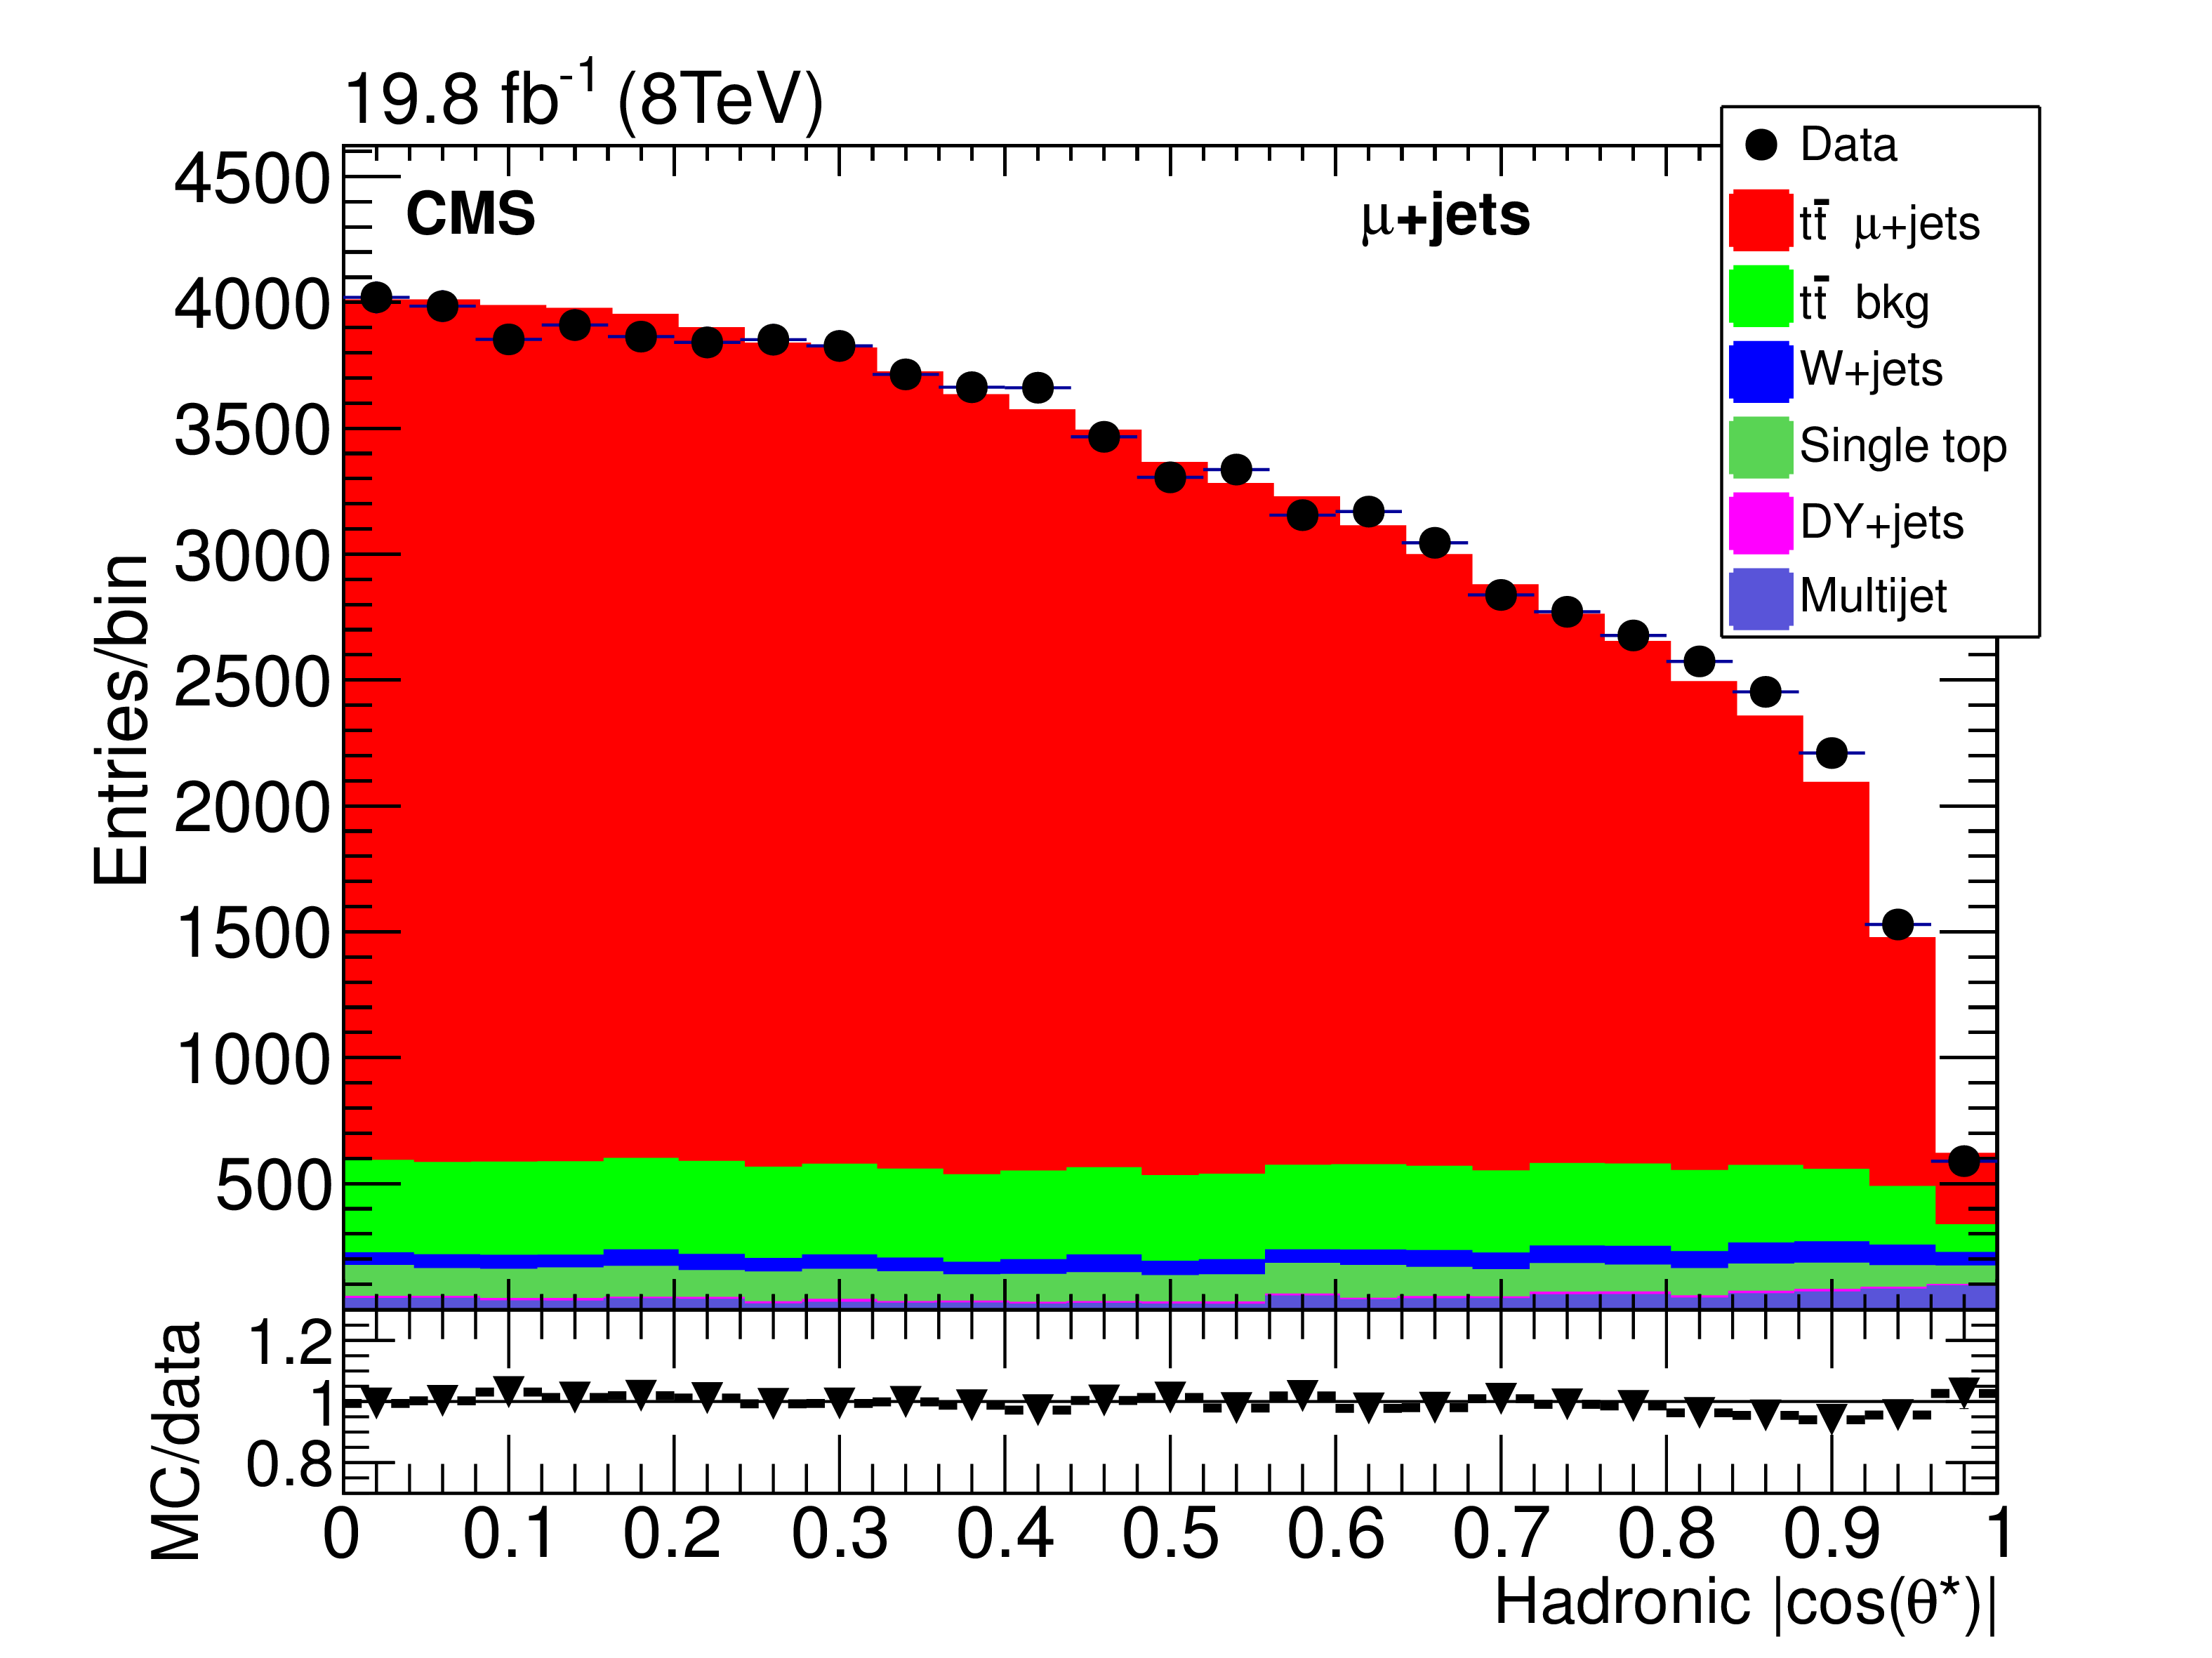
Distributions for the cosine of the helicity angle in the leptonic (upper row) and hadronic (lower row) branches, for the $\mathrm{ e } $+jets (left) and $\mu $+jets (right) decay channels. The combined $\ell $+jets post-fit measurements of the helicity fractions were used in the simulation of $ {\mathrm{ t } {}\mathrm{ \bar{t} } } $ and single top quark events. The data are displayed as solid points, simulated samples of $ {\mathrm{ t } {}\mathrm{ \bar{t} } } $ (signal) processes and the contribution from background processes as histograms. At the bottom of each plot, the ratio between MC simulation and data is displayed. The error bars correspond to the statistical uncertainties. |
png pdf |
Figure 2-a:
Distributions for the cosine of the helicity angle in the leptonic (upper row) and hadronic (lower row) branches, for the $\mathrm{ e } $+jets (left) and $\mu $+jets (right) decay channels. The combined $\ell $+jets post-fit measurements of the helicity fractions were used in the simulation of $ {\mathrm{ t } {}\mathrm{ \bar{t} } } $ and single top quark events. The data are displayed as solid points, simulated samples of $ {\mathrm{ t } {}\mathrm{ \bar{t} } } $ (signal) processes and the contribution from background processes as histograms. At the bottom of each plot, the ratio between MC simulation and data is displayed. The error bars correspond to the statistical uncertainties. |
png pdf |
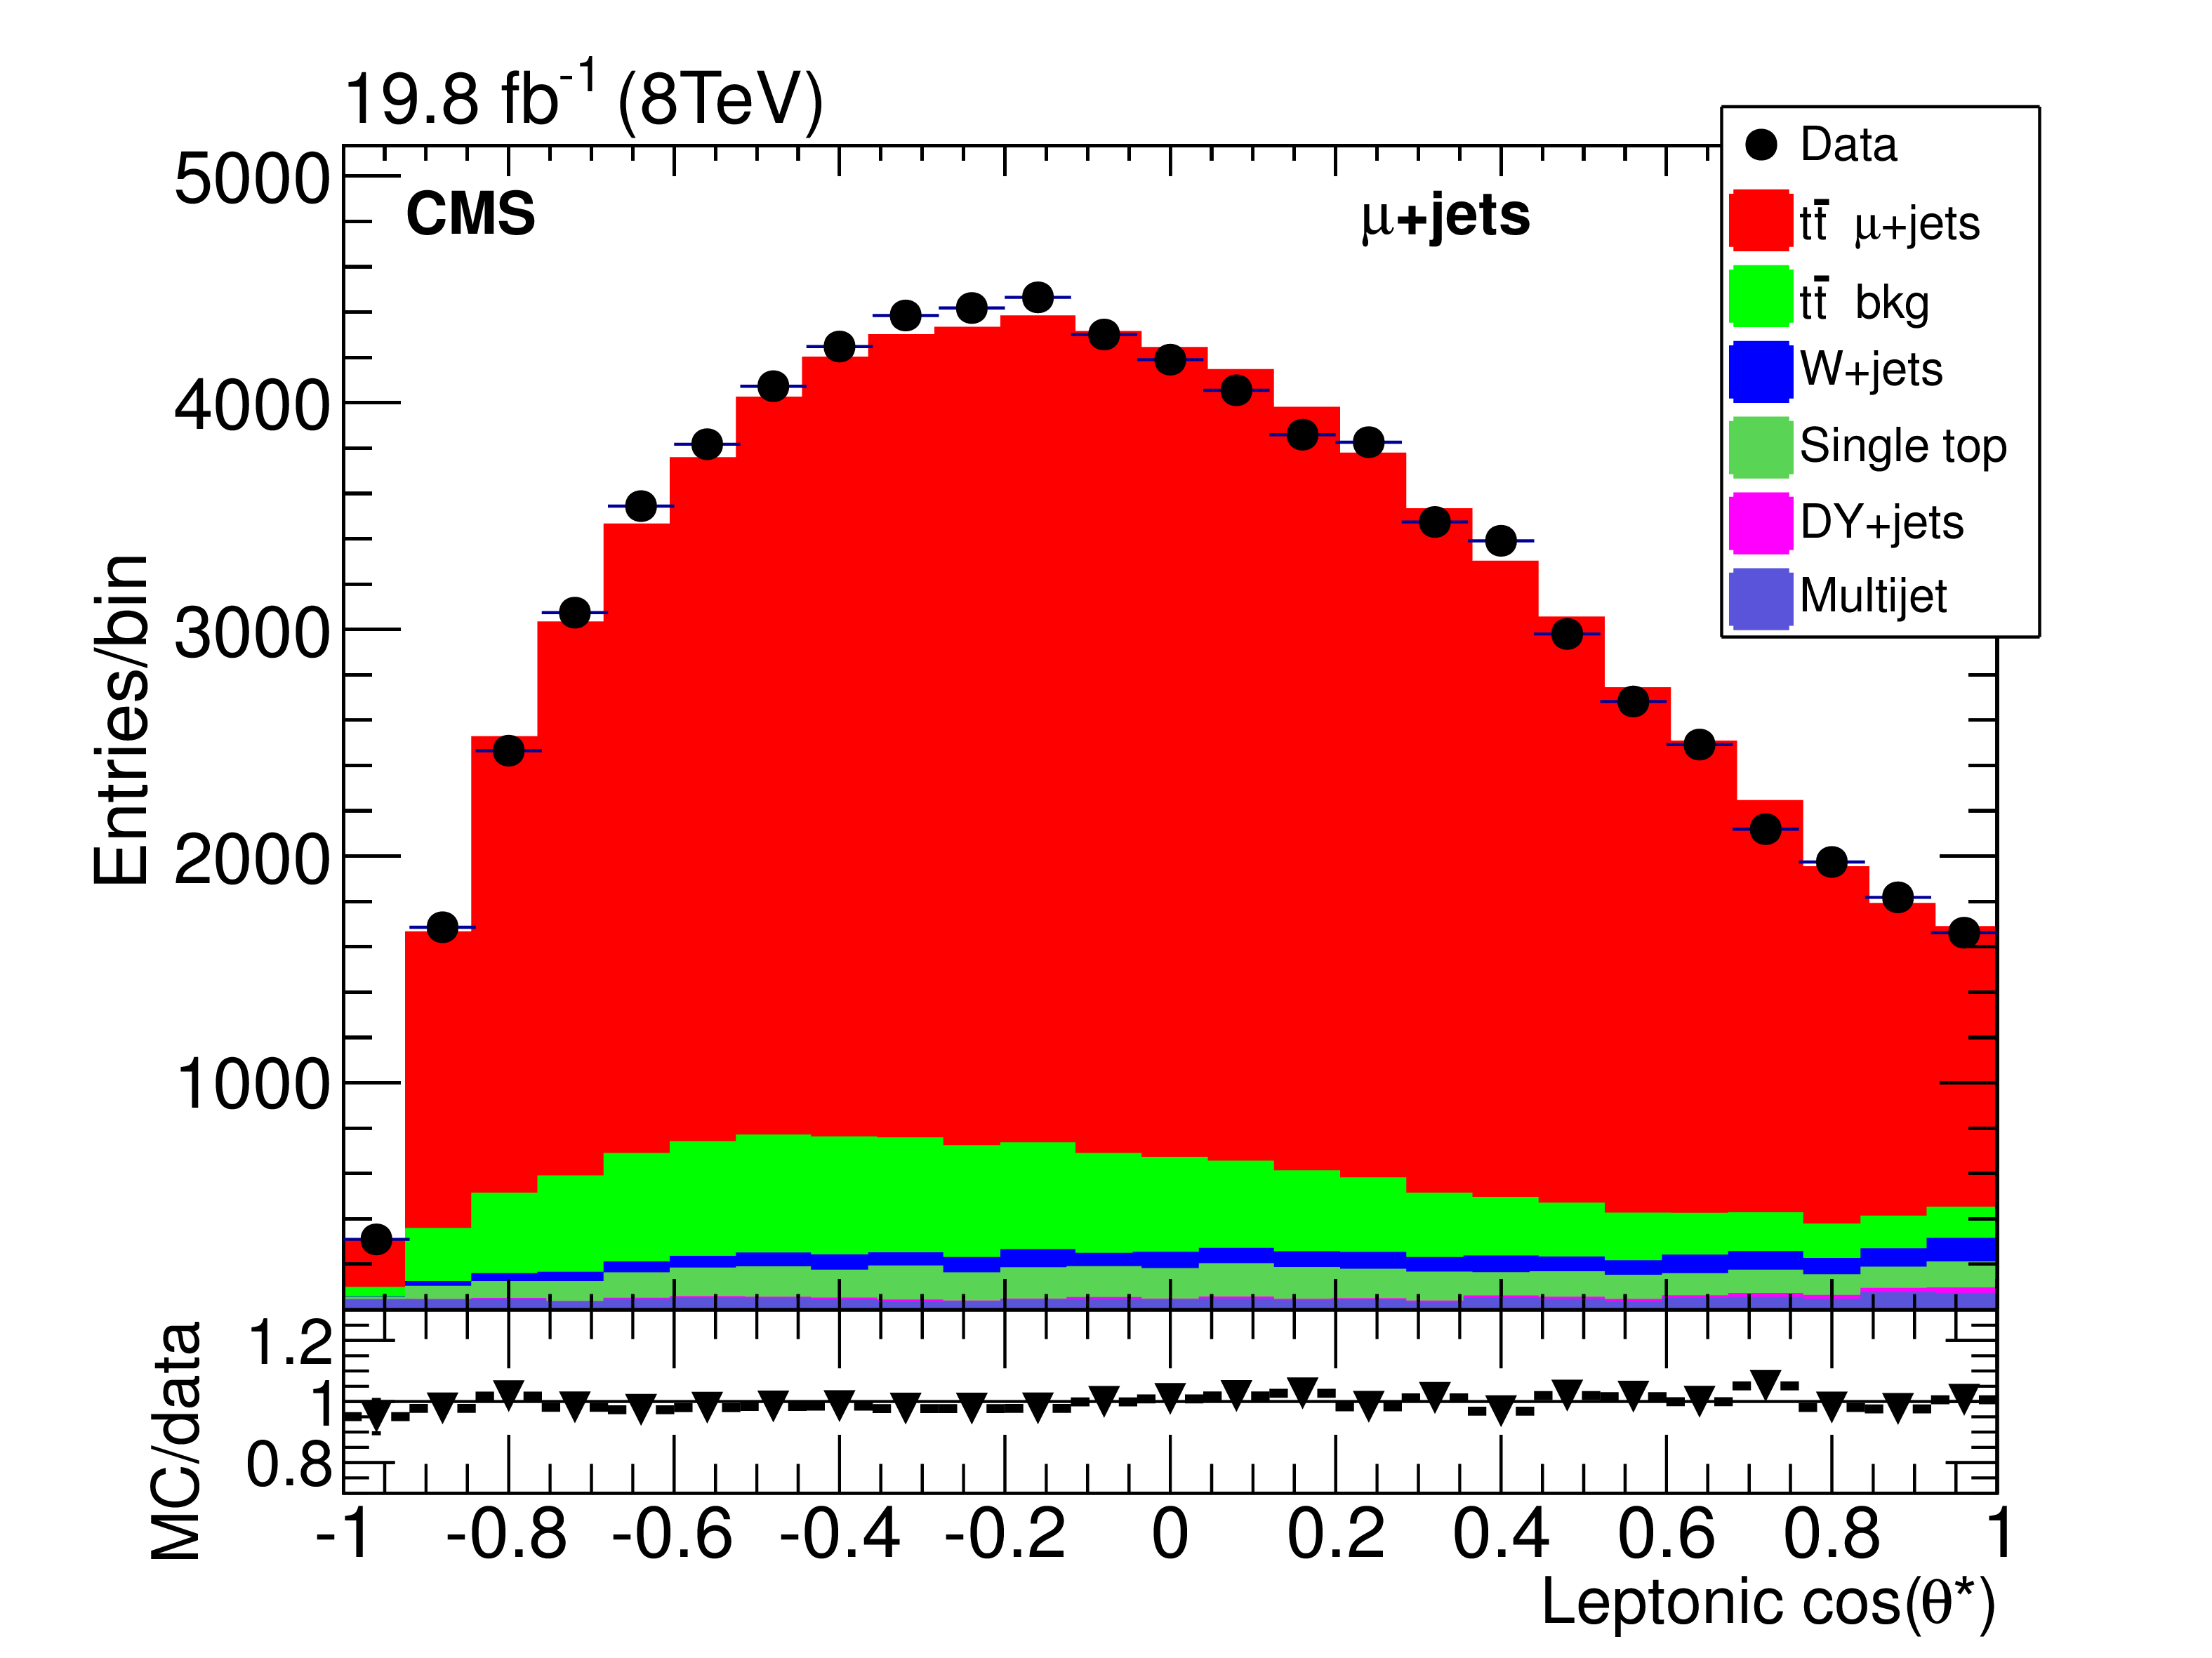
Figure 2-b:
Distributions for the cosine of the helicity angle in the leptonic (upper row) and hadronic (lower row) branches, for the $\mathrm{ e } $+jets (left) and $\mu $+jets (right) decay channels. The combined $\ell $+jets post-fit measurements of the helicity fractions were used in the simulation of $ {\mathrm{ t } {}\mathrm{ \bar{t} } } $ and single top quark events. The data are displayed as solid points, simulated samples of $ {\mathrm{ t } {}\mathrm{ \bar{t} } } $ (signal) processes and the contribution from background processes as histograms. At the bottom of each plot, the ratio between MC simulation and data is displayed. The error bars correspond to the statistical uncertainties. |
png pdf |
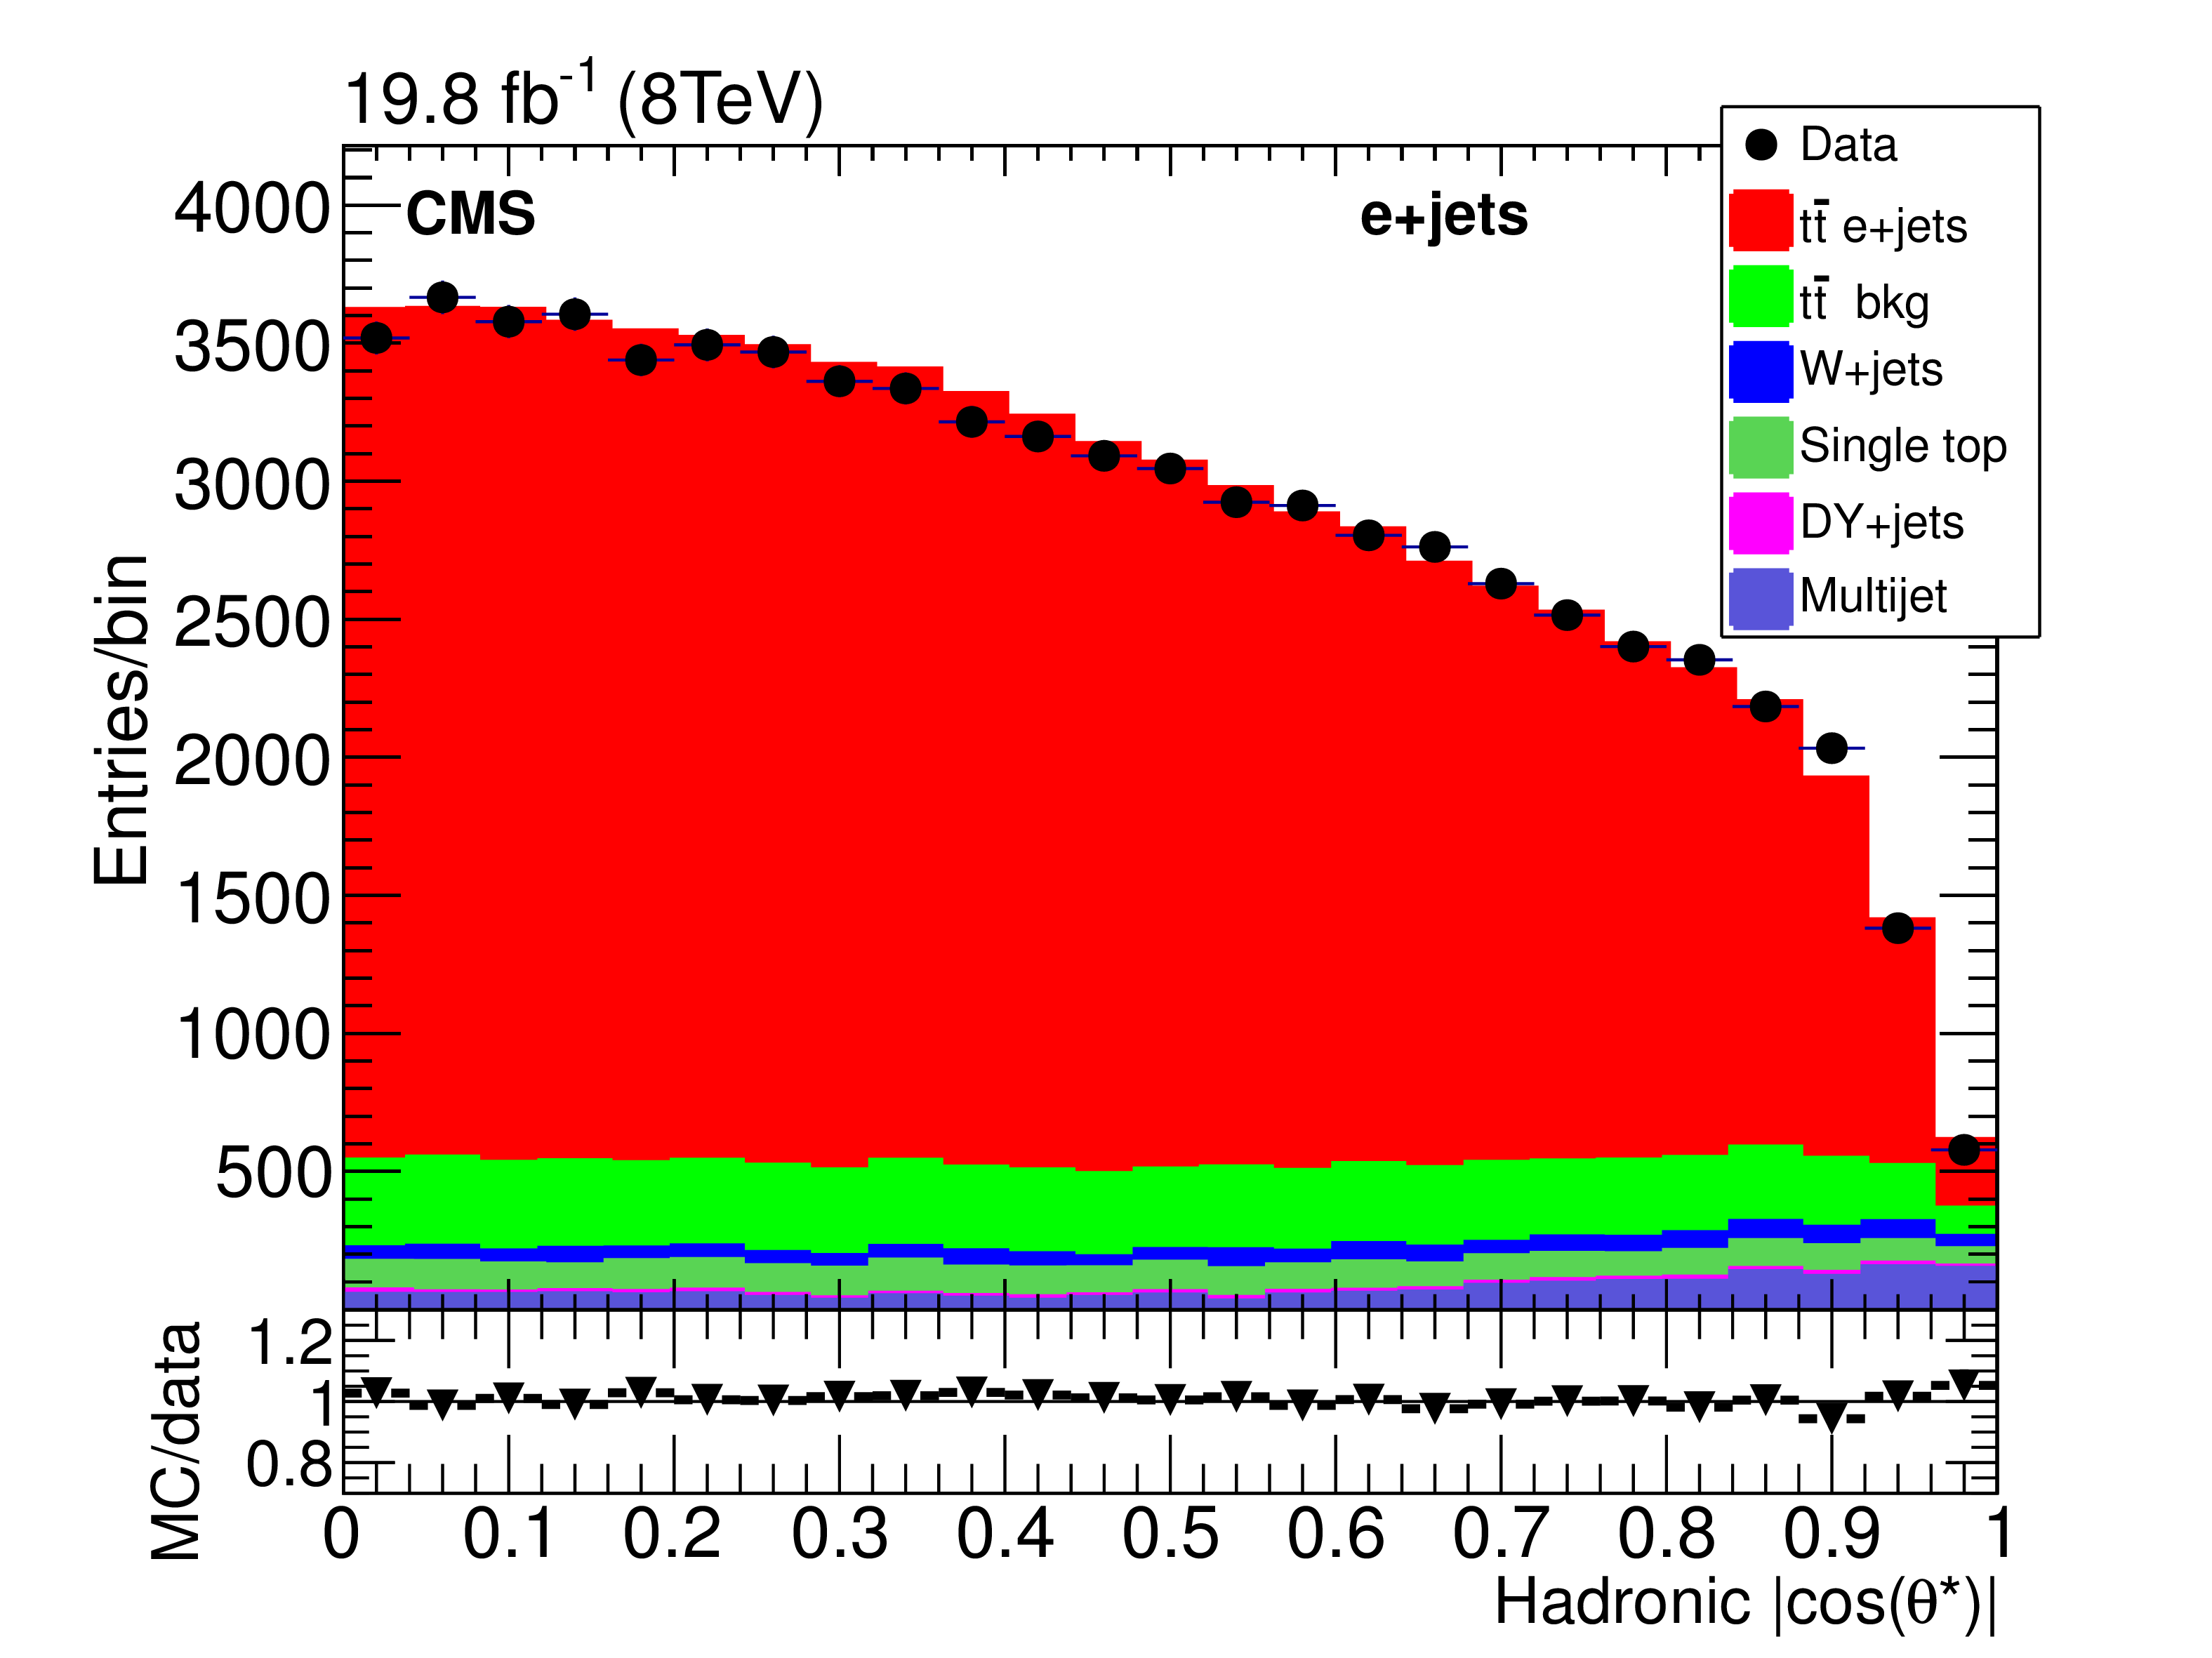
Figure 2-c:
Distributions for the cosine of the helicity angle in the leptonic (upper row) and hadronic (lower row) branches, for the $\mathrm{ e } $+jets (left) and $\mu $+jets (right) decay channels. The combined $\ell $+jets post-fit measurements of the helicity fractions were used in the simulation of $ {\mathrm{ t } {}\mathrm{ \bar{t} } } $ and single top quark events. The data are displayed as solid points, simulated samples of $ {\mathrm{ t } {}\mathrm{ \bar{t} } } $ (signal) processes and the contribution from background processes as histograms. At the bottom of each plot, the ratio between MC simulation and data is displayed. The error bars correspond to the statistical uncertainties. |
png pdf |
Figure 2-d:
Distributions for the cosine of the helicity angle in the leptonic (upper row) and hadronic (lower row) branches, for the $\mathrm{ e } $+jets (left) and $\mu $+jets (right) decay channels. The combined $\ell $+jets post-fit measurements of the helicity fractions were used in the simulation of $ {\mathrm{ t } {}\mathrm{ \bar{t} } } $ and single top quark events. The data are displayed as solid points, simulated samples of $ {\mathrm{ t } {}\mathrm{ \bar{t} } } $ (signal) processes and the contribution from background processes as histograms. At the bottom of each plot, the ratio between MC simulation and data is displayed. The error bars correspond to the statistical uncertainties. |
png pdf |
Figure 3:
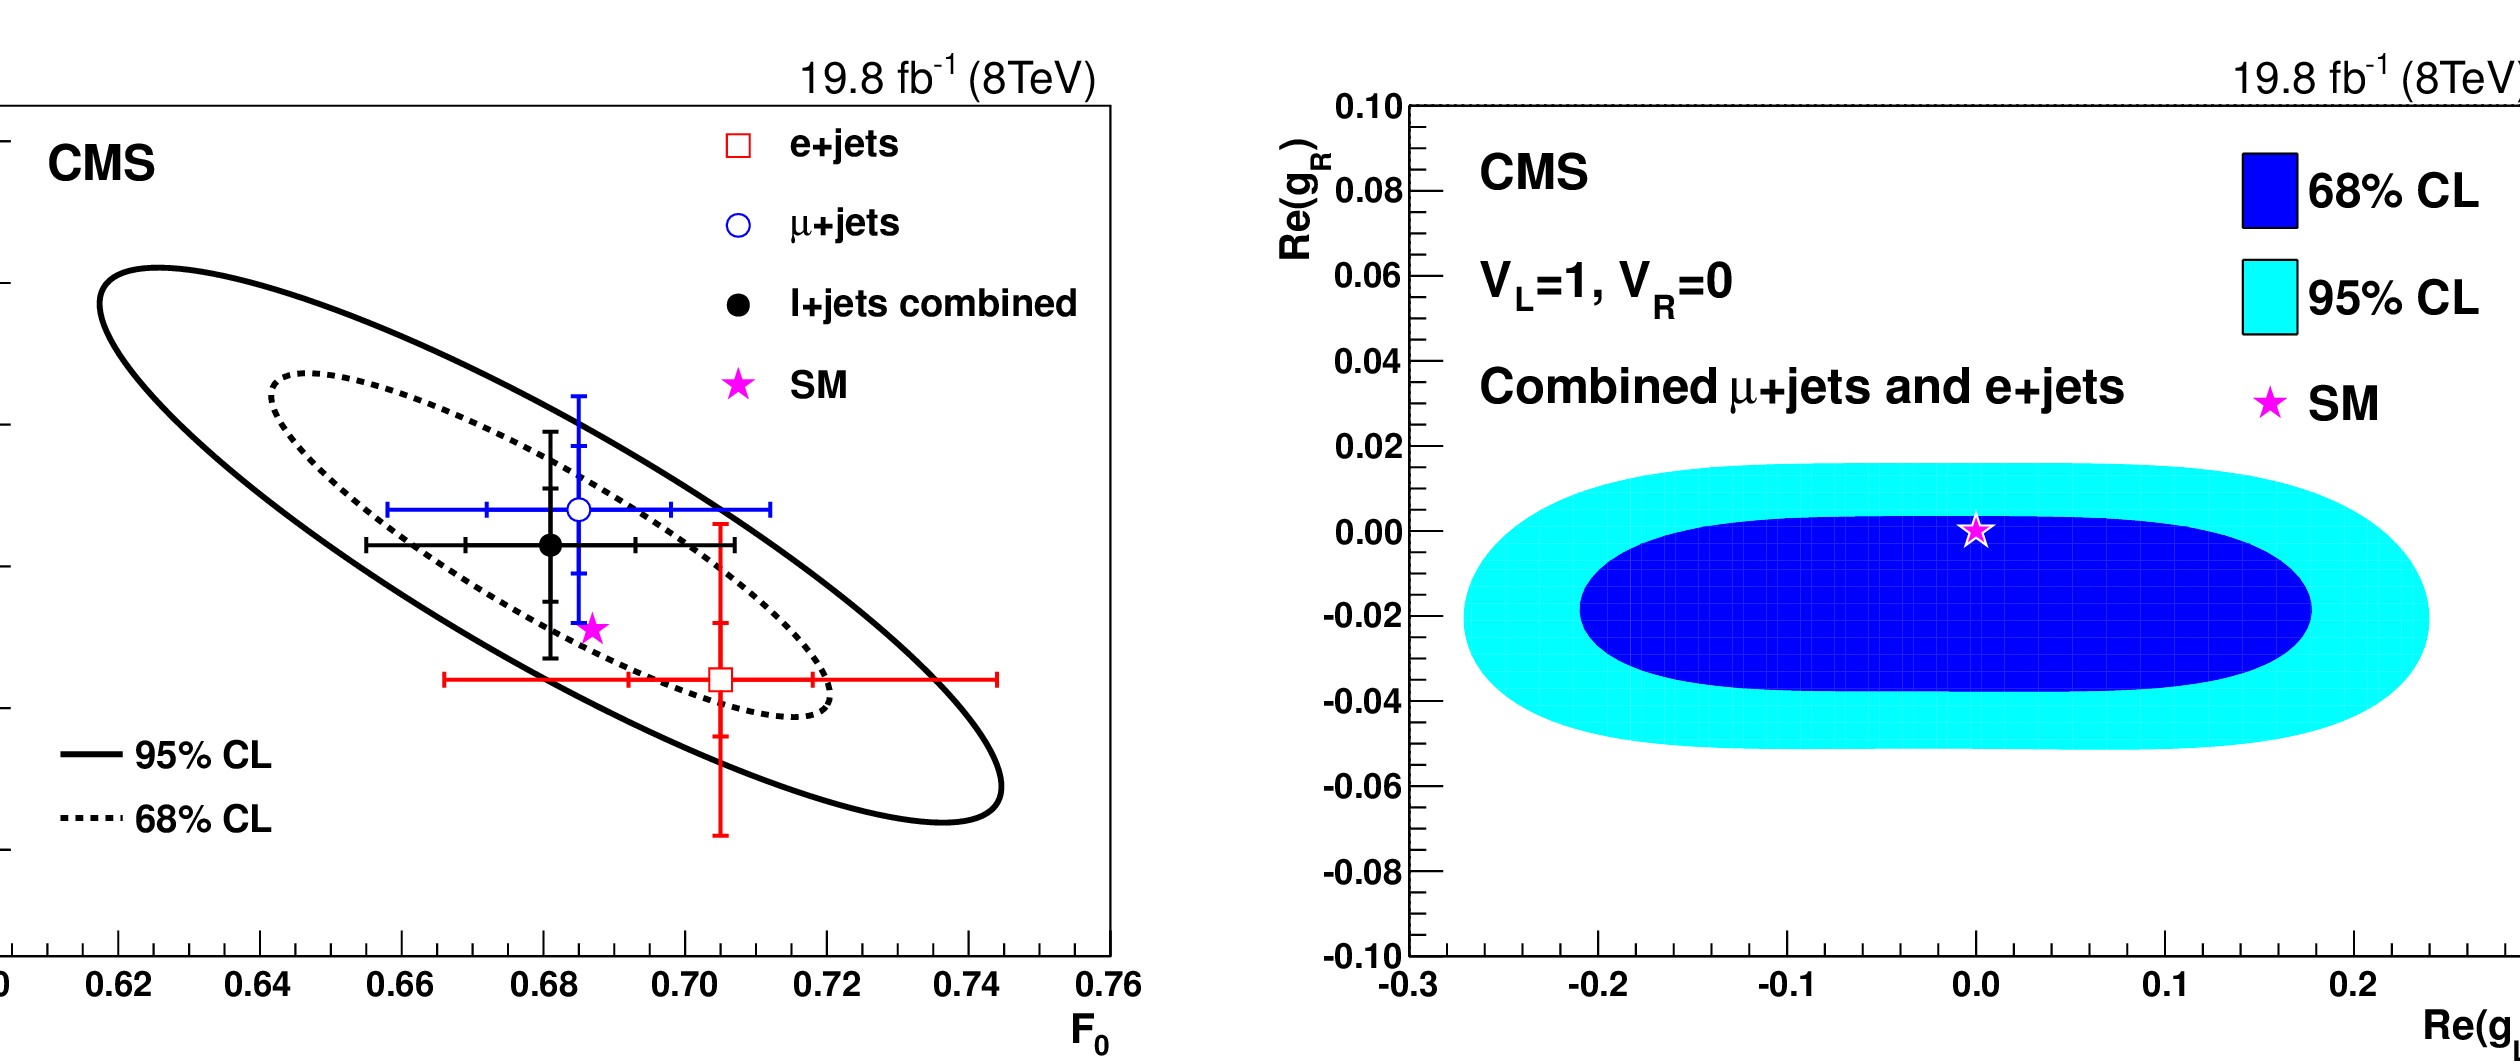
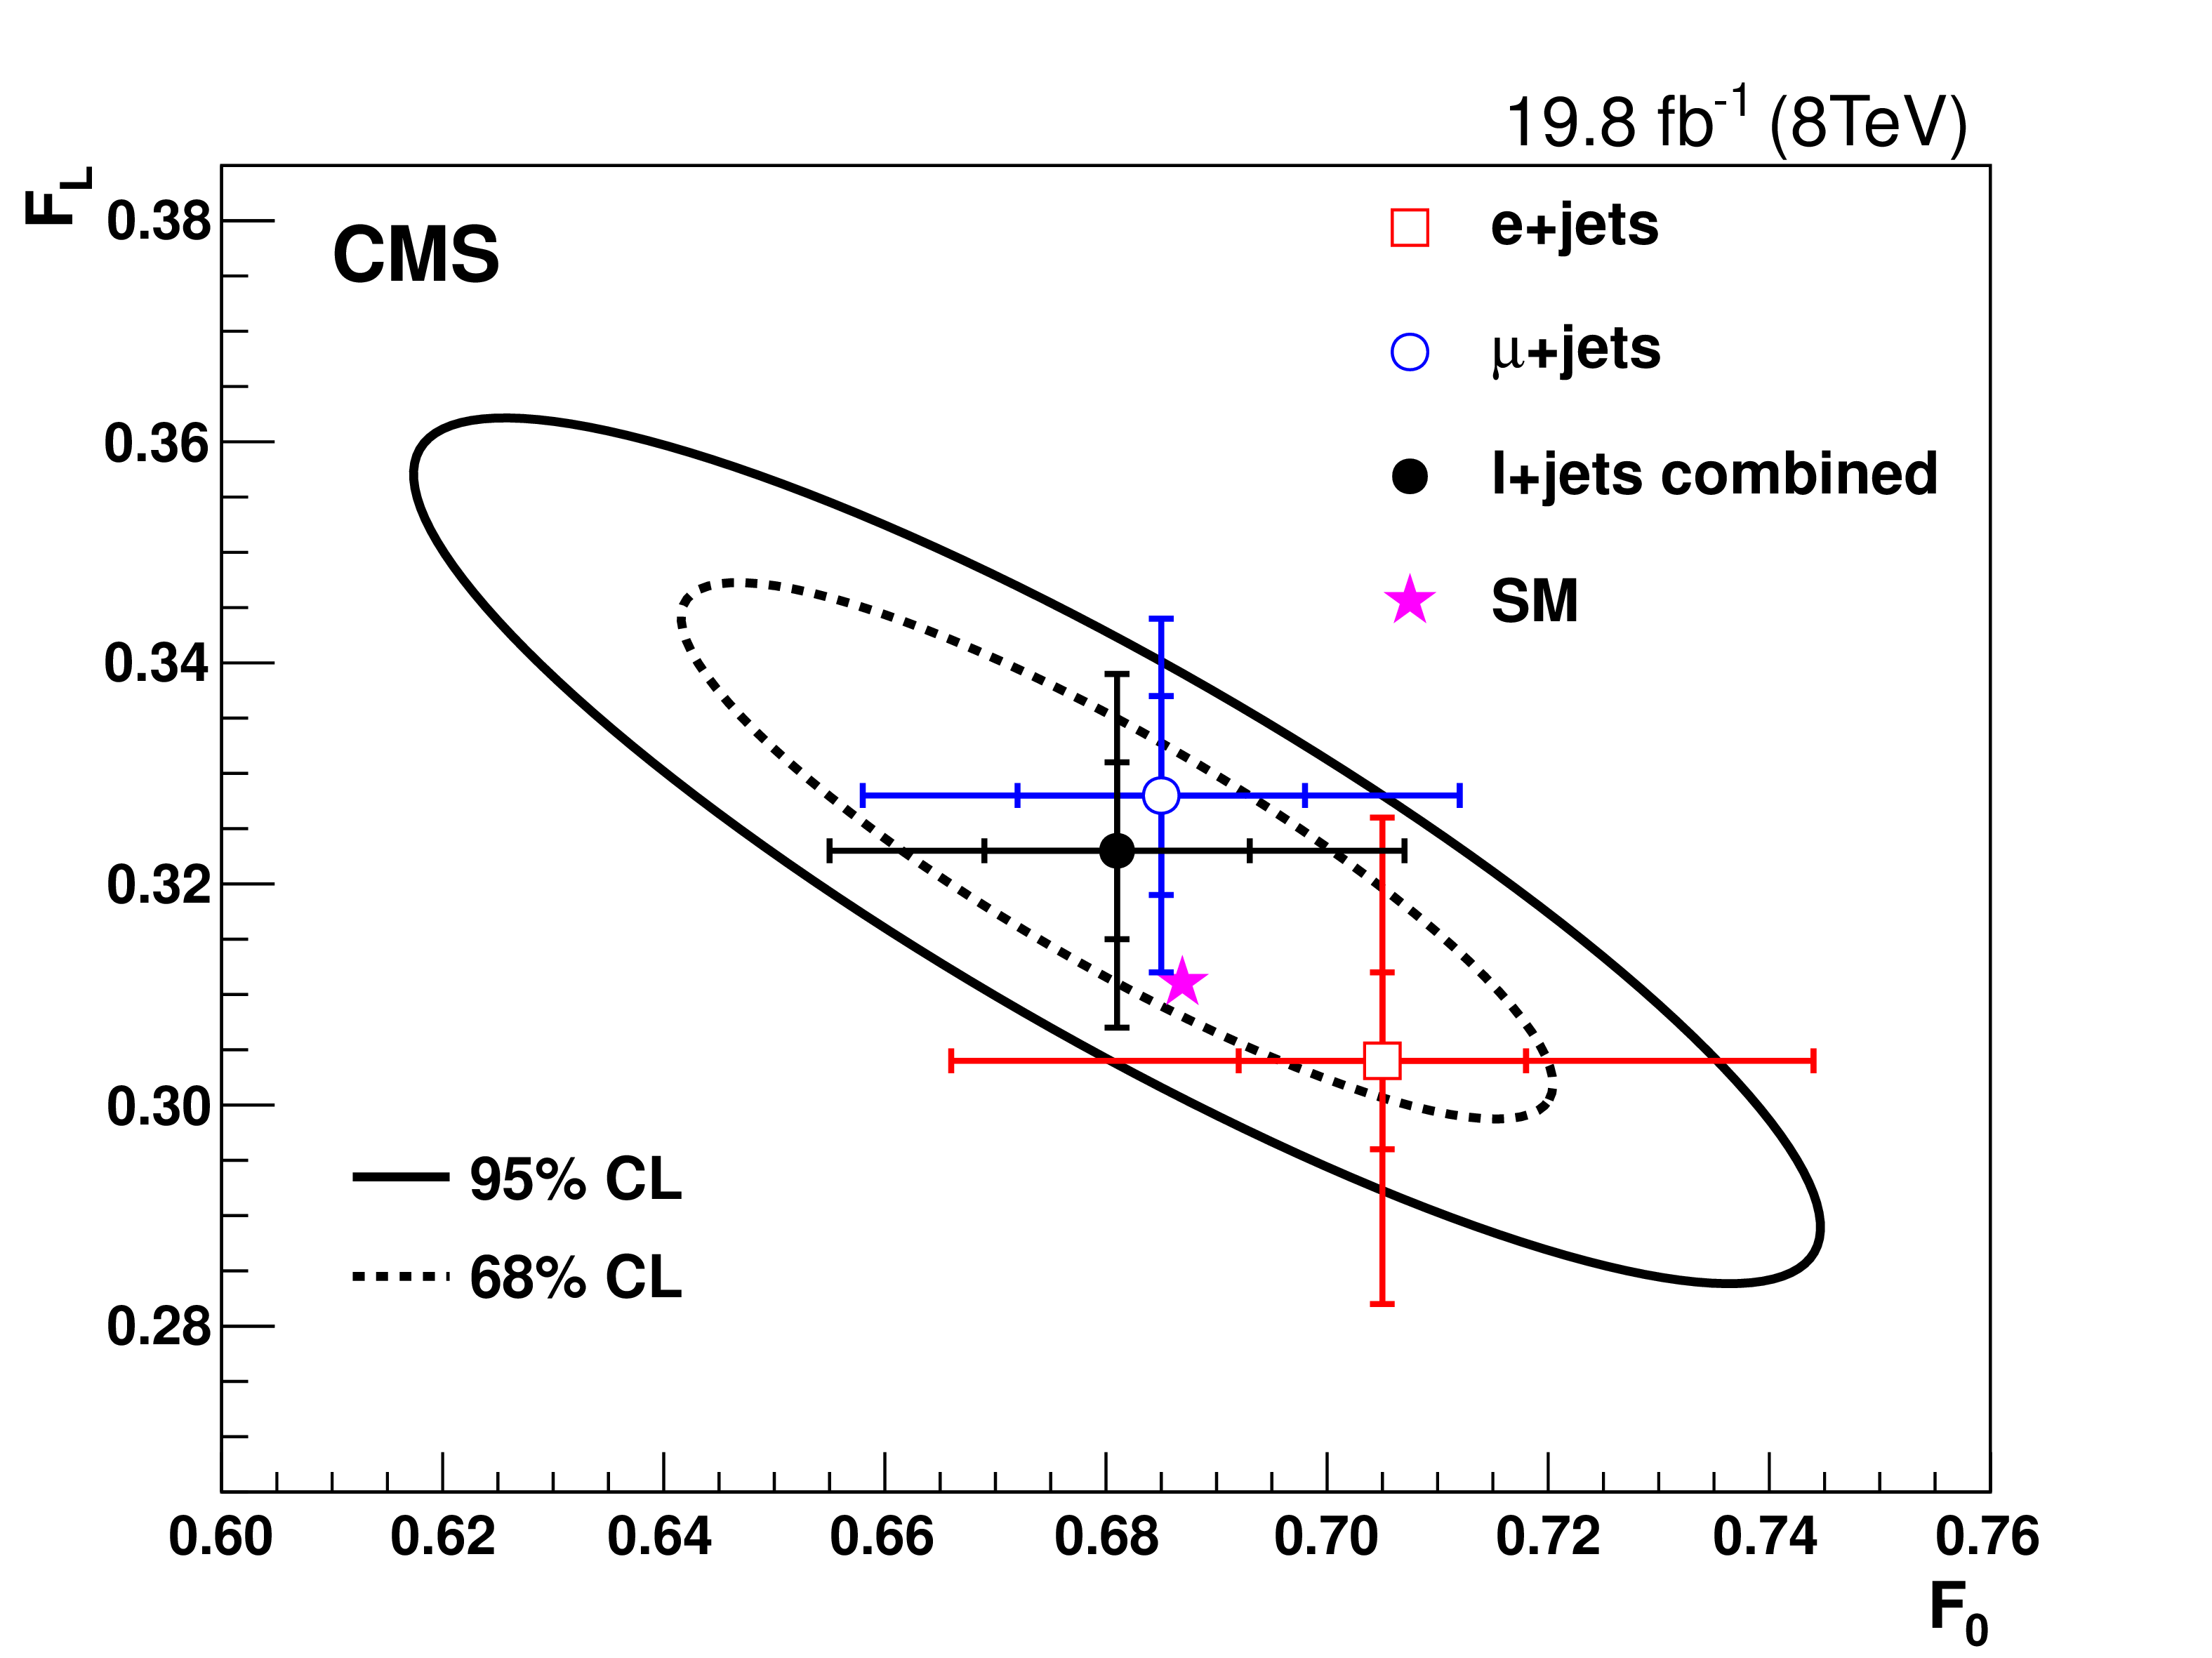
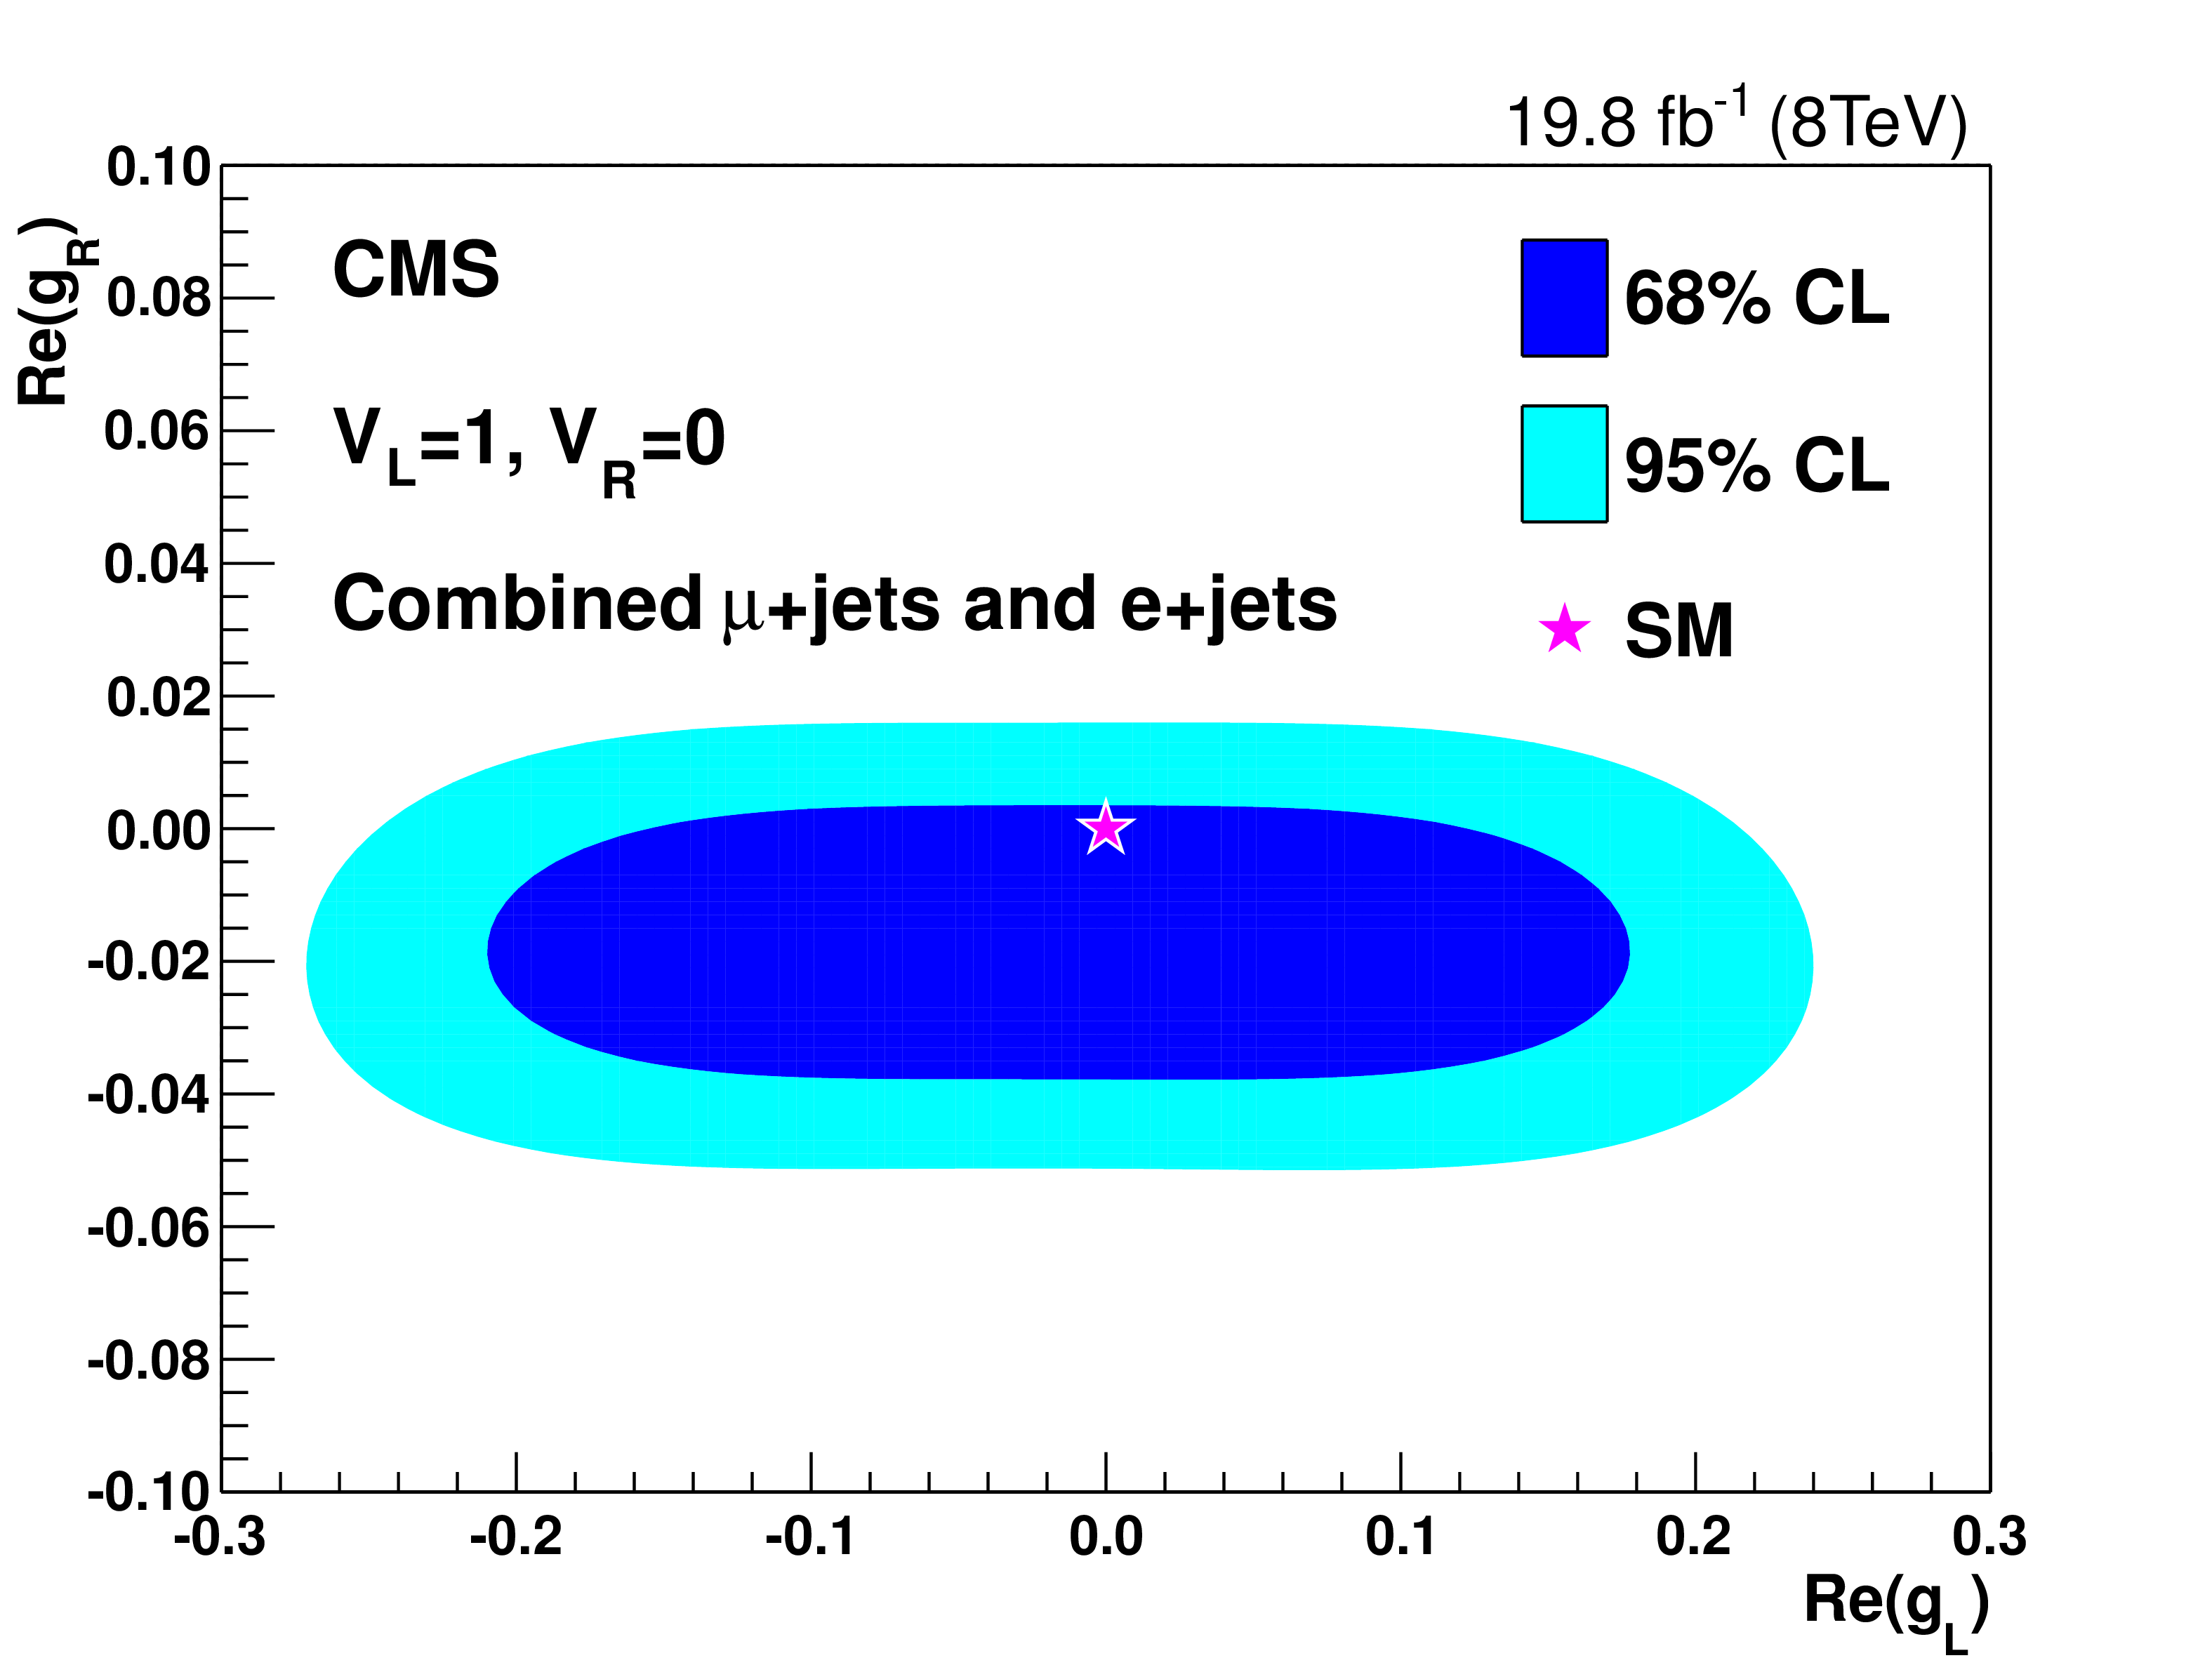
Left: the measured W boson helicity fractions in the $(F_\mathrm {0},F_\mathrm {L})$ plane. The dashed and solid ellipses enclose the allowed two-dimensional 68% and 95% CL regions, for the combined $\ell $+jets measurement, taking into account the correlations on the total (including systematic) uncertainties. The error bars give the one-dimensional 68% CL interval for the separate $F_\mathrm {0}$ and $F_\mathrm {L}$ measurements, with the inner-tick (outer-tick) mark representing the statistical (total) uncertainty. Right: the corresponding allowed regions for the real components of the anomalous couplings $g_\mathrm {L}$ and $g_\mathrm {R}$ at 68% and 95% CL, for $V_\mathrm {L}=$ 1 and $V_\mathrm {R}= $ 0. A region near $\mathrm {Re}(g_\mathrm {L})= $ 0 and $\mathrm {Re}(g_\mathrm {R}) \gg 0$, allowed by the fit but excluded by the CMS single top quark production measurement, is omitted. The SM predictions are shown as stars. |
png pdf |
Figure 3-a:
Left: the measured W boson helicity fractions in the $(F_\mathrm {0},F_\mathrm {L})$ plane. The dashed and solid ellipses enclose the allowed two-dimensional 68% and 95% CL regions, for the combined $\ell $+jets measurement, taking into account the correlations on the total (including systematic) uncertainties. The error bars give the one-dimensional 68% CL interval for the separate $F_\mathrm {0}$ and $F_\mathrm {L}$ measurements, with the inner-tick (outer-tick) mark representing the statistical (total) uncertainty. Right: the corresponding allowed regions for the real components of the anomalous couplings $g_\mathrm {L}$ and $g_\mathrm {R}$ at 68% and 95% CL, for $V_\mathrm {L}=$ 1 and $V_\mathrm {R}= $ 0. A region near $\mathrm {Re}(g_\mathrm {L})= $ 0 and $\mathrm {Re}(g_\mathrm {R}) \gg 0$, allowed by the fit but excluded by the CMS single top quark production measurement, is omitted. The SM predictions are shown as stars. |
png pdf |
Figure 3-b:
Left: the measured W boson helicity fractions in the $(F_\mathrm {0},F_\mathrm {L})$ plane. The dashed and solid ellipses enclose the allowed two-dimensional 68% and 95% CL regions, for the combined $\ell $+jets measurement, taking into account the correlations on the total (including systematic) uncertainties. The error bars give the one-dimensional 68% CL interval for the separate $F_\mathrm {0}$ and $F_\mathrm {L}$ measurements, with the inner-tick (outer-tick) mark representing the statistical (total) uncertainty. Right: the corresponding allowed regions for the real components of the anomalous couplings $g_\mathrm {L}$ and $g_\mathrm {R}$ at 68% and 95% CL, for $V_\mathrm {L}=$ 1 and $V_\mathrm {R}= $ 0. A region near $\mathrm {Re}(g_\mathrm {L})= $ 0 and $\mathrm {Re}(g_\mathrm {R}) \gg 0$, allowed by the fit but excluded by the CMS single top quark production measurement, is omitted. The SM predictions are shown as stars. |
| Tables | |
png pdf |
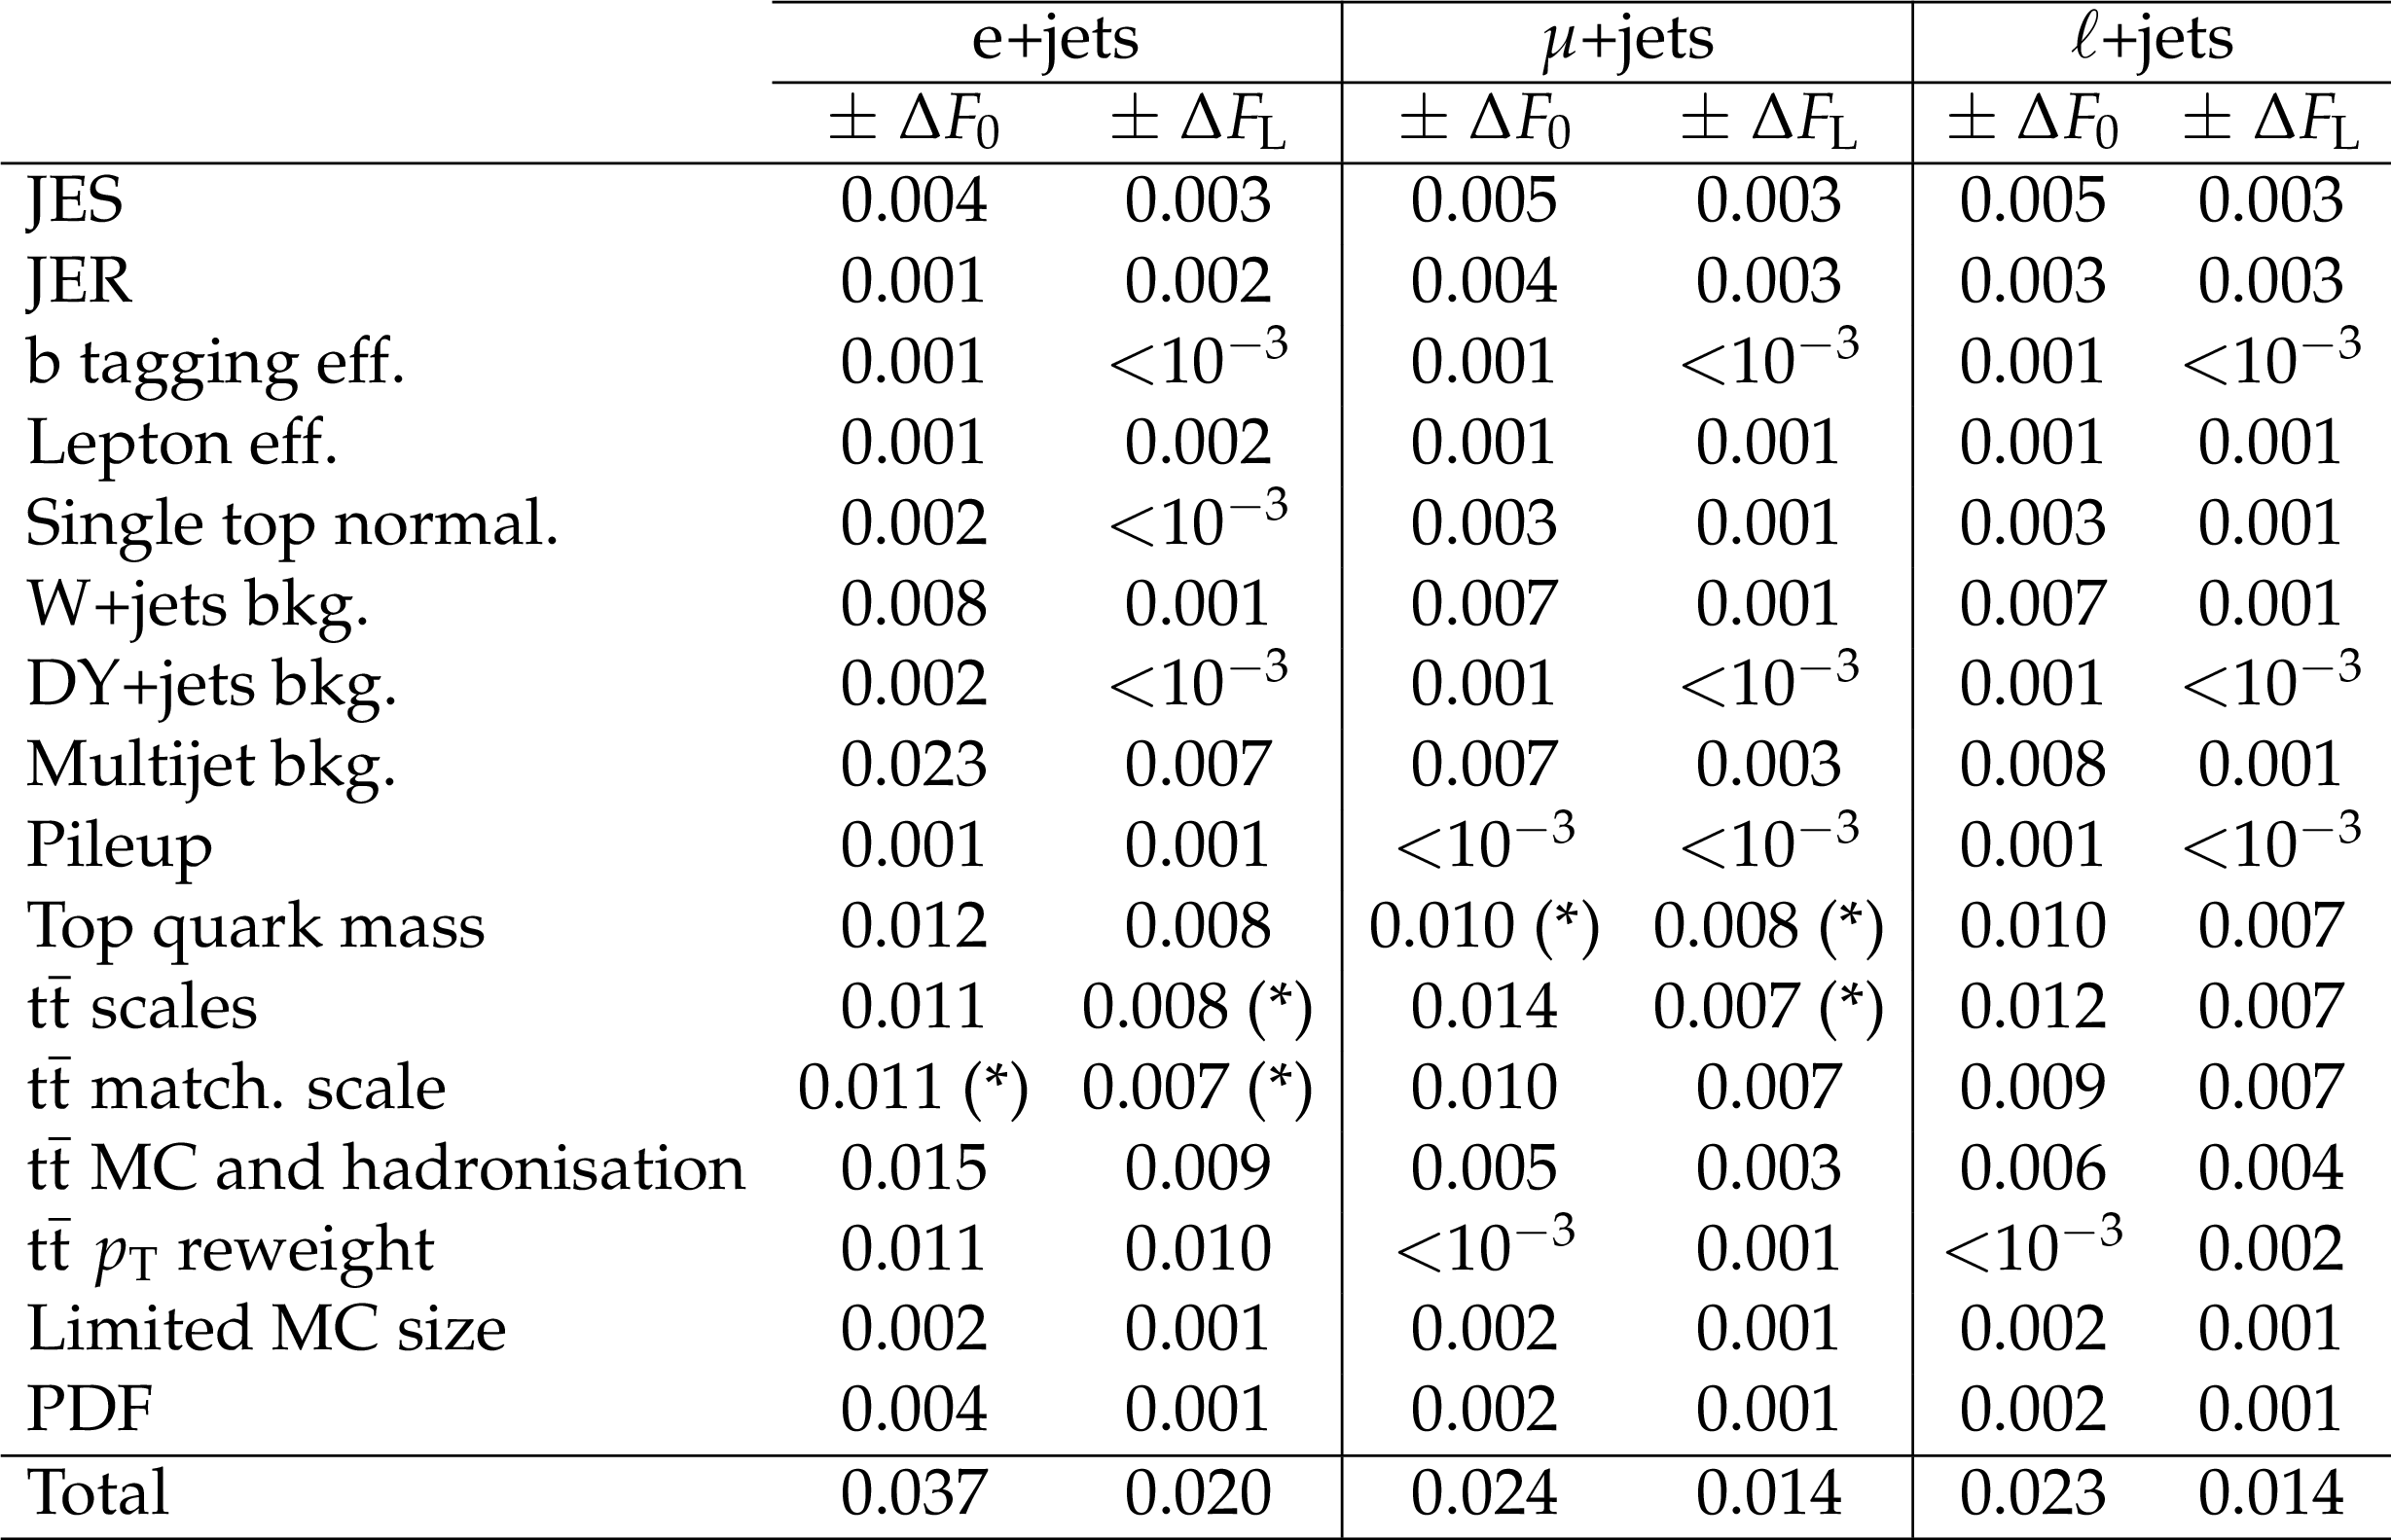
Table 1:
Systematic uncertainties on the measurements of the W boson helicity fractions from lepton+jets events. The cases in which the statistical precision of the limited sample size was assigned as systematic uncertainties are denoted by the symbol (*). |
png pdf |
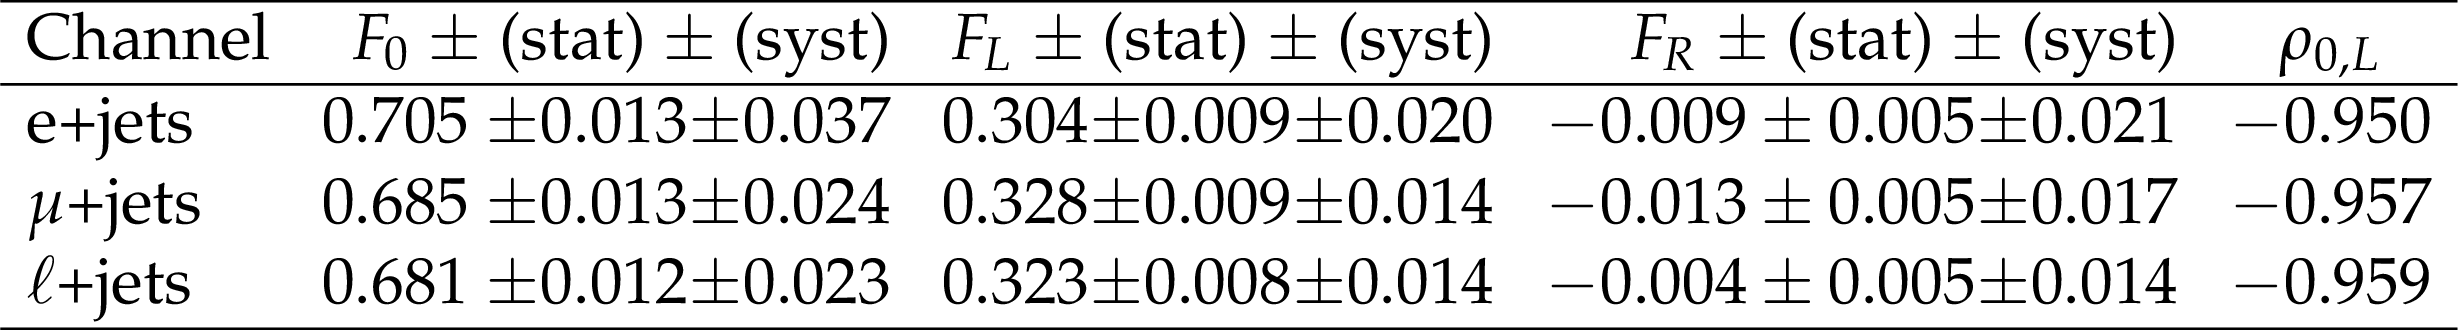
Table 2:
Measurements of the W boson helicity fractions from lepton+jets final states in $ {\mathrm{ t } {}\mathrm{ \bar{t} } } $ decays. The helicity fractions $ F_\mathrm {0}$ and $ F_\mathrm {L}$ are measured simultaneously and are strongly anti-correlated, as indicated by a correlation coefficient $\rho _\mathrm {0,L}$, because $F_\mathrm {R}$ is derived from the unitarity condition. |
| Summary |
| A measurement of the W boson helicity fractions in top quark pair events decaying in the $\mathrm{ e }$+jets and $\mu$+jets channels has been presented, using proton-proton collision data at $ \sqrt{s} = $ 8 TeV, and corresponding to an integrated luminosity of 19.8 fb$^{-1}$. The helicity fractions $F_{\rm 0}$ and $F_{\rm L}$ are measured with a precision of better than 5%, yielding the most accurate experimental determination of the W boson helicity fractions in $\mathrm{ t \bar{t} }$ processes to date. The measured W boson helicity fractions are $F_{\rm 0}=0.681 \pm 0.012 $ (stat) $\pm 0.023 $ (syst), $F_{\rm L}=0.323 \pm 0.008 $ (stat) $\pm 0.014 $ (syst), and $F_{\rm R}=-0.004 \pm 0.005 $ (stat) $\pm 0.014 $ (syst), with a correlation coefficient of $-0.87$ between $F_{\rm 0}$ and $F_{\rm L}$, and they are consistent with the expectations from the standard model. |
| References | ||||
| 1 | J. A. Aguilar-Saavedra et al. | Probing anomalous Wtb couplings in top pair decays | EPJC 50 (2007) 519 | hep-ph/0605190 |
| 2 | C. Bernardo et al. | Studying the Wtb vertex structure using recent LHC results | PRD 90 (2014) 113007 | 1408.7063 |
| 3 | G. A. Gonz\'alez-Sprinberg and J. Vidal | The top quark right coupling in the tbW vertex | EPJC 75 (2015) 615 | 1510.02153 |
| 4 | M. Fabbrichesi, M. Pinamonti, and A. Tonero | Limits on anomalous top quark gauge couplings from Tevatron and LHC data | EPJC 74 (2014) 3193 | 1406.5393 |
| 5 | A. Czarnecki, J.G. Korner, J.H. Piclum | Helicity fractions of W bosons from top quark decays at NNLO in QCD | PRD 81 (2010) 111503(R) | 1005.2625 |
| 6 | J. A. Aguilar-Saavedra | A minimal set of top anomalous couplings | NPB 812 (2009) 181 | 0811.3842 |
| 7 | J. A. Aguilar-Saavedra | A minimal set of top-Higgs anomalous couplings | NPB 821 (2009) 215 | 0904.2387 |
| 8 | J. A. Aguilar-Saavedra and J. Bernabeu | W polarisation beyond helicity fractions in top quark decays | NPB 840 (2010) 349 | 1005.5382 |
| 9 | V.M. Abazov, et al., D0 Collaboration | Measurement of the w boson helicity in top quark decays using 5.4 fb$ ^{-1} $ of p$ \bar{\rm{p}} $ collision data | PRD 83 (2011) 032009 | 1011.6549 |
| 10 | T. Aaltonen, et al., CDF Collaboration | Measurement of W-boson polarization in top-quark decay using the full CDF Run II data set | PRD 87 (2012) 031104(R) | 1211.4523 |
| 11 | T. Aaltonen, et al., CDF and D0 Collaborations | Combination of CDF and D0 measurements of the W boson helicity in top quark decays | PRD 85 (2012) 071106(R) | 1202.5272 |
| 12 | ATLAS Collaboration | Measurement of the W boson polarization in top quark decays with the ATLAS detector | JHEP 06 (2012) 088 | 1205.2484 |
| 13 | CMS Collaboration | Measurement of the W-boson helicity in top-quark decays from $ \mathrm{ t \bar{t} } $ production in lepton+jets events in pp collisions at $ \sqrt{s} = $ 7 TeV | JHEP 10 (2013) 167 | CMS-TOP-11-020 1308.3879 |
| 14 | CMS Collaboration | Measurement of the W boson helicity in events with a single reconstructed top quark in pp collisions at $ \sqrt{s} = $ 8 TeV | JHEP 01 (2015) 053 | CMS-TOP-12-020 1410.1154 |
| 15 | ATLAS Collaboration | Search for anomalous couplings in the W tb vertex from the measurement of double differential angular decay rates of single top quarks produced in the $ t $-channel with the ATLAS detector | JHEP 04 (2016) 023 | 1510.03764 |
| 16 | CMS Collaboration | The CMS experiment at the CERN LHC | JINST 3 (2008) S08004 | CMS-00-001 |
| 17 | S. Agostinelli, et al. | GEANT4 -- a simulation toolkit | NIMA 506 (2003) 250 | |
| 18 | J. Alwall et al. | The automated computation of tree-level and next-to-leading order differential cross sections, and their matching to parton shower simulations | JHEP 07 (2014) 079 | 1405.0301 |
| 19 | J. Pumplin et al. | New generation of parton distributions with uncertainties from global QCD analysis | JHEP 07 (2002) 012 | hep-ph/0201195 |
| 20 | T. Sjostrand, S. Mrenna, and P. Z. Skands | PYTHIA 6.4 physics and manual | JHEP 05 (2006) 026 | hep-ph/0603175 |
| 21 | CMS Collaboration | Jet and underlying event properties as a function of charged-particle multiplicity in proton-proton collisions at $ \sqrt{s} = $ 7 TeV | EPJC 73 (2013) 2674 | CMS-FSQ-12-022 1310.4554 |
| 22 | N. Davidson et al. | Universal interface of TAUOLA: technical and physics documentation | CPC 183 (2012) 821 | 1002.0543 |
| 23 | S. Alioli, P. Nason, C. Oleari, and E. Re | NLO vector-boson production matched with shower in POWHEG | JHEP 07 (2008) 060 | 0805.4802 |
| 24 | CMS Collaboration | Determination of jet energy calibration and transverse momentum resolution in CMS | JINST 6 (2011) P11002 | CMS-JME-10-011 1107.4277 |
| 25 | CMS Collaboration | Measurement of the differential cross section for top quark pair production in pp collisions at $ \sqrt{s} = $ 8 TeV | EPJC 75 (2015) 542 | CMS-TOP-12-028 1505.04480 |
| 26 | CMS Collaboration | Particle--flow event reconstruction in CMS and performance for jets, taus, and $ E_{\mathrm{T}}^{\text{miss}} $ | CMS-PAS-PFT-09-001 | |
| 27 | CMS Collaboration | Commissioning of the particle--flow event reconstruction with the first LHC collisions recorded in the CMS detector | CMS-PAS-PFT-10-001 | |
| 28 | CMS Collaboration | Description and performance of track and primary-vertex reconstruction with the CMS tracker | JINST 9 (2014) P10009 | CMS-TRK-11-001 1405.6569 |
| 29 | CMS Collaboration | Performance of electron reconstruction and selection with the CMS detector in proton-proton collisions at $ \sqrt{s} = $ 8 TeV | JINST 10 (2015) P06005 | CMS-EGM-13-001 1502.02701 |
| 30 | CMS Collaboration | The performance of the CMS muon detector in proton-proton collisions at $ \sqrt{s} = $ 7 TeV at the LHC | JINST 8 (2013) P11002 | CMS-MUO-11-001 1306.6905 |
| 31 | M. Cacciari, G. P. Salam, and G. Soyez | The anti-$ k_t $ jet clustering algorithm | JHEP 04 (2008) 063 | 0802.1189 |
| 32 | CMS Collaboration | Identification of b-quark jets with the CMS experiment | JINST 8 (2013) P04013 | CMS-BTV-12-001 1211.4462 |
| 33 | CMS Collaboration | Performance of b tagging at $ \sqrt{s} = $ 8 TeV in multijet, $ \mathrm{ t \bar{t} } $ and boosted topology events | CMS-PAS-BTV-13-001 | CMS-PAS-BTV-13-001 |
| 34 | A. Ferroglia, B. D. Pecjak, and L. L. Yang | Top-quark pair production at high invariant mass: an NNLO soft plus virtual approximation | JHEP 09 (2013) 032 | 1306.1537 |
| 35 | H. T. Li et al. | Top-quark pair production at small transverse momentum in hadronic collisions | PRD 88 (2013) 074004 | 1307.2464 |
| 36 | N. Kidonakis | Differential and total cross sections for top pair and single top production | presented at XX International Workshop on Deep-Inelastic Scattering and Related Subjects (DIS2012), Bonn, Germany | 1205.3453 |
| 37 | R. Gavin, Y. Li, F. Petriello, and S. Quackenbush | FEWZ 2.0: a code for hadronic Z production at next-to-next-to-leading order | CPC 182 (2011) 2388 | 1011.3540 |
| 38 | S. Frixione and B. R. Webber | Matching NLO QCD computations and parton shower simulations | JHEP 06 (2002) 029 | hep-ph/0204244 |
| 39 | G. Corcella et al. | HERWIG 6: an event generator for hadron emission reactions with interfering gluons (including supersymmetric processes) | JHEP 01 (2001) 010 | hep-ph/0011363 |
| 40 | CMS Collaboration | Measurement of differential top-quark pair production cross sections in pp collisions at $ \sqrt{s} = $ 7 TeV | EPJC 73 (2013) 2339 | CMS-TOP-11-013 1211.2220 |
| 41 | S. Alekhin et al. | The PDF4LHC Working Group interim report | 1101.0536 | |
| 42 | M. Botje et al. | The PDF4LHC Working Group interim recommendations | 1101.0538 | |
| 43 | NNPDF Collaboration | Impact of heavy quark masses on parton distributions and LHC phenomenology | NPB 849 (2011) 296 | 1101.1300 |
| 44 | A. D. Martin, W. J. Stirling, R. S. Thorne, and G. Watt | Parton distributions for the LHC | EPJC 63 (2009) 189 | 0901.0002 |
| 45 | L. Lyons, D. Gibaut, and P. Clifford | How to combine correlated estimates of a single physical quantity | NIMA 270 (1988) 110 | |
| 46 | A. Valassi | Combining correlated measurements of several different physical quantities | NIMA 500 (2003) 391 | |
| 47 | CMS Collaboration | Measurement of the $ t $-channel single-top-quark production cross section and of the $ |V_{\rm tb}| $ CKM matrix element in pp collisions at $ \sqrt{s} = $ 8 TeV | JHEP 06 (2014) 090 | CMS-TOP-12-038 1403.7366 |
|
|
Compact Muon Solenoid LHC, CERN |
|

|

|

|

|

|