

Compact Muon Solenoid
LHC, CERN
| CMS-TOP-15-001 ; CERN-EP-2017-012 | ||
| Measurement of the top quark mass using single top quark events in proton-proton collisions at $\sqrt{s}= $ 8 TeV | ||
| CMS Collaboration | ||
| 7 March 2017 | ||
| EPJC 77 (2017) 354 | ||
| Abstract: A measurement of the top quark mass is reported in events containing a single top quark produced via the electroweak $t$ channel. The analysis is performed using data from proton-proton collisions collected with the CMS detector at the LHC at a centre-of-mass energy of 8 TeV, corresponding to an integrated luminosity of 19.7 fb$^{-1}$. The top quark is reconstructed from its decay to a W boson and a b quark, with the W boson decaying leptonically to a muon and a neutrino. The specific topology and kinematic properties of single top quark events in the $t$ channel are used to enhance the purity of the sample, suppressing the contribution from top quark pair production. A fit to the invariant mass distribution of reconstructed top quark candidates yields a value of the top quark mass of 172.95 $\pm$ 0.77 (stat) $^{+0.97}_{-0.93}$ (syst) GeV. This result is in agreement with the current world average, and represents the first measurement of the top quark mass in event topologies not dominated by top quark pair production. | ||
| Links: e-print arXiv:1703.02530 [hep-ex] (PDF) ; CDS record ; inSPIRE record ; CADI line (restricted) ; | ||
| Figures | |
png pdf |
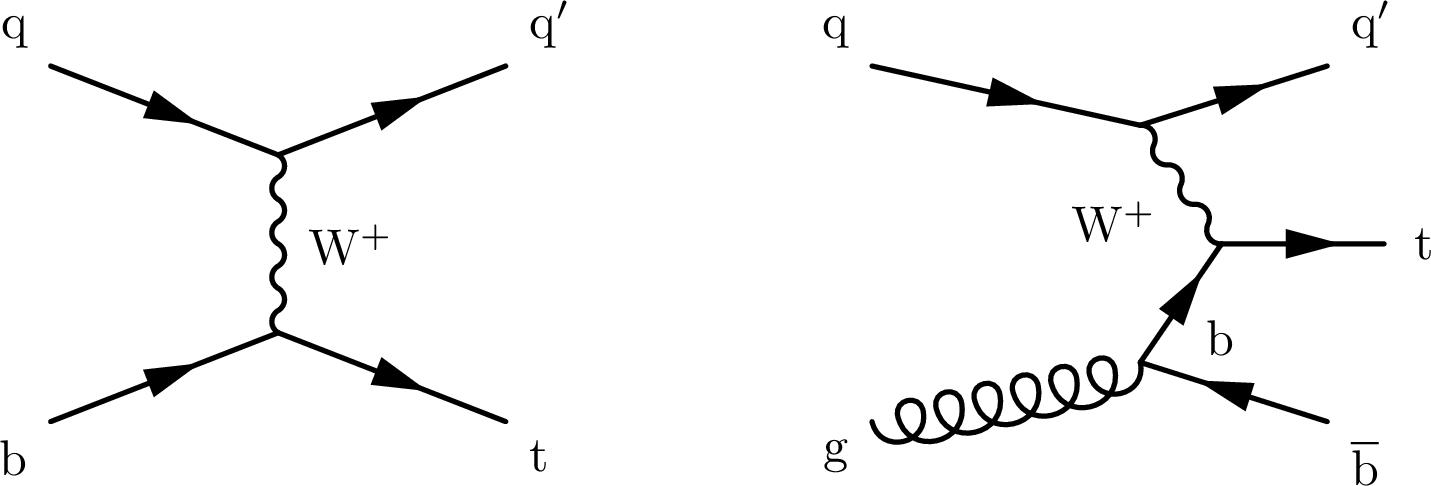
Figure 1:
The dominant Feynman diagrams for single top quark production in the $t$ channel. |
png pdf |
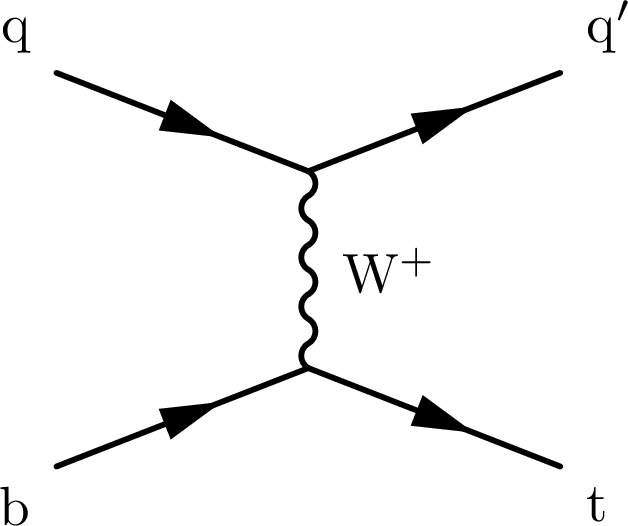
Figure 1-a:
One of the dominant Feynman diagrams for single top quark production in the $t$ channel. |
png pdf |
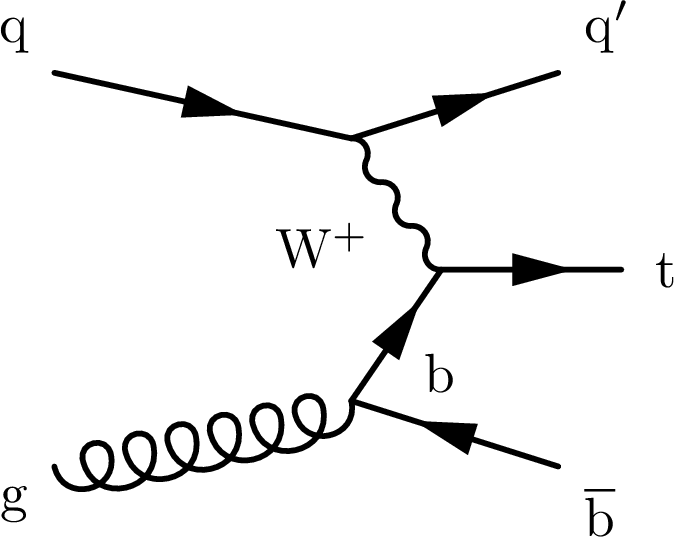
Figure 1-b:
One of the dominant Feynman diagrams for single top quark production in the $t$ channel. |
png pdf |
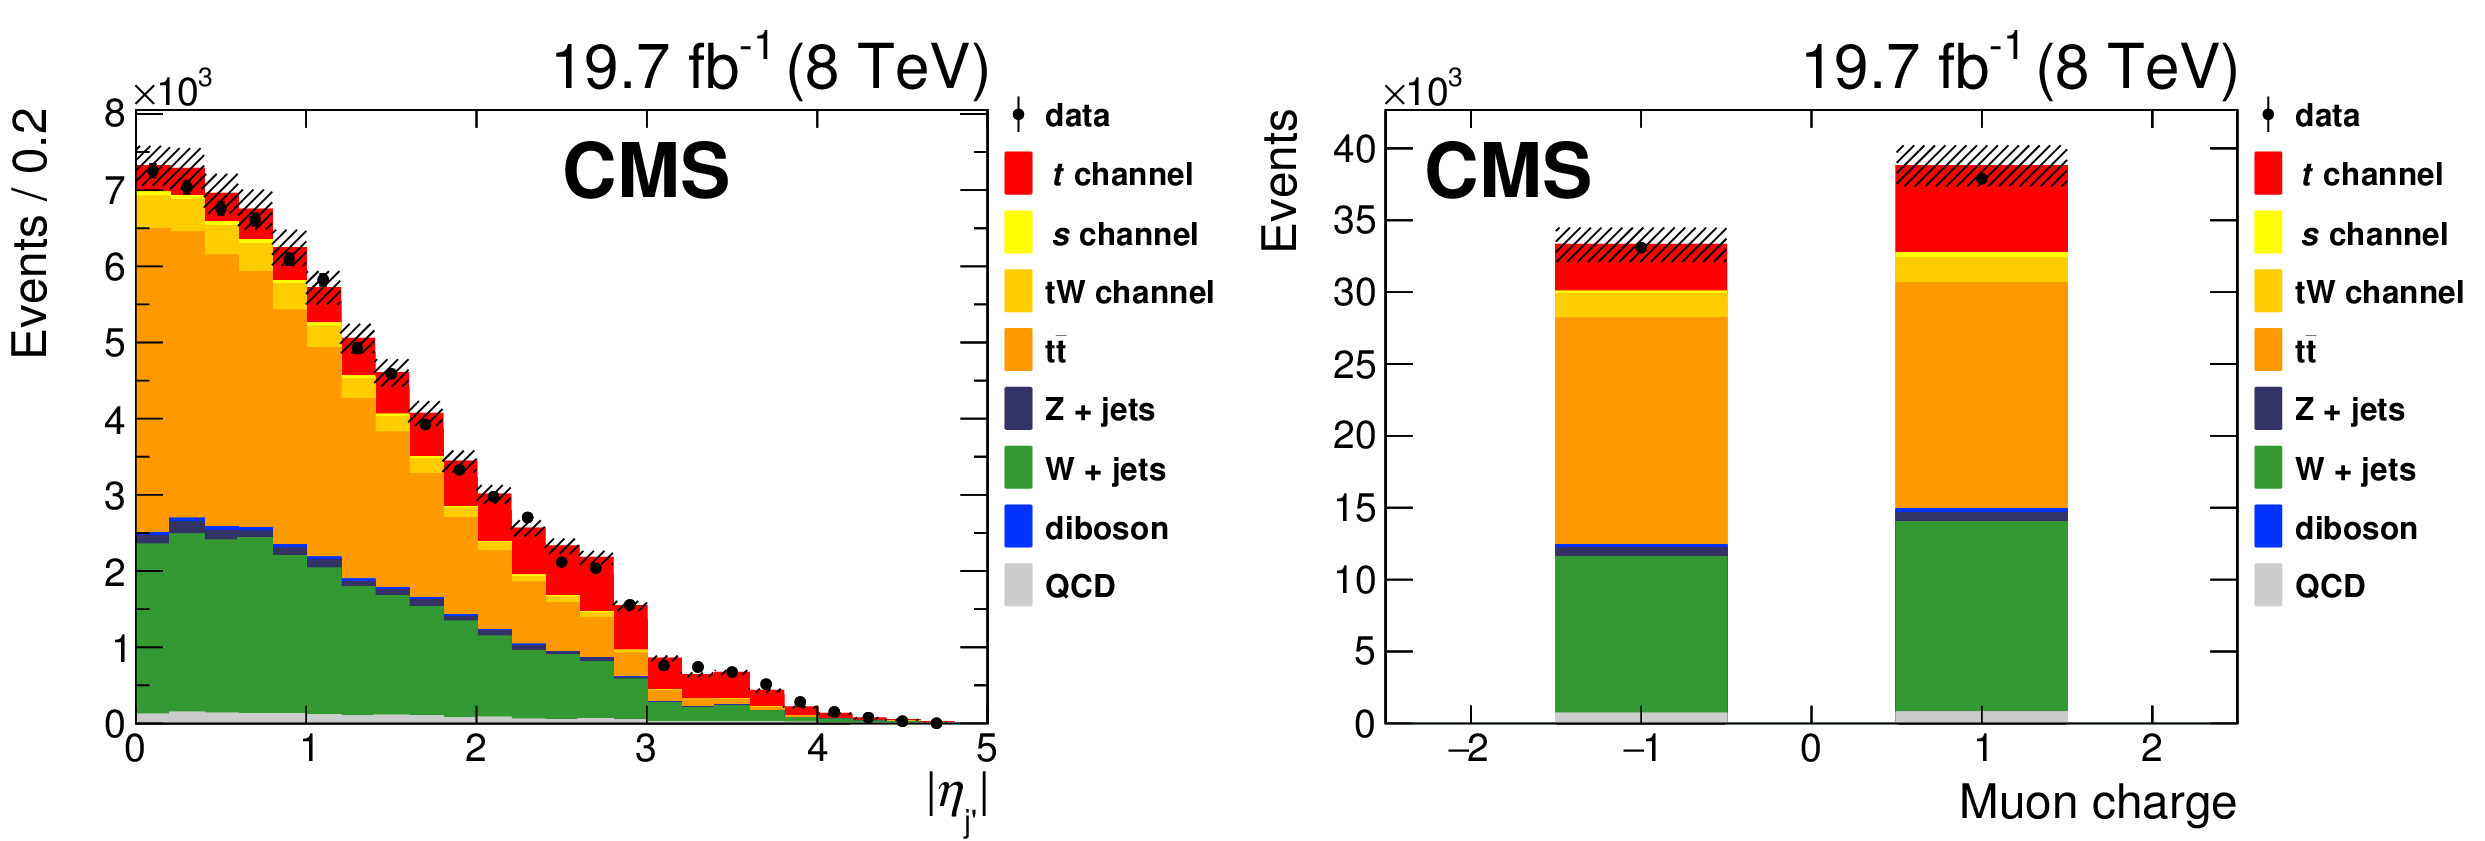
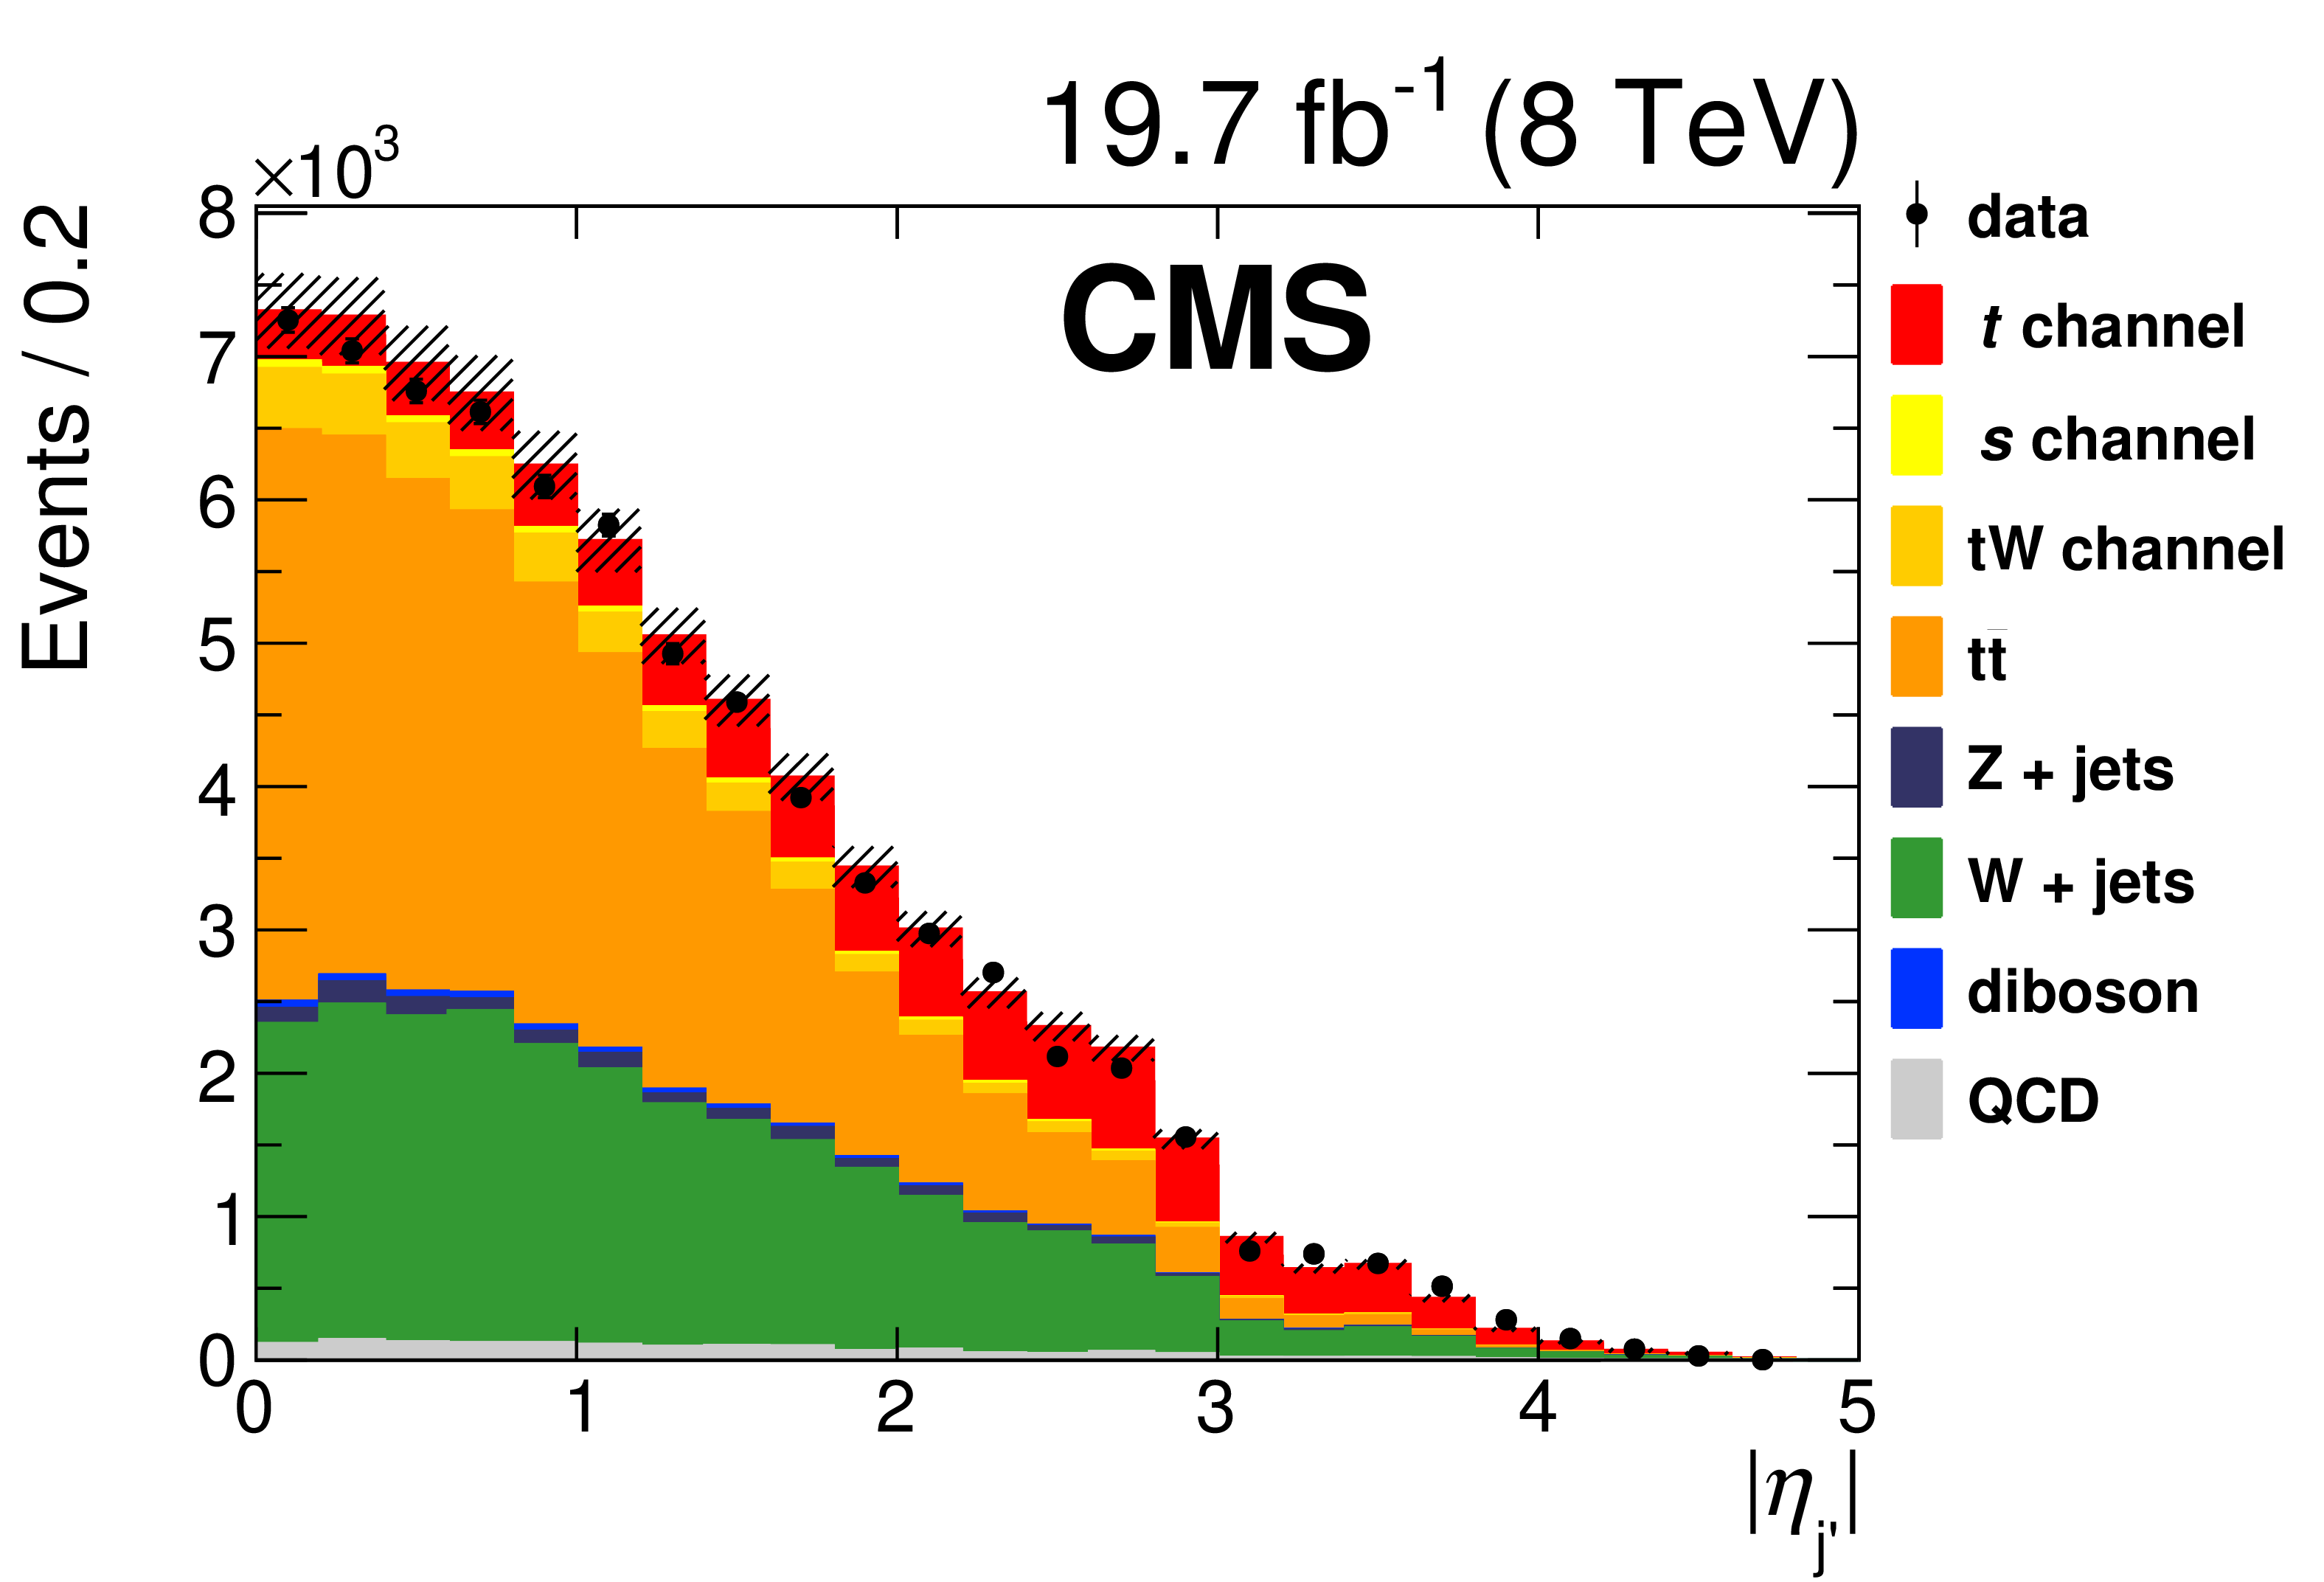
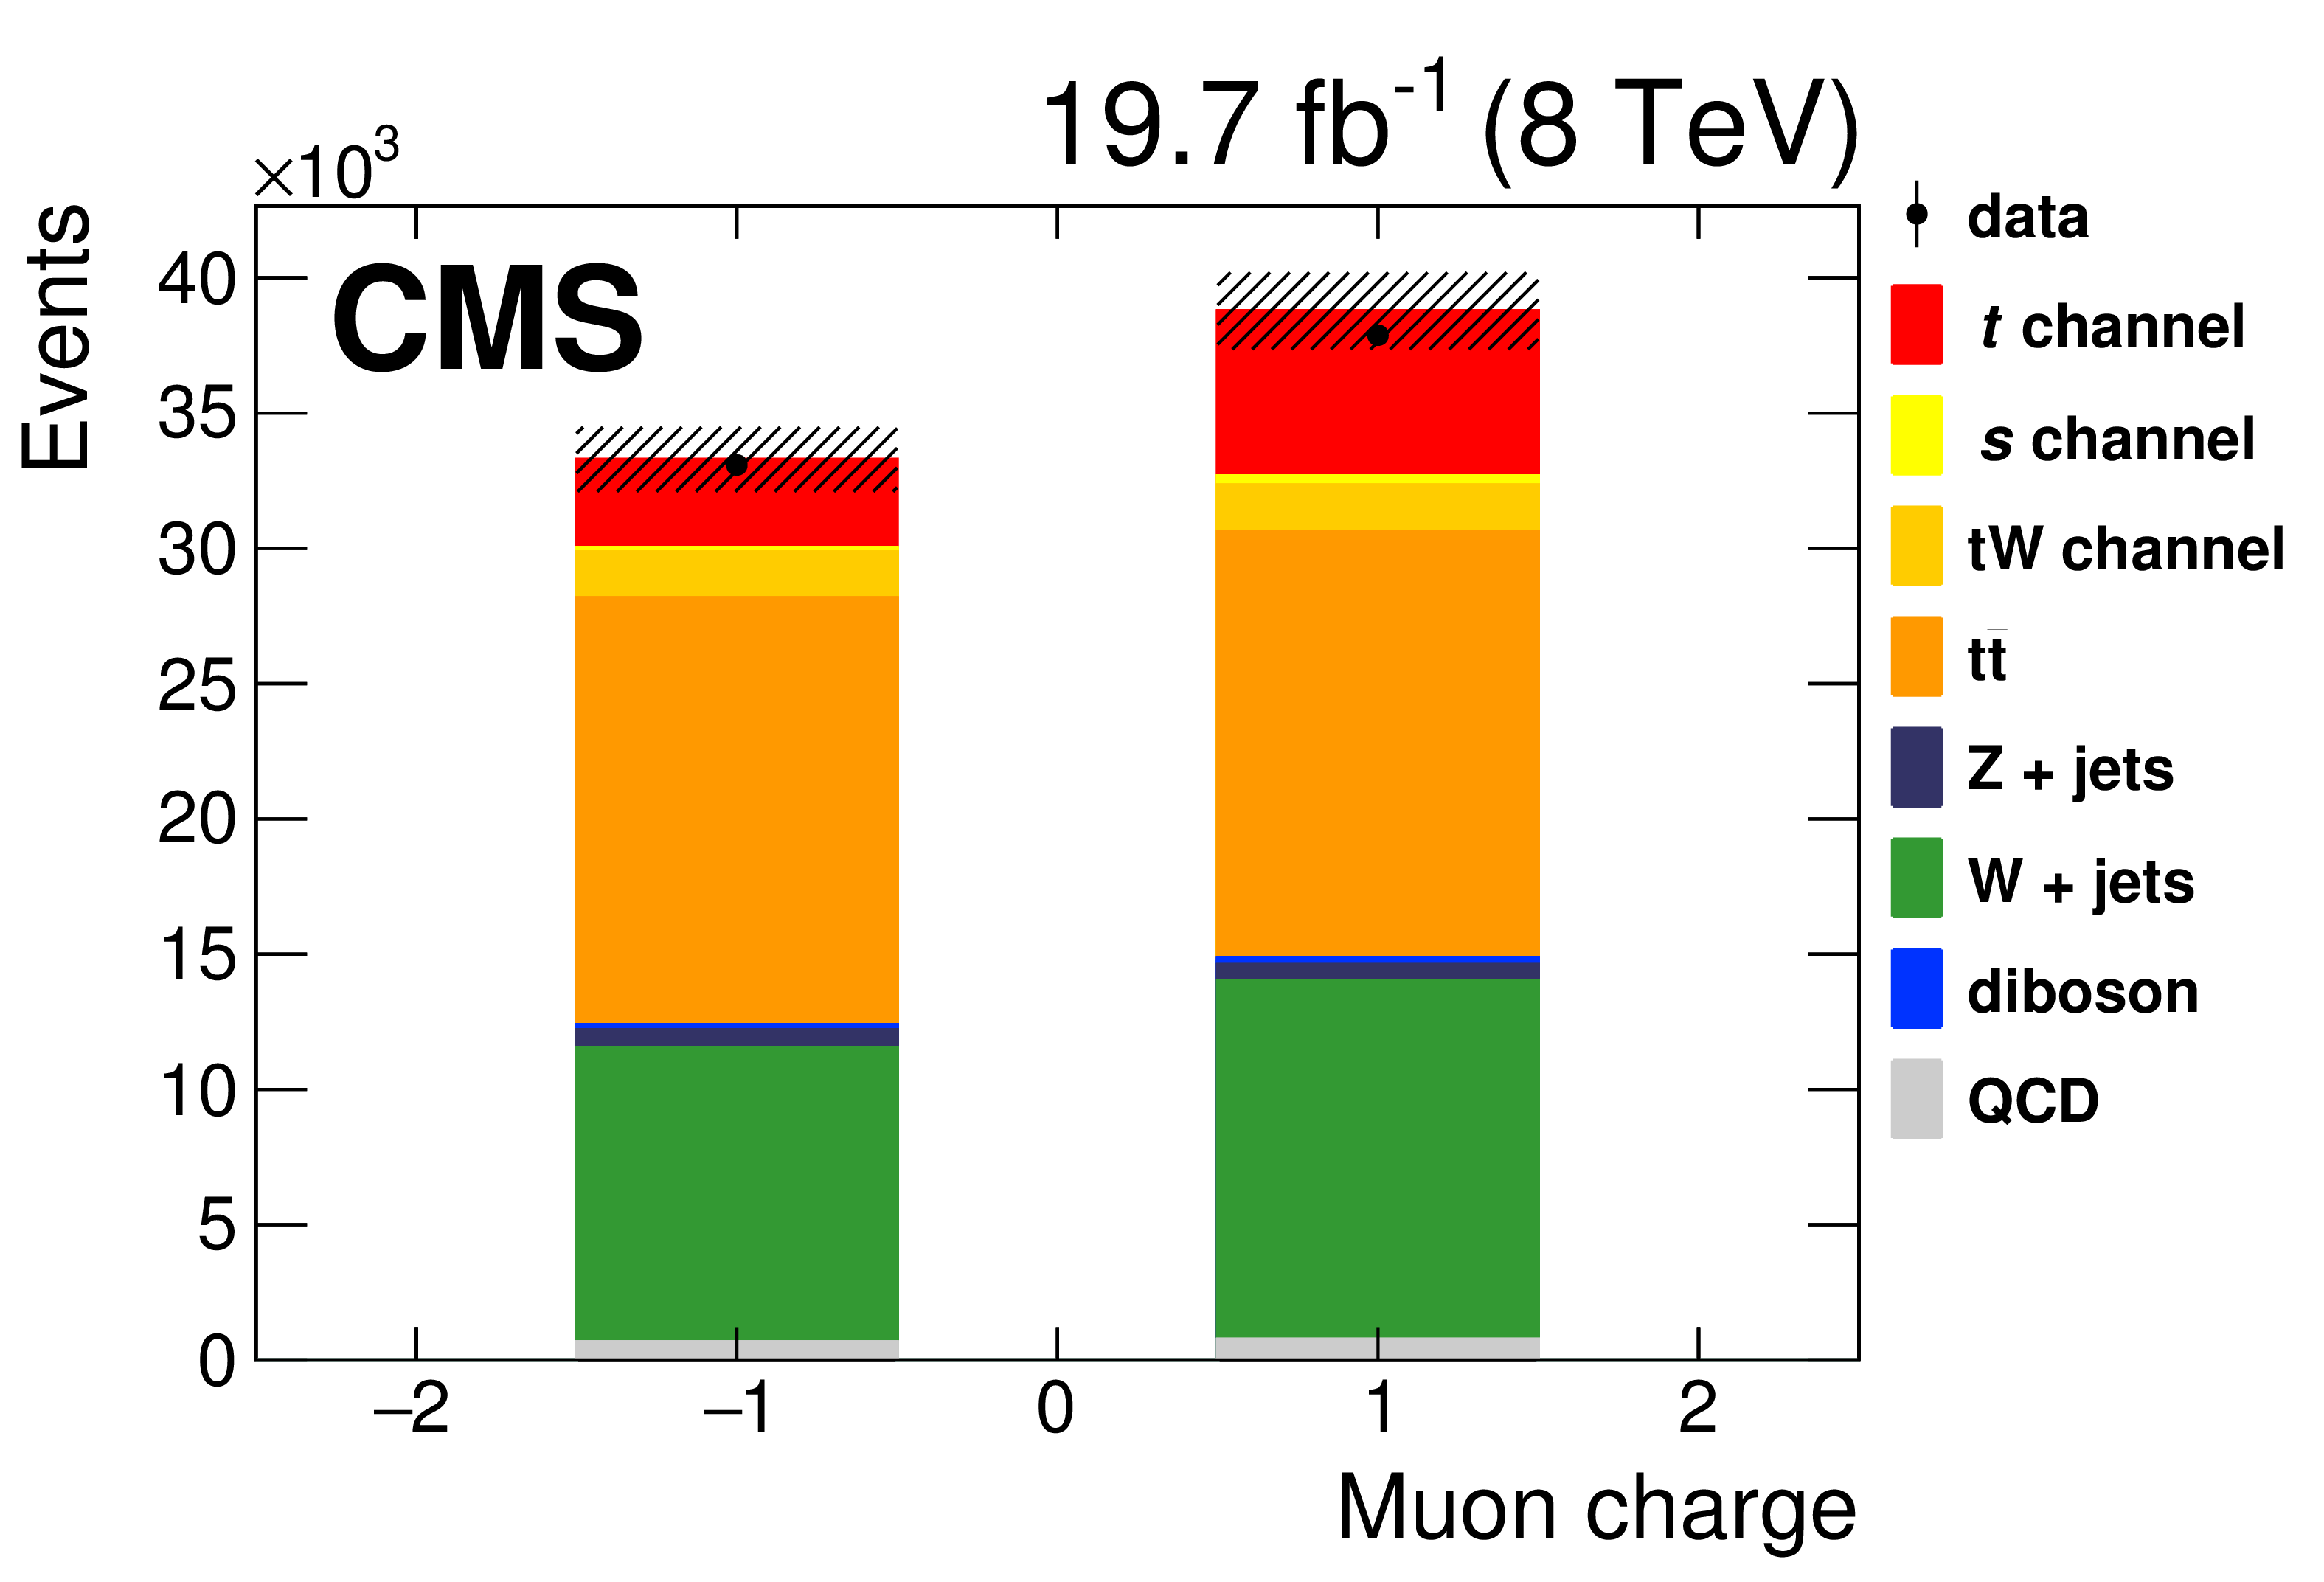
Figure 2:
Distribution of the light-quark jet pseudorapidity (left) and of the muon charge (right) for all top quark candidates in the muonic decay channel. Points with error bars represent data, stacked histograms show expected contributions from Monte Carlo simulation. The hatched area represents the uncertainty on the Monte Carlo predictions associated to the finite size of the samples and their normalization, and the integrated luminosity. |
png pdf |
Figure 2-a:
Distribution of the light-quark jet pseudorapidity for all top quark candidates in the muonic decay channel. Points with error bars represent data, stacked histograms show expected contributions from Monte Carlo simulation. The hatched area represents the uncertainty on the Monte Carlo predictions associated to the finite size of the samples and their normalization, and the integrated luminosity. |
png pdf |
Figure 2-b:
Distribution of the muon charge for all top quark candidates in the muonic decay channel. Points with error bars represent data, stacked histograms show expected contributions from Monte Carlo simulation. The hatched area represents the uncertainty on the Monte Carlo predictions associated to the finite size of the samples and their normalization, and the integrated luminosity. |
png pdf |
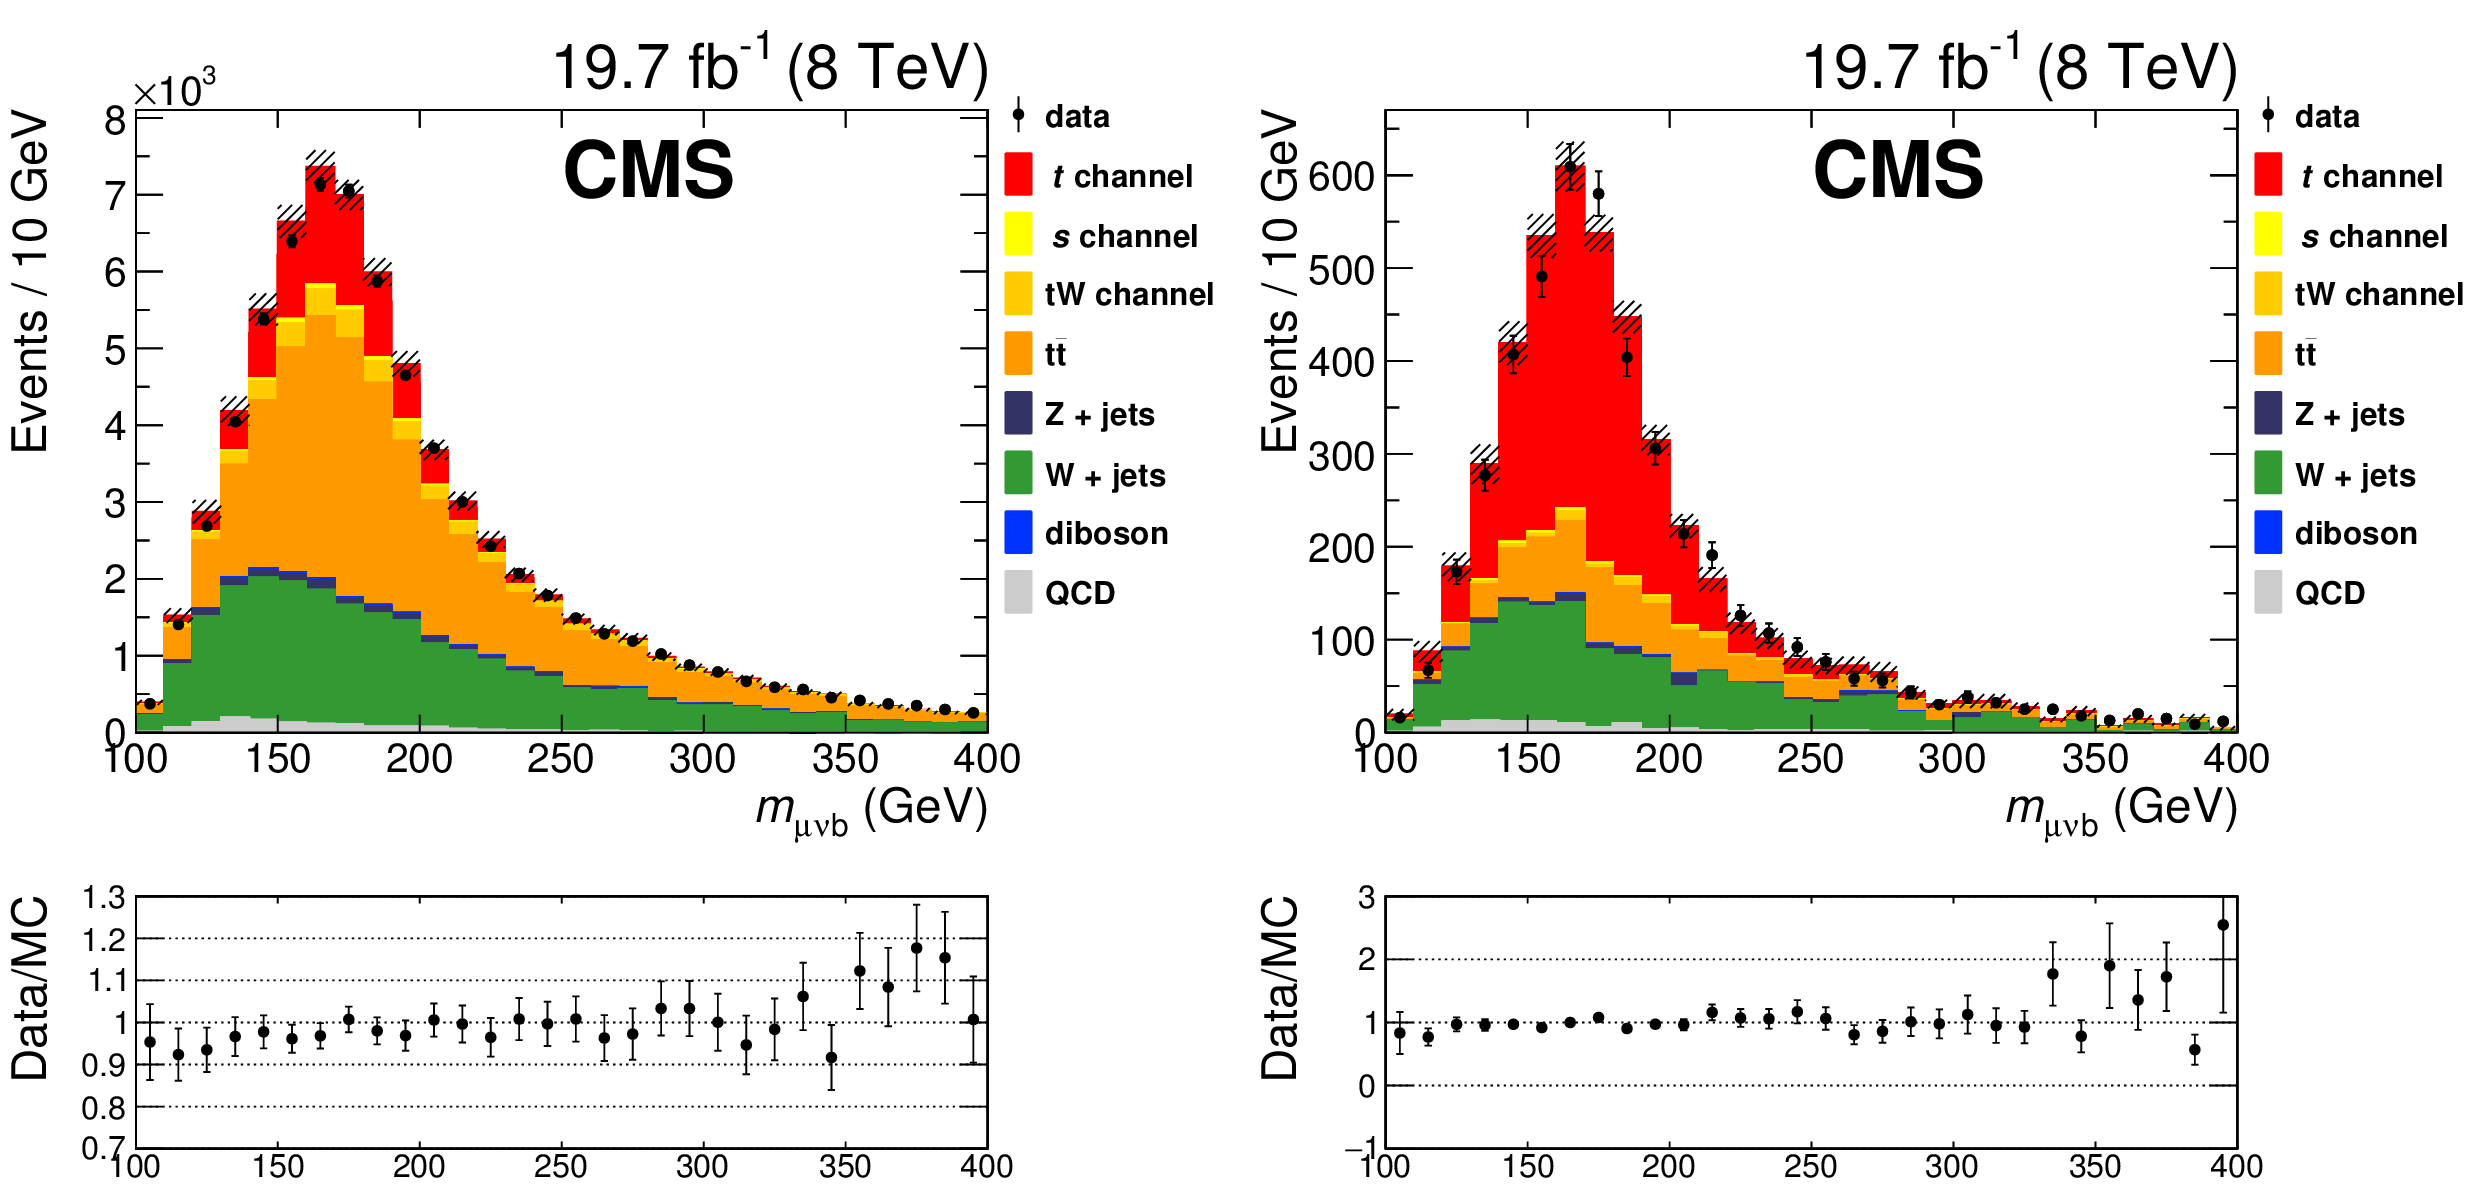
Figure 3:
Reconstructed $\mu \nu \mathrm{ b } $ invariant mass distribution for data (points with error bars) and Monte Carlo events (stacked histograms). Left: initial selection; right: final selection after the charge and light-quark jet pseudorapidity requirements. The ratio of the observed number of events in data to the number predicted by simulation is shown in the lower plots. The hatched area represents the uncertainty on the Monte Carlo predictions associated to the finite size of the samples and their normalization, and the integrated luminosity. |

png pdf |
Figure 3-a:
Reconstructed $\mu \nu \mathrm{ b } $ invariant mass distribution for data (points with error bars) and Monte Carlo events (stacked histograms): initial selection after the charge and light-quark jet pseudorapidity requirements. The ratio of the observed number of events in data to the number predicted by simulation is shown in the lower plots. The hatched area represents the uncertainty on the Monte Carlo predictions associated to the finite size of the samples and their normalization, and the integrated luminosity. |
png pdf |
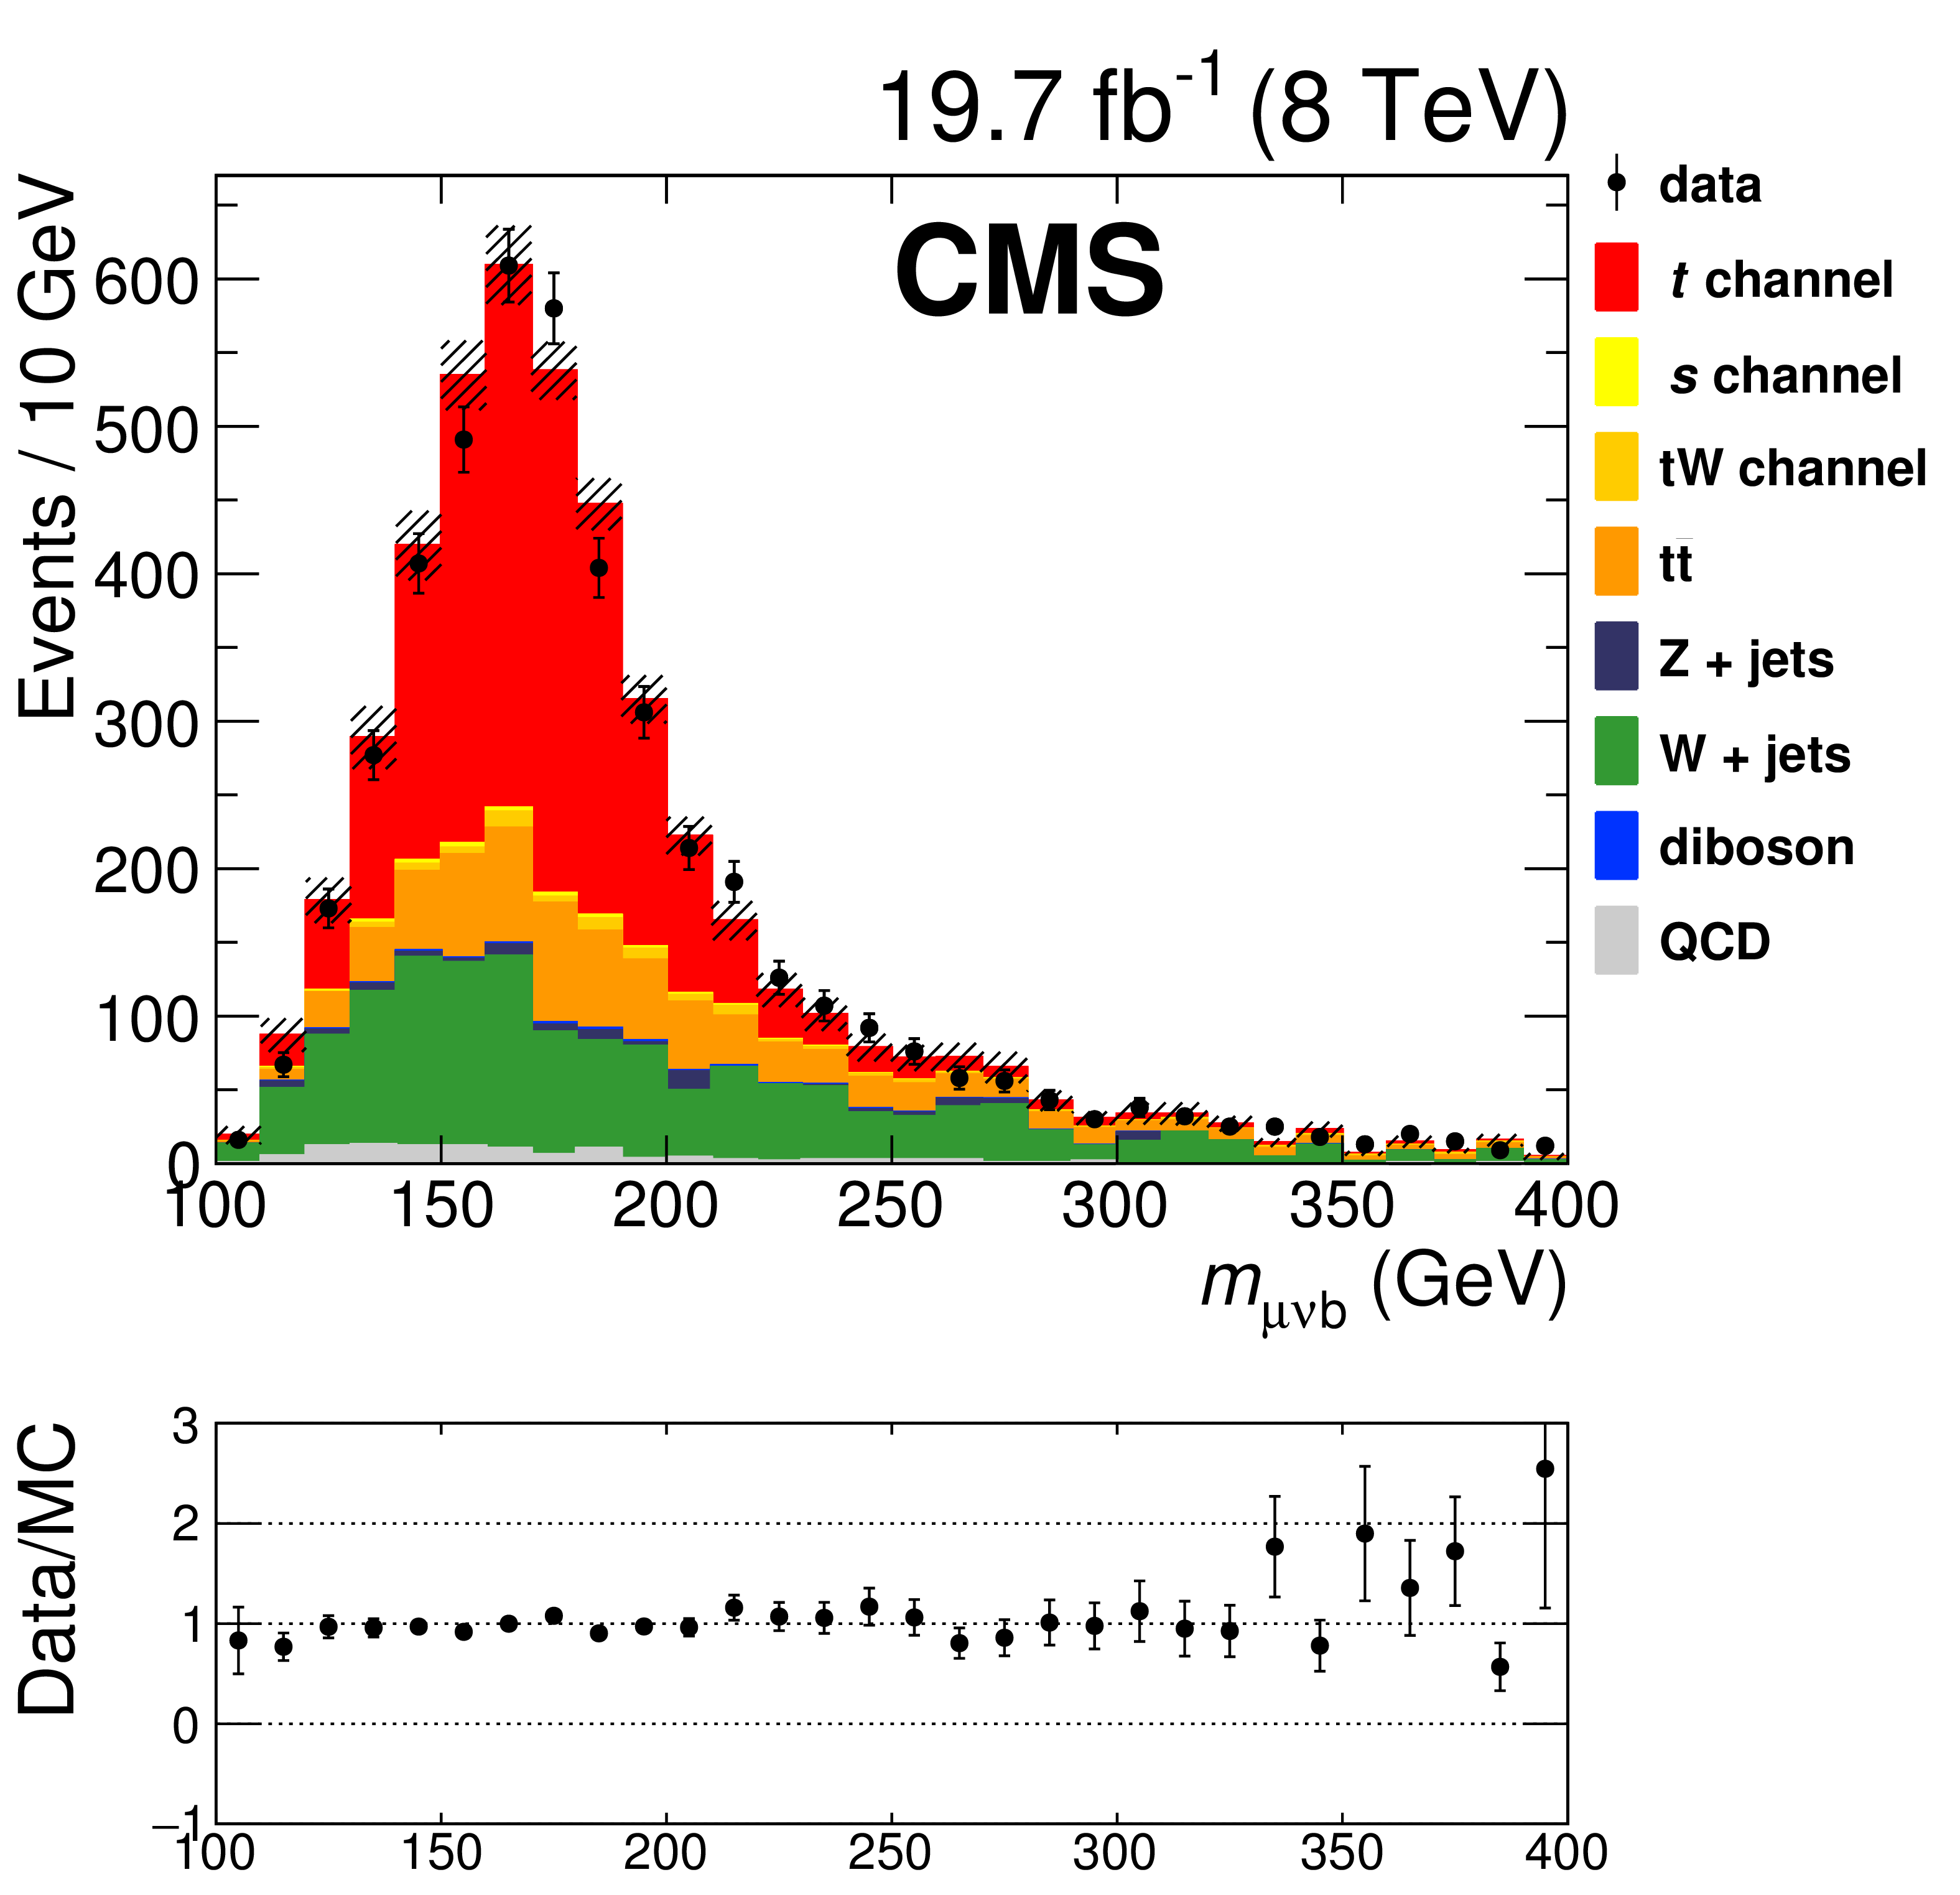
Figure 3-b:
Reconstructed $\mu \nu \mathrm{ b } $ invariant mass distribution for data (points with error bars) and Monte Carlo events (stacked histograms): final selection after the charge and light-quark jet pseudorapidity requirements. The ratio of the observed number of events in data to the number predicted by simulation is shown in the lower plots. The hatched area represents the uncertainty on the Monte Carlo predictions associated to the finite size of the samples and their normalization, and the integrated luminosity. |
png pdf |
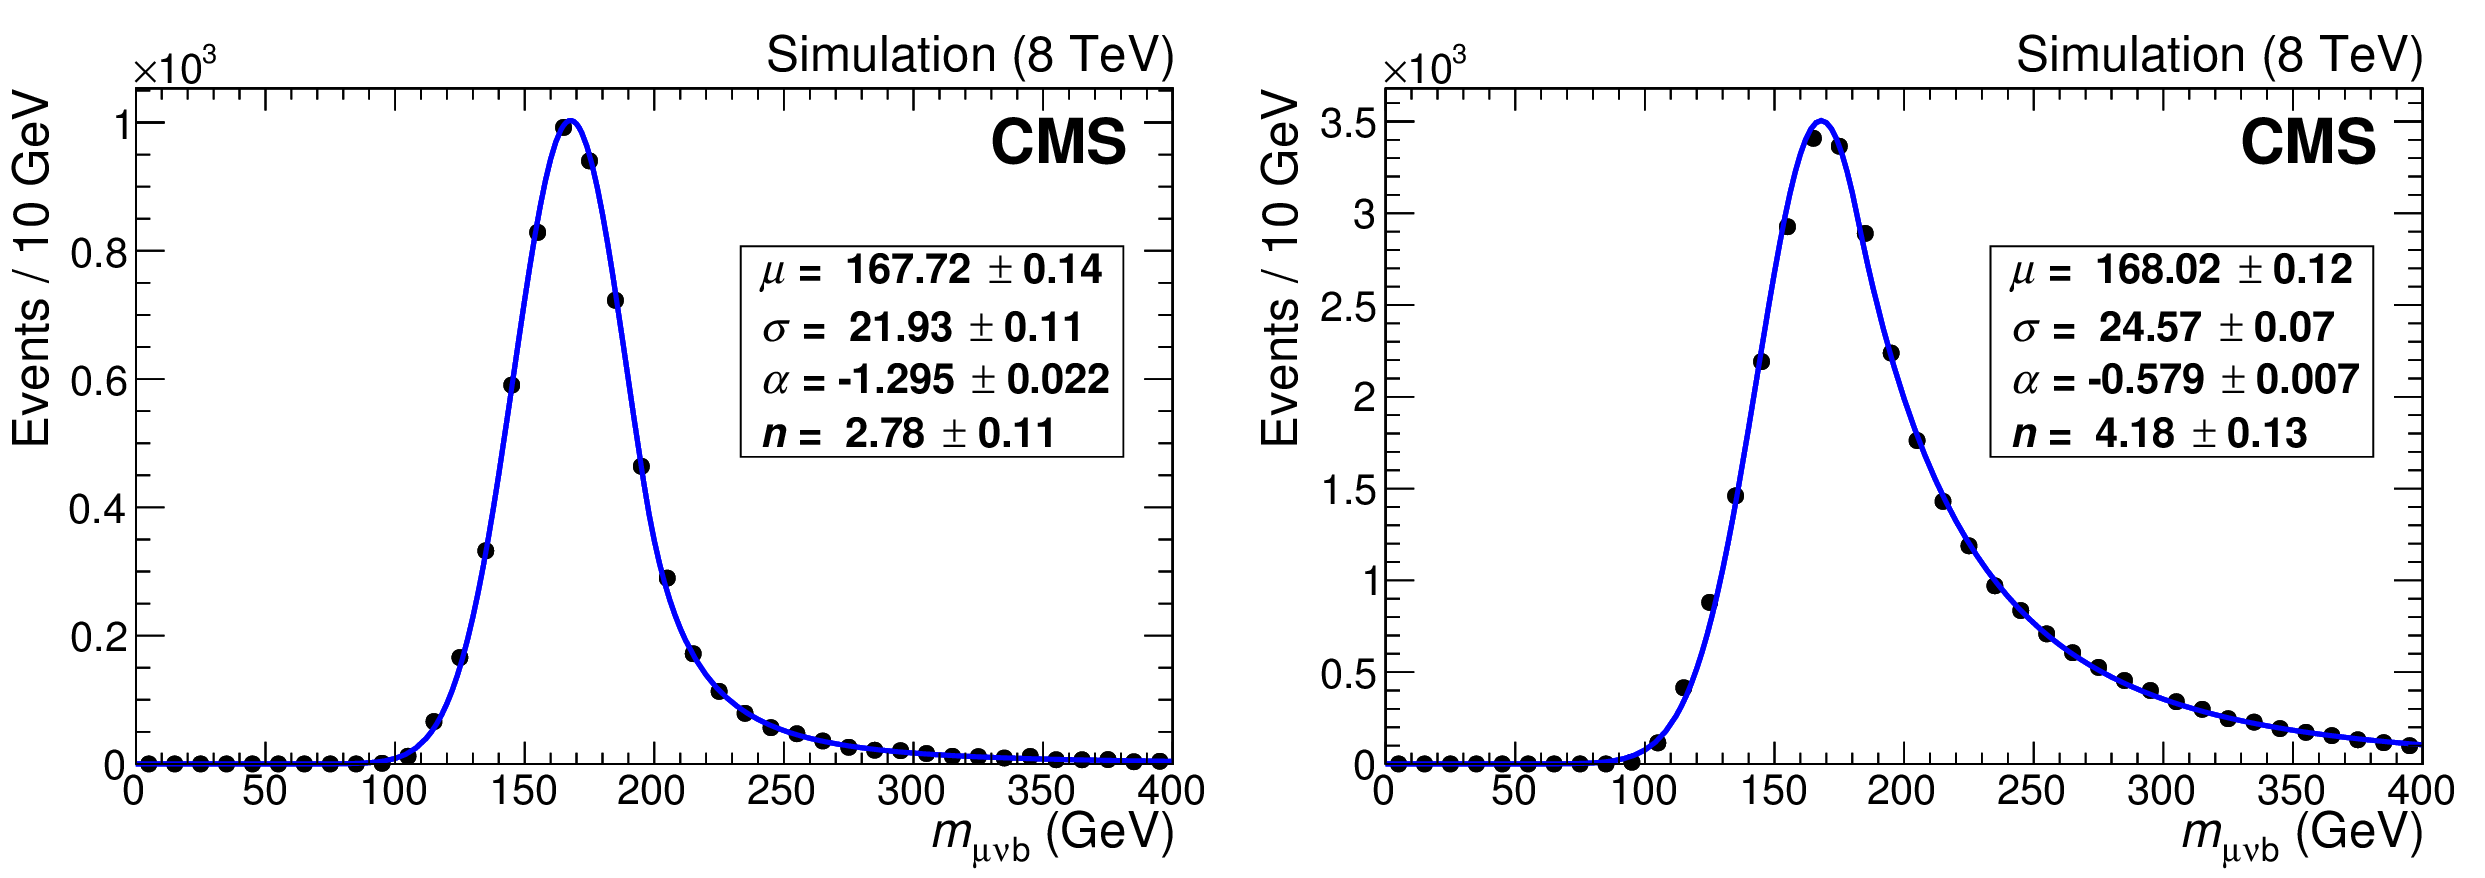
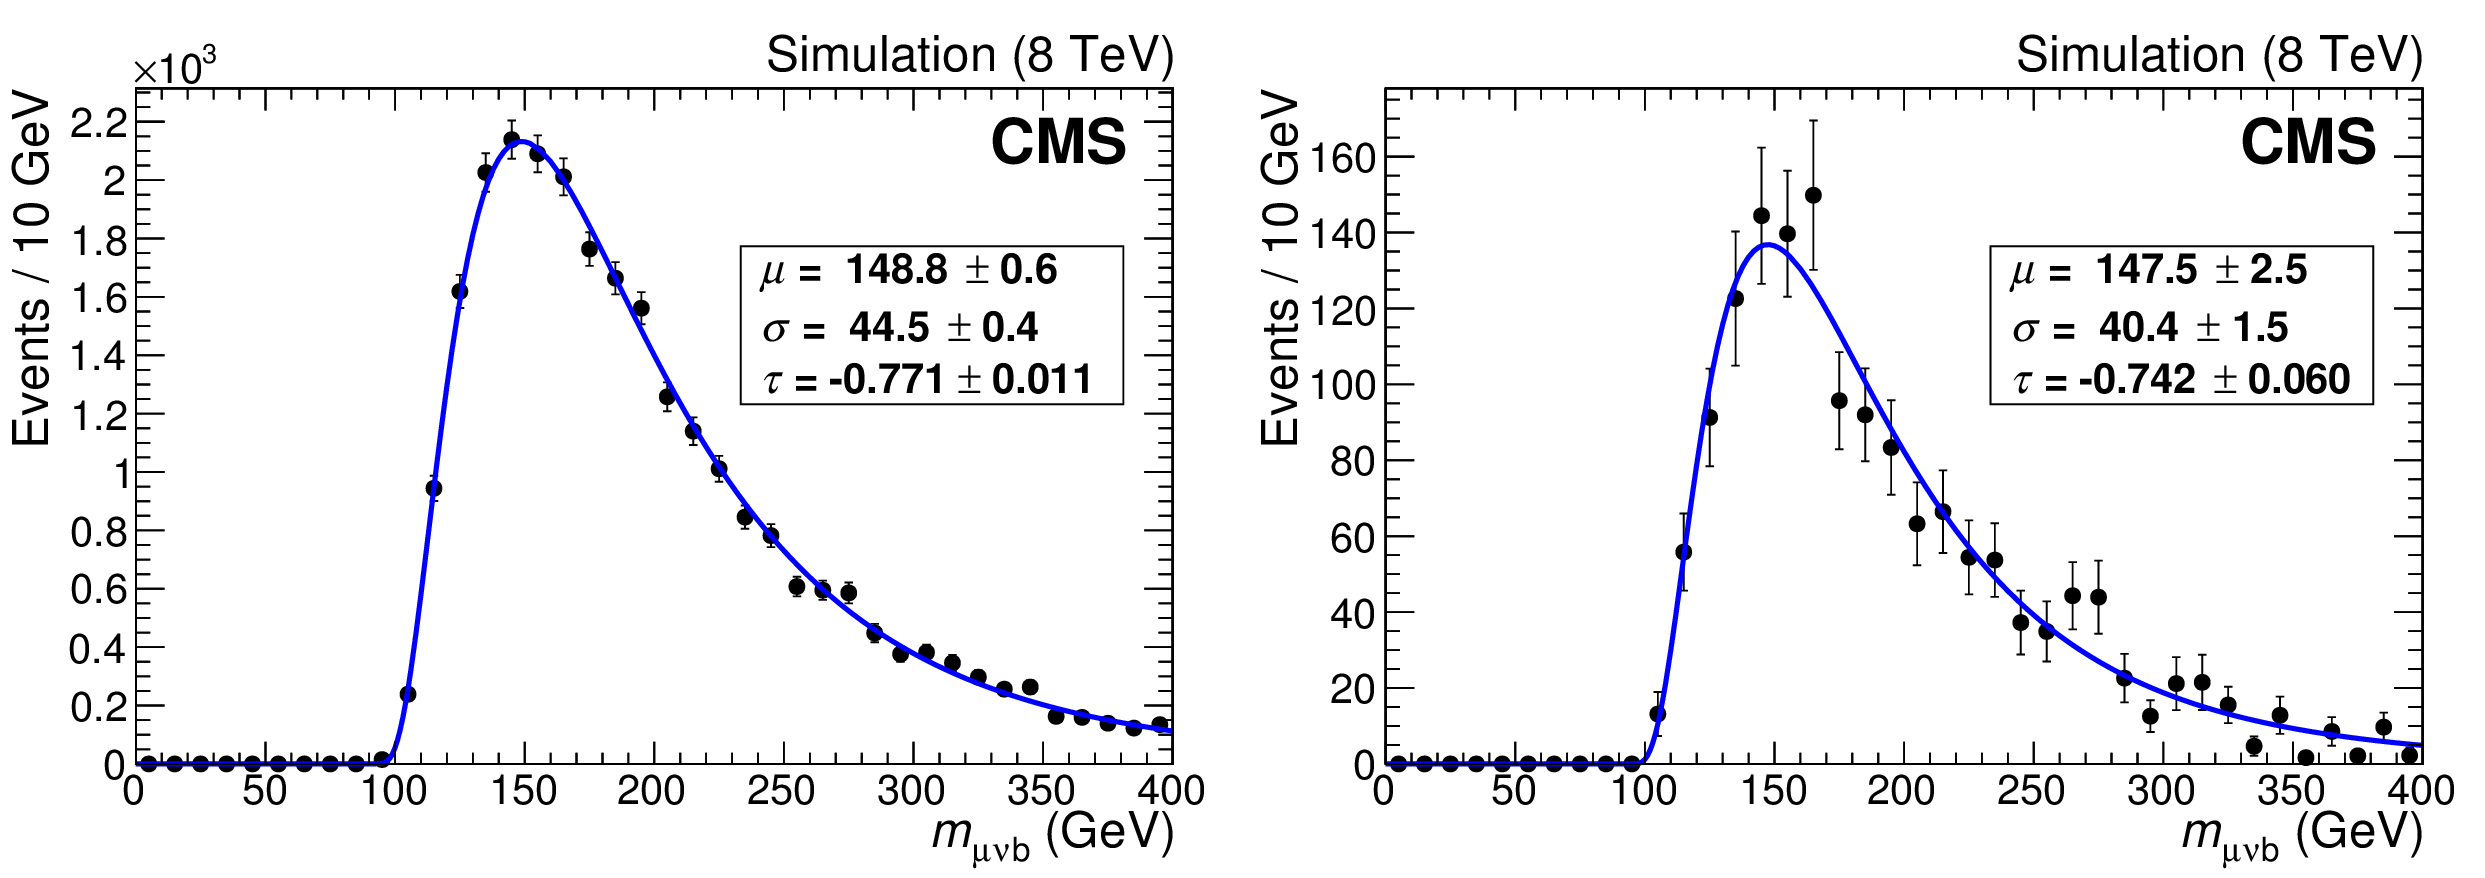
Figure 4:
Reconstructed $\mu \nu \mathrm{ b } $ invariant mass from Monte Carlo simulated events for single top quark $t$ channel (left) and ${\mathrm{ t } {}\mathrm{ \bar{t} } }$ (right). The continuous lines show the results of fits to Crystal Ball shapes. |

png pdf |
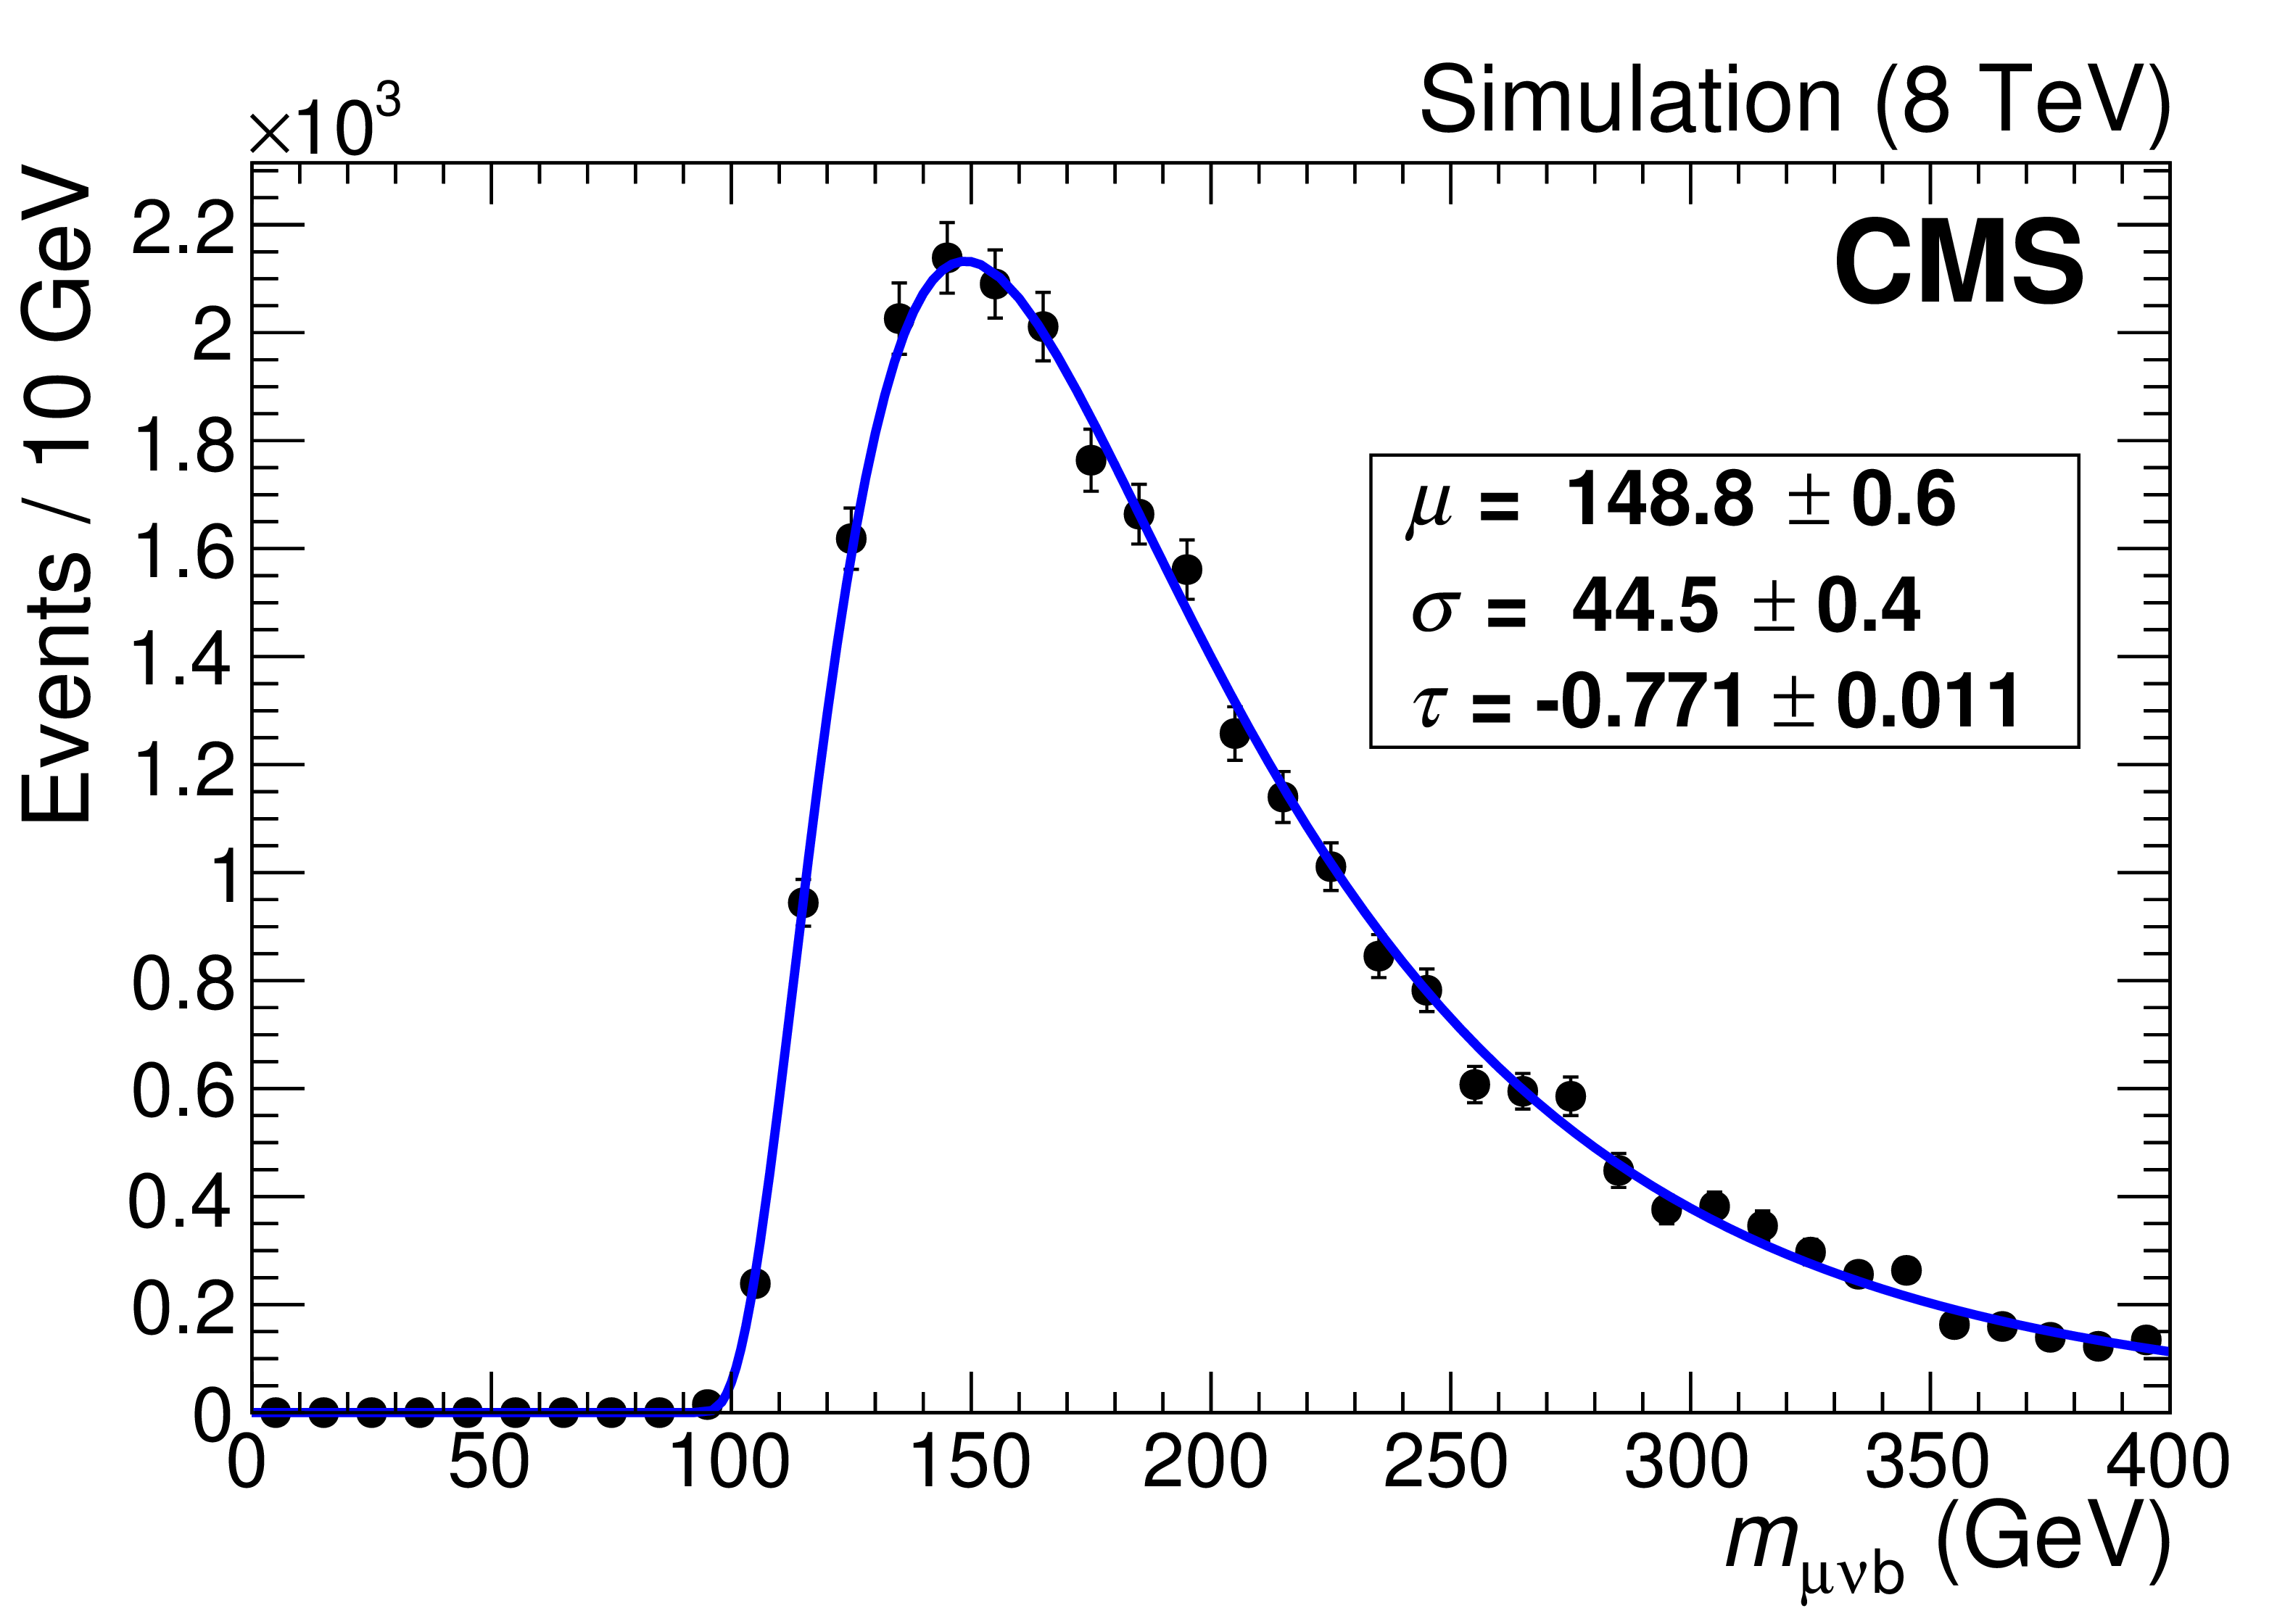
Figure 4-a:
Reconstructed $\mu \nu \mathrm{ b } $ invariant mass from Monte Carlo simulated events for single top quark $t$ channel. The continuous lines show the results of fits to Crystal Ball shapes. |
png pdf |
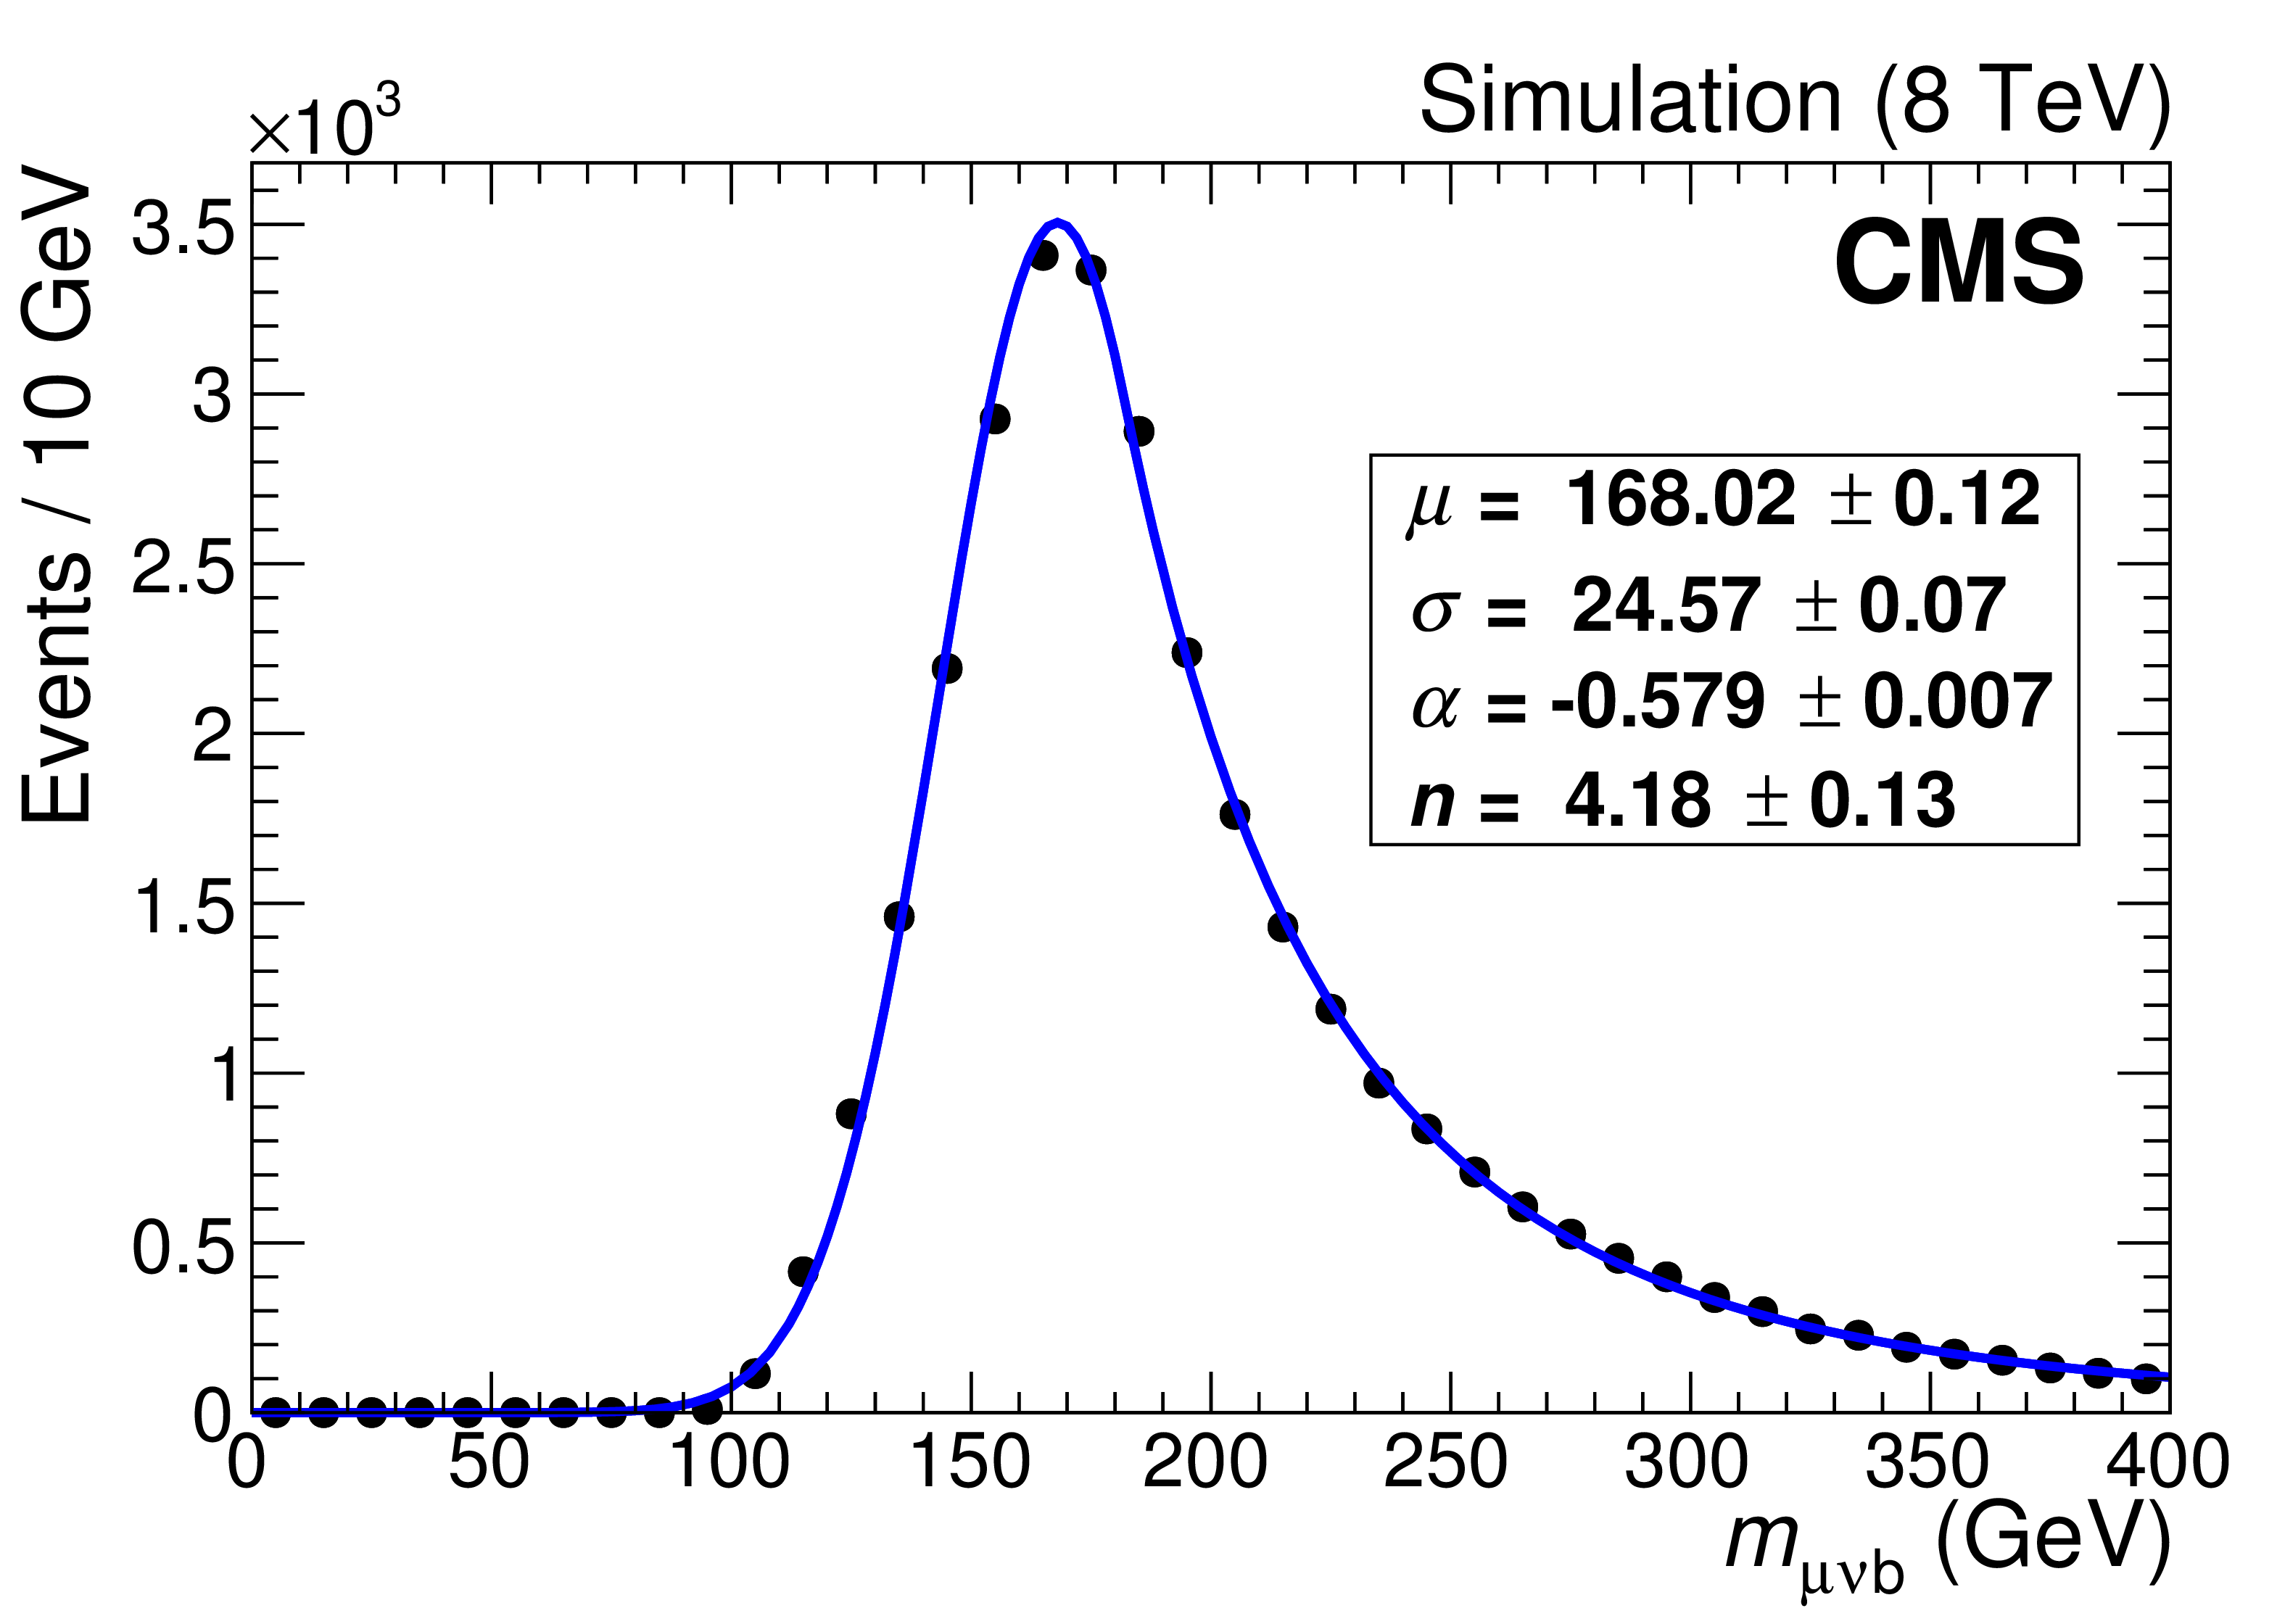
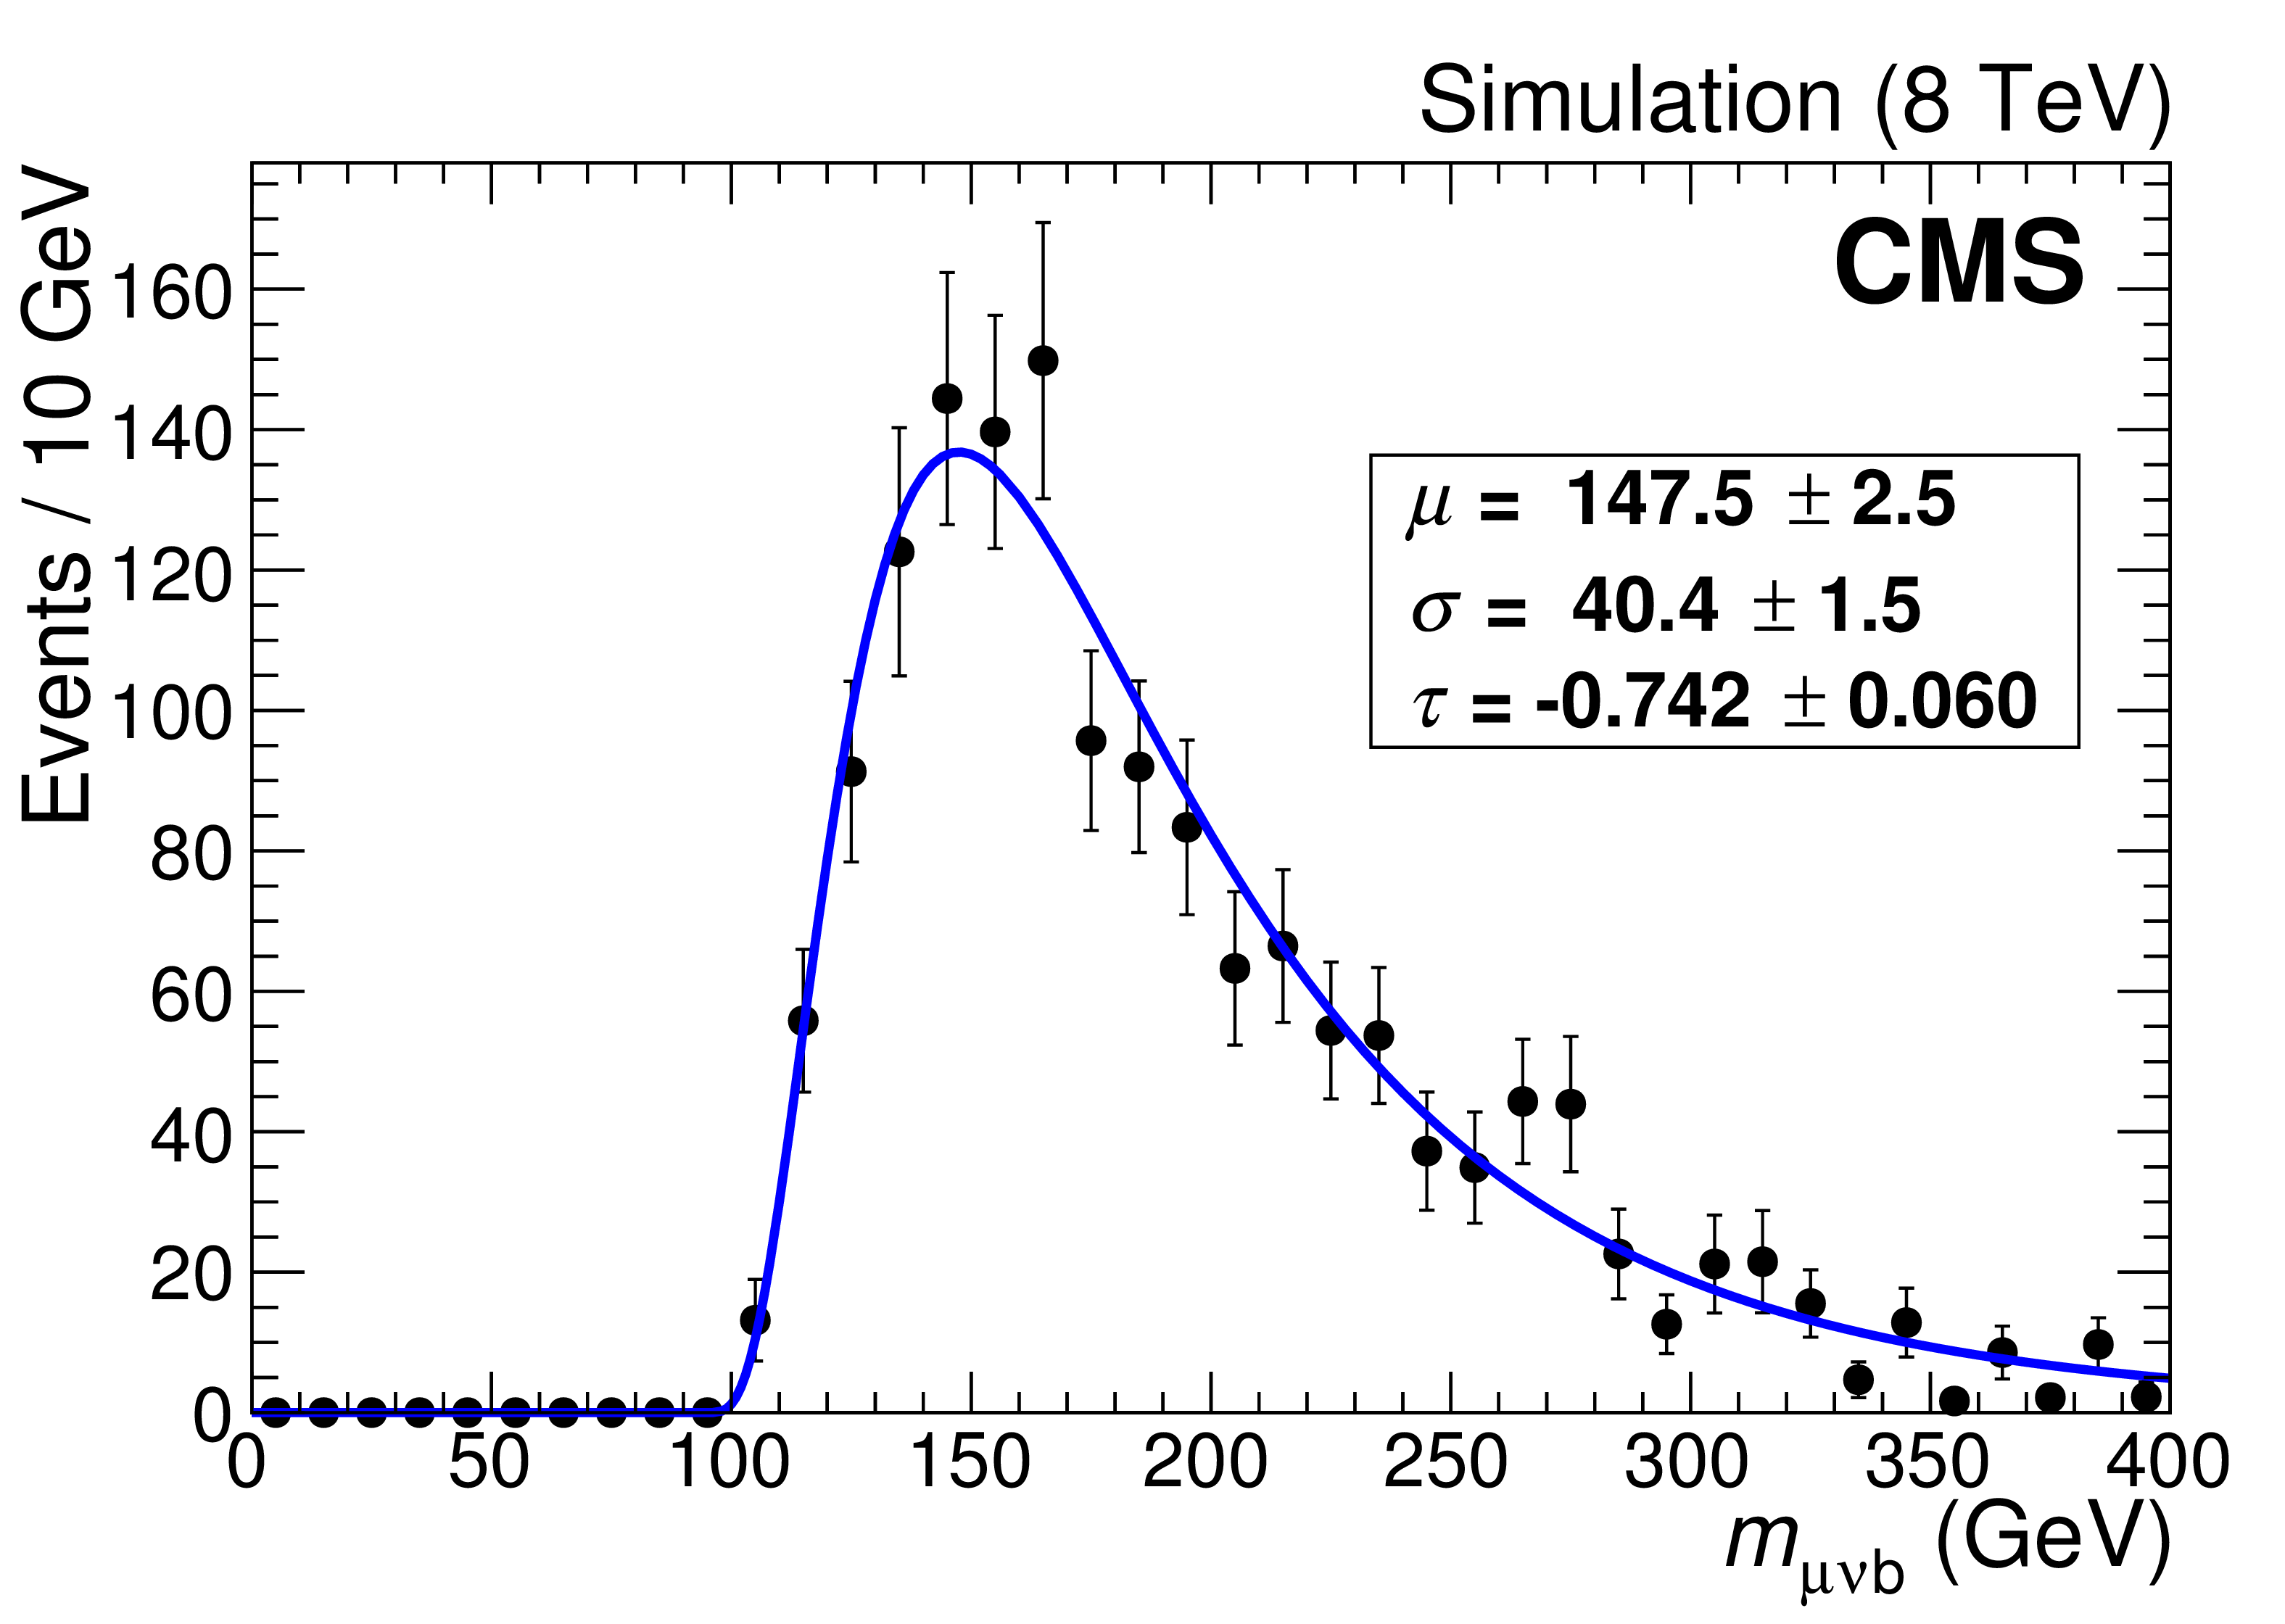
Figure 4-b:
Reconstructed $\mu \nu \mathrm{ b } $ invariant mass from Monte Carlo simulated events for ${\mathrm{ t } {}\mathrm{ \bar{t} } }$. The continuous lines show the results of fits to Crystal Ball shapes. |
png pdf |
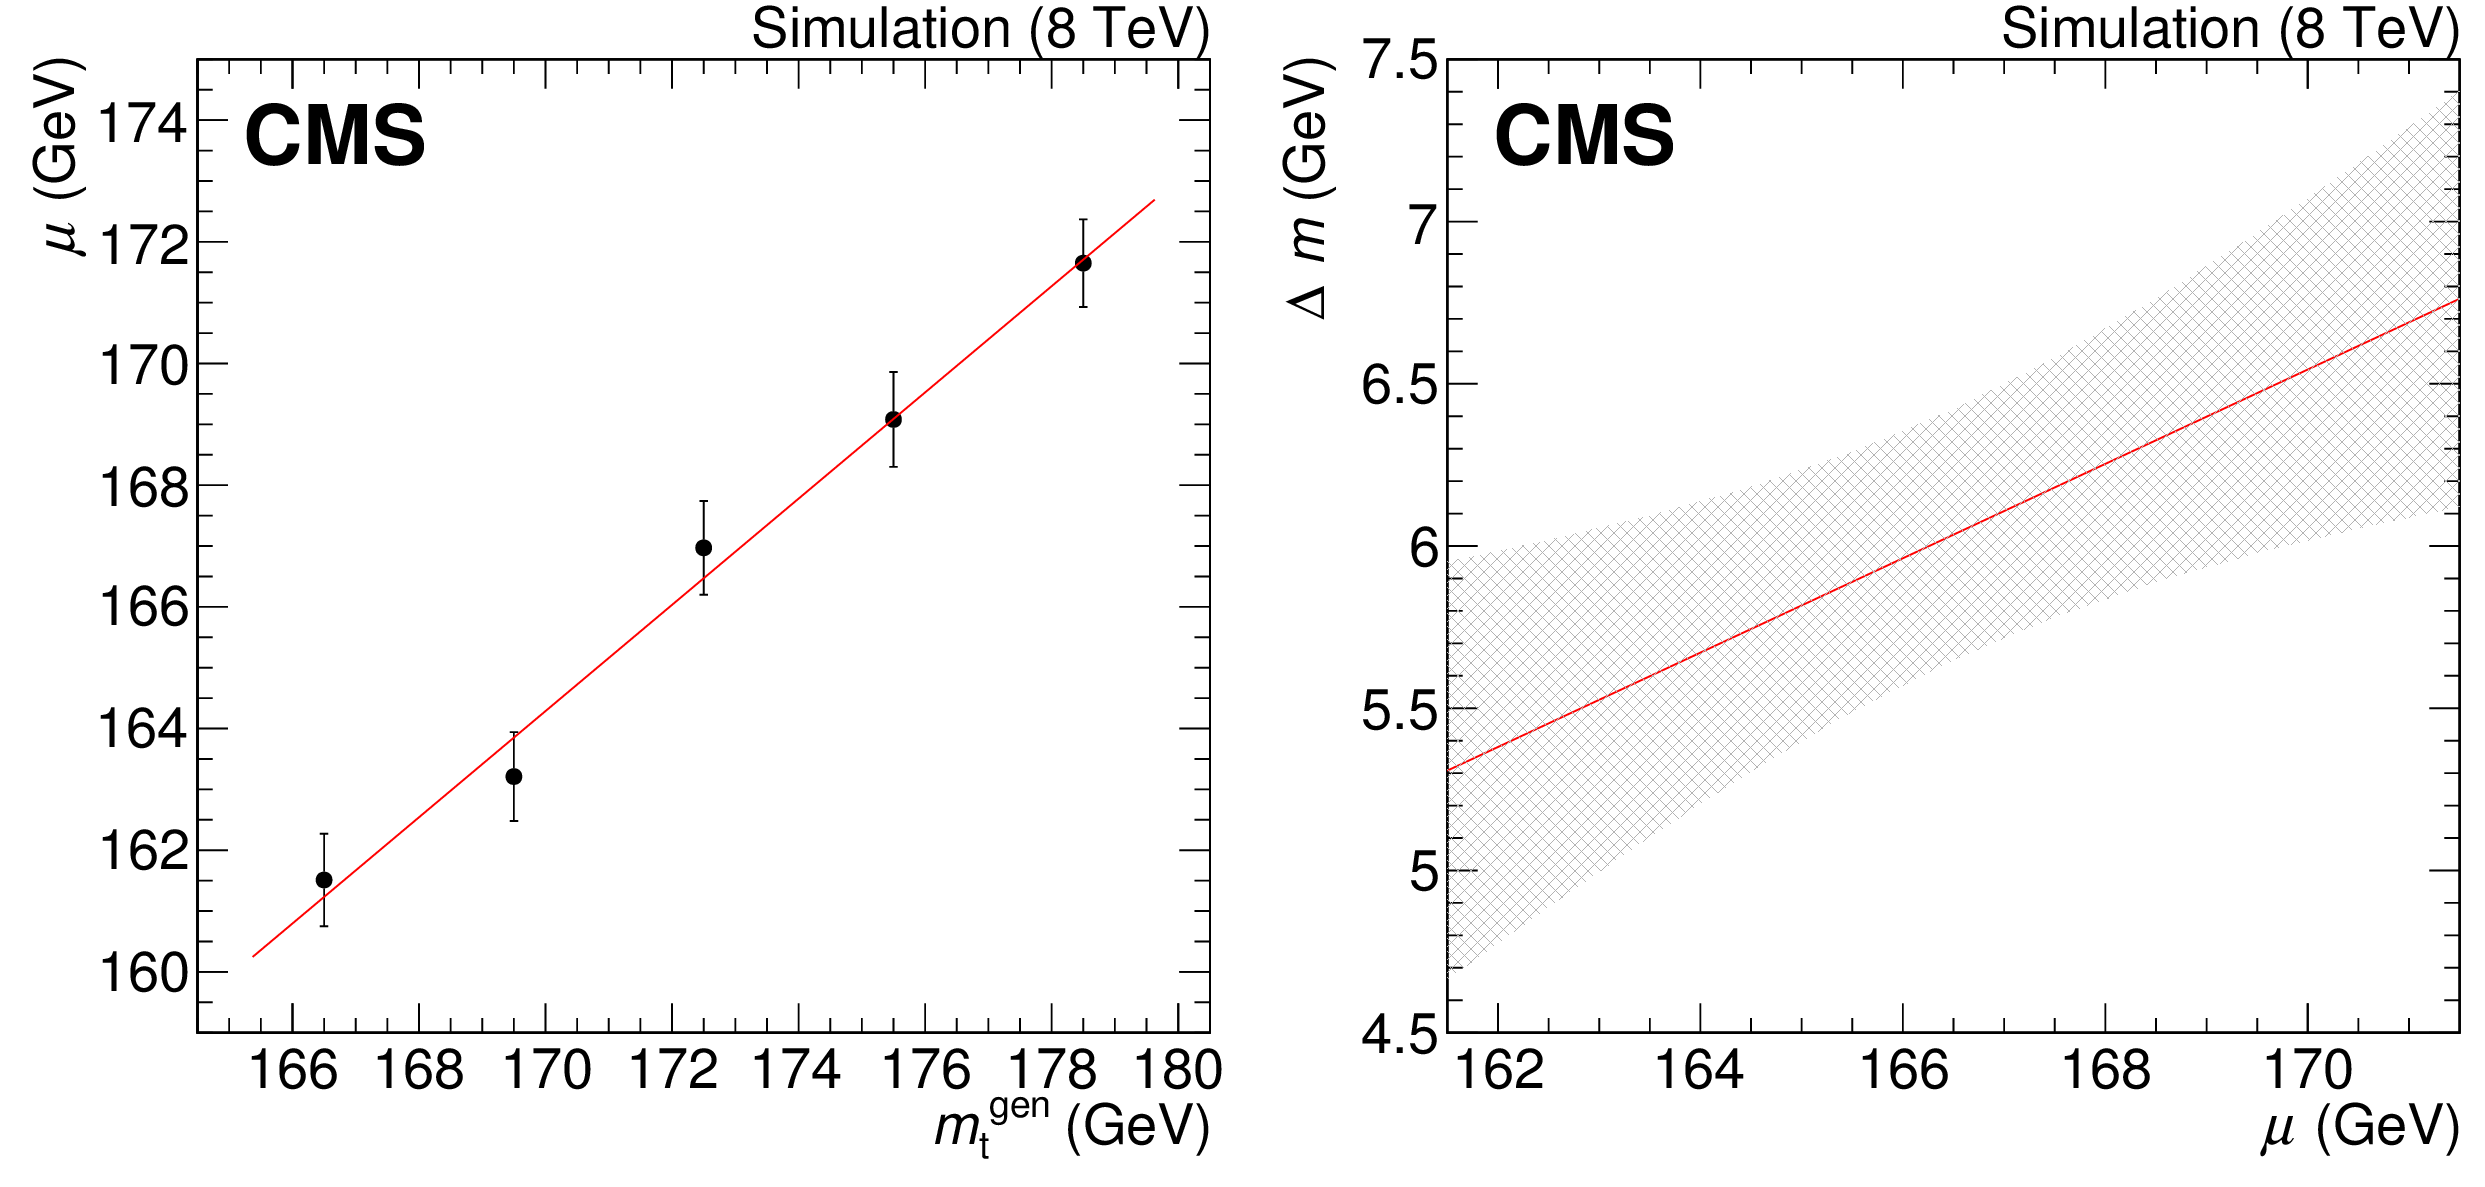
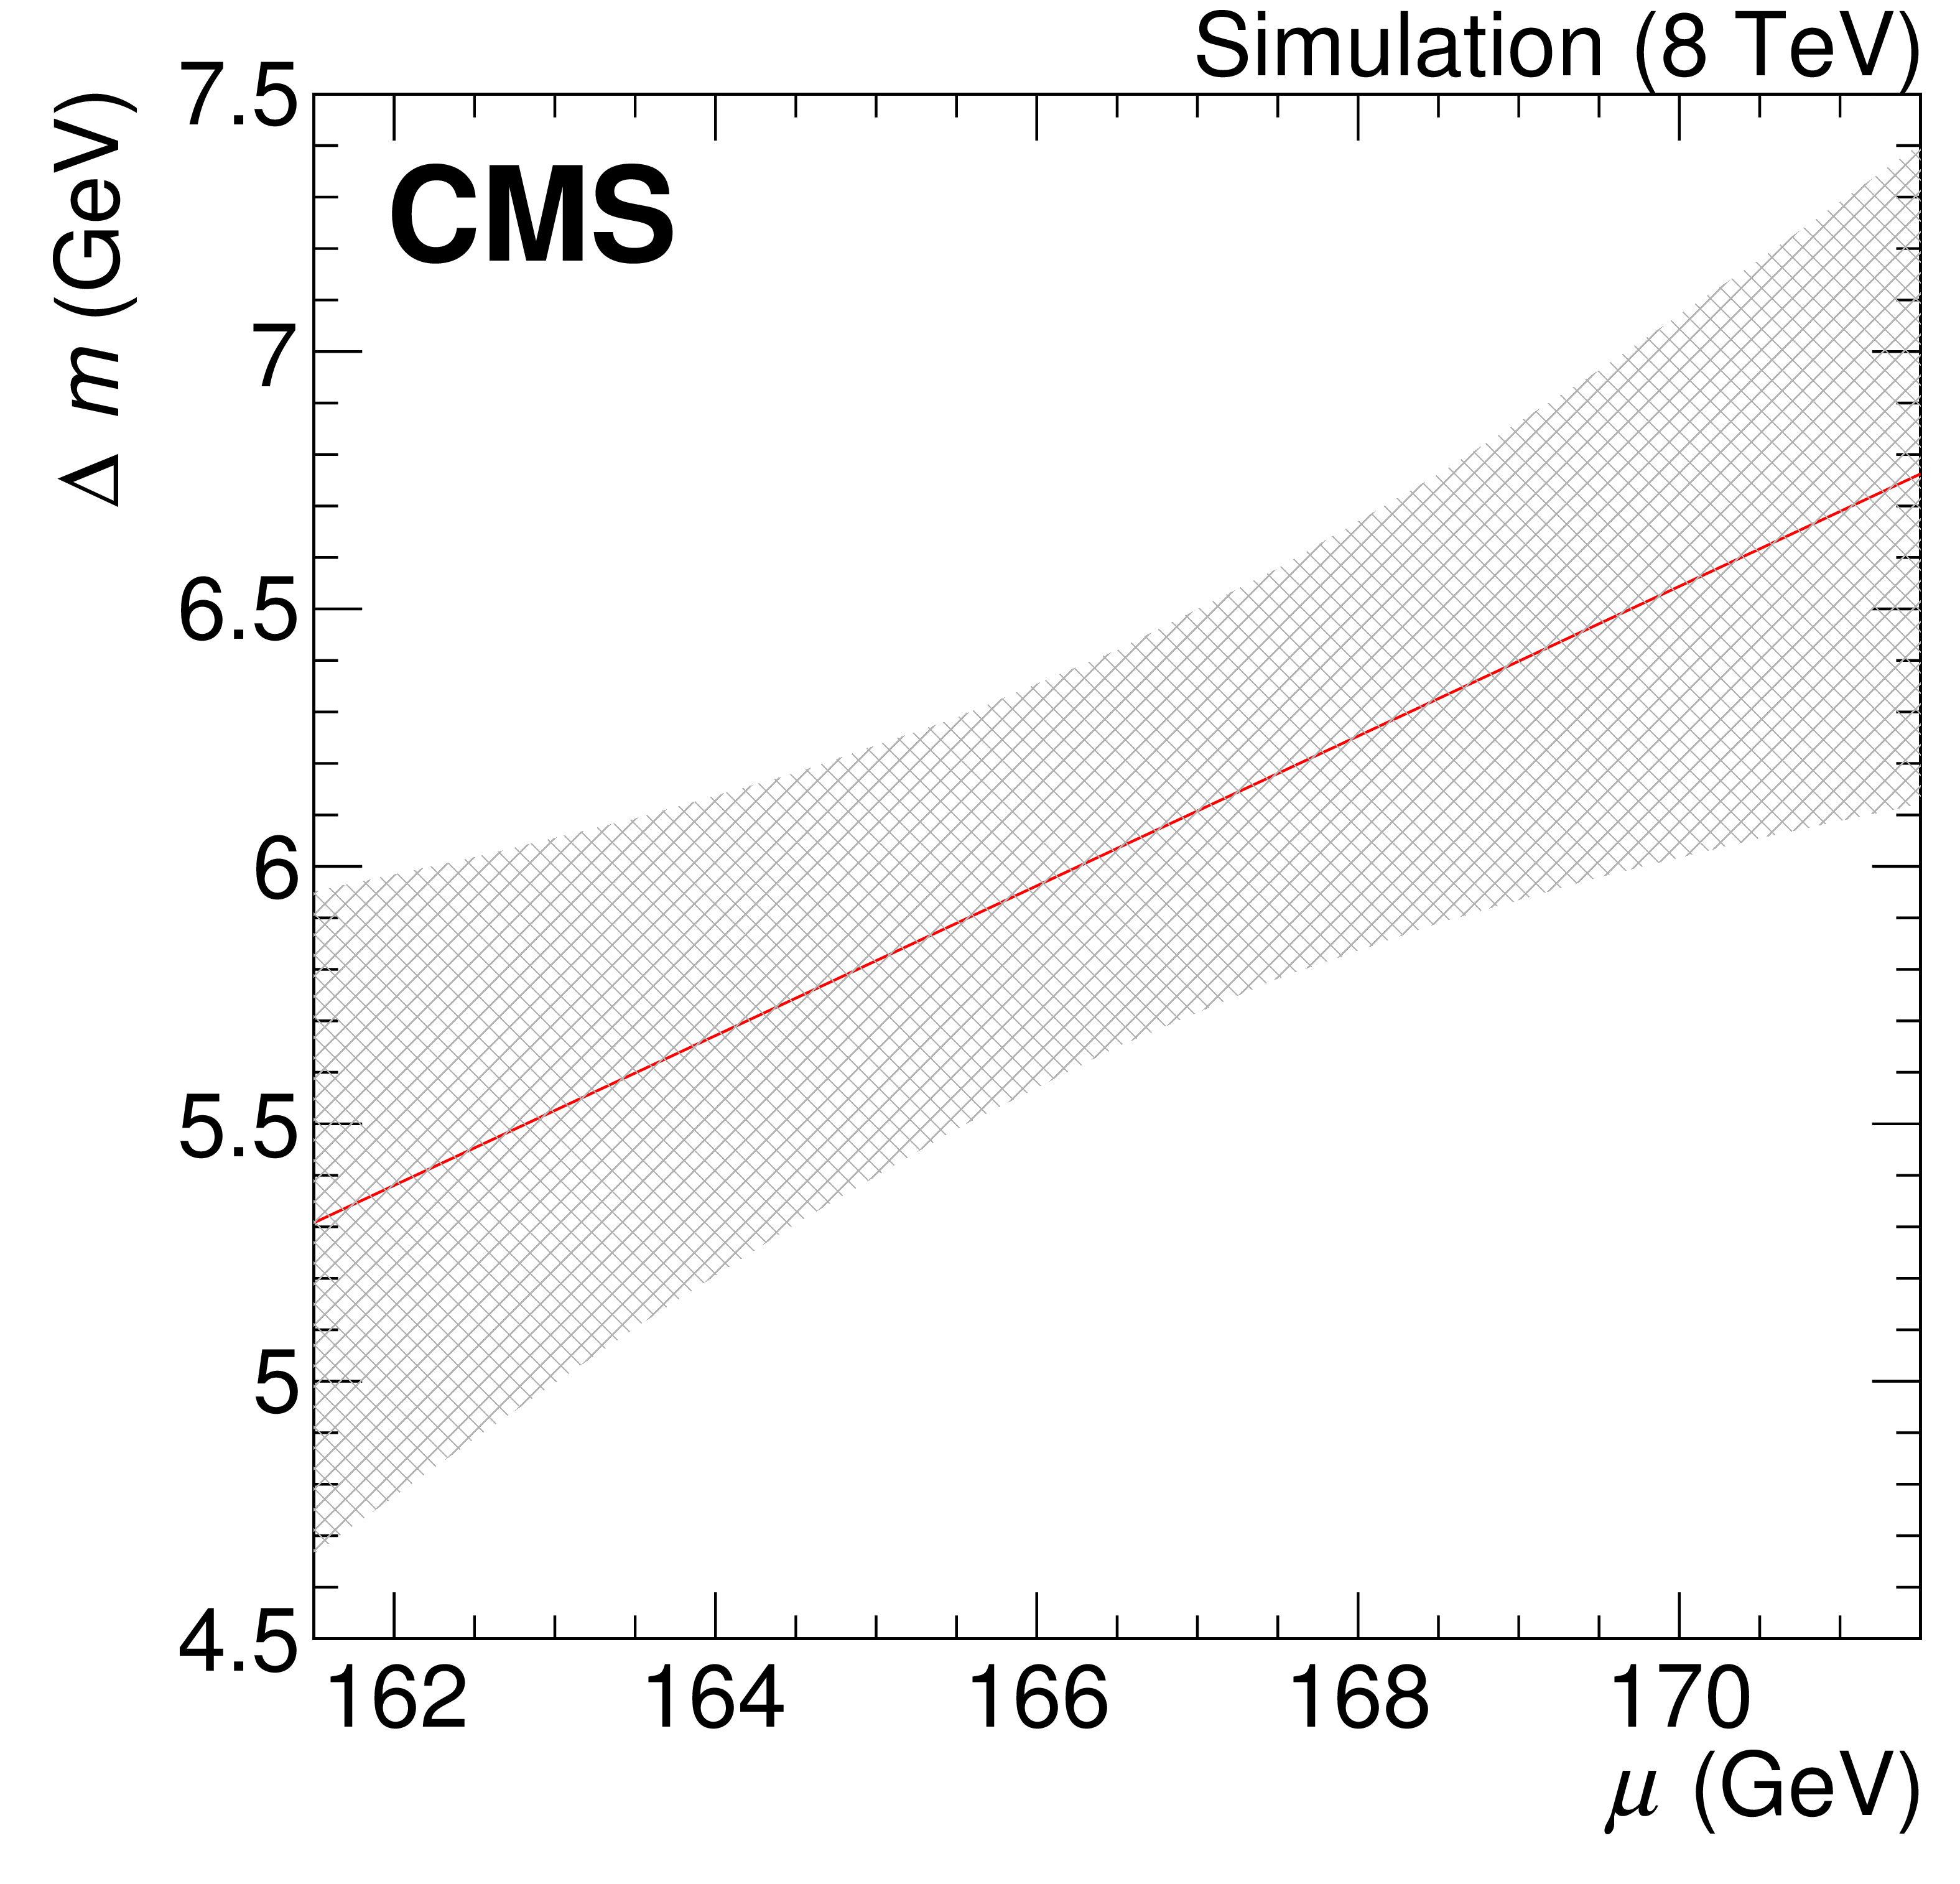
Figure 5:
Mass calibration from fits to samples with different generated top quark mass. Left: fit results as a function of the generated top quark mass. The straight line shows the result of a linear fit to the chosen top quark mass values. Right: mass correction, as a function of the fitted top quark mass (straight line). The shaded grey area represents the associated systematic uncertainty. |
png pdf |
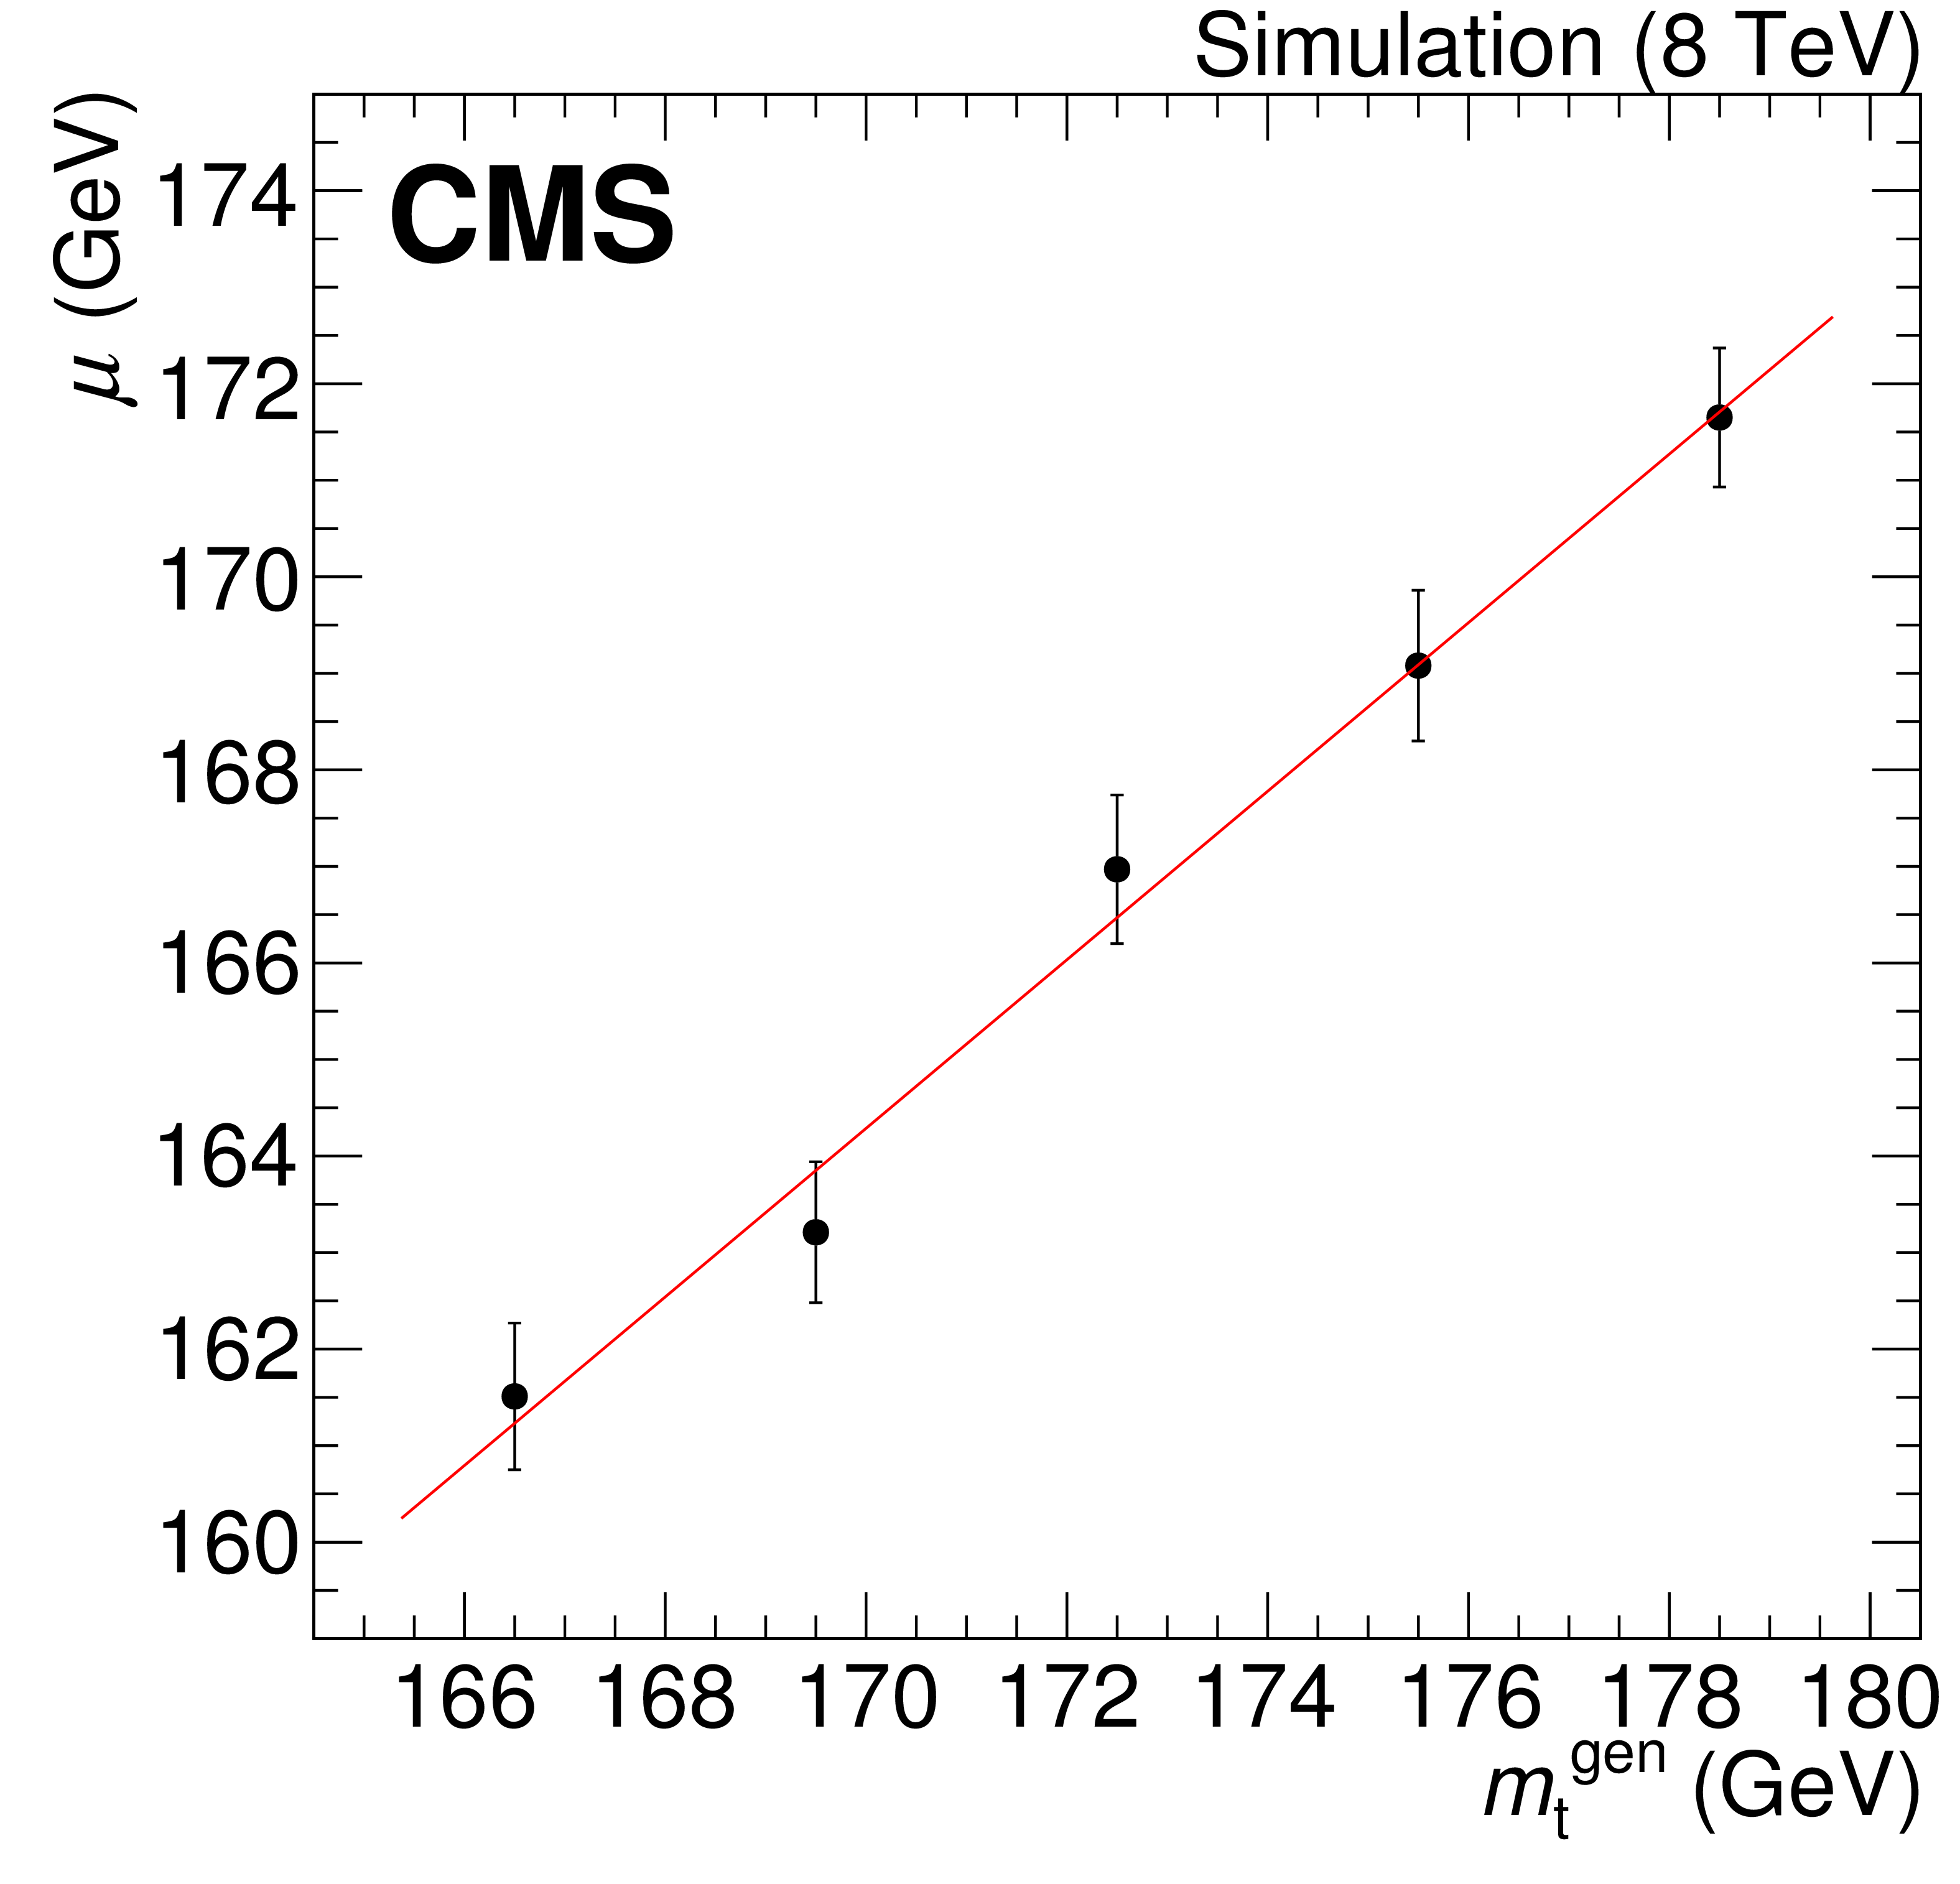
Figure 5-a:
Mass calibration from fits to samples with different generated top quark mass: fit results as a function of the generated top quark mass. The straight line shows the result of a linear fit to the chosen top quark mass values. |
png pdf |
Figure 5-b:
Mass calibration from fits to samples with different generated top quark mass: mass correction, as a function of the fitted top quark mass (straight line). The shaded grey area represents the associated systematic uncertainty. |
png pdf |
Figure 6:
Reconstructed $\mu \nu \mathrm{ b } $ invariant mass for non-top-quark background events, from Monte Carlo simulation. Left: before final selection; right: after final selection. The continuous lines show the results of fits to Novosibirsk functions. |
png pdf |
Figure 6-a:
Reconstructed $\mu \nu \mathrm{ b } $ invariant mass for non-top-quark background events, from Monte Carlo simulation before final selection. The continuous lines show the results of fits to Novosibirsk functions. |
png pdf |
Figure 6-b:
Reconstructed $\mu \nu \mathrm{ b } $ invariant mass for non-top-quark background events, from Monte Carlo simulation after final selection. The continuous lines show the results of fits to Novosibirsk functions. |

png pdf |
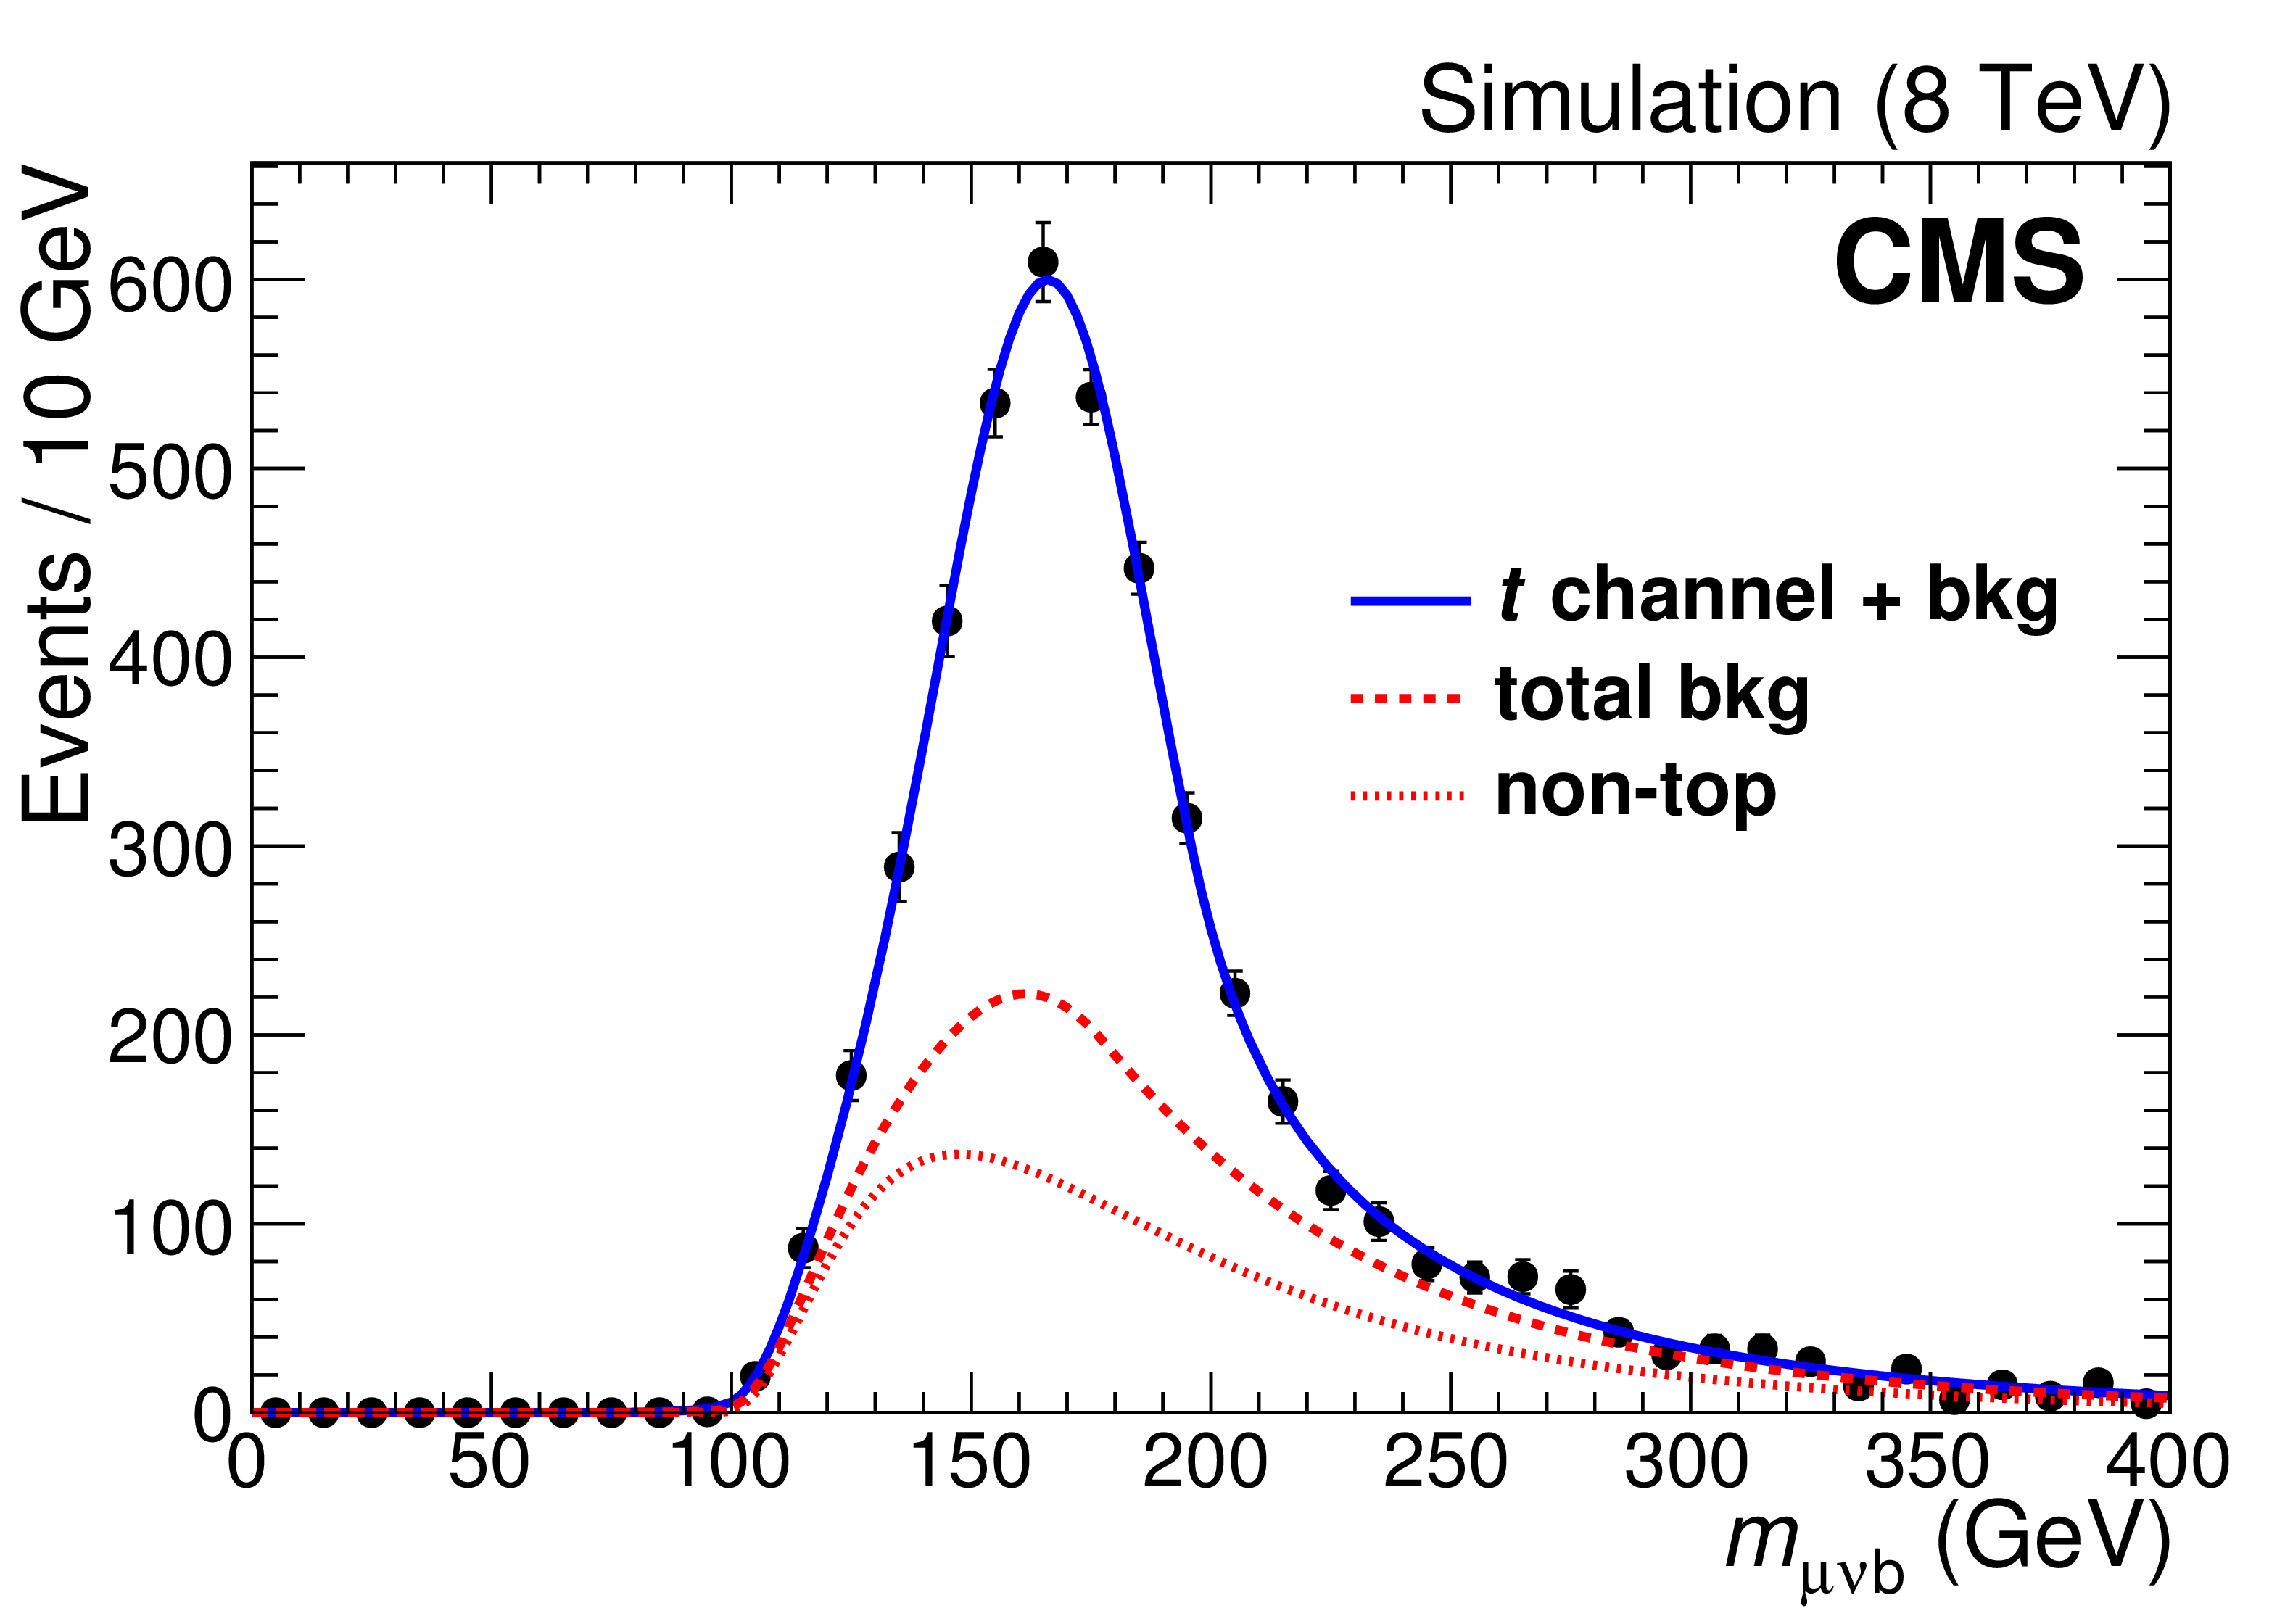
Figure 7:
Result of the fit to the reconstructed $\mu \nu \mathrm{ b } $ invariant mass. Left: Monte Carlo simulation; right: data. In each plot, the solid line represents the result of the full fit; the dotted line shows the non-top-quark component, while the dashed line shows the sum of all background components. |
png pdf |
Figure 7-a:
Result of the fit to the reconstructed $\mu \nu \mathrm{ b } $ invariant mass: Monte Carlo simulation. The solid line represents the result of the full fit; the dotted line shows the non-top-quark component, while the dashed line shows the sum of all background components. |

png pdf |
Figure 7-b:
Result of the fit to the reconstructed $\mu \nu \mathrm{ b } $ invariant mass: data. The solid line represents the result of the full fit; the dotted line shows the non-top-quark component, while the dashed line shows the sum of all background components. |
| Tables | |
png pdf |
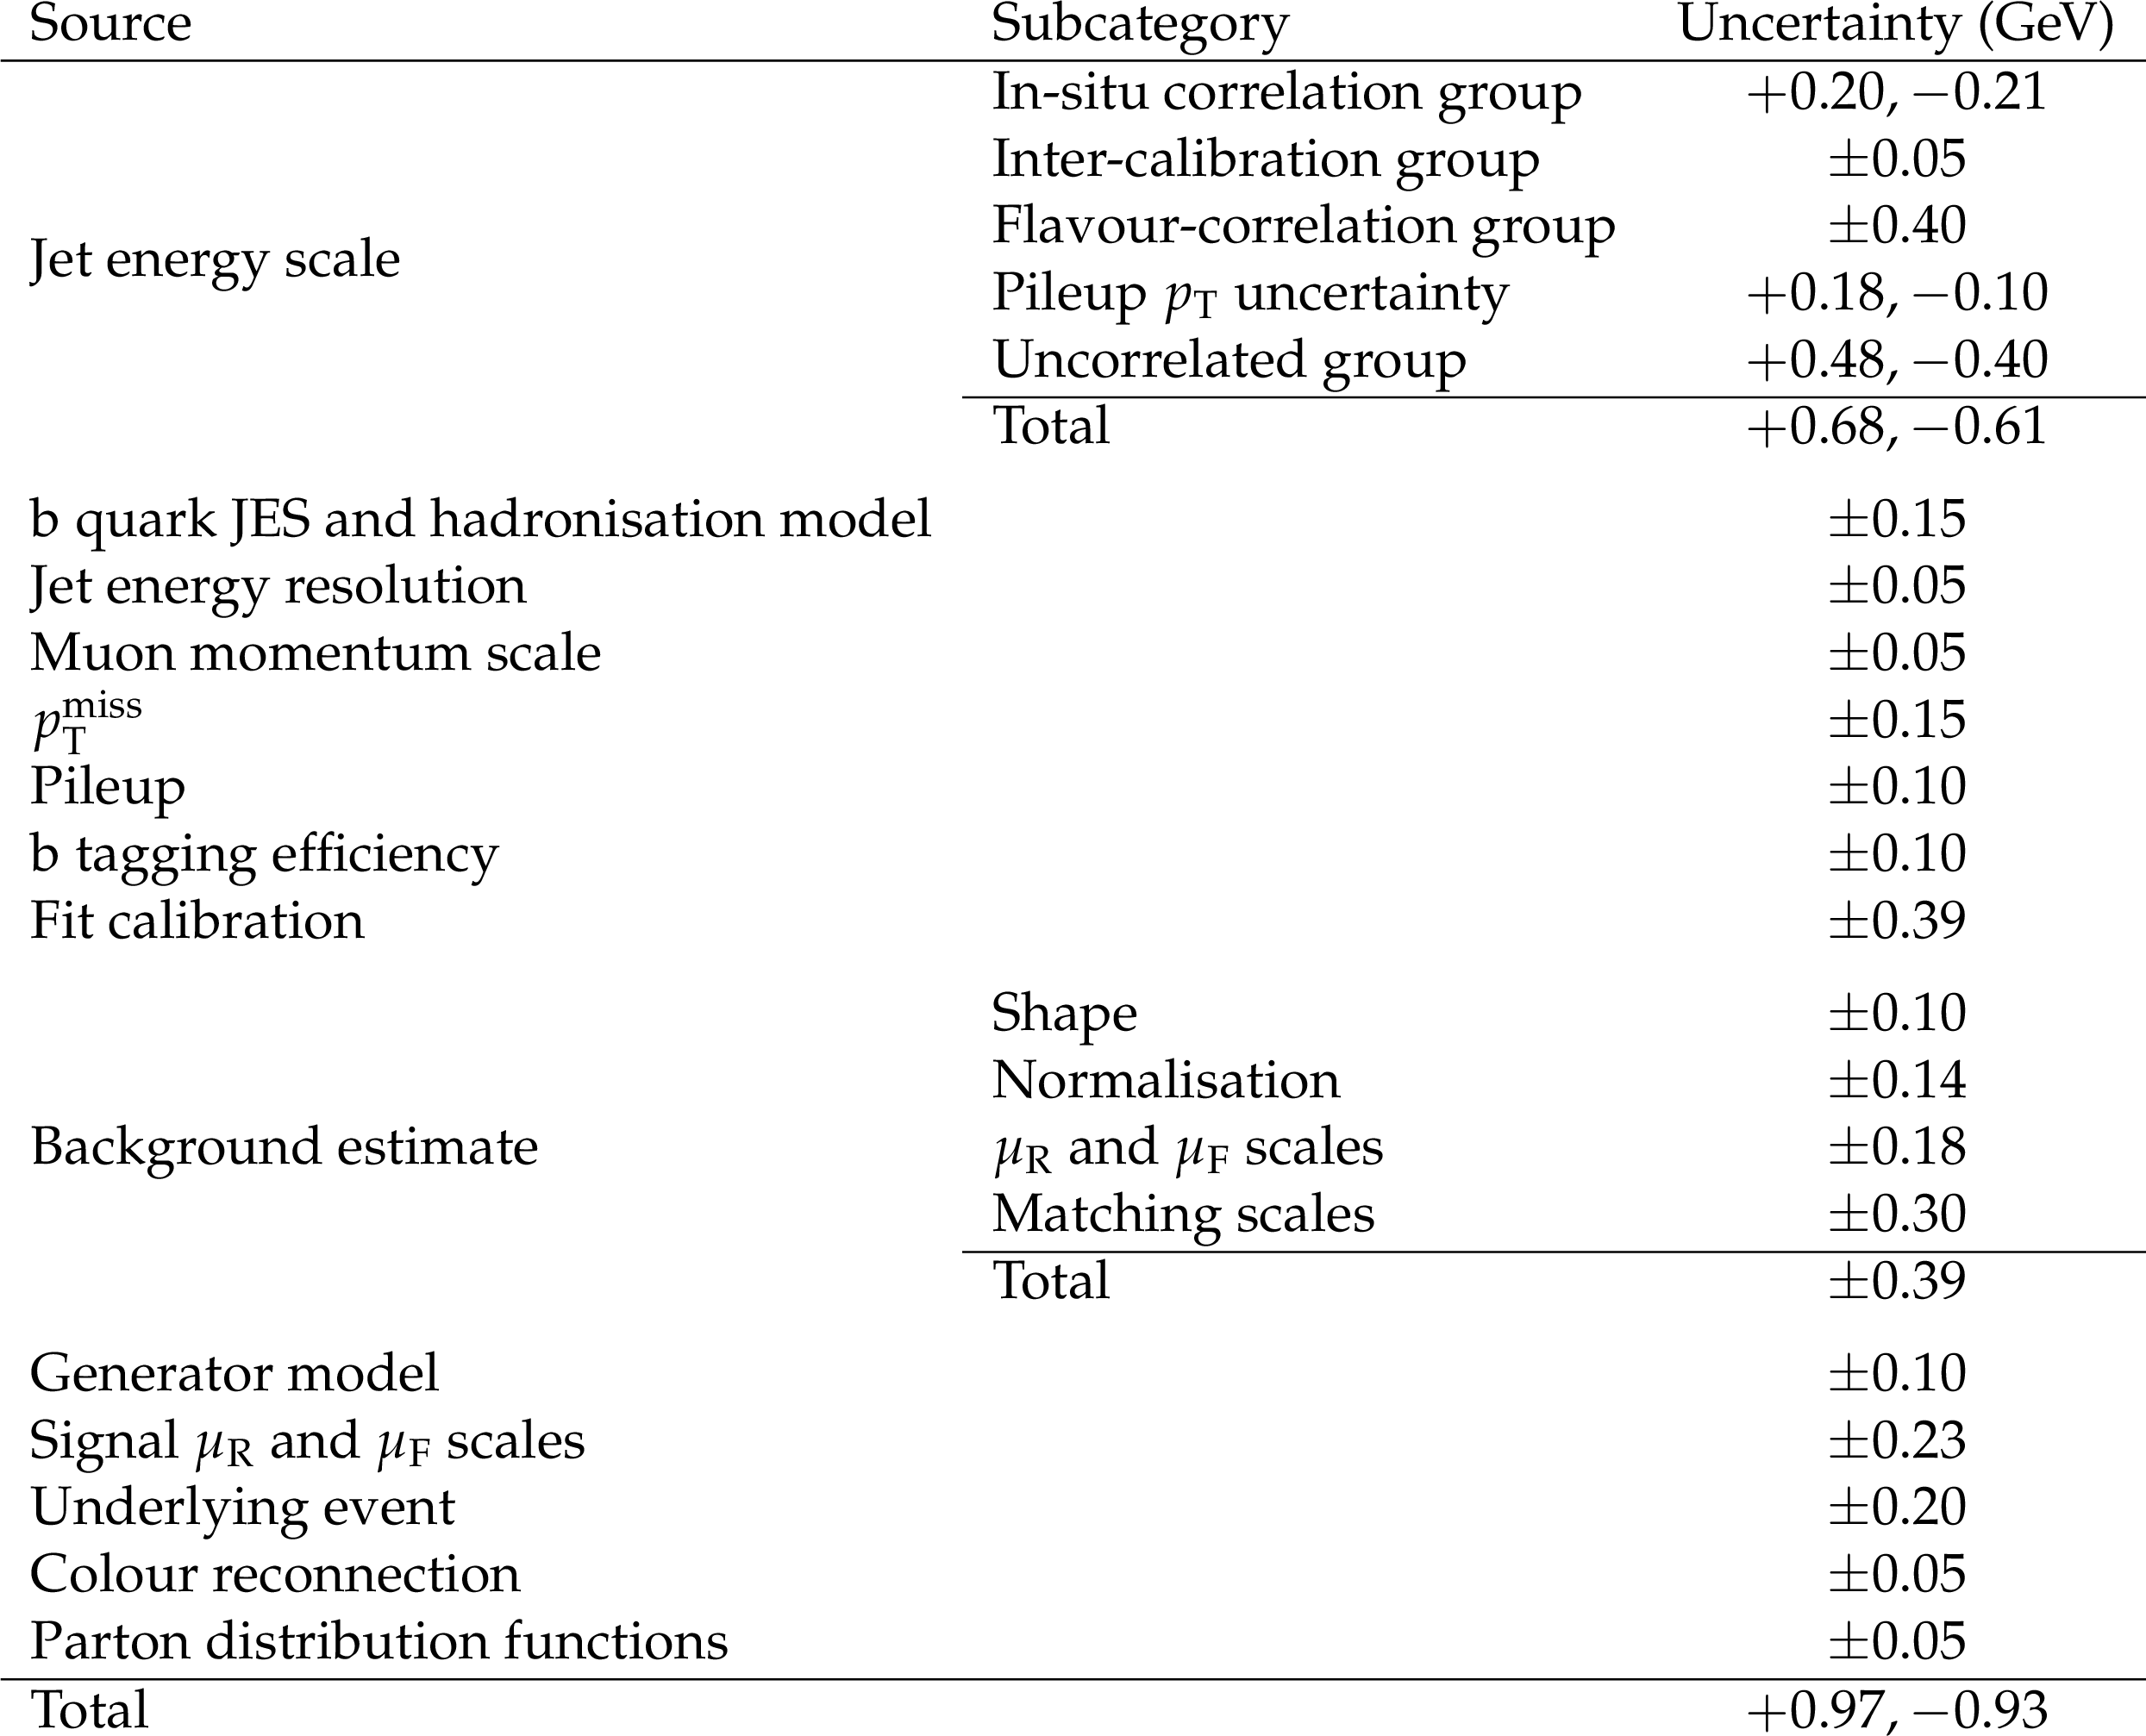
Table 1:
Systematic uncertainties in the top quark mass. |
| Summary |
| The top quark mass is measured in a sample enriched in events with a single top quark for the first time. Top quarks are reconstructed from decays to a W boson and a b quark, with the W boson decaying to a muon and a neutrino. In the final sample, events with a top quark from single production in the $t$-channel account for 73% of the total number of events with a top quark. The measurement is obtained from a fit to the distribution of the reconstructed mass of top quark candidates, where the $t$-channel single top quark component is modelled separately from the contribution of other top quark production channels. The measured value is $m_{\mathrm{ t }} =$ 172.95 $\pm$ 0.77 (stat) $^{+0.97}_{-0.93}$ (syst) GeV. This is in agreement with the current combination of Tevatron and LHC results, 173.34 $\pm$ 0.27 (stat) $\pm$ 0.71 (syst) GeV, which is based on measurements using $\mathrm{ t \bar{t} }$ events. |
| References | ||||
| 1 | ATLAS, CDF, CMS and D0 Collaboration | First combination of Tevatron and LHC measurements of the top-quark mass | CMS-PAS-TOP-13-014 | 1403.4427 |
| 2 | A. Juste et al. | Determination of the top quark mass circa 2013: methods, subtleties, perspectives | EPJC 74 (2014) 3119 | 1310.0799 |
| 3 | S. Argyropoulos and T. Sjostrand | Effects of color reconnection on $ t\bar{t} $ final states at the LHC | JHEP 11 (2014) 043 | 1407.6653 |
| 4 | CDF and D0 Collaboration | Combination of measurements of the top-quark pair production cross section from the Tevatron collider | PRD 89 (2014) 072001 | 1309.7570 |
| 5 | CMS Collaboration | Measurement of the $ t $-channel single-top-quark production cross section and of the $ |V_{\mathrm{tb}}| $ CKM matrix element in pp collisions at $ \sqrt{s} = $ 8 TeV | JHEP 06 (2014) 090 | CMS-TOP-12-038 1403.7366 |
| 6 | ATLAS Collaboration | Comprehensive measurements of $ t $-channel single top-quark production cross sections at $ \sqrt{s} = $ 7 TeV with the ATLAS detector | PRD 90 (2014) 112006 | 1406.7844 |
| 7 | CMS Collaboration | The CMS experiment at the CERN LHC | JINST 3 (2008) S08004 | CMS-00-001 |
| 8 | J. M. Campbell, R. Frederix, F. Maltoni, and F. Tramontano | NLO predictions for $ t $-channel production of single top and fourth generation quarks at hadron colliders | JHEP 10 (2009) 042 | 0907.3933 |
| 9 | F. Maltoni, G. Ridolfi, and M. Ubiali | b-initiated processes at the LHC: a reappraisal | JHEP 07 (2012) 022 | 1203.6393 |
| 10 | R. Frederix, E. Re, and P. Torrielli | Single-top $ t $-channel hadroproduction in the four-flavour scheme with POWHEG and aMC@NLO | JHEP 09 (2012) 130 | 1207.5391 |
| 11 | M. Aliev et al. | HATHOR: HAdronic Top and Heavy quarks crOss section calculatoR | CPC 182 (2011) 1034 | 1007.1327 |
| 12 | P. Kant et al. | HatHor for single top-quark production: Updated predictions and uncertainty estimates for single top-quark production in hadronic collisions | CPC 191 (2015) 74 | 1406.4403 |
| 13 | S. Alekhin et al. | The PDF4LHC Working Group Interim Report | 1101.0536 | |
| 14 | M. Botje et al. | The PDF4LHC Working Group Interim Recommendations | 1101.0538 | |
| 15 | A. D. Martin, W. J. Stirling, R. M. Thorne, and G. Watt | Parton distributions for the LHC | EPJC 63 (2009) 189 | 0901.0002 |
| 16 | A. D. Martin, W. J. Stirling, R. S. Thorne, and G. Watt | Uncertainties on $ \alpha_S $ in global PDF analyses and implications for predicted hadronic cross sections | EPJC 64 (2009) 653 | 0905.3531 |
| 17 | H.-L. Lai et al. | New parton distributions for collider physics | PRD 82 (2010) 074024 | 1007.2241 |
| 18 | NNPDF Collaboration | Parton distributions with LHC data | Nucl. Phys. B 867 (2013) 244 | 1207.1303 |
| 19 | M. Czakon and A. Mitov | Top++: A program for the calculation of the top-pair cross-section at hadron colliders | CPC 185 (2014) 2930 | 1112.5675 |
| 20 | J. Gao et al. | CT10 next-to-next-to-leading order global analysis of QCD | PRD 89 (2014) 033009 | 1302.6246 |
| 21 | S. Alioli, P. Nason, C. Oleari, and E. Re | A general framework for implementing NLO calculations in shower Monte Carlo programs: the POWHEG BOX | JHEP 06 (2010) 043 | 1002.2581 |
| 22 | T. Sjostrand, S. Mrenna, and P. Z. Skands | PYTHIA 6.4 physics and manual | JHEP 05 (2006) 026 | hep-ph/0603175 |
| 23 | J. Alwall et al. | The automated computation of tree-level and next-to-leading order differential cross sections, and their matching to parton shower simulations | JHEP 07 (2014) 079 | 1405.0301 |
| 24 | P. M. Nadolsky et al. | Implications of CTEQ global analysis for collider observables | PRD 78 (2008) 013004 | 0802.0007 |
| 25 | CMS Collaboration | Study of the underlying event at forward rapidity in pp collisions at $ \sqrt{s} = $ 0.9, 2.76, and 7 TeV | JHEP 04 (2013) 072 | |
| 26 | GEANT4 Collaboration | $ Geant 4--a $ simulation toolkit | NIMA 506 (2003) 250 | |
| 27 | CMS Collaboration | Particle--Flow Event Reconstruction in CMS and Performance for Jets, Taus, and $ E_{\mathrm{T}}^{\text{miss}} $ | CDS | |
| 28 | CMS Collaboration | Commissioning of the Particle-Flow Reconstruction in Minimum-Bias and Jet Events from $ \mathrm{ p }\mathrm{ p } $ Collisions at 7 TeV | CDS | |
| 29 | M. Cacciari and G. Salam | Pileup subtraction using jet areas | PLB 659 (2008) 119 | 0707.1378 |
| 30 | M. Cacciari, G. P. Salam, and G. Soyez | The anti-$ k_{\mathrm{t}} $ jet clustering algorithm | JHEP 04 (2008) 063 | 0802.1189 |
| 31 | CMS Collaboration | Determination of jet energy calibration and transverse momentum resolution in CMS | JINST 6 (2011) P11002 | CMS-JME-10-011 1107.4277 |
| 32 | CMS Collaboration | Identification of b-quark jets with the CMS experiment | JINST 8 (2013) P04013 | CMS-BTV-12-001 1211.4462 |
| 33 | N. Kidonakis | Differential and total cross sections for top pair and single top production | in XX Int. Workshop on Deep-Inelastic Scattering and Related Subjects, Bonn, Germany | 1205.3453 |
| 34 | J. Bauer | Prospects for the Observation of Electroweak Top-Quark Production with the CMS Experiment | PhD thesis, KIT, Karlsruhe, 2010CERN Thesis CERN-THESIS-2010-146, see pages 98-99 | |
| 35 | Particle Data Group, C. Patrignani et al. | Review of Particle Physics | CPC 40 (2016) 100001 | |
| 36 | M. J. Oreglia | A Study of the Reactions $ \psi' \to \gamma \gamma \psi$ | PhD thesis, Stanford University, 1980 SLAC Report SLAC-R-236, see Appendix D | |
| 37 | BELLE Collaboration | A detailed test of the CsI(Tl) calorimeter for BELLE with photon beams of energy between 20 MeV and 5.4 GeV | NIMA 441 (2000) 401 | |
| 38 | CMS Collaboration | Measurement of the top quark mass using proton-proton data at $ \sqrt{s} = $ 7 and 8 TeV | PRD 93 (2016) 072004 | CMS-TOP-14-022 1509.04044 |
| 39 | CMS and ATLAS Collaboration | Jet energy scale uncertainty correlations between ATLAS and CMS at 8 TeV | ||
| 40 | ALEPH Collaboration | Study of the fragmentation of b quarks into B mesons at the Z peak | PLB 512 (2001) 30 | hep-ex/0106051 |
| 41 | DELPHI Collaboration | A study of the b-quark fragmentation function with the DELPHI detector at LEP I and an averaged distribution obtained at the Z Pole | EPJC 71 (2011) 1557 | 1102.4748 |
| 42 | CMS Collaboration | Measurement of the lepton charge asymmetry in inclusive W production in $ \mathrm{pp} $ collisions at $ \sqrt{s} = $ 7 TeV | JHEP 04 (2011) 050 | |
| 43 | \COMPHEP Collaboration | COMPHEP 4.4: Automatic computations from Lagrangians to events | NIMA 534 (2004) 250 | hep-ph/0403113 |
| 44 | G. Corcella et al. | HERWIG 6: an event generator for hadron emission reactions with interfering gluons (including supersymmetric processes) | JHEP 01 (2001) 010 | hep-ph/0011363 |
| 45 | ATLAS Collaboration | New ATLAS event generator tunes to 2010 data | ATLAS PUB Note ATL-PHYS-PUB-2011-008 | |
| 46 | P. Z. Skands | Tuning Monte Carlo generators: The Perugia tunes | PRD 82 (2010) 074018 | 1005.3457 |
|
|
Compact Muon Solenoid LHC, CERN |
|

|

|

|

|

|