

Compact Muon Solenoid
LHC, CERN
| CMS-TOP-16-001 ; CERN-EP-2016-266 | ||
| Search for CP violation in $\mathrm{ t \bar{t} }$ production and decay in proton-proton collisions at $ \sqrt{s} = $ 8 TeV | ||
| CMS Collaboration | ||
| 28 November 2016 | ||
| JHEP 03 (2017) 101 | ||
| Abstract: The results of a first search for CP violation in the production and decay of top quark-antiquark ($\mathrm{ t \bar{t} }$) pairs are presented. The search is based on asymmetries in T-odd, triple-product correlation observables, where T is the time-reversal operator. The analysis uses a sample of proton-proton collisions at $ \sqrt{s} = $ 8 TeV collected by the CMS experiment, corresponding to an integrated luminosity of 19.7 fb$^{-1}$. Events are selected having one electron or muon and at least four jets. The T-odd observables are measured using four-momentum vectors associated with $ \mathrm{ t \bar{t} } $ production and decay. The measured asymmetries exhibit no evidence for CP-violating effects, consistent with the expectation from the standard model. | ||
| Links: e-print arXiv:1611.08931 [hep-ex] (PDF) ; CDS record ; inSPIRE record ; CADI line (restricted) ; | ||
| Figures | |

png pdf |
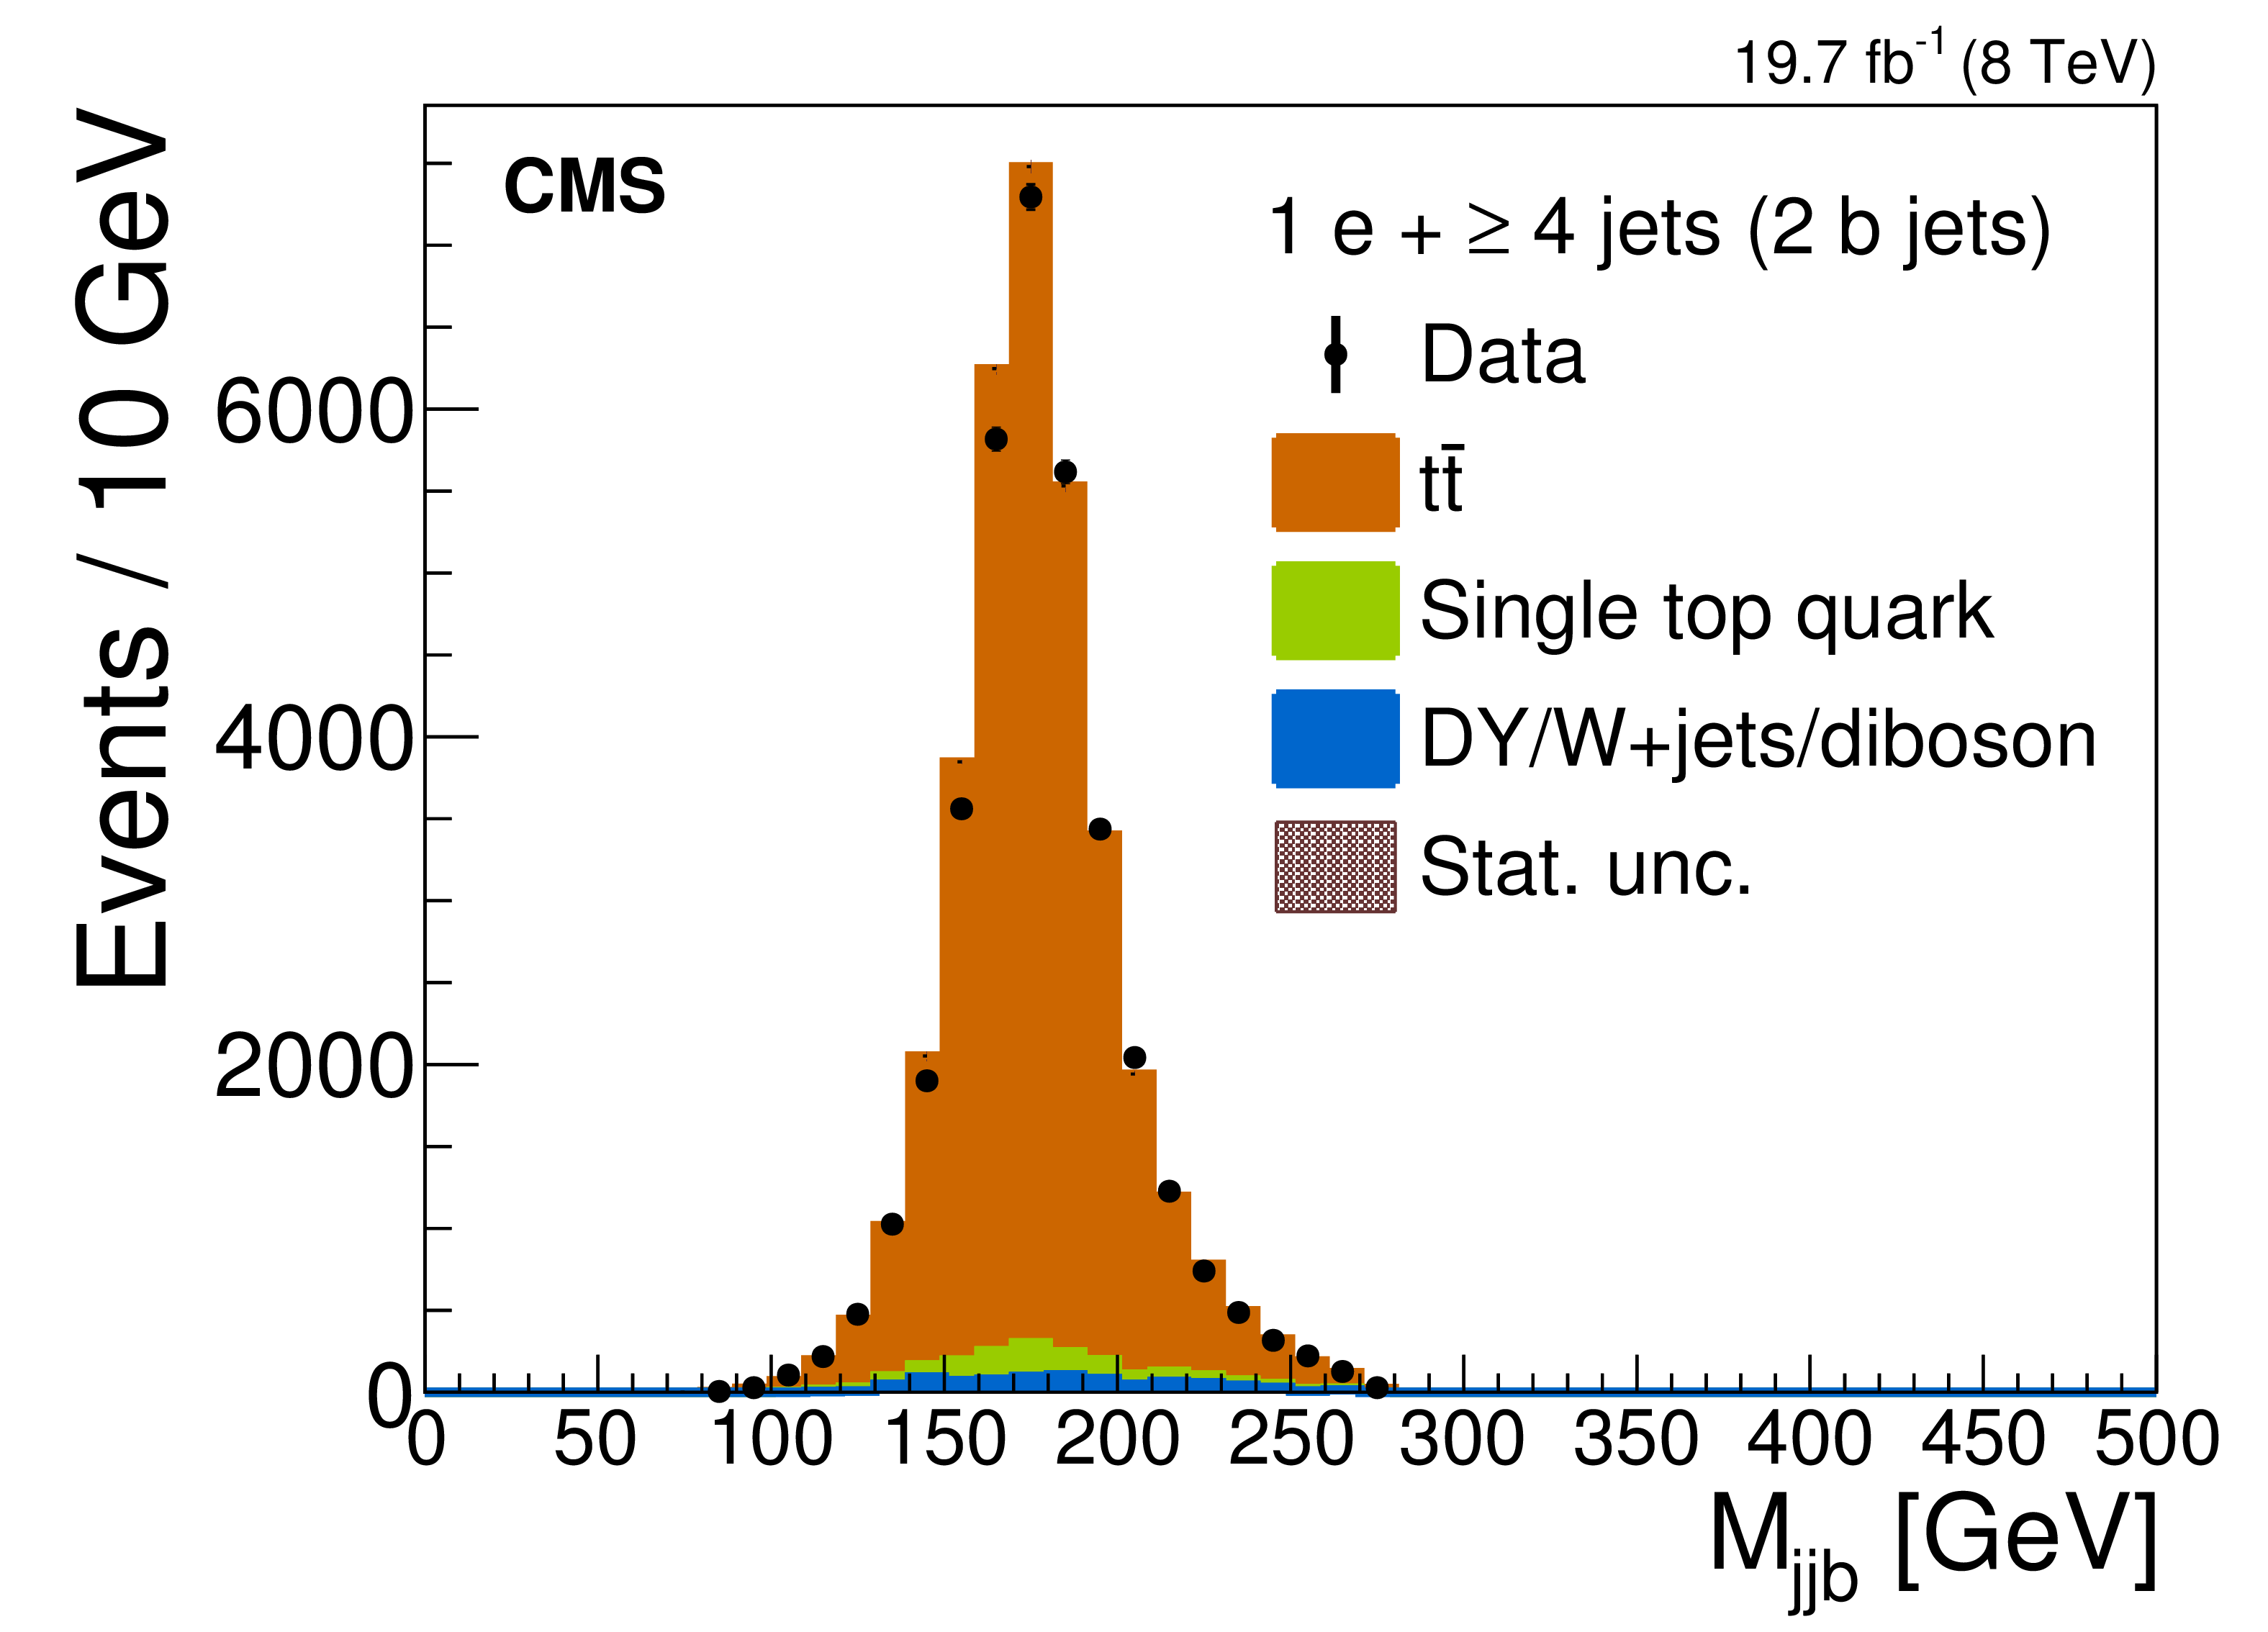
Figure 1:
The measured invariant mass distributions from data (points) of (upper) hadronically and (lower) semileptonically decaying top quark candidates in the (left) electron and (right) muon channels, compared to the predictions for the signal and various backgrounds from simulation (filled histograms). The QCD background is found to be negligible. The overflow events are collected in the last bins. The vertical bars on the data points and the hatched bands indicate the statistical uncertainties in the data and simulation, respectively. The lower panels show the relative fractional difference between the data and simulation, with its statistical uncertainty. |
png pdf |
Figure 1-a:
The measured invariant mass distribution from data (points) of hadronically decaying top quark candidates in the electron channel, compared to the predictions for the signal and various backgrounds from simulation (filled histograms). The QCD background is found to be negligible. The overflow events are collected in the last bin. The vertical bars on the data points and the hatched bands indicate the statistical uncertainties in the data and simulation, respectively. The lower panel shows the relative fractional difference between the data and simulation, with its statistical uncertainty. |
png pdf |
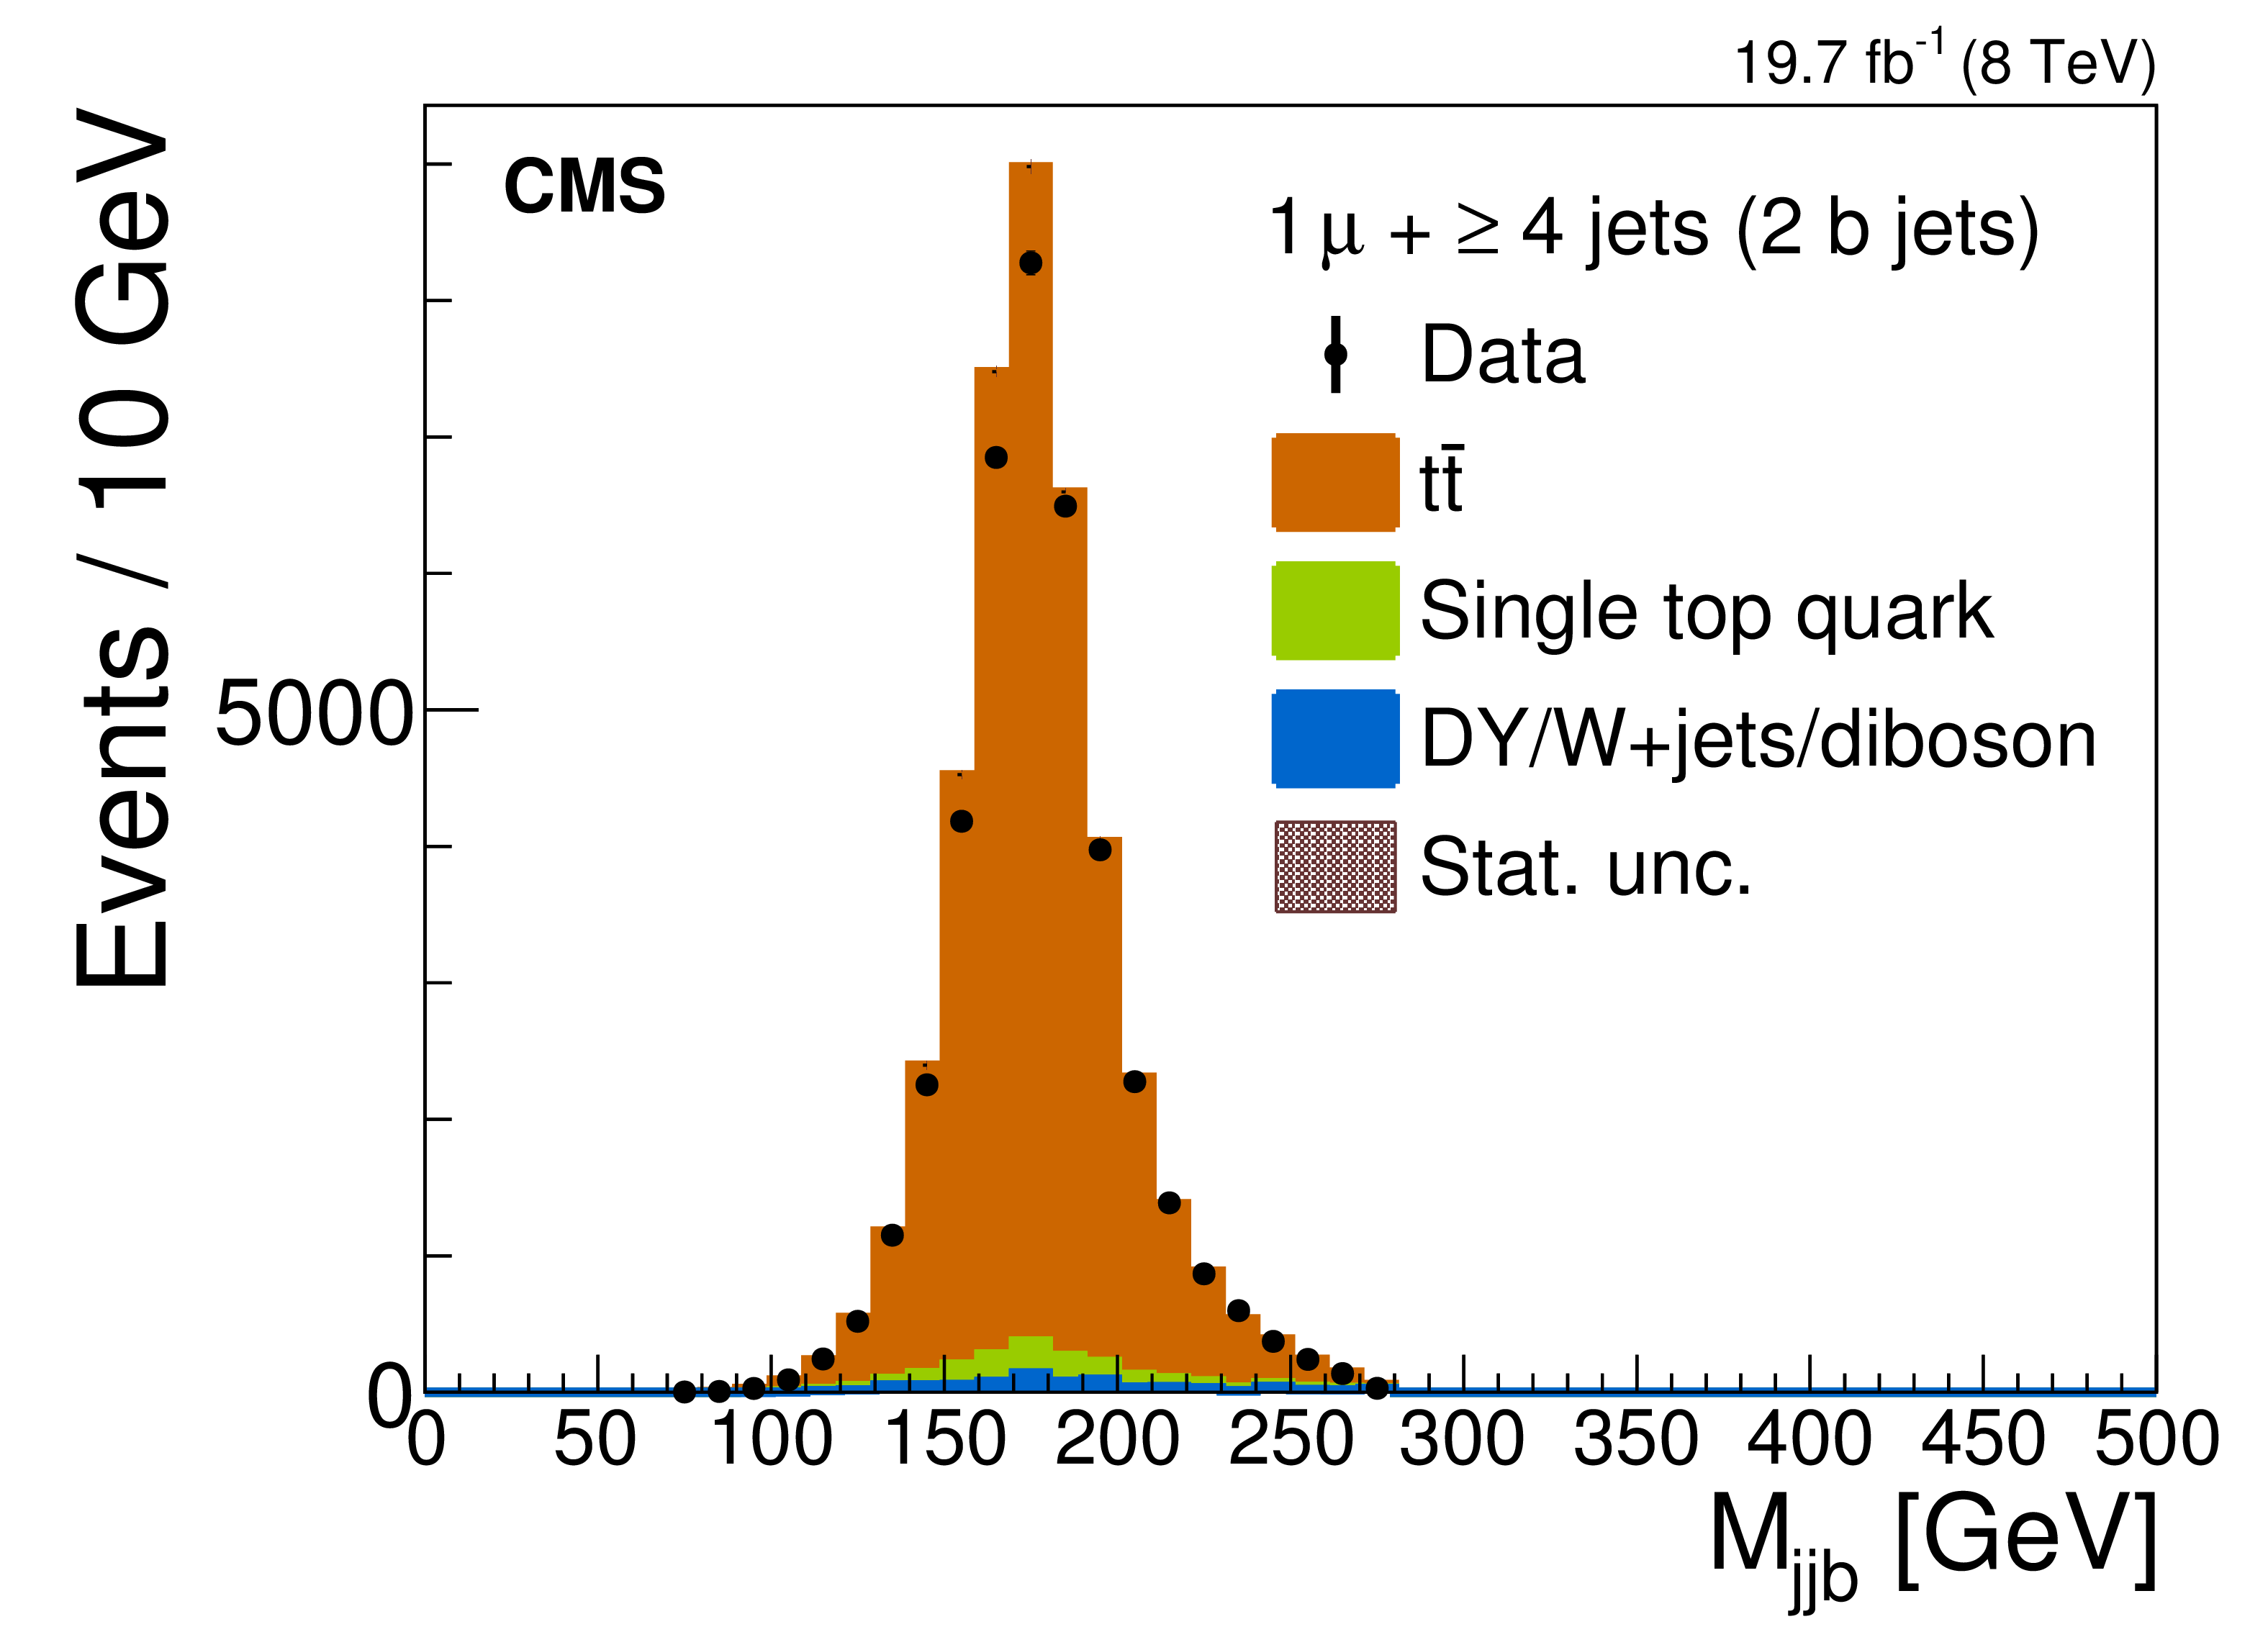
Figure 1-b:
The measured invariant mass distribution from data (points) of hadronically decaying top quark candidates in the muon channel, compared to the predictions for the signal and various backgrounds from simulation (filled histograms). The QCD background is found to be negligible. The overflow events are collected in the last bin. The vertical bars on the data points and the hatched bands indicate the statistical uncertainties in the data and simulation, respectively. The lower panel shows the relative fractional difference between the data and simulation, with its statistical uncertainty. |
png pdf |
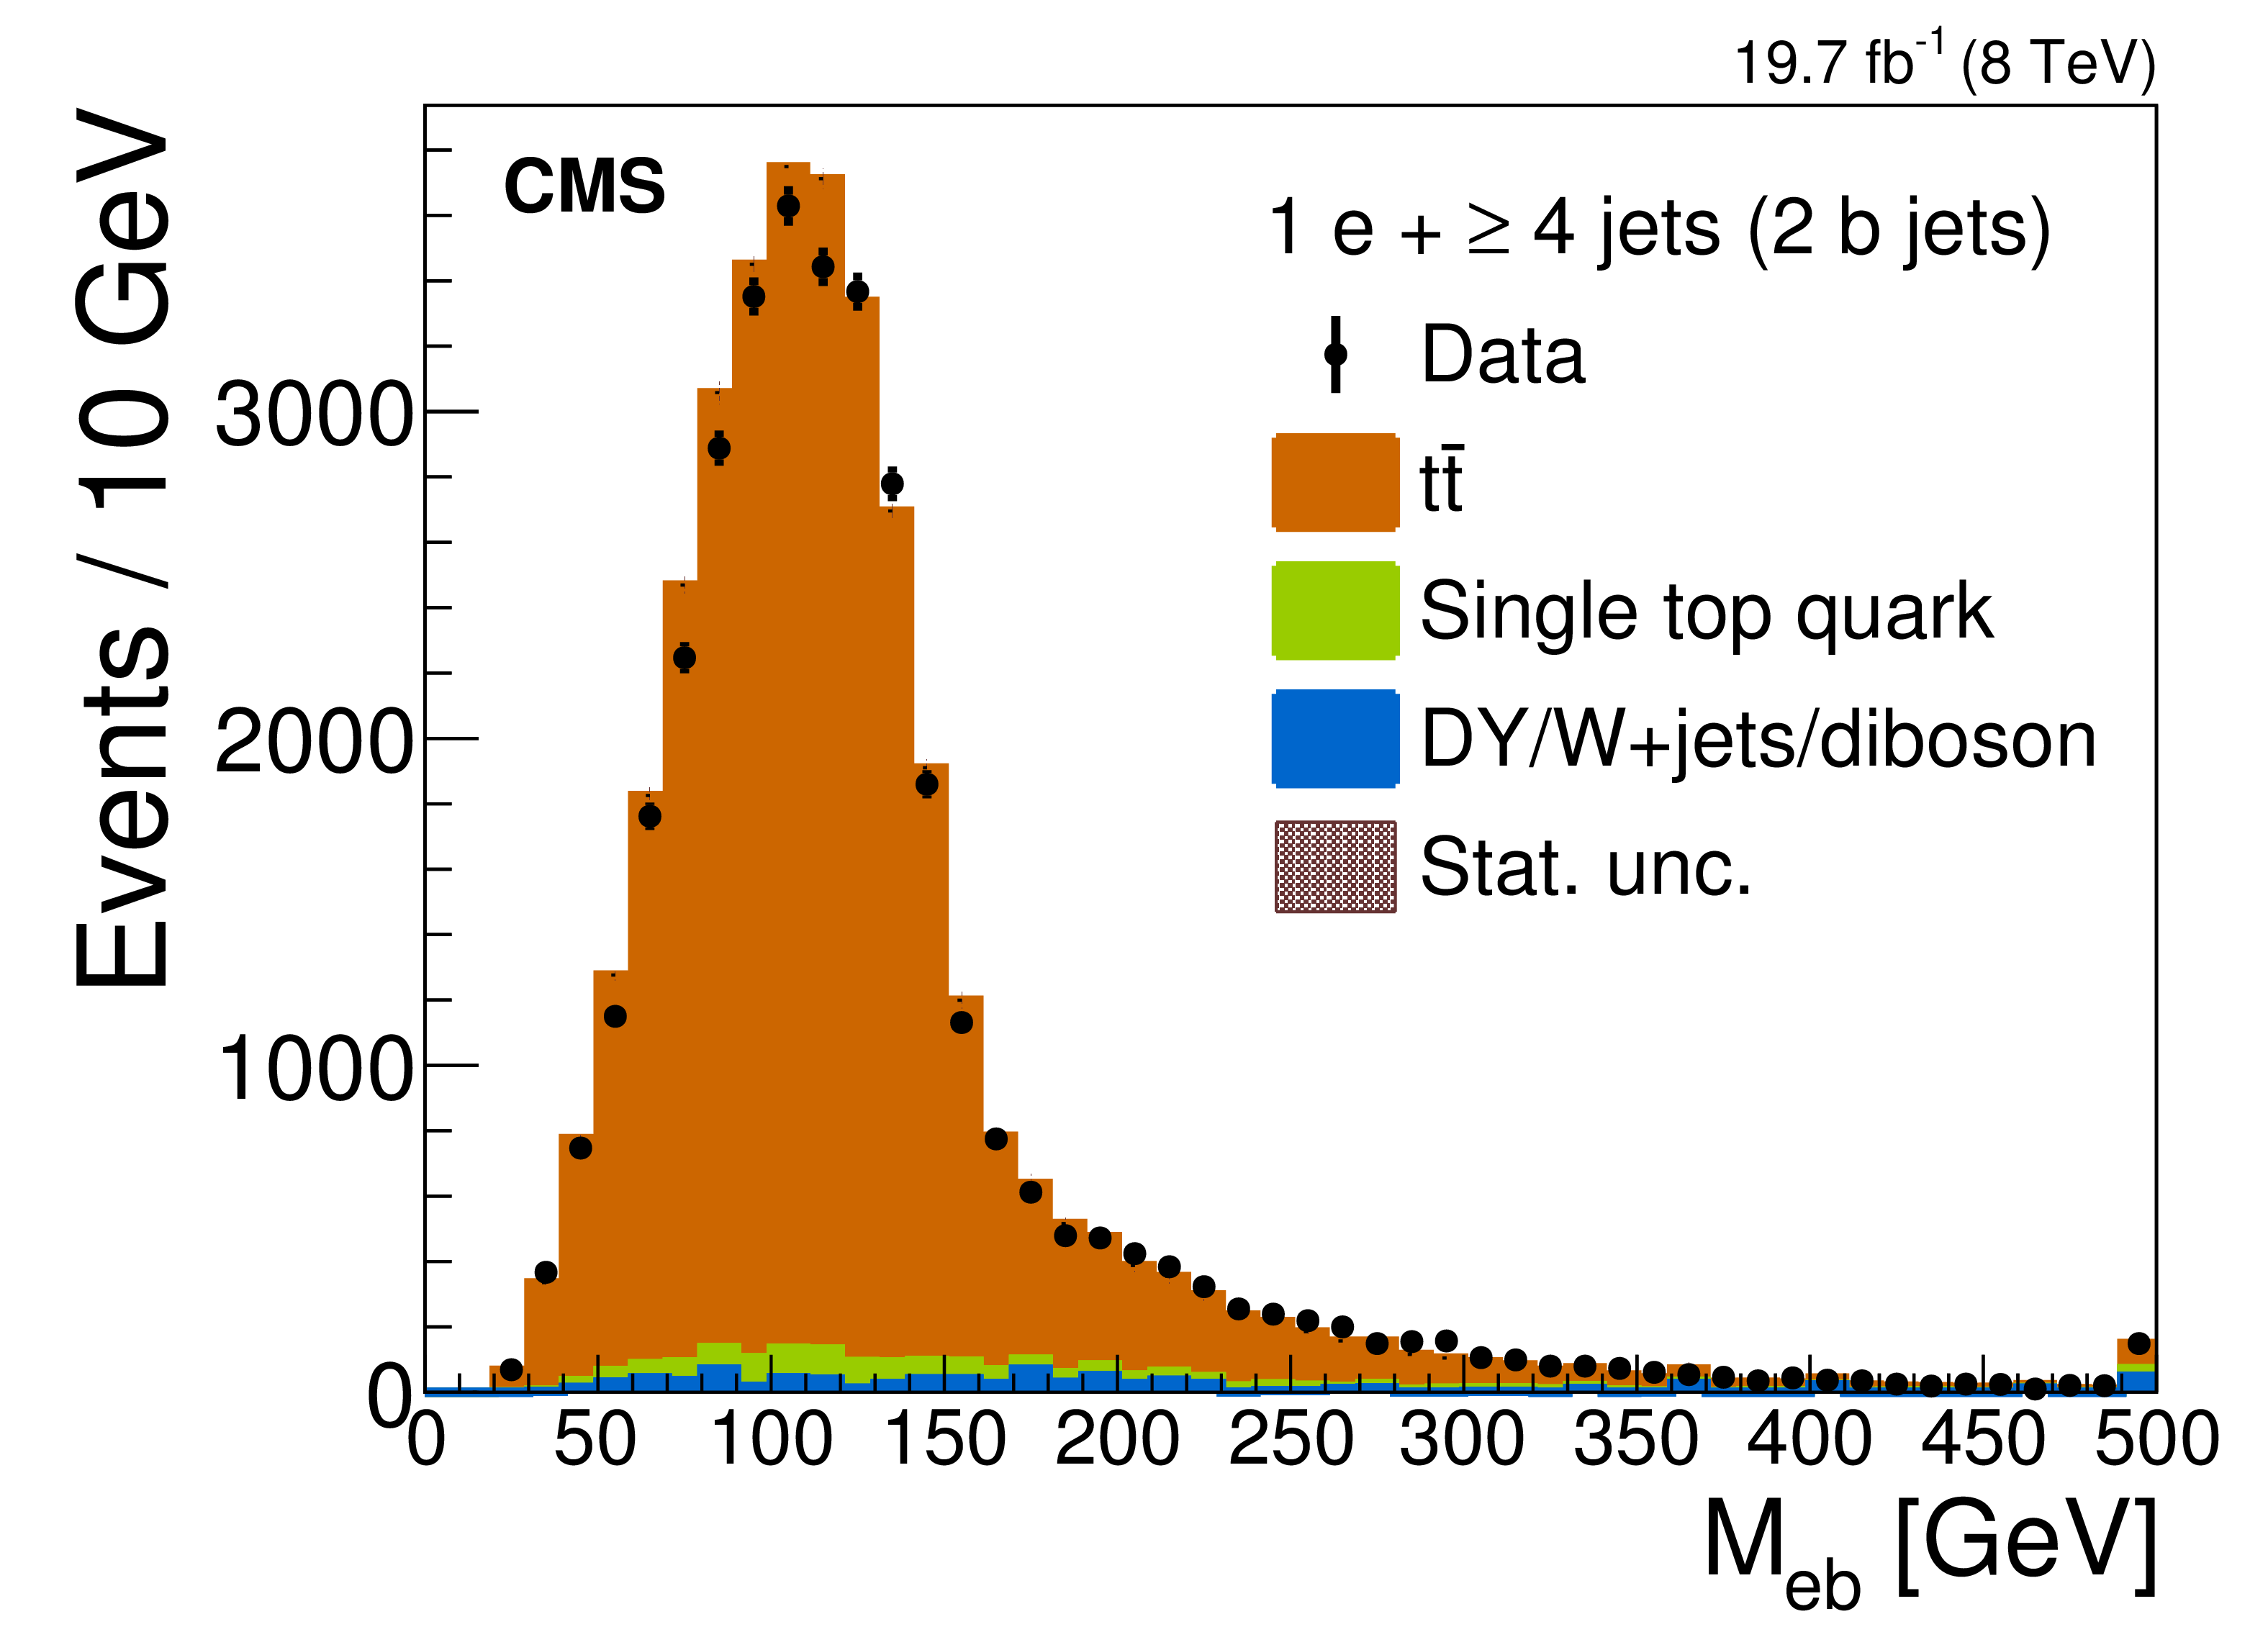
Figure 1-c:
The measured invariant mass distribution from data (points) of semileptonically decaying top quark candidates in the electron channel, compared to the predictions for the signal and various backgrounds from simulation (filled histograms). The QCD background is found to be negligible. The overflow events are collected in the last bin. The vertical bars on the data points and the hatched bands indicate the statistical uncertainties in the data and simulation, respectively. The lower panel shows the relative fractional difference between the data and simulation, with its statistical uncertainty. |

png pdf |
Figure 1-d:
The measured invariant mass distribution from data (points) of semileptonically decaying top quark candidates in the muon channel, compared to the predictions for the signal and various backgrounds from simulation (filled histograms). The QCD background is found to be negligible. The overflow events are collected in the last bin. The vertical bars on the data points and the hatched bands indicate the statistical uncertainties in the data and simulation, respectively. The lower panel shows the relative fractional difference between the data and simulation, with its statistical uncertainty. |
png pdf |
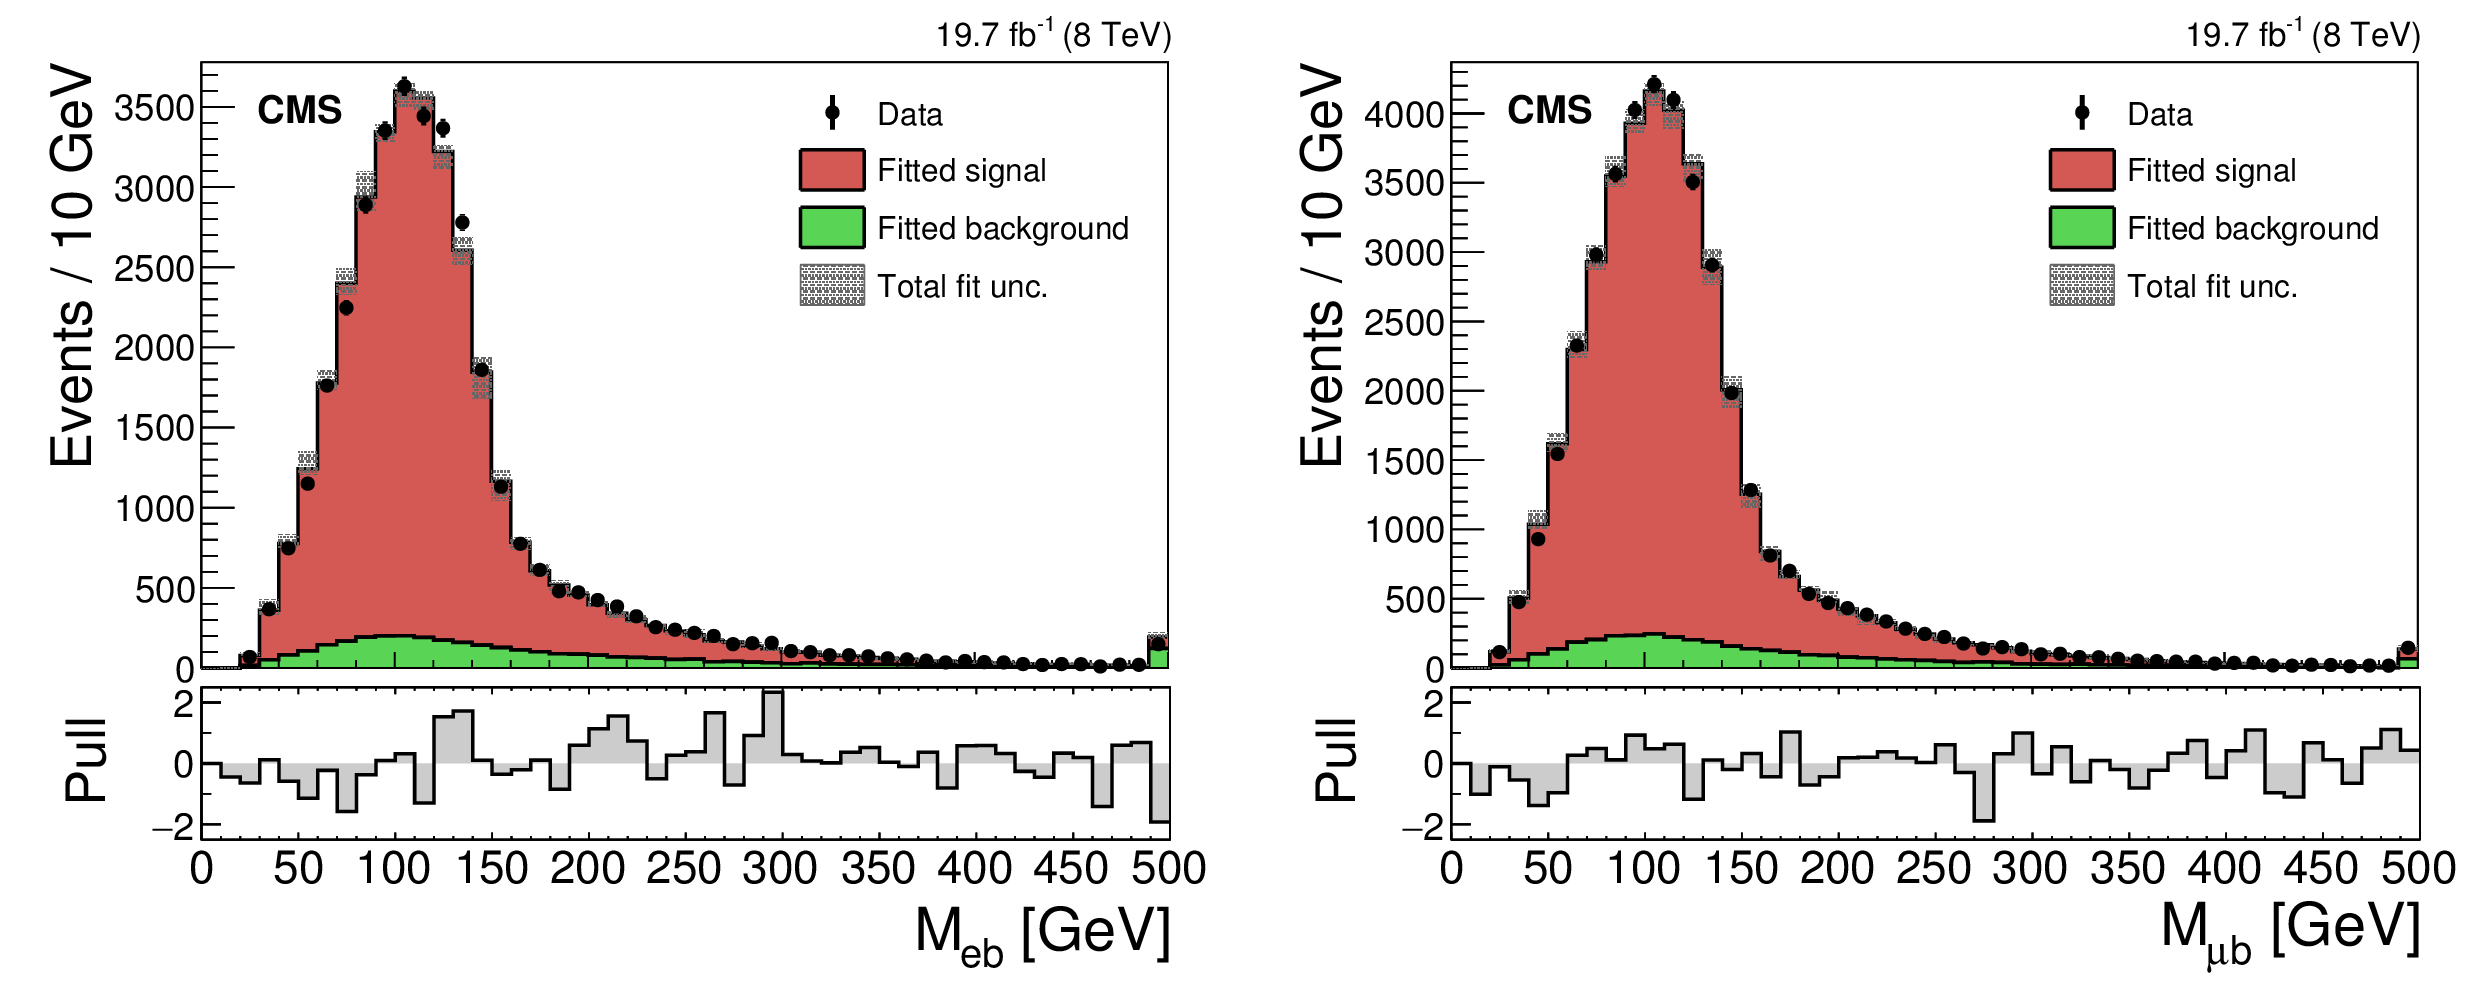
Figure 2:
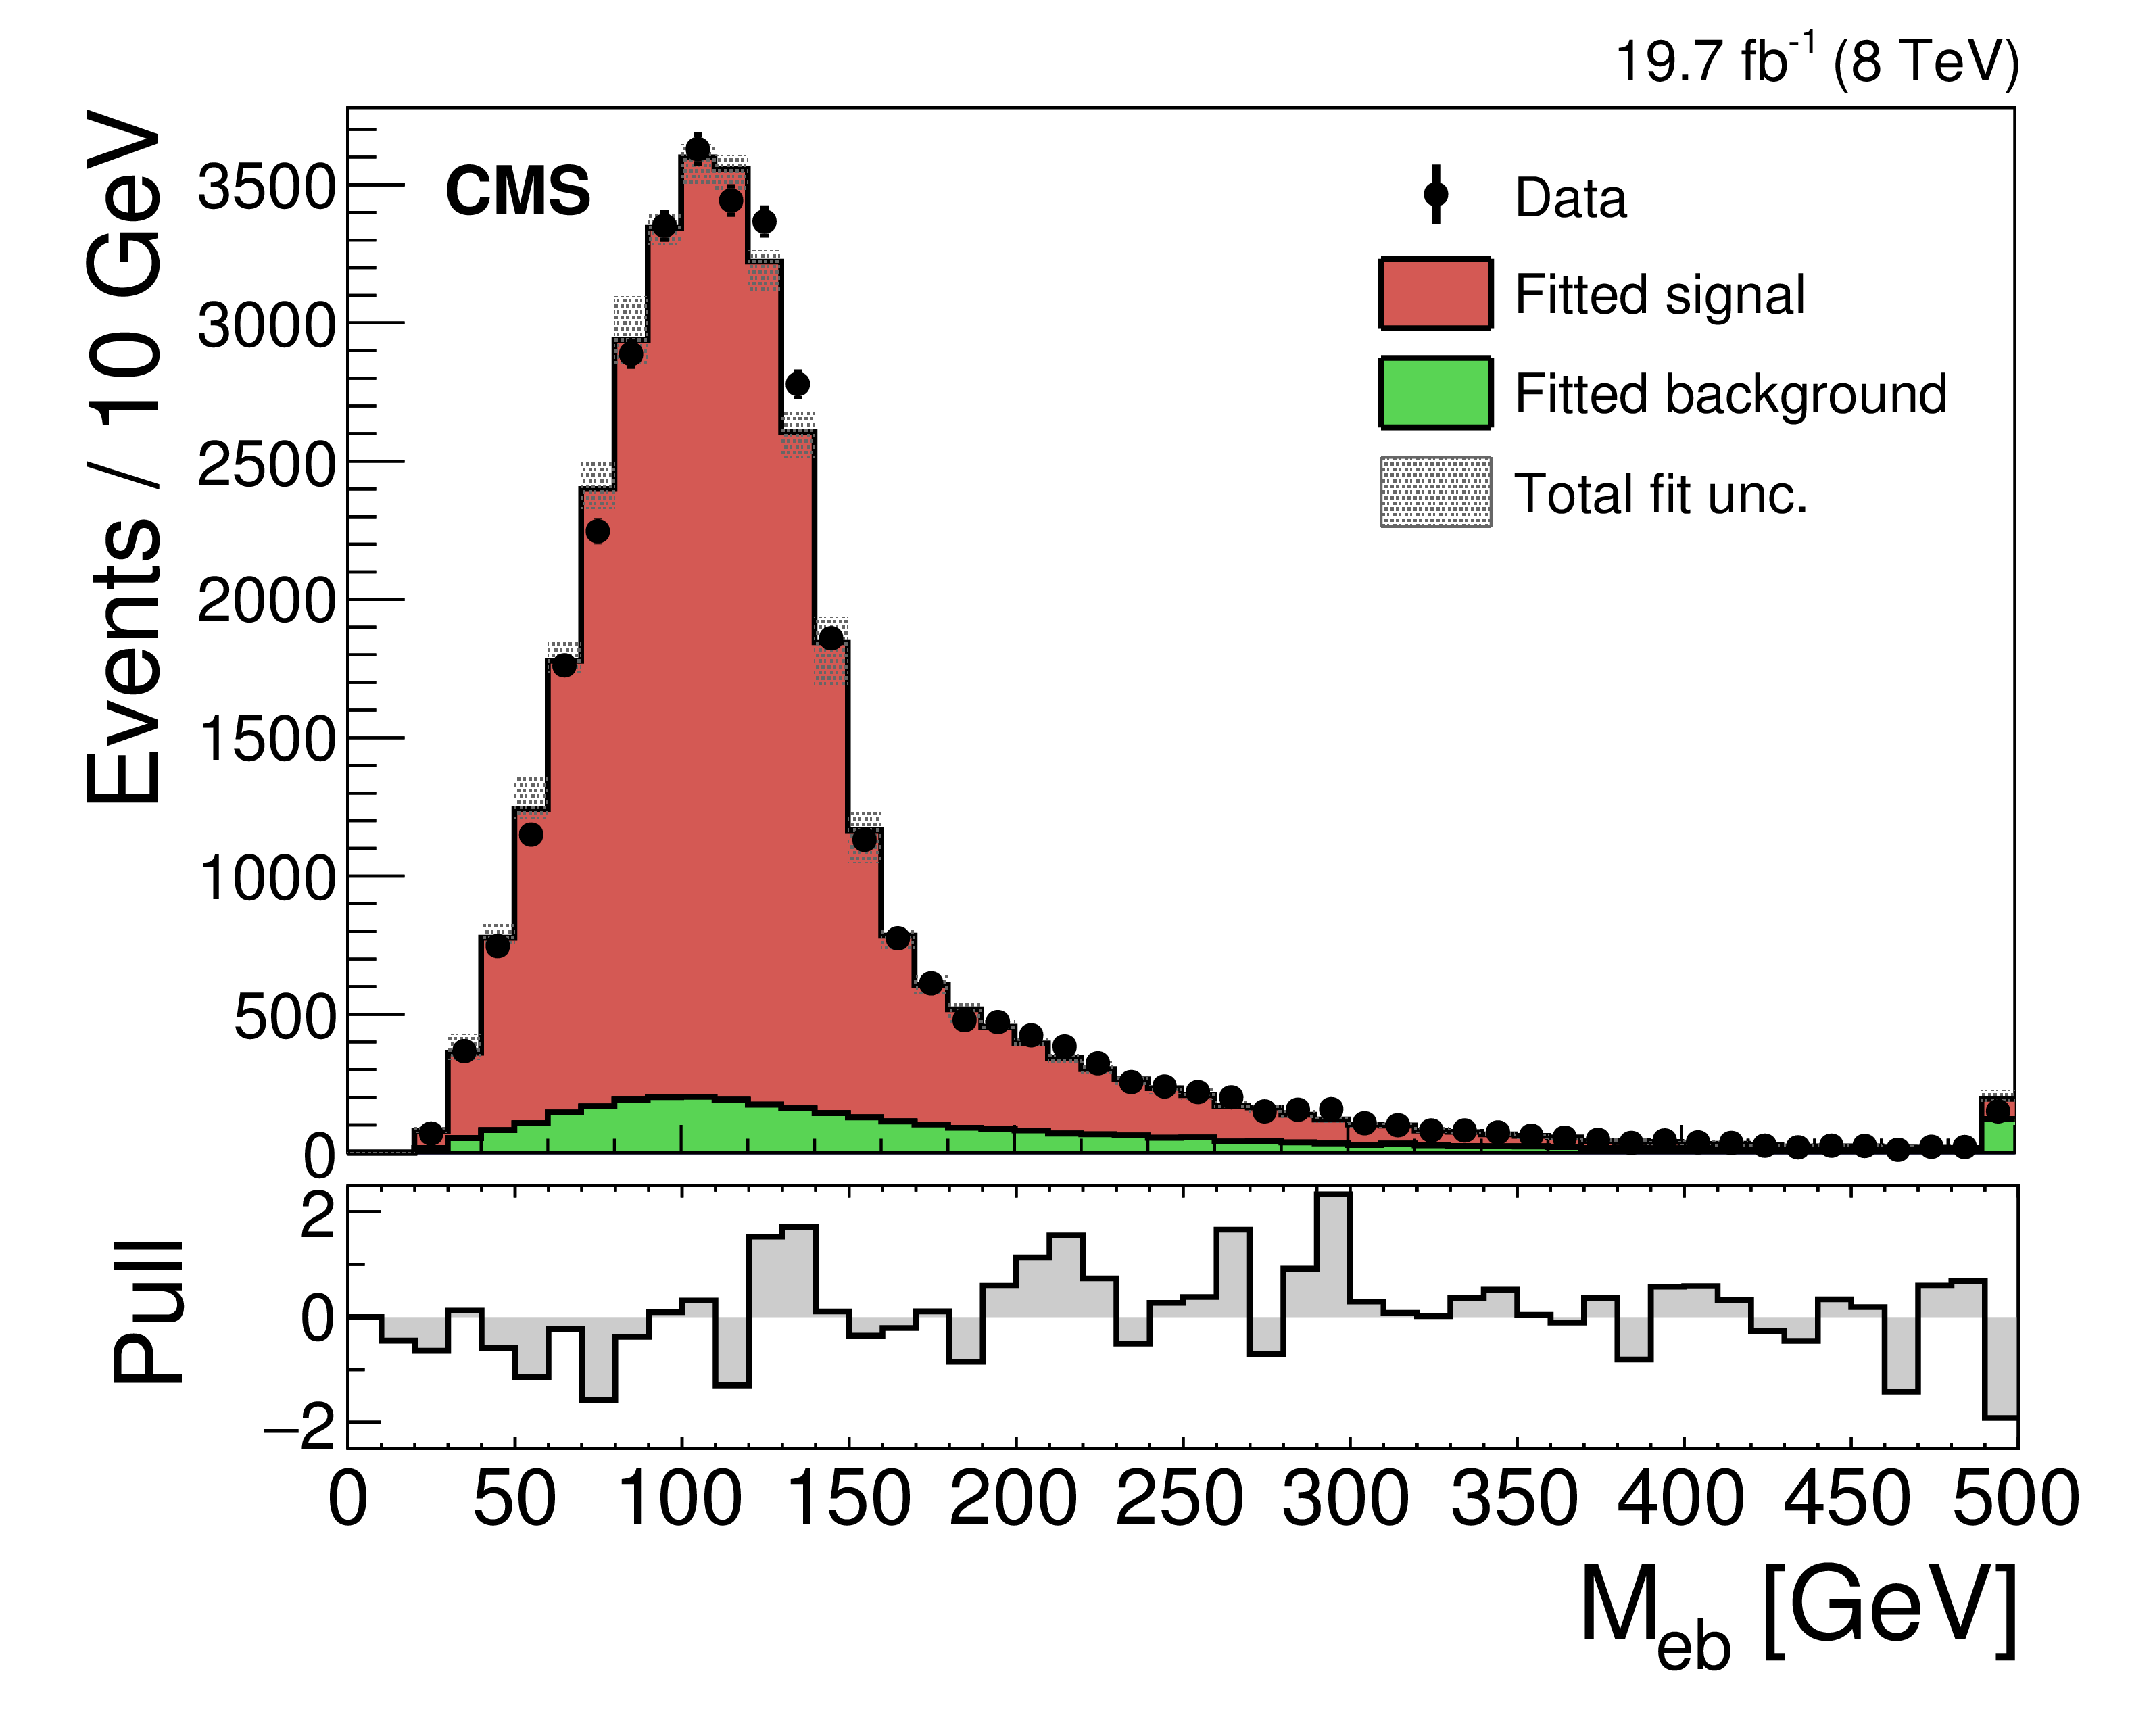
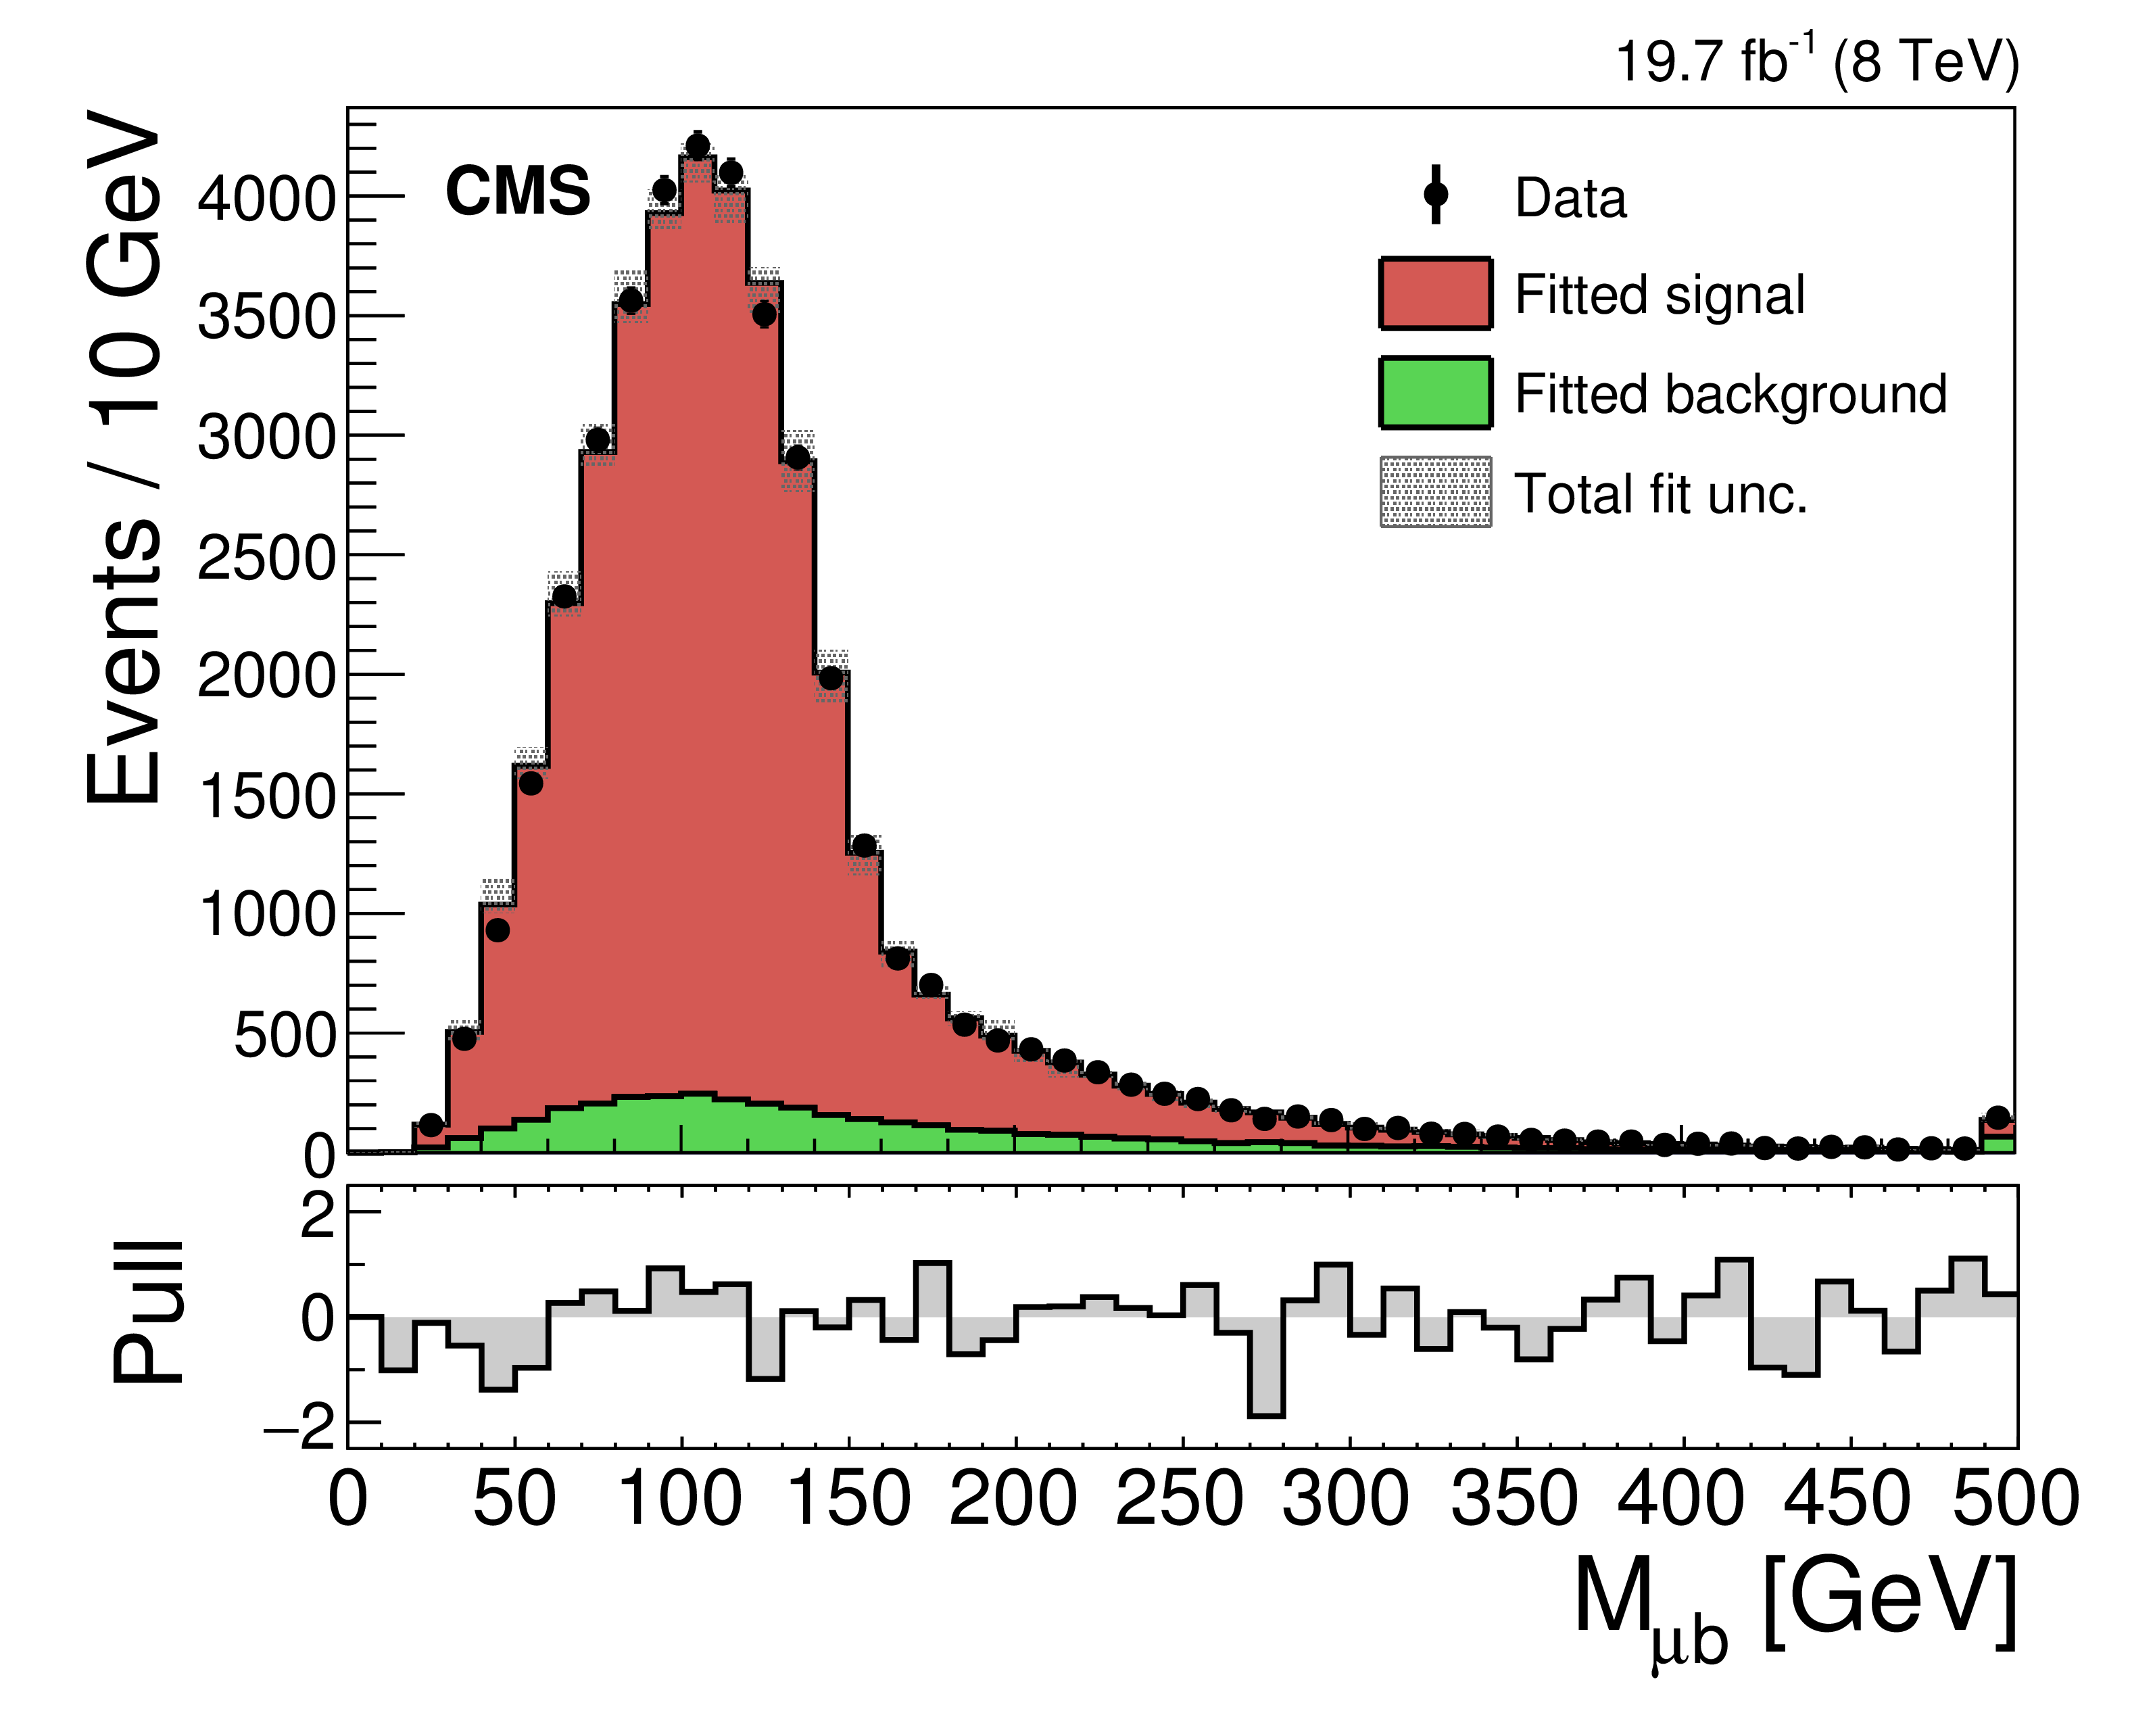
Distribution of the invariant mass $M_{\ell \mathrm{ b } }$ of the semileptonically decaying top quark candidates for the (left) electron and (right) muon channels, in comparison to the results of the fit described in the text. Overflow events are collected in the last bins. The vertical bars on the data points indicate the statistical uncertainties. The hatched bands shows the combined statistical and systematic uncertainties in the fit results added in quadrature. The lower panels show the relative fractional difference between the data and simulation, with vertical bars that indicate the total uncertainties from the fit. |
png pdf |
Figure 2-a:
Distribution of the invariant mass $M_{\ell \mathrm{ b } }$ of the semileptonically decaying top quark candidates for the electron channel, in comparison to the results of the fit described in the text. Overflow events are collected in the last bin. The vertical bars on the data points indicate the statistical uncertainties. The hatched bands shows the combined statistical and systematic uncertainties in the fit results added in quadrature. The lower panel shows the relative fractional difference between the data and simulation, with vertical bars that indicate the total uncertainties from the fit. |
png pdf |
Figure 2-b:
Distribution of the invariant mass $M_{\ell \mathrm{ b } }$ of the semileptonically decaying top quark candidates for the muon channel, in comparison to the results of the fit described in the text. Overflow events are collected in the last bin. The vertical bars on the data points indicate the statistical uncertainties. The hatched bands shows the combined statistical and systematic uncertainties in the fit results added in quadrature. The lower panel shows the relative fractional difference between the data and simulation, with vertical bars that indicate the total uncertainties from the fit. |
png pdf |
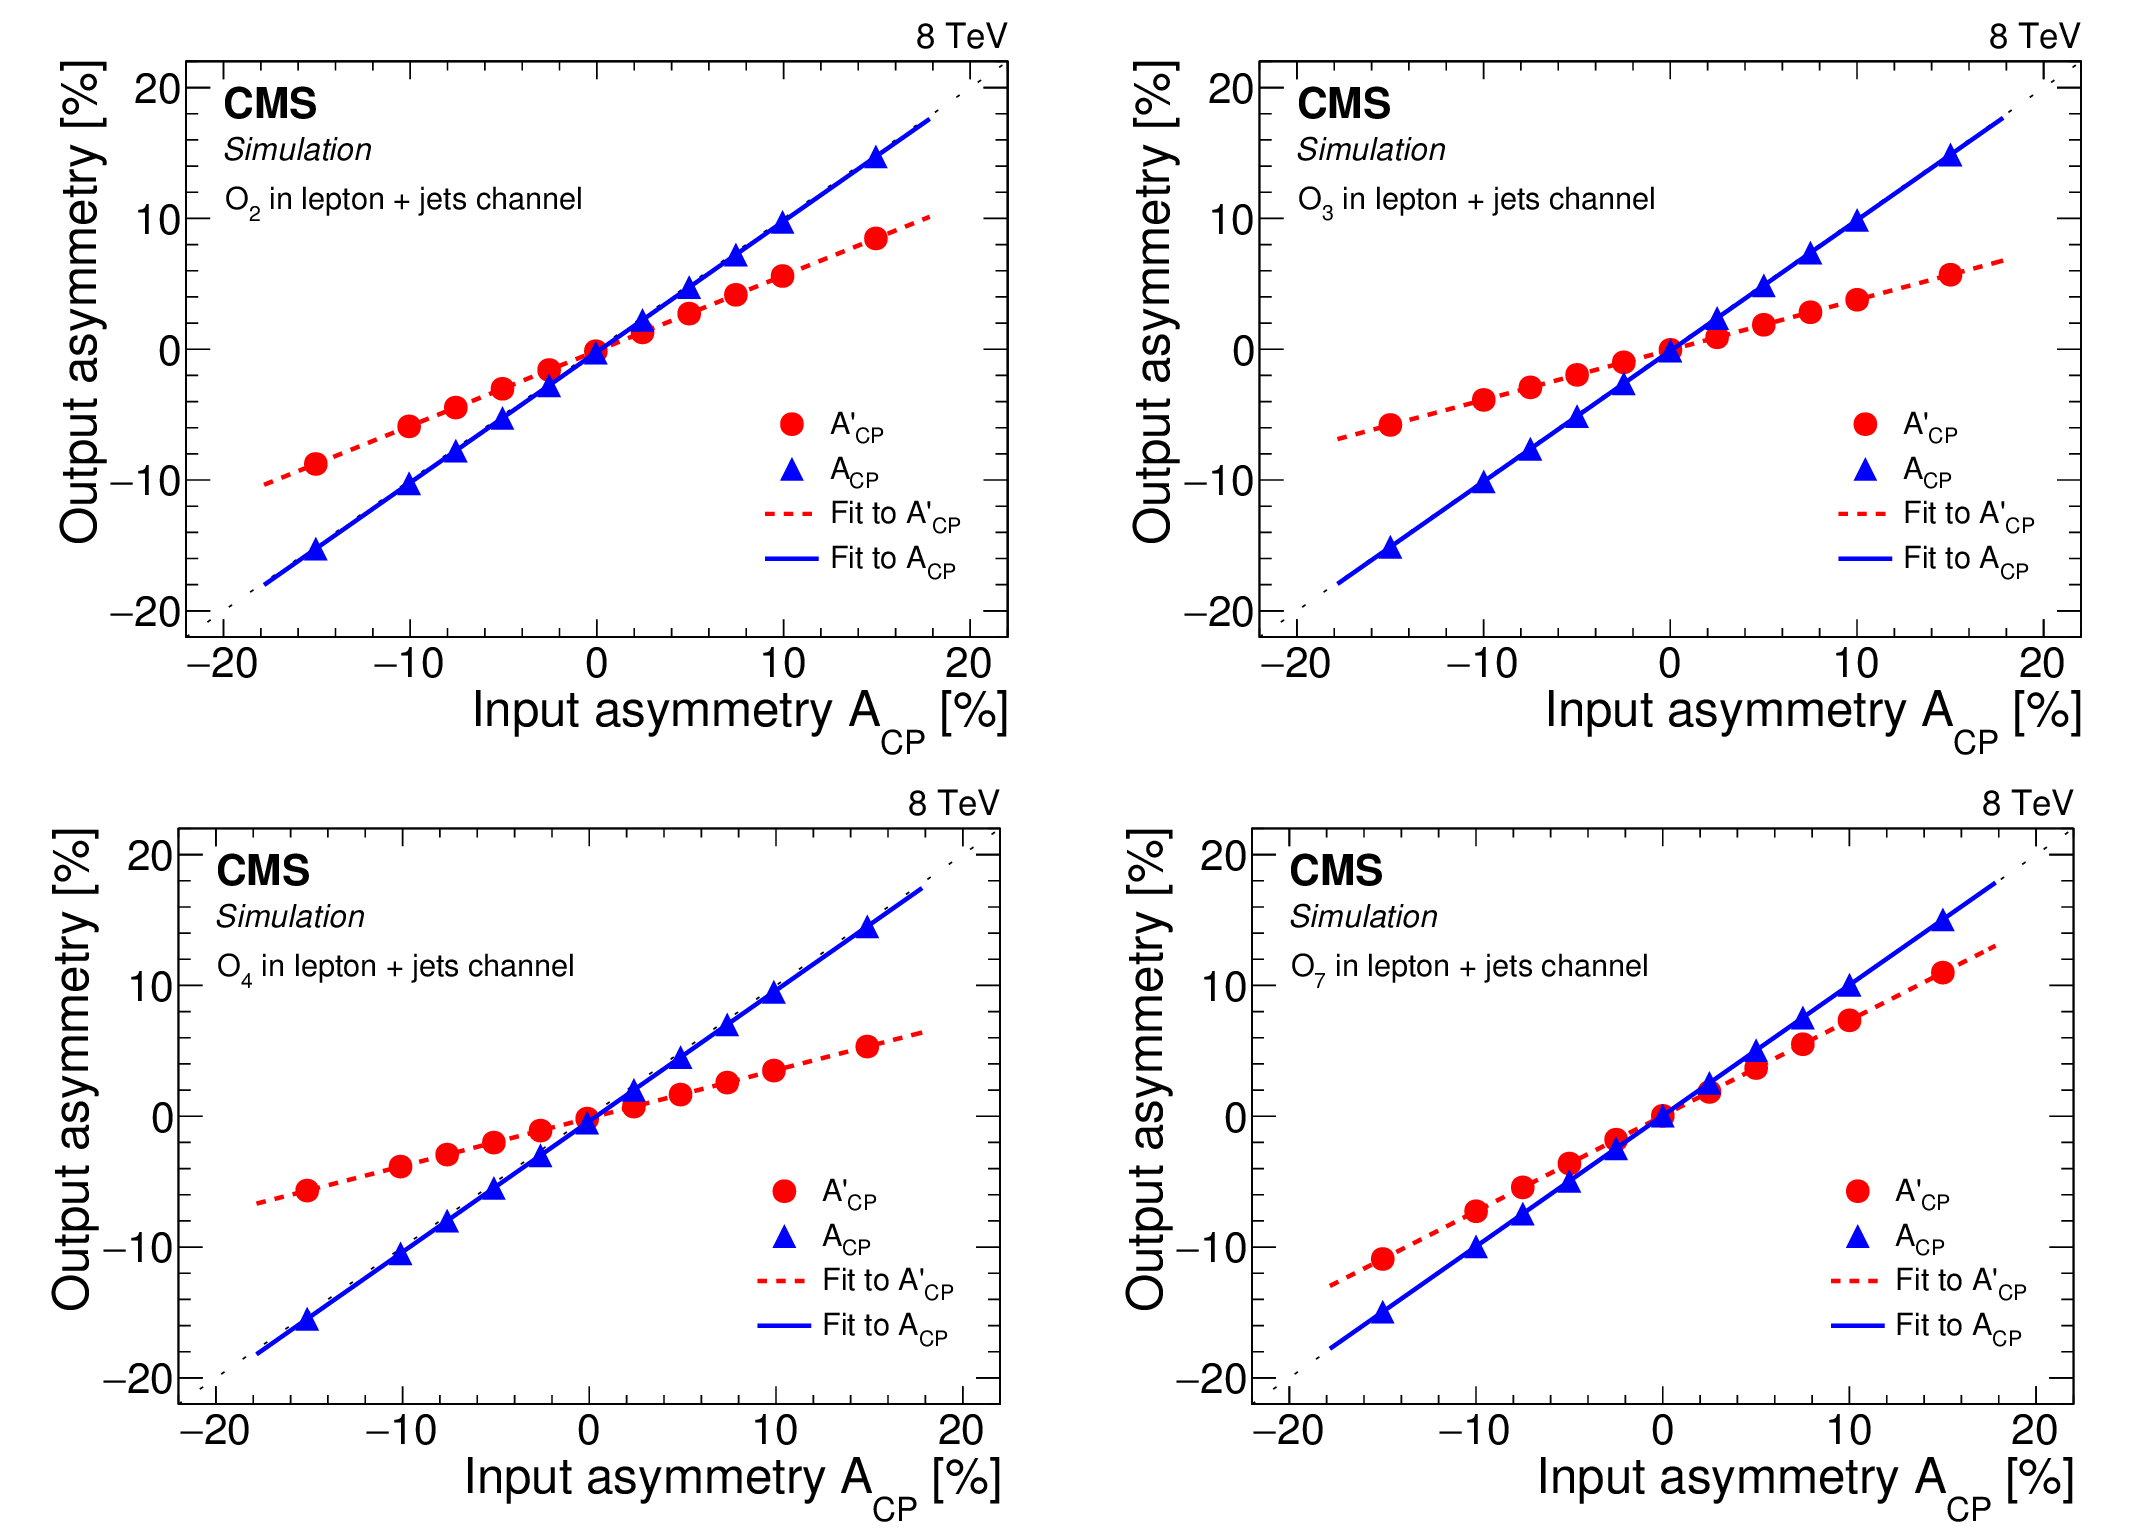
Figure 3:
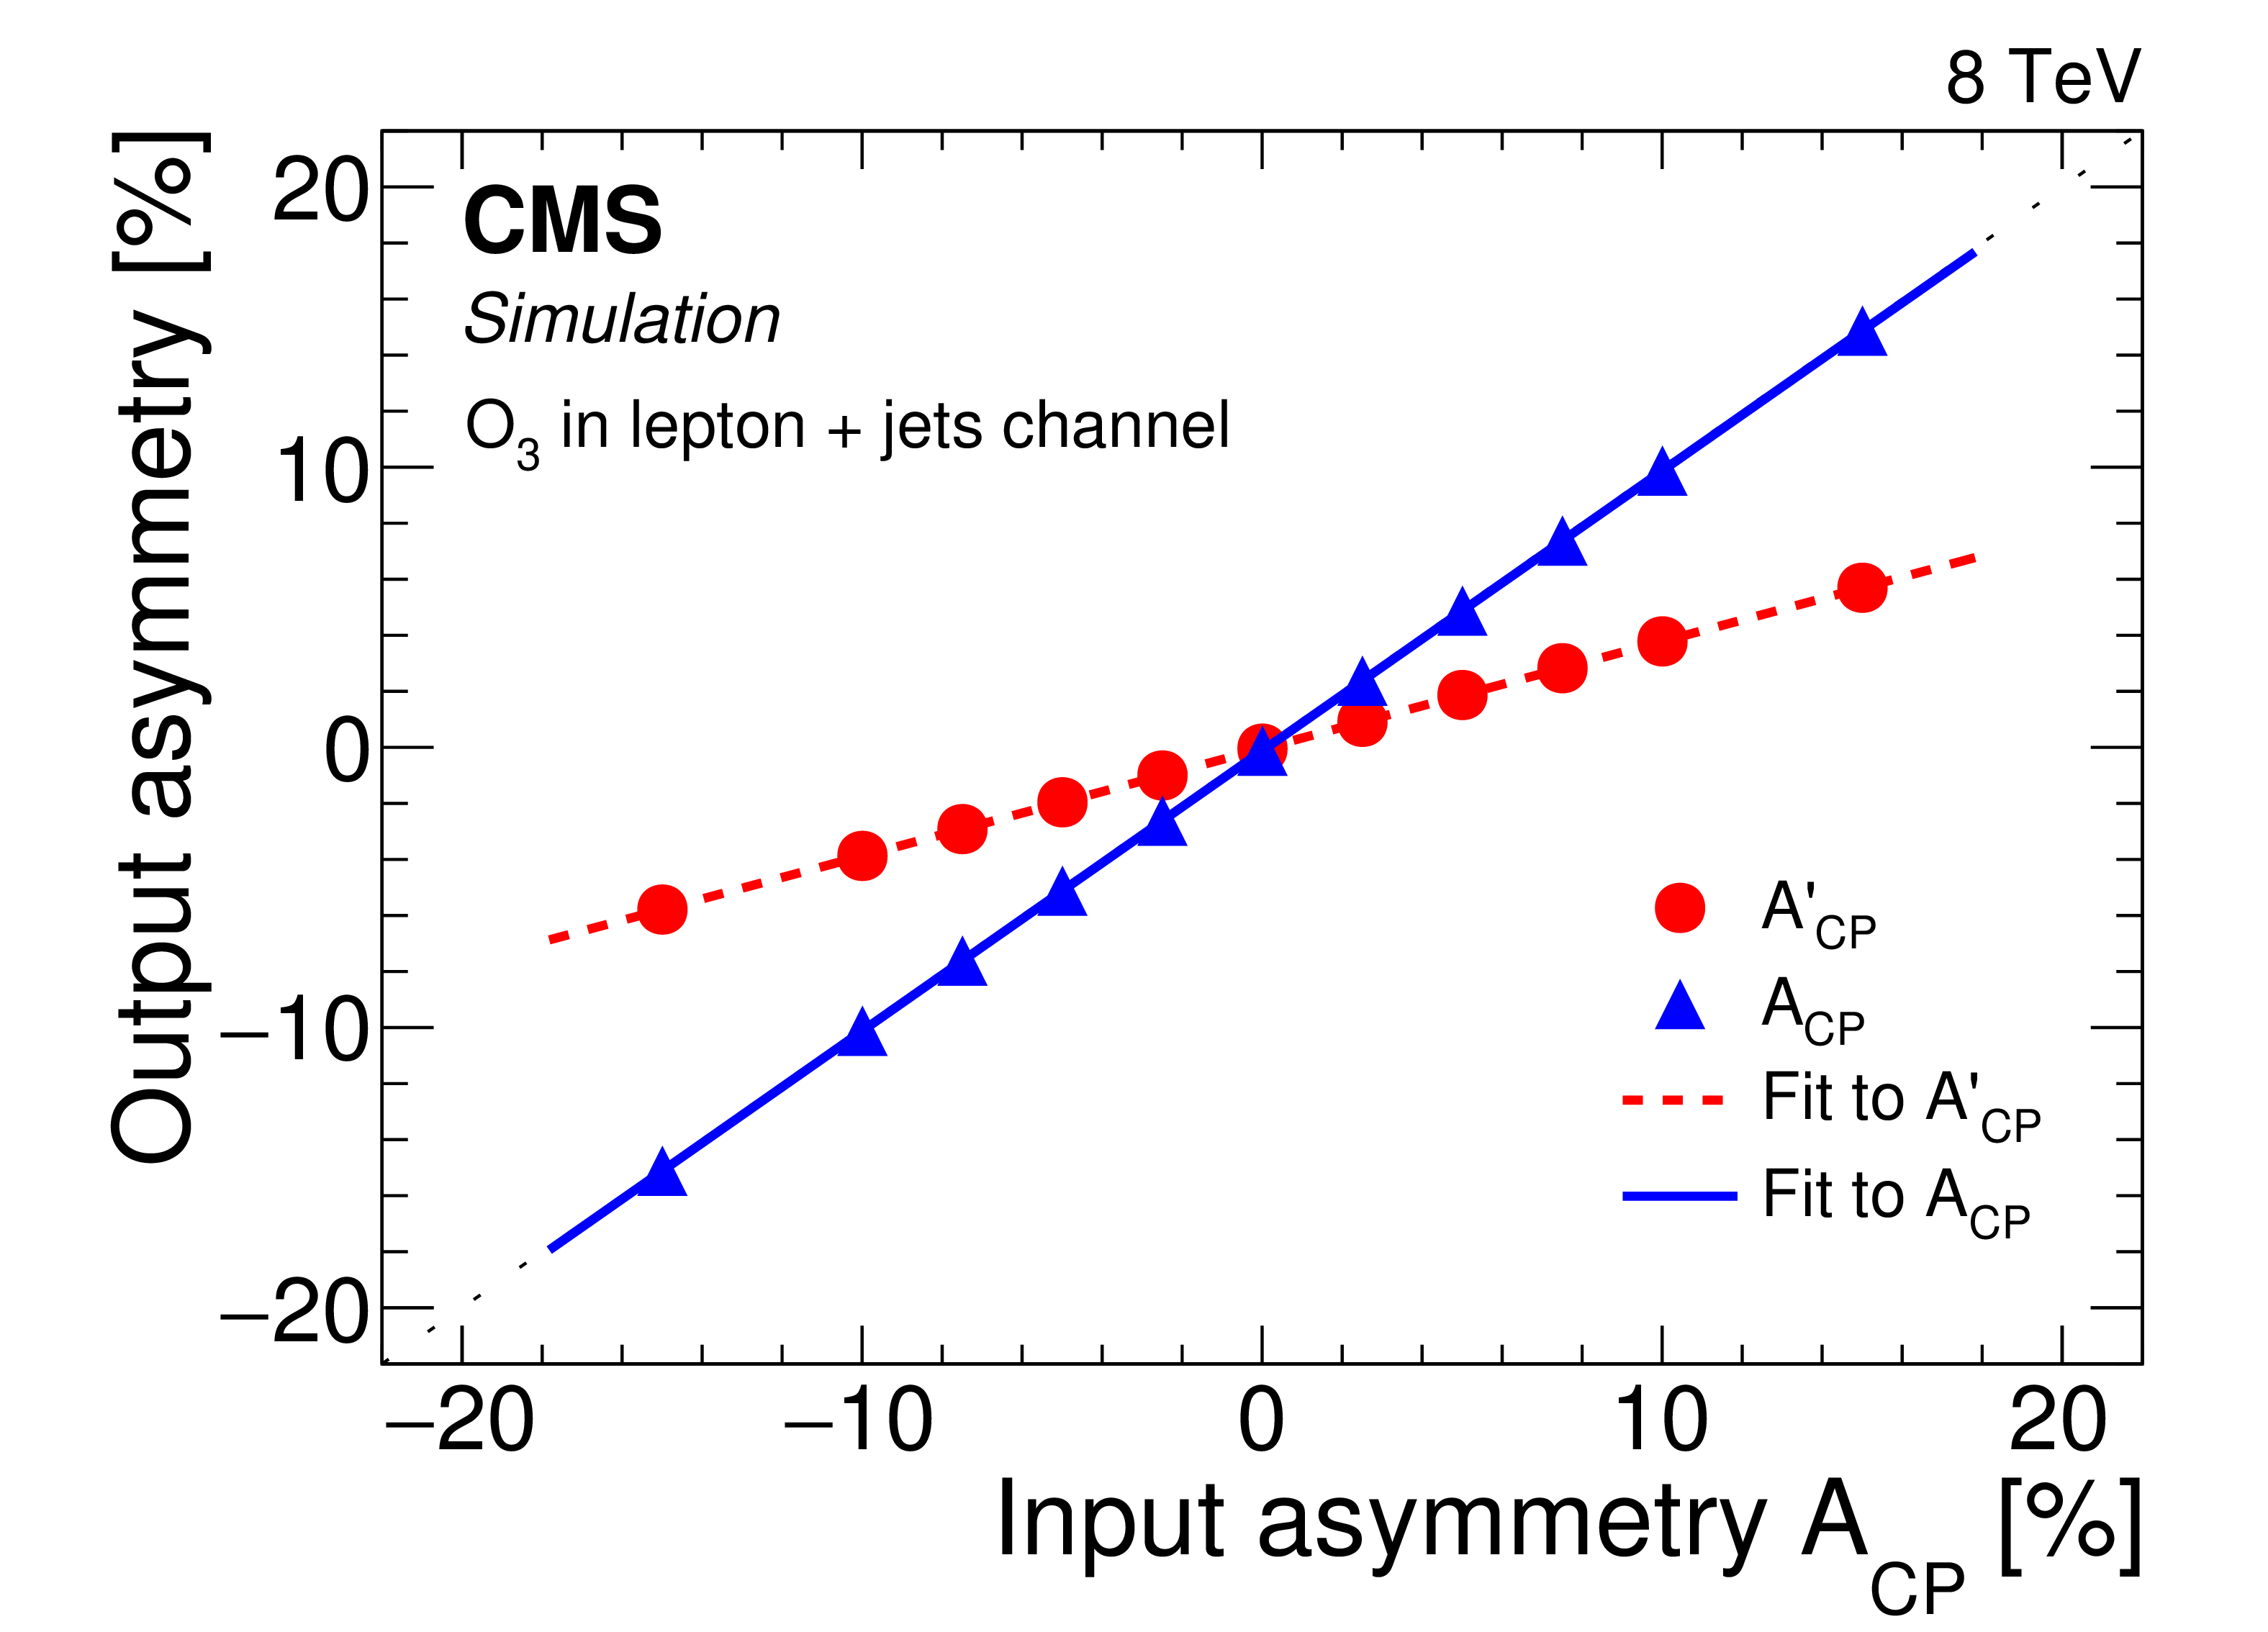
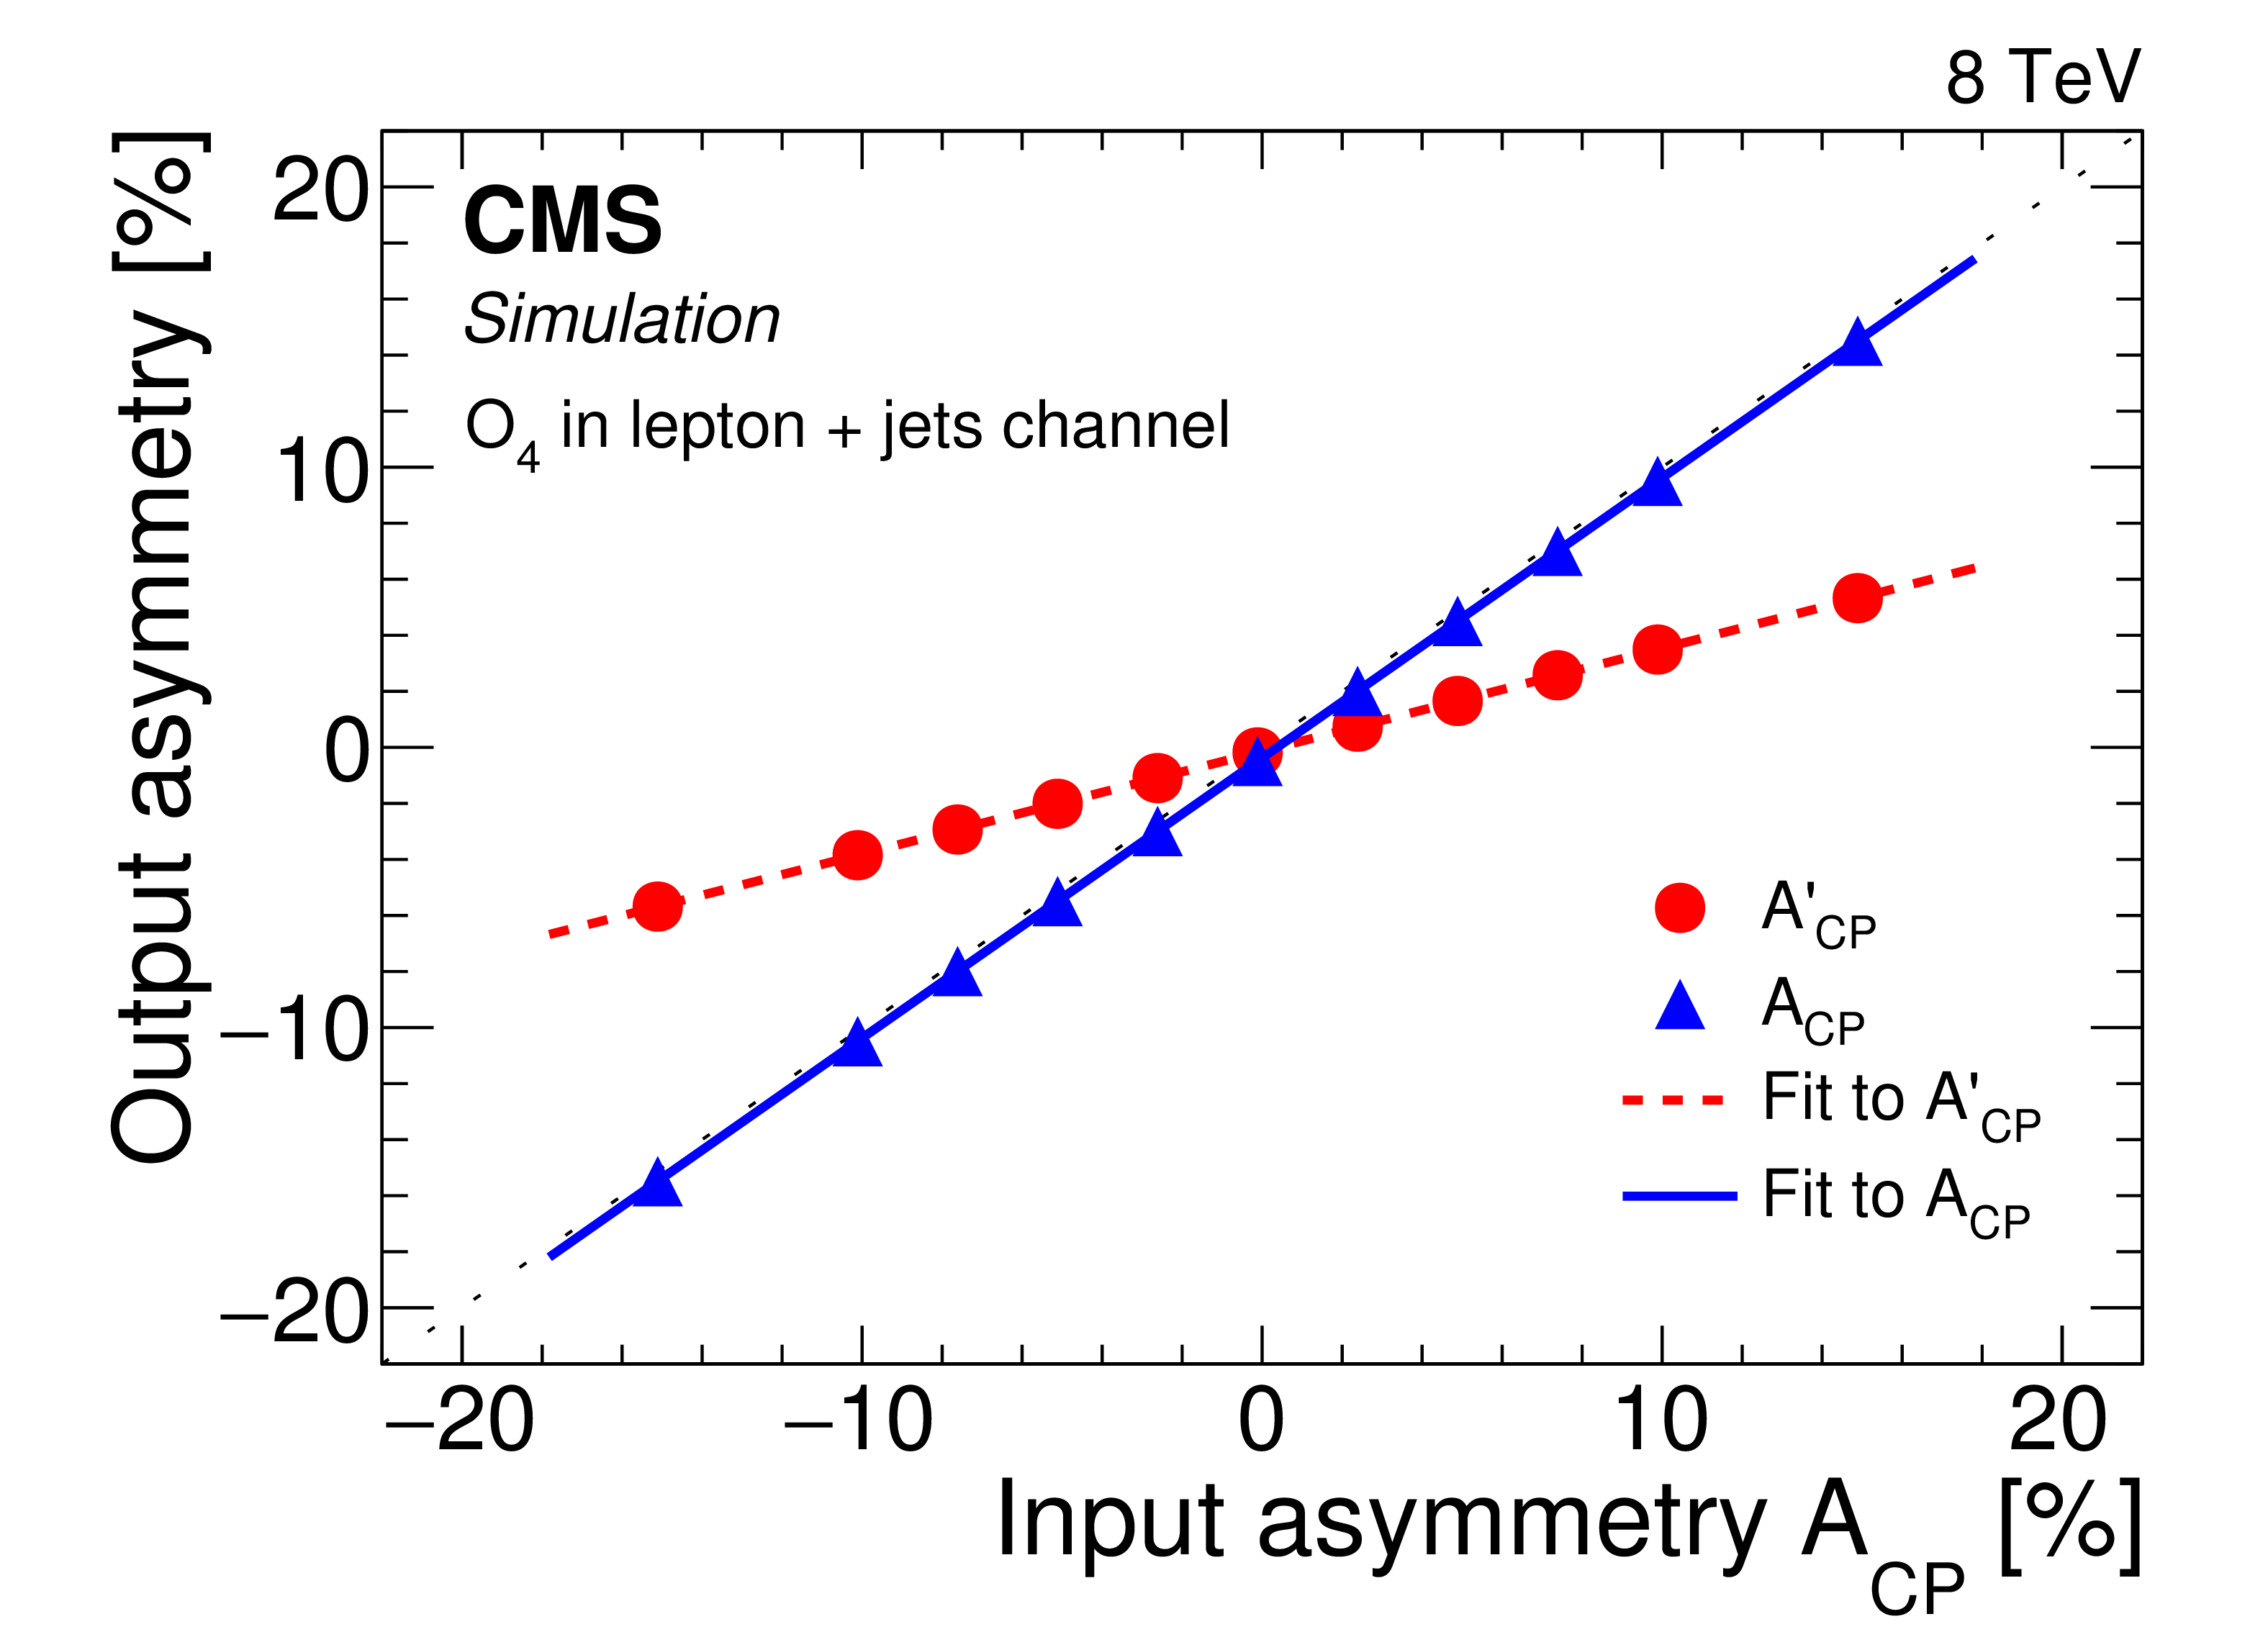
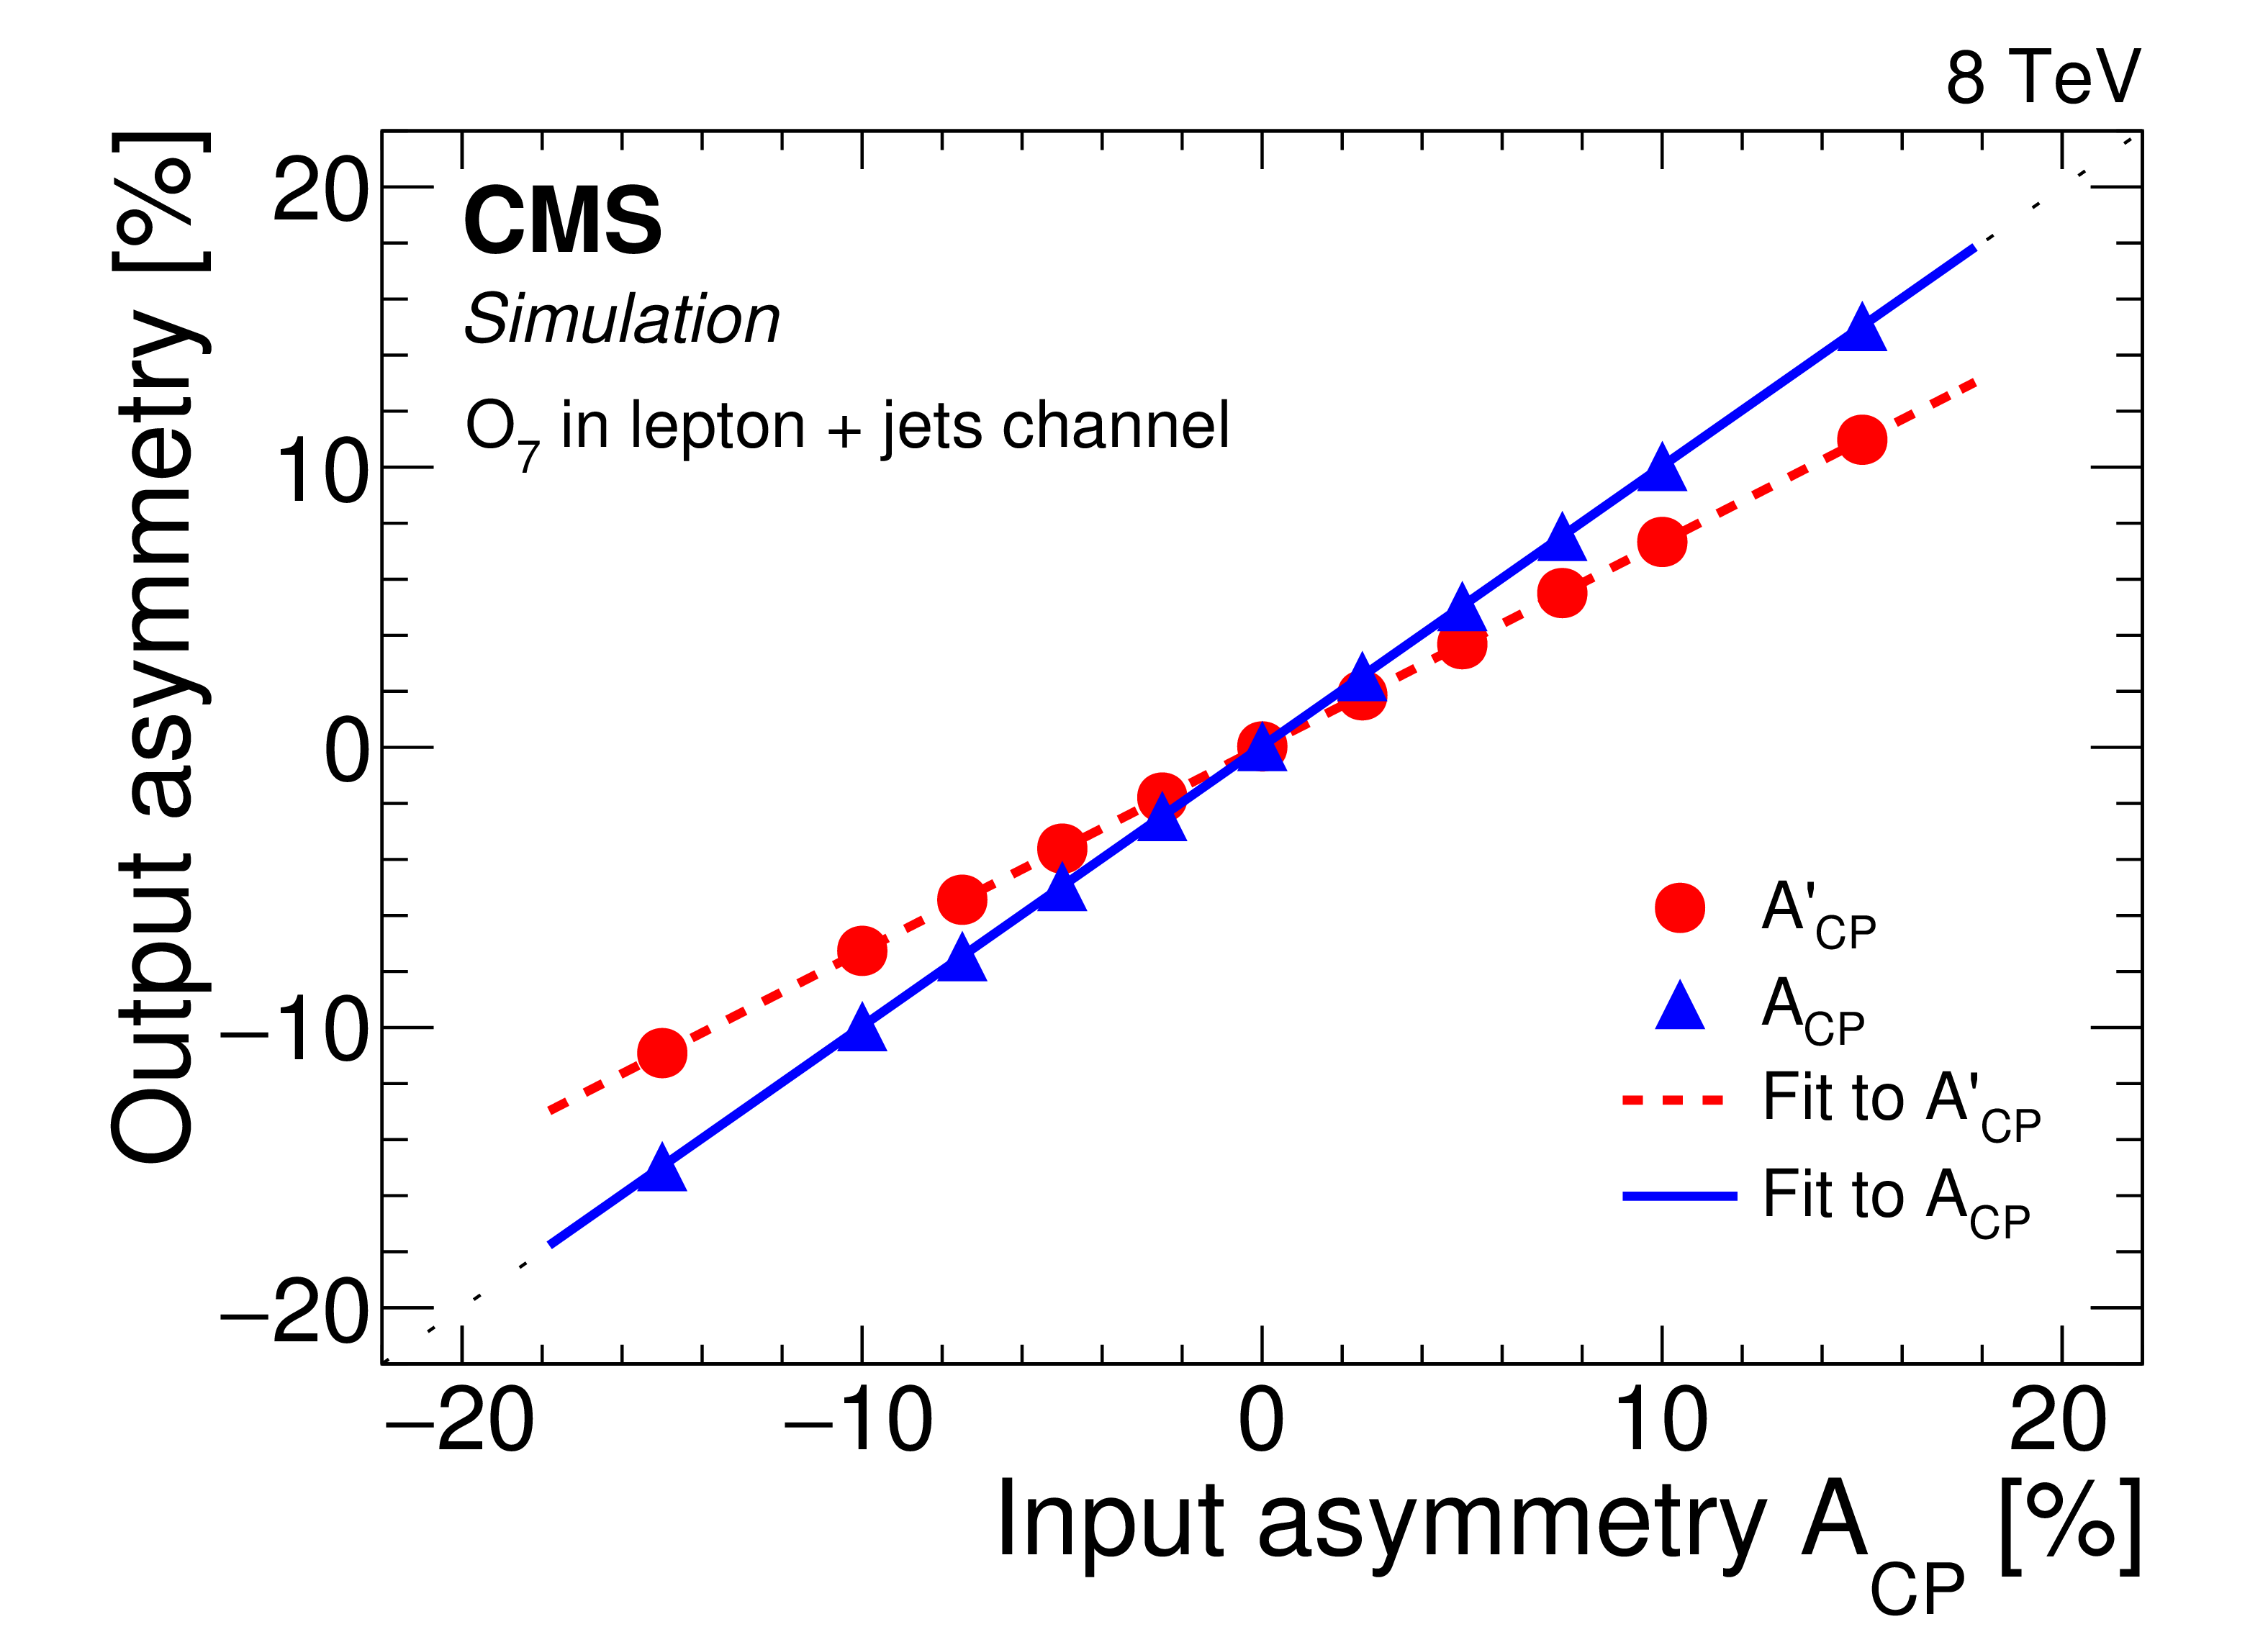
The results from simulation of the asymmetry correction procedure using a dilution factor for the four different CPV observables. The circular markers show the output $ { A_\mathrm {CP}^\prime } $ measurements for each generated $ {A_\mathrm {CP}} $ value. The dashed lines are the result of linear fits to the $ { A_\mathrm {CP}^\prime } $ points. The triangular markers give the corrected $ {A_\mathrm {CP}} $ values, obtained after applying the dilution factor. The solid lines are the result of linear fits to the corrected $ {A_\mathrm {CP}} $ points. The statistical uncertainties in both sets of asymmetries are smaller than the markers. |
png pdf |
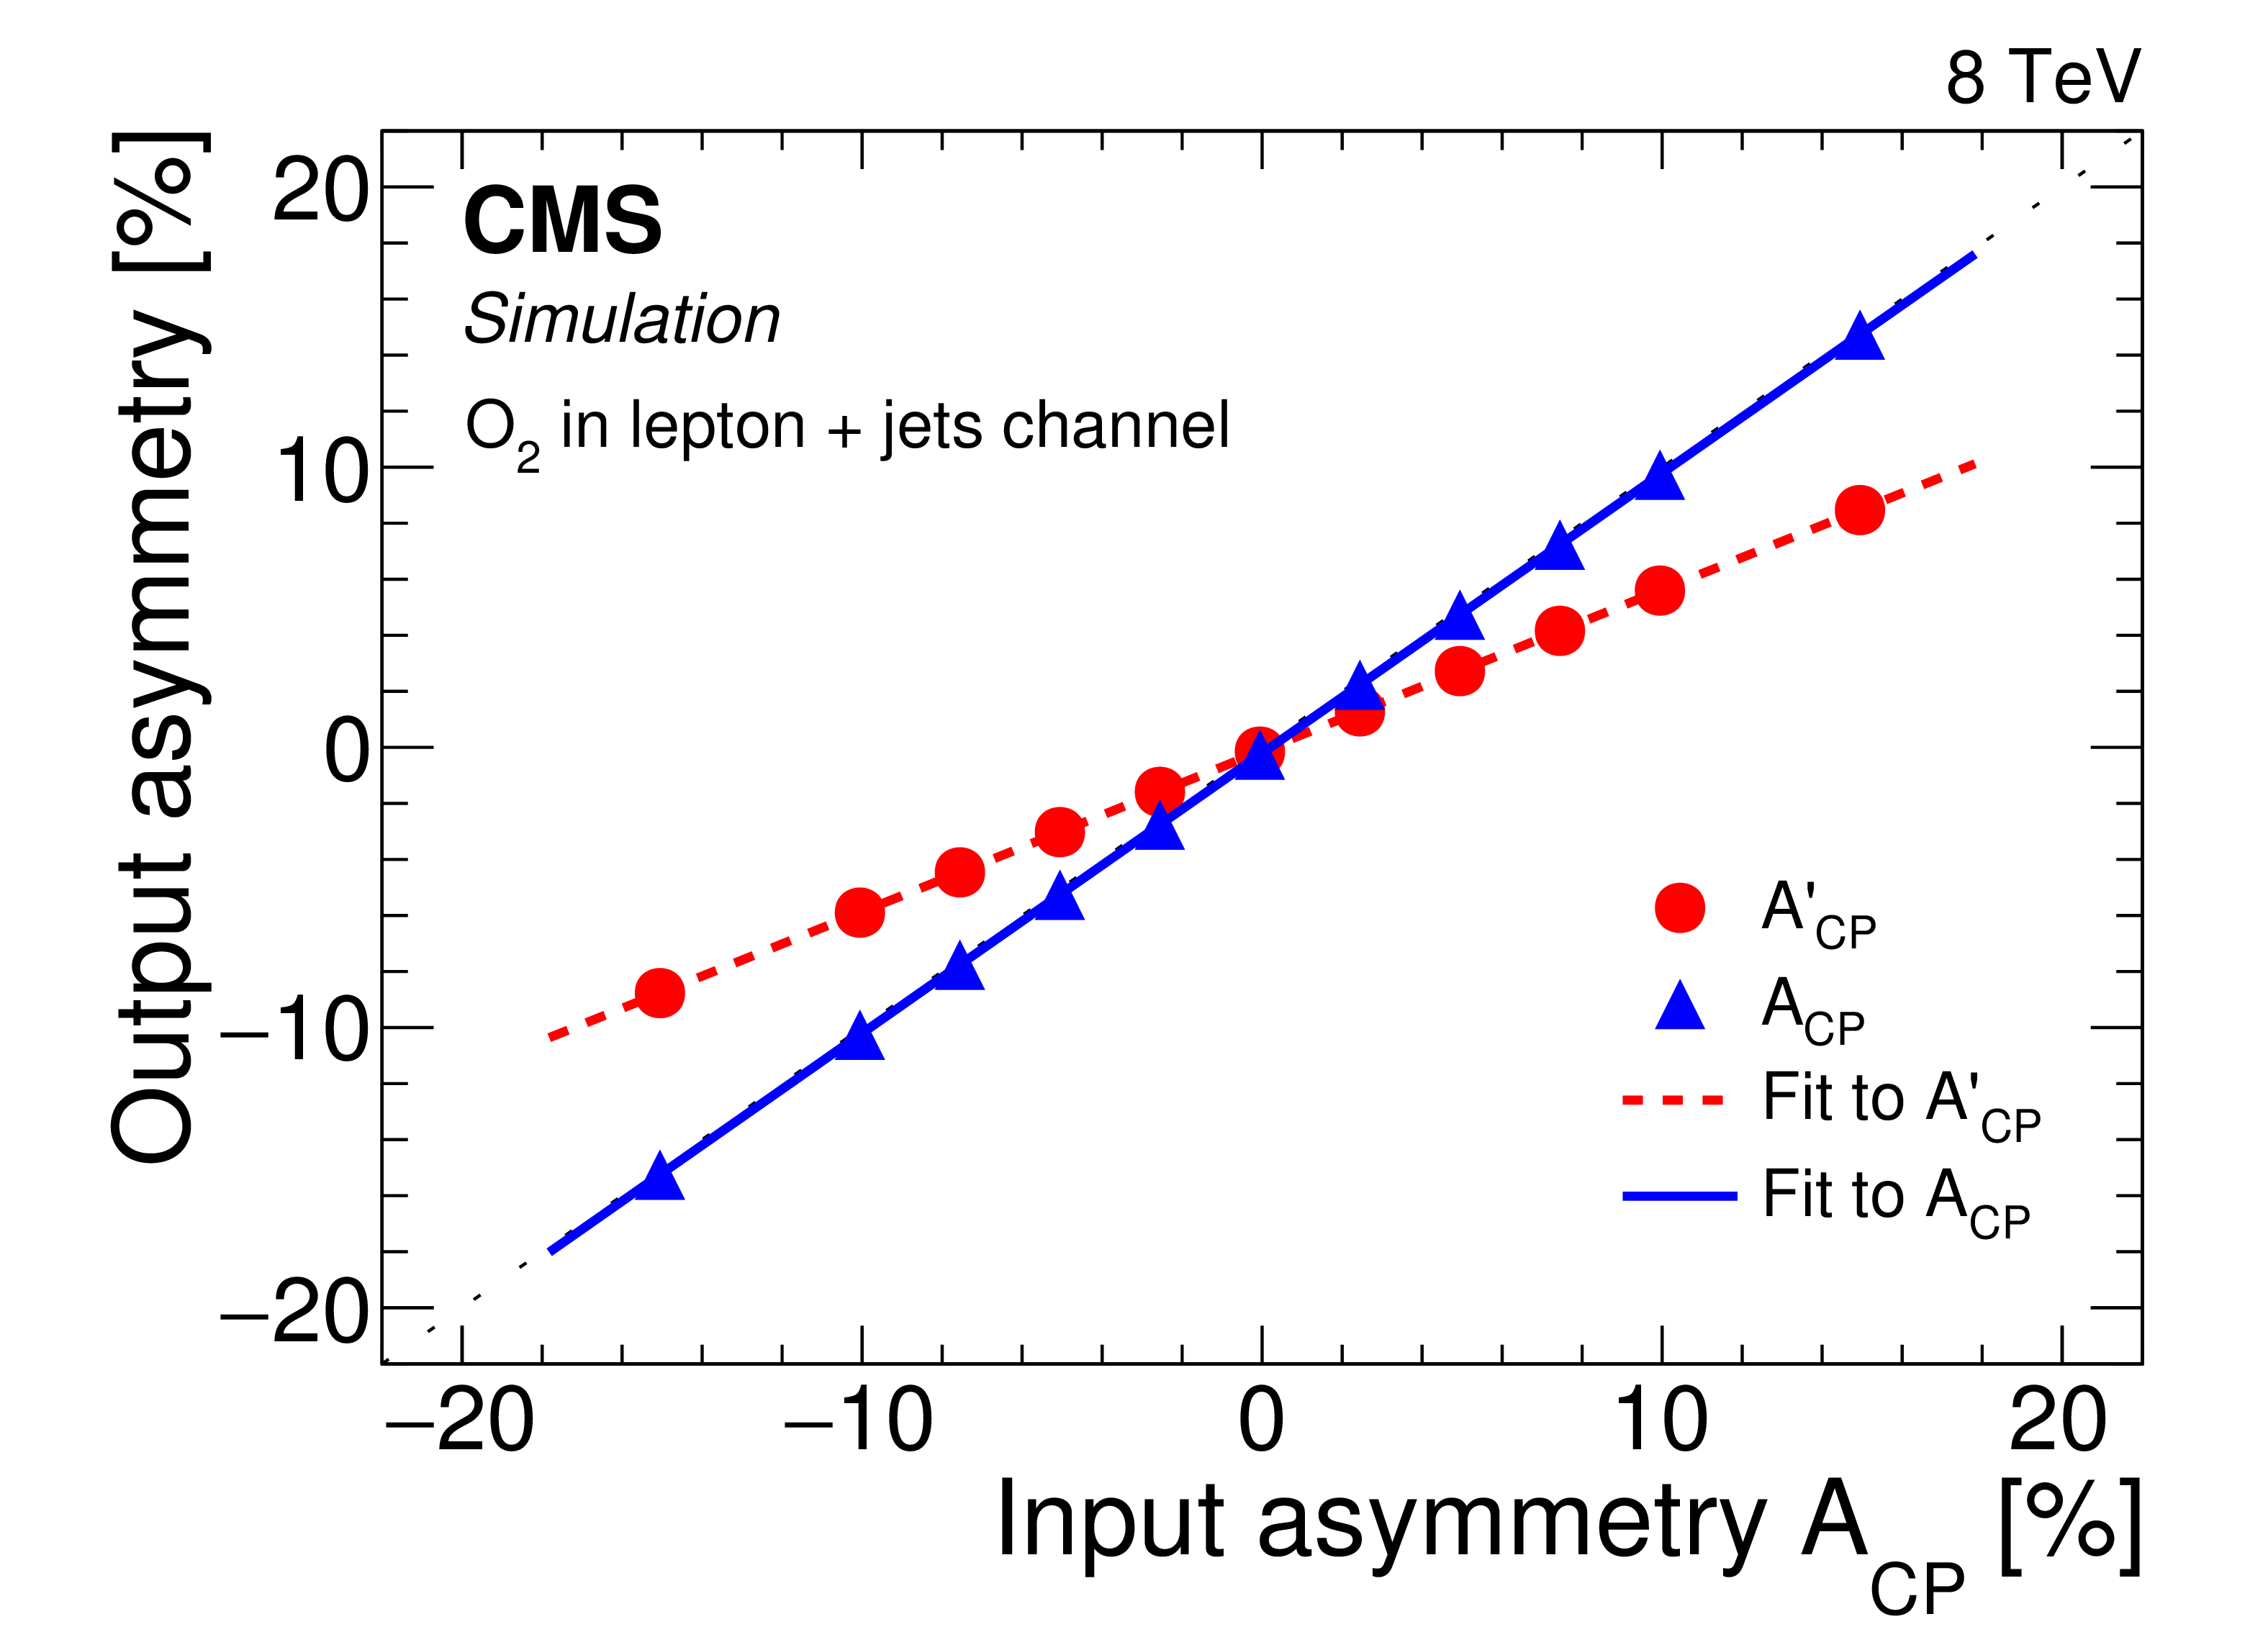
Figure 3-a:
The results from simulation of the asymmetry correction procedure using a dilution factor for the "$O_2$ in lepton+jets" observable. The circular markers show the output $ { A_\mathrm {CP}^\prime } $ measurements for each generated $ {A_\mathrm {CP}} $ value. The dashed lines is the result of a linear fit to the $ { A_\mathrm {CP}^\prime } $ points. The triangular markers give the corrected $ {A_\mathrm {CP}} $ values, obtained after applying the dilution factor. The solid line is the result of a linear fit to the corrected $ {A_\mathrm {CP}} $ points. The statistical uncertainties in both sets of asymmetries are smaller than the markers. |
png pdf |
Figure 3-b:
The results from simulation of the asymmetry correction procedure using a dilution factor for the "$O_3$ in lepton+jets" observable. The circular markers show the output $ { A_\mathrm {CP}^\prime } $ measurements for each generated $ {A_\mathrm {CP}} $ value. The dashed lines is the result of a linear fit to the $ { A_\mathrm {CP}^\prime } $ points. The triangular markers give the corrected $ {A_\mathrm {CP}} $ values, obtained after applying the dilution factor. The solid line is the result of a linear fit to the corrected $ {A_\mathrm {CP}} $ points. The statistical uncertainties in both sets of asymmetries are smaller than the markers. |
png pdf |
Figure 3-c:
The results from simulation of the asymmetry correction procedure using a dilution factor for the "$O_4$ in lepton+jets" observable. The circular markers show the output $ { A_\mathrm {CP}^\prime } $ measurements for each generated $ {A_\mathrm {CP}} $ value. The dashed lines is the result of a linear fit to the $ { A_\mathrm {CP}^\prime } $ points. The triangular markers give the corrected $ {A_\mathrm {CP}} $ values, obtained after applying the dilution factor. The solid line is the result of a linear fit to the corrected $ {A_\mathrm {CP}} $ points. The statistical uncertainties in both sets of asymmetries are smaller than the markers. |
png pdf |
Figure 3-d:
The results from simulation of the asymmetry correction procedure using a dilution factor for the "$O_7$ in lepton+jets" observable. The circular markers show the output $ { A_\mathrm {CP}^\prime } $ measurements for each generated $ {A_\mathrm {CP}} $ value. The dashed lines is the result of a linear fit to the $ { A_\mathrm {CP}^\prime } $ points. The triangular markers give the corrected $ {A_\mathrm {CP}} $ values, obtained after applying the dilution factor. The solid line is the result of a linear fit to the corrected $ {A_\mathrm {CP}} $ points. The statistical uncertainties in both sets of asymmetries are smaller than the markers. |
png pdf |
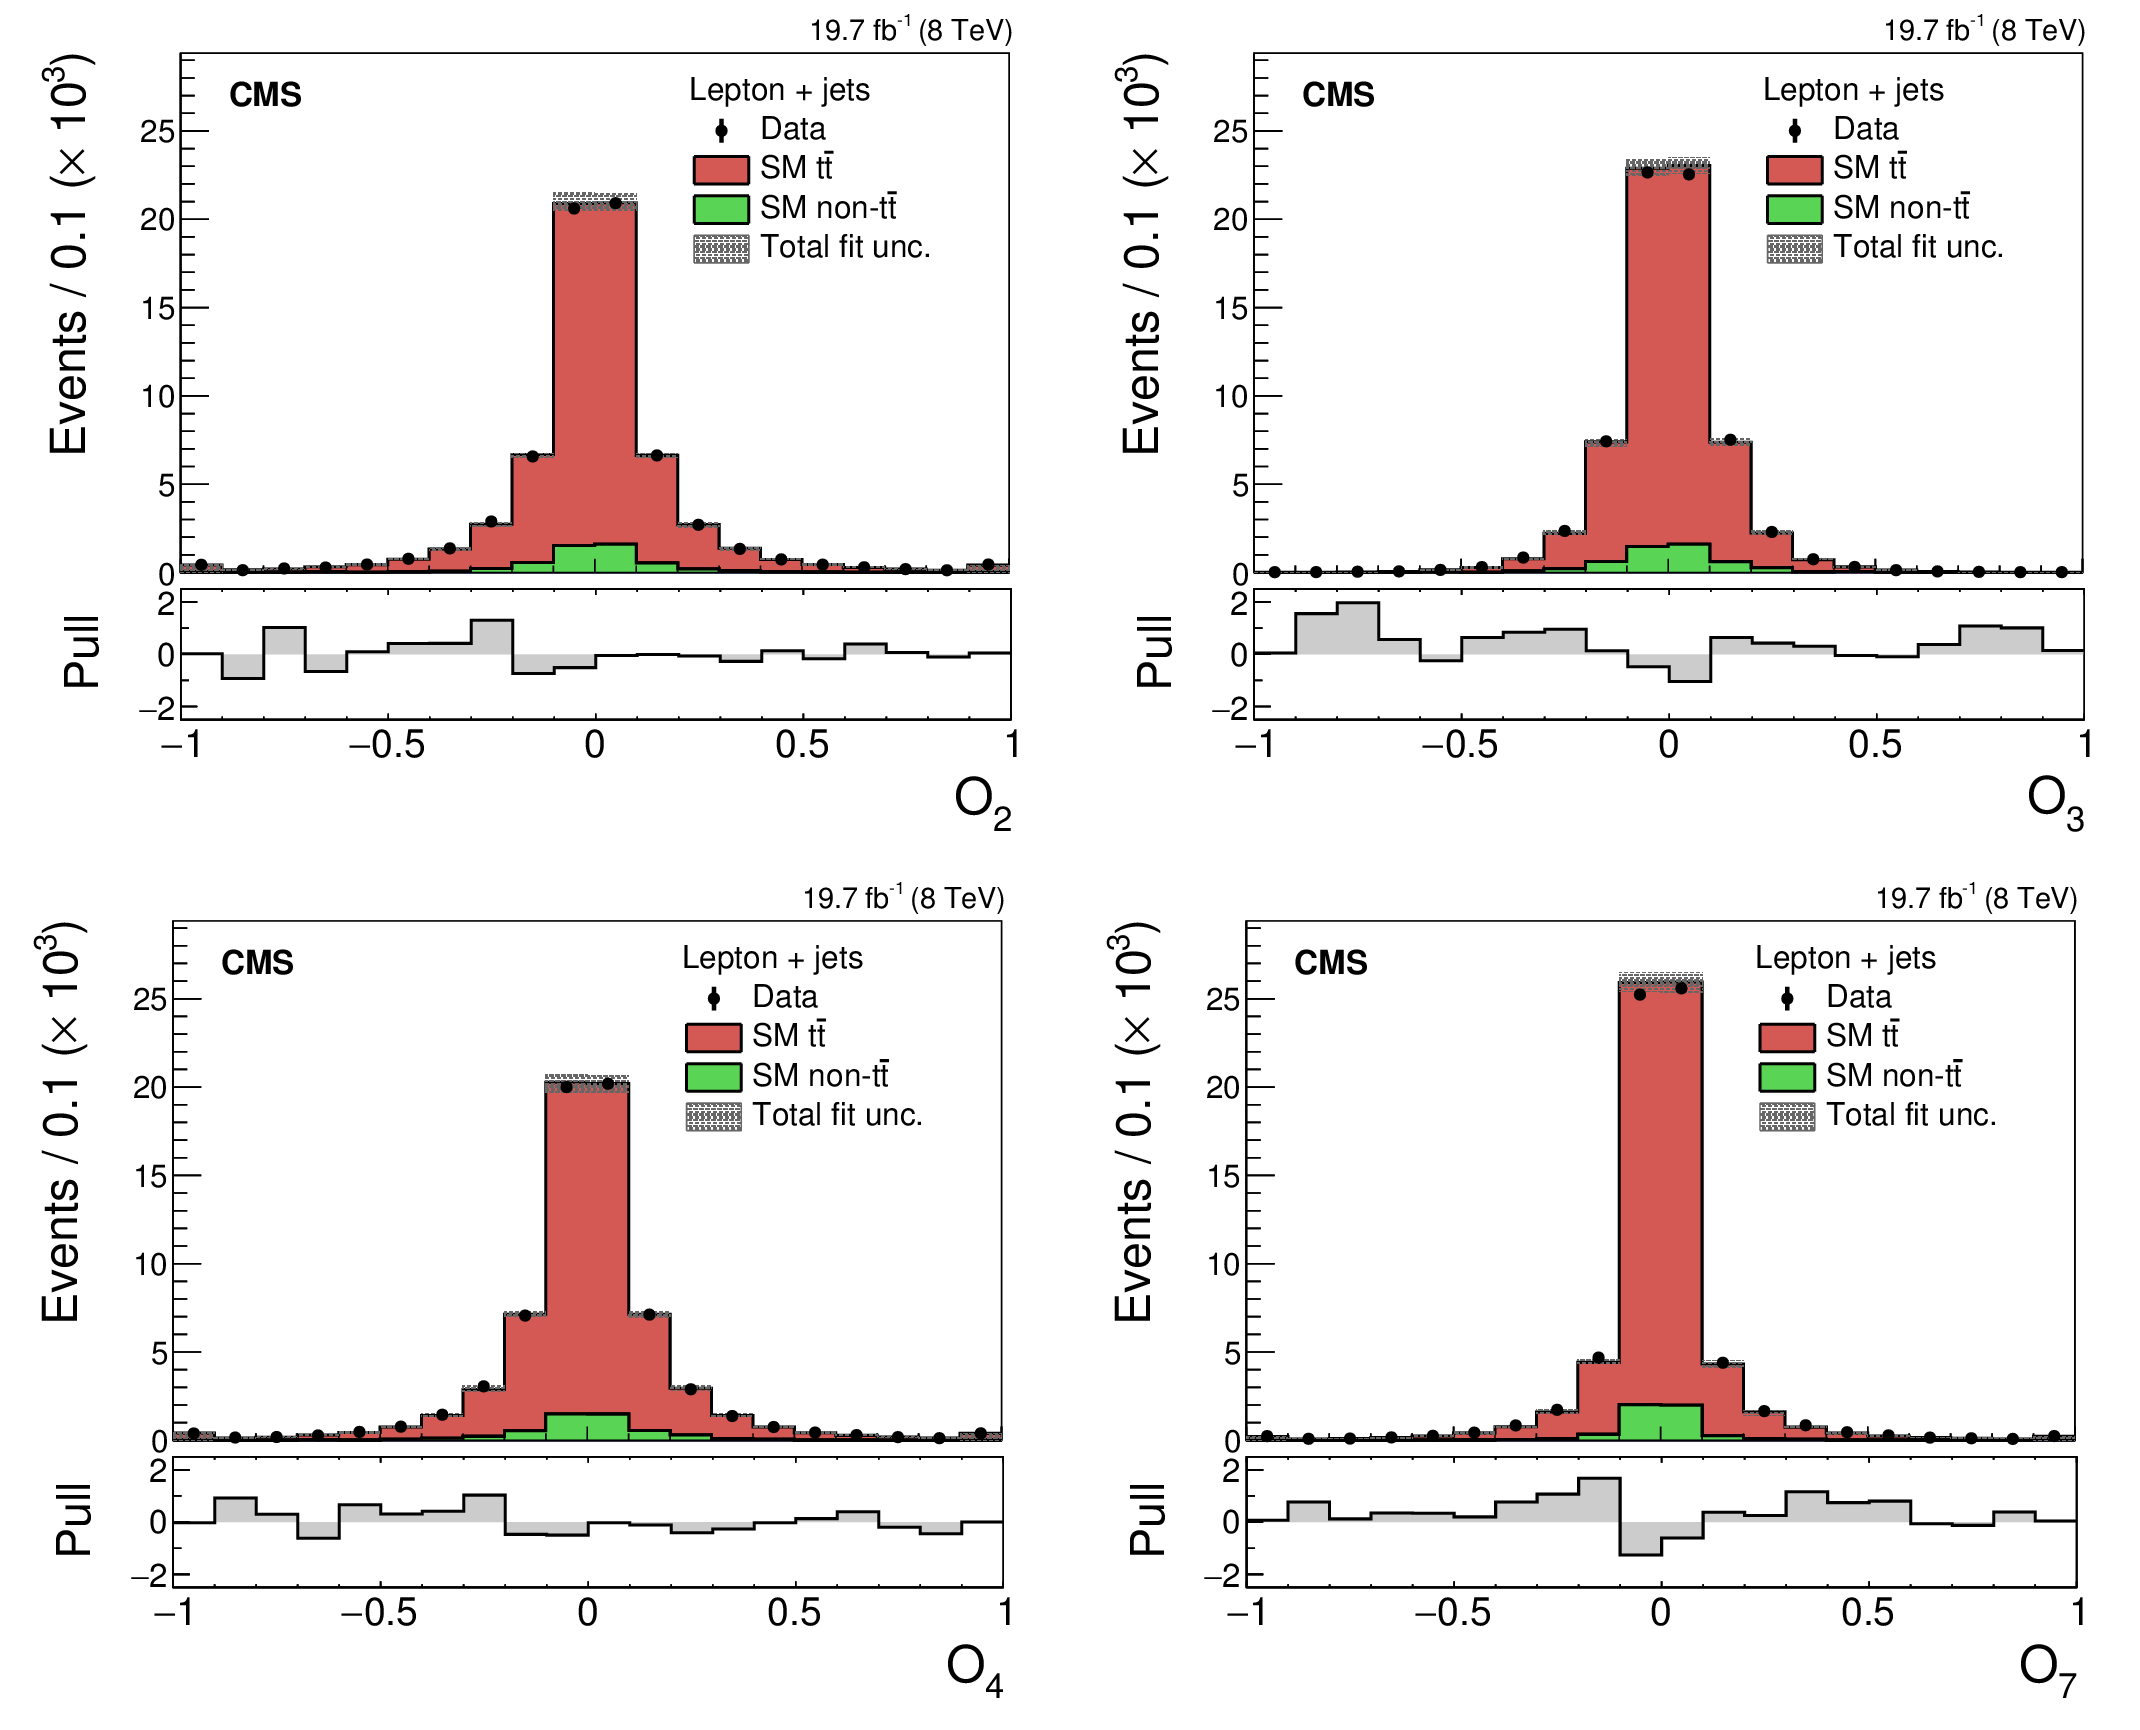
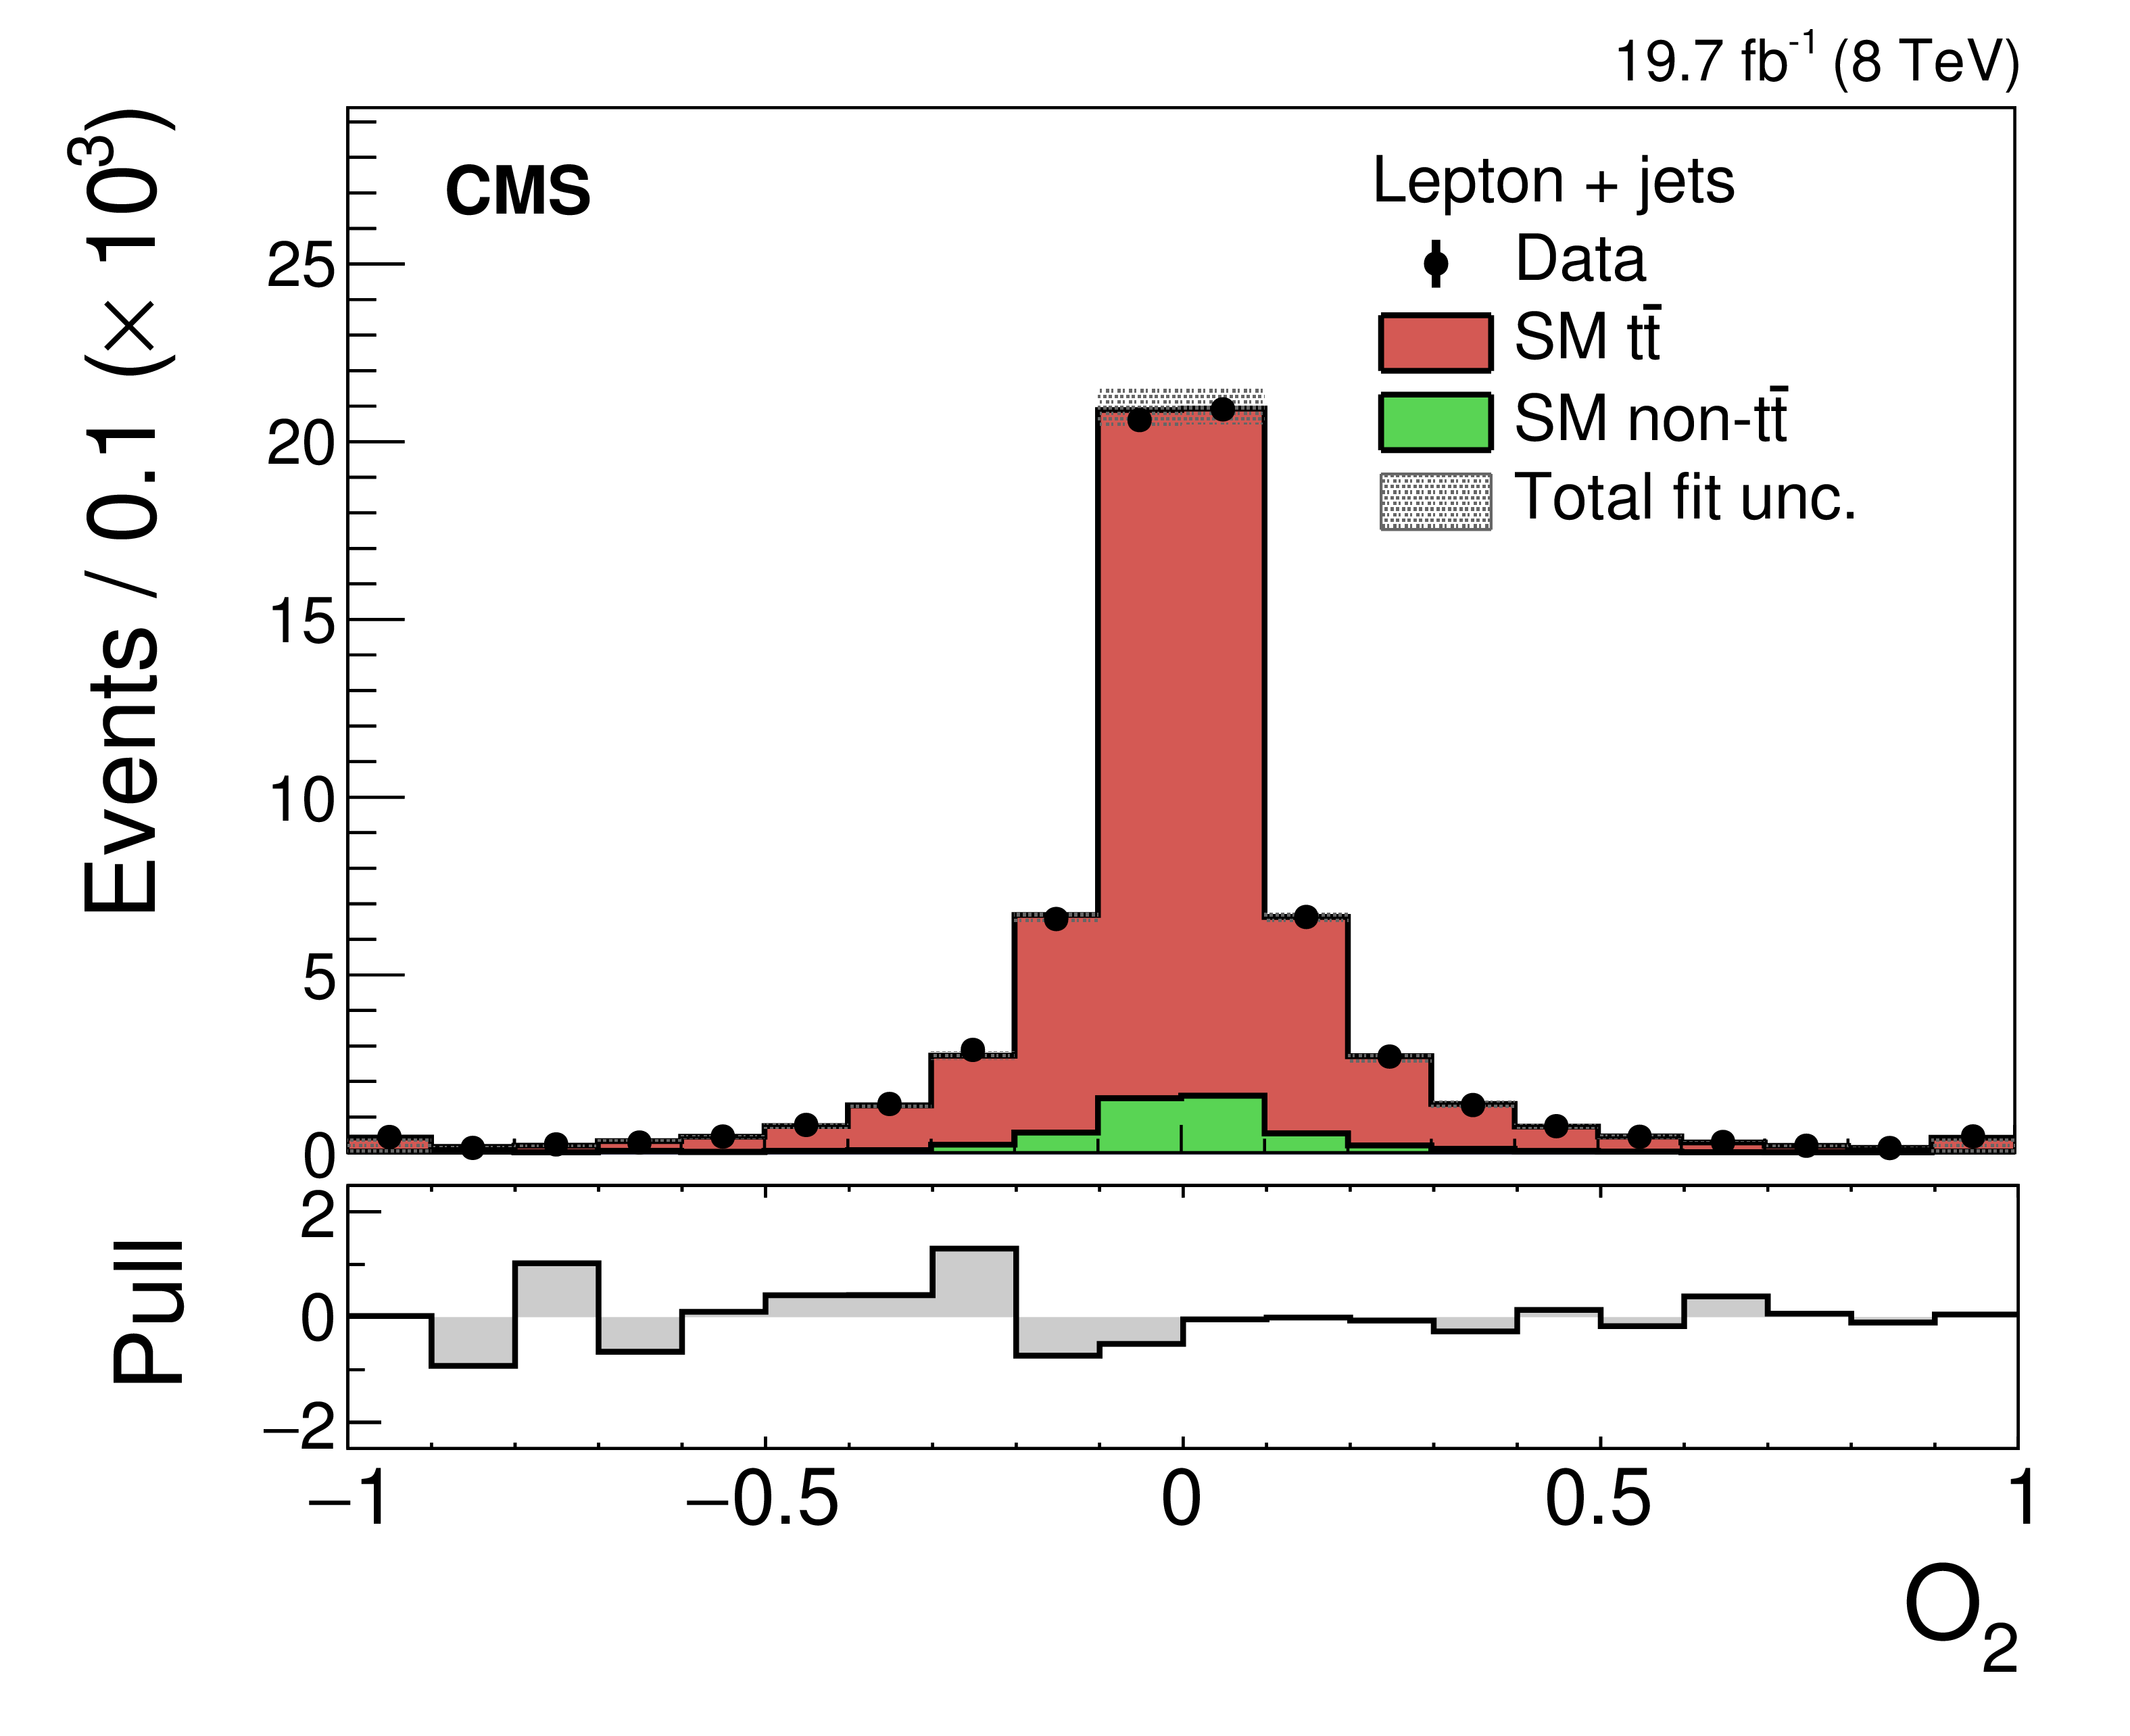
Figure 4:
Distributions of the four CPV observables given in Eq.(2), determined from the combined electron and muon channels from data (points) and simulated signal and background (filled histograms). The simulated $ \mathrm{ t \bar{t} } $ and background samples are normalized to the fitted yields. The overflow events are collected in the first and last bins. Each observable is given in units of $m_{\mathrm{ t } }^3$, where $m_{\mathrm{ t } }=$ 172.5 GeV. The vertical bars represent the statistical uncertainties in the data. The hatched bands give the combined statistical and systematic uncertainties added in quadrature. |
png pdf |
Figure 4-a:
Distribution of the "O_2" CPV observable given in Eq.(2), determined from the combined electron and muon channels from data (points) and simulated signal and background (filled histograms). The simulated $ \mathrm{ t \bar{t} } $ and background samples are normalized to the fitted yields. The overflow events are collected in the first and last bins. Each observable is given in units of $m_{\mathrm{ t } }^3$, where $m_{\mathrm{ t } }=$ 172.5 GeV. The vertical bars represent the statistical uncertainties in the data. The hatched bands give the combined statistical and systematic uncertainties added in quadrature. |
png pdf |
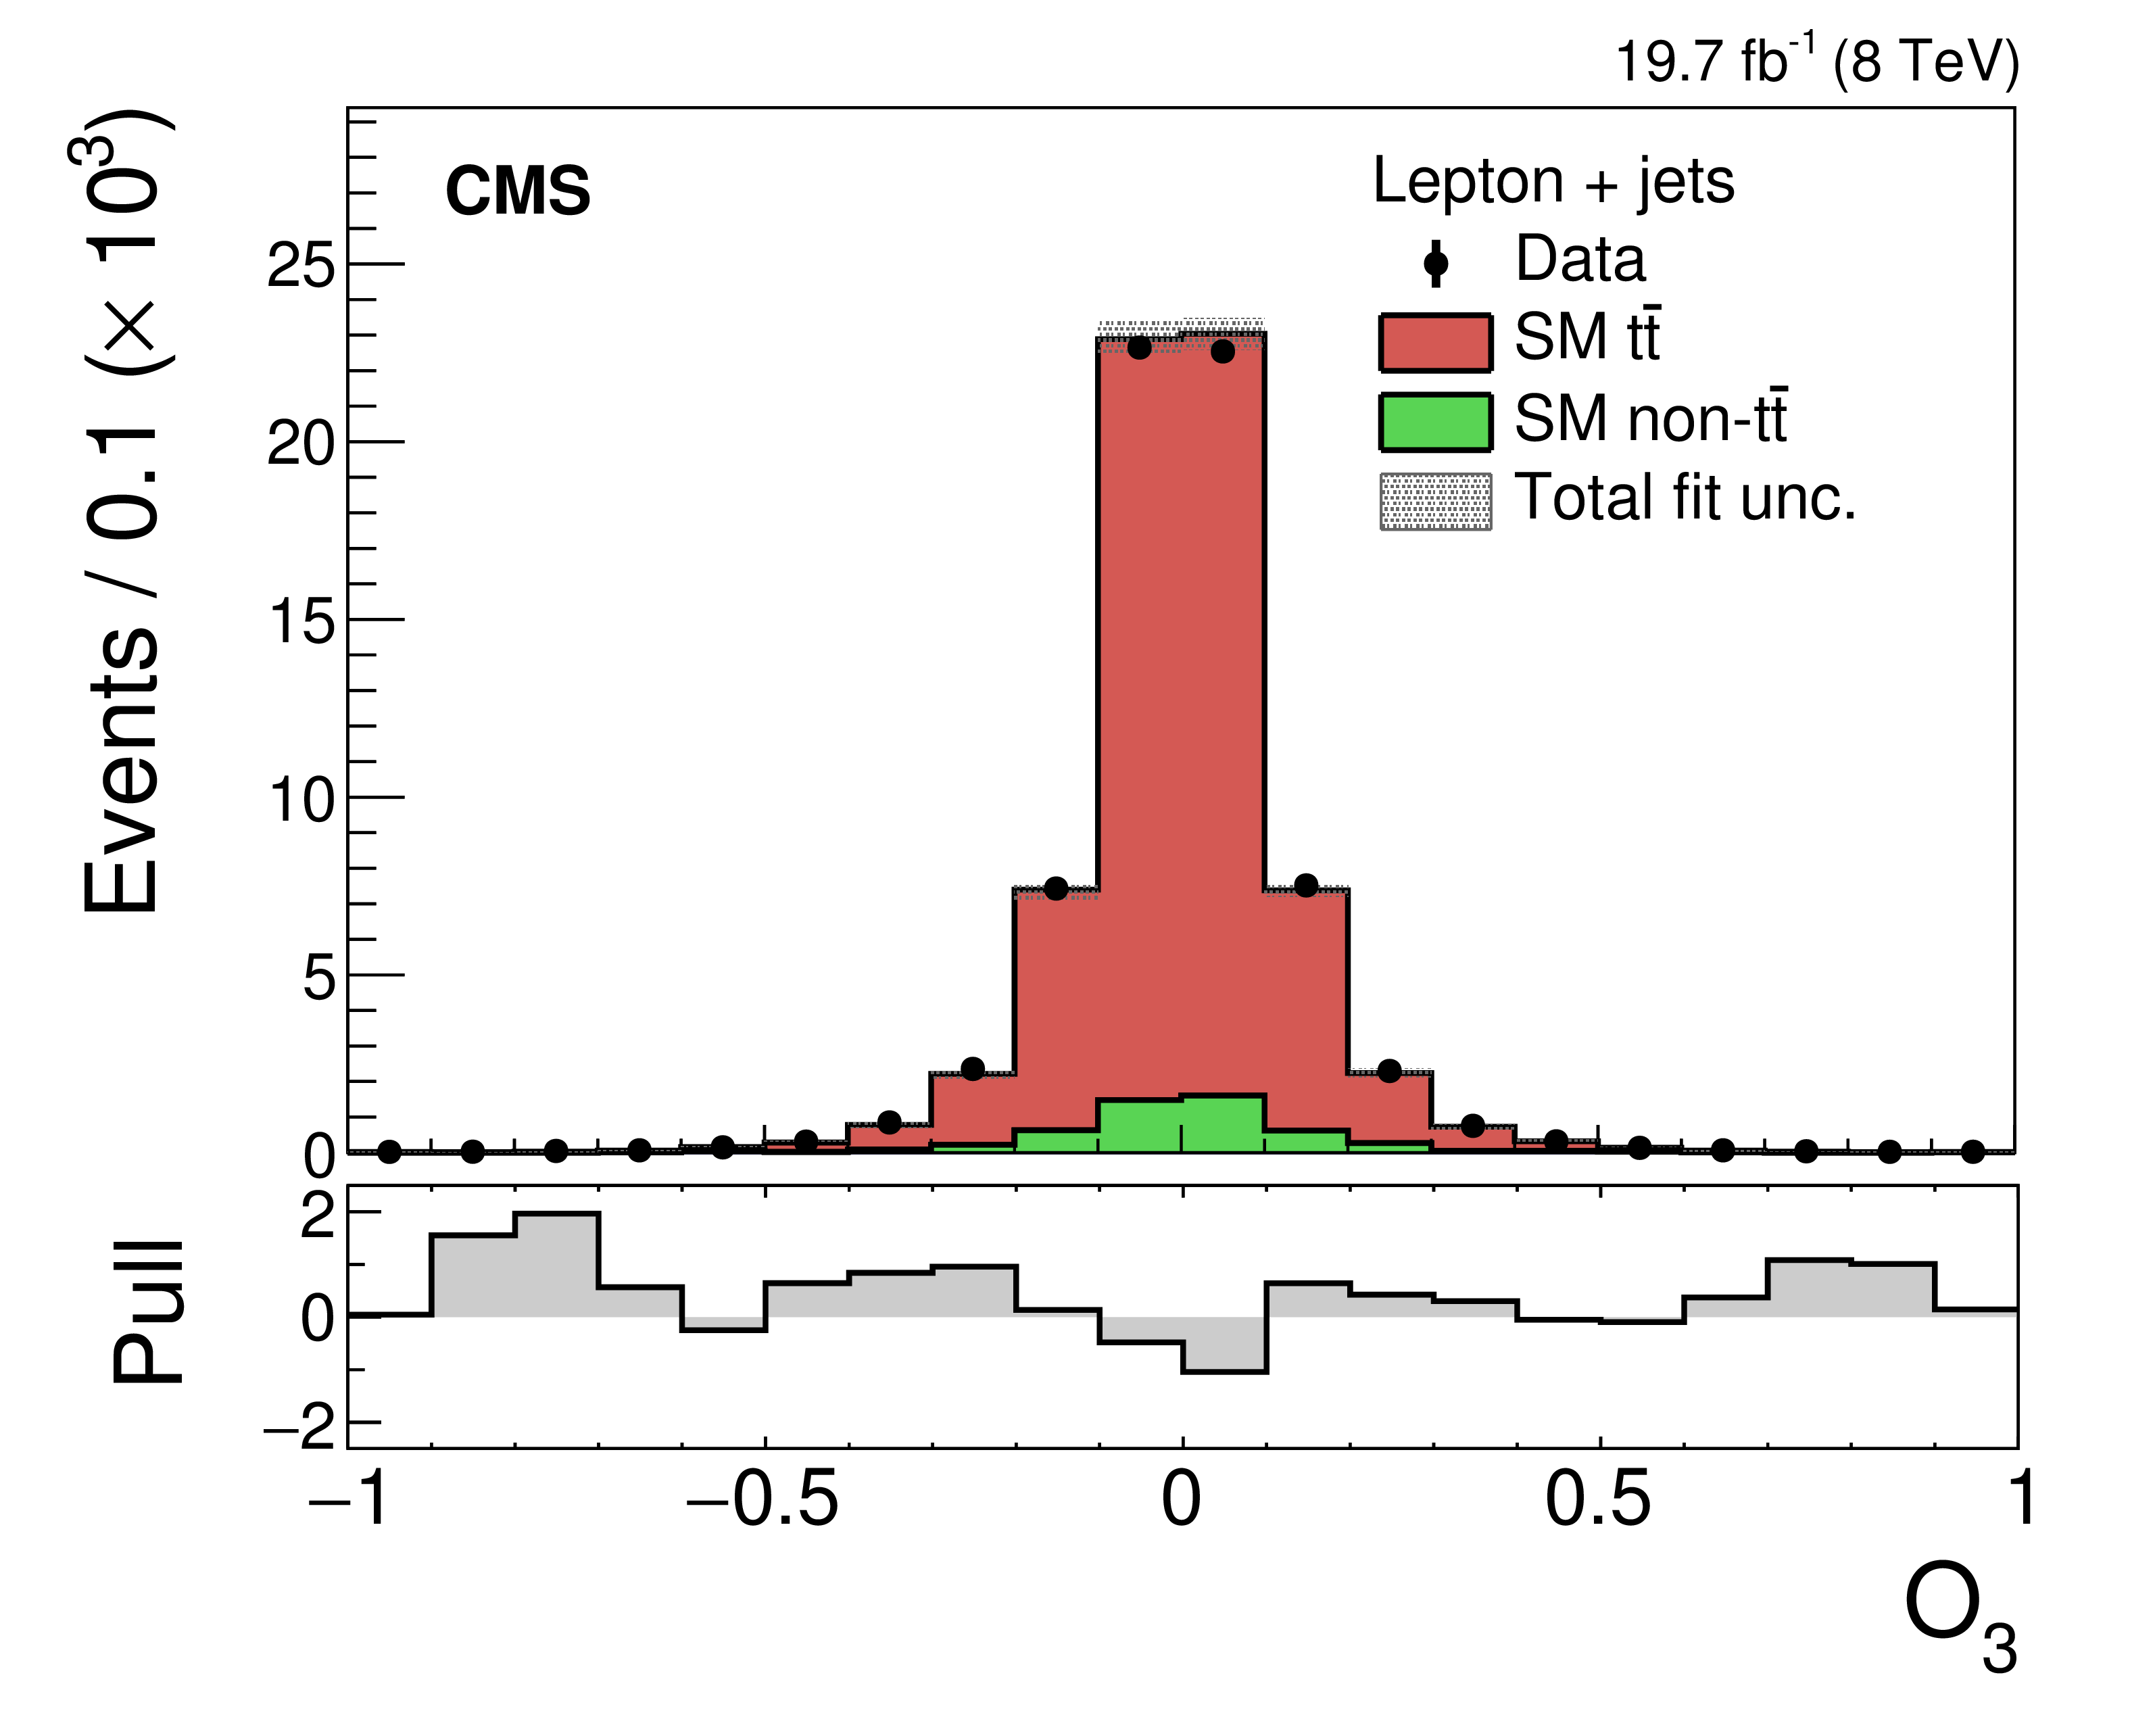
Figure 4-b:
Distribution of the "O_3" CPV observable given in Eq.(2), determined from the combined electron and muon channels from data (points) and simulated signal and background (filled histograms). The simulated $ \mathrm{ t \bar{t} } $ and background samples are normalized to the fitted yields. The overflow events are collected in the first and last bins. Each observable is given in units of $m_{\mathrm{ t } }^3$, where $m_{\mathrm{ t } }=$ 172.5 GeV. The vertical bars represent the statistical uncertainties in the data. The hatched bands give the combined statistical and systematic uncertainties added in quadrature. |
png pdf |
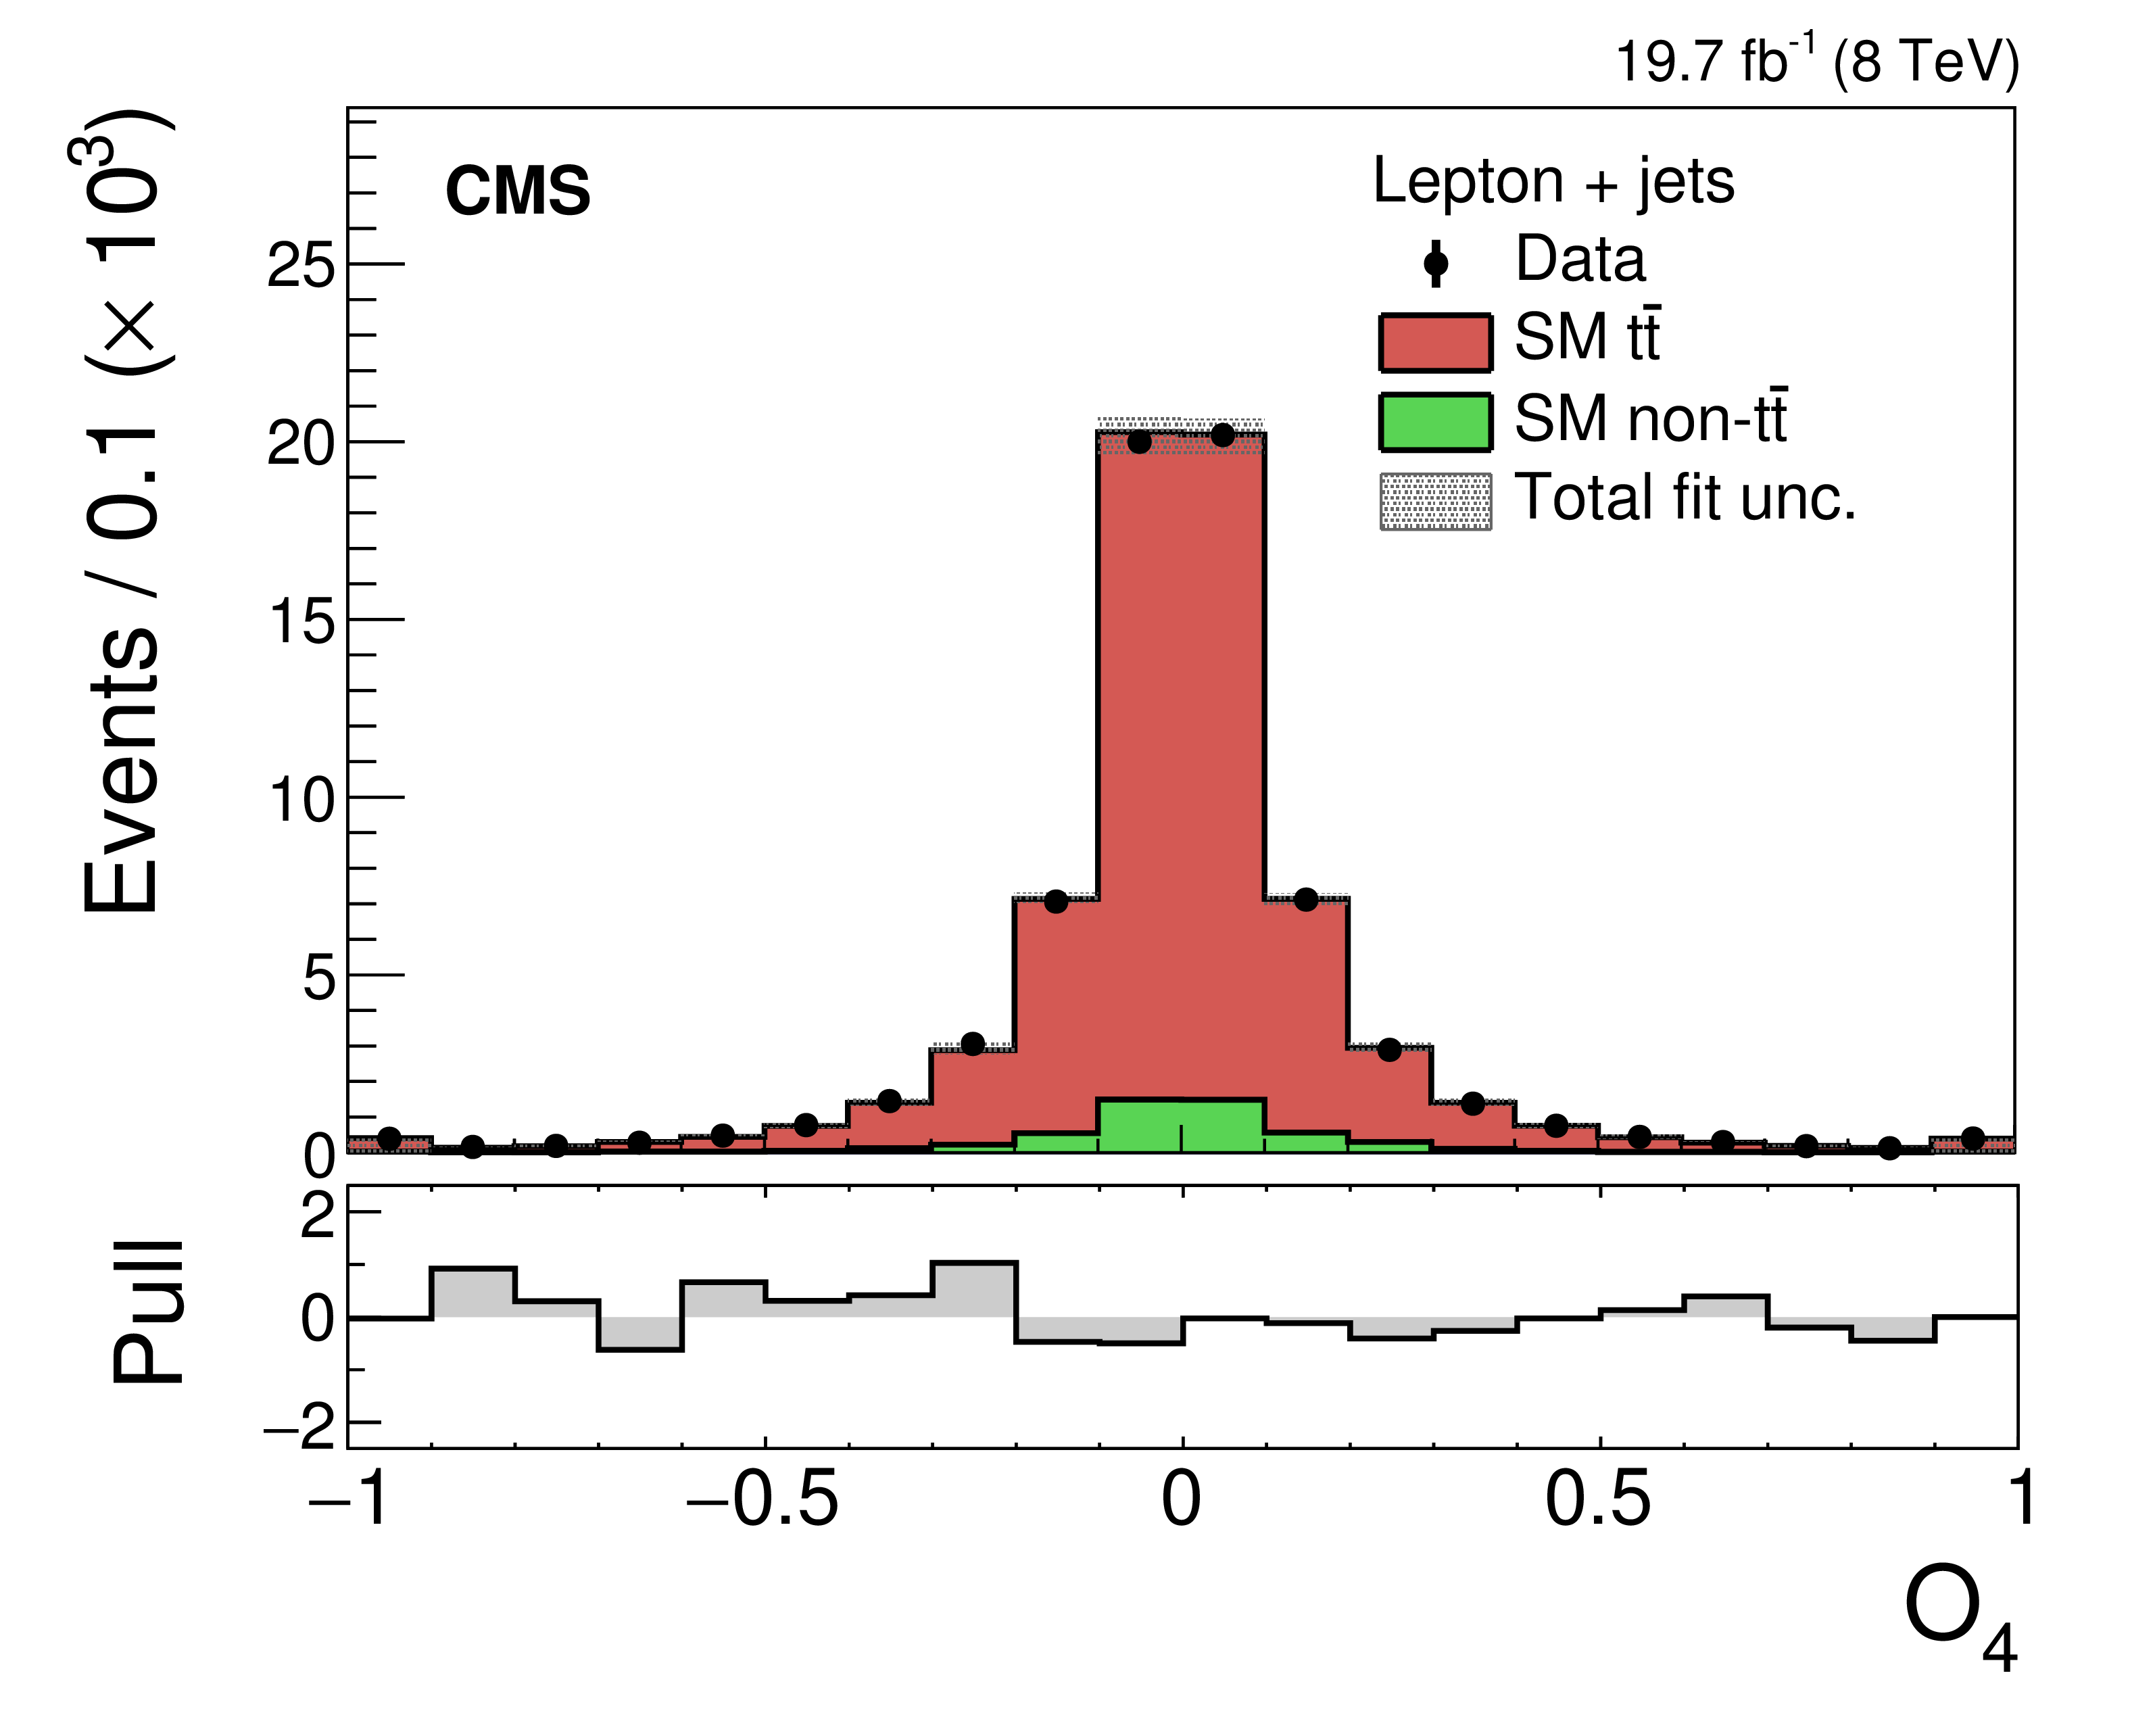
Figure 4-c:
Distribution of the "O_4" CPV observable given in Eq.(2), determined from the combined electron and muon channels from data (points) and simulated signal and background (filled histograms). The simulated $ \mathrm{ t \bar{t} } $ and background samples are normalized to the fitted yields. The overflow events are collected in the first and last bins. Each observable is given in units of $m_{\mathrm{ t } }^3$, where $m_{\mathrm{ t } }=$ 172.5 GeV. The vertical bars represent the statistical uncertainties in the data. The hatched bands give the combined statistical and systematic uncertainties added in quadrature. |
png pdf |
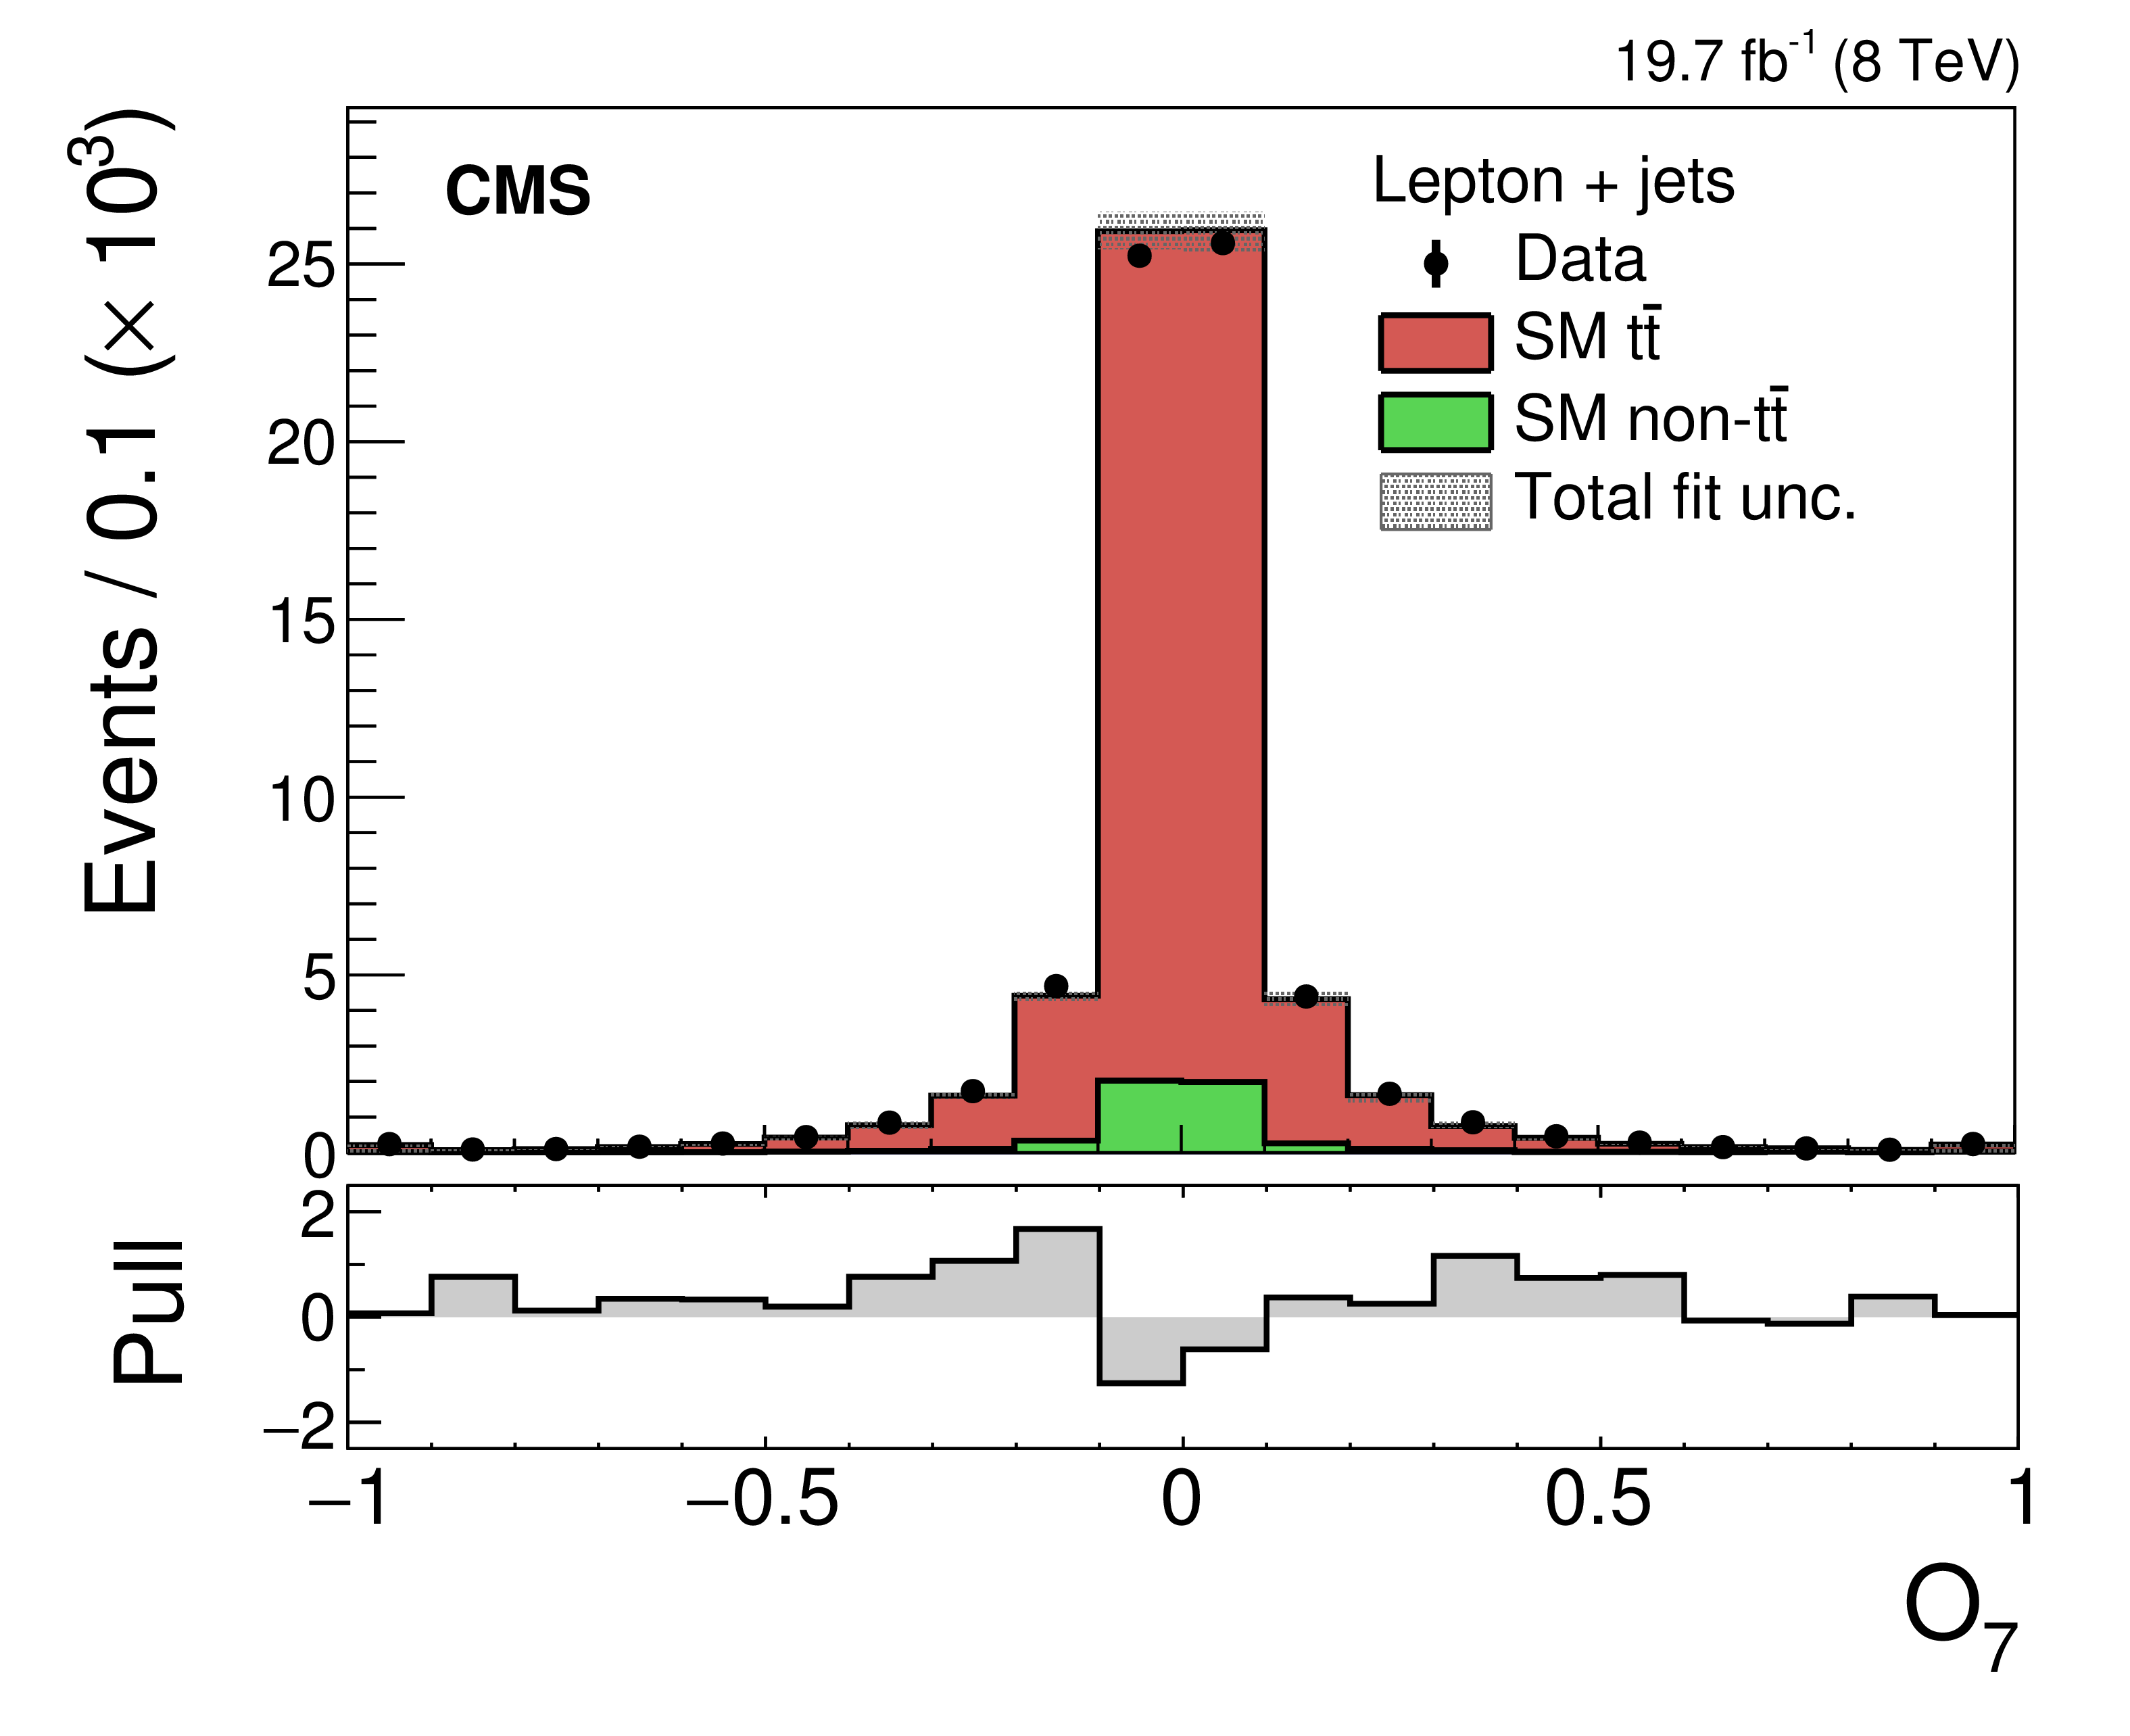
Figure 4-d:
Distribution of the "O_7" CPV observable given in Eq.(2), determined from the combined electron and muon channels from data (points) and simulated signal and background (filled histograms). The simulated $ \mathrm{ t \bar{t} } $ and background samples are normalized to the fitted yields. The overflow events are collected in the first and last bins. Each observable is given in units of $m_{\mathrm{ t } }^3$, where $m_{\mathrm{ t } }=$ 172.5 GeV. The vertical bars represent the statistical uncertainties in the data. The hatched bands give the combined statistical and systematic uncertainties added in quadrature. |
png pdf |
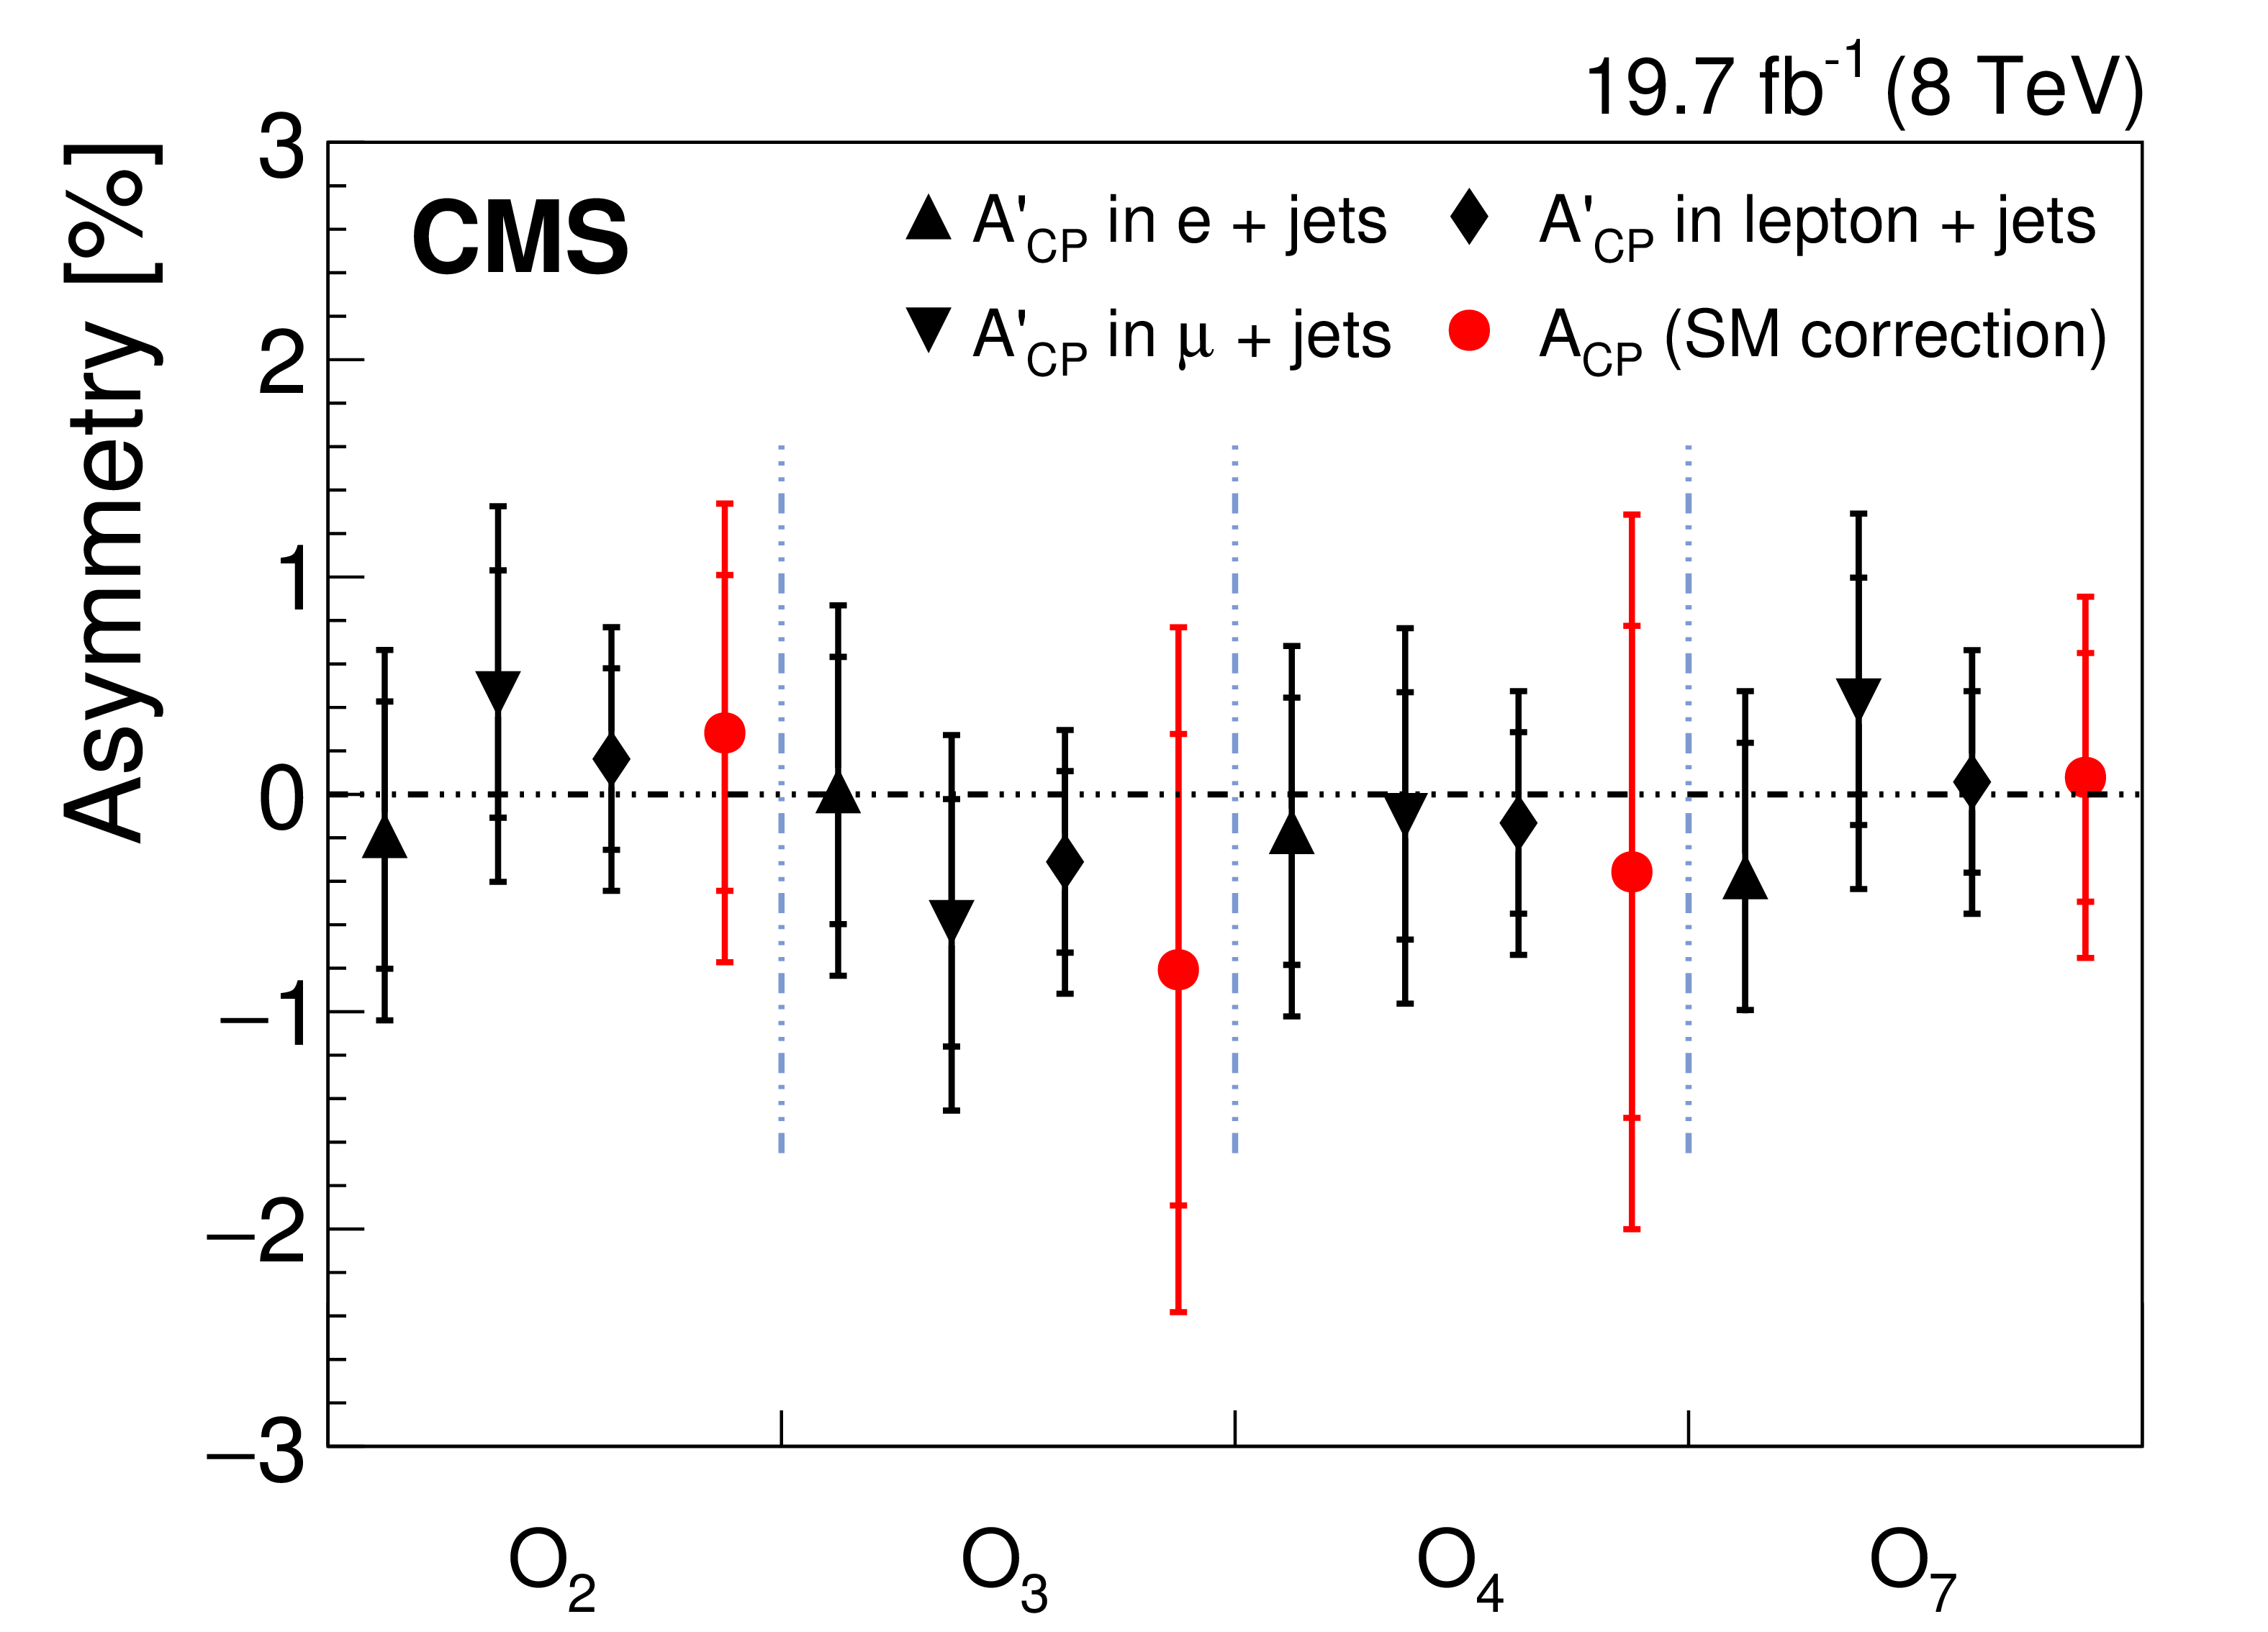
Figure 5:
Summary of the uncorrected (corrected) CP asymmetries $ { A_\mathrm {CP}^\prime } $ ($ {A_\mathrm {CP}} $) for the observables defined in Eq.(2). The results for $ { A_\mathrm {CP}^\prime } $ are shown for the electron and muon channels separately and for their combination. The results for $ {A_\mathrm {CP}} $ are shown for the combined electron and muon channels, using the dilution factors from SM simulation of $ \mathrm{ t \bar{t} } $ production. The inner bars represent the statistical uncertainties, and the outer bars the combined statistical and systematic uncertainties added in quadrature. |
| Tables | |
png pdf |
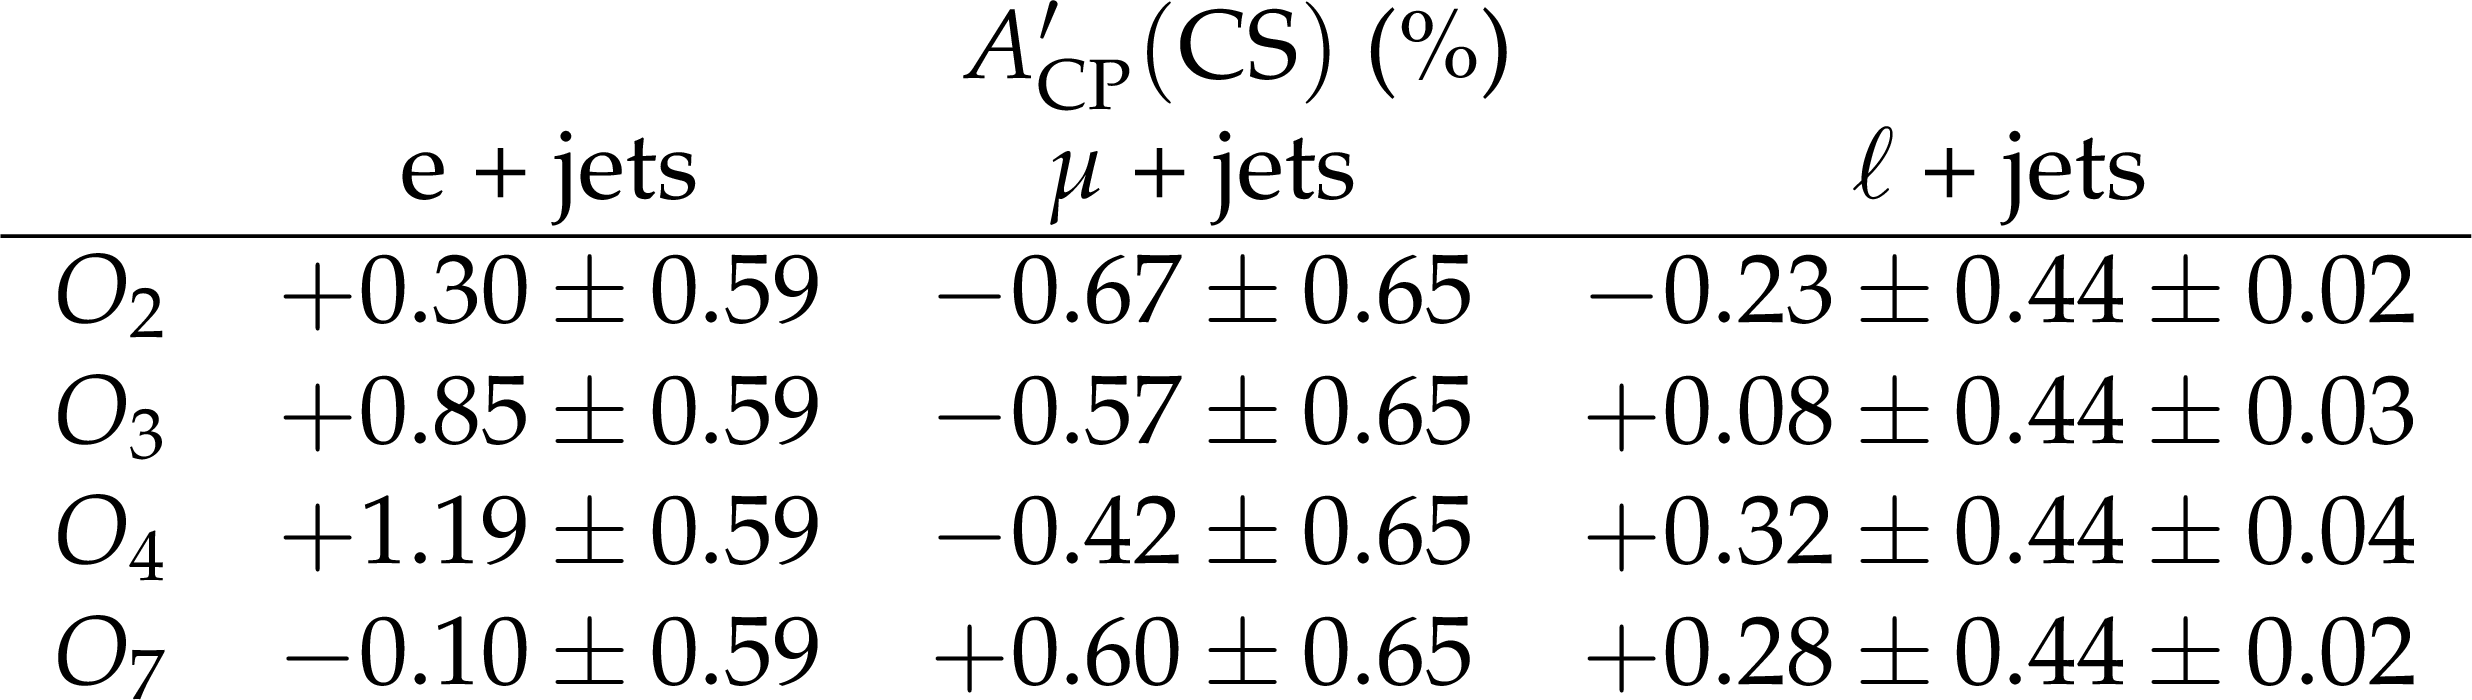
Table 1:
The uncorrected CP asymmetry ${A_\mathrm {CP}^\prime } $, measured in percent, obtained from the control sample as described in the text for each of the four observables. Results are given for the electron and muon channels separately and for their combination. For the separate electron and muon channels, the uncertainties are statistical. For the combined results, the first uncertainty is statistical and the second systematic. |
png pdf |
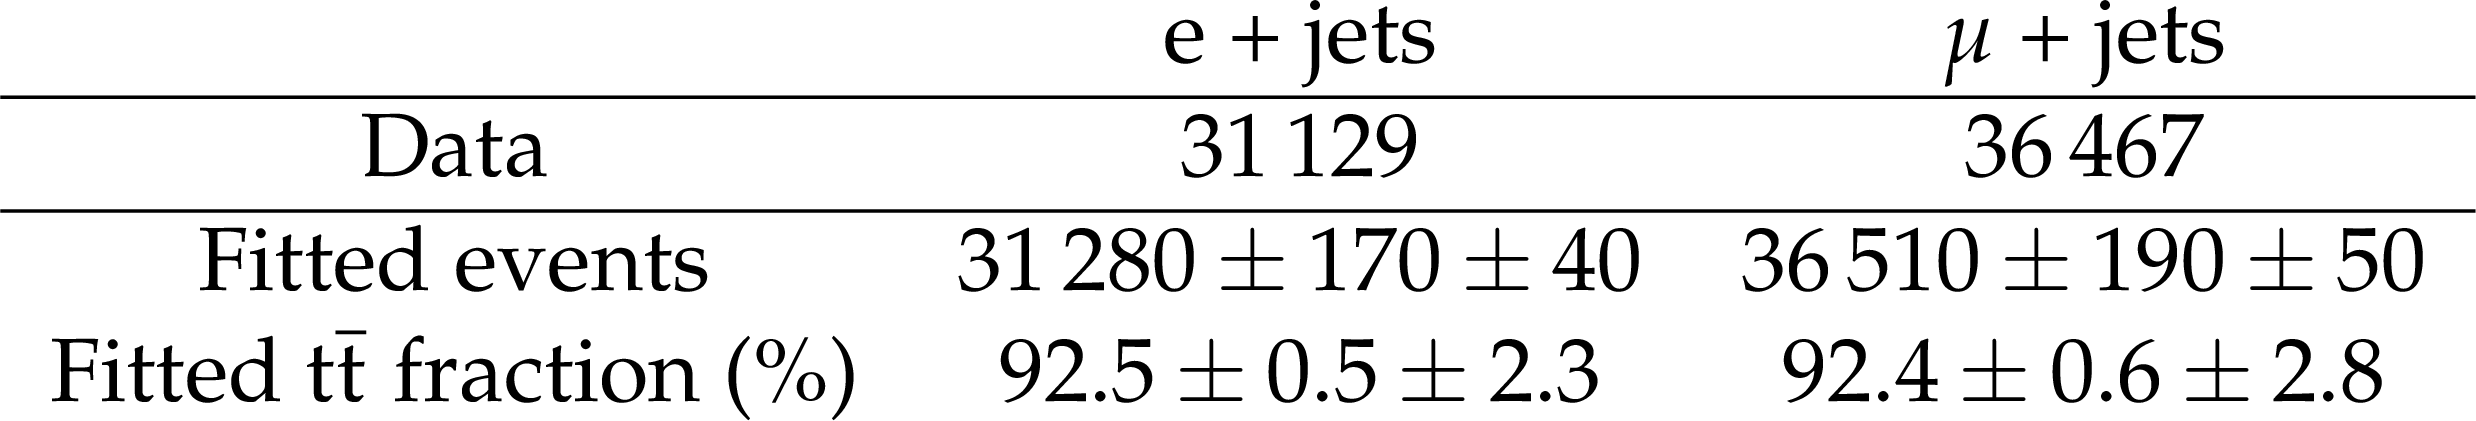
Table 2:
The observed and fitted number of events in the electron and muon channels as well as the fitted $ \mathrm{ t \bar{t} } $ fraction (purity) in percent. While the fit is performed over the full mass range, the fitted and observed results are for $M_{\ell \mathrm{ b } } < $ 200 GeV. The first uncertainty is statistical and the second systematic. |

png pdf |
Table 3:
For each of the four CPV observables, the fraction $k$ of wrong-sign events and the associated dilution factor $\mathcal {D}$ computed from $k$, determined from simulated $ \mathrm{ t \bar{t} } $ events. The first uncertainty is statistical and the second is systematic. |
png pdf |
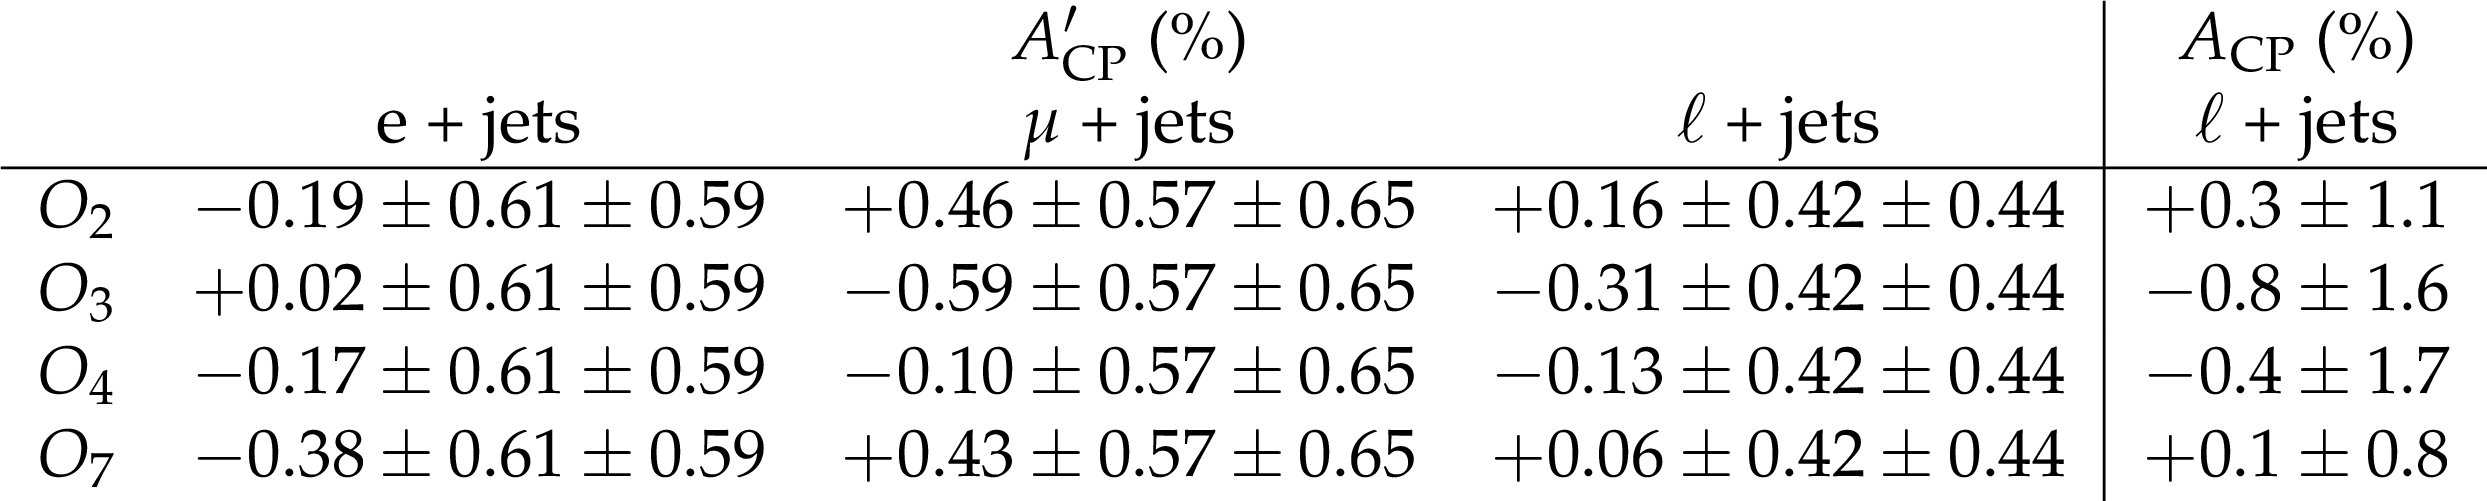
Table 4:
The uncorrected (corrected) CP asymmetry $ { A_\mathrm {CP}^\prime } $ ($ {A_\mathrm {CP}} $), measured in percent, for each of the four CPV observables. Results for $ { A_\mathrm {CP}^\prime } $ are given for the electron and muon channels separately and for their combination. For the $ { A_\mathrm {CP}^\prime } $ results, the first uncertainty is statistical and the second systematic. The $ {A_\mathrm {CP}} $ values assume the dilution factors found from the SM simulation. The uncertainties in the $ {A_\mathrm {CP}} $ results are the combined statistical and systematic terms added in quadrature. |
| Summary |
| The first search for CP-violating effects in top quark-antiquark events has been presented. The search is performed in the electron + jets and muon + jets final states, with one top quark assumed to decay hadronically and the other semileptonically. The search is based on a sample of proton-proton collision data collected at $ \sqrt{s} = $ 8 TeV with the CMS detector in 2012, corresponding to an integrated luminosity of 19.7 fb$^{-1}$. The CP-violating asymmetries are measured using four T-odd, triple-product observables, where T is the time-reversal operator. A data control sample is used to verify that no significant spurious CP asymmetry is introduced by background processes, and to model the shape of the background in the asymmetry observables. The normalization of the background contribution in the signal region is determined from a fit to the mass distribution $M_{\ell\mathrm{ b }}$ associated with the semileptonically decaying top quarks. The background-subtracted distributions of the observables are used to compute the uncorrected asymmetries. The corrected asymmetries are obtained by using a multiplicative dilution factor derived from simulation. Both the uncorrected and corrected asymmetries are consistent with zero, in agreement with the expectation from the standard model. |
| References | ||||
| 1 | A. Hocker and Z. Ligeti | CP violation and the CKM matrix | Ann. Rev. Nucl. Part. Sci. 56 (2006) 501 | hep-ph/0605217 |
| 2 | A. J. Bevan et al. | The physics of the B factories | EPJC 74 (2014) 3026 | 1406.6311 |
| 3 | Particle Data Group, K. A. Olive et al. | Review of particle physics | CPC 38 (2014) 090001 | |
| 4 | D. Atwood, S. Bar-Shalom, G. Eilam, and A. Soni | CP violation in top physics | PR 347 (2001) 1 | hep-ph/0006032 |
| 5 | S. K. Gupta and G. Valencia | CP-odd correlations using jet momenta from $ \mathrm{ t \bar{t} } $ events at the Tevatron | PRD 81 (2010) 034013 | 0912.0707 |
| 6 | S. K. Gupta, A. S. Mete, and G. Valencia | CP-violating anomalous top-quark couplings at the LHC | PRD 80 (2009) 034013 | 0905.1074 |
| 7 | A. Hayreter and G. Valencia | T-odd correlations from the top-quark chromoelectric dipole moment in lepton plus jets top-pair events | PRD 93 (2016) 014020 | 1511.01464 |
| 8 | CMS Collaboration | The CMS experiment at the CERN LHC | JINST 3 (2008) S08004 | CMS-00-001 |
| 9 | J. Alwall et al. | The automated computation of tree-level and next-to-leading order differential cross sections, and their matching to parton shower simulations | JHEP 07 (2014) 079 | 1405.0301 |
| 10 | J. Gao et al. | CT10 next-to-next-to-leading order global analysis of QCD | PRD 89 (2014) 033009 | 1302.6246 |
| 11 | T. Sjostrand, S. Mrenna, and P. Z. Skands | PYTHIA 6.4 Physics and Manual | JHEP 05 (2006) 026 | hep-ph/0603175 |
| 12 | CMS Collaboration | Study of the underlying event at forward rapidity in pp collisions at $ \sqrt{s} = $ 0.9, 2.76, and 7 TeV | JHEP 04 (2013) 072 | CMS-FWD-11-003 1302.2394 |
| 13 | M. Cacciari et al. | Top-pair production at hadron colliders with next-to-next-to-leading logarithmic soft-gluon resummation | PLB 710 (2012) 612 | 1111.5869 |
| 14 | CMS Collaboration | Measurement of the differential cross section for top quark pair production in pp collisions at $ \sqrt{s} = $ 8 TeV | EPJC 75 (2015) 542 | CMS-TOP-12-028 1505.04480 |
| 15 | CMS Collaboration | Measurement of the $ \mathrm{t}\overline{{\mathrm{t}}} $ production cross section in the all-jets final state in pp collisions at $ \sqrt{s}= $ 8 TeV | EPJC 76 (2016) 128 | CMS-TOP-14-018 1509.06076 |
| 16 | C. Oleari | The POWHEG-BOX | NPPS 205-206 (2010) 36 | 1007.3893 |
| 17 | P. Nason | A New method for combining NLO QCD with shower Monte Carlo algorithms | JHEP 11 (2004) 040 | hep-ph/0409146 |
| 18 | S. Alioli, P. Nason, C. Oleari, and E. Re | A general framework for implementing NLO calculations in shower Monte Carlo programs: the POWHEG BOX | JHEP 06 (2010) 043 | 1002.2581 |
| 19 | S. Frixione, P. Nason, and C. Oleari | Matching NLO QCD computations with Parton Shower simulations: the POWHEG method | JHEP 11 (2007) 070 | 0709.2092 |
| 20 | S. Alioli, P. Nason, C. Oleari, and E. Re | NLO single-top production matched with shower in POWHEG: $ s $- and $ t $-channel contributions | JHEP 09 (2009) 111 | 0907.4076 |
| 21 | E. Re | Single-top Wt-channel production matched with parton showers using the POWHEG method | EPJC 71 (2011) 1547 | 1009.2450 |
| 22 | P. Kant et al. | HATHOR for single top-quark production: Updated predictions and uncertainty estimates for single top-quark production in hadronic collisions | CPC 191 (2015) 74 | 1406.4403 |
| 23 | M. Aliev et al. | HATHOR: HAdronic Top and Heavy quarks crOss section calculatoR | CPC 182 (2011) 1034 | 1007.1327 |
| 24 | R. Gavin, Y. Li, F. Petriello, and S. Quackenbush | W Physics at the LHC with FEWZ 2.1 | CPC 184 (2013) 208 | 1201.5896 |
| 25 | R. Gavin, Y. Li, F. Petriello, and S. Quackenbush | FEWZ 2.0: A code for hadronic Z production at next-to-next-to-leading order | CPC 182 (2011) 2388 | 1011.3540 |
| 26 | J. M. Campbell and R. K. Ellis | MCFM for the Tevatron and the LHC | NPPS 205-206 (2010) 10 | 1007.3492 |
| 27 | GEANT4 Collaboration | GEANT 4---A simulation toolkit | NIMA 506 (2003) 250 | |
| 28 | CMS Collaboration | Particle--flow event reconstruction in CMS and performance for jets, taus, and $ E_{\mathrm{T}}^{\text{miss}} $ | CMS-PAS-PFT-09-001 | |
| 29 | CMS Collaboration | Commissioning of the particle-flow event reconstruction with the first LHC collisions recorded in the CMS detector | CMS-PAS-PFT-10-001 | |
| 30 | CMS Collaboration | Performance of electron reconstruction and selection with the CMS detector in proton-proton collisions at $ \sqrt{s} = $ 8 TeV | JINST 10 (2015) P06005 | CMS-EGM-13-001 1502.02701 |
| 31 | CMS Collaboration | Performance of CMS muon reconstruction in pp collision events at $ \sqrt{s} = $ 7 TeV | JINST 7 (2012) P10002 | CMS-MUO-10-004 |
| 32 | CMS Collaboration | Measurements of inclusive W and Z cross sections in pp collisions at $ \sqrt{s}= $ 7 TeV | JHEP 01 (2011) 080 | CMS-EWK-10-002 1012.2466 |
| 33 | M. Cacciari, G. P. Salam, and G. Soyez | The anti-$ k_t $ jet clustering algorithm | JHEP 04 (2008) 063 | 0802.1189 |
| 34 | M. Cacciari, G. P. Salam, and G. Soyez | FastJet user manual | EPJC 72 (2012) 1896 | 1111.6097 |
| 35 | CMS Collaboration | Jet energy scale and resolution in the CMS experiment in pp collisions at 8 TeV | Submitted to JINST | CMS-JME-13-004 1607.03663 |
| 36 | CMS Collaboration | Commissioning of the particle-flow reconstruction in minimum-bias and jet events from pp collisions at 7 TeV | CMS-PAS-PFT-10-002 | |
| 37 | CMS Collaboration | Identification of b-quark jets with the CMS experiment | JINST 8 (2013) P04013 | CMS-BTV-12-001 1211.4462 |
| 38 | CMS Collaboration | Performance of b tagging at $ \sqrt{s}= $ 8 TeV in multijet, $ \rm{t}\overline{\rm t} $ and boosted topology events | CMS-PAS-BTV-13-001 | CMS-PAS-BTV-13-001 |
| 39 | CMS Collaboration | Measurements of the $ \mathrm{ t \overline{t} } $ production cross section in lepton+jets final states in pp collisions at 8 TeV and ratio of 8 to 7 TeV cross sections | Submitted to EPJC | CMS-TOP-12-006 1602.09024 |
| 40 | TOTEM Collaboration | First measurement of the total proton-proton cross section at the LHC energy of $ \sqrt{s}= $ 7 TeV | Europhys. Lett. 96 (2011) 21002 | 1110.1395 |
| 41 | H.-L. Lai et al. | New parton distributions for collider physics | PRD 82 (2010) 074024 | 1007.2241 |
| 42 | CMS Collaboration | Measurement of the top quark mass using proton-proton data at $ {\sqrt{s}} = $ 7 and 8 TeV | PRD 93 (2016) 072004 | CMS-TOP-14-022 1509.04044 |
|
|
Compact Muon Solenoid LHC, CERN |
|

|

|

|

|

|