

Compact Muon Solenoid
LHC, CERN
| CMS-TOP-16-003 ; CERN-EP-2016-233 | ||
| Cross section measurement of $t$-channel single top quark production in pp collisions at $ \sqrt{s} = $ 13 TeV | ||
| CMS Collaboration | ||
| 3 October 2016 | ||
| Phys. Lett. B 772 (2017) 752 | ||
| Abstract: The cross section for the production of single top quarks in the $t$ channel is measured in proton-proton collisions at 13 TeV with the CMS detector at the LHC. The analyzed data correspond to an integrated luminosity of 2.2 fb$^{-1}$. The event selection requires one muon and two jets where one of the jets is identified as originating from a bottom quark. Several kinematic variables are then combined into a multivariate discriminator to distinguish signal from background events. A fit to the distribution of the discriminating variable yields a total cross section of 238 $\pm$ 13 (stat) $\pm$ 29 (syst) pb and a ratio of top quark and top antiquark production of $R_{t\text{-ch.}}= $ 1.81 $\pm$ 0.18 (stat) $\pm$ 0.15 (syst). From the total cross section the absolute value of the CKM matrix element $V_{\mathrm{ t }\mathrm{ b }}$ is calculated to be 1.05 $\pm$ 0.07 (exp) $\pm$ 0.02 (theory). All results are in agreement with the standard model predictions. | ||
| Links: e-print arXiv:1610.00678 [hep-ex] (PDF) ; CDS record ; inSPIRE record ; CADI line (restricted) ; | ||
| Figures | |
png pdf |
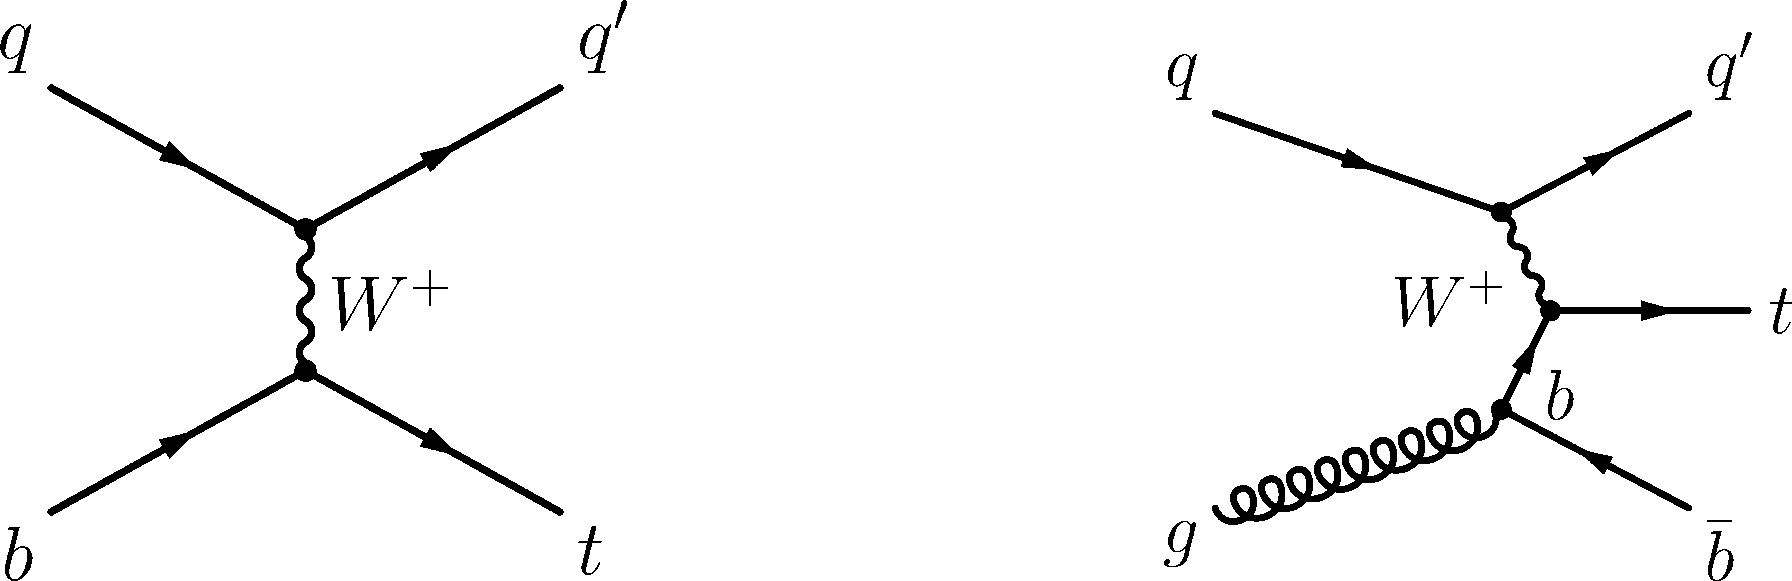
Figure 1:
Feynman diagrams for single top quark production in the $t$ channel: (a) 2$\rightarrow $2 and (b) 2$\rightarrow $3 processes. |
png pdf |
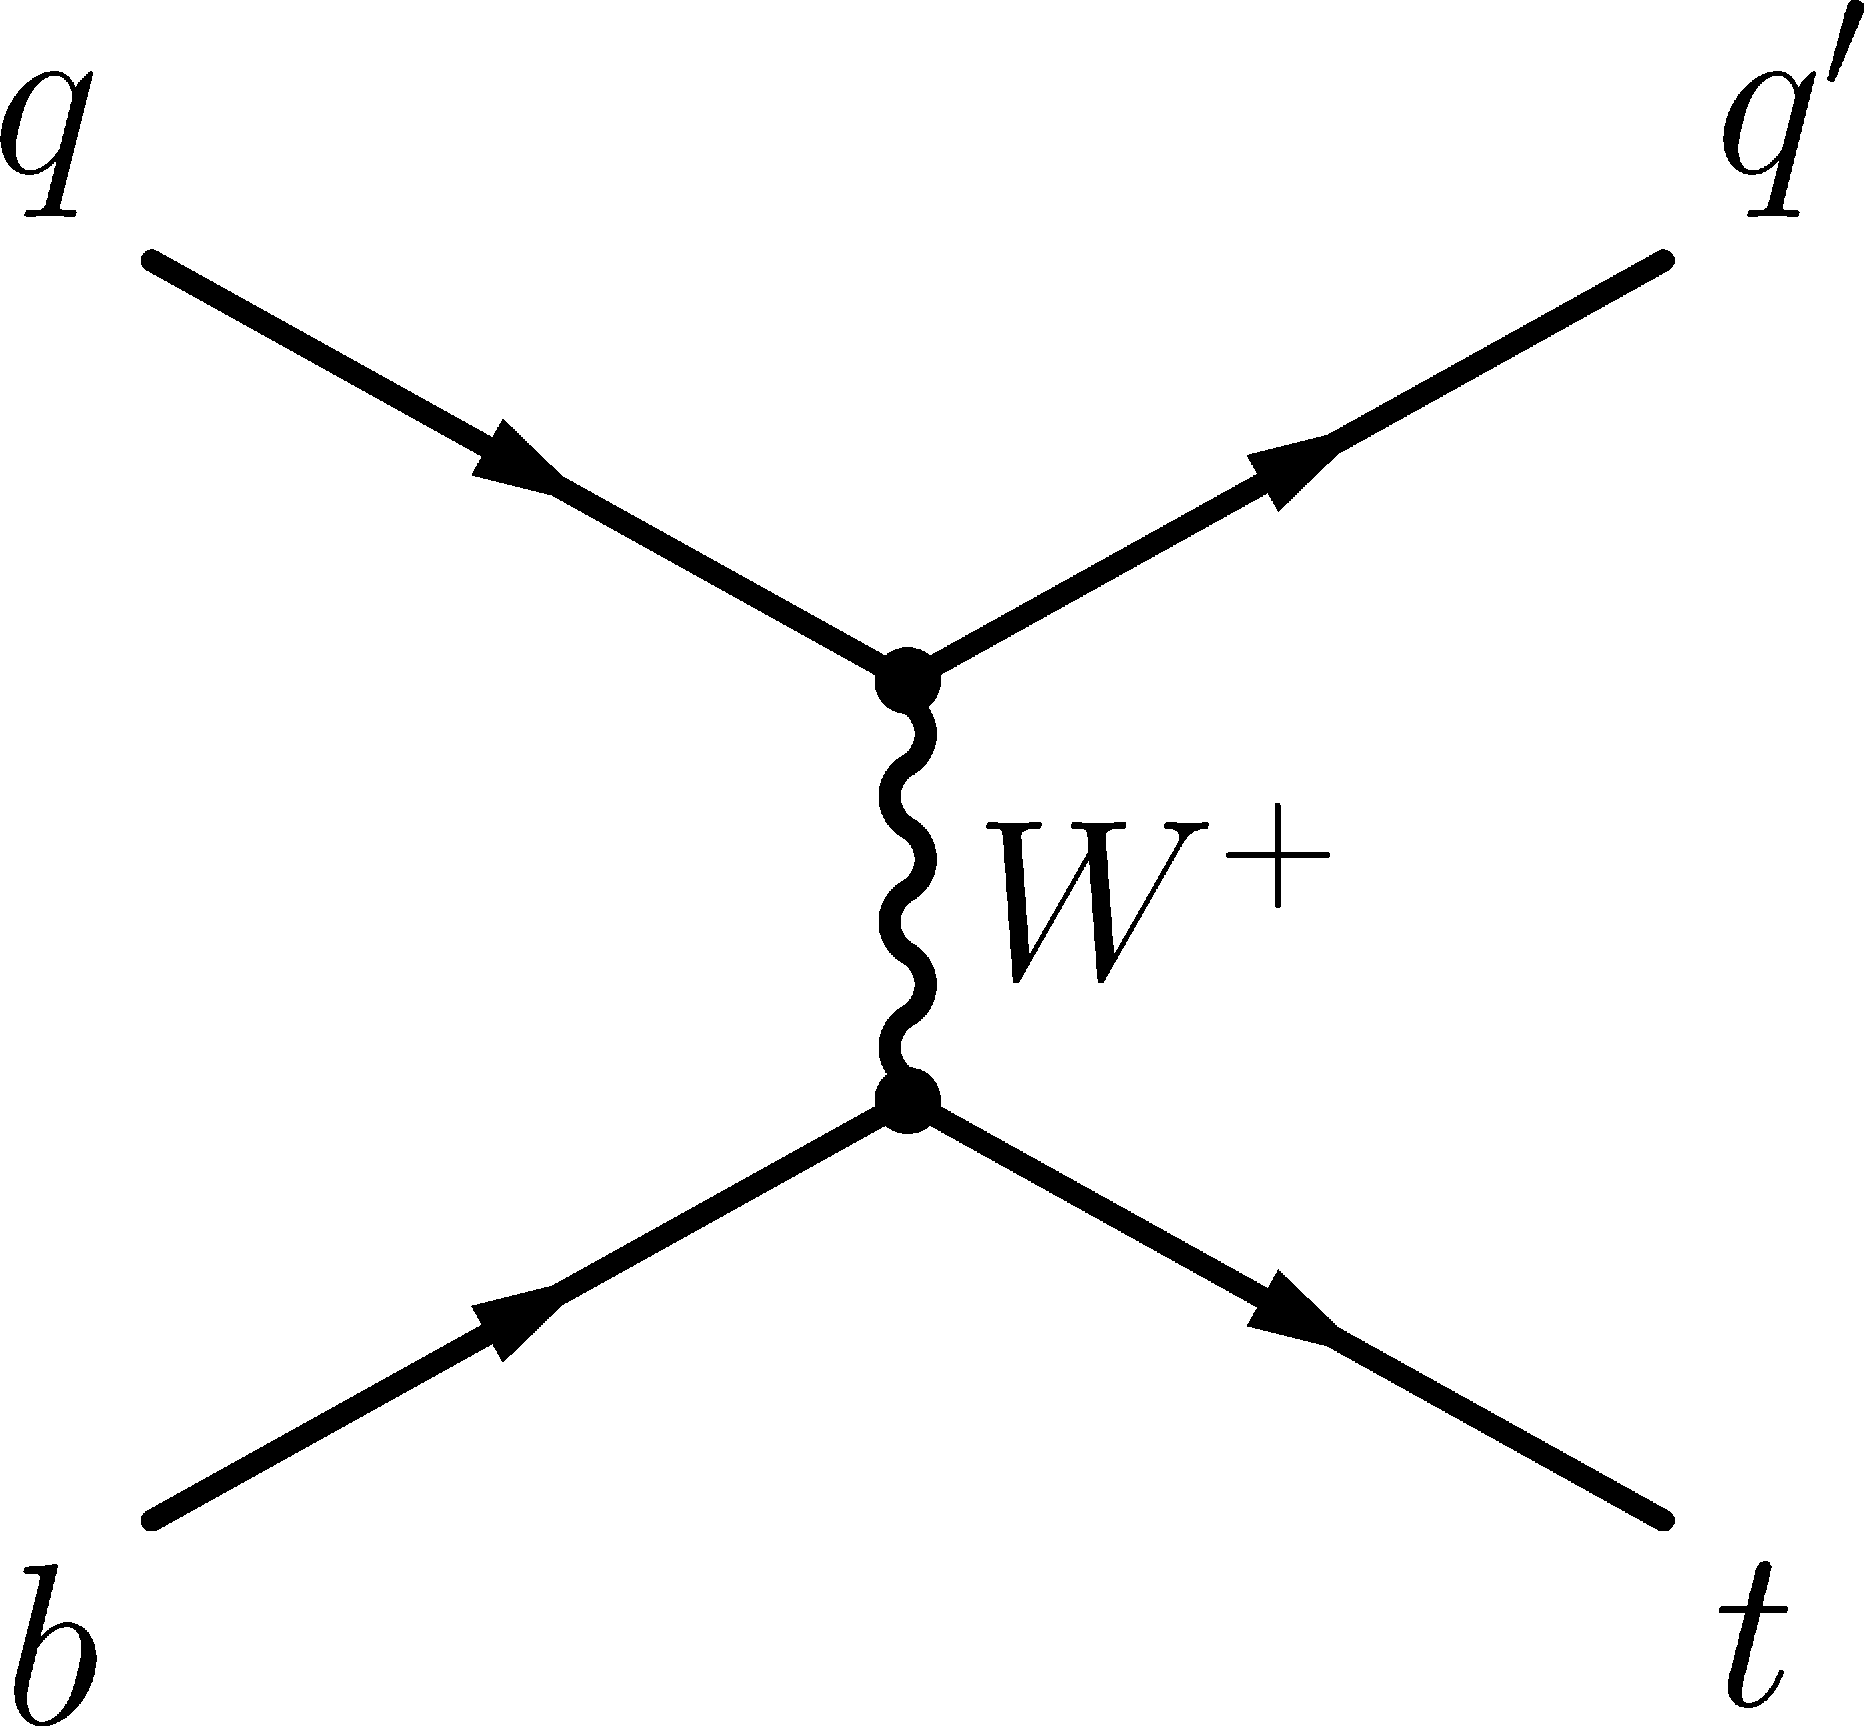
Figure 1-a:
Feynman diagrams for single top quark production in the $t$ channel: (a) 2$\rightarrow $2 and (b) 2$\rightarrow $3 processes. |
png pdf |
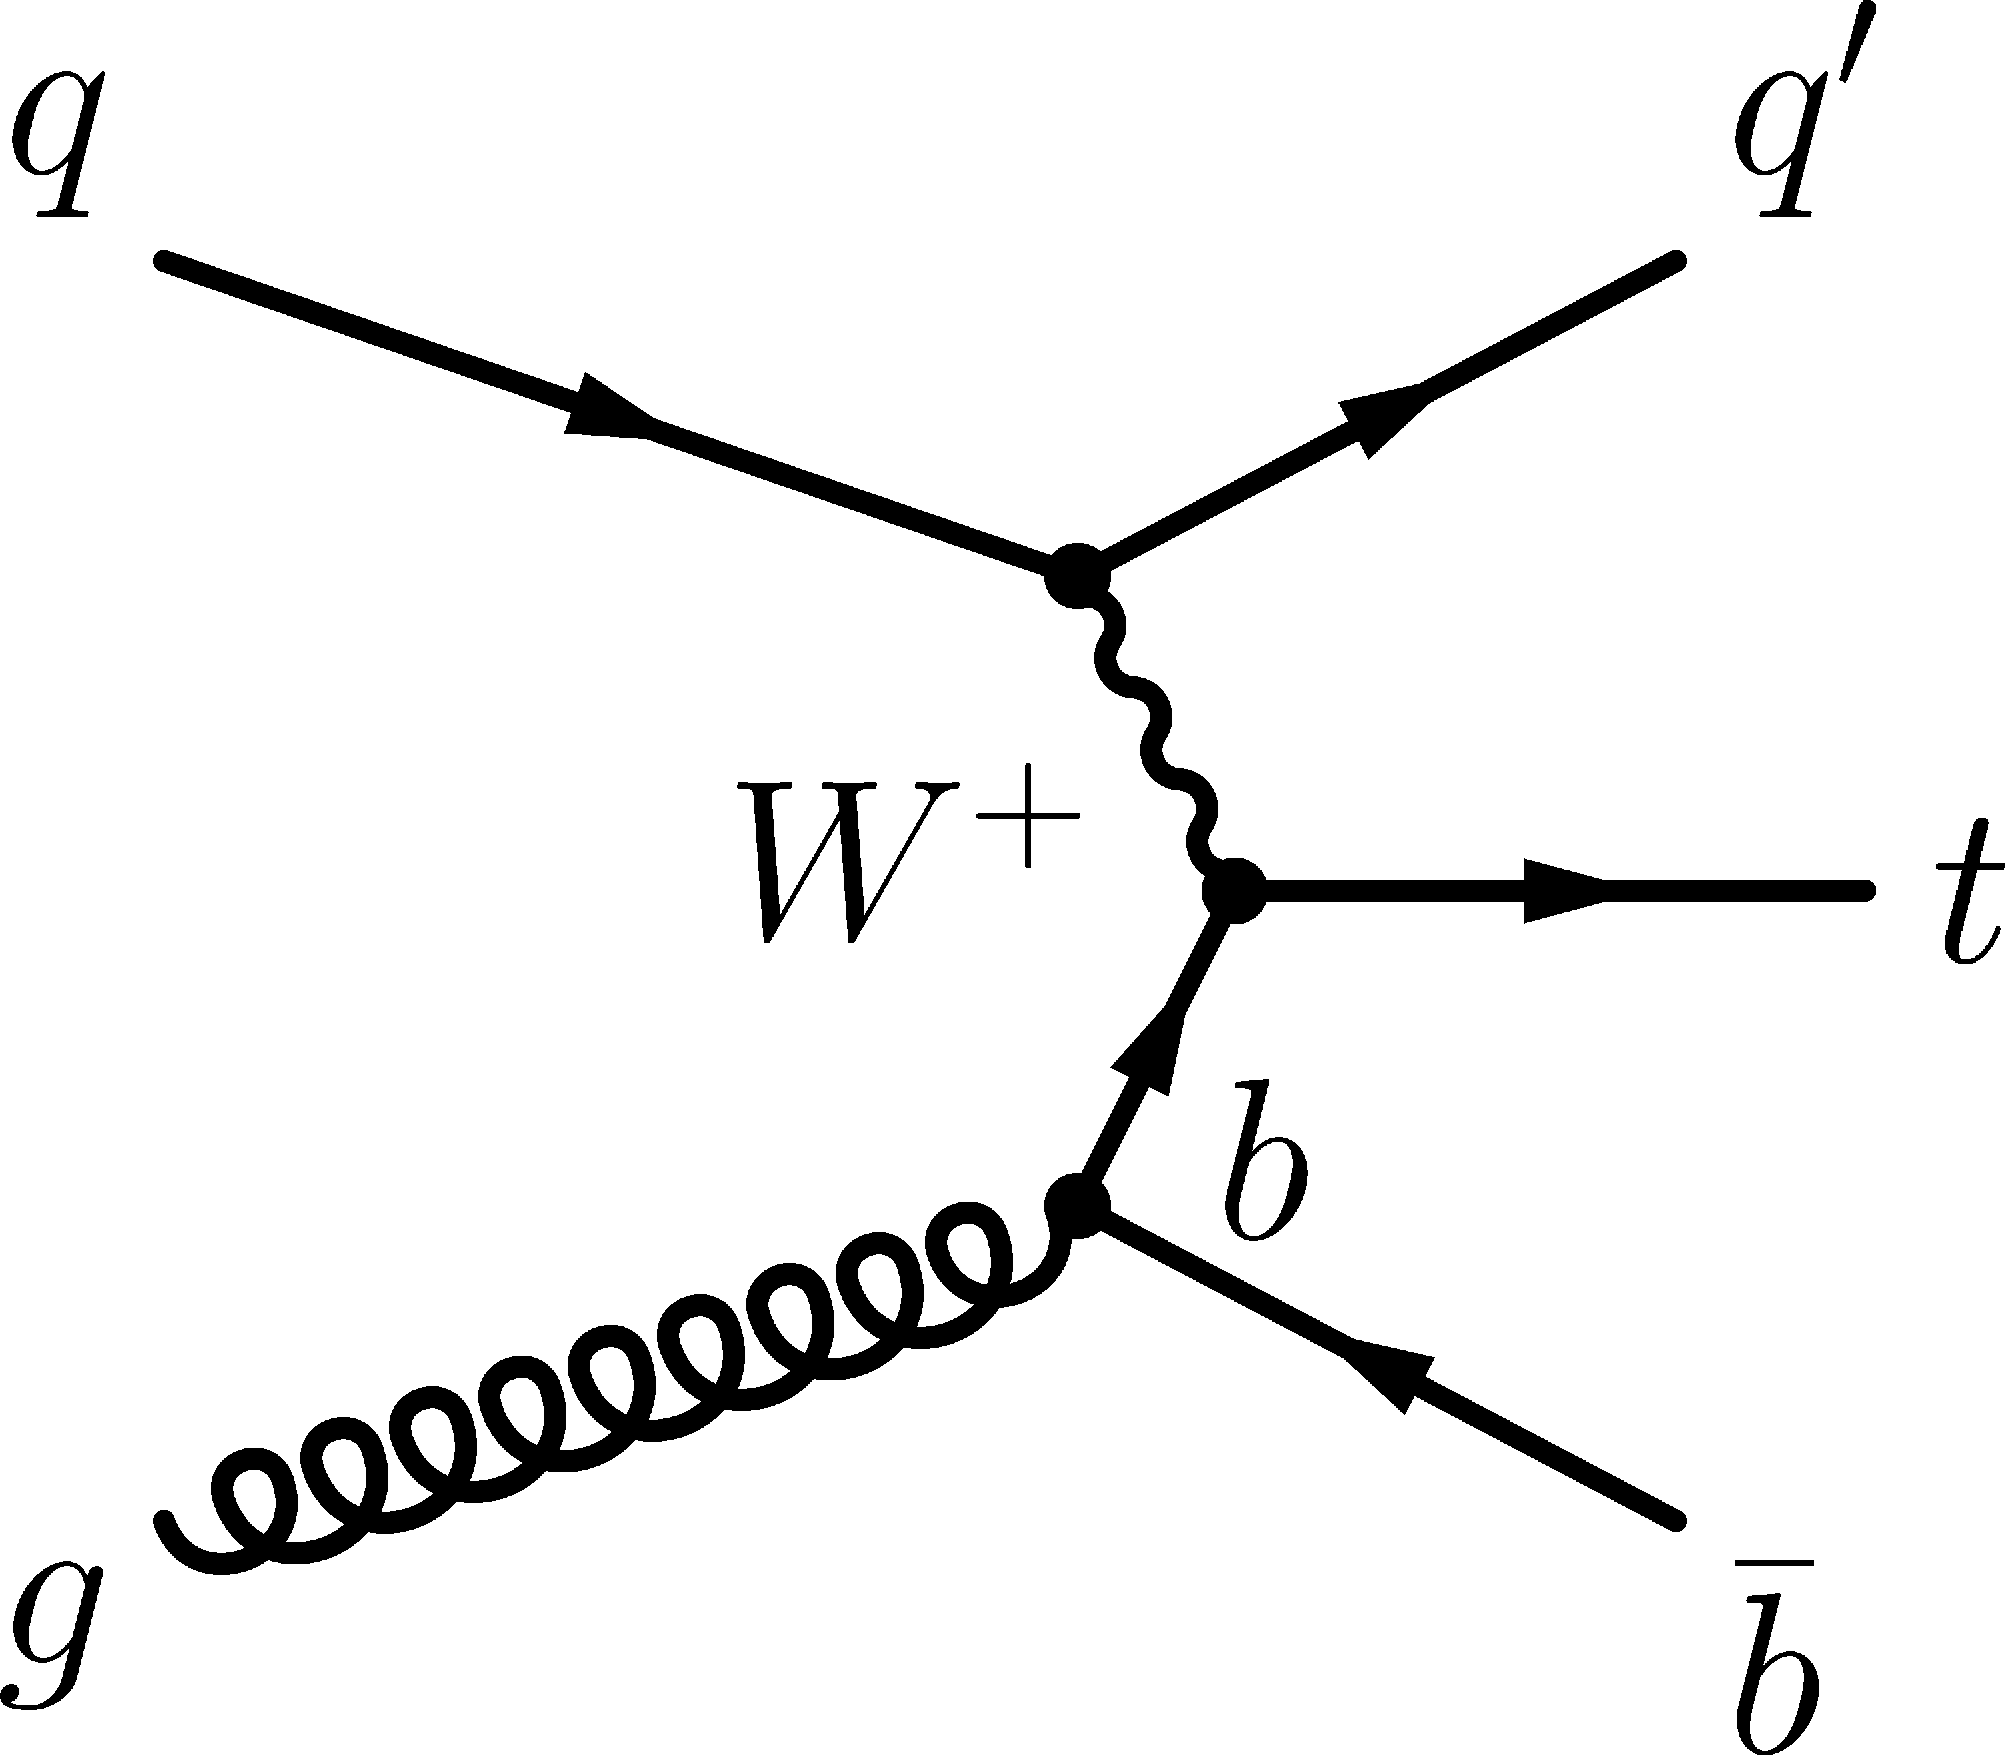
Figure 1-b:
Feynman diagrams for single top quark production in the $t$ channel: (a) 2$\rightarrow $2 and (b) 2$\rightarrow $3 processes. |
png pdf |
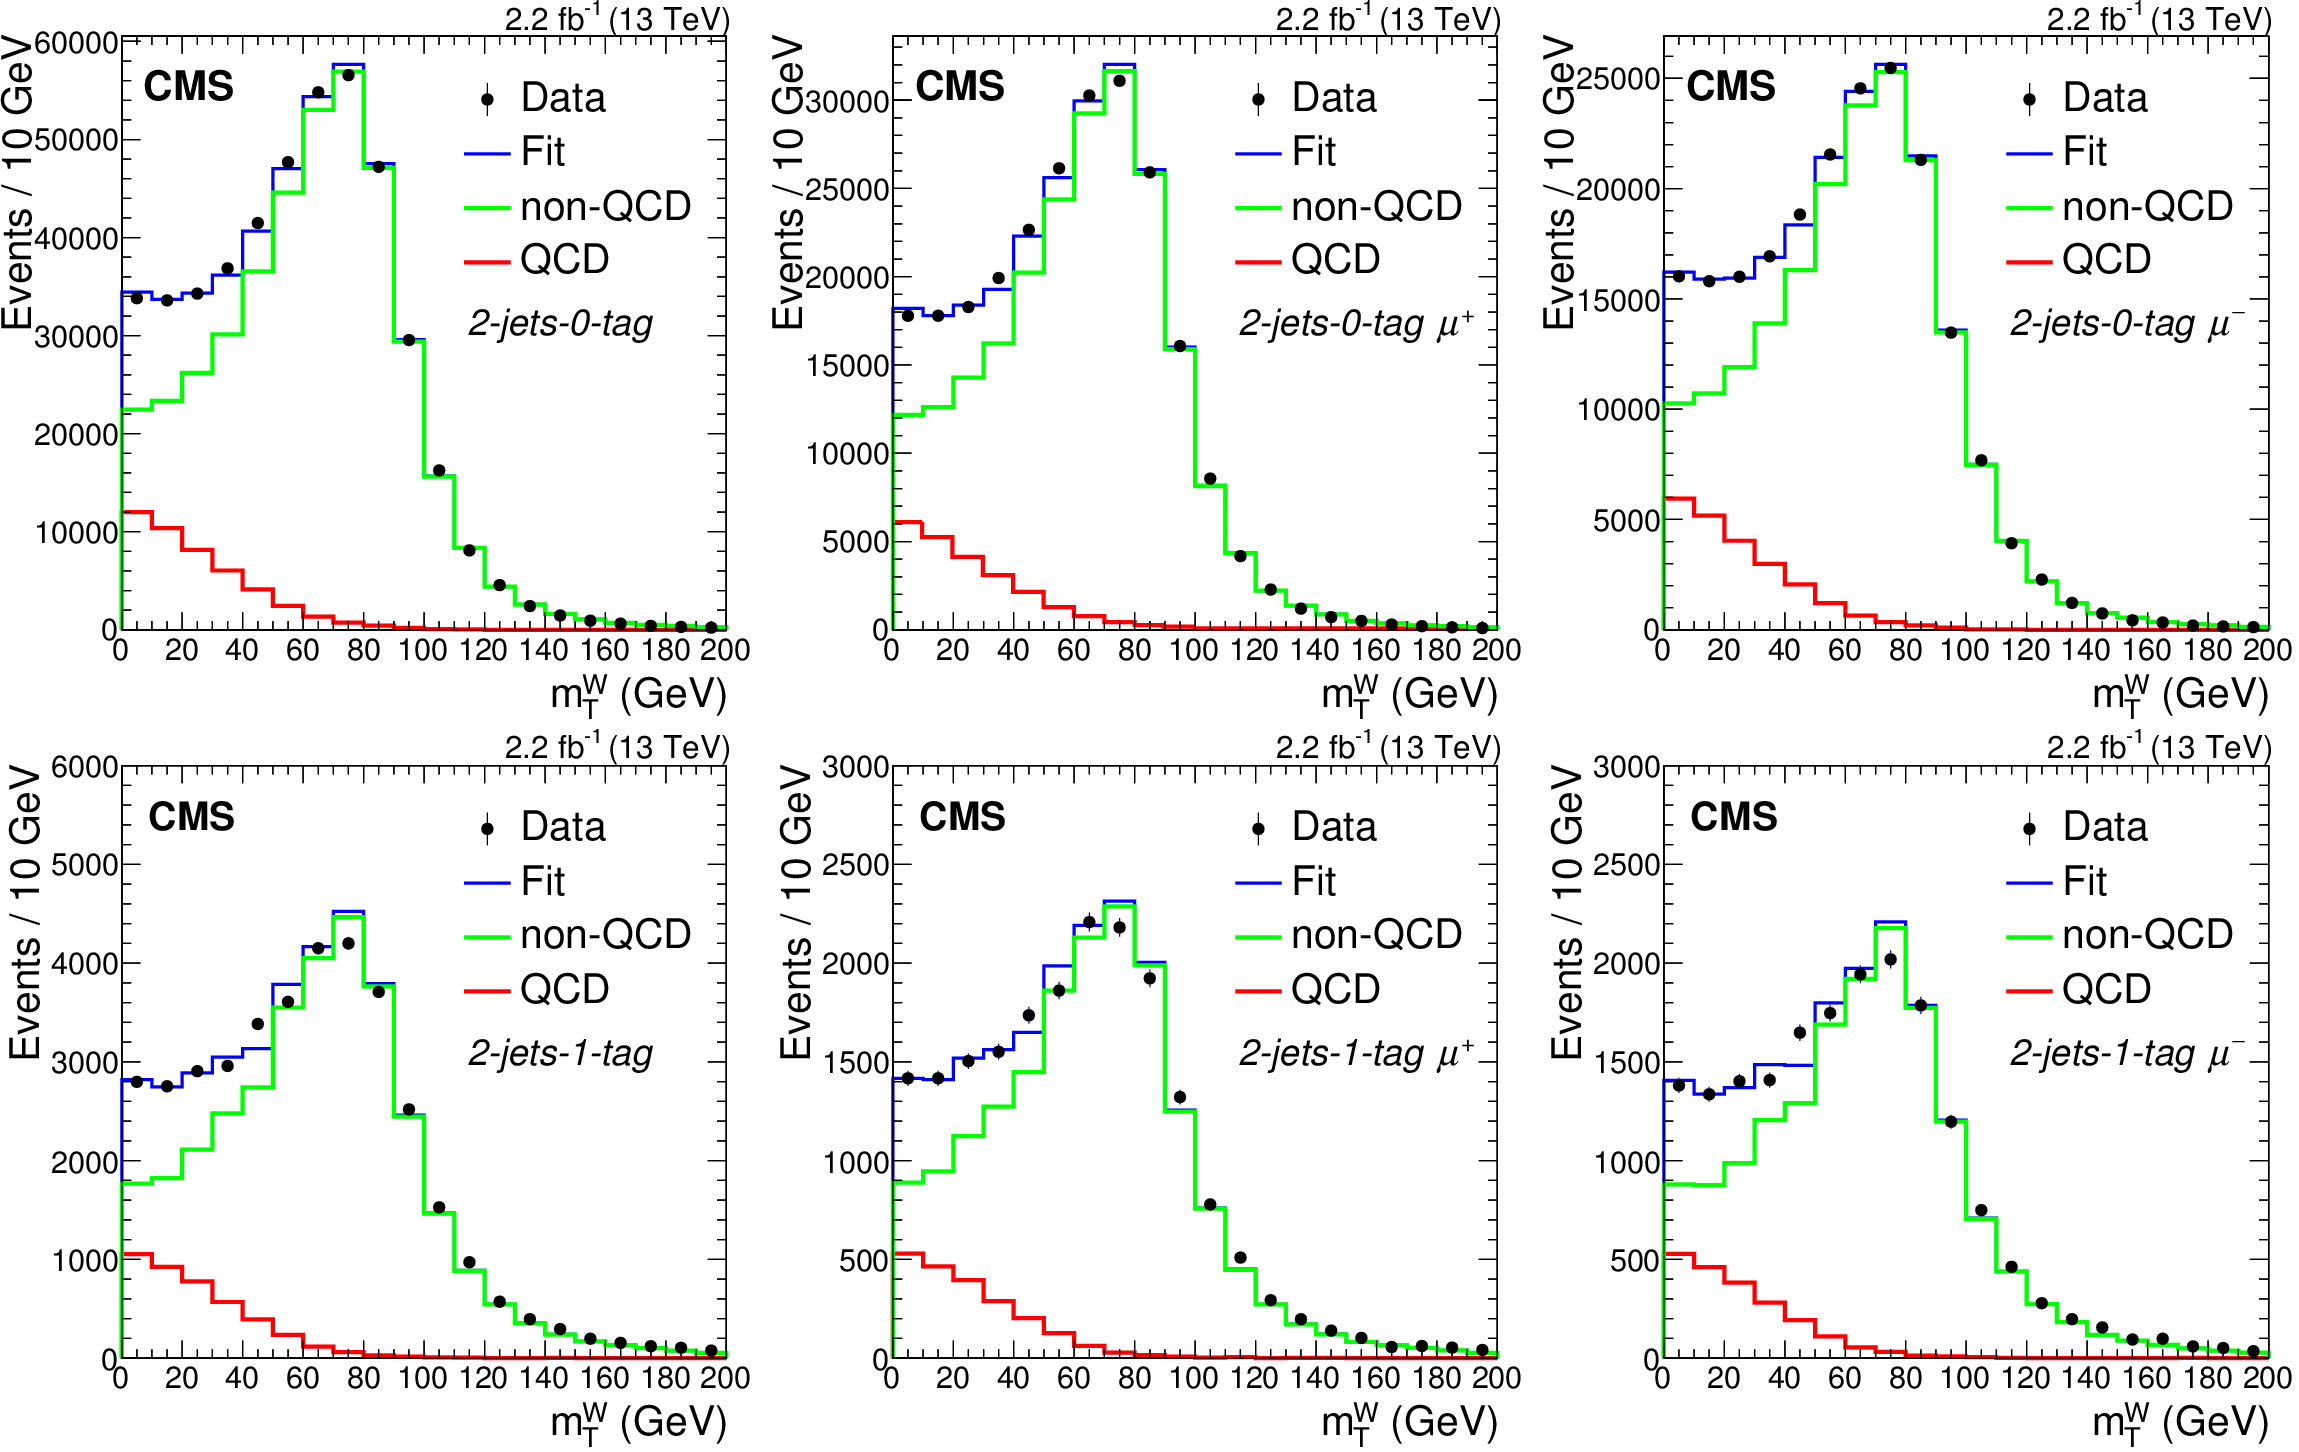
Figure 2:
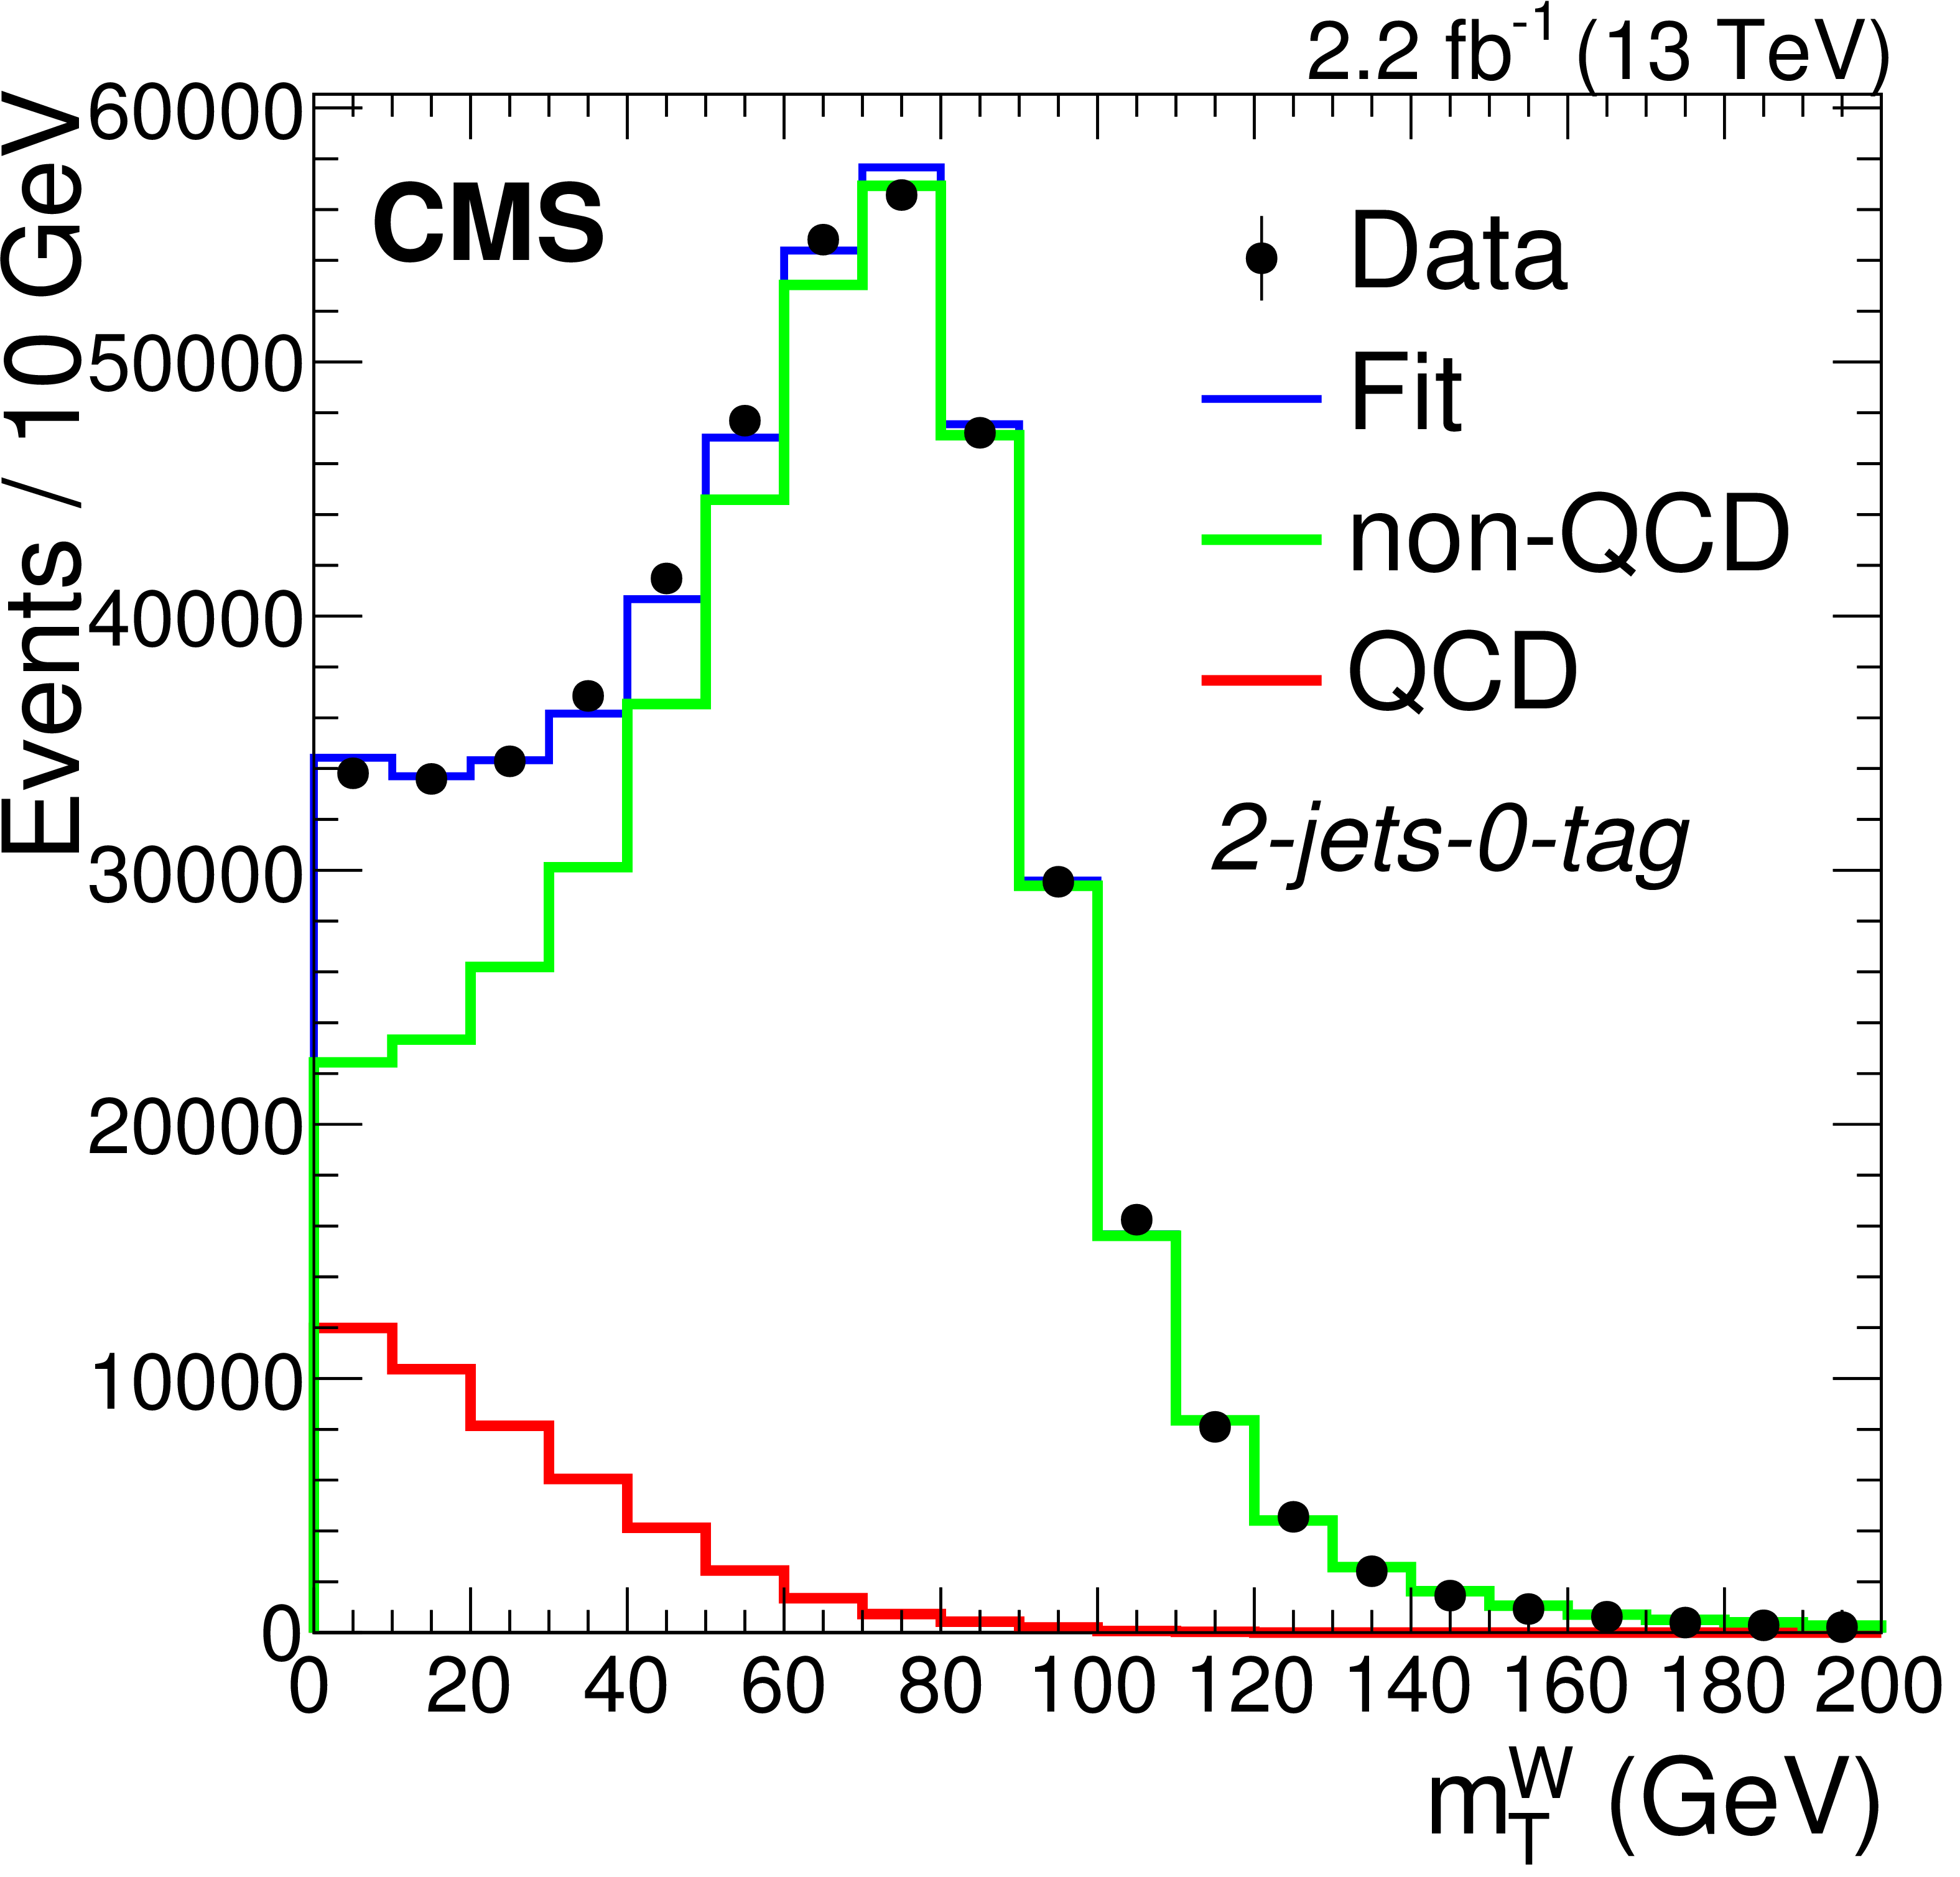
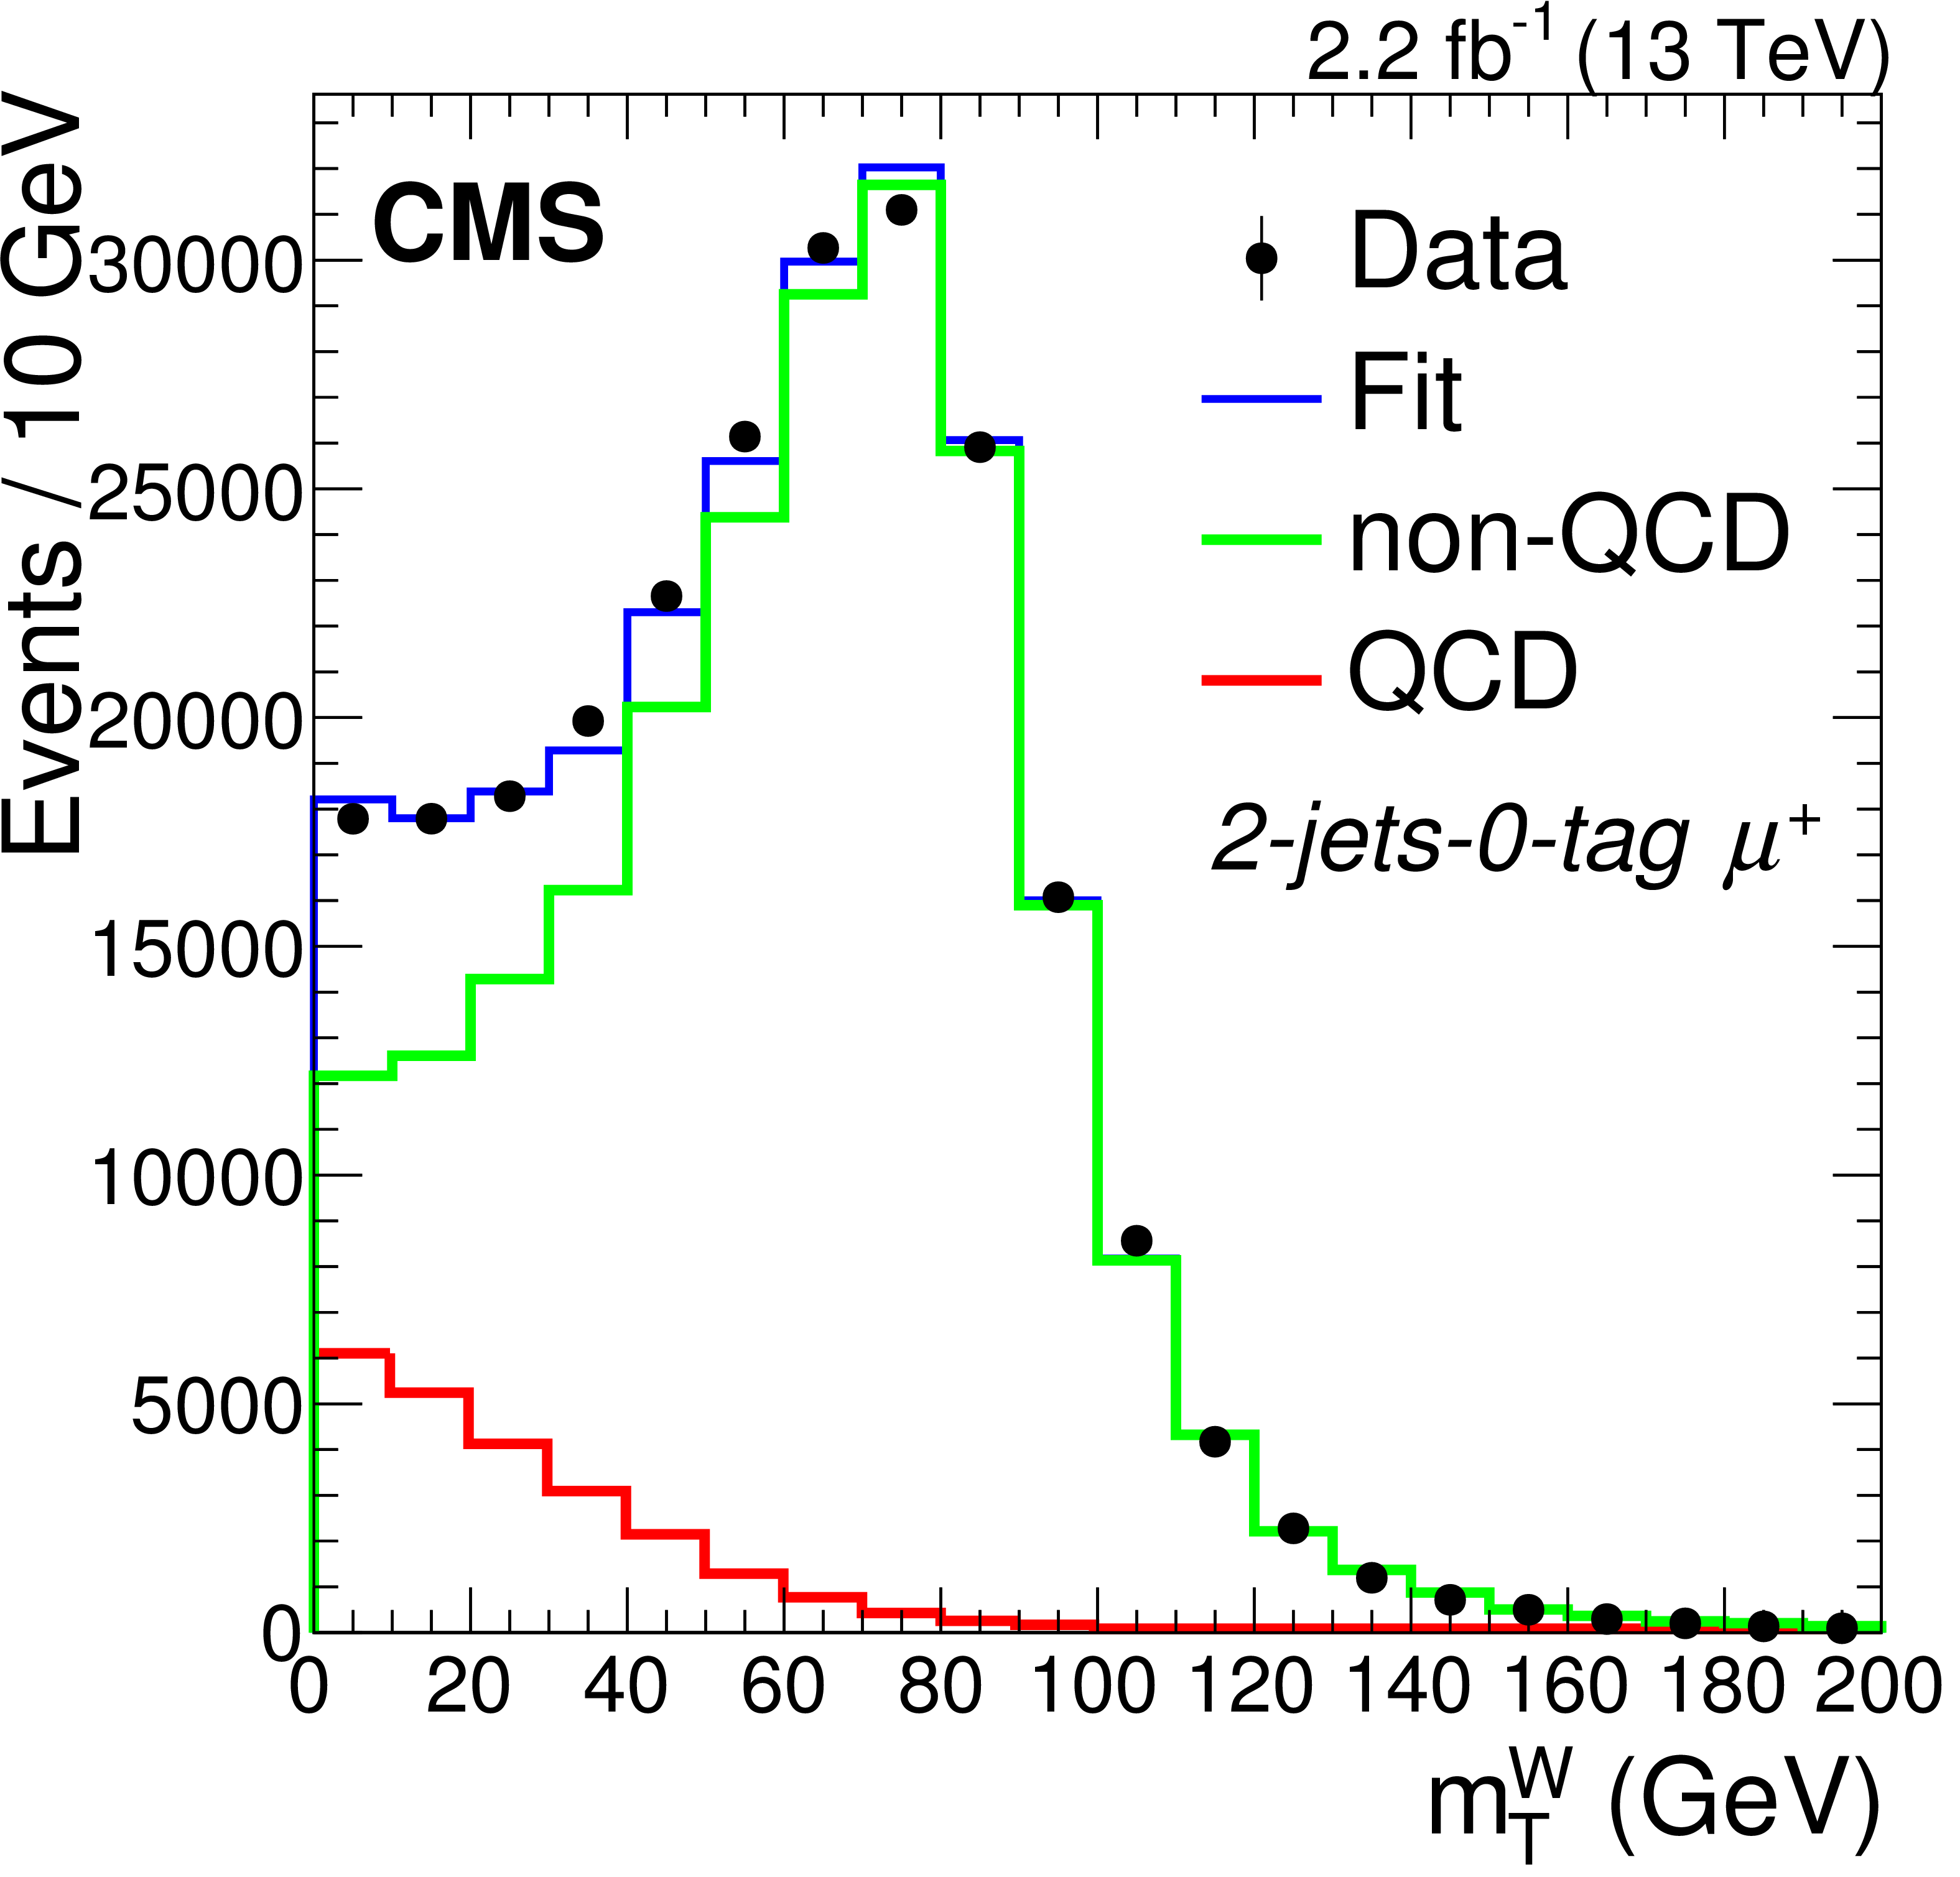
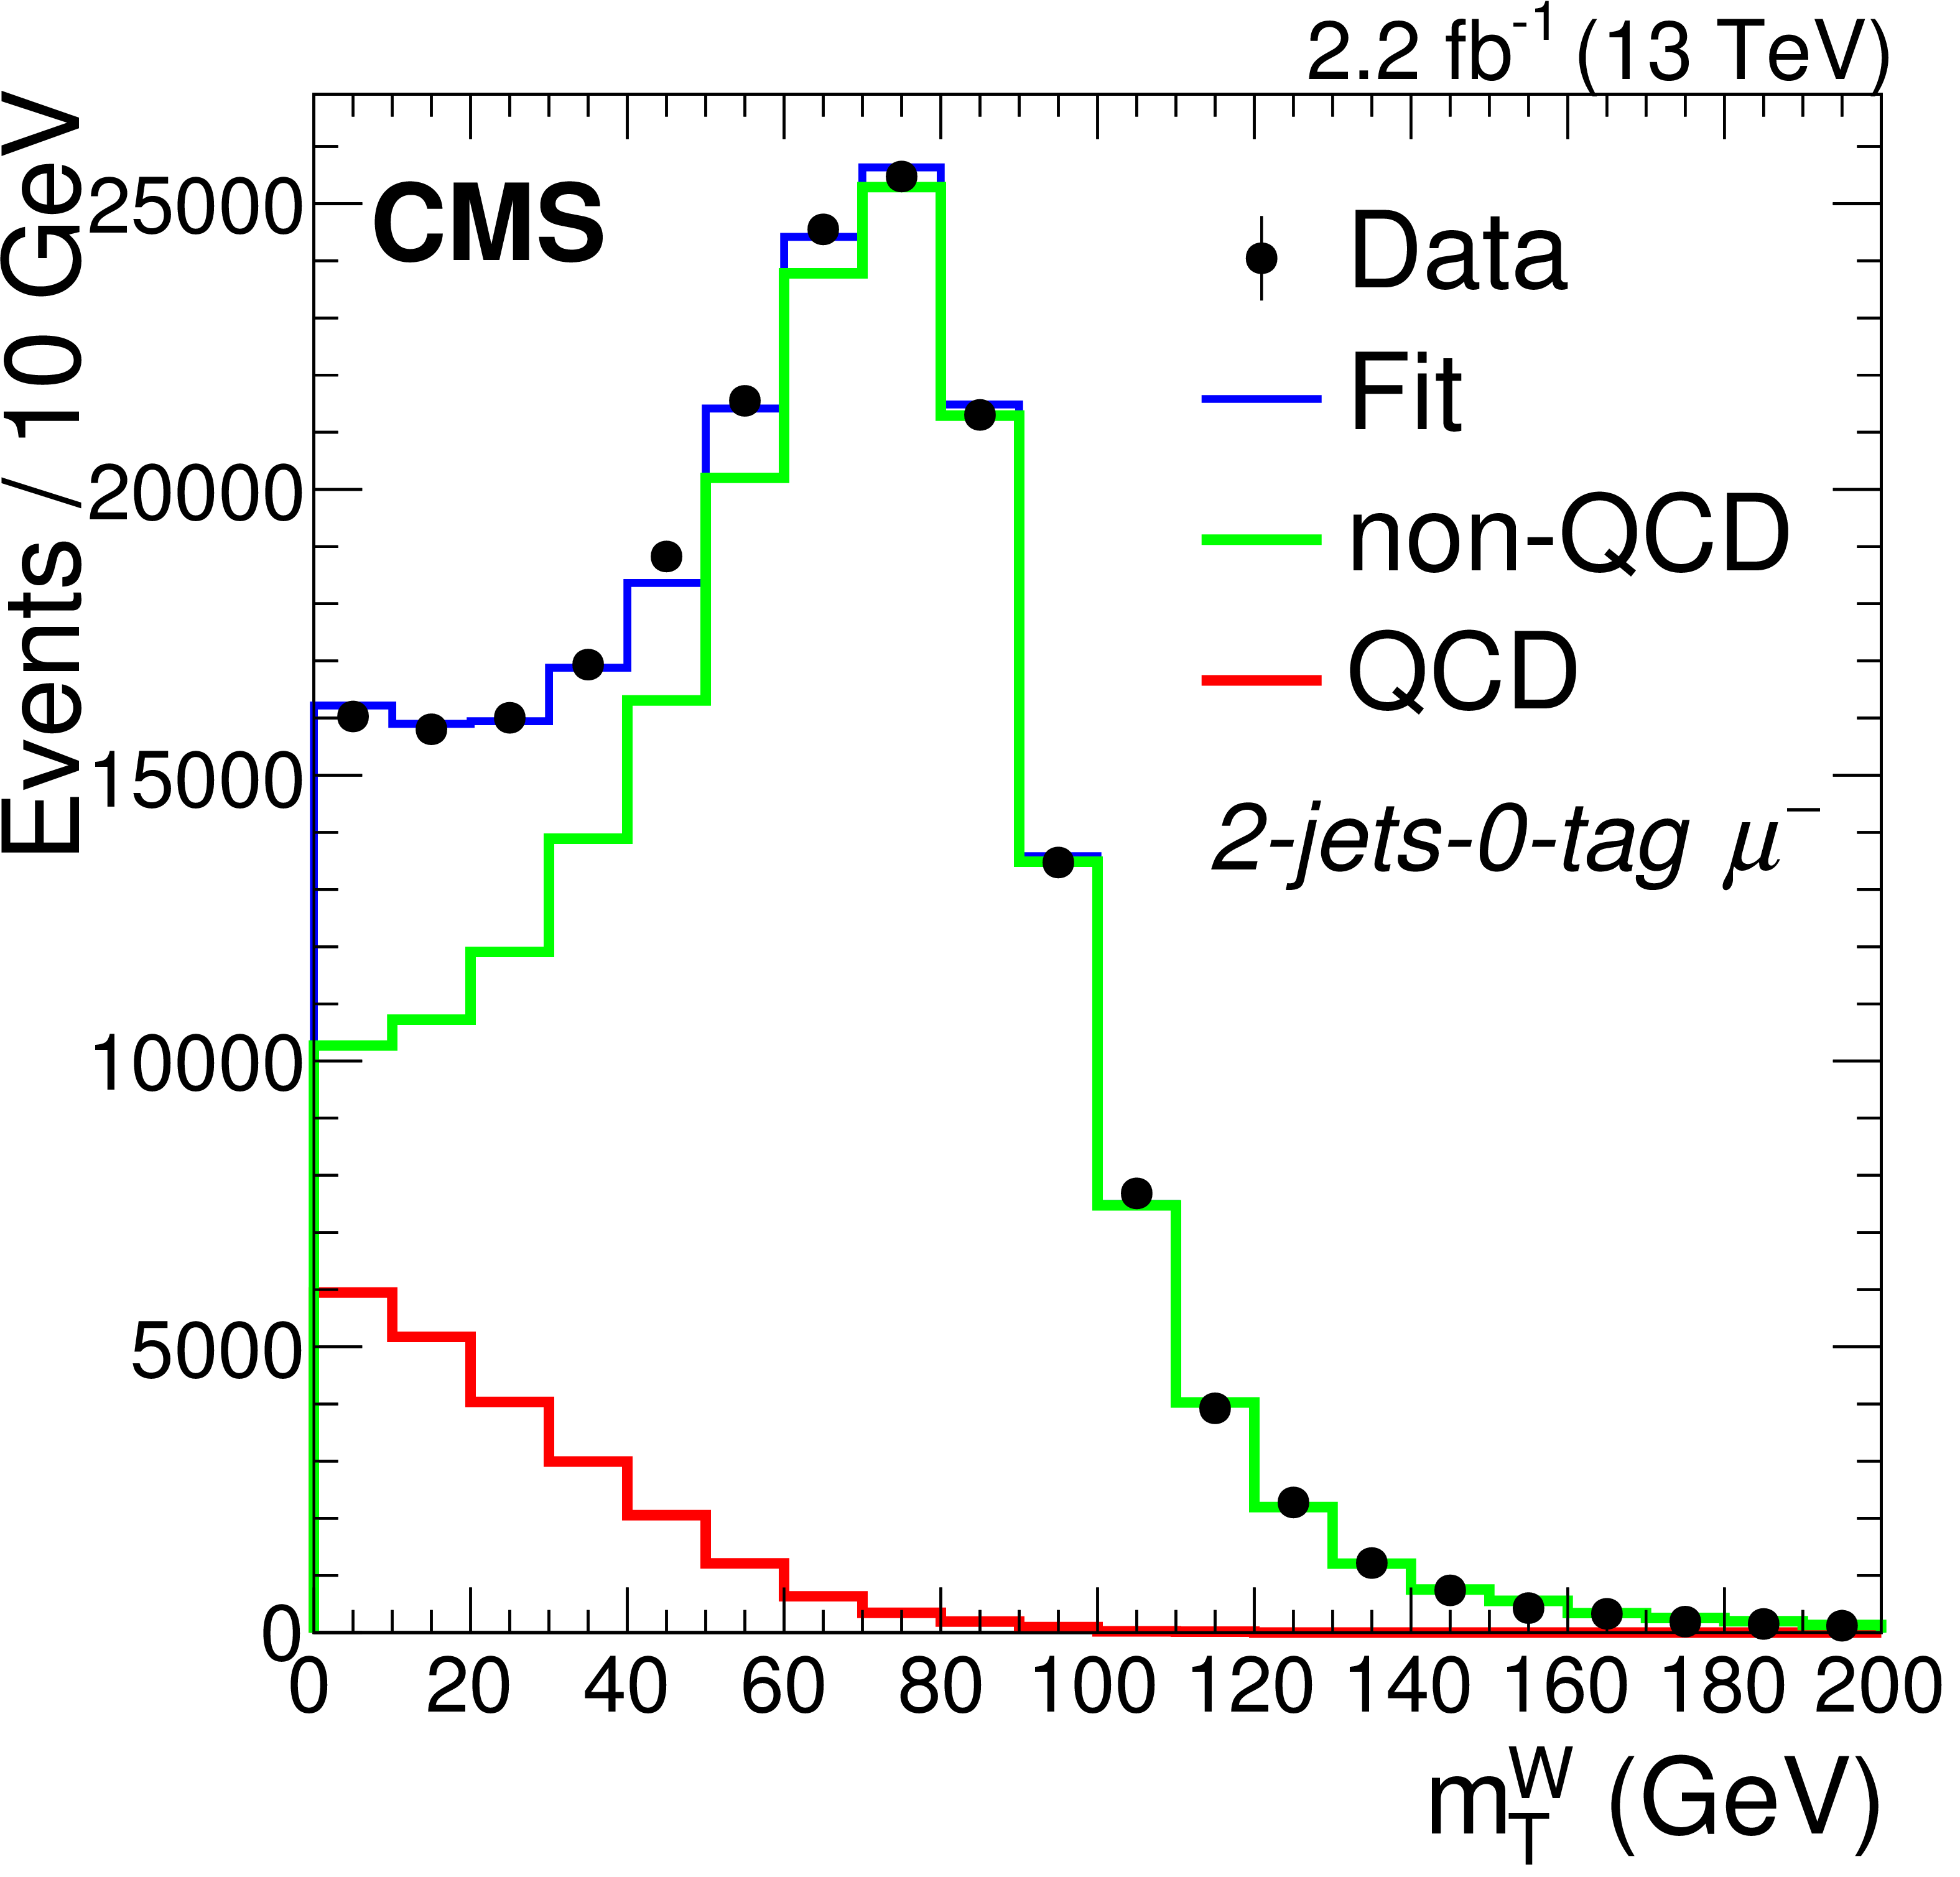
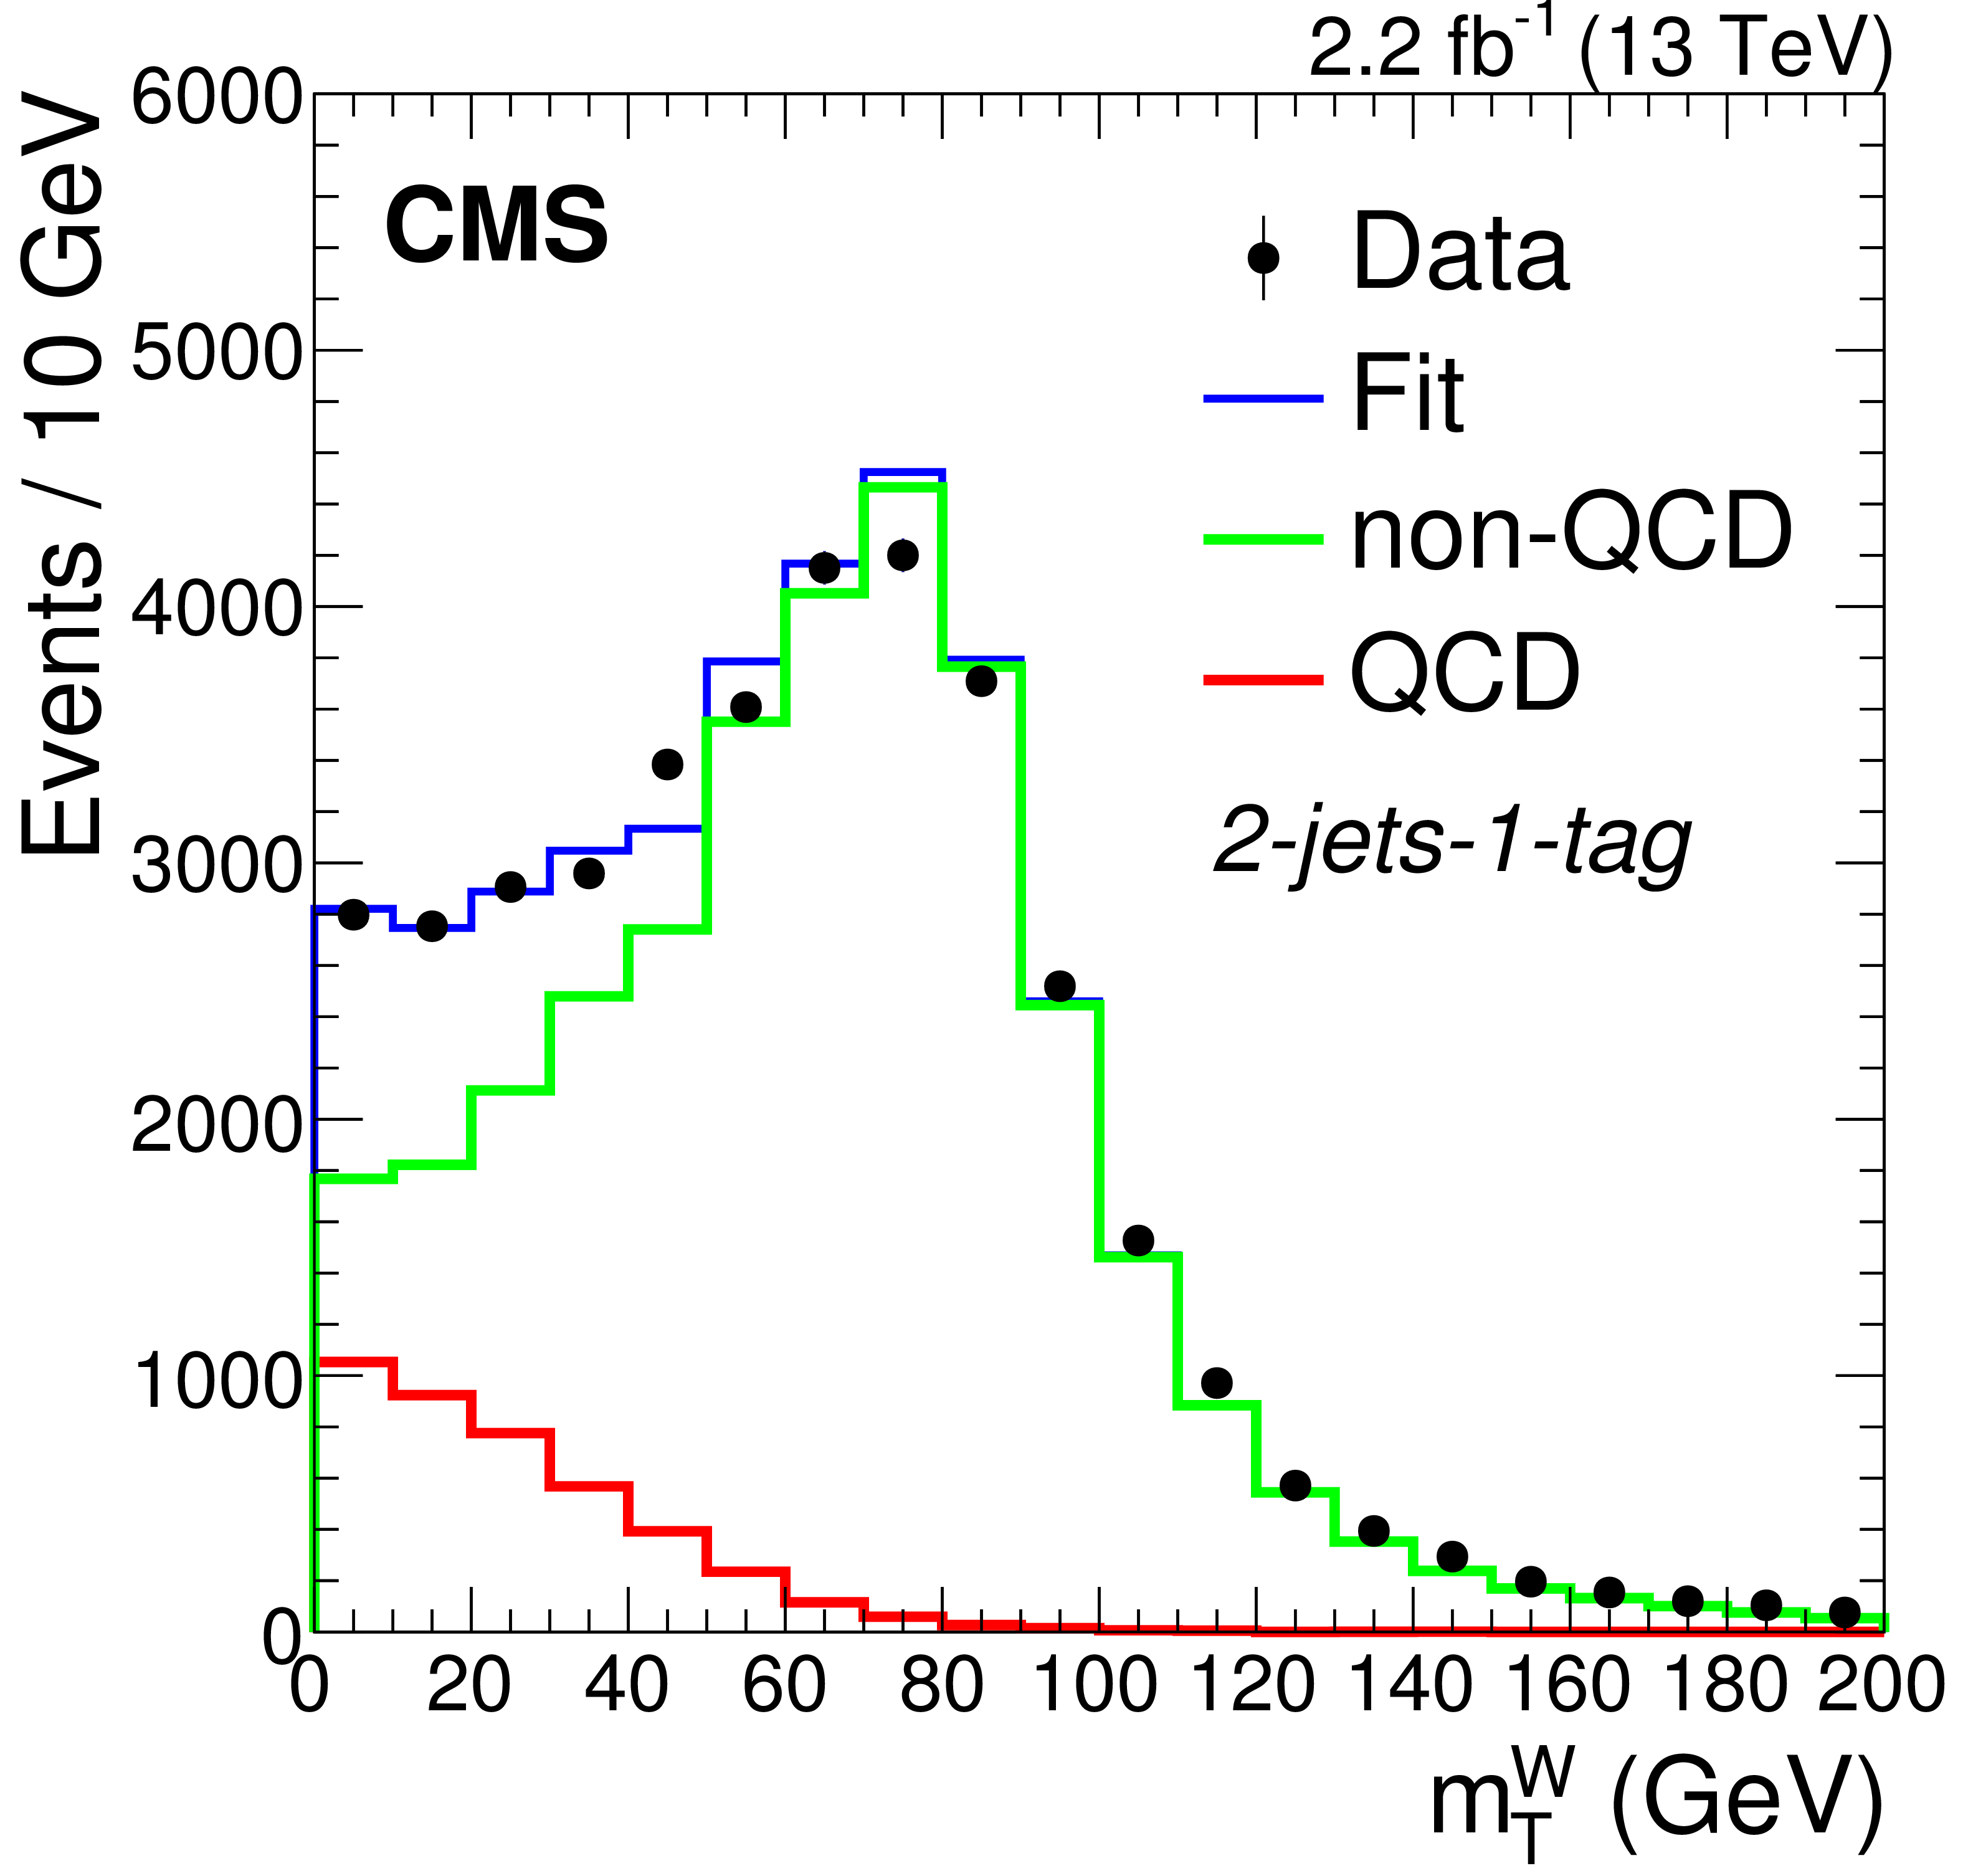
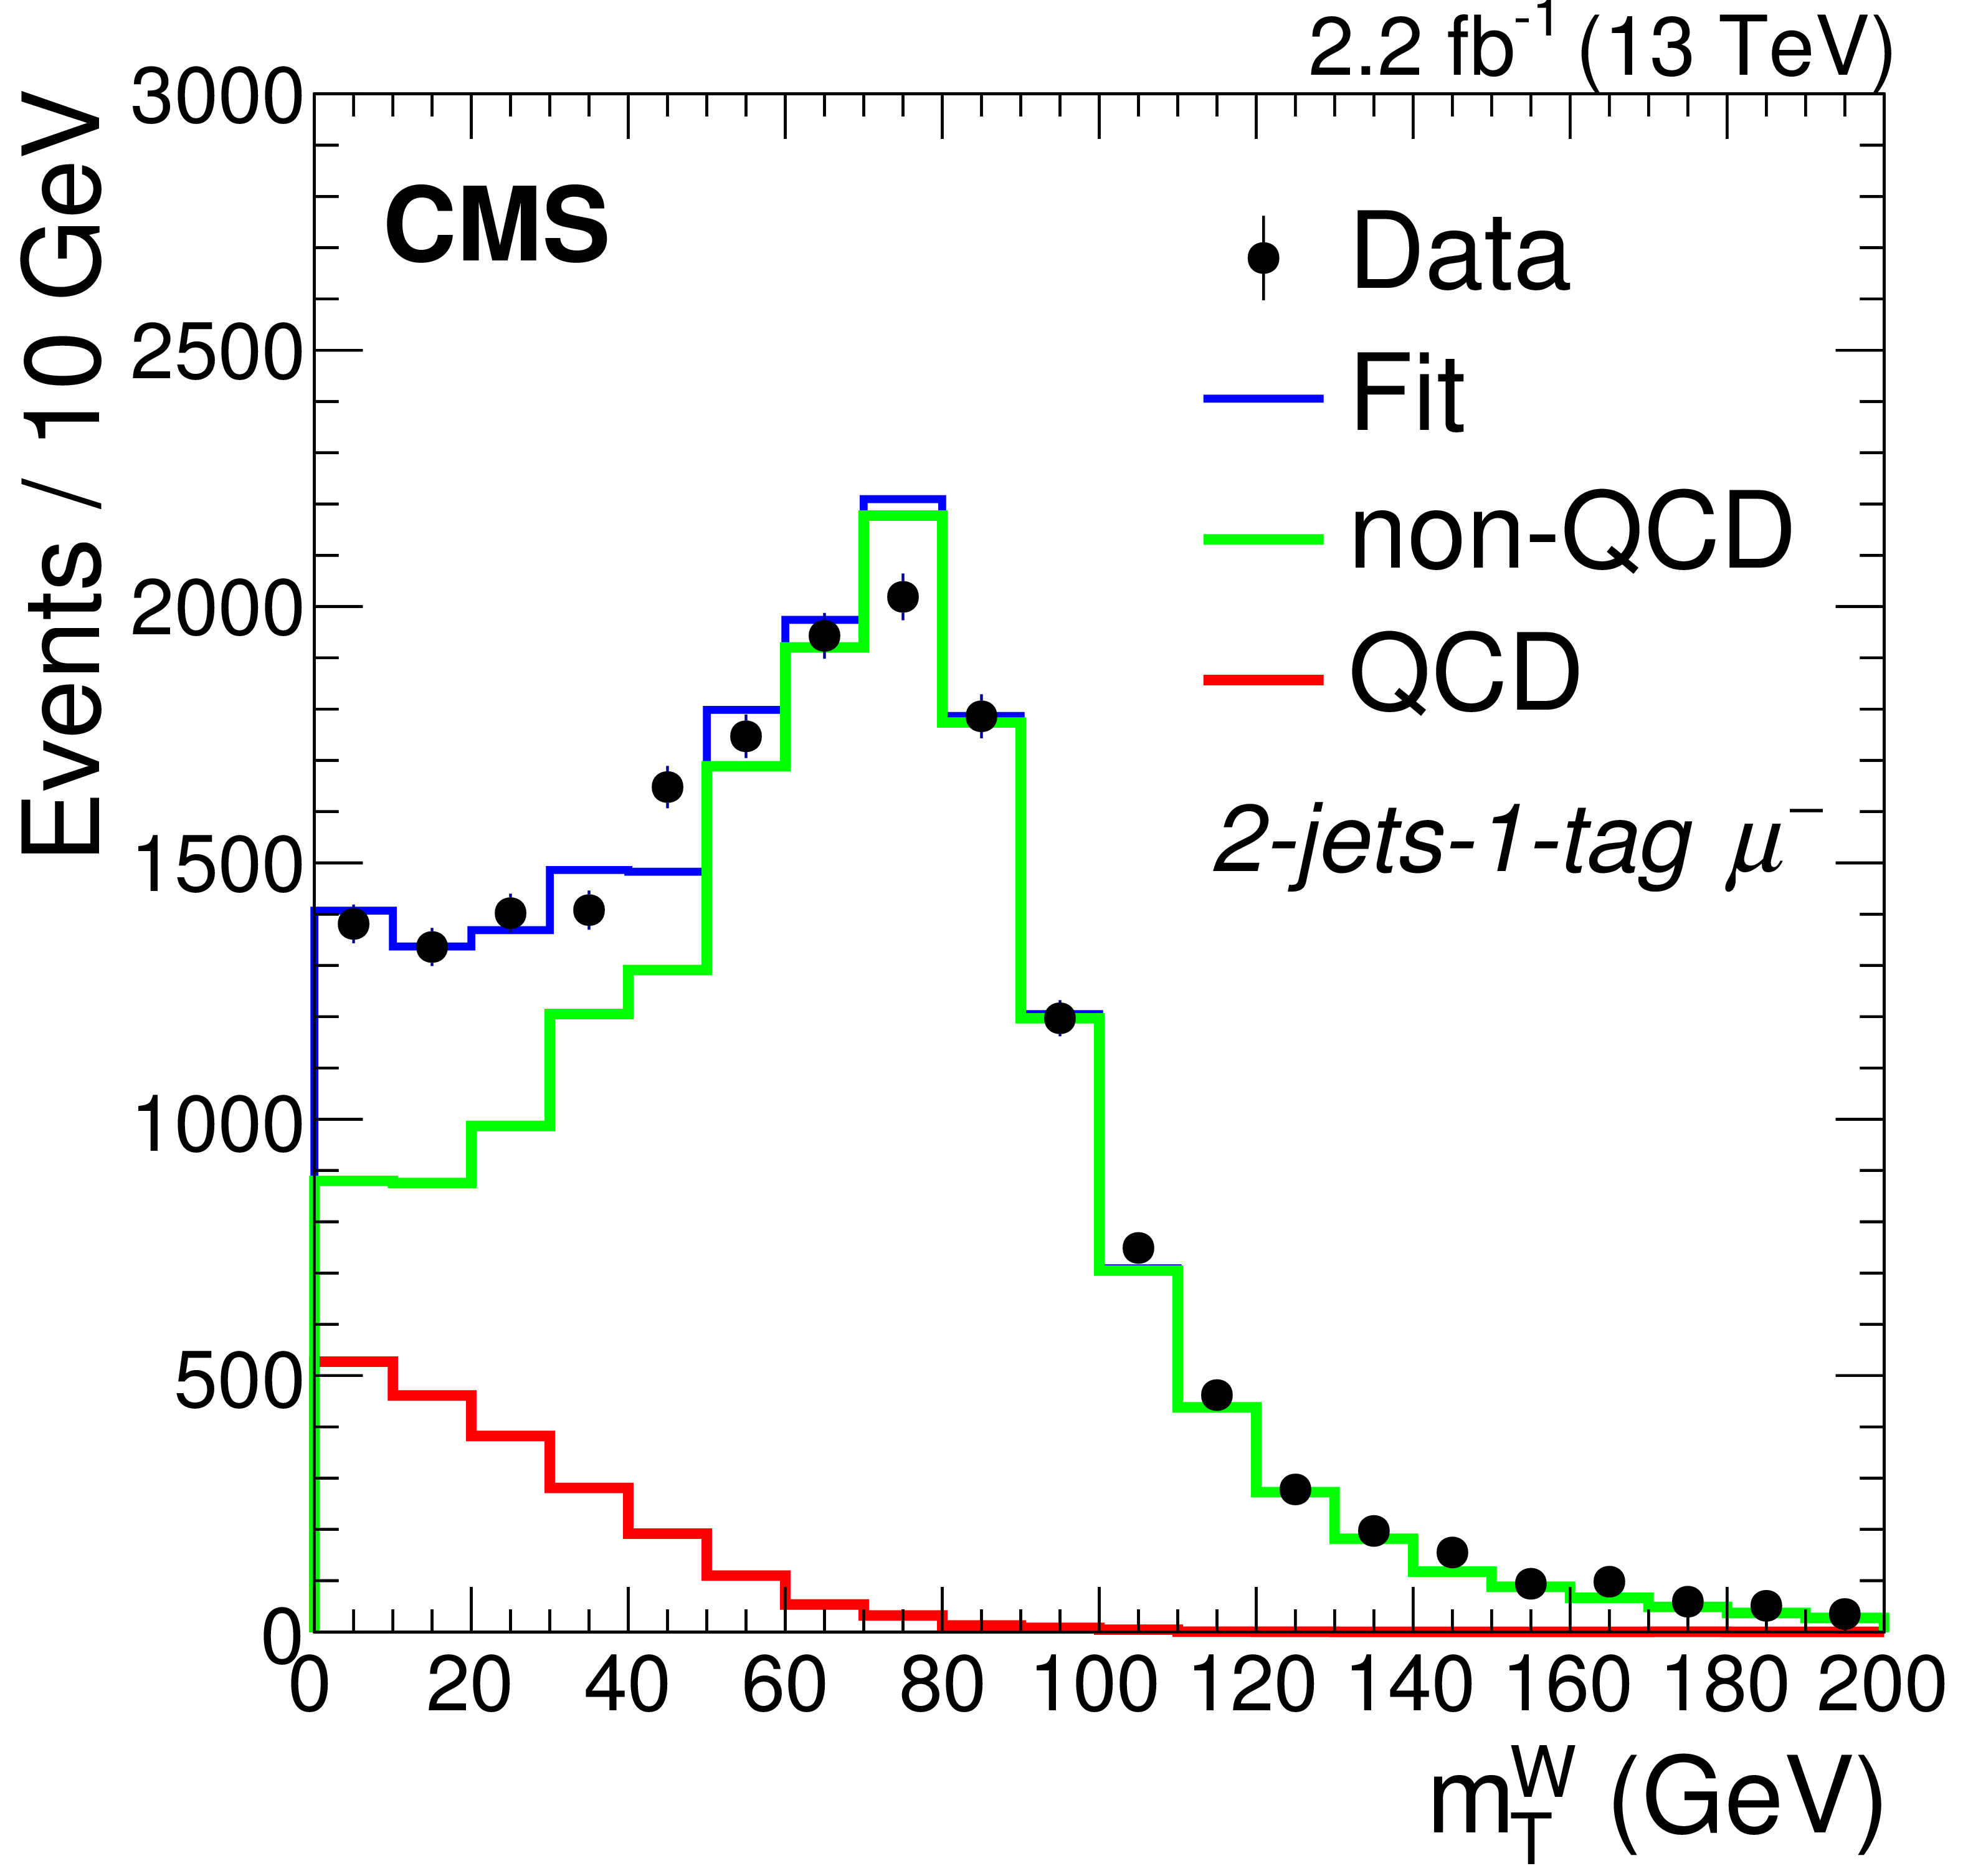
Fit to the $ {m_{\mathrm {\rm T}}^{\rm W}} $ distributions in the 2-jets-1-tag sample (left), for positively charged muons only (middle), and for negatively charged muons only (right). The QCD fit template is derived from a sideband region in data. Only statistical uncertainties are taken into account in the fit. |
png pdf |
Figure 2-a:
Fit to the $ {m_{\mathrm {\rm T}}^{\rm W}} $ distributions in the 2-jets-1-tag sample. The QCD fit template is derived from a sideband region in data. Only statistical uncertainties are taken into account in the fit. |
png pdf |
Figure 2-b:
Fit to the $ {m_{\mathrm {\rm T}}^{\rm W}} $ distributions in the 2-jets-1-tag sample, for positively charged muons only. The QCD fit template is derived from a sideband region in data. Only statistical uncertainties are taken into account in the fit. |
png pdf |
Figure 2-c:
Fit to the $ {m_{\mathrm {\rm T}}^{\rm W}} $ distributions in the 2-jets-1-tag sample for negatively charged muons only. The QCD fit template is derived from a sideband region in data. Only statistical uncertainties are taken into account in the fit. |
png pdf |
Figure 2-d:
Fit to the $ {m_{\mathrm {\rm T}}^{\rm W}} $ distributions in the 2-jets-1-tag sample (left), for positively charged muons only (middle), and for negatively charged muons only (right). The QCD fit template is derived from a sideband region in data. Only statistical uncertainties are taken into account in the fit. |

png pdf |
Figure 2-e:
Fit to the $ {m_{\mathrm {\rm T}}^{\rm W}} $ distributions in the 2-jets-1-tag sample (left), for positively charged muons only (middle), and for negatively charged muons only (right). The QCD fit template is derived from a sideband region in data. Only statistical uncertainties are taken into account in the fit. |
png pdf |
Figure 2-f:
Fit to the $ {m_{\mathrm {\rm T}}^{\rm W}} $ distributions in the 2-jets-1-tag sample (left), for positively charged muons only (middle), and for negatively charged muons only (right). The QCD fit template is derived from a sideband region in data. Only statistical uncertainties are taken into account in the fit. |
png pdf |
Figure 3:
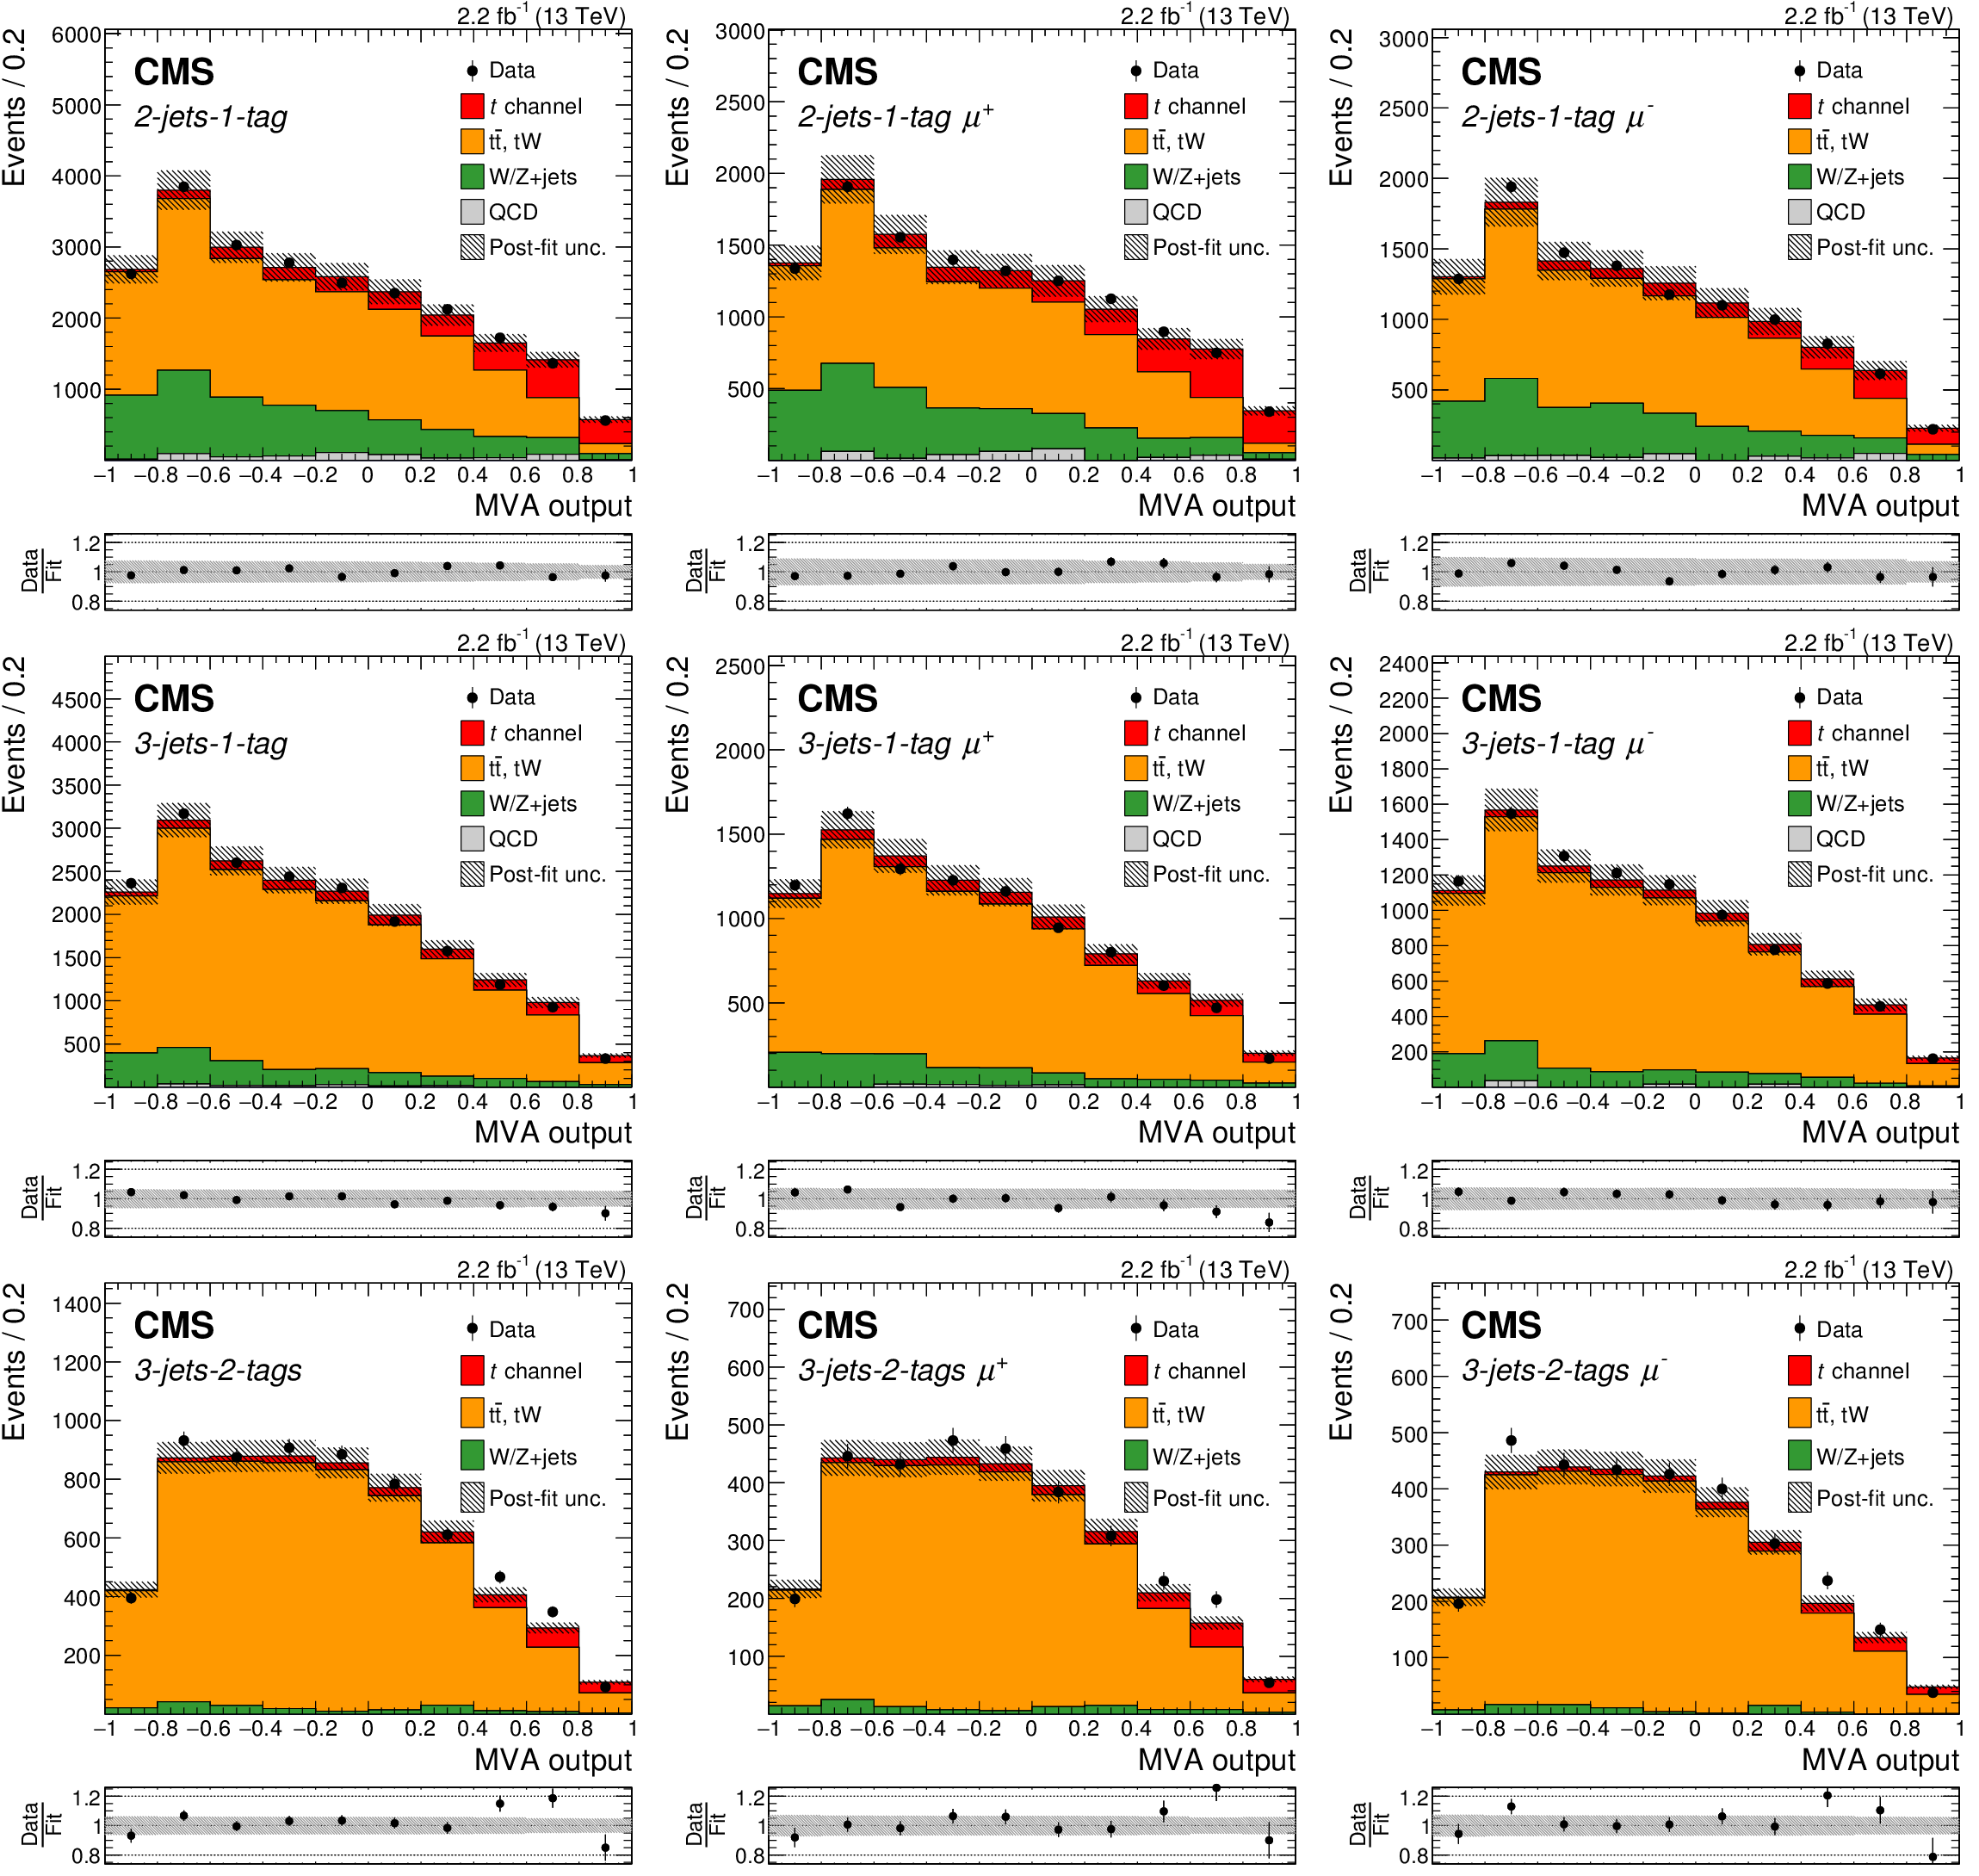
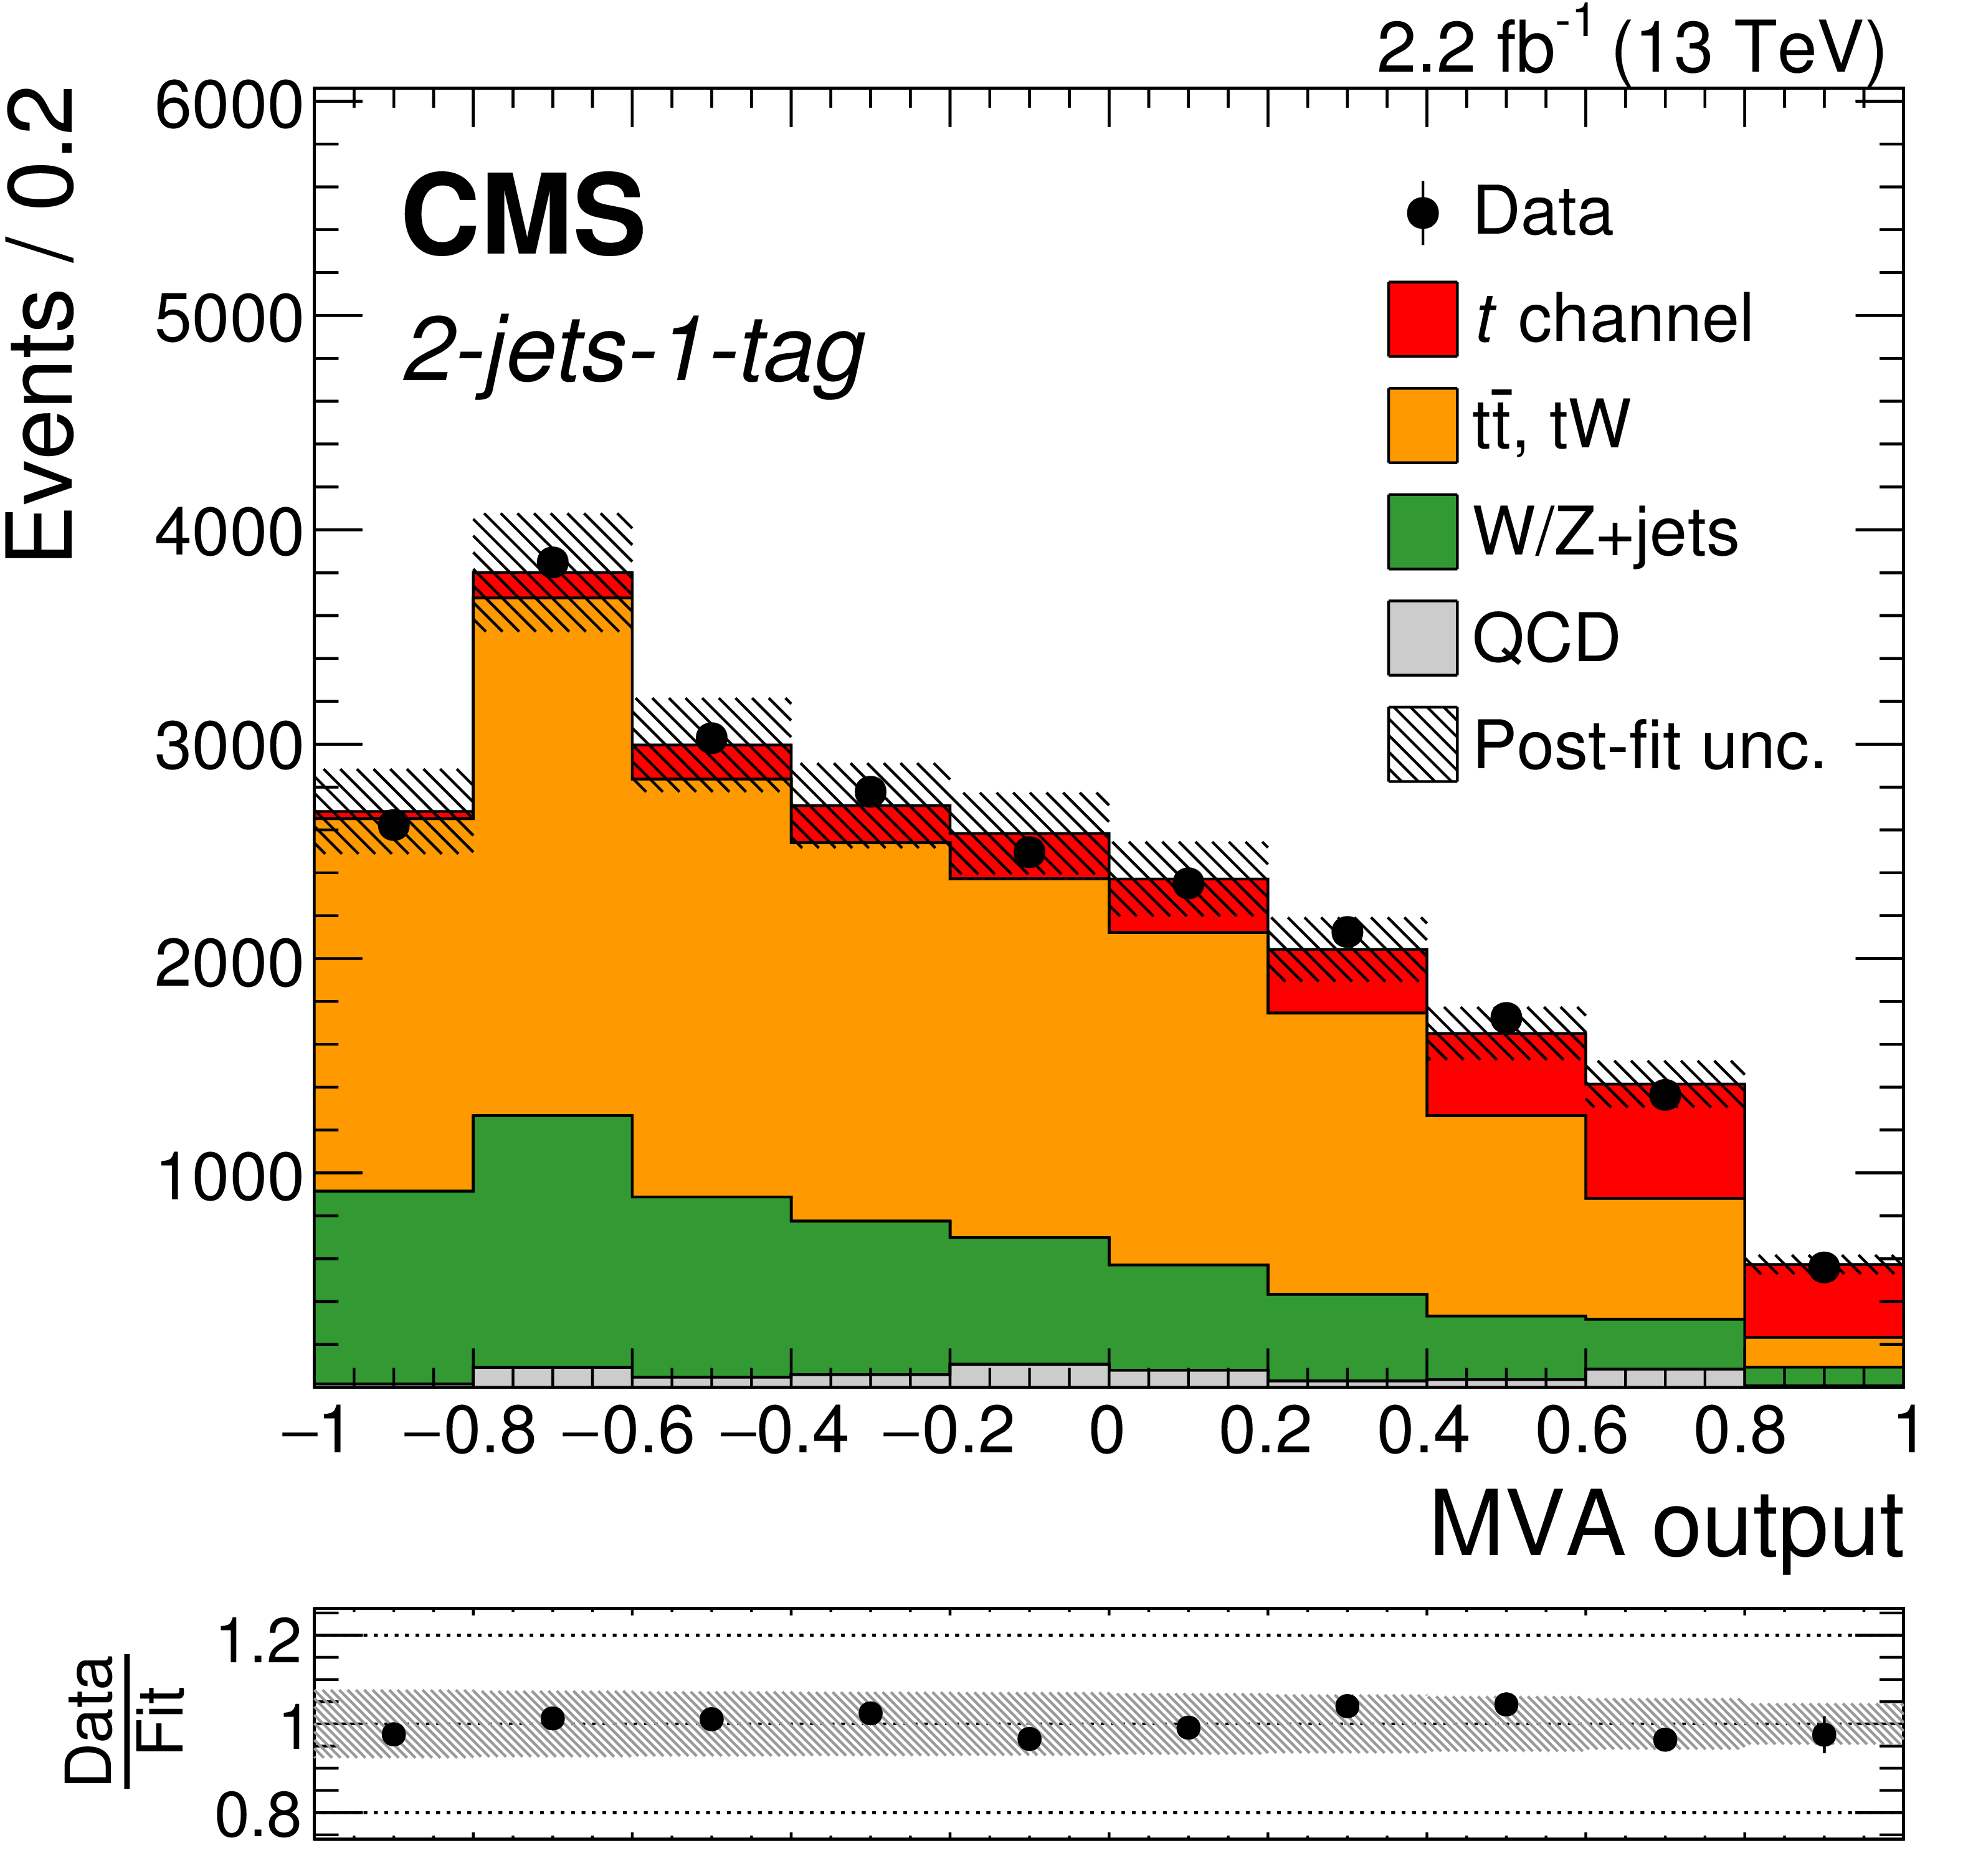
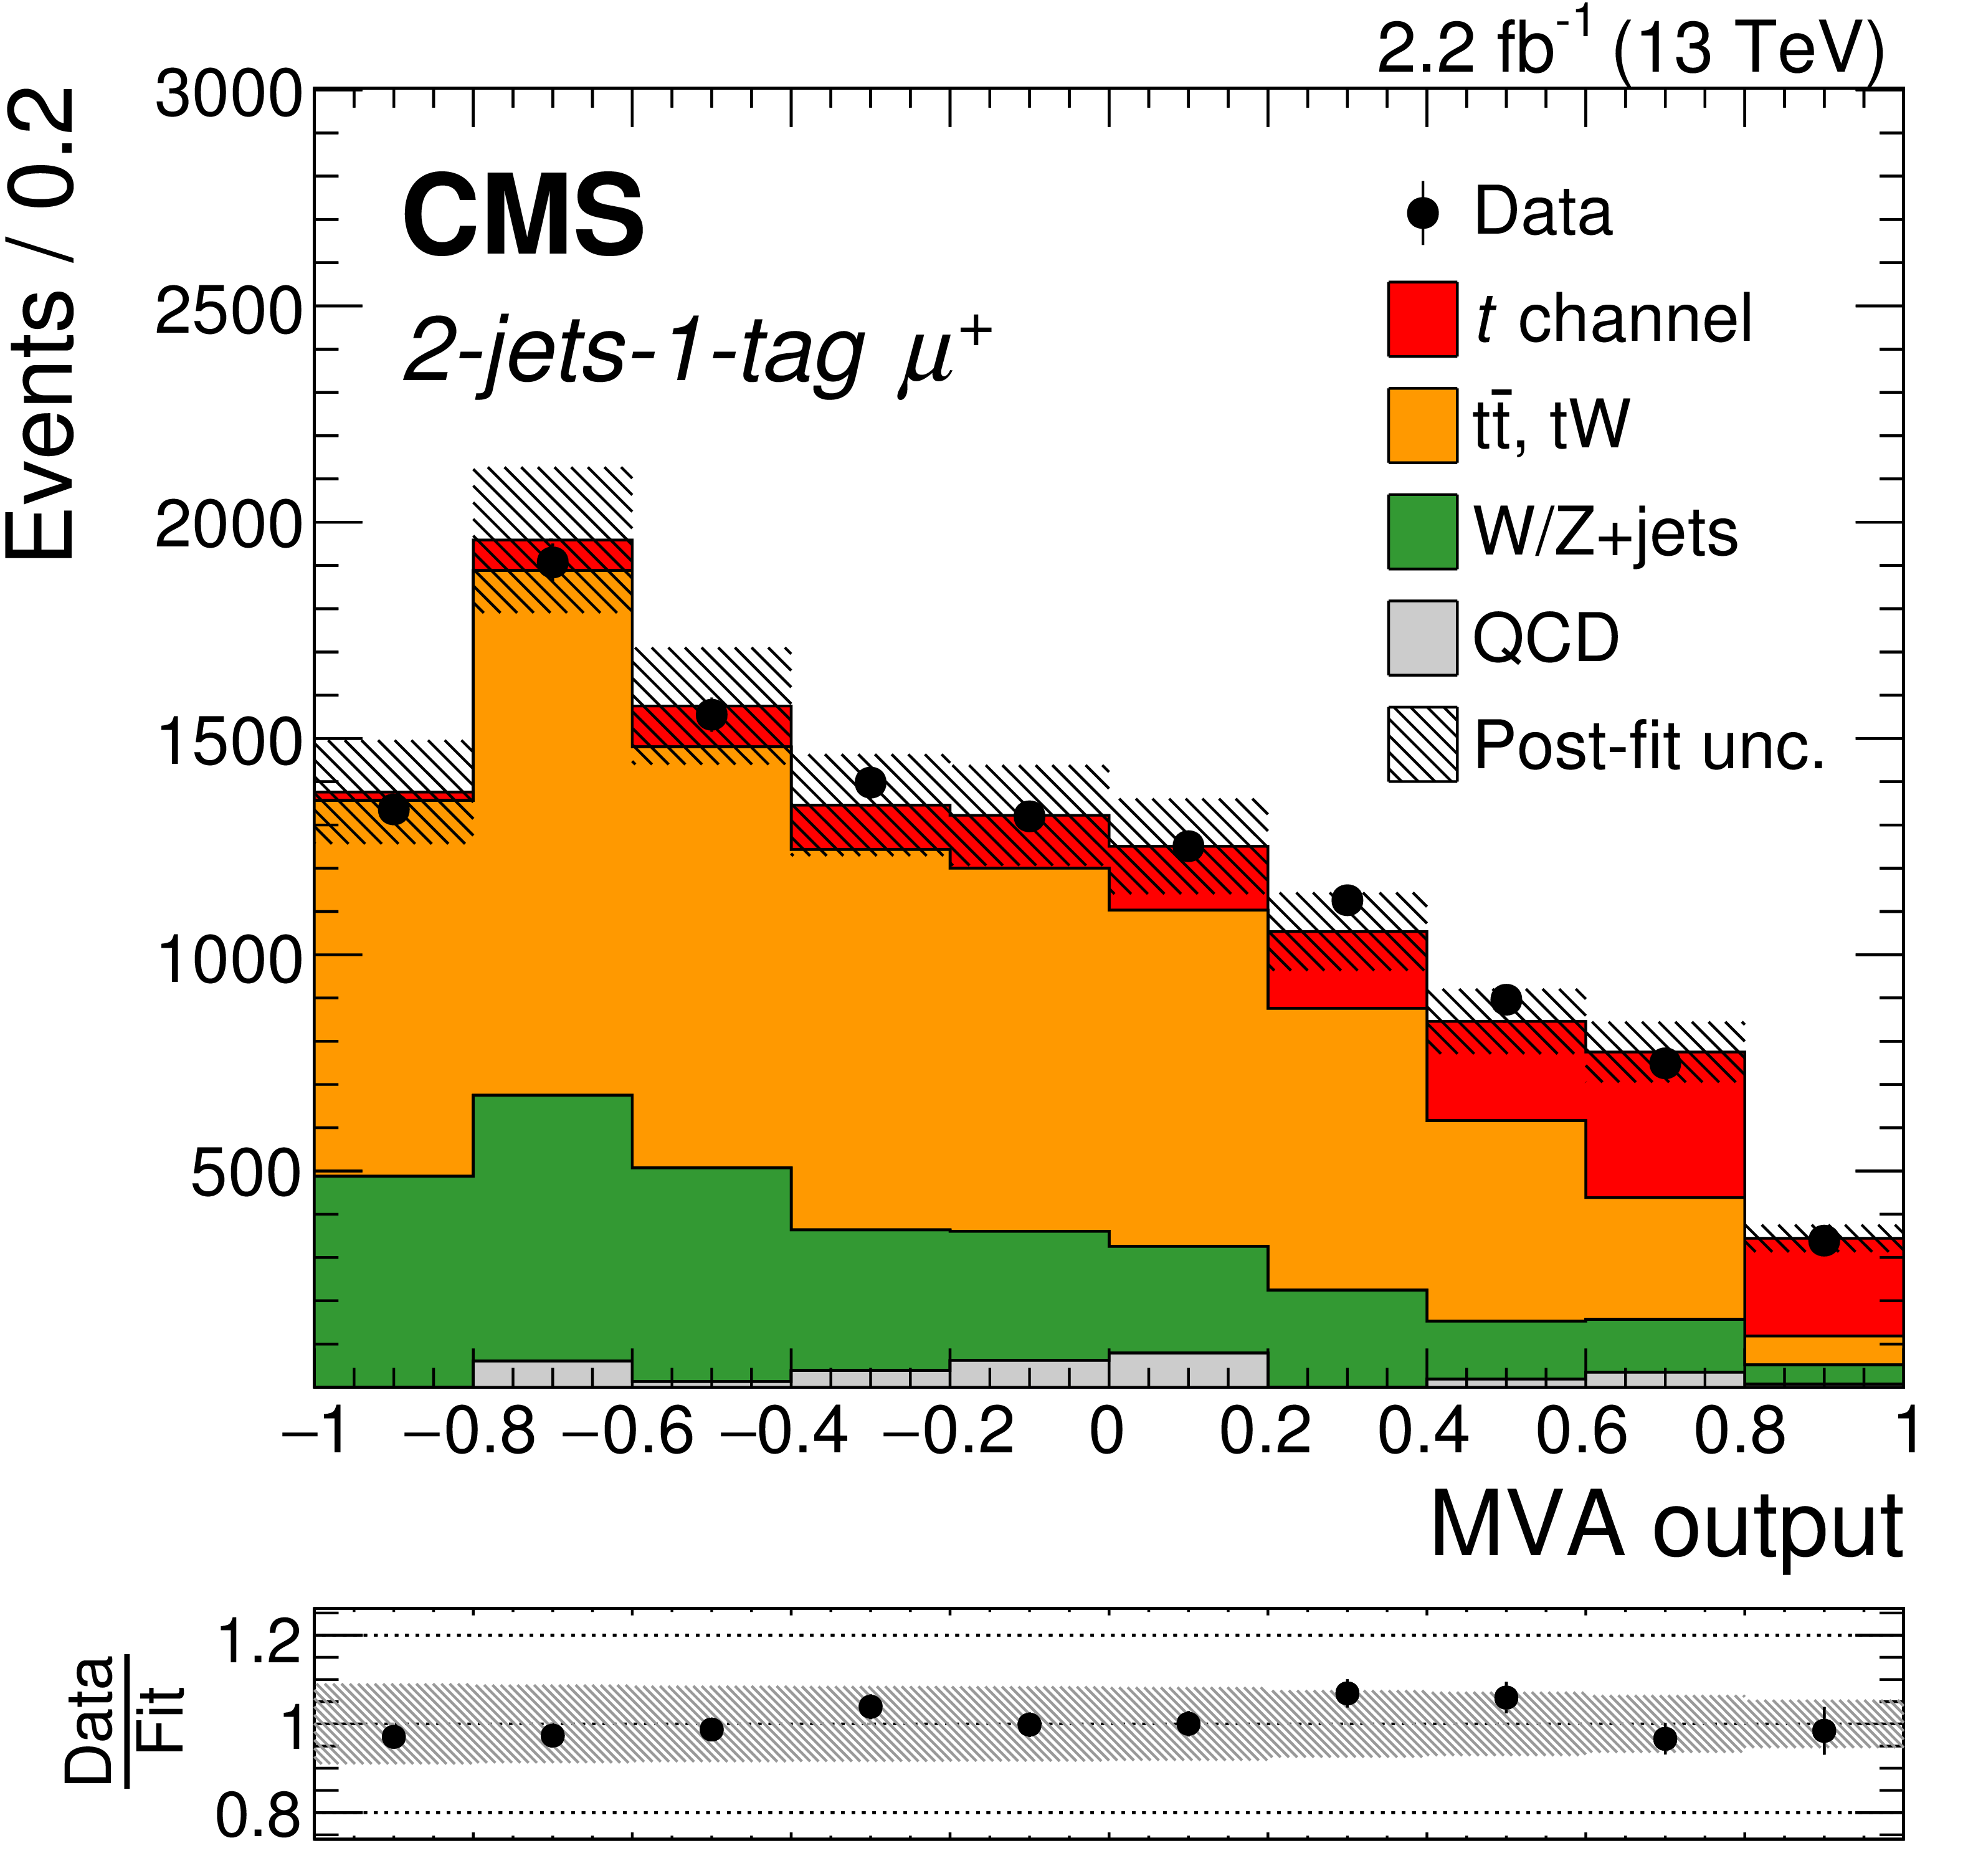
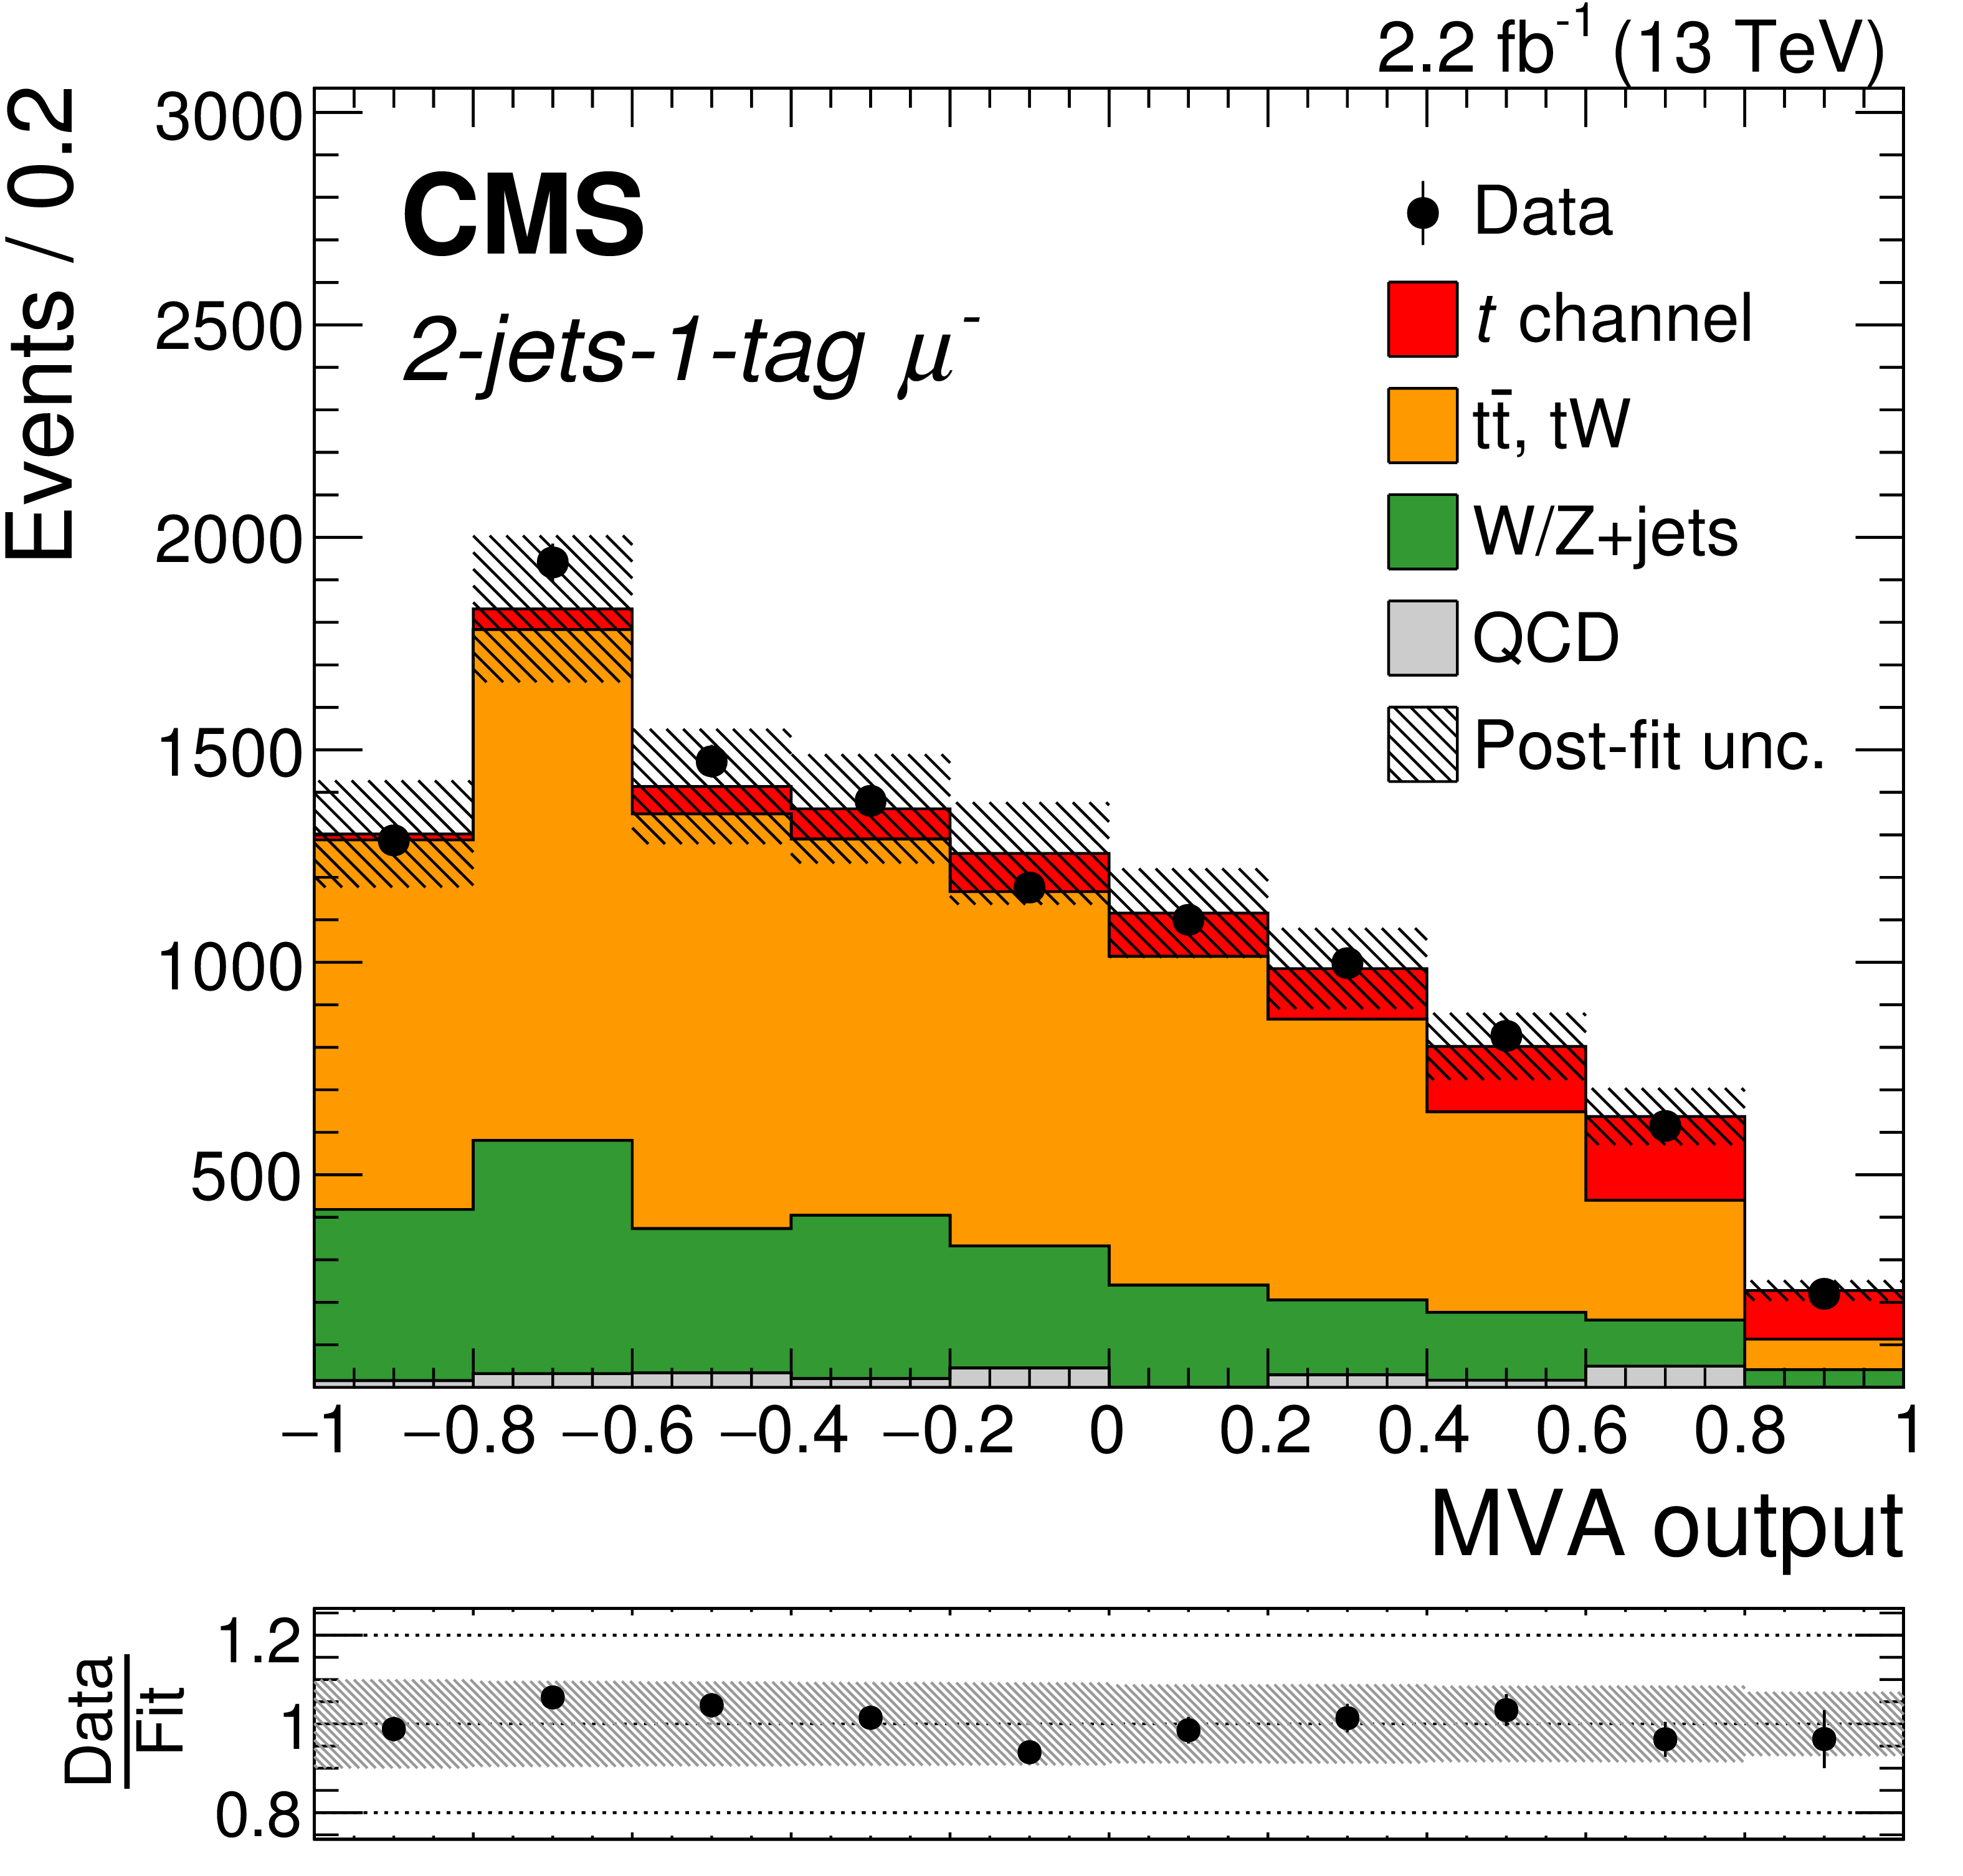
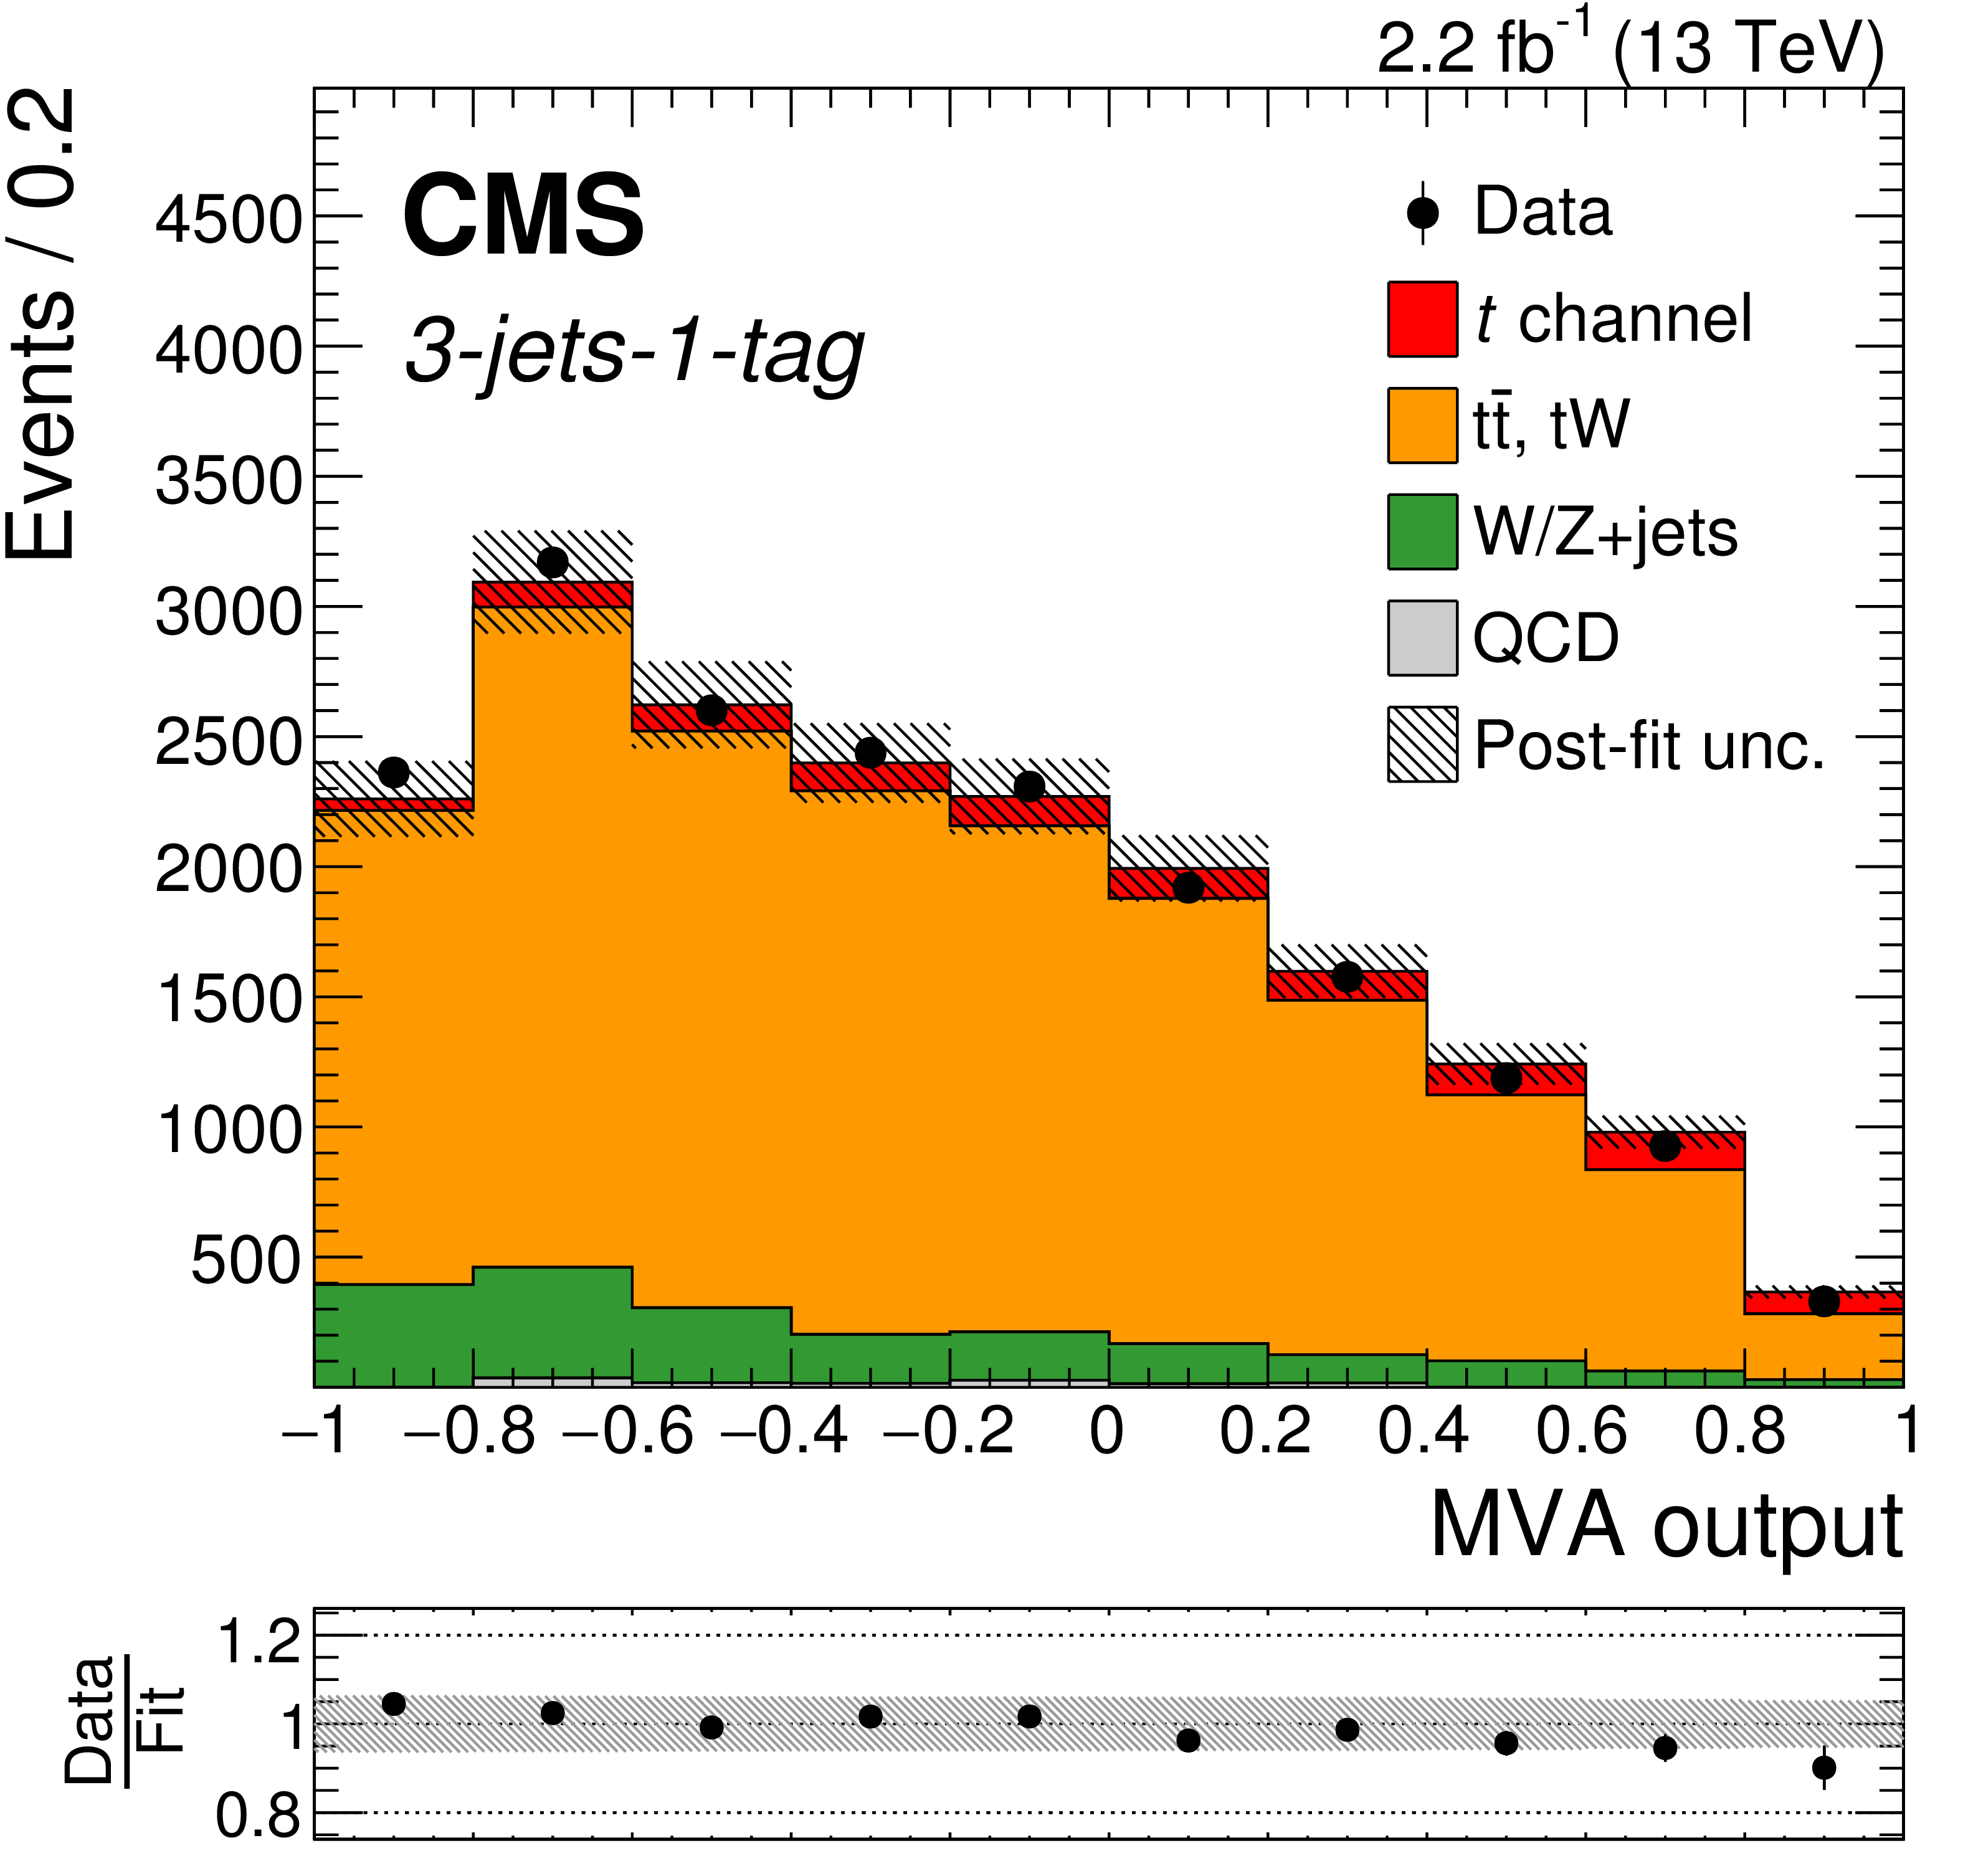
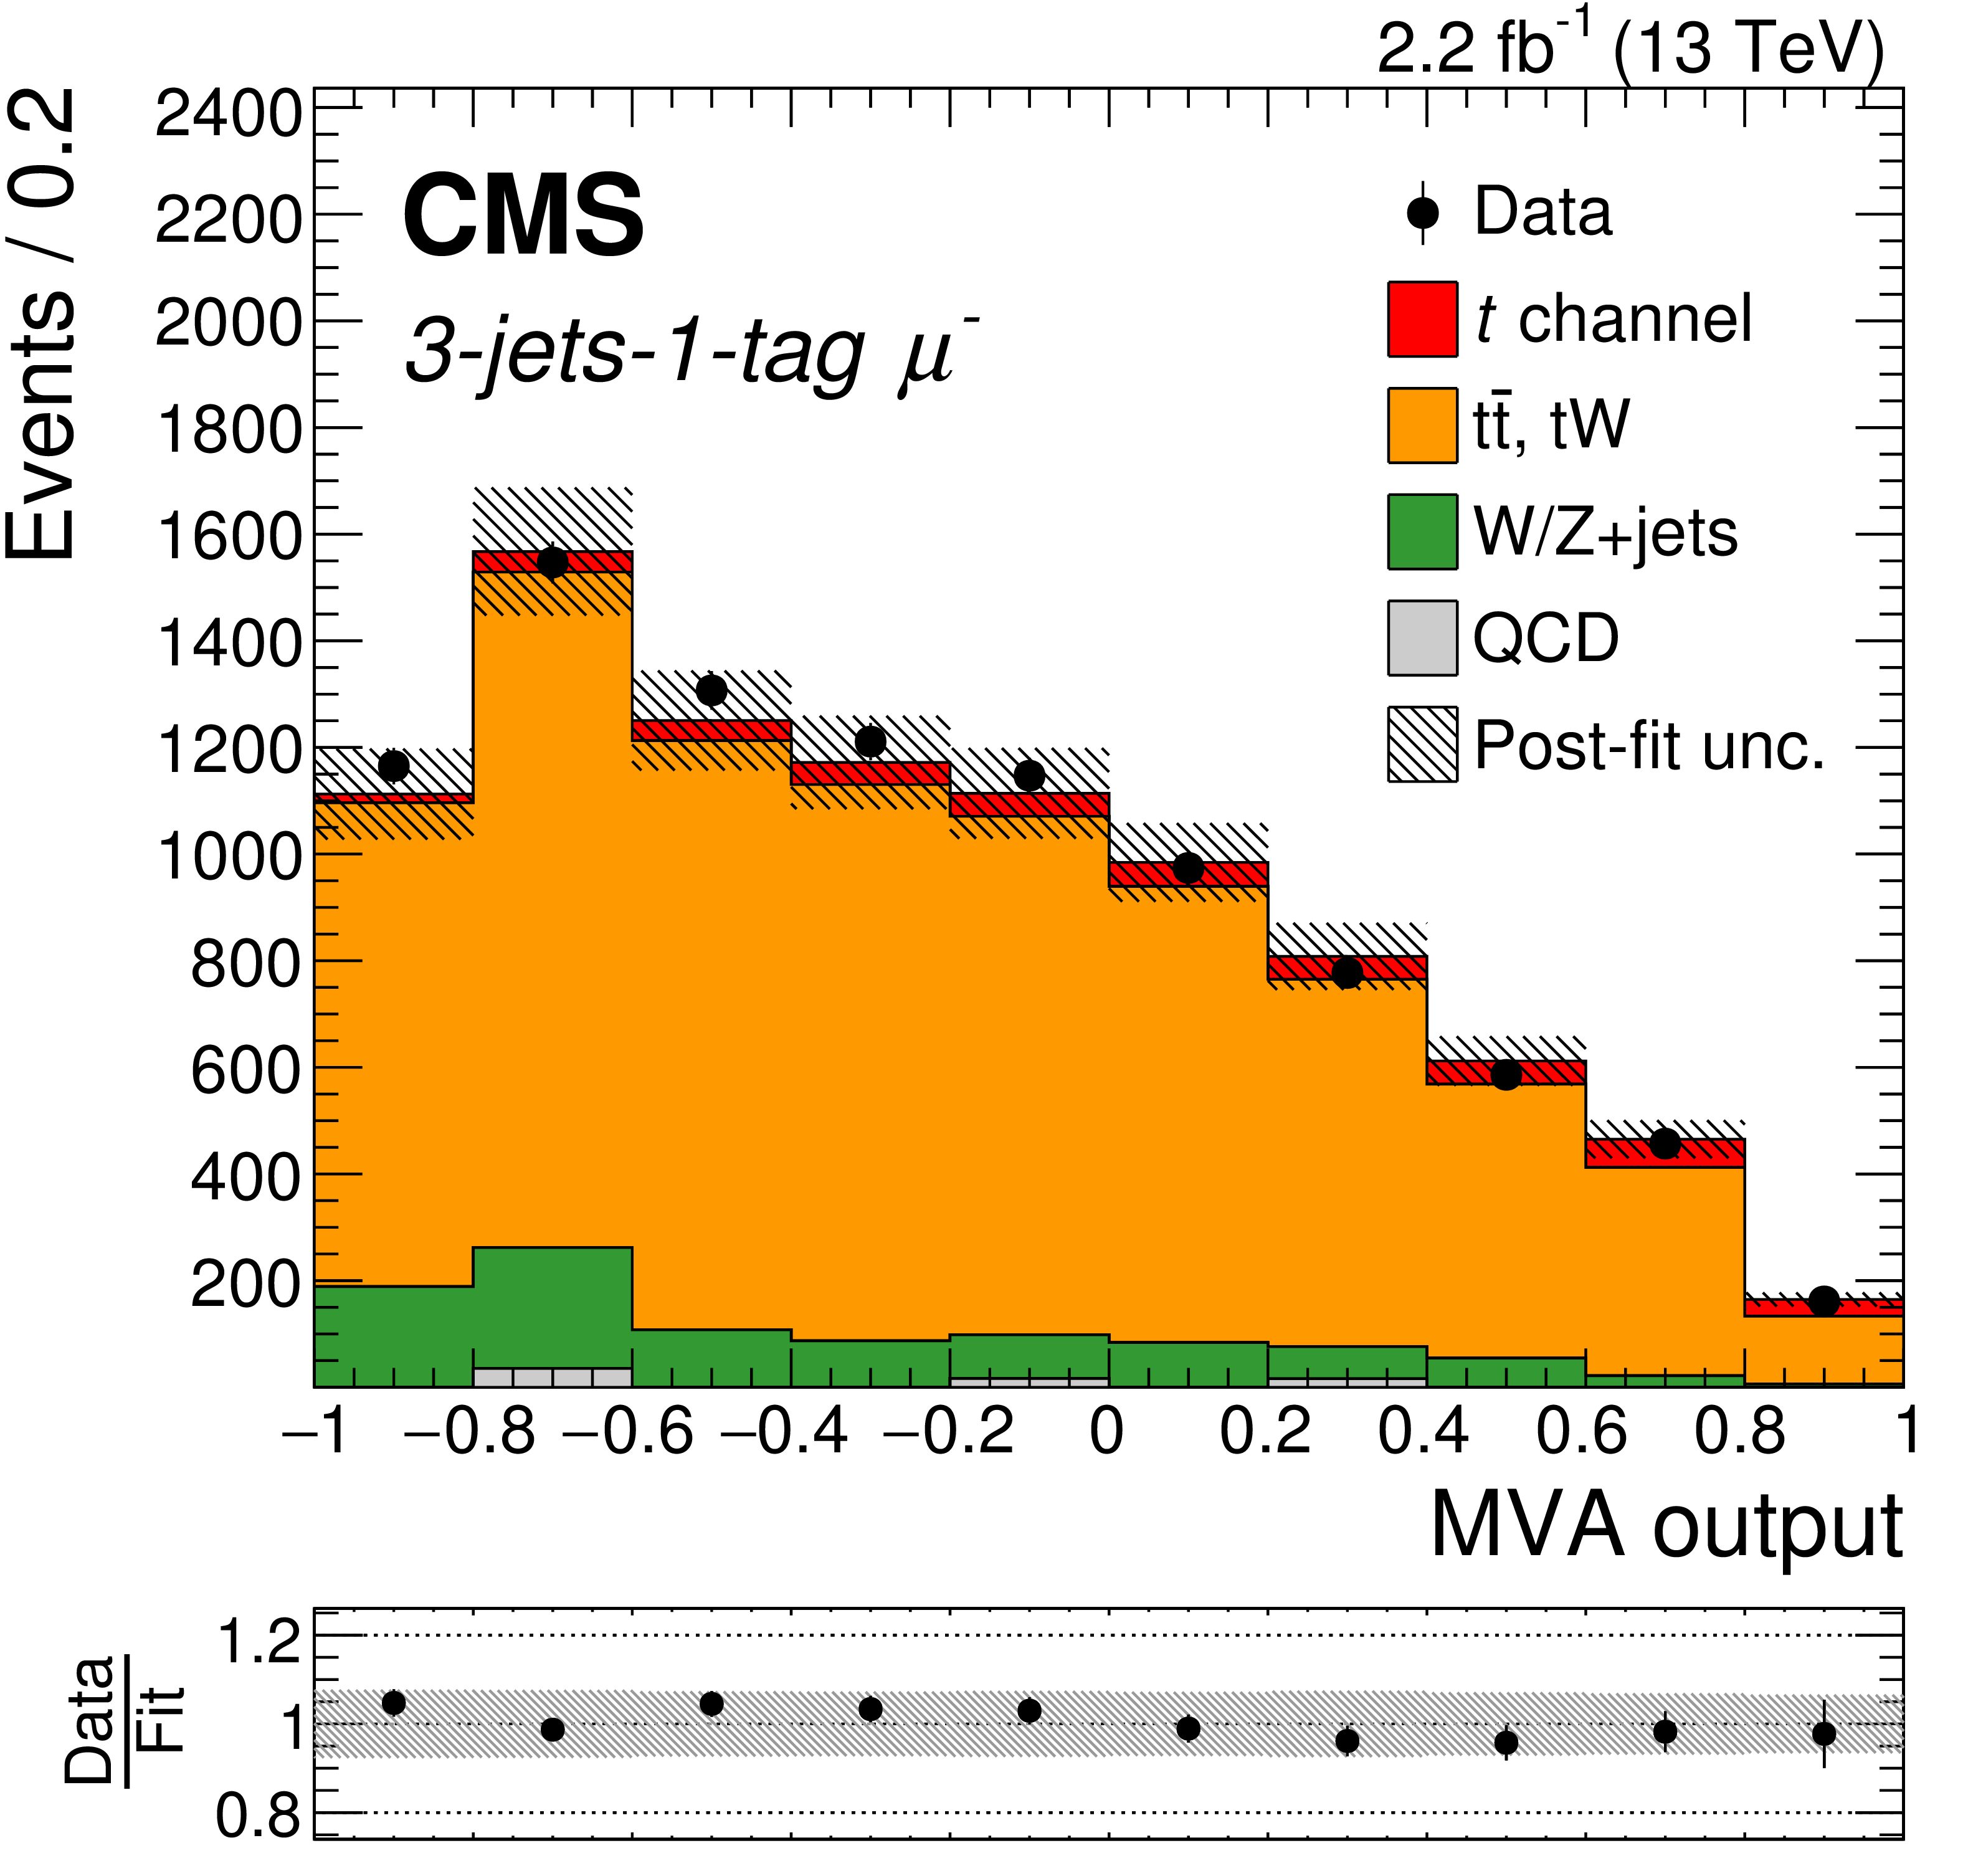
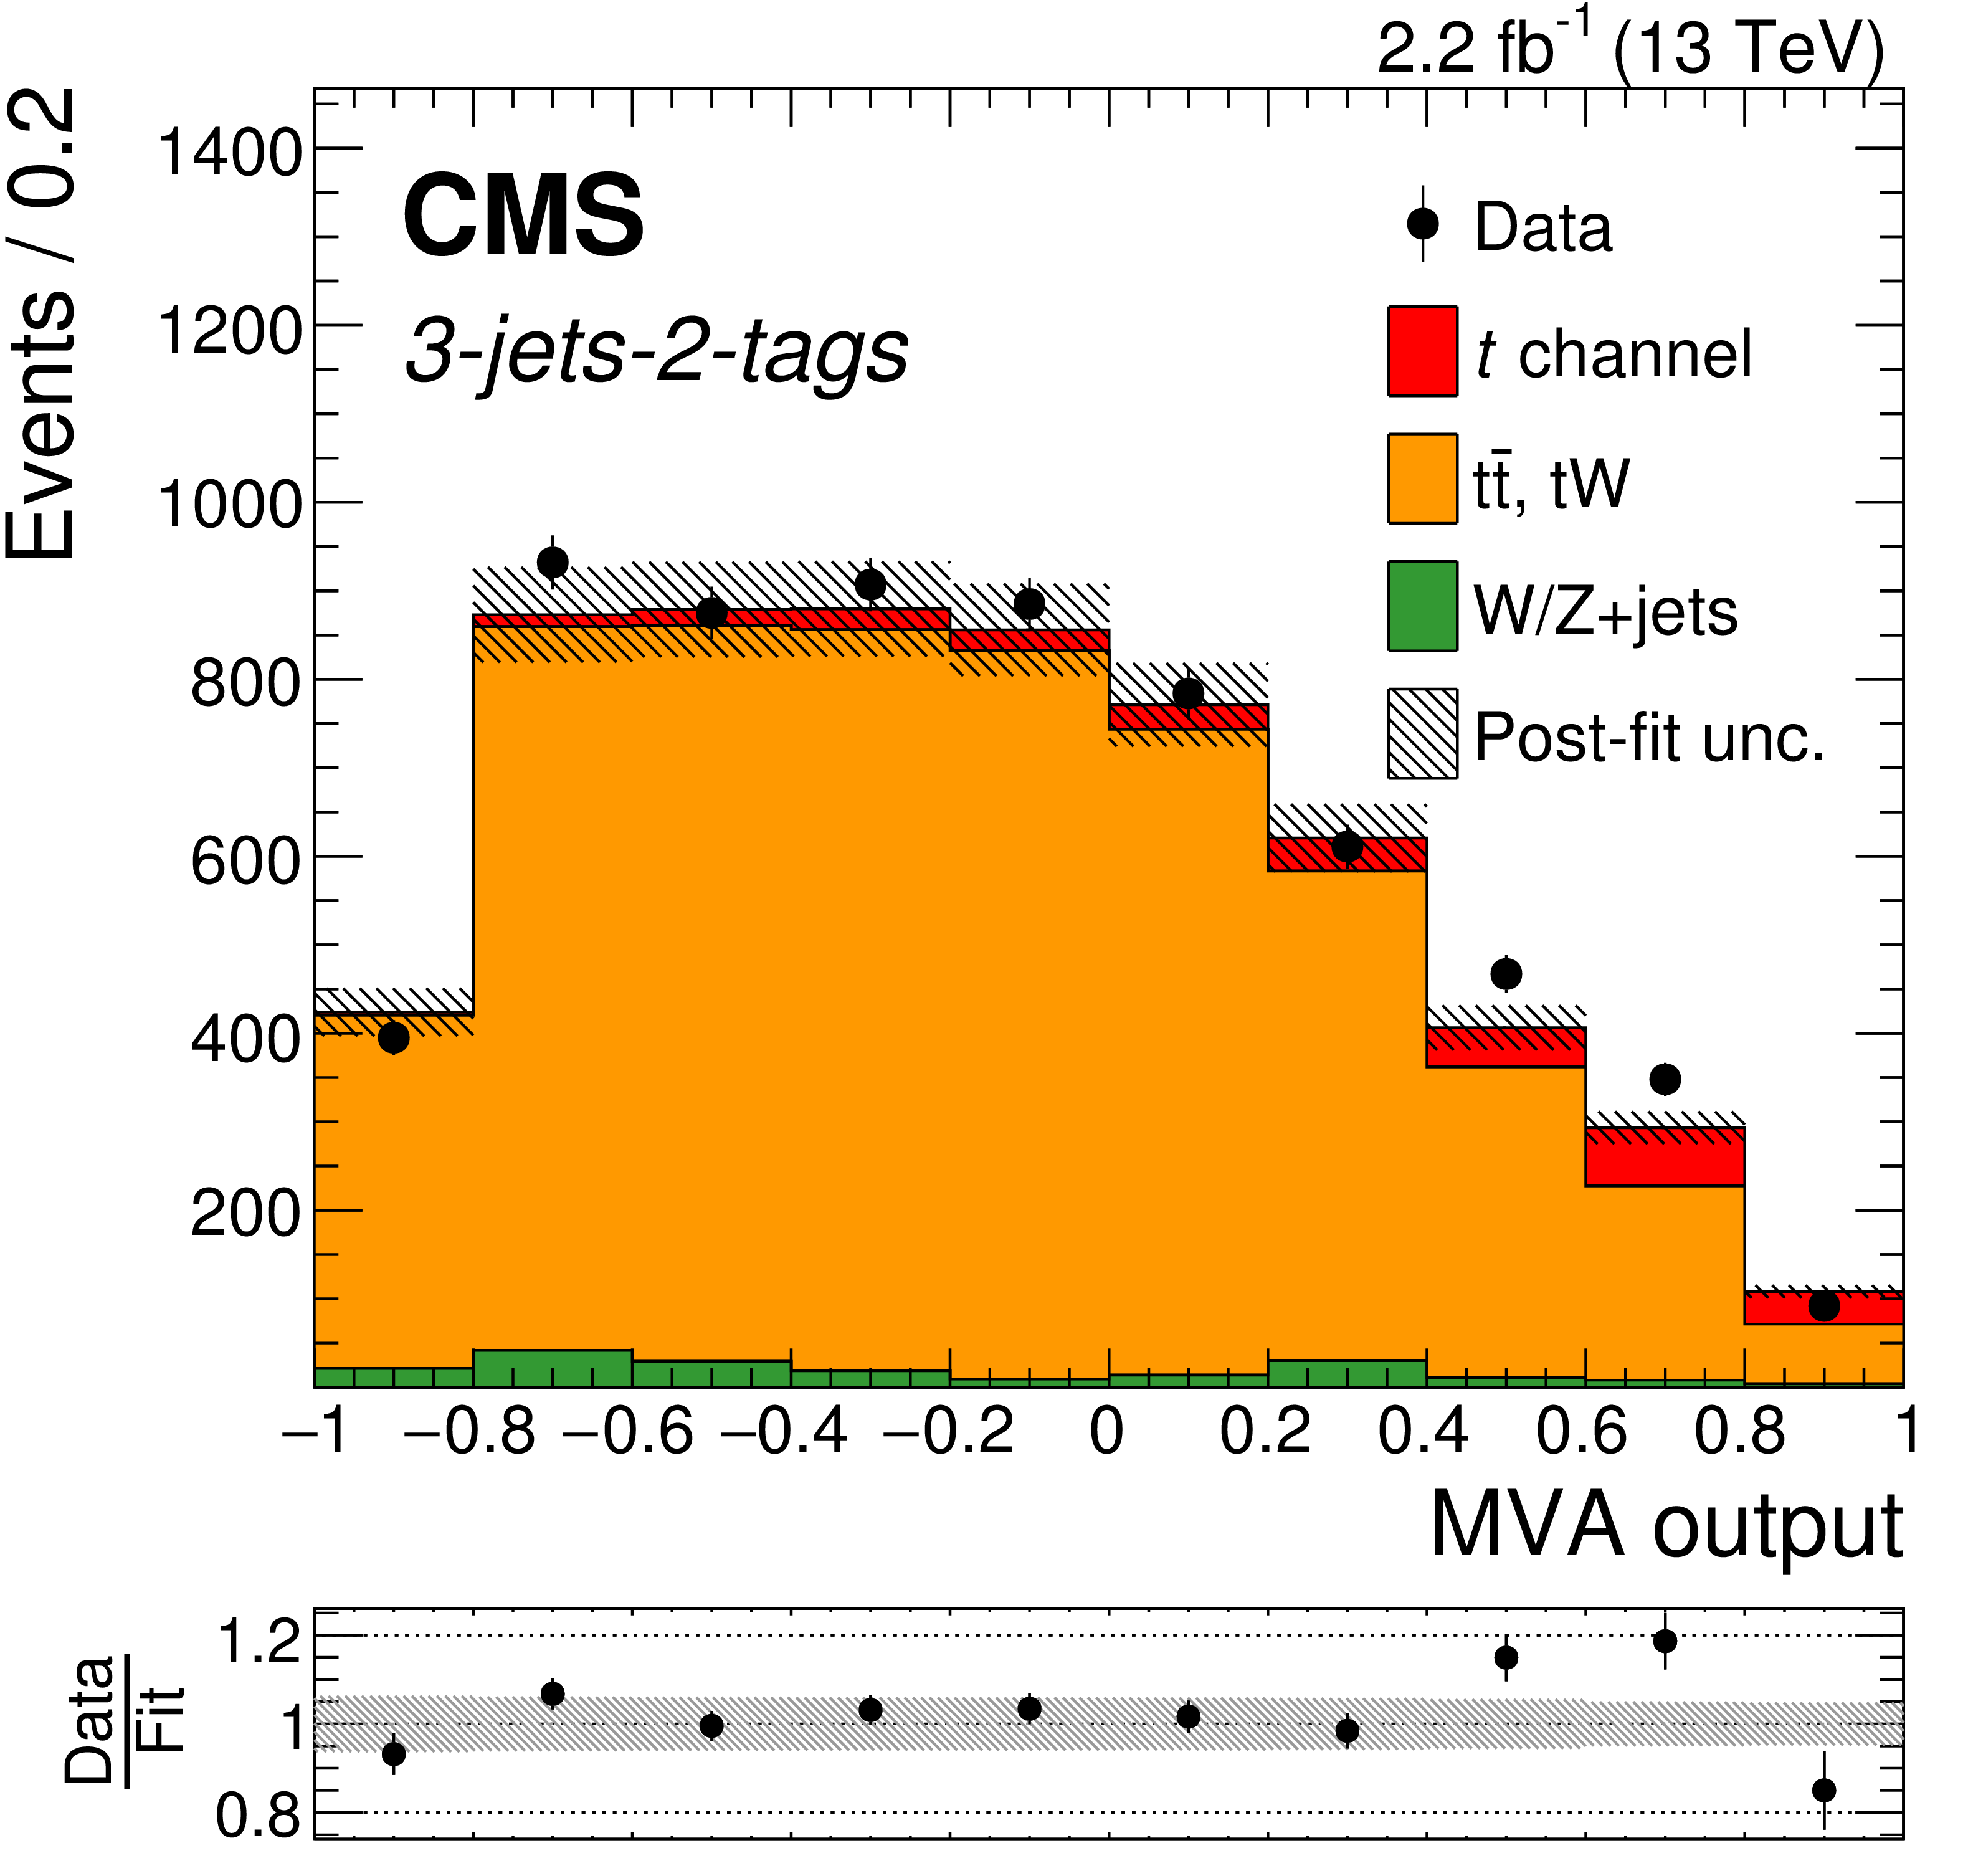
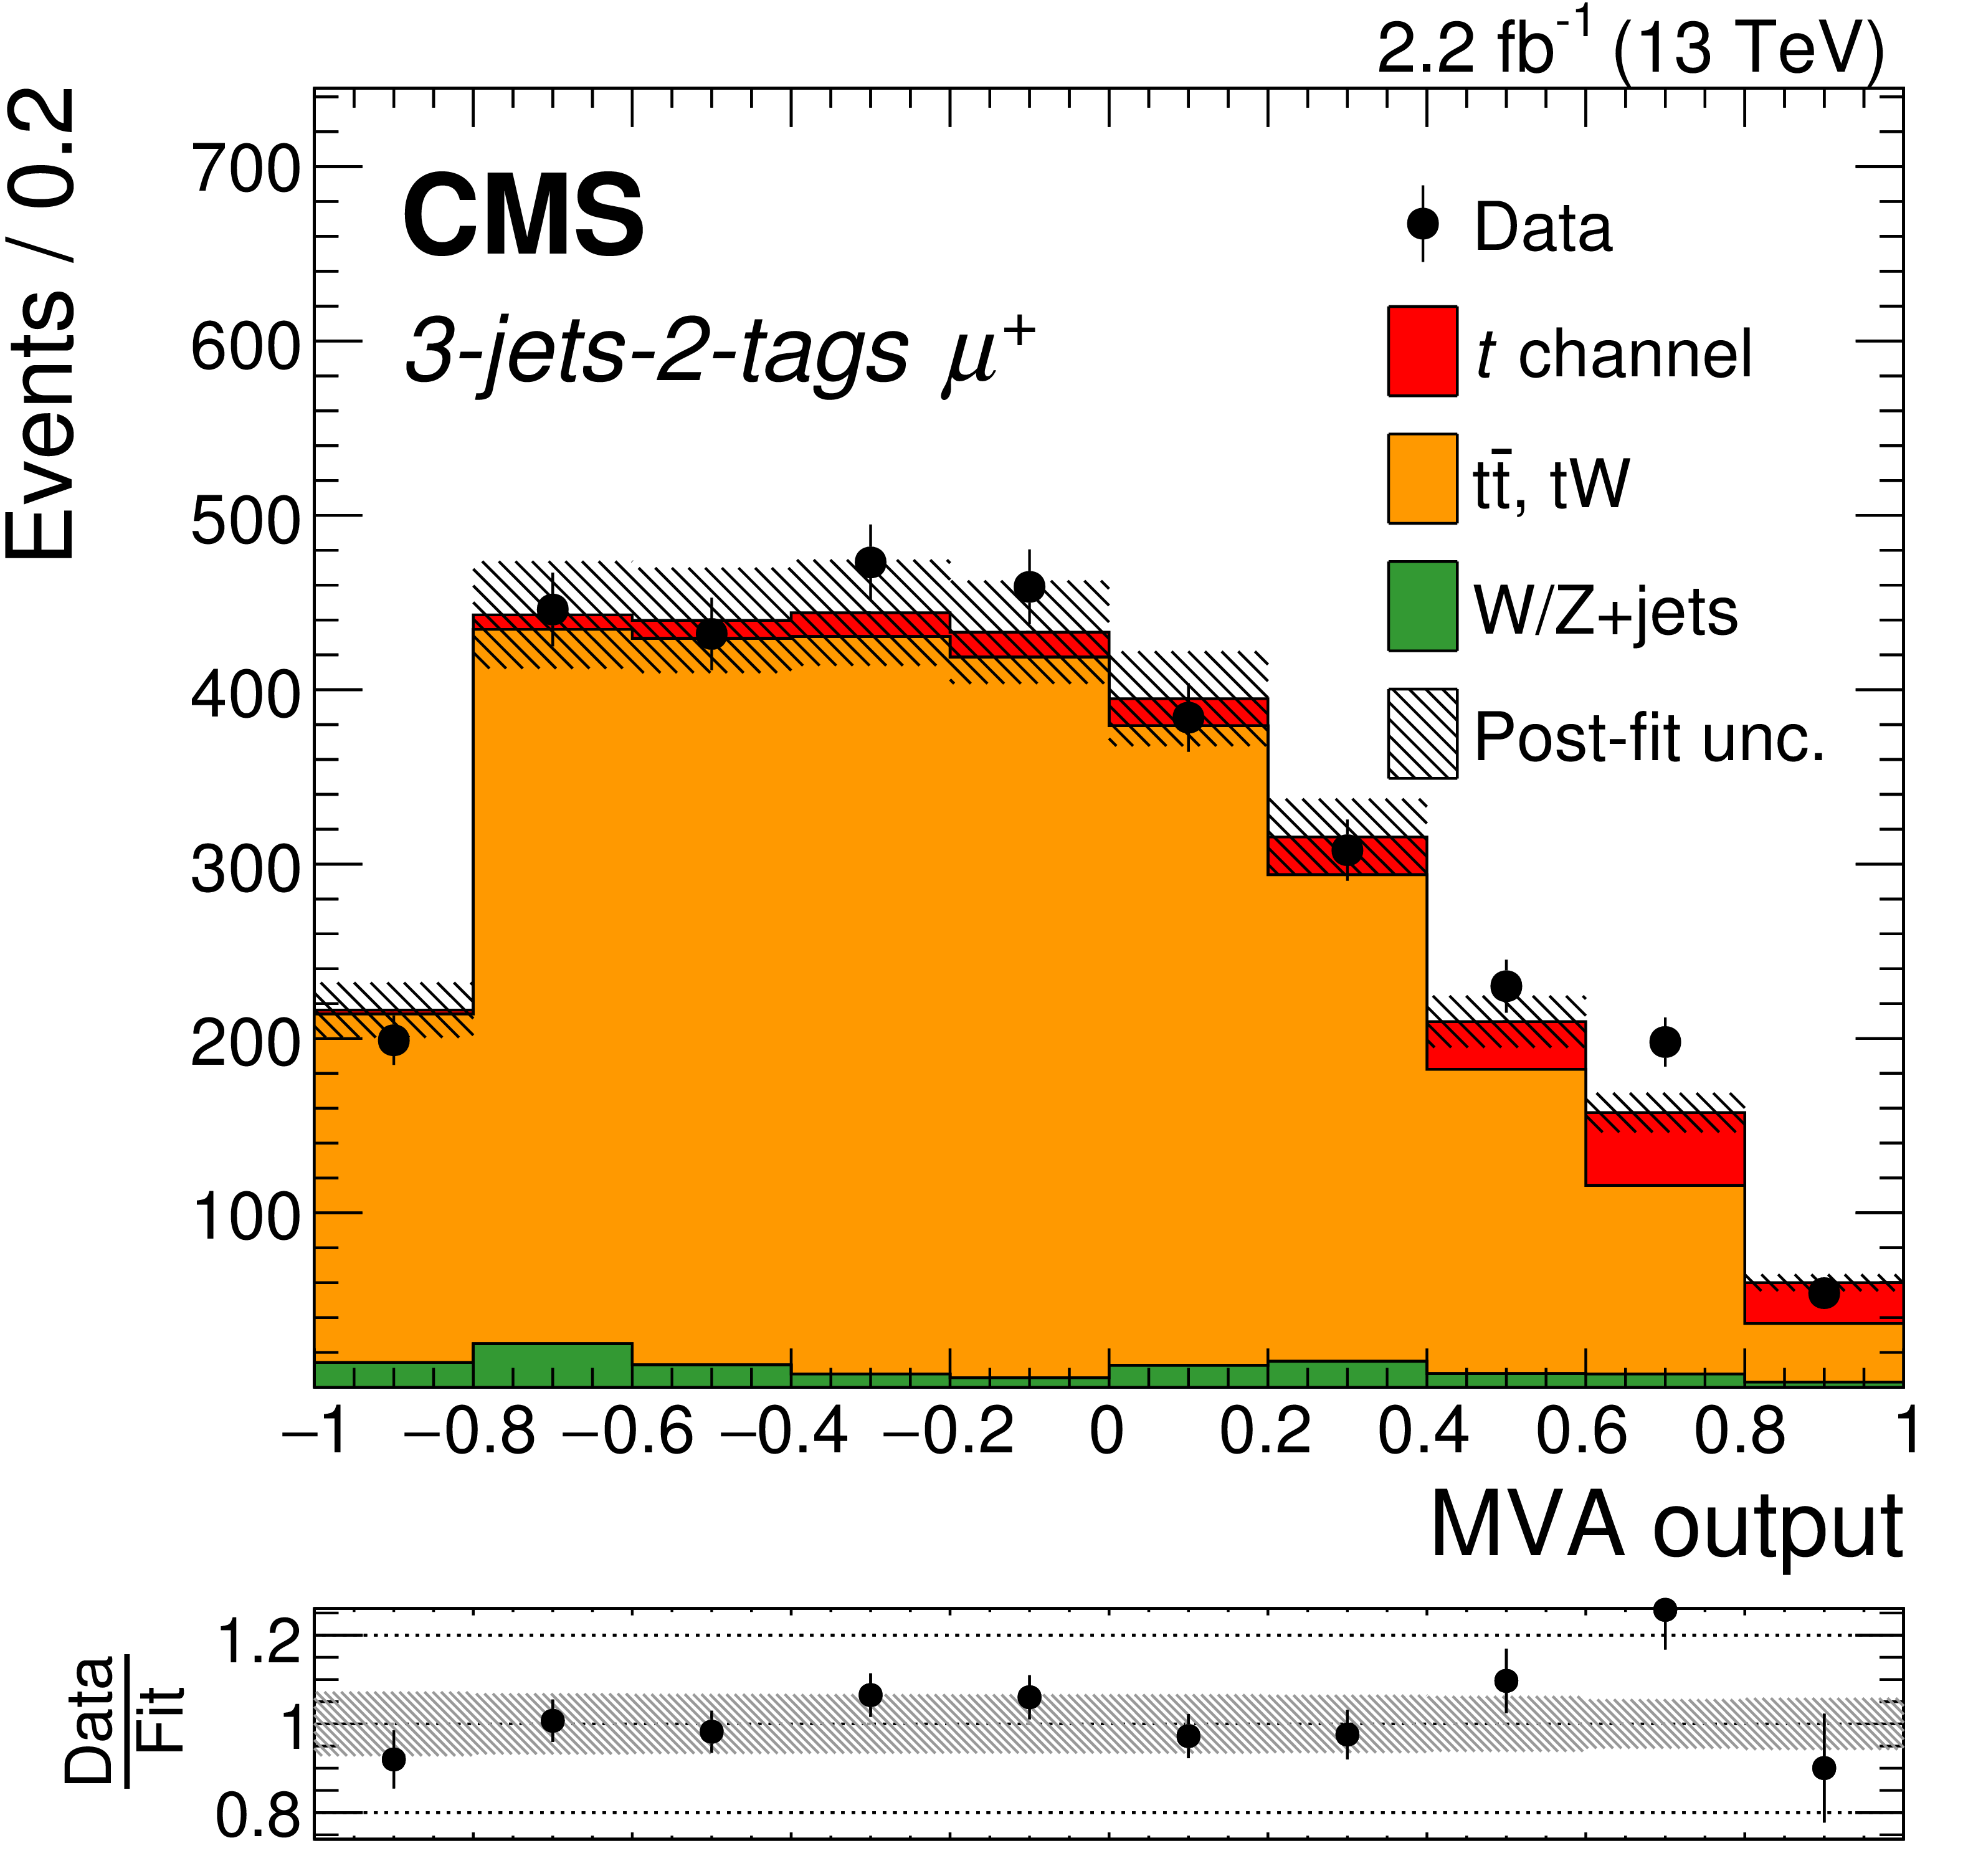
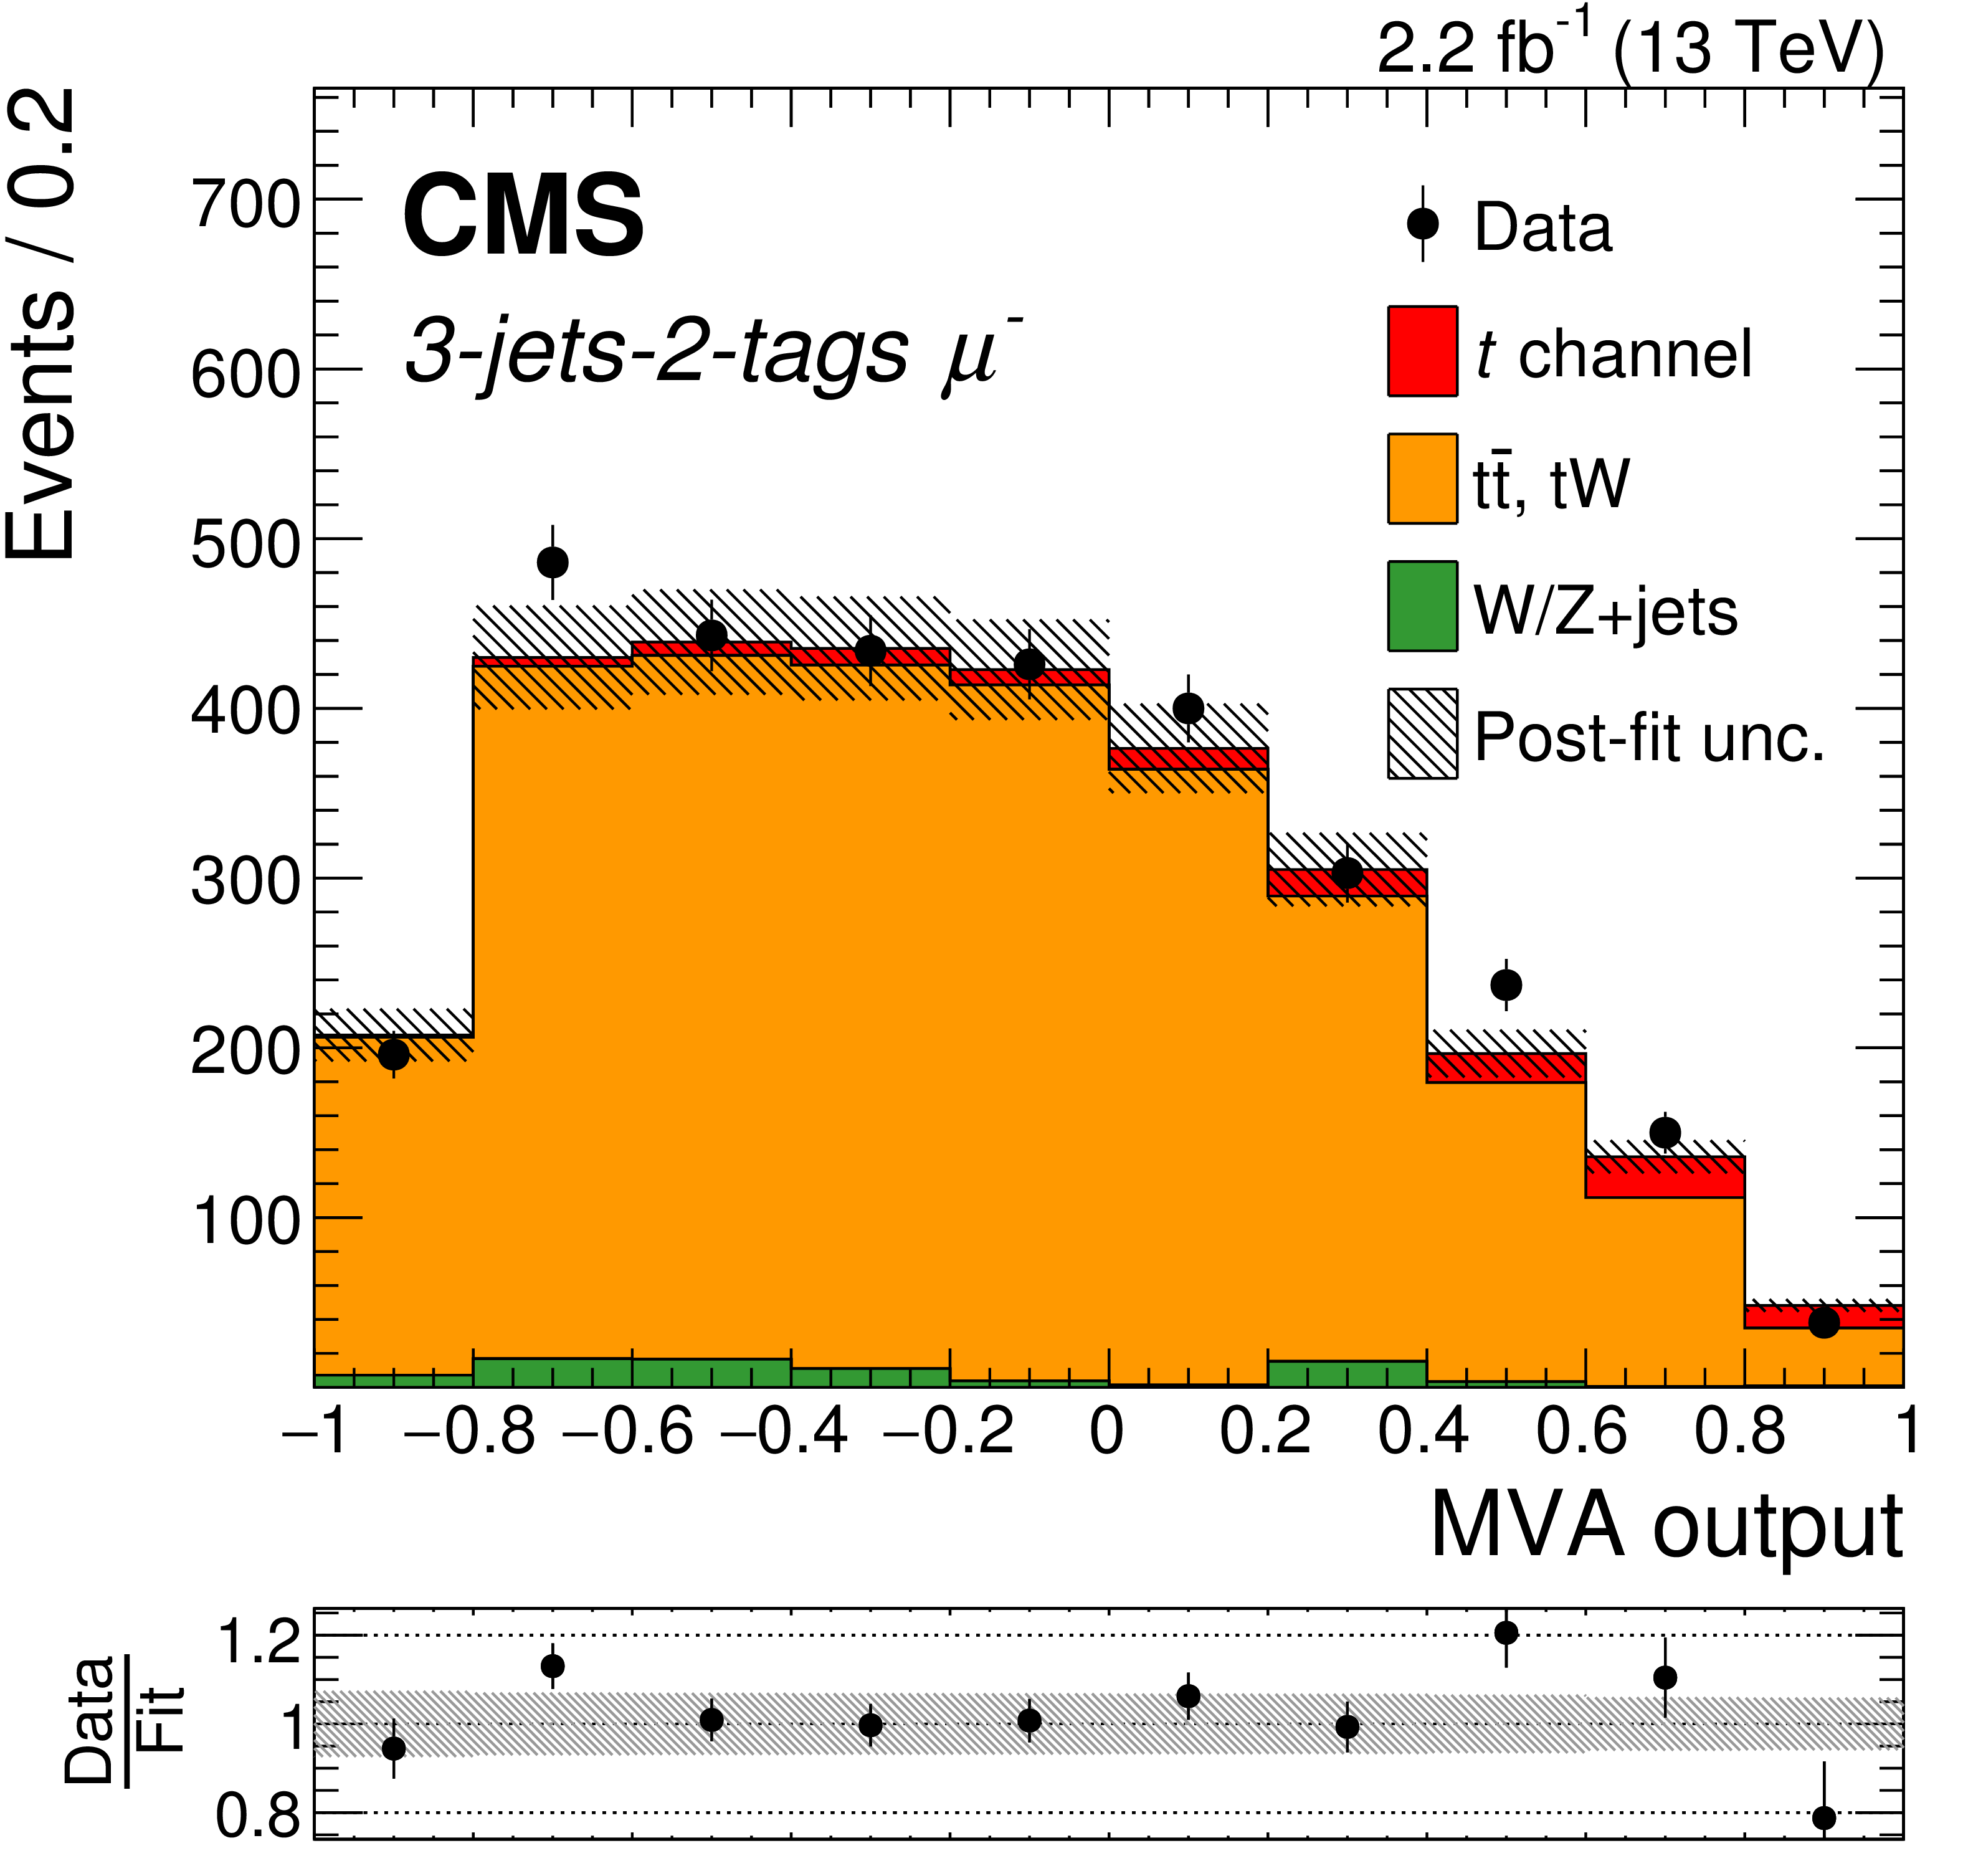
Neural network distributions for all (left), positively (middle), and negatively (right) charged muons normalized to the yields obtained from the simultaneous fit in the 2-jets-1-tag (upper), 3-jets-1-tag (middle), and 3-jets-2-tags region (lower). The ratio between data and simulated distributions after the fit is shown at the bottom of each figure. The hatched areas indicate the post-fit uncertainties. |
png pdf |
Figure 3-a:
Neural network distributions for all muons normalized to the yields obtained from the simultaneous fit in the 2-jets-1-tag region. The ratio between data and simulated distributions after the fit is shown at the bottom of each figure. The hatched areas indicate the post-fit uncertainties. |
png pdf |
Figure 3-b:
Neural network distributions for positively charged muons normalized to the yields obtained from the simultaneous fit in the 2-jets-1-tag region. The ratio between data and simulated distributions after the fit is shown at the bottom of each figure. The hatched areas indicate the post-fit uncertainties. |
png pdf |
Figure 3-c:
Neural network distributions for negatively charged muons normalized to the yields obtained from the simultaneous fit in the 2-jets-1-tag region. The ratio between data and simulated distributions after the fit is shown at the bottom of each figure. The hatched areas indicate the post-fit uncertainties. |
png pdf |
Figure 3-d:
Neural network distributions for all muons normalized to the yields obtained from the simultaneous fit in the 3-jets-1-tag region. The ratio between data and simulated distributions after the fit is shown at the bottom of each figure. The hatched areas indicate the post-fit uncertainties. |

png pdf |
Figure 3-e:
Neural network distributions for positively charged muons normalized to the yields obtained from the simultaneous fit in the 3-jets-1-tag region. The ratio between data and simulated distributions after the fit is shown at the bottom of each figure. The hatched areas indicate the post-fit uncertainties. |
png pdf |
Figure 3-f:
Neural network distributions for negatively charged muons normalized to the yields obtained from the simultaneous fit in the 3-jets-1-tag region. The ratio between data and simulated distributions after the fit is shown at the bottom of each figure. The hatched areas indicate the post-fit uncertainties. |
png pdf |
Figure 3-g:
Neural network distributions for all muons normalized to the yields obtained from the simultaneous fit in the 3-jets-2-tags region. The ratio between data and simulated distributions after the fit is shown at the bottom of each figure. The hatched areas indicate the post-fit uncertainties. |
png pdf |
Figure 3-h:
Neural network distributions for positively charged muons normalized to the yields obtained from the simultaneous fit in the 3-jets-2-tags region. The ratio between data and simulated distributions after the fit is shown at the bottom of each figure. The hatched areas indicate the post-fit uncertainties. |
png pdf |
Figure 3-i:
Neural network distributions for negatively charged muons normalized to the yields obtained from the simultaneous fit in the 3-jets-2-tags region. The ratio between data and simulated distributions after the fit is shown at the bottom of each figure. The hatched areas indicate the post-fit uncertainties. |
png pdf |
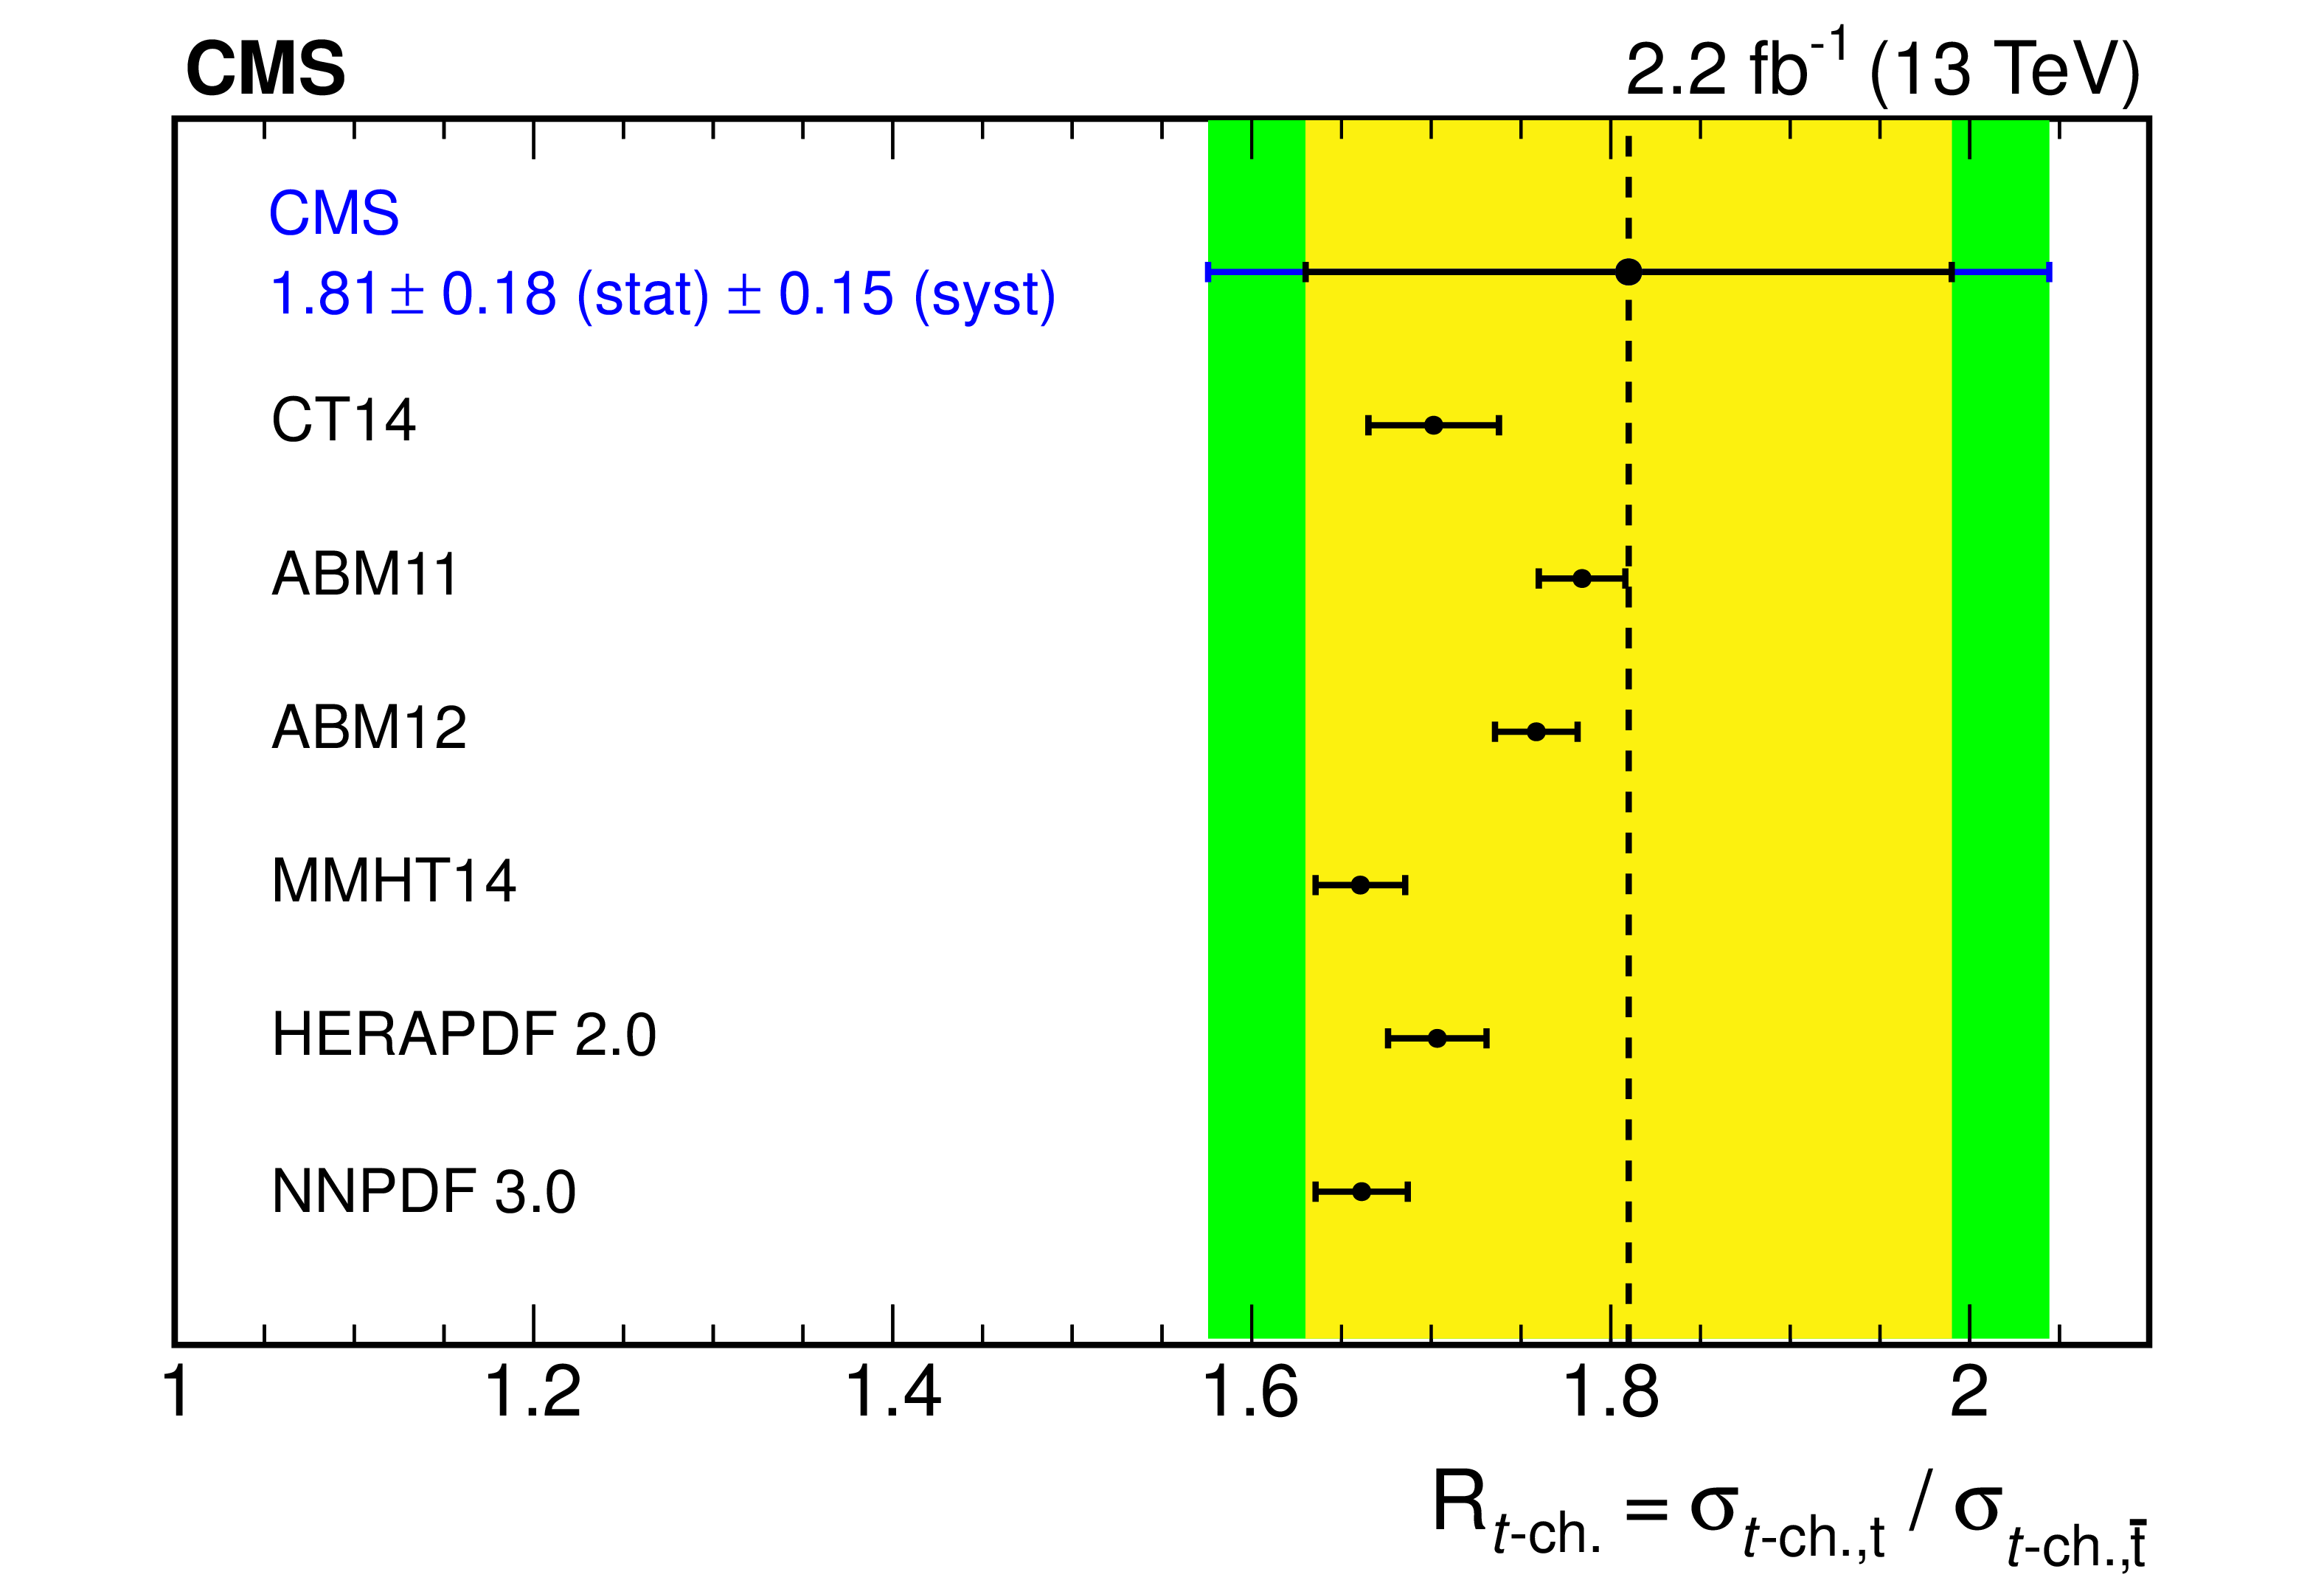
Figure 4:
Comparison of the measured $R_{t\textrm {-ch.}}$ (dotted line) with the prediction from different PDF sets: CT14 NLO [51], ABM11 NLO and ABM12 NNLO [52], MMHT14 NLO [53], HERAPDF2.0 NLO [54], NNPDF 3.0 NLO [55]. The PowHeg 4FS calculation is used. The nominal value for the top quark mass is $172.5 GeV $. The error bars for the different PDF sets include the statistical uncertainty, the uncertainty due to the factorization and renormalization scales, derived varying both of them by a factor 0.5 and 2, and the uncertainty in the top quark mass, derived varying the top quark mass between 171.5 and 173.5 GeV. For the measurement, the inner and outer error bars correspond to the statistical and total uncertainties, respectively. |
png pdf |
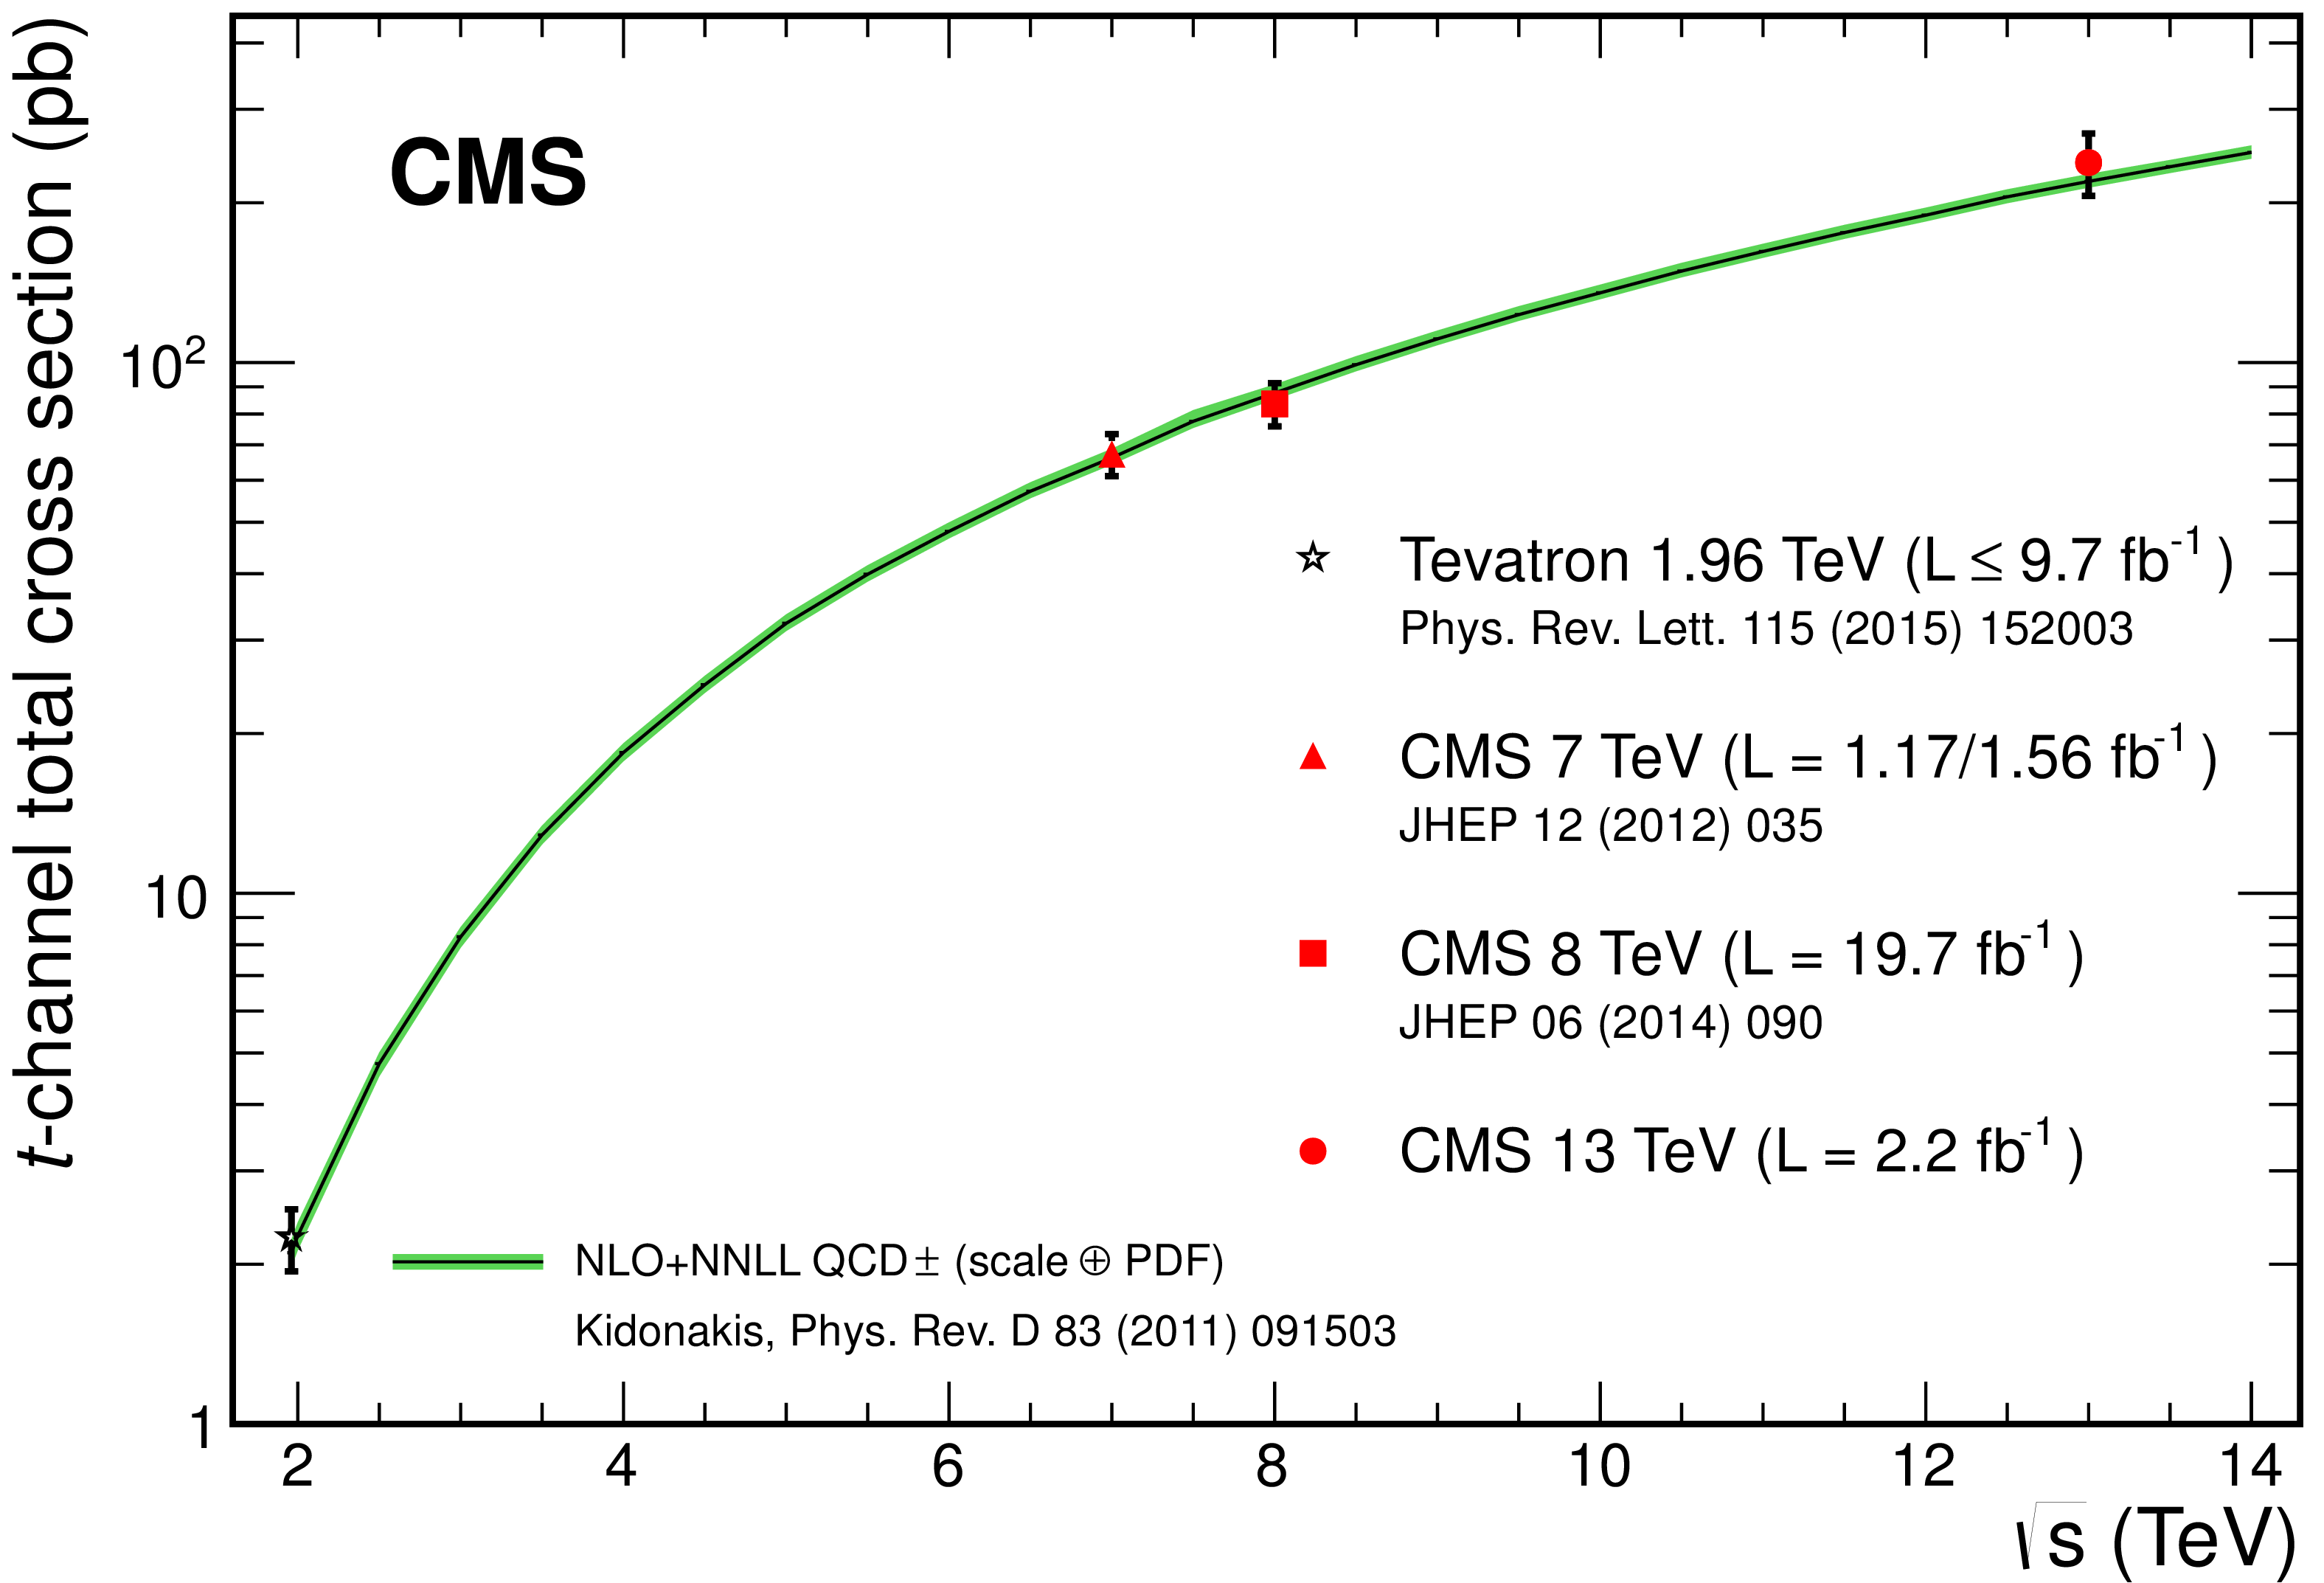
Figure 5:
The summary of the most precise CMS measurements [3,5] for the total $t$-channel single top quark cross section, in comparison with NLO+NNLL QCD calculations [22]. The combination of the Tevatron measurements [56] is also shown. |
| Tables | |
png pdf |
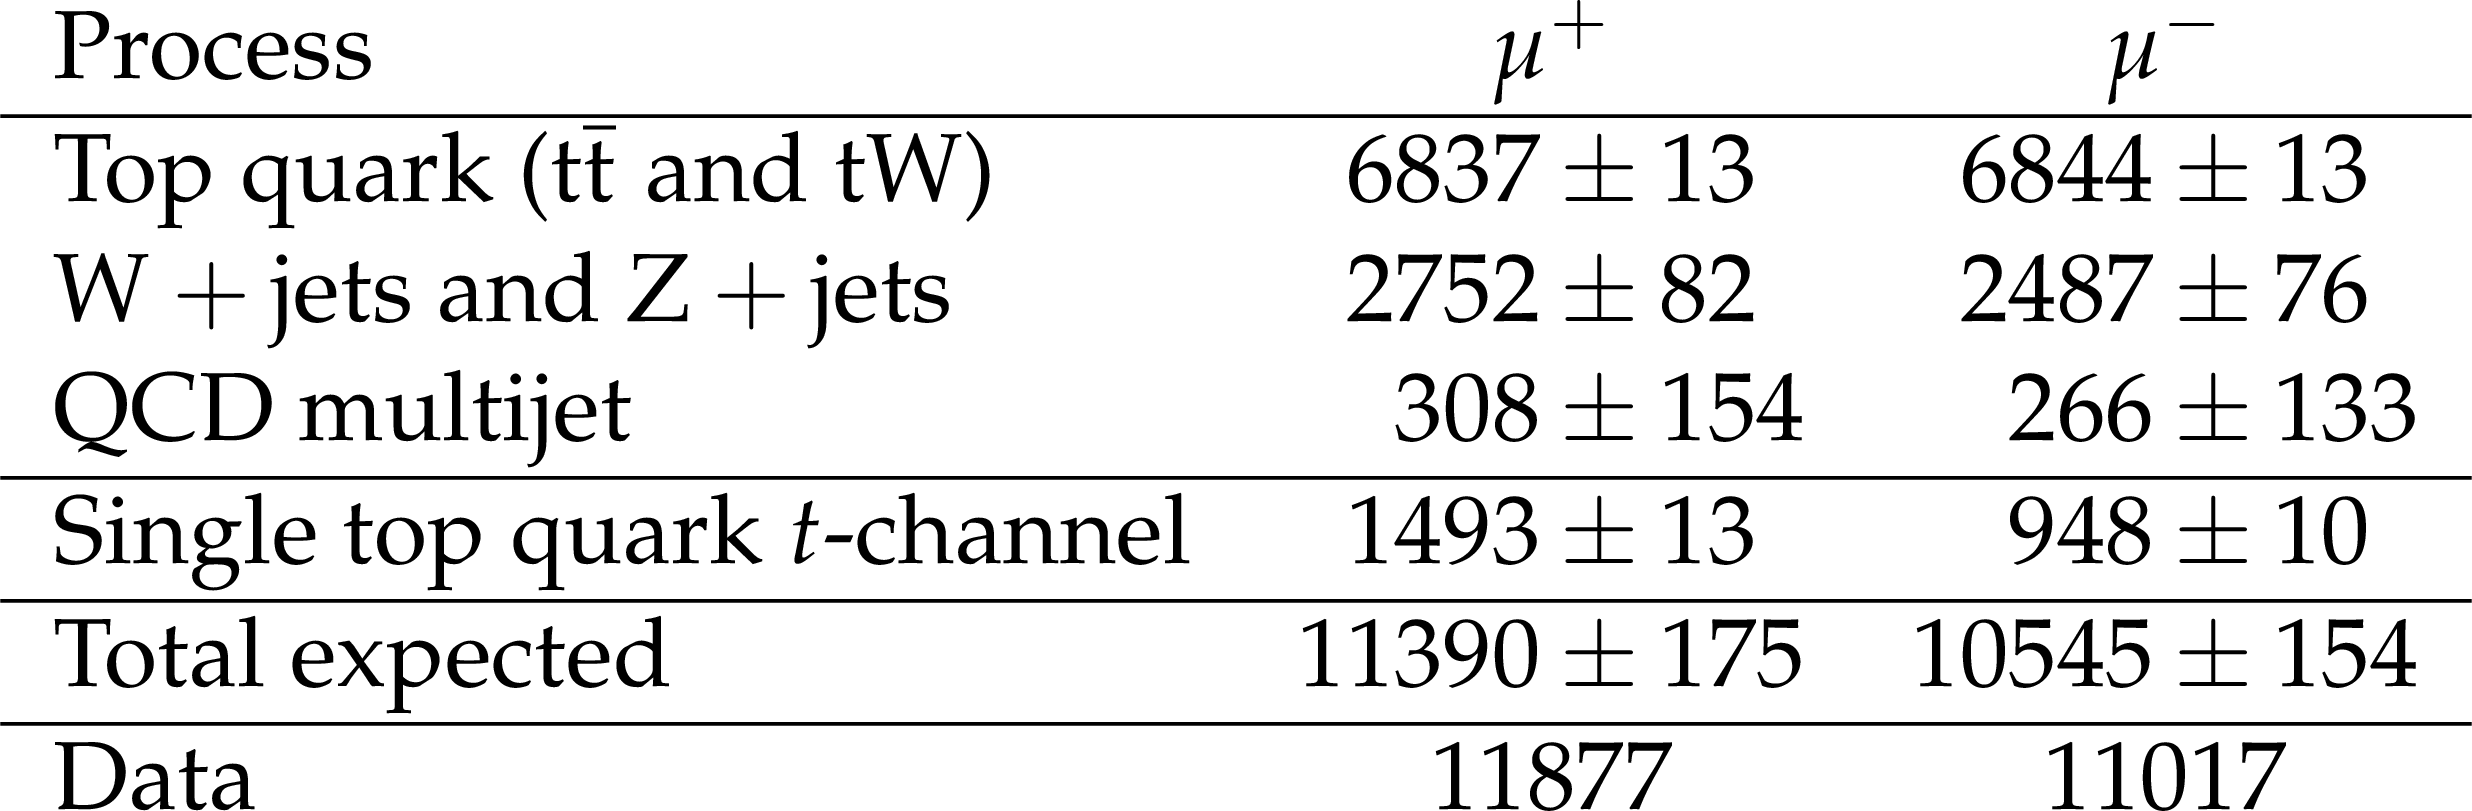
Table 1:
Event yields for the main processes in the 2-jets-1-tag sample. The quoted uncertainties are statistical only. All yields are taken from simulation, except for QCD multijet events where the yield and the associated uncertainty are determined from data (as discussed in Section 4). |
png pdf |
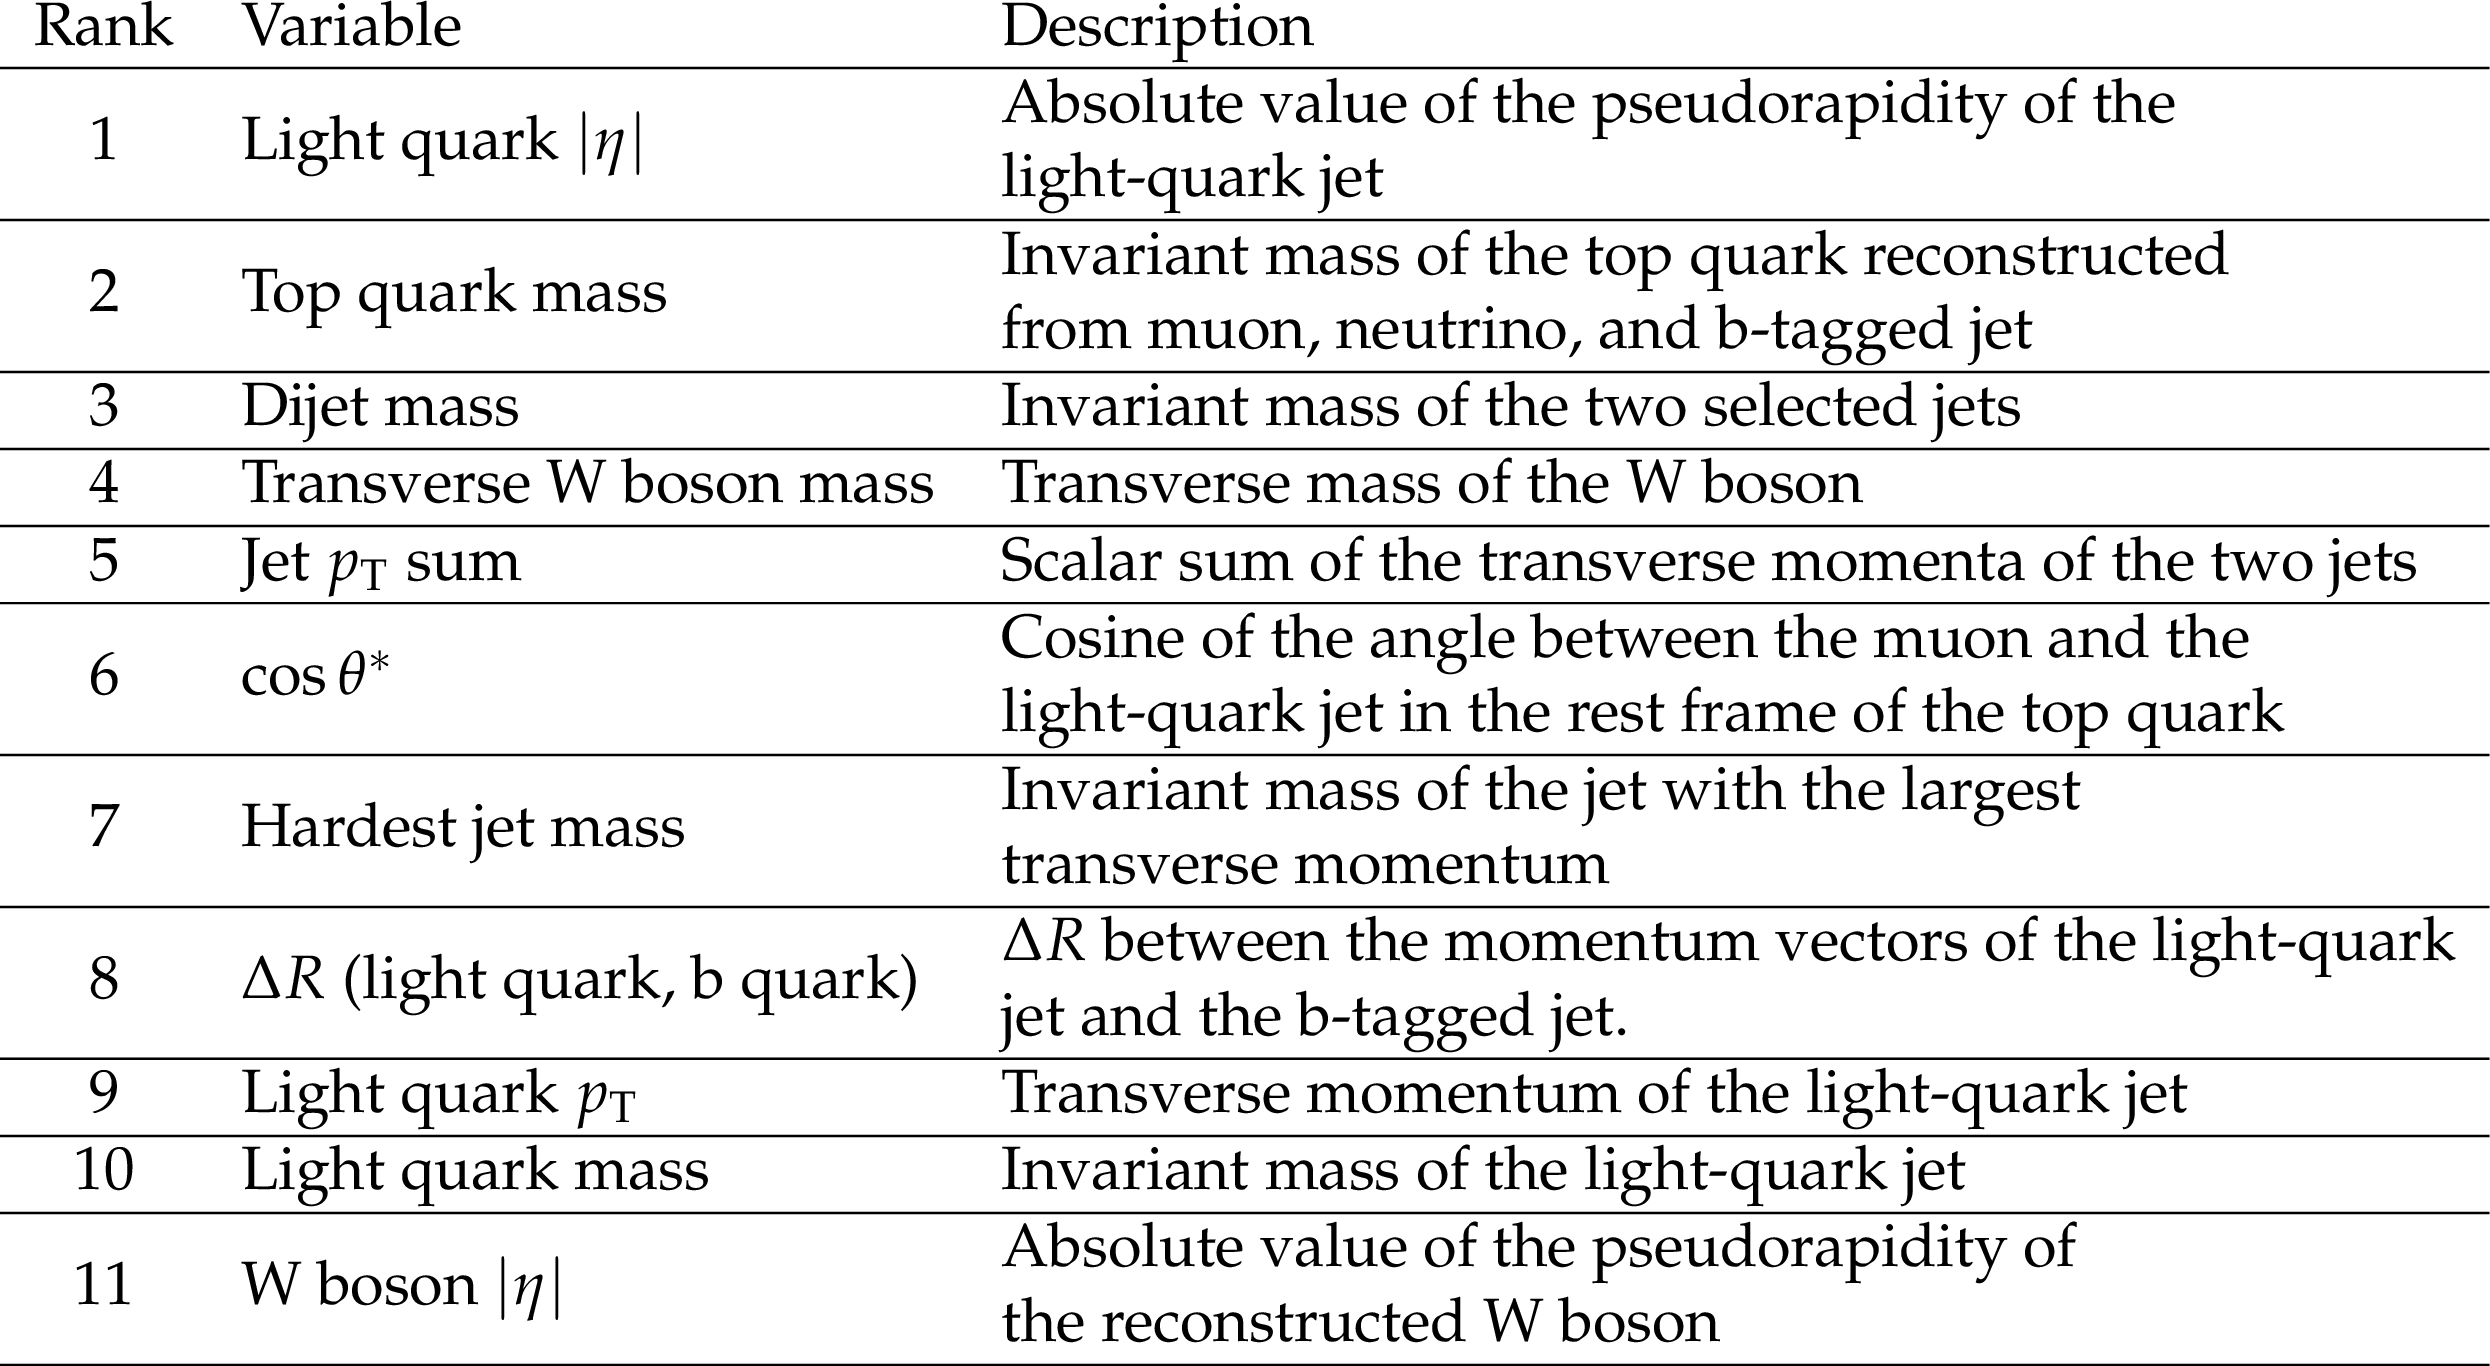
Table 2:
Input variables used in the neural network ranked according to their importance. |
png pdf |
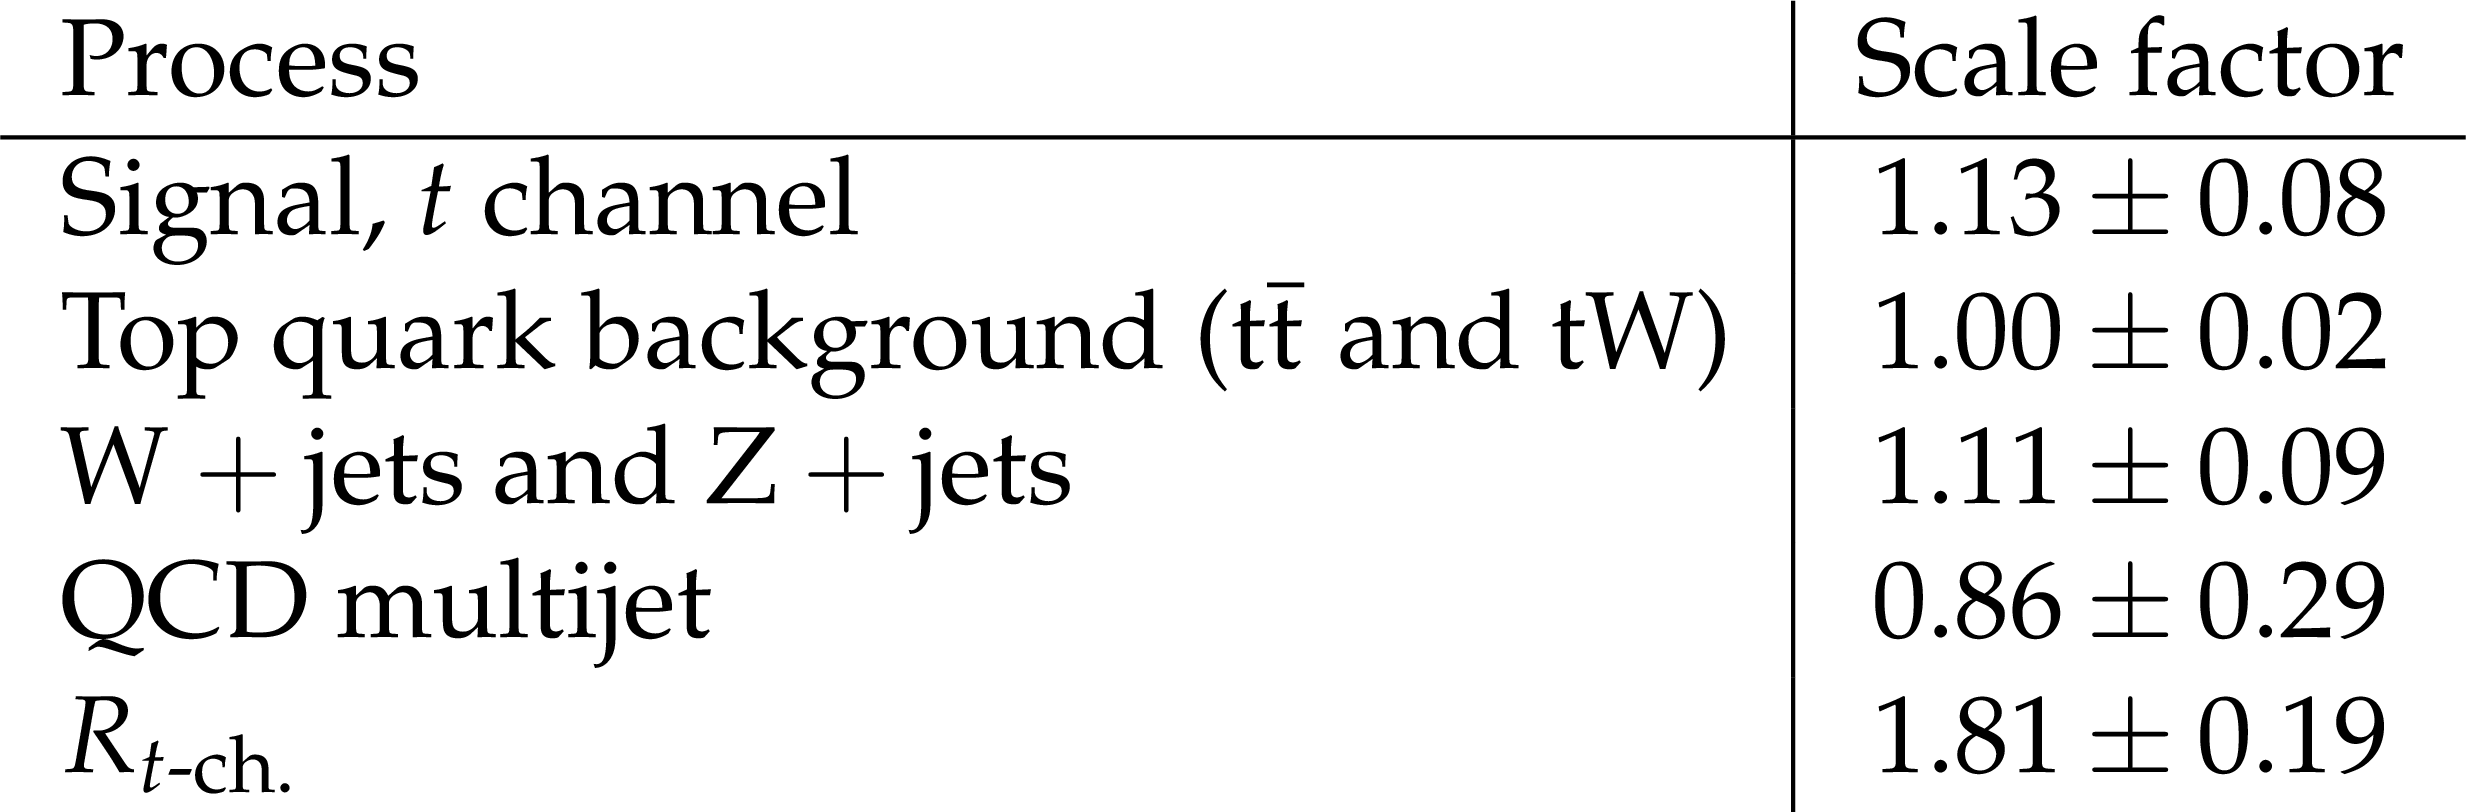
Table 3:
Scale factors from the fit for the normalization of events with a positively charged muon for the signal process, the background categories, and the ratio of single top quark to top antiquark production. The uncertainties include the statistical uncertainty and the experimental sources of uncertainty which are considered as nuisance parameters in the fit. |
png pdf |
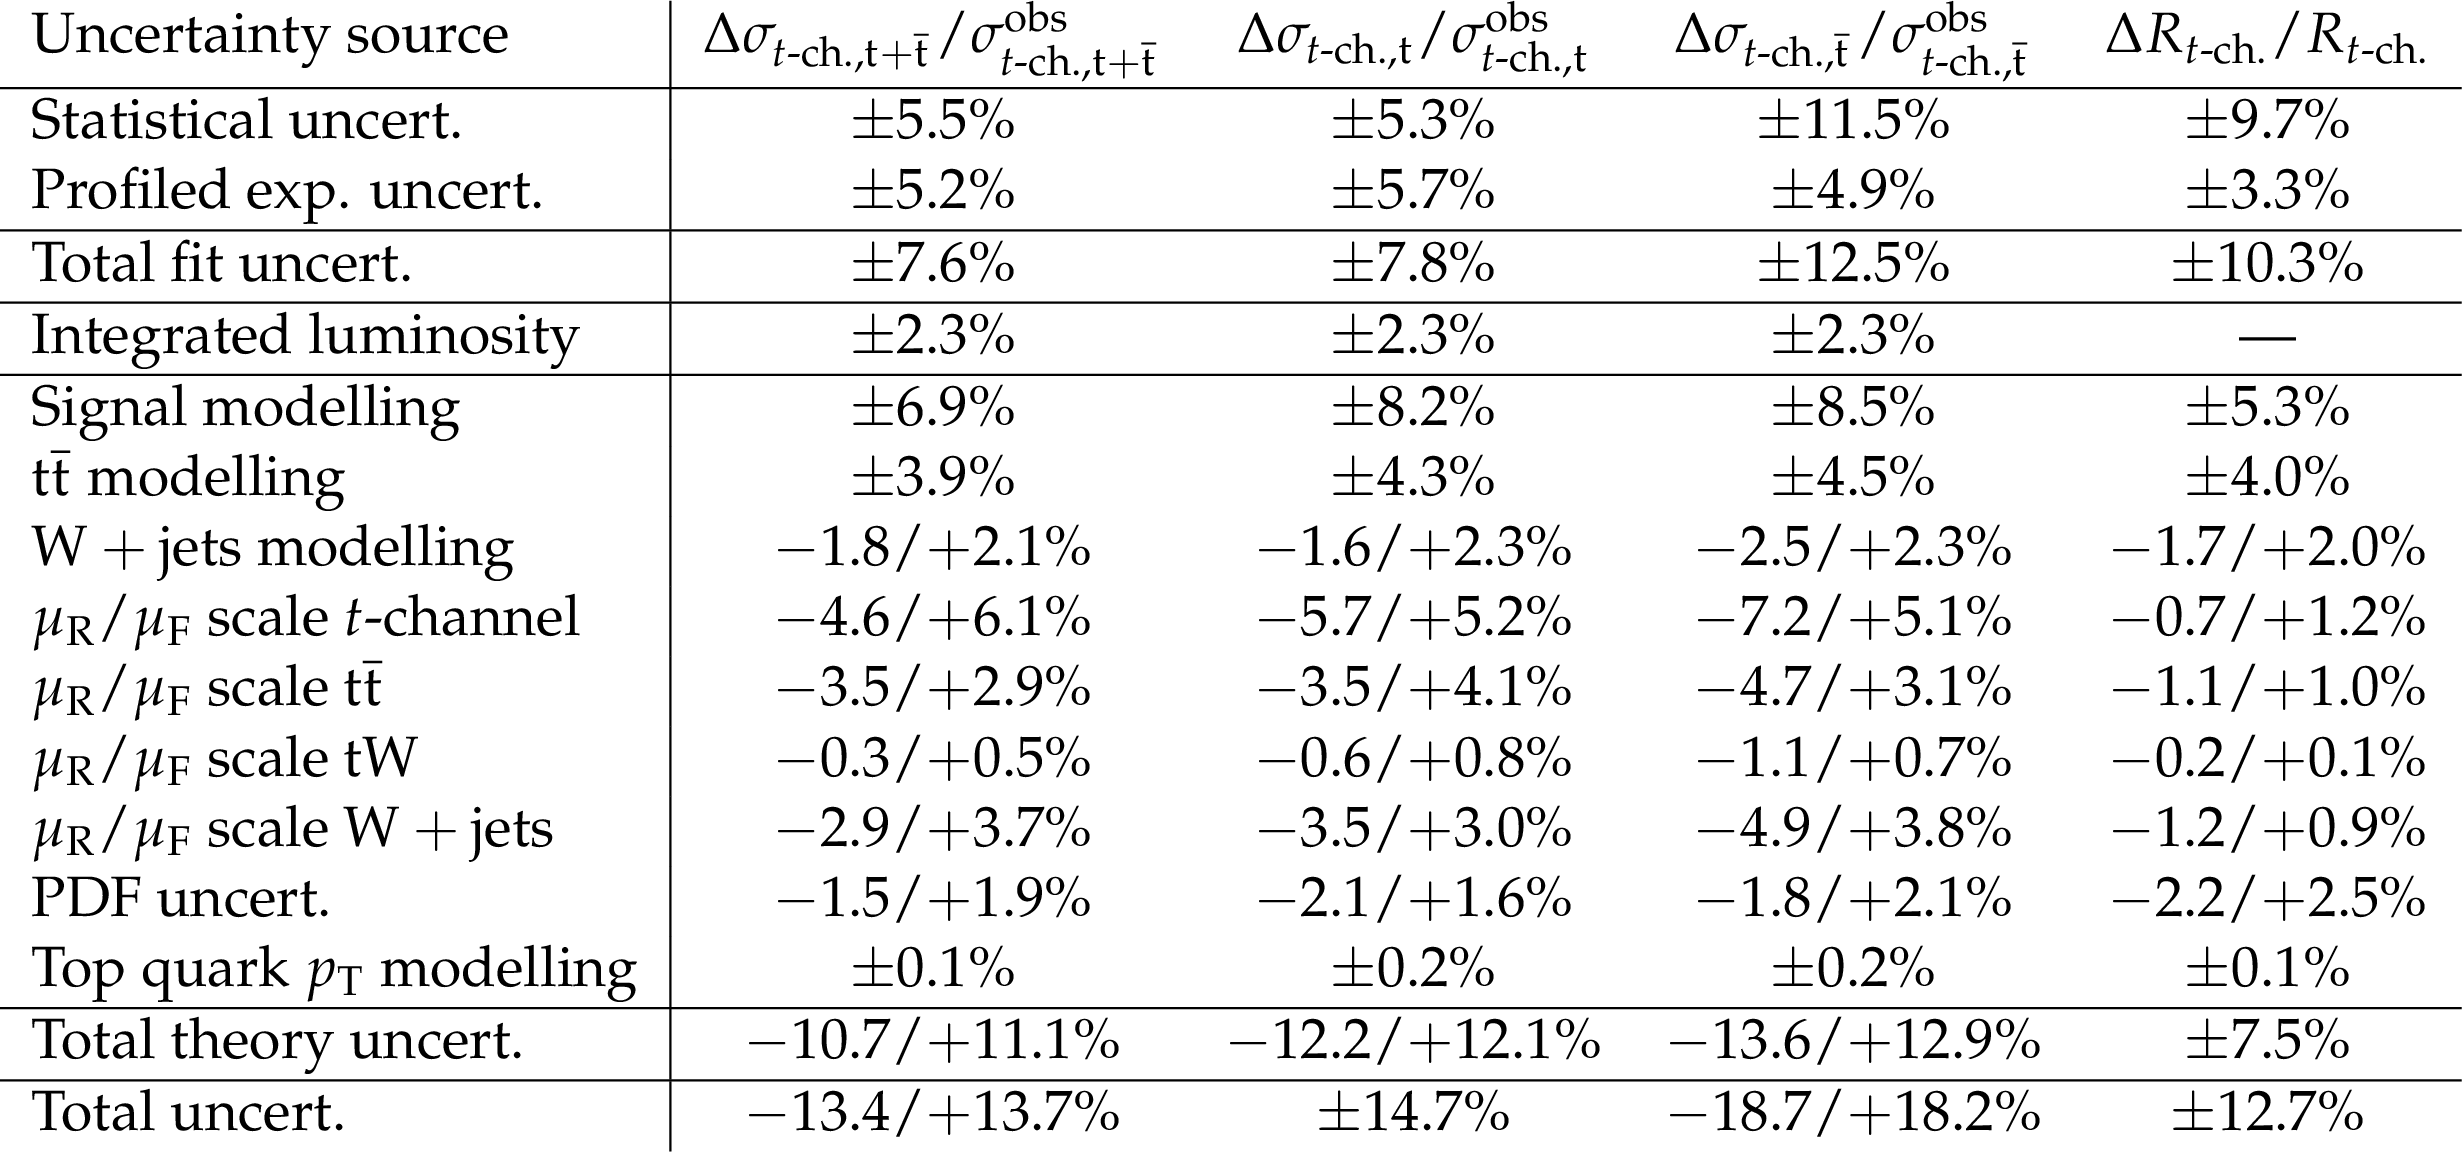
Table 4:
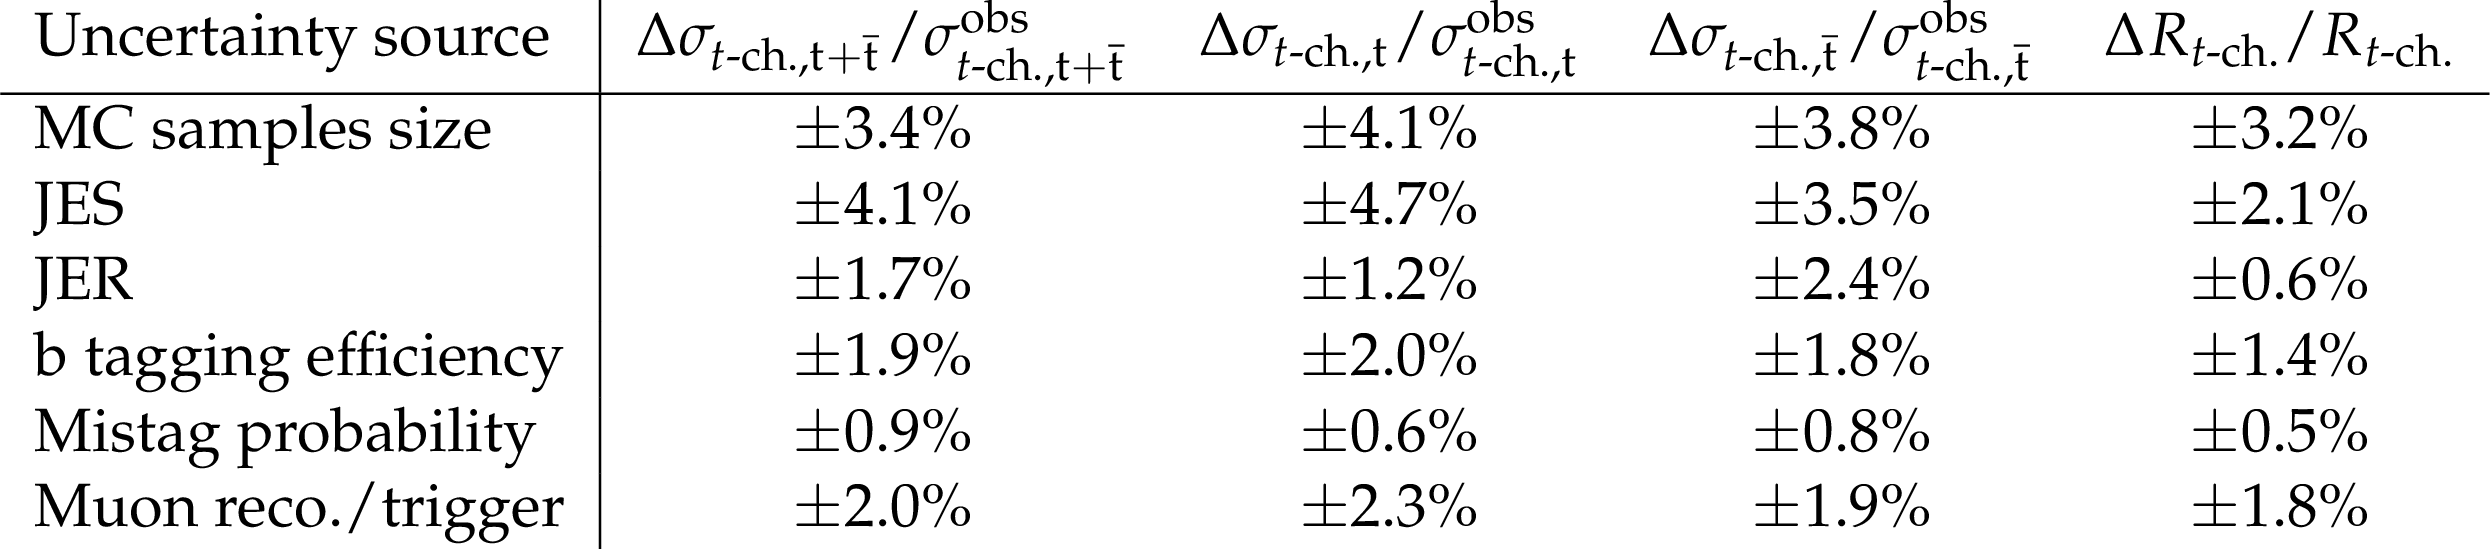
Relative impact of systematic uncertainties with respect to the observed cross sections as well as the top quark to top antiquark cross section ratio. Uncertainties are grouped and summed together with the method suggested in Ref. [45]. |
png pdf |
Table 5:
Relative impact of the experimental systematic uncertainties included in the fit with respect to the observed cross sections as well as the top quark to top antiquark cross section ratio. The impact due to the size of the samples of simulated events is estimated by comparing the central values obtained by applying or not applying the Barlow-Beeston method in the fit. All other estimates are obtained by fixing one uncertainty at a time and considering all others as nuisance parameters in the fit and comparing to the uncertainty obtained when treating all uncertainty sources as nuisance parameters. These numbers are for illustration only, the uncertainty quoted for the result is the total experimental uncertainty from the fit. |
| Summary |
| A measurement of the cross section of the $t$-channel single top quark production is presented using events with one muon and jets in the final state. The cross section for the production of single top quarks and the ratio of the top quark to top antiquark production are measured together in a simultaneous fit where the results are used to evaluate the production cross section of single top antiquarks. The measured total cross section, which currently constitutes the most precise result at 13 TeV, is used to calculate the absolute value of the CKM matrix element $ | \mathrm{V_{tb}} | $. All results are in agreement with recent theoretical standard model predictions. |
| References | ||||
| 1 | D0 Collaboration | Observation of single top-quark production | PRL 103 (2009) 092001 | 0903.0850 |
| 2 | CDF Collaboration | First observation of electroweak single top quark production | PRL 103 (2009) 092002 | 0903.0885 |
| 3 | CMS Collaboration | Measurement of the single-top-quark $ t $-channel cross section in pp collisions at $ \sqrt{s}= $ 7 TeV | JHEP 12 (2012) 035 | CMS-TOP-11-021 1209.4533 |
| 4 | ATLAS Collaboration | Measurement of the $ t $-channel single top-quark production cross section in pp collisions at $ \sqrt{s}= $ 7 TeV with the ATLAS detector | PLB 717 (2012) 330 | 1205.3130 |
| 5 | CMS Collaboration | Measurement of the $ t $-channel single-top-quark production cross section and of the $ | V_{\rm tb} | $ CKM matrix element in pp collisions at $ \sqrt{s} = $ 8 TeV | JHEP 06 (2014) 090 | CMS-TOP-12-038 1403.7366 |
| 6 | CMS Collaboration | Observation of the associated production of a single top quark and a W boson in pp collisions at $ \sqrt{s}= $ 8 TeV | PRL 112 (2014) 231802 | CMS-TOP-12-040 1401.2942 |
| 7 | L. Evans and P. Bryant | LHC Machine | JINST 3 (2008) S08001 | |
| 8 | N. Kidonakis | Differential and total cross sections for top pair and single top production | 1205.3453 | |
| 9 | CMS Collaboration | Measurement of top quark polarisation in $ t $-channel single top quark production | JHEP 04 (2016) 073 | CMS-TOP-13-001 1511.02138 |
| 10 | CMS Collaboration | Measurement of the W boson helicity in events with a single reconstructed top quark in pp collisions at $ \sqrt{s} = $ 8 TeV | JHEP 10 (2015) 053 | CMS-TOP-12-020 1410.1154 |
| 11 | J. Campbell, R. Frederix, F. Maltoni, and F. Tramontano | NLO predictions for $ t $-channel production of single top and fourth generation quarks at hadron colliders | JHEP 10 (2009) 042 | 0907.3933 |
| 12 | F. Maltoni, G. Ridolfi, and M. Ubiali | b-initiated processes at the LHC: a reappraisal | JHEP 04 (2012) 022 | 1203.6393 |
| 13 | R. Frederix, E. Re, and P. Torrielli | Single-top $ t $-channel hadroproduction in the four-flavour scheme with POWHEG and aMC@NLO | JHEP 09 (2012) 130 | 1207.5391 |
| 14 | M. Aliev et al. | HATHOR: HAdronic Top and Heavy quarks crOss section calculatoR | CPC 182 (2011) 1034 | 1007.1327 |
| 15 | P. Kant et al. | HATHOR for single top-quark production: updated predictions and uncertainty estimates for single top-quark production in hadronic collisions | CPC 191 (2015) 74 | 1406.4403 |
| 16 | M. Botje et al. | The PDF4LHC Working Group interim recommendations | 1101.0538 | |
| 17 | A. D. Martin, W. J. Stirling, R. S. Thorne, and G. Watt | Parton distributions for the LHC | EPJC 63 (2009) 189 | 0901.0002 |
| 18 | A. D. Martin, W. J. Stirling, R. S. Thorne, and G. Watt | Uncertainties on $ \alpha_S $ in global PDF analyses and implications for predicted hadronic cross sections | EPJC 64 (2009) 653 | 0905.3531 |
| 19 | H.-L. Lai et al. | New parton distributions for collider physics | PRD 82 (2010) 074024 | 1007.2241 |
| 20 | NNPDF Collaboration | Parton distributions with LHC data | Nucl. Phys. B 867 (2013) 244 | 1207.1303 |
| 21 | M. Brucherseifer, F. Caola, and K. Melnikov | On the NNLO QCD corrections to single-top production at the LHC | PLB 736 (2014) 58 | 1404.7116 |
| 22 | N. Kidonakis | Next-to-next-to-leading-order collinear and soft gluon corrections for $ t $-channel single top quark production | PRD 83 (2011) 091503 | 1103.2792 |
| 23 | CMS Collaboration | The CMS experiment at the CERN LHC | JINST 3 (2008) S08004 | CMS-00-001 |
| 24 | CMS Collaboration | Performance of CMS muon reconstruction in pp collision events at $ \sqrt{s} = $ 7 TeV | JINST 7 (2012) P10002 | CMS-MUO-10-004 1206.4071 |
| 25 | J. Alwall et al. | The automated computation of tree-level and next-to-leading order differential cross sections, and their matching to parton shower simulations | JHEP 07 (2014) 079 | 1405.0301 |
| 26 | E. Re | Single-top $ Wt $-channel production matched with parton showers using the POWHEG method | EPJC 71 (2011) 1547 | 1009.2450 |
| 27 | S. Alioli, P. Nason, C. Oleari, and E. Re | A general framework for implementing NLO calculations in shower Monte Carlo programs: the POWHEG BOX | JHEP 06 (2010) 043 | 1002.2581 |
| 28 | S. Alioli, P. Nason, C. Oleari, and E. Re | NLO single-top production matched with shower in POWHEG: $ s $- and $ t $-channel contributions | JHEP 09 (2009) 111 | 0907.4076 |
| 29 | S. Frixione, P. Nason, and C. Oleari | Matching NLO QCD computations with Parton Shower simulations: the POWHEG method | JHEP 11 (2007) 070 | 0709.2092 |
| 30 | T. Sjostrand, S. Mrenna, and P. Skands | PYTHIA 6.4 physics and manual | JHEP 05 (2006) 026 | hep-ph/0603175 |
| 31 | P. Skands, S. Carrazza, and J. Rojo | Tuning PYTHIA 8.1: the Monash 2013 Tune | EPJC 74 (2014) 3024 | 1404.5630 |
| 32 | R. Frederix and S. Frixione | Merging meets matching in MC@NLO | JHEP 12 (2012) 061 | 1209.6215 |
| 33 | NNPDF Collaboration | Parton distributions for the LHC Run II | JHEP 04 (2015) 040 | 1410.8849 |
| 34 | J. Allison et al. | GEANT4 developments and applications | IEEE Trans. Nucl. Sci. 53 (2006) 270 | |
| 35 | CMS Collaboration | Particle--flow event reconstruction in CMS and performance for jets, taus, and $E_{\mathrm{T}^{\text{miss}} $ | CDS | |
| 36 | CMS Collaboration | Commissioning of the particle-flow event with the first LHC collisions recorded in the CMS detector | CDS | |
| 37 | M. Cacciari, G. P. Salam, and G. Soyez | The anti-$ k_t $ jet clustering algorithm | JHEP 04 (2008) 063 | 0802.1189 |
| 38 | M. Cacciari and G. P. Salam | Pileup subtraction using jet areas | PLB 659 (2008) 119 | 0707.1378 |
| 39 | CMS Collaboration | Identification of b-quark jets with the CMS experiment | JINST 8 (2013) P04013 | CMS-BTV-12-001 1211.4462 |
| 40 | CMS Collaboration | Identification of b quark jets at the CMS Experiment in the LHC Run 2 | CMS-PAS-BTV-15-001 | CMS-PAS-BTV-15-001 |
| 41 | Particle Data Group, K. A. Olive et al. | Review of Particle Physics | CPC 38 (2014) 090001 | |
| 42 | M. Feindt and U. Kerzel | The NeuroBayes neural network package | NIMA 559 (2006) 190 | |
| 43 | H. Voss, A. Hocker, J. Stelzer, and F. Tegenfeldt | TMVA, the toolkit for multivariate data analysis with ROOT | physics/0703039 | |
| 44 | R. Barlow and C. Beeston | Fitting using finite Monte Carlo samples | CPC 77 (1993) 219 | |
| 45 | R. Barlow | Asymmetric systematic errors | physics/0306138 | |
| 46 | CMS Collaboration | Determination of jet energy calibration and transverse momentum resolution in CMS | JINST 6 (2011) P11002 | CMS-JME-10-011 1107.4277 |
| 47 | CMS Collaboration | Measurements of inclusive W and Z Cross Sections in pp Collisions at $ \sqrt{s}= $ 7 TeV | JHEP 01 (2011) 080 | CMS-EWK-10-002 1012.2466 |
| 48 | CMS Collaboration | CMS luminosity measurement for the 2015 data-taking period | CMS-PAS-LUM-15-001 | CMS-PAS-LUM-15-001 |
| 49 | M. Bahr et al. | Herwig++ physics and manual | EPJC 58 (2008) 639 | 0803.0883 |
| 50 | CMS Collaboration | Measurement of the differential cross section for top quark pair production in pp collisions at $ \sqrt{s} = $ 8 TeV | EPJC 75 (2015) 542 | CMS-TOP-12-028 1505.04480 |
| 51 | S. Dulat et al. | New parton distribution functions from a global analysis of quantum chromodynamics | PRD 93 (2016) 033006 | 1506.07443 |
| 52 | S. Alekhin, J. Blumlein, and S. Moch | The ABM parton distributions tuned to LHC data | PRD 89 (2014) 054028 | 1310.3059 |
| 53 | L. A. Harland-Lang, A. D. Martin, P. Motylinski, and R. S. Thorne | Parton distributions in the LHC era: MMHT 2014 PDFs | EPJC 75 (2015) 204 | 1412.3989 |
| 54 | H1 and ZEUS Collaborations | Combined measurement and QCD analysis of the inclusive $ \mathrm{ e^{\pm}p } $ scattering cross sections at HERA | JHEP 01 (2010) 109 | hep-ph/0911.0884 |
| 55 | R. D. Ball et al. | Reweighting and unweighting of parton distributions and the LHC W lepton asymmetry data | Nucl. Phys. B 855 (2012) 608 | 1108.1758 |
| 56 | CDF and D0 Collaborations | Tevatron combination of single-top-quark cross sections and determination of the magnitude of the cabibbo-kobayashi-maskawa matrix element $ {V}_{\rm tb} $ | PRL 115 (2015) 152003 | 1503.05027 |
| 57 | J. A. Aguilar-Saavedra | A Minimal set of top anomalous couplings | Nucl. Phys. B 812 (2009) 181 | 0811.3842 |
|
|
Compact Muon Solenoid LHC, CERN |
|

|

|

|

|

|