

Compact Muon Solenoid
LHC, CERN
| CMS-PAS-EXO-22-014 | ||
| Search for dark matter produced in association with a single top quark or a top quark pair in proton-proton collisions at $ \sqrt{s}= $ 13 TeV | ||
| CMS Collaboration | ||
| 15 April 2024 | ||
| Abstract: A search is performed for dark matter produced in association with top quarks using the data collected by the CMS detector at the LHC from proton-proton collisions at a centre-of-mass energy of 13 TeV, corresponding to 138 fb$ ^{-1} $ of integrated luminosity. The analysis explores the production of dark matter particles in association with a single top quark or a pair of top quarks. Various decay modes of the top quark are probed, resulting in three separate channels based on the number of leptons in the final state, namely the all-hadronic (zero lepton), semileptonic (one lepton), and the dileptonic (two leptons) final states. The results are derived from the combination of these different categories. The analysis looks for an excess of events with respect to the background-only prescription in events with a large imbalance in the transverse momentum. Novel multivariate techniques are used to take advantage of the differences in kinematics between the two dark matter associated production modes. No significant deviations with respect to the standard model predictions are observed. The results are interpreted in the context of a simplified model in which either a scalar or pseudoscalar mediator couples to top quarks and to dark matter fermions. The largest local significance is within 2 standard deviations for all mediator hypotheses. | ||
| Links: CDS record (PDF) ; CADI line (restricted) ; | ||
| Figures | |
png pdf |
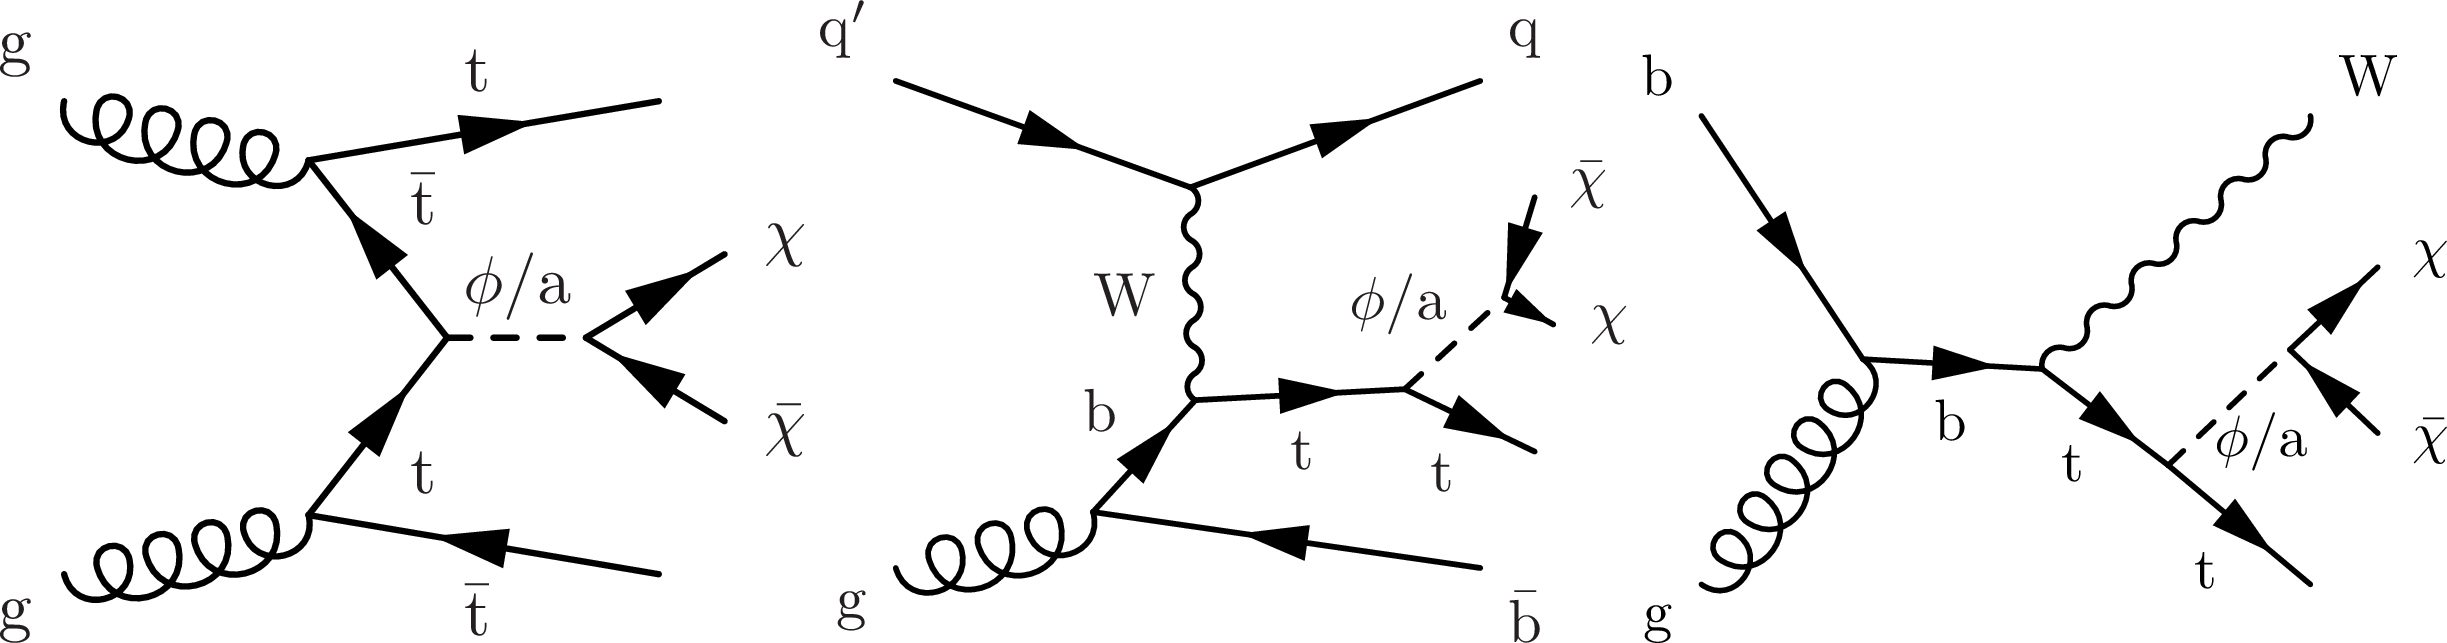
Figure 1:
Principal production diagrams in the context of the simplified model with a scalar/pseudoscalar ($ \phi/\mathrm{a} $) mediator for the associated production of DM particles ($ \chi $) with a top quark pair $ {\mathrm{t}\overline{\mathrm{t}}} $+DM (left) and a single top quark $ {\mathrm{t}}/\overline{{\mathrm{t}}} $+DM in both t-channel (center) and $ \mathrm{t}\mathrm{W} $-channel (right) production modes. Note that the additional quark, $ \mathrm{q} $ in the t-channel diagram, is often produced at high pseudorapidities. |

png pdf |
Figure 1-a:
Principal production diagrams in the context of the simplified model with a scalar/pseudoscalar ($ \phi/\mathrm{a} $) mediator for the associated production of DM particles ($ \chi $) with a top quark pair $ {\mathrm{t}\overline{\mathrm{t}}} $+DM (left) and a single top quark $ {\mathrm{t}}/\overline{{\mathrm{t}}} $+DM in both t-channel (center) and $ \mathrm{t}\mathrm{W} $-channel (right) production modes. Note that the additional quark, $ \mathrm{q} $ in the t-channel diagram, is often produced at high pseudorapidities. |

png pdf |
Figure 1-b:
Principal production diagrams in the context of the simplified model with a scalar/pseudoscalar ($ \phi/\mathrm{a} $) mediator for the associated production of DM particles ($ \chi $) with a top quark pair $ {\mathrm{t}\overline{\mathrm{t}}} $+DM (left) and a single top quark $ {\mathrm{t}}/\overline{{\mathrm{t}}} $+DM in both t-channel (center) and $ \mathrm{t}\mathrm{W} $-channel (right) production modes. Note that the additional quark, $ \mathrm{q} $ in the t-channel diagram, is often produced at high pseudorapidities. |
png pdf |
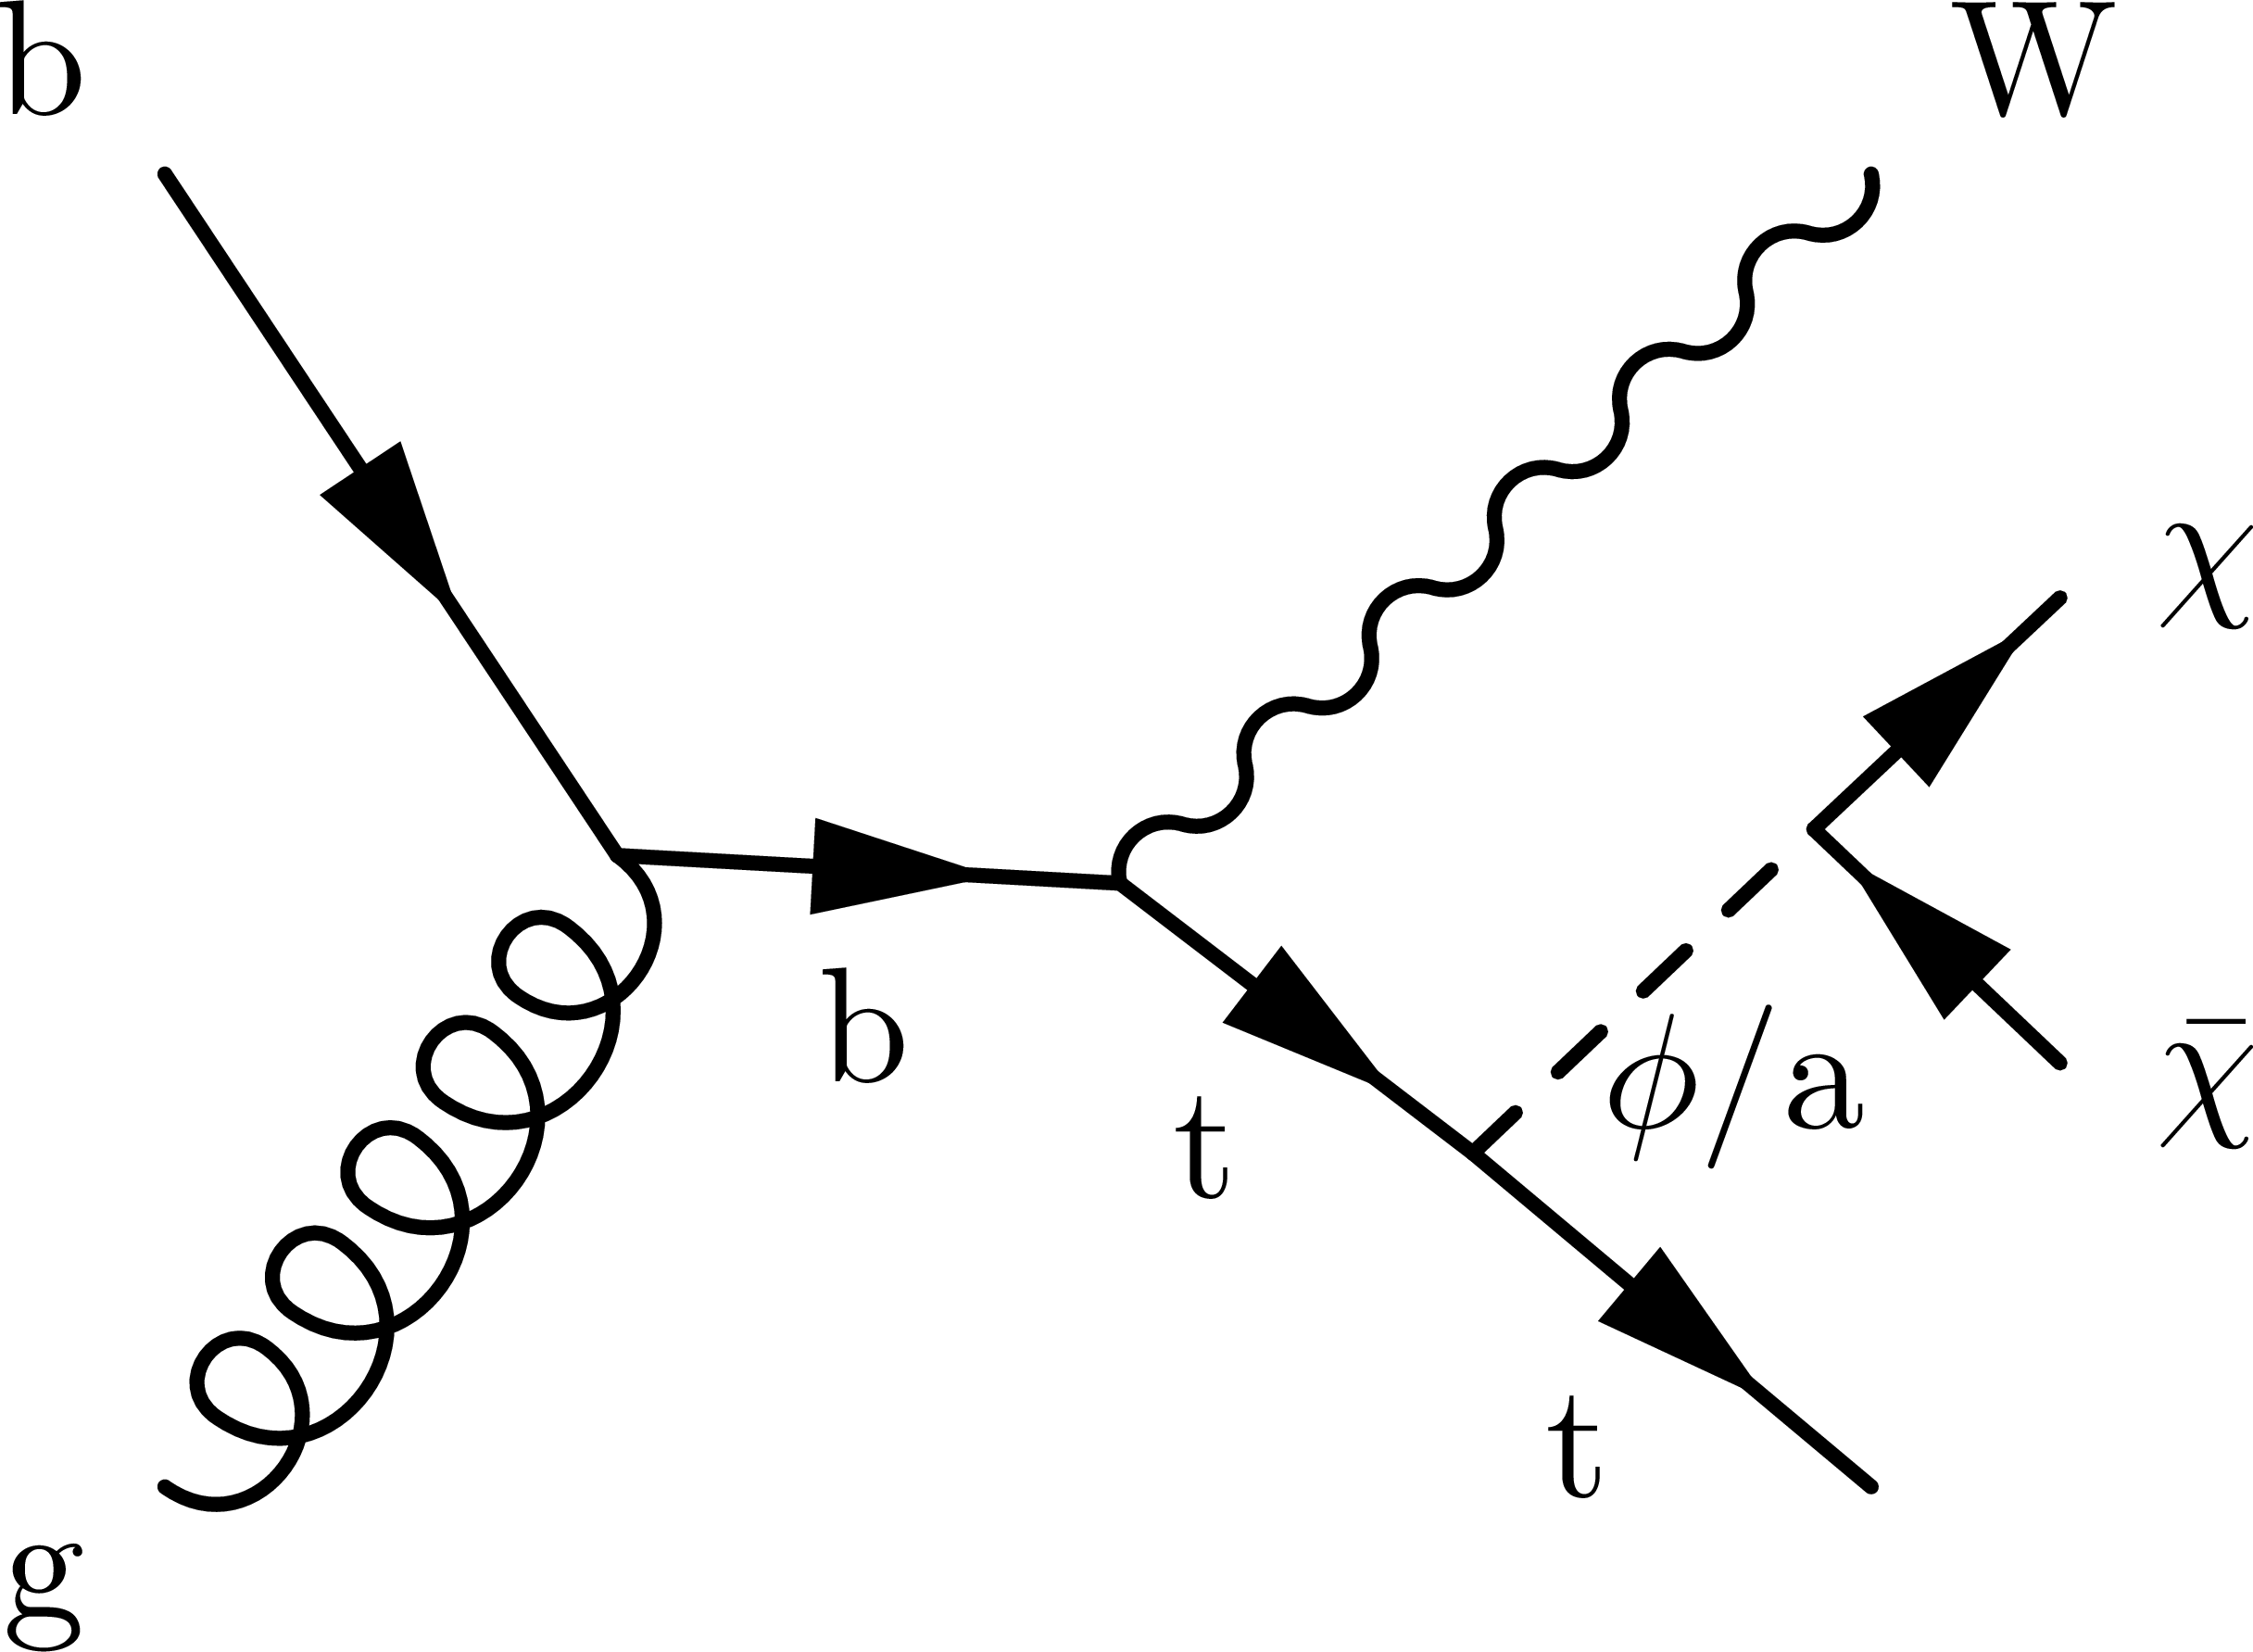
Figure 1-c:
Principal production diagrams in the context of the simplified model with a scalar/pseudoscalar ($ \phi/\mathrm{a} $) mediator for the associated production of DM particles ($ \chi $) with a top quark pair $ {\mathrm{t}\overline{\mathrm{t}}} $+DM (left) and a single top quark $ {\mathrm{t}}/\overline{{\mathrm{t}}} $+DM in both t-channel (center) and $ \mathrm{t}\mathrm{W} $-channel (right) production modes. Note that the additional quark, $ \mathrm{q} $ in the t-channel diagram, is often produced at high pseudorapidities. |

png pdf |
Figure 2:
The main discriminator distribution ($ p_{\mathrm{T}}^\text{miss} $) employed in the AH channel for the three SRs: 0f (left), 1f (center), and 2b (right). The last bin contains overflow events. The various background processes are represented with color-filled histograms as indicated in the legend. A representative signal model distribution is also shown. The grey dashed area in the upper panel represents the total post-fit background and one signal hypothesis summed together and their associated statistical and systematic uncertainties. The data points are shown as black dots with vertical and horizontal error bars. The lower panel shows the post-fit values and uncertainties of the ratio between the observed data and the predicted SM background. The figure comprises the total collected data in Run 2. |

png pdf |
Figure 2-a:
The main discriminator distribution ($ p_{\mathrm{T}}^\text{miss} $) employed in the AH channel for the three SRs: 0f (left), 1f (center), and 2b (right). The last bin contains overflow events. The various background processes are represented with color-filled histograms as indicated in the legend. A representative signal model distribution is also shown. The grey dashed area in the upper panel represents the total post-fit background and one signal hypothesis summed together and their associated statistical and systematic uncertainties. The data points are shown as black dots with vertical and horizontal error bars. The lower panel shows the post-fit values and uncertainties of the ratio between the observed data and the predicted SM background. The figure comprises the total collected data in Run 2. |

png pdf |
Figure 2-b:
The main discriminator distribution ($ p_{\mathrm{T}}^\text{miss} $) employed in the AH channel for the three SRs: 0f (left), 1f (center), and 2b (right). The last bin contains overflow events. The various background processes are represented with color-filled histograms as indicated in the legend. A representative signal model distribution is also shown. The grey dashed area in the upper panel represents the total post-fit background and one signal hypothesis summed together and their associated statistical and systematic uncertainties. The data points are shown as black dots with vertical and horizontal error bars. The lower panel shows the post-fit values and uncertainties of the ratio between the observed data and the predicted SM background. The figure comprises the total collected data in Run 2. |

png pdf |
Figure 2-c:
The main discriminator distribution ($ p_{\mathrm{T}}^\text{miss} $) employed in the AH channel for the three SRs: 0f (left), 1f (center), and 2b (right). The last bin contains overflow events. The various background processes are represented with color-filled histograms as indicated in the legend. A representative signal model distribution is also shown. The grey dashed area in the upper panel represents the total post-fit background and one signal hypothesis summed together and their associated statistical and systematic uncertainties. The data points are shown as black dots with vertical and horizontal error bars. The lower panel shows the post-fit values and uncertainties of the ratio between the observed data and the predicted SM background. The figure comprises the total collected data in Run 2. |

png pdf |
Figure 3:
The main discriminator distribution ($ p_{\mathrm{T}}^\text{miss} $) employed in the SL channel for the six SRs devised: T1 0f (upper left), T1 1f (upper center), T1 2b (upper right), T2 0f (lower left), T2 1f (lower center), and T2 2b (lower right). The last bin contains overflow events. The various background processes are represented with color-filled histograms as indicated in the legend. A representative signal model distribution is also shown. The grey dashed area in the upper panel represents the total post-fit background and one signal hypothesis summed together and their associated statistical and systematic uncertainties. The data points are shown as black dots with vertical and horizontal error bars. The lower panel shows the post-fit values and uncertainties of the ratio between the observed data and the predicted SM background. The figure comprises the total collected data in Run 2. |

png pdf |
Figure 3-a:
The main discriminator distribution ($ p_{\mathrm{T}}^\text{miss} $) employed in the SL channel for the six SRs devised: T1 0f (upper left), T1 1f (upper center), T1 2b (upper right), T2 0f (lower left), T2 1f (lower center), and T2 2b (lower right). The last bin contains overflow events. The various background processes are represented with color-filled histograms as indicated in the legend. A representative signal model distribution is also shown. The grey dashed area in the upper panel represents the total post-fit background and one signal hypothesis summed together and their associated statistical and systematic uncertainties. The data points are shown as black dots with vertical and horizontal error bars. The lower panel shows the post-fit values and uncertainties of the ratio between the observed data and the predicted SM background. The figure comprises the total collected data in Run 2. |

png pdf |
Figure 3-b:
The main discriminator distribution ($ p_{\mathrm{T}}^\text{miss} $) employed in the SL channel for the six SRs devised: T1 0f (upper left), T1 1f (upper center), T1 2b (upper right), T2 0f (lower left), T2 1f (lower center), and T2 2b (lower right). The last bin contains overflow events. The various background processes are represented with color-filled histograms as indicated in the legend. A representative signal model distribution is also shown. The grey dashed area in the upper panel represents the total post-fit background and one signal hypothesis summed together and their associated statistical and systematic uncertainties. The data points are shown as black dots with vertical and horizontal error bars. The lower panel shows the post-fit values and uncertainties of the ratio between the observed data and the predicted SM background. The figure comprises the total collected data in Run 2. |

png pdf |
Figure 3-c:
The main discriminator distribution ($ p_{\mathrm{T}}^\text{miss} $) employed in the SL channel for the six SRs devised: T1 0f (upper left), T1 1f (upper center), T1 2b (upper right), T2 0f (lower left), T2 1f (lower center), and T2 2b (lower right). The last bin contains overflow events. The various background processes are represented with color-filled histograms as indicated in the legend. A representative signal model distribution is also shown. The grey dashed area in the upper panel represents the total post-fit background and one signal hypothesis summed together and their associated statistical and systematic uncertainties. The data points are shown as black dots with vertical and horizontal error bars. The lower panel shows the post-fit values and uncertainties of the ratio between the observed data and the predicted SM background. The figure comprises the total collected data in Run 2. |

png pdf |
Figure 3-d:
The main discriminator distribution ($ p_{\mathrm{T}}^\text{miss} $) employed in the SL channel for the six SRs devised: T1 0f (upper left), T1 1f (upper center), T1 2b (upper right), T2 0f (lower left), T2 1f (lower center), and T2 2b (lower right). The last bin contains overflow events. The various background processes are represented with color-filled histograms as indicated in the legend. A representative signal model distribution is also shown. The grey dashed area in the upper panel represents the total post-fit background and one signal hypothesis summed together and their associated statistical and systematic uncertainties. The data points are shown as black dots with vertical and horizontal error bars. The lower panel shows the post-fit values and uncertainties of the ratio between the observed data and the predicted SM background. The figure comprises the total collected data in Run 2. |

png pdf |
Figure 3-e:
The main discriminator distribution ($ p_{\mathrm{T}}^\text{miss} $) employed in the SL channel for the six SRs devised: T1 0f (upper left), T1 1f (upper center), T1 2b (upper right), T2 0f (lower left), T2 1f (lower center), and T2 2b (lower right). The last bin contains overflow events. The various background processes are represented with color-filled histograms as indicated in the legend. A representative signal model distribution is also shown. The grey dashed area in the upper panel represents the total post-fit background and one signal hypothesis summed together and their associated statistical and systematic uncertainties. The data points are shown as black dots with vertical and horizontal error bars. The lower panel shows the post-fit values and uncertainties of the ratio between the observed data and the predicted SM background. The figure comprises the total collected data in Run 2. |

png pdf |
Figure 3-f:
The main discriminator distribution ($ p_{\mathrm{T}}^\text{miss} $) employed in the SL channel for the six SRs devised: T1 0f (upper left), T1 1f (upper center), T1 2b (upper right), T2 0f (lower left), T2 1f (lower center), and T2 2b (lower right). The last bin contains overflow events. The various background processes are represented with color-filled histograms as indicated in the legend. A representative signal model distribution is also shown. The grey dashed area in the upper panel represents the total post-fit background and one signal hypothesis summed together and their associated statistical and systematic uncertainties. The data points are shown as black dots with vertical and horizontal error bars. The lower panel shows the post-fit values and uncertainties of the ratio between the observed data and the predicted SM background. The figure comprises the total collected data in Run 2. |

png pdf |
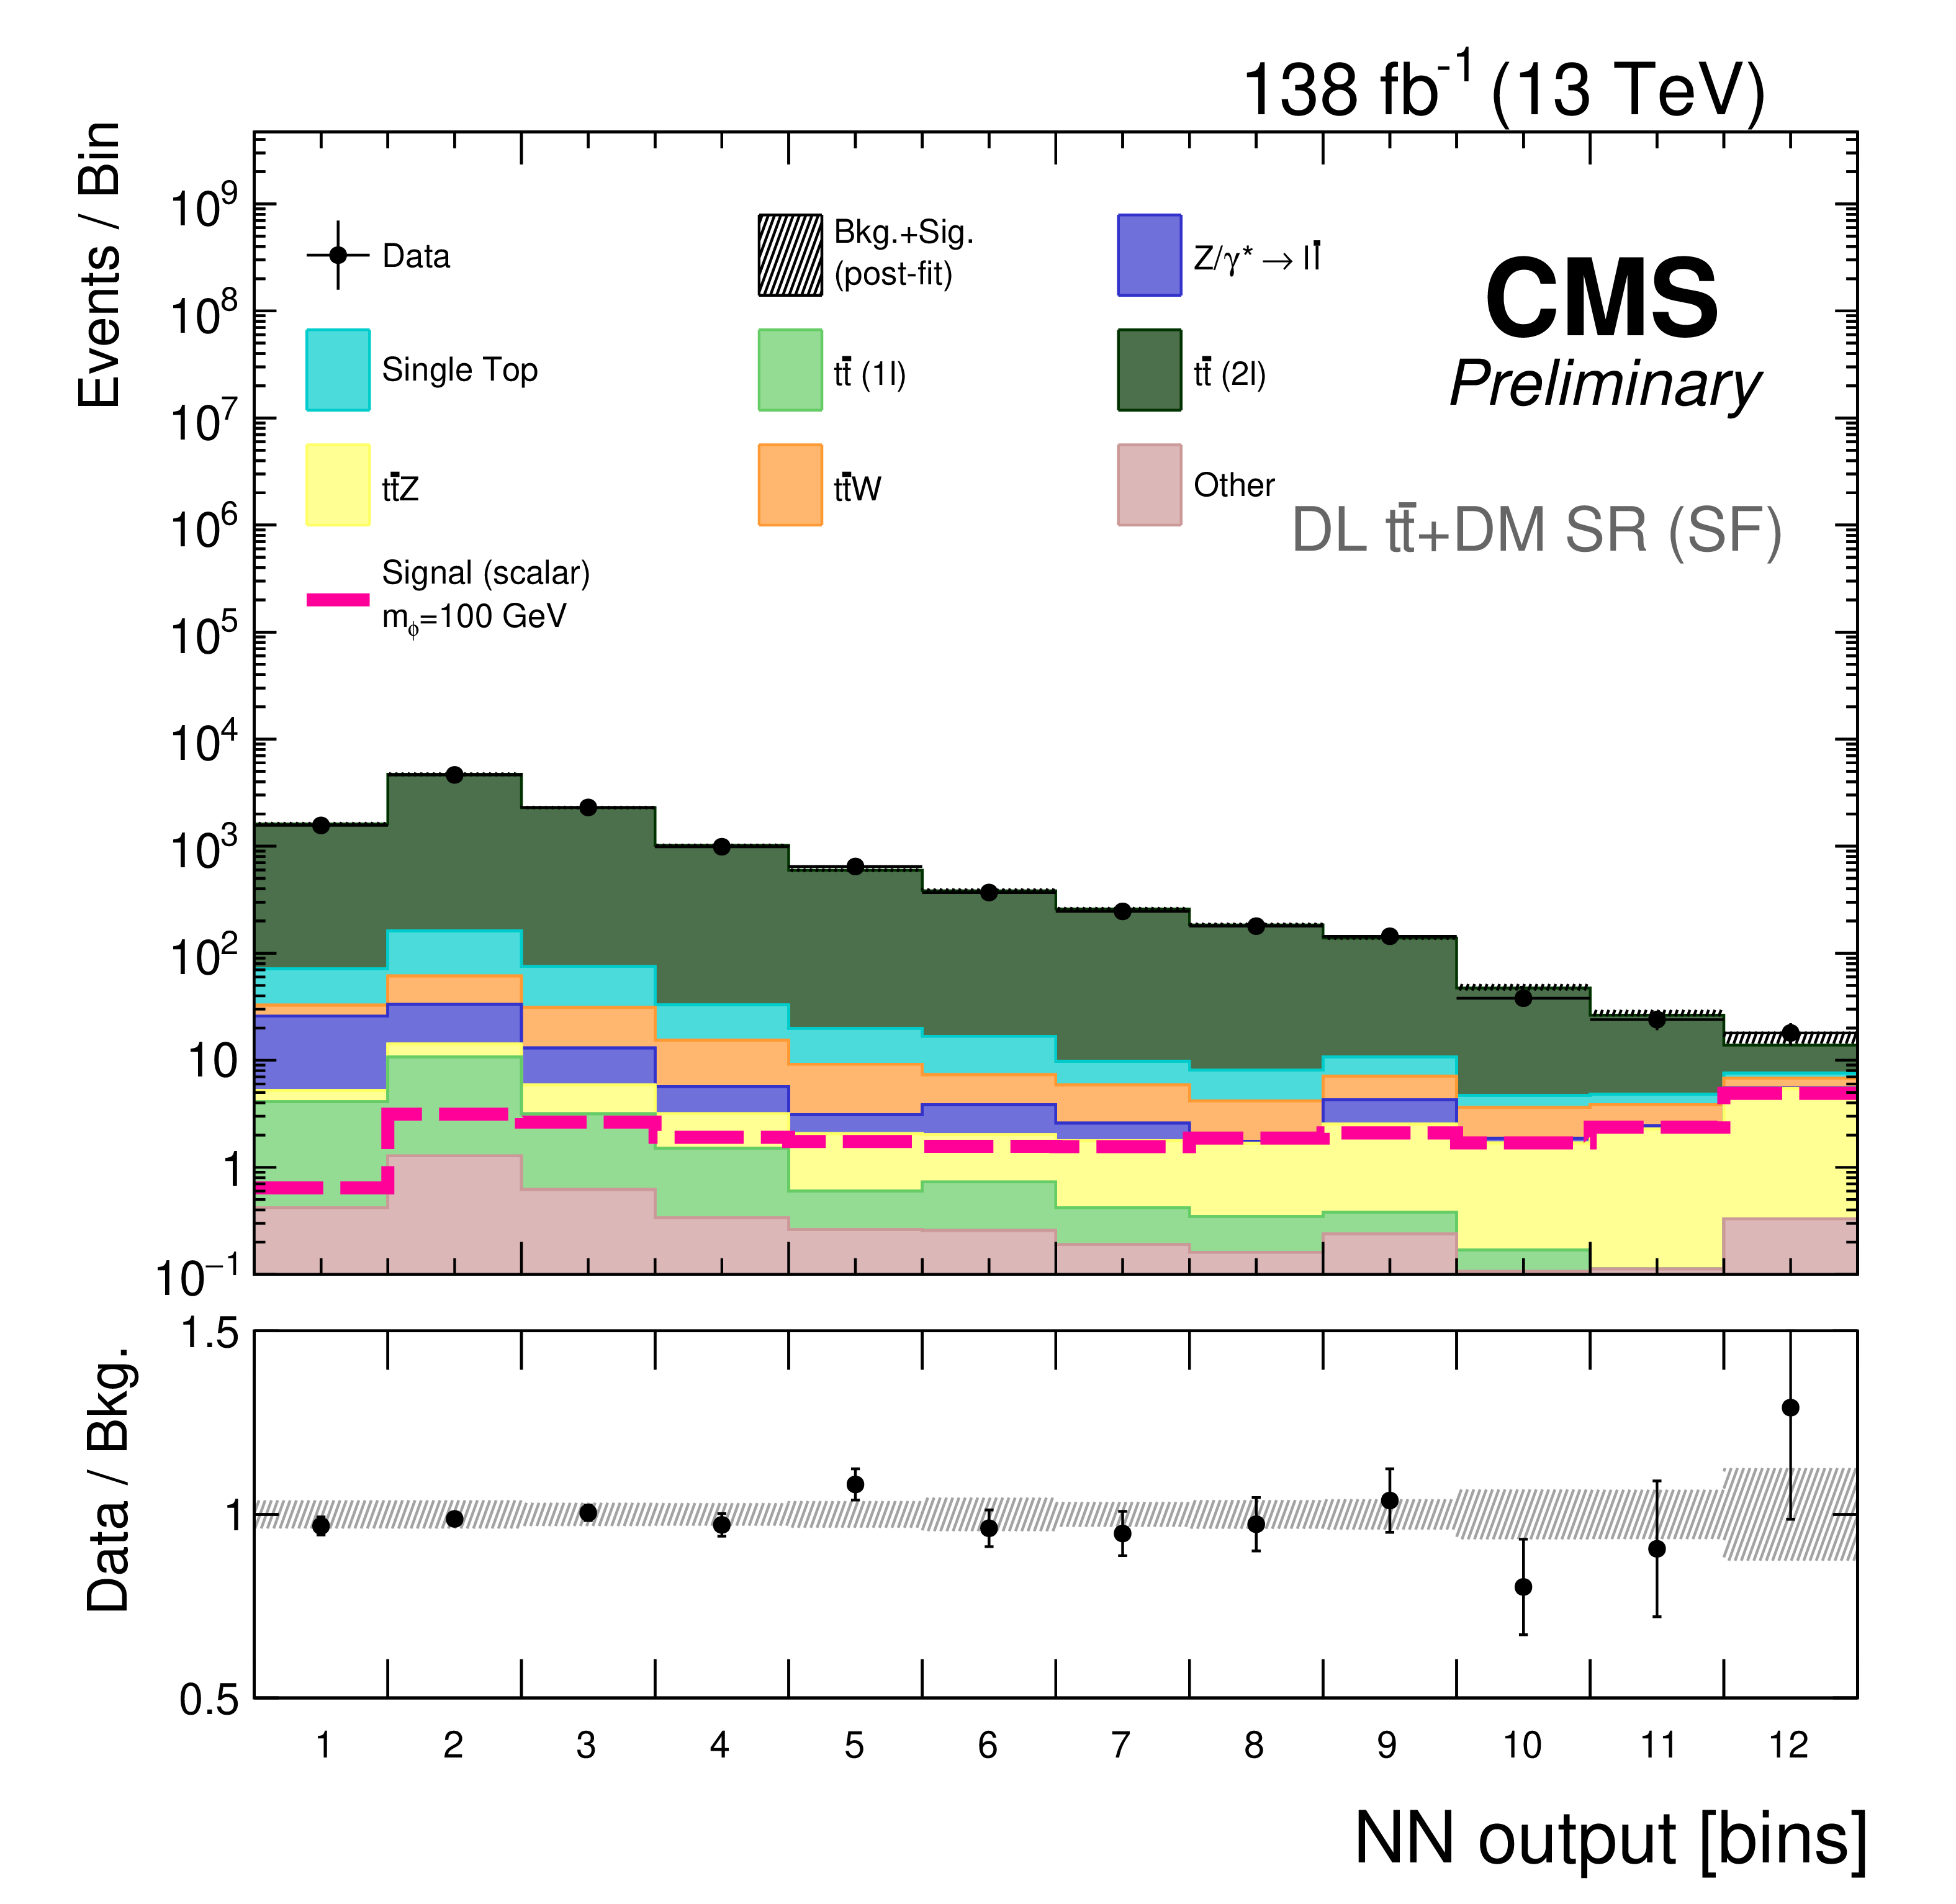
Figure 4:
The main discriminator distribution (NN) employed in the DL channel for the four SRs devised: $ {\mathrm{t}\overline{\mathrm{t}}} $+DM OF (upper left), $ {\mathrm{t}\overline{\mathrm{t}}} $+DM SF (upper right), $ \mathrm{t}\mathrm{W} $+DM OF (lower left), and $ \mathrm{t}\mathrm{W} $+DM SF (lower right). The last bin contains overflow events. The various background processes are represented with color-filled histograms as indicated in the legend. A representative signal model distribution is also shown. The grey dashed area in the upper panel represents the total post-fit background and one signal hypothesis summed together and their associated statistical and systematic uncertainties. The data points are shown as black dots with vertical and horizontal error bars. The lower panel shows the post-fit values and uncertainties of the ratio between the observed data and the predicted SM background. The figure comprises the total collected data in Run 2. |

png pdf |
Figure 4-a:
The main discriminator distribution (NN) employed in the DL channel for the four SRs devised: $ {\mathrm{t}\overline{\mathrm{t}}} $+DM OF (upper left), $ {\mathrm{t}\overline{\mathrm{t}}} $+DM SF (upper right), $ \mathrm{t}\mathrm{W} $+DM OF (lower left), and $ \mathrm{t}\mathrm{W} $+DM SF (lower right). The last bin contains overflow events. The various background processes are represented with color-filled histograms as indicated in the legend. A representative signal model distribution is also shown. The grey dashed area in the upper panel represents the total post-fit background and one signal hypothesis summed together and their associated statistical and systematic uncertainties. The data points are shown as black dots with vertical and horizontal error bars. The lower panel shows the post-fit values and uncertainties of the ratio between the observed data and the predicted SM background. The figure comprises the total collected data in Run 2. |
png pdf |
Figure 4-b:
The main discriminator distribution (NN) employed in the DL channel for the four SRs devised: $ {\mathrm{t}\overline{\mathrm{t}}} $+DM OF (upper left), $ {\mathrm{t}\overline{\mathrm{t}}} $+DM SF (upper right), $ \mathrm{t}\mathrm{W} $+DM OF (lower left), and $ \mathrm{t}\mathrm{W} $+DM SF (lower right). The last bin contains overflow events. The various background processes are represented with color-filled histograms as indicated in the legend. A representative signal model distribution is also shown. The grey dashed area in the upper panel represents the total post-fit background and one signal hypothesis summed together and their associated statistical and systematic uncertainties. The data points are shown as black dots with vertical and horizontal error bars. The lower panel shows the post-fit values and uncertainties of the ratio between the observed data and the predicted SM background. The figure comprises the total collected data in Run 2. |

png pdf |
Figure 4-c:
The main discriminator distribution (NN) employed in the DL channel for the four SRs devised: $ {\mathrm{t}\overline{\mathrm{t}}} $+DM OF (upper left), $ {\mathrm{t}\overline{\mathrm{t}}} $+DM SF (upper right), $ \mathrm{t}\mathrm{W} $+DM OF (lower left), and $ \mathrm{t}\mathrm{W} $+DM SF (lower right). The last bin contains overflow events. The various background processes are represented with color-filled histograms as indicated in the legend. A representative signal model distribution is also shown. The grey dashed area in the upper panel represents the total post-fit background and one signal hypothesis summed together and their associated statistical and systematic uncertainties. The data points are shown as black dots with vertical and horizontal error bars. The lower panel shows the post-fit values and uncertainties of the ratio between the observed data and the predicted SM background. The figure comprises the total collected data in Run 2. |

png pdf |
Figure 4-d:
The main discriminator distribution (NN) employed in the DL channel for the four SRs devised: $ {\mathrm{t}\overline{\mathrm{t}}} $+DM OF (upper left), $ {\mathrm{t}\overline{\mathrm{t}}} $+DM SF (upper right), $ \mathrm{t}\mathrm{W} $+DM OF (lower left), and $ \mathrm{t}\mathrm{W} $+DM SF (lower right). The last bin contains overflow events. The various background processes are represented with color-filled histograms as indicated in the legend. A representative signal model distribution is also shown. The grey dashed area in the upper panel represents the total post-fit background and one signal hypothesis summed together and their associated statistical and systematic uncertainties. The data points are shown as black dots with vertical and horizontal error bars. The lower panel shows the post-fit values and uncertainties of the ratio between the observed data and the predicted SM background. The figure comprises the total collected data in Run 2. |
png pdf |
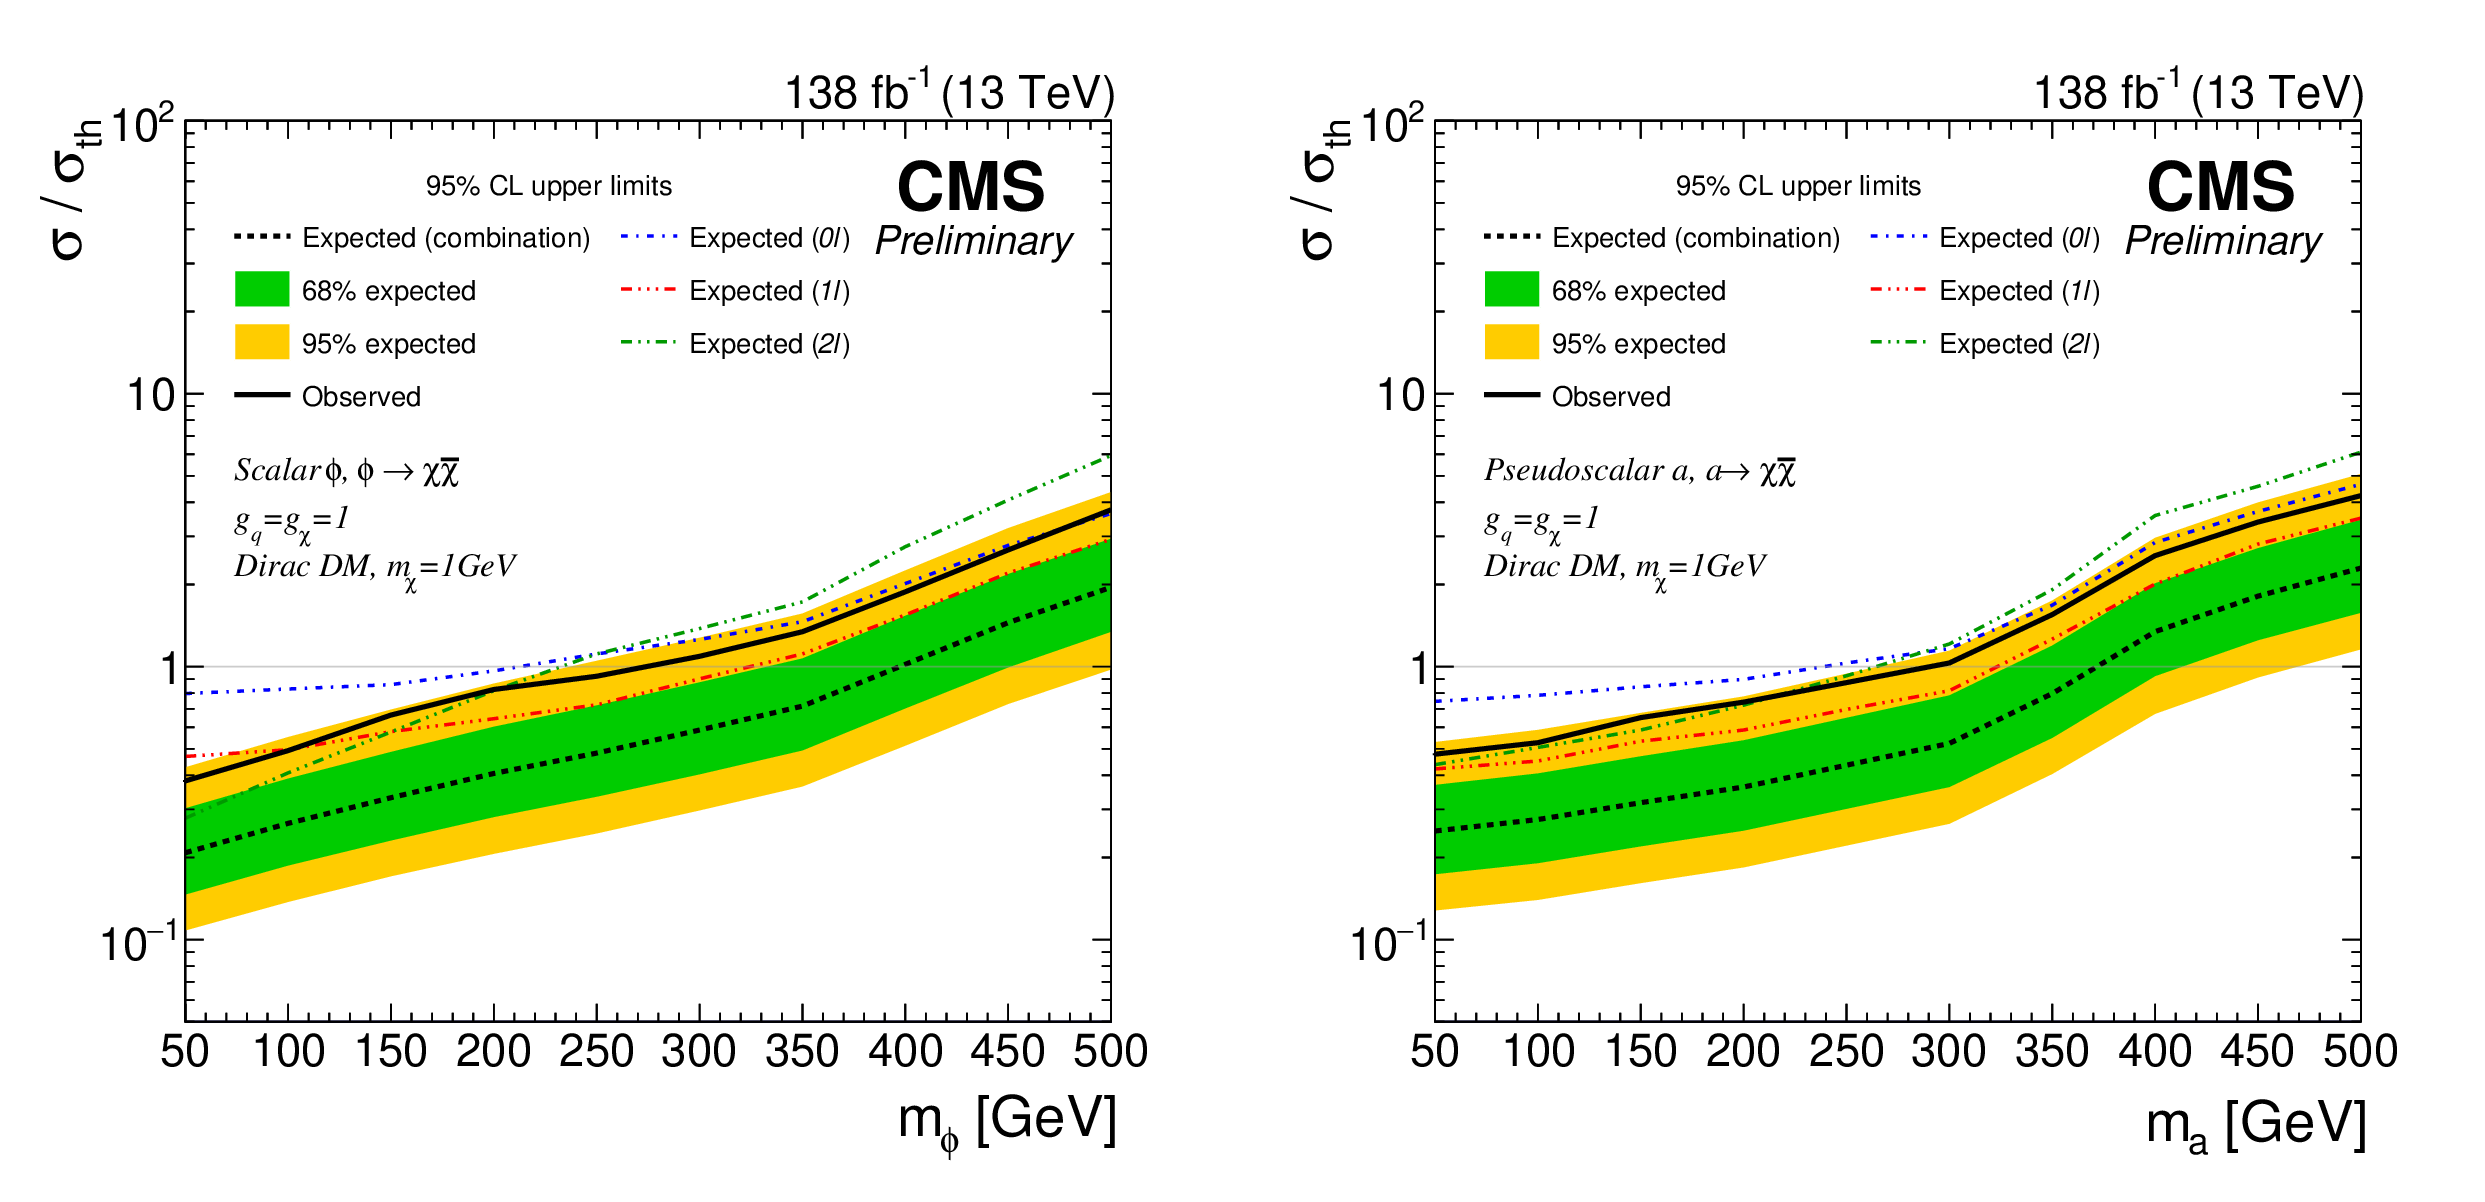
Figure 5:
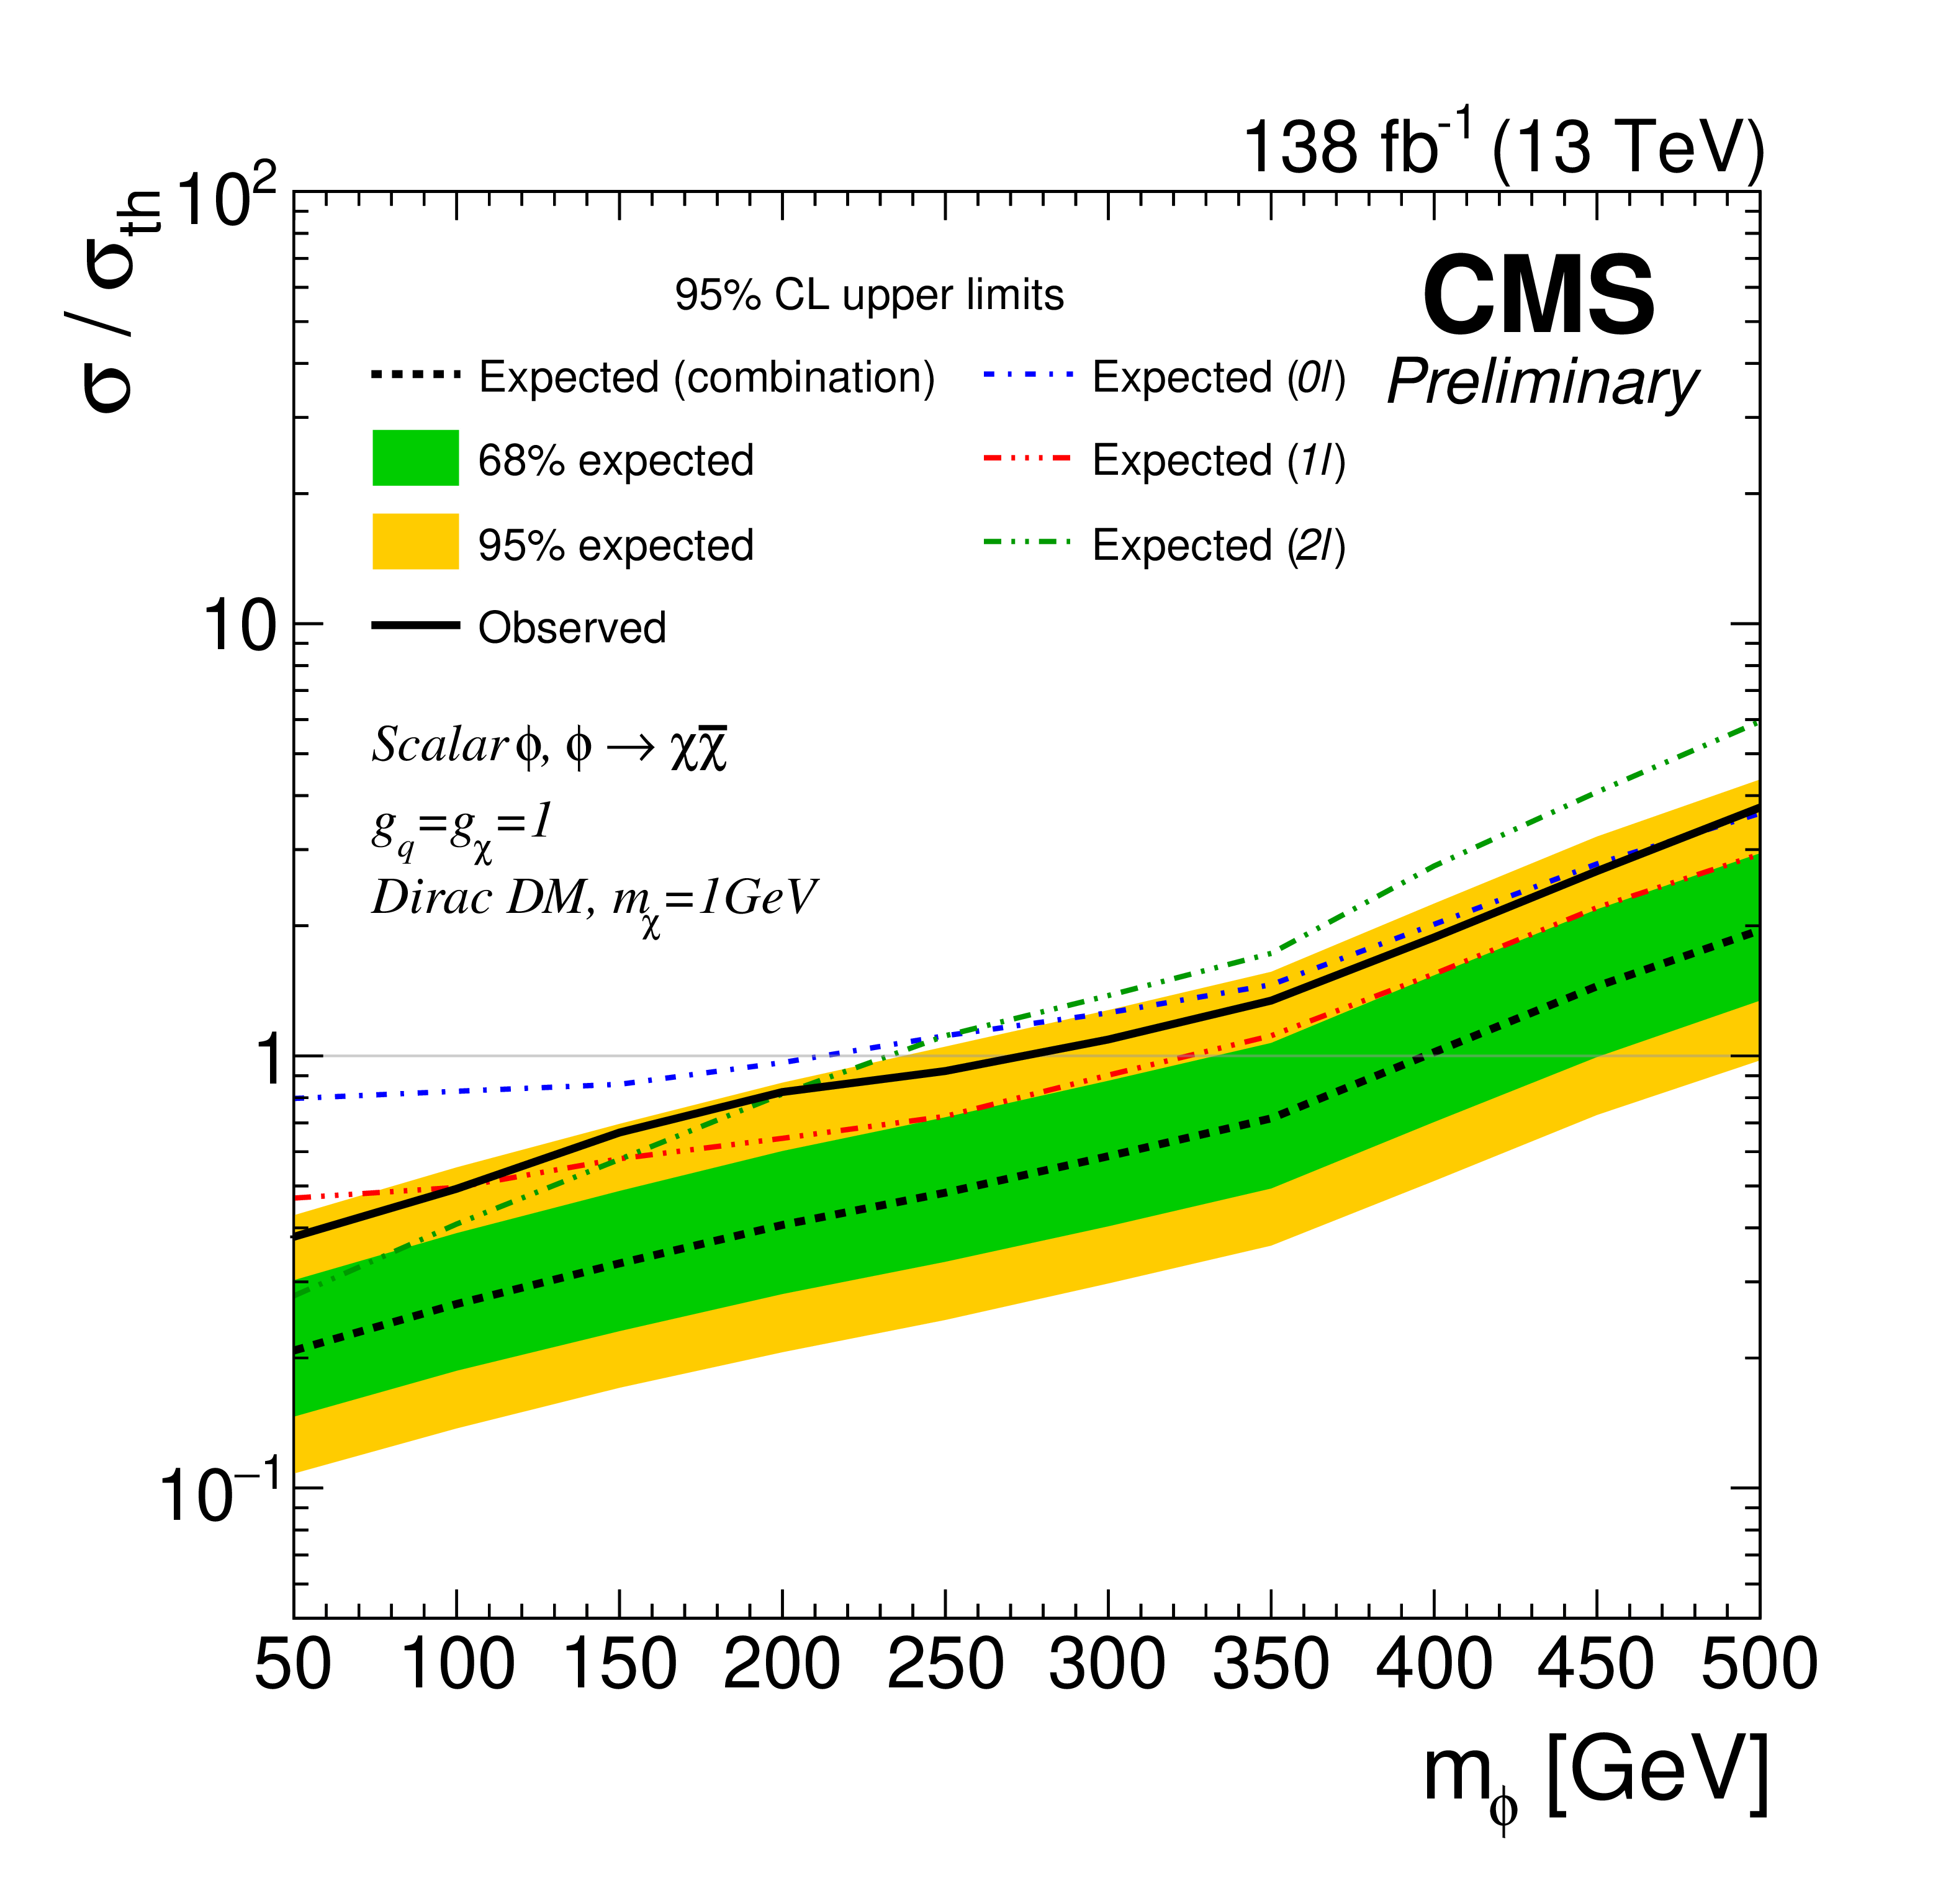
The expected 95% CL limits on the DM production cross sections relative to the theory predictions shown for the scalar (left) and pseudoscalar (right) models. The expected limit on the sum of both signals is shown by the black dashed line with the 68 and 95% CL uncertainty bands in green and yellow, respectively, while the observed limit is shown by the solid black line. The solid horizontal line corresponds to $ \sigma/\sigma_{\text{th}}= $ 1. |
png pdf |
Figure 5-a:
The expected 95% CL limits on the DM production cross sections relative to the theory predictions shown for the scalar (left) and pseudoscalar (right) models. The expected limit on the sum of both signals is shown by the black dashed line with the 68 and 95% CL uncertainty bands in green and yellow, respectively, while the observed limit is shown by the solid black line. The solid horizontal line corresponds to $ \sigma/\sigma_{\text{th}}= $ 1. |

png pdf |
Figure 5-b:
The expected 95% CL limits on the DM production cross sections relative to the theory predictions shown for the scalar (left) and pseudoscalar (right) models. The expected limit on the sum of both signals is shown by the black dashed line with the 68 and 95% CL uncertainty bands in green and yellow, respectively, while the observed limit is shown by the solid black line. The solid horizontal line corresponds to $ \sigma/\sigma_{\text{th}}= $ 1. |
| Tables | |

png pdf |
Table 1:
Final event selections for the AH, SL, and DL SRs. For the SL channel, a categorization in terms of modified topness, with bins of $ t\leq $ 0 and $ t > $ 0, is also applied after the event selection. The DL channel is instead split into same flavour (SF) $ e^{+}e^{-} $/$ \mu^{+}\mu^{-} $ and opposite flavour (OF) $ e^{\pm}\mu^{\mp} $ regions. |
png pdf |
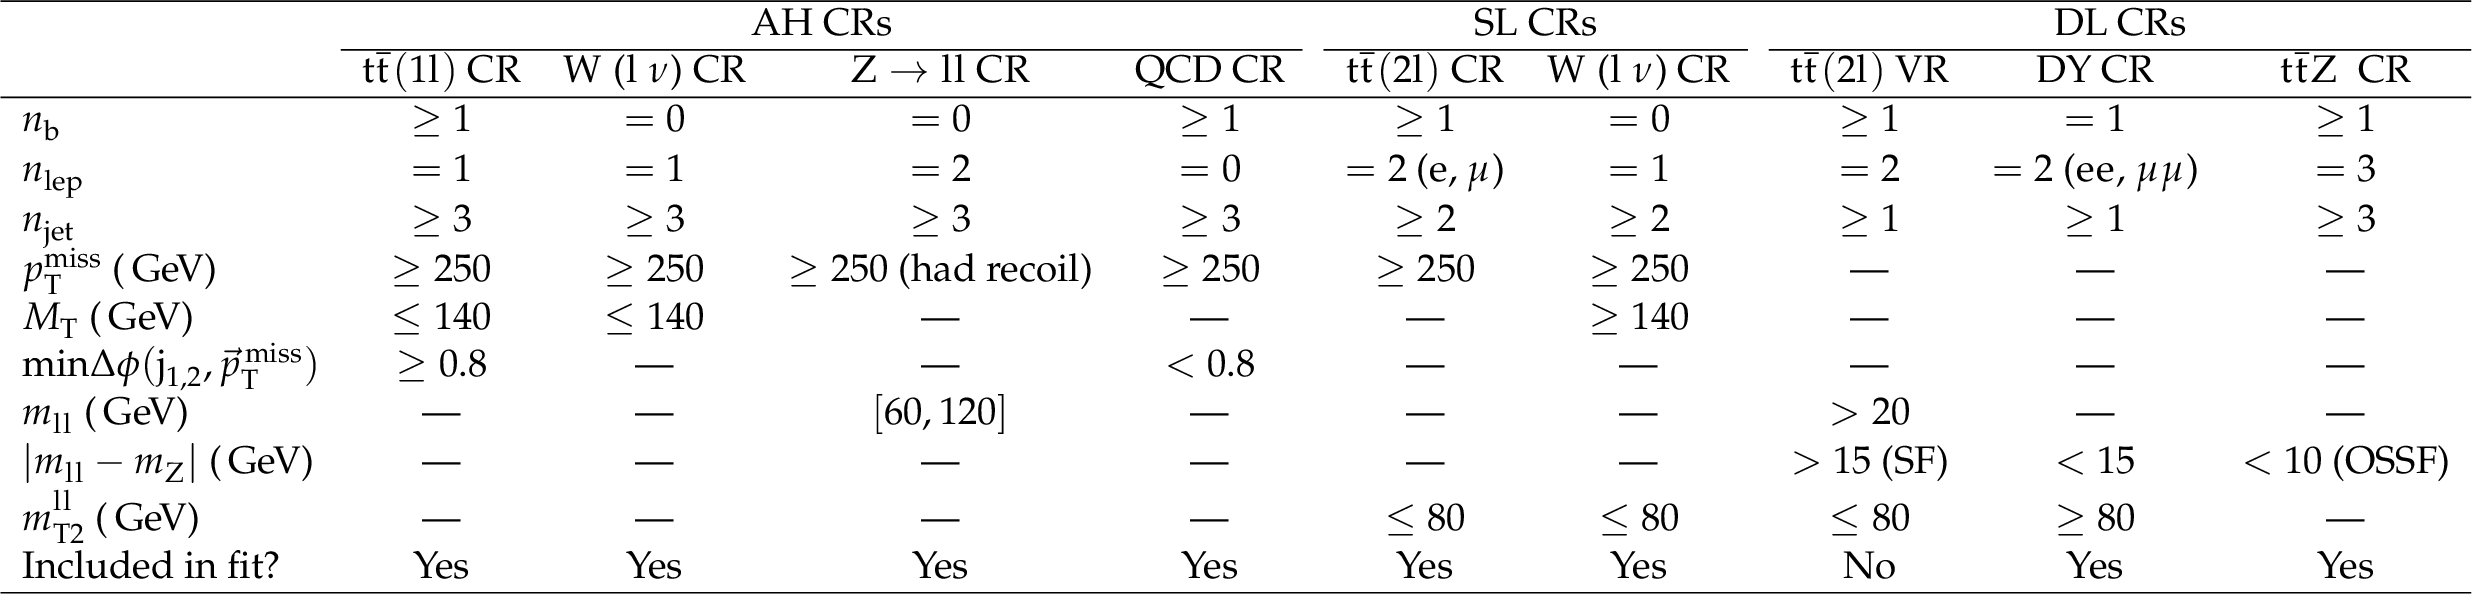
Table 2:
CRs defined for the main backgrounds of the AH SRs (first 4 columns, $ {\mathrm{t}\overline{\mathrm{t}}} (1\mathrm{l}) $, W+jets, $ {\mathrm{Z}} \to \mathrm{l} \mathrm{l} $, QCD), the SL SRs (central two columns, $ {\mathrm{t}\overline{\mathrm{t}}} (2\mathrm{l}) $ and W+jets ), and the DL SRs (last 2 columns, $ {\mathrm{t}\overline{\mathrm{t}}} (2\mathrm{l}) $ and $ {\mathrm{t}\overline{\mathrm{t}}} \mathrm{Z} $). Some selection criteria applied in the SRs are removed in the corresponding CRs to increase the event counts and are therefore not listed. The $ p_{\mathrm{T}}^\text{miss} $ selection for the $ {\mathrm{Z}} \to \mathrm{l} \mathrm{l} $ CR refers to the hadronic recoil. |
| Summary |
| A search for dark matter (DM) produced in association with a single top quark or a top quark pair in interactions mediated by a neutral scalar or pseudoscalar particle in proton-proton collisions at a center-of-mass energy of 13 TeV has been presented. The data correspond to an integrated luminosity of 138 fb$ ^{-1} $ recorded by the CMS experiment between 2016 and 2018. Various decay modes of the top quark are probed, resulting in three separate channels based on the number of leptons in the final state, namely the all-hadronic (zero leptons), semileptonic (one lepton), and dileptonic (two leptons) final states. The results are interpreted in the context of a simplified model in which a scalar or pseudoscalar mediator particle couples to the top quark and subsequently decays into two DM particles. Scalar and pseudoscalar mediator masses below 400 and 380 GeV, respectively, are expected to be excluded at 95% confidence level assuming a DM particle mass of 1 GeV and mediator couplings to fermions and DM particles equal to unity. A signal-like excess is observed in data. Because the signal kinematics are not very sensitive to the mass of the mediator, this excess is consistent with all mediator mass hypotheses. The largest excess for all mediator hypotheses is within two standard deviations. Because of this excess, we only exclude mediator masses below 280 (290) GeV for the scalar (pseudoscalar) mediator. |
| References | ||||
| 1 | T. A. Porter, R. P. Johnson, and P. W. Graham | Dark matter searches with astroparticle data | Ann. Rev. Astron. Astrophys. 49 (2011) 155 | 1104.2836 |
| 2 | G. Bertone, D. Hooper, and J. Silk | Particle dark matter: evidence, candidates and constraints | Phys. Rept. 405 (2005) 279 | hep-ph/0404175 |
| 3 | D. Abercrombie et al. | Dark matter benchmark models for early LHC run-2 searches: Report of the ATLAS/CMS dark matter forum | Phys. Dark Univ. 27 (2020) 100371 | 1507.00966 |
| 4 | M. R. Buckley, D. Feld, and D. Gonçalves | Scalar simplified models for dark matter | PRD 91 (2015) 015017 | 1410.6497 |
| 5 | D. Pinna, A. Zucchetta, M. R. Buckley, and F. Canelli | Single top quarks and dark matter | PRD 96 (2017) 035031 | 1701.05195 |
| 6 | LHC Dark Matter Working Group Collaboration | LHC dark matter working group: Next-generation spin-0 dark matter models | Phys. Dark Univ. 27 (2020) 100351 | 1810.09420 |
| 7 | M. Bauer, U. Haisch, and F. Kahlhoefer | Simplified dark matter models with two Higgs doublets: I. pseudoscalar mediators | JHEP 05 (2017) 138 | 1701.07427 |
| 8 | CMS Collaboration | Combined searches for the production of supersymmetric top quark partners in proton-proton collisions at $ \sqrt{s} = $ 13 TeV | EPJC 81 (2021) 970 | CMS-SUS-20-002 2107.10892 |
| 9 | ATLAS Collaboration | Constraints on spin-0 dark matter mediators and invisible Higgs decays using ATLAS 13 TeV pp collision data with two top quarks and missing transverse momentum in the final state | EPJC 83 (2023) 503 | 2211.05426 |
| 10 | CMS Collaboration | Search for dark matter produced in association with a single top quark or a top quark pair in proton-proton collisions at $ \sqrt{s}= $ 13 TeV | JHEP 03 (2019) 141 | CMS-EXO-18-010 1901.01553 |
| 11 | ATLAS Collaboration | Search for dark matter produced in association with a single top quark and an energetic $ W $ boson in $ \sqrt{s}= $ 13 TeV $ pp $ collisions with the ATLAS detector. | EPJC 83 (2023) 603 | 2211.13138 |
| 12 | CMS Collaboration | The CMS experiment at the CERN LHC | JINST 3 (2008) S08004 | |
| 13 | CMS Collaboration | The CMS trigger system | JINST 12 (2017) P01020 | CMS-TRG-12-001 1609.02366 |
| 14 | CMS Collaboration | Particle-flow reconstruction and global event description with the CMS detector | JINST 12 (2017) P10003 | CMS-PRF-14-001 1706.04965 |
| 15 | M. Cacciari, G. P. Salam, and G. Soyez | The anti-$ k_{\mathrm{T}} $ jet clustering algorithm | JHEP 04 (2008) 063 | 0802.1189 |
| 16 | M. Cacciari, G. P. Salam, and G. Soyez | FastJet user manual | EPJC 72 (2012) 1896 | 1111.6097 |
| 17 | M. Cacciari, G. P. Salam, and G. Soyez | The catchment area of jets | JHEP 04 (2008) 005 | 0802.1188 |
| 18 | CMS Collaboration | Jet algorithms performance in 13 TeV data | CMS Physics Analysis Summary, 2017 CMS-PAS-JME-16-003 |
CMS-PAS-JME-16-003 |
| 19 | CMS Collaboration | Identification of heavy-flavour jets with the CMS detector in pp collisions at 13 TeV | JINST 13 (2018) P05011 | CMS-BTV-16-002 1712.07158 |
| 20 | S. Frixione, P. Nason, and C. Oleari | Matching NLO QCD computations with parton shower simulations: the POWHEG method | JHEP 11 (2007) 070 | 0709.2092 |
| 21 | S. Alioli, P. Nason, C. Oleari, and E. Re | A general framework for implementing NLO calculations in shower Monte Carlo programs: the POWHEG box | JHEP 06 (2010) 043 | 1002.2581 |
| 22 | M. Czakon et al. | Top-pair production at the LHC through NNLO QCD and NLO EW | JHEP 10 (2017) 186 | 1705.04105 |
| 23 | J. Alwall et al. | The automated computation of tree-level and next-to-leading order differential cross sections, and their matching to parton shower simulations | JHEP 07 (2014) 079 | 1405.0301 |
| 24 | M. L. Mangano, M. Moretti, F. Piccinini, and M. Treccani | Matching matrix elements and shower evolution for top-quark production in hadronic collisions | JHEP 01 (2007) 013 | hep-ph/0611129 |
| 25 | A. Denner, S. Dittmaier, T. Kasprzik, and A. Muck | Electroweak corrections to W+jet hadroproduction including leptonic W-boson decays | JHEP 08 (2009) 075 | 0906.1656 |
| 26 | A. Denner, S. Dittmaier, T. Kasprzik, and A. Muck | Electroweak corrections to dilepton+jet production at hadron colliders | JHEP 06 (2011) 069 | 1103.0914 |
| 27 | A. Denner, S. Dittmaier, T. Kasprzik, and A. Maeck | Electroweak corrections to monojet production at the LHC | EPJC 73 (2013) 2297 | 1211.5078 |
| 28 | J. H. Kuhn, A. Kulesza, S. Pozzorini, and M. Schulze | Electroweak corrections to hadronic photon production at large transverse momenta | JHEP 03 (2006) 059 | hep-ph/0508253 |
| 29 | S. Kallweit et al. | NLO electroweak automation and precise predictions for W+multijet production at the LHC | JHEP 04 (2015) 012 | 1412.5157 |
| 30 | S. Kallweit et al. | NLO QCD+EW predictions for V+jets including off-shell vector-boson decays and multijet merging | JHEP 04 (2016) 021 | 1511.08692 |
| 31 | R. Frederix and S. Frixione | Merging meets matching in MC@NLO | JHEP 12 (2012) 061 | 1209.6215 |
| 32 | G. Busoni et al. | Recommendations on presenting LHC searches for missing transverse energy signals using simplified $ s $-channel models of dark matter | 1603.04156 | |
| 33 | NNPDF Collaboration | Parton distributions for the LHC Run II | JHEP 04 (2015) 040 | 1410.8849 |
| 34 | NNPDF Collaboration | Parton distributions from high-precision collider data | EPJC 77 (2017) 663 | 1706.00428 |
| 35 | T. Sjöstrand, S. Mrenna, and P. Z. Skands | A brief introduction to PYTHIA 8.1 | Comput. Phys. Commun. 178 (2008) 852 | 0710.3820 |
| 36 | CMS Collaboration | Event generator tunes obtained from underlying event and multiparton scattering measurements | EPJC 76 (2016) 155 | CMS-GEN-14-001 1512.00815 |
| 37 | CMS Collaboration | Extraction and validation of a new set of CMS PYTHIA8 tunes from underlying-event measurements | EPJC 80 (2020) 4 | CMS-GEN-17-001 1903.12179 |
| 38 | GEANT4 Collaboration | GEANT 4---a simulation toolkit | NIM A 506 (2003) 250 | |
| 39 | CMS Collaboration | Performance of CMS muon reconstruction in pp collision events at $ \sqrt{s} = $ 7 TeV | JINST 7 (2012) P10002 | CMS-MUO-10-004 1206.4071 |
| 40 | CMS Collaboration | Performance of electron reconstruction and selection with the CMS detector in proton-proton collisions at $ \sqrt{s} = $ 8 TeV | JINST 10 (2015) P06005 | CMS-EGM-13-001 1502.02701 |
| 41 | Y. Bai, H.-C. Cheng, J. Gallicchio, and J. Gu | Stop the top background of the stop search | JHEP 07 (2012) 110 | 1203.4813 |
| 42 | M. L. Graesser and J. Shelton | Hunting mixed top squark decays | PRL 111 (2013) 121802 | 1212.4495 |
| 43 | C. Lester and D. Summers | Measuring masses of semi-invisibly decaying particle pairs produced at hadron colliders | PLB 46 (1999) 99 | |
| 44 | CMS Collaboration | Searches for supersymmetry using the m$ _{T2} $ variable in hadronic events produced in pp collisions at 8 TeV | JHEP 05 (2015) 078 | CMS-SUS-13-019 1502.04358 |
| 45 | CMS Collaboration | Search for dark matter in association with a $ \mathrm{t\overline{t}} $ pair at $ \sqrt{s}= $ 13 TeV in the dilepton channel with 2016 data | CMS Physics Analysis Summary, 2018 CMS-PAS-EXO-17-014 |
CMS-PAS-EXO-17-014 |
| 46 | B. A. Betchart, R. Demina, and A. Harel | Analytic solutions for neutrino momenta in decay of top quarks | NIM A 736 (2014) 169 | 1305.1878 |
| 47 | CMS Collaboration | Precision luminosity measurement in proton-proton collisions at $ \sqrt{s}= $ 13 TeV in 2015 and 2016 at CMS | EPJC 81 (2021) 800 | CMS-LUM-17-003 2104.01927 |
| 48 | CMS Collaboration | CMS luminosity measurement for the 2017 data-taking period at $ \sqrt{s} = $ 13 TeV | CMS Physics Analysis Summary, 2018 CMS-PAS-LUM-17-004 |
CMS-PAS-LUM-17-004 |
| 49 | CMS Collaboration | CMS luminosity measurement for the 2018 data-taking period at $ \sqrt{s} = $ 13 TeV | CMS Physics Analysis Summary, 2019 CMS-PAS-LUM-18-002 |
CMS-PAS-LUM-18-002 |
| 50 | J. Butterworth et al. | PDF4LHC recommendations for LHC Run II | JPG 43 (2016) 023001 | 1510.03865 |
| 51 | CMS Collaboration | Measurement of the inelastic proton-proton cross section at $ \sqrt{s}= $ 13 TeV | JHEP 07 (2018) 161 | CMS-FSQ-15-005 1802.02613 |
| 52 | CMS Collaboration | Jet energy scale and resolution in the CMS experiment in pp collisions at 8 TeV | JINST 12 (2017) P02014 | CMS-JME-13-004 1607.03663 |
| 53 | R. J. Barlow and C. Beeston | Fitting using finite Monte Carlo samples | Comput. Phys. Commun. 77 (1993) 219 | |
| 54 | CMS Collaboration | Measurement of differential cross sections for top quark pair production using the lepton+jets final state in proton-proton collisions at 13 TeV | PRD 95 (2017) 092001 | CMS-TOP-16-008 1610.04191 |
| 55 | CMS Collaboration | The CMS statistical analysis and combination tool: COMBINE | CMS-CAT-23-001 2404.06614 |
|
| 56 | L. Moneta et al. | The RooStats project | in 13th International Workshop on Advanced Computing and Analysis Techniques in Physics Research (ACAT), SISSA, 2010 PoS (ACAT) 057 |
1009.1003 |
| 57 | T. Junk | Confidence level computation for combining searches with small statistics | Nucl. Inst. Meth. A 434 (1999) 435 | hep-ex/9902226 |
| 58 | A. L. Read | Presentation of search results: the CL$ _{s} $ technique | JPG 28 (2002) 2693 | |
| 59 | G. Cowan, K. Cranmer, E. Gross, and O. Vitells | Asymptotic formulae for likelihood-based tests of new physics | EPJC 71 (2011) 1554 | 1007.1727 |
|
|
Compact Muon Solenoid LHC, CERN |
|

|

|

|

|

|