

Compact Muon Solenoid
LHC, CERN
| CMS-PAS-EXO-17-014 | ||
| Search for dark matter in association with a $\mathrm{t\overline{t}}$ pair at $\sqrt{s}= $ 13 TeV in the dilepton channel with 2016 data | ||
| CMS Collaboration | ||
| March 2018 | ||
| Abstract: A search is performed for dark matter produced in association with $\mathrm{t\overline{t}}$ pairs in data from proton-proton collisions at a center-of-mass energy of 13 TeV at the LHC. The data corresponds to 35.9 fb$^{-1}$ collected with the CMS detector in 2016. The analysis looks for an excess of events with large imbalance in transverse momentum and a top quark pair decaying in the dileptonic mode. The results are interpreted in the context of simplified models of dark matter production. Assuming unitary coupling values to standard model (SM) particles $g_{\text{q}}$, and dark matter (DM) particles $g_{\chi}$, and DM mass $m_{\chi} = $ 1 GeV, the observed (expected) 95% CL exclusions for a scalar mediator are $m_{\phi} < $ 74 (99) GeV. The 95% CL exclusion expected for a pseudoscalar mediator is $m_{a} < $ 50 GeV, while none is observed. | ||
| Links: CDS record (PDF) ; inSPIRE record ; CADI line (restricted) ; | ||
| Figures | |
png pdf |
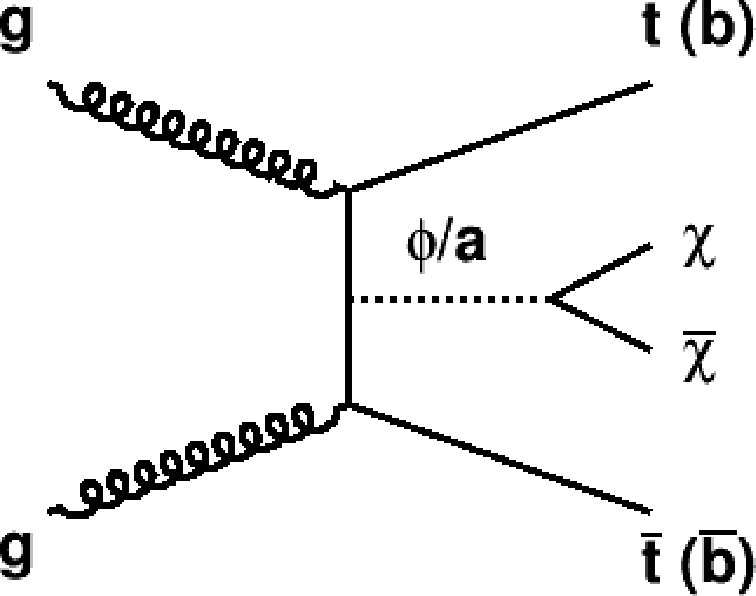
Figure 1:
Leading order Feynman diagram describing the production of DM particles ($\chi $) in association with a top (bottom) quark pair through a spin-0 mediator ($\phi /a$). |

png pdf |
Figure 2:
The $M_{\text {T2}}^{\ell \ell}$ distributions for events passing selection requirements for the (a) $\mathrm{e}\mu$ and (b) $ \mathrm{ee} + \mu\mu$ channels. The $M_{\text{T2}}^{\ell\ell}$ distribution of two example signals (scalar and pseudoscalar mediator, $m_{\phi/a} = $ 100 GeV) with $m_{\chi}= $ 1 GeV is scaled up by a factor of 200. The last bin includes overflow. Uncertainties are statistical only. |
png pdf |
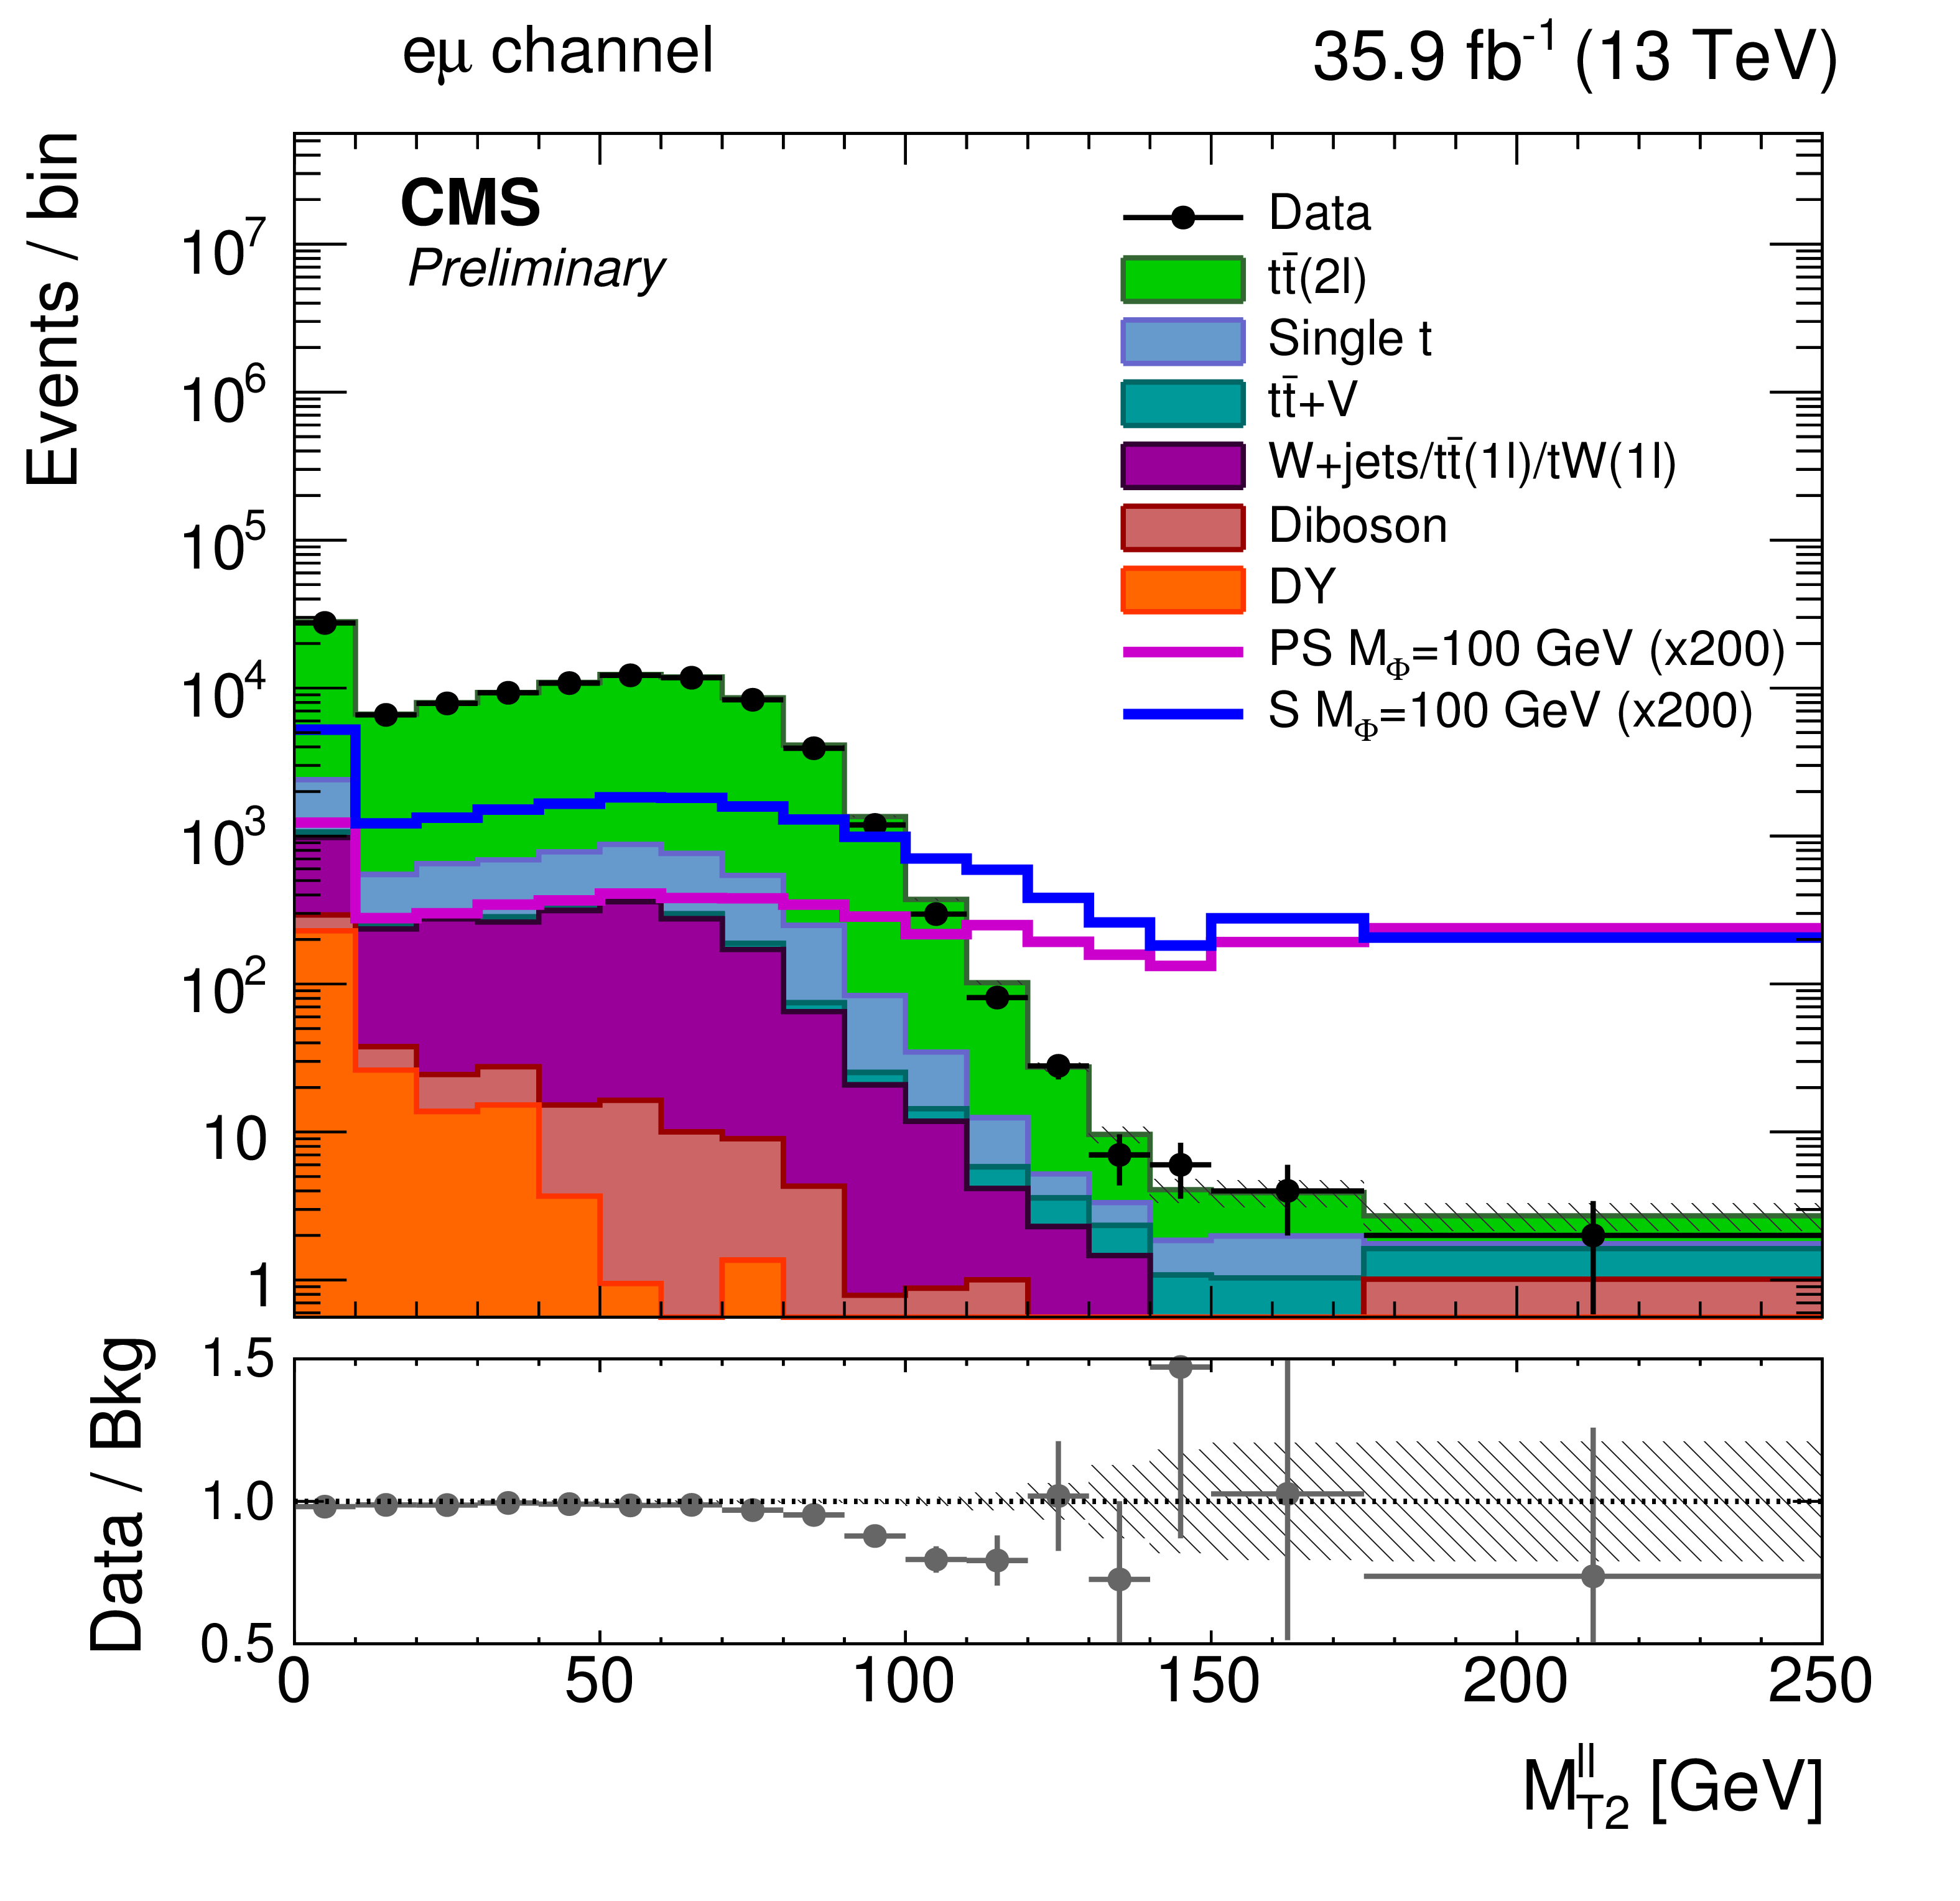
Figure 2-a:
The $M_{\text {T2}}^{\ell \ell}$ distributions for events passing selection requirements for the $\mathrm{e}\mu$ channel. The $M_{\text{T2}}^{\ell\ell}$ distribution of two example signals (scalar and pseudoscalar mediator, $m_{\phi/a} = $ 100 GeV) with $m_{\chi}= $ 1 GeV is scaled up by a factor of 200. The last bin includes overflow. Uncertainties are statistical only. |
png pdf |
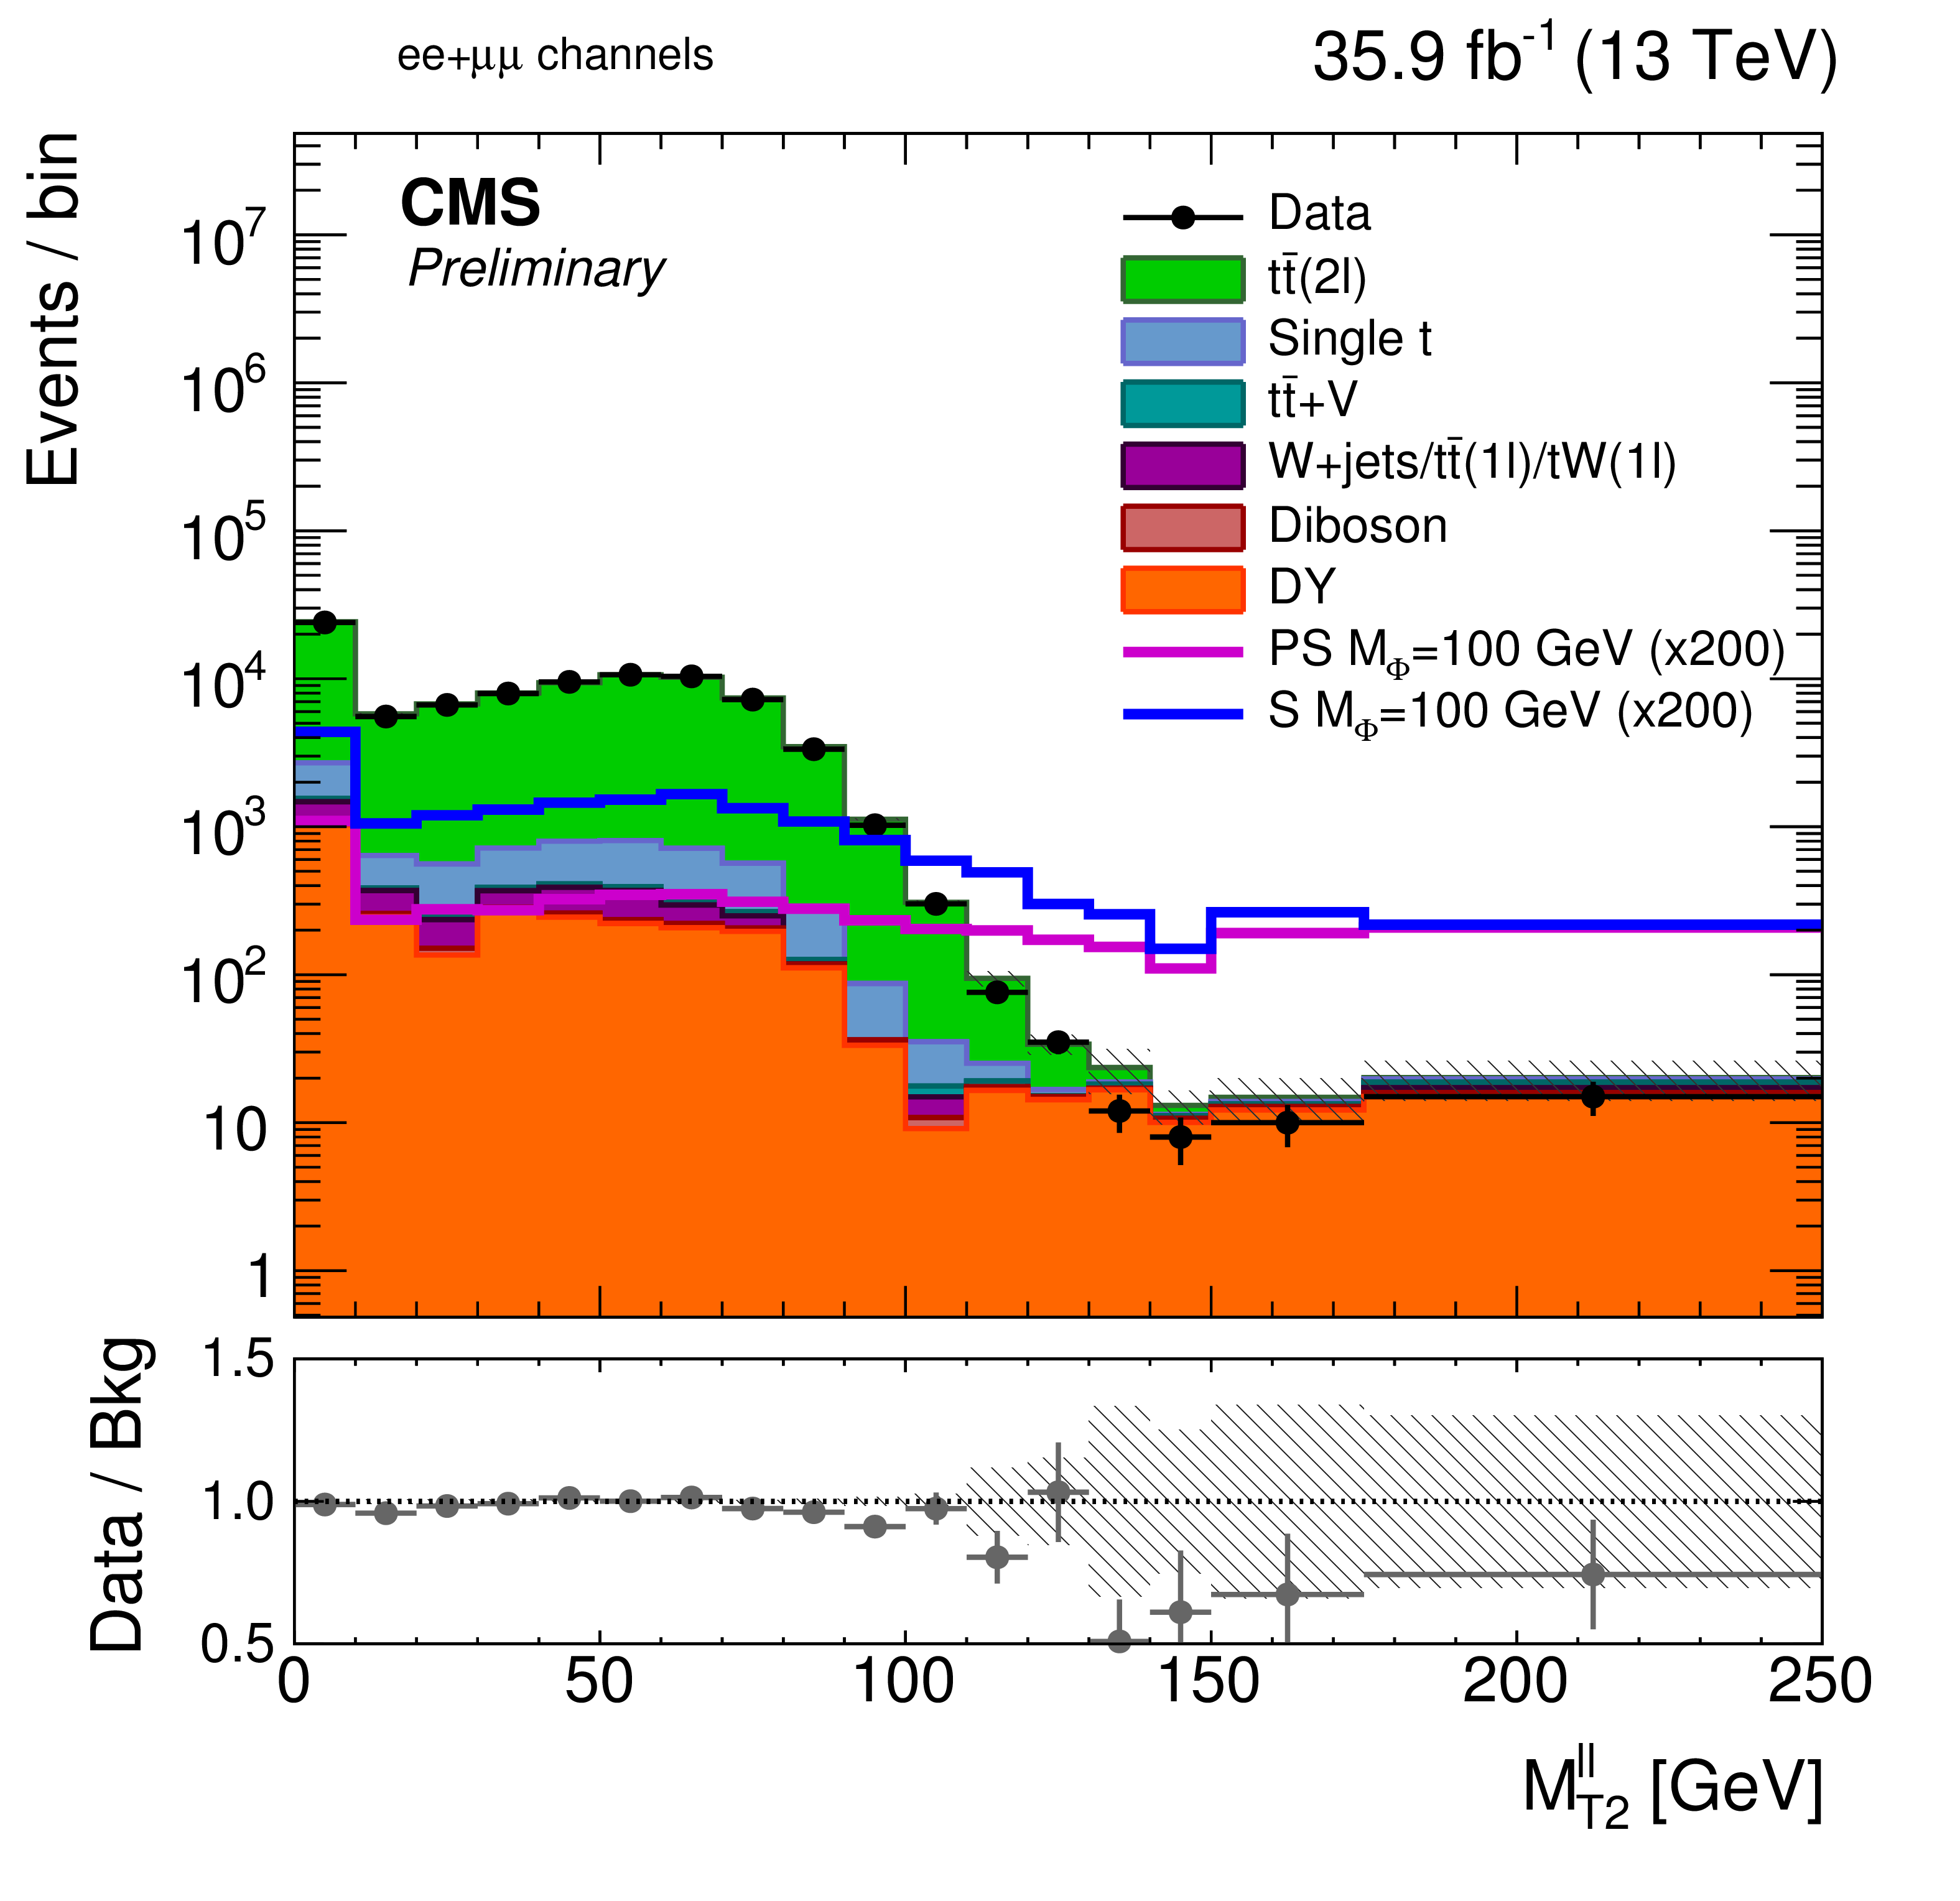
Figure 2-b:
The $M_{\text {T2}}^{\ell \ell}$ distributions for events passing selection requirements for the $ \mathrm{ee} + \mu\mu$ channel. The $M_{\text{T2}}^{\ell\ell}$ distribution of two example signals (scalar and pseudoscalar mediator, $m_{\phi/a} = $ 100 GeV) with $m_{\chi}= $ 1 GeV is scaled up by a factor of 200. The last bin includes overflow. Uncertainties are statistical only. |

png pdf |
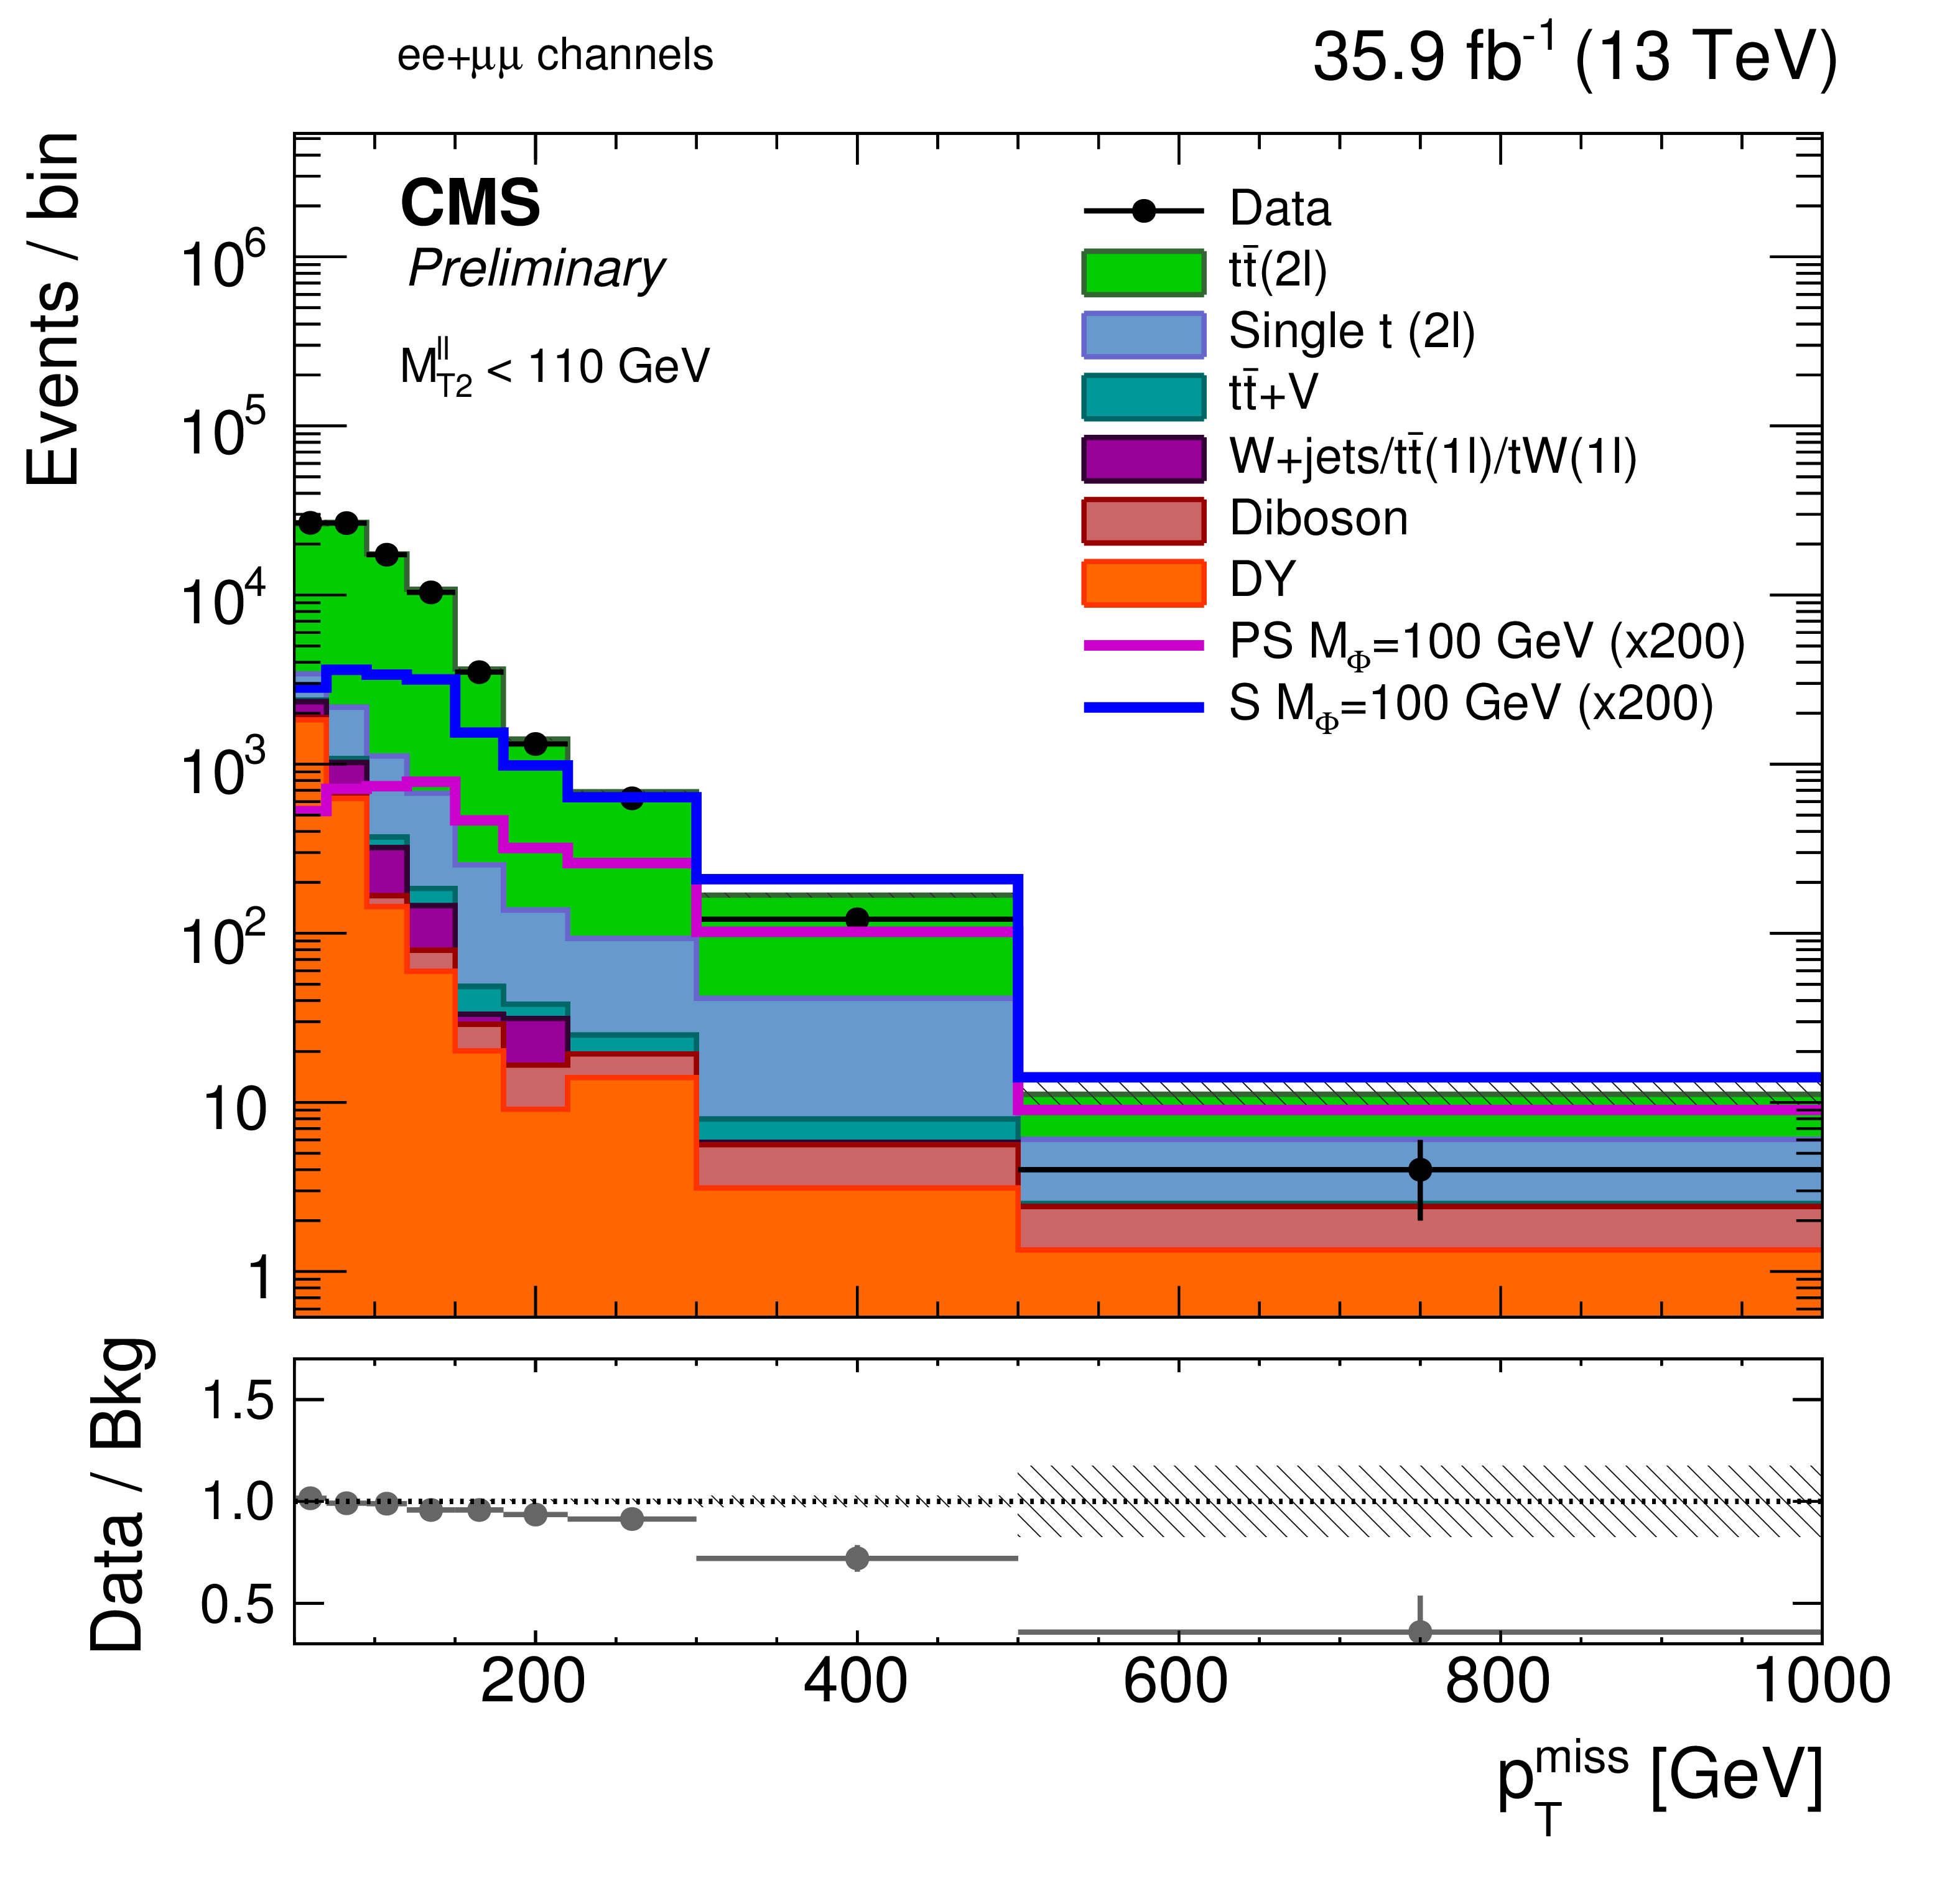
Figure 3:
The pre-fit $ {p_{\text {T}}^{\text {miss}}}$ distributions in the four signal extraction regions. The $ {p_{\text {T}}^{\text {miss}}}$ distribution of two example signals (scalar and pseudoscalar mediator, $m_{\phi /a} = $ 100 GeV) with $m_{\chi}= $ 1 GeV is scaled up by a factor of 200. The last bin includes overflow. Uncertainties are statistical only. |

png pdf |
Figure 3-a:
The pre-fit $ {p_{\text {T}}^{\text {miss}}}$ distributions in the high-purity $\mathrm{e}\mu$ extraction region. The $ {p_{\text {T}}^{\text {miss}}}$ distribution of two example signals (scalar and pseudoscalar mediator, $m_{\phi /a} = $ 100 GeV) with $m_{\chi}= $ 1 GeV is scaled up by a factor of 200. The last bin includes overflow. Uncertainties are statistical only. |
png pdf |
Figure 3-b:
The pre-fit $ {p_{\text {T}}^{\text {miss}}}$ distributions in the high-purity $ \mathrm{ee} + \mu\mu$ extraction region. The $ {p_{\text {T}}^{\text {miss}}}$ distribution of two example signals (scalar and pseudoscalar mediator, $m_{\phi /a} = $ 100 GeV) with $m_{\chi}= $ 1 GeV is scaled up by a factor of 200. The last bin includes overflow. Uncertainties are statistical only. |

png pdf |
Figure 3-c:
The pre-fit $ {p_{\text {T}}^{\text {miss}}}$ distributions in the low-purity $\mathrm{e}\mu$ extraction region. The $ {p_{\text {T}}^{\text {miss}}}$ distribution of two example signals (scalar and pseudoscalar mediator, $m_{\phi /a} = $ 100 GeV) with $m_{\chi}= $ 1 GeV is scaled up by a factor of 200. The last bin includes overflow. Uncertainties are statistical only. |

png pdf |
Figure 3-d:
The pre-fit $ {p_{\text {T}}^{\text {miss}}}$ distributions in the low-purity $ \mathrm{ee} + \mu\mu$ extraction region. The $ {p_{\text {T}}^{\text {miss}}}$ distribution of two example signals (scalar and pseudoscalar mediator, $m_{\phi /a} = $ 100 GeV) with $m_{\chi}= $ 1 GeV is scaled up by a factor of 200. The last bin includes overflow. Uncertainties are statistical only. |

png pdf |
Figure 4:
The (a) significance and (b) $M_{\mathrm{T}}^{\ell\mathrm{b},\ell\mathrm{b}} $ distributions for events passing selection requirements. The distributions of two example signals (scalar and pseudoscalar mediator, $m_{\phi/a} = $ 100 GeV) with $m_{\chi}= $ 1 GeV are scaled up by a factor of 200. The $\mathrm{ee}$, $\mathrm{e}\mu$ and $\mu\mu$ channels have been combined. The last bin contains overflow. Uncertainties are statistical only. |
png pdf |
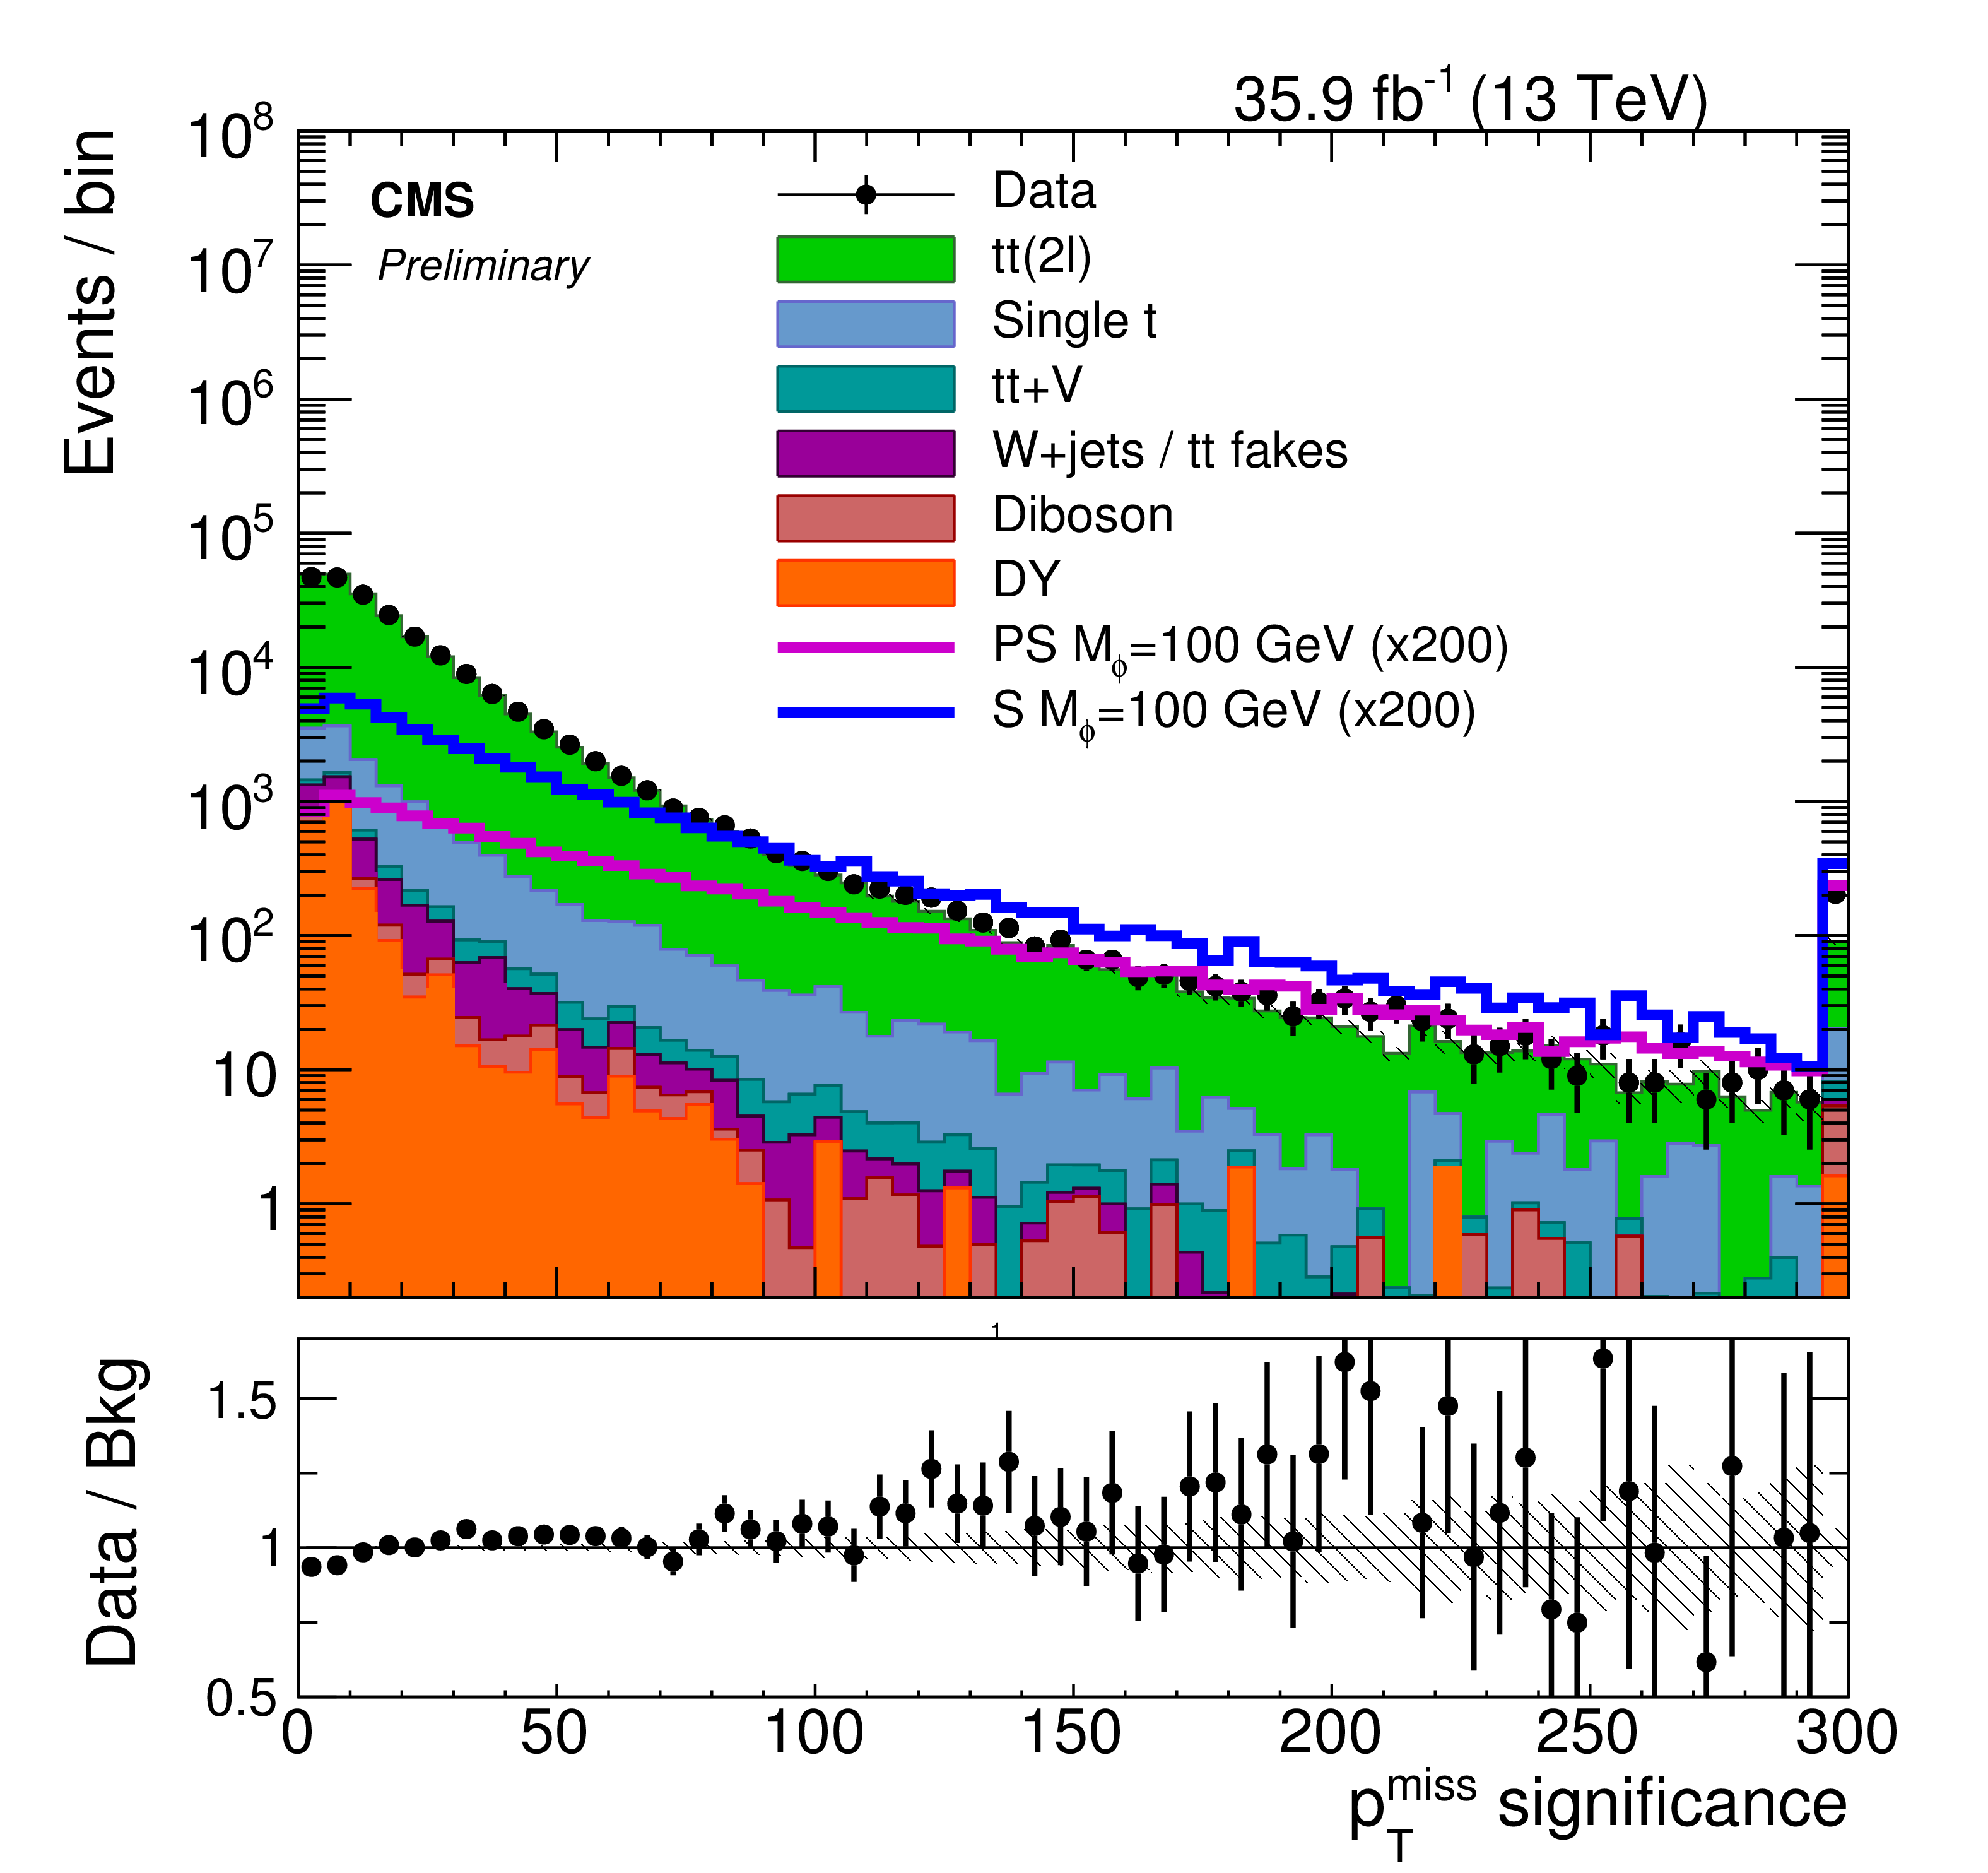
Figure 4-a:
The significance distribution for events passing selection requirements. The distributions of two example signals (scalar and pseudoscalar mediator, $m_{\phi/a} = $ 100 GeV) with $m_{\chi}= $ 1 GeV are scaled up by a factor of 200. The $\mathrm{ee}$, $\mathrm{e}\mu$ and $\mu\mu$ channels have been combined. The last bin contains overflow. Uncertainties are statistical only. |

png pdf |
Figure 4-b:
The $M_{\mathrm{T}}^{\ell\mathrm{b},\ell\mathrm{b}} $ distribution for events passing selection requirements. The distributions of two example signals (scalar and pseudoscalar mediator, $m_{\phi/a} = $ 100 GeV) with $m_{\chi}= $ 1 GeV are scaled up by a factor of 200. The $\mathrm{ee}$, $\mathrm{e}\mu$ and $\mu\mu$ channels have been combined. The last bin contains overflow. Uncertainties are statistical only. |

png pdf |
Figure 5:
The (a) $ \Delta \phi ( p_{\mathrm{T}}, \ell\ell ) $ and the (b) log of the kinematic reconstruction weight ($\ln w$) distributions for events passing selection requirements. The distributions of two example signals (scalar and pseudoscalar mediator, $m_{\phi/a} = $ 100 GeV) with $m_{\chi}= $ 1 GeV are scaled up by a factor of 200. The $\mathrm{ee}$, $\mathrm{e}\mu$ and $\mu\mu$ channels have been combined. Uncertainties are statistical only. |

png pdf |
Figure 5-a:
The $ \Delta \phi ( p_{\mathrm{T}}, \ell\ell ) $ distribution for events passing selection requirements. The distributions of two example signals (scalar and pseudoscalar mediator, $m_{\phi/a} = $ 100 GeV) with $m_{\chi}= $ 1 GeV are scaled up by a factor of 200. The $\mathrm{ee}$, $\mathrm{e}\mu$ and $\mu\mu$ channels have been combined. Uncertainties are statistical only. |

png pdf |
Figure 5-b:
The log of the kinematic reconstruction weight ($\ln w$) distribution for events passing selection requirements. The distributions of two example signals (scalar and pseudoscalar mediator, $m_{\phi/a} = $ 100 GeV) with $m_{\chi}= $ 1 GeV are scaled up by a factor of 200. The $\mathrm{ee}$, $\mathrm{e}\mu$ and $\mu\mu$ channels have been combined. Uncertainties are statistical only. |

png pdf |
Figure 6:
The (a) $\Delta \eta_{\ell^{+},\ell^{-}}$ and (b) $\cos{\Phi_{\ell^{+}\ell^{-}}}$ distributions for events passing selection requirements. The distributions of two example signals (scalar and pseudoscalar mediator, $m_{\phi/a} = $ 100 GeV) with $m_{\chi}= $ 1 GeV are scaled up by a factor of 200. The $\mathrm{ee}$, $\mathrm{e}\mu$ and $\mu\mu$ channels have been combined. The last bin contains overflow. Uncertainties are statistical only. |

png pdf |
Figure 6-a:
The $\Delta \eta_{\ell^{+},\ell^{-}}$ distribution for events passing selection requirements. The distributions of two example signals (scalar and pseudoscalar mediator, $m_{\phi/a} = $ 100 GeV) with $m_{\chi}= $ 1 GeV are scaled up by a factor of 200. The $\mathrm{ee}$, $\mathrm{e}\mu$ and $\mu\mu$ channels have been combined. The last bin contains overflow. Uncertainties are statistical only. |
png pdf |
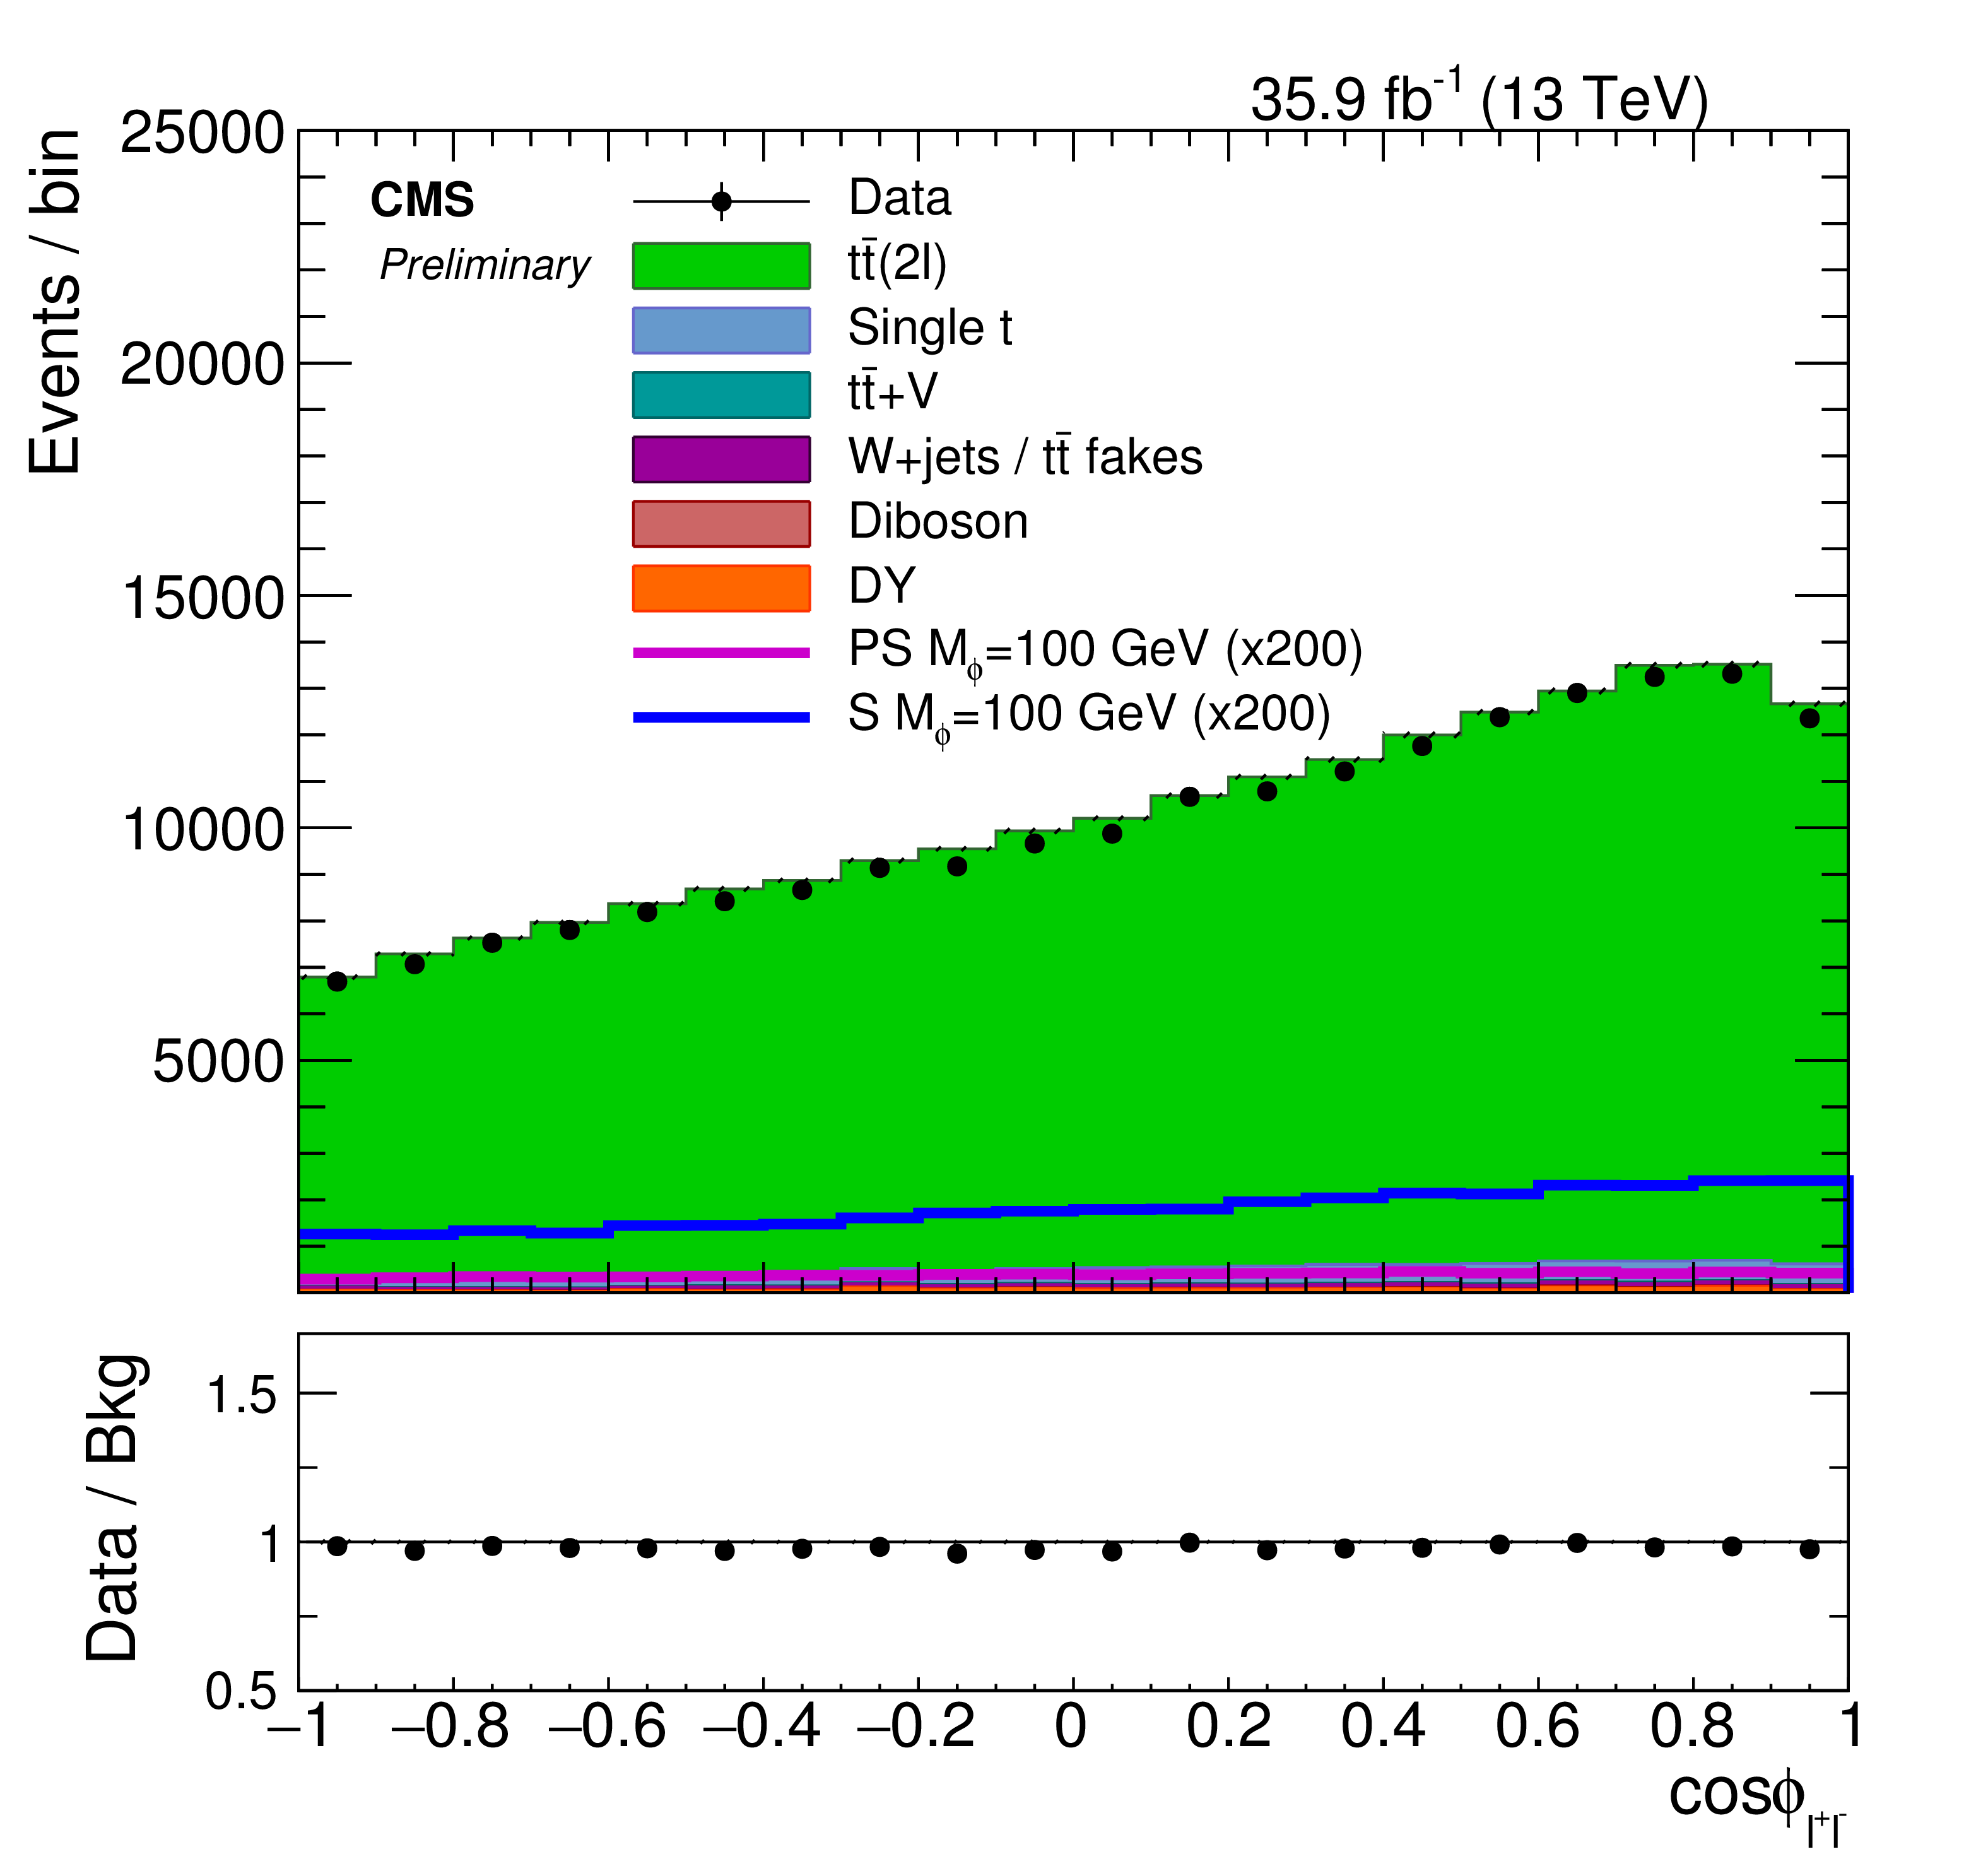
Figure 6-b:
The $\cos{\Phi_{\ell^{+}\ell^{-}}}$ distribution for events passing selection requirements. The distributions of two example signals (scalar and pseudoscalar mediator, $m_{\phi/a} = $ 100 GeV) with $m_{\chi}= $ 1 GeV are scaled up by a factor of 200. The $\mathrm{ee}$, $\mathrm{e}\mu$ and $\mu\mu$ channels have been combined. The last bin contains overflow. Uncertainties are statistical only. |

png pdf |
Figure 7:
The pre-fit BDT discriminant distribution trained on the working point 1 GeV dark matter mass and 500 GeV mediator mass for a (a) scalar mediator and a (b) pseudoscalar mediator. The distributions of two example signals (scalar and pseudoscalar mediator, $m_{\phi/a} = $ 100 GeV) with $m_{\chi}= $ 1 GeV are scaled up by a factor of 200. The $\mathrm{ee}$, $\mathrm{e}\mu$ and $\mu\mu$ channels have been combined. Uncertainties are statistical only. |
png pdf |
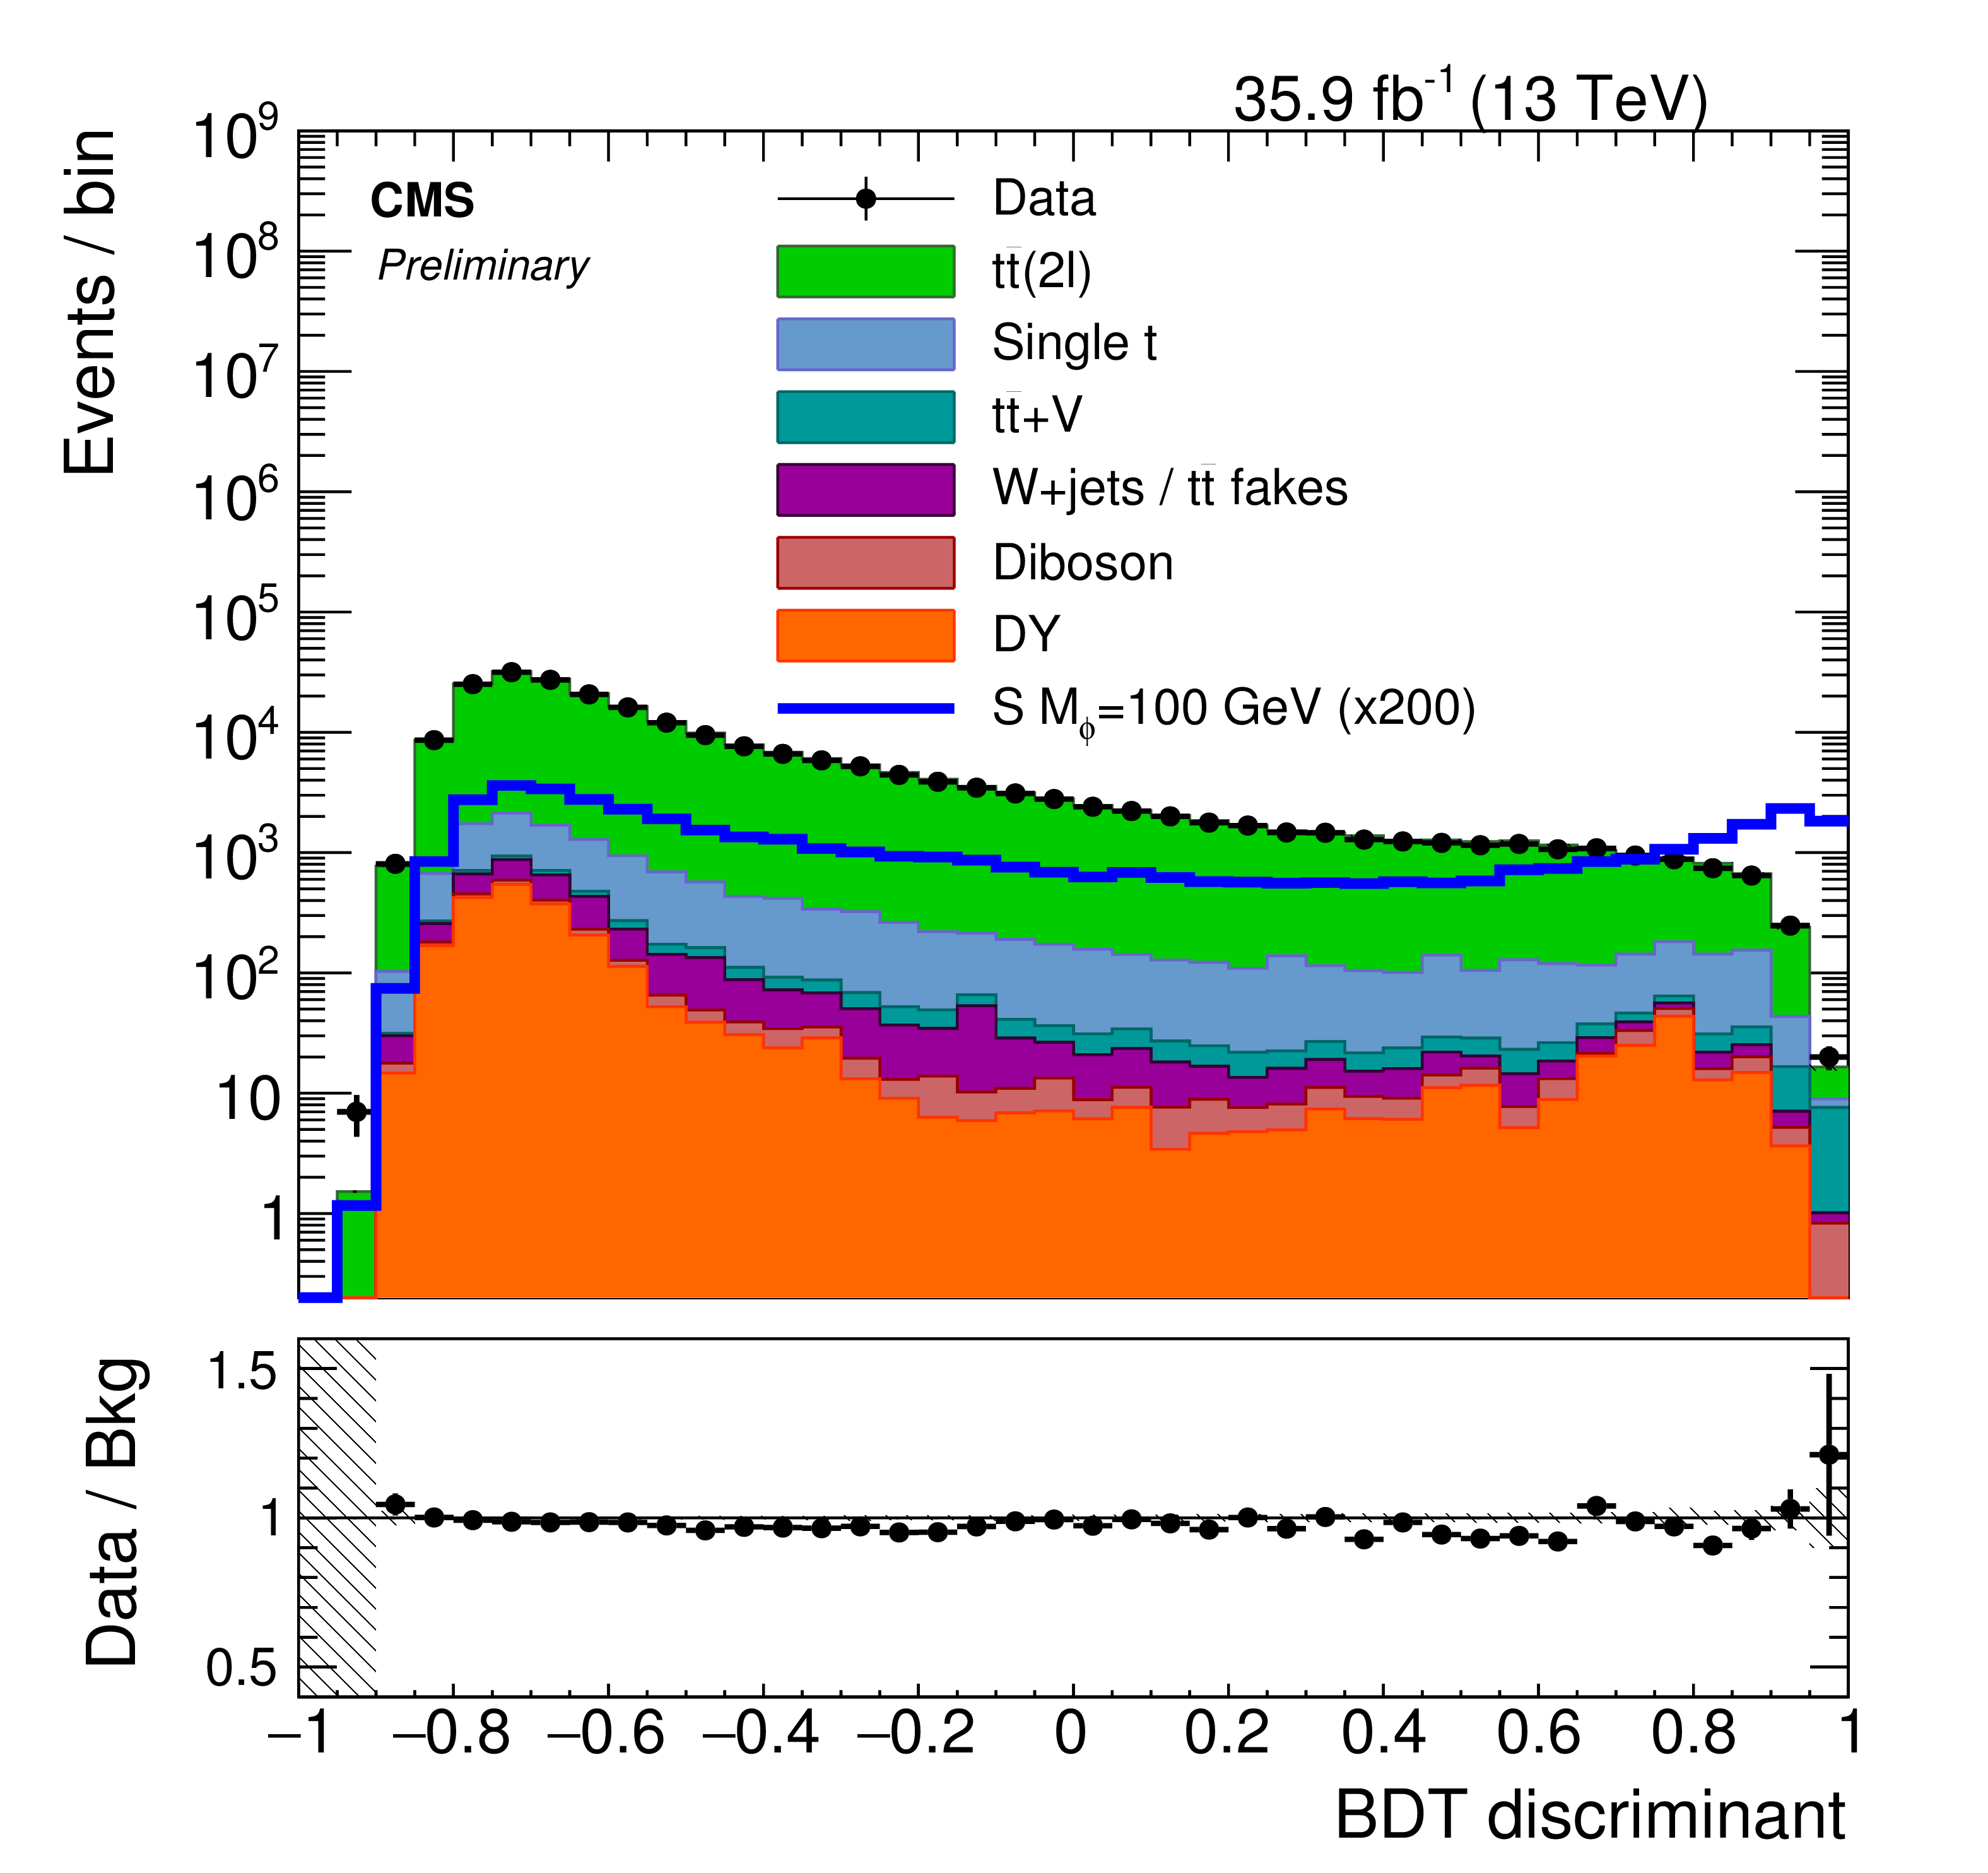
Figure 7-a:
The pre-fit BDT discriminant distribution trained on the working point 1 GeV dark matter mass and 500 GeV mediator mass for a scalar mediator. The distributions of two example signals (scalar and pseudoscalar mediator, $m_{\phi/a} = $ 100 GeV) with $m_{\chi}= $ 1 GeV are scaled up by a factor of 200. The $\mathrm{ee}$, $\mathrm{e}\mu$ and $\mu\mu$ channels have been combined. Uncertainties are statistical only. |

png pdf |
Figure 7-b:
The pre-fit BDT discriminant distribution trained on the working point 1 GeV dark matter mass and 500 GeV mediator mass for a pseudoscalar mediator. The distributions of two example signals (scalar and pseudoscalar mediator, $m_{\phi/a} = $ 100 GeV) with $m_{\chi}= $ 1 GeV are scaled up by a factor of 200. The $\mathrm{ee}$, $\mathrm{e}\mu$ and $\mu\mu$ channels have been combined. Uncertainties are statistical only. |

png pdf |
Figure 8:
Distribution of the $p_{\text {T}}^{\text {Dark}} $input variable used to train the ANN for a scalar signal model hypothesis with $m_{\chi}= $ 1 GeV, and $m_{\phi}= $ 100 GeV. The signal distributions are scaled up by a factor of 200. The last bin contains overflow. Uncertainties are statistical only. |

png pdf |
Figure 9:
Distribution of the ANN discriminant for a signal model with $m_{\chi}=$ 1 GeV and $m_{\phi}= $ 100 GeV for a (a) scalar hypothesis and a (b) pseudoscalar hypothesis. The signal distributions are scaled up by a factor of 200. Uncertainties are statistical only. |
png pdf |
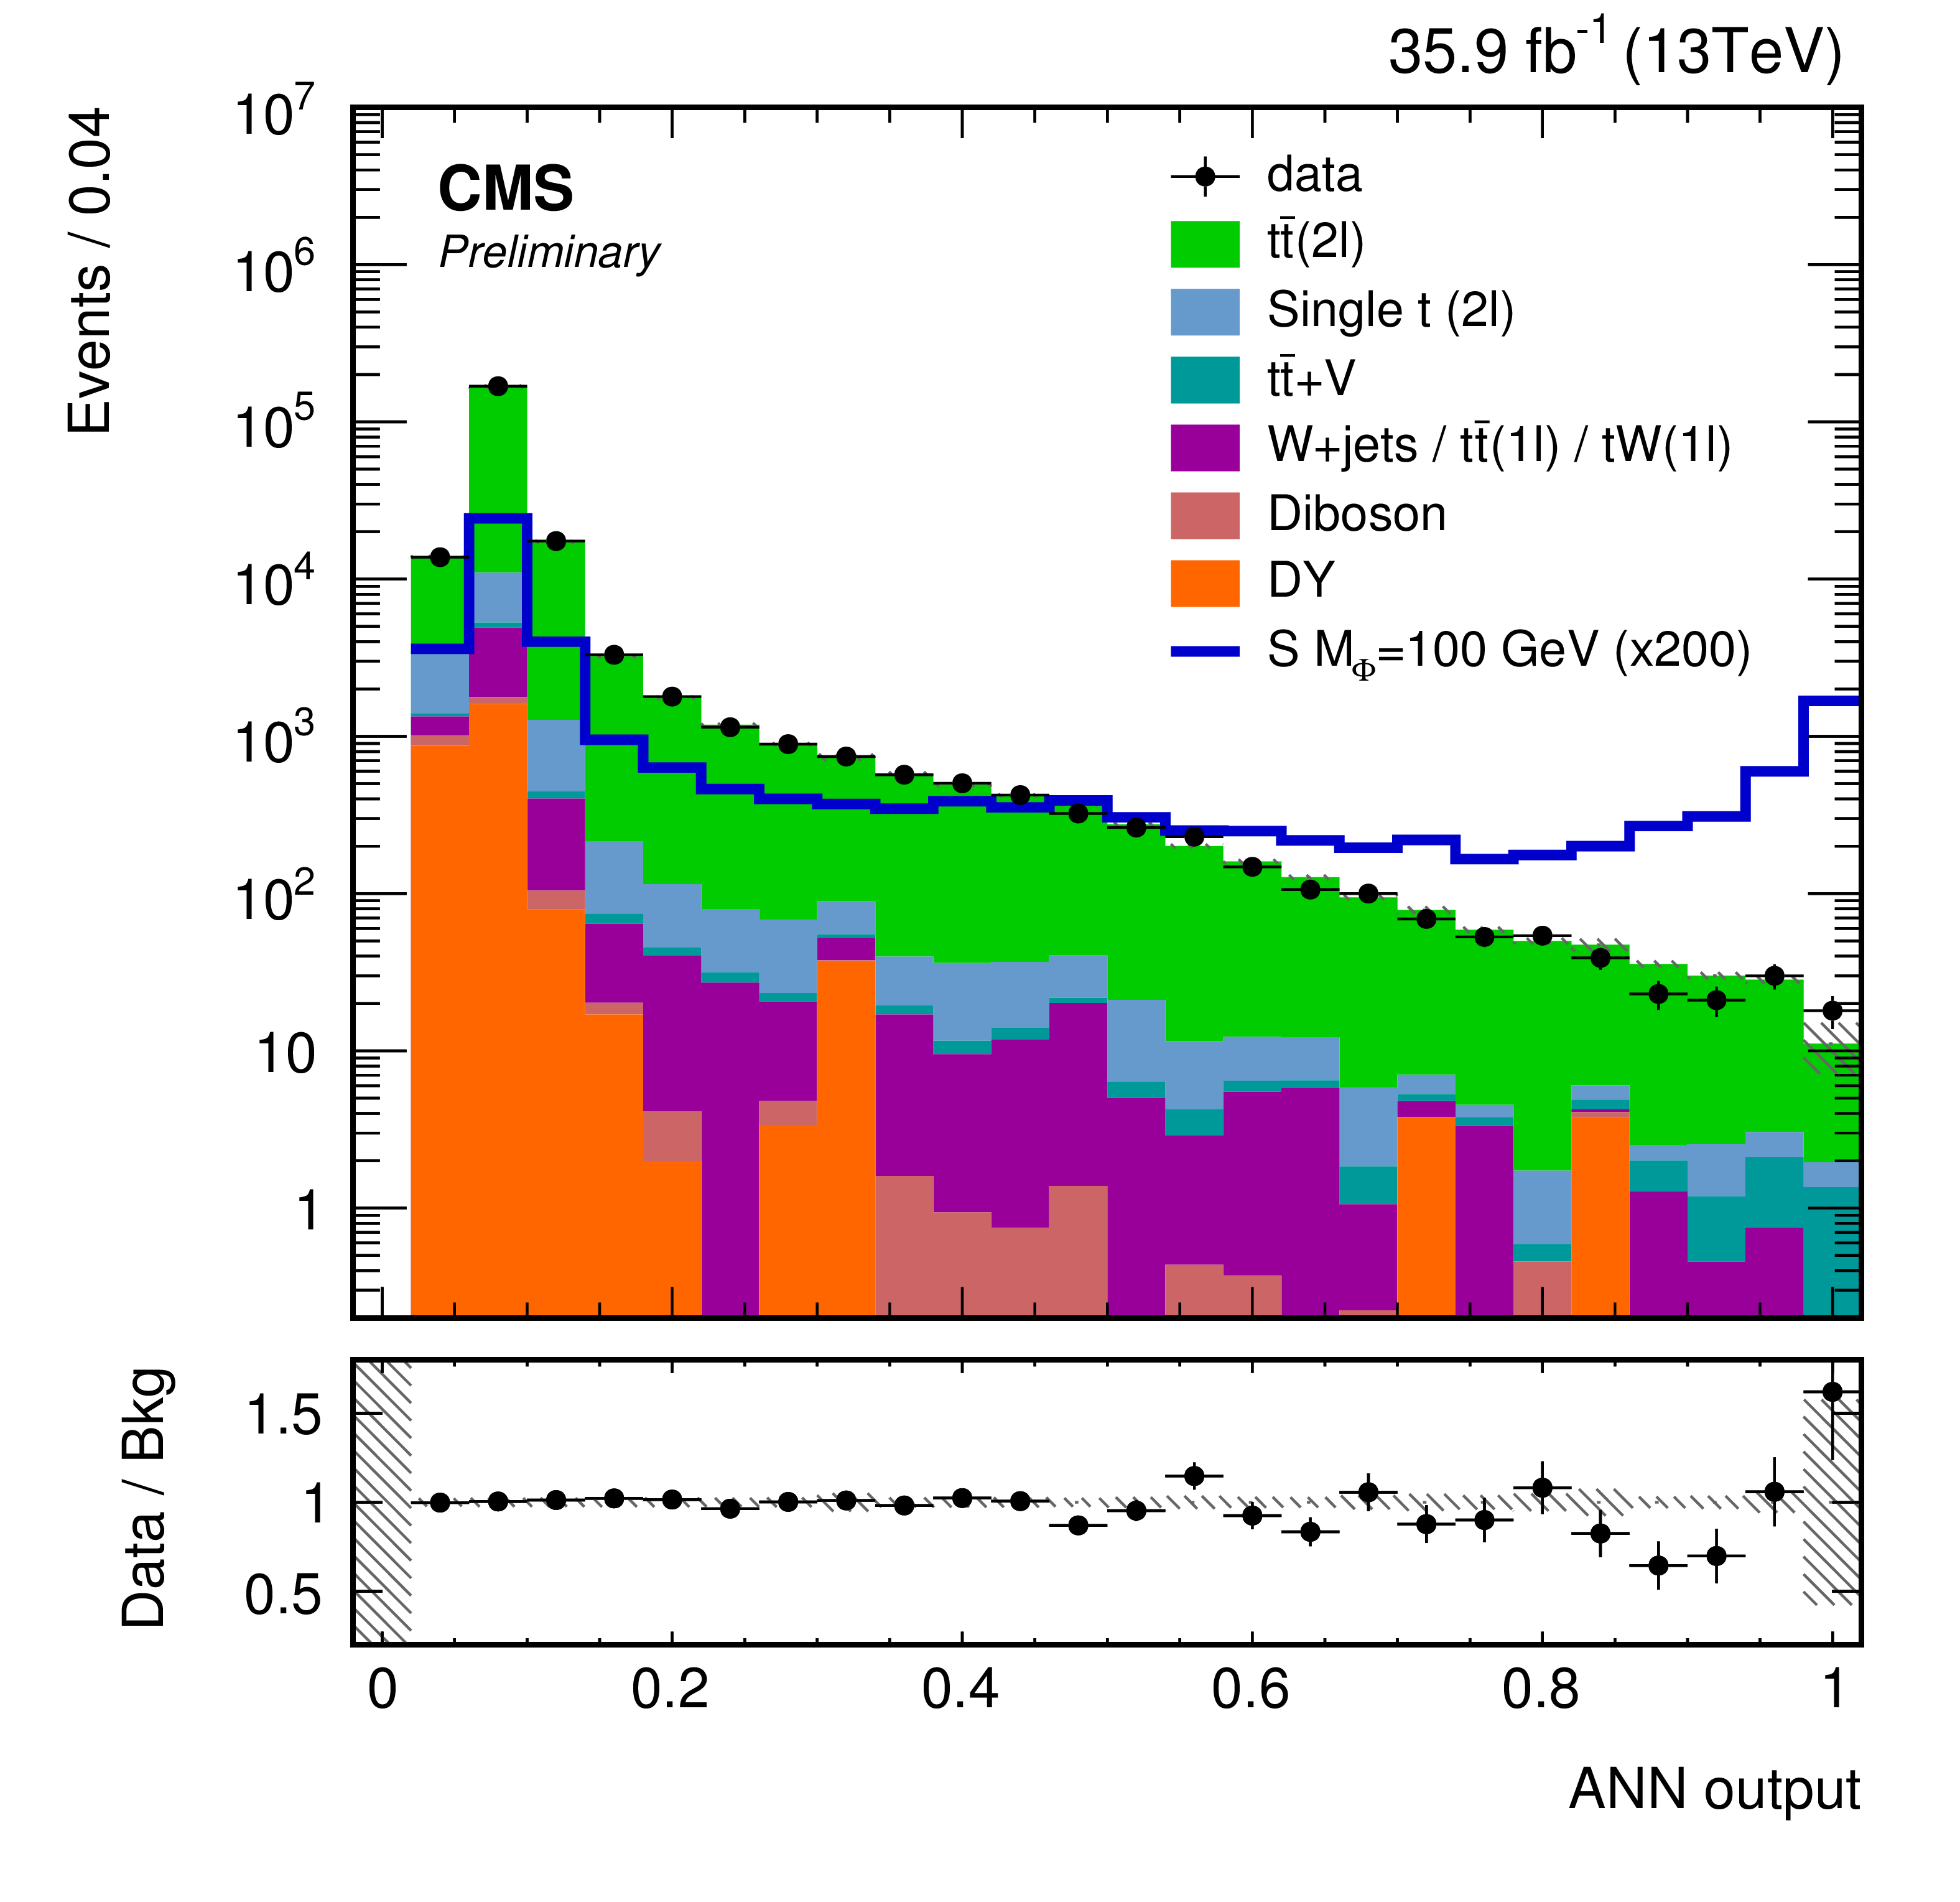
Figure 9-a:
Distribution of the ANN discriminant for a signal model with $m_{\chi}=$ 1 GeV and $m_{\phi}= $ 100 GeV for a scalar hypothesis. The signal distributions are scaled up by a factor of 200. Uncertainties are statistical only. |
png pdf |
Figure 9-b:
Distribution of the ANN discriminant for a signal model with $m_{\chi}=$ 1 GeV and $m_{\phi}= $ 100 GeV for a pseudoscalar hypothesis. The signal distributions are scaled up by a factor of 200. Uncertainties are statistical only. |

png pdf |
Figure 10:
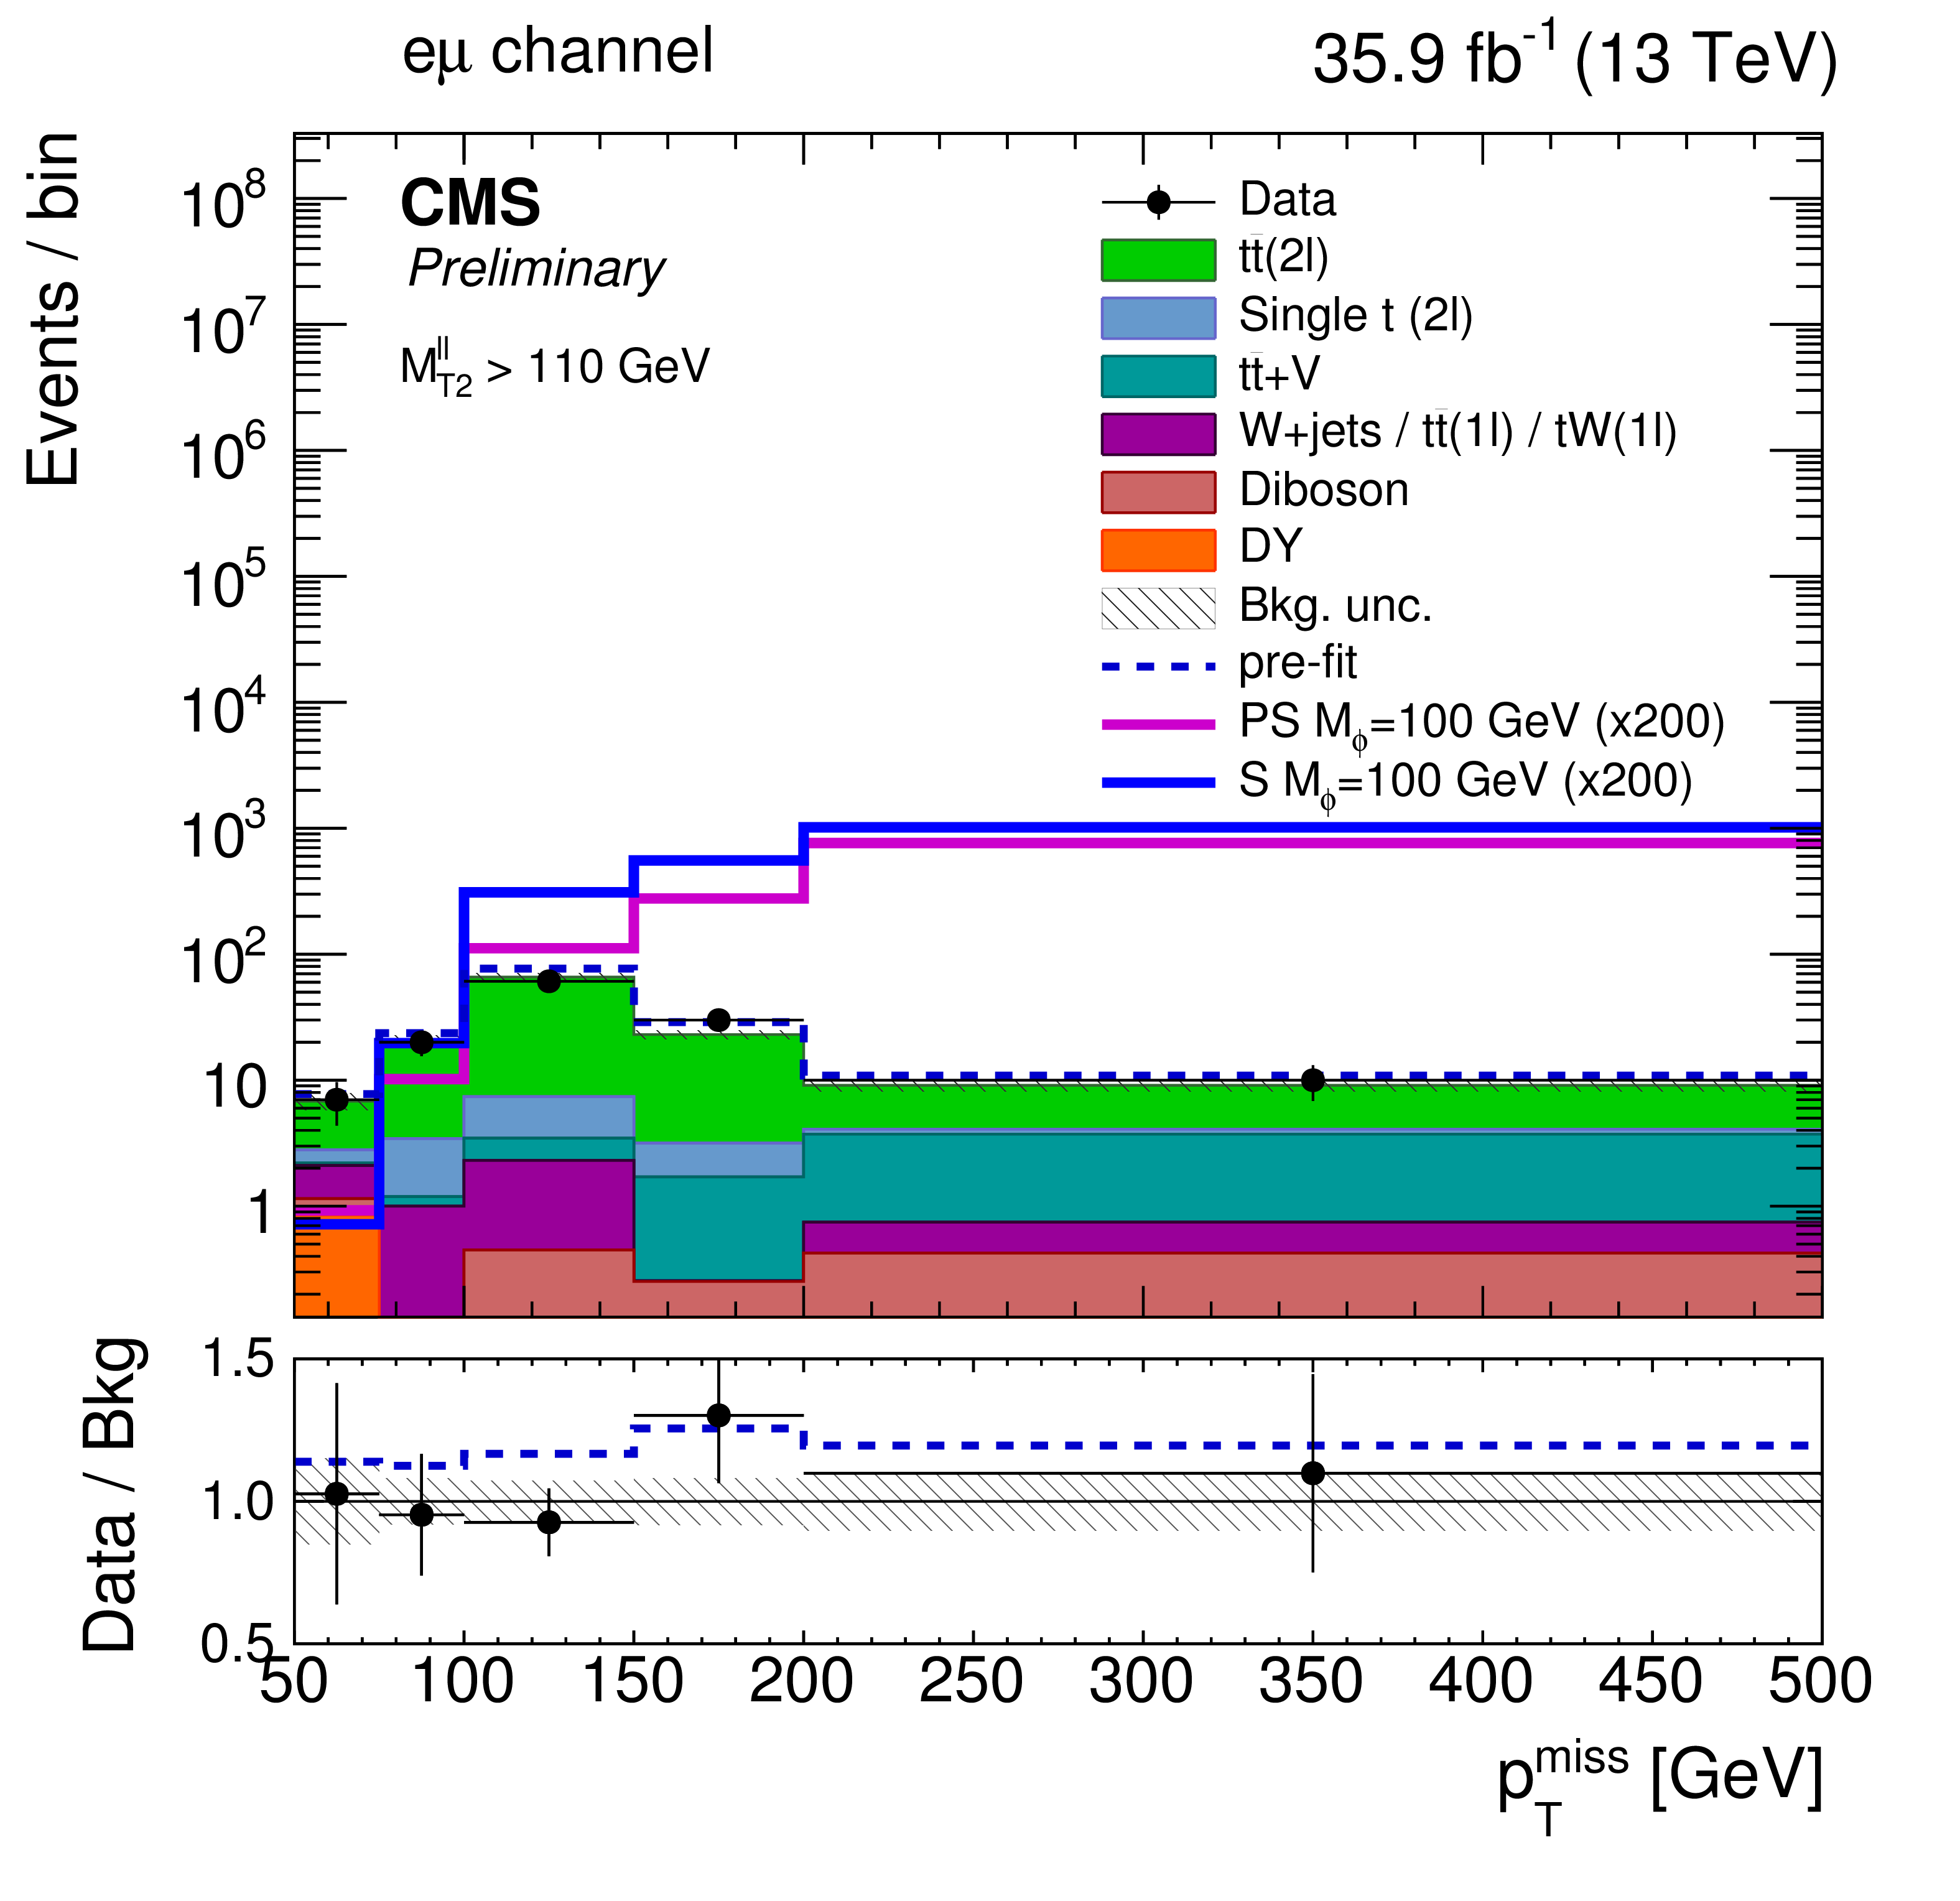
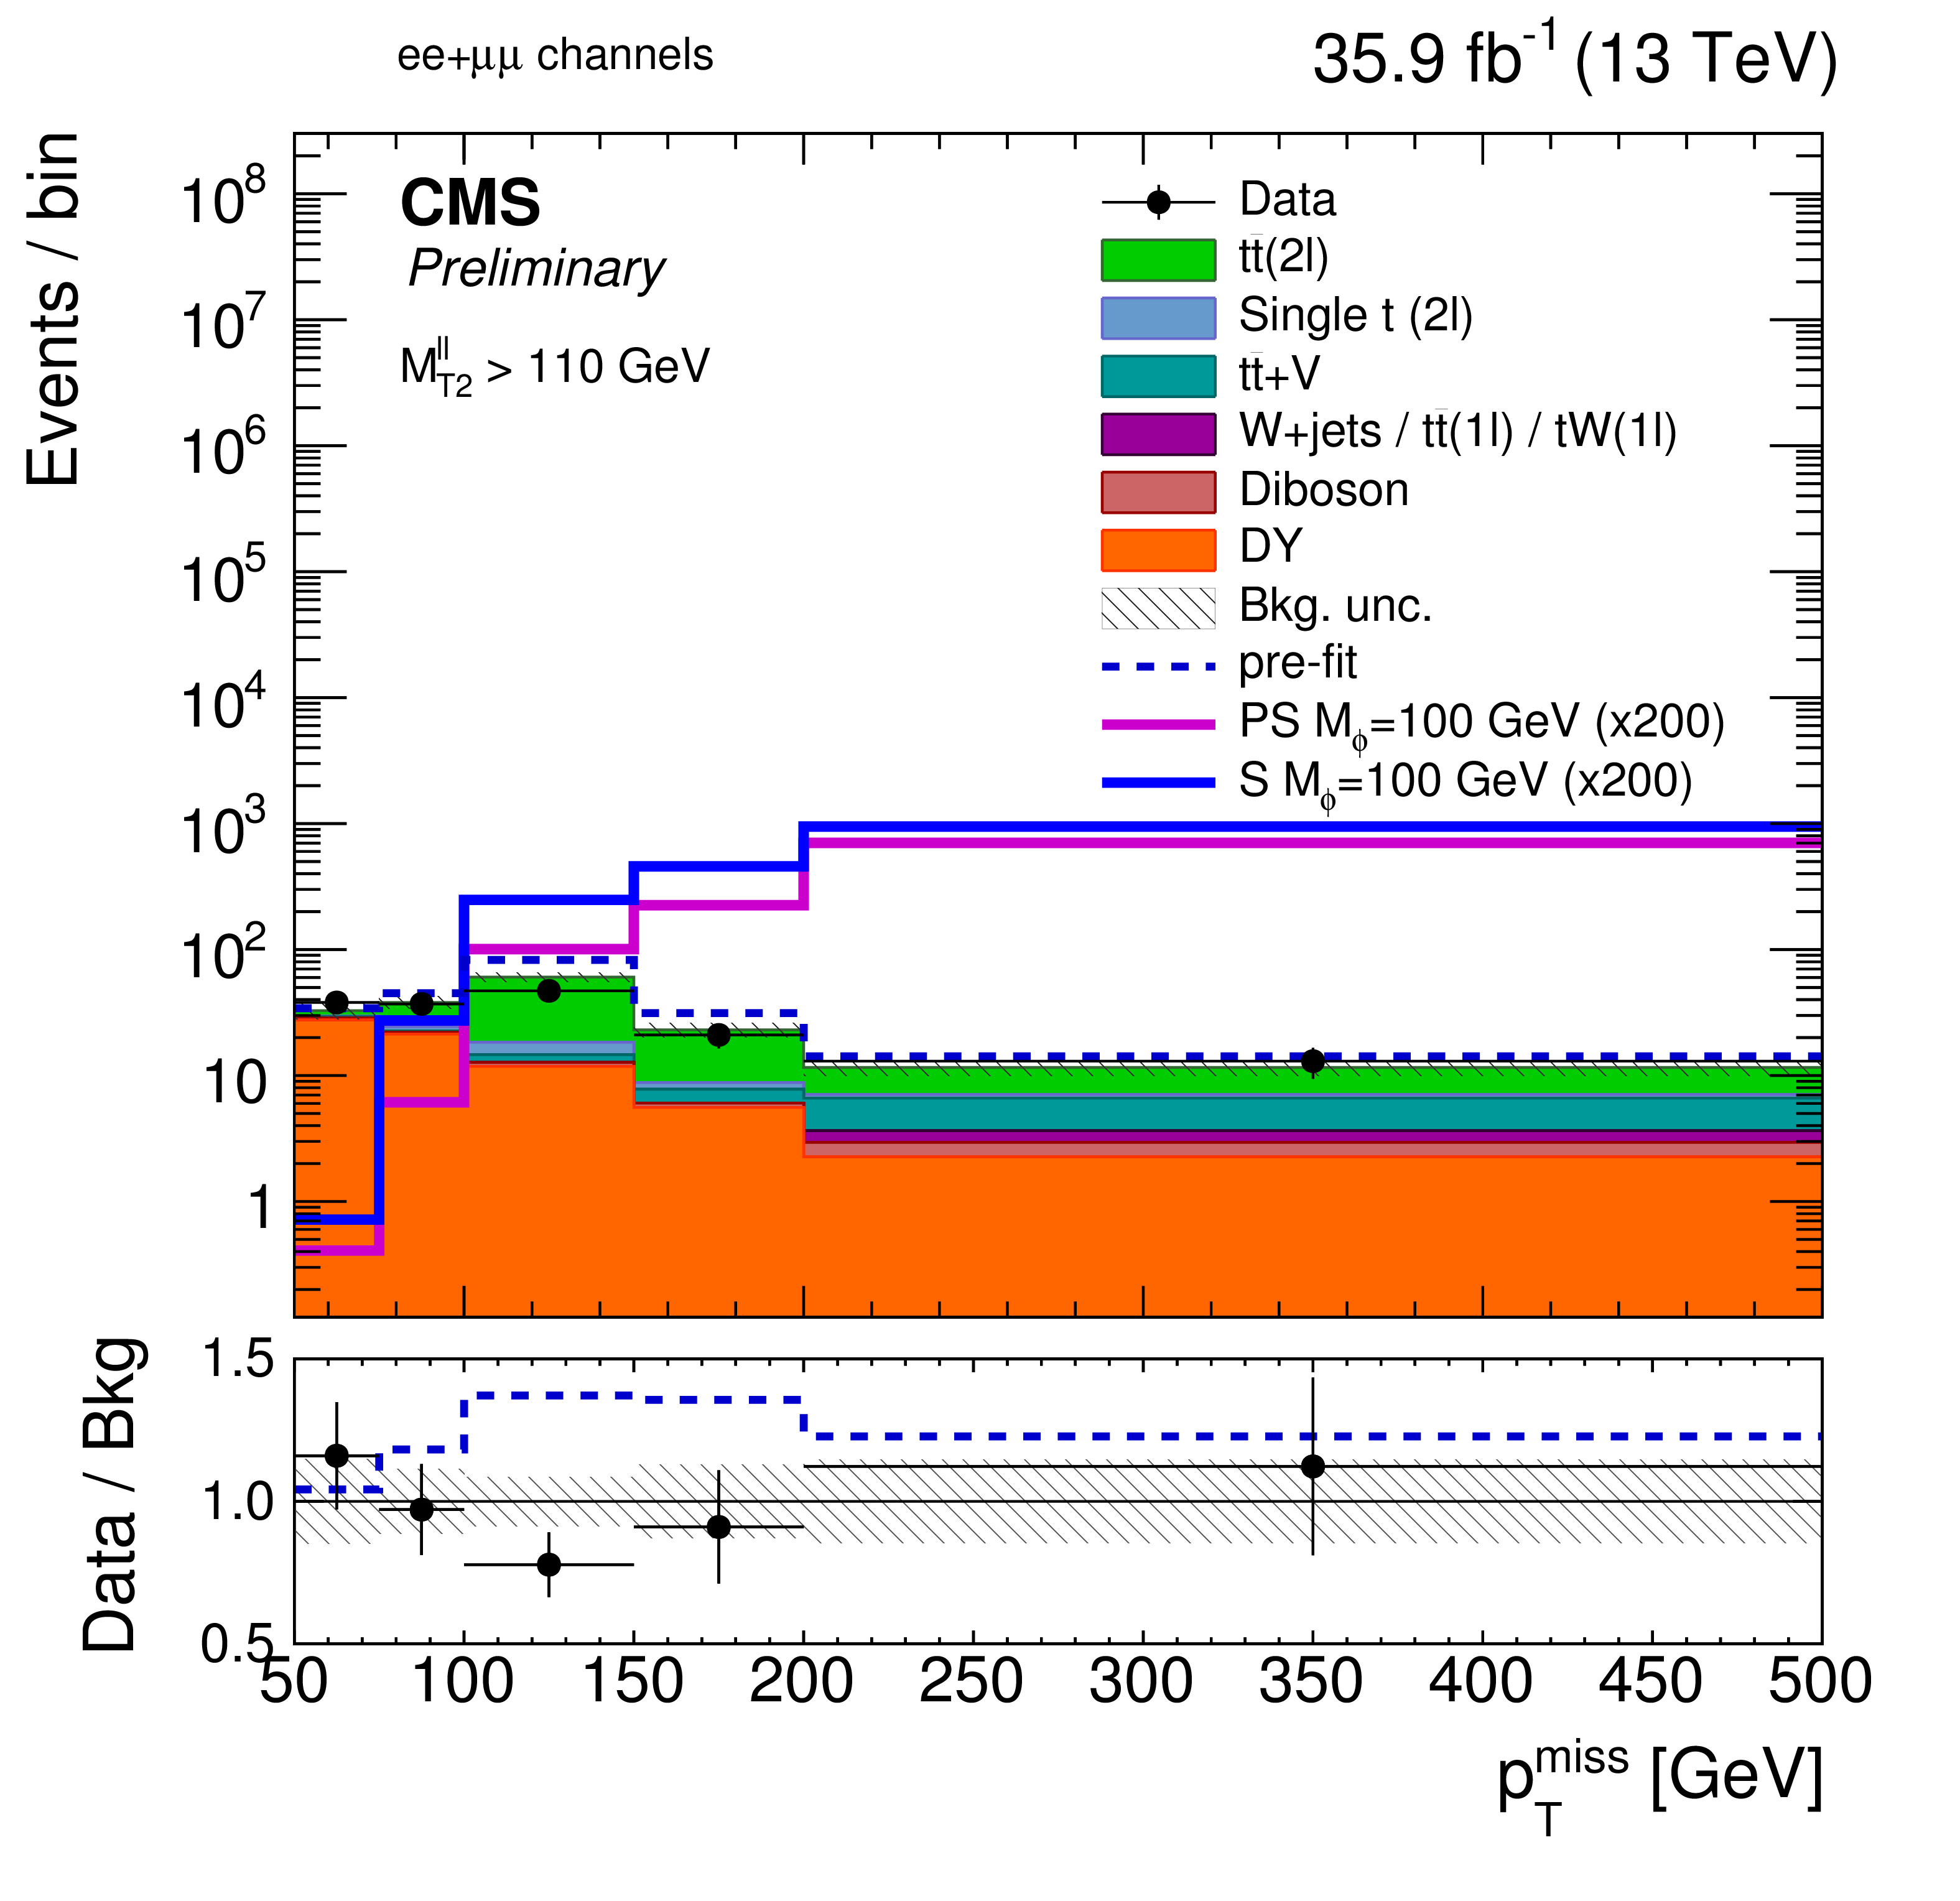
The post-fit $ {p_{\text {T}}^{\text {miss}}}$ distributions in the four signal extraction regions of the $ {p_{\text {T}}^{\text {miss}}}$ shape analysis. The pre-fit $ {p_{\text {T}}^{\text {miss}}}$ distributions for two example signals (scalar and pseudoscalar mediator, $m_{\phi /a}= $ 100 GeV) with $m_{\chi}= $ 1 GeV are scaled up by a factor of 200. The last bin includes overflow. Statistical and systematic uncertainties are shown. |

png pdf |
Figure 10-a:
The post-fit $ {p_{\text {T}}^{\text {miss}}}$ distribution in the high-purity $\mathrm{e}\mu$ extraction region of the $ {p_{\text {T}}^{\text {miss}}}$ shape analysis. The pre-fit $ {p_{\text {T}}^{\text {miss}}}$ distributions for two example signals (scalar and pseudoscalar mediator, $m_{\phi /a}= $ 100 GeV) with $m_{\chi}= $ 1 GeV are scaled up by a factor of 200. The last bin includes overflow. Statistical and systematic uncertainties are shown. |

png pdf |
Figure 10-b:
The post-fit $ {p_{\text {T}}^{\text {miss}}}$ distribution in the high-purity $ \mathrm{ee} + \mu\mu$ extraction region of the $ {p_{\text {T}}^{\text {miss}}}$ shape analysis. The pre-fit $ {p_{\text {T}}^{\text {miss}}}$ distributions for two example signals (scalar and pseudoscalar mediator, $m_{\phi /a}= $ 100 GeV) with $m_{\chi}= $ 1 GeV are scaled up by a factor of 200. The last bin includes overflow. Statistical and systematic uncertainties are shown. |
png pdf |
Figure 10-c:
The post-fit $ {p_{\text {T}}^{\text {miss}}}$ distribution in the low-purity $\mathrm{e}\mu$ extraction region of the $ {p_{\text {T}}^{\text {miss}}}$ shape analysis. The pre-fit $ {p_{\text {T}}^{\text {miss}}}$ distributions for two example signals (scalar and pseudoscalar mediator, $m_{\phi /a}= $ 100 GeV) with $m_{\chi}= $ 1 GeV are scaled up by a factor of 200. The last bin includes overflow. Statistical and systematic uncertainties are shown. |
png pdf |
Figure 10-d:
The post-fit $ {p_{\text {T}}^{\text {miss}}}$ distribution in the low-purity $ \mathrm{ee} + \mu\mu$ extraction region of the $ {p_{\text {T}}^{\text {miss}}}$ shape analysis. The pre-fit $ {p_{\text {T}}^{\text {miss}}}$ distributions for two example signals (scalar and pseudoscalar mediator, $m_{\phi /a}= $ 100 GeV) with $m_{\chi}= $ 1 GeV are scaled up by a factor of 200. The last bin includes overflow. Statistical and systematic uncertainties are shown. |

png pdf |
Figure 11:
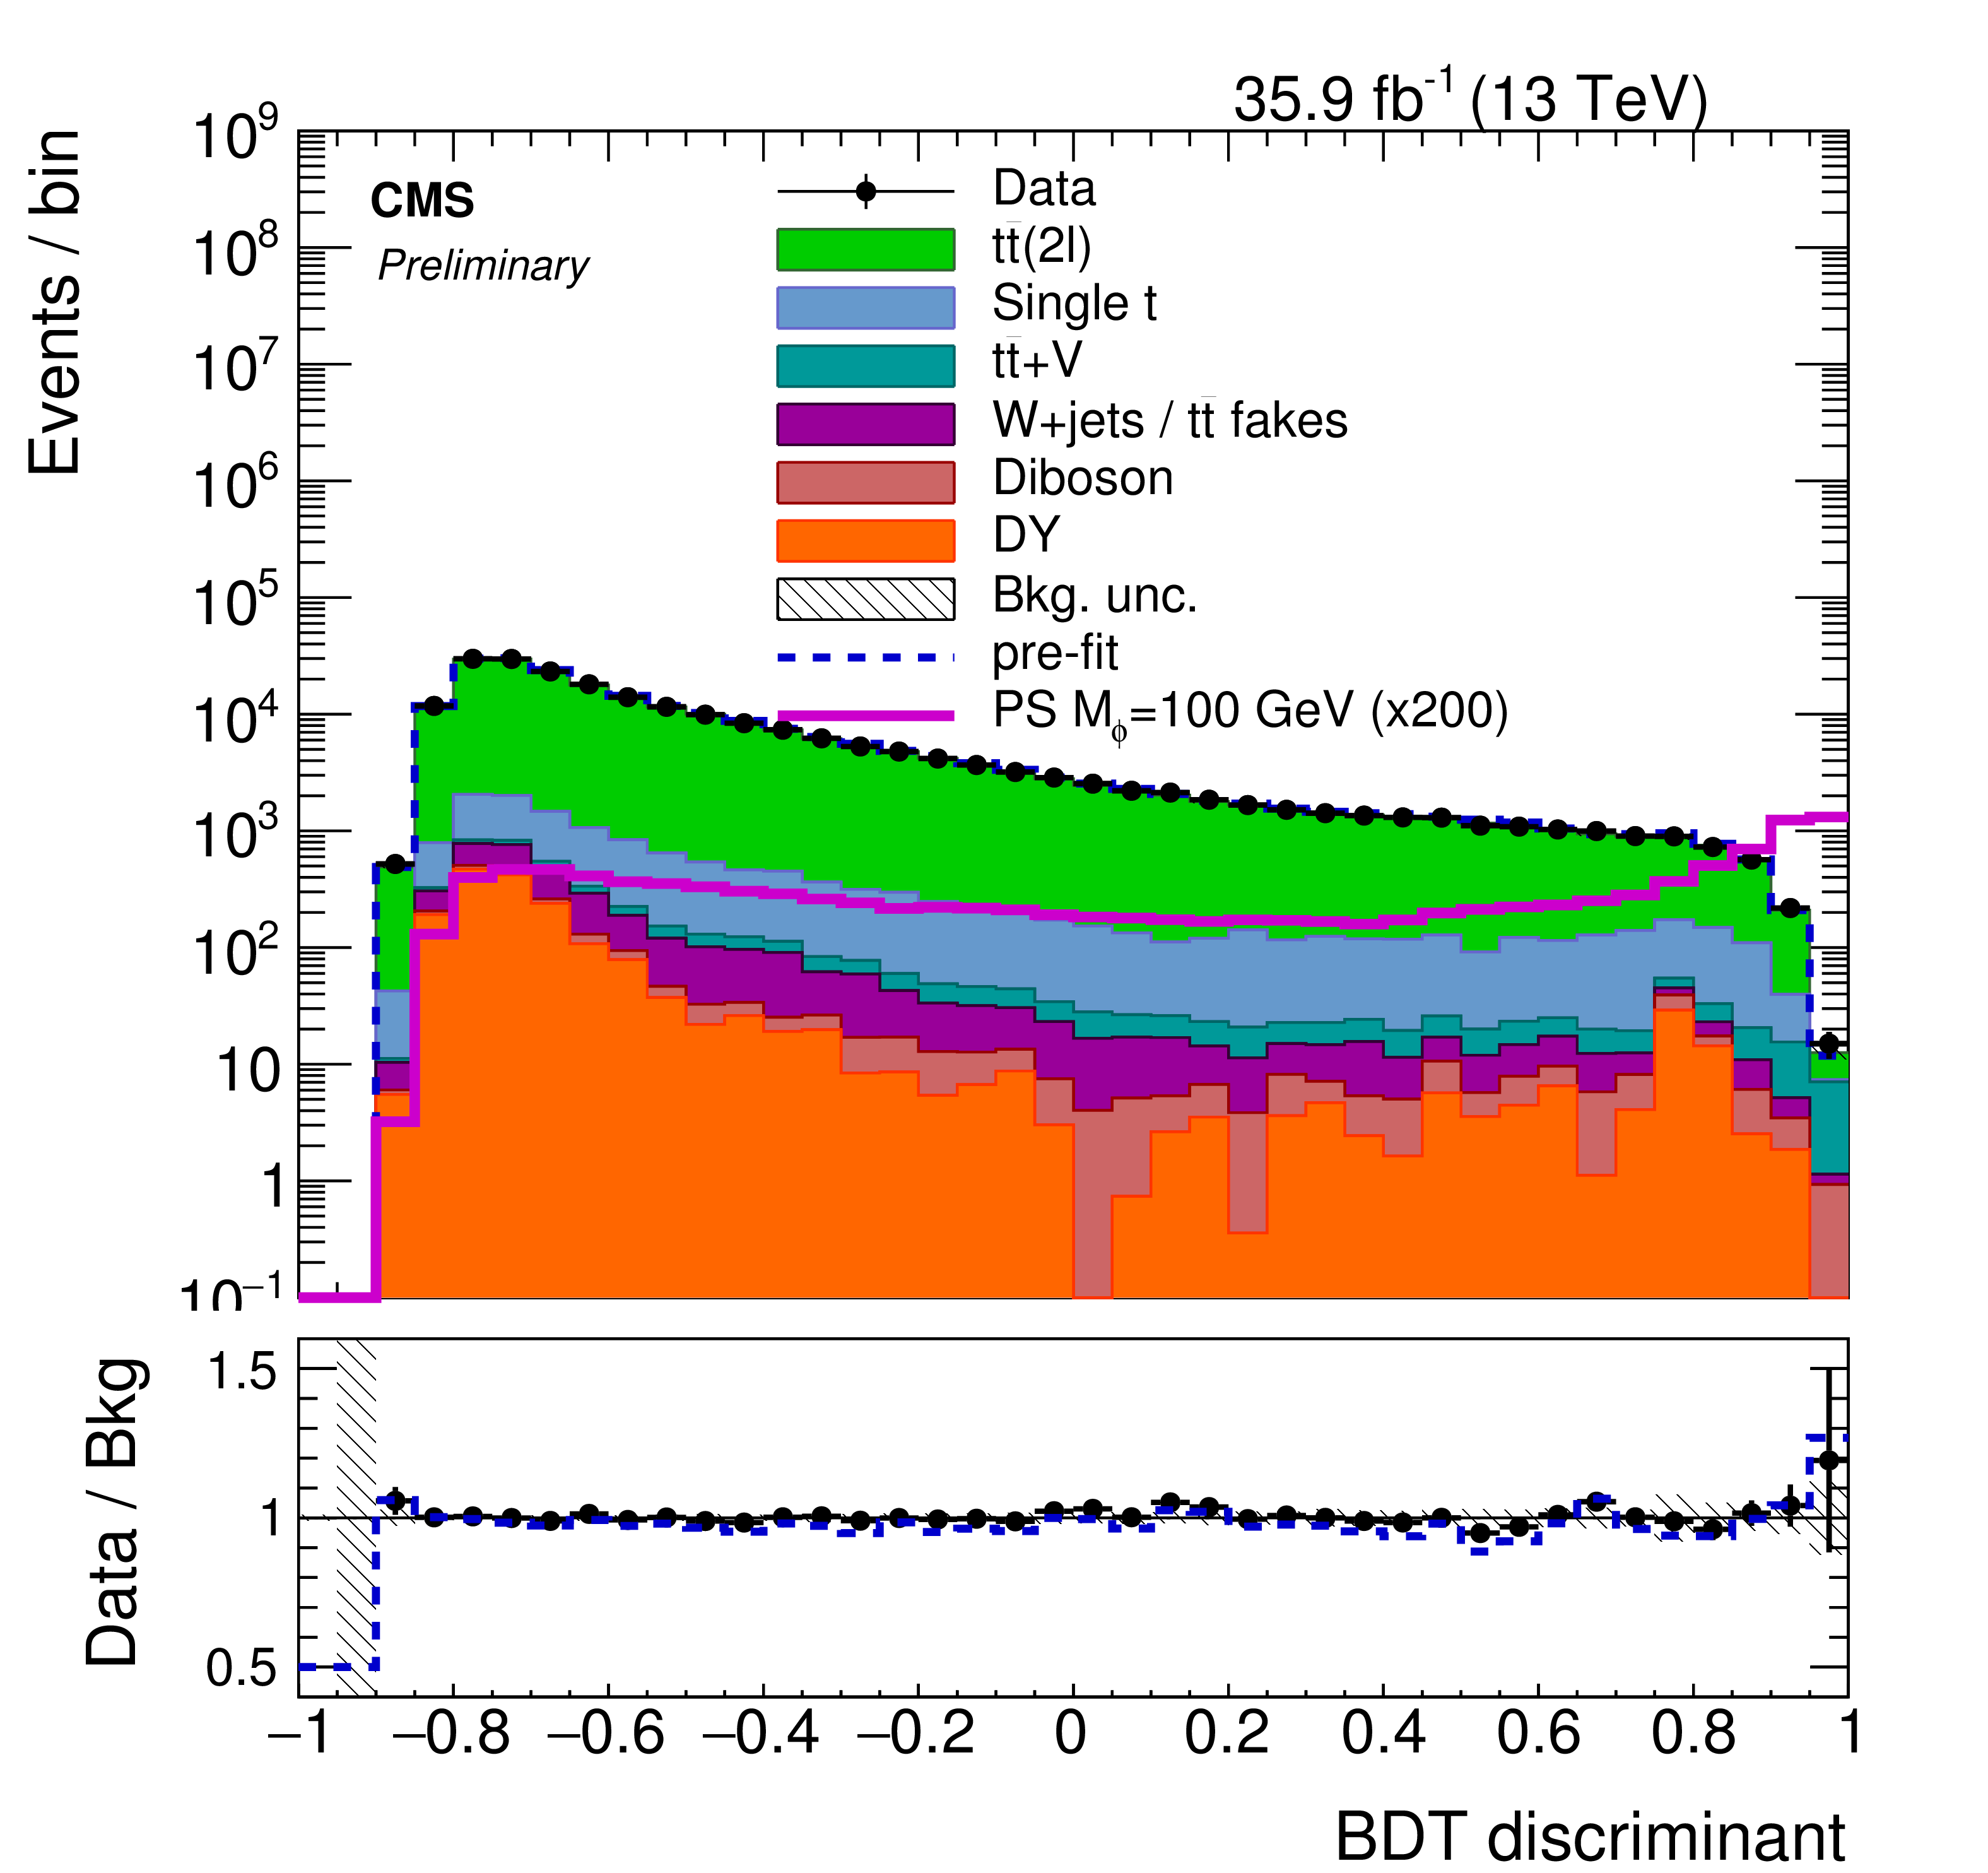
The post-fit BDT discriminant distribution in the signal region trained on the working point for $m_\phi= $ 500 GeV, $m_\chi= $ 1 GeV for a (a) scalar mediator and a (b) pseudoscalar mediator. The pre-fit BDT discriminant distributions for two example signals (scalar and pseudoscalar mediator, $m_{\phi/a} = $ 100 GeV) with $m_{\chi} = $ 1 GeV are scaled up by a factor of 200. Statistical and systematic uncertainties are shown. |

png pdf |
Figure 11-a:
The post-fit BDT discriminant distribution in the signal region trained on the working point for $m_\phi= $ 500 GeV, $m_\chi= $ 1 GeV for a scalar mediator. The pre-fit BDT discriminant distributions for two example signals (scalar and pseudoscalar mediator, $m_{\phi/a} = $ 100 GeV) with $m_{\chi} = $ 1 GeV are scaled up by a factor of 200. Statistical and systematic uncertainties are shown. |
png pdf |
Figure 11-b:
The post-fit BDT discriminant distribution in the signal region trained on the working point for $m_\phi= $ 500 GeV, $m_\chi= $ 1 GeV for a pseudoscalar mediator. The pre-fit BDT discriminant distributions for two example signals (scalar and pseudoscalar mediator, $m_{\phi/a} = $ 100 GeV) with $m_{\chi} = $ 1 GeV are scaled up by a factor of 200. Statistical and systematic uncertainties are shown. |
png pdf |
Figure 12:
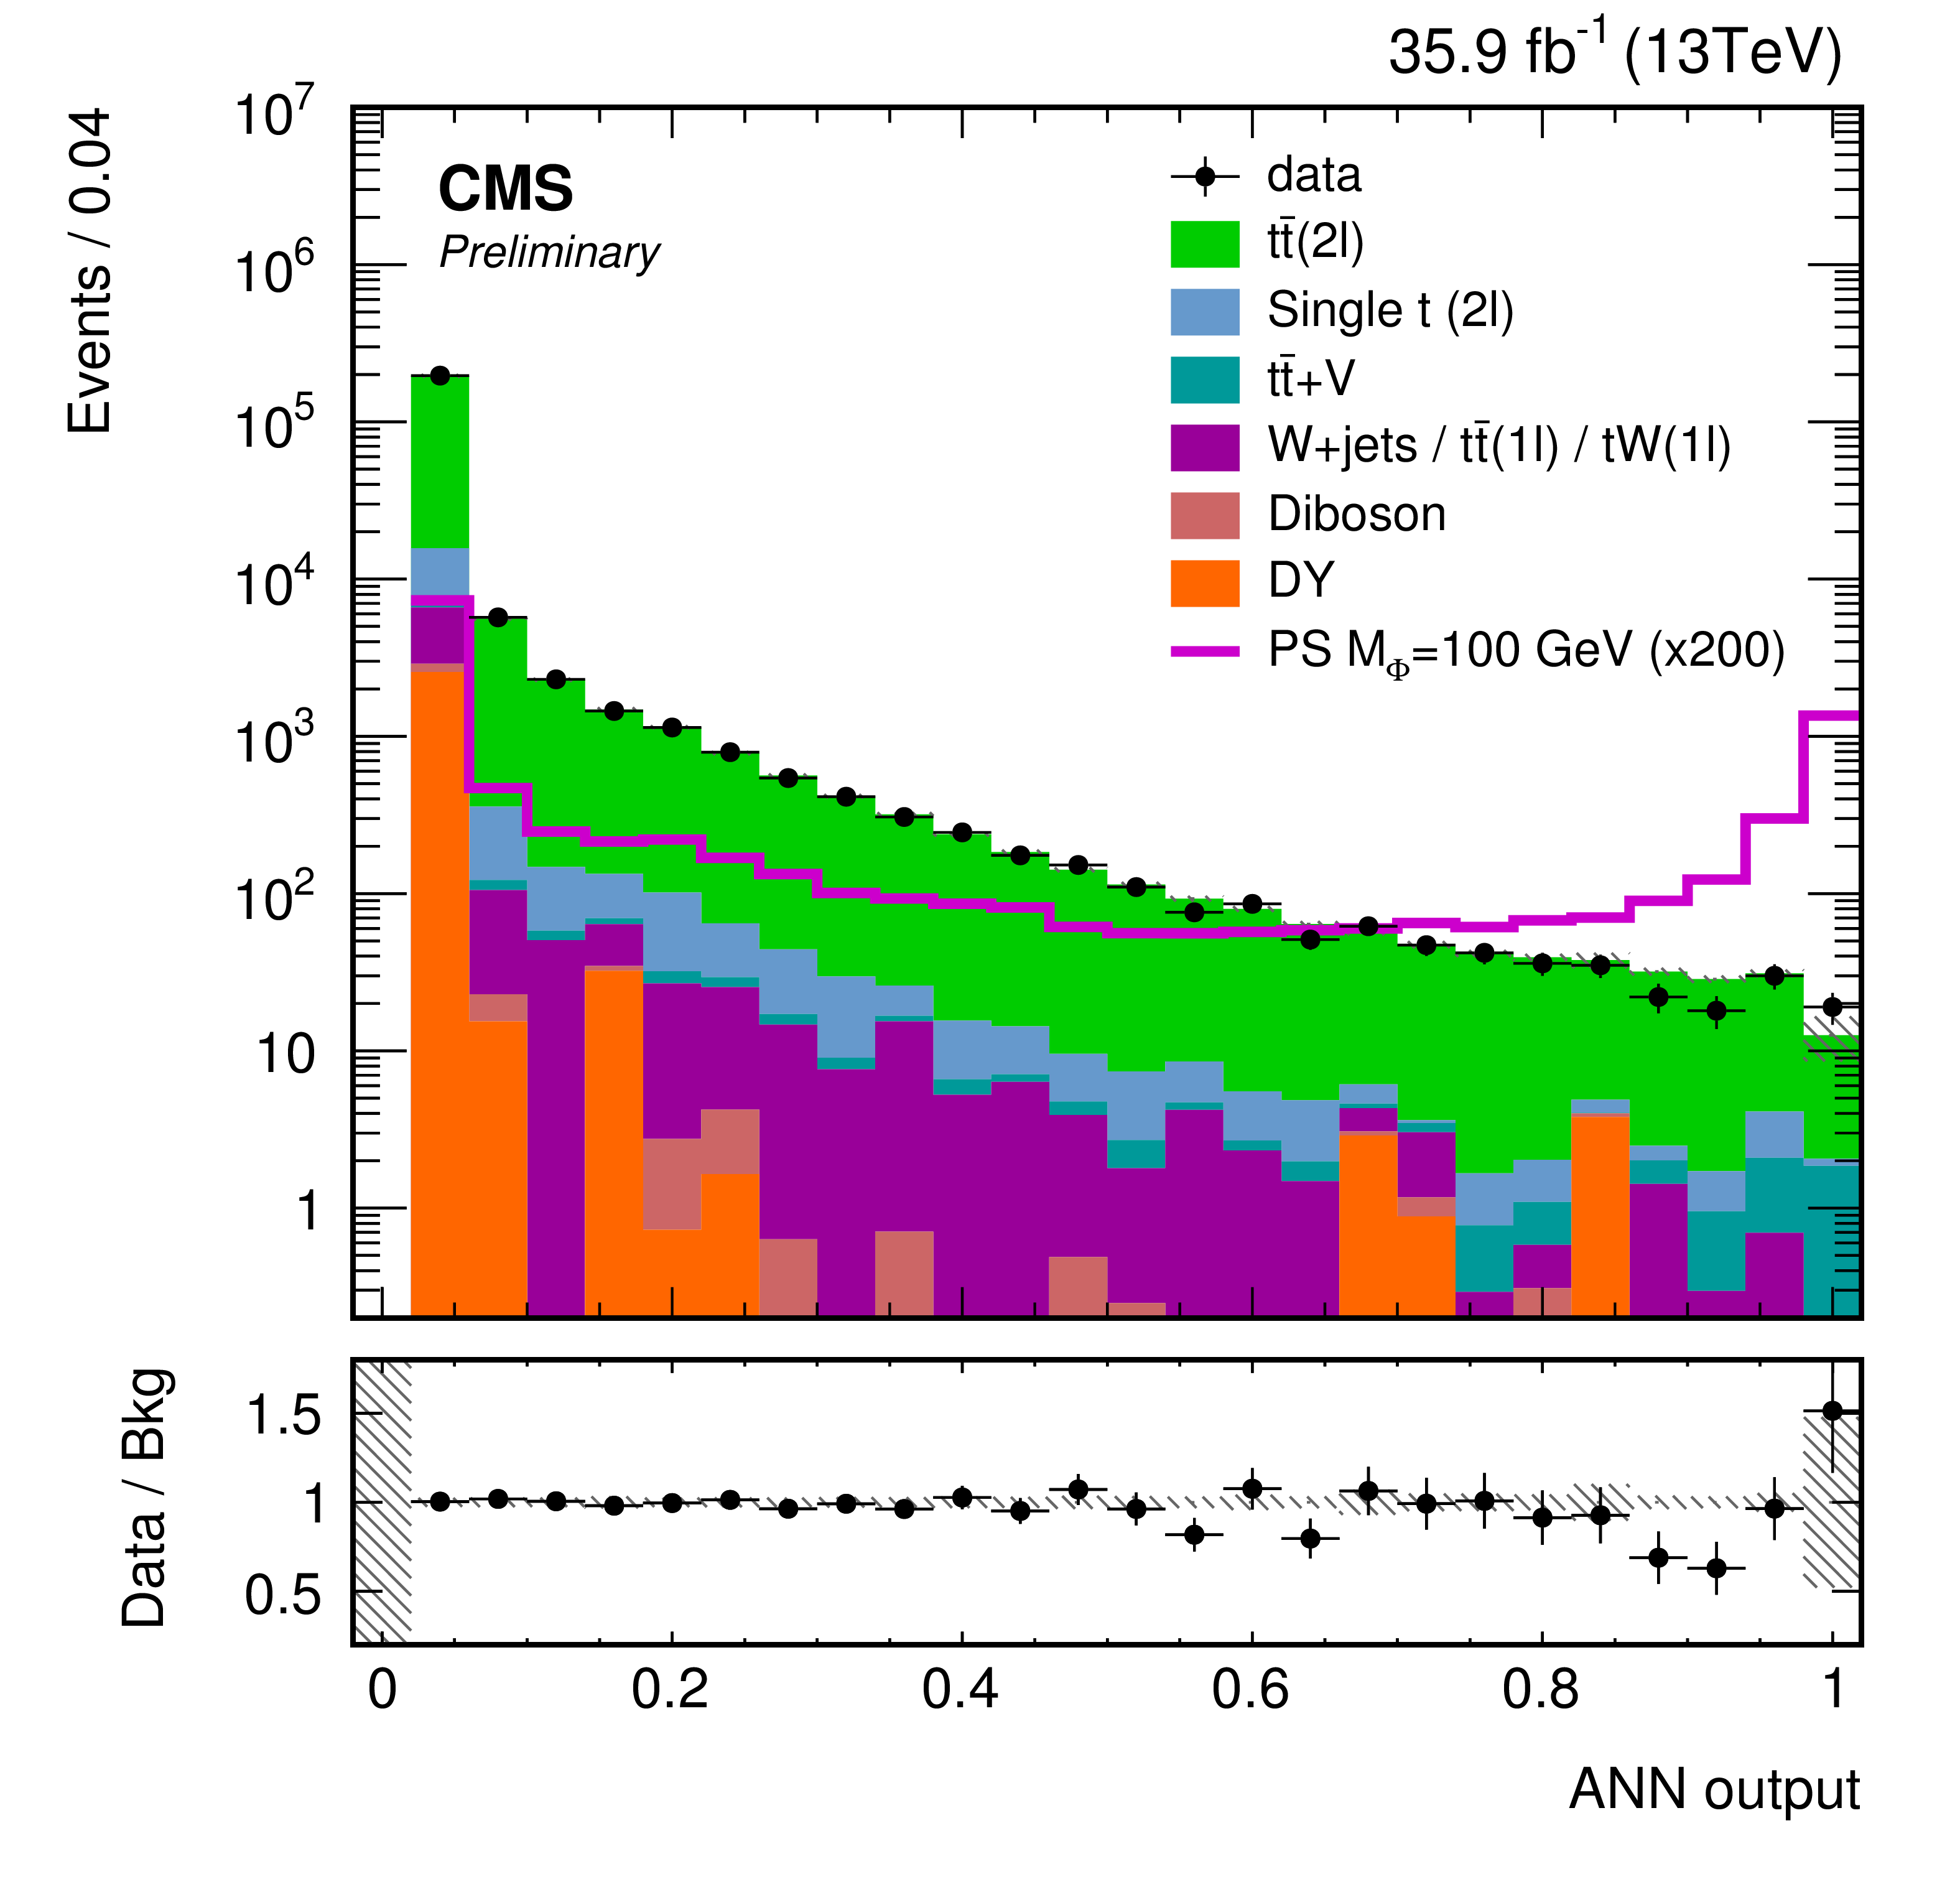
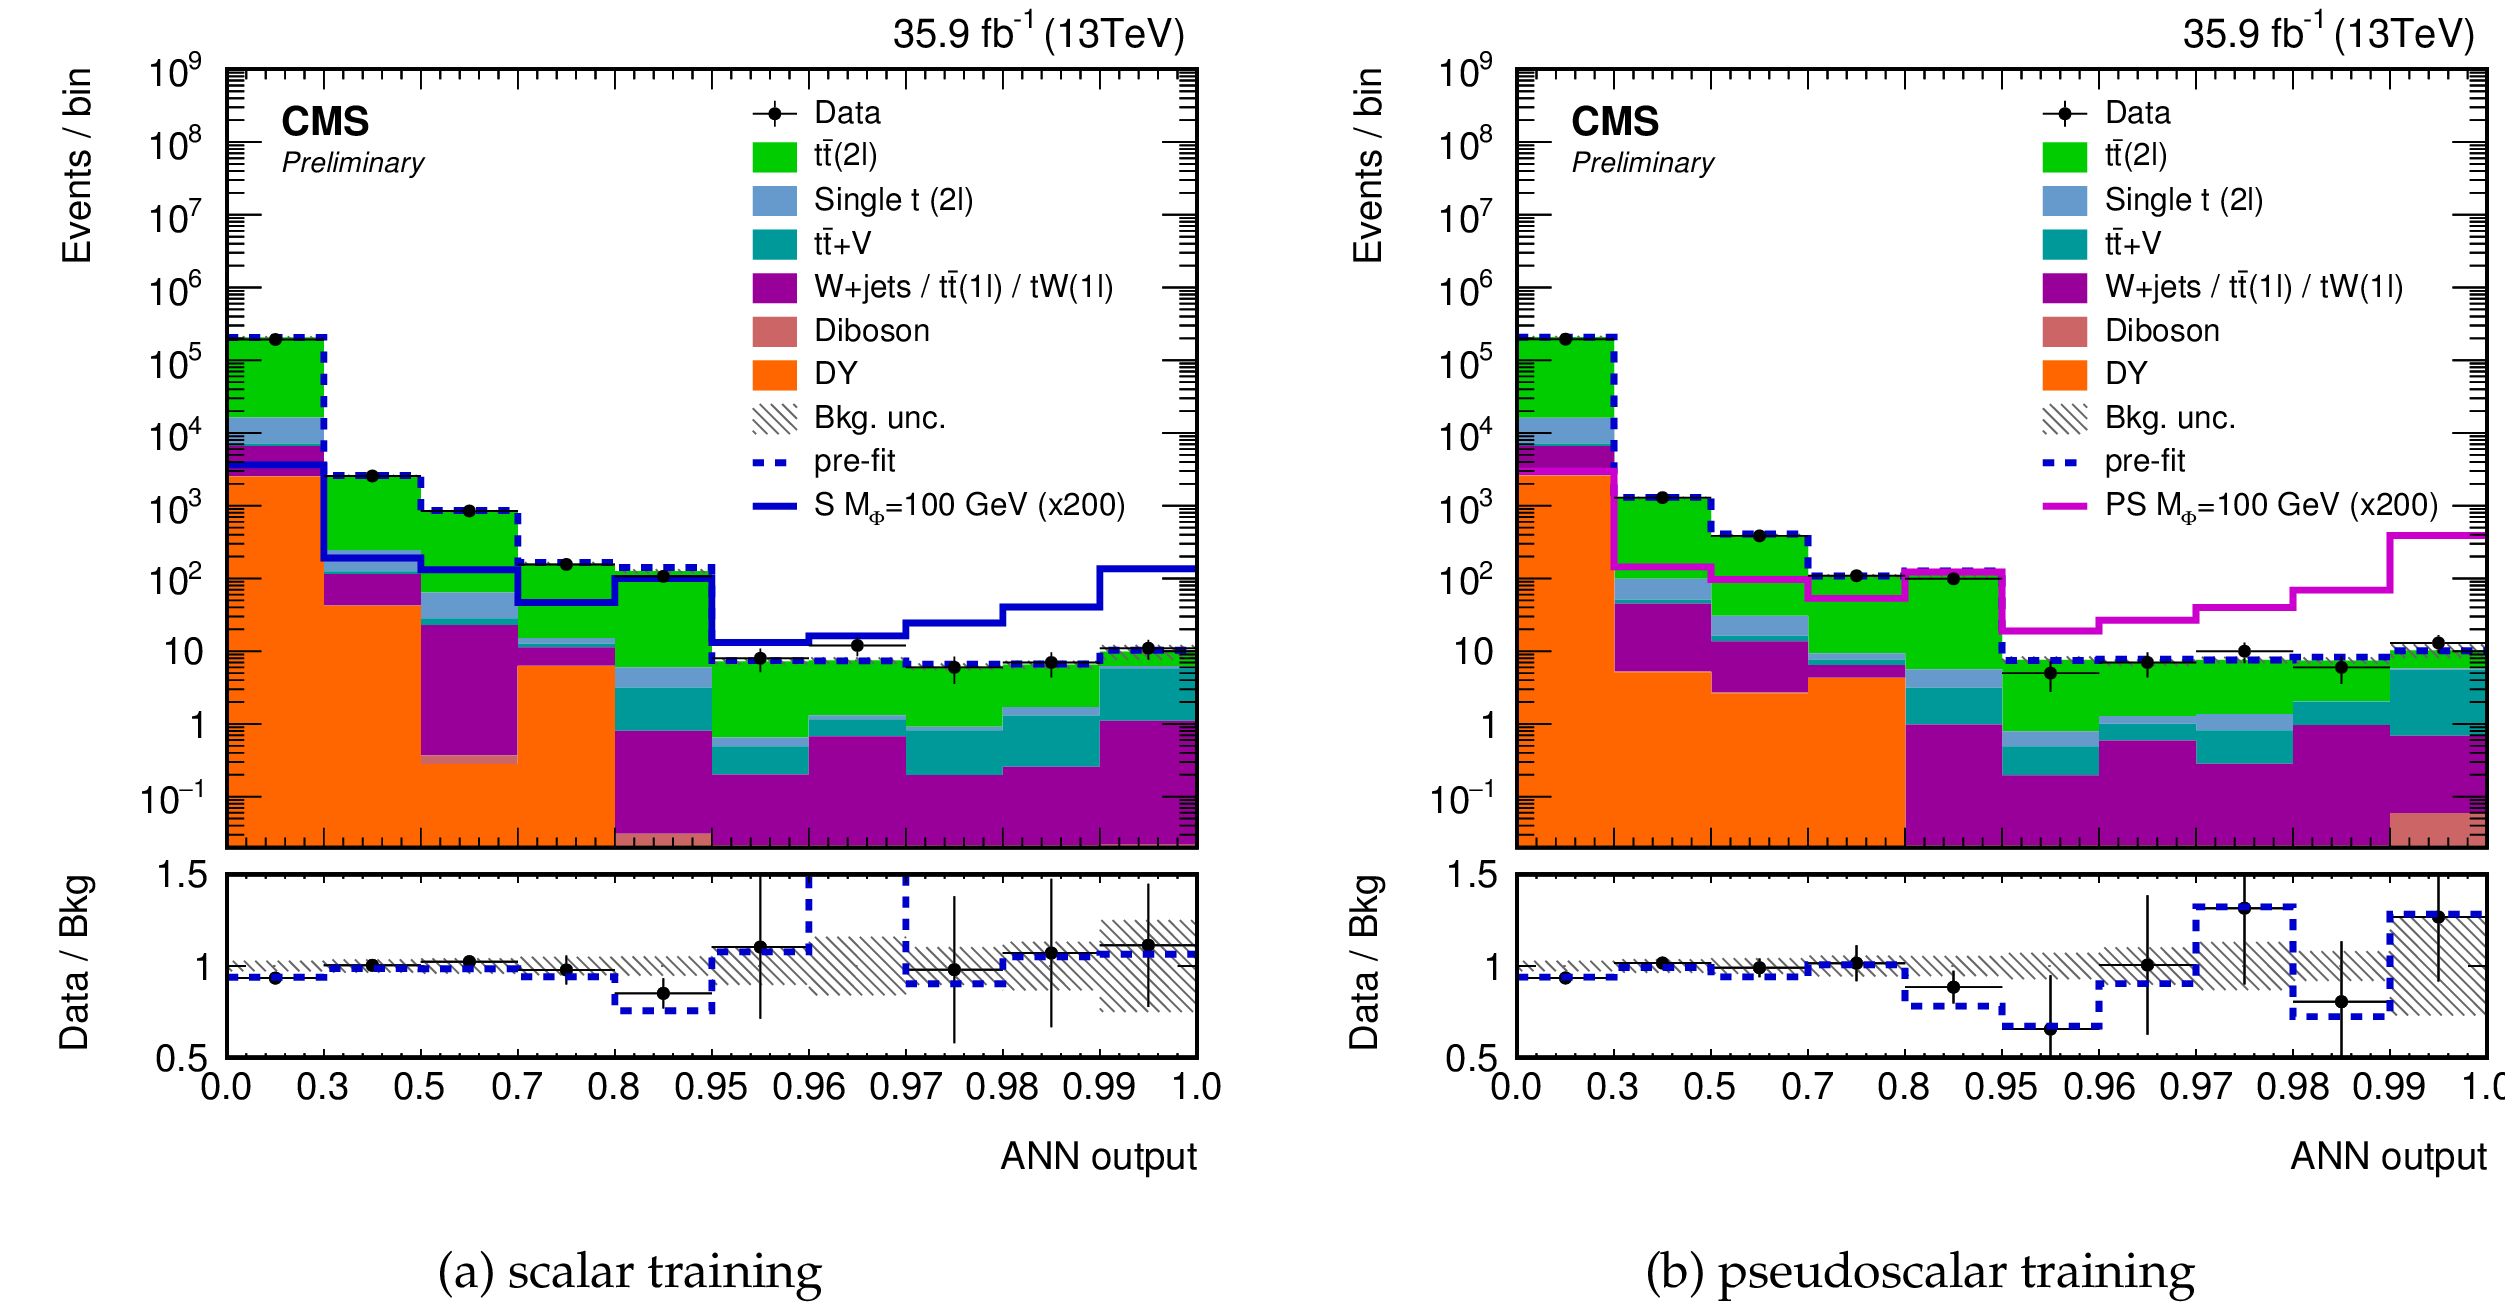
The post-fit ANN discriminant distribution in the signal region trained on the working point for $m_{\phi/a}= $ 100 GeV, $m_\chi= $ 1 GeV for a (a) scalar mediator and a (b) pseudoscalar mediator. The pre-fit ANN discriminant distributions for two example signals (scalar and pseudoscalar mediator, $m_{\phi/a} = $ 100 GeV) with $m_{\chi} = $ 1 GeV are scaled up by a factor of 200. Statistical and systematic uncertainties are shown. The apparent bin width has been fixed to the same size to improve the clarity. The axis labels indicate the actual sizes of the different bins. |

png pdf |
Figure 12-a:
The post-fit ANN discriminant distribution in the signal region trained on the working point for $m_{\phi/a}= $ 100 GeV, $m_\chi= $ 1 GeV for a scalar mediator. The pre-fit ANN discriminant distributions for two example signals (scalar and pseudoscalar mediator, $m_{\phi/a} = $ 100 GeV) with $m_{\chi} = $ 1 GeV are scaled up by a factor of 200. Statistical and systematic uncertainties are shown. The apparent bin width has been fixed to the same size to improve the clarity. The axis labels indicate the actual sizes of the different bins. |

png pdf |
Figure 12-b:
The post-fit ANN discriminant distribution in the signal region trained on the working point for $m_{\phi/a}= $ 100 GeV, $m_\chi= $ 1 GeV for a pseudoscalar mediator. The pre-fit ANN discriminant distributions for two example signals (scalar and pseudoscalar mediator, $m_{\phi/a} = $ 100 GeV) with $m_{\chi} = $ 1 GeV are scaled up by a factor of 200. Statistical and systematic uncertainties are shown. The apparent bin width has been fixed to the same size to improve the clarity. The axis labels indicate the actual sizes of the different bins. |

png pdf |
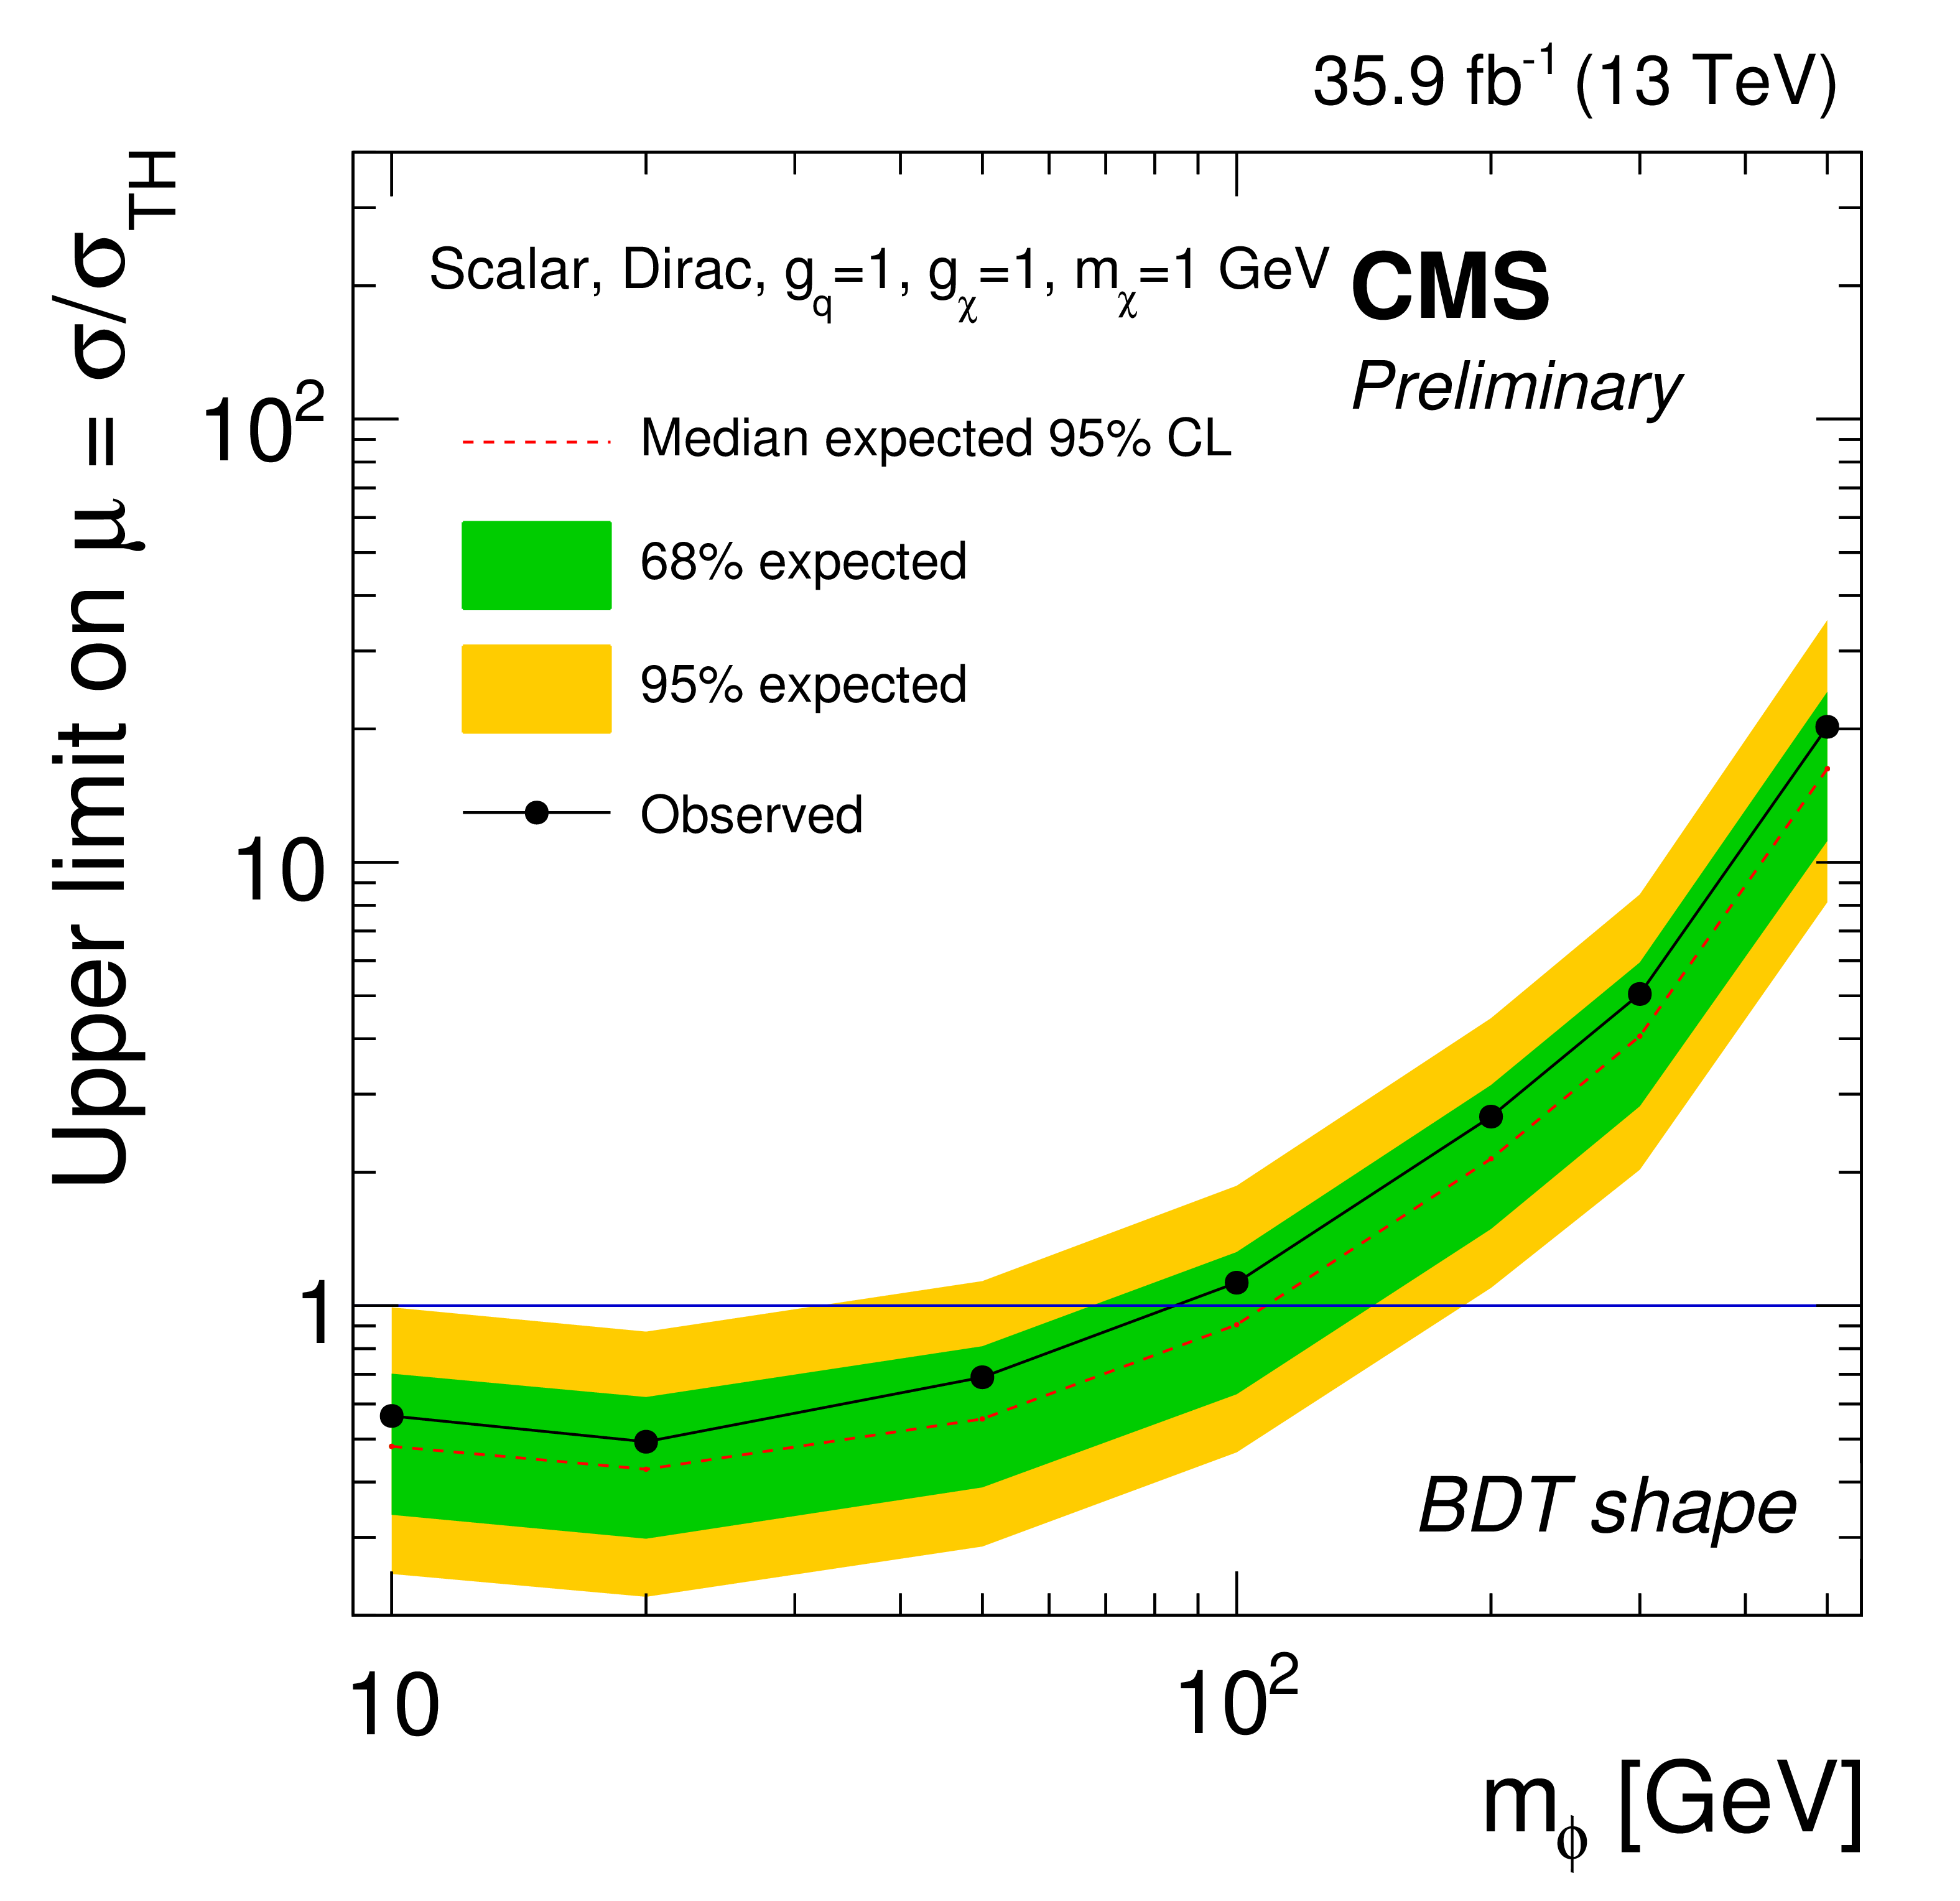
Figure 13:
The expected and observed limits for the three different strategies for scalar (left) and pseudoscalar models (right) with $m_{\chi}= $ 1 GeV and $g_{\textrm {q}} = g_{\chi}=$ 1. |

png pdf |
Figure 13-a:
Expected and observed limits for the $p_{\mathrm{T}}^{\text{miss}}$ shape strategy, for the scalar model with $m_{\chi}= $ 1 GeV and $g_{\textrm {q}} = g_{\chi}=$ 1. |

png pdf |
Figure 13-b:
Expected and observed limits for the $p_{\mathrm{T}}^{\text{miss}}$ shape strategy, for the pseudoscalar model with $m_{\chi}= $ 1 GeV and $g_{\textrm {q}} = g_{\chi}=$ 1. |
png pdf |
Figure 13-c:
Expected and observed limits for the BDT discriminant strategy, for the scalar model with $m_{\chi}= $ 1 GeV and $g_{\textrm {q}} = g_{\chi}=$ 1. |

png pdf |
Figure 13-d:
Expected and observed limits for the BDT discriminant strategy, for the pseudoscalar model with $m_{\chi}= $ 1 GeV and $g_{\textrm {q}} = g_{\chi}=$ 1. |

png pdf |
Figure 13-e:
Expected and observed limits for the ANN discriminant strategy, for the scalar model with $m_{\chi}= $ 1 GeV and $g_{\textrm {q}} = g_{\chi}=$ 1. |

png pdf |
Figure 13-f:
Expected and observed limits for the ANN discriminant strategy, for the pseudoscalar model with $m_{\chi}= $ 1 GeV and $g_{\textrm {q}} = g_{\chi}=$ 1. |

png pdf |
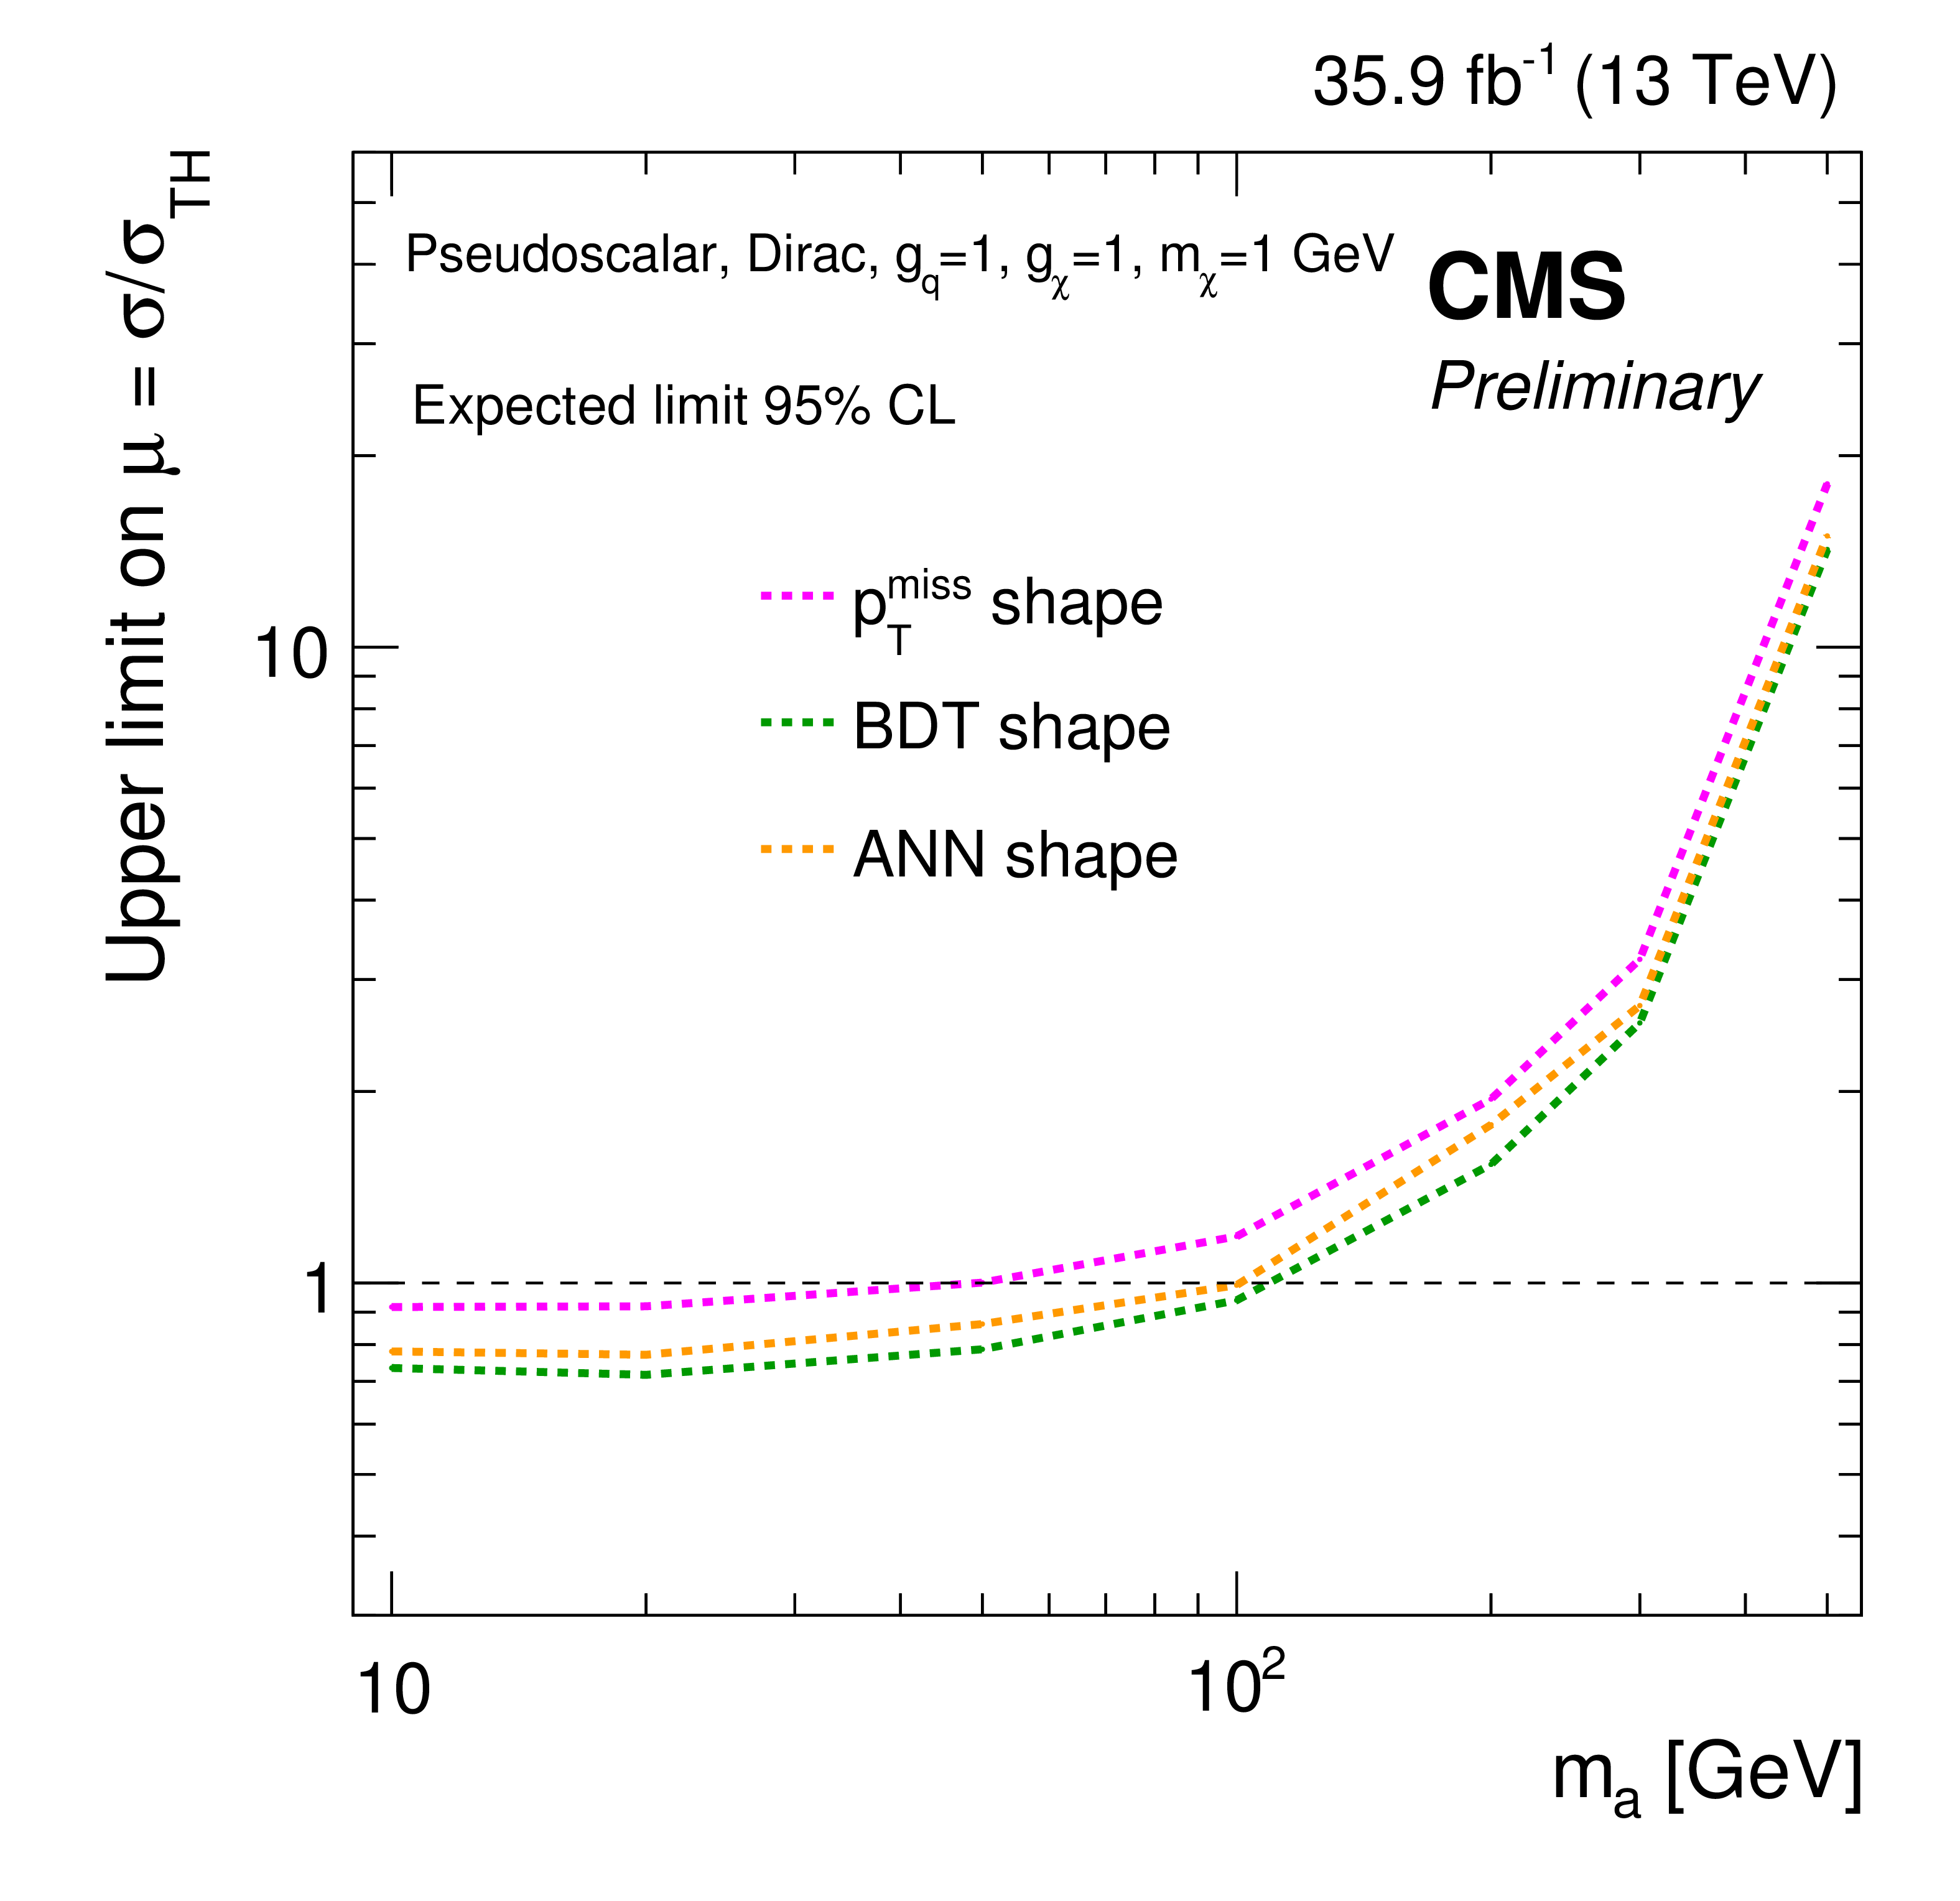
Figure 14:
The expected limits at 95% CL for the $ {p_{\text {T}}^{\text {miss}}}$ shape (magenta), BDT shape (green), and ANN shape (orange) strategies for (a) scalar and (b) pseudoscalar models with $m_{\chi}= $ 1 GeV and $g_{\textrm{q}} = g_{\chi}= $ 1. |

png pdf |
Figure 14-a:
The expected limits at 95% CL for the $ {p_{\text {T}}^{\text {miss}}}$ shape (magenta), BDT shape (green), and ANN shape (orange) strategies for scalar model with $m_{\chi}= $ 1 GeV and $g_{\textrm{q}} = g_{\chi}= $ 1. |
png pdf |
Figure 14-b:
The expected limits at 95% CL for the $ {p_{\text {T}}^{\text {miss}}}$ shape (magenta), BDT shape (green), and ANN shape (orange) strategies for pseudoscalar model with $m_{\chi}= $ 1 GeV and $g_{\textrm{q}} = g_{\chi}= $ 1. |
| Tables | |

png pdf |
Table 1:
Summary of the signal MC samples and their corresponding NLO cross sections as used in this analysis. $m_\chi =$ 1 GeV is assumed in all samples. Left column: mass of the mediators; central: scalar mediator case; right: pseudoscalar mediator case. |

png pdf |
Table 2:
Expected and observed limits on the signal strength including the one sigma uncertainties for 35.9 fb$^{-1}$ of data for the scalar hypothesis with $m_{\chi} = $ 1 GeV in the respective strategies. |

png pdf |
Table 3:
Expected and observed limits on the signal strength including the one sigma uncertainties for 35.9 fb$^{-1}$ of data for the pseudoscalar hypothesis with $m_{\chi} = $ 1 GeV in the respective strategies. |
| Summary |
| A search for an excess of events with large $ {p_{\mathrm{T}}^{\text{miss}}} $ produced in association with a top quark pair decaying to the dilepton final state has been presented. The integrated luminosity of the proton-proton collision data sample used corresponds to 35.9 fb$^{-1}$ , and was collected by the CMS detector at $\sqrt{s}=$ 13 TeV at the LHC during 2016. Observations are consistent with no significant deviation from the SM background expectation in the $ {p_{\mathrm{T}}^{\text{miss}}} $ spectrum, the BDT discriminant distribution, and the ANN discriminant distribution in same and opposite lepton flavor channels. Results are interpreted in terms of simplified dark matter (DM) models with scalar and pseudoscalar mediators using the NLO cross sections as shown in Table xxxxx. Assuming coupling values of $g_{\textrm{q}} = g_{\chi} = $ 1 and DM mass $m_{\chi} = $ 1 GeV, the observed (expected) 95% CL exclusions for a scalar mediator are $m_{\phi} < $ 74 (99) GeV, and the expected exclusion for a pseudoscalar mediator is $m_{a} < $ 50 GeV, while no pseudoscalar mediator exclusion is observed using the $ {p_{\mathrm{T}}^{\text{miss}}} $ shape strategy. This result improves upon the previous search for dark matter production in association with a top quark pair [50] performed using a data sample with integrated luminosity of 2.2 fb$^{-1}$ collected by the CMS detector at $\sqrt{s}=$ 13 TeV at the LHC during 2015. The previous search fell short of observing and expecting to observe an exclusion at 95% CL for simplified DM models with scalar and pseudoscalar mediators. |
| References | ||||
| 1 | F. Zwicky | On the Masses of Nebulae and of Clusters of Nebulae | Astrophys. J. 86 (October, 1937) 217 | |
| 2 | M. Persic, P. Salucci, and F. Stel | The Universal rotation curve of spiral galaxies: 1. The Dark matter connection | Mon. Not. Roy. Astron. Soc. 281 (1996) 27 | astro-ph/9506004 |
| 3 | D. Walsh, R. F. Carswell, and R. J. Weymann | 0957 + 561 A, B - Twin quasistellar objects or gravitational lens | \nat 279 (May, 1979) 381--384 | |
| 4 | G. t'Hooft | Naturalness, chiral symmetry, and spontaneous chiral symmetral breaking | NATO Sci. Ser. B 59 (1980) 135 | |
| 5 | E. Witten | Dynamical breaking of supersymmetry | Nuclear Physics B 188 (1981) 513 | |
| 6 | S. Dimopoulos and H. Georgi | Softly broken supersymmetry and su(5) | Nuclear Physics B 193 (1981) 150 | |
| 7 | G. Steigman and M. S. Turner | Cosmological constraints on the properties of weakly interacting massive particles | Nuclear Physics B 253 (1985), no. Supplement C, 375 -- 386 | |
| 8 | G. D'Ambrosio, G. Giudice, G. Isidori, and A. Strumia | Minimal flavour violation: an effective field theory approach | Nuclear Physics B 645 (2002), no. 1, 155 -- 187 | |
| 9 | G. Isidori and D. M. Straub | Minimal flavour violation and beyond | EPJC 72 (Aug, 2012) 2103 | |
| 10 | J. Abdallah et al. | Simplified Models for Dark Matter Searches at the LHC | Phys. Dark Univ. 9-10 (2015) 8--23 | 1506.03116 |
| 11 | D. Abercrombie et al. | Dark Matter Benchmark Models for Early LHC Run-2 Searches: Report of the ATLAS/CMS Dark Matter Forum | 1507.00966 | |
| 12 | M. Bauer et al. | Towards the next generation of simplified Dark Matter models | 1607.06680 | |
| 13 | J. Alwall et al. | The automated computation of tree-level and next-to-leading order differential cross sections, and their matching to parton shower simulations | JHEP 07 (2014) 079 | 1405.0301 |
| 14 | P. Artoisenet et al. | Automatic spin-entangled decays of heavy resonances in Monte Carlo simulations | JHEP 03 (2013) 015 | 1212.3460 |
| 15 | J. Alwall et al. | Comparative study of various algorithms for the merging of parton showers and matrix elements in hadronic collisions | EPJC53 (2008) 473--500 | 0706.2569 |
| 16 | P. Harris, V. V. Khoze, M. Spannowsky, and C. Williams | Constraining dark sectors at colliders: Beyond the effective theory approach | PRD 91 (2015) 055009 | |
| 17 | R. D. Ball et al. | Parton distributions for the lhc run ii | JHEP 2015 (Apr, 2015) 40 | |
| 18 | T. Sjostrand, S. Mrenna, and P. Skands | PYTHIA 6.4 physics and manual | JHEP 05 (2006) 026 | hep-ph/0603175 |
| 19 | T. Sjostrand et al. | An Introduction to PYTHIA 8.2 | CPC 191 (2015) 159--177 | 1410.3012 |
| 20 | P. Skands, S. Carrazza, and J. Rojo | Tuning PYTHIA 8.1: the Monash 2013 Tune | EPJC74 (2014), no. 8 | 1404.5630 |
| 21 | CMS Collaboration | Event generator tunes obtained from underlying event and multiparton scattering measurements | EPJC76 (2016), no. 3, 155 | CMS-GEN-14-001 1512.00815 |
| 22 | S. Frixione, P. Nason, and C. Oleari | Matching NLO QCD computations with Parton Shower simulations: the POWHEG method | JHEP 11 (2007) 070 | 0709.2092 |
| 23 | S. Alioli et al. | A general framework for implementing NLO calculations in shower Monte Carlo programs: the POWHEG BOX | JHEP 06 (2010) 043 | 1002.2581 |
| 24 | CMS Collaboration | Investigations of the impact of the parton shower tuning in Pythia 8 in the modelling of $ \mathrm{t\overline{t}} $ at $ \sqrt{s}= $ 8 and 13 TeV | CMS-PAS-TOP-16-021 | CMS-PAS-TOP-16-021 |
| 25 | M. Beneke, P. Falgari, S. Klein, and C. Schwinn | Hadronic top-quark pair production with NNLL threshold resummation | NPB 855 (2012) 695 | 1109.1536 |
| 26 | M. Cacciari et al. | Top-pair production at hadron colliders with next-to-next-to-leading logarithmic soft-gluon resummation | PLB 710 (2012) 612 | 1111.5869 |
| 27 | P. Barnreuther, M. Czakon, and A. Mitov | Percent-Level-Precision Physics at the Tevatron: Next-to-Next-to-Leading Order QCD Corrections to $ \rm q \bar{q} \to t \bar{t} + X $ | PRL 109 (2012) 132001 | 1204.5201 |
| 28 | M. Czakon and A. Mitov | NNLO corrections to top-pair production at hadron colliders: the all-fermionic scattering channels | JHEP 12 (2012) 054 | 1207.0236 |
| 29 | M. Czakon and A. Mitov | NNLO corrections to top pair production at hadron colliders: the quark-gluon reaction | JHEP 01 (2013) 080 | 1210.6832 |
| 30 | M. Czakon, P. Fiedler and A. Mitov | Total Top-Quark Pair-Production Cross Sec. at Hadron Colliders Through O($ \alpha_S^4 $) | PRL 110 (2013) 252004 | 1303.6254 |
| 31 | S. Frixione and B. R. Webber | Matching NLO QCD computations and parton shower simulations | JHEP 06 (2002) 029 | hep-ph/0204244 |
| 32 | N. Kidonakis | Top Quark Production | in Proceedings, Helmholtz International Summer School on Physics of Heavy Quarks and Hadrons (HQ 2013), pp. 139--168 2014 | 1311.0283 |
| 33 | E. Re | Single-top Wt-channel production matched with parton showers using the POWHEG method | EPJC 71 (2011) 1547 | 1009.2450 |
| 34 | J. M. Campbell and R. K. Ellis | MCFM for the Tevatron and the LHC | NPPS 205-206 (2010) 10 | 1007.3492 |
| 35 | S. Agostinelli et al. | Geant4—a simulation toolkit | Nuclear Instruments and Methods in Physics Research Sec. A: Accelerators, Spectrometers, Detectors and Associated Equipment 506 (2003), no. 3, 250 -- 303 | |
| 36 | CMS Collaboration | Particle-flow reconstruction and global event description with the cms detector | JINST 12 (2017) no. 10, P10003 | CMS-PRF-14-001 1706.04965 |
| 37 | CMS Collaboration | Jet energy scale and resolution in the CMS experiment in pp collisions at 8 TeV | JINST 12 (2017) P02014 | CMS-JME-13-004 1607.03663 |
| 38 | CMS Collaboration | Performance of electron reconstruction and selection with the CMS detector in proton-proton collisions at $ \sqrt{s} = $ 8 TeV | JINST 10 (2015) P06005 | CMS-EGM-13-001 1502.02701 |
| 39 | CMS Collaboration | Performance of CMS muon reconstruction in $ pp $ collision events at $ \sqrt{s} = $ 7 TeV | JINST 7 (2012) P10002 | CMS-MUO-10-004 1206.4071 |
| 40 | CMS Collaboration | The CMS experiment at the CERN LHC | JINST 3 (2008) S08004 | CMS-00-001 |
| 41 | CMS Collaboration | Identification of heavy-flavour jets with the CMS detector in pp collisions at 13 TeV | Submitted to \it JINST | CMS-BTV-16-002 1712.07158 |
| 42 | CMS Collaboration | Measurement of the differential cross section for top quark pair production in pp collisions at $ \sqrt{s} = 8 {\rm tev} $ | EPJC 75 (Nov, 2015) 542 | |
| 43 | CMS Collaboration | First measurement of the differential cross section for ttbar production in the dilepton final state at $ \sqrt{s} = $ 13 TeV | CMS-PAS-TOP-15-010 | CMS-PAS-TOP-15-010 |
| 44 | CDF Collaboration | Measurement of the top quark mass using template methods on dilepton events in proton antiproton collisions at $ \sqrt{s} = $ 1.96-TeV. | PRD73 (2006) 112006 | hep-ex/0602008 |
| 45 | L. Moneta et al. | The RooStats Project | in 13$^\textth$ International Workshop on Advanced Computing and Analysis Techniques in Physics Research (ACAT2010) SISSA, 2010 PoS(ACAT2010)057 | 1009.1003 |
| 46 | J. S. Conway | Incorporating Nuisance Parameters in Likelihoods for Multisource Spectra | in Proceedings, PHYSTAT 2011 Workshop on Statistical Issues Related to Discovery Claims in Search Experiments and Unfolding, CERN,Geneva, Switzerland 17-20 January 2011, pp. 115--120 2011 | 1103.0354 |
| 47 | C. G. Lester and D. J. Summers | Measuring masses of semiinvisibly decaying particles pair produced at hadron colliders | PLB463 (1999) 99--103 | hep-ph/9906349 |
| 48 | M. Burns, K. Kong, K. T. Matchev, and M. Park | Using Subsystem MT2 for Complete Mass Determinations in Decay Chains with Missing Energy at Hadron Colliders | JHEP 03 (2009) 143 | 0810.5576 |
| 49 | H.-C. Cheng and Z. Han | Minimal Kinematic Constraints and m(T2) | JHEP 12 (2008) 063 | 0810.5178 |
| 50 | CMS Collaboration | Search for dark matter produced in association with heavy-flavor quarks in proton-proton collisions at sqrt(s)=13 TeV | CMS-EXO-16-005 1706.02581 |
|
| 51 | A. Hoecker et al. | TMVA: Toolkit for Multivariate Data Analysis | PoS ACAT (2007) 040 | physics/0703039 |
| 52 | CMS Collaboration | Performance of the cms missing transverse momentum reconstruction in pp data at √ s = 8 tev | Journal of Instrumentation 10 (2015), no. 02, P02006 | |
| 53 | J. Butterworth et al. | Pdf4lhc recommendations for lhc run ii | Journal of Physics G: Nuclear and Particle Physics 43 (2016), no. 2, 023001 | |
| 54 | CMS Collaboration | CMS Luminosity Measurements for the 2016 Data Taking Period | CMS-PAS-LUM-17-001 | CMS-PAS-LUM-17-001 |
| 55 | CMS Collaboration | Identification of b quark jets at the CMS Experiment in the LHC Run 2 | CMS-PAS-BTV-15-001 | CMS-PAS-BTV-15-001 |
| 56 | ATLAS and CMS Collaborations | Procedure for the LHC Higgs boson search combination in summer 2011 | CMS-NOTE-2011-005 | |
| 57 | T. Junk | Confidence level computation for combining searches with small statistics | NIMA 434 (1999) 435 | hep-ex/9902006 |
| 58 | A. L. Read | Presentation of search results: the $ CL_s $ technique | JPG 28 (2002) 2693 | |
| 59 | G. Cowan, K. Cranmer, E. Gross, and O. Vitells | Asymptotic formulae for likelihood-based tests of new physics | EPJC 71 (2011) 1554 | 1007.1727 |
|
|
Compact Muon Solenoid LHC, CERN |
|

|

|

|

|

|