

Compact Muon Solenoid
LHC, CERN
| CMS-PAS-HIG-17-015 | ||
| Measurement of differential fiducial cross sections for Higgs boson production in the diphoton decay channel in pp collisions at $\sqrt{s}= $ 13 TeV | ||
| CMS Collaboration | ||
| March 2017 | ||
| Abstract: A measurement of the integrated and differential fiducial production cross sections for the Higgs boson in the diphoton decay channel at $\sqrt{s}= $ 13 TeV is performed using 35.9 fb$^{-1}$ of pp collisions data collected by the CMS experiment at the CERN LHC. Differential cross sections are measured as a function of the diphoton transverse momentum and jet multiplicity. All cross sections are measured within a fiducial phase space defined by the requirements on the photons kinematics, their isolation, and the event topology. The measured cross sections are compared to state of the art theoretical predictions for the Standard Model Higgs bosons. A good agreement between observations and predictions is observed. | ||
| Links: CDS record (PDF) ; inSPIRE record ; CADI line (restricted) ; | ||
| Figures | Summary | Additional Figures | References | CMS Publications |
|---|
| Figures | |

png pdf |
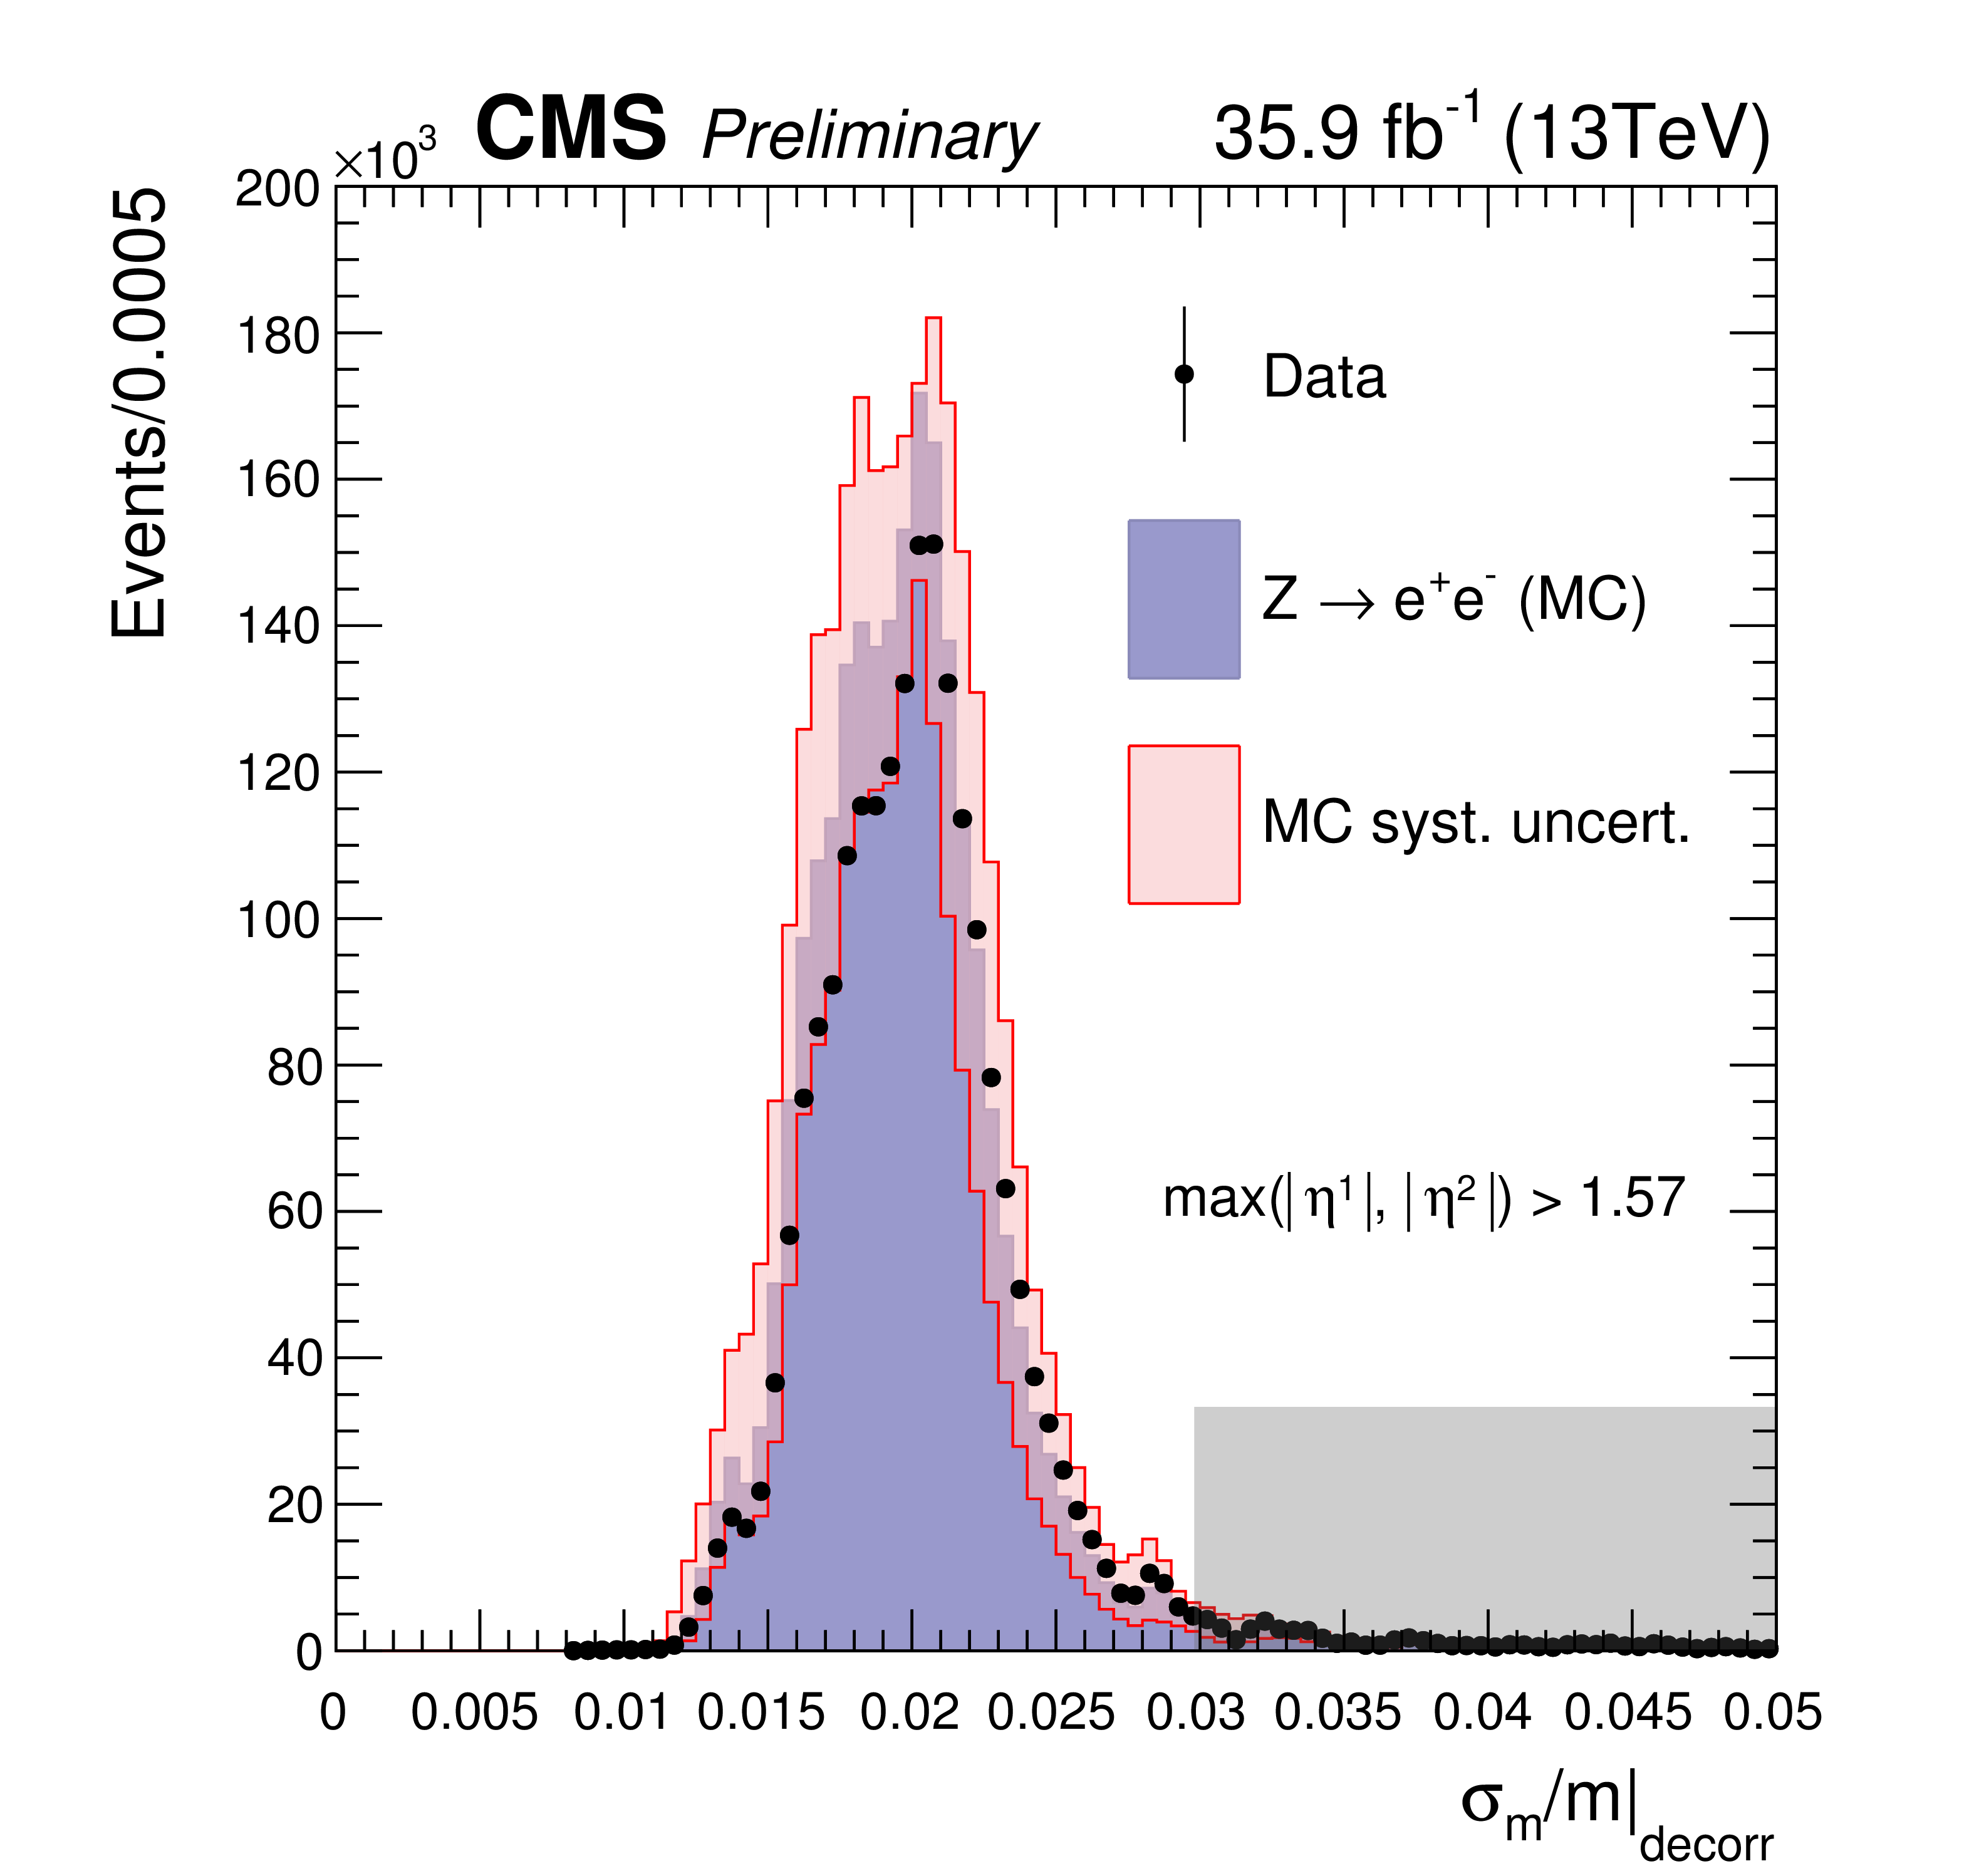
Figure 1:
Data-simulation comparison for the decorrelated mass resolution estimator $\sigma _{\mathrm {m}}/\mathrm {m} | _\text {decorr} $, along with the impact of the systematic uncertainty on the $\sigma _E/E$ (red band), for events with both photons in the ECAL barrel (left) and the remainder of the events. Events in region depicted in grey are discarded and not used in the final analysis. |

png pdf |
Figure 1-a:
Data-simulation comparison for the decorrelated mass resolution estimator $\sigma _{\mathrm {m}}/\mathrm {m} | _\text {decorr} $, along with the impact of the systematic uncertainty on the $\sigma _E/E$ (red band), for events with both photons in the ECAL barrel. Events in region depicted in grey are discarded and not used in the final analysis. |
png pdf |
Figure 1-b:
Data-simulation comparison for the decorrelated mass resolution estimator $\sigma _{\mathrm {m}}/\mathrm {m} | _\text {decorr} $, along with the impact of the systematic uncertainty on the $\sigma _E/E$ (red band), for the remainder of the events. Events in region depicted in grey are discarded and not used in the final analysis. |
png pdf |
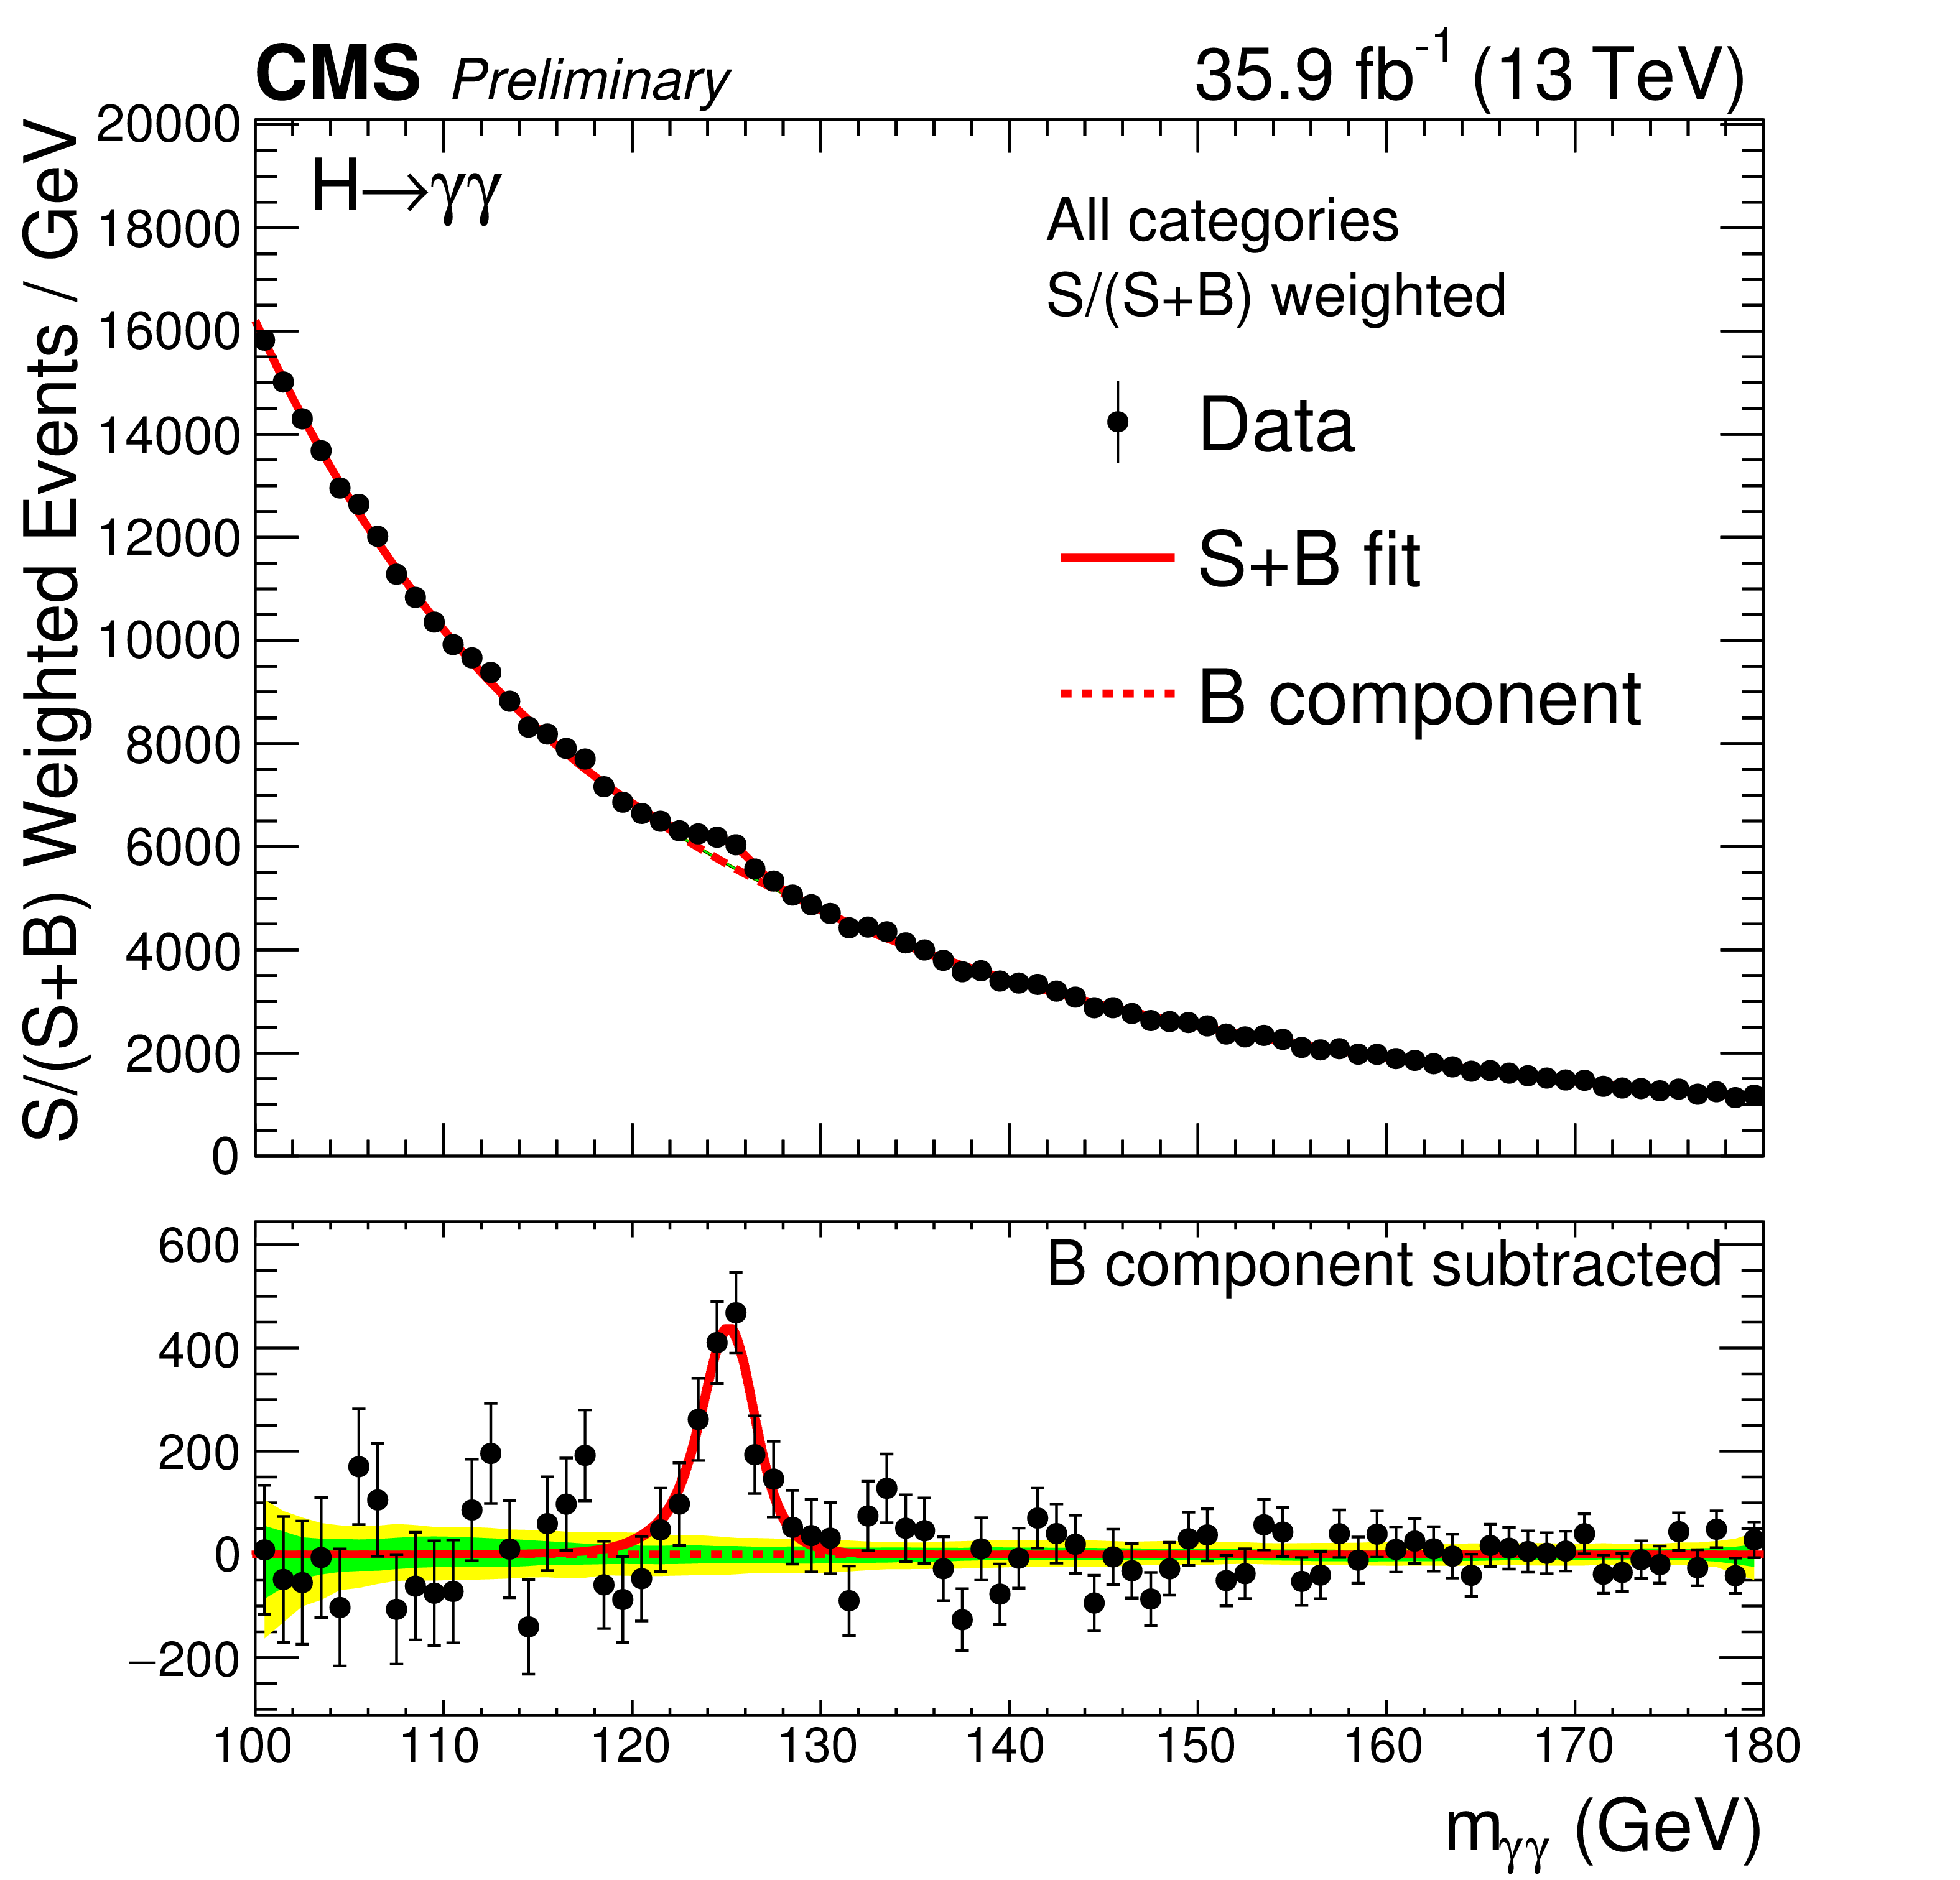
Figure 2:
Diphoton mass spectrum weighted by the ratio S/(S + B) in each event class, together with the background subtracted weighted mass spectrum. |

png pdf |
Figure 3:
Likelihood scan (black curve) for the fiducial cross section where the value of the SM Higgs boson mass is profiled in the fit. The measurement is compared to the theoretical prediction (in red) and shows good agreement within uncertainties. |
png pdf |
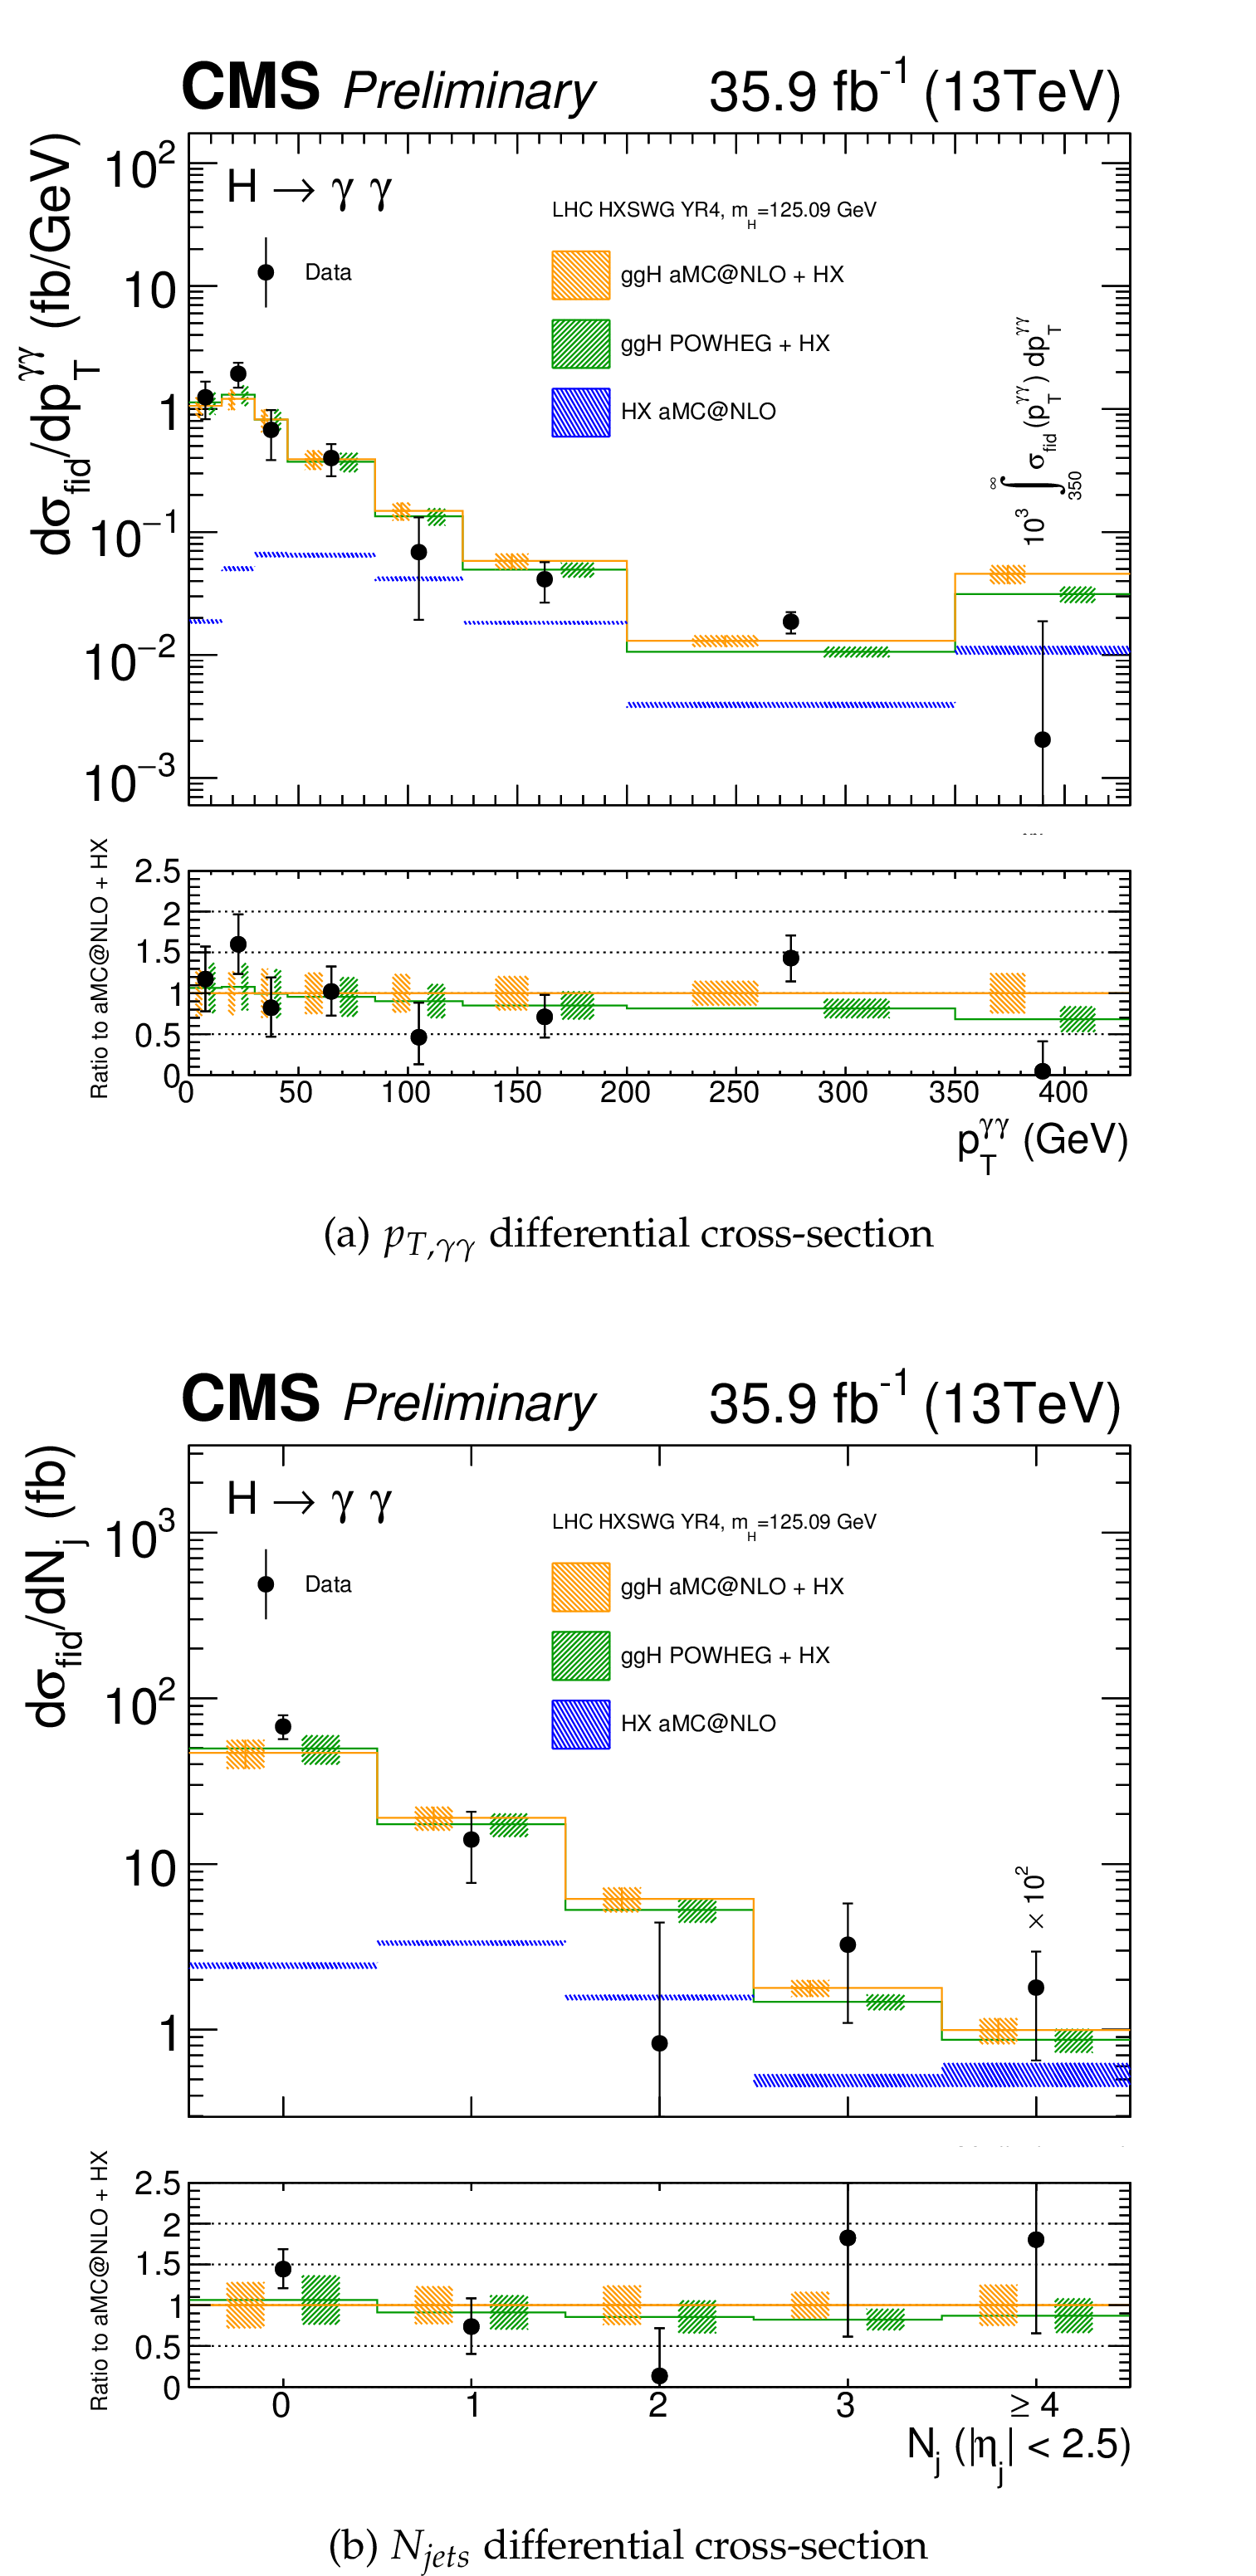
Figure 4:
Measured ${\mathrm{ H } \to \gamma \gamma }$ differential cross-section (black points) for (a) $p_{T,\gamma \gamma }$, (b) $N_{jets}$. The measurements are compared to the theoretical predictions, combining the Higgs boson cross sections and branching fraction as in the LHC Higgs Cross Section Working Group [15] with two different generators for the gluon-gluon fusion process: MADGRAPH-aMC@NLO (in orange) and POWHEG (in green). The sum of the contributions from VBF, VH and ttH processes, labeled as HX, is generated using MADGRAPH-aMC@NLO and is shown in blue in the plot. |

png pdf |
Figure 4-a:
Measured ${\mathrm{ H } \to \gamma \gamma }$ differential cross-section (black points) for $p_{T,\gamma \gamma }$. The measurements are compared to the theoretical predictions, combining the Higgs boson cross sections and branching fraction as in the LHC Higgs Cross Section Working Group [15] with two different generators for the gluon-gluon fusion process: MADGRAPH-aMC@NLO (in orange) and POWHEG (in green). The sum of the contributions from VBF, VH and ttH processes, labeled as HX, is generated using MADGRAPH-aMC@NLO and is shown in blue in the plot. |

png pdf |
Figure 4-b:
Measured ${\mathrm{ H } \to \gamma \gamma }$ differential cross-section (black points) for $N_{jets}$. The measurements are compared to the theoretical predictions, combining the Higgs boson cross sections and branching fraction as in the LHC Higgs Cross Section Working Group [15] with two different generators for the gluon-gluon fusion process: MADGRAPH-aMC@NLO (in orange) and POWHEG (in green). The sum of the contributions from VBF, VH and ttH processes, labeled as HX, is generated using MADGRAPH-aMC@NLO and is shown in blue in the plot. |
| Summary |
| The measurement of the integrated and differential fiducial production cross sections for the Higgs boson in the diphoton decay channel has been performed using 34.5 fb$^{-1}$ of proton-proton collision data collected by the CMS experiment at $\sqrt{s}= $ 13 TeV. The measurement of the differential cross section are reported as a function of the Higgs boson transverse momentum and the jet multiplicity. The measurements are performed for isolated photons in the fiducial region defined requiring both photons within $|\eta^{\gamma}_{1,2}| < $ 2.5 and $p_{\mathrm{T}}/m_{\gamma\gamma}> $ 1/3 (1/4) for the leading (subleading) photon. In this fiducial region the cross section is measured to be $\hat{\sigma}_{\mathrm{fiducial}} = $ 84 $\pm$ 11 (stat) $\pm$ 7 (syst) fb = 84$^{+13}_{-12}$ (stat+syst) fb. The presented measurements are the most precise to date and show good agreement with the Standard Model predictions. |
| Additional Figures | |
png pdf |
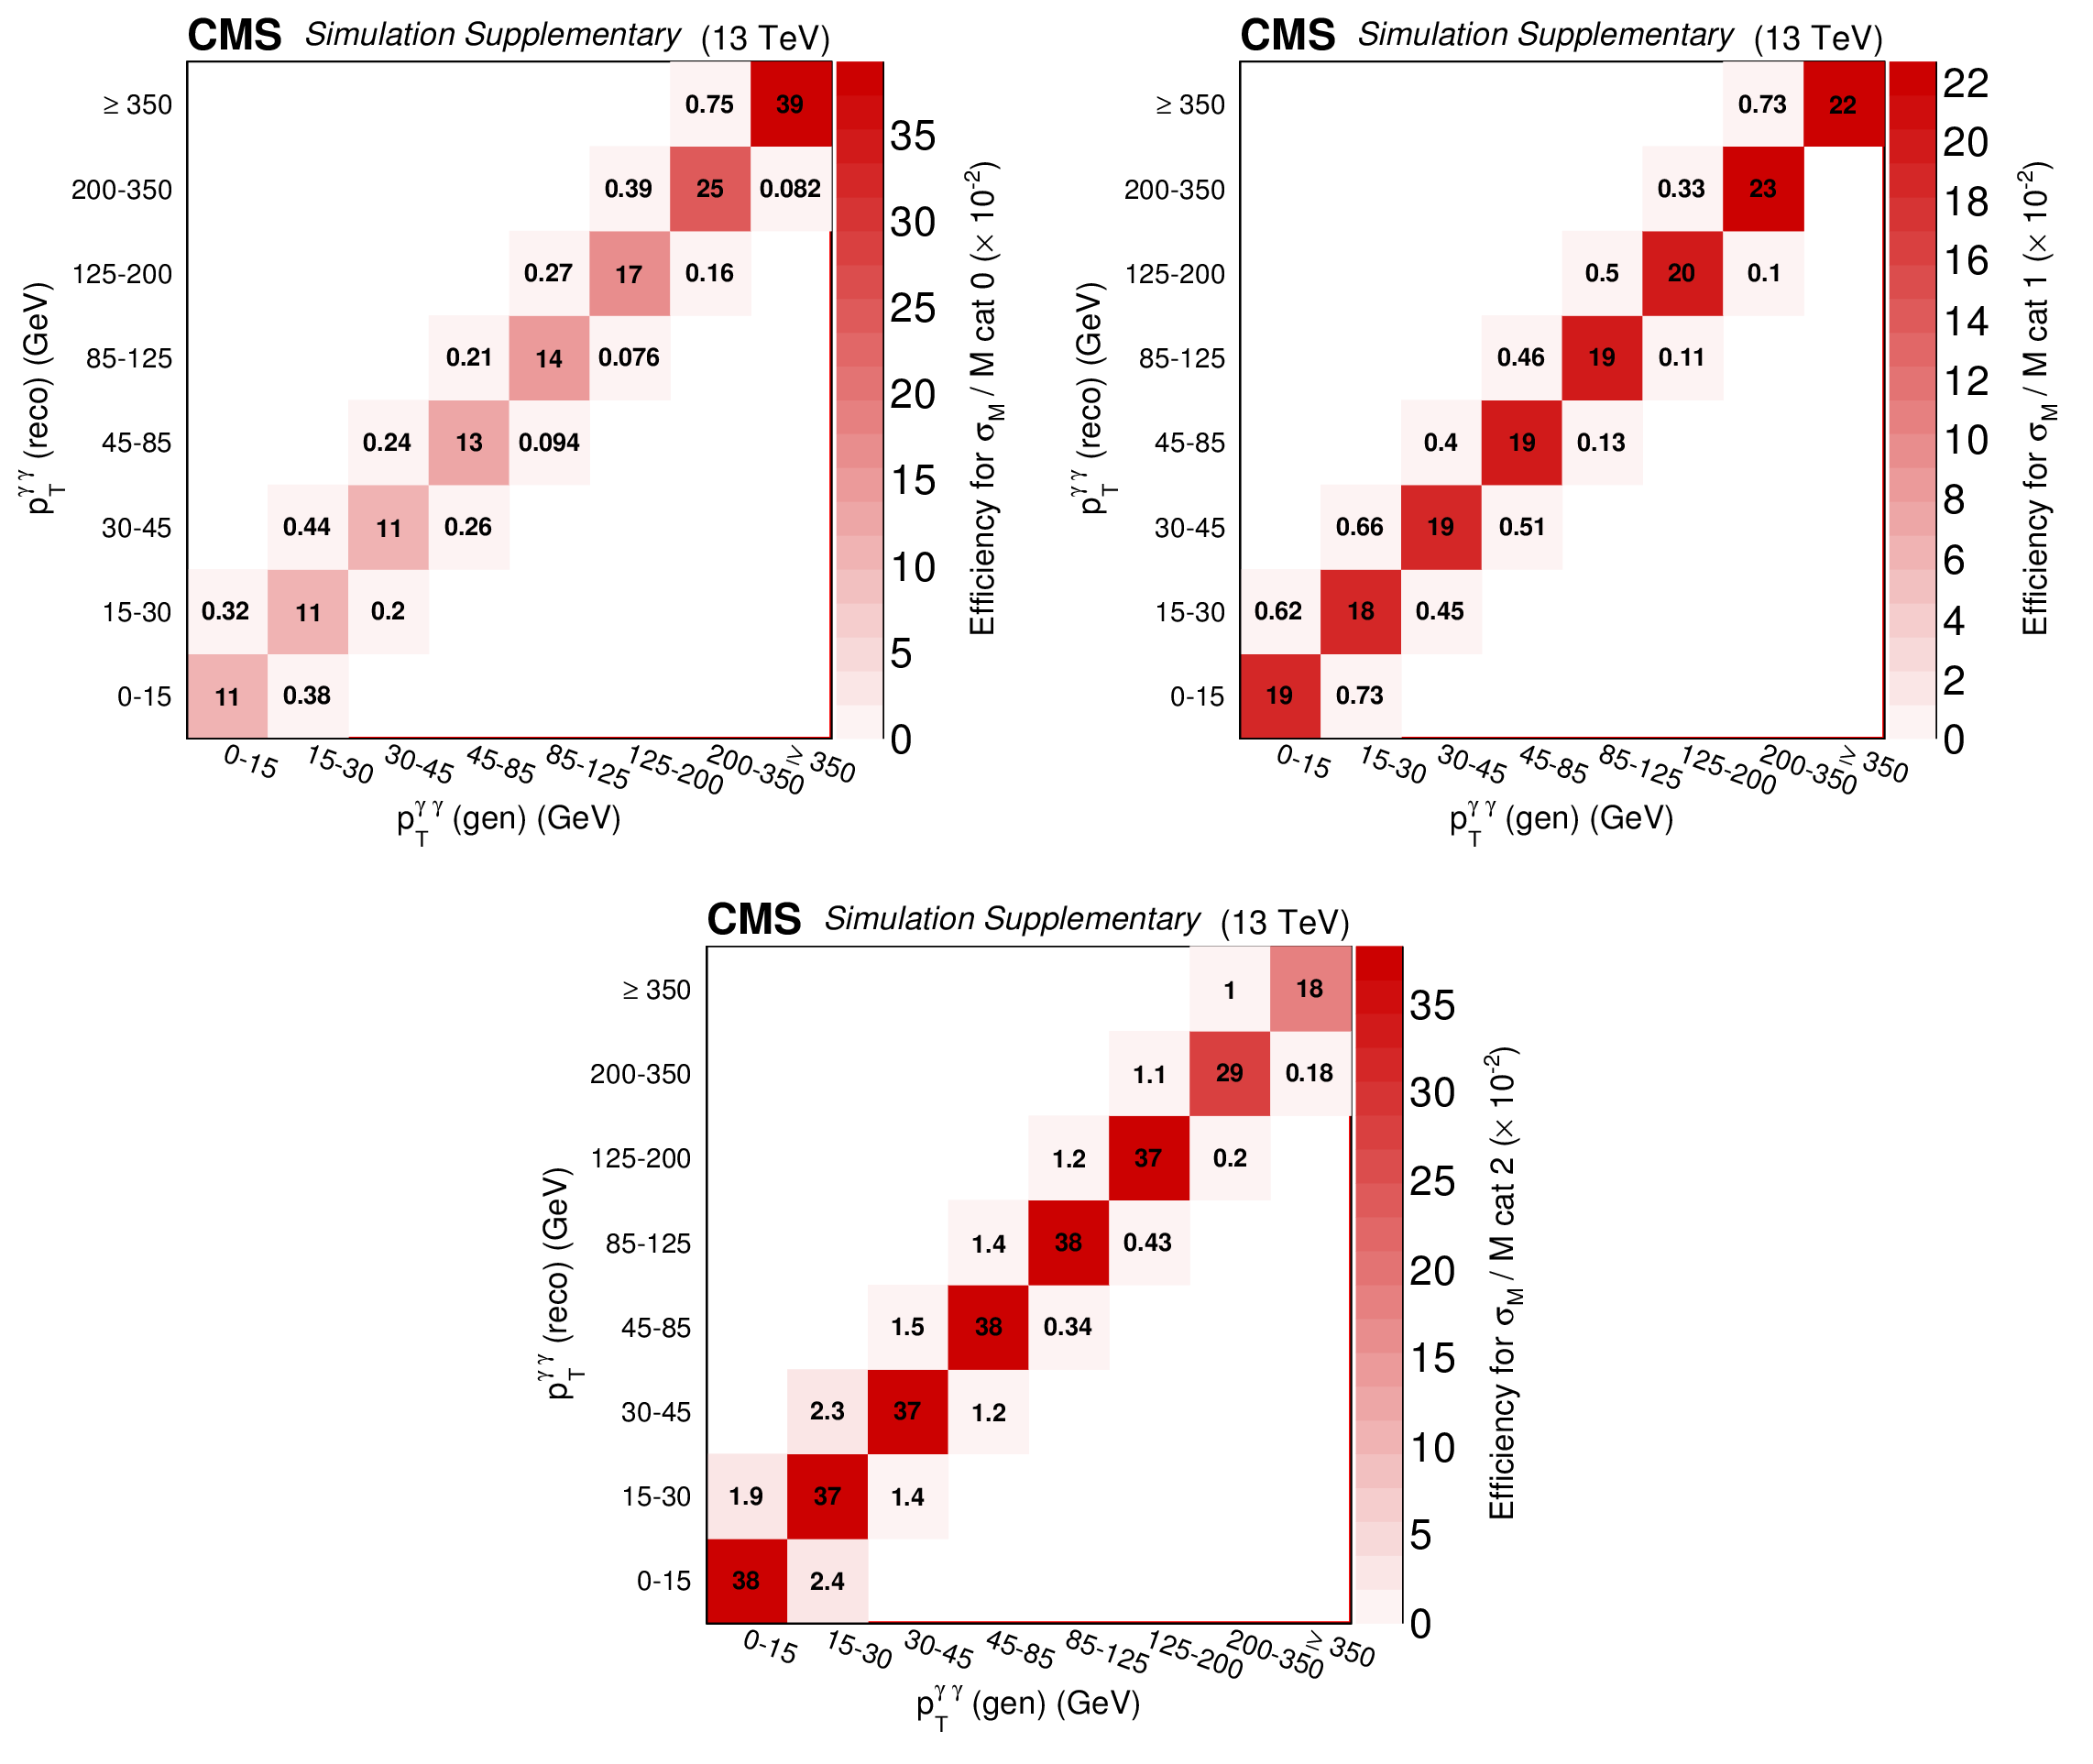
Additional Figure 1:
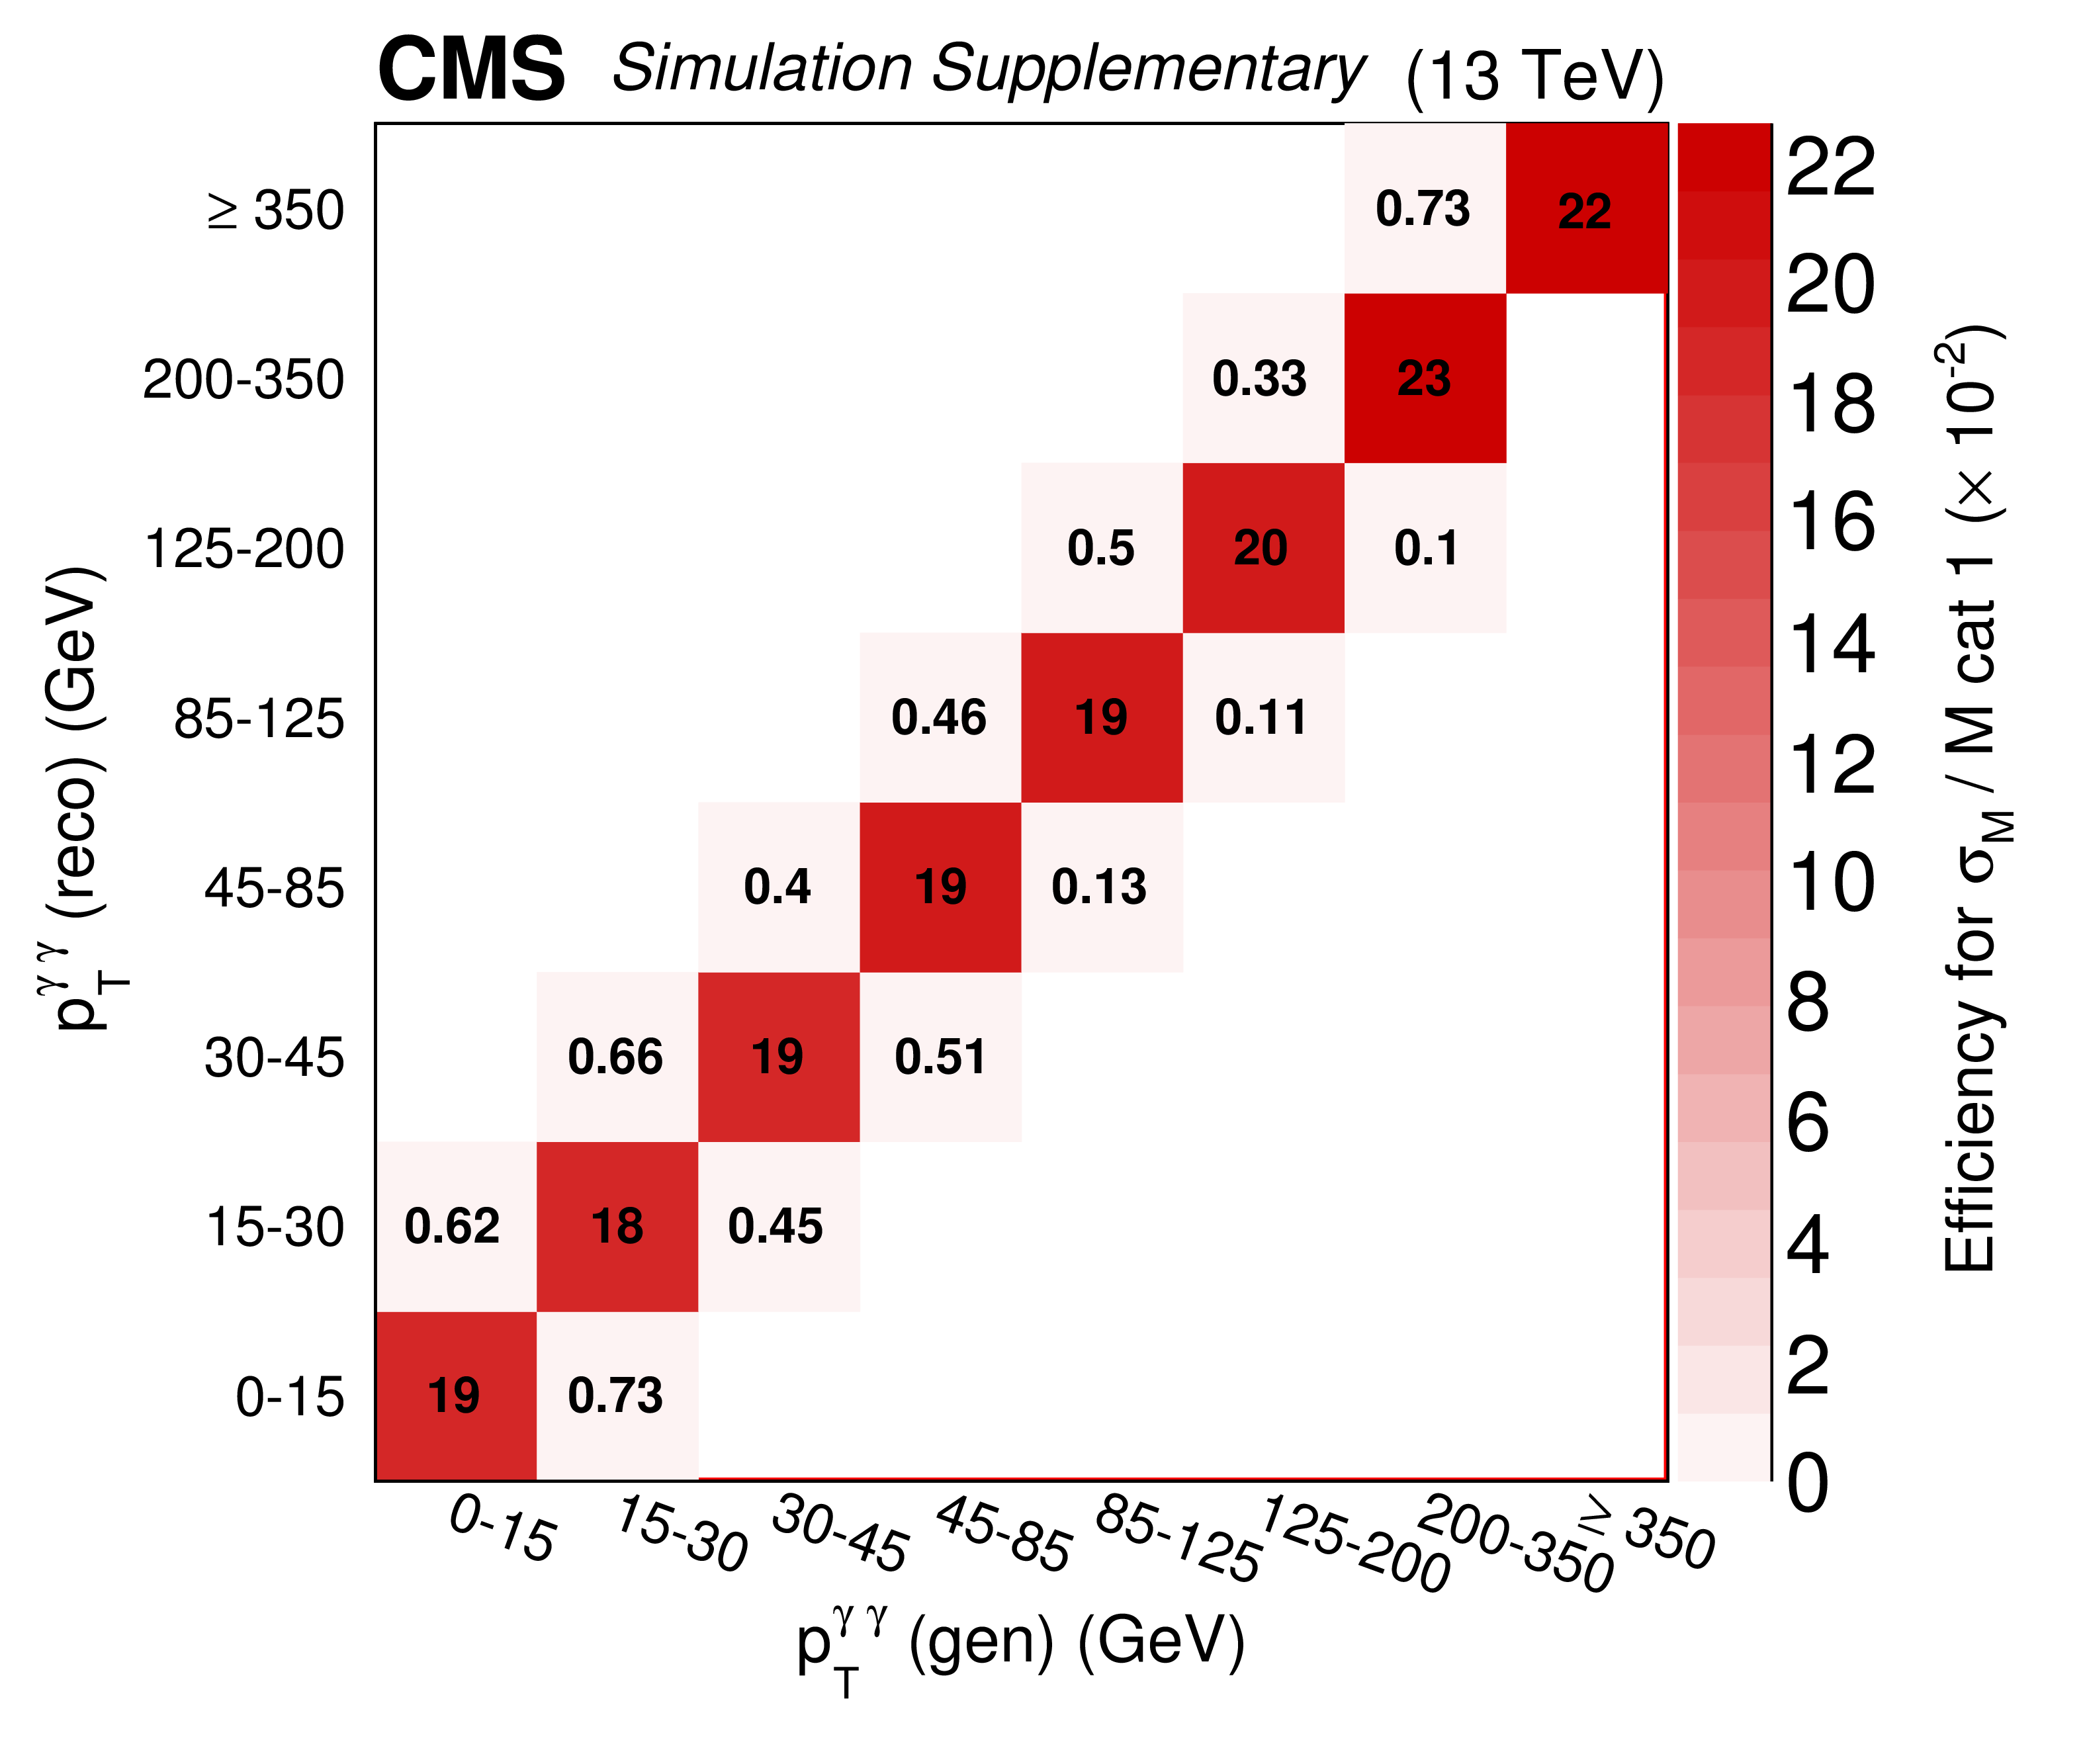
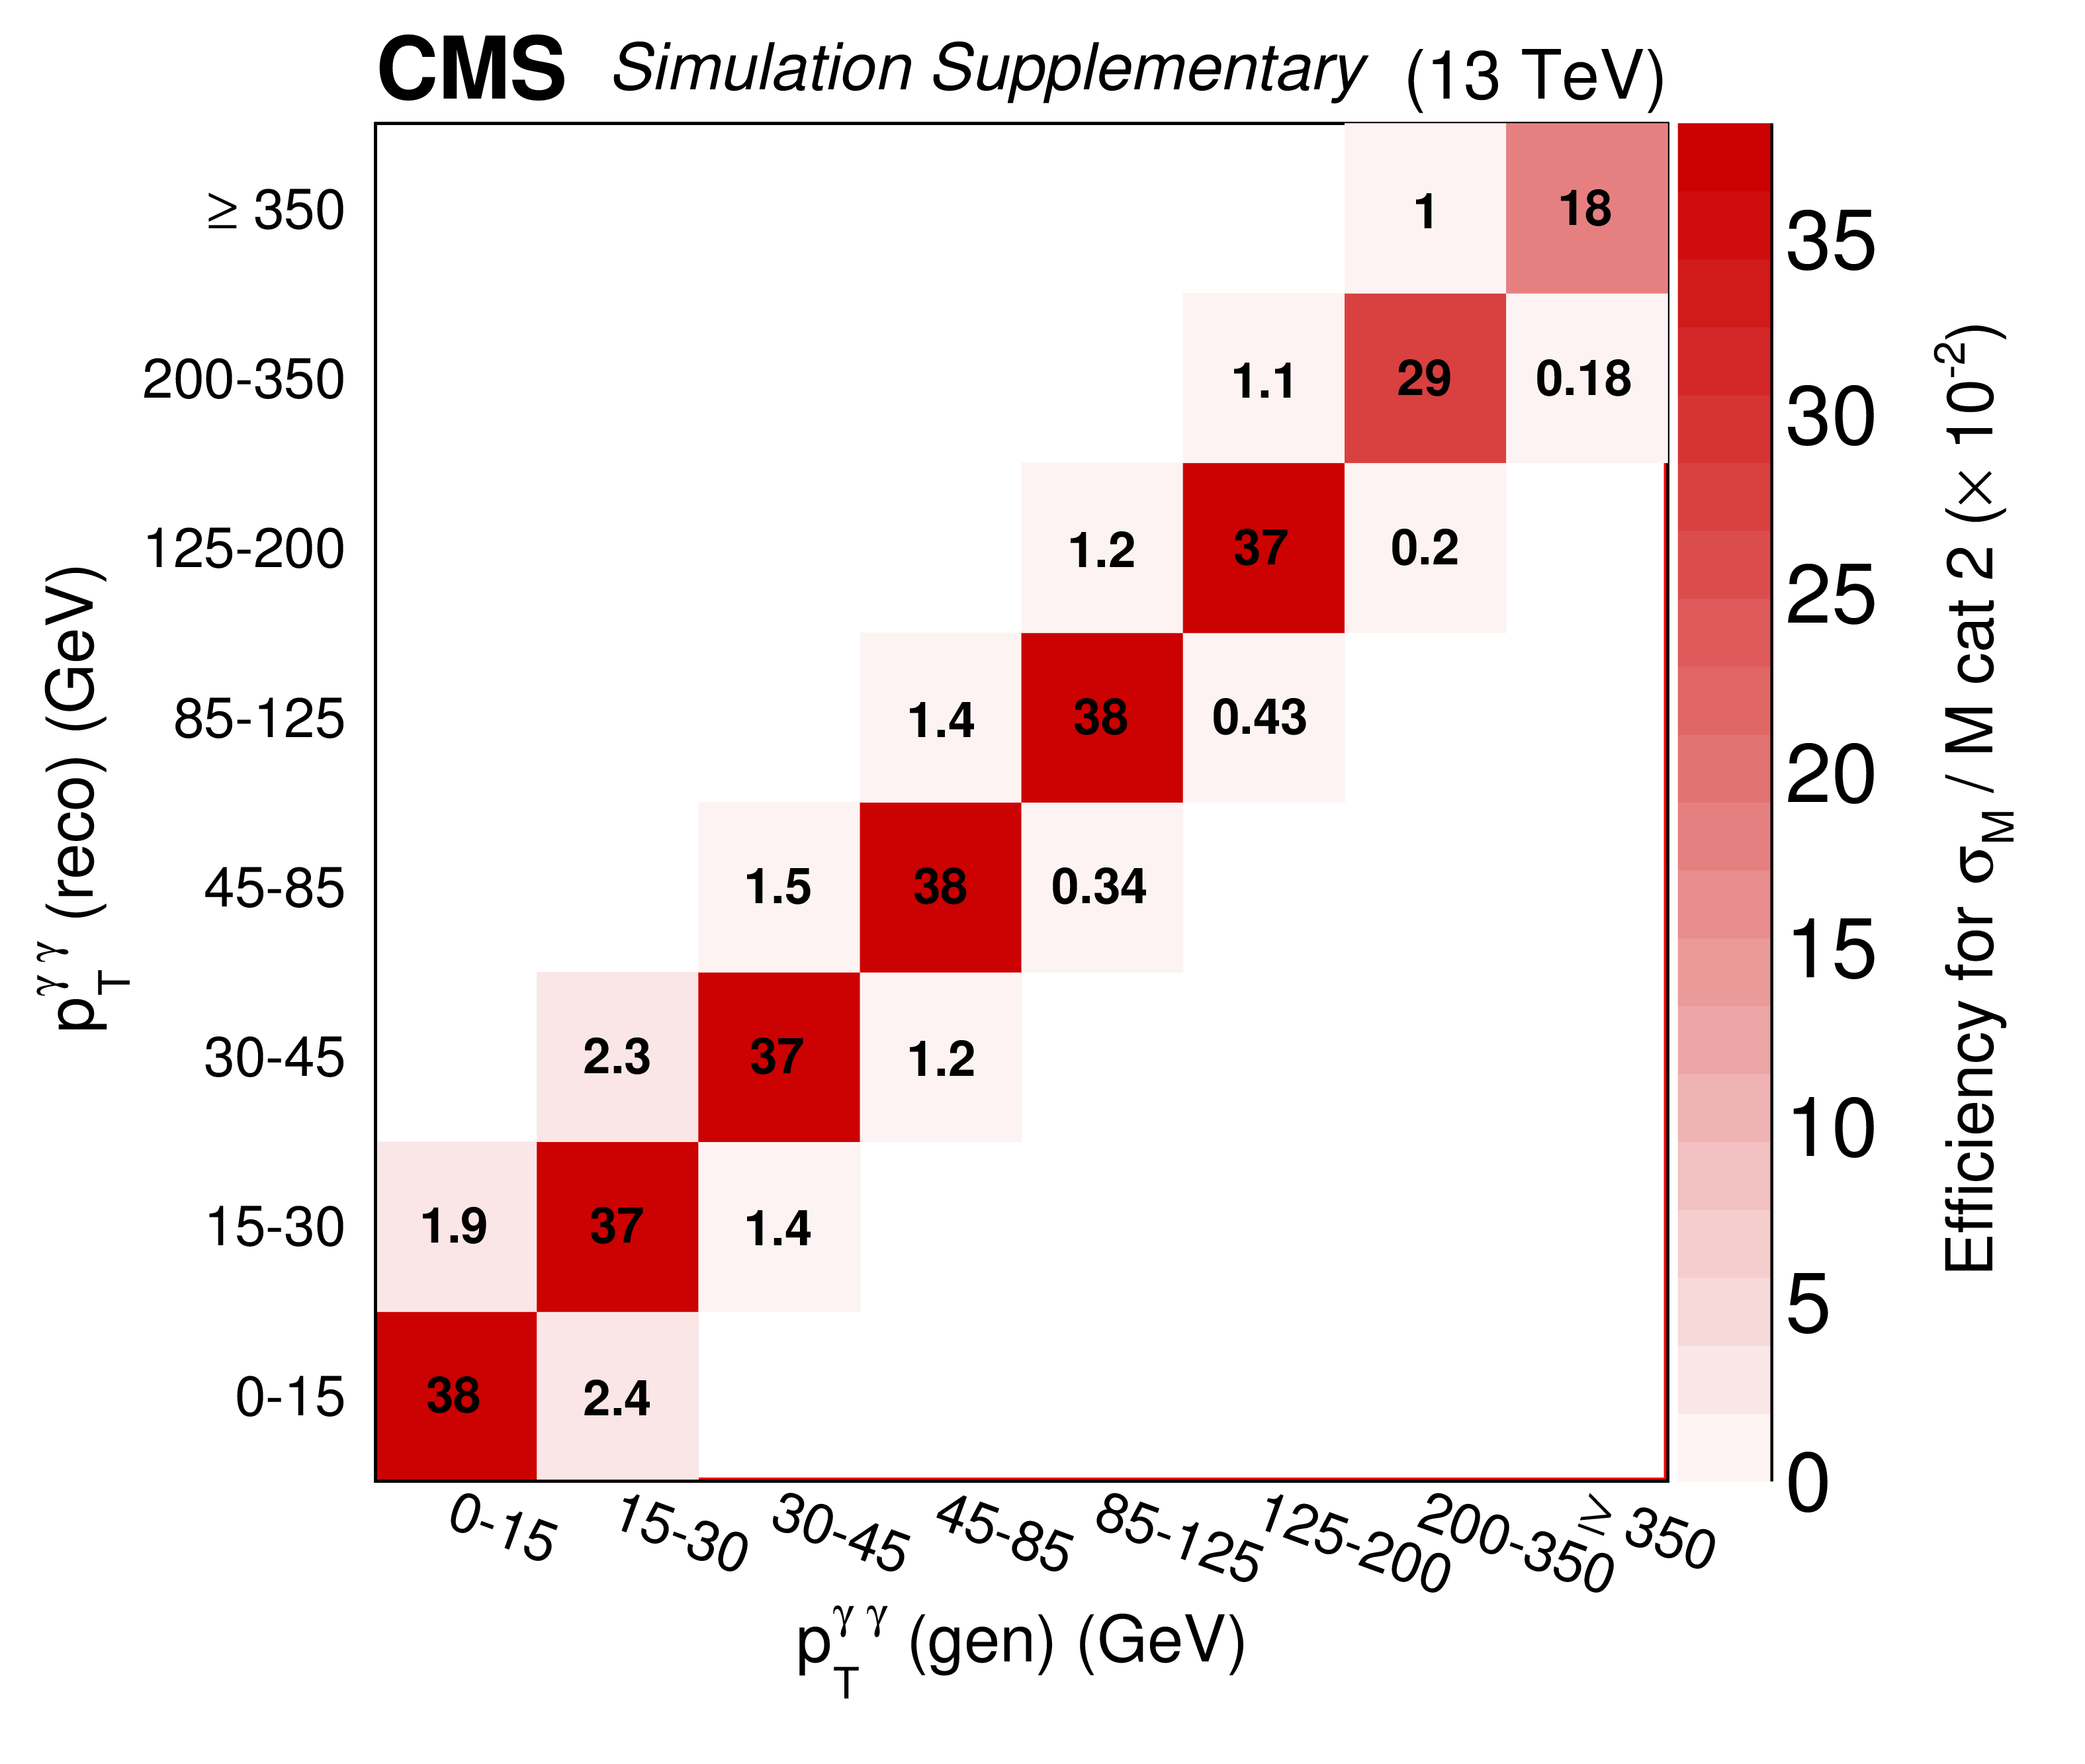
${p_{\mathrm {T}}}$ response matrices for ${\sigma _{\mathrm {m}}/\mathrm {m} |_\text {decorr}}$ categories 0, 1 and 2, in figure (a), (b) and (c), respectively. The sum of the values over the same columns in all categories gives the efficiency for a given generator-level bin. |

png pdf |
Additional Figure 1-a:
${p_{\mathrm {T}}}$ response matrix for ${\sigma _{\mathrm {m}}/\mathrm {m} |_\text {decorr}}$ category 0. The sum of the values over the same columns in all categories gives the efficiency for a given generator-level bin. |
png pdf |
Additional Figure 1-b:
${p_{\mathrm {T}}}$ response matrix for ${\sigma _{\mathrm {m}}/\mathrm {m} |_\text {decorr}}$ category 1. The sum of the values over the same columns in all categories gives the efficiency for a given generator-level bin. |
png pdf |
Additional Figure 1-c:
${p_{\mathrm {T}}}$ response matrix for ${\sigma _{\mathrm {m}}/\mathrm {m} |_\text {decorr}}$ category 2. The sum of the values over the same columns in all categories gives the efficiency for a given generator-level bin. |

png pdf |
Additional Figure 2:
N-jets response matrices for $ { \sigma _{\mathrm {m}}/\mathrm {m} |_\text {decorr}} $ categories 0, 1 and 2, in figure (a), (b) and (c), respectively. The sum of the values over the same columns in all categories gives the efficiency for a given generator-level bin. |

png pdf |
Additional Figure 2-a:
N-jets response matrix for $ { \sigma _{\mathrm {m}}/\mathrm {m} |_\text {decorr}} $ category 0. The sum of the values over the same columns in all categories gives the efficiency for a given generator-level bin. |

png pdf |
Additional Figure 2-b:
N-jets response matrix for $ { \sigma _{\mathrm {m}}/\mathrm {m} |_\text {decorr}} $ category 1. The sum of the values over the same columns in all categories gives the efficiency for a given generator-level bin. |

png pdf |
Additional Figure 2-c:
N-jets response matrix for $ { \sigma _{\mathrm {m}}/\mathrm {m} |_\text {decorr}} $ category 2. The sum of the values over the same columns in all categories gives the efficiency for a given generator-level bin. |

png pdf |
Additional Figure 3:
Distribution of the $\sigma _E/E$ in a) EB and b) EE for photons selected from $\mathrm{Z} \rightarrow \mu \mu \gamma $ events. Data (black points) are compared to simulation (green filled histogram). The distributions in simulation are normalized to the number of entries in data. The systematic uncertainty (red band) applied to the shape obtained from simulated events corresponds to a shift of $\sigma _E/E$ by $\pm$0.03. The bottom panel in each figure shows the data to simulation ratio together with the systematic uncertainty. |

png pdf |
Additional Figure 3-a:
Distribution of the $\sigma _E/E$ in EB for photons selected from $\mathrm{Z} \rightarrow \mu \mu \gamma $ events. Data (black points) are compared to simulation (green filled histogram). The distributions in simulation are normalized to the number of entries in data. The systematic uncertainty (red band) applied to the shape obtained from simulated events corresponds to a shift of $\sigma _E/E$ by $\pm$0.03. The bottom panel in each figure shows the data to simulation ratio together with the systematic uncertainty. |

png pdf |
Additional Figure 3-b:
Distribution of the $\sigma _E/E$ in EE for photons selected from $\mathrm{Z} \rightarrow \mu \mu \gamma $ events. Data (black points) are compared to simulation (green filled histogram). The distributions in simulation are normalized to the number of entries in data. The systematic uncertainty (red band) applied to the shape obtained from simulated events corresponds to a shift of $\sigma _E/E$ by $\pm$0.03. The bottom panel in each figure shows the data to simulation ratio together with the systematic uncertainty. |
png pdf |
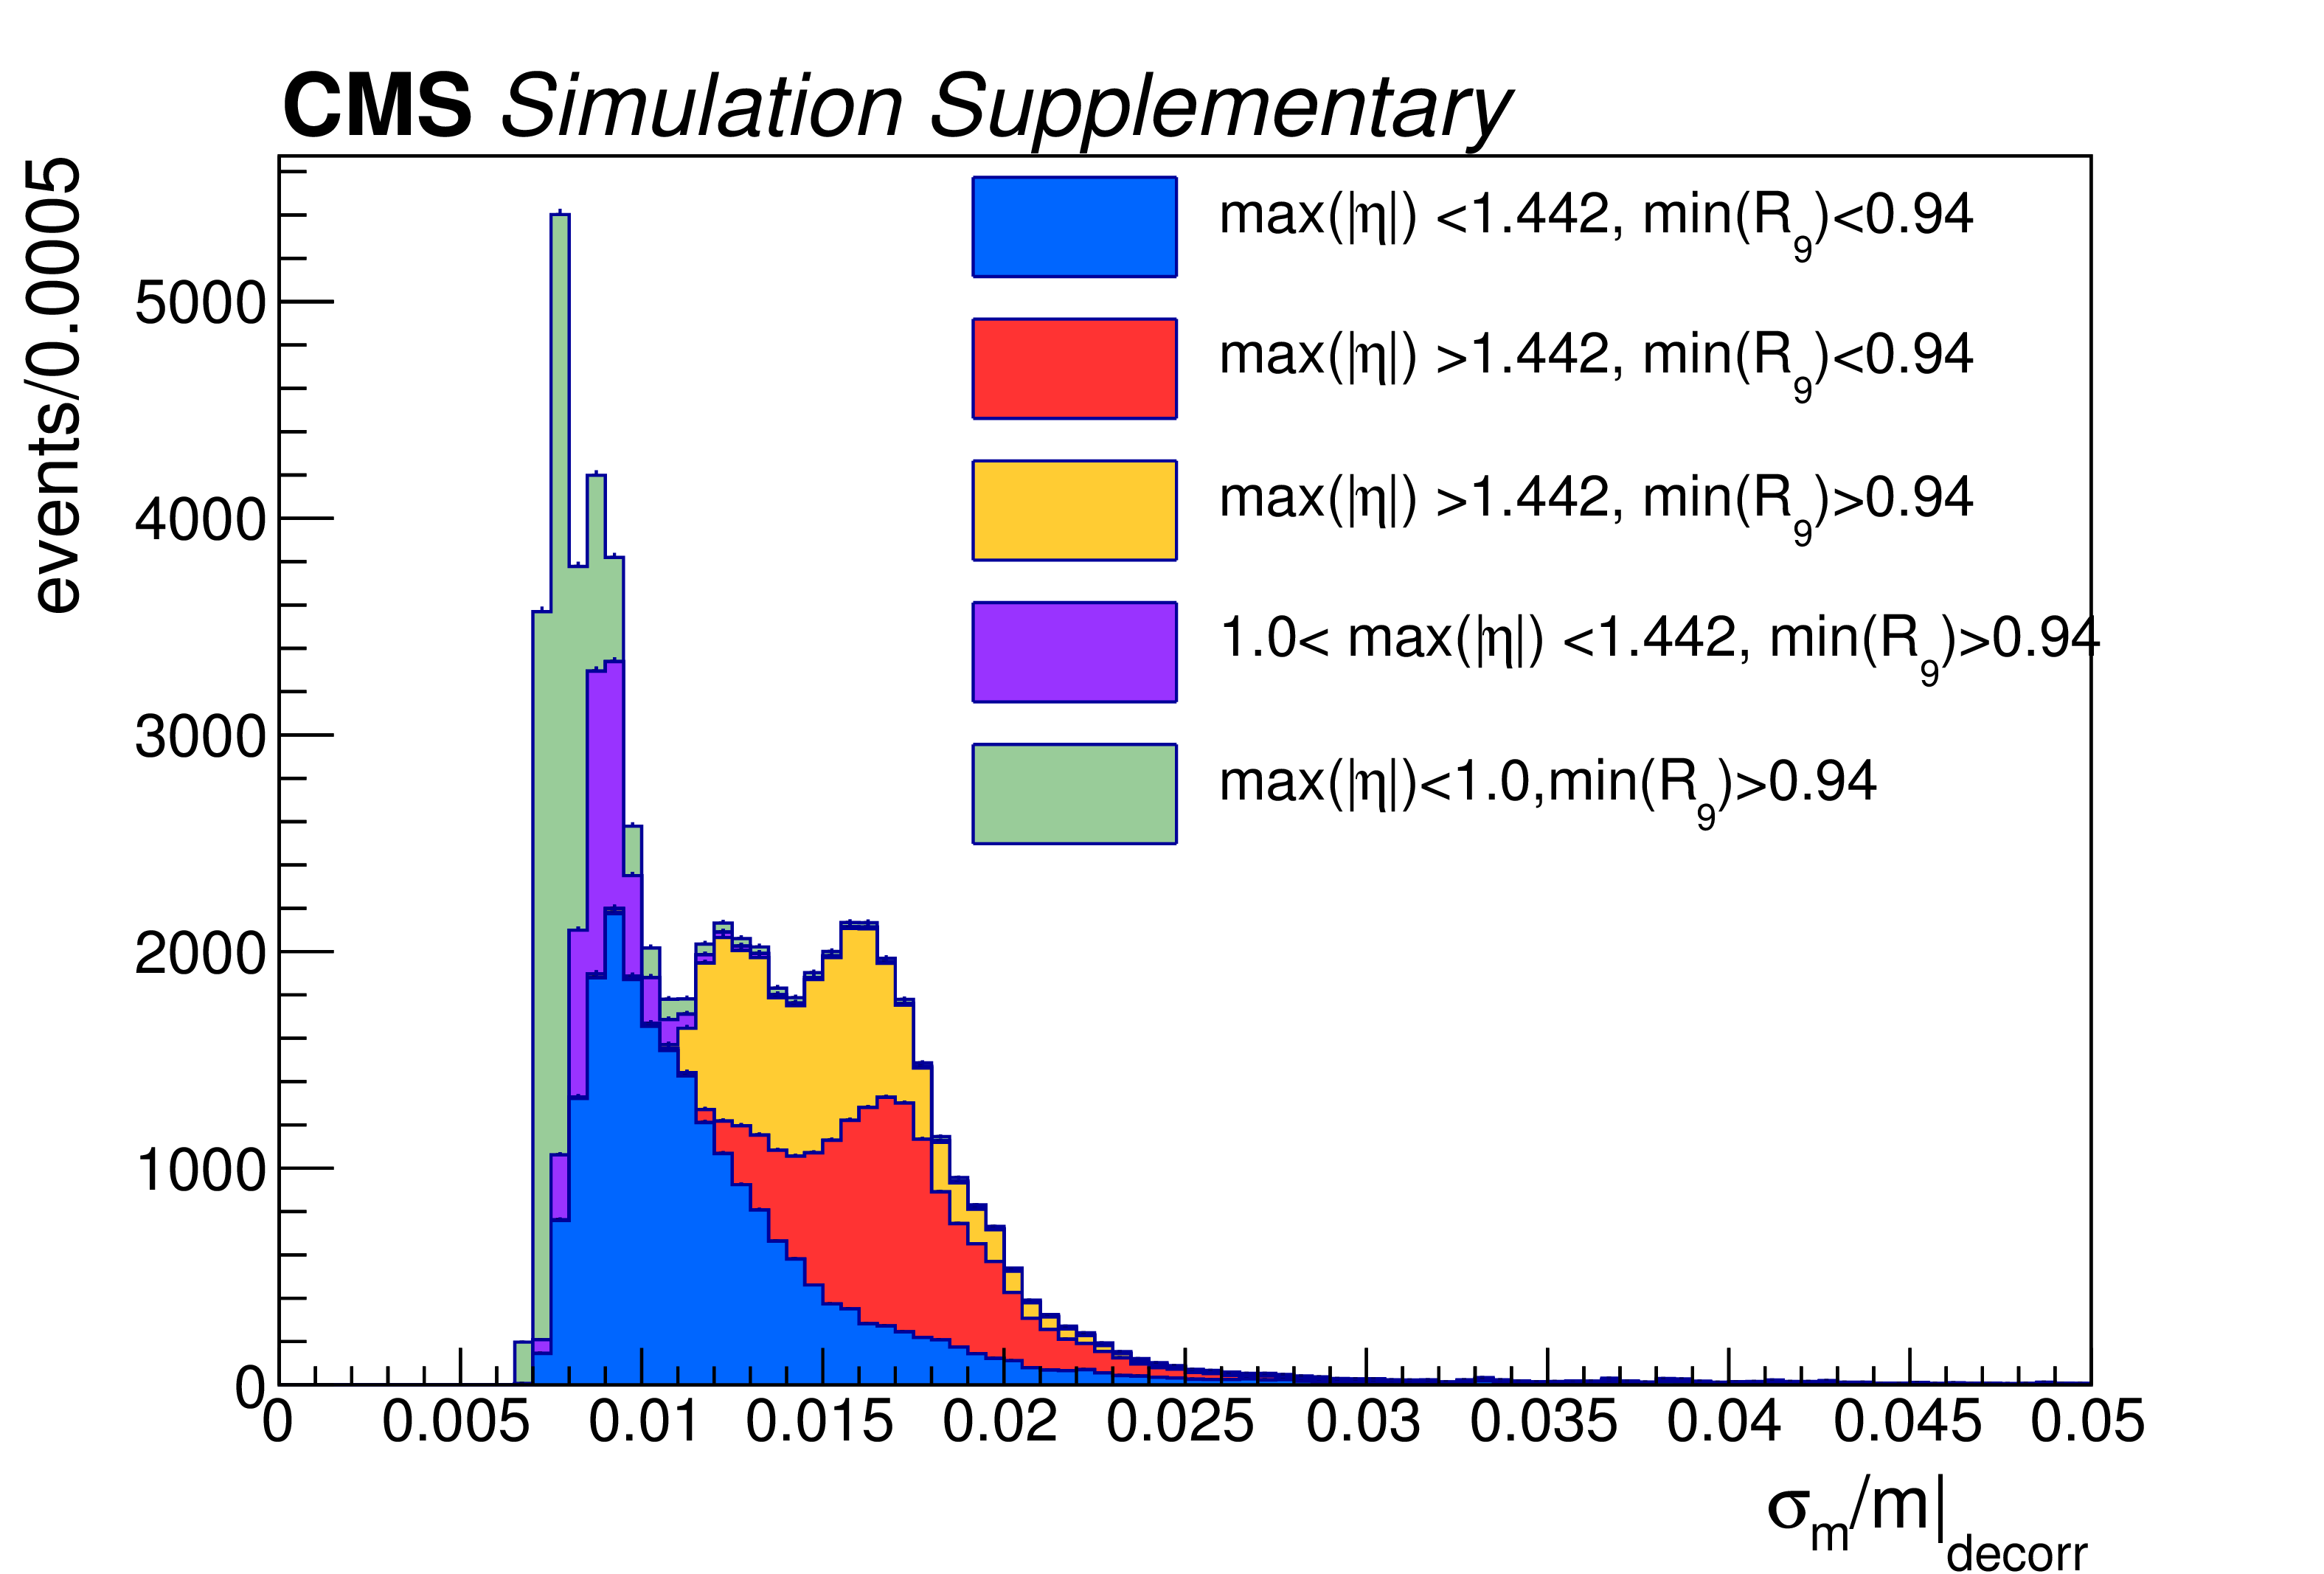
Additional Figure 4:
Distribution of $ { \sigma _{\mathrm {m}}/\mathrm {m} |_\text {decorr}} $ in diphoton events passing the analysis preselection. Each of the stacked histograms corresponds to the categories of pseudorapidities and ${R_\mathrm {9}}$ where the photon energy resolution corrections are derived. The correspondence between categories and structures in the $ { \sigma _{\mathrm {m}}/\mathrm {m} |_\text {decorr}} $ shows how the correlation between the mass resolution and the pseudorapities of the photons is preserved. |

png pdf |
Additional Figure 5:
Events in the $ { \sigma _{\mathrm {m}}/\mathrm {m} |_\text {decorr}} $ classes 0, 1, 2 of the fiducial phase space measurement, respectively in figure (a), (b), (c), binned as a function of ${m_{\gamma \gamma }} $, together with the result of a fit of the signal-plus-background model. |
png pdf |
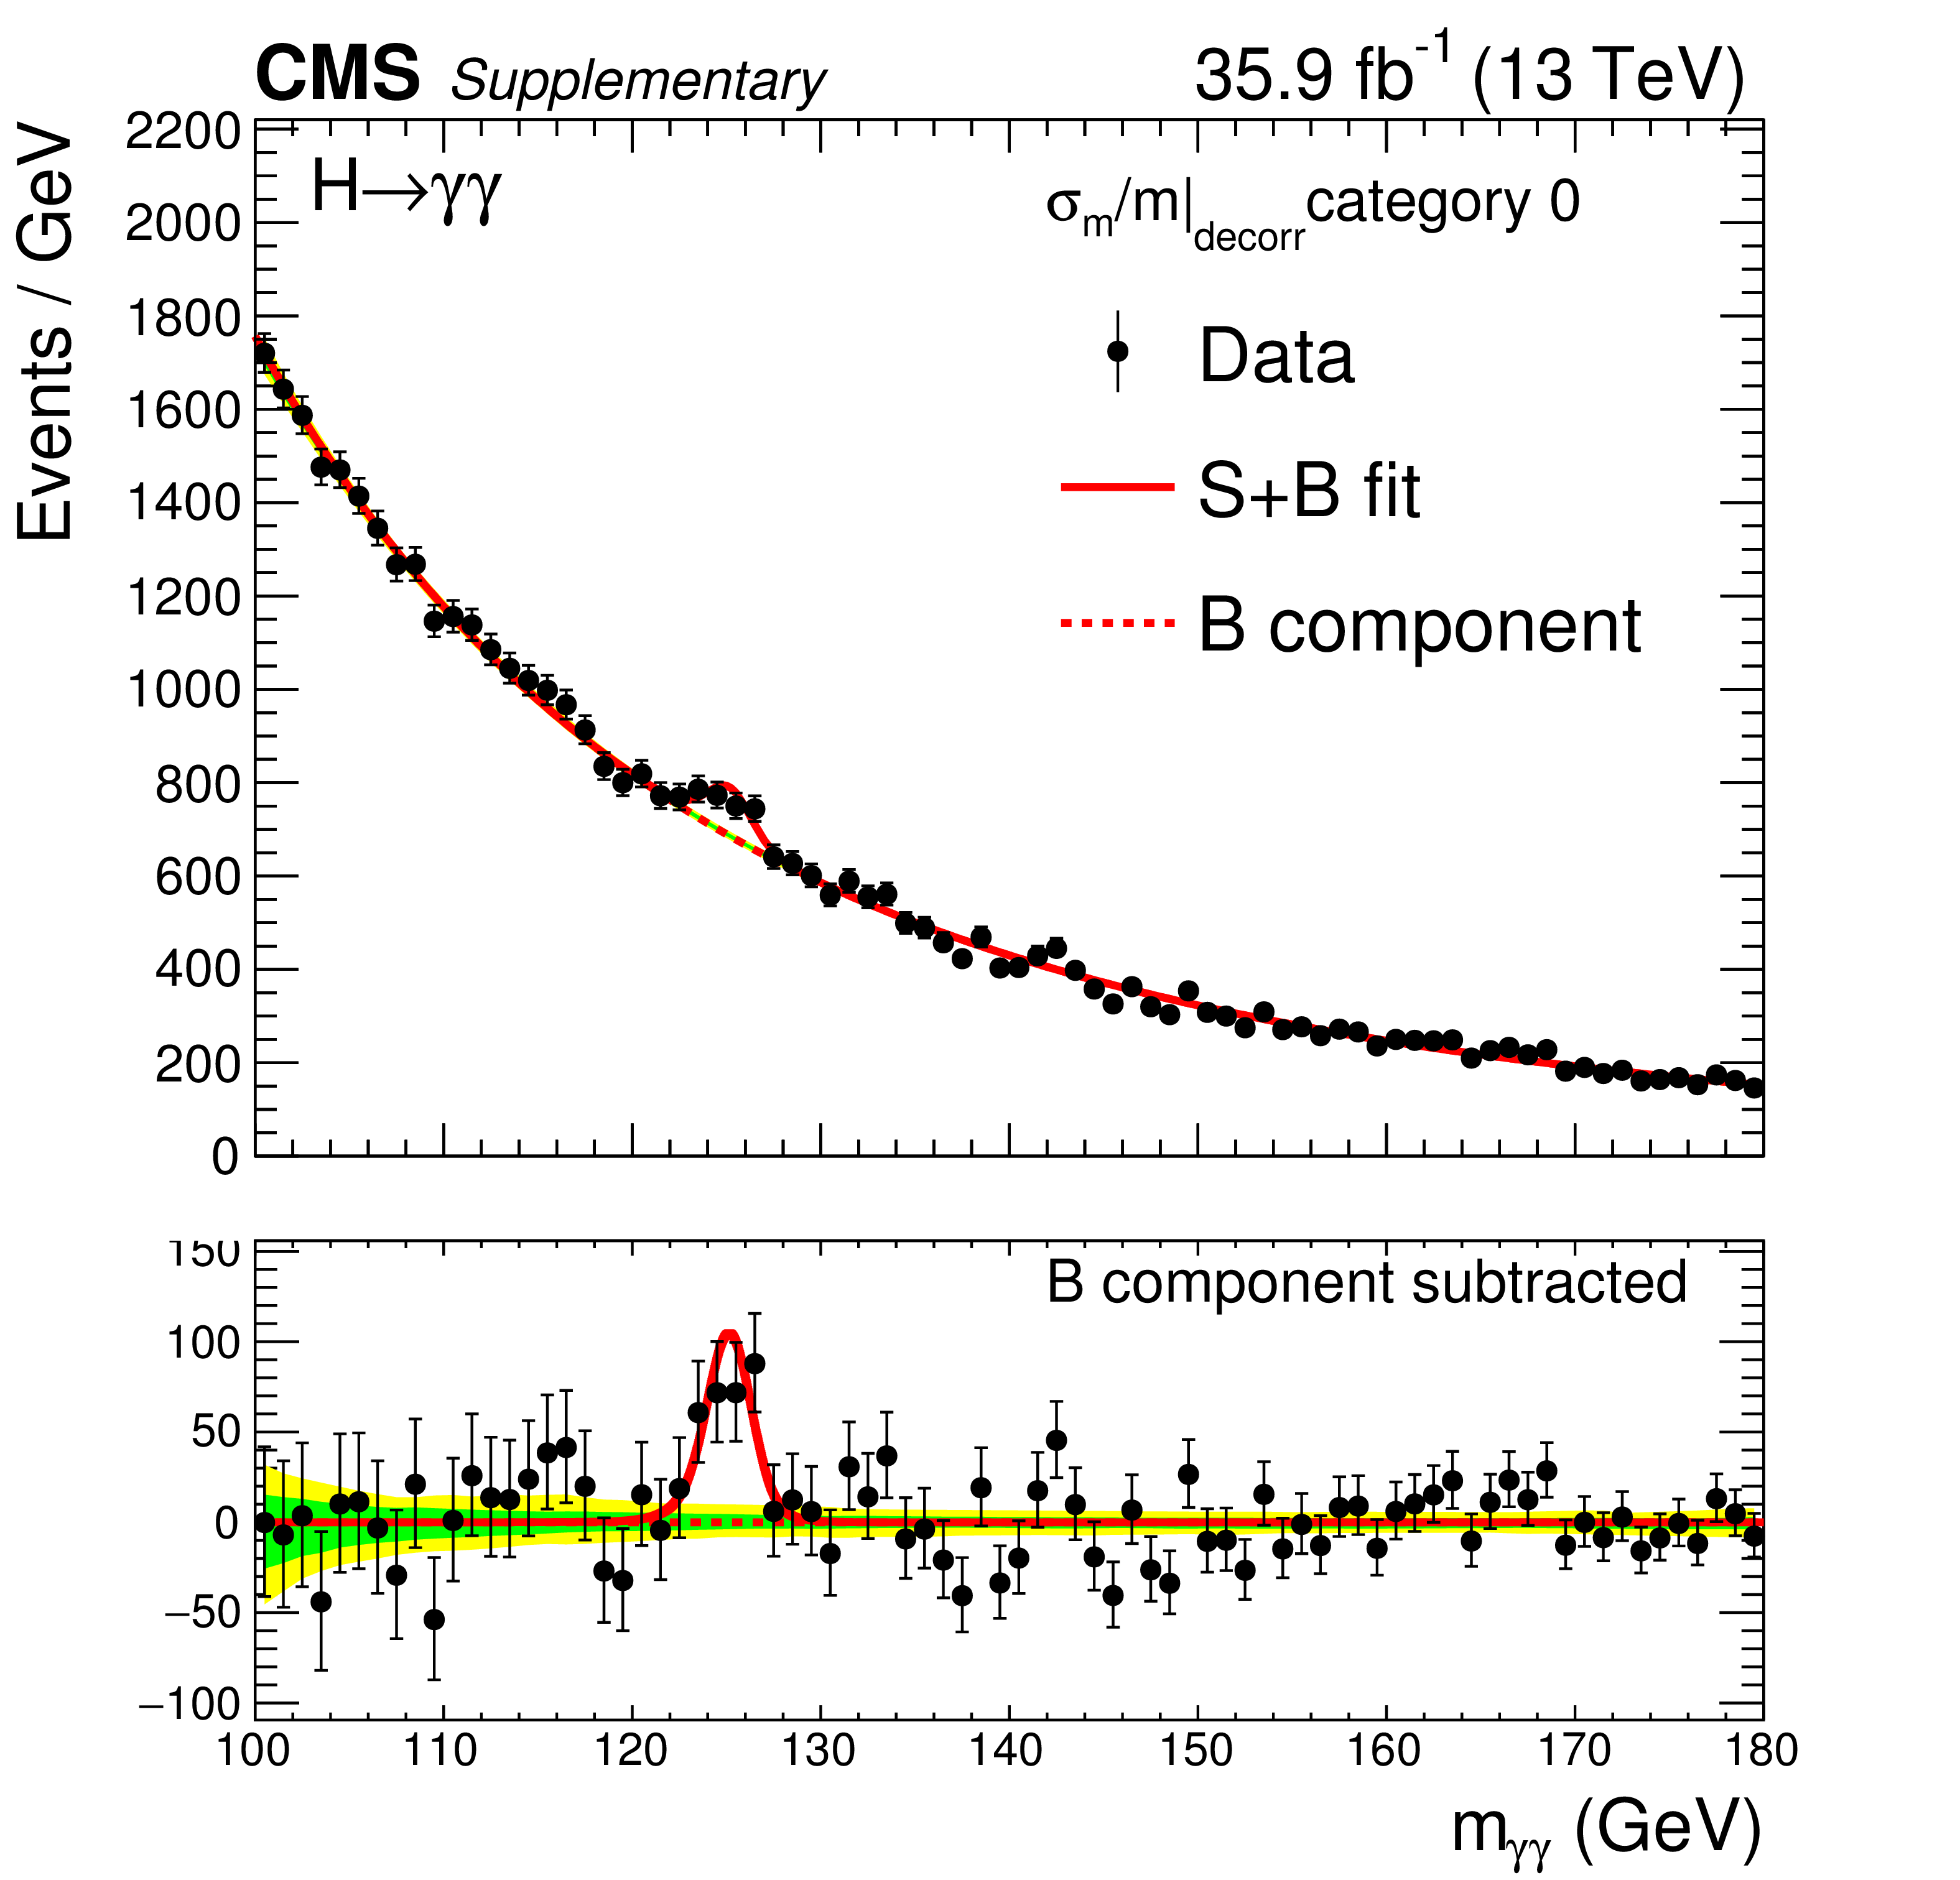
Additional Figure 5-a:
Events in the $ { \sigma _{\mathrm {m}}/\mathrm {m} |_\text {decorr}} $ class 0 of the fiducial phase space measurement, binned as a function of ${m_{\gamma \gamma }} $, together with the result of a fit of the signal-plus-background model. |

png pdf |
Additional Figure 5-b:
Events in the $ { \sigma _{\mathrm {m}}/\mathrm {m} |_\text {decorr}} $ class 1 of the fiducial phase space measurement, binned as a function of ${m_{\gamma \gamma }} $, together with the result of a fit of the signal-plus-background model. |
png pdf |
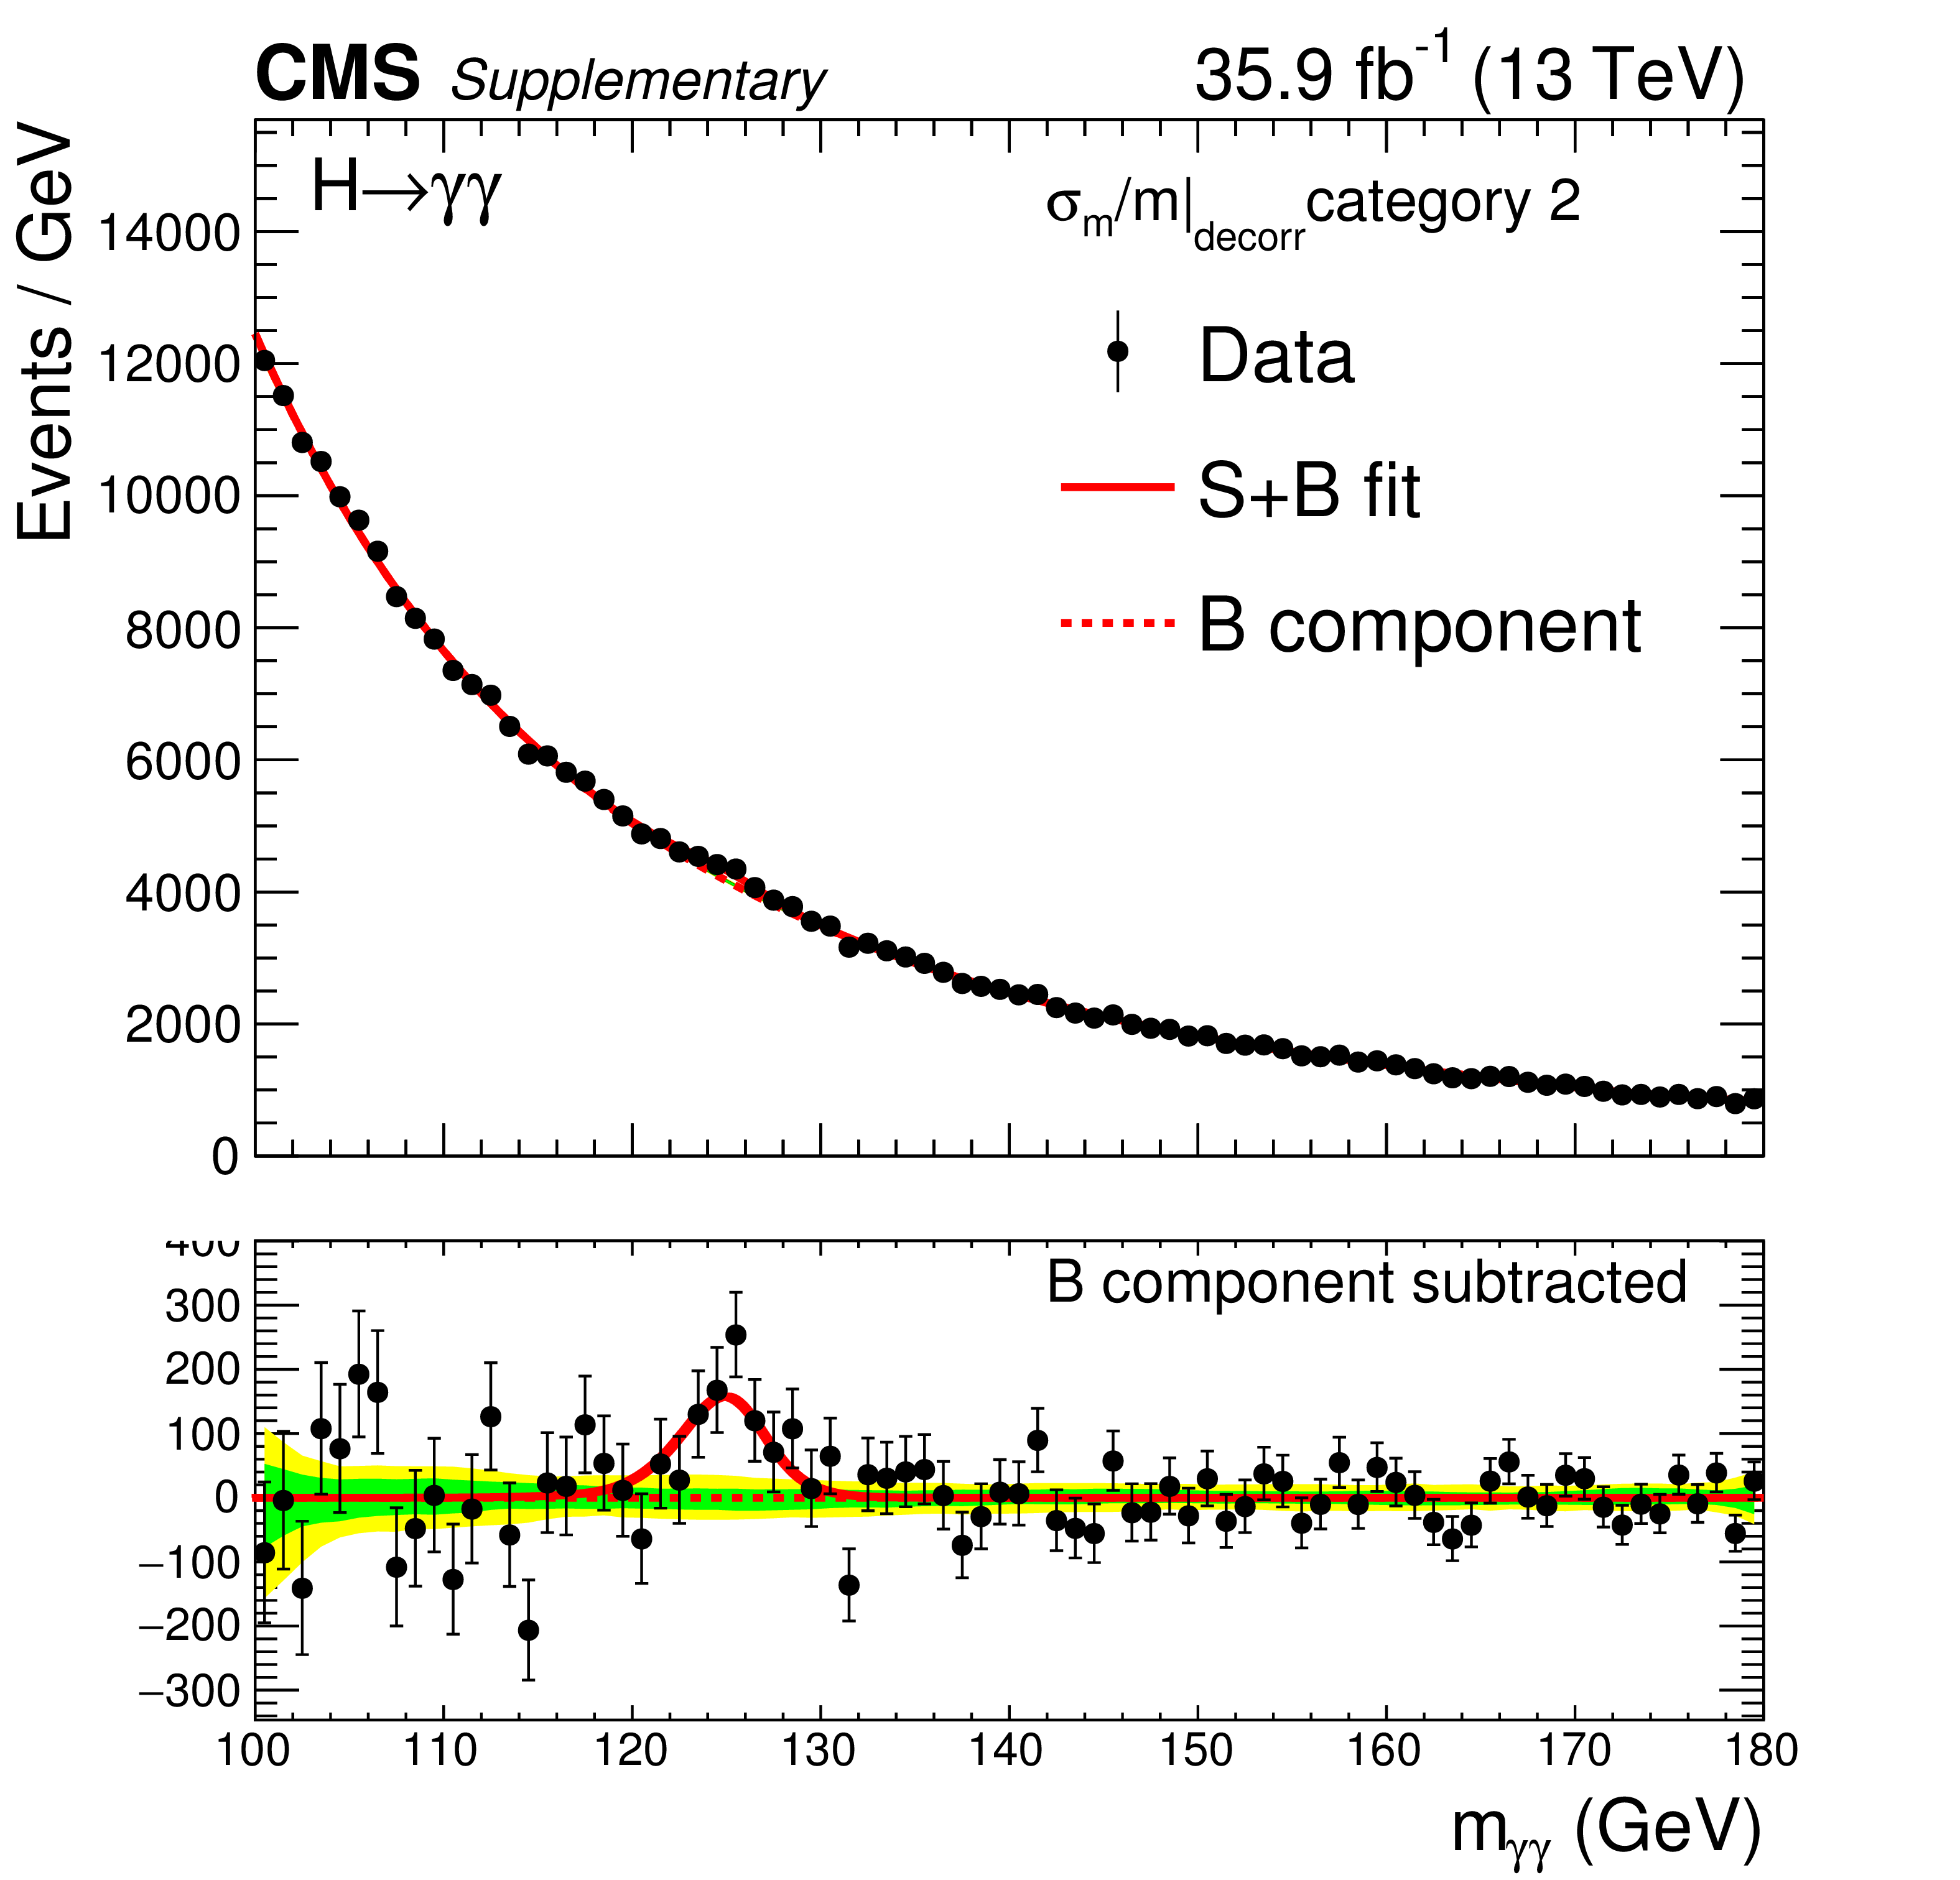
Additional Figure 5-c:
Events in the $ { \sigma _{\mathrm {m}}/\mathrm {m} |_\text {decorr}} $ class 2 of the fiducial phase space measurement, binned as a function of ${m_{\gamma \gamma }} $, together with the result of a fit of the signal-plus-background model. |
png pdf |
Additional Figure 6:
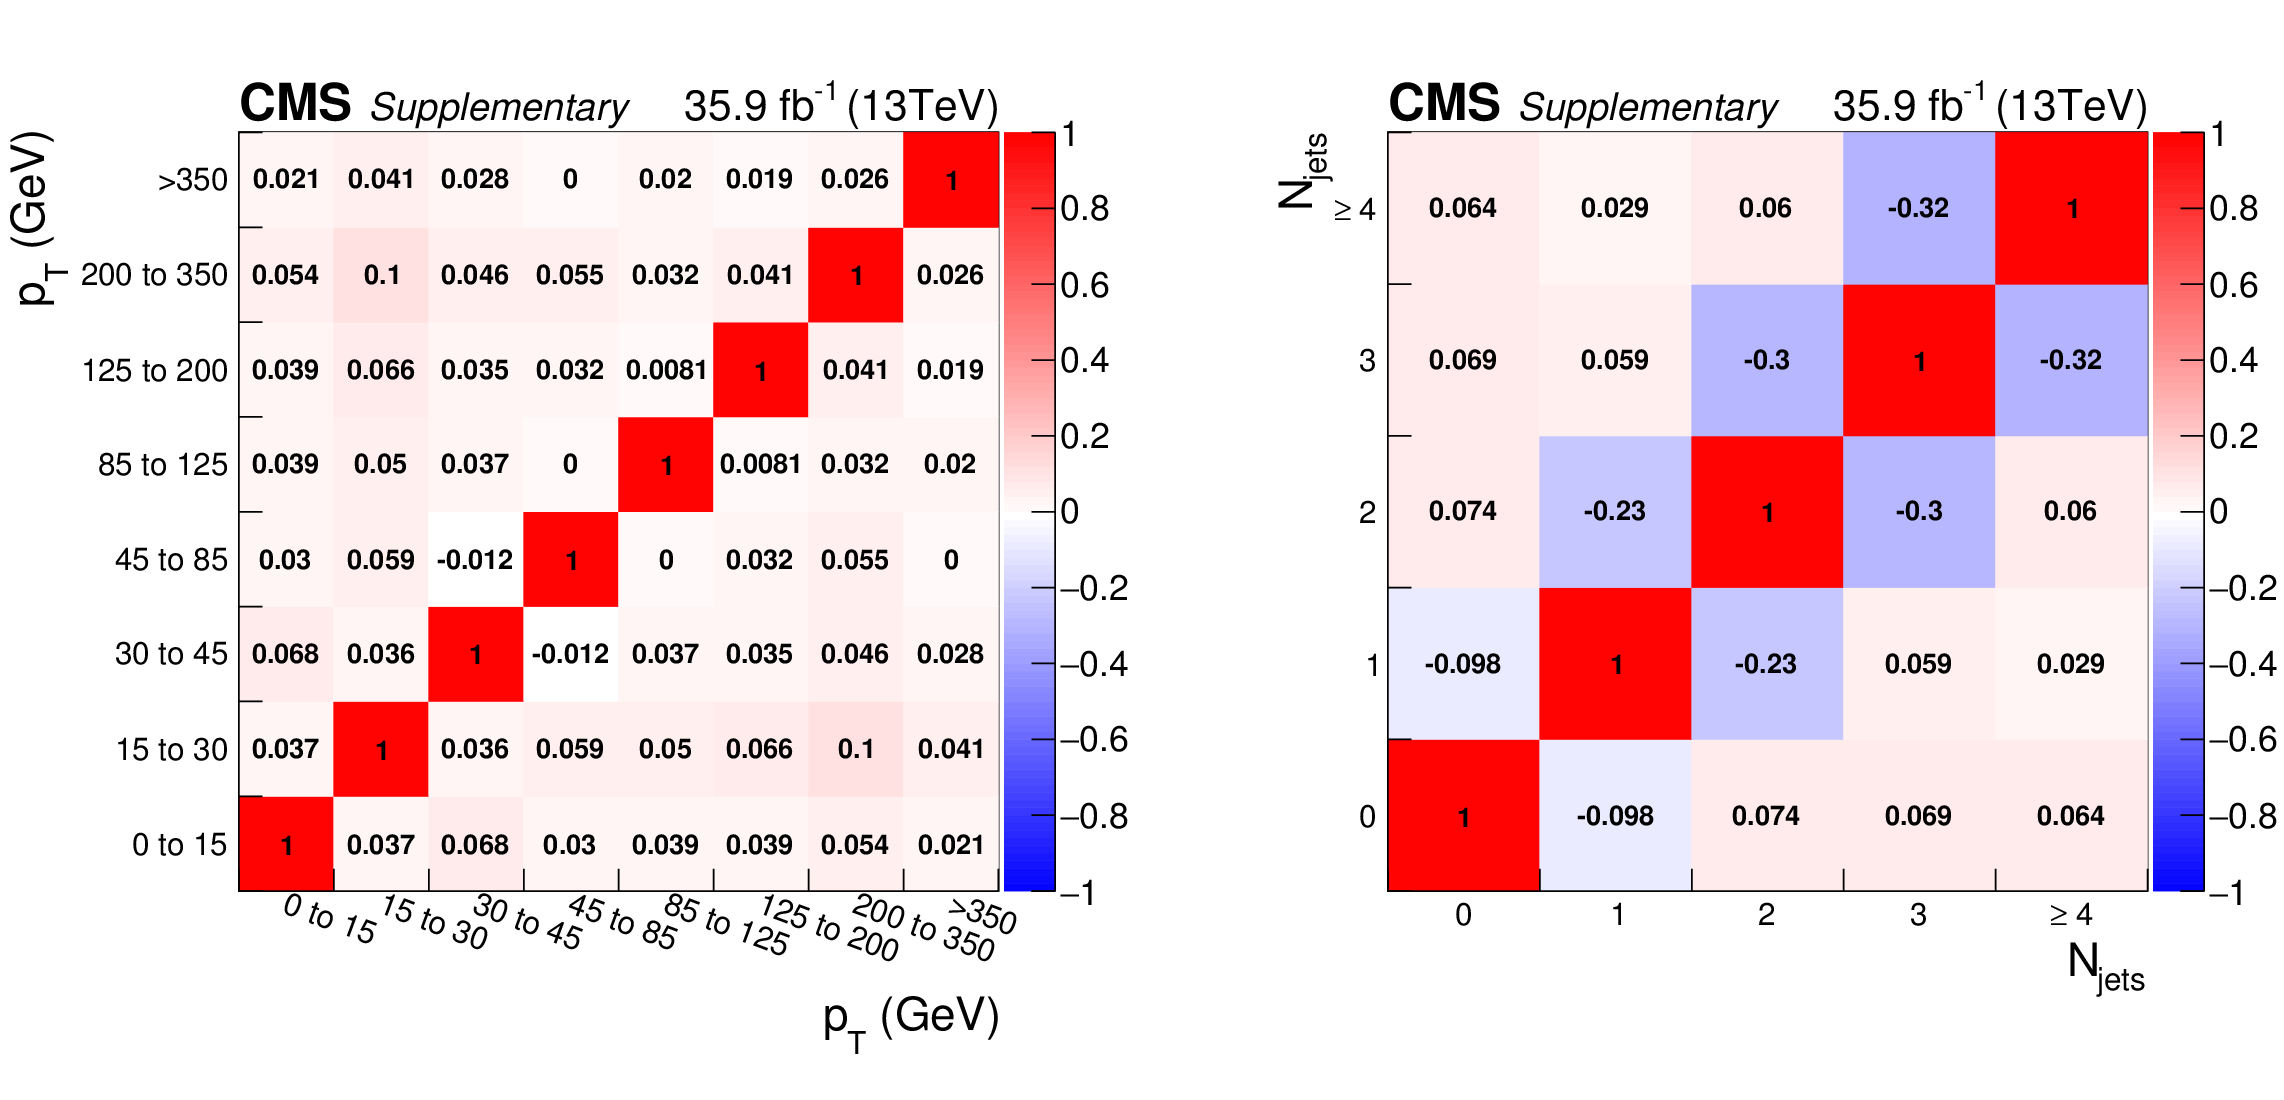
Matrices showing the correlation between signal strengths across bins of the differential cross section measurements, for the diphoton transverse momentum (a) and the jet multiplicity (b). |

png pdf |
Additional Figure 6-a:
Matrix showing the correlation between signal strengths across bins of the differential cross section measurements, for the diphoton transverse momentum. |

png pdf |
Additional Figure 6-b:
Matrix showing the correlation between signal strengths across bins of the differential cross section measurements, for the jet multiplicity. |

png pdf |
Additional Figure 7:
Higgs boson fiducial cross section measurements in the diphoton decay channel performed by the CMS collaboration as a function of the center of mass energy $\sqrt {s}$. In the definition of the fiducial phase space of the analysis performed at $\sqrt {s}= $ 8 (13) TeV, the maximum generator level total hadronic energy contained in a cone of radius $\Delta R= $ 0.4 (0.3) around each photon candidate is required to be less than 10 GeV. The fiducial phase space definition is otherwise the same between the two analyses. The detailed description of the measurement performed at $\sqrt {s}= $ 8 TeV can be found in EPJC (2016) 76. |
| References | ||||
| 1 | CMS Collaboration | Observation of a new boson at a mass of 125 GeV with the CMS experiment at the LHC | PLB 716 (2012) 30 | CMS-HIG-12-028 1207.7235 |
| 2 | ATLAS Collaboration | Observation of a new particle in the search for the Standard Model Higgs boson with the ATLAS detector at the LHC | PLB 716 (2012) 1 | 1207.7214 |
| 3 | ATLAS and CMS Collaborations | Measurements of the Higgs boson production and decay rates and constraints on its couplings from a combined ATLAS and CMS analysis of the LHC pp collision data at $ \sqrt{s}= $ 7 and 8 TeV | JHEP 2016 (2016) 45 | |
| 4 | ATLAS Collaboration | Measurements of fiducial and differential cross sections for Higgs boson production in the diphoton decay channel at $ \sqrt{s}= $ 8 TeV with ATLAS | JHEP 2014 (2014) 112 | |
| 5 | CMS Collaboration | Measurement of differential cross sections for Higgs boson production in the diphoton decay channel in pp collisions at $ \sqrt{s}= $ 8 TeV | EPJC 76 (2016)13 | |
| 6 | CMS Collaboration | Updated measurements of Higgs boson production in the diphoton decay channel at $ \sqrt{s}= $ 13 TeV in pp collisions at CMS | technical report | CMS-PAS-HIG-16-020 |
| 7 | ATLAS Collaboration | Measurement of fiducial, differential and production cross sections in the $ H \to \gamma\gamma $ decay channel with 13.3 fb$^{-1}$ of 13 TeV proton-proton collision data with the ATLAS detector | ATLAS-CONF-2016-067 | |
| 8 | LHC Higgs Cross Section Working Group | Handbook of LHC Higgs cross sections: 3. Higgs Properties | CERN Report CERN-2013-004 | 1307.1347 |
| 9 | CMS Collaboration | The CMS experiment at the CERN LHC | JINST 3 (2008) S08004 | CMS-00-001 |
| 10 | GEANT4 Collaboration | GEANT4 - a simulation toolkit | NIMA 506 (2003) 250 | |
| 11 | J. Alwall et al | The automated computation of tree-level and next-to-leading order differential cross sections, and their matching to parton shower simulations | 1405.0301 | |
| 12 | S. Frixione, P. Nason, and C. Oleari | Matching NLO QCD computations with parton shower simulations: the POWHEG method | JHEP 11 (2007) 070 | 0709.2092 |
| 13 | T. Sjostrand, S. Mrenna, and P. Z. Skands | A Brief Introduction to PYTHIA 8.1 | Comput.Phys.Commun. 178 (2008) 852--867 | 0710.3820 |
| 14 | P. Skands et al. | Tuning PYTHIA 8.1: the Monash 2013 Tune | 1404.5630 | |
| 15 | LHC Higgs Cross Section Working Group Collaboration | Handbook of LHC Higgs Cross Sections: 4. Deciphering the Nature of the Higgs Sector | 1610.07922 | |
| 16 | T. Gleisberg et al. | Event generation with SHERPA 1.1 | JHEP 02 (2009) 007 | 0811.4622 |
| 17 | CMS Collaboration | Performance of electron reconstruction and selection with the CMS detector in proton-proton collisions at $\sqrt{s} = $ 8 TeV | JINST 10 (2015) P06005 | |
| 18 | CMS Collaboration | Energy calibration and resolution of the CMS electromagnetic calorimeter in pp collisions at $ \sqrt{s} $ = 7 TeV | JINST 8 (2013) P09009 | CMS-EGM-11-001 1306.2016 |
| 19 | CMS Collaboration | Performance of photon reconstruction and identification with the CMS detector in proton-proton collisions at $ \sqrt{s}= $ 8 TeV | JINST 10 (2015) P08010 | CMS-EGM-14-001 1502.02702 |
| 20 | M. Oreglia | PhD thesis, Stanford University, 1980 SLAC Report SLAC-R-236 | ||
| 21 | CMS Collaboration | Observation of the diphoton decay of the Higgs boson and measurement of its properties | CMS-HIG-13-001 1407.0558 |
|
| 22 | CMS Collaboration | Particle-Flow Event Reconstruction in CMS and Performance for Jets, Taus, and MET | CDS | |
| 23 | CMS Collaboration | Commissioning of the Particle-flow Event Reconstruction with the first LHC collisions recorded in the CMS detector | CDS | |
| 24 | M. Cacciari, G. P. Salam, and G. Soyez | The anti-$ k_t $ jet clustering algorithm | JHEP 04 (2008) 063 | 0802.1189 |
| 25 | CMS Collaboration | Pileup Jet Identification | CMS-PAS-JME-13-005 | CMS-PAS-JME-13-005 |
| 26 | CMS Collaboration Collaboration | Electron and photon performance in CMS with the full 2016 data sample. | ||
| 27 | G. Cowan et al. | Asymptotic formulae for likelihood-based tests of new physics | EPJC 71 (2011) 1 | 1007.1727 |
| 28 | F. Demartin et al. | The impact of PDF and alphas uncertainties on Higgs Production in gluon fusion at hadron colliders | PRD82 (2010) 014002 | 1004.0962 |
| 29 | S. Carrazza et al. | An Unbiased Hessian Representation for Monte Carlo PDFs | EPJC75 (2015), no. 8, 369 | 1505.06736 |
| 30 | ATLAS and CMS Collaborations | Combined Measurement of the Higgs Boson Mass in $ pp $ Collisions at $ \sqrt{s}= $ 7 and 8 TeV with the ATLAS and CMS Experiments | PRL 114 (May, 2015) 191803 | |
|
|
Compact Muon Solenoid LHC, CERN |
|

|

|

|

|

|