

Compact Muon Solenoid
LHC, CERN
| CMS-PAS-HIG-17-023 | ||
| Search for invisible decays of the Higgs boson produced through vector boson fusion at $\sqrt{s} = $ 13 TeV | ||
| CMS Collaboration | ||
| March 2018 | ||
| Abstract: A search for invisible decays of the Higgs boson is performed using 13 TeV proton-proton collision data collected by the CMS experiment at the LHC in 2016, corresponding to an integrated luminosity of 35.9 fb$^{-1}$. The search targets the production of the Higgs boson through vector boson fusion. The data are found to be in agreement with the predicted background contributions from standard model processes. An observed (expected) upper limit of 0.28 (0.21), at 95% confidence level, is placed on the invisible branching fraction of the 125 GeV Higgs boson. Upper limits are also computed on the product of the cross section and branching fraction of a scalar Higgs boson-like particle, with mass ranging between 110 and 1000 GeV. Finally, a combination of several analyses searching for invisible decays of the Higgs boson, based on 35.9 fb$^{-1}$ of data collected by the CMS detector in 2016, is performed. An observed (expected) upper limit of 0.24 (0.18) is placed on the invisible branching fraction. This result is also interpreted in the context of Higgs-portal dark matter models, setting upper bounds on the spin-independent dark matter-nucleon scattering cross section. | ||
|
Links:
CDS record (PDF) ;
inSPIRE record ;
CADI line (restricted) ;
These preliminary results are superseded in this paper, PLB 793 (2019) 520. The superseded preliminary plots can be found here. |
||
| Figures | |

png pdf |
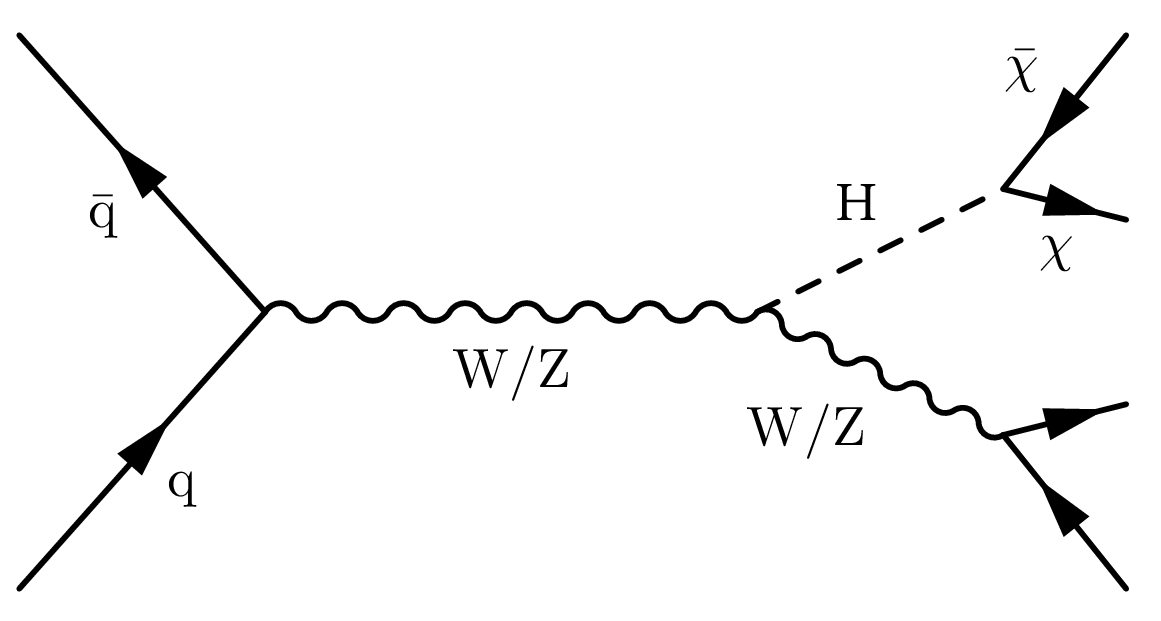
Figure 1:
Feynman diagrams for the main production processes targeted in the searches considered in the combination: qq $\to $ qqH (left), qq $\to $ VH (center), and gg $\to $ gH (right). |

png pdf |
Figure 1-a:
Feynman diagrams for the main production processes targeted in the searches considered in the combination: qq $\to $ qqH (left), qq $\to $ VH (center), and gg $\to $ gH (right). |
png pdf |
Figure 1-b:
Feynman diagrams for the main production processes targeted in the searches considered in the combination: qq $\to $ qqH (left), qq $\to $ VH (center), and gg $\to $ gH (right). |

png pdf |
Figure 1-c:
Feynman diagrams for the main production processes targeted in the searches considered in the combination: qq $\to $ qqH (left), qq $\to $ VH (center), and gg $\to $ gH (right). |

png pdf |
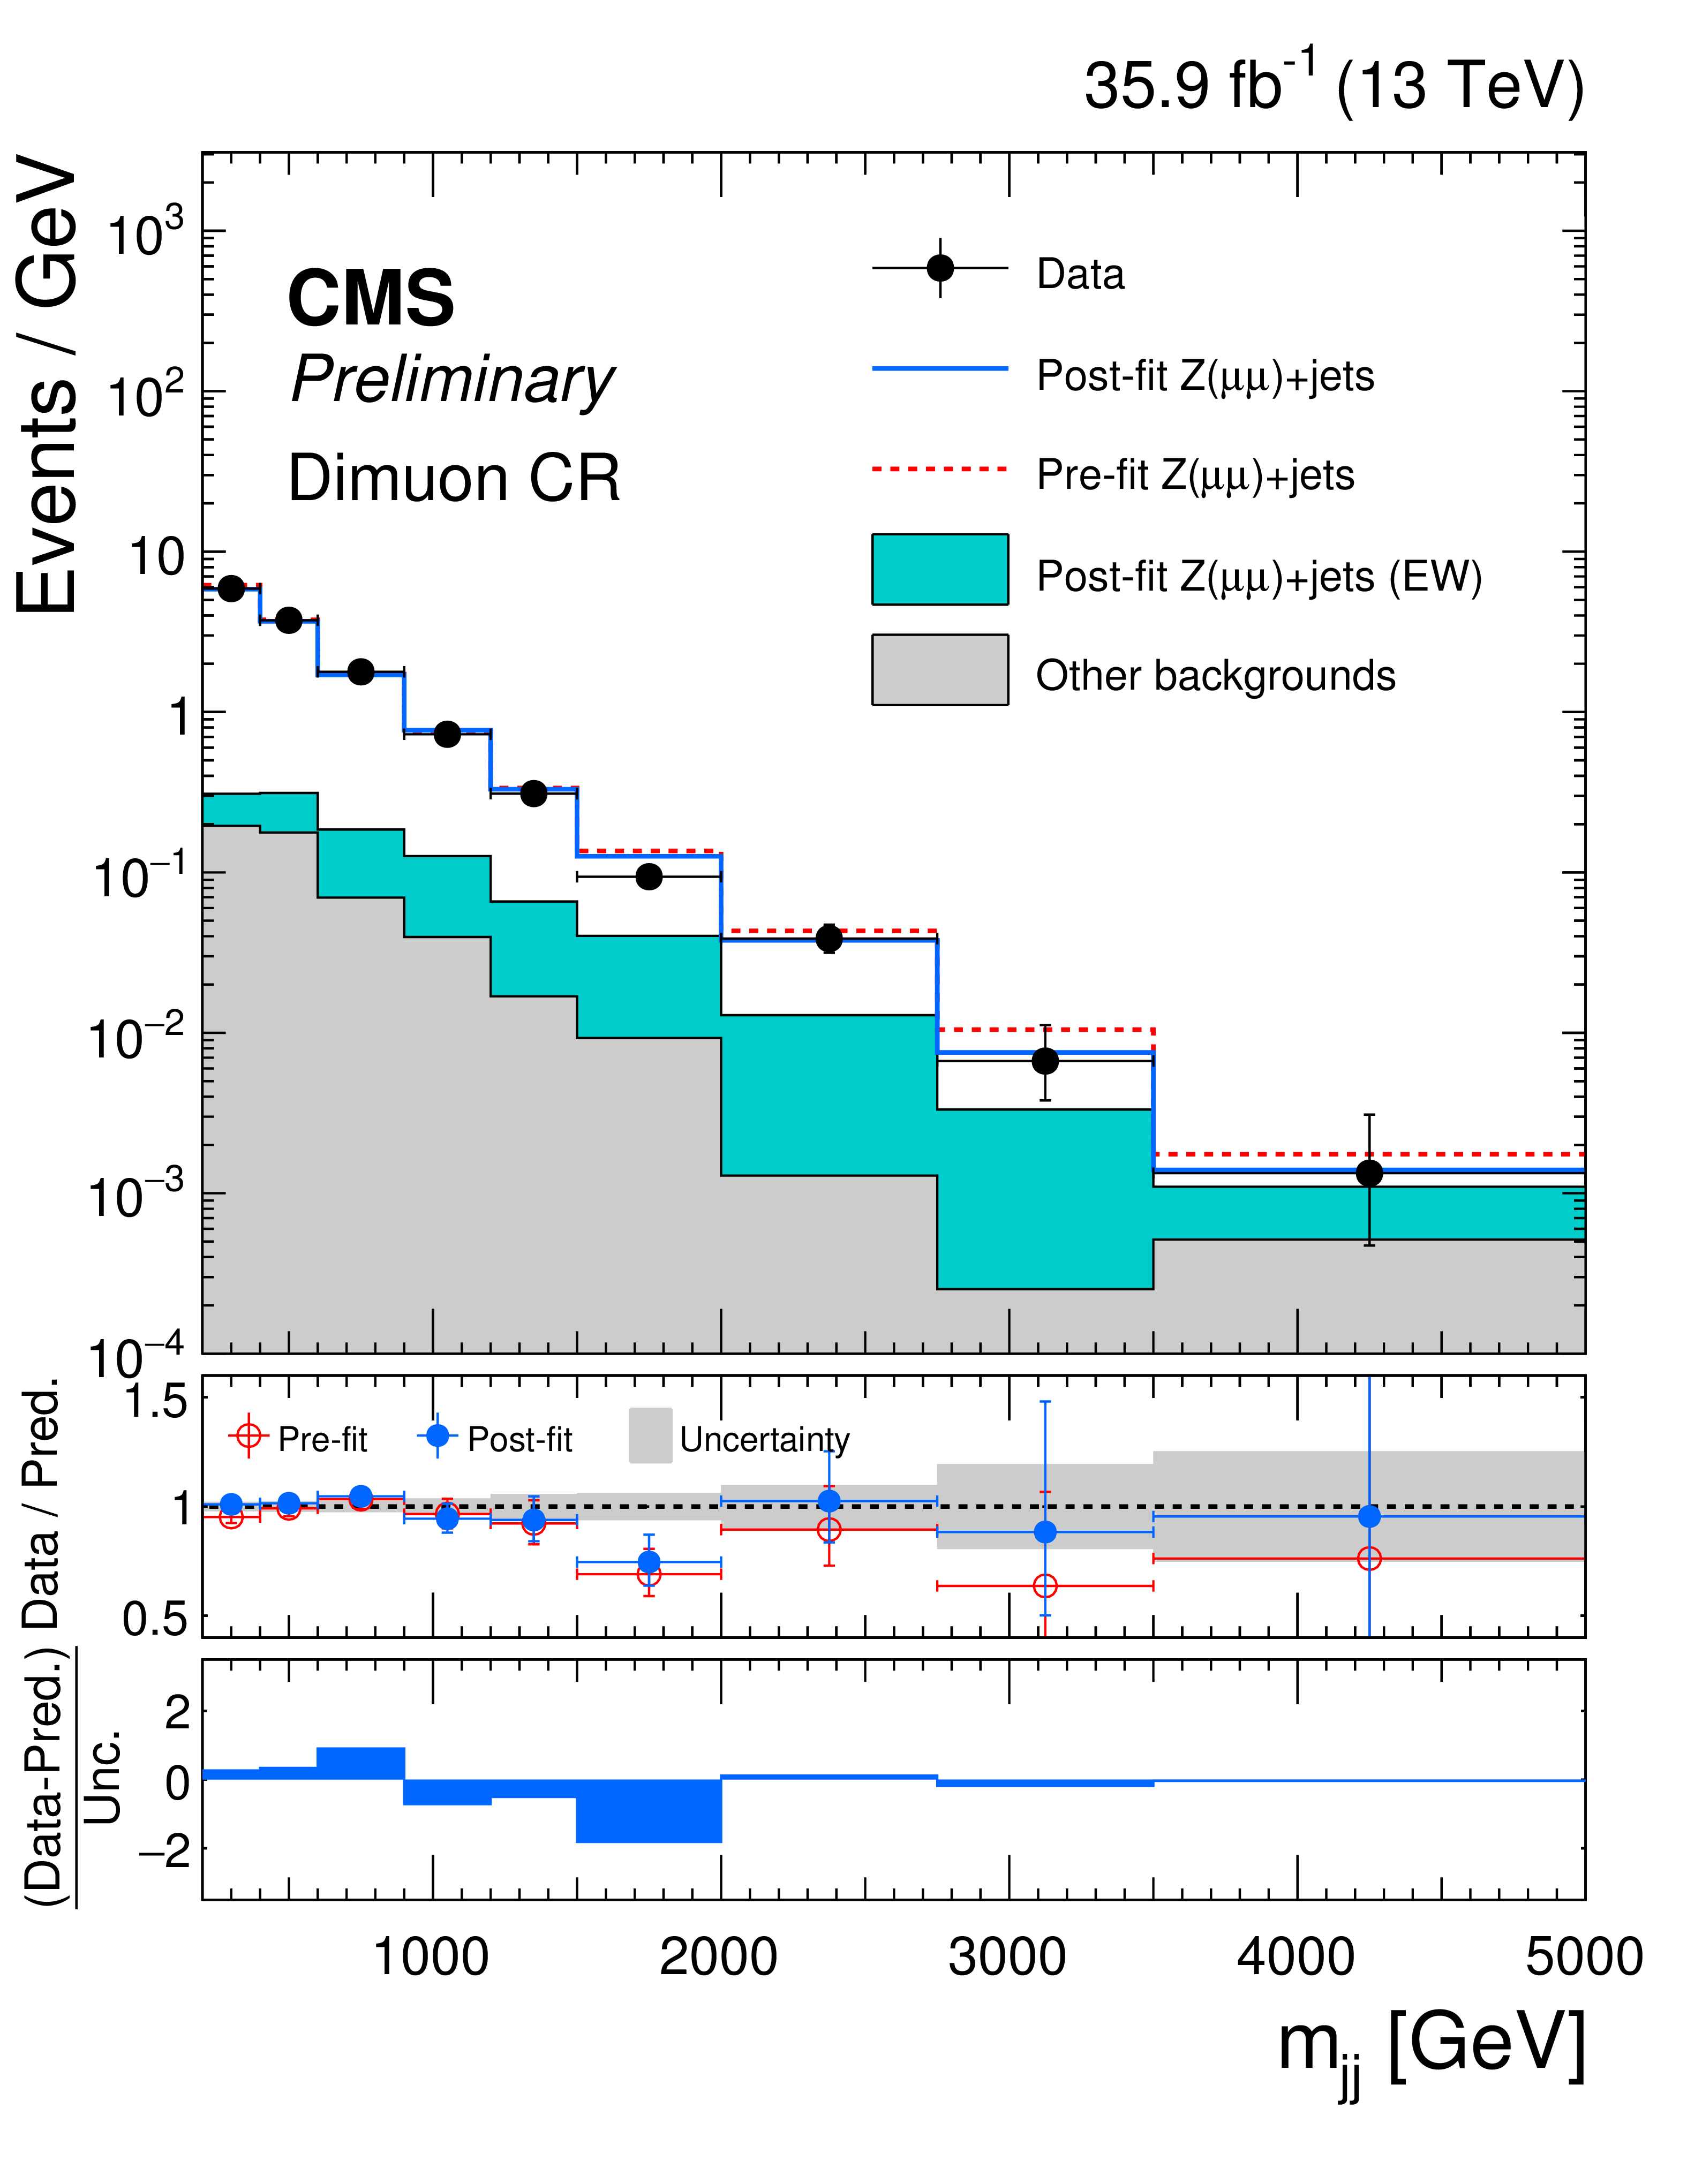
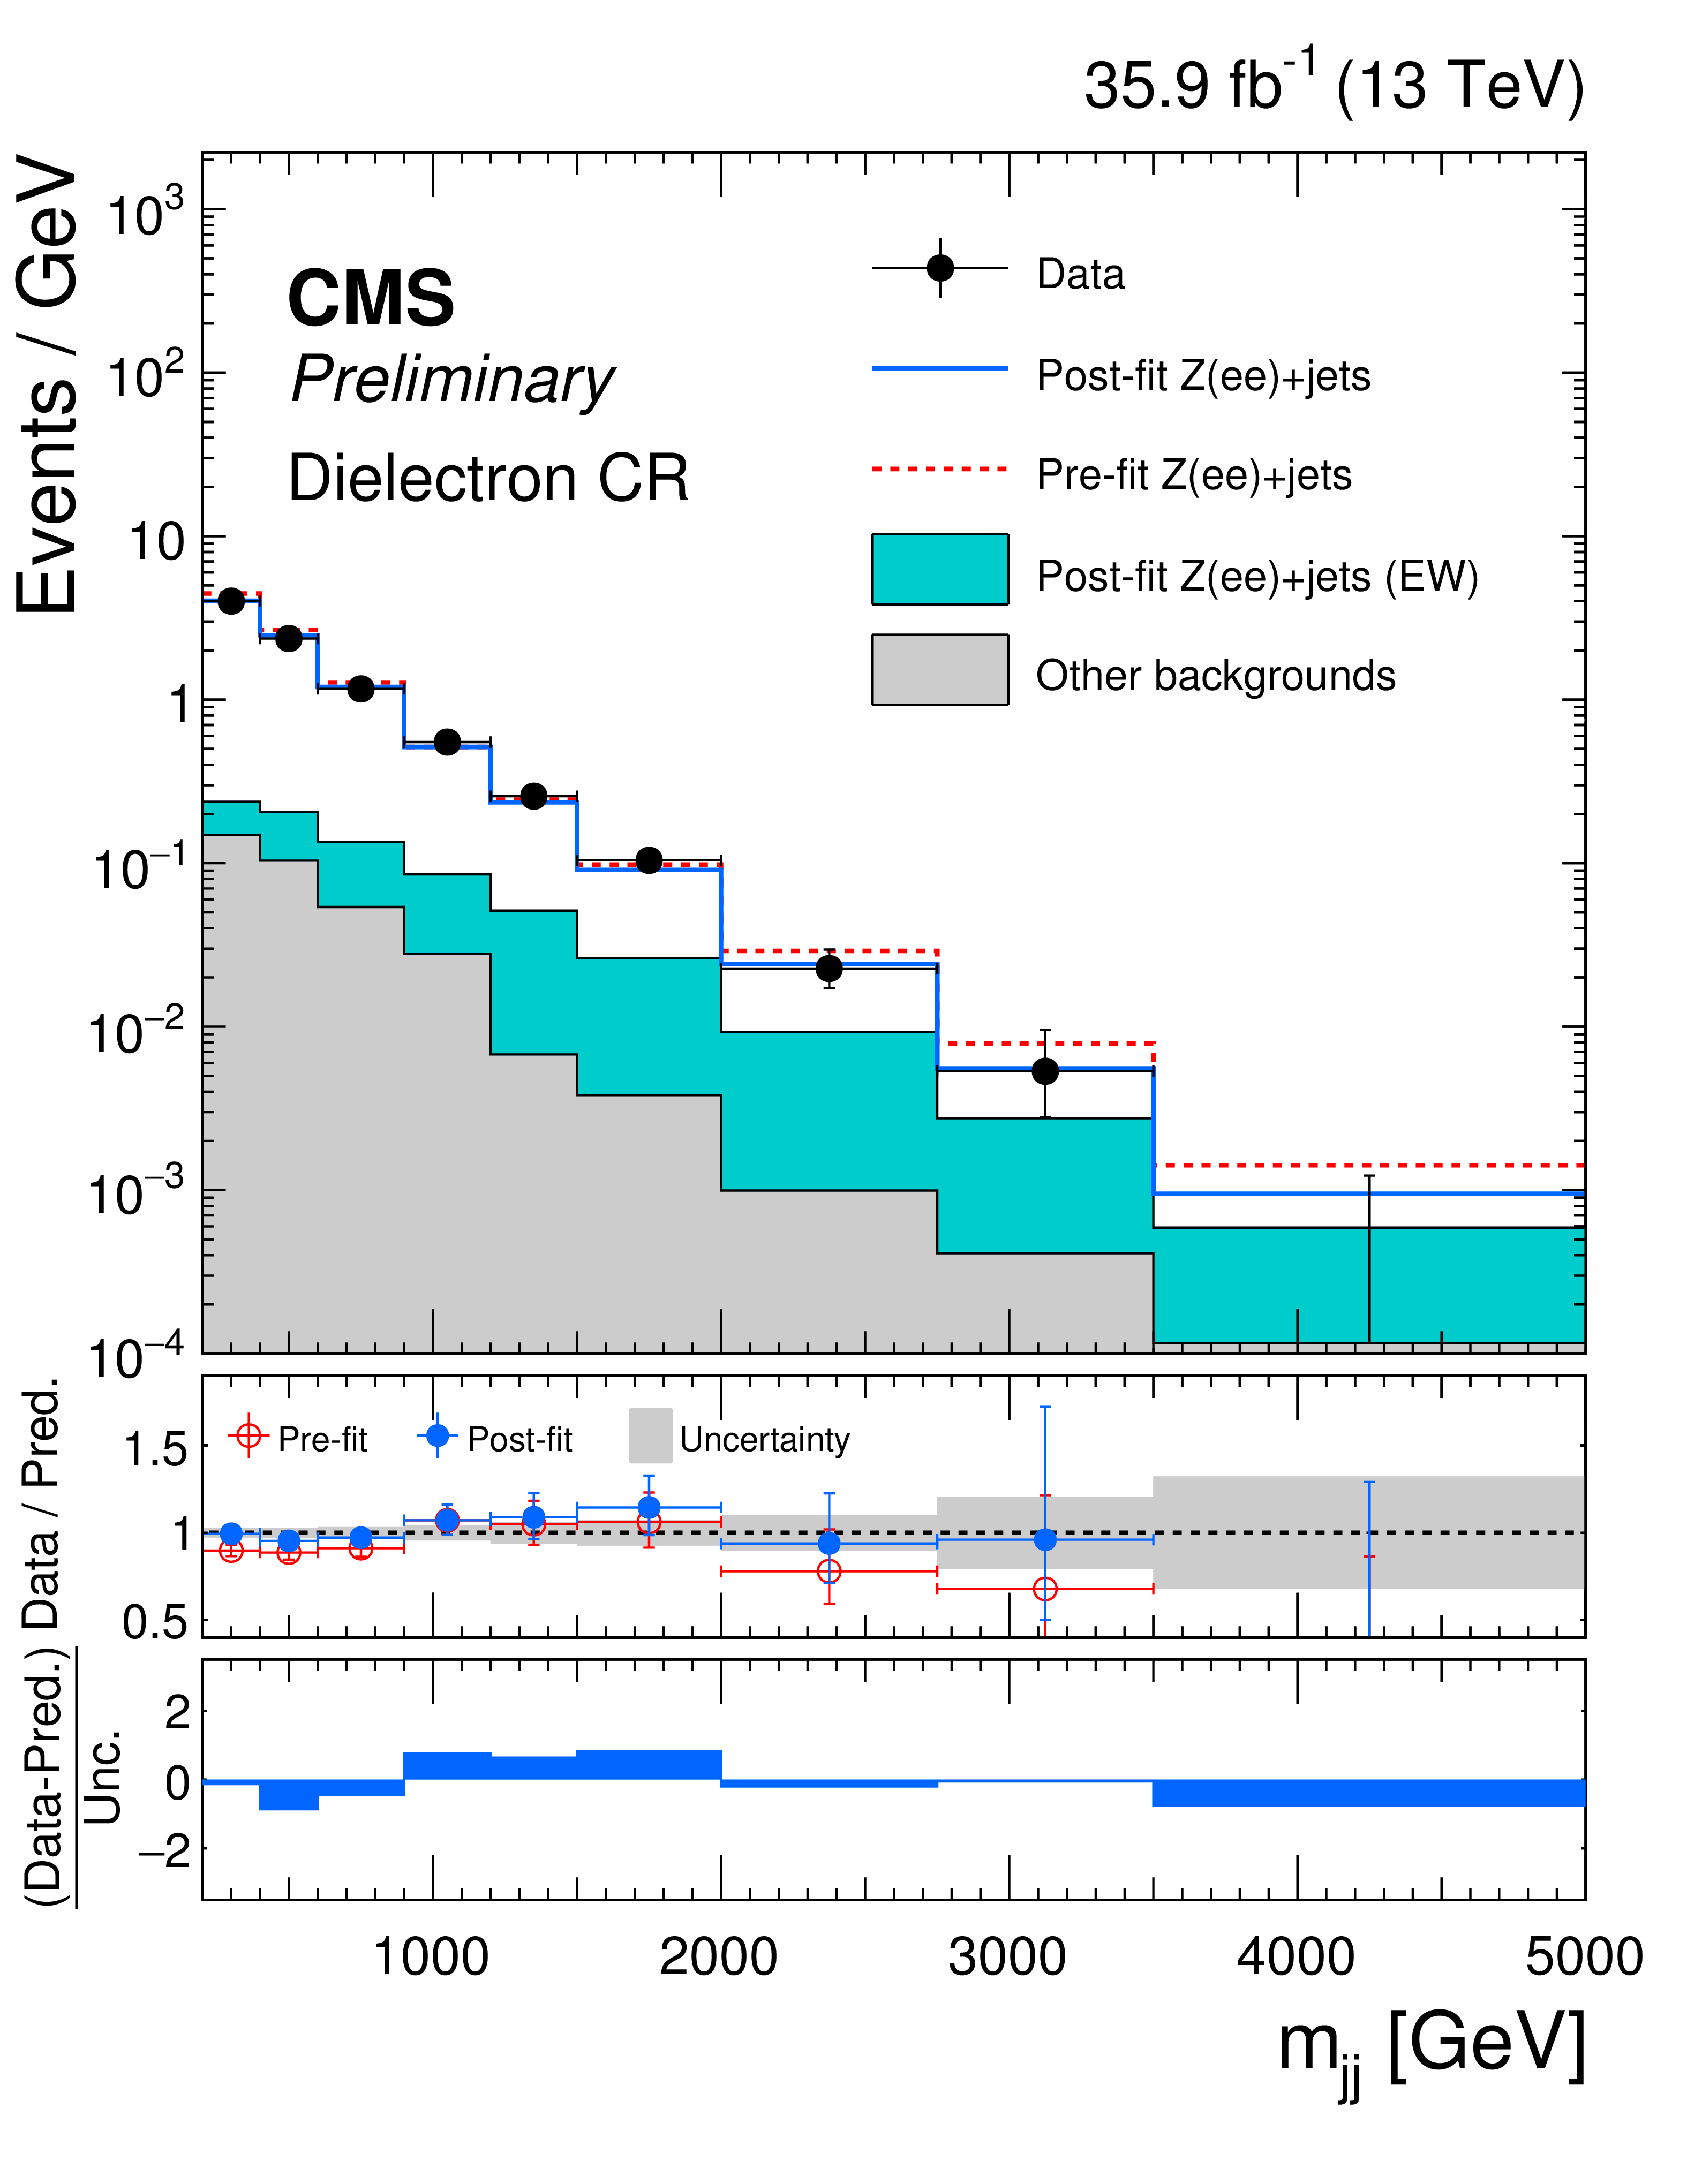
Figure 2:
The $ {m_{\mathrm {jj}}} $ distributions in the dimuon (left) and dielectron (right) control samples. Data are compared to the simulation, before (dashed red) and after (solid blue) performing the fit. Signal region data are not included in the fit. The filled histograms indicate all processes other than ${\mathrm {Z}(\ell \ell)}$+jets (QCD). The last bin includes all events with $ {m_{\mathrm {jj}}} > $ 3.5 TeV. Ratios of data and the pre-fit background (red points) and the post-fit background prediction (blue points) are shown. The gray band indicates the overall post-fit uncertainty. The lowest panel shows the distribution of the differences between data and the post-fit background prediction relative to the quadrature sum of the post-fit uncertainty and the statistical uncertainty in data. |
png pdf |
Figure 2-a:
The $ {m_{\mathrm {jj}}} $ distributions in the dimuon (left) and dielectron (right) control samples. Data are compared to the simulation, before (dashed red) and after (solid blue) performing the fit. Signal region data are not included in the fit. The filled histograms indicate all processes other than ${\mathrm {Z}(\ell \ell)}$+jets (QCD). The last bin includes all events with $ {m_{\mathrm {jj}}} > $ 3.5 TeV. Ratios of data and the pre-fit background (red points) and the post-fit background prediction (blue points) are shown. The gray band indicates the overall post-fit uncertainty. The lowest panel shows the distribution of the differences between data and the post-fit background prediction relative to the quadrature sum of the post-fit uncertainty and the statistical uncertainty in data. |
png pdf |
Figure 2-b:
The $ {m_{\mathrm {jj}}} $ distributions in the dimuon (left) and dielectron (right) control samples. Data are compared to the simulation, before (dashed red) and after (solid blue) performing the fit. Signal region data are not included in the fit. The filled histograms indicate all processes other than ${\mathrm {Z}(\ell \ell)}$+jets (QCD). The last bin includes all events with $ {m_{\mathrm {jj}}} > $ 3.5 TeV. Ratios of data and the pre-fit background (red points) and the post-fit background prediction (blue points) are shown. The gray band indicates the overall post-fit uncertainty. The lowest panel shows the distribution of the differences between data and the post-fit background prediction relative to the quadrature sum of the post-fit uncertainty and the statistical uncertainty in data. |

png pdf |
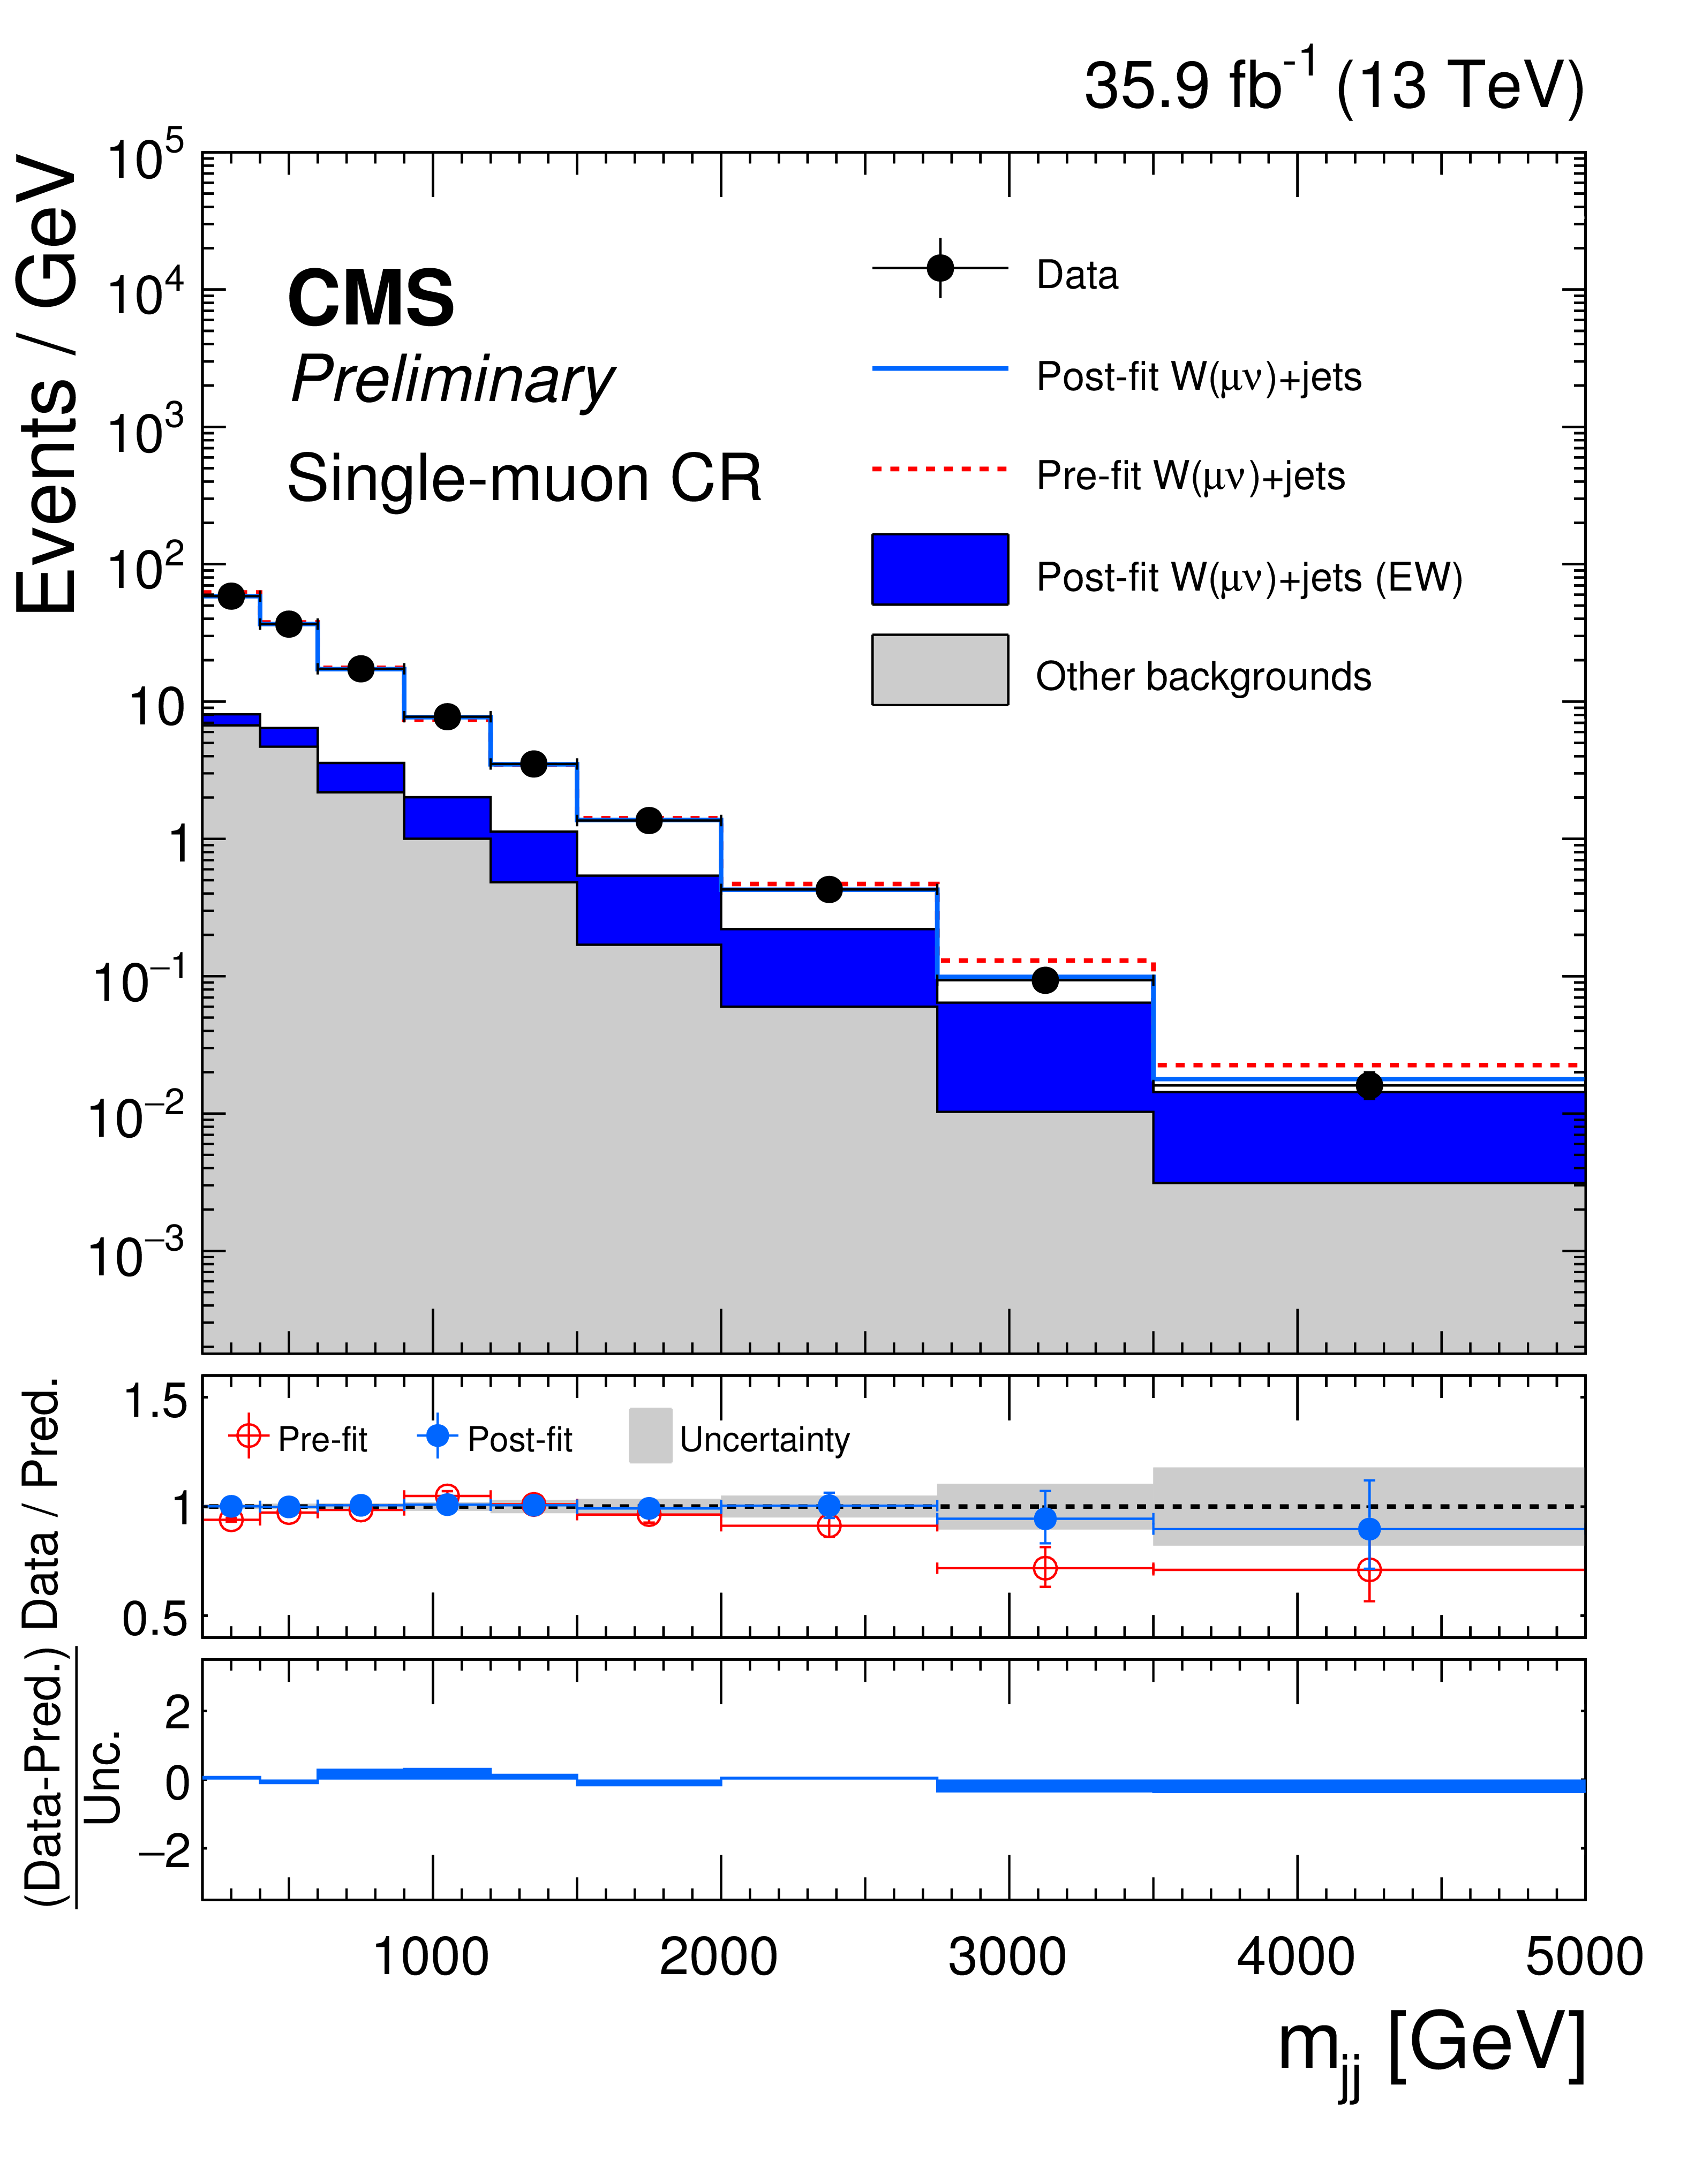
Figure 3:
The $ {m_{\mathrm {jj}}} $ distributions in the single-muon (left) and single-electron (right) control samples. Data are compared to the simulation, before (dashed red) and after (solid blue) performing the fit. Signal region data are not included in the fit. The filled histograms indicate all processes other than ${\mathrm {W}(\ell \nu)}$+jets (QCD). The last bin includes all events with $ {m_{\mathrm {jj}}} > $ 3.5 TeV. The description of the lower panels is as in Fig. xxxxx. |
png pdf |
Figure 3-a:
The $ {m_{\mathrm {jj}}} $ distributions in the single-muon (left) and single-electron (right) control samples. Data are compared to the simulation, before (dashed red) and after (solid blue) performing the fit. Signal region data are not included in the fit. The filled histograms indicate all processes other than ${\mathrm {W}(\ell \nu)}$+jets (QCD). The last bin includes all events with $ {m_{\mathrm {jj}}} > $ 3.5 TeV. The description of the lower panels is as in Fig. xxxxx. |

png pdf |
Figure 3-b:
The $ {m_{\mathrm {jj}}} $ distributions in the single-muon (left) and single-electron (right) control samples. Data are compared to the simulation, before (dashed red) and after (solid blue) performing the fit. Signal region data are not included in the fit. The filled histograms indicate all processes other than ${\mathrm {W}(\ell \nu)}$+jets (QCD). The last bin includes all events with $ {m_{\mathrm {jj}}} > $ 3.5 TeV. The description of the lower panels is as in Fig. xxxxx. |

png pdf |
Figure 4:
The observed $ {m_{\mathrm {jj}}} $ distribution of the shape analysis signal region compared to the post-fit backgrounds from various SM processes. On the left, the predicted backgrounds are obtained from a combined fit to the data in all the control samples but excluding the signal region. On the right, the predicted backgrounds are obtained from a combined fit to the data in all the control samples, as well as in the signal region, assuming the absence of any signal. Expected signal distributions for a 125 GeV Higgs boson produced through ggH and qqH modes, and decaying exclusively to invisible particles, are overlaid. The last bin includes all events with $ {m_{\mathrm {jj}}} > $ 3.5 TeV. The description of the ratio panels is the same as in Fig. xxxxx. |

png pdf |
Figure 4-a:
The observed $ {m_{\mathrm {jj}}} $ distribution of the shape analysis signal region compared to the post-fit backgrounds from various SM processes. On the left, the predicted backgrounds are obtained from a combined fit to the data in all the control samples but excluding the signal region. On the right, the predicted backgrounds are obtained from a combined fit to the data in all the control samples, as well as in the signal region, assuming the absence of any signal. Expected signal distributions for a 125 GeV Higgs boson produced through ggH and qqH modes, and decaying exclusively to invisible particles, are overlaid. The last bin includes all events with $ {m_{\mathrm {jj}}} > $ 3.5 TeV. The description of the ratio panels is the same as in Fig. xxxxx. |

png pdf |
Figure 4-b:
The observed $ {m_{\mathrm {jj}}} $ distribution of the shape analysis signal region compared to the post-fit backgrounds from various SM processes. On the left, the predicted backgrounds are obtained from a combined fit to the data in all the control samples but excluding the signal region. On the right, the predicted backgrounds are obtained from a combined fit to the data in all the control samples, as well as in the signal region, assuming the absence of any signal. Expected signal distributions for a 125 GeV Higgs boson produced through ggH and qqH modes, and decaying exclusively to invisible particles, are overlaid. The last bin includes all events with $ {m_{\mathrm {jj}}} > $ 3.5 TeV. The description of the ratio panels is the same as in Fig. xxxxx. |

png pdf |
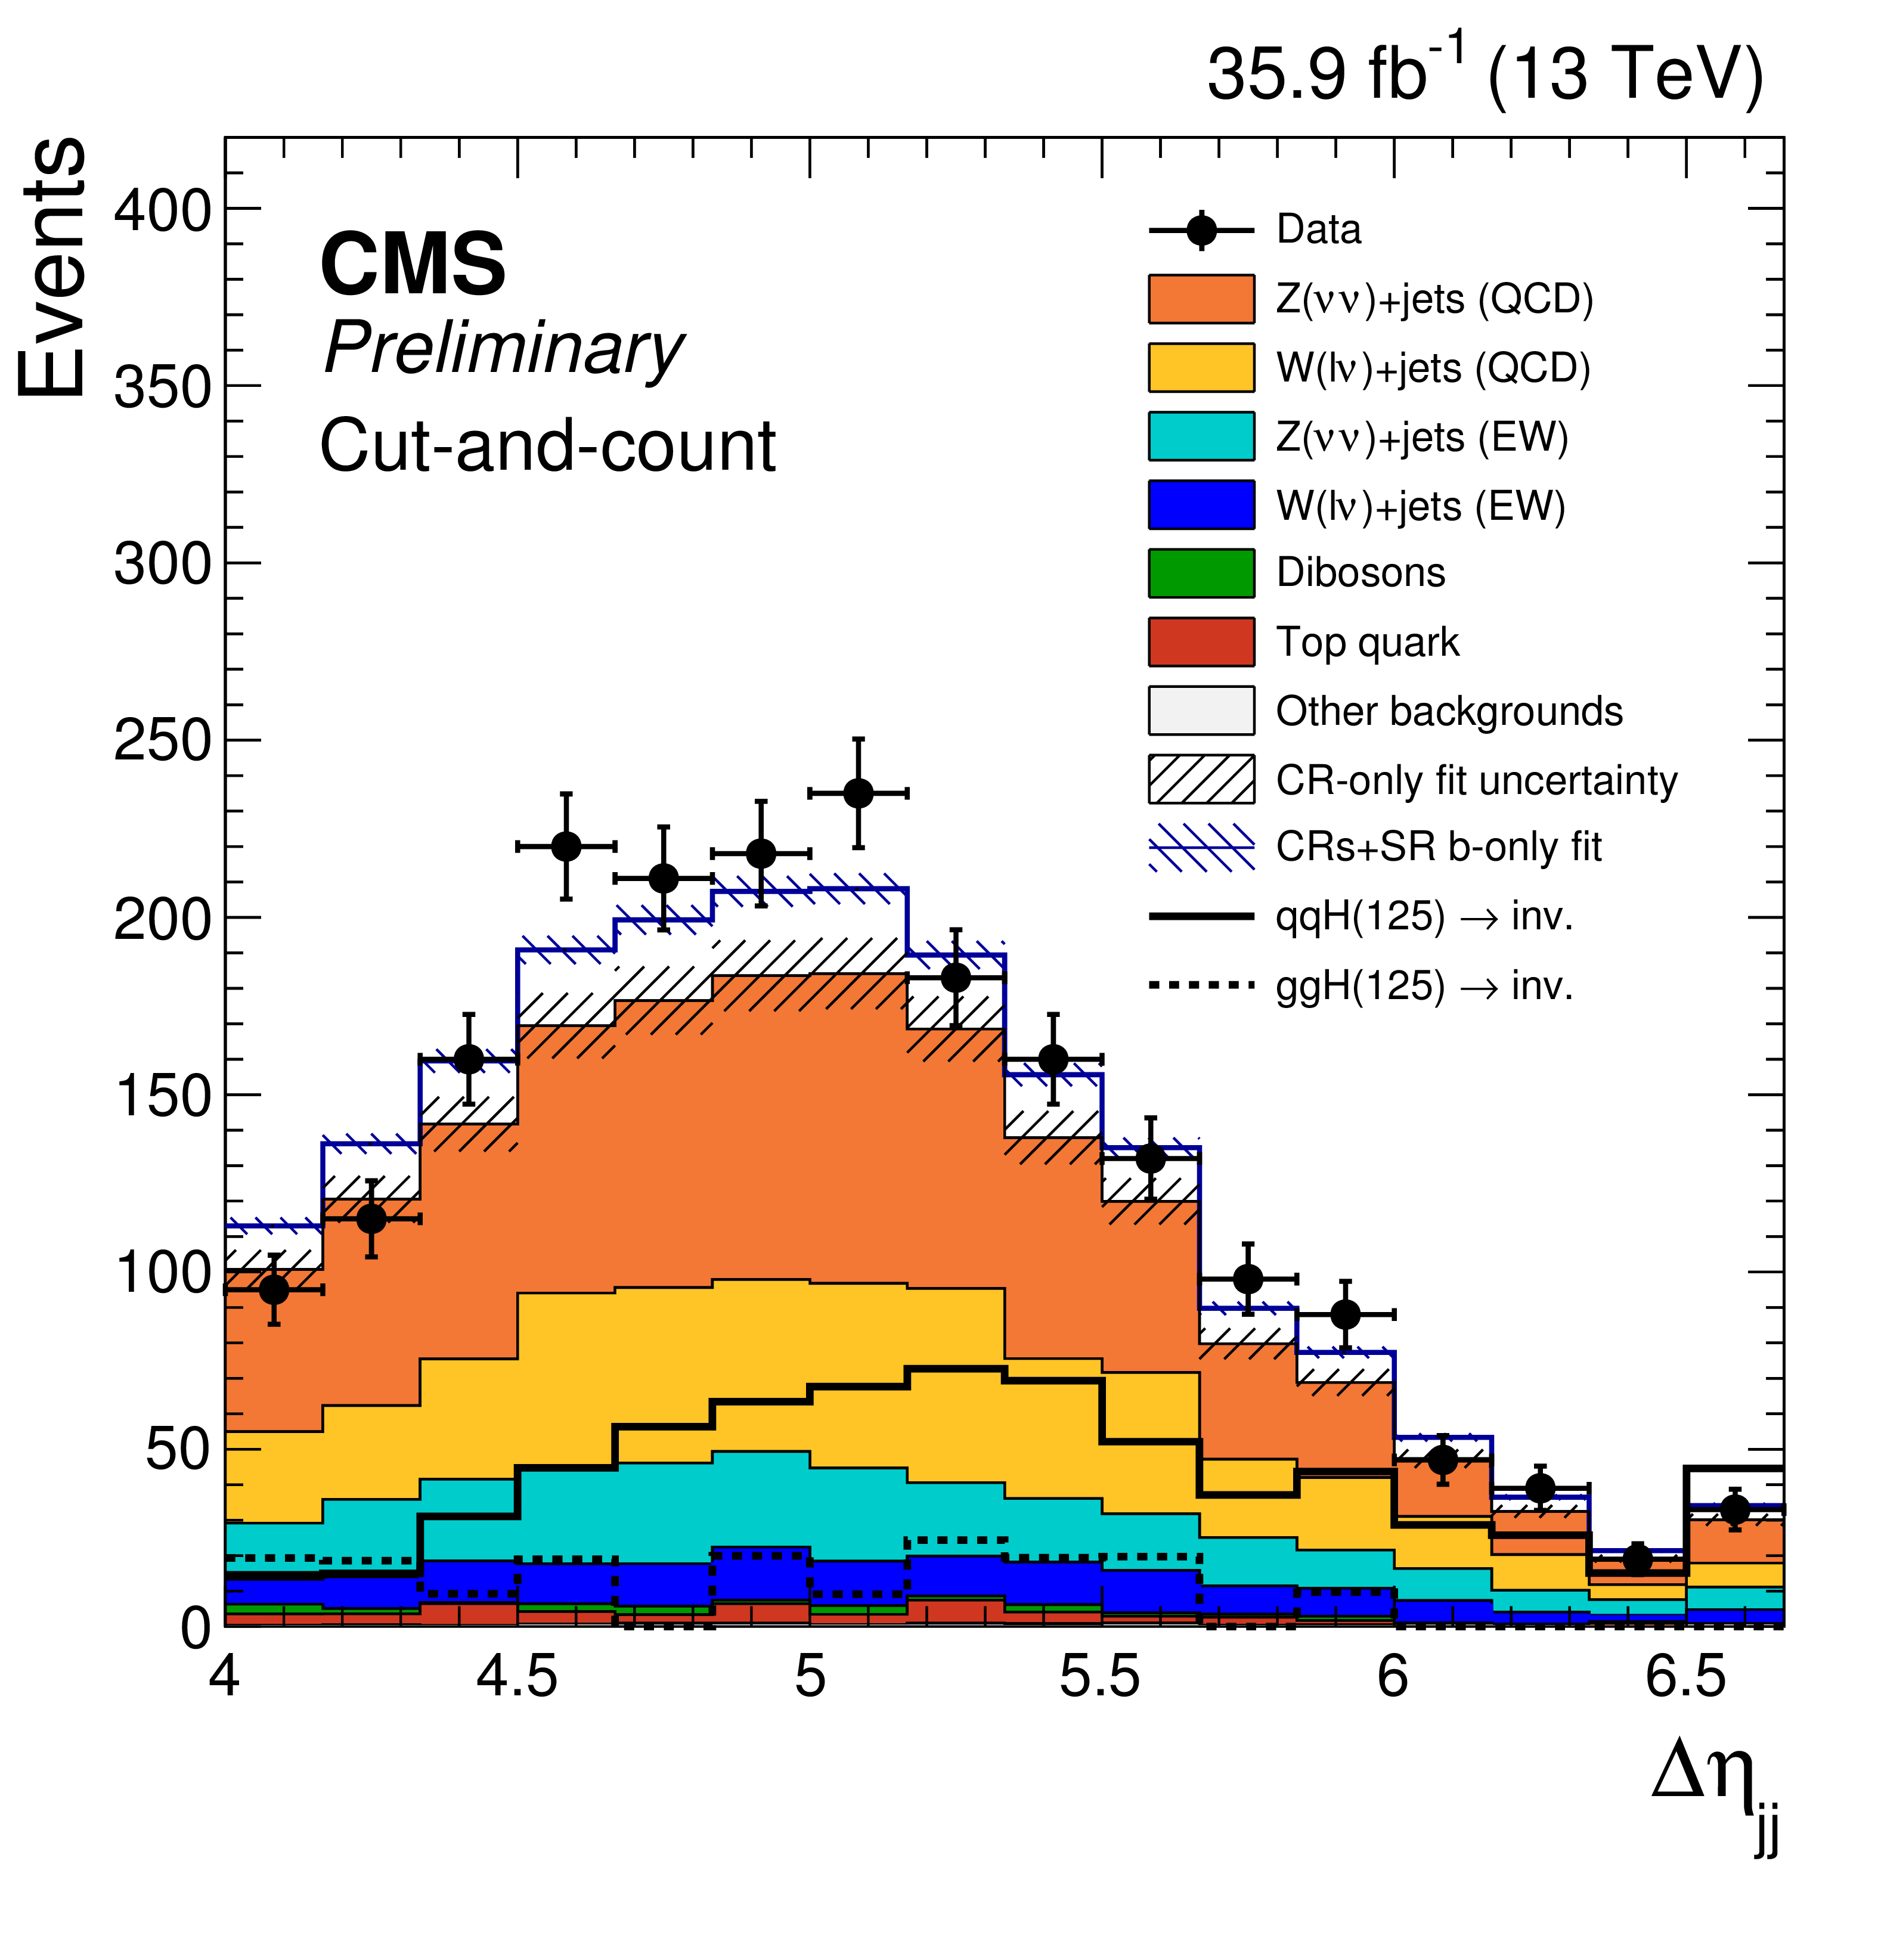
Figure 5:
The observed $ {m_{\mathrm {jj}}} $ (left) and $ {\Delta \eta _{\mathrm {jj}}} $ (right) distributions in the signal region of the cut-and-count analysis compared to the post-fit backgrounds from various SM processes. The predicted background normalizations are obtained either from a combined fit to the data in all the control samples but excluding the signal region (solid stack) or from a background-only fit performed across signal and control regions (dark blue line). Expected signal distributions for a 125 GeV Higgs boson produced through ggH and qqH modes, and decaying exclusively to invisible particles, are overlaid. |

png pdf |
Figure 5-a:
The observed $ {m_{\mathrm {jj}}} $ (left) and $ {\Delta \eta _{\mathrm {jj}}} $ (right) distributions in the signal region of the cut-and-count analysis compared to the post-fit backgrounds from various SM processes. The predicted background normalizations are obtained either from a combined fit to the data in all the control samples but excluding the signal region (solid stack) or from a background-only fit performed across signal and control regions (dark blue line). Expected signal distributions for a 125 GeV Higgs boson produced through ggH and qqH modes, and decaying exclusively to invisible particles, are overlaid. |
png pdf |
Figure 5-b:
The observed $ {m_{\mathrm {jj}}} $ (left) and $ {\Delta \eta _{\mathrm {jj}}} $ (right) distributions in the signal region of the cut-and-count analysis compared to the post-fit backgrounds from various SM processes. The predicted background normalizations are obtained either from a combined fit to the data in all the control samples but excluding the signal region (solid stack) or from a background-only fit performed across signal and control regions (dark blue line). Expected signal distributions for a 125 GeV Higgs boson produced through ggH and qqH modes, and decaying exclusively to invisible particles, are overlaid. |

png pdf |
Figure 6:
Expected (dashed line) and observed (solid line) 95% CL upper limits on $\sigma {\mathcal {B}(\mathrm {H}\rightarrow \mathrm {inv})} /\sigma _{\mathrm {SM}}$ for a SM-like Higgs boson particle as a function of its mass ($m_{\mathrm {H}}$). Limits are shown for both the shape (black) and the cut-and-count (blue) analyses. The 68 and 95% CL intervals around the expected upper limits for the shape analysis are also reported. |

png pdf |
Figure 7:
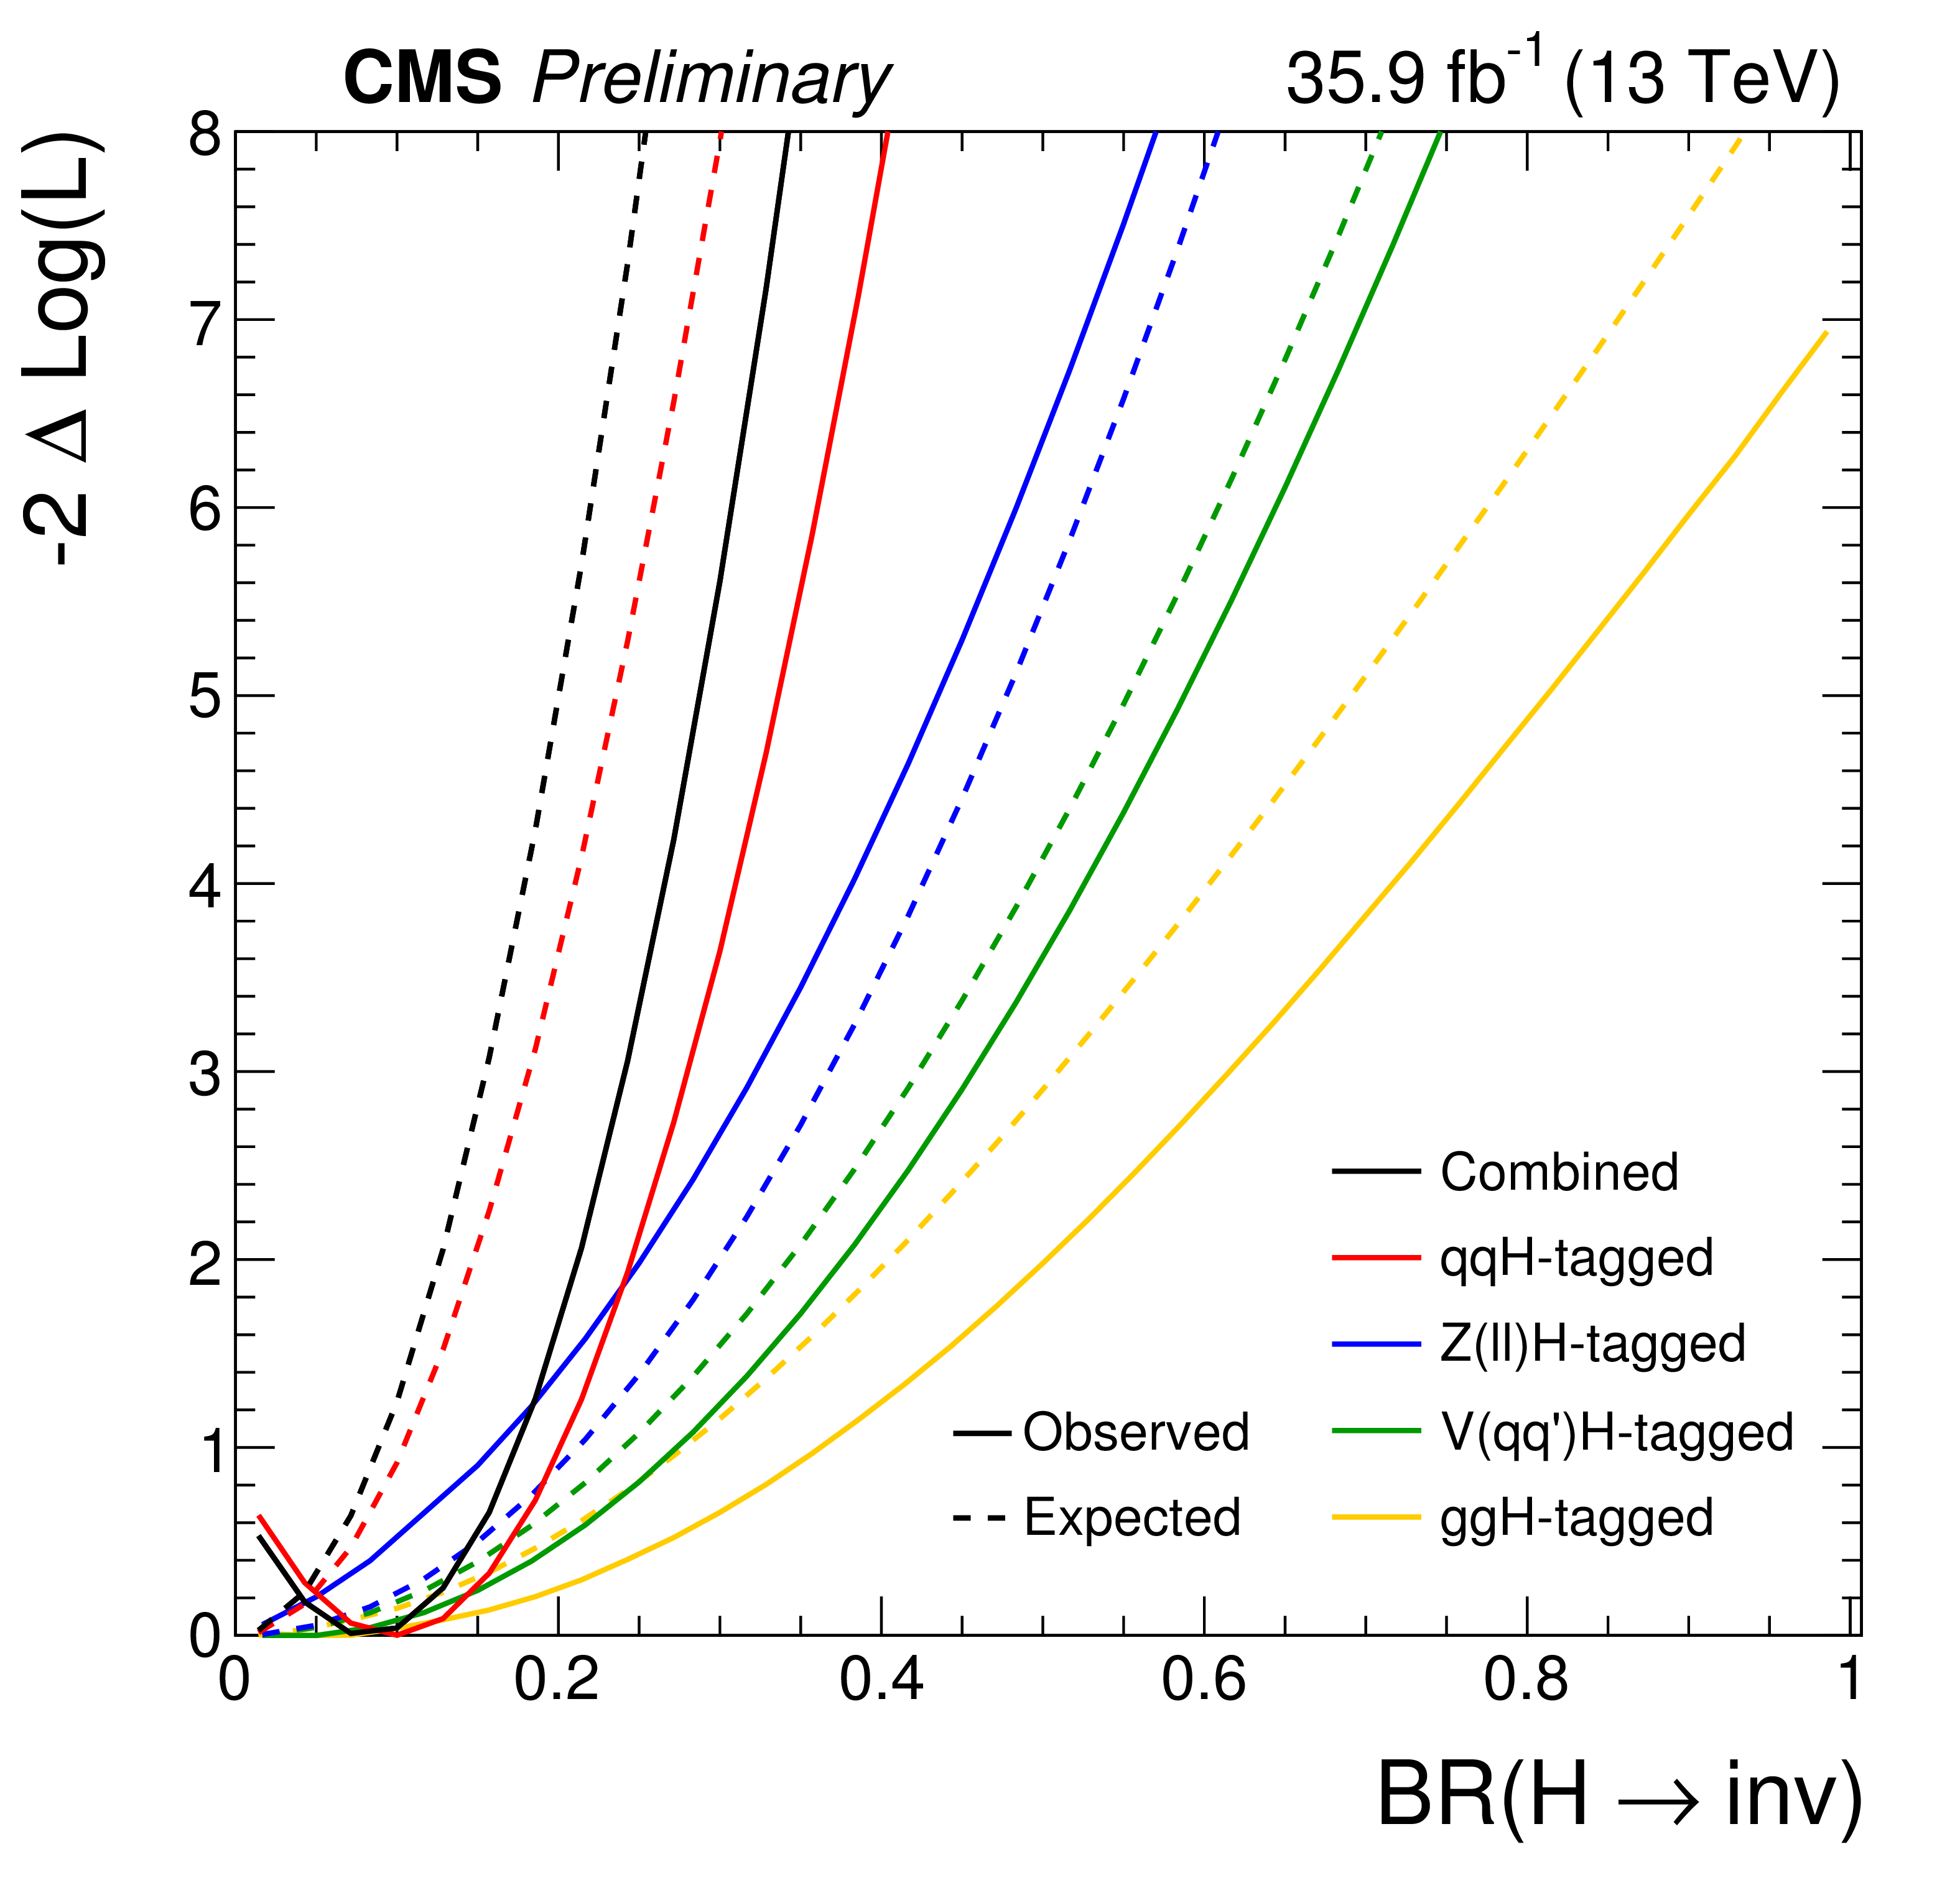
On the left, observed and expected 95% CL upper limits on $\sigma {\mathcal {B}(\mathrm {H}\rightarrow \mathrm {inv})} / \sigma _{\mathrm {SM}}$ for both individual categories targeting qqH, Z$(\ell \ell)$H, V$(qq')$H and ggH production model, as well as their combination, assuming a SM Higgs boson with a mass of 125 GeV. On the right, profile likelihood ratios as a function of $ {\mathcal {B}(\mathrm {H}\rightarrow \mathrm {inv})} $. The solid curves represent the observations in data, while the dashed lines represent the expected result assuming the absence of any signal. The observed and expected likelihood scans are reported for the full combination, as well as for the individual qqH, Z$(\ell \ell $)H, V$(qq')$H and ggH tagged analyses. |

png pdf |
Figure 7-a:
On the left, observed and expected 95% CL upper limits on $\sigma {\mathcal {B}(\mathrm {H}\rightarrow \mathrm {inv})} / \sigma _{\mathrm {SM}}$ for both individual categories targeting qqH, Z$(\ell \ell)$H, V$(qq')$H and ggH production model, as well as their combination, assuming a SM Higgs boson with a mass of 125 GeV. On the right, profile likelihood ratios as a function of $ {\mathcal {B}(\mathrm {H}\rightarrow \mathrm {inv})} $. The solid curves represent the observations in data, while the dashed lines represent the expected result assuming the absence of any signal. The observed and expected likelihood scans are reported for the full combination, as well as for the individual qqH, Z$(\ell \ell $)H, V$(qq')$H and ggH tagged analyses. |
png pdf |
Figure 7-b:
On the left, observed and expected 95% CL upper limits on $\sigma {\mathcal {B}(\mathrm {H}\rightarrow \mathrm {inv})} / \sigma _{\mathrm {SM}}$ for both individual categories targeting qqH, Z$(\ell \ell)$H, V$(qq')$H and ggH production model, as well as their combination, assuming a SM Higgs boson with a mass of 125 GeV. On the right, profile likelihood ratios as a function of $ {\mathcal {B}(\mathrm {H}\rightarrow \mathrm {inv})} $. The solid curves represent the observations in data, while the dashed lines represent the expected result assuming the absence of any signal. The observed and expected likelihood scans are reported for the full combination, as well as for the individual qqH, Z$(\ell \ell $)H, V$(qq')$H and ggH tagged analyses. |
png pdf |
Figure 8:
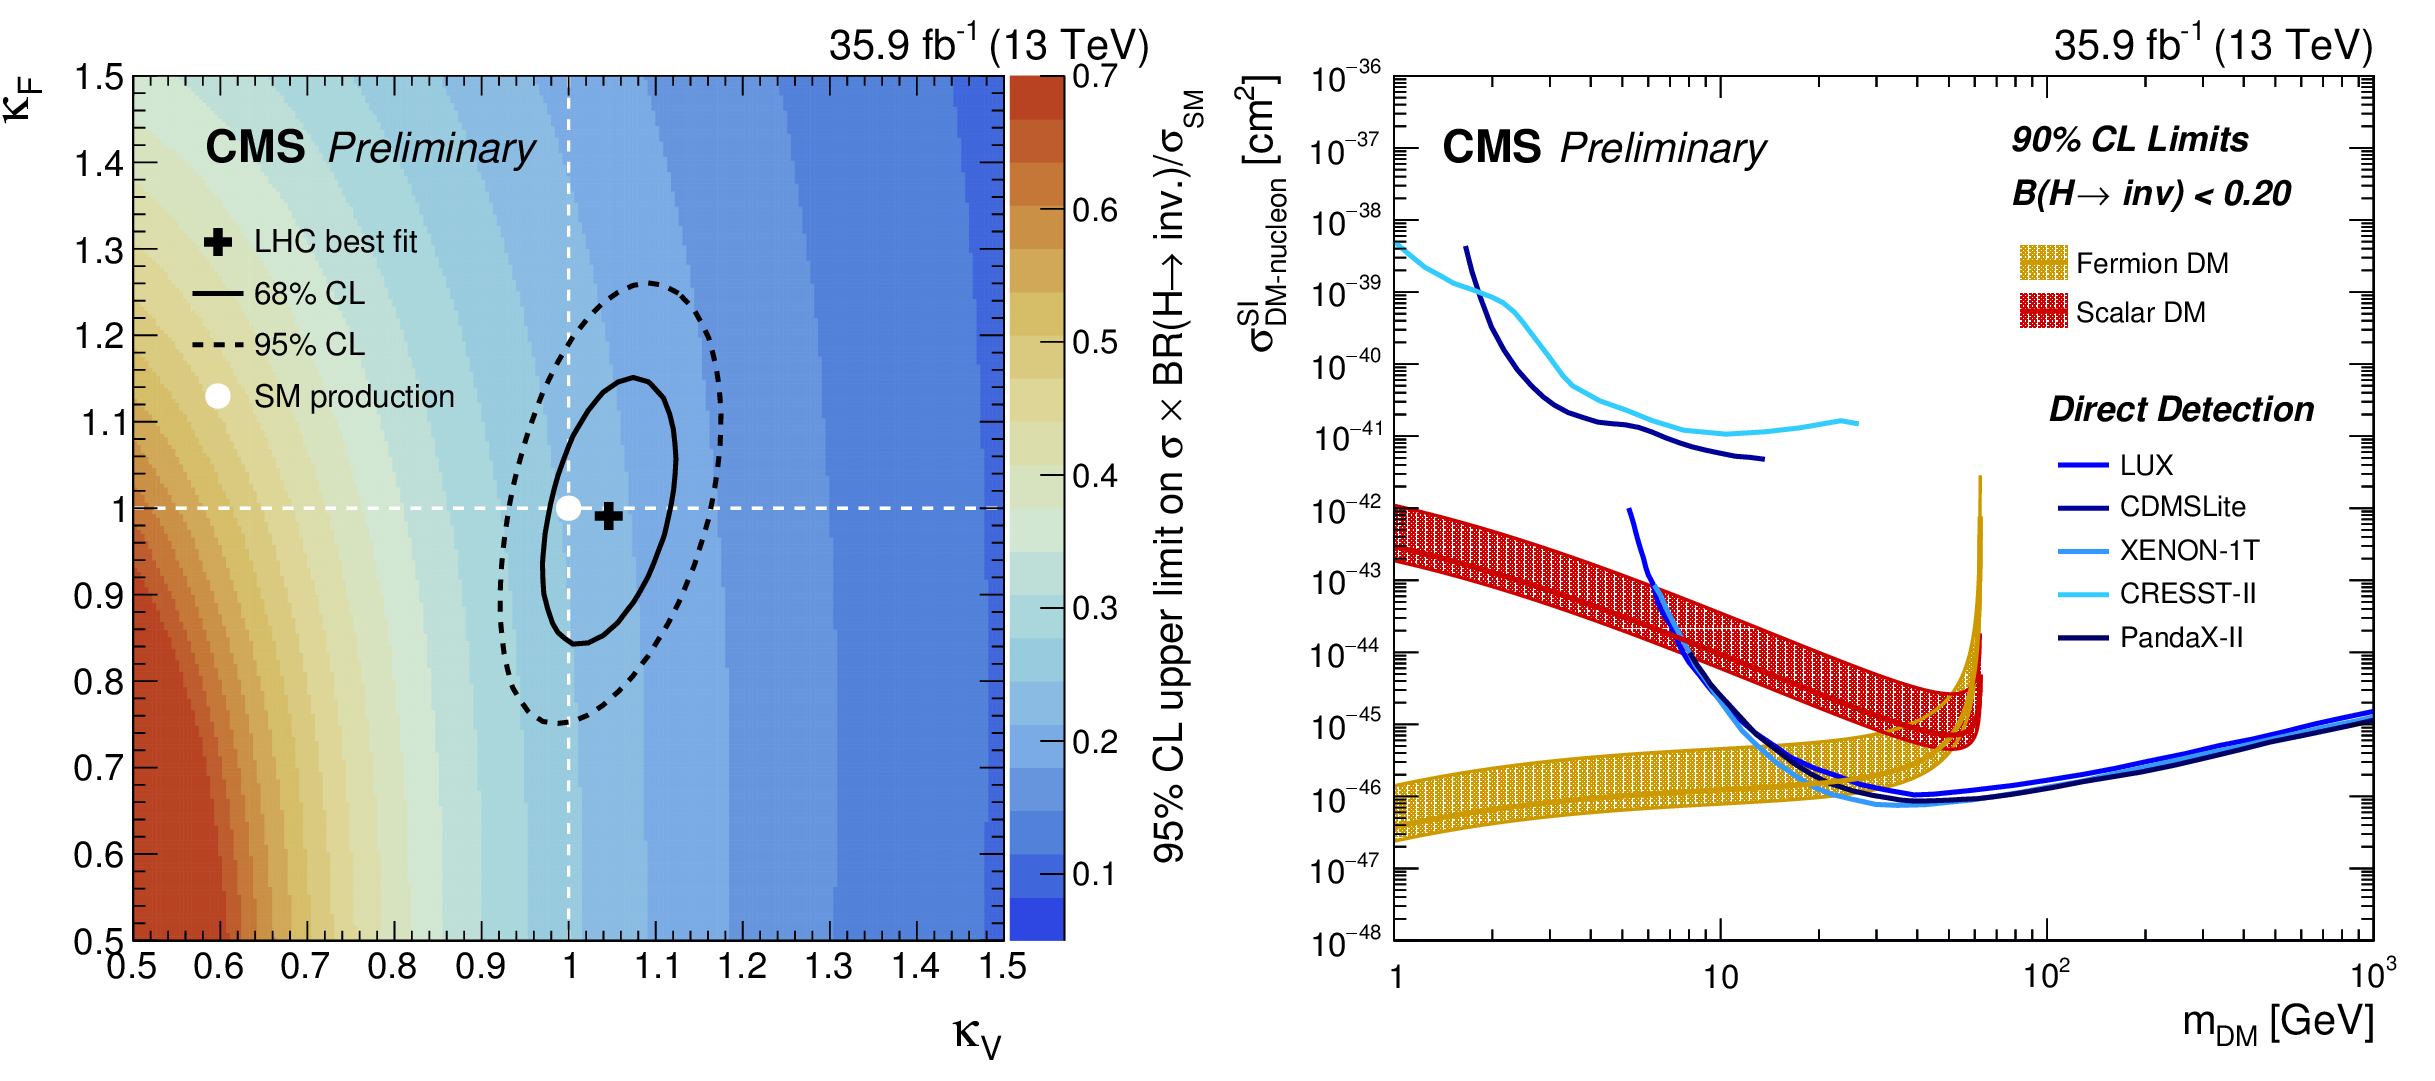
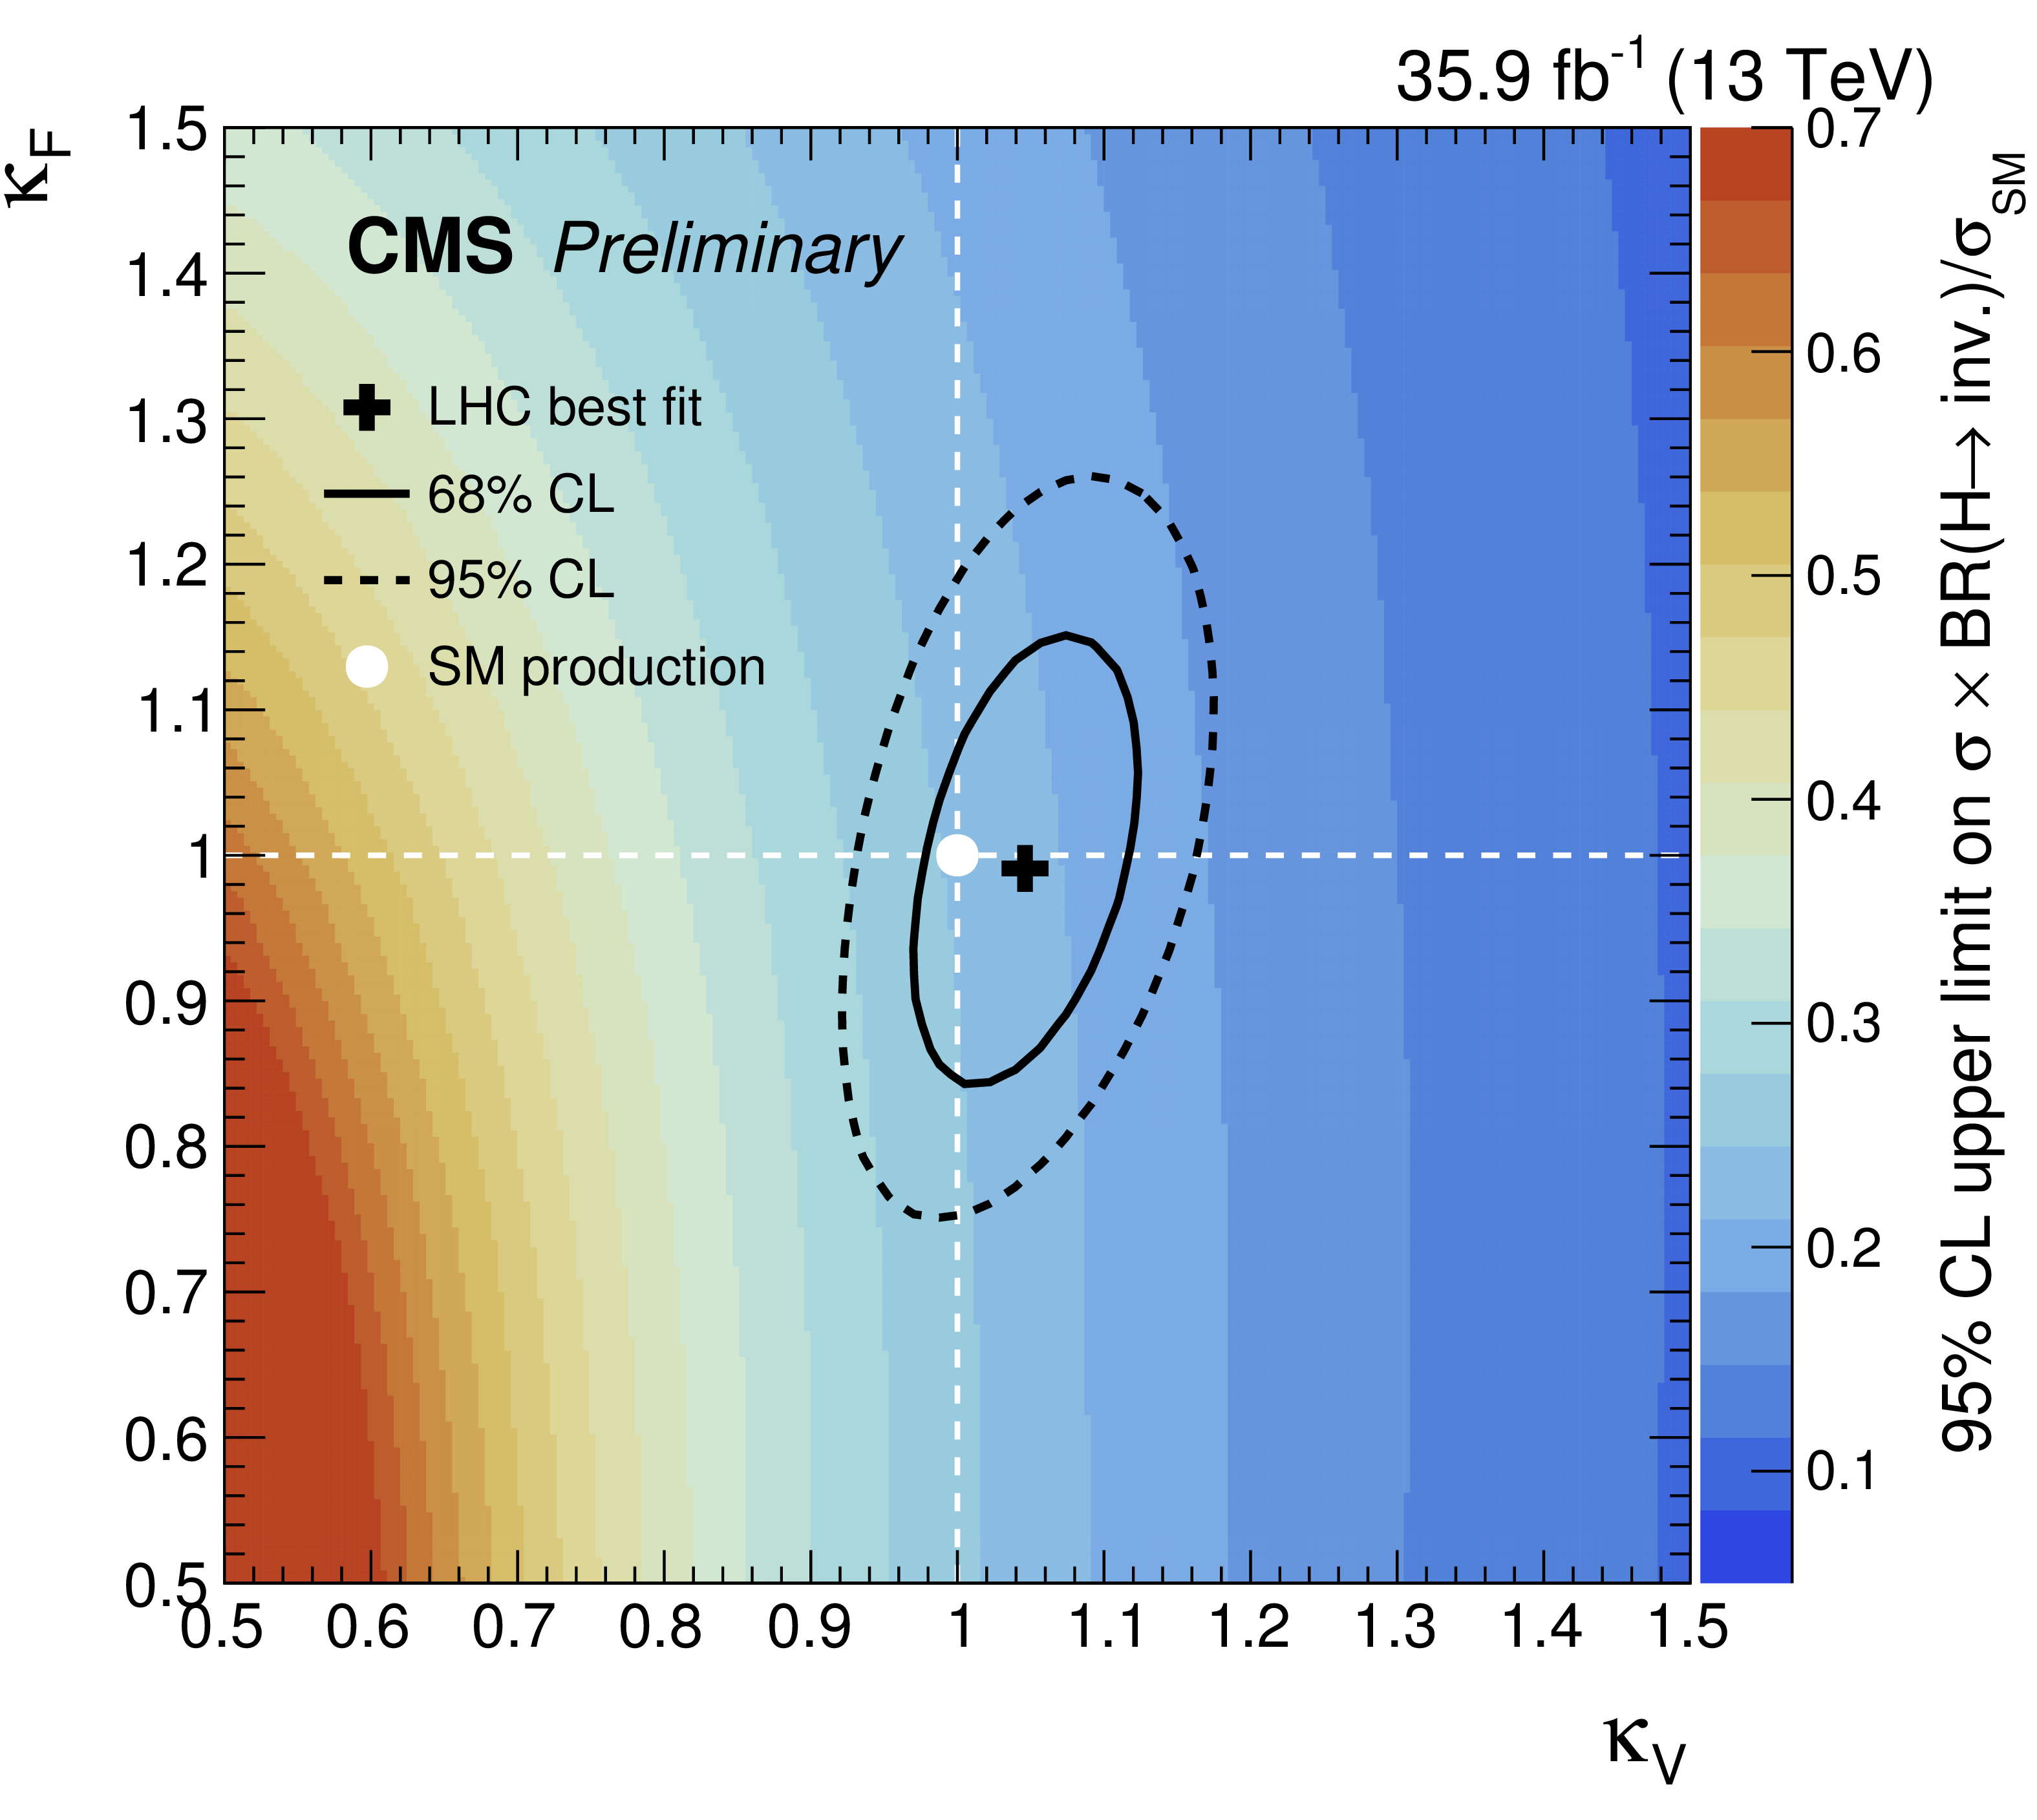
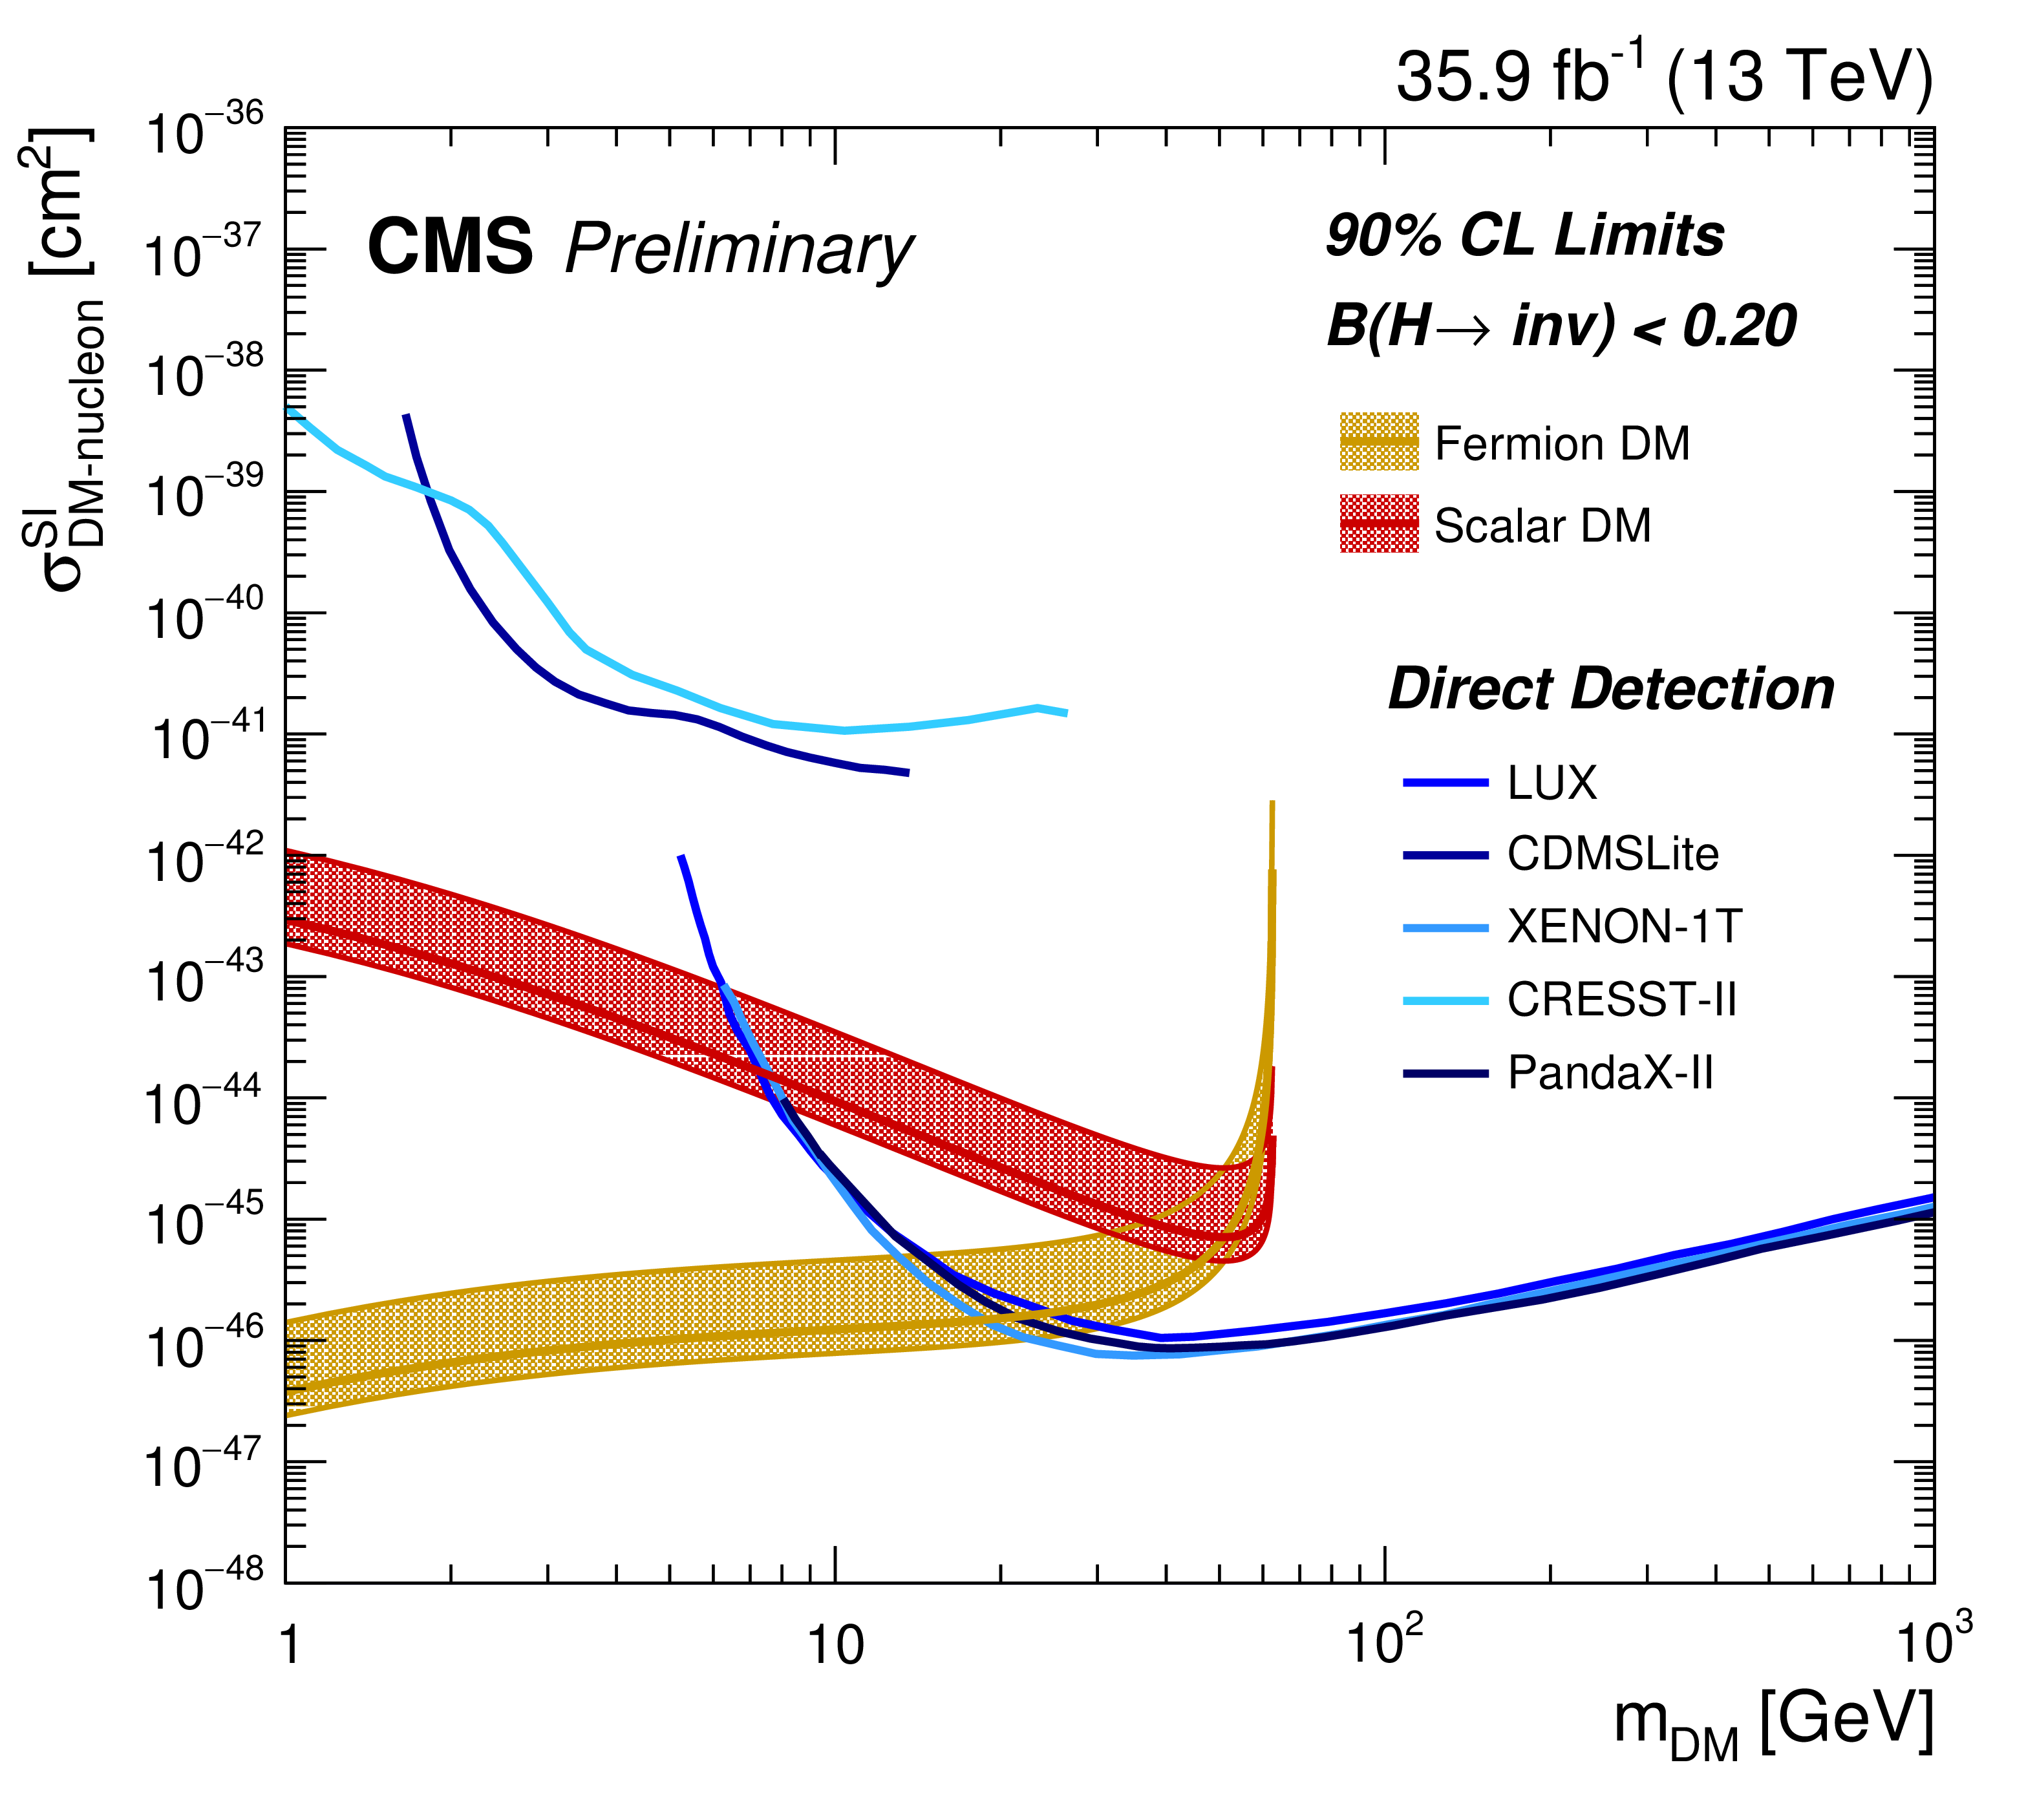
On the left, observed 95% CL upper limits on ${\mathcal {B}(\mathrm {H}\rightarrow \mathrm {inv})}$ for a Higgs boson with a mass of 125 GeV, whose production cross sections varies as a function of the coupling modifiers $\kappa _{V}$ and $\kappa _{F}$. Their best estimate, along with the 68 and 95% CL contours from Ref. [4], are also reported. The SM prediction corresponds to $\kappa _{V} = \kappa _{F} = $ 1. On the right, 90% CL upper limits on the spin-independent DM-nucleon scattering cross section in Higgs-portal models assuming a scalar (red solid line) or fermion (orange solid line) DM candidate. Limits are computed as a function of $m_{\chi}$ and are compared to those from LUX [67], Panda-X II [68], CDMSlite [69] and CRESST-II [70] experiments. |
png pdf |
Figure 8-a:
On the left, observed 95% CL upper limits on ${\mathcal {B}(\mathrm {H}\rightarrow \mathrm {inv})}$ for a Higgs boson with a mass of 125 GeV, whose production cross sections varies as a function of the coupling modifiers $\kappa _{V}$ and $\kappa _{F}$. Their best estimate, along with the 68 and 95% CL contours from Ref. [4], are also reported. The SM prediction corresponds to $\kappa _{V} = \kappa _{F} = $ 1. On the right, 90% CL upper limits on the spin-independent DM-nucleon scattering cross section in Higgs-portal models assuming a scalar (red solid line) or fermion (orange solid line) DM candidate. Limits are computed as a function of $m_{\chi}$ and are compared to those from LUX [67], Panda-X II [68], CDMSlite [69] and CRESST-II [70] experiments. |
png pdf |
Figure 8-b:
On the left, observed 95% CL upper limits on ${\mathcal {B}(\mathrm {H}\rightarrow \mathrm {inv})}$ for a Higgs boson with a mass of 125 GeV, whose production cross sections varies as a function of the coupling modifiers $\kappa _{V}$ and $\kappa _{F}$. Their best estimate, along with the 68 and 95% CL contours from Ref. [4], are also reported. The SM prediction corresponds to $\kappa _{V} = \kappa _{F} = $ 1. On the right, 90% CL upper limits on the spin-independent DM-nucleon scattering cross section in Higgs-portal models assuming a scalar (red solid line) or fermion (orange solid line) DM candidate. Limits are computed as a function of $m_{\chi}$ and are compared to those from LUX [67], Panda-X II [68], CDMSlite [69] and CRESST-II [70] experiments. |
| Tables | |

png pdf |
Table 1:
Summary of the kinematic selections used to define the signal region for both the shape and the cut-and-count analyses. |

png pdf |
Table 2:
Experimental and theoretical sources of systematic uncertainties on the V+jets transfer factors, which enter in the simultaneous fit used to estimate V+jets (QCD) and V+jets (EW) backgrounds as constrained nuisance parameters. In addition, the impact on the fitted signal strength, $\sigma {\mathcal {B}(\mathrm {H}\rightarrow \mathrm {inv})} /\sigma _{\mathrm {SM}}$, is also reported in the last column after performing the ${m_{\mathrm {jj}}}$ shape analysis fit to the observed data across signal and control regions. |

png pdf |
Table 3:
Expected event yields in each $ {m_{\mathrm {jj}}} $ bin for various background processes in the signal region of the shape analysis. The background yields and the corresponding uncertainties are obtained after performing a combined fit to data in all the control samples, but excluding data in the signal region. The "other backgrounds'' includes QCD multijet and ${\mathrm {Z}(\ell \ell)}$+jets processes. The expected total signal contribution for the 125 GeV Higgs boson, decaying exclusively to invisible particles, and the observed event yields are also reported. |

png pdf |
Table 4:
Expected event yields in the signal region and in the control samples of the cut-and-count analysis for various SM processes. The background yields and the corresponding uncertainties are obtained from a combined fit to data in all the control samples, but excluding data in the signal region. The expected total signal contribution for the 125 GeV Higgs boson, decaying exclusively to invisible particles, and the observed event yields are also reported. |

png pdf |
Table 5:
Expected and observed 95% CL upper limits on the invisible branching fraction of the Higgs boson, obtained in the shape and cut-and-count analyses. The one and two standard deviation uncertainty range on the expected limits is reported. The signal composition expected in the signal region is also shown. |
png pdf |
Table 6:
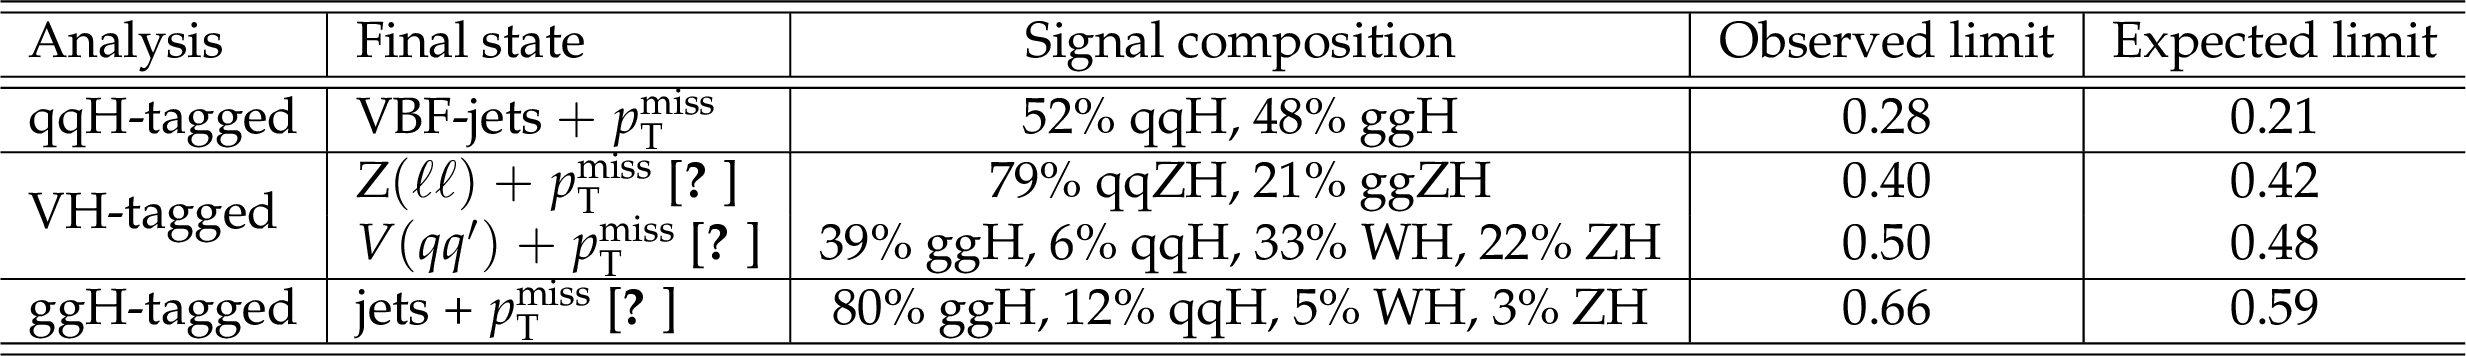
Analyses used in this combination, showing final state, expected signal composition along with their observed and expected upper limits on the Higgs invisible branching fraction. The relative contributions assume SM production cross sections. |
| Summary |
|
A search for invisible decays of the Higgs boson is presented using 13 TeV proton-proton collision data, collected by the CMS experiment in 2016 and corresponding to an integrated luminosity of 35.9 fb$^{-1}$ . The search targets events in which the Higgs boson is produced through vector boson fusion (VBF). The data are found to be consistent with the predicted standard model (SM) backgrounds. An observed (expected) upper limit of 0.28 (0.21) is set, at 95% confidence level (CL), on the invisible branching fraction, ${\mathcal{B}(\mathrm{H}\rightarrow \mathrm{inv})} $, of the 125 GeV Higgs boson. Furthermore, upper limits are also set on the product of the cross section and branching fraction of a SM-like Higgs boson particle, with mass ranging between 110 and 1000 GeV. Finally, a combination of searches for a Higgs boson decaying to invisible particles, using 35.9 fb$^{-1}$ of data collected by the CMS detector during 2016, is presented. The combination includes searches targeting Higgs boson production in the qqH, ZH (in which a Z boson decays to $\ell^{+}\ell^{-}$), VH (in which the vector boson decays hadronically) and ggH modes. The VBF search represents, by far, the most sensitive channel involved in the combination. No significant deviations from the SM predictions are observed in any of these searches. The combination yields an observed (expected) upper limit on ${\mathcal{B}(\mathrm{H}\rightarrow \mathrm{inv})} $ of 0.24 (0.18) at 95% CL, assuming SM production of the Higgs boson. The observed 90% CL limit of ${\mathcal{B}(\mathrm{H}\rightarrow \mathrm{inv})} < $ 0.2 is interpreted in terms of Higgs-portal models of dark matter (DM) interactions. Constraints are placed on the spin-independent DM-nucleon interaction cross section. When compared to the upper bounds from direct detection experiments, this limit provides the strongest constraints on fermion (scalar) DM particles with masses smaller than about 20 (7) GeV. |
| References | ||||
| 1 | ATLAS Collaboration | Observation of a new particle in the search for the Standard Model Higgs boson with the ATLAS detector at the LHC | PLB 716 (2012) 1 | 1207.7214 |
| 2 | CMS Collaboration | Observation of a new boson at a mass of 125 GeV with the CMS experiment at the LHC | PLB 716 (2012) 30 | CMS-HIG-12-028 1207.7235 |
| 3 | CMS Collaboration | Observation of a new boson with mass near 125 GeV in pp collisions at $ \sqrt{s} = $ 7 and 8 TeV | JHEP 06 (2013) 081 | CMS-HIG-12-036 1303.4571 |
| 4 | ATLAS and CMS Collaborations | Measurements of the Higgs boson production and decay rates and constraints on its couplings from a combined ATLAS and CMS analysis of the LHC pp collision data at $ \sqrt{s} = $ 7 and 8 TeV | JHEP 08 (2016) 045 | 1606.02266 |
| 5 | G. Belanger et al. | The MSSM invisible Higgs in the light of dark matter and g-2 | PLB 519 (2001) 93--102 | hep-ph/0106275 |
| 6 | A. Datta, K. Huitu, J. Laamanen, and B. Mukhopadhyaya | Invisible Higgs in theories of large extra dimensions | PRD70 (2004) 075003 | hep-ph/0404056 |
| 7 | D. Dominici and J. F. Gunion | Invisible Higgs Decays from Higgs Graviscalar Mixing | PRD80 (2009) 115006 | 0902.1512 |
| 8 | ATLAS Collaboration | Constraints on new phenomena via Higgs boson couplings and invisible decays with the ATLAS detector | JHEP 11 (2015) 206 | 1509.00672 |
| 9 | CMS Collaboration | Searches for invisible decays of the Higgs boson in pp collisions at sqrt(s) = 7, 8, and 13 TeV | JHEP 02 (2017) 135 | CMS-HIG-16-016 1610.09218 |
| 10 | CMS Collaboration | Search for invisible decays of Higgs bosons in the vector boson fusion and associated ZH production modes | EPJC74 (2014) 2980 | CMS-HIG-13-030 1404.1344 |
| 11 | CMS Collaboration | Search for new physics in events with a leptonically decaying Z boson and a large transverse momentum imbalance in proton-proton collisions at $ \sqrt{s} = $ 13 TeV | CMS-EXO-16-052 1711.00431 |
|
| 12 | CMS Collaboration | Search for new physics in final states with an energetic jet or a hadronically decaying W or Z boson and transverse momentum imbalance at $ \sqrt{s} = $ 13 TeV | CMS-EXO-16-048 1712.02345 |
|
| 13 | R. E. Shrock and M. Suzuki | Invisible decays of Higgs bosons | Phy. Lett. B 110 (1982) 250 | |
| 14 | A. Djouadi, O. Lebedev, Y. Mambrini, and J. Quevillon | Implications of LHC searches for Higgs--portal dark matter | PLB709 (2012) 65--69 | 1112.3299 |
| 15 | S. Baek, P. Ko, W.-I. Park, and E. Senaha | Higgs Portal Vector Dark Matter : Revisited | JHEP 05 (2013) 036 | 1212.2131 |
| 16 | A. Djouadi, A. Falkowski, Y. Mambrini, and J. Quevillon | Direct Detection of Higgs-Portal Dark Matter at the LHC | EPJC73 (2013), no. 6 | 1205.3169 |
| 17 | A. Beniwal et al. | Combined analysis of effective Higgs portal dark matter models | PRD93 (2016), no. 11, 115016 | 1512.06458 |
| 18 | CMS Collaboration | The CMS trigger system | JINST 12 (2017), no. 01, P01020 | CMS-TRG-12-001 1609.02366 |
| 19 | CMS Collaboration | The CMS experiment at the CERN LHC | JINST 3 (2008) S08004 | CMS-00-001 |
| 20 | CMS Collaboration | Particle-flow reconstruction and global event description with the CMS detector | JINST 12 (2017), no. 10, P10003 | CMS-PRF-14-001 1706.04965 |
| 21 | M. Cacciari, G. P. Salam, and G. Soyez | The Anti-k(t) jet clustering algorithm | JHEP 04 (2008) 063 | 0802.1189 |
| 22 | M. Cacciari, G. P. Salam, and G. Soyez | FastJet User Manual | EPJC72 (2012) 1896 | 1111.6097 |
| 23 | CMS Collaboration | Jet energy scale and resolution in the CMS experiment in pp collisions at 8 TeV | JINST 12 (2017), no. 02, P02014 | CMS-JME-13-004 1607.03663 |
| 24 | CMS Collaboration | Performance of the CMS missing transverse momentum reconstruction in pp data at $ \sqrt{s} = $ 8 TeV | JINST 10 (2015), no. 02, P02006 | CMS-JME-13-003 1411.0511 |
| 25 | CMS Collaboration | Performance of CMS muon reconstruction in $ pp $ collision events at $ \sqrt{s} = $ 7 TeV | JINST 7 (2012) P10002 | CMS-MUO-10-004 1206.4071 |
| 26 | CMS Collaboration | Performance of electron reconstruction and selection with the CMS detector in proton-proton collisions at $ \sqrt{s} = $ 8 TeV | JINST 10 (2015) P06005 | CMS-EGM-13-001 1502.02701 |
| 27 | CMS Collaboration | Reconstruction and identification of $ \tau $ lepton decays to hadrons and $ \nu_\tau $ at CMS | JINST 11 (2016) P01019 | CMS-TAU-14-001 1510.07488 |
| 28 | P. Nason | A New method for combining NLO QCD with shower Monte Carlo algorithms | JHEP 11 (2004) 040 | hep-ph/0409146 |
| 29 | S. Frixione, P. Nason, and C. Oleari | Matching NLO QCD computations with Parton Shower simulations: the POWHEG method | JHEP 11 (2007) 070 | 0709.2092 |
| 30 | S. Alioli, P. Nason, C. Oleari, and E. Re | A general framework for implementing NLO calculations in shower Monte Carlo programs: the POWHEG BOX | JHEP 06 (2010) 043 | 1002.2581 |
| 31 | E. Bagnaschi, G. Degrassi, P. Slavich, and A. Vicini | Higgs production via gluon fusion in the POWHEG approach in the SM and in the MSSM | JHEP 02 (2012) 088 | 1111.2854 |
| 32 | P. Nason and C. Oleari | NLO Higgs boson production via vector-boson fusion matched with shower in POWHEG | JHEP 02 (2010) 037 | 0911.5299 |
| 33 | LHC Higgs Cross Section Working Group Collaboration | Handbook of LHC Higgs Cross Sections: 4. Deciphering the Nature of the Higgs Sector | 1610.07922 | |
| 34 | C. Anastasiou et al. | High precision determination of the gluon fusion Higgs boson cross-section at the LHC | JHEP 05 (2016) 058 | 1602.00695 |
| 35 | D. de Florian, G. Ferrera, M. Grazzini, and D. Tommasini | Higgs boson production at the LHC: transverse momentum resummation effects in the $ \mathrm{H} \to 2\gamma $, $ \mathrm{H} \to \mathrm{WW} \to \ell\nu \ell\nu $ and $ \mathrm{H} \to \mathrm{ZZ} \to {4\ell} $ decay modes | JHEP 06 (2012) 132 | 1203.6321 |
| 36 | M. Grazzini and H. Sargsyan | Heavy-quark mass effects in Higgs boson production at the LHC | JHEP 09 (2013) 129 | 1306.4581 |
| 37 | ATLAS, CMS Collaboration | Combined Measurement of the Higgs Boson Mass in $ pp $ Collisions at $ \sqrt{s}= $ 7 and 8 TeV with the ATLAS and CMS Experiments | PRL 114 (2015) 191803 | 1503.07589 |
| 38 | J. Alwall et al. | The automated computation of tree-level and next-to-leading order differential cross sections, and their matching to parton shower simulations | JHEP 07 (2014) 079 | 1405.0301 |
| 39 | T. Sjostrand et al. | An Introduction to PYTHIA 8.2 | CPC 191 (2015) 159 | 1410.3012 |
| 40 | CMS Collaboration | Event generator tunes obtained from underlying event and multiparton scattering measurements | EPJC 76 (2016) 155 | CMS-GEN-14-001 1512.00815 |
| 41 | J. Alwall et al. | Comparative study of various algorithms for the merging of parton showers and matrix elements in hadronic collisions | EPJC53 (2008) 473--500 | 0706.2569 |
| 42 | NNPDF Collaboration | Parton distributions for the LHC Run II | JHEP 04 (2015) 040 | 1410.8849 |
| 43 | GEANT4 Collaboration | GEANT4: A Simulation toolkit | NIMA506 (2003) 250--303 | |
| 44 | CMS Collaboration | Performance of missing energy reconstruction in 13 TeV pp collision data using the CMS detector | CMS-PAS-JME-16-004 | CMS-PAS-JME-16-004 |
| 45 | CMS Collaboration | Performance of photon reconstruction and identification with the CMS detector in proton-proton collisions at $ \sqrt{s} = $ 8 TeV | JINST 10 (2015) P08010 | CMS-EGM-14-001 1502.02702 |
| 46 | CMS Collaboration | Identification of b-quark jets with the CMS experiment | JINST 8 (2013) P04013 | CMS-BTV-12-001 1211.4462 |
| 47 | CMS Collaboration | Identification of heavy-flavour jets with the CMS detector in pp collisions at 13 TeV | Submitted to: JINST (2017) | CMS-BTV-16-002 1712.07158 |
| 48 | J. H. Kuhn, A. Kulesza, S. Pozzorini, and M. Schulze | Electroweak corrections to hadronic photon production at large transverse momenta | JHEP 03 (2006) 059 | hep-ph/0508253 |
| 49 | S. Kallweit et al. | NLO electroweak automation and precise predictions for W+multijet production at the LHC | JHEP 04 (2015) 012 | 1412.5157 |
| 50 | S. Kallweit et al. | NLO QCD+EW predictions for V+jets including off-shell vector-boson decays and multijet merging | JHEP 04 (2016) 021 | 1511.08692 |
| 51 | K. Arnold et al. | VBFNLO: A Parton level Monte Carlo for processes with electroweak bosons | CPC 180 (2009) 1661--1670 | 0811.4559 |
| 52 | J. Baglio et al. | Release Note - VBFNLO 2.7.0 | 1404.3940 | |
| 53 | J. M. Lindert et al. | Precise predictions for $ V+ $ jets dark matter backgrounds | EPJC77 (2017), no. 12, 829 | 1705.04664 |
| 54 | CMS Collaboration | Search for new physics with jets and missing transverse momentum in pp collisions at $ \sqrt{s} = $ 7 TeV | JHEP 08 (2011) 155 | CMS-SUS-10-005 1106.4503 |
| 55 | M. Czakon, D. Heymes, and A. Mitov | High-precision differential predictions for top-quark pairs at the LHC | PRL 116 (2016) 082003 | 1511.00549 |
| 56 | CMS Collaboration | Measurement of the ZZ production cross section and Z $ \to \ell^+\ell^-\ell'^+\ell'^- $ branching fraction in pp collisions at $ \sqrt{s} = $ 13 TeV | PLB 763 (2016) 280 | CMS-SMP-16-001 1607.08834 |
| 57 | CMS Collaboration | Measurement of the WZ production cross section in pp collisions at $ \sqrt{s} = $ 13 TeV | PLB 766 (2017) 268 | CMS-SMP-16-002 1607.06943 |
| 58 | CMS Collaboration Collaboration | CMS Luminosity Measurements for the 2016 Data Taking Period | CMS-PAS-LUM-17-001, CERN, Geneva | |
| 59 | CMS Collaboration | Simplified likelihood for the re-interpretation of public CMS results | CDS | |
| 60 | T. Junk | Confidence level computation for combining searches with small statistics | NIMA 434 (1999) 435 | hep-ex/9902006 |
| 61 | A. L. Read | Presentation of search results: the $ CL_s $ technique | JPG 28 (2002) 2693 | |
| 62 | G. Cowan, K. Cranmer, E. Gross, and O. Vitells | Asymptotic formulae for likelihood-based tests of new physics | EPJC 71 (2011) 1554 | 1007.1727 |
| 63 | The ATLAS Collaboration, The CMS Collaboration, The LHC Higgs Combination Group Collaboration | Procedure for the LHC Higgs boson search combination in Summer 2011 | CMS-NOTE-2011-005 | |
| 64 | CMS Collaboration | Search for a Higgs boson in the mass range from 145 to 1000 GeV decaying to a pair of W or Z bosons | JHEP 10 (2015) 144 | CMS-HIG-13-031 1504.00936 |
| 65 | LHC Higgs Cross Section Working Group Collaboration | Handbook of LHC Higgs Cross Sections: 3. Higgs Properties | 1307.1347 | |
| 66 | R. D. Young and A. W. Thomas | Octet baryon masses and sigma terms from an SU(3) chiral extrapolation | PRD81 (2010) 014503 | 0901.3310 |
| 67 | LUX Collaboration | Results from a search for dark matter in the complete LUX exposure | PRL 118 (2017), no. 2, 021303 | 1608.07648 |
| 68 | PandaX-II Collaboration | Dark Matter Results from First 98.7 Days of Data from the PandaX-II Experiment | PRL 117 (2016), no. 12, 121303 | 1607.07400 |
| 69 | SuperCDMS Collaboration | New Results from the Search for Low-Mass Weakly Interacting Massive Particles with the CDMS Low Ionization Threshold Experiment | PRL 116 (2016), no. 7, 071301 | 1509.02448 |
| 70 | CRESST Collaboration | Results on light dark matter particles with a low-threshold CRESST-II detector | EPJC76 (2016), no. 1, 25 | 1509.01515 |
|
|
Compact Muon Solenoid LHC, CERN |
|

|

|

|

|

|