

Compact Muon Solenoid
LHC, CERN
| CMS-PAS-SUS-16-019 | ||
| Search for supersymmetry in events with one lepton and multiple jets in proton-proton collisions at $\sqrt{s} =$ 13 TeV in 2016 | ||
| CMS Collaboration | ||
| August 2016 | ||
| Abstract: A search for supersymmetry is performed in events with a single electron or muon in proton-proton collisions at a center-of-mass energy of 13 TeV in 2016. The data were recorded by the CMS experiment at the LHC, and correspond to an integrated luminosity of 12.9 fb$^{-1}$. Several exclusive search regions are defined based on the number of jets and b-tagged jets, the scalar sum of the jet transverse momenta, and the scalar sum of the missing transverse momentum and the transverse momentum of the lepton. The observed yields are compatible with predictions from standard model processes. The results are interpreted in two simplified models of gluino pair production. In a model where each gluino decays to top quarks and a neutralino, gluinos with masses up to 1.65 TeV are excluded for neutralino masses below 600 GeV. In the other model, each gluino decays to two light quarks and an intermediate chargino, with the latter decaying to a W boson and a neutralino. Here, gluino masses below 1.6 TeV are excluded for neutralino masses below 500 GeV, assuming a chargino with mass midway between the gluino and neutralino masses. | ||
| Links: CDS record (PDF) ; inSPIRE record ; CADI line (restricted) ; | ||
| Figures & Tables | Summary | Additional Figures & Tables | References | CMS Publications |
|---|
| Additional information on efficiencies needed for reinterpretation of these results are available here. |
| Figures | |
png pdf |
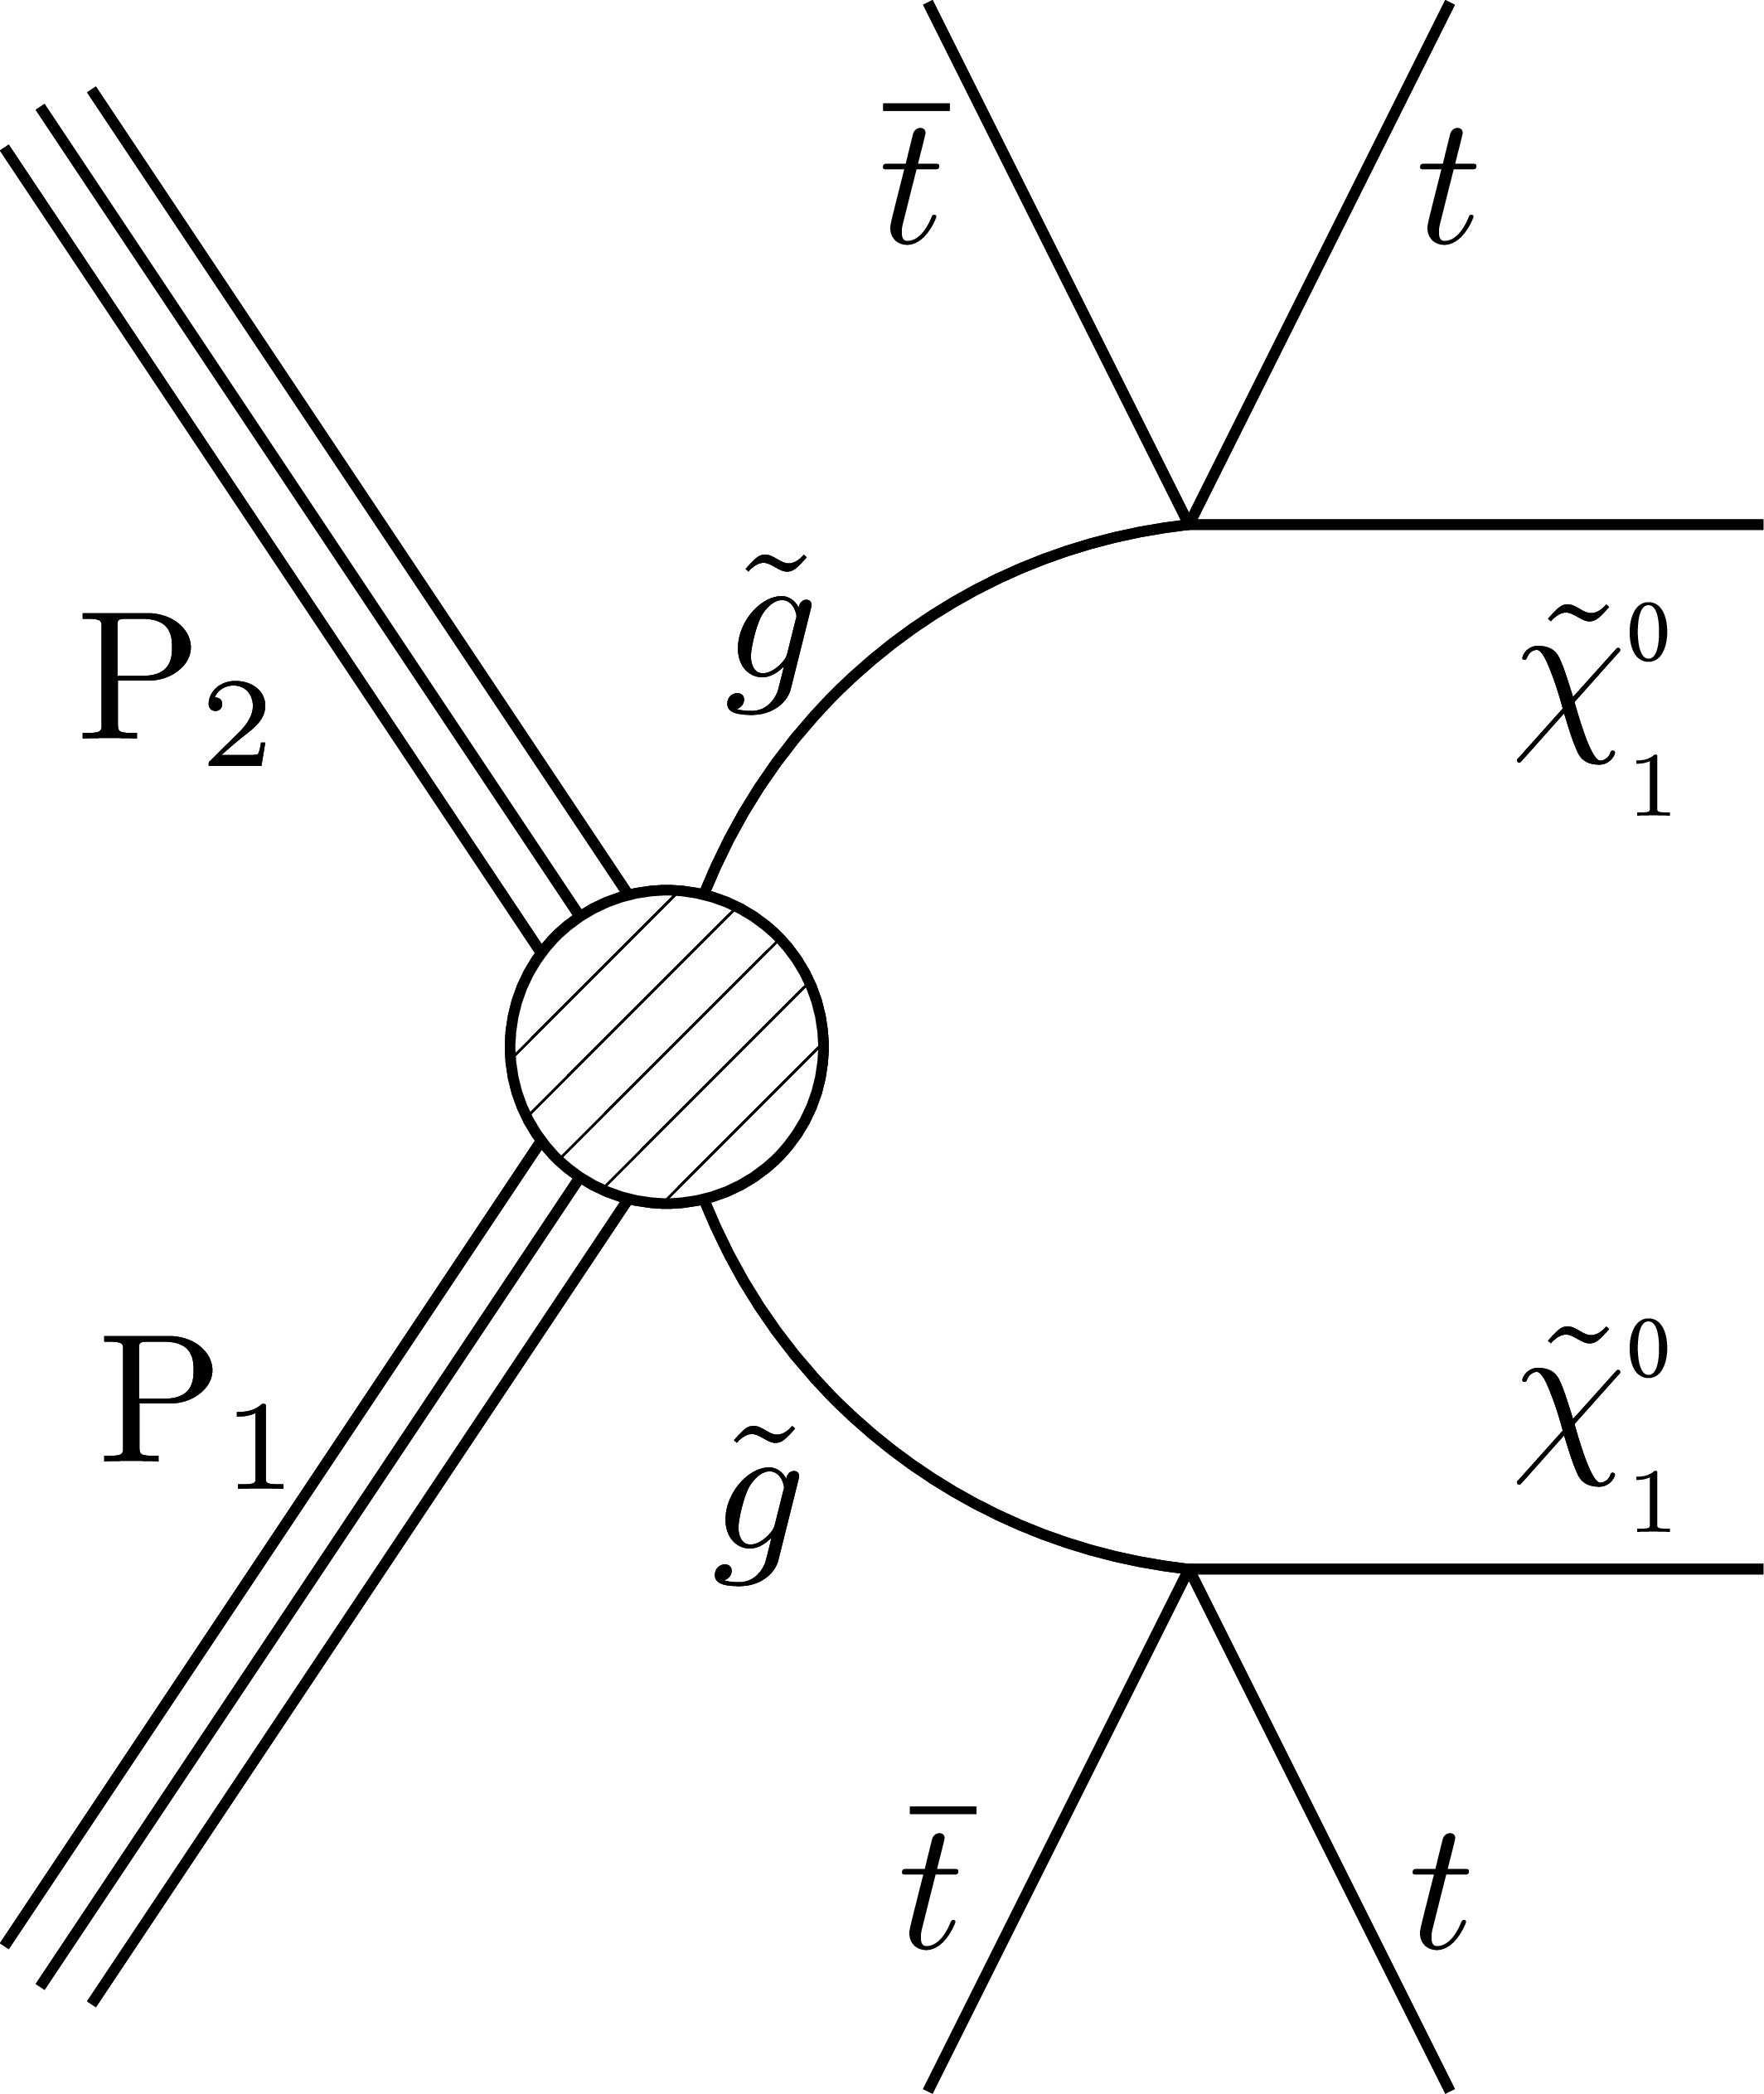
Figure 1-a:
Graphs showing the simplified models (a) T1tttt and (b) T5qqqqWW. Depending on the mass difference between the chargino ($ {\tilde{\chi}^{\pm }_1} $) and the neutralino ($ {\tilde{\chi}^0_1} $), the W boson can be virtual. |
png pdf |
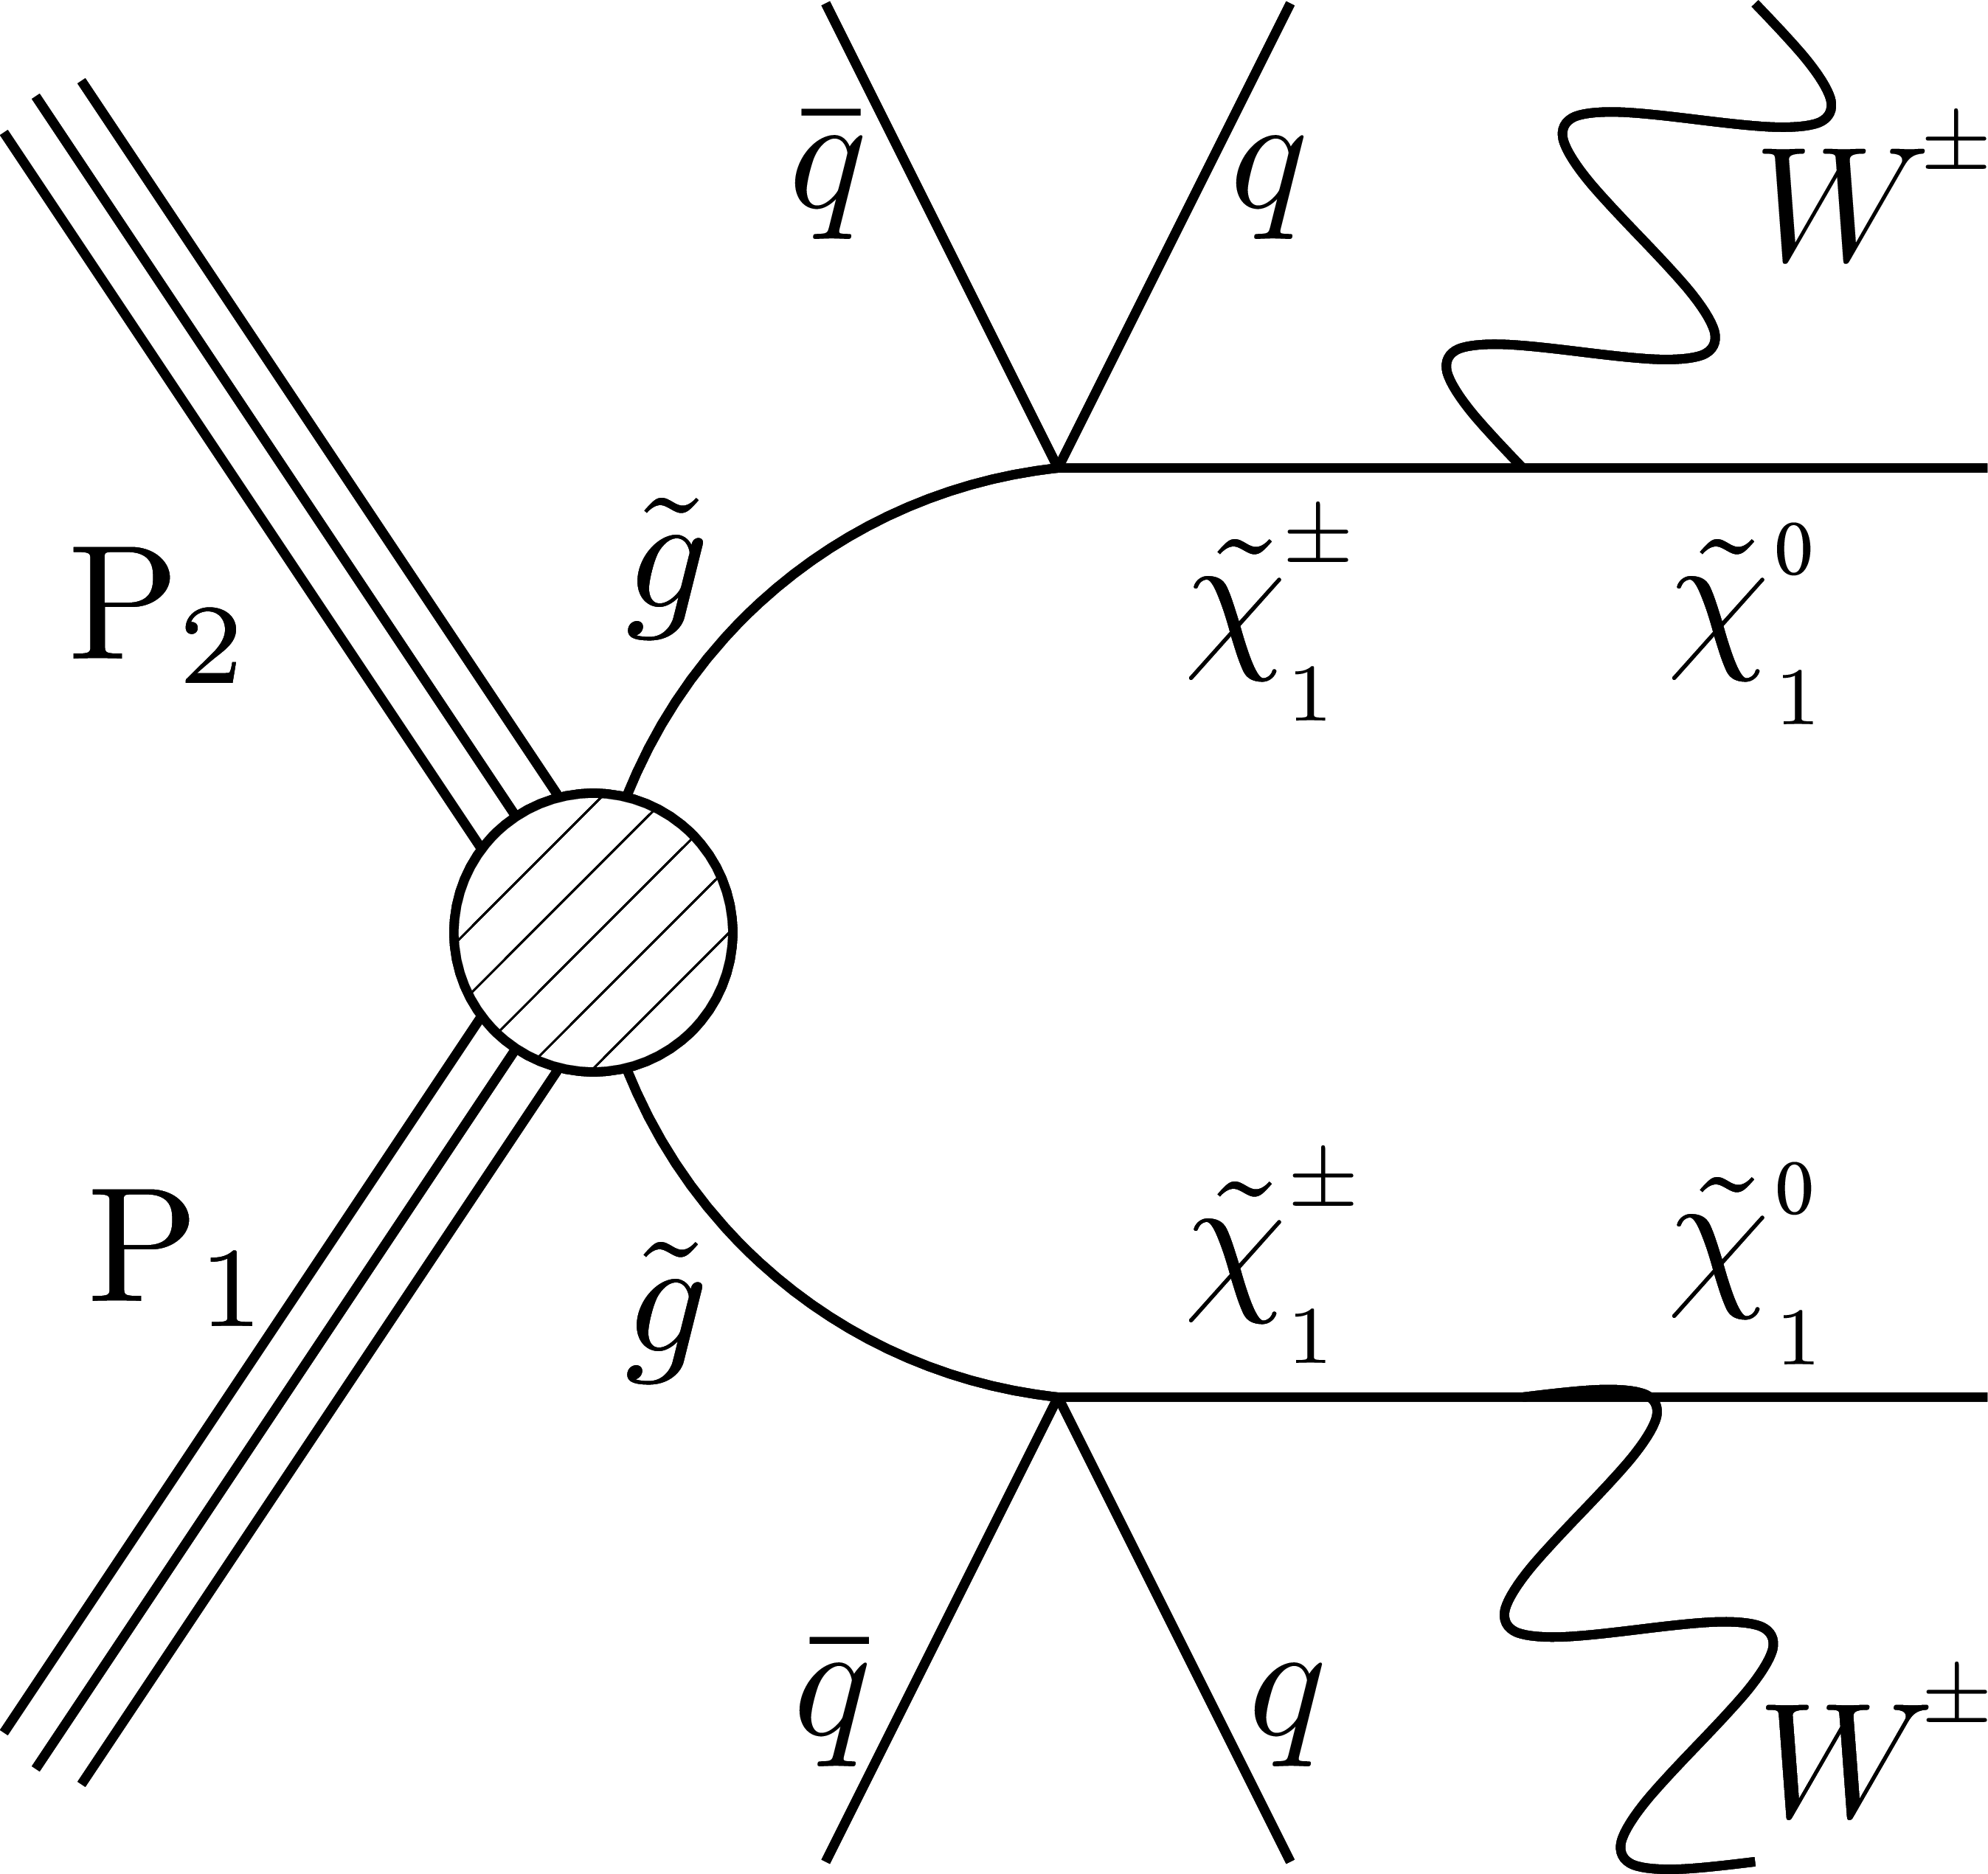
Figure 1-b:
Graphs showing the simplified models (a) T1tttt and (b) T5qqqqWW. Depending on the mass difference between the chargino ($ {\tilde{\chi}^{\pm }_1} $) and the neutralino ($ {\tilde{\chi}^0_1} $), the W boson can be virtual. |
png pdf |
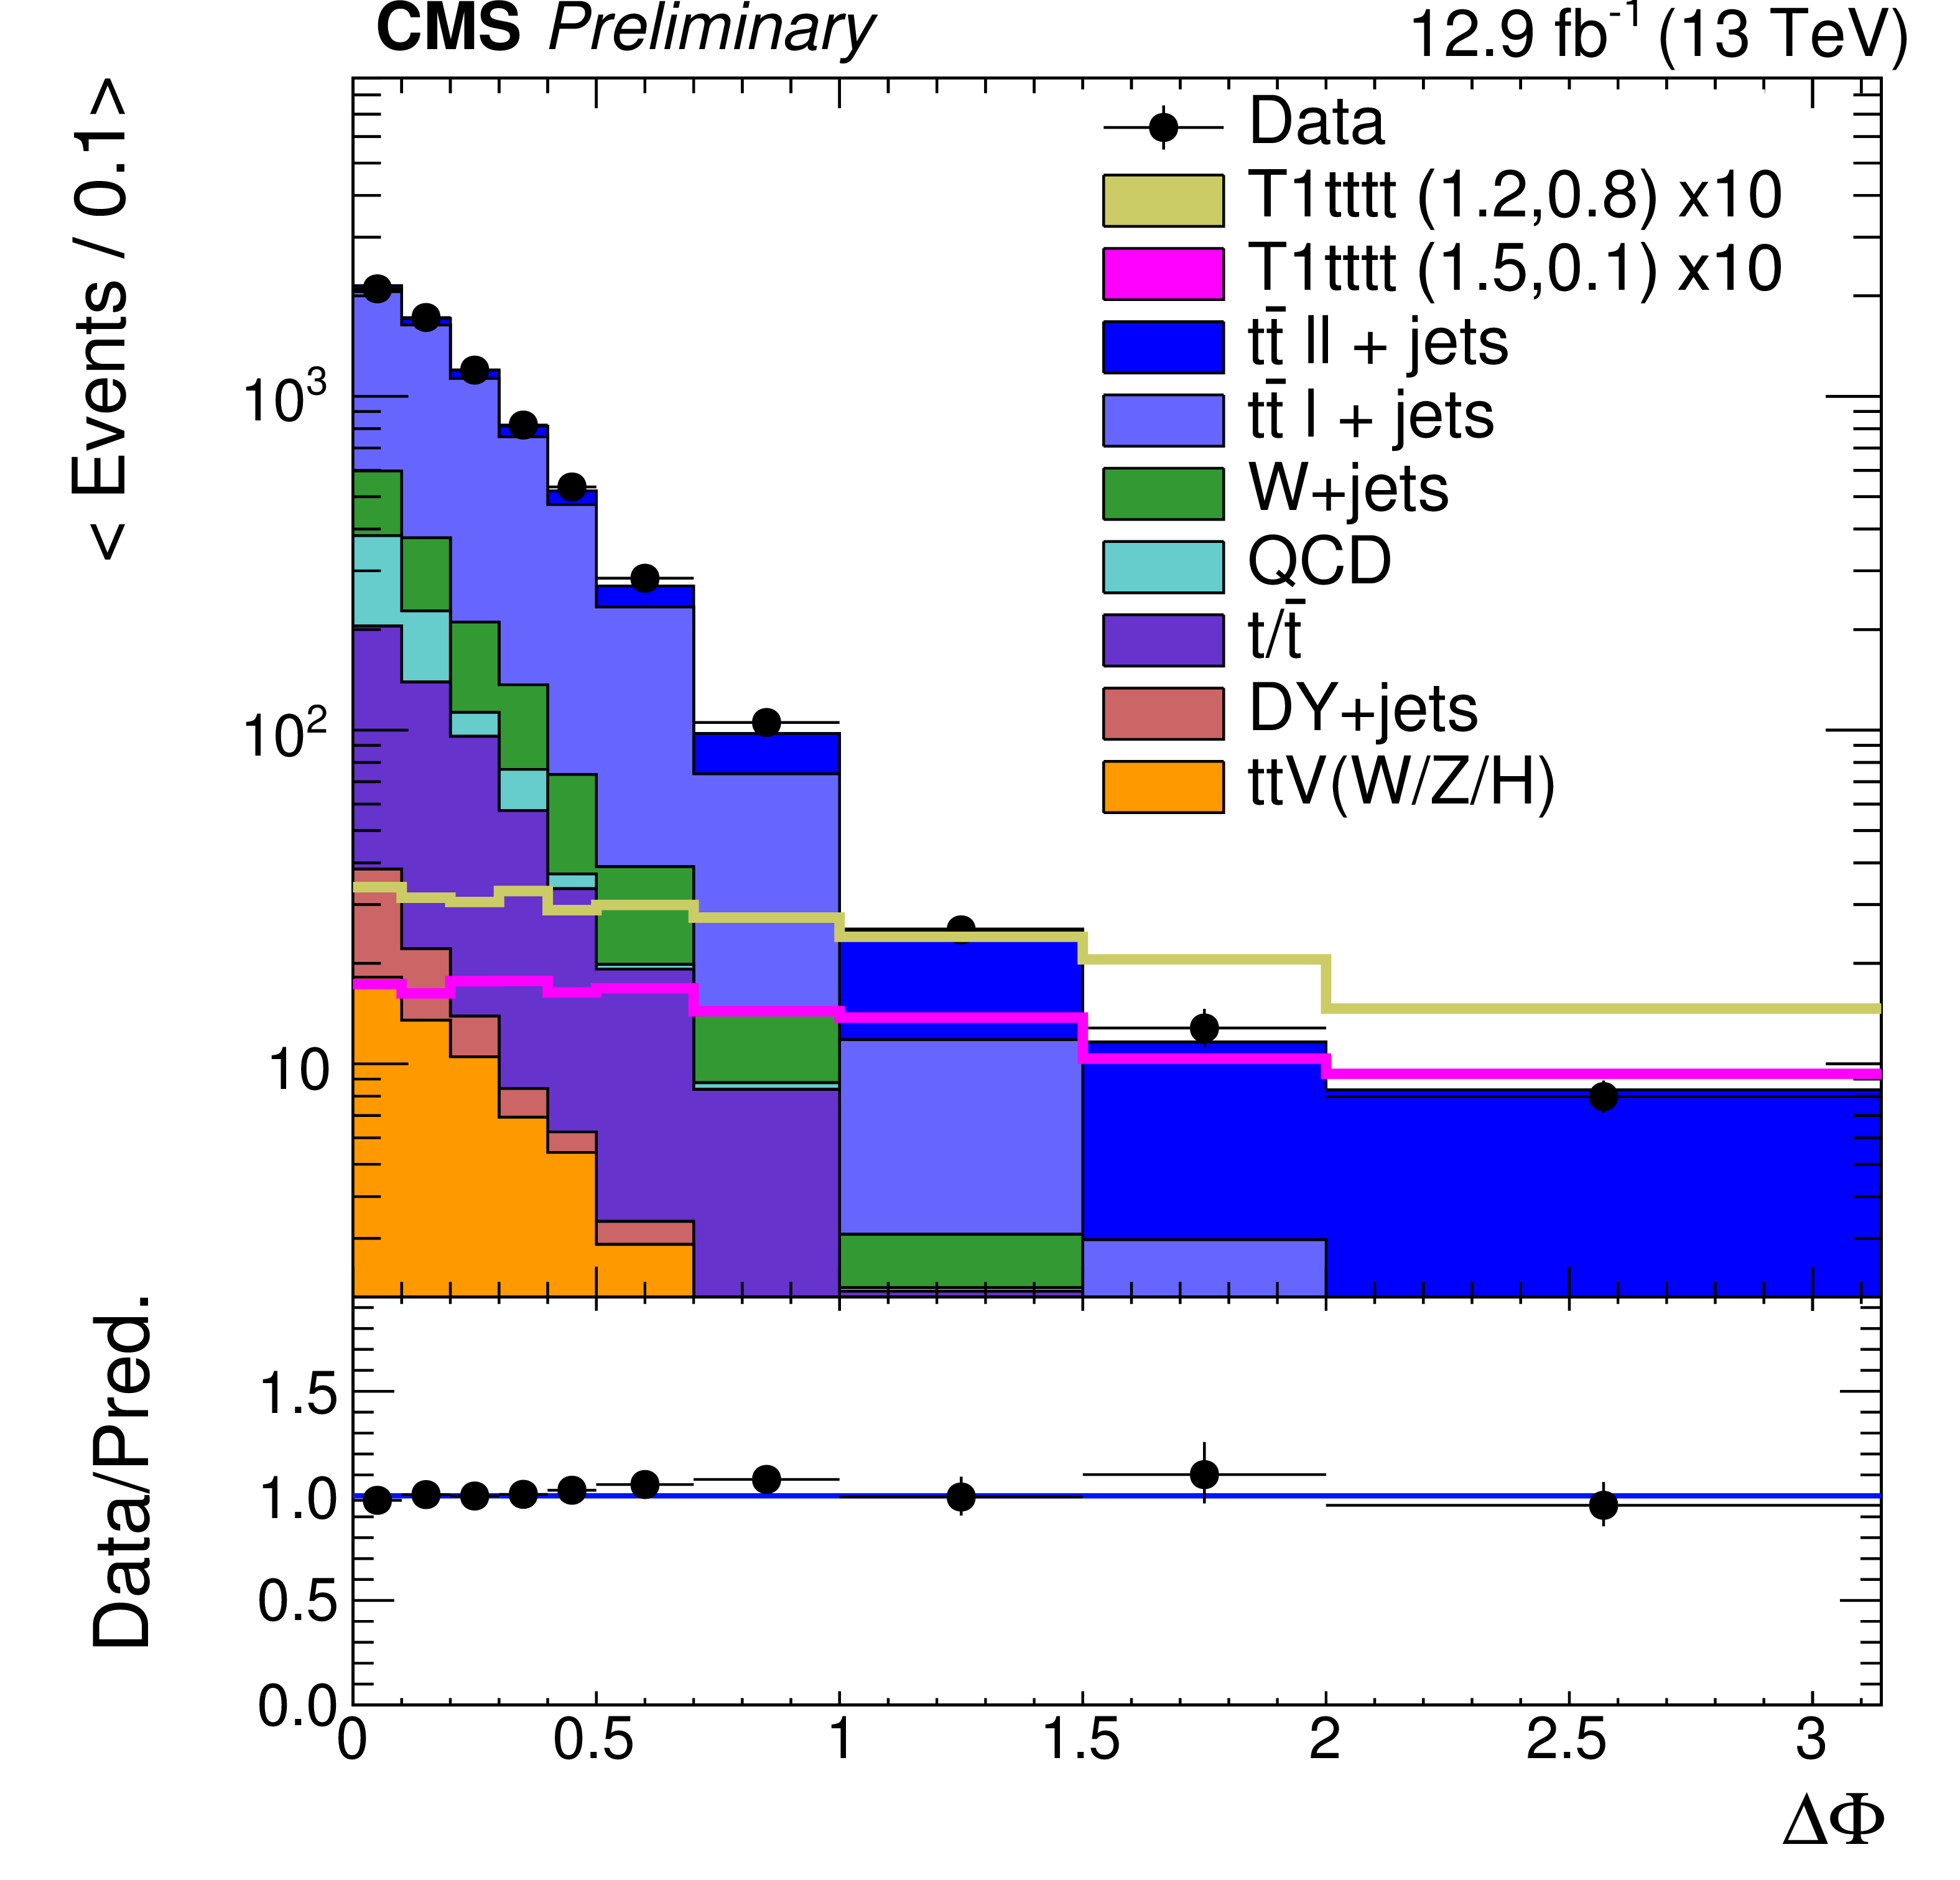
Figure 2-a:
Comparison of the ${\Delta \Phi }$ distribution for (a) the multi-b and (b) the zero-b analysis after the baseline selection. The simulated background contributions are stacked on top of each other, and several signal points are overlaid for illustration, but without stacking. For the multi-b analysis, the models T1tttt(1.2,0.8) (T1tttt(1.5,0.1)) correspond to a gluino mass of 1.2 TeV (1.5 TeV ) and neutralino mass of 0.8 TeV (0.1 TeV ), respectively. For the zero-b analysis, the models T5qqqqWW(1.2,0.8) (T5qqqqWW(1.6,0.1)) correspond to a gluino mass of 1.2 TeV (1.6 TeV ) and neutralino mass of 0.8 TeV (0.1 TeV ), and the intermediate chargino mass is fixed at 1.0 TeV (0.85 TeV ), respectively. The DY refers to $\mathrm{ q \bar{q} } \rightarrow \mathrm{Z} \gamma ^* \rightarrow \ell ^{+}\ell ^{-}$ events, and QCD refers to multijet events. The ratio of data to simulation is given below each of the panels. All uncertainties are statistical only. |
png pdf |
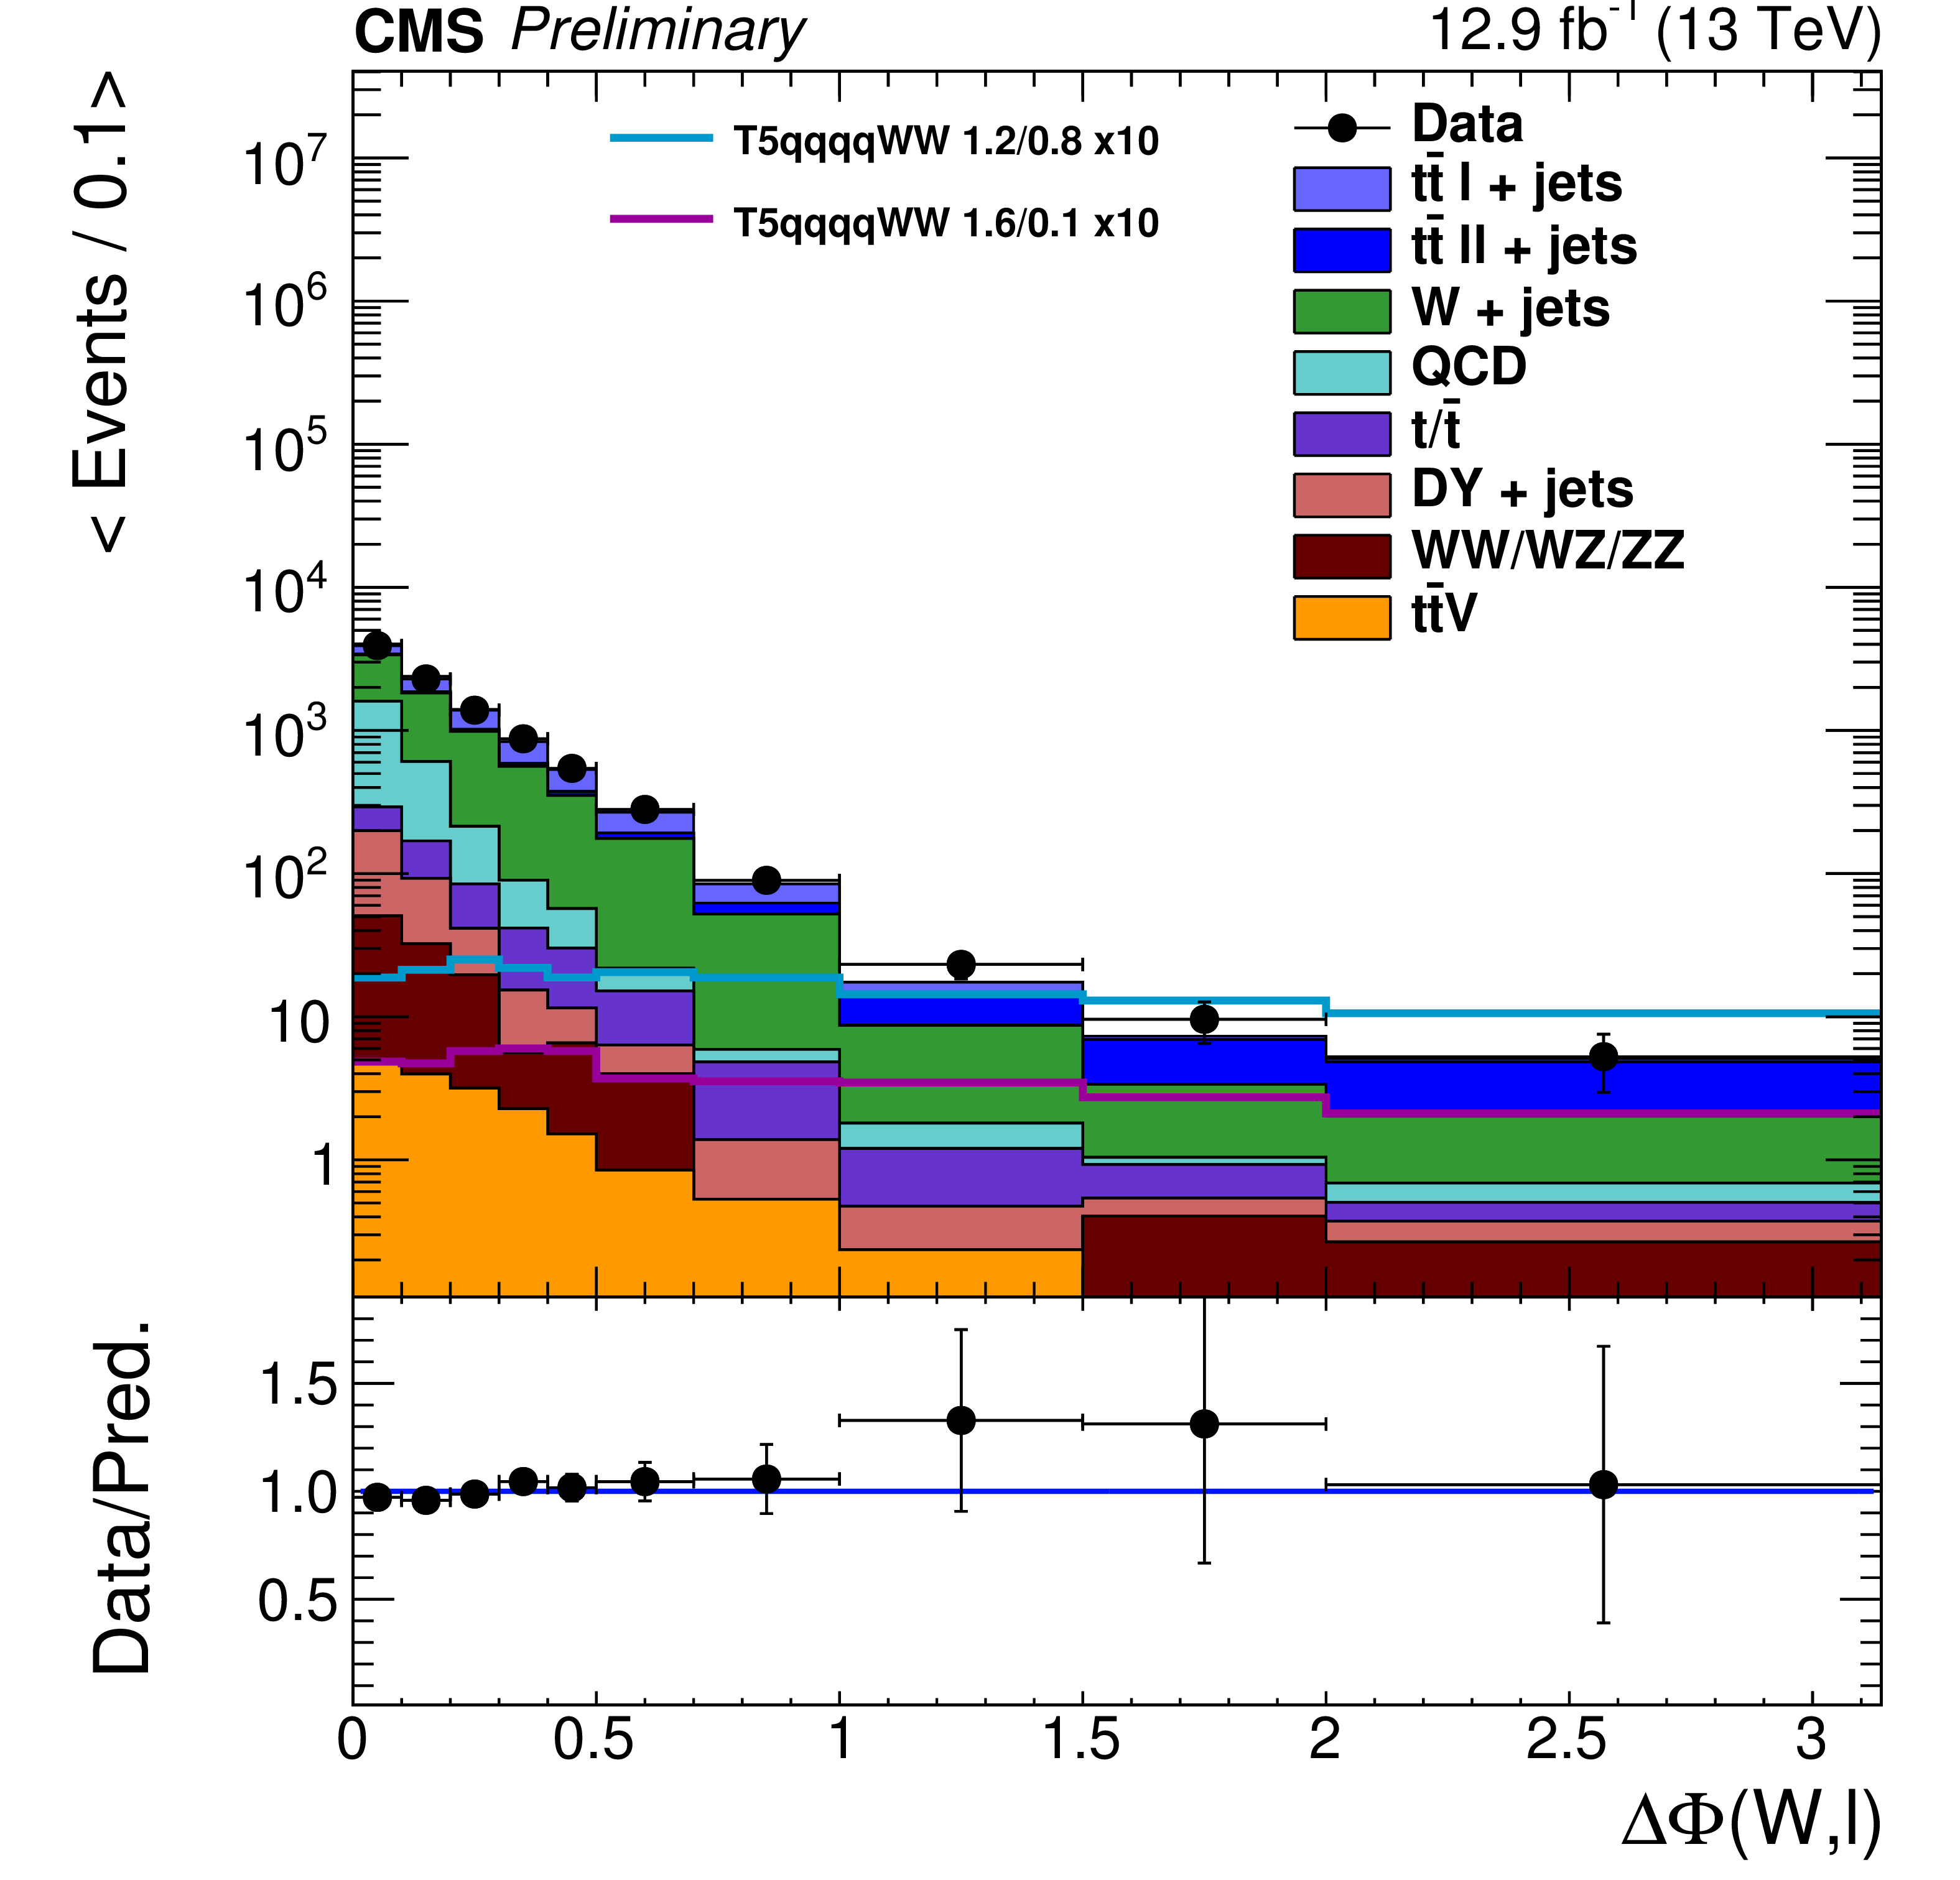
Figure 2-b:
Comparison of the ${\Delta \Phi }$ distribution for (a) the multi-b and (b) the zero-b analysis after the baseline selection. The simulated background contributions are stacked on top of each other, and several signal points are overlaid for illustration, but without stacking. For the multi-b analysis, the models T1tttt(1.2,0.8) (T1tttt(1.5,0.1)) correspond to a gluino mass of 1.2 TeV (1.5 TeV ) and neutralino mass of 0.8 TeV (0.1 TeV ), respectively. For the zero-b analysis, the models T5qqqqWW(1.2,0.8) (T5qqqqWW(1.6,0.1)) correspond to a gluino mass of 1.2 TeV (1.6 TeV ) and neutralino mass of 0.8 TeV (0.1 TeV ), and the intermediate chargino mass is fixed at 1.0 TeV (0.85 TeV ), respectively. The DY refers to $\mathrm{ q \bar{q} } \rightarrow \mathrm{Z} \gamma ^* \rightarrow \ell ^{+}\ell ^{-}$ events, and QCD refers to multijet events. The ratio of data to simulation is given below each of the panels. All uncertainties are statistical only. |
png pdf |
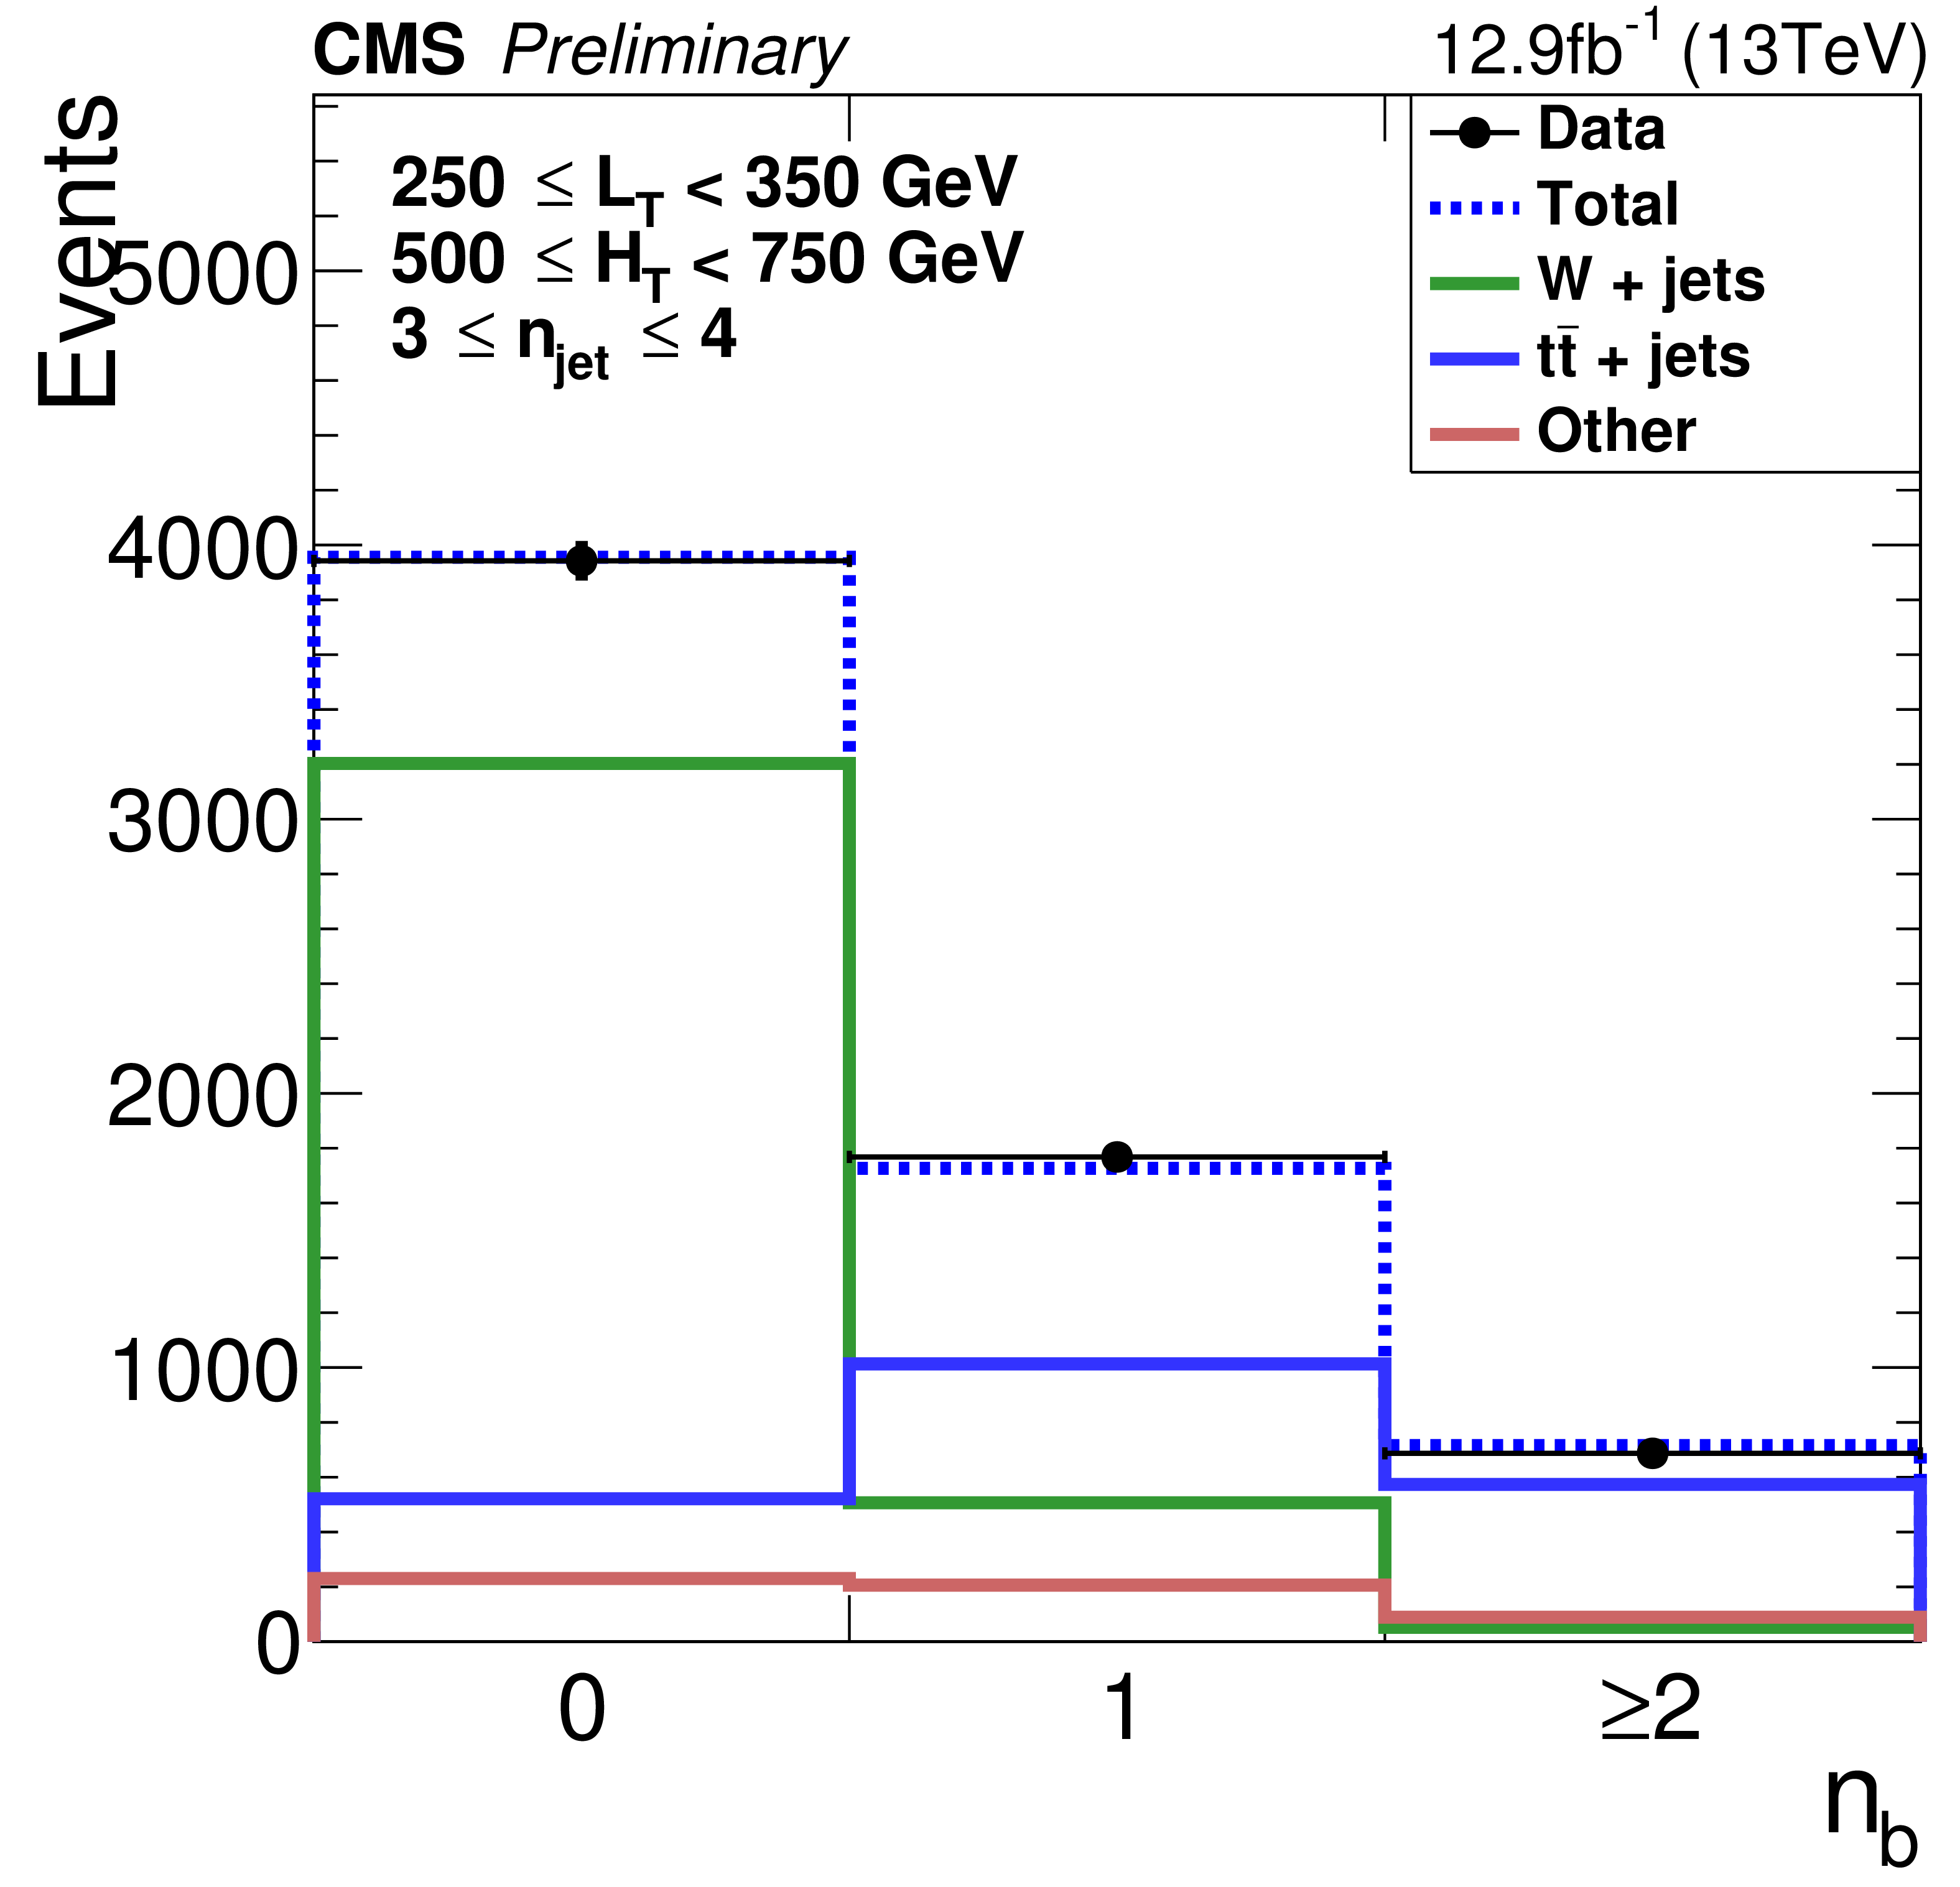
Figure 3-a:
Fits to the ${n_\textrm {b}}$ multiplicity for control regions in (a) 3 $\leq {n_\textrm {jet}} \leq$ 4 (250 $\leq {L_{\textrm T}} < $ 350 GeV, 500 $ \leq {H_{\mathrm {T}}} < $ 750 GeV, $ {\Delta \Phi } < $ 1, muon channel) and (b) 6 $ \leq {n_\textrm {jet}} \leq $ 7 (350 $ \leq {L_{\textrm T}} < $ 450 GeV, ${H_{\mathrm {T}}} \geq $ 750 GeV, $ {\Delta \Phi } < $ 1) in data. The solid lines represent the templates scaled according to the fit result (blue for ${\mathrm {t}\overline {\mathrm {t}}} $, green for W+jet, turquoise for QCD, and red for the remaining backgrounds), the dashed line shows the sum after fit, and the points with error bars represent data. |

png pdf |
Figure 3-b:
Fits to the ${n_\textrm {b}}$ multiplicity for control regions in (a) 3 $\leq {n_\textrm {jet}} \leq$ 4 (250 $\leq {L_{\textrm T}} < $ 350 GeV, 500 $ \leq {H_{\mathrm {T}}} < $ 750 GeV, $ {\Delta \Phi } < $ 1, muon channel) and (b) 6 $ \leq {n_\textrm {jet}} \leq $ 7 (350 $ \leq {L_{\textrm T}} < $ 450 GeV, ${H_{\mathrm {T}}} \geq $ 750 GeV, $ {\Delta \Phi } < $ 1) in data. The solid lines represent the templates scaled according to the fit result (blue for ${\mathrm {t}\overline {\mathrm {t}}} $, green for W+jet, turquoise for QCD, and red for the remaining backgrounds), the dashed line shows the sum after fit, and the points with error bars represent data. |
png pdf |
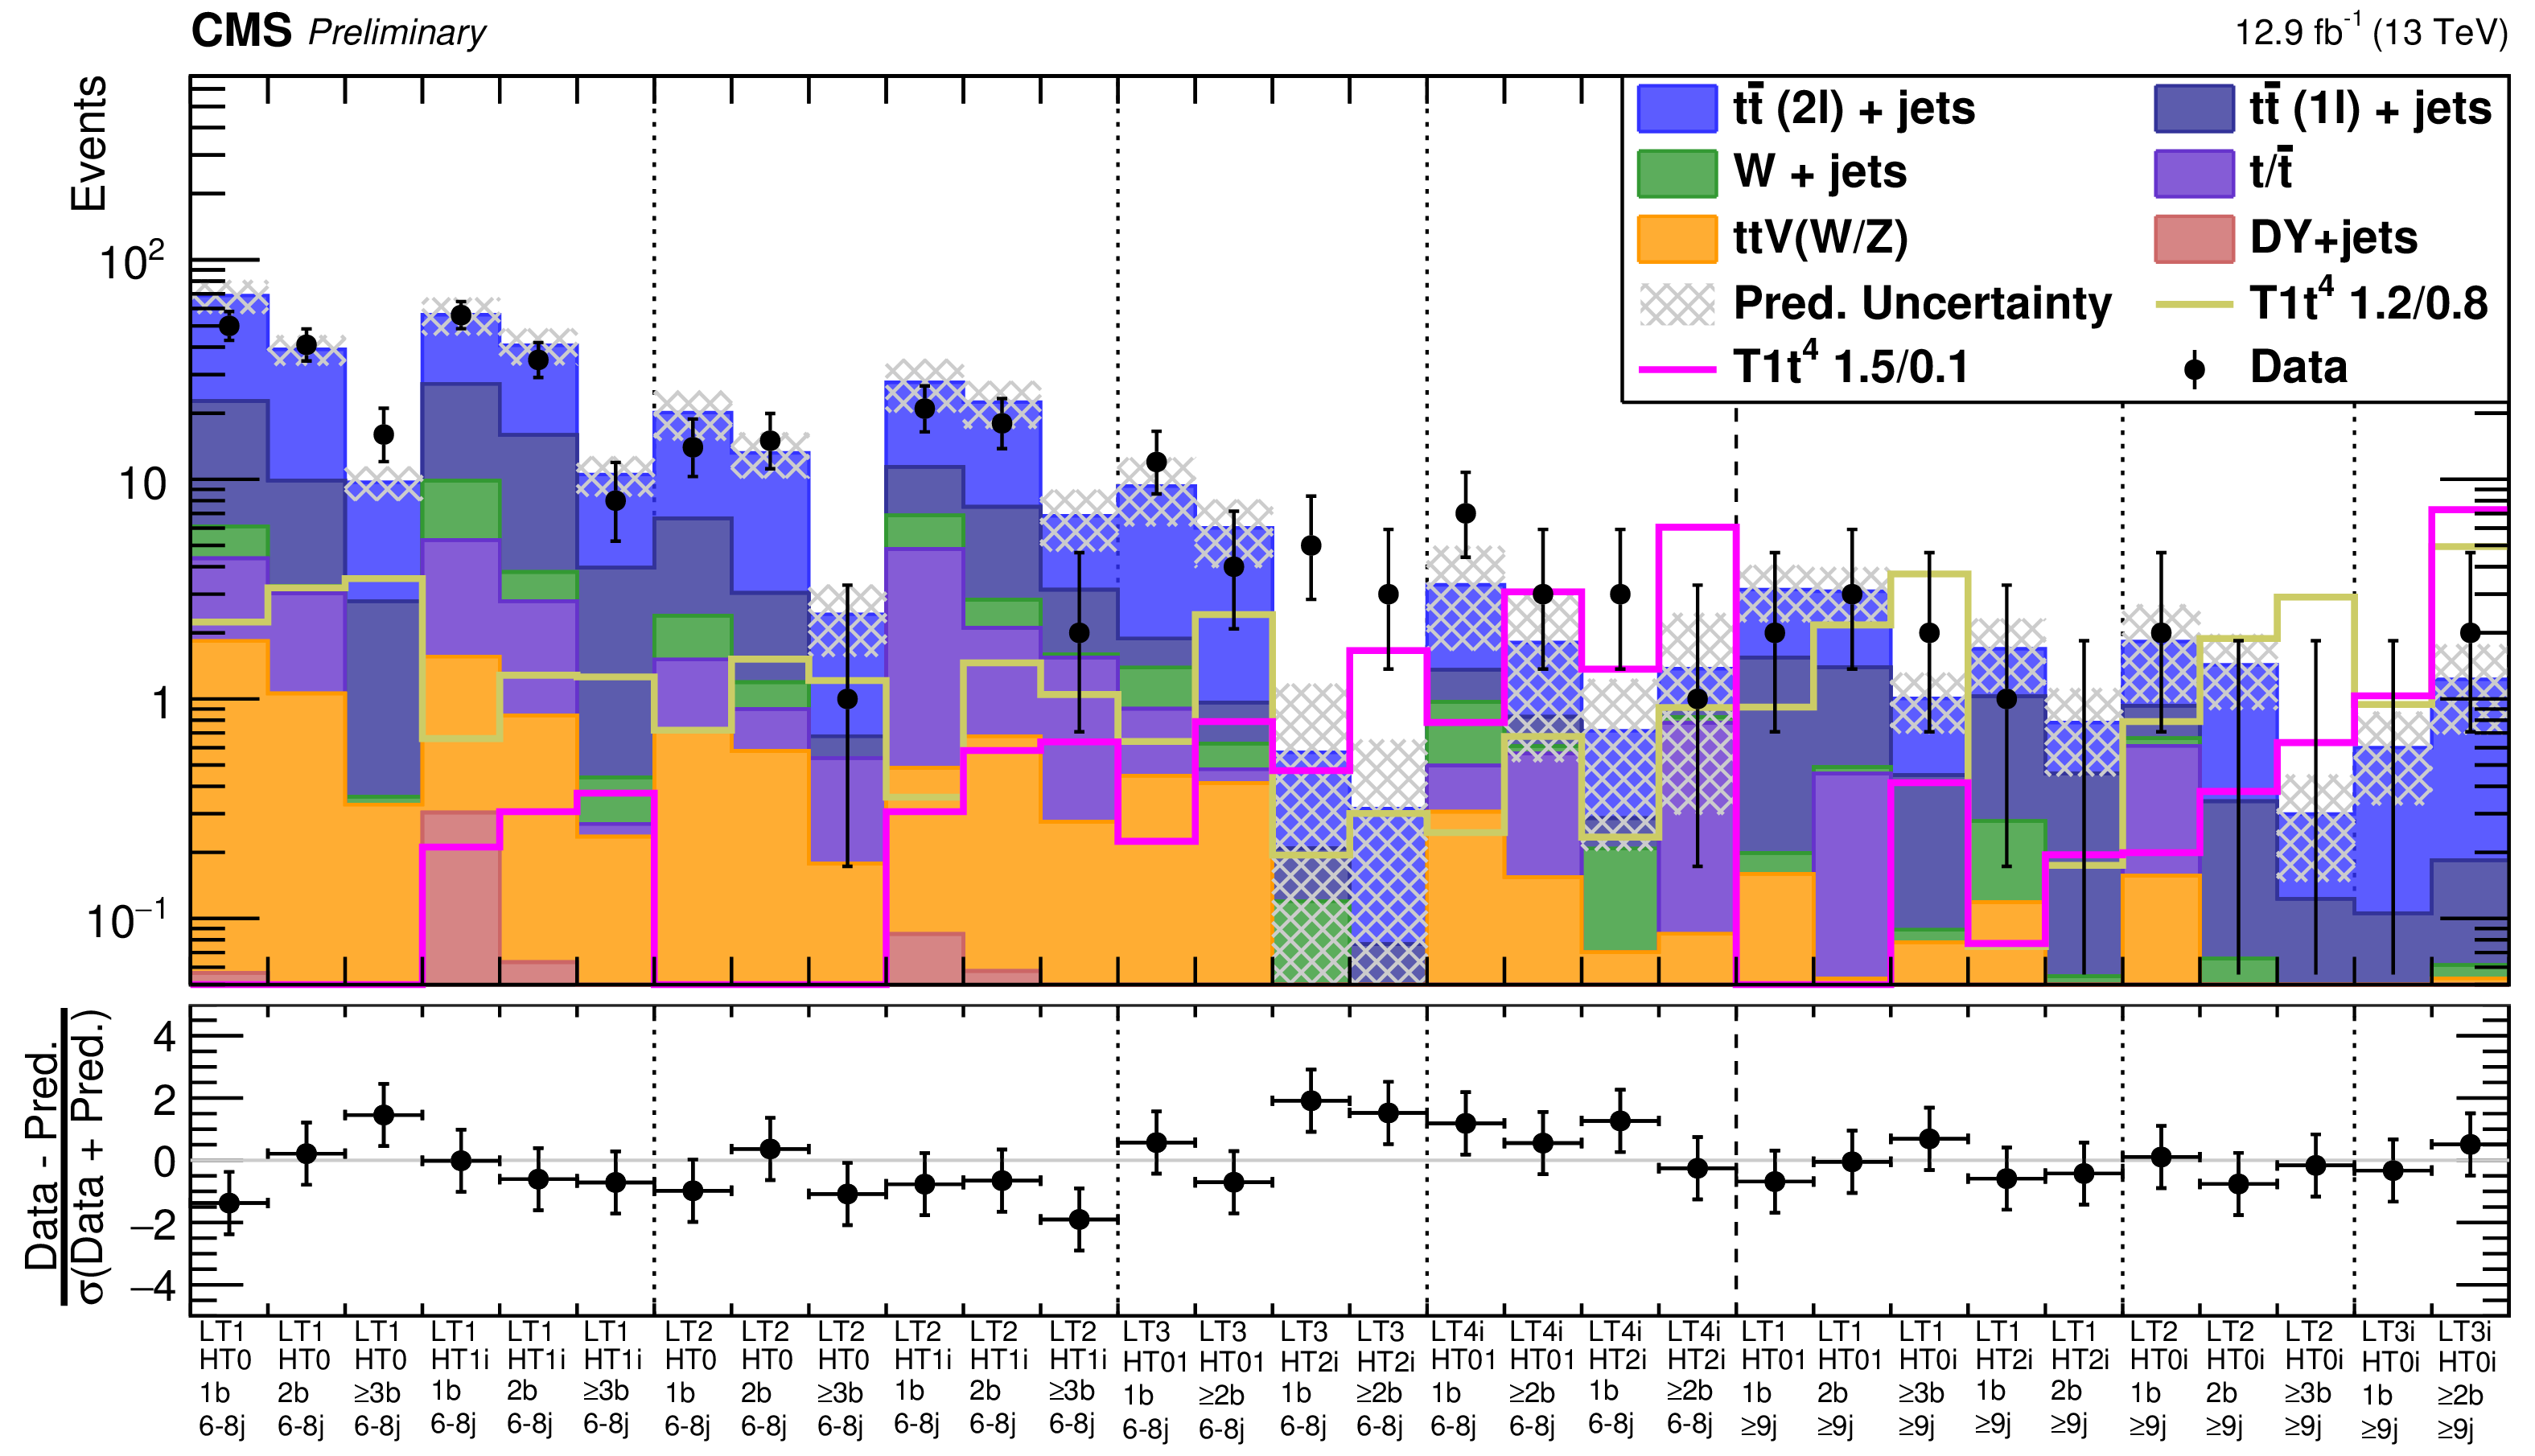
Figure 4:
Multi-b search: observed and predicted event counts in the 30 search regions. The black points with error bars show the number of events observed in data. The total expected contribution from standard model background processes is determined from control samples in the data and is used to set the overall normalization of the stacked background histograms. The relative fraction of the individual background components is taken from simulation and shown for illustration only. The uncertainty on the background prediction is shown as a grey, hatched region. The expected event yields for two T1tttt benchmark SUSY models are represented by open histograms. The vertical dashed and dotted lines separate different ${n_\textrm {jet}}$ and ${L_{\textrm T}}$ bins, respectively. The lower panel shows the ratio of the difference between data and background to the sum of the uncertainties on data and background prediction. The error bars indicate the total statistical and systematic uncertainty in the ratio. |
png pdf |
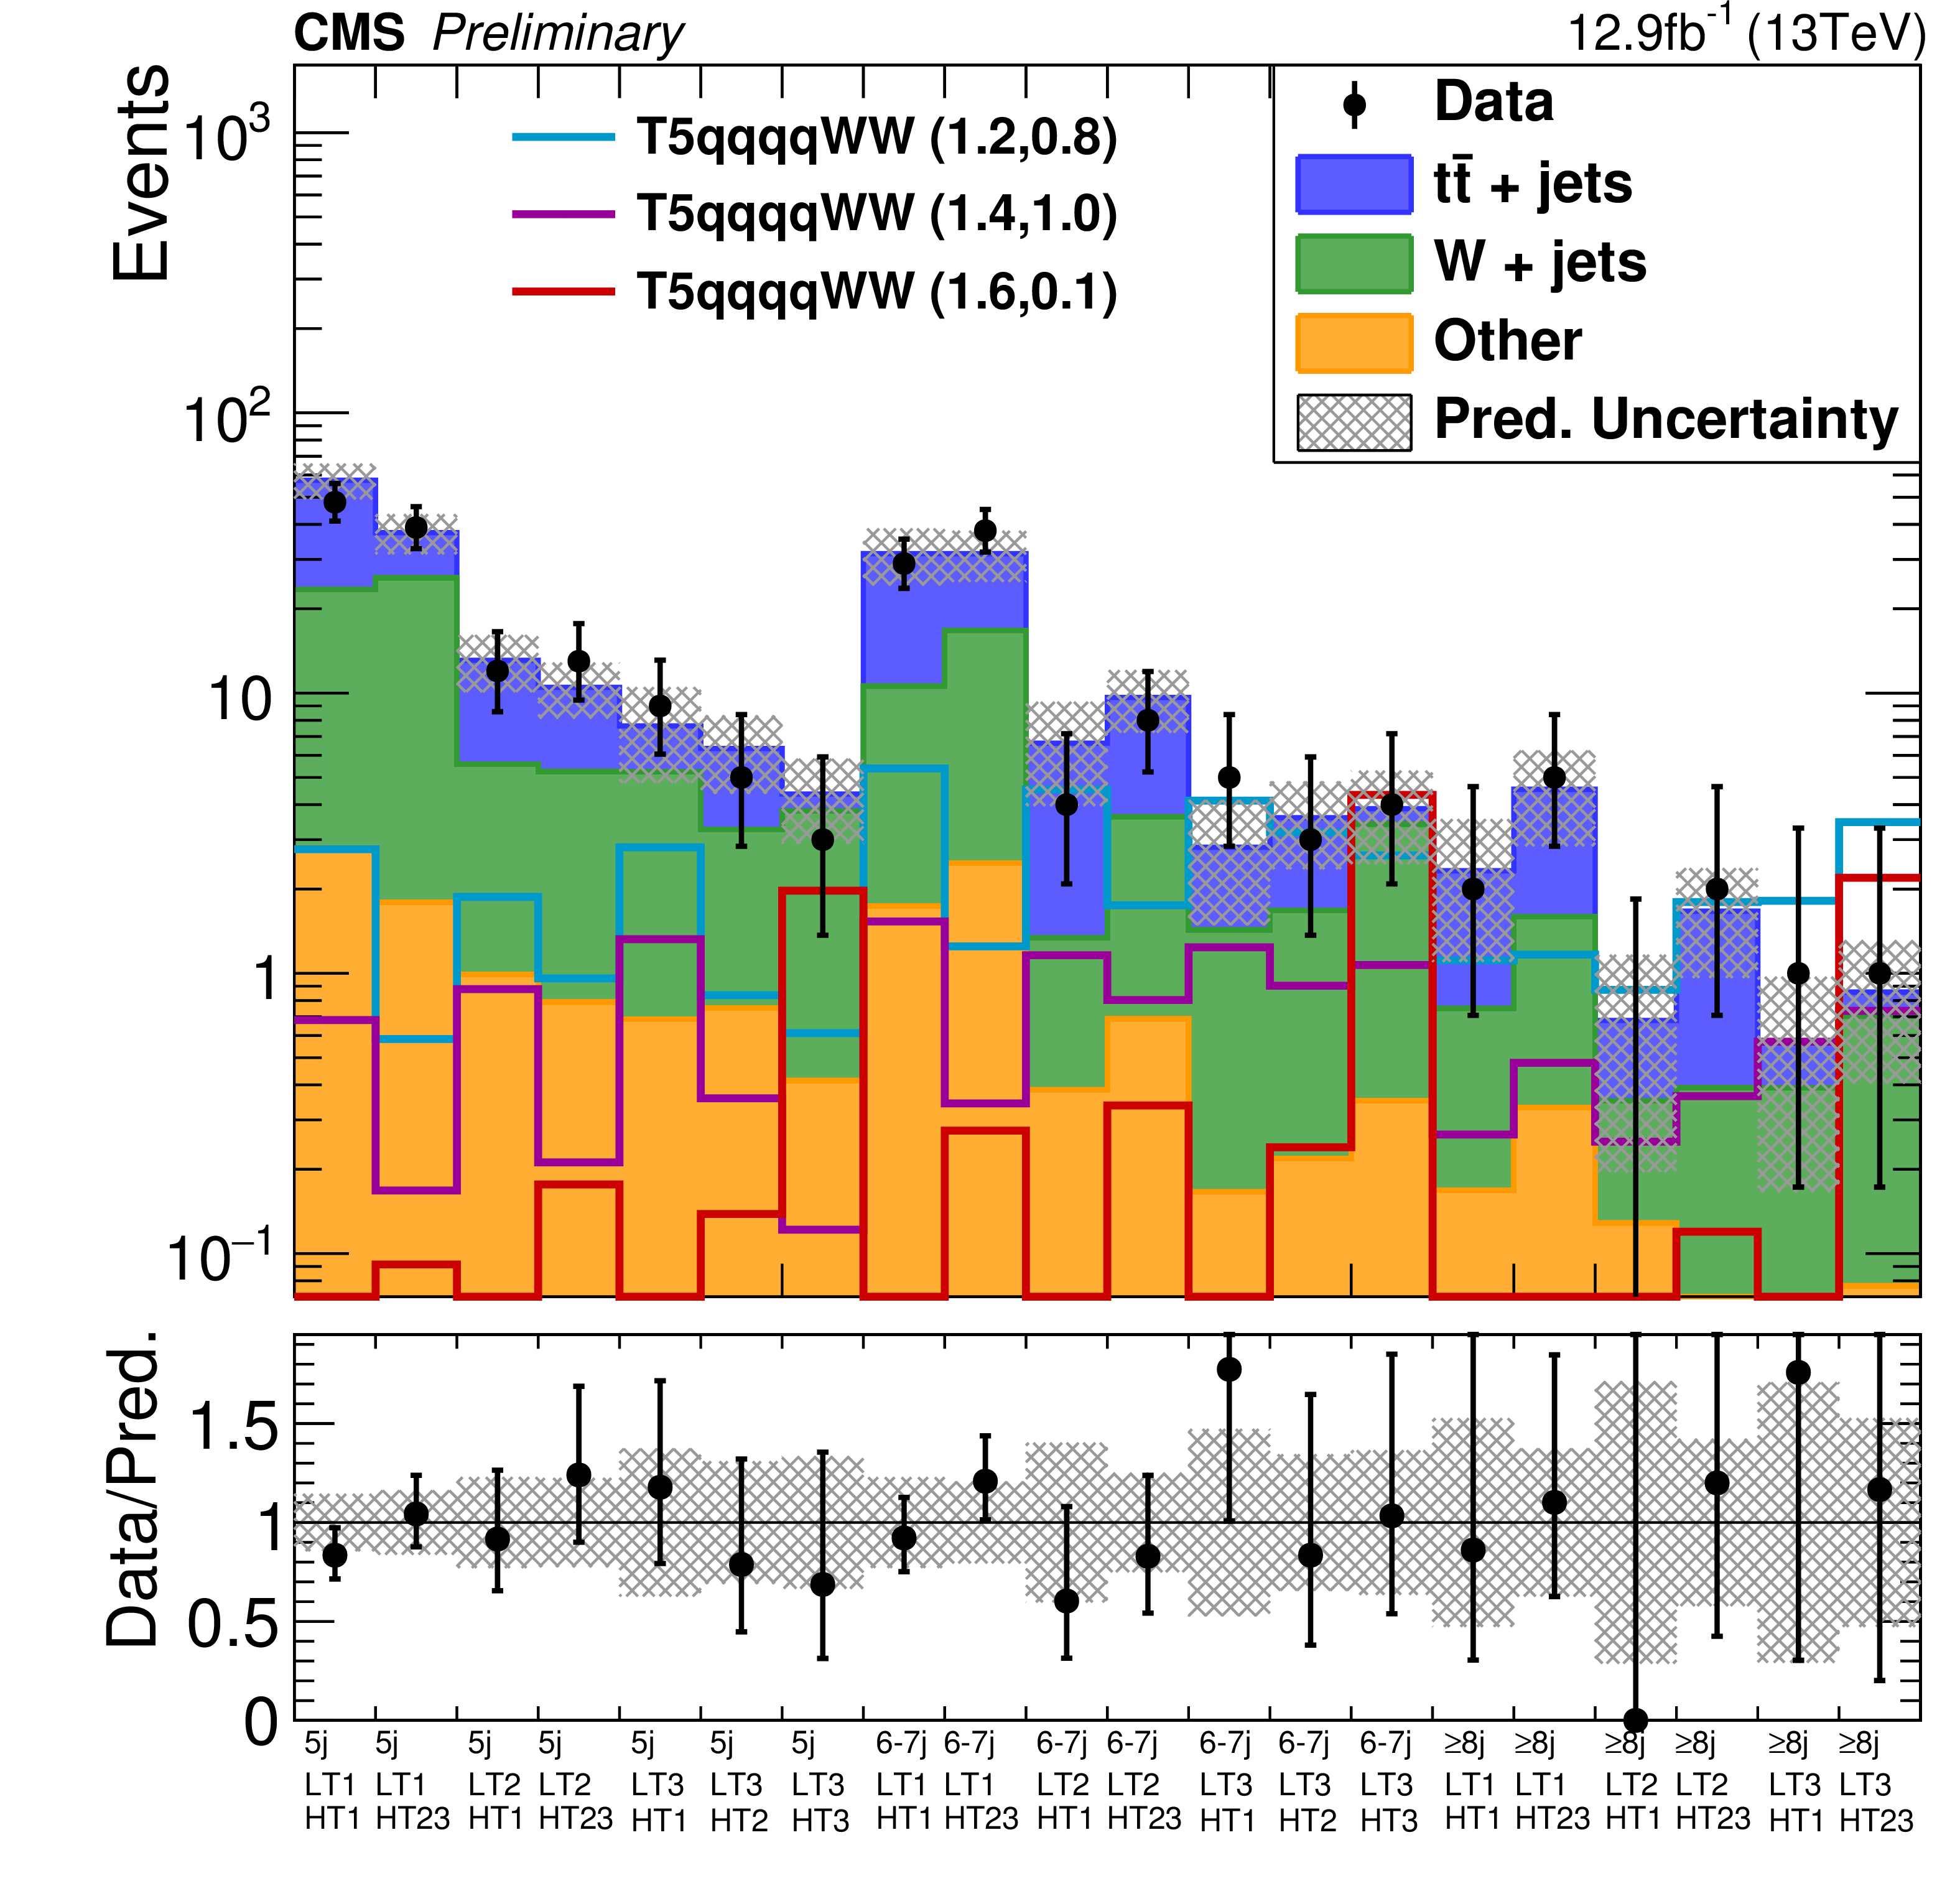
Figure 5:
Zero-b search: observed and predicted event counts in the 20 search regions. The black points with error bars show the number of observed events. The background components are shown as stacked histograms. The contributions from ${\mathrm {t}\overline {\mathrm {t}}}$ and W+jet are both estimated from control samples in the data. The uncertainty on the background prediction is shown as a grey, hatched region. The expected event yields for three T5qqqqWW benchmark SUSY models are represented by open histograms. The lower panel shows the ratio of data to background prediction. The grey, hatched area indicates the total statistical and systematic uncertainty on the prediction, while the black error bars correspond to the uncertainty on data. |
png pdf root |
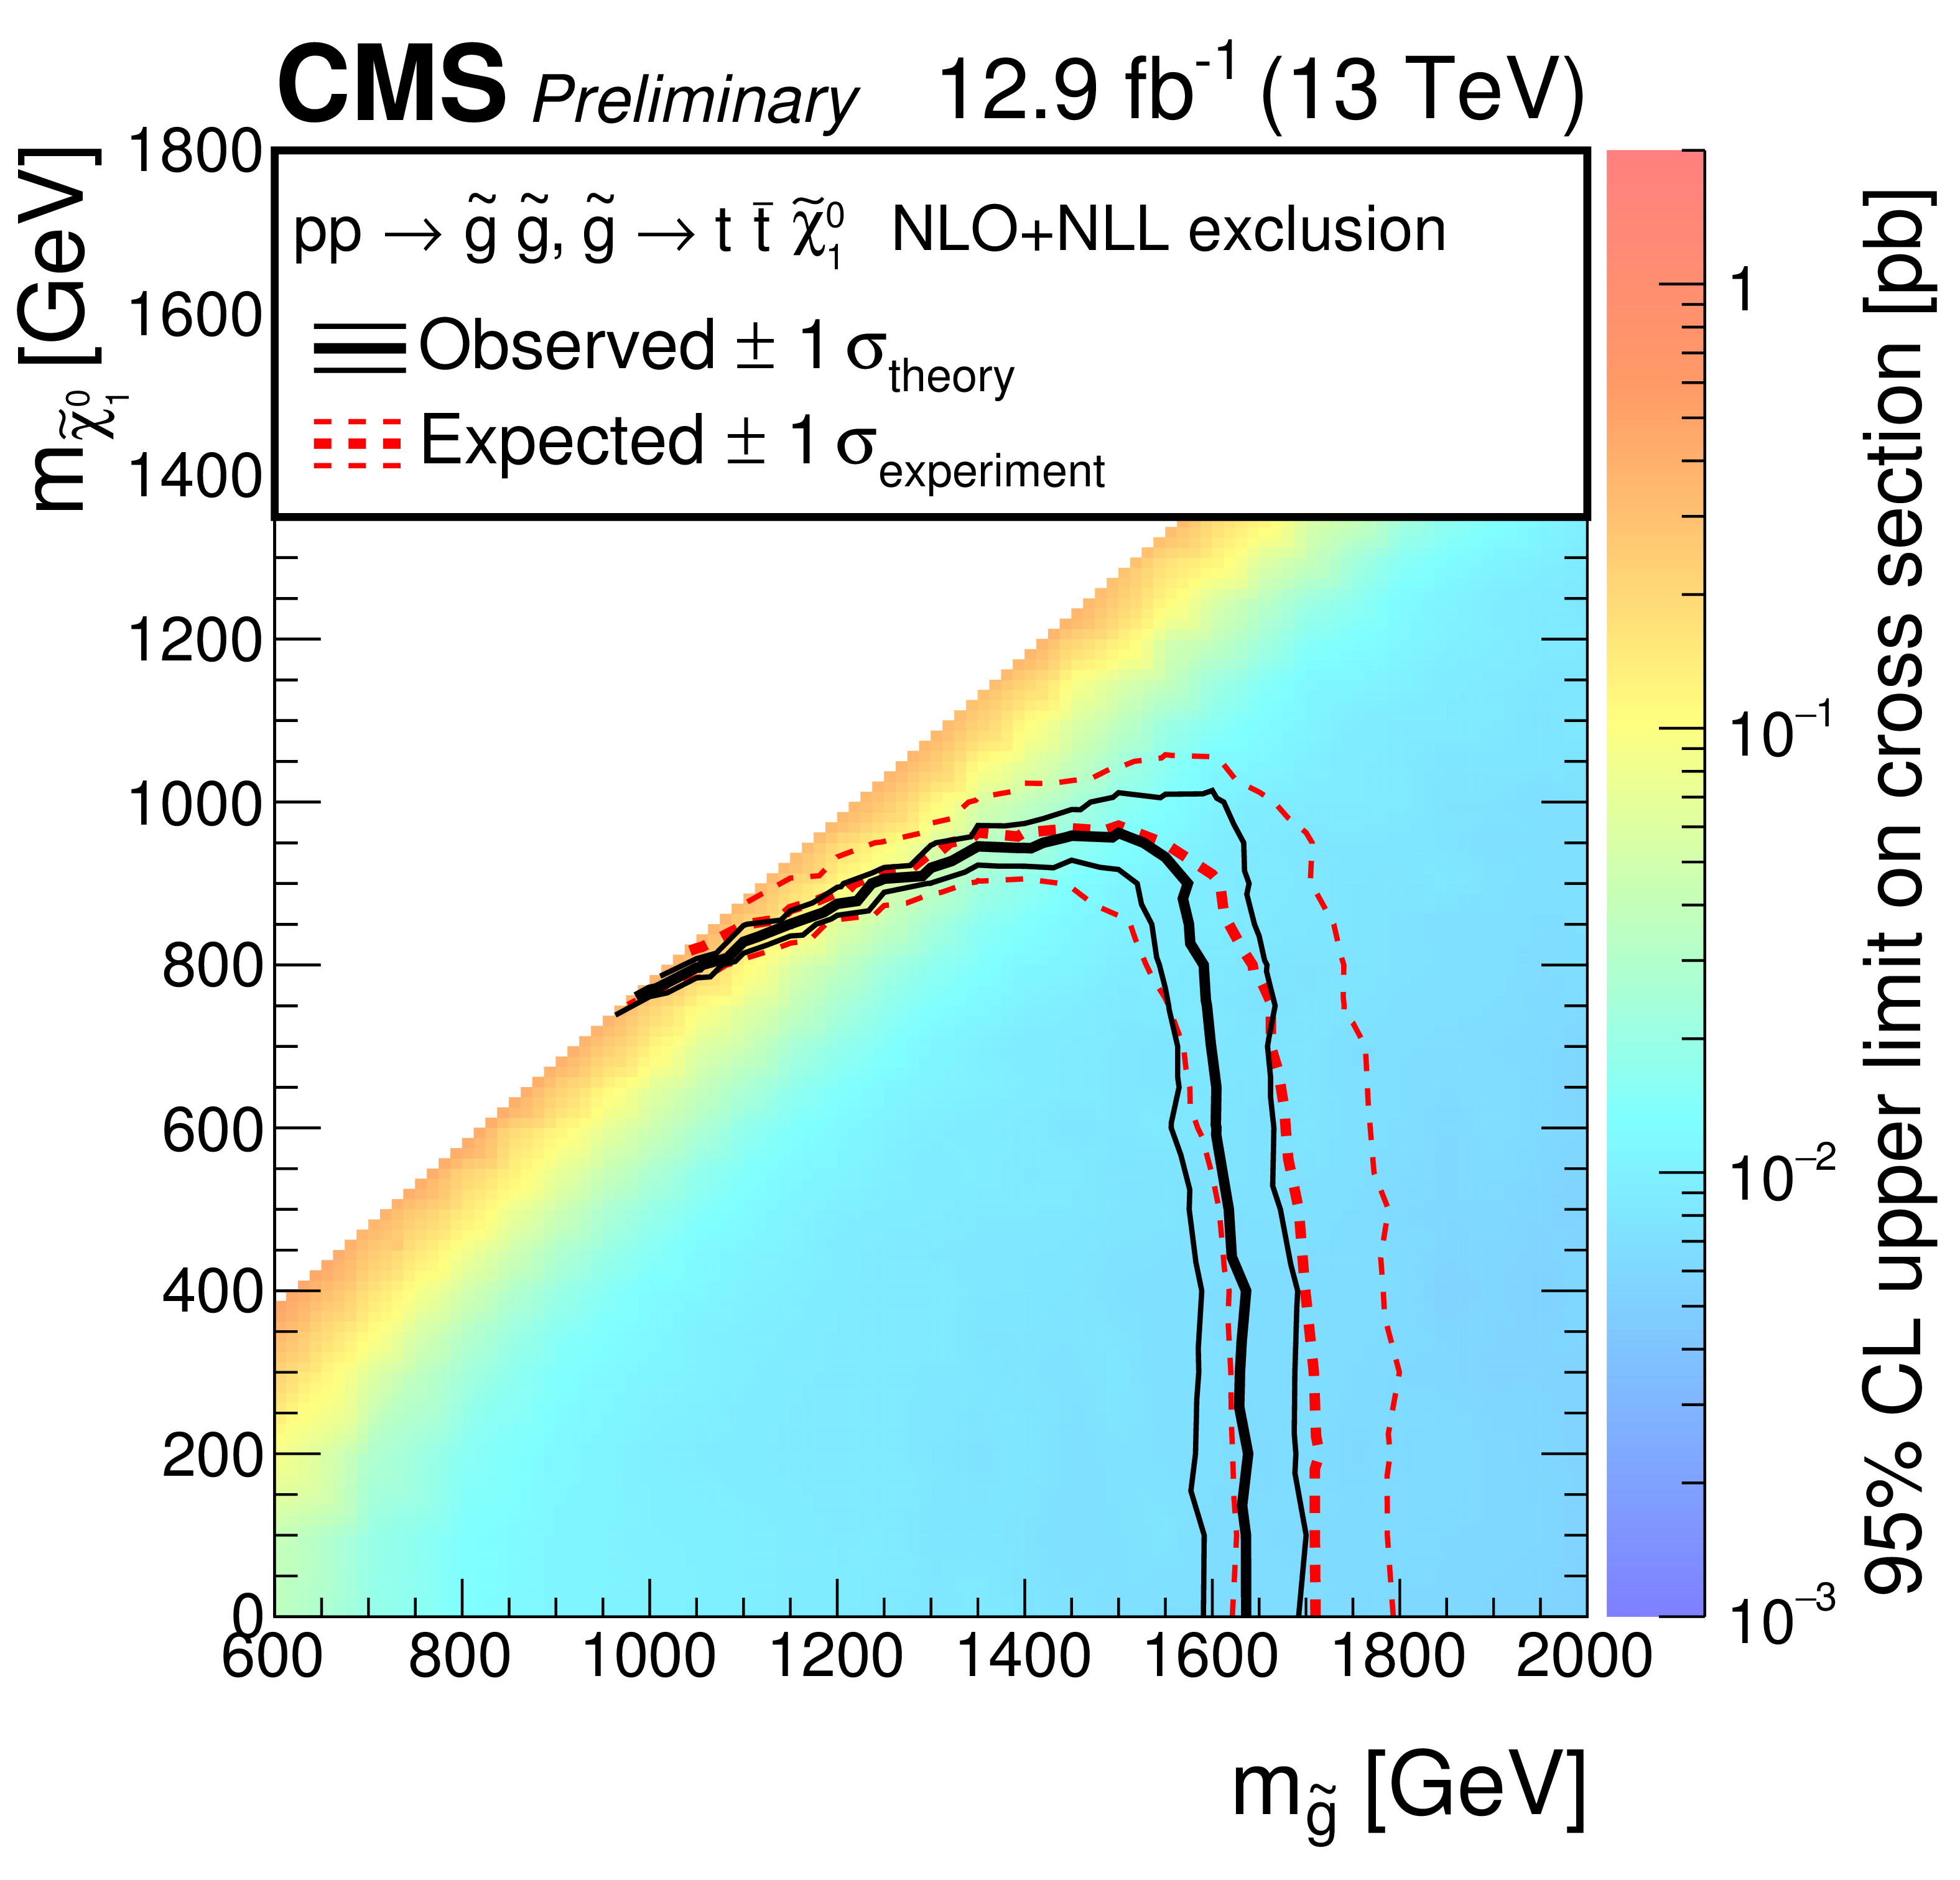
Figure 6-a:
Cross section limits at a 95% CL for (a) the T1tttt model, and (b) the T5qqqqWW model. For the T5qqqqWW model, the mass of the chargino is taken to be $m_{ {\tilde{\chi}^{\pm }_1} }=0.5(m_{ \tilde{ \mathrm{g} } }+m_{ {\tilde{\chi}^0_1} })$. The solid black (dashed red) lines correspond to the observed (expected) mass limits, with the thicker lines representing the central values and the thinner lines representing the $\pm$1$ \sigma $ uncertainty bands related to the theoretical (experimental) uncertainties. |
png pdf root |
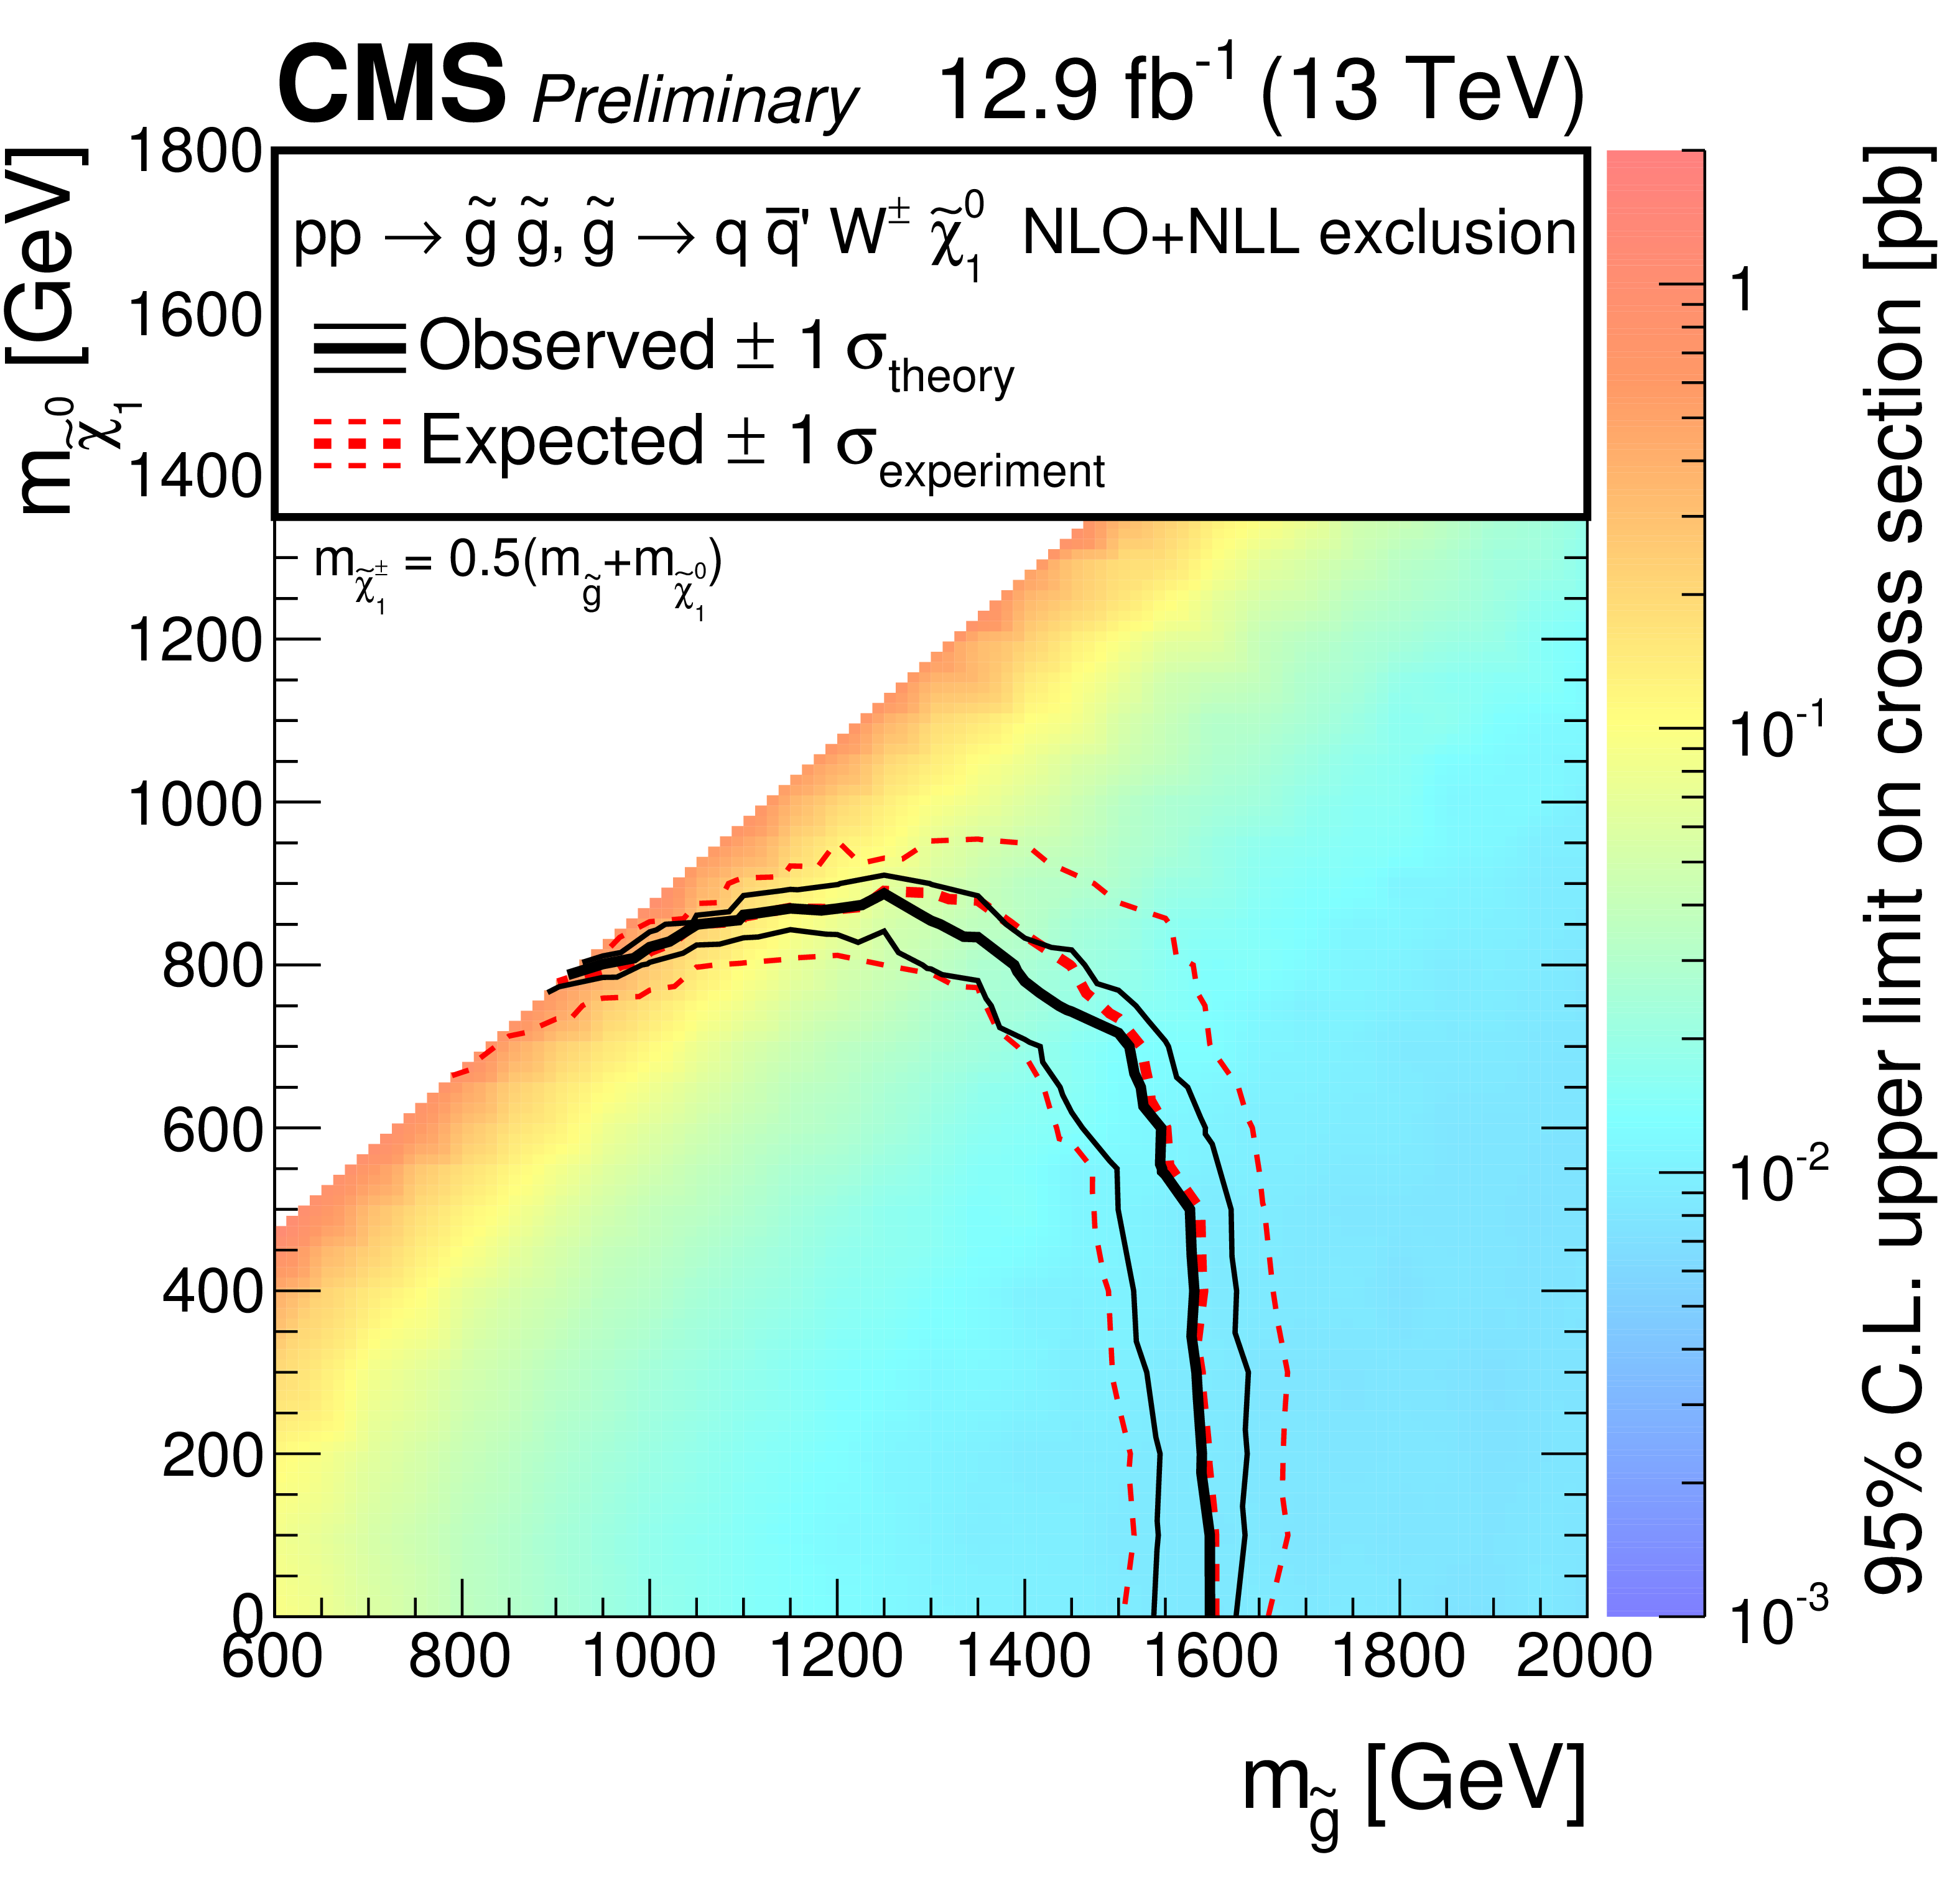
Figure 6-b:
Cross section limits at a 95% CL for (a) the T1tttt model, and (b) the T5qqqqWW model. For the T5qqqqWW model, the mass of the chargino is taken to be $m_{ {\tilde{\chi}^{\pm }_1} }=0.5(m_{ \tilde{ \mathrm{g} } }+m_{ {\tilde{\chi}^0_1} })$. The solid black (dashed red) lines correspond to the observed (expected) mass limits, with the thicker lines representing the central values and the thinner lines representing the $\pm$1$ \sigma $ uncertainty bands related to the theoretical (experimental) uncertainties. |
| Tables | |

png pdf |
Table 1:
Search regions and the corresponding minimum $ {\Delta \Phi }$ requirements. |
png pdf |
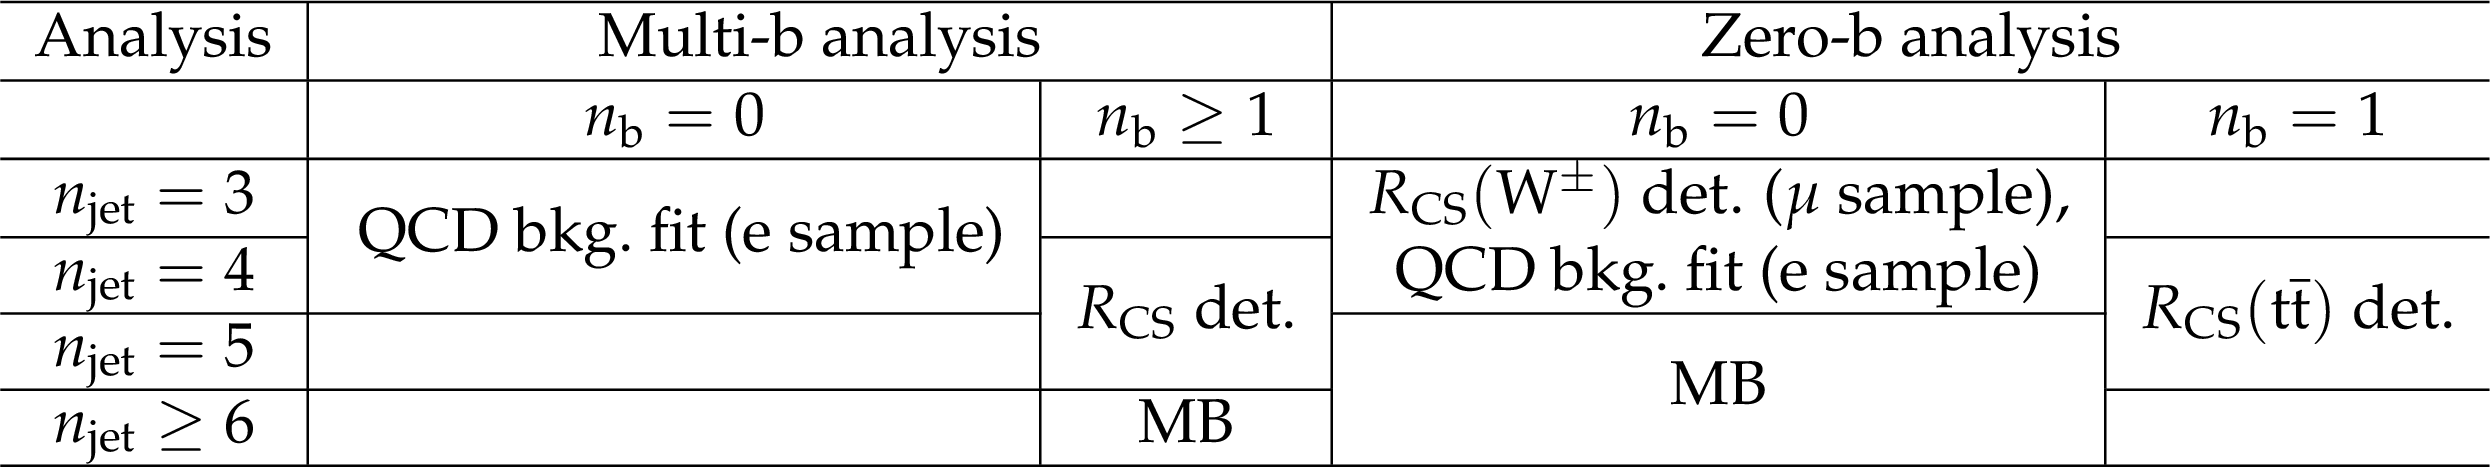
Table 2:
Overview of the definitions of sideband and mainband regions. For the multijet (QCD) fit the electron (e) sample is used, while for the determination (det.) of $ {R_{\textrm {CS}}} ( {\mathrm {W}^{\pm }} )$ the muon ($\mu $) sample is used. |
png pdf |
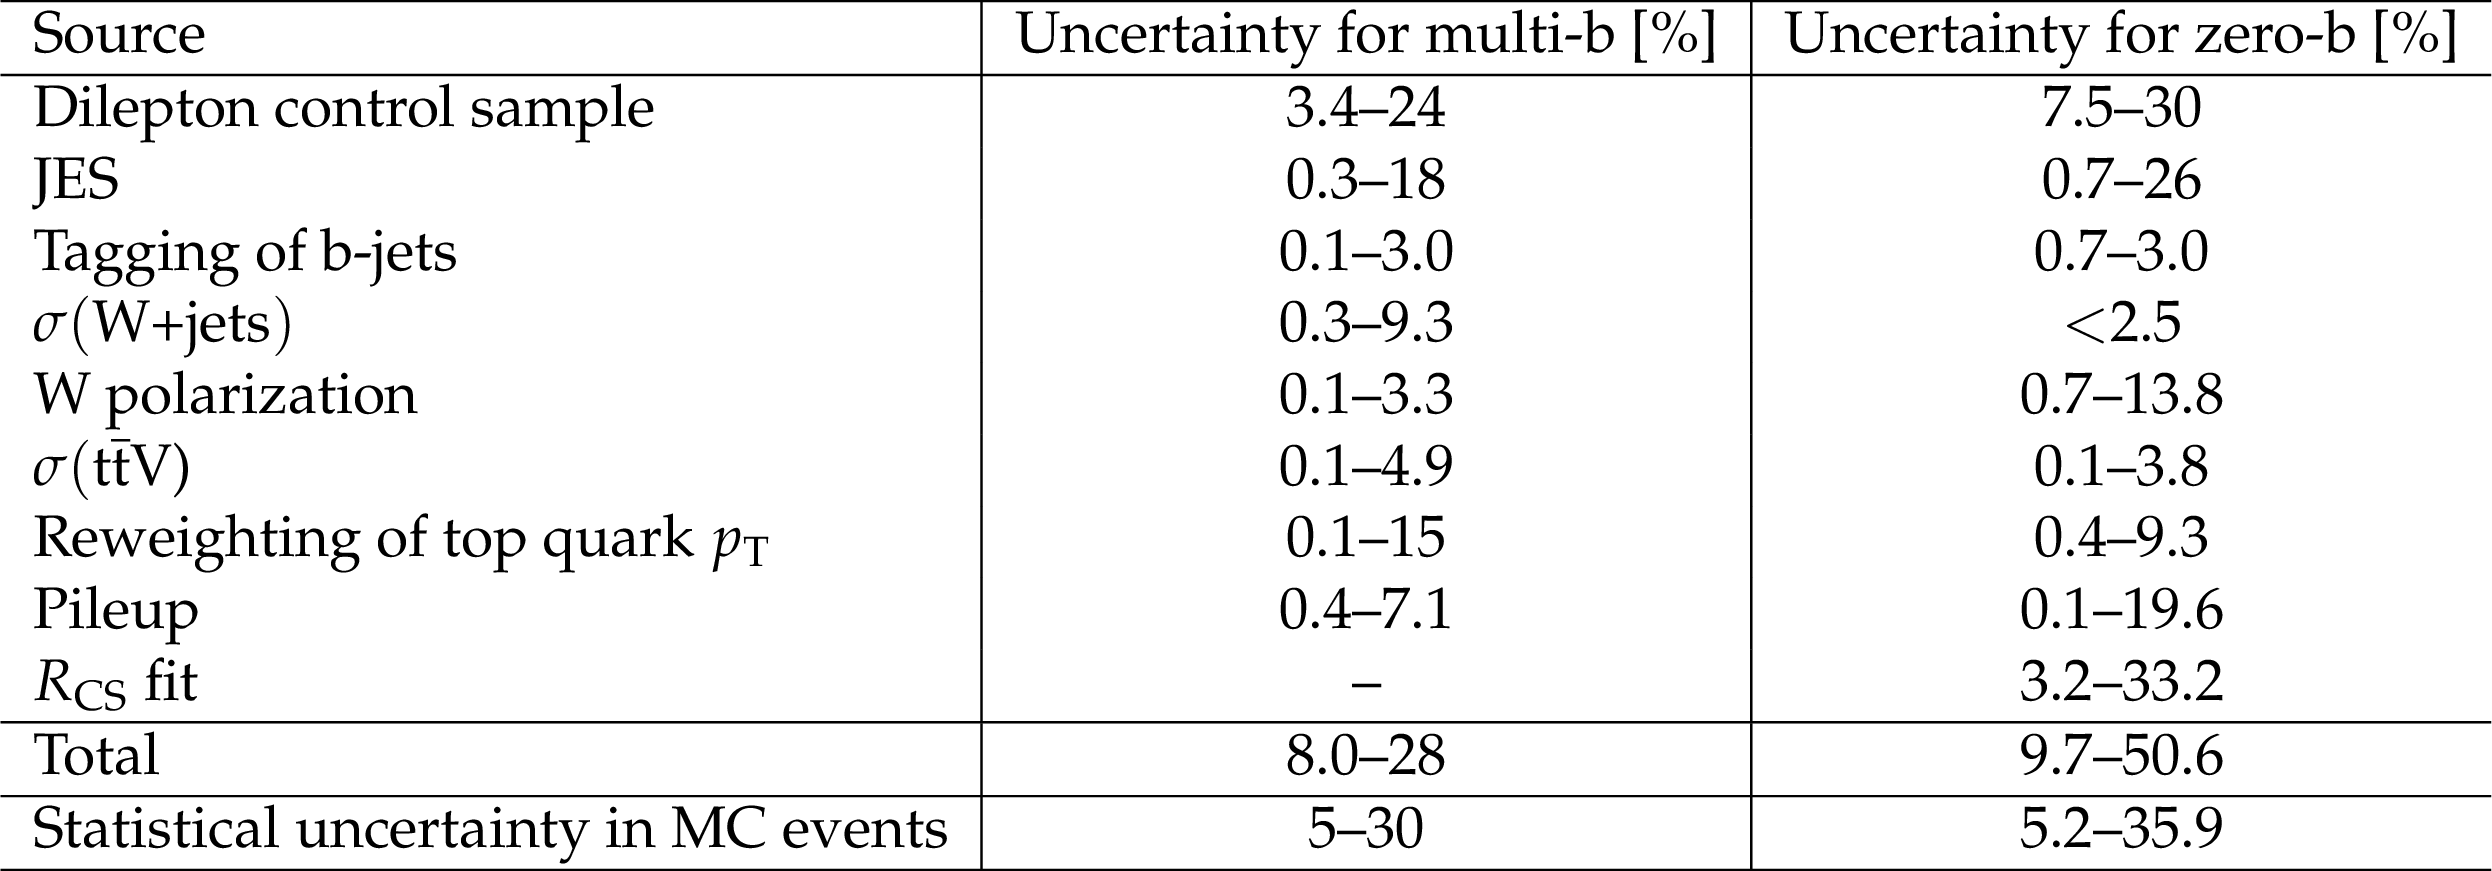
Table 3:
Summary of systematic uncertainties in the total background prediction for the multi-b and for the zero-b analysis. |
png pdf |
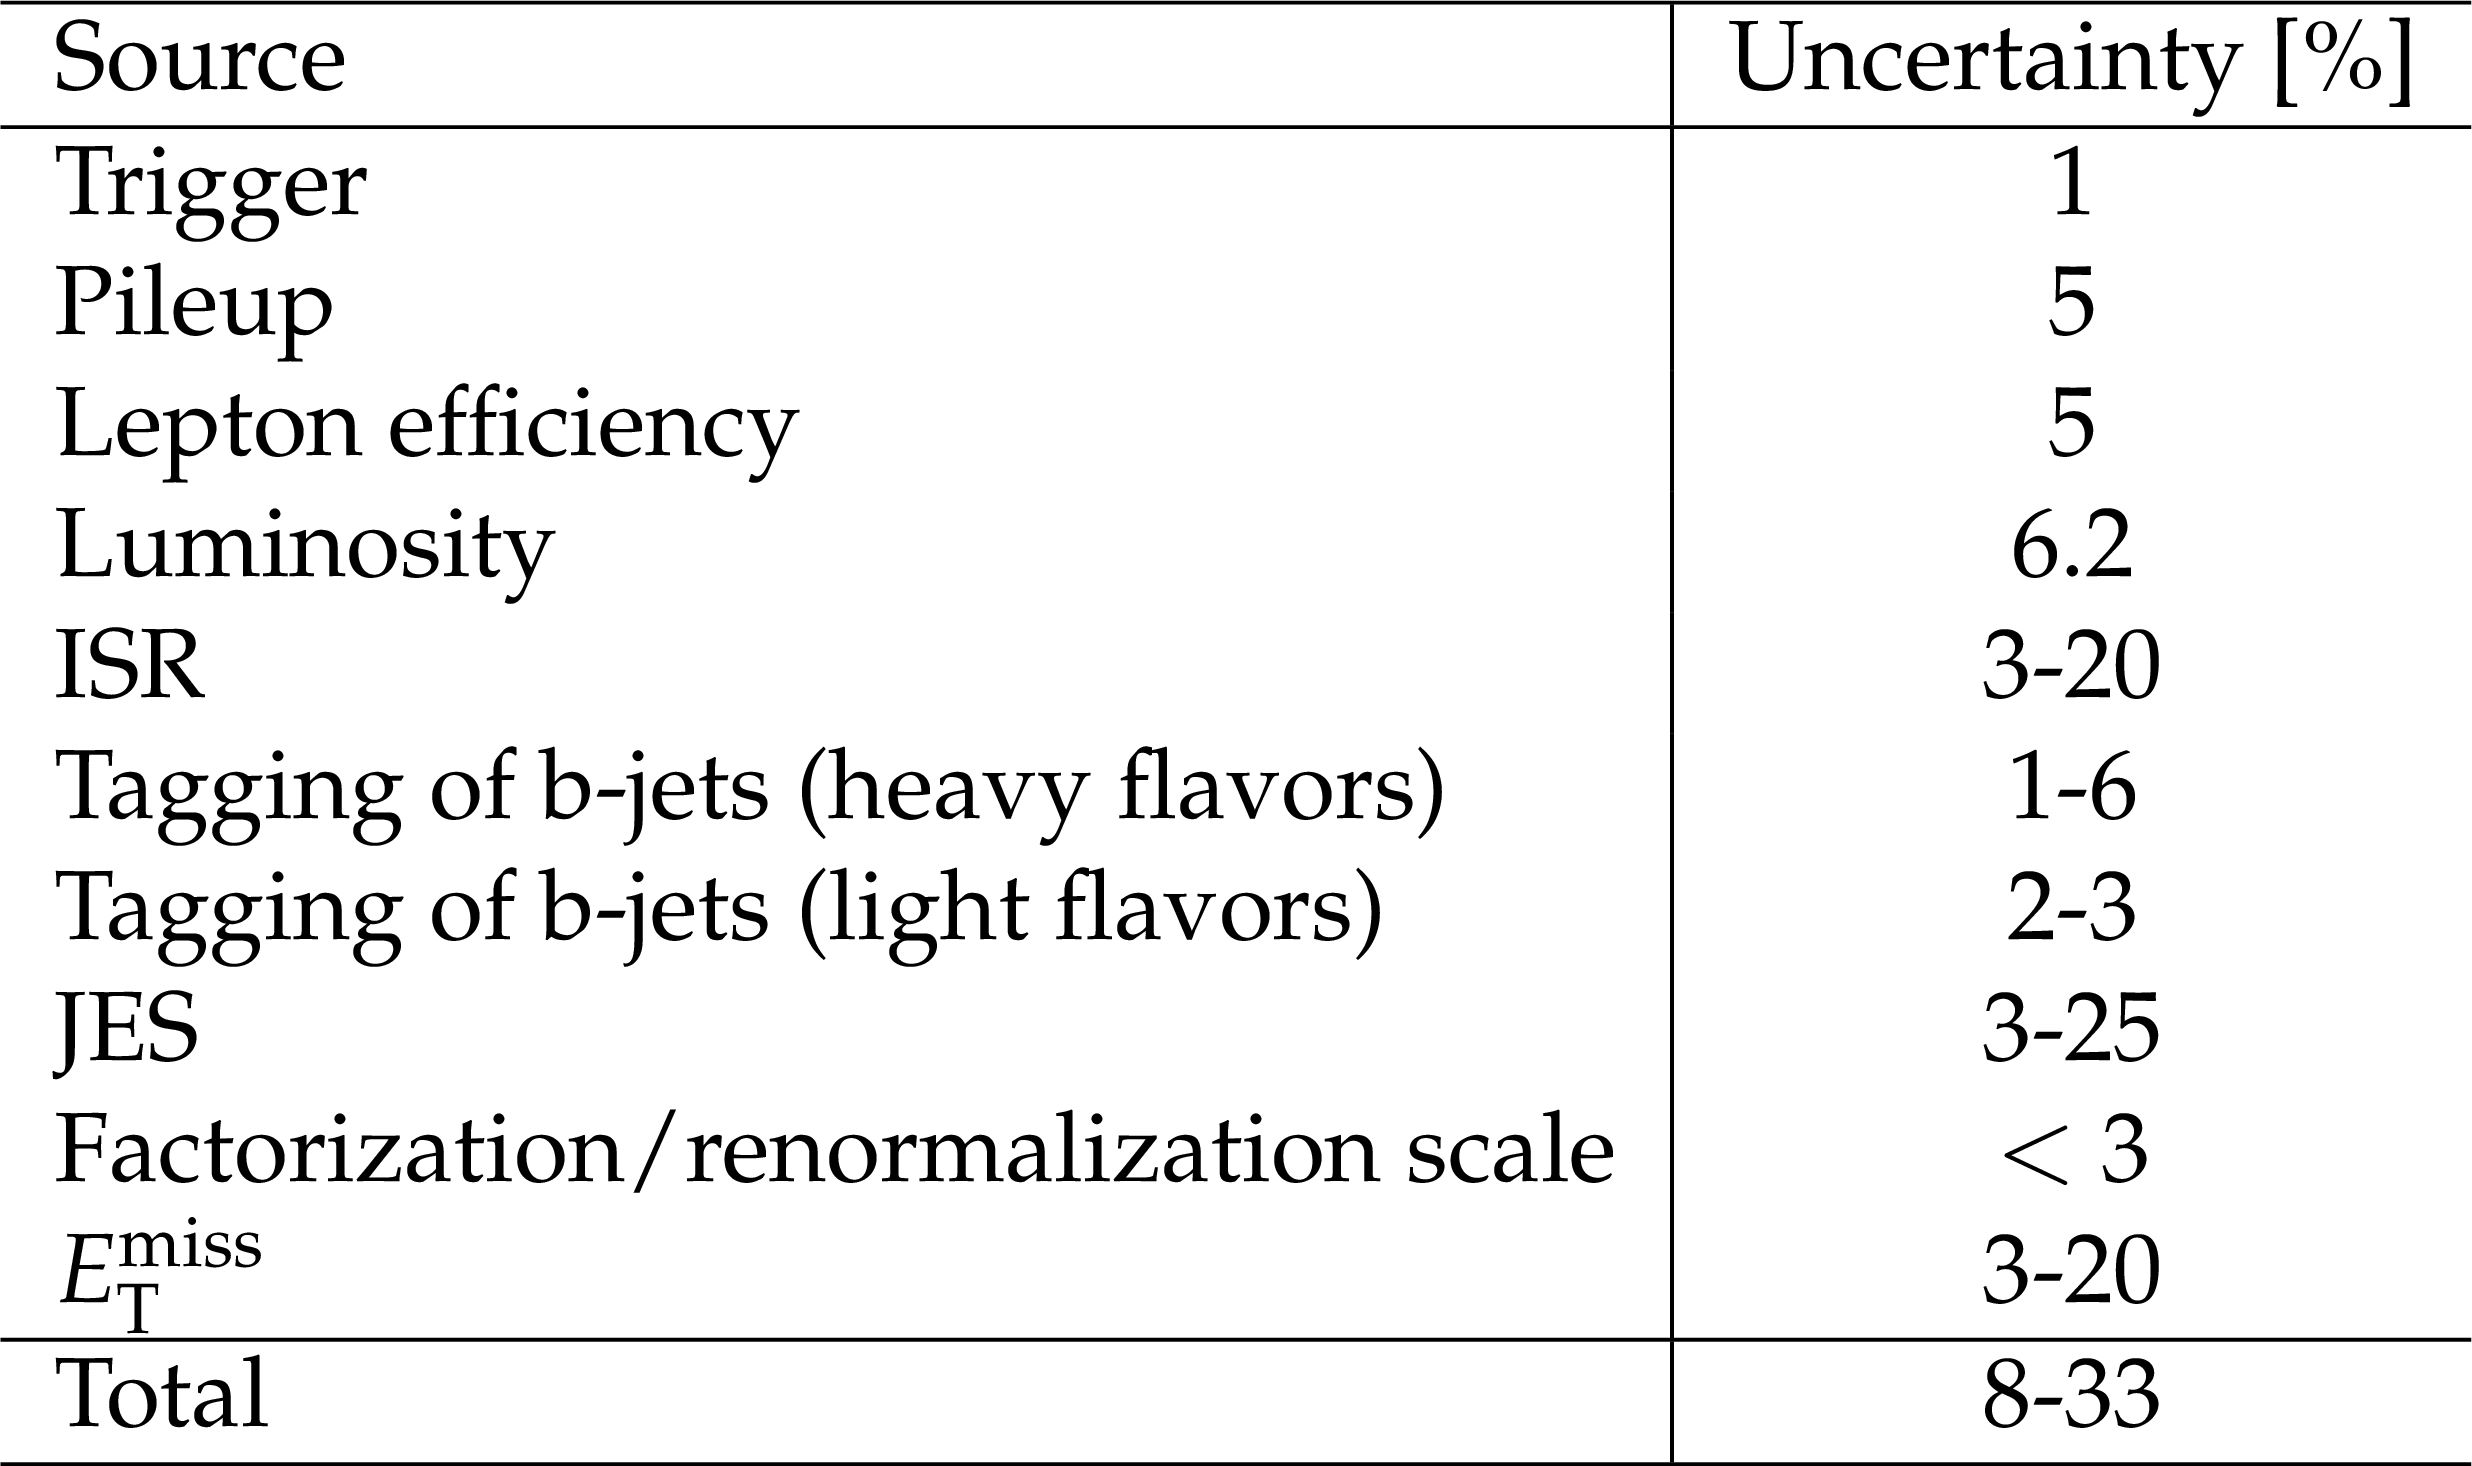
Table 4:
Summary of the systematic uncertainties and their average effect on the yields of the benchmark signals. The values are very similar for the multi-b and the zero-b analysis, and are usually larger for compressed scenarios, where the mass difference between gluino and neutralino is small. |
png pdf |
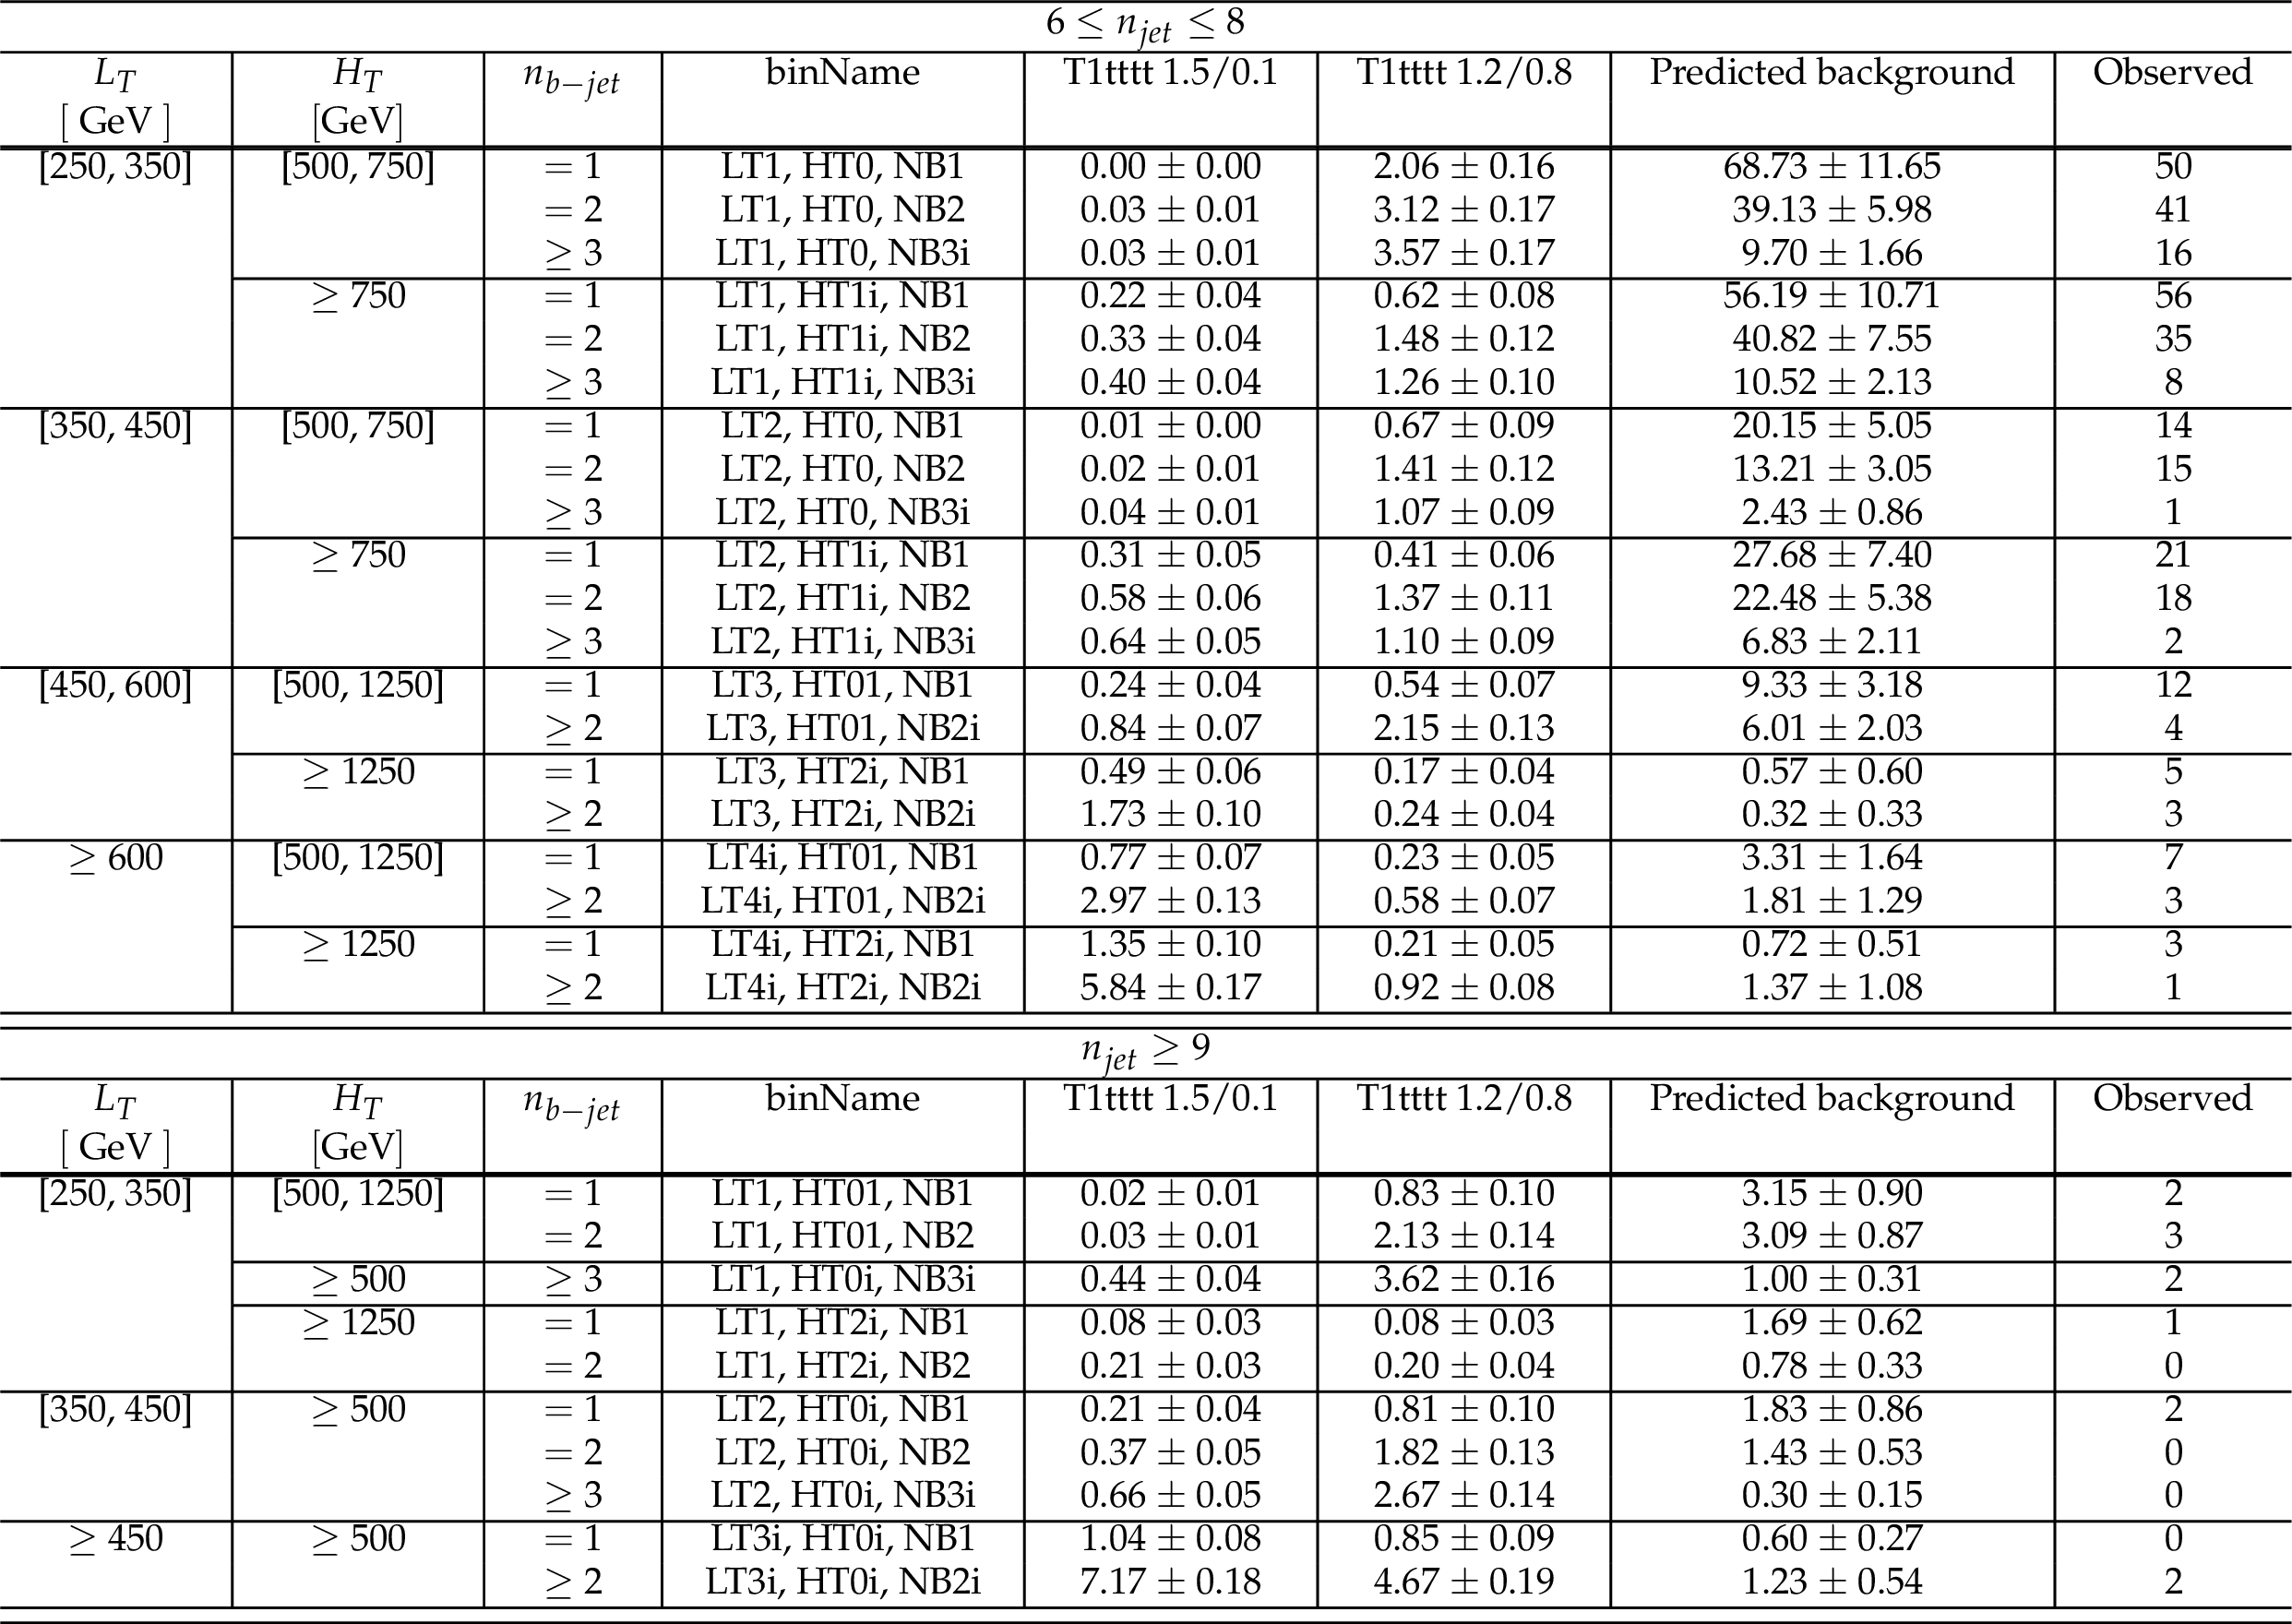
Table 5:
Summary of the results in the multi-b search. |

png pdf |
Table 6:
Background prediction and observation in the 0-tag regions, 12.9 fb$^{-1}$ |
| Summary |
| A search for supersymmetry has been performed with 12.9 fb$^{-1}$ of proton-proton collision data recorded by the CMS experiment at $ \sqrt{s} = $ 13 TeV in 2016. The data are analyzed in several exclusive categories, differing in the number of jets and b-tagged jets, the scalar sum of all jet transverse momenta, and the scalar sum of the imbalance in transverse momentum and the transverse momentum of the lepton. The main background is significantly reduced by requiring a large azimuthal angle between the directions of the lepton and of the reconstructed W boson $p_{\mathrm{T}}$. No significant excess is observed, and the results are interpreted in terms of two simplified models that describe gluino pair production. For a simplified model in which each gluino decays through an off-shell top squark to a $\mathrm{ t \bar{t} }$ pair and the lightest neutralino, gluino masses up to 1.65 TeV are excluded for neutralino masses below 600 GeV. Neutralino masses below 950 GeV can be excluded for a gluino mass of approximately 1.5 TeV. A second simplified model also describes gluino pair production, with the gluinos decaying to first or second generation quarks and a chargino, which then decays to a W boson and the lightest neutralino. The chargino mass in this decay chain is taken to be $m_{{\widetilde{\chi}^{\pm}_1} }=0.5(m_{{\widetilde{\mathrm g}} }+m_{{\widetilde{\chi}^0_1} })$. In this model, gluino masses below 1.6 TeV are excluded for neutralino masses below 500 GeV. Neutralino masses below 850 GeV can be excluded for a gluino mass of approximately 1.3 TeV. These results extend the limits obtained from the dataset recorded in 2015 by up to 200 GeV. |
| Additional Figures | |
png pdf |
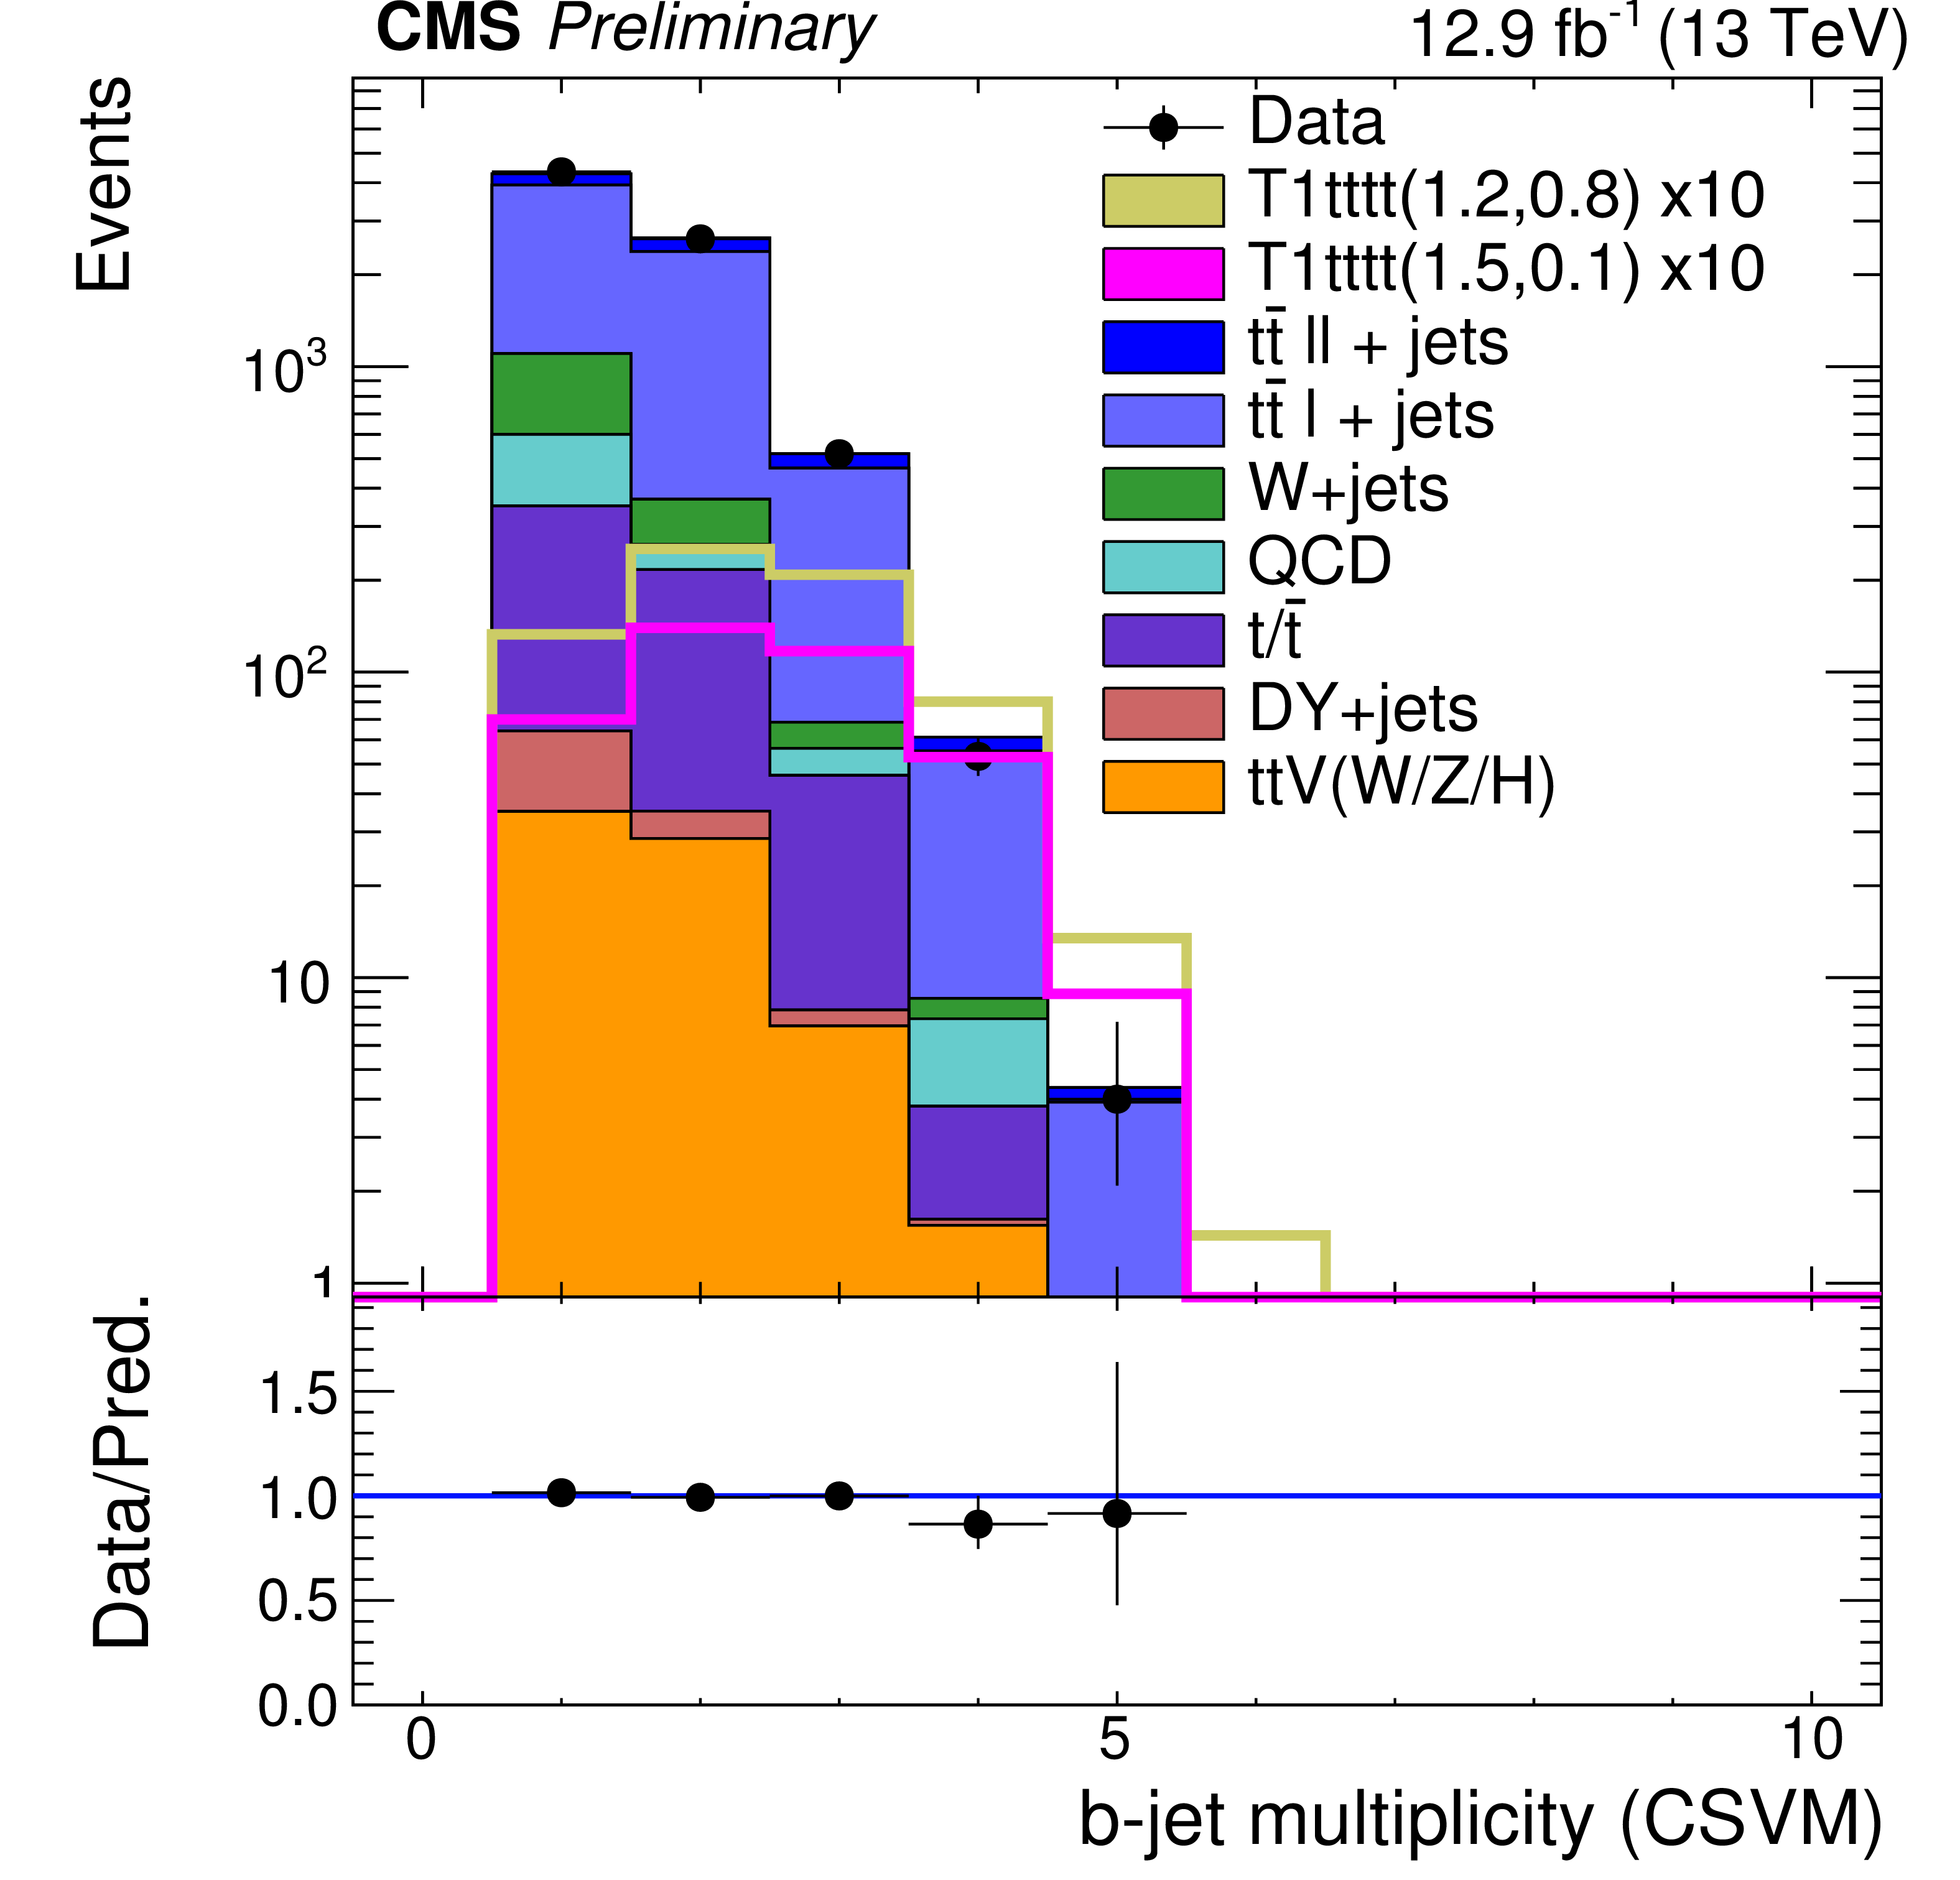
Additional Figure 1:
The number of b-tagged jets after requiring at least six jets and one b-tagged jet. A minimum ${H_{\mathrm {T}}}$ of 500 GeV and a minimum $ {L_{\textrm T}} $ of 250 GeV is required in addition to exactly one lepton with $ {p_{\mathrm {T}}} > $ 25 GeV. The simulated background events are stacked on top of each other, and two signal points are overlaid for illustration without being stacked. The model T1tttt(1.2,0.8) (T1tttt(1.5,0.1)) corresponds to a gluino mass of 1.2 TeV (1.5 TeV) and neutralino mass of 0.8 TeV (0.1 TeV), respectively. |
png pdf |
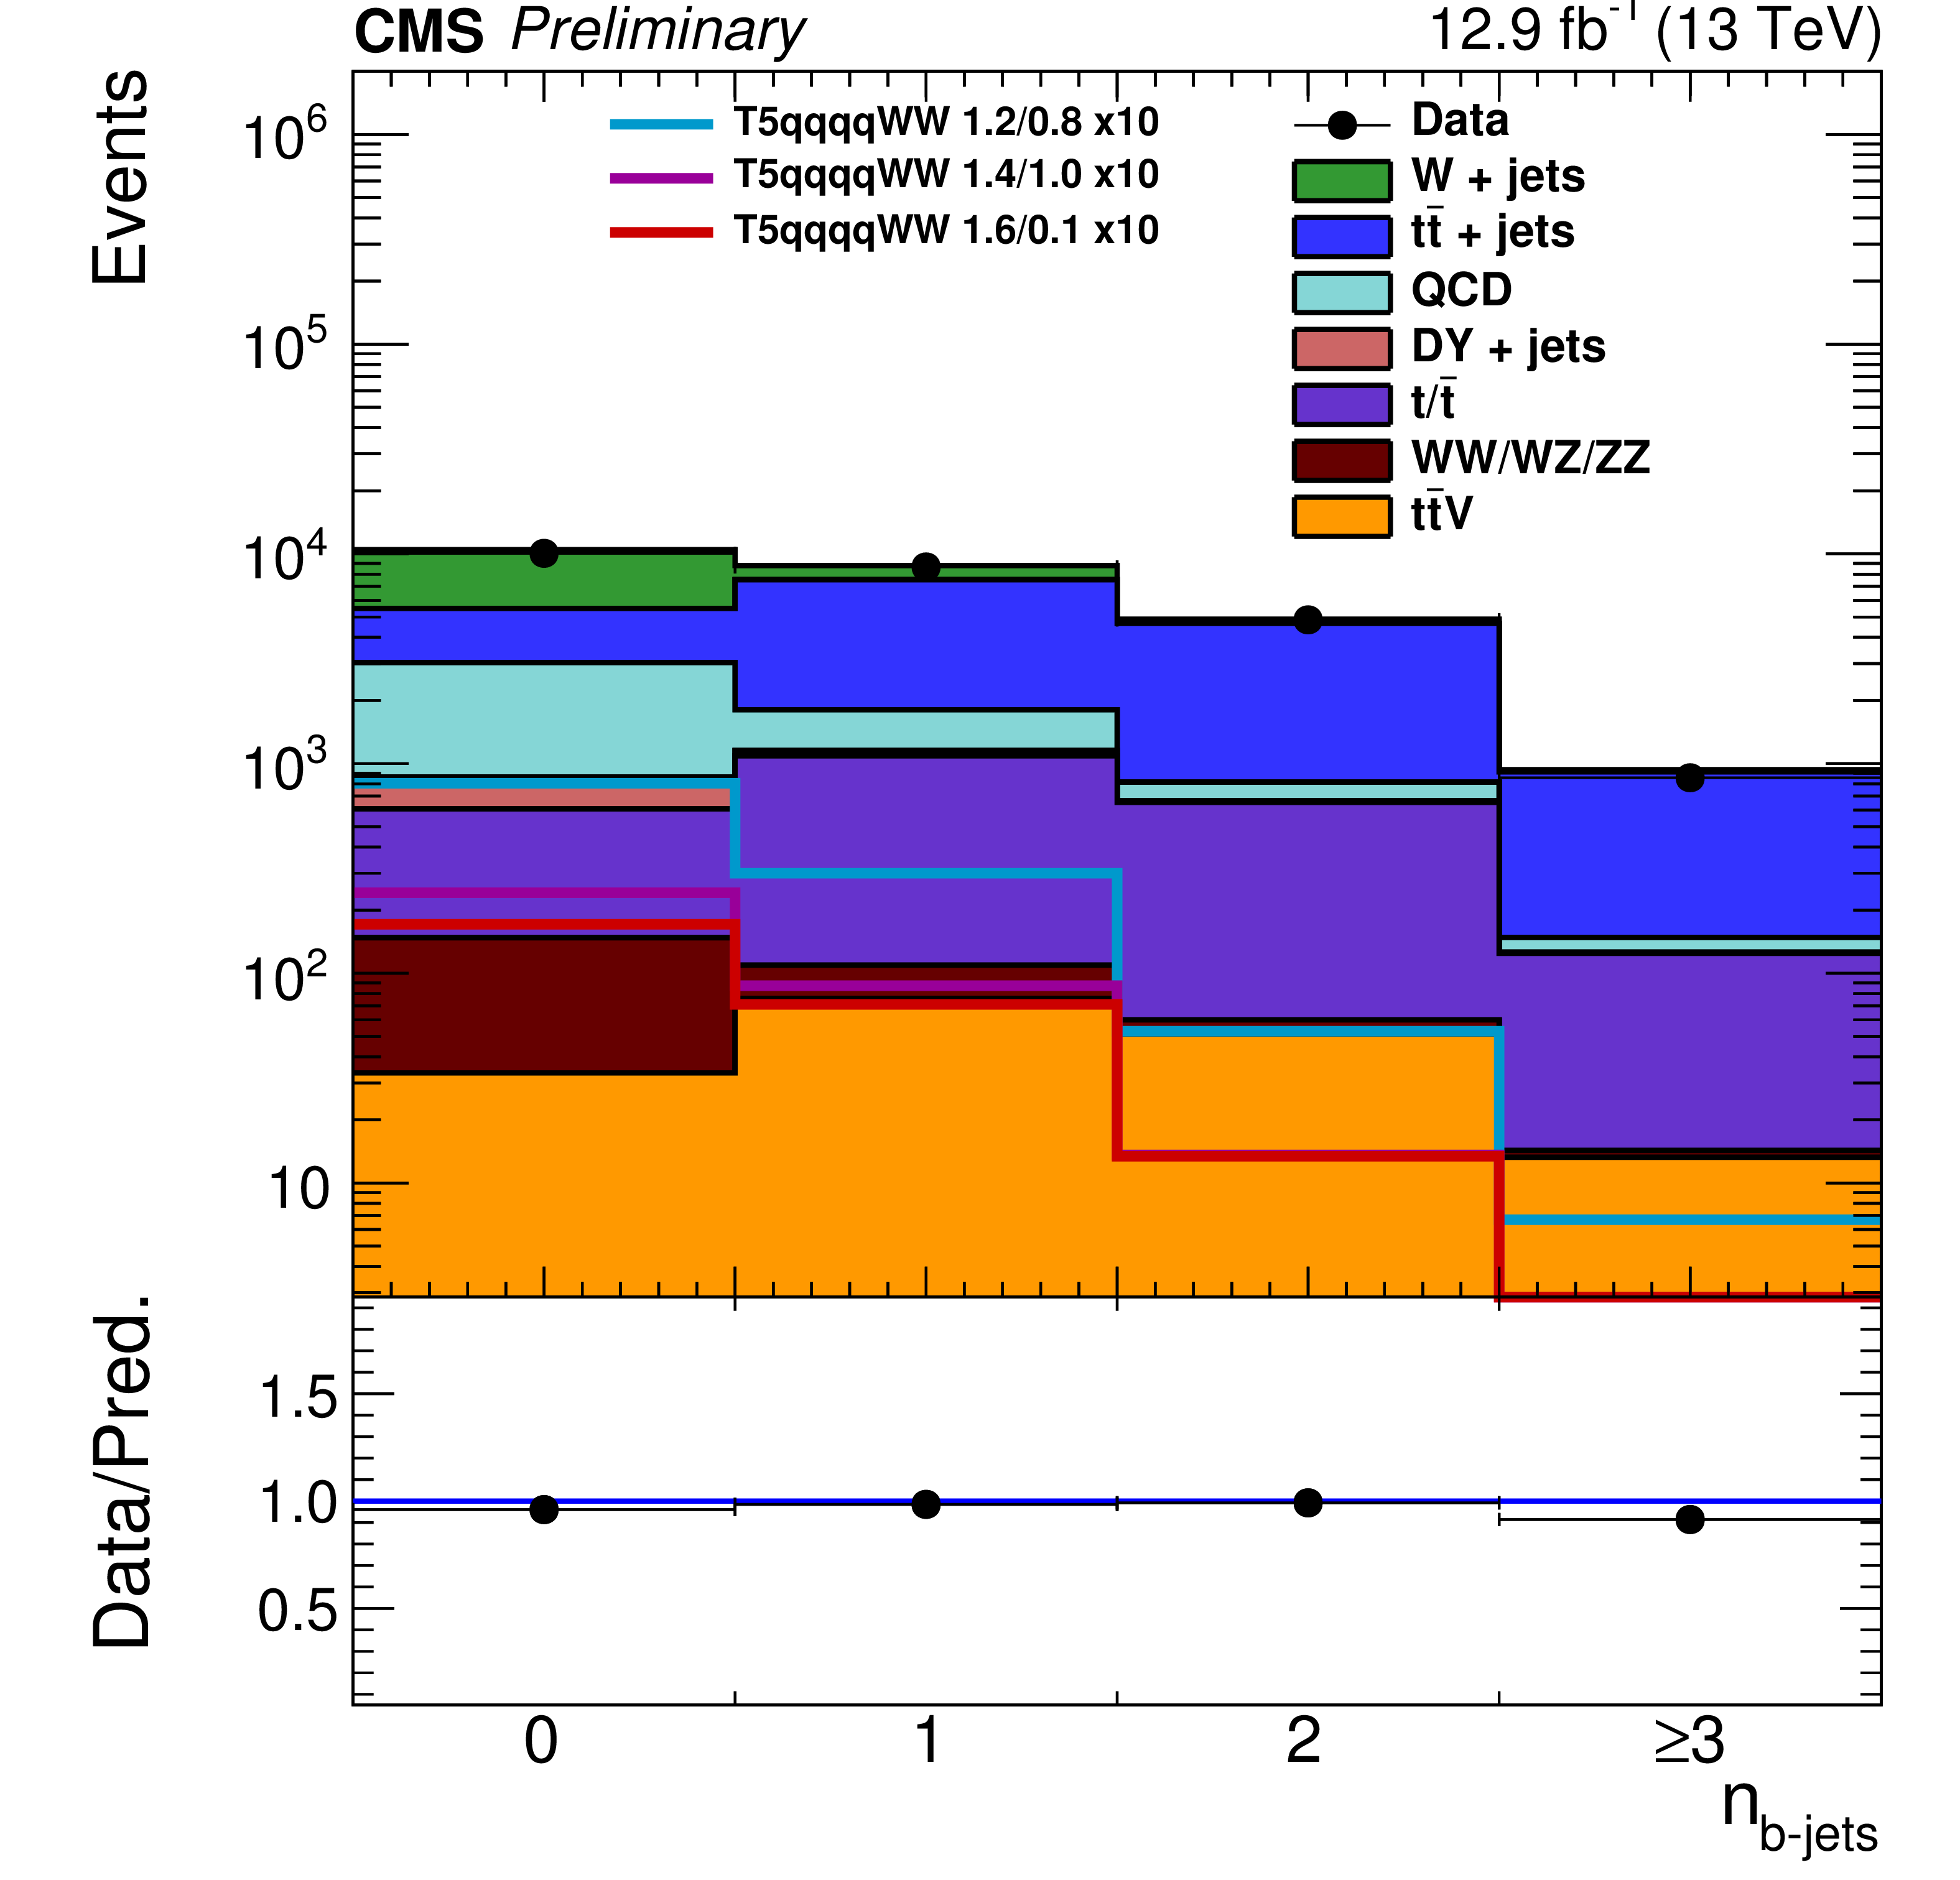
Additional Figure 2:
The number of b-tagged jets, after the preselection, requiring at least five jets. A minimum ${H_{\mathrm {T}}}$ of 500 GeV and a minimum $ {L_{\textrm T}} $ of 250 GeV is required in addition to exactly one lepton with $ {p_{\mathrm {T}}} > $ 25 GeV. The simulated background events are stacked on top of each other, and several signal points are overlaid for illustration without being stacked. The model T5qqqqWW(1.2,0.8) (T5qqqqWW(1.4,1.0) and T5qqqqWW(1.6,0.1)) corresponds to a gluino mass of 1.2 TeV (1.4 TeV and 1.6 TeV) and neutralino mass of 0.8 TeV (1.0 TeV and 0.1 TeV), respectively. The intermediate chargino mass is fixed at 1.0 TeV (1.2 TeV and 0.85 TeV). |

png pdf |
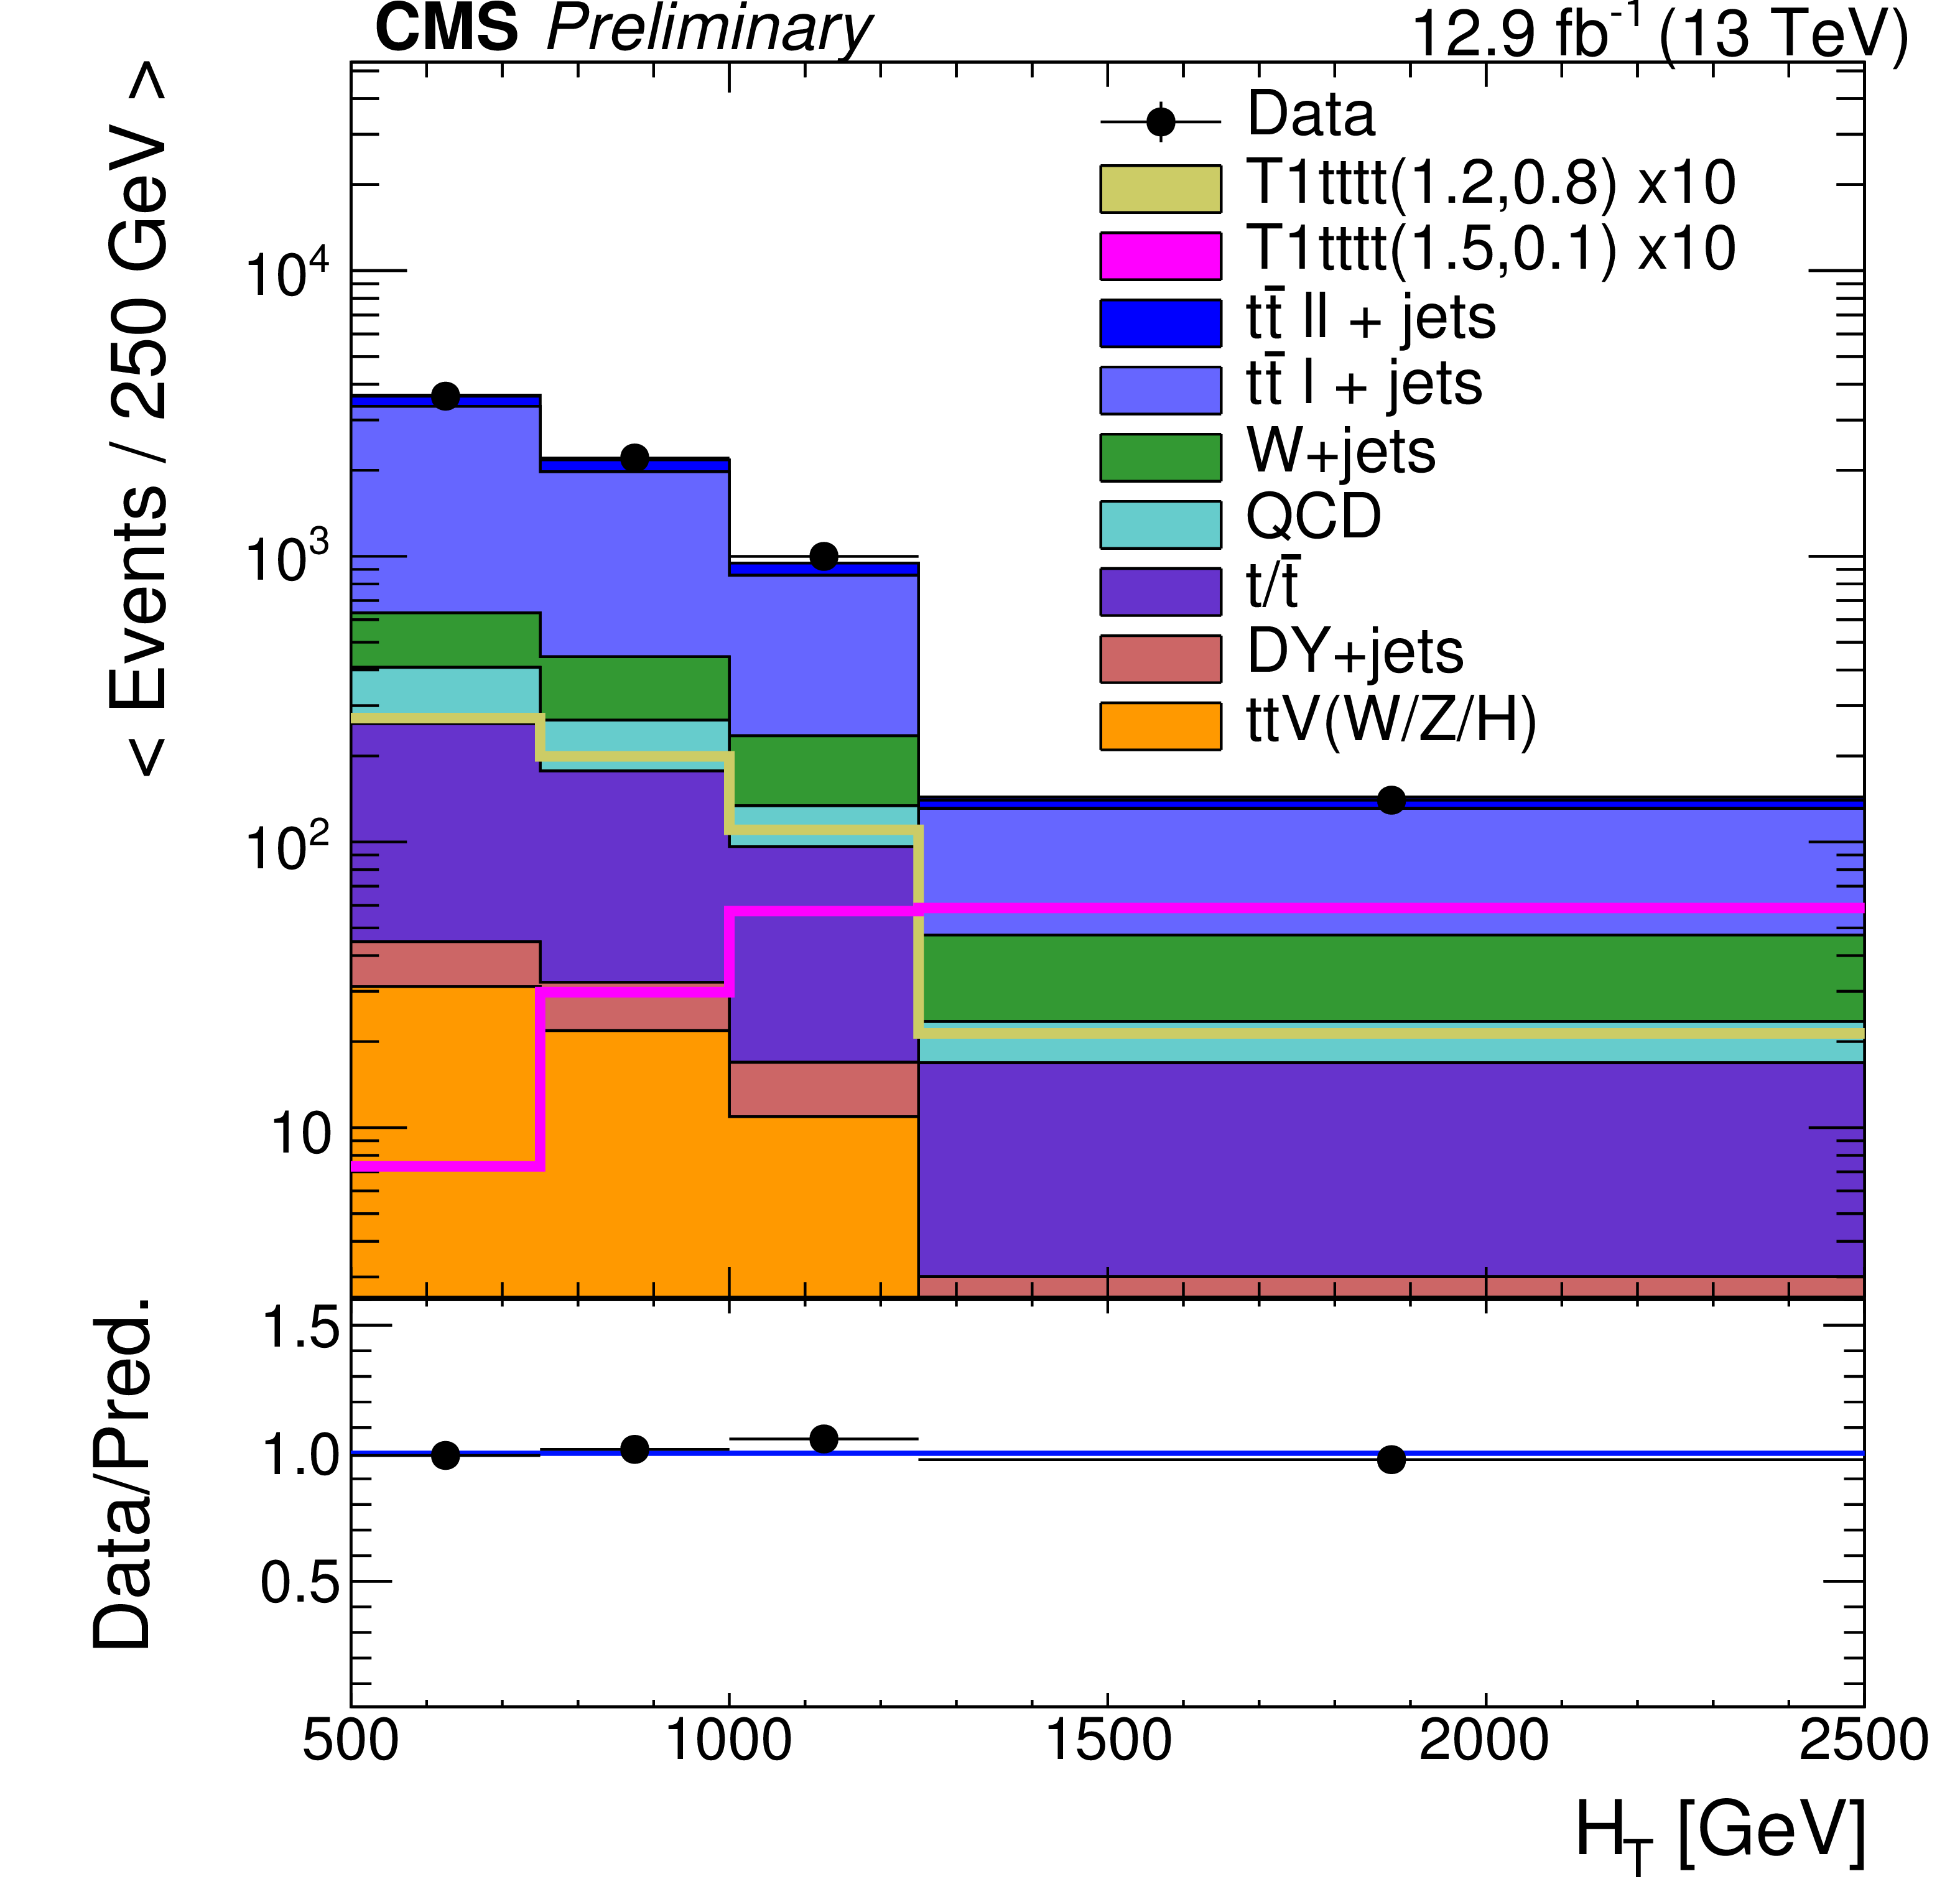
Additional Figure 3:
The ${H_{\mathrm {T}}}$ distribution for the zero-b analysis, after the preselection, requiring at least five jets, with no b-tagged jet. A minimum ${H_{\mathrm {T}}}$ of 500 GeV and a minimum $ {L_{\textrm T}} $ of 250 GeV is required in addition to exactly one lepton with $ {p_{\mathrm {T}}} > $ 25 GeV. The simulated background events are stacked on top of each other, and several signal points are overlaid for illustration without being stacked. The model T5qqqqWW(1.2,0.8) (T5qqqqWW(1.6,0.1)) corresponds to a gluino mass of 1.2 TeV (1.6 TeV) and neutralino mass of 0.8 TeV (0.1 TeV), respectively. The intermediate chargino mass is fixed at 1.0 TeV (0.85 TeV). |
png pdf |
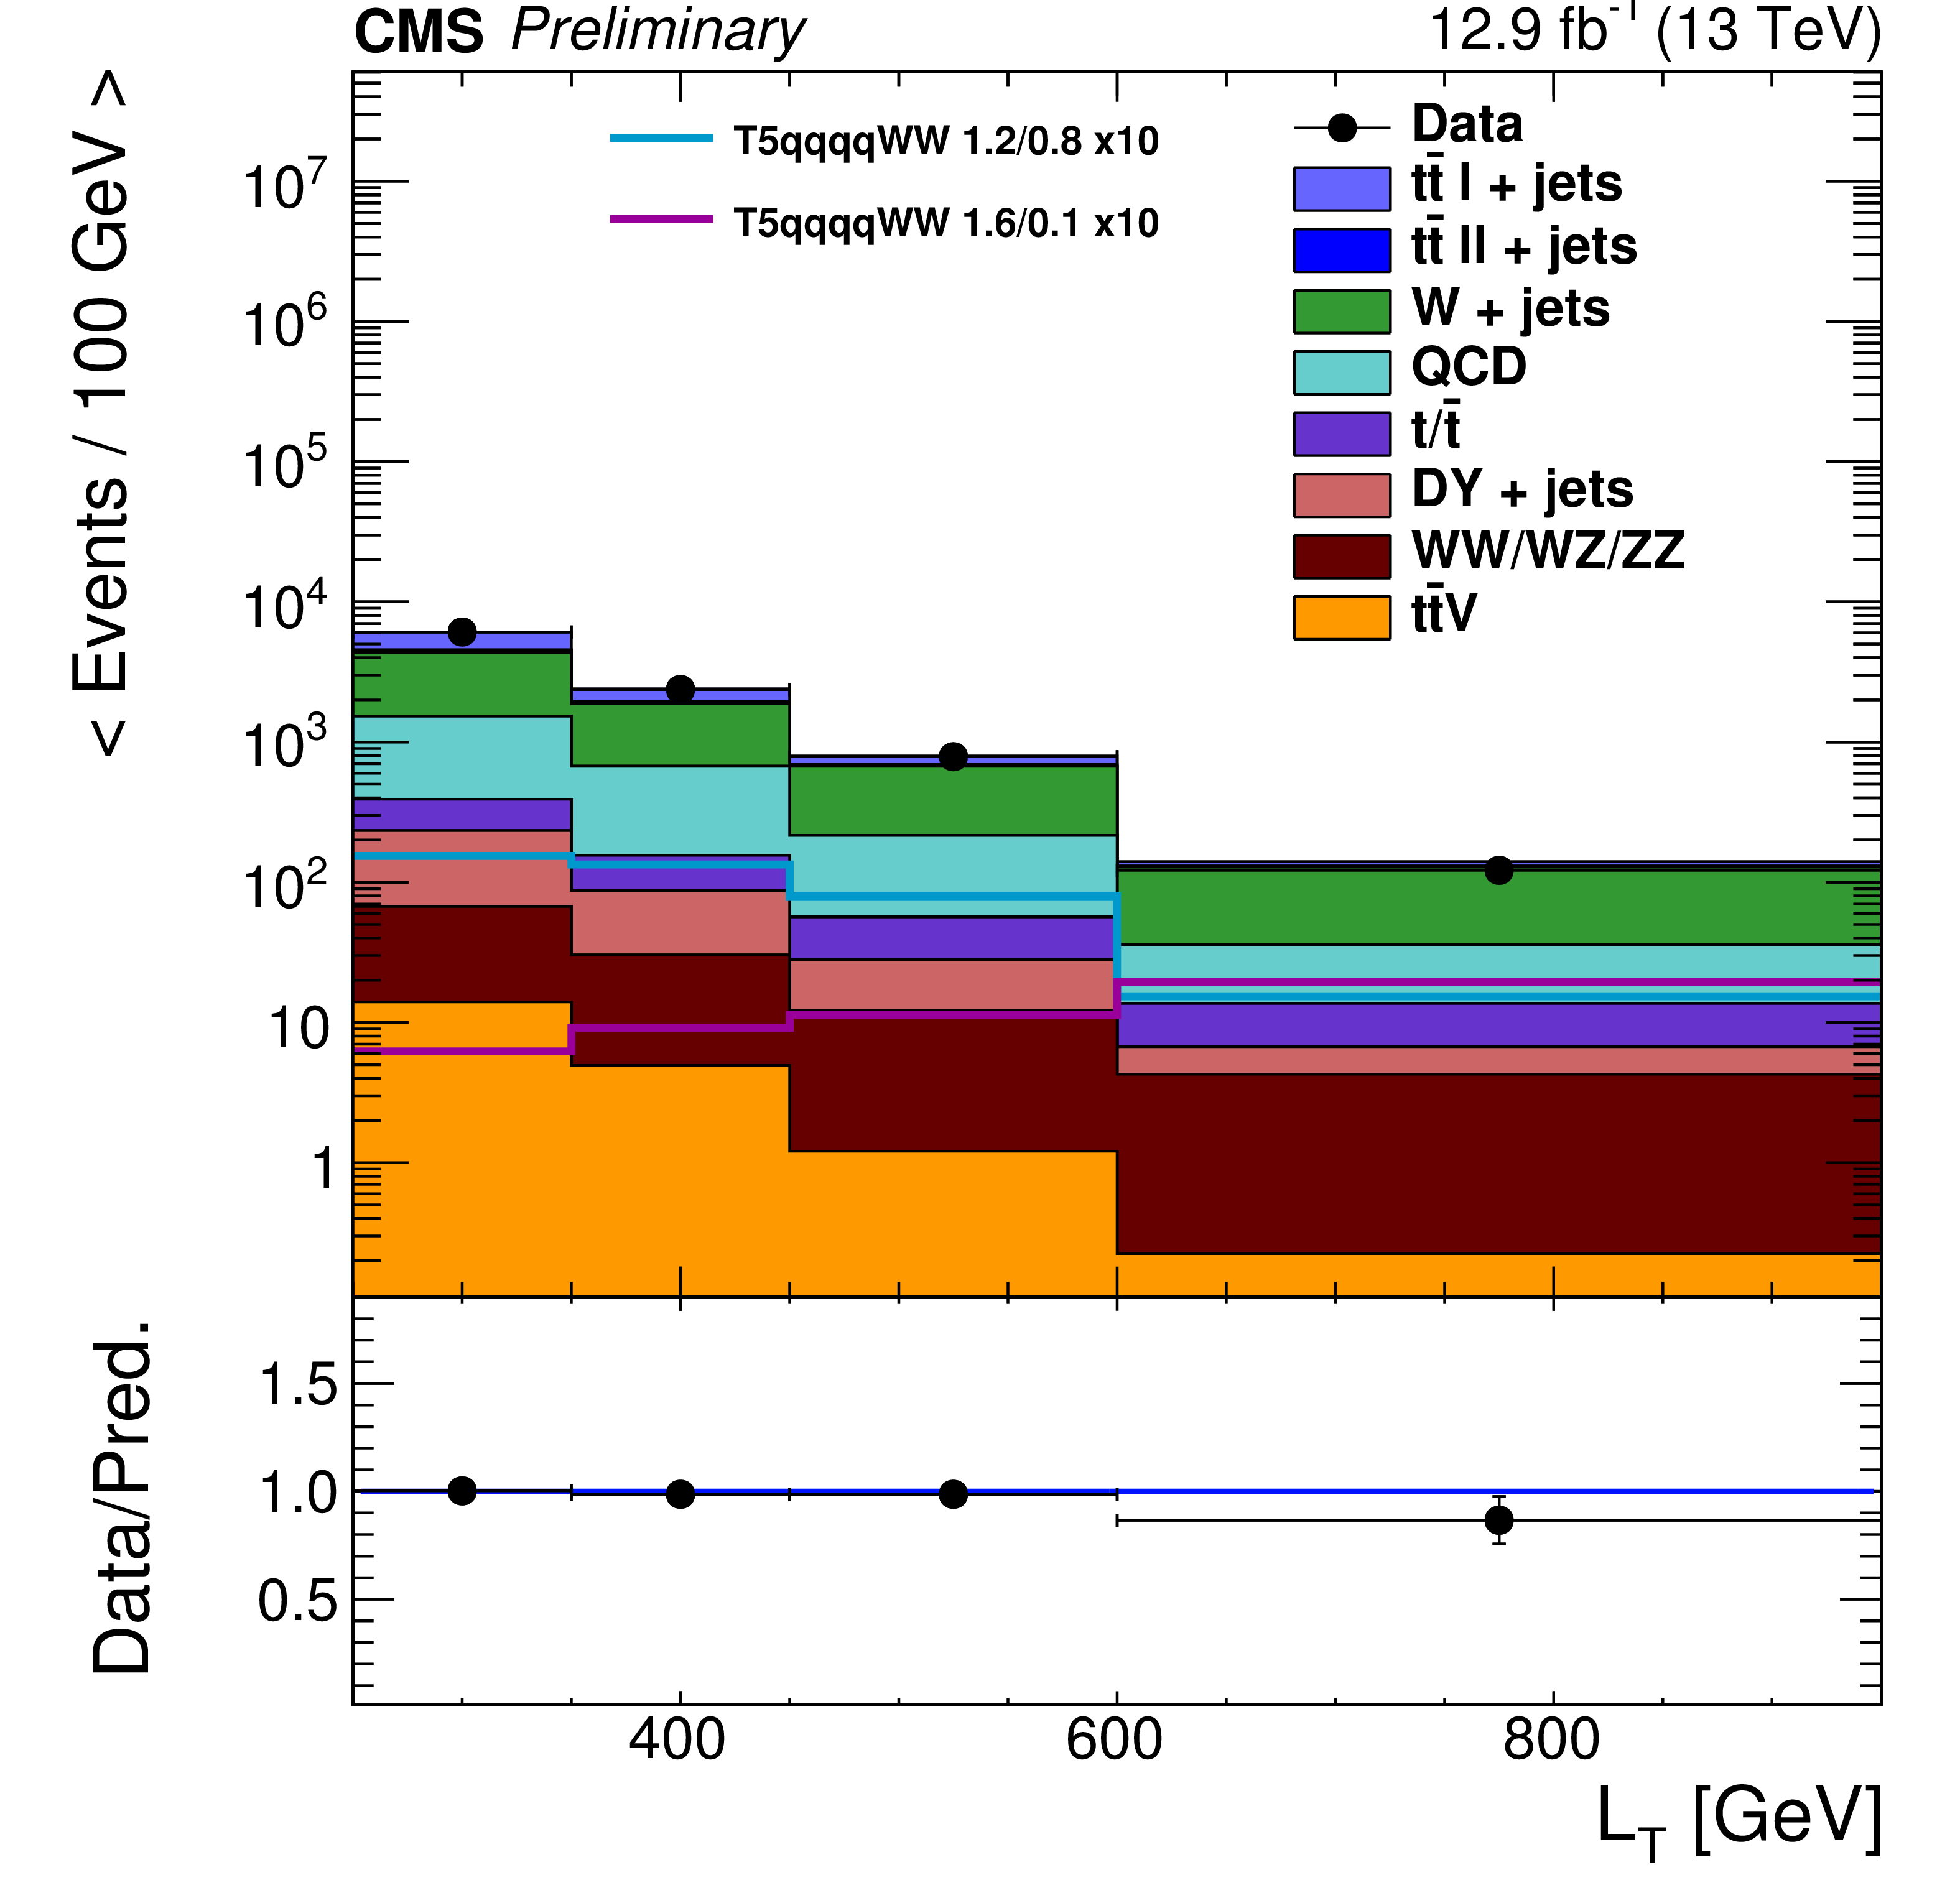
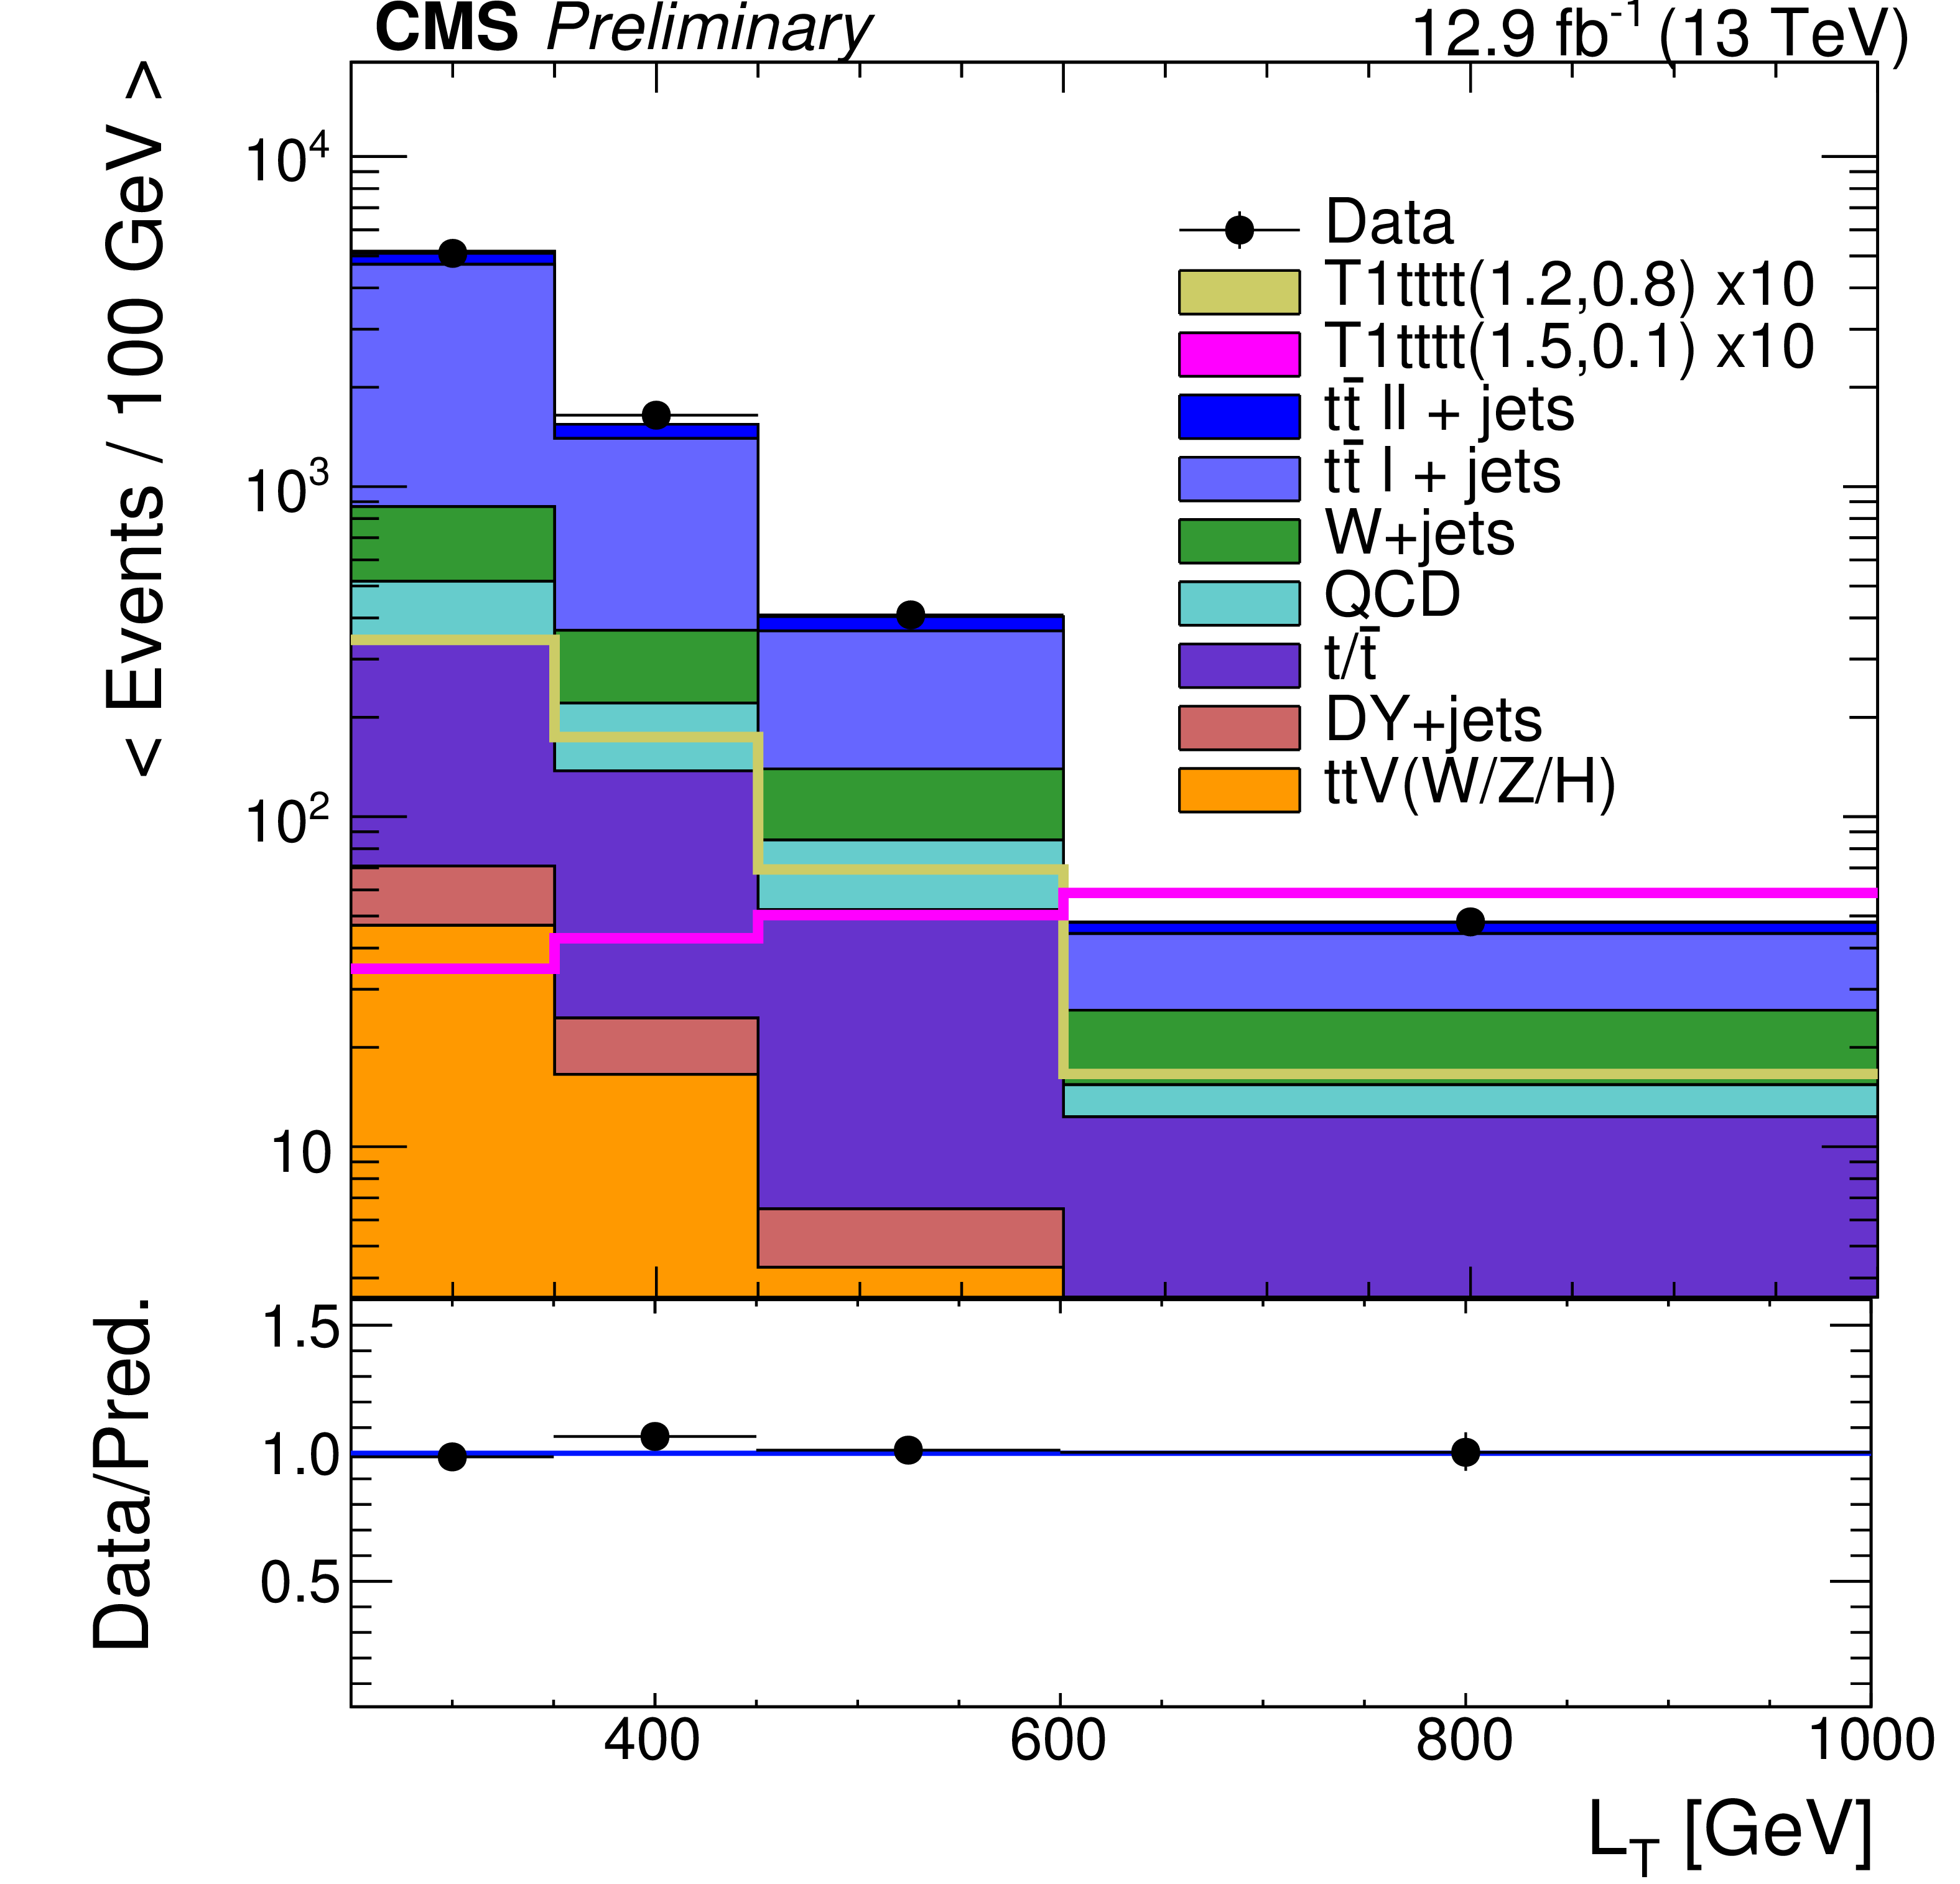
Additional Figure 4:
The $ {L_{\textrm T}} $ distribution for the zero-b analysis, after the preselection, requiring at least five jets, with no b-tagged jet. A minimum ${H_{\mathrm {T}}}$ of 500 GeV and a minimum $ {L_{\textrm T}} $ of 250 GeV is required in addition to exactly one lepton with $ {p_{\mathrm {T}}} > $ 25 GeV. The simulated background events are stacked on top of each other, and several signal points are overlaid for illustration without being stacked. The model T5qqqqWW(1.2,0.8) (T5qqqqWW(1.6,0.1)) corresponds to a gluino mass of 1.2 TeV (1.6 TeV) and neutralino mass of 0.8 TeV (0.1 TeV), respectively. The intermediate chargino mass is fixed at 1.0 TeV (0.85 TeV). |
png pdf |
Additional Figure 5:
The $ {L_{\textrm T}} $ distribution for the multi-b analysis, after the preselection, requiring at least six jets, of which at least one is b-tagged. A minimum ${H_{\mathrm {T}}}$ of 500 GeV and a minimum $ {L_{\textrm T}} $ of 250 GeV is required in addition to exactly one lepton with $ {p_{\mathrm {T}}} > $ 25 GeV. The simulated background events are stacked on top of each other, and several signal points are overlaid for illustration without being stacked. The model T1tttt(1.2,0.8) (T1tttt(1.5,0.1)) corresponds to a gluino mass of 1.2 TeV (1.5 TeV) and neutralino mass of 0.8 TeV (0.1 TeV), respectively. |
png pdf |
Additional Figure 6:
The ${H_{\mathrm {T}}}$ distribution for the multi-b analysis, after the preselection, requiring at least six jets, of which at least one is b-tagged. A minimum ${H_{\mathrm {T}}}$ of 500 GeV and a minimum $ {L_{\textrm T}} $ of 250 GeV is required in addition to exactly one lepton with $ {p_{\mathrm {T}}} > $ 25 GeV. The simulated background events are stacked on top of each other, and several signal points are overlaid for illustration without being stacked. The model T1tttt (1.2,0.8) (T1tttt (1.5,0.1)) corresponds to a gluino mass of 1.2 TeV (1.5 TeV) and neutralino mass of 0.8 TeV (0.1 TeV), respectively. |
png pdf |
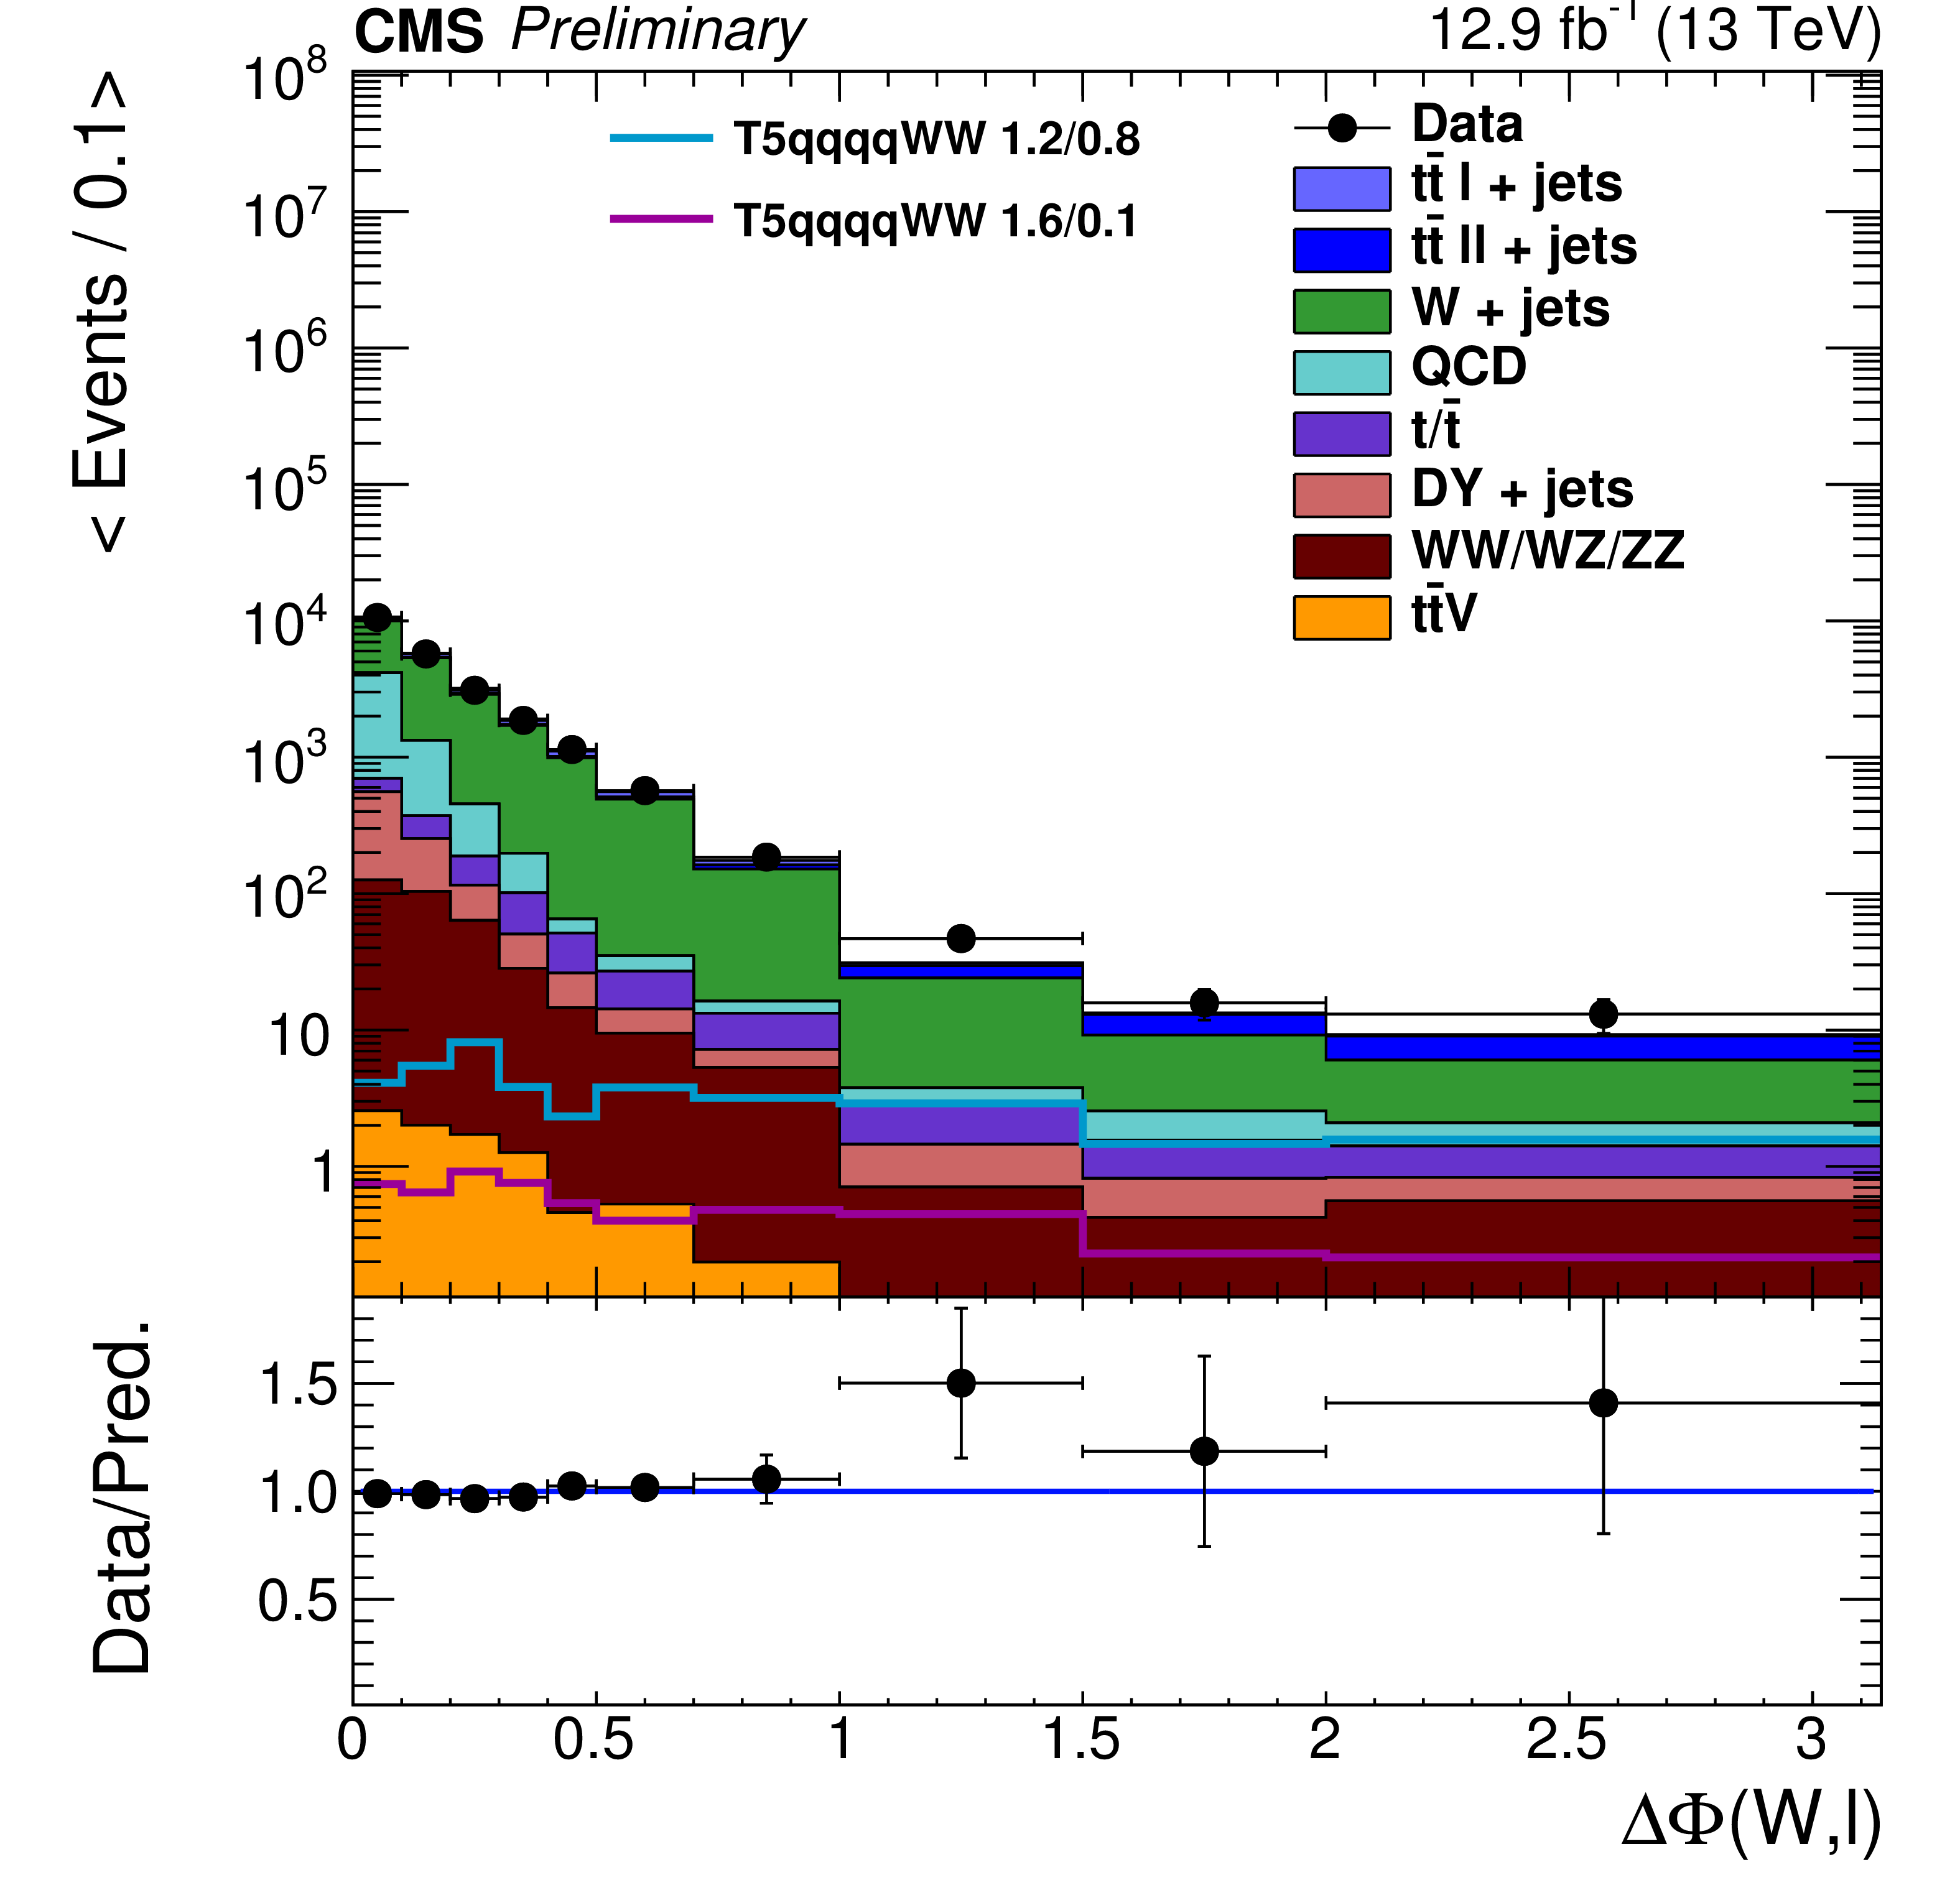
Additional Figure 7:
The $ {\Delta \Phi } $ distribution for the zero-b analysis, in the W+jets sideband. A minimum ${H_{\mathrm {T}}}$ of 500 GeV and $ {L_{\textrm T}} >250 GeV $ is required in addition to exactly one lepton with $ {p_{\mathrm {T}}} > $ 25 GeV. The simulated background events are stacked on top of each other, and several signal points are overlaid for illustration without being stacked. The model T5qqqqWW(1.2,0.8) (T5qqqqWW(1.6,0.1)) corresponds to a gluino mass of 1.2 TeV (1.6 TeV) and neutralino mass of 0.8 TeV (0.1 TeV), respectively. The intermediate chargino mass is fixed at 1.0 TeV (0.85 TeV). |
png pdf |
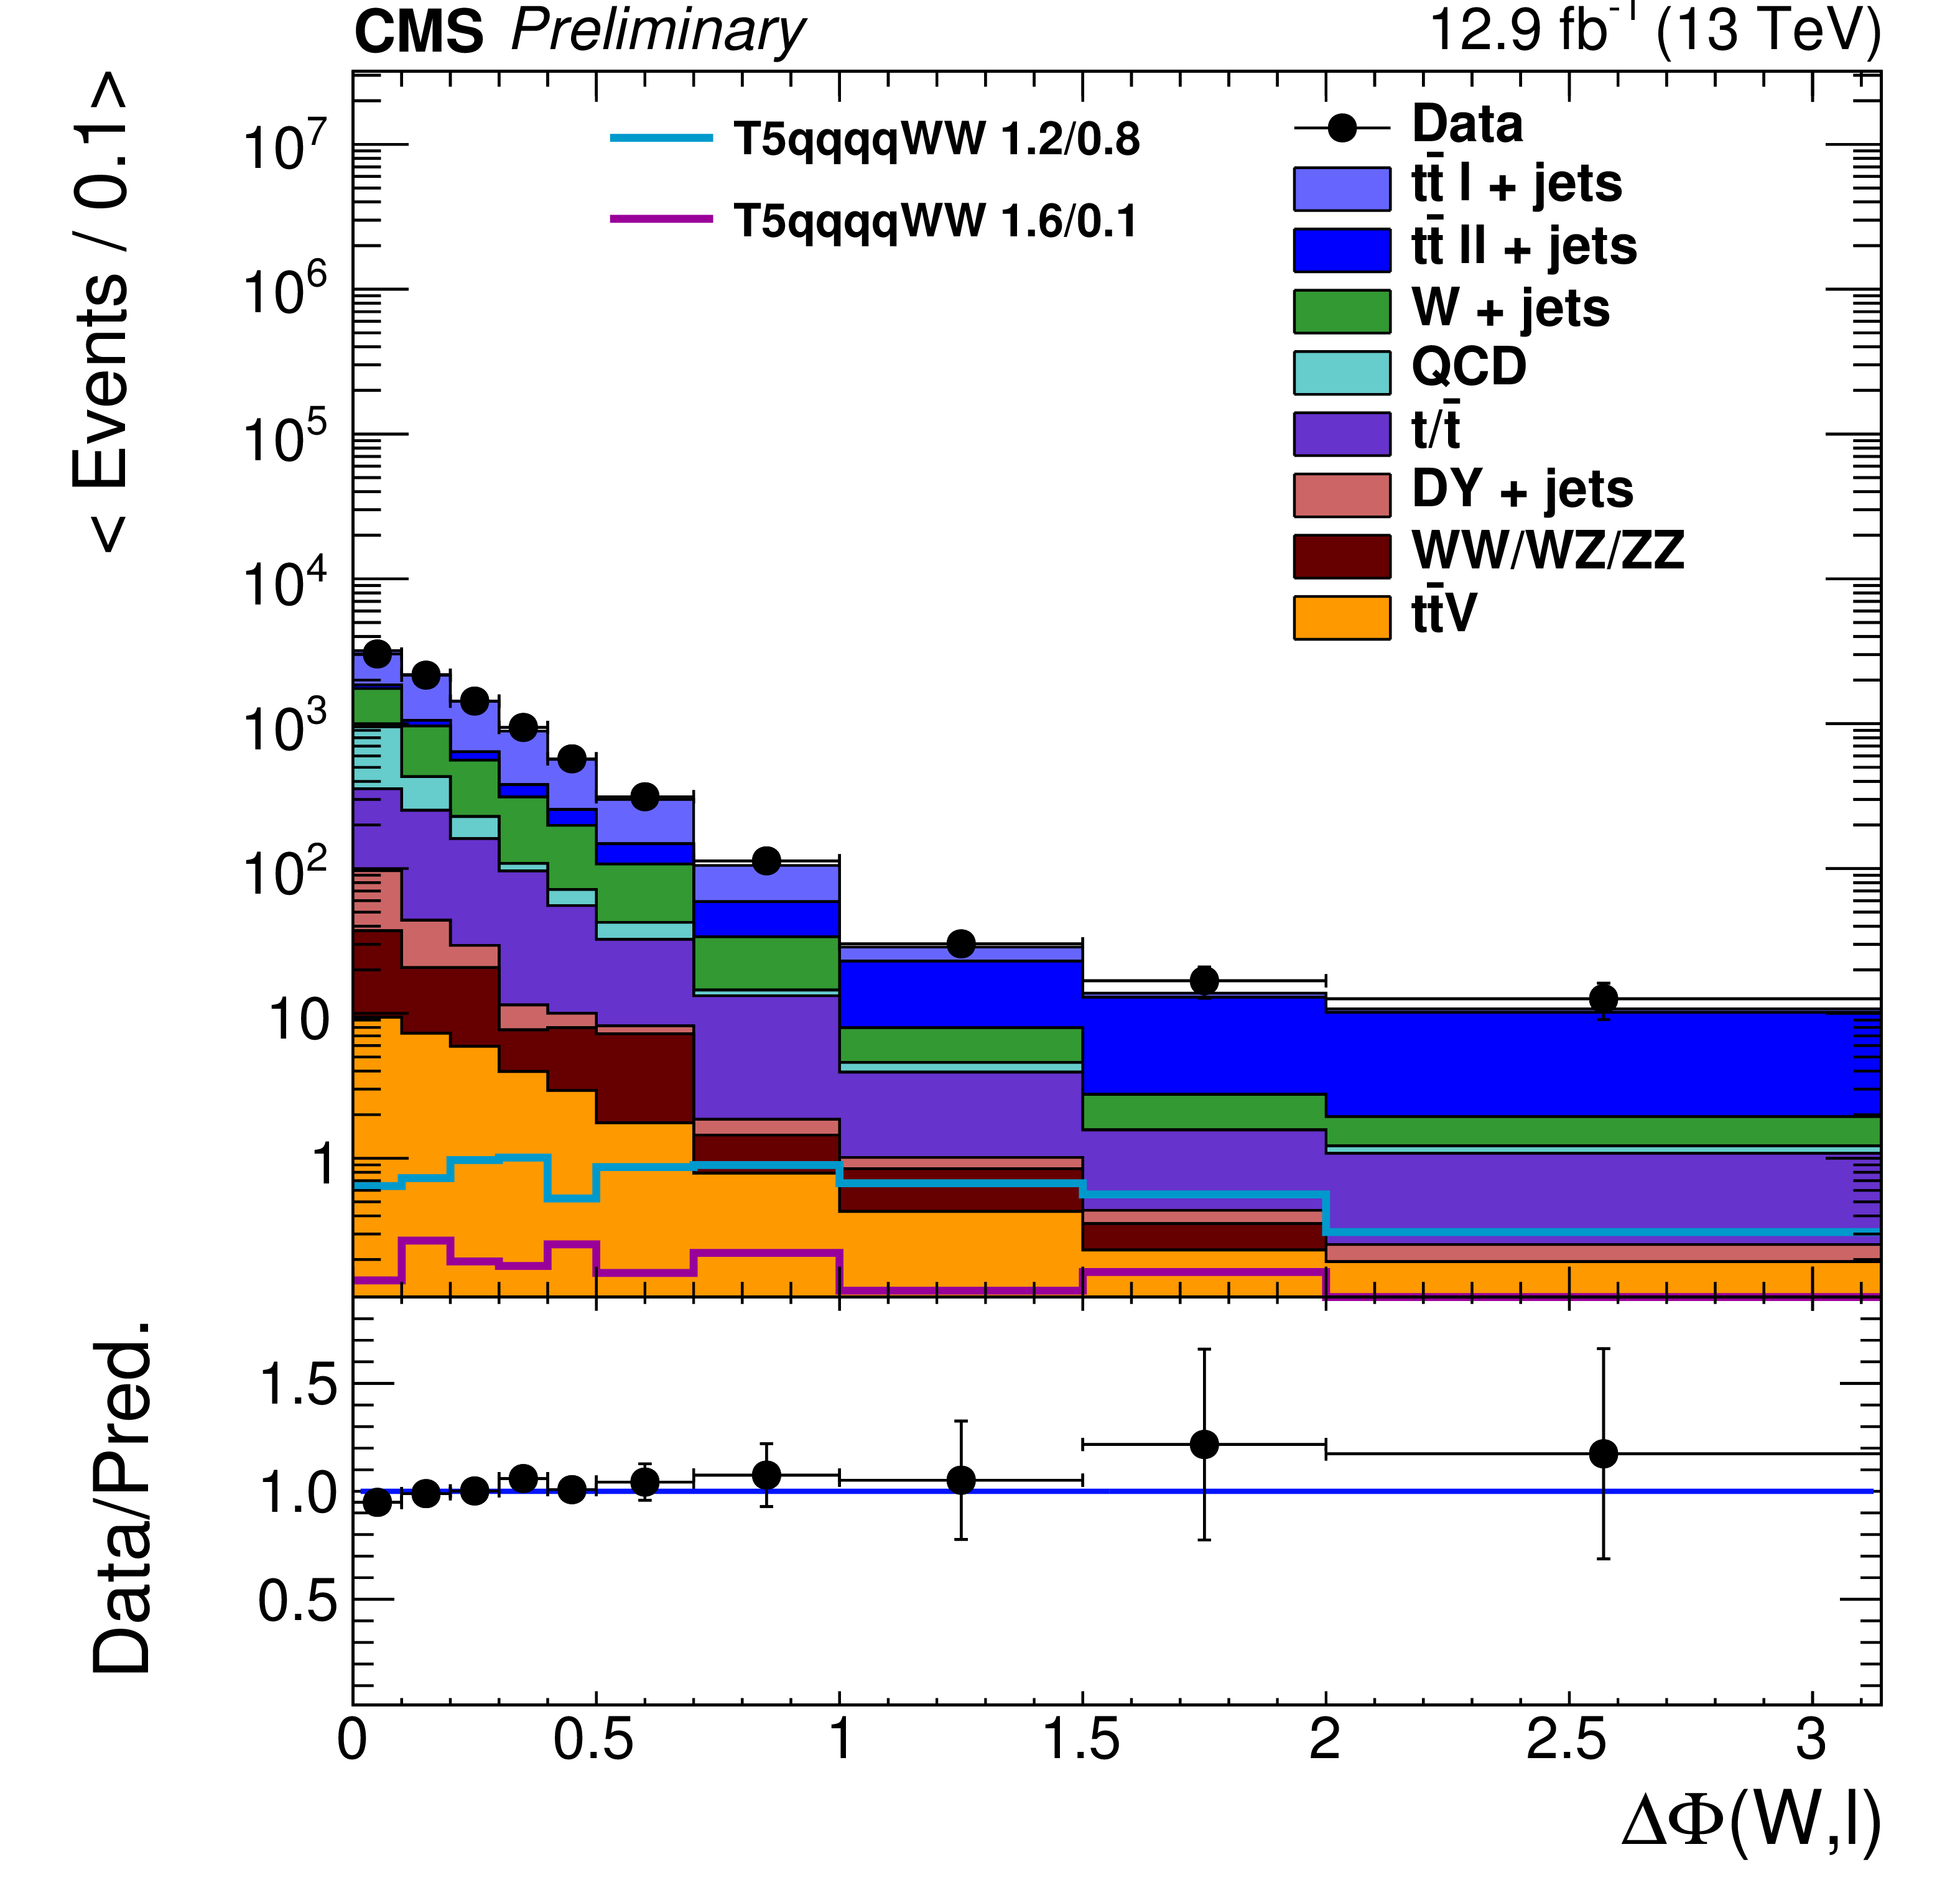
Additional Figure 8:
The $ {\Delta \Phi } $ distribution for the zero-b analysis, in the $ {\mathrm{ t } {}\mathrm{ \bar{t} } } $ sideband. A minimum ${H_{\mathrm {T}}}$ of 500 GeV and $ {L_{\textrm T}} >250 GeV $ is required in addition to exactly one lepton with $ {p_{\mathrm {T}}} > $ 25 GeV. The simulated background events are stacked on top of each other, and several signal points are overlaid for illustration without being stacked. The model T5qqqqWW(1.2,0.8) (T5qqqqWW(1.6,0.1)) corresponds to a gluino mass of 1.2 TeV (1.6 TeV) and neutralino mass of 0.8 TeV (0.1 TeV), respectively. The intermediate chargino mass is fixed at 1.0 TeV (0.85 TeV). |
png pdf |
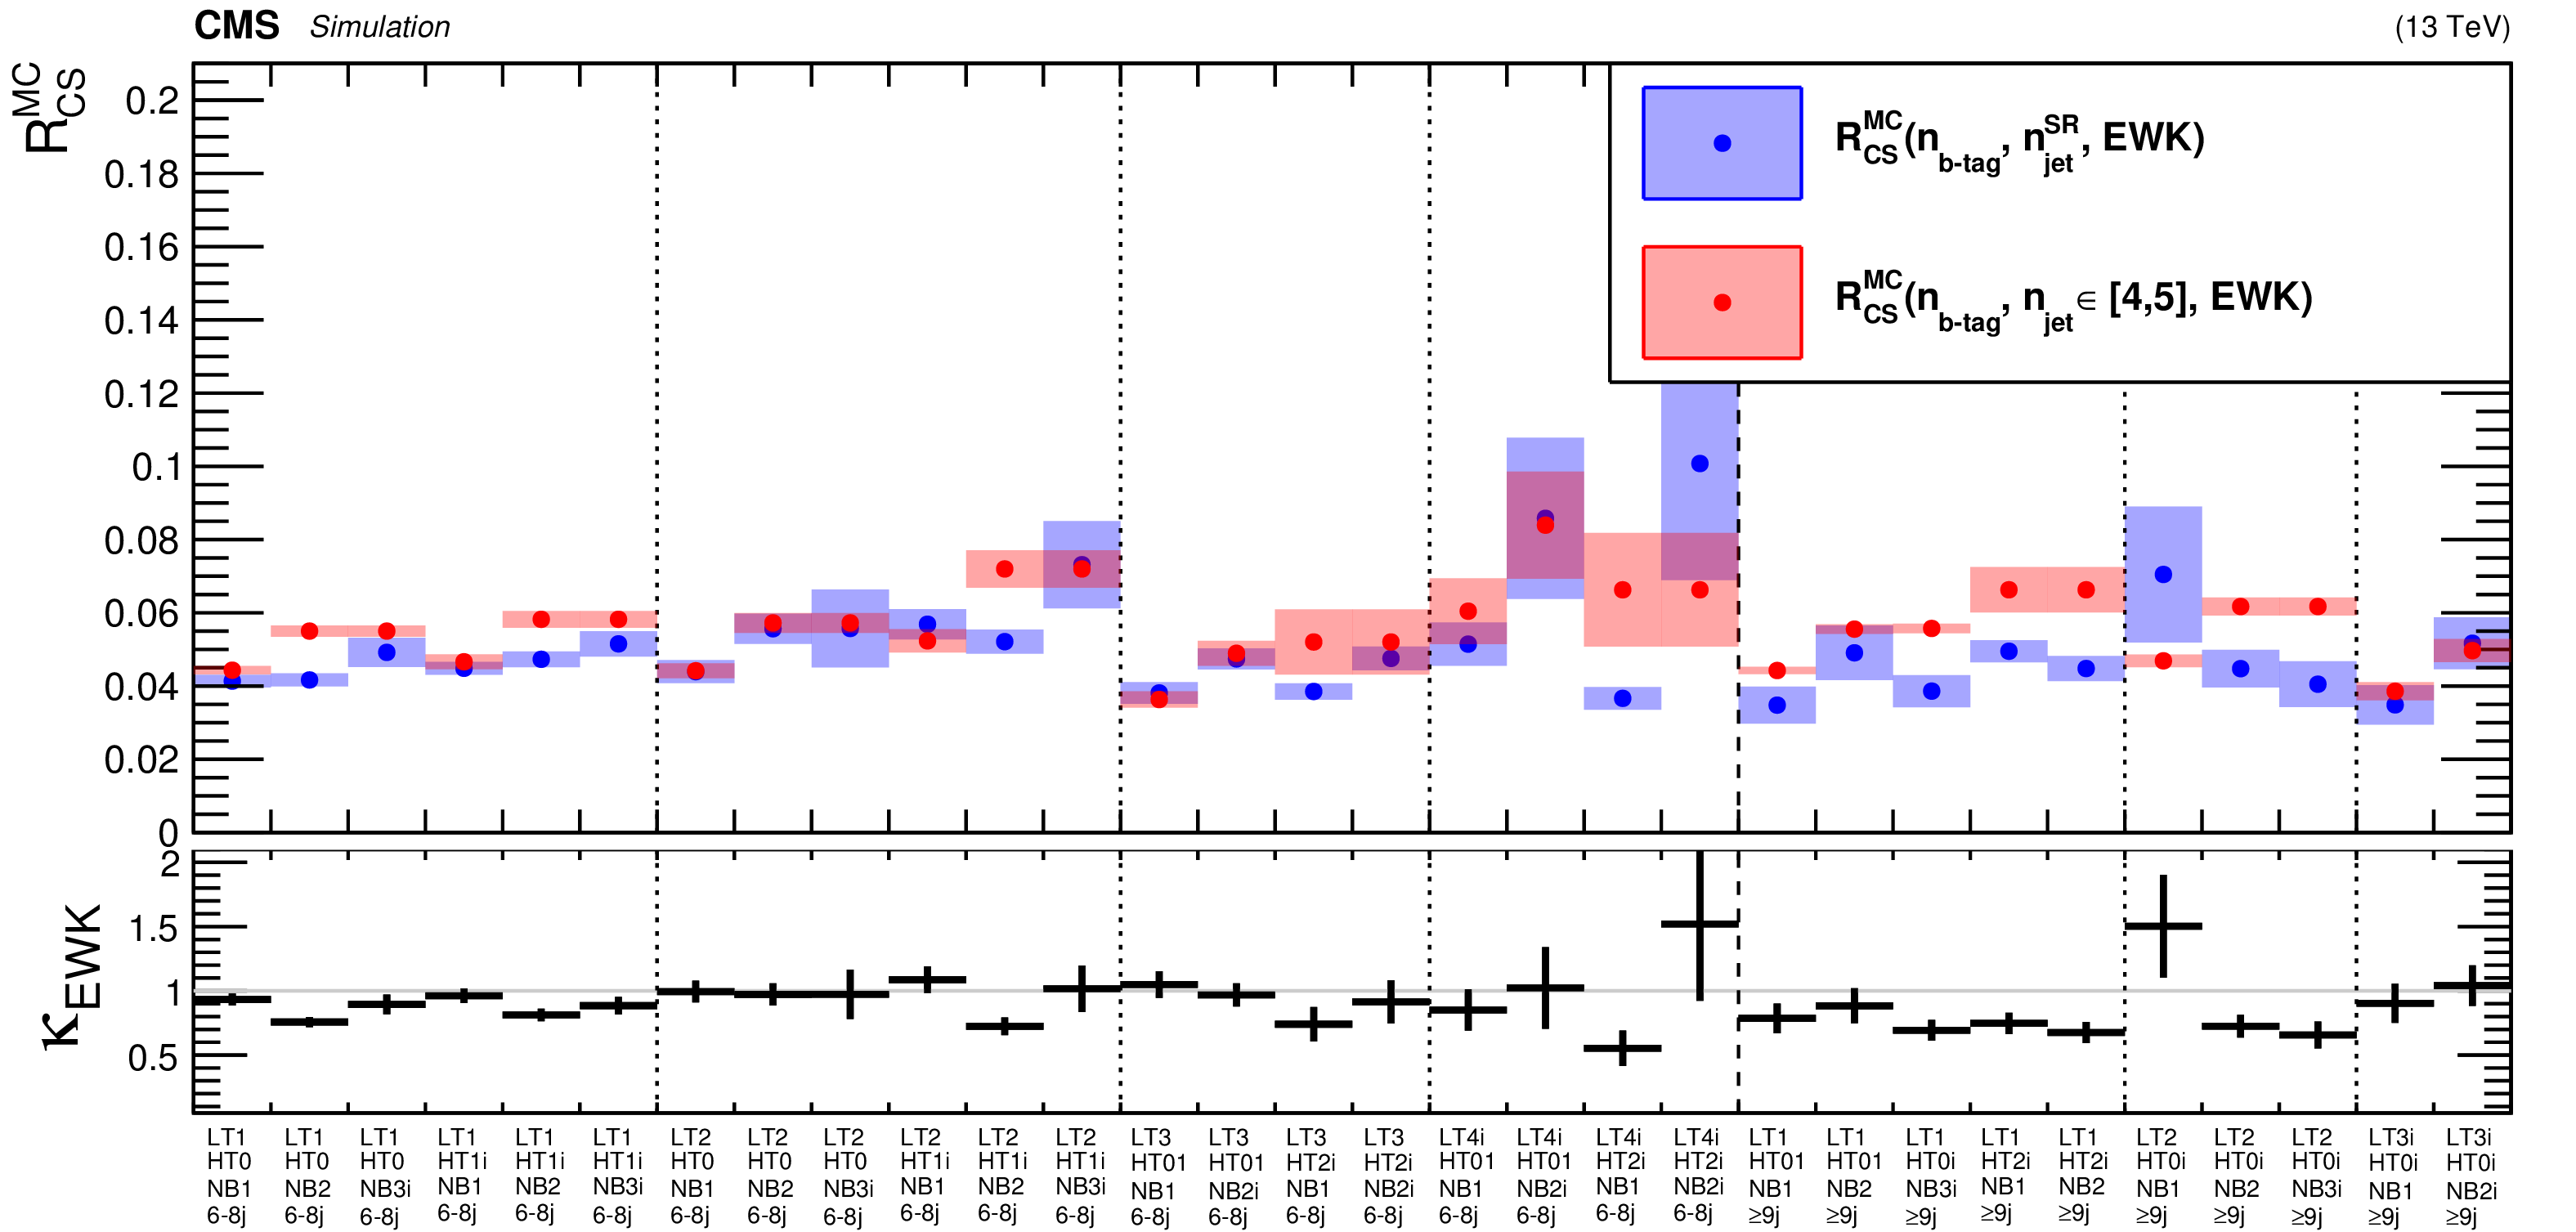
Additional Figure 9:
The $ {R_{\textrm {CS}}} $ values from simulation (excluding the QCD sample) and $\kappa _{\rm EWK}$ for all signal regions of the multi-b analysis. |
png pdf |
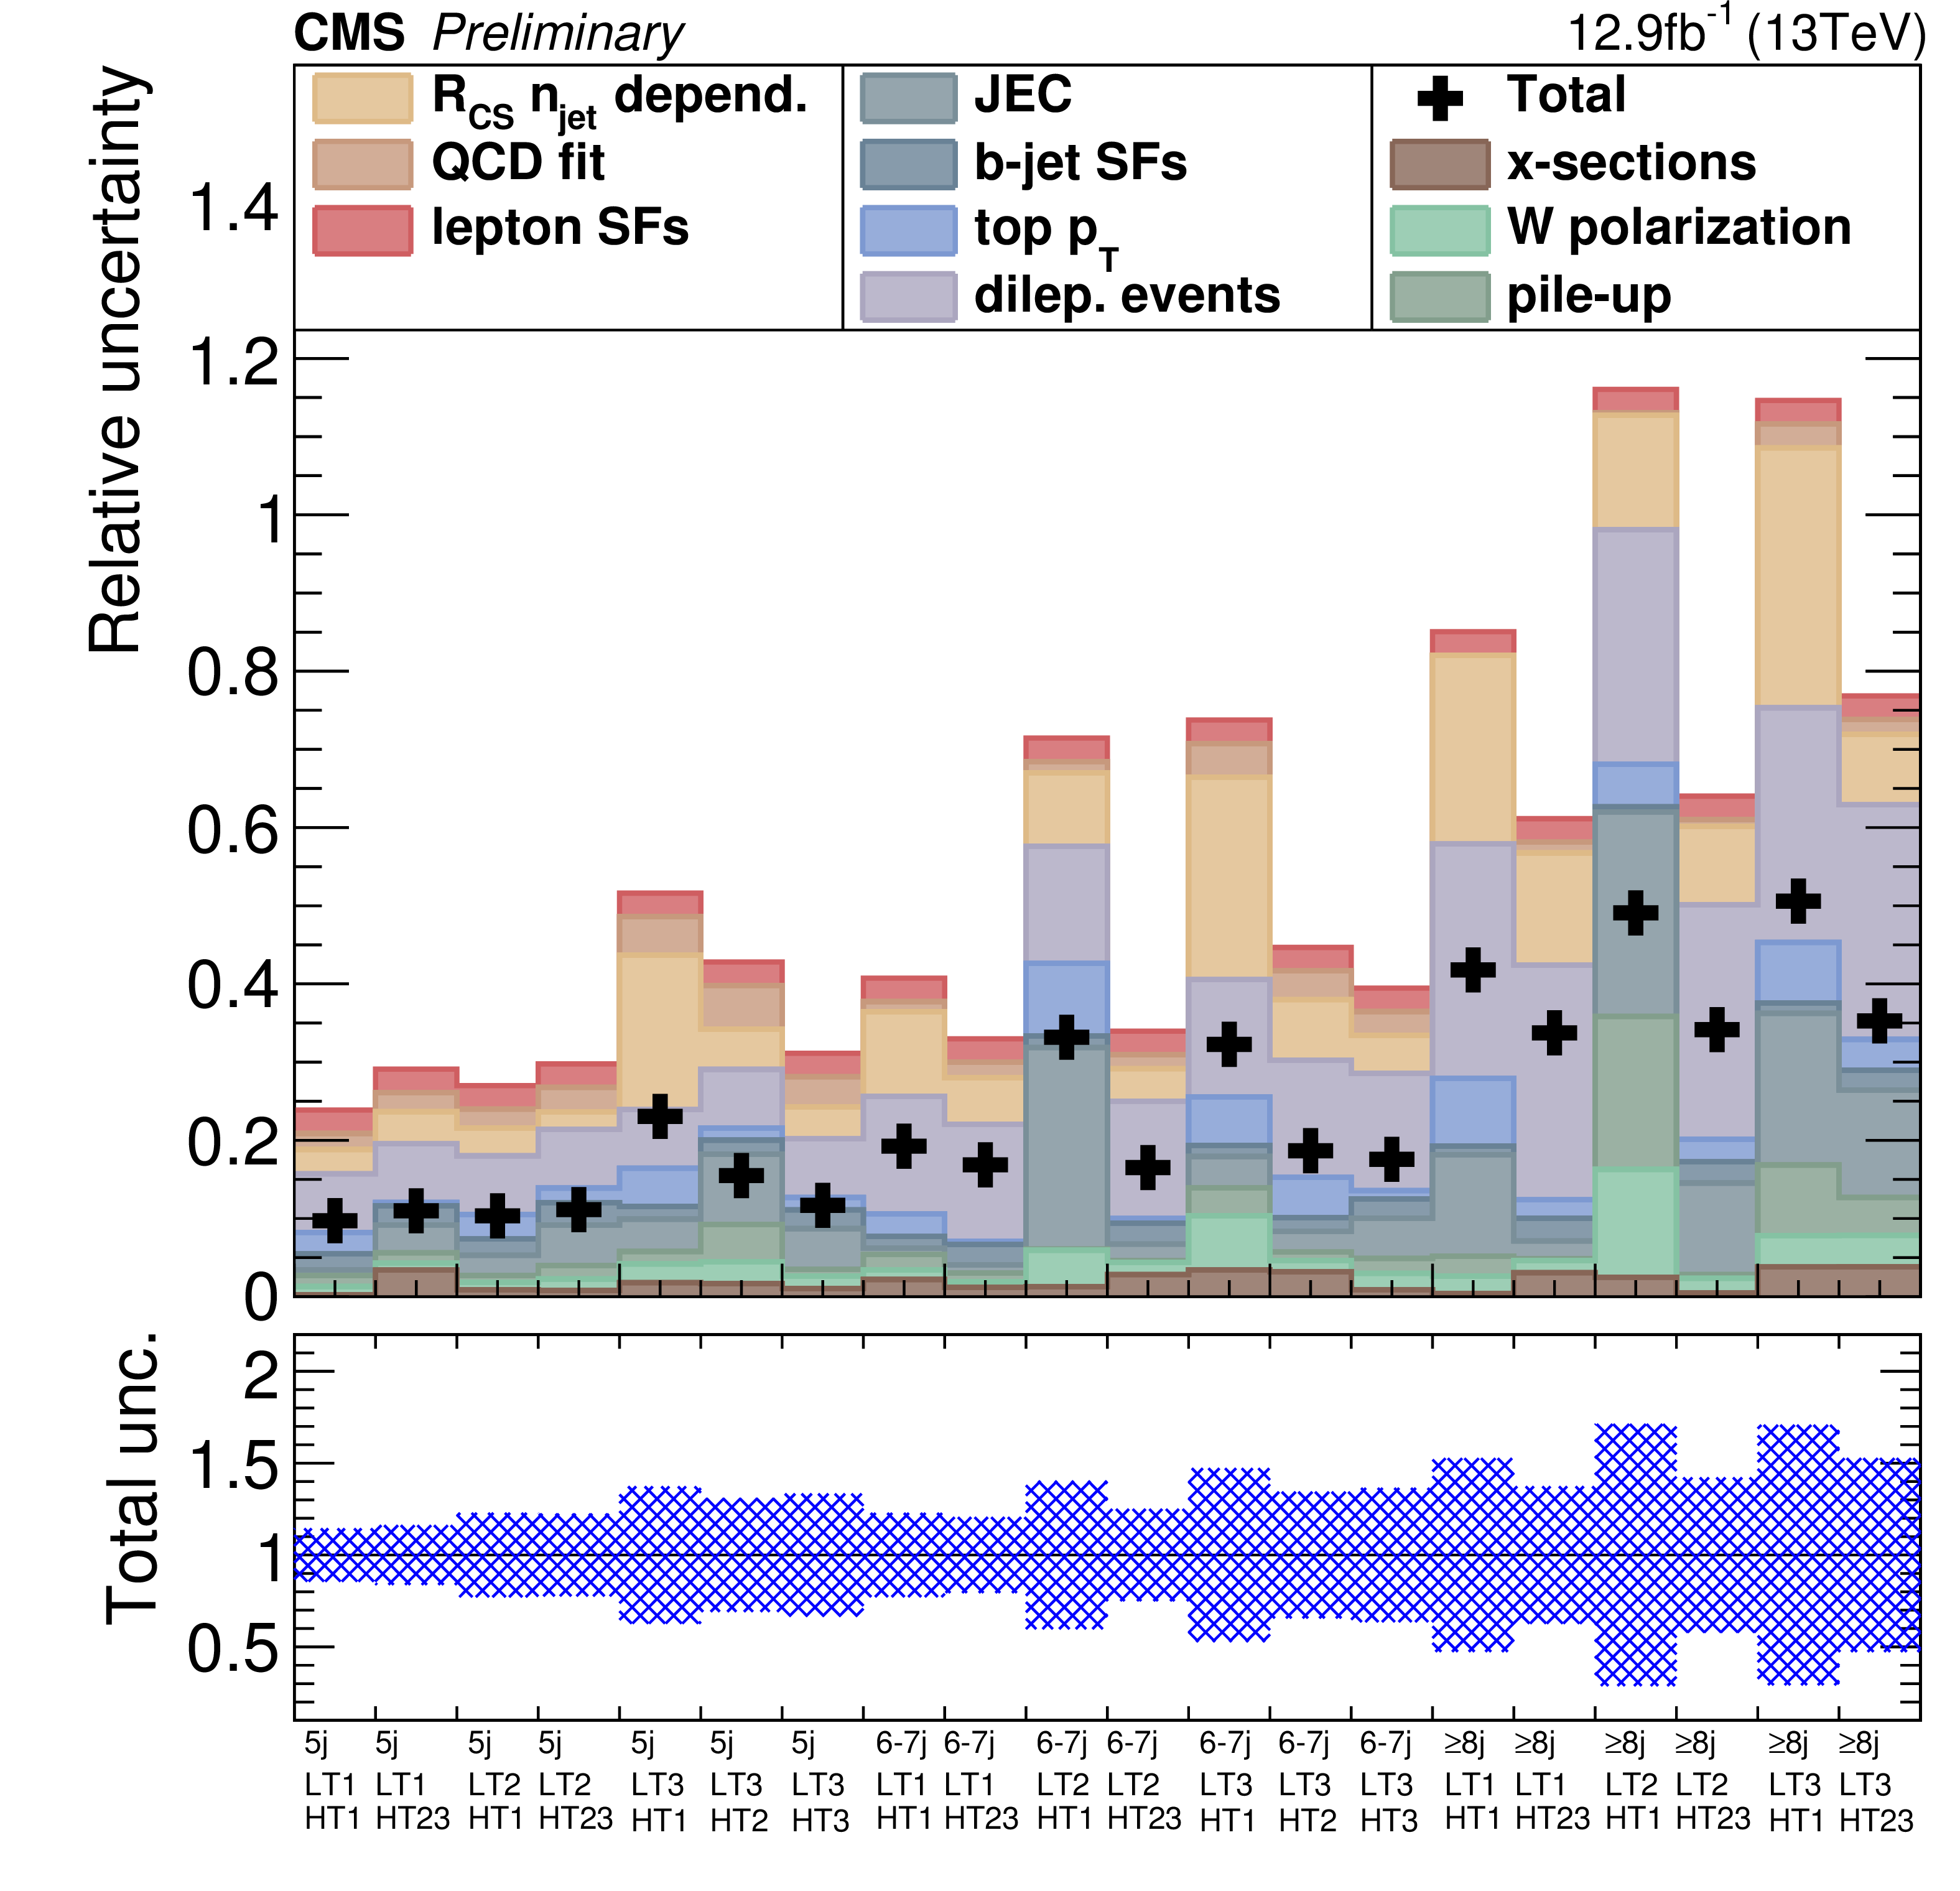
Additional Figure 10:
The systematic uncertainties for all signal regions of the zero-b analysis. The top part of the plot shows the relative uncertainty on the background prediction for the different sources of uncertainties. The various uncertainties are stacked linearly on top of each other, while the black crosses represent the square root of the sum of squares. The bottom part of the plot shows the total relative uncertainty, including statistical and systematic terms, as a blue dotted area around unity. |
png pdf |
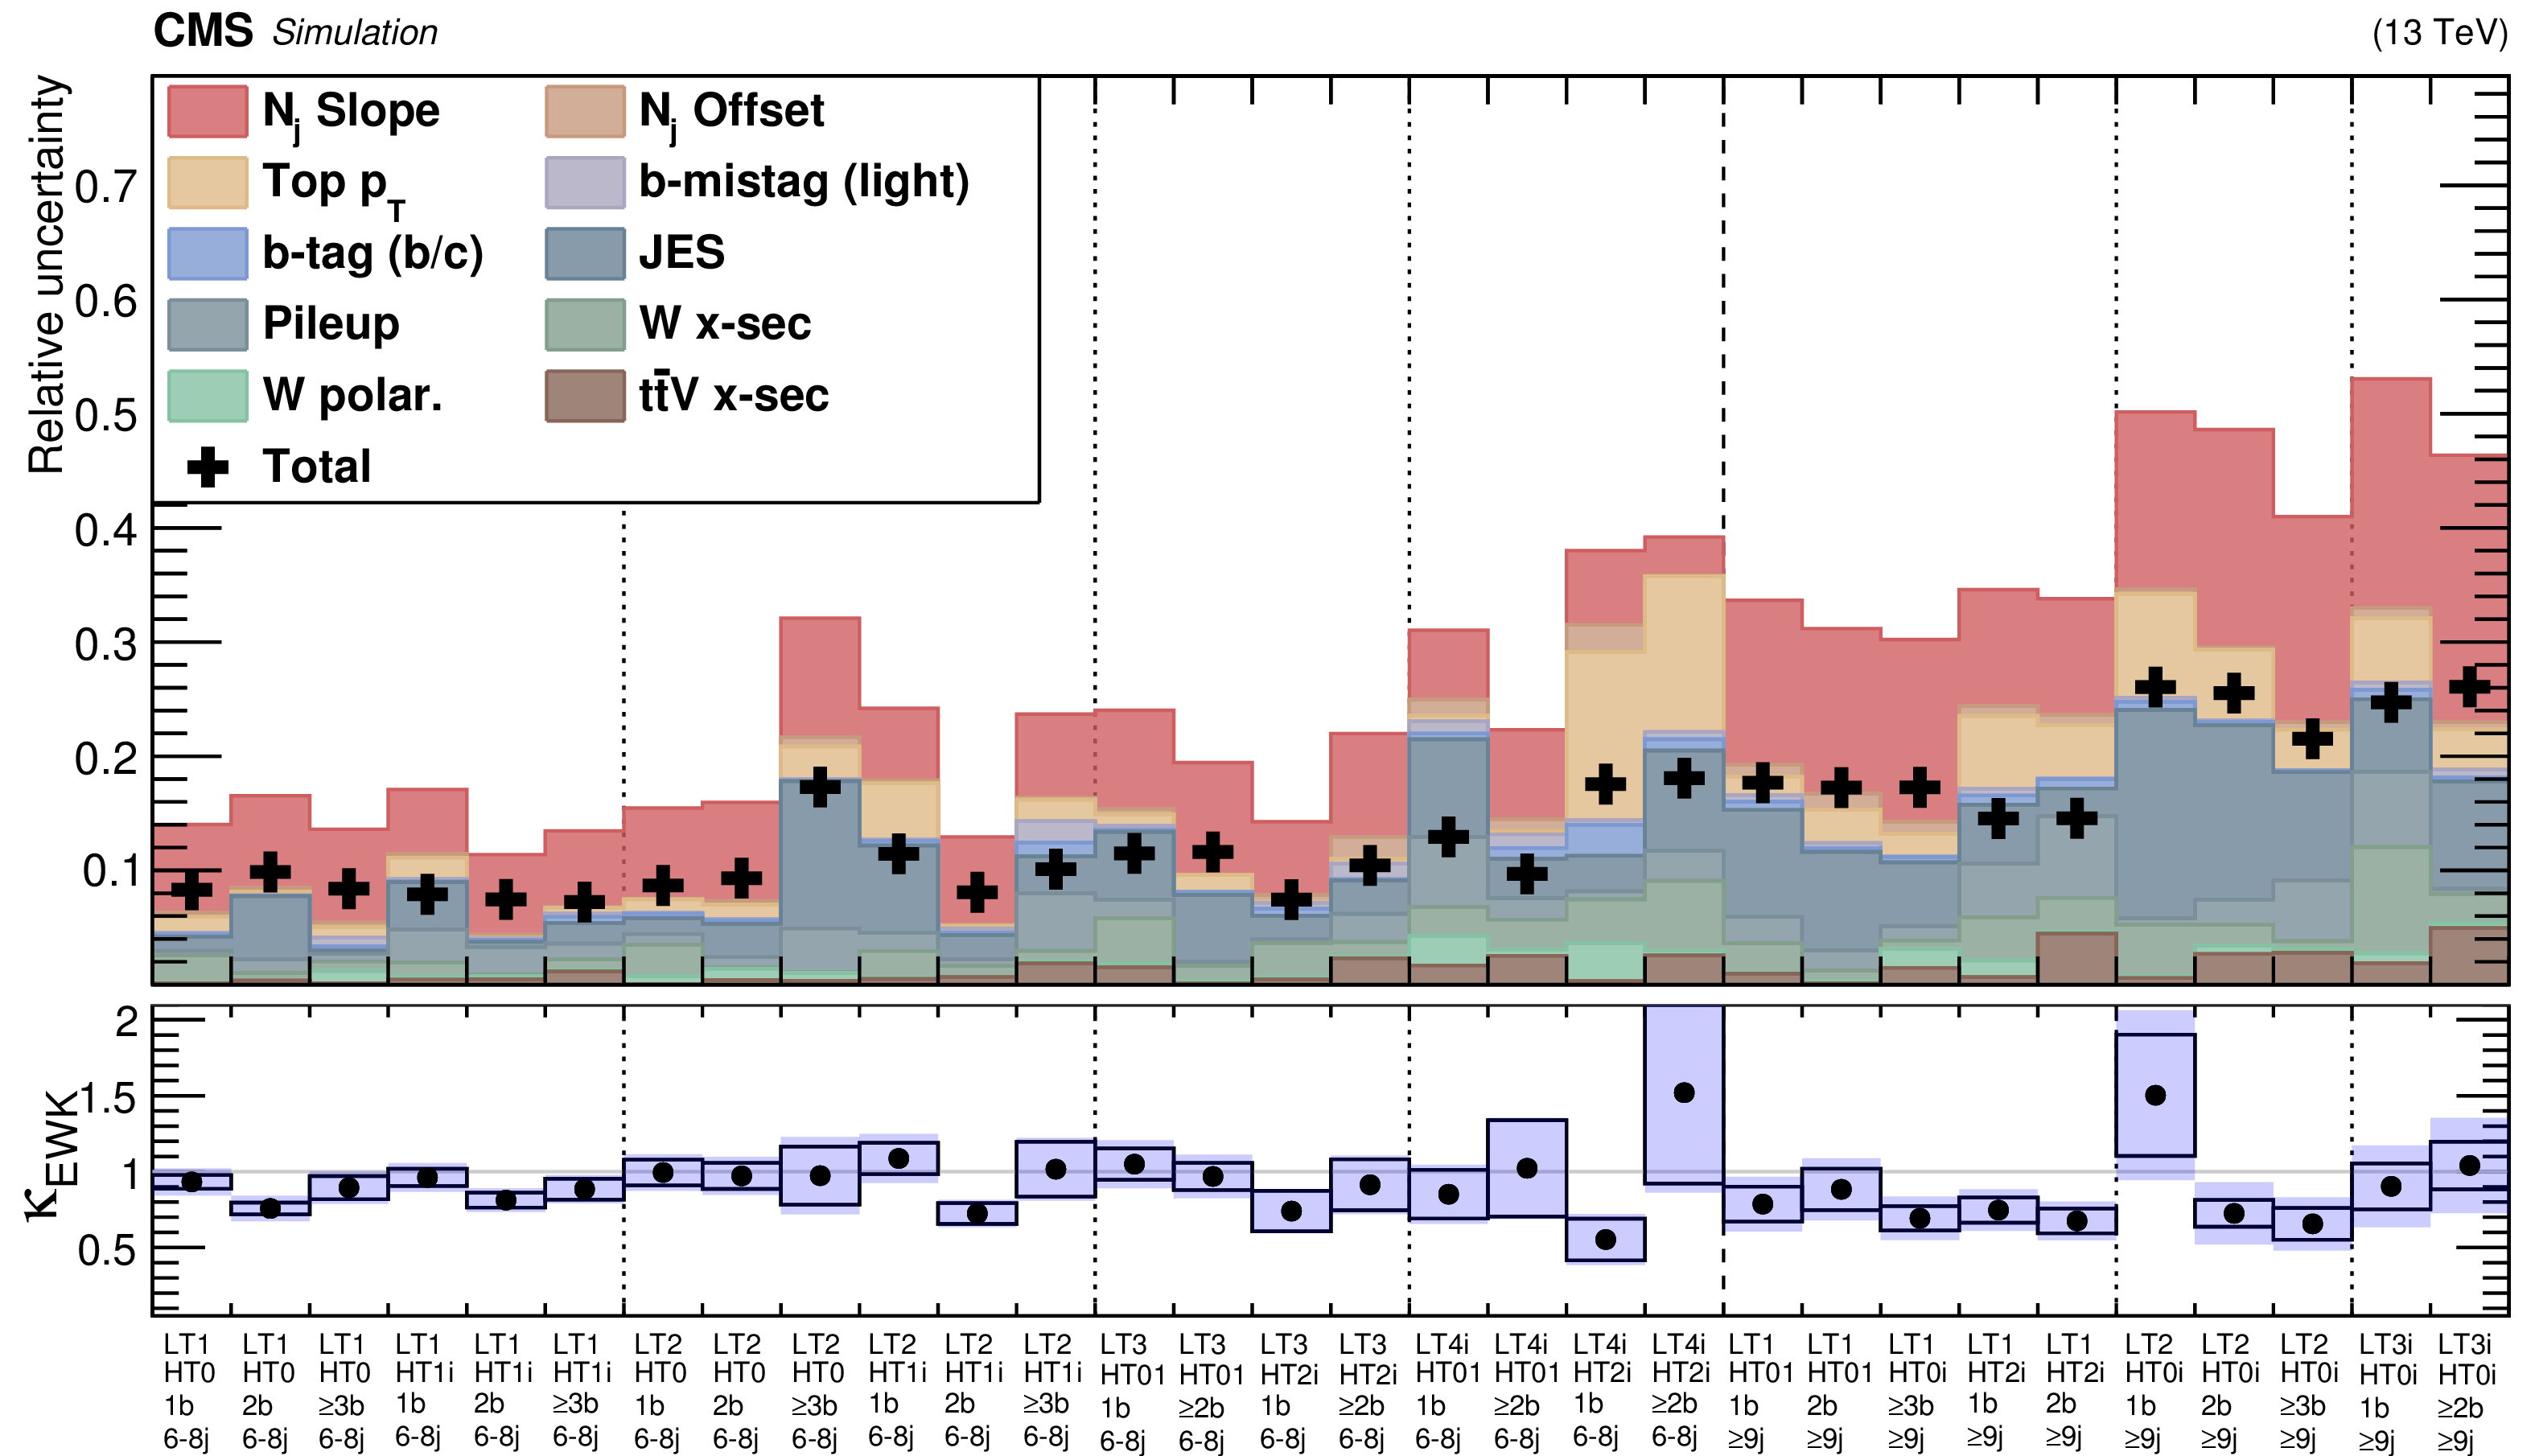
Additional Figure 11:
The systematic uncertainties for all signal regions of the multi-b analysis.The top part of the plot shows the relative uncertainty on the background prediction for the different sources of uncertainties. The various uncertainties are stacked linearly on top of each other, while the black crosses represent the square root of the sum of squares. The bottom part of the plot shows the nominal $\kappa $ values with the statistical uncertainty represented by the black line and the sum of statistical and systematic uncertainty shown by the blue dotted area. |
png pdf |
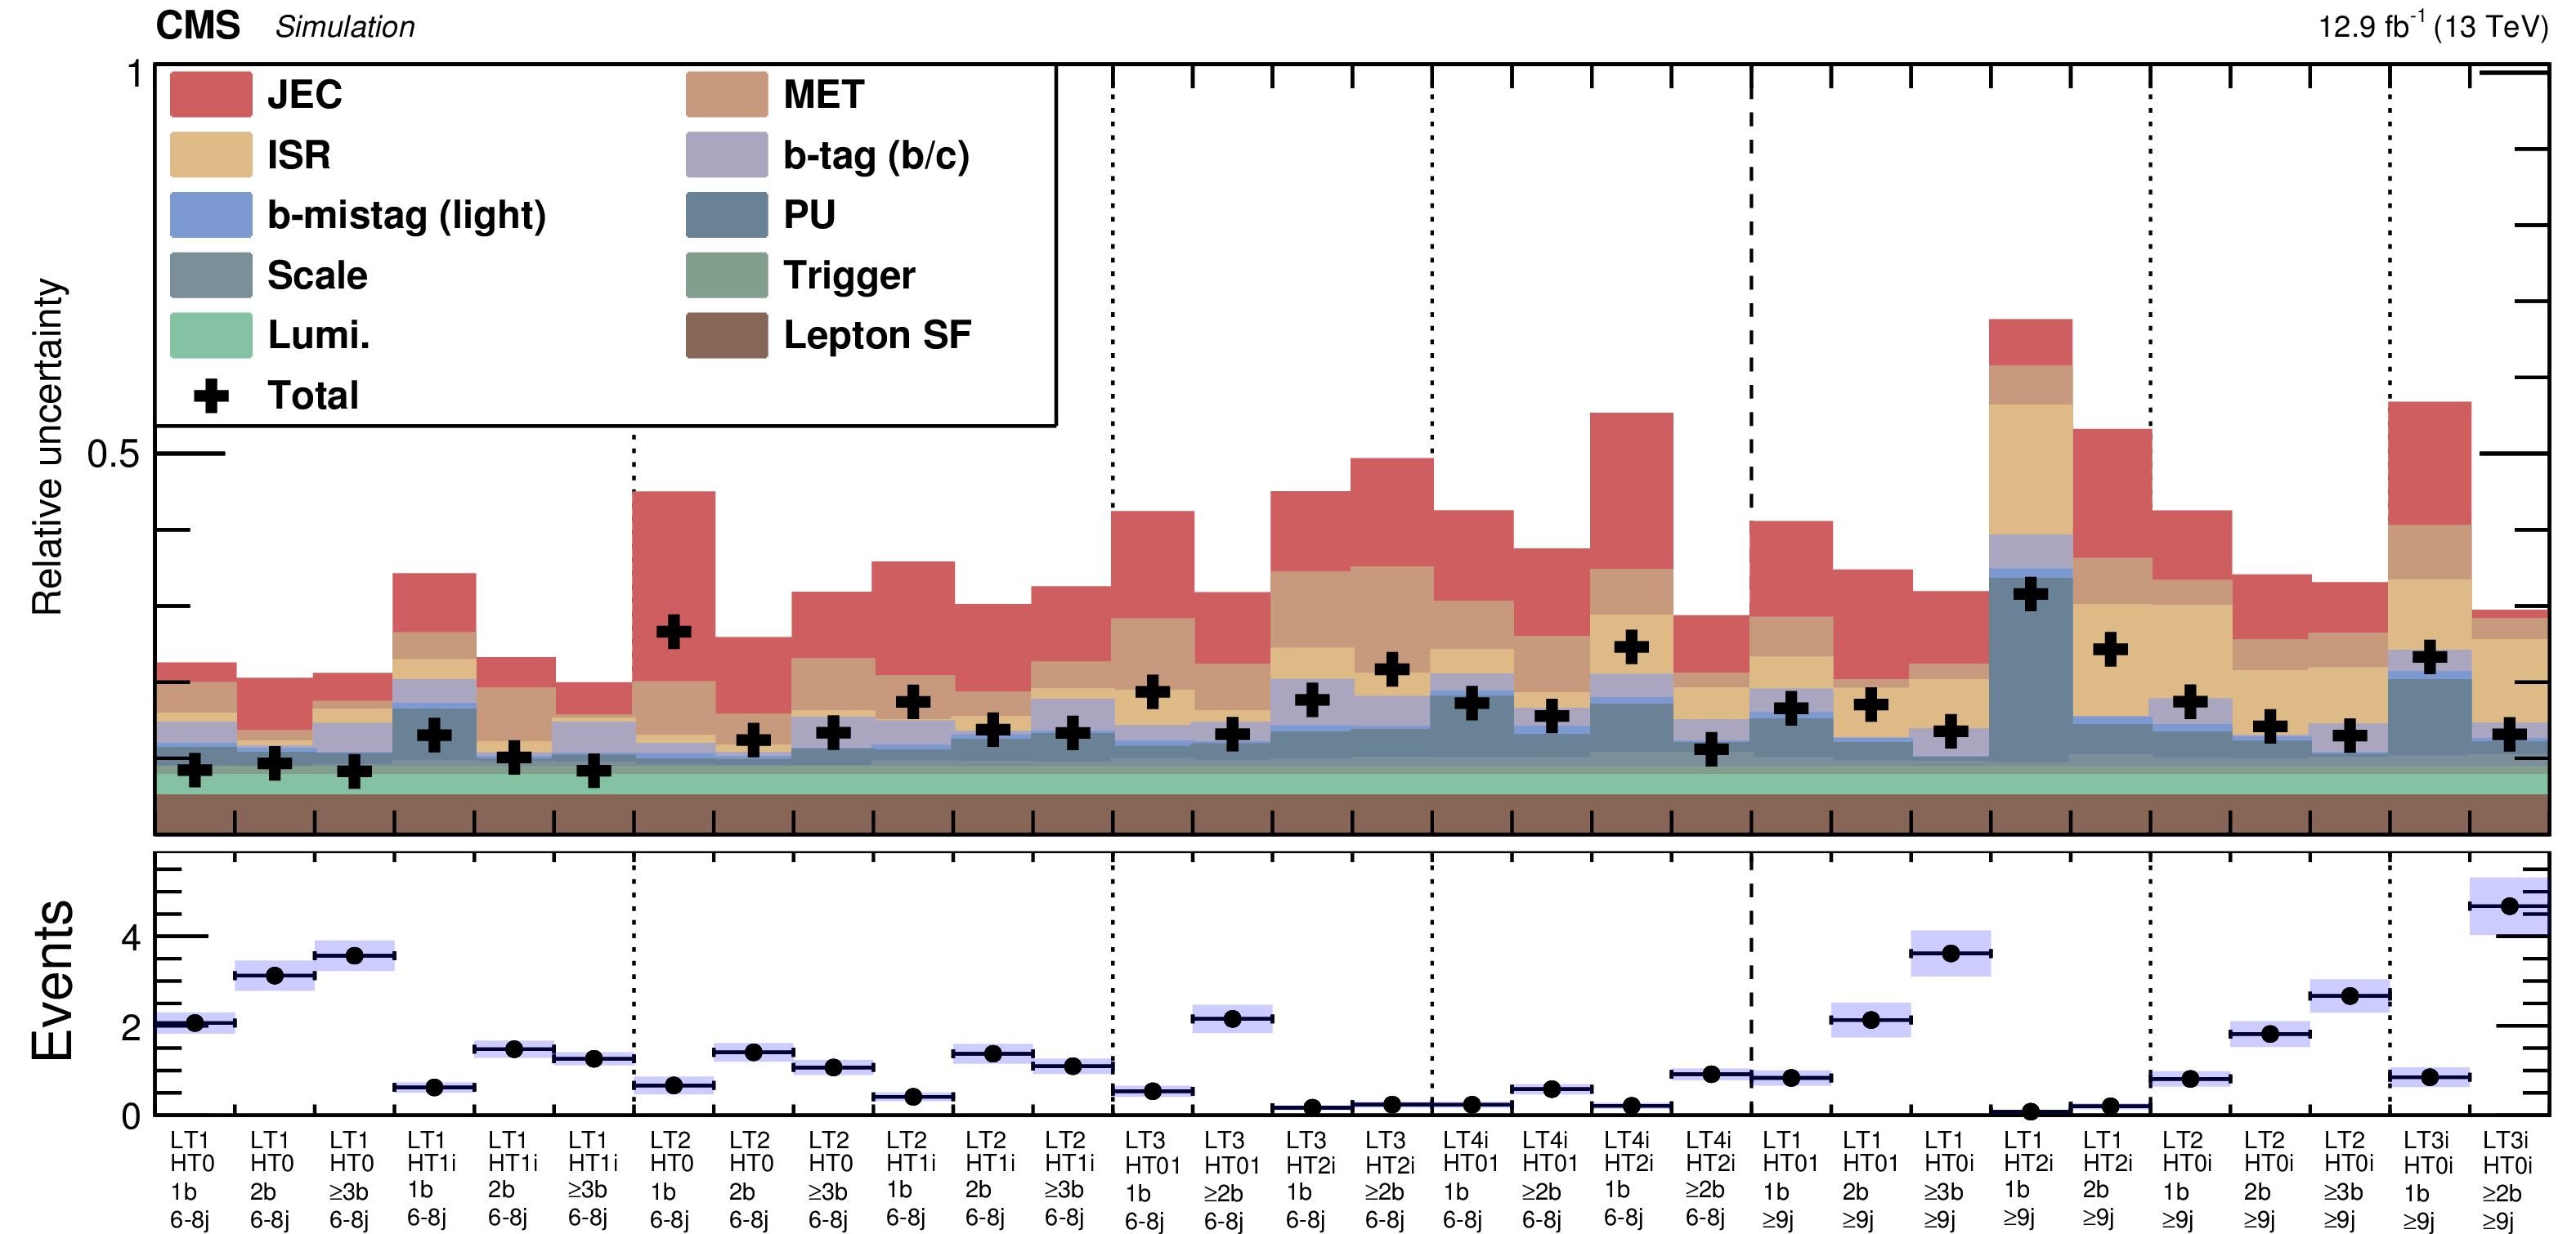
Additional Figure 12:
The systematic uncertainties for all signal regions of the multi-b analysis. The top part of the plot shows the relative uncertainty for an example signal point T1tttt (1.2,0.8) for the different sources of uncertainties. The various uncertainties are stacked linearly on top of each other, while the black crosses represent the square root of the sum of squares. The bottom part of the plot shows the expected number of events with the statistical uncertainty represented by the black line and the sum of statistical and systematic uncertainty shown by the blue area. |
png pdf |
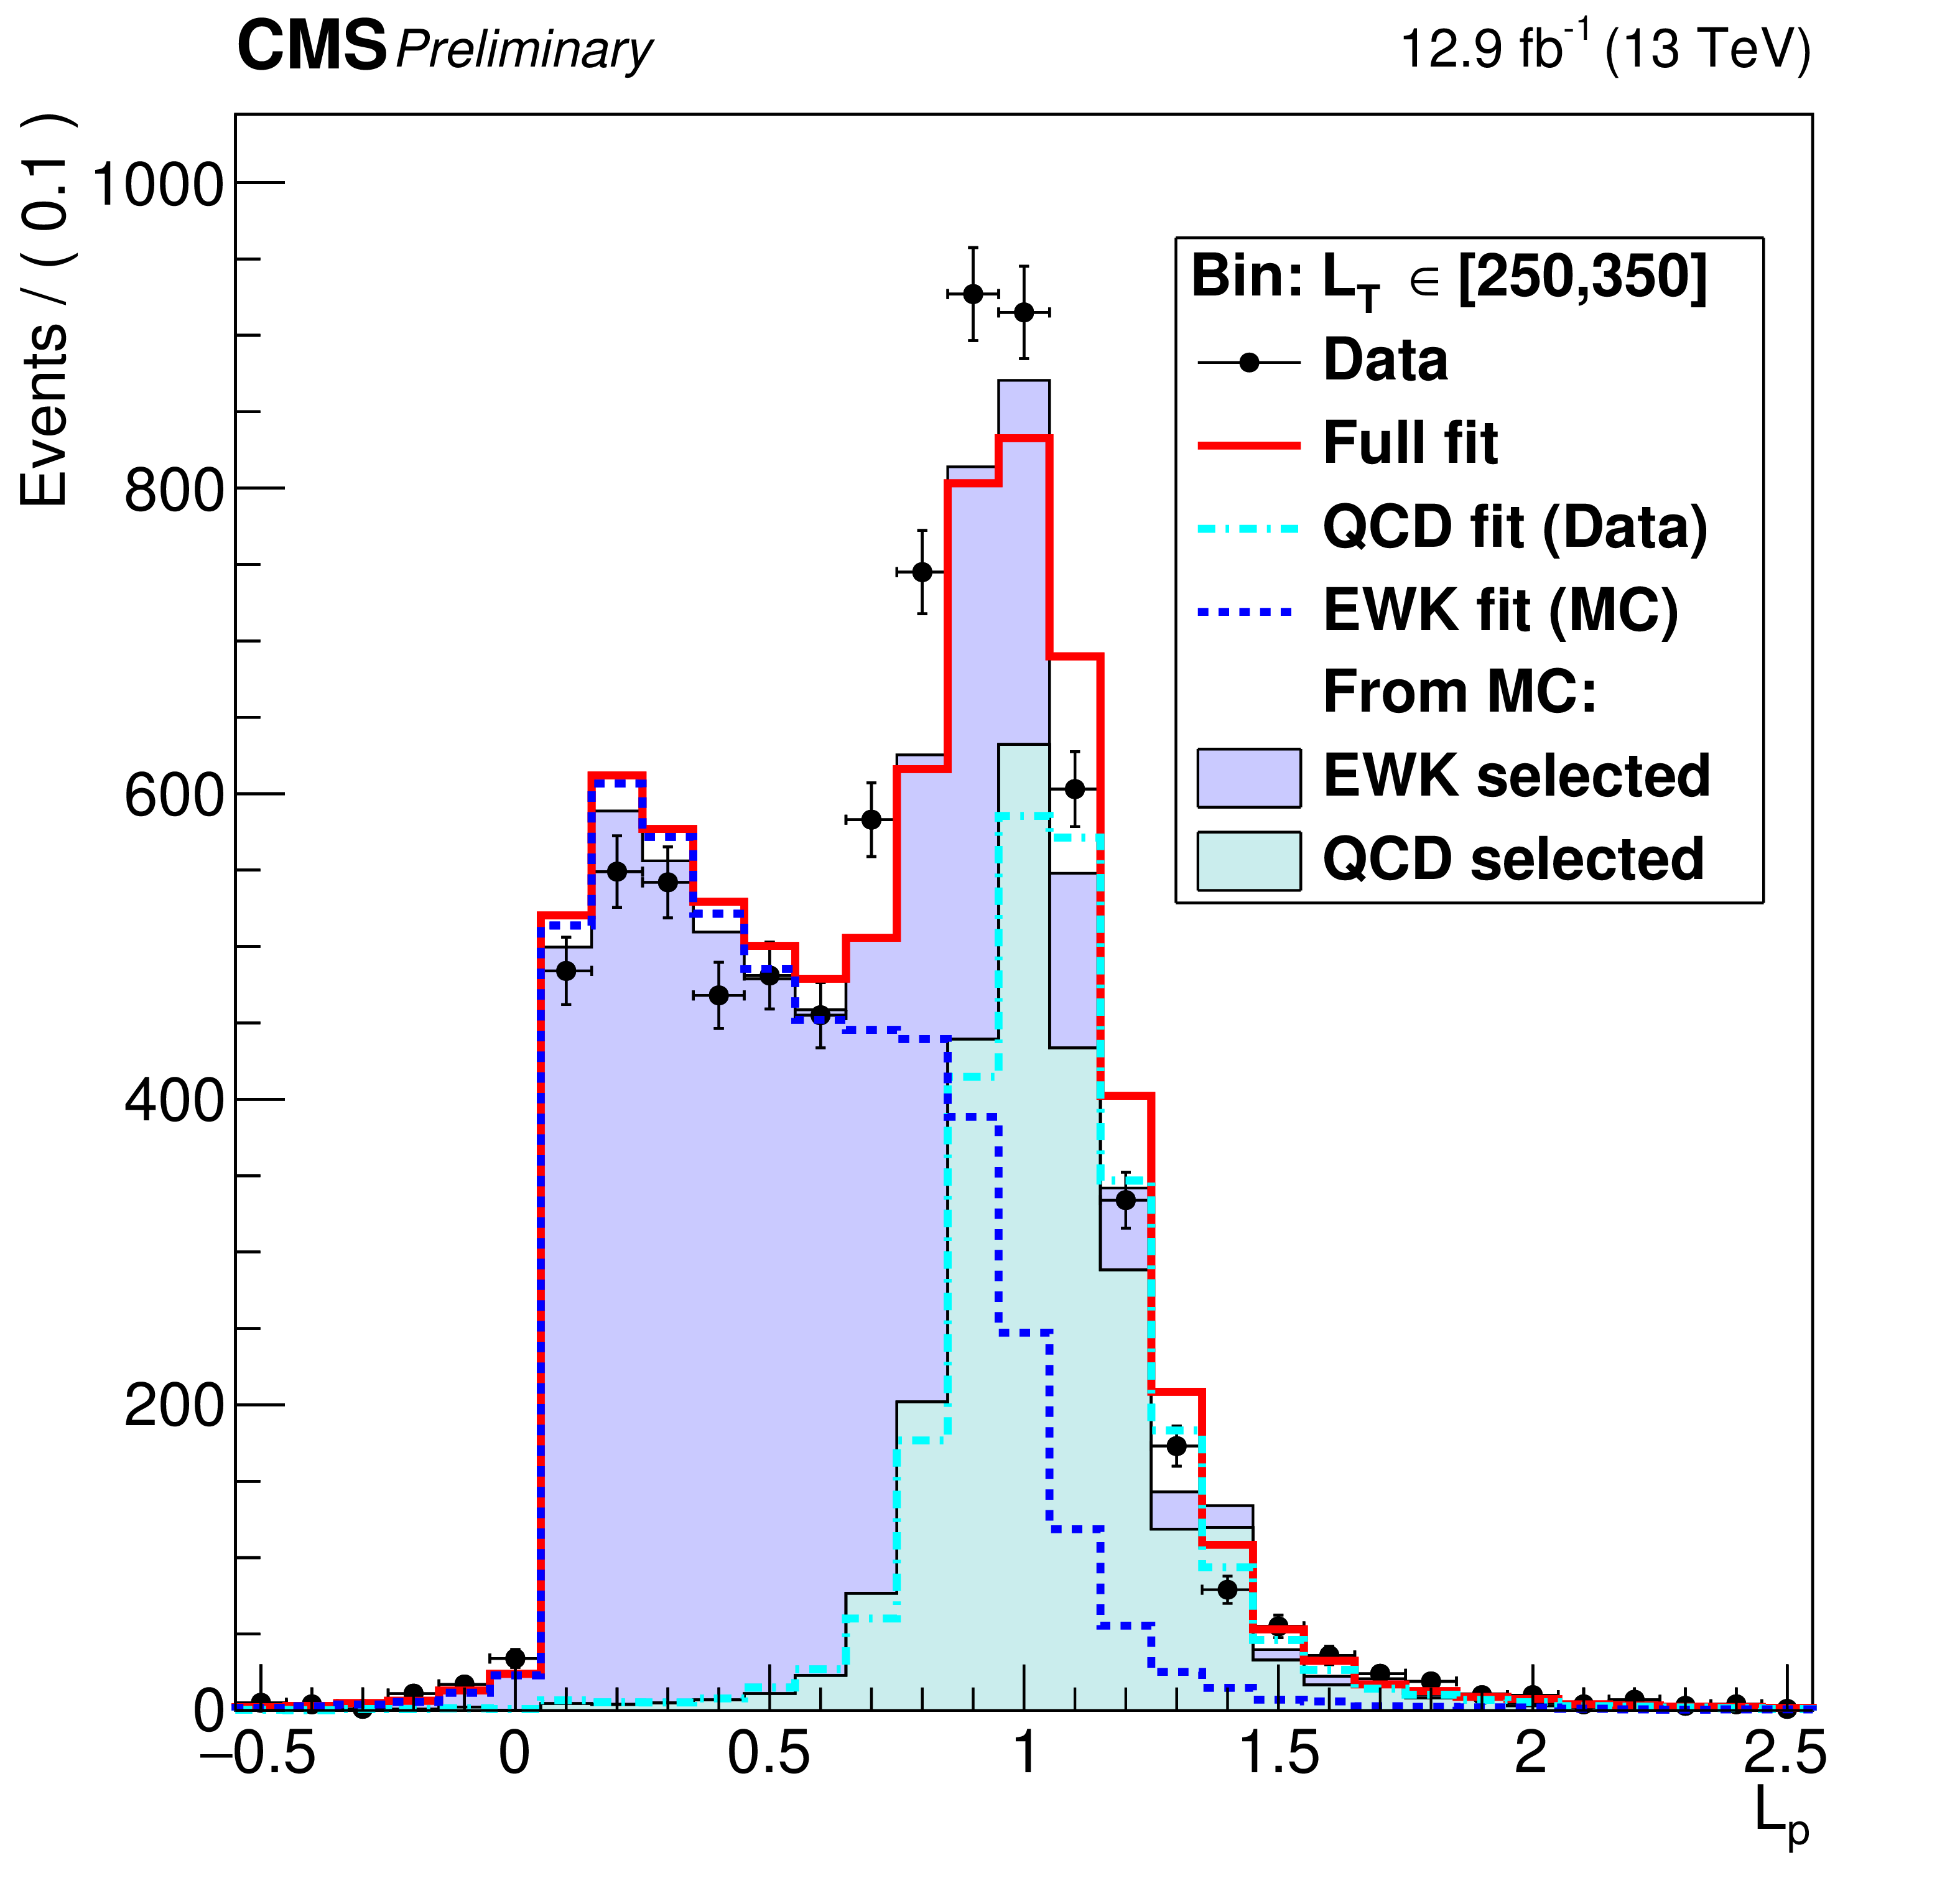
Additional Figure 13:
Fit results for $n_{\text{jet}} \in $ [3, 4], $n_{\text{btag}} =$ 0, and $ L_{\textrm{T}} \in $ [250,350] GeV. The black dots represent data. EWK and QCD selected events from simulation normalized to the luminosity are shown with the blue and cyan filled histograms. The full fit result is shown with the solid red line, while the separate EWK and QCD components are depicted by the blue dashed and cyan dotted-dashed line, respectively. |

png pdf |
Additional Figure 14:
Ratio of selected to anti-selected electron events from QCD for $ {n_\textrm {jet}} \in $ [3, 4], $ {n_\textrm {b-tag}} = $ 0, in bins of $ {L_{\textrm T}} $ in data. The number of selected electrons from QCD events is extracted from the fit of the $ {L_{\textrm P}} $ distribution. |
| Additional Tables | |
png pdf |
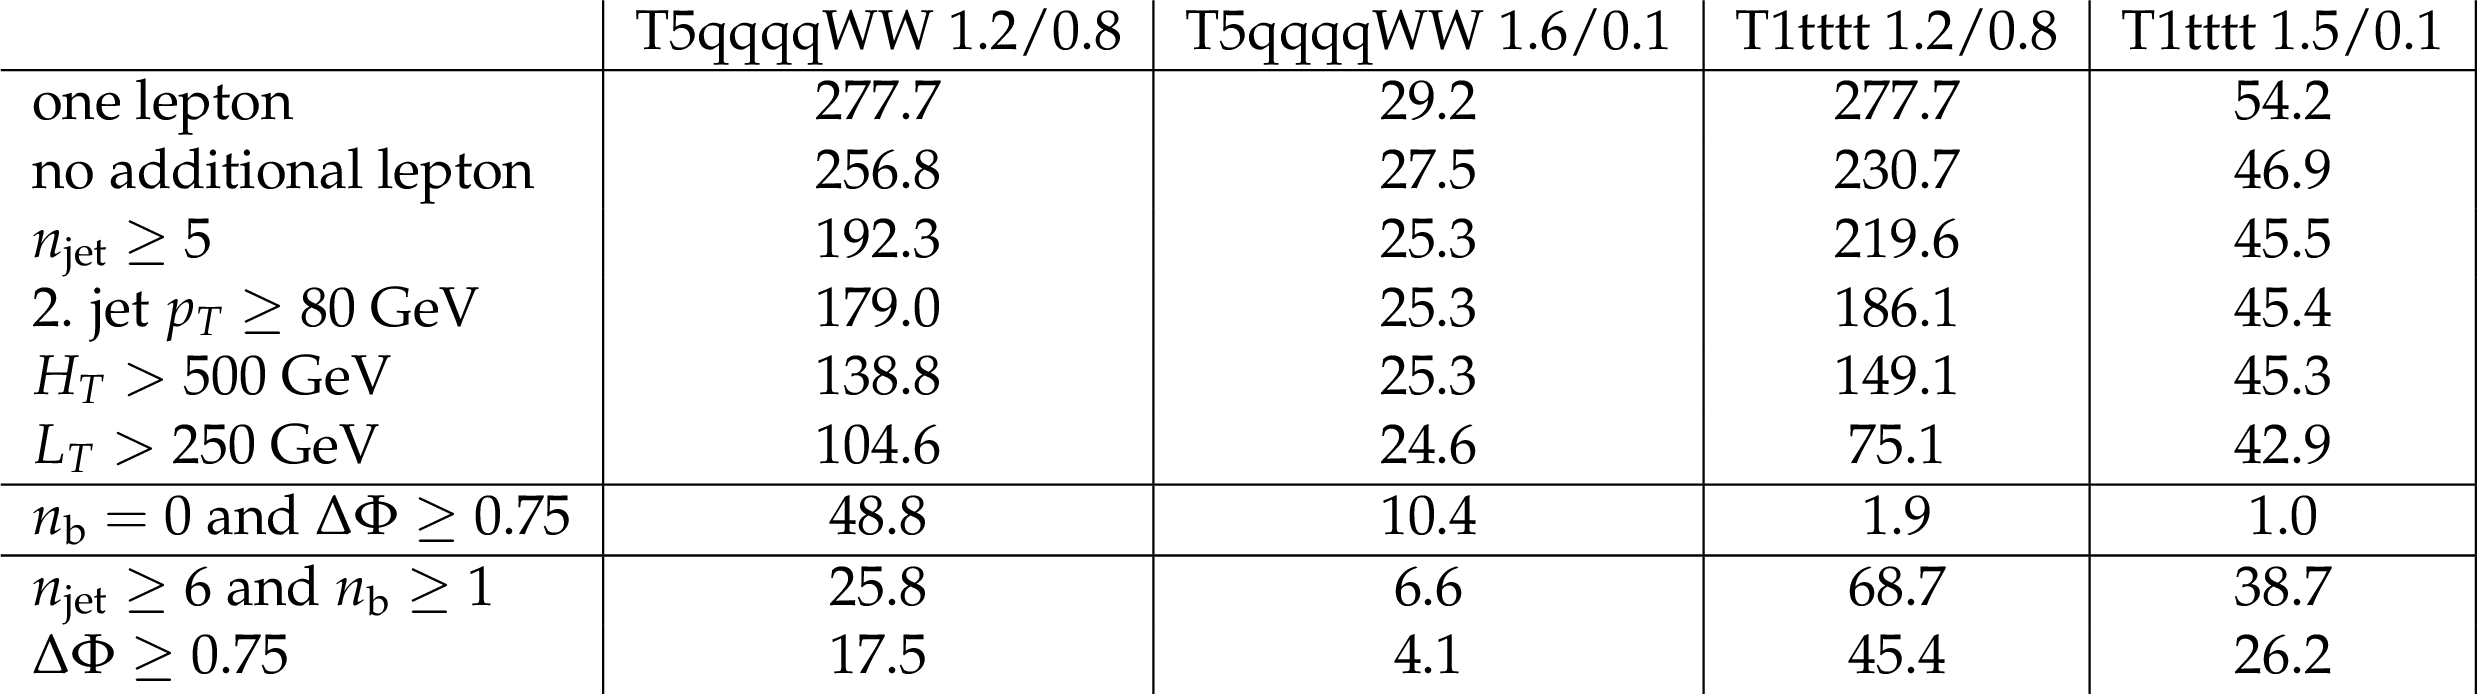
Additional Table 1:
Yields table for 12.9 fb$^{-1}$ for the baseline selections and the two different signal models, with two mass configurations respectively. |
| Additional root files containing the limit curves for T1tttt can be found here and for T5qqqqWW here. |
| References | ||||
| 1 | P. Ramond | Dual theory for free fermions | PRD 3 (1971) 2415 | |
| 2 | Y. A. Golfand and E. P. Likhtman | Extension of the algebra of Poincar$ \'e $ group generators and violation of P invariance | JEPTL 13 (1971)323 | |
| 3 | A. Neveu and J. H. Schwarz | Factorizable dual model of pions | Nucl. Phys. B 31 (1971) 86 | |
| 4 | D. V. Volkov and V. P. Akulov | Possible universal neutrino interaction | JEPTL 16 (1972)438 | |
| 5 | J. Wess and B. Zumino | A Lagrangian model invariant under supergauge transformations | PLB 49 (1974) 52 | |
| 6 | J. Wess and B. Zumino | Supergauge transformations in four dimensions | Nucl. Phys. B 70 (1974) 39 | |
| 7 | P. Fayet | Supergauge invariant extension of the Higgs mechanism and a model for the electron and its neutrino | Nucl. Phys. B 90 (1975) 104 | |
| 8 | H. P. Nilles | Supersymmetry, supergravity and particle physics | Phys. Rep. 110 (1984) 1 | |
| 9 | G. R. Farrar and P. Fayet | Phenomenology of the production, decay, and detection of new hadronic states associated with supersymmetry | Physics Letters B 76 (1978), no. 5, 575 -- 579 | |
| 10 | CMS Collaboration | Search for supersymmetry in events with one lepton in proton-proton collisions at $ \sqrt{s} = $ 13 TeV with the CMS experiment | CMS-PAS-SUS-15-006 | CMS-PAS-SUS-15-006 |
| 11 | CMS Collaboration | Search for supersymmetry in pp collisions at $ \sqrt{s} = $ 7 TeV in events with a single lepton, jets, and missing transverse momentum | EPJC 73 (2013) 2404 | CMS-SUS-12-010 1212.6428 |
| 12 | CMS Collaboration | Search for supersymmetry in final states with a single lepton, b-quark jets, and missing transverse energy in proton-proton collisions at $ \sqrt{s} = $ 7 TeV | PRD 87 (2013) 052006 | CMS-SUS-11-028 1211.3143 |
| 13 | ATLAS Collaboration | Further search for supersymmetry at $ \sqrt{s}=7 $$ TeV $ in final states with jets, missing transverse momentum and isolated leptons with the ATLAS detector | PRD 86 (2012) 092002 | 1208.4688 |
| 14 | CMS Collaboration | Search for supersymmetry in pp collisions at $ \sqrt{s} = $ 8 TeV in events with a single lepton, large jet multiplicity, and multiple b jets | PLB 733 (2014) 328 | CMS-SUS-13-007 1311.4937 |
| 15 | ATLAS Collaboration | Search for squarks and gluinos in events with isolated leptons, jets and missing transverse momentum at $ \sqrt{s}=8 $ TeV with the ATLAS detector | JHEP 04 (2015) 116 | 1501.03555 |
| 16 | ATLAS Collaboration | Search for strong production of supersymmetric particles in final states with missing transverse momentum and at least three b-jets at $ \sqrt{s} $= 8 TeV proton-proton collisions with the ATLAS detector | JHEP 10 (2014) 024 | 1407.0600 |
| 17 | CMS Collaboration | Search for supersymmetry in pp collisions at sqrt(s) = 13 TeV in the single-lepton final state using the sum of masses of large-radius jets | Submitted to JHEP | CMS-SUS-15-007 1605.04608 |
| 18 | ATLAS Collaboration | Search for gluinos in events with an isolated lepton, jets and missing transverse momentum at $ \sqrt{s} $ = 13 TeV with the ATLAS detector | Submitted to EPJC | 1605.04285 |
| 19 | ATLAS Collaboration | Search for pair production of gluinos decaying via stop and sbottom in events with b-jets and large missing transverse momentum in pp collisions at $ \sqrt{s} = 13 $ TeV with the ATLAS detector | 1605.09318 | |
| 20 | N. Arkani-Hamed et al. | MARMOSET: The path from LHC data to the new standard model via on-shell effective theories | hep-ph/0703088 | |
| 21 | J. Alwall, P. Schuster, and N. Toro | Simplified models for a first characterization of new physics at the LHC | PRD 79 (2009) 075020 | 0810.3921 |
| 22 | J. Alwall, M.-P. Le, M. Lisanti, and J. G. Wacker | Model-independent jets plus missing energy searches | PRD 79 (2009) 015005 | 0809.3264 |
| 23 | D. Alves et al. | Simplified models for LHC new physics searches | JPG 39 (2012) 105005 | 1105.2838 |
| 24 | CMS Collaboration | The CMS experiment at the CERN LHC | JINST 3 (2008) S08004 | CMS-00-001 |
| 25 | CMS Collaboration | Description and performance of track and primary-vertex reconstruction with the CMS tracker | JINST 9 (2014) P10009 | CMS-TRK-11-001 1405.6569 |
| 26 | CMS Collaboration | Determination of jet energy calibration and transverse momentum resolution in CMS | JINST 6 (2011) P11002 | CMS-JME-10-011 1107.4277 |
| 27 | CMS Collaboration | Performance of electron reconstruction and selection with the CMS detector in proton-proton collisions at $ \sqrt{s} = 8 $$ TeV $ | JINST 10 (2015) P06005 | CMS-EGM-13-001 1502.02701 |
| 28 | CMS Collaboration | Performance of CMS muon reconstruction in pp collision events at $ \sqrt{s} = 7 $$ TeV $ | JINST 7 (2012) P10002 | CMS-MUO-10-004 1206.4071 |
| 29 | CMS Collaboration | Particle-flow event reconstruction in CMS and performance for jets, taus, and $ E_{\mathrm{T}}^{\text{miss}} $ | CDS | |
| 30 | CMS Collaboration | Commissioning of the particle-flow event with the first LHC collisions recorded in the CMS detector | CDS | |
| 31 | M. Cacciari and G. P. Salam | Pileup subtraction using jet areas | PLB 659 (2008) 119 | 0707.1378 |
| 32 | CMS Collaboration | Identification of $ \mathrm{b }-quark $ jets with the CMS experiment | JINST 8 (2013) P04013 | CMS-BTV-12-001 1211.4462 |
| 33 | CMS Collaboration | Identification of b quark jets at the CMS Experiment in the LHC Run 2 | CMS-PAS-BTV-15-001 | CMS-PAS-BTV-15-001 |
| 34 | CMS Collaboration | Performance of $ \mathrm{b } $ tagging at $ \sqrt{s} = $ 8 TeV in multijet, $ \mathrm{ t \bar{t} } $ and boosted topology events | CMS-PAS-BTV-13-001 | CMS-PAS-BTV-13-001 |
| 35 | J. Alwall et al. | MadGraph5: going beyond | JHEP 06 (2011) 128 | 1106.0522 |
| 36 | NNPDF Collaboration | Parton distributions for the LHC Run II | JHEP 04 (2015) 040 | 1410.8849 |
| 37 | P. Nason | A new method for combining NLO QCD with shower Monte Carlo algorithms | JHEP 11 (2004) 040 | hep-ph/0409146 |
| 38 | S. Frixione, P. Nason, and C. Oleari | Matching NLO QCD computations with parton shower simulations: the POWHEG method | JHEP 11 (2007) 070 | 0709.2092 |
| 39 | S. Alioli, P. Nason, C. Oleari, and E. Re | A general framework for implementing NLO calculations in shower Monte Carlo programs: the POWHEG BOX | JHEP 06 (2010) 043 | 1002.2581 |
| 40 | S. Alioli, P. Nason, C. Oleari, and E. Re | NLO single-top production matched with shower in POWHEG: $ s $- and $ t $-channel contributions | JHEP 09 (2009) 111, , [Erratum: JHEP \bf 02 (2010) 011] | 0907.4076 |
| 41 | E. Re | Single-top Wt-channel production matched with parton showers using the POWHEG method | EPJC 71 (2011) 1547 | 1009.2450 |
| 42 | J. Alwall et al. | The automated computation of tree-level and next-to-leading order differential cross sections, and their matching to parton shower simulations | JHEP 07 (2014) 079 | 1405.0301 |
| 43 | T. Sj\"ostrand et al. | An Introduction to PYTHIA 8.2 | CPC 191 (2015) 159 | 1410.3012 |
| 44 | W. Beenakker, R. H\"opker, M. Spira, and P. M. Zerwas | Squark and gluino production at hadron colliders | Nucl. Phys. B 492 (1997) 51 | hep-ph/9610490 |
| 45 | A. Kulesza and L. Motyka | Threshold resummation for squark-antisquark and gluino-pair production at the LHC | PRL 102 (2009) 111802 | 0807.2405 |
| 46 | A. Kulesza and L. Motyka | Soft gluon resummation for the production of gluino-gluino and squark-antisquark pairs at the LHC | PRD 80 (2009) 095004 | 0905.4749 |
| 47 | W. Beenakker et al. | Soft-gluon resummation for squark and gluino hadroproduction | JHEP 12 (2009) 041 | 0909.4418 |
| 48 | W. Beenakker et al. | Squark and gluino hadroproduction | Int. J. Mod. Phys. A 26 (2011) 2637 | 1105.1110 |
| 49 | S. Agostinelli et al. | GEANT4 --- a simulation toolkit | Nucl. Instr. and Meth. A 506 (2003) 250 | |
| 50 | CMS Collaboration | The Fast Simulation of the CMS Detector at LHC | Technical Report 3, CERN | |
| 51 | CMS Collaboration | Measurement of the Polarization of W Bosons with Large Transverse Momenta in W+Jets Events at the LHC | PRL 107 (2011) 021802 | CMS-EWK-10-014 1104.3829 |
| 52 | ATLAS Collaboration | Measurement of the Inelastic Proton-Proton Cross Section at $ \sqrt{s} = 13 $ TeV with the ATLAS Detector at the LHC | Submitted to PRL | 1606.02625 |
| 53 | CMS Collaboration | CMS Luminosity Measurement for the 2015 Data Taking Period | CMS-PAS-LUM-15-001 | CMS-PAS-LUM-15-001 |
| 54 | CMS Collaboration | Measurement of the differential cross section for top quark pair production in pp collisions at $ \sqrt{s} = $ 8 TeV | EPJC75 (2015), no. 11, 542 | CMS-TOP-12-028 1505.04480 |
| 55 | Z. Bern et al. | Left-Handed W Bosons at the LHC | PRD84 (2011) 034008 | 1103.5445 |
| 56 | CMS Collaboration | Angular coefficients of Z bosons produced in pp collisions at $ \sqrt{s} = $ 8 TeV and decaying to $ \mu^+ \mu^- $ as a function of transverse momentum and rapidity | PLB 750 (2015) 154 | CMS-SMP-13-010 1504.03512 |
| 57 | ATLAS Collaboration | Measurement of the polarisation of W bosons produced with large transverse momentum in pp collisions at $ \sqrt{s}=7 $ TeV with the ATLAS experiment | EPJC 72 (2012) 2001 | 1203.2165 |
| 58 | G. Cowan, K. Cranmer, E. Gross, and O. Vitells | Asymptotic formulae for likelihood-based tests of new physics | EPJC 71 (2011) 1554, , [Erratum: Eur. Phys. J. C \bf 73 (2013) 2501] | 1007.1727 |
| 59 | T. Junk | Confidence level computation for combining searches with small statistics | Nucl. Instr. and Meth. A 434 (1999) 435 | hep-ex/9902006 |
| 60 | A. L. Read | Presentation of search results: the $ {CL}_s $ technique | JPG 28 (2002) 2693 | |
|
|
Compact Muon Solenoid LHC, CERN |
|

|

|

|

|

|