

Compact Muon Solenoid
LHC, CERN
| CMS-BPH-14-009 ; CERN-EP-2020-075 | ||
| Investigation into the event-activity dependence of $\Upsilon(\text{nS})$ relative production in proton-proton collisions at $\sqrt{s} = $ 7 TeV | ||
| CMS Collaboration | ||
| 9 July 2020 | ||
| JHEP 11 (2020) 001 | ||
| Abstract: The ratios of the production cross sections between the excited $\Upsilon\text{(2S)}$ and $\Upsilon\text{(3S)}$ mesons and the $\Upsilon\text{(1S)}$ ground state, detected via their decay into two muons, are studied as a function of the number of charged particles in the event. The data are from proton-proton collisions at $\sqrt{s} = $ 7 TeV, corresponding to an integrated luminosity of 4.8 fb$^{-1}$, collected with the CMS detector at the LHC. Evidence of a decrease in these ratios as a function of the particle multiplicity is observed, more pronounced at low transverse momentum ${{p_{\mathrm{T}}}^{\mu\mu}} $. For $\Upsilon(\text{nS})$ mesons with ${{p_{\mathrm{T}}}^{\mu\mu}} > $ 7 GeV, where most of the data were collected, the correlation with multiplicity is studied as a function of the underlying event transverse sphericity and the number of particles in a cone around the $\Upsilon(\text{nS})$ direction. The ratios are found to be multiplicity independent for jet-like events. The mean ${{p_{\mathrm{T}}}^{\mu\mu}} $ values for the $\Upsilon(\text{nS})$ states as a function of particle multiplicity are also measured and found to grow more steeply as their mass increases. | ||
| Links: e-print arXiv:2007.04277 [hep-ex] (PDF) ; CDS record ; inSPIRE record ; HepData record ; CADI line (restricted) ; | ||
| Figures | |

png pdf |
Figure 1:
The $\mu^{+} \mu^{-}$ invariant mass distributions for dimuon candidates with $ {{p_{\mathrm {T}}} ^{\mu \mu}} > $ 7 GeV and $ {{| y^{\mu \mu} |}} < $ 1.2, in two intervals of charged particle multiplicity, 0-6 (left) and 110-140 (right). The result of the fit is shown by the solid lines, with the various dotted lines giving the different components. The lower panel displays the pull distribution. |

png pdf |
Figure 1-a:
The $\mu^{+} \mu^{-}$ invariant mass distributions for dimuon candidates with $ {{p_{\mathrm {T}}} ^{\mu \mu}} > $ 7 GeV and $ {{| y^{\mu \mu} |}} < $ 1.2, in the 0-6 interval of charged particle multiplicity. The result of the fit is shown by the solid lines, with the various dotted lines giving the different components. The lower panel displays the pull distribution. |

png pdf |
Figure 1-b:
The $\mu^{+} \mu^{-}$ invariant mass distributions for dimuon candidates with $ {{p_{\mathrm {T}}} ^{\mu \mu}} > $ 7 GeV and $ {{| y^{\mu \mu} |}} < $ 1.2, in the 110-140 interval of charged particle multiplicity. The result of the fit is shown by the solid lines, with the various dotted lines giving the different components. The lower panel displays the pull distribution. |

png pdf |
Figure 2:
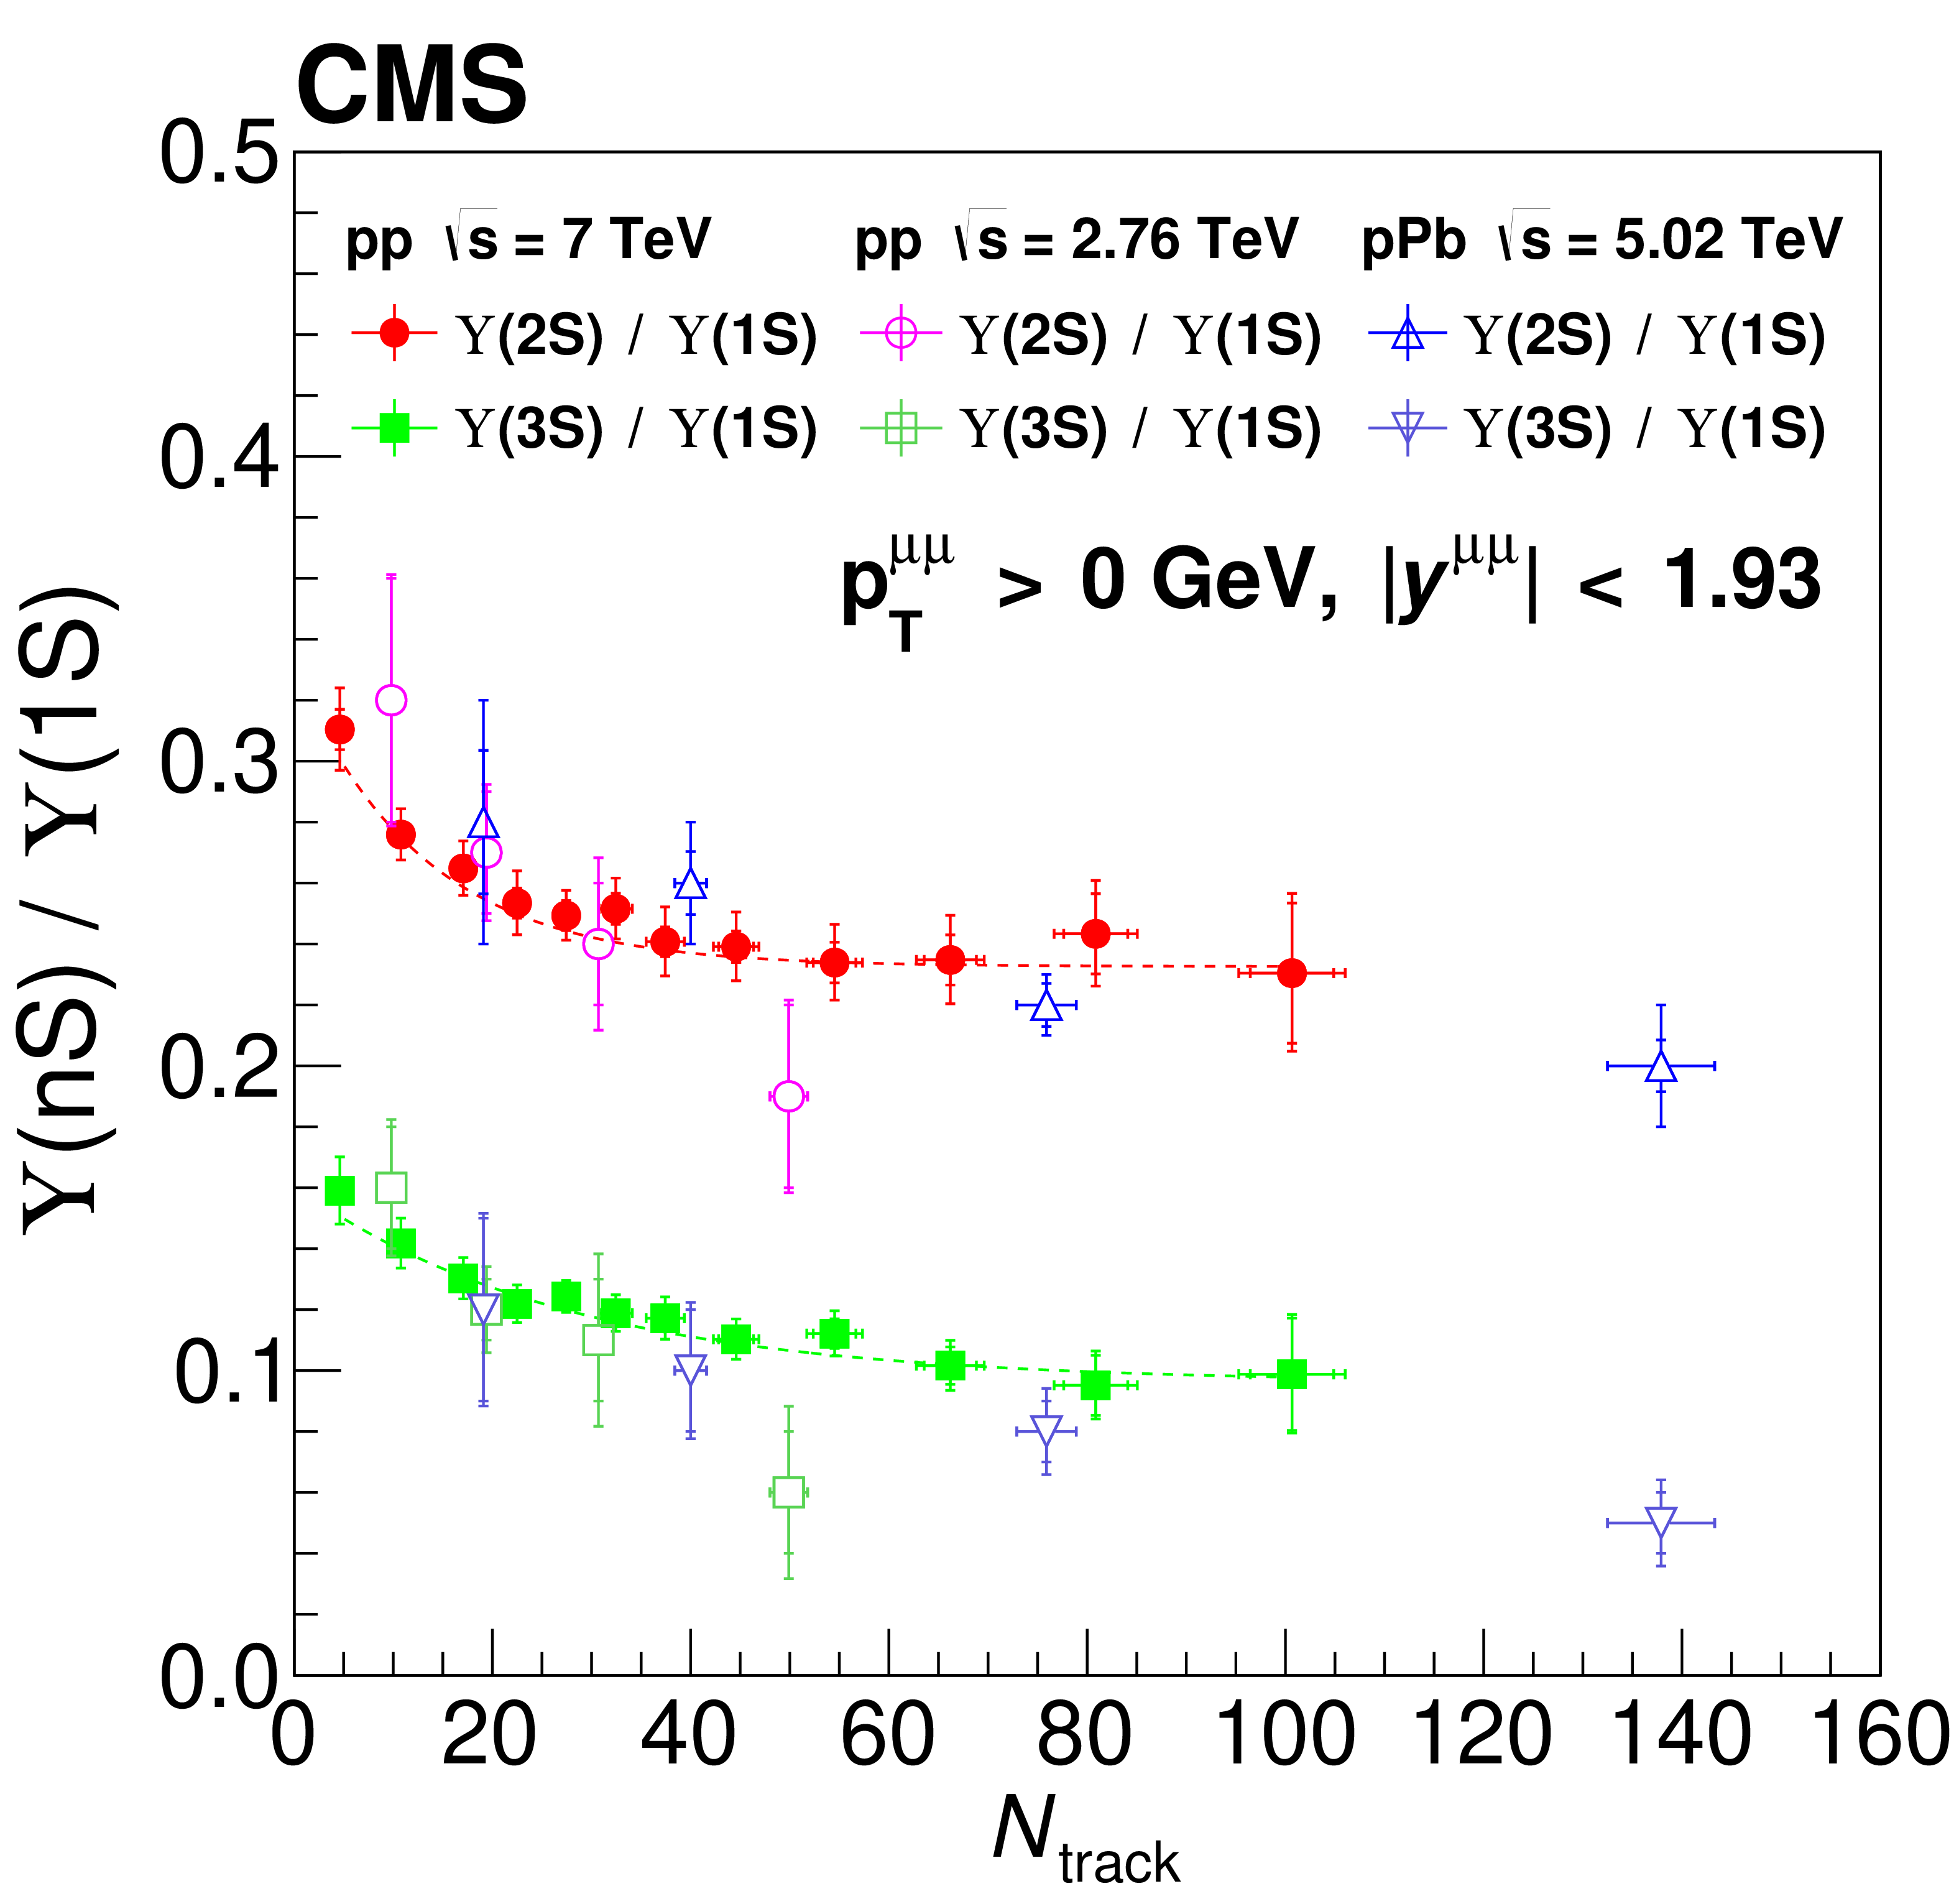
The ratios ${\Upsilon(\text{2S})/\Upsilon(\text{1S})}$ and ${\Upsilon(\text{3S})/\Upsilon(\text{1S})}$ with $ {{p_{\mathrm {T}}} ^{\mu \mu}} > $ 7 GeV (left) and $ {{p_{\mathrm {T}}} ^{\mu \mu}} > $ 0 GeV (right) as a function of ${N_{\text {track}}}$. The lines are fits to the data with an exponential function. The outer vertical bars represent the combined statistical and systematic uncertainties in the ratios, while the horizontal bars give the uncertainty in $ {<} N_{\text {track}} {>} $ in each bin. Inner tick marks show only the statistical uncertainty, both in the ratio and in $ {<} N_{\text {track}} {>} $. The results of Ref. [7] are shown in the right plot for comparison, and a small correction is applied to the present results to account for the different rapidity ranges in the measurements, $ {{| y^{\mu \mu} |}} < $ 1.20 here and $ {{| y^{\mu \mu} |}} < $ 1.93 in Ref. [7]. |

png pdf |
Figure 2-a:
The ratios ${\Upsilon(\text{2S})/\Upsilon(\text{1S})}$ and ${\Upsilon(\text{3S})/\Upsilon(\text{1S})}$ with $ {{p_{\mathrm {T}}} ^{\mu \mu}} > $ 7 GeV $ {{p_{\mathrm {T}}} ^{\mu \mu}} > $ 0 GeV as a function of ${N_{\text {track}}}$. The lines are fits to the data with an exponential function. The outer vertical bars represent the combined statistical and systematic uncertainties in the ratios, while the horizontal bars give the uncertainty in $ {<} N_{\text {track}} {>} $ in each bin. Inner tick marks show only the statistical uncertainty, both in the ratio and in $ {<} N_{\text {track}} {>} $. The results of Ref. [7] are shown in the right plot for comparison, and a small correction is applied to the present results to account for the different rapidity ranges in the measurements, $ {{| y^{\mu \mu} |}} < $ 1.20 here and $ {{| y^{\mu \mu} |}} < $ 1.93 in Ref. [7]. |
png pdf |
Figure 2-b:
The ratios ${\Upsilon(\text{2S})/\Upsilon(\text{1S})}$ and ${\Upsilon(\text{3S})/\Upsilon(\text{1S})}$ with $ {{p_{\mathrm {T}}} ^{\mu \mu}} > $ 7 GeV $ {{p_{\mathrm {T}}} ^{\mu \mu}} > $ 0 GeV as a function of ${N_{\text {track}}}$. The lines are fits to the data with an exponential function. The outer vertical bars represent the combined statistical and systematic uncertainties in the ratios, while the horizontal bars give the uncertainty in $ {<} N_{\text {track}} {>} $ in each bin. Inner tick marks show only the statistical uncertainty, both in the ratio and in $ {<} N_{\text {track}} {>} $. The results of Ref. [7] are shown in the right plot for comparison, and a small correction is applied to the present results to account for the different rapidity ranges in the measurements, $ {{| y^{\mu \mu} |}} < $ 1.20 here and $ {{| y^{\mu \mu} |}} < $ 1.93 in Ref. [7]. |

png pdf |
Figure 3:
Mean ${{p_{\mathrm {T}}} ^{\mu \mu}}$ values for the three $\Upsilon(\text{nS})$ states as a function of ${N_{\text {track}}}$ for $ {{p_{\mathrm {T}}} ^{\mu \mu}} > $ 7 GeV (left) and $ > $ 0 GeV (right). The outer vertical bars represent the combined statistical and systematic uncertainties in the ratios, while the horizontal bars give the uncertainty in $ {<} N_{\text {track}} {>} $ in each bin. Inner tick marks show only the statistical uncertainty, both in the ratio and in $ {<} N_{\text {track}} {>} $. |

png pdf |
Figure 3-a:
Mean ${{p_{\mathrm {T}}} ^{\mu \mu}}$ values for the three $\Upsilon(\text{nS})$ states as a function of ${N_{\text {track}}}$ for $ {{p_{\mathrm {T}}} ^{\mu \mu}} > $ 7 GeV. The outer vertical bars represent the combined statistical and systematic uncertainties in the ratios, while the horizontal bars give the uncertainty in $ {<} N_{\text {track}} {>} $ in each bin. Inner tick marks show only the statistical uncertainty, both in the ratio and in $ {<} N_{\text {track}} {>} $. |

png pdf |
Figure 3-b:
Mean ${{p_{\mathrm {T}}} ^{\mu \mu}}$ values for the three $\Upsilon(\text{nS})$ states as a function of ${N_{\text {track}}}$ for $ {{p_{\mathrm {T}}} ^{\mu \mu}} > $ 0 GeV. The outer vertical bars represent the combined statistical and systematic uncertainties in the ratios, while the horizontal bars give the uncertainty in $ {<} N_{\text {track}} {>} $ in each bin. Inner tick marks show only the statistical uncertainty, both in the ratio and in $ {<} N_{\text {track}} {>} $. |

png pdf |
Figure 4:
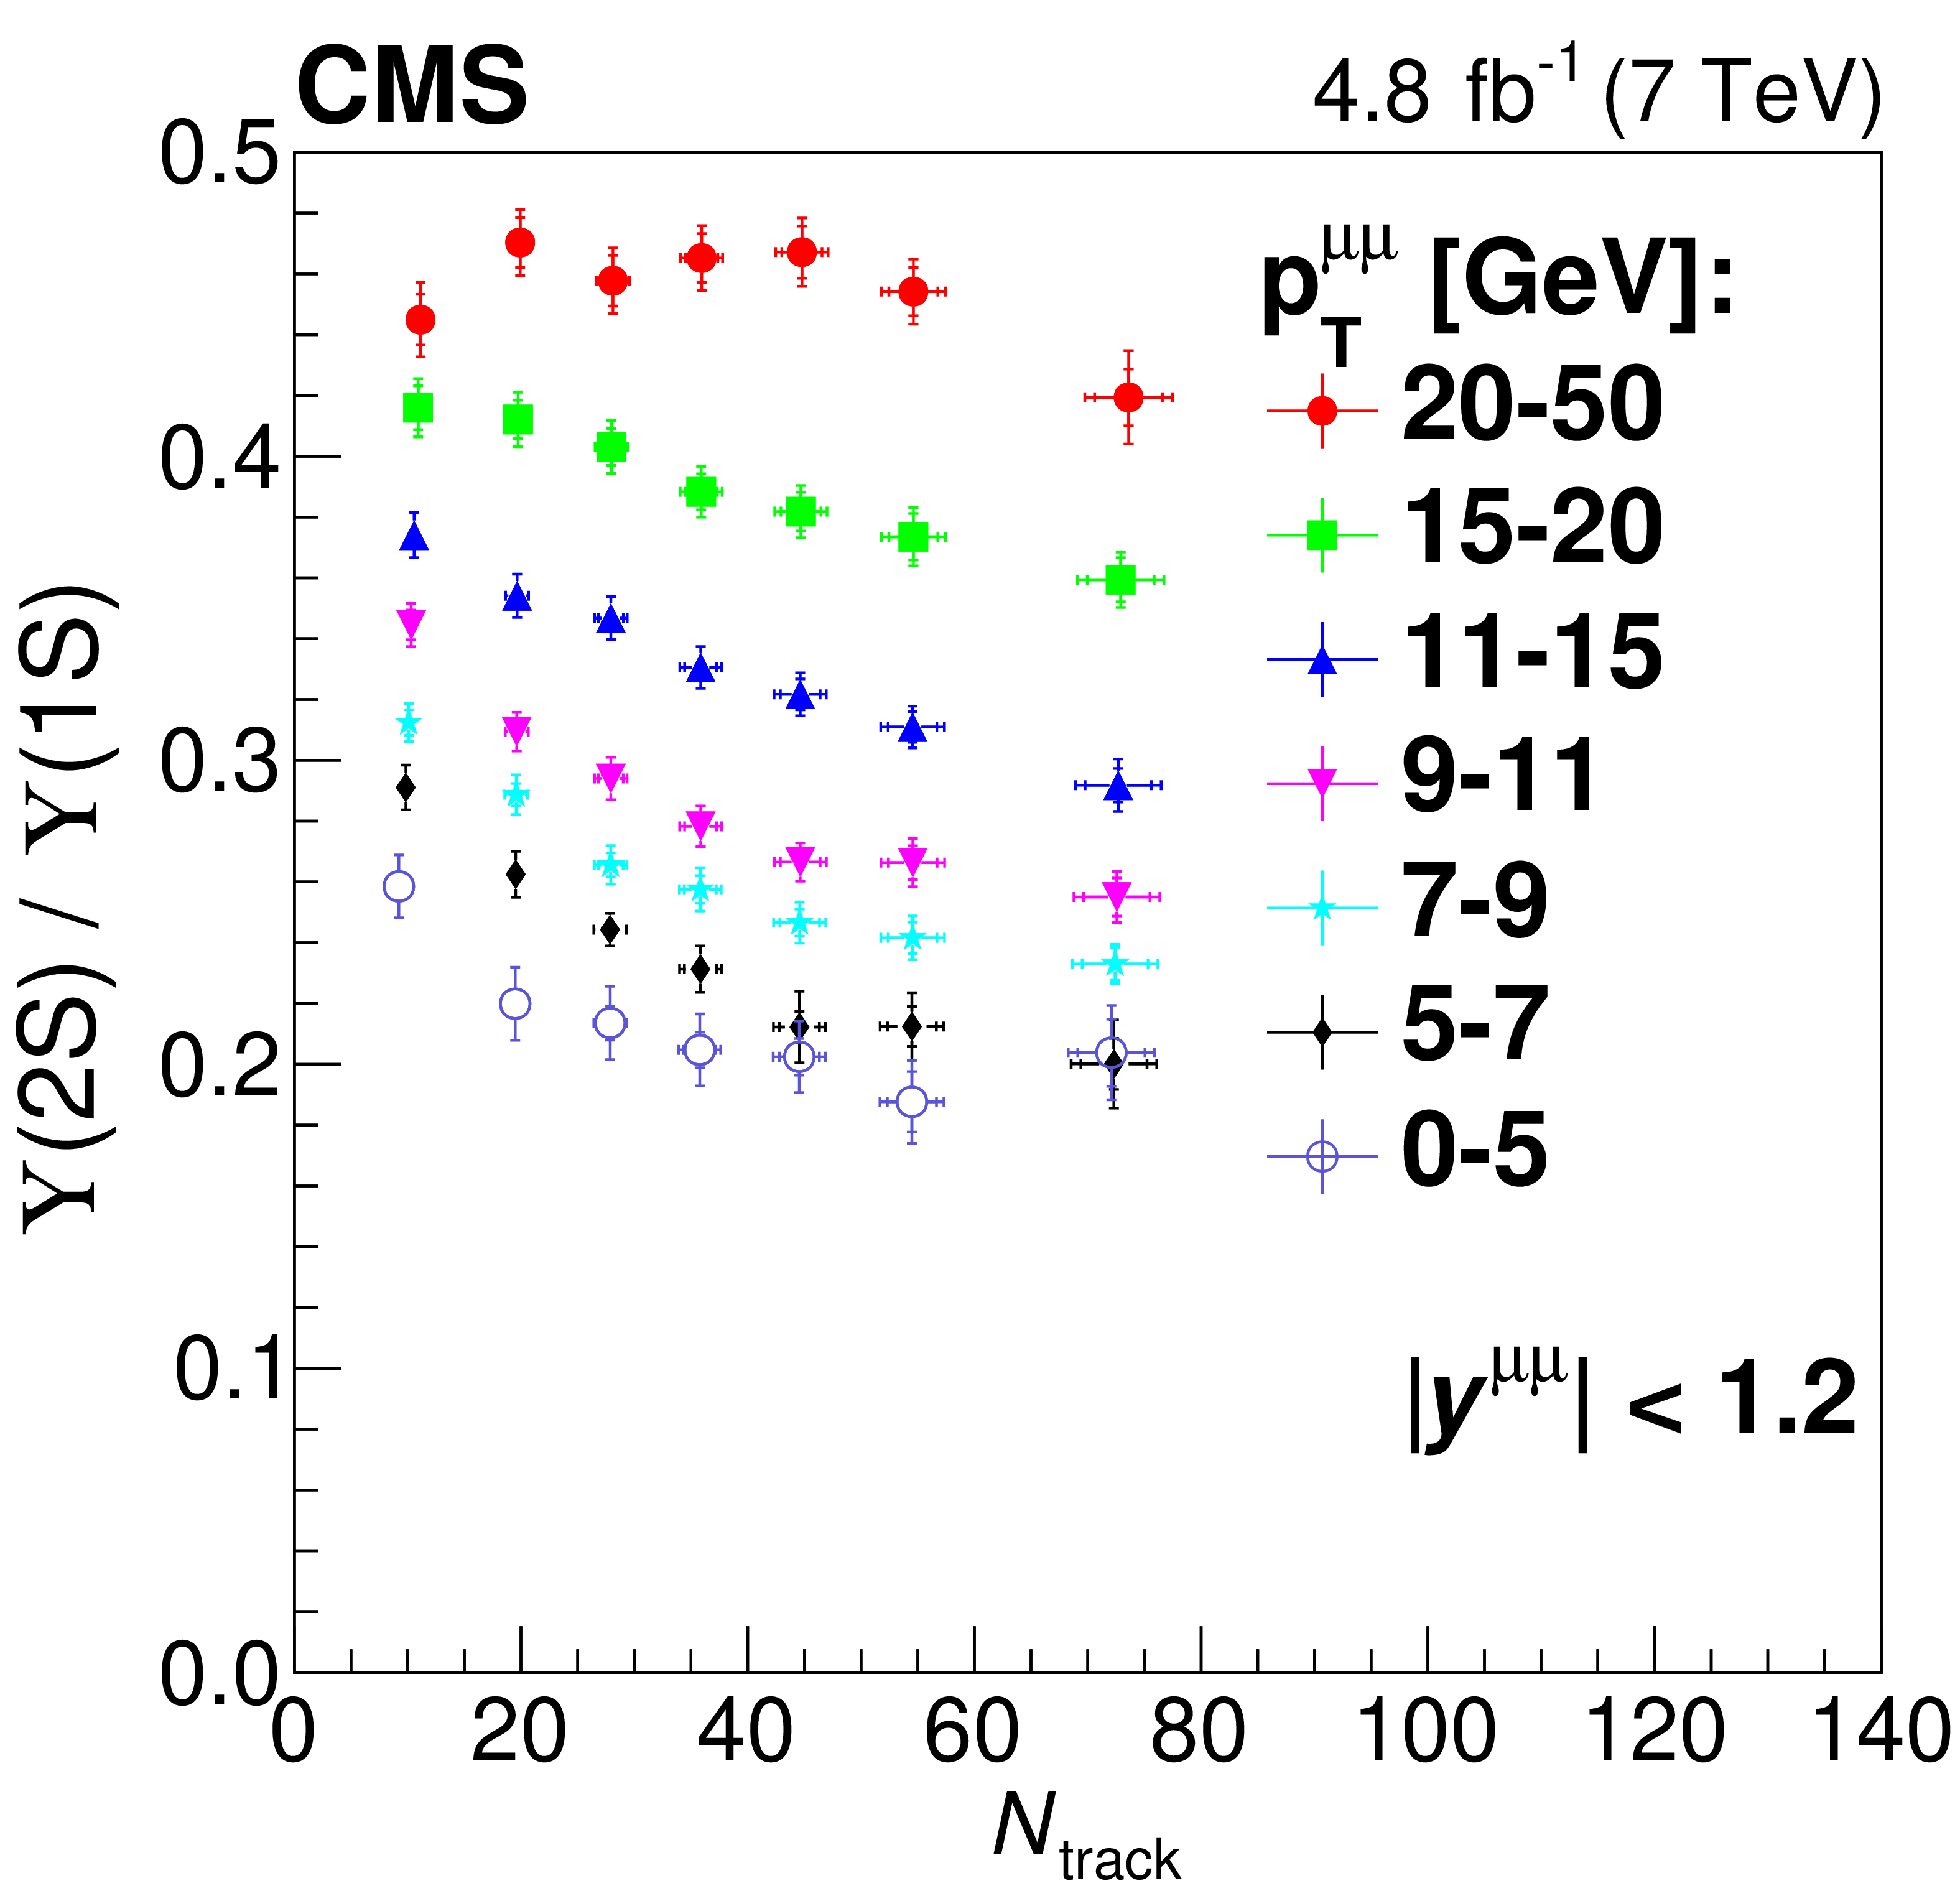
The ratios ${\Upsilon(\text{2S})/\Upsilon(\text{1S})}$ (left) and ${\Upsilon(\text{3S})/\Upsilon(\text{1S})}$ (right) as a function of ${N_{\text {track}}}$, for different ${{p_{\mathrm {T}}} ^{\mu \mu}}$ intervals. The interval 0-5 GeV corresponds to an integrated luminosity of 0.3 fb$^{-1}$, the interval 5-7 GeV to 1.9 fb$^{-1}$, and the rest to the full integrated luminosity of 4.8 fb$^{-1}$. The outer vertical bars represent the combined statistical and systematic uncertainties in the ratios, while the horizontal bars give the uncertainty in $ {<} N_{\text {track}} {>} $ in each bin. Inner tick marks show only the statistical uncertainty, both in the ratio and in $ {<} N_{\text {track}} {>} $. |
png pdf |
Figure 4-a:
The ratio ${\Upsilon(\text{2S})/\Upsilon(\text{1S})}$ as a function of ${N_{\text {track}}}$, for different ${{p_{\mathrm {T}}} ^{\mu \mu}}$ intervals. The interval 0-5 GeV corresponds to an integrated luminosity of 0.3 fb$^{-1}$, the interval 5-7 GeV to 1.9 fb$^{-1}$, and the rest to the full integrated luminosity of 4.8 fb$^{-1}$. The outer vertical bars represent the combined statistical and systematic uncertainties in the ratios, while the horizontal bars give the uncertainty in $ {<} N_{\text {track}} {>} $ in each bin. Inner tick marks show only the statistical uncertainty, both in the ratio and in $ {<} N_{\text {track}} {>} $. |

png pdf |
Figure 4-b:
The ratio ${\Upsilon(\text{3S})/\Upsilon(\text{1S})}$ as a function of ${N_{\text {track}}}$, for different ${{p_{\mathrm {T}}} ^{\mu \mu}}$ intervals. The interval 0-5 GeV corresponds to an integrated luminosity of 0.3 fb$^{-1}$, the interval 5-7 GeV to 1.9 fb$^{-1}$, and the rest to the full integrated luminosity of 4.8 fb$^{-1}$. The outer vertical bars represent the combined statistical and systematic uncertainties in the ratios, while the horizontal bars give the uncertainty in $ {<} N_{\text {track}} {>} $ in each bin. Inner tick marks show only the statistical uncertainty, both in the ratio and in $ {<} N_{\text {track}} {>} $. |
png pdf |
Figure 5:
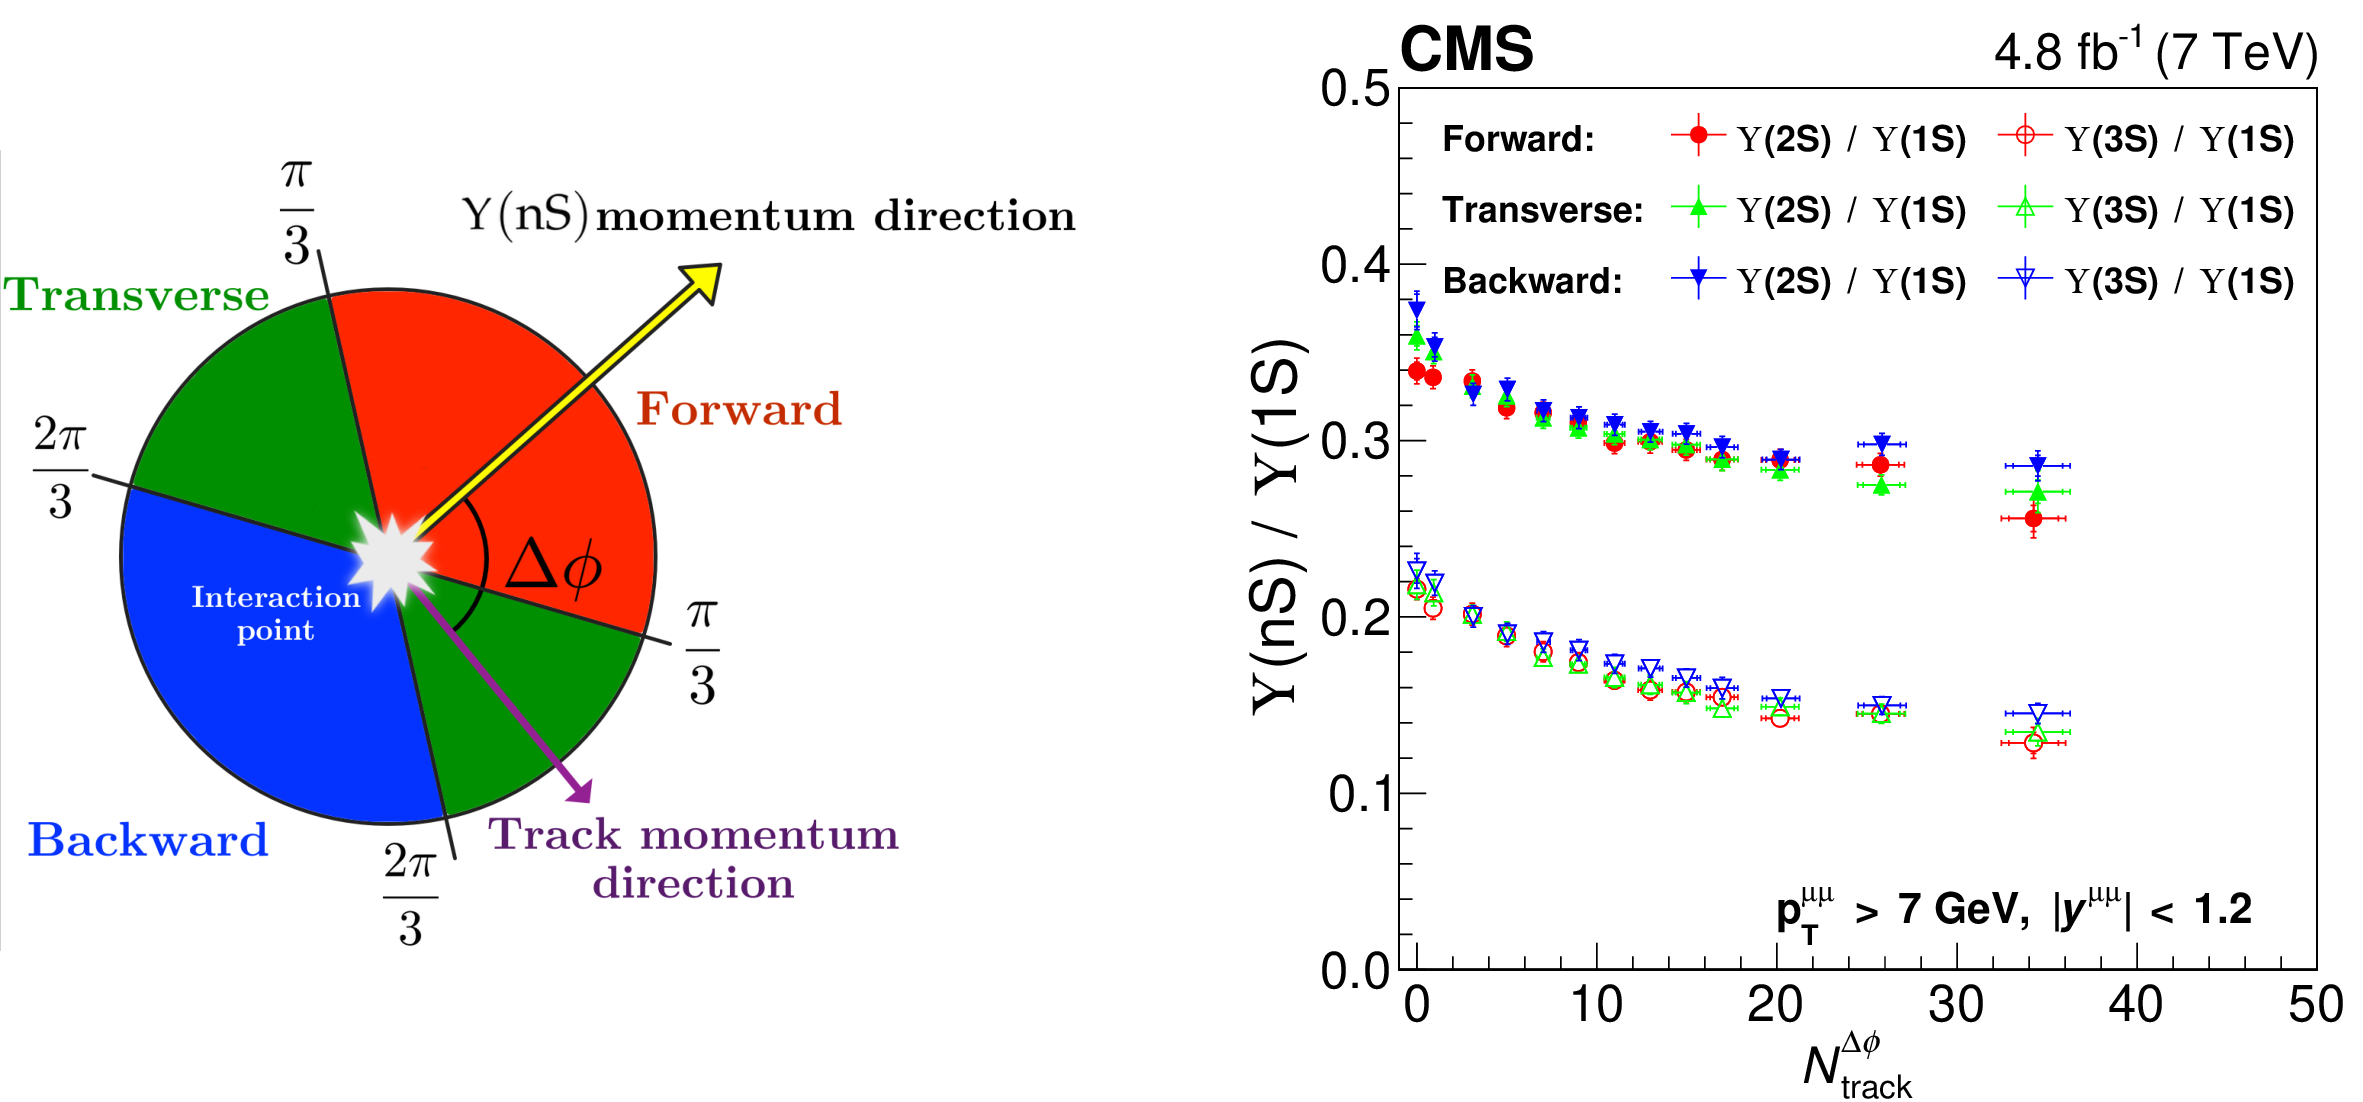
Left: A schematic view in the azimuthal plane of the three $\Delta \phi $ regions with respect to the $\Upsilon(\text{nS})$ momentum direction. Right: The ratios ${\Upsilon(\text{2S})/\Upsilon(\text{1S})}$ and ${\Upsilon(\text{3S})/\Upsilon(\text{1S})}$, as a function of ${N_{\text {track}}^{\Delta \phi}}$ for the three $\Delta \phi $ regions shown in the left plot. The outer vertical bars represent the combined statistical and systematic uncertainties in the ratios, while the horizontal bars give the uncertainty in $ {<} N_{\text {track}}^{\Delta \phi} {>}$ for each bin. Inner tick marks show only the statistical uncertainty, both in the ratio and in $ {<} N_{\text {track}}^{\Delta \phi} {>}$. |

png pdf |
Figure 5-a:
A schematic view in the azimuthal plane of the three $\Delta \phi $ regions with respect to the $\Upsilon(\text{nS})$ momentum direction. |

png pdf |
Figure 5-b:
The ratios ${\Upsilon(\text{2S})/\Upsilon(\text{1S})}$ and ${\Upsilon(\text{3S})/\Upsilon(\text{1S})}$, as a function of ${N_{\text {track}}^{\Delta \phi}}$ for the three $\Delta \phi $ regions shown in the left plot. The outer vertical bars represent the combined statistical and systematic uncertainties in the ratios, while the horizontal bars give the uncertainty in $ {<} N_{\text {track}}^{\Delta \phi} {>}$ for each bin. Inner tick marks show only the statistical uncertainty, both in the ratio and in $ {<} N_{\text {track}}^{\Delta \phi} {>}$. |

png pdf |
Figure 6:
The ratios ${\Upsilon(\text{2S})/\Upsilon(\text{1S})}$ and ${\Upsilon(\text{3S})/\Upsilon(\text{1S})}$ are shown as a function of the track multiplicity ${N_{\text {track}}}$ : in four categories based on the number of charged particles produced in a $\Delta \mathrm {R} < $ 0.5 cone around the $\Upsilon$ direction (left), and in different intervals of charged particle transverse sphericity, ${S_{\mathrm {T}}}$ (right). The outer vertical bars represent the combined statistical and systematic uncertainties in the ratios, while the horizontal bars give the uncertainty in $ {<} N_{\text {track}} {>} $ in each bin. Inner tick marks show only the statistical uncertainty, both in the ratio and in $ {<} N_{\text {track}} {>} $. |

png pdf |
Figure 6-a:
The ratios ${\Upsilon(\text{2S})/\Upsilon(\text{1S})}$ and ${\Upsilon(\text{3S})/\Upsilon(\text{1S})}$ are shown as a function of the track multiplicity ${N_{\text {track}}}$, in four categories based on the number of charged particles produced in a $\Delta \mathrm {R} < $ 0.5 cone around the $\Upsilon$ direction. The outer vertical bars represent the combined statistical and systematic uncertainties in the ratios, while the horizontal bars give the uncertainty in $ {<} N_{\text {track}} {>} $ in each bin. Inner tick marks show only the statistical uncertainty, both in the ratio and in $ {<} N_{\text {track}} {>} $. |

png pdf |
Figure 6-b:
The ratios ${\Upsilon(\text{2S})/\Upsilon(\text{1S})}$ and ${\Upsilon(\text{3S})/\Upsilon(\text{1S})}$ are shown as a function of the track multiplicity ${N_{\text {track}}}$, in different intervals of charged particle transverse sphericity, ${S_{\mathrm {T}}}$. The outer vertical bars represent the combined statistical and systematic uncertainties in the ratios, while the horizontal bars give the uncertainty in $ {<} N_{\text {track}} {>} $ in each bin. Inner tick marks show only the statistical uncertainty, both in the ratio and in $ {<} N_{\text {track}} {>} $. |
| Tables | |

png pdf |
Table 1:
Efficiency-corrected multiplicity bins used in the $\Upsilon(\text{nS})$ ratio analysis and the corresponding mean number of charged particle tracks with $ {{p_{\mathrm {T}}} ^{\text {track}}} > $ 0.4 GeV in the data sample. The most probable values of the two half-Gaussian fit to the corresponding ${N^{\text {true}}_{\text {track}}}$ in simulation, for $ {{p_{\mathrm {T}}} ^{\text {track}}} > $ 0.4 GeV and $ {{p_{\mathrm {T}}} ^{\text {track}}} > $ 0 GeV, are also indicated. The uncertainties shown are statistical, except for $ {<} N_{\text {track}} {>} $, where the systematic uncertainties are also reported. In the last column, the percentage of minimum bias (MB) events in the different multiplicity bins is also indicated. |
| Summary |
| The measurement of ratios of the $\Upsilon(\text{nS}) \to \mu^{+} \mu^{-}$ yields in proton-proton collisions at $\sqrt{s} = $ 7 TeV, corresponding to an integrated luminosity of 4.8 fb$^{-1}$, collected with the CMS detector at the LHC, are reported as a function of the number of charged particles produced with pseudorapidity ${|{\eta^{\text{track}}}|} < $ 2.4 and transverse momentum ${{p_{\mathrm{T}}}^{\text{track}}} > $ 0.4 GeV. A significant reduction of the $\Upsilon\text{(2S)}/\Upsilon\text{(1S)}$ and $\Upsilon\text{(3S)}/\Upsilon\text{(1S)}$ production ratios is observed with increasing multiplicity. This result confirms the observation made in proton-proton and proton-lead collisions at lower centre-of-mass energy [7], with increased precision. The effect is present in different ranges of ${{p_{\mathrm{T}}}^{\mu\mu}} $, but decreases with increasing ${{p_{\mathrm{T}}}^{\mu\mu}} $. For ${{p_{\mathrm{T}}}^{\mu\mu}} > $ 7 GeV, different observables are studied in order to obtain a better description of the phenomenon in connection with the underlying event. No variation in the decrease of the ratios is found by changing the azimuthal angle separation of the charged particles with respect to the $\Upsilon$ momentum direction. The same applies when varying the number of tracks in a restricted cone around the Y momentum direction. However, the ratios are observed to be multiplicity independent for jet-like events. The presented results give for the first time a comprehensive review of the connection between $\Upsilon(\text{nS})$ production and the underlying event, stressing the need for an improved theoretical description of quarkonium production in proton-proton collisions. |
| References | ||||
| 1 | A. Andronic et al. | Heavy-flavour and quarkonium production in the LHC era: From proton-proton to heavy-ion collisions | EPJC 76 (2016) 107 | 1506.03981 |
| 2 | M. Kramer | Quarkonium production at high-energy colliders | Prog. Part. NP 47 (2001) 141 | hep-ph/0106120 |
| 3 | S. Digal, P. Petreczky, and H. Satz | Quarkonium feed-down and sequential suppression | PRD 64 (2001) 094015 | hep-ph/0106017 |
| 4 | ALICE Collaboration | $ \mathrm{J}/\psi $ production as a function of charged particle multiplicity in pp collisions at $ \sqrt{s} = $ 7 TeV | PLB 712 (2012) 165 | 1202.2816 |
| 5 | ALICE Collaboration | D-meson production in pPb collisions at $ {\sqrt {\smash [b]{s_{_{\mathrm {NN}}}}}} = $ 5.02 TeV and in pp collisions at $ \sqrt{s} = $ 7 TeV | PRC 94 (2016) 054908 | 1605.07569 |
| 6 | D. Thakur, S. De, R. Sahoo, and S. Dansana | Role of multiparton interactions on $ \mathrm{J}/\psi $ production in pp collisions at LHC energies | PRD 97 (2018) 094002 | 1709.06358 |
| 7 | CMS Collaboration | Event activity dependence of $ \Upsilon(\text{nS}) $ production in $ {\sqrt {\smash [b]{s_{_{\mathrm {NN}}}}}} = $ 5.02 TeV pPb and $ \sqrt{s} = $ 2.76 TeV pp collisions | JHEP 04 (2014) 103 | CMS-HIN-13-003 1312.6300 |
| 8 | CMS Collaboration | Observation of long-range near-side angular correlations in proton-proton collisions at the LHC | JHEP 09 (2010) 091 | CMS-QCD-10-002 1009.4122 |
| 9 | ATLAS Collaboration | Observation of long-range elliptic azimuthal anisotropies in $ \sqrt{s} = $ 13 and 2.76 TeV pp collisions with the ATLAS detector | PRL 116 (2016) 172301 | 1509.04776 |
| 10 | CMS Collaboration | Measurement of long-range near-side two-particle angular correlations in pp collisions at $ \sqrt{s} = $ 13 TeV | PRL 116 (2016) 172302 | CMS-FSQ-15-002 1510.03068 |
| 11 | ALICE Collaboration | Enhanced production of multi-strange hadrons in high-multiplicity proton-proton collisions | NP 13 (2017) 535 | 1606.07424 |
| 12 | CMS Collaboration | Evidence for collectivity in pp collisions at the LHC | PLB 765 (2017) 193 | CMS-HIN-16-010 1606.06198 |
| 13 | CMS Collaboration | Multiplicity and rapidity dependence of strange hadron production in pp, pPb, and PbPb collisions at the LHC | PLB 768 (2017) 103 | CMS-HIN-15-006 1605.06699 |
| 14 | R. Campanini and G. Ferri | Experimental equation of state in proton-proton and proton-antiproton collisions and phase transition to quark gluon plasma | PLB 703 (2011) 237 | 1106.2008 |
| 15 | K. Dusling, W. Li, and B. Schenke | Novel collective phenomena in high-energy proton-proton and proton-nucleus collisions | Int. J. Mod. Phys. E 25 (2016) 1630002 | 1509.07939 |
| 16 | F. G. Gardim, G. Giacalone, M. Luzum, and J.-Y. Ollitrault | Thermodynamics of hot strong-interaction matter from ultrarelativistic nuclear collisions | NP 16 (2020) 615 | |
| 17 | J. L. Nagle and W. A. Zajc | Small system collectivity in relativistic hadronic and nuclear collisions | Ann. Rev. Nucl. Part. Sci. 68 (2018) 211 | 1801.03477 |
| 18 | B. Schenke, S. Schlichting, P. Tribedy, and R. Venugopalan | Mass ordering of spectra from fragmentation of saturated gluon states in high multiplicity proton-proton collisions | PRL 117 (2016) 162301 | 1607.02496 |
| 19 | S. Ferreres-Sol\'e and T. Sjostrand | The space-time structure of hadronization in the Lund model | EPJC 78 (2018) 983 | 1808.04619 |
| 20 | T. Lang and M. Bleicher | Possibility for $ \mathrm{J}/\psi $ suppression in high multiplicity proton-proton collisions at $ {\sqrt {\smash [b]{s_{_{\mathrm {NN}}}}}}= $ 7 ~ TeV | PRC 87 (2013) 024907 | 1302.0655 |
| 21 | E. G. Ferreiro and C. Pajares | High multiplicity pp events and $ \mathrm{J}/\psi $ production at LHC | PRC 86 (2012) 034903 | 1203.5936 |
| 22 | CMS Collaboration | Measurement of nuclear modification factors of $ \Upsilon(\text{1S})$, $\Upsilon(\text{2S})$, and $ \Upsilon(\text{3S}) $ mesons in PbPb collisions at $ \sqrt{s_{_\mathrm{NN}}} = $ 5.02 TeV | PLB 790 (2019) 270 | CMS-HIN-16-023 1805.09215 |
| 23 | Particle Data Group, M. Tanabashi et al. | Review of particle physics | PRD 98 (2018) 030001 | |
| 24 | CMS Collaboration | Description and performance of track and primary-vertex reconstruction with the CMS tracker | JINST 9 (2014) P10009 | CMS-TRK-11-001 1405.6569 |
| 25 | CMS Collaboration | Performance of CMS muon reconstruction in pp collision events at $ \sqrt{s} = $ 7 TeV | JINST 7 (2012) P10002 | CMS-MUO-10-004 1206.4071 |
| 26 | CMS Collaboration | The CMS trigger system | JINST 12 (2017) P01020 | CMS-TRG-12-001 1609.02366 |
| 27 | CMS Collaboration | The CMS experiment at the CERN LHC | JINST 3 (2008) S08004 | CMS-00-001 |
| 28 | CMS Collaboration | The performance of the CMS muon detector in proton-proton collisions at $ \sqrt{s} = $ 7 TeV at the LHC | JINST 8 (2013) P11002 | CMS-MUO-11-001 1306.6905 |
| 29 | T. Sjostrand et al. | An introduction to PYTHIA 8.2 | CPC 191 (2015) 159 | 1410.3012 |
| 30 | CMS Collaboration | Event generator tunes obtained from underlying event and multiparton scattering measurements | EPJC 76 (2016) 155 | CMS-GEN-14-001 1512.00815 |
| 31 | GEANT4 Collaboration | GEANT4--a simulation toolkit | NIMA 506 (2003) 250 | |
| 32 | CMS Collaboration | Jet and underlying event properties as a function of charged-particle multiplicity in proton-proton collisions at $ \sqrt{s} = $ 7 TeV | EPJC 73 (2013) 2674 | CMS-FSQ-12-022 1310.4554 |
| 33 | R. Corke and T. Sjostrand | Interleaved parton showers and tuning prospects | JHEP 03 (2011) 032 | 1011.1759 |
| 34 | W. Verkerke and D. P. Kirkby | The RooFit toolkit for data modeling | in 13$^\textth$ International Conference for Computing in High-Energy and Nuclear Physics (CHEP03) 2003 | physics/0306116 |
| 35 | S. Das | A simple alternative to the Crystal Ball function | 1603.08591 | |
| 36 | M. J. Oreglia | A study of the reactions $\psi' \to \gamma\gamma \psi$ | PhD thesis, Stanford University, 1980 SLAC Report SLAC-R-236, see A | |
| 37 | CMS Collaboration | Measurements of inclusive $ \mathrm{W} $ and $ \mathrm{Z} $ cross sections in pp collisions at $ \sqrt{s} = $ 7 TeV | JHEP 01 (2011) 080 | CMS-EWK-10-002 1012.2466 |
| 38 | CMS Collaboration | Measurements of the $ \Upsilon(\text{1S})$, $\Upsilon(\text{2S})$, and $ \Upsilon(\text{3S}) $ differential cross sections in pp collisions at $ \sqrt{s} = $ 7 TeV | PLB 749 (2015) 14 | CMS-BPH-12-006 1501.07750 |
| 39 | D. J. Lange | The EVTGEN particle decay simulation package | in Proceedings, 7th International Conference on B physics at hadron machines (BEAUTY 2000), Maagan, Israel, 2000 | |
| 40 | E. Barberio and Z. Wąs | PHOTOS -- a universal Monte Carlo for QED radiative corrections: Version 2.0 | CPC 79 (1994) 291 | |
| 41 | CMS Collaboration | Measurement of the $ \Upsilon(\text{1S}), \Upsilon(\text{2S}) $, and $ \Upsilon(\text{3S}) $ polarizations in pp collisions at $ \sqrt{s} = $ 7 TeV | PRL 110 (2013) 081802 | CMS-BPH-11-023 1209.2922 |
| 42 | CMS Collaboration | $ \Upsilon(\text{nS}) $ polarizations versus particle multiplicity in pp collisions at $ \sqrt{s} = $ 7 TeV | PLB 761 (2016) 31 | CMS-HIN-15-003 1603.02913 |
| 43 | M. Pivk and F. R. Le Diberder | sPlot: A statistical tool to unfold data distributions | NIMA 555 (2005) 356 | physics/0402083 |
| 44 | CMS Collaboration | Measurement of the $ \Upsilon(\text{1S})$, $\Upsilon(\text{2S})$, and $ \Upsilon(\text{3S}) $ cross sections in pp collisions at $ \sqrt{s} = $ 7 TeV | PLB 727 (2013) 101 | CMS-BPH-11-001 1303.5900 |
| 45 | CMS Collaboration | Study of the inclusive production of charged pions, kaons, and protons in pp collisions at $ \sqrt{s} = $ 0.9 , 2.76, and 7 TeV | EPJC 72 (2012) 2164 | CMS-FSQ-12-014 1207.4724 |
| 46 | CMS Collaboration | First measurement of the underlying event activity at the LHC with $ \sqrt{s} = $ 0.9 TeV | EPJC 70 (2010) 555 | CMS-QCD-10-001 1006.2083 |
| 47 | E. G. Ferreiro | Charmonium dissociation and recombination at LHC: Revisiting comovers | PLB 731 (2014) 57 | 1210.3209 |
| 48 | CMS Collaboration | Search for a new bottomonium state decaying to $ \Upsilon(\text{1S}) \pi^{+}\pi^{-} $ in pp collisions at $ \sqrt{s} = $ 8 TeV | PLB 727 (2013) 57 | CMS-BPH-11-016 1309.0250 |
| 49 | ALICE Collaboration | Transverse sphericity of primary charged particles in minimum bias proton-proton collisions at $ \sqrt{s}= $ 0.9 , 2.76, and 7 TeV | EPJC 72 (2012) 2124 | 1205.3963 |
|
|
Compact Muon Solenoid LHC, CERN |
|

|

|

|

|

|