

Compact Muon Solenoid
LHC, CERN
| CMS-EXO-16-023 ; CERN-EP-2017-025 | ||
| Search for third-generation scalar leptoquarks and heavy right-handed neutrinos in final states with two tau leptons and two jets in proton-proton collisions at $ \sqrt{s} = $ 13 TeV | ||
| CMS Collaboration | ||
| 11 March 2017 | ||
| JHEP 07 (2017) 121 | ||
| Abstract: A search is performed for third-generation scalar leptoquarks and heavy right-handed neutrinos in events containing one electron or muon, one hadronically decaying $\tau$ lepton, and at least two jets, using a $ \sqrt{s} = $ 13 TeV pp collision data sample corresponding to an integrated luminosity of 12.9 fb$^{-1}$ collected with the CMS detector at the LHC in 2016. The number of observed events is found to be in agreement with the standard model prediction. A limit is set at 95% confidence level on the product of the leptoquark pair production cross section and $\beta^2$, where $\beta$ is the branching fraction of leptoquark decay to a $\tau$ lepton and a bottom quark. Assuming $\beta=$ 1, third-generation leptoquarks with masses below 850 GeV are excluded at 95% confidence level. An additional search based on the same event topology involves heavy right-handed neutrinos, $\mathrm{N_R} $, and right-handed W bosons, $\mathrm{W_R} $, arising in a left-right symmetric extension of the standard model. In this search, $\mathrm{W_R} $ bosons are assumed to decay to a tau lepton and $\mathrm{N_R} $ followed by the decay of the $\mathrm{N_R} $ to a tau lepton and an off-shell $\mathrm{W_R} $ boson. Assuming the mass of the right-handed neutrino to be half of the mass of the right-handed W boson, $\mathrm{W_R} $ boson masses below 2.9 TeV are excluded at 95% confidence level. These results improve on the limits from previous searches for third-generation leptoquarks and heavy right-handed neutrinos with $\tau$ leptons in the final state. | ||
| Links: e-print arXiv:1703.03995 [hep-ex] (PDF) ; CDS record ; inSPIRE record ; CADI line (restricted) ; | ||
| Figures | Summary | Additional Figures | References | CMS Publications |
|---|
| Figures | |

png pdf |
Figure 1:
Measured $ {S_{\mathrm {T}}} $ distribution in the $ {\mu {\tau _\mathrm {h}} } $ (left) and $ {\mathrm{ e } {\tau _\mathrm {h}} } $ (right) channels of the LQ (upper) and heavy RH neutrino (lower) analyses, compared to the expected SM background contribution. A hypothetical LQ signal of mass $ M_\mathrm {LQ}= $ 900 GeV and a hypothetical heavy $\mathrm{W_R} $ signal of mass ${M}_{\mathrm{W_R} }= $ 3 TeV are overlaid to illustrate the sensitivity. The electroweak background represents the sum of W boson, Z boson, and diboson production. The last bin of each plot contains overflow events. A binned maximum likelihood fit is performed on the $ {S_{\mathrm {T}}} $ distribution. The uncertainty bands represent the sum in quadrature of statistical and systematic uncertainties, obtained from the fit. The lower panels in all plots compare the observed and expected events in each bin of distribution. |

png pdf |
Figure 1-a:
Measured $ {S_{\mathrm {T}}} $ distribution in the $ {\mu {\tau _\mathrm {h}} } $ channel of the LQ analysis, compared to the expected SM background contribution. A hypothetical LQ signal of mass $ M_\mathrm {LQ}= $ 900 GeV and a hypothetical heavy $\mathrm{W_R} $ signal of mass ${M}_{\mathrm{W_R} }= $ 3 TeV are overlaid to illustrate the sensitivity. The electroweak background represents the sum of W boson, Z boson, and diboson production. The last bin of the plot contains overflow events. A binned maximum likelihood fit is performed on the $ {S_{\mathrm {T}}} $ distribution. The uncertainty bands represent the sum in quadrature of statistical and systematic uncertainties, obtained from the fit. The lower panel compares the observed and expected events in each bin of distribution. |

png pdf |
Figure 1-b:
Measured $ {S_{\mathrm {T}}} $ distribution in the $ {\mathrm{ e } {\tau _\mathrm {h}} } $ channel of the LQ analysis, compared to the expected SM background contribution. A hypothetical LQ signal of mass $ M_\mathrm {LQ}= $ 900 GeV and a hypothetical heavy $\mathrm{W_R} $ signal of mass ${M}_{\mathrm{W_R} }= $ 3 TeV are overlaid to illustrate the sensitivity. The electroweak background represents the sum of W boson, Z boson, and diboson production. The last bin of the plot contains overflow events. A binned maximum likelihood fit is performed on the $ {S_{\mathrm {T}}} $ distribution. The uncertainty bands represent the sum in quadrature of statistical and systematic uncertainties, obtained from the fit. The lower panel compares the observed and expected events in each bin of distribution. |

png pdf |
Figure 1-c:
Measured $ {S_{\mathrm {T}}} $ distribution in the $ {\mu {\tau _\mathrm {h}} } $ channel of the heavy RH neutrino analysis, compared to the expected SM background contribution. A hypothetical LQ signal of mass $ M_\mathrm {LQ}= $ 900 GeV and a hypothetical heavy $\mathrm{W_R} $ signal of mass ${M}_{\mathrm{W_R} }= $ 3 TeV are overlaid to illustrate the sensitivity. The electroweak background represents the sum of W boson, Z boson, and diboson production. The last bin of the plot contains overflow events. A binned maximum likelihood fit is performed on the $ {S_{\mathrm {T}}} $ distribution. The uncertainty bands represent the sum in quadrature of statistical and systematic uncertainties, obtained from the fit. The lower panel compares the observed and expected events in each bin of distribution. |

png pdf |
Figure 1-d:
Measured $ {S_{\mathrm {T}}} $ distribution in the $ {\mathrm{ e } {\tau _\mathrm {h}} } $ channel of the heavy RH neutrino analysis, compared to the expected SM background contribution. A hypothetical LQ signal of mass $ M_\mathrm {LQ}= $ 900 GeV and a hypothetical heavy $\mathrm{W_R} $ signal of mass ${M}_{\mathrm{W_R} }= $ 3 TeV are overlaid to illustrate the sensitivity. The electroweak background represents the sum of W boson, Z boson, and diboson production. The last bin of the plot contains overflow events. A binned maximum likelihood fit is performed on the $ {S_{\mathrm {T}}} $ distribution. The uncertainty bands represent the sum in quadrature of statistical and systematic uncertainties, obtained from the fit. The lower panel compares the observed and expected events in each bin of distribution. |

png pdf |
Figure 2:
Observed and expected limits at 95% CL on the product of cross section and branching fraction squared, obtained from the combination of the $ {\mathrm{ e } {\tau _\mathrm {h}} } $ and $ {\mu {\tau _\mathrm {h}} } $ channels, in the LQ analysis (left) and 95% CL observed and expected exclusion limits on the LQ mass, as a function of $\beta $ (right). In the left plot, the green and yellow bands represent the one and two standard deviation uncertainties in the expected limits. The dashed dark blue curve represents the theoretical LQ pair production cross section, assuming $\beta = $ 100% [20,21]. In the right plot, the grey band represents the one standard deviation uncertainty in the expected limit. |

png pdf |
Figure 2-a:
Observed and expected limits at 95% CL on the product of cross section and branching fraction squared, obtained from the combination of the $ {\mathrm{ e } {\tau _\mathrm {h}} } $ and $ {\mu {\tau _\mathrm {h}} } $ channels, in the LQ analysis.The green and yellow bands represent the one and two standard deviation uncertainties in the expected limits. The dashed dark blue curve represents the theoretical LQ pair production cross section, assuming $\beta = $ 100% [20,21]. |

png pdf |
Figure 2-b:
95% CL observed and expected exclusion limits on the LQ mass, as a function of $\beta $. The grey band represents the one standard deviation uncertainty in the expected limit. |

png pdf |
Figure 3:
Observed and expected limits at 95% CL on the product of cross section and branching fraction, obtained from the combination of the $ {\mathrm{ e } {\tau _\mathrm {h}} } $ and $ {\mu {\tau _\mathrm {h}} } $ channels in the heavy right-handed neutrino analysis (left) and the observed and expected limits at 95% CL on the production cross section as a function of $M_{\mathrm{W_R} }$ and $M_{ {\mathrm {N}_\mathrm {R}} }$ (right). The green and yellow bands represent the one and two standard deviation uncertainties in the expected limits. The dashed dark blue curve represents the theoretical prediction for the product of the $\mathrm{W_R} $ boson production cross section and the branching fraction for decay to a $\tau $ lepton and RH neutrino, assuming the mass of the RH neutrino to be half the mass of the $\mathrm{W_R} $ boson [22]. |

png pdf |
Figure 3-a:
Observed and expected limits at 95% CL on the product of cross section and branching fraction, obtained from the combination of the $ {\mathrm{ e } {\tau _\mathrm {h}} } $ and $ {\mu {\tau _\mathrm {h}} } $ channels in the heavy right-handed neutrino analysis. The green and yellow bands represent the one and two standard deviation uncertainties in the expected limits. The dashed dark blue curve represents the theoretical prediction for the product of the $\mathrm{W_R} $ boson production cross section and the branching fraction for decay to a $\tau $ lepton and RH neutrino, assuming the mass of the RH neutrino to be half the mass of the $\mathrm{W_R} $ boson [22]. |

png pdf |
Figure 3-b:
The observed and expected limits at 95% CL on the production cross section as a function of $M_{\mathrm{W_R} }$ and $M_{ {\mathrm {N}_\mathrm {R}} }$. The green and yellow bands represent the one and two standard deviation uncertainties in the expected limits. The dashed dark blue curve represents the theoretical prediction for the product of the $\mathrm{W_R} $ boson production cross section and the branching fraction for decay to a $\tau $ lepton and RH neutrino, assuming the mass of the RH neutrino to be half the mass of the $\mathrm{W_R} $ boson [22]. |
| Summary |
| Searches have been performed for third-generation scalar leptoquarks and for heavy right-handed neutrinos in events containing one electron or muon, one hadronically decaying $\tau$ lepton, and two or more jets, using pp collision data at $\sqrt{s} = $ 13 TeV, recorded by the CMS detector at the LHC and corresponding to an integrated luminosity of 12.9 fb$^{-1}$. The data are found to be in good agreement with the standard model prediction in both analyses. A limit at 95% confidence level is set on the product of the leptoquark pair production cross section and $\beta^2$, where $\beta$ denotes the branching fraction for the decay of the leptoquark into a $\tau$ lepton and a bottom quark. Assuming $\beta=$ 1, third-generation leptoquarks with masses below 850 GeV are excluded at 95% confidence level. In the heavy RH neutrino analysis, considering the decay $\mathrm{W_R} \to\tau\mathrm{N_R} $ and assuming the mass of the heavy neutrino to be half the mass of the $\mathrm{W_R} $ boson, we exclude $\mathrm{W_R} $ boson masses below 2.9 TeV at 95% confidence level. These are the best mass limits to date for third-generation leptoquarks and heavy right-handed neutrinos with $\tau$ leptons in the final state. |
| Additional Figures | |

png pdf |
Additional Figure 1:
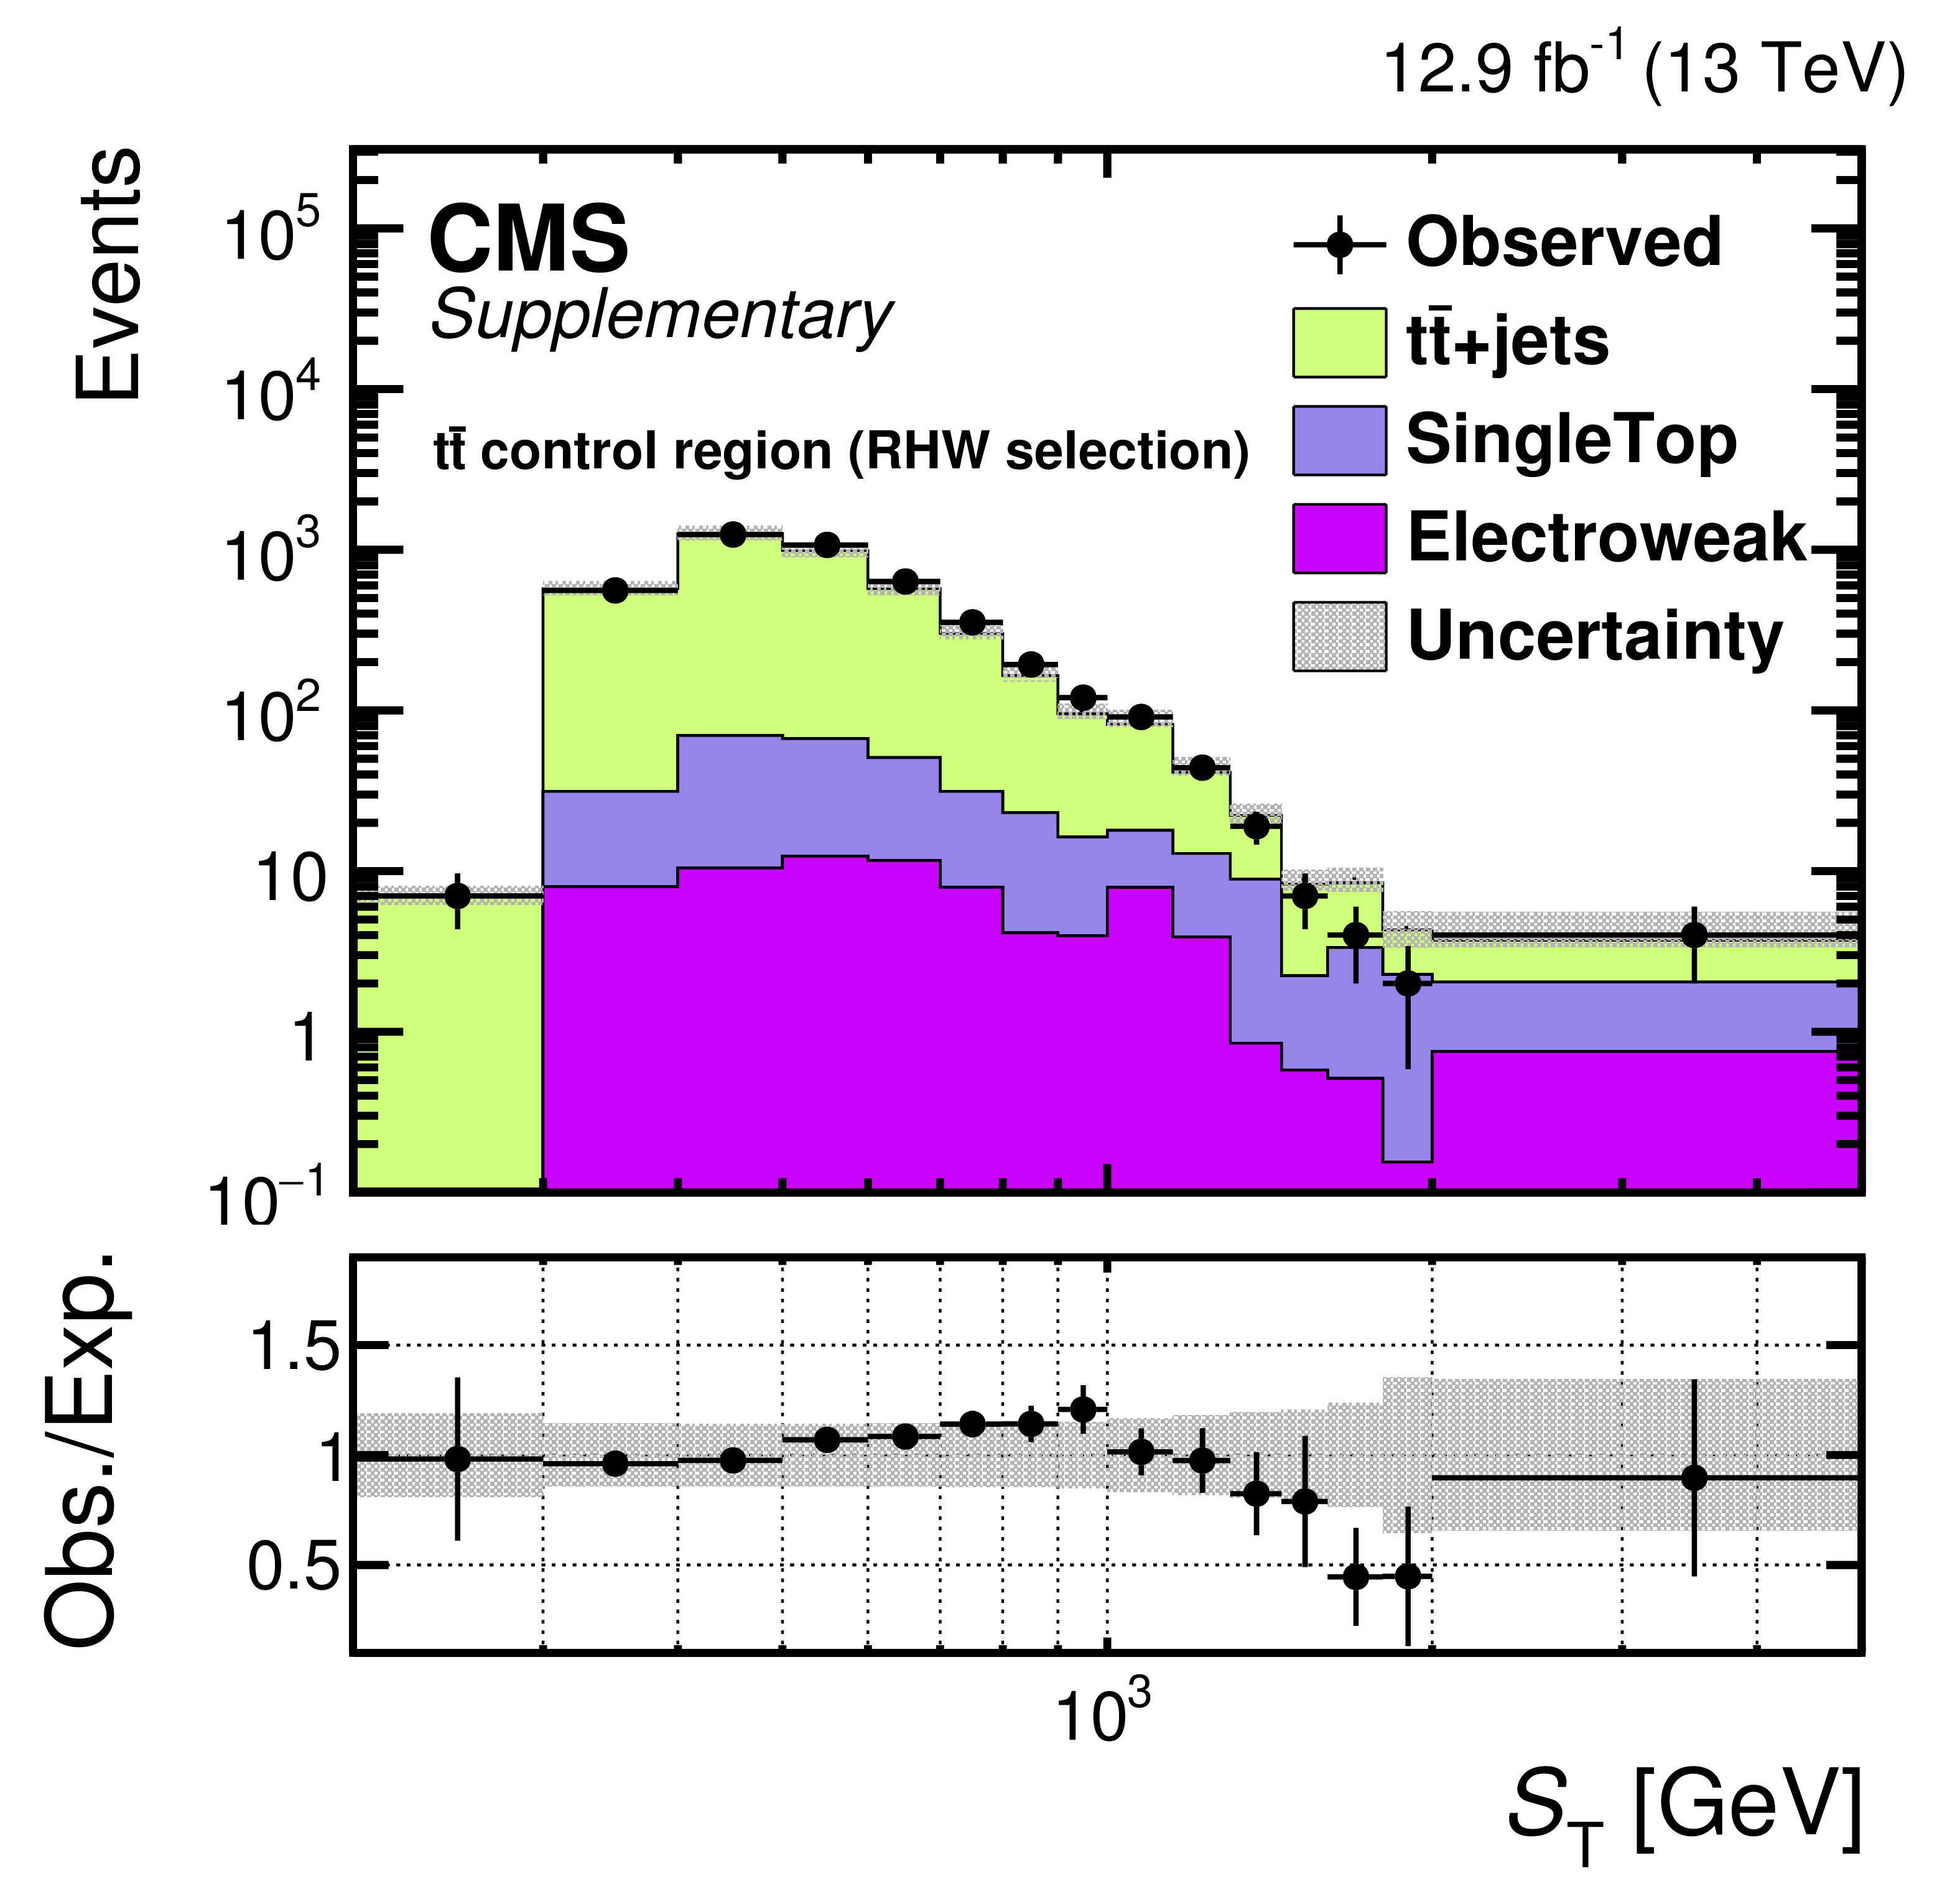
Measured $S_{\mathrm{T}} $ distribution in the ${\mathrm{ t } {}\mathrm{ \bar{t} } }$ control region in e$\mu $ channel for the LQ selection (left) and heavy RH neutrino selection (right), compared to the expected SM background contribution. The electroweak background represents the sum of W boson, Z boson, and diboson production. The last bin of each plot contains overflow events. The lower panels in all plots compare the observed and expected events in each bin. |

png pdf |
Additional Figure 1-a:
Measured $S_{\mathrm{T}} $ distribution in the ${\mathrm{ t } {}\mathrm{ \bar{t} } }$ control region in e$\mu $ channel for the LQ selection, compared to the expected SM background contribution. The electroweak background represents the sum of W boson, Z boson, and diboson production. The last bin contains overflow events. The lower panel compares the observed and expected events in each bin. |
png pdf |
Additional Figure 1-b:
Measured $S_{\mathrm{T}} $ distribution in the ${\mathrm{ t } {}\mathrm{ \bar{t} } }$ control region in e$\mu $ channel for the heavy RH neutrino selection, compared to the expected SM background contribution. The electroweak background represents the sum of W boson, Z boson, and diboson production. The last bin contains overflow events. The lower panel compares the observed and expected events in each bin. |

png pdf |
Additional Figure 2:
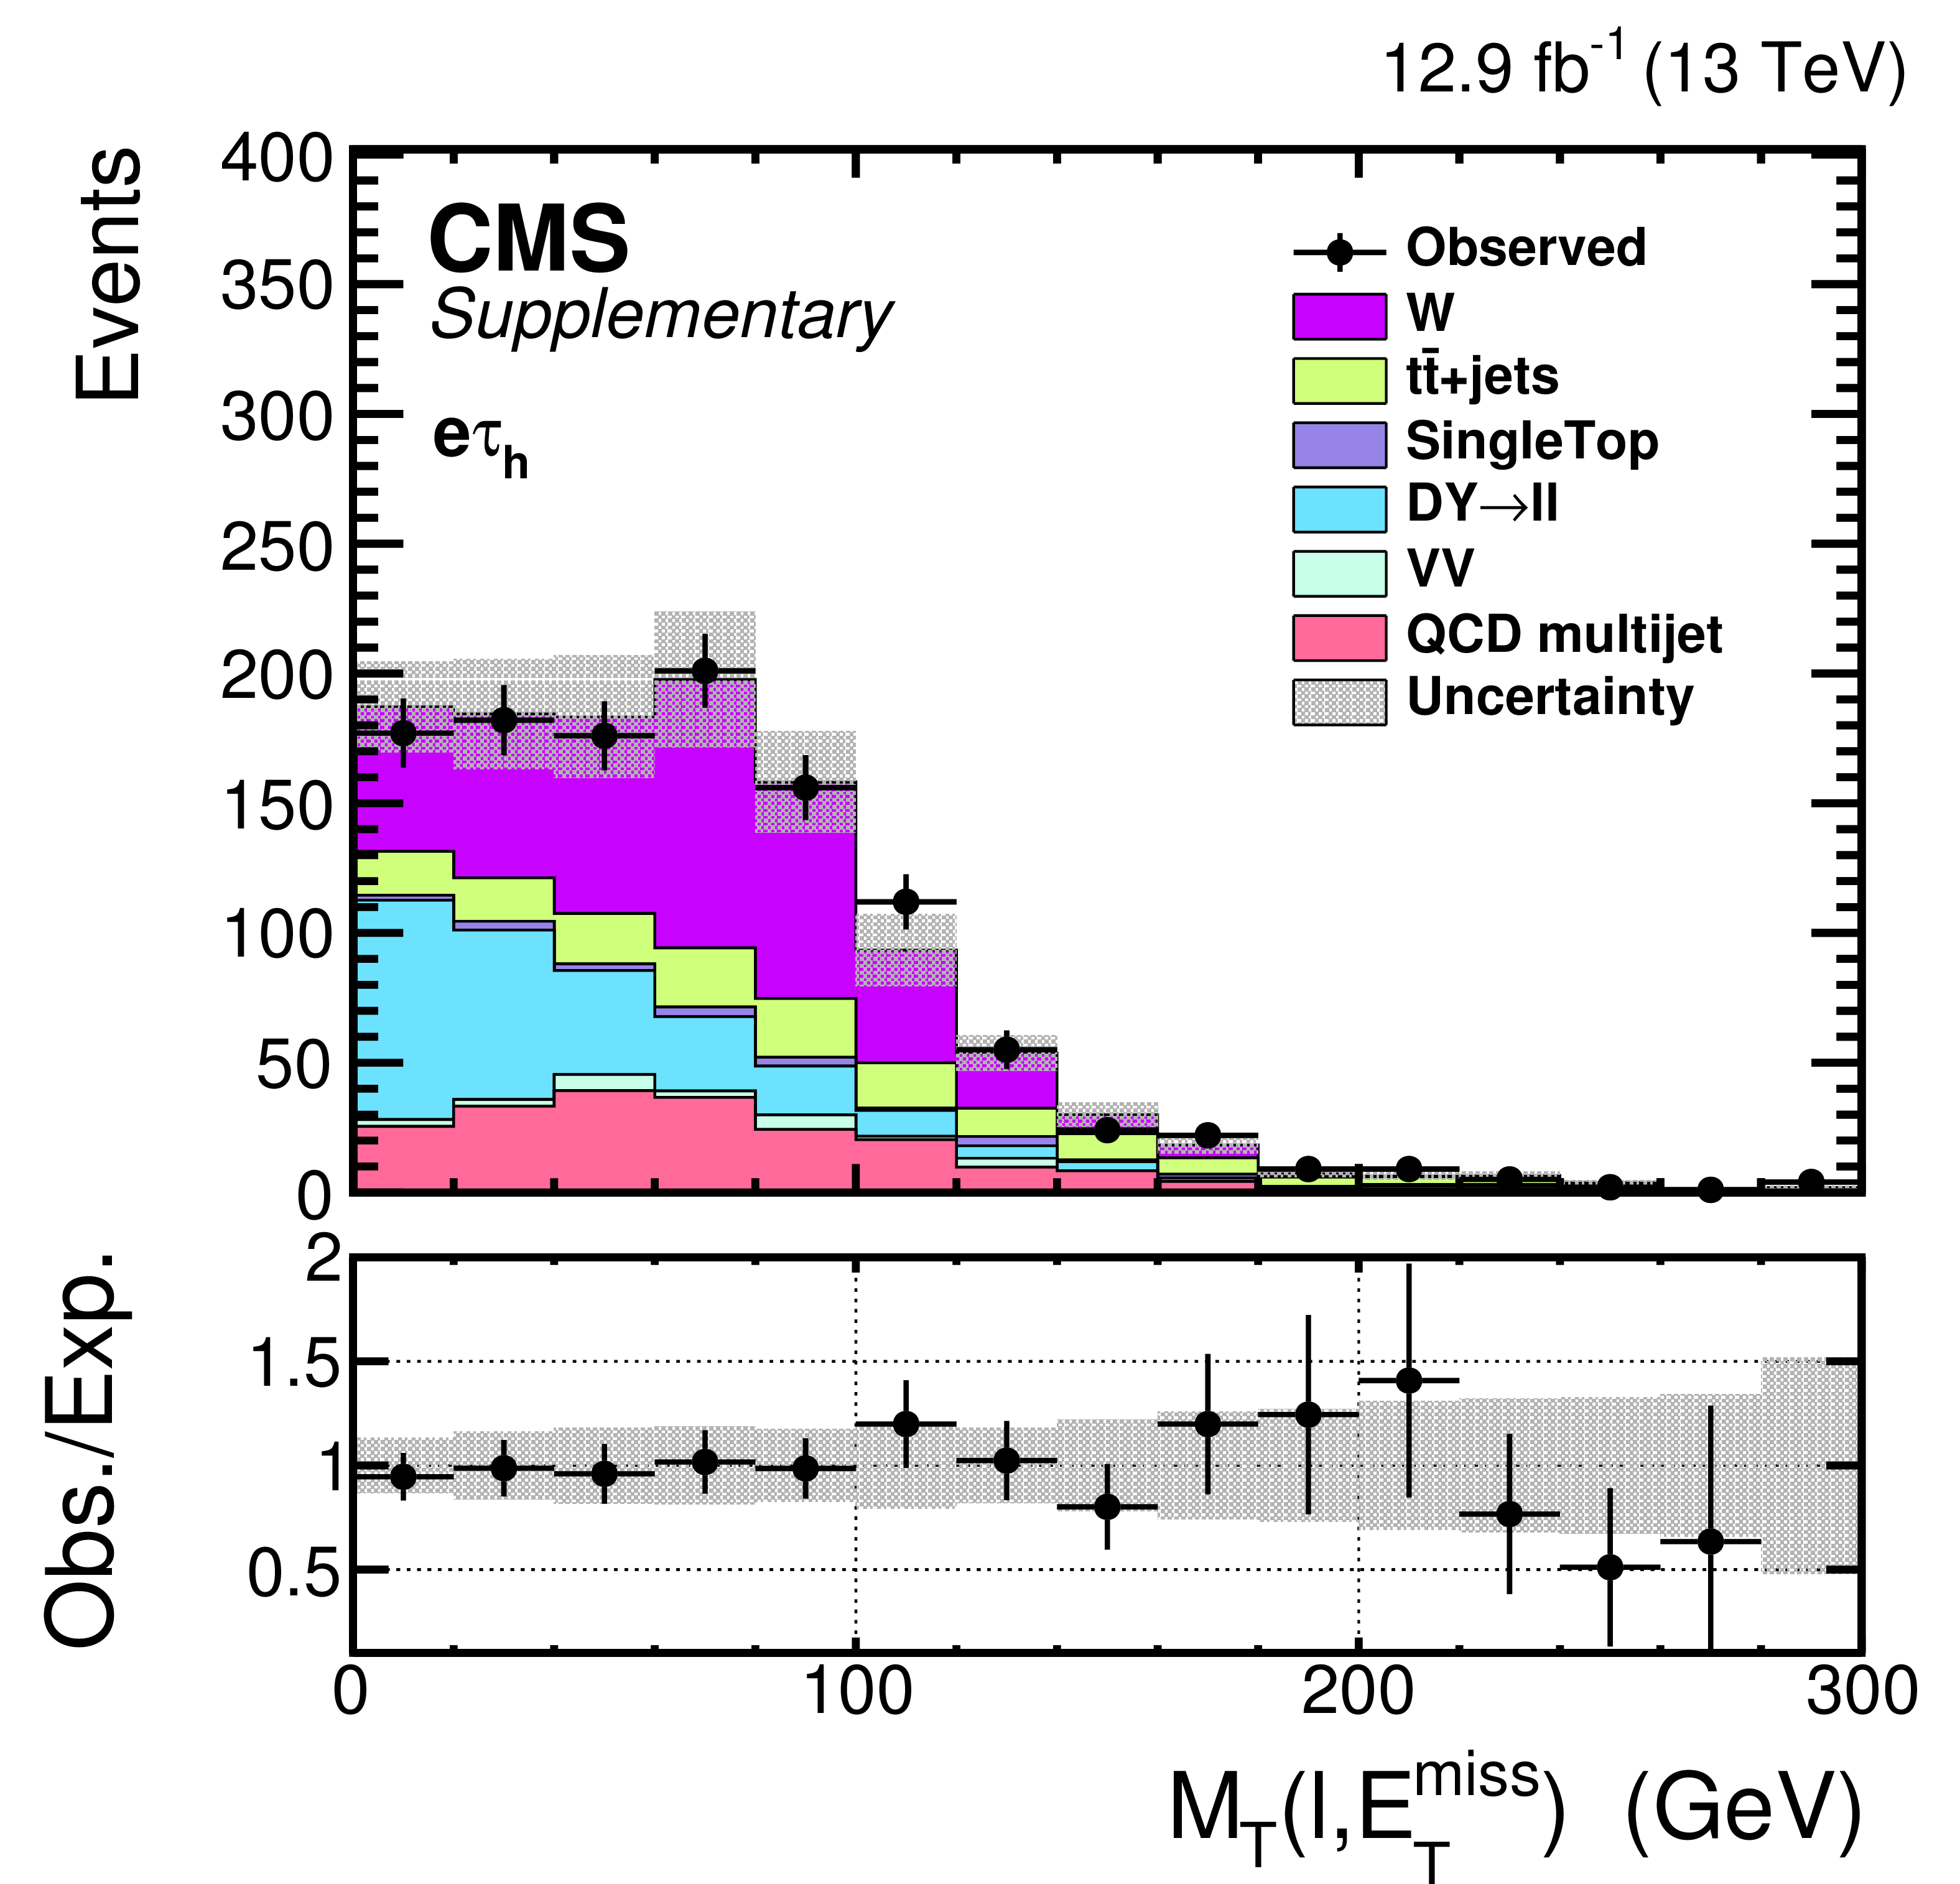
Measured $\mathrm {M_{T}}(l, {\vec{p}_{\mathrm {T}}^{\text {miss}}} )$ distribution in the $ {\mu \tau _\mathrm {h} } $ (left) and $ {\mathrm{ e } {\tau _\mathrm {h}} }$ (right) channels in the W control region compared to the expected SM background contribution. A binned maximum likelihood fit is performed on the $\mathrm {M_{T}}(l, {\vec{p}_{\mathrm {T}}^{\text {miss}}} )$ distribution. The uncertainty bands represent the sum in quadrature of statistical and systematic uncertainties, obtained from the fit. The lower panels in all plots compare the observed and expected events in each bin. |

png pdf |
Additional Figure 2-a:
Measured $\mathrm {M_{T}}(l, {\vec{p}_{\mathrm {T}}^{\text {miss}}} )$ distribution in the $ {\mu {\tau _\mathrm {h}} } $ channel in the W control region compared to the expected SM background contribution. A binned maximum likelihood fit is performed on the $\mathrm {M_{T}}(l, {\vec{p}_{\mathrm {T}}^{\text {miss}}} )$ distribution. The uncertainty band represents the sum in quadrature of statistical and systematic uncertainties, obtained from the fit. The lower panel compares the observed and expected events in each bin. |
png pdf |
Additional Figure 2-b:
Measured $\mathrm {M_{T}}(l, {\vec{p}_{\mathrm {T}}^{\text {miss}}} )$ distribution in the $ {\mathrm{ e } {\tau _\mathrm {h}} } $ channel in the W control region compared to the expected SM background contribution. A binned maximum likelihood fit is performed on the $\mathrm {M_{T}}(l, {\vec{p}_{\mathrm {T}}^{\text {miss}}} )$ distribution. The uncertainty band represents the sum in quadrature of statistical and systematic uncertainties, obtained from the fit. The lower panel compares the observed and expected events in each bin. |
| References | ||||
| 1 | H. Georgi and S. L. Glashow | Unity of All Elementary Particle Forces | PRL 32 (1974) 438 | |
| 2 | B. Schrempp and F. Schrempp | Light leptoquarks | PLB 153 (1985) 101 | |
| 3 | W. Buchmuller, R. Ruckl, and D. Wyler | Leptoquarks in lepton-quark collisions | PLB 191 (1987) 442 | |
| 4 | J. L. Hewett and T. G. Rizzo | Low-energy phenomenology of superstring-inspired E6 models | Phys. Rep. 183 (1989) 193 | |
| 5 | M. Leurer | Comprehensive study of leptoquark bounds | PRD 49 (1994) 333 | |
| 6 | B. Gripaios, A. Papaefstathiou, K. Sakurai, and B. Webber | Searching for third-generation composite leptoquarks at the LHC | JHEP 01 (2011) 156 | 1010.3962 |
| 7 | Particle Data Group Collaboration | Review of Particle Physics | CPC 40 (2016), no. 10, 100001 | |
| 8 | R. N. Mohapatra and J. C. Pati | ``Natural" left-right symmetry | PRD 11 (1975) 2558 | |
| 9 | W.-Y. Keung and G. Senjanovic | Majorana Neutrinos and the Production of the Right-handed Charged Gauge Boson | PRL 50 (1983) 1427 | |
| 10 | ATLAS Collaboration | Search for third generation scalar leptoquarks in pp collisions at $ \sqrt{s} = $ 7 TeV with the ATLAS detector | JHEP 06 (2013) 033 | 1303.0526 |
| 11 | CMS Collaboration | Search for pair production of third-generation scalar leptoquarks and top squarks in proton-proton collisions at $ \sqrt{s} = $ 8 TeV | PLB 739 (2014) 229 | CMS-EXO-12-032 1408.0806 |
| 12 | CMS Collaboration | Search for Pair Production of Third-Generation Leptoquarks and Top Squarks in $ pp $ Collisions at $ \sqrt{s} = $ 7 TeV | PRL 110 (2013) 081801 | CMS-EXO-12-002 1210.5629 |
| 13 | CMS Collaboration | Search for heavy neutrinos or third-generation leptoquarks in final states with two hadronically decaying tau leptons and two jets in proton-proton collisions at $ \sqrt{s} = $ 13 TeV | Submitted to: JHEP | CMS-EXO-16-016 1612.01190 |
| 14 | DELPHI Collaboration | Search for neutral heavy leptons produced in Z decays | Z. Phys. C 74 (1997) 57 | |
| 15 | L3 Collaboration | Search for isosinglet neutral heavy leptons in Z0 decays | PLB 295 (1992) 371 | |
| 16 | ATLAS Collaboration | Search for heavy neutrinos and right-handed $ W $ bosons in events with two leptons and jets in $ pp $ collisions at $ \sqrt{s} = $ 7 TeV with the ATLAS detector | EPJC 72 (2012) 2056 | 1203.5420 |
| 17 | CMS Collaboration | Search for heavy neutrinos and $ \mathrm {W} $ bosons with right-handed couplings in proton-proton collisions at $ \sqrt{s} = $ 8 TeV | EPJC 74 (2014) 3149 | CMS-EXO-13-008 1407.3683 |
| 18 | CMS Collaboration | The CMS experiment at the CERN LHC | JINST 3 (2008) S08004 | CMS-00-001 |
| 19 | T. Sjostrand et al. | An introduction to PYTHIA 8.2 | CPC 191 (2015) 159 | 1410.3012 |
| 20 | M. Kramer, T. Plehn, M. Spira, and P. M. Zerwas | Pair production of scalar leptoquarks at the CERN LHC | PRD 71 (2005) 057503 | hep-ph/0411038 |
| 21 | M. Kramer, T. Plehn, M. Spira, and P. M. Zerwas | Pair production of scalar leptoquarks at the Tevatron | PRL 79 (1997) 341 | hep-ph/9704322 |
| 22 | F. del Aguila, J. A. Aguilar-Saavedra, and R. Pittau | Heavy neutrino signals at large hadron colliders | JHEP 10 (2007) 047 | hep-ph/0703261 |
| 23 | F. Maltoni and T. Stelzer | MadEvent: automatic event generation with MadGraph | JHEP 02 (2003) 027 | hep-ph/0208156 |
| 24 | P. Nason | A new method for combining NLO QCD with shower Monte Carlo algorithms | JHEP 11 (2004) 040 | hep-ph/0409146 |
| 25 | S. Frixione, P. Nason, and C. Oleari | Matching NLO QCD computations with Parton Shower simulations: the POWHEG method | JHEP 11 (2007) 070 | 0709.2092 |
| 26 | S. Alioli, P. Nason, C. Oleari, and E. Re | A general framework for implementing NLO calculations in shower Monte Carlo programs: the POWHEG BOX | JHEP 06 (2010) 043 | 1002.2581 |
| 27 | NNPDF Collaboration | Parton distributions for the LHC Run II | JHEP 04 (2015) 040 | 1410.8849 |
| 28 | CMS Collaboration | Event generator tunes obtained from underlying event and multiparton scattering measurements | EPJC 76 (2016), no. 3, 155 | CMS-GEN-14-001 1512.00815 |
| 29 | GEANT4 Collaboration | GEANT4---a simulation toolkit | NIMA 506 (2003) 250 | |
| 30 | CMS Collaboration | Particle--Flow Event Reconstruction in CMS and Performance for Jets, Taus, and $ E_{\mathrm{T}}^{\text{miss}} $ | CDS | |
| 31 | CMS Collaboration | Commissioning of the Particle--flow Event Reconstruction with the first LHC collisions recorded in the CMS detector | CDS | |
| 32 | CMS Collaboration | Performance of electron reconstruction and selection with the CMS detector in proton-proton collisions at $ \sqrt{s} = $ 8 TeV | JINST 10 (2015), no. 06, P06005 | CMS-EGM-13-001 1502.02701 |
| 33 | H. Voss, A. Hocker, J. Stelzer, and F. Tegenfeldt | TMVA, the Toolkit for Multivariate Data Analysis with ROOT | in XIth International Workshop on Advanced Computing and Analysis Techniques in Physics Research (ACAT), p. 40 2007 | physics/0703039 |
| 34 | CMS Collaboration | Performance of CMS muon reconstruction in pp collision events at $ \sqrt{s} = $ 7 TeV | JINST 7 (2012) P10002 | CMS-MUO-10-004 1206.4071 |
| 35 | CMS Collaboration | Reconstruction and identification of $ \tau $ lepton decays to hadrons and $ \nu_{\tau} $ at CMS | JINST 11 (2016) P01019 | CMS-TAU-14-001 1510.07488 |
| 36 | CMS Collaboration | Tau ID Performance at CMS in Run 2 | CMS-PAS-BTV-15-001 | CMS-PAS-BTV-15-001 |
| 37 | G. P. Salam | Towards Jetography | EPJC 67 (2010) 637 | 0906.1833 |
| 38 | M. Cacciari, G. P. Salam, and G. Soyez | The anti-$ k_t $ jet clustering algorithm | JHEP 04 (2008) 063 | 0802.1189 |
| 39 | CMS Collaboration | Pileup Removal Algorithms | CMS-PAS-JME-14-001 | CMS-PAS-JME-14-001 |
| 40 | CMS Collaboration | Jet energy scale and resolution in the CMS experiment in pp collisions at 8 TeV | JINST 12 (2017) P02014 | CMS-JME-13-004 1607.03663 |
| 41 | CMS Collaboration | Pileup jet identification | CMS-PAS-JME-13-005 | CMS-PAS-JME-13-005 |
| 42 | CMS Collaboration | Performance of missing energy reconstruction in 13 TeV pp collision data using the CMS detector | CMS-PAS-JME-16-004 | CMS-PAS-JME-16-004 |
| 43 | CMS Collaboration | Identification of b quark jets at the CMS Experiment in the LHC Run 2 | CMS-PAS-BTV-15-001 | CMS-PAS-BTV-15-001 |
| 44 | CMS Collaboration | Measurement of the differential cross section for top quark pair production in pp collisions at $ \sqrt{s} = $ 8 TeV | EPJC 75 (2015) 542 | CMS-TOP-12-028 1505.04480 |
| 45 | CMS Collaboration | Measurement of differential top-quark pair production cross sections in pp collisions at $ \sqrt{s} = $ 7 TeV | EPJC 73 (2013) 2339 | CMS-TOP-11-013 1211.2220 |
| 46 | CMS Collaboration | CMS Luminosity Calibration for the pp Reference Run at $ \sqrt{s}= $ 5.02 TeV | CMS-PAS-LUM-16-001 | CMS-PAS-LUM-16-001 |
| 47 | CMS Collaboration | Measurement of the inclusive W and Z production cross sections in pp collisions at $ \sqrt{s} = $ 7 TeV with the CMS experiment | JHEP 10 (2011) 132 | CMS-EWK-10-005 1107.4789 |
| 48 | CMS Collaboration | Performance of tau-lepton reconstruction and identification in CMS | JINST 7 (2012) P01001 | CMS-TAU-11-001 1109.6034 |
| 49 | M. Czakon and A. Mitov | Top++: a program for the calculation of the top-pair cross-section at hadron colliders | CPC 185 (2014) 2930 | 1112.5675 |
| 50 | M. Botje et al. | The PDF4LHC Working Group Interim Recommendations | 1101.0538 | |
| 51 | CMS Collaboration | Measurement of W$ ^+ $W$ ^- $ and ZZ production cross sections in pp collisions at $ \sqrt{s} = $ 8 TeV | PLB 721 (2013) 190 | CMS-SMP-12-024 1301.4698 |
| 52 | S. Alekhin et al. | The PDF4LHC Working Group Interim Report | 1101.0536 | |
| 53 | P. M. Nadolsky et al. | Implications of CTEQ global analysis for collider observables | PRD 78 (2008) 013004 | 0802.0007 |
| 54 | A. D. Martin, W. J. Stirling, R. S. Thorne, and G. Watt | Update of parton distributions at NNLO | PLB 652 (2007) 292 | 0706.0459 |
| 55 | M. Ubiali | NNPDF1.0 parton set for the LHC | in Proceedings, 14th High-Energy Physics International Conference on Quantum Chromodynamics (QCD 08): Montpellier, France, 2008 | 0809.3716 |
| 56 | CMS Collaboration | Determination of Jet Energy Calibration and Transverse Momentum Resolution in CMS | JINST 6 (2011) P11002 | CMS-JME-10-011 1107.4277 |
| 57 | R. Barlow and C. Beeston | Fitting using finite Monte Carlo samples | Comp. Phys. Comm. 77 (1993) 219 | |
| 58 | T. Junk | Confidence level computation for combining searches with small statistics | NIMA 434 (1999) 435 | hep-ex/9902006 |
| 59 | A. L. Read | Presentation of search results: the $ CL_s $ technique | JPG 28 (2002) 2693 | |
|
|
Compact Muon Solenoid LHC, CERN |
|

|

|

|

|

|