

Compact Muon Solenoid
LHC, CERN
| CMS-EXO-16-037 ; CERN-EP-2017-031 | ||
| Search for dark matter produced with an energetic jet or a hadronically decaying W or Z boson at $ \sqrt{s} = $ 13 TeV | ||
| CMS Collaboration | ||
| 5 March 2017 | ||
| JHEP 07 (2017) 014 | ||
| Abstract: A search for dark matter particles is performed using events with large missing transverse momentum, at least one energetic jet, and no leptons, in proton-proton collisions at $ \sqrt{s} = $ 13 TeV collected with the CMS detector at the LHC. The data sample corresponds to an integrated luminosity of 12.9 fb$^{-1}$. The search includes events with jets from the hadronic decays of a W or Z boson. The data are found to be in agreement with the predicted background contributions from standard model processes. The results are presented in terms of simplified models in which dark matter particles are produced through interactions involving a vector, axial-vector, scalar, or pseudoscalar mediator. Vector and axial-vector mediator particles with masses up to 1.95 TeV, and scalar and pseudoscalar mediator particles with masses up to 100 and 430 GeV respectively, are excluded at 95% confidence level. The results are also interpreted in terms of the invisible decays of the Higgs boson, yielding an observed (expected) 95% confidence level upper limit of 0.44 (0.56) on the corresponding branching fraction. The results of this search provide the strongest constraints on the dark matter pair production cross section through vector and axial-vector mediators at a particle collider. When compared to the direct detection experiments, the limits obtained from this search provide stronger constraints for dark matter masses less than 5, 9, and 550 GeV, assuming vector, scalar, and axial-vector mediators, respectively. The search yields stronger constraints for dark matter masses less than 200 GeV, assuming a pseudoscalar mediator, when compared to the indirect detection results from Fermi-LAT. | ||
| Links: e-print arXiv:1703.01651 [hep-ex] (PDF) ; CDS record ; inSPIRE record ; CADI line (restricted) ; | ||
| Figures | |
png pdf |
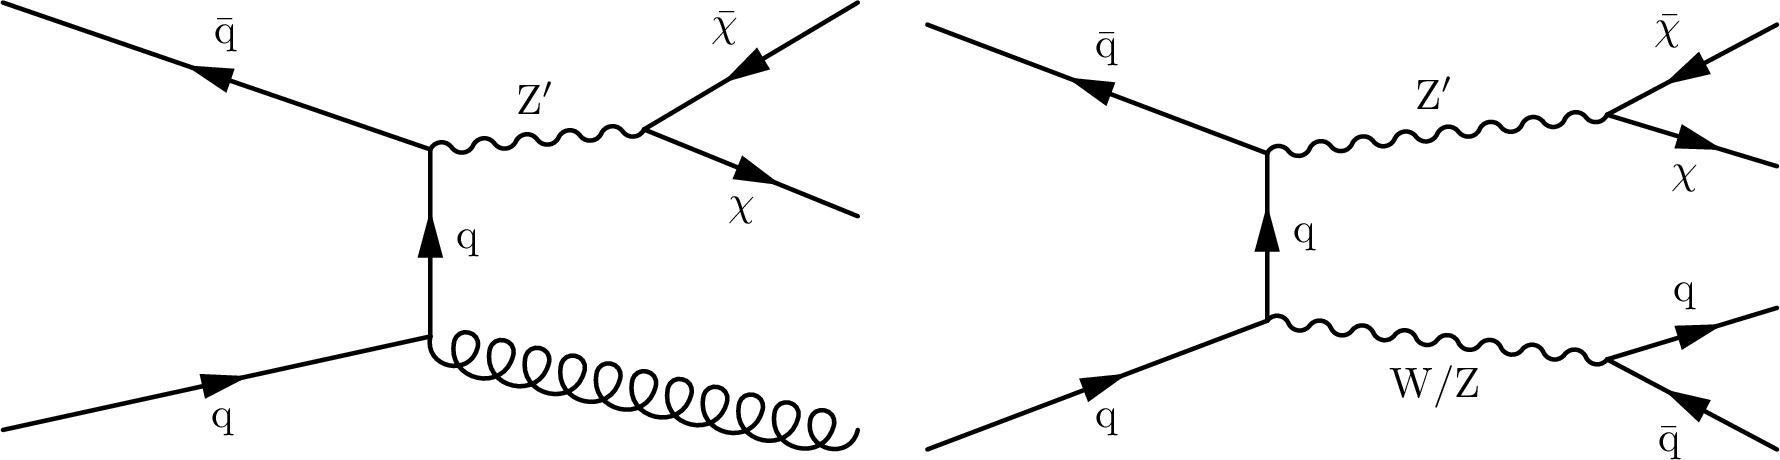
Figure 1:
Leading order Feynman diagrams of monojet (left) and mono-V (right) production and decay of a spin-1 mediator. |
png pdf |
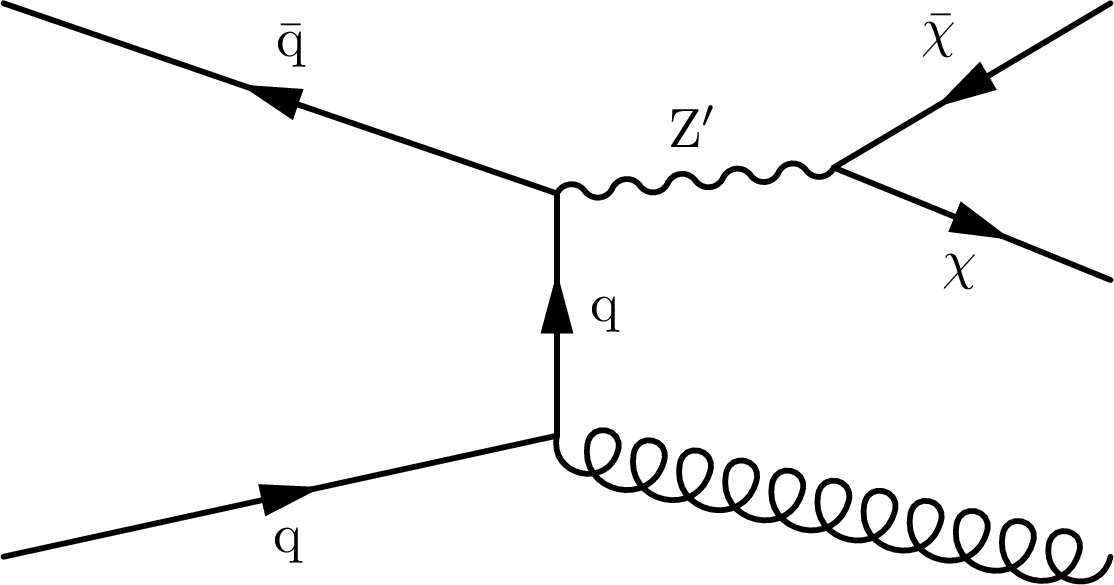
Figure 1-a:
Leading order Feynman diagram of monojet production and decay of a spin-1 mediator. |
png pdf |
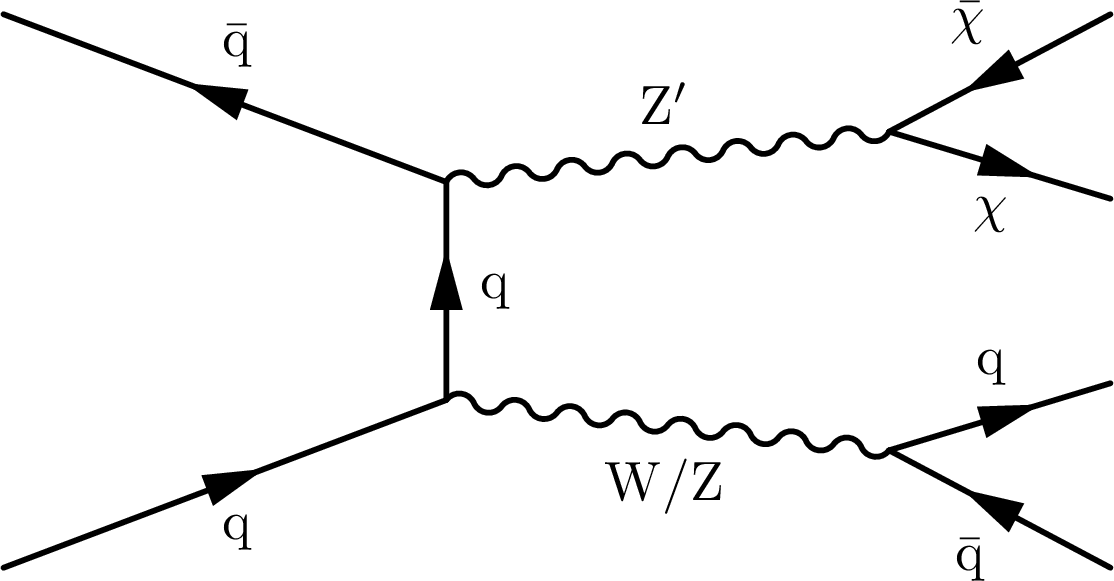
Figure 1-b:
Leading order Feynman diagram of mono-V production and decay of a spin-1 mediator. |
png pdf |
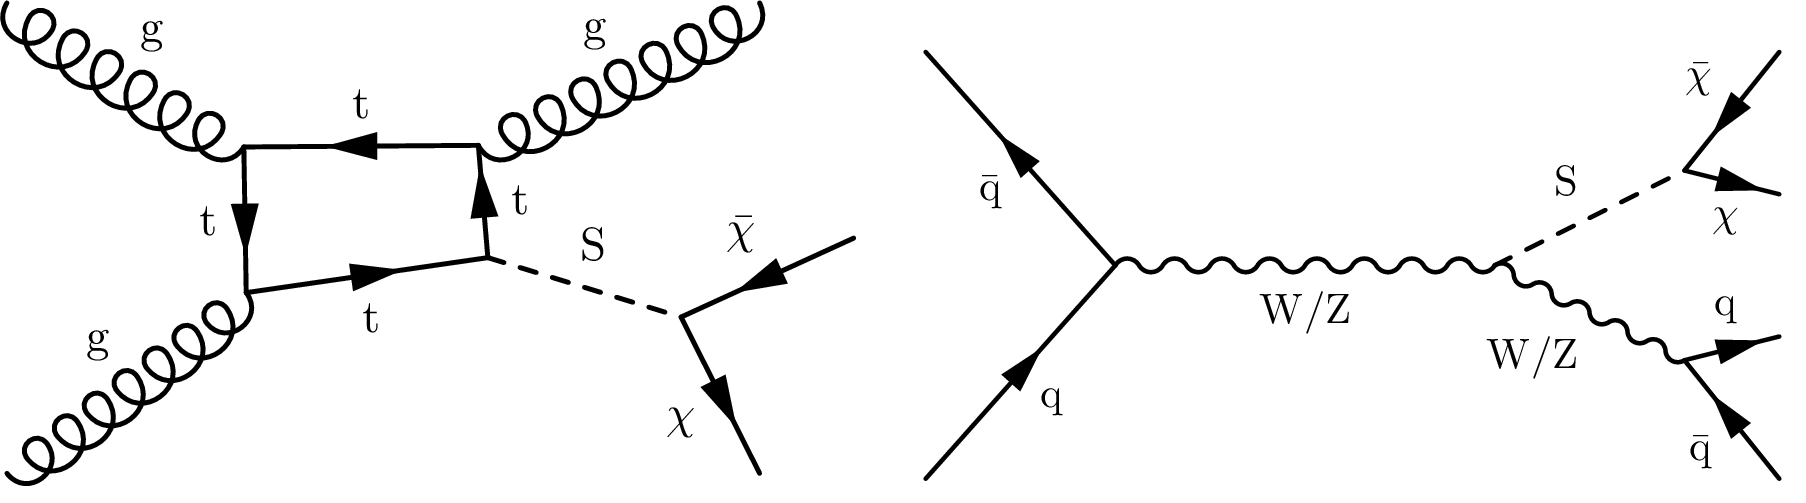
Figure 2:
Leading order Feynman diagrams of monojet (left) and mono-V (right) production and decay of a spin-0 mediator. |

png pdf |
Figure 2-a:
Leading order Feynman diagram of monojet production and decay of a spin-0 mediator. |

png pdf |
Figure 2-b:
Leading order Feynman diagram of mono-V production and decay of a spin-0 mediator. |
png pdf |
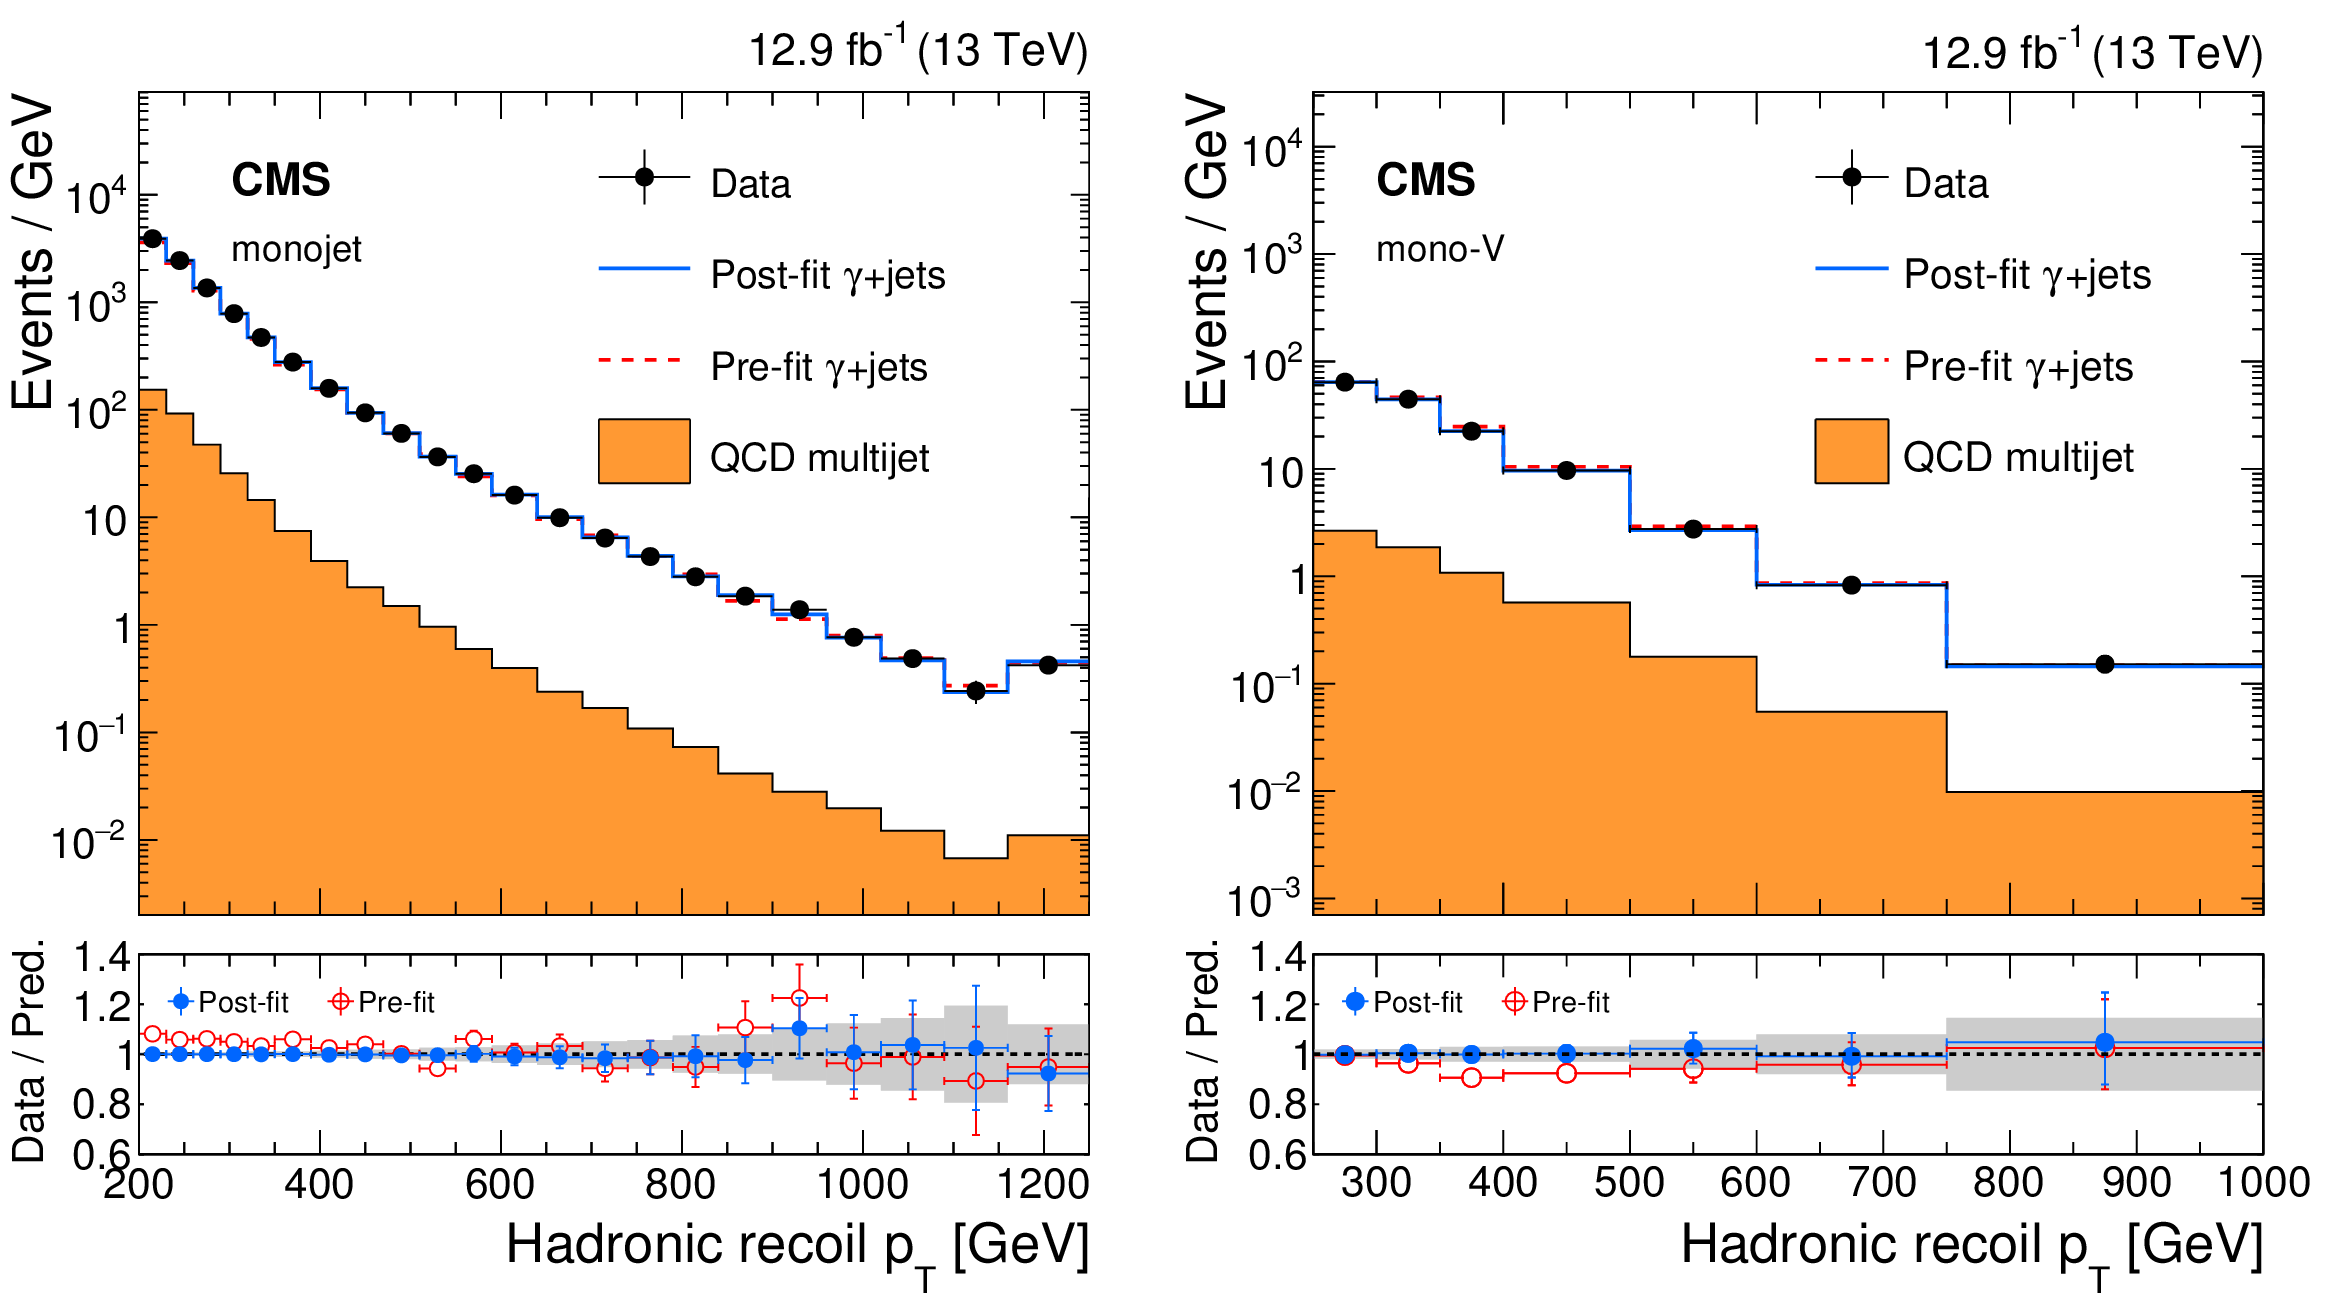
Figure 3:
Comparison between data and Monte Carlo simulation in the $\gamma$+jets control sample before and after performing the simultaneous fit across all the control samples and the signal region, assuming the absence of any signal. The left plot shows the monojet category and the right plot shows the mono-V category. The hadronic recoil $ {p_{\mathrm {T}}} $ in $\gamma$+jets events is used as a proxy for $ {E_{\mathrm {T}}^{\text {miss}}} $ in the signal region. The filled histogram indicates the multijet background. Ratios of data and the pre-fit background prediction (red points) and post-fit background prediction (blue points) are shown for both the monojet and mono-V signal categories. The gray band indicates the overall post-fit uncertainty. The last bin includes all events with hadronic recoil $ {p_{\mathrm {T}}} $ larger than 1160 (750) GeV in the monojet (mono-V) category. |
png pdf |
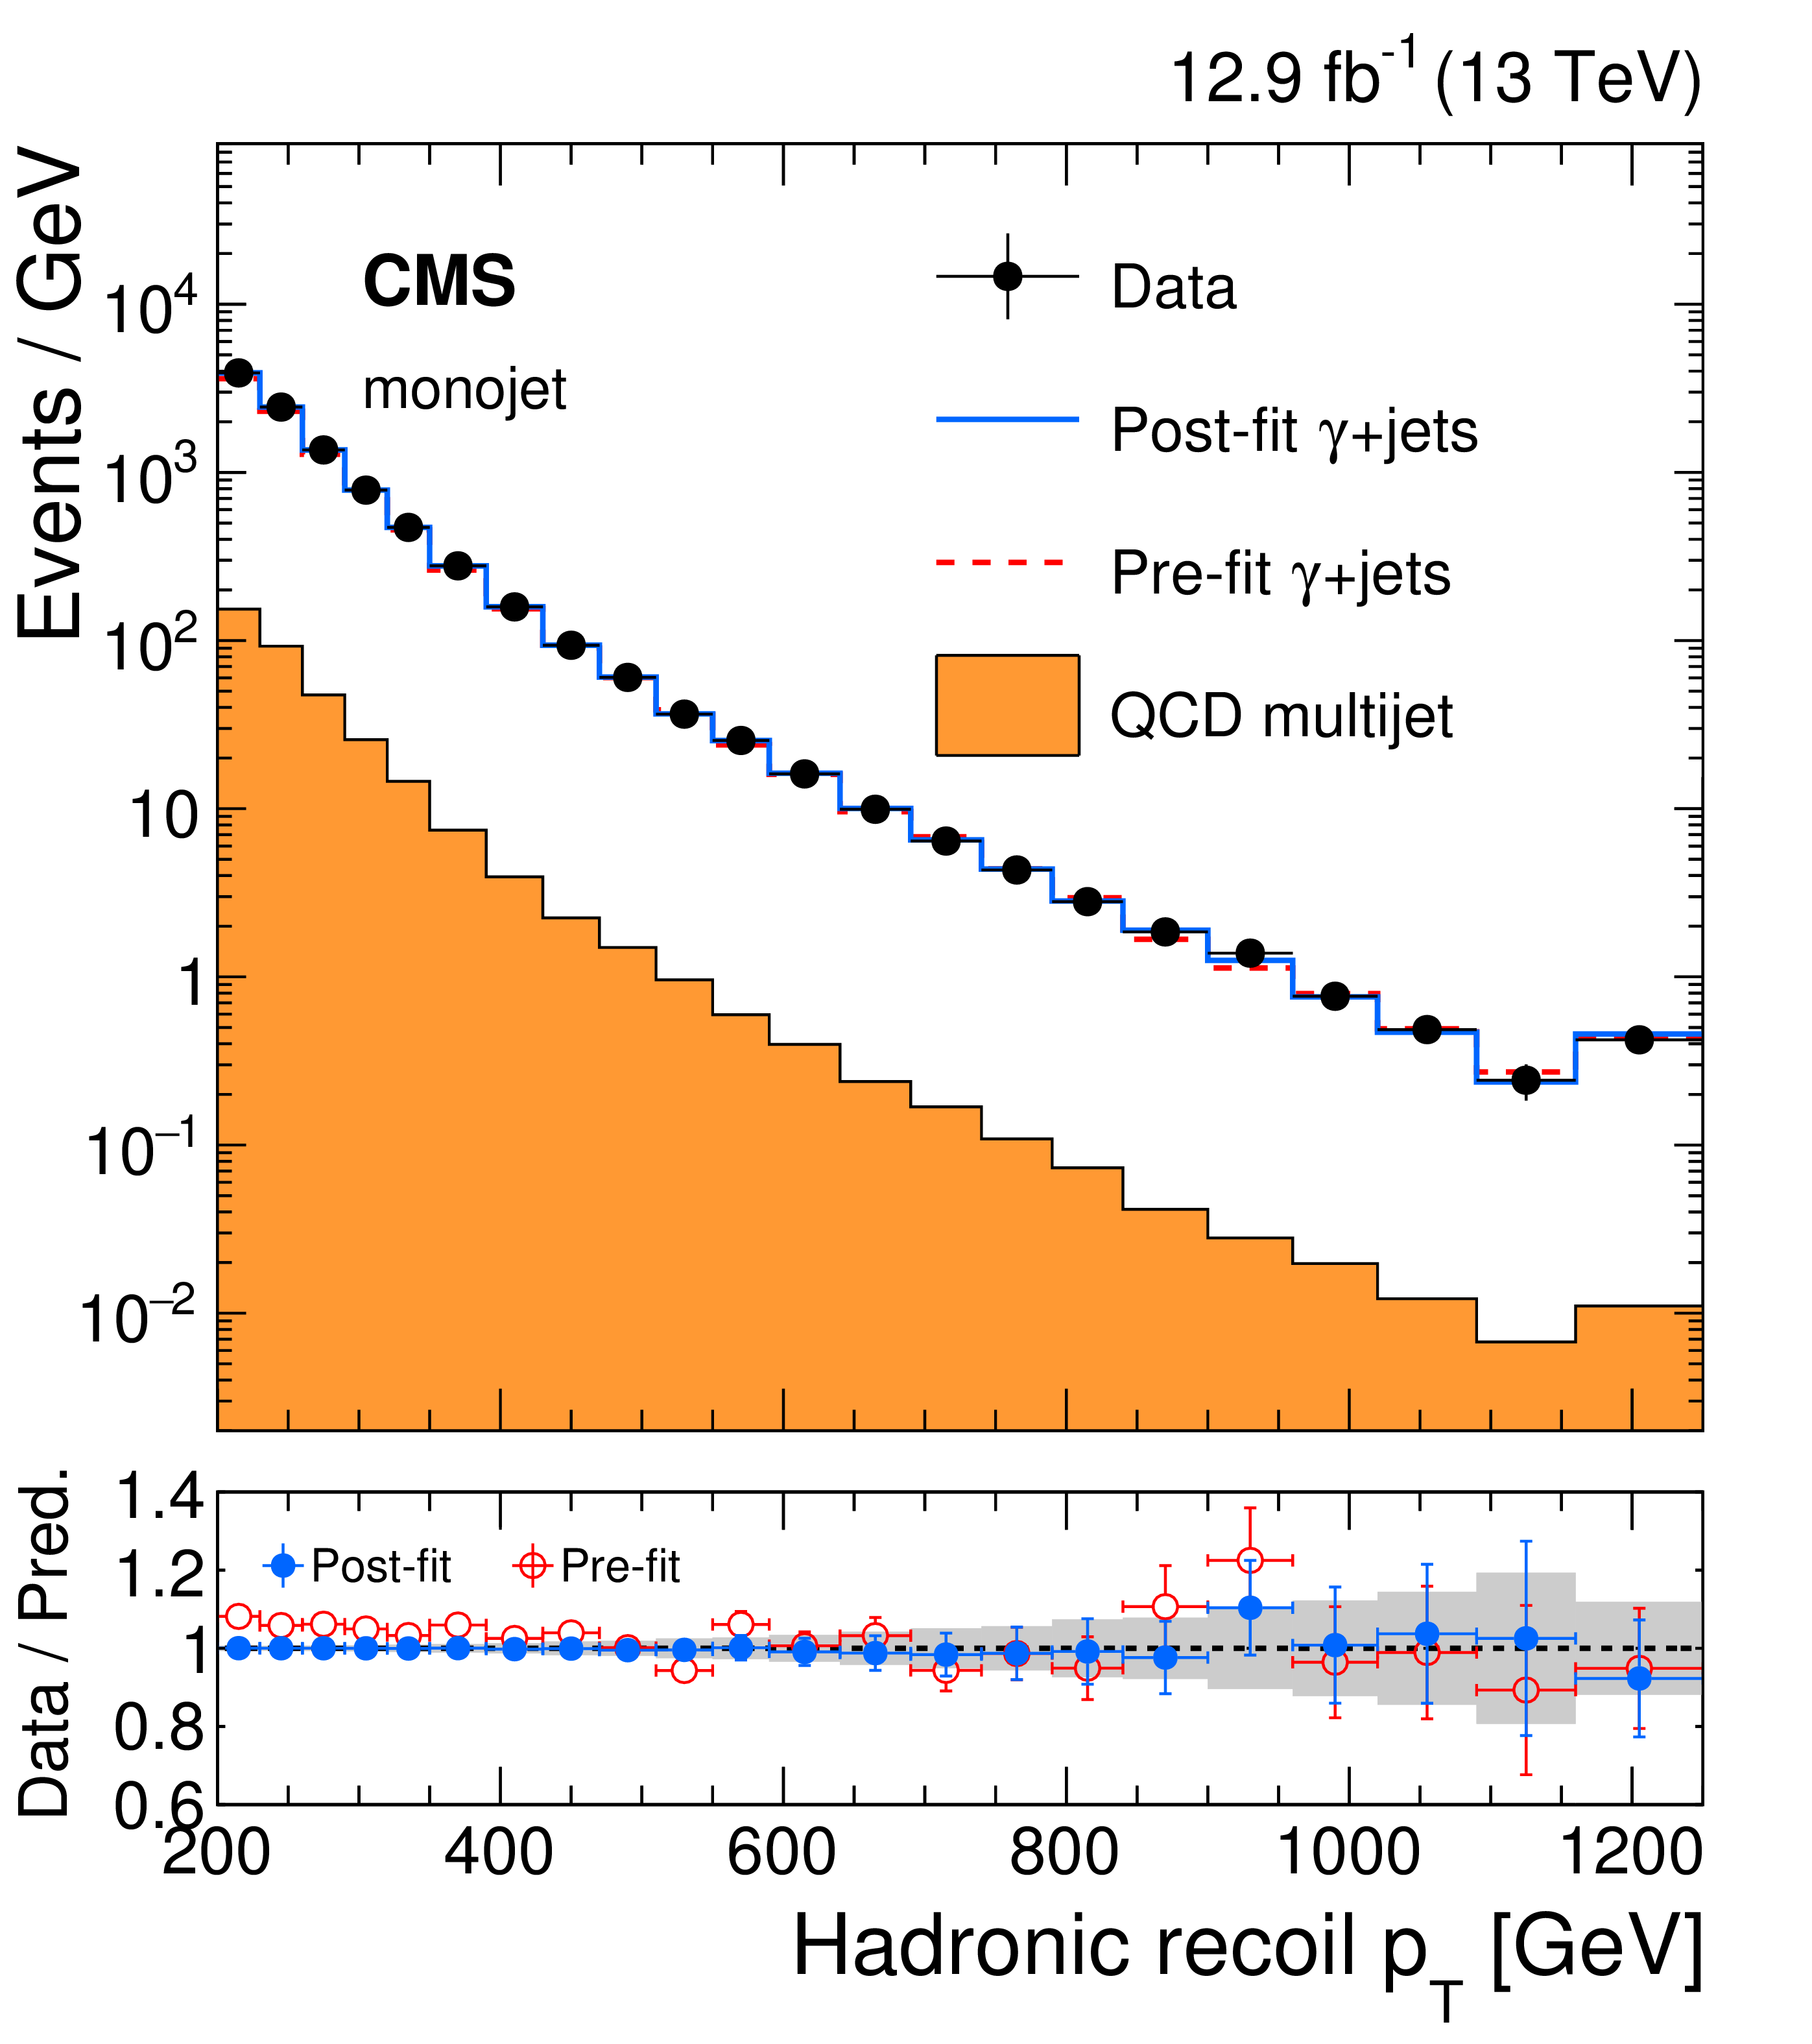
Figure 3-a:
Comparison between data and Monte Carlo simulation in the $\gamma$+jets control sample before and after performing the simultaneous fit across all the control samples and the signal region, assuming the absence of any signal. The plot shows the monojet category. The hadronic recoil $ {p_{\mathrm {T}}} $ in $\gamma$+jets events is used as a proxy for $ {E_{\mathrm {T}}^{\text {miss}}} $ in the signal region. The filled histogram indicates the multijet background. Ratios of data and the pre-fit background prediction (red points) and post-fit background prediction (blue points) are shown. The gray band indicates the overall post-fit uncertainty. The last bin includes all events with hadronic recoil $ {p_{\mathrm {T}}} $ larger than 1160 GeV in the monojet category. |
png pdf |
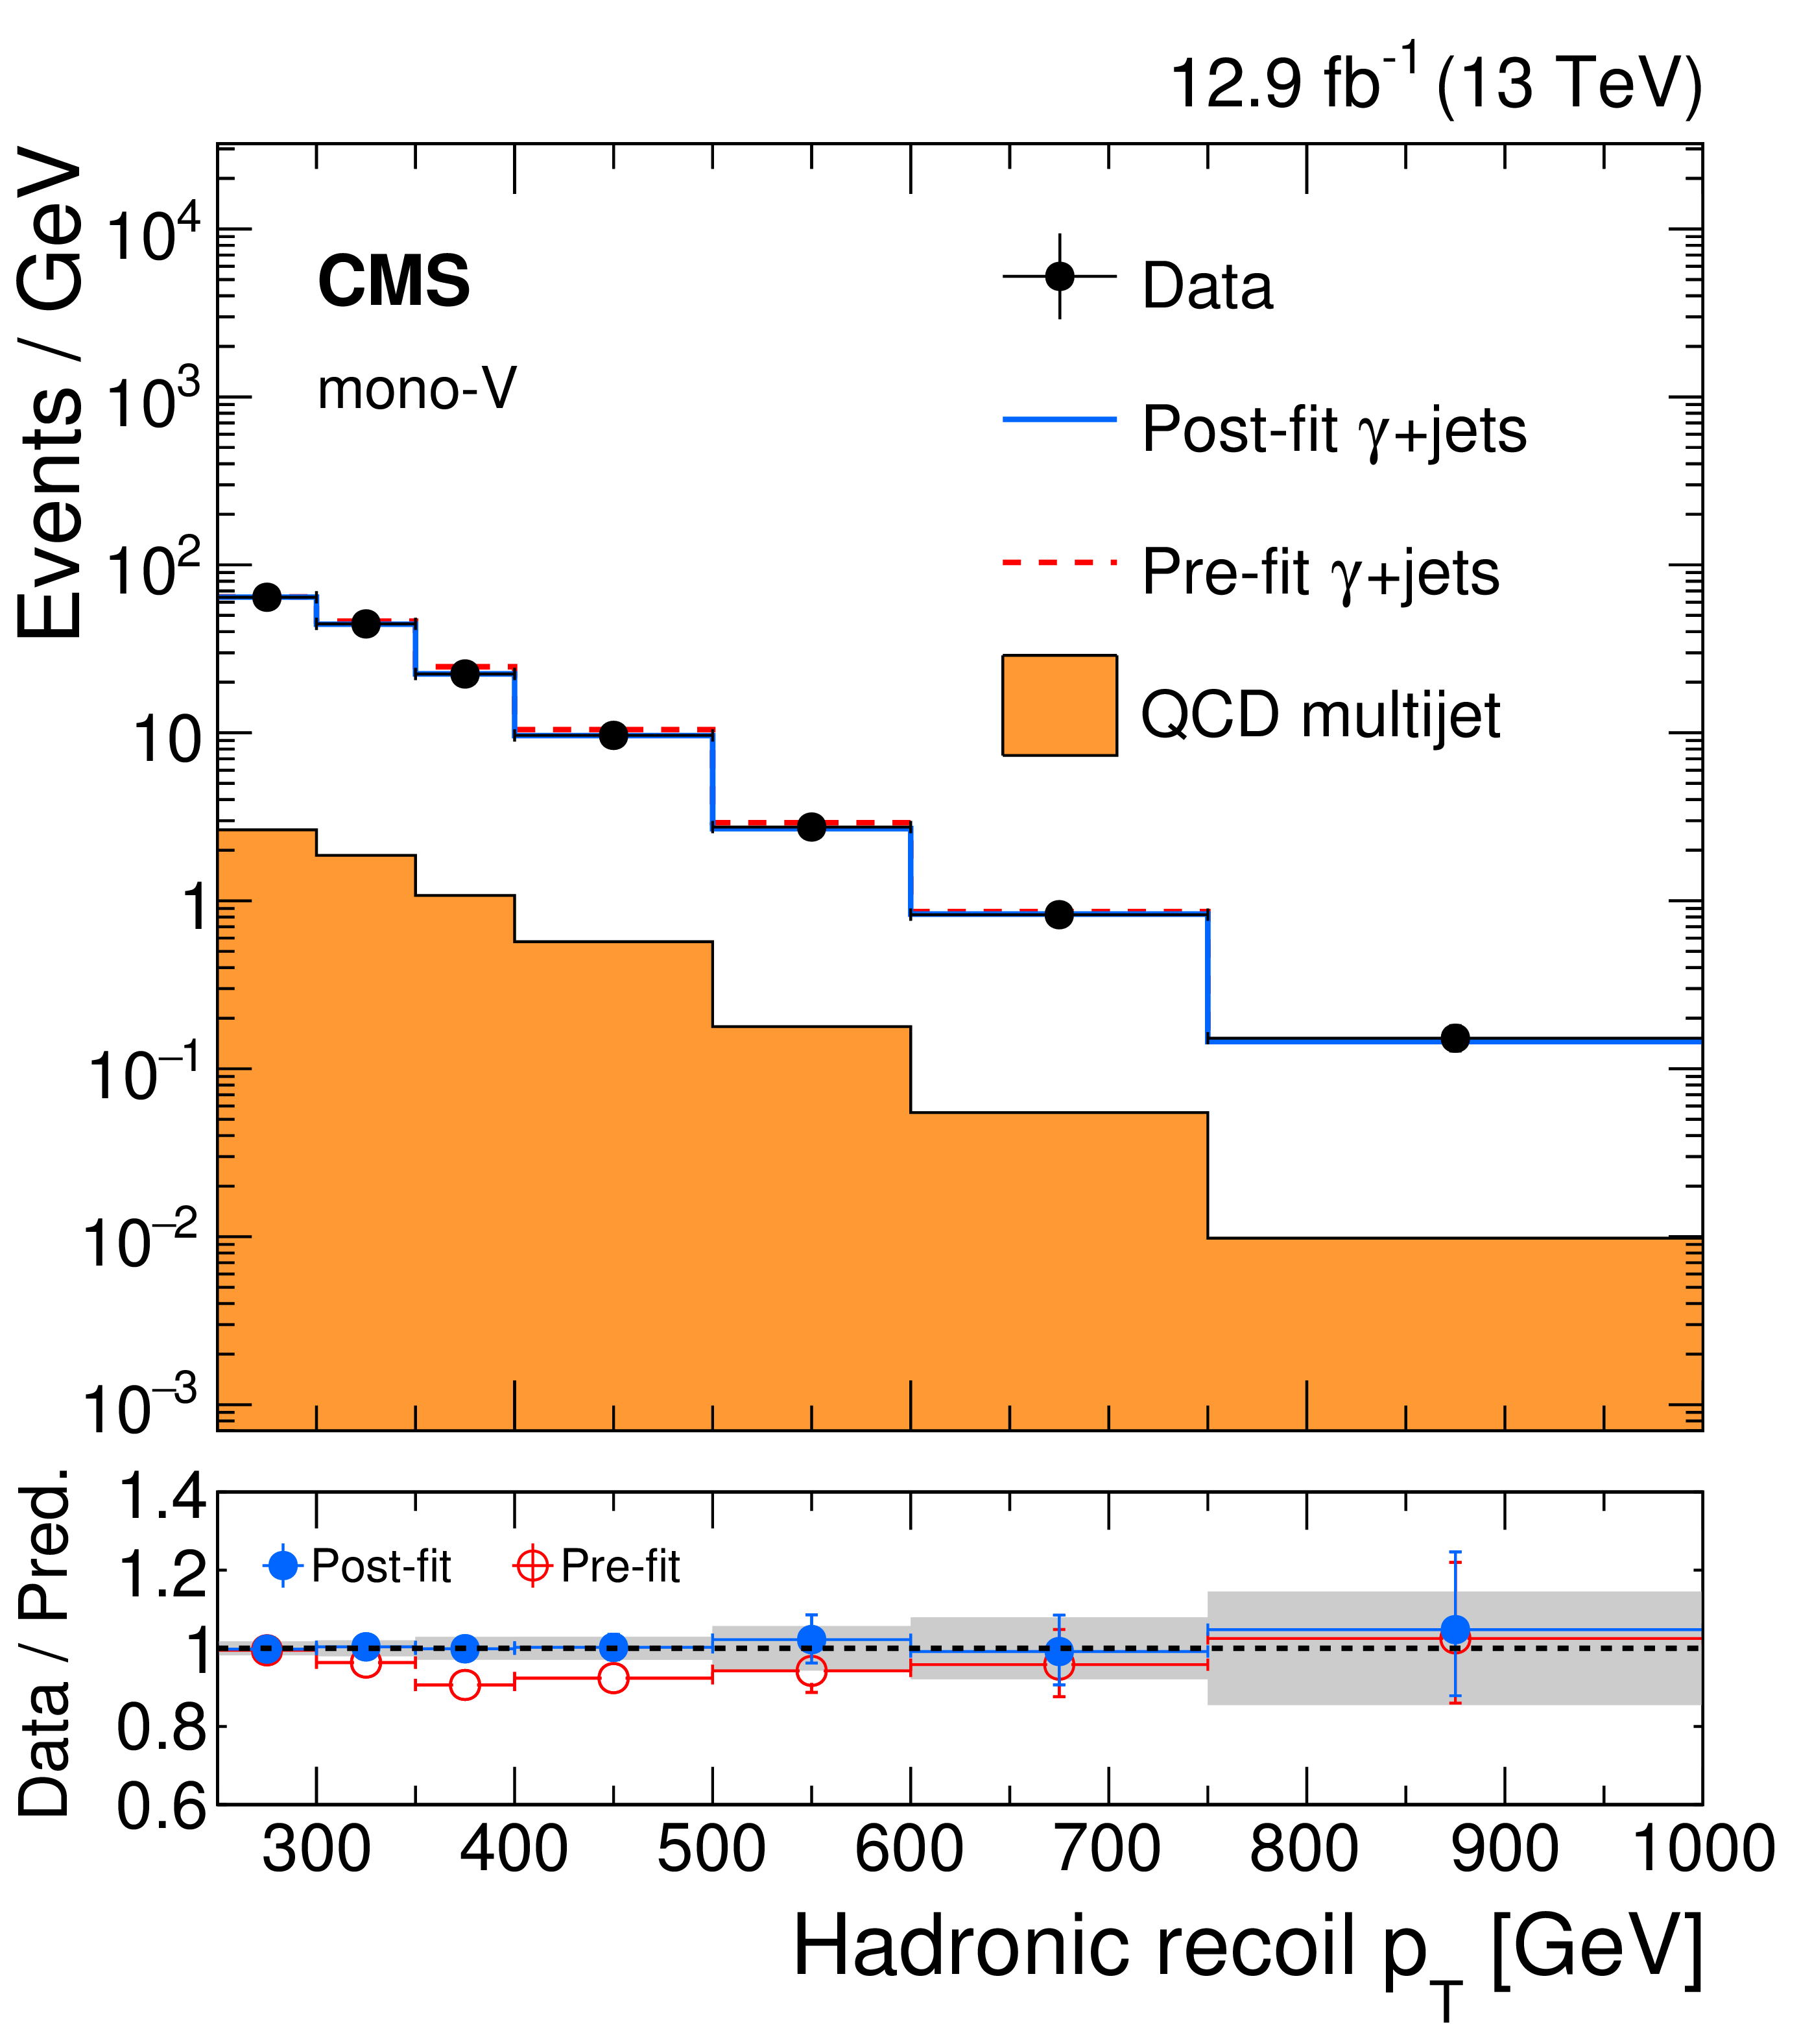
Figure 3-b:
Comparison between data and Monte Carlo simulation in the $\gamma$+jets control sample before and after performing the simultaneous fit across all the control samples and the signal region, assuming the absence of any signal. The plot shows the mono-V category. The hadronic recoil $ {p_{\mathrm {T}}} $ in $\gamma$+jets events is used as a proxy for $ {E_{\mathrm {T}}^{\text {miss}}} $ in the signal region. The filled histogram indicates the multijet background. Ratios of data and the pre-fit background prediction (red points) and post-fit background prediction (blue points) are shown. The gray band indicates the overall post-fit uncertainty. The last bin includes all events with hadronic recoil $ {p_{\mathrm {T}}} $ larger than 750 GeV in the mono-V category. |
png pdf |
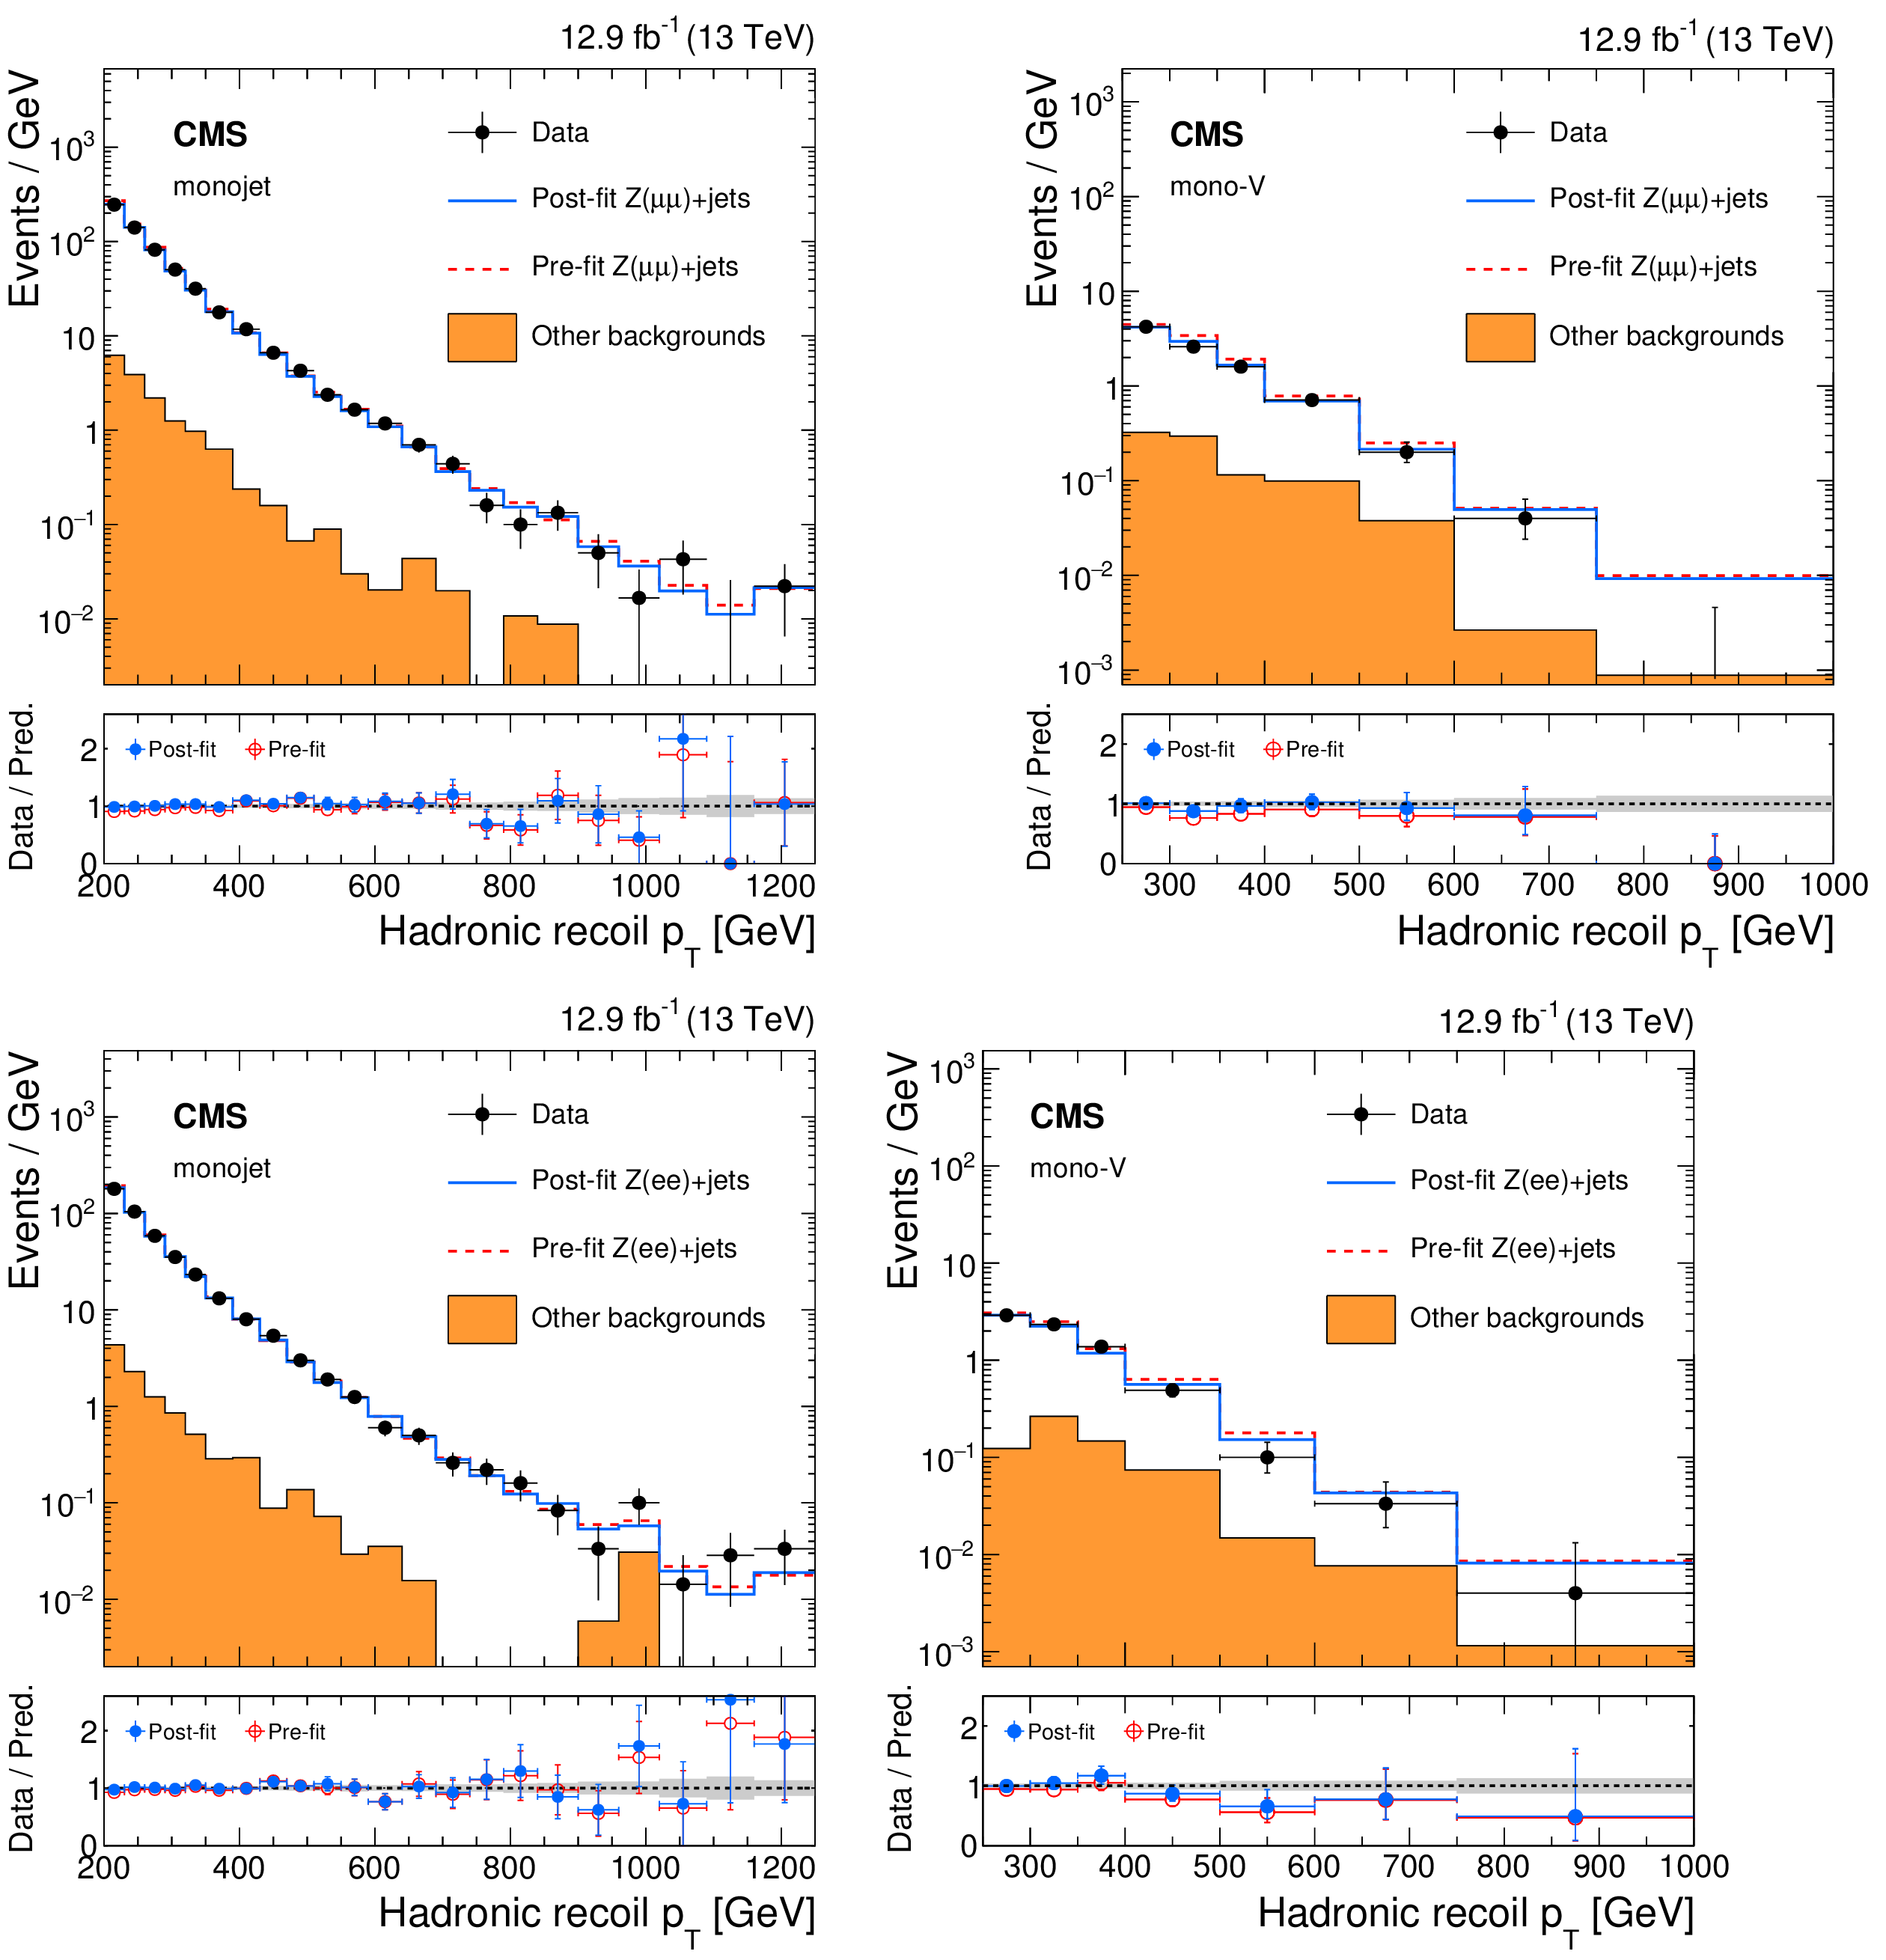
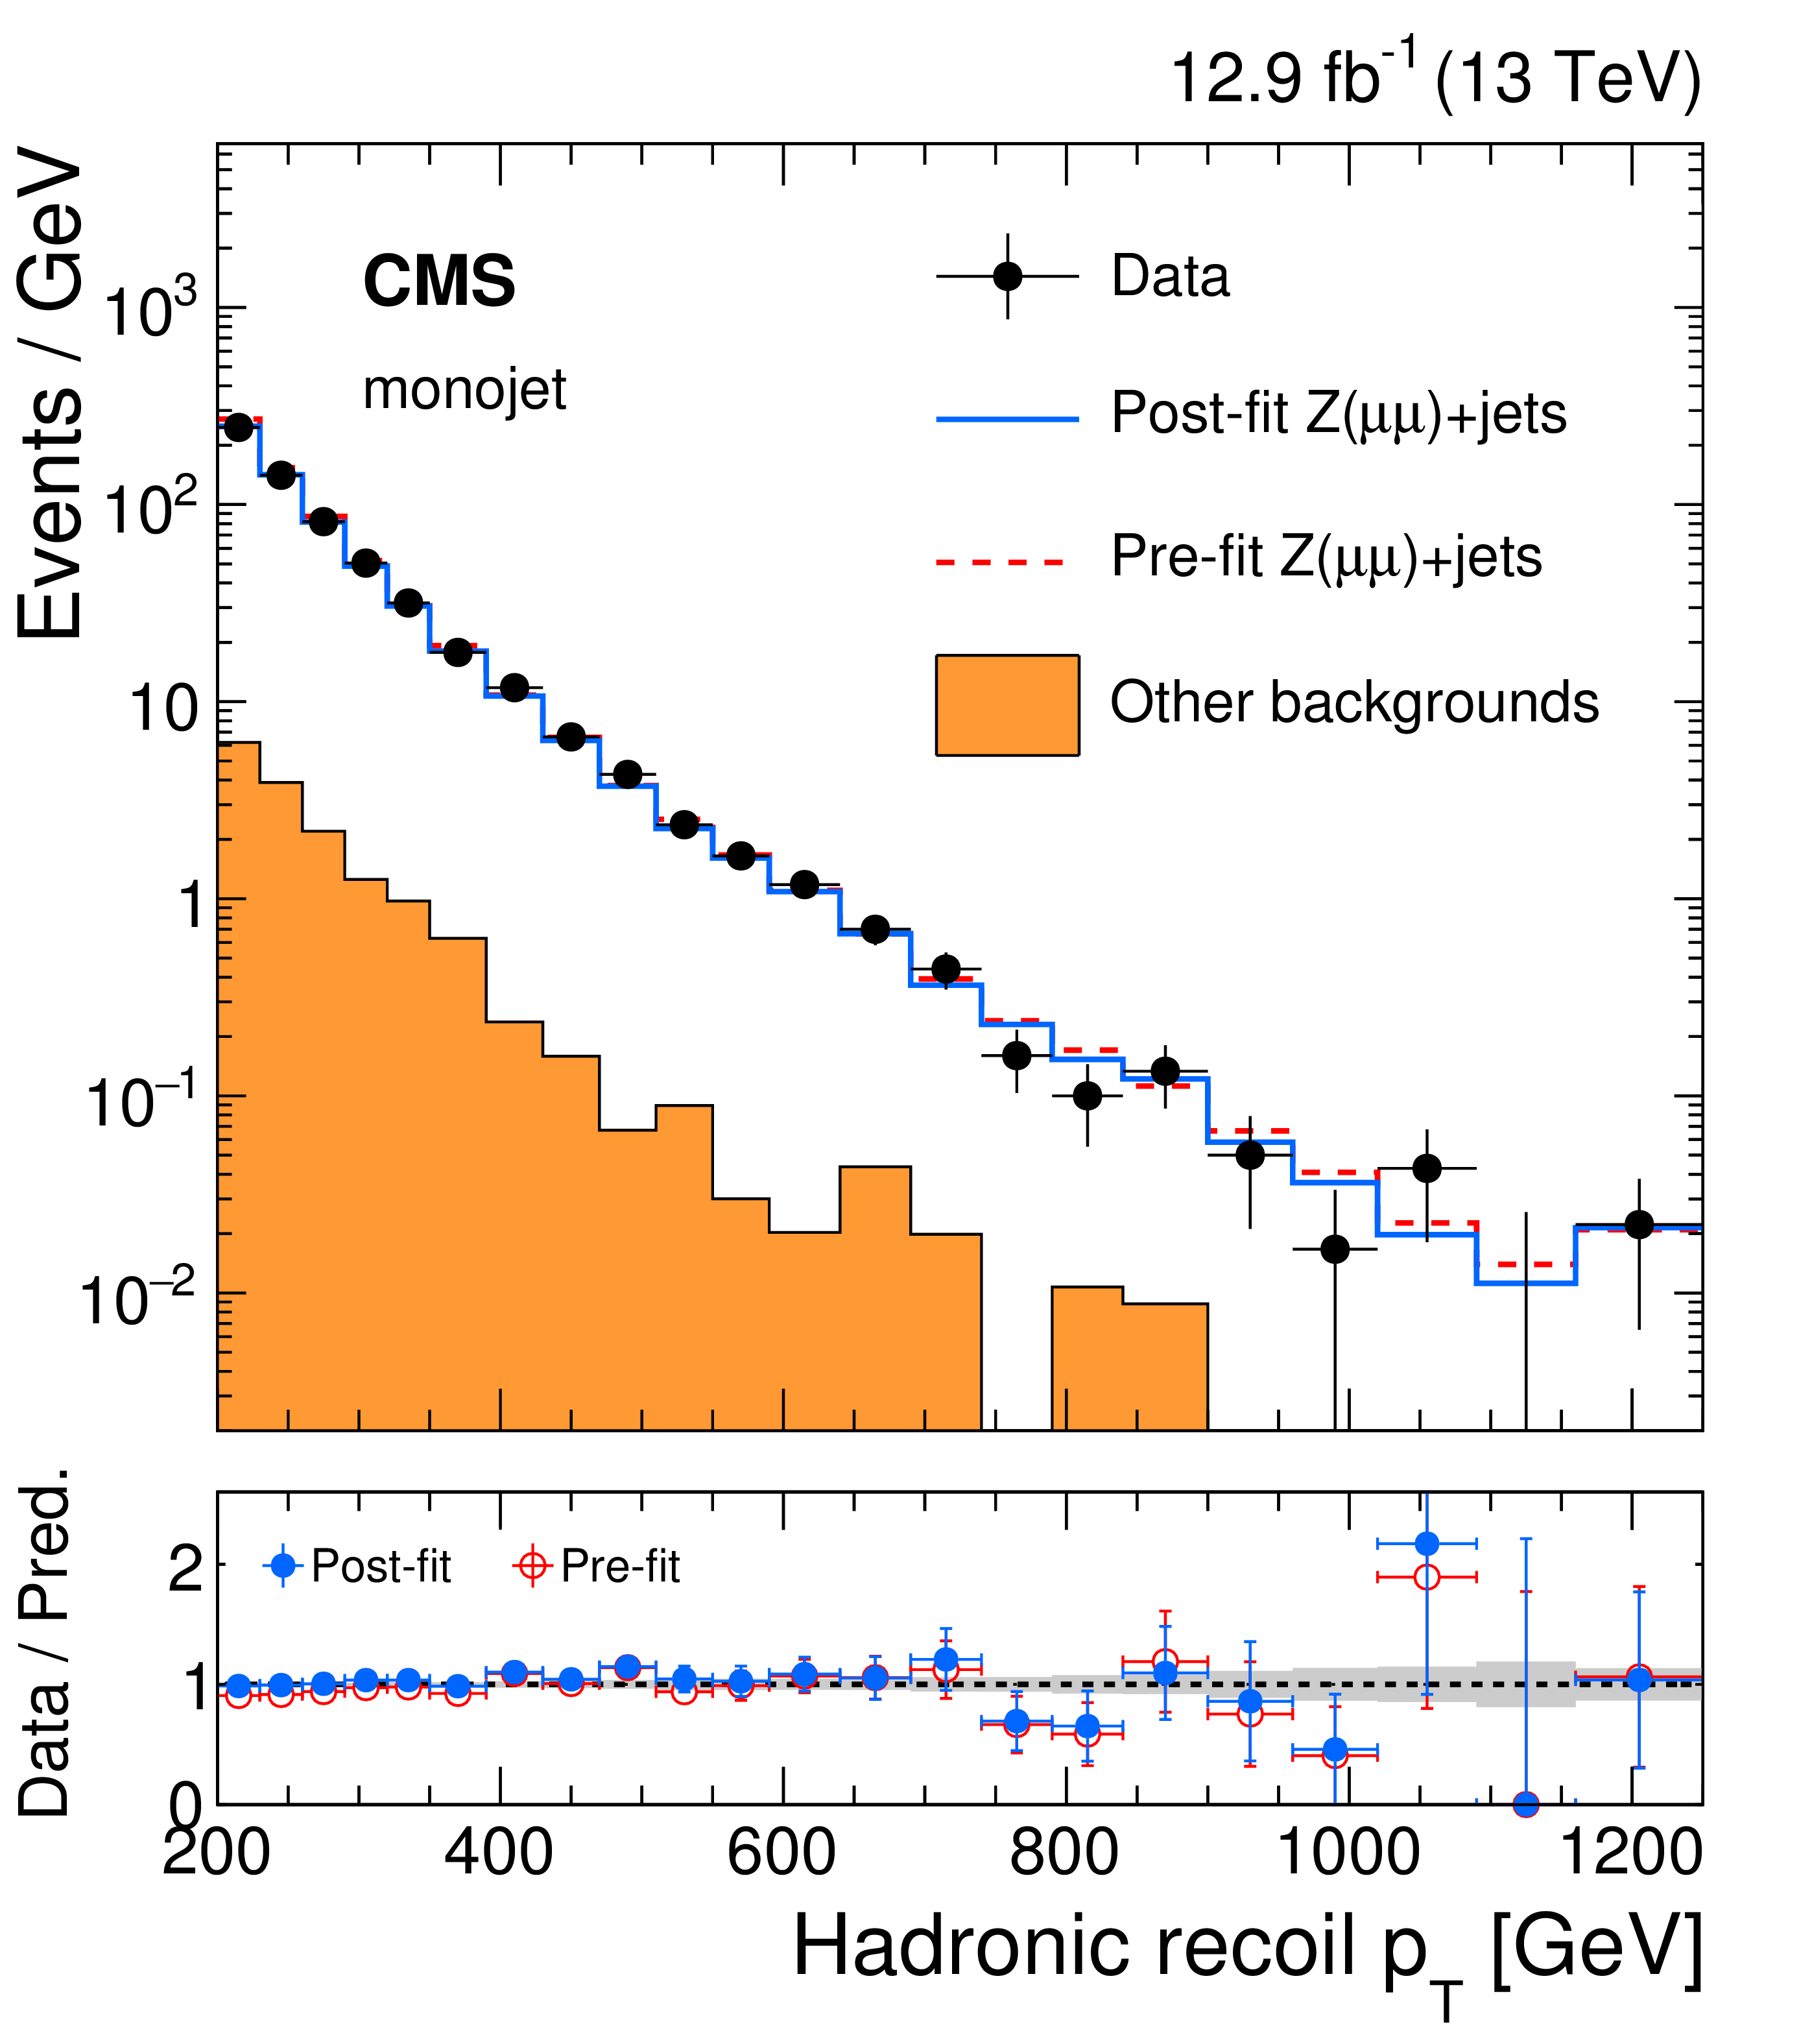
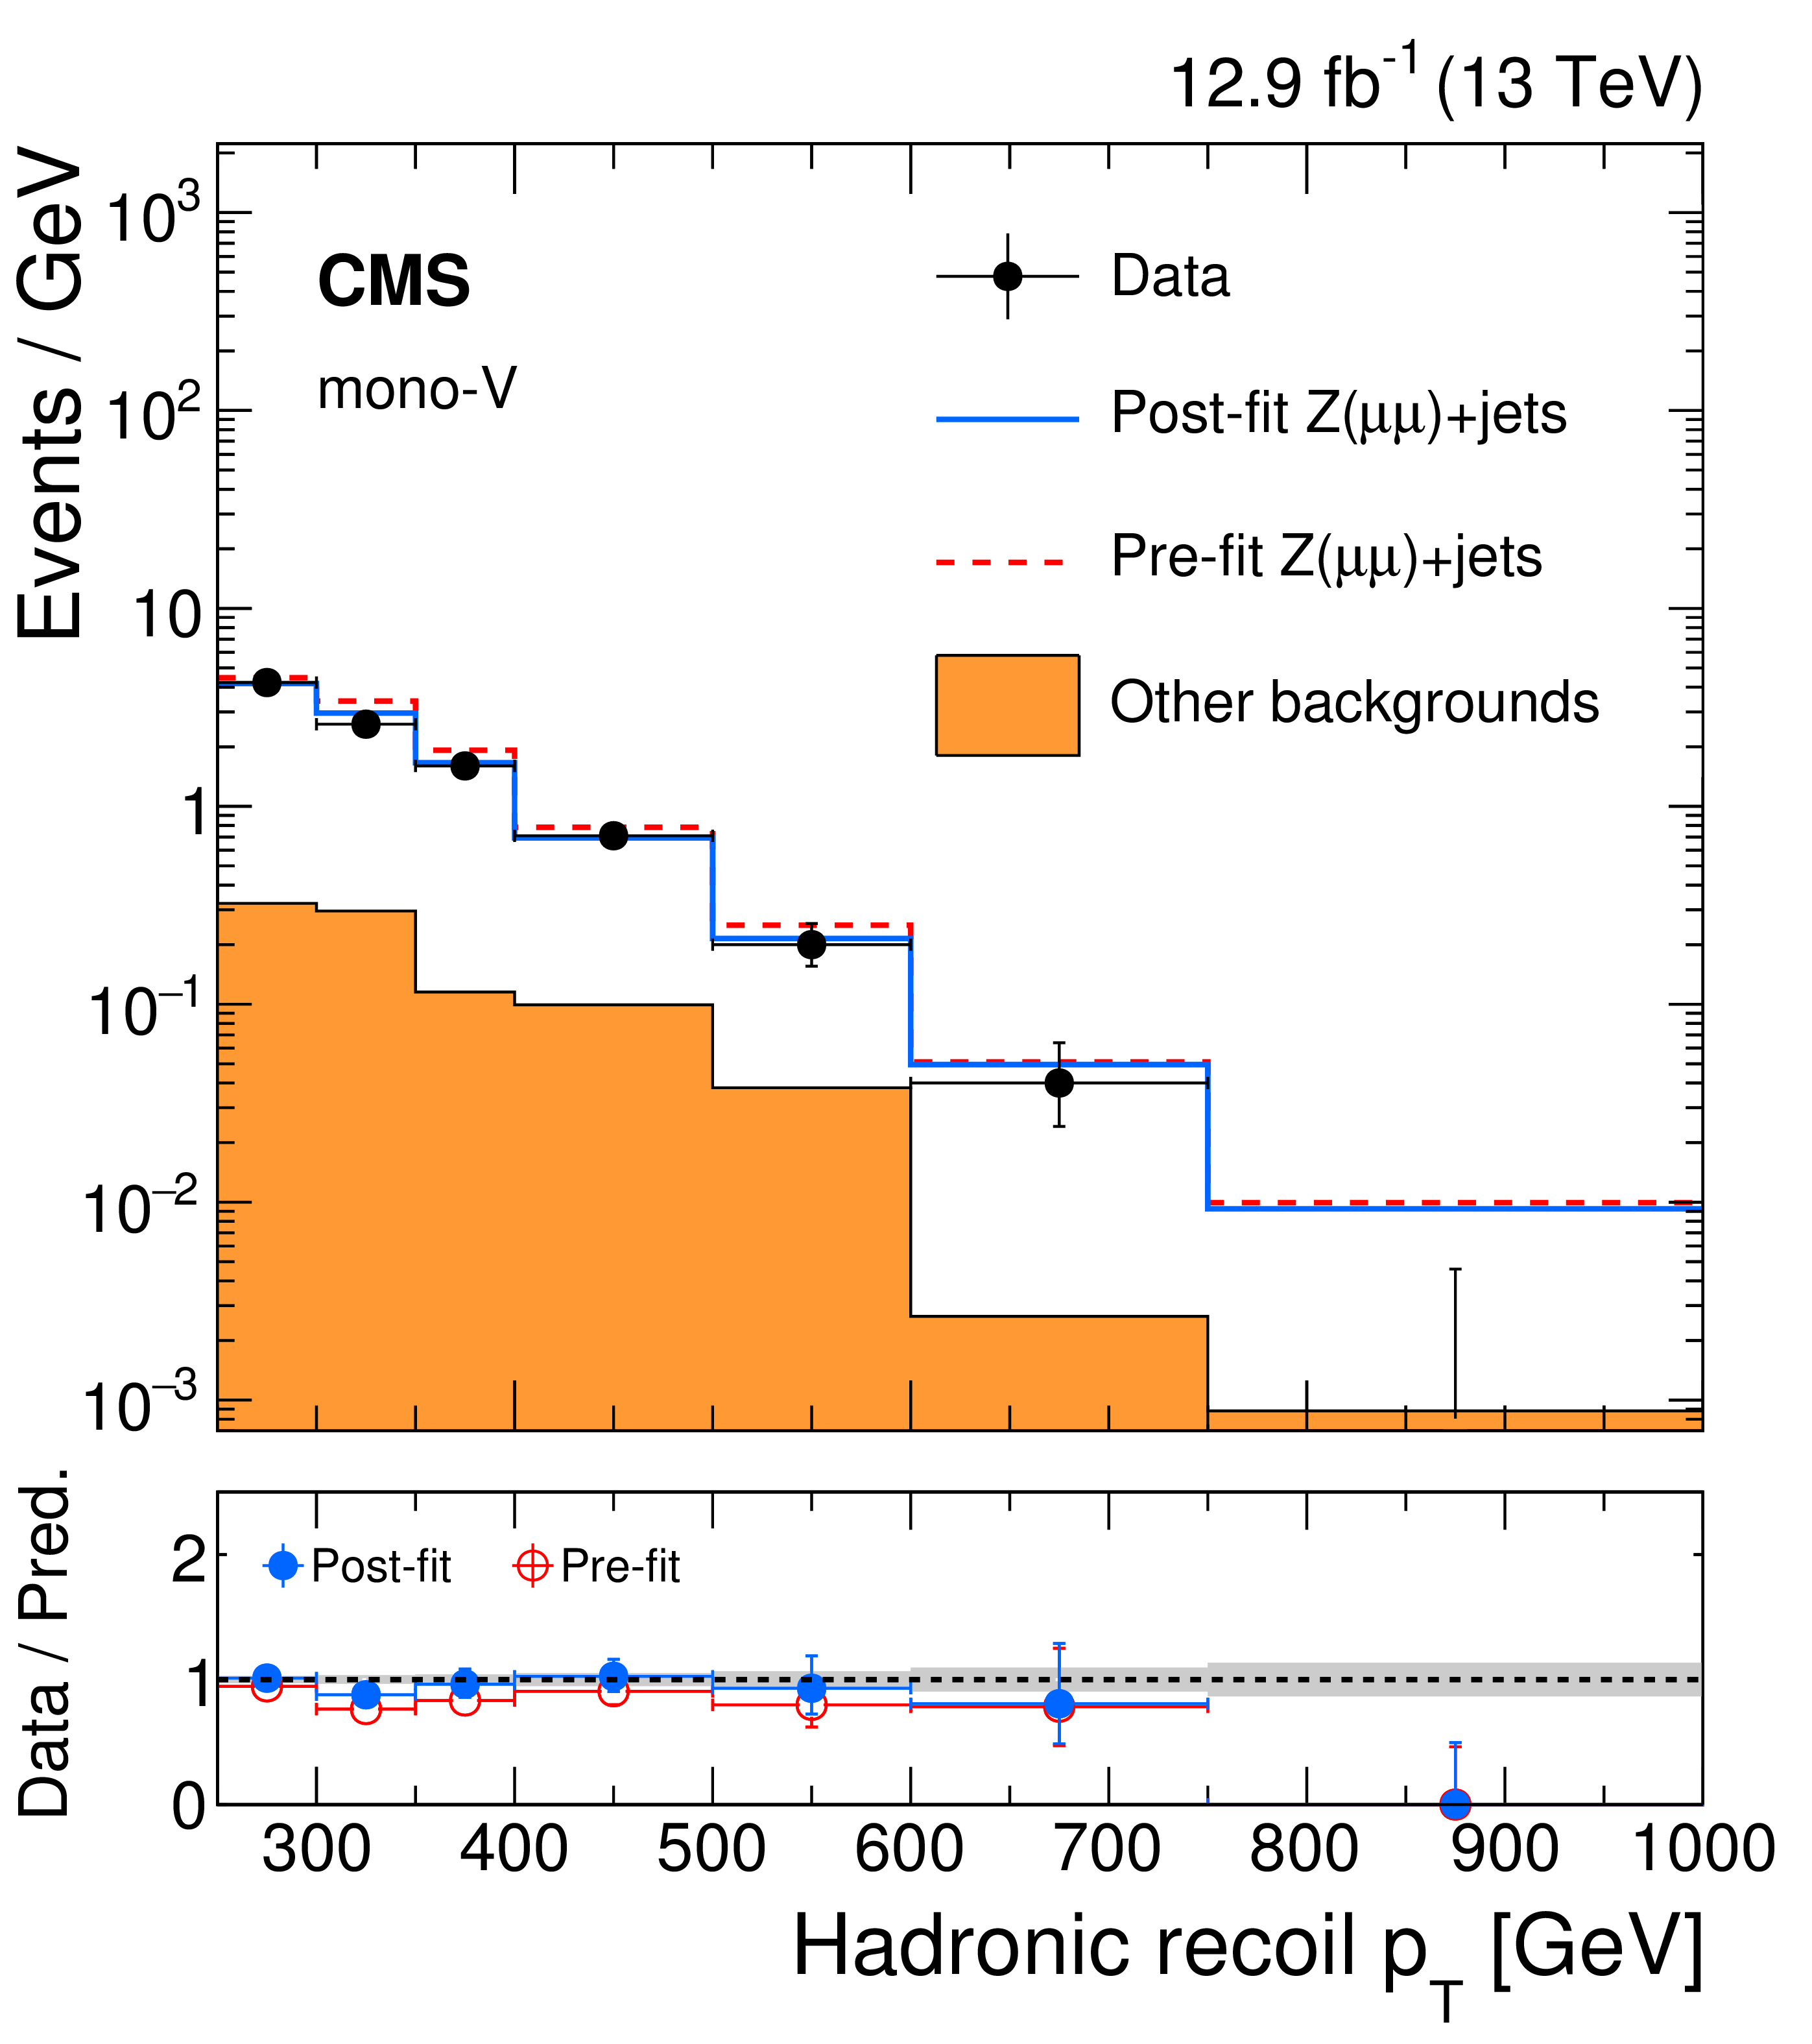
Figure 4:
Comparison between data and Monte Carlo simulation in the dilepton control samples before and after performing the simultaneous fit across all the control samples and the signal region, assuming the absence of any signal. Plots on the upper left and right correspond to the monojet and mono-V categories, respectively, in the dimuon control sample. Plots on the bottom left and right correspond to the monojet and mono-V categories, respectively, in the dielectron control sample. The hadronic recoil $ {p_{\mathrm {T}}} $ in dilepton events is used as a proxy for $ {E_{\mathrm {T}}^{\text {miss}}} $ in the signal region. The filled histogram indicates all processes other than ${\mathrm {Z}(\ell ^{+} \ell ^{-})}$+jets. Ratios of data and the pre-fit background prediction (red points) and post-fit background prediction (blue points) are shown for both the monojet and mono-V signal categories. The gray band indicates the overall post-fit uncertainty. The last bin includes all events with hadronic recoil $ {p_{\mathrm {T}}} $ larger than 1160 (750) GeV in the monojet (mono-V) category. |
png pdf |
Figure 4-a:
Comparison between data and Monte Carlo simulation in the dilepton control samples before and after performing the simultaneous fit across all the control samples and the signal region, assuming the absence of any signal. The plot corresponds to the monojet category, in the dimuon control sample. The hadronic recoil $ {p_{\mathrm {T}}} $ in dilepton events is used as a proxy for $ {E_{\mathrm {T}}^{\text {miss}}} $ in the signal region. The filled histogram indicates all processes other than ${\mathrm {Z}(\ell ^{+} \ell ^{-})}$+jets. Ratios of data and the pre-fit background prediction (red points) and post-fit background prediction (blue points) are shown for both the monojet and mono-V signal categories. The gray band indicates the overall post-fit uncertainty. The last bin includes all events with hadronic recoil $ {p_{\mathrm {T}}} $ larger than 1160 GeV in the monojet category. |
png pdf |
Figure 4-b:
Comparison between data and Monte Carlo simulation in the dilepton control samples before and after performing the simultaneous fit across all the control samples and the signal region, assuming the absence of any signal. The plot corresponds to the mono-V category, in the dielectron control sample. The hadronic recoil $ {p_{\mathrm {T}}} $ in dilepton events is used as a proxy for $ {E_{\mathrm {T}}^{\text {miss}}} $ in the signal region. The filled histogram indicates all processes other than ${\mathrm {Z}(\ell ^{+} \ell ^{-})}$+jets. Ratios of data and the pre-fit background prediction (red points) and post-fit background prediction (blue points) are shown for both the monojet and mono-V signal categories. The gray band indicates the overall post-fit uncertainty. The last bin includes all events with hadronic recoil $ {p_{\mathrm {T}}} $ larger than 750 GeV in the mono-V category. |
png pdf |
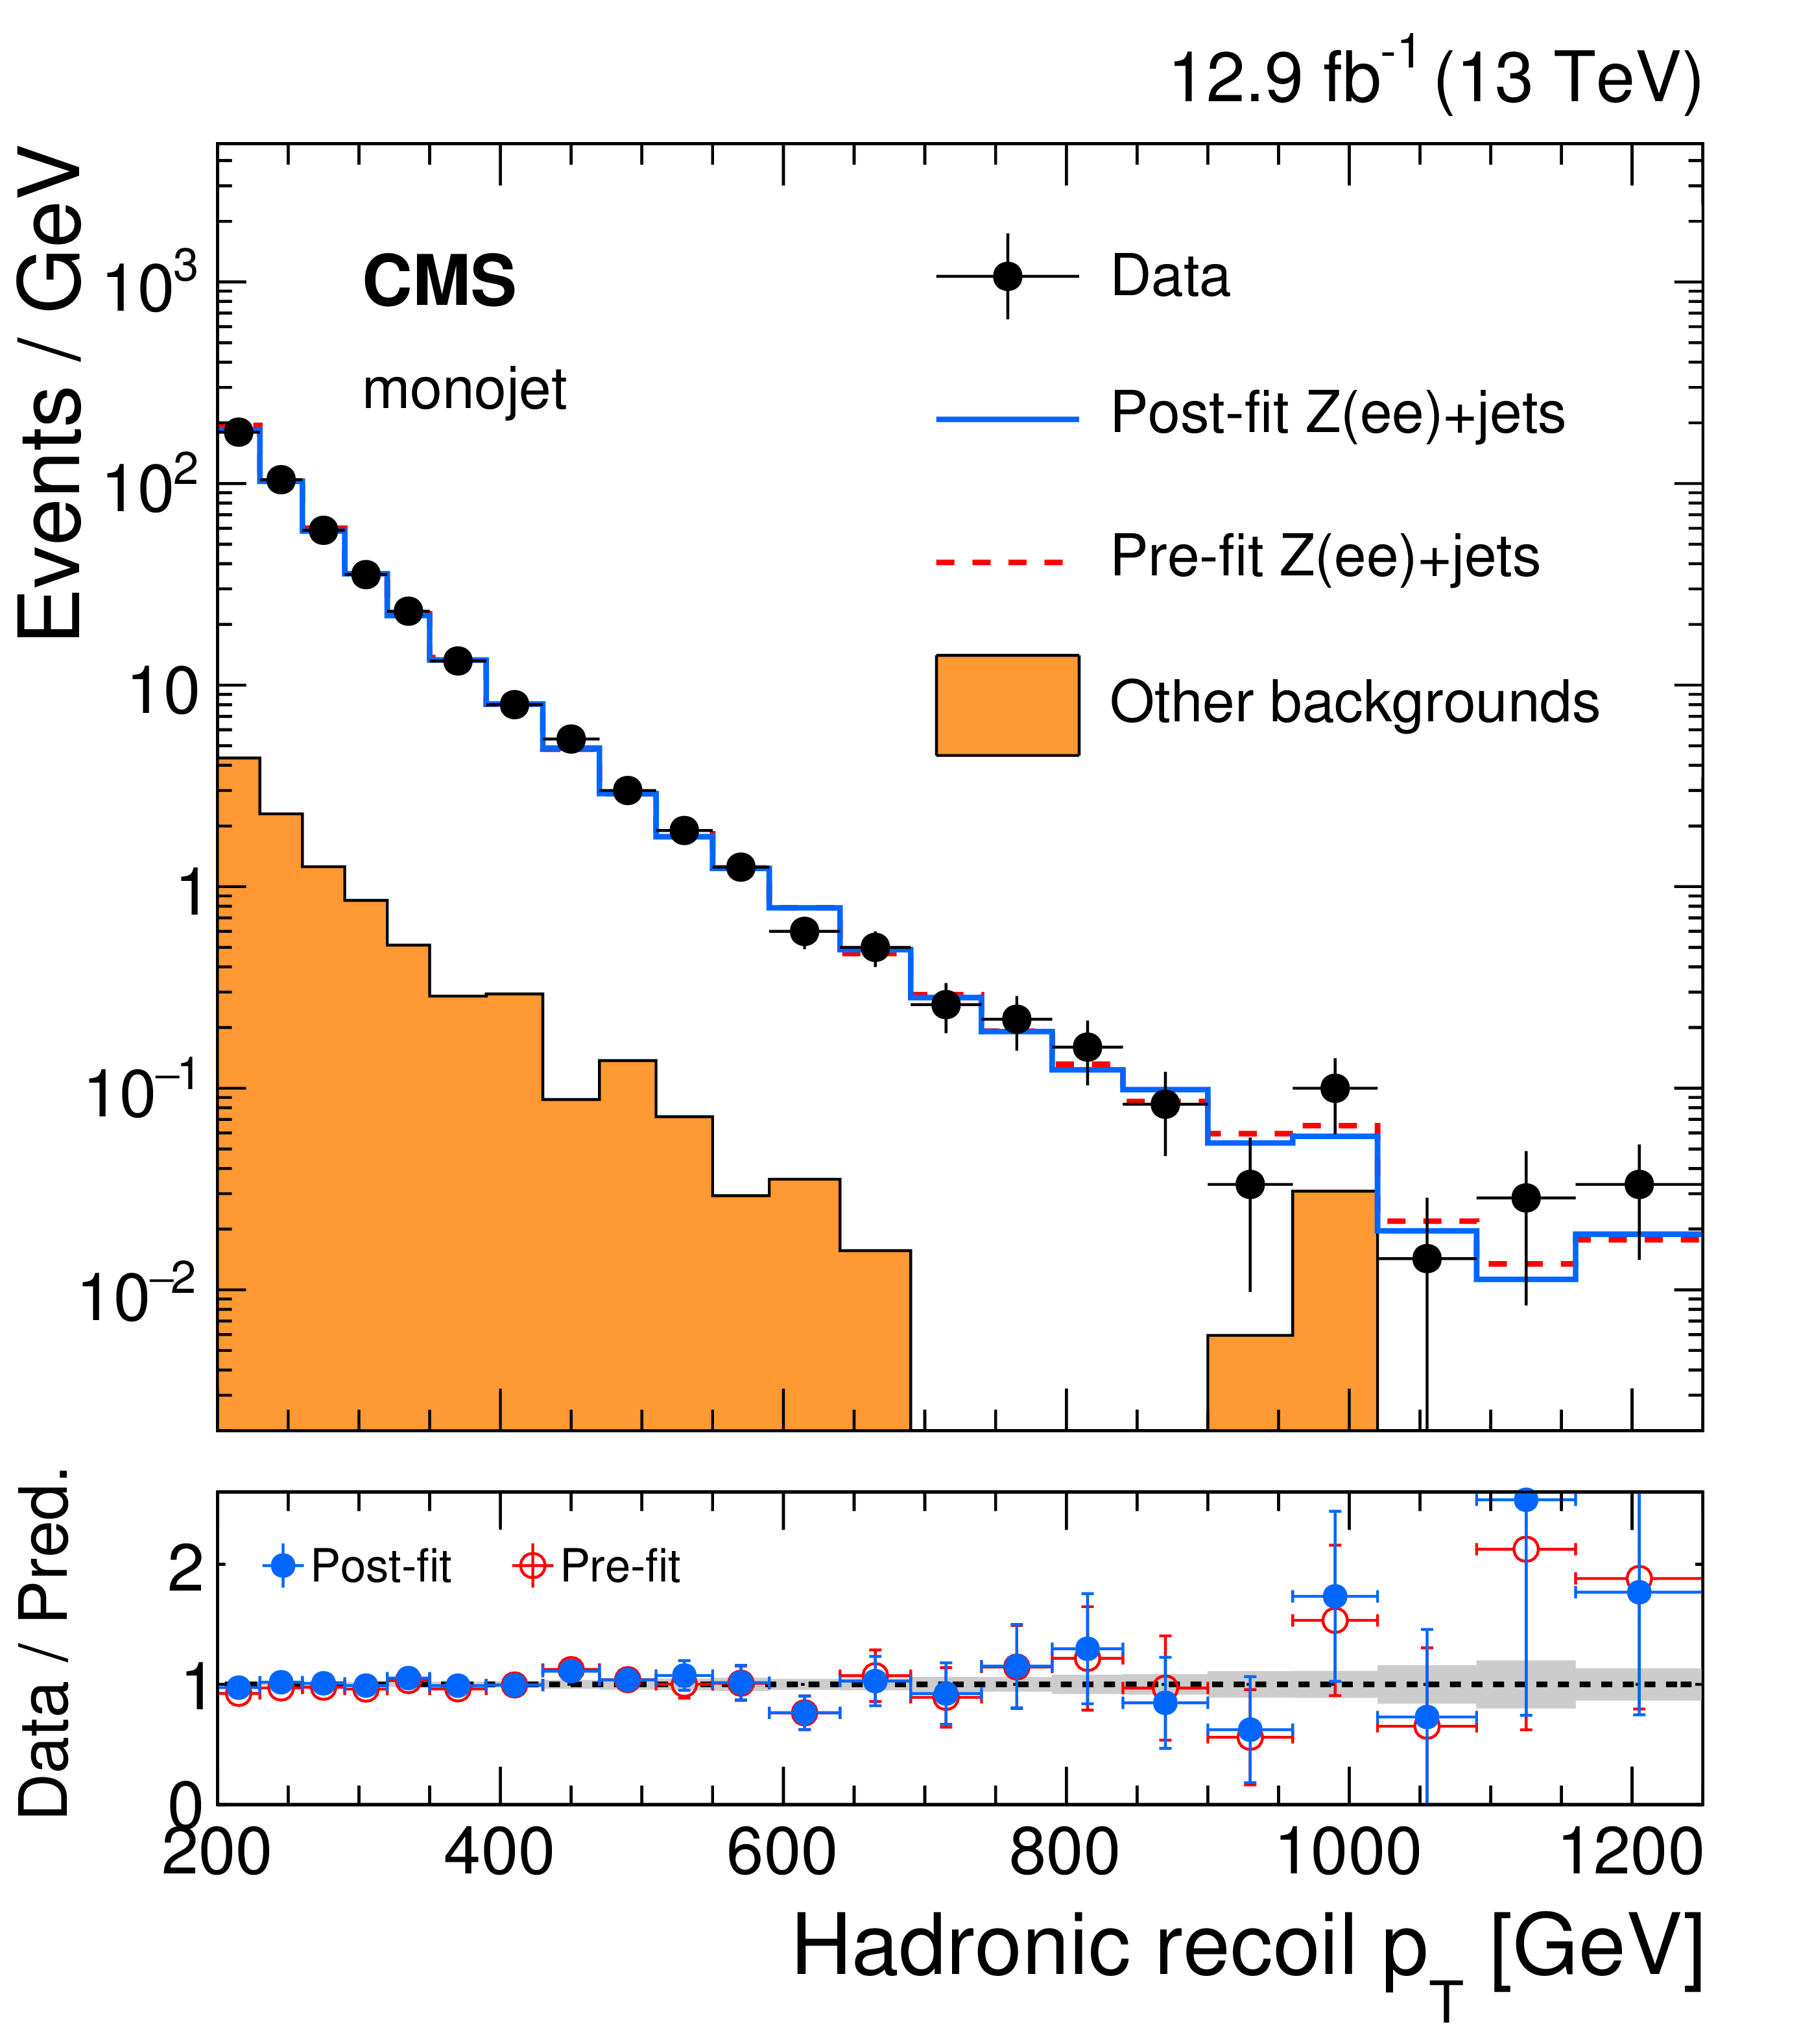
Figure 4-c:
Comparison between data and Monte Carlo simulation in the dilepton control samples before and after performing the simultaneous fit across all the control samples and the signal region, assuming the absence of any signal. The plot corresponds to the monojet category, in the dimuon control sample. The hadronic recoil $ {p_{\mathrm {T}}} $ in dilepton events is used as a proxy for $ {E_{\mathrm {T}}^{\text {miss}}} $ in the signal region. The filled histogram indicates all processes other than ${\mathrm {Z}(\ell ^{+} \ell ^{-})}$+jets. Ratios of data and the pre-fit background prediction (red points) and post-fit background prediction (blue points) are shown for both the monojet and mono-V signal categories. The gray band indicates the overall post-fit uncertainty. The last bin includes all events with hadronic recoil $ {p_{\mathrm {T}}} $ larger than 1160 GeV in the monojet category. |
png pdf |
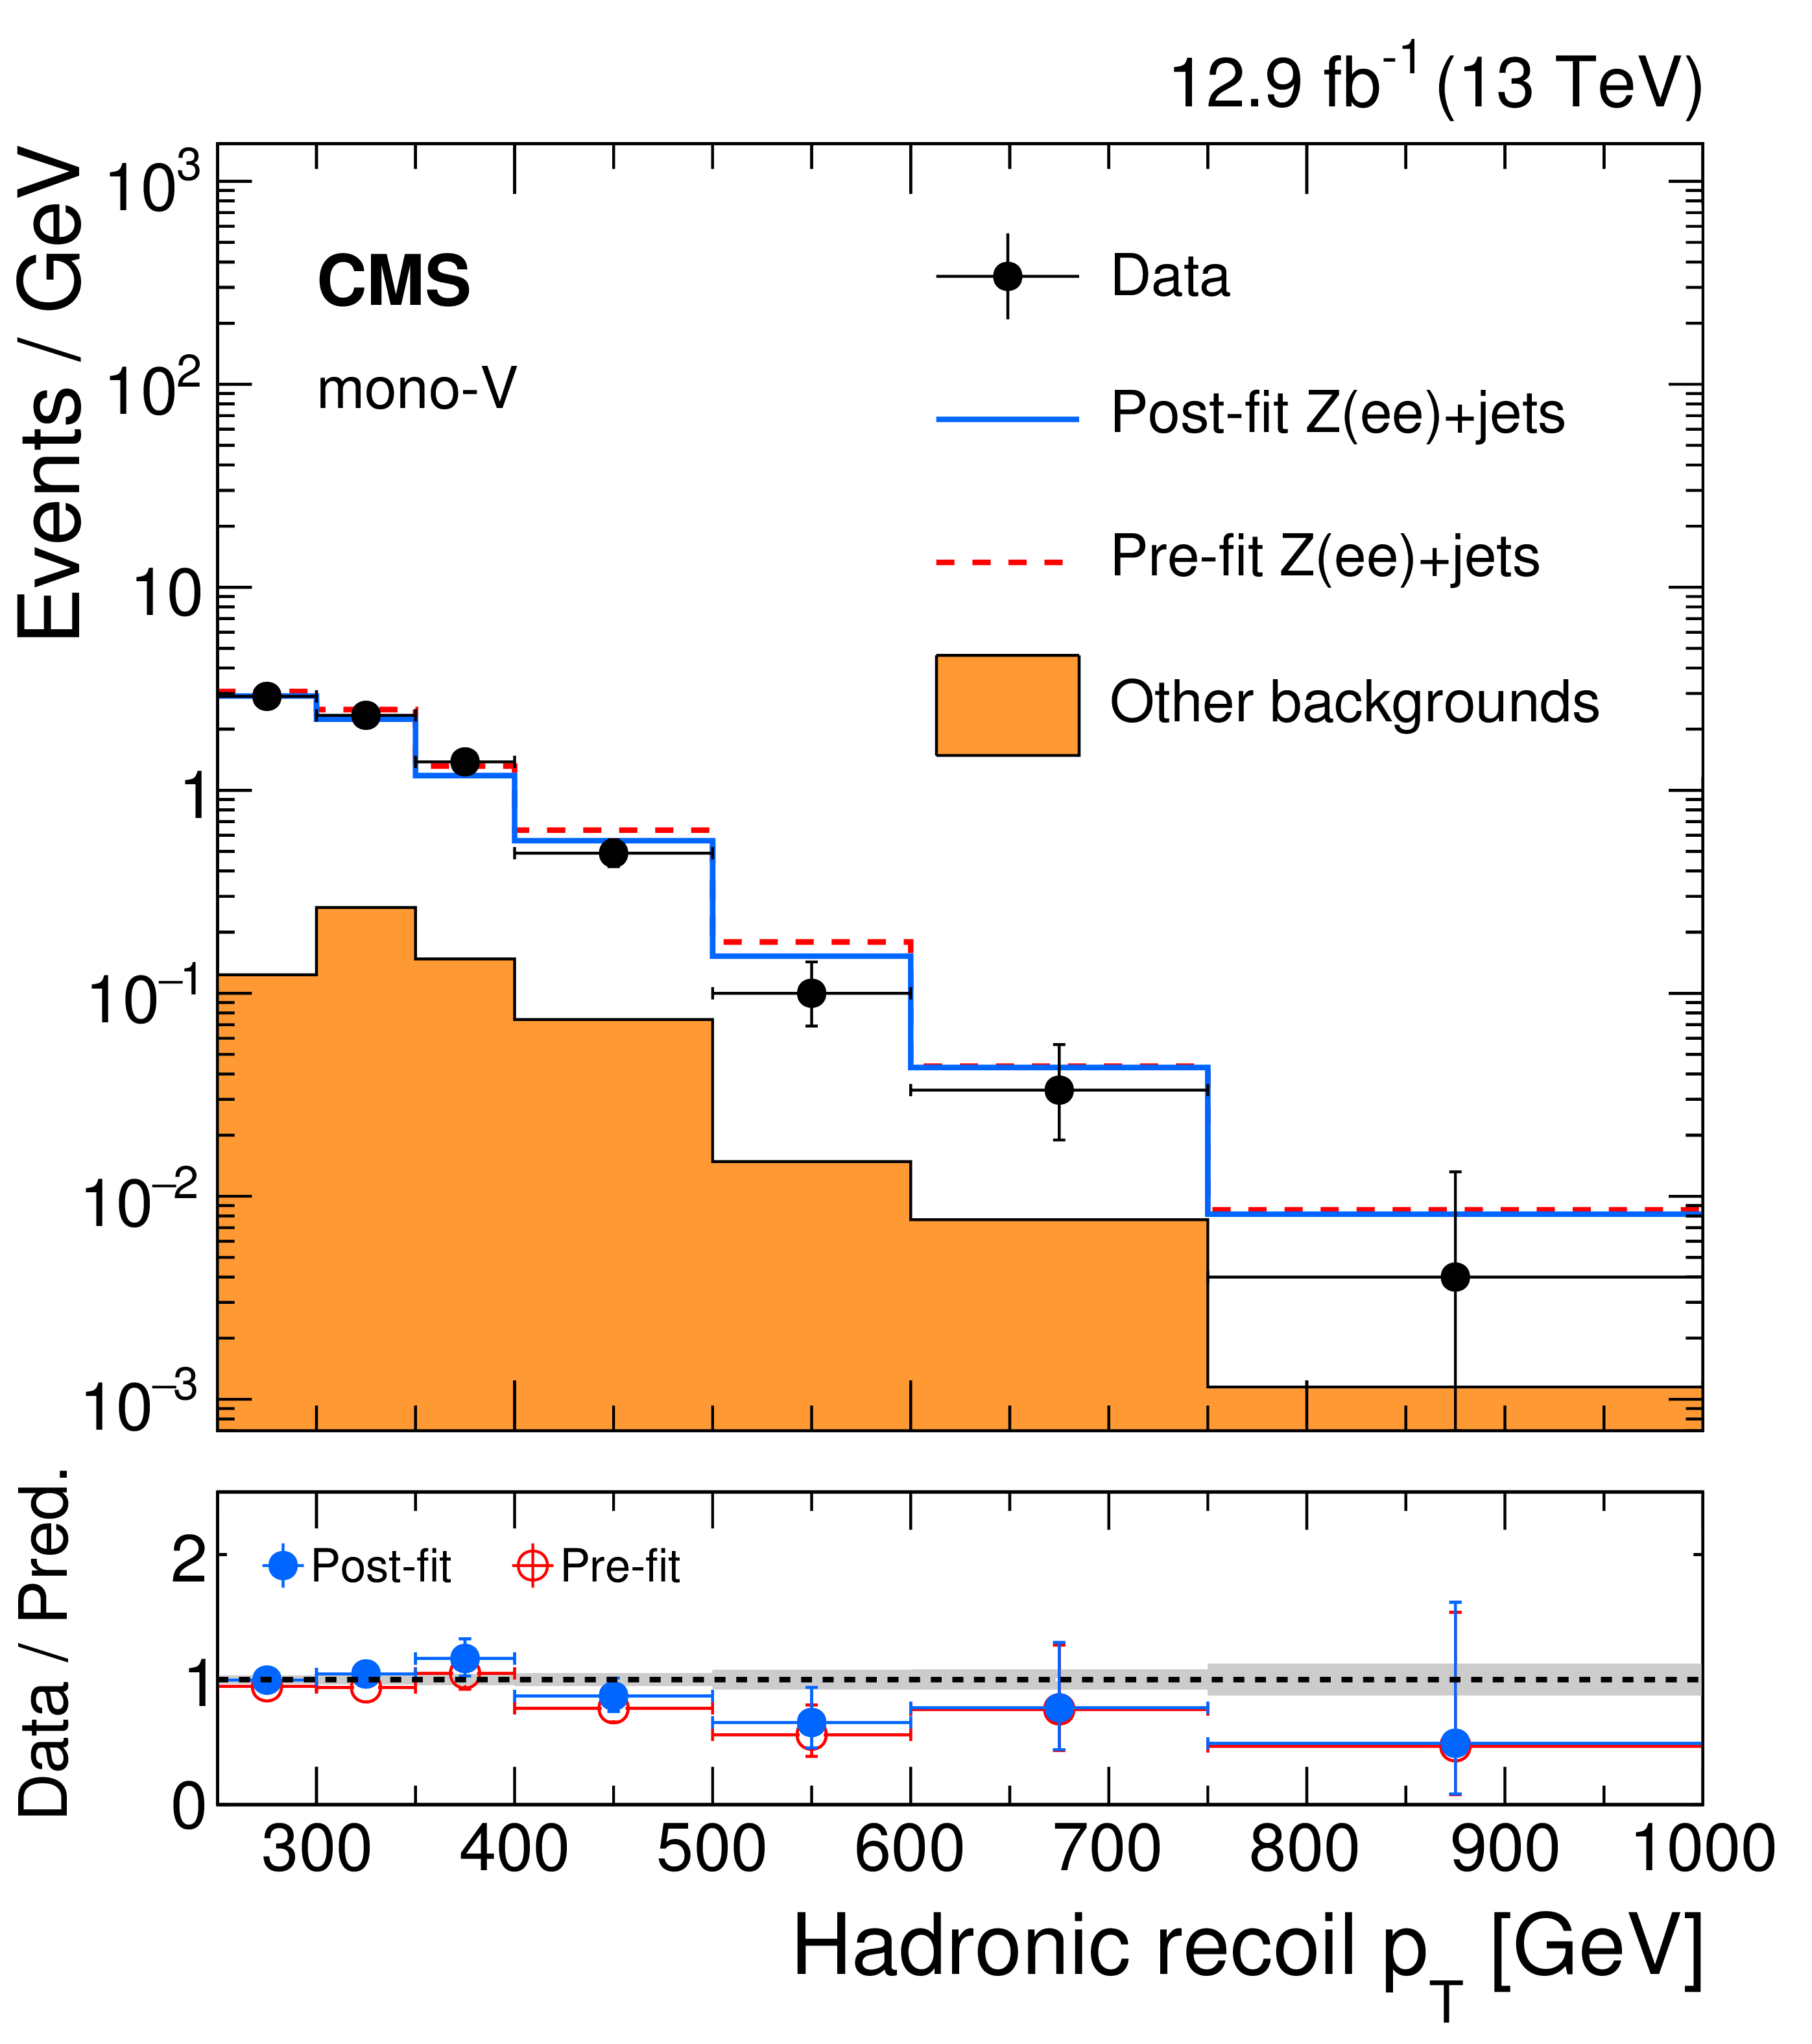
Figure 4-d:
Comparison between data and Monte Carlo simulation in the dilepton control samples before and after performing the simultaneous fit across all the control samples and the signal region, assuming the absence of any signal. The plot corresponds to the mono-V category, in the dielectron control sample. The hadronic recoil $ {p_{\mathrm {T}}} $ in dilepton events is used as a proxy for $ {E_{\mathrm {T}}^{\text {miss}}} $ in the signal region. The filled histogram indicates all processes other than ${\mathrm {Z}(\ell ^{+} \ell ^{-})}$+jets. Ratios of data and the pre-fit background prediction (red points) and post-fit background prediction (blue points) are shown for both the monojet and mono-V signal categories. The gray band indicates the overall post-fit uncertainty. The last bin includes all events with hadronic recoil $ {p_{\mathrm {T}}} $ larger than 750 GeV in the mono-V category. |
png pdf |
Figure 5:
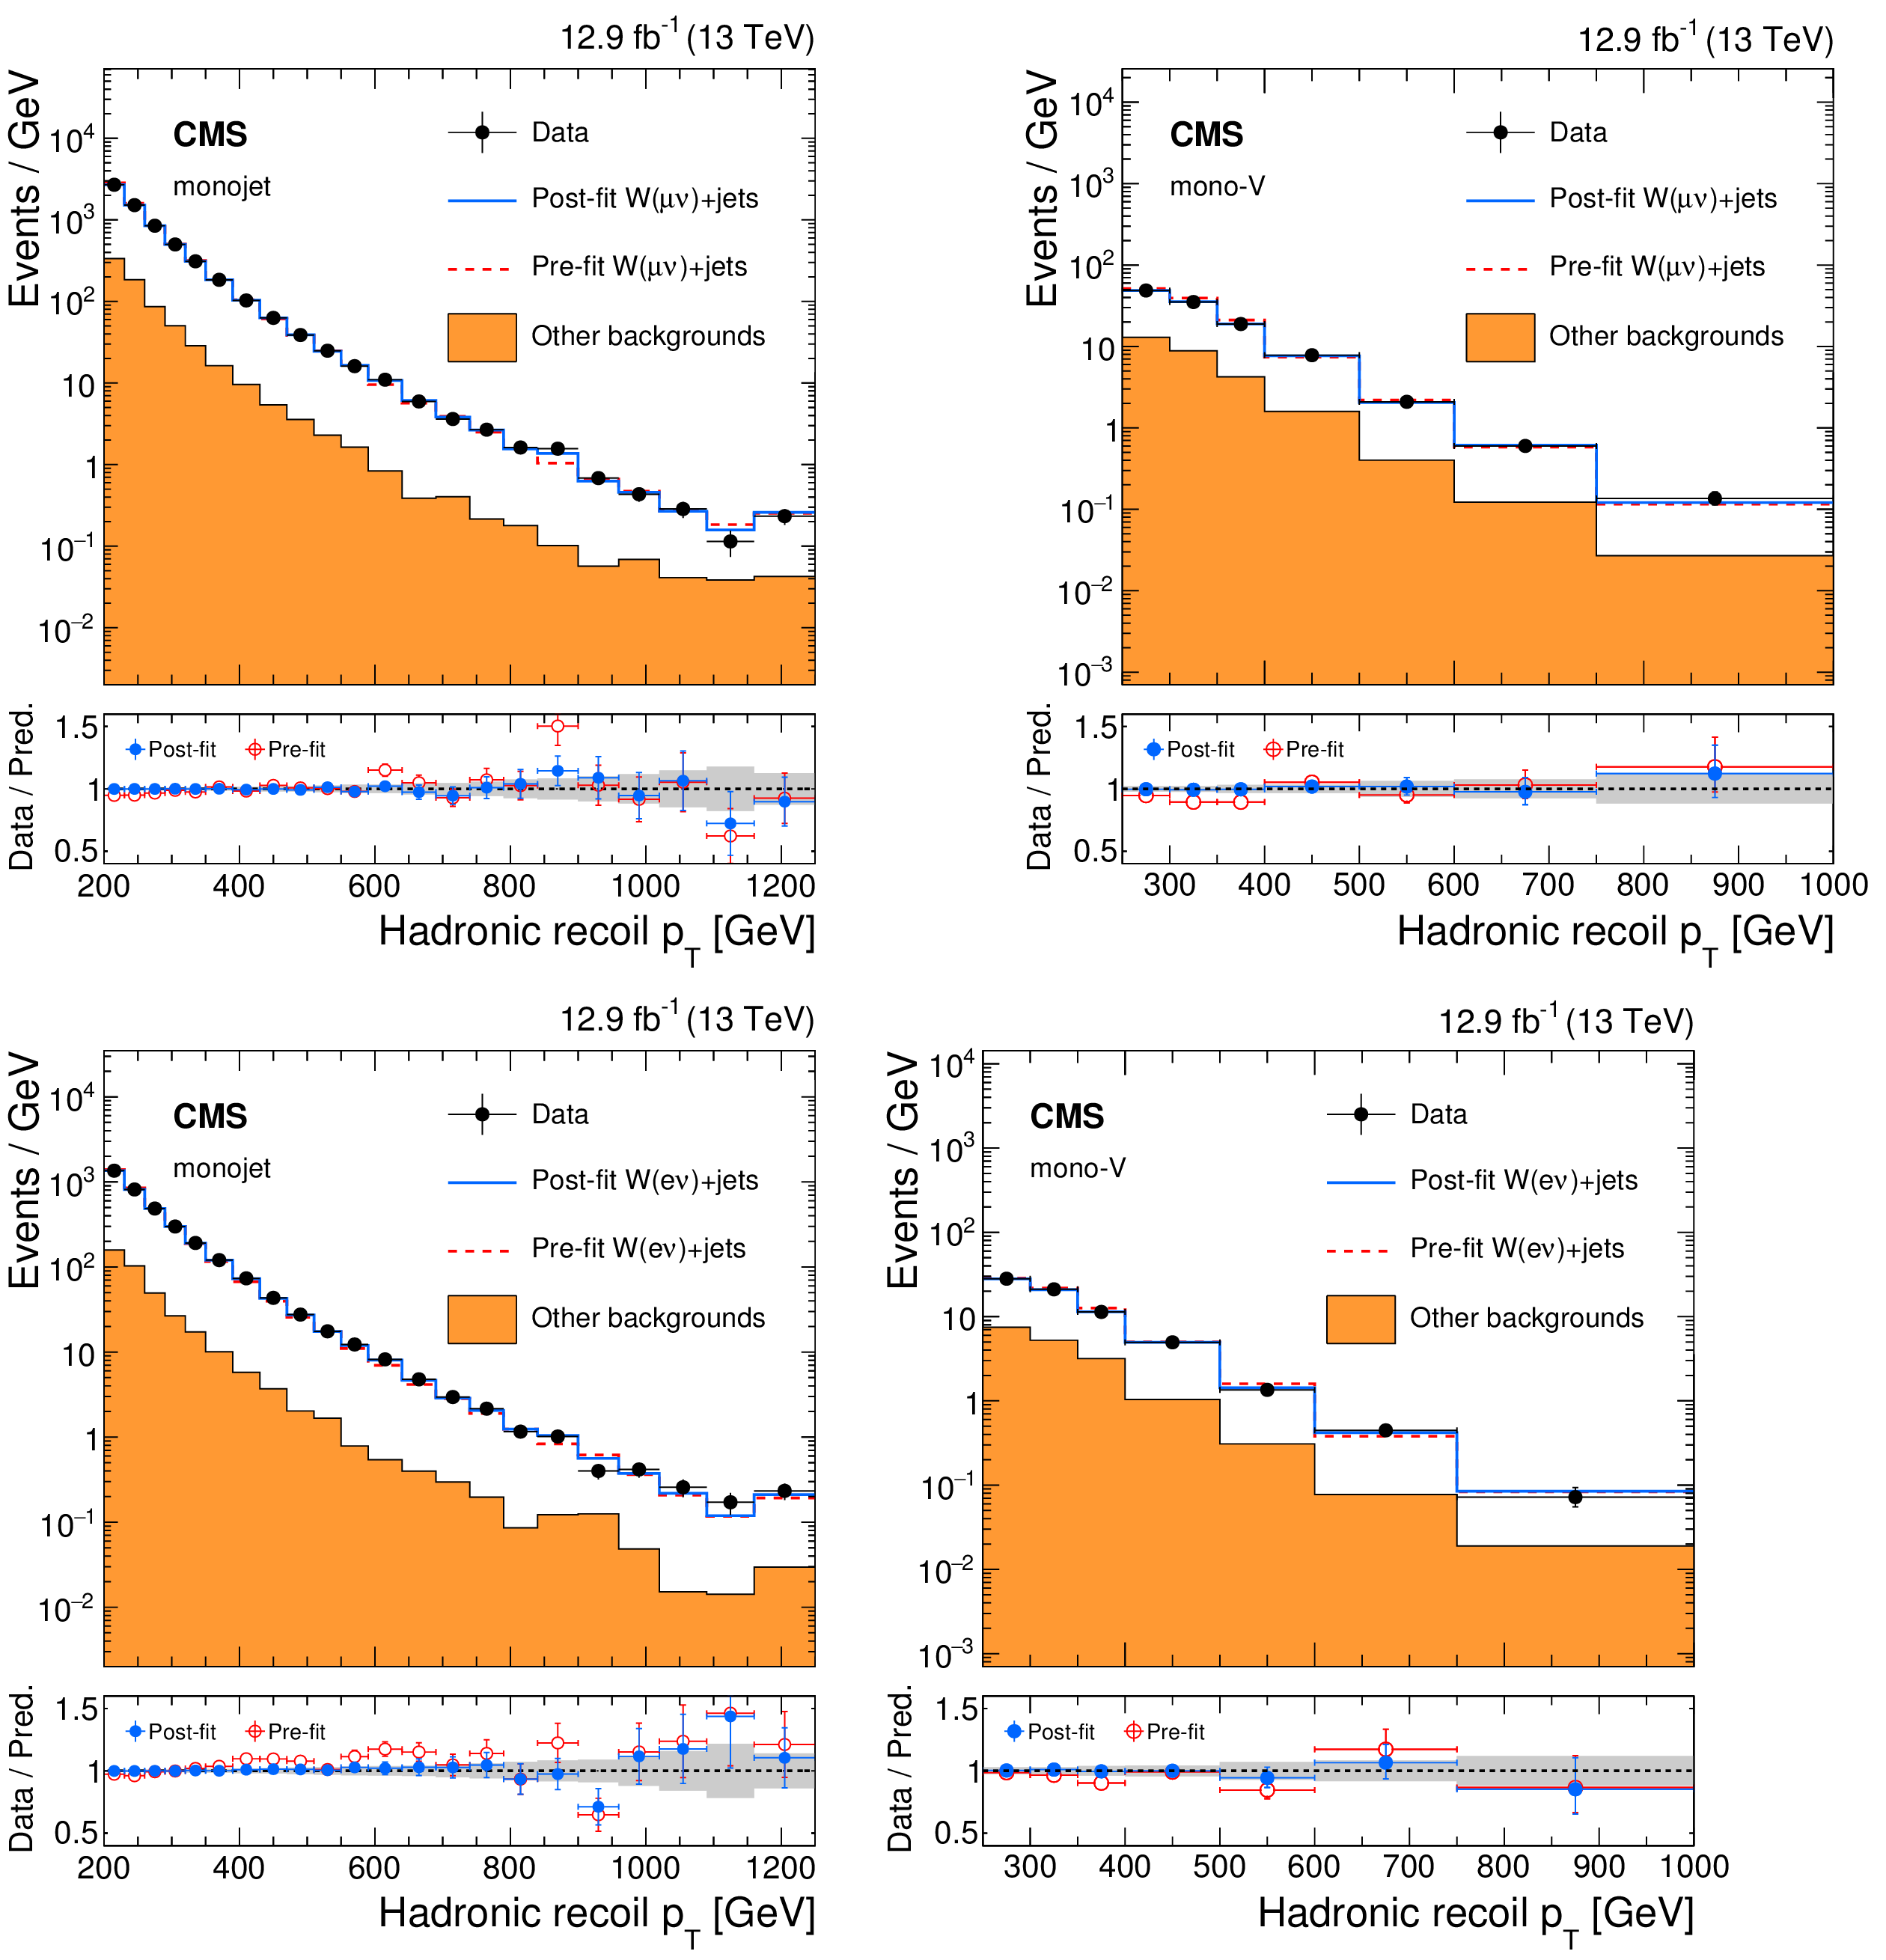
Comparison between data and Monte Carlo simulation in the single-lepton control samples before and after performing the simultaneous fit across all the control samples and the signal region, assuming the absence of any signal. Plots on the upper left and right correspond to the monojet and mono-V categories, respectively, in the single-muon control sample. Plots on the bottom left and right correspond to the monojet and mono-V categories, respectively, in the single-electron control sample. The hadronic recoil $ {p_{\mathrm {T}}} $ in single-lepton events is used as a proxy for $ {E_{\mathrm {T}}^{\text {miss}}} $ in the signal region. The filled histogram indicates all processes other than ${\mathrm {W}(\ell \nu )}$+jets. Ratios of data and the pre-fit background prediction (red points) and post-fit background prediction (blue points) are shown for both the monojet and mono-V signal categories. The gray band indicates the overall post-fit uncertainty. The last bin includes all events with hadronic recoil $ {p_{\mathrm {T}}} $ larger than 1160 (750) GeV in the monojet (mono-V) category. |
png pdf |
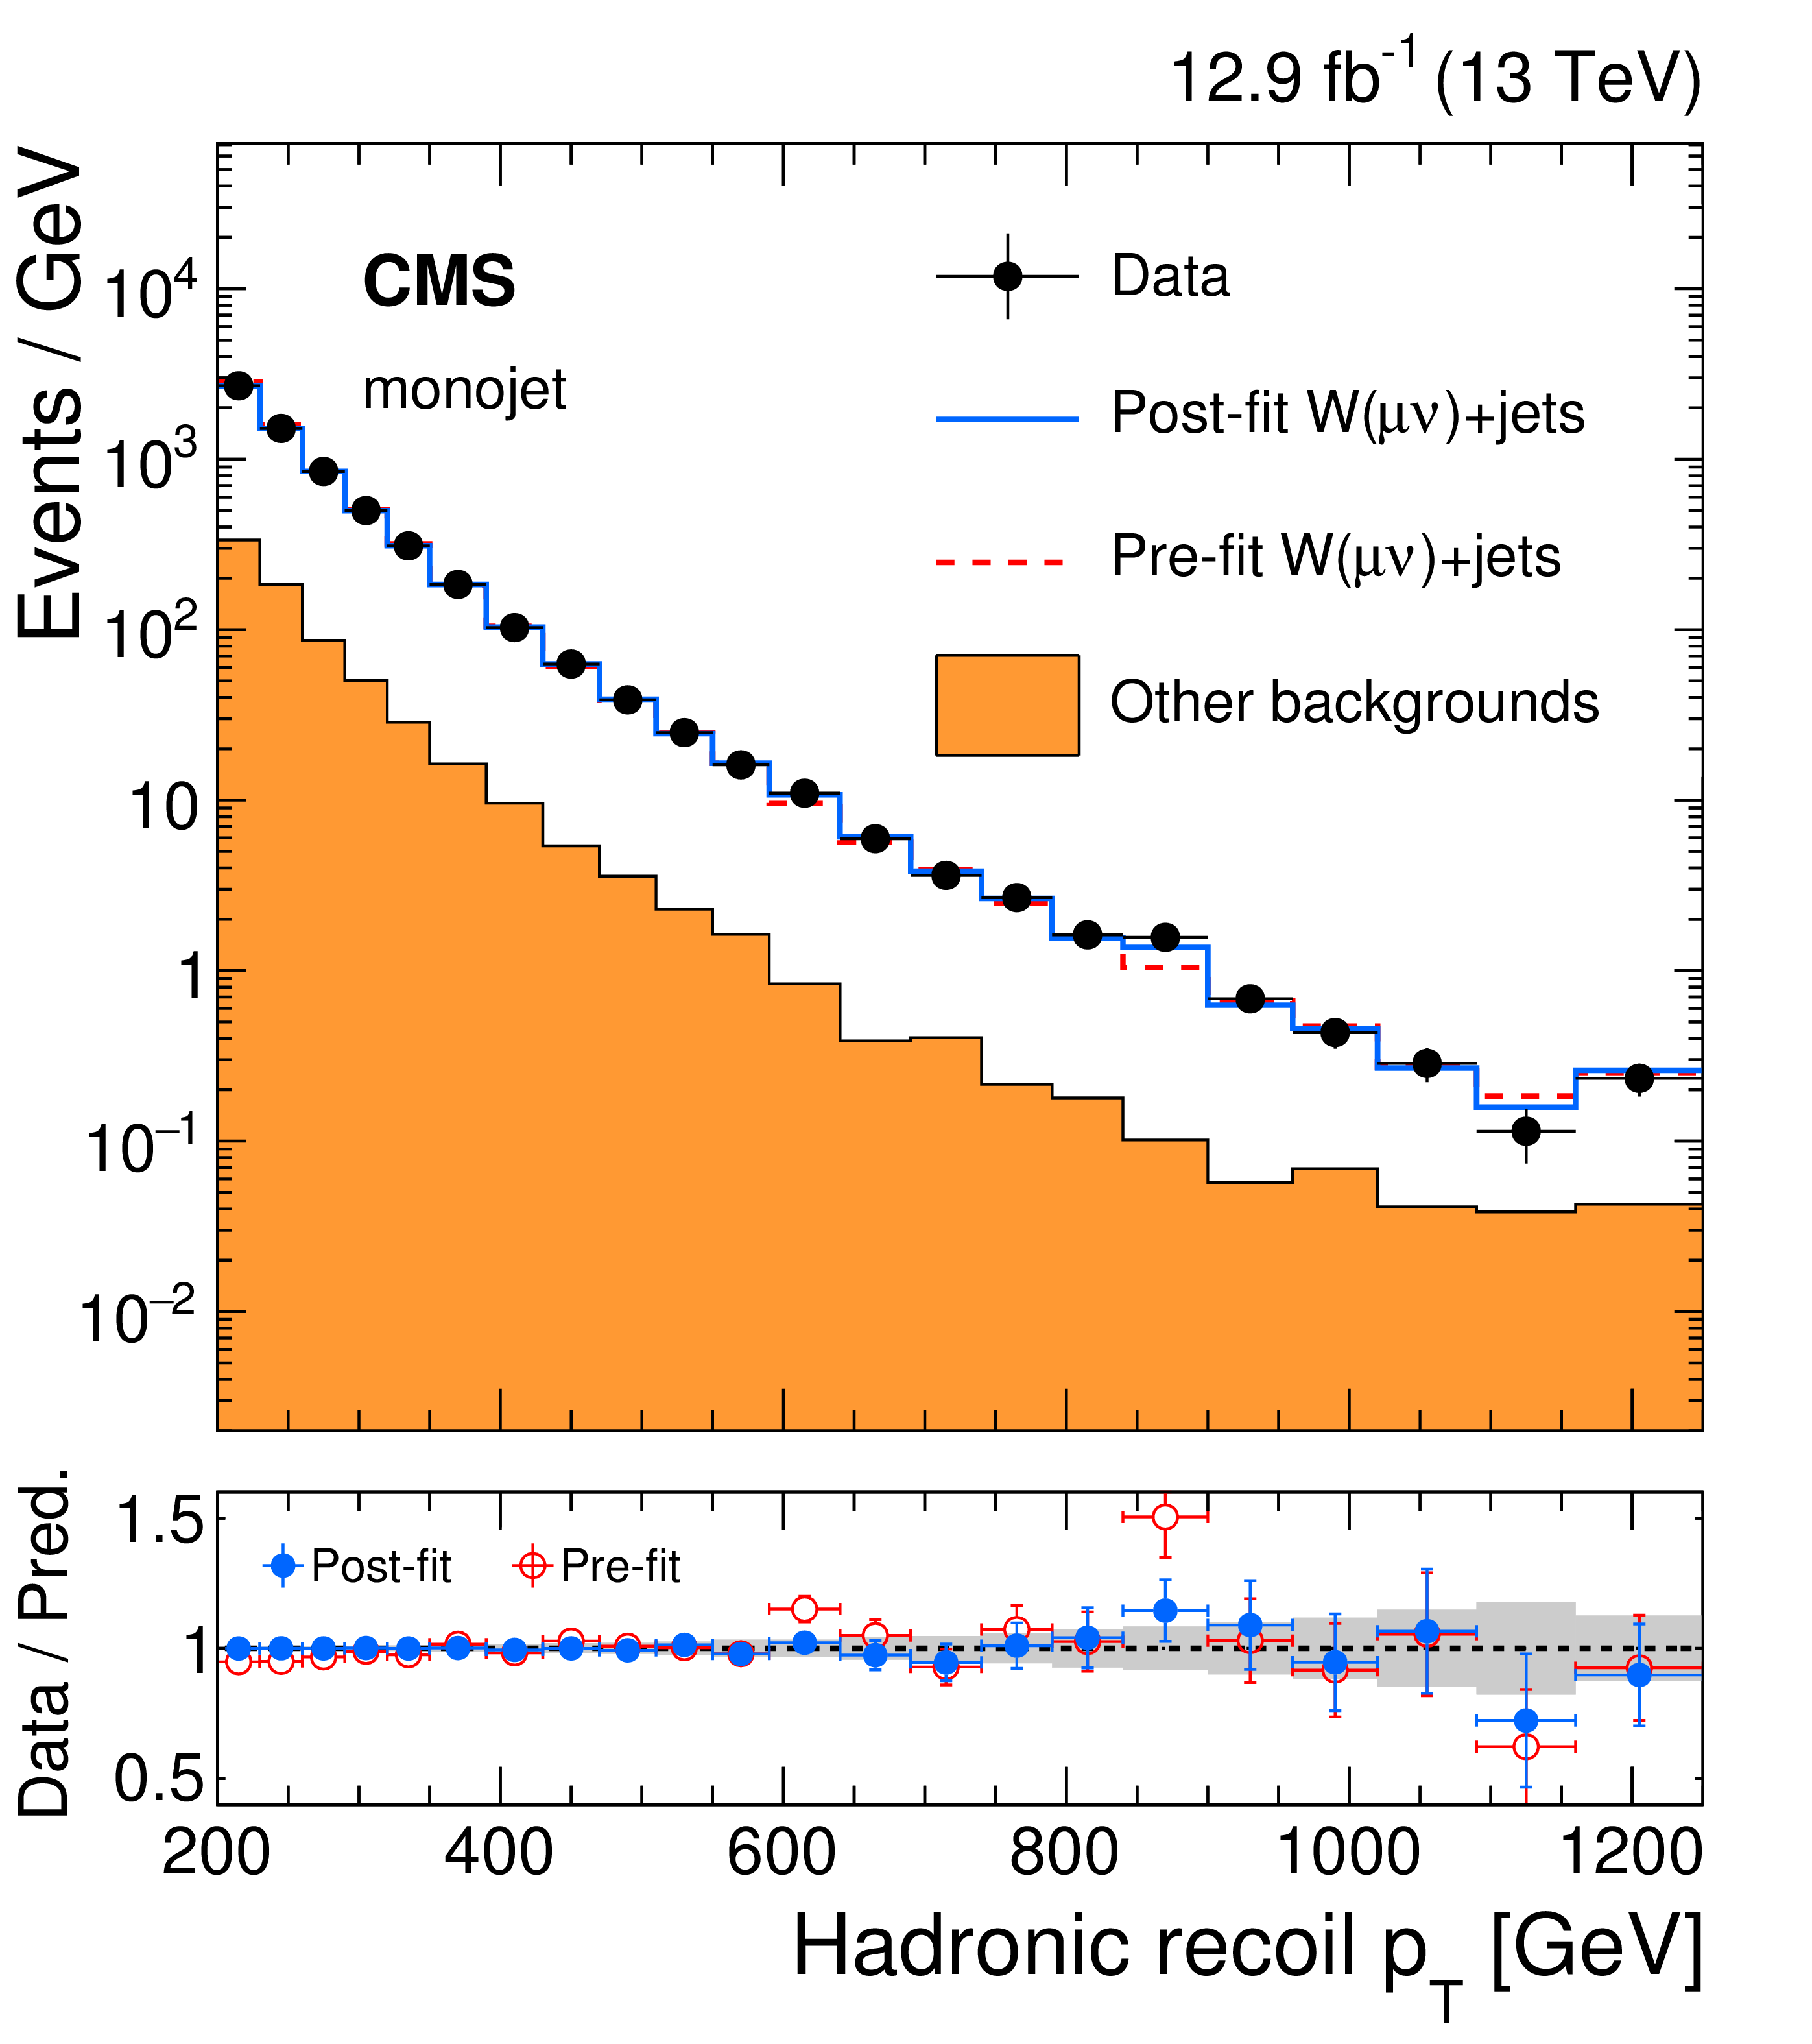
Figure 5-a:
Comparison between data and Monte Carlo simulation in the single-lepton control samples before and after performing the simultaneous fit across all the control samples and the signal region, assuming the absence of any signal. The plot corresponds to the monojet category, in the single-muon control sample. The hadronic recoil $ {p_{\mathrm {T}}} $ in single-lepton events is used as a proxy for $ {E_{\mathrm {T}}^{\text {miss}}} $ in the signal region. The filled histogram indicates all processes other than ${\mathrm {W}(\ell \nu )}$+jets. Ratios of data and the pre-fit background prediction (red points) and post-fit background prediction (blue points) are shown for both the monojet and mono-V signal categories. The gray band indicates the overall post-fit uncertainty. The last bin includes all events with hadronic recoil $ {p_{\mathrm {T}}} $ larger than 1160 GeV in the monojet category. |

png pdf |
Figure 5-b:
Comparison between data and Monte Carlo simulation in the single-lepton control samples before and after performing the simultaneous fit across all the control samples and the signal region, assuming the absence of any signal. The plot corresponds to the mono-V category, in the single-electron control sample. The hadronic recoil $ {p_{\mathrm {T}}} $ in single-lepton events is used as a proxy for $ {E_{\mathrm {T}}^{\text {miss}}} $ in the signal region. The filled histogram indicates all processes other than ${\mathrm {W}(\ell \nu )}$+jets. Ratios of data and the pre-fit background prediction (red points) and post-fit background prediction (blue points) are shown for both the monojet and mono-V signal categories. The gray band indicates the overall post-fit uncertainty. The last bin includes all events with hadronic recoil $ {p_{\mathrm {T}}} $ larger than 750 GeV in the mono-V category. |
png pdf |
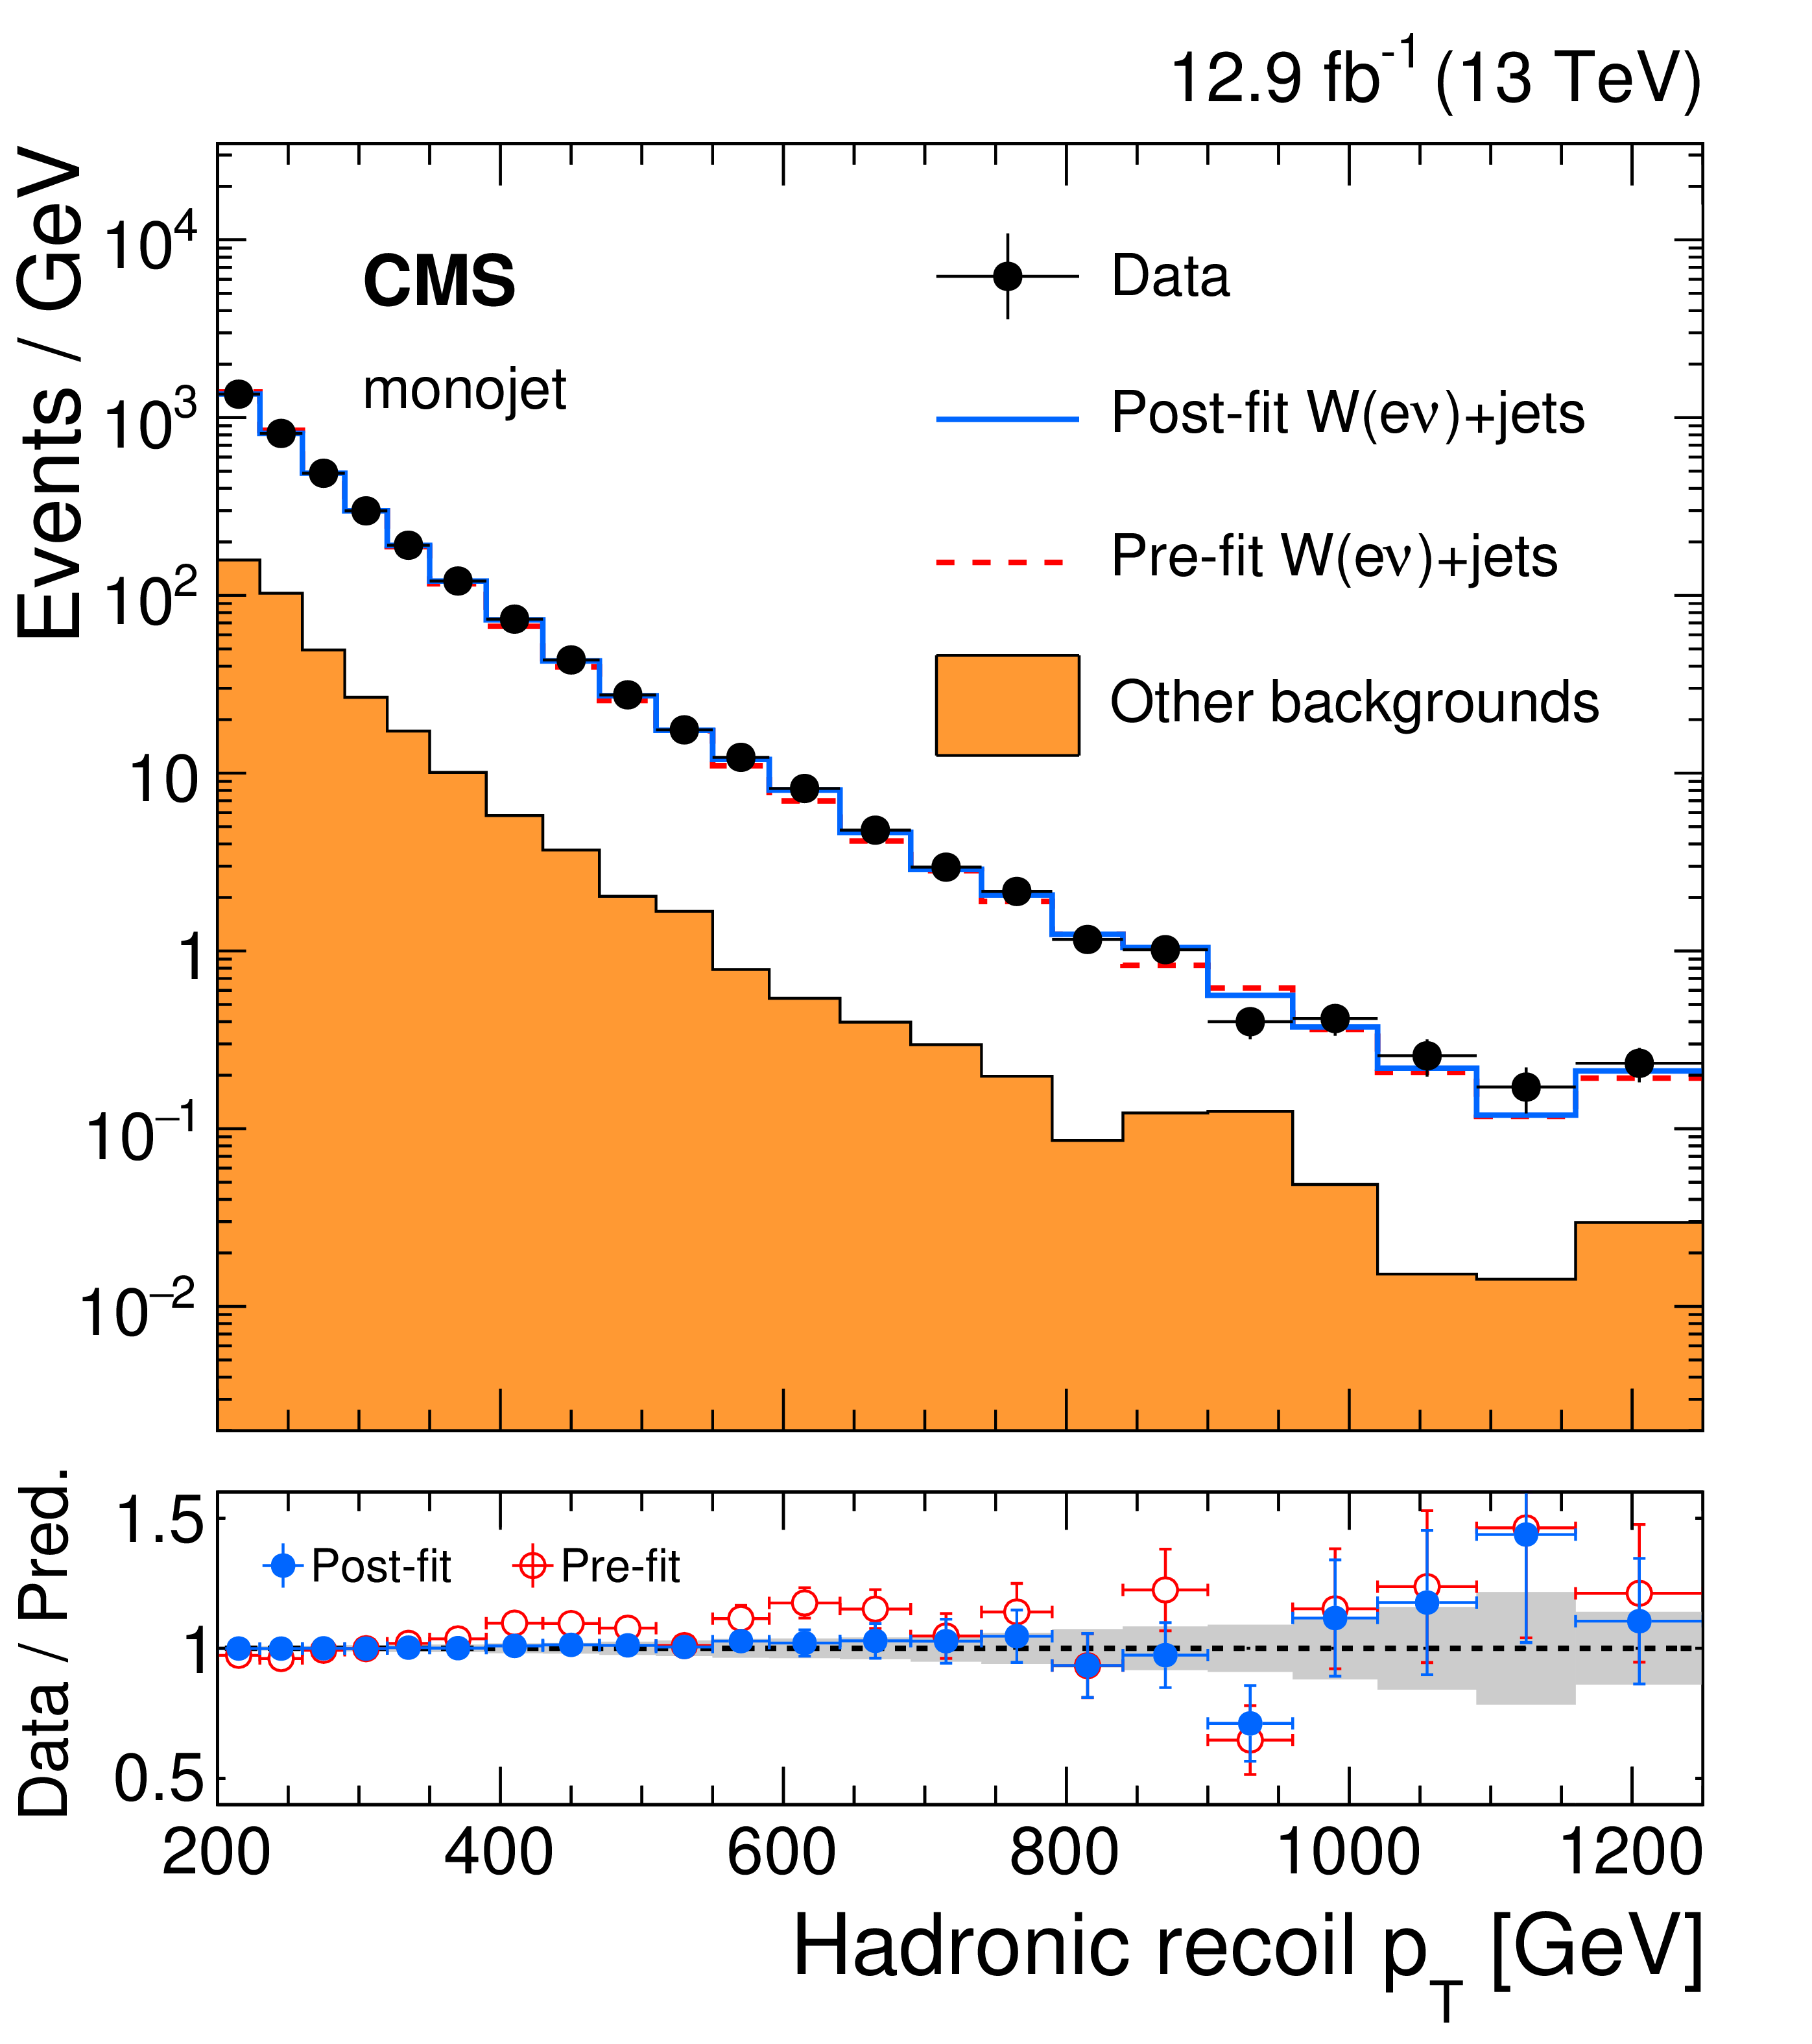
Figure 5-c:
Comparison between data and Monte Carlo simulation in the single-lepton control samples before and after performing the simultaneous fit across all the control samples and the signal region, assuming the absence of any signal. The plot corresponds to the monojet category, in the single-muon control sample. The hadronic recoil $ {p_{\mathrm {T}}} $ in single-lepton events is used as a proxy for $ {E_{\mathrm {T}}^{\text {miss}}} $ in the signal region. The filled histogram indicates all processes other than ${\mathrm {W}(\ell \nu )}$+jets. Ratios of data and the pre-fit background prediction (red points) and post-fit background prediction (blue points) are shown for both the monojet and mono-V signal categories. The gray band indicates the overall post-fit uncertainty. The last bin includes all events with hadronic recoil $ {p_{\mathrm {T}}} $ larger than 1160 GeV in the monojet category. |

png pdf |
Figure 5-d:
Comparison between data and Monte Carlo simulation in the single-lepton control samples before and after performing the simultaneous fit across all the control samples and the signal region, assuming the absence of any signal. The plot corresponds to the mono-V category, in the single-electron control sample. The hadronic recoil $ {p_{\mathrm {T}}} $ in single-lepton events is used as a proxy for $ {E_{\mathrm {T}}^{\text {miss}}} $ in the signal region. The filled histogram indicates all processes other than ${\mathrm {W}(\ell \nu )}$+jets. Ratios of data and the pre-fit background prediction (red points) and post-fit background prediction (blue points) are shown for both the monojet and mono-V signal categories. The gray band indicates the overall post-fit uncertainty. The last bin includes all events with hadronic recoil $ {p_{\mathrm {T}}} $ larger than 750 GeV in the mono-V category. |
png pdf |
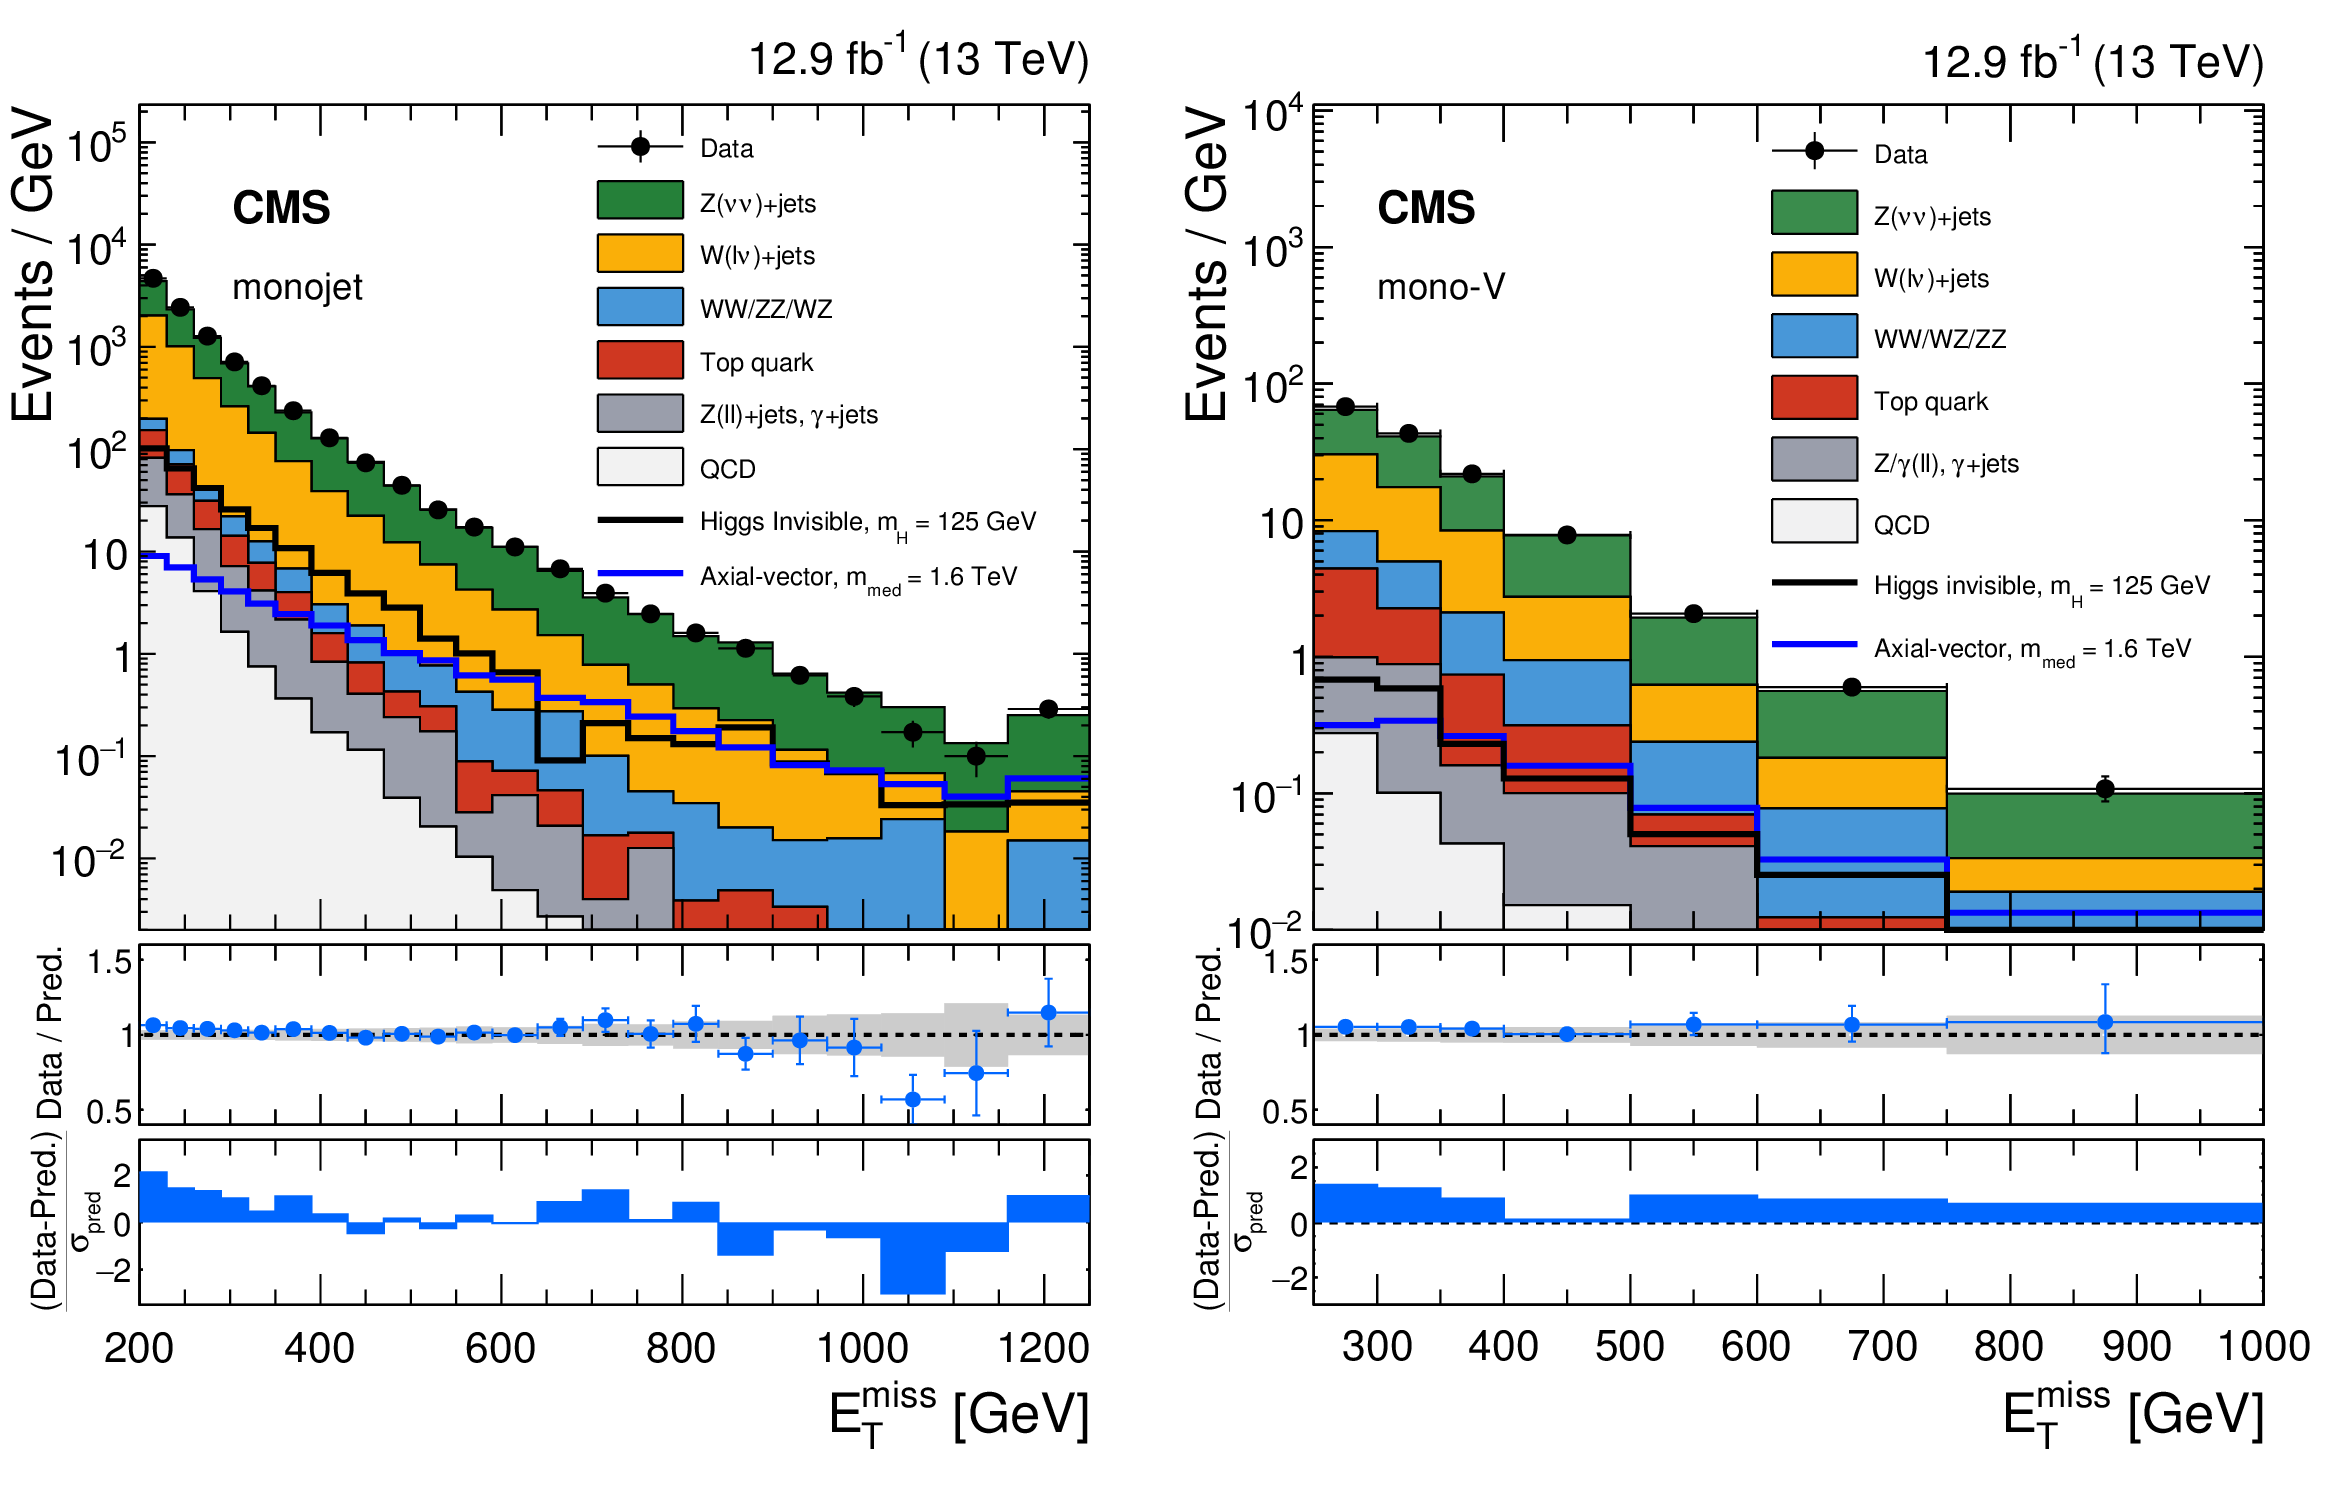
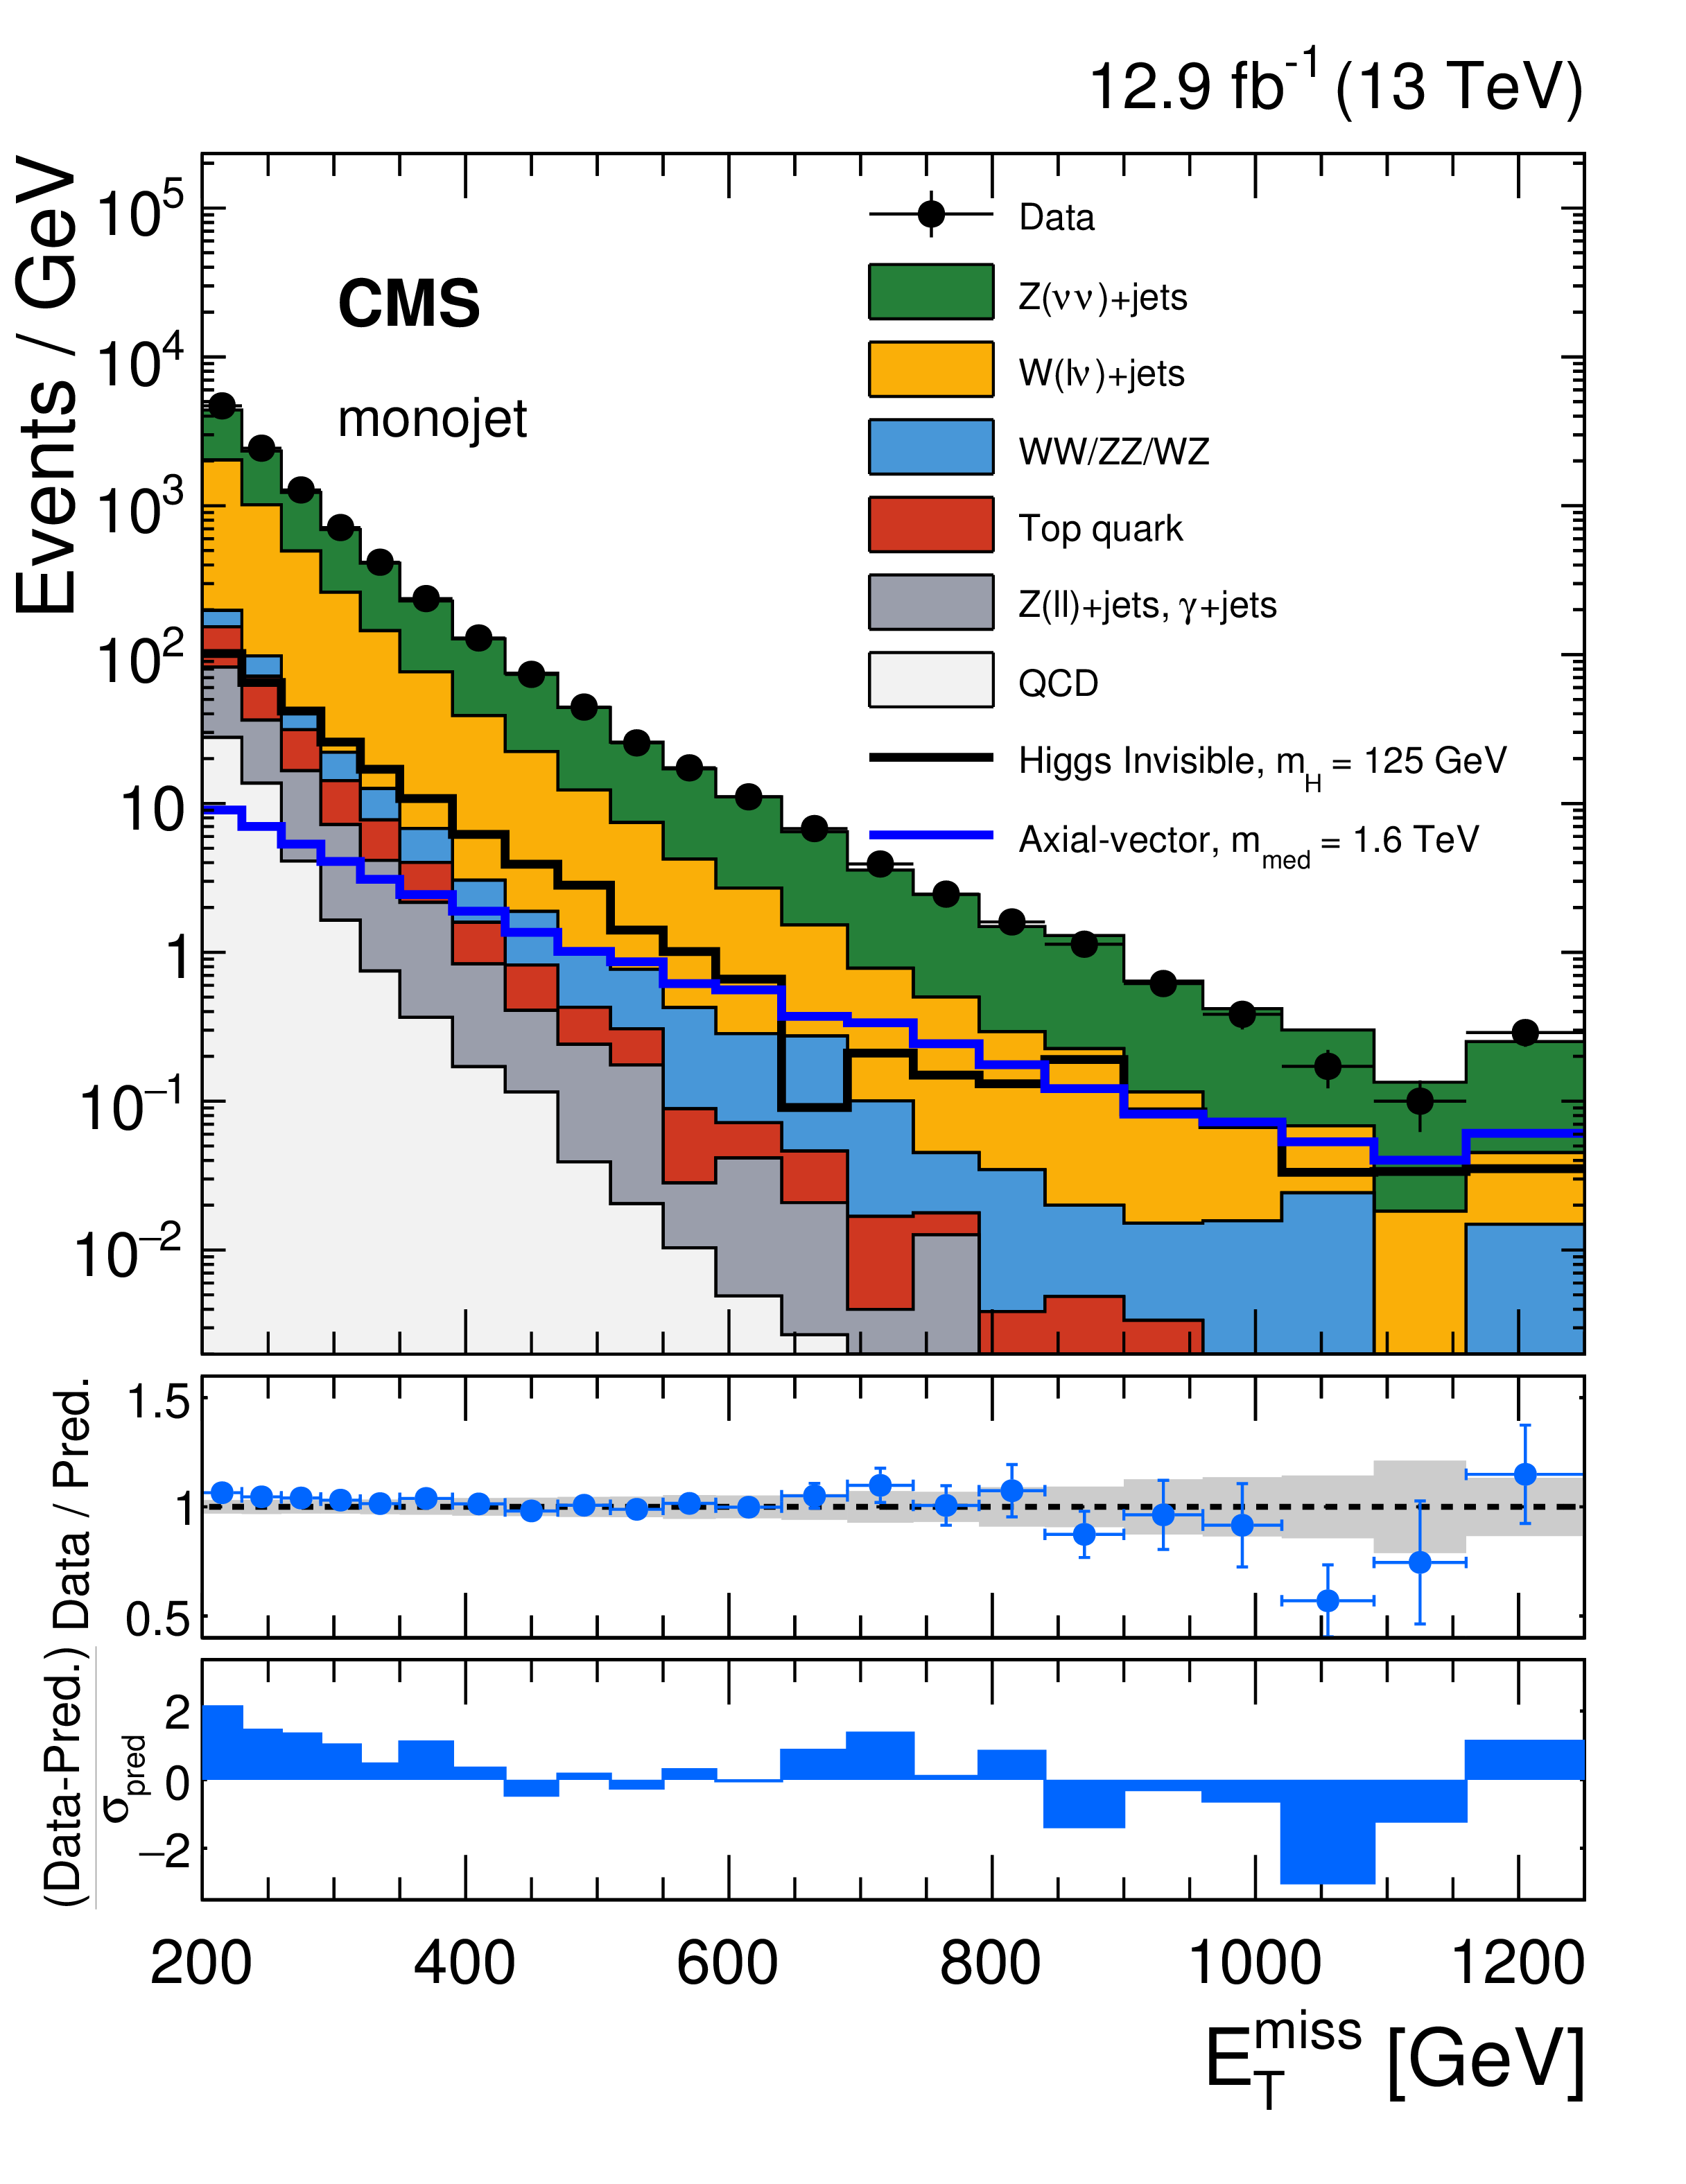
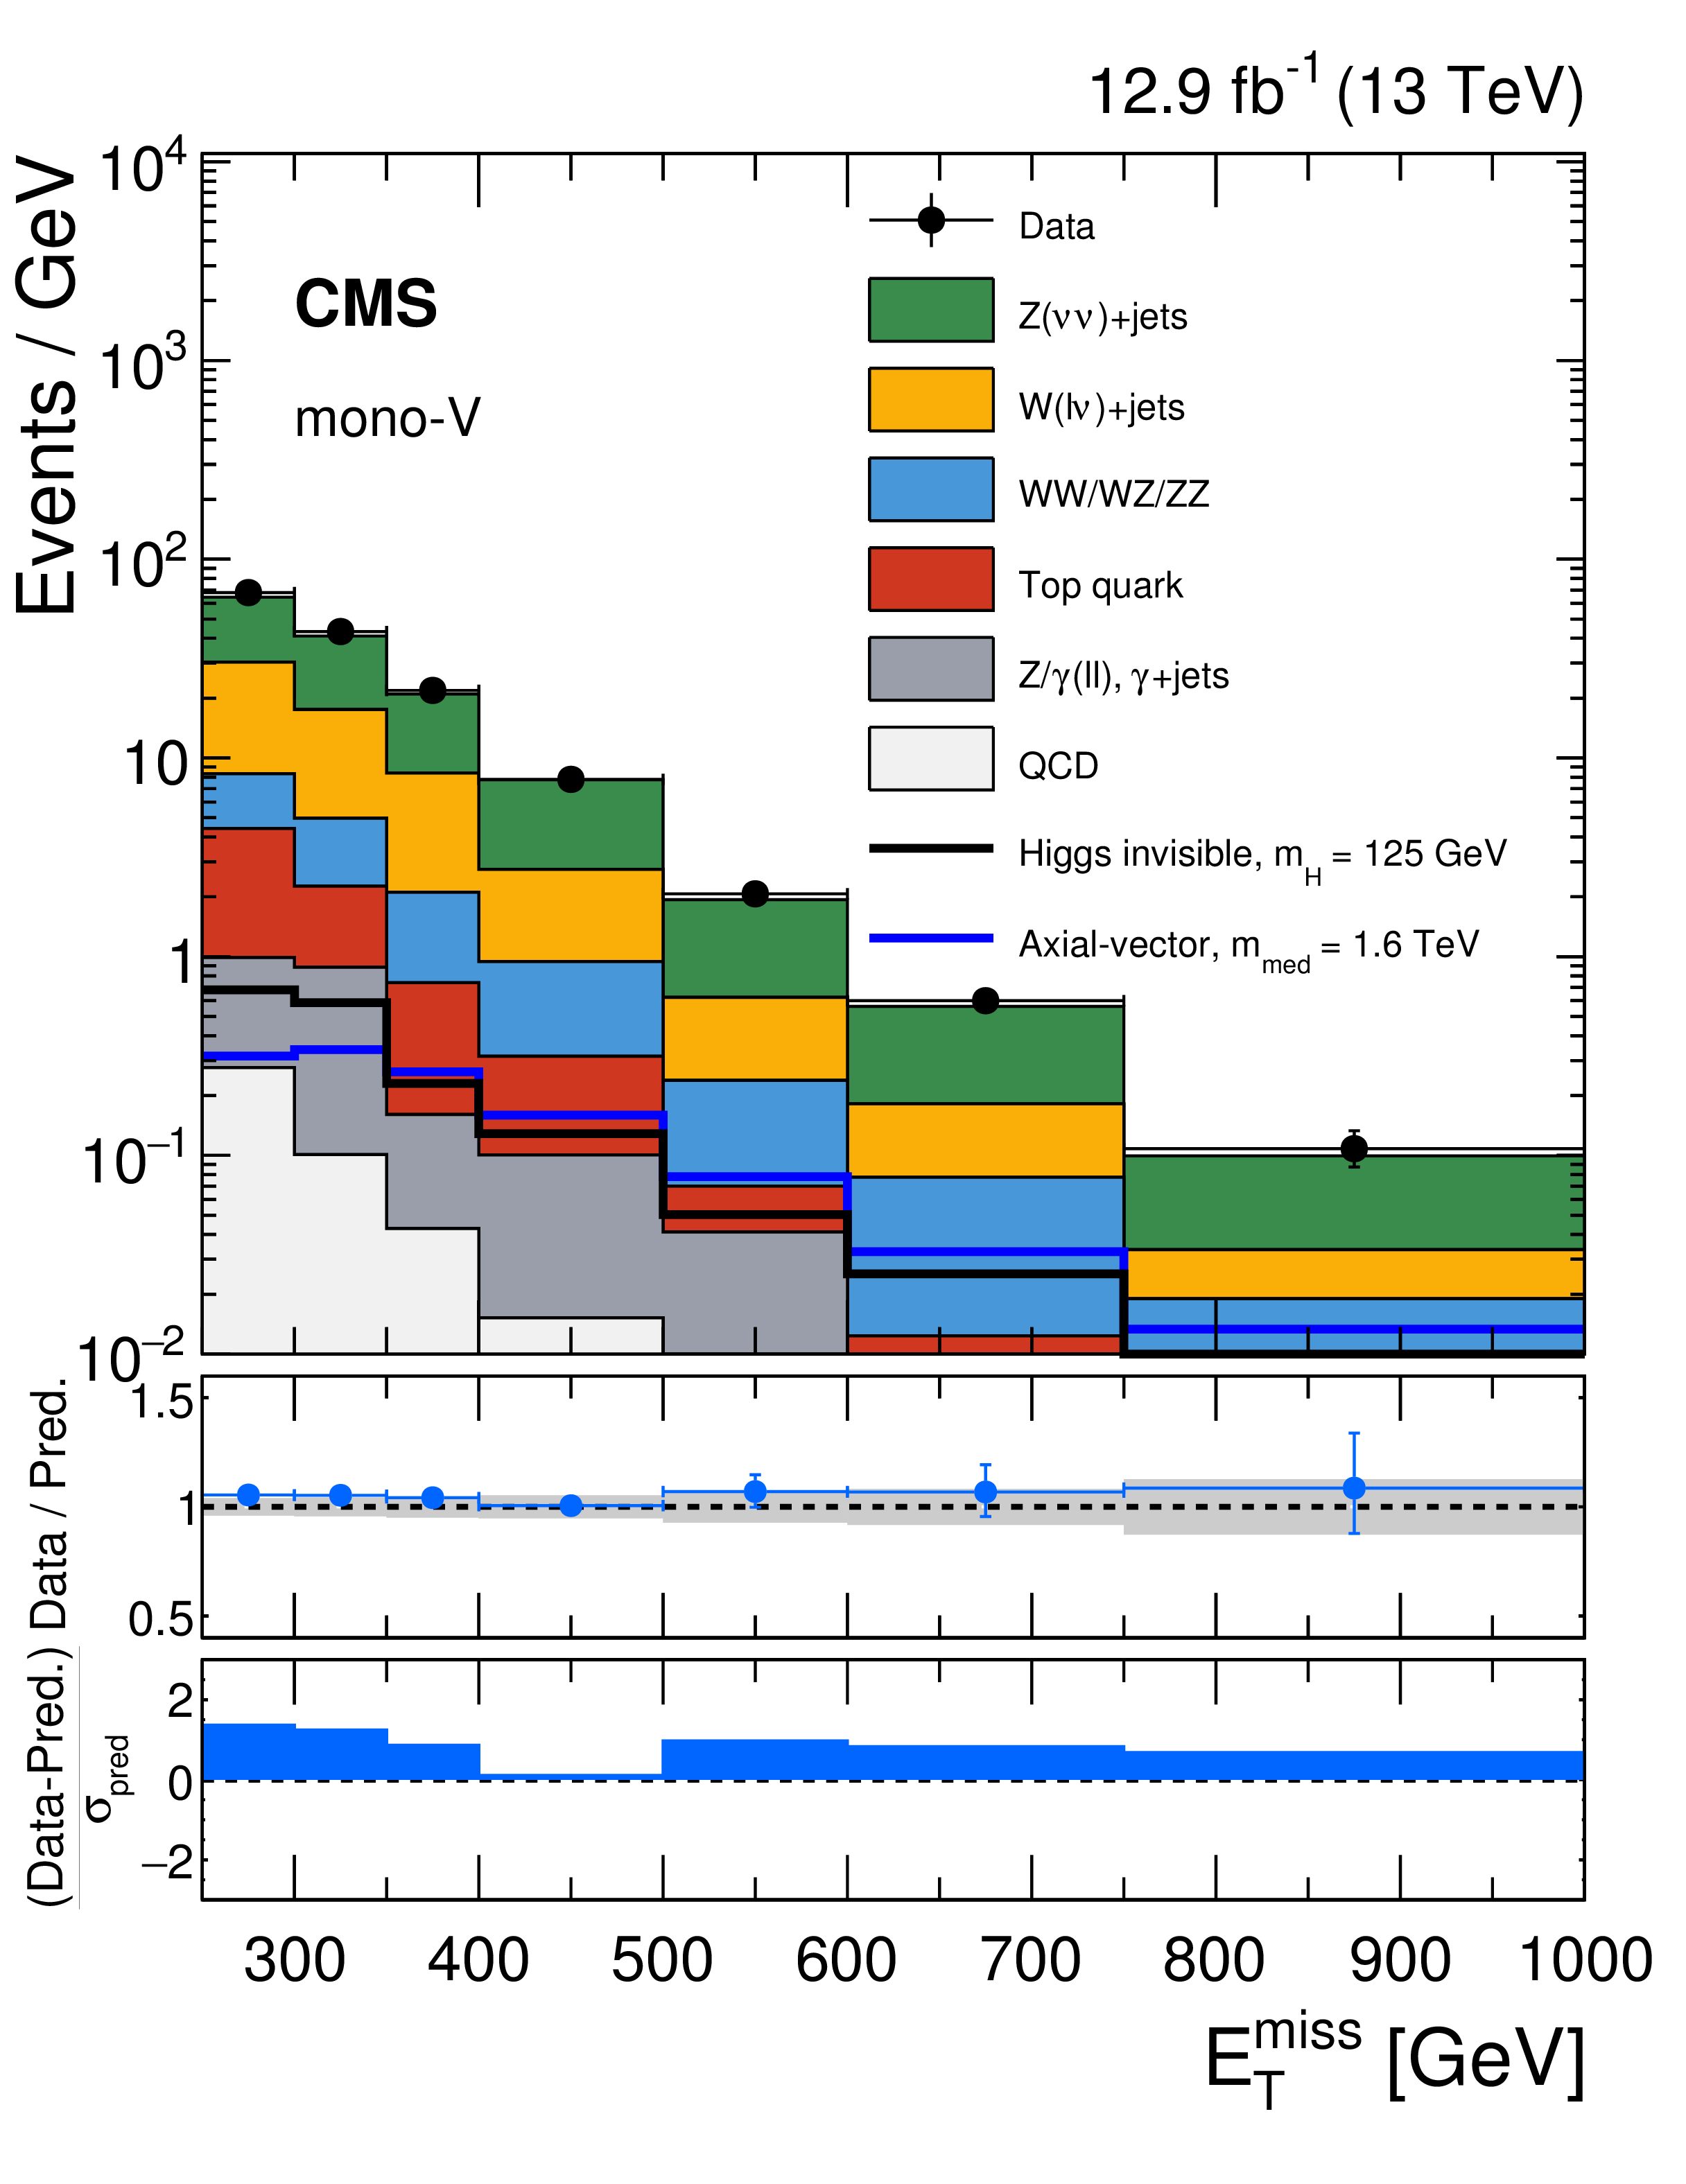
Figure 6:
Observed $ {E_{\mathrm {T}}^{\text {miss}}} $ distribution in the monojet (left) and mono-V (right) signal regions compared with the background expectations for various SM processes evaluated after performing a combined fit to the data in all the control samples, but excluding the signal region. The last bin includes all events with $ {E_{\mathrm {T}}^{\text {miss}}} > $ 1160 (750) GeV for the monojet (mono-V) category. Expected signal distributions for a 125 GeV Higgs boson decaying exclusively to invisible particles, and for a 1.6 TeV axial-vector mediator decaying to 1 GeV DM particles, are overlaid. The ratio of data and the post-fit background prediction is shown for both the monojet and mono-V signal regions. The gray bands in these ratio plots indicate the post-fit uncertainty in the background prediction. Finally, the distributions of the pulls, defined as the difference between data and the post-fit background prediction relative to the post-fit uncertainty in the prediction, are also shown in the lower panels. |
png pdf |
Figure 6-a:
Observed $ {E_{\mathrm {T}}^{\text {miss}}} $ distribution in the monojet signal regions compared with the background expectations for various SM processes evaluated after performing a combined fit to the data in all the control samples, but excluding the signal region. The last bin includes all events with $ {E_{\mathrm {T}}^{\text {miss}}} > $ 1160 GeV for the monojet category. Expected signal distributions for a 125 GeV Higgs boson decaying exclusively to invisible particles, and for a 1.6 TeV axial-vector mediator decaying to 1 GeV DM particles, are overlaid. The ratio of data and the post-fit background prediction is shown. The gray bands in these ratio plots indicate the post-fit uncertainty in the background prediction. Finally, the distributions of the pulls, defined as the difference between data and the post-fit background prediction relative to the post-fit uncertainty in the prediction, are also shown in the lower panels. |
png pdf |
Figure 6-b:
Observed $ {E_{\mathrm {T}}^{\text {miss}}} $ distribution in the mono-V signal regions compared with the background expectations for various SM processes evaluated after performing a combined fit to the data in all the control samples, but excluding the signal region. The last bin includes all events with $ {E_{\mathrm {T}}^{\text {miss}}} > $ 750 GeV for the mono-V category. Expected signal distributions for a 125 GeV Higgs boson decaying exclusively to invisible particles, and for a 1.6 TeV axial-vector mediator decaying to 1 GeV DM particles, are overlaid. The ratio of data and the post-fit background prediction is shown. The gray bands in these ratio plots indicate the post-fit uncertainty in the background prediction. Finally, the distributions of the pulls, defined as the difference between data and the post-fit background prediction relative to the post-fit uncertainty in the prediction, are also shown in the lower panels. |

png pdf |
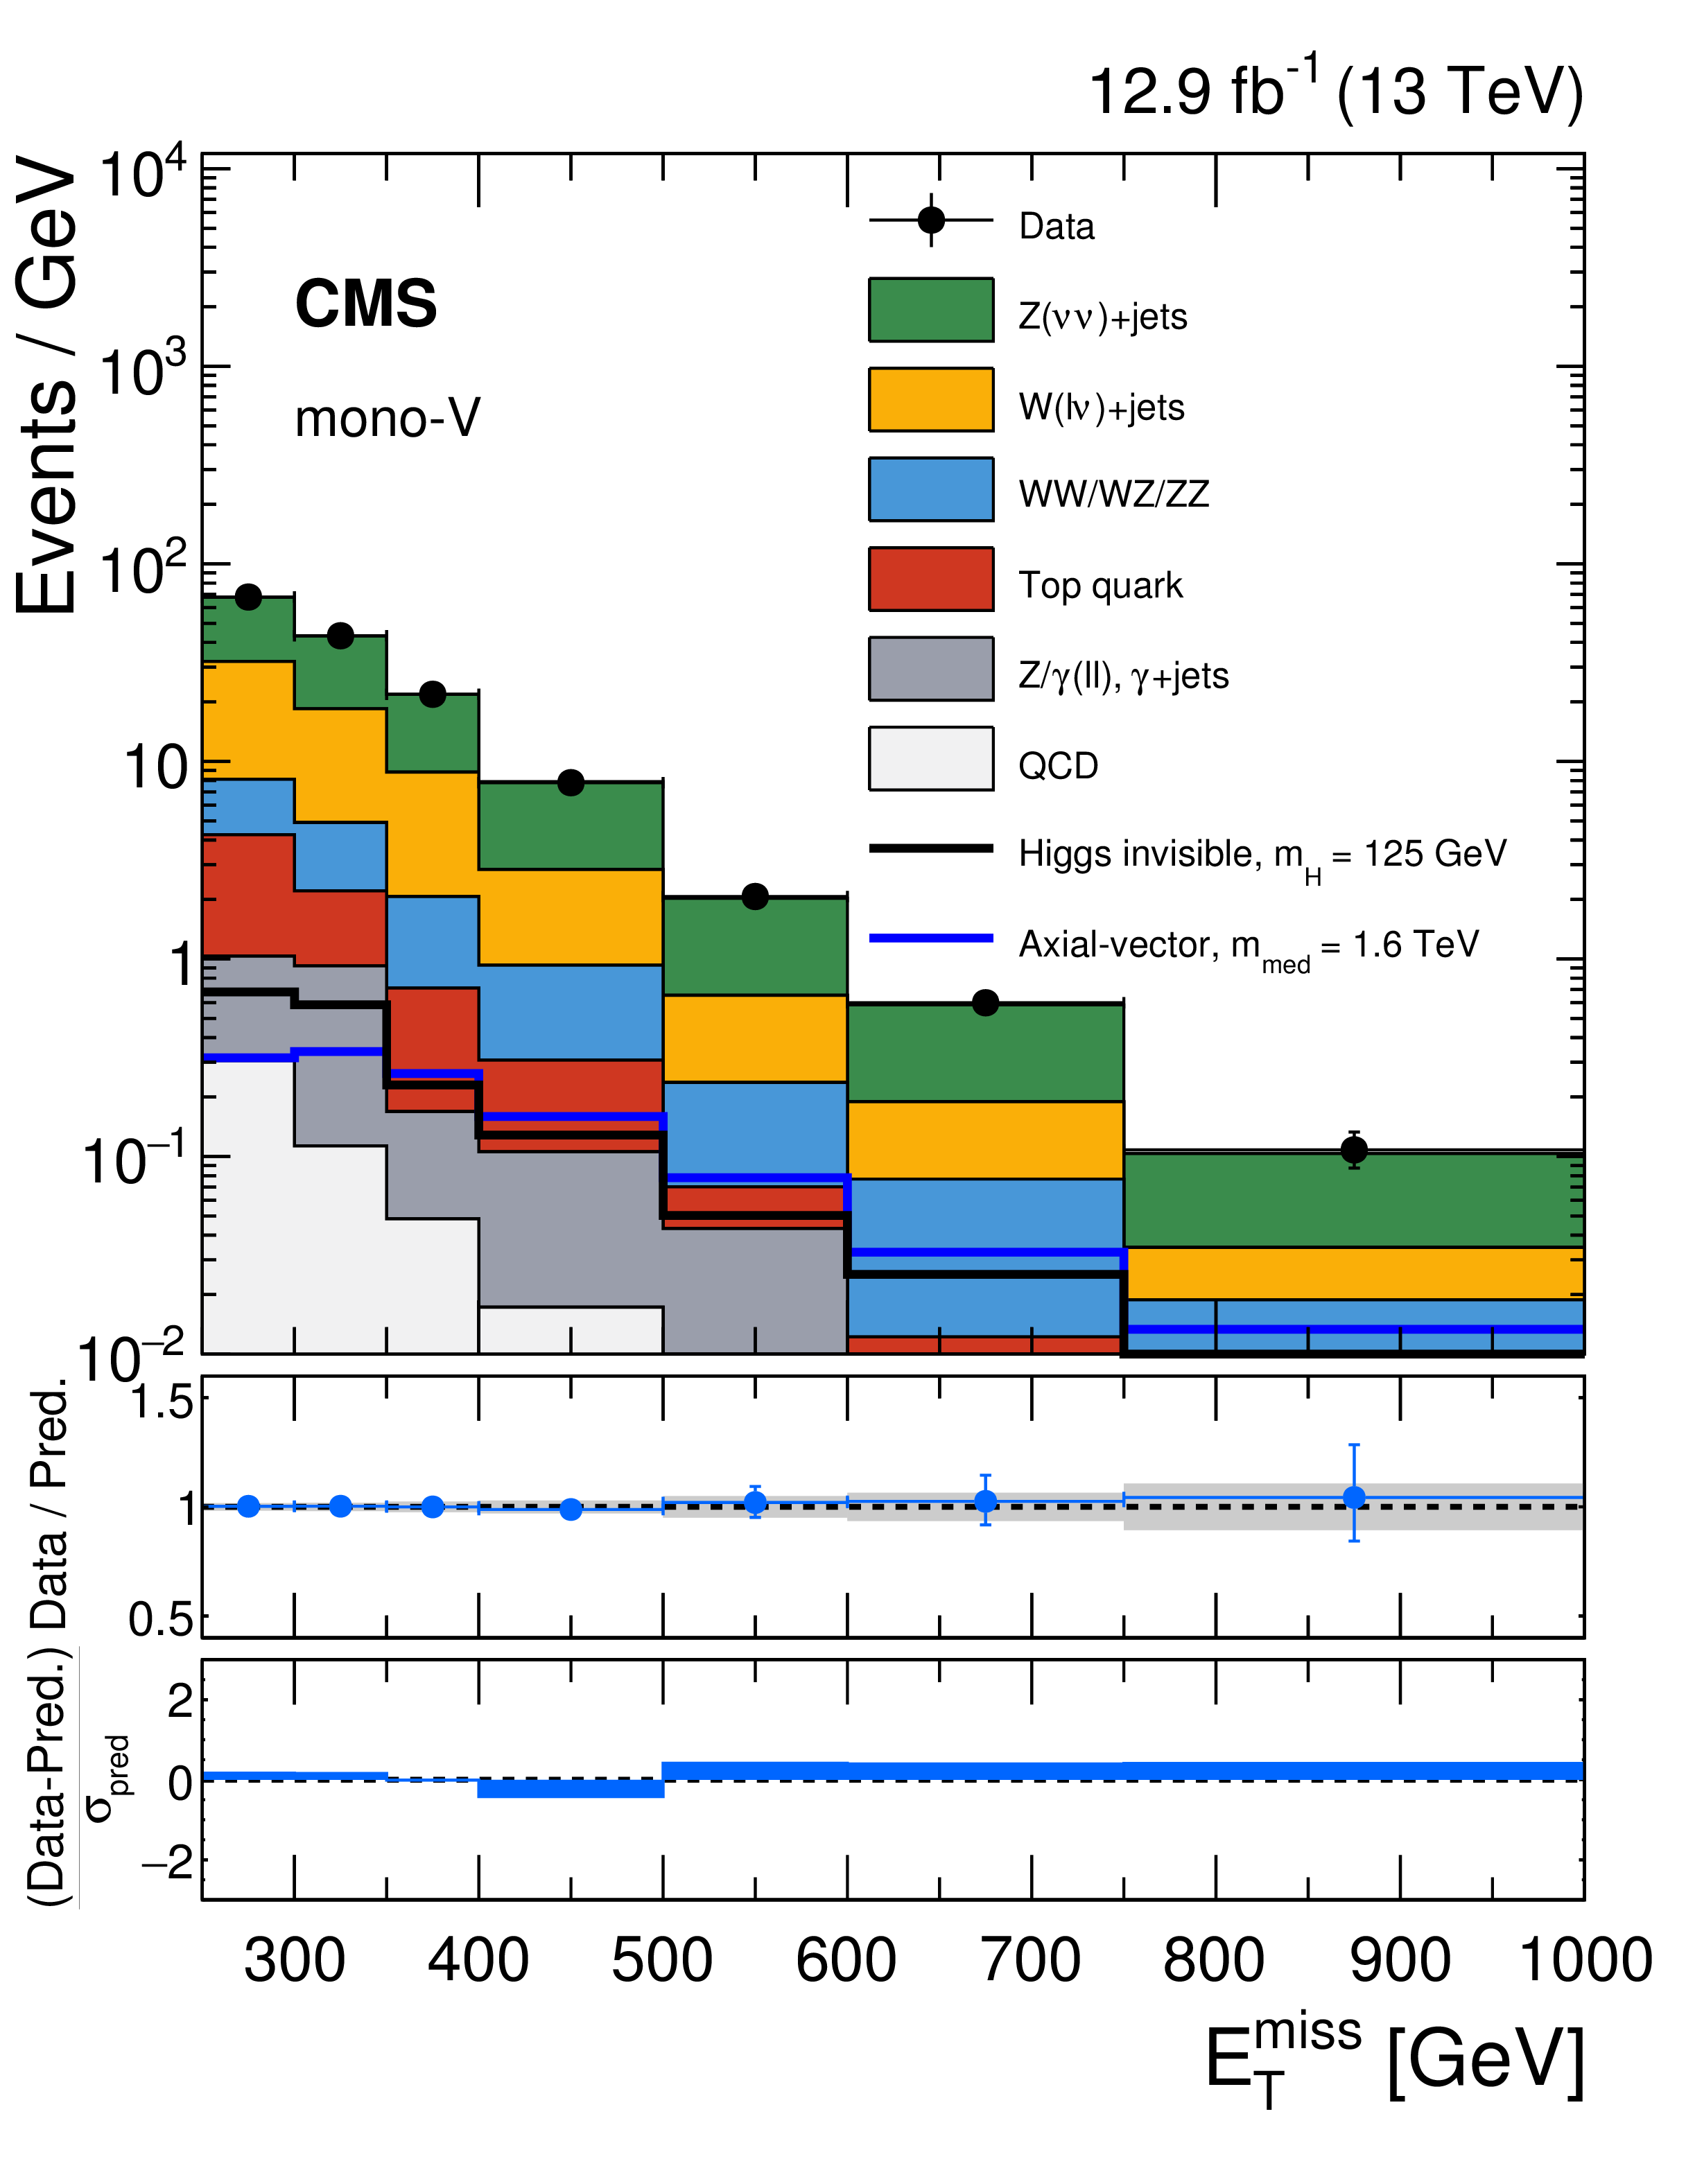
Figure 7:
Observed $ {E_{\mathrm {T}}^{\text {miss}}} $ distribution in the monojet (left) and mono-V (right) signal regions compared with the background expectations for various SM processes evaluated after performing a combined fit to the data in all the control samples, as well as in the signal region. The fit is performed assuming the absence of any signal. The last bin includes all events with $ {E_{\mathrm {T}}^{\text {miss}}} > $ 1160 (750) GeV for the monojet (mono-V) category. Expected signal distributions for a 125 GeV Higgs boson decaying exclusively to invisible particles, and for a 1.6 TeV axial-vector mediator decaying to 1 GeV DM particles, are overlaid. The ratio of data and the post-fit background prediction is shown for both the monojet and mono-V signal regions. The gray bands in these ratio plots indicate the post-fit uncertainty in the background prediction. Finally, the distributions of the pulls, defined as the difference between data and the post-fit background prediction relative to the post-fit uncertainty in the prediction, are also shown in the lower panels. |

png pdf |
Figure 7-a:
Observed $ {E_{\mathrm {T}}^{\text {miss}}} $ distribution in the monojet signal regions compared with the background expectations for various SM processes evaluated after performing a combined fit to the data in all the control samples, as well as in the signal region. The fit is performed assuming the absence of any signal. The last bin includes all events with $ {E_{\mathrm {T}}^{\text {miss}}} > $ 1160 GeV for the monojet category. Expected signal distributions for a 125 GeV Higgs boson decaying exclusively to invisible particles, and for a 1.6 TeV axial-vector mediator decaying to 1 GeV DM particles, are overlaid. The ratio of data and the post-fit background prediction is shown for both the monojet and mono-V signal regions. The gray bands in these ratio plots indicate the post-fit uncertainty in the background prediction. Finally, the distributions of the pulls, defined as the difference between data and the post-fit background prediction relative to the post-fit uncertainty in the prediction, are also shown in the lower panels. |
png pdf |
Figure 7-b:
Observed $ {E_{\mathrm {T}}^{\text {miss}}} $ distribution in the mono-V signal regions compared with the background expectations for various SM processes evaluated after performing a combined fit to the data in all the control samples, as well as in the signal region. The fit is performed assuming the absence of any signal. The last bin includes all events with $ {E_{\mathrm {T}}^{\text {miss}}} > $ 750 GeV for the mono-V category. Expected signal distributions for a 125 GeV Higgs boson decaying exclusively to invisible particles, and for a 1.6 TeV axial-vector mediator decaying to 1 GeV DM particles, are overlaid. The ratio of data and the post-fit background prediction is shown for both the monojet and mono-V signal regions. The gray bands in these ratio plots indicate the post-fit uncertainty in the background prediction. Finally, the distributions of the pulls, defined as the difference between data and the post-fit background prediction relative to the post-fit uncertainty in the prediction, are also shown in the lower panels. |

png pdf |
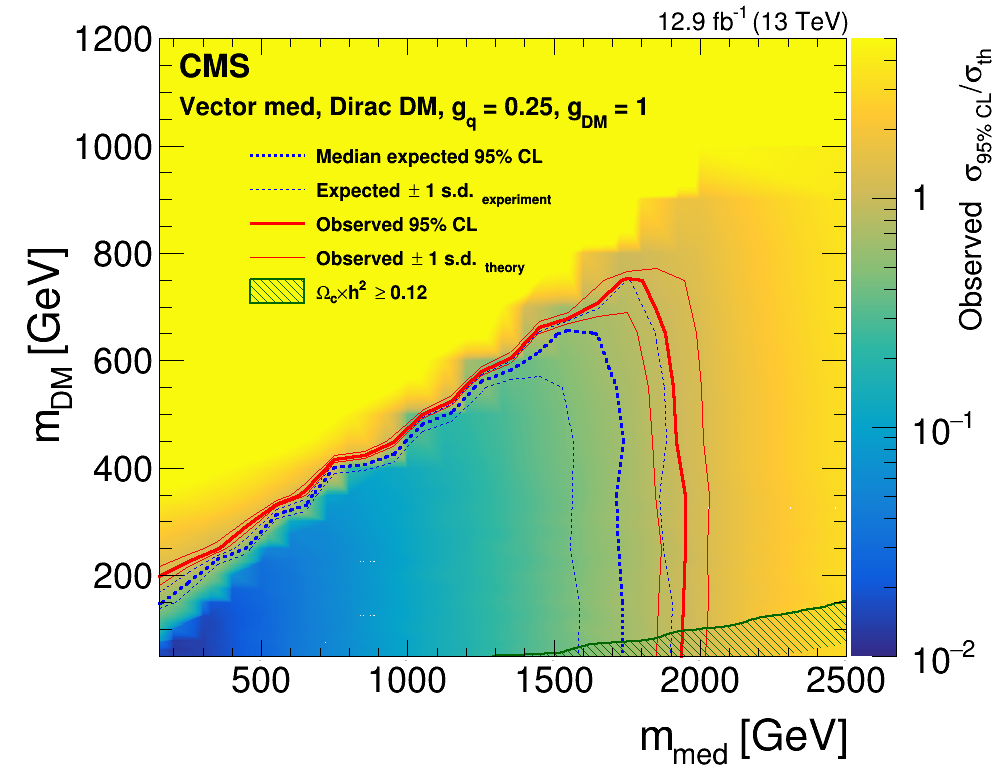
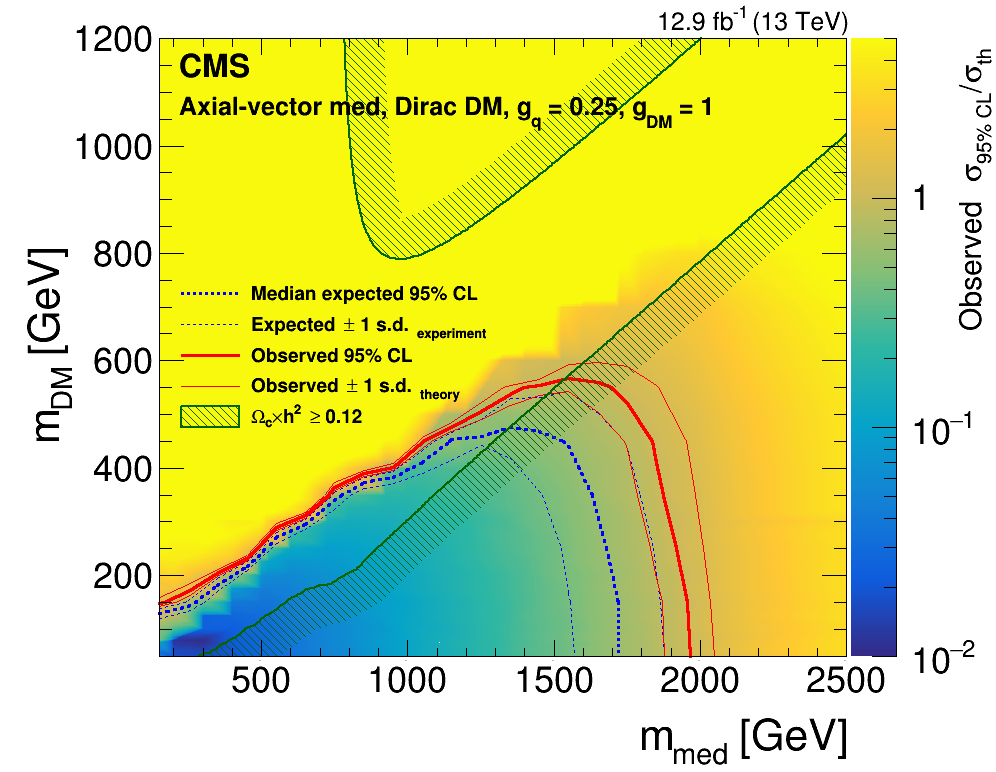
Figure 8:
Exclusion limits at 95% CL on the signal strength $\mu =\sigma /\sigma _{\textrm {th}}$ in the $m_{\textrm {med}}$-$m_{\textrm {DM}}$ plane assuming vector (left) and axial-vector (right) mediators. The limits are shown for $m_{\textrm {med}}$ between 150 GeV and 2.5 TeV, and $m_{\textrm {DM}}$ between 50 GeV and 1.2 TeV. While the excluded area is expected to extend below these minimum values of $m_{\textrm {med}}$ and $m_{\textrm {DM}}$, the axes do not extend below these values as the signal simulation was not performed in this region. The solid (dotted) red (blue) line shows the contour for the observed (expected) exclusion. The solid contours around the observed limit and the dashed contours around the expected limit represent one standard deviation theoretical uncertainties in the signal cross section and the combination of the statistical and experimental systematic uncertainties, respectively. Constraints from the Planck satellite experiment [83] are shown with the dark green contours and associated hatching. The hatched area indicates the region where the DM density exceeds the observed value. |
png |
Figure 8-a:
Exclusion limits at 95% CL on the signal strength $\mu =\sigma /\sigma _{\textrm {th}}$ in the $m_{\textrm {med}}$-$m_{\textrm {DM}}$ plane assuming vector mediators. The limits are shown for $m_{\textrm {med}}$ between 150 GeV and 2.5 TeV, and $m_{\textrm {DM}}$ between 50 GeV and 1.2 TeV. While the excluded area is expected to extend below these minimum values of $m_{\textrm {med}}$ and $m_{\textrm {DM}}$, the axes do not extend below these values as the signal simulation was not performed in this region. The solid (dotted) red (blue) line shows the contour for the observed (expected) exclusion. The solid contours around the observed limit and the dashed contours around the expected limit represent one standard deviation theoretical uncertainties in the signal cross section and the combination of the statistical and experimental systematic uncertainties, respectively. Constraints from the Planck satellite experiment [83] are shown with the dark green contours and associated hatching. The hatched area indicates the region where the DM density exceeds the observed value. |
png |
Figure 8-b:
Exclusion limits at 95% CL on the signal strength $\mu =\sigma /\sigma _{\textrm {th}}$ in the $m_{\textrm {med}}$-$m_{\textrm {DM}}$ plane assuming axial-vector mediators. The limits are shown for $m_{\textrm {med}}$ between 150 GeV and 2.5 TeV, and $m_{\textrm {DM}}$ between 50 GeV and 1.2 TeV. While the excluded area is expected to extend below these minimum values of $m_{\textrm {med}}$ and $m_{\textrm {DM}}$, the axes do not extend below these values as the signal simulation was not performed in this region. The solid (dotted) red (blue) line shows the contour for the observed (expected) exclusion. The solid contours around the observed limit and the dashed contours around the expected limit represent one standard deviation theoretical uncertainties in the signal cross section and the combination of the statistical and experimental systematic uncertainties, respectively. Constraints from the Planck satellite experiment [83] are shown with the dark green contours and associated hatching. The hatched area indicates the region where the DM density exceeds the observed value. |
png pdf |
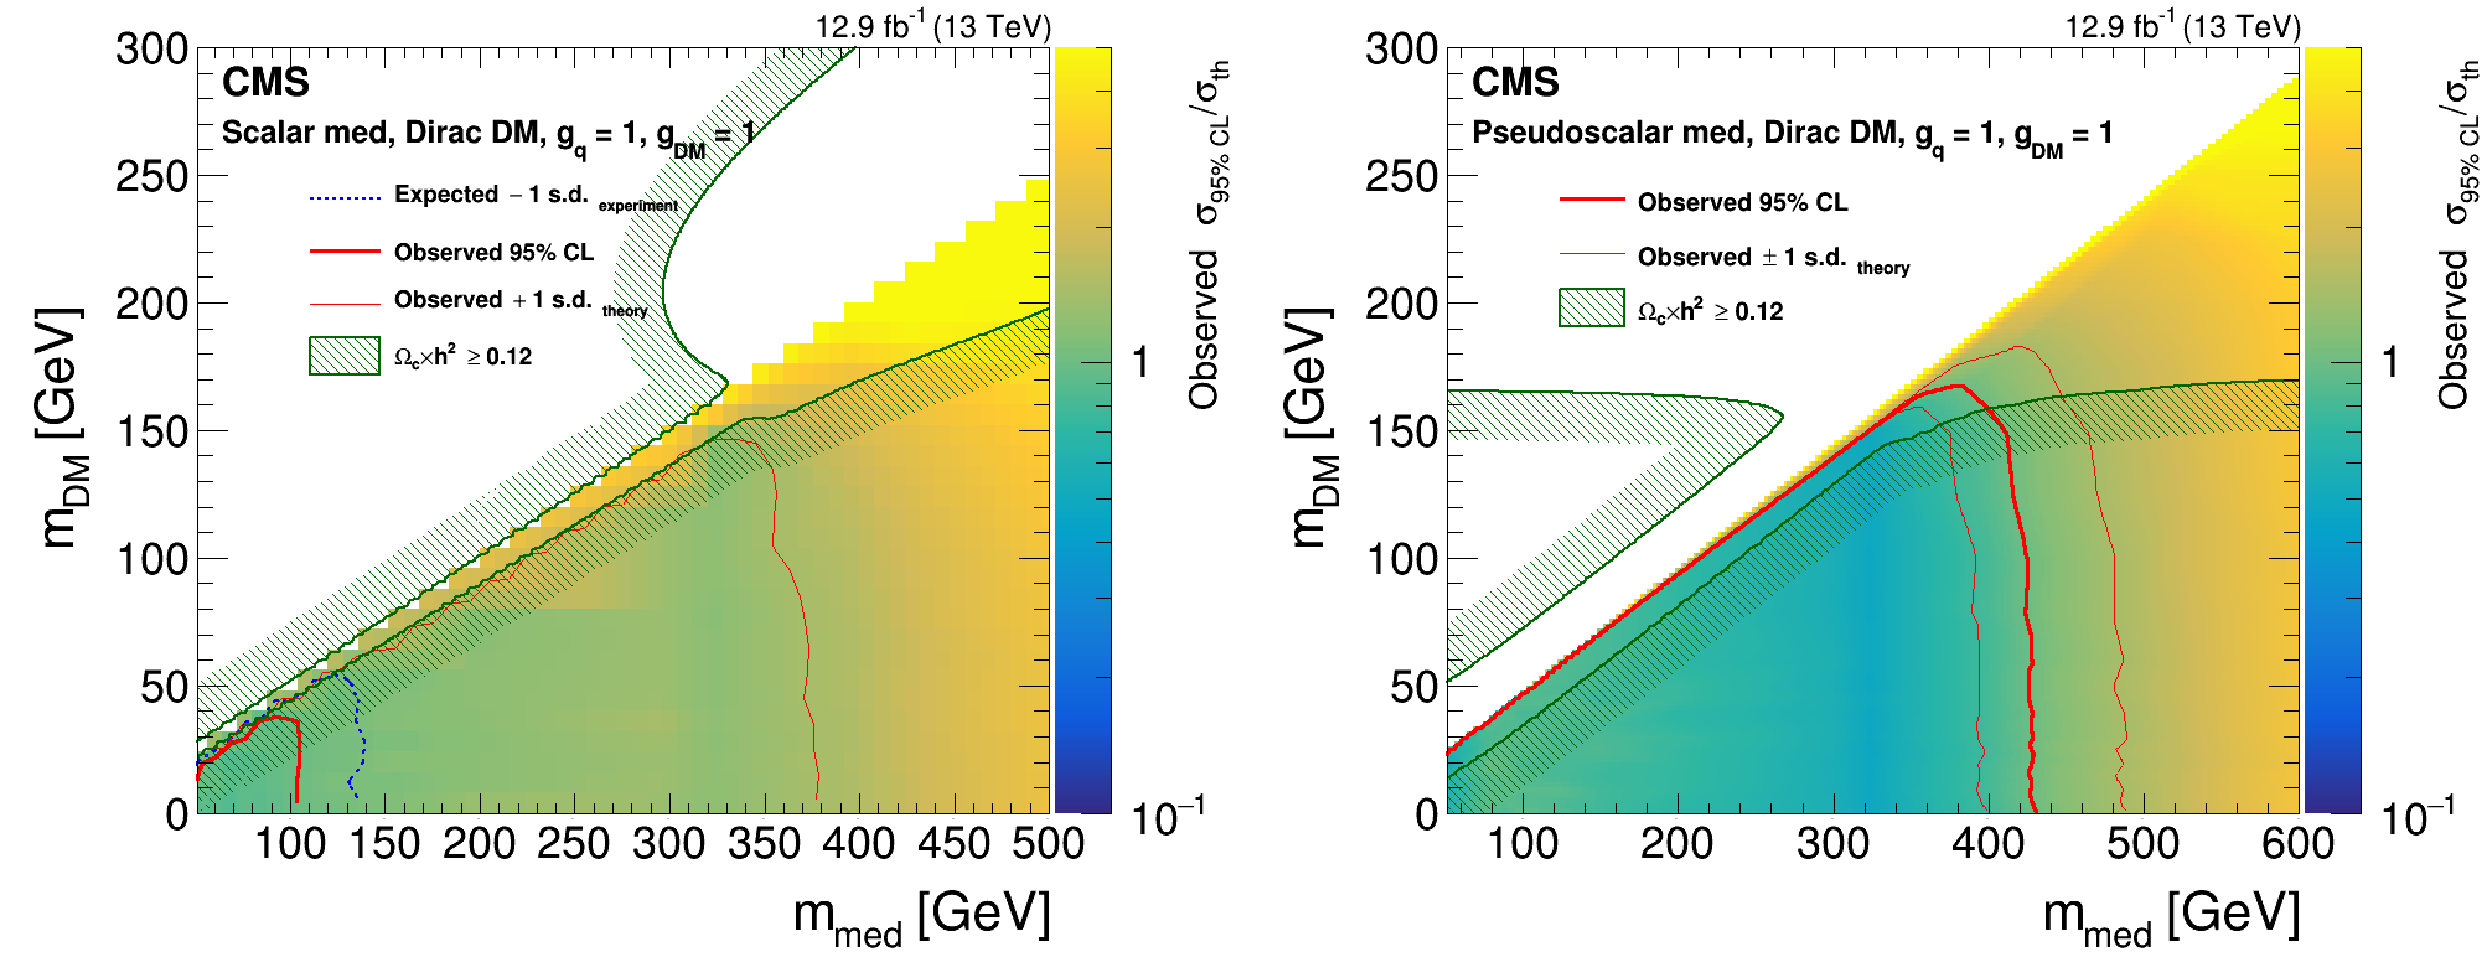
Figure 9:
Exclusion limits at 95% CL on signal strength the $\mu =\sigma /\sigma _{\textrm {th}}$ in the $m_{\textrm {med}}$-$m_{\textrm {DM}}$ plane assuming scalar (left) and pseudoscalar (right) mediators. The limits are shown for $m_{\textrm {med}}$ between 50 and 500 GeV, and $m_{\textrm {DM}}$ between 0 and 300 GeV. While the excluded area is expected to extend below the minimum value of $m_{\textrm {med}}$, the axis does not extend below this value as the signal simulation was not performed in this region. The red line shows the contour for the observed exclusion. The solid red contours around the observed limit represent one standard deviation theoretical uncertainties in the signal cross section. The dashed blue contour in the case of the scalar mediator shows the $-1\sigma $ deviation due to the combination of the statistical and experimental systematic uncertainties. Constraints from the Planck satellite experiment [83] are shown with the dark green contours and associated hatching. The hatched area indicates the region where the DM density exceeds the observed value. |
png |
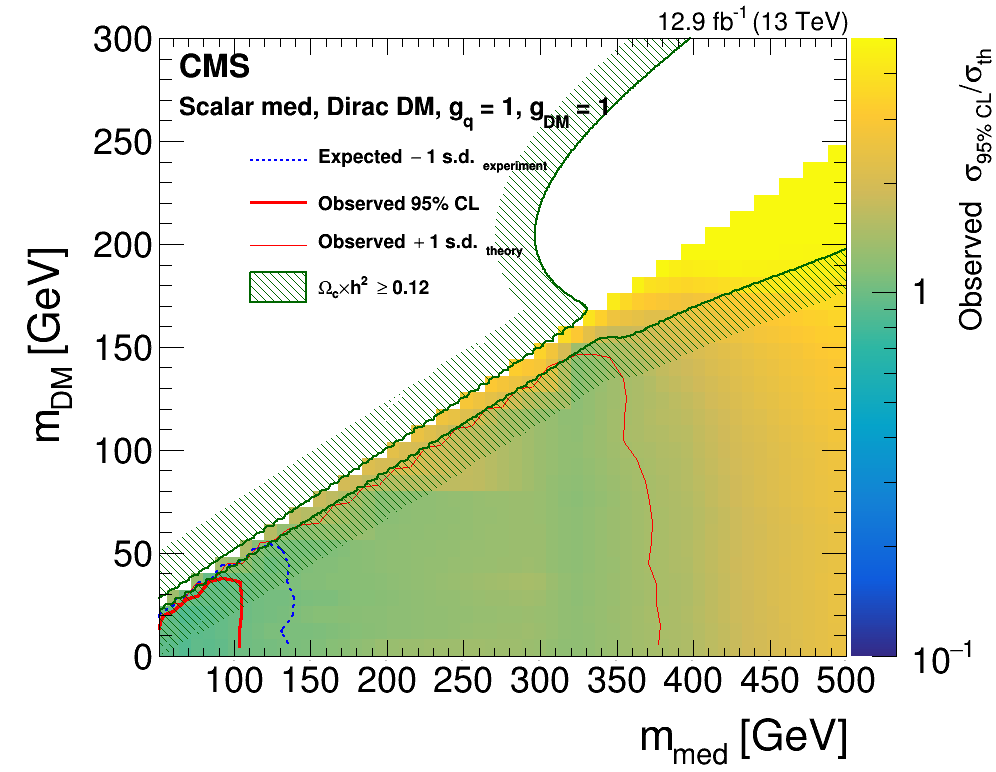
Figure 9-a:
Exclusion limits at 95% CL on signal strength the $\mu =\sigma /\sigma _{\textrm {th}}$ in the $m_{\textrm {med}}$-$m_{\textrm {DM}}$ plane assuming scalar mediators. The limits are shown for $m_{\textrm {med}}$ between 50 and 500 GeV, and $m_{\textrm {DM}}$ between 0 and 300 GeV. While the excluded area is expected to extend below the minimum value of $m_{\textrm {med}}$, the axis does not extend below this value as the signal simulation was not performed in this region. The red line shows the contour for the observed exclusion. The solid red contours around the observed limit represent one standard deviation theoretical uncertainties in the signal cross section. The dashed blue contour in the case of the scalar mediator shows the $-1\sigma $ deviation due to the combination of the statistical and experimental systematic uncertainties. Constraints from the Planck satellite experiment [83] are shown with the dark green contours and associated hatching. The hatched area indicates the region where the DM density exceeds the observed value. |
png |
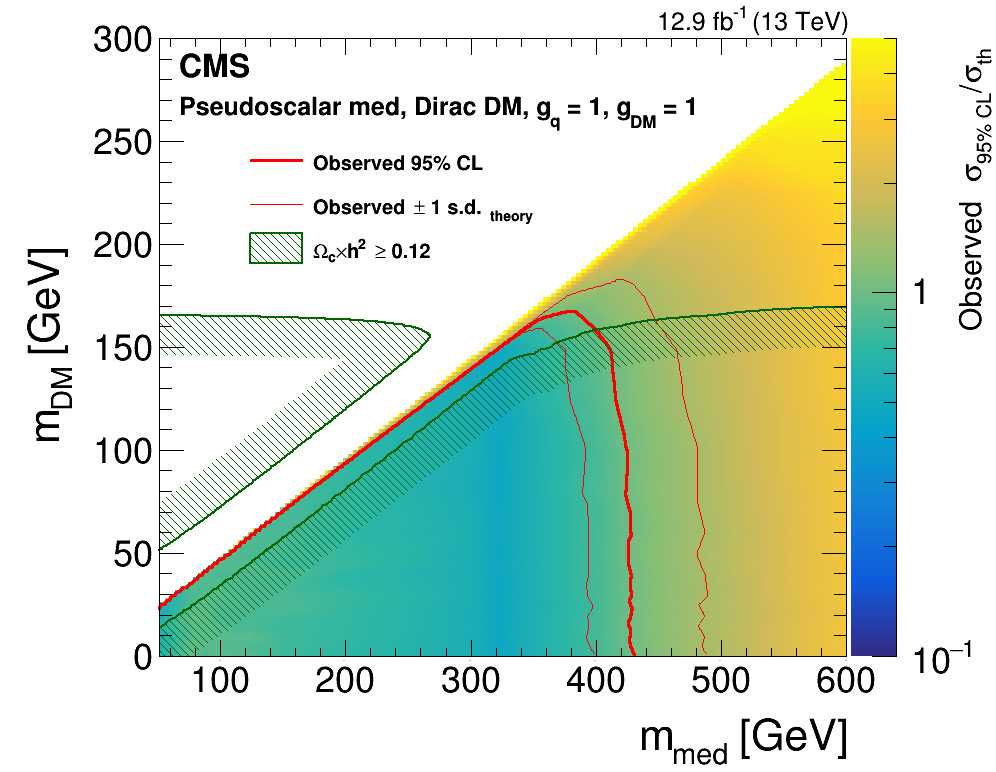
Figure 9-b:
Exclusion limits at 95% CL on signal strength the $\mu =\sigma /\sigma _{\textrm {th}}$ in the $m_{\textrm {med}}$-$m_{\textrm {DM}}$ plane assuming pseudoscalar mediators. The limits are shown for $m_{\textrm {med}}$ between 50 and 500 GeV, and $m_{\textrm {DM}}$ between 0 and 300 GeV. While the excluded area is expected to extend below the minimum value of $m_{\textrm {med}}$, the axis does not extend below this value as the signal simulation was not performed in this region. The red line shows the contour for the observed exclusion. The solid red contours around the observed limit represent one standard deviation theoretical uncertainties in the signal cross section. The dashed blue contour in the case of the scalar mediator shows the $-1\sigma $ deviation due to the combination of the statistical and experimental systematic uncertainties. Constraints from the Planck satellite experiment [83] are shown with the dark green contours and associated hatching. The hatched area indicates the region where the DM density exceeds the observed value. |
png pdf |
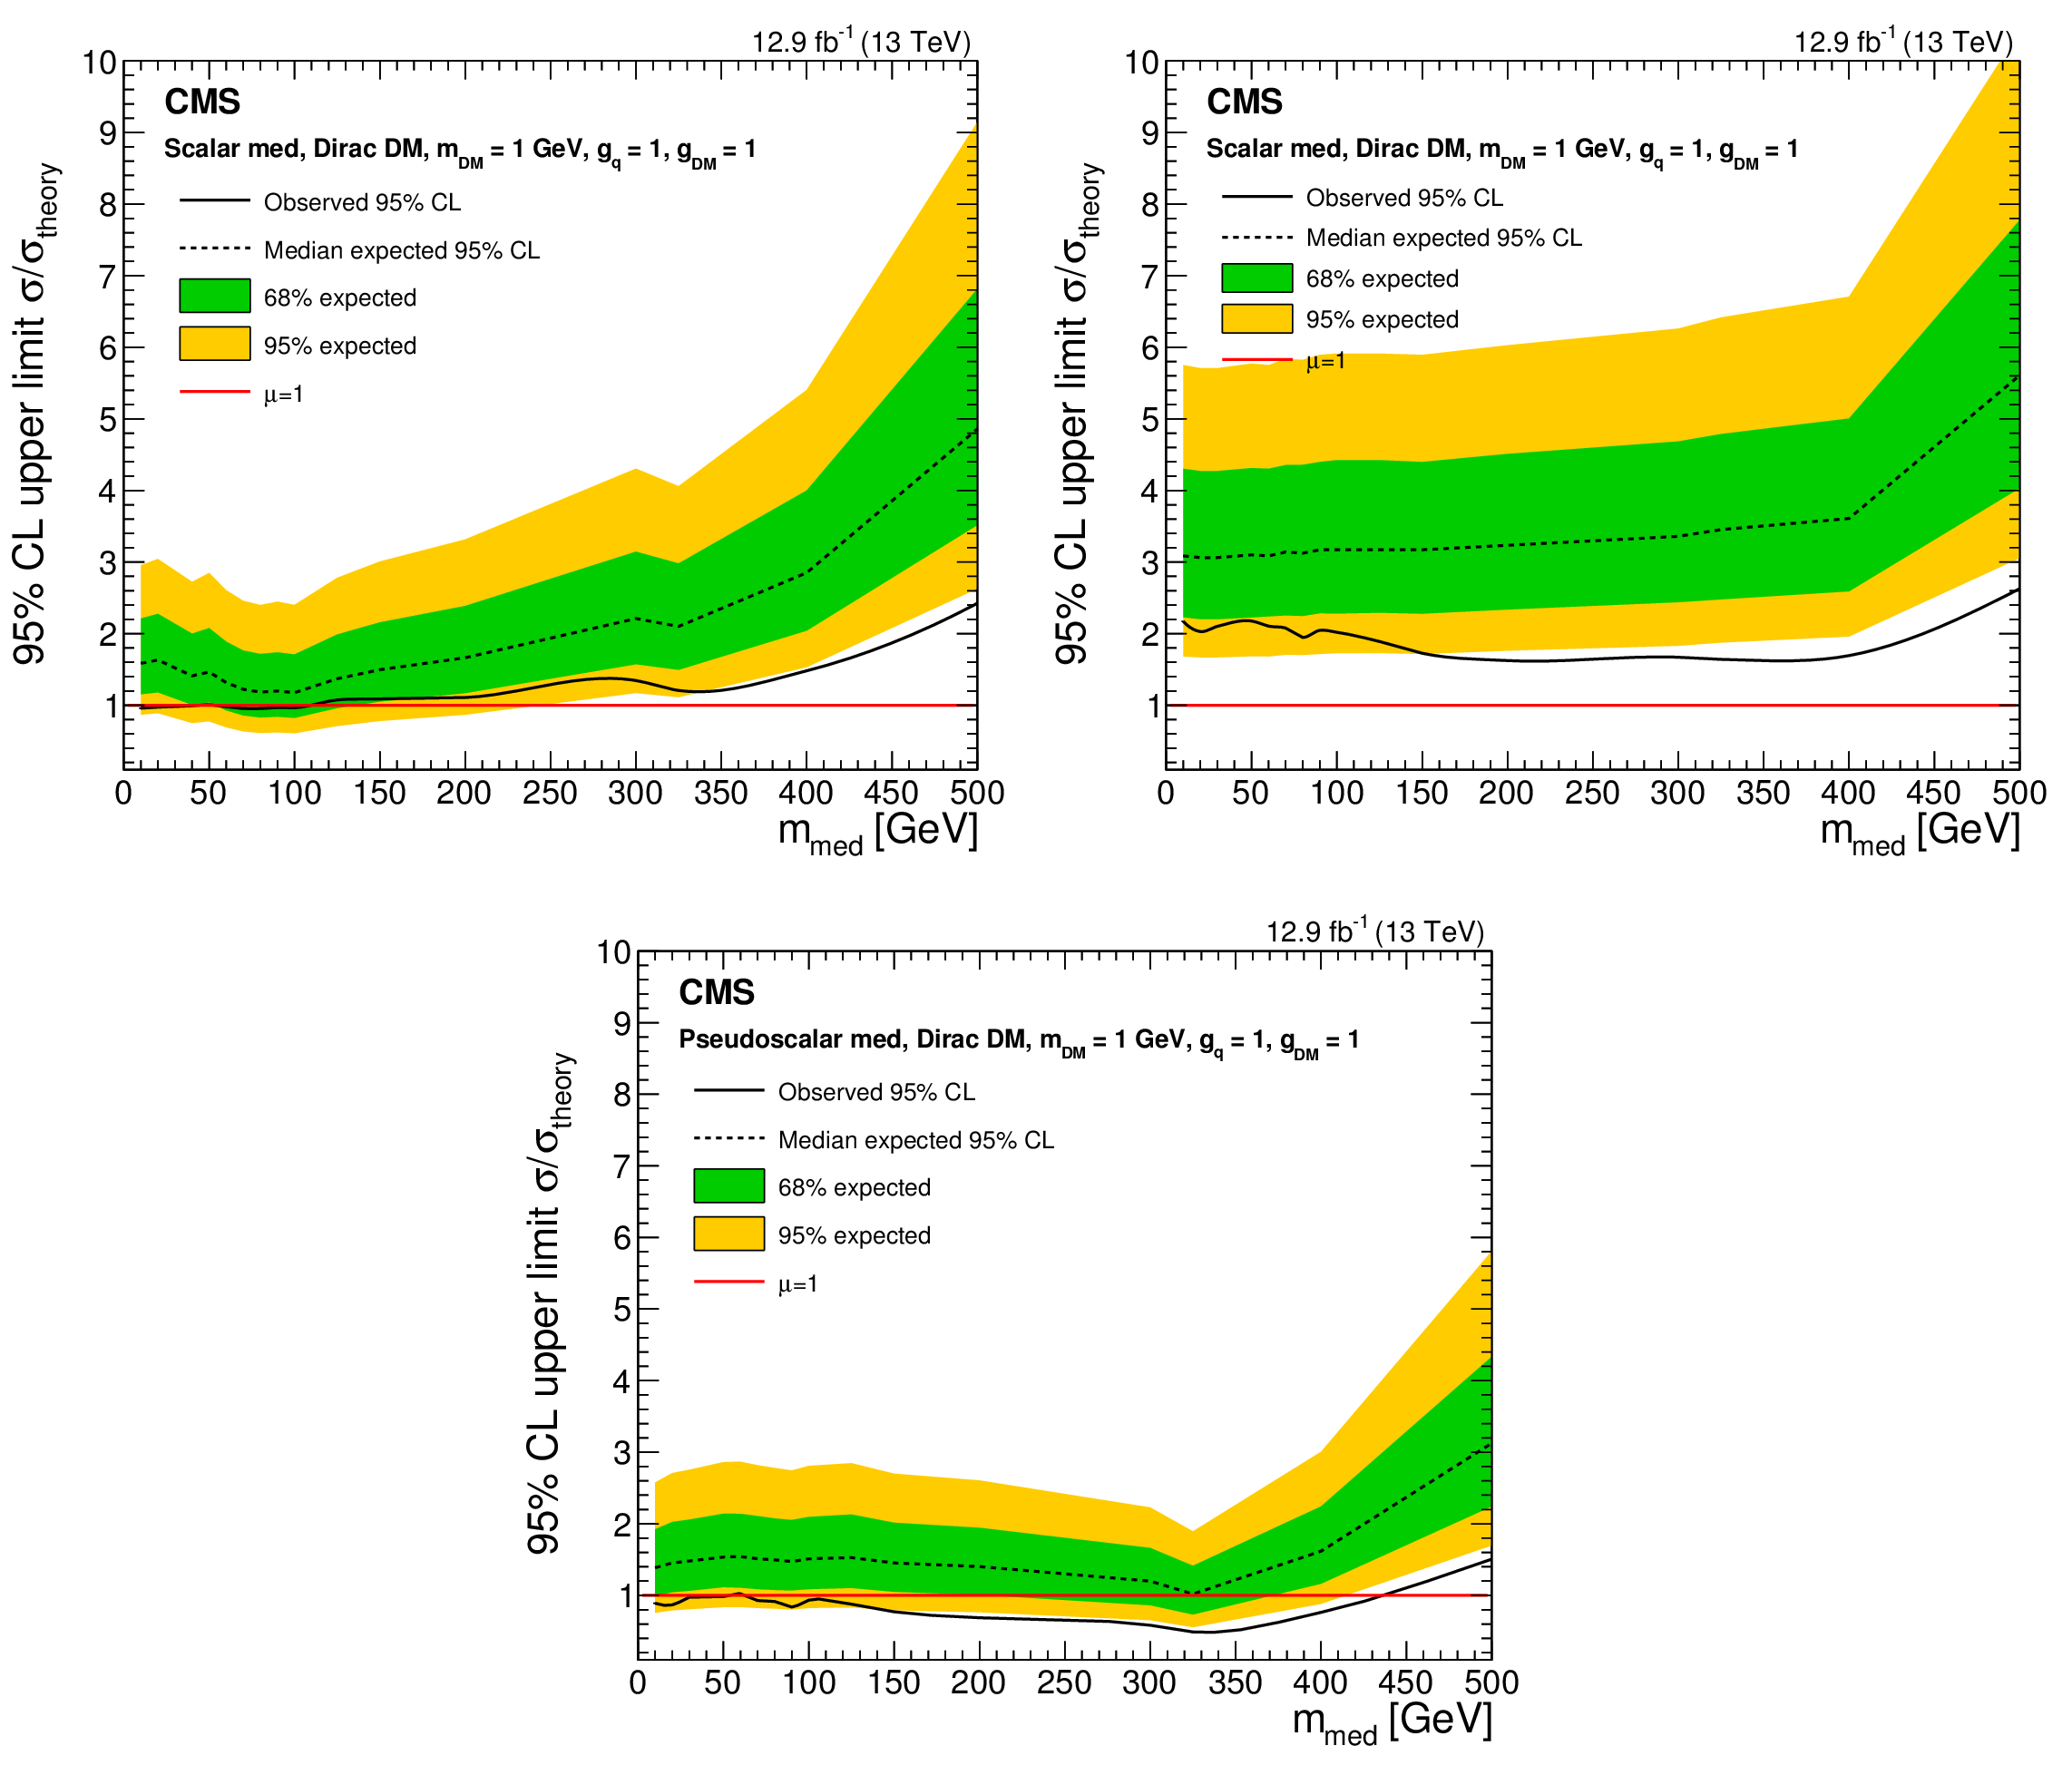
Figure 10:
Expected (dotted black line) and observed (solid black line) 95% CL upper limits on the signal strength $\mu $ as a function of the mediator mass for the spin-0 models. The horizontal red line denotes $\mu = 1$. Limits for the scalar model on the combined cross section of the monojet and mono-V processes (upper left). Limits for the scalar (upper right) and pseudoscalar (bottom) models, respectively, assuming only the monojet signal process. |
png pdf |
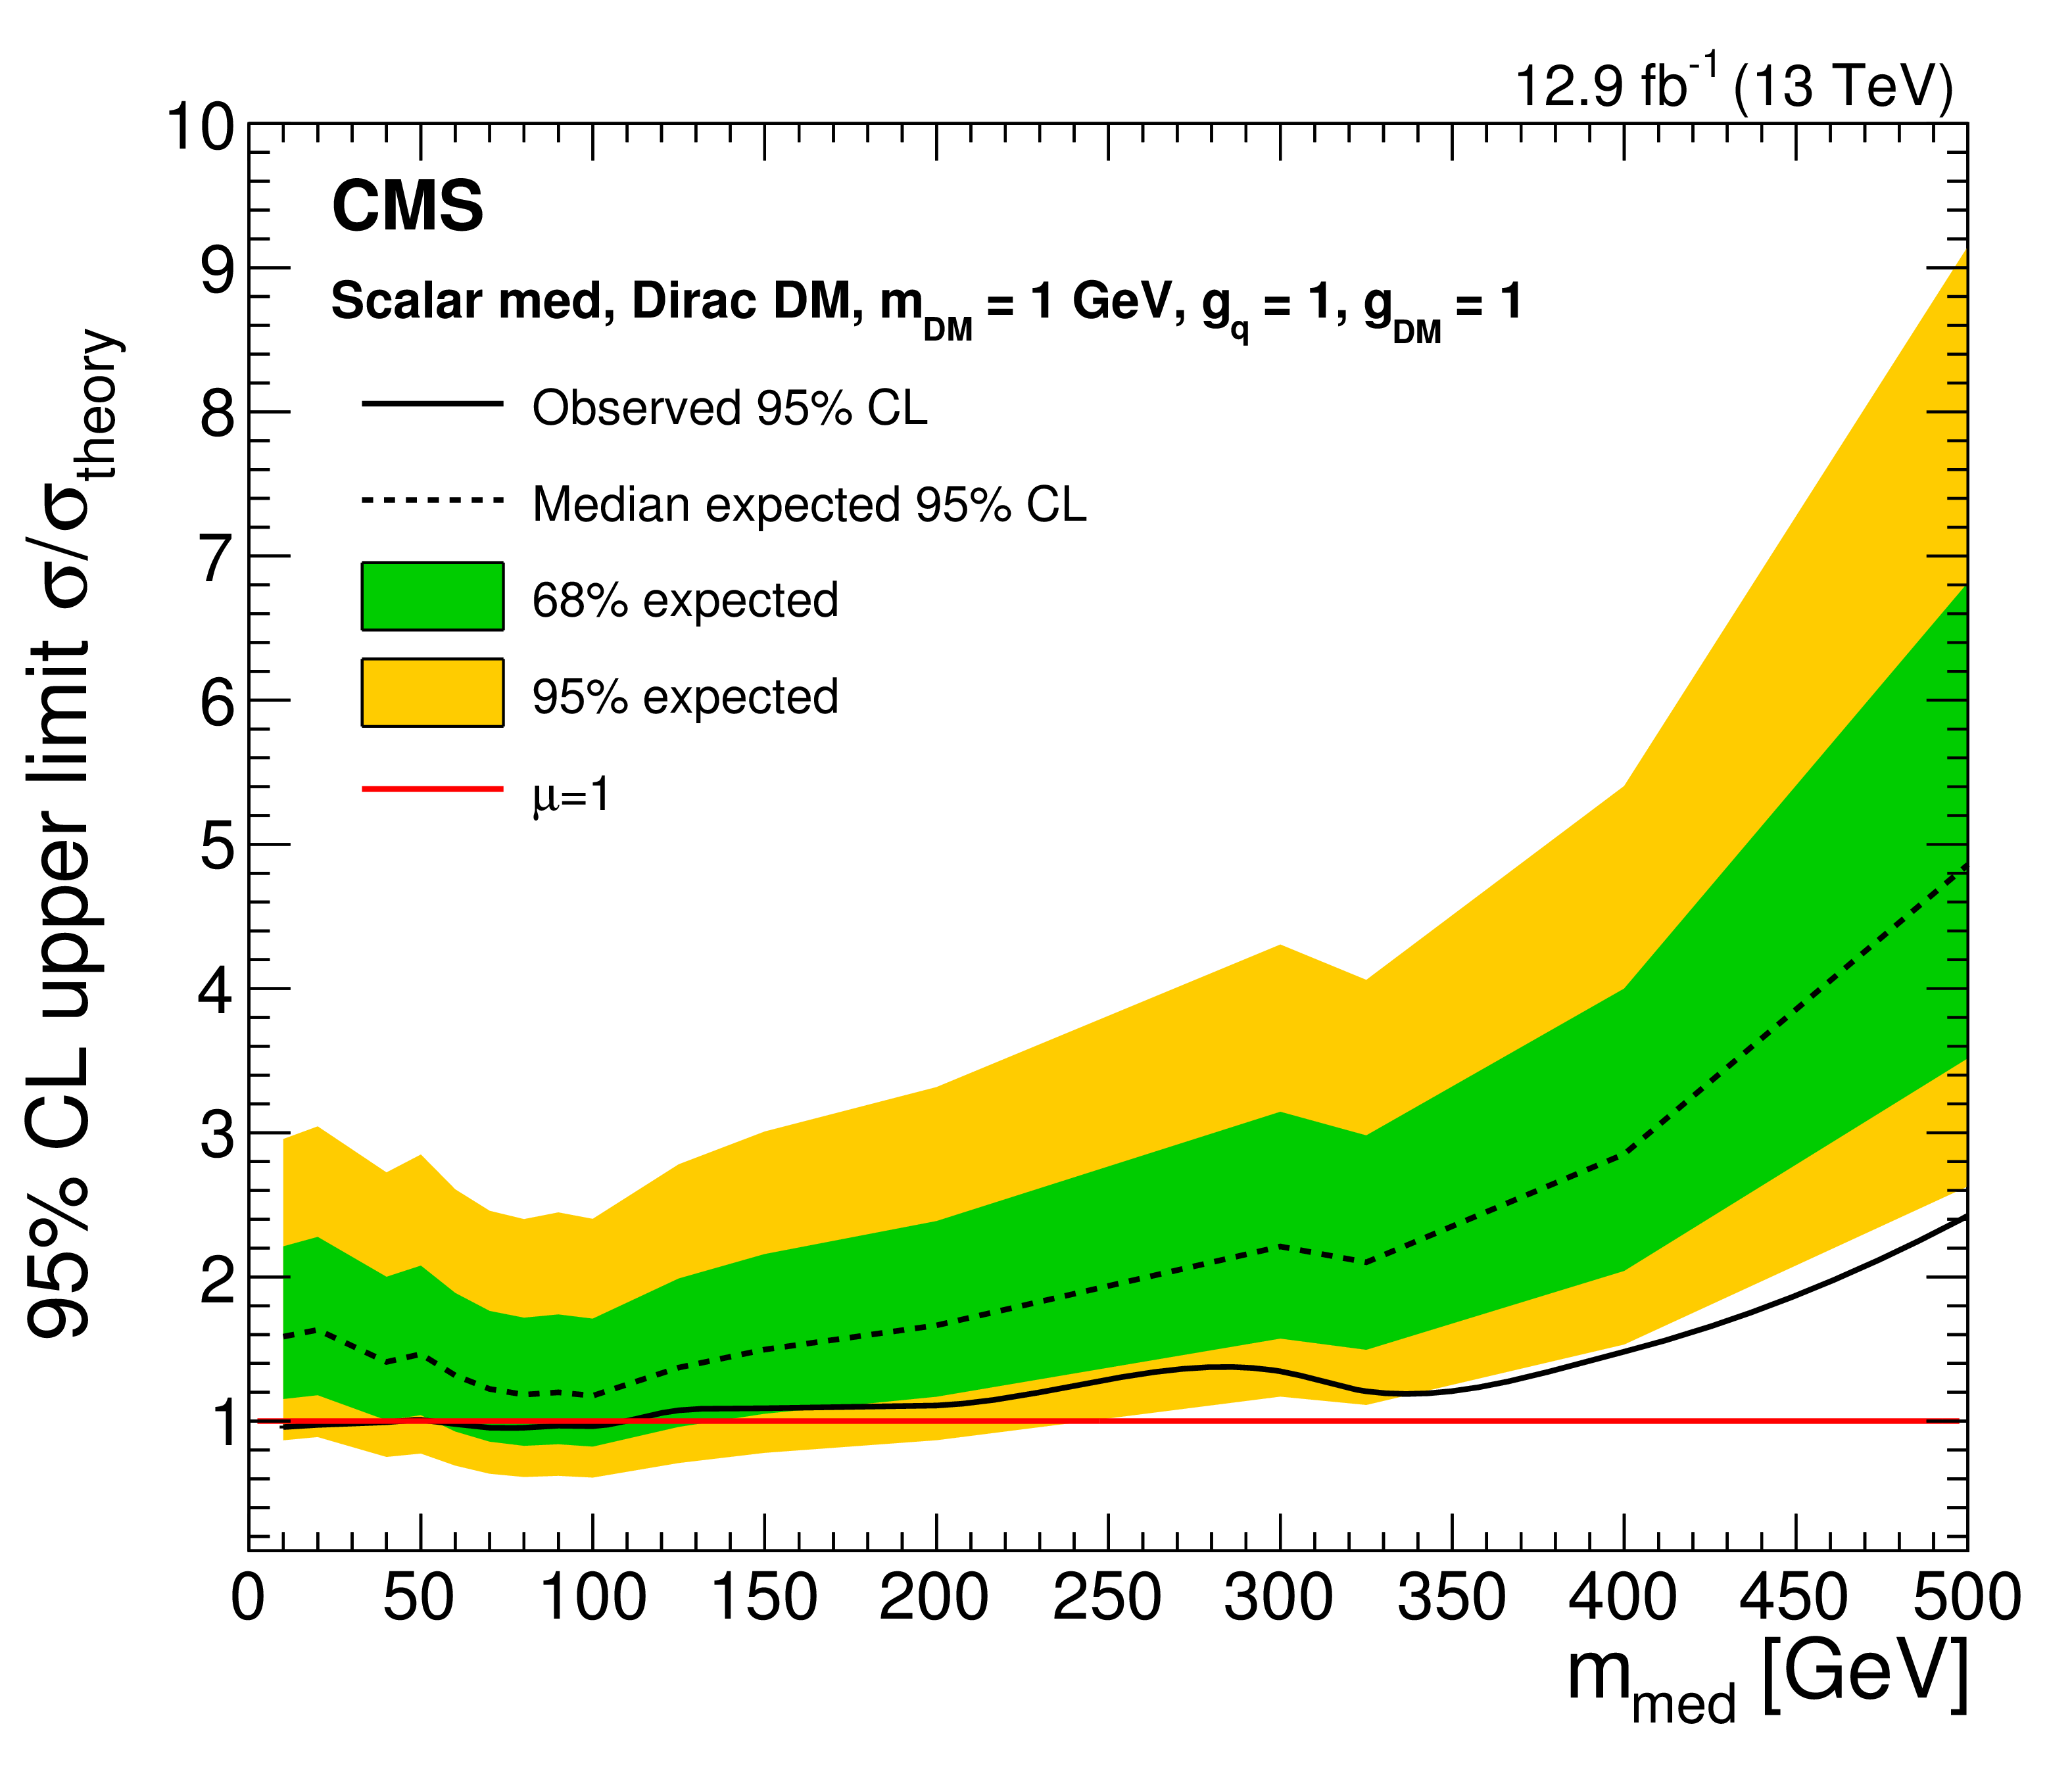
Figure 10-a:
Expected (dotted black line) and observed (solid black line) 95% CL upper limits on the signal strength $\mu $ as a function of the mediator mass for the spin-0 models. The horizontal red line denotes $\mu = 1$. Limits for the scalar model on the combined cross section of the monojet and mono-V processes. |
png pdf |
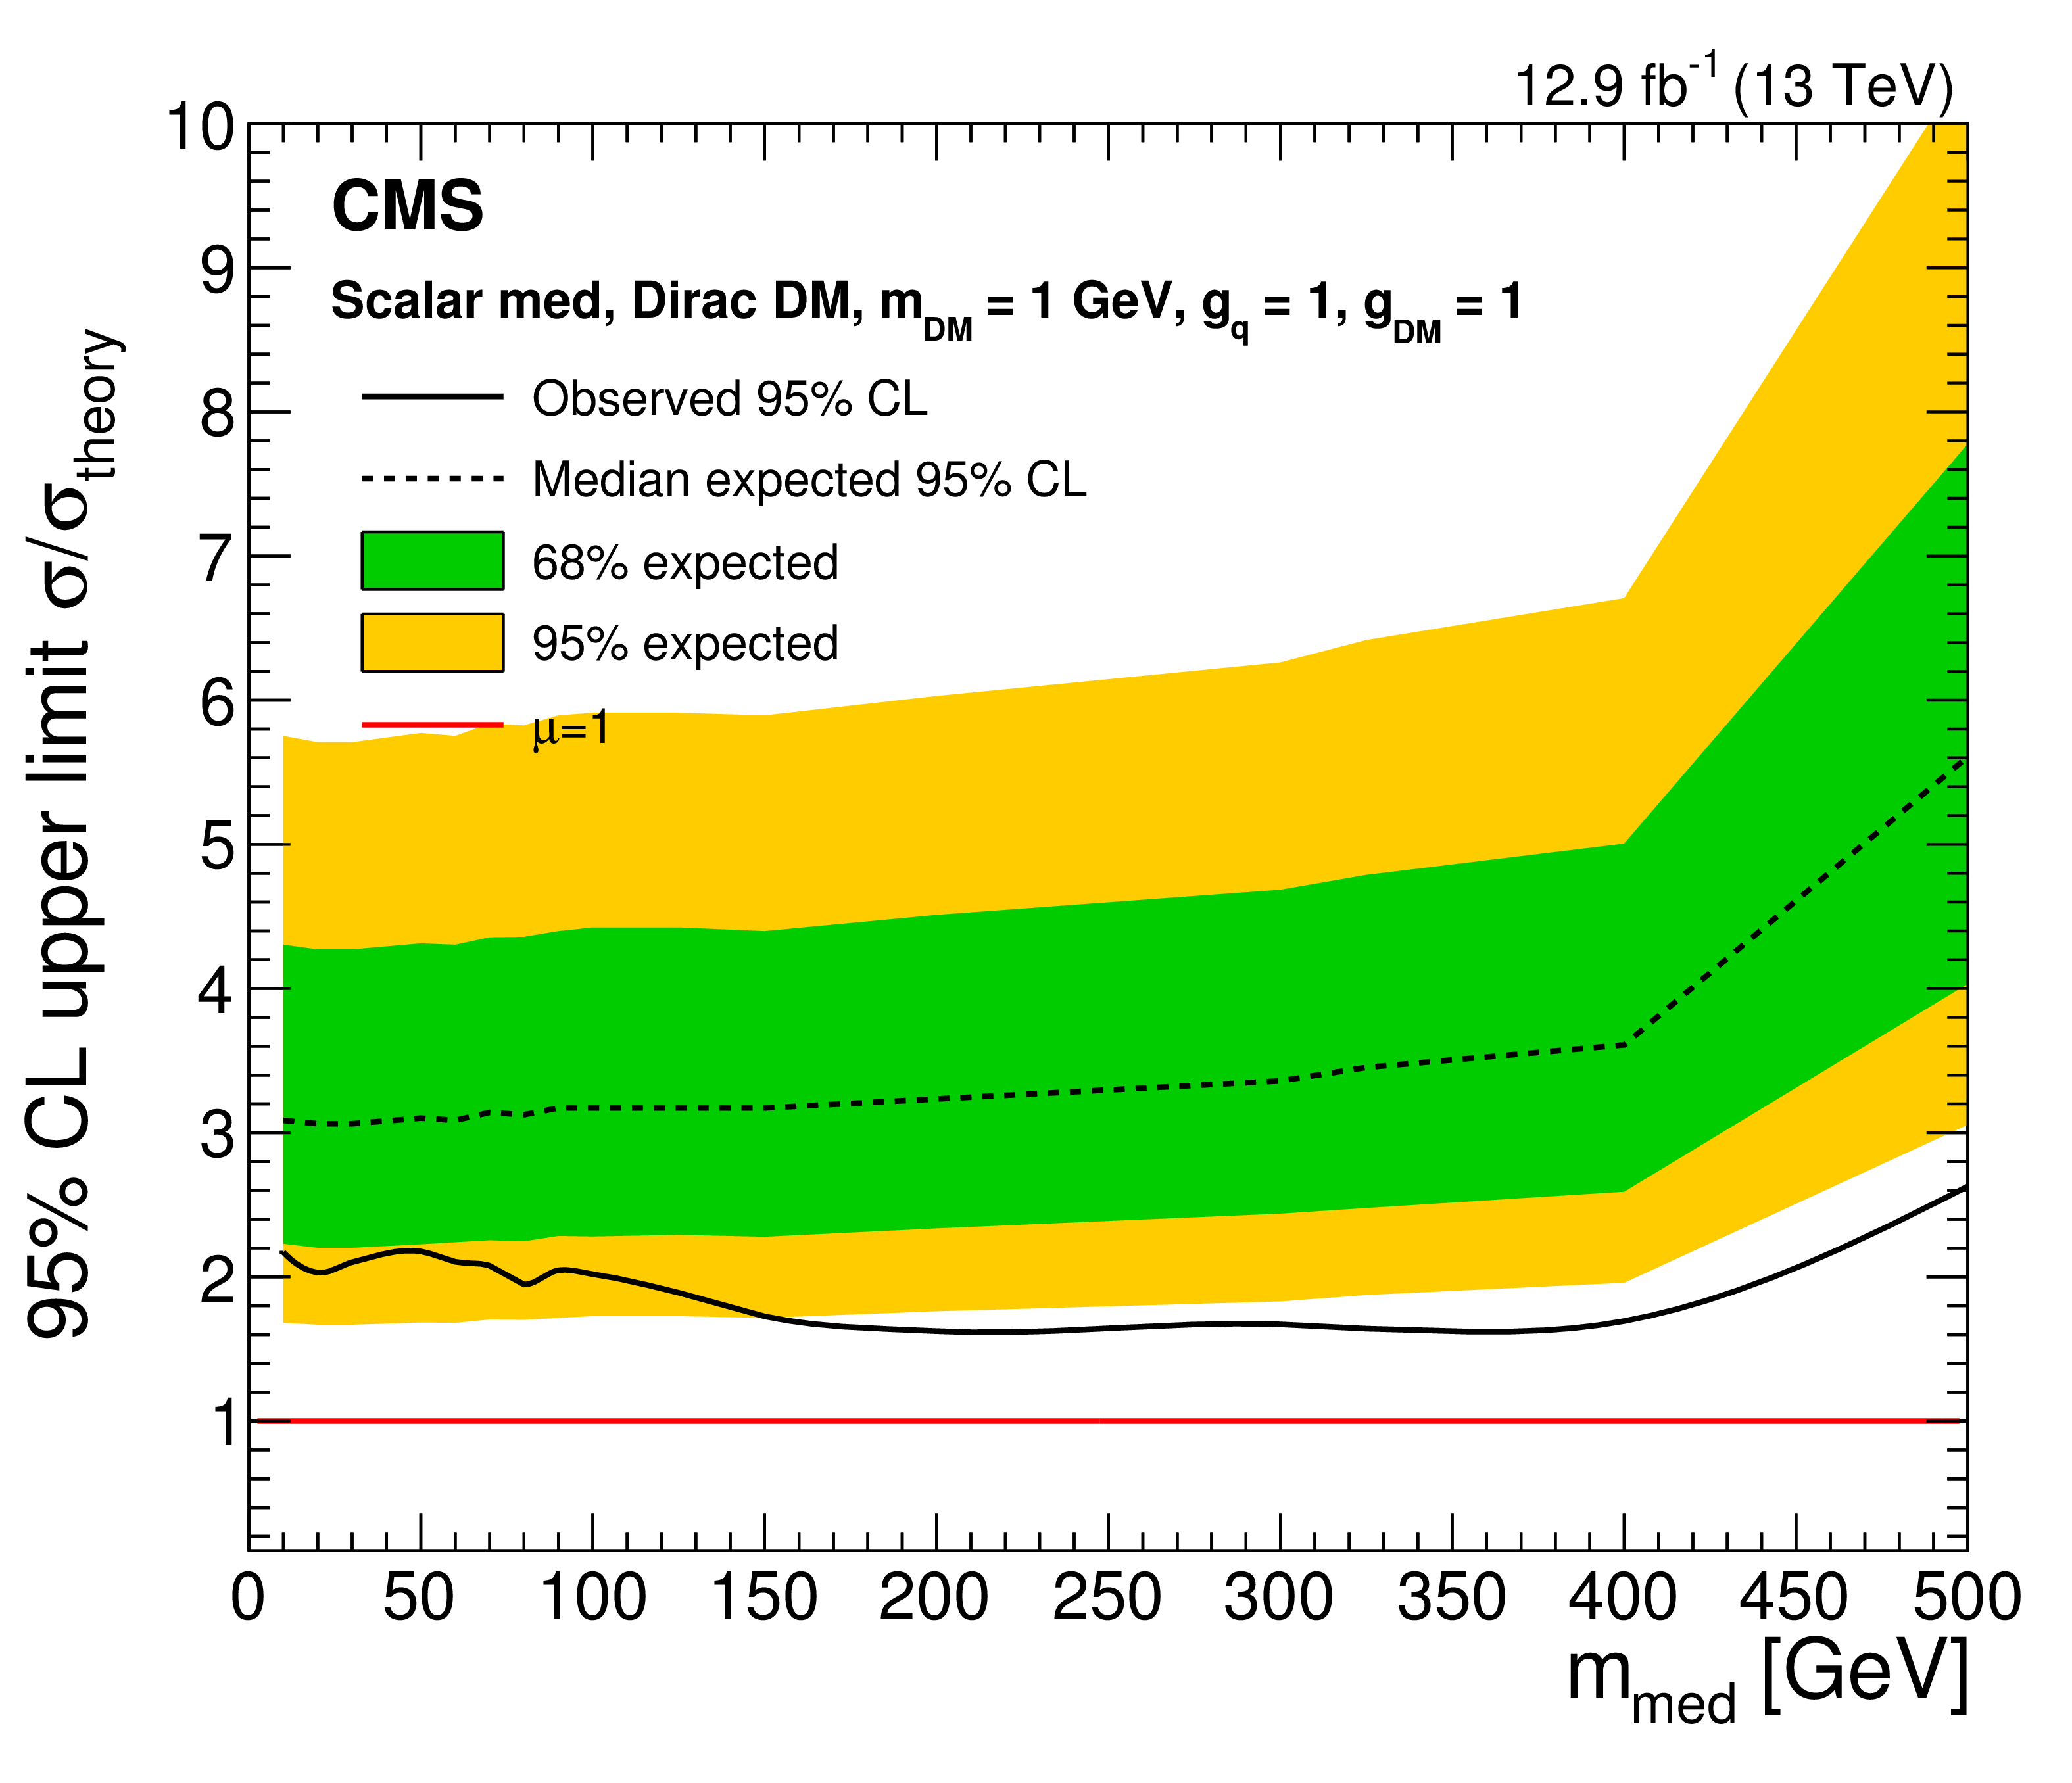
Figure 10-b:
Expected (dotted black line) and observed (solid black line) 95% CL upper limits on the signal strength $\mu $ as a function of the mediator mass for the spin-0 models. The horizontal red line denotes $\mu = 1$. Limit for the scalar model, assuming only the monojet signal process. |
png pdf |
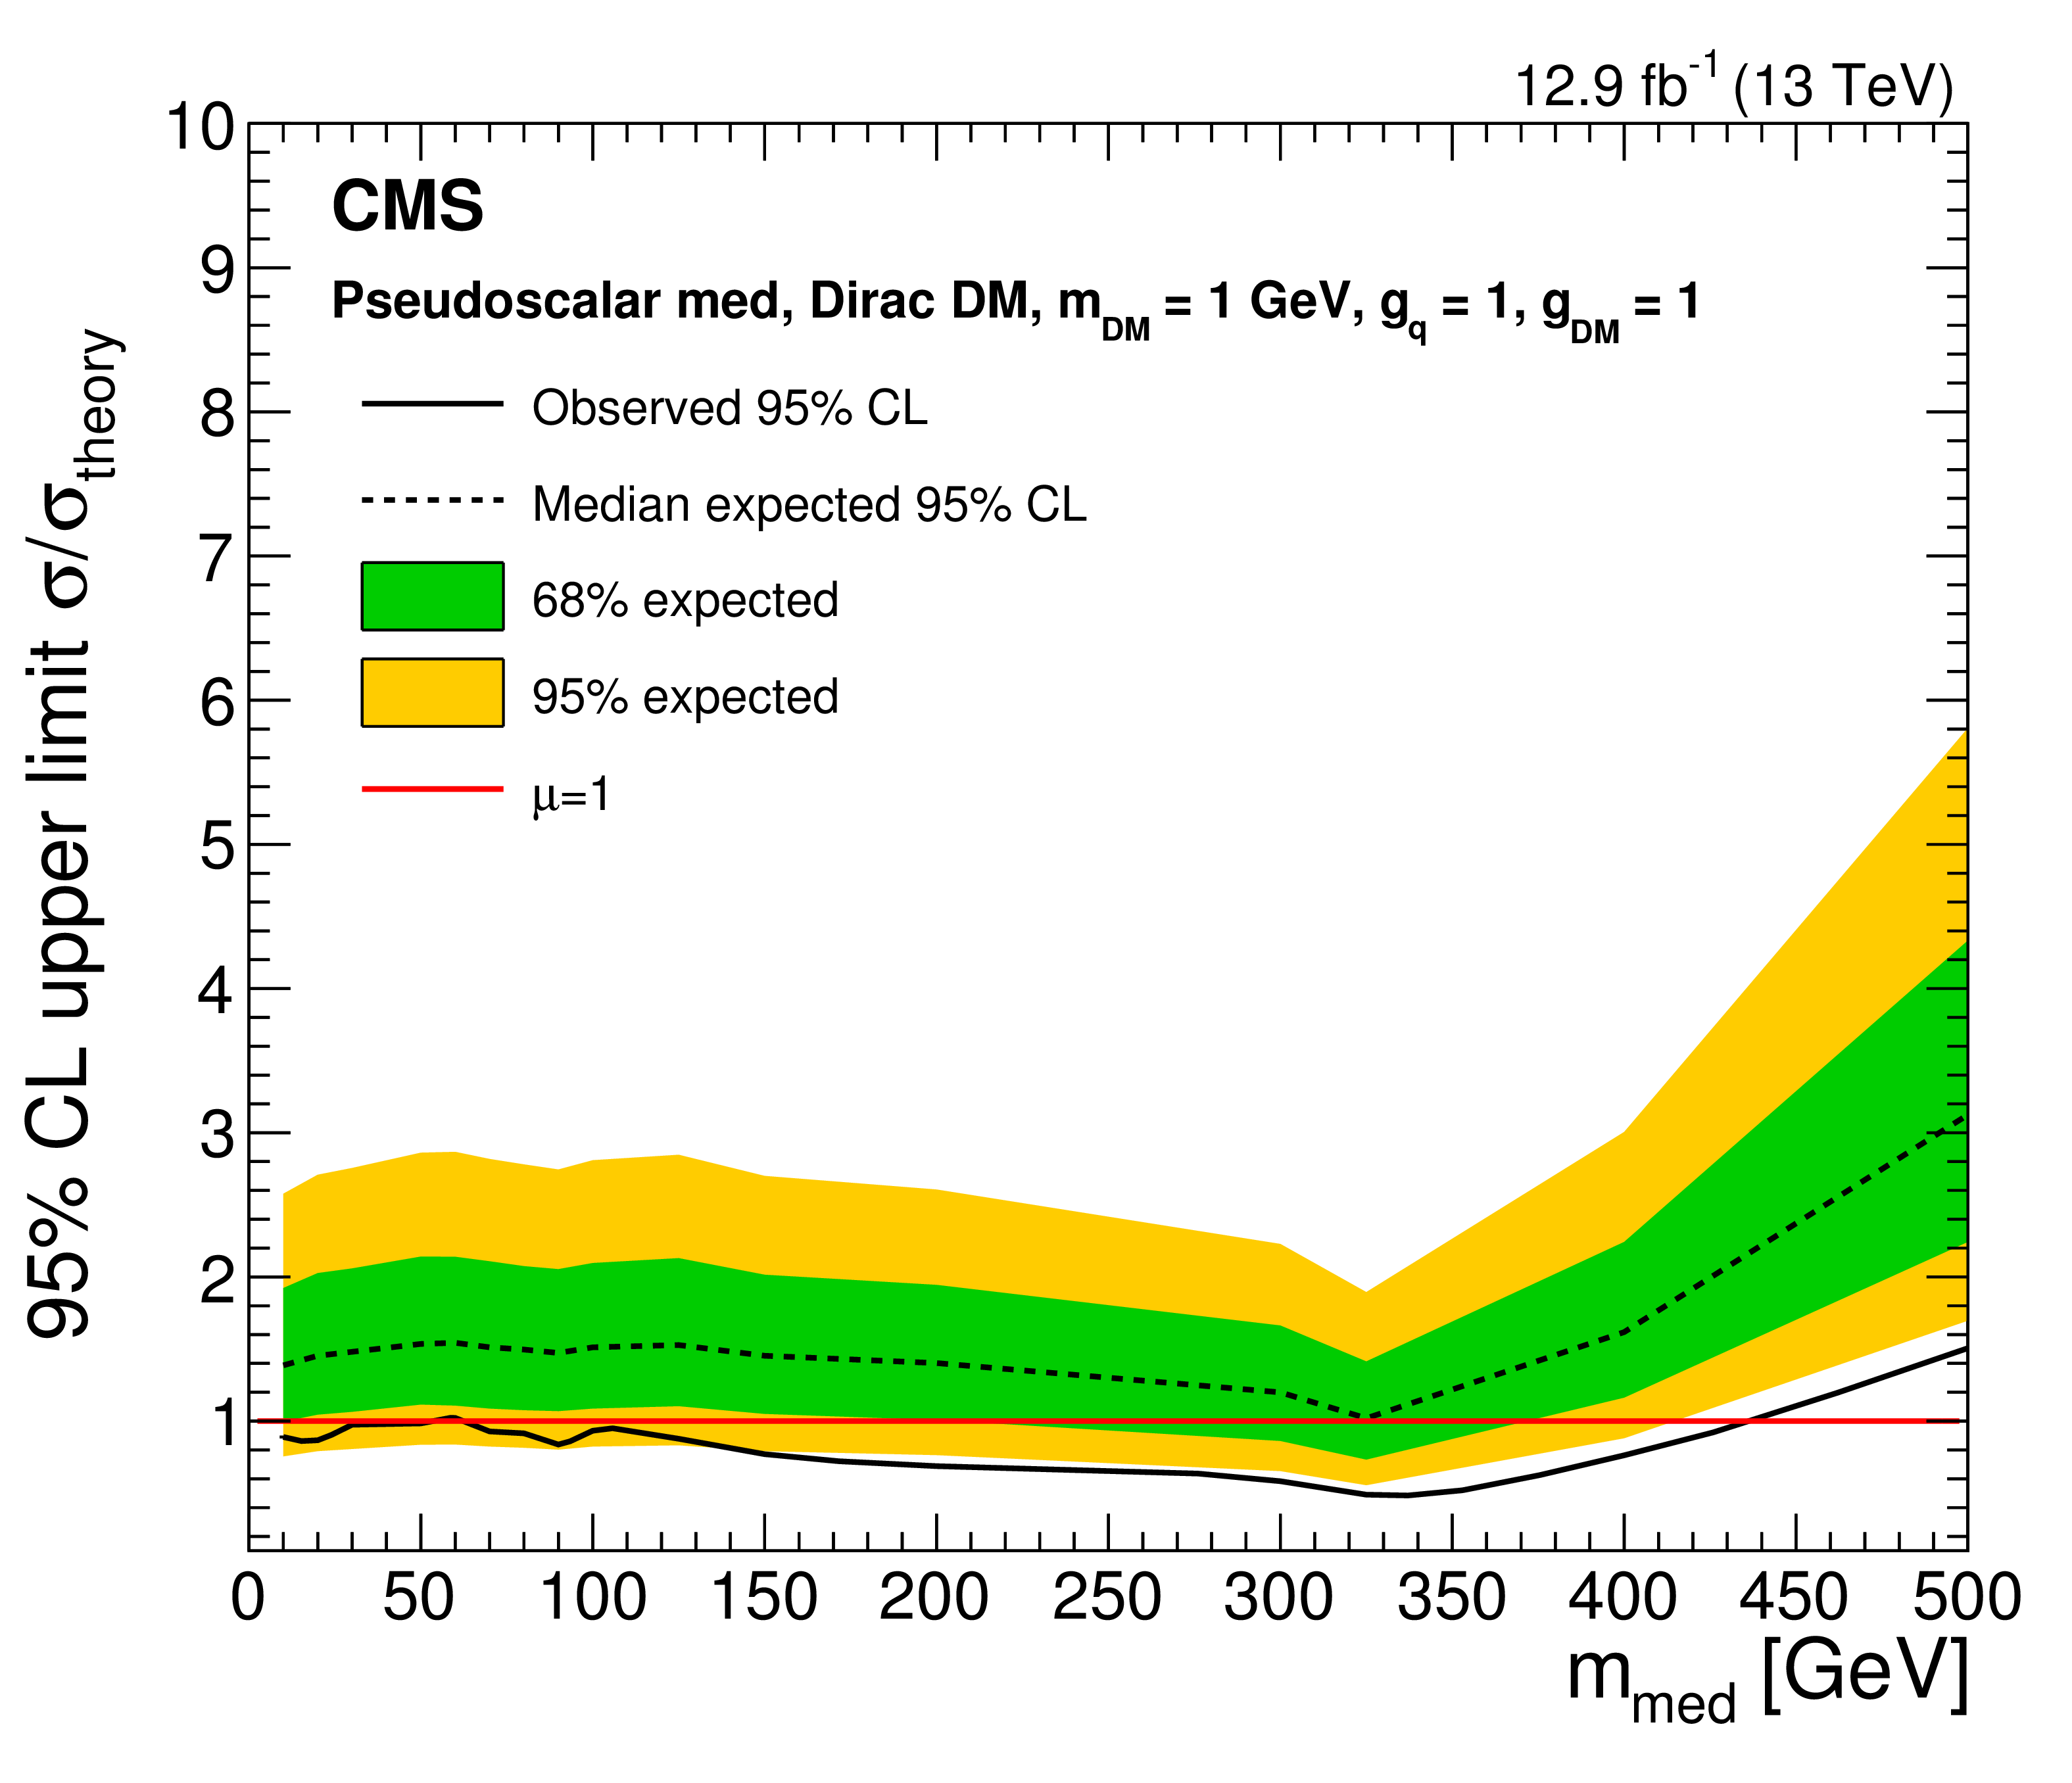
Figure 10-c:
Expected (dotted black line) and observed (solid black line) 95% CL upper limits on the signal strength $\mu $ as a function of the mediator mass for the spin-0 models. The horizontal red line denotes $\mu = 1$. Limit for the pseudoscalar model, assuming only the monojet signal process. |
png pdf |
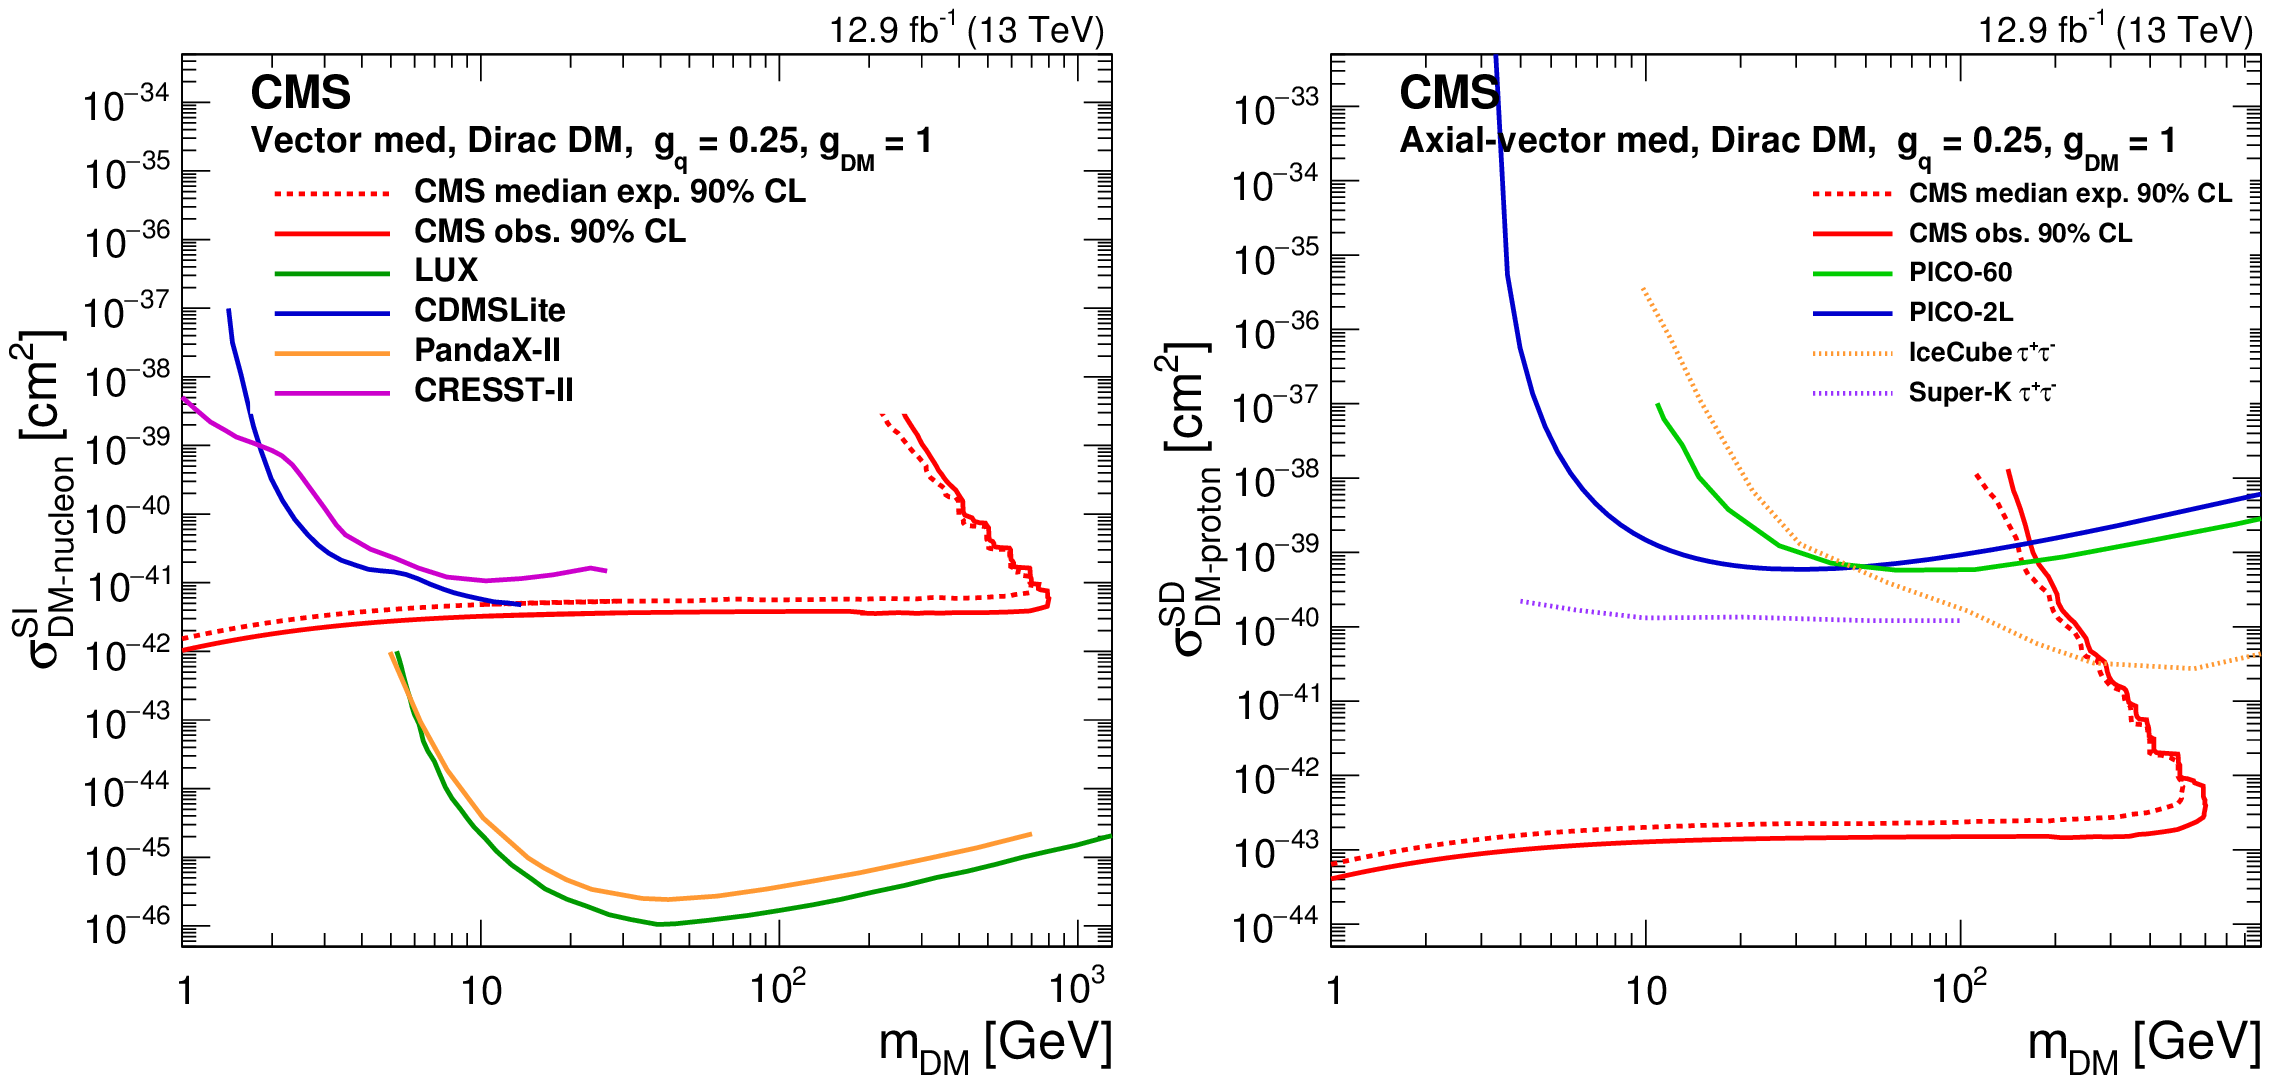
Figure 11:
Exclusion limits at 90% CL in the $m_{\textrm {DM}}$ vs. $\sigma _{\textrm {SI/SD}}$ plane for vector (left) and axial-vector (right) mediator models. The solid (dotted) red line shows the contour for the observed (expected) exclusion in this search. Limits from the CDMSLite [90], LUX [91], PandaX-II [92], and CRESST-II [93] experiments are shown for the vector mediator. Limits from the PICO-2L [94], PICO-60 [95], IceCube [96], and Super-Kamiokande [97] experiments are shown for the axial-vector mediator. |
png pdf |
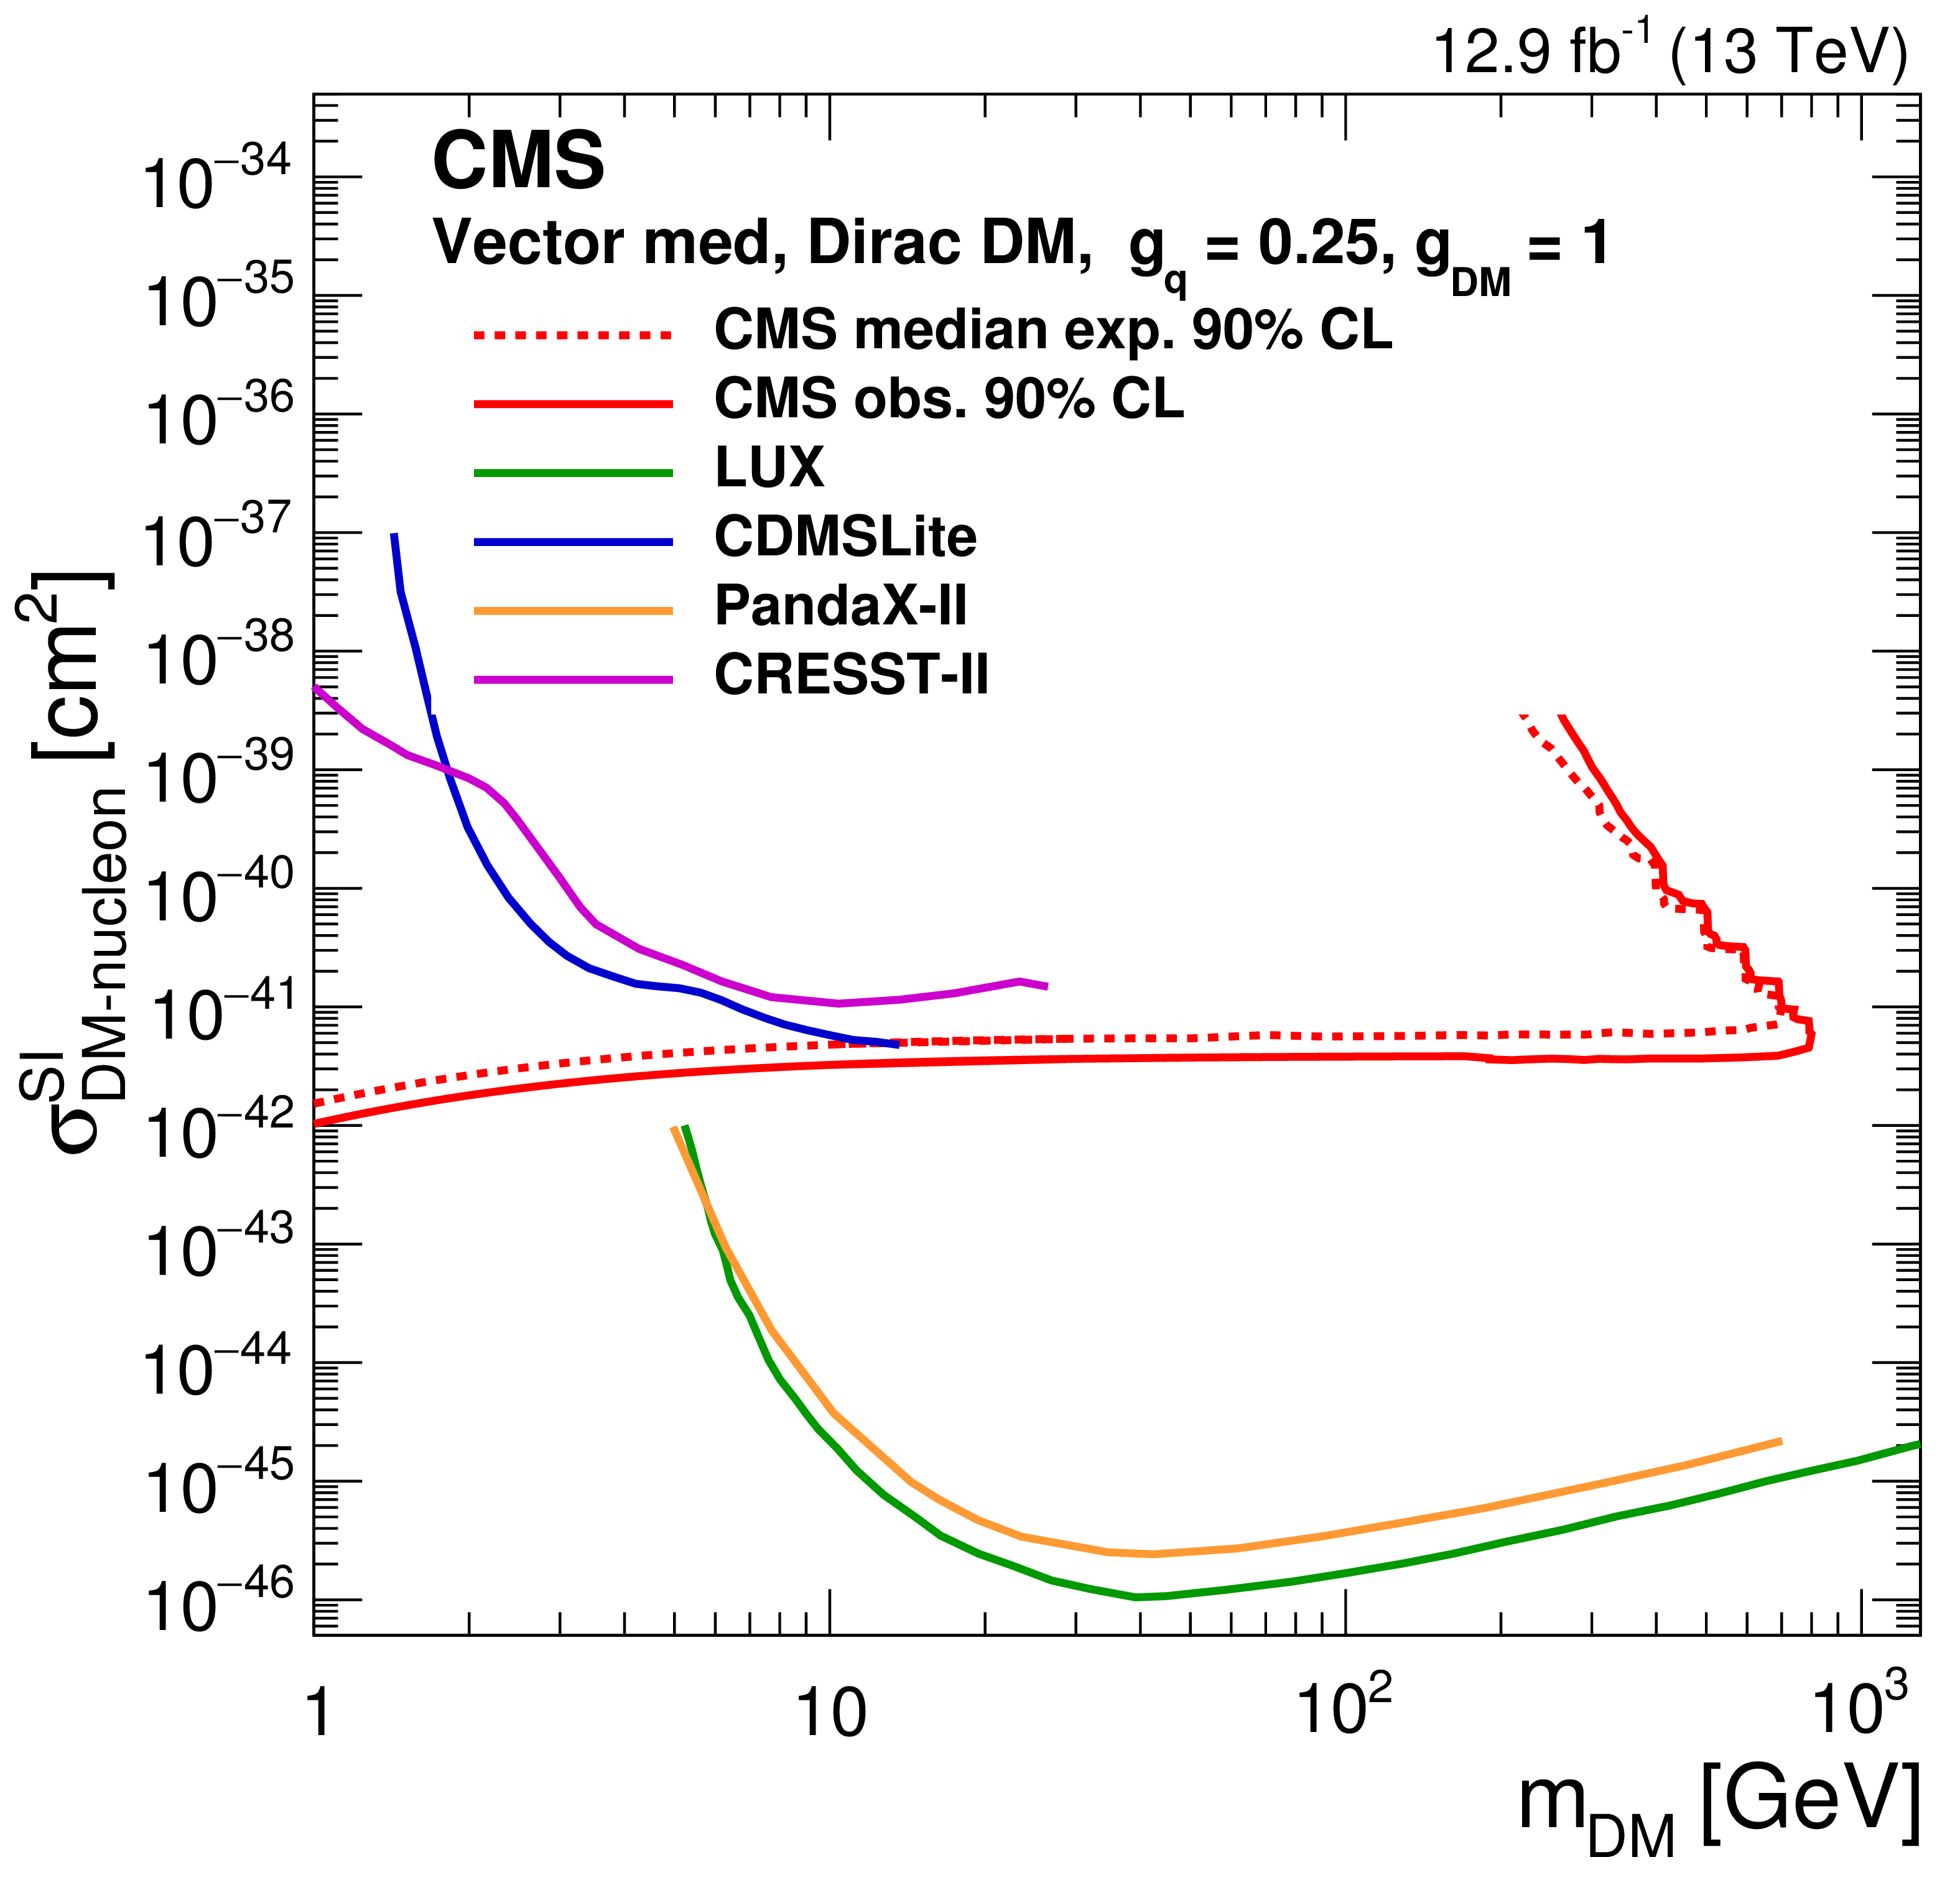
Figure 11-a:
Exclusion limits at 90% CL in the $m_{\textrm {DM}}$ vs. $\sigma _{\textrm {SI/SD}}$ plane for the vector mediator model. The solid (dotted) red line shows the contour for the observed (expected) exclusion in this search. Limits from the CDMSLite [90], LUX [91], PandaX-II [92], and CRESST-II [93] experiments are shown. |
png pdf |
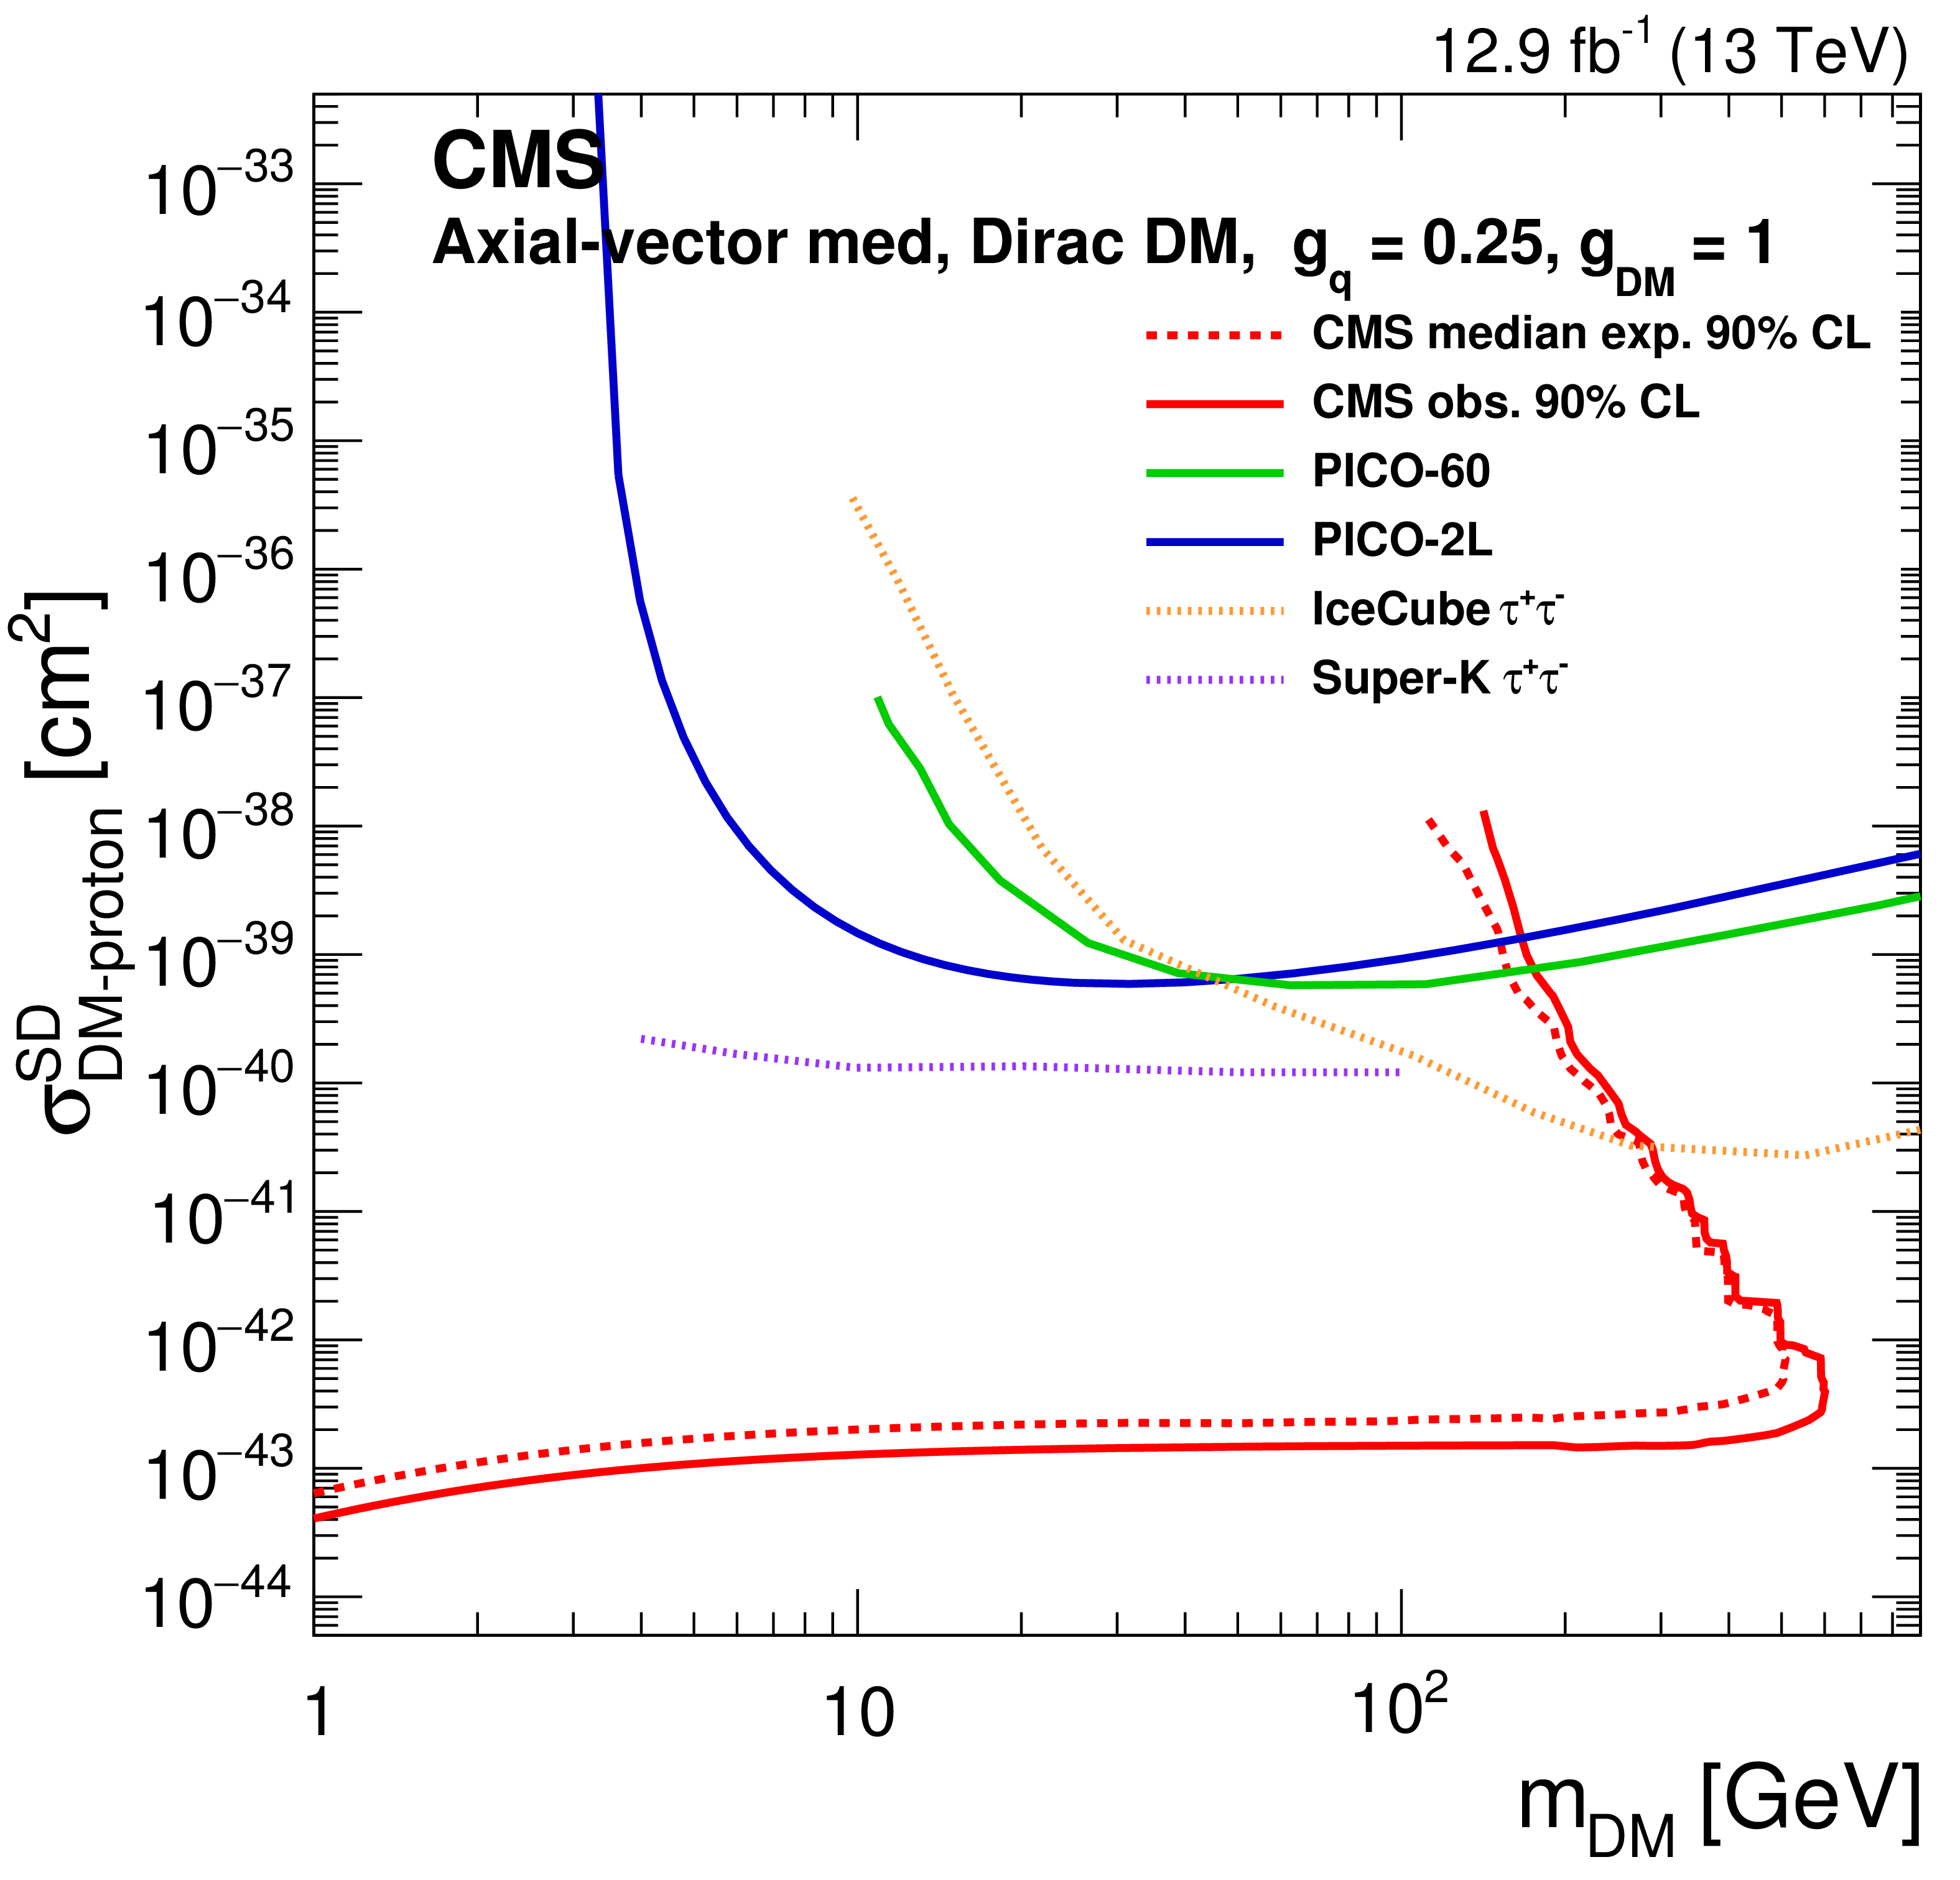
Figure 11-b:
Exclusion limits at 90% CL in the $m_{\textrm {DM}}$ vs. $\sigma _{\textrm {SI/SD}}$ plane for axial-vector mediator models. The solid (dotted) red line shows the contour for the observed (expected) exclusion in this search. Limits from the PICO-2L [94], PICO-60 [95], IceCube [96], and Super-Kamiokande [97] experiments are shown. |
png pdf |
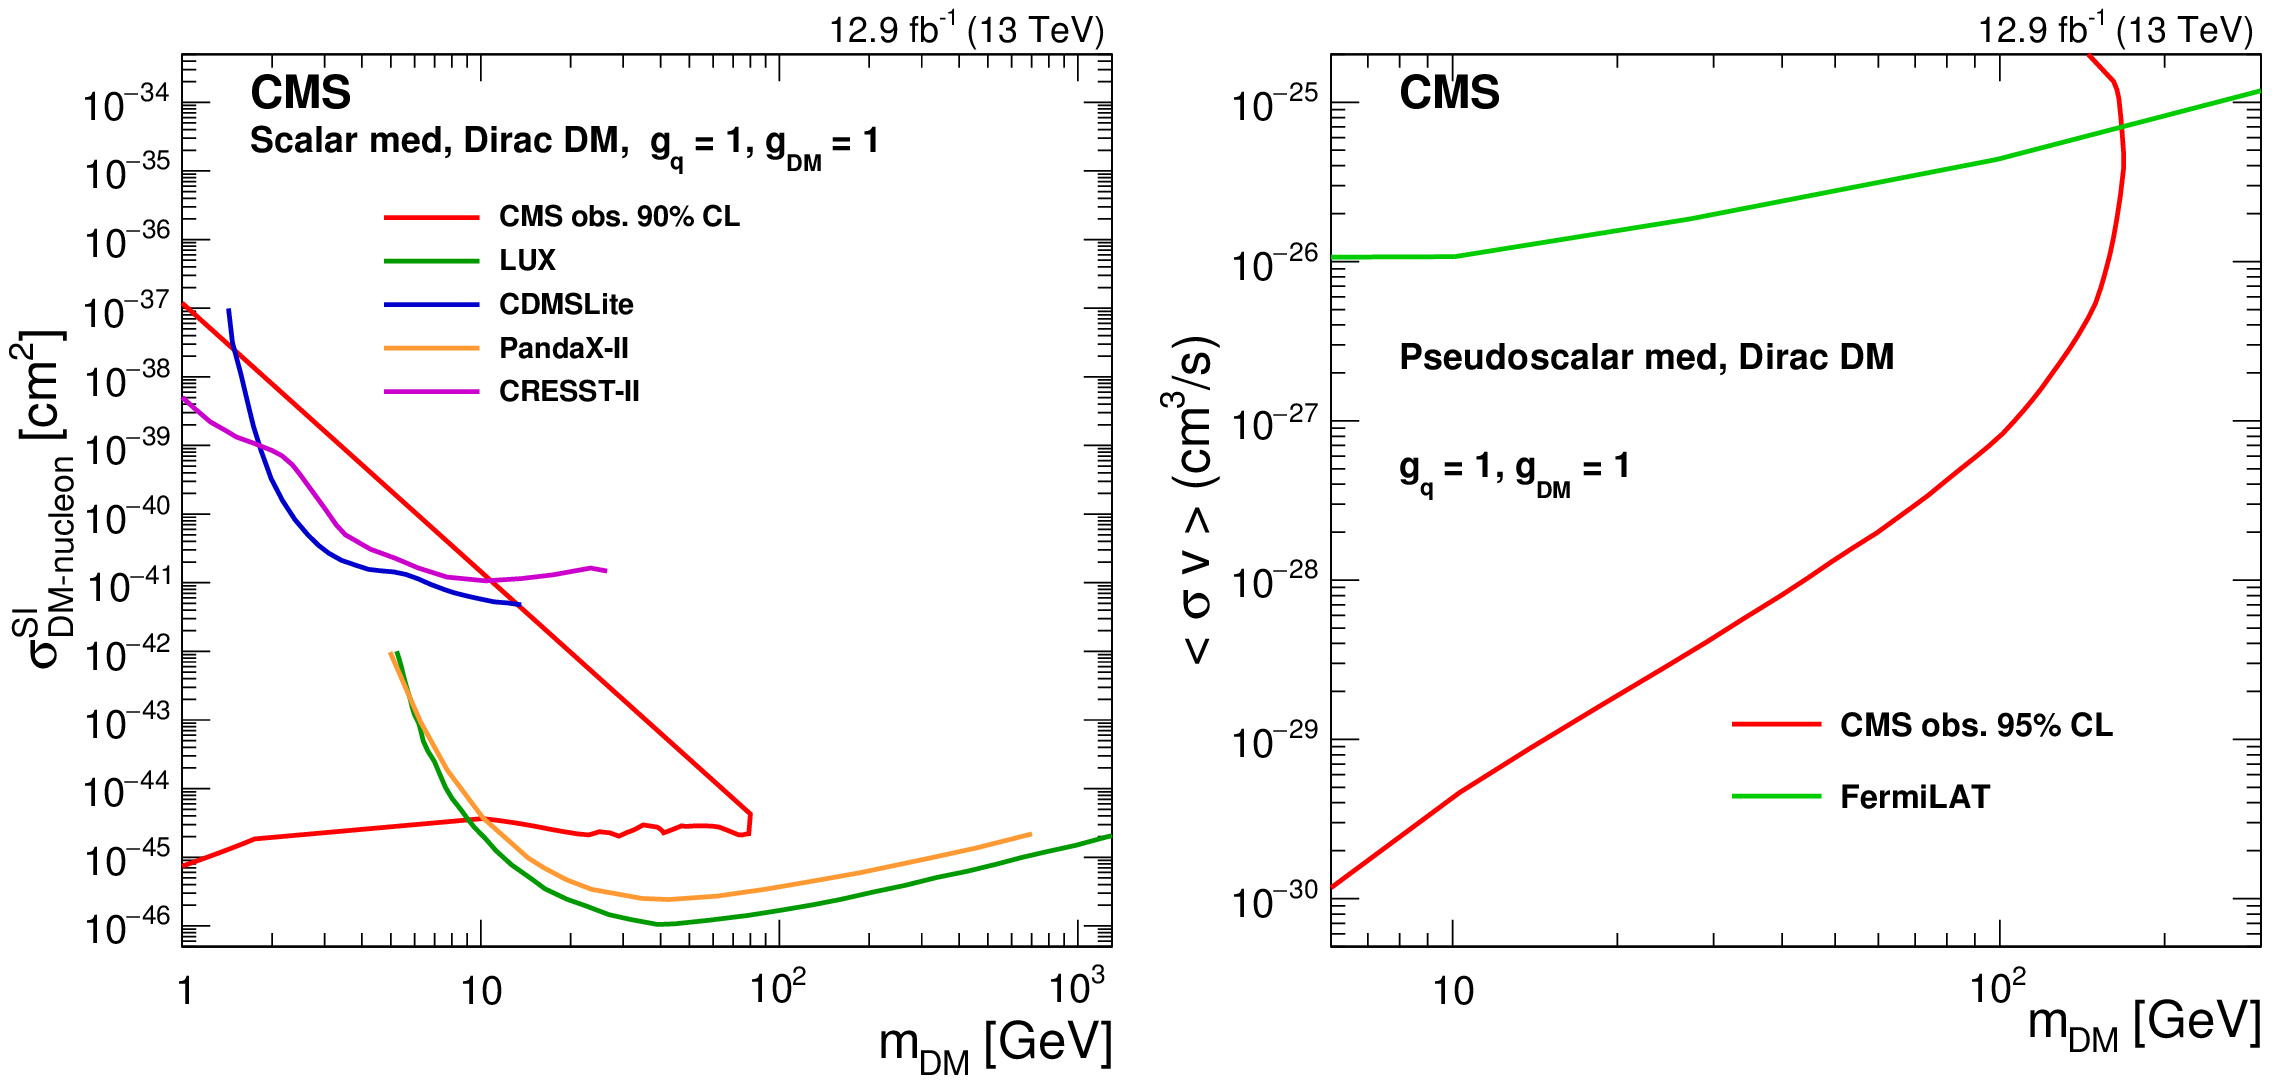
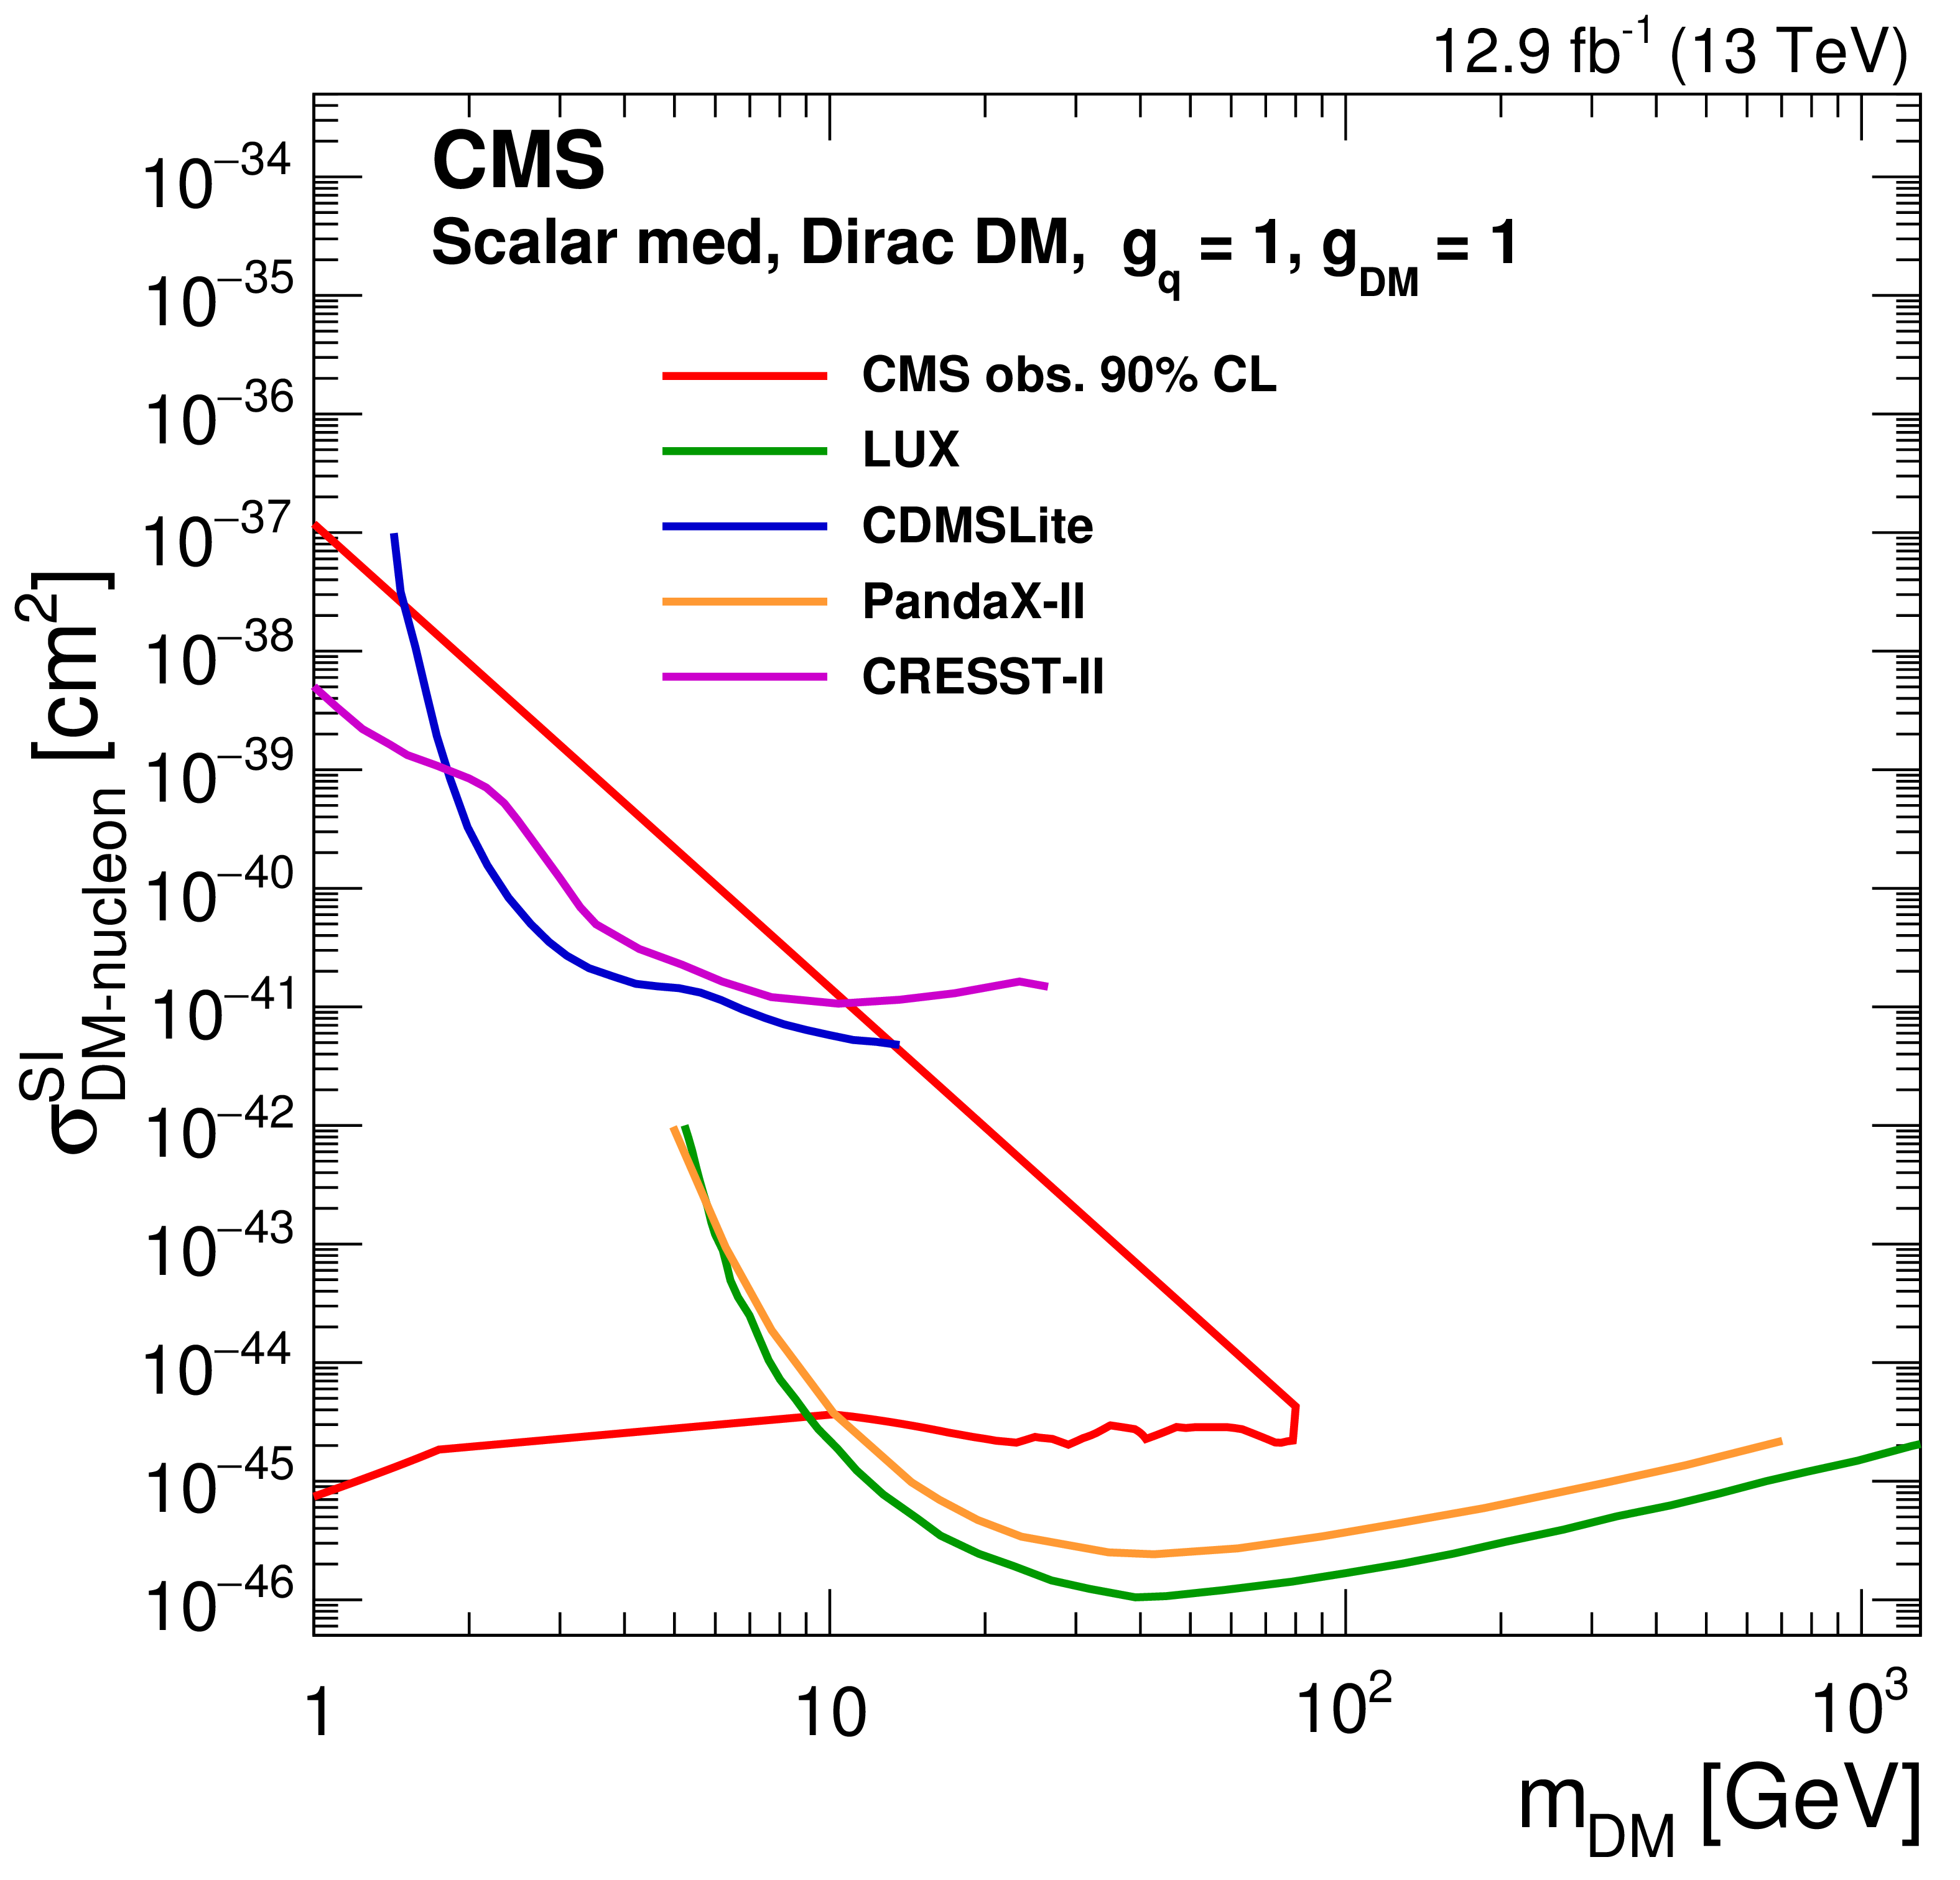
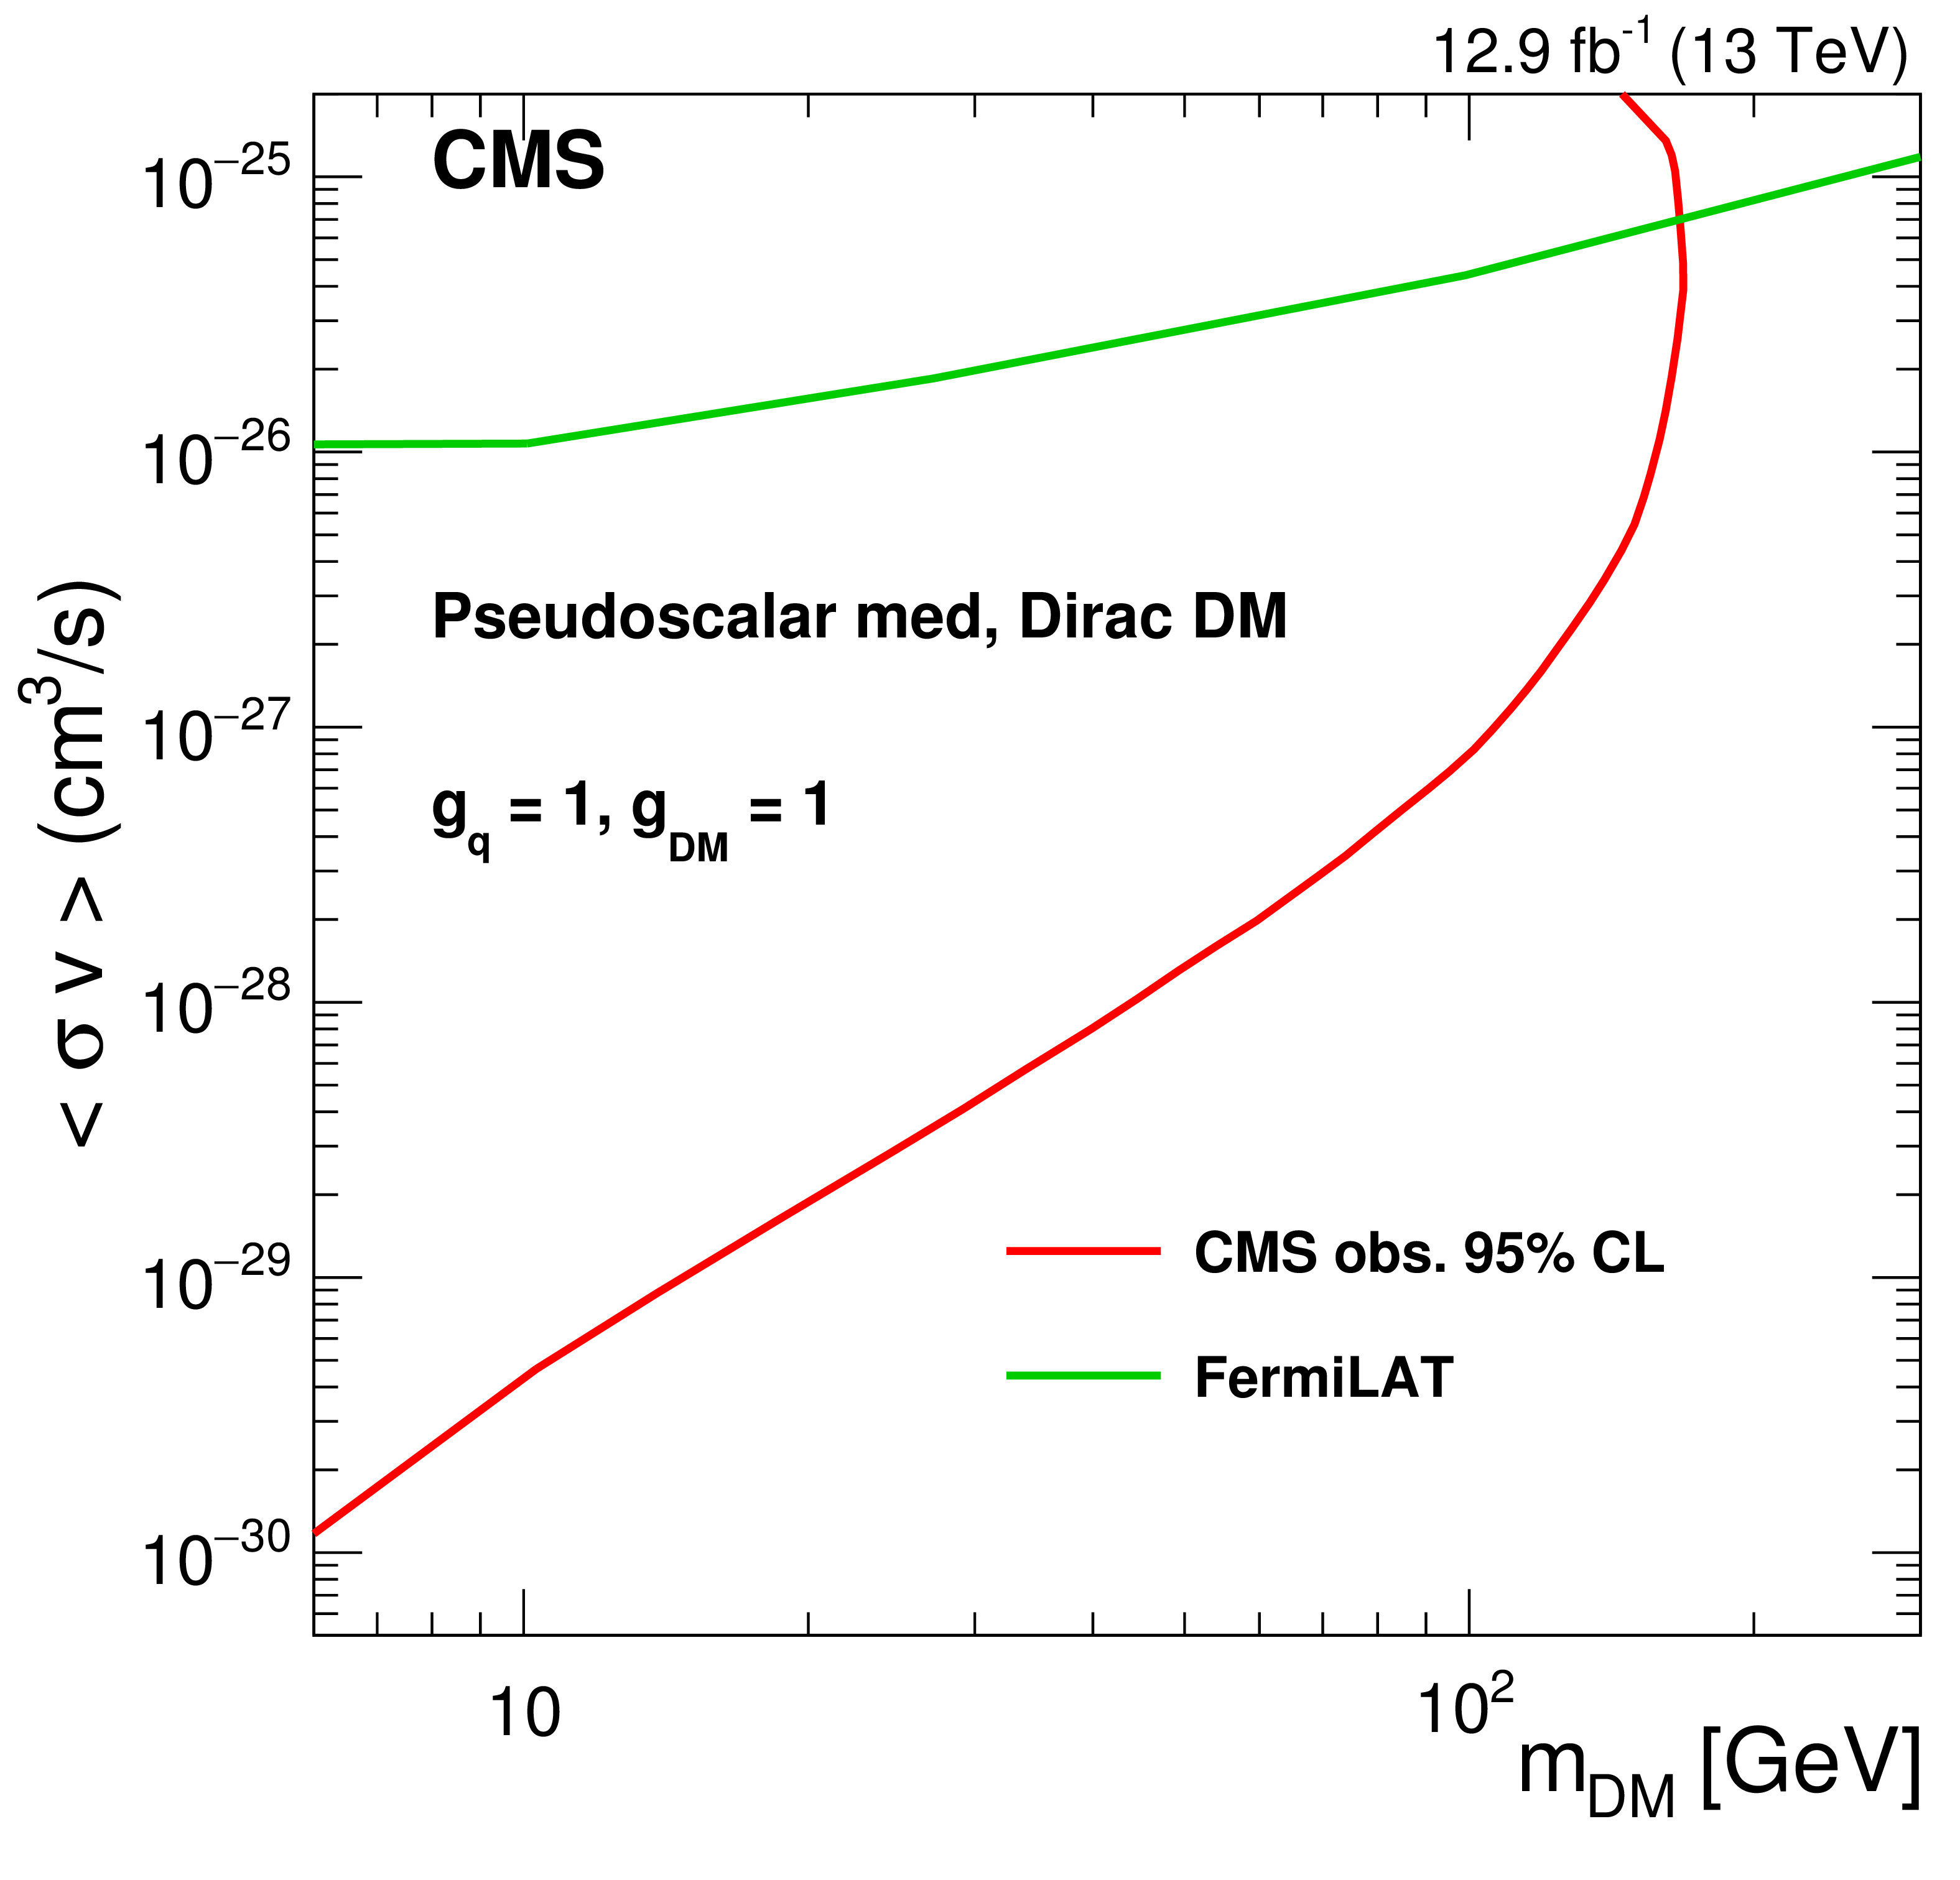
Figure 12:
Exclusion limits at 90% CL in the $m_{\textrm {DM}}$ vs. $\sigma _{\textrm {SI/SD}}$ plane for the scalar mediator model (left). The observed exclusion in this search (red line) is compared to the results from the CDMSLite [90], LUX [91], PandaX-II [92], and CRESST-II [93] experiments. For the pseudoscalar mediator (right), limits are compared to the the velocity-averaged DM annihilation cross section upper limits from Fermi-LAT [89]. There are no comparable limits from direct detection experiments as the scattering cross section between DM particles and SM quarks is suppressed at nonrelativistic velocities for a pseudoscalar mediator [98,99]. |
png pdf |
Figure 12-a:
Exclusion limits at 90% CL in the $m_{\textrm {DM}}$ vs. $\sigma _{\textrm {SI/SD}}$ plane for the scalar mediator model. The observed exclusion in this search (red line) is compared to the results from the CDMSLite [90], LUX [91], PandaX-II [92], and CRESST-II [93] experiments. |
png pdf |
Figure 12-b:
Exclusion limits at 90% CL in the $m_{\textrm {DM}}$ vs. $\sigma _{\textrm {SI/SD}}$ plane for the pseudoscalar mediator. Limits are compared to the the velocity-averaged DM annihilation cross section upper limits from Fermi-LAT [89]. There are no comparable limits from direct detection experiments as the scattering cross section between DM particles and SM quarks is suppressed at nonrelativistic velocities for a pseudoscalar mediator [98,99]. |
png pdf |
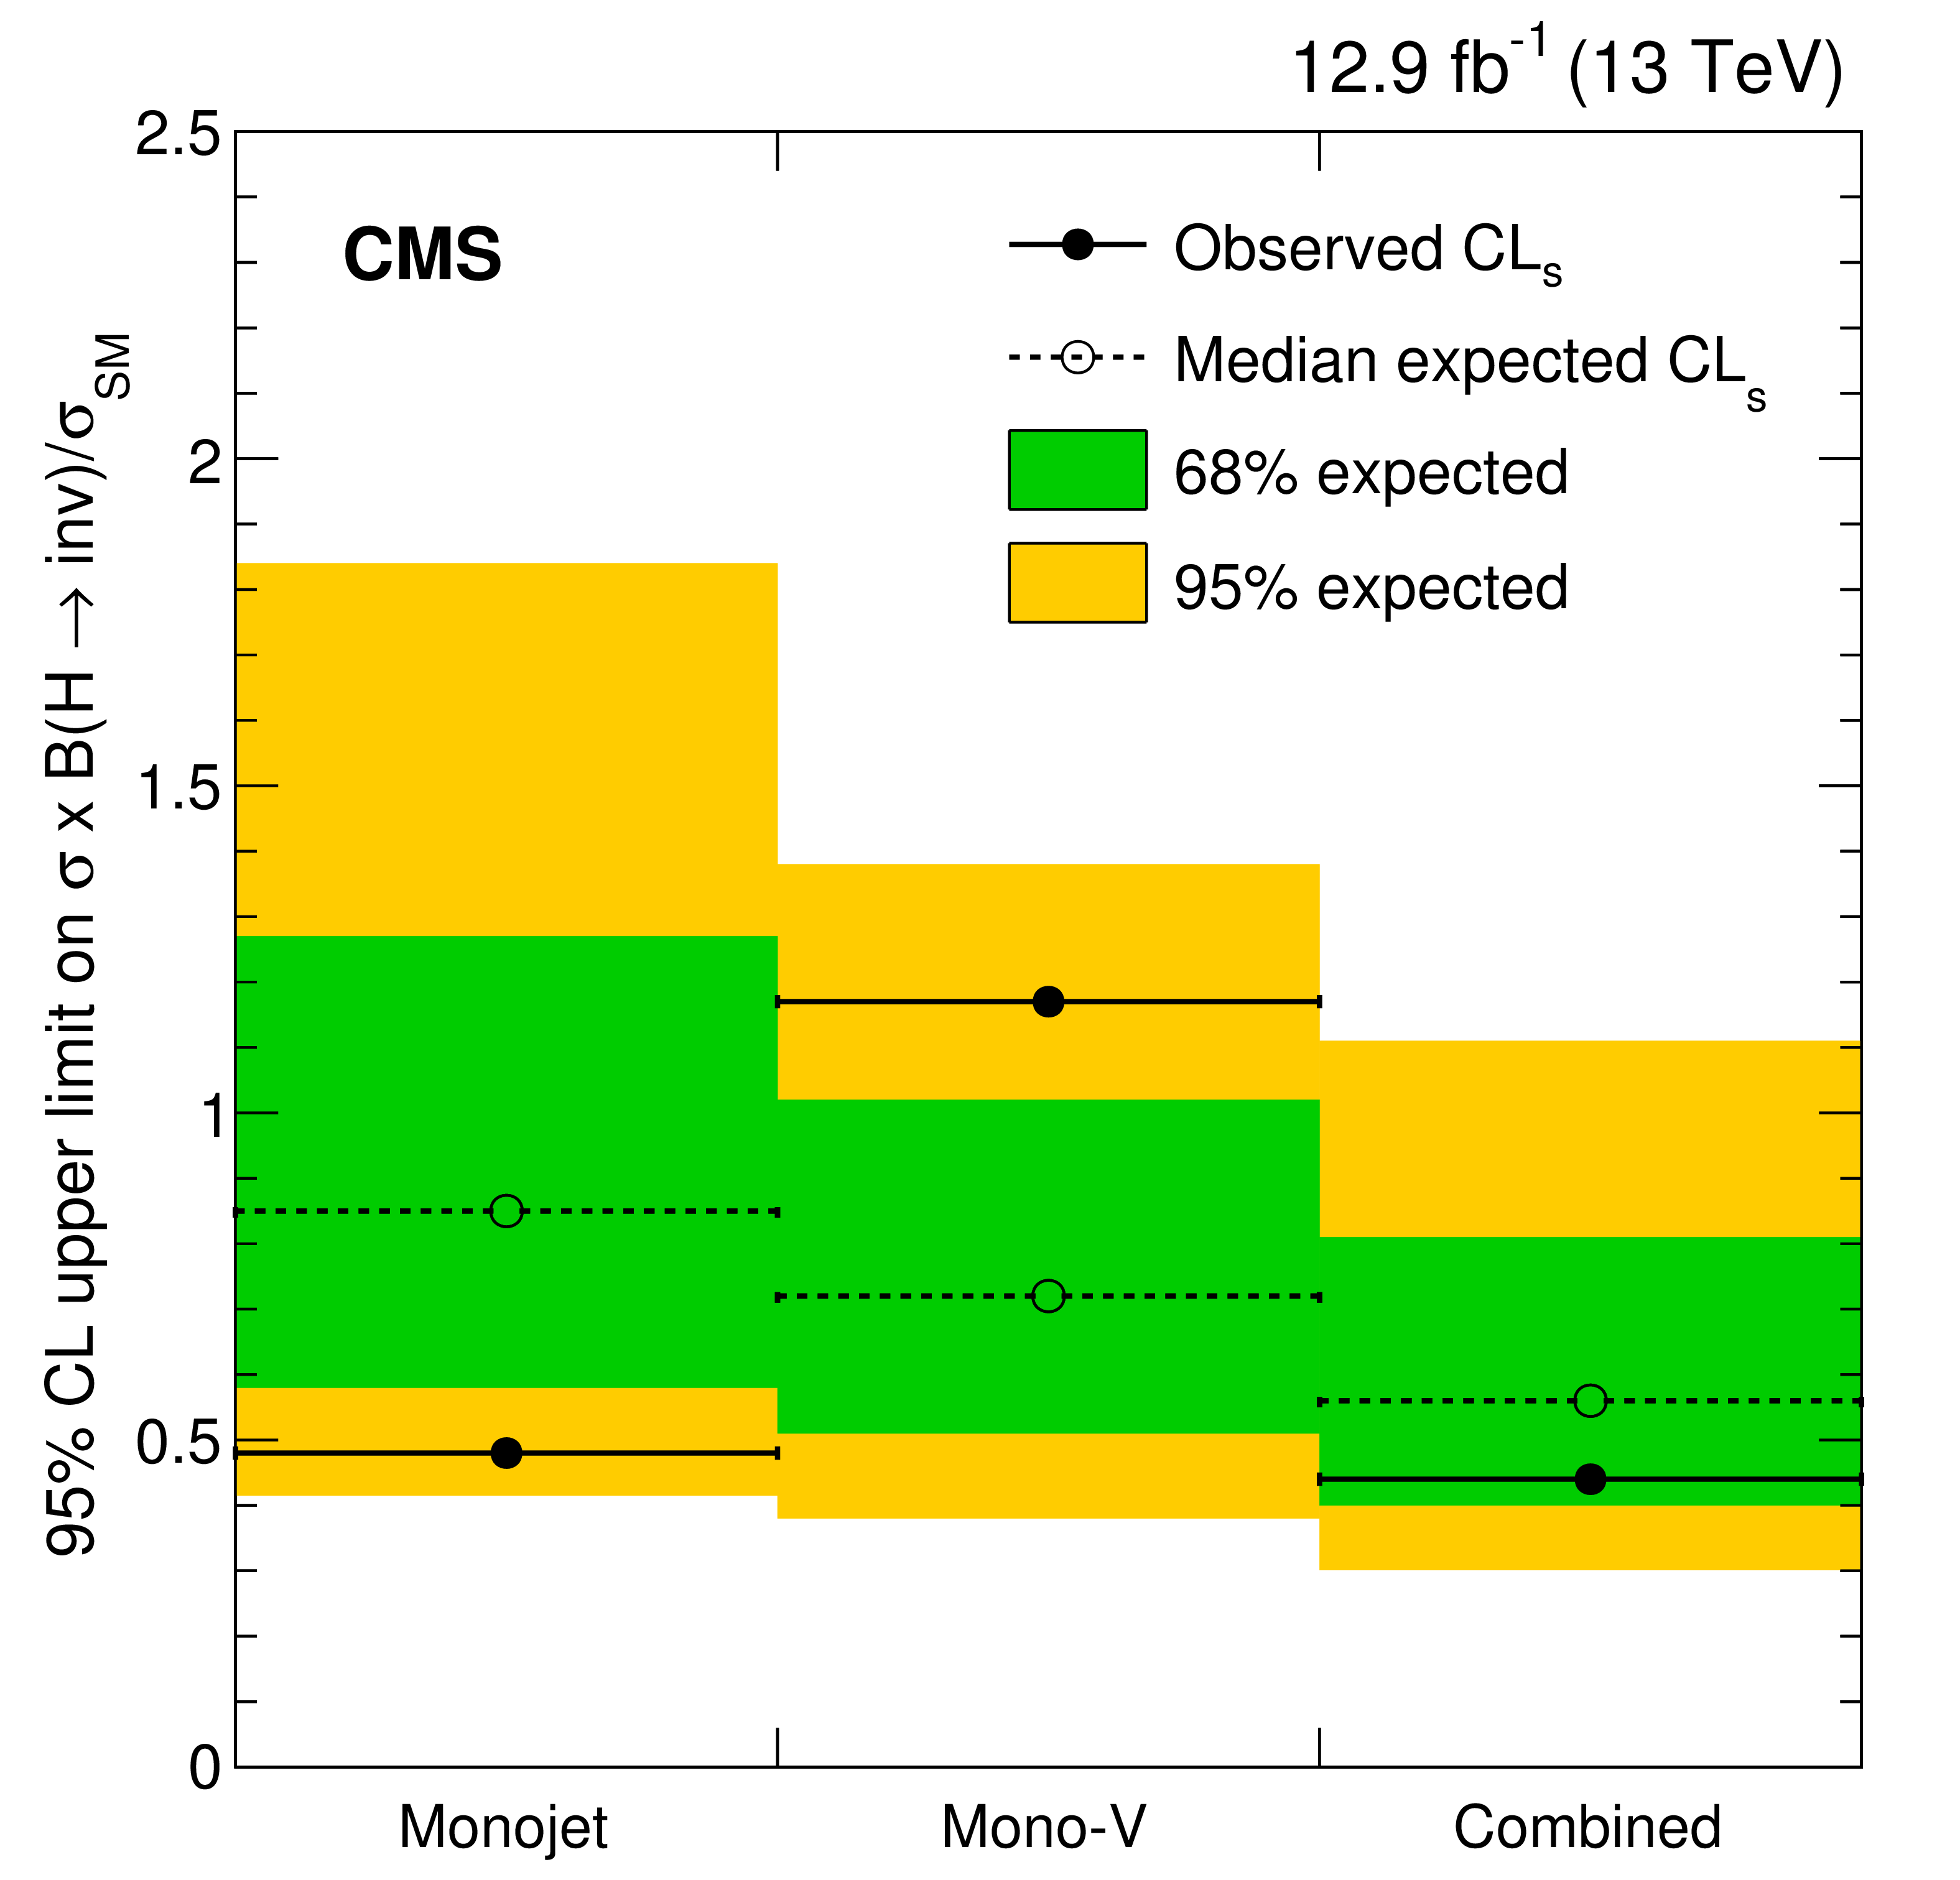
Figure 13:
Expected (dotted black line) and observed (solid black line) 95% CL upper limits on the invisible branching fraction of a 125 GeV SM-like Higgs boson. Limits are shown for the monojet and mono-V categories separately, and also for their combination. |
png pdf |
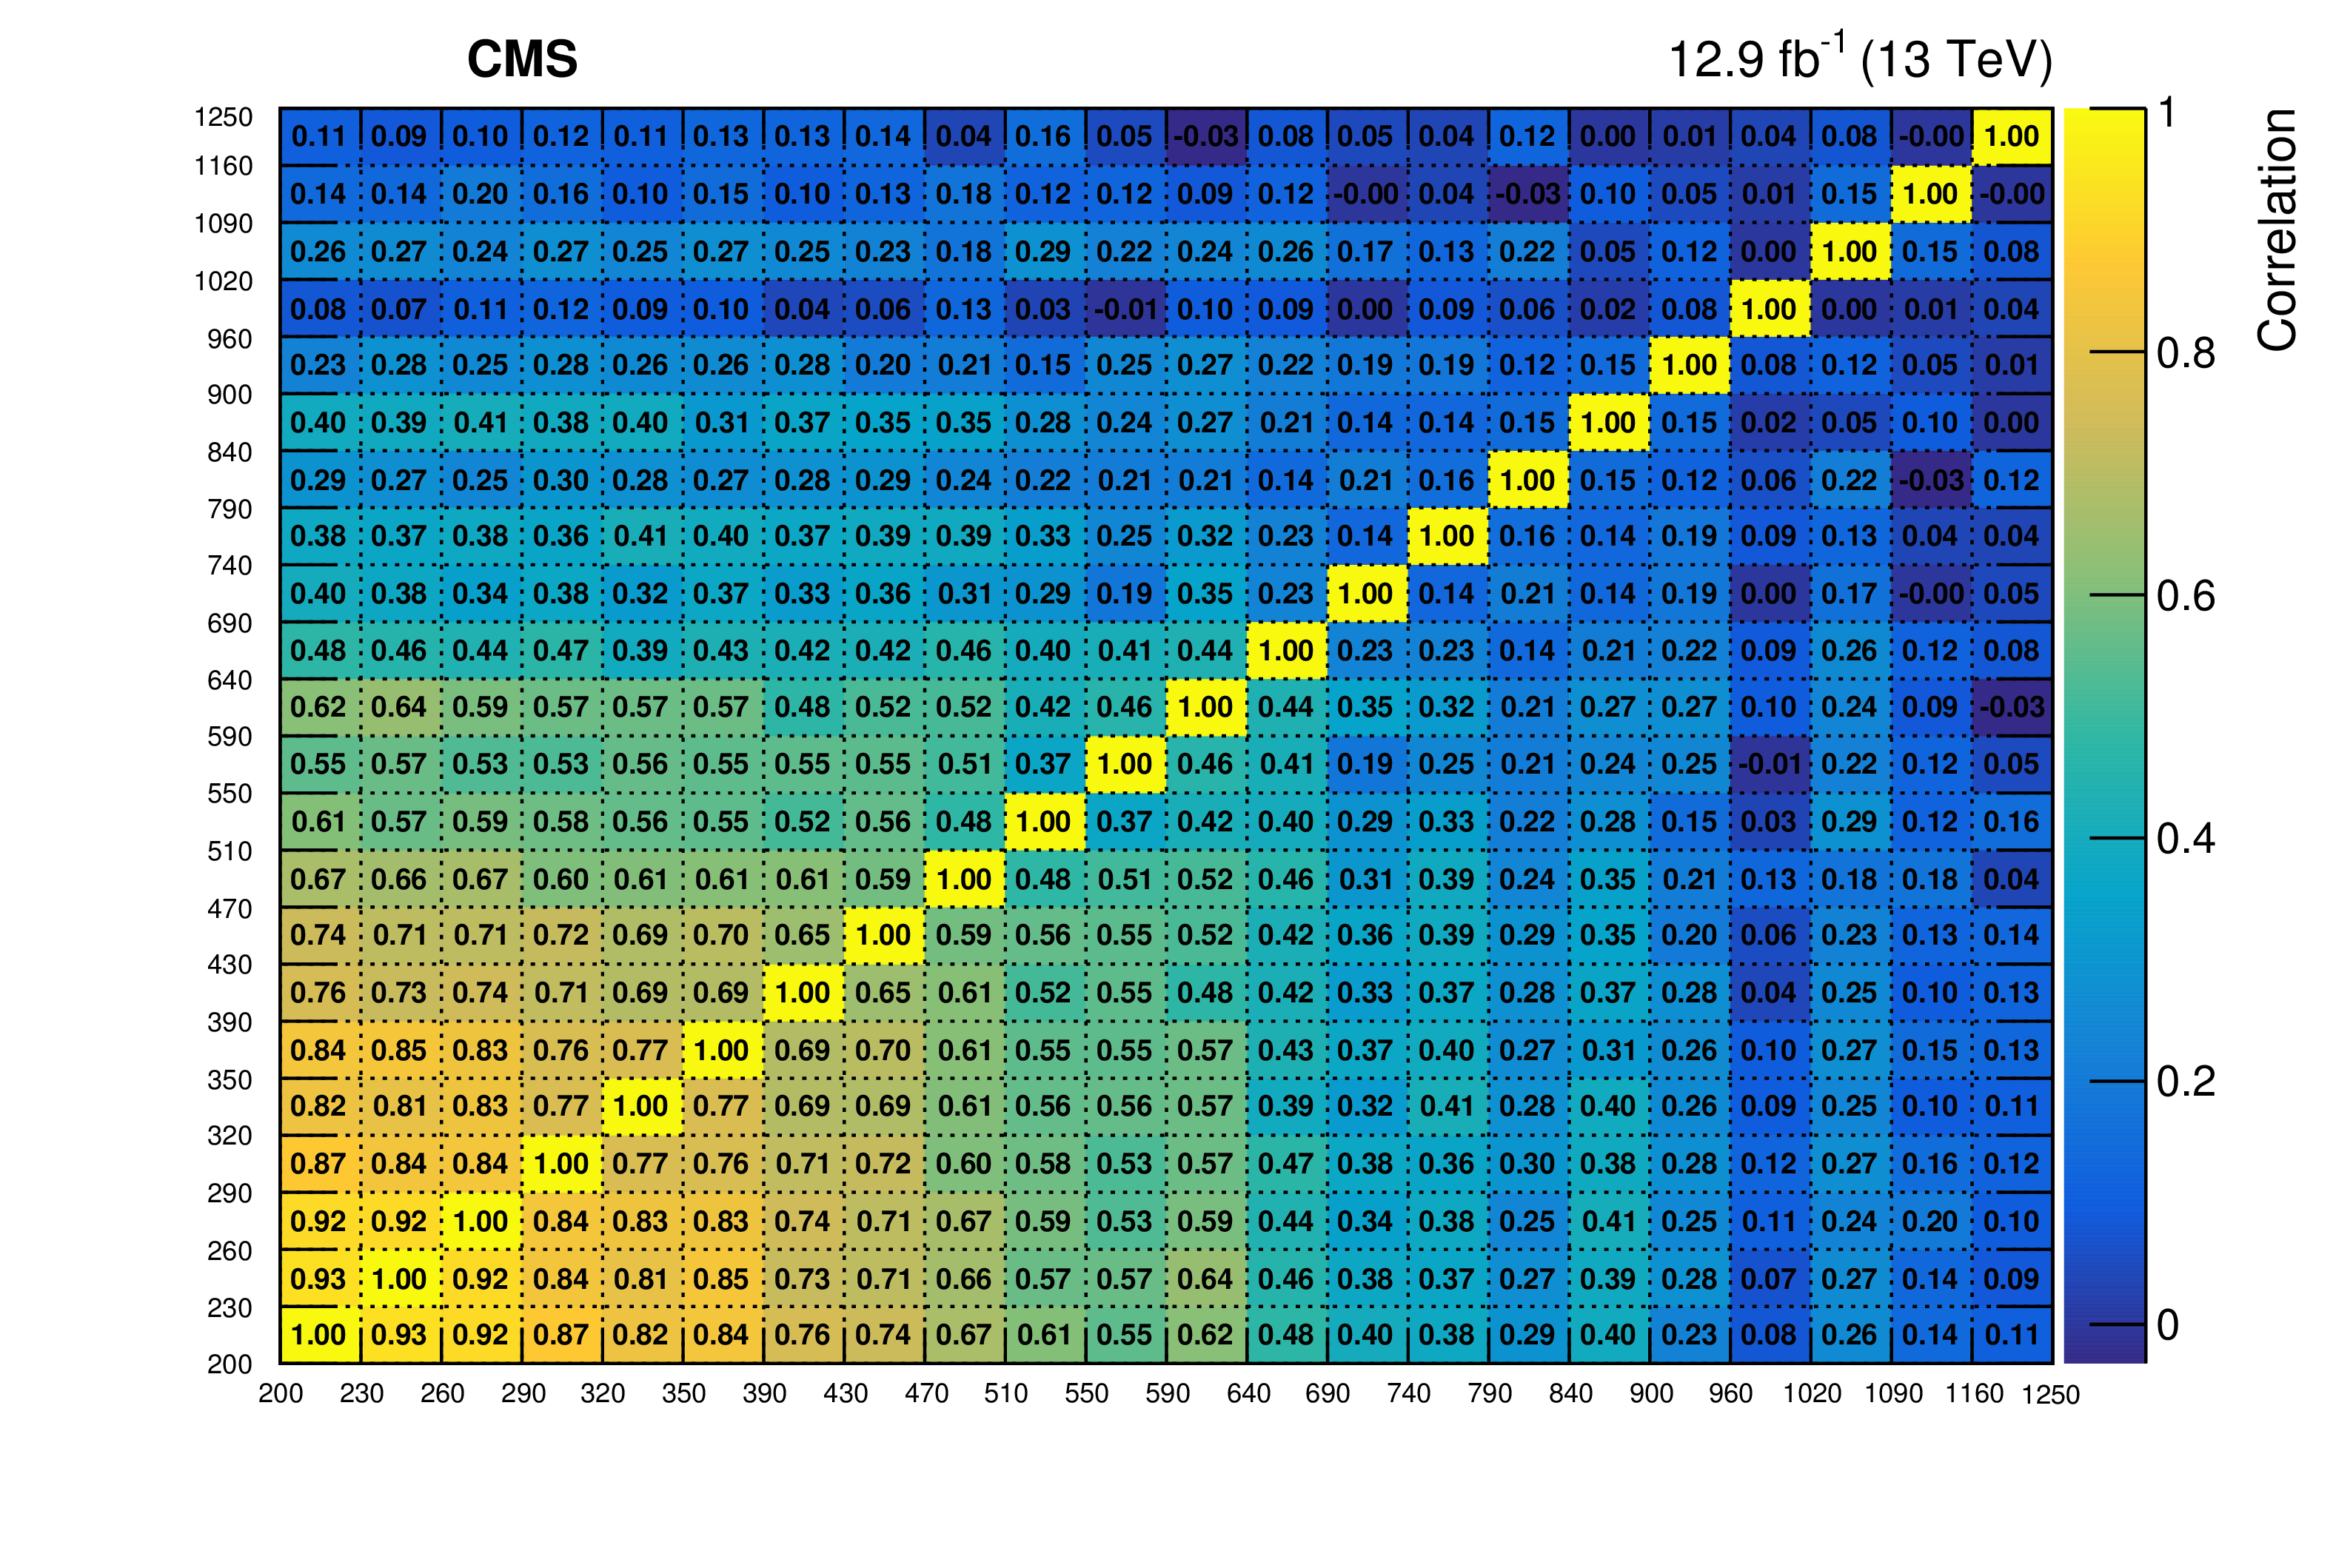
Figure 14:
Correlations between the uncertainties in the estimated background yields in all the $ {E_{\mathrm {T}}^{\text {miss}}} $ bins of the monojet signal region. The boundaries of the $ {E_{\mathrm {T}}^{\text {miss}}} $ bins, expressed in GeV, are shown at the bottom and on the left. |

png pdf |
Figure 15:
Correlations between the uncertainties in the estimated background yields in all the $ {E_{\mathrm {T}}^{\text {miss}}} $ bins of the mono-V signal region. The boundaries of the $ {E_{\mathrm {T}}^{\text {miss}}} $ bins, expressed in GeV, are shown at the bottom and on the left. |
| Tables | |
png pdf |
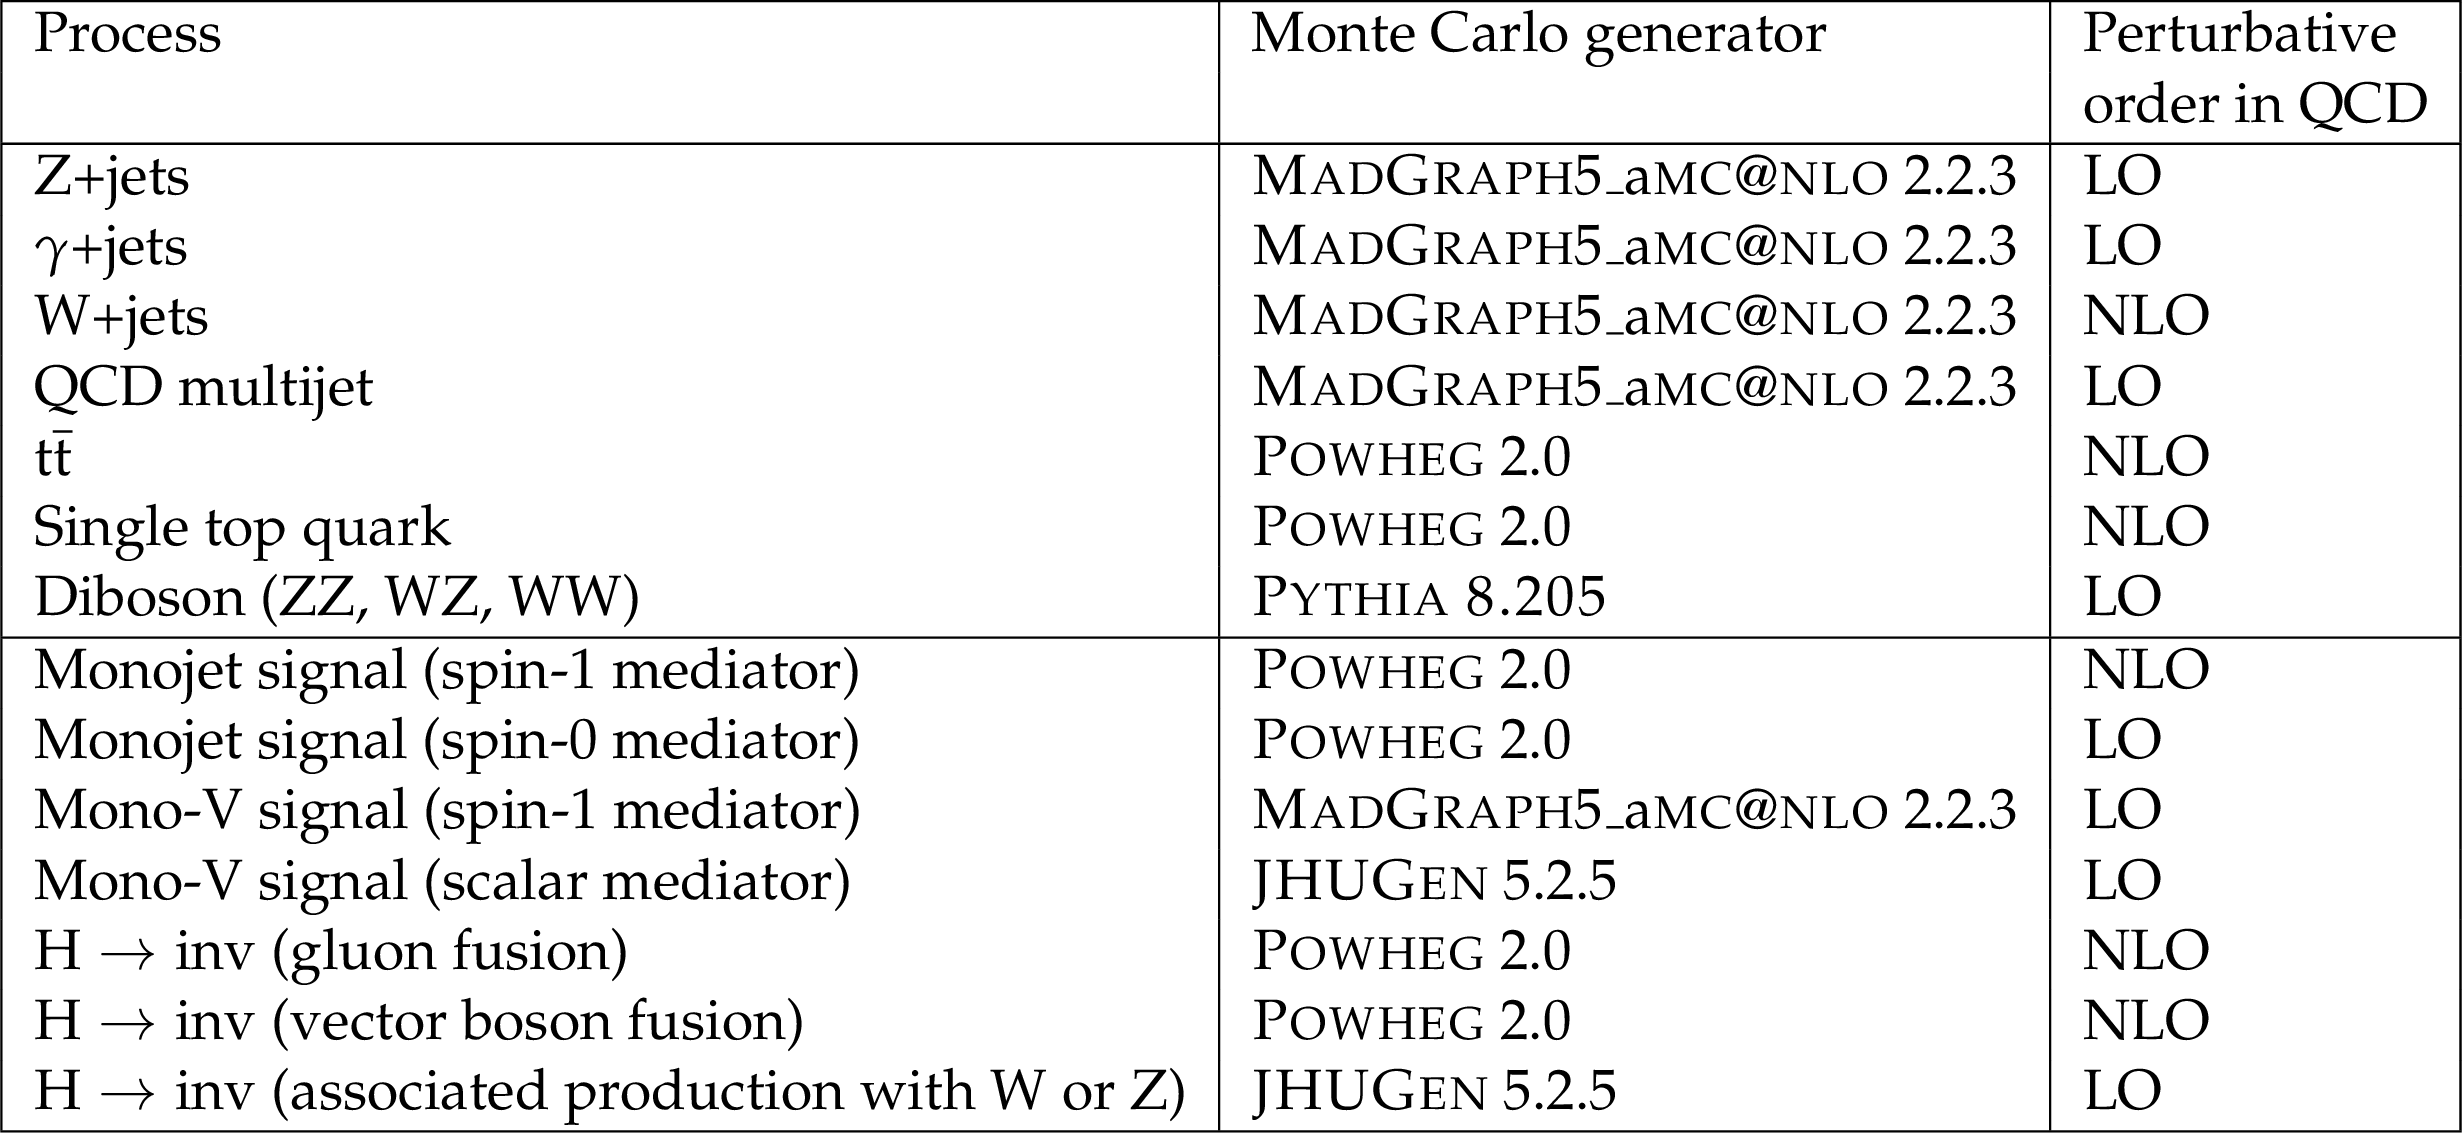
Table 1:
Monte Carlo generators used for simulating various signal and background processes. |
png pdf |
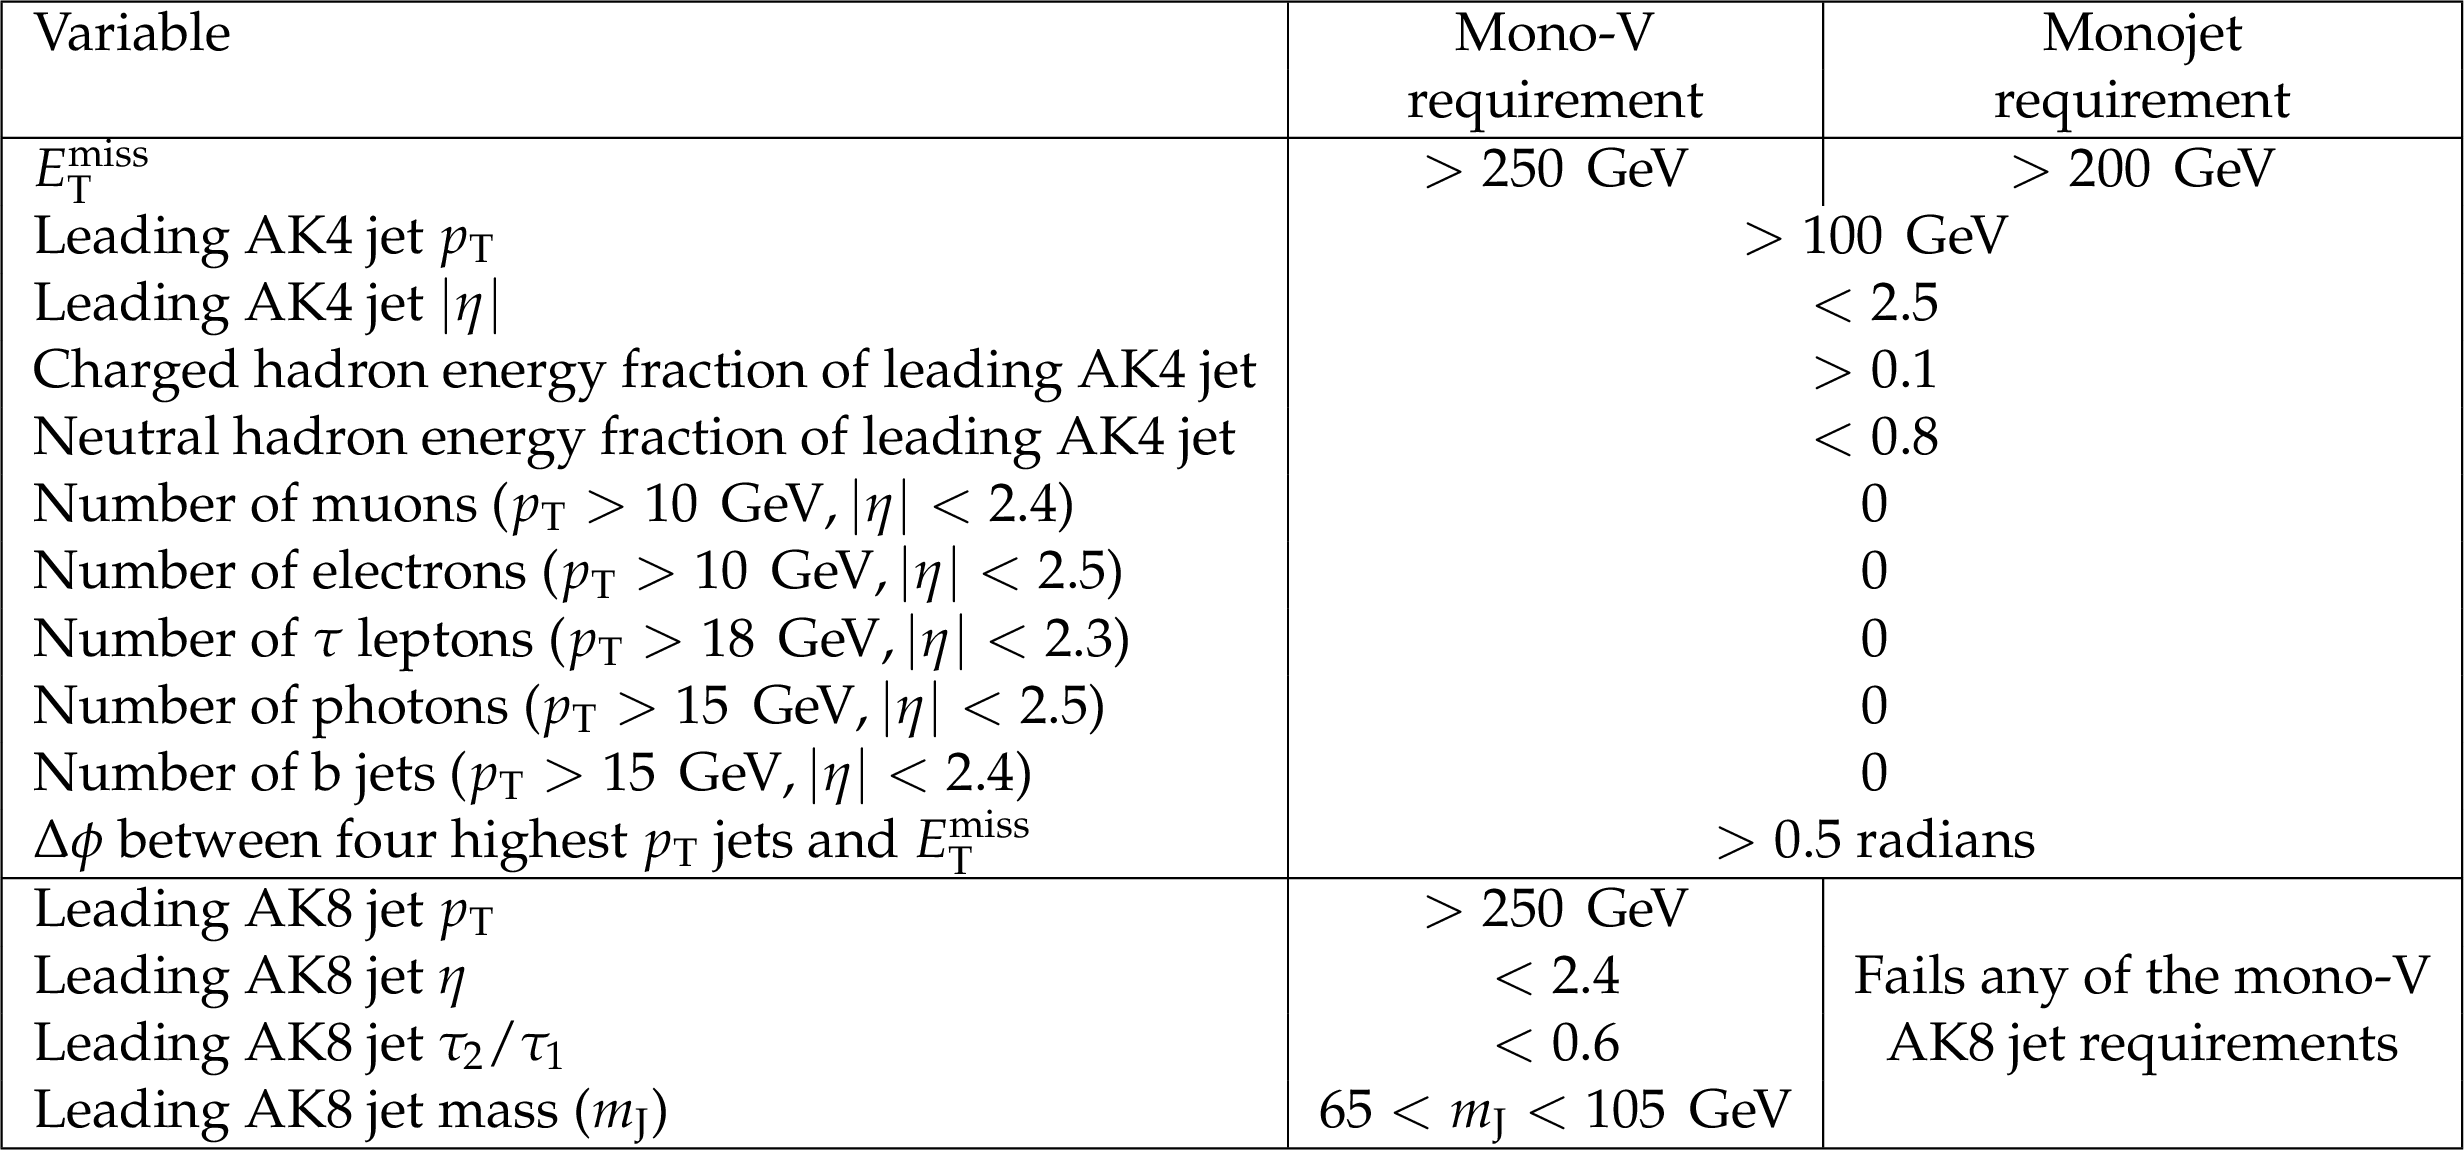
Table 2:
Selection requirements for the mono-V and monojet event categories. |
png pdf |
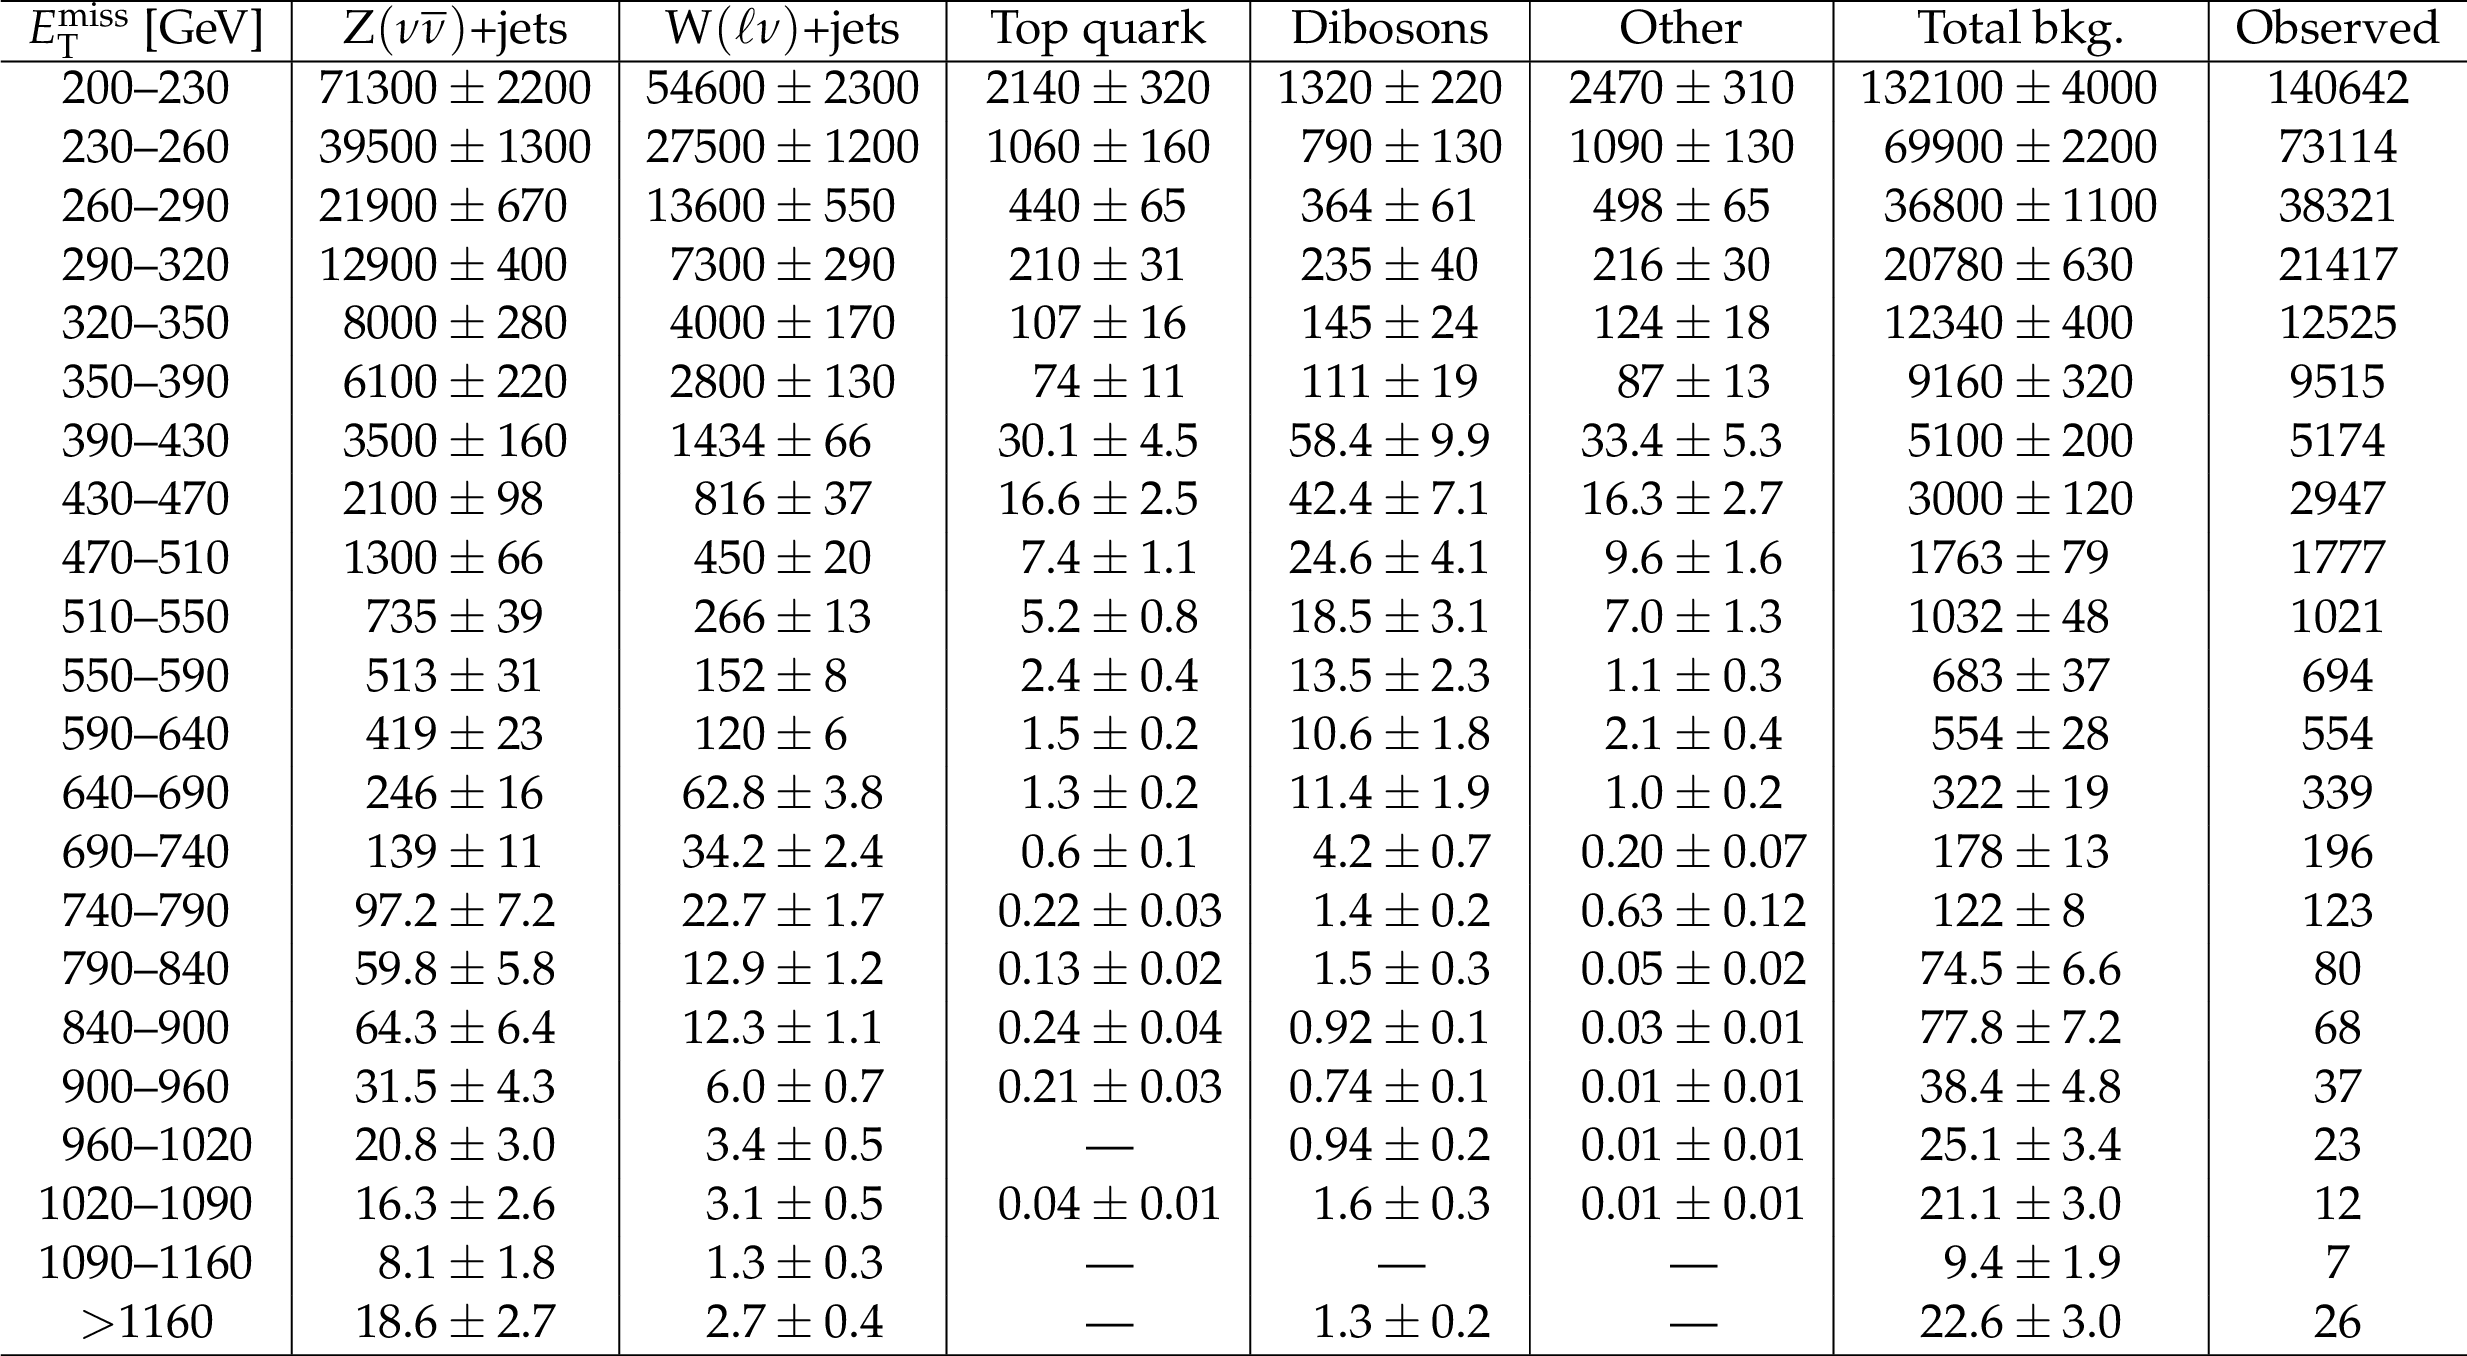
Table 3:
Expected event yields in each $ {E_{\mathrm {T}}^{\text {miss}}} $ bin for various background processes in the monojet signal region. The background yields and the corresponding uncertainties are obtained after performing a combined fit to data in all the control samples, but excluding data in the signal region. The observed event yields in the monojet signal region are also reported. |

png pdf |
Table 4:
Expected event yields in each $ {E_{\mathrm {T}}^{\text {miss}}} $ bin for various background processes in the mono-V signal region. The background yields and the corresponding uncertainties are obtained after performing a combined fit to data in all the control samples, excluding data in the signal region. The observed event yields in the mono-V signal region are also reported. |
png pdf |
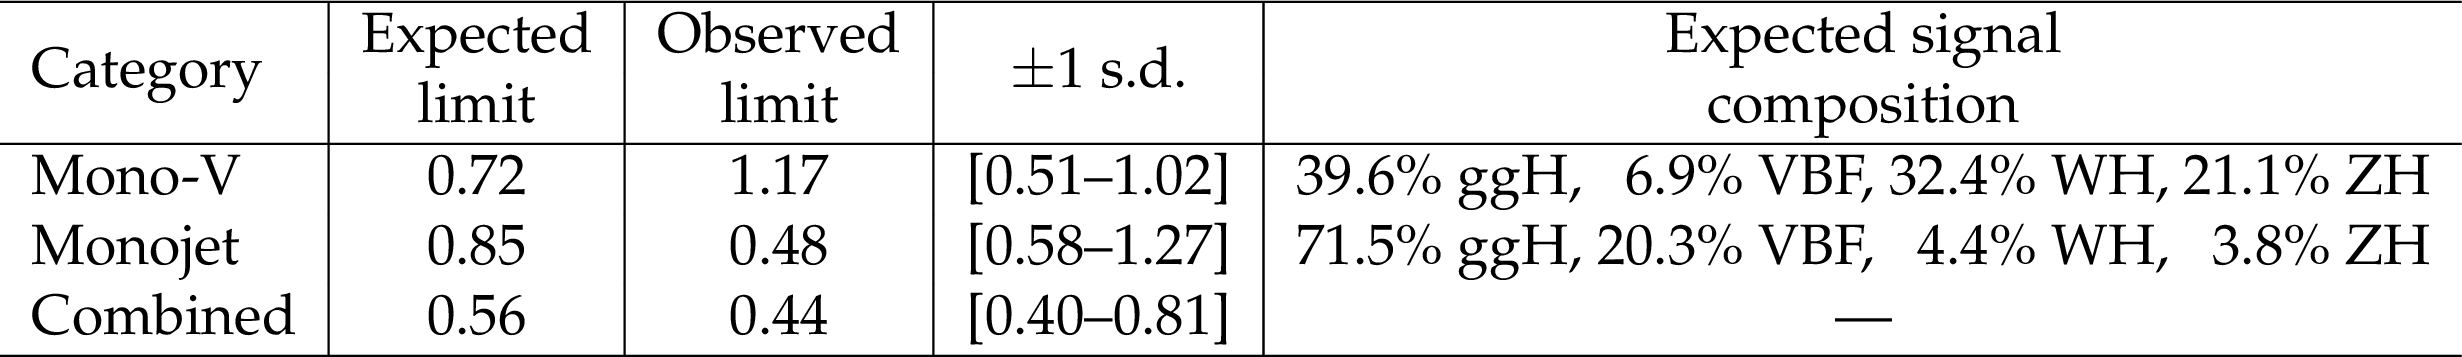
Table 5:
Expected and observed 95% CL upper limits on the invisible branching fraction of the Higgs boson. Limits are tabulated for the monojet and mono-V categories separately, and for their combination. The one standard deviation uncertainty range on the expected limits is listed. The signal composition in terms of gluon fusion, vector boson fusion, and an associated production with a W or Z boson is also provided. |
| Summary |
|
A search for dark matter (DM) is presented using events with jets and large missing transverse momentum in a $ \sqrt{s} = $ 13 TeV proton-proton collision data set corresponding to an integrated luminosity of 12.9 fb$^{-1}$. The search also exploits events with a hadronic decay of a W or Z boson reconstructed as a single large-radius jet. No significant excess is observed with respect to the standard model backgrounds. Limits are computed on the DM production cross section using simplified models in which DM production is mediated by spin-1 or spin-0 particles. Vector and axial-vector mediators with masses up to 1.95 TeV are excluded at 95% confidence level, assuming a coupling strength of 0.25 between the mediators and the standard model fermions, and a coupling strength of 1.0 between the mediators and the DM particles. The results of this search provide the strongest constraints on DM pair production through vector and axial-vector mediators at a particle collider. Scalar and pseudoscalar mediators with masses up to 100 and 430 GeV, respectively, are excluded at 95% confidence level, assuming the coupling of the spin-0 mediators with DM particles to be 1.0 and the coupling of the spin-0 mediators with standard model fermions to be the same as the standard model Yukawa interactions. When compared to the direct detection experiments, the limits obtained from this search provide stronger constraints for dark matter masses less than 5, 9, and 550 GeV, assuming vector, scalar, and axial-vector mediators, respectively. The search yields stronger constraints for dark matter masses less than 200 GeV, assuming a pseudoscalar mediator, when compared to the indirect detection results from Fermi-LAT. The search also yields an observed (expected) 95% confidence level upper limit of 0.44 (0.56) on the invisible branching fraction of a standard model-like 125 GeV Higgs boson, assuming the standard model production cross section. |
| References | ||||
| 1 | G. Bertone, D. Hooper, and J. Silk | Particle dark matter: evidence, candidates and constraints | PR 405 (2005) 279 | hep-ph/0404175 |
| 2 | J. L. Feng | Dark matter candidates from particle physics and methods of detection | Ann. Rev. Astron. Astrophys. 48 (2010) 495 | 1003.0904 |
| 3 | T. A. Porter, R. P. Johnson, and P. W. Graham | Dark matter searches with astroparticle data | Ann. Rev. Astron. Astrophys. 49 (2011) 155 | 1104.2836 |
| 4 | M. Beltran et al. | Maverick dark matter at colliders | JHEP 09 (2010) 037 | 1002.4137 |
| 5 | J. Goodman et al. | Constraints on dark matter from colliders | PRD 82 (2010) 116010 | 1008.1783 |
| 6 | Y. Bai, P. J. Fox, and R. Harnik | The Tevatron at the frontier of dark matter direct detection | JHEP 12 (2010) 048 | 1005.3797 |
| 7 | N. F. Bell et al. | Searching for dark matter at the LHC with a mono-Z | PRD 86 (2012) 096011 | 1209.0231 |
| 8 | H. An, R. Huo, and L.-T. Wang | Searching for low mass dark portal at the LHC | Phys. Dark Univ. 2 (2013) 50 | 1212.2221 |
| 9 | L. M. Carpenter et al. | Collider searches for dark matter in events with a Z boson and missing energy | PRD 87 (2013) 074005 | 1212.3352 |
| 10 | ATLAS Collaboration | Observation of a new particle in the search for the Standard Model Higgs boson with the ATLAS detector at the LHC | PLB 716 (2012) 1 | 1207.7214 |
| 11 | CMS Collaboration | Observation of a new boson at a mass of 125$ GeV $ with the CMS experiment at the LHC | PLB 716 (2012) 30 | CMS-HIG-12-028 1207.7235 |
| 12 | CMS Collaboration | Observation of a new boson with mass near 125$ GeV $ in pp collisions at $ \sqrt{s} = $ 7 and 8 TeV | JHEP 06 (2013) 081 | CMS-HIG-12-036 1303.4571 |
| 13 | K. Y. Lee, Y. G. Kim, and S. Shin | Singlet fermionic dark matter as a natural higgs portal model | in Proceedings, 16th International Conference on Supersymmetry and the Unification of Fundamental Interactions (SUSY08): Seoul, Korea 2008 | 0809.2745 |
| 14 | S. Baek, P. Ko, W.-I. Park, and E. Senaha | Higgs portal vector dark matter: revisited | JHEP 05 (2013) 036 | 1212.2131 |
| 15 | A. Djouadi, O. Lebedev, Y. Mambrini, and J. Quevillon | Implications of LHC searches for Higgs--portal dark matter | PLB 709 (2012) 65 | 1112.3299 |
| 16 | A. Djouadi, A. Falkowski, Y. Mambrini, and J. Quevillon | Direct detection of Higgs--portal dark matter at the LHC | EPJC 73 (2013) 2455 | 1205.3169 |
| 17 | A. Beniwal et al. | Combined analysis of effective Higgs portal dark matter models | PRD 93 (2016) 115016 | 1512.06458 |
| 18 | ATLAS Collaboration | Search for dark matter in events with a hadronically decaying W or Z boson and missing transverse momentum in pp collisions at $ \sqrt{s} = $ 8 TeV with the ATLAS detector | PRL 112 (2014) 041802 | 1309.4017 |
| 19 | CMS Collaboration | Search for dark matter, extra dimensions, and unparticles in monojet events in proto-proton collisions at $ \sqrt{s} = $ 8 TeV | EPJC 75 (2015) 235 | CMS-EXO-12-048 1408.3583 |
| 20 | ATLAS Collaboration | Search for new phenomena in final states with an energetic jet and large missing transverse momentum in pp collisions at $ \sqrt{s} = $ 8 TeV with the ATLAS detector | EPJC 75 (2015) 299 | 1502.01518 |
| 21 | CMS Collaboration | Search for dark matter in proton-proton collisions at 8 TeV with missing transverse momentum and vector boson tagged jets | JHEP 12 (2016) 083 | CMS-EXO-12-055 1607.05764 |
| 22 | ATLAS Collaboration | Search for new phenomena in final states with an energetic jet and large missing transverse momentum in pp collisions at $ \sqrt{s} = $ 13 TeV using the ATLAS detector | PRD 94 (2016) 032005 | 1604.07773 |
| 23 | ATLAS Collaboration | Search for dark matter produced in association with a hadronically decaying vector boson in pp collisions at $ \sqrt{s} = $ 13 TeV with the ATLAS detector | PLB 763 (2016) 251 | 1608.02372 |
| 24 | H. An, X. Ji, and L.-T. Wang | Light dark matter and $ Z' $ dark force at colliders | JHEP 07 (2012) 182 | 1202.2894 |
| 25 | O. Buchmueller, M. J. Dolan, and C. McCabe | Beyond effective field theory for dark matter searches at the LHC | JHEP 01 (2014) 025 | 1308.6799 |
| 26 | S. A. Malik et al. | Interplay and characterization of dark matter searches at colliders and in direct detection experiments | Phys. Dark Univ. 9 (2015) 51 | 1409.4075 |
| 27 | P. Harris, V. V. Khoze, M. Spannowsky, and C. Williams | Constraining dark sectors at colliders: beyond the effective theory approach | PRD 91 (2015) 055009 | 1411.0535 |
| 28 | M. R. Buckley, D. Feld, and D. Goncalves | Scalar simplified models for dark matter | PRD 91 (2015) 015017 | 1410.6497 |
| 29 | U. Haisch and E. Re | Simplified dark matter top-quark interactions at the LHC | JHEP 06 (2015) 078 | 1503.00691 |
| 30 | P. Harris, V. V. Khoze, M. Spannowsky, and C. Williams | Closing up on dark sectors at colliders: from 14 to 100 TeV | PRD 93 (2016) 054030 | 1509.02904 |
| 31 | ATLAS Collaboration | Search for invisible decays of a Higgs boson produced in association with a Z boson in ATLAS | PRL 112 (2014) 201802 | 1402.3244 |
| 32 | CMS Collaboration | Search for invisible decays of Higgs bosons in the vector boson fusion and associated ZH production modes | EPJC 74 (2014) 2980 | CMS-HIG-13-030 1404.1344 |
| 33 | ATLAS Collaboration | Search for invisible decays of the Higgs boson produced in association with a hadronically decaying vector boson in pp collisions at $ \sqrt{s} = $ 8 TeV with the ATLAS detector | EPJC 75 (2015) 337 | 1504.04324 |
| 34 | ATLAS Collaboration | Search for invisible decays of a Higgs boson using vector-boson fusion in pp collisions at $ \sqrt{s} = $ 8 TeV with the ATLAS detector | JHEP 01 (2016) 172 | 1508.07869 |
| 35 | ATLAS Collaboration | Constraints on new phenomena via Higgs boson couplings and invisible decays with the ATLAS detector | JHEP 11 (2015) 206 | 1509.00672 |
| 36 | CMS Collaboration | Searches for invisible decays of the Higgs boson in pp collisions at $ \sqrt{s} = $ 7, 8, and 13 TeV | Submitted to $JHEP$ | CMS-HIG-16-016 1610.09218 |
| 37 | ATLAS and CMS Collaborations | Measurements of the Higgs boson production and decay rates and constraints on its couplings from a combined ATLAS and CMS analysis of the LHC pp collision data at $ \sqrt{s} = $ 7 and 8 TeV | JHEP 08 (2016) 045 | 1606.02266 |
| 38 | CMS Collaboration | The CMS experiment at the CERN LHC | JINST 3 (2008) S08004 | CMS-00-001 |
| 39 | CMS Collaboration | Particle--flow event reconstruction in CMS and performance for jets, taus, and $ E_{\mathrm{T}}^{\text{miss}} $ | CDS | |
| 40 | CMS Collaboration | Commissioning of the particle--flow event reconstruction with the first LHC collisions recorded in the CMS detector | CDS | |
| 41 | M. Cacciari, G. P. Salam, and G. Soyez | The anti-$ k_t $ jet clustering algorithm | JHEP 04 (2008) 063 | 0802.1189 |
| 42 | CMS Collaboration | Determination of jet energy calibration and transverse momentum resolution in CMS | JINST 6 (2011) 11002 | CMS-JME-10-011 1107.4277 |
| 43 | CMS Collaboration | Performance of missing energy reconstruction in 13 TeV pp collision data using the CMS detector | CMS-PAS-JME-16-004 | CMS-PAS-JME-16-004 |
| 44 | J. Alwall et al. | The automated computation of tree-level and next-to-leading order differential cross sections, and their matching to parton shower simulations | JHEP 07 (2014) 079 | 1405.0301 |
| 45 | P. Nason | A New method for combining NLO QCD with shower Monte Carlo algorithms | JHEP 11 (2004) 040 | hep-ph/0409146 |
| 46 | S. Frixione, P. Nason, and C. Oleari | Matching NLO QCD computations with parton shower simulations: the POWHEG method | JHEP 11 (2007) 070 | 0709.2092 |
| 47 | S. Alioli, P. Nason, C. Oleari, and E. Re | A general framework for implementing NLO calculations in shower Monte Carlo programs: the POWHEG BOX | JHEP 06 (2010) 043 | 1002.2581 |
| 48 | T. Sj\"ostrand et al. | An Introduction to PYTHIA 8.2 | CPC 191 (2015) 159 | 1410.3012 |
| 49 | U. Haisch, F. Kahlhoefer, and E. Re | QCD effects in mono-jet searches for dark matter | JHEP 12 (2013) 007 | 1310.4491 |
| 50 | Y. Gao et al. | Spin determination of single-produced resonances at hadron colliders | PRD 81 (2010) 075022 | 1001.3396 |
| 51 | S. Bolognesi et al. | On the spin and parity of a single-produced resonance at the LHC | PRD 86 (2012) 095031 | 1208.4018 |
| 52 | I. Anderson et al. | Constraining anomalous HVV interactions at proton and lepton colliders | PRD 89 (2014) 035007 | 1309.4819 |
| 53 | CMS Collaboration | Event generator tunes obtained from underlying event and multiparton scattering measurements | EPJC 76 (2016) 155 | CMS-GEN-14-001 1512.00815 |
| 54 | R. Frederix and S. Frixione | Merging meets matching in MC@NLO | JHEP 12 (2012) 061 | 1209.6215 |
| 55 | M. L. Mangano, M. Moretti, F. Piccinini, and M. Treccani | Matching matrix elements and shower evolution for top-quark production in hadronic collisions | JHEP 01 (2007) 013 | hep-ph/0611129 |
| 56 | NNPDF Collaboration | Parton distributions for the LHC Run II | JHEP 04 (2015) 040 | 1410.8849 |
| 57 | GEANT4 Collaboration | GEANT4---a simulation toolkit | NIMA 506 (2003) 250 | |
| 58 | CMS Collaboration | Performance of electron reconstruction and selection with the CMS detector in proton-proton collisions at $ \sqrt{s} = $ 8 TeV | JINST 10 (2015) P06005 | CMS-EGM-13-001 1502.02701 |
| 59 | CMS Collaboration | Reconstruction and identification of $ \tau $ lepton decays to hadrons and $ \nu_\tau $ at CMS | JINST 11 (2016) P01019 | CMS-TAU-14-001 1510.07488 |
| 60 | CMS Collaboration | Performance of photon reconstruction and identification with the CMS detector in proton-proton collisions at $ \sqrt{s} = $ 8 TeV | JINST 10 (2015) P08010 | CMS-EGM-14-001 1502.02702 |
| 61 | CMS Collaboration | Identification of b-quark jets with the CMS experiment | JINST 8 (2013) P04013 | CMS-BTV-12-001 1211.4462 |
| 62 | CMS Collaboration | Identification of b quark jets at the CMS experiment in the LHC Run 2 | CMS-PAS-BTV-15-001 | CMS-PAS-BTV-15-001 |
| 63 | J. Thaler and K. Van Tilburg | Identifying boosted objects with N-subjettiness | JHEP 03 (2011) 015 | 1011.2268 |
| 64 | S. D. Ellis, C. K. Vermilion, and J. R. Walsh | Recombination algorithms and jet substructure: pruning as a tool for heavy particle searches | PRD 81 (2010) 094023 | 0912.0033 |
| 65 | Y. L. Dokshitzer, G. D. Leder, S. Moretti, and B. R. Webber | Better jet clustering algorithms | JHEP 08 (1997) 001 | hep-ph/9707323 |
| 66 | M. Wobisch and T. Wengler | Hadronization corrections to jet cross-sections in deep inelastic scattering | in Monte Carlo generators for HERA physics. Proceedings, Workshop, Hamburg, Germany, p. 270 1998 | hep-ph/9907280 |
| 67 | J. H. Kuhn, A. Kulesza, S. Pozzorini, and M. Schulze | Electroweak corrections to hadronic photon production at large transverse momenta | JHEP 03 (2006) 059 | hep-ph/0508253 |
| 68 | S. Kallweit et al. | NLO electroweak automation and precise predictions for W+multijet production at the LHC | JHEP 04 (2015) 012 | 1412.5157 |
| 69 | S. Kallweit et al. | NLO QCD+EW predictions for V+jets including off-shell vector-boson decays and multijet merging | JHEP 04 (2016) 021 | 1511.08692 |
| 70 | CMS Collaboration | Search for new physics with jets and missing transverse momentum in pp collisions at $ \sqrt{s} = $ 7 TeV | JHEP 08 (2011) 155 | CMS-SUS-10-005 1106.4503 |
| 71 | M. Czakon, D. Heymes, and A. Mitov | High-precision differential predictions for top-quark pairs at the LHC | PRL 116 (2016) 082003 | 1511.00549 |
| 72 | CMS Collaboration | Measurement of the top quark pair production cross section in proton-proton collisions at $ \sqrt{s} = $ 13 TeV | PRL 116 (2016) 052002 | CMS-TOP-15-003 1510.05302 |
| 73 | CMS Collaboration | Measurement of the ZZ production cross section and Z $ \to \ell^+\ell^-\ell'^+\ell'^- $ branching fraction in pp collisions at $ \sqrt{s} = $ 13 TeV | PLB 763 (2016) 280 | CMS-SMP-16-001 1607.08834 |
| 74 | CMS Collaboration | Measurement of the $ WZ $ production cross section in pp collisions at $ \sqrt{s} = $ 13 TeV | Submitted to $Phys.$ $Lett.$ $B$ | CMS-SMP-16-002 1607.06943 |
| 75 | CMS Collaboration | CMS luminosity calibration for the pp reference run at $ \sqrt{s} = $ 5.02 TeV | CMS-PAS-LUM-16-001 | CMS-PAS-LUM-16-001 |
| 76 | CMS Collaboration | Performance of the CMS missing transverse momentum reconstruction in pp data at $ \sqrt{s} = $ 8 TeV | JINST 10 (2015) P02006 | CMS-JME-13-003 1411.0511 |
| 77 | CMS Collaboration | Simplified likelihood for the re-interpretation of public CMS results | CDS | |
| 78 | D. Abercrombie et al. | Dark matter benchmark models for early LHC Run-2 searches: report of the ATLAS/CMS dark matter forum | 1507.00966 | |
| 79 | T. Junk | Confidence level computation for combining searches with small statistics | NIMA 434 (1999) 435 | hep-ex/9902006 |
| 80 | A. L. Read | Presentation of search results: the $ CL_s $ technique | JPG 28 (2002) 2693 | |
| 81 | G. Cowan, K. Cranmer, E. Gross, and O. Vitells | Asymptotic formulae for likelihood-based tests of new physics | EPJC 71 (2011) 1554 | 1007.1727 |
| 82 | J. F. Gunion, H. E. Haber, and J. Wudka | Sum rules for Higgs bosons | PRD 43 (1991) 904 | |
| 83 | Planck Collaboration | Planck 2015 results. XIII. Cosmological parameters | Astron. Astrophys. 594 (2016) A13 | 1502.01589 |
| 84 | M. Backovic, K. Kong, and M. McCaskey | MadDM v.1.0: computation of dark matter relic abundance using MadGraph5 | Phys. Dark Univ. 5-6 (2014) 18 | 1308.4955 |
| 85 | Planck Collaboration | Planck 2013 results. XVI. Cosmological parameters | Astron. Astrophys. 571 (2014) A16 | 1303.5076 |
| 86 | T. du Pree, K. Hahn, P. Harris, and C. Roskas | Cosmological constraints on dark matter models for collider searches | 1603.08525 | |
| 87 | O. Buchmueller, M. J. Dolan, S. A. Malik, and C. McCabe | Characterising dark matter searches at colliders and direct detection experiments: vector mediators | JHEP 01 (2015) 037 | 1407.8257 |
| 88 | G. Busoni et al. | Recommendations on presenting LHC searches for missing transverse energy signals using simplified $ s $-channel models of dark matter | 1603.04156 | |
| 89 | Fermi-LAT Collaboration | Searching for dark matter annihilation from milky way dwarf spheroidal galaxies with six years of fermi large area telescope data | PRL 115 (2015) 231301 | 1503.02641 |
| 90 | SuperCDMS Collaboration | New results from the search for low-mass weakly interacting massive particles with the CDMS low ionization threshold experiment | PRL 116 (2016) 071301 | 1509.02448 |
| 91 | LUX Collaboration | Results from a search for dark matter in the complete LUX exposure | PRL 118 (2017) 021303 | 1608.07648 |
| 92 | PandaX-II Collaboration | Dark matter results from first 98.7 days of data from the PandaX-II experiment | PRL 117 (2016) 121303 | 1607.07400 |
| 93 | CRESST Collaboration | Results on light dark matter particles with a low-threshold CRESST-II detector | EPJC 76 (2016) 25 | 1509.01515 |
| 94 | PICO Collaboration | Improved dark matter search results from PICO-2L Run 2 | PRD 93 (2016) 061101 | 1601.03729 |
| 95 | PICO Collaboration | Dark matter search results from the PICO-60 CF$ _3 $I bubble chamber | PRD 93 (2016) 052014 | 1510.07754 |
| 96 | IceCube Collaboration | Improved limits on dark matter annihilation in the Sun with the 79-string IceCube detector and implications for supersymmetry | JCAP 04 (2016) 022 | 1601.00653 |
| 97 | Super-Kamiokande Collaboration | Search for neutrinos from annihilation of captured low-mass dark matter particles in the Sun by Super-Kamiokande | PRL 114 (2015) 141301 | 1503.04858 |
| 98 | U. Haisch, F. Kahlhoefer, and J. Unwin | The impact of heavy-quark loops on LHC dark matter searches | JHEP 07 (2013) 125 | 1208.4605 |
| 99 | A. Berlin, D. Hooper, and S. D. McDermott | Simplified dark matter models for the galactic center gamma-ray excess | PRD 89 (2014) 115022 | 1404.0022 |
| 100 | LHC Higgs Cross Section Working Group | Handbook of LHC Higgs cross sections: 4. Deciphering the nature of the Higgs sector | 1610.07922 | |
|
|
Compact Muon Solenoid LHC, CERN |
|

|

|

|

|

|