

Compact Muon Solenoid
LHC, CERN
| CMS-EXO-12-055 ; CERN-EP-2016-178 | ||
| Search for dark matter in proton-proton collisions at 8 TeV with missing transverse momentum and vector boson tagged jets | ||
| CMS Collaboration | ||
| 20 July 2016 | ||
| JHEP 12 (2016) 083 [Erratum] | ||
| Abstract: A search is presented for an excess of events with large missing transverse momentum in association with at least one highly energetic jet, in a data sample of proton-proton collisions at a centre-of-mass energy of 8 TeV. The data correspond to an integrated luminosity of 19.7 fb$^{-1}$ collected by the CMS experiment at the LHC. The results are interpreted using a set of simplified models for the production of dark matter via a scalar, pseudoscalar, vector, or axial vector mediator. Additional sensitivity is achieved by tagging events consistent with the jets originating from a hadronically decaying vector boson. This search uses jet substructure techniques to identify hadronically decaying vector bosons in both Lorentz-boosted and resolved scenarios. This analysis yields improvements of 80% in terms of excluded signal cross sections with respect to the previous CMS analysis using the same data set. No significant excess with respect to the standard model expectation is observed and limits are placed on the parameter space of the simplified models. Mediator masses between 80 and 400 GeV in the scalar and pseudoscalar models, and up to 1.5 TeV in the vector and axial vector models, are excluded. | ||
| Links: e-print arXiv:1607.05764 [hep-ex] (PDF) ; CDS record ; inSPIRE record ; CADI line (restricted) ; | ||
| Figures & Tables | Summary | Additional Figures | References | CMS Publications |
|---|
| Figures | |

png pdf |
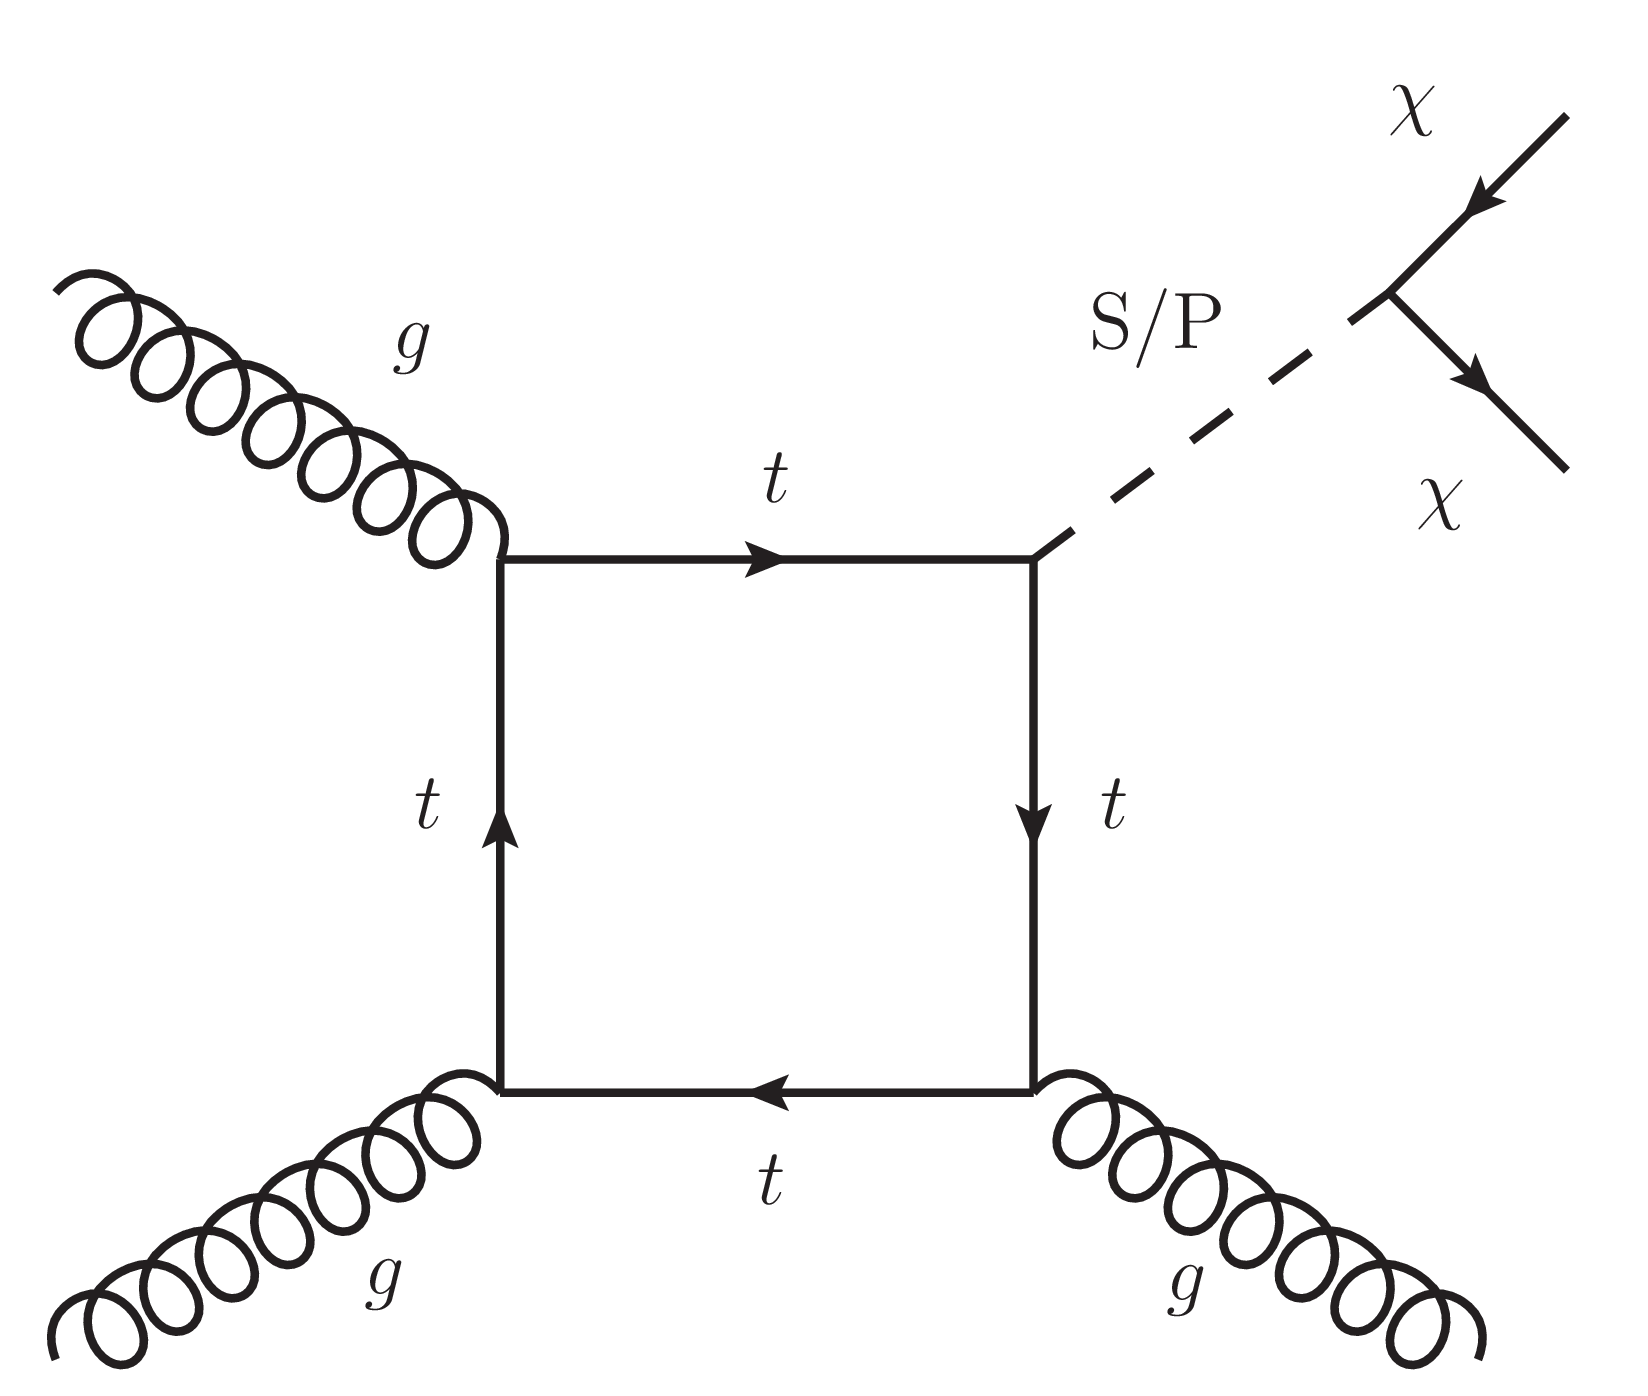
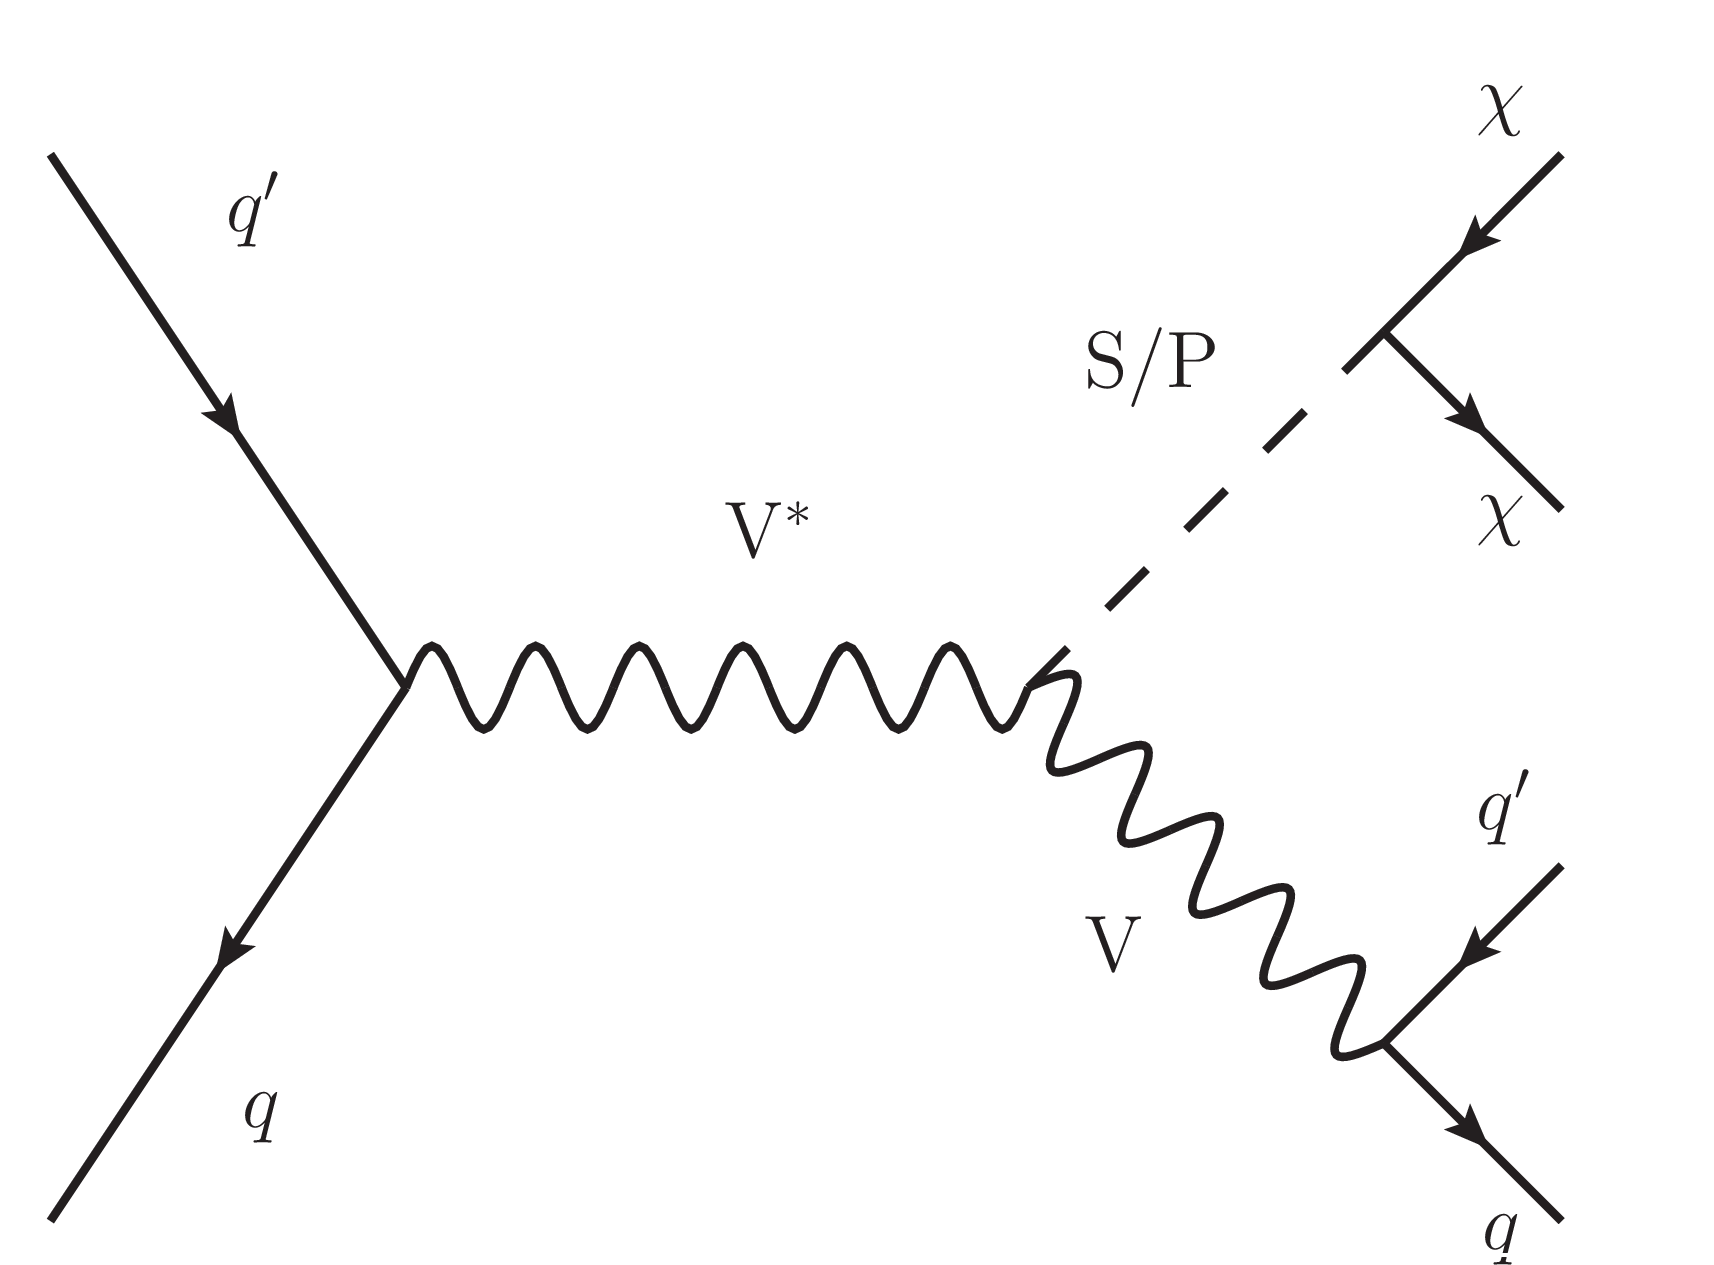
Figure 1:
Diagrams for production of DM via a scalar (S) or pseudoscalar (P) mediator in the cases providing monojet (left) and mono-V (right) signatures. |
png pdf |
Figure 1-a:
Diagrams for production of DM via a scalar (S) or pseudoscalar (P) mediator in the cases providing monojet (left) and mono-V (right) signatures. |
png pdf |
Figure 1-b:
Diagrams for production of DM via a scalar (S) or pseudoscalar (P) mediator in the cases providing monojet (left) and mono-V (right) signatures. |
png pdf |
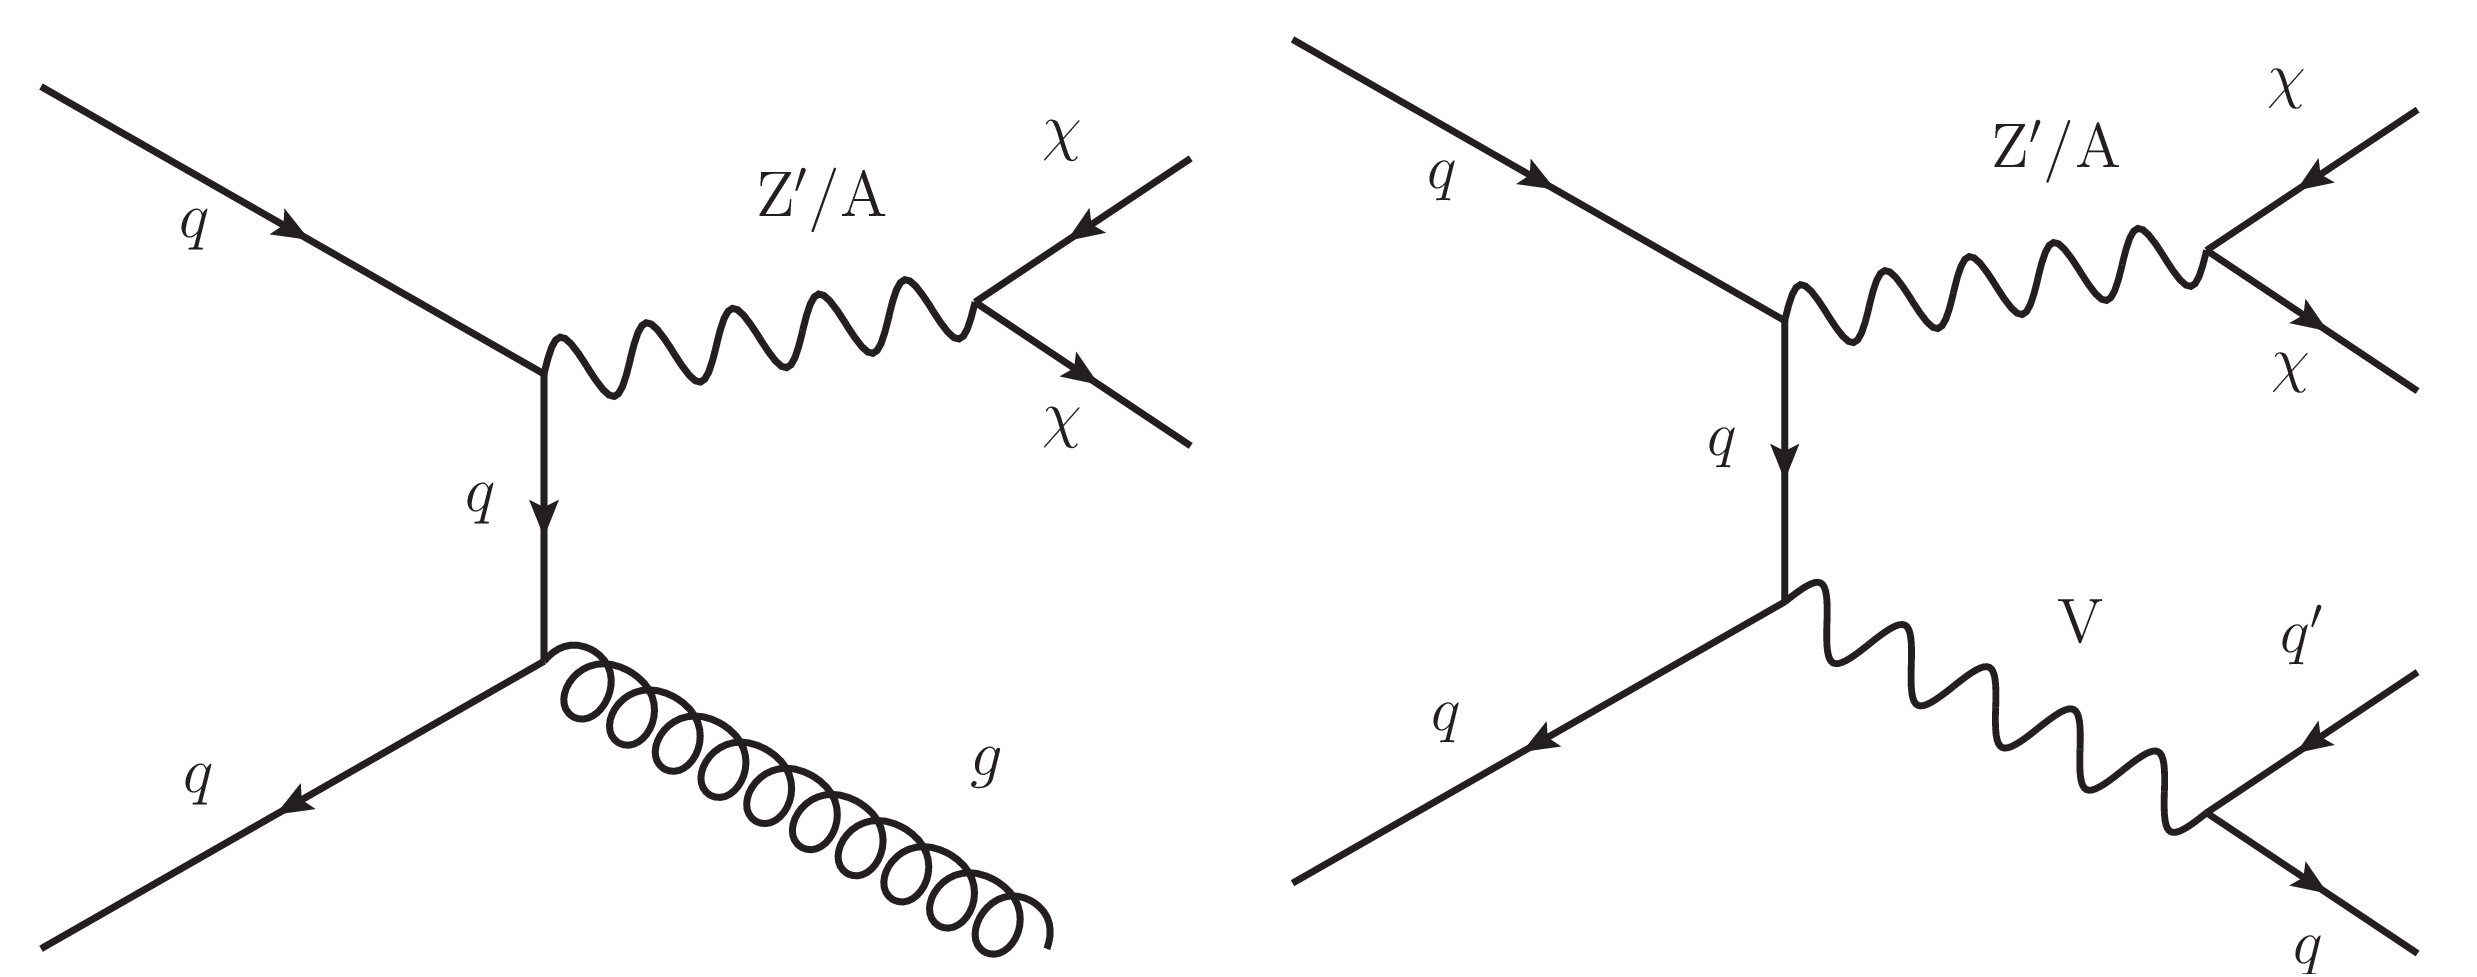
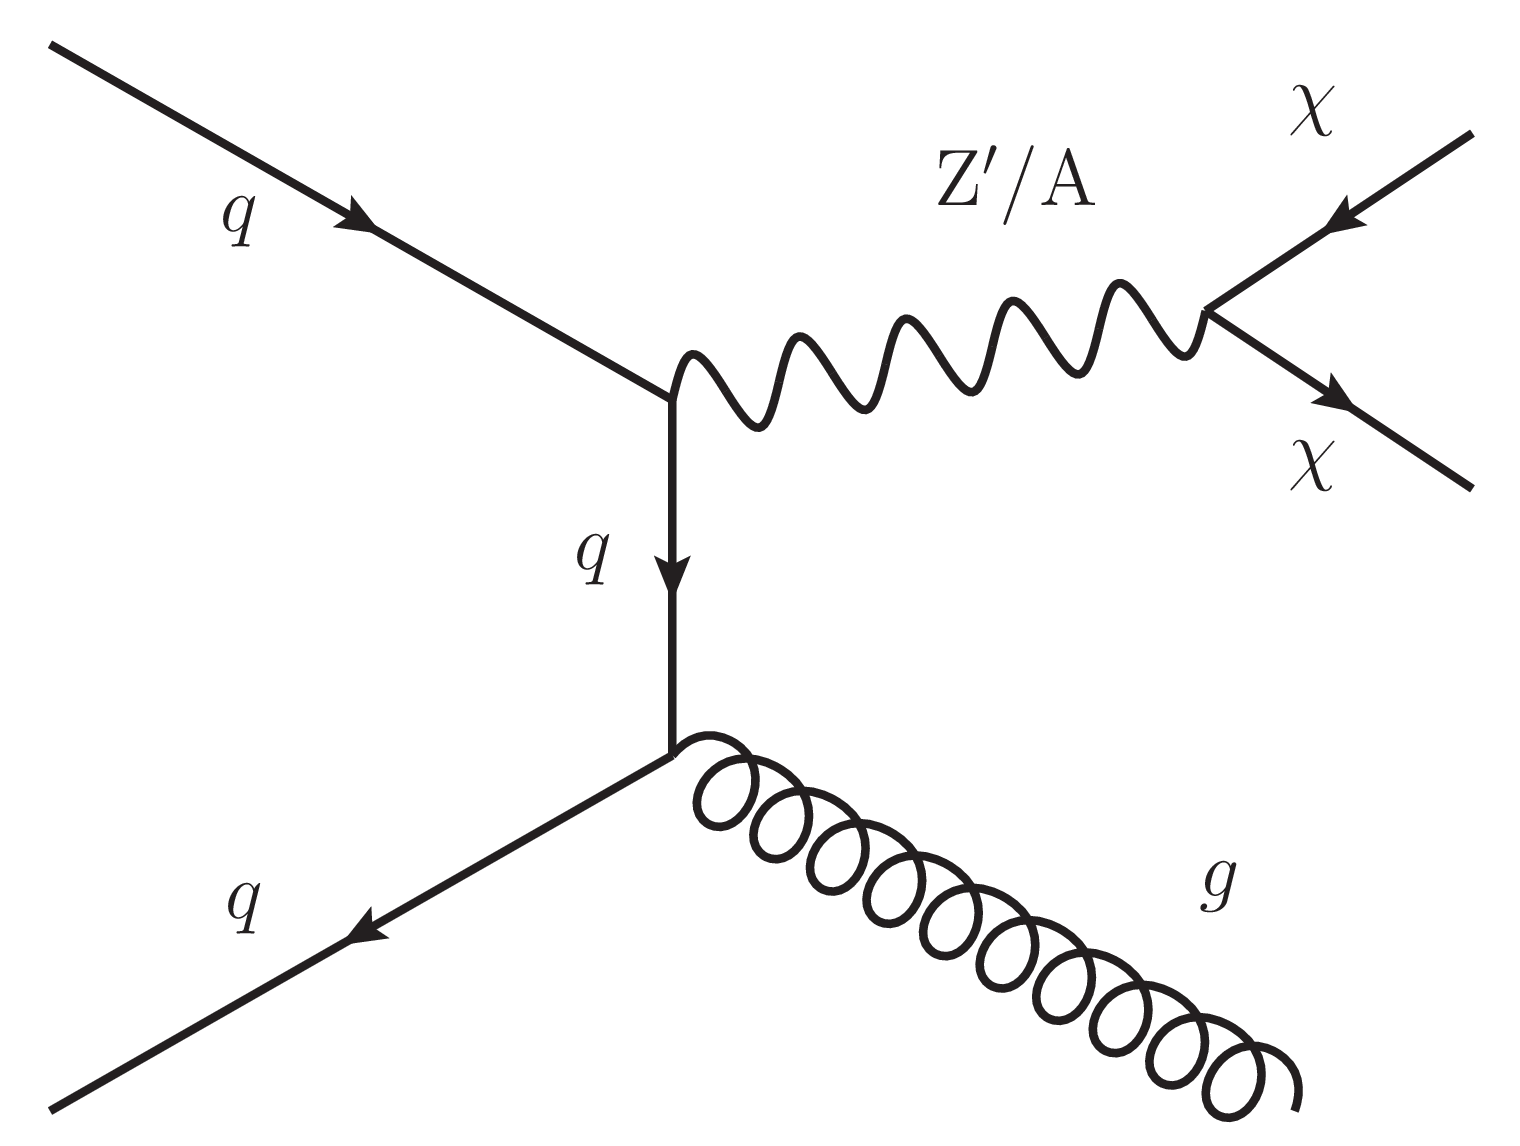
Figure 2:
Diagrams for production of DM via a vector (Z') or axial vector (A) mediator providing monojet (left) and mono-V (right) signatures. |
png pdf |
Figure 2-a:
Diagrams for production of DM via a vector (Z') or axial vector (A) mediator providing monojet (left) and mono-V (right) signatures. |

png pdf |
Figure 2-b:
Diagrams for production of DM via a vector (Z') or axial vector (A) mediator providing monojet (left) and mono-V (right) signatures. |
png pdf |
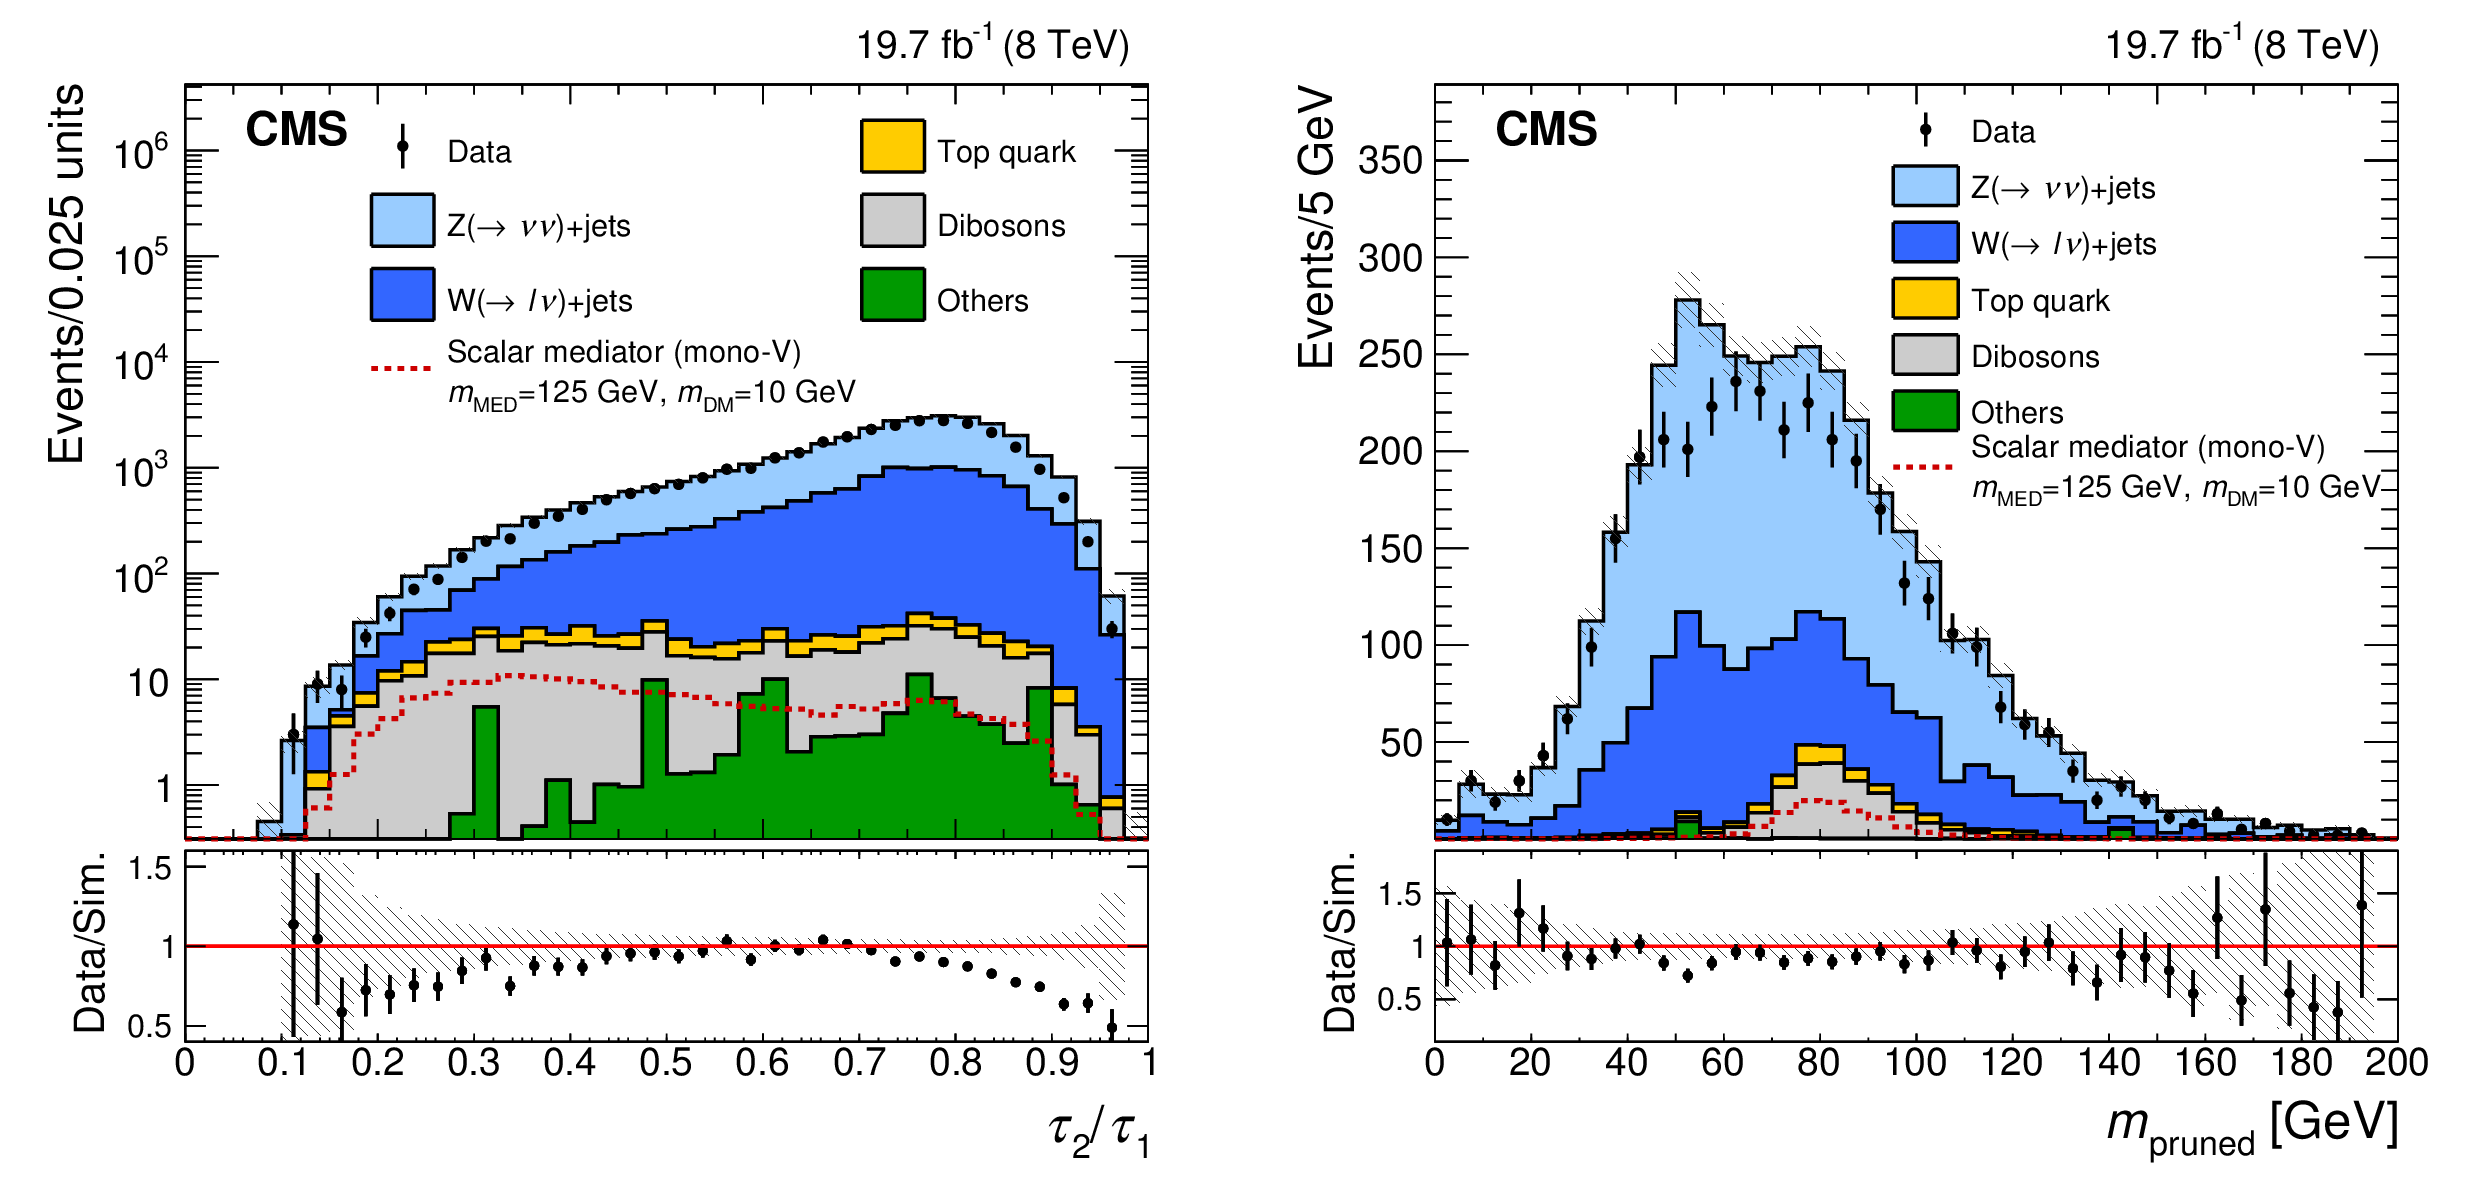
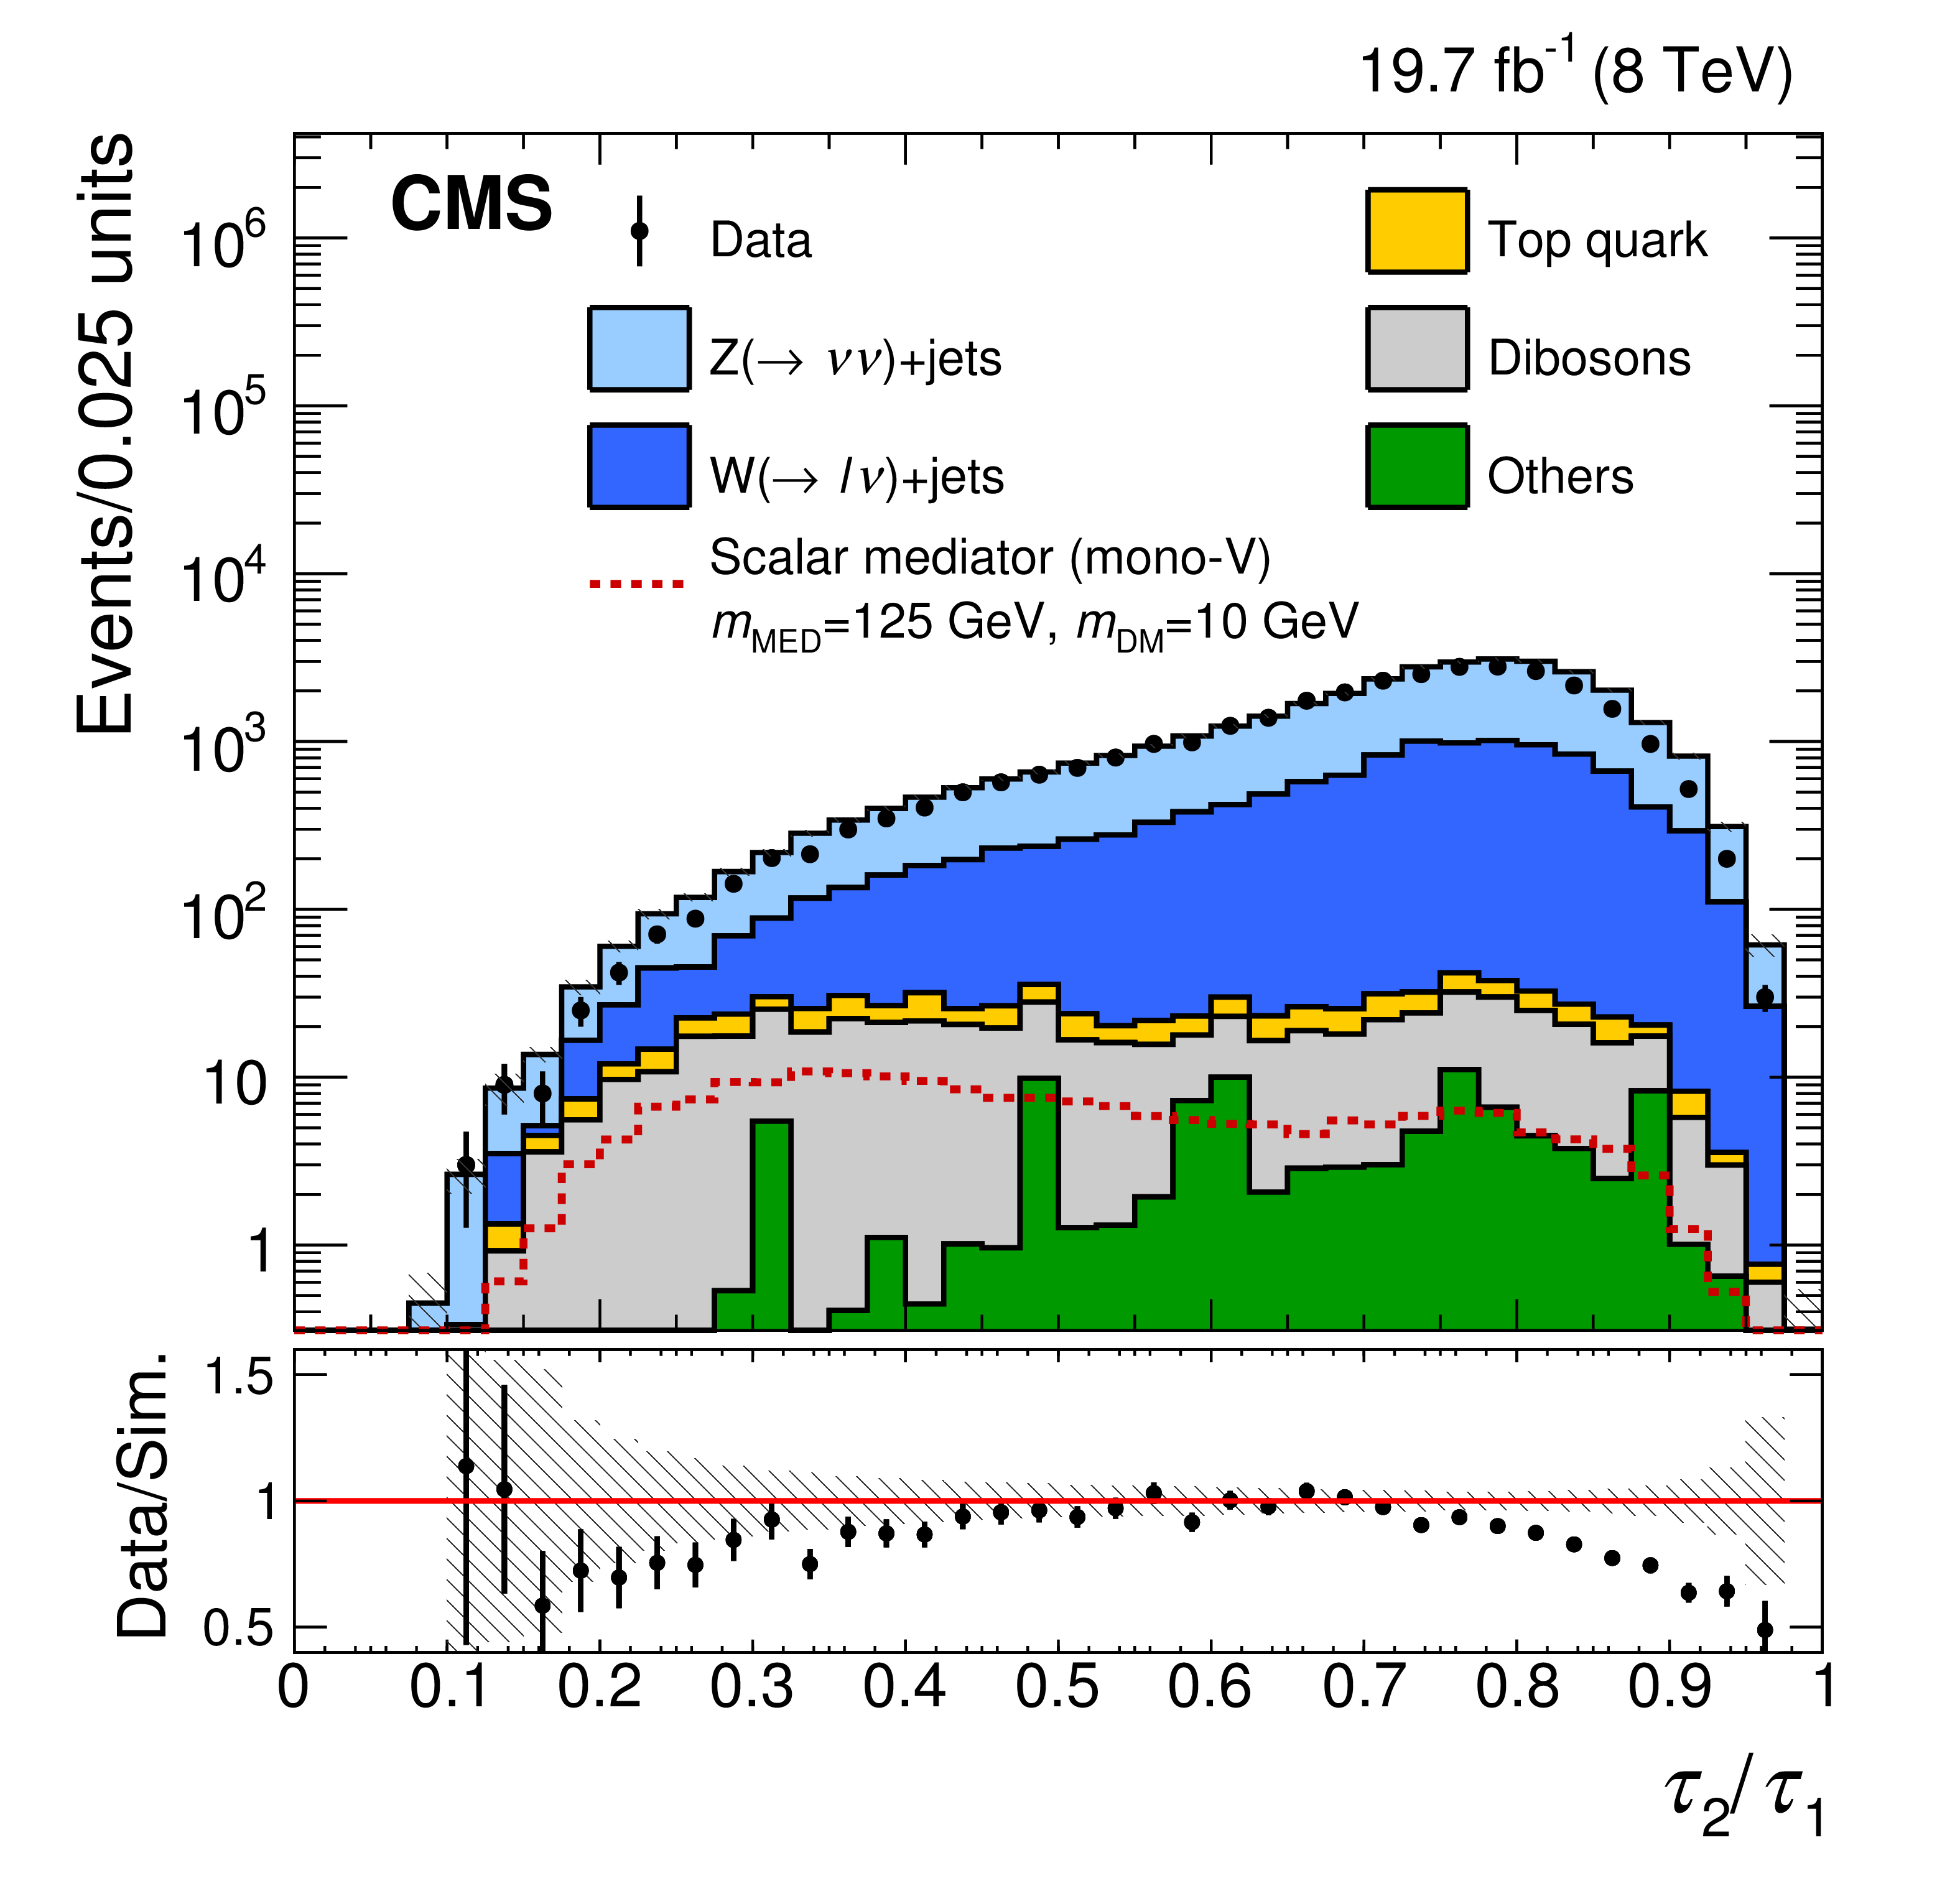
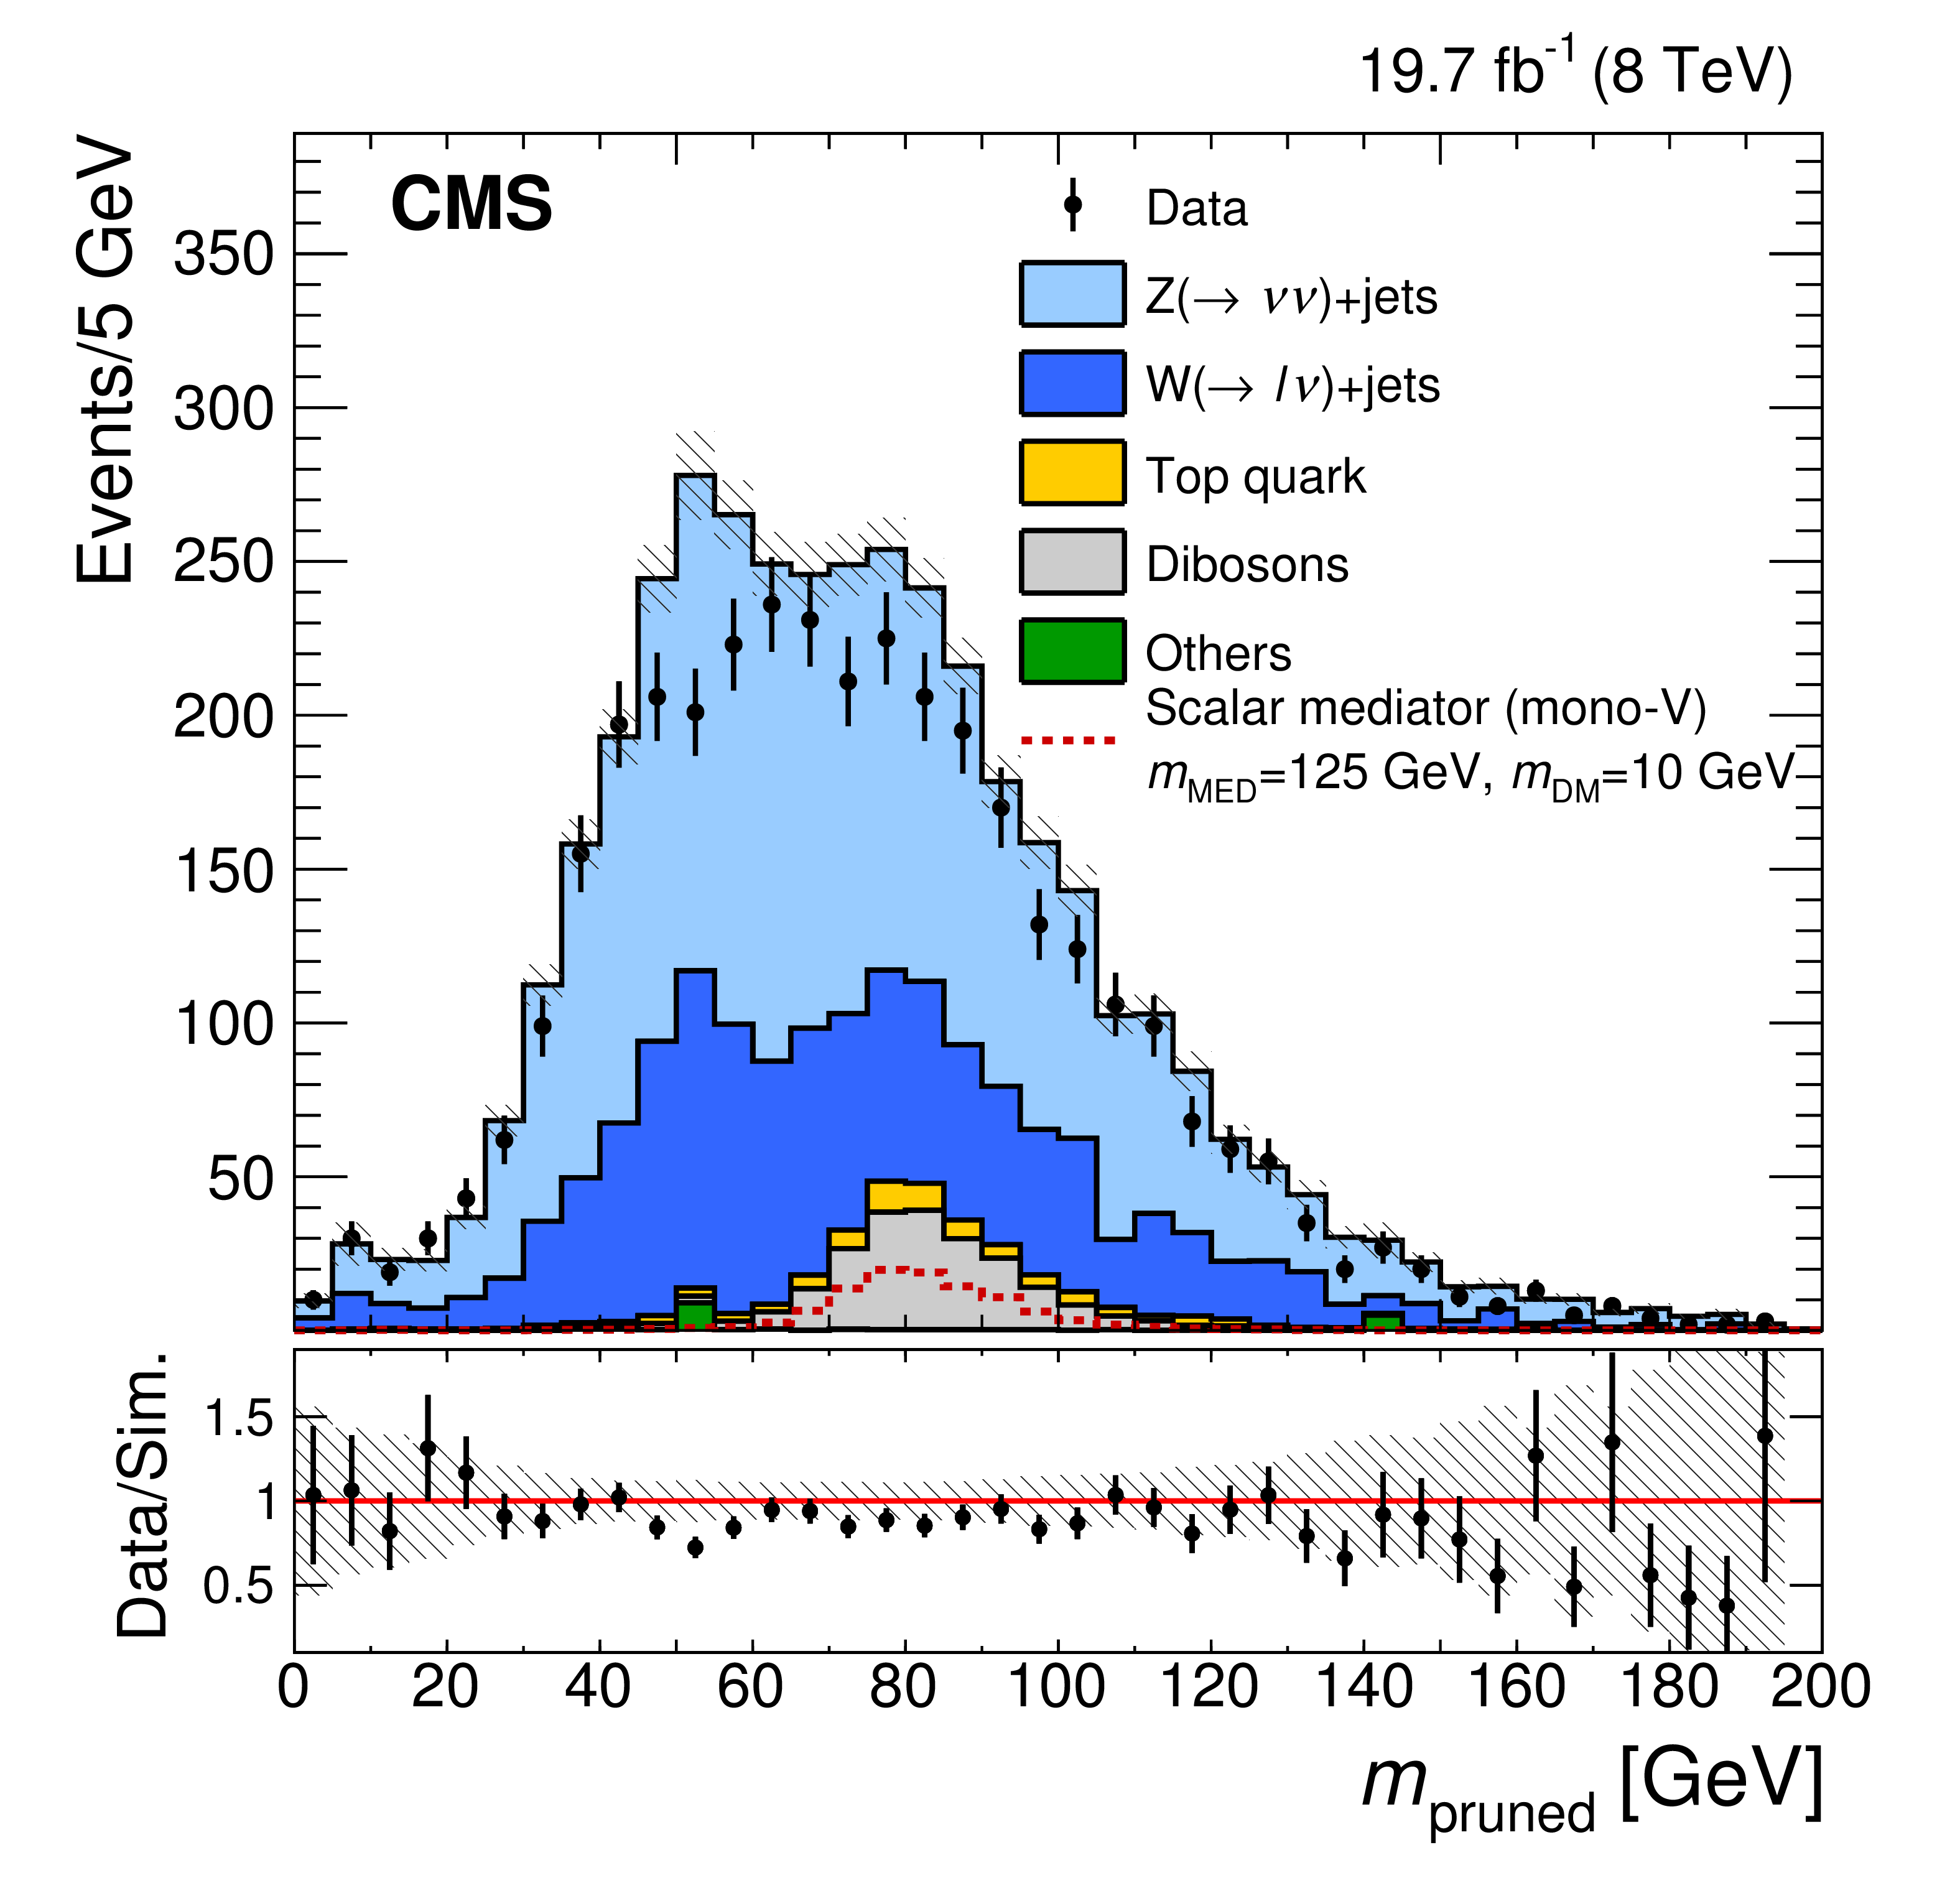
Figure 3:
Left: The distribution of $\tau _2/\tau _1$ in highly Lorentz-boosted events, before the jet mass selection. Right: The distribution of $m_{\text {pruned}}$ for the CA8 jets, before applying the jet mass selection but after the requirement of $\tau _2/\tau _1 < $ 0.5 has been applied. The discrepancy between data and simulation is within systematic uncertainties (not shown). The dashed red line shows the expected distribution for scalar-mediated DM production with $m_{\mathrm {MED}} = $ 125 GeV and $m_{\mathrm {DM}} = $ 10 GeV. The shaded bands indicate the statistical uncertainty from the limited number of simulated events. |
png pdf |
Figure 3-a:
Left: The distribution of $\tau _2/\tau _1$ in highly Lorentz-boosted events, before the jet mass selection. Right: The distribution of $m_{\text {pruned}}$ for the CA8 jets, before applying the jet mass selection but after the requirement of $\tau _2/\tau _1 < $ 0.5 has been applied. The discrepancy between data and simulation is within systematic uncertainties (not shown). The dashed red line shows the expected distribution for scalar-mediated DM production with $m_{\mathrm {MED}} = $ 125 GeV and $m_{\mathrm {DM}} = $ 10 GeV. The shaded bands indicate the statistical uncertainty from the limited number of simulated events. |
png pdf |
Figure 3-b:
Left: The distribution of $\tau _2/\tau _1$ in highly Lorentz-boosted events, before the jet mass selection. Right: The distribution of $m_{\text {pruned}}$ for the CA8 jets, before applying the jet mass selection but after the requirement of $\tau _2/\tau _1 < $ 0.5 has been applied. The discrepancy between data and simulation is within systematic uncertainties (not shown). The dashed red line shows the expected distribution for scalar-mediated DM production with $m_{\mathrm {MED}} = $ 125 GeV and $m_{\mathrm {DM}} = $ 10 GeV. The shaded bands indicate the statistical uncertainty from the limited number of simulated events. |
png pdf |
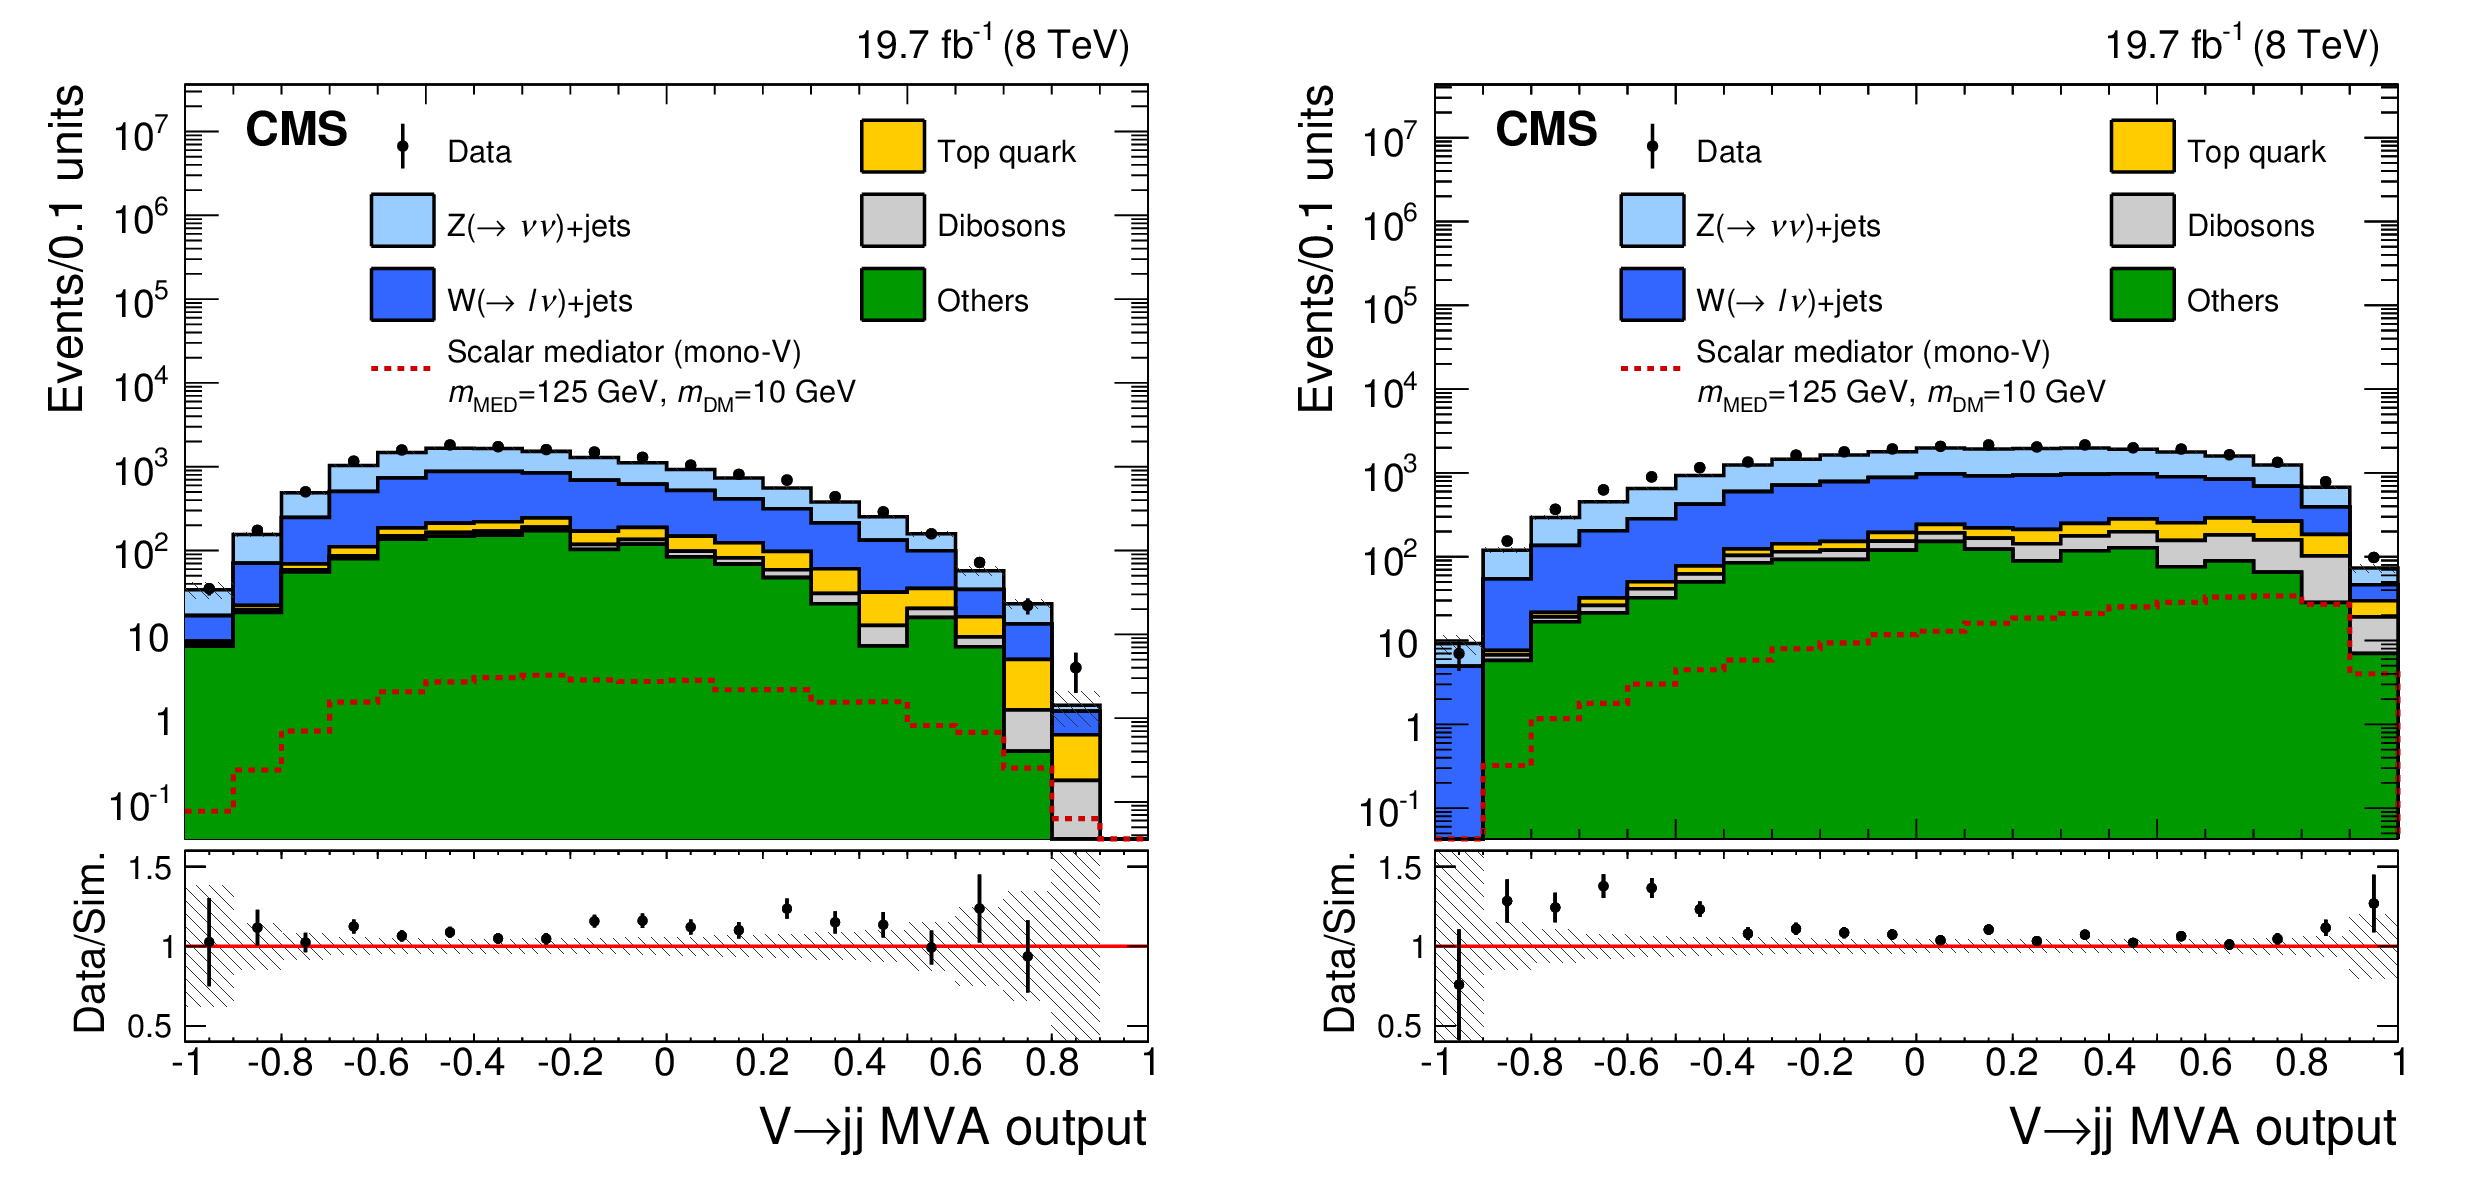
Figure 4:
The MVA output distributions for V-tagged events in simulation and data after signal selection for $ {p_{\mathrm {T}}} < $ 160 GeV (left) and $ {p_{\mathrm {T}}} > $ 160 GeV (right). Above a $ {p_{\mathrm {T}}} $ of about 160 GeV, the jets from the V-boson decay begin to overlap. The dashed red line shows the expected distribution for scalar-mediated DM production with $m_{\mathrm {MED}} = $ 125 GeV and $m_{\mathrm {DM}} = $ 10 GeV. The shaded bands indicate the statistical uncertainty arising from the limited number of simulated events. |
png pdf |
Figure 4-a:
The MVA output distributions for V-tagged events in simulation and data after signal selection for $ {p_{\mathrm {T}}} < $ 160 GeV (left) and $ {p_{\mathrm {T}}} > $ 160 GeV (right). Above a $ {p_{\mathrm {T}}} $ of about 160 GeV, the jets from the V-boson decay begin to overlap. The dashed red line shows the expected distribution for scalar-mediated DM production with $m_{\mathrm {MED}} = $ 125 GeV and $m_{\mathrm {DM}} = $ 10 GeV. The shaded bands indicate the statistical uncertainty arising from the limited number of simulated events. |
png pdf |
Figure 4-b:
The MVA output distributions for V-tagged events in simulation and data after signal selection for $ {p_{\mathrm {T}}} < $ 160 GeV (left) and $ {p_{\mathrm {T}}} > $ 160 GeV (right). Above a $ {p_{\mathrm {T}}} $ of about 160 GeV, the jets from the V-boson decay begin to overlap. The dashed red line shows the expected distribution for scalar-mediated DM production with $m_{\mathrm {MED}} = $ 125 GeV and $m_{\mathrm {DM}} = $ 10 GeV. The shaded bands indicate the statistical uncertainty arising from the limited number of simulated events. |
png pdf |
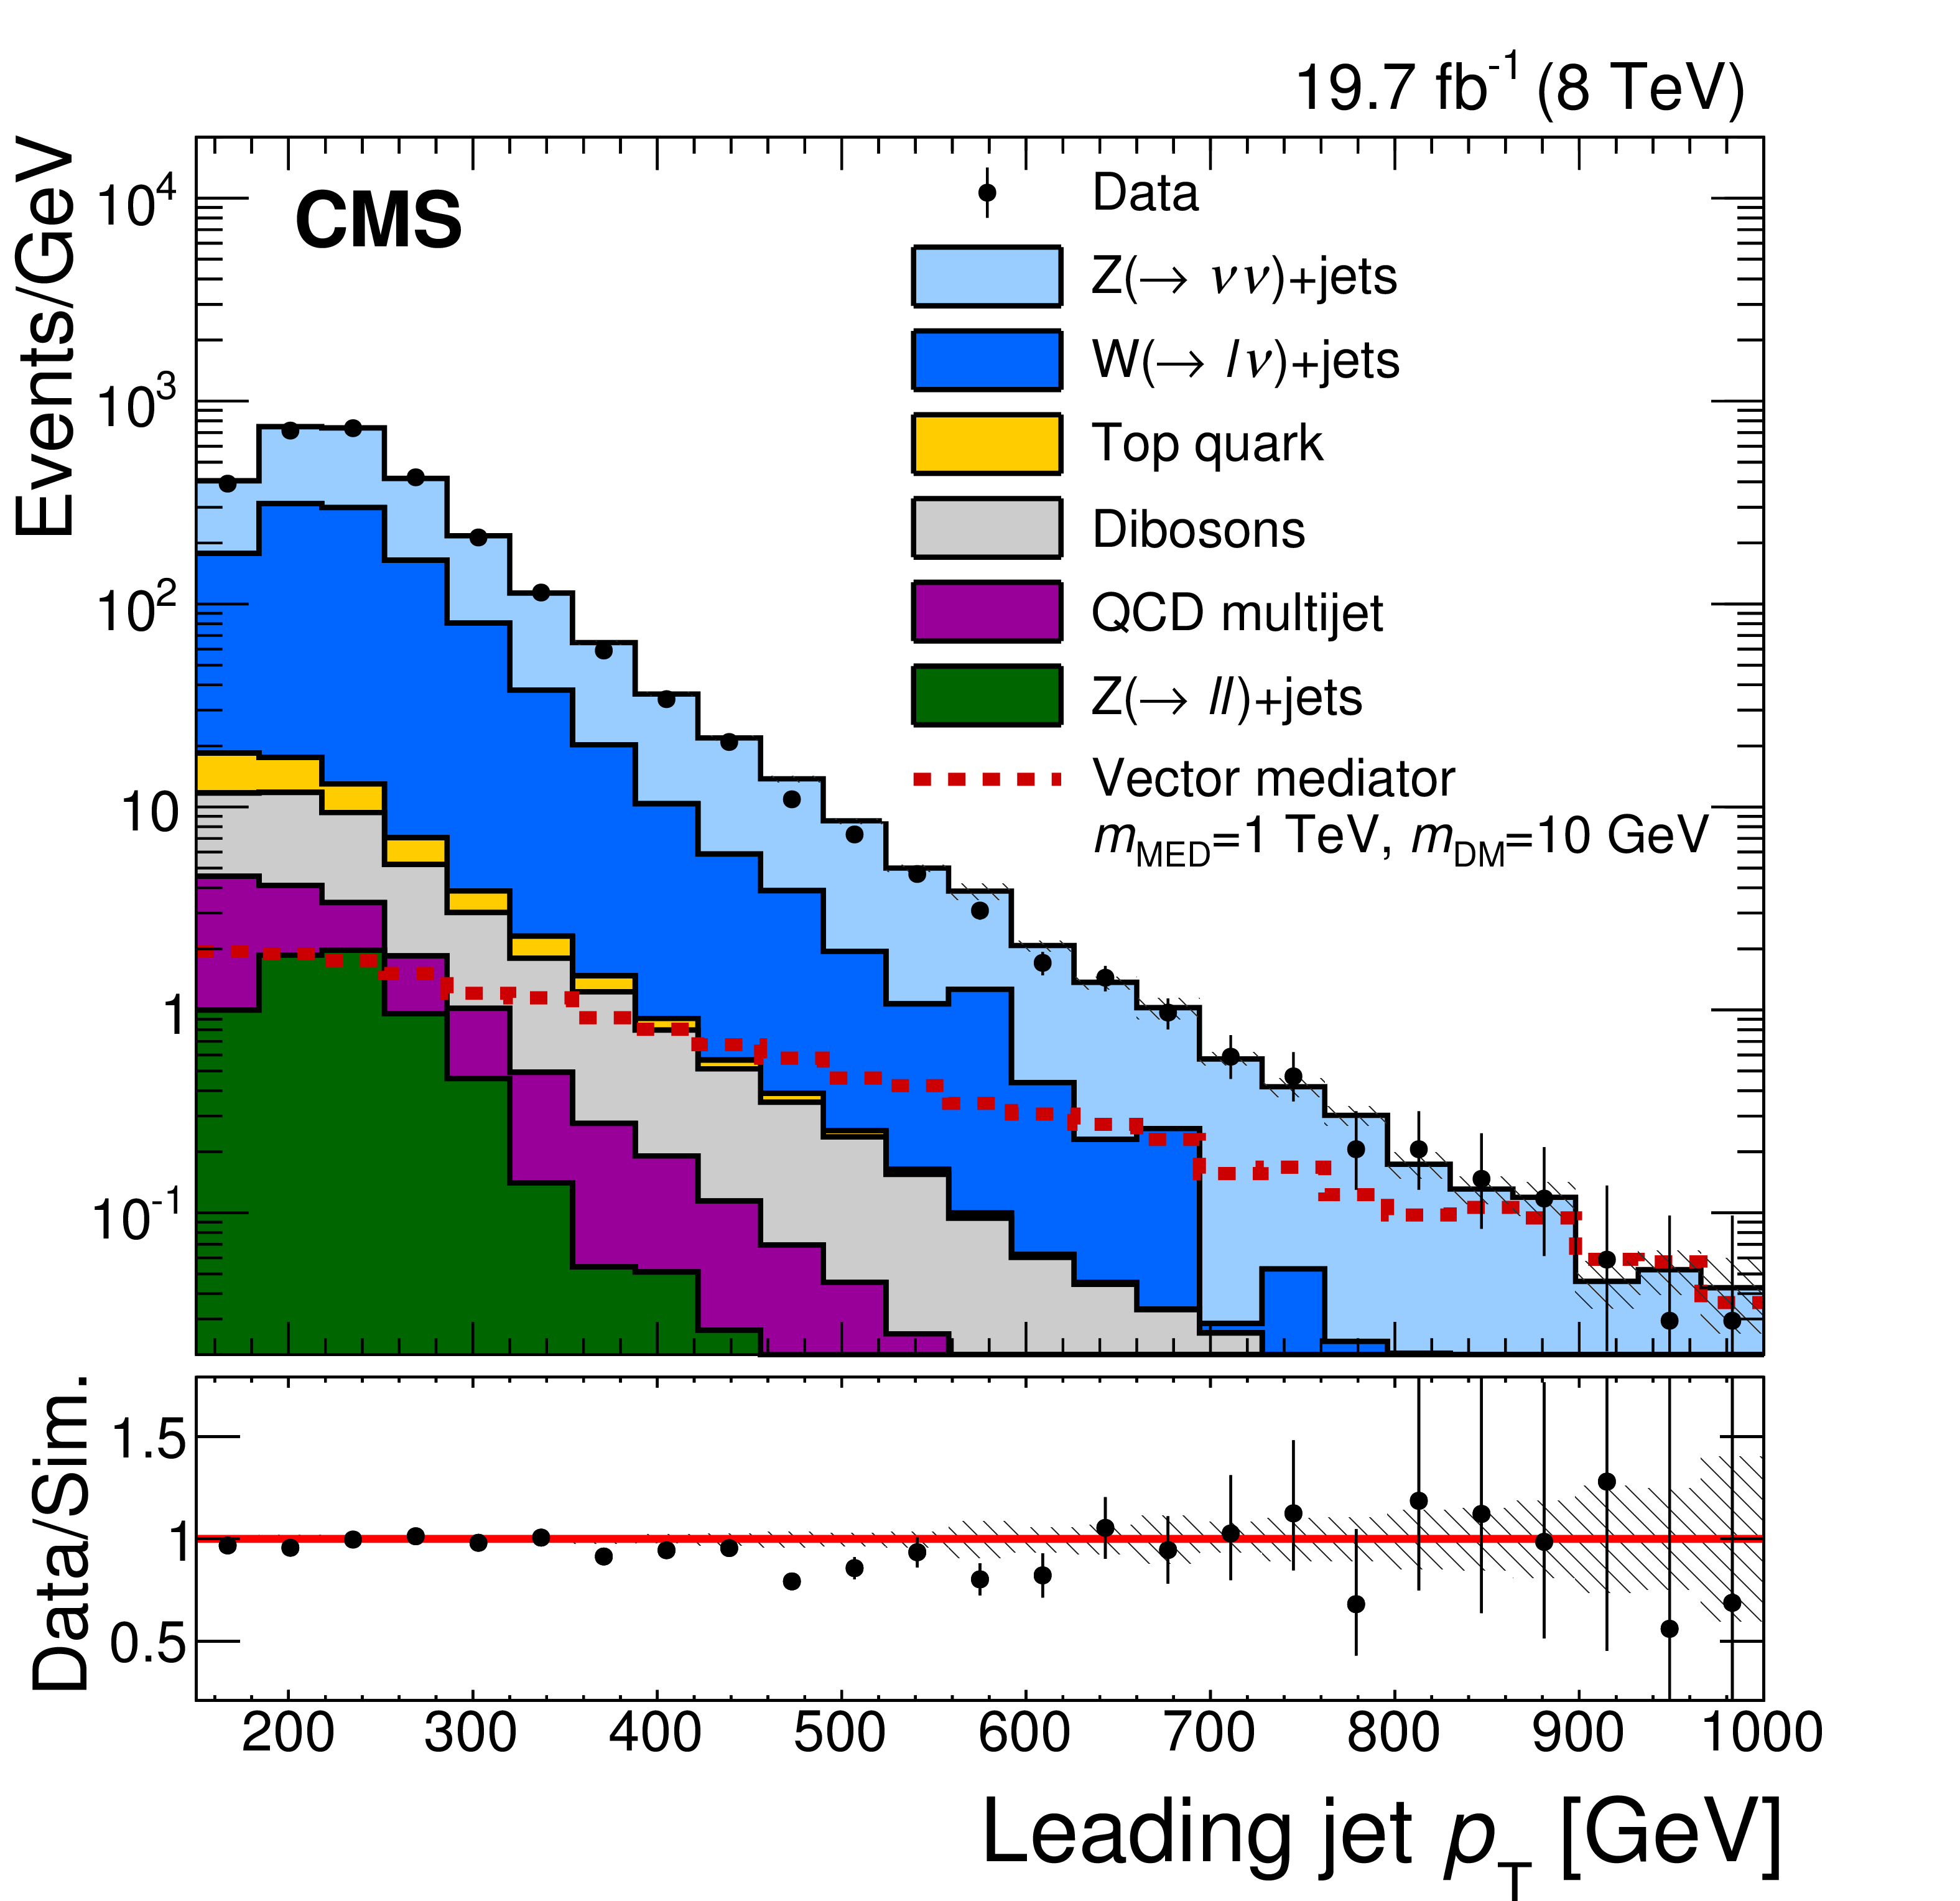
Figure 5:
Distributions in ${E_{\mathrm {T}}^{\text {miss}}}$ (left) and leading jet $ {p_{\mathrm {T}}} $ (right) in simulated events and data, resulting from the combined signal selections for the three event categories. The dashed red line shows the expected distribution, assuming vector mediated DM production with $m_{\mathrm {MED}}= $ 1 TeV and $m_{\mathrm {DM}}=$ 10 GeV. The shaded bands indicate the statistical uncertainty from the limited number of simulated events. |
png pdf |
Figure 5-a:
Distributions in ${E_{\mathrm {T}}^{\text {miss}}}$ (left) and leading jet $ {p_{\mathrm {T}}} $ (right) in simulated events and data, resulting from the combined signal selections for the three event categories. The dashed red line shows the expected distribution, assuming vector mediated DM production with $m_{\mathrm {MED}}= $ 1 TeV and $m_{\mathrm {DM}}=$ 10 GeV. The shaded bands indicate the statistical uncertainty from the limited number of simulated events. |
png pdf |
Figure 5-b:
Distributions in ${E_{\mathrm {T}}^{\text {miss}}}$ (left) and leading jet $ {p_{\mathrm {T}}} $ (right) in simulated events and data, resulting from the combined signal selections for the three event categories. The dashed red line shows the expected distribution, assuming vector mediated DM production with $m_{\mathrm {MED}}= $ 1 TeV and $m_{\mathrm {DM}}=$ 10 GeV. The shaded bands indicate the statistical uncertainty from the limited number of simulated events. |
png pdf |
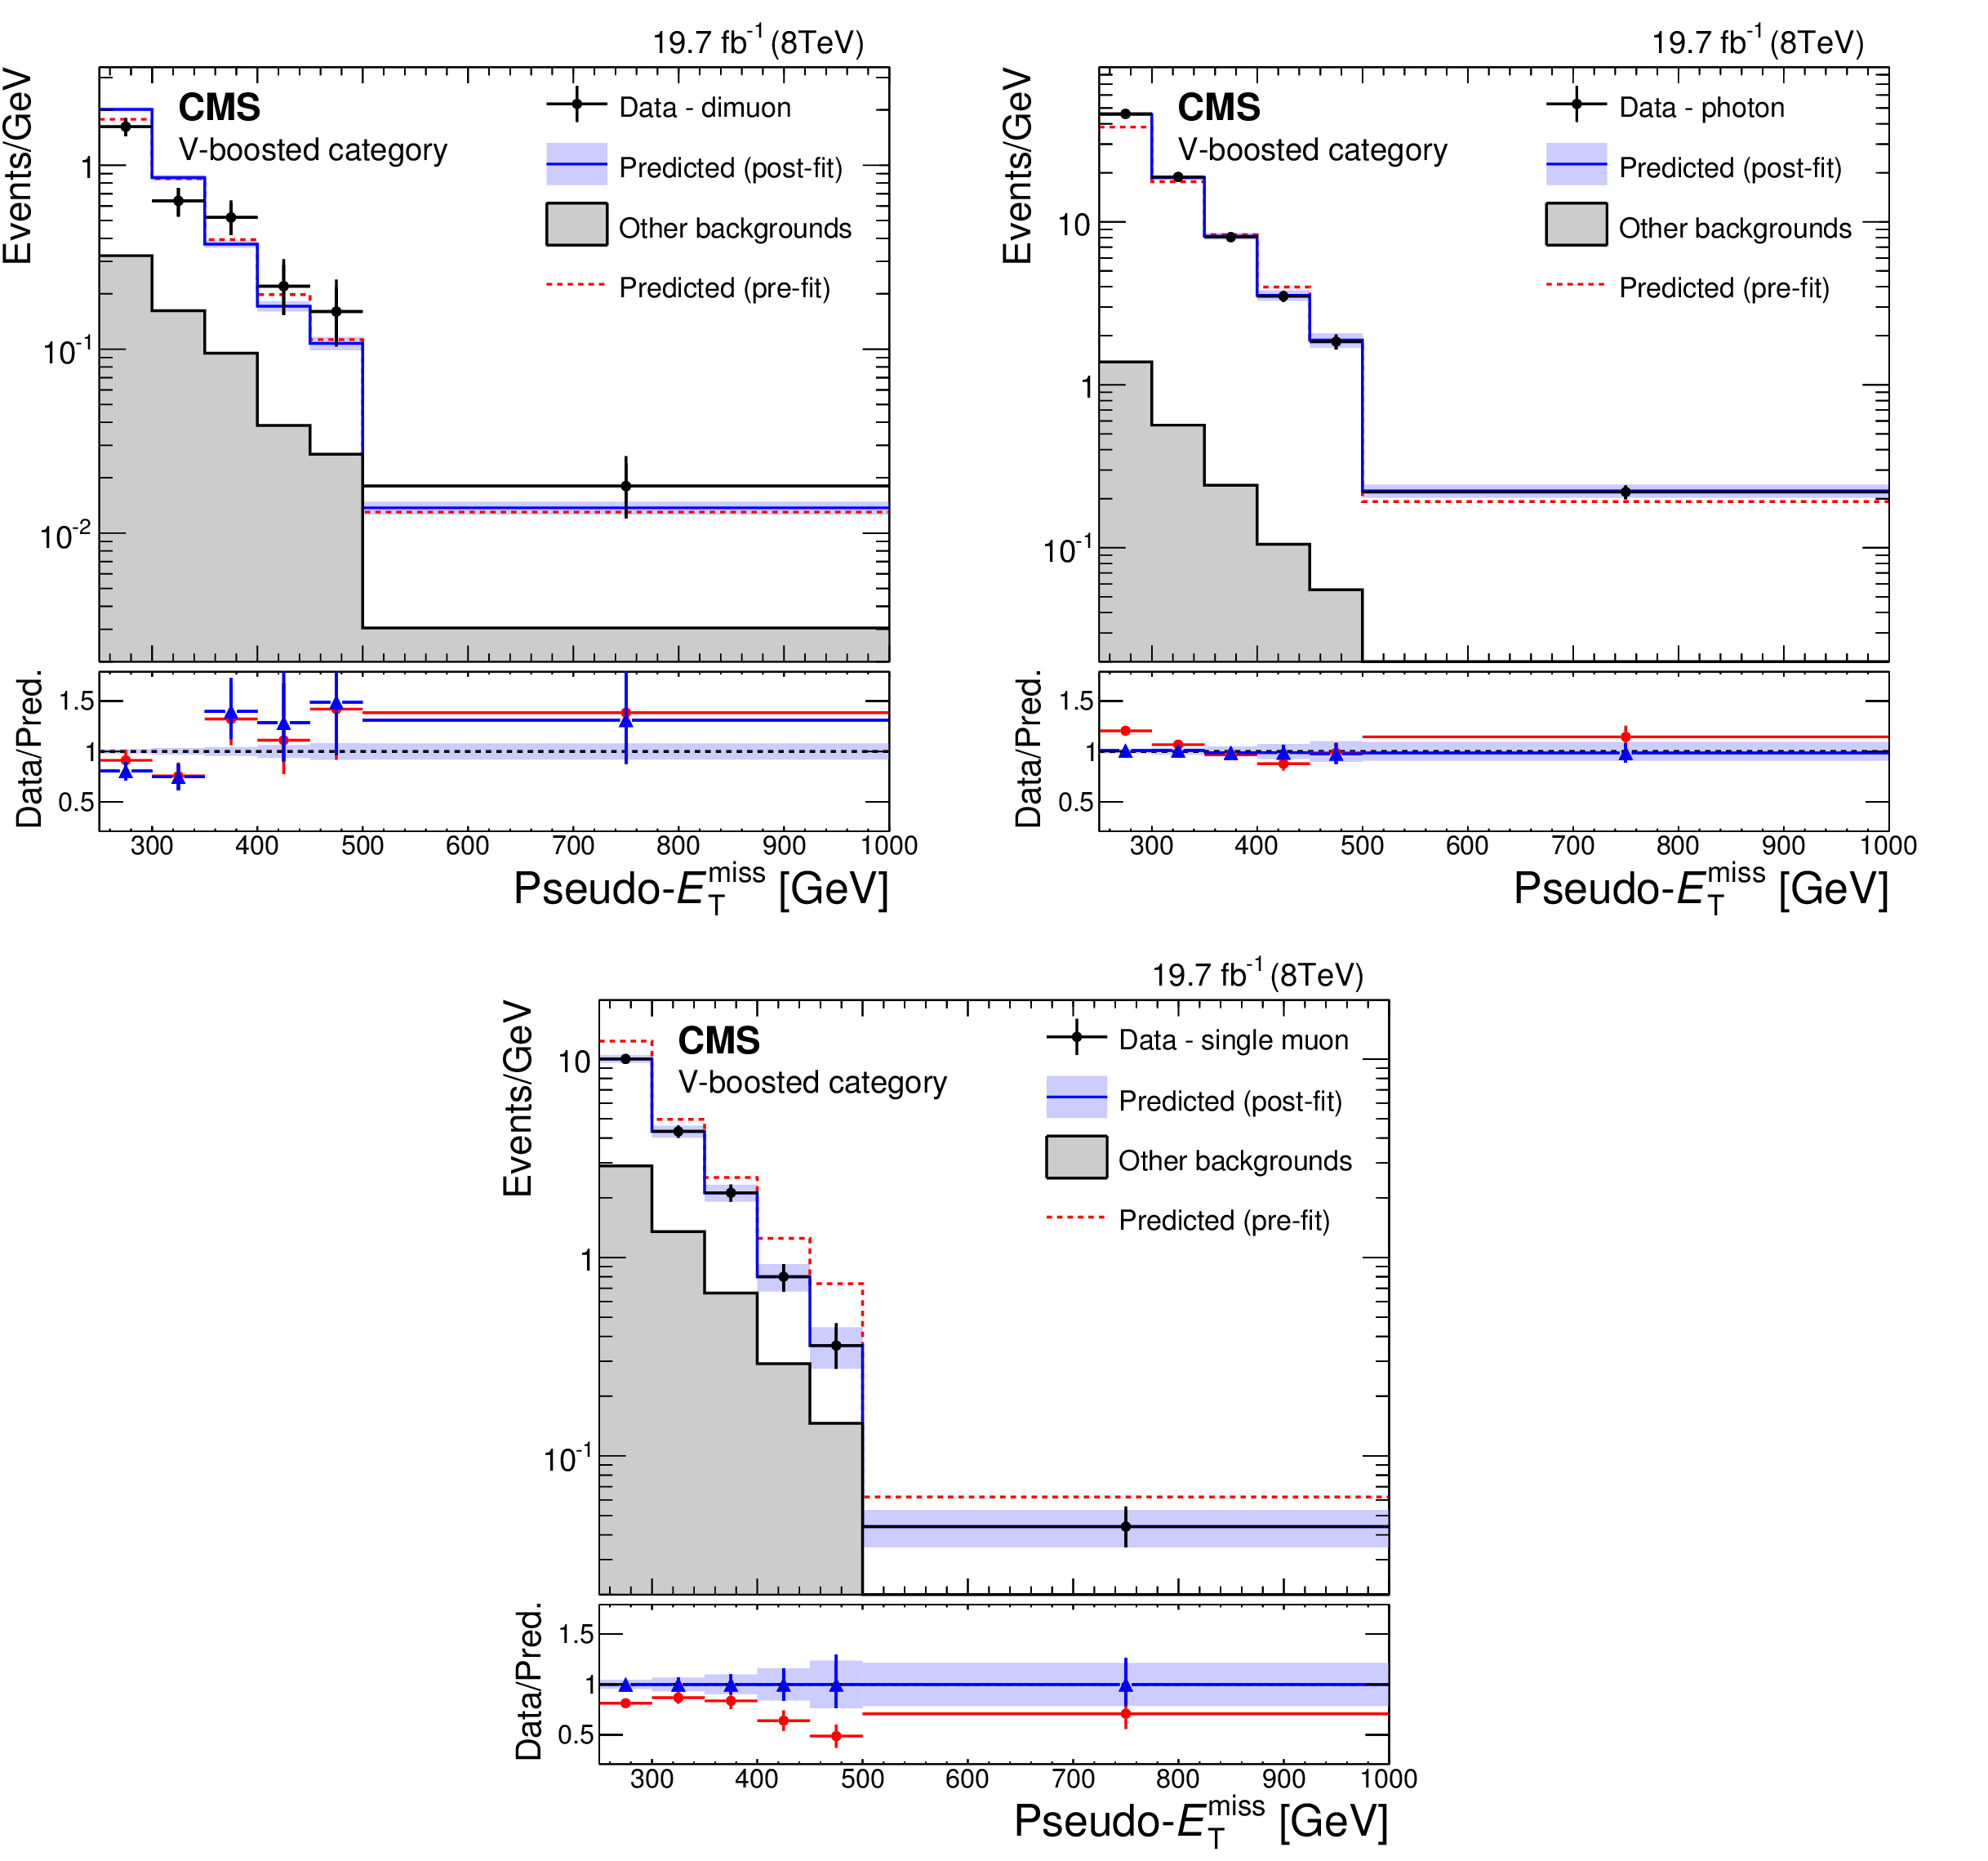
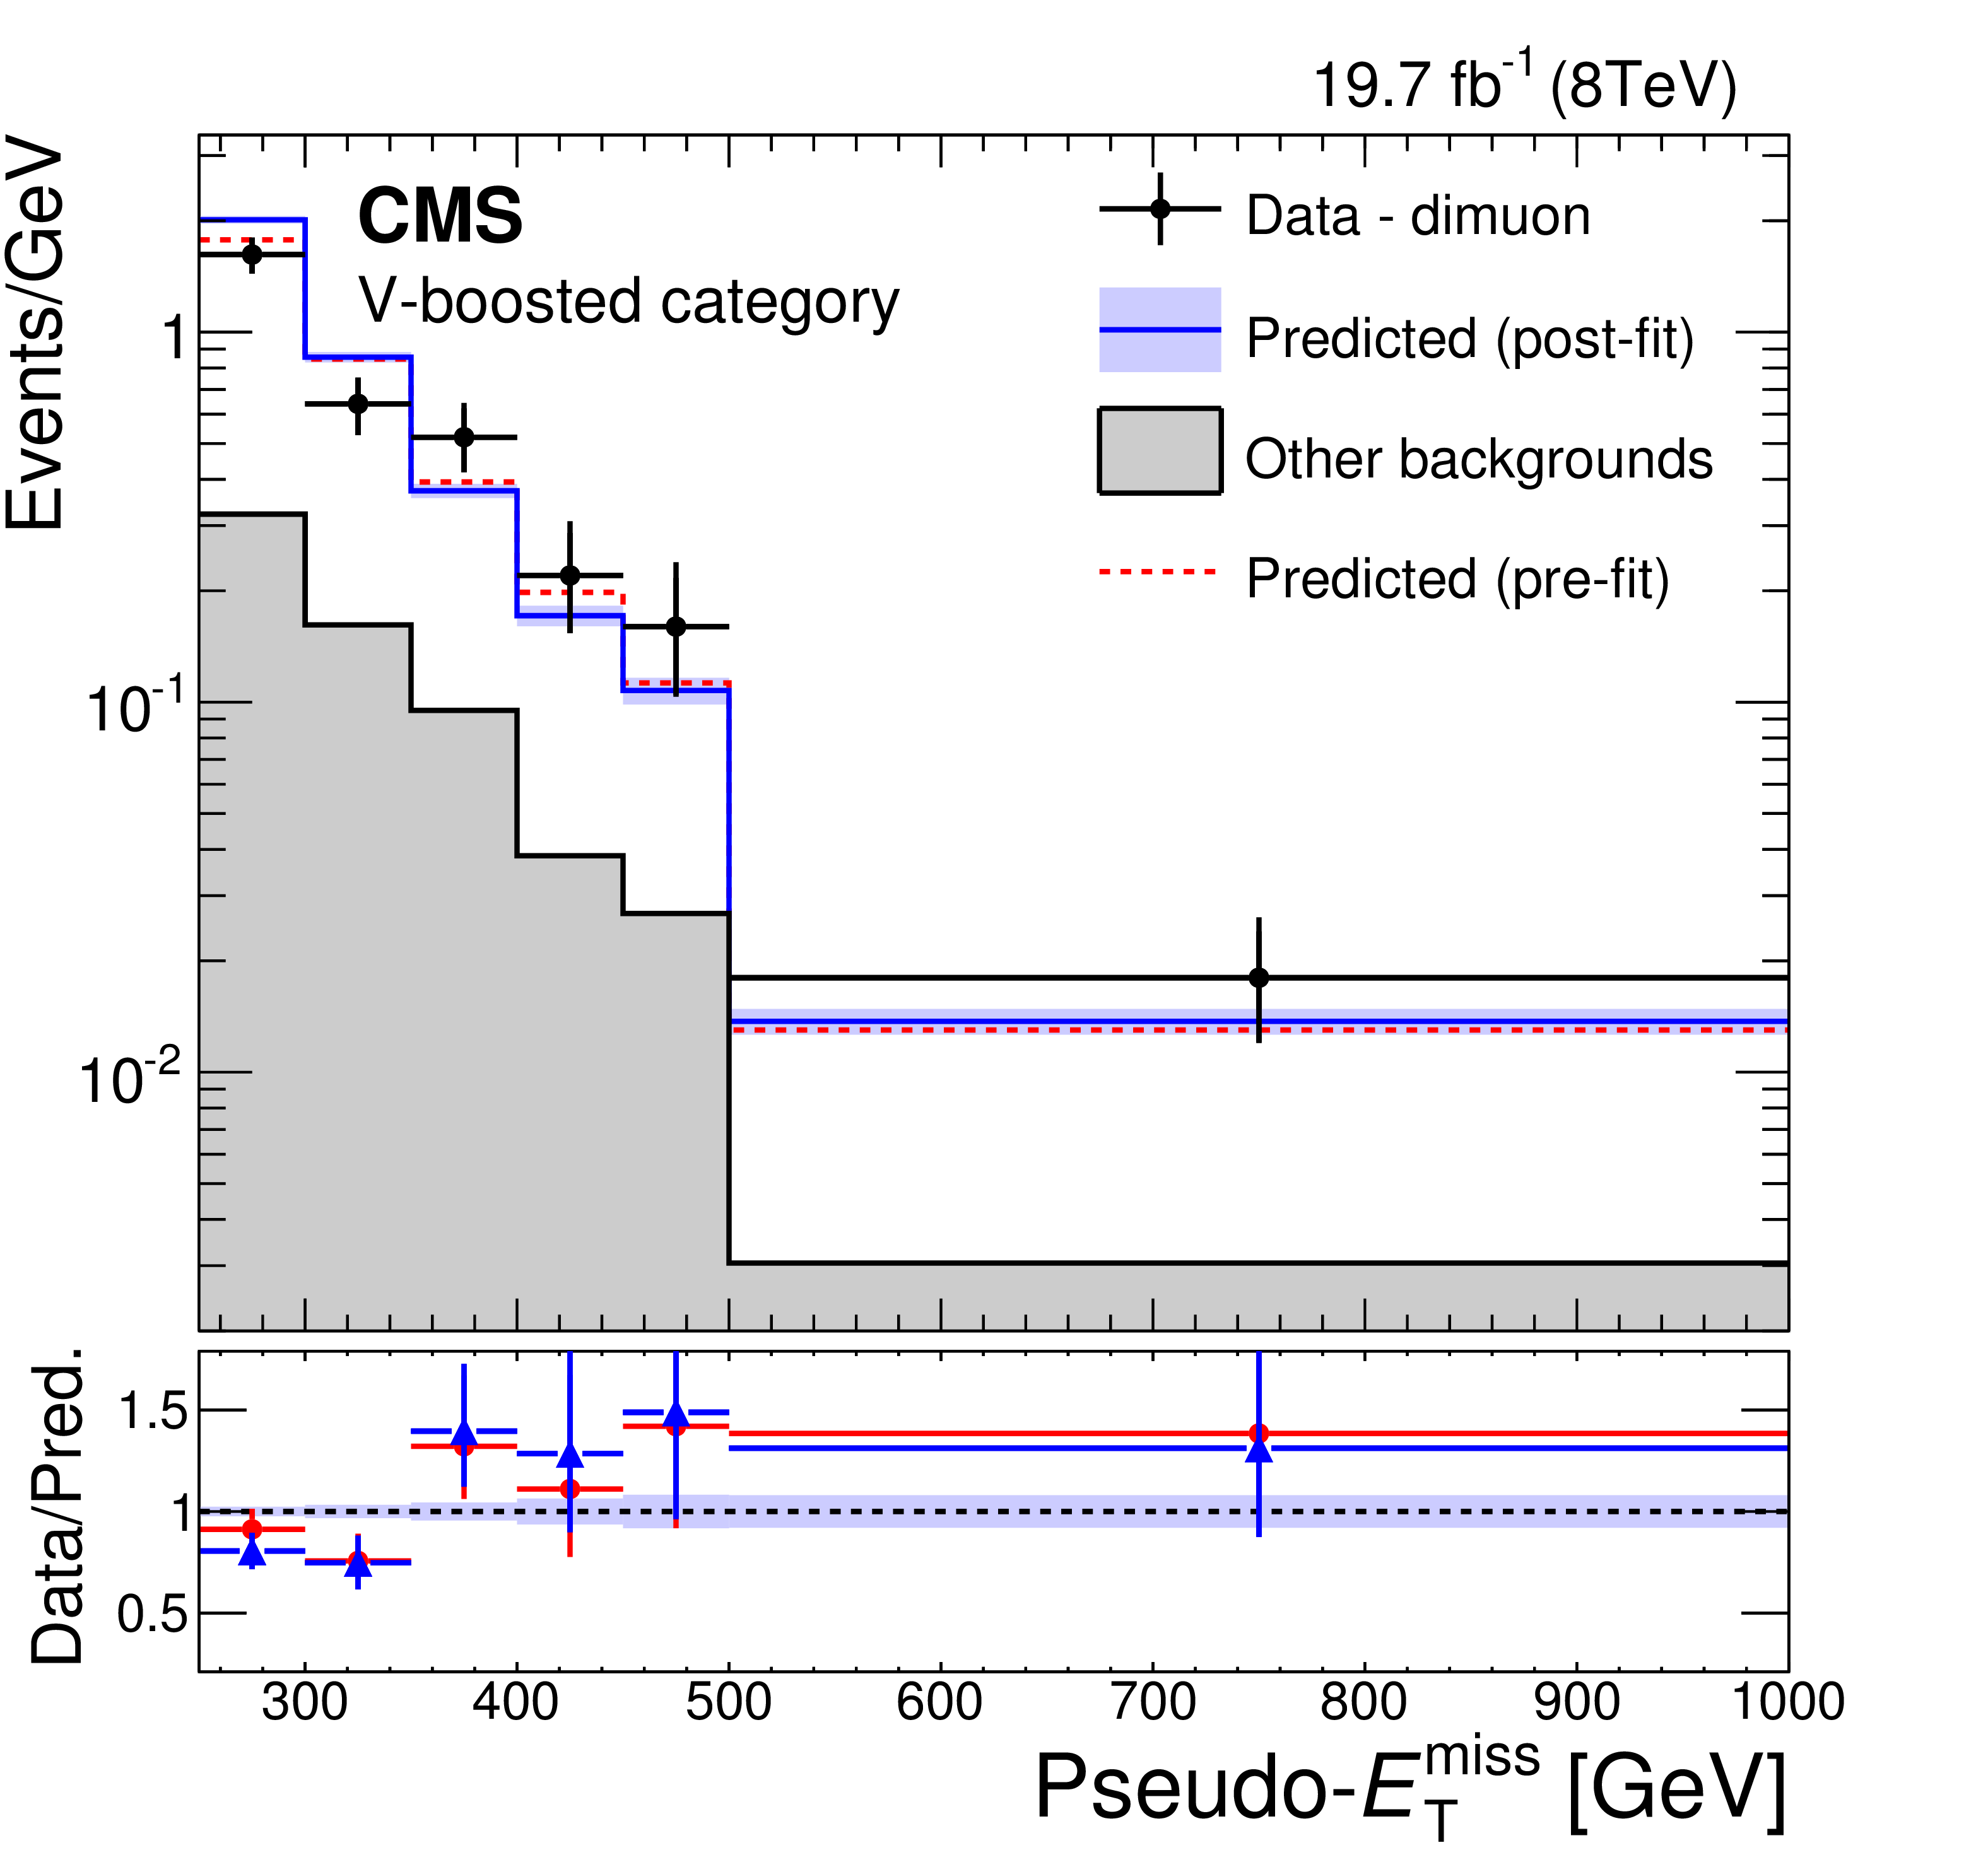
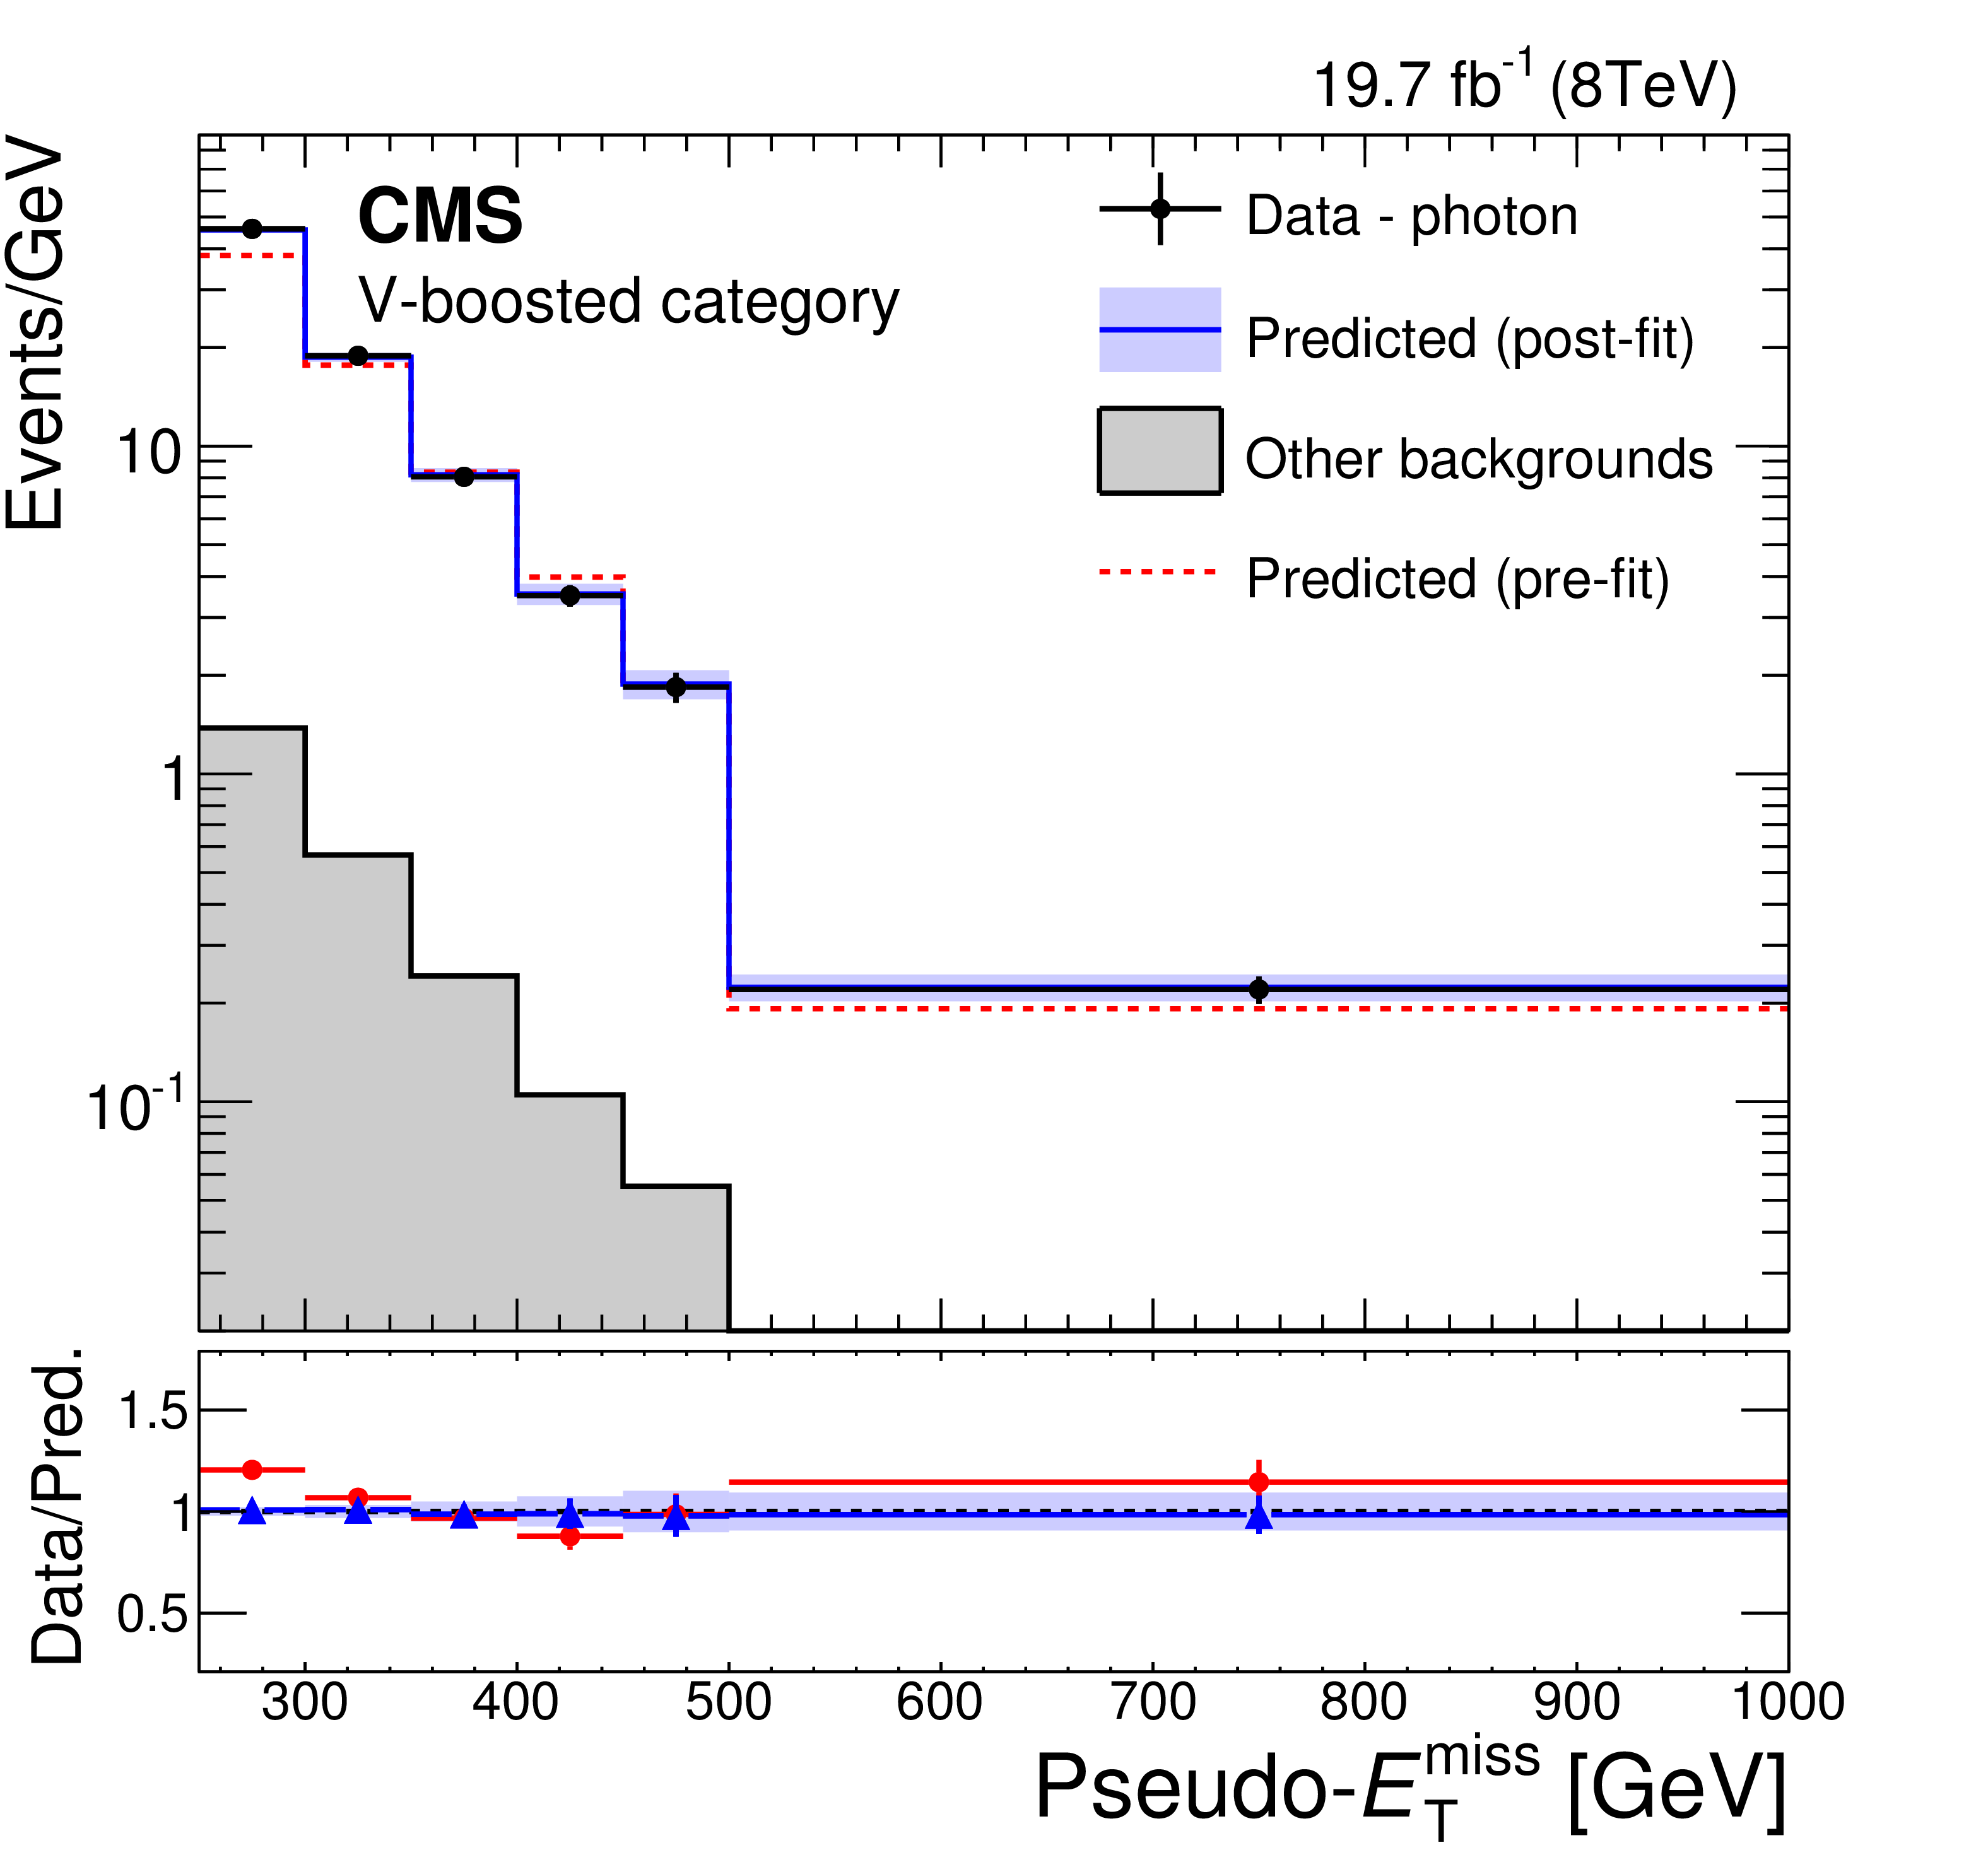
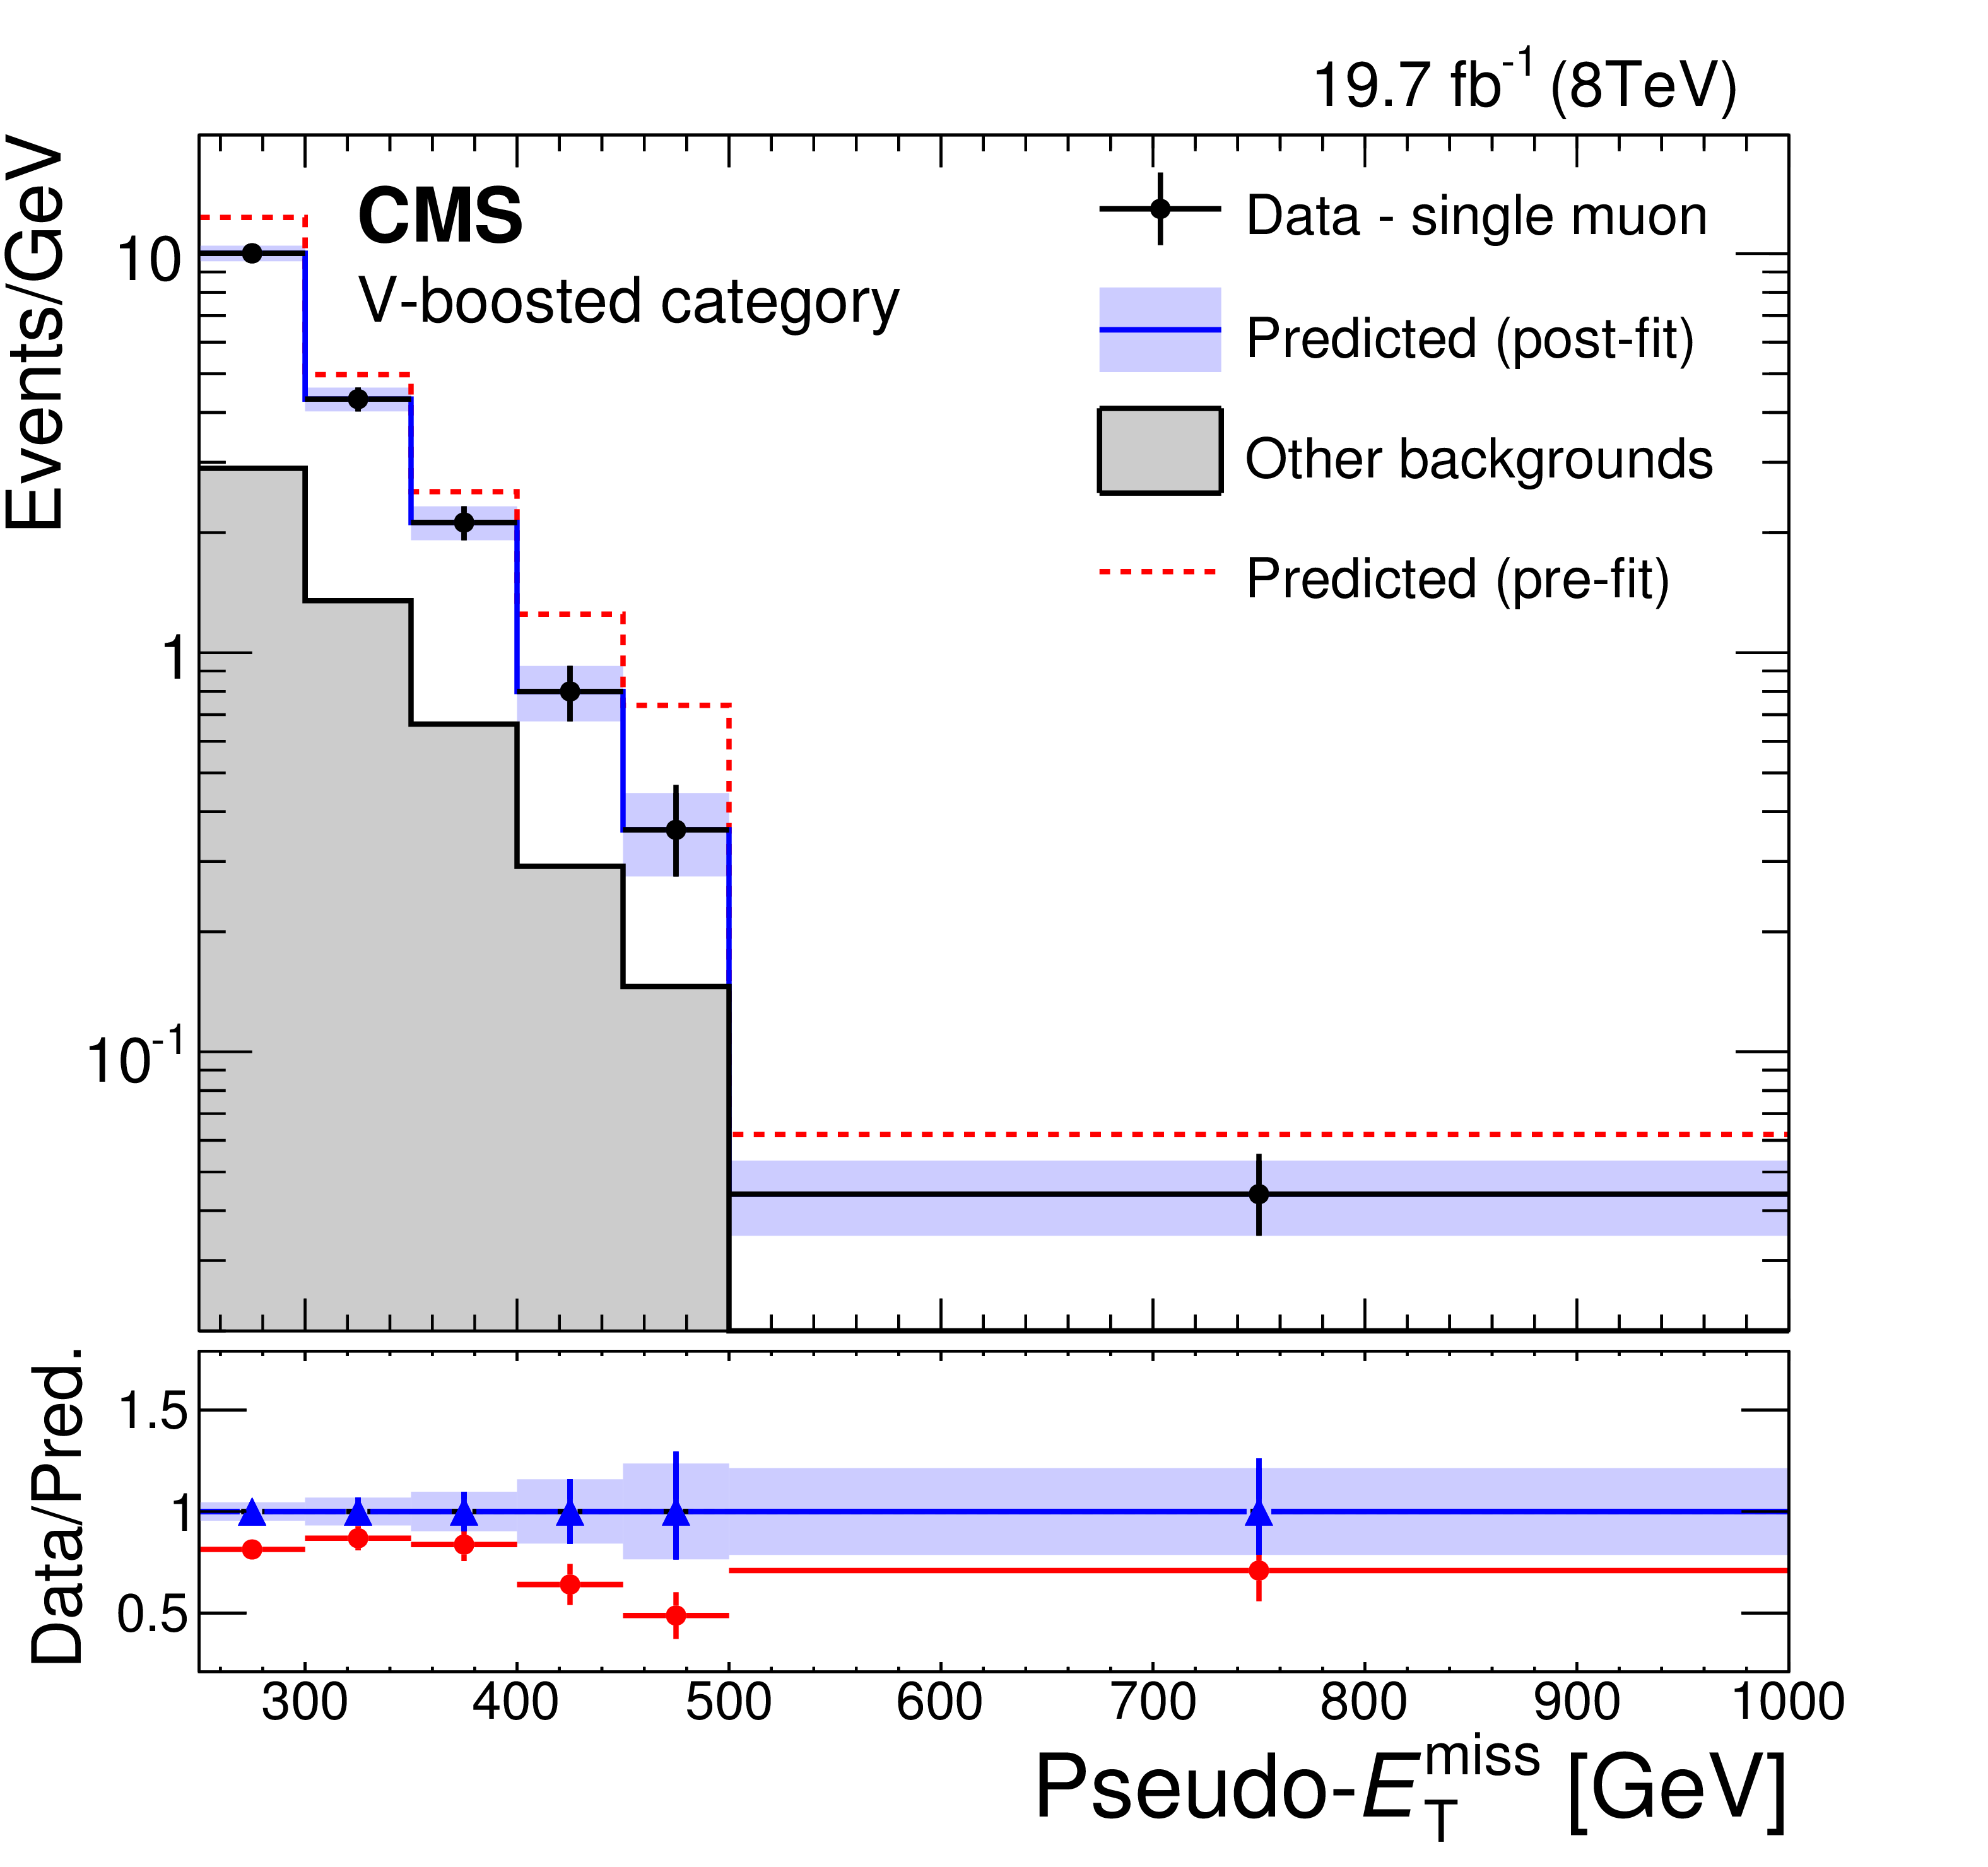
Figure 6:
Predicted and observed pseudo-$ {E_{\mathrm {T}}^{\text {miss}}}$ distributions in the dimuon (top-left), photon (top-right), and single muon (bottom) control regions, before and after performing the simultaneous likelihood fit to the data in the control regions, for the V-boosted category. The predictions for the distributions before fitting to the control region data (pre-fit), and after (post-fit) are shown as the dashed red and solid blue lines, respectively. The red circles in the lower panels show the ratio of the observed data to the pre-fit predictions, while the blue triangles show the ratio to the post-fit predictions. The horizontal bars on the data points indicate the width of the bin that is centred at that point. The filled bands around the post-fit prediction indicate the combined statistical and systematic uncertainties from the fit. |
png pdf |
Figure 6-a:
Predicted and observed pseudo-$ {E_{\mathrm {T}}^{\text {miss}}}$ distributions in the dimuon (top-left), photon (top-right), and single muon (bottom) control regions, before and after performing the simultaneous likelihood fit to the data in the control regions, for the V-boosted category. The predictions for the distributions before fitting to the control region data (pre-fit), and after (post-fit) are shown as the dashed red and solid blue lines, respectively. The red circles in the lower panels show the ratio of the observed data to the pre-fit predictions, while the blue triangles show the ratio to the post-fit predictions. The horizontal bars on the data points indicate the width of the bin that is centred at that point. The filled bands around the post-fit prediction indicate the combined statistical and systematic uncertainties from the fit. |
png pdf |
Figure 6-b:
Predicted and observed pseudo-$ {E_{\mathrm {T}}^{\text {miss}}}$ distributions in the dimuon (top-left), photon (top-right), and single muon (bottom) control regions, before and after performing the simultaneous likelihood fit to the data in the control regions, for the V-boosted category. The predictions for the distributions before fitting to the control region data (pre-fit), and after (post-fit) are shown as the dashed red and solid blue lines, respectively. The red circles in the lower panels show the ratio of the observed data to the pre-fit predictions, while the blue triangles show the ratio to the post-fit predictions. The horizontal bars on the data points indicate the width of the bin that is centred at that point. The filled bands around the post-fit prediction indicate the combined statistical and systematic uncertainties from the fit. |
png pdf |
Figure 6-c:
Predicted and observed pseudo-$ {E_{\mathrm {T}}^{\text {miss}}}$ distributions in the dimuon (top-left), photon (top-right), and single muon (bottom) control regions, before and after performing the simultaneous likelihood fit to the data in the control regions, for the V-boosted category. The predictions for the distributions before fitting to the control region data (pre-fit), and after (post-fit) are shown as the dashed red and solid blue lines, respectively. The red circles in the lower panels show the ratio of the observed data to the pre-fit predictions, while the blue triangles show the ratio to the post-fit predictions. The horizontal bars on the data points indicate the width of the bin that is centred at that point. The filled bands around the post-fit prediction indicate the combined statistical and systematic uncertainties from the fit. |

png pdf |
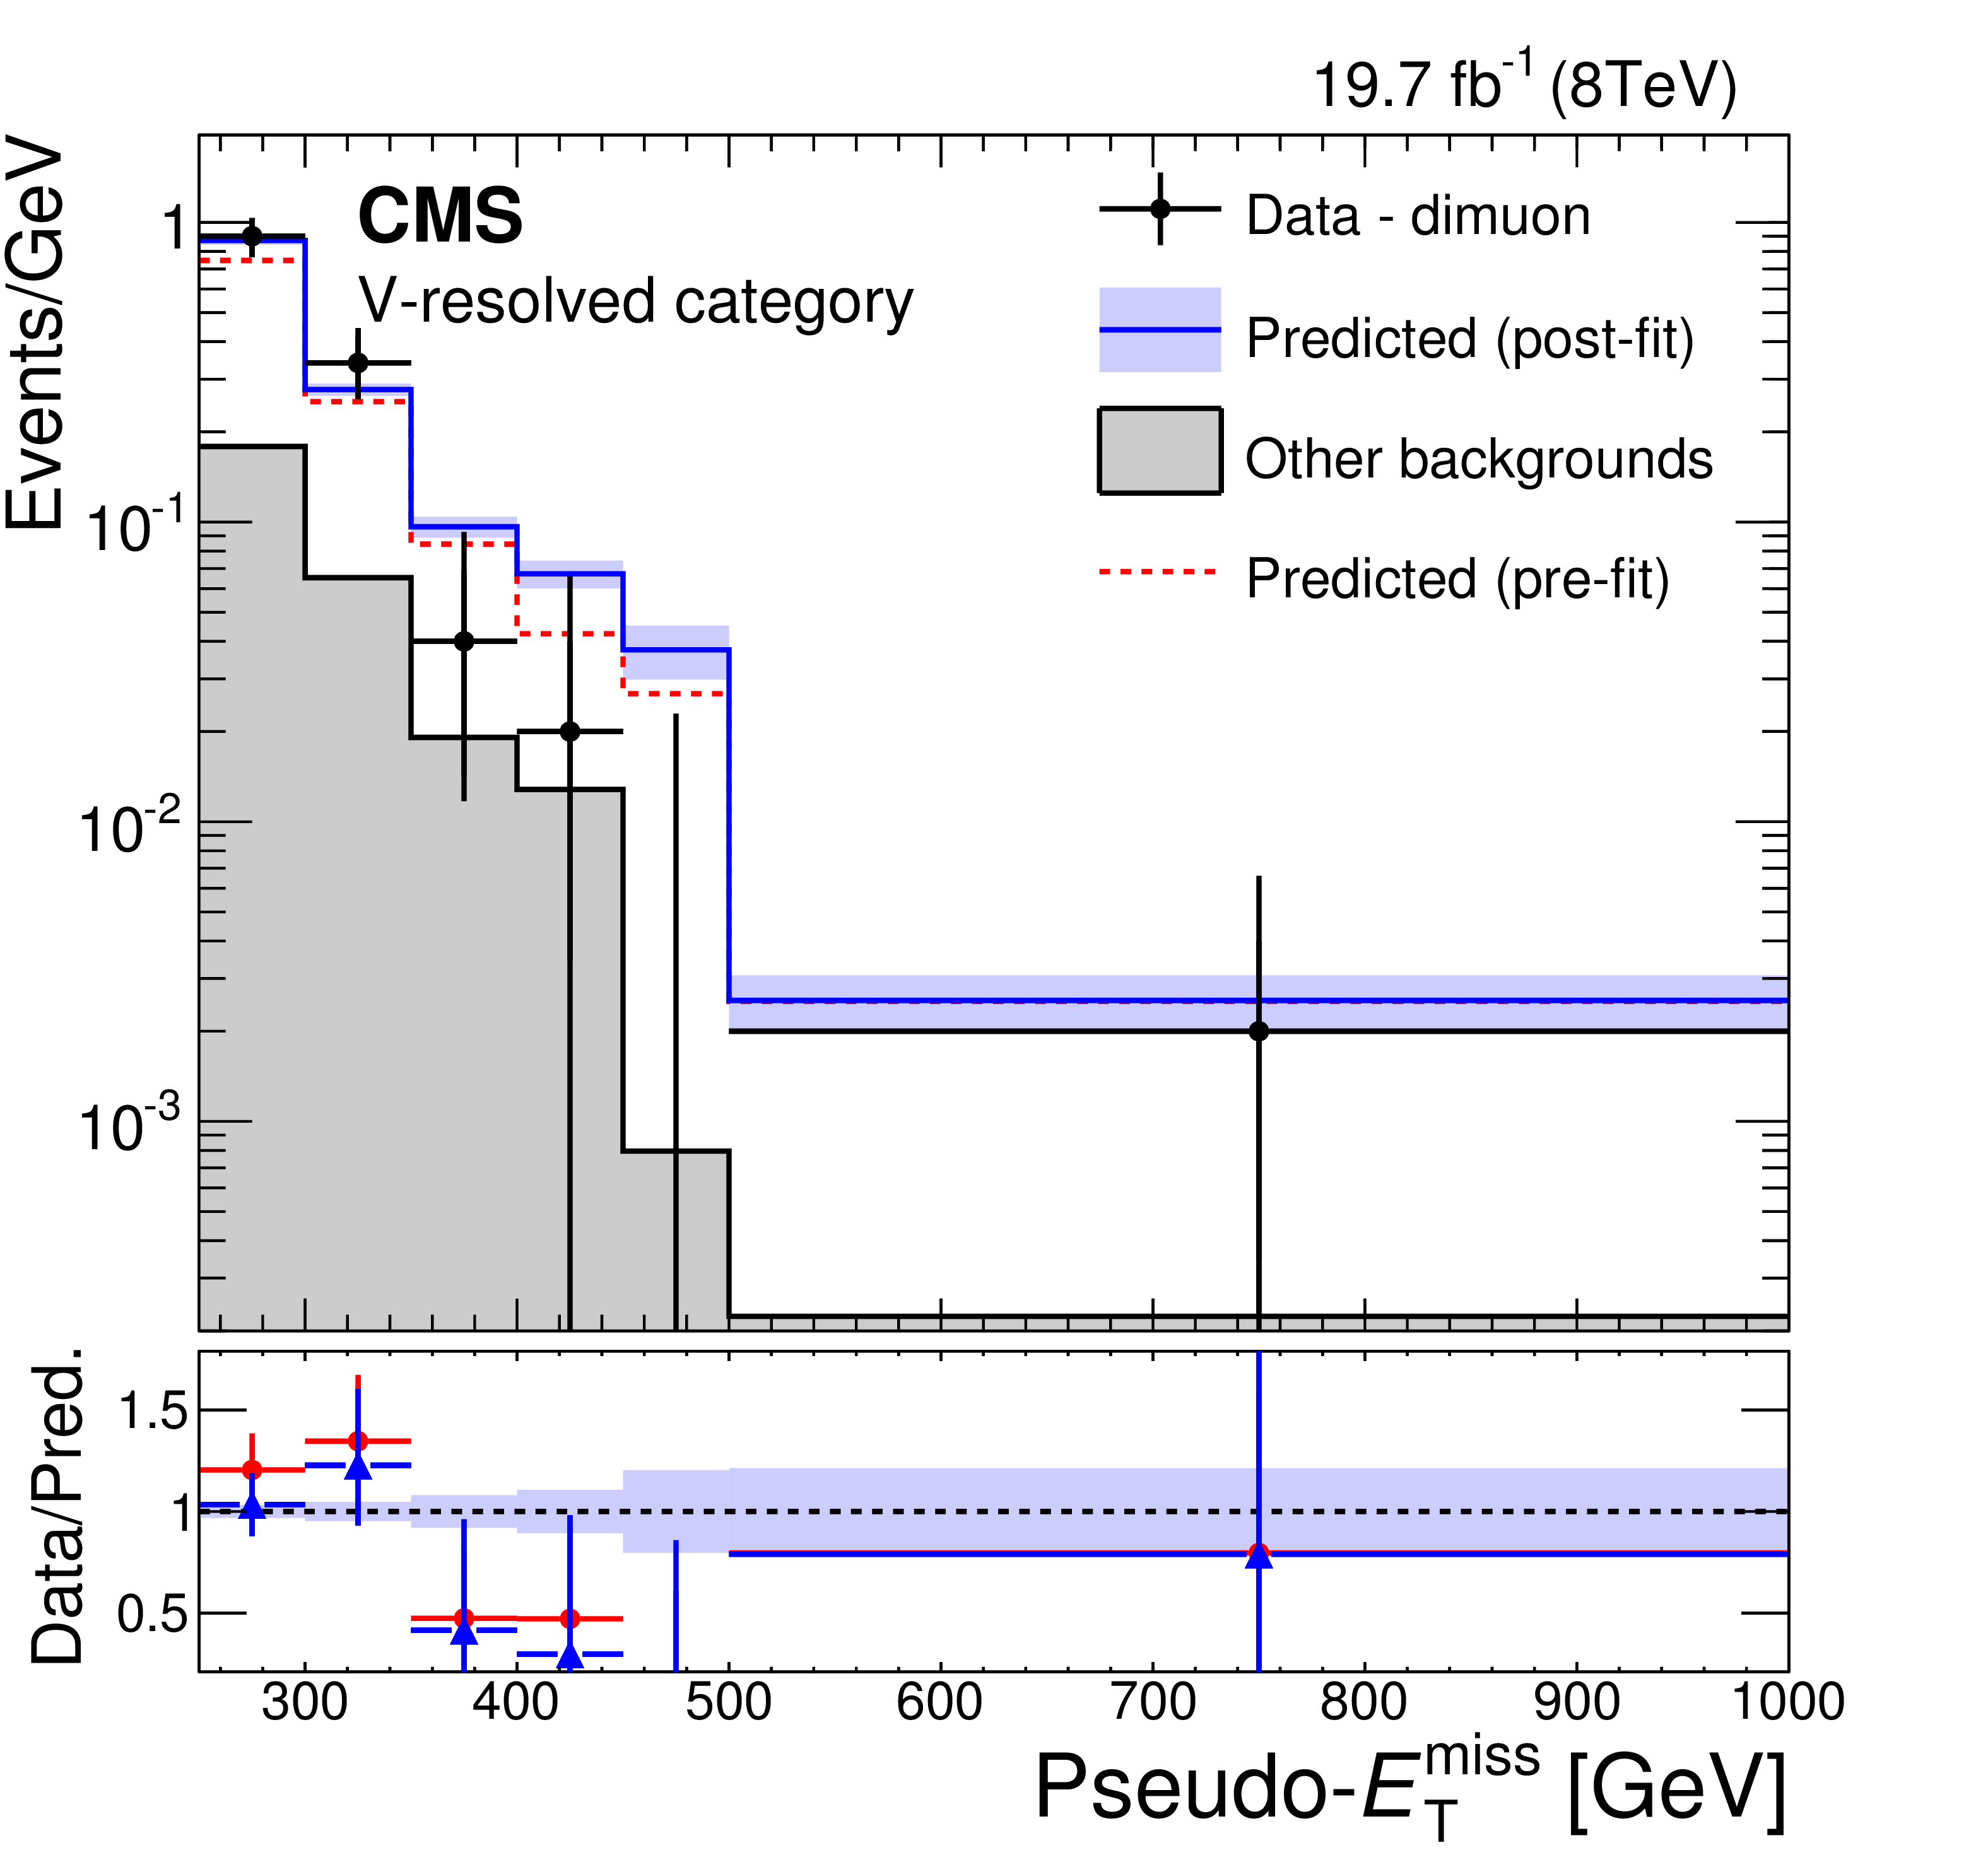
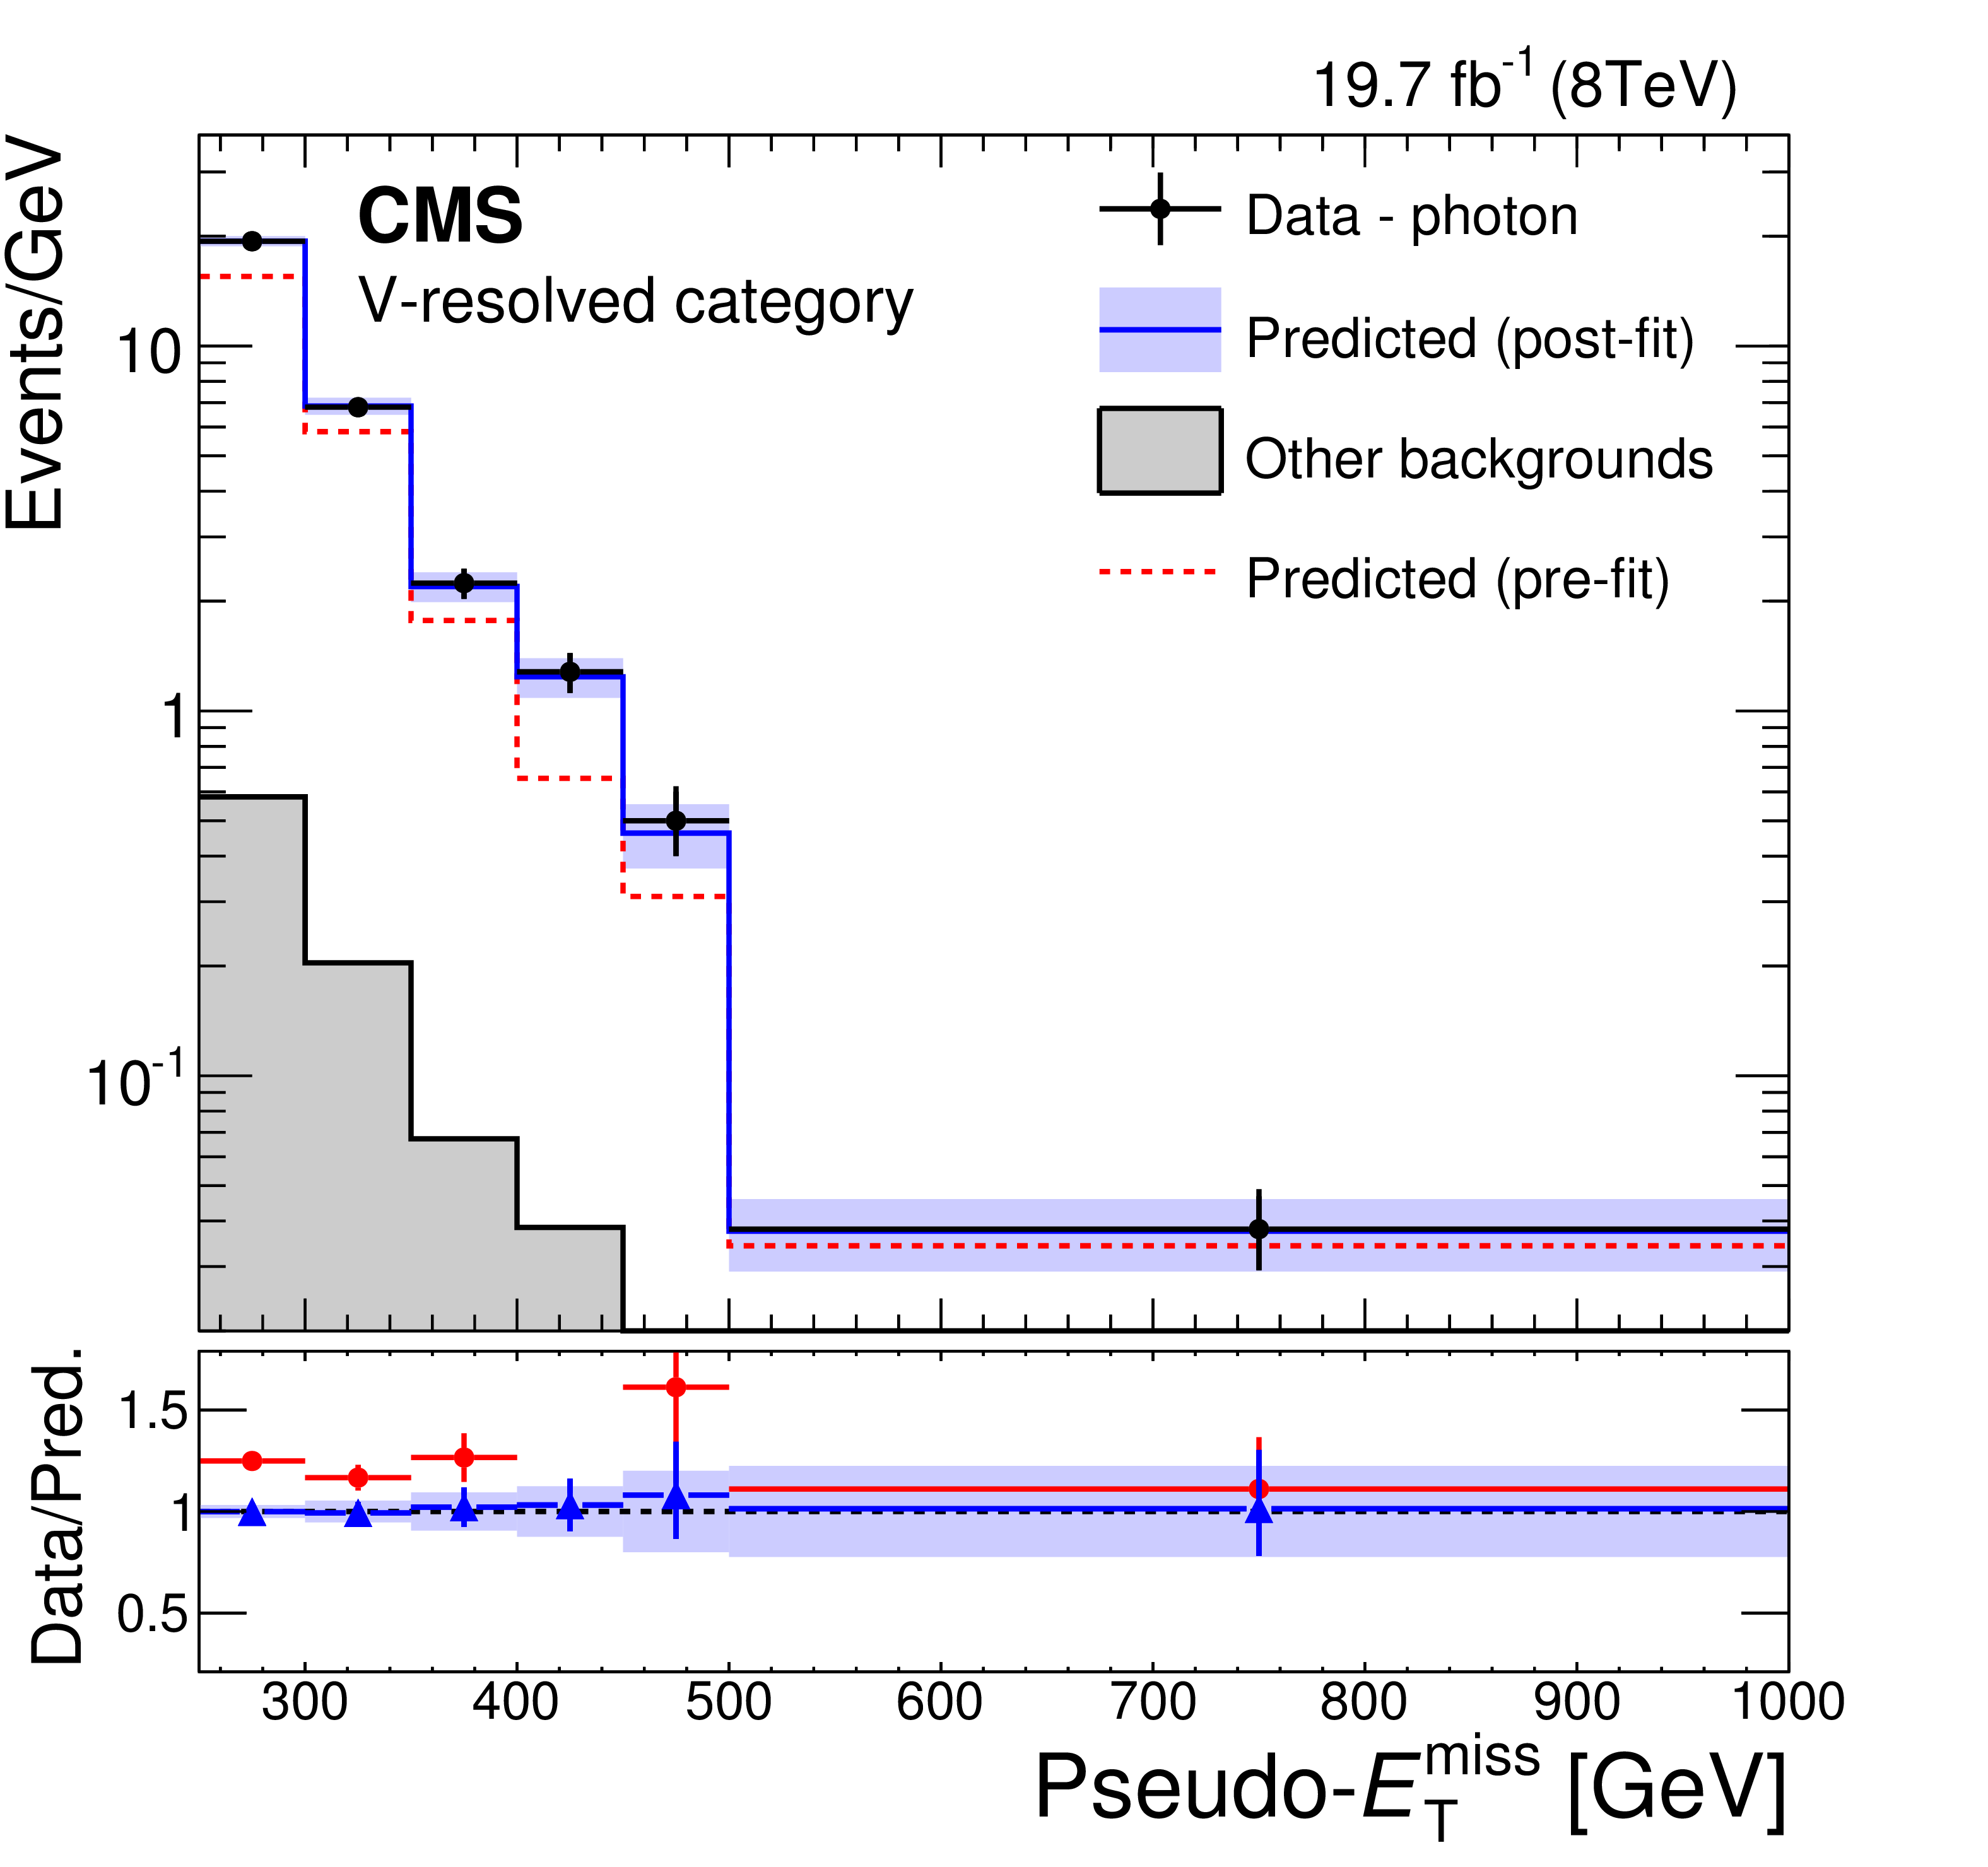
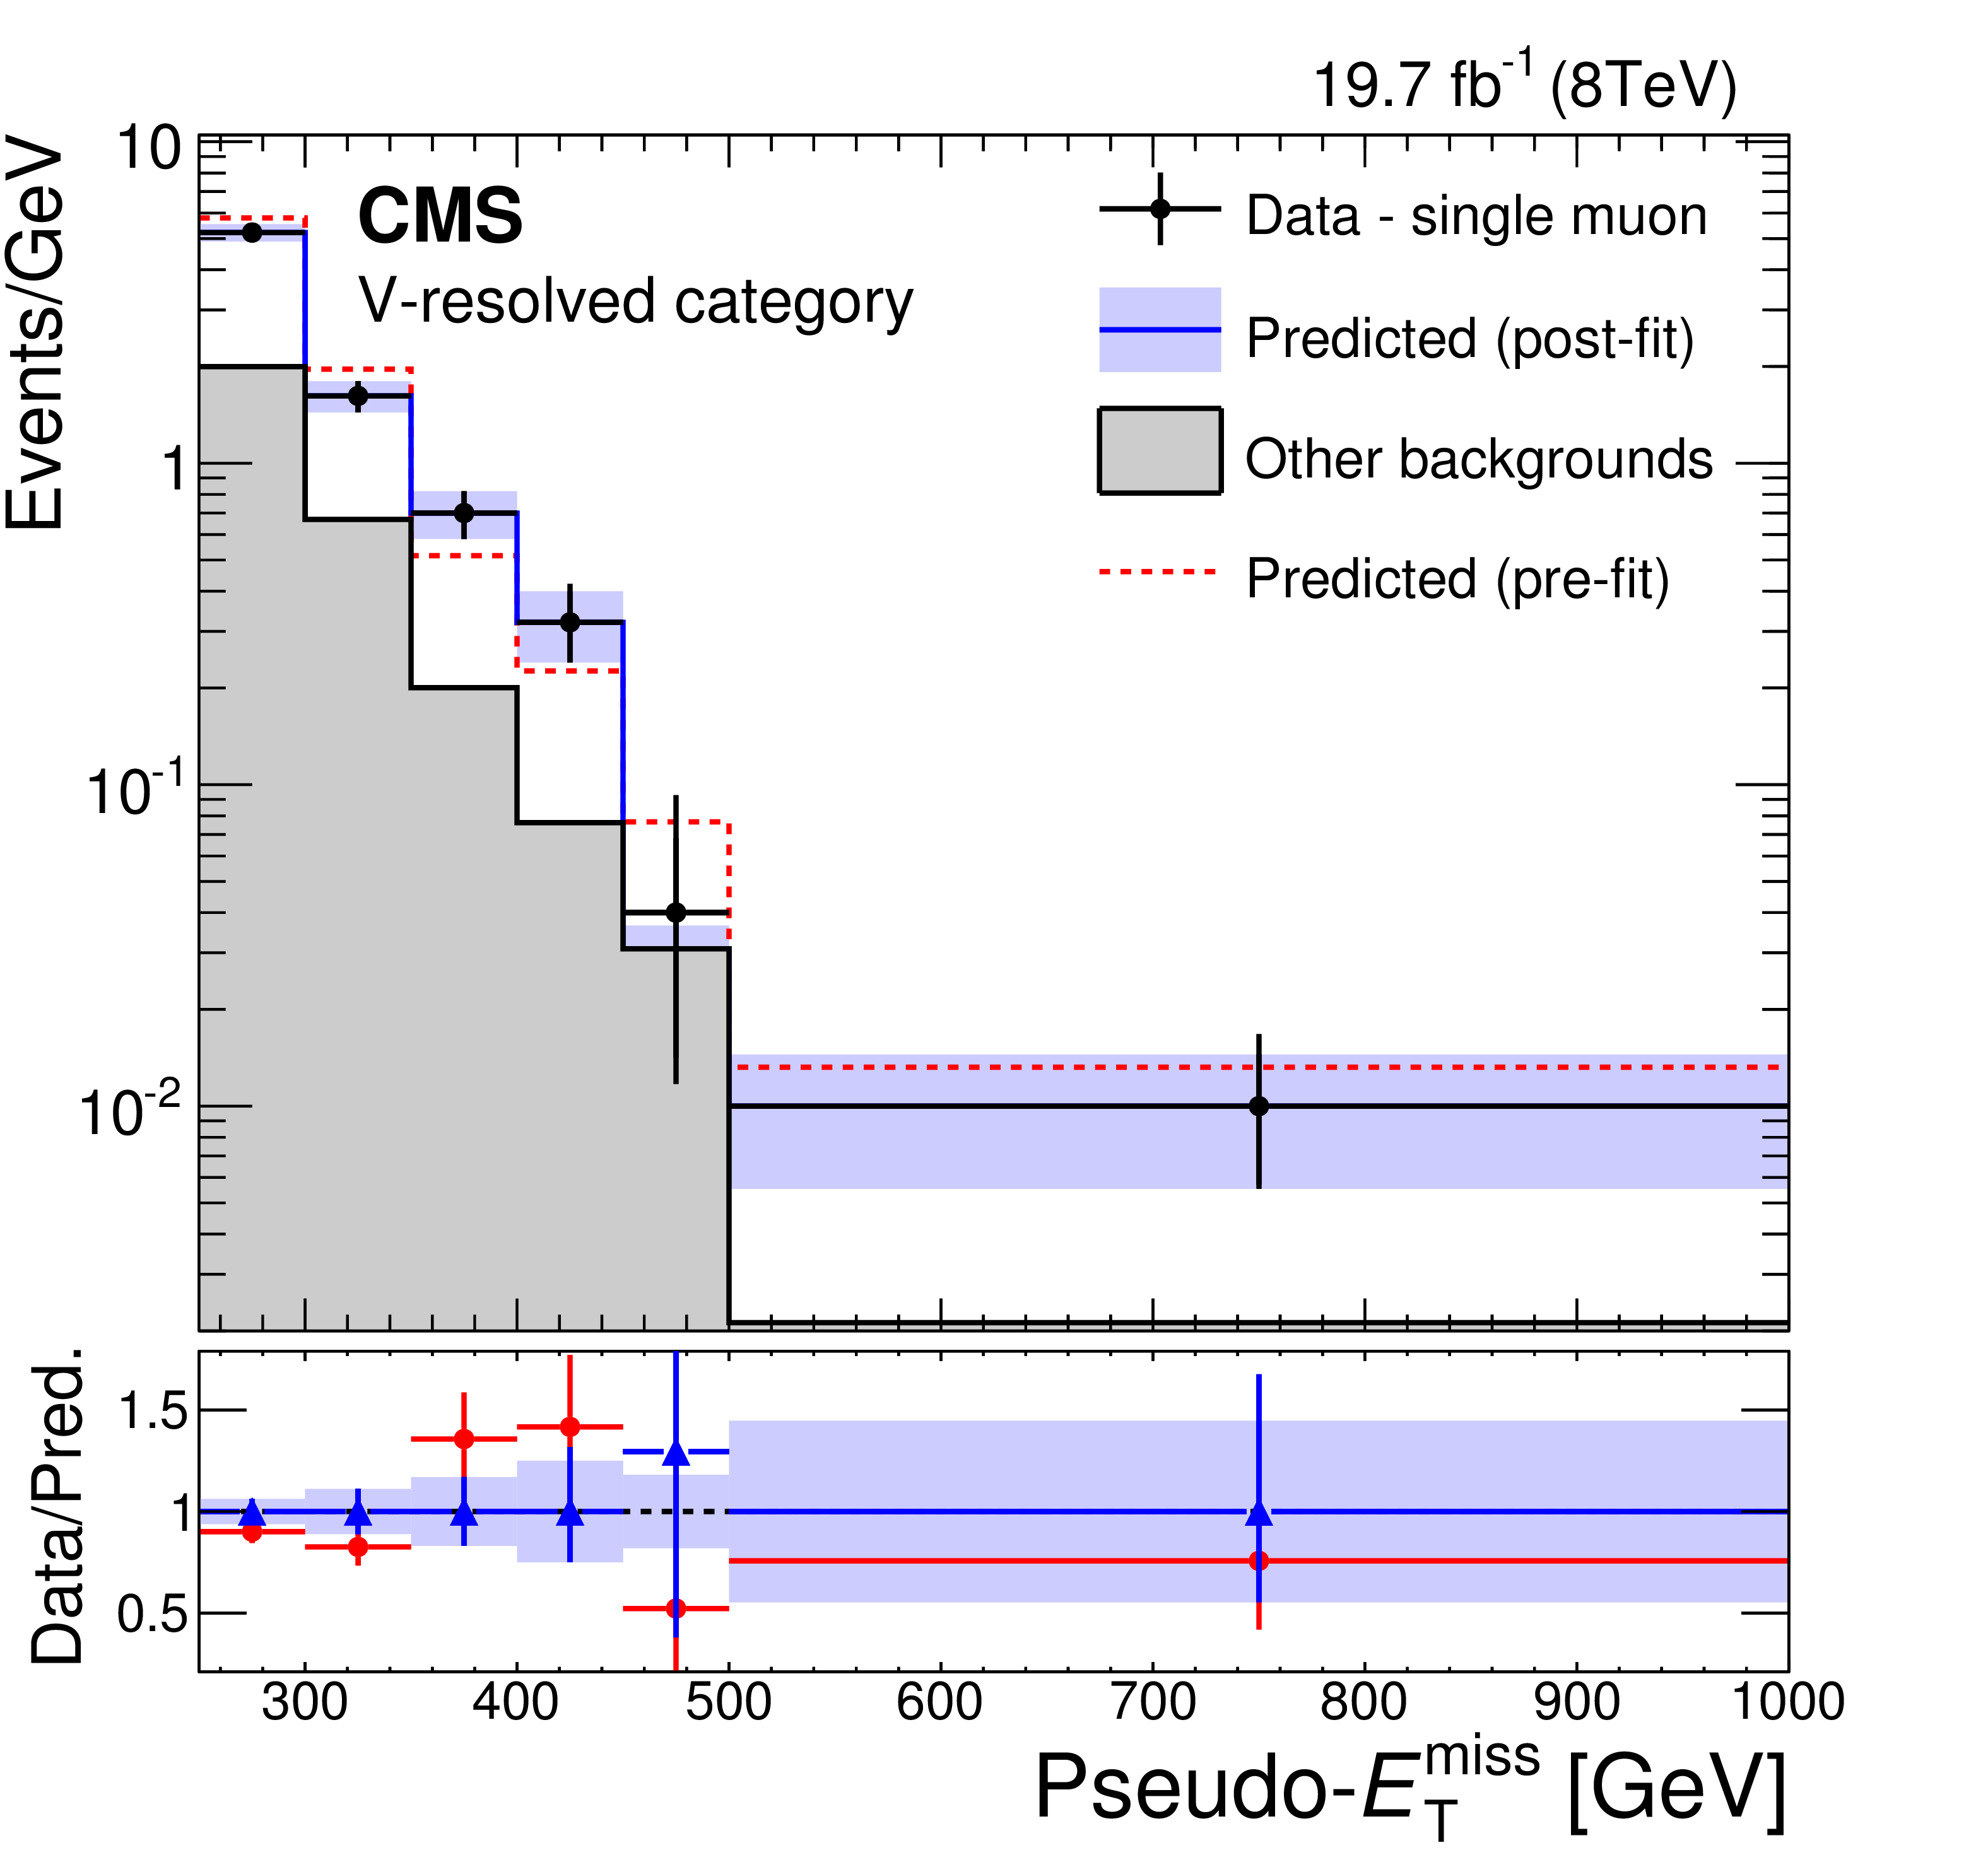
Figure 7:
Predicted and observed pseudo-$ {E_{\mathrm {T}}^{\text {miss}}}$ distributions in the dimuon (top-left), photon (top-right), and single muon (bottom) control regions, before and after performing the simultaneous likelihood fit to the data in the control regions, for the V-resolved category. The predictions for the distributions before fitting to the control region data (pre-fit), and after (post-fit) are shown as the dashed red and solid blue lines, respectively. The red circles in the lower panels show the ratio of the observed data to the pre-fit predictions, while the blue triangles show the ratio to the post-fit predictions. The horizontal bars on the data points indicate the width of the bin that is centred at that point. The filled bands around the post-fit prediction indicate the combined statistical and systematic uncertainties from the fit. |
png pdf |
Figure 7-a:
Predicted and observed pseudo-$ {E_{\mathrm {T}}^{\text {miss}}}$ distributions in the dimuon (top-left), photon (top-right), and single muon (bottom) control regions, before and after performing the simultaneous likelihood fit to the data in the control regions, for the V-resolved category. The predictions for the distributions before fitting to the control region data (pre-fit), and after (post-fit) are shown as the dashed red and solid blue lines, respectively. The red circles in the lower panels show the ratio of the observed data to the pre-fit predictions, while the blue triangles show the ratio to the post-fit predictions. The horizontal bars on the data points indicate the width of the bin that is centred at that point. The filled bands around the post-fit prediction indicate the combined statistical and systematic uncertainties from the fit. |
png pdf |
Figure 7-b:
Predicted and observed pseudo-$ {E_{\mathrm {T}}^{\text {miss}}}$ distributions in the dimuon (top-left), photon (top-right), and single muon (bottom) control regions, before and after performing the simultaneous likelihood fit to the data in the control regions, for the V-resolved category. The predictions for the distributions before fitting to the control region data (pre-fit), and after (post-fit) are shown as the dashed red and solid blue lines, respectively. The red circles in the lower panels show the ratio of the observed data to the pre-fit predictions, while the blue triangles show the ratio to the post-fit predictions. The horizontal bars on the data points indicate the width of the bin that is centred at that point. The filled bands around the post-fit prediction indicate the combined statistical and systematic uncertainties from the fit. |
png pdf |
Figure 7-c:
Predicted and observed pseudo-$ {E_{\mathrm {T}}^{\text {miss}}}$ distributions in the dimuon (top-left), photon (top-right), and single muon (bottom) control regions, before and after performing the simultaneous likelihood fit to the data in the control regions, for the V-resolved category. The predictions for the distributions before fitting to the control region data (pre-fit), and after (post-fit) are shown as the dashed red and solid blue lines, respectively. The red circles in the lower panels show the ratio of the observed data to the pre-fit predictions, while the blue triangles show the ratio to the post-fit predictions. The horizontal bars on the data points indicate the width of the bin that is centred at that point. The filled bands around the post-fit prediction indicate the combined statistical and systematic uncertainties from the fit. |
png pdf |
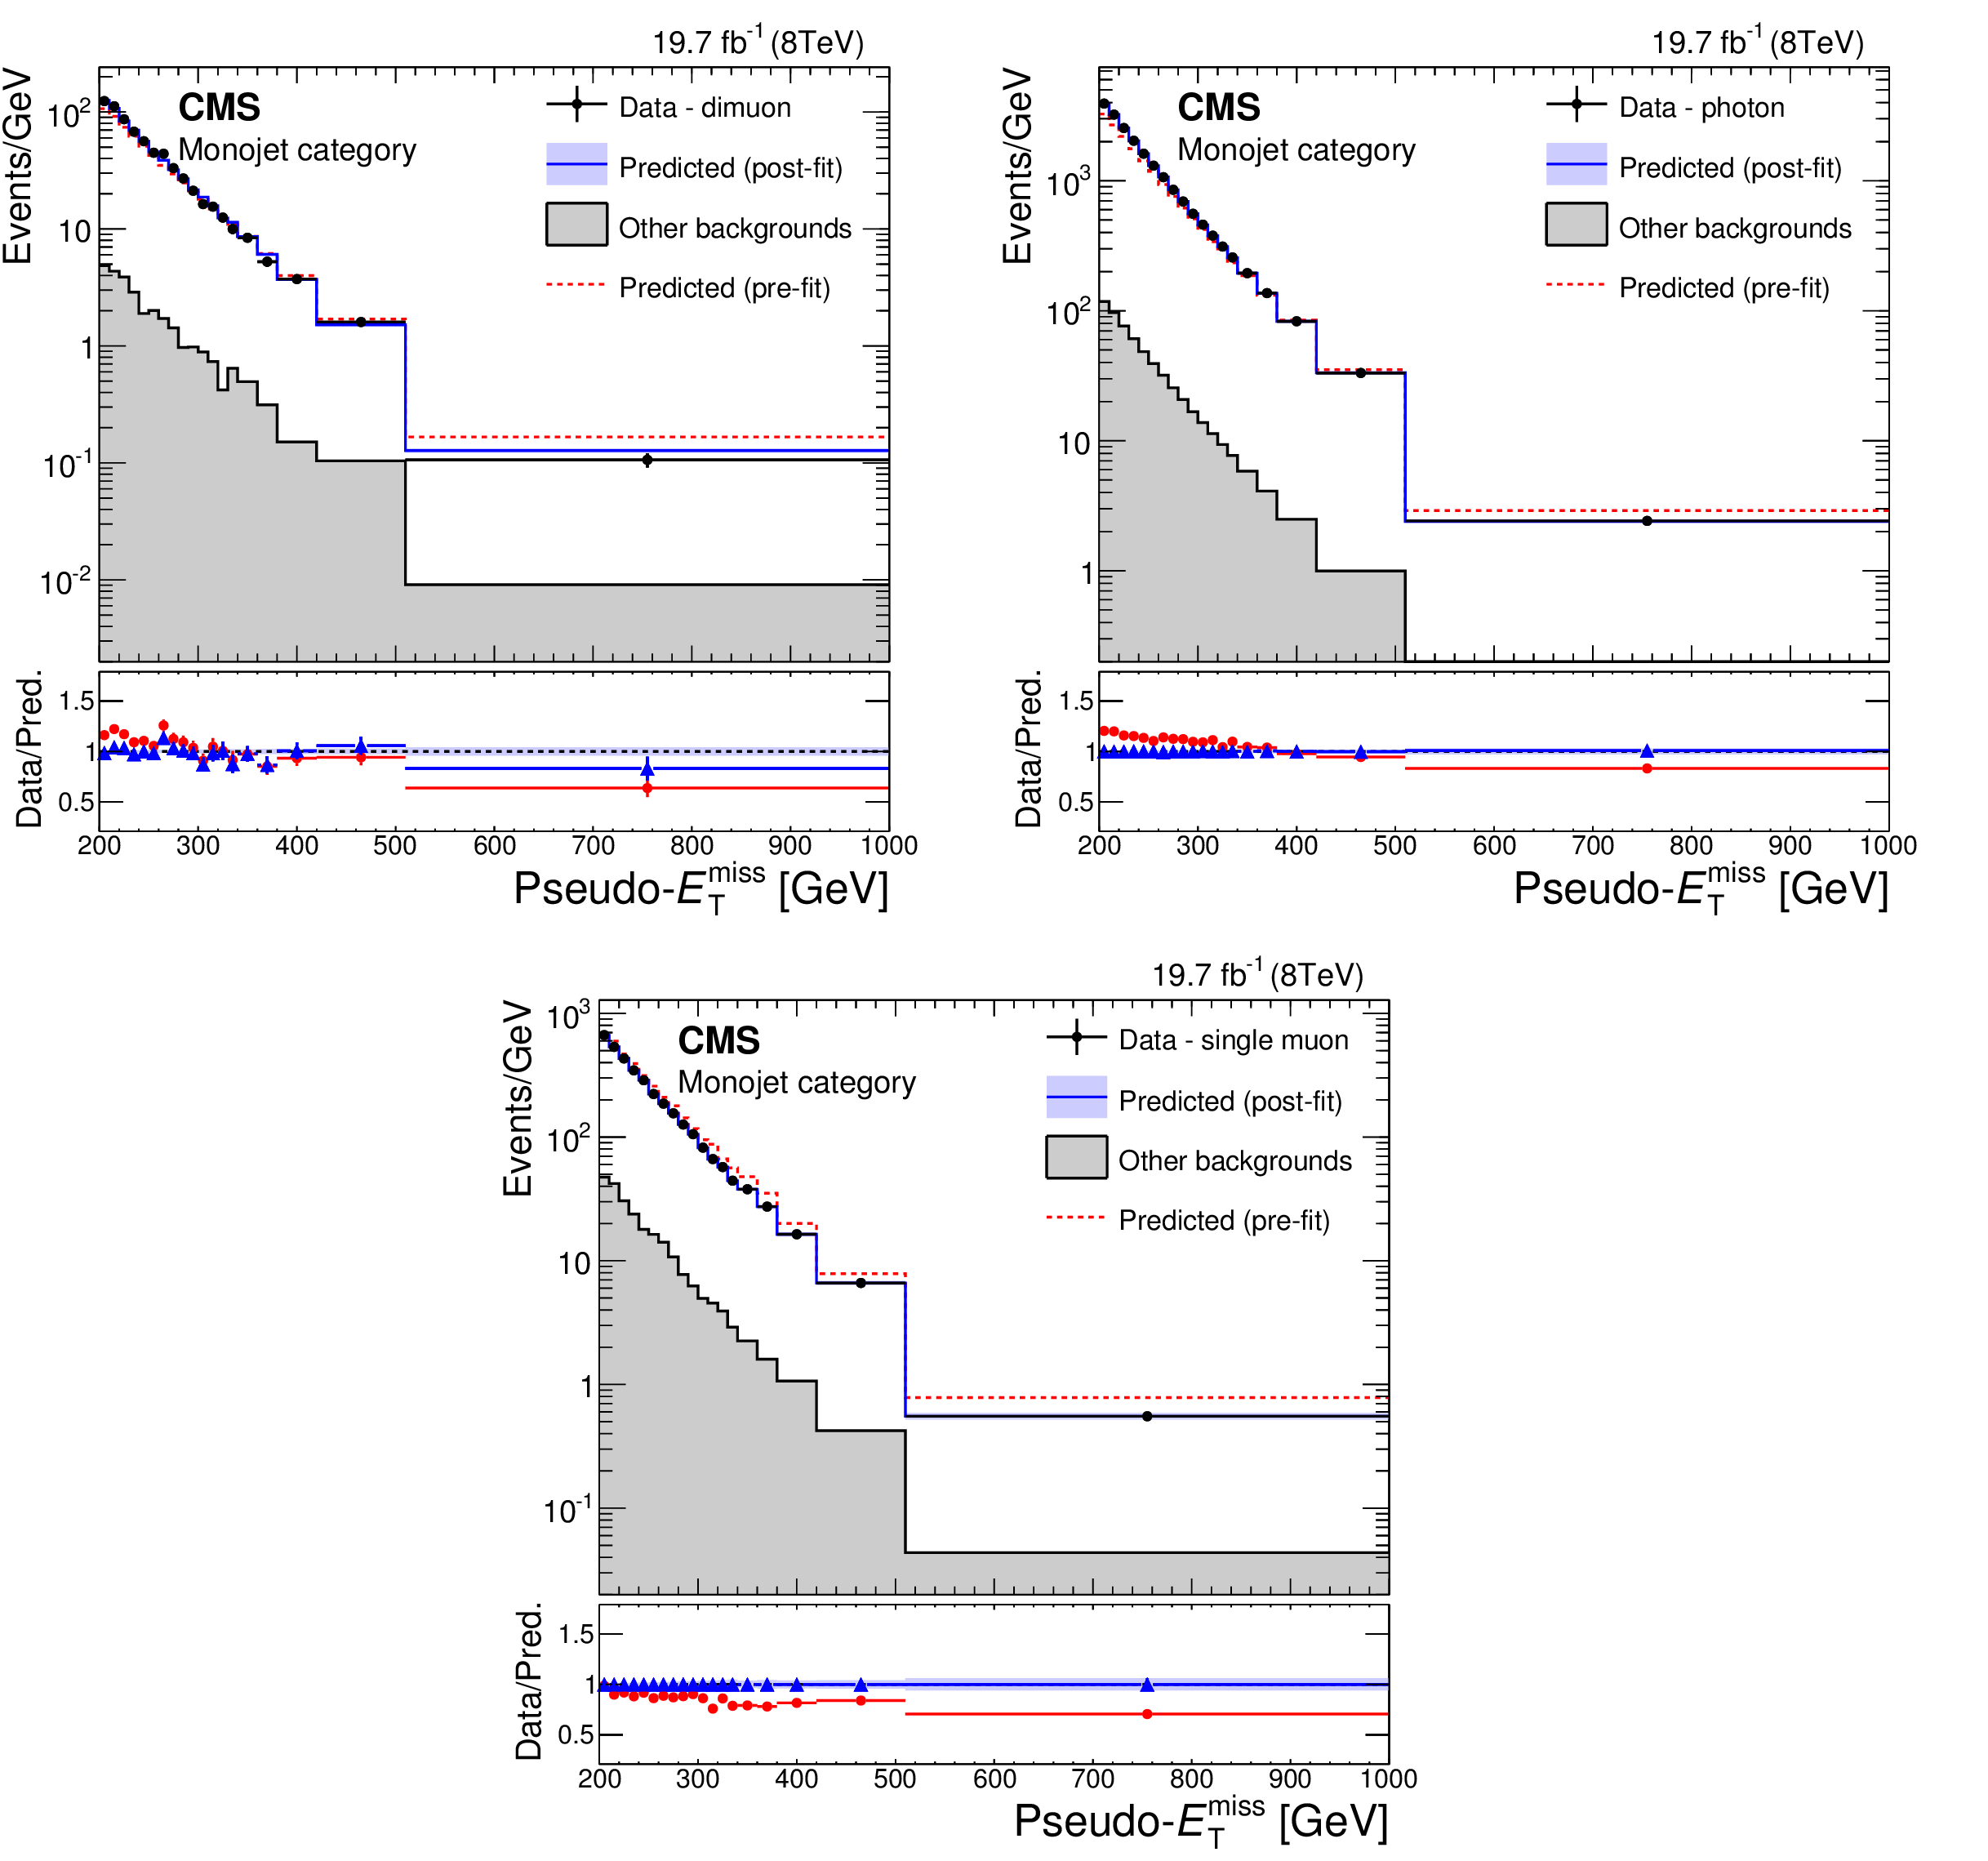
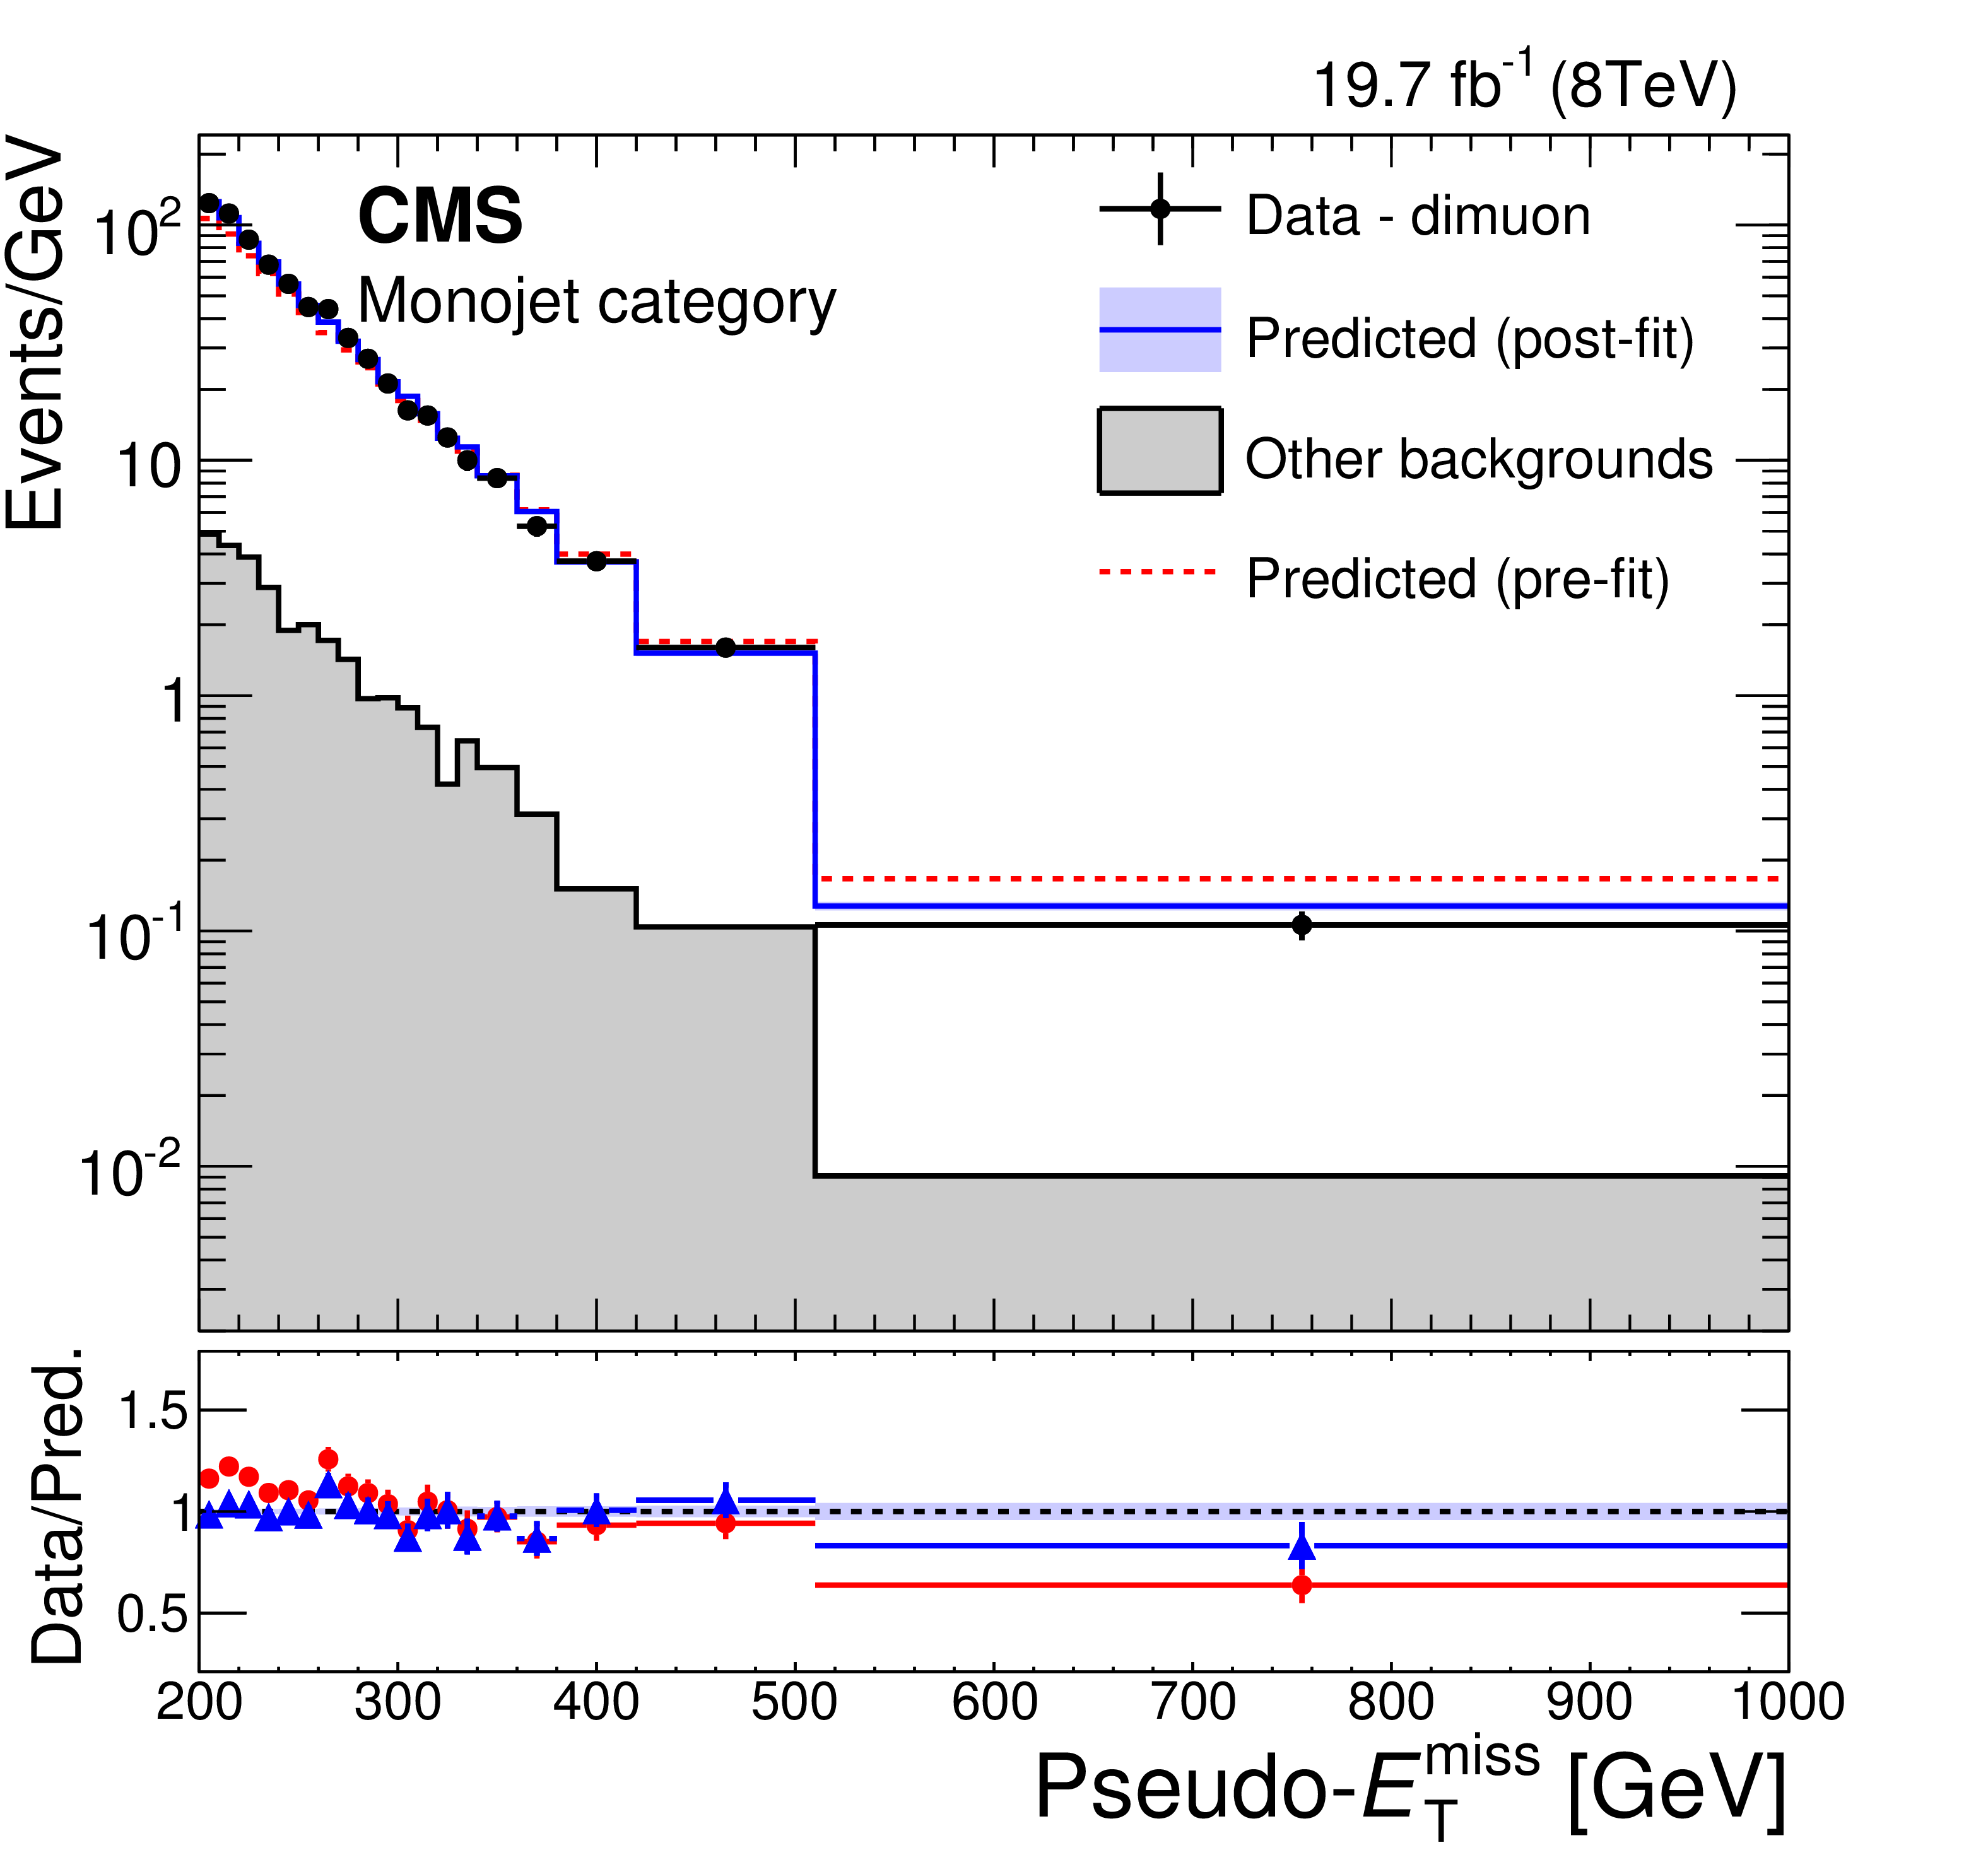
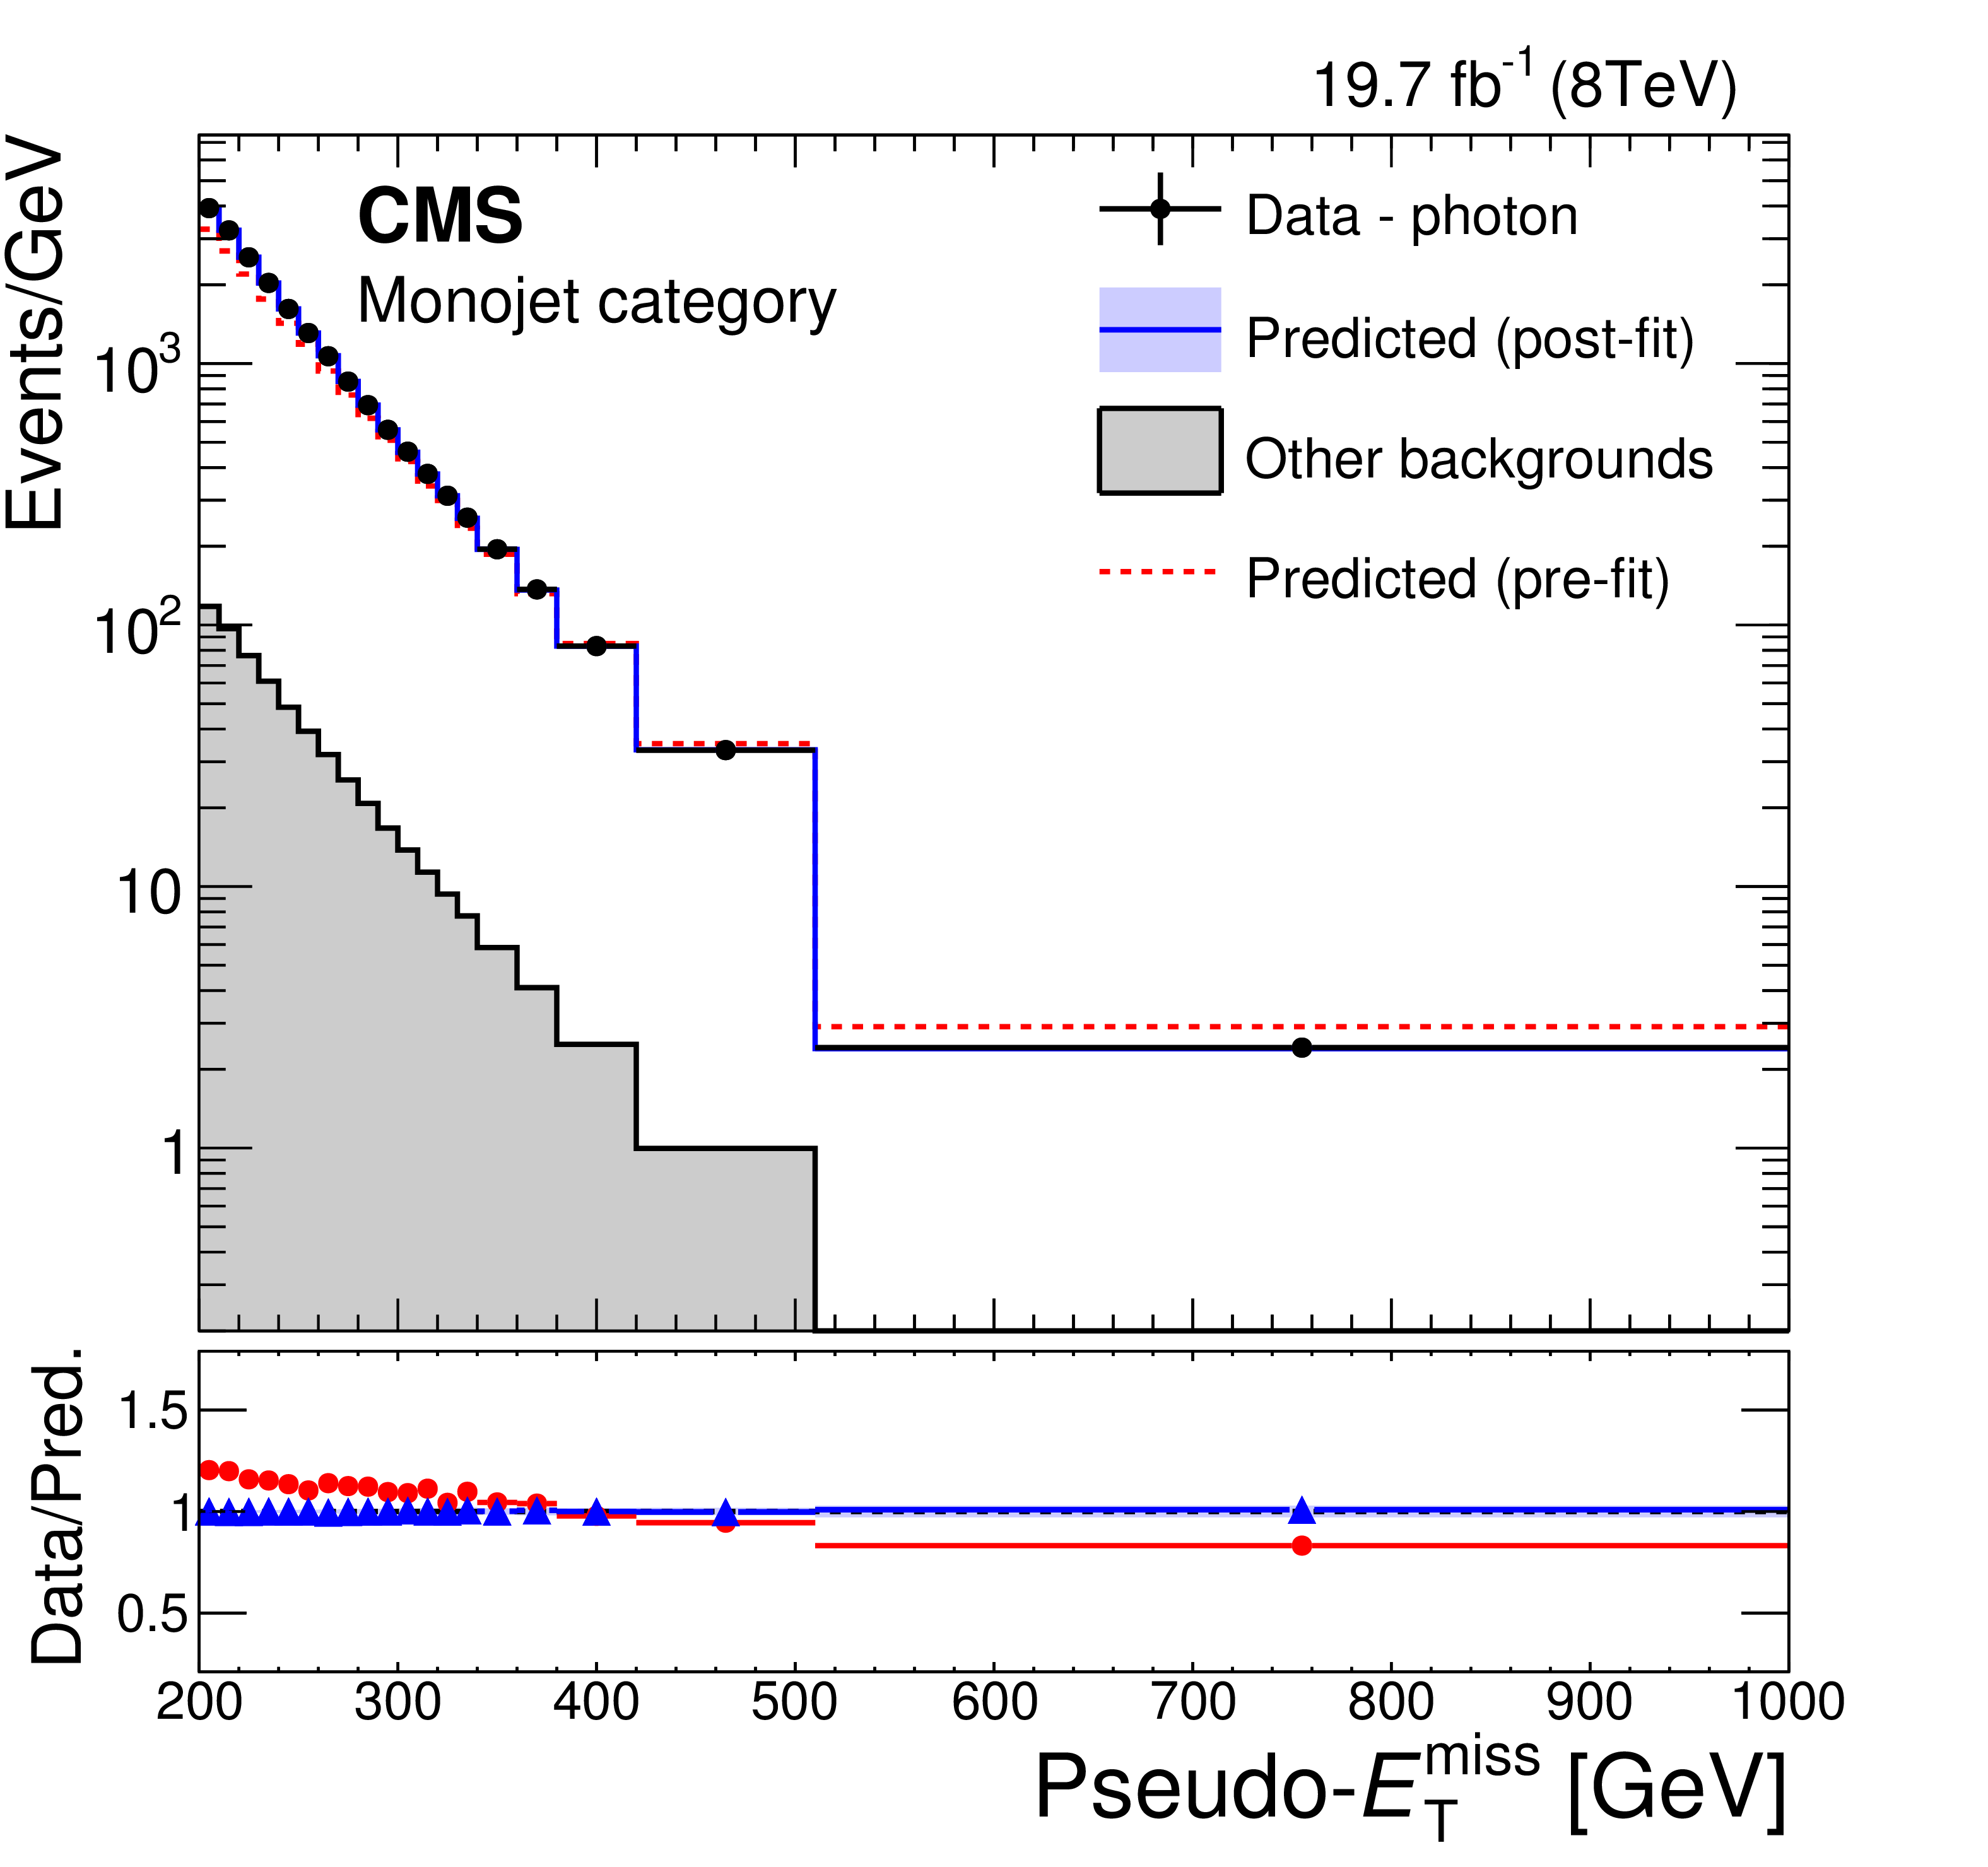
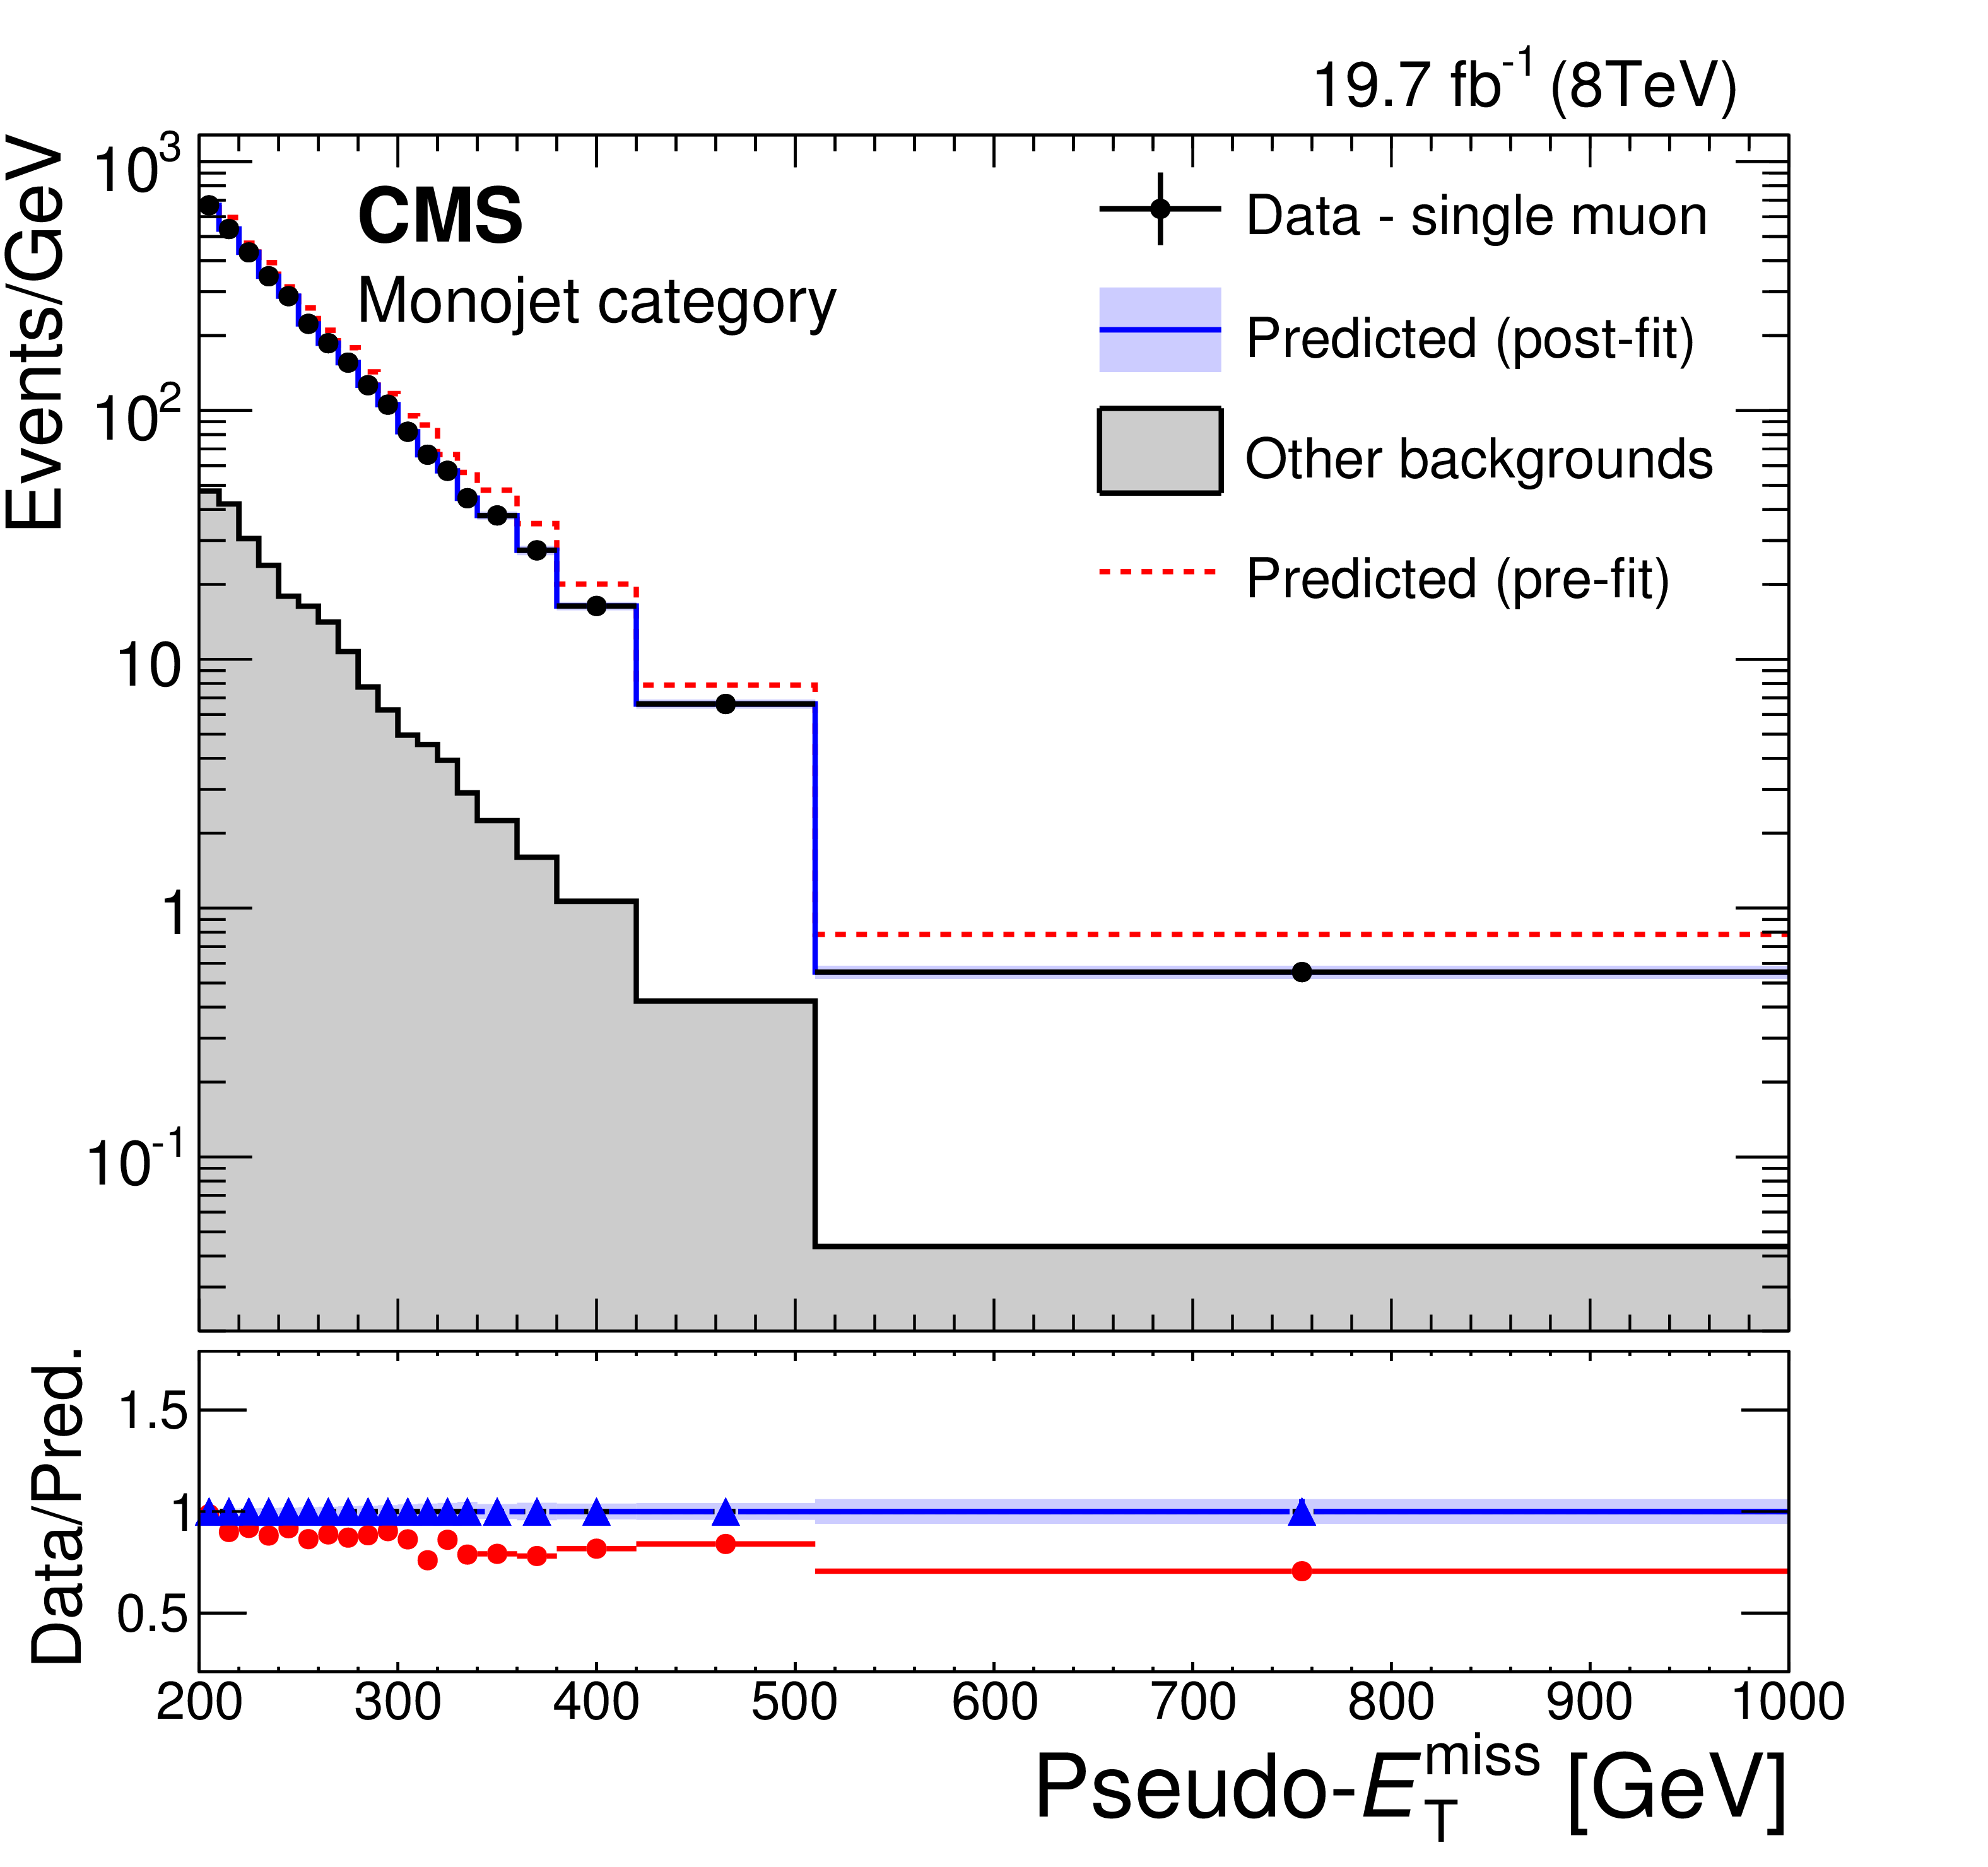
Figure 8:
Predicted and observed pseudo-$ {E_{\mathrm {T}}^{\text {miss}}}$ distributions in the dimuon (top-left), photon (top-right), and single muon (bottom) control regions, before and after performing the simultaneous likelihood fit to the data in the control regions, for the monojet category. The predictions for the distributions before fitting to the control region data (pre-fit), and after (post-fit) are shown as the dashed red and solid blue lines, respectively. The red circles in the lower panels show the ratio of the observed data to the pre-fit predictions, while the blue triangles show the ratio to the post-fit predictions. The horizontal bars on the data points indicate the width of the bin that is centred at that point. The filled bands around the post-fit prediction indicate the combined statistical and systematic uncertainties from the fit. |
png pdf |
Figure 8-a:
Predicted and observed pseudo-$ {E_{\mathrm {T}}^{\text {miss}}}$ distributions in the dimuon (top-left), photon (top-right), and single muon (bottom) control regions, before and after performing the simultaneous likelihood fit to the data in the control regions, for the monojet category. The predictions for the distributions before fitting to the control region data (pre-fit), and after (post-fit) are shown as the dashed red and solid blue lines, respectively. The red circles in the lower panels show the ratio of the observed data to the pre-fit predictions, while the blue triangles show the ratio to the post-fit predictions. The horizontal bars on the data points indicate the width of the bin that is centred at that point. The filled bands around the post-fit prediction indicate the combined statistical and systematic uncertainties from the fit. |
png pdf |
Figure 8-b:
Predicted and observed pseudo-$ {E_{\mathrm {T}}^{\text {miss}}}$ distributions in the dimuon (top-left), photon (top-right), and single muon (bottom) control regions, before and after performing the simultaneous likelihood fit to the data in the control regions, for the monojet category. The predictions for the distributions before fitting to the control region data (pre-fit), and after (post-fit) are shown as the dashed red and solid blue lines, respectively. The red circles in the lower panels show the ratio of the observed data to the pre-fit predictions, while the blue triangles show the ratio to the post-fit predictions. The horizontal bars on the data points indicate the width of the bin that is centred at that point. The filled bands around the post-fit prediction indicate the combined statistical and systematic uncertainties from the fit. |
png pdf |
Figure 8-c:
Predicted and observed pseudo-$ {E_{\mathrm {T}}^{\text {miss}}}$ distributions in the dimuon (top-left), photon (top-right), and single muon (bottom) control regions, before and after performing the simultaneous likelihood fit to the data in the control regions, for the monojet category. The predictions for the distributions before fitting to the control region data (pre-fit), and after (post-fit) are shown as the dashed red and solid blue lines, respectively. The red circles in the lower panels show the ratio of the observed data to the pre-fit predictions, while the blue triangles show the ratio to the post-fit predictions. The horizontal bars on the data points indicate the width of the bin that is centred at that point. The filled bands around the post-fit prediction indicate the combined statistical and systematic uncertainties from the fit. |

png pdf |
Figure 9:
Post-fit distributions in $ {E_{\mathrm {T}}^{\text {miss}}} $ expected from SM backgrounds and observed in the signal region. The expected distributions are evaluated after fitting to the observed data simultaneously across the V-boosted (top-left), V-resolved (top-right), and monojet (bottom) categories. The ratio of the data to the post-fit background prediction is shown in the lower panels. The shaded bands indicate the post-fit uncertainty in the background, assuming no signal. The horizontal bars on the data points indicate the width of the bin that is centred at that point. The expected distribution for a signal assuming vector mediated DM production is shown for $m_{\mathrm {MED}}= $ 1 TeV and $m_{\mathrm {DM}}=$ 10 GeV. |

png pdf |
Figure 9-a:
Post-fit distributions in $ {E_{\mathrm {T}}^{\text {miss}}} $ expected from SM backgrounds and observed in the signal region. The expected distributions are evaluated after fitting to the observed data simultaneously across the V-boosted (top-left), V-resolved (top-right), and monojet (bottom) categories. The ratio of the data to the post-fit background prediction is shown in the lower panels. The shaded bands indicate the post-fit uncertainty in the background, assuming no signal. The horizontal bars on the data points indicate the width of the bin that is centred at that point. The expected distribution for a signal assuming vector mediated DM production is shown for $m_{\mathrm {MED}}= $ 1 TeV and $m_{\mathrm {DM}}=$ 10 GeV. |
png pdf |
Figure 9-b:
Post-fit distributions in $ {E_{\mathrm {T}}^{\text {miss}}} $ expected from SM backgrounds and observed in the signal region. The expected distributions are evaluated after fitting to the observed data simultaneously across the V-boosted (top-left), V-resolved (top-right), and monojet (bottom) categories. The ratio of the data to the post-fit background prediction is shown in the lower panels. The shaded bands indicate the post-fit uncertainty in the background, assuming no signal. The horizontal bars on the data points indicate the width of the bin that is centred at that point. The expected distribution for a signal assuming vector mediated DM production is shown for $m_{\mathrm {MED}}= $ 1 TeV and $m_{\mathrm {DM}}=$ 10 GeV. |
png pdf |
Figure 9-c:
Post-fit distributions in $ {E_{\mathrm {T}}^{\text {miss}}} $ expected from SM backgrounds and observed in the signal region. The expected distributions are evaluated after fitting to the observed data simultaneously across the V-boosted (top-left), V-resolved (top-right), and monojet (bottom) categories. The ratio of the data to the post-fit background prediction is shown in the lower panels. The shaded bands indicate the post-fit uncertainty in the background, assuming no signal. The horizontal bars on the data points indicate the width of the bin that is centred at that point. The expected distribution for a signal assuming vector mediated DM production is shown for $m_{\mathrm {MED}}= $ 1 TeV and $m_{\mathrm {DM}}=$ 10 GeV. |
png pdf |
Figure 10:
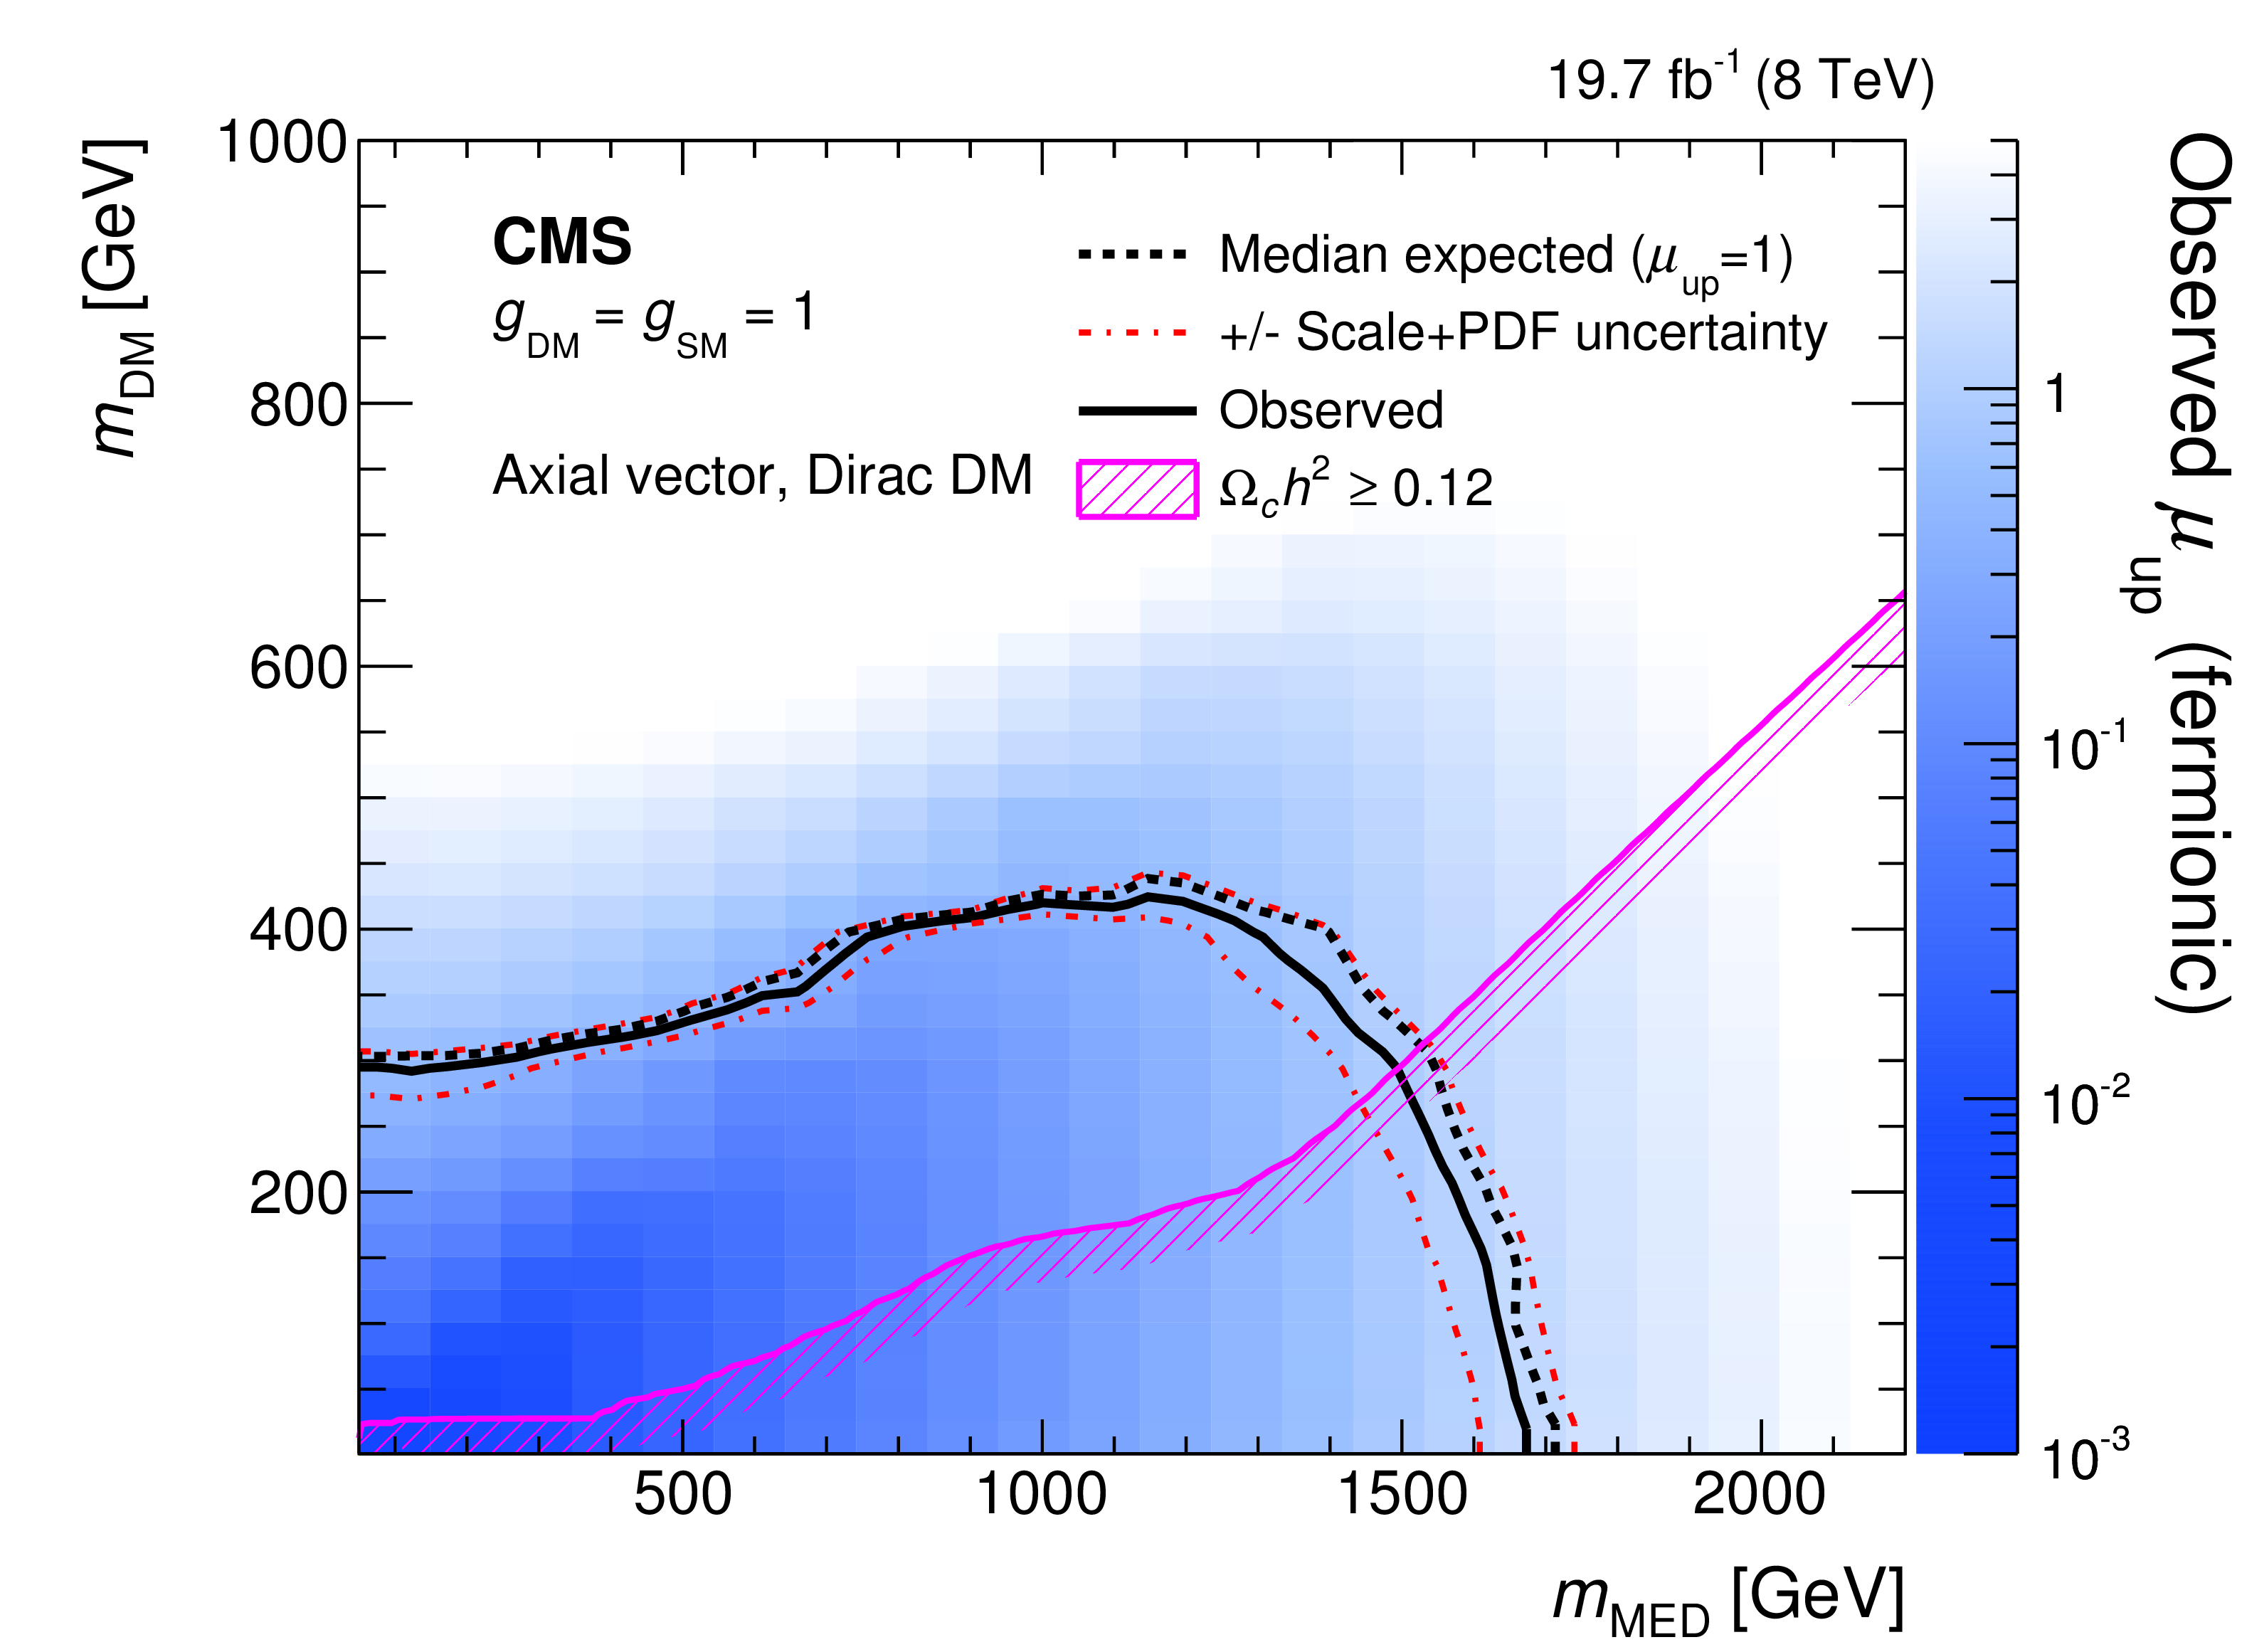
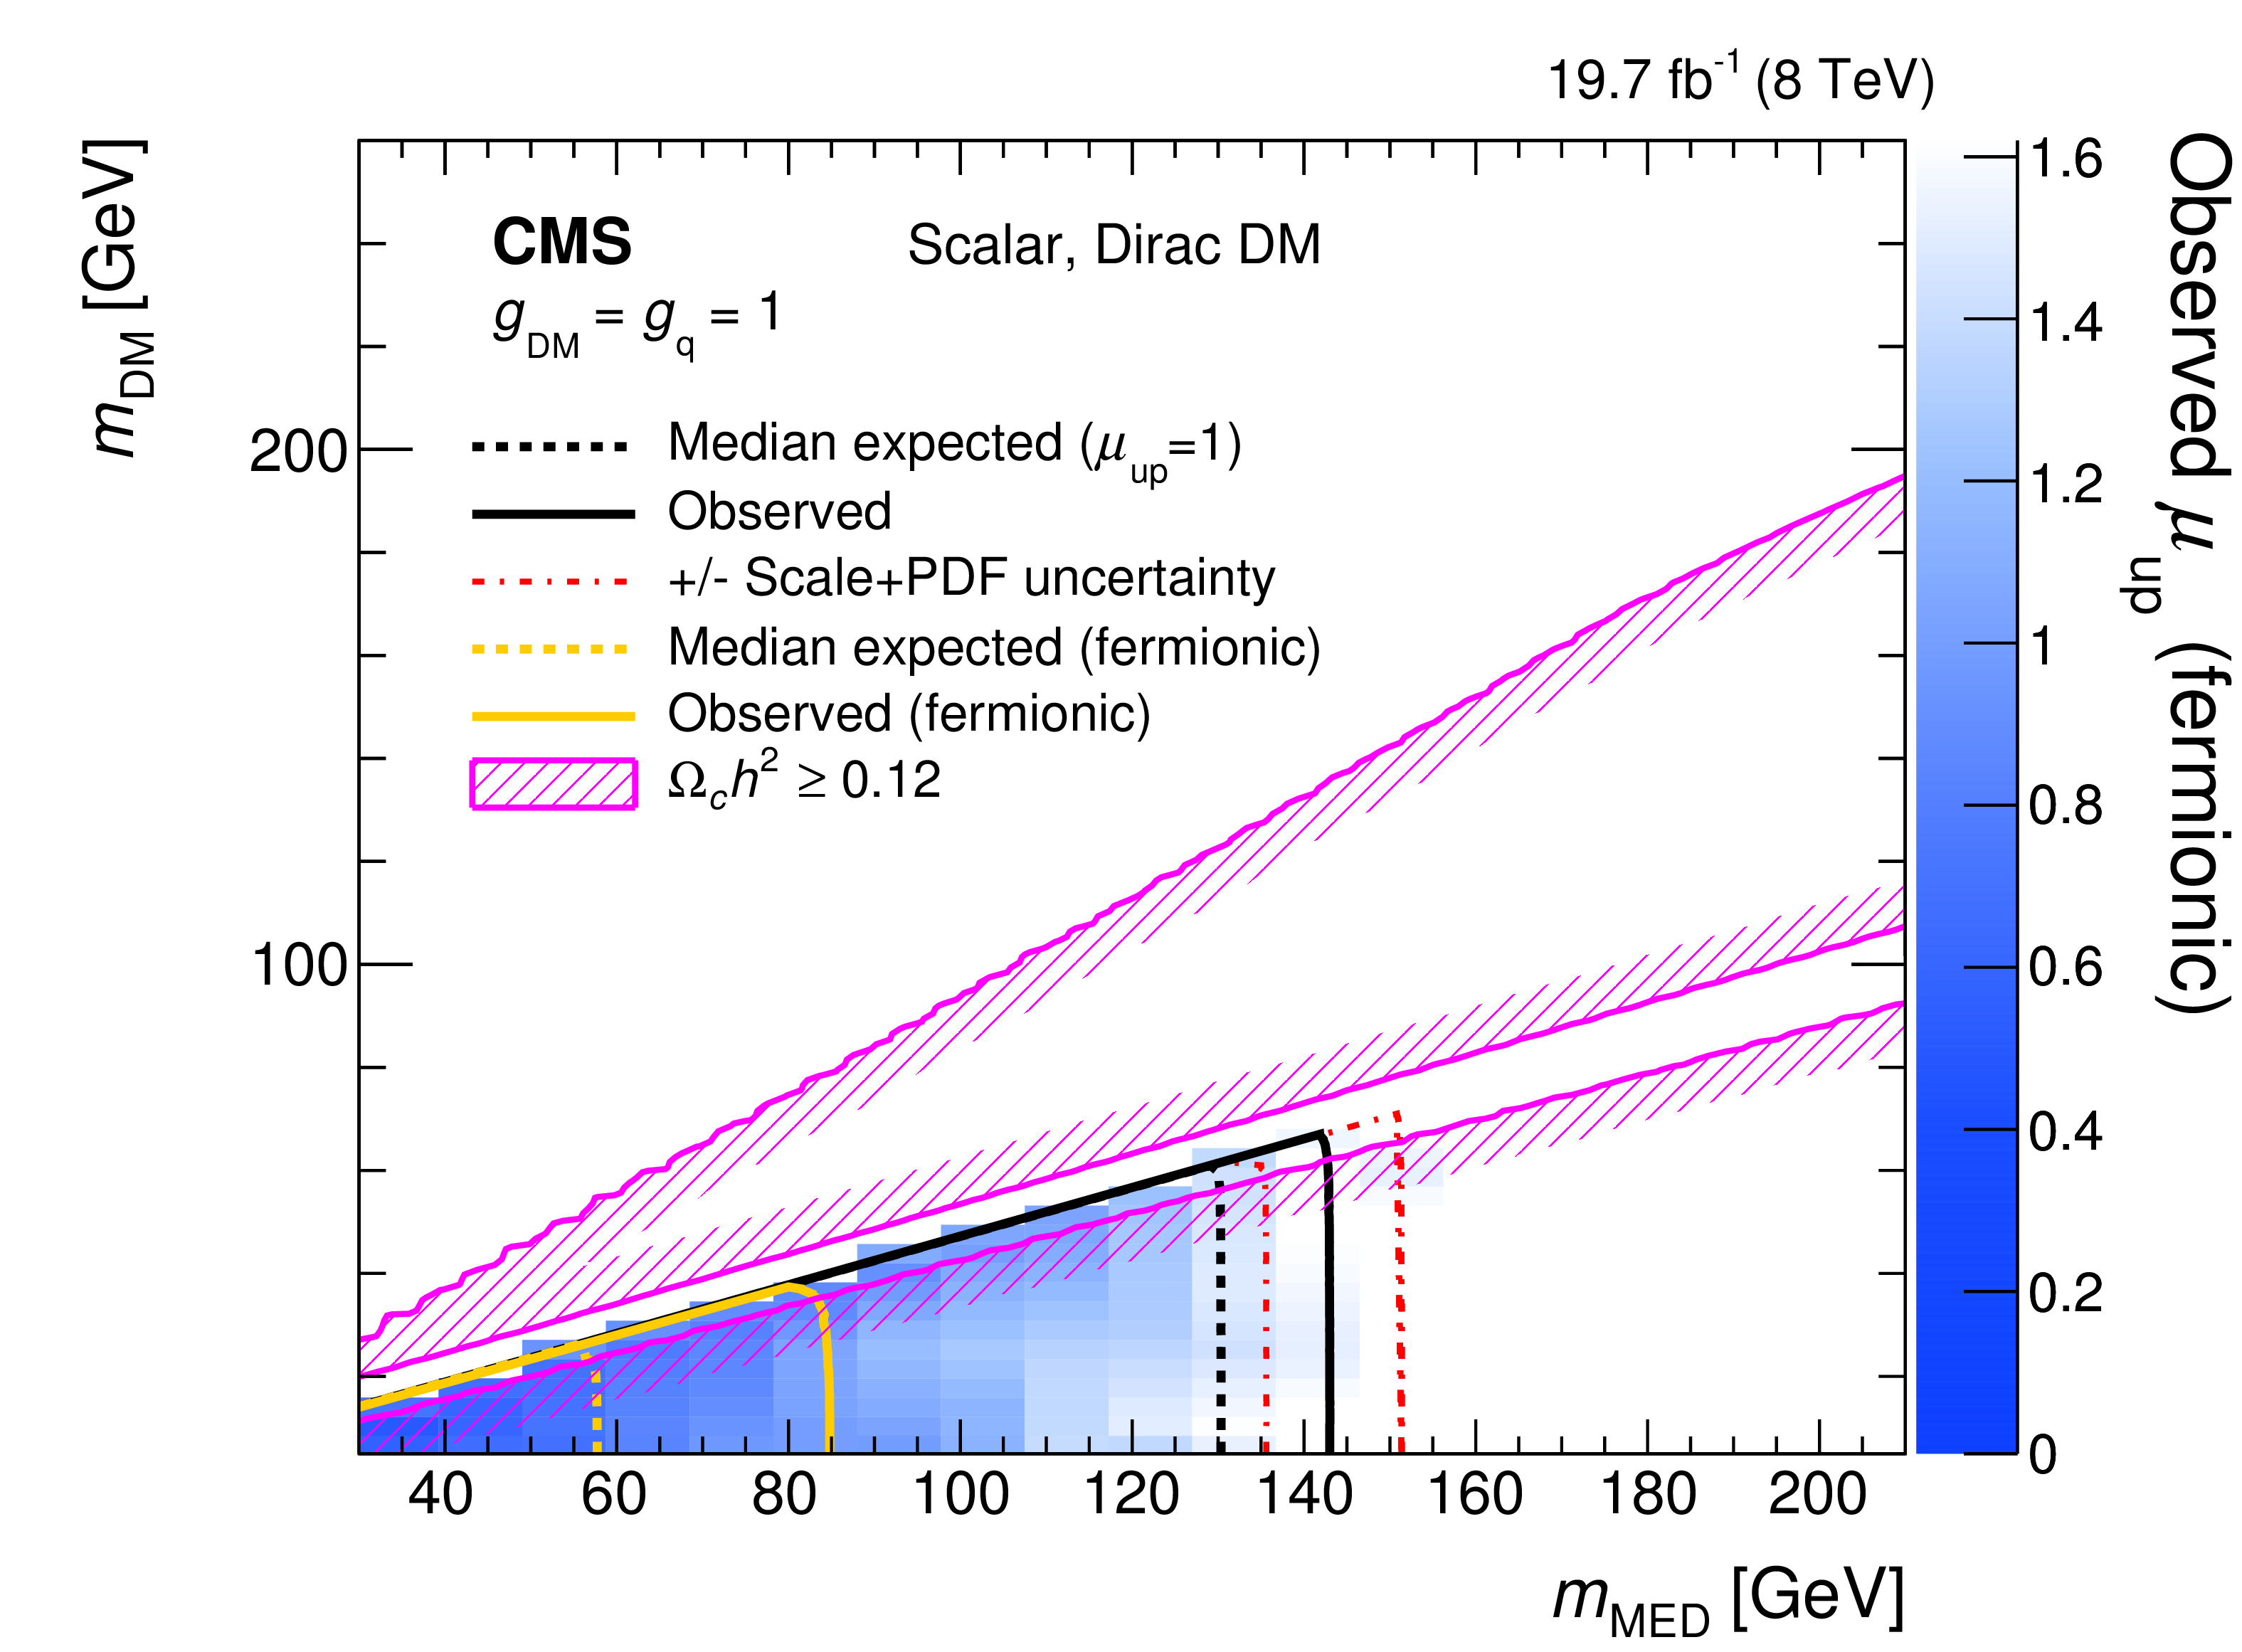
The 90% CL exclusion contours in the $m_{\mathrm {MED}}-m_{\mathrm {DM}}$ plane assuming vector (top-left), axial vector (top-right), scalar (bottom-left), and pseudoscalar (bottom-right) mediators. The scale shown on the right hand axis shows the expected 90% CL exclusion upper limit on the signal strength, assuming the mediator only couples to fermions. For the scalar and pseudoscalar mediators, the exclusion contour assuming coupling only to fermions (fermionic) is also shown. The white region shows model points that are not tested when assuming coupling only to fermions and are not expected to be excluded by this analysis under this assumption. The red dot-dashed lines indicate the variation in the exclusion contours due to modifying the renormalization and factorization scales by a factor of two in the generation of the signal. In all cases, the excluded region is to the bottom-left of the contours, except for the relic density, which shows the regions for which $\Omega _c h^2\ge 0.12$, as indicated by the shading. In all of the models, the mediator width is determined using the minimum width assumption. |
png pdf |
Figure 10-a:
The 90% CL exclusion contours in the $m_{\mathrm {MED}}-m_{\mathrm {DM}}$ plane assuming vector (top-left), axial vector (top-right), scalar (bottom-left), and pseudoscalar (bottom-right) mediators. The scale shown on the right hand axis shows the expected 90% CL exclusion upper limit on the signal strength, assuming the mediator only couples to fermions. For the scalar and pseudoscalar mediators, the exclusion contour assuming coupling only to fermions (fermionic) is also shown. The white region shows model points that are not tested when assuming coupling only to fermions and are not expected to be excluded by this analysis under this assumption. The red dot-dashed lines indicate the variation in the exclusion contours due to modifying the renormalization and factorization scales by a factor of two in the generation of the signal. In all cases, the excluded region is to the bottom-left of the contours, except for the relic density, which shows the regions for which $\Omega _c h^2\ge 0.12$, as indicated by the shading. In all of the models, the mediator width is determined using the minimum width assumption. |
png pdf |
Figure 10-b:
The 90% CL exclusion contours in the $m_{\mathrm {MED}}-m_{\mathrm {DM}}$ plane assuming vector (top-left), axial vector (top-right), scalar (bottom-left), and pseudoscalar (bottom-right) mediators. The scale shown on the right hand axis shows the expected 90% CL exclusion upper limit on the signal strength, assuming the mediator only couples to fermions. For the scalar and pseudoscalar mediators, the exclusion contour assuming coupling only to fermions (fermionic) is also shown. The white region shows model points that are not tested when assuming coupling only to fermions and are not expected to be excluded by this analysis under this assumption. The red dot-dashed lines indicate the variation in the exclusion contours due to modifying the renormalization and factorization scales by a factor of two in the generation of the signal. In all cases, the excluded region is to the bottom-left of the contours, except for the relic density, which shows the regions for which $\Omega _c h^2\ge 0.12$, as indicated by the shading. In all of the models, the mediator width is determined using the minimum width assumption. |
png pdf |
Figure 10-c:
The 90% CL exclusion contours in the $m_{\mathrm {MED}}-m_{\mathrm {DM}}$ plane assuming vector (top-left), axial vector (top-right), scalar (bottom-left), and pseudoscalar (bottom-right) mediators. The scale shown on the right hand axis shows the expected 90% CL exclusion upper limit on the signal strength, assuming the mediator only couples to fermions. For the scalar and pseudoscalar mediators, the exclusion contour assuming coupling only to fermions (fermionic) is also shown. The white region shows model points that are not tested when assuming coupling only to fermions and are not expected to be excluded by this analysis under this assumption. The red dot-dashed lines indicate the variation in the exclusion contours due to modifying the renormalization and factorization scales by a factor of two in the generation of the signal. In all cases, the excluded region is to the bottom-left of the contours, except for the relic density, which shows the regions for which $\Omega _c h^2\ge 0.12$, as indicated by the shading. In all of the models, the mediator width is determined using the minimum width assumption. |

png pdf |
Figure 10-d:
The 90% CL exclusion contours in the $m_{\mathrm {MED}}-m_{\mathrm {DM}}$ plane assuming vector (top-left), axial vector (top-right), scalar (bottom-left), and pseudoscalar (bottom-right) mediators. The scale shown on the right hand axis shows the expected 90% CL exclusion upper limit on the signal strength, assuming the mediator only couples to fermions. For the scalar and pseudoscalar mediators, the exclusion contour assuming coupling only to fermions (fermionic) is also shown. The white region shows model points that are not tested when assuming coupling only to fermions and are not expected to be excluded by this analysis under this assumption. The red dot-dashed lines indicate the variation in the exclusion contours due to modifying the renormalization and factorization scales by a factor of two in the generation of the signal. In all cases, the excluded region is to the bottom-left of the contours, except for the relic density, which shows the regions for which $\Omega _c h^2\ge 0.12$, as indicated by the shading. In all of the models, the mediator width is determined using the minimum width assumption. |
png pdf |
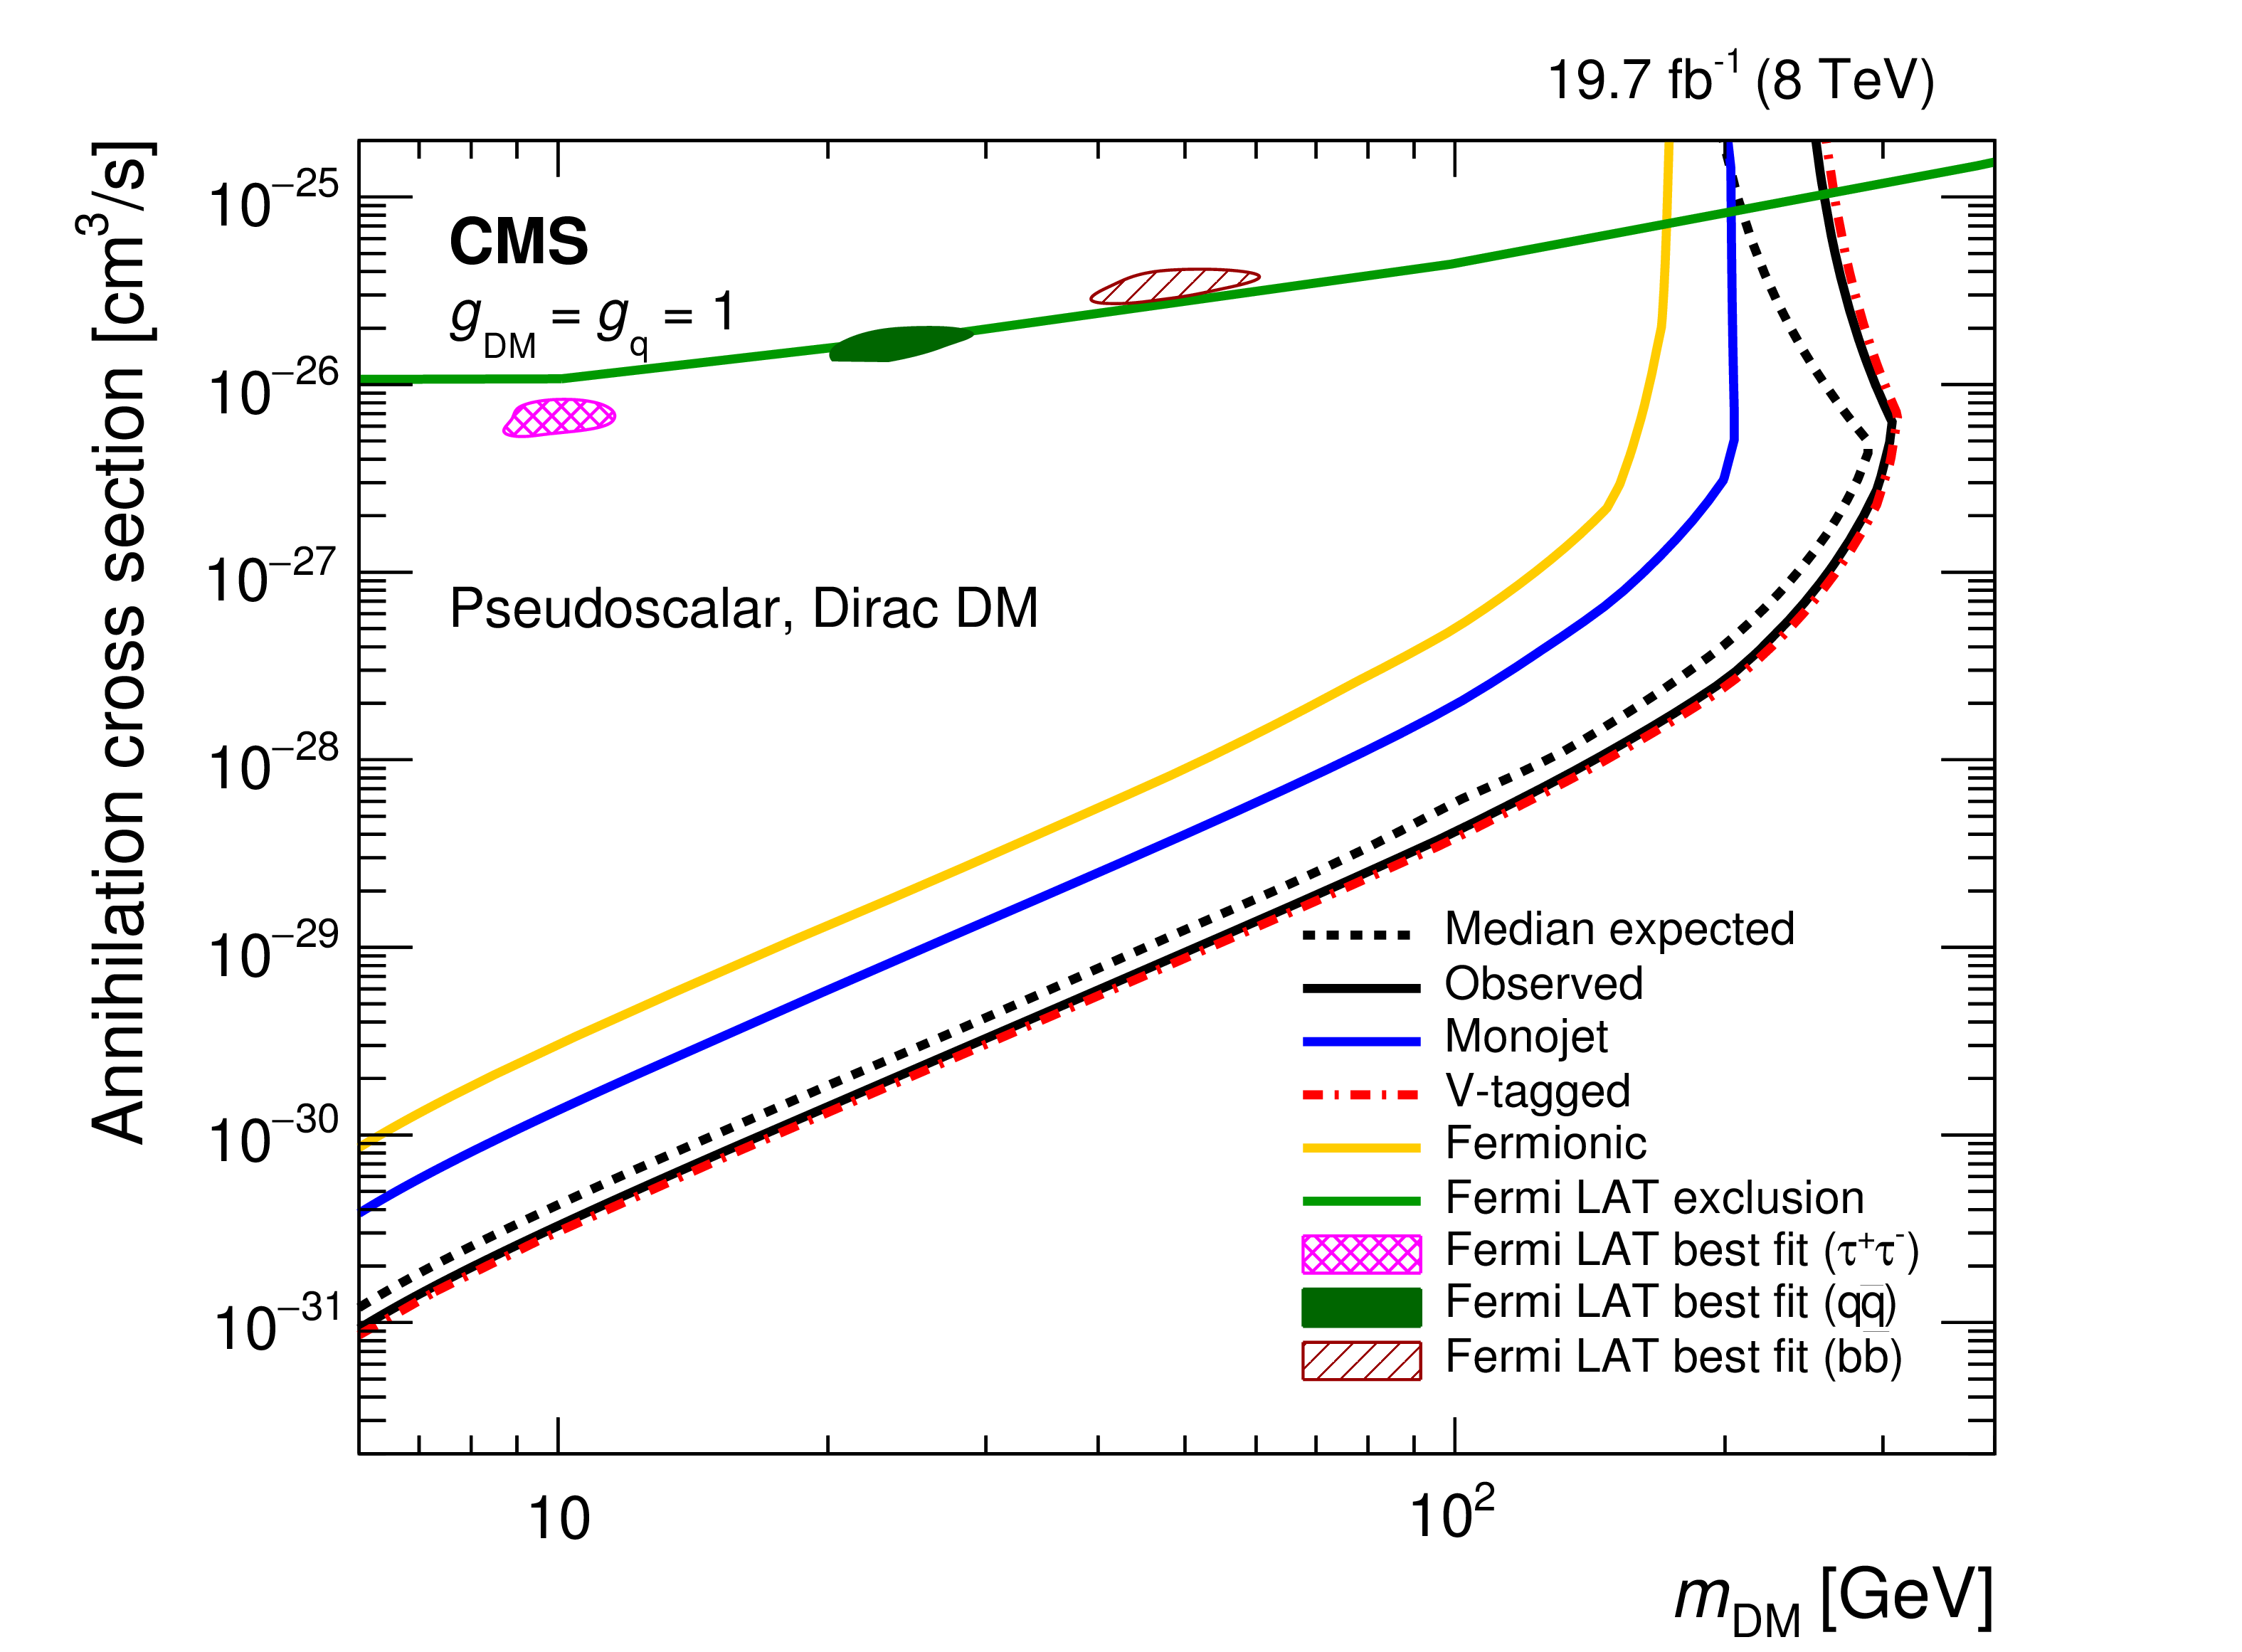
Figure 11:
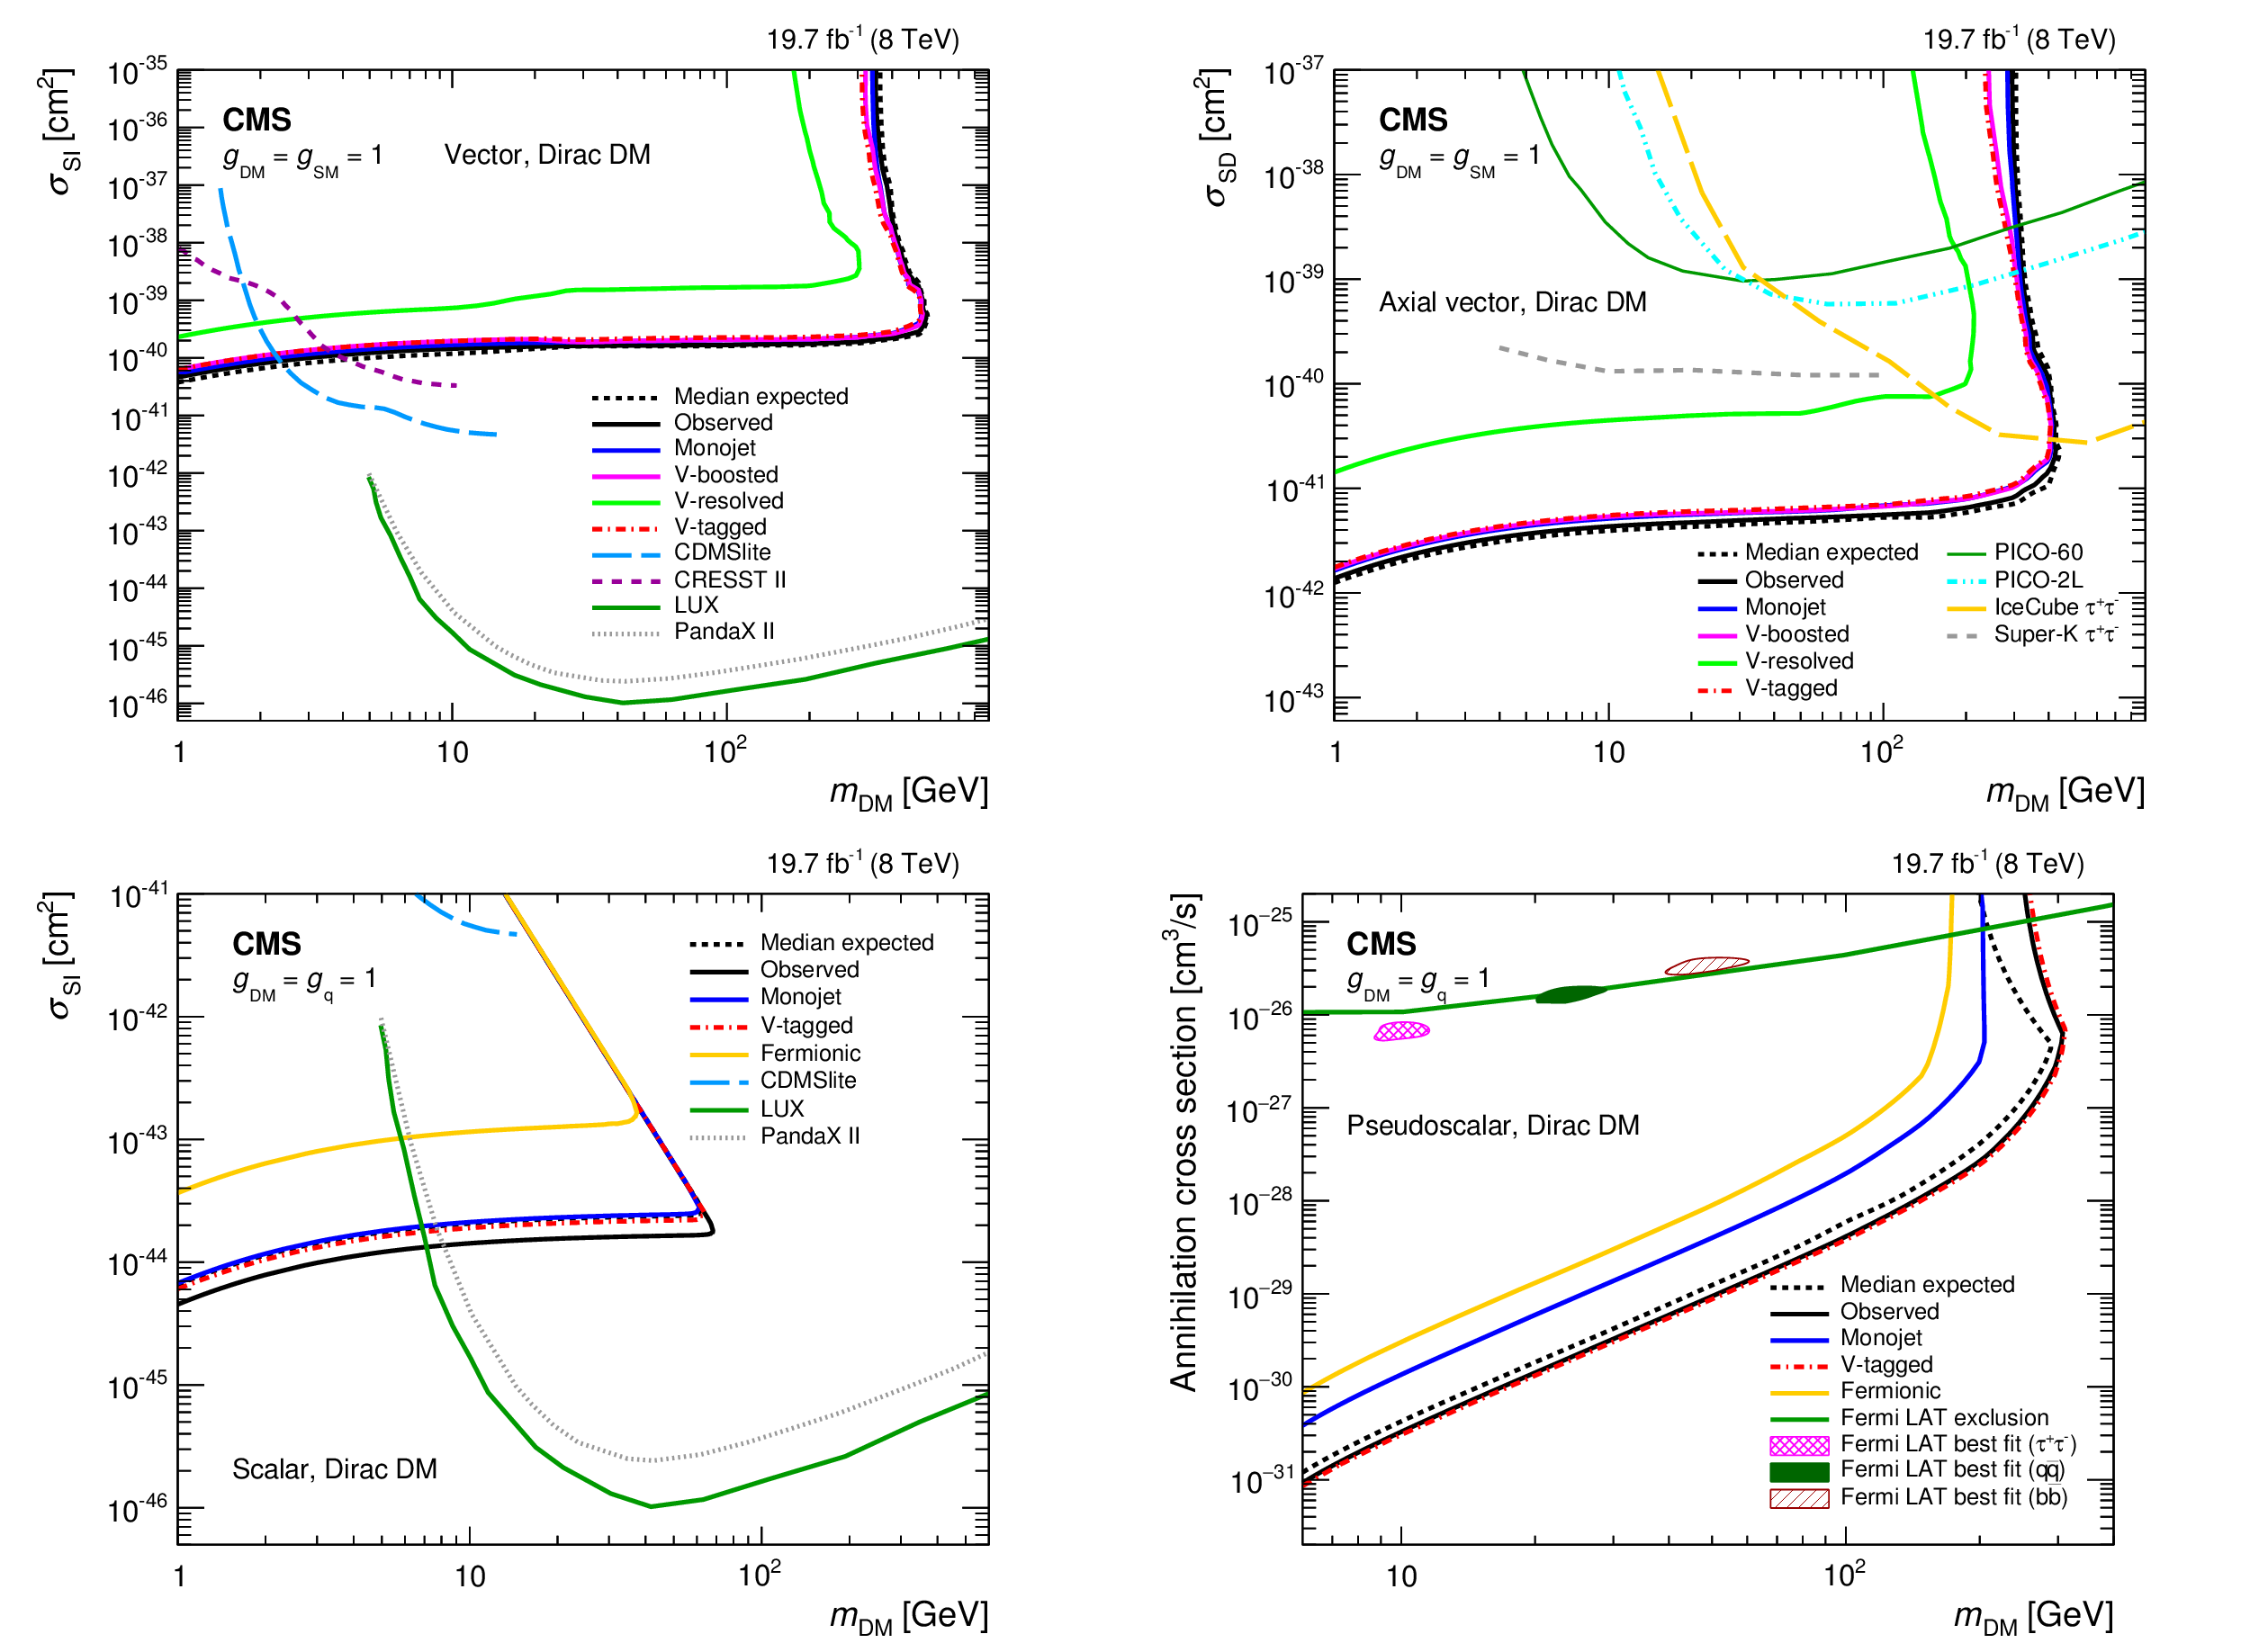
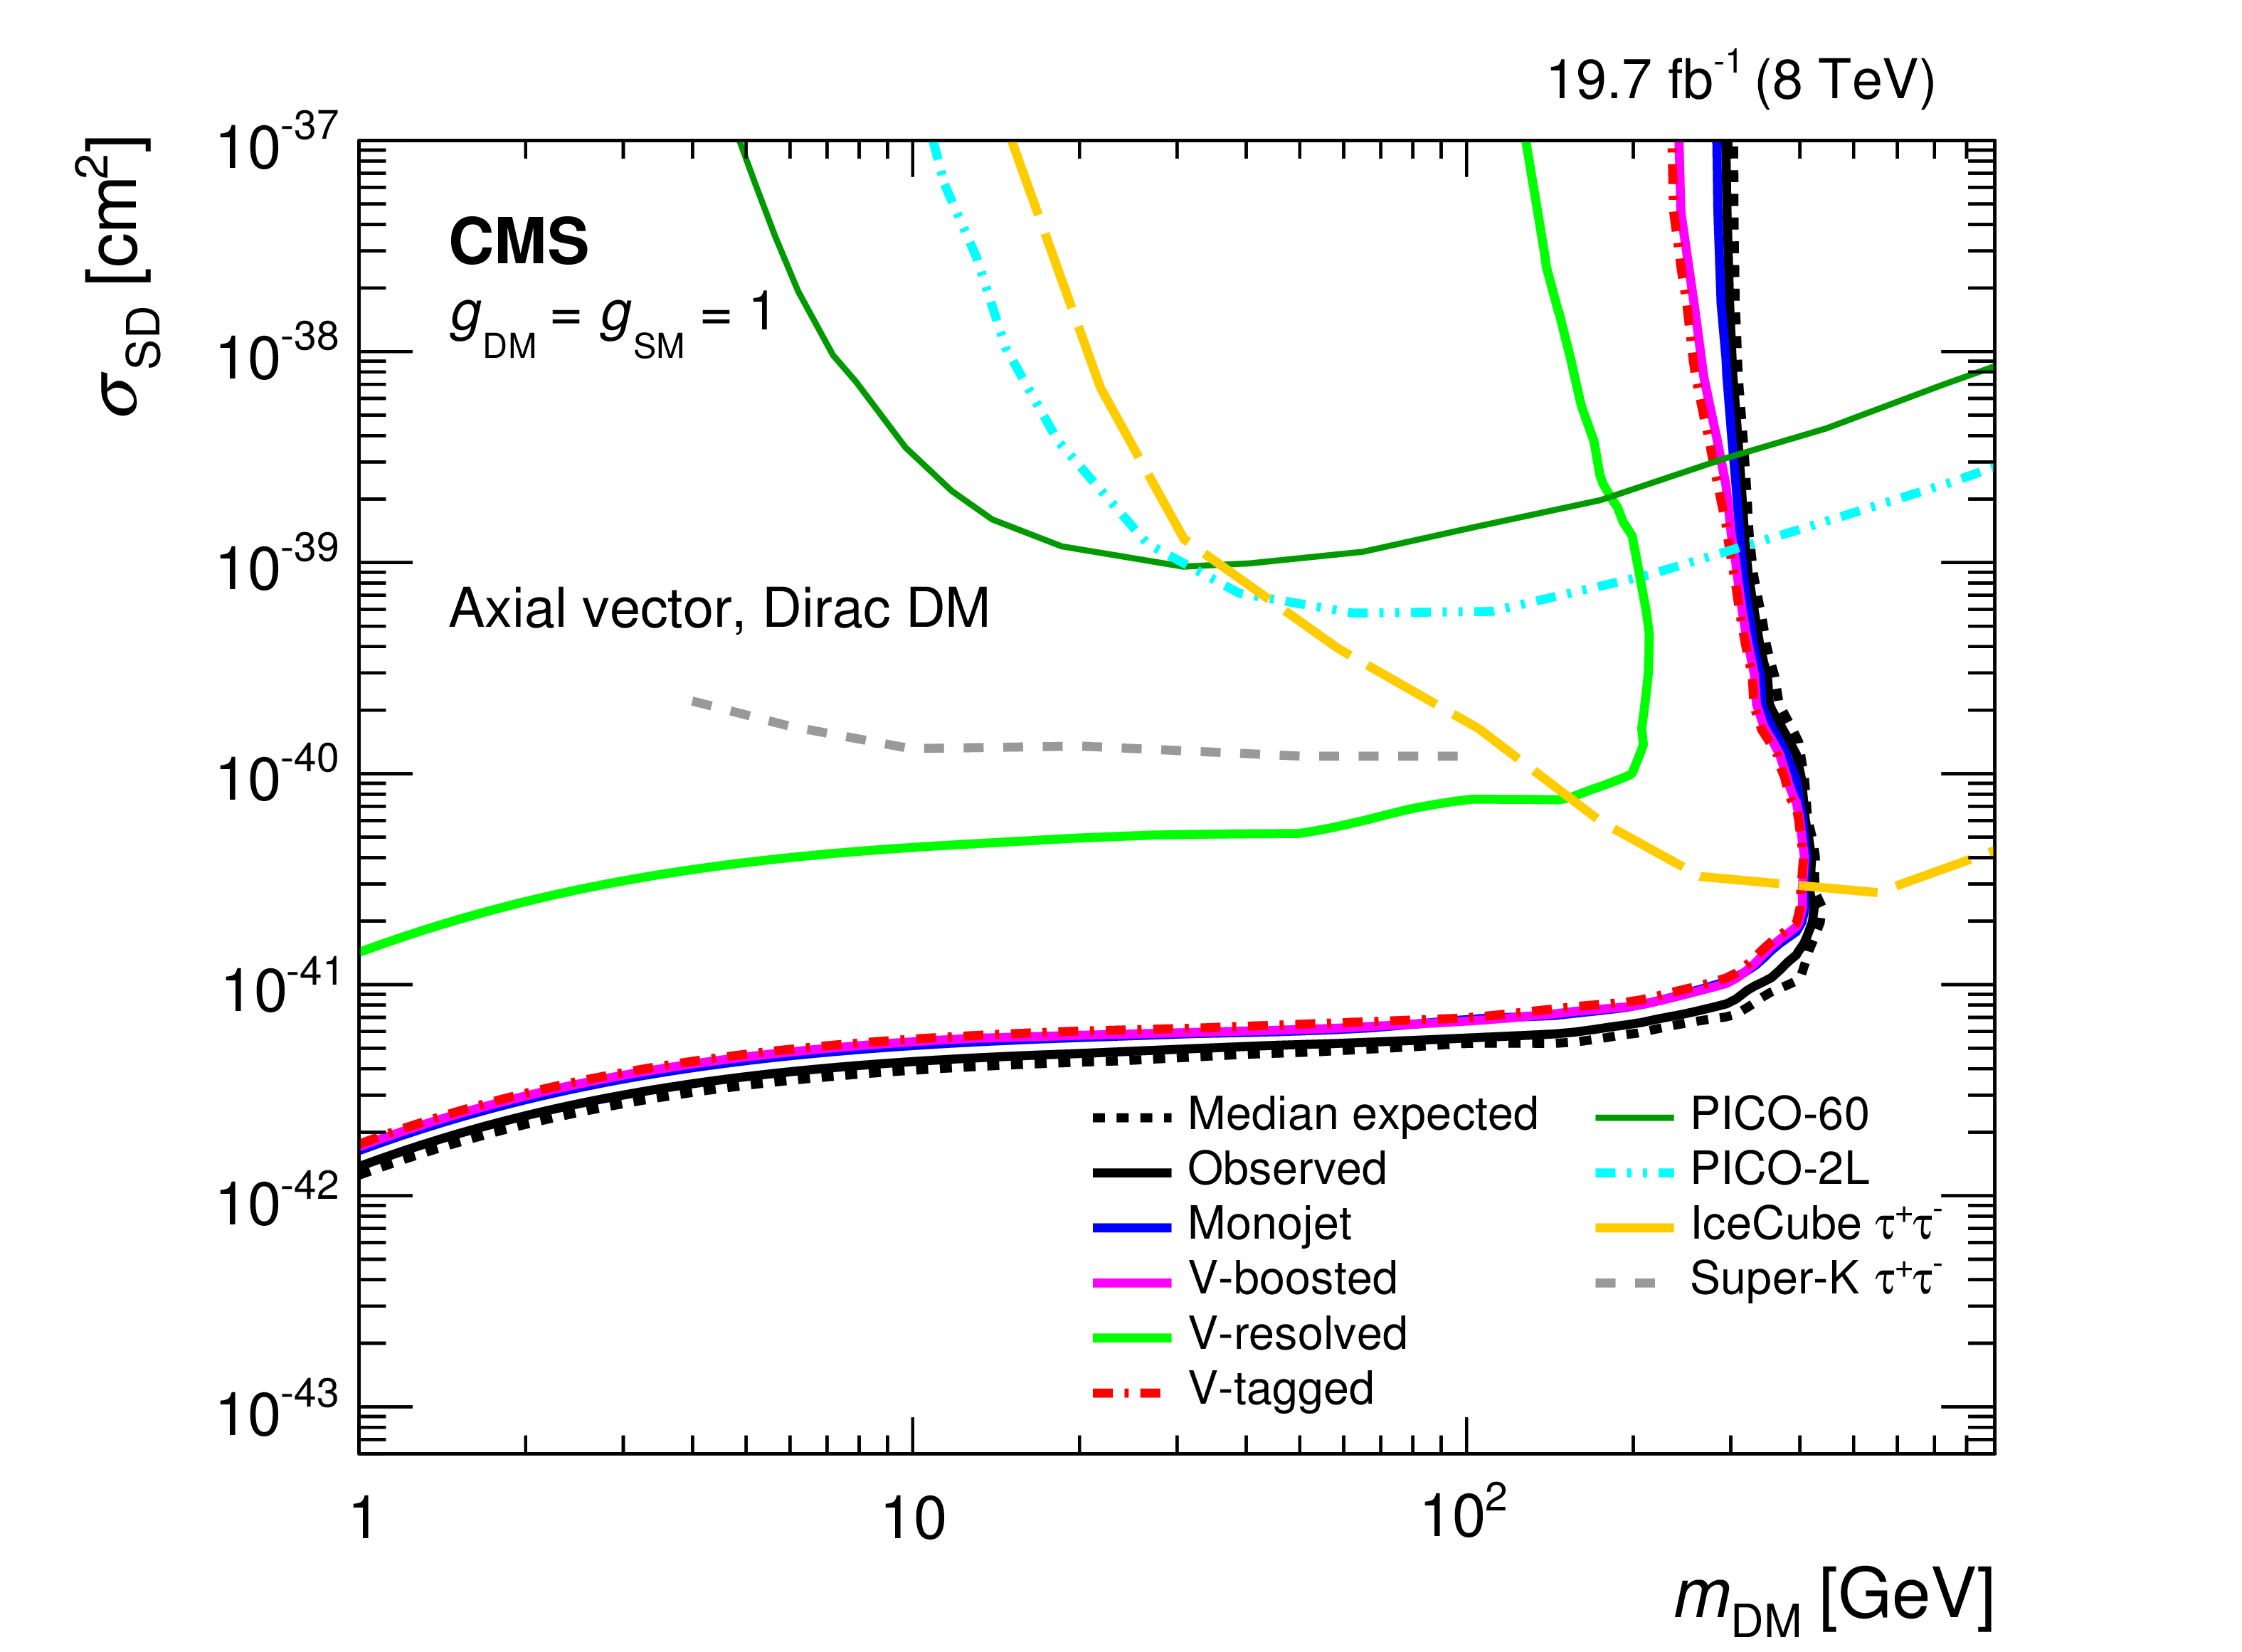
The 90% CL exclusion contours in the $m_{\mathrm {DM}}-\sigma _{\mathrm {SI}}$ or $m_{\mathrm {DM}}-\sigma _{\mathrm {SD}}$ plane assuming vector (top-left), axial vector (top-right), scalar (bottom-left) mediators. Also shown is the 90% CL exclusion in DM annihilation cross section as a function of $m_{\mathrm {DM}}$ for a pseudoscalar mediator (bottom-right). For the scalar and pseudoscalar mediators, the exclusion contours assuming the mediator only couples to fermions (fermionic) is also shown. The excluded region in all plots is to the top-left of the contours for the results from this analysis while the DD experiments and Fermi LAT excluded regions are above the lines shown. In the vector and axial vector models, limits are shown independently for monojet, V-boosted, and V-resolved categories. The red dot-dashed line shows the partial combination of the V-tagged categories for which the V-boosted category provides the dominant contribution. In all of the mediator models, a minimum mediator width is assumed. For the pseudoscalar mediator, 68% CL preferred regions, obtained using data from Fermi LAT, for DM annihilation to light-quarks ($\mathrm{ q } \mathrm{ \bar{q} } $), $\tau ^{+}\tau ^{-}$, and $ {\mathrm{ b \bar{b} } } $ are given by the solid green, hatched pink, and shaded brown coloured regions, respectively. |

png pdf |
Figure 11-a:
The 90% CL exclusion contours in the $m_{\mathrm {DM}}-\sigma _{\mathrm {SI}}$ or $m_{\mathrm {DM}}-\sigma _{\mathrm {SD}}$ plane assuming vector (top-left), axial vector (top-right), scalar (bottom-left) mediators. Also shown is the 90% CL exclusion in DM annihilation cross section as a function of $m_{\mathrm {DM}}$ for a pseudoscalar mediator (bottom-right). For the scalar and pseudoscalar mediators, the exclusion contours assuming the mediator only couples to fermions (fermionic) is also shown. The excluded region in all plots is to the top-left of the contours for the results from this analysis while the DD experiments and Fermi LAT excluded regions are above the lines shown. In the vector and axial vector models, limits are shown independently for monojet, V-boosted, and V-resolved categories. The red dot-dashed line shows the partial combination of the V-tagged categories for which the V-boosted category provides the dominant contribution. In all of the mediator models, a minimum mediator width is assumed. For the pseudoscalar mediator, 68% CL preferred regions, obtained using data from Fermi LAT, for DM annihilation to light-quarks ($\mathrm{ q } \mathrm{ \bar{q} } $), $\tau ^{+}\tau ^{-}$, and $ {\mathrm{ b \bar{b} } } $ are given by the solid green, hatched pink, and shaded brown coloured regions, respectively. |
png pdf |
Figure 11-b:
The 90% CL exclusion contours in the $m_{\mathrm {DM}}-\sigma _{\mathrm {SI}}$ or $m_{\mathrm {DM}}-\sigma _{\mathrm {SD}}$ plane assuming vector (top-left), axial vector (top-right), scalar (bottom-left) mediators. Also shown is the 90% CL exclusion in DM annihilation cross section as a function of $m_{\mathrm {DM}}$ for a pseudoscalar mediator (bottom-right). For the scalar and pseudoscalar mediators, the exclusion contours assuming the mediator only couples to fermions (fermionic) is also shown. The excluded region in all plots is to the top-left of the contours for the results from this analysis while the DD experiments and Fermi LAT excluded regions are above the lines shown. In the vector and axial vector models, limits are shown independently for monojet, V-boosted, and V-resolved categories. The red dot-dashed line shows the partial combination of the V-tagged categories for which the V-boosted category provides the dominant contribution. In all of the mediator models, a minimum mediator width is assumed. For the pseudoscalar mediator, 68% CL preferred regions, obtained using data from Fermi LAT, for DM annihilation to light-quarks ($\mathrm{ q } \mathrm{ \bar{q} } $), $\tau ^{+}\tau ^{-}$, and $ {\mathrm{ b \bar{b} } } $ are given by the solid green, hatched pink, and shaded brown coloured regions, respectively. |

png pdf |
Figure 11-c:
The 90% CL exclusion contours in the $m_{\mathrm {DM}}-\sigma _{\mathrm {SI}}$ or $m_{\mathrm {DM}}-\sigma _{\mathrm {SD}}$ plane assuming vector (top-left), axial vector (top-right), scalar (bottom-left) mediators. Also shown is the 90% CL exclusion in DM annihilation cross section as a function of $m_{\mathrm {DM}}$ for a pseudoscalar mediator (bottom-right). For the scalar and pseudoscalar mediators, the exclusion contours assuming the mediator only couples to fermions (fermionic) is also shown. The excluded region in all plots is to the top-left of the contours for the results from this analysis while the DD experiments and Fermi LAT excluded regions are above the lines shown. In the vector and axial vector models, limits are shown independently for monojet, V-boosted, and V-resolved categories. The red dot-dashed line shows the partial combination of the V-tagged categories for which the V-boosted category provides the dominant contribution. In all of the mediator models, a minimum mediator width is assumed. For the pseudoscalar mediator, 68% CL preferred regions, obtained using data from Fermi LAT, for DM annihilation to light-quarks ($\mathrm{ q } \mathrm{ \bar{q} } $), $\tau ^{+}\tau ^{-}$, and $ {\mathrm{ b \bar{b} } } $ are given by the solid green, hatched pink, and shaded brown coloured regions, respectively. |
png pdf |
Figure 11-d:
The 90% CL exclusion contours in the $m_{\mathrm {DM}}-\sigma _{\mathrm {SI}}$ or $m_{\mathrm {DM}}-\sigma _{\mathrm {SD}}$ plane assuming vector (top-left), axial vector (top-right), scalar (bottom-left) mediators. Also shown is the 90% CL exclusion in DM annihilation cross section as a function of $m_{\mathrm {DM}}$ for a pseudoscalar mediator (bottom-right). For the scalar and pseudoscalar mediators, the exclusion contours assuming the mediator only couples to fermions (fermionic) is also shown. The excluded region in all plots is to the top-left of the contours for the results from this analysis while the DD experiments and Fermi LAT excluded regions are above the lines shown. In the vector and axial vector models, limits are shown independently for monojet, V-boosted, and V-resolved categories. The red dot-dashed line shows the partial combination of the V-tagged categories for which the V-boosted category provides the dominant contribution. In all of the mediator models, a minimum mediator width is assumed. For the pseudoscalar mediator, 68% CL preferred regions, obtained using data from Fermi LAT, for DM annihilation to light-quarks ($\mathrm{ q } \mathrm{ \bar{q} } $), $\tau ^{+}\tau ^{-}$, and $ {\mathrm{ b \bar{b} } } $ are given by the solid green, hatched pink, and shaded brown coloured regions, respectively. |

png pdf |
Figure 12:
Correlations between the predicted number of background events in each bin of $ {E_{\mathrm {T}}^{\text {miss}}} $ in the V-boosted category. The correlation is determined from the simultaneous fit to data in the dimuon, single muon, and photon control regions in all the three event categories. |
png pdf |
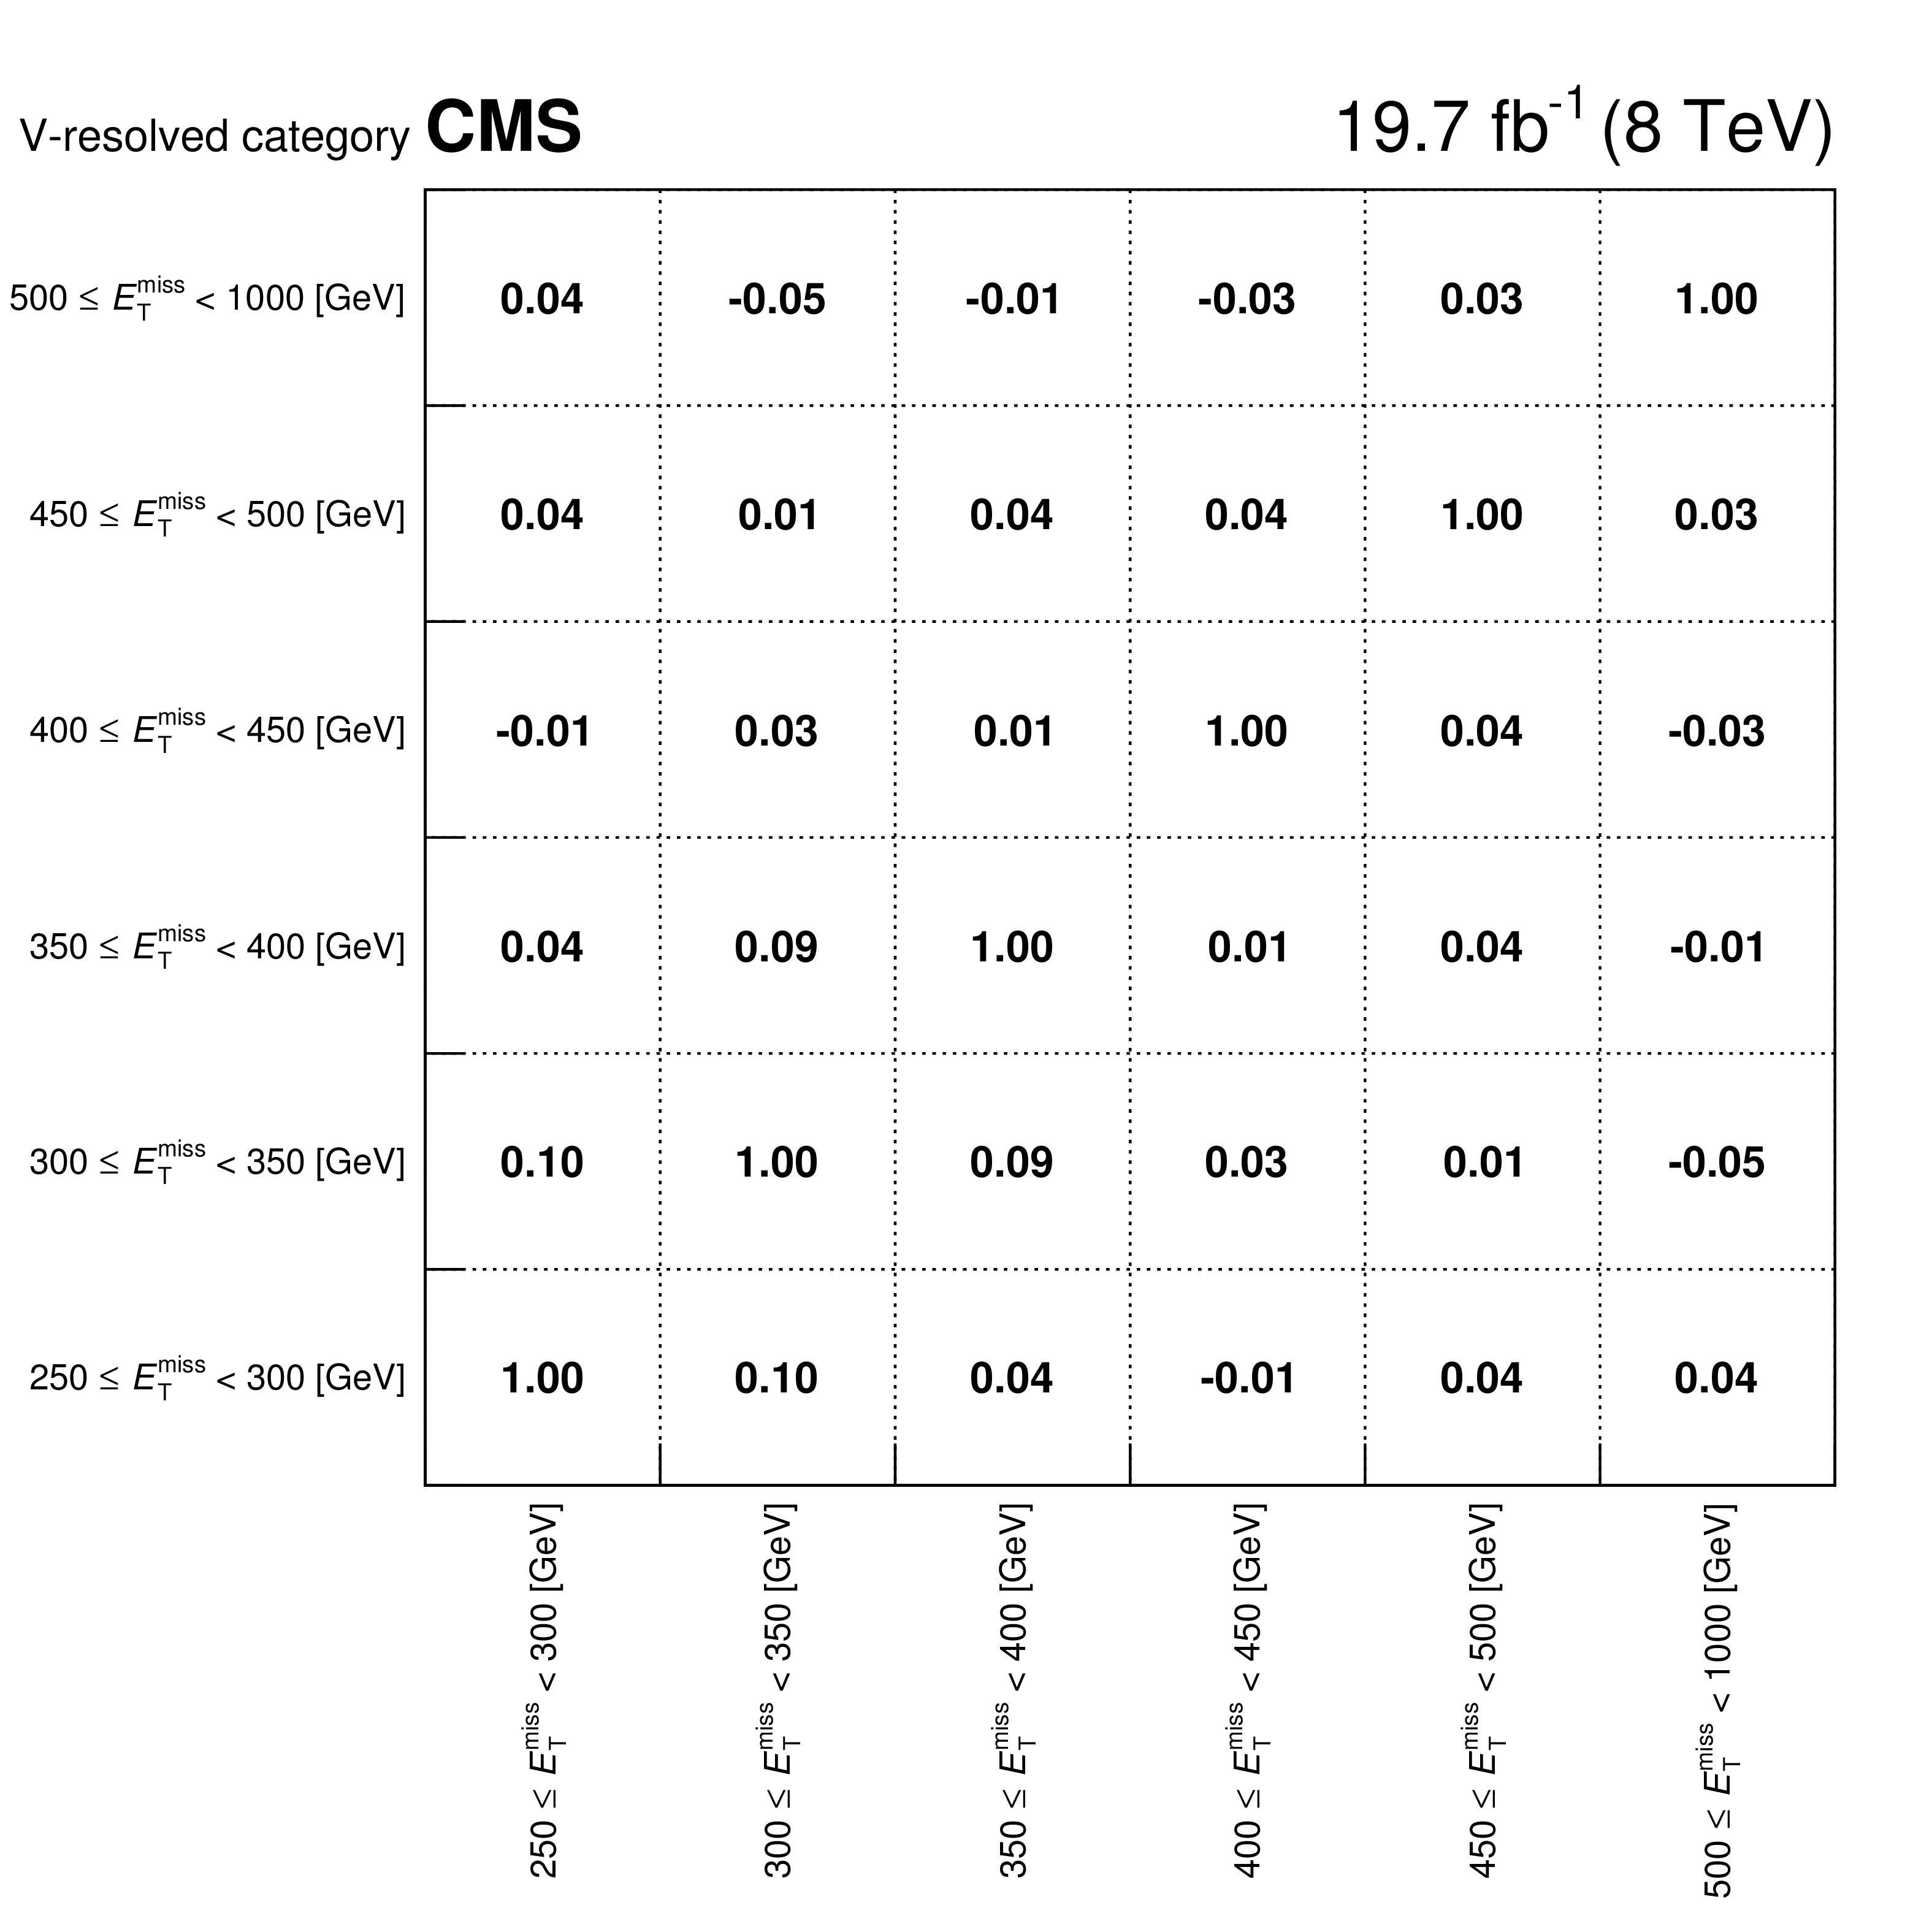
Figure 13:
Correlations between the predicted number of background events in each bin of $ {E_{\mathrm {T}}^{\text {miss}}} $ in the V-resolved category. The correlation is determined from the simultaneous fit to data in the dimuon, single muon, and photon control regions in all the three event categories. |

png pdf |
Figure 14:
Correlations between the predicted number of background events in each bin of $ {E_{\mathrm {T}}^{\text {miss}}} $ in the monojet category. The correlation is determined from the simultaneous fit to data in the dimuon, single muon, and photon control regions in all the three event categories. |
| Tables | |
png pdf |
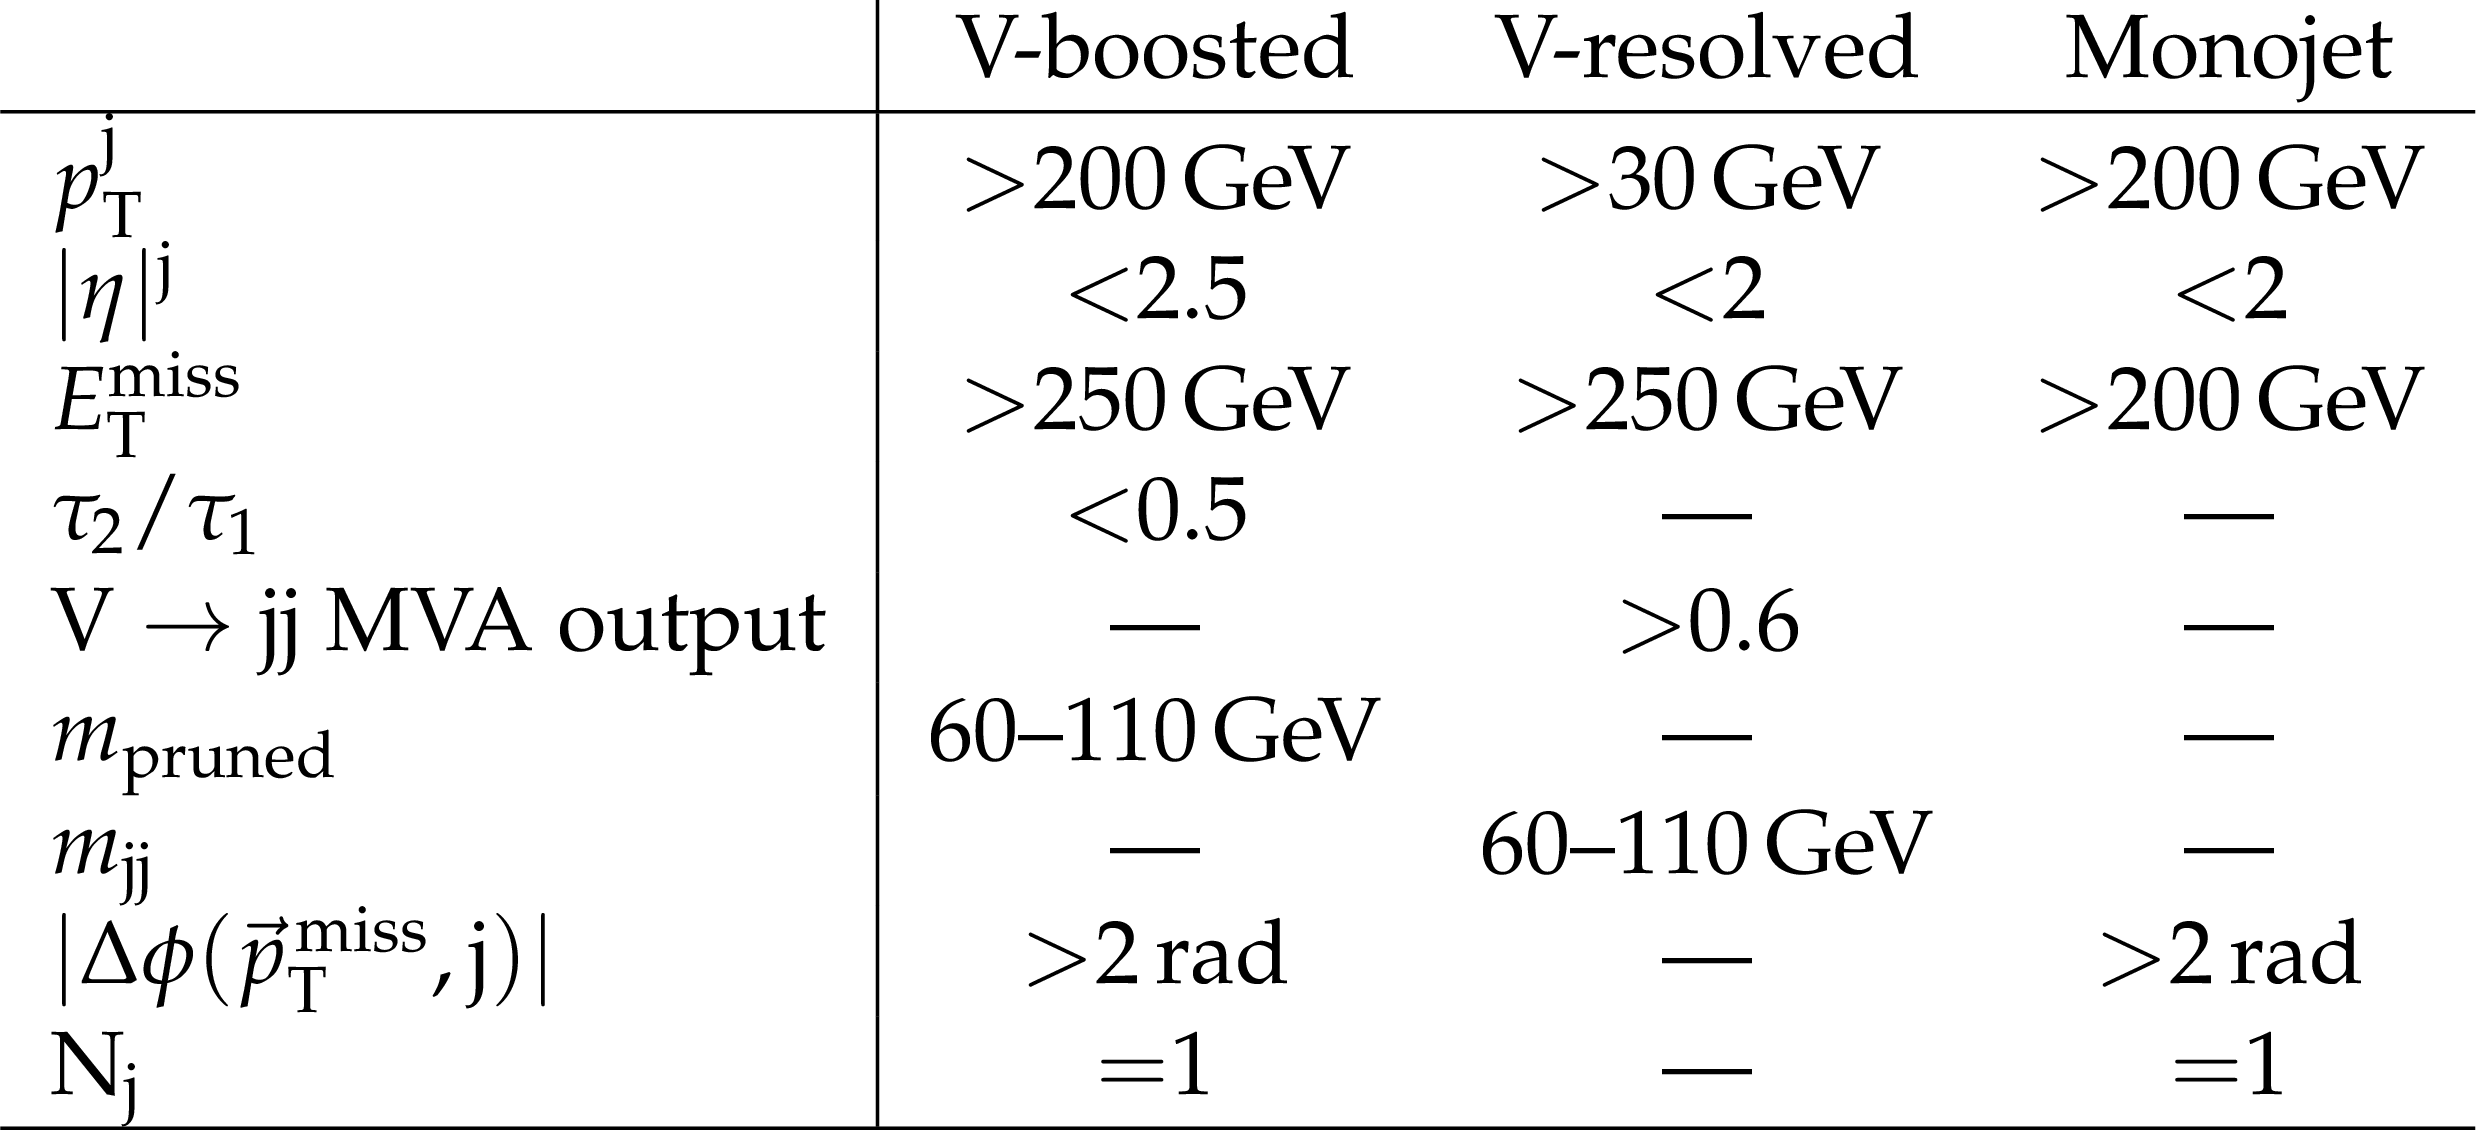
Table 1:
Event selections for the V-boosted, V-resolved, and monojet categories The requirements on $ {p_{\mathrm {T}}} ^{\mathrm {j}}$ and $ {| \eta | }^{\mathrm {j}}$ refer to the highest $ {p_{\mathrm {T}}} $ CA8 or AK5 jet in the V-boosted or monojet categories, and to both leading AK5 jets in the V-resolved category. The requirement on the number of jets ($N_\mathrm {j}$) is applied in the V-boosted and monojet categories. An additional jet is allowed only if it falls within $ {| \Delta \phi | } < $ 2 radians of the leading AK5 or CA8 jet for the monojet or V-boosted category. The additional AK5 jets in the V-boosted category must be further than $\Delta R > $ 0.5 for the event to fail this criteria. |
png pdf |
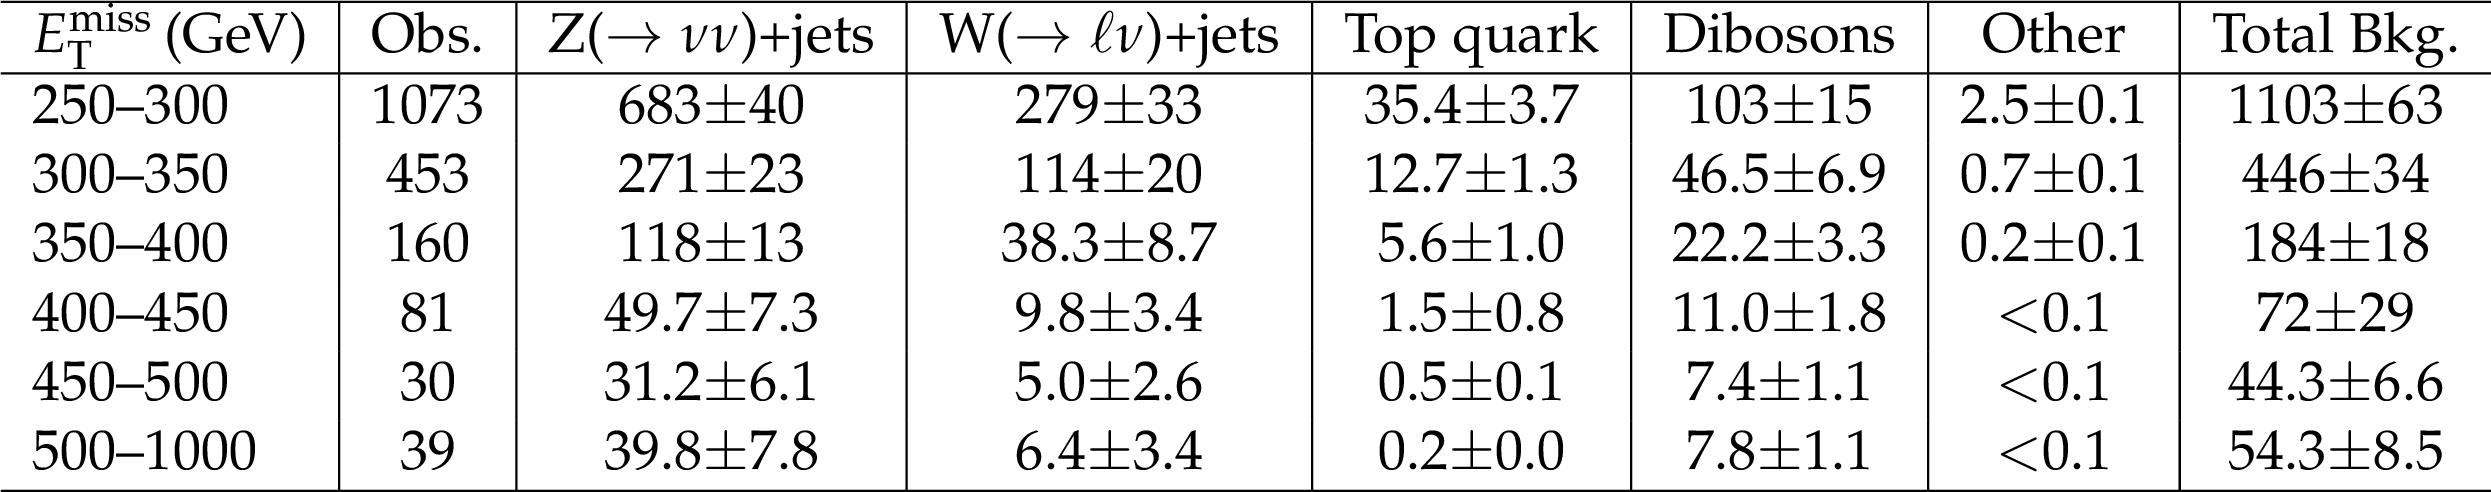
Table 2:
Expected yields of the SM processes and their uncertainties per bin for the V-boosted category after the fit to the control regions. |
png pdf |
Table 3:
Expected yields of the SM processes and their uncertainties per bin for the V-resolved category after the fit to the control regions. |
png pdf |
Table 4:
Expected yields of the SM processes and their uncertainties per bin for the monojet category after the fit to the control regions. |
png pdf |
Table 5:
Expected signal event yields in each of the three event categories for monojet and mono-V production assuming a vector, axial vector, pseudoscalar, or scalar mediator. The yields are determined assuming $m_{\mathrm {DM}}= $ 1 GeV and $g_{\mathrm {DM}}=g_{\mathrm {SM}}=g_{\mathrm{ q } }= $ 1. |
| Summary |
| A search has been presented for an excess of events with at least one energetic jet in association with large $ E_{\mathrm{T}}^{\text{miss}} $ in a data sample of proton-proton collisions at a centre-of-mass energy of 8 TeV. The data correspond to an integrated luminosity of 19.7 fb$^{-1}$ collected with the CMS detector at the LHC. Sensitivity to a potential mono-V signature is achieved by the addition of two event categories that select hadronically decaying V-bosons using novel jet substructure techniques. This search is the first at CMS to use jet substructure techniques to identify hadronically decaying vector bosons in both Lorentz-boosted and resolved scenarios. The sensitivity of the search has been increased compared to the previous CMS result by using the full shape of the $ E_{\mathrm{T}}^{\text{miss}} $ distribution to discriminate signal from standard model backgrounds and by using additional data control regions. No significant deviation is observed in the $ E_{\mathrm{T}}^{\text{miss}} $ distributions relative to the expectation from standard model backgrounds. The results of the search are interpreted under a set of simplified models that describe the production of dark matter (DM) particle pairs via vector, axial vector, scalar, or pseudoscalar mediation. Constraints are placed on the parameter space of these models. The search is the first at CMS to be interpreted using the simplified models for DM production. The search excludes DM production via vector or axial vector mediation with mediator masses up to 1.5 TeV, within the simplified model assumptions. When compared to direct detection experiments, the limits from this analysis provide the strongest constraints at small DM masses in the vector model and for DM masses up to 300 GeV in the axial vector model. For scalar and pseudoscalar mediated DM production, this analysis excludes mediator masses up to 80 and 400 GeV, respectively. The results of this analysis provide the strongest constraints on DM pair annihilation cross section via a pseudoscalar interaction for DM masses up to 150 GeV compared to the latest indirect detection results from Fermi LAT. |
| Additional Figures | |

png pdf |
Additional Figure 1:
Correlations between the predicted number of background events in each bin of ${E_{\mathrm {T}}^{\text {miss}}}$ in the V-boosted category. The correlation is determined from the simultaneous fit to data in the dimuon, single muon, and photon control regions in all the three event categories. |

png pdf |
Additional Figure 2:
Correlations between the predicted number of background events in each bin of ${E_{\mathrm {T}}^{\text {miss}}}$ in the V-resolved category. The correlation is determined from the simultaneous fit to data in the dimuon, single muon, and photon control regions in all the three event categories. |
png pdf |
Additional Figure 3:
Correlations between the predicted number of background events in each bin of ${E_{\mathrm {T}}^{\text {miss}}}$ in the monojet category. The correlation is determined from the simultaneous fit to data in the dimuon, single muon, and photon control regions in all the three event categories. |
| References | ||||
| 1 | H. C. van de Hulst, E. Raimond, and H. van Woerden | Rotation and density distribution of the Andromeda nebula derived from observations of the 21-cm line | Bull. Astr. Inst. Netherlands 14 (1957) 1 | |
| 2 | V. C. Rubin, N. Thonnard, and W. K. Ford Jr. | Rotational properties of 21 SC galaxies with a large range of luminosities and radii, from NGC 4605/R = 4 kpc to UGC 2885/R = 122 kpc | Astrophys. J. 238 (1980) 471 | |
| 3 | G. F. Smoot et al. | Structure in the COBE differential microwave radiometer first year maps | Astrophys. J. 396 (1992) L1 | |
| 4 | Boomerang Collaboration | A flat Universe from high resolution maps of the cosmic microwave background radiation | Nature 404 (2000) 955 | astro-ph/0004404 |
| 5 | WMAP Collaboration | Wilkinson microwave anisotropy probe (WMAP) three year results: implications for cosmology | Astrophys. J. Suppl. 170 (2007) 377 | astro-ph/0603449 |
| 6 | J. L. Feng | Dark matter candidates from particle physics and methods of detection | Ann. Rev. Astron. Astrophys. 48 (2010) 495 | 1003.0904 |
| 7 | T. A. Porter, R. P. Johnson, and P. W. Graham | Dark matter searches with astroparticle data | Ann. Rev. Astron. Astrophys. 49 (2011) 155 | 1104.2836 |
| 8 | ATLAS Collaboration | Search for new phenomena in final states with an energetic jet and large missing transverse momentum in pp collisions at $ \sqrt{s}=13 $ TeV using the ATLAS detector | Submitted to PRD | 1604.07773 |
| 9 | CMS Collaboration | Search for dark matter, extra dimensions, and unparticles in monojet events in proton proton collisions at $ \sqrt{s} = 8 $ TeV | EPJC 75 (2015) 235 | CMS-EXO-12-048 1408.3583 |
| 10 | ATLAS Collaboration | Search for new phenomena in final states with an energetic jet and large missing transverse momentum in pp collisions at $ \sqrt{s}=8 $ TeV with the ATLAS detector | EPJC 75 (2015) 299, , [Erratum: \DOI10.1140/epjc/s10052-015-3639-7] | 1502.01518 |
| 11 | ATLAS Collaboration | Search for dark matter candidates and large extra dimensions in events with a jet and missing transverse momentum with the ATLAS detector | JHEP 04 (2013) 075 | 1210.4491 |
| 12 | ATLAS Collaboration | Search for new phenomena with the monojet and missing transverse momentum signature using the ATLAS detector in $ \sqrt{s}=7 $ TeV proton-proton collisions | PLB 705 (2011) 294 | 1106.5327 |
| 13 | CMS Collaboration | Search for dark matter and large extra dimensions in monojet events in pp collisions at $ \sqrt{s}=7 $ TeV | JHEP 09 (2012) 094 | CMS-EXO-11-059 1206.5663 |
| 14 | CMS Collaboration | Search for dark matter particles in proton-proton collisions at $ \sqrt{s} $ = 8 TeV using the razor variables | Submitted to JHEP | CMS-EXO-14-004 1603.08914 |
| 15 | CMS Collaboration | Search for physics beyond the standard model in final states with a lepton and missing transverse energy in proton-proton collisions at $ \sqrt{s} $ = 8 TeV | PRD 91 (2015) 092005 | CMS-EXO-12-060 1408.2745 |
| 16 | ATLAS Collaboration | Search for dark matter in events with a Z boson and missing transverse momentum in pp collisions at $ \sqrt{s} $ = 8 TeV with the ATLAS detector | PRD 90 (2014) 012004 | 1404.0051 |
| 17 | ATLAS Collaboration | Search for dark matter in events with a hadronically decaying W or Z boson and missing transverse momentum in pp collisions at $ \sqrt{s} = $ 8 TeV with the ATLAS detector | PRL 112 (2014) 041802 | 1309.4017 |
| 18 | ATLAS Collaboration | Search for new particles in events with one lepton and missing transverse momentum in pp collisions at $ \sqrt{s} $ = 8 TeV with the ATLAS detector | JHEP 09 (2014) 037 | 1407.7494 |
| 19 | P. J. Fox, R. Harnik, J. Kopp, and Y. Tsai | Missing energy signatures of dark matter at the LHC | PRD 85 (2012) 056011 | 1109.4398 |
| 20 | G. Busoni, A. D. Simone, E. Morgante, and A. Riotto | On the validity of the effective field theory for dark matter searches at the LHC | PLB 728C (2014) 412. | 1307.2253 |
| 21 | O. Buchmueller, M. J. Dolan, and C. McCabe | Beyond effective field theory for dark matter searches at the LHC | JHEP 01 (2014) 025 | 1308.6799 |
| 22 | O. Buchmueller, M. J. Dolan, S. A. Malik, and C. McCabe | Characterising dark matter searches at colliders and direct detection experiments: Vector mediators | JHEP 01 (2015) 037 | 1407.8257 |
| 23 | D. Abercrombie et al. | Dark matter benchmark models for early LHC Run-2 searches: Report of the ATLAS/CMS Dark Matter Forum | 1507.00966 | |
| 24 | CMS Collaboration | The CMS experiment at the CERN LHC | JINST 3 (2008) S08004 | CMS-00-001 |
| 25 | CMS Collaboration | Particle--Flow Event Reconstruction in CMS and Performance for Jets, Taus, and $ E_{\mathrm{T}}^{\text{miss}} $ | CDS | |
| 26 | CMS Collaboration | Commissioning of the Particle-flow Event Reconstruction with the first LHC collisions recorded in the CMS detector | CDS | |
| 27 | M. Cacciari, G. P. Salam, and G. Soyez | The anti-$ k_{t} $ jet clustering algorithm | JHEP 04 (2008) 063 | 0802.1189 |
| 28 | CMS Collaboration | A Cambridge-Aachen (C-A) based jet algorithm for boosted top-jet tagging | CDS | |
| 29 | CMS Collaboration | Determination of jet energy calibration and transverse momentum resolution in CMS | JINST 6 (2011) P11002 | |
| 30 | M. Cacciari, G. P. Salam, and G. Soyez | FastJet user manual | EPJC 72 (2012) 1896 | 1111.6097 |
| 31 | P. Harris, V. V. Khoze, M. Spannowsky, and C. Williams | Constraining dark sectors at colliders: beyond the effective theory approach | PRD 91 (2015) 055009 | 1411.0535 |
| 32 | U. Haisch, F. Kahlhoefer, and J. Unwin | The impact of heavy-quark loops on LHC dark matter searches | JHEP 07 (2013) 125 | 1208.4605 |
| 33 | L. Lopez-Honorez, T. Schwetz, and J. Zupan | Higgs portal, fermionic dark matter, and a Standard Model like Higgs at 125 GeV | PLB 716 (2012) 179 | 1203.2064 |
| 34 | V. V. Khoze, G. Ro, and M. Spannowsky | Spectroscopy of scalar mediators to dark matter at the LHC and at 100 TeV | PRD 92 (2015) 075006 | 1505.03019 |
| 35 | T. Hambye and A. Strumia | Dynamical generation of the weak and dark matter scale | PRD 88 (2013) 055022 | 1306.2329 |
| 36 | V. V. Khoze, C. McCabe, and G. Ro | Higgs vacuum stability from the dark matter portal | JHEP 08 (2014) 026 | 1403.4953 |
| 37 | V. V. Khoze and G. Ro | Dark matter monopoles, vectors and photons | JHEP 10 (2014) 61 | 1406.2291 |
| 38 | W. Altmannshofer et al. | Light dark matter, naturalness, and the radiative origin of the electroweak scale | JHEP 01 (2015) 032 | 1408.3429 |
| 39 | C. D. Carone and R. Ramos | Classical scale-invariance, the electroweak scale and vector dark matter | PRD 88 (2013) 055020 | 1307.8428 |
| 40 | M. Heikinheimo et al. | Physical naturalness and dynamical breaking of classical scale invariance | MPLA 29 (2014) 1450077 | 1304.7006 |
| 41 | J. M. Campbell and R. K. Ellis | MCFM for the Tevatron and the LHC | NPPS 205-206 (2010) 10 | 1007.3492 |
| 42 | I. Anderson et al. | Constraining anomalous HVV interactions at proton and lepton colliders | PRD 89 (2014) 035007 | 1309.4819 |
| 43 | T. Sj\"ostrand, S. Mrenna, and P. Z. Skands | PYTHIA 6.4 physics and manual | JHEP 05 (2006) 026 | hep-ph/0603175 |
| 44 | GEANT4 Collaboration | GEANT4---a simulation toolkit | NIMA 506 (2003) 250 | |
| 45 | U. Haisch, F. Kahlhoefer, and E. Re | QCD effects in mono-jet searches for dark matter | JHEP 12 (2013) 007 | 1310.4491 |
| 46 | P. Nason | A mew method for combining NLO QCD with shower Monte Carlo algorithms | JHEP 11 (2004) 040 | hep-ph/0409146 |
| 47 | S. Frixione, P. Nason, and C. Oleari | Matching NLO QCD computations with parton shower simulations: the POWHEG method | JHEP 11 (2007) 070 | 0709.2092 |
| 48 | C. Oleari | The POWHEG BOX | Nuc. Phys. B Proc. Sup. 205 (2010) 36 | 1007.3893 |
| 49 | S. Alioli, P. Nason, C. Oleari, and E. Re | A general framework for implementing NLO calculations in shower Monte Carlo programs: the POWHEG BOX | JHEP 06 (2010) 043 | 1002.2581 |
| 50 | S. Alioli, P. Nason, C. Oleari, and E. Re | NLO single-top production matched with shower in POWHEG: $ s $- and $ t $-channel contributions | JHEP 09 (2009) 111, , [Erratum: \DOI10.1007/JHEP02(2010)011] | 0907.4076 |
| 51 | T. Sj\"ostrand, S. Mrenna, and P. Z. Skands | A brief introduction to PYTHIA 8.1 | CPC 178 (2008) 852 | 0710.3820 |
| 52 | CMS Collaboration | Event generator tunes obtained from underlying event and multiparton scattering measurements | EPJC 76 (2016) 155 | CMS-GEN-14-001 1512.00815 |
| 53 | A. Denner, S. Dittmaier, S. Kallweit, and A. Muck | Electroweak corrections to Higgs-strahlung off W/Z bosons at the Tevatron and the LHC with HAWK | JHEP 03 (2012) 075 | 1112.5142 |
| 54 | O. Brein, A. Djouadi, and R. Harlander | NNLO QCD corrections to the Higgs-strahlung processes at hadron colliders | PLB 579 (2004) 149 | hep-ph/0307206 |
| 55 | NNPDF Collaboration | Parton distributions for the LHC Run II | JHEP 04 (2015) 040 | 1410.8849 |
| 56 | J. Alwall et al. | The automated computation of tree-level and next-to-leading order differential cross sections, and their matching to parton shower simulations | JHEP 07 (2014) 079 | 1405.0301 |
| 57 | M. L. Mangano, M. Moretti, F. Piccinini, and M. Treccani | Matching matrix elements and shower evolution for top-quark production in hadronic collisions | JHEP 01 (2007) 013 | hep-ph/0611129 |
| 58 | J. Gao et al. | CT10 next-to-next-to-leading order global analysis of QCD | PRD 89 (2014) 033009 | 1302.6246 |
| 59 | CMS Collaboration | Performance of the CMS missing transverse momentum reconstruction in pp data at $ \sqrt{s} $ = 8 TeV | JINST 10 (2015) P02006 | CMS-JME-13-003 1411.0511 |
| 60 | CMS Collaboration | Performance of photon reconstruction and identification with the CMS detector in proton-proton collisions at $ \sqrt{s} $ = 8 TeV | JINST 10 (2015) P08010 | CMS-EGM-14-001 1502.02702 |
| 61 | CMS Collaboration | Performance of electron reconstruction and selection with the CMS Detector in proton-proton collisions at $ \sqrt{s}=8 $ TeV | JINST 10 (2015) P06005 | CMS-EGM-13-001 1502.02701 |
| 62 | CMS Collaboration | Reconstruction and identification of tau lepton decays to hadrons and tau neutrinos at CMS | JINST 11 (2016) P01019 | CMS-TAU-14-001 1510.07488 |
| 63 | CMS Collaboration | The performance of the CMS muon detector in proton-proton collisions at sqrt(s) = 7 TeV at the LHC | JINST 8 (2013) P11002 | CMS-MUO-11-001 1306.6905 |
| 64 | CMS Collaboration | The CMS Particle Flow Algorithm | in Proceedings, International Conference on Calorimetry for the High Energy Frontier (CHEF 2013), p. 295 2013 | 1401.8155 |
| 65 | J. Thaler and K. Van Tilburg | Identifying boosted objects with $ N $-subjettiness | JHEP 03 (2011) 015 | 1011.2268 |
| 66 | J. Thaler and K. Van Tilburg | Maximizing boosted top identification by minimizing $ N $-subjettiness | JHEP 02 (2012) 093 | 1108.2701 |
| 67 | S. D. Ellis, C. K. Vermilion, and J. R. Walsh | Recombination algorithms and jet substructure: pruning as a tool for heavy particle searches | PRD 81 (2010) 094023 | 0912.0033 |
| 68 | CMS Collaboration | Identification techniques for highly boosted W bosons that decay into hadrons | JHEP 12 (2014) 017 | CMS-JME-13-006 1410.4227 |
| 69 | J. Gallicchio and M. D. Schwartz | Seeing in color: jet superstructure | PRL 105 (2010) 022001 | 1001.5027 |
| 70 | E. Izaguirre, B. Shuve, and I. Yavin | Improving identification of dijet resonances at hadron colliders | PRL 114 (2015) 041802 | 1407.7037 |
| 71 | CMS Collaboration | V tagging observables and correlations | ||
| 72 | CMS Collaboration | Identification of b-quark jets with the CMS experiment | JINST 8 (2013) P04013 | CMS-BTV-12-001 1211.4462 |
| 73 | S. Ask et al. | Using $ \gamma $+jets production to calibrate the Standard Model $ Z(\to \nu\nu) $+jets background to new physics processes at the LHC | JHEP 10 (2011) 058 | 1107.2803 |
| 74 | J. H. Kuhn, A. Kulesza, S. Pozzorini, and M. Schulze | Electroweak corrections to hadronic photon production at large transverse momenta | JHEP 03 (2006) 059 | hep-ph/0508253 |
| 75 | CMS Collaboration | Performance of b tagging at $ \sqrt{s}=8 $ TeV in multijet, $ \rm{t}\overline{\rm t} $ and boosted topology events | CMS-PAS-BTV-13-001 | CMS-PAS-BTV-13-001 |
| 76 | CMS Collaboration | Measurement of the differential cross section for top quark pair production in pp collisions at $ \sqrt{s} = 8\,\text {TeV} $ | EPJC 75 (2015) 542 | CMS-TOP-12-028 1505.04480 |
| 77 | CMS Collaboration | Measurement of the pp $ \to $ ZZ production cross section and constraints on anomalous triple gauge couplings in four-lepton final states at $ \sqrt s=8 $ TeV | PLB 740 (2015) 250 | CMS-SMP-13-005 1406.0113 |
| 78 | CMS Collaboration | Measurement of the $ W^+W^- $ cross section in pp collisions at $ \sqrt{s} $ = 8 TeV and limits on anomalous gauge couplings | Submitted to EPJC | CMS-SMP-14-016 1507.03268 |
| 79 | CMS Collaboration | CMS Luminosity Based on Pixel Cluster Counting - Summer 2013 Update | CMS-PAS-LUM-13-001 | CMS-PAS-LUM-13-001 |
| 80 | G. Cowan, K. Cranmer, E. Gross, and O. Vitells | Asymptotic formulae for likelihood-based tests of new physics | EPJC 71 (2011) 1554, , [Erratum: \DOI10.1140/epjc/s10052-013-2501-z] | 1007.1727 |
| 81 | ATLAS/CMS/LHC Higgs Combination Group Collaboration | Procedure for the LHC Higgs boson search combination in summer 2011 | CMS-NOTE-2011-005 | |
| 82 | A. L. Read | Presentation of search results: the $ CL_s $ technique | JPG 28 (2002) 2693 | |
| 83 | H. An, X. Ji, and L.-T. Wang | Light dark matter and $ Z' $ dark force at colliders | JHEP 07 (2012) 182 | 1202.2894 |
| 84 | WMAP Collaboration | The Microwave Anisotropy Probe (MAP) mission | Astrophys. J. 583 (2003) 1 | astro-ph/0301158 |
| 85 | Planck Collaboration | The scientific programme of Planck | technical report | astro-ph/0604069 |
| 86 | M. Backovic, K. Kong, and M. McCaskey | MadDM v.1.0: Computation of dark matter relic abundance using MadGraph5 | Phys. Dark Univ. 5-6 (2014) 18 | 1308.4955 |
| 87 | Planck Collaboration | Planck 2013 results. XVI. Cosmological parameters | Astron. Astrophys. 571 (2014) A16 | 1303.5076 |
| 88 | T. du Pree, K. Hahn, P. Harris, and C. Roskas | Cosmological constraints on dark matter models for collider searches | 1603.08525 | |
| 89 | S. A. Malik et al. | Interplay and characterization of dark matter searches at colliders and in direct detection experiments | Phys. Dark Univ. 9-10 (2015) 51 | 1409.4075 |
| 90 | P. Harris, V. V. Khoze, M. Spannowsky, and C. Williams | Closing up on dark sectors at colliders: from 14 to 100 TeV | PRD 93 (2016) 054030 | 1509.02904 |
| 91 | LUX Collaboration | The Large Underground Xenon (LUX) experiment | NIMA 704 (2013) 111 | 1211.3788 |
| 92 | R. Agnese et al. | New Results from the Search for Low-Mass Weakly Interacting Massive Particles with the CDMS Low Ionization Threshold Experiment | ||
| 93 | CRESST Collaboration | Results on light dark matter particles with a low-threshold CRESST-II detector | EPJC 76 (2016) 25 | 1509.01515 |
| 94 | LUX Collaboration | Improved Limits on Scattering of Weakly Interacting Massive Particles from Reanalysis of 2013 LUX Data | PRL 116 (2016) 161301 | 1512.03506 |
| 95 | PICO Collaboration | Dark matter search results from the PICO-2L C$ _3 $F$ _8 $ bubble chamber | PRL 114 (2015) 231302 | 1503.00008 |
| 96 | PICO Collaboration | Dark matter search results from the PICO-60 CF$ _3 $I bubble chamber | PRD 93 (2016) 052014 | 1510.07754 |
| 97 | IceCube Collaboration | Improved limits on dark matter annihilation in the Sun with the 79-string IceCube detector and implications for supersymmetry | JCAP 04 (2016) 022 | 1601.00653 |
| 98 | Super-Kamiokande Collaboration | Search for neutrinos from annihilation of captured low-mass dark matter particles in the Sun by Super-Kamiokande | PRL 114 (2015) 141301 | 1503.04858 |
| 99 | Fermi-LAT Collaboration | Constraining dark matter models from a combined analysis of milky way satellites with the Fermi large area telescope | PRL 107 (2011) 241302 | 1108.3546 |
| 100 | Fermi-LAT Collaboration | Observations of milky way dwarf spheroidal galaxies with the Fermi-LAT detector and constraints on dark matter models | Astrophys. J. 712 (2010) 147 | 1001.4531 |
| 101 | O. Buchmueller, S. A. Malik, C. McCabe, and B. Penning | Constraining dark matter interactions with pseudoscalar and scalar mediators using collider searches for multijets plus missing transverse energy | PRL 115 (2015) 181802 | 1505.07826 |
| 102 | M. R. Buckley, D. Feld, and D. Goncalves | Scalar simplified models for dark matter | PRD 91 (2015) 015017 | 1410.6497 |
| 103 | C. Gordon and O. Macias | Dark matter and pulsar model constraints from galactic center Fermi-LAT gamma ray observations | PRD 88 (2013) 083521, , [Erratum: \DOI10.1103/PhysRevD.89.049901] | 1306.5725 |
| 104 | K. N. Abazajian and M. Kaplinghat | Detection of a gamma-ray source in the galactic center consistent with extended emission from dark matter annihilation and concentrated astrophysical emission | PRD 86 (2012) 083511, , [Erratum: \DOI10.1103/PhysRevD.87.129902] | 1207.6047 |
| 105 | D. Hooper and L. Goodenough | Dark matter annihilation in the galactic center as seen by the Fermi gamma ray space telescope | PLB 697 (2011) 412 | 1010.2752 |
| 106 | P. Agrawal, B. Batell, P. J. Fox, and R. Harnik | WIMPs at the galactic center | JCAP 05 (2015) 011 | 1411.2592 |
| 107 | F. Calore, I. Cholis, C. McCabe, and C. Weniger | A tale of tails: dark matter interpretations of the Fermi GeV excess in light of background model systematics | PRD 91 (2015) 063003 | 1411.4647 |
|
|
Compact Muon Solenoid LHC, CERN |
|

|

|

|

|

|