

Compact Muon Solenoid
LHC, CERN
| CMS-EXO-16-056 ; CERN-EP-2018-123 | ||
| Search for narrow and broad dijet resonances in proton-proton collisions at $\sqrt{s} = $ 13 TeV and constraints on dark matter mediators and other new particles | ||
| CMS Collaboration | ||
| 3 June 2018 | ||
| JHEP 08 (2018) 130 | ||
| Abstract: Searches for resonances decaying into pairs of jets are performed using proton-proton collision data collected at $\sqrt{s} = $ 13 TeV corresponding to an integrated luminosity of up to 36 fb$^{-1}$. A low-mass search, for resonances with masses between 0.6 and 1.6 TeV, is performed based on events with dijets reconstructed at the trigger level from calorimeter information. A high-mass search, for resonances with masses above 1.6 TeV, is performed using dijets reconstructed offline with a particle-flow algorithm. The dijet mass spectrum is well described by a smooth parameterization and no evidence for the production of new particles is observed. Upper limits at 95% confidence level are reported on the production cross section for narrow resonances with masses above 0.6 TeV. In the context of specific models, the limits exclude string resonances with masses below 7.7 TeV, scalar diquarks below 7.2 TeV, axigluons and colorons below 6.1 TeV, excited quarks below 6.0 TeV, color-octet scalars below 3.4 TeV, W' bosons below 3.3 TeV, Z' bosons below 2.7 TeV, Randall-Sundrum gravitons below 1.8 TeV and in the range 1.9 to 2.5 TeV, and dark matter mediators below 2.6 TeV. The limits on both vector and axial-vector mediators, in a simplified model of interactions between quarks and dark matter particles, are presented as functions of dark matter particle mass and coupling to quarks. Searches are also presented for broad resonances, including for the first time spin-1 resonances with intrinsic widths as large as 30% of the resonance mass. The broad resonance search improves and extends the exclusions of a dark matter mediator to larger values of its mass and coupling to quarks. | ||
| Links: e-print arXiv:1806.00843 [hep-ex] (PDF) ; CDS record ; inSPIRE record ; HepData record ; CADI line (restricted) ; | ||
| Figures | |
png pdf |
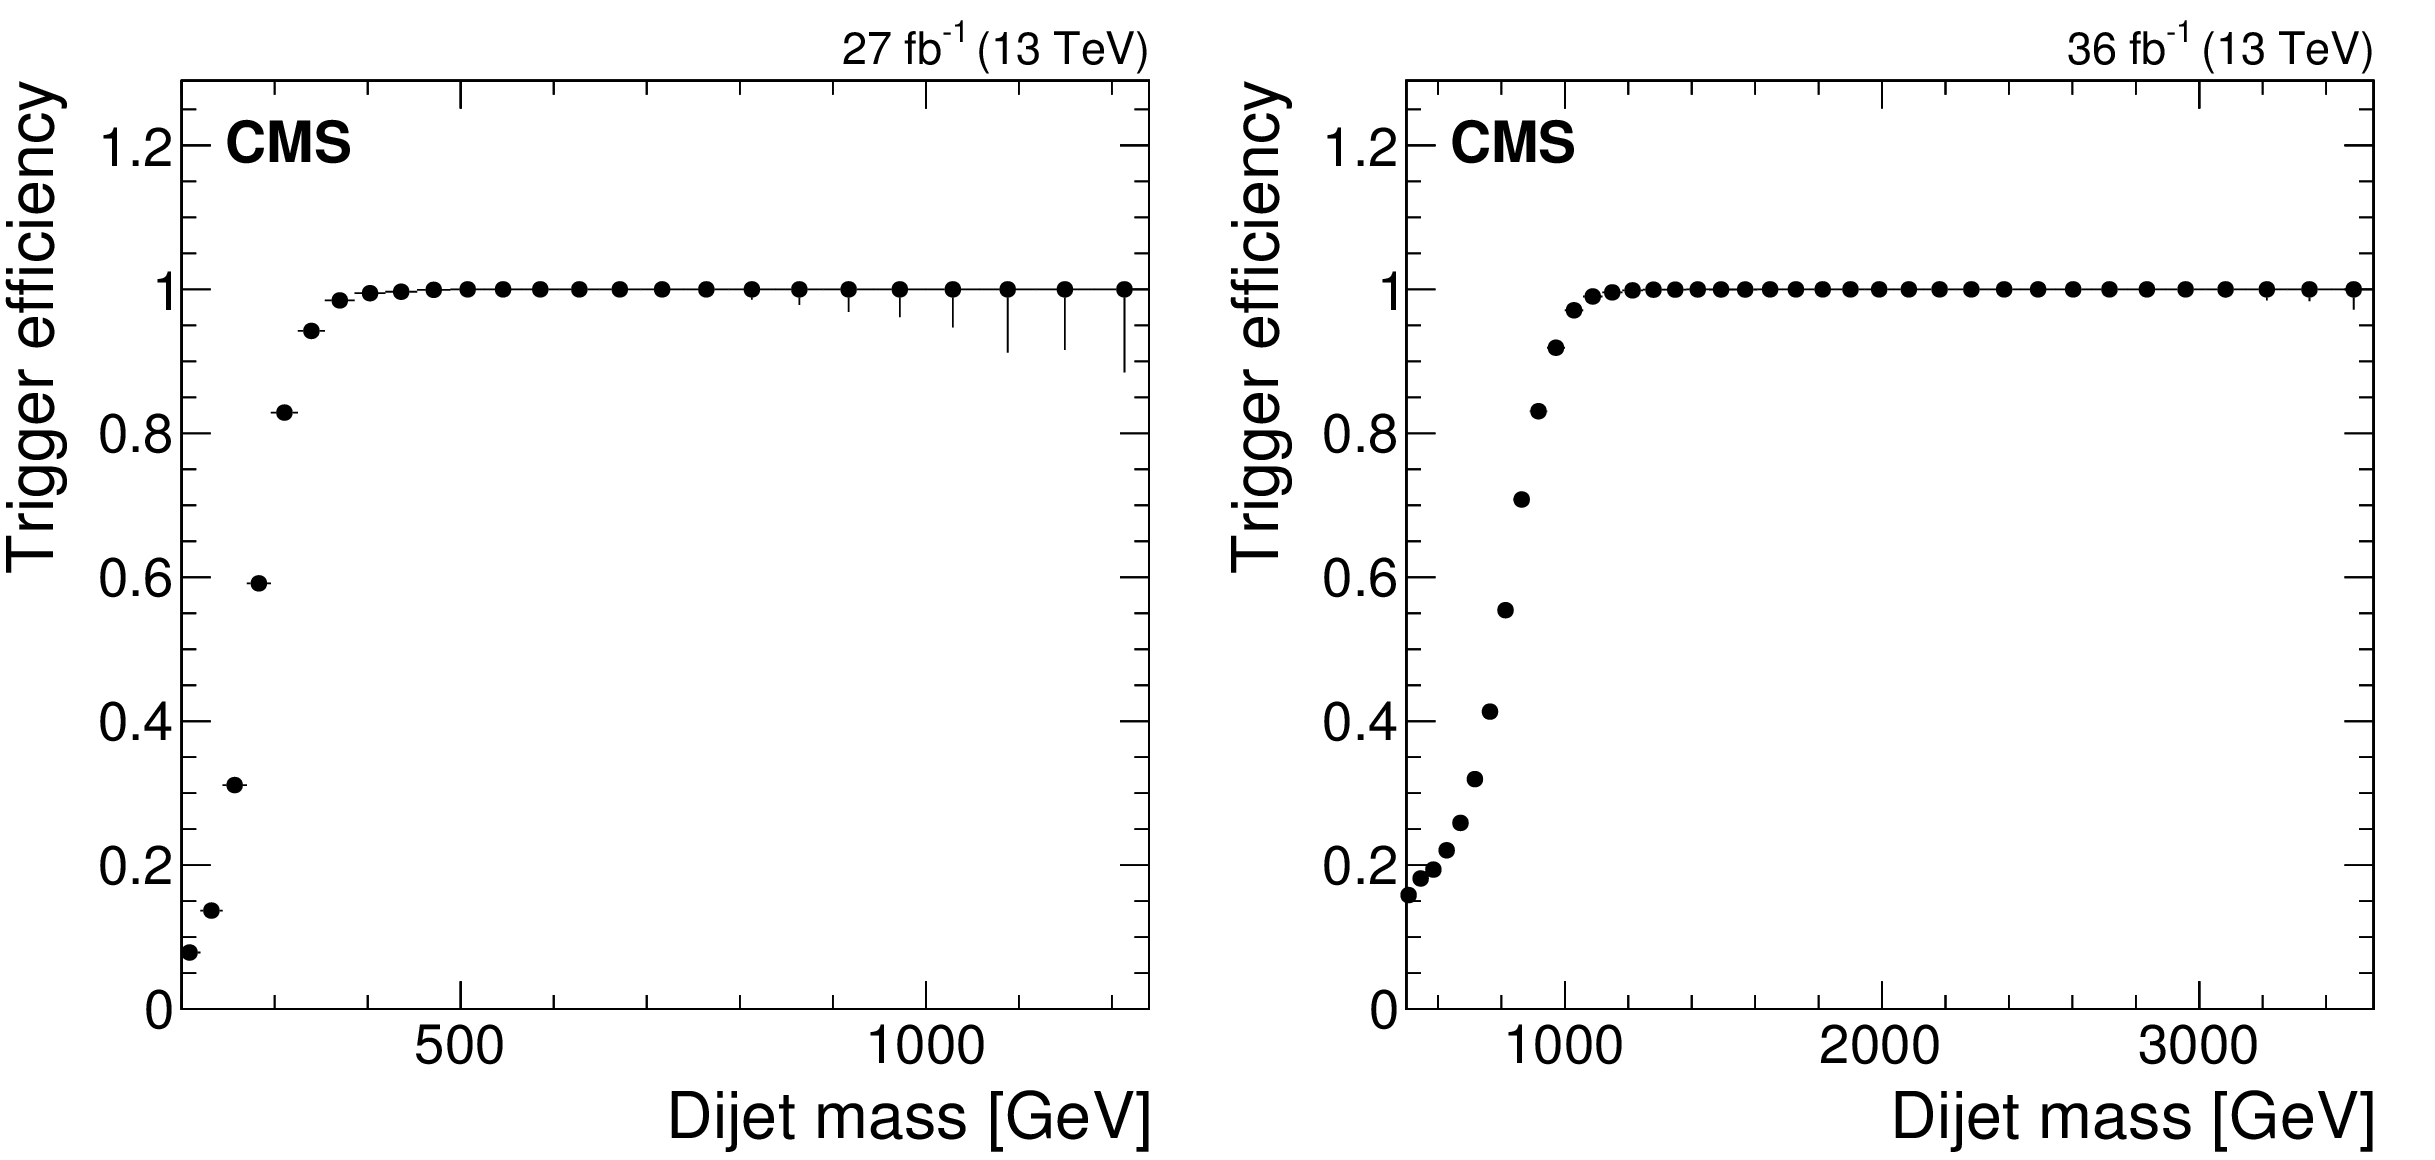
Figure 1:
The efficiency of the trigger for the low-mass search (left) and the high-mass search (right) as a function of dijet mass for wide jets, defined in Section 2.5, after all jet calibrations and event selections discussed in Section 2. The horizontal lines on the data points show the variable bin sizes. |
png pdf |
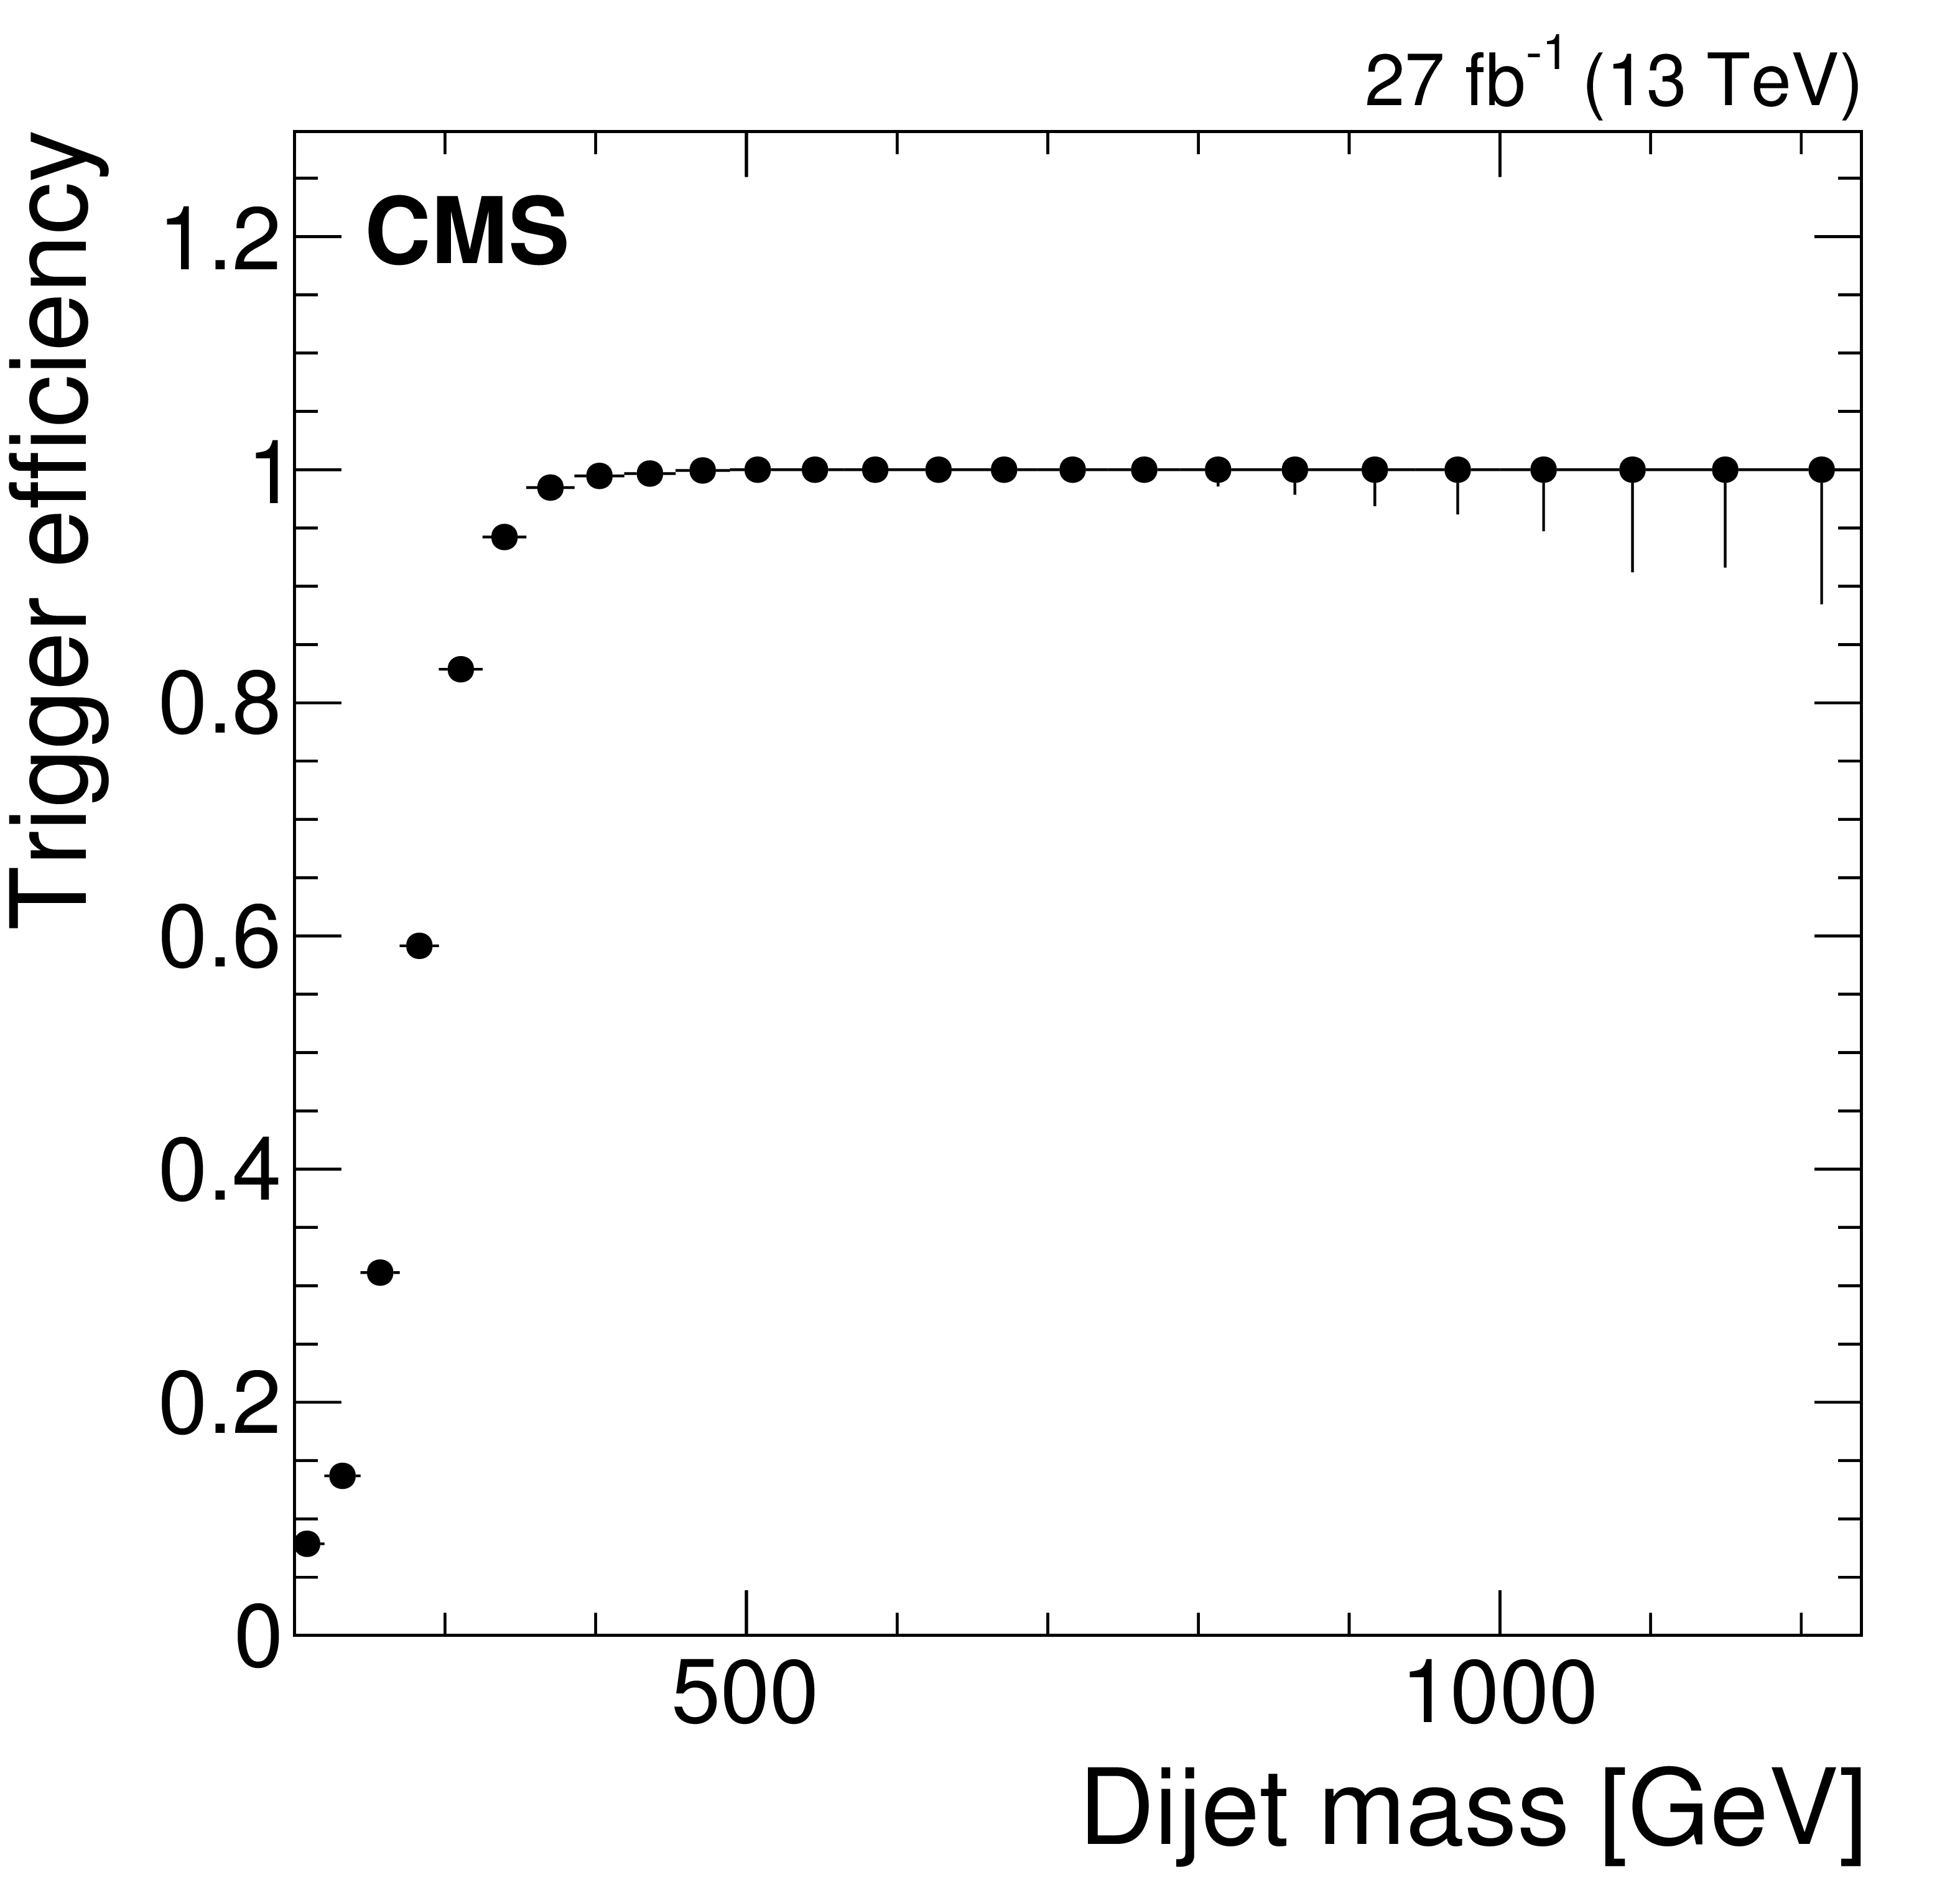
Figure 1-a:
The efficiency of the trigger for the low-mass search as a function of dijet mass for wide jets, defined in Section 2.5, after all jet calibrations and event selections discussed in Section 2. The horizontal lines on the data points show the variable bin sizes. |
png pdf |
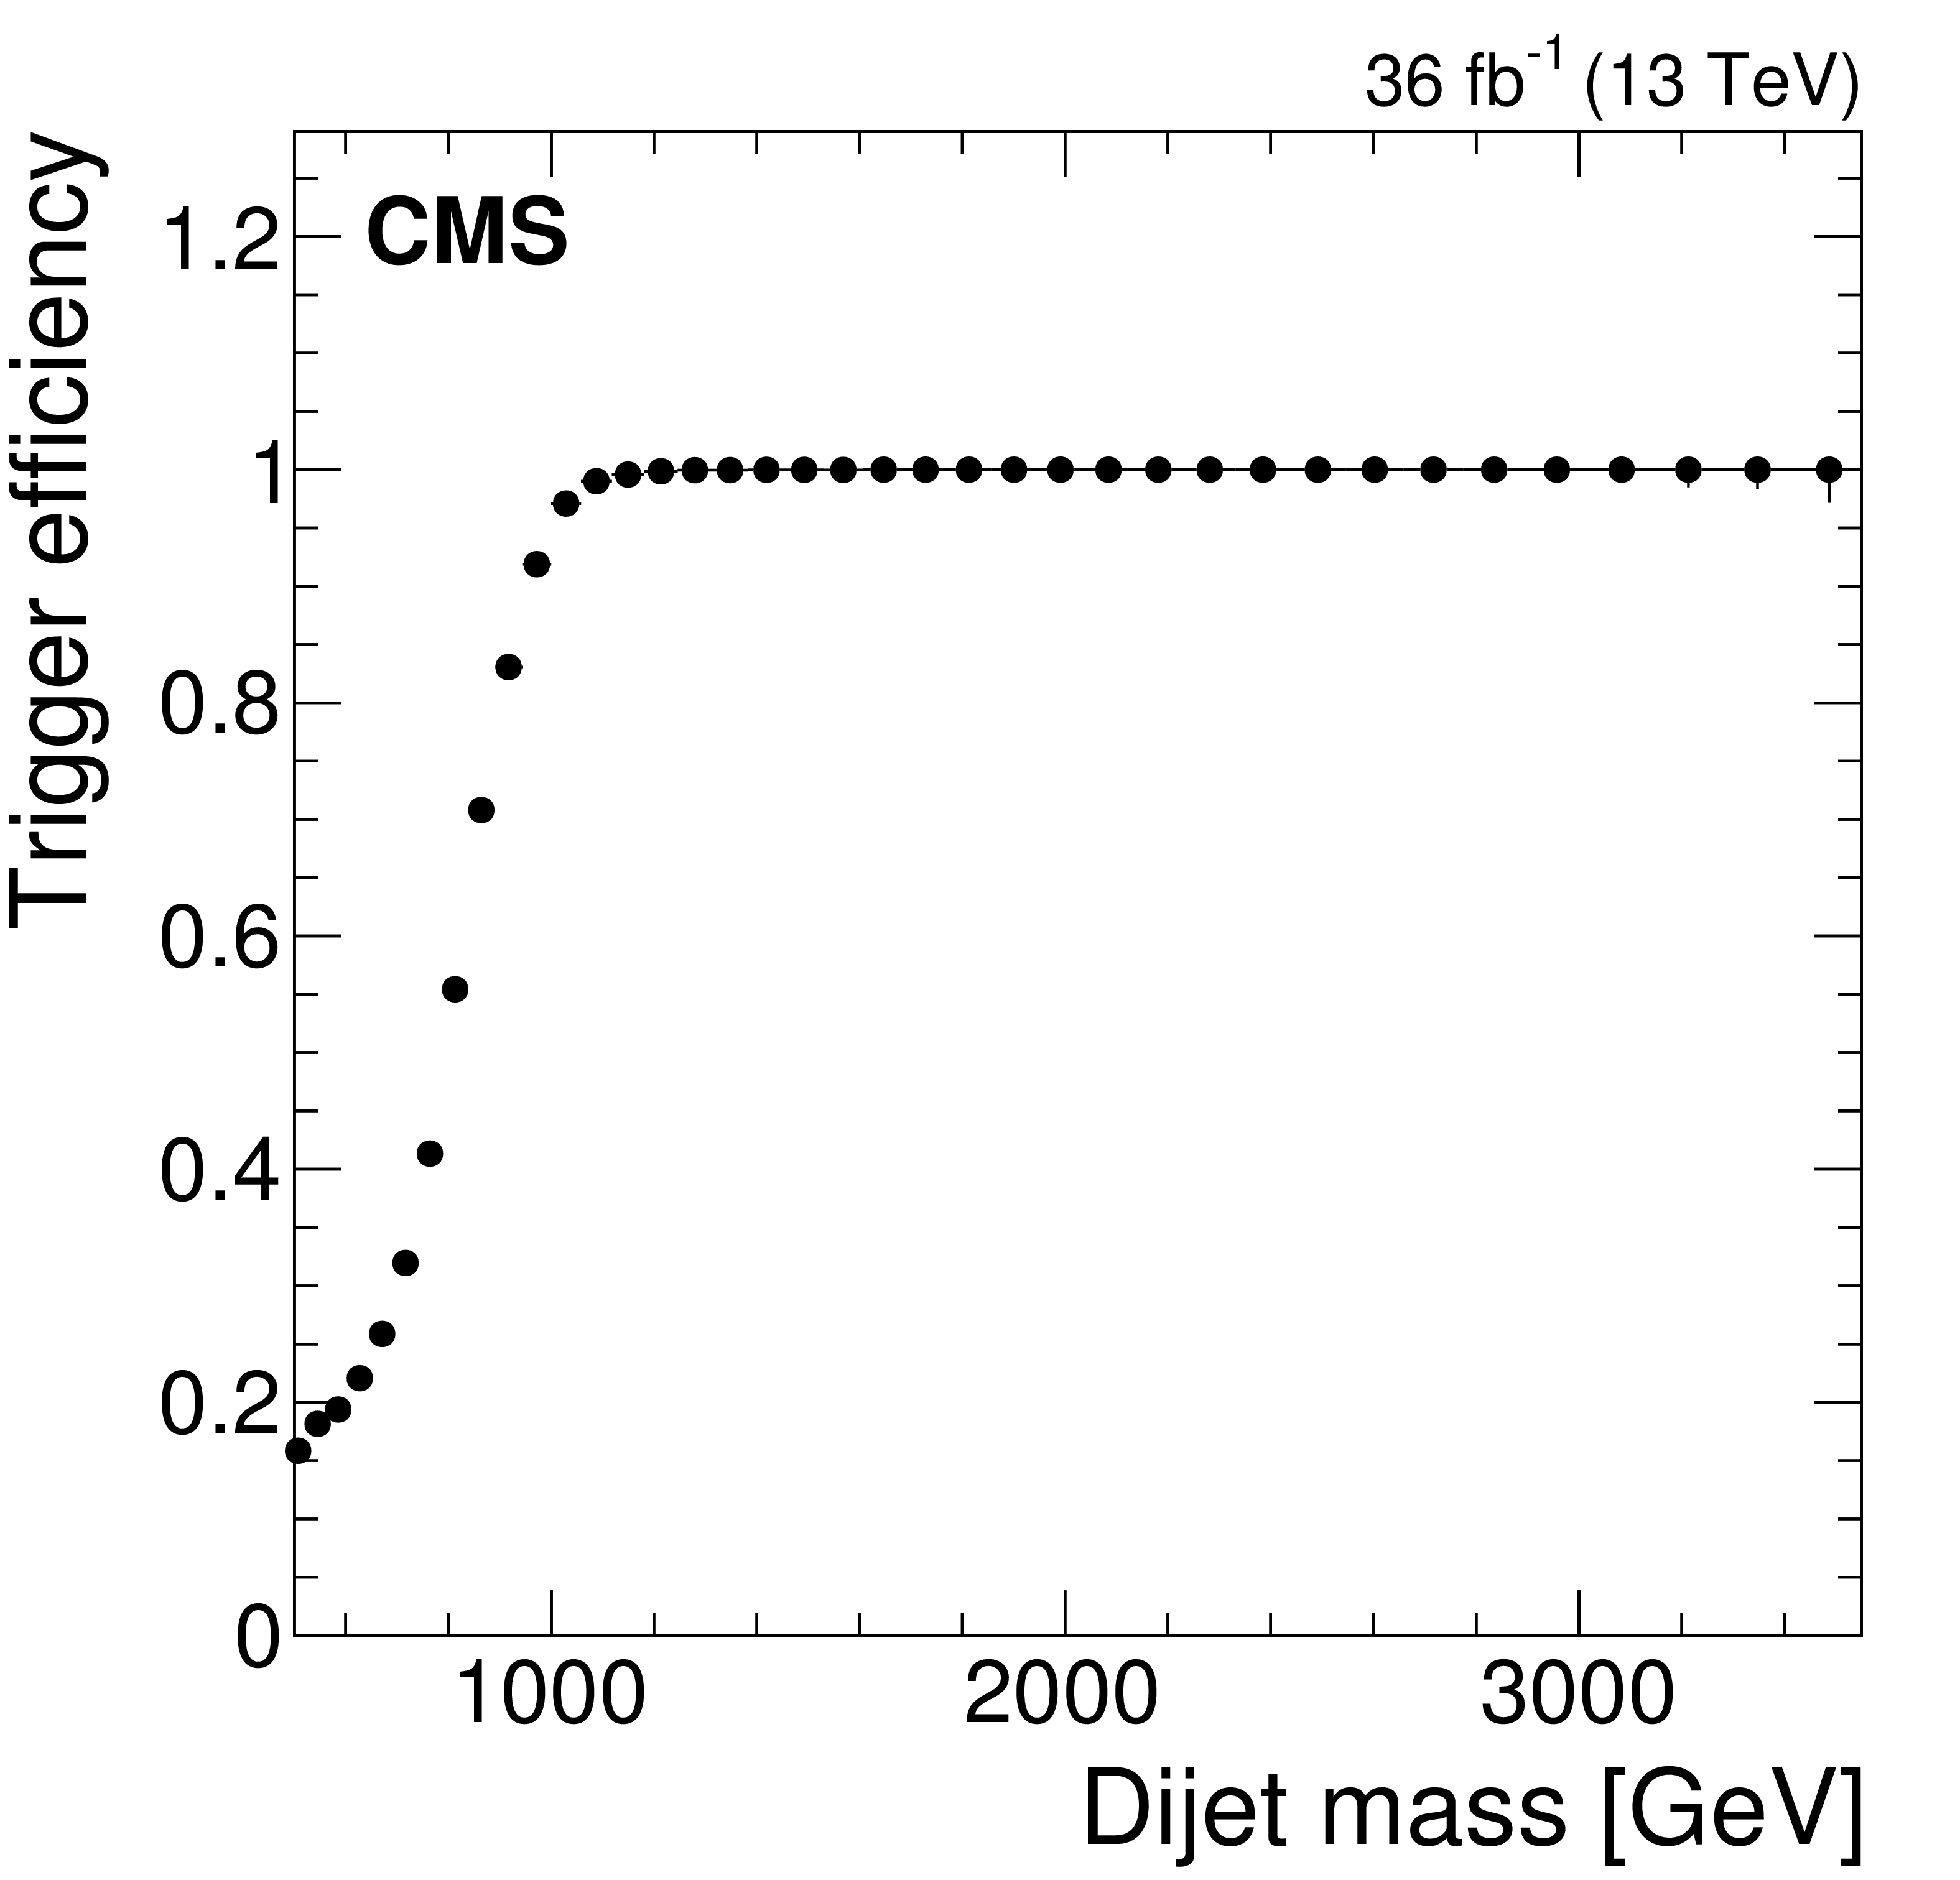
Figure 1-b:
The efficiency of the trigger for the high-mass search as a function of dijet mass for wide jets, defined in Section 2.5, after all jet calibrations and event selections discussed in Section 2. The horizontal lines on the data points show the variable bin sizes. |
png pdf |
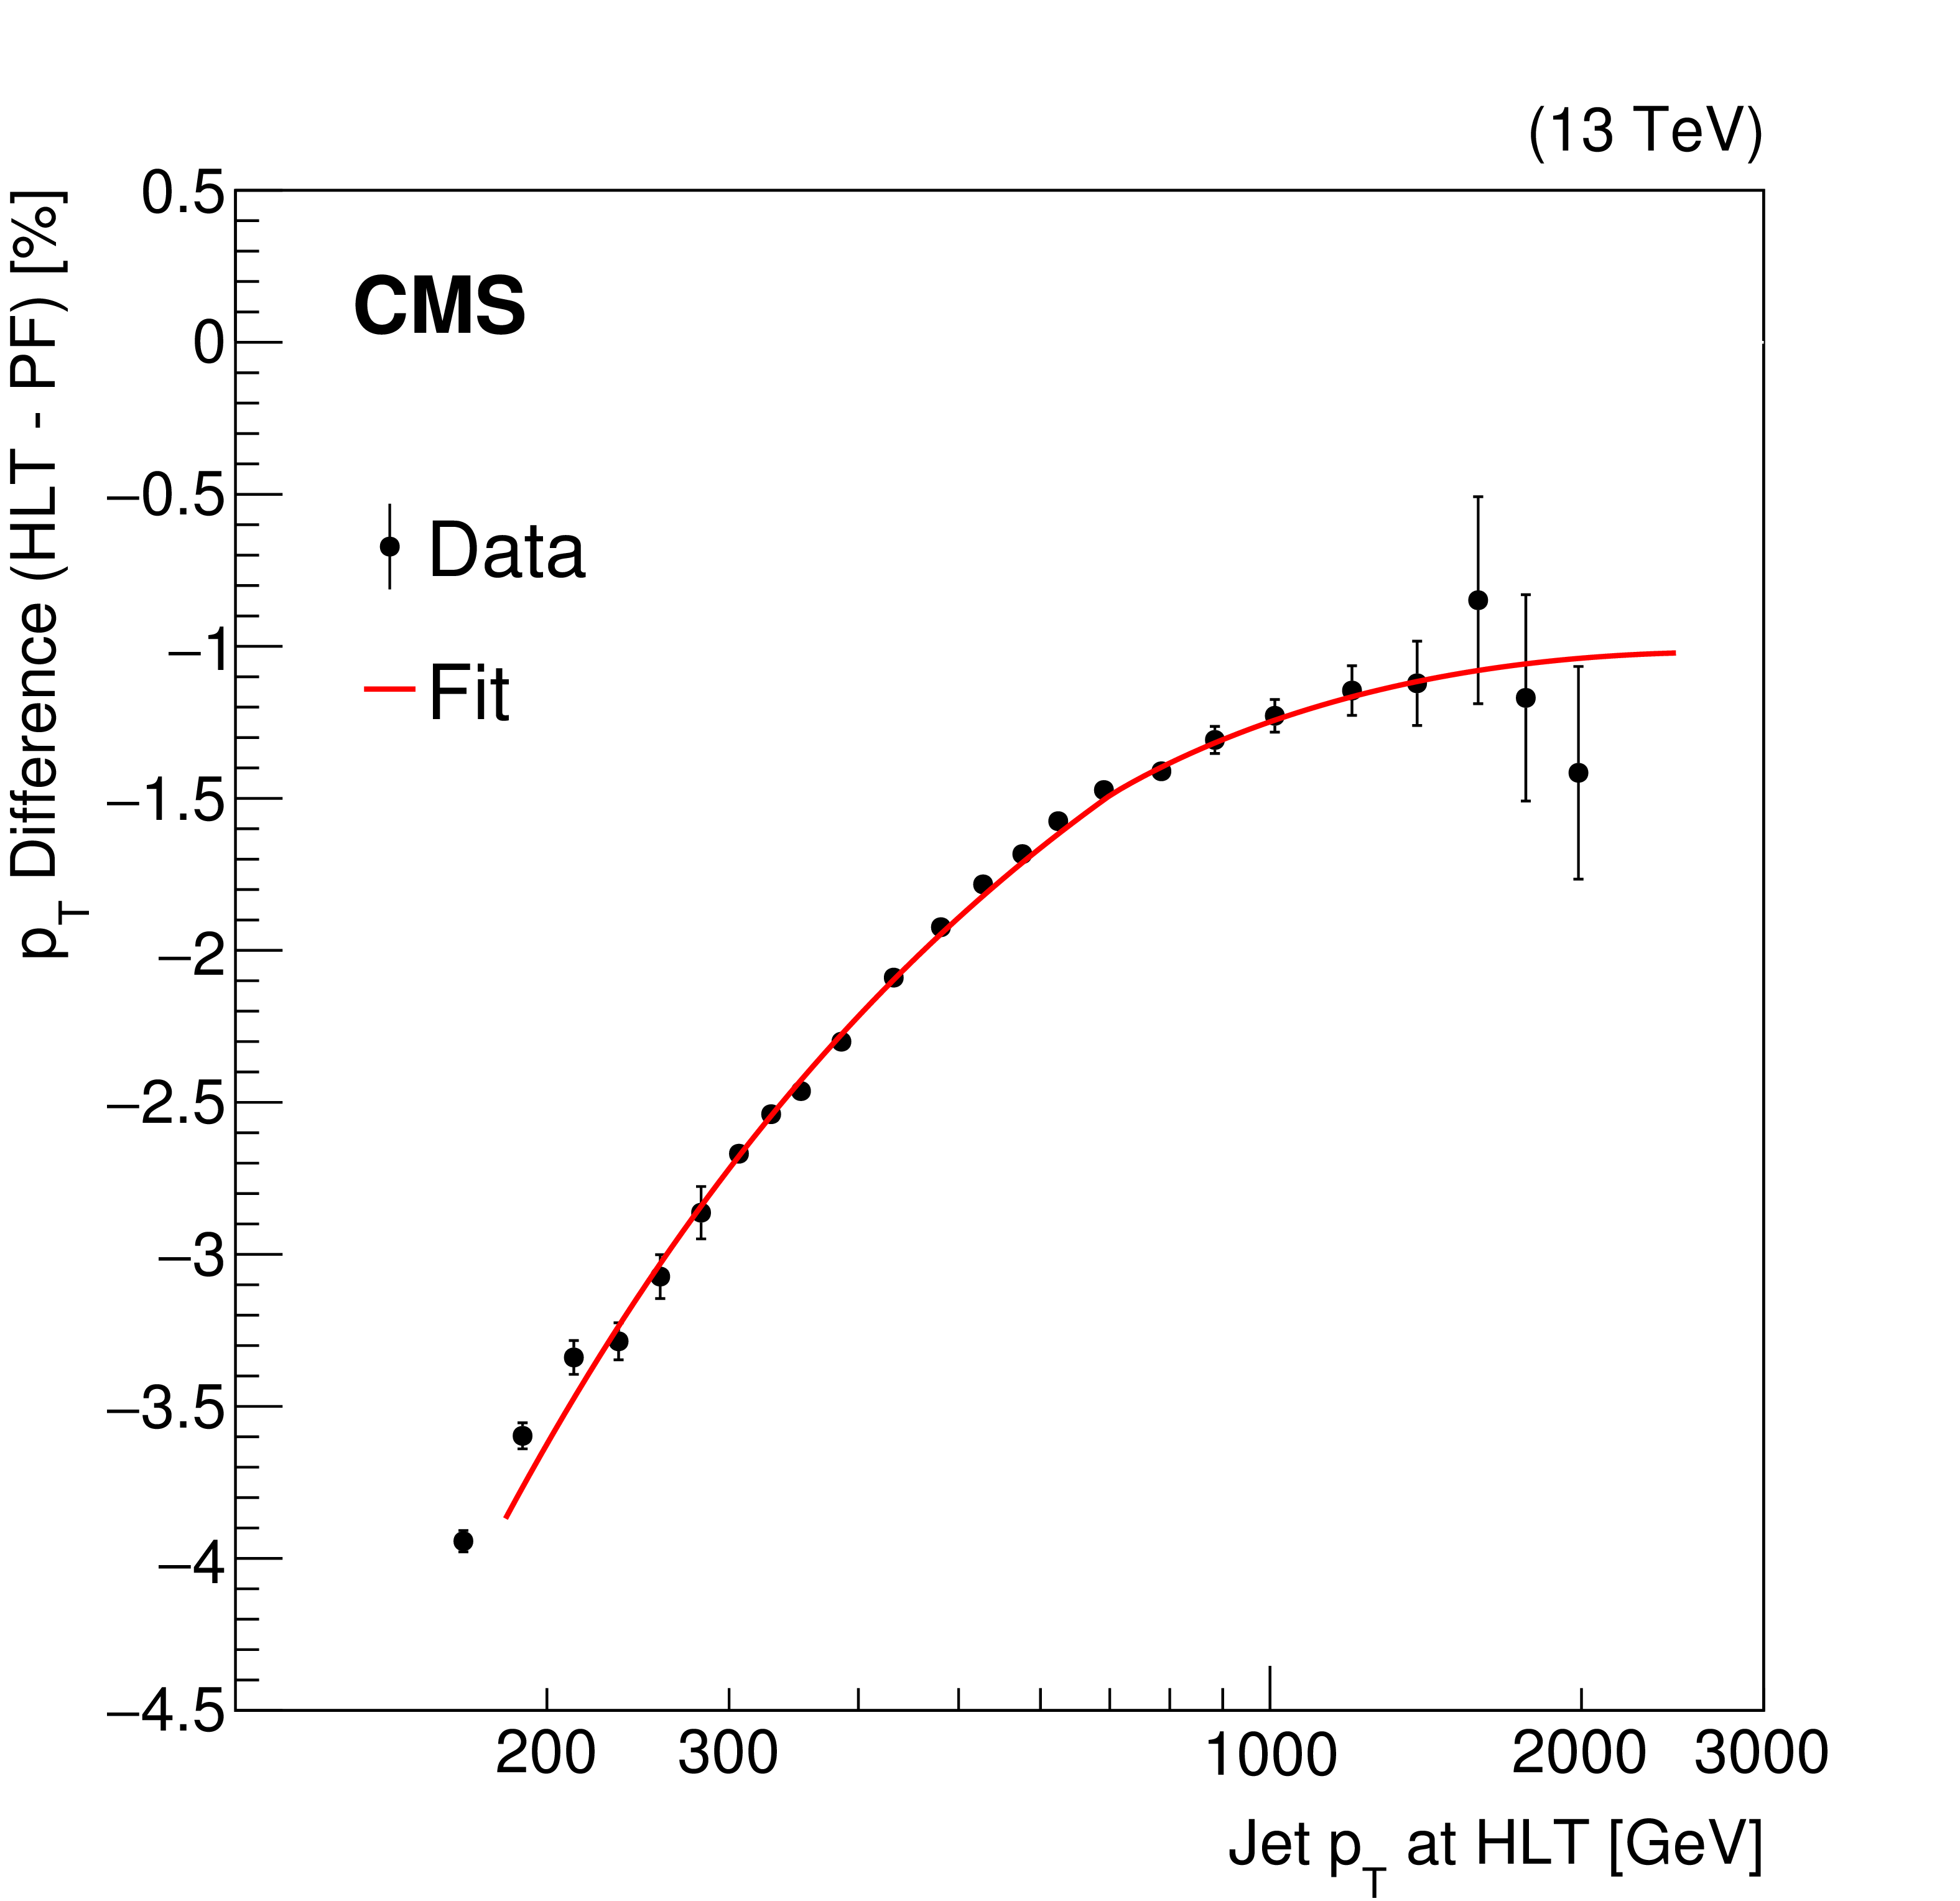
Figure 2:
The calibration of jets in the low-mass analysis. The percent difference in data (points), between the $ {p_{\mathrm {T}}} $ of the wide jets reconstructed from Calo-jets at the HLT and the wide jets reconstructed from PF-jets, is fit to a smooth parameterization (curve), as a function of the HLT $ {p_{\mathrm {T}}} $. |

png pdf |
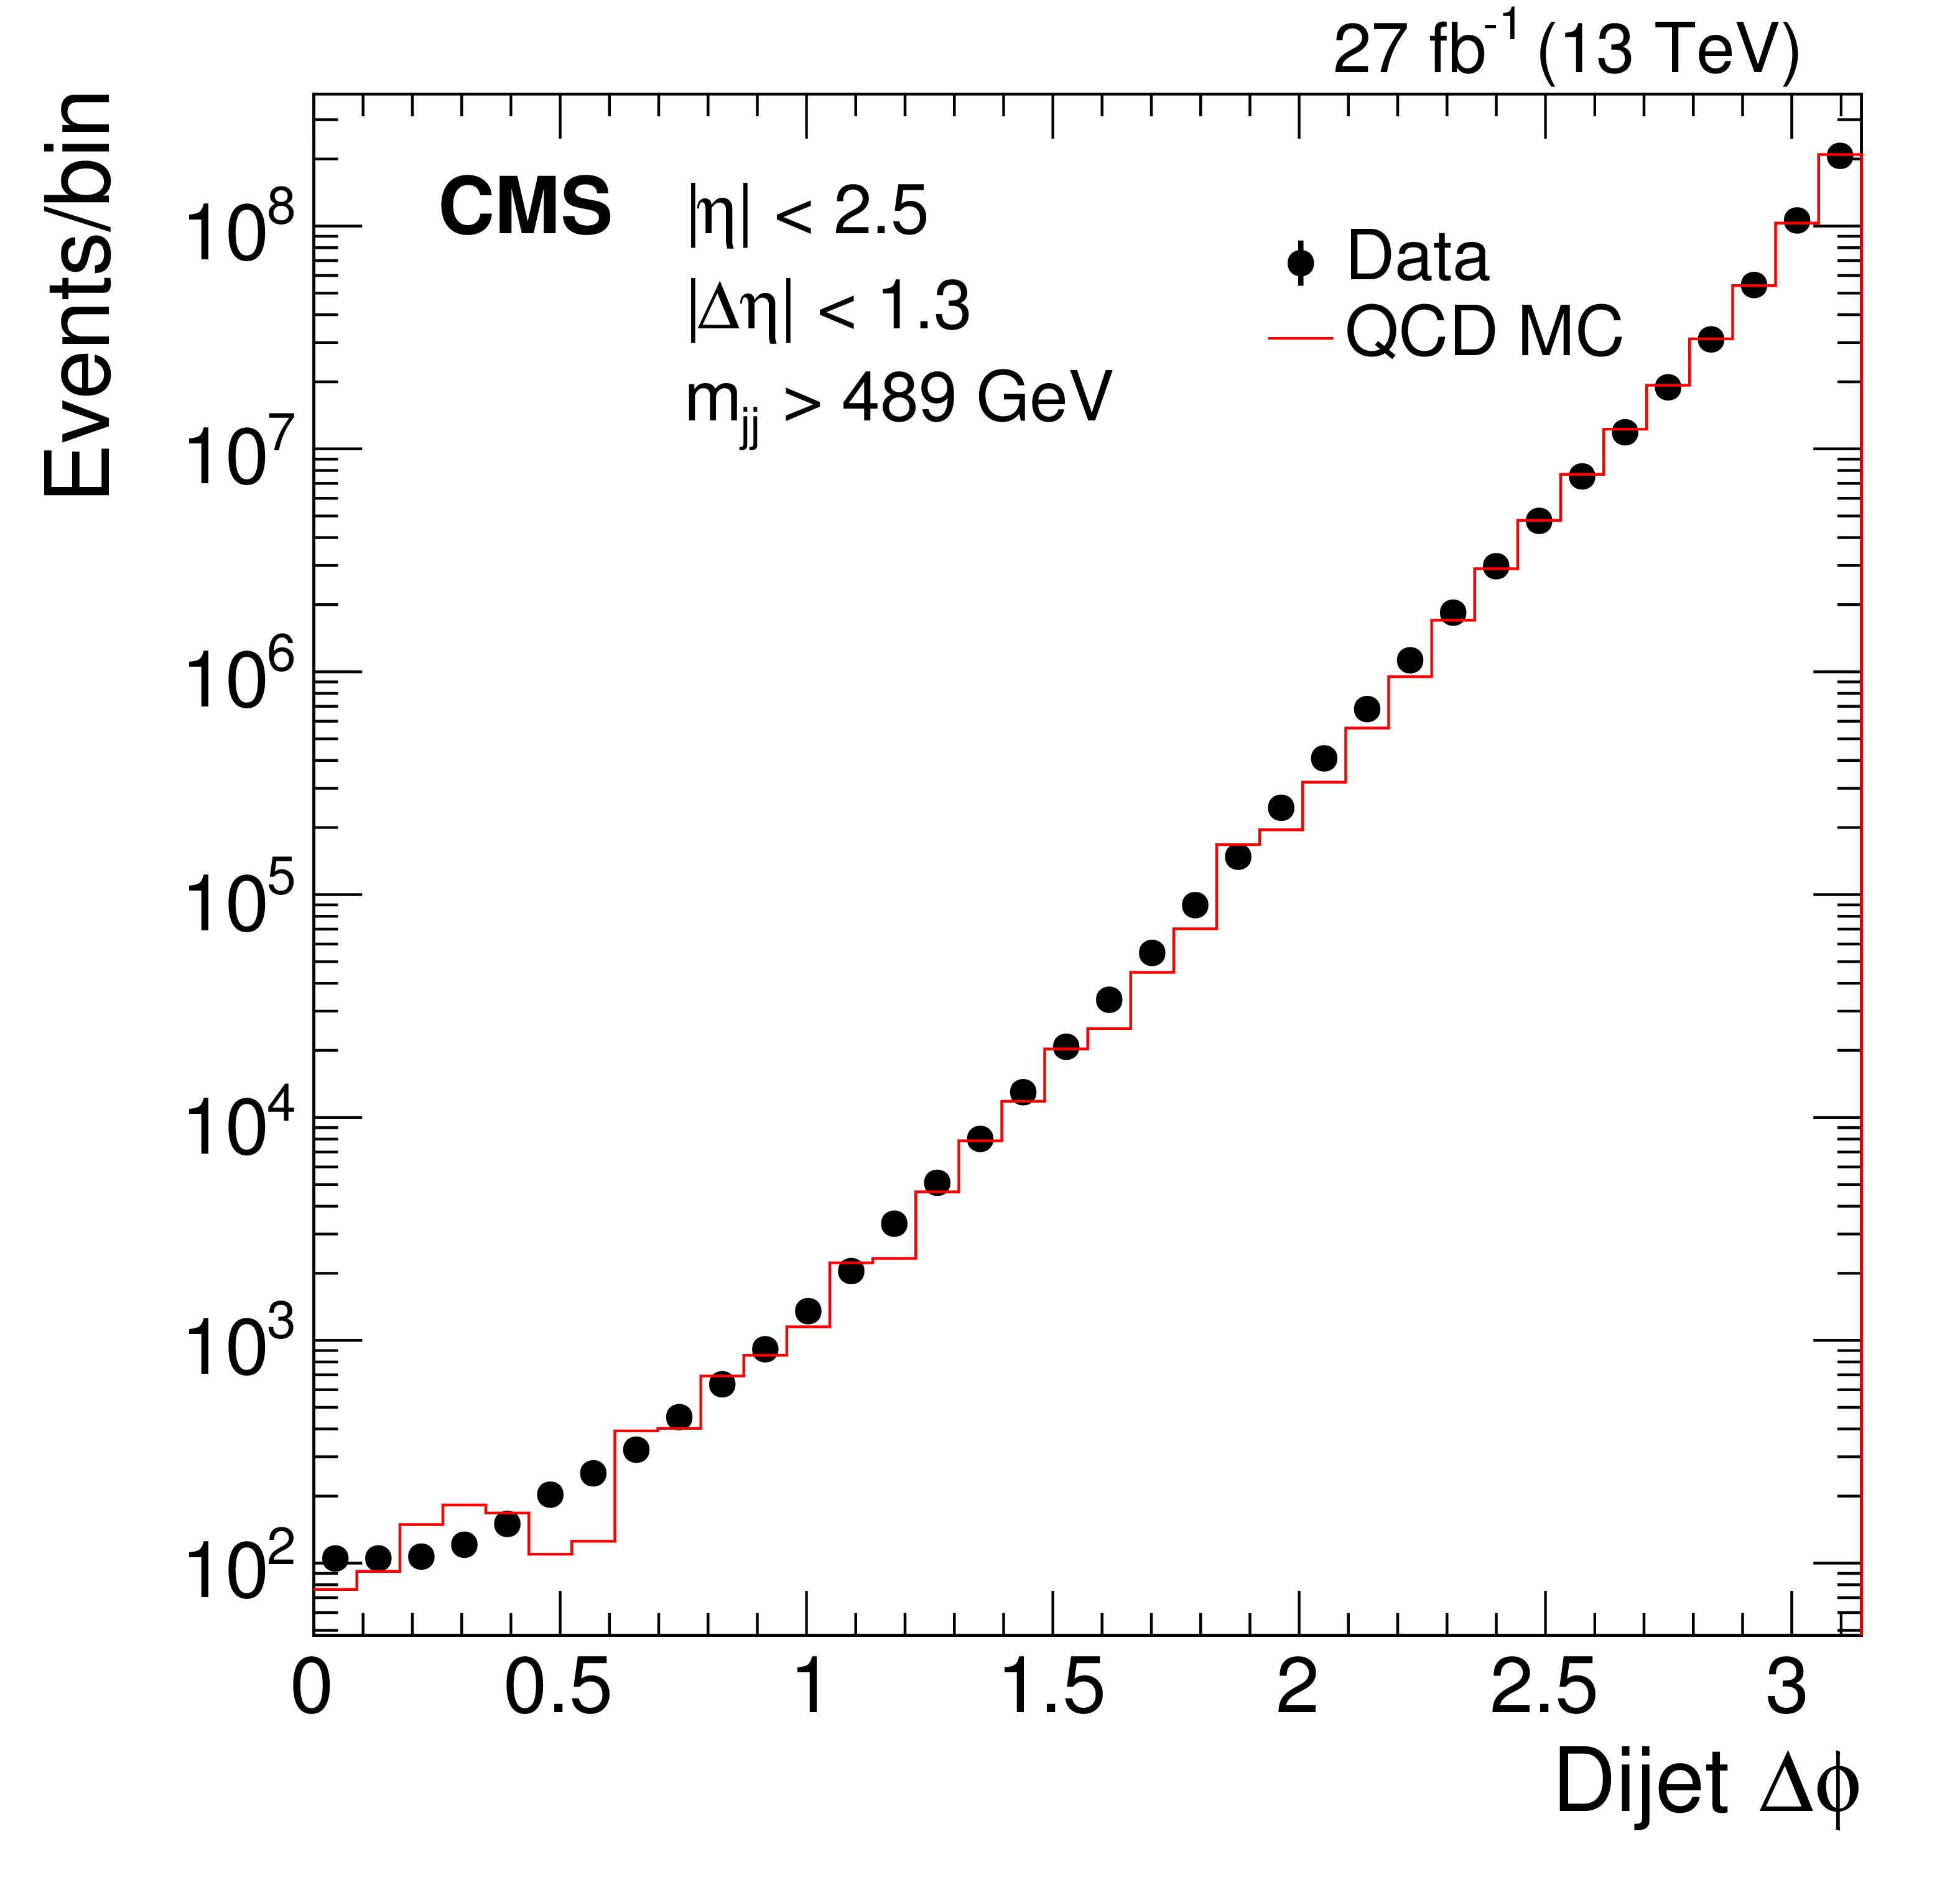
Figure 3:
The azimuthal angular separation between the two wide jets (in radians) from the low-mass search (left) and the high-mass search (right). Data (points) are compared to QCD predictions from the PYTHIA 8 MC including detector simulation (histogram) normalized to the data. |
png pdf |
Figure 3-a:
The azimuthal angular separation between the two wide jets (in radians) from the low-mass search. Data (points) are compared to QCD predictions from the PYTHIA 8 MC including detector simulation (histogram) normalized to the data. |
png pdf |
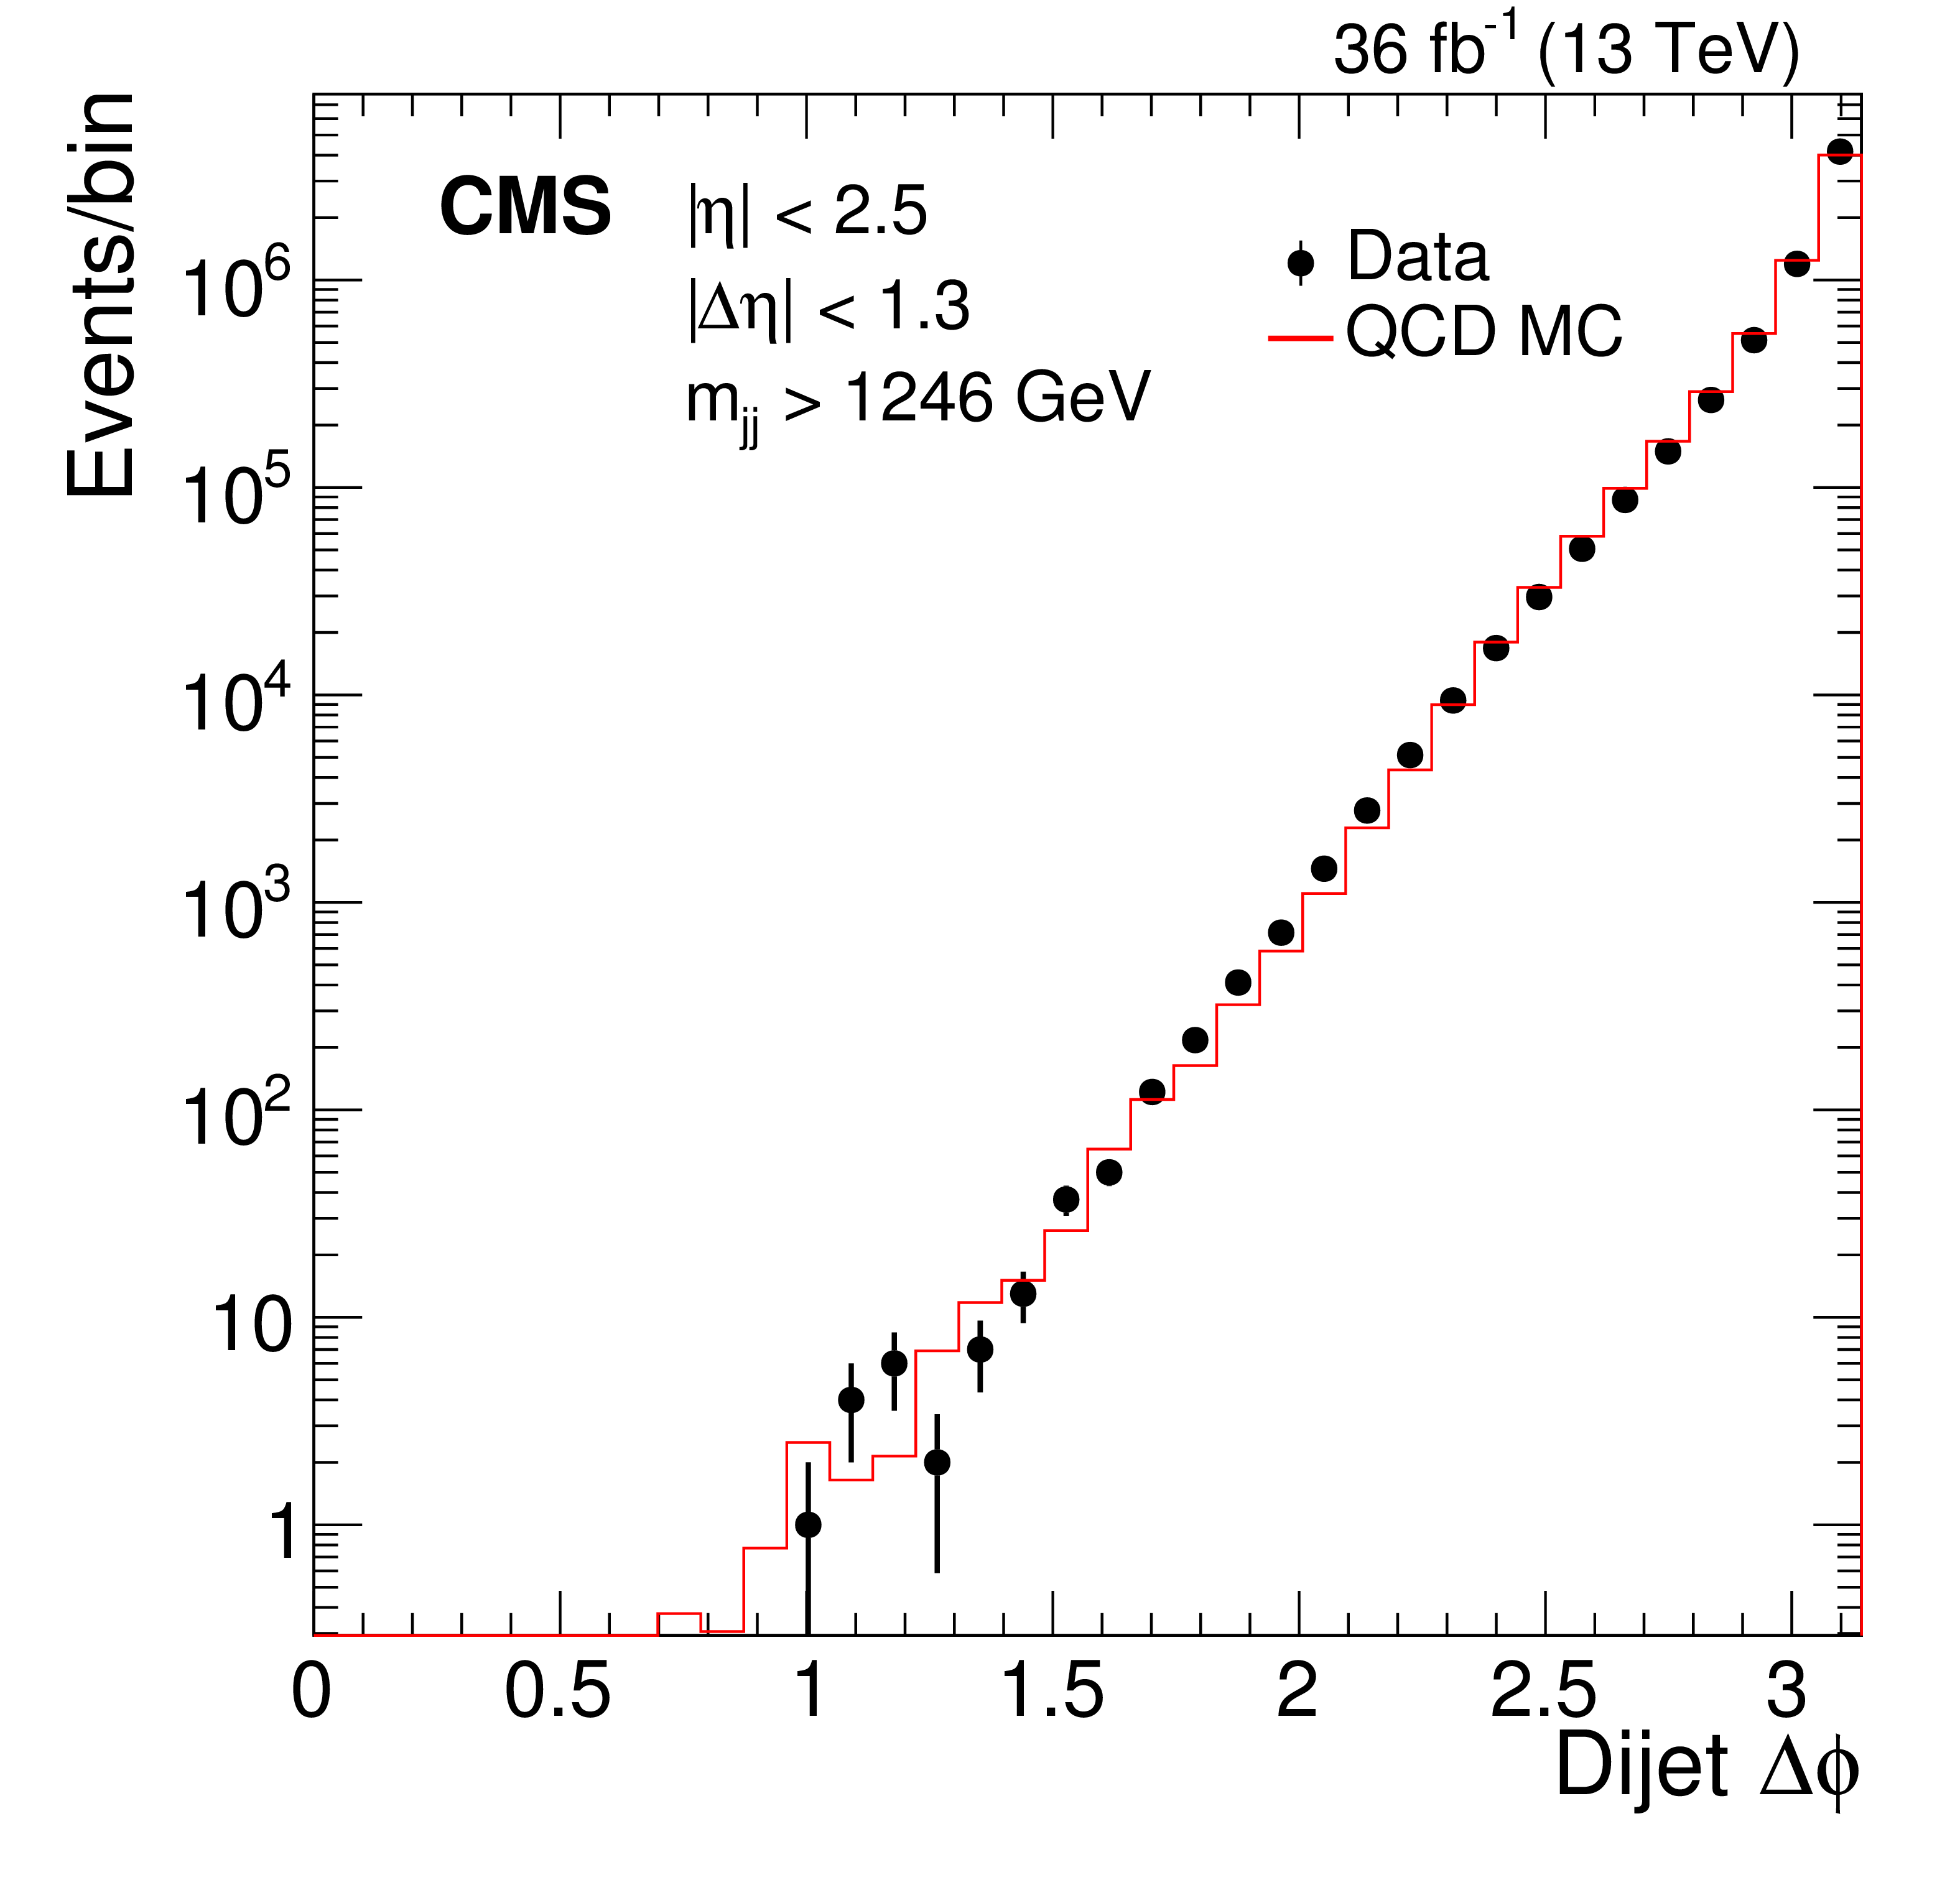
Figure 3-b:
The azimuthal angular separation between the two wide jets (in radians) from the high-mass search. Data (points) are compared to QCD predictions from the PYTHIA 8 MC including detector simulation (histogram) normalized to the data. |
png pdf |
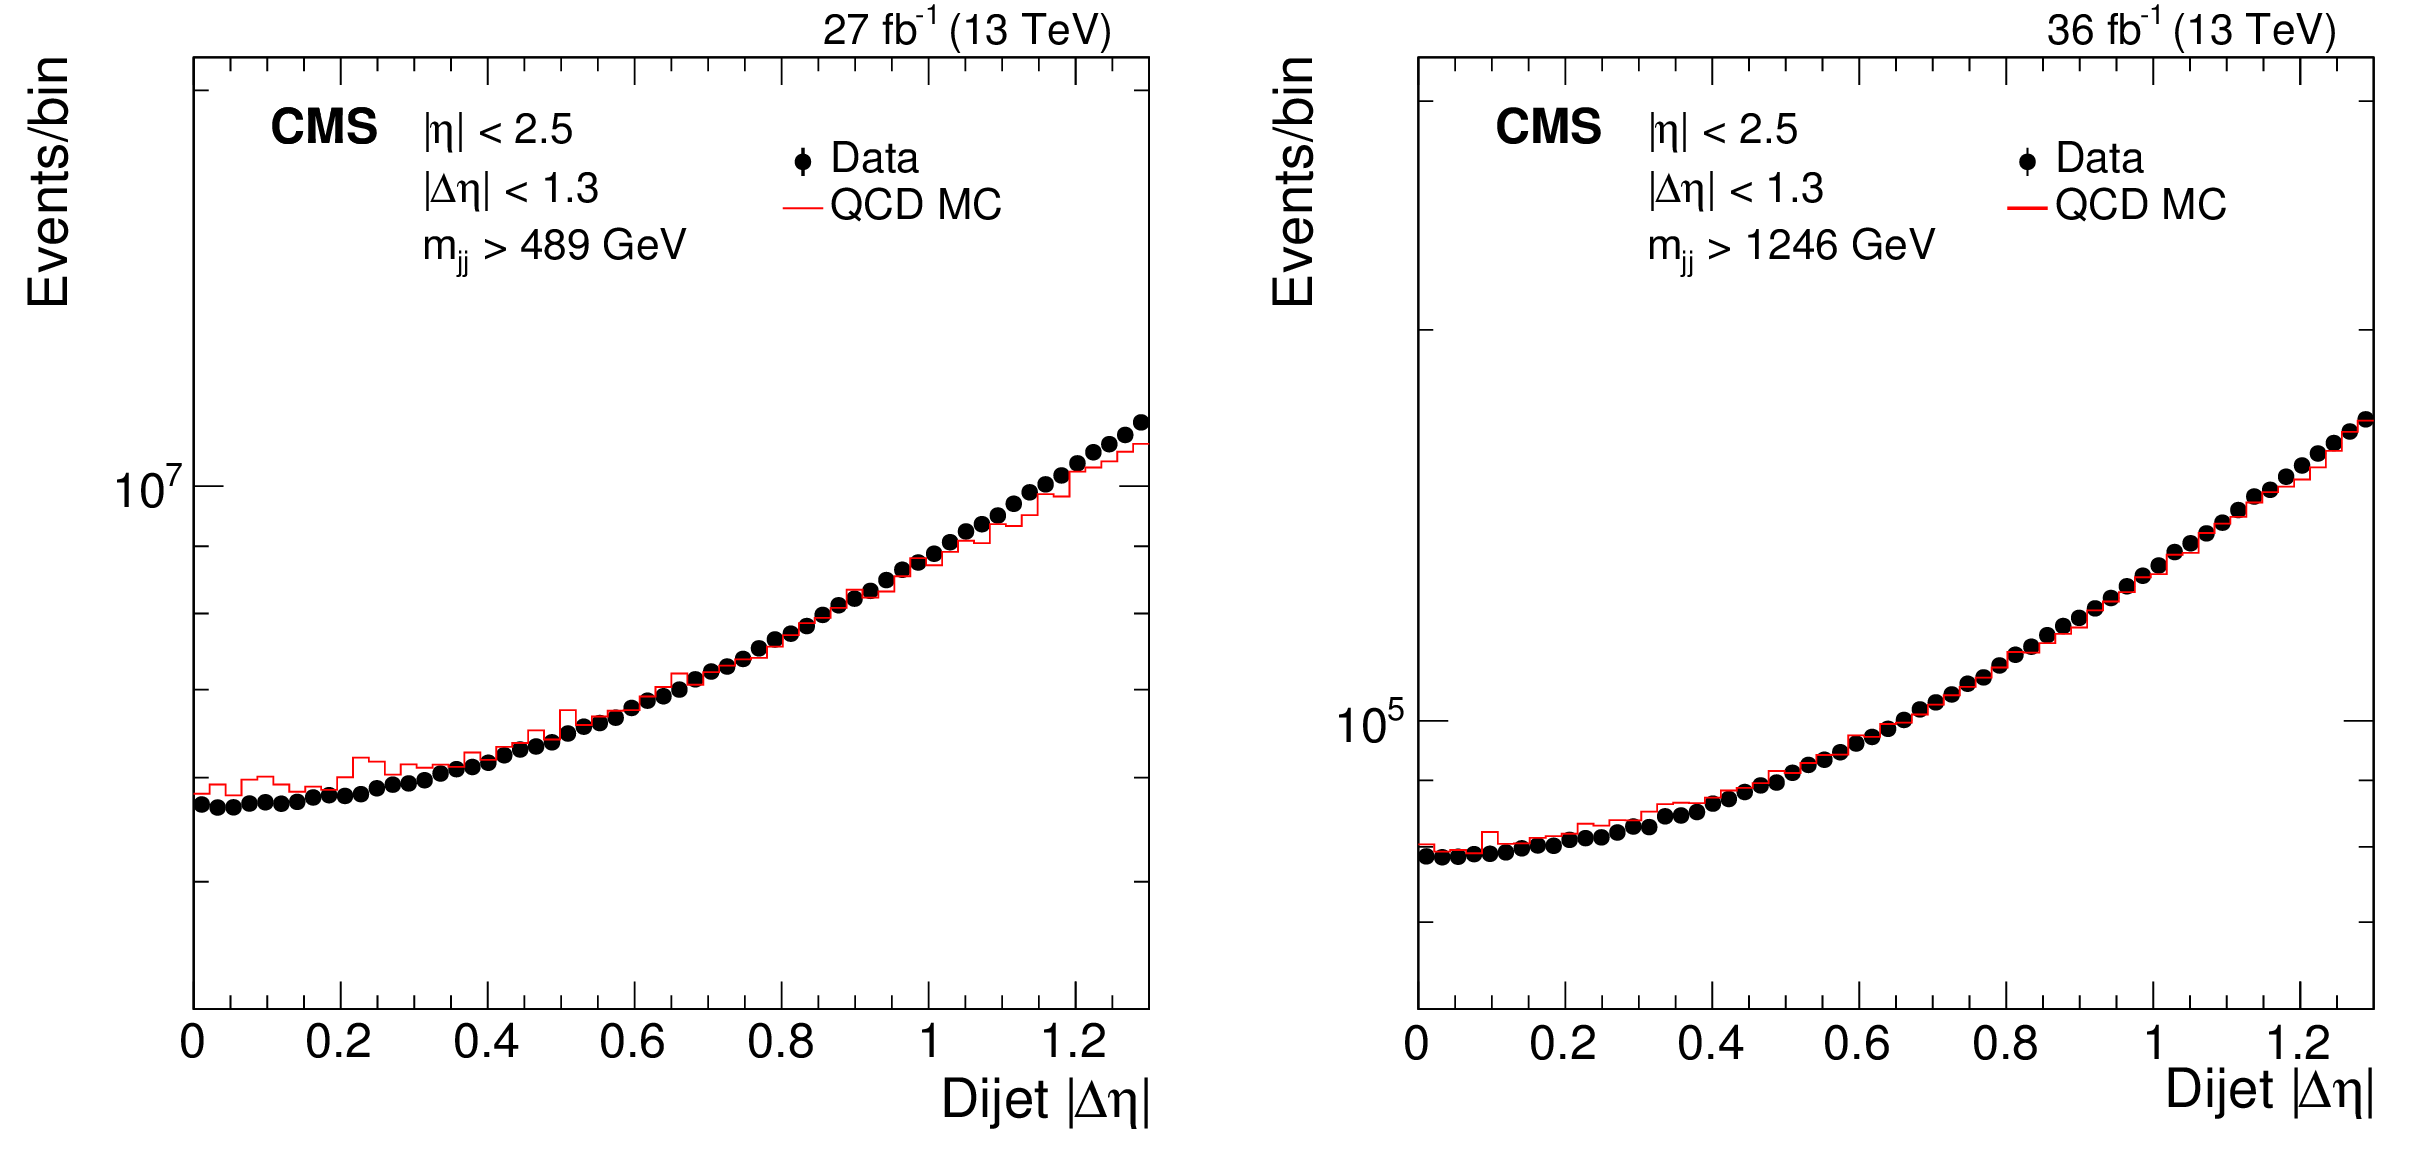
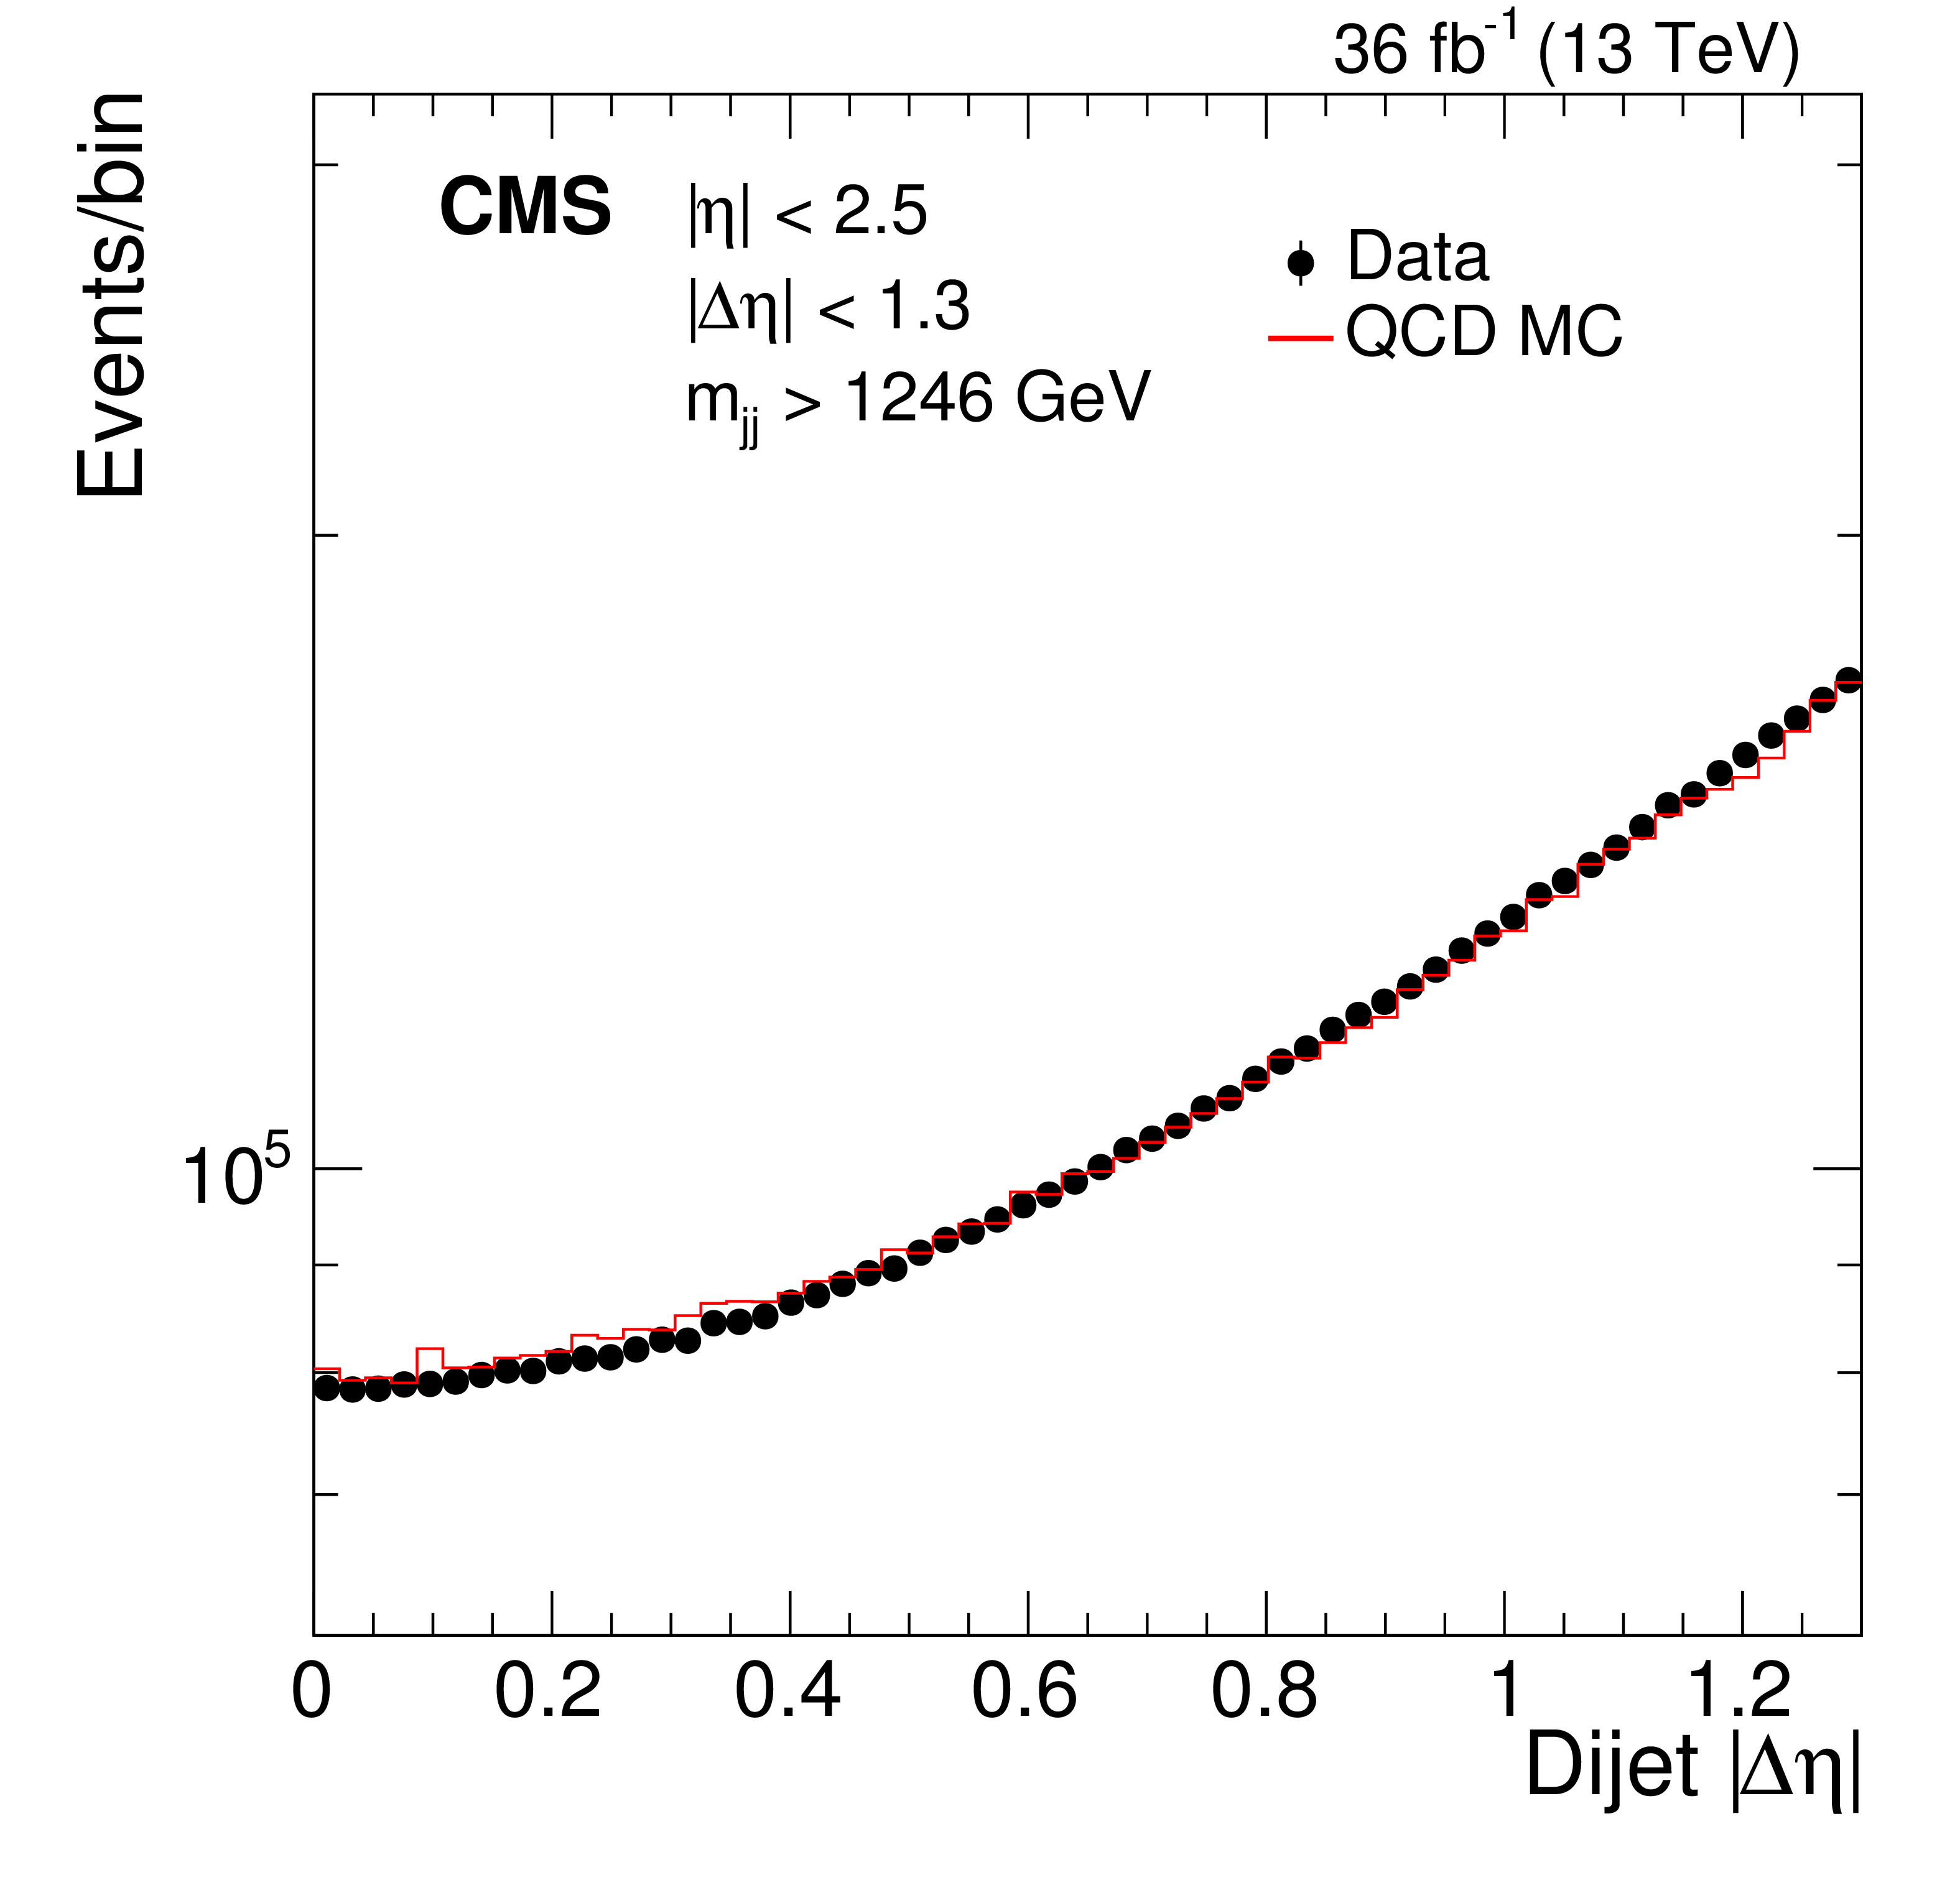
Figure 4:
The pseudorapidity separation between the two wide jets from the low-mass search (left) and the high-mass search (right). Data (points) are compared to QCD predictions from the PYTHIA 8 MC including detector simulation (histogram) normalized to the data. |
png pdf |
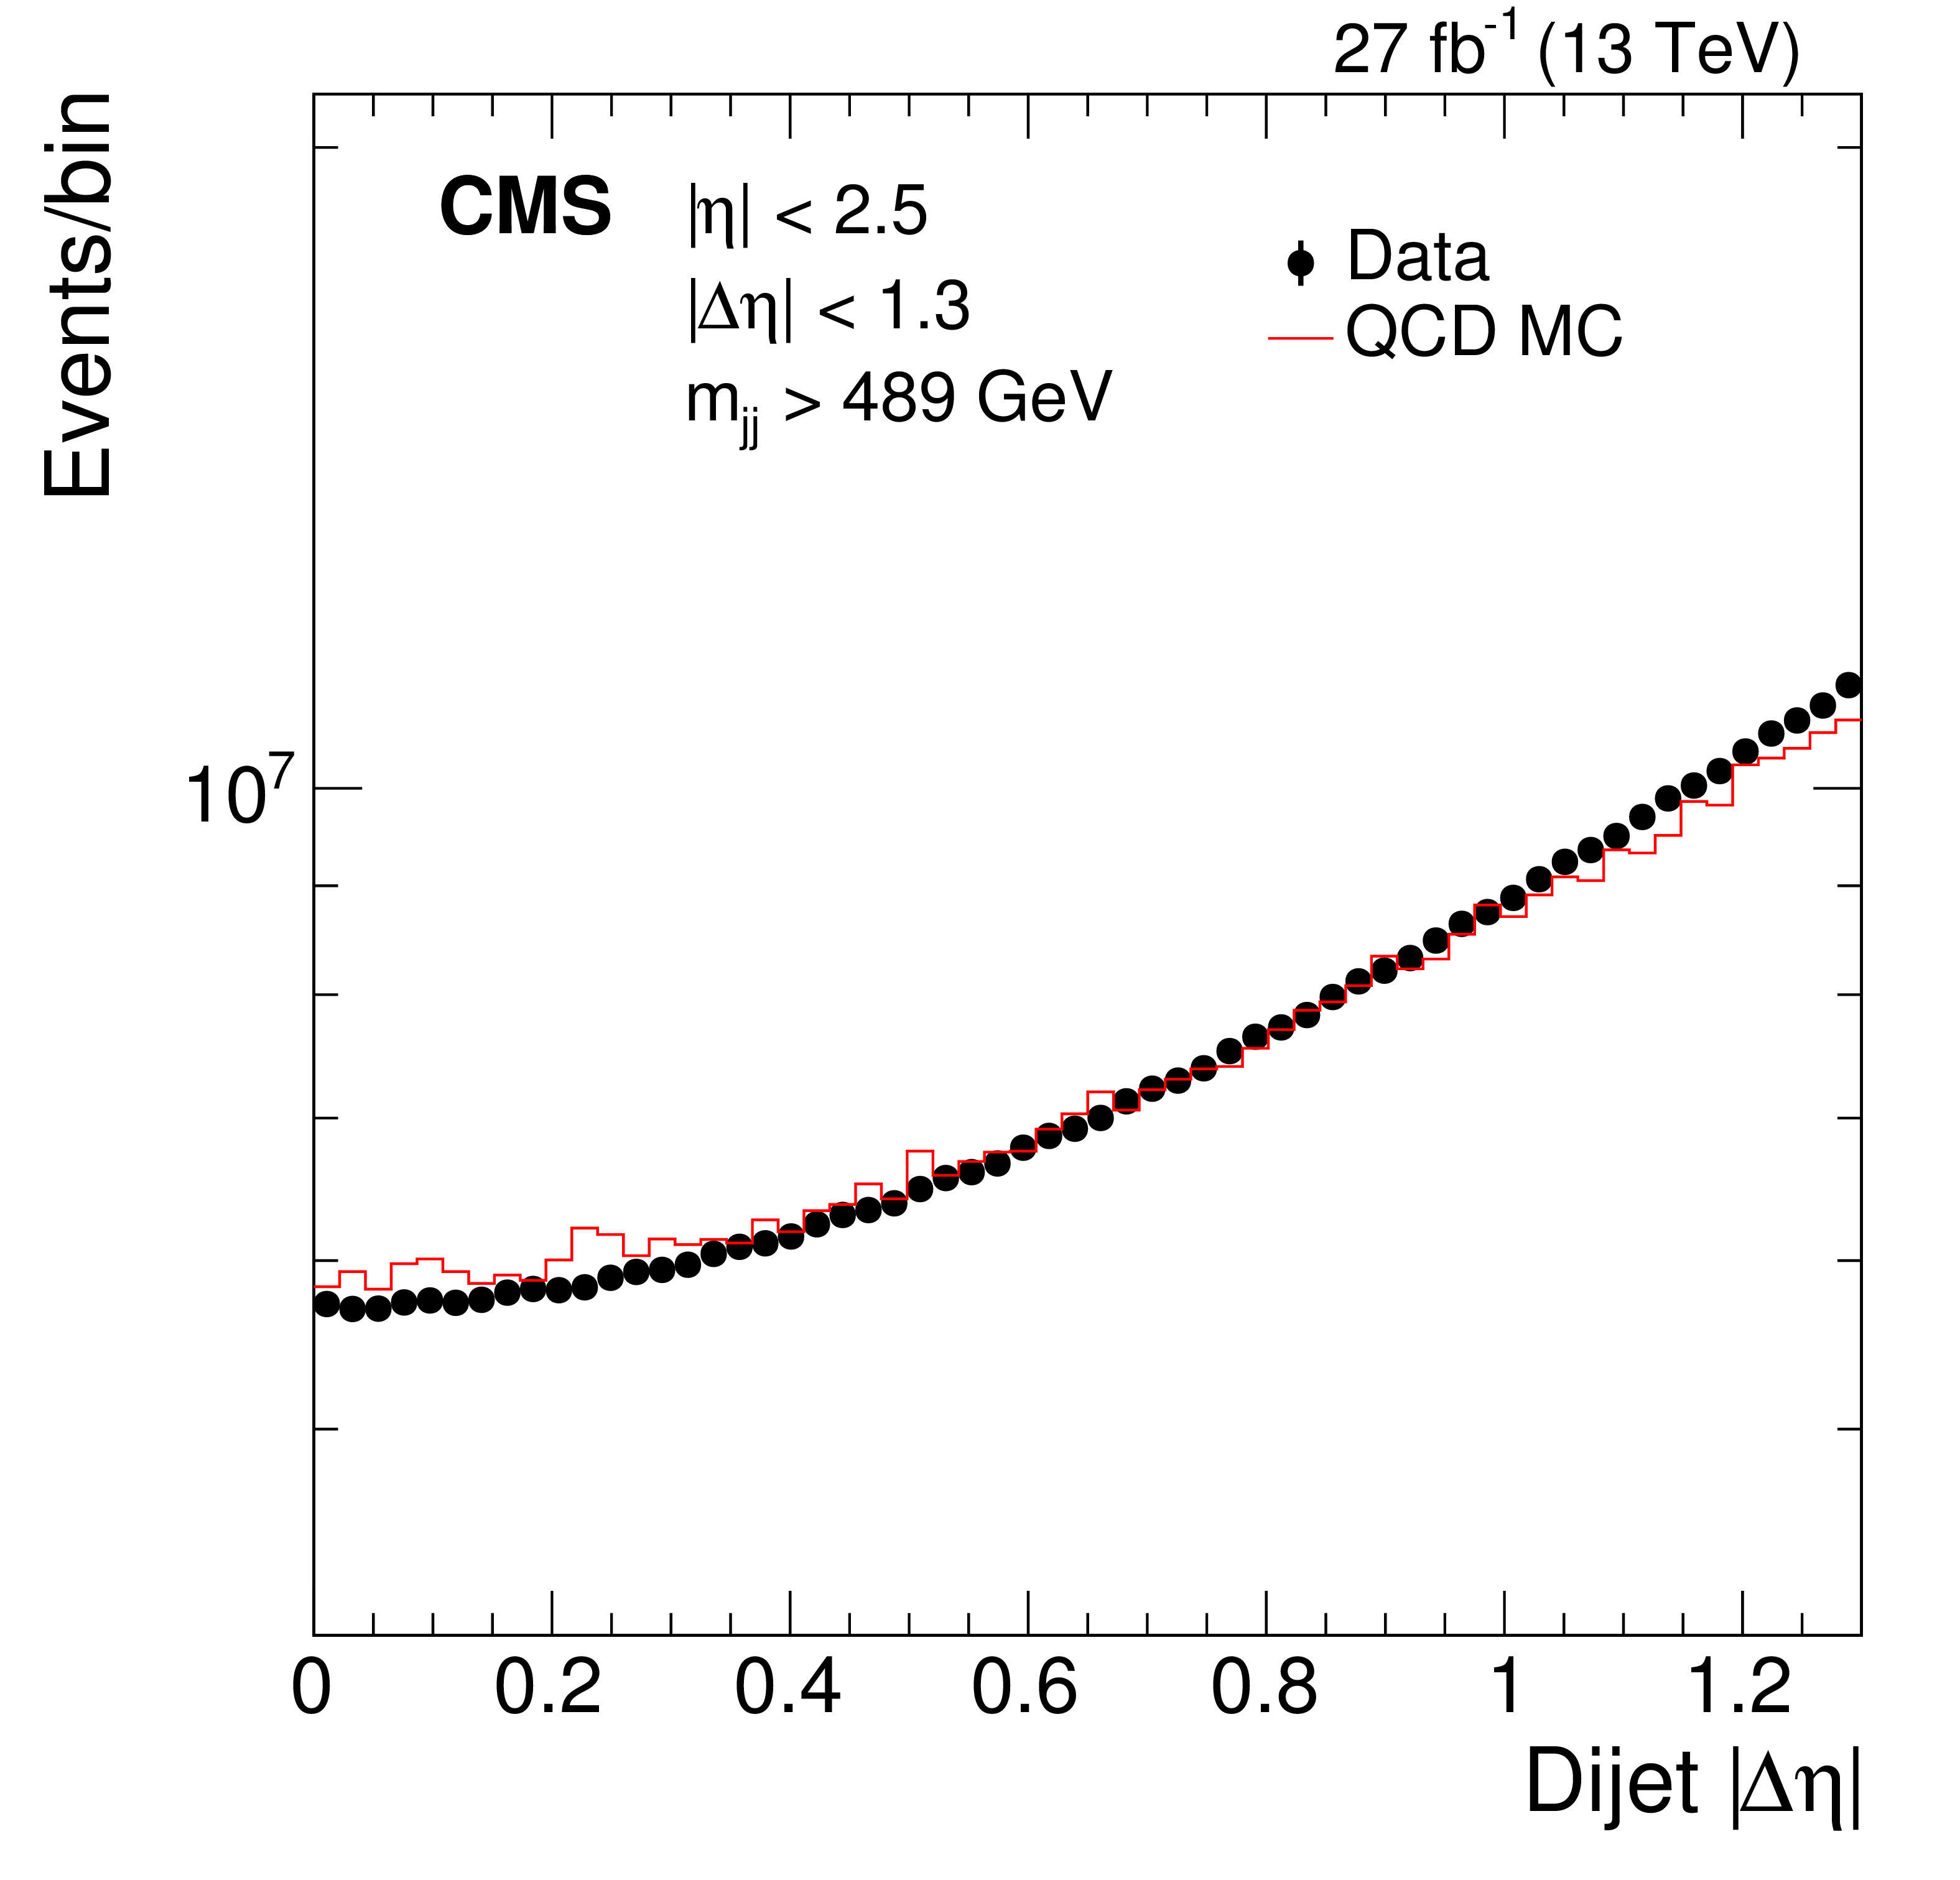
Figure 4-a:
The pseudorapidity separation between the two wide jets from the low-mass search. Data (points) are compared to QCD predictions from the PYTHIA 8 MC including detector simulation (histogram) normalized to the data. |
png pdf |
Figure 4-b:
The pseudorapidity separation between the two wide jets from the high-mass search. Data (points) are compared to QCD predictions from the PYTHIA 8 MC including detector simulation (histogram) normalized to the data. |

png pdf |
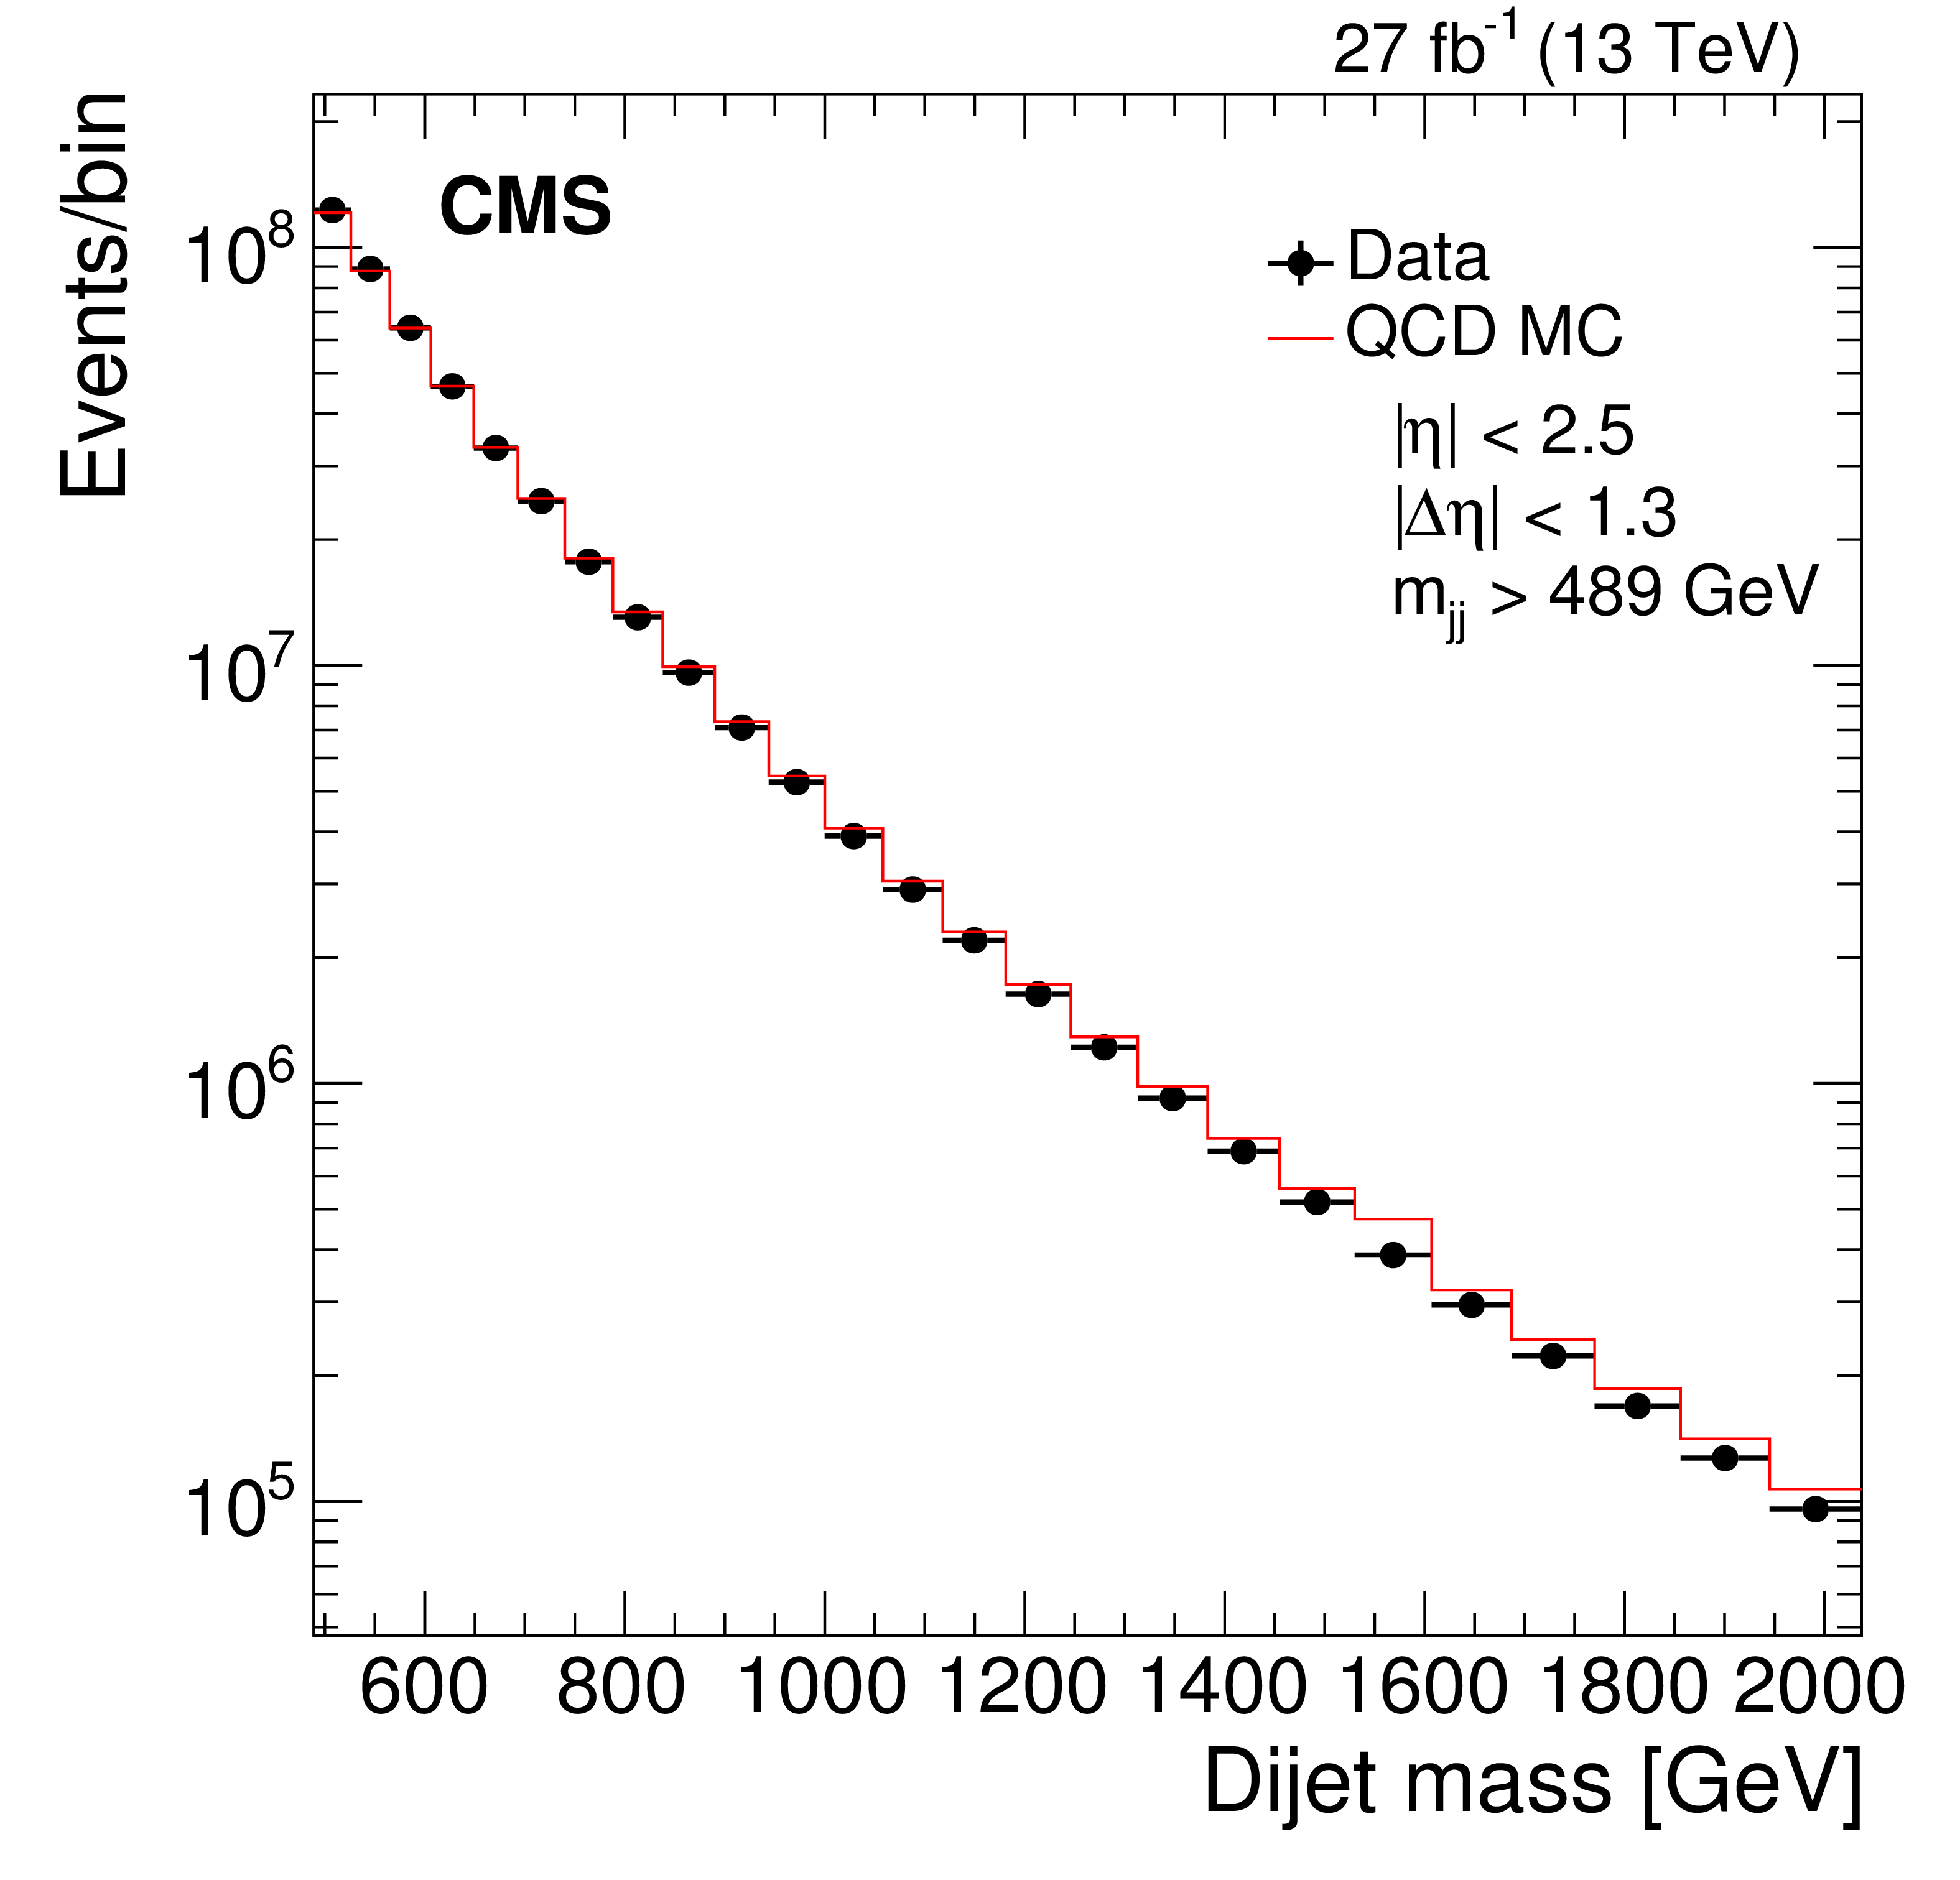
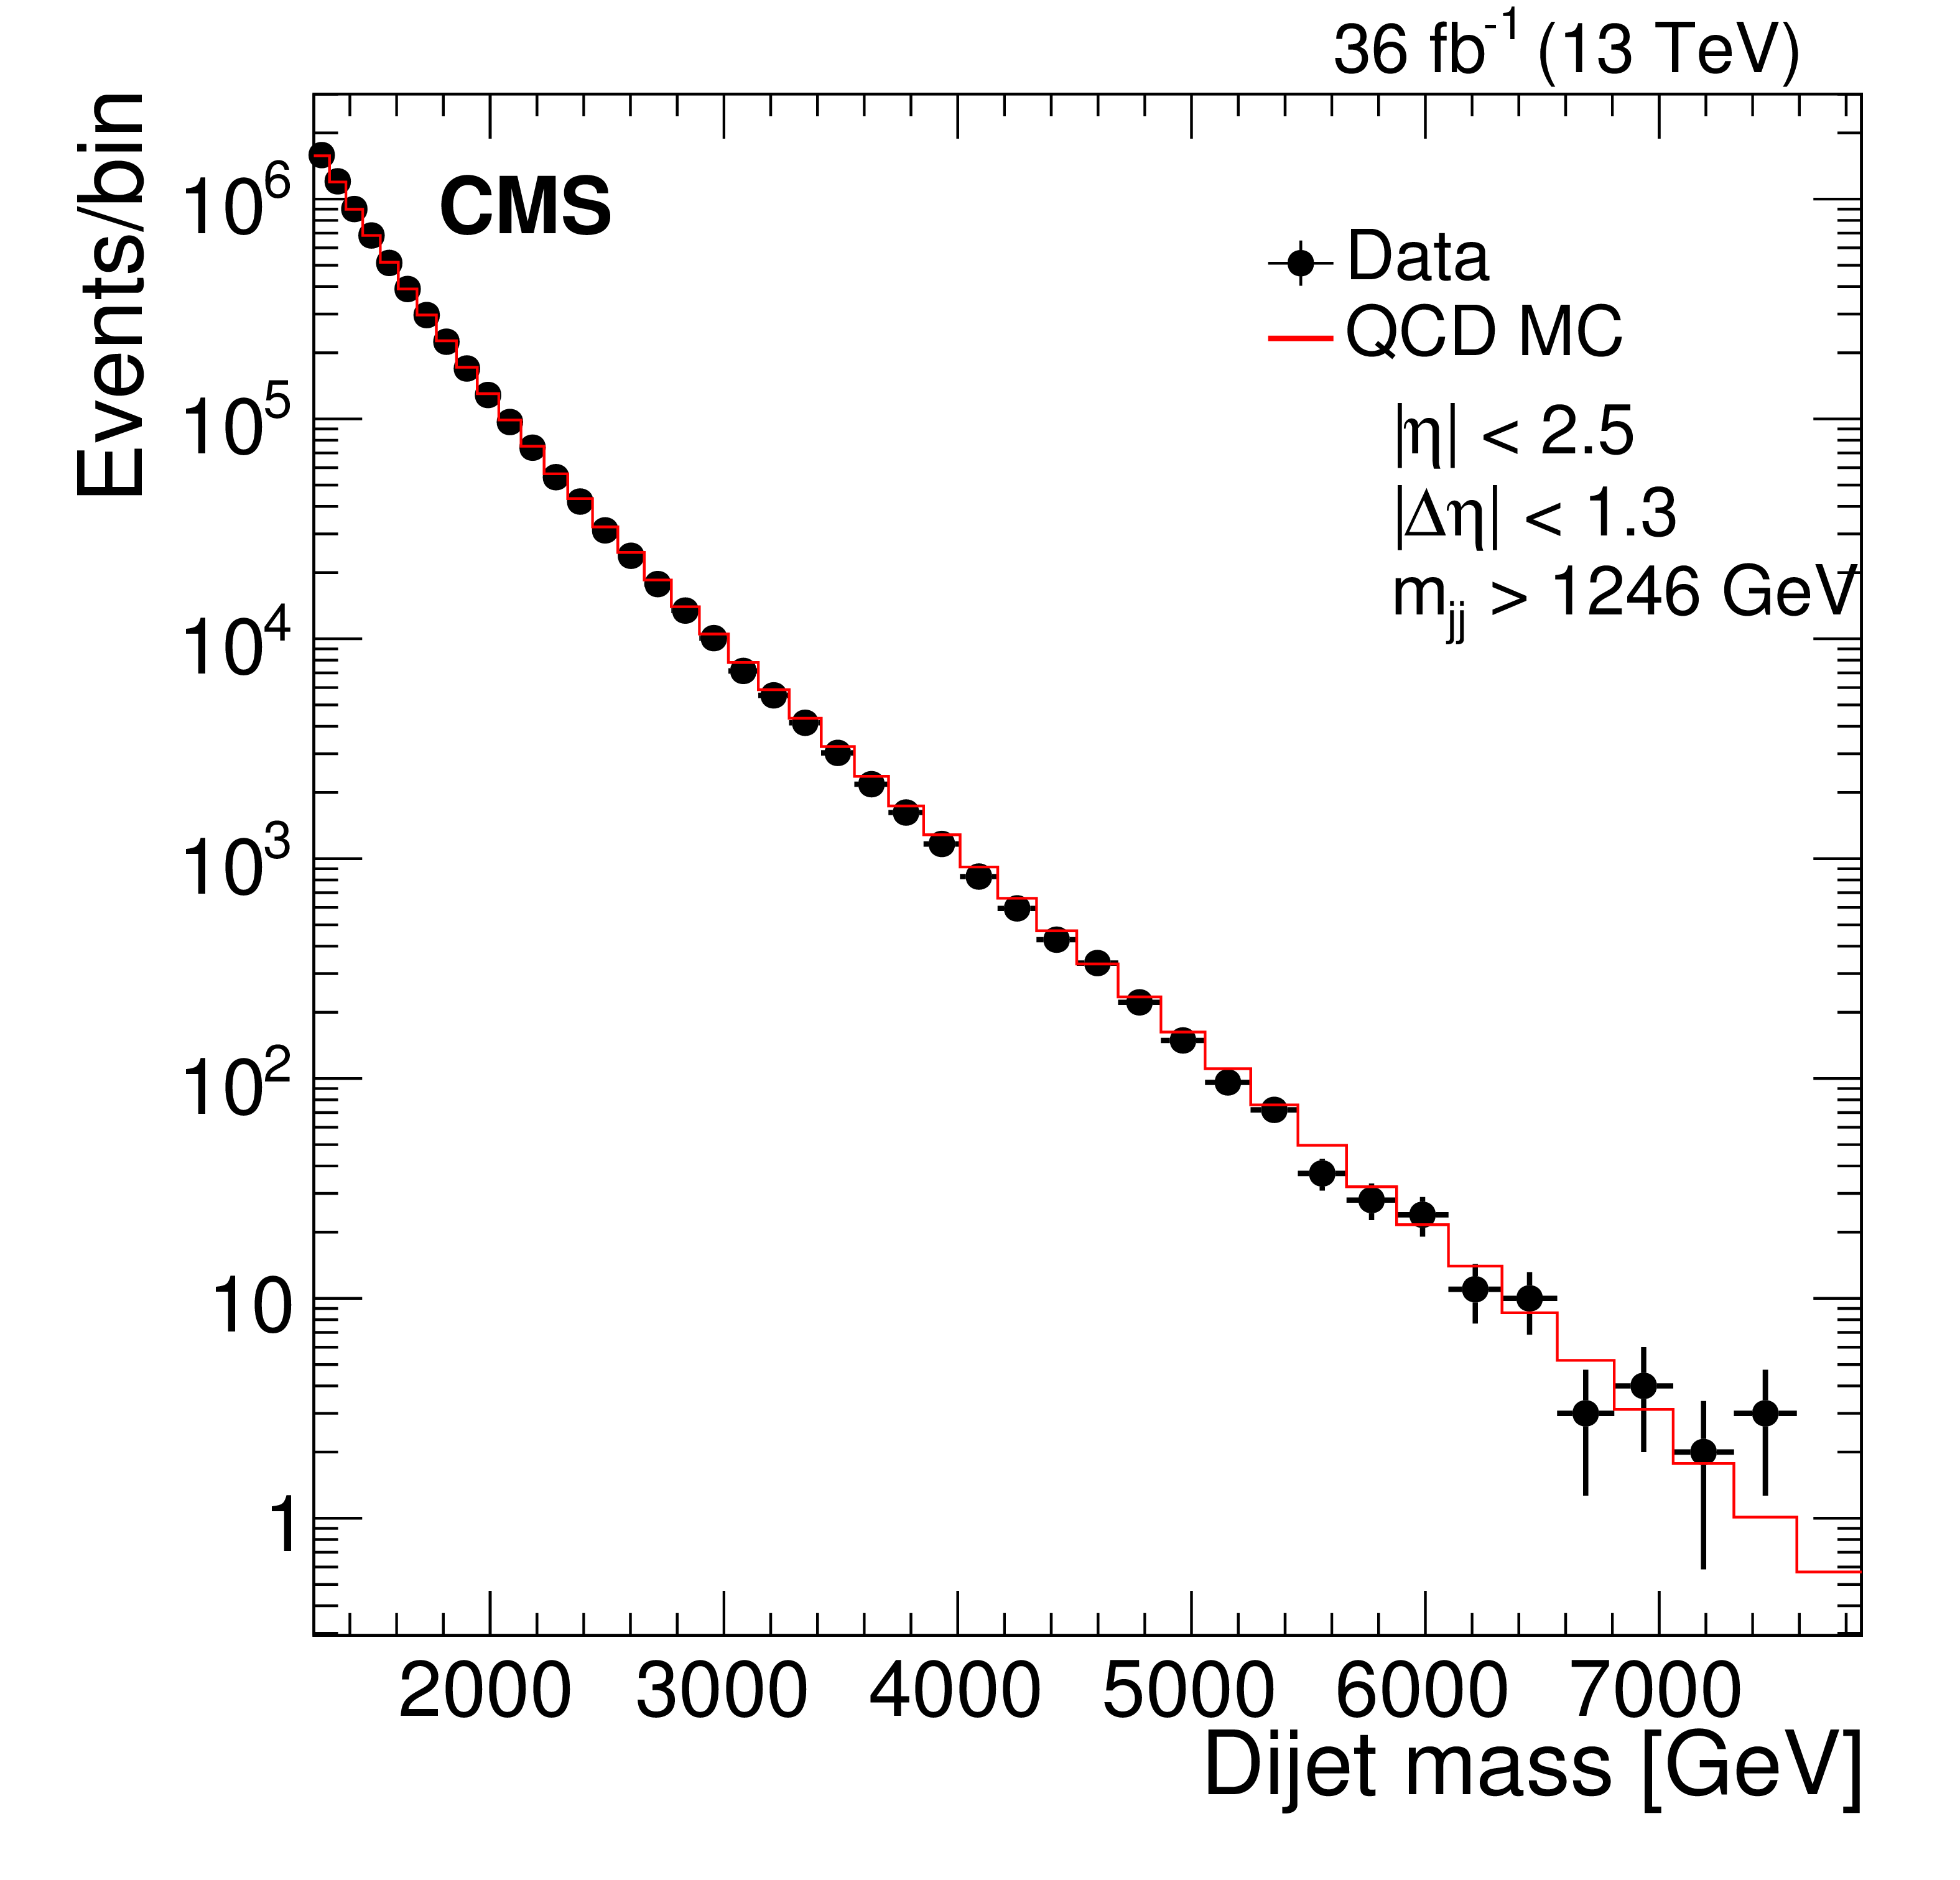
Figure 5:
The dijet mass of the two wide jets from the low-mass search (left) and the high-mass search (right). Data (points) are compared to QCD predictions from the PYTHIA 8 MC including detector simulation (histogram) normalized to the data. The horizontal lines on the data points show the variable bin sizes. |
png pdf |
Figure 5-a:
The dijet mass of the two wide jets from the low-mass search. Data (points) are compared to QCD predictions from the PYTHIA 8 MC including detector simulation (histogram) normalized to the data. The horizontal lines on the data points show the variable bin sizes. |
png pdf |
Figure 5-b:
The dijet mass of the two wide jets from the high-mass search. Data (points) are compared to QCD predictions from the PYTHIA 8 MC including detector simulation (histogram) normalized to the data. The horizontal lines on the data points show the variable bin sizes. |
png pdf |
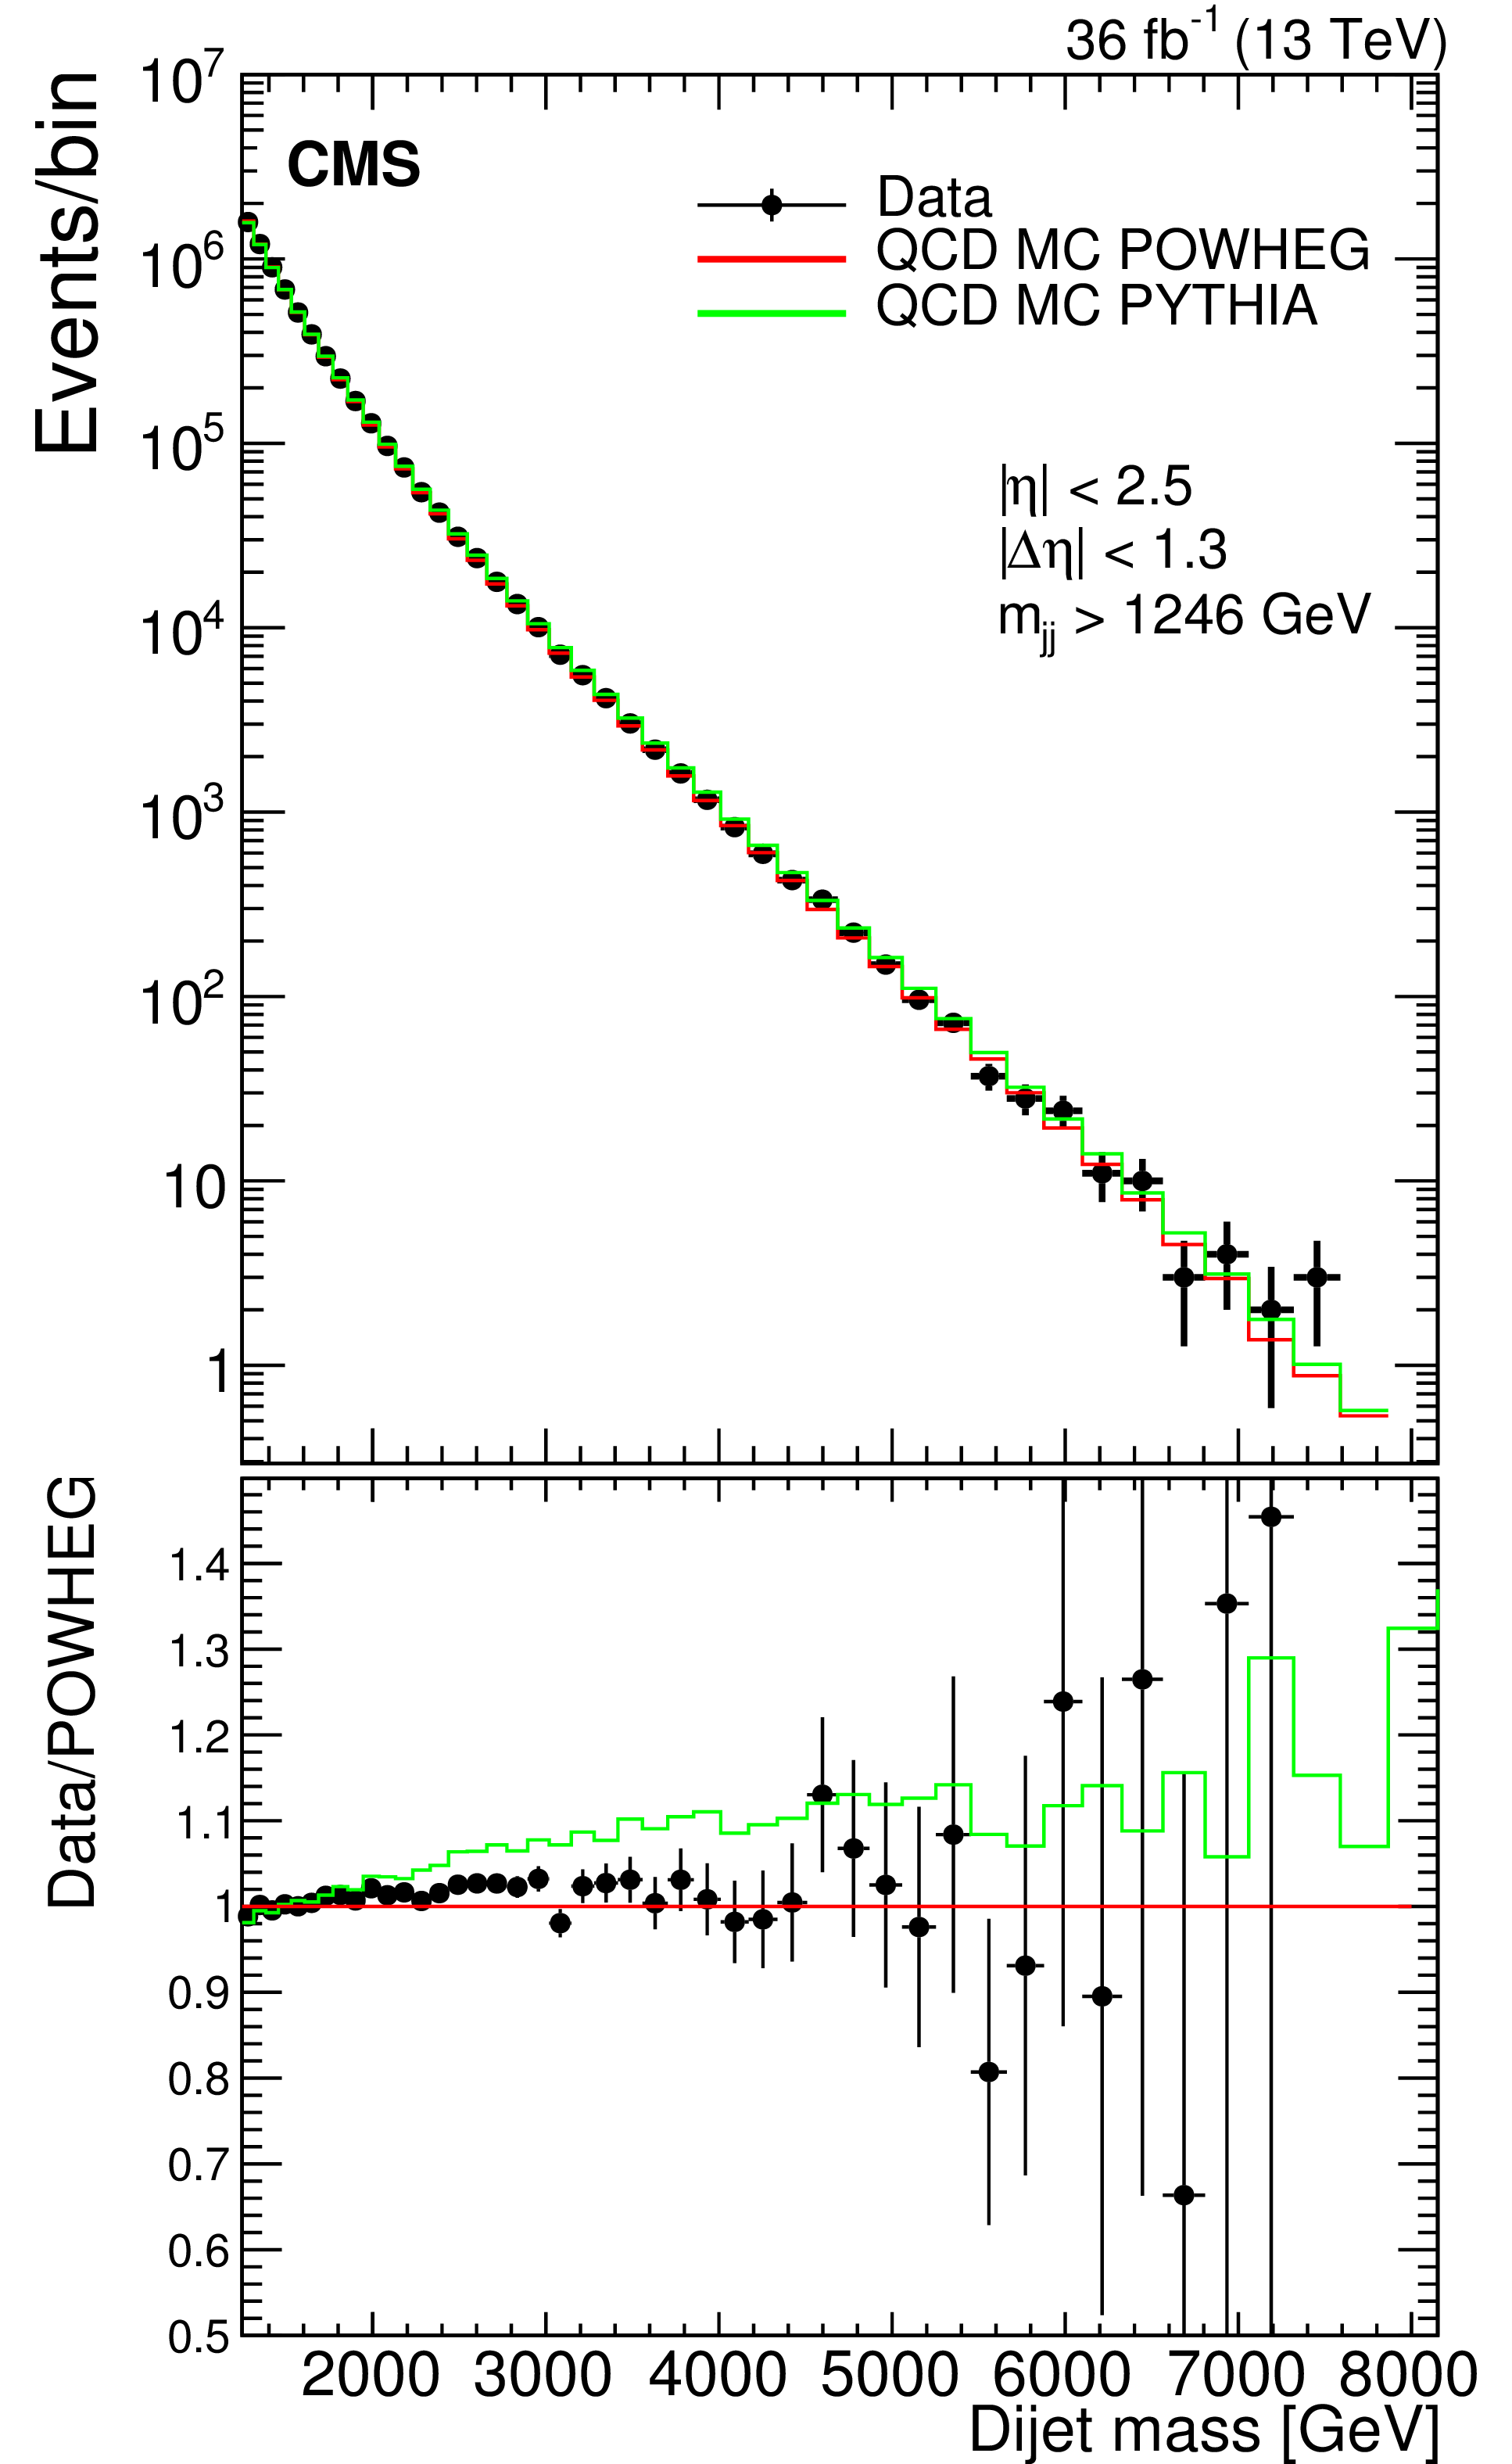
Figure 6:
The dijet mass distribution of the two wide jets from the high-mass search. (Upper) Data (points) are compared to predictions from the POWHEG MC in red (darker) and the PYTHIA 8 MC in green (lighter), including detector simulation, each normalized to the data. (Lower) The ratio of data to the POWHEG prediction, compared to unity and compared to the ratio of the PYTHIA 8 MC to the POWHEG prediction. The horizontal lines on the data points show the variable bin sizes. |
png pdf |
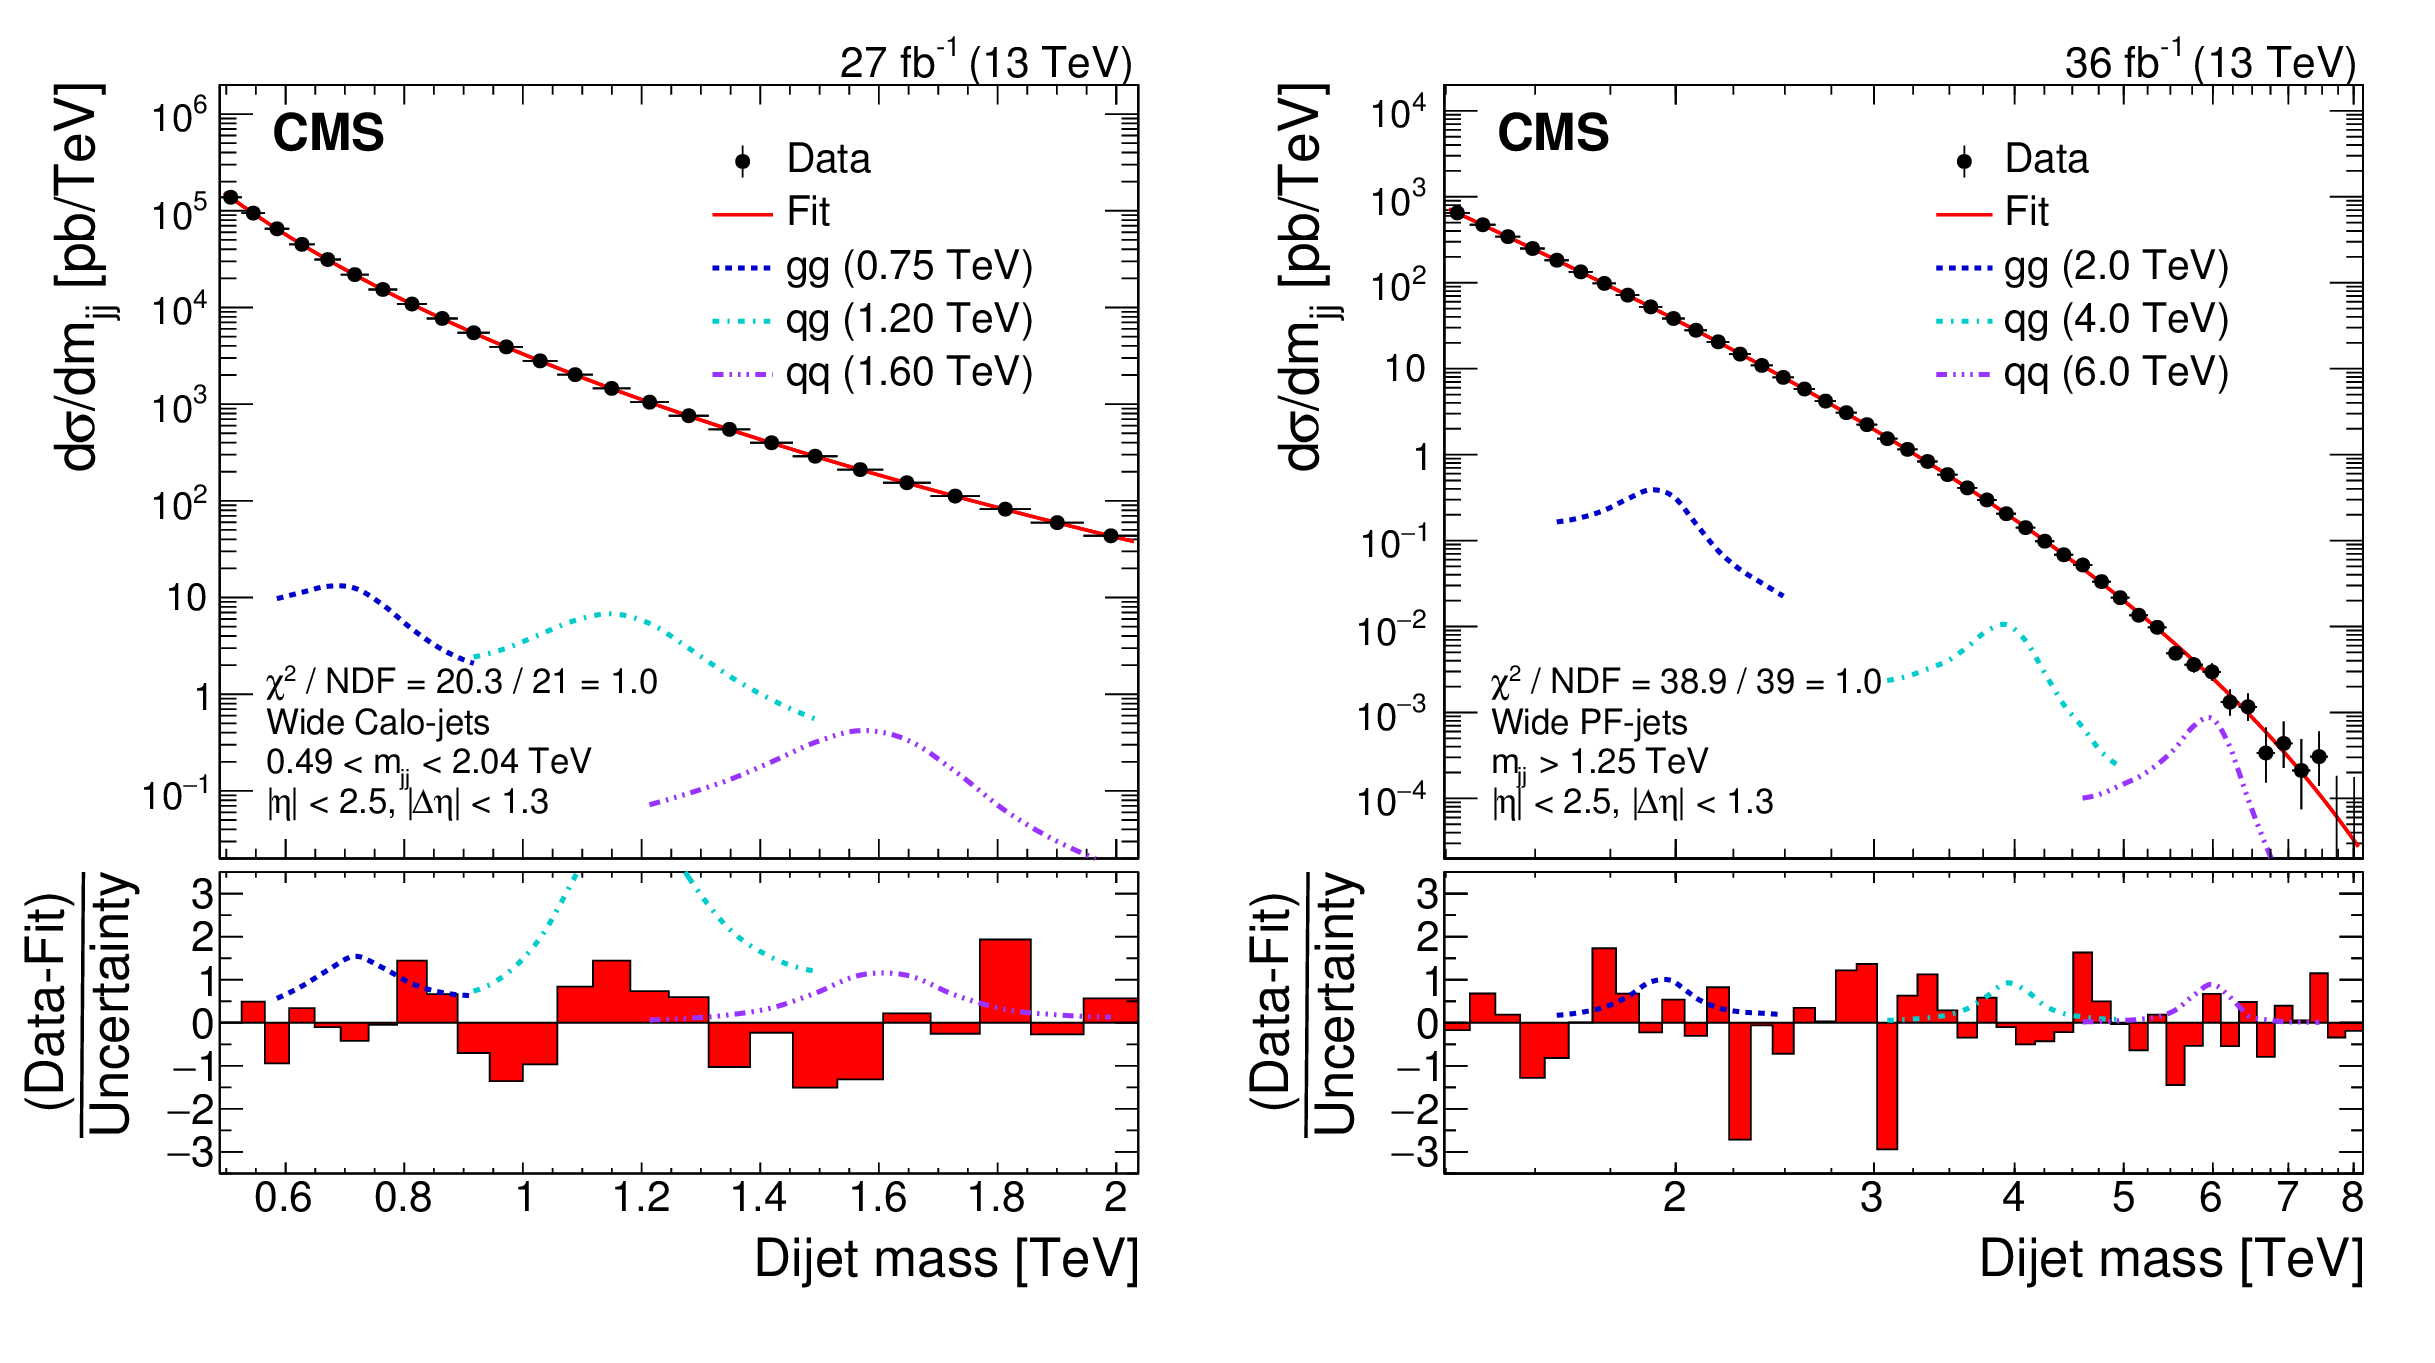
Figure 7:
Dijet mass spectra (points) compared to a fitted parameterization of the background (solid curve) for the low-mass search (left) and the high-mass search (right). The horizontal lines on the data points show the variable bin sizes. The lower panel in each plot shows the difference between the data and the fitted parametrization, divided by the statistical uncertainty of the data. Examples of predicted signals from narrow gluon-gluon, quark-gluon, and quark-quark resonances are shown with cross sections equal to the observed upper limits at 95% CL. |
png pdf |
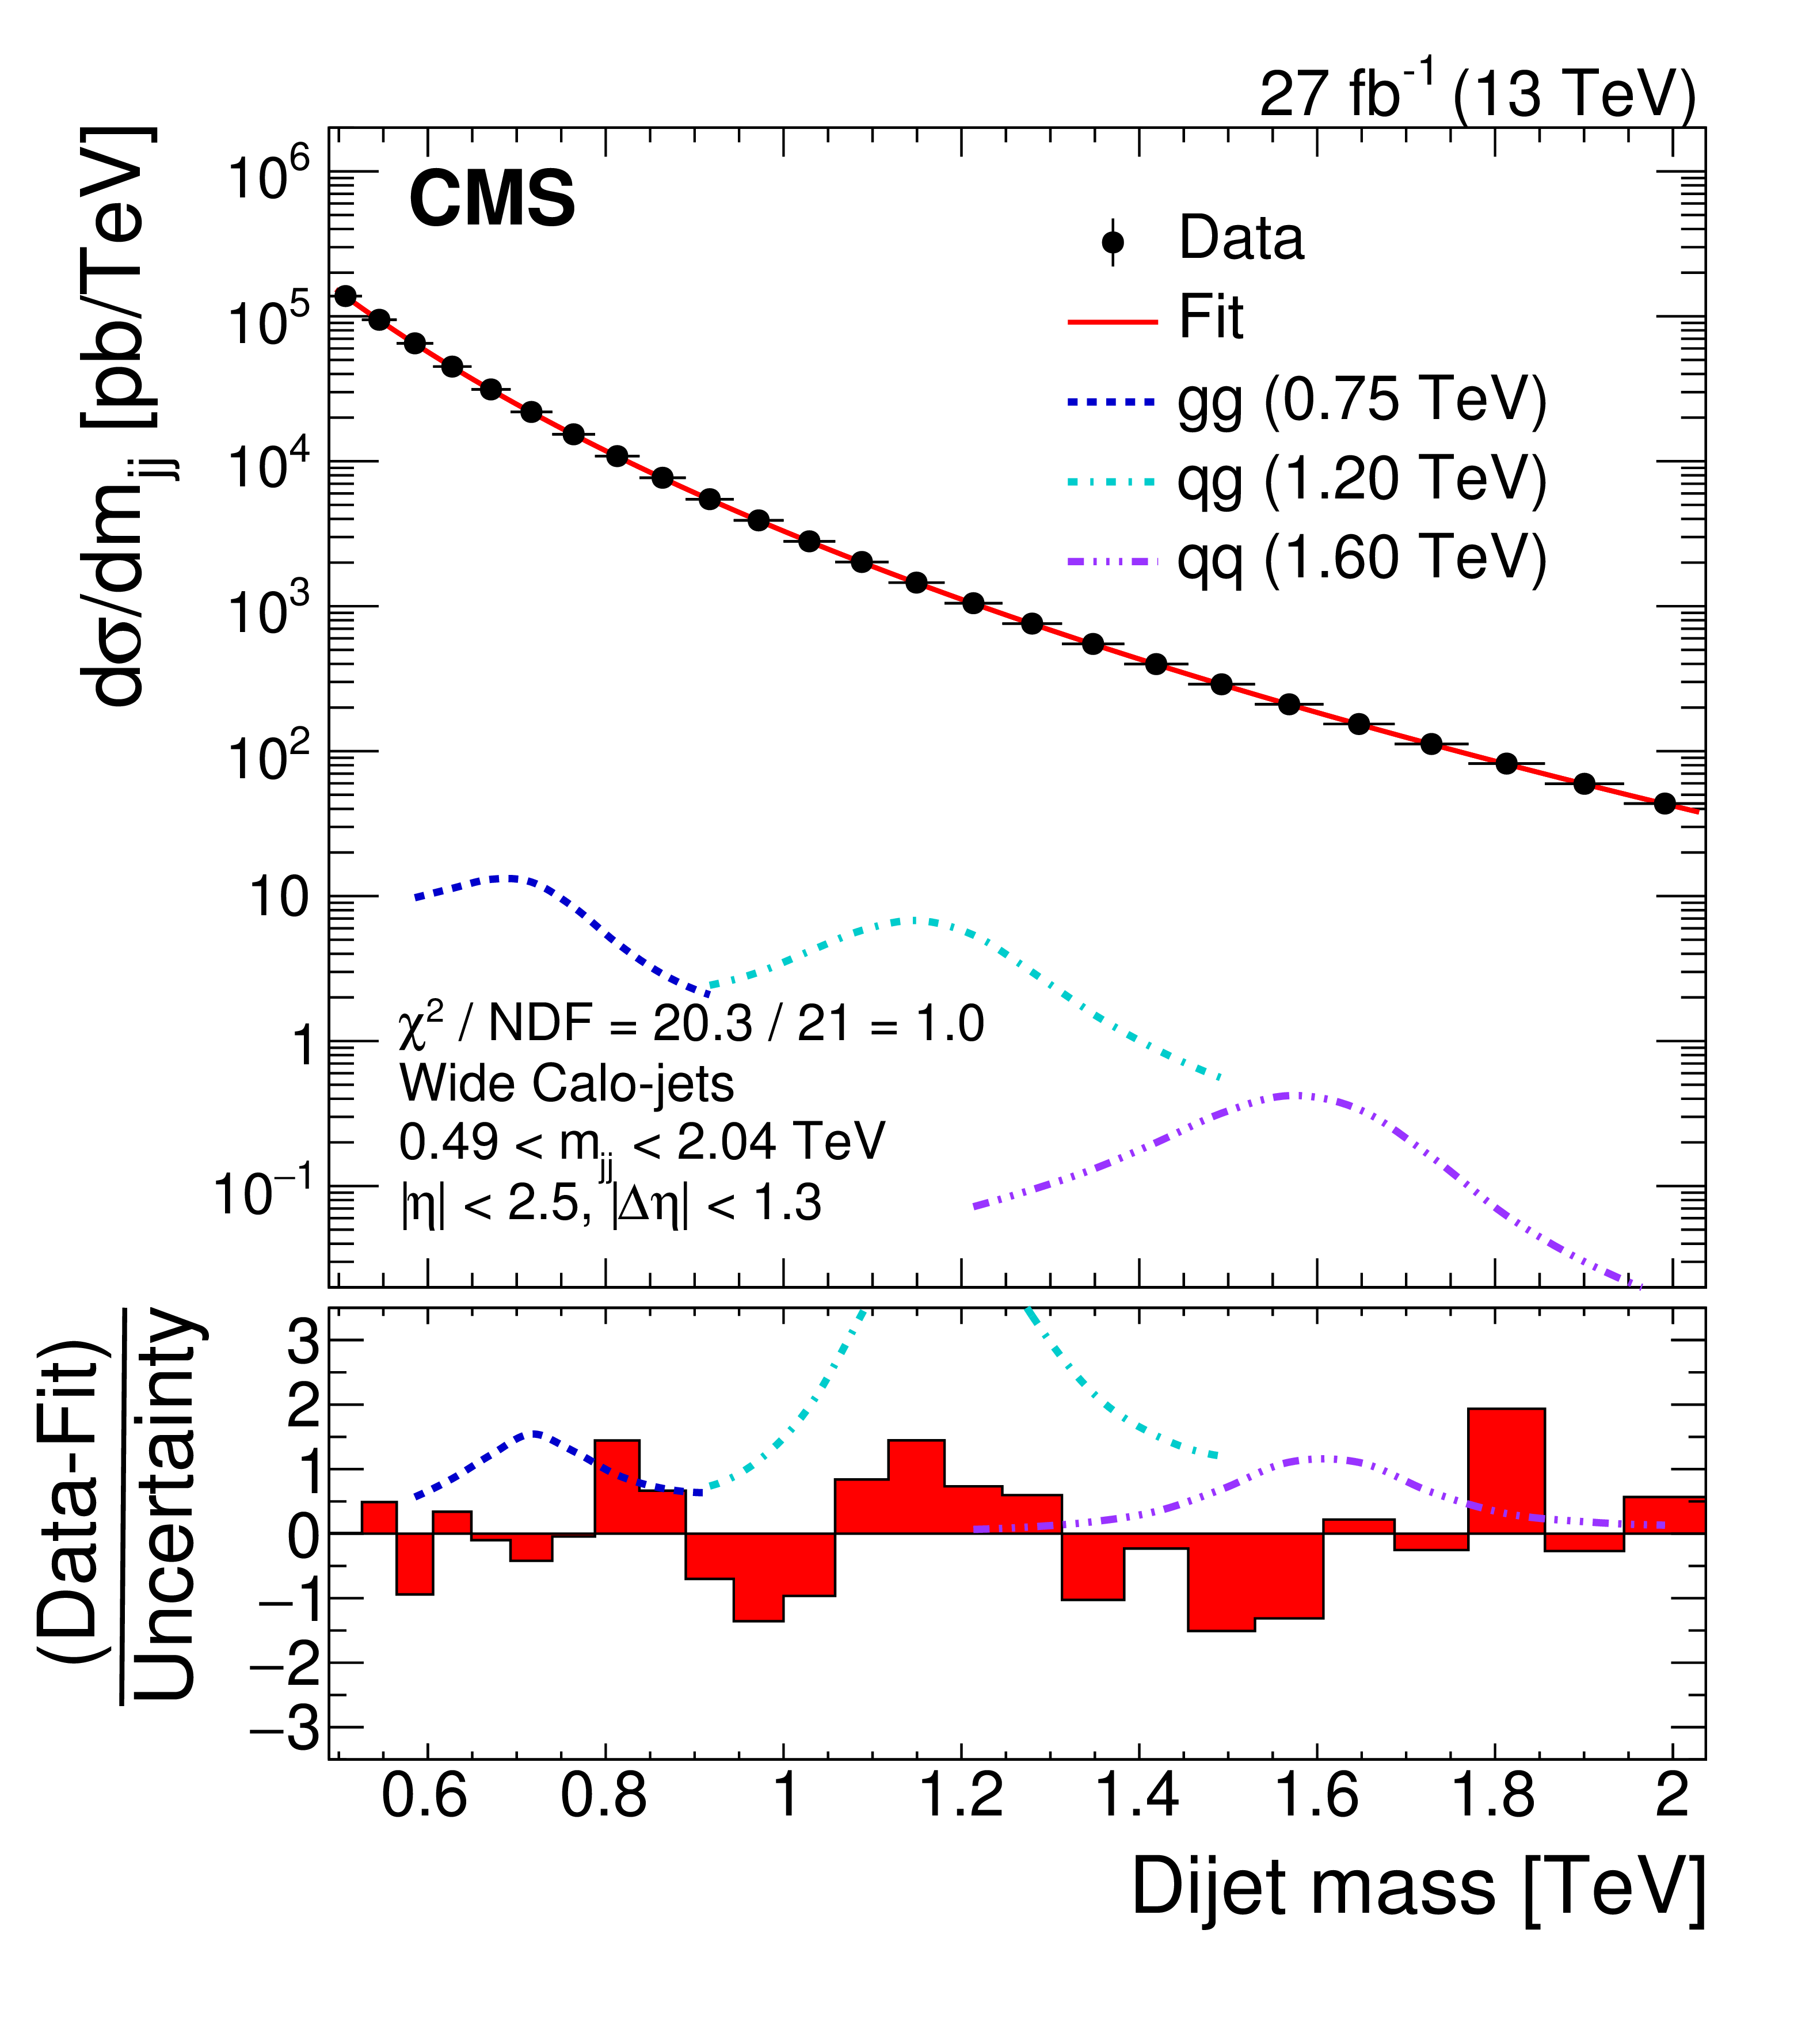
Figure 7-a:
Dijet mass spectra (points) compared to a fitted parameterization of the background (solid curve) for the low-mass search. The horizontal lines on the data points show the variable bin sizes. The lower panel in each plot shows the difference between the data and the fitted parametrization, divided by the statistical uncertainty of the data. Examples of predicted signals from narrow gluon-gluon, quark-gluon, and quark-quark resonances are shown with cross sections equal to the observed upper limits at 95% CL. |
png pdf |
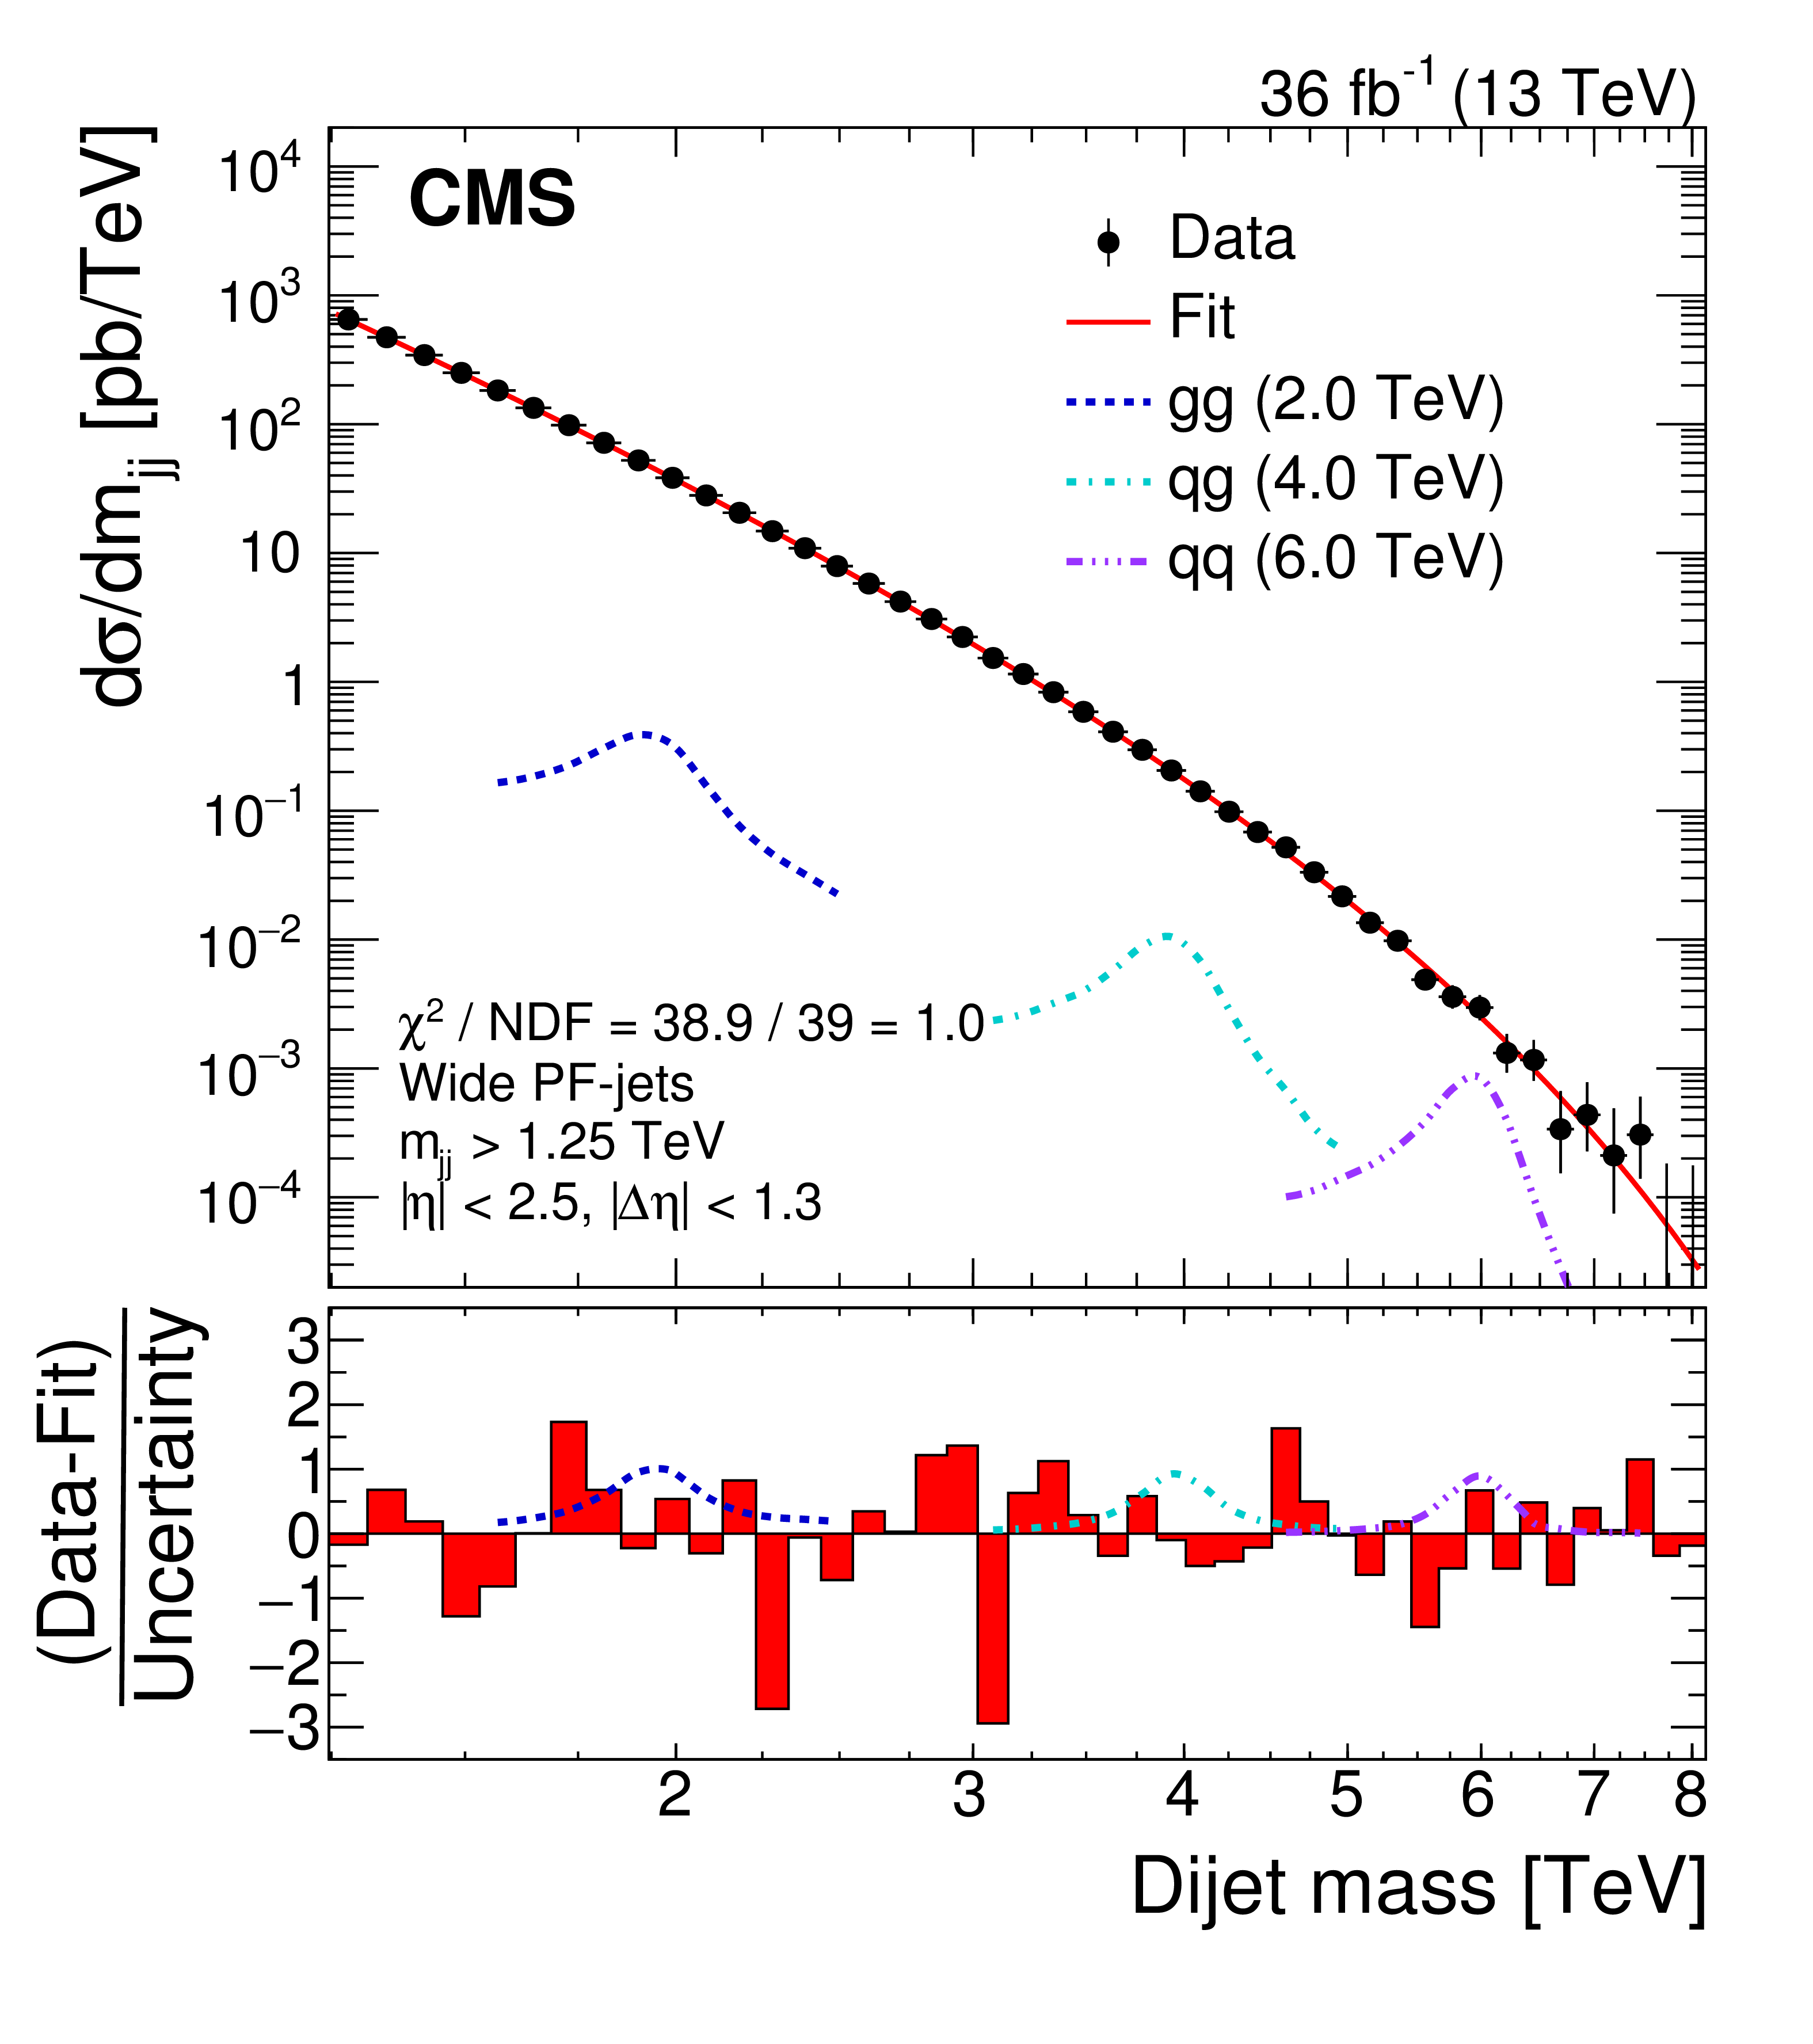
Figure 7-b:
Dijet mass spectra (points) compared to a fitted parameterization of the background (solid curve) for the high-mass search. The horizontal lines on the data points show the variable bin sizes. The lower panel in each plot shows the difference between the data and the fitted parametrization, divided by the statistical uncertainty of the data. Examples of predicted signals from narrow gluon-gluon, quark-gluon, and quark-quark resonances are shown with cross sections equal to the observed upper limits at 95% CL. |
png pdf |
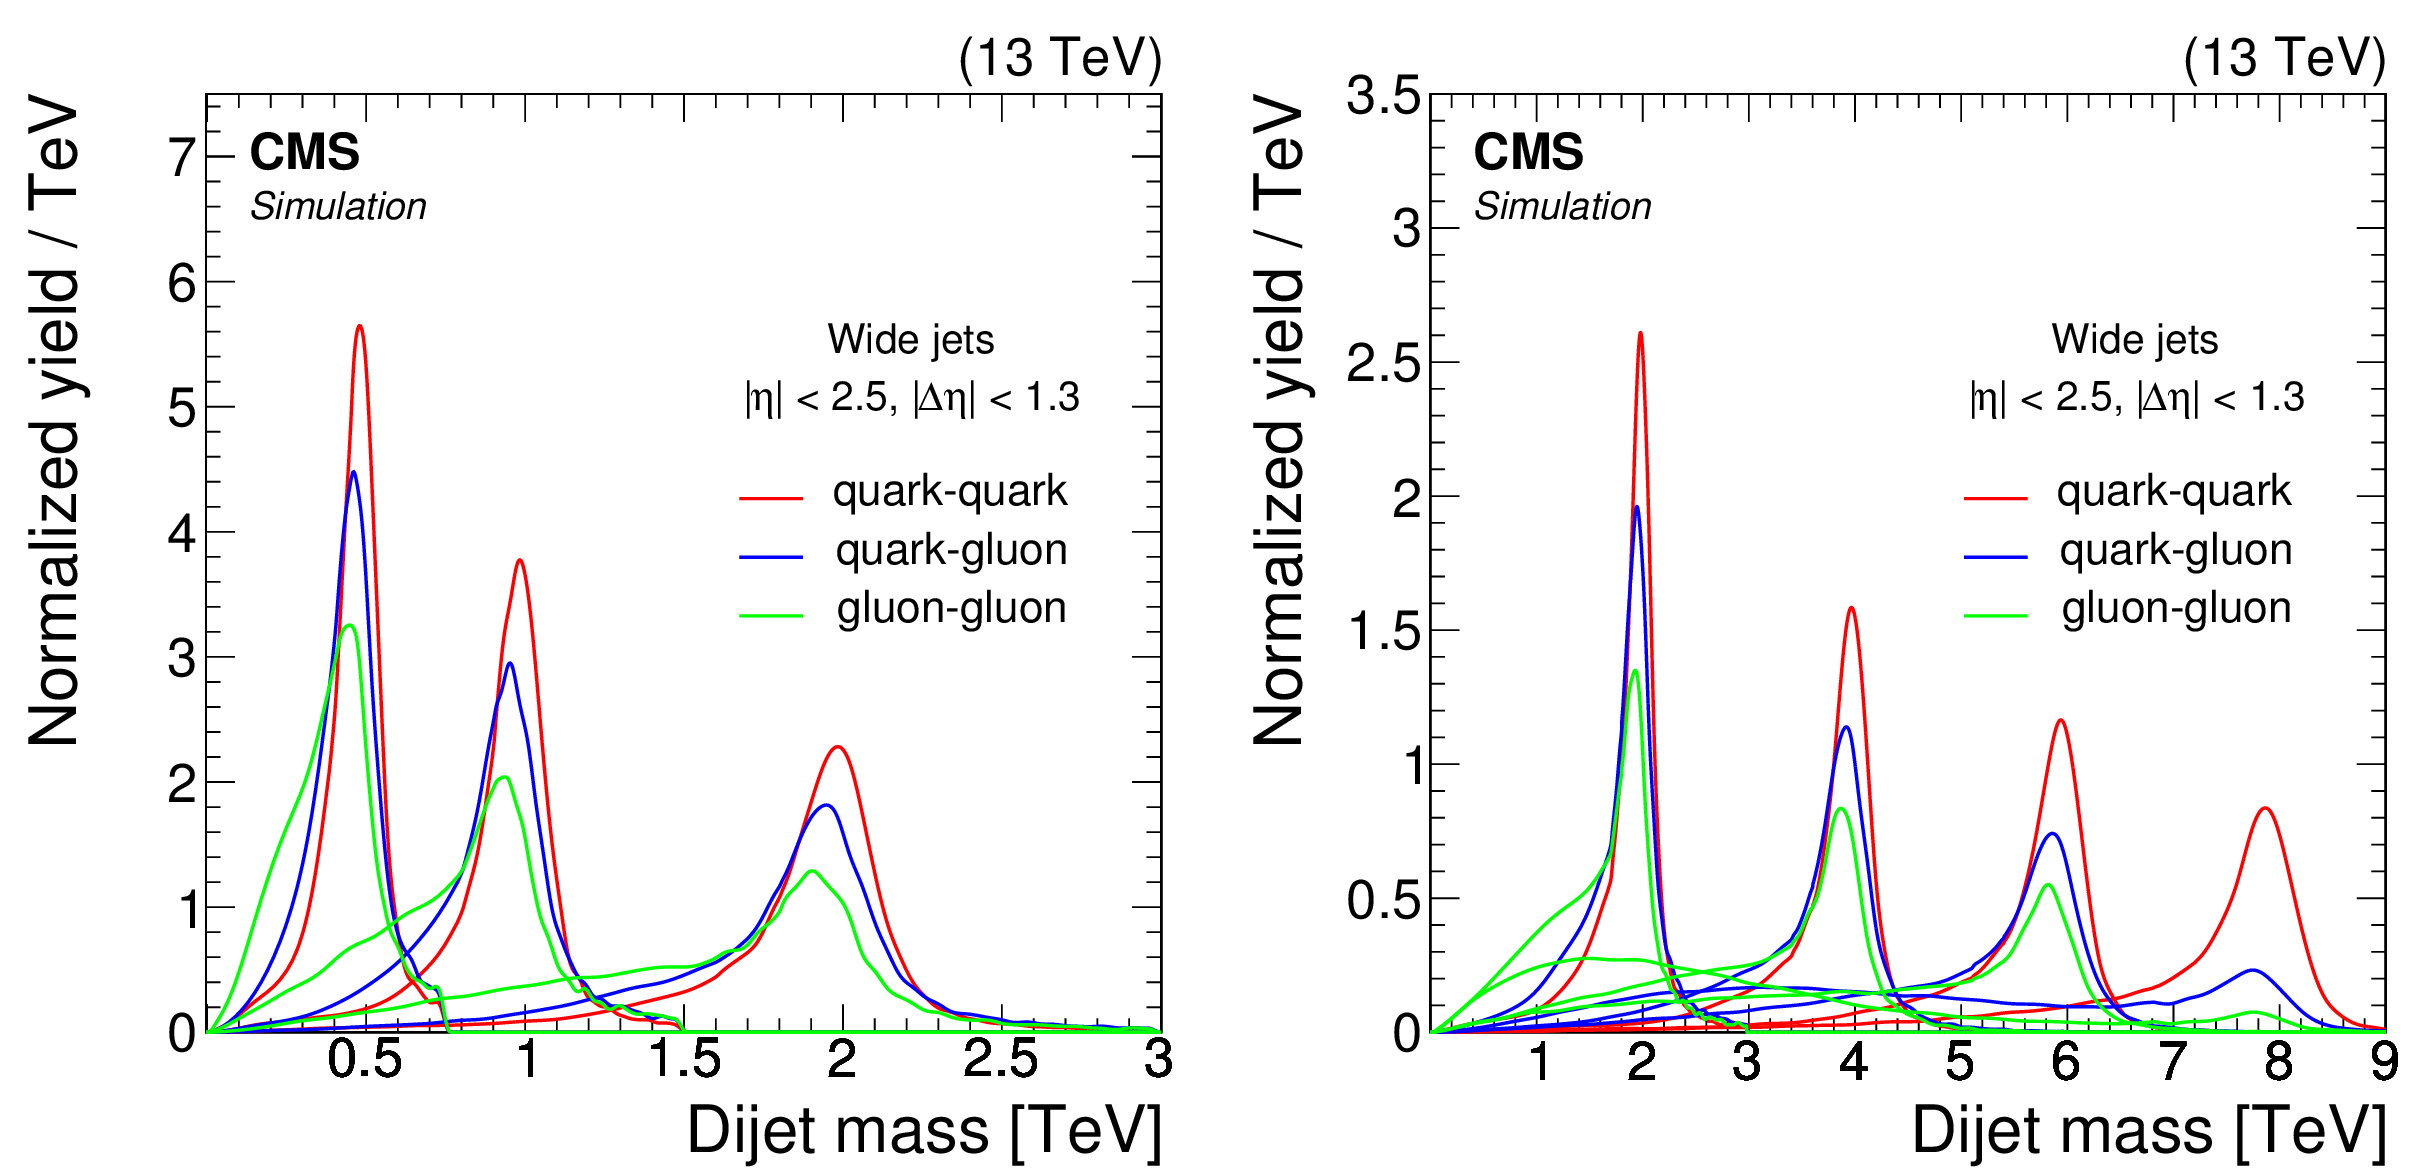
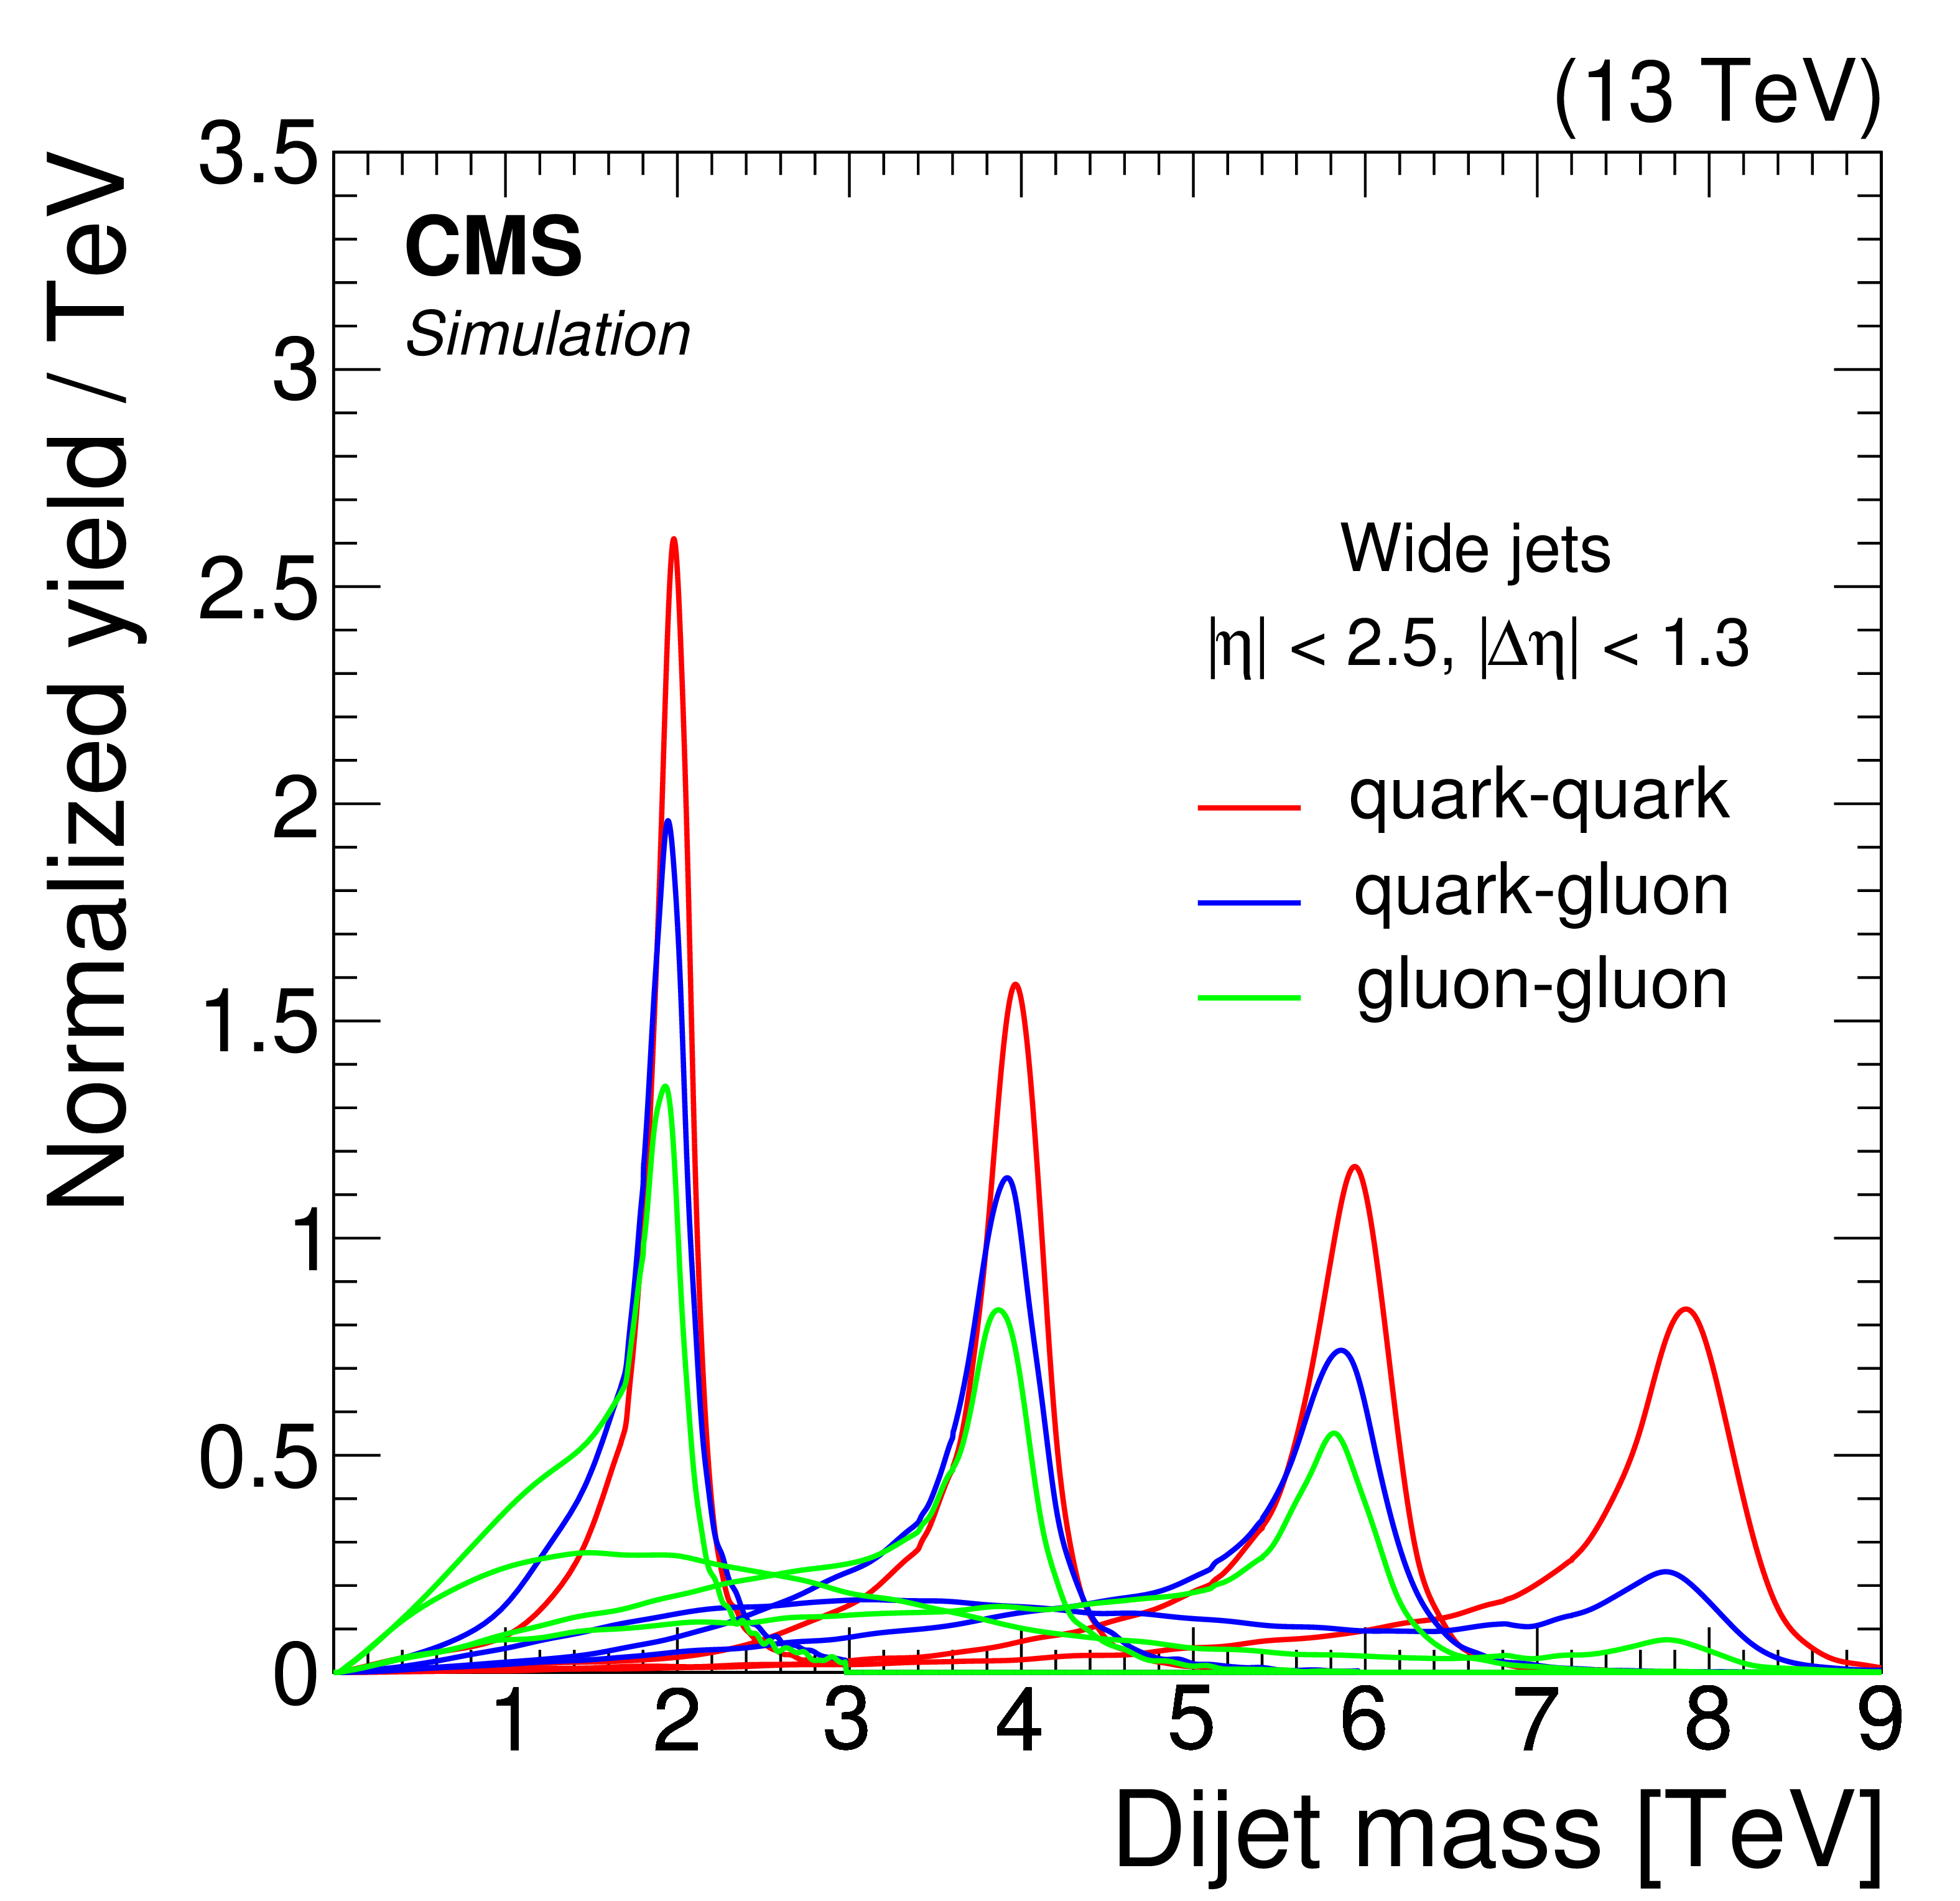
Figure 8:
Signal shapes of narrow resonances with masses of 0.5, 1, and 2 TeV in the low-mass search (left) and masses of 2, 4, 6, and 8 TeV in the high-mass search (right). These reconstructed dijet mass spectra show wide jets from the PYTHIA 8 MC event generator including simulation of the CMS detector. |

png pdf |
Figure 8-a:
Signal shapes of narrow resonances with masses of 0.5, 1, and 2 TeV in the low-mass search. These reconstructed dijet mass spectra show wide jets from the PYTHIA 8 MC event generator including simulation of the CMS detector. |
png pdf |
Figure 8-b:
Signal shapes of narrow resonances with masses of 2, 4, 6, and 8 TeV in the high-mass search. These reconstructed dijet mass spectra show wide jets from the PYTHIA 8 MC event generator including simulation of the CMS detector. |
png pdf |
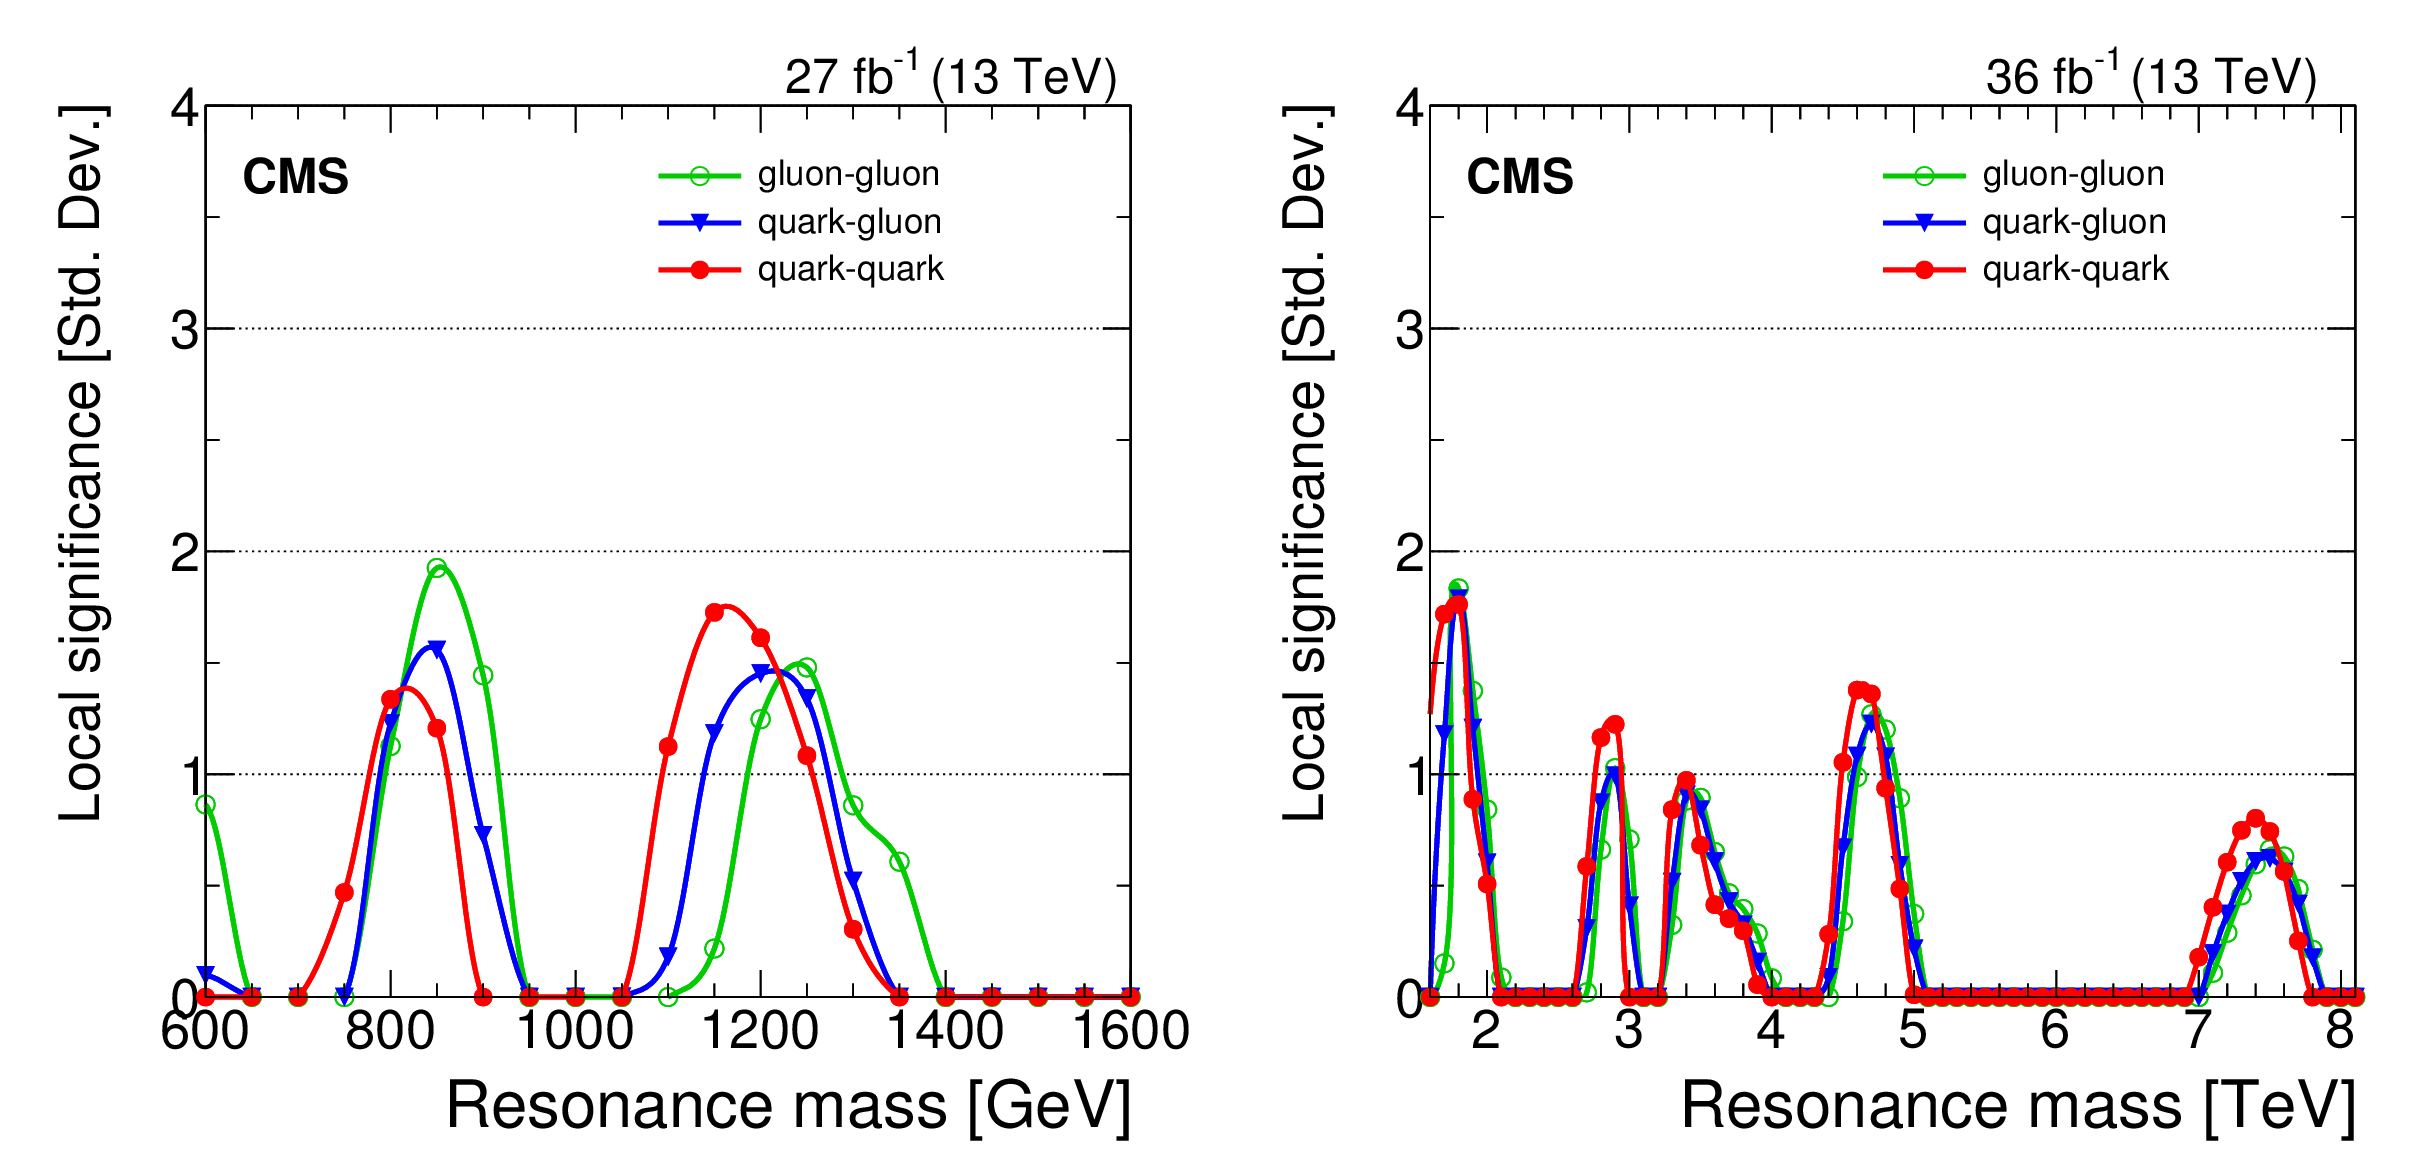
Figure 9:
Local significance for a narrow resonance from the low-mass search (left) and the high-mass search (right). |
png pdf |
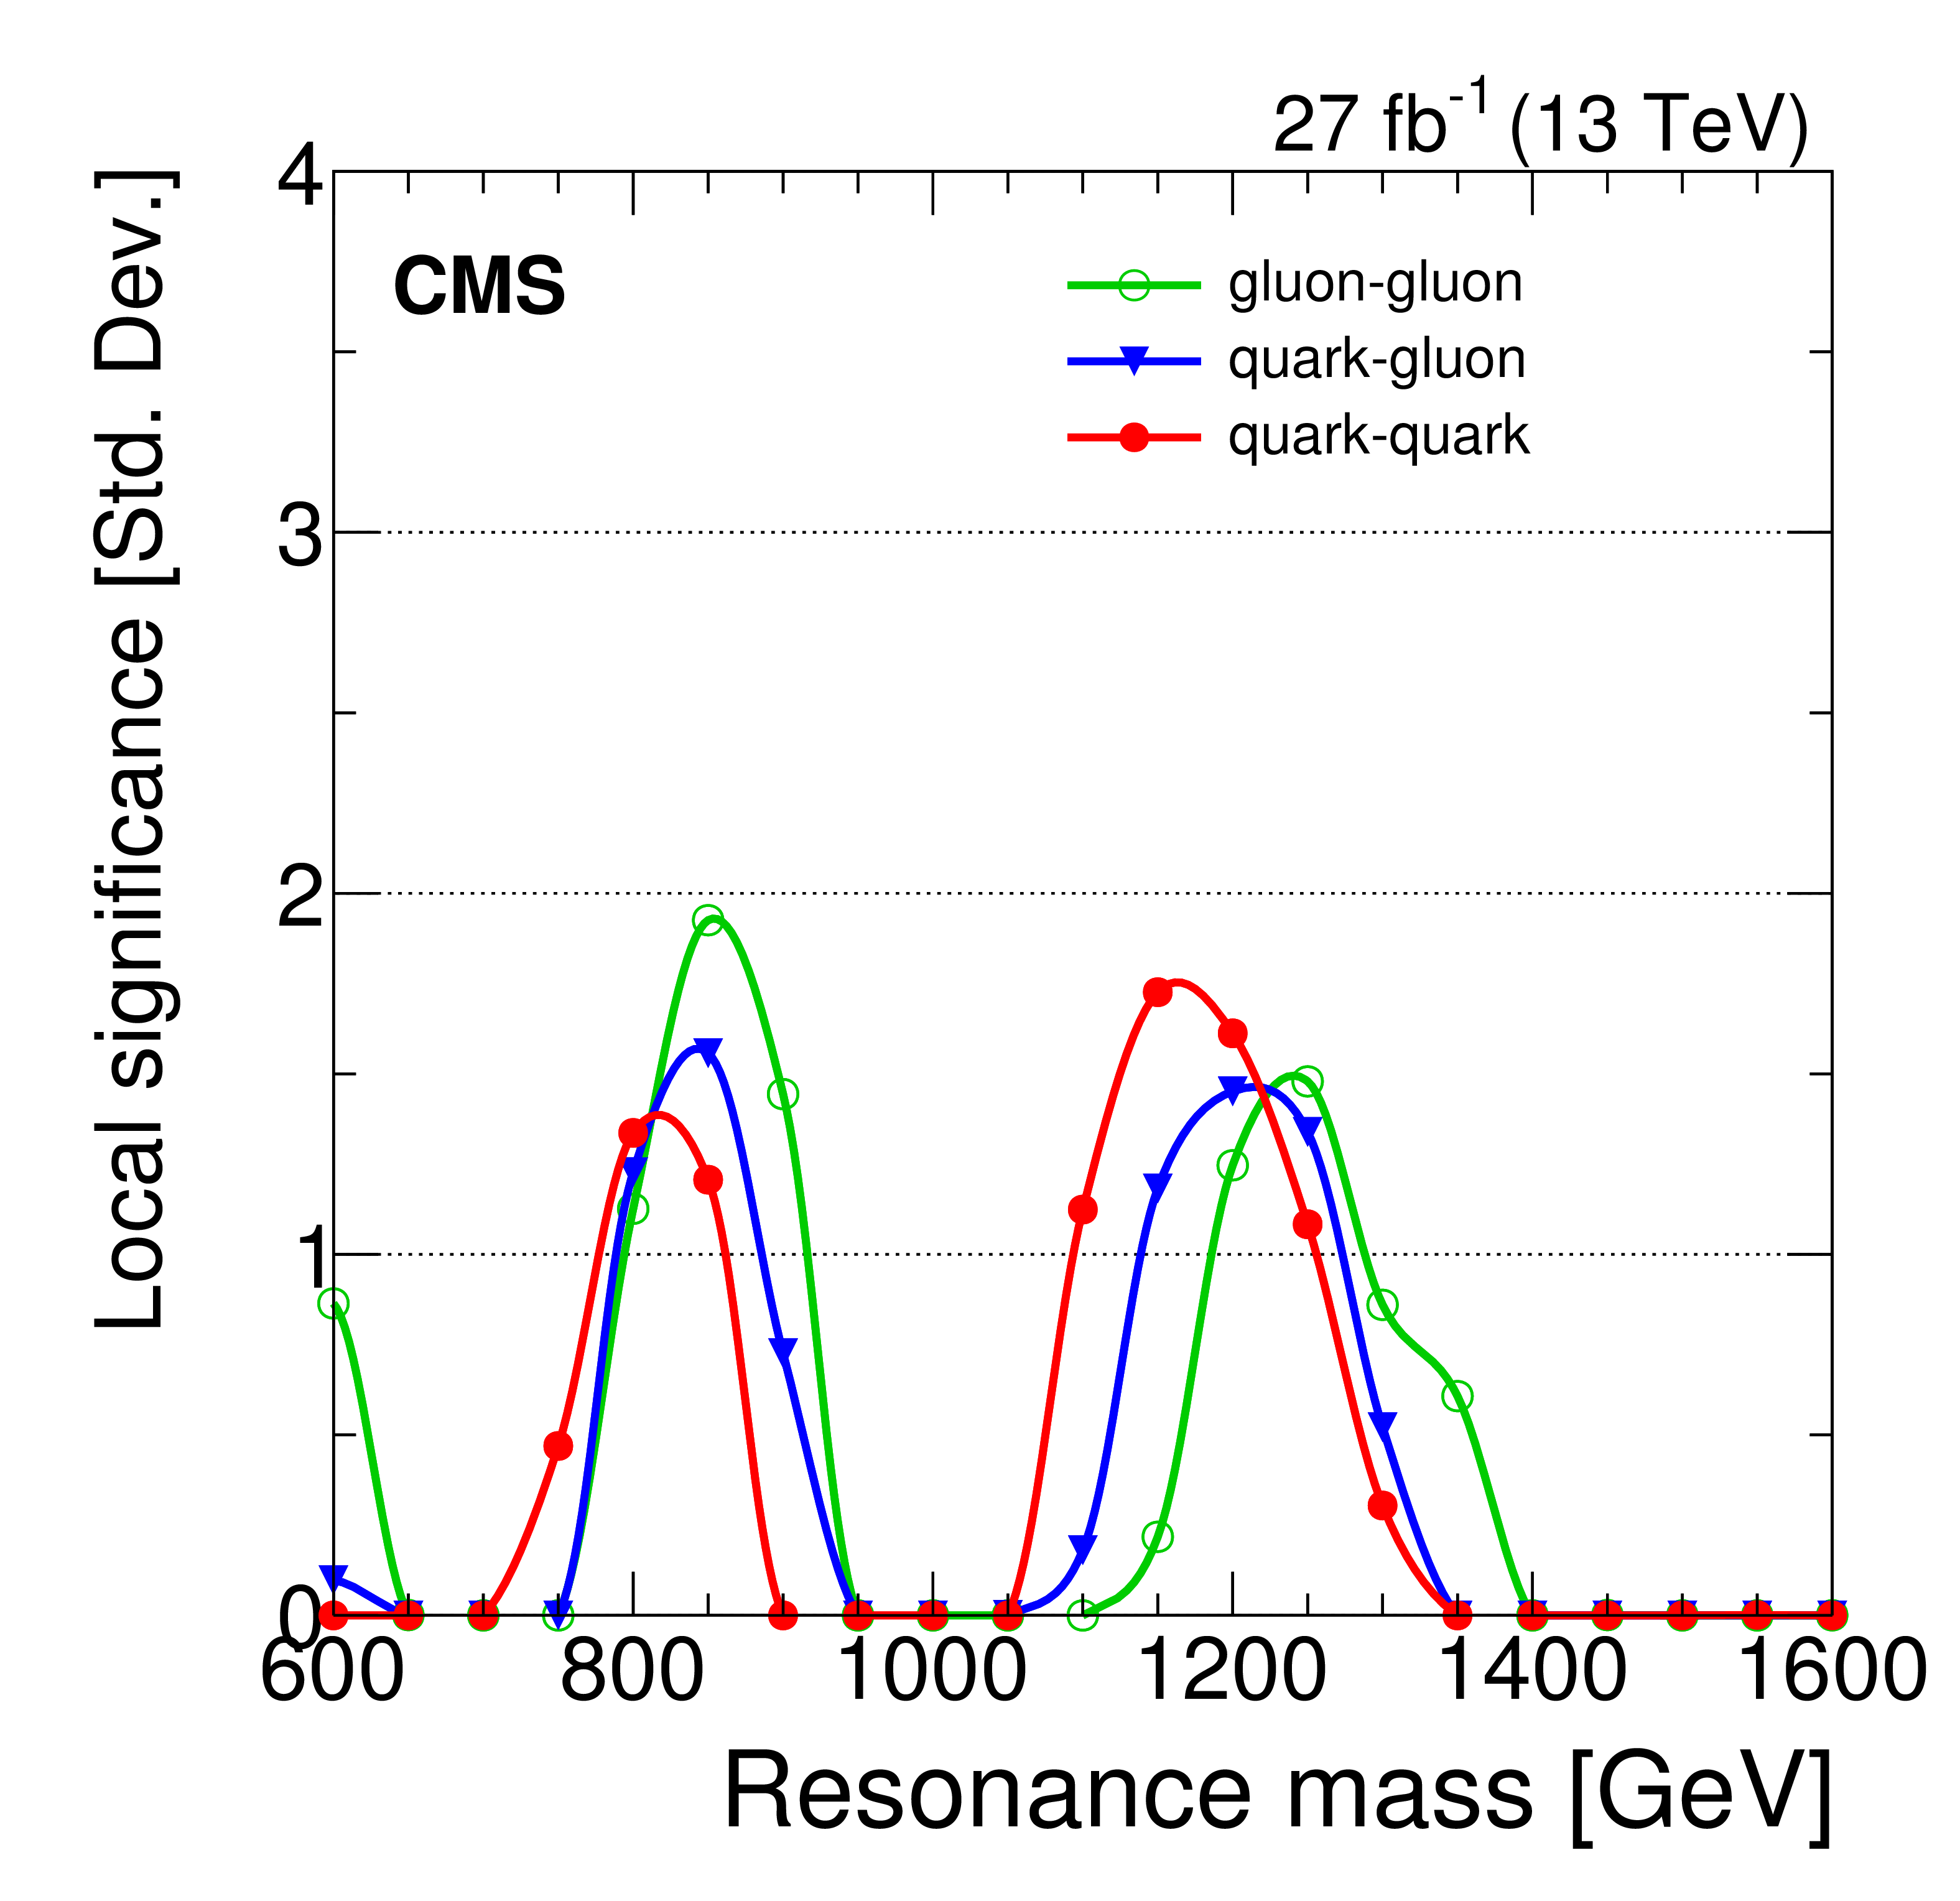
Figure 9-a:
Local significance for a narrow resonance from the low-mass search. |
png pdf |
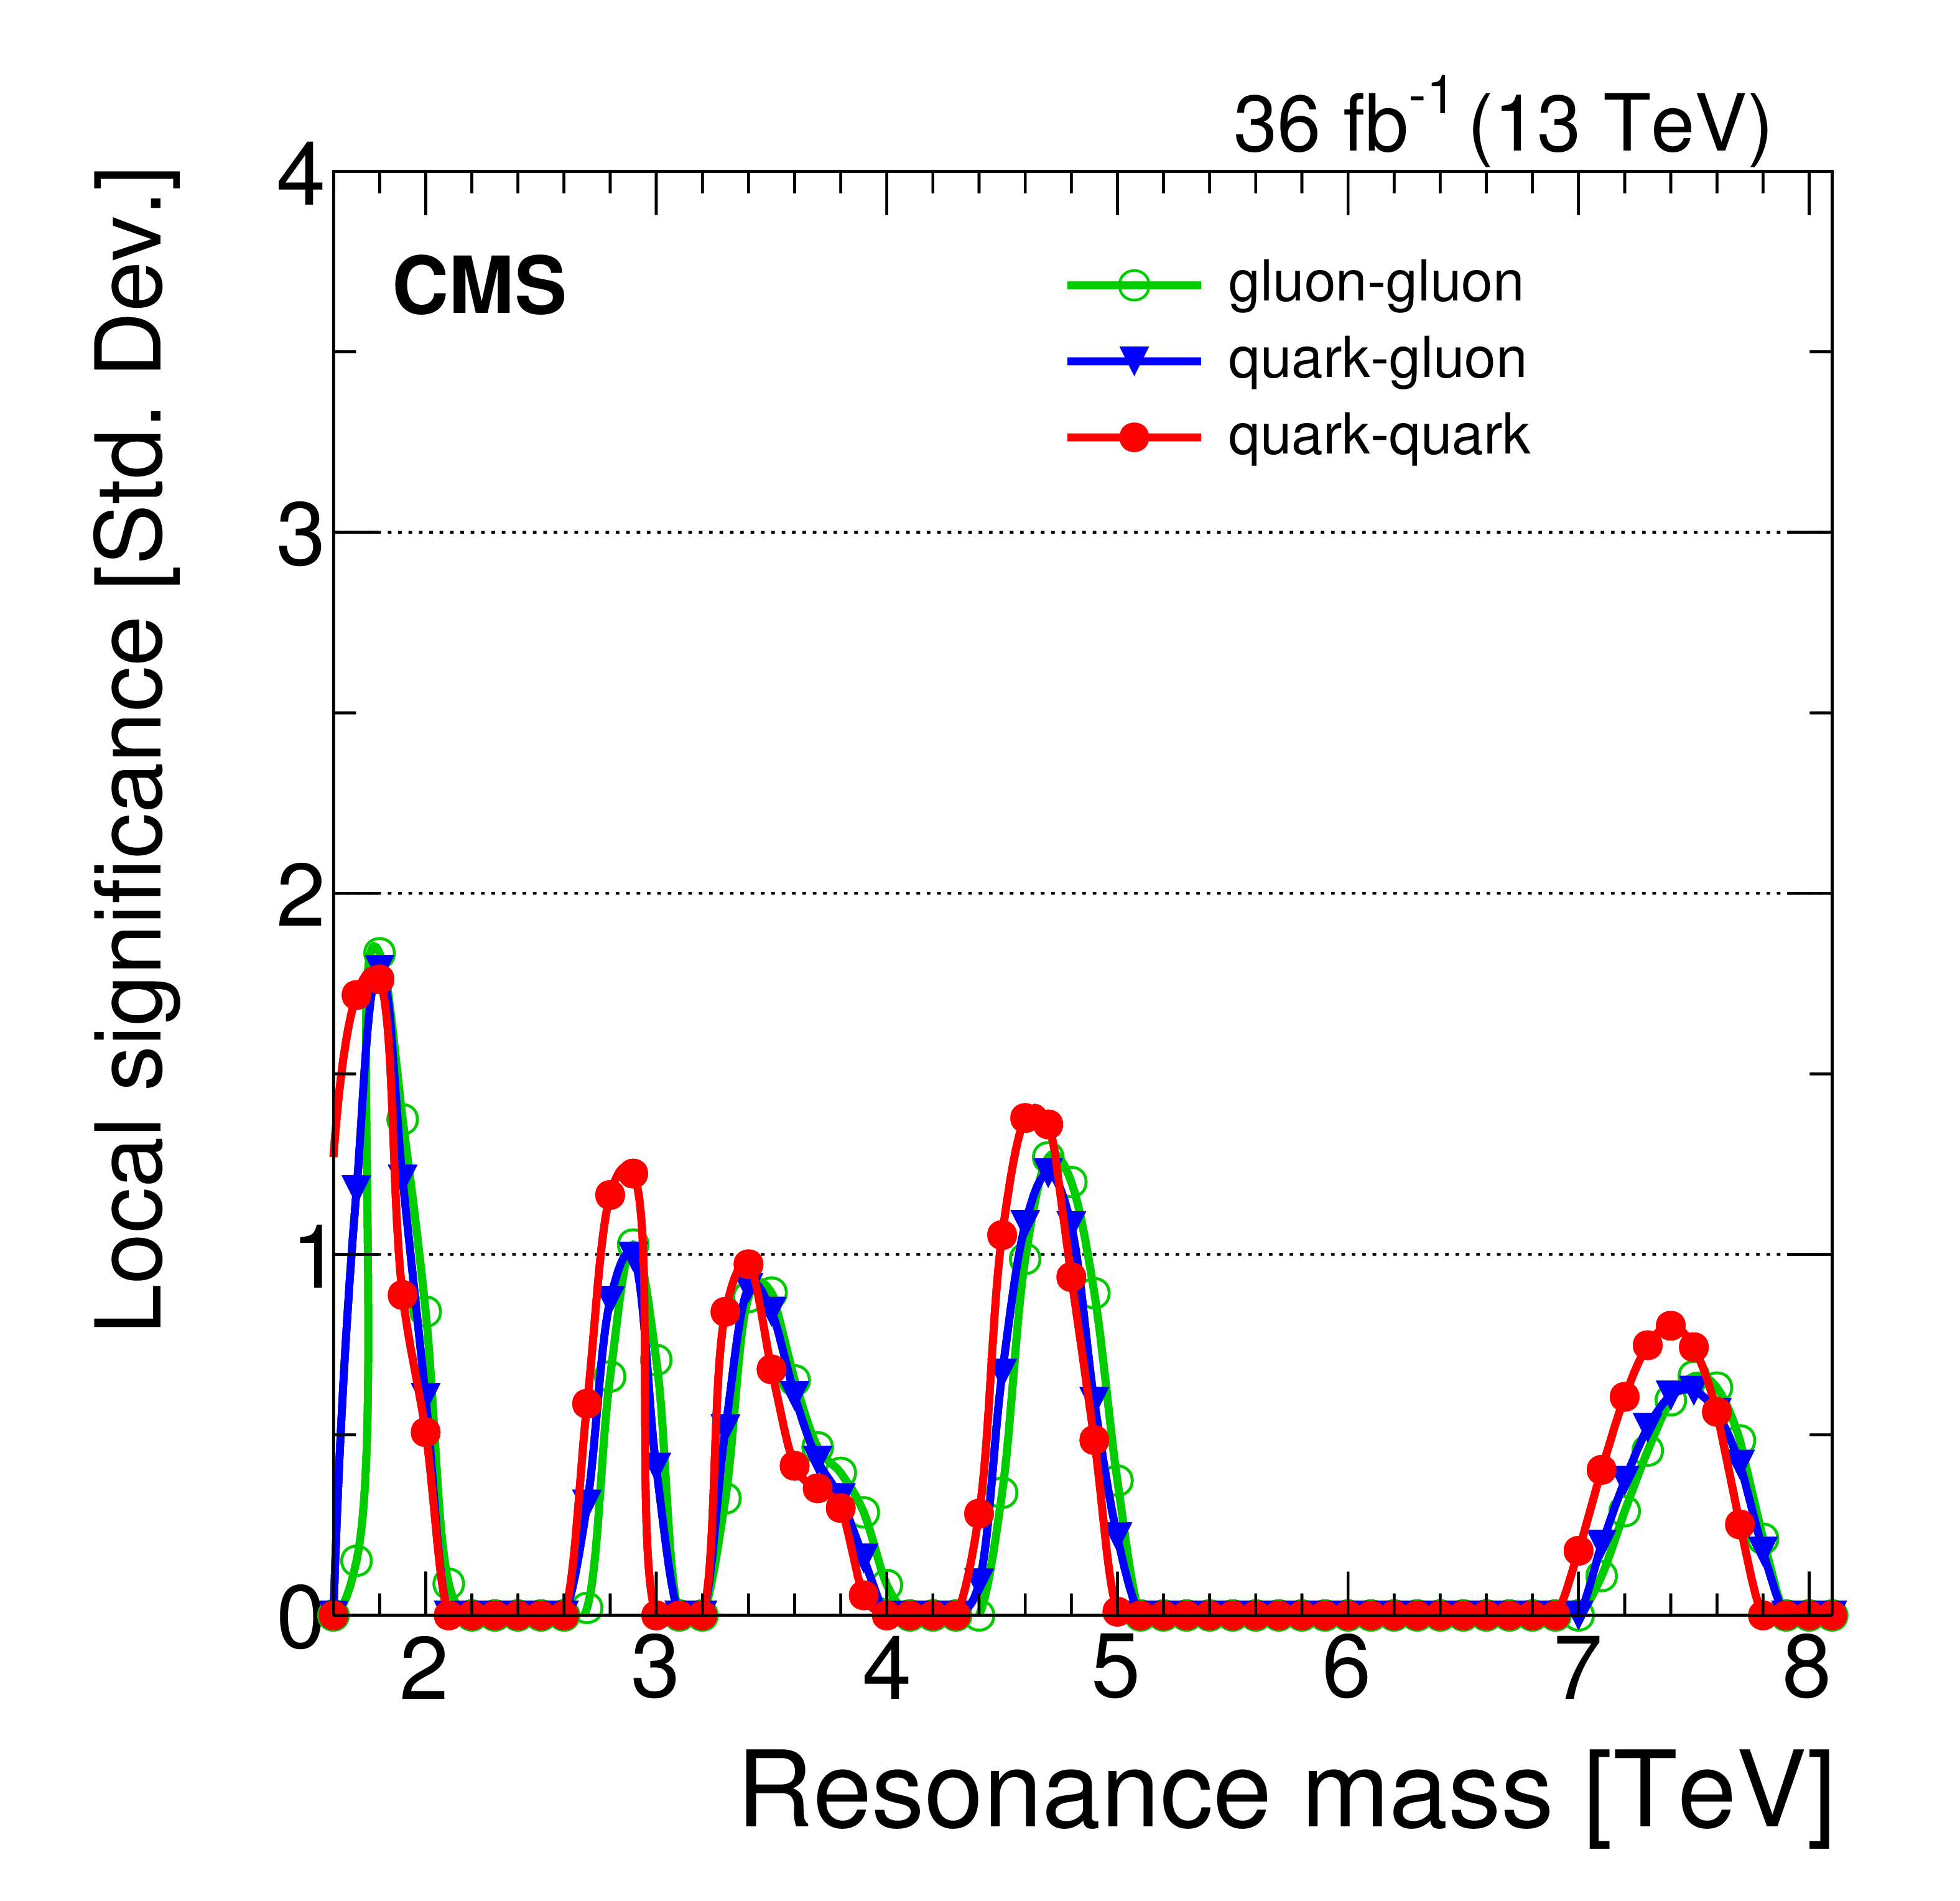
Figure 9-b:
Local significance for a narrow resonance from the high-mass search. |
png pdf |
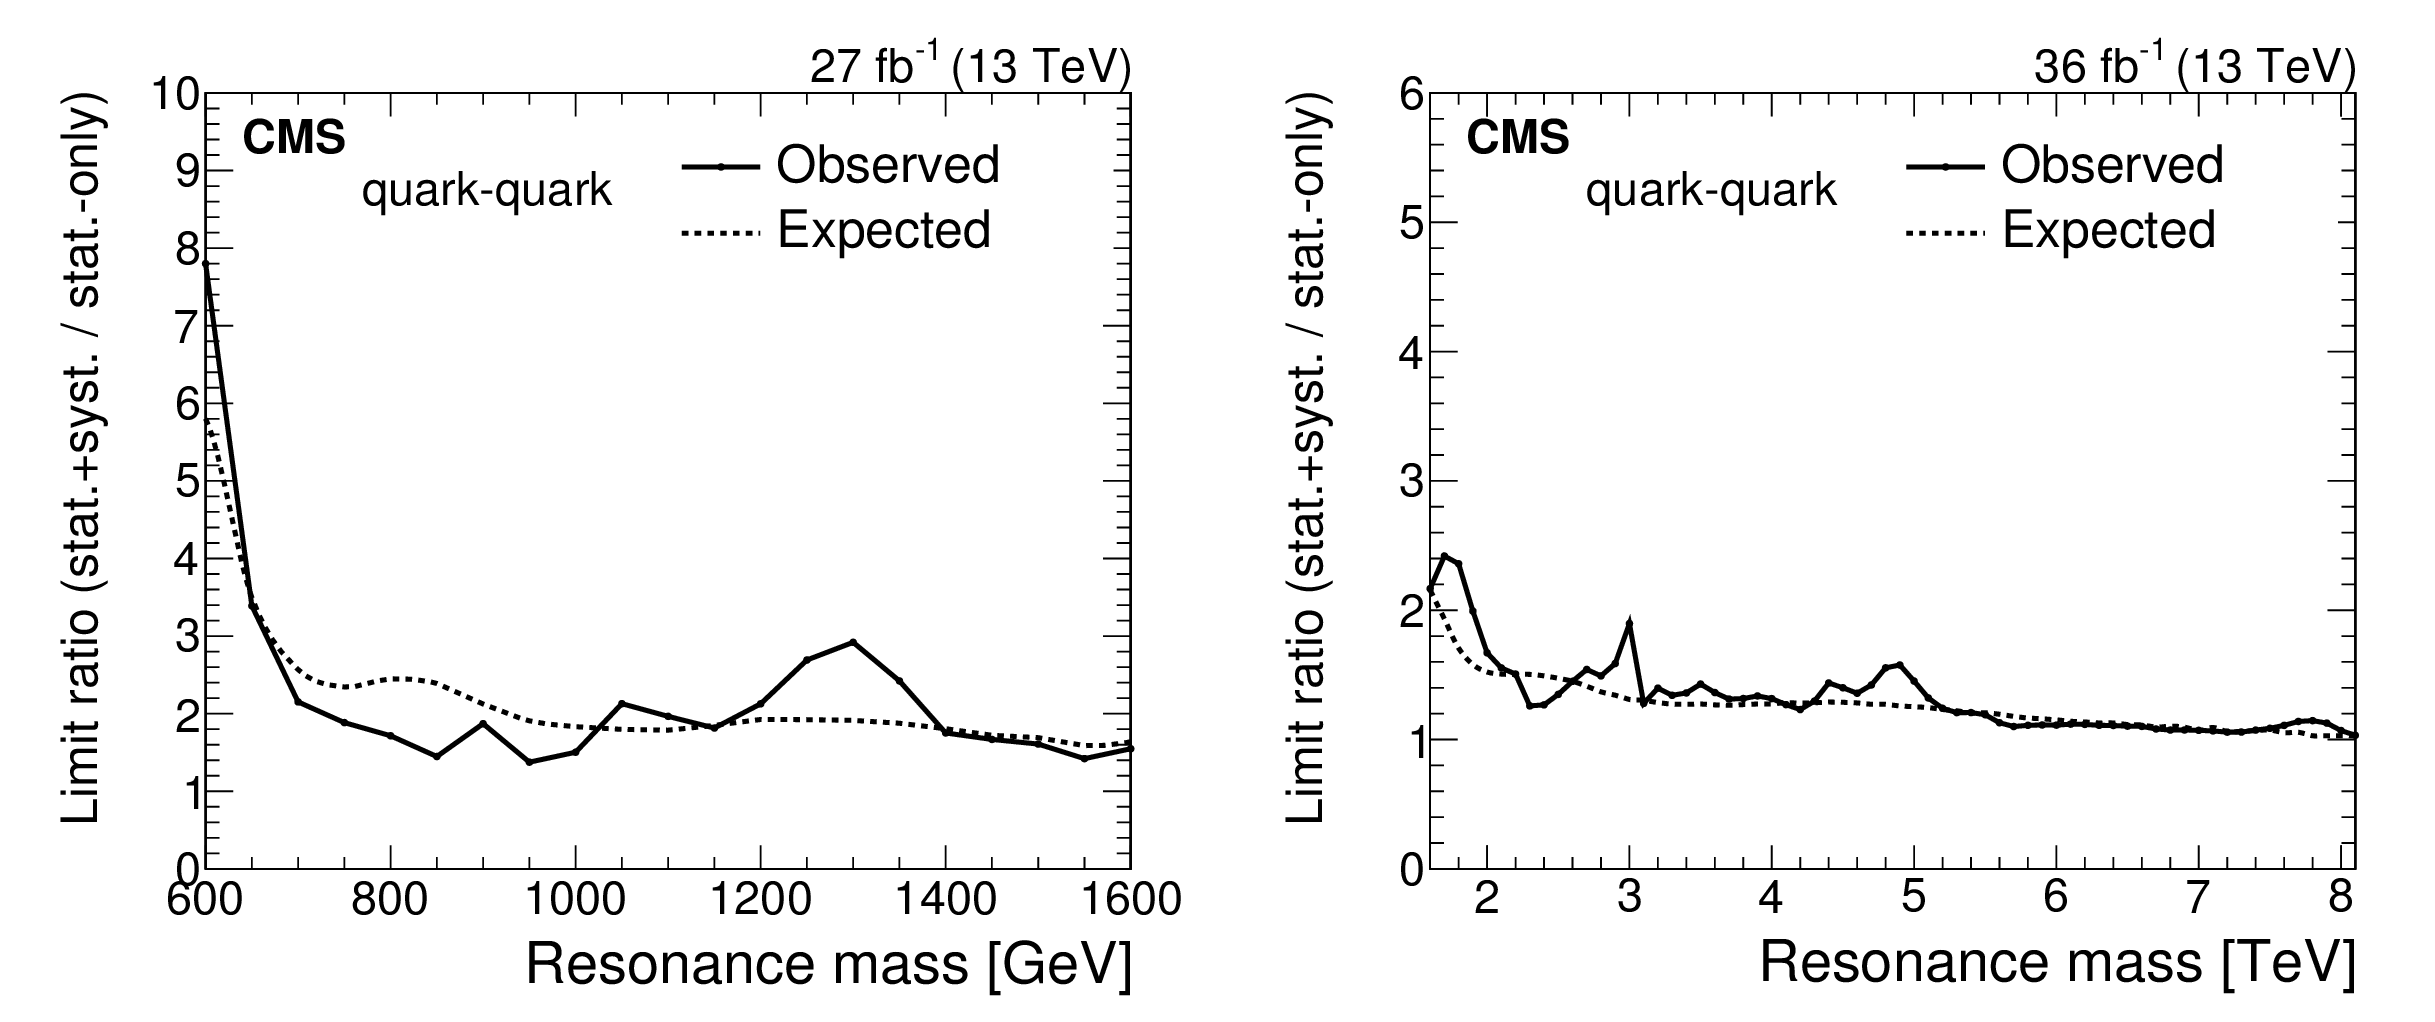
Figure 10:
The observed (points) and expected (dashed) ratio between the 95% CL limit on the cross section, including systematic uncertainties, and the limit including statistical uncertainties only for dijet resonances decaying to quark-quark in the low-mass search (left) and in the high-mass search (right). |

png pdf |
Figure 10-a:
The observed (points) and expected (dashed) ratio between the 95% CL limit on the cross section, including systematic uncertainties, and the limit including statistical uncertainties only for dijet resonances decaying to quark-quark in the low-mass search. |
png pdf |
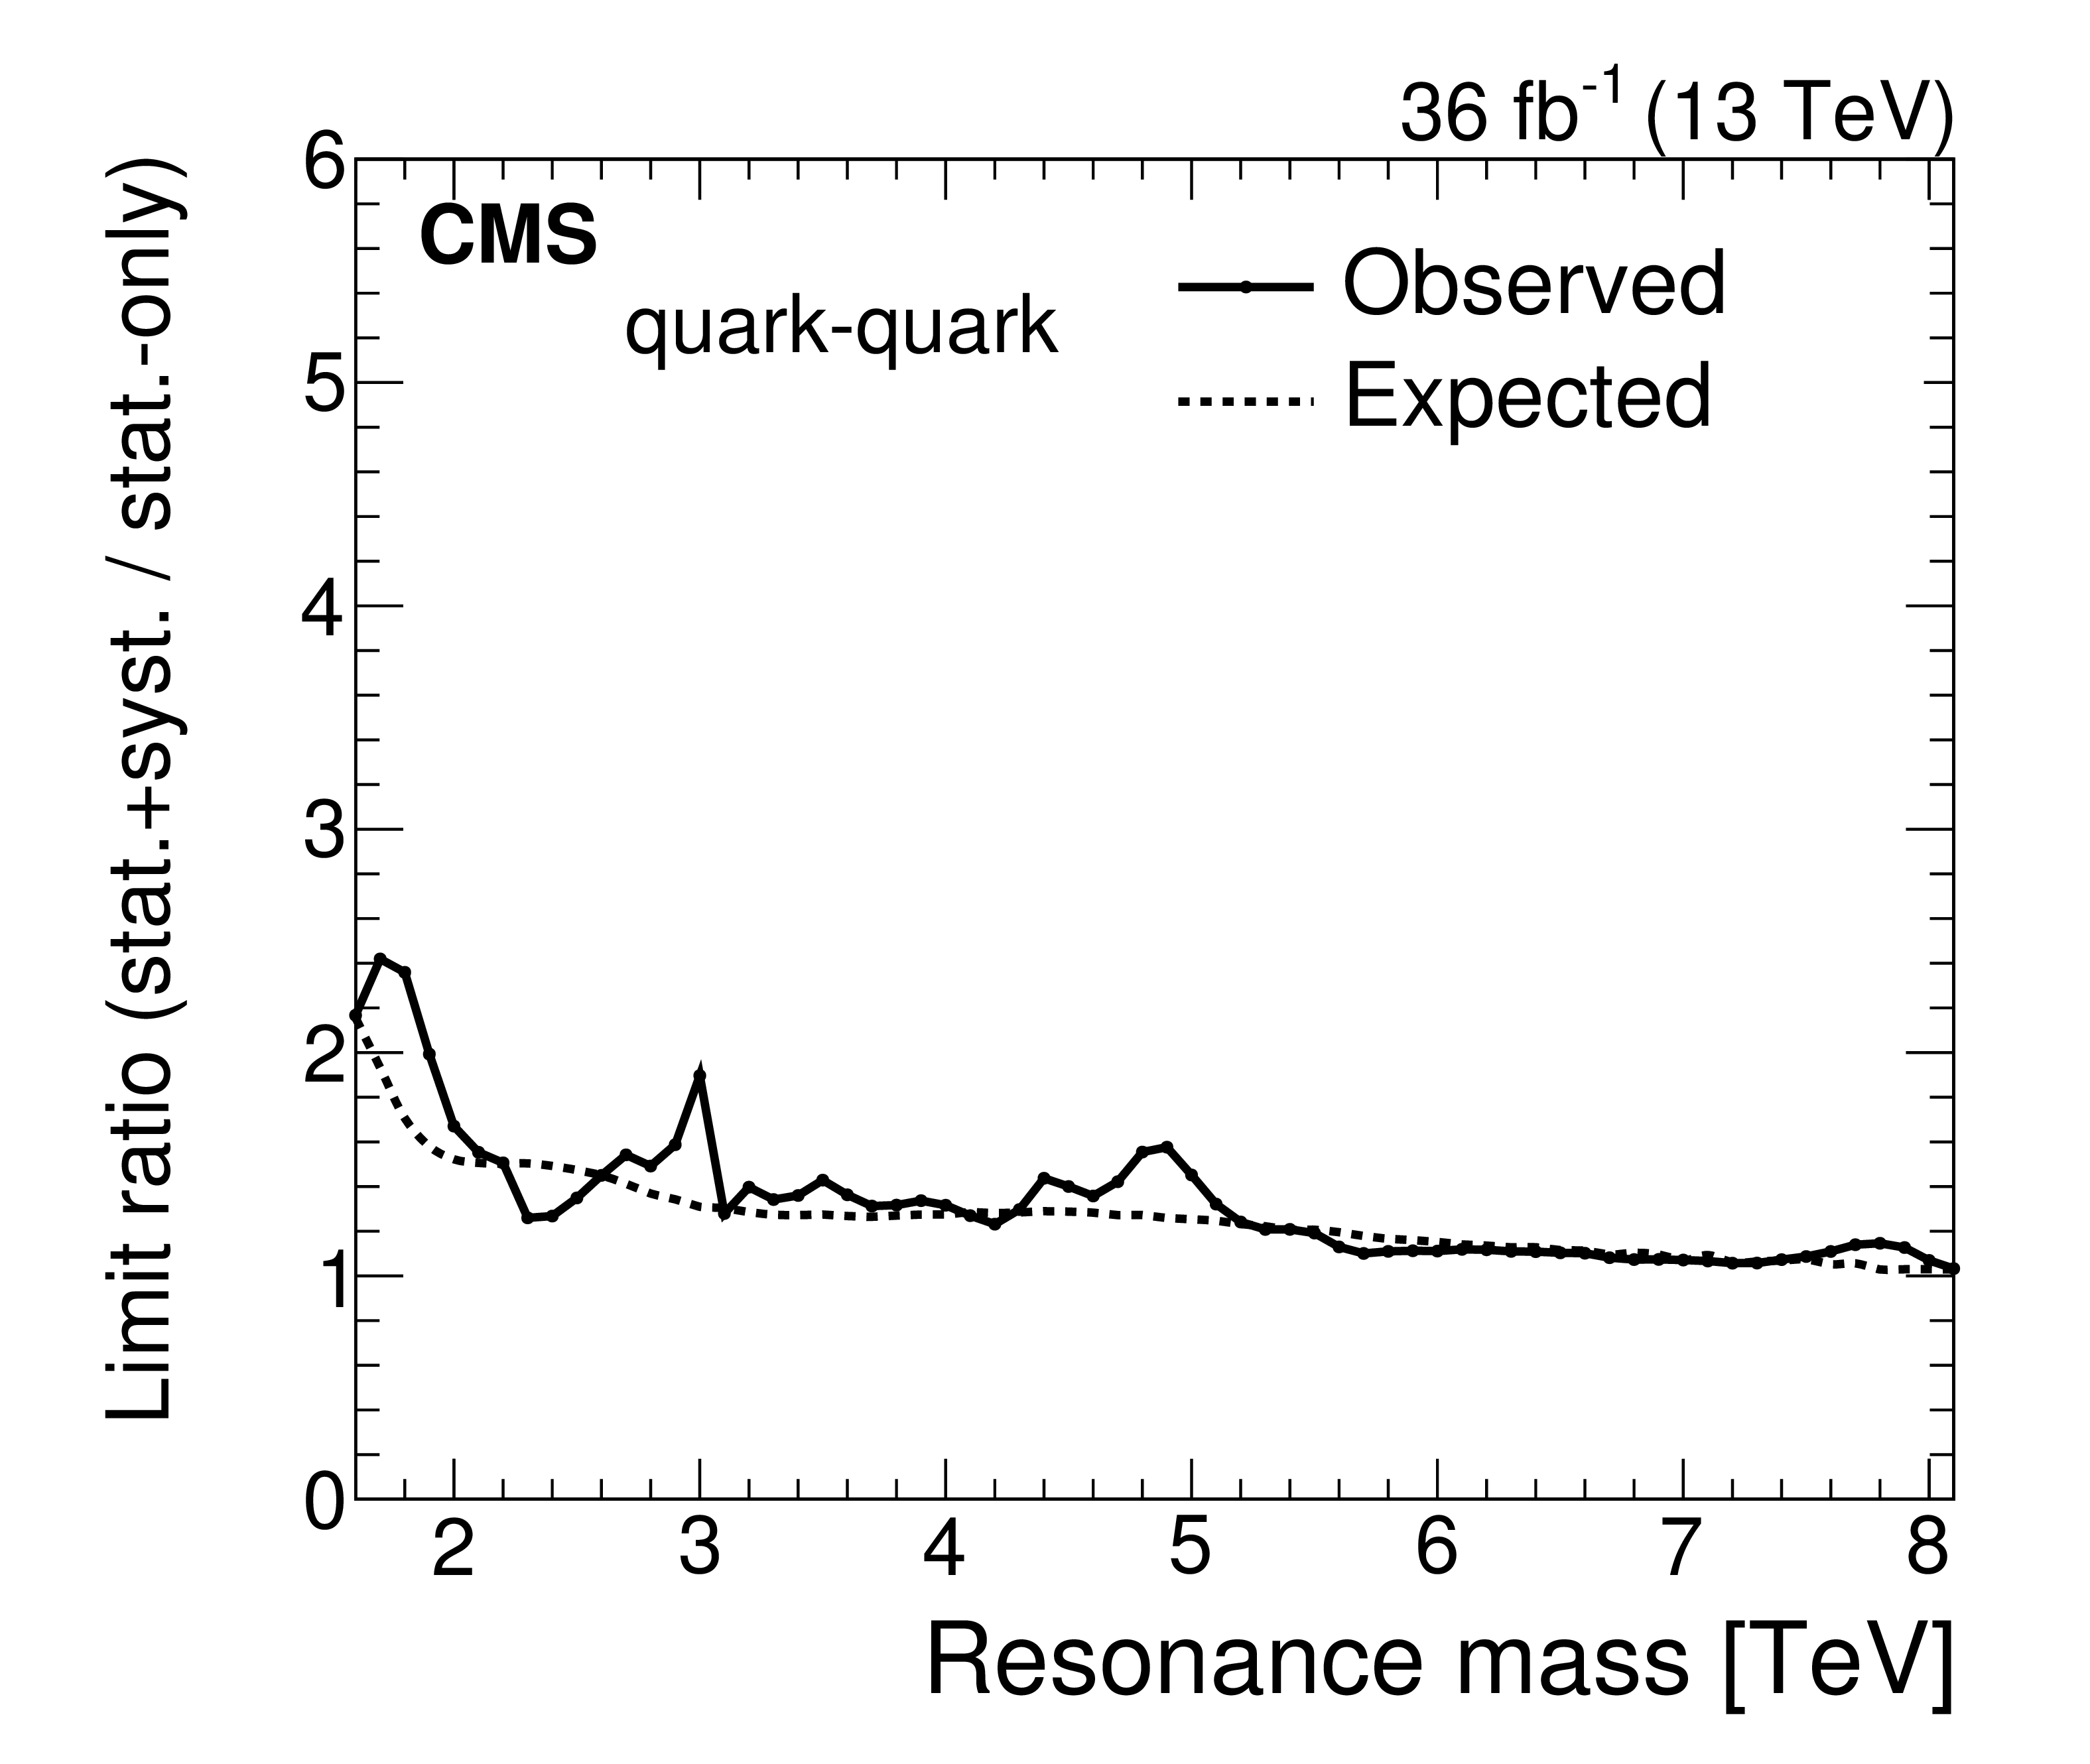
Figure 10-b:
The observed (points) and expected (dashed) ratio between the 95% CL limit on the cross section, including systematic uncertainties, and the limit including statistical uncertainties only for dijet resonances decaying to quark-quark in the high-mass search. |
png pdf |
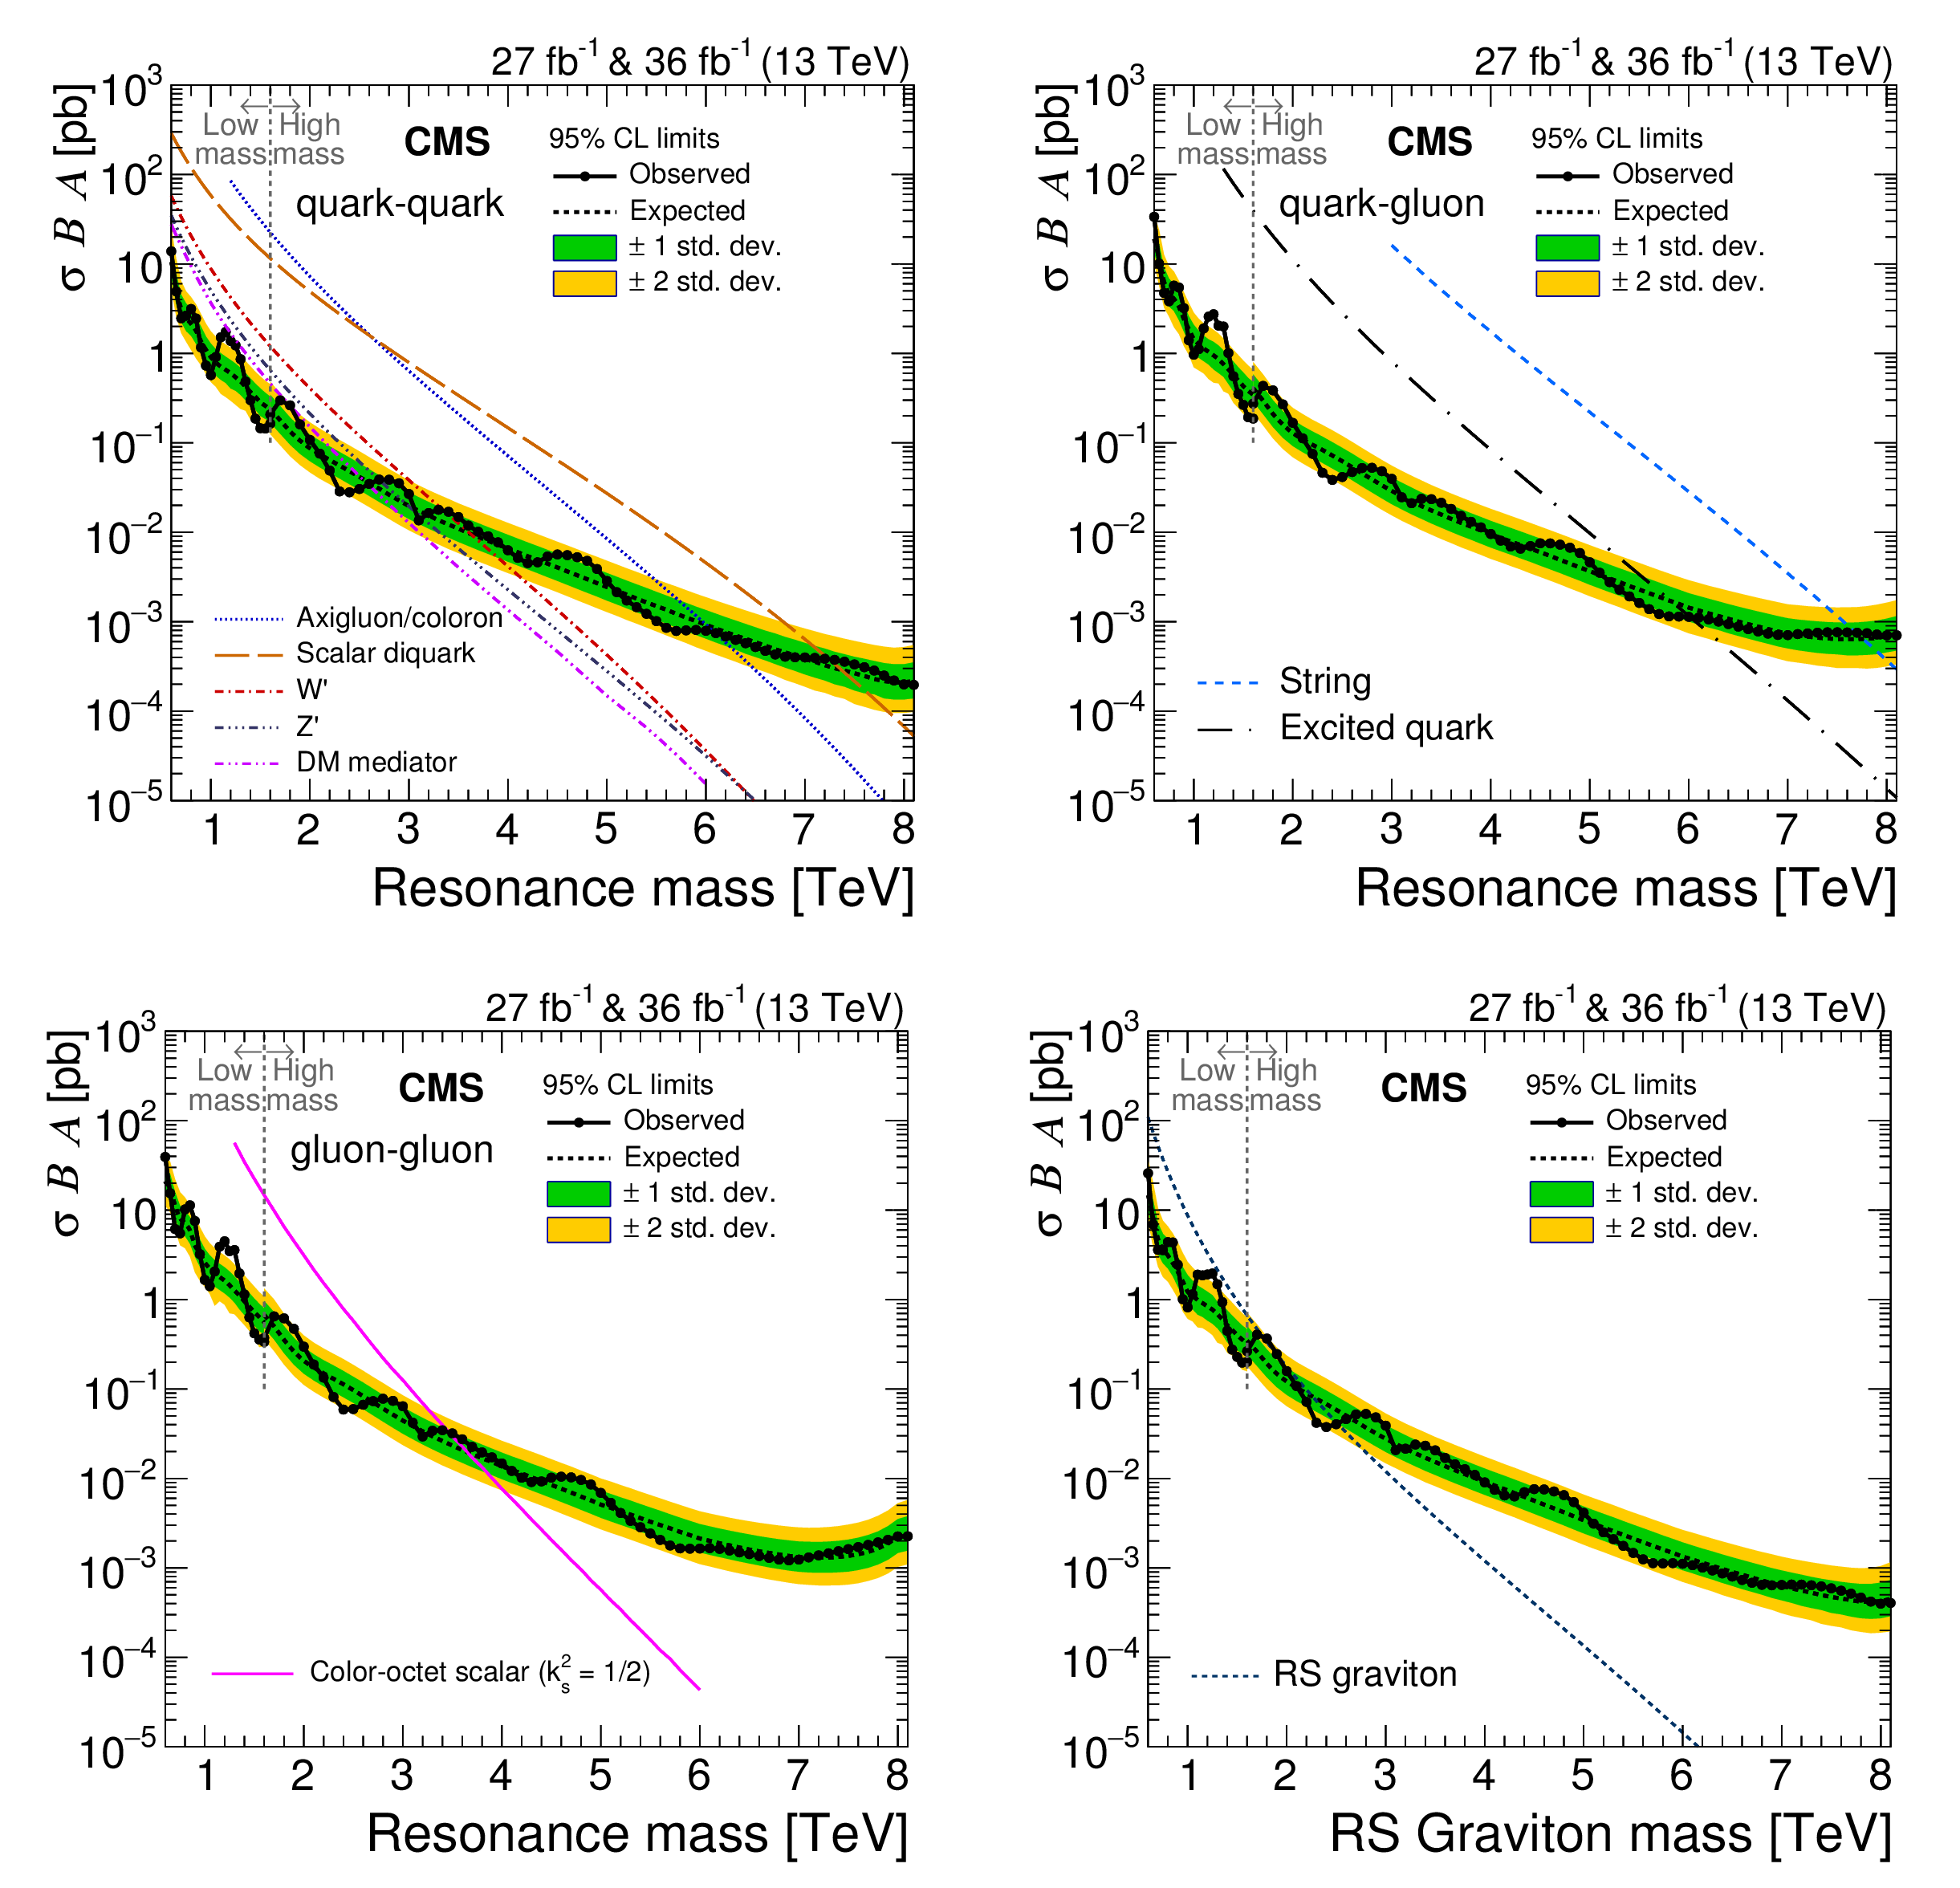
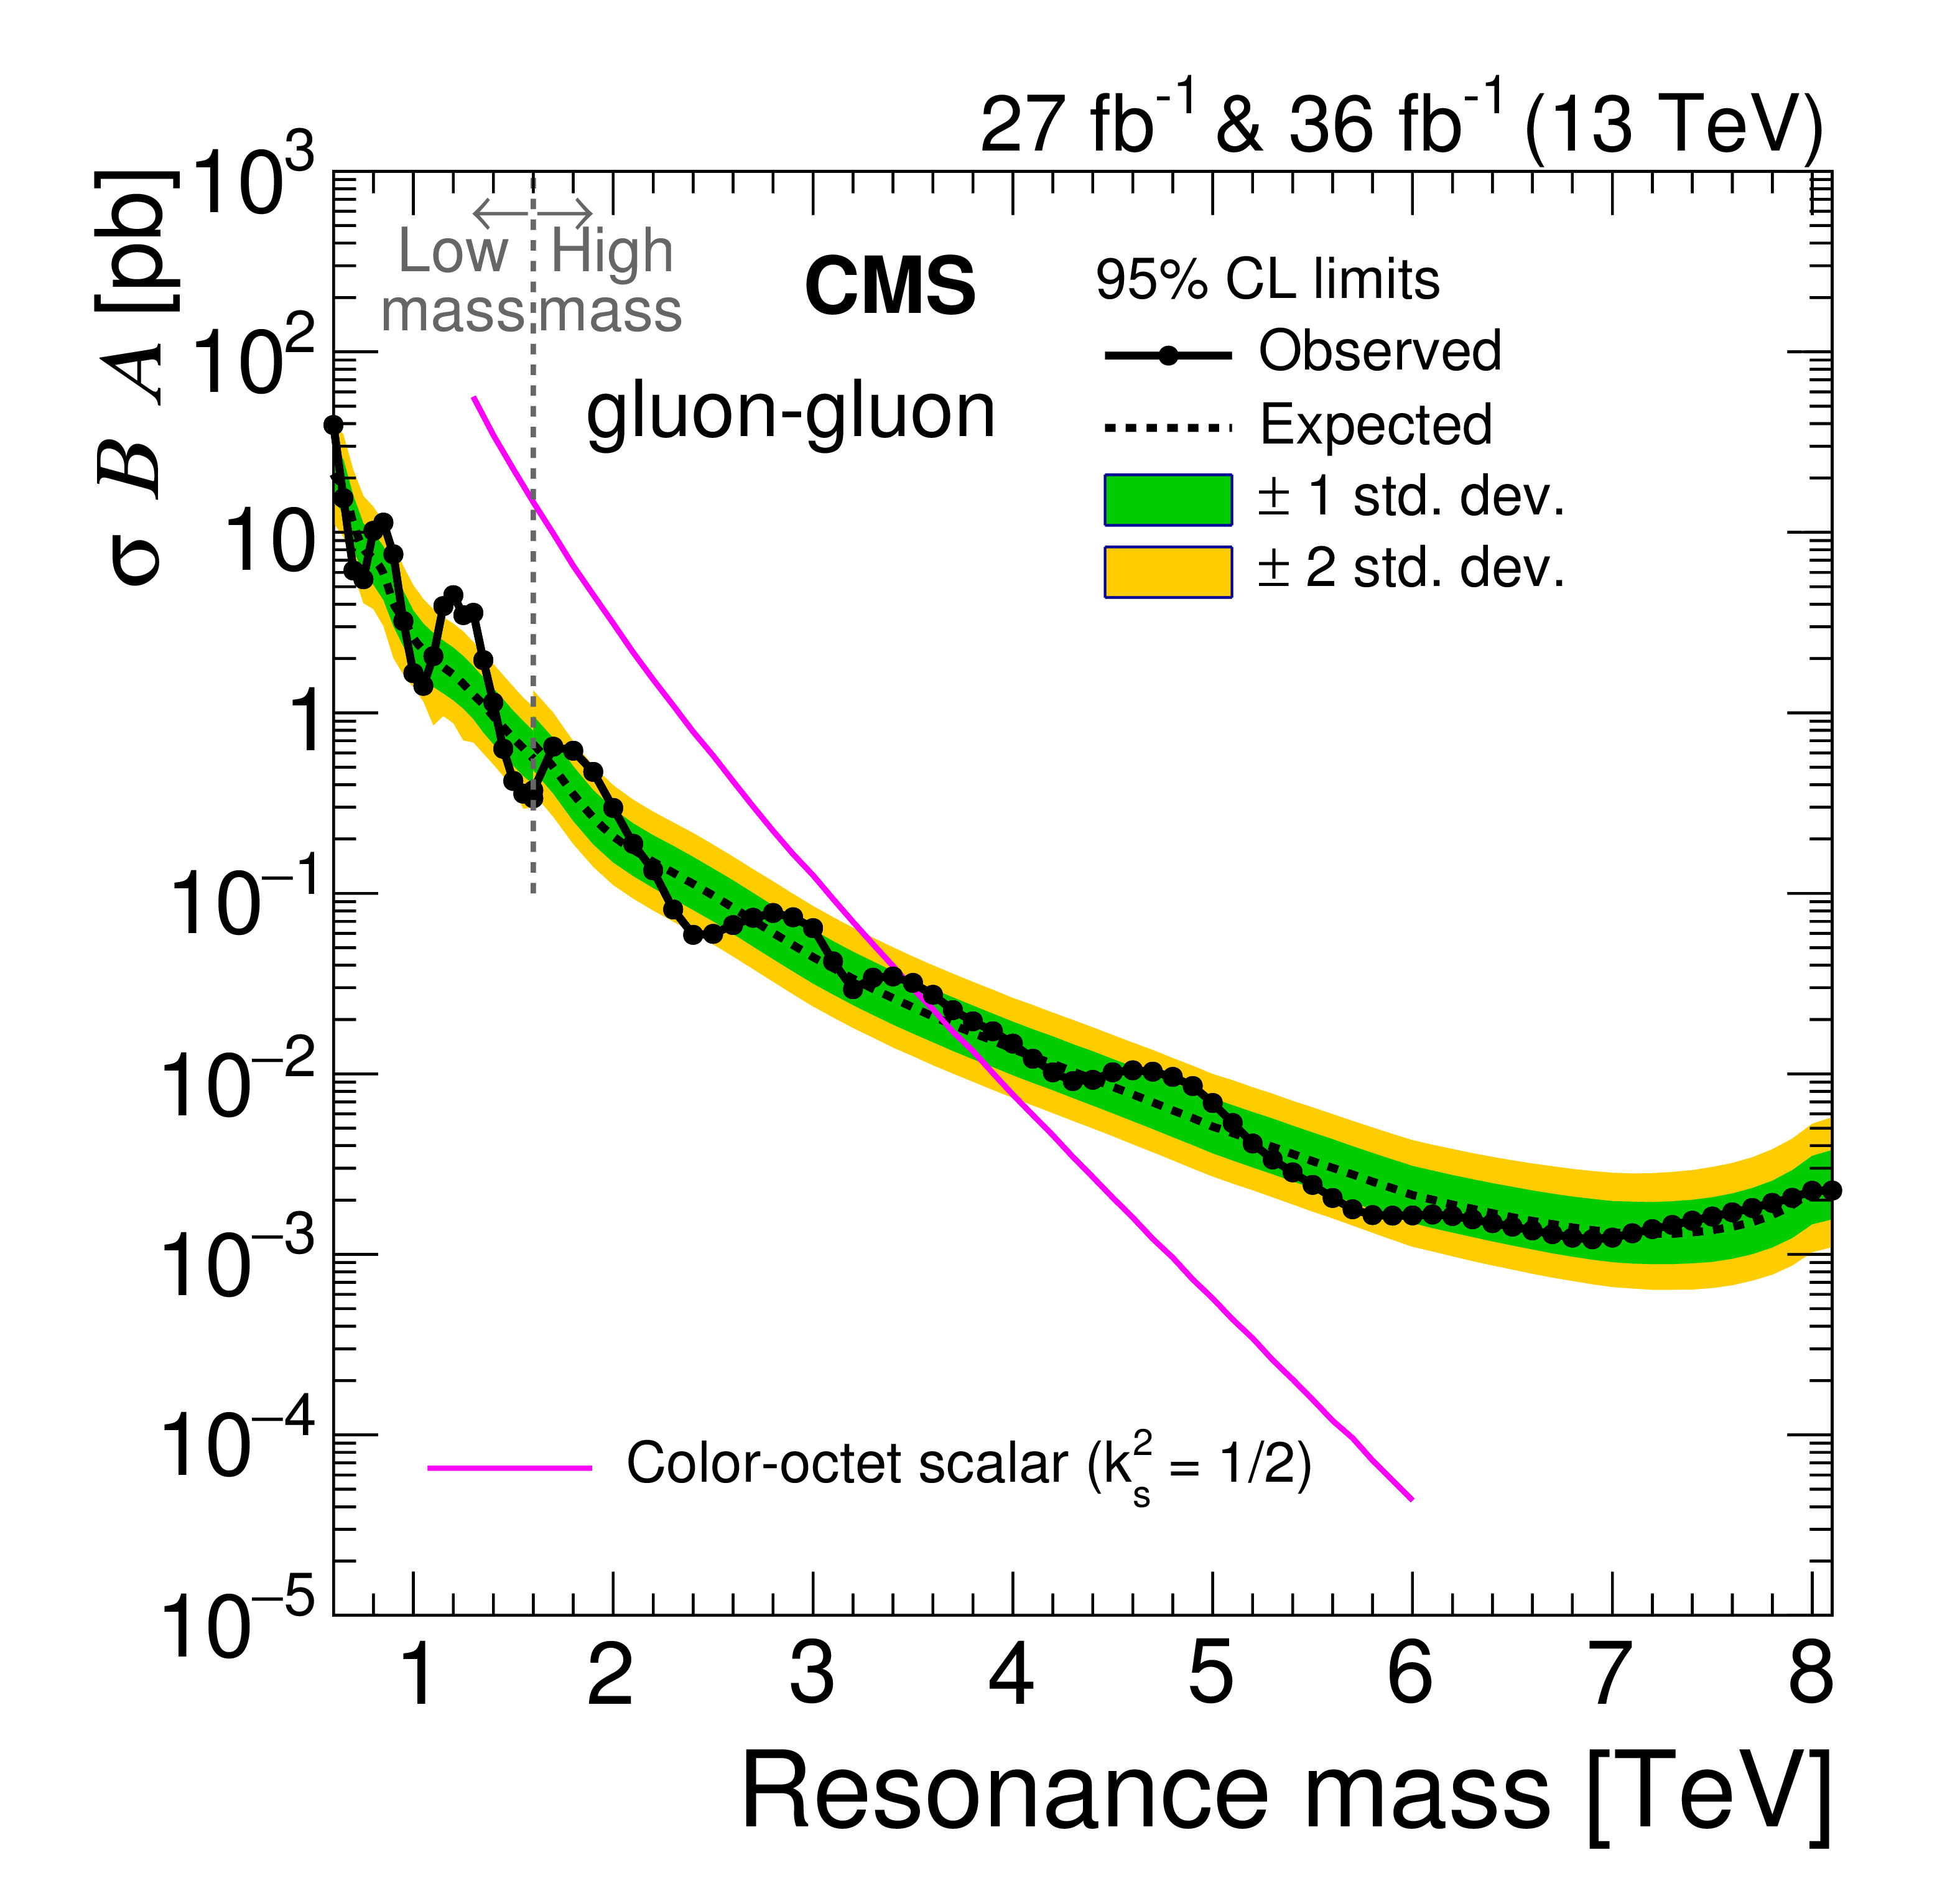
Figure 11:
The observed 95% CL upper limits on the product of the cross section, branching fraction, and acceptance for dijet resonances decaying to quark-quark (upper left), quark-gluon (upper right), gluon-gluon (lower left), and for RS gravitons (lower right). The corresponding expected limits (dashed) and their variations at the 1 and 2 standard deviation levels (shaded bands) are also shown. Limits are compared to predicted cross sections for string resonances [20,21], excited quarks [23,24], axigluons [25], colorons [26], scalar diquarks [22], color-octet scalars [27], new gauge bosons W' and Z' with SM-like couplings [29], dark matter mediators for $m_{\mathrm {DM}}=$ 1 GeV [31,32], and RS gravitons [30]. |
png pdf |
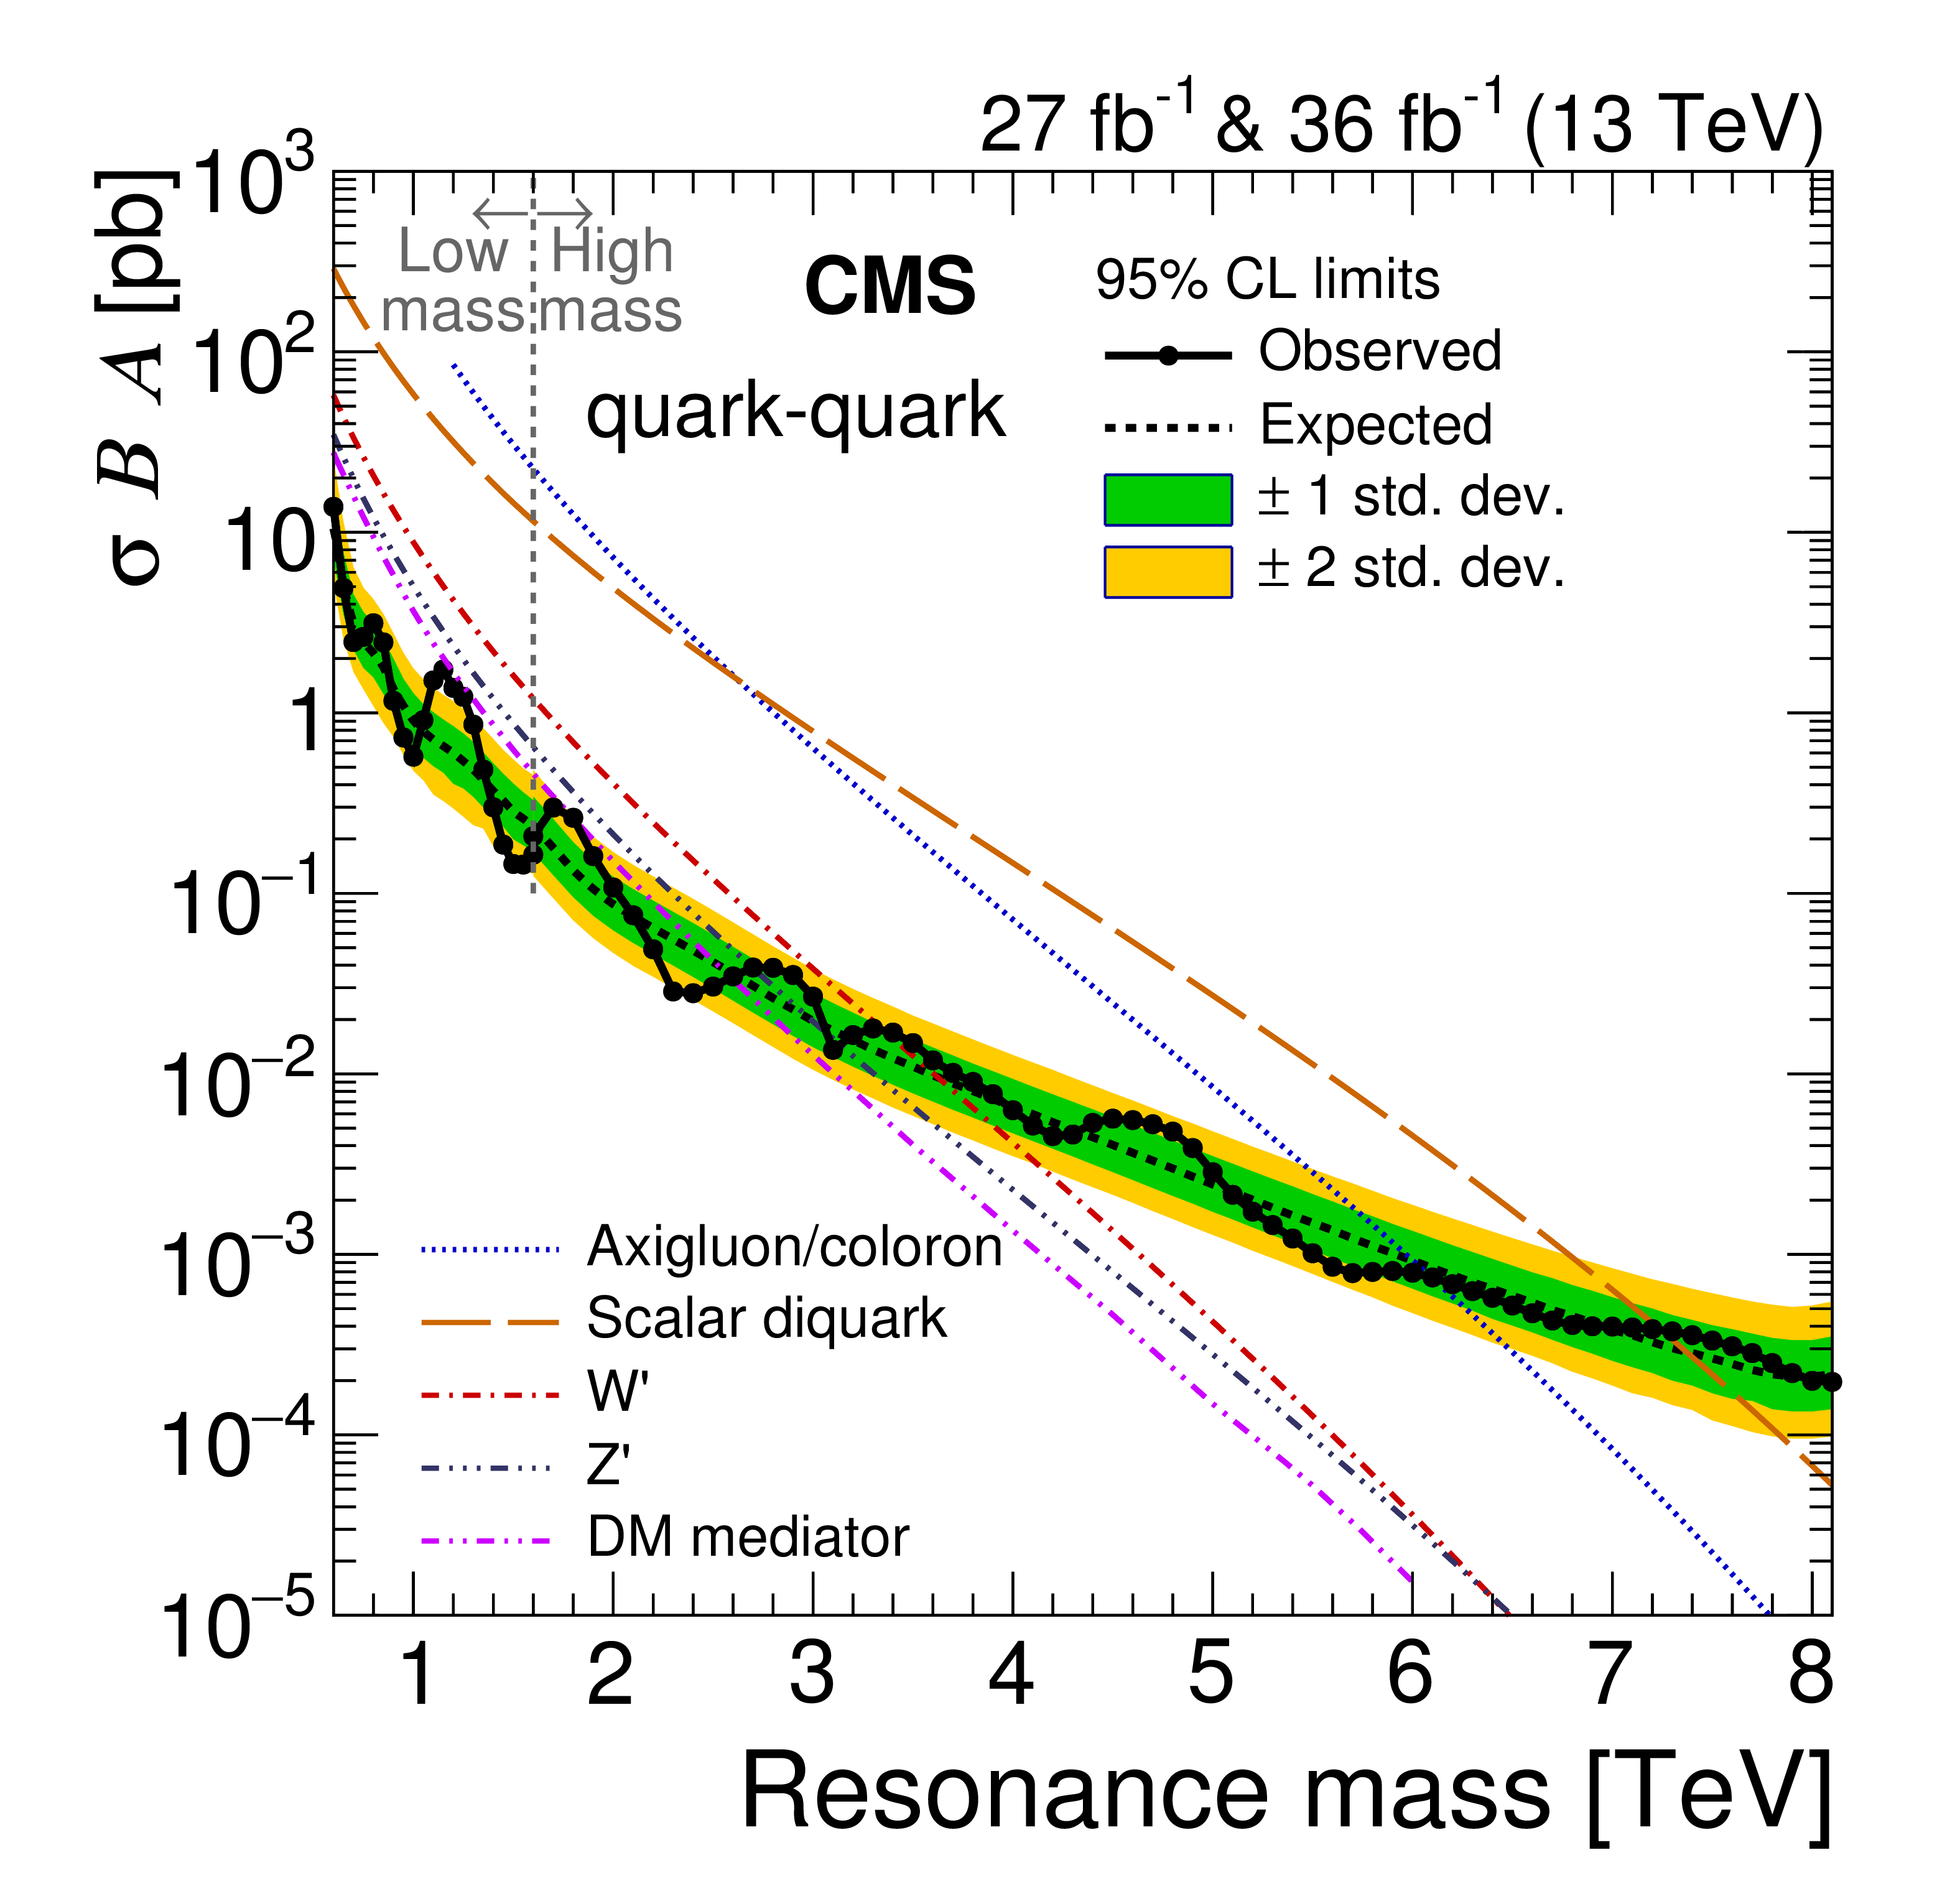
Figure 11-a:
The observed 95% CL upper limits on the product of the cross section, branching fraction, and acceptance for dijet resonances decaying to quark-quark. The corresponding expected limits (dashed) and their variations at the 1 and 2 standard deviation levels (shaded bands) are also shown. Limits are compared to predicted cross sections for axigluons [25], colorons [26], scalar diquarks [22], new gauge bosons W' and Z' with SM-like couplings [29], and dark matter mediators for $m_{\mathrm {DM}}=$ 1 GeV [31,32]. |

png pdf |
Figure 11-b:
The observed 95% CL upper limits on the product of the cross section, branching fraction, and acceptance for dijet resonances decaying to quark-gluon. The corresponding expected limits (dashed) and their variations at the 1 and 2 standard deviation levels (shaded bands) are also shown. Limits are compared to predicted cross sections for string resonances [20,21], and excited quarks [23,24]. |
png pdf |
Figure 11-c:
The observed 95% CL upper limits on the product of the cross section, branching fraction, and acceptance for dijet resonances decaying to gluon-gluon. The corresponding expected limits (dashed) and their variations at the 1 and 2 standard deviation levels (shaded bands) are also shown. Limits are compared to predicted cross sections for color-octet scalars [27]. |

png pdf |
Figure 11-d:
The observed 95% CL upper limits on the product of the cross section, branching fraction, and acceptance for RS gravitons. The corresponding expected limits (dashed) and their variations at the 1 and 2 standard deviation levels (shaded bands) are also shown. Limits are compared to predicted cross sections for RS gravitons [30]. |

png pdf |
Figure 12:
The observed 95% CL upper limits on the product of the cross section, branching fraction, and acceptance for quark-quark, quark-gluon, and gluon-gluon dijet resonances. Limits are compared to predicted cross sections for string resonances [20,21], excited quarks [23,24], axigluons [25], colorons [26], scalar diquarks [22], color-octet scalars [27], new gauge bosons W' and Z' with SM-like couplings [29], dark matter mediators for $m_{\mathrm {DM}}=1$ GeV [31,32], and RS gravitons [30]. |
png pdf |
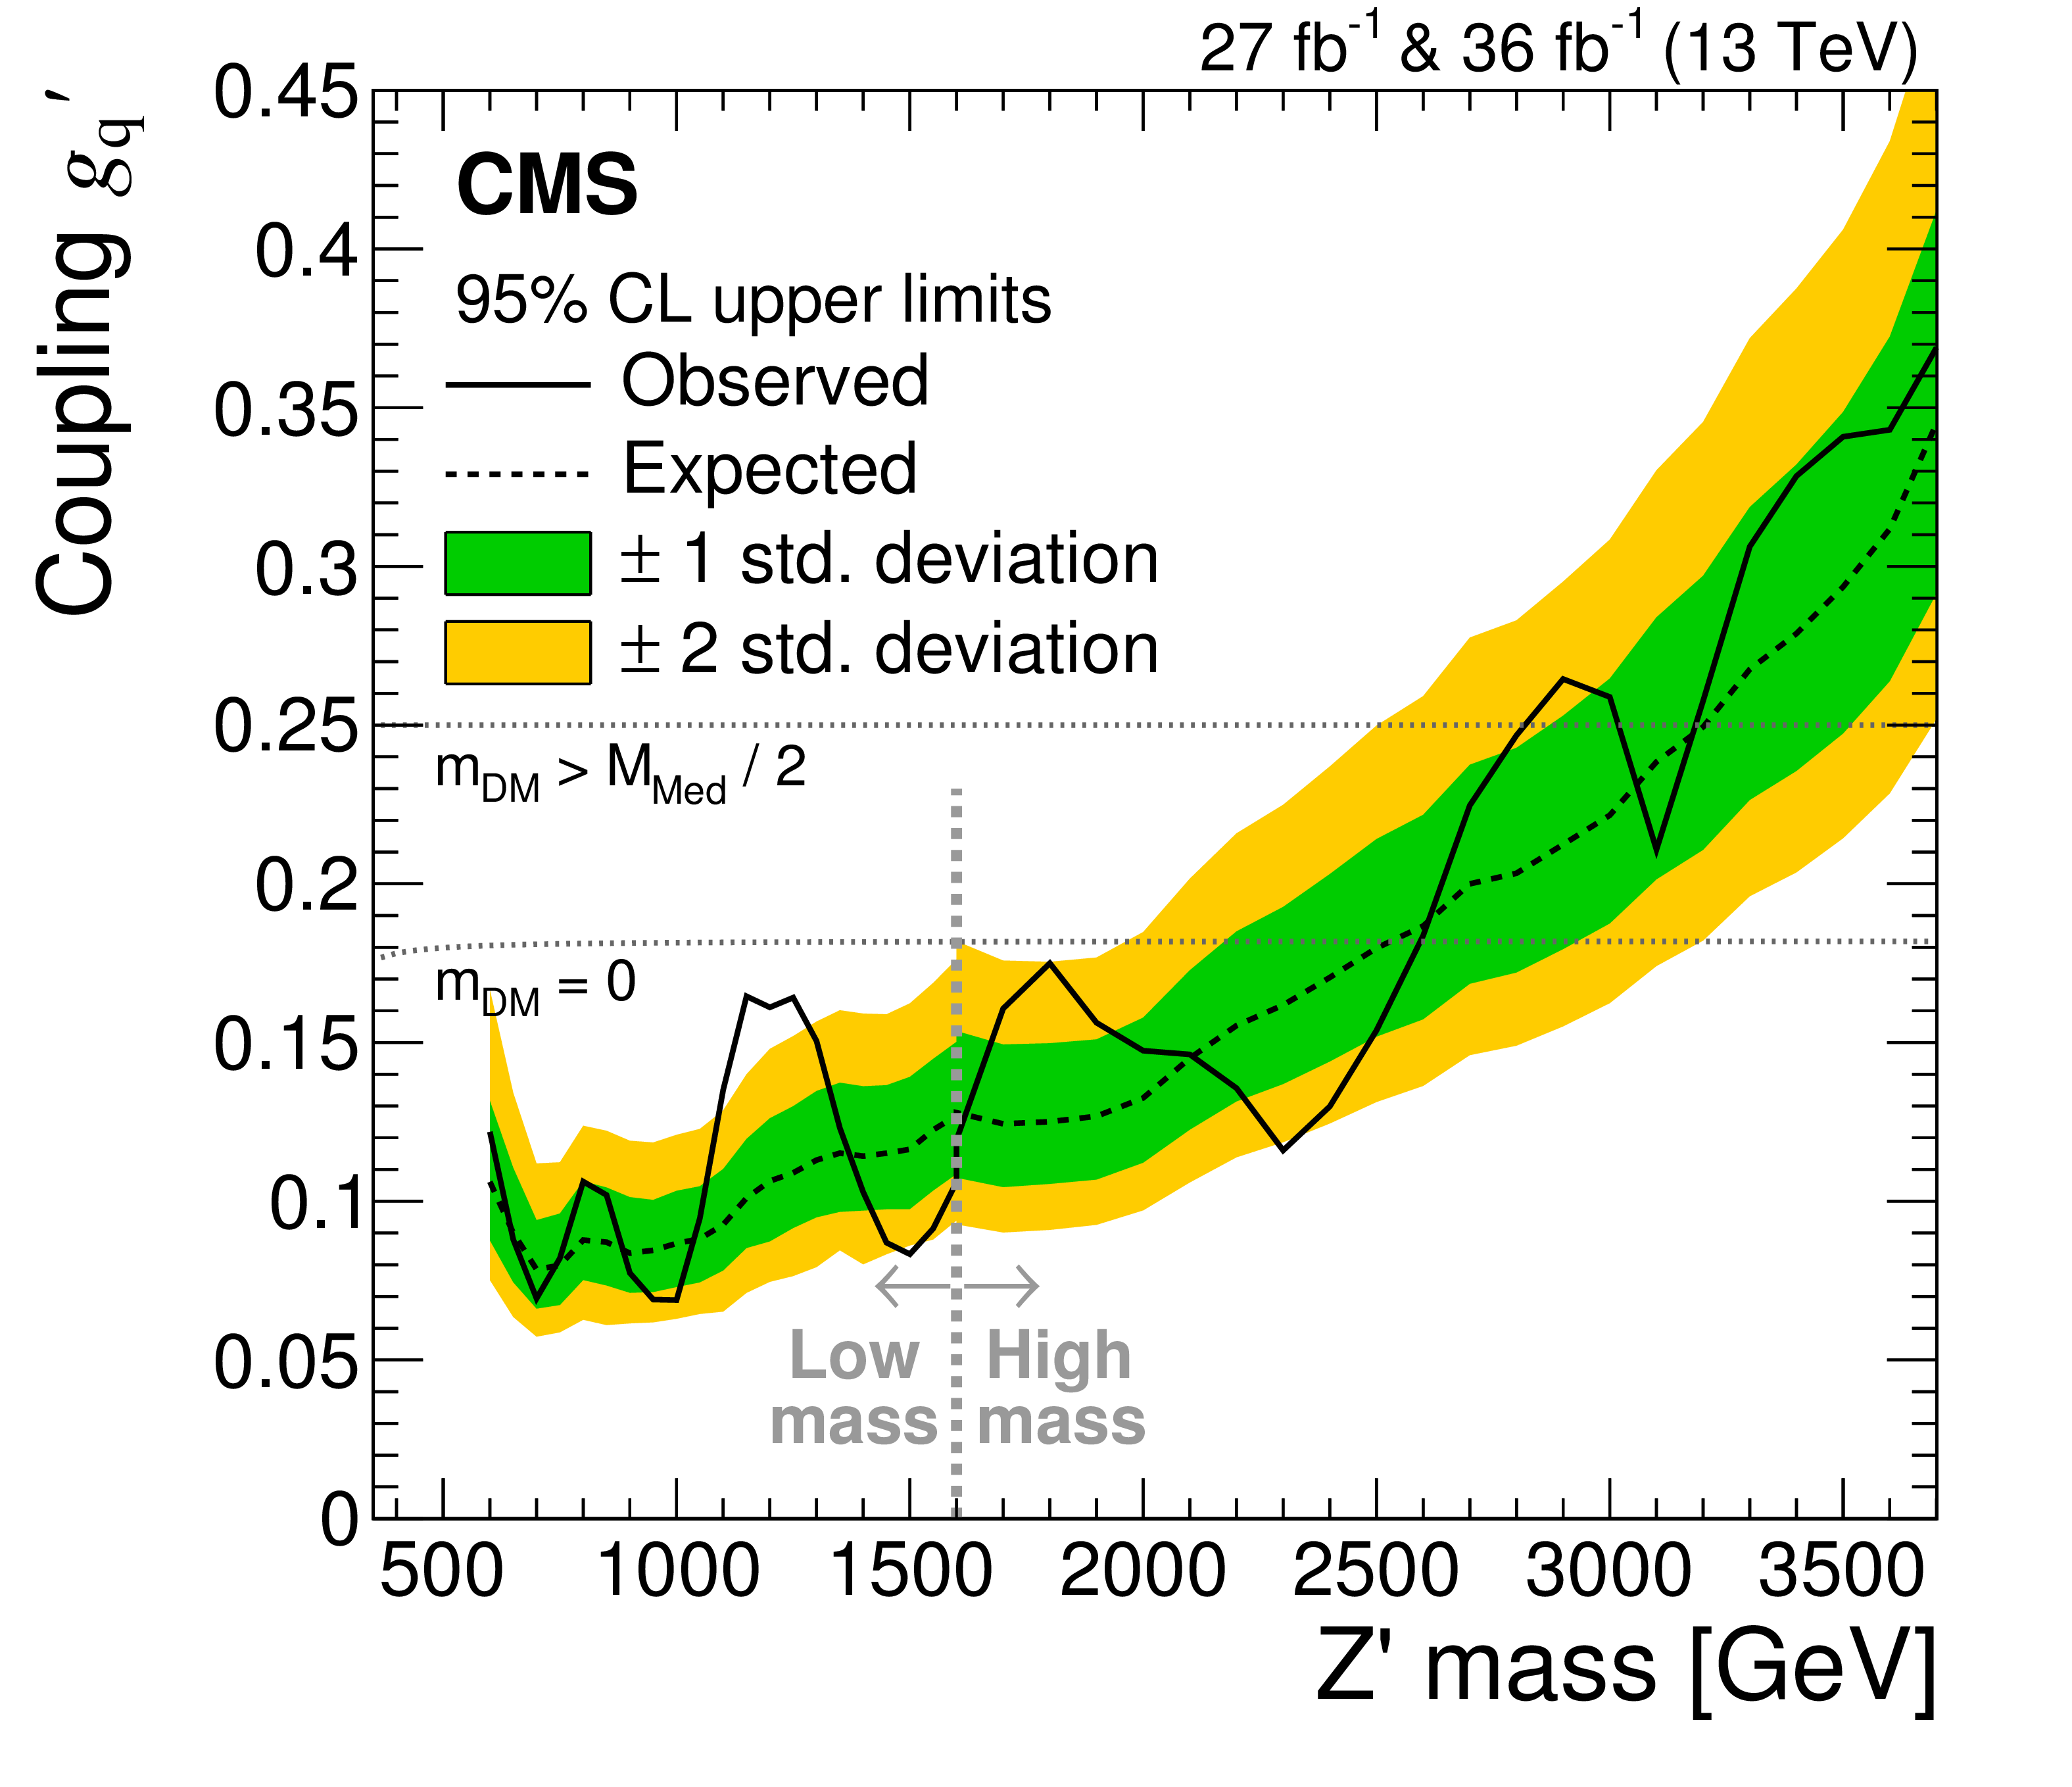
Figure 13:
The 95% CL upper limits on the universal quark coupling $ {g_ {\mathrm {q}}} ^{\prime}$ as a function of resonance mass for a leptophobic Z' resonance that only couples to quarks. The observed limits (solid), expected limits (dashed) and their variation at the 1 and 2 standard deviation levels (shaded bands) are shown. The dotted horizontal lines show the coupling strength for which the cross section for dijet production in this model is the same as for a DM mediator (see text). |
png pdf |
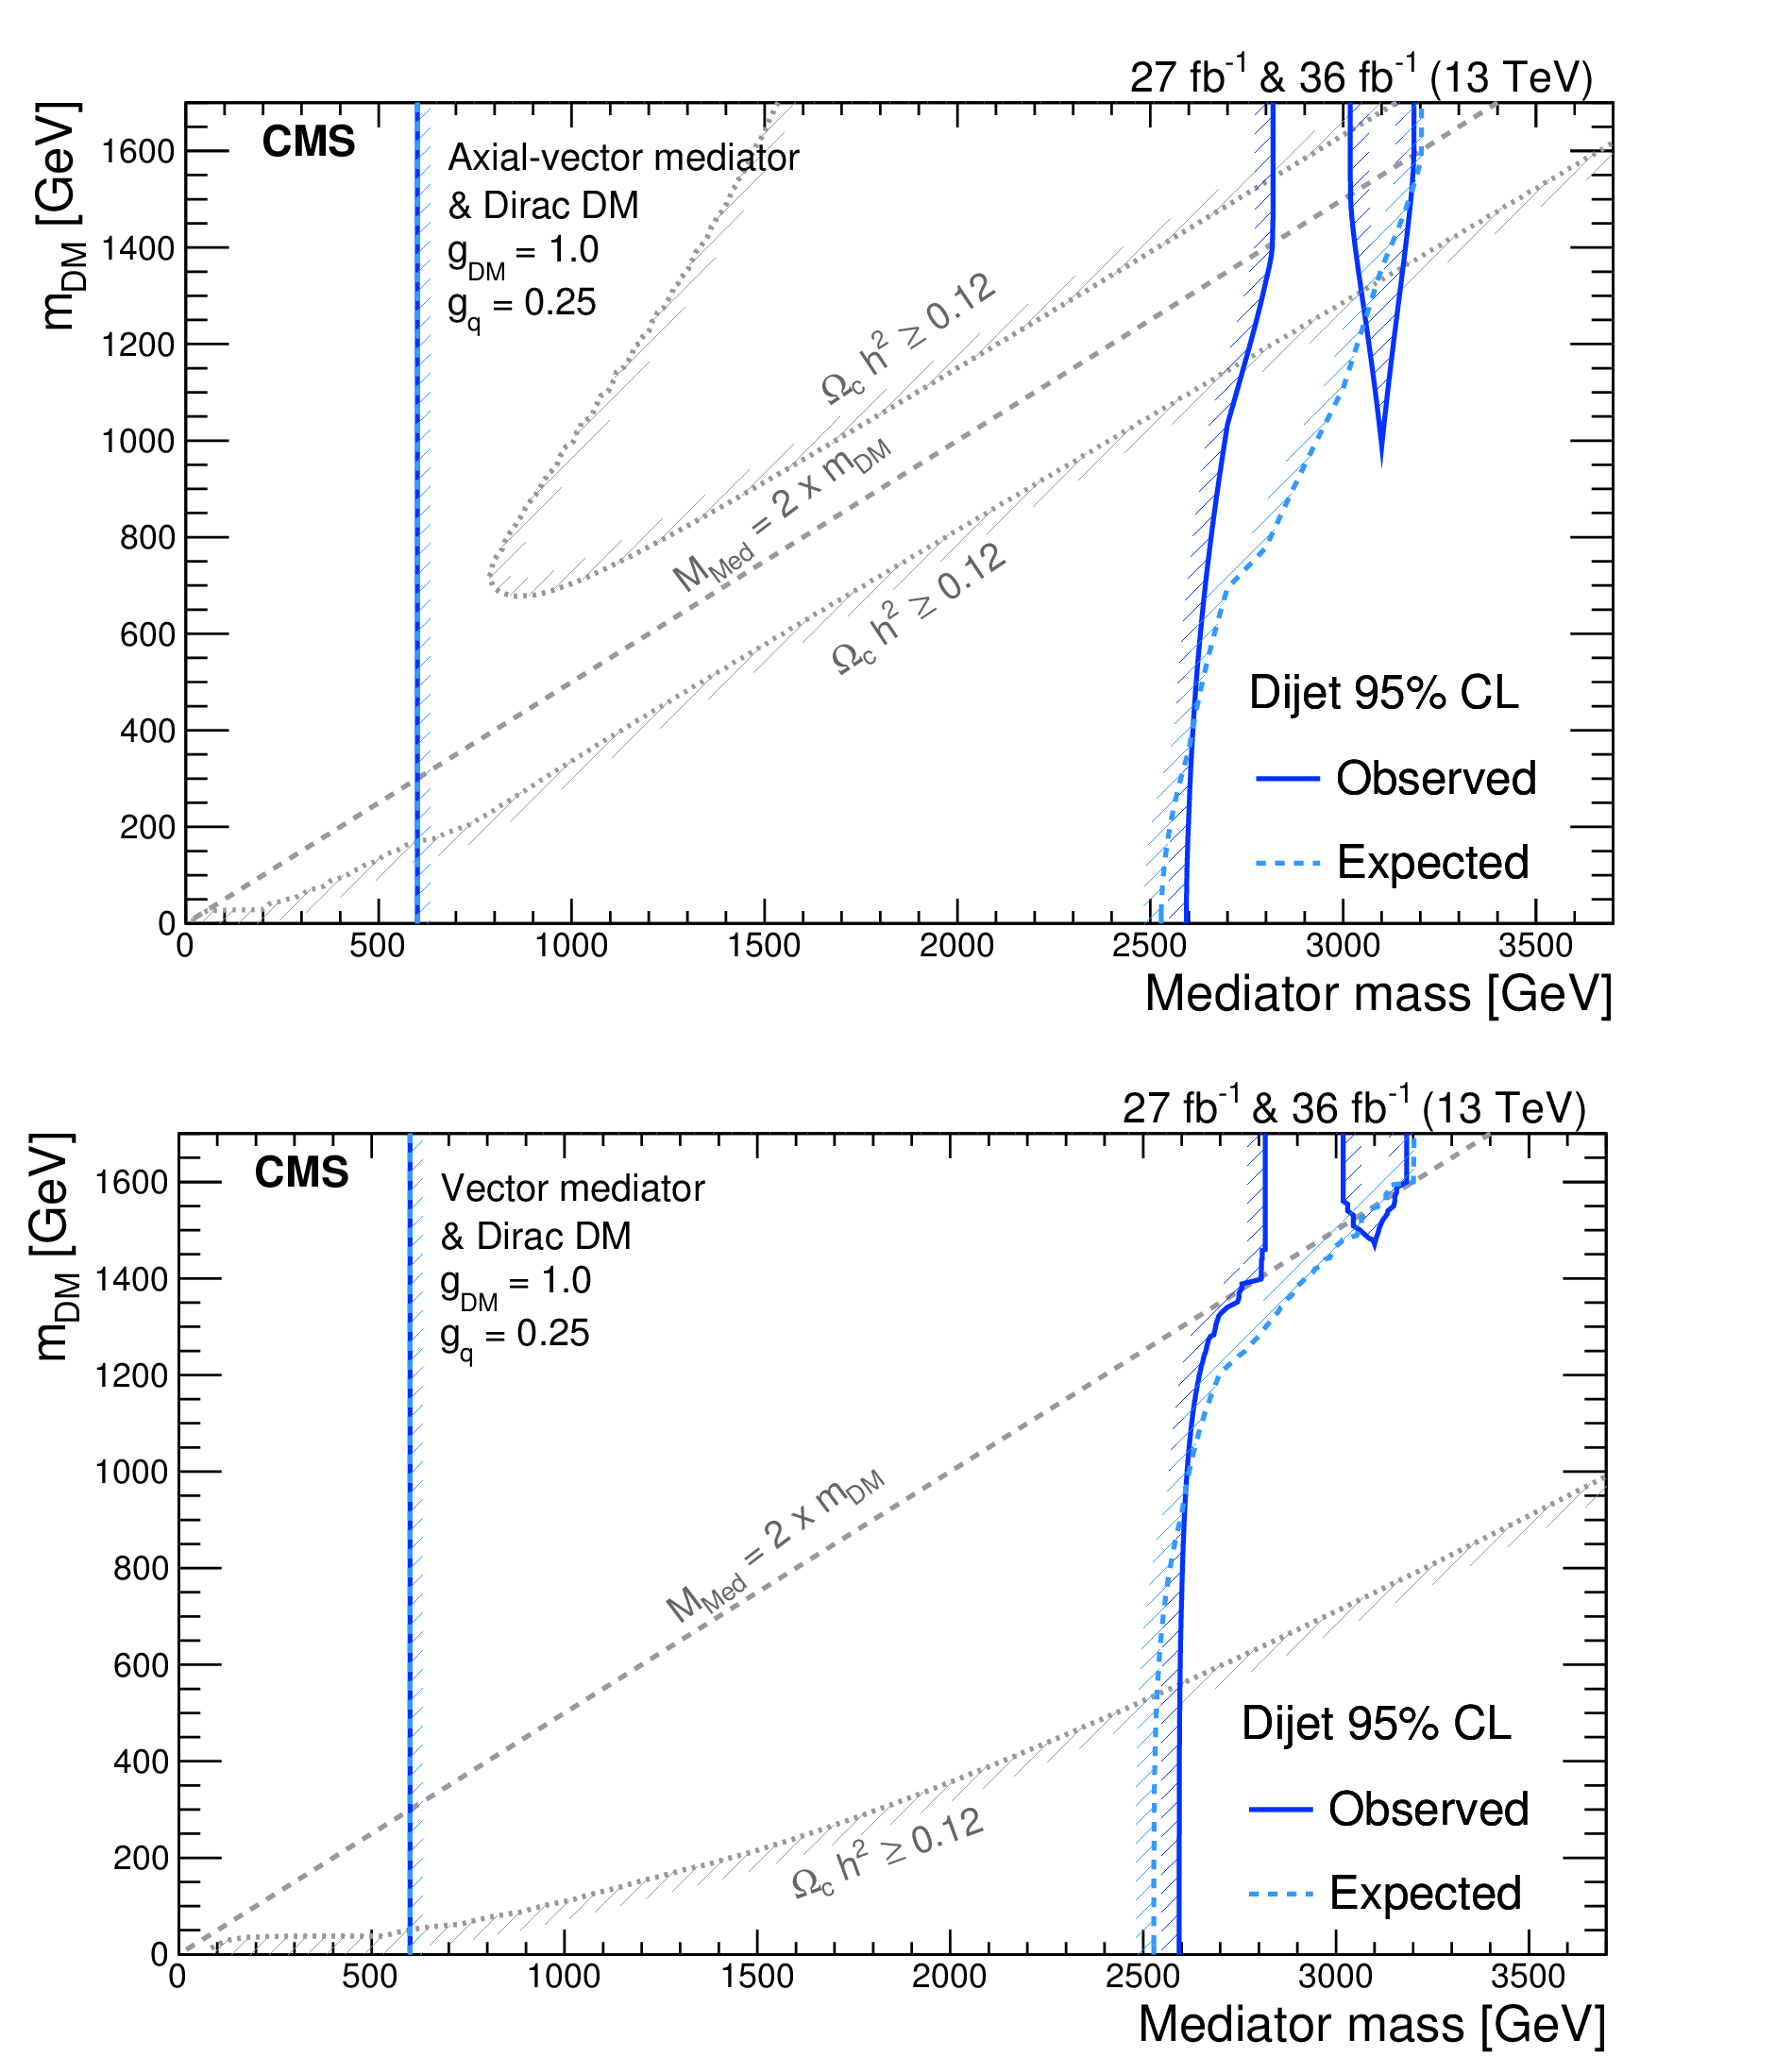
Figure 14:
The 95% CL observed (solid) and expected (dashed) excluded regions in the plane of dark matter mass vs. mediator mass, for an axial-vector mediator (upper) and a vector mediator (lower), compared to the excluded regions where the abundance of DM exceeds the cosmological relic density (light gray). Following the recommendation of the LHC DM working group [31,32], the exclusions are computed for Dirac DM and for a universal quark coupling $ {g_ {\mathrm {q}}} = $ 0.25 and for a DM coupling of $ {g_{\text {DM}}} = $ 1.0. It should also be noted that the excluded region strongly depends on the chosen coupling and model scenario. Therefore, the excluded regions and relic density contours shown in this plot are not applicable to other choices of coupling values or models. |

png pdf |
Figure 14-a:
The 95% CL observed (solid) and expected (dashed) excluded regions in the plane of dark matter mass vs. mediator mass, for an axial-vector mediator, compared to the excluded regions where the abundance of DM exceeds the cosmological relic density (light gray). Following the recommendation of the LHC DM working group [31,32], the exclusions are computed for Dirac DM and for a universal quark coupling $ {g_ {\mathrm {q}}} = $ 0.25 and for a DM coupling of $ {g_{\text {DM}}} = $ 1.0. It should also be noted that the excluded region strongly depends on the chosen coupling and model scenario. Therefore, the excluded regions and relic density contours shown in this plot are not applicable to other choices of coupling values or models. |

png pdf |
Figure 14-b:
The 95% CL observed (solid) and expected (dashed) excluded regions in the plane of dark matter mass vs. mediator mass, for a vector mediator, compared to the excluded regions where the abundance of DM exceeds the cosmological relic density (light gray). Following the recommendation of the LHC DM working group [31,32], the exclusions are computed for Dirac DM and for a universal quark coupling $ {g_ {\mathrm {q}}} = $ 0.25 and for a DM coupling of $ {g_{\text {DM}}} = $ 1.0. It should also be noted that the excluded region strongly depends on the chosen coupling and model scenario. Therefore, the excluded regions and relic density contours shown in this plot are not applicable to other choices of coupling values or models. |

png pdf |
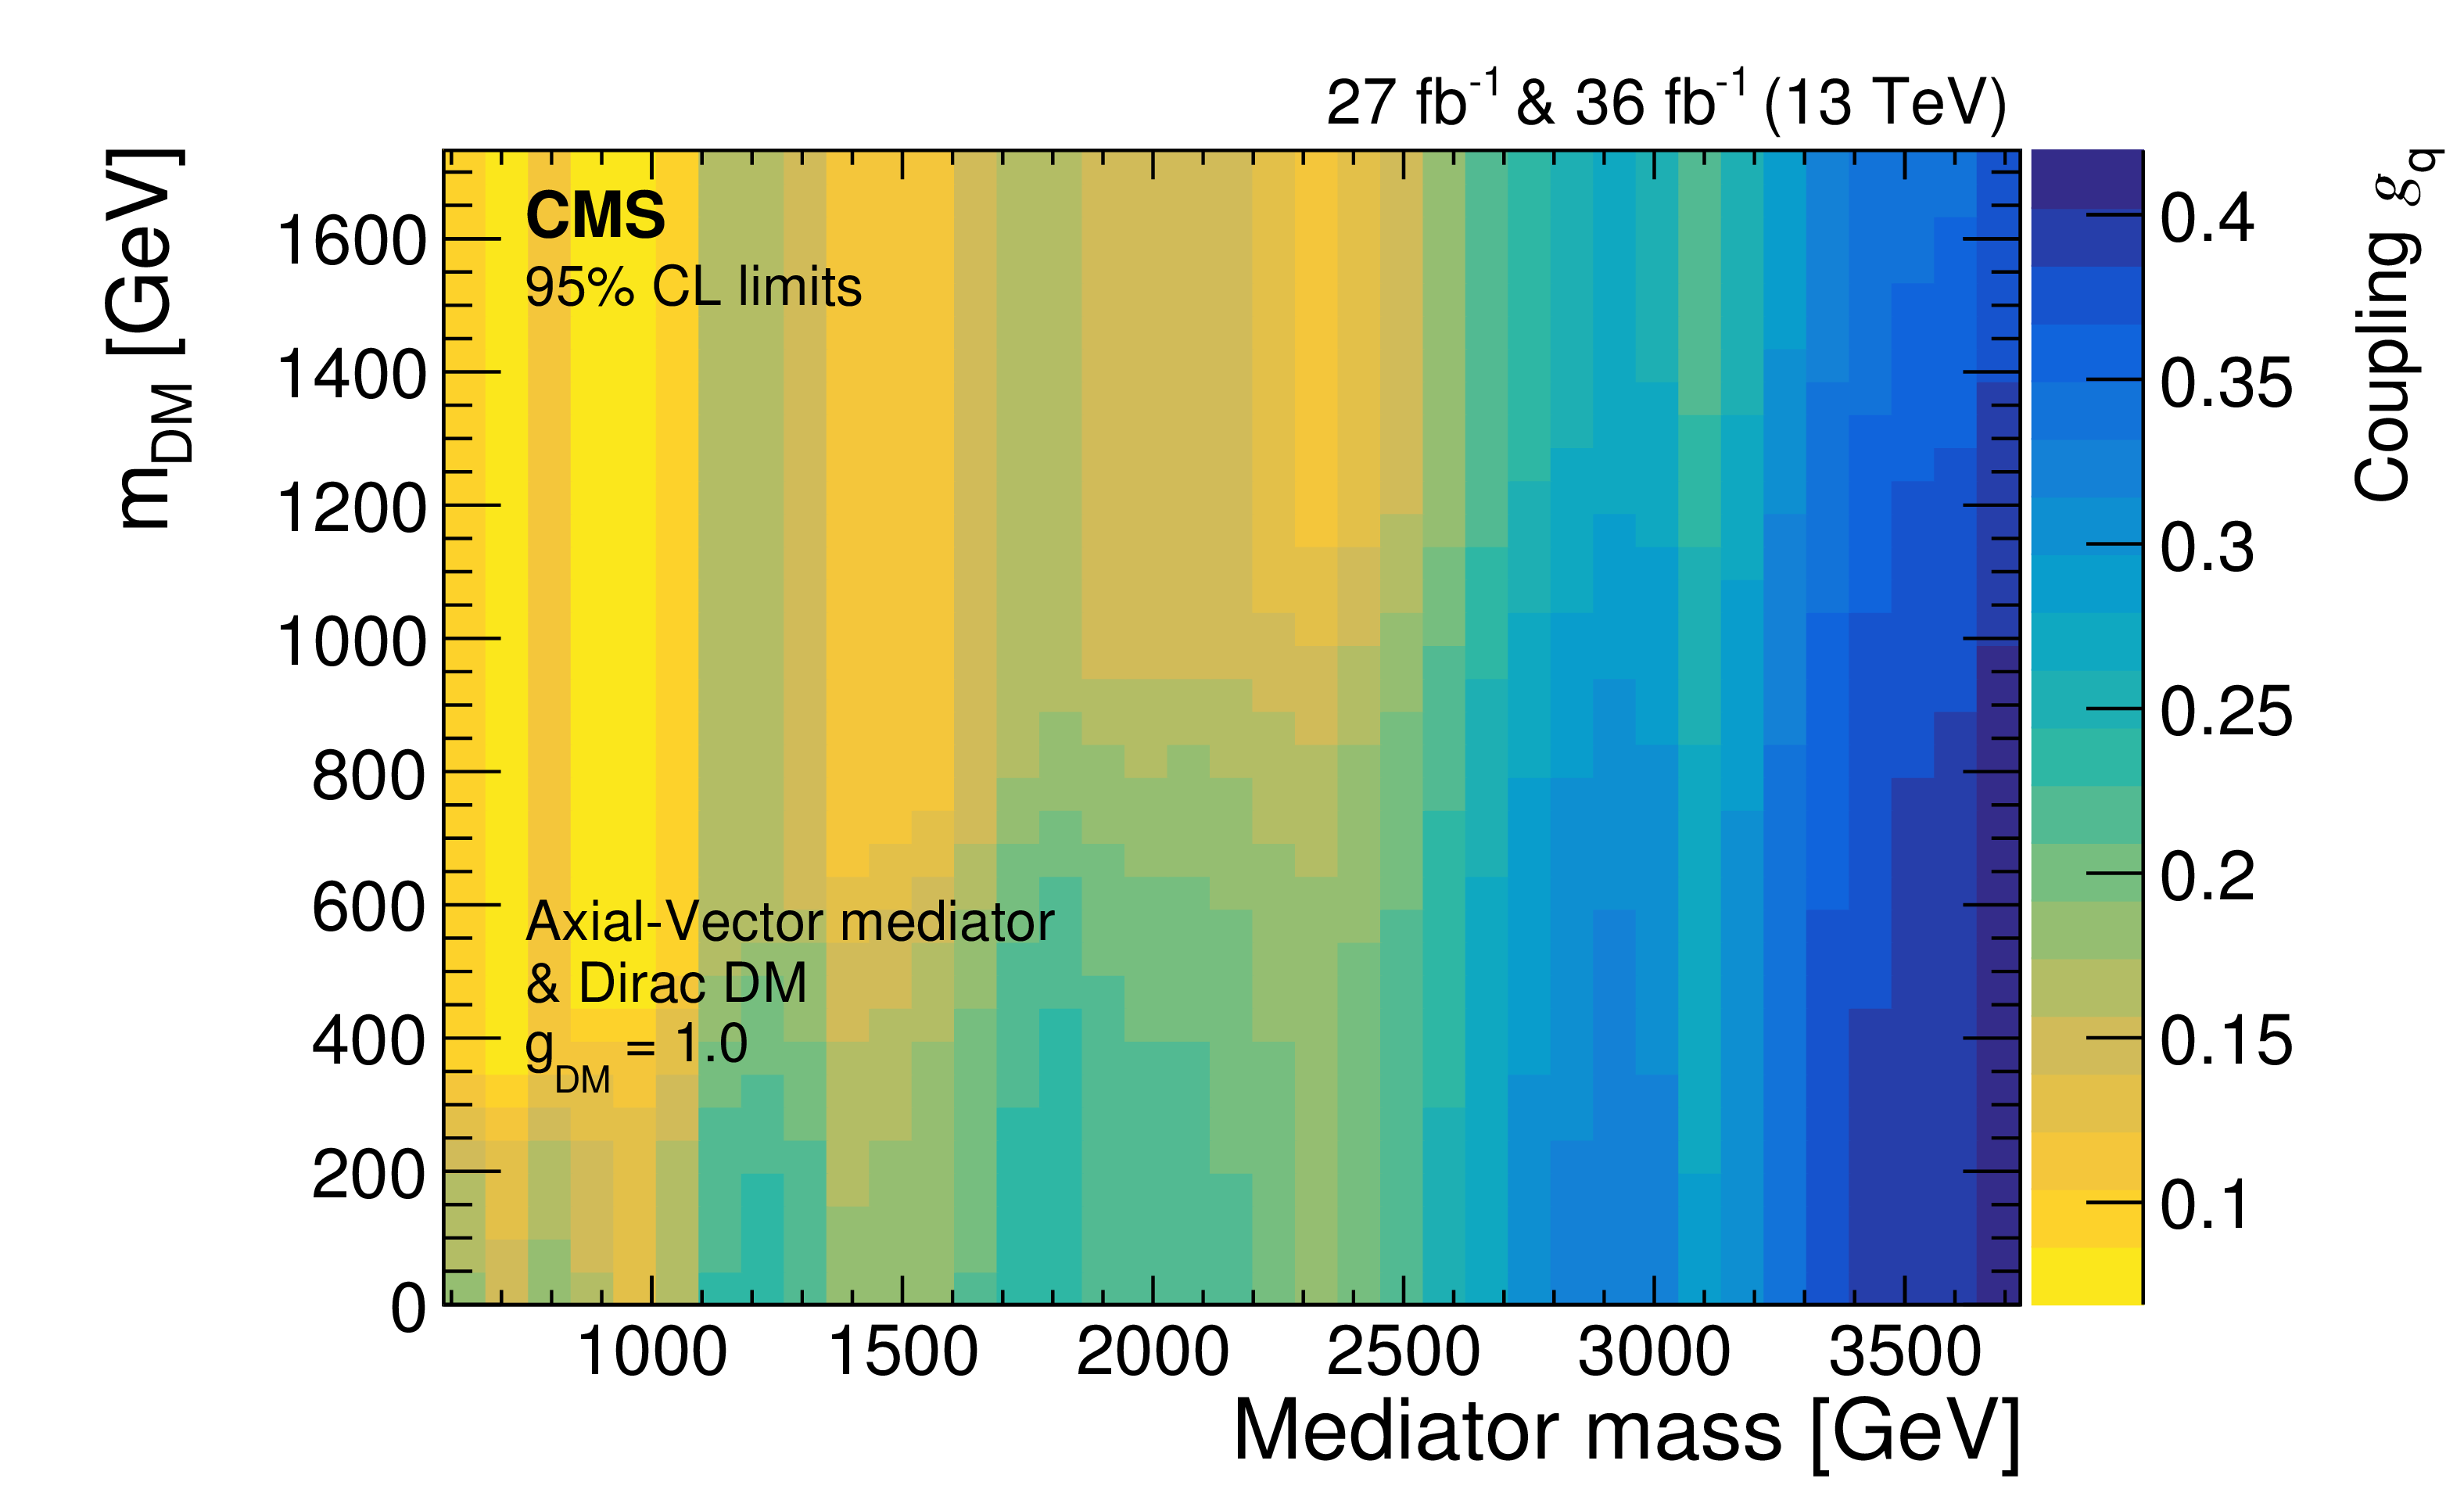
Figure 15:
The 95% CL observed upper limits on a universal quark coupling ${g_ {\mathrm {q}}}$ (color scale at right) in the plane of the dark matter particle mass versus mediator mass for an axial-vector mediator (upper) and a vector mediator (lower). |
png pdf |
Figure 15-a:
The 95% CL observed upper limits on a universal quark coupling ${g_ {\mathrm {q}}}$ (color scale at right) in the plane of the dark matter particle mass versus mediator mass for an axial-vector mediator. |

png pdf |
Figure 15-b:
The 95% CL observed upper limits on a universal quark coupling ${g_ {\mathrm {q}}}$ (color scale at right) in the plane of the dark matter particle mass versus mediator mass for a vector mediator. |

png pdf |
Figure 16:
The resonance signal shapes (left) and observed 95% CL upper limits on the product of the cross section, branching fraction, and acceptance (right) for spin-2 resonances produced and decaying in the quark-quark channel are shown for various values of intrinsic width and resonance mass. The reconstructed dijet mass spectrum for these resonances is estimated from the PYTHIA 8 MC event generator, followed by the simulation of the CMS detector response. |

png pdf |
Figure 16-a:
The resonance signal shapes for spin-2 resonances produced and decaying in the quark-quark channel are shown for various values of intrinsic width and resonance mass. The reconstructed dijet mass spectrum for these resonances is estimated from the PYTHIA 8 MC event generator, followed by the simulation of the CMS detector response. |

png pdf |
Figure 16-b:
Observed 95% CL upper limits on the product of the cross section, branching fraction, and acceptance for spin-2 resonances produced and decaying in the quark-quark channel are shown for various values of intrinsic width and resonance mass. The reconstructed dijet mass spectrum for these resonances is estimated from the PYTHIA 8 MC event generator, followed by the simulation of the CMS detector response. |

png pdf |
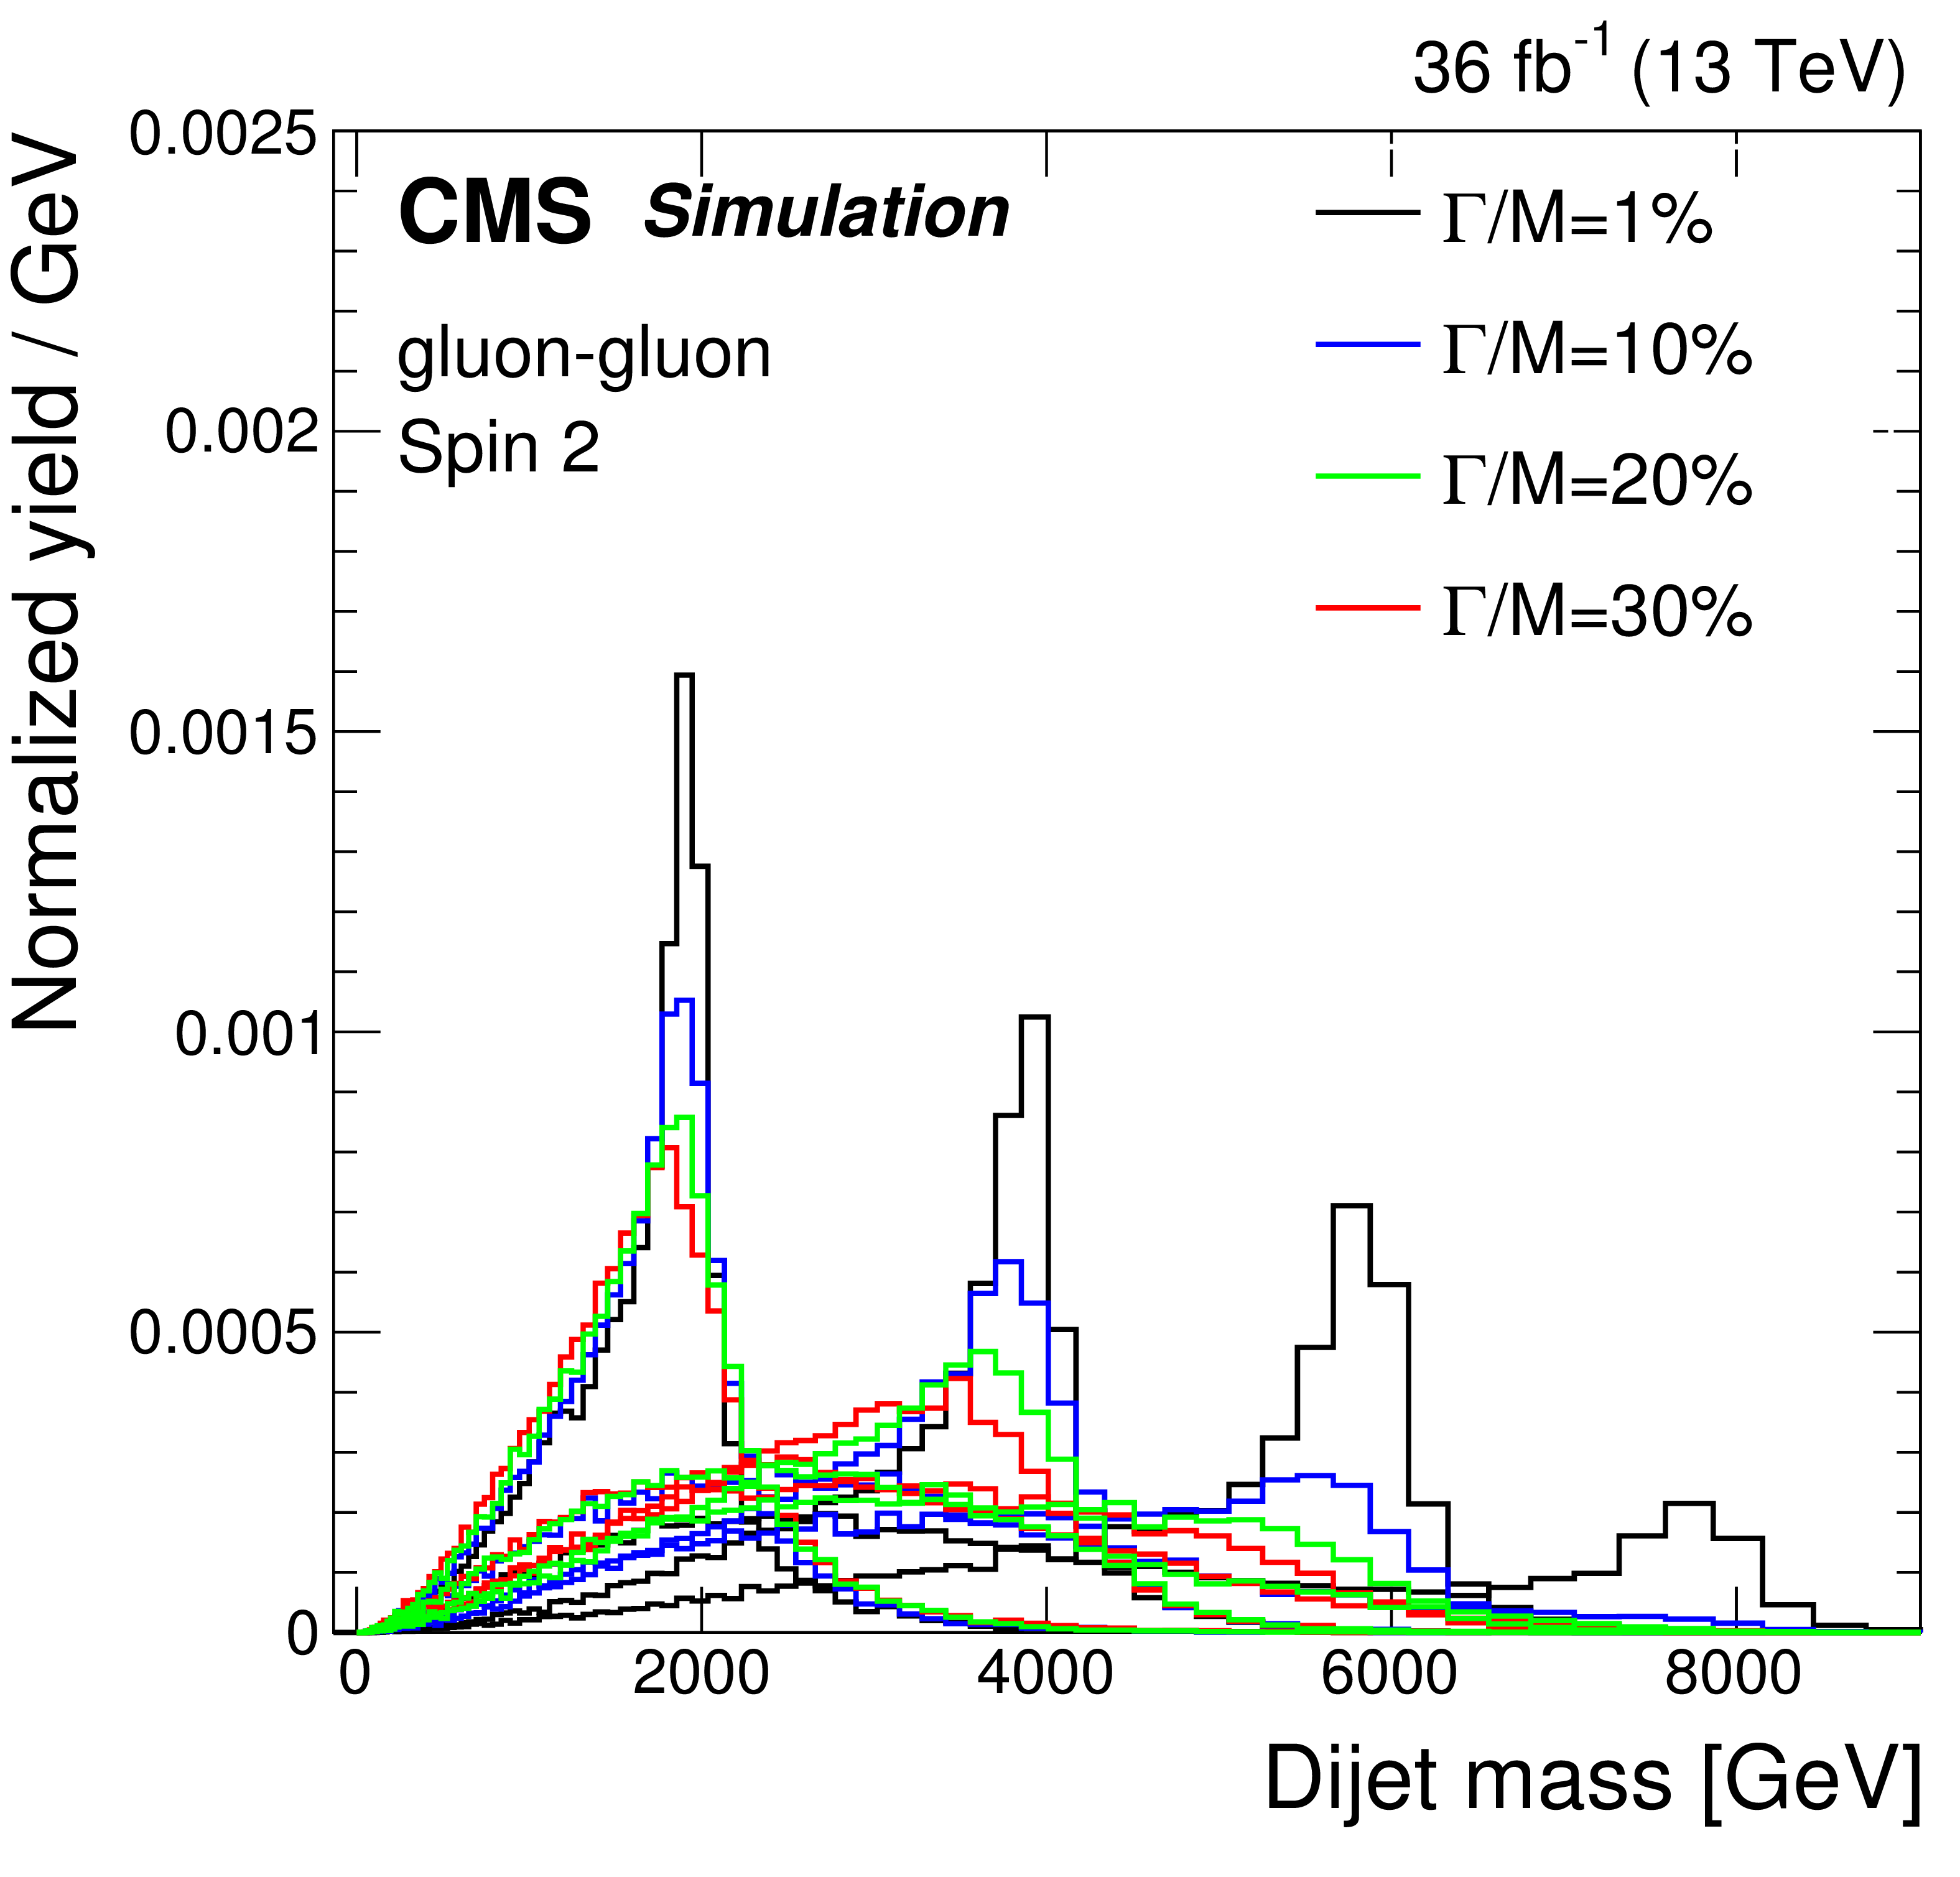
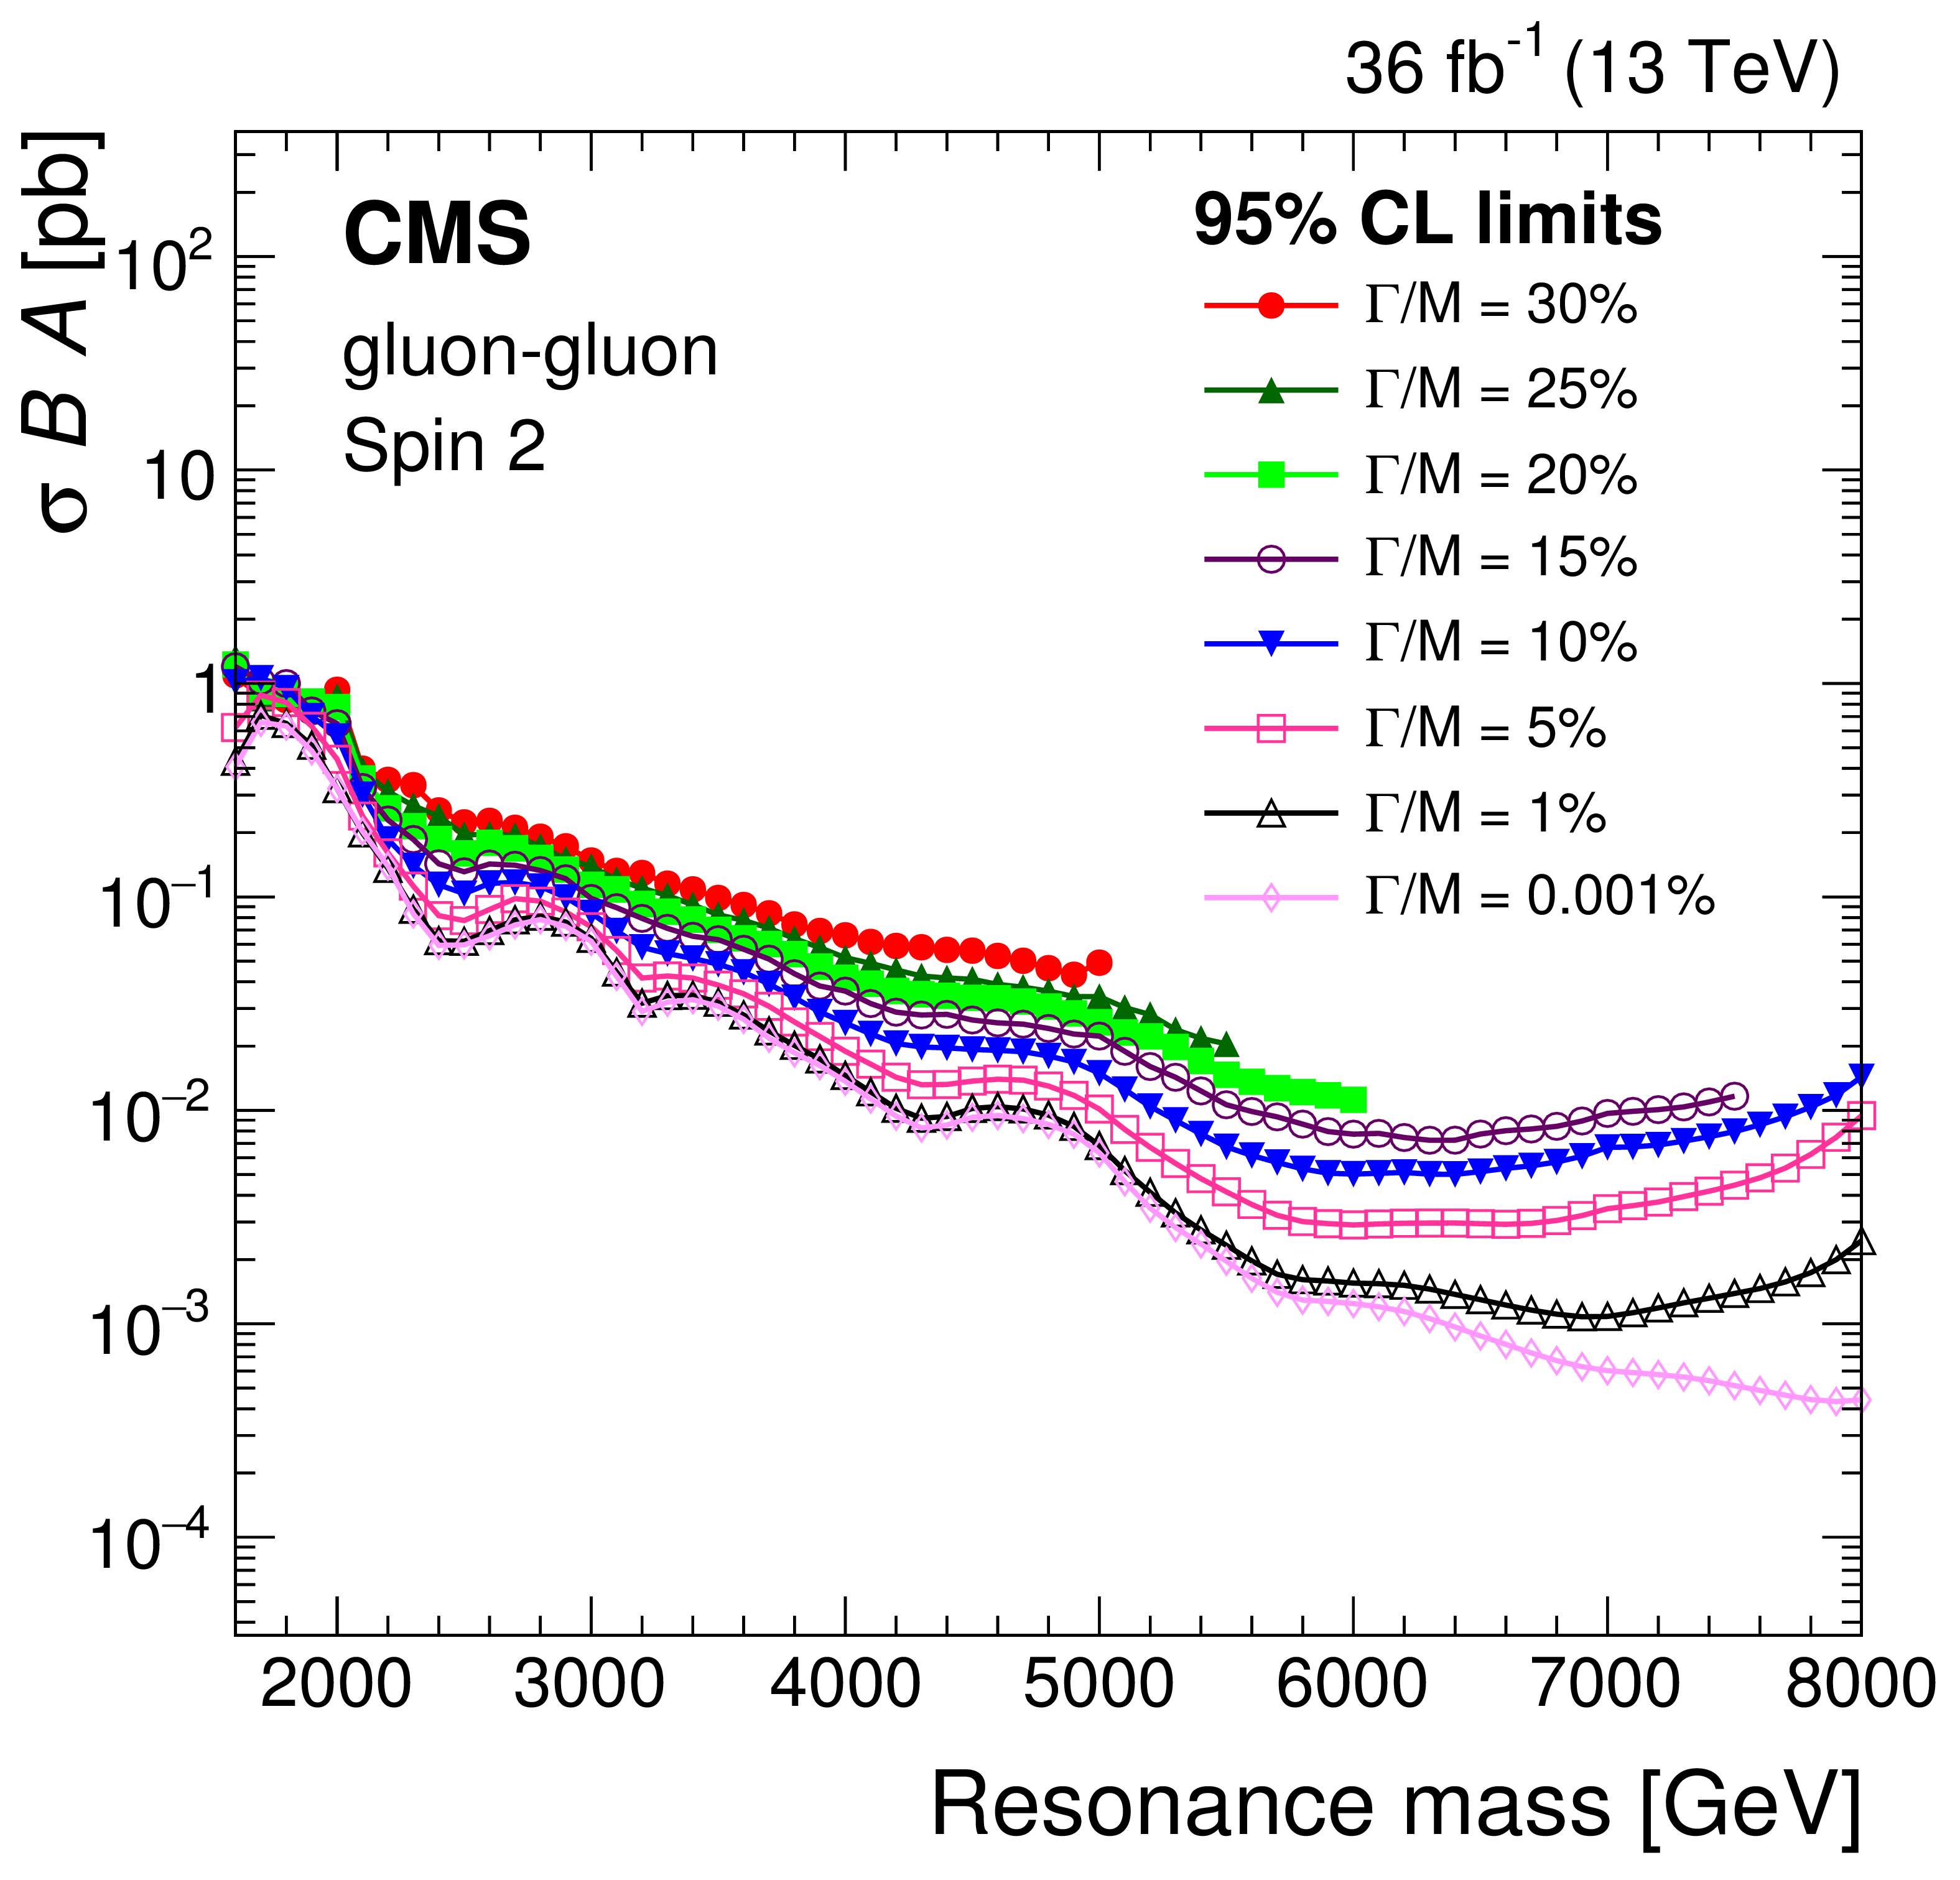
Figure 17:
The resonance signal shapes (left) and observed 95% CL upper limits on the product of the cross section, branching fraction, and acceptance (right) for spin-2 resonances produced and decaying in the gluon-gluon channel are shown for various values of intrinsic width and resonance mass. The reconstructed dijet mass spectrum for these resonances is estimated from the PYTHIA 8 MC event generator, followed by the simulation of the CMS detector response. |
png pdf |
Figure 17-a:
The resonance signal shapes for spin-2 resonances produced and decaying in the gluon-gluon channel are shown for various values of intrinsic width and resonance mass. The reconstructed dijet mass spectrum for these resonances is estimated from the PYTHIA 8 MC event generator, followed by the simulation of the CMS detector response. |
png pdf |
Figure 17-b:
Observed 95% CL upper limits on the product of the cross section, branching fraction, and acceptance for spin-2 resonances produced and decaying in the gluon-gluon channel are shown for various values of intrinsic width and resonance mass. The reconstructed dijet mass spectrum for these resonances is estimated from the PYTHIA 8 MC event generator, followed by the simulation of the CMS detector response. |

png pdf |
Figure 18:
The resonance signal shapes (left) and observed 95% CL upper limits on the product of the cross section, branching fraction, and acceptance (right) for spin-1 resonances produced and decaying in the quark-quark channel are shown for various values of intrinsic width and resonance mass. The reconstructed dijet mass spectrum for these resonances is estimated from the PYTHIA 8 MC event generator, followed by the simulation of the CMS detector response. |

png pdf |
Figure 18-a:
The resonance signal shapes for spin-1 resonances produced and decaying in the quark-quark channel are shown for various values of intrinsic width and resonance mass. The reconstructed dijet mass spectrum for these resonances is estimated from the PYTHIA 8 MC event generator, followed by the simulation of the CMS detector response. |

png pdf |
Figure 18-b:
Observed 95% CL upper limits on the product of the cross section, branching fraction, and acceptance for spin-1 resonances produced and decaying in the quark-quark channel are shown for various values of intrinsic width and resonance mass. The reconstructed dijet mass spectrum for these resonances is estimated from the PYTHIA 8 MC event generator, followed by the simulation of the CMS detector response. |
png pdf |
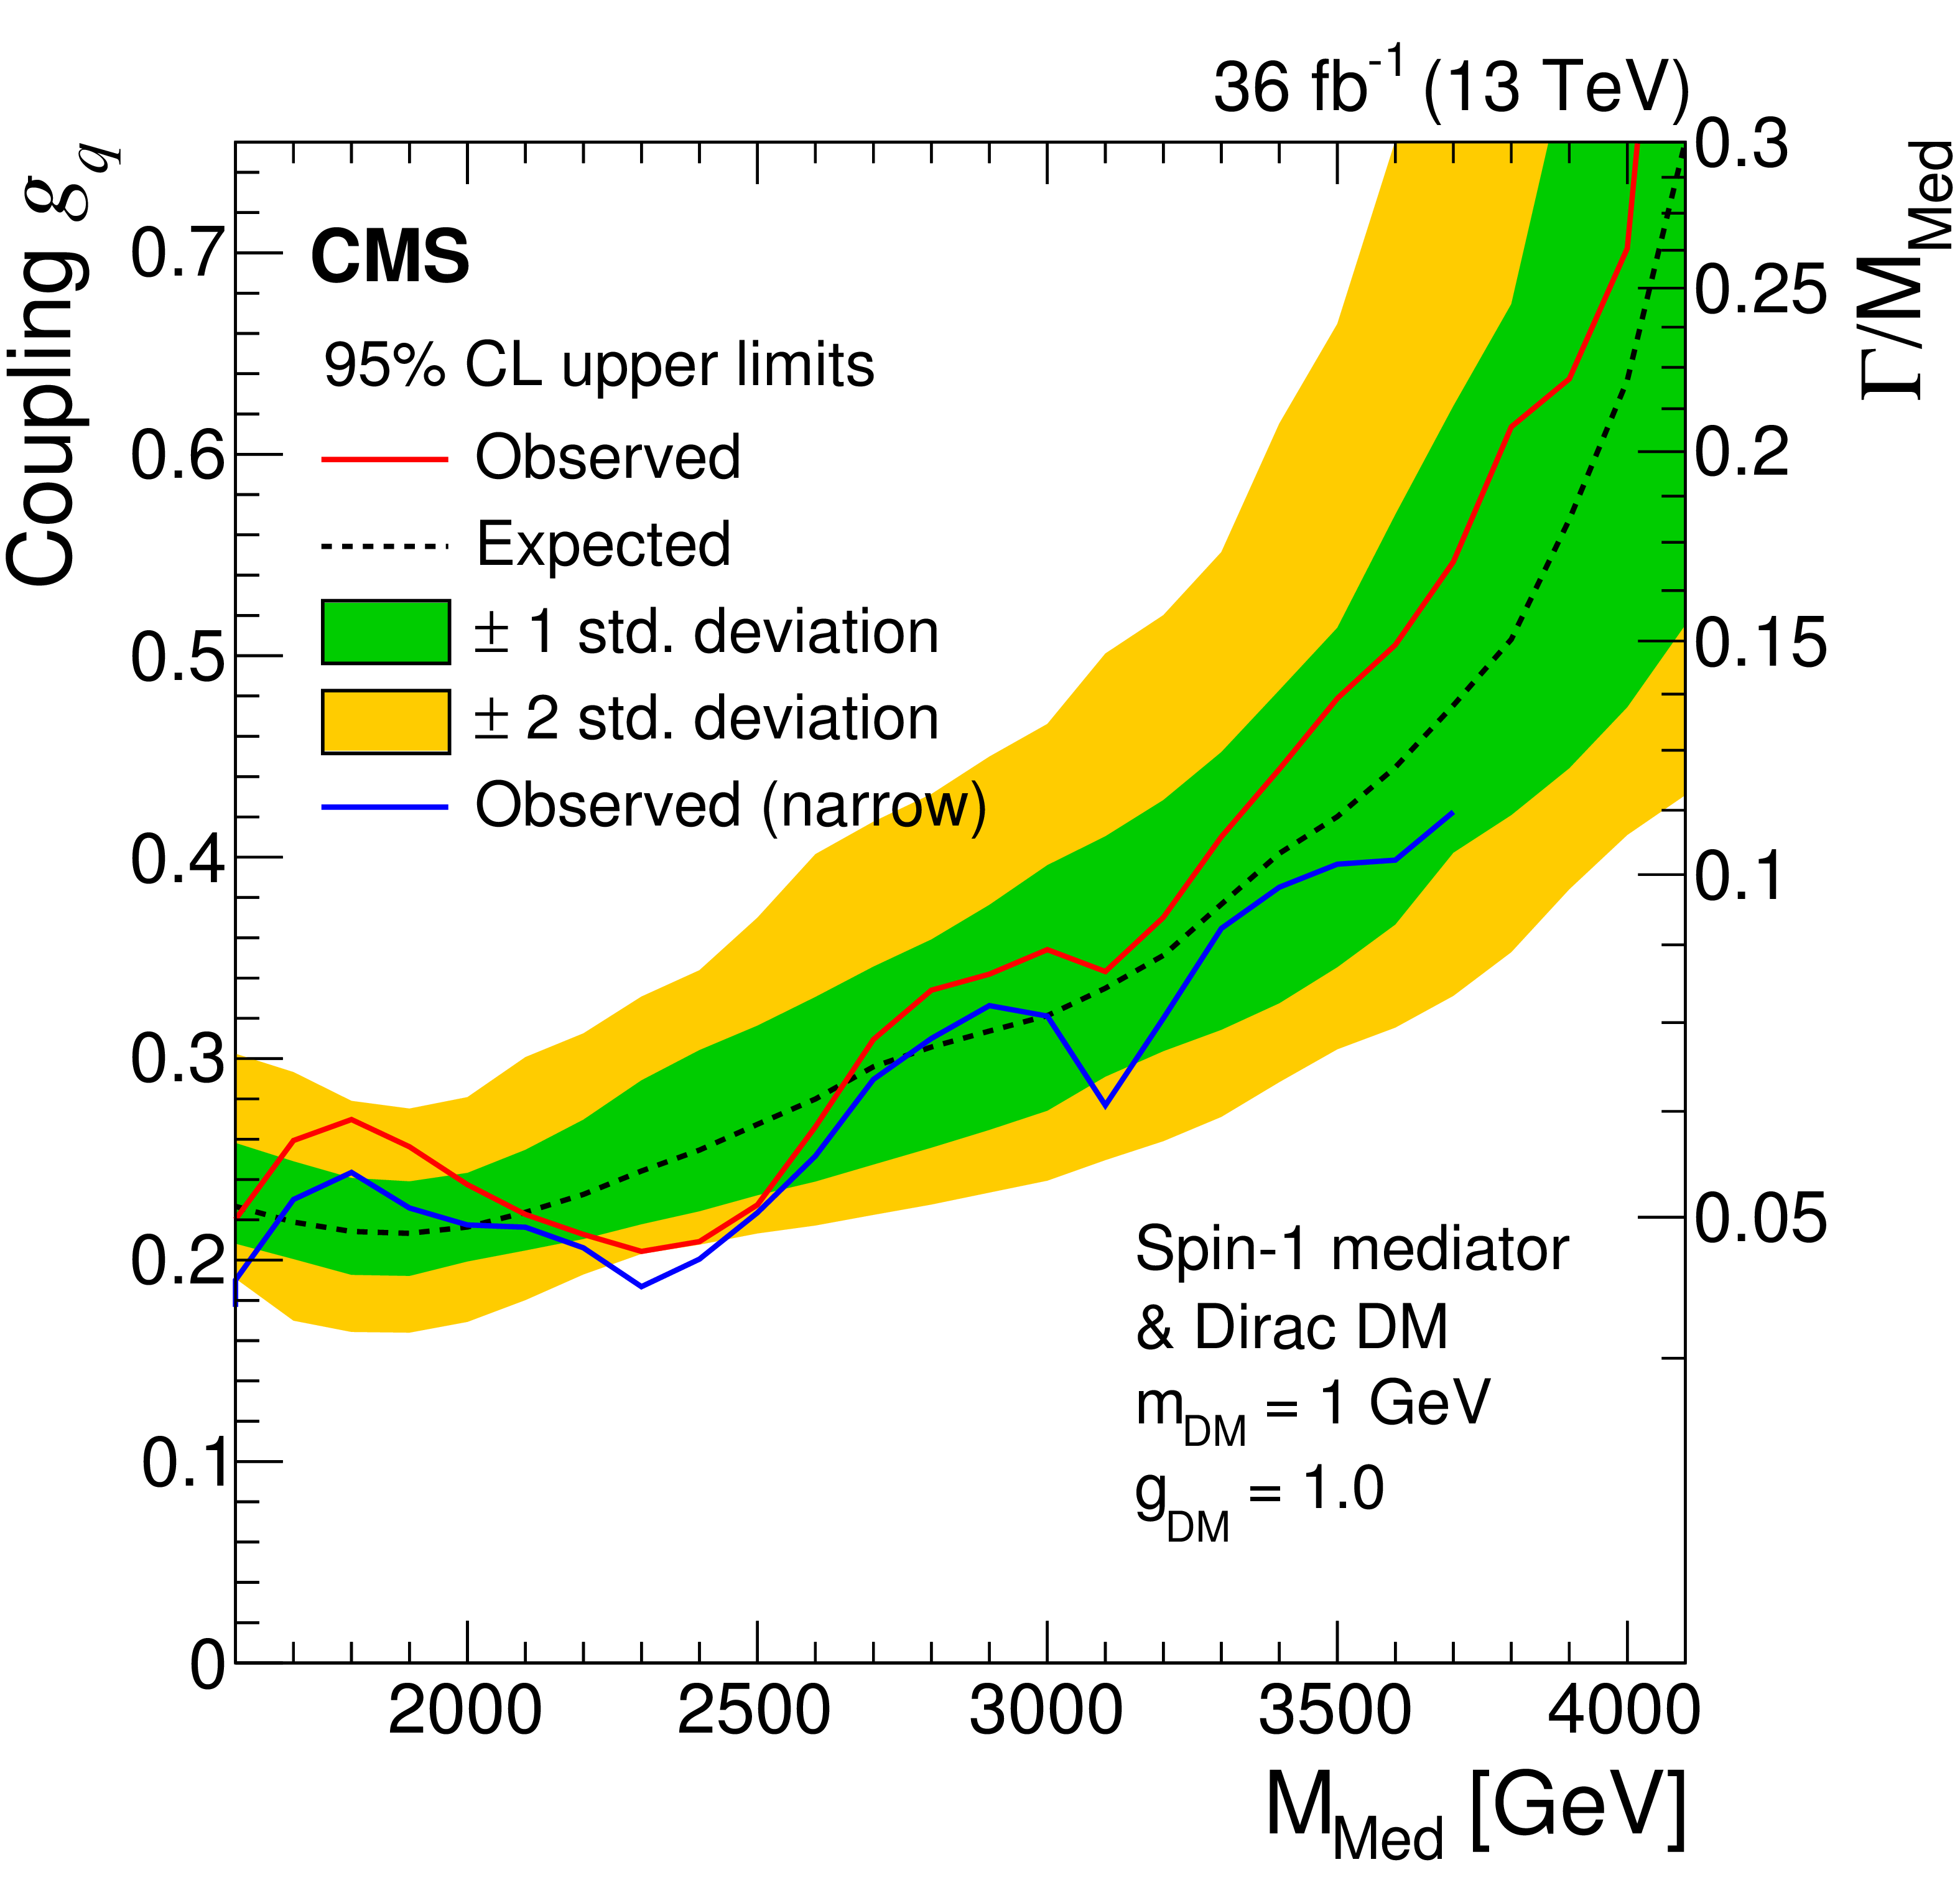
Figure 19:
The 95% CL upper limits on the universal quark coupling $ {g_ {\mathrm {q}}} $ as a function of resonance mass for a vector mediator of interactions between quarks and DM particles. The right vertical axis shows the natural width of the mediator divided by its mass. The observed limits taking into account the natural width of the resonance are in red(upper solid curve), expected limits (dashed) and their variation at the 1 and 2 standard deviation levels (shaded bands) are shown. The observed limits from the narrow resonance search are in blue (lower solid curve), but are only valid for the width values up to approximately 10% of the resonance mass. The exclusions are computed for a spin-1 mediator and, Dirac DM particle with a mass $ {m_{\text {DM}}} =$ 1 GeV and a coupling $ {g_{\text {DM}}} = $ 1.0. |
| Tables | |
png pdf |
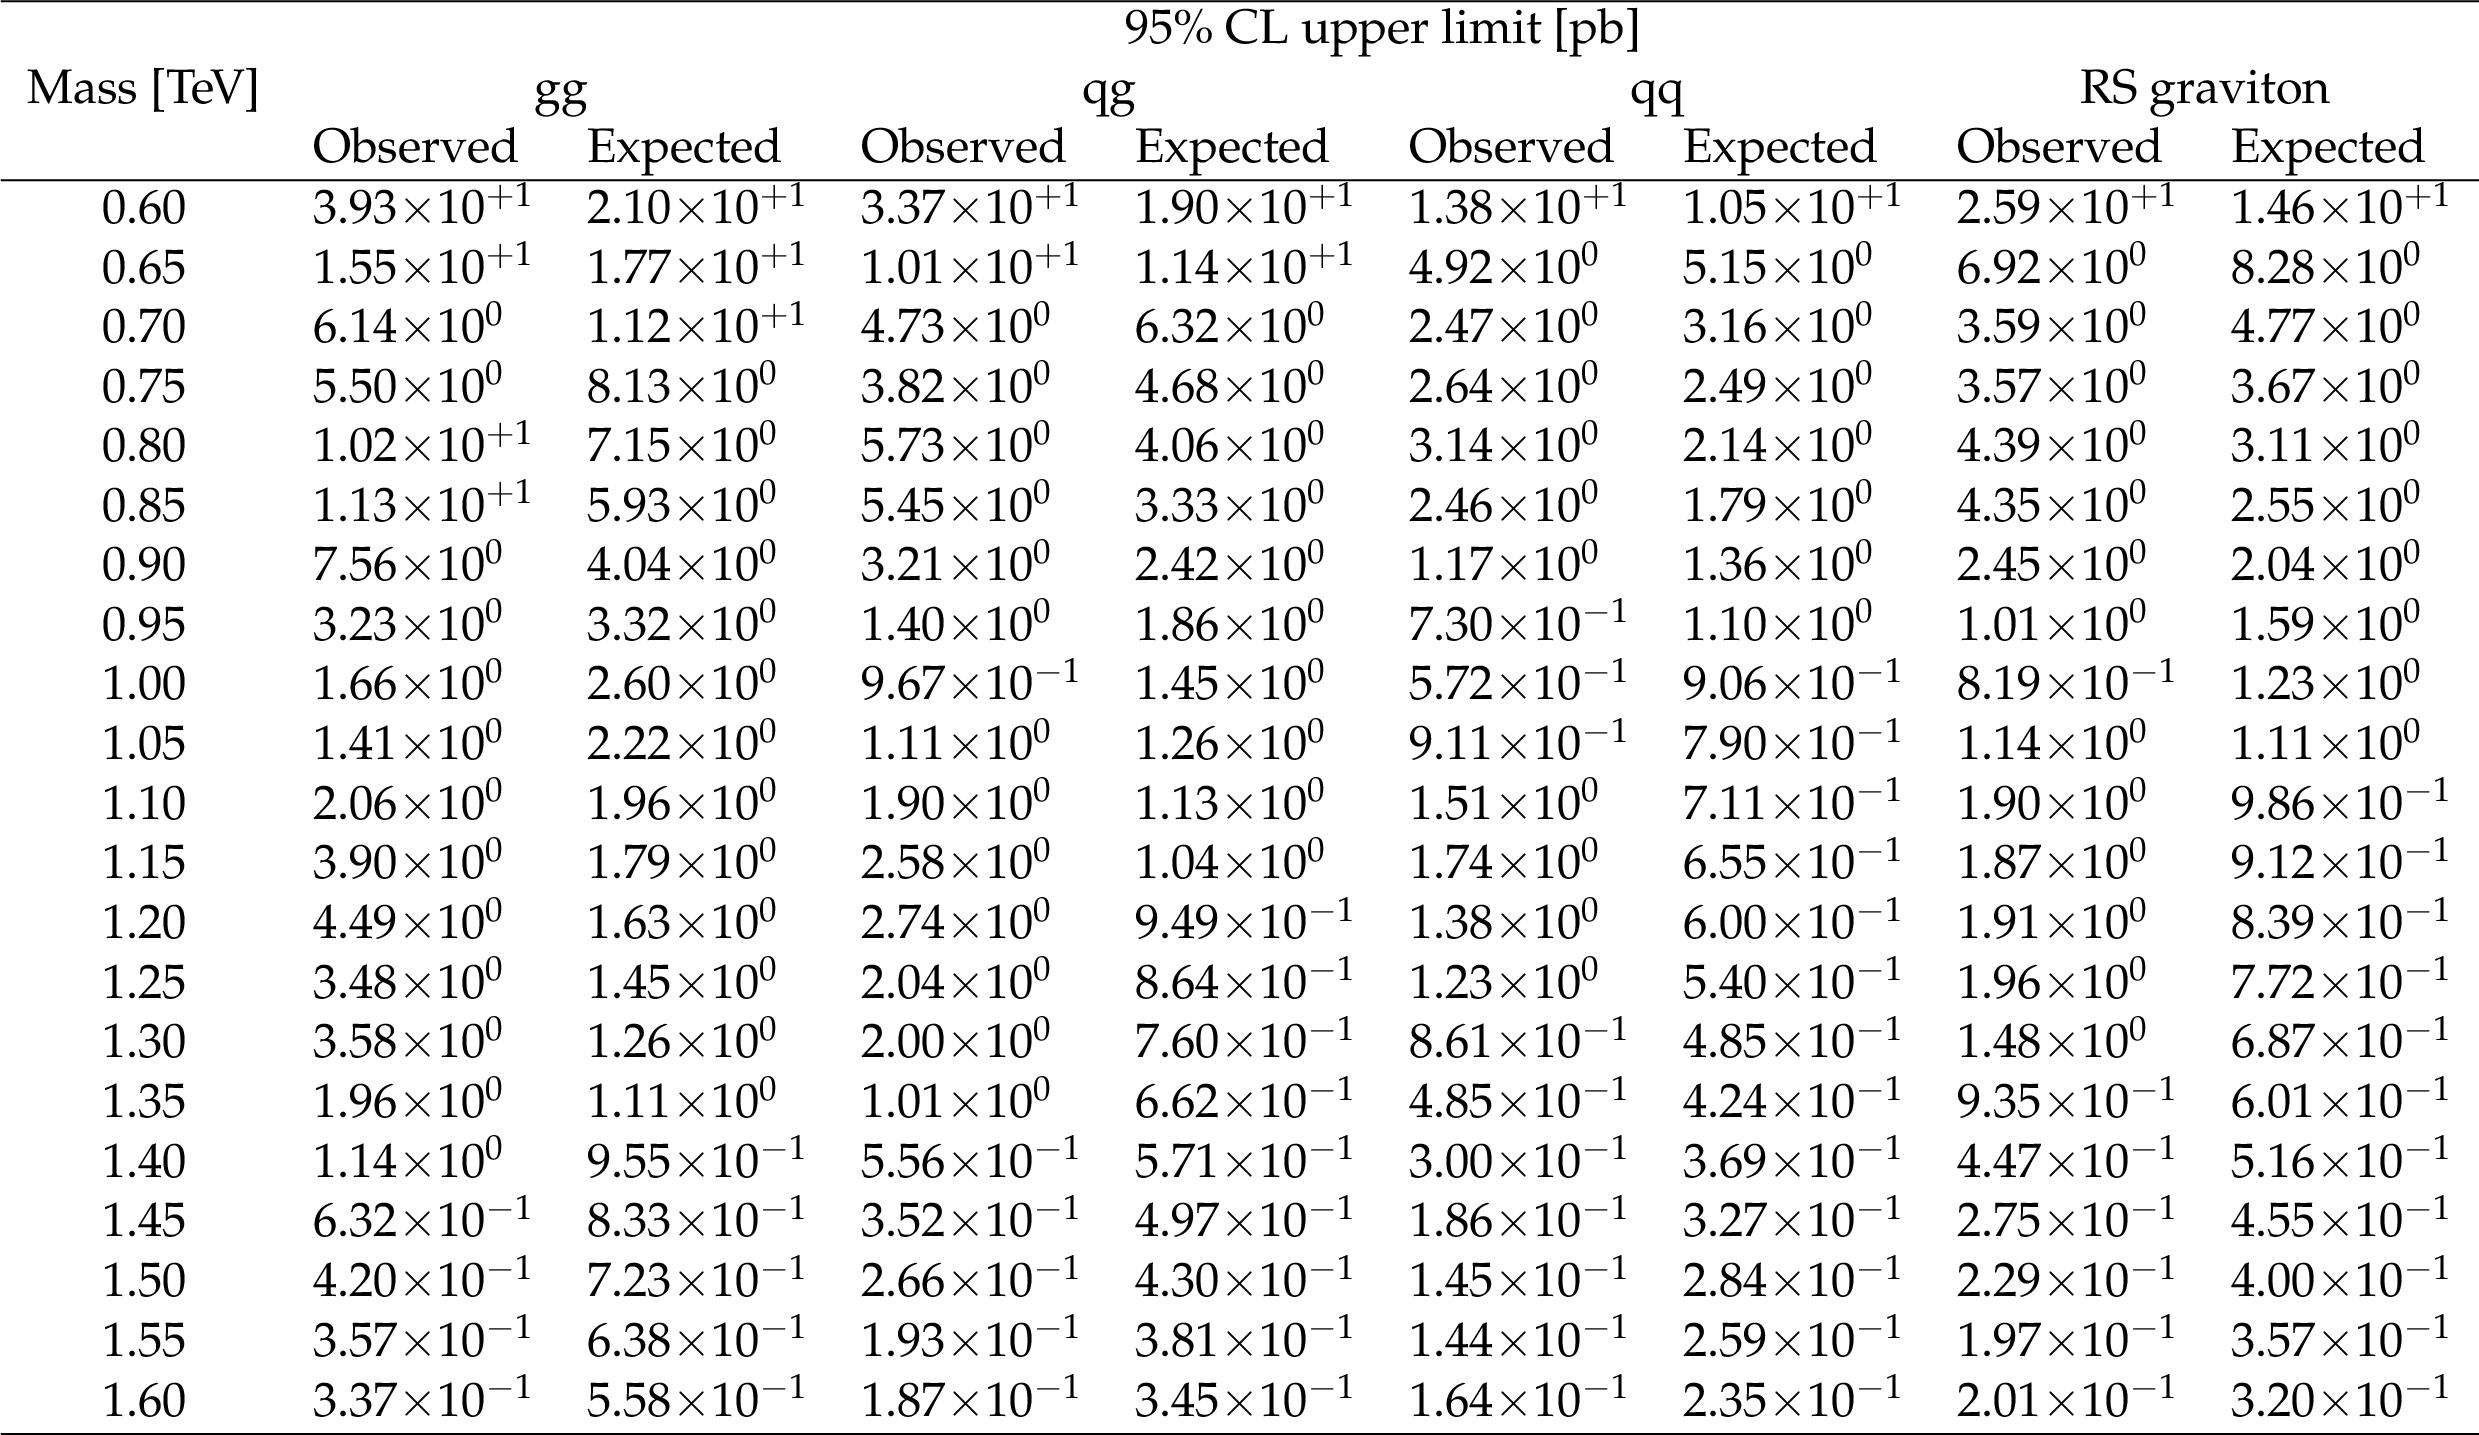
Table 1:
Limits from the low-mass search. The observed and expected upper limits at 95% CL on $\sigma B A$ for gluon-gluon, quark-gluon, and quark-quark resonances, and an RS graviton are given as a function of the resonance mass. |
png pdf |
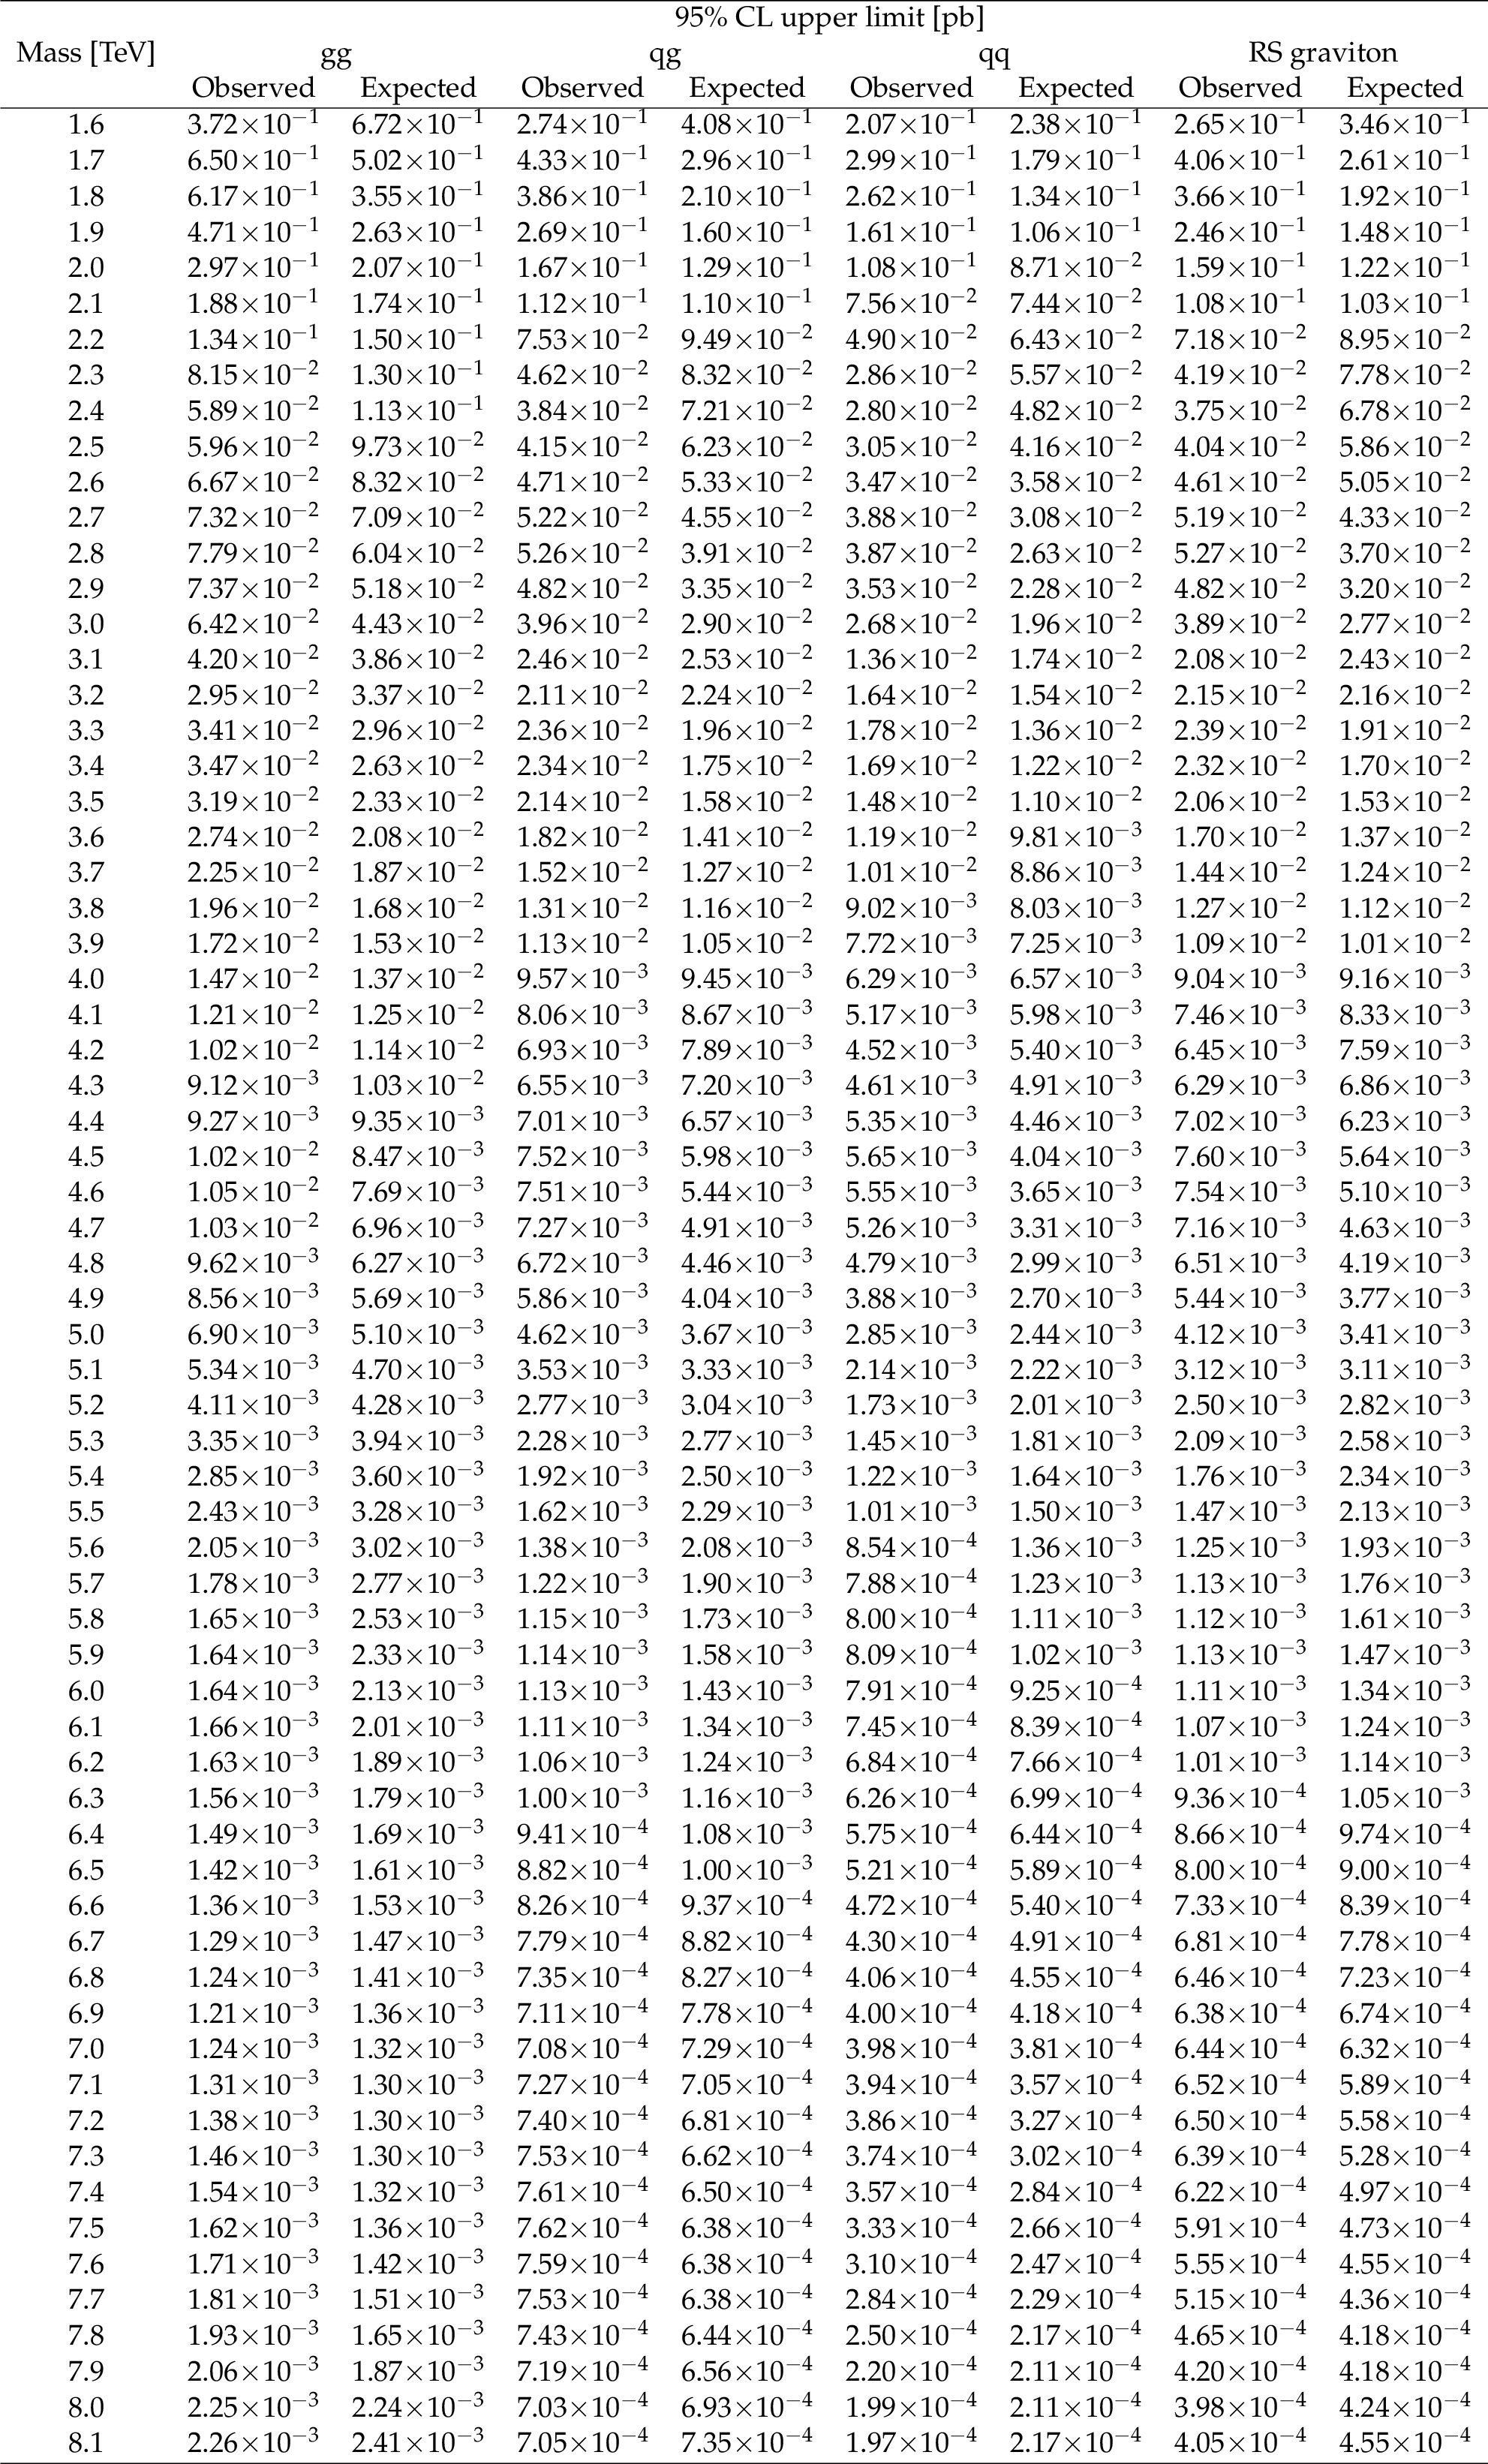
Table 2:
Limits from the high-mass search. The observed and expected upper limits at 95% CL on $\sigma B A$ for gluon-gluon, quark-gluon, and quark-quark resonances, and an RS graviton are shown as functions of the resonance mass. |

png pdf |
Table 3:
Observed and expected mass limits at 95% CL from this analysis compared to previously published limits on narrow resonances from CMS with 12.9 fb$^{-1}$ [4]. The listed models are excluded between 0.6 TeV and the indicated mass limit by this analysis. In addition to the observed mass limits listed below, this analysis also excludes the RS graviton model within the mass interval between 1.9 and 2.5 TeV and the Z' model within roughly a 50 GeV window around 3.1 TeV. |
| Summary |
| Searches have been presented for resonances decaying into pairs of jets using proton-proton collision data collected at $\sqrt{s} = $ 13 TeV corresponding to an integrated luminosity of up to 36 fb$^{-1}$. A low-mass search, for resonances with masses between 0.6 and 1.6 TeV, is performed based on events with dijets reconstructed at the trigger level from calorimeter information. A high-mass search, for resonances with masses above 1.6 TeV, is performed using dijets reconstructed offline with a particle-flow algorithm. The dijet mass spectra are observed to be smoothly falling distributions. In the analyzed data samples, there is no evidence for resonant particle production. Generic upper limits are presented on the product of the cross section, the branching fraction to dijets, and the acceptance for narrow quark-quark, quark-gluon, and gluon-gluon resonances that are applicable to any model of narrow dijet resonance production. String resonances with masses below 7.7 TeV are excluded at 95% confidence level, as are scalar diquarks below 7.2 TeV, axigluons and colorons below 6.1 TeV, excited quarks below 6.0 TeV, color-octet scalars below 3.4 TeV, W' bosons with the SM-like couplings below 3.3 TeV, Z' bosons with the SM-like couplings below 2.7 TeV, Randall-Sundrum gravitons below 1.8 TeV and in the range 1.9 to 2.5 TeV, and dark matter mediators below 2.6 TeV. The limits on both vector and axial-vector mediators, in a simplified model of interactions between quarks and dark matter particles, are presented as functions of dark matter particle mass. Searches are also presented for broad resonances, including for the first time spin-1 resonances with intrinsic widths as large as 30% of the resonance mass. The broad resonance search improves and extends the exclusions of a dark matter mediator to larger values of its mass and coupling to quarks. The narrow and broad resonance searches extend limits previously reported by CMS in the dijet channel, resulting in the most stringent constraints on many of the models considered. |
| References | ||||
| 1 | M. Chala et al. | Constraining dark sectors with monojets and dijets | JHEP 07 (2015) 089 | 1503.05916 |
| 2 | ATLAS Collaboration | Search for low-mass dijet resonances using trigger-level jets with the ATLAS detector in $ pp $ collisions at $ \sqrt{s}= $ 13 TeV | Submitted to PRLett | 1804.03496 |
| 3 | ATLAS Collaboration | Search for new phenomena in dijet events using 37 fb$ ^{-1} $ of $ pp $ collision data collected at $ \sqrt{s}= $ 13 TeV with the ATLAS detector | PRD 96 (2017) 052004 | 1703.09127 |
| 4 | CMS Collaboration | Search for dijet resonances in proton-proton collisions at $ \sqrt{s} = $ 13 TeV and constraints on dark matter and other models | PLB 769 (2017) 520 | CMS-EXO-16-032 1611.03568 |
| 5 | CMS Collaboration | Search for narrow resonances decaying to dijets in proton-proton collisions at $ \sqrt{s} = $ 13 TeV | PRL 116 (2016) 071801 | CMS-EXO-15-001 1512.01224 |
| 6 | ATLAS Collaboration | Search for new phenomena in dijet mass and angular distributions from pp collisions at $ \sqrt{s}= $ 13 TeV with the ATLAS detector | PLB 754 (2016) 302 | 1512.01530 |
| 7 | CMS Collaboration | Search for narrow resonances in dijet final states at $ \sqrt{s}= $ 8 TeV with the novel CMS technique of data scouting | PRL 117 (2016) 031802 | CMS-EXO-14-005 1604.08907 |
| 8 | CMS Collaboration | Search for resonances and quantum black holes using dijet mass spectra in proton-proton collisions at $ \sqrt{s} = $ 8 TeV | PRD 91 (2015) 052009 | CMS-EXO-12-059 1501.04198 |
| 9 | ATLAS Collaboration | Search for new phenomena in the dijet mass distribution using pp collision data at $ \sqrt{s}= $ 8 TeV with the ATLAS detector | PRD 91 (2015) 052007 | 1407.1376 |
| 10 | CMS Collaboration | Search for narrow resonances using the dijet mass spectrum in pp collisions at $ \sqrt{s} = $ 8 TeV | PRD 87 (2013) 114015 | CMS-EXO-12-016 1302.4794 |
| 11 | CMS Collaboration | Search for narrow resonances and quantum black holes in inclusive and b-tagged dijet mass spectra from pp collisions at $ \sqrt{s}= $ 7 TeV | JHEP 01 (2013) 013 | CMS-EXO-11-094 1210.2387 |
| 12 | ATLAS Collaboration | Search for new physics in the dijet mass distribution using 1 fb$ ^{-1} $ of $ pp $ collision data at $ \sqrt{s} = $ 7 TeV collected by the ATLAS detector | PLB 708 (2012) 37 | 1108.6311 |
| 13 | ATLAS Collaboration | ATLAS search for new phenomena in dijet mass and angular distributions using pp collisions at $ \sqrt{s}= $ 7 TeV | JHEP 01 (2013) 029 | 1210.1718 |
| 14 | CMS Collaboration | Search for resonances in the dijet mass spectrum from 7 TeV pp collisions at CMS | PLB 704 (2011) 123 | CMS-EXO-11-015 1107.4771 |
| 15 | ATLAS Collaboration | Search for new physics in dijet mass and angular distributions in $ pp $ collisions at $ \sqrt{s} = $ 7 TeV measured with the ATLAS detector | New J. Phys. 13 (2011) 053044 | 1103.3864 |
| 16 | CMS Collaboration | Search for Dijet Resonances in 7 TeV pp Collisions at CMS | PRL 105 (2010) 211801 | CMS-EXO-10-010 1010.0203 |
| 17 | ATLAS Collaboration | Search for new particles in two-jet final states in 7 TeV proton-proton collisions with the ATLAS detector at the LHC | PRL 105 (2010) 161801 | 1008.2461 |
| 18 | R. M. Harris and K. Kousouris | Searches for dijet resonances at hadron colliders | Int. J. Mod. Phys. A 26 (2011) 5005 | 1110.5302 |
| 19 | S. Mukherjee | Data Scouting : A New Trigger Paradigm | in 5th Large Hadron Collider Physics Conference (LHCP 2017) Shanghai, China, May 15-20 | 1708.06925 |
| 20 | L. A. Anchordoqui et al. | Dijet signals for low mass strings at the Large Hadron Collider | PRL 101 (2008) 241803 | 0808.0497 |
| 21 | S. Cullen, M. Perelstein, and M. E. Peskin | TeV strings and collider probes of large extra dimensions | PRD 62 (2000) 055012 | hep-ph/0001166 |
| 22 | J. L. Hewett and T. G. Rizzo | Low-energy phenomenology of superstring-inspired $ E_6 $ models | PR 183 (1989) 193 | |
| 23 | U. Baur, I. Hinchliffe, and D. Zeppenfeld | Excited quark production at hadron colliders | Int. J. Mod. Phys. A 02 (1987) 1285 | |
| 24 | U. Baur, M. Spira, and P. M. Zerwas | Excited-quark and -lepton production at hadron colliders | PRD 42 (1990) 815 | |
| 25 | P. H. Frampton and S. L. Glashow | Chiral color: An alternative to the standard model | PLB 190 (1987) 157 | |
| 26 | E. H. Simmons | Coloron phenomenology | PRD 55 (1997) 1678 | hep-ph/9608269 |
| 27 | T. Han, I. Lewis, and Z. Liu | Colored resonant signals at the LHC: largest rate and simplest topology | JHEP 12 (2010) 085 | 1010.4309 |
| 28 | R. S. Chivukula, E. H. Simmons, and N. Vignaroli | Distinguishing dijet resonances at the LHC | PRD 91 (2015) 055019 | 1412.3094 |
| 29 | E. Eichten, I. Hinchliffe, K. D. Lane, and C. Quigg | Supercollider physics | Rev. Mod. Phys. 56 (1984) 579 | |
| 30 | L. Randall and R. Sundrum | An alternative to compactification | PRL 83 (1999) 4690 | hep-th/9906064 |
| 31 | A. Boveia et al. | Recommendations on presenting LHC searches for missing transverse energy signals using simplified $ s $-channel models of dark matter | 1603.04156 | |
| 32 | J. Abdallah et al. | Simplified models for dark matter searches at the LHC | Phys. Dark Univ. 9-10 (2015) 8 | 1506.03116 |
| 33 | B. A. Dobrescu and F. Yu | Coupling-mass mapping of dijet peak searches | PRD 88 (2013) 035021 | 1306.2629 |
| 34 | CMS Collaboration | The CMS experiment at the CERN LHC | JINST 3 (2008) S08004 | CMS-00-001 |
| 35 | CMS Collaboration | Particle-flow reconstruction and global event description with the CMS detector | JINST 12 (2017) P10003 | CMS-PRF-14-001 1706.04965 |
| 36 | M. Cacciari and G. P. Salam | Dispelling the $ N^{3} $ myth for the $ k_\mathrm{t} $ jet-finder | PLB 641 (2006) 57 | hep-ph/0512210 |
| 37 | M. Cacciari, G. P. Salam, and G. Soyez | The anti-$ {k_{\mathrm{T}}} $ jet clustering algorithm | JHEP 04 (2008) 063 | 0802.1189 |
| 38 | M. Cacciari, G. P. Salam, and G. Soyez | FastJet user manual | EPJC 72 (2012) 1896 | 1111.6097 |
| 39 | M. Cacciari and G. P. Salam | Pileup subtraction using jet areas | PLB 659 (2008) 119 | 0707.1378 |
| 40 | CMS Collaboration | Jet energy scale and resolution in the CMS experiment in pp collisions at 8 TeV | JINST 12 (2017) P02014 | CMS-JME-13-004 1607.03663 |
| 41 | CMS Collaboration | The CMS trigger system | JINST 12 (2017) P01020 | CMS-TRG-12-001 1609.02366 |
| 42 | CMS Collaboration | Jet algorithms performance in 13 TeV data | CMS-PAS-JME-16-003 | CMS-PAS-JME-16-003 |
| 43 | D. Krohn, J. Thaler, and L.-T. Wang | Jet trimming | JHEP 02 (2010) 084 | |
| 44 | T. Sjostrand, S. Mrenna, and P. Skands | A brief introduction to PYTHIA 8.1 | Comp. Phys. Comm. 178 (2008) 852 | 0710.3820 |
| 45 | CMS Collaboration | Event generator tunes obtained from underlying event and multiparton scattering measurements | EPJC 76 (2016) 155 | CMS-GEN-14-001 1512.00815 |
| 46 | P. Skands, S. Carrazza, and J. Rojo | Tuning PYTHIA 8.1: the Monash 2013 tune | EPJC 74 (2014) 3024 | 1404.5630 |
| 47 | GEANT4 Collaboration | GEANT4 --- a simulation toolkit | Nucl. Instr. Meth. A 506 (2003) 250 | |
| 48 | S. Alioli, P. Nason, C. Oleari, and E. Re | A general framework for implementing NLO calculations in shower Monte Carlo programs: the POWHEG BOX | JHEP 06 (2010) 043 | 1002.2581 |
| 49 | S. Alioli et al. | Jet pair production in POWHEG | JHEP 04 (2011) 081 | 1012.3380 |
| 50 | NNPDF Collaboration | Parton distributions for the LHC Run II | JHEP 04 (2015) 040 | 1410.8849 |
| 51 | CDF Collaboration | Search for new particles decaying into dijets in proton-antiproton collisions at $ \sqrt{s} = $ 1.96 ~TeV | PRD 79 (2009) 112002 | 0812.4036 |
| 52 | R. G. Lomax and D. L. Hahs-Vaughn | Statistical concepts: A second course | Routledge Academic, London | |
| 53 | T. Sjostrand, S. Mrenna, and P. Z. Skands | PYTHIA 6.4 physics and manual | JHEP 05 (2006) 026 | hep-ph/0603175 |
| 54 | S. P. Martin | Signal-background interference for a singlet spin-0 digluon resonance at the LHC | PRD 94 (2016) 035003 | 1606.03026 |
| 55 | CMS Collaboration | CMS luminosity measurements for the 2016 data taking period | CMS-PAS-LUM-17-001 | CMS-PAS-LUM-17-001 |
| 56 | G. Cowan, K. Cranmer, E. Gross, and O. Vitells | Asymptotic formulae for likelihood-based tests of new physics | EPJC 71 (2011) 1554 | 1007.1727 |
| 57 | T. Junk | Confidence level computation for combining searches with small statistics | Nucl. Instr. Meth. A 434 (1999) 435 | hep-ex/9902006 |
| 58 | A. L. Read | Presentation of search results: the $ CL_s $ technique | JPG 28 (2002) 2693 | |
| 59 | LHC Higgs Combination Group | Procedure for the LHC Higgs boson search combination in Summer 2011 | CMS-NOTE-2011-005 | |
| 60 | J. Pumplin et al. | New generation of parton distributions with uncertainties from global QCD analysis | JHEP 07 (2002) 012 | hep-ph/0201195 |
| 61 | V. D. Barger and R. J. N. Phillips | Collider Physics, Updated Edition | Frontiers in Physics, Volume 71, Westview Press, Boulder, Colorado, 1996ISBN 0-201-14945-1 | |
| 62 | R. S. Chivukula, E. H. Simmons, A. Farzinnia, and J. Ren | Hadron collider production of massive color-octet vector bosons at next-to-leading order | PRD 87 (2013) 094011 | 1303.1120 |
| 63 | D. N. Spergel et al. | Three-Year Wilkinson Microwave Anisotropy Probe (WMAP) Observations: Implications for Cosmology | Astrophys. J. Suppl. 170 (2007) 377 | astro-ph/0603449 |
| 64 | Planck Collaboration | Planck 2013 results. XVI. Cosmological parameters | Astron. Astrophys. 571 (2014) A16 | 1303.5076 |
| 65 | M. Backovi\'c, K. Kong, and M. McCaskey | MadDM v.1.0: Computation of Dark Matter Relic Abundance Using MadGraph5 | Phys. Dark Univ. 5 (2014) 18 | 1308.4955 |
| 66 | M. Backovi\'c et al. | Direct detection of dark matter with MadDM v.2.0 | Phys. Dark Univ. 9 (2015) 37 | 1505.04190 |
| 67 | T. du Pree, K. Hahn, P. Harris, and C. Roskas | Cosmological constraints on dark matter models for collider searches | 1603.08525 | |
| 68 | Particle Data Group Collaboration | Review of particle physics | CPC 40 (2016) 100001 | |
| 69 | H. M. Lee, D. Kim, K. Kong, and S. C. Park | Diboson excesses demystified in effective field theory approach | JHEP 11 (2015) 150 | 1507.06312 |
| 70 | J. Bijnens et al. | QCD signatures of narrow graviton resonances in hadron colliders | PLB 503 (2001) 341 | hep-ph/0101316 |
| 71 | T. Han, J. D. Lykken, and R.-J. Zhang | Kaluza-Klein states from large extra dimensions | PRD 59 (1999) 105006 | hep-ph/9811350 |
| 72 | J. Ellis, M. K. Gaillard, and D. V. Nanopoulos | A phenomenological profile of the Higgs boson | NPB 106 (1976) 292 | |
| 73 | O. \c Cakir and M. \c Sahin | Resonant production of diquarks at high energy $ p p $, $ e p $ and $ e^{+} e^{-} $ colliders | PRD 72 (2005) 115011 | hep-ph/0508205 |
| 74 | J. Alwall et al. | The automated computation of tree-level and next-to-leading order differential cross sections, and their matching to parton shower simulations | JHEP 07 (2014) 079 | 1405.0301 |
|
|
Compact Muon Solenoid LHC, CERN |
|

|

|

|

|

|