

Compact Muon Solenoid
LHC, CERN
| CMS-EXO-17-002 ; CERN-EP-2017-271 | ||
| Search for excited quarks of light and heavy flavor in $ \gamma $+jet final states in proton-proton collisions at $\sqrt{s} = $ 13 TeV | ||
| CMS Collaboration | ||
| 13 November 2017 | ||
| Phys. Lett. B 781 (2018) 390 | ||
| Abstract: A search is presented for excited quarks of light and heavy flavor that decay to $ \gamma $+jet final states. The analysis is based on data corresponding to an integrated luminosity of 35.9 fb$^{-1}$ collected by the CMS experiment in proton-proton collisions at $\sqrt{s} = $ 13 TeV at the LHC. A signal would appear as a resonant contribution to the invariant mass spectrum of the $ \gamma $+jet system, above the background expected from standard model processes. No resonant excess is found, and upper limits are set on the product of the excited quark cross section and its branching fraction as a function of its mass. These are the most stringent limits to date in the $ \gamma $+jet final state, and exclude excited light quarks with masses below 5.5 TeV and excited b quarks with masses below 1.8 TeV, assuming standard model couplings. | ||
| Links: e-print arXiv:1711.04652 [hep-ex] (PDF) ; CDS record ; inSPIRE record ; CADI line (restricted) ; | ||
| Figures | |
png pdf |
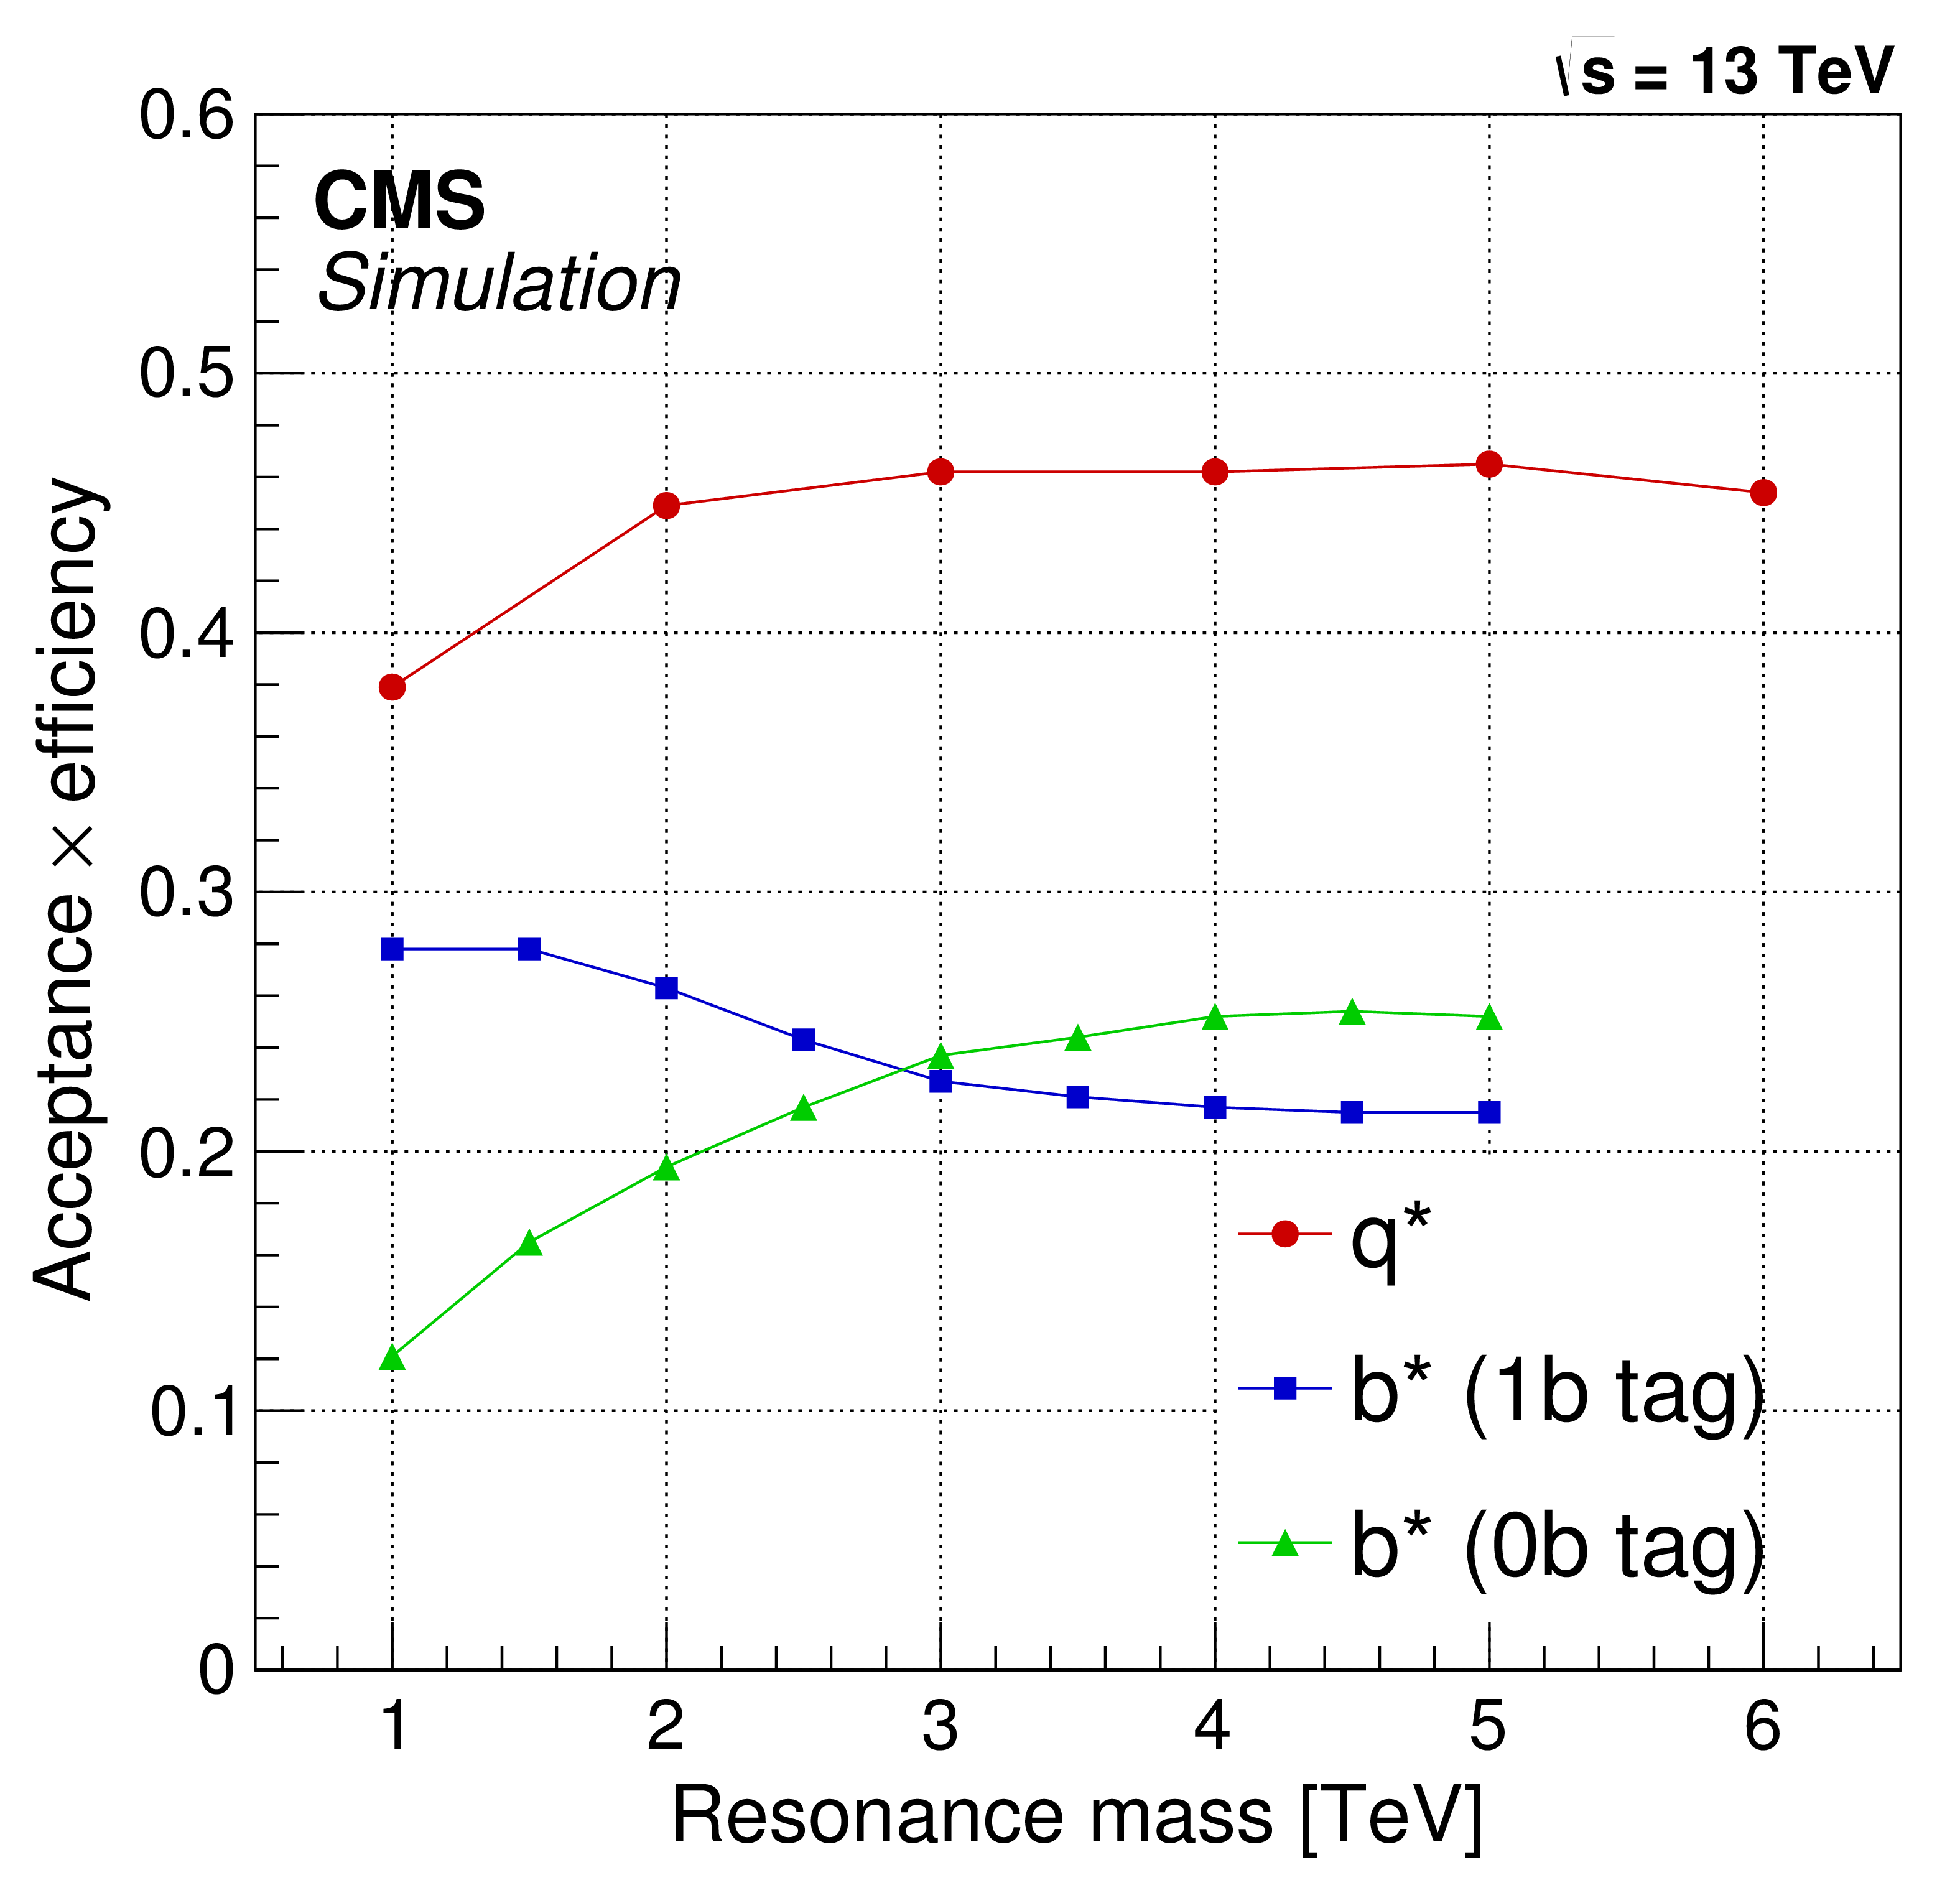
Figure 1:
The product of acceptance and efficiency for ${{\mathrm{q} *}}$ and ${{\mathrm{b} *}}$ signals as a function of generated $m_{{{\mathrm{q} *}}}$ or $m_{{{\mathrm{b} *}}}$ mass, calculated using MC simulation. |
png pdf |
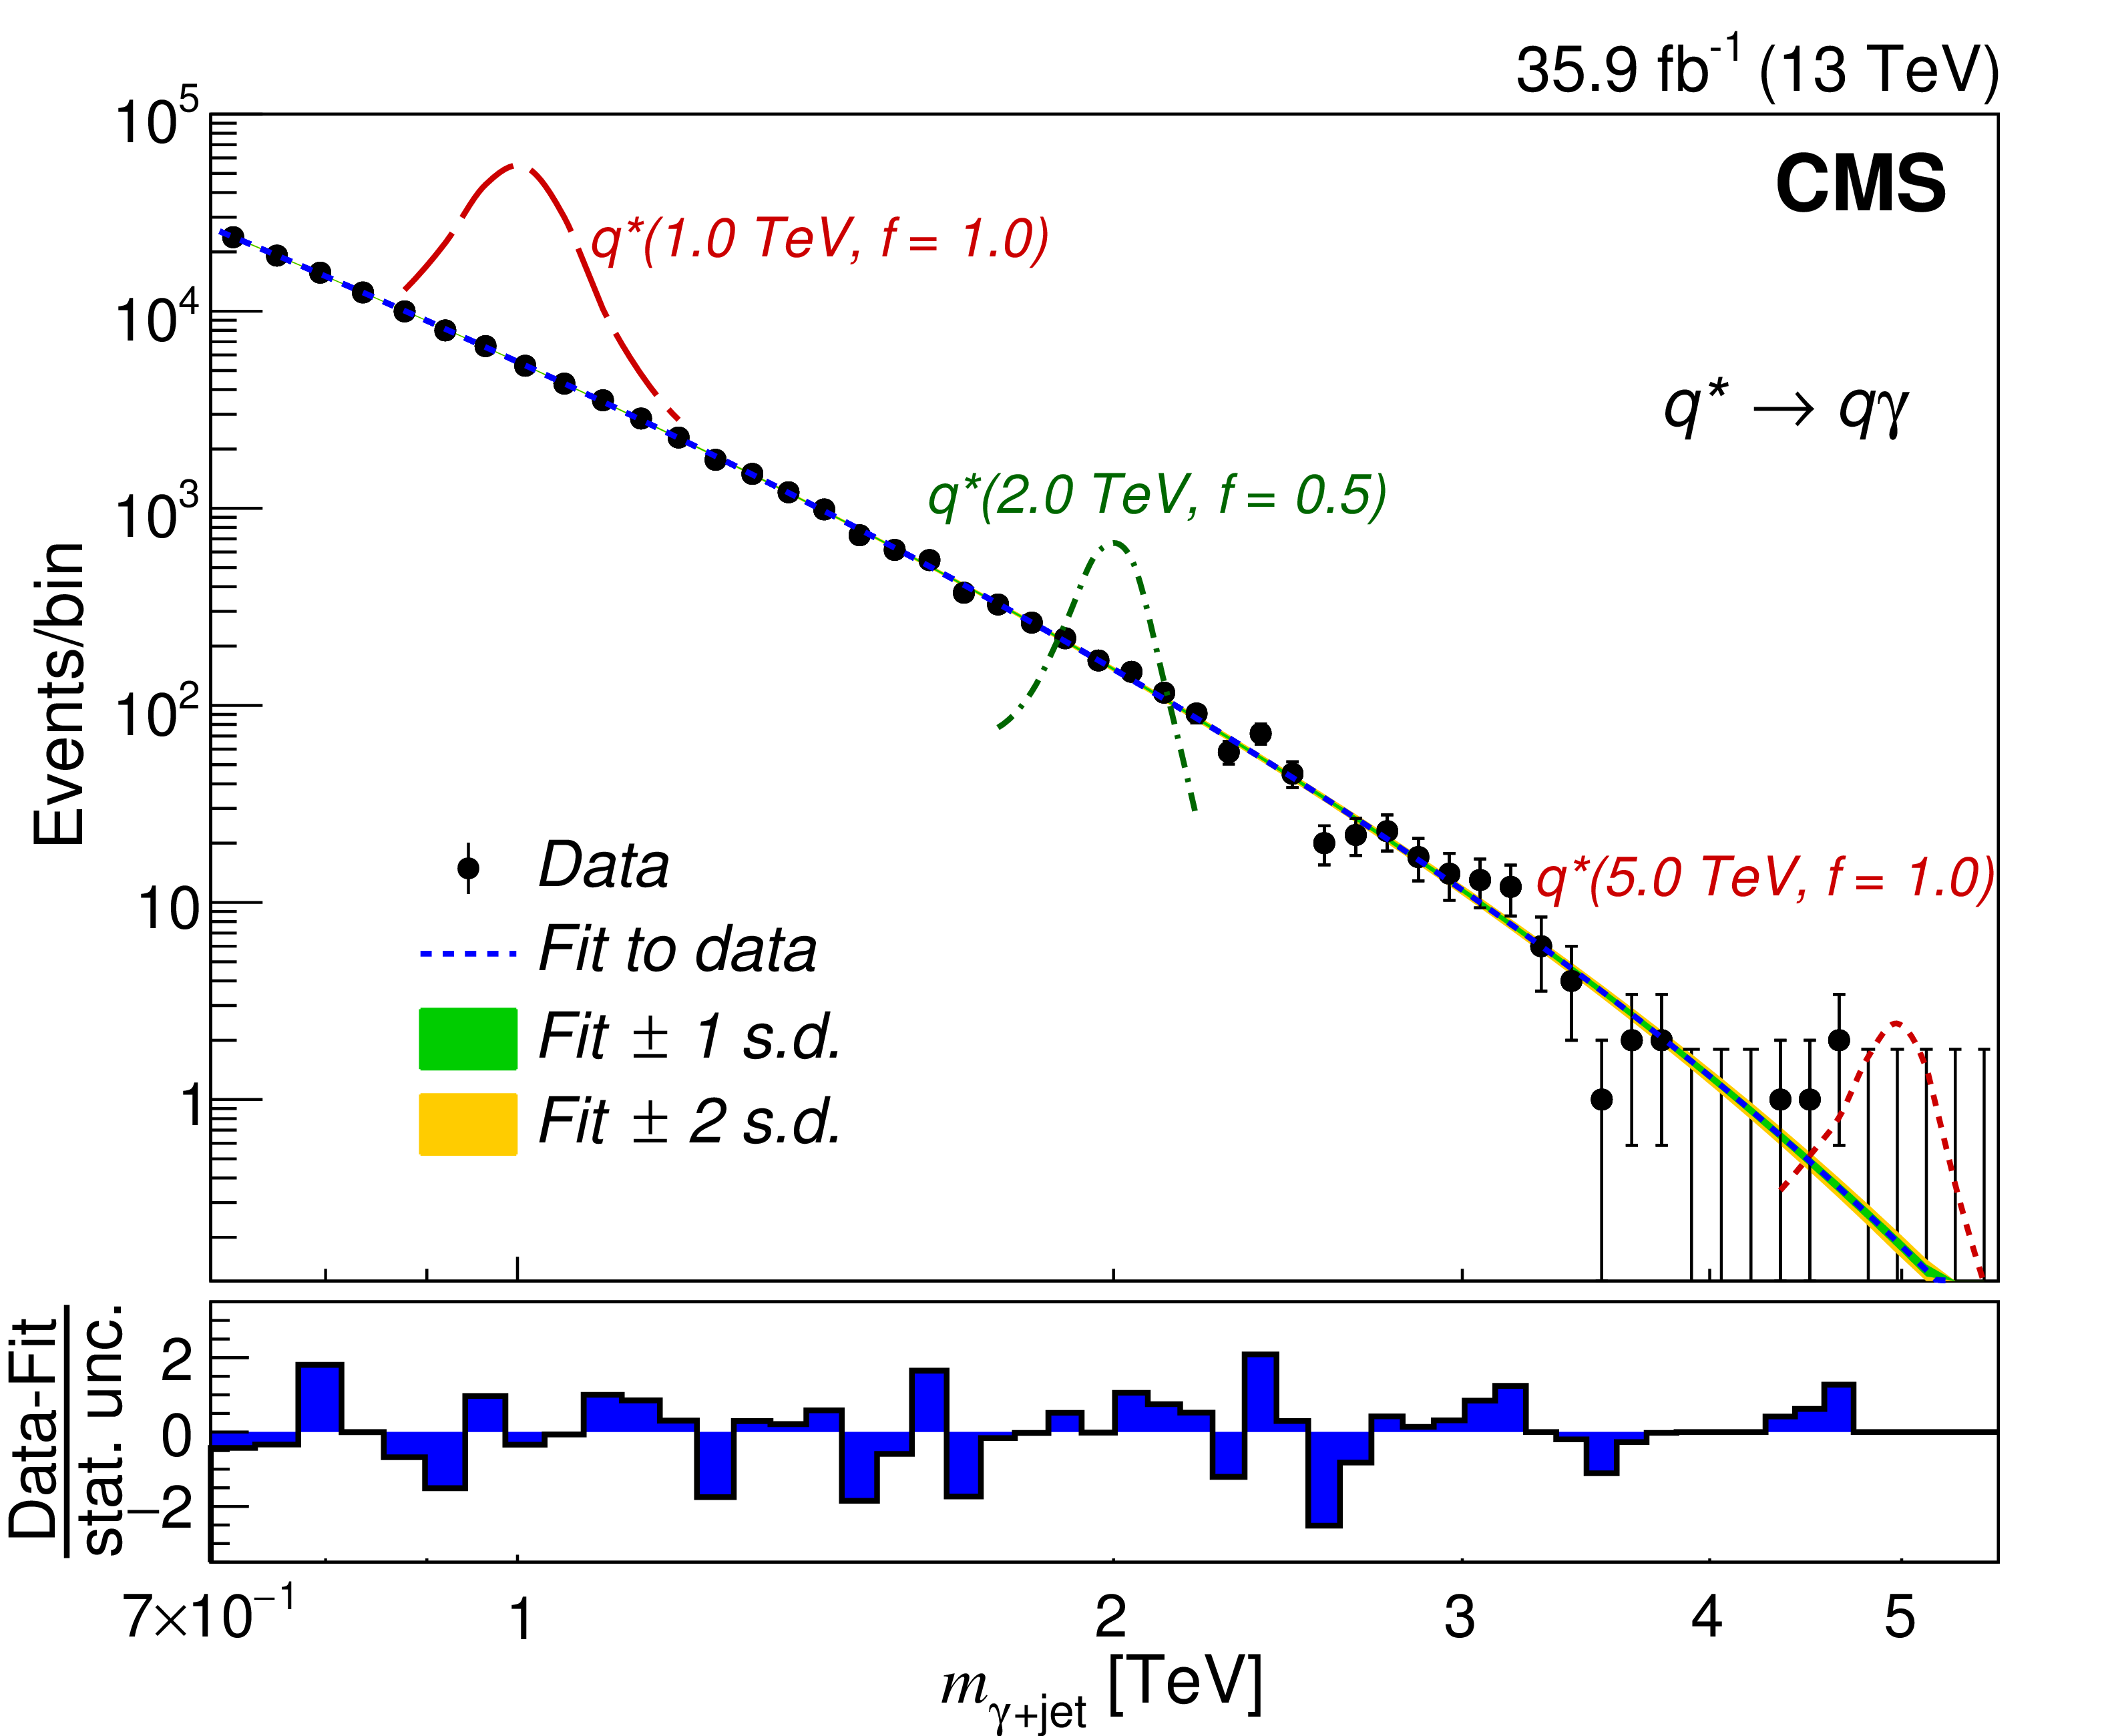
Figure 2:
The $ {\gamma + \text {jet}}$ invariant mass distribution in data (black points) for the inclusive category used for the ${{\mathrm{q} *}}$ analysis, after final selection. The result of the fit to the data using the parametrization defined in Eq. xxxxx) is shown by the blue dashed curve with associated bands indicating the uncertainty. The bin-by-bin pull, (Data-Fit)/(stat. unc.), where the denominator refers to the statistical uncertainty in data, is also presented. The green and yellow bands corresponds to 1 and 2 standard deviations, respectively from the mean value. Simulations of excited quark signals representing the expected excess of signal events over the background are shown for the mass values of 1.0 and 5.0 TeV for $f = 1.0$, and 2.0 TeV for $f = 0.5$. |
png pdf |
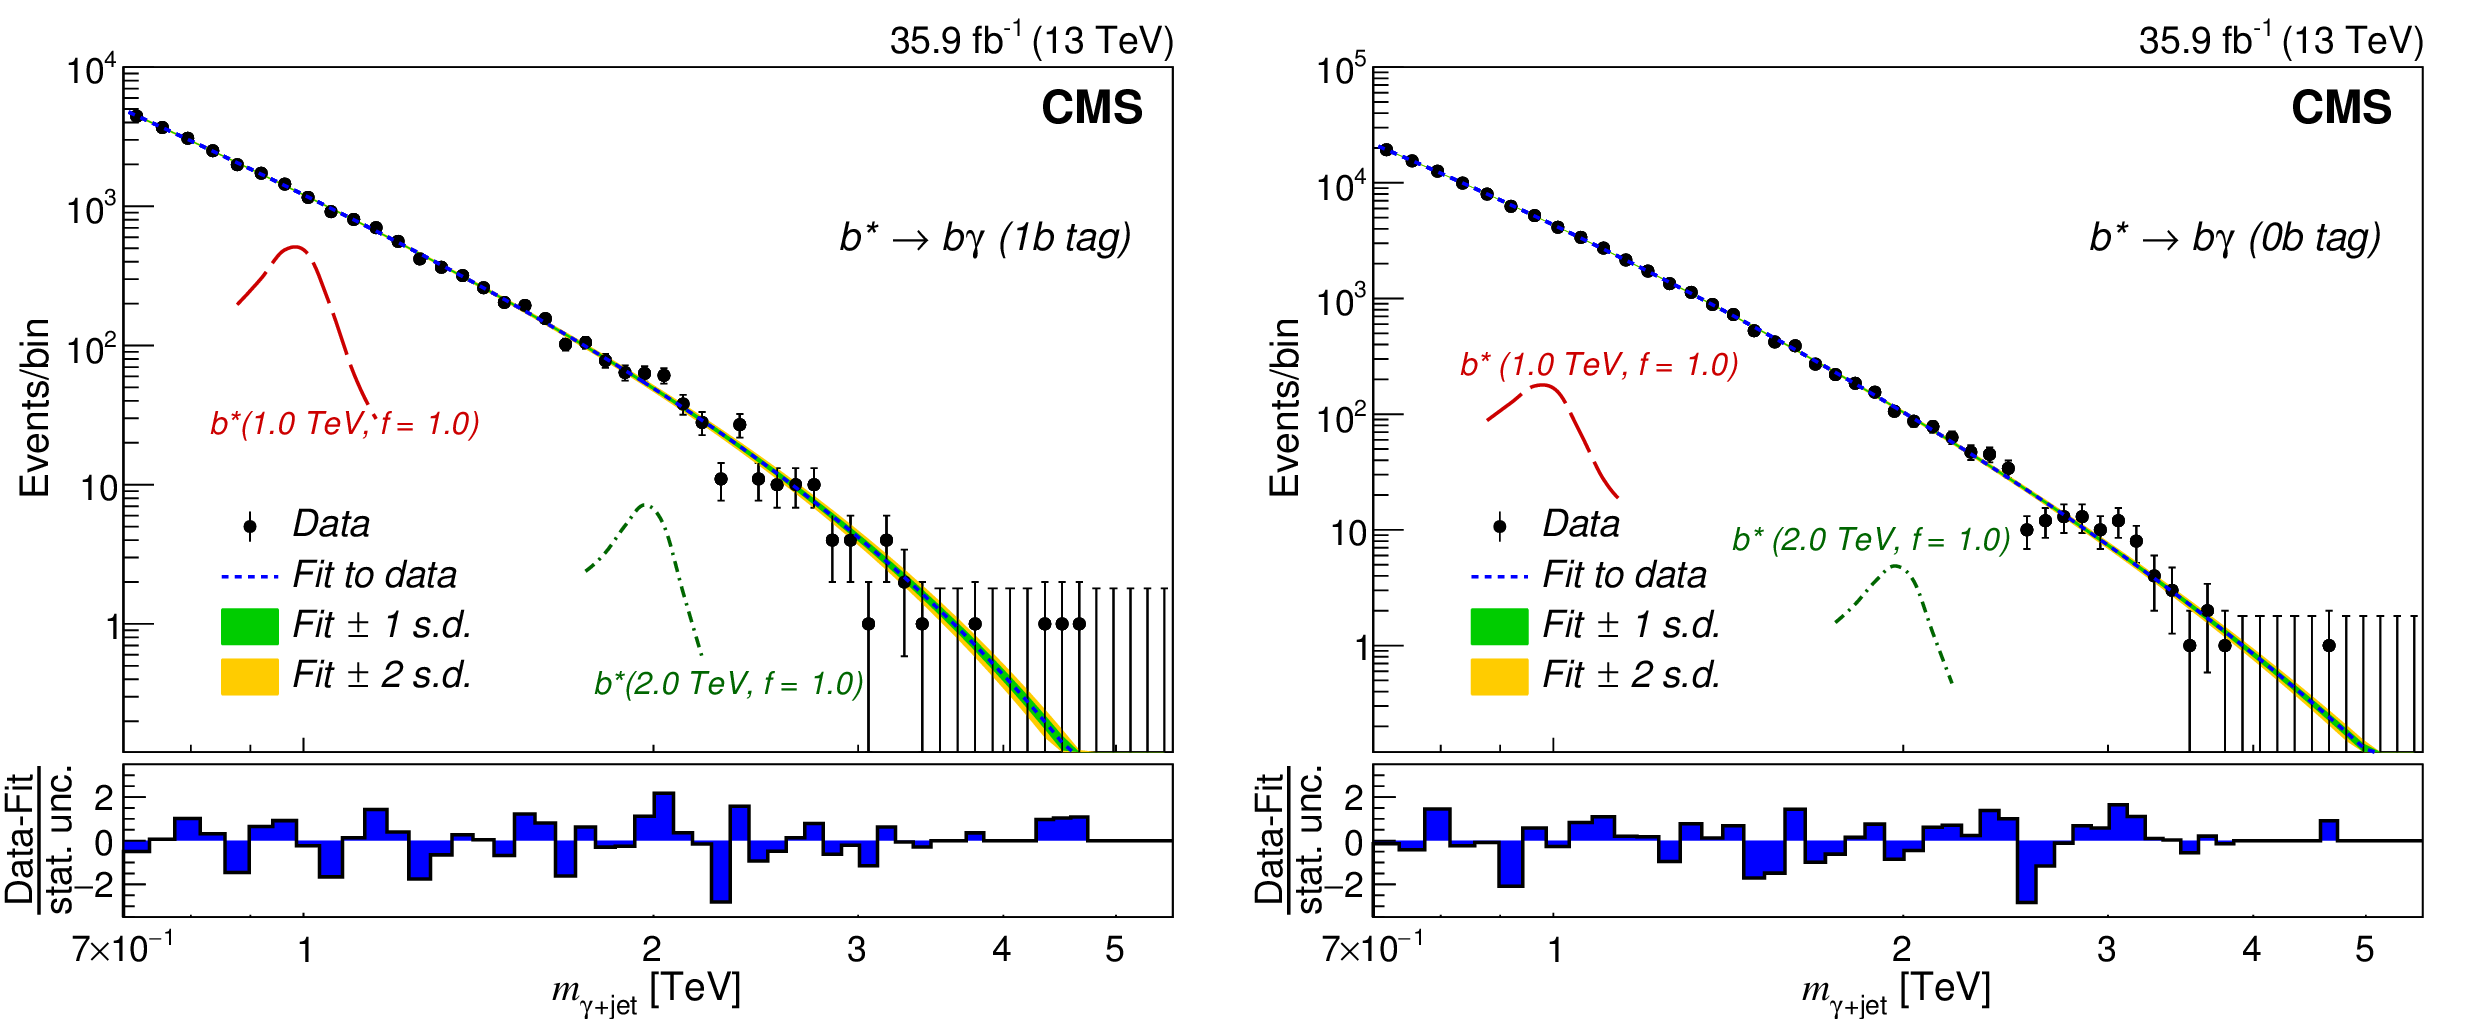
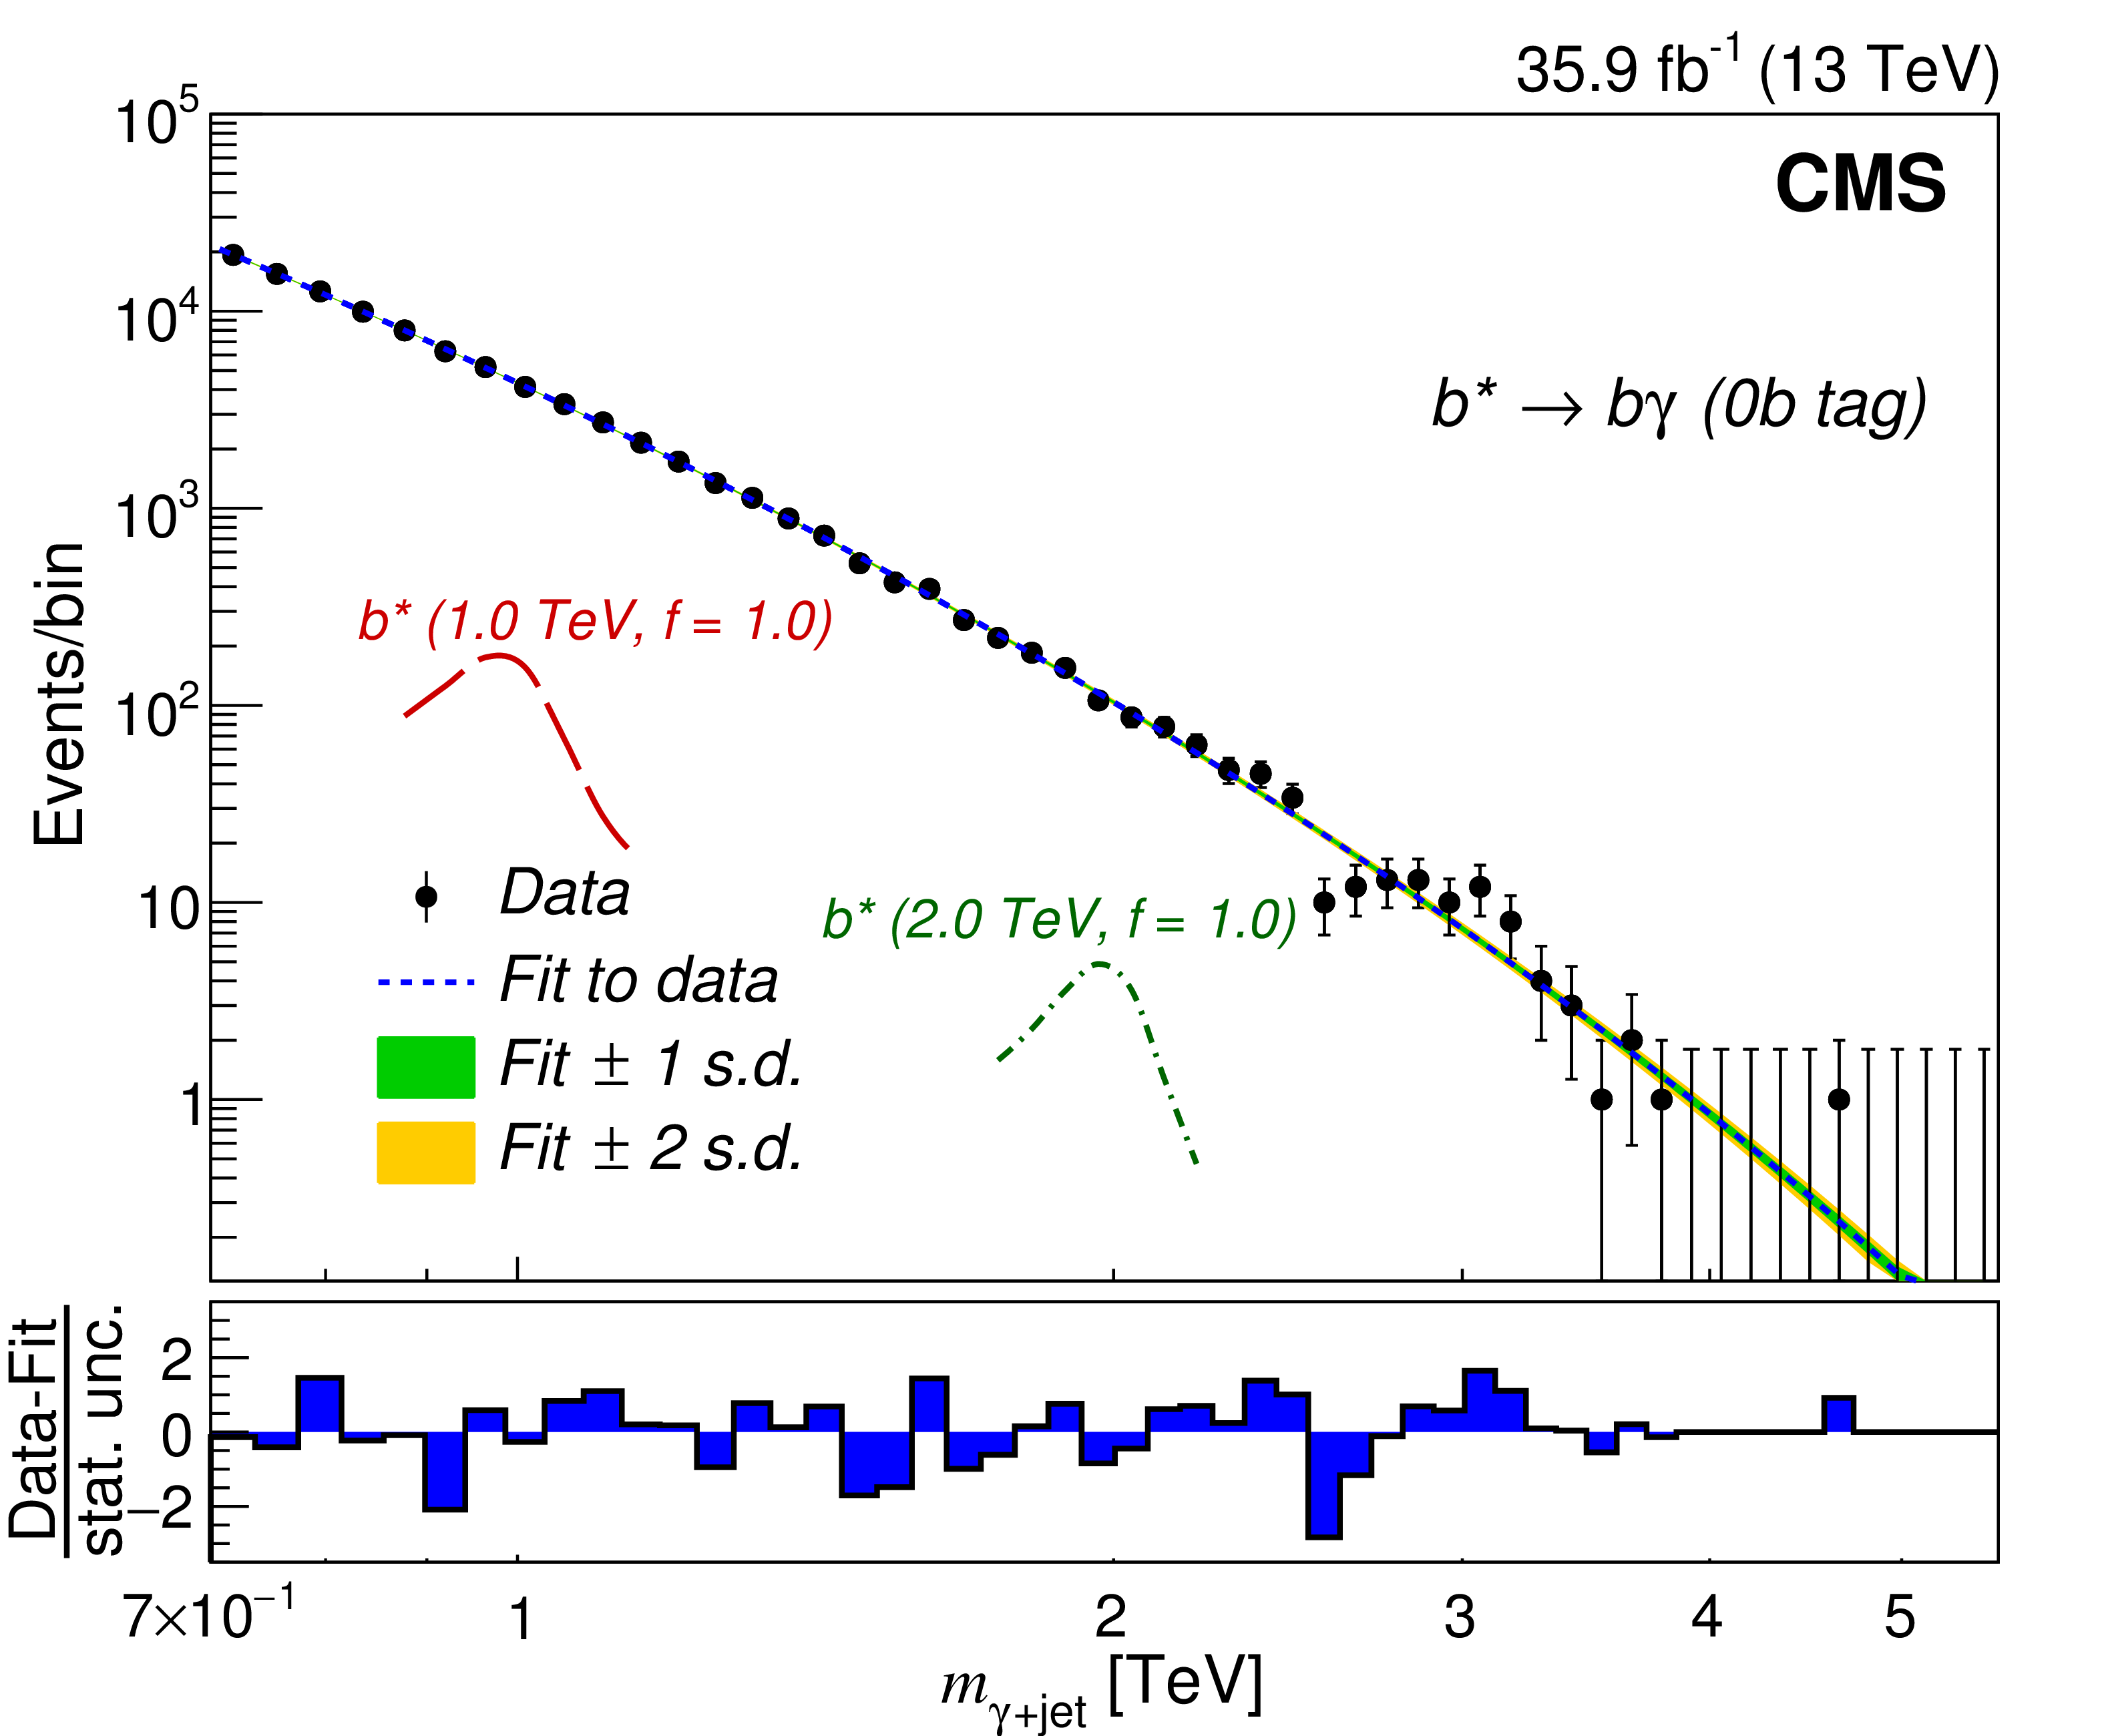
Figure 3:
The $ \gamma $+b-jet invariant mass distribution in data (black points) used for the ${{\mathrm{b} *}}$ analysis, after final selection for (left) 1b tag category and (right) 0b tag category. The result of the fit to the data using the parametrization defined in Eq. xxxxx) is shown by the blue dashed curve with associated bands indicating the uncertainty. The bin-by-bin pull, (Data-Fit)/(stat. unc.), where the denominator refers to the statistical uncertainty in data, is also presented. The green and yellow bands corresponds to 1 and 2 standard deviations, respectively from the mean value. Simulations of excited b quark signals representing the expected excess of signal events over the background are shown for the 1b and 0b tag categories for the mass values of 1.0 and 2.0 TeV for $f = 1.0$. |
png pdf |
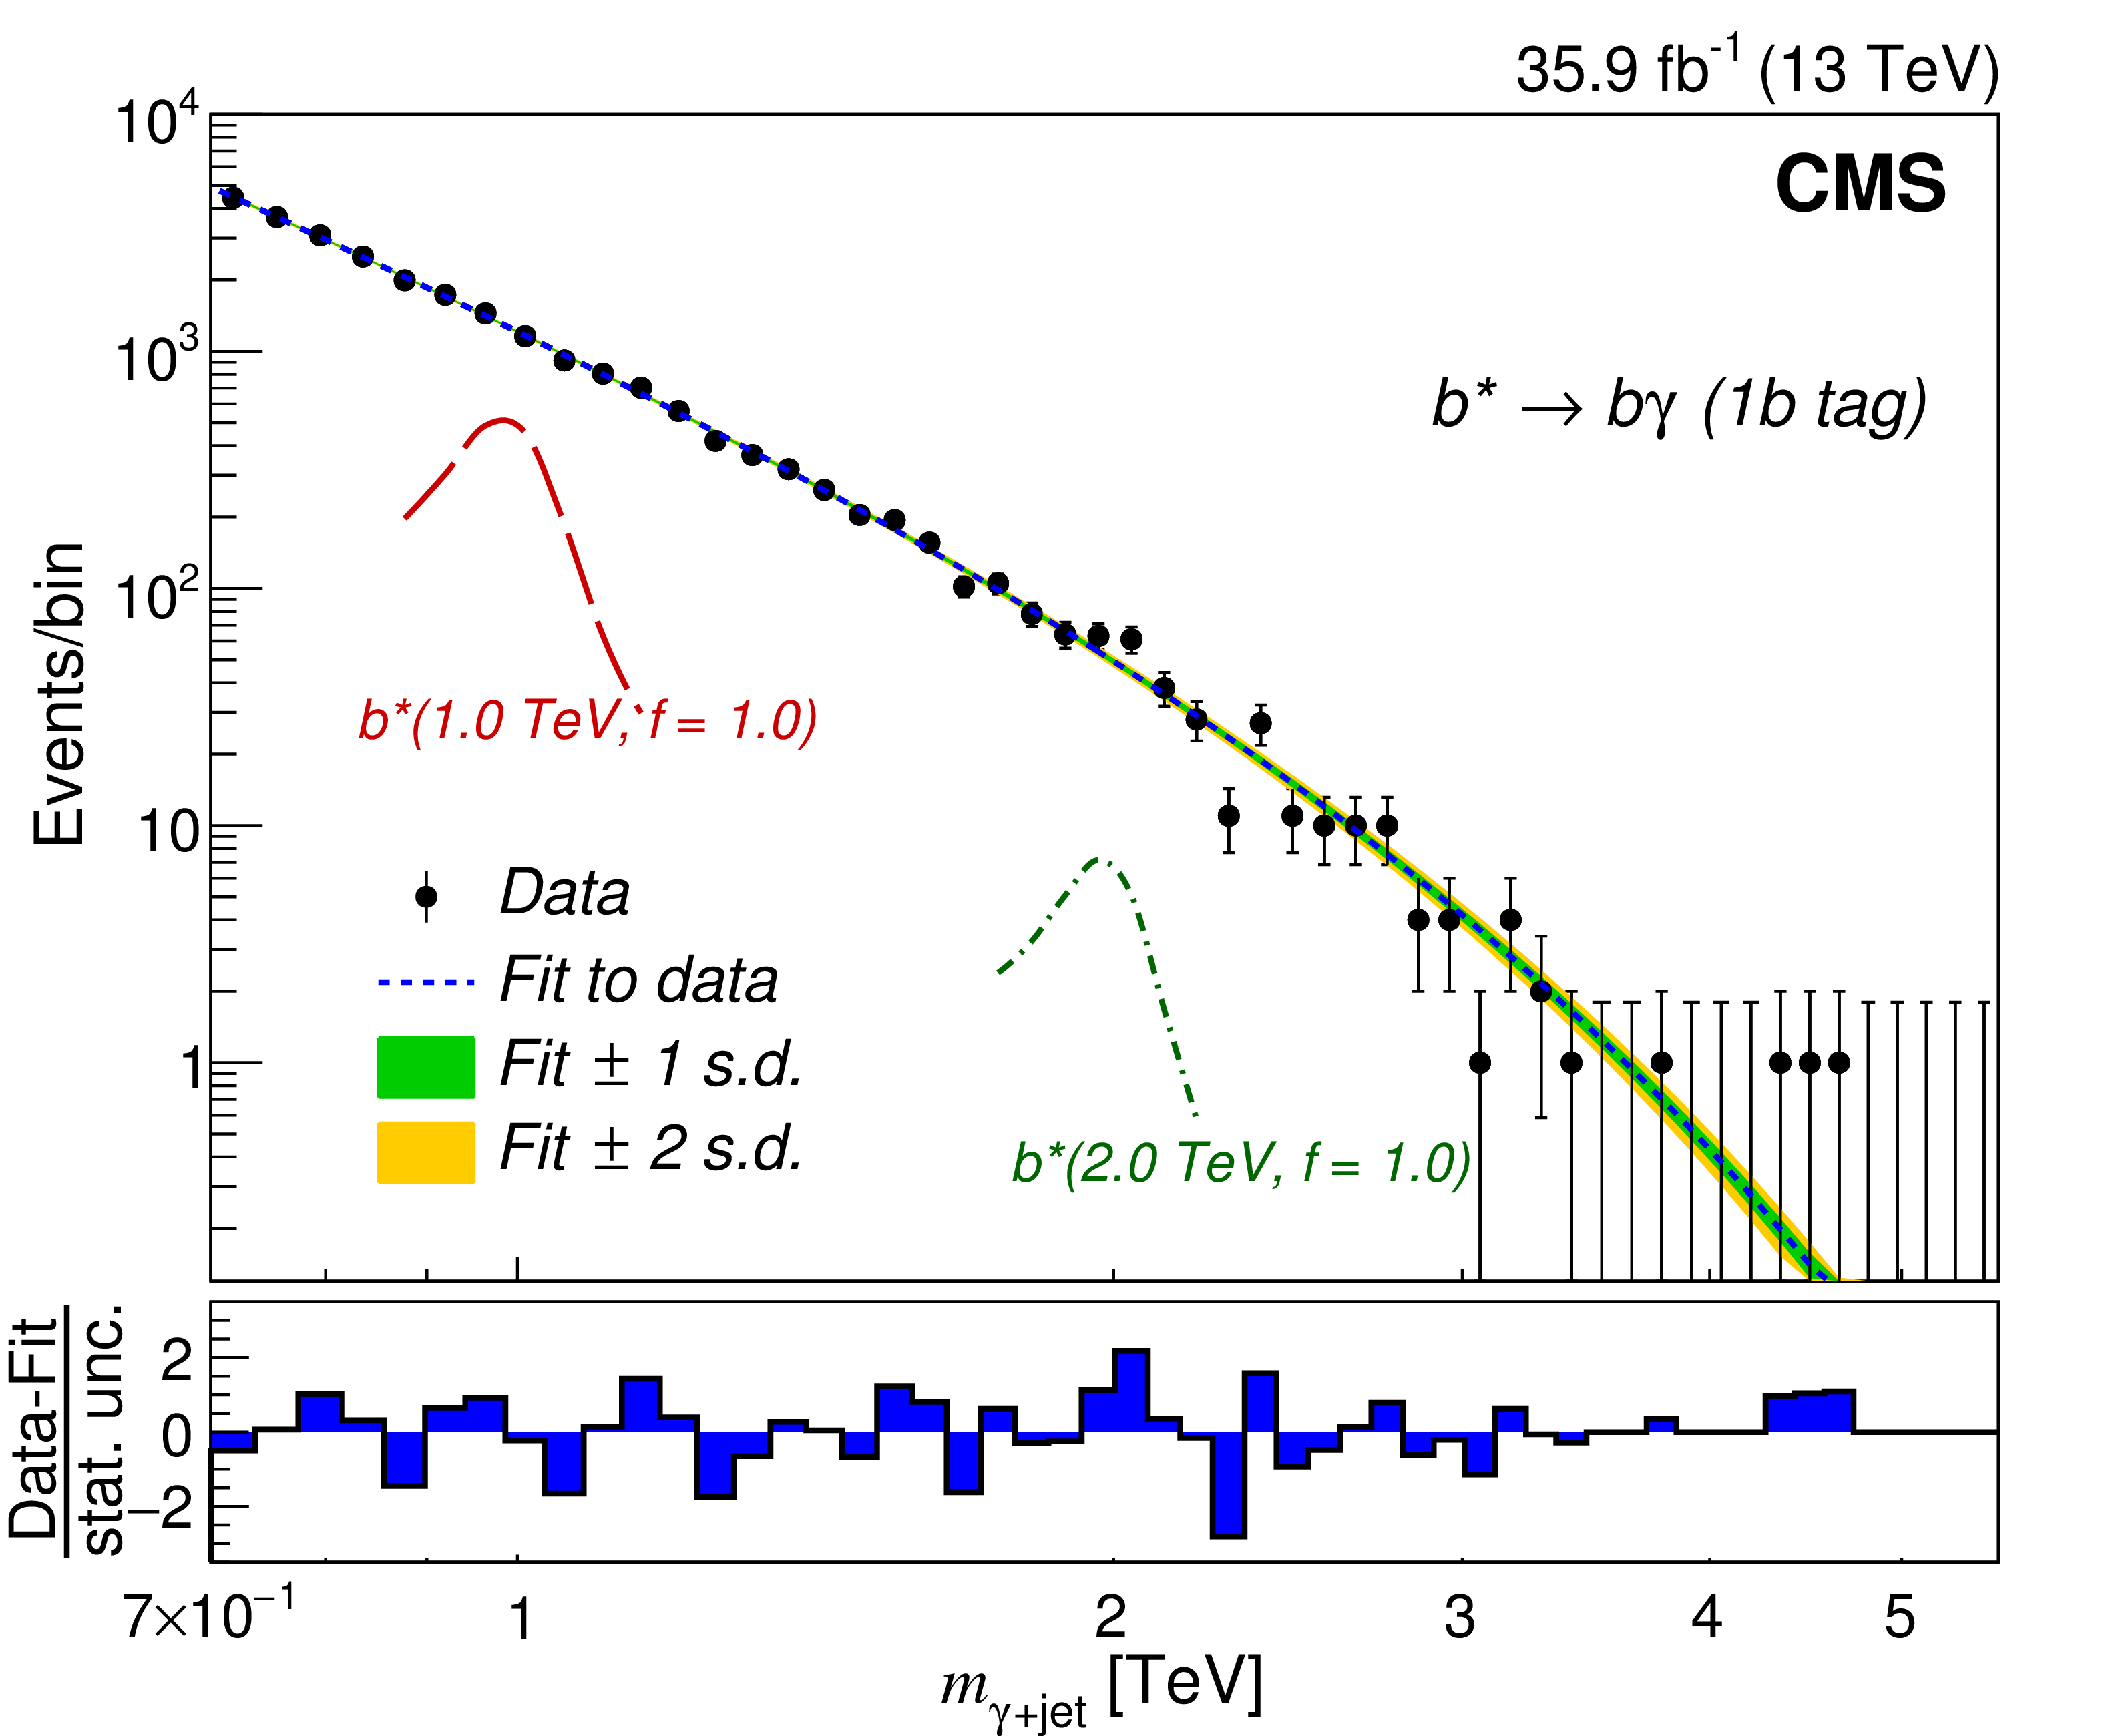
Figure 3-a:
The $ \gamma $+b-jet invariant mass distribution in data (black points) used for the ${{\mathrm{b} *}}$ analysis, after final selection for (left) 1b tag category and (right) 0b tag category. The result of the fit to the data using the parametrization defined in Eq. xxxxx) is shown by the blue dashed curve with associated bands indicating the uncertainty. The bin-by-bin pull, (Data-Fit)/(stat. unc.), where the denominator refers to the statistical uncertainty in data, is also presented. The green and yellow bands corresponds to 1 and 2 standard deviations, respectively from the mean value. Simulations of excited b quark signals representing the expected excess of signal events over the background are shown for the 1b and 0b tag categories for the mass values of 1.0 and 2.0 TeV for $f = 1.0$. |
png pdf |
Figure 3-b:
The $ \gamma $+b-jet invariant mass distribution in data (black points) used for the ${{\mathrm{b} *}}$ analysis, after final selection for (left) 1b tag category and (right) 0b tag category. The result of the fit to the data using the parametrization defined in Eq. xxxxx) is shown by the blue dashed curve with associated bands indicating the uncertainty. The bin-by-bin pull, (Data-Fit)/(stat. unc.), where the denominator refers to the statistical uncertainty in data, is also presented. The green and yellow bands corresponds to 1 and 2 standard deviations, respectively from the mean value. Simulations of excited b quark signals representing the expected excess of signal events over the background are shown for the 1b and 0b tag categories for the mass values of 1.0 and 2.0 TeV for $f = 1.0$. |
png pdf |
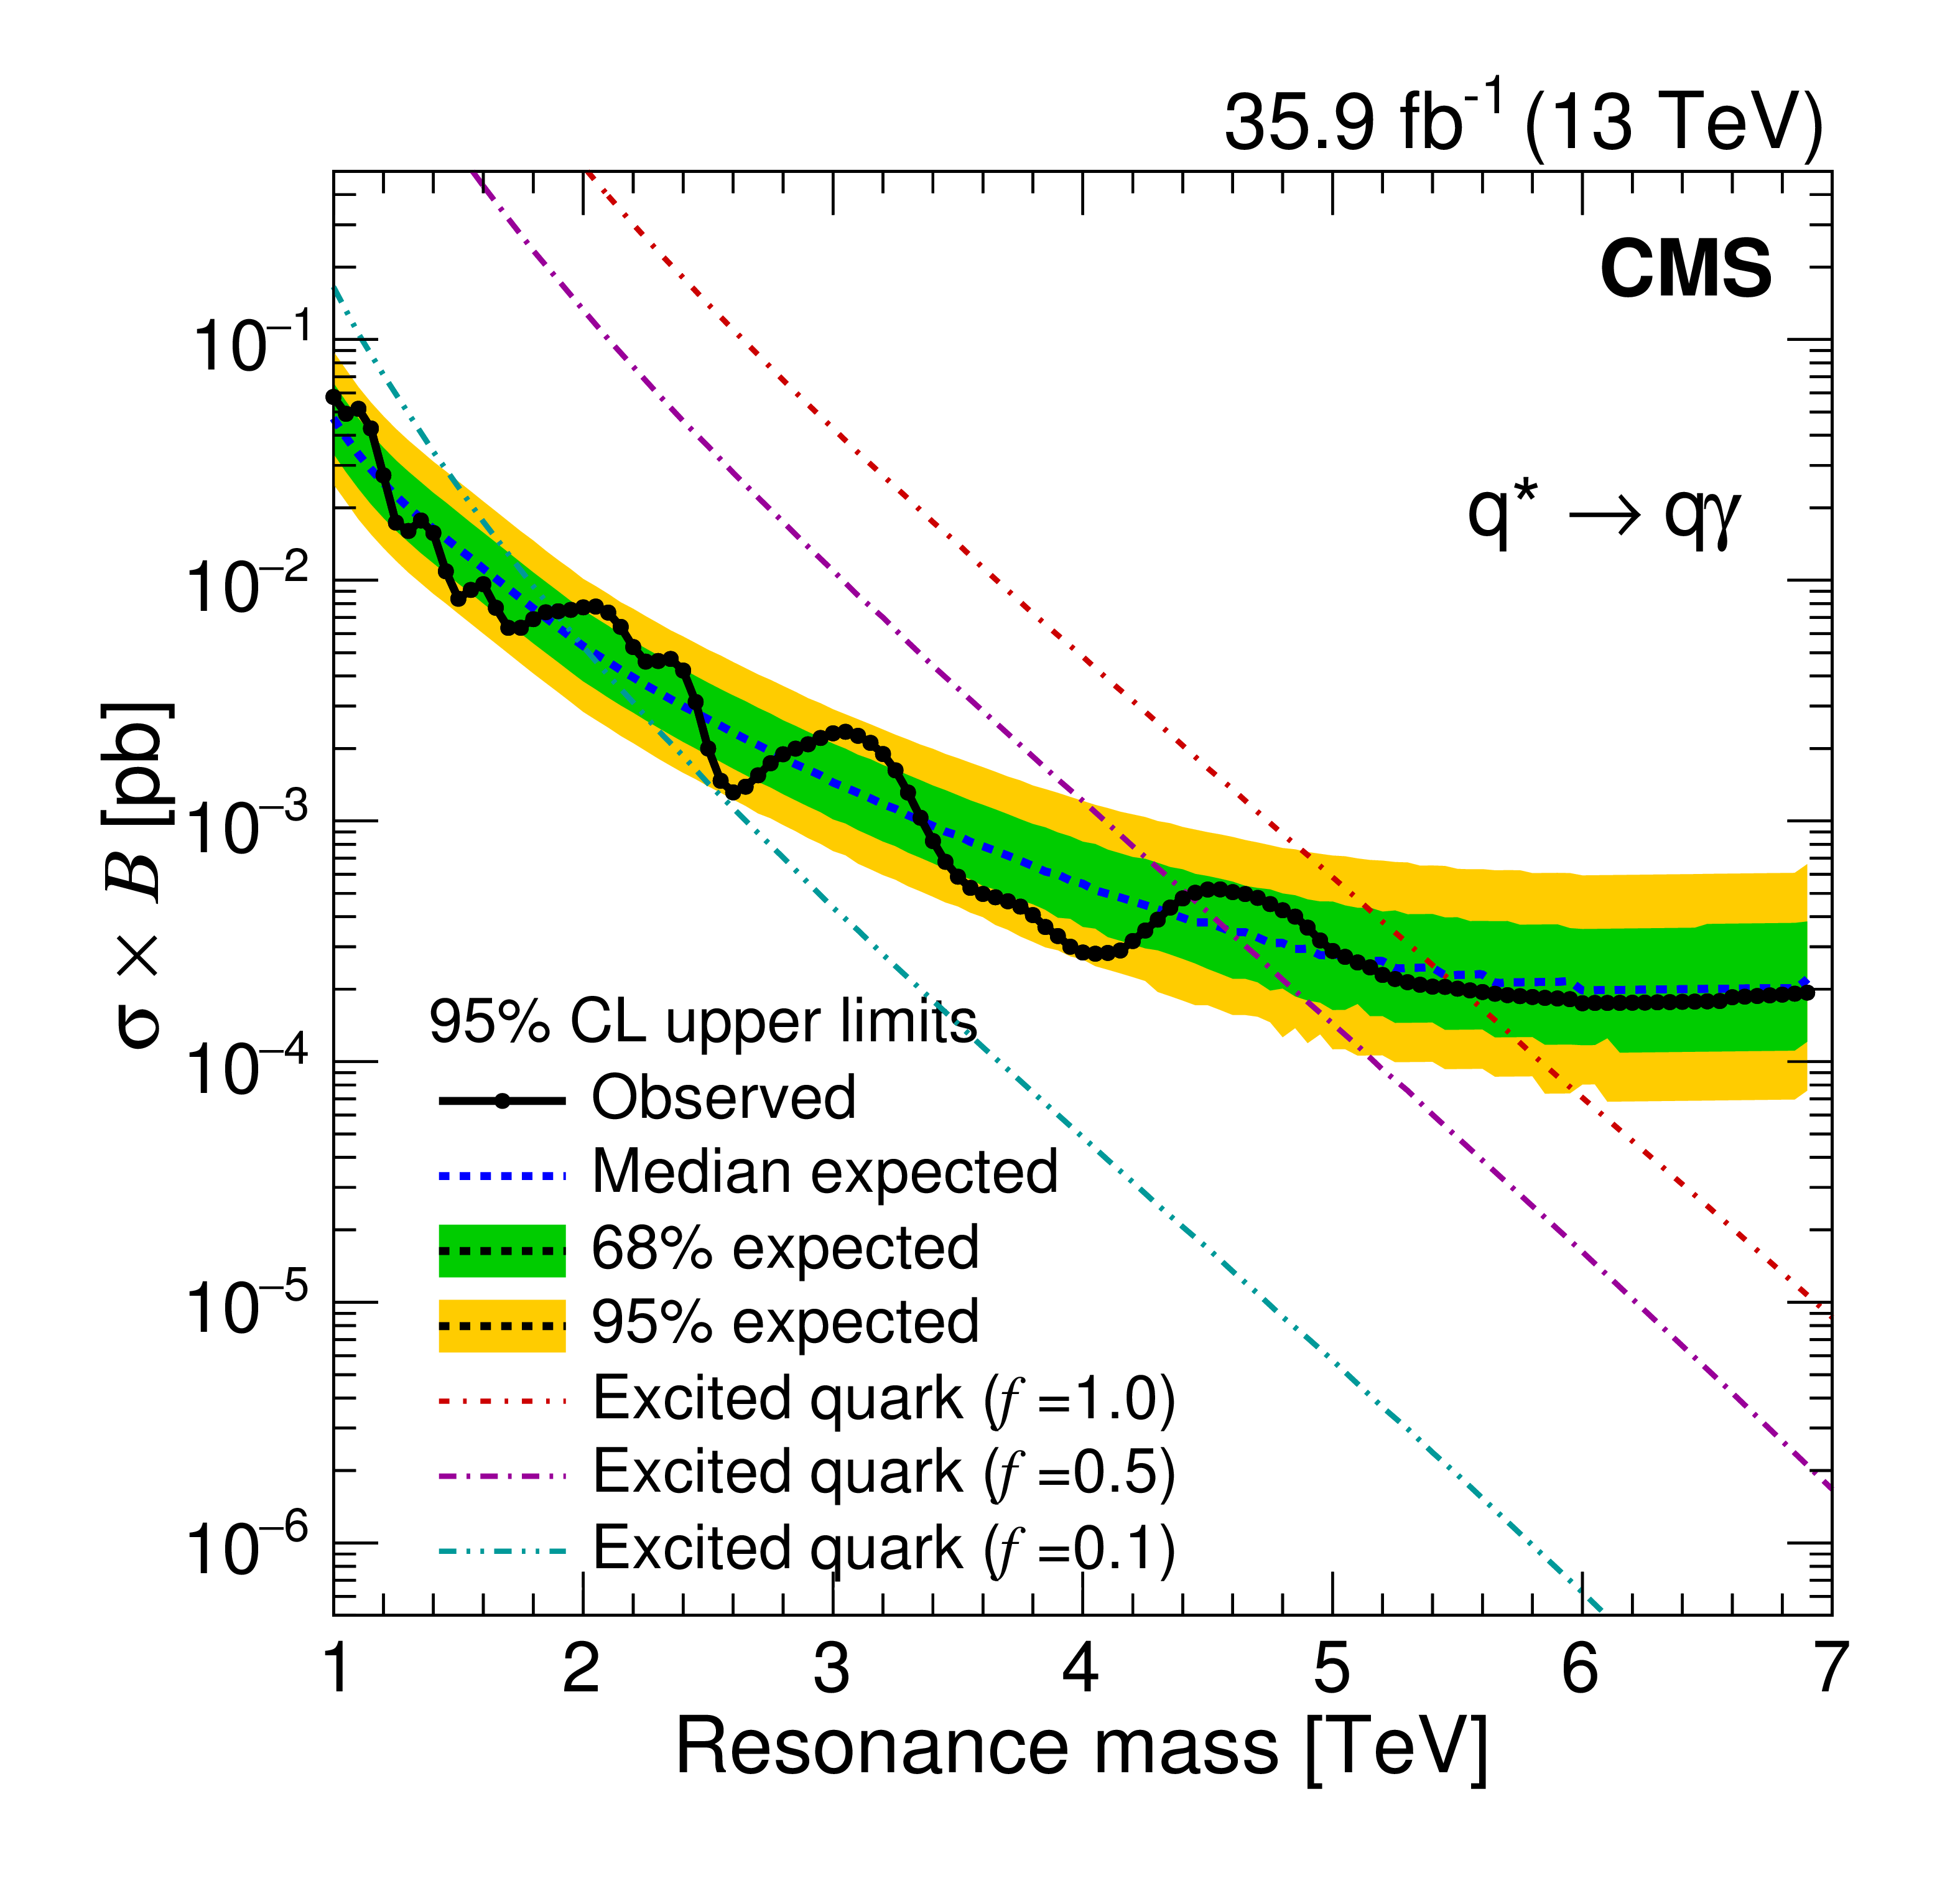
Figure 4:
The observed and expected upper limits at 95% CL on $\sigma \mathcal {B}$ as a function of the mass of the excited quark, for $f = 1.0$. The limits are compared with theoretical predictions for excited quark production for three couplings. The inner (green) band and the outer (yellow) band indicate the regions containing 68 and 95%, respectively, of the mean limits under the background-only hypothesis. |

png pdf |
Figure 5:
The observed and expected upper limits at 95% CL on $\sigma \mathcal {B}$ as a function of the mass of the excited b quark, for $f = 1.0$. The limits are compared with theoretical predictions for excited b quark production for three couplings. The inner (green) band and the outer (yellow) band indicate the regions containing 68 and 95%, respectively, of the mean limits under the background-only hypothesis. |

png pdf |
Figure 6:
The observed and expected regions excluded at 95% CL for ${{\mathrm{q} *}}$ and ${{\mathrm{b} *}}$ production and decay, as a function of $m_{{{\mathrm{q} *}}}$, $m_{{{\mathrm{b} *}}}$ and $f$. |
| Tables | |
png pdf |
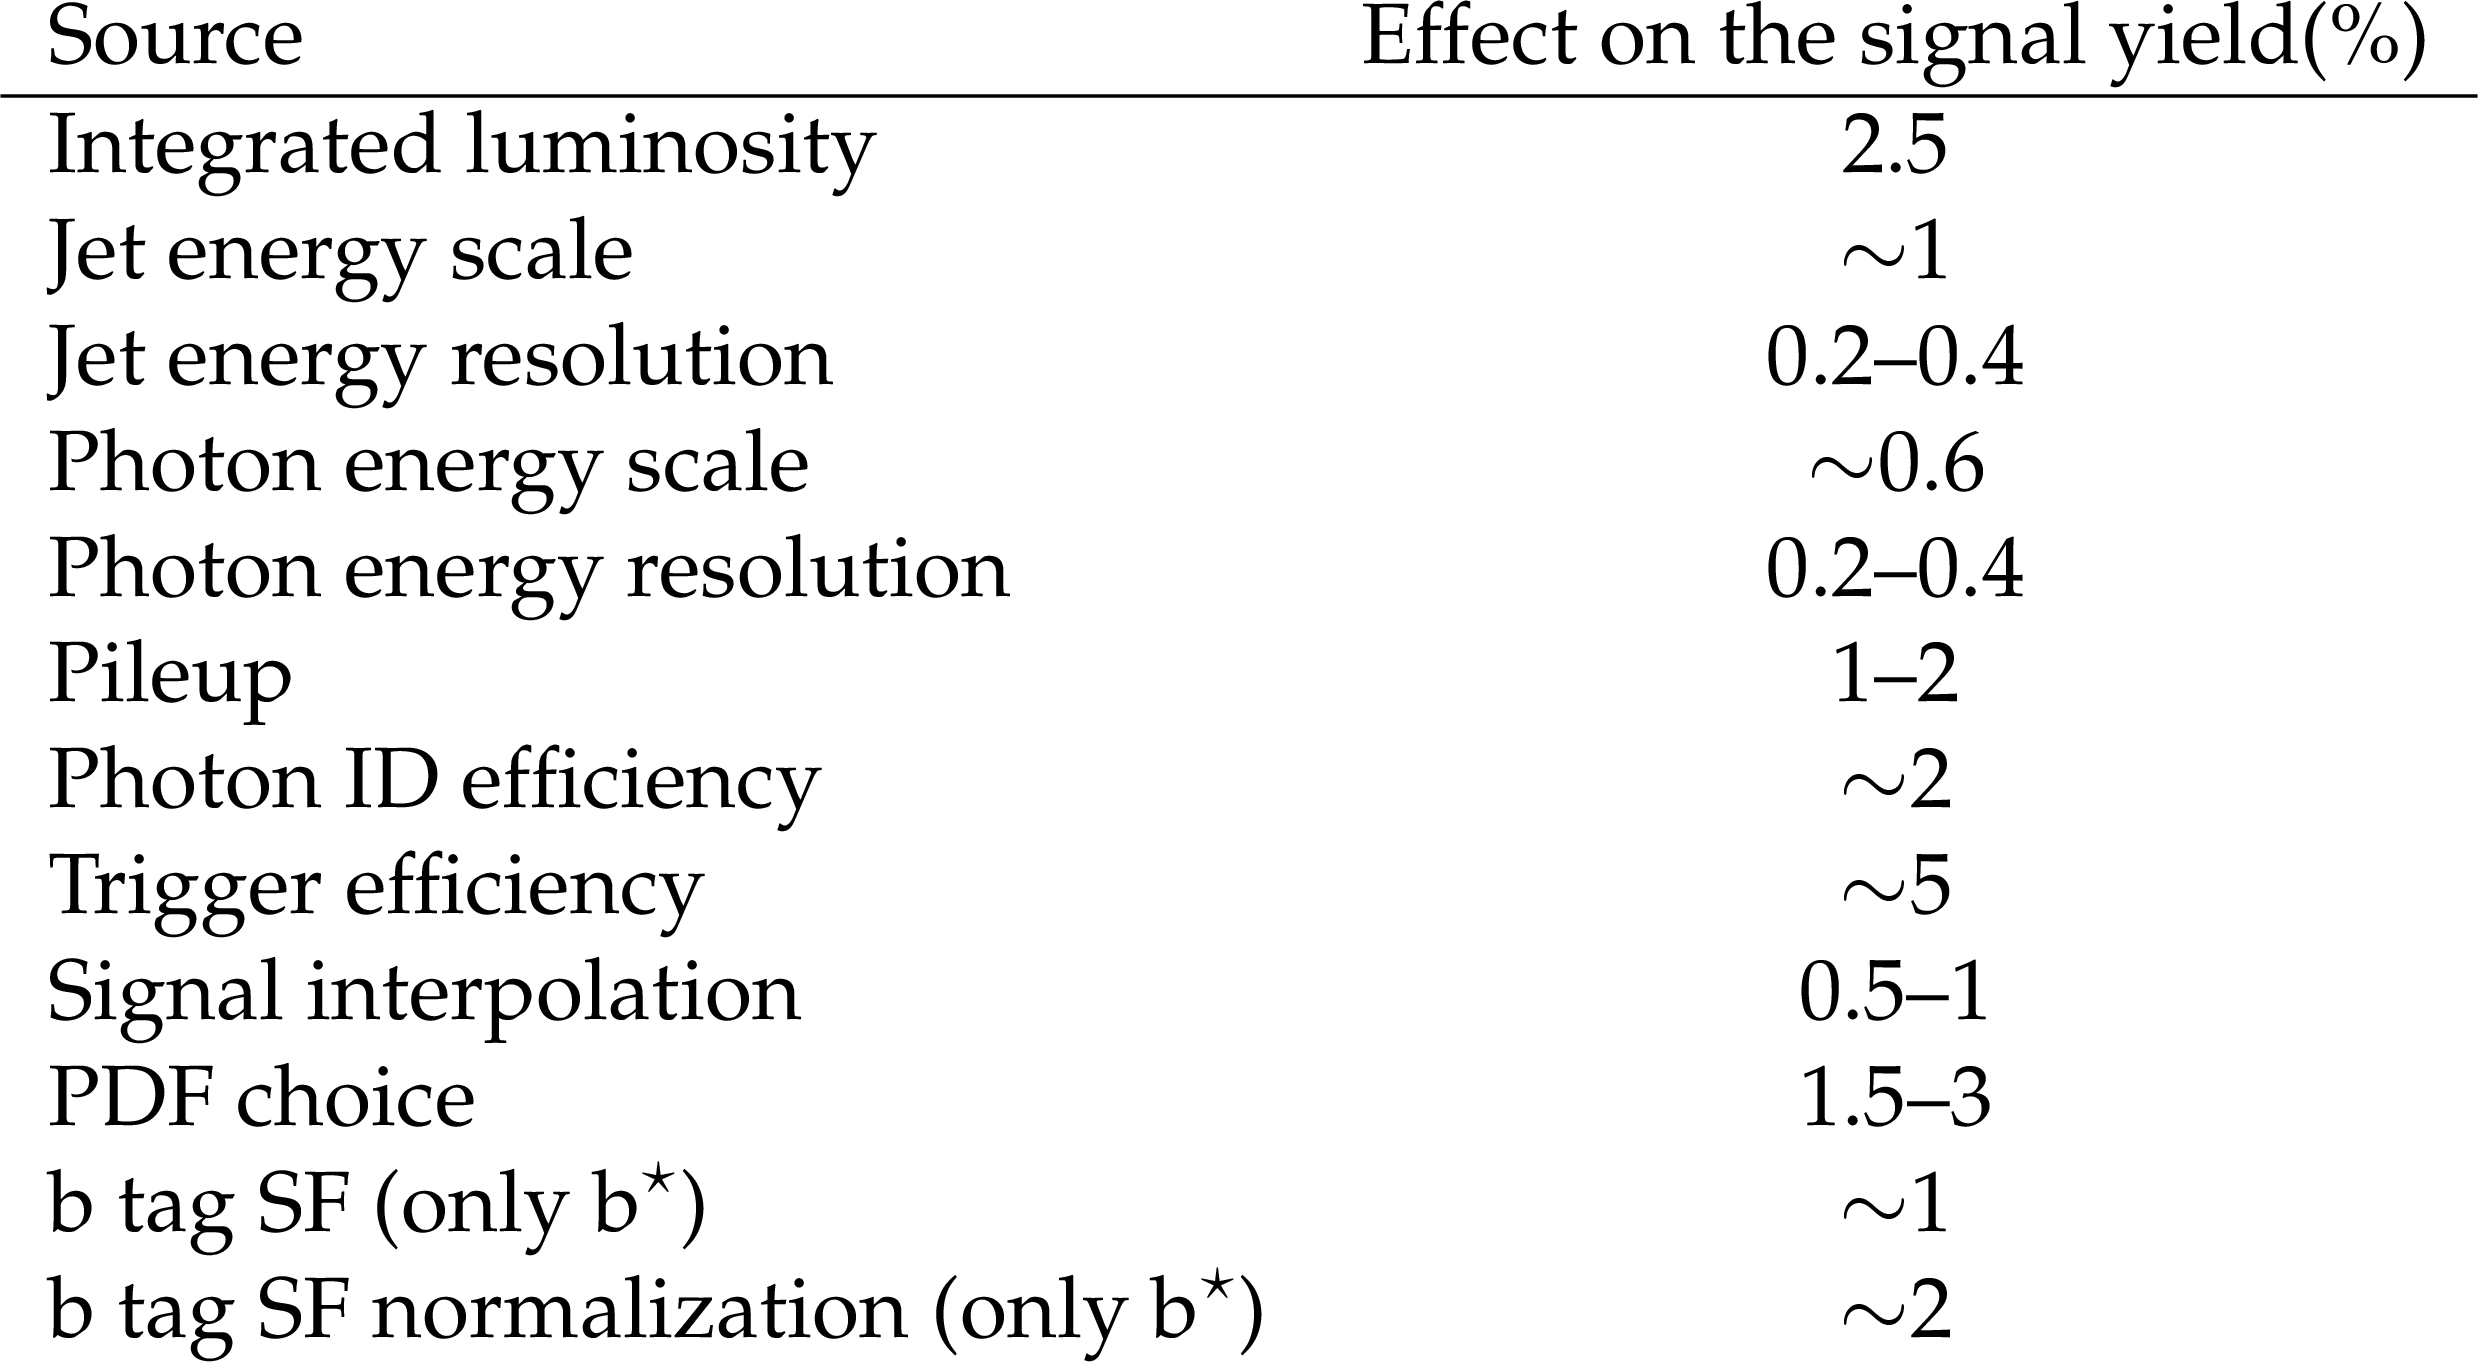
Table 1:
Summary of the dominant sources of uncertainties and their effect on the signal yield. |
| Summary |
| A search has been presented for excited states of light and b quarks in $ \gamma $+jet final states, using data corresponding to an integrated luminosity of 35.9 fb$^{-1}$, collected at $\sqrt{s} = $ 13 TeV. Upper limits at the 95% confidence level are placed on the product of production cross section and decay branching fraction for the presence of ${\mathrm{q}*}$ and ${\mathrm{b}*}$ excited quarks in $ \gamma $+jet final states. Comparing these upper limits with theoretical predictions, excited light quarks within the mass range 1.0 $ < m_{\mathrm{q}*} < $ 5.5 TeV and excited b quarks within the mass range 1.0 $ < m_{\mathrm{b}*} < $ 1.8 TeV are excluded at 95% confidence level, assuming standard model couplings. These are the most sensitive limits for ${\mathrm{q}*}$ and ${\mathrm{b}*}$ searches in the $ \gamma $+jet final states. In addition, the search for excited b quarks is the first to be presented in any final state at $\sqrt{s} = $ 13 TeV. |
| References | ||||
| 1 | W. Buchmuller | Composite quarks and leptons | Acta Phys. Austriaca Suppl. 27 (1985) 517 | |
| 2 | U. Baur, I. Hinchliffe, and D. Zeppenfeld | Excited quark production at hadron colliders | Int. J. Mod. Phys. A 2 (1987) 1285 | |
| 3 | U. Baur, M. Spira, and P. M. Zerwas | Excited quark and lepton production at hadron colliders | PRD 42 (1990) 815 | |
| 4 | S. Bhattacharya, S. S. Chauhan, B. C. Choudhary, and D. Choudhury | Quark excitations through the prism of direct photon plus jet at the LHC | PRD 80 (2009) 015014 | 0901.3927 |
| 5 | CDF Collaboration | Search for excited quarks in $ \text{p}\bar{\text{p}} $ collisions at $ \sqrt{s} = $ 1.8 TeV | PRL 72 (1994) 3004 | |
| 6 | CDF Collaboration | Search for new particles decaying to dijets at CDF | PRD 55 (1997) 5263 | hep-ex/9702004 |
| 7 | CDF Collaboration | Search for new particles decaying into dijets in proton-antiproton collisions at $ \sqrt{s} = $ 1.96 TeV | PRD 79 (2009) 112002 | 0812.4036 |
| 8 | CMS Collaboration | Search for excited quarks in the $ \gamma + $jet final state in proton-proton collisions at $ \sqrt{s}= $ 8 TeV | PLB 738 (2014) 274 | CMS-EXO-13-003 1406.5171 |
| 9 | CMS Collaboration | Search for resonances and quantum black holes using dijet mass spectra in proton-proton collisions at $ \sqrt{s} = $ 8 TeV | PRD 91 (2015) 052009 | CMS-EXO-12-059 1501.04198 |
| 10 | CMS Collaboration | Search for narrow resonances decaying to dijets in proton-proton collisions at $ \sqrt{s} = $ 13 TeV | PRL 116 (2016) 071801 | CMS-EXO-15-001 1512.01224 |
| 11 | ATLAS Collaboration | Search for new phenomena with photon+jet events in proton-proton collisions at $ \sqrt{s}= $ 13 TeV with the ATLAS detector | JHEP 03 (2016) 041 | 1512.05910 |
| 12 | CMS Collaboration | Performance of photon reconstruction and identification with the CMS detector in proton-proton collisions at $ \sqrt{s} = $ 8 TeV | JINST 10 (2015) P08010 | CMS-EGM-14-001 1502.02702 |
| 13 | CMS Collaboration | The CMS experiment at the CERN LHC | JINST 3 (2008) S08004 | CMS-00-001 |
| 14 | CMS Collaboration | Particle-flow reconstruction and global event description with the cms detector | JINST 12 (2017) P10003 | CMS-PRF-14-001 1706.04965 |
| 15 | M. Cacciari, G. P. Salam, and G. Soyez | The anti-$ k_t $ jet clustering algorithm | JHEP 04 (2008) 063 | 0802.1189 |
| 16 | CMS Collaboration | Jet energy scale and resolution in the CMS experiment in pp collisions at 8 TeV | JINST 12 (2017) P02014 | CMS-JME-13-004 1607.03663 |
| 17 | M. Cacciari, G. P. Salam, and G. Soyez | FastJet user manual | EPJC 72 (2012) 1896 | 1111.6097 |
| 18 | CMS Collaboration | Jet algorithms performance in 13 TeV data | CMS-PAS-JME-16-003 | CMS-PAS-JME-16-003 |
| 19 | CMS Collaboration | Identification of b quark jets at the CMS Experiment in the LHC Run 2 | CMS-PAS-BTV-15-001 | CMS-PAS-BTV-15-001 |
| 20 | CMS Collaboration | Identification of b-quark jets with the CMS experiment | JINST 8 (2013) P04013 | CMS-BTV-12-001 1211.4462 |
| 21 | T. Sj$\ddot\texto$strand et al. | An introduction to PYTHIA 8.2 | CPC 191 (2015) 159 | 1410.3012 |
| 22 | GEANT4 Collaboration | GEANT4 --- a simulation toolkit | NIMA 506 (2003) 250 | |
| 23 | CMS Collaboration | Event generator tunes obtained from underlying event and multiparton scattering measurements | EPJC 76 (2016) 155 | CMS-GEN-14-001 1512.00815 |
| 24 | P. Skands, S. Carrazza, and J. Rojo | Tuning PYTHIA 8.1: the Monash 2013 Tune | EPJC 74 (2014) 3024 | 1404.5630 |
| 25 | NNPDF Collaboration | Parton distributions with LHC data | NPB 867 (2013) 244 | 1207.1303 |
| 26 | J. Alwall et al. | The automated computation of tree-level and next-to-leading order differential cross sections, and their matching to parton shower simulations | JHEP 07 (2014) 079 | 1405.0301 |
| 27 | J. Alwall et al. | Comparative study of various algorithms for the merging of parton showers and matrix elements in hadronic collisions | EPJC 53 (2008) 473 | 0706.2569 |
| 28 | R. A. Fisher | On the interpretation of $ \chi^{2} $ from contingency tables, and the calculation of p | J. Roy. Stat. Soc. 85 (1922) 87 | |
| 29 | J. Butterworth et al. | PDF4LHC recommendations for LHC Run II | JPG 43 (2016) 023001 | 1510.03865 |
| 30 | CMS Collaboration | CMS luminosity measurement for the 2016 data taking period | CMS-PAS-LUM-17-001 | CMS-PAS-LUM-17-001 |
| 31 | T. Junk | Confidence level computation for combining searches with small statistics | NIMA 434 (1999) 435 | hep-ex/9902006 |
| 32 | A. L. Read | Presentation of search results: The CLs technique | JPG 28 (2002) 2693 | |
| 33 | G. Cowan, K. Cranmer, E. Gross, and O. Vitells | Asymptotic formulae for likelihood-based tests of new physics | EPJC 71 (2011) 1554 | 1007.1727 |
|
|
Compact Muon Solenoid LHC, CERN |
|

|

|

|

|

|