

Compact Muon Solenoid
LHC, CERN
| CMS-FSQ-13-010 ; CERN-EP-2016-191 | ||
| Studies of inclusive four-jet production with two b-tagged jets in proton-proton collisions at 7 TeV | ||
| CMS Collaboration | ||
| 12 September 2016 | ||
| Phys. Rev. D 94 (2016) 112005 | ||
| Abstract: Measurements are presented of the cross section for the production of at least four jets, of which at least two originate from b quarks, in proton-proton collisions. Data collected with the CMS detector at the LHC at a center-of-mass energy of 7 TeV are used, corresponding to an integrated luminosity of 3 pb$^{-1}$. The cross section is measured as a function of the jet transverse momentum for $p_{\mathrm{T}} > $ 20 GeV, and of the jet pseudorapidity for $ | {\eta} | < $ 2.4 (b jets), 4.7 (untagged jets). The correlations in azimuthal angle and $p_{\mathrm{T}}$ between the jets are also studied. The inclusive cross section is measured to be $\sigma(\mathrm{ p }\mathrm{ p }\to 2 \mathrm{ b } + 2 \mathrm{j} + \mathrm{X}) =$ 69 $\pm$ 3 (stat) $\pm$ 24 (syst) nb. The $\eta$ and $ p_{\mathrm{T}}$ distributions of the four jets and the correlations between them are well reproduced by event generators that combine perturbative QCD calculations at next-to-leading-order accuracy with contributions from parton showers and multiparton interactions. | ||
| Links: e-print arXiv:1609.03489 [hep-ex] (PDF) ; CDS record ; inSPIRE record ; HepData record ; CADI line (restricted) ; | ||
| Figures | |
png pdf |
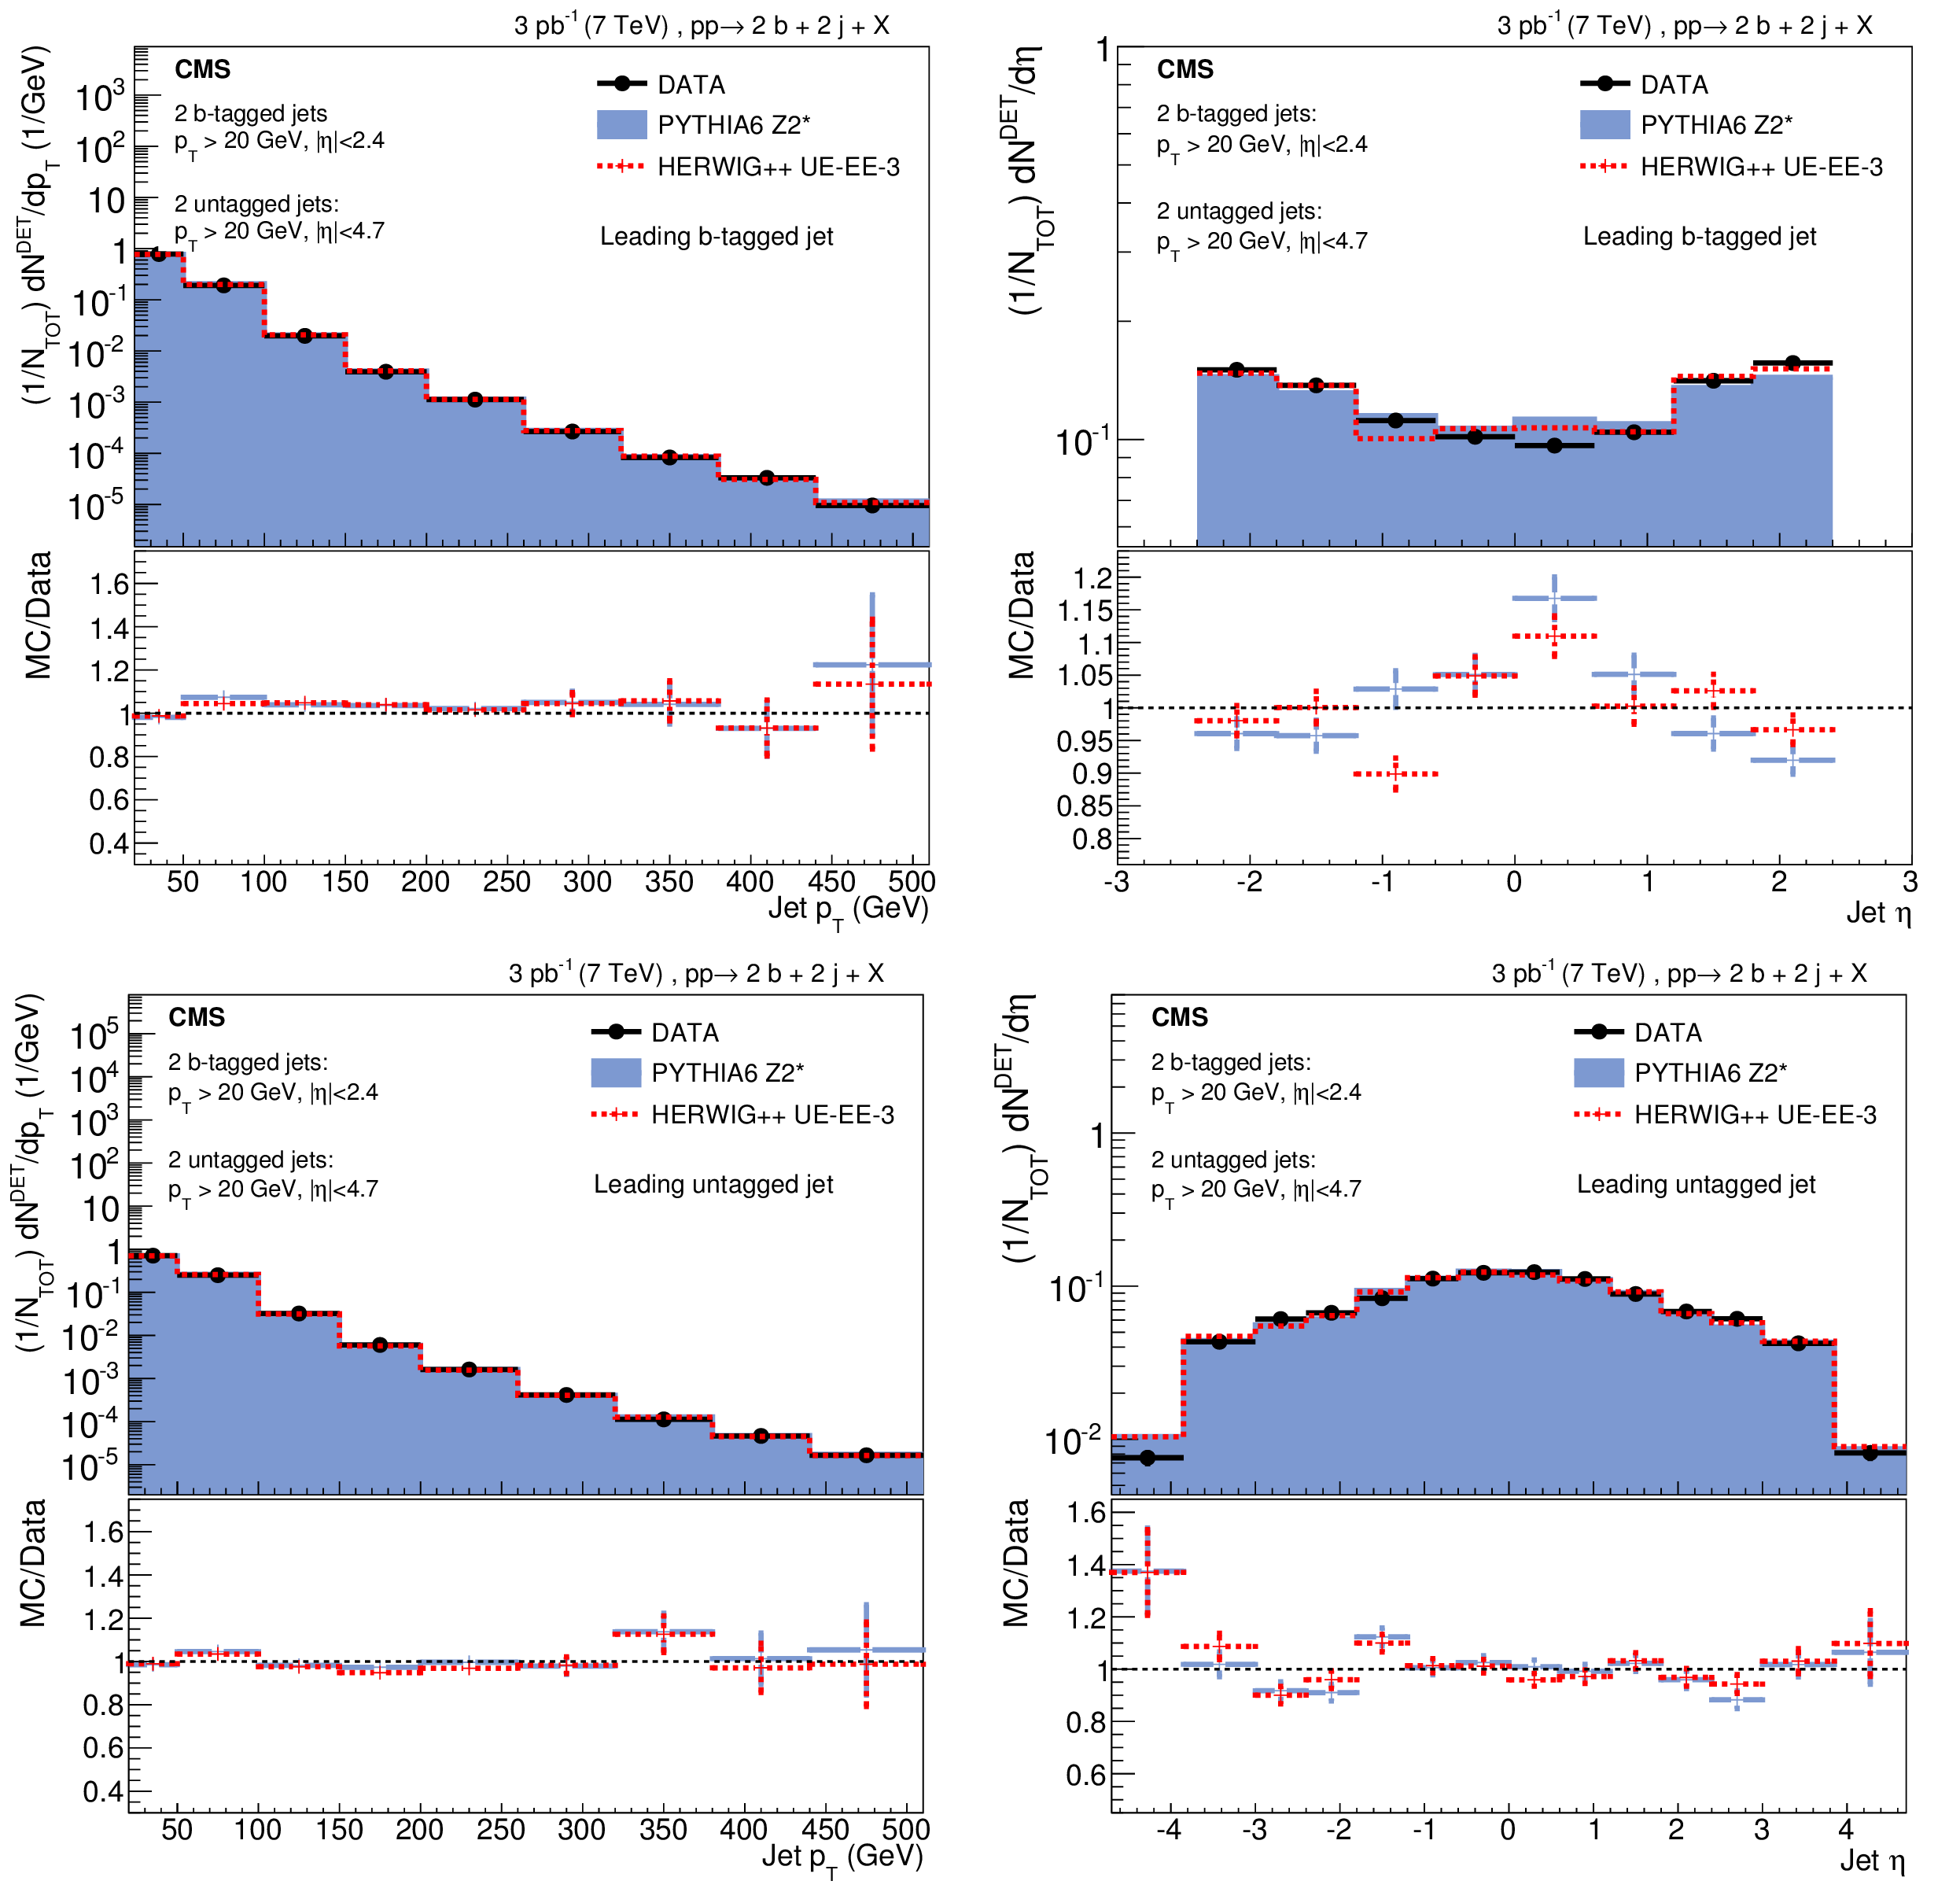
Figure 1:
Uncorrected transverse momentum (left) and pseudorapidity (right) distributions of data and simulations (PYTHIA 6 and HERWIG++) for the leading b-tagged (top) and leading untagged (bottom) jets. Only statistical uncertainties are shown. |

png pdf |
Figure 1-a:
Uncorrected transverse momentum distribution of data and simulations (PYTHIA 6 and HERWIG++) for the leading b-tagged jet. Only statistical uncertainties are shown. |
png pdf |
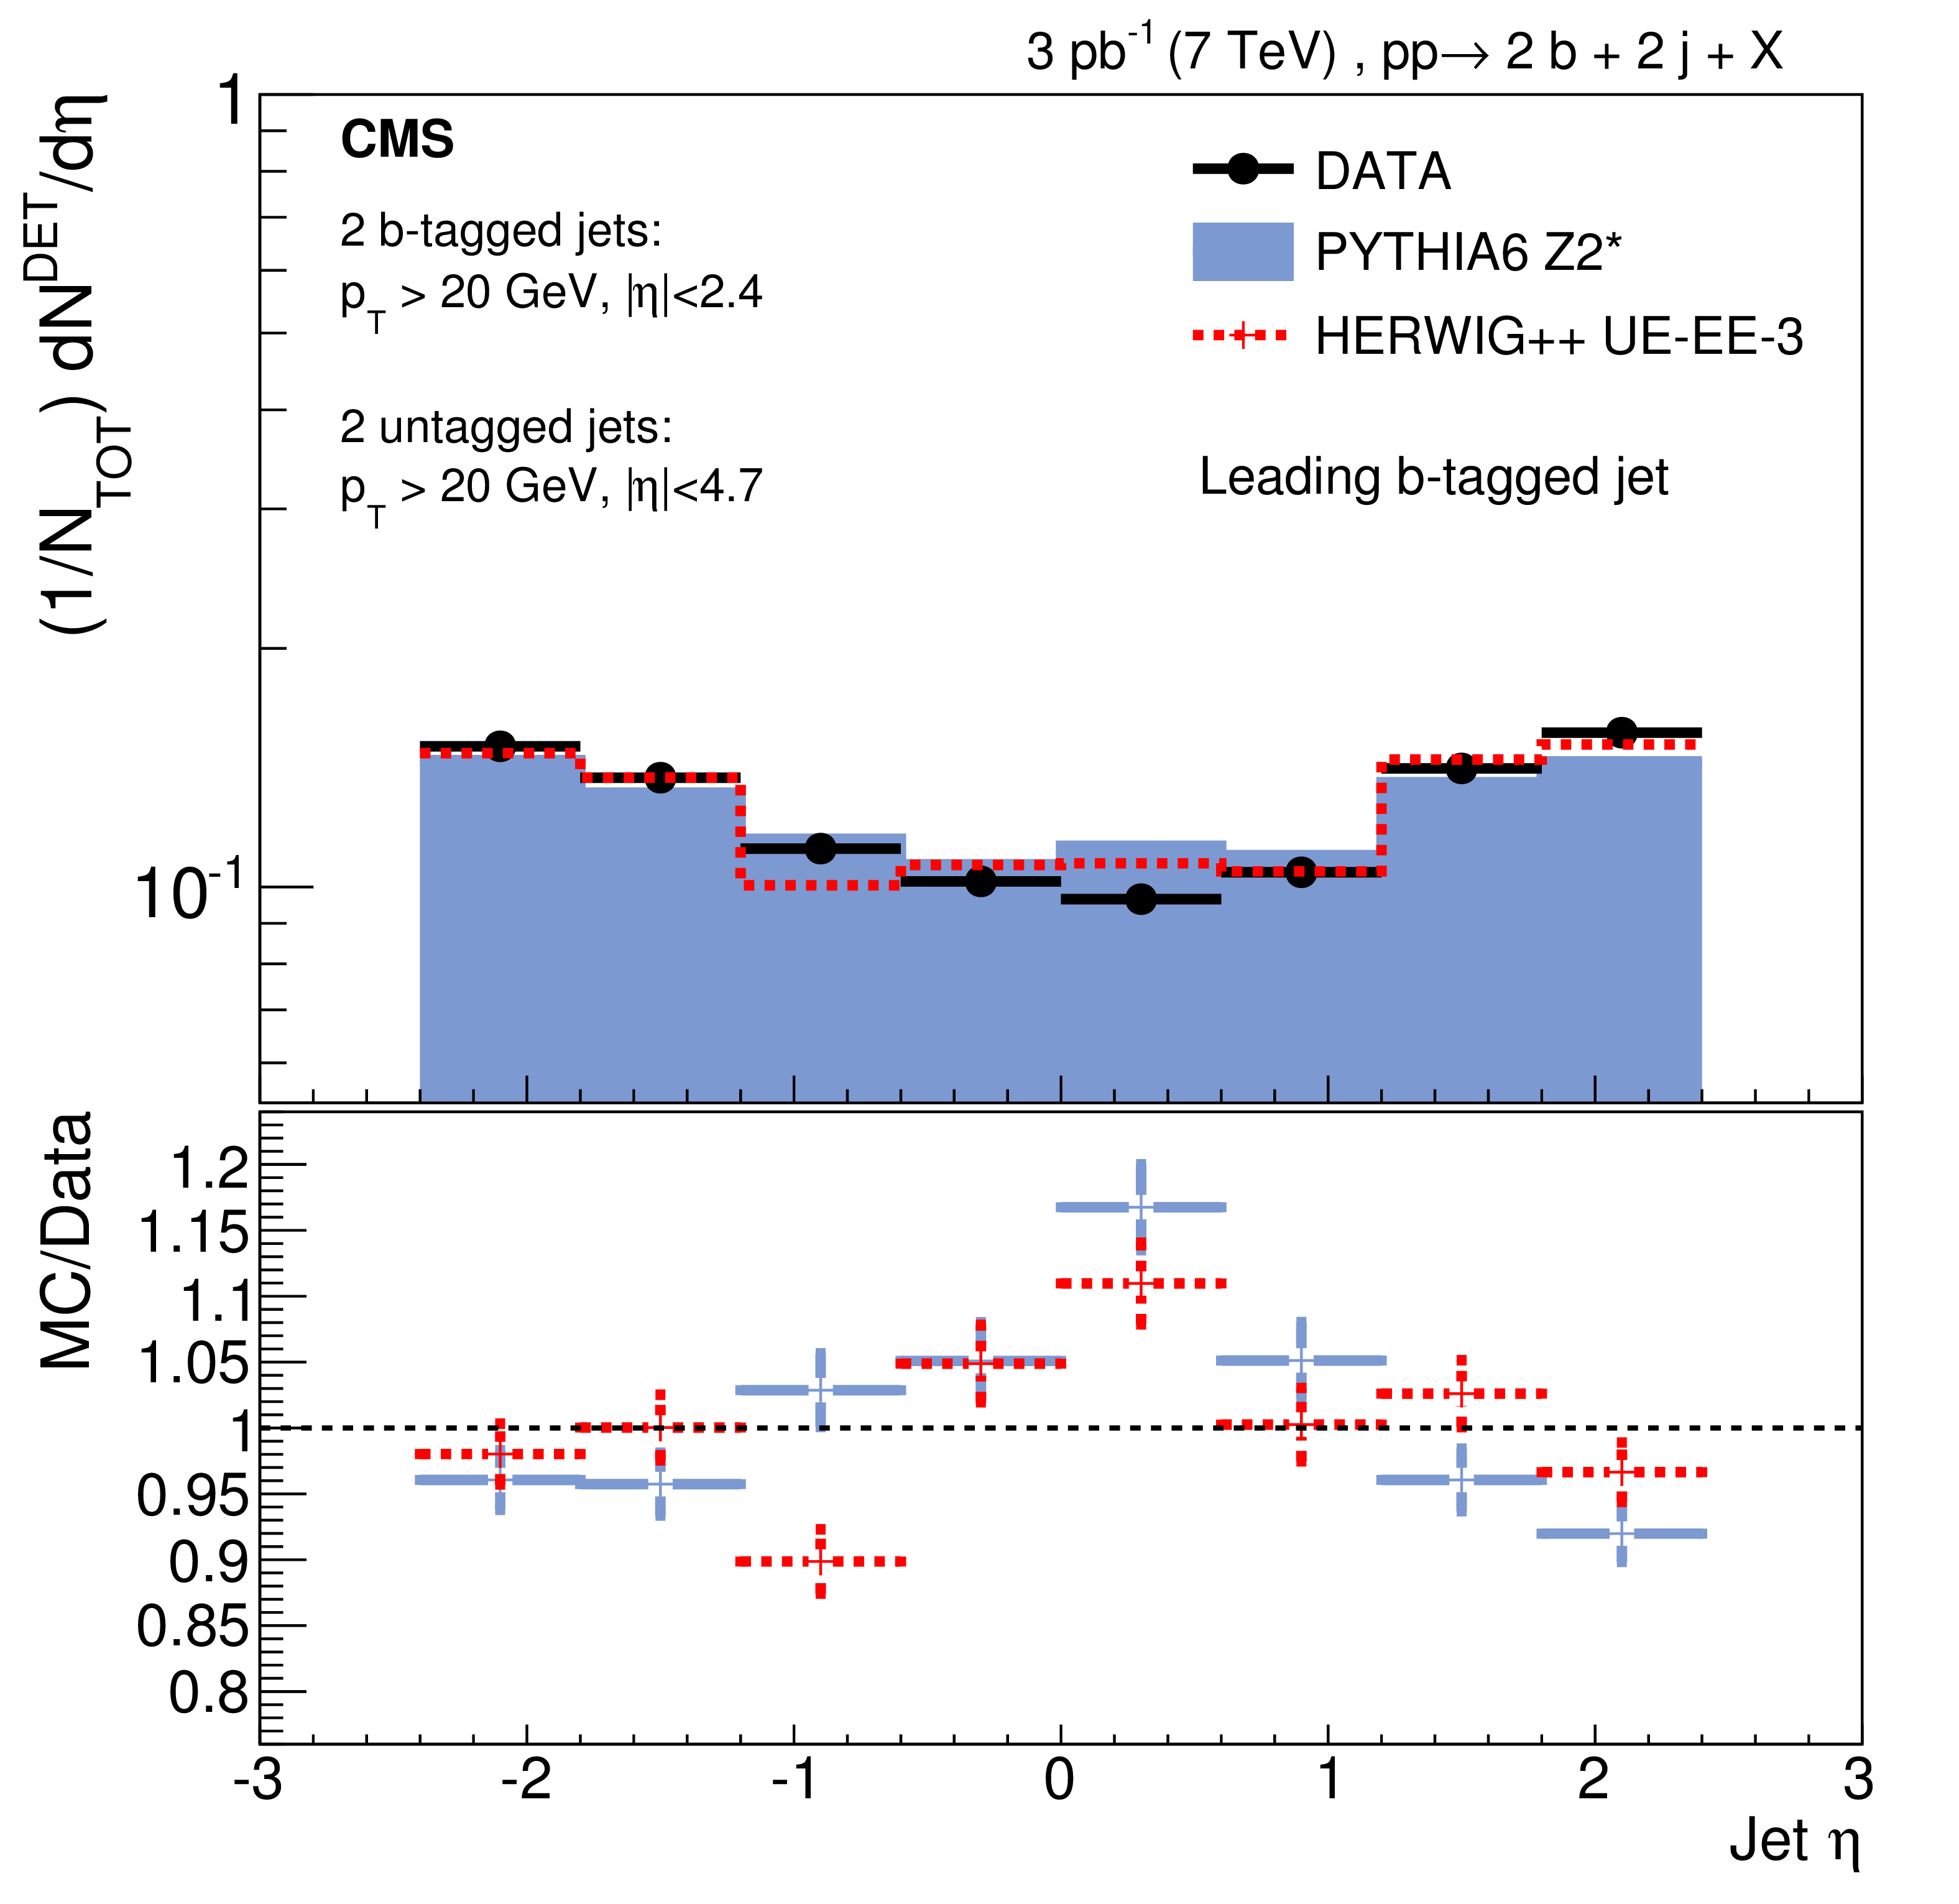
Figure 1-b:
Uncorrected pseudorapidity distribution of data and simulations (PYTHIA 6 and HERWIG++) for the leading b-tagged jet. Only statistical uncertainties are shown. |
png pdf |
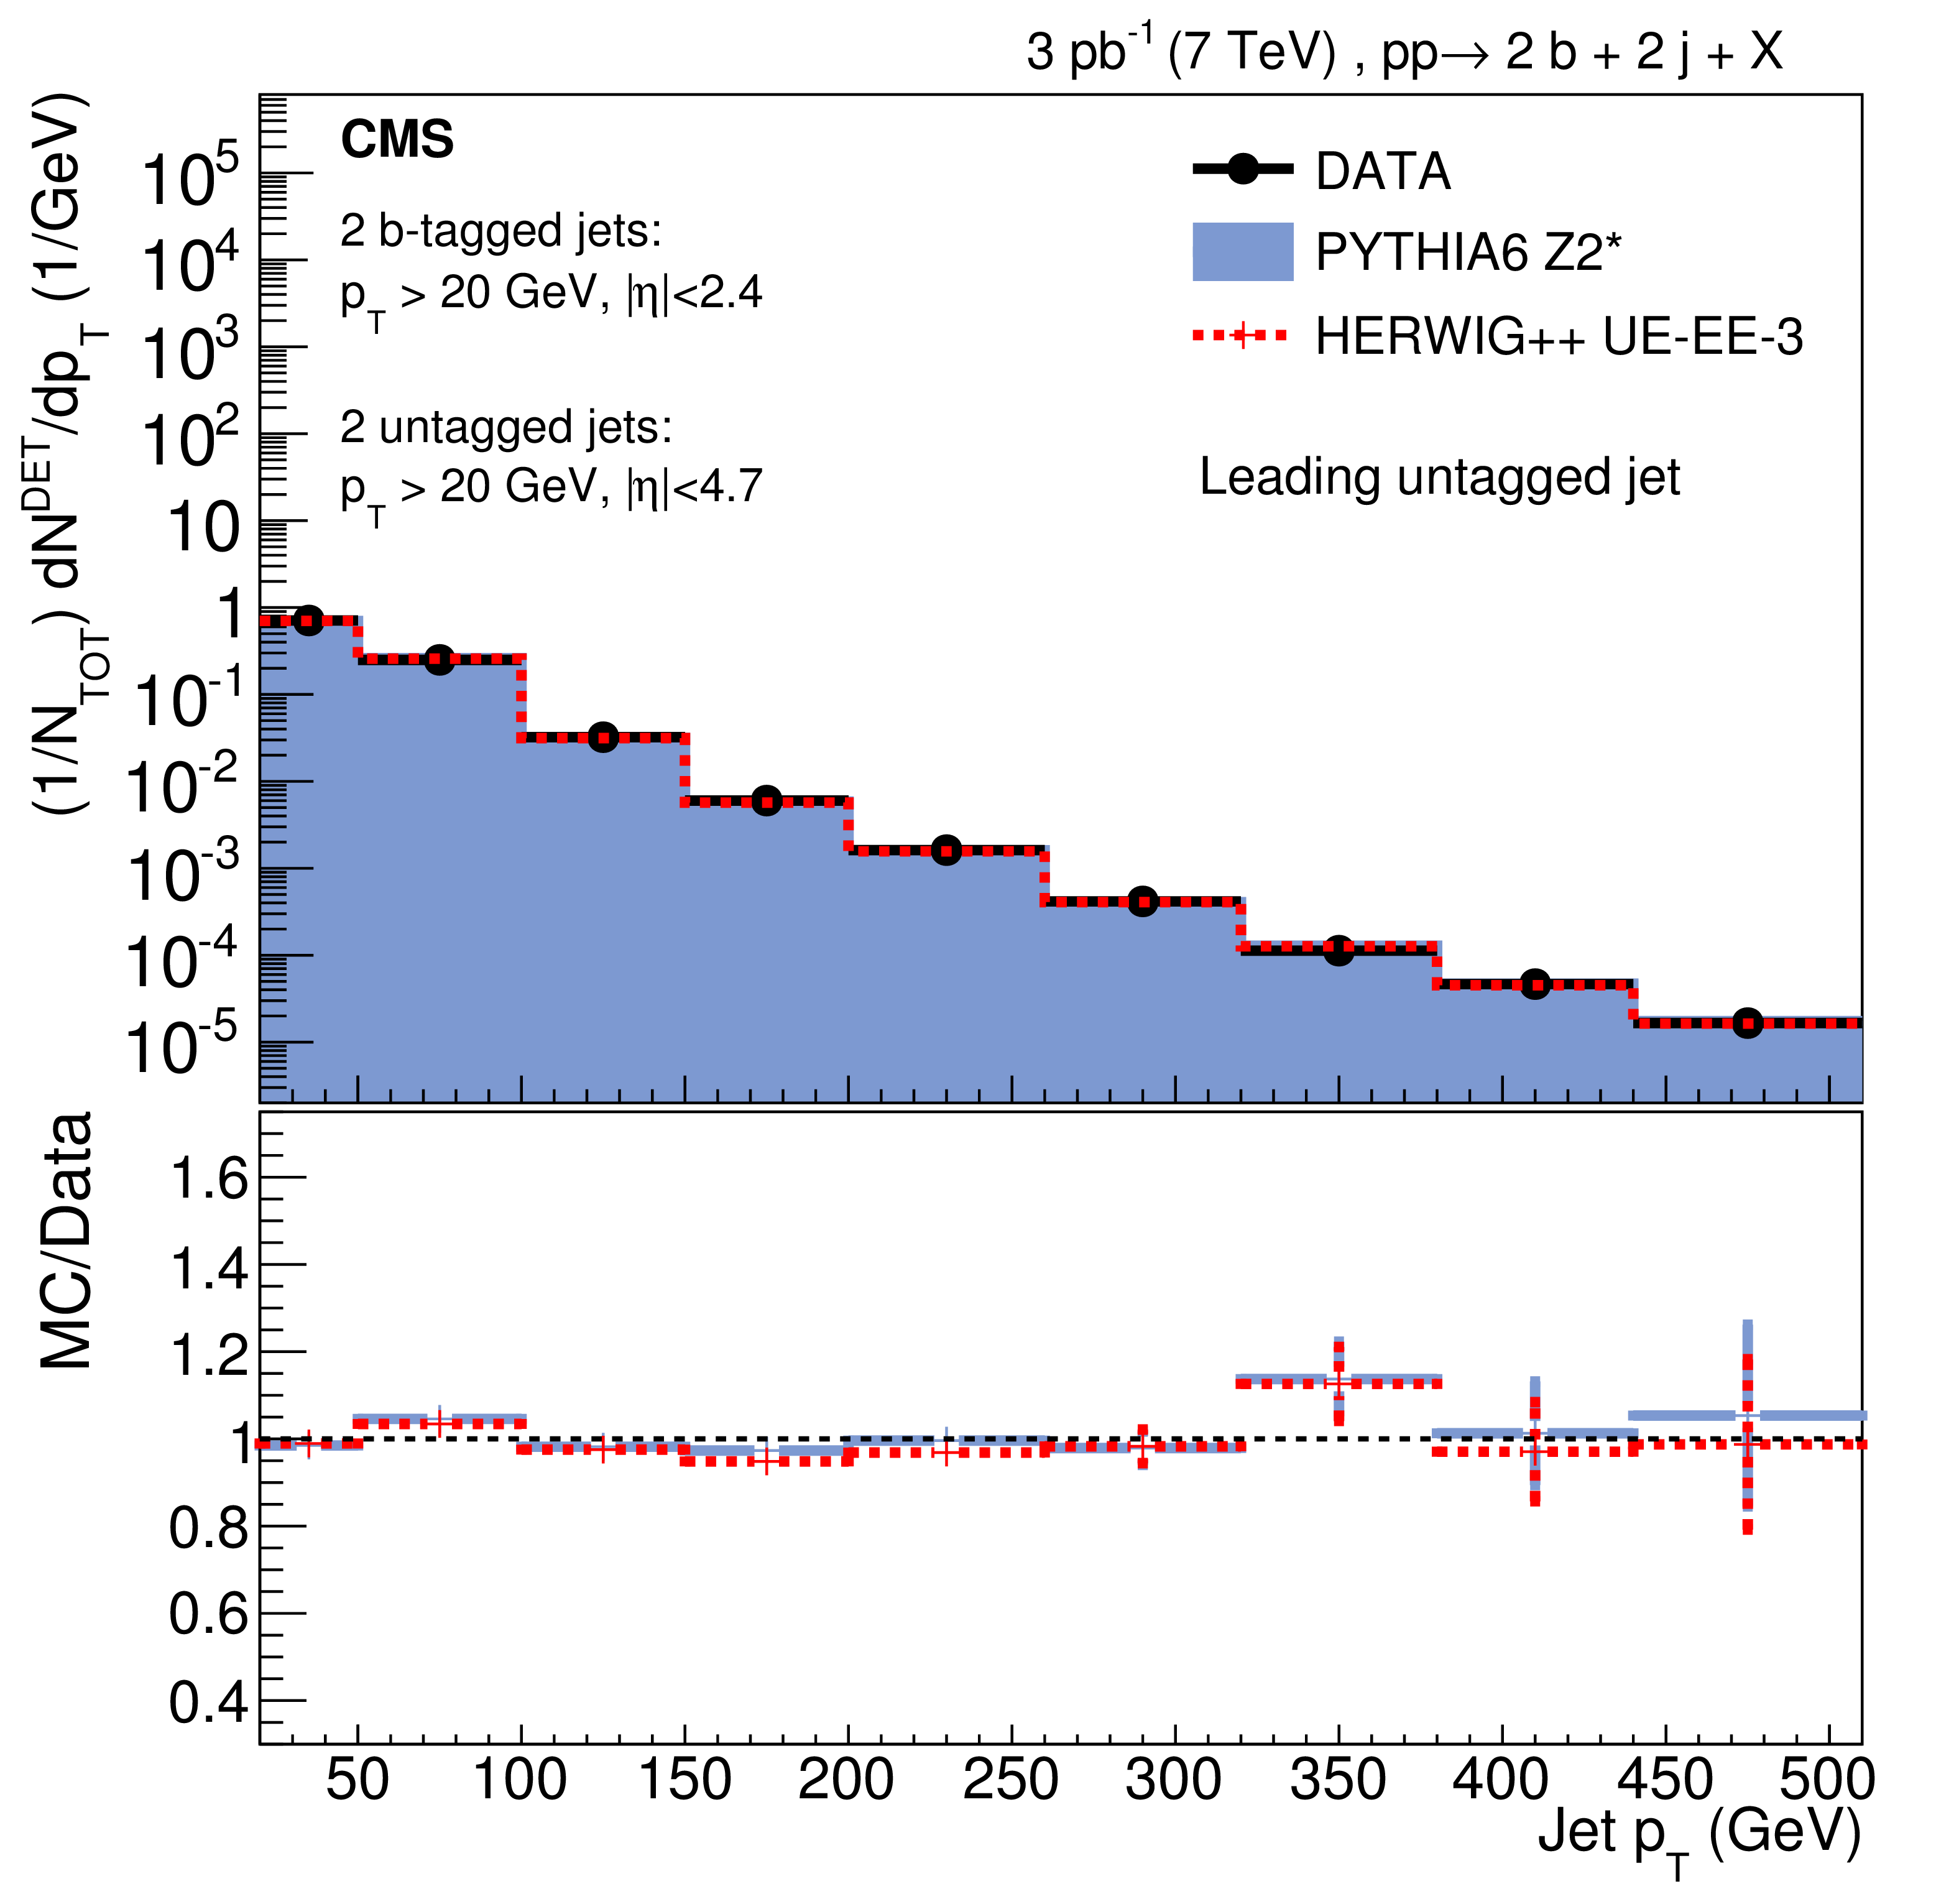
Figure 1-c:
Uncorrected transverse momentum distribution of data and simulations (PYTHIA 6 and HERWIG++) for the leading untagged jet. Only statistical uncertainties are shown. |

png pdf |
Figure 1-d:
Uncorrected pseudorapidity distribution of data and simulations (PYTHIA 6 and HERWIG++) for the leading untagged jet. Only statistical uncertainties are shown. |
png pdf |
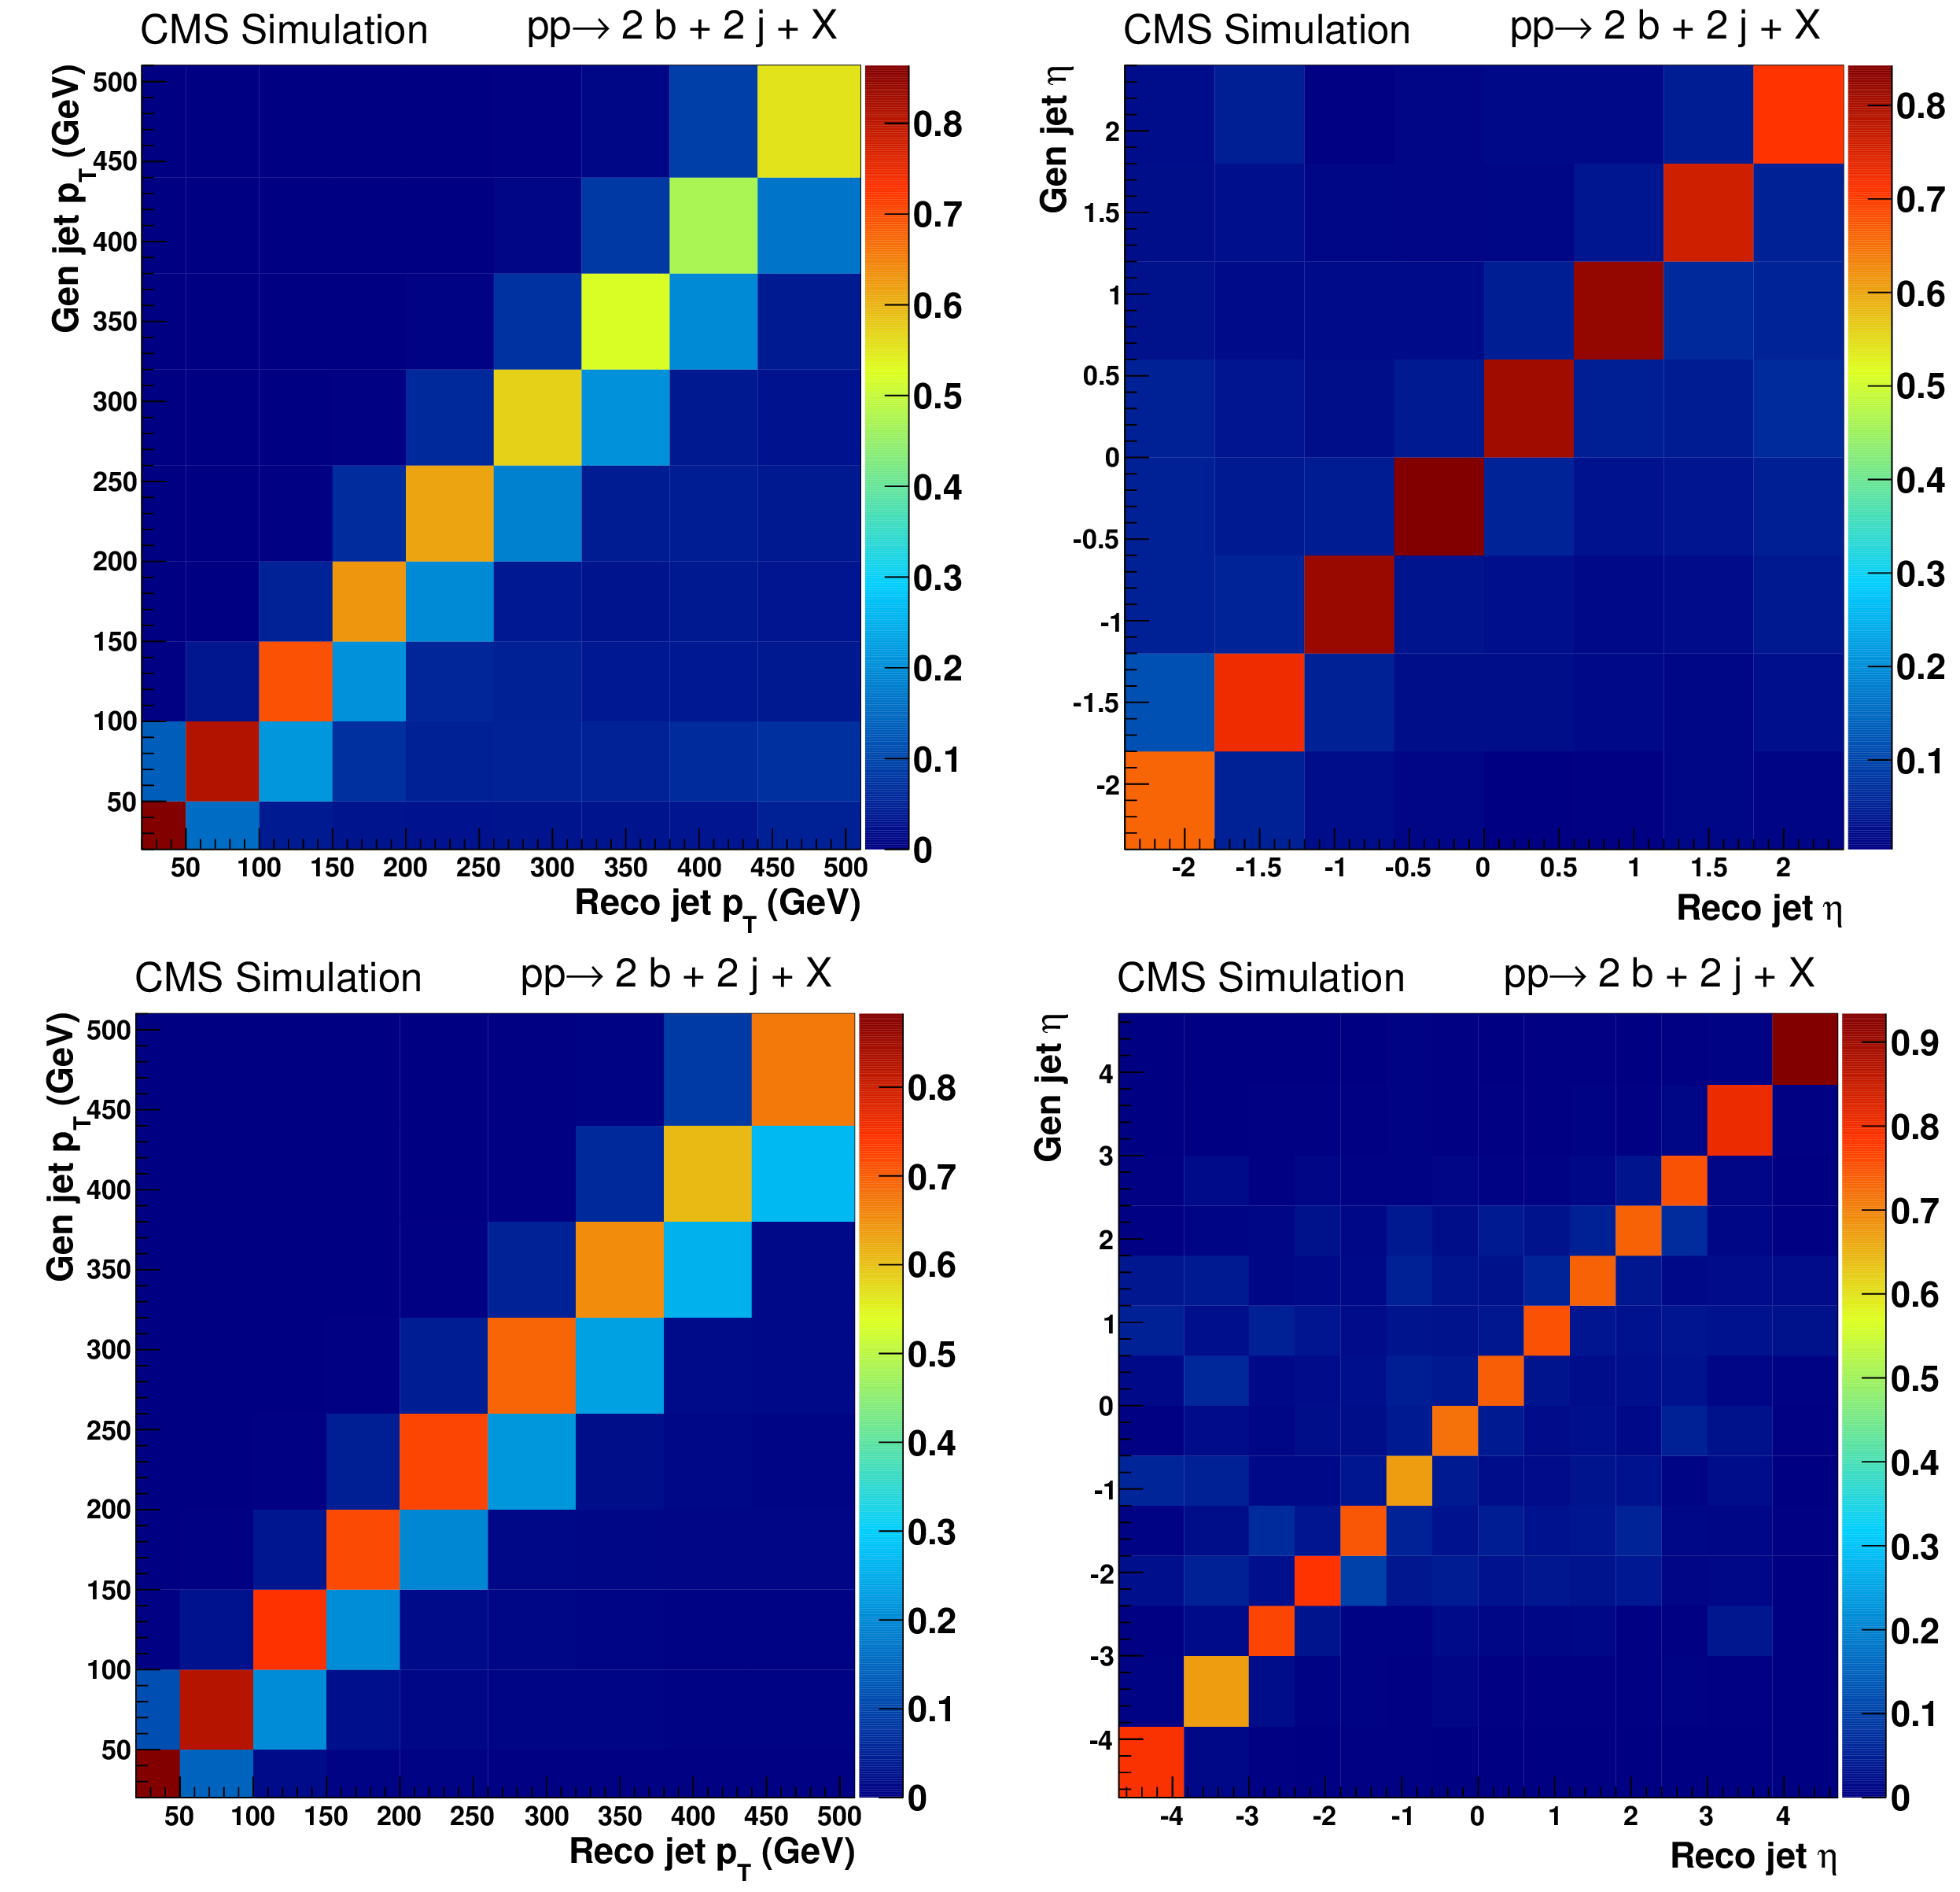
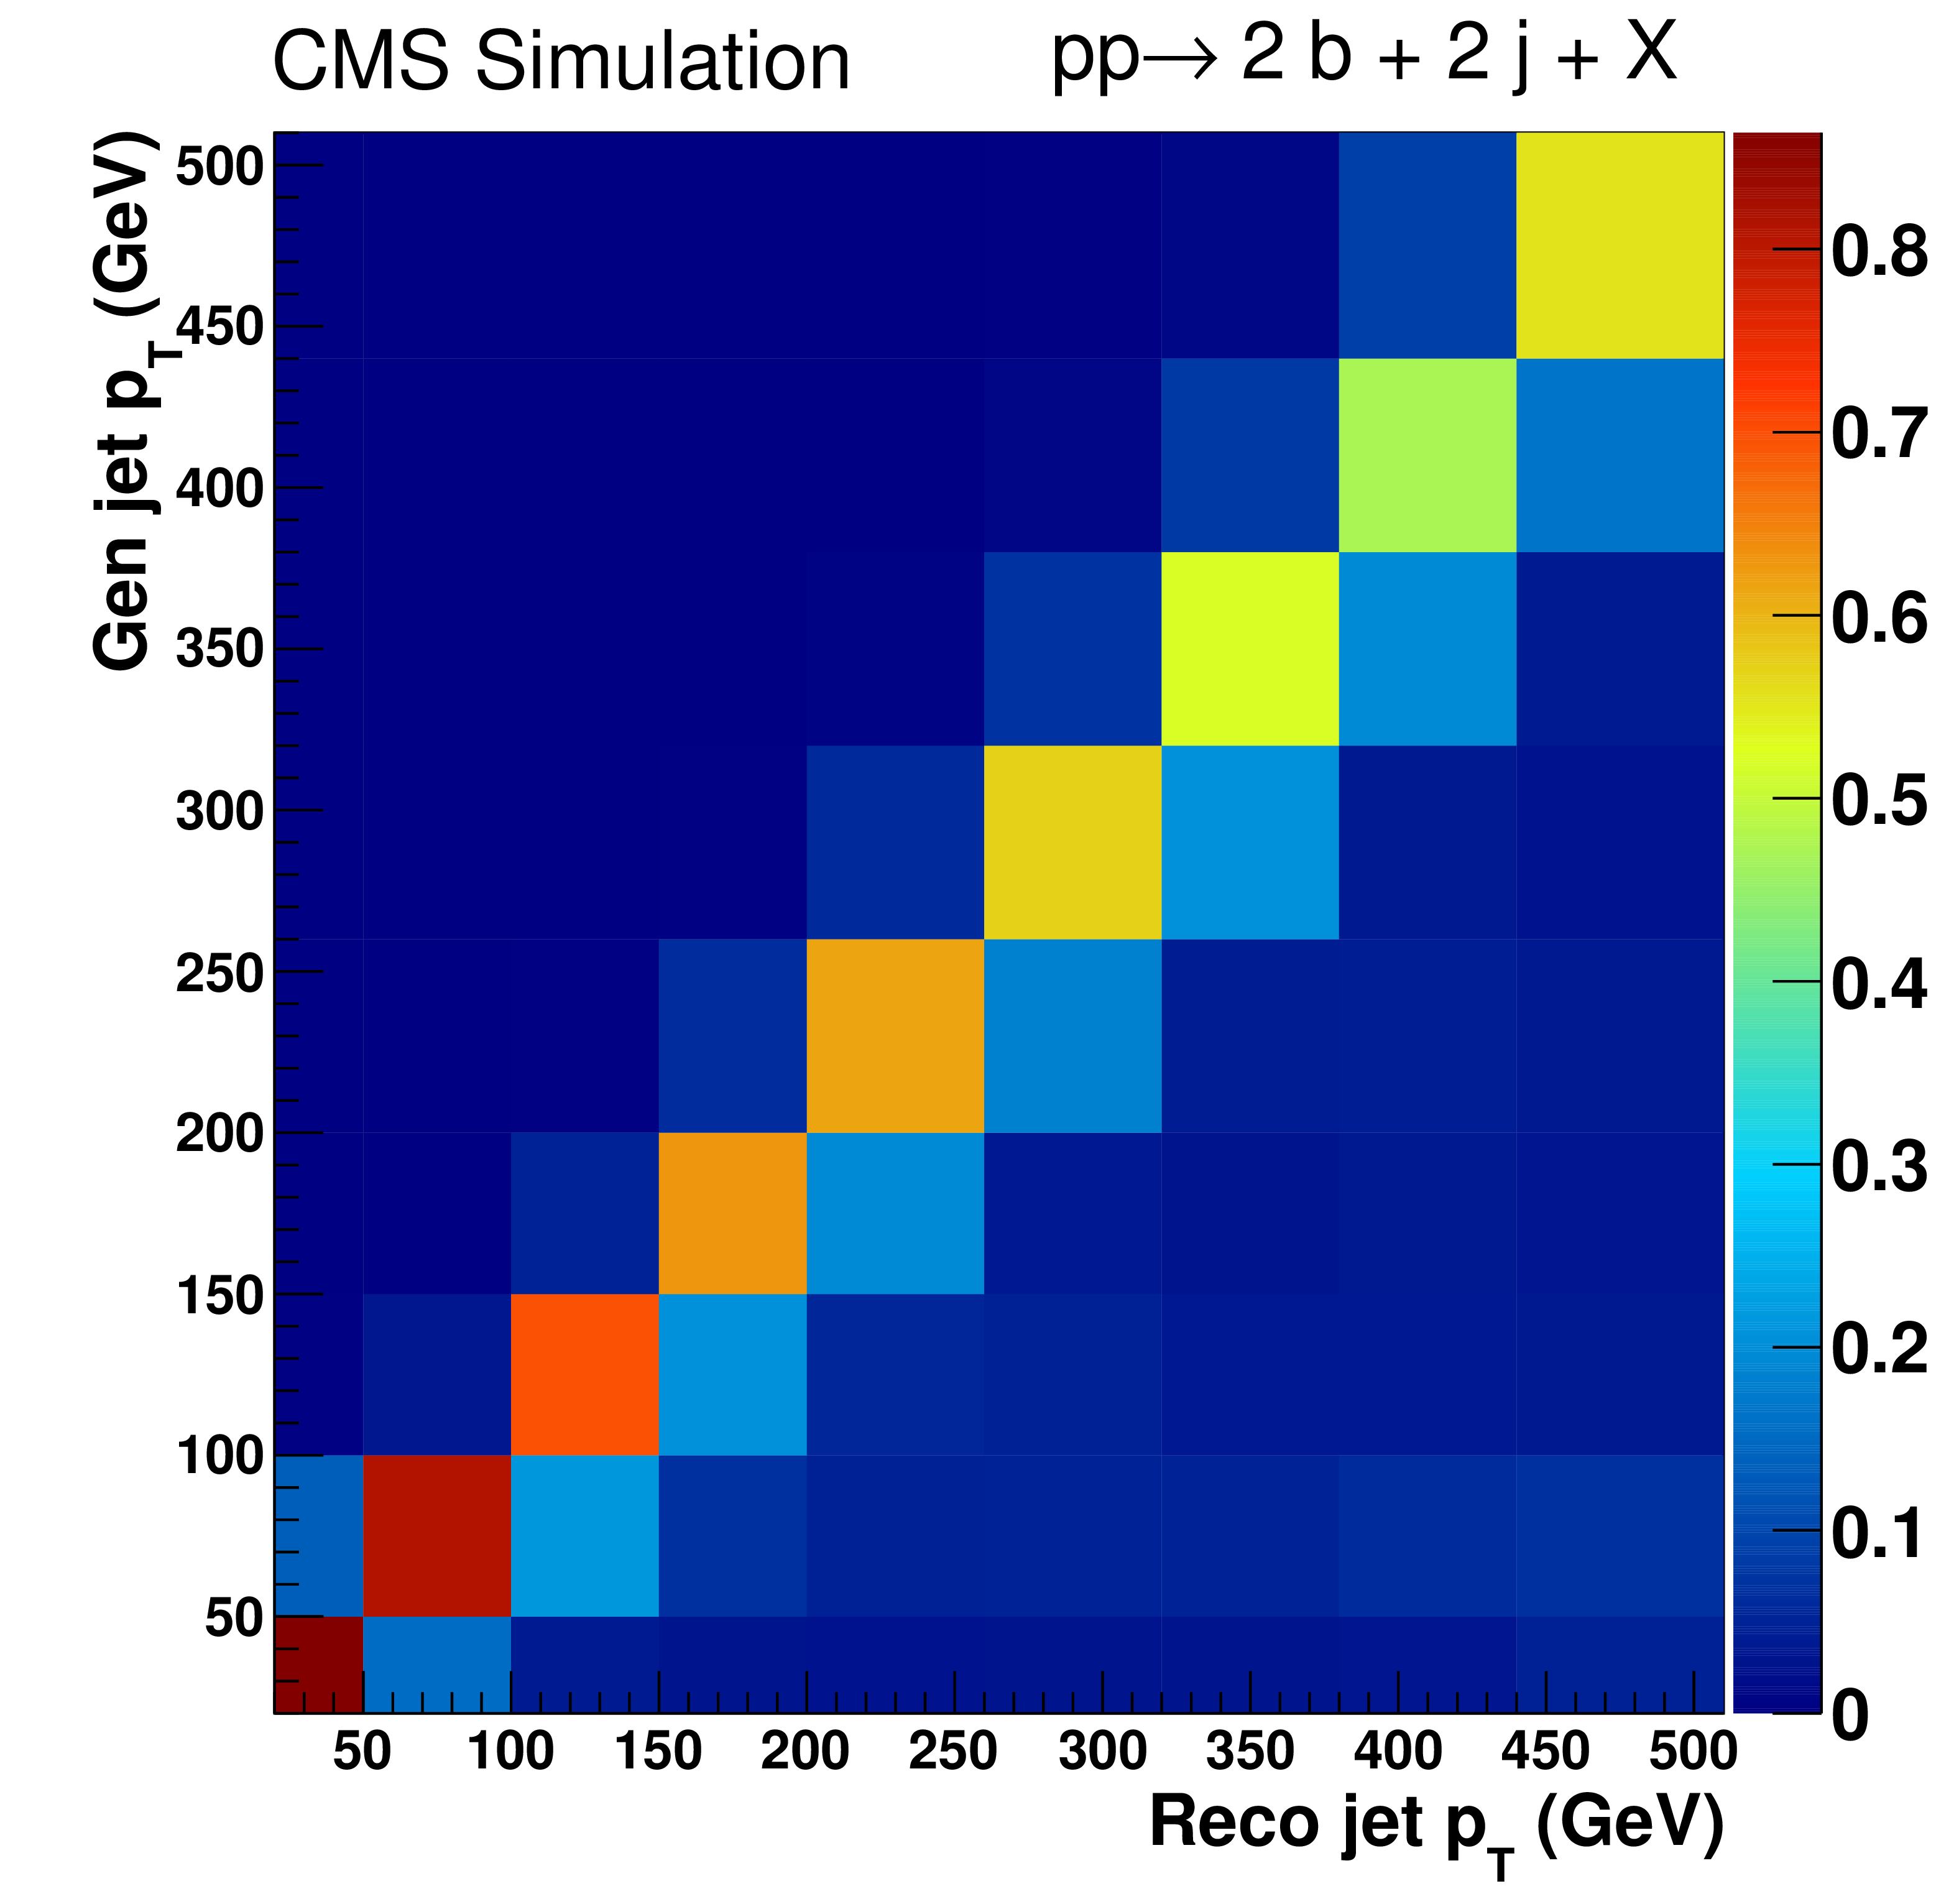
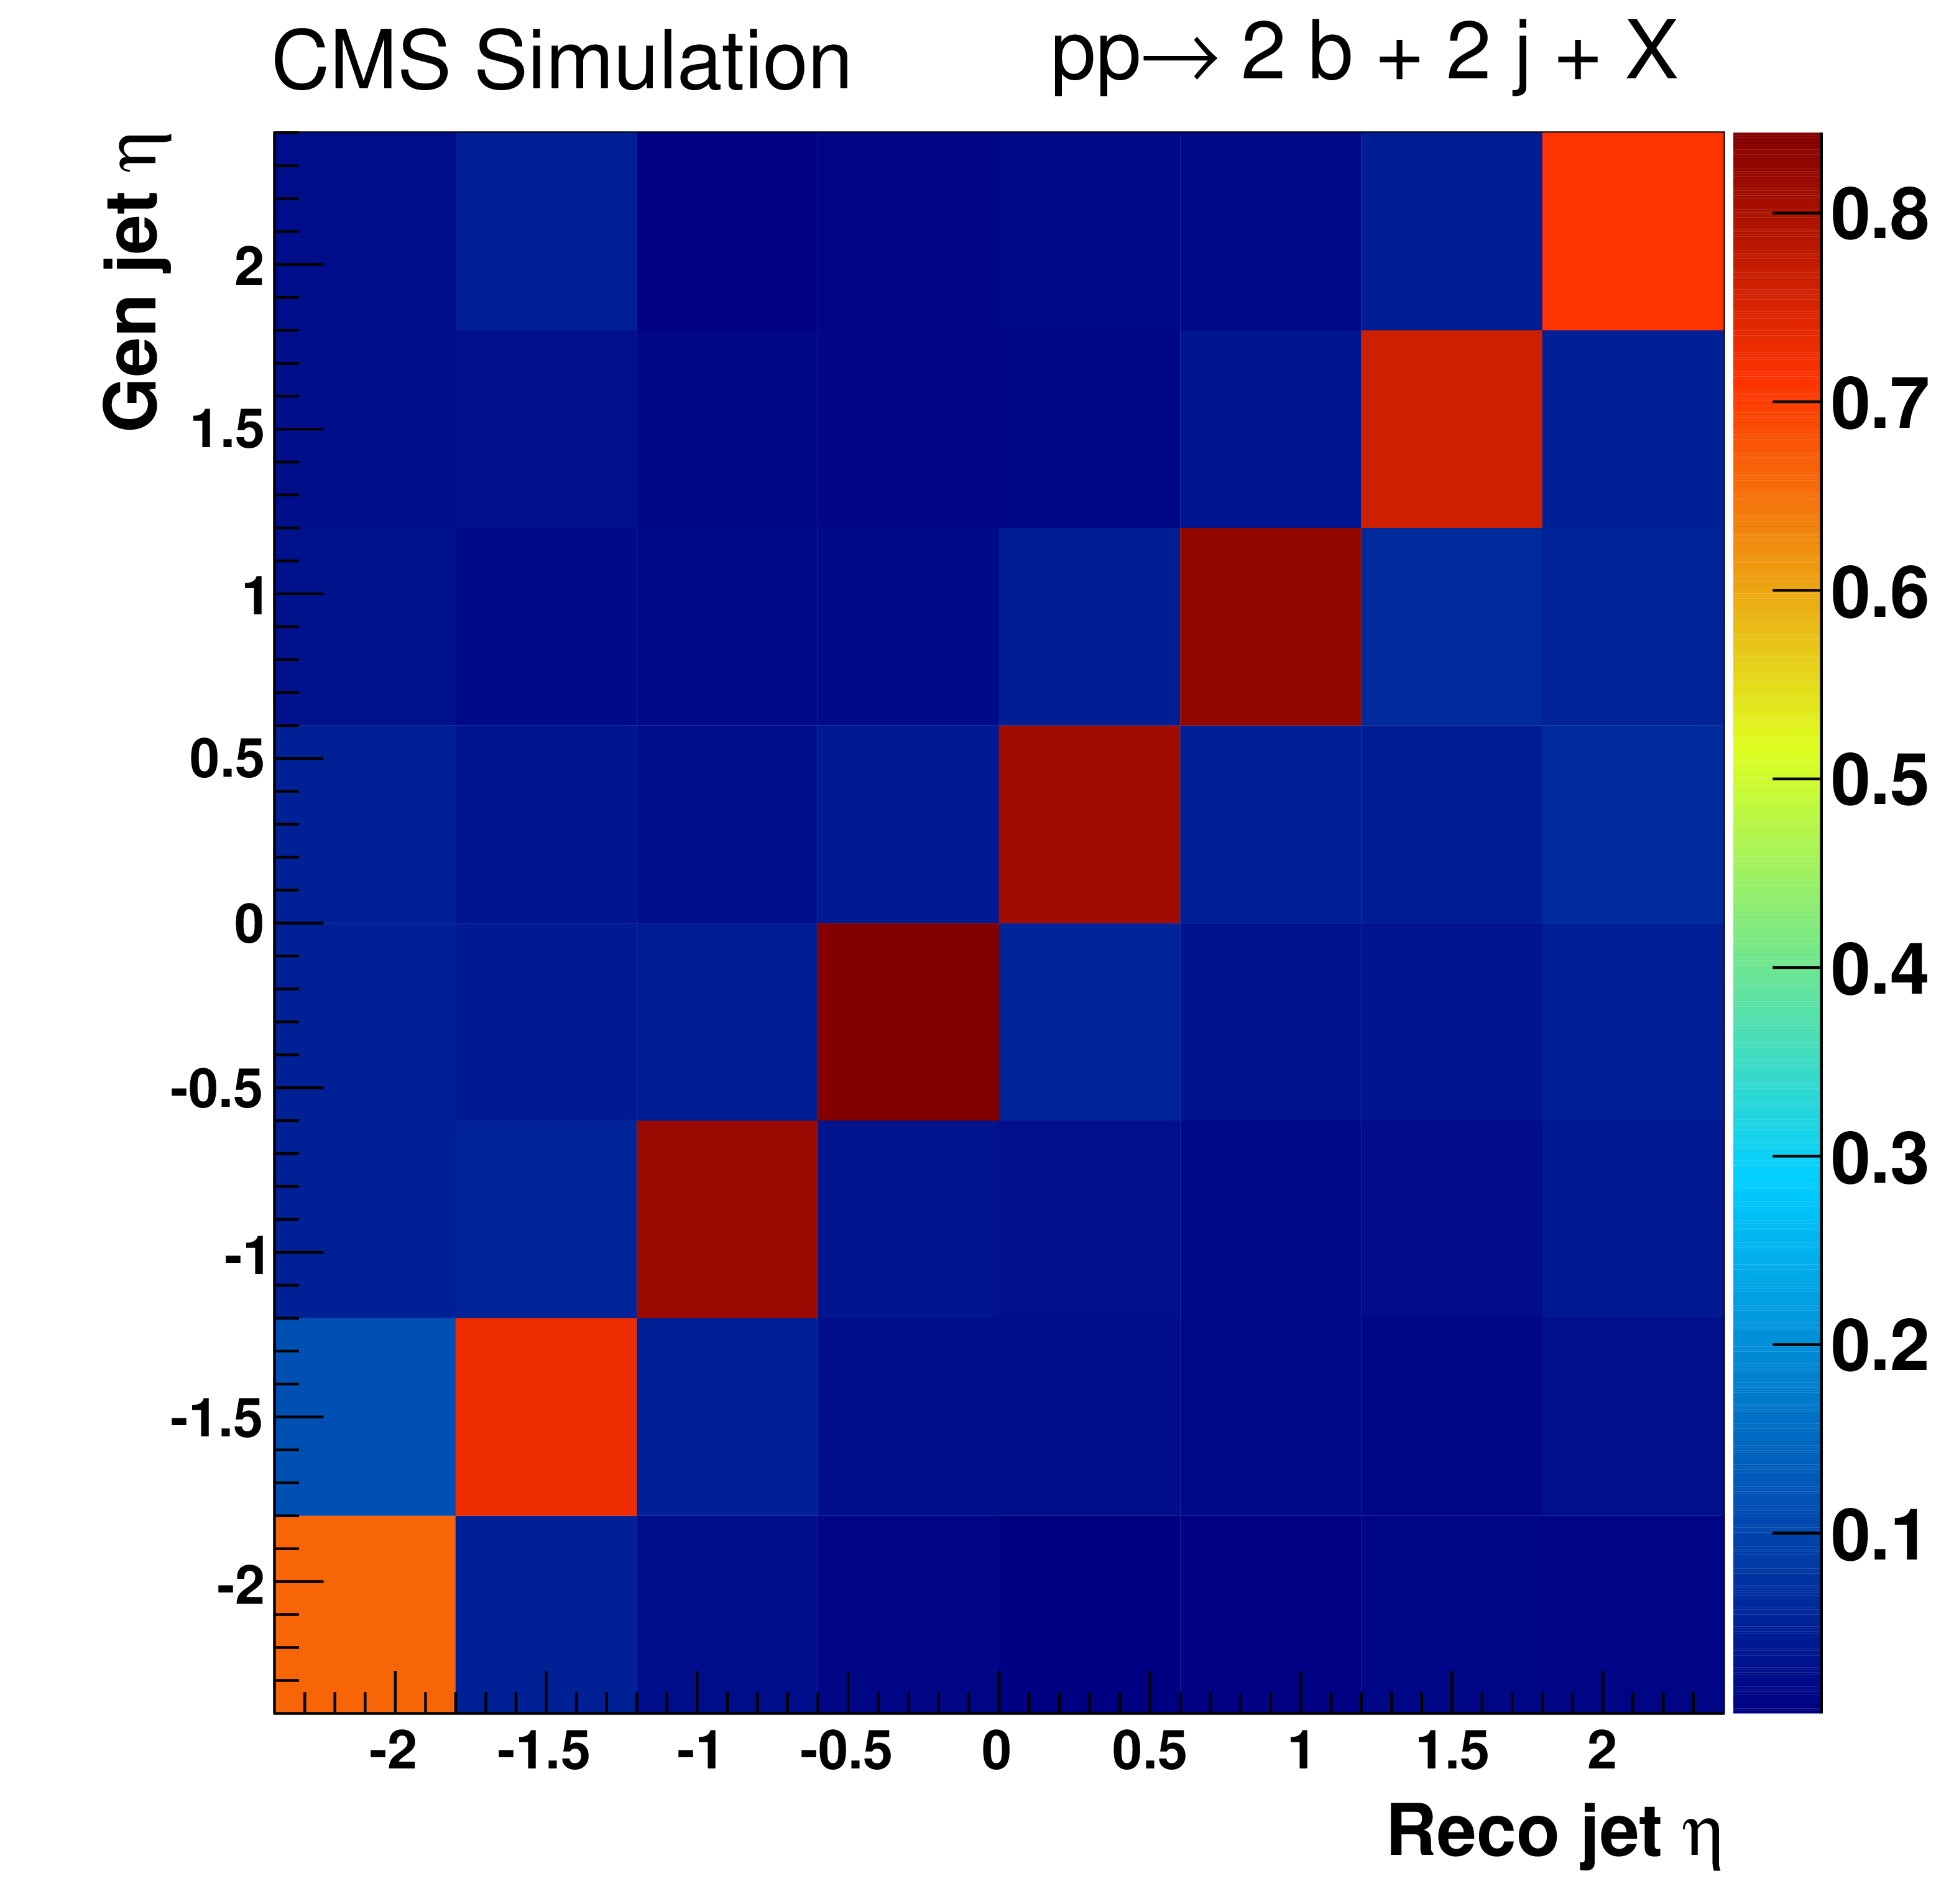
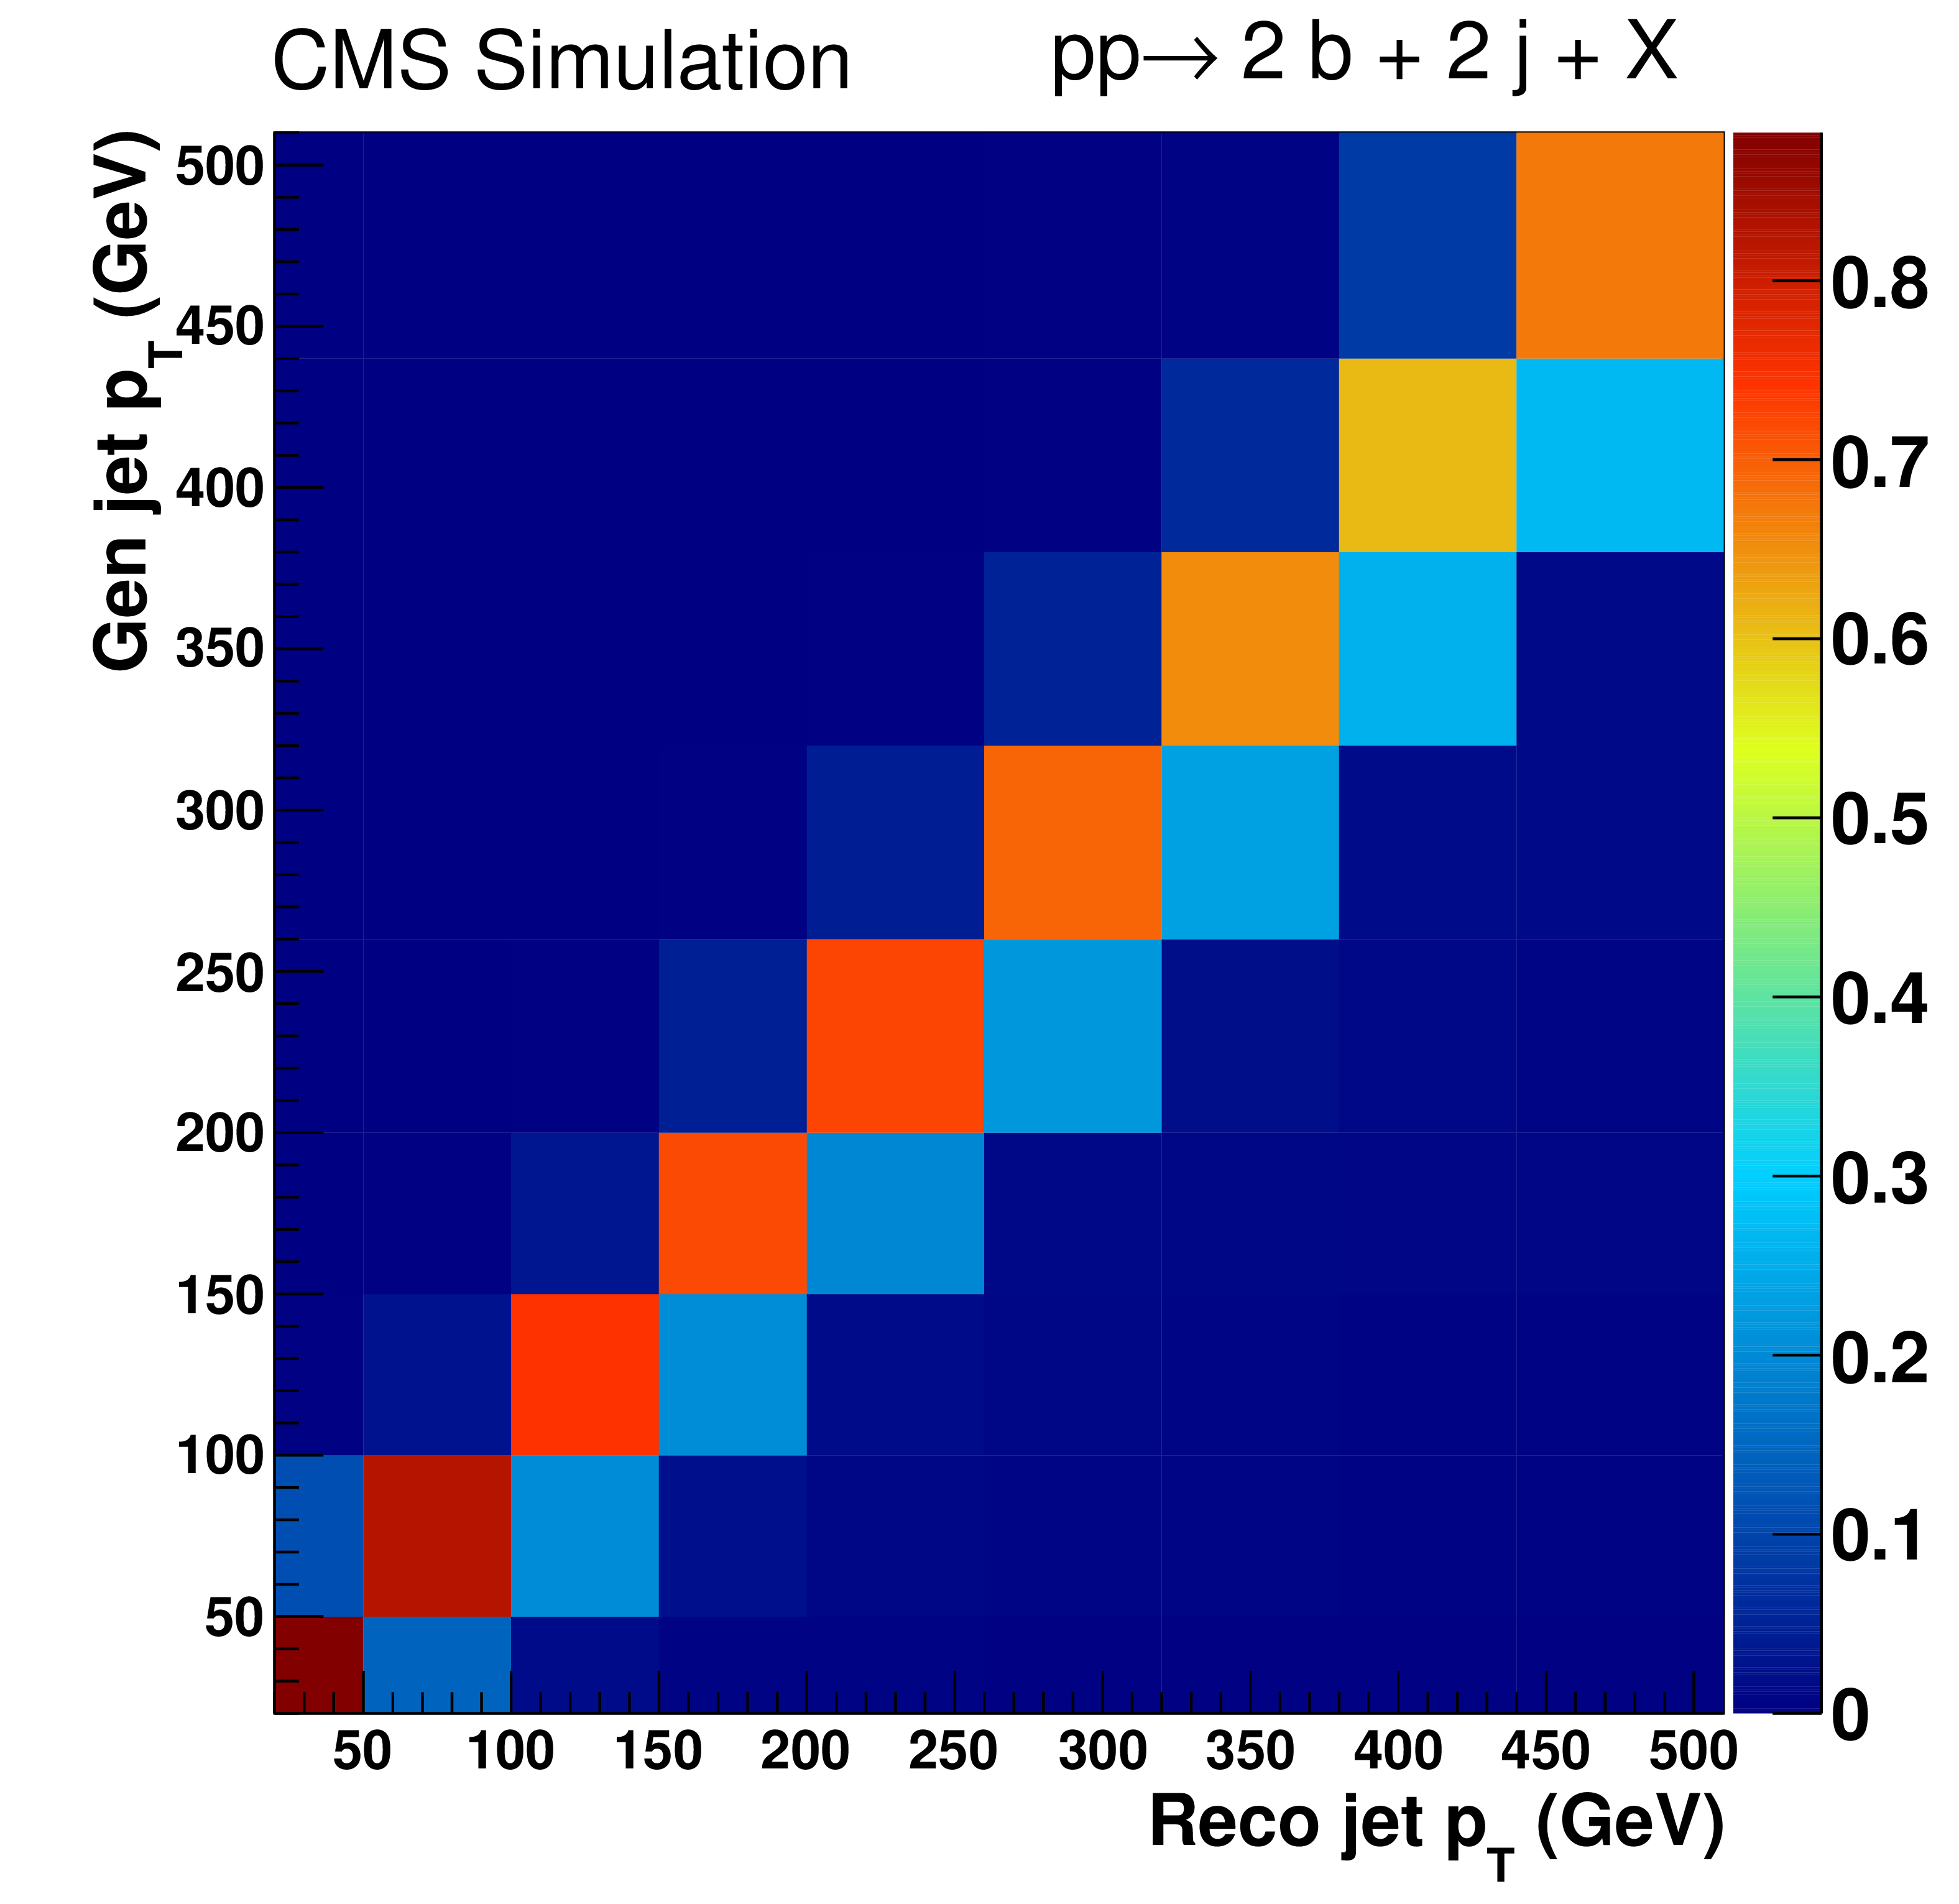
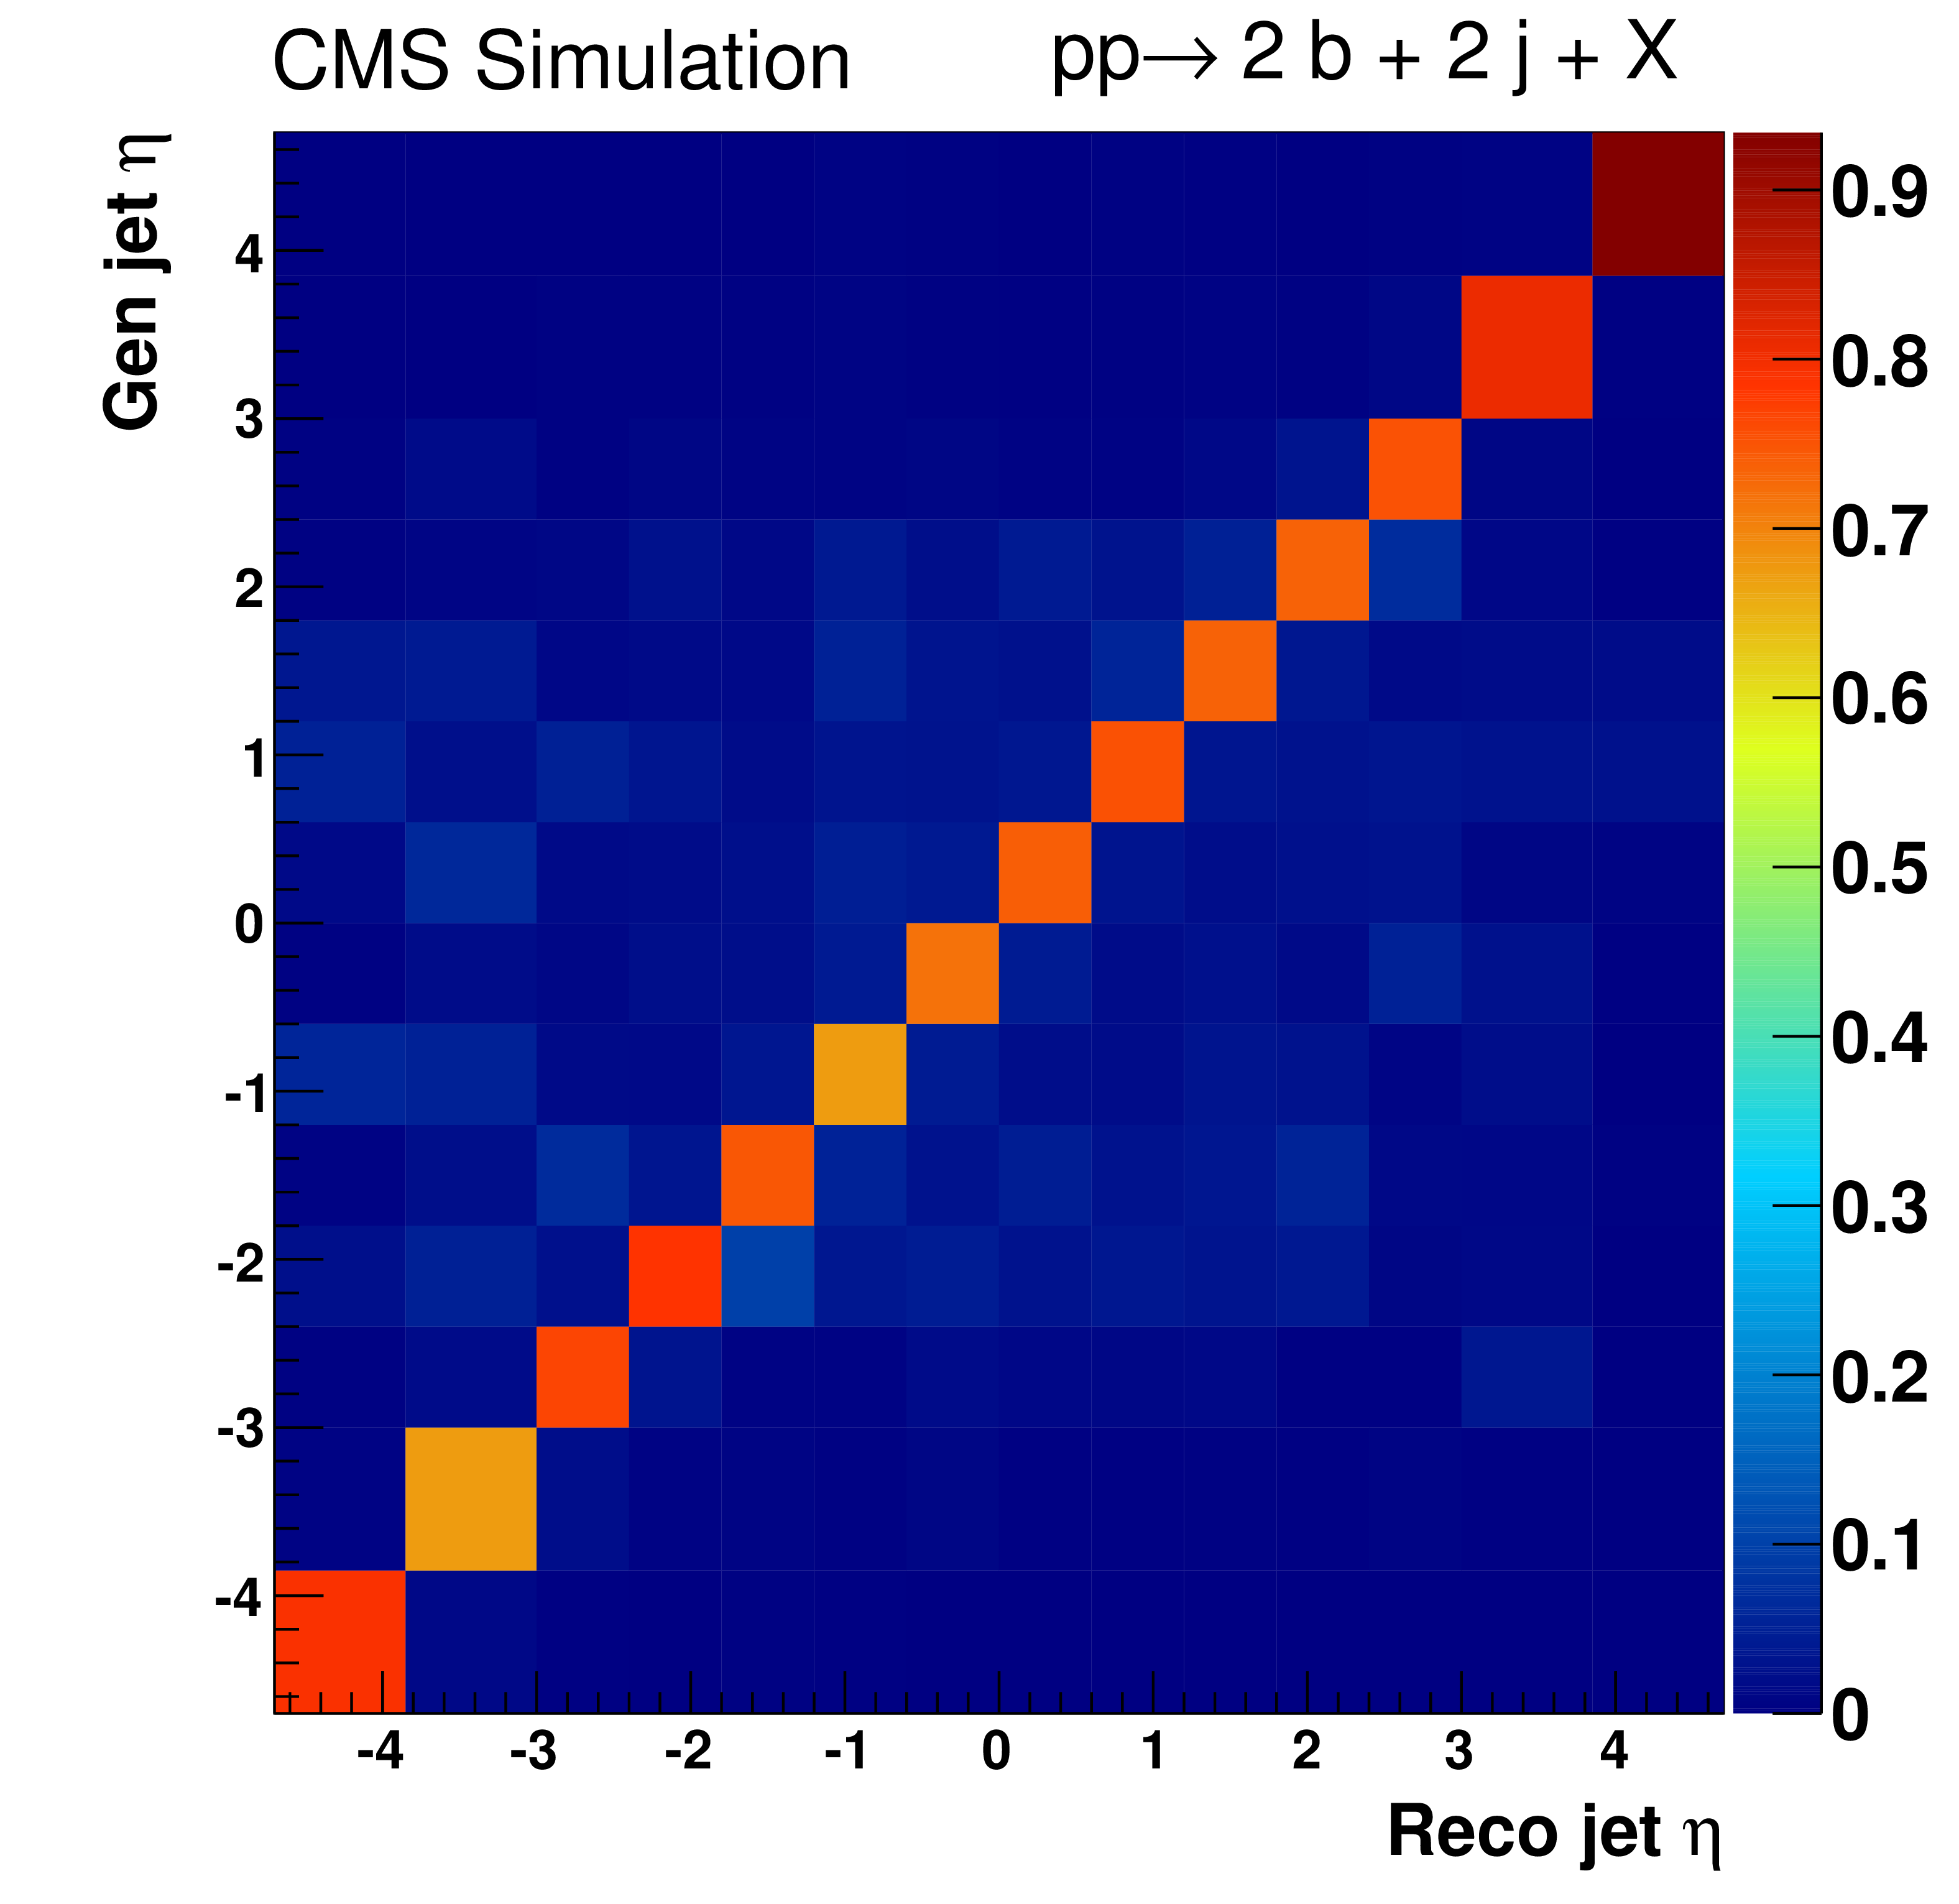
Figure 2:
Response matrices obtained with the PYTHIA 6 tune Z2* simulation for the transverse momentum (left) and pseudorapidity (right) of the leading b-tagged (top) and leading untagged (bottom) jets. |
png pdf |
Figure 2-a:
Response matrices obtained with the PYTHIA 6 tune Z2* simulation for the transverse momentum of the leading b-tagged jet. |
png pdf |
Figure 2-b:
Response matrices obtained with the PYTHIA 6 tune Z2* simulation for the pseudorapidity of the leading b-tagged jet. |
png pdf |
Figure 2-c:
Response matrices obtained with the PYTHIA 6 tune Z2* simulation for the transverse momentum of the leading untagged jet. |
png pdf |
Figure 2-d:
Response matrices obtained with the PYTHIA 6 tune Z2* simulation for the pseudorapidity of the leading untagged jet. |
png pdf |
Figure 3:
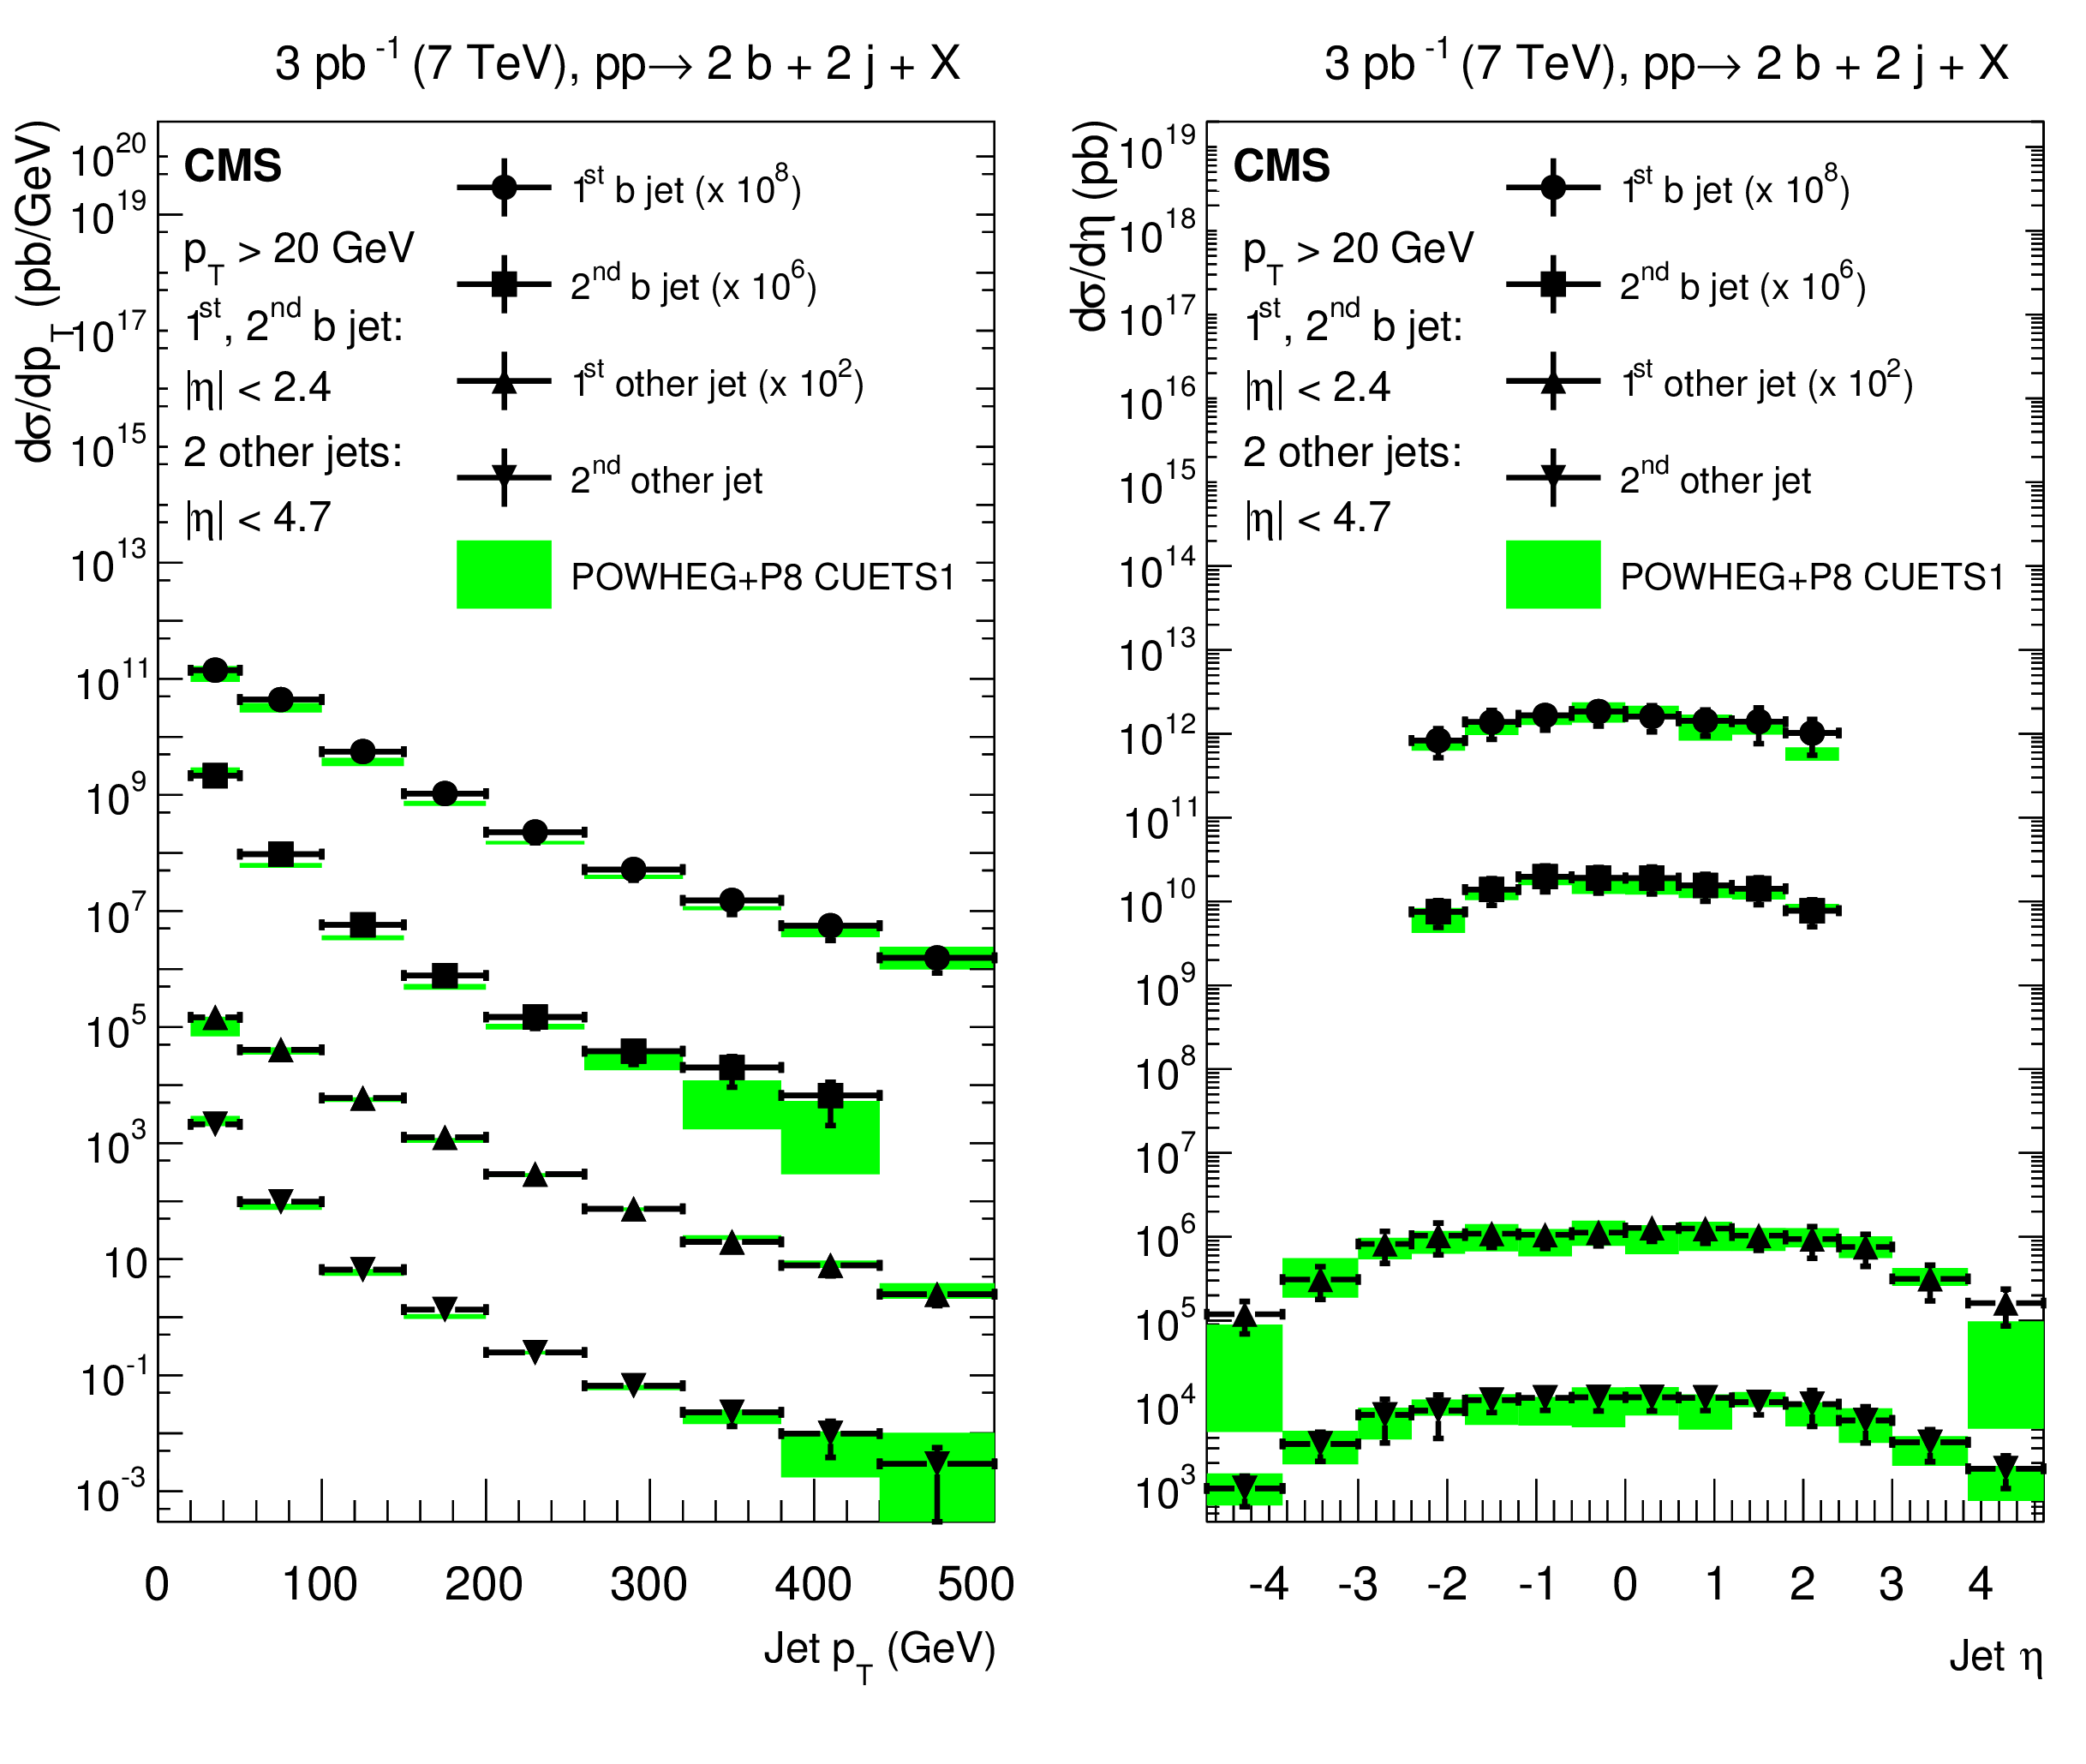
Differential cross sections unfolded to the particle level as a function of the jet transverse momenta $ {p_{\mathrm {T}}} $ (left) and pseudorapidity $\eta $ (right) compared to predictions of POWHEG+PYTHIA 8 tune CUETS1. Scale factors of $10^8$, $10^6$, and $10^2$ are applied (for clarity) to the measurement of the leading, subleading, and third jet, respectively. The error bars on the data represent the total uncertainties, i.e., statistical and systematic added quadratically. The band represents the theoretical uncertainty due to the choice of the scales and PDFs. |
png pdf |
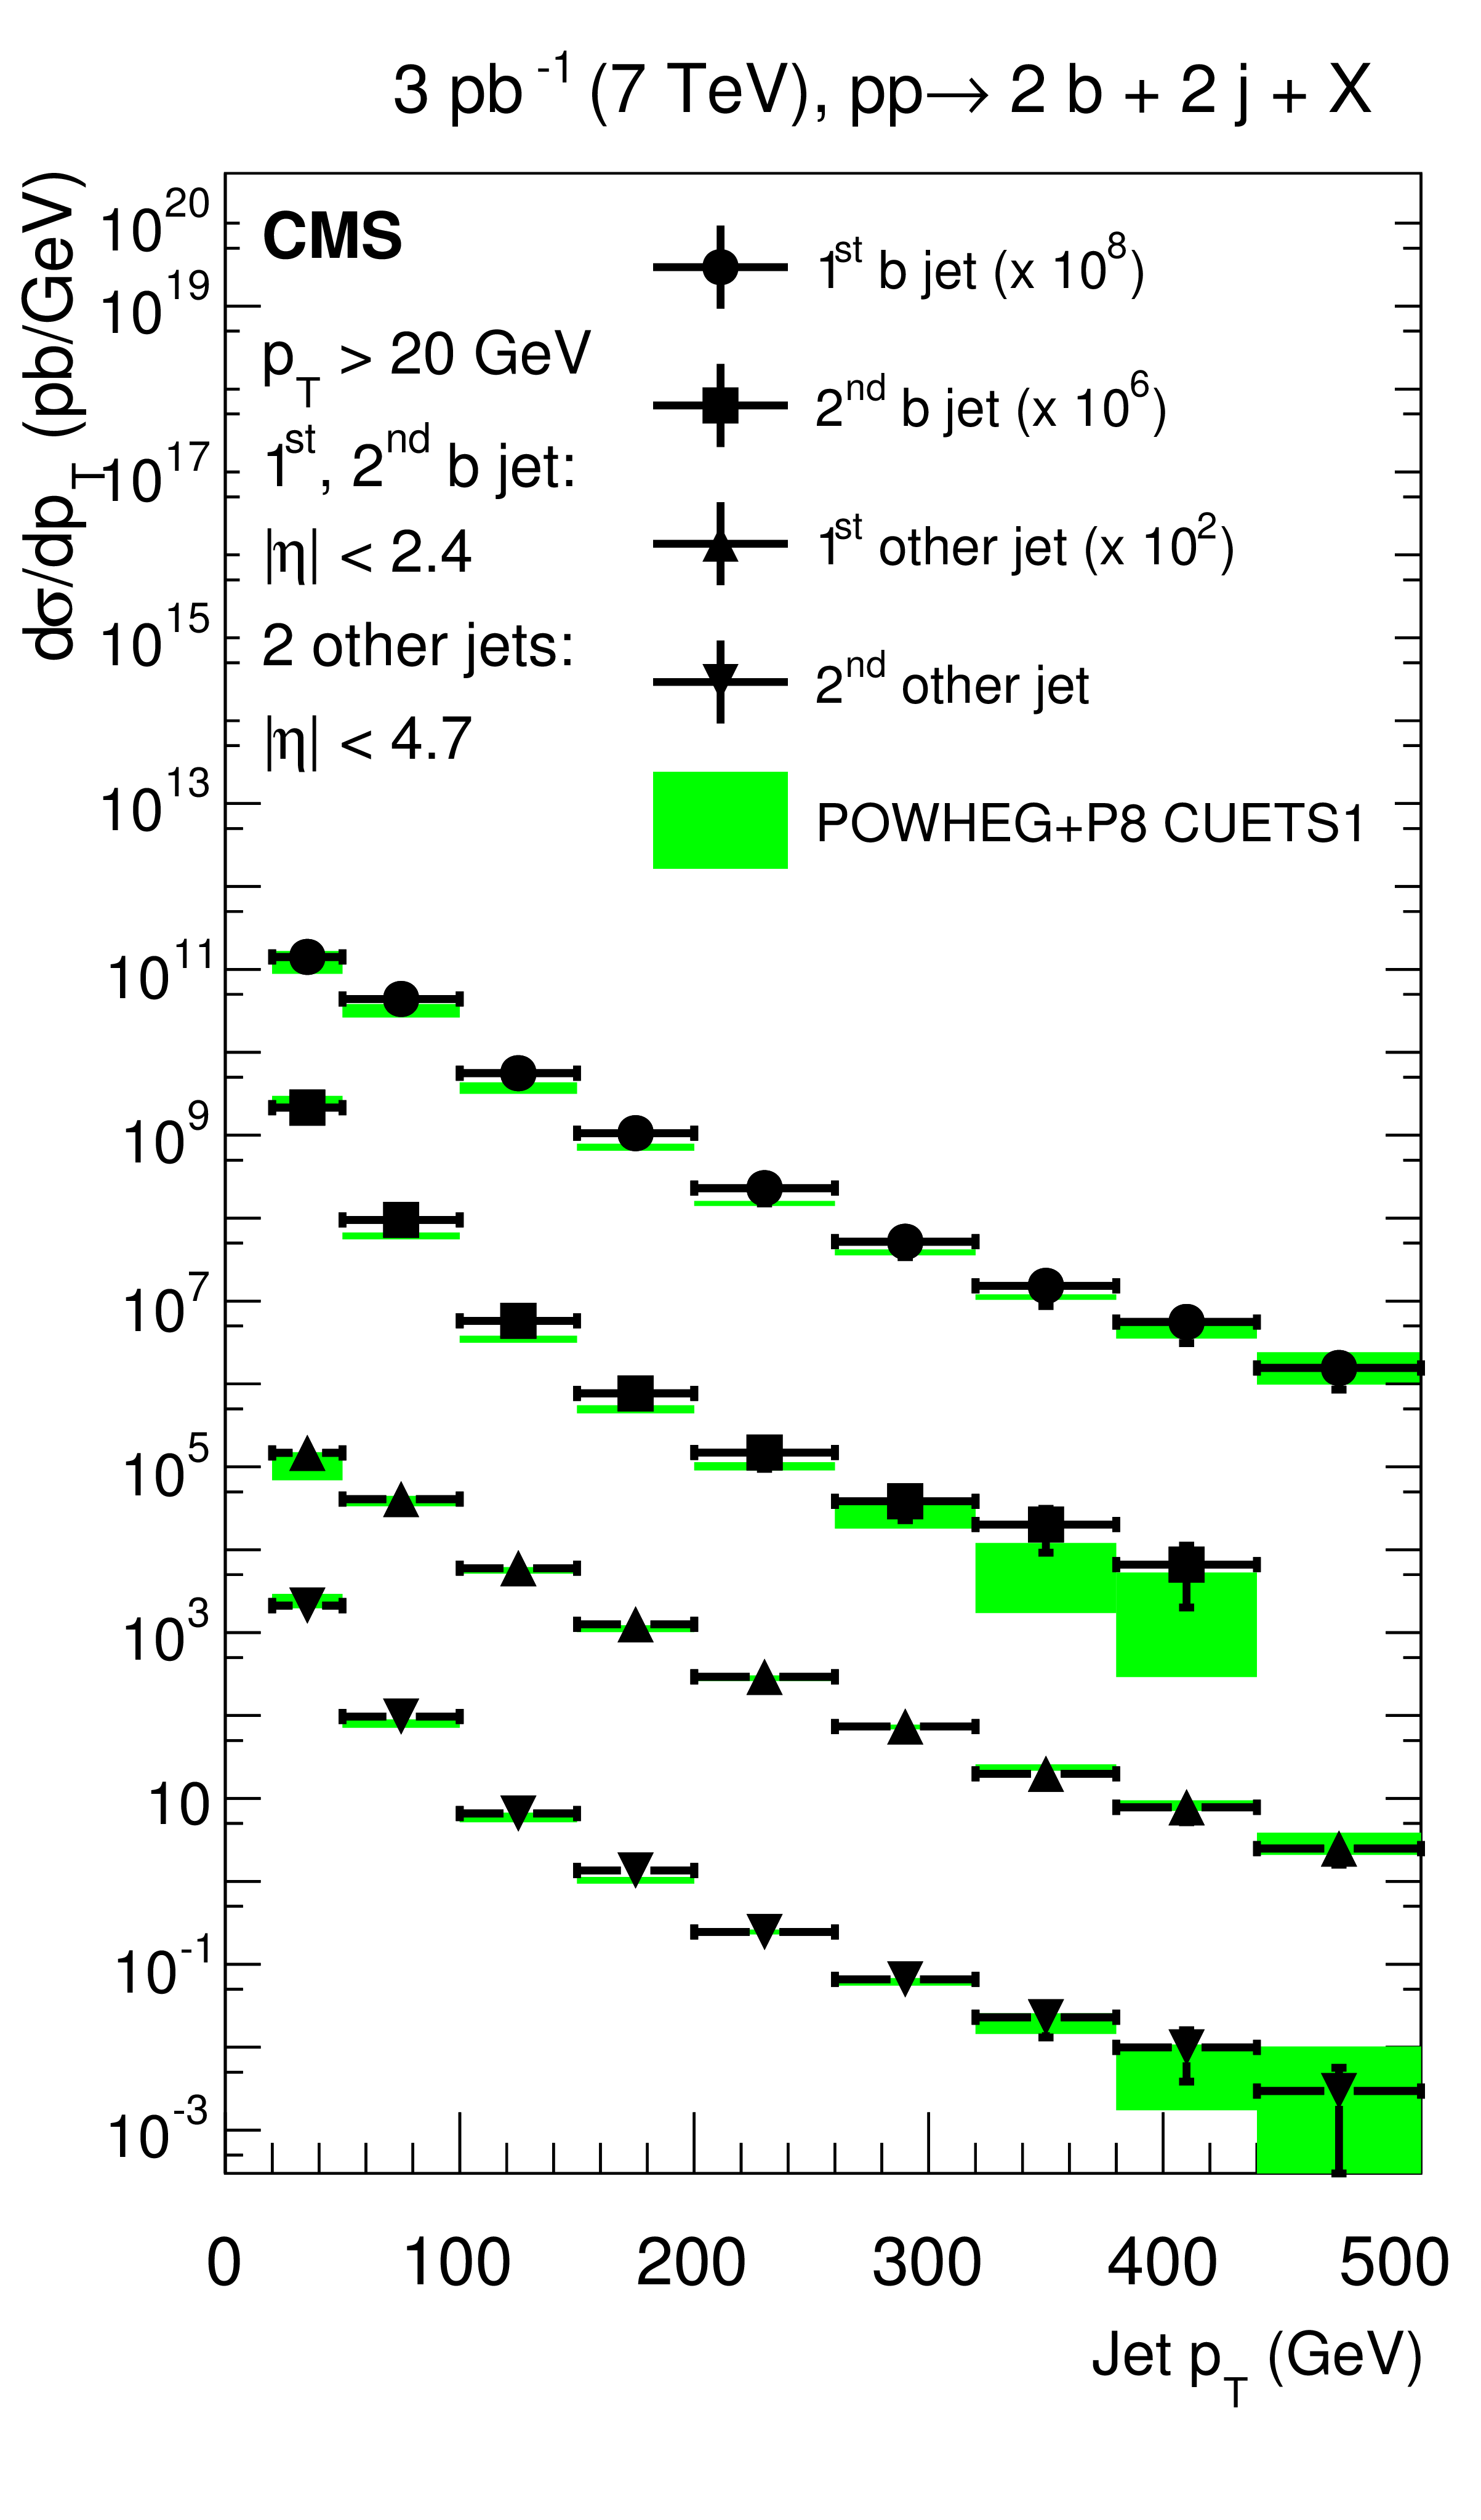
Figure 3-a:
Differential cross sections unfolded to the particle level as a function of the jet transverse momenta $ {p_{\mathrm {T}}} $ compared to predictions of POWHEG+PYTHIA 8 tune CUETS1. Scale factors of $10^8$, $10^6$, and $10^2$ are applied (for clarity) to the measurement of the leading, subleading, and third jet, respectively. The error bars on the data represent the total uncertainties, i.e., statistical and systematic added quadratically. The band represents the theoretical uncertainty due to the choice of the scales and PDFs. |
png pdf |
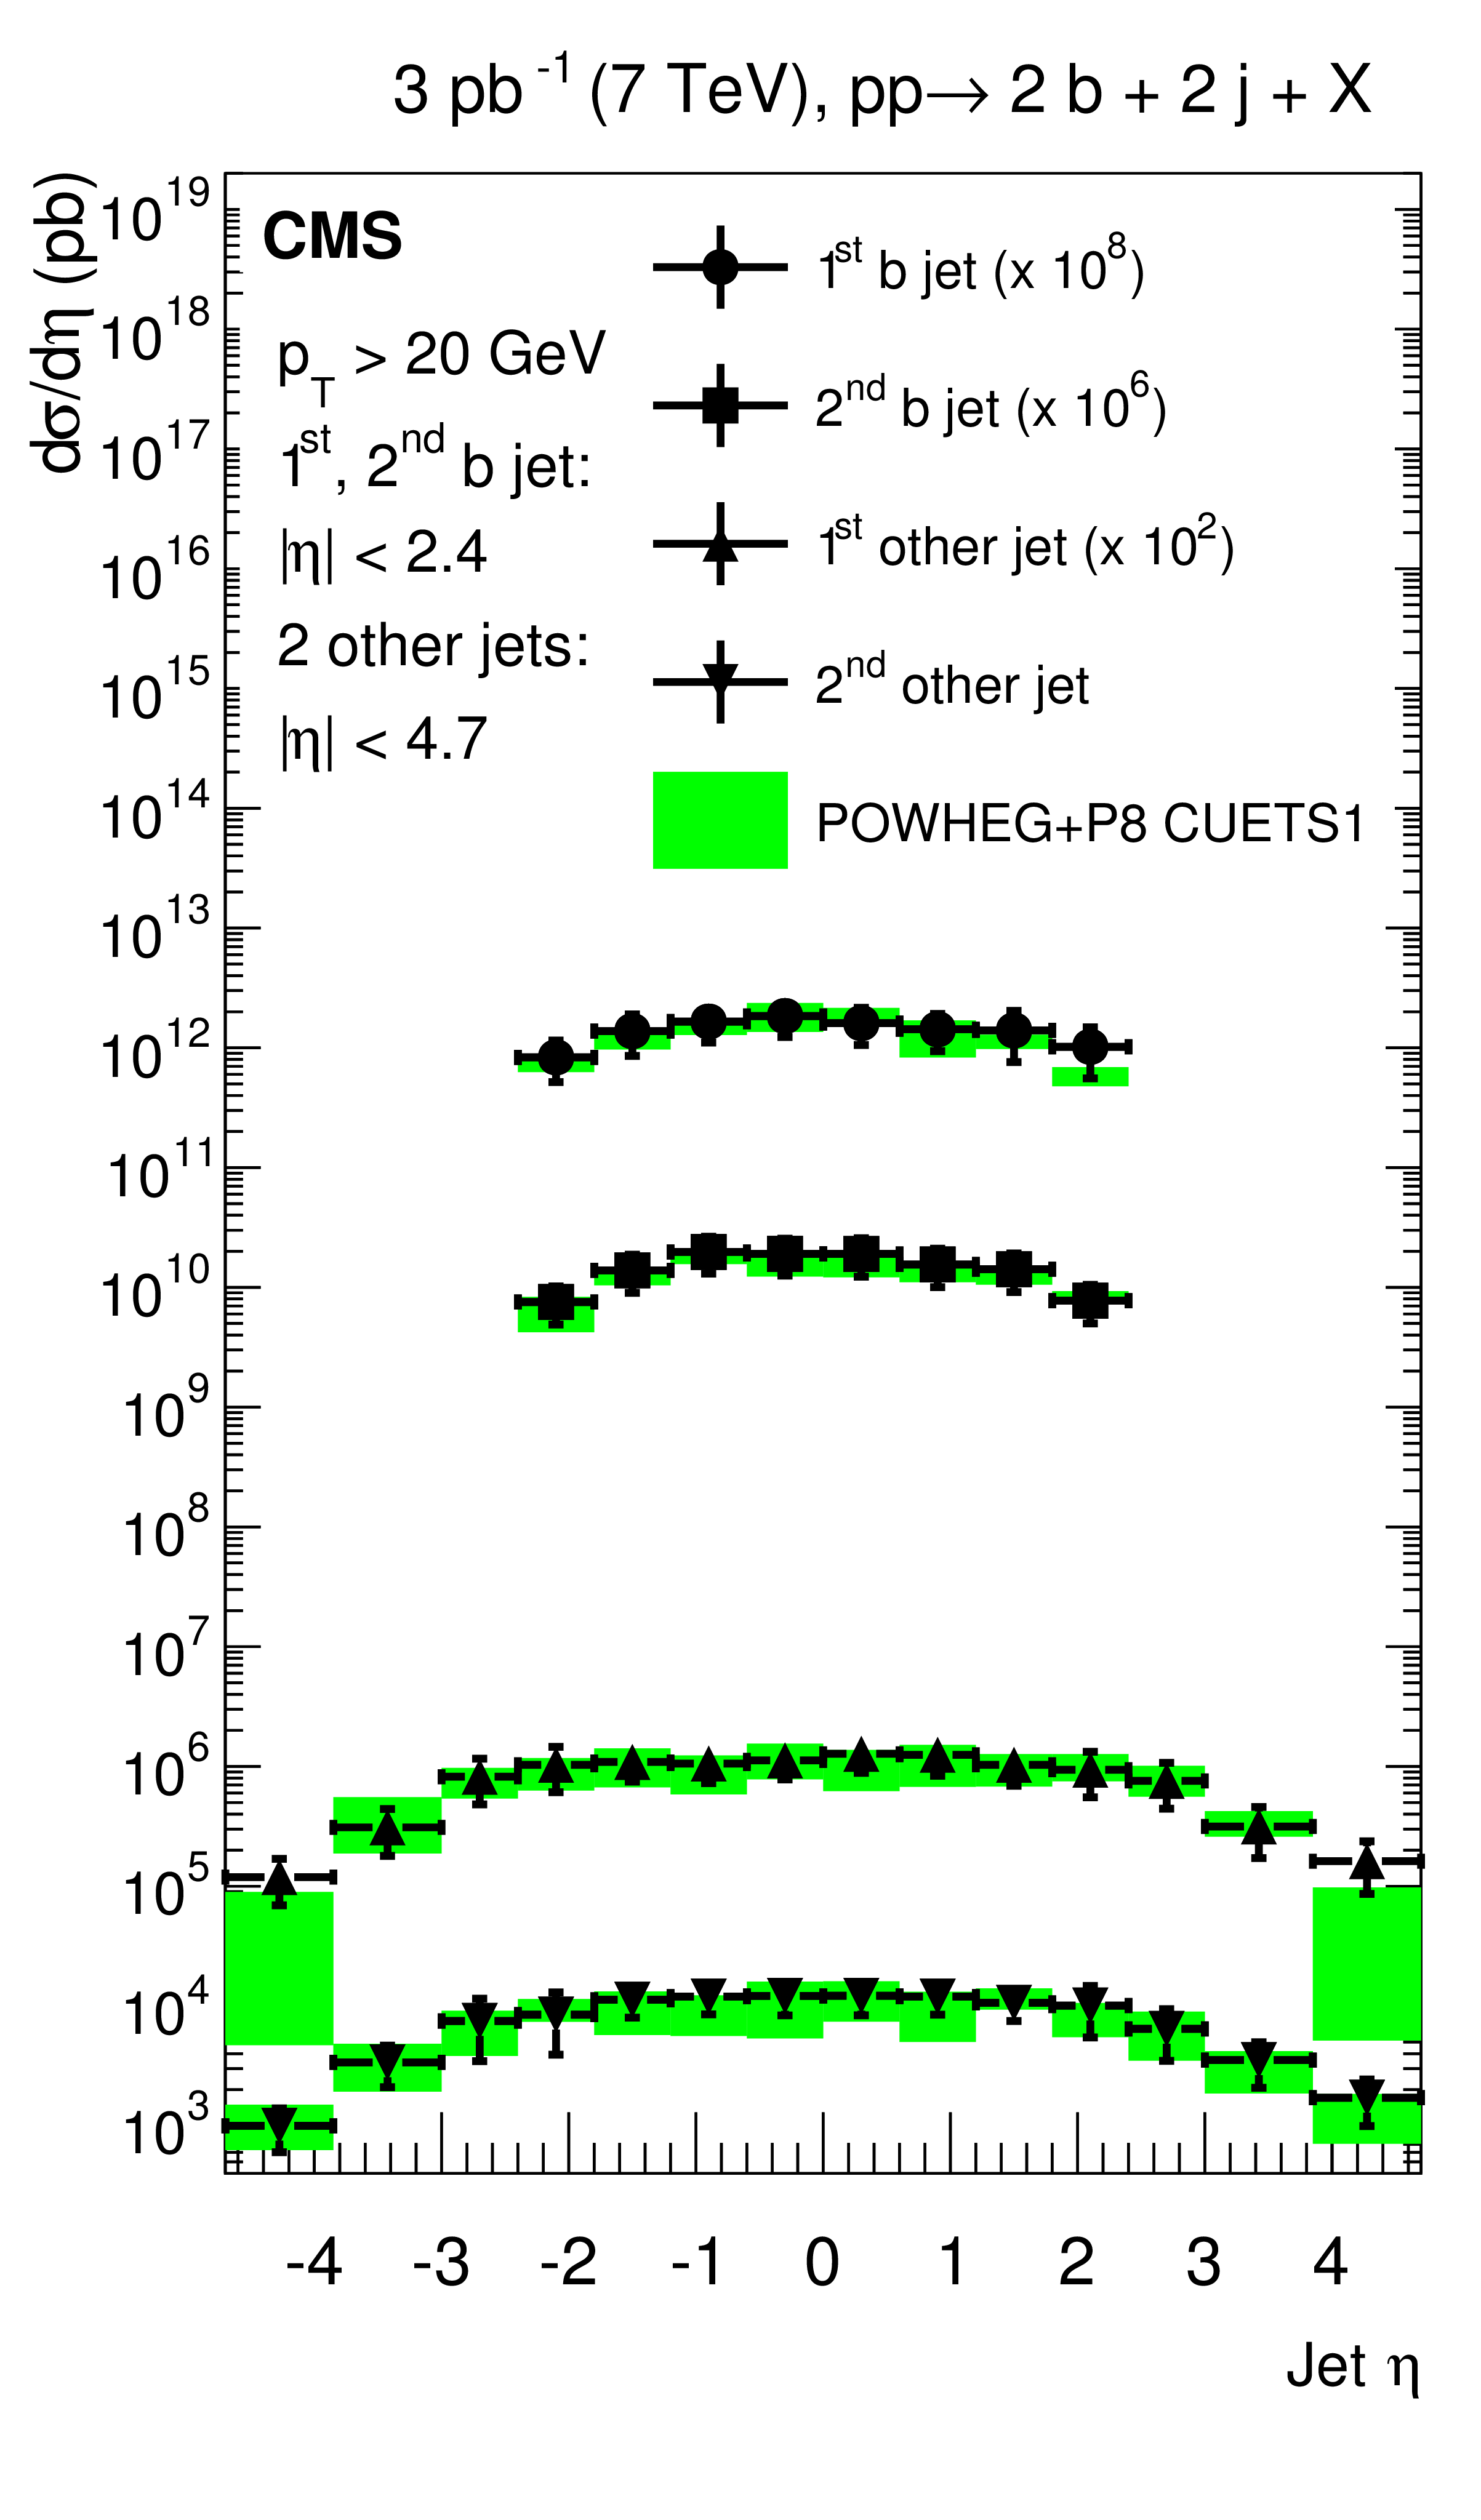
Figure 3-b:
Differential cross sections unfolded to the particle level as a function of the jet pseudorapidity $\eta $ compared to predictions of POWHEG+PYTHIA 8 tune CUETS1. Scale factors of $10^8$, $10^6$, and $10^2$ are applied (for clarity) to the measurement of the leading, subleading, and third jet, respectively. The error bars on the data represent the total uncertainties, i.e., statistical and systematic added quadratically. The band represents the theoretical uncertainty due to the choice of the scales and PDFs. |
png pdf |
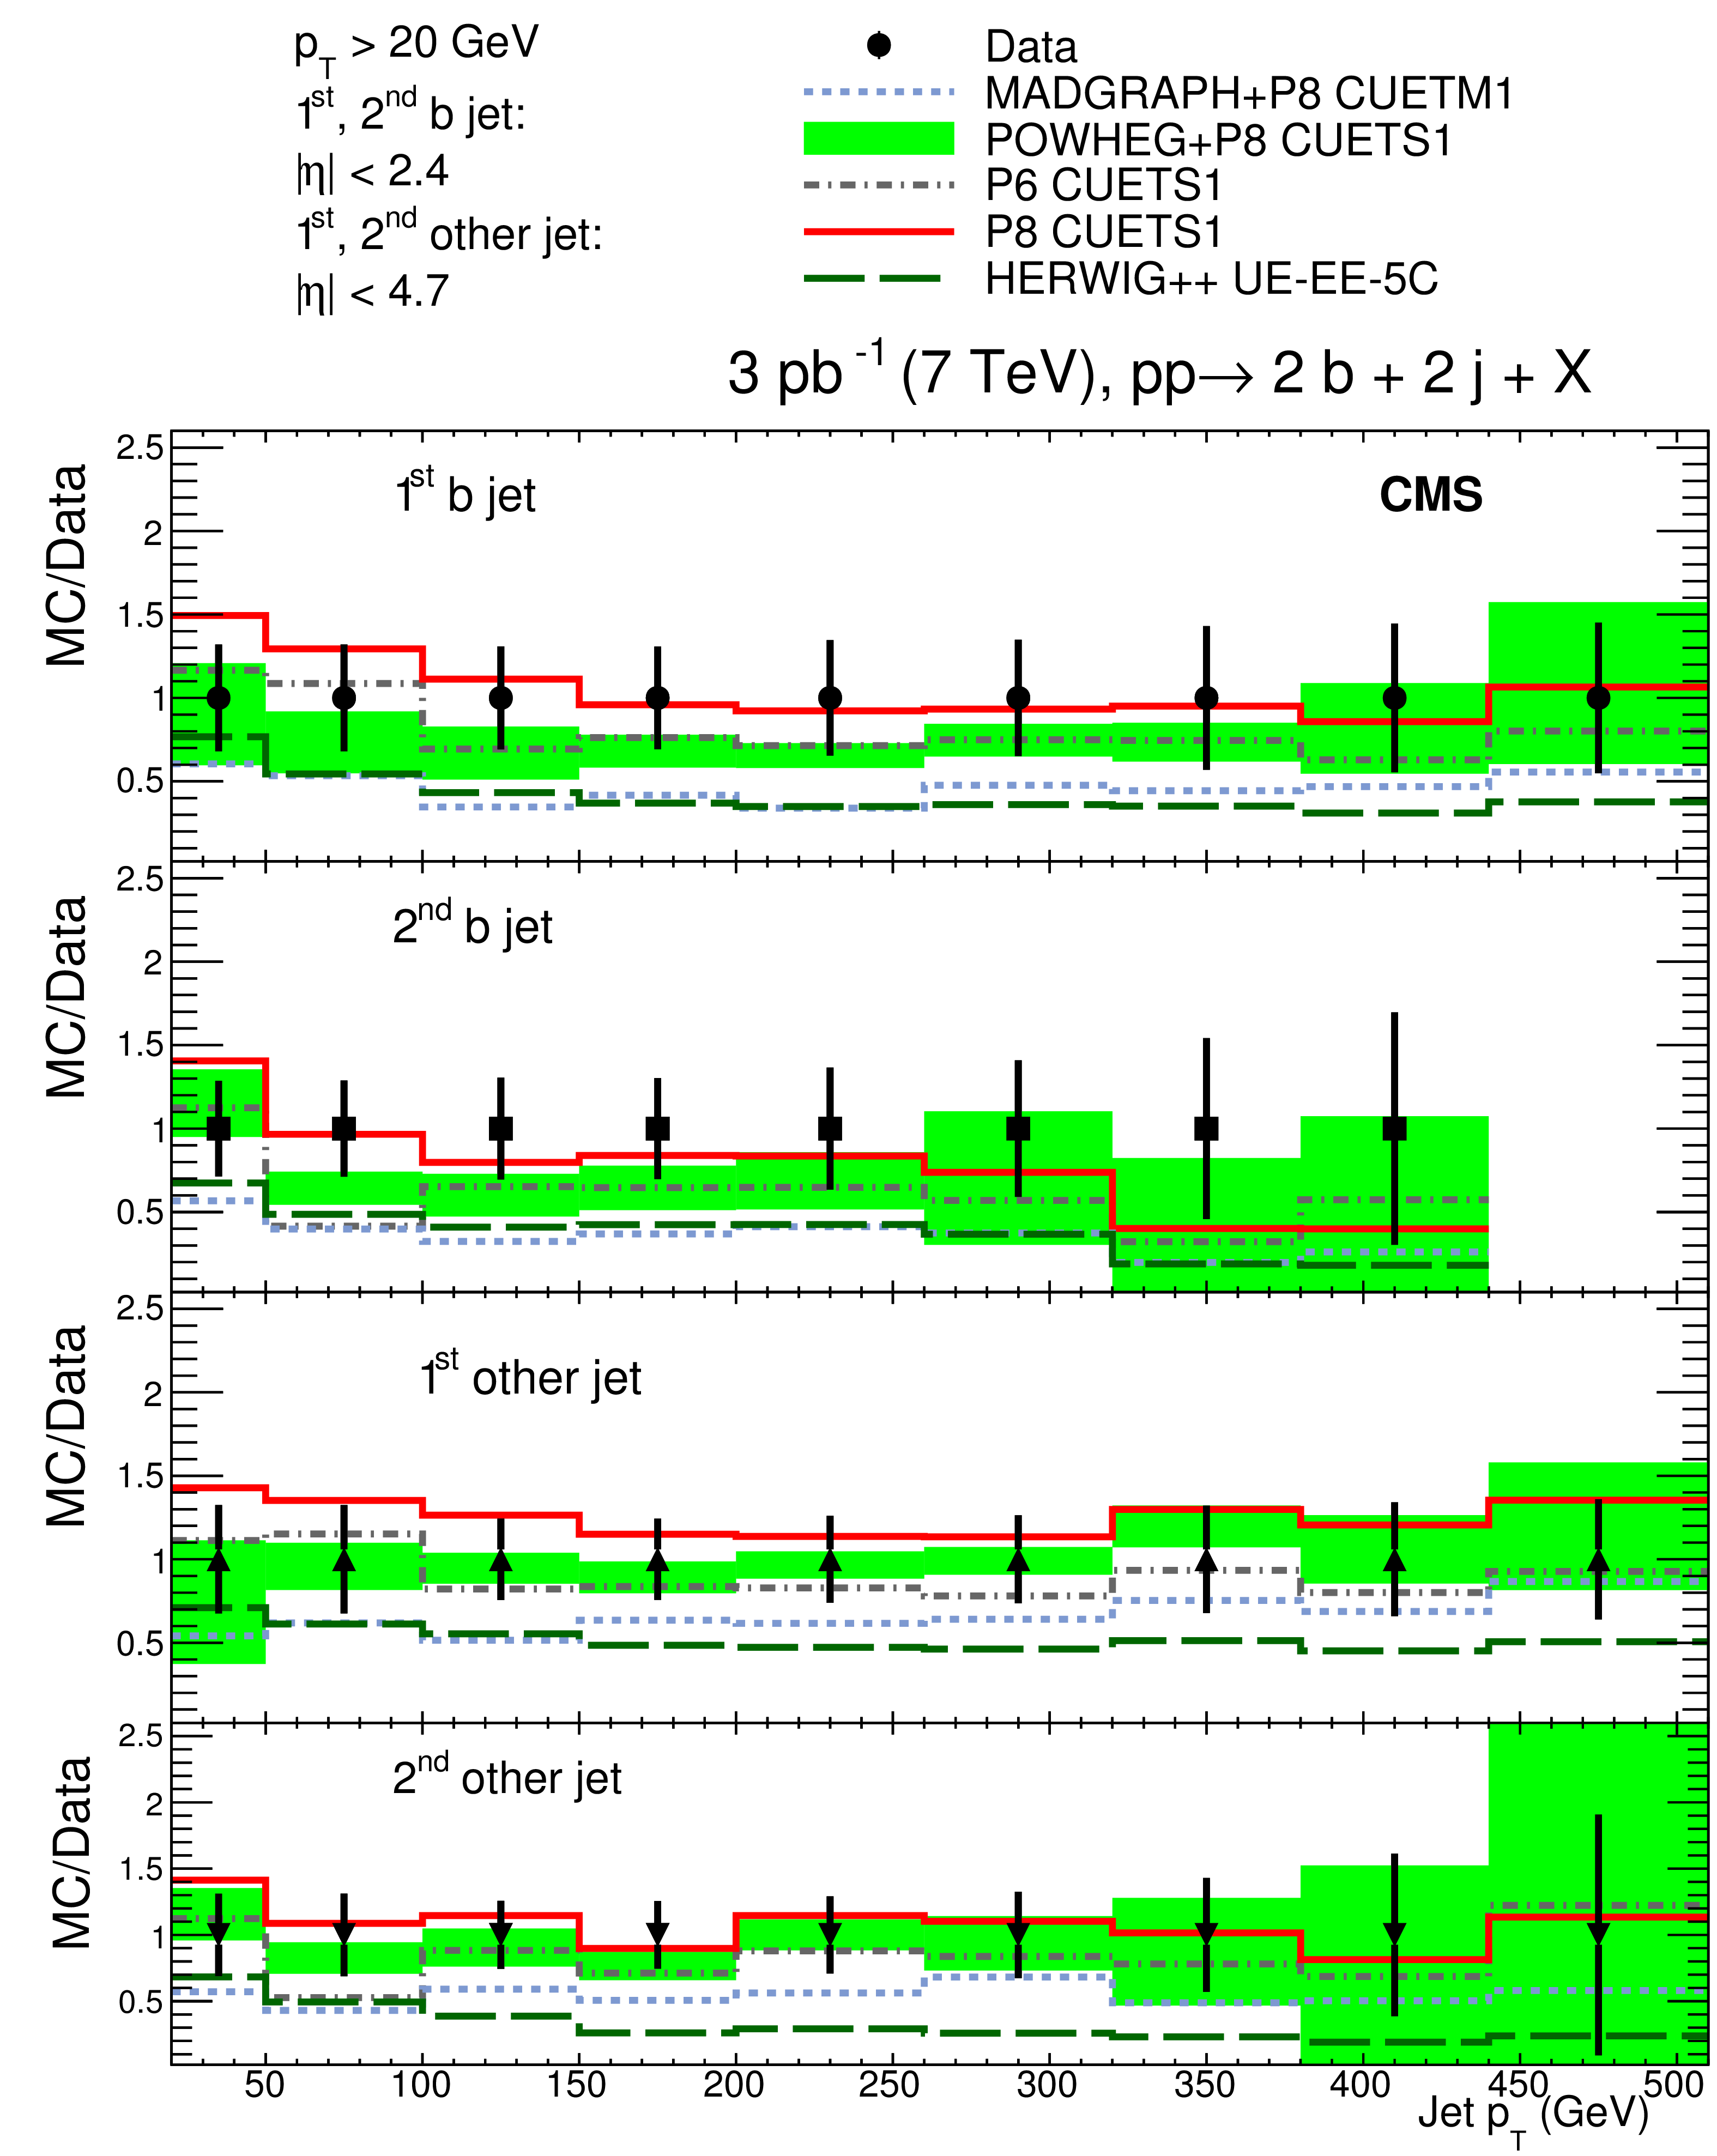
Figure 4:
Ratios of the absolute cross section predictions of POWHEG, MadGraph, PYTHIA 6 (P6), PYTHIA 8 (P8), and HERWIG++ over data (unfolded to the particle level) as a function of the jet transverse momenta $ {p_{\mathrm {T}}} $ for each jet. The error bars on the data represent the total uncertainties, i.e., statistical and systematic added quadratically. Data are shown with markers at unity. The band represents the theoretical uncertainty due to the choice of the scales and PDFs (shown only around the POWHEG ratio for clarity, but affecting all predictions in the same way). |
png pdf |
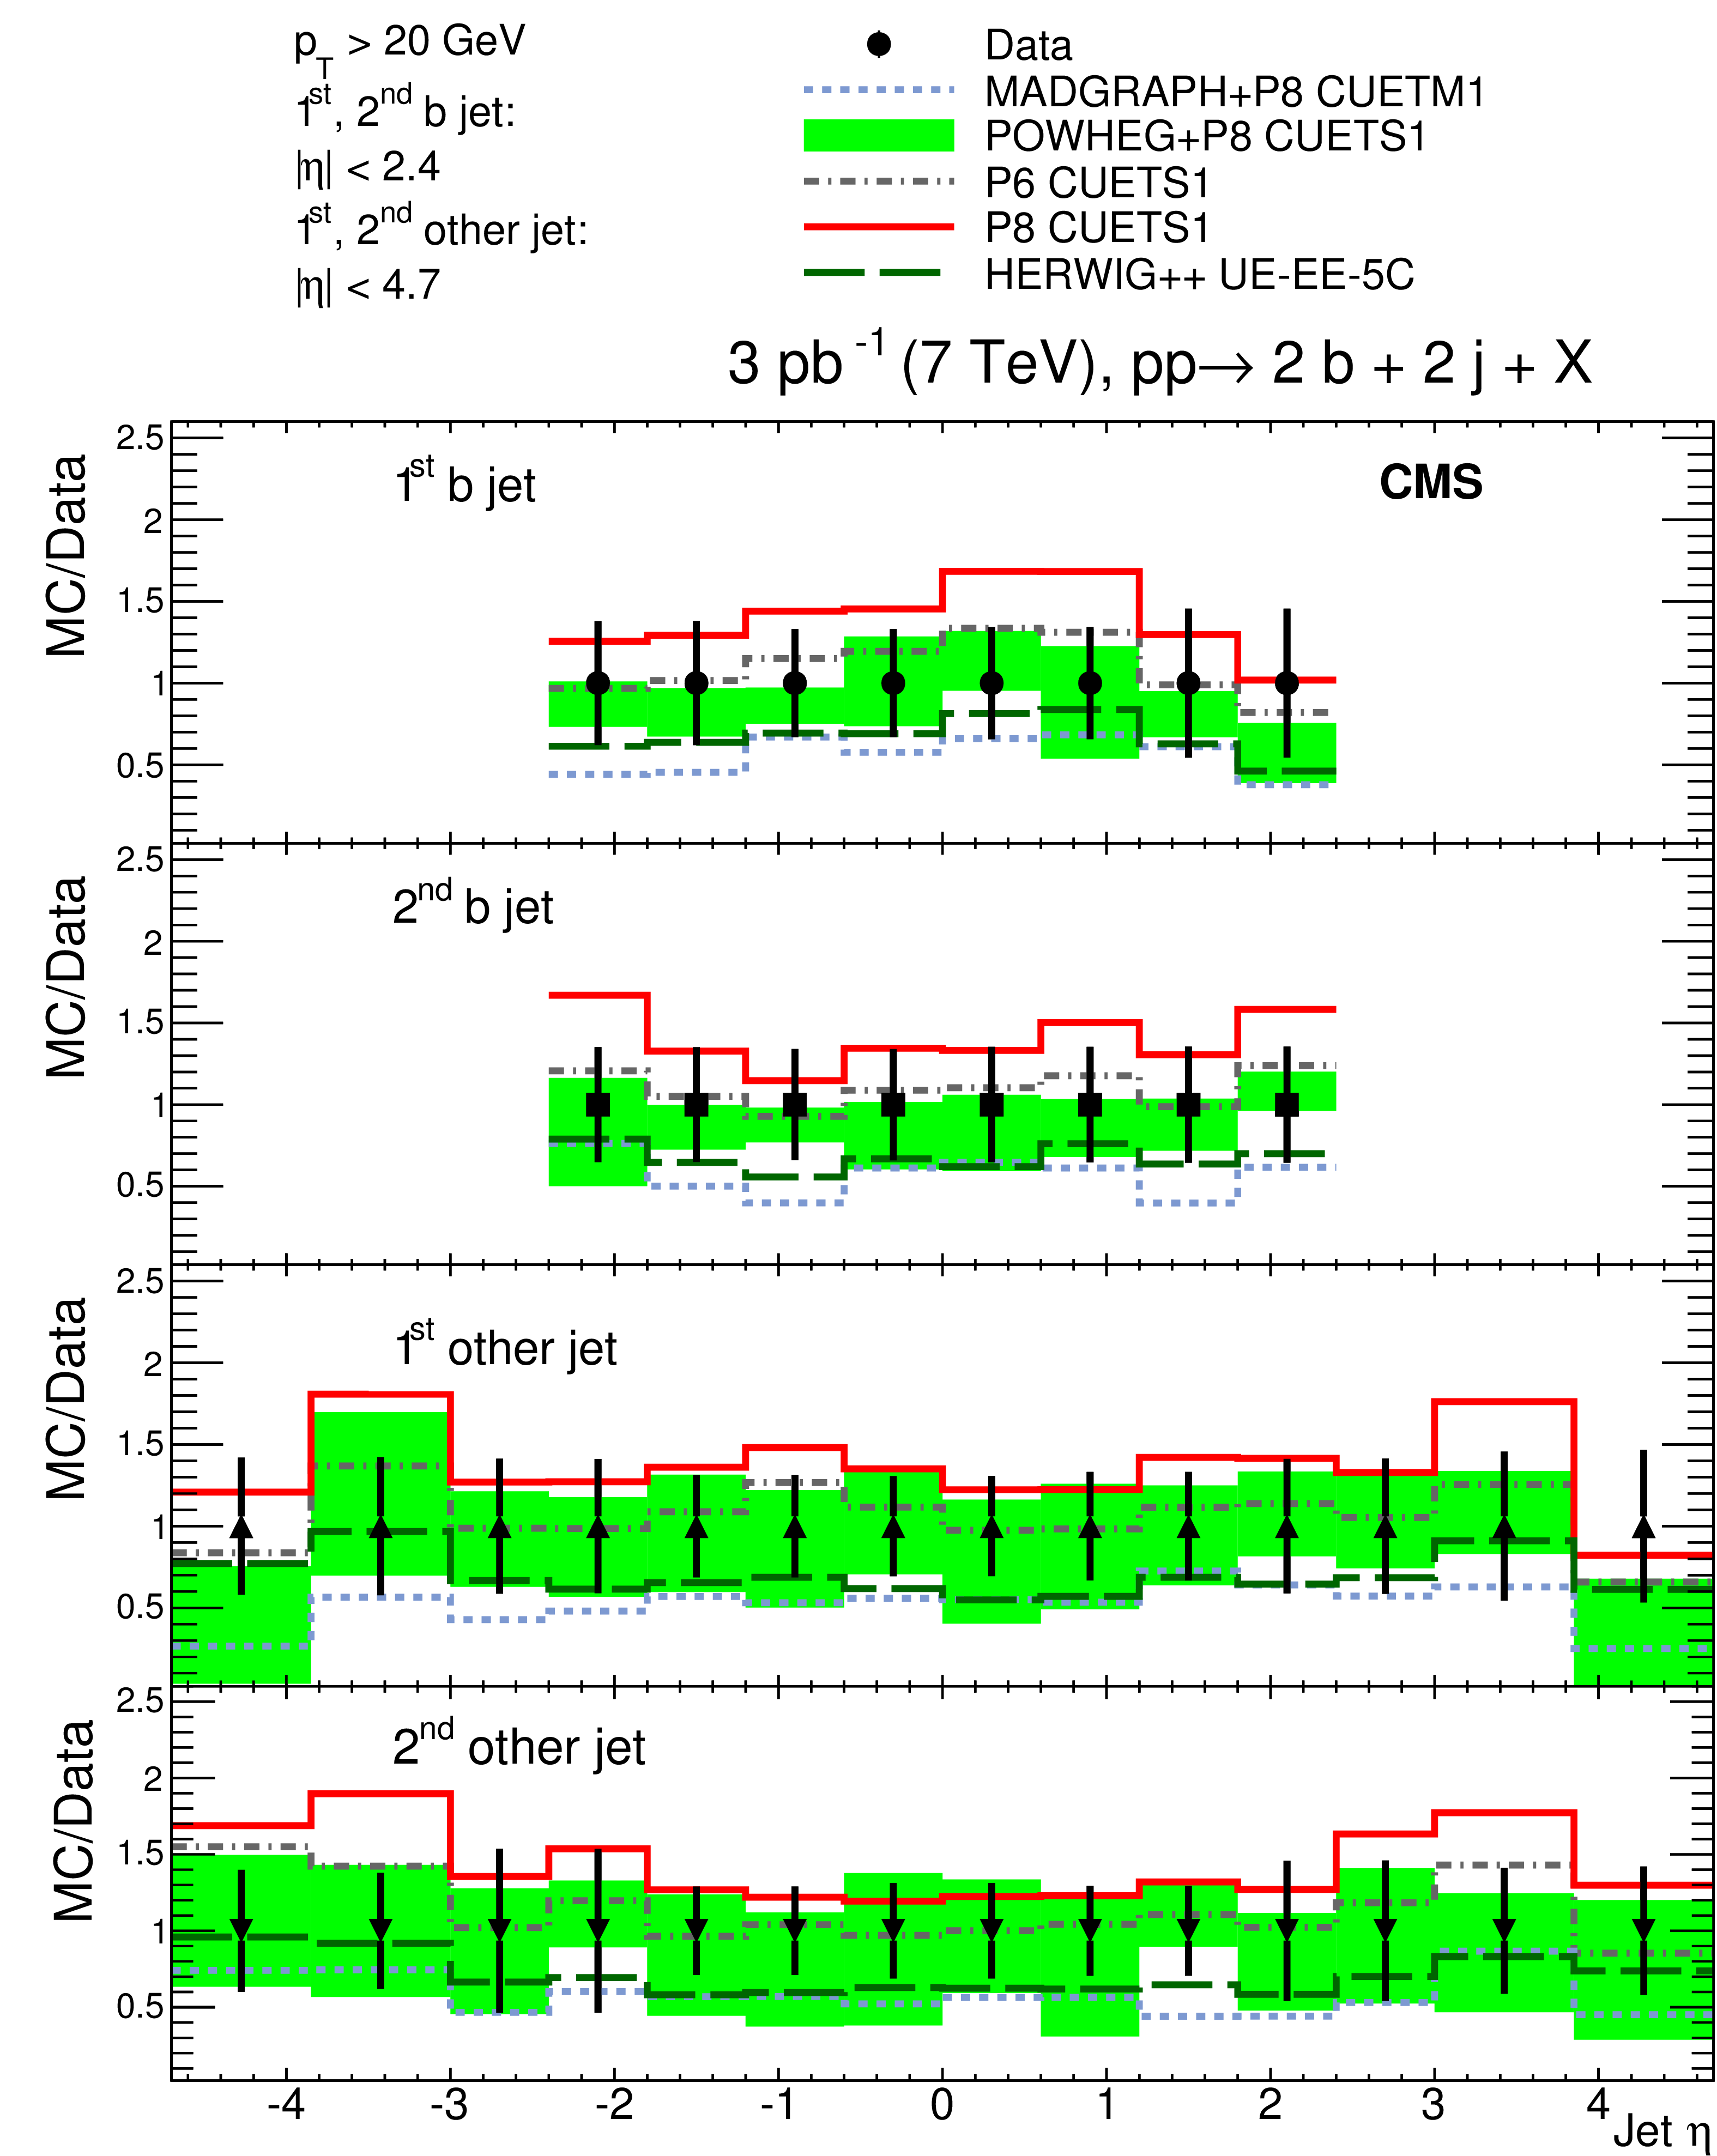
Figure 5:
Ratios of the absolute cross section predictions of POWHEG, MadGraph, PYTHIA 6 (P6), PYTHIA 8 (P8), and HERWIG++ over data (unfolded to the particle level) as a function of the jet pseudorapidity $\eta $ for each jet. The error bars on the data represent the total uncertainties, i.e., statistical and systematic added quadratically. Data are shown with markers at unity. The band represents the theoretical uncertainty due to the choice of the scales and PDFs (shown only around the POWHEG ratio for clarity, but affecting all predictions in the same way). |
png pdf |
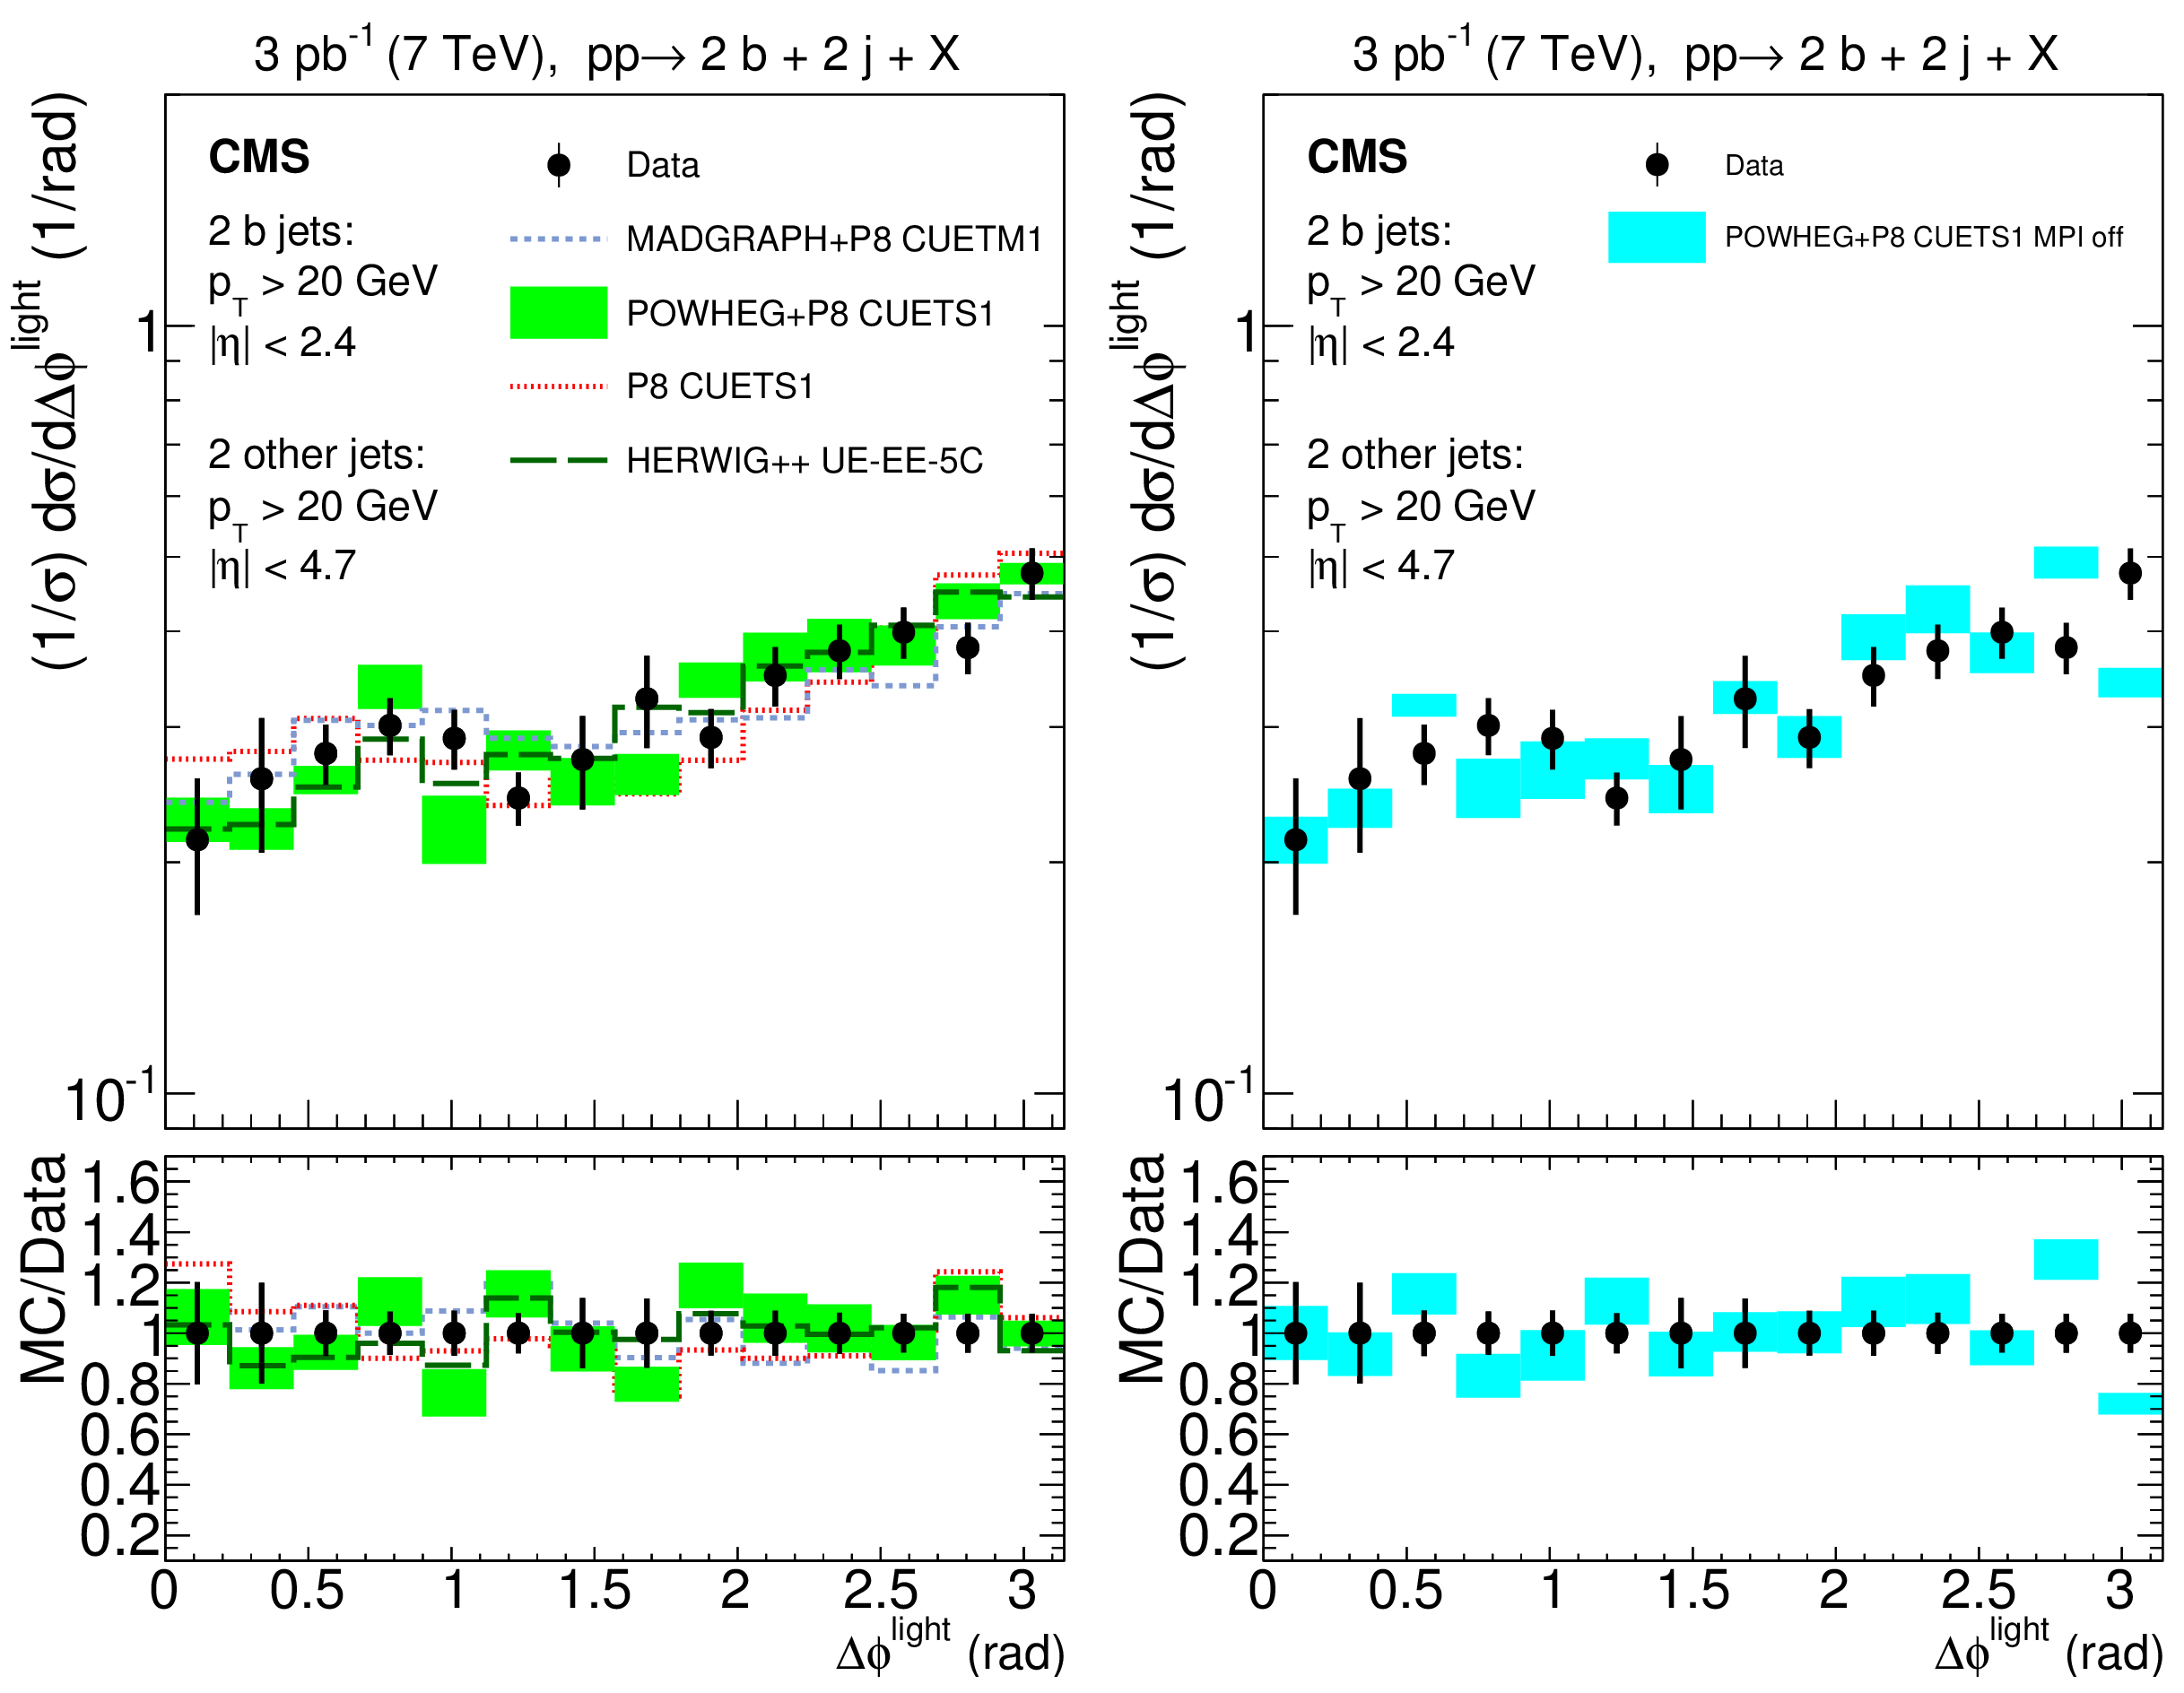
Figure 6:
Normalized cross sections unfolded to the particle level as a function of $\Delta \phi ^{\text {light}}$, compared to predictions of POWHEG, MadGraph, PYTHIA 8 (P8), and HERWIG++ (left), and of the POWHEG+PYTHIA 8 tune CUETS1 without MPI (right). The lower panels show the ratios of the MC predictions over the data. The error bars on the data represent the total uncertainties, i.e., statistical and systematic added quadratically. Data are shown with markers at unity. The band represents the theoretical uncertainty due to the choice of the scales and PDFs (shown only around the POWHEG line for clarity, but affecting all predictions in the same way). |
png pdf |
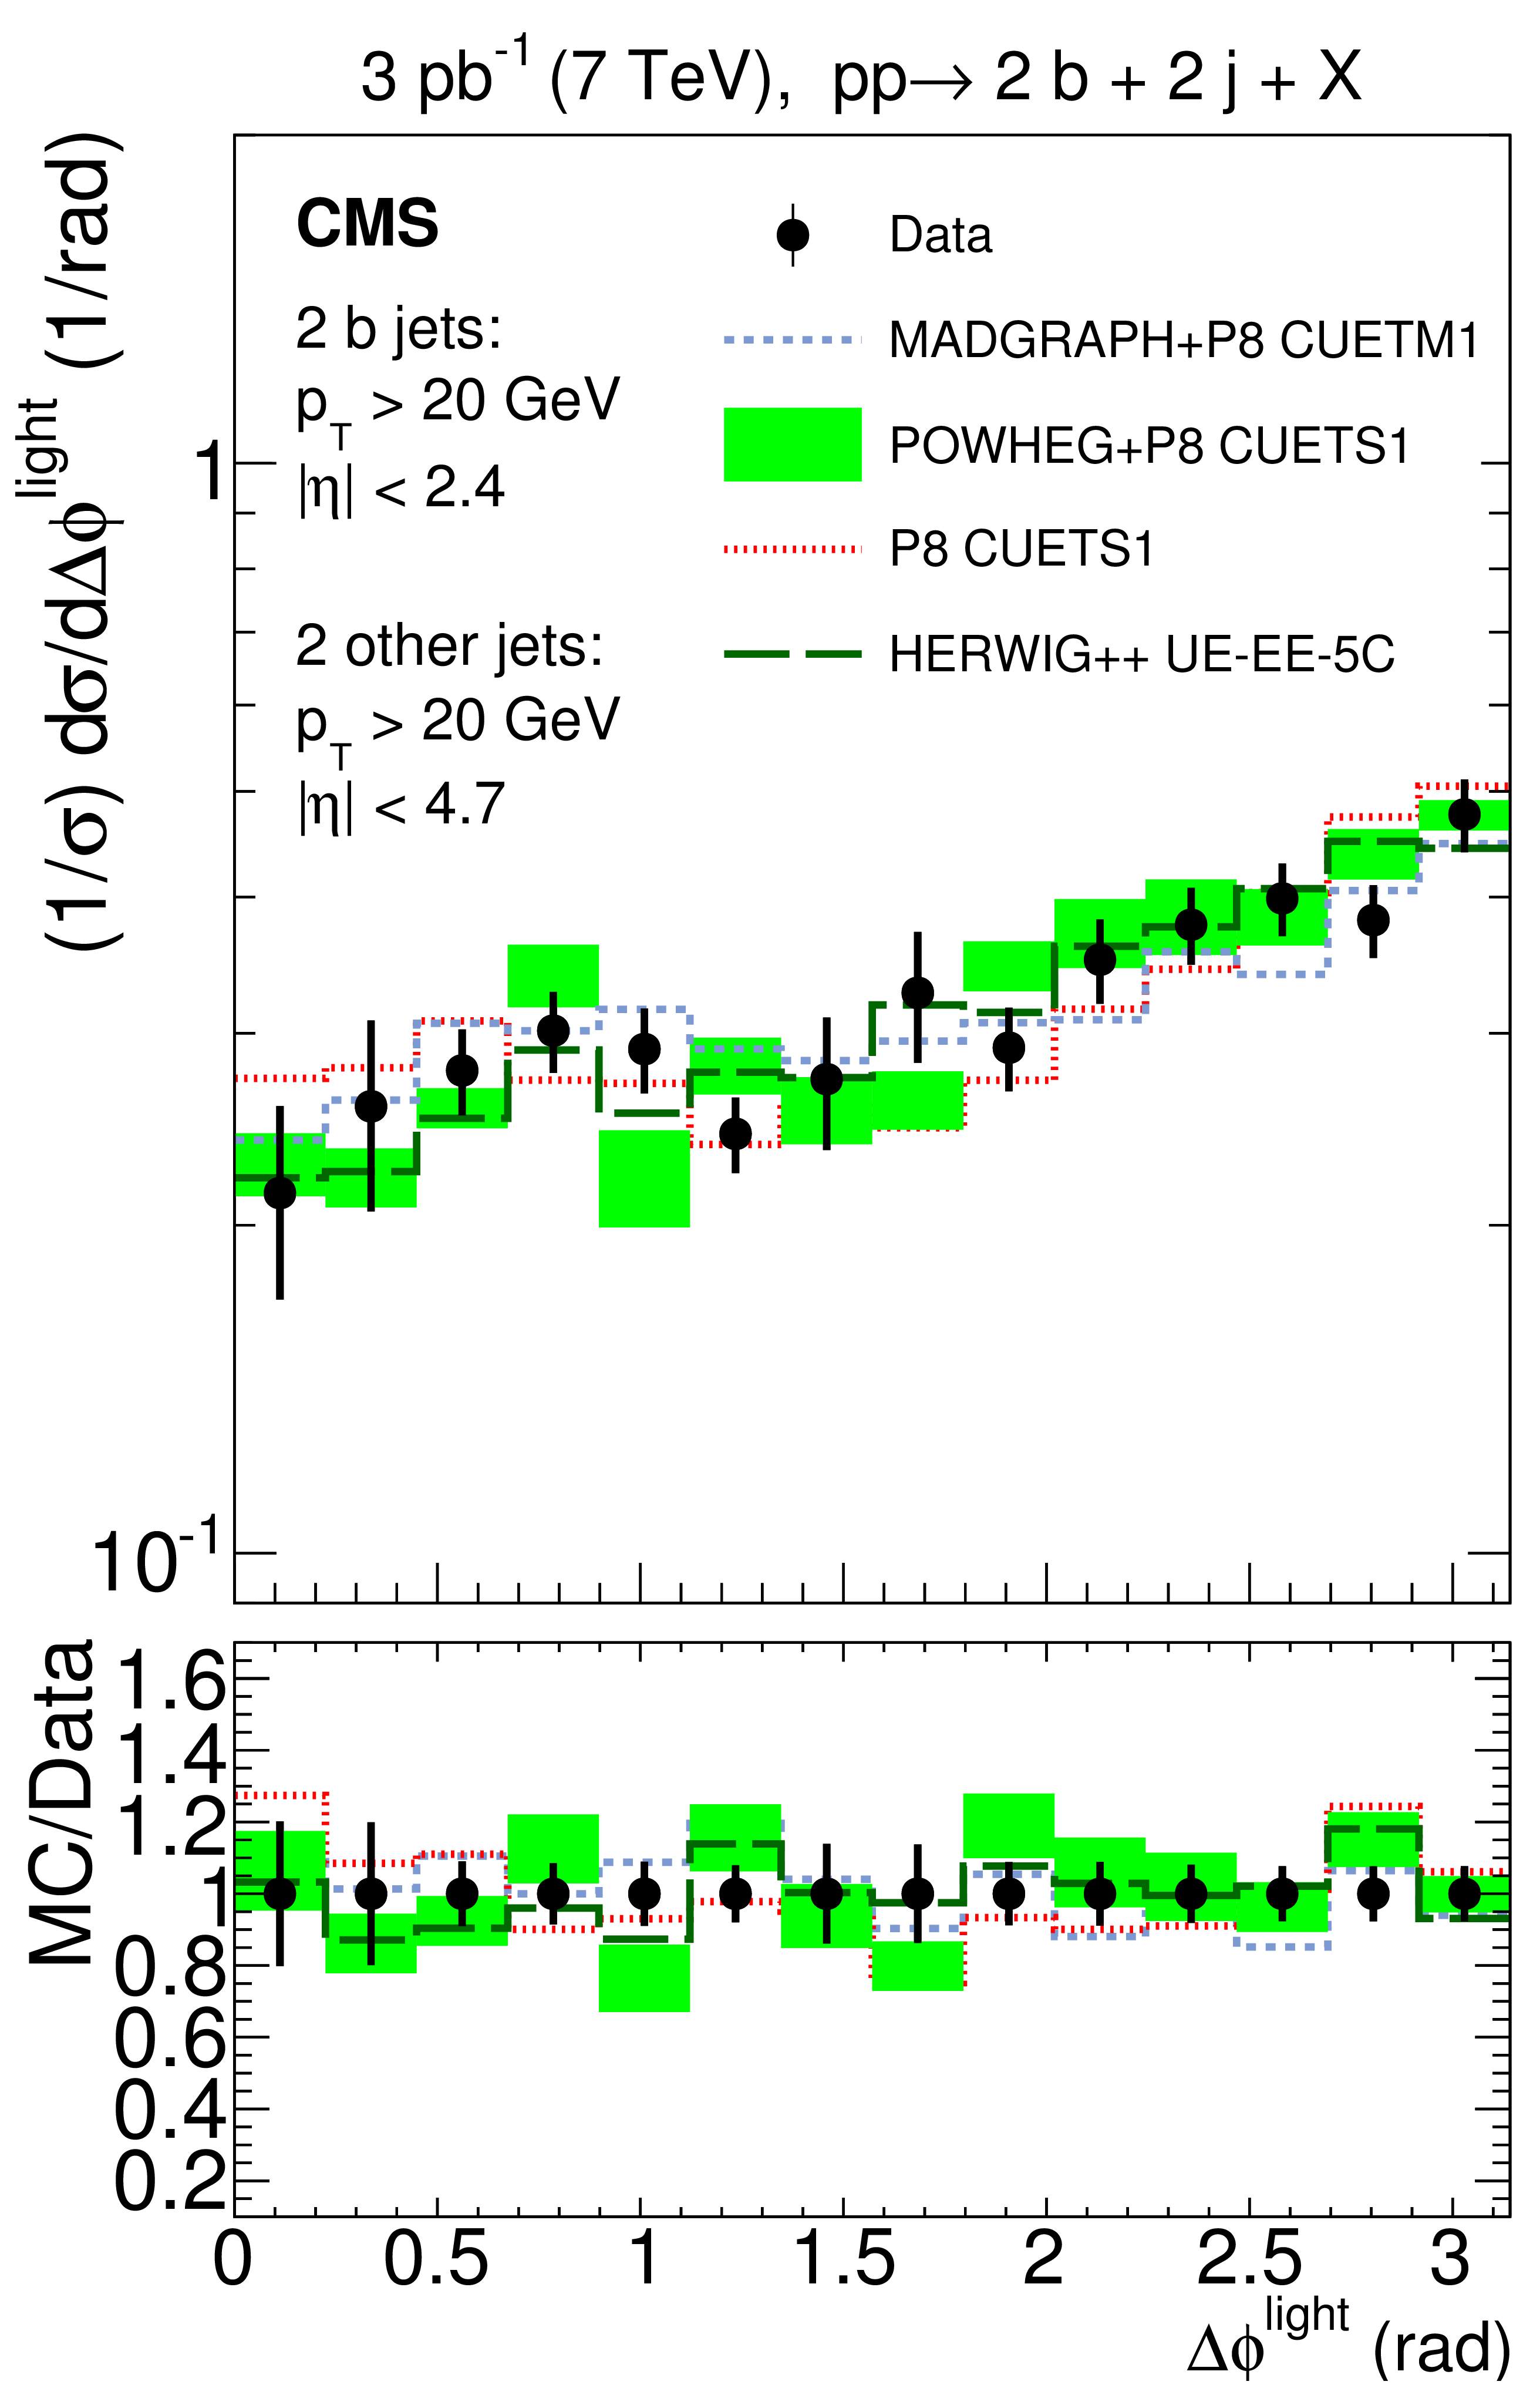
Figure 6-a:
Normalized cross sections unfolded to the particle level as a function of $\Delta \phi ^{\text {light}}$, compared to predictions of POWHEG, MadGraph, PYTHIA 8 (P8), and HERWIG++. The lower panels show the ratios of the MC predictions over the data. The error bars on the data represent the total uncertainties, i.e., statistical and systematic added quadratically. Data are shown with markers at unity. The band represents the theoretical uncertainty due to the choice of the scales and PDFs (shown only around the POWHEG line for clarity, but affecting all predictions in the same way). |
png pdf |
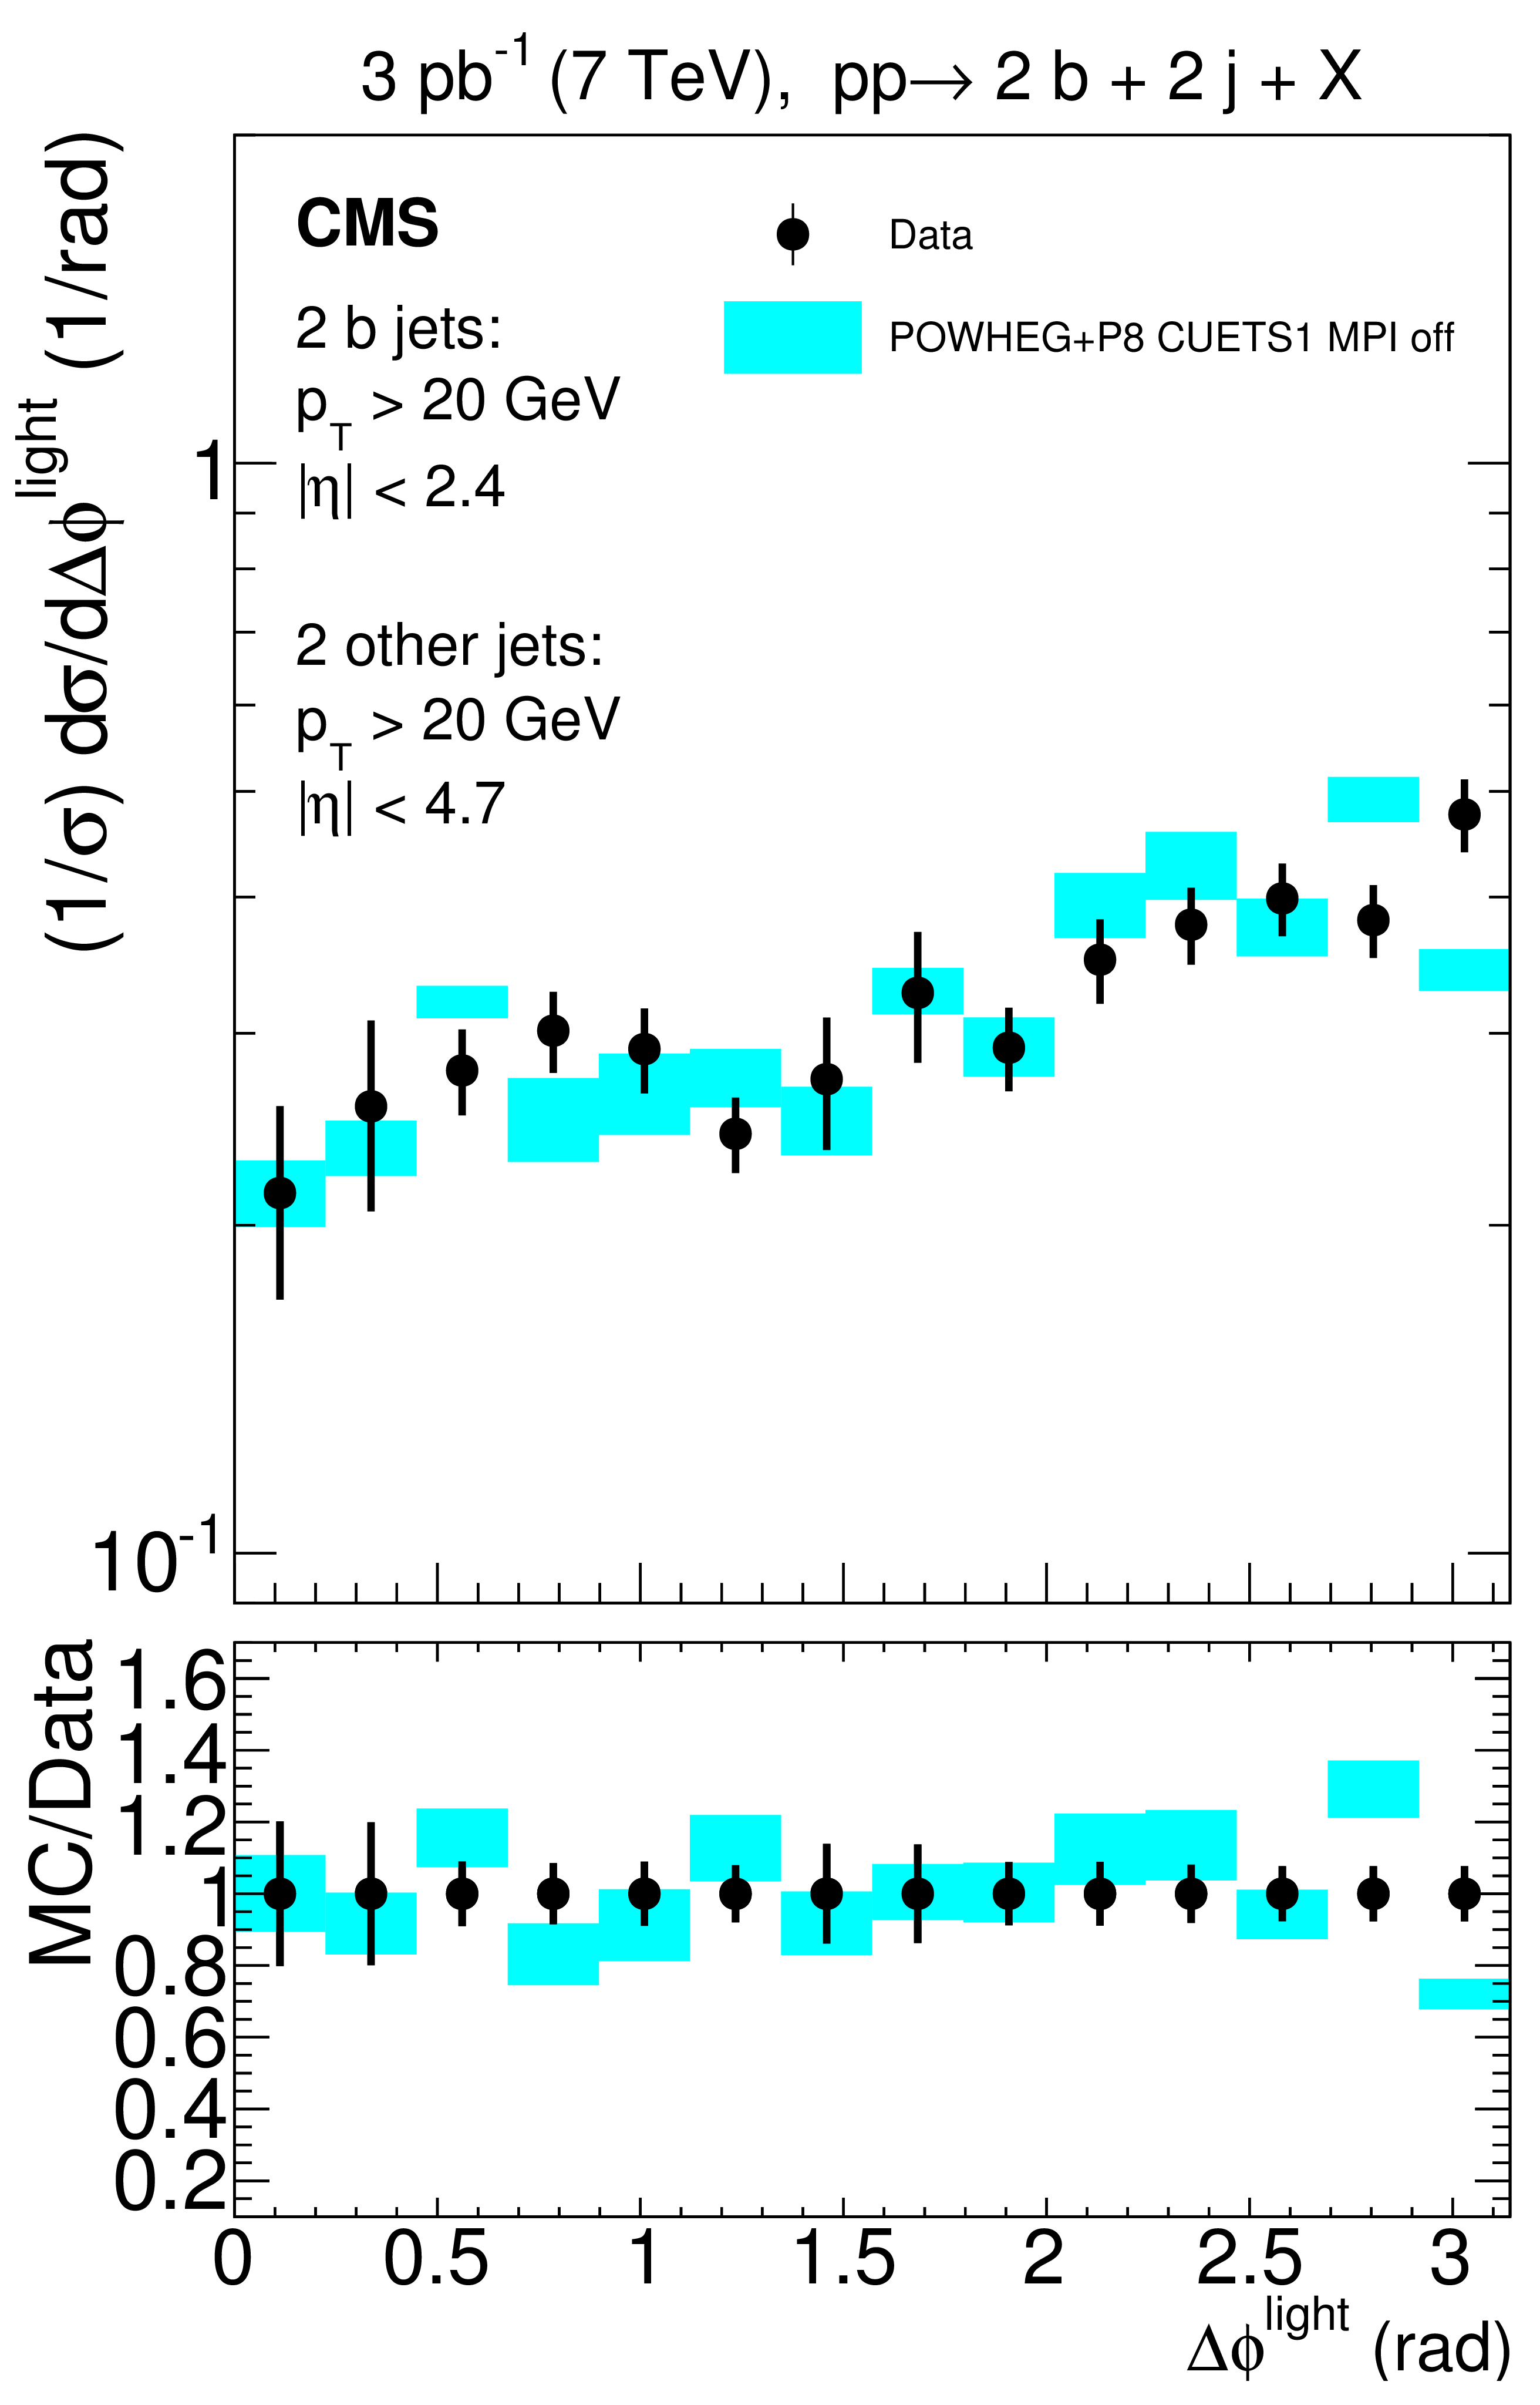
Figure 6-b:
Normalized cross sections unfolded to the particle level as a function of $\Delta \phi ^{\text {light}}$, compared to predictions of the POWHEG+PYTHIA 8 tune CUETS1 without MPI. The lower panels show the ratios of the MC predictions over the data. The error bars on the data represent the total uncertainties, i.e., statistical and systematic added quadratically. Data are shown with markers at unity. The band represents the theoretical uncertainty due to the choice of the scales and PDFs (shown only around the POWHEG line for clarity, but affecting all predictions in the same way). |
png pdf |
Figure 7:
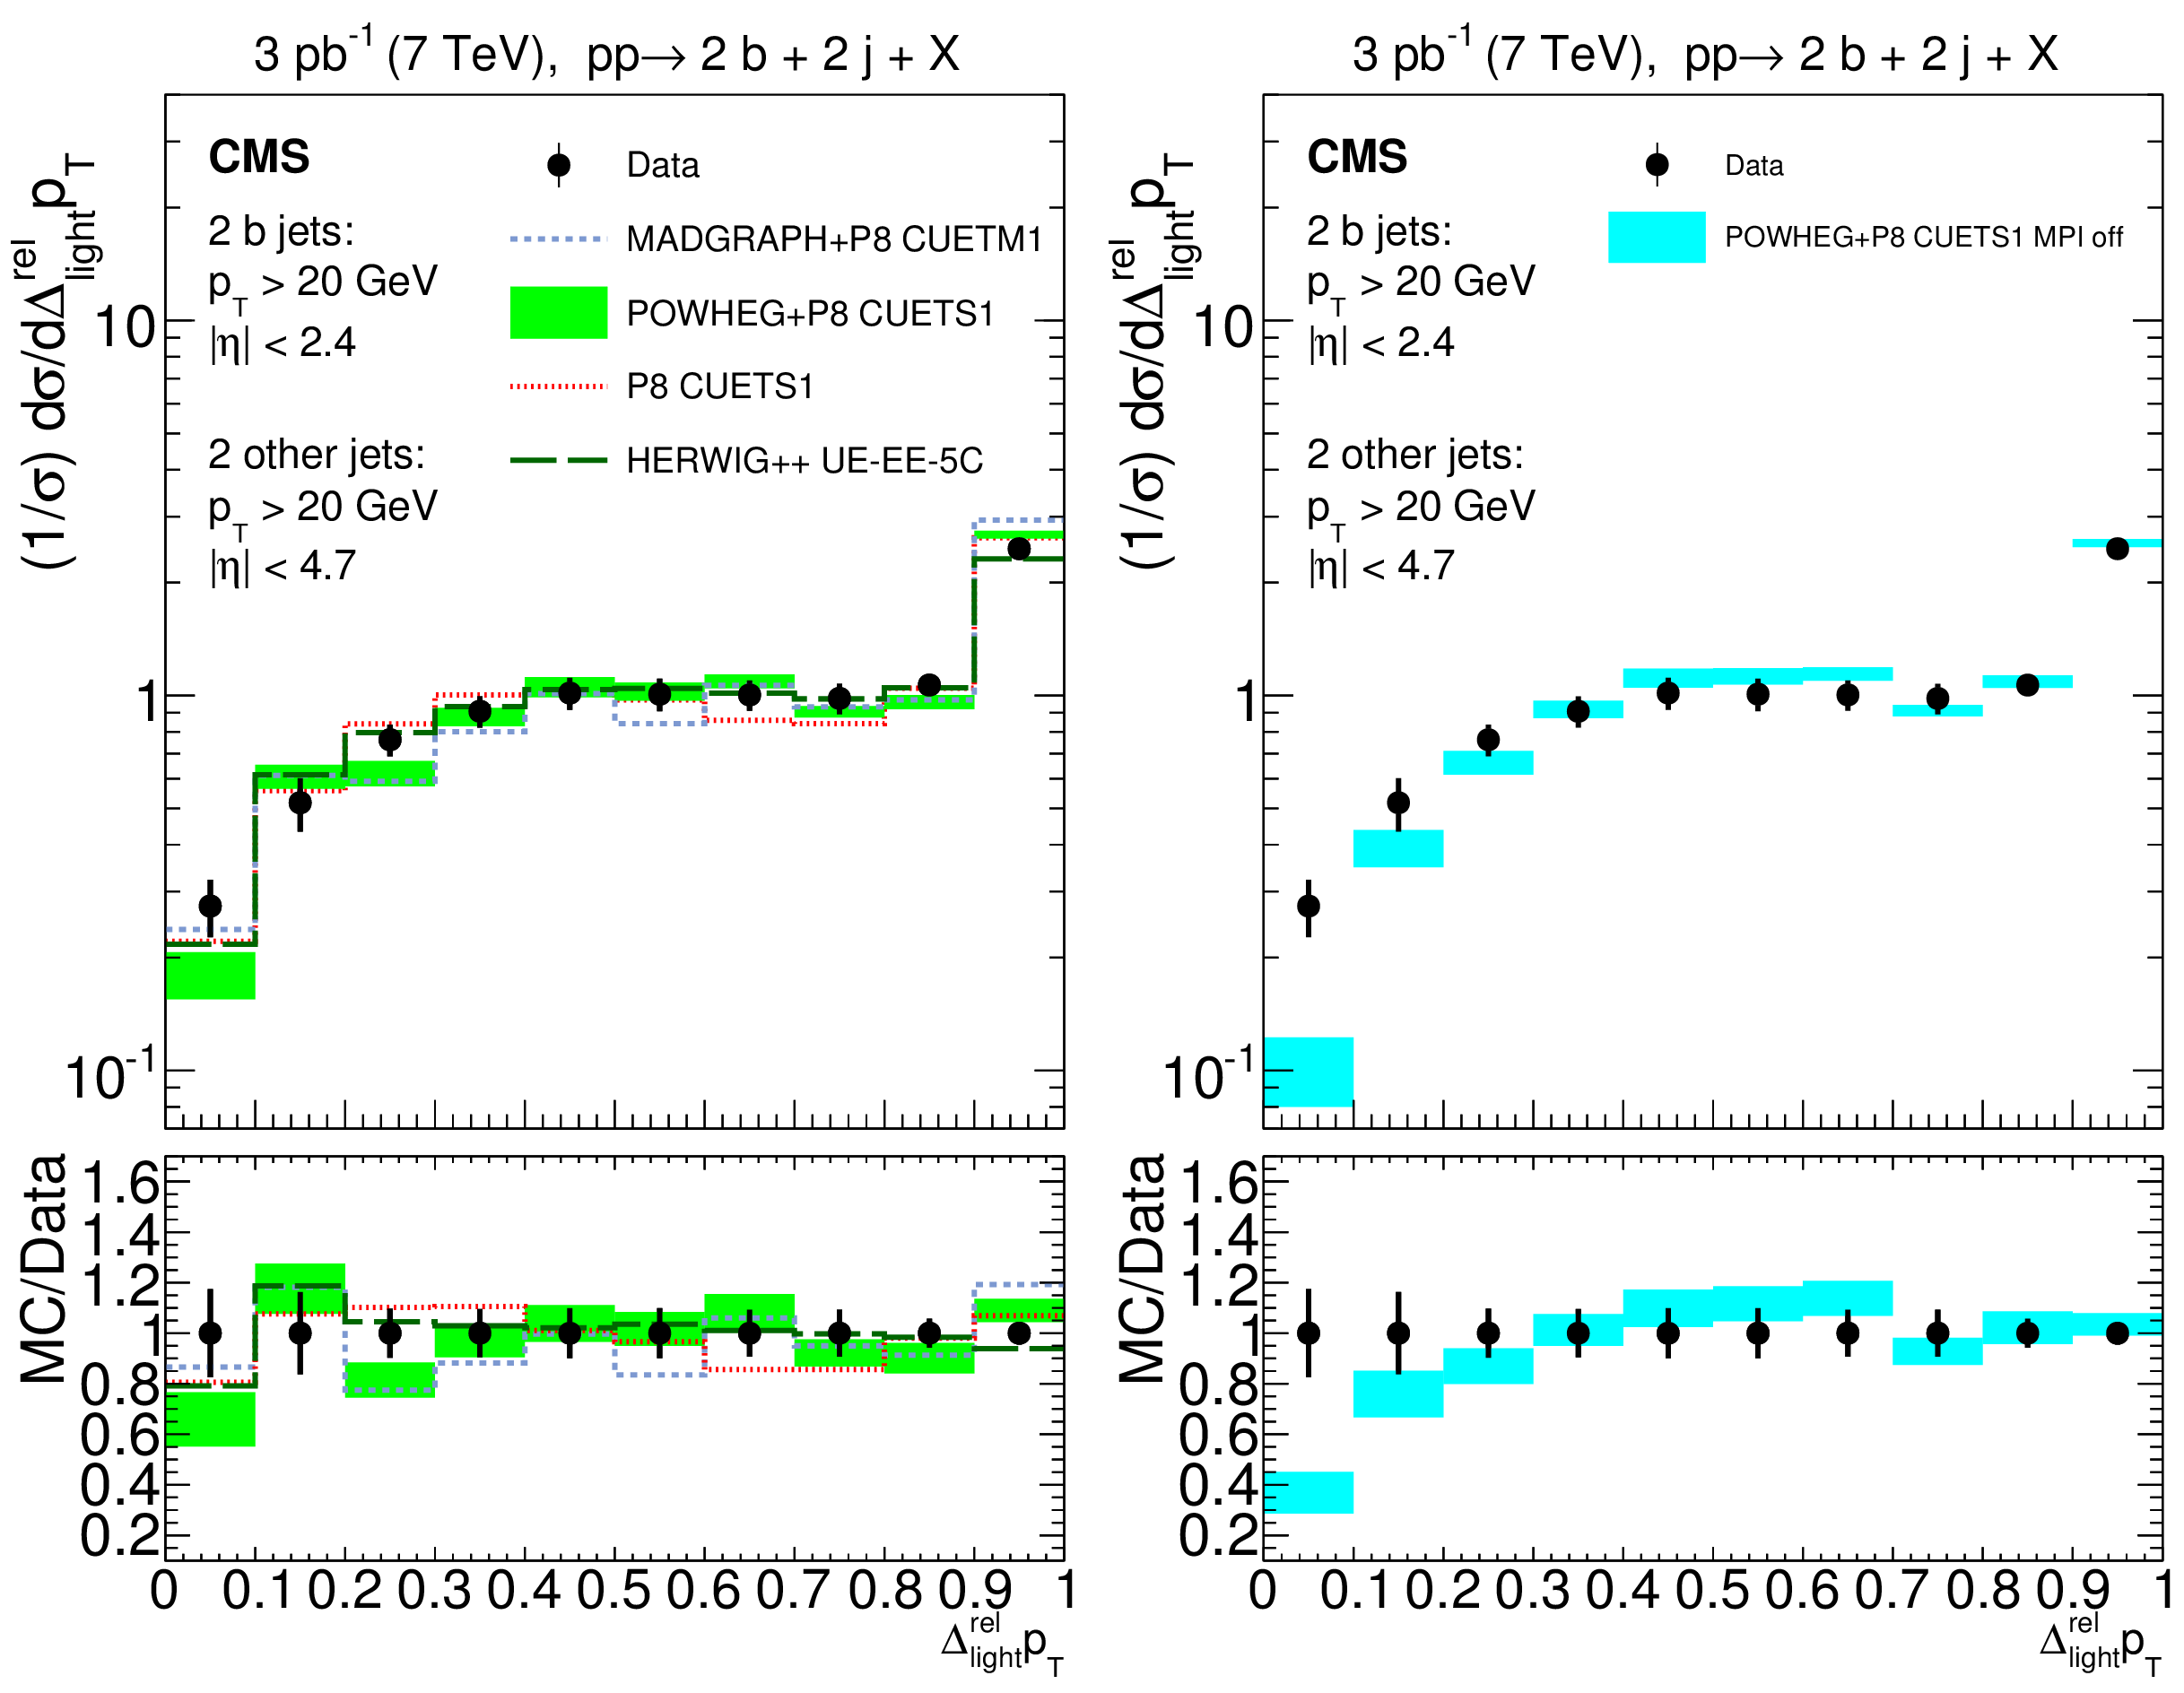
Normalized cross sections unfolded to the particle level as a function of $\Delta ^{\text {rel}}_{\text {light}} {p_{\mathrm {T}}} $, compared to predictions of POWHEG, MadGraph, PYTHIA 8 (P8), and HERWIG++ (left), and of the POWHEG+PYTHIA 8 tune CUETS1 without MPI (right). The lower panels show the ratios of the MC predictions over the data. The error bars on the data represent the total uncertainties, i.e., statistical and systematic added quadratically. Data are shown with markers at unity. The band represents the theoretical uncertainty due to the choice of the scales and PDFs (shown only around the POWHEG line for clarity, but affecting all predictions in the same way). |
png pdf |
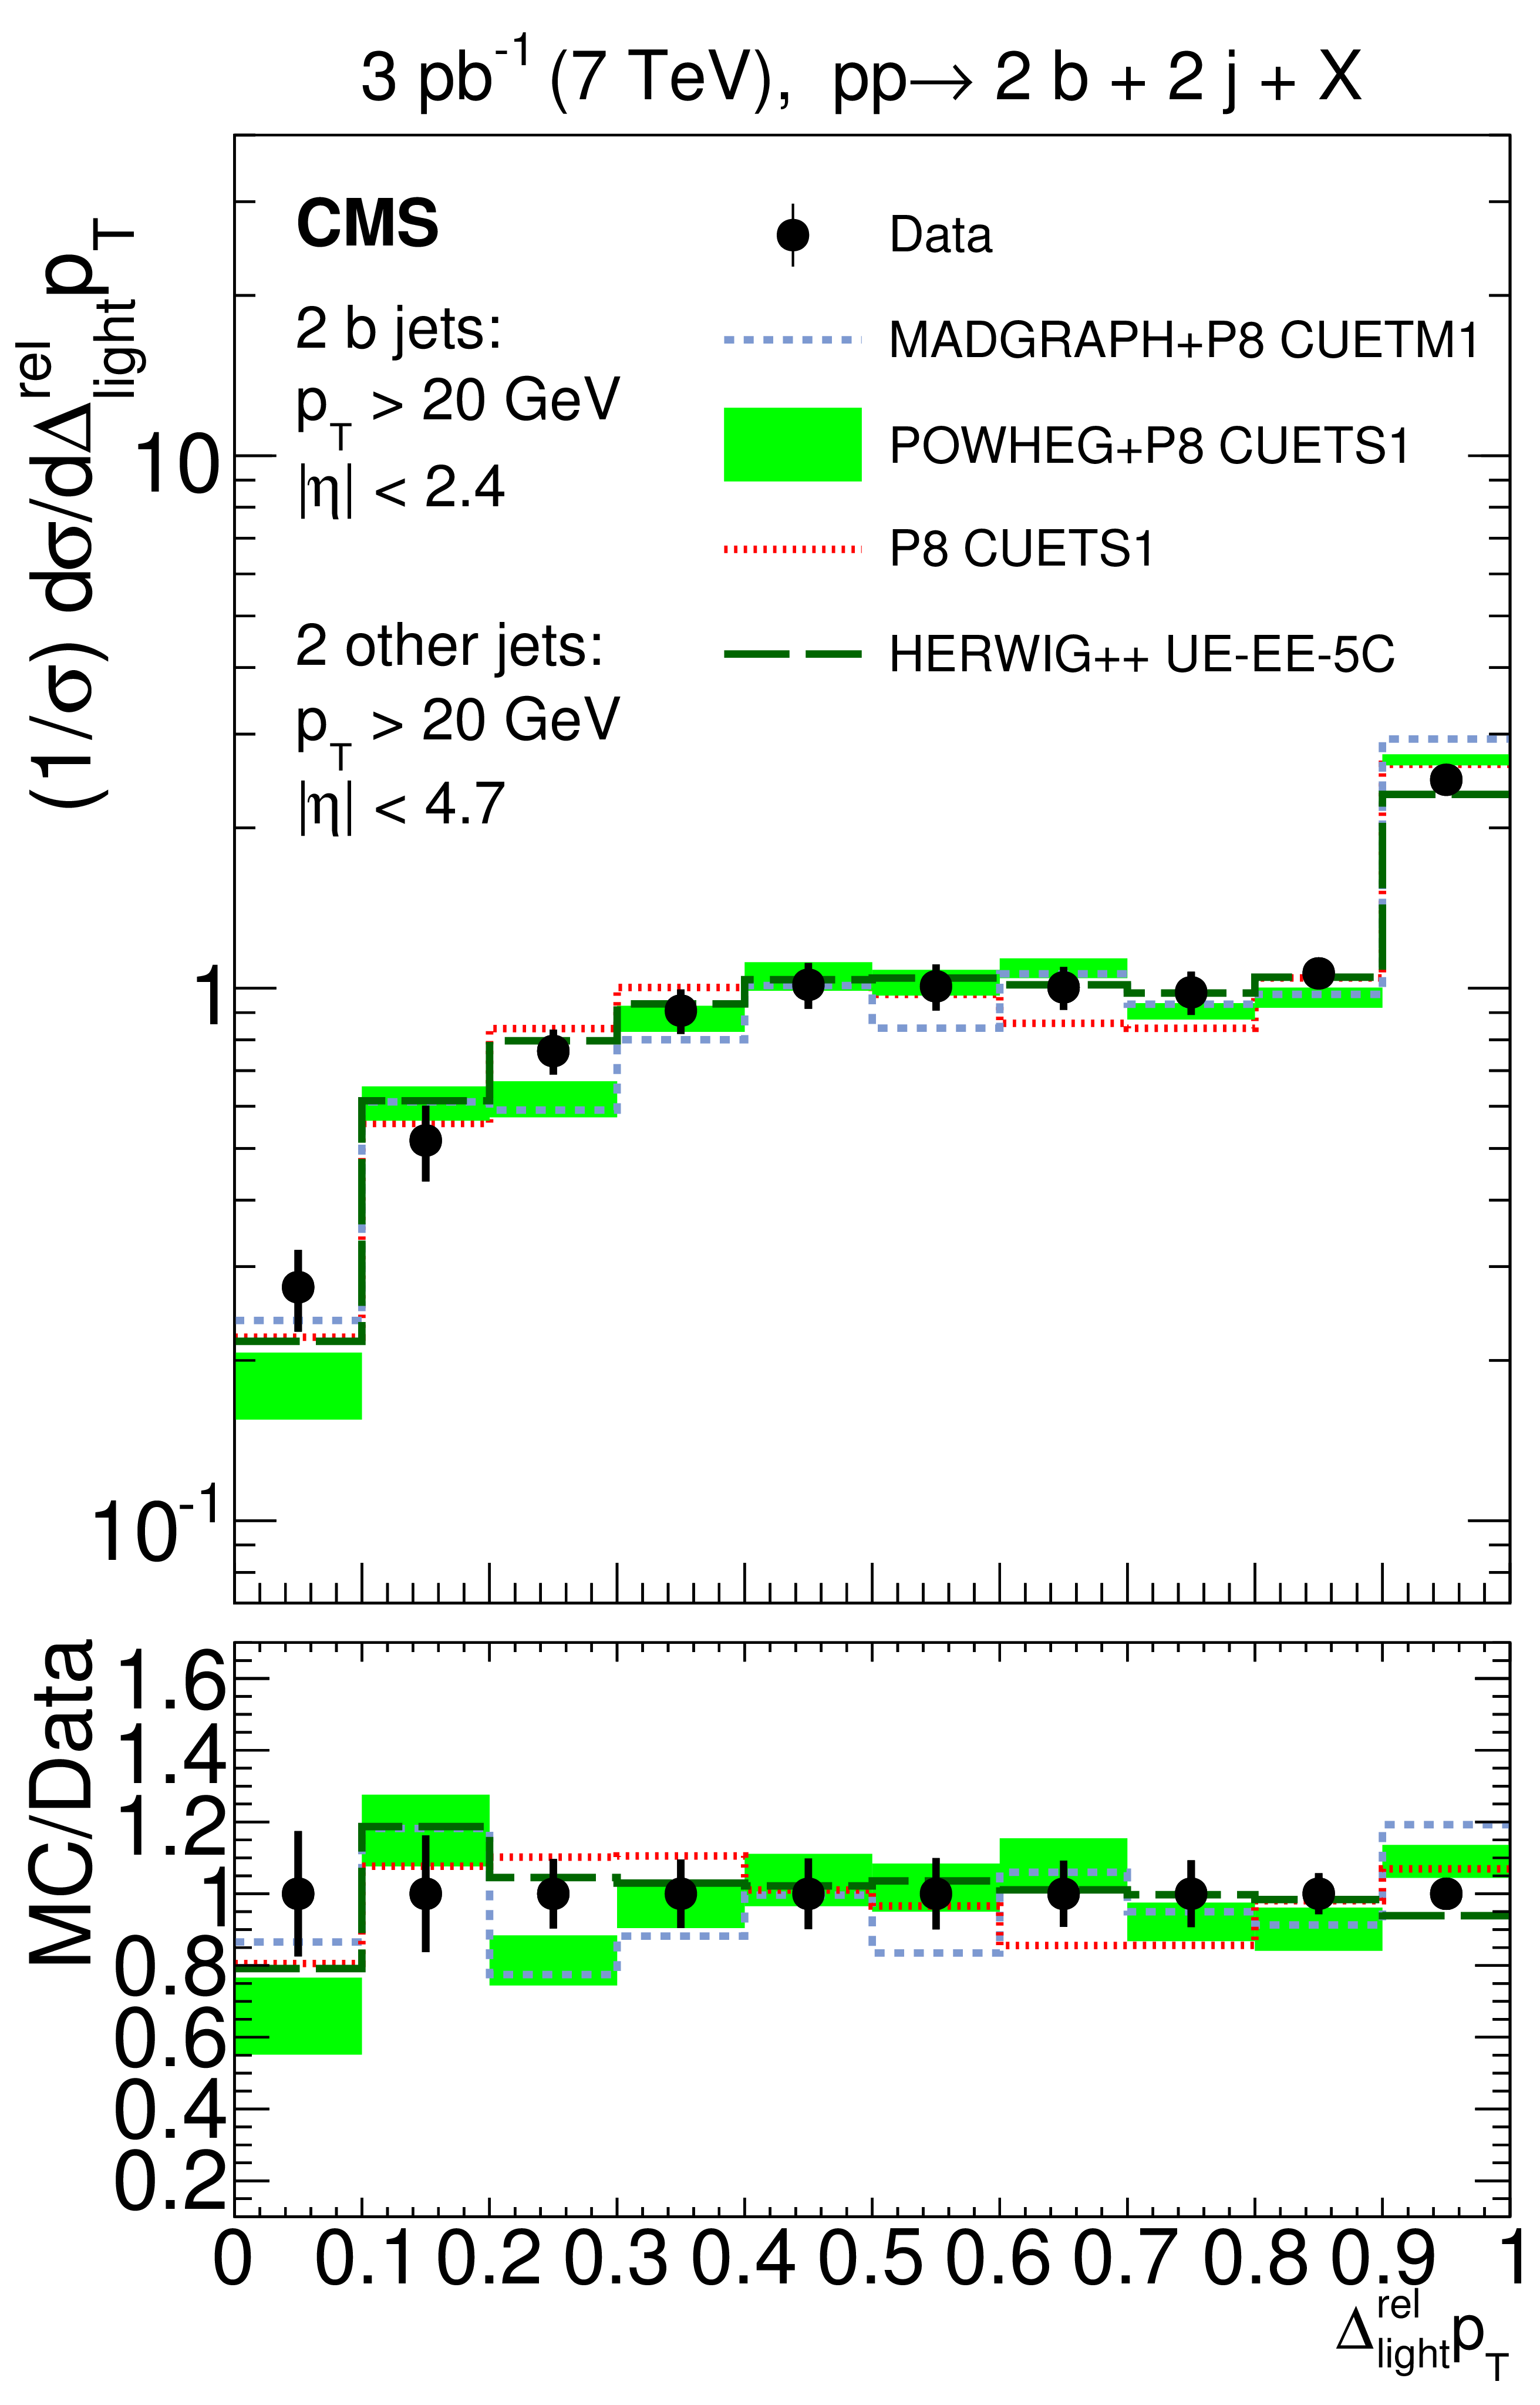
Figure 7-a:
Normalized cross sections unfolded to the particle level as a function of $\Delta ^{\text {rel}}_{\text {light}} {p_{\mathrm {T}}} $, compared to predictions of POWHEG, MadGraph, PYTHIA 8 (P8), and HERWIG++. The lower panels show the ratios of the MC predictions over the data. The error bars on the data represent the total uncertainties, i.e., statistical and systematic added quadratically. Data are shown with markers at unity. The band represents the theoretical uncertainty due to the choice of the scales and PDFs (shown only around the POWHEG line for clarity, but affecting all predictions in the same way). |
png pdf |
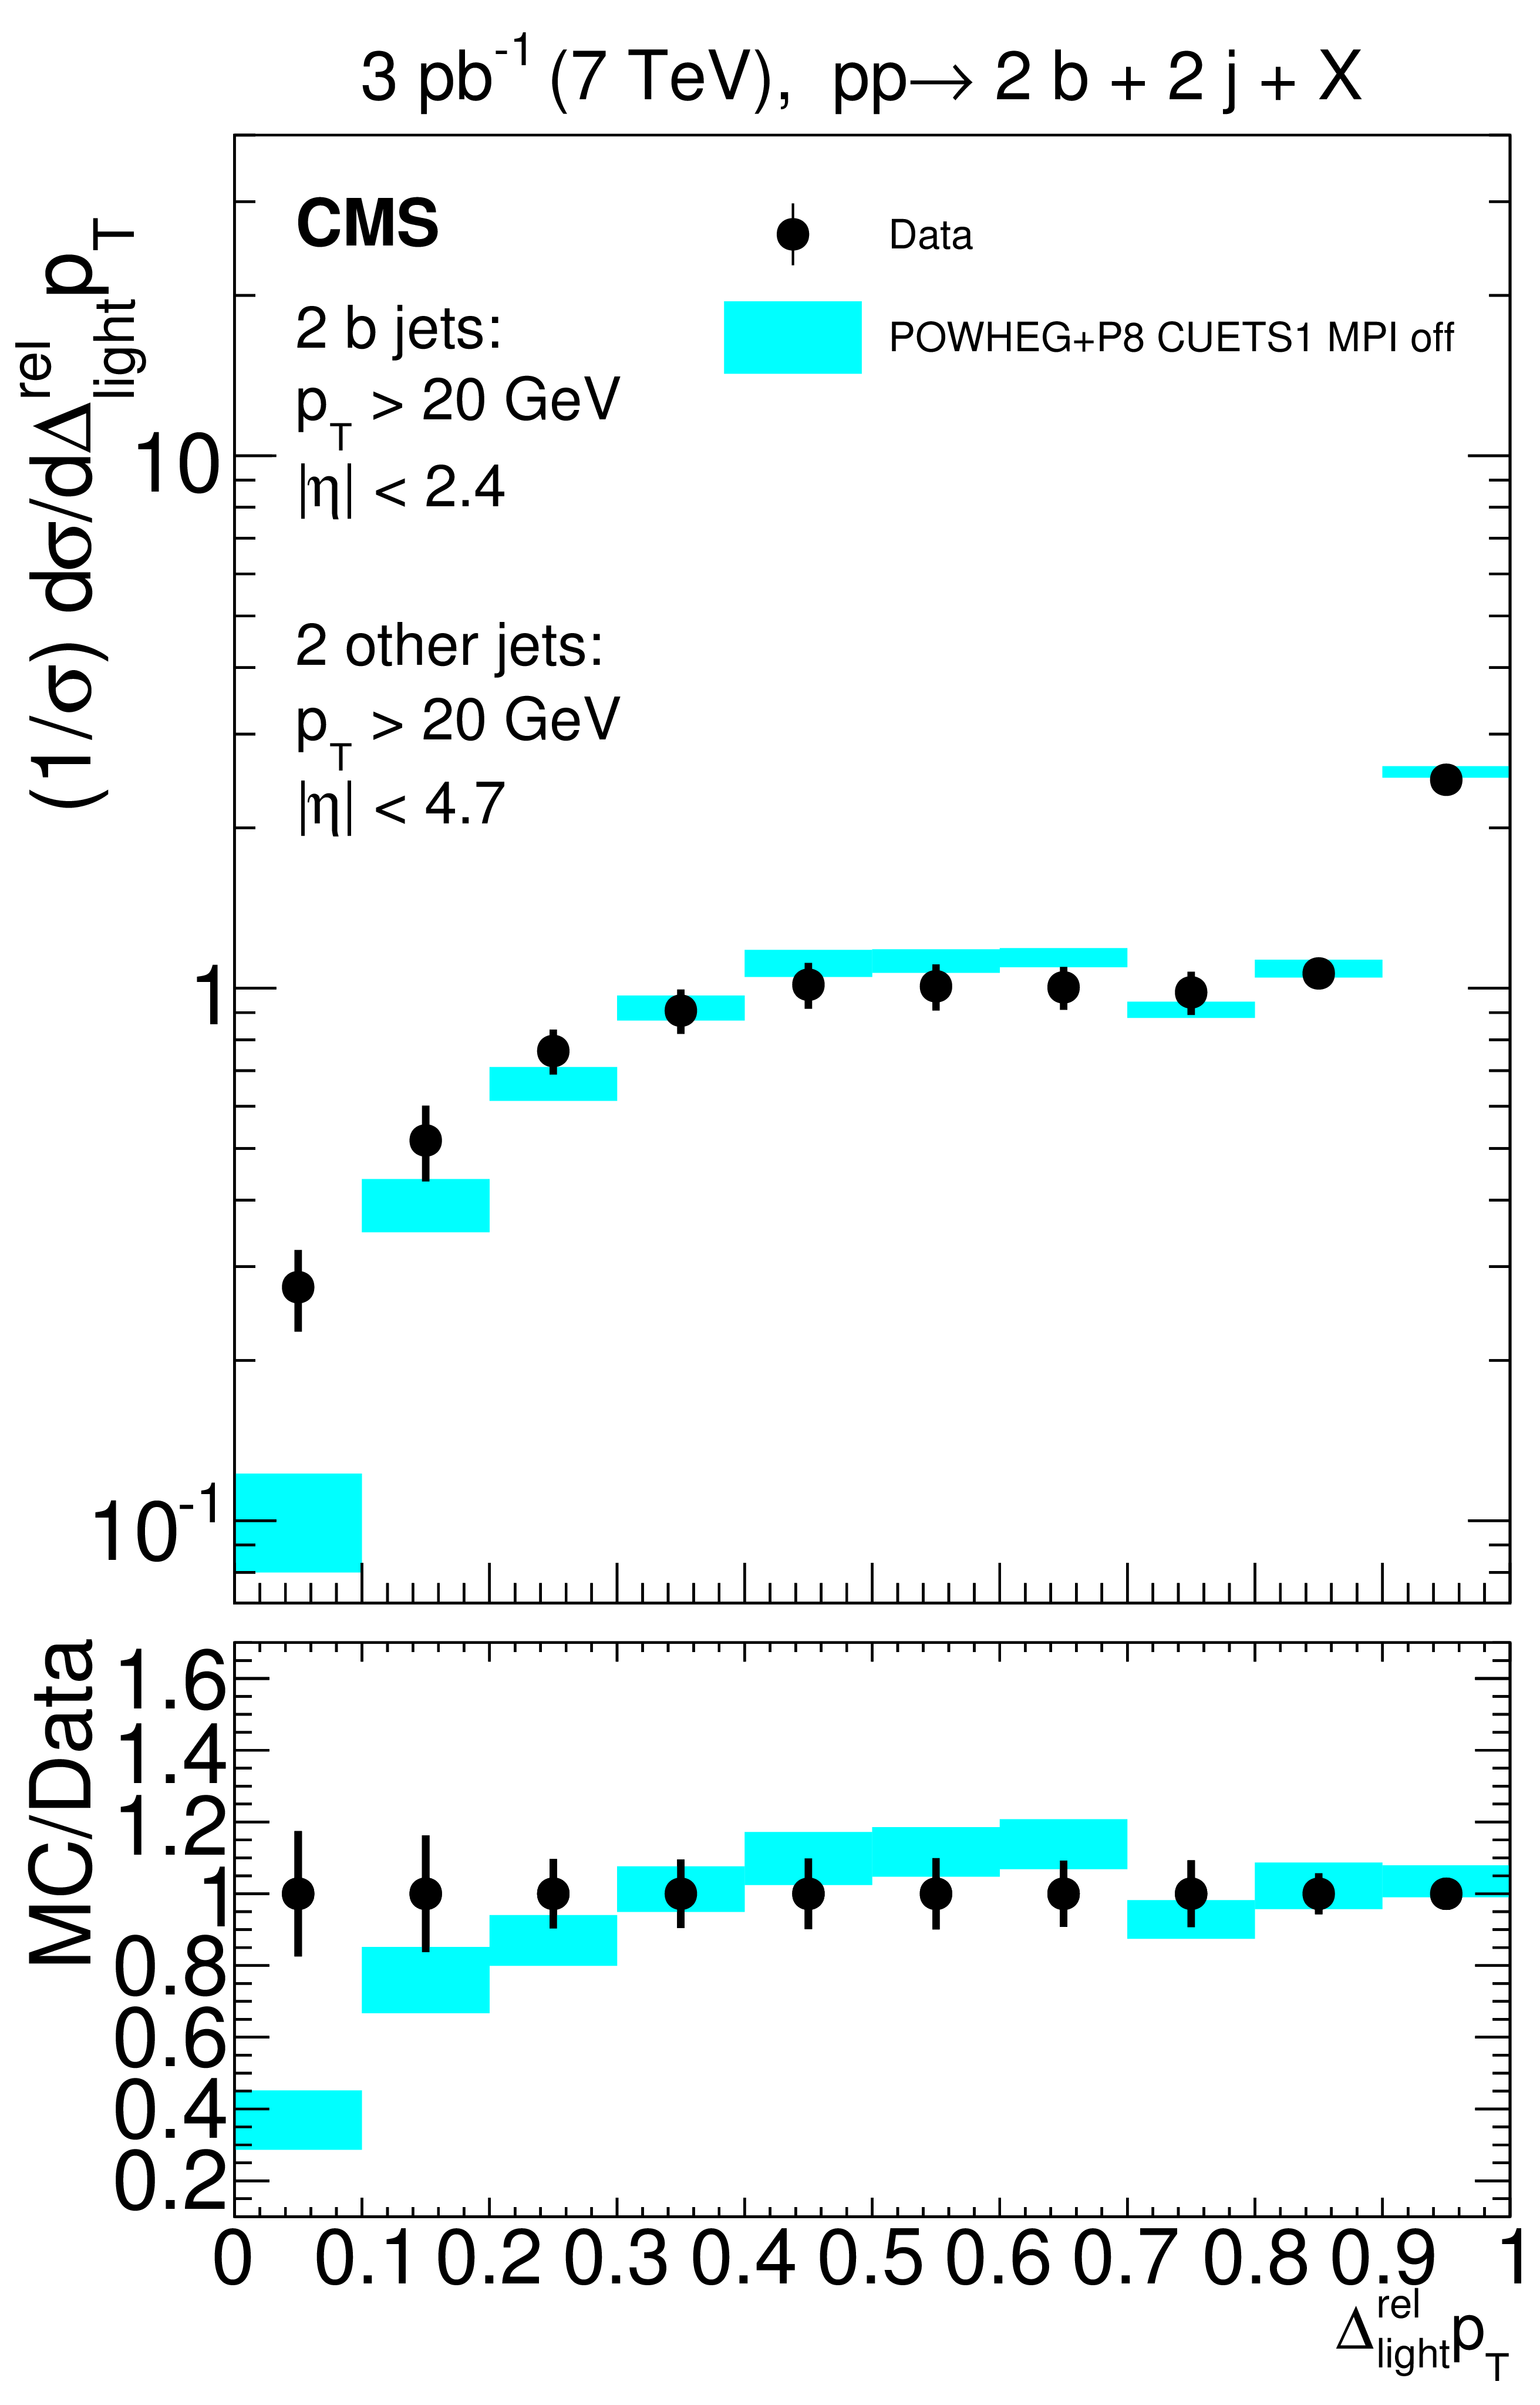
Figure 7-b:
Normalized cross sections unfolded to the particle level as a function of $\Delta ^{\text {rel}}_{\text {light}} {p_{\mathrm {T}}} $, compared to predictions of the POWHEG+PYTHIA 8 tune CUETS1 without MPI. The lower panels show the ratios of the MC predictions over the data. The error bars on the data represent the total uncertainties, i.e., statistical and systematic added quadratically. Data are shown with markers at unity. The band represents the theoretical uncertainty due to the choice of the scales and PDFs (shown only around the POWHEG line for clarity, but affecting all predictions in the same way). |
png pdf |
Figure 8:
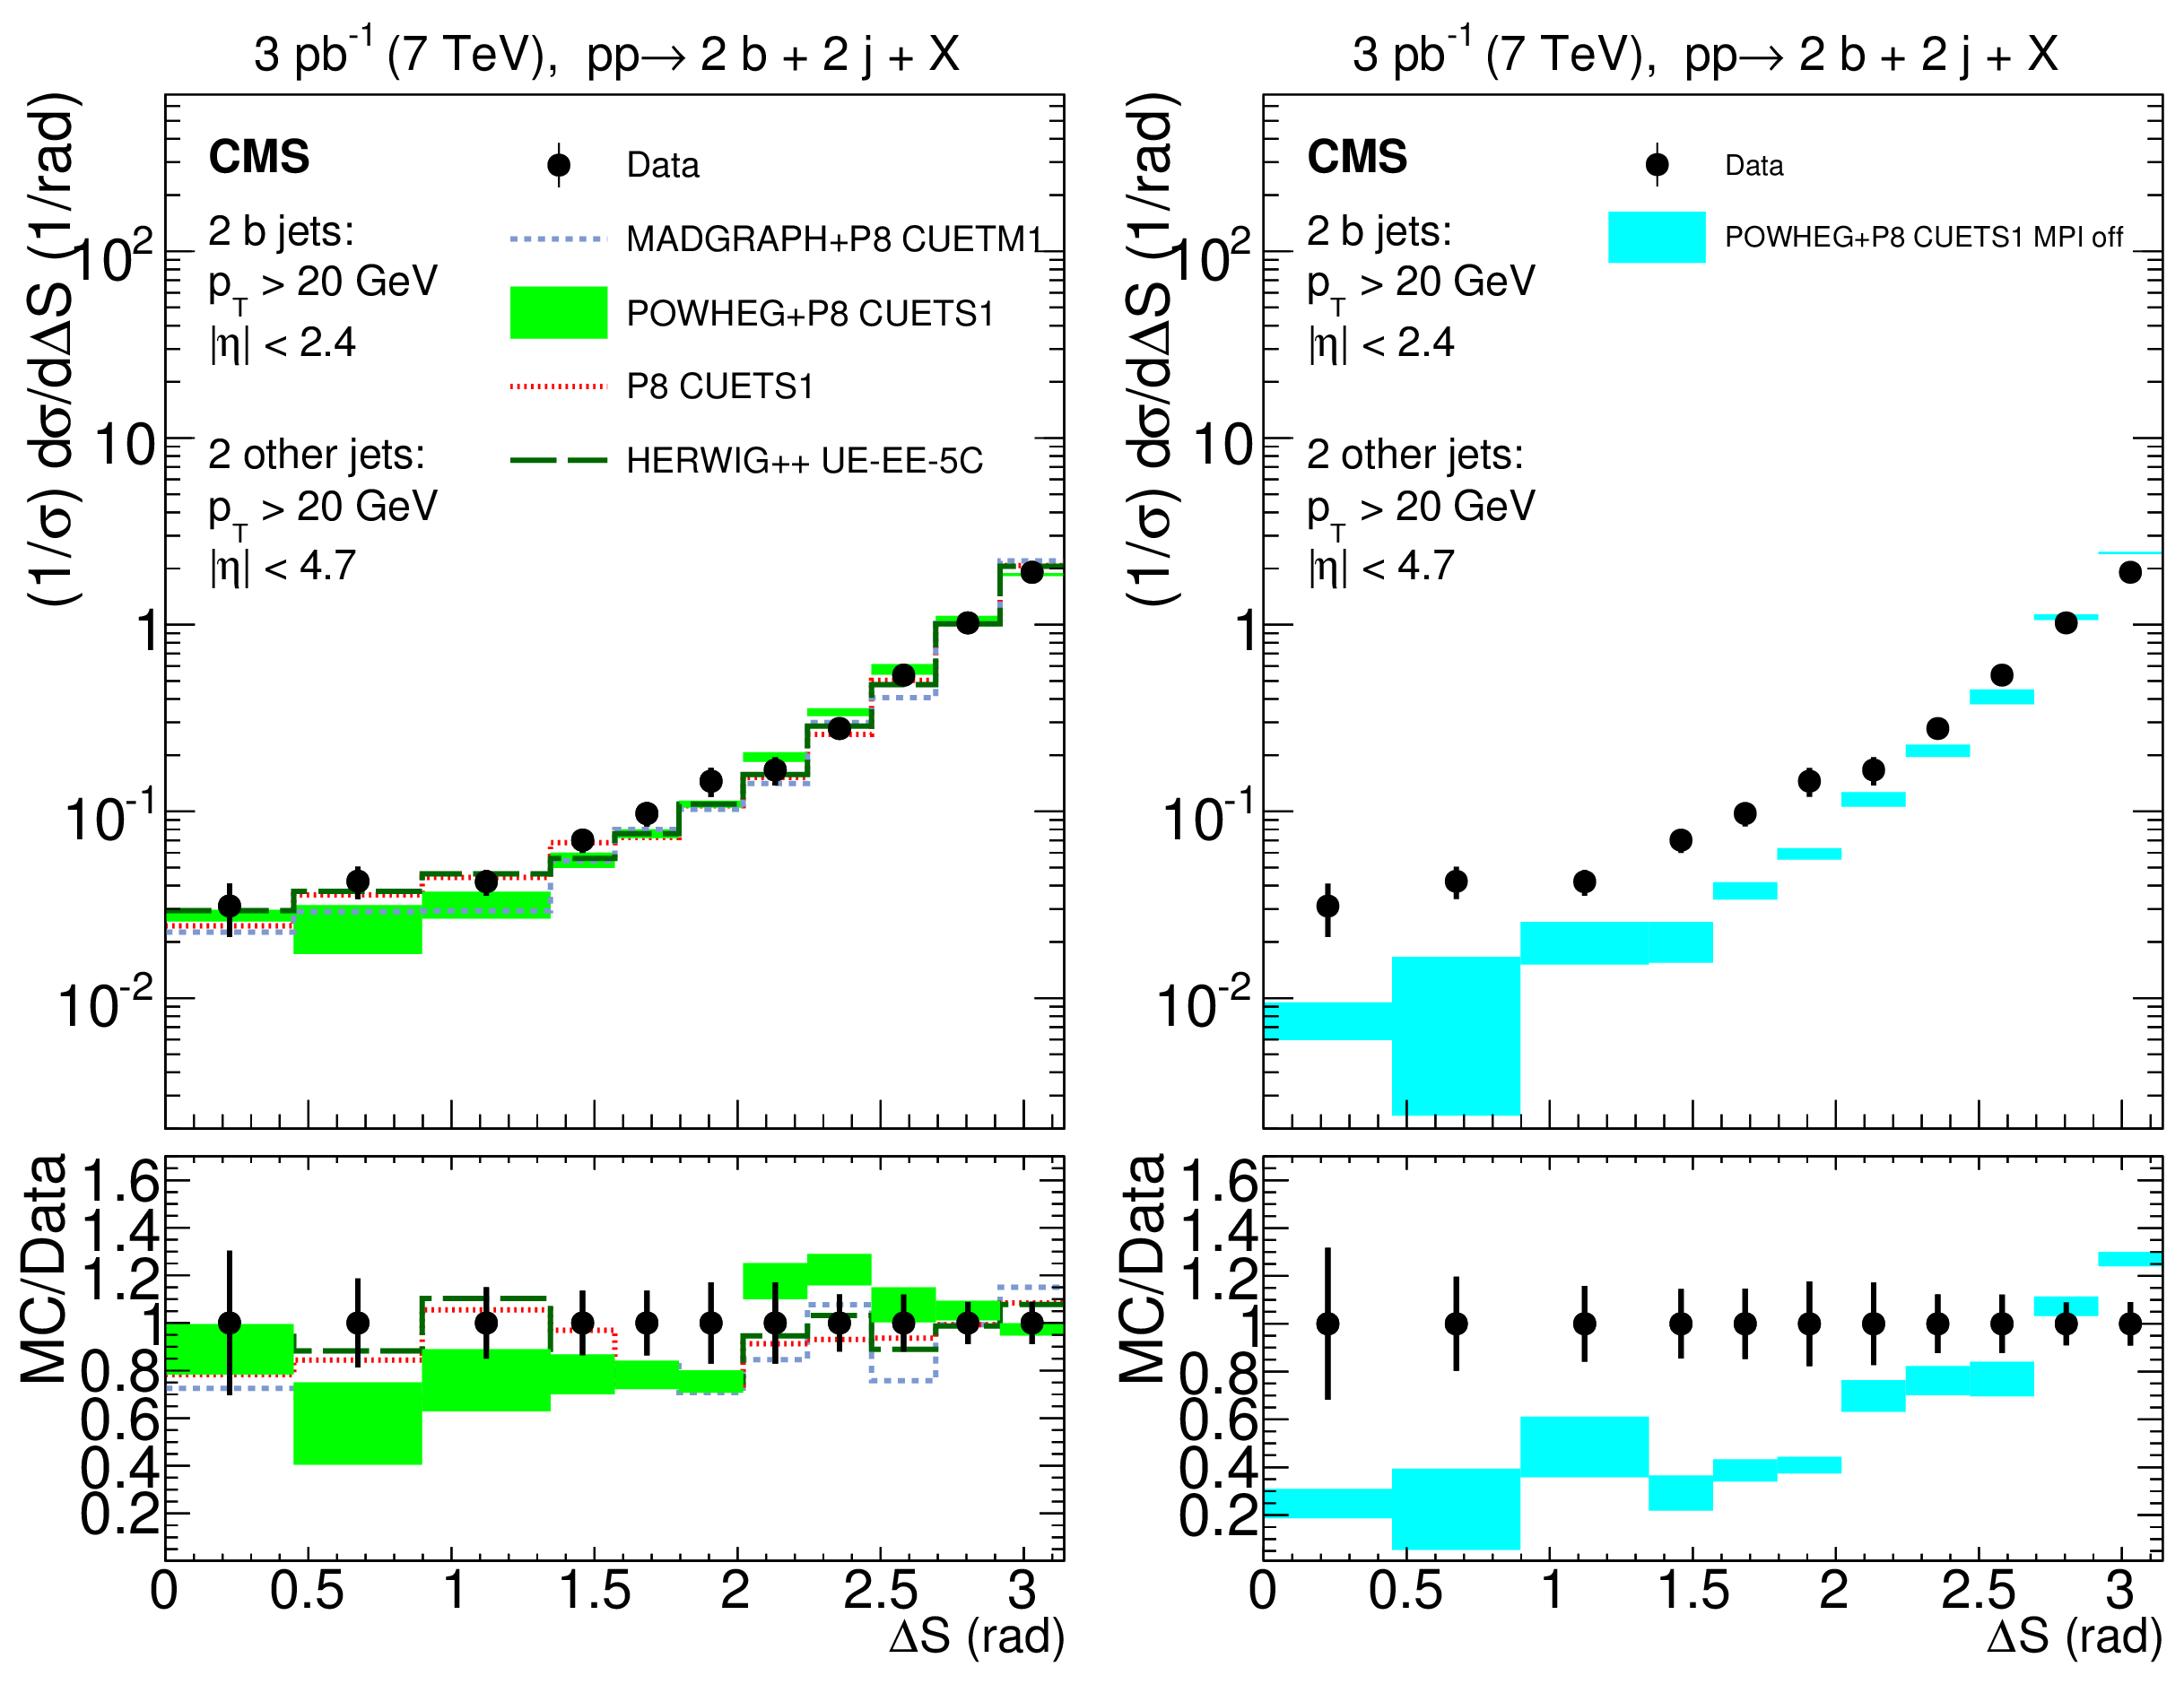
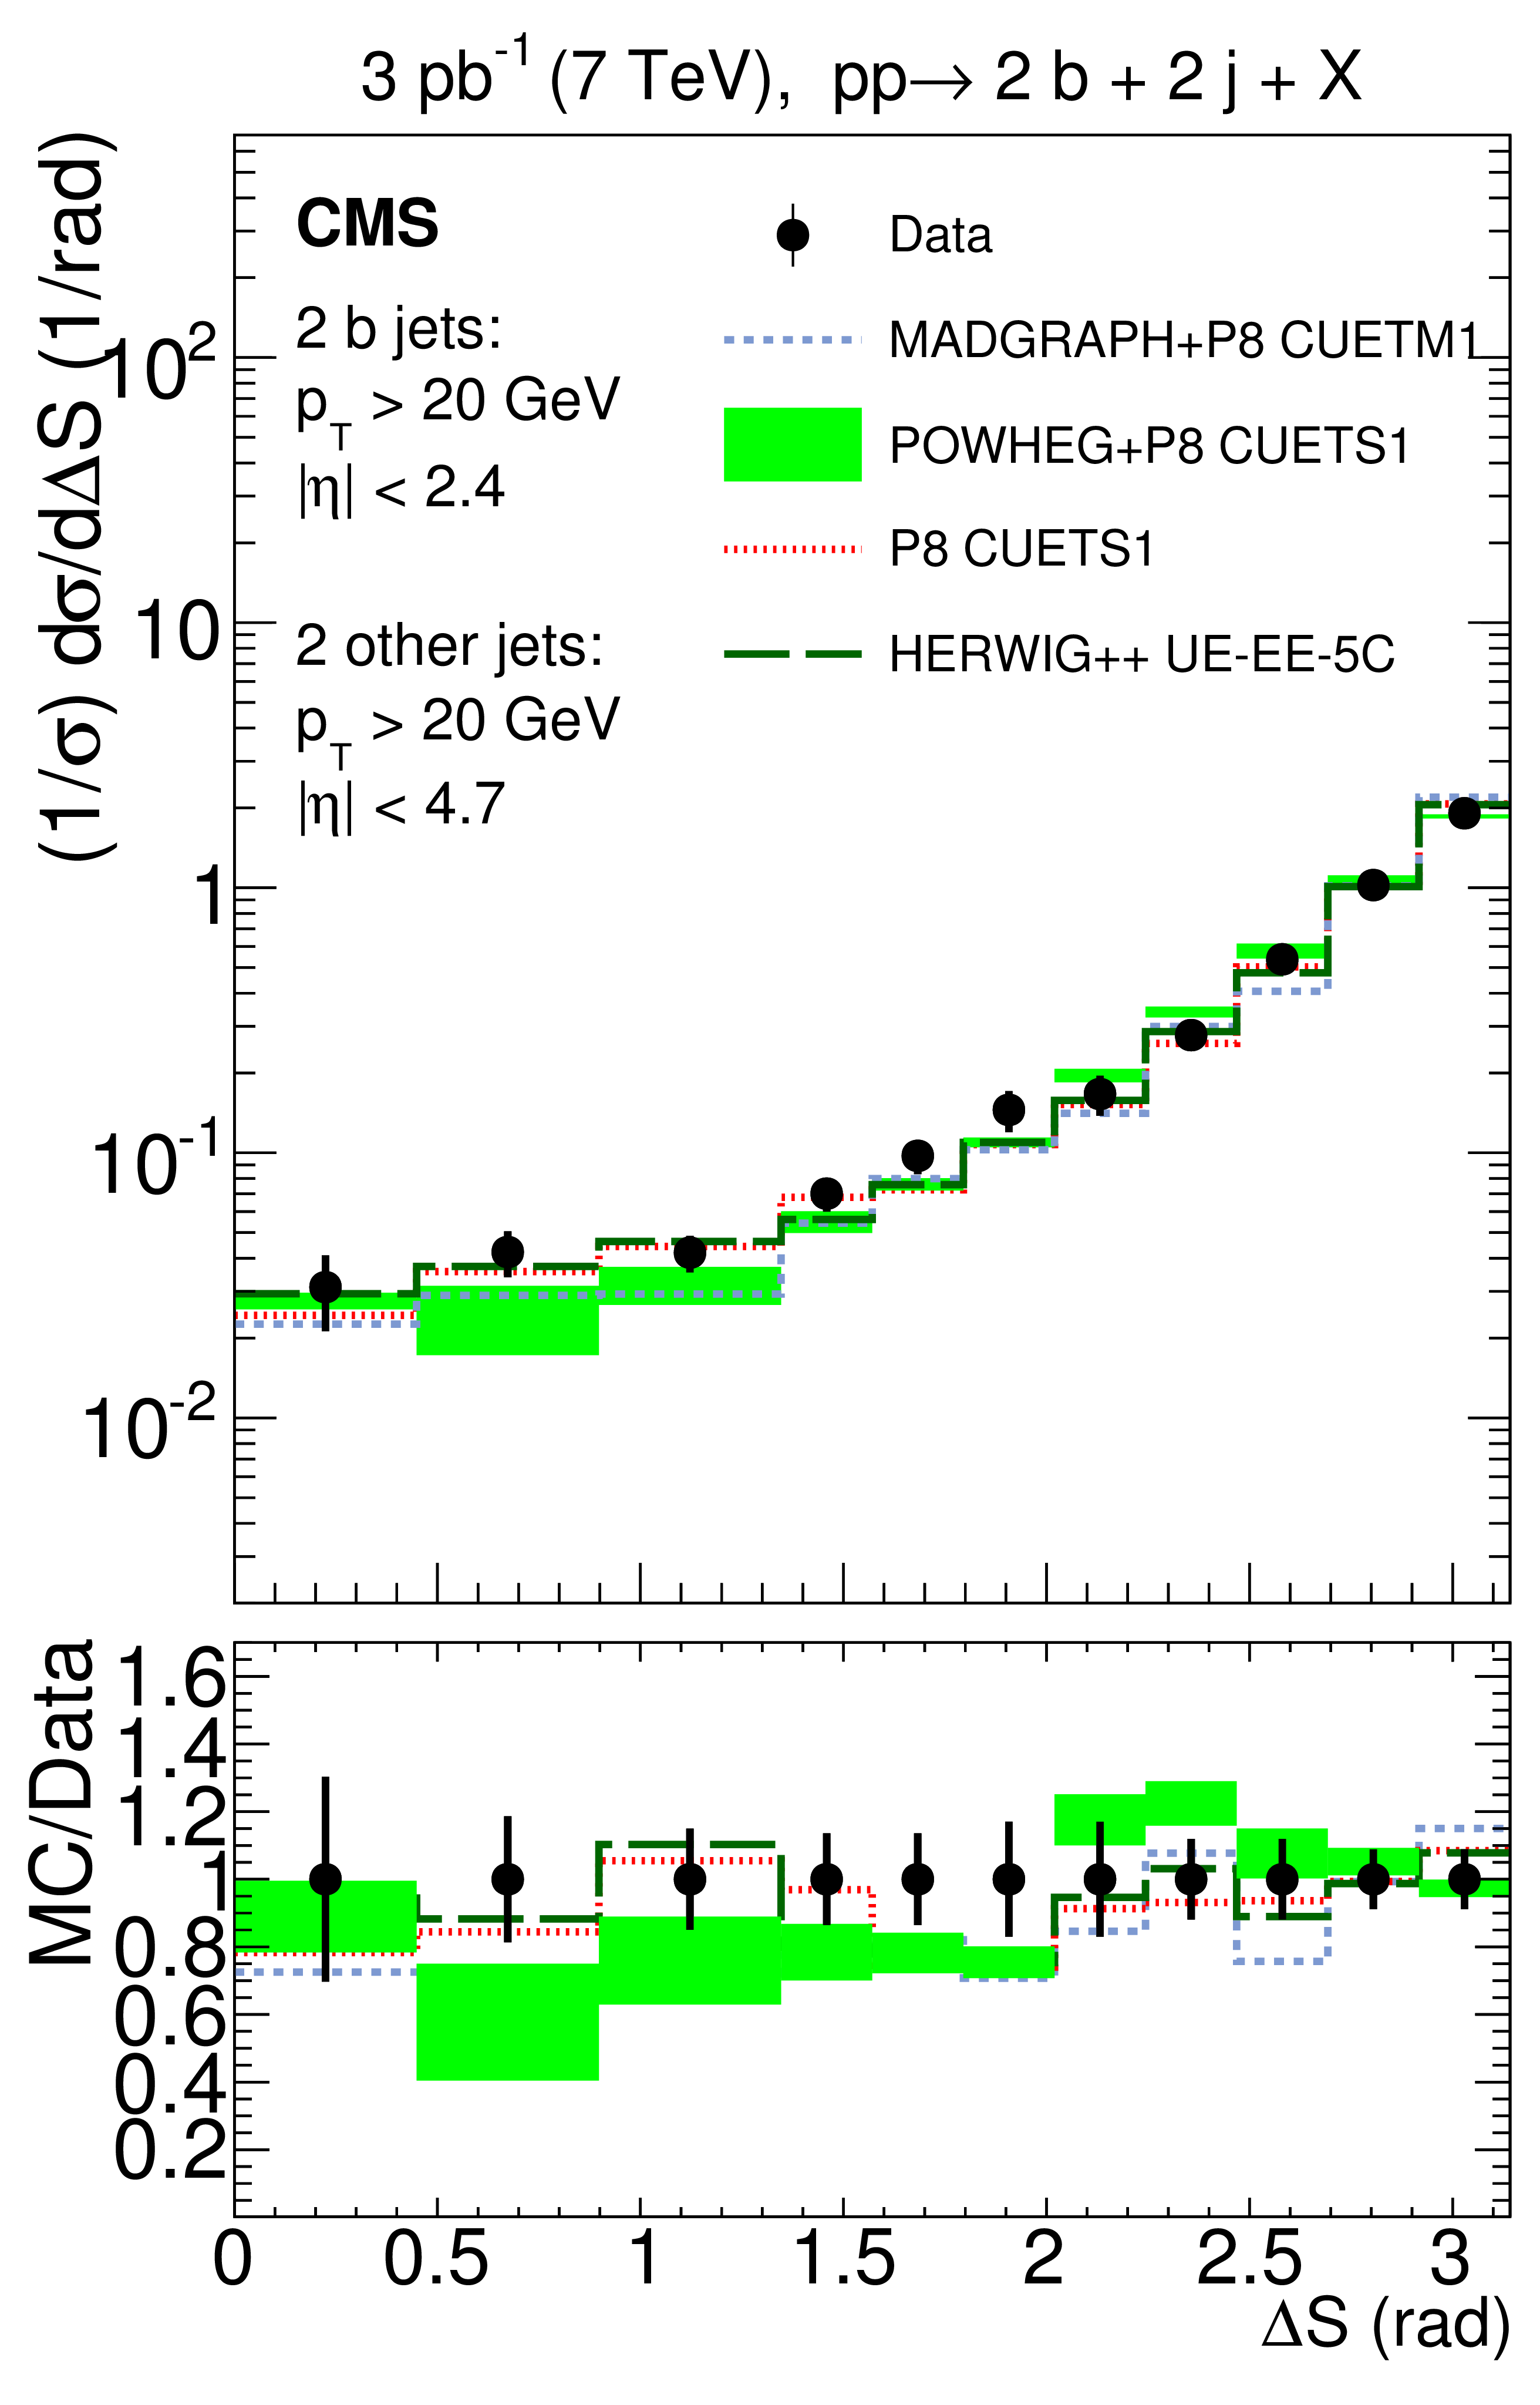
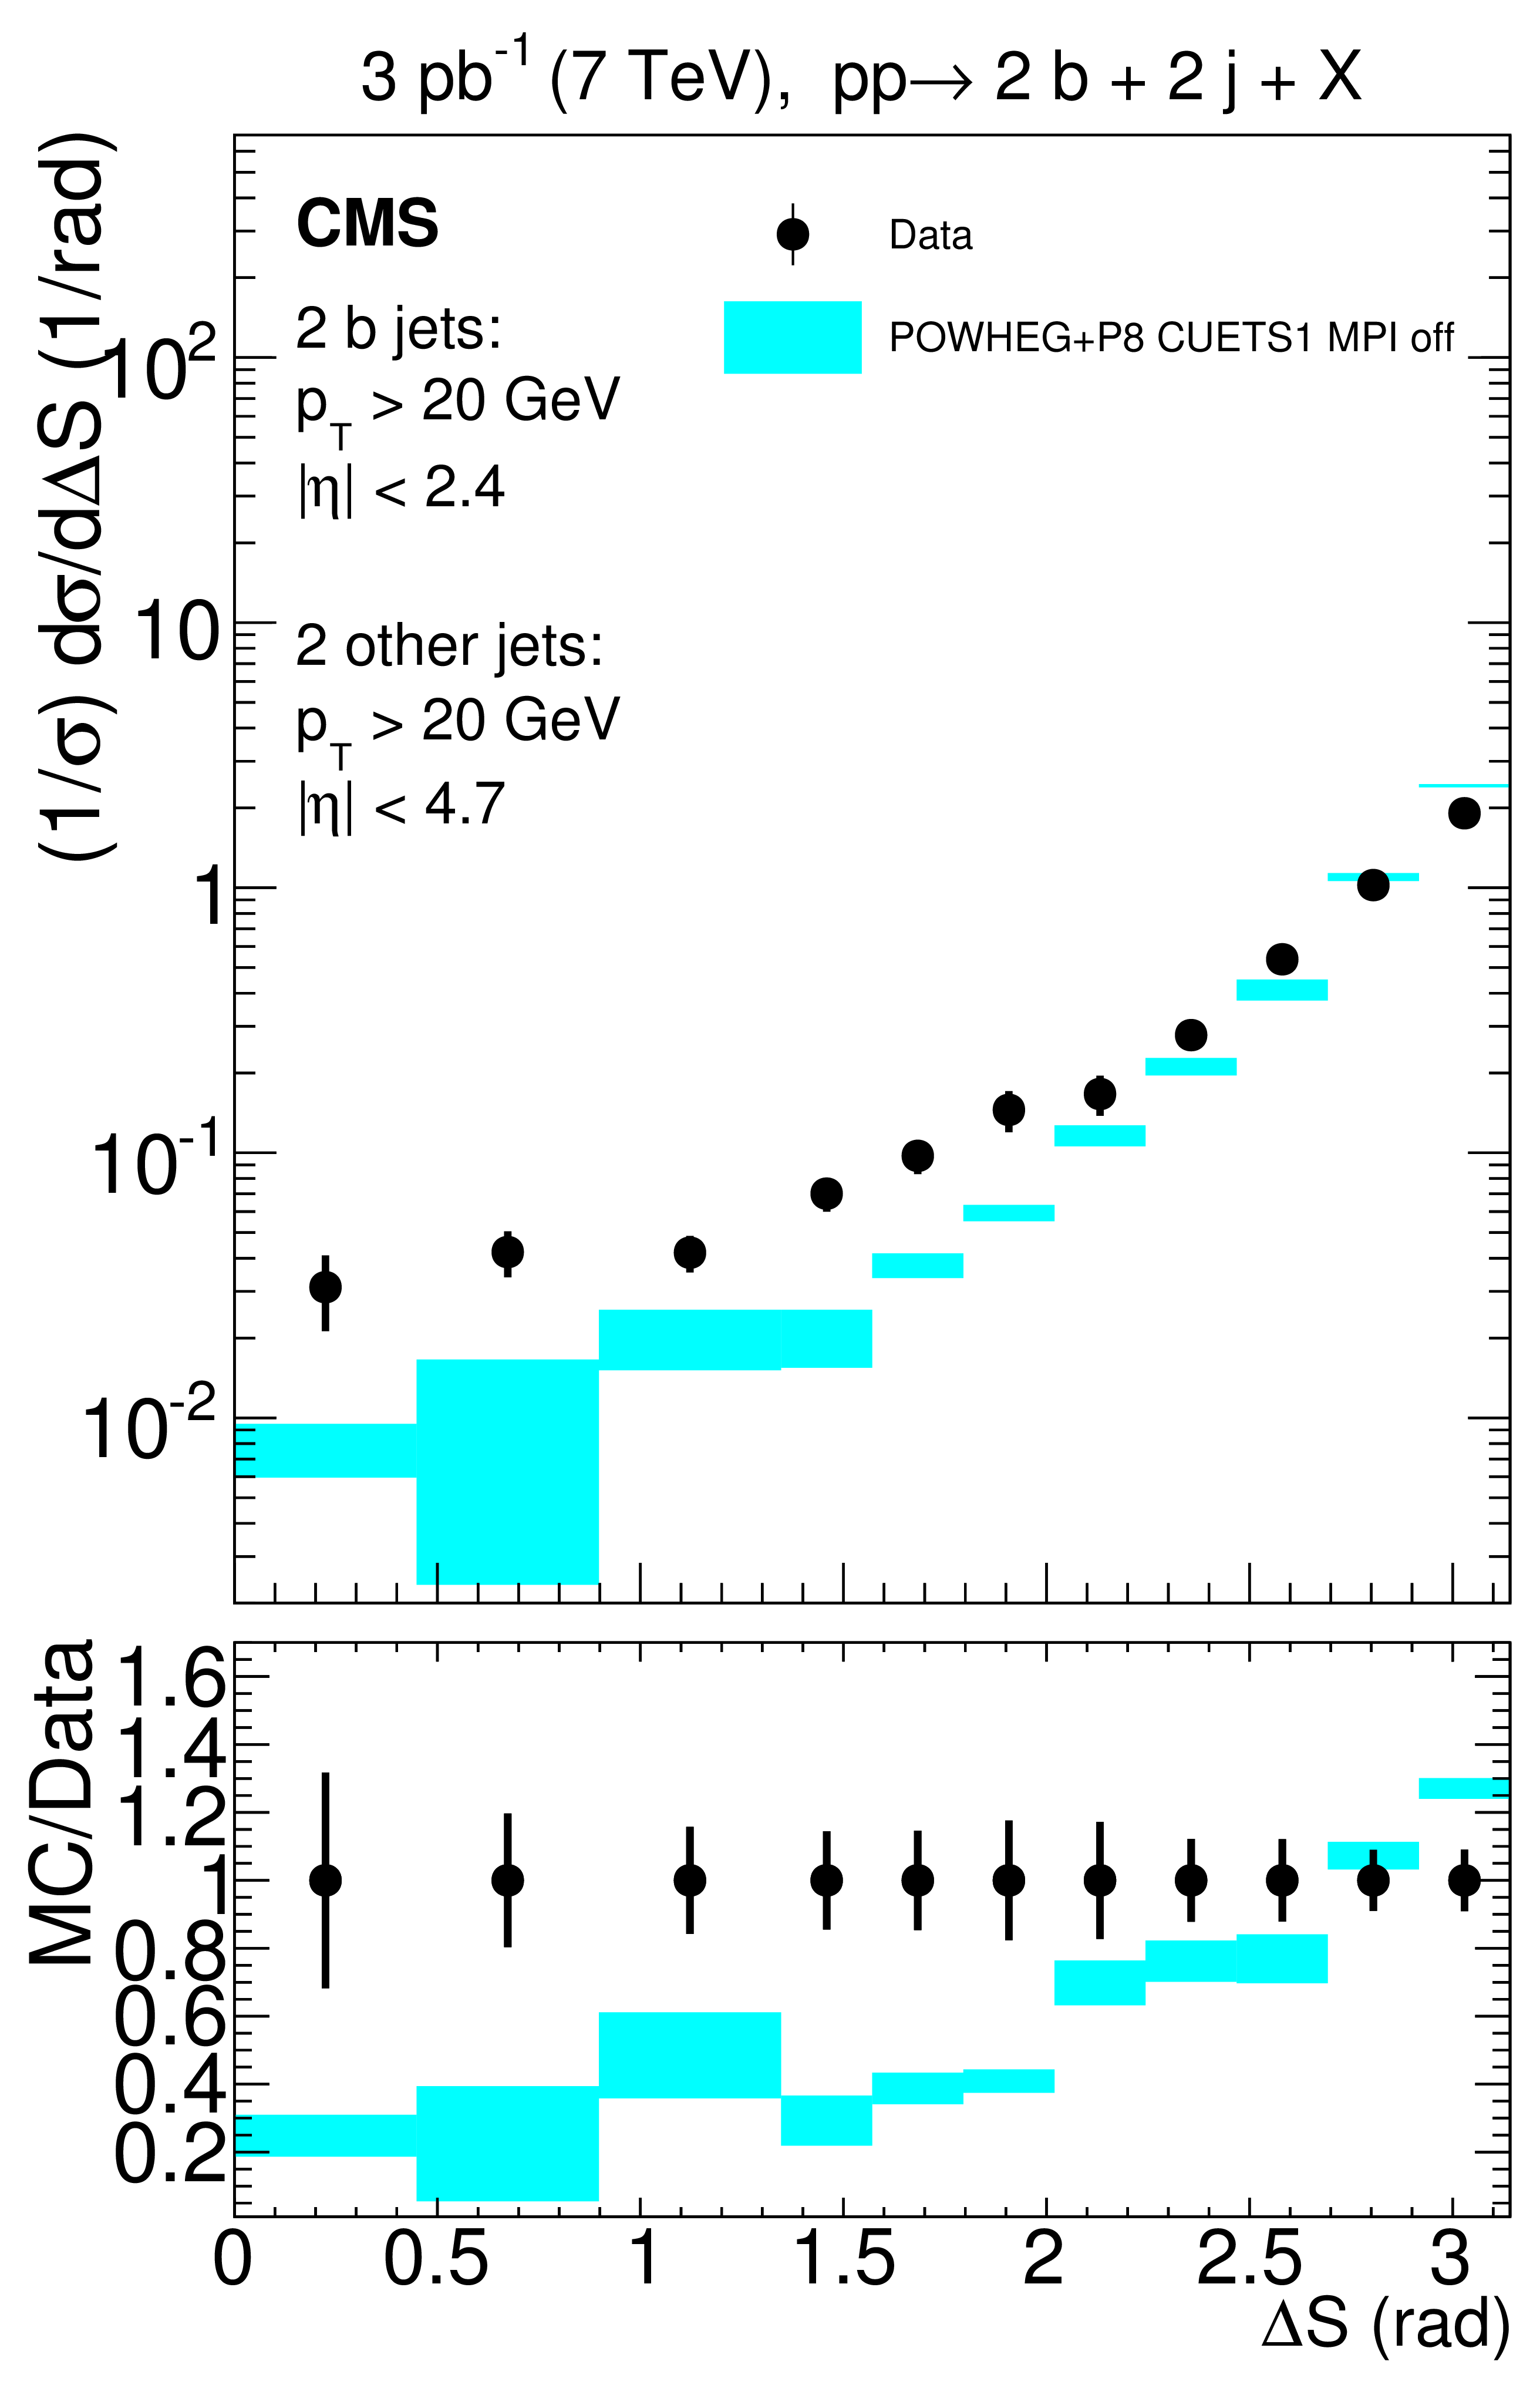
Normalized cross sections unfolded to the particle level as a function of $\Delta $S, compared to predictions of POWHEG, MadGraph, PYTHIA 8 (P8), and HERWIG++ (left), and of the POWHEG+PYTHIA 8 tune CUETS1 without MPI (right). The lower panels show the ratios of the MC predictions over the data. The error bars on the data represent the total uncertainties, i.e., statistical and systematic added quadratically. Data are shown with markers at unity. The band represents the theoretical uncertainty due to the choice of the scales and PDFs (shown only around the POWHEG line for clarity, but affecting all predictions in the same way). |
png pdf |
Figure 8-a:
Normalized cross sections unfolded to the particle level as a function of $\Delta $S, compared to predictions of POWHEG, MadGraph, PYTHIA 8 (P8), and HERWIG++. The lower panels show the ratios of the MC predictions over the data. The error bars on the data represent the total uncertainties, i.e., statistical and systematic added quadratically. Data are shown with markers at unity. The band represents the theoretical uncertainty due to the choice of the scales and PDFs (shown only around the POWHEG line for clarity, but affecting all predictions in the same way). |
png pdf |
Figure 8-b:
Normalized cross sections unfolded to the particle level as a function of $\Delta $S, compared to predictions of the POWHEG+PYTHIA 8 tune CUETS1 without MPI. The lower panels show the ratios of the MC predictions over the data. The error bars on the data represent the total uncertainties, i.e., statistical and systematic added quadratically. Data are shown with markers at unity. The band represents the theoretical uncertainty due to the choice of the scales and PDFs (shown only around the POWHEG line for clarity, but affecting all predictions in the same way). |
| Tables | |
png pdf |
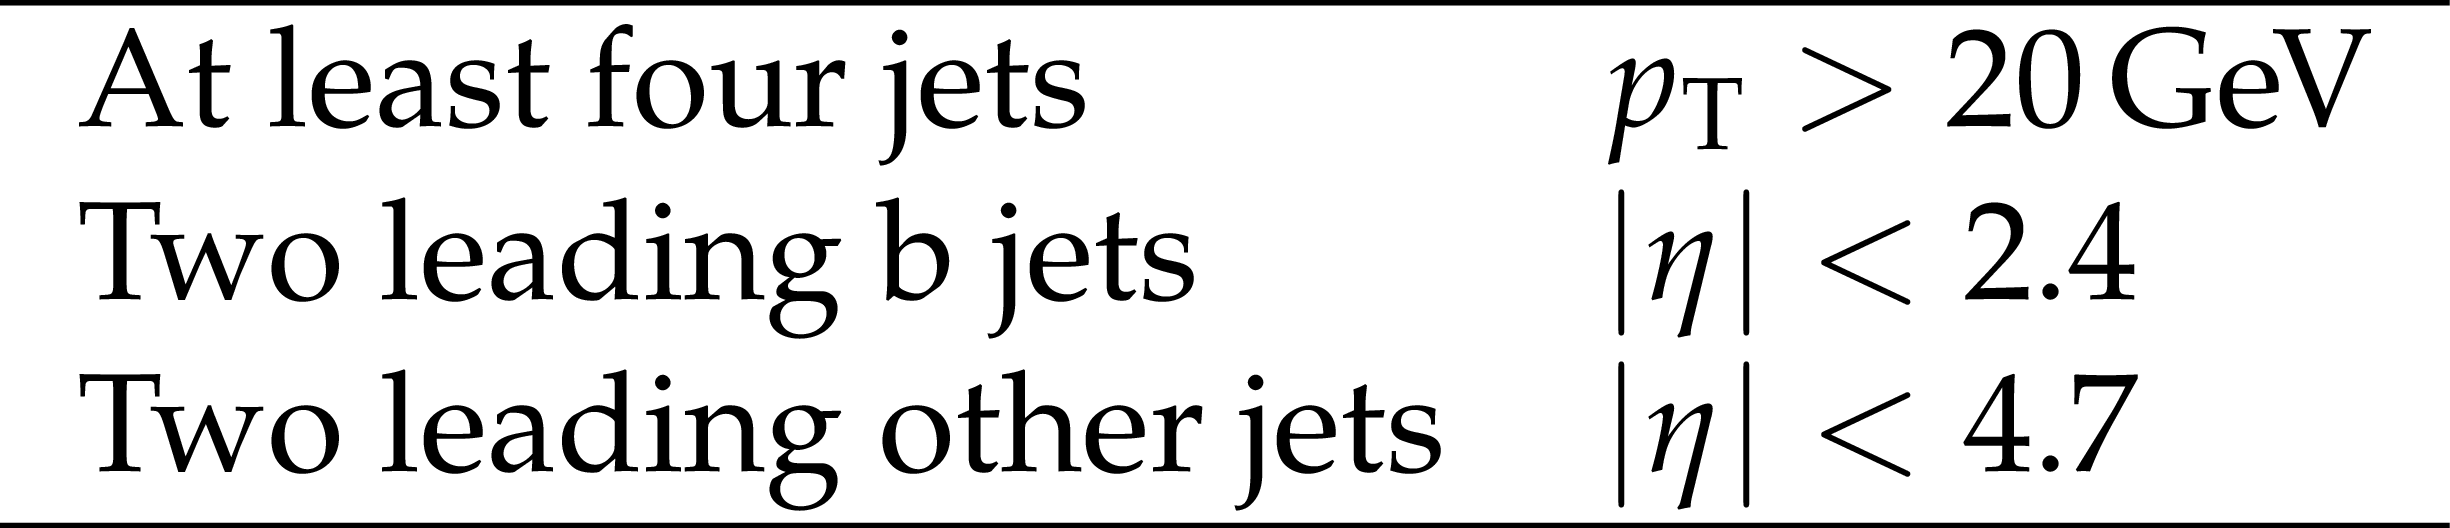
Table 1:
Phase space for the cross section measurement. |

png pdf |
Table 2:
Systematic and statistical uncertainties affecting the absolute and the normalized cross sections for each measured observable: each source of uncertainty is specified and the value is the average over all the bins of the observable. The 4% uncertainty from the integrated luminosity is included in the total uncertainty affecting the absolute cross sections. The total uncertainty is obtained by summing the individual experimental uncertainties quadratically. The theoretical uncertainties, listed in the last two columns, affect all the predictions. The systematic uncertainties in the normalized cross sections are smaller than those for the absolute cross sections, since, among others, they are not affected by the migration effects from outside the selected phase space. |

png pdf |
Table 3:
Inclusive cross section for $\mathrm{ p } \mathrm{ p } \to 2 \mathrm{ b } + 2 {\mathrm {j}} + \mathrm{X} $ for jet $ {p_{\mathrm {T}}} > $ 20 GeV, with b jets within $ {| \eta | }< $ 2.4, and the other jets within $ {| \eta | }< $ 4.7. The measurements are compared to the MC predictions. |
| Summary |
| A study of events with at least four jets, at least two of which are b jets, in proton-proton collisions at 7 TeV is presented. The data, corresponding to an integrated luminosity of 3 pb$^{-1}$, were collected with the CMS experiment in 2010. The two b jets must be within pseudorapidity $ | {\eta} | < $ 2.4, and the two other jets must be within $ | {\eta} | < $ 4.7. The transverse momenta of all the jets are required to be greater than 20 GeV. The cross section is measured to be $\sigma(\mathrm{ p }\mathrm{ p } \to 2 \mathrm{ b } + 2 \mathrm{j} + \mathrm{X}) = $ 69 $\pm$ 3 (stat) $\pm$ 24 (syst) nb. The differential cross sections as a function of the $ p_{\mathrm{T}} $ and $\eta$ of each of the four jets are presented, along with the cross sections as a function of kinematic jet correlation variables. The results are compared to several theoretical predictions with and without contributions from double parton scattering. The models based on leading order or next-to-leading-order dijet matrix element calculations, matched to parton shower and including multiparton interaction (MPI) contributions, describe well the differential cross sections as a function of $ p_{\mathrm{T}} $ and $\eta$ in the whole measured region. The differential cross sections as a function of the jet correlation variables are poorly reproduced by models that do not include contributions from MPI. Specifically, the predictions of POWHEG interfaced with PYTHIA 8 without the simulation of multiple parton interactions underestimate the cross sections as a function of $\Delta \mathrm{S} $ and $\Delta^{\text{rel}}_{\text{light}}p_{\mathrm{T}}$ in the regions of the phase space where a double parton scattering (DPS) signal is expected. These results demonstrate, for the first time, the sensitivity of kinematic jet correlation variables, such as $\Delta \mathrm{S} $ and $\Delta^{\text{rel}}_{\text{light}}p_{\mathrm{T}}$, to DPS processes in multijet final states with heavy-quarks. |
| References | ||||
| 1 | ATLAS Collaboration | Measurement of inclusive jet and dijet production in pp collisions at $ \sqrt{s}= $ 7 TeV using the ATLAS detector | PRD 86 (2012) 014022 | 1112.6297 |
| 2 | CMS Collaboration | Measurements of differential jet cross sections in proton-proton collisions at $ \sqrt{s}= $ 7 TeV with the CMS detector | PRD 87 (2013) 112002 | CMS-QCD-11-004 1212.6660 |
| 3 | CMS Collaboration | Measurement of the double-differential inclusive jet cross section in proton-proton collisions at $ \sqrt{s} = $ 13 TeV | CMS-SMP-15-007 1605.04436 |
|
| 4 | CDF Collaboration | Study of four jet events and evidence for double parton interactions in p$ \bar{\rm p} $ collisions at $ \sqrt{s} = $ 1.8 TeV | PRD 47 (1993) 4857 | |
| 5 | CDF Collaboration | Double parton scattering in p$ \bar{\rm p} $ collisions at $ \sqrt{s} = $ 1.8 TeV | PRD 56 (1997) 3811 | |
| 6 | D0 Collaboration | Double parton interactions in photon + 3 jet events in p$ \bar{\rm p} $ collisions $ \sqrt{s} = $ 1.96 TeV | PRD 81 (2010) 052012 | 0912.5104 |
| 7 | D0 Collaboration | Double parton interactions in $ \gamma+3 $ jet and $ \gamma+b/c $ jet + 2 jet events in p$ \bar{\rm p} $ collisions at $ \sqrt{s} = $ 1.96 TeV | PRD 89 (2014) 072006 | 1402.1550 |
| 8 | D0 Collaboration | Study of double parton interactions in diphoton + dijet events in p$ \bar{\rm p} $ collisions at $ \sqrt{s} = $ 1.96 TeV | PRD 93 (2016) 052008 | 1512.05291 |
| 9 | LHCb Collaboration | Observation of double charm production involving open charm in pp collisions at $ \sqrt{s} = $ 7 TeV | JHEP 06 (2012) 141 | 1205.0975 |
| 10 | LHCb Collaboration | Production of associated $ \Upsilon $ and open charm hadrons in pp collisions at $ \sqrt{s}= $ 7 and 8 TeV via double parton scattering | JHEP 07 (2016) 052 | 1510.05949 |
| 11 | CMS Collaboration | Measurement of four-jet production in proton-proton collisions at $ \sqrt{s} = $ 7 TeV | PRD 89 (2014) 092010 | CMS-FSQ-12-013 1312.6440 |
| 12 | ATLAS Collaboration | Measurement of hard double-parton interactions in $ W(\to l\nu) $+ 2 jet events at $ \sqrt{s} = $ 7 TeV with the ATLAS detector | New J. Phys. 15 (2013) 033038 | 1301.6872 |
| 13 | CMS Collaboration | Study of double parton scattering using W + 2-jet events in proton-proton collisions at $ \sqrt{s} = $ 7 TeV | JHEP 03 (2014) 032 | CMS-FSQ-12-028 1312.5729 |
| 14 | CMS Collaboration | Measurement of the cross section and angular correlations for associated production of a Z boson with b hadrons in pp collisions at $ \sqrt{s} = $ 7 TeV | JHEP 12 (2013) 039 | CMS-EWK-11-015 1310.1349 |
| 15 | CMS Collaboration | Measurement of $ J/ \psi $ and $ \psi $(2S) prompt double-differential cross sections in pp collisions at $ \sqrt{s} = $ 7 TeV | PRL 114 (2015) 191802 | CMS-BPH-14-001 1502.04155 |
| 16 | ATLAS Collaboration | Measurement of the production cross section of prompt $ J/\psi $ mesons in association with a $ W^\pm $ boson in pp collisions at $ \sqrt{s} = $ 7 TeV with the ATLAS detector | JHEP 04 (2014) 172 | 1401.2831 |
| 17 | ATLAS Collaboration | Observation and measurements of the production of prompt and non-prompt $ J/\psi $ mesons in association with a $ Z $ boson in pp collisions at $ \sqrt{s} = $ 8 TeV with the ATLAS detector | EPJC 75 (2015) 229 | 1412.6428 |
| 18 | E. L. Berger, C. B. Jackson, and G. Shaughnessy | Characteristics and Estimates of Double Parton Scattering at the Large Hadron Collider | PRD 81 (2010) 014014 | 0911.5348 |
| 19 | B. Blok and P. Gunnellini | Dynamical approach to MPI four-jet production in PYTHIA | EPJC 75 (2015) 282 | 1503.08246 |
| 20 | B. Blok and P. Gunnellini | Dynamical approach to MPI in W+dijet and Z+dijet production within the PYTHIA event generator | EPJC 76 (2016) 202 | 1510.07436 |
| 21 | CMS Collaboration | Event generator tunes obtained from underlying event and multiparton scattering measurements | EPJC 76 (2016) 155 | CMS-GEN-14-001 1512.00815 |
| 22 | CMS Collaboration | The CMS experiment at the CERN LHC | JINST 3 (2008) S08004 | CMS-00-001 |
| 23 | T. Sjostrand, S. Mrenna, and P. Skands | PYTHIA 6.4 physics and manual | JHEP 05 (2006) 026 | hep-ph/0603175 |
| 24 | T. Sjostrand, S. Mrenna, and P. Z. Skands | A brief introduction to PYTHIA 8.1 | CPC 178 (2008) 852 | 0710.3820 |
| 25 | M. Bahr et al. | Herwig++ physics and manual | EPJC 58 (2008) 639 | 0803.0883 |
| 26 | B. Andersson | The LUND model | Cambridge Monographs on Particle Physics, Nuclear Physics and Cosmology. Cambridge University Press, 1998ISBN 9780521420945 | |
| 27 | B. R. Webber | A QCD model for jet fragmentation including soft gluon interference | NPB 238 (1984) 492 | |
| 28 | CMS Collaboration | Study of the underlying event at forward rapidity in pp collisions at $ \sqrt{s} = $ 0.9, 2.76, and 7 TeV | JHEP 04 (2013) 072 | CMS-FWD-11-003 1302.2394 |
| 29 | P. Z. Skands and D. Wicke | Non-perturbative QCD effects and the top mass at the Tevatron | EPJC 52 (2007) 133 | hep-ph/0703081 |
| 30 | J. Pumplin et al. | New generation of parton distributions with uncertainties from global QCD analysis | JHEP 07 (2002) 012 | hep-ph/0201195 |
| 31 | S. Gieseke et al. | Herwig++ 2.5 release note | 1102.1672 | |
| 32 | R. S. Thorne, A. D. Martin, W. J. Stirling, and G. Watt | Status of MRST/MSTW PDF sets | in Proceedings, 17th International Workshop on Deep-Inelastic Scattering and Related Subjects (DIS 2009) 2009 | 0907.2387 |
| 33 | A. Sherstnev and R. S. Thorne | Parton distributions for LO generators | EPJC 55 (2008) 553 | 0711.2473 |
| 34 | M. H. Seymour and A. Si\'odmok | Constraining MPI models using $ \sigma_\text{eff} $ and recent Tevatron and LHC Underlying Event data | JHEP 10 (2013) 113 | 1307.5015 |
| 35 | R. Corke and T. Sjostrand | Interleaved Parton Showers and Tuning Prospects | JHEP 03 (2011) 032 | 1011.1759 |
| 36 | P. Nason | A new method for combining NLO QCD with shower Monte Carlo algorithms | JHEP 11 (2004) 040 | hep-ph/0409146 |
| 37 | S. Frixione, P. Nason, and C. Oleari | Matching NLO QCD computations with parton shower simulations: the POWHEG method | JHEP 11 (2007) 070 | 0709.2092 |
| 38 | A. M. Cooper-Sarkar | HERAPDF1.5LO PDF set with experimental uncertainties | in Proceedings, 22nd International Workshop on Deep-Inelastic Scattering and Related Subjects (DIS 2014), p. 032 2014PoS (DIS2014) 032 | |
| 39 | J. Alwall et al. | MadGraph 5: going beyond | JHEP 06 (2011) 128 | 1106.0522 |
| 40 | NNPDF Collaboration | Parton distributions with QED corrections | NPB 877 (2013) 290 | 1308.0598 |
| 41 | NNPDF Collaboration | Unbiased global determination of parton distributions and their uncertainties at NNLO and at LO | NPB 855 (2012) 153 | 1107.2652 |
| 42 | J. Alwall et al. | Comparative study of various algorithms for the merging of parton showers and matrix elements in hadronic collisions | EPJC 53 (2008) 473 | 0706.2569 |
| 43 | GEANT4 Collaboration | GEANT4---a simulation toolkit | NIMA 506 (2003) 250 | |
| 44 | CMS Collaboration | Particle--flow event reconstruction in CMS and performance for jets, taus, and $ E_{\mathrm{T}}^{\text{miss}} $ | CDS | |
| 45 | CMS Collaboration | Commissioning of the particle-flow event reconstruction with the first LHC collisions recorded in the CMS detector | CMS-PAS-PFT-10-001 | |
| 46 | M. Cacciari, G. P. Salam, and G. Soyez | The anti-$ k_t $ jet clustering algorithm | JHEP 04 (2008) 063 | 0802.1189 |
| 47 | CMS Collaboration | Calorimeter jet quality criteria for the first CMS collision data | CMS-PAS-JME-09-008 | |
| 48 | CMS Collaboration | Determination of Jet Energy Calibration and Transverse Momentum Resolution in CMS | JINST 6 (2011) P11002 | CMS-JME-10-011 1107.4277 |
| 49 | CMS Collaboration | Identification of b-quark jets with the CMS experiment | JINST 8 (2013) P04013 | CMS-BTV-12-001 1211.4462 |
| 50 | G. D'Agostini | A multidimensional unfolding method based on Bayes' theorem | NIMA 362 (1995) 487 | |
| 51 | T. Adye | Unfolding algorithms and tests using RooUnfold | 1105.1160 | |
| 52 | CMS Collaboration | Absolute luminosity normalization | CDS | |
|
|
Compact Muon Solenoid LHC, CERN |
|

|

|

|

|

|