

Compact Muon Solenoid
LHC, CERN
| CMS-FSQ-16-008 ; CERN-EP-2017-249 | ||
| Measurement of the underlying event activity in inclusive Z boson production in proton-proton collisions at $\sqrt{s} = $ 13 TeV | ||
| CMS Collaboration | ||
| 12 November 2017 | ||
| JHEP 07 (2018) 032 | ||
| Abstract: This paper presents a measurement of the underlying event activity in proton-proton collisions at a center-of-mass energy of 13 TeV, performed using inclusive Z boson production events collected with the CMS experiment at the LHC. The analyzed data correspond to an integrated luminosity of 2.1 fb$^{-1}$. The underlying event activity is quantified in terms of the charged particle multiplicity, as well as of the scalar sum of the charged particles' transverse momenta in different topological regions defined with respect to the Z boson direction. The distributions are unfolded to the stable particle level and compared with predictions from various Monte Carlo event generators, as well as with similar CDF and CMS measurements at center-of-mass energies of 1.96 and 7 TeV respectively. | ||
| Links: e-print arXiv:1711.04299 [hep-ex] (PDF) ; CDS record ; inSPIRE record ; HepData record ; CADI line (restricted) ; | ||
| Figures | |
png pdf |
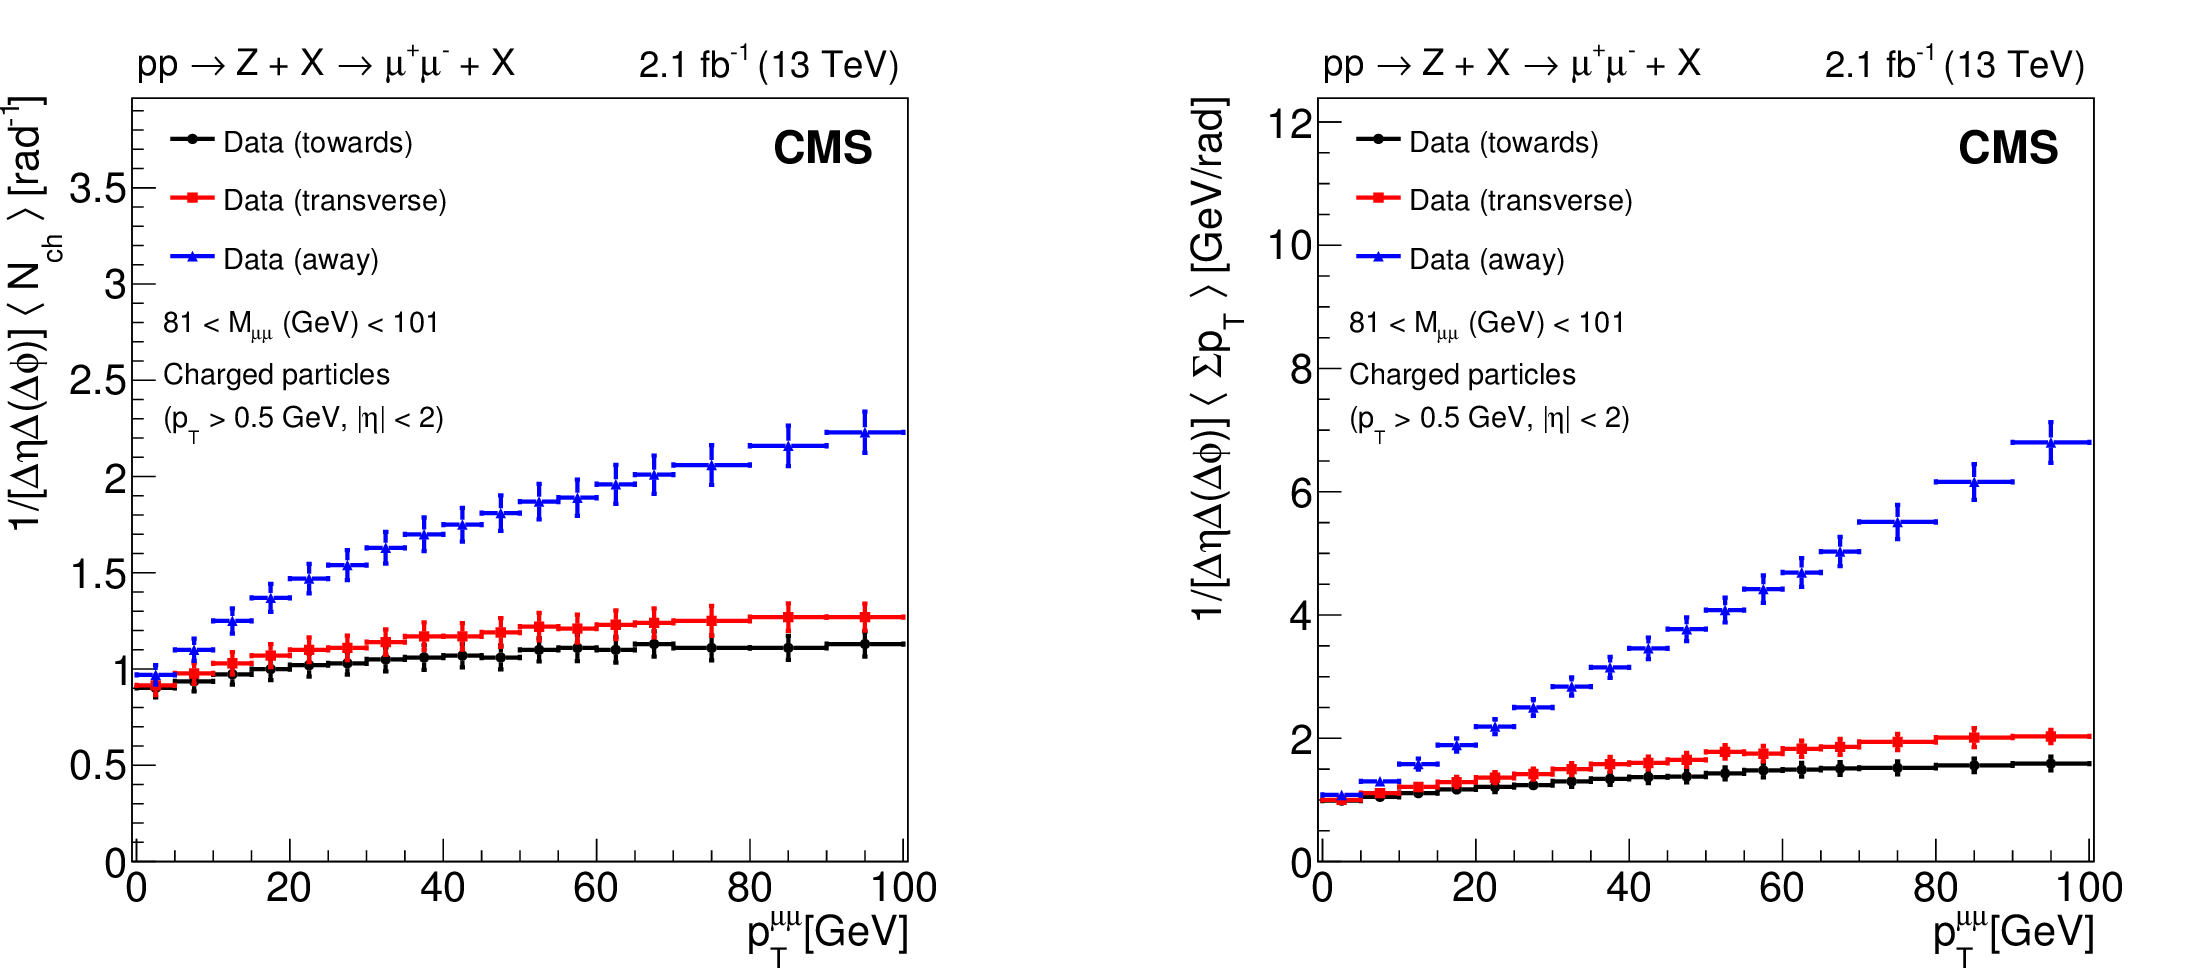
Figure 1:
Unfolded distributions of particle density (left) and $\Sigma {p_{\mathrm {T}}} $ density (right) in Z events, as a function of ${{p_{\mathrm {T}}} ^{\mu \mu}}$ in the towards ($\Delta \phi < 60^{\circ}$), transverse ($60^{\circ} < \Delta \phi < 120^{\circ}$), and away ($\Delta \phi > 120^{\circ}$) regions. Error bars represent the statistical and systematic uncertainties added in quadrature. |
png pdf |
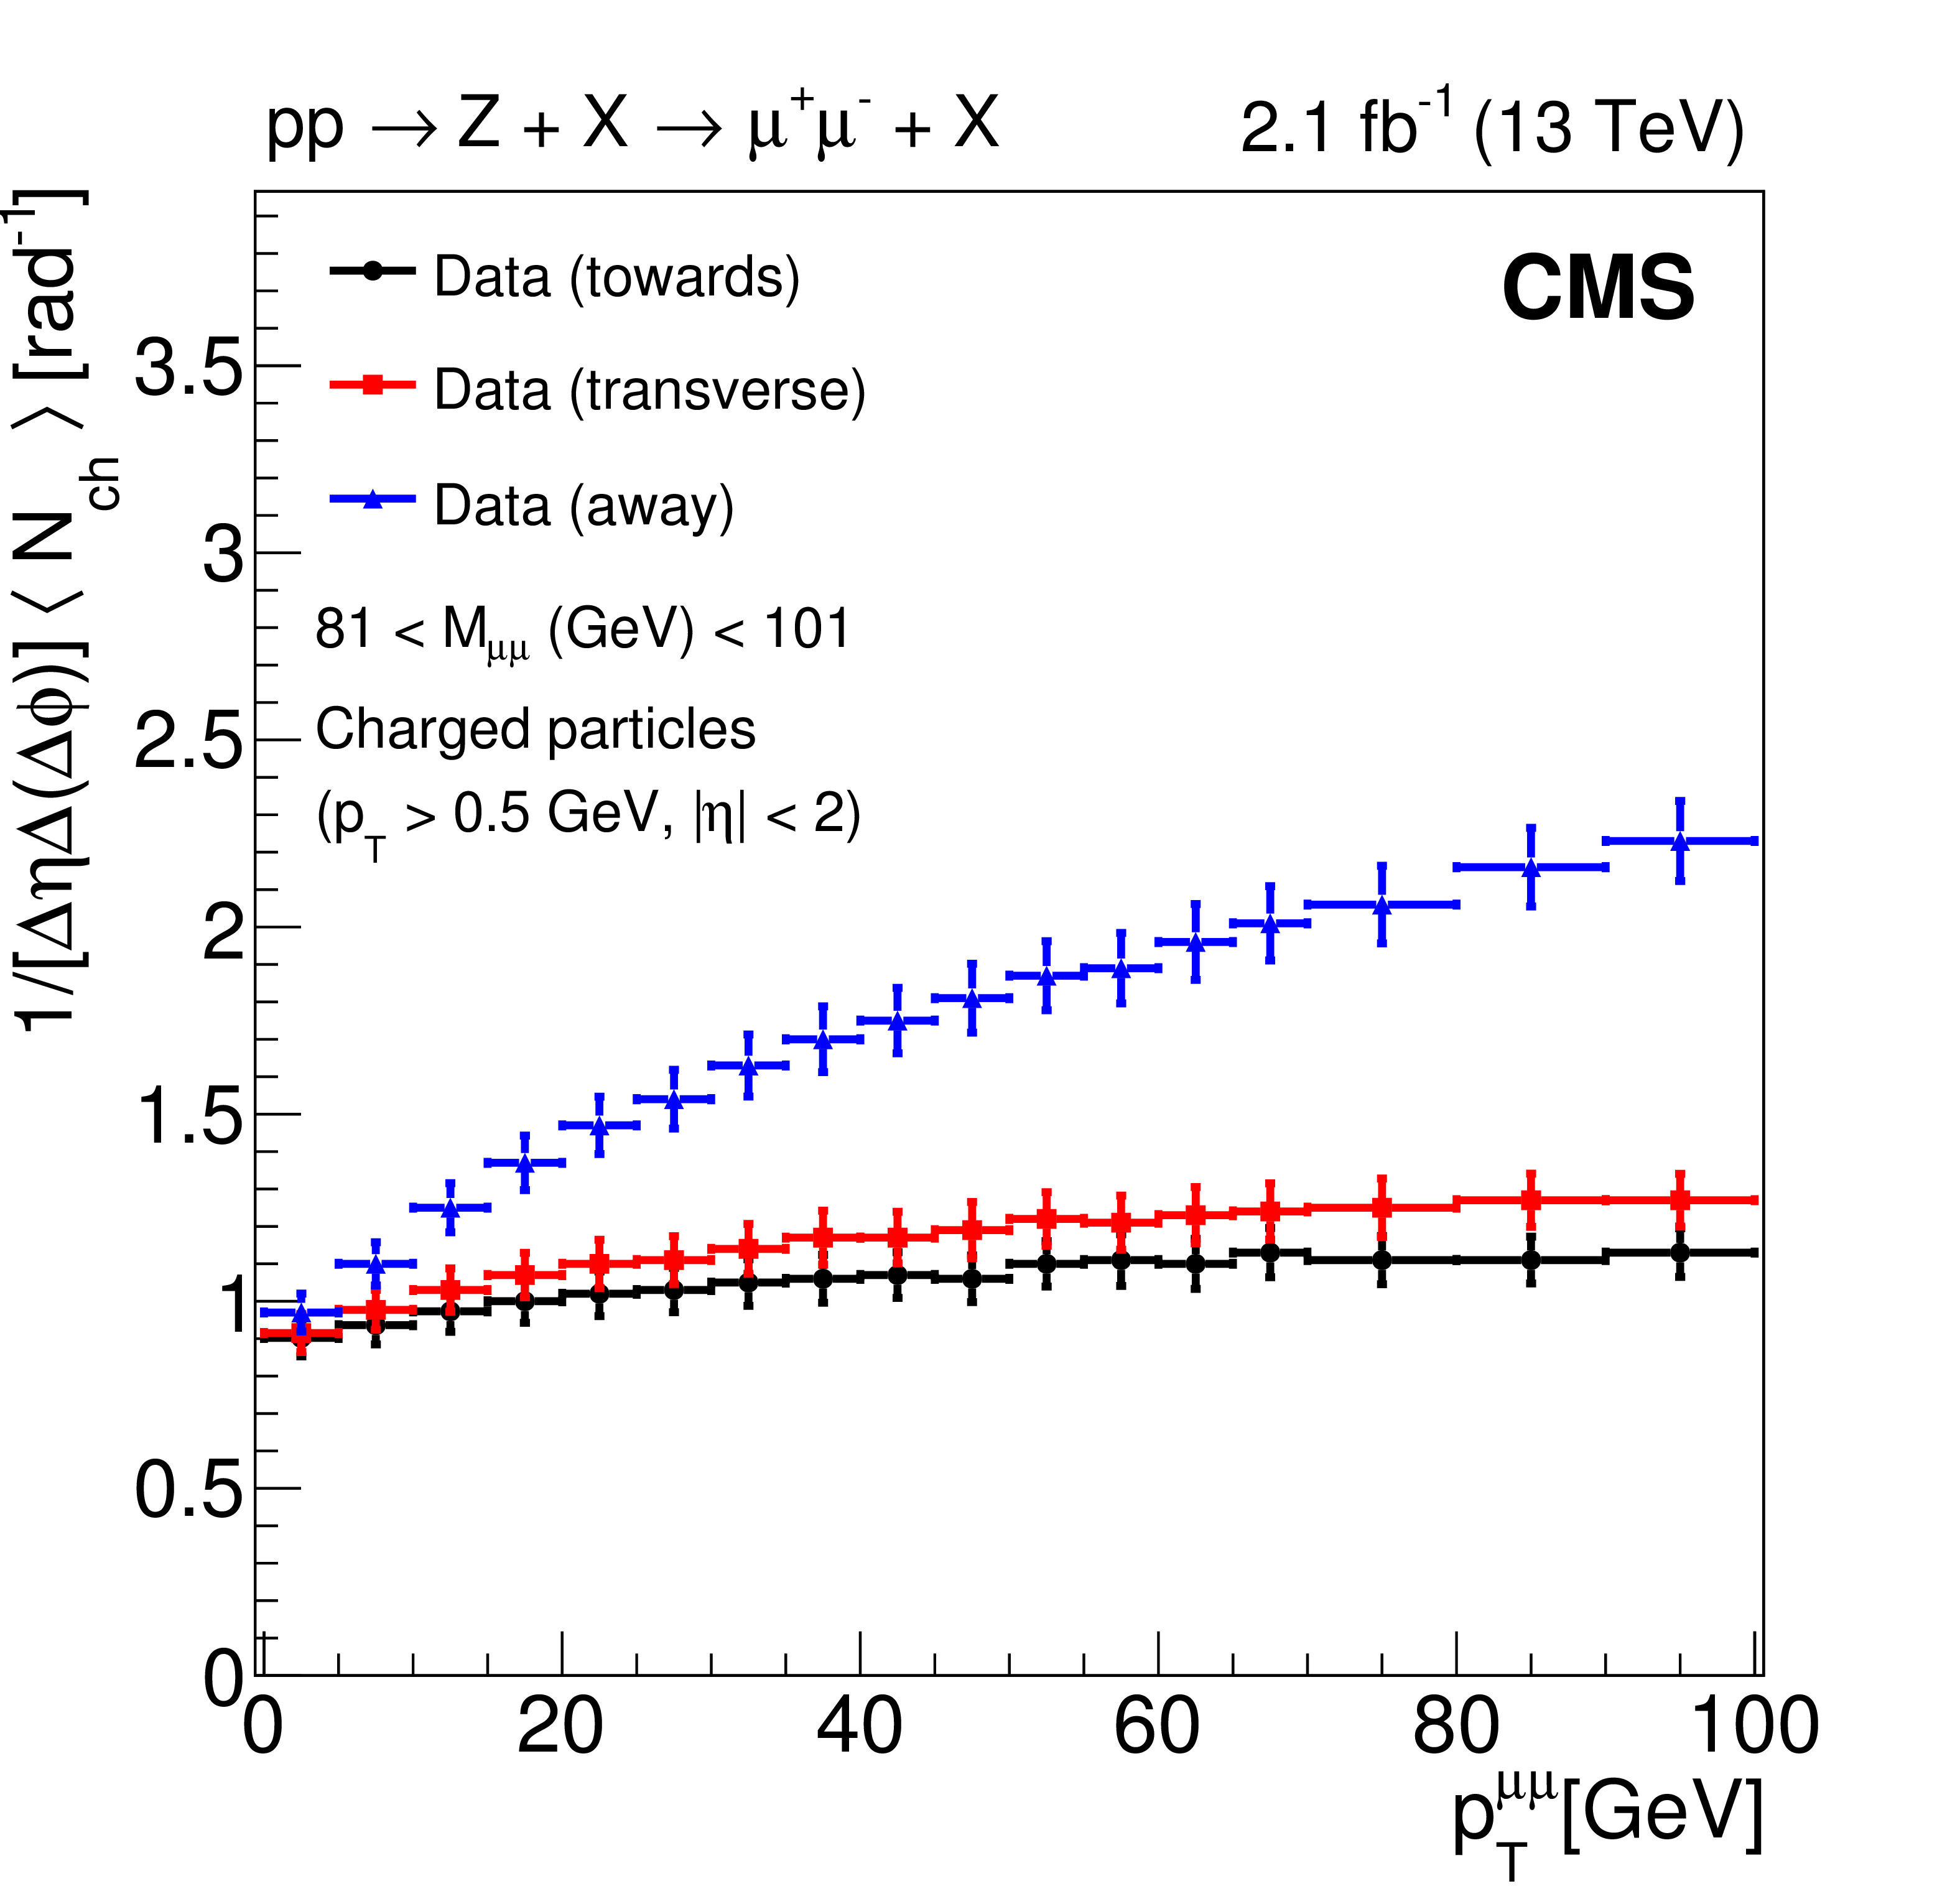
Figure 1-a:
Unfolded distributions of particle density in Z events, as a function of ${{p_{\mathrm {T}}} ^{\mu \mu}}$ in the towards ($\Delta \phi < 60^{\circ}$), transverse ($60^{\circ} < \Delta \phi < 120^{\circ}$), and away ($\Delta \phi > 120^{\circ}$) regions. Error bars represent the statistical and systematic uncertainties added in quadrature. |
png pdf |
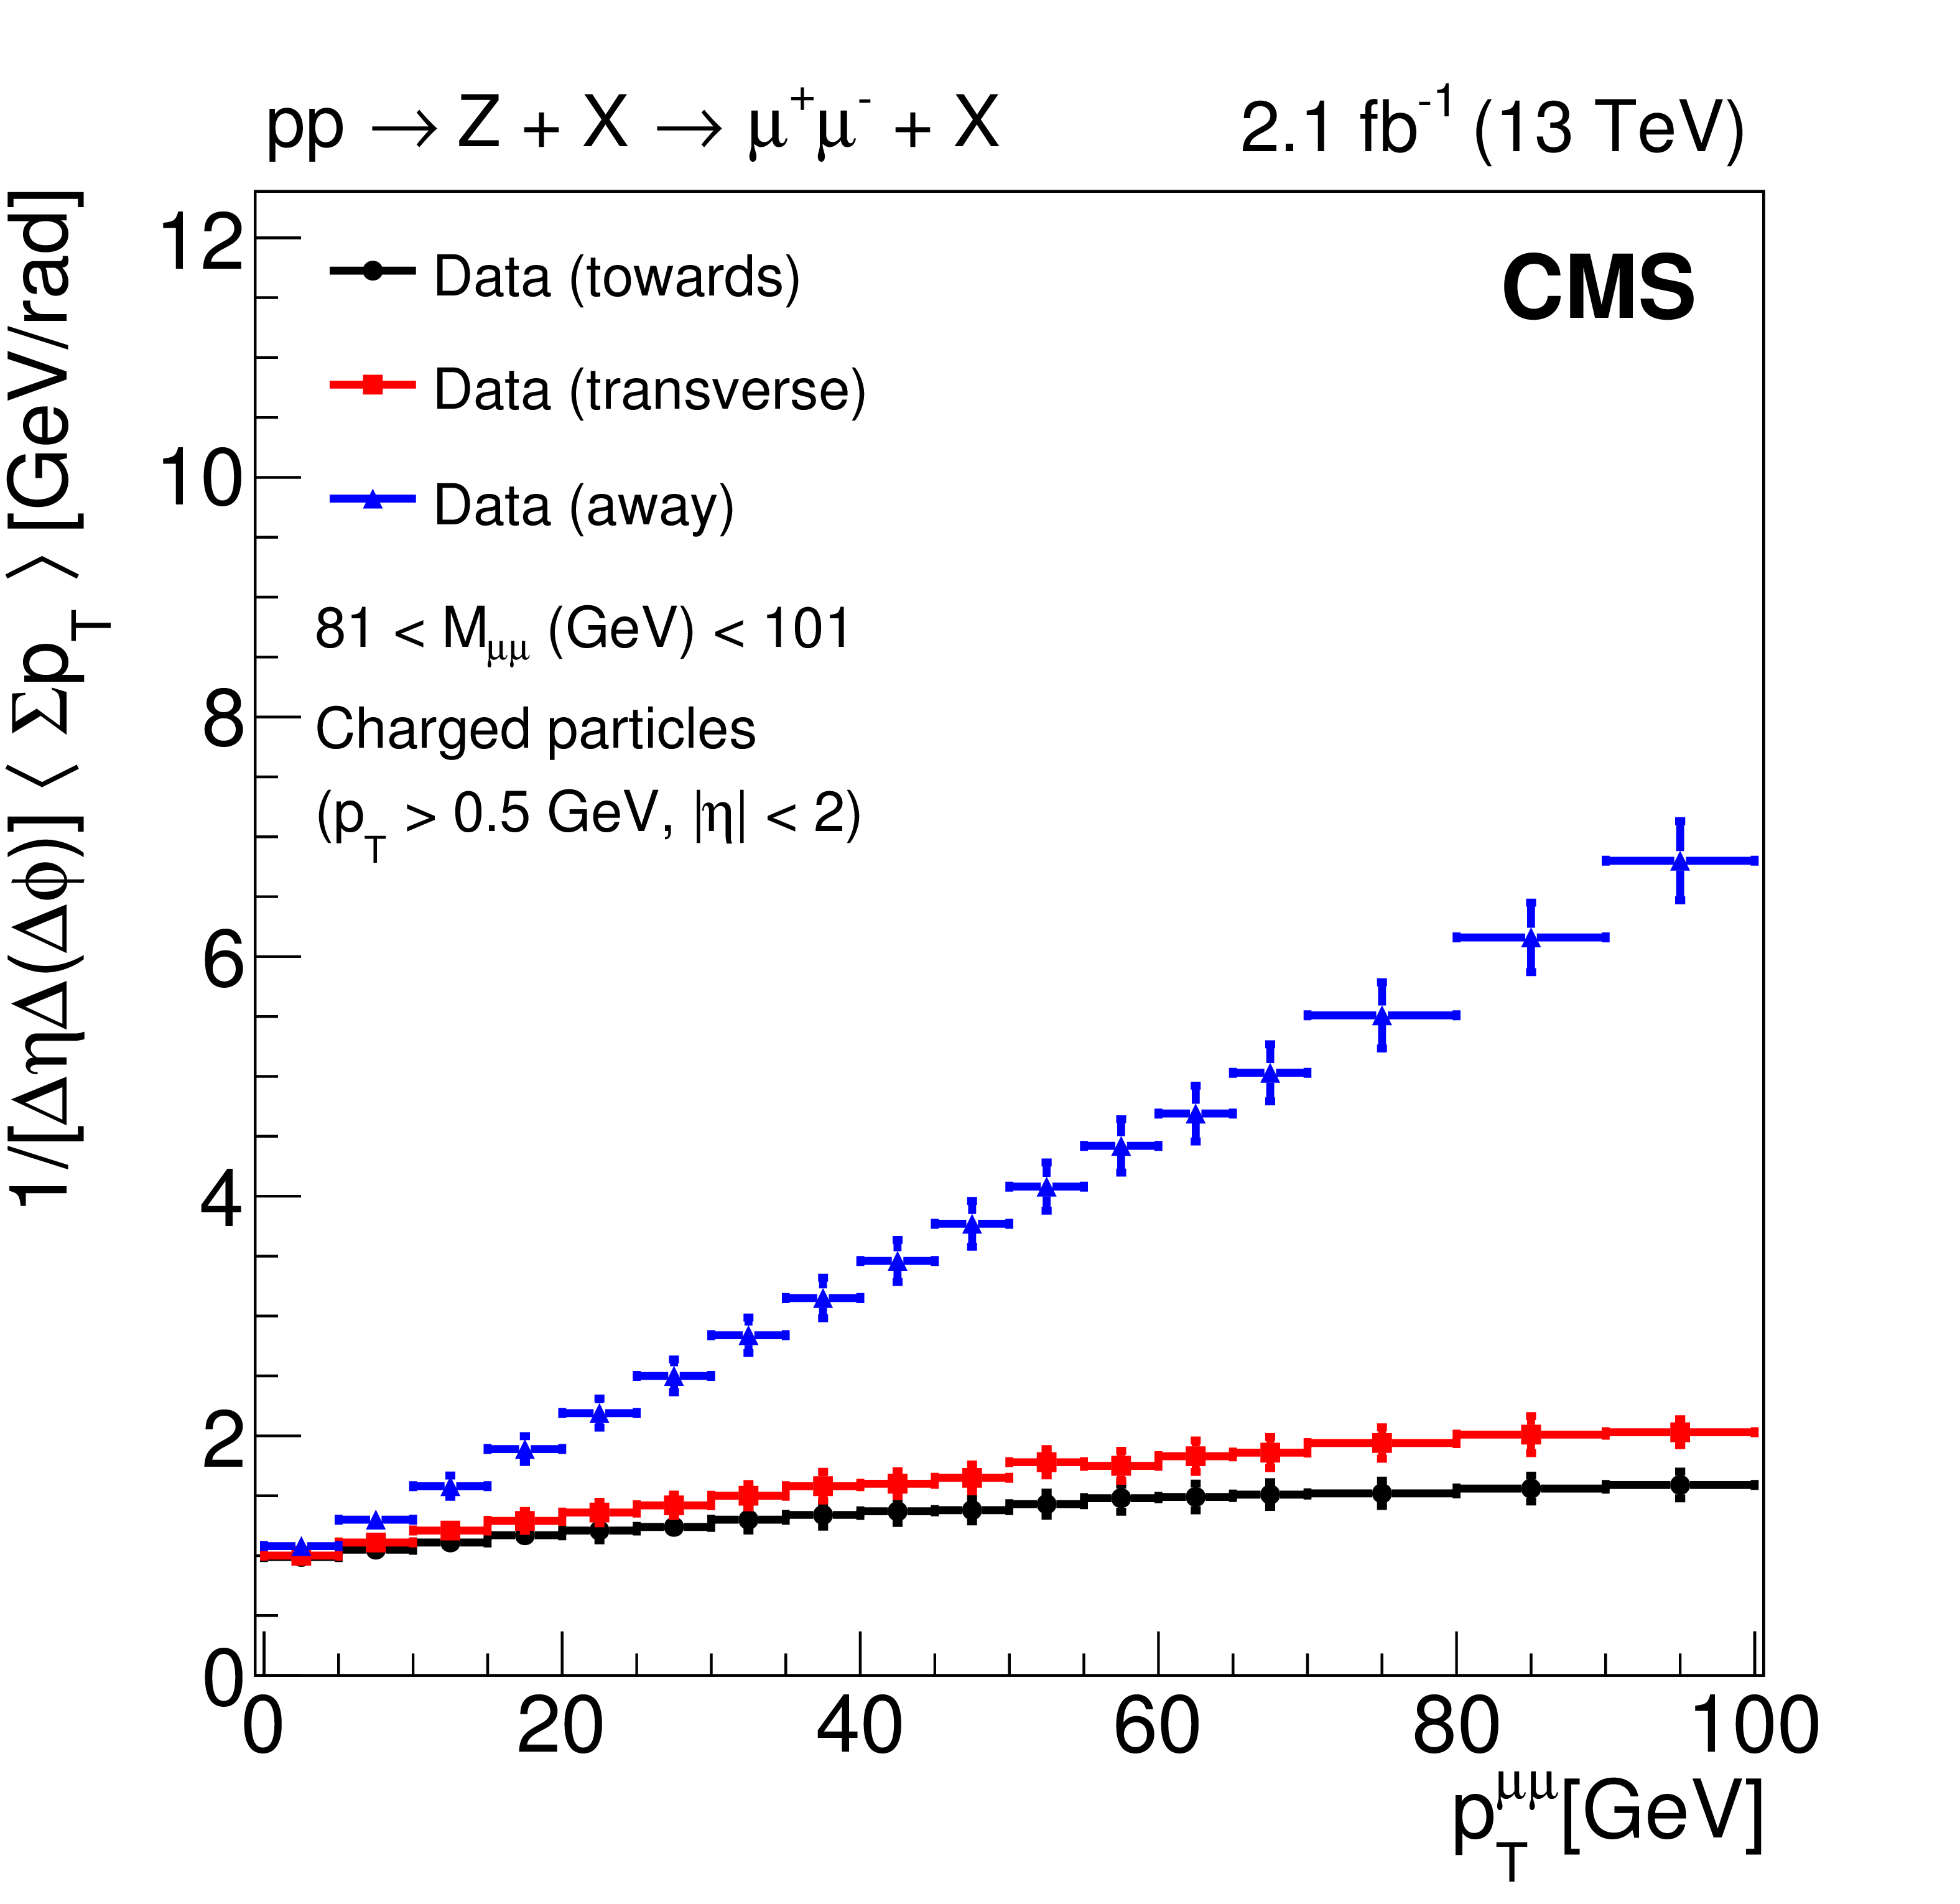
Figure 1-b:
$\Sigma {p_{\mathrm {T}}} $ density in Z events, as a function of ${{p_{\mathrm {T}}} ^{\mu \mu}}$ in the towards ($\Delta \phi < 60^{\circ}$), transverse ($60^{\circ} < \Delta \phi < 120^{\circ}$), and away ($\Delta \phi > 120^{\circ}$) regions. Error bars represent the statistical and systematic uncertainties added in quadrature. |
png pdf |
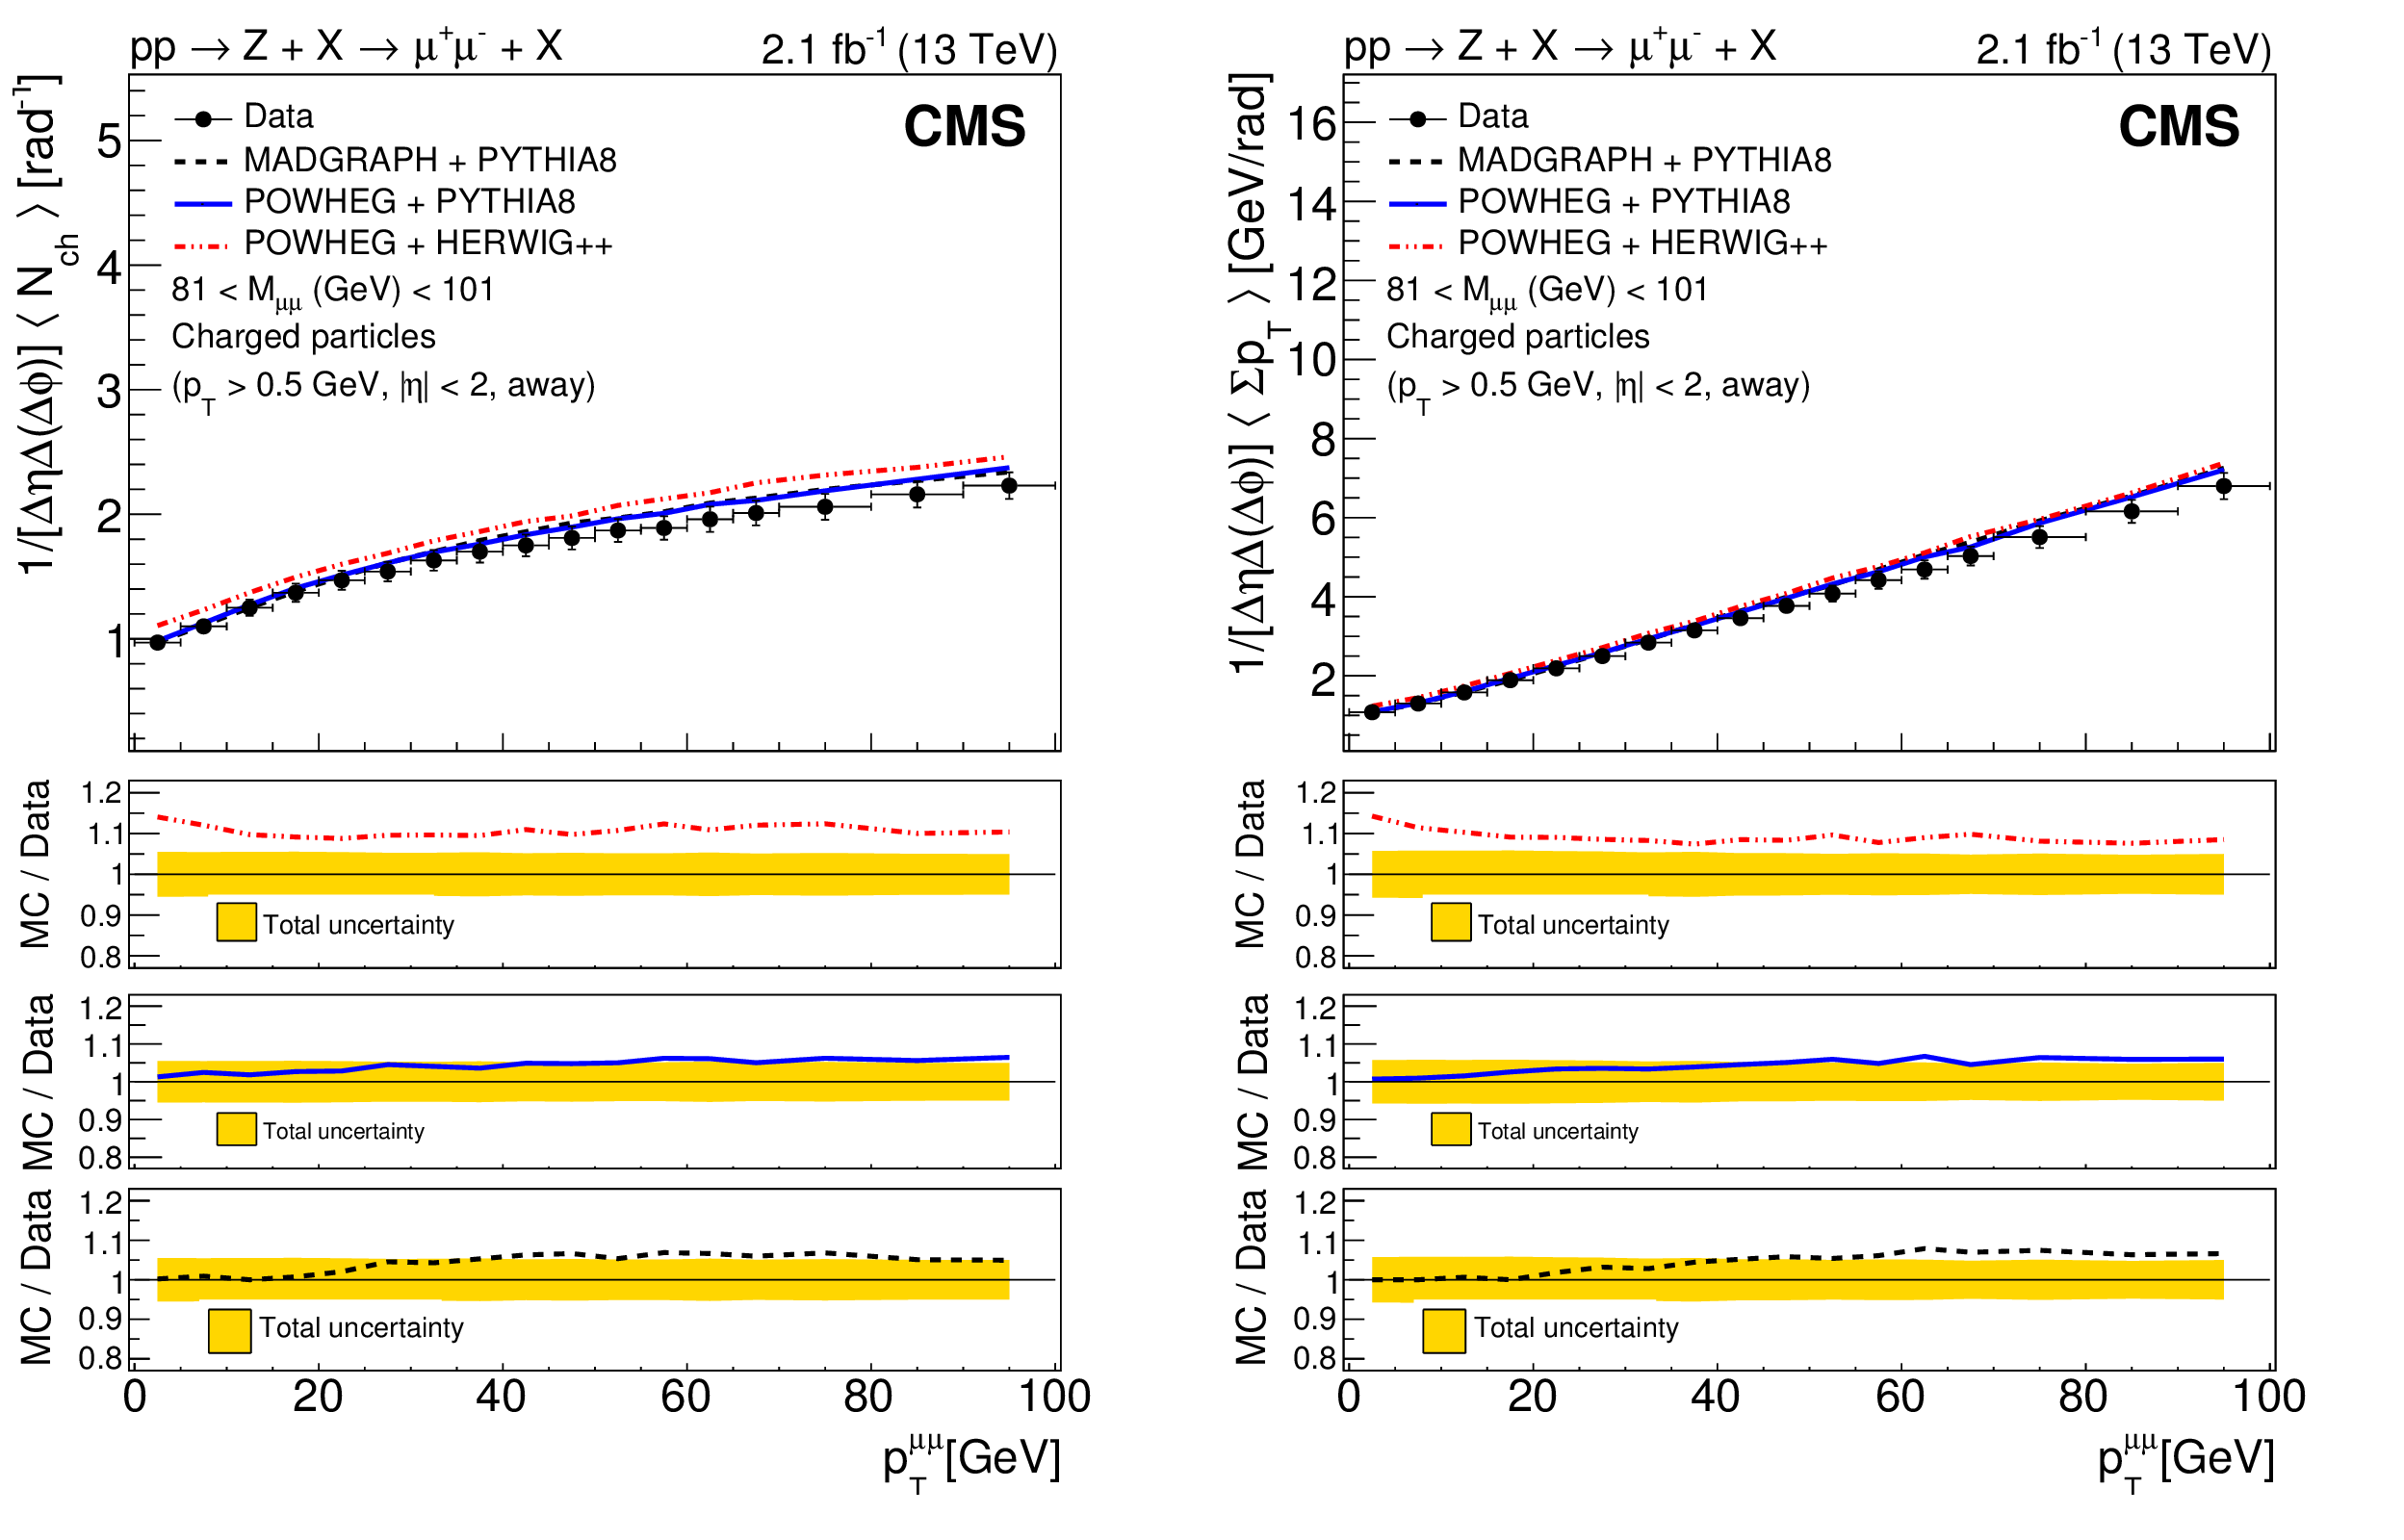
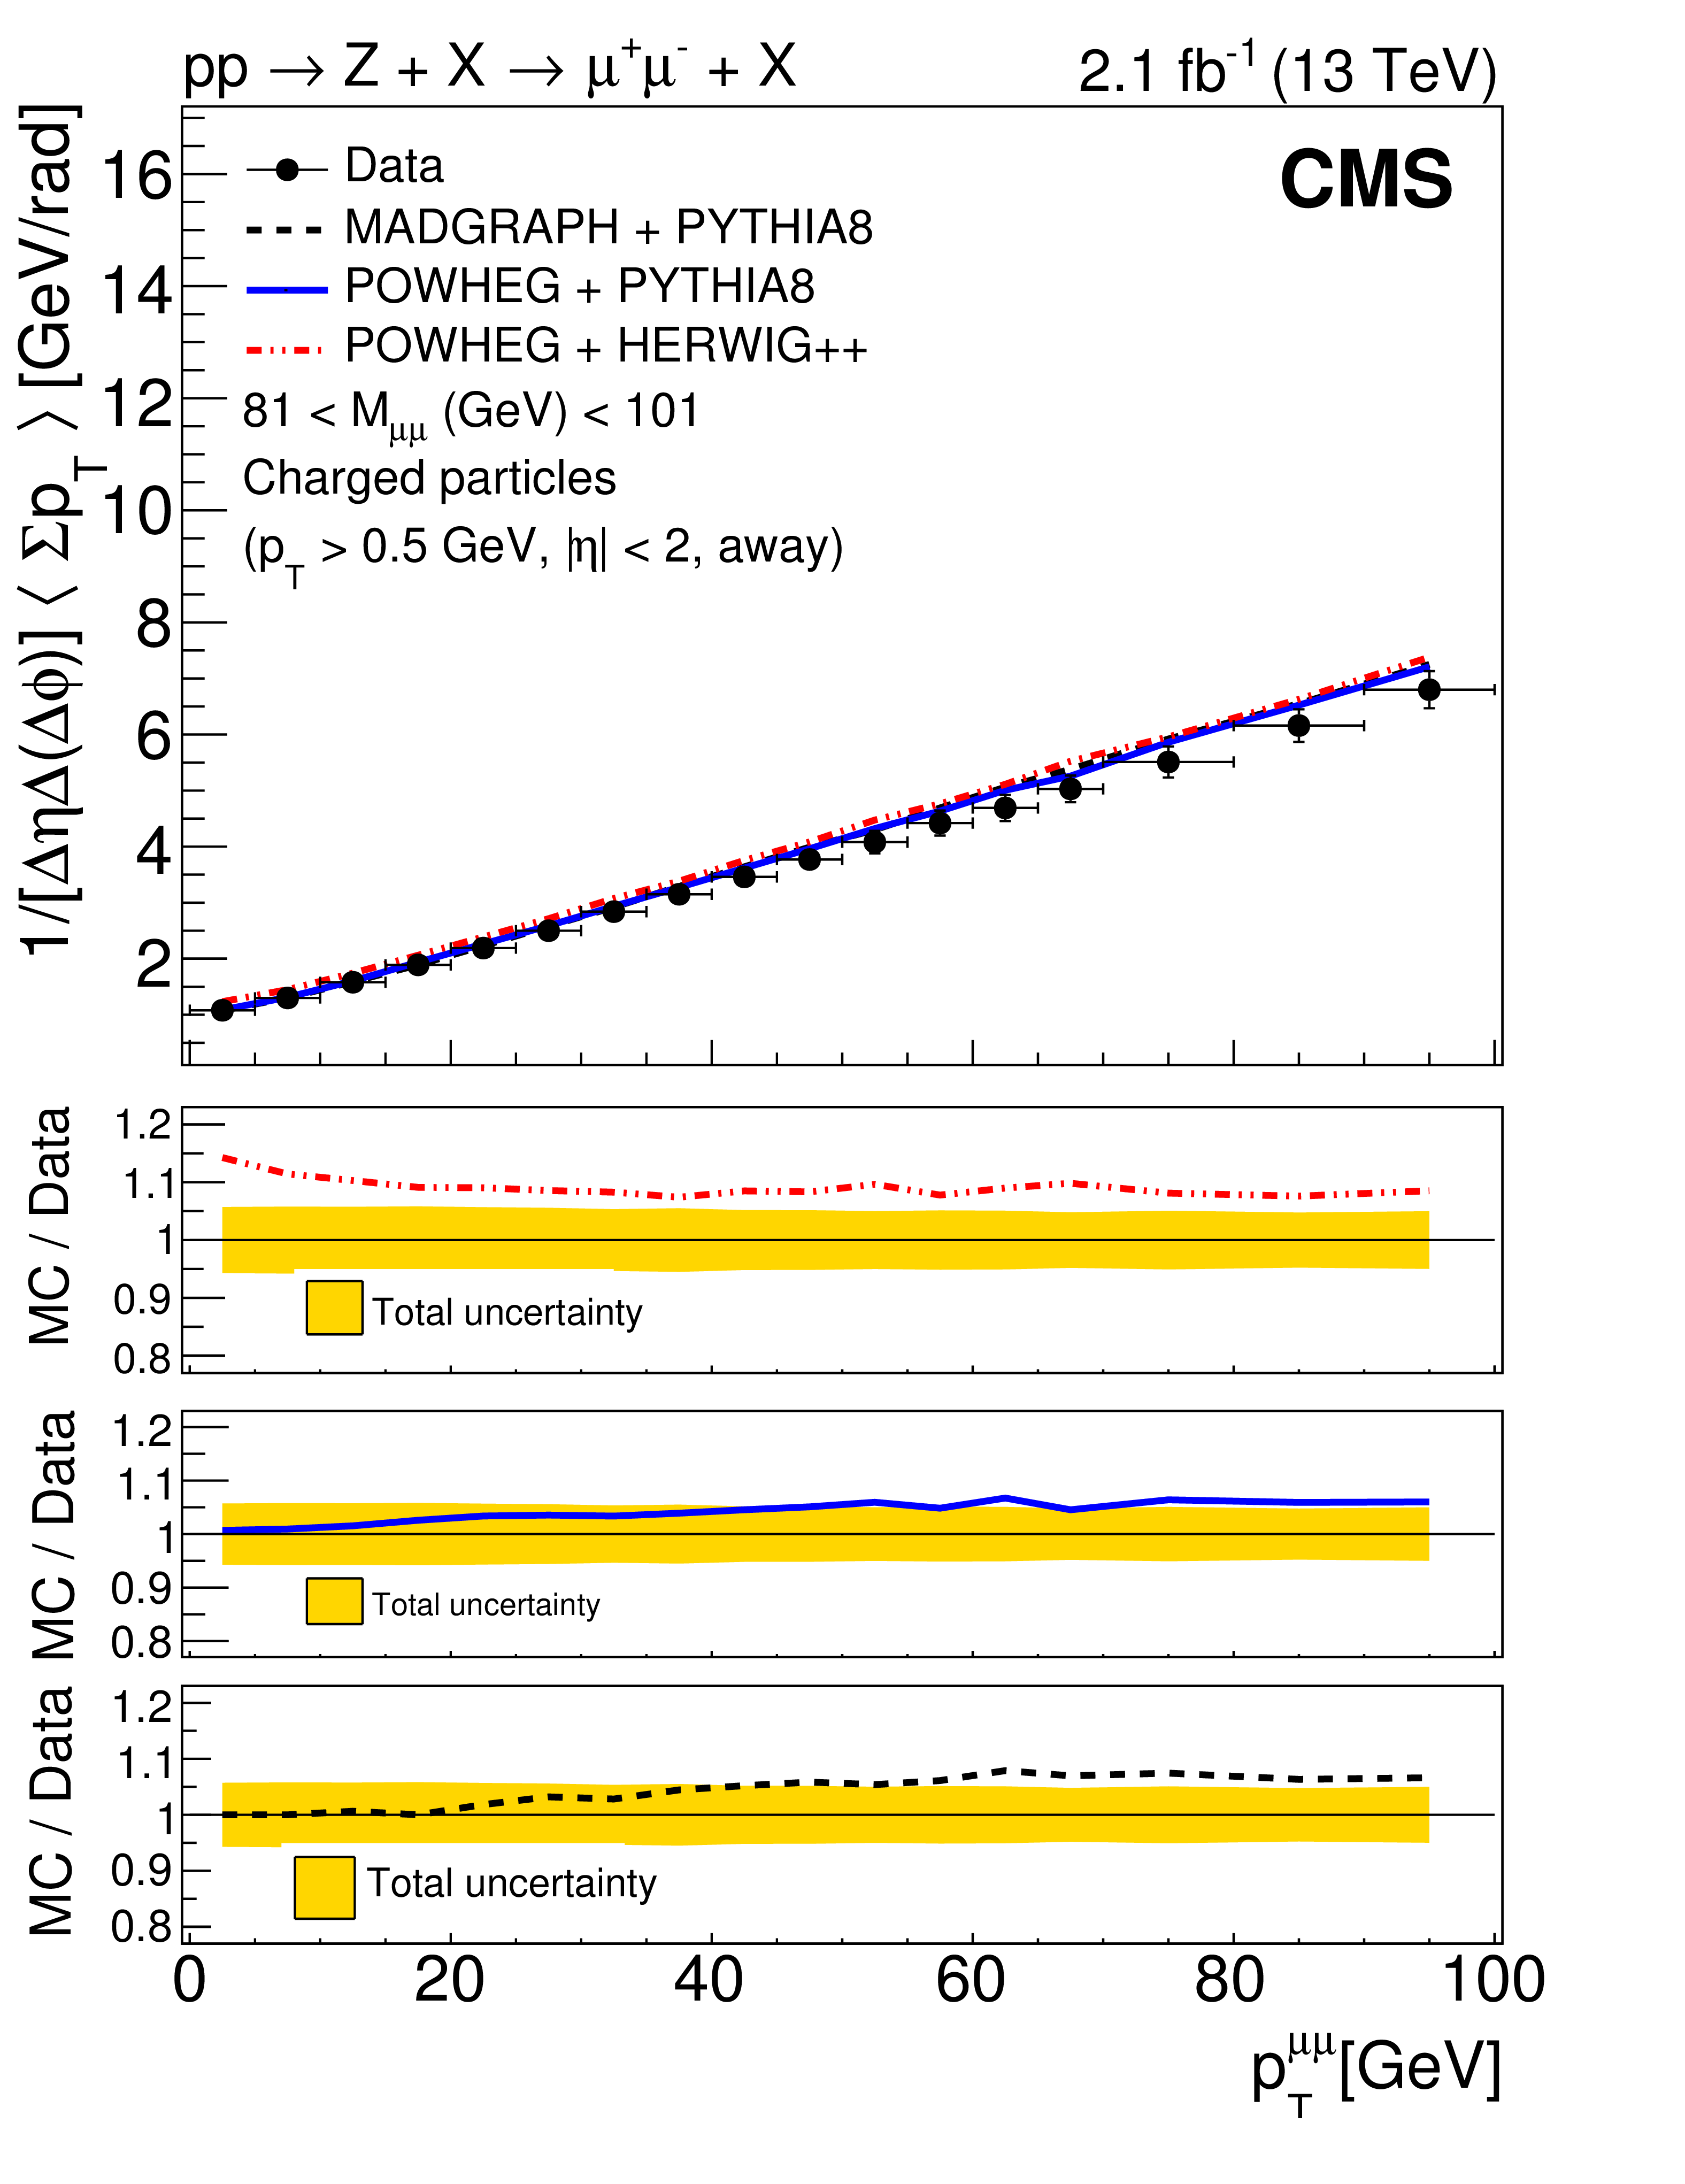
Figure 2:
Unfolded distributions of particle density (left) and $\Sigma {p_{\mathrm {T}}} $ density (right) in Z events in the away region as a function of ${{p_{\mathrm {T}}} ^{\mu \mu}}$, compared to various models predictions: MadGraph + PYTHIA8, POWHEG + PYTHIA8, and POWHEG + HERWIG++. The bottom panels of each plot show the ratios of the simulations to the measured distributions. The bands in the bottom panels represent the statistical and systematic uncertainties added in quadrature. |

png pdf |
Figure 2-a:
Unfolded distributions of particle density in Z events in the away region as a function of ${{p_{\mathrm {T}}} ^{\mu \mu}}$, compared to various models predictions: MadGraph + PYTHIA8, POWHEG + PYTHIA8, and POWHEG + HERWIG++. The bottom panel shows the ratios of the simulations to the measured distributions. The bands in the bottom panel represent the statistical and systematic uncertainties added in quadrature. |
png pdf |
Figure 2-b:
$\Sigma {p_{\mathrm {T}}} $ density in Z events in the away region as a function of ${{p_{\mathrm {T}}} ^{\mu \mu}}$, compared to various models predictions: MadGraph + PYTHIA8, POWHEG + PYTHIA8, and POWHEG + HERWIG++. The bottom panel shows the ratios of the simulations to the measured distributions. The bands in the bottom panel represent the statistical and systematic uncertainties added in quadrature. |

png pdf |
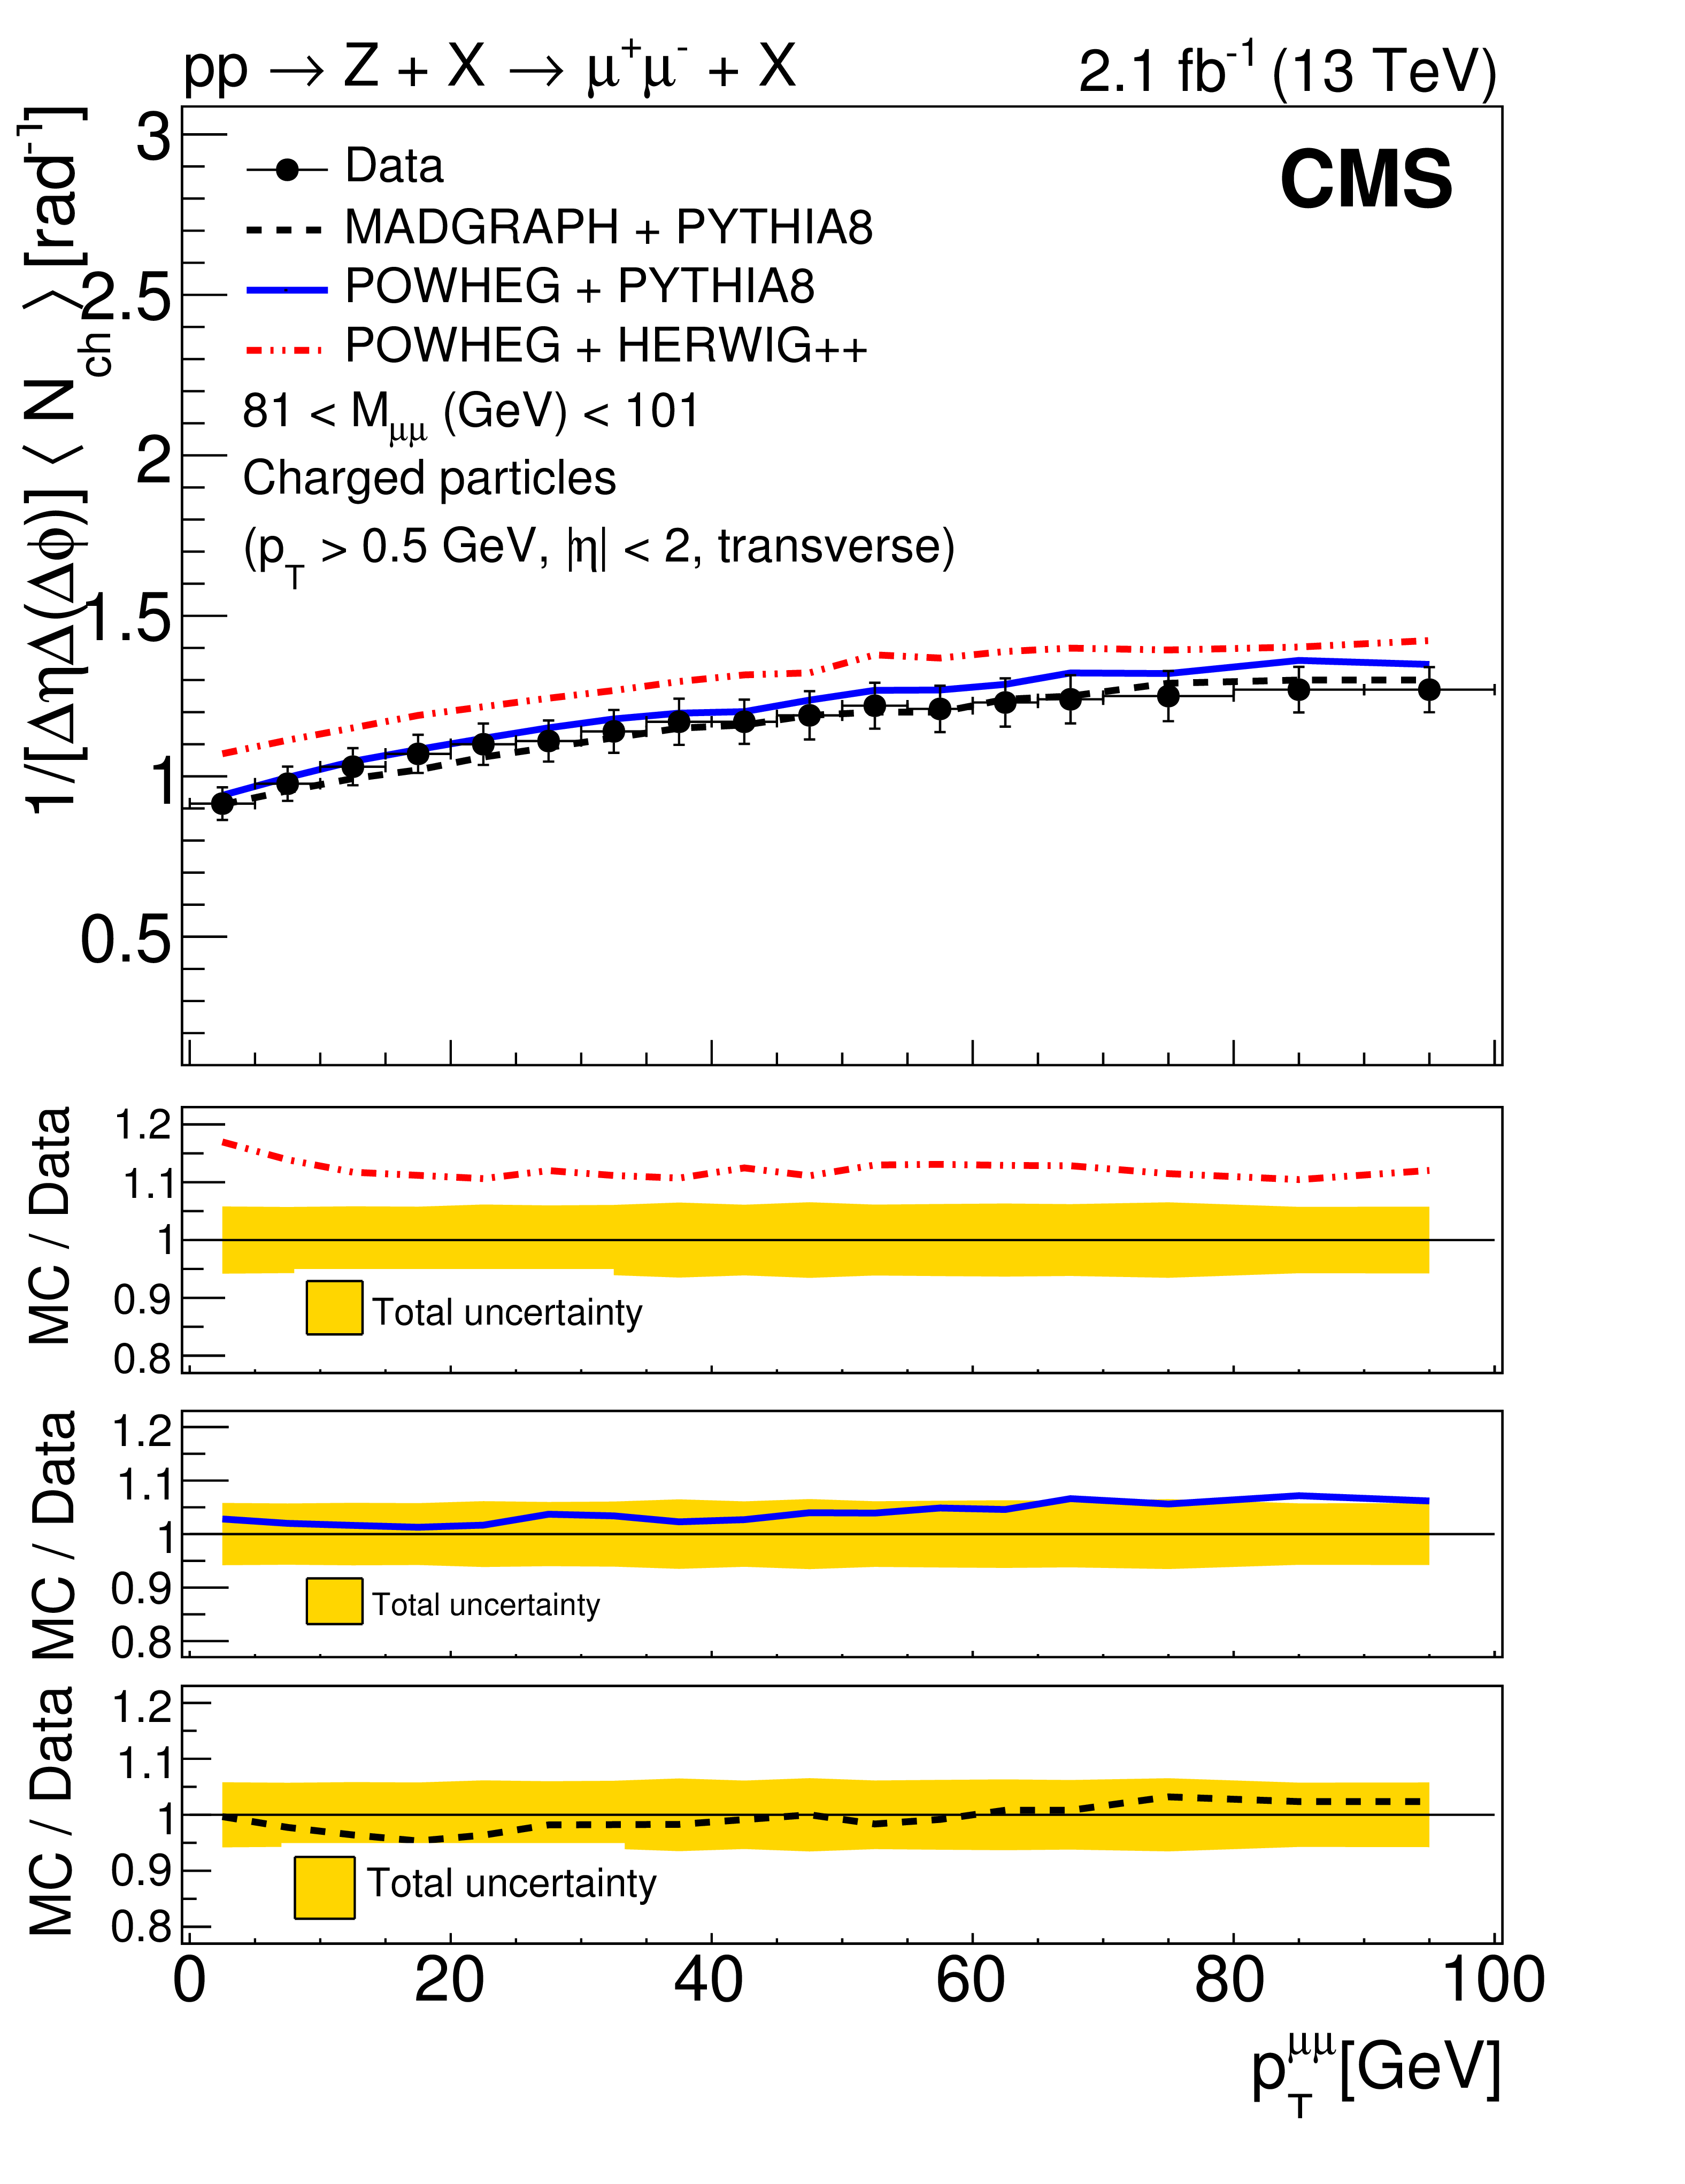
Figure 3:
Unfolded distributions of particle density (left) and $\Sigma {p_{\mathrm {T}}} $ density (right) in Z events in the transverse region as a function of ${{p_{\mathrm {T}}} ^{\mu \mu}}$, compared to various models predictions: MadGraph + PYTHIA8, POWHEG + PYTHIA8, and POWHEG + HERWIG++. The bottom panels of each plot show the ratios of the simulations to the measured distributions. The bands in the bottom panels represent the statistical and systematic uncertainties added in quadrature. |
png pdf |
Figure 3-a:
Unfolded distribution of particle density in Z events in the transverse region as a function of ${{p_{\mathrm {T}}} ^{\mu \mu}}$, compared to various models predictions: MadGraph + PYTHIA8, POWHEG + PYTHIA8, and POWHEG + HERWIG++. The bottom panel shows the ratios of the simulations to the measured distributions. The bands in the bottom panel represent the statistical and systematic uncertainties added in quadrature. |
png pdf |
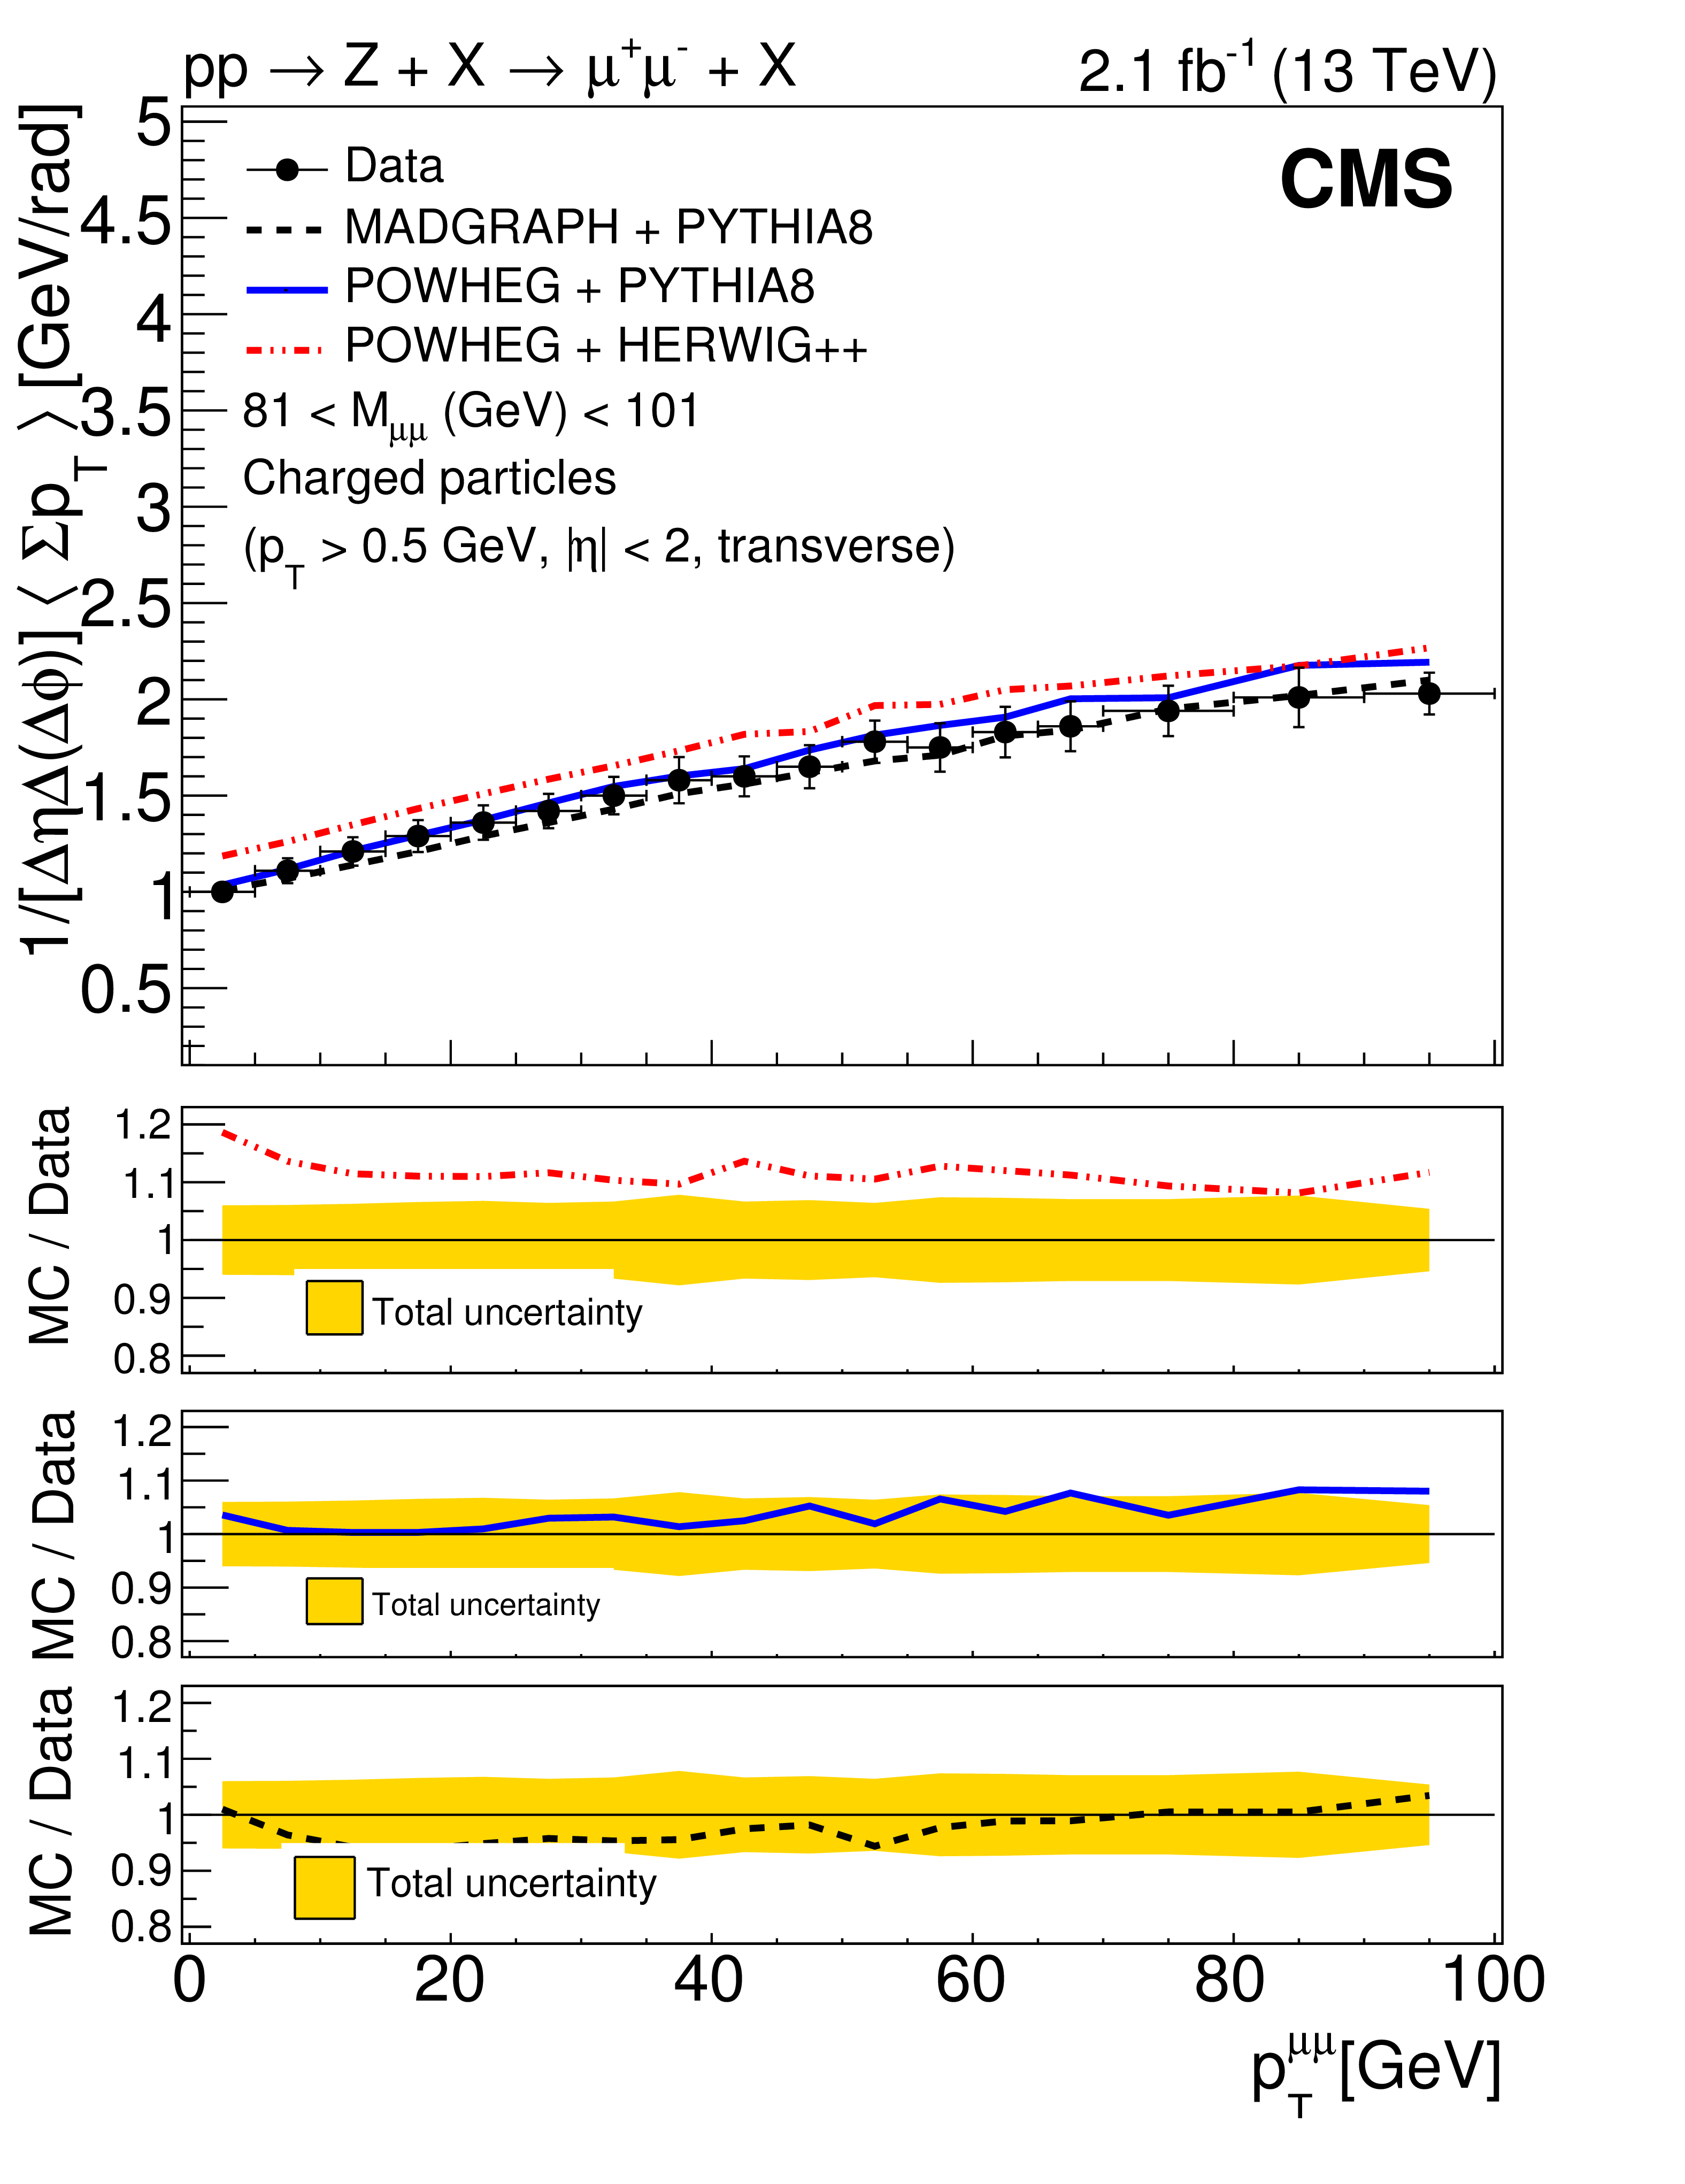
Figure 3-b:
Unfolded distribution of $\Sigma {p_{\mathrm {T}}} $ density in Z events in the transverse region as a function of ${{p_{\mathrm {T}}} ^{\mu \mu}}$, compared to various models predictions: MadGraph + PYTHIA8, POWHEG + PYTHIA8, and POWHEG + HERWIG++. The bottom panel shows the ratios of the simulations to the measured distributions. The bands in the bottom panel represent the statistical and systematic uncertainties added in quadrature. |
png pdf |
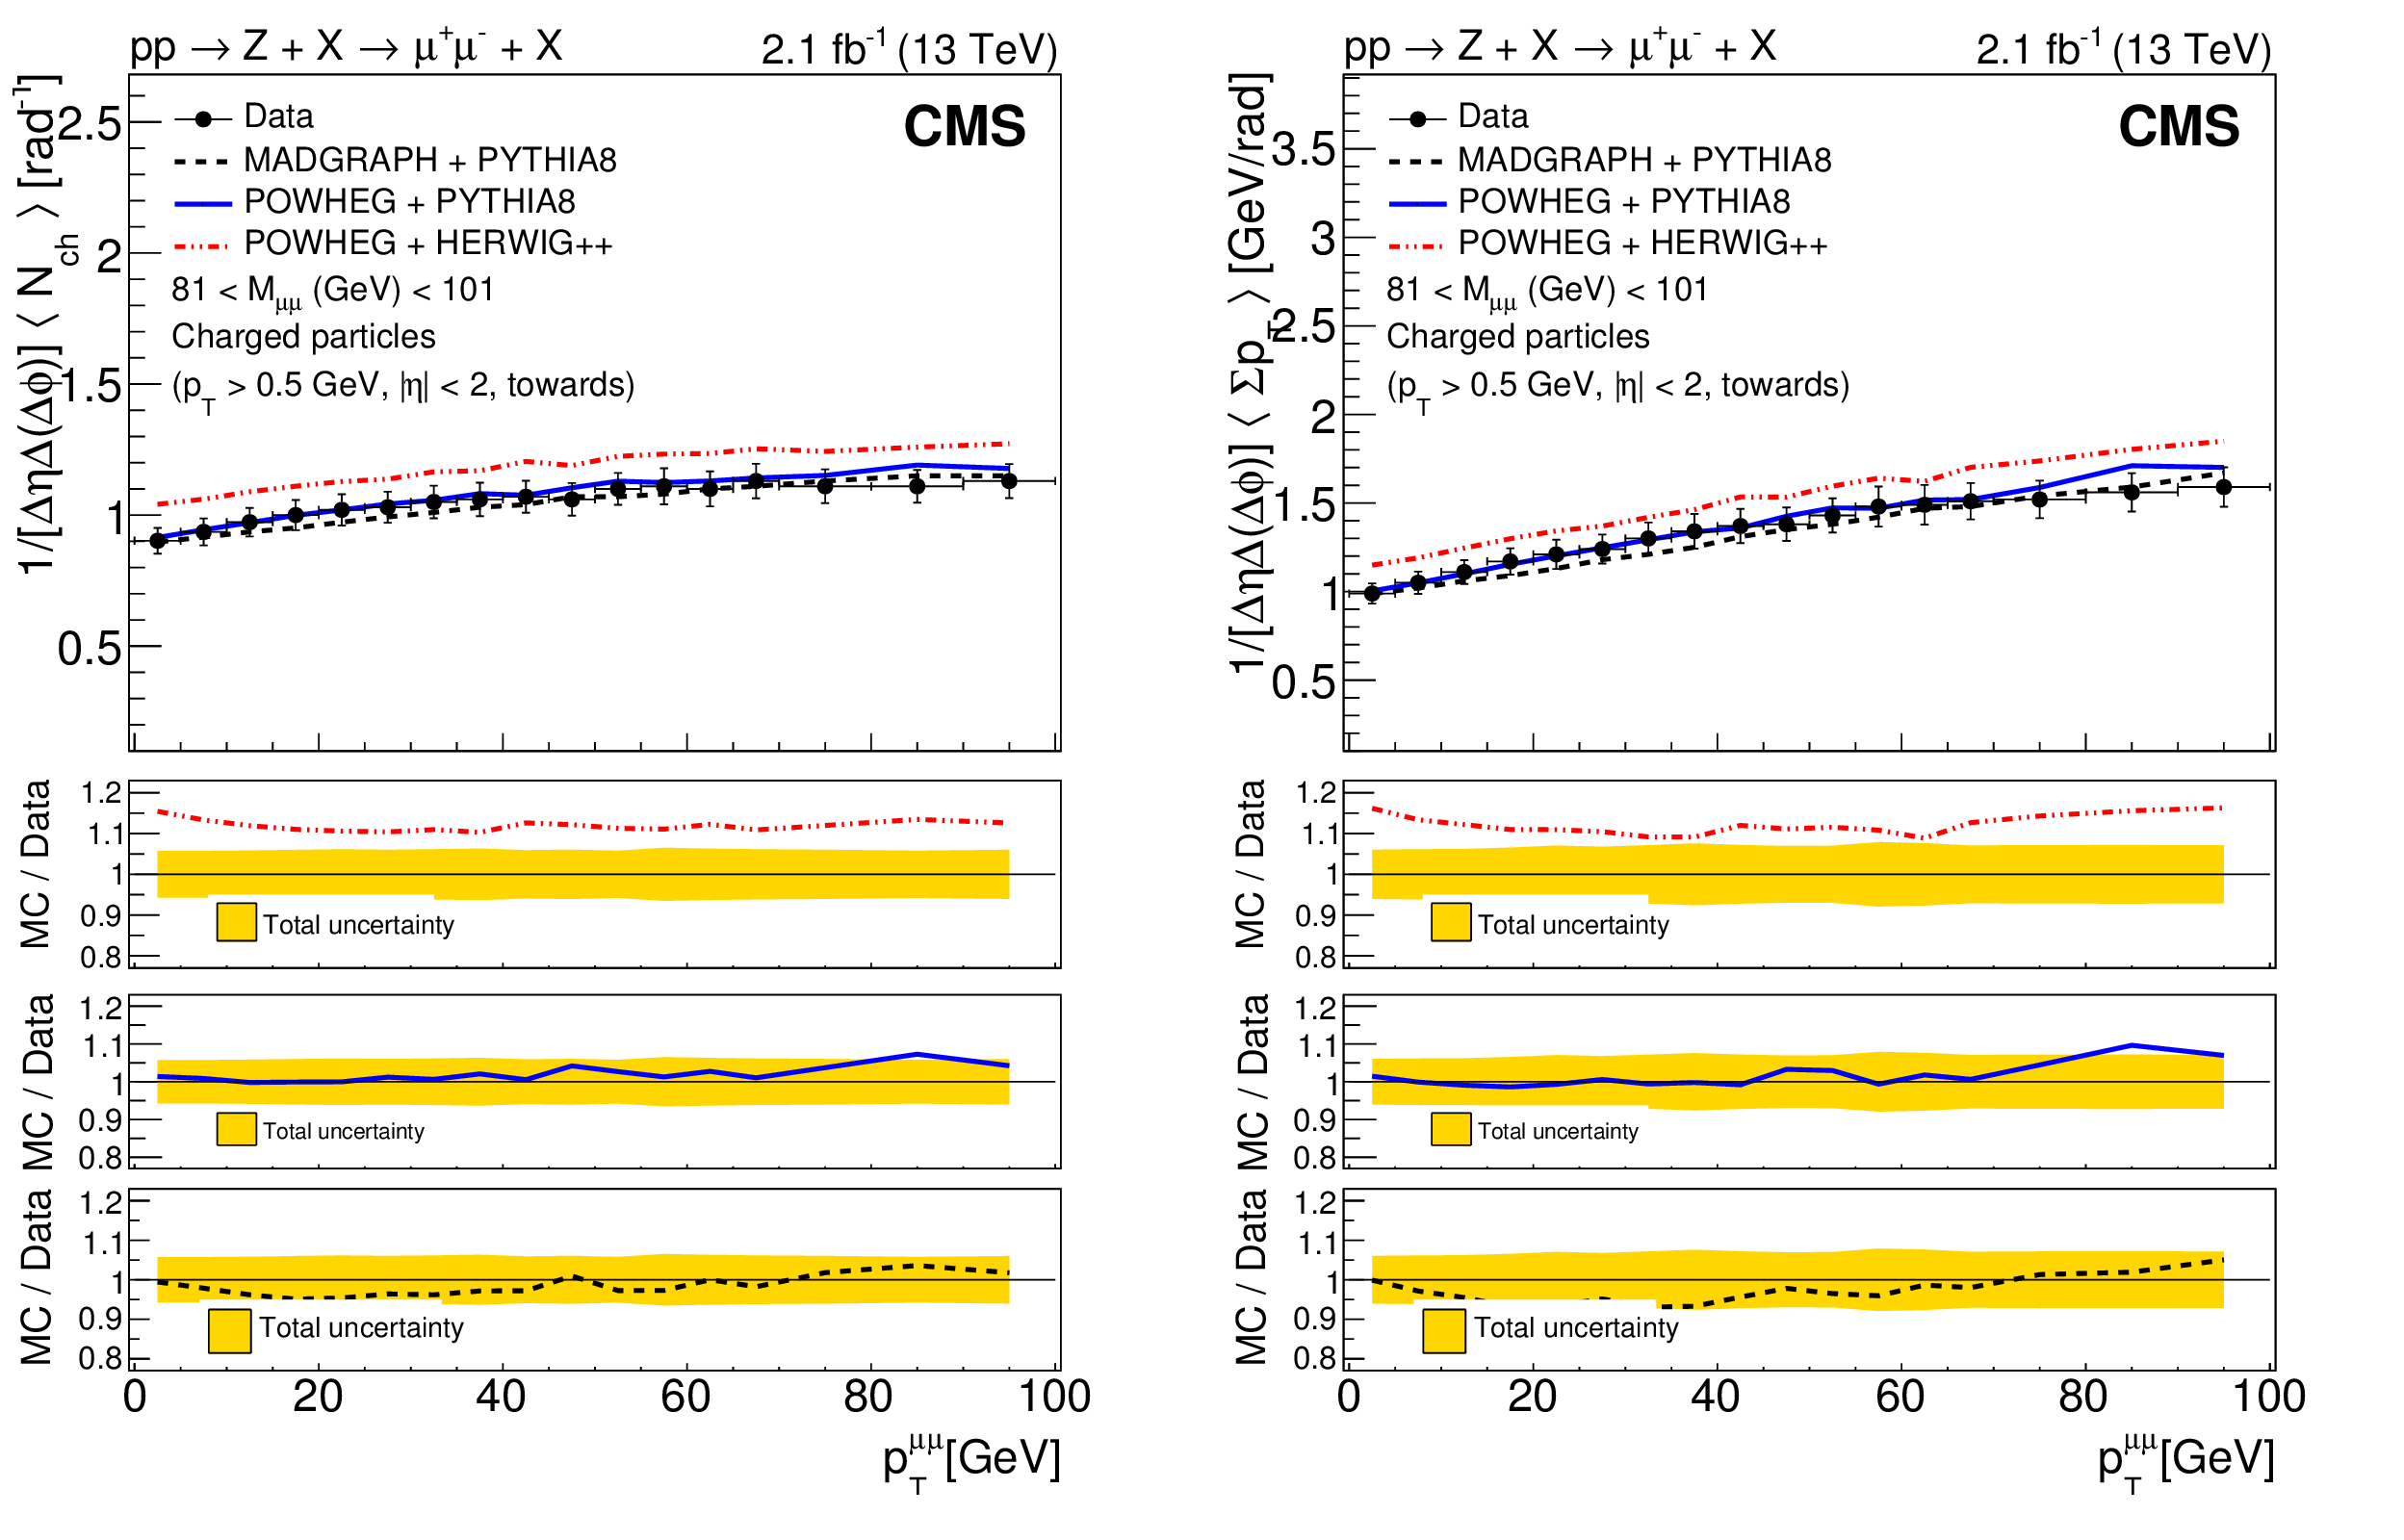
Figure 4:
Unfolded distributions of particle density (left) and $\Sigma {p_{\mathrm {T}}} $ density (right) in Z events in the towards region as a function of ${{p_{\mathrm {T}}} ^{\mu \mu}}$, compared to various models predictions: MadGraph + PYTHIA8, POWHEG + PYTHIA8, and POWHEG + HERWIG++. The bottom panels of each plot show the ratios of the simulations to the measured distributions. The bands in the bottom panels represent the statistical and systematic uncertainties added in quadrature. |

png pdf |
Figure 4-a:
Unfolded distribution of particle density in Z events in the towards region as a function of ${{p_{\mathrm {T}}} ^{\mu \mu}}$, compared to various models predictions: MadGraph + PYTHIA8, POWHEG + PYTHIA8, and POWHEG + HERWIG++. The bottom panel shows the ratios of the simulations to the measured distributions. The bands in the bottom panel represent the statistical and systematic uncertainties added in quadrature. |
png pdf |
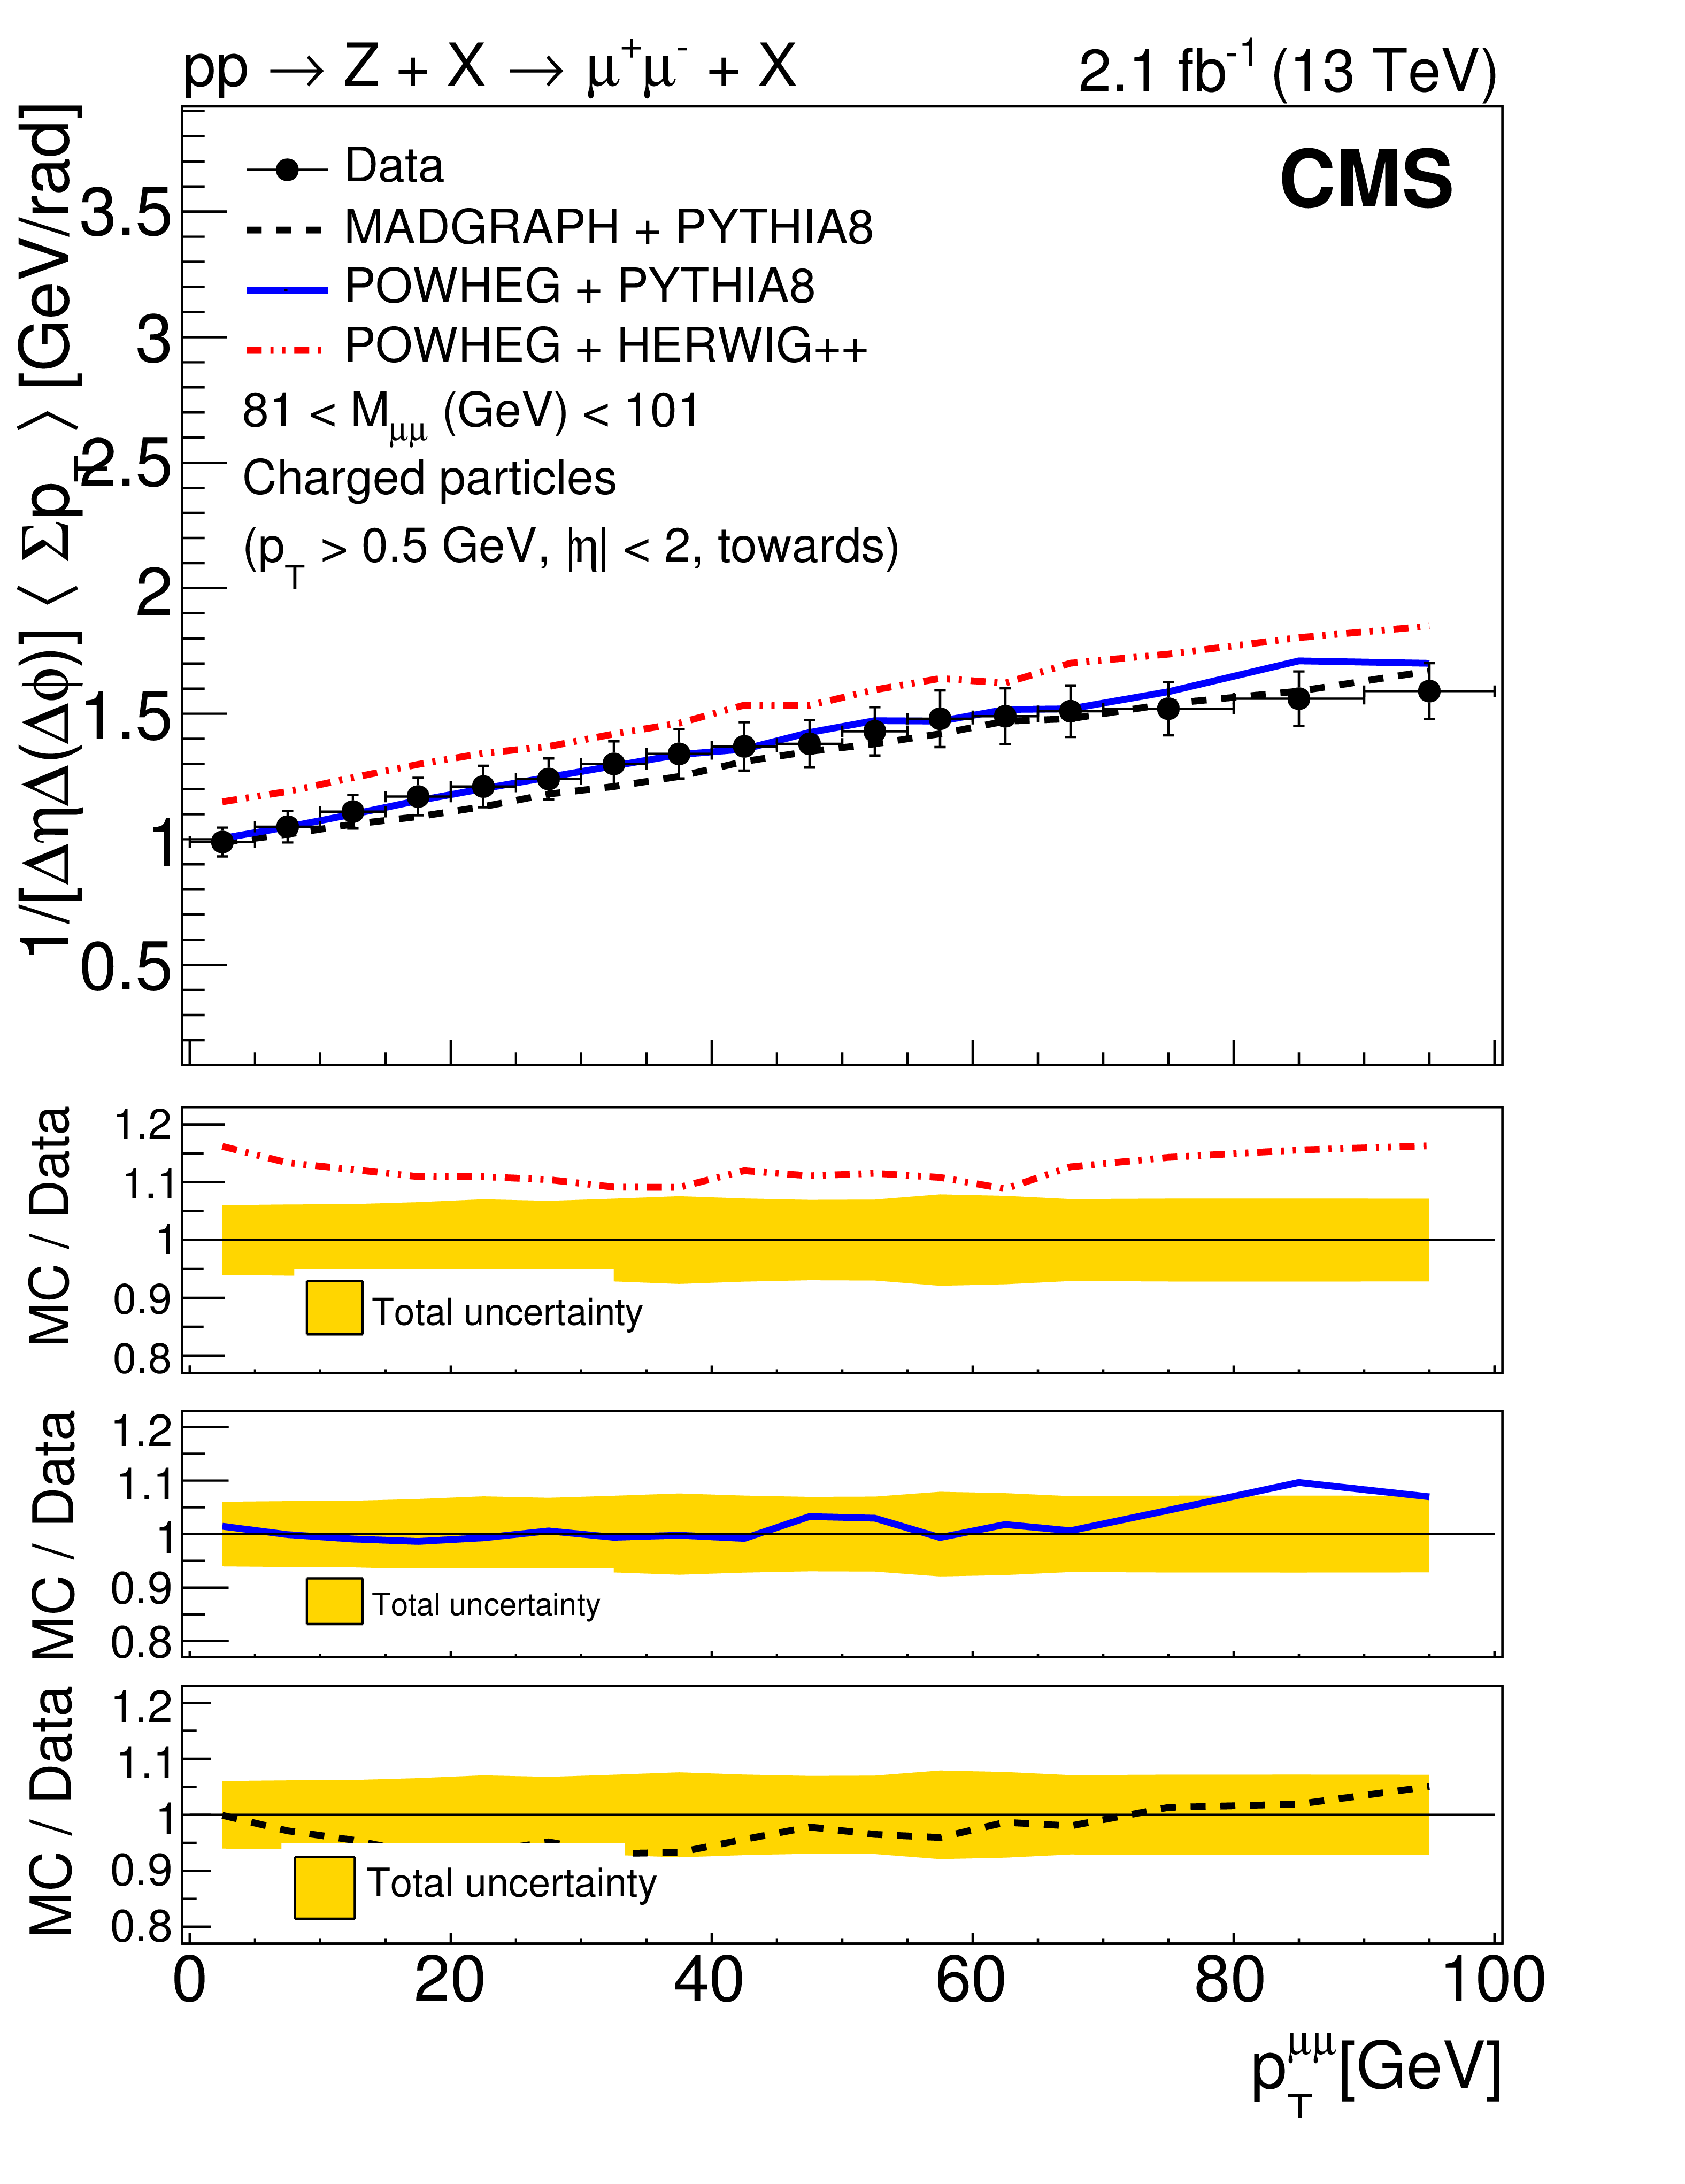
Figure 4-b:
Unfolded distribution $\Sigma {p_{\mathrm {T}}} $ density in Z events in the towards region as a function of ${{p_{\mathrm {T}}} ^{\mu \mu}}$, compared to various models predictions: MadGraph + PYTHIA8, POWHEG + PYTHIA8, and POWHEG + HERWIG++. The bottom panel shows the ratios of the simulations to the measured distributions. The bands in the bottom panel represent the statistical and systematic uncertainties added in quadrature. |
png pdf |
Figure 5:
Comparison of the particle density measured in Z events at $\sqrt {s} = $ 13 TeV with that at 7 (CMS) [3] and 1.96 TeV (CDF) [9] in the towards region as a function of ${{p_{\mathrm {T}}} ^{\mu \mu}}$. The data are also compared with the model predictions of POWHEG + PYTHIA8 and POWHEG + HERWIG++. The bottom panels of each plot show the ratios of the model predictions to the measurements. The bands in the bottom panels represents the statistical and systematic uncertainties added in quadrature. |
png pdf |
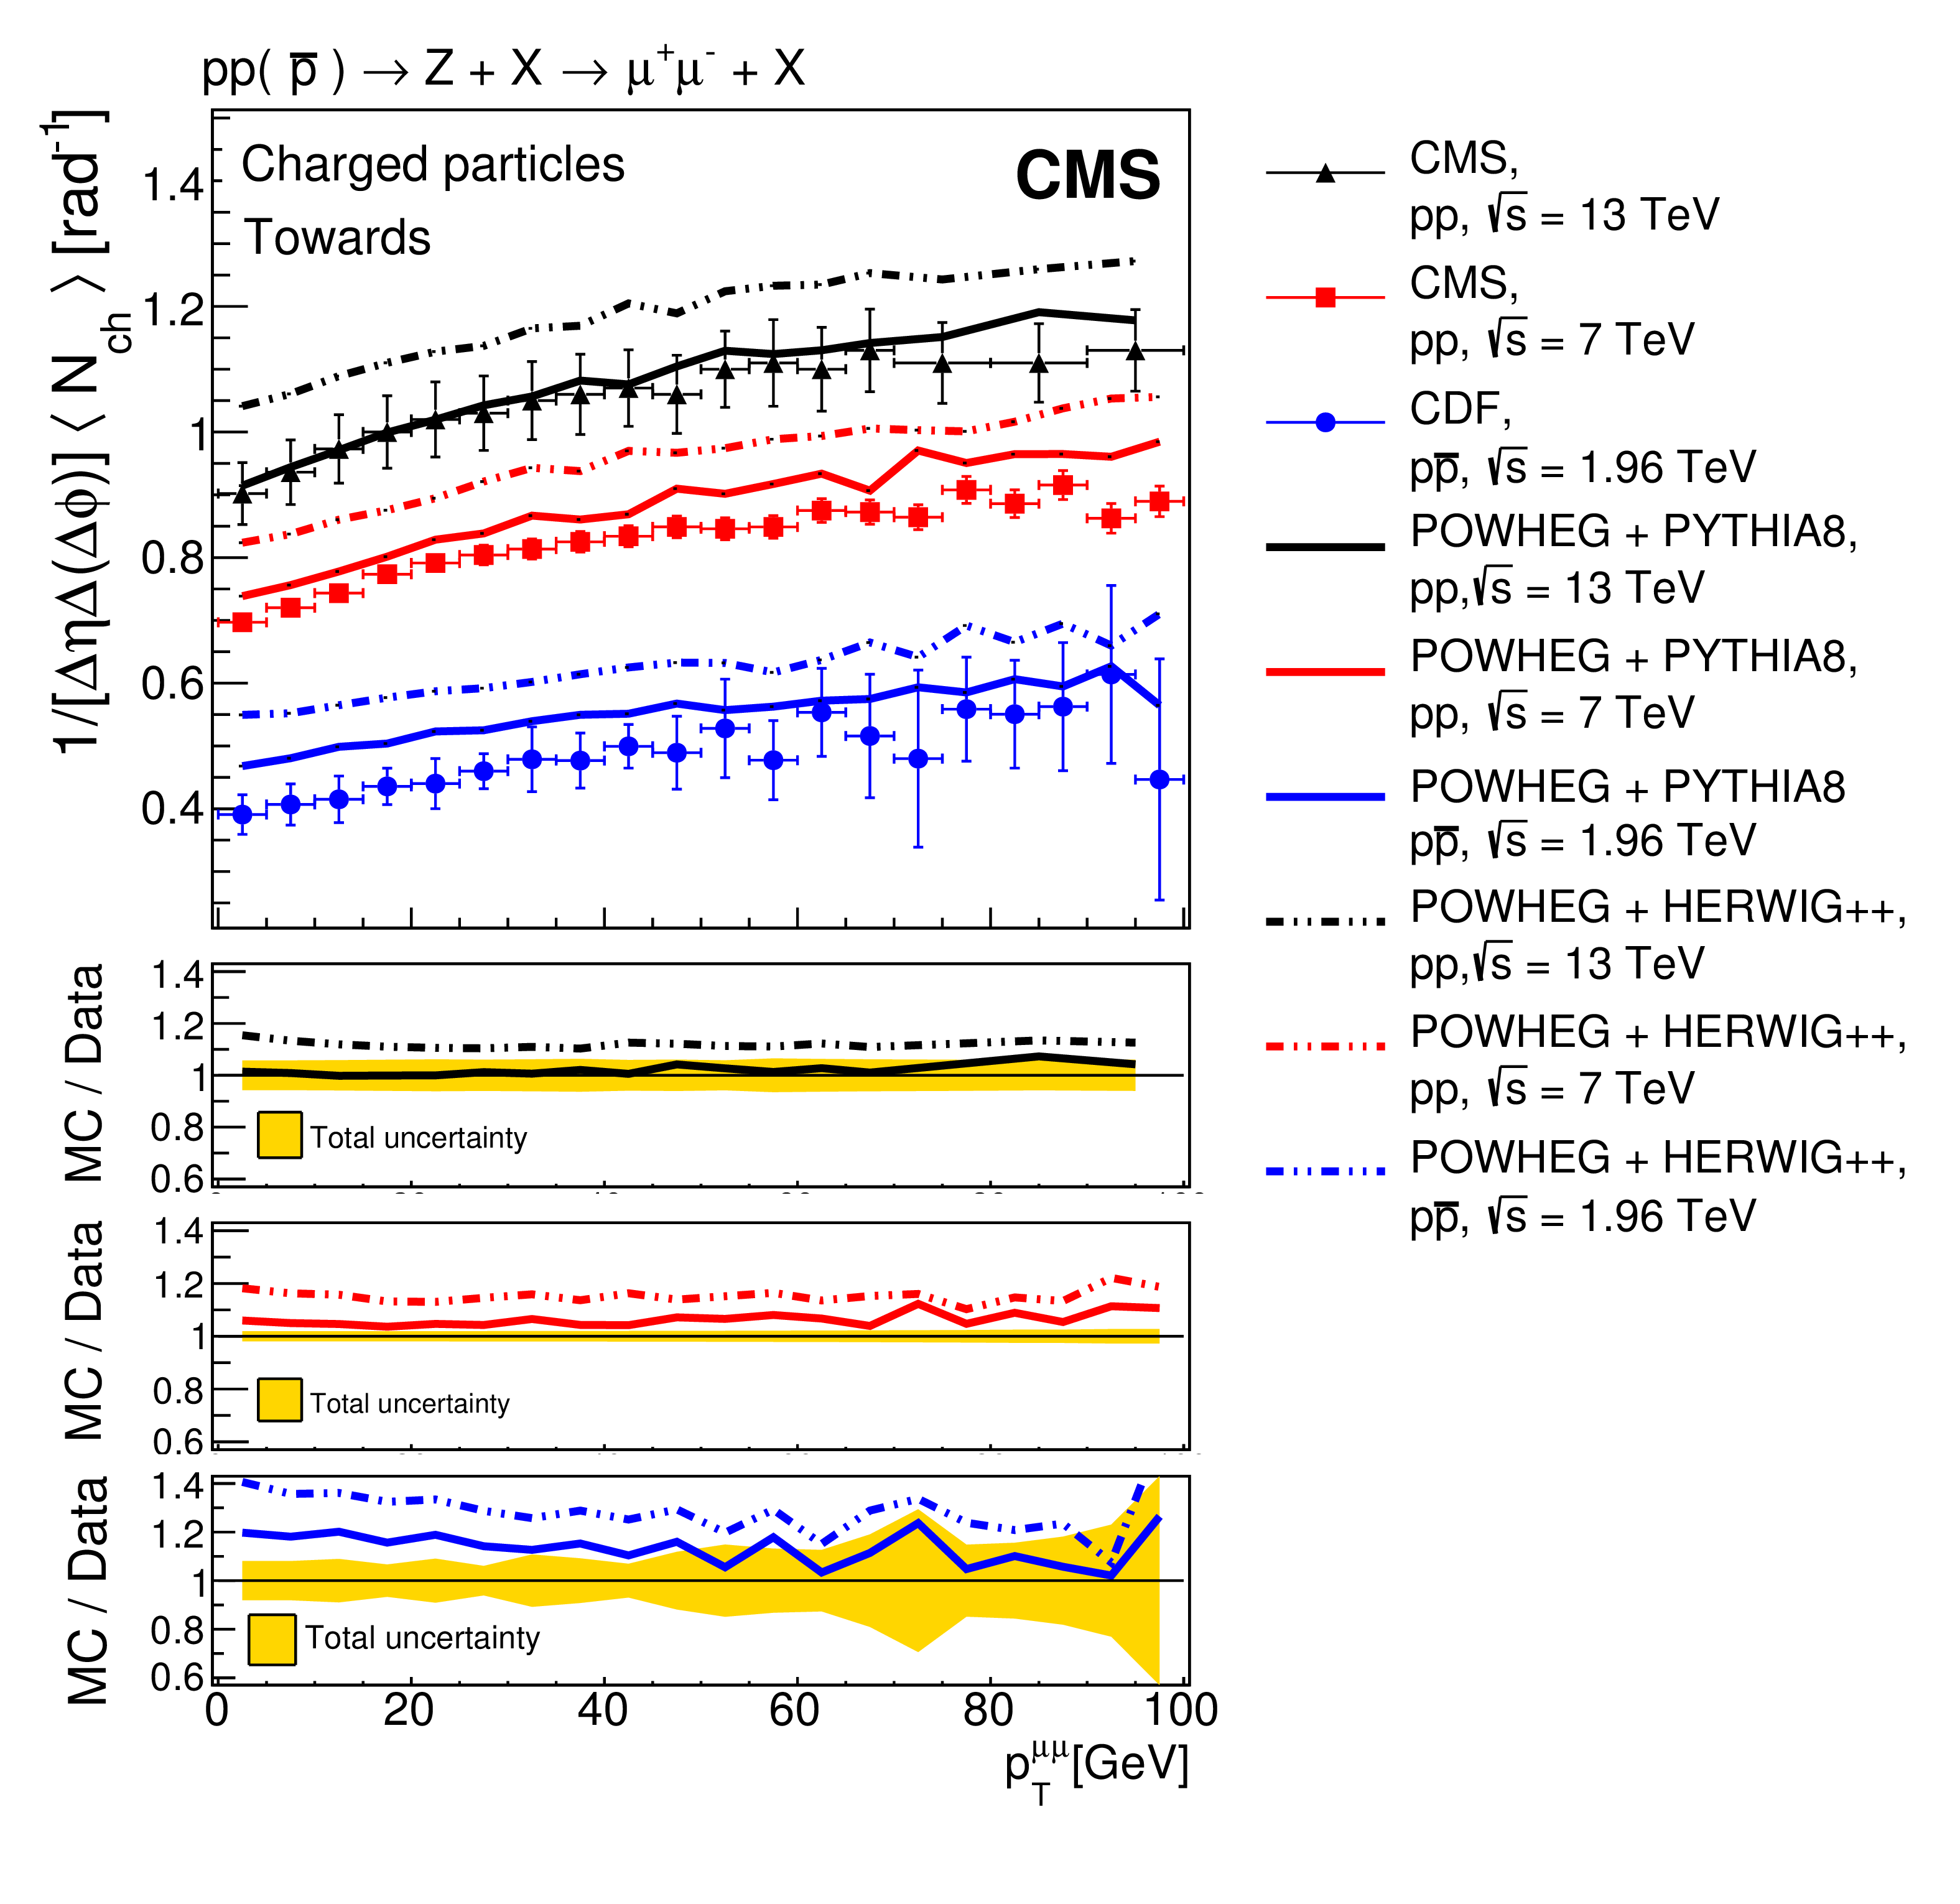
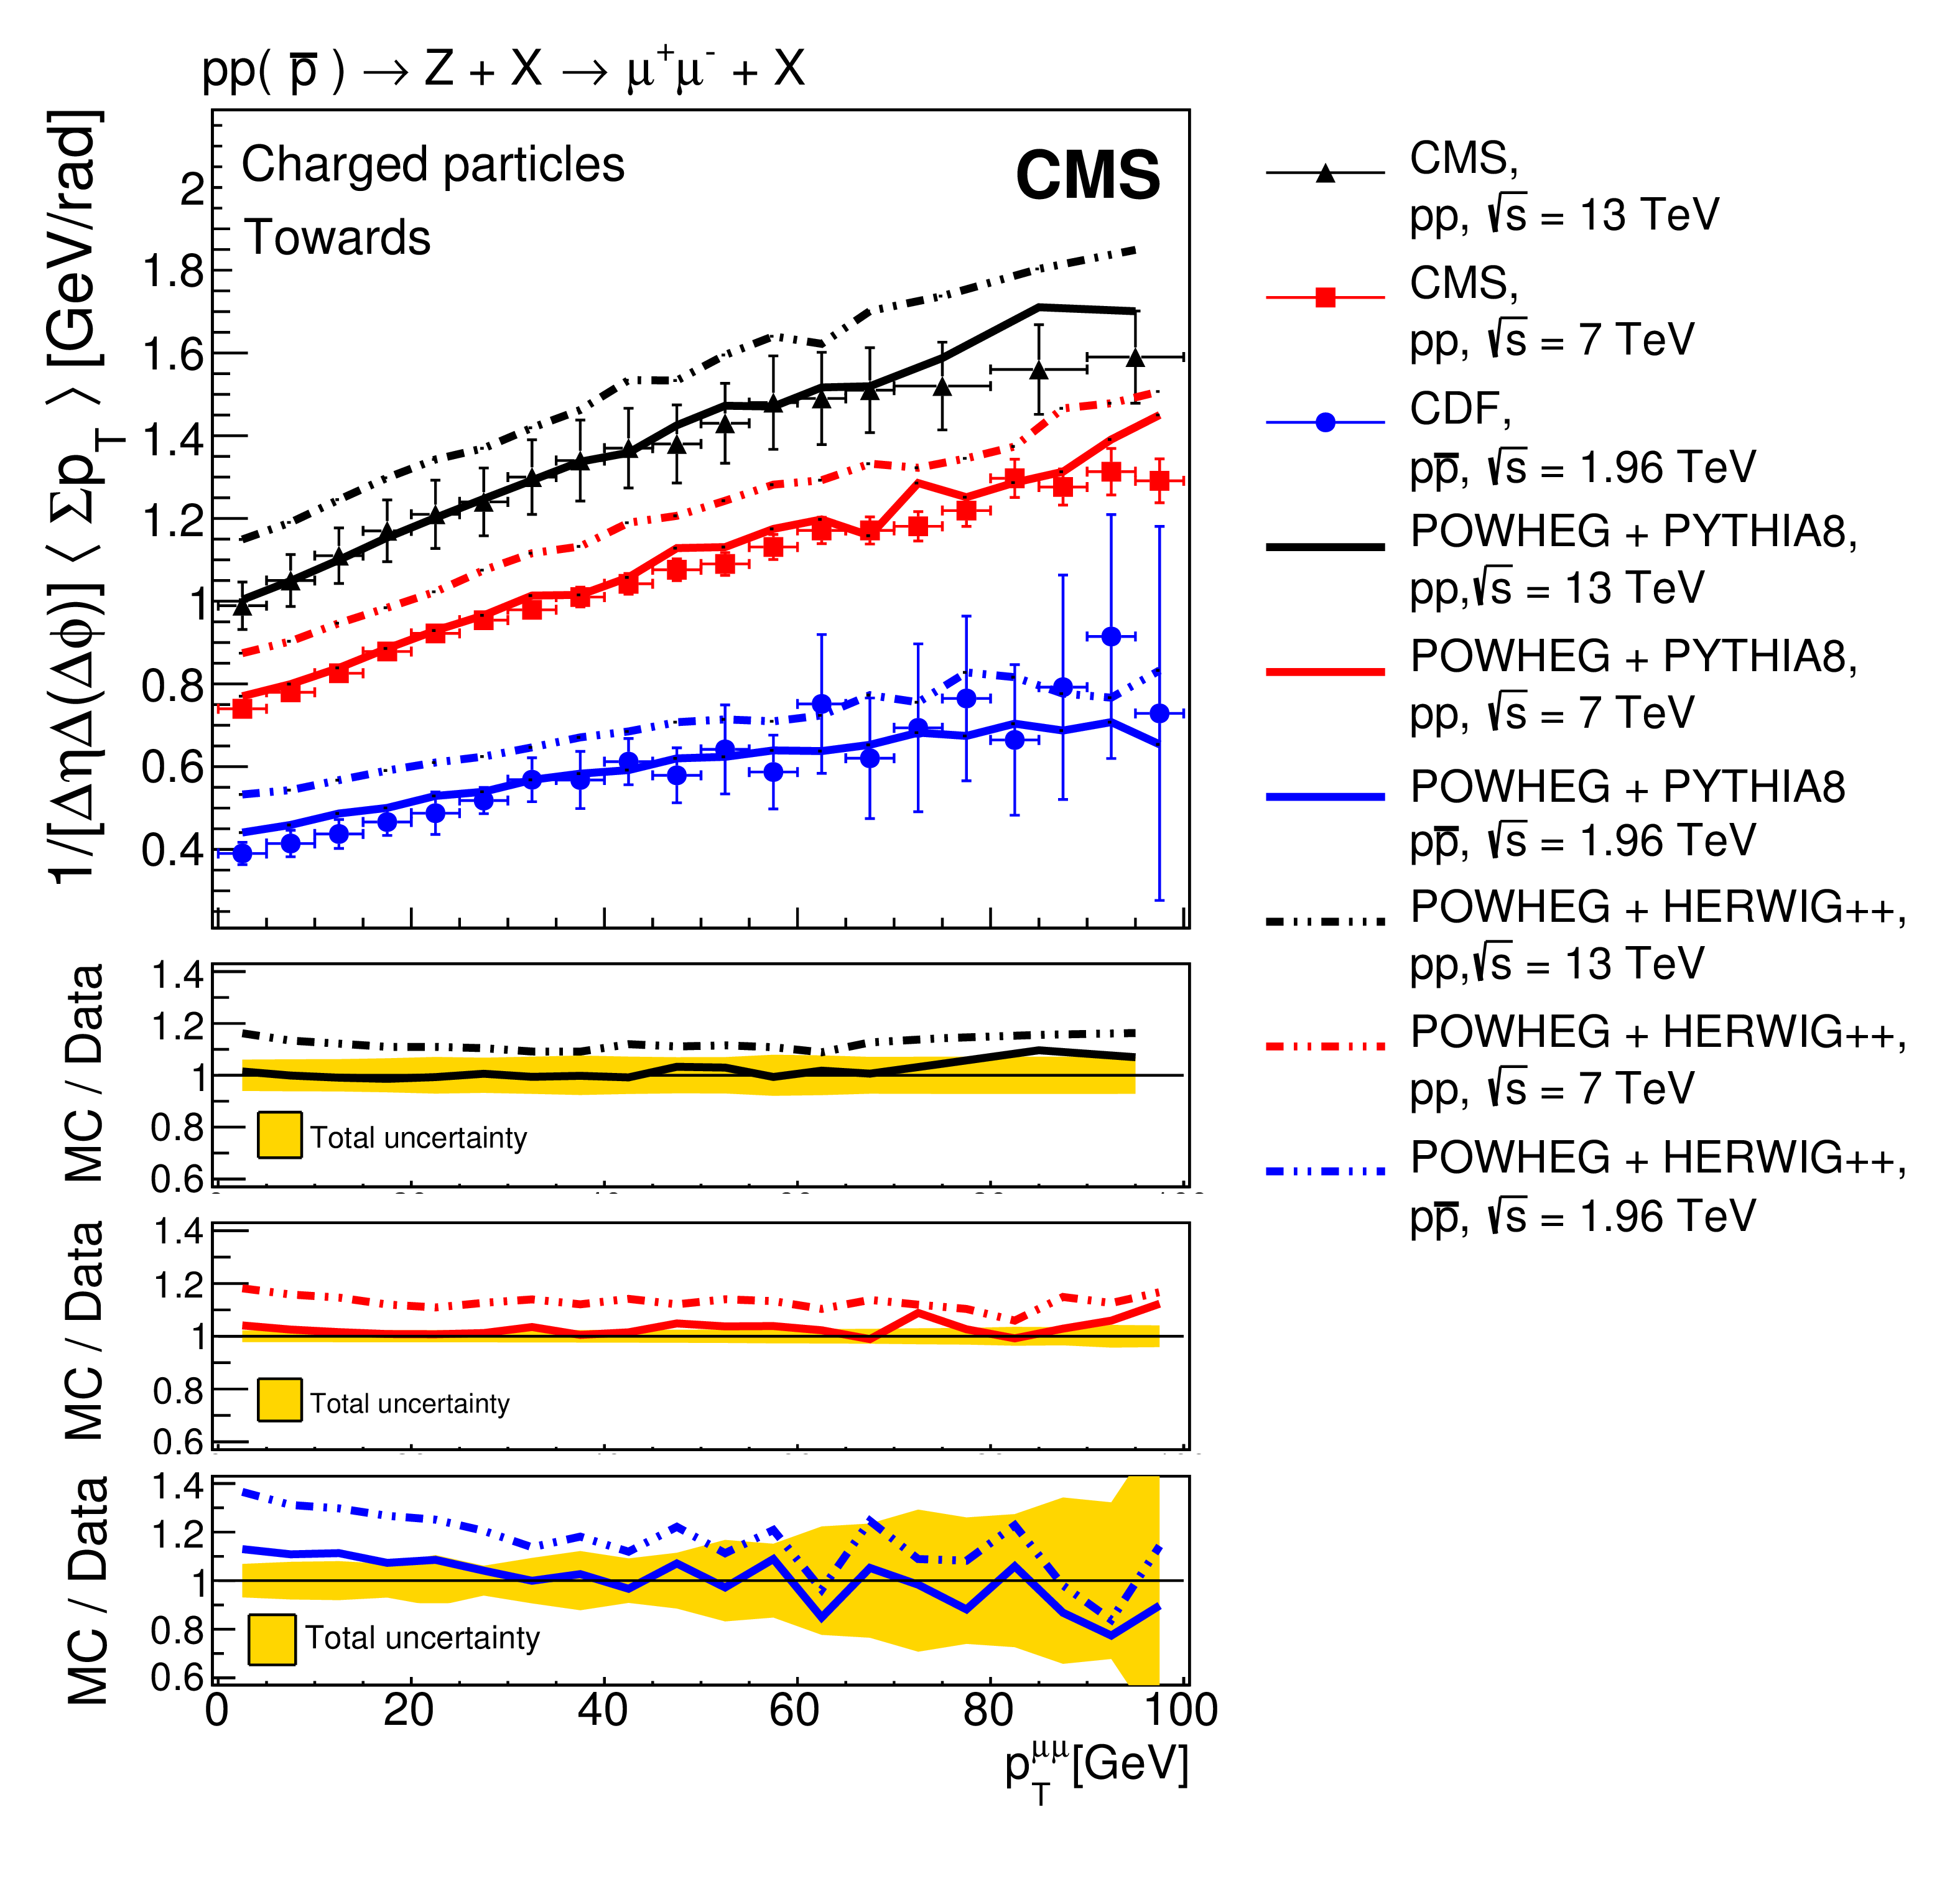
Figure 6:
Comparison of the $\Sigma {p_{\mathrm {T}}} $ density measured in Z events at $\sqrt {s} = $ 13 TeV with that at 7 (CMS) [3] and 1.96 TeV (CDF) [9] in the towards region as a function of $ {{p_{\mathrm {T}}} ^{\mu \mu}} $. The data are also compared with the model predictions of POWHEG + PYTHIA8 and POWHEG + HERWIG++. The bottom panels of each plot show the ratios of the model predictions to the measurements. The bands in the bottom panels represent the statistical and systematic uncertainties added in quadrature. |

png pdf |
Figure 7:
Comparison of the particle density measured in Z events at $\sqrt {s} = $ 13 TeV with that at 7 (CMS) [3] and 1.96 TeV (CDF) [9] in the transverse region as a function of $ {{p_{\mathrm {T}}} ^{\mu \mu}} $. The data are also compared with the model predictions of POWHEG + PYTHIA8 and POWHEG + HERWIG++. The bottom panels of each plot show the ratios of model predictions to the measurements. The bands in the bottom panels represent the statistical and systematic uncertainties added in quadrature. |
png pdf |
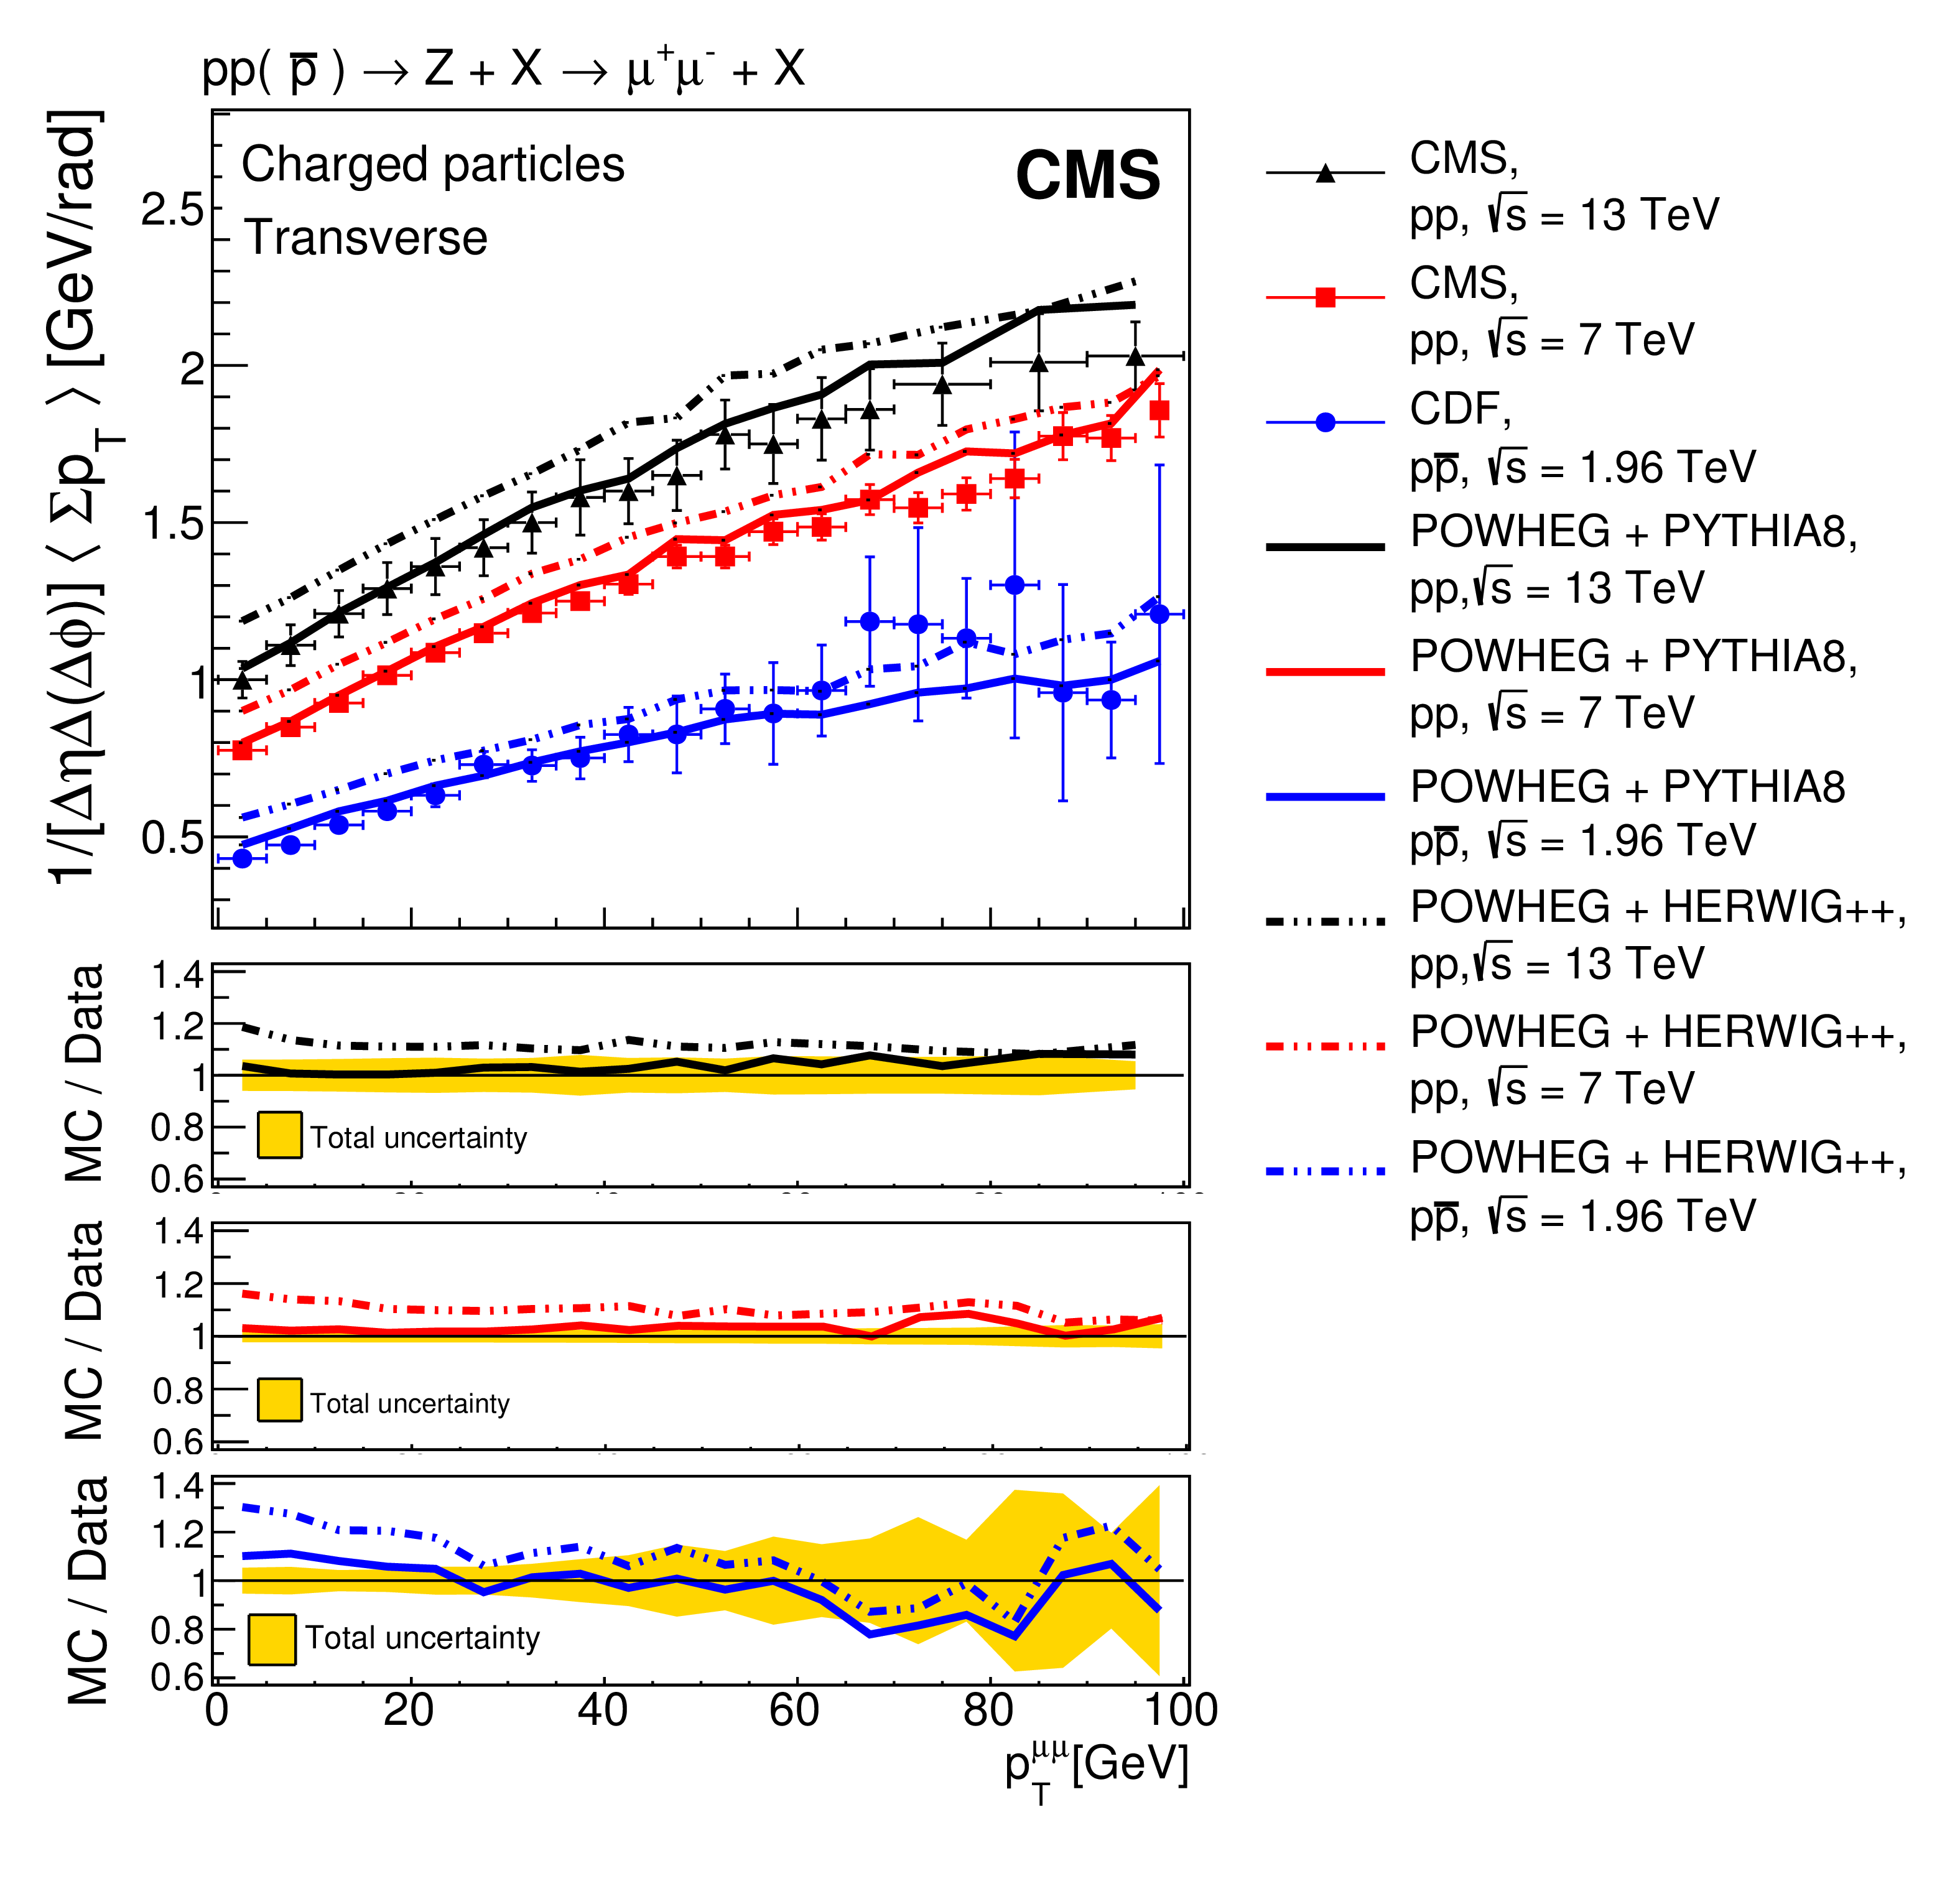
Figure 8:
Comparison of the $\Sigma {p_{\mathrm {T}}} $ density measured in Z events at $\sqrt {s} = $ 13 TeV with that at 7 (CMS) [3] and 1.96 TeV (CDF) [9] in the transverse region as a function of $ {{p_{\mathrm {T}}} ^{\mu \mu}} $. The data are also compared with the predictions of POWHEG + PYTHIA8 and POWHEG + HERWIG++. The bottom panels of each plot show the ratios of the model predictions to the measurements. The bands in the bottom panels represent the statistical and systematic uncertainties added in quadrature. |

png pdf |
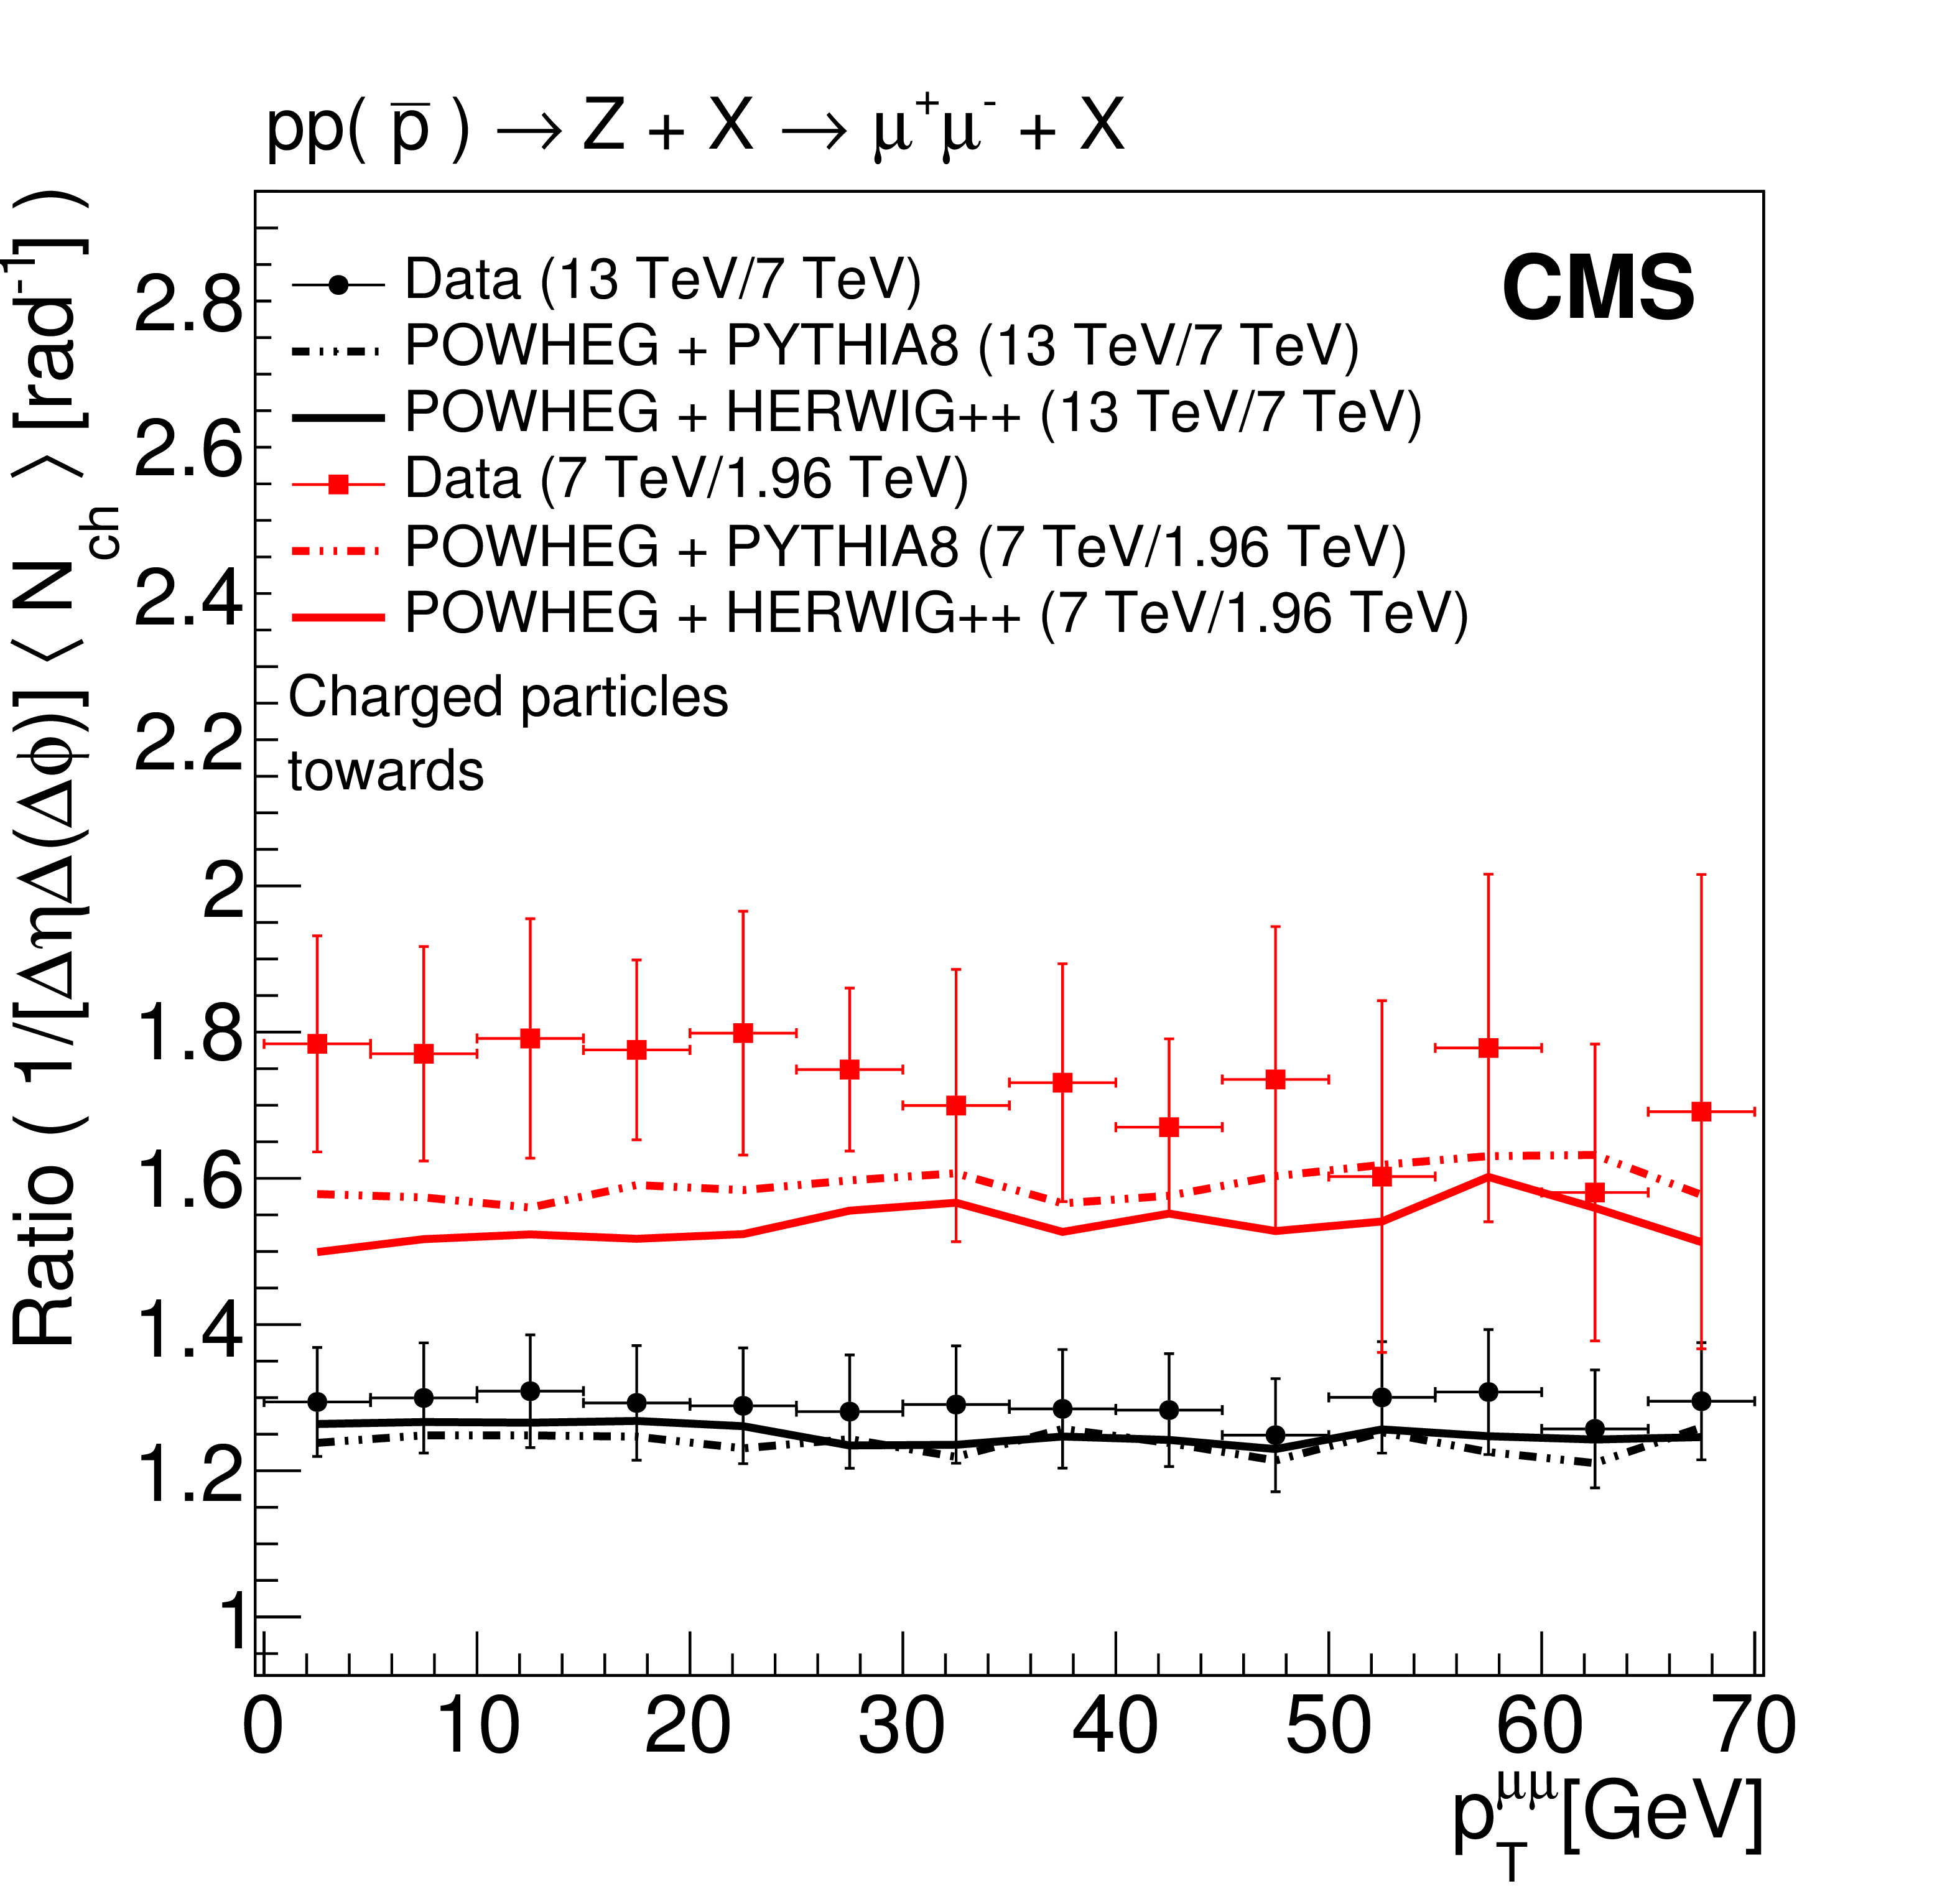
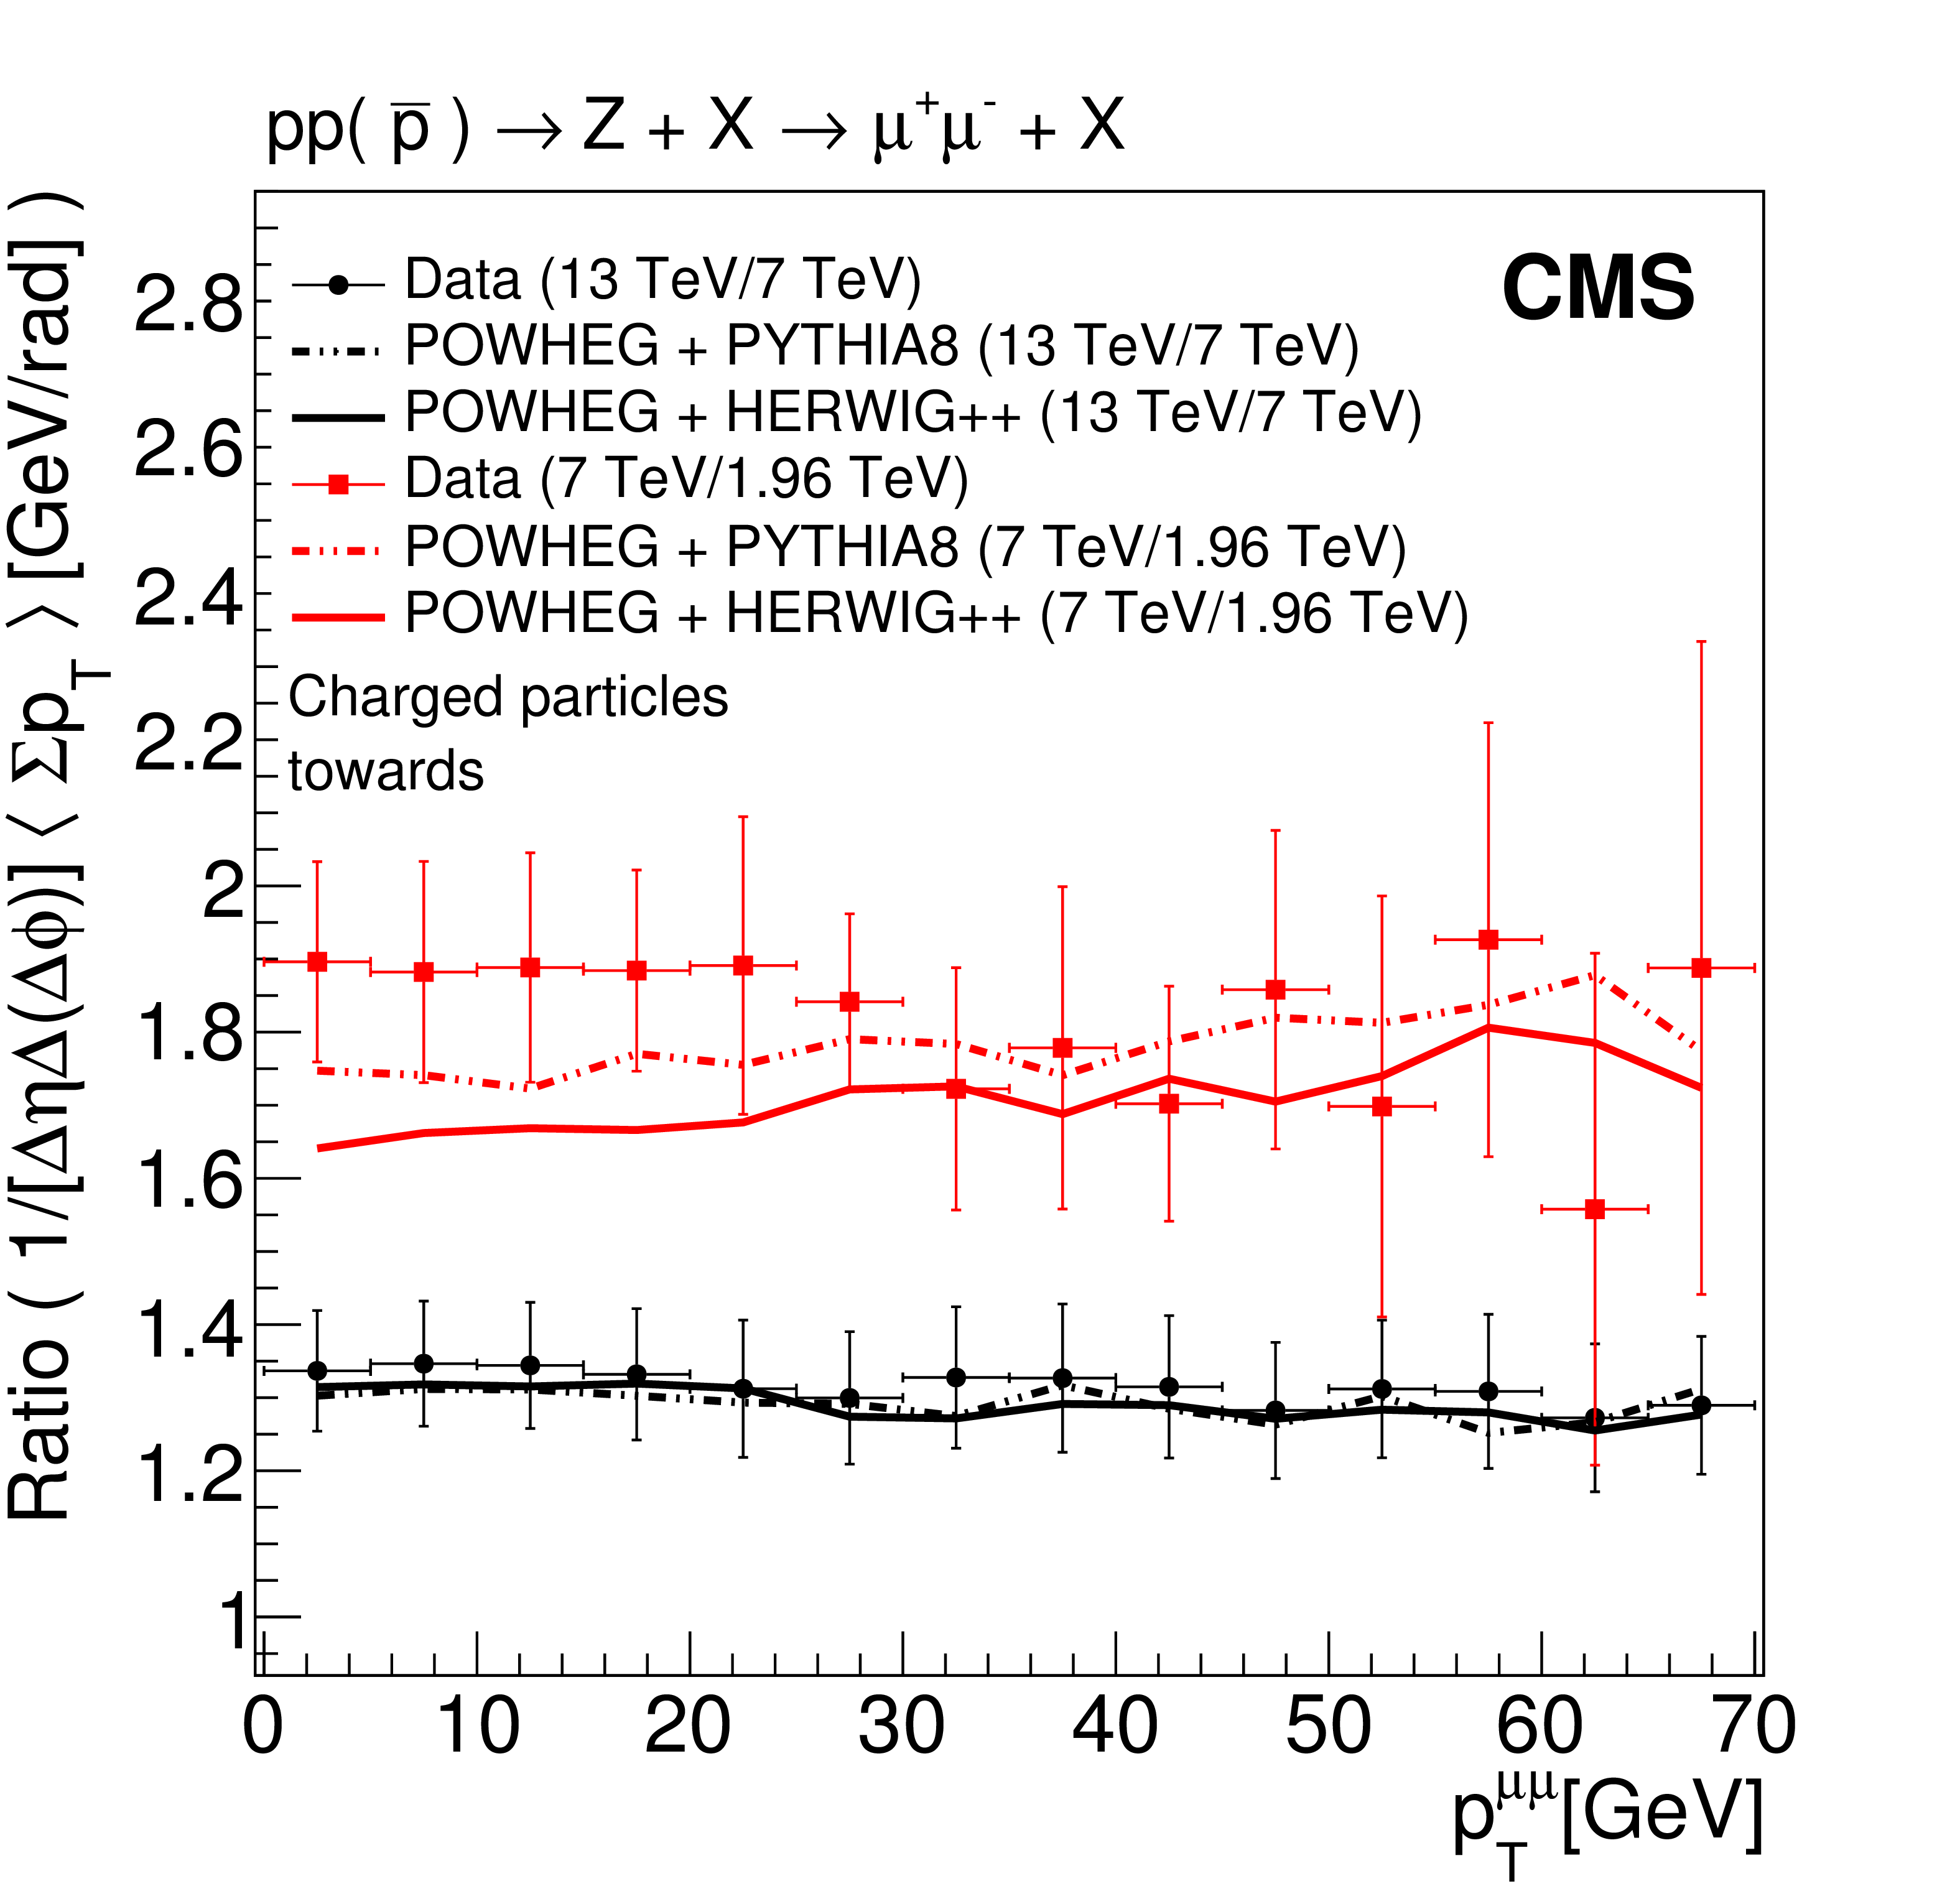
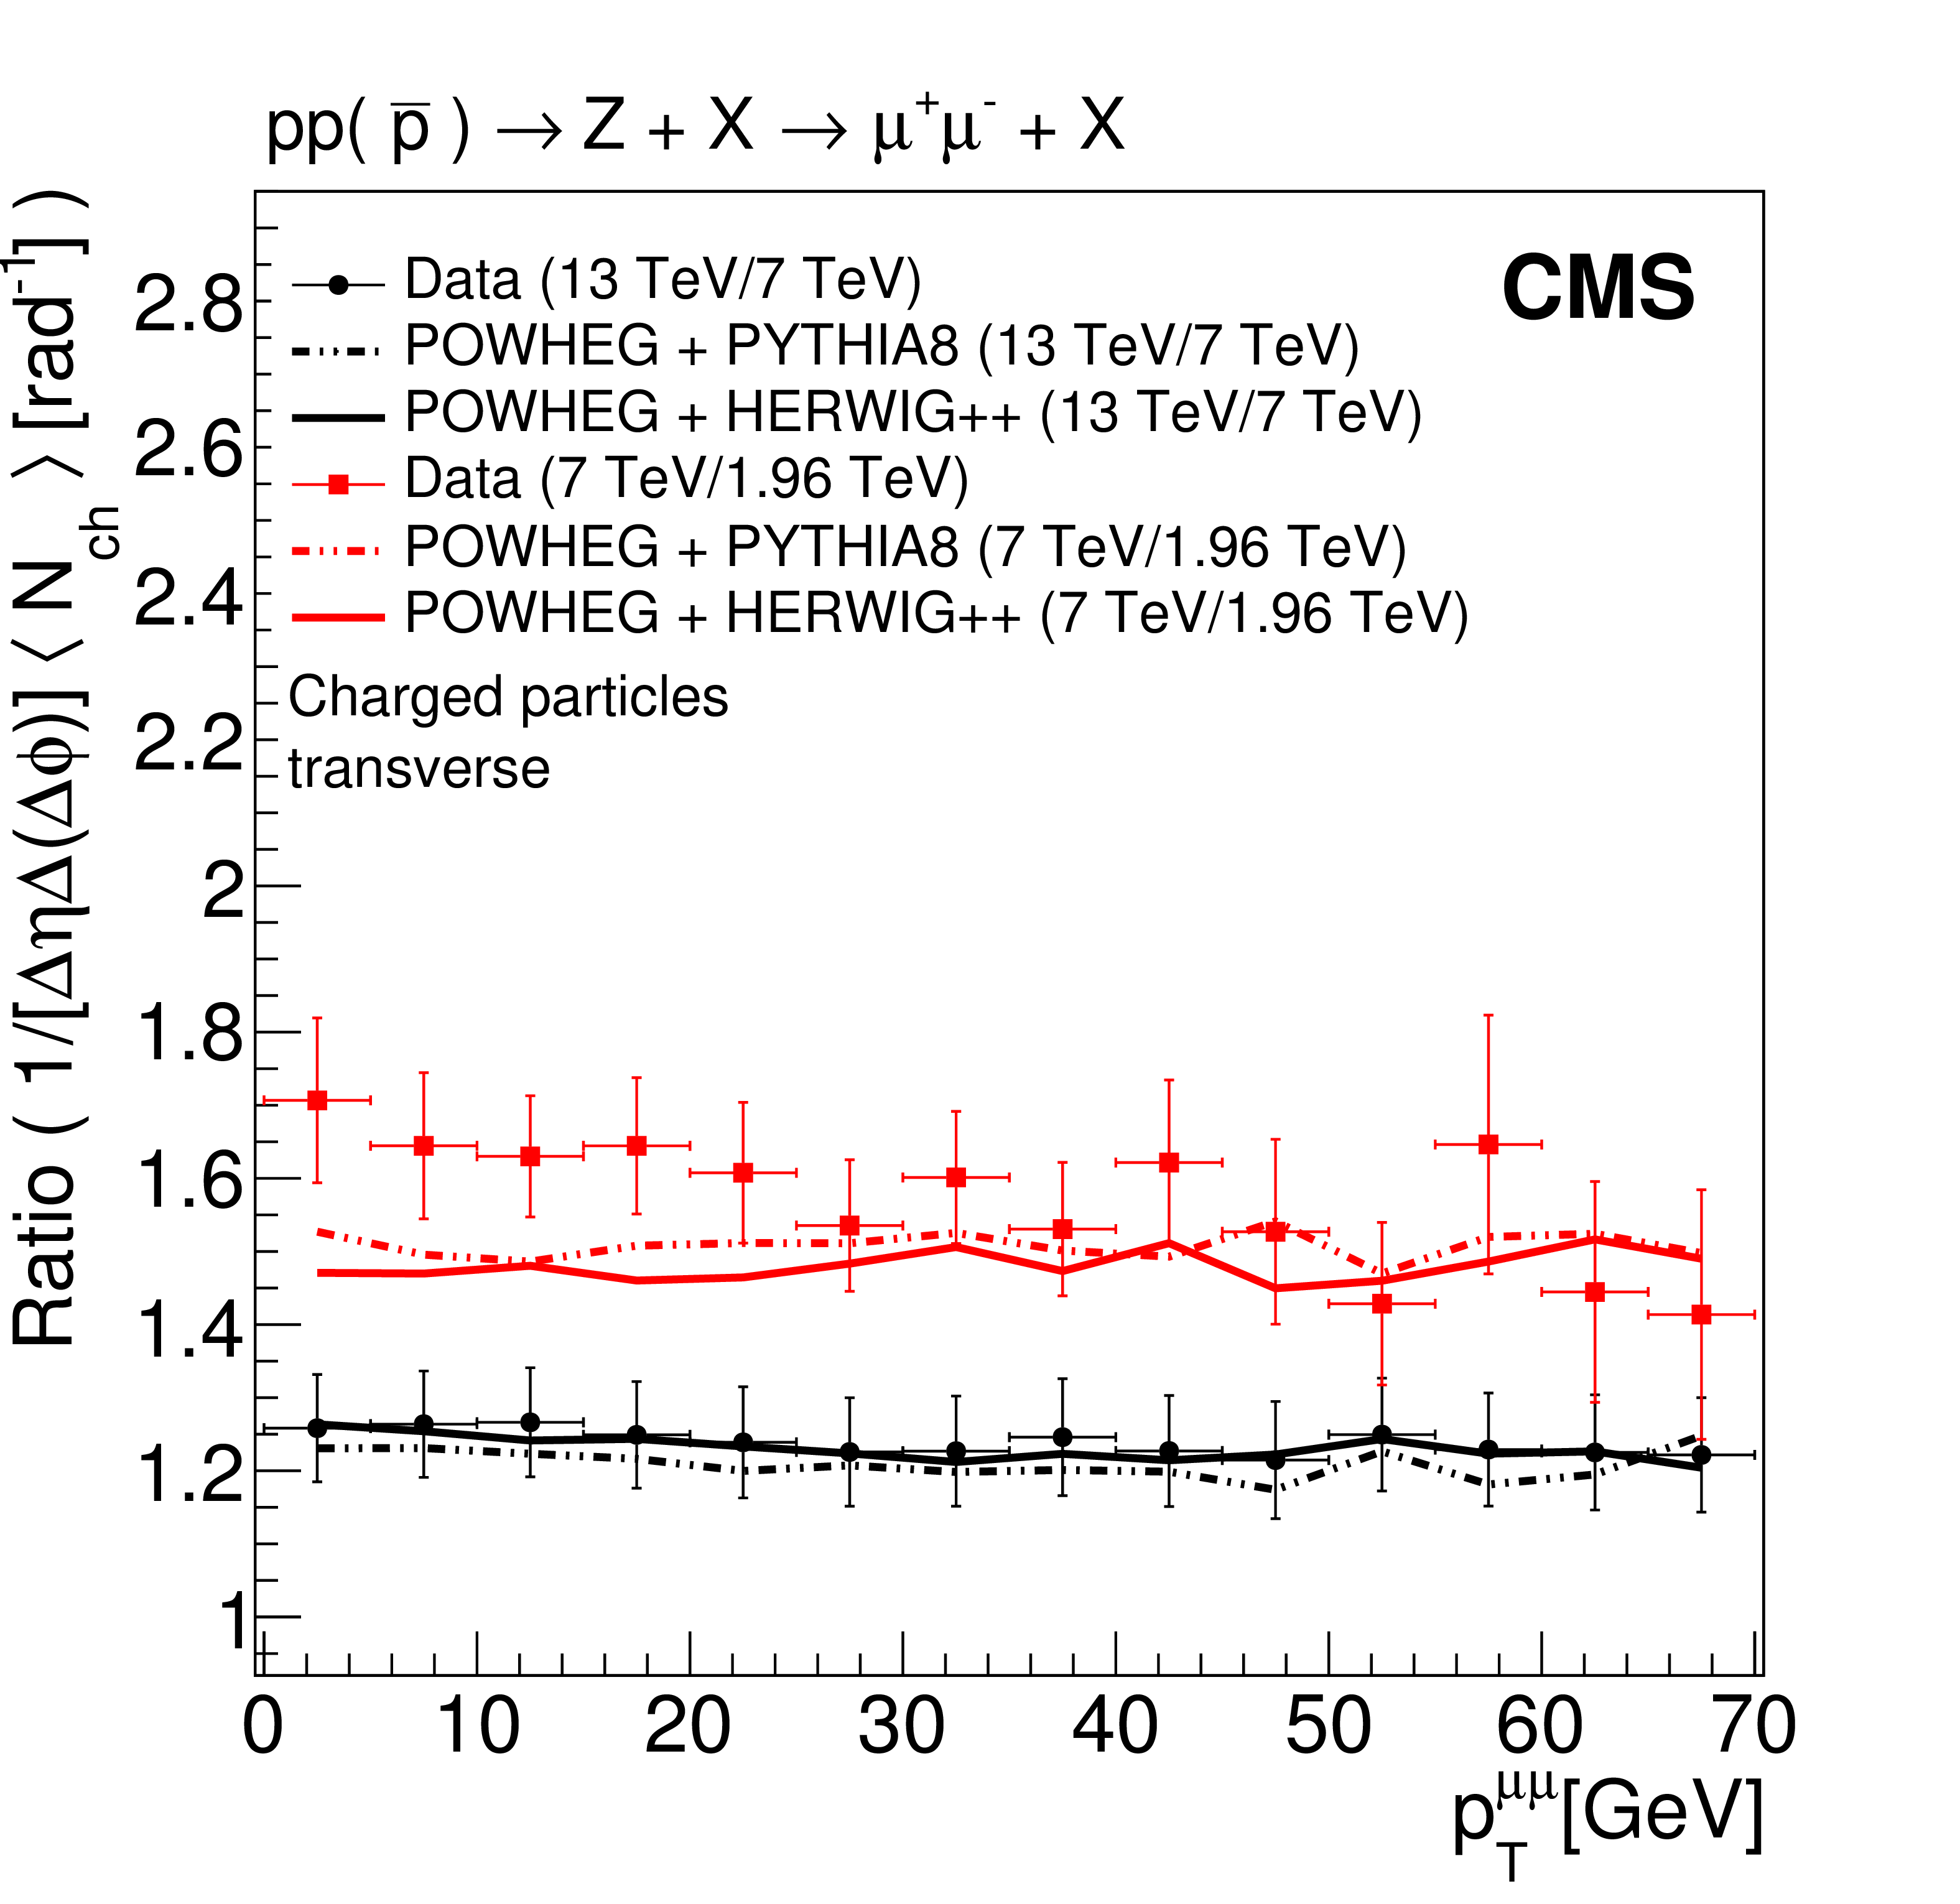
Figure 9:
Comparison of the increase in UE activity in Z events, from $\sqrt {s} = $ 1.96 TeV (CDF) [9] to 7 TeV (CMS) [3], with that from $\sqrt {s} = $ 7 TeV (CMS) to 13 TeV (CMS) in the towards (top) and transverse (bottom) regions. Panels on the left show the particle density, whereas panels on the right show the $\Sigma {p_{\mathrm {T}}} $ density as a function of $ {{p_{\mathrm {T}}} ^{\mu \mu}} $. The data distributions are also compared with predictions of POWHEG + PYTHIA8 and POWHEG + HERWIG++. The error bars represent the statistical and systematic uncertainties added in quadrature. |
png pdf |
Figure 9-a:
Comparison of the increase in UE activity in Z events, from $\sqrt {s} = $ 1.96 TeV (CDF) [9] to 7 TeV (CMS) [3], with that from $\sqrt {s} = $ 7 TeV (CMS) to 13 TeV (CMS) in the towards region: particle density as a function of $ {{p_{\mathrm {T}}} ^{\mu \mu}} $. The data distribution is also compared with predictions of POWHEG + PYTHIA8 and POWHEG + HERWIG++. The error bars represent the statistical and systematic uncertainties added in quadrature. |
png pdf |
Figure 9-b:
Comparison of the increase in UE activity in Z events, from $\sqrt {s} = $ 1.96 TeV (CDF) [9] to 7 TeV (CMS) [3], with that from $\sqrt {s} = $ 7 TeV (CMS) to 13 TeV (CMS) in the towards region: $\Sigma {p_{\mathrm {T}}} $ density as a function of $ {{p_{\mathrm {T}}} ^{\mu \mu}} $. The data distribution is also compared with predictions of POWHEG + PYTHIA8 and POWHEG + HERWIG++. The error bars represent the statistical and systematic uncertainties added in quadrature. |
png pdf |
Figure 9-c:
Comparison of the increase in UE activity in Z events, from $\sqrt {s} = $ 1.96 TeV (CDF) [9] to 7 TeV (CMS) [3], with that from $\sqrt {s} = $ 7 TeV (CMS) to 13 TeV (CMS) in the transverse region: particle density density as a function of $ {{p_{\mathrm {T}}} ^{\mu \mu}} $. The data distribution is also compared with predictions of POWHEG + PYTHIA8 and POWHEG + HERWIG++. The error bars represent the statistical and systematic uncertainties added in quadrature. |

png pdf |
Figure 9-d:
Comparison of the increase in UE activity in Z events, from $\sqrt {s} = $ 1.96 TeV (CDF) [9] to 7 TeV (CMS) [3], with that from $\sqrt {s} = $ 7 TeV (CMS) to 13 TeV (CMS) in the transverse region: $\Sigma {p_{\mathrm {T}}} $ density as a function of $ {{p_{\mathrm {T}}} ^{\mu \mu}} $. The data distribution is also compared with predictions of POWHEG + PYTHIA8 and POWHEG + HERWIG++. The error bars represent the statistical and systematic uncertainties added in quadrature. |
png pdf |
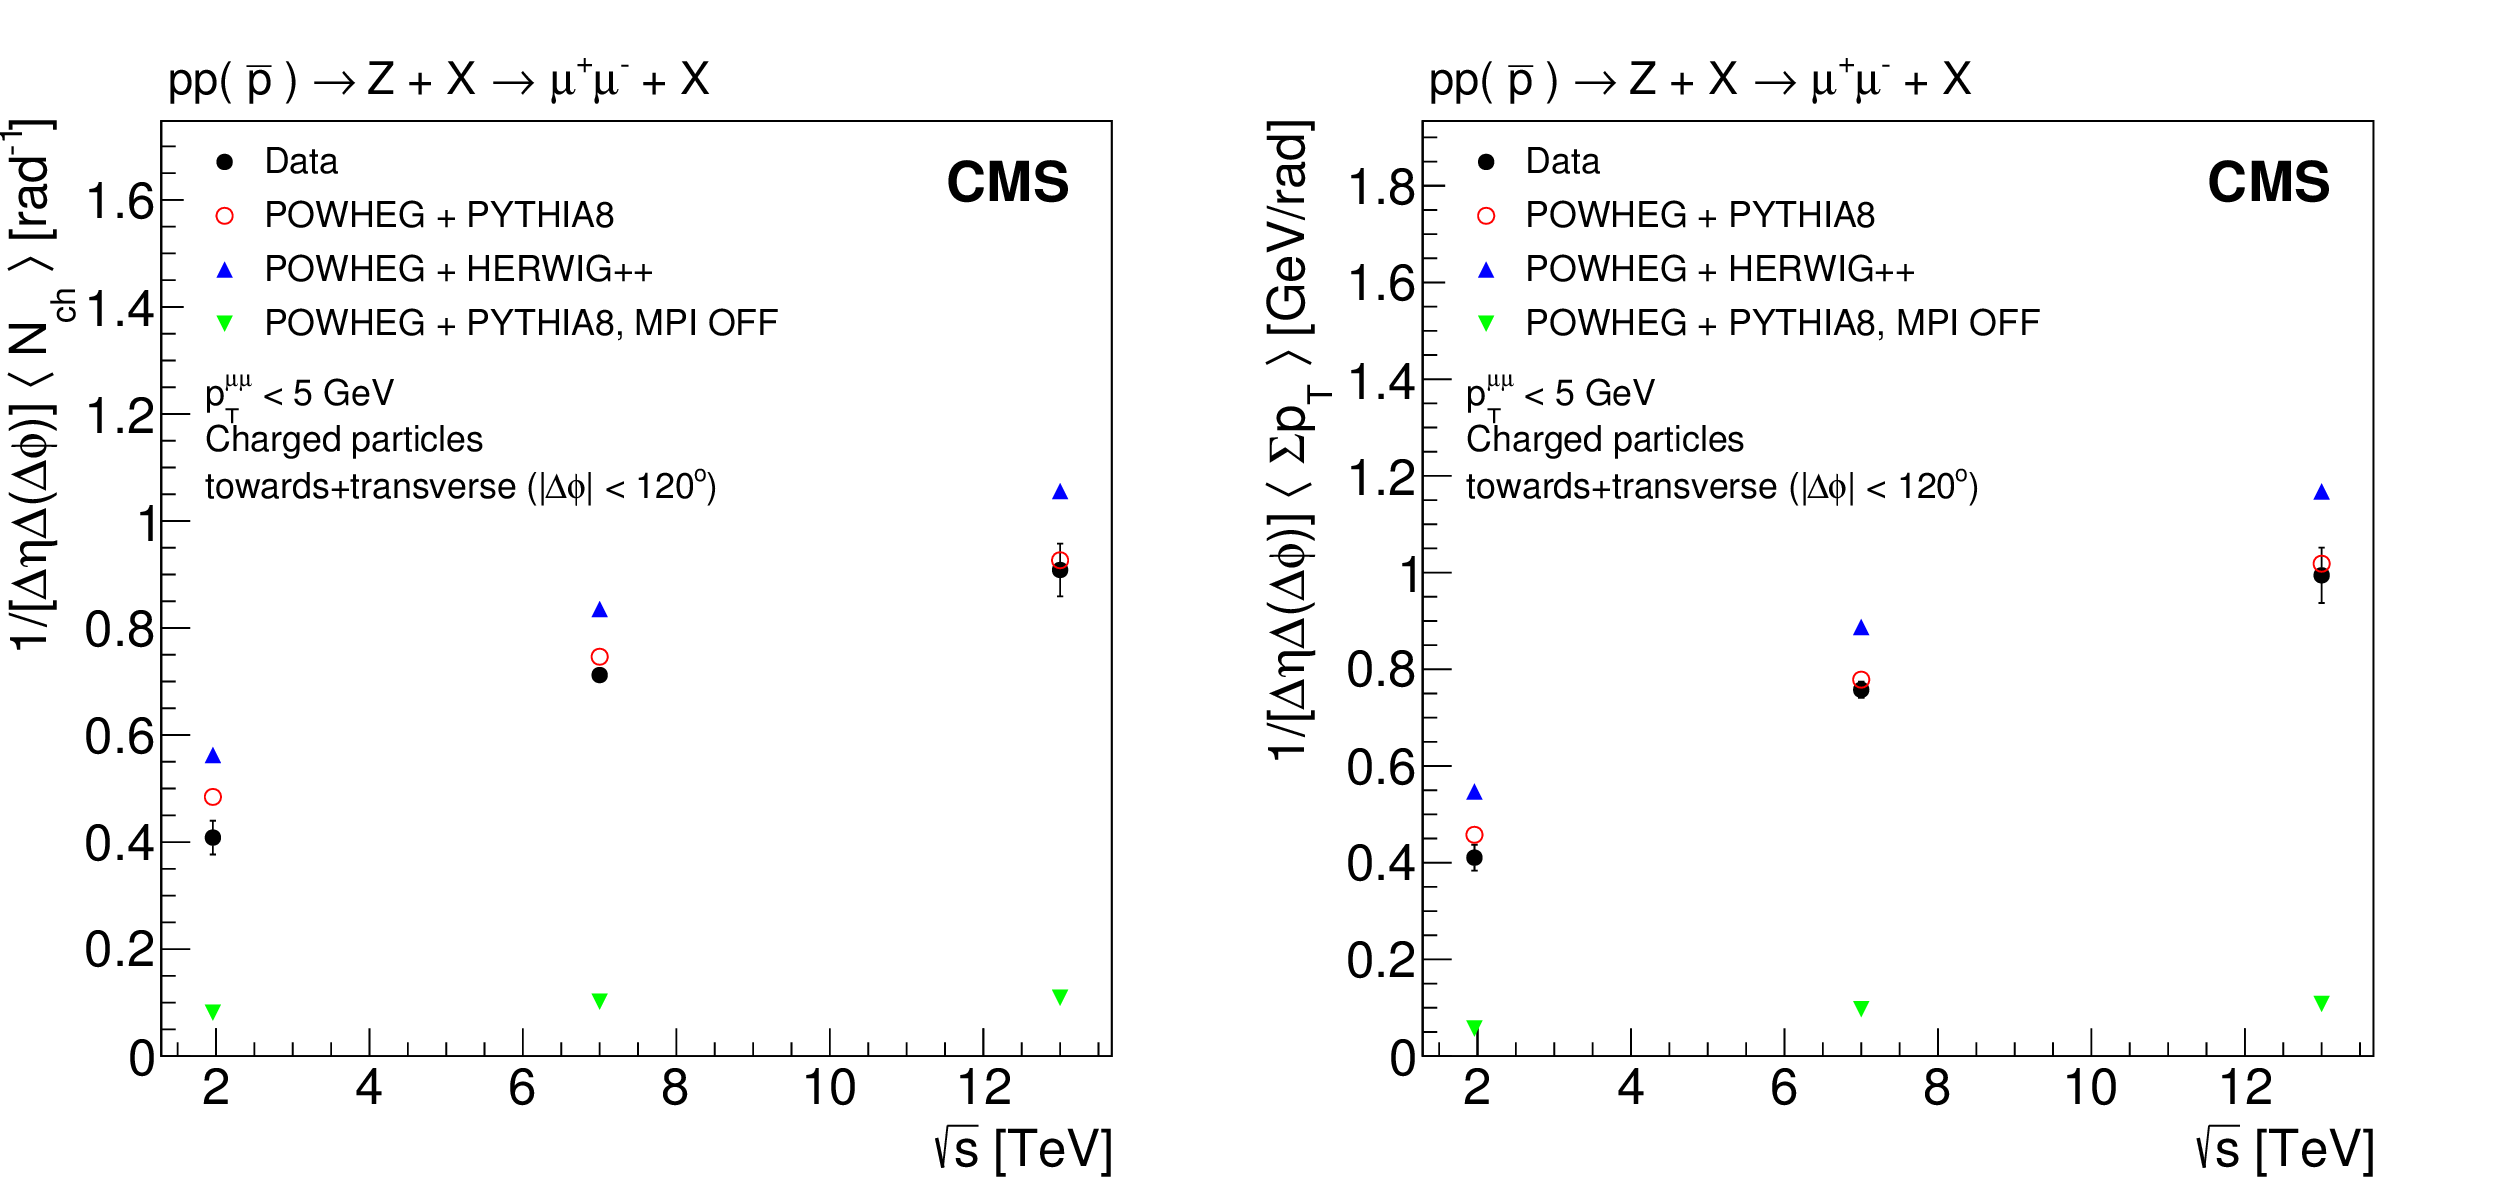
Figure 10:
Average particle density (left) and average $\Sigma {p_{\mathrm {T}}} $ density (right) for Z events with $ {{p_{\mathrm {T}}} ^{\mu \mu}} < $ 5 GeV as a function of the center-of-mass energy, measured by CMS and CDF [9] in the combined towards + transverse regions, compared to predictions from POWHEG + PYTHIA8, POWHEG + HERWIG++, and POWHEG + PYTHIA8 without MPI. The error bars represent the statistical and systematic uncertainties added in quadrature. |

png pdf |
Figure 10-a:
Average particle density for Z events with $ {{p_{\mathrm {T}}} ^{\mu \mu}} < $ 5 GeV as a function of the center-of-mass energy, measured by CMS and CDF [9] in the combined towards + transverse regions, compared to predictions from POWHEG + PYTHIA8, POWHEG + HERWIG++, and POWHEG + PYTHIA8 without MPI. The error bars represent the statistical and systematic uncertainties added in quadrature. |
png pdf |
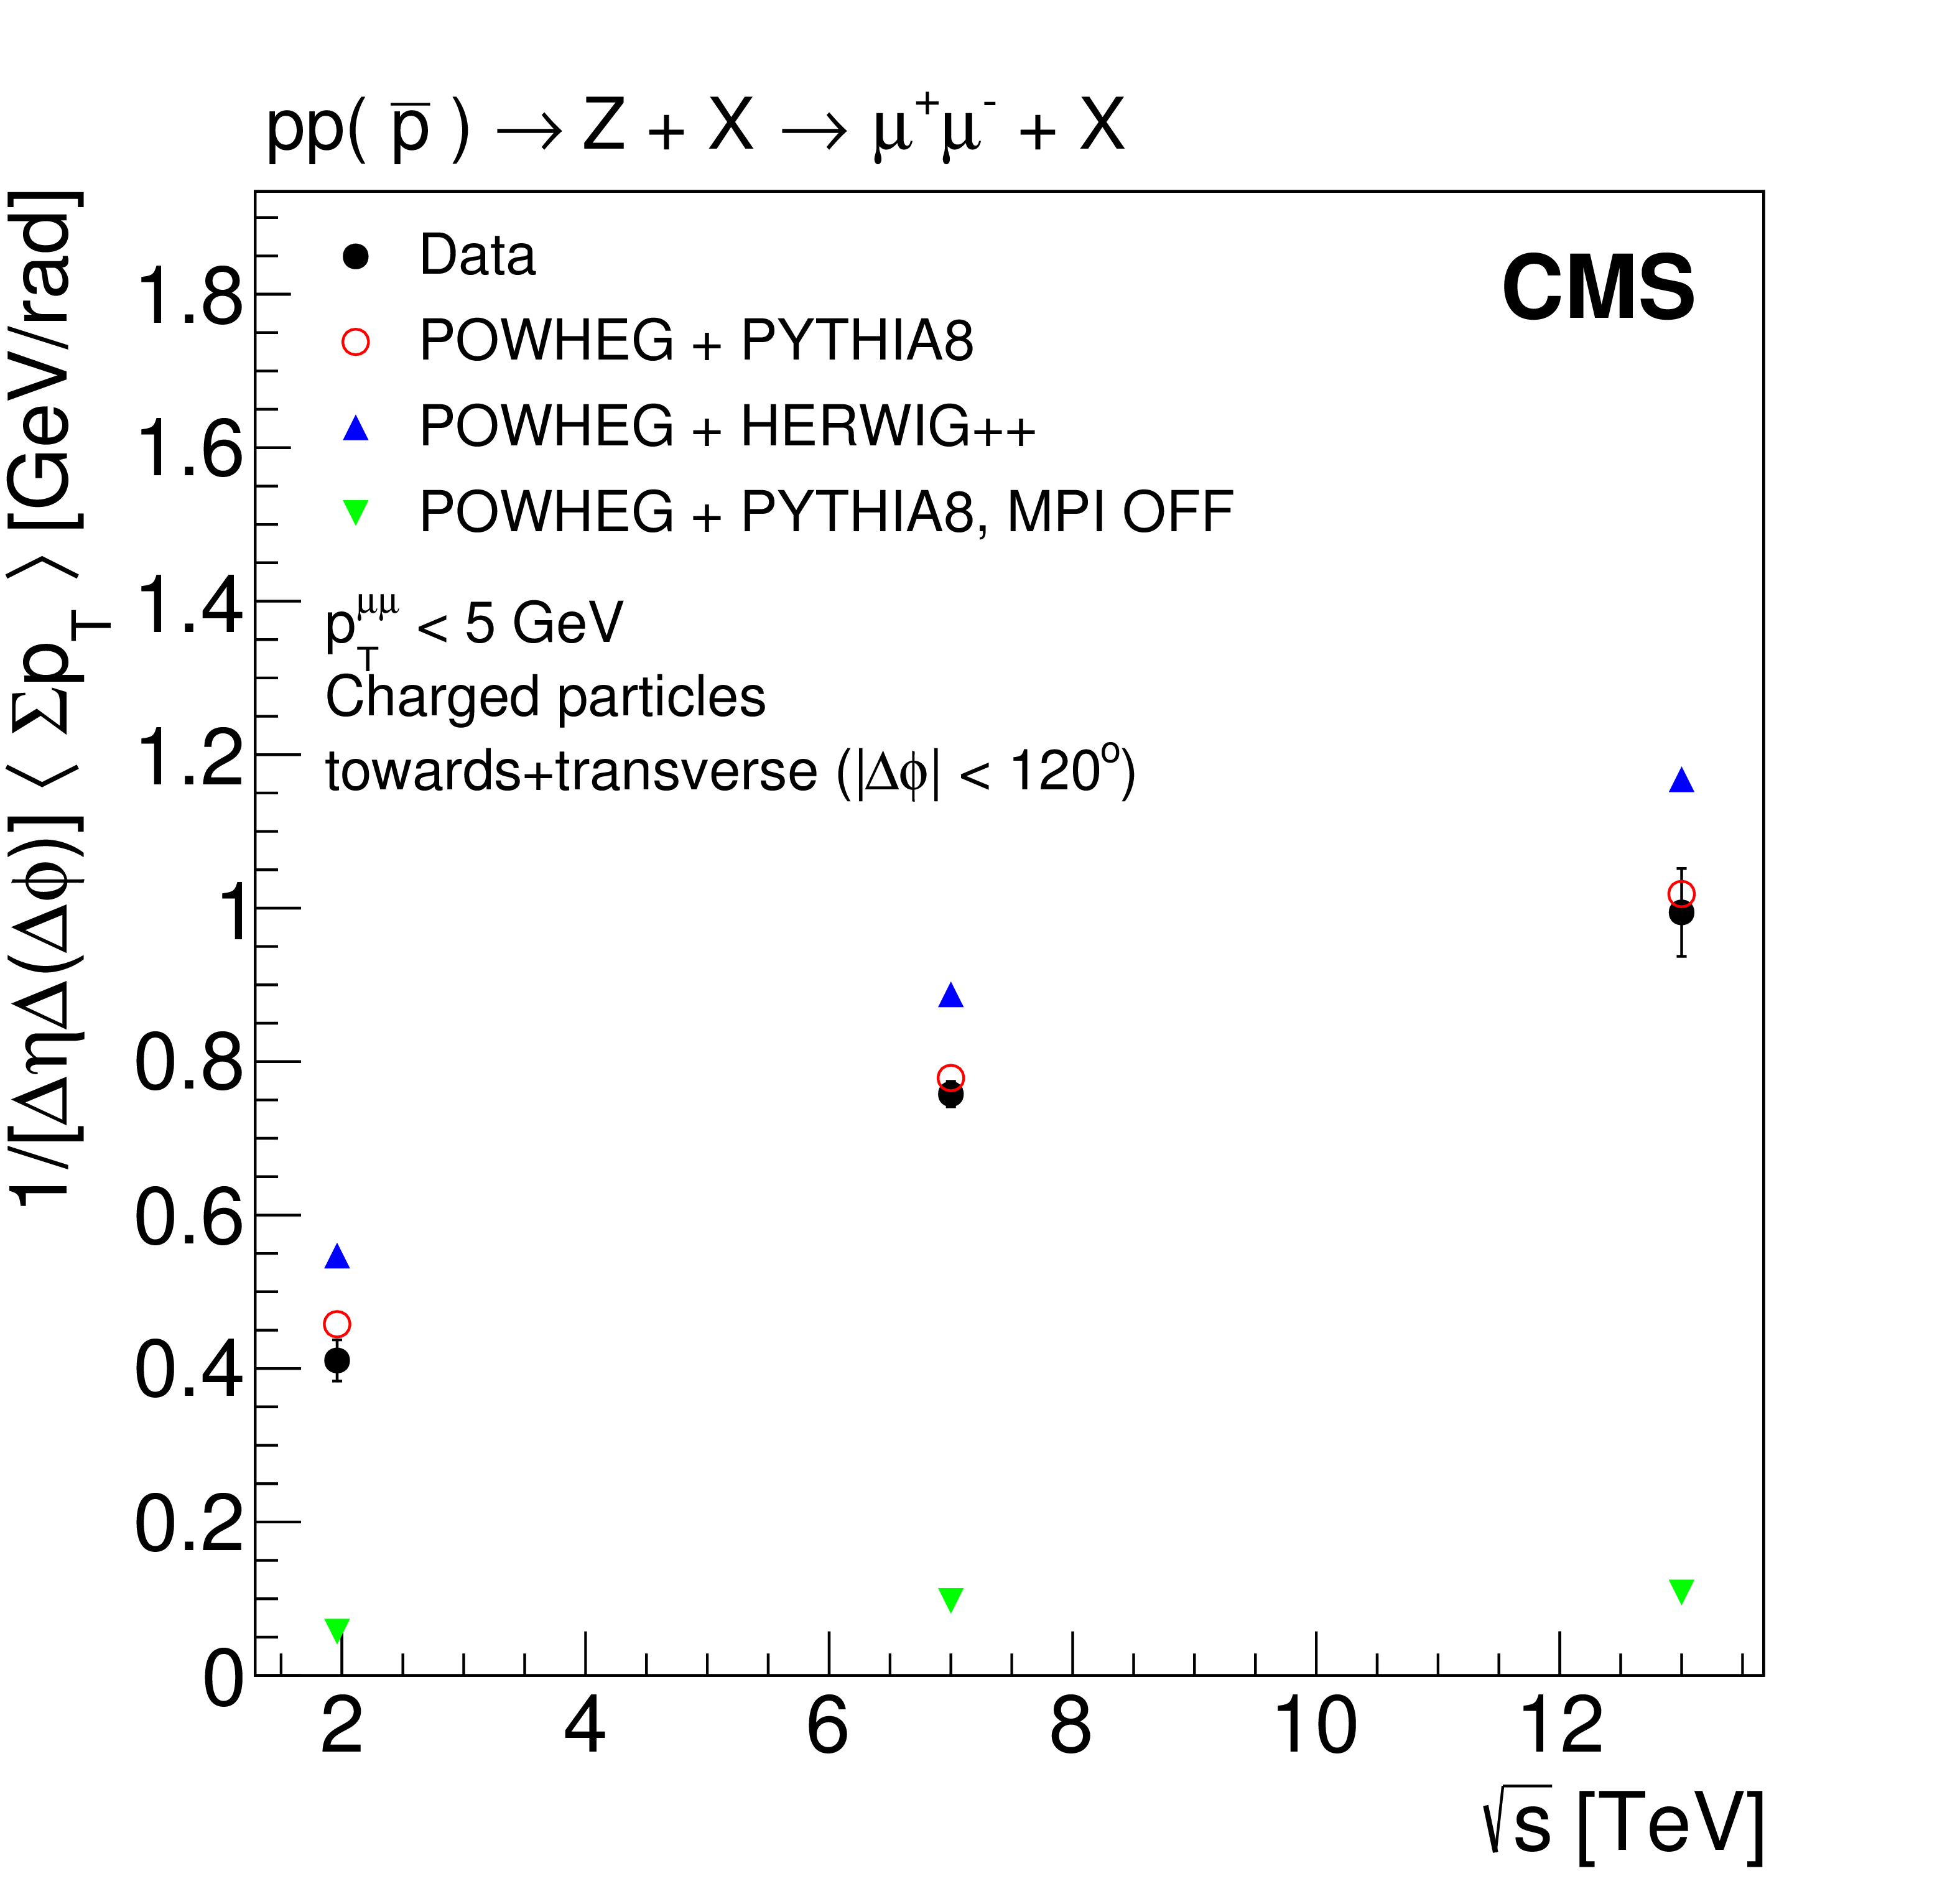
Figure 10-b:
Average $\Sigma {p_{\mathrm {T}}} $ density for Z events with $ {{p_{\mathrm {T}}} ^{\mu \mu}} < $ 5 GeV as a function of the center-of-mass energy, measured by CMS and CDF [9] in the combined towards + transverse regions, compared to predictions from POWHEG + PYTHIA8, POWHEG + HERWIG++, and POWHEG + PYTHIA8 without MPI. The error bars represent the statistical and systematic uncertainties added in quadrature. |
| Tables | |
png pdf |
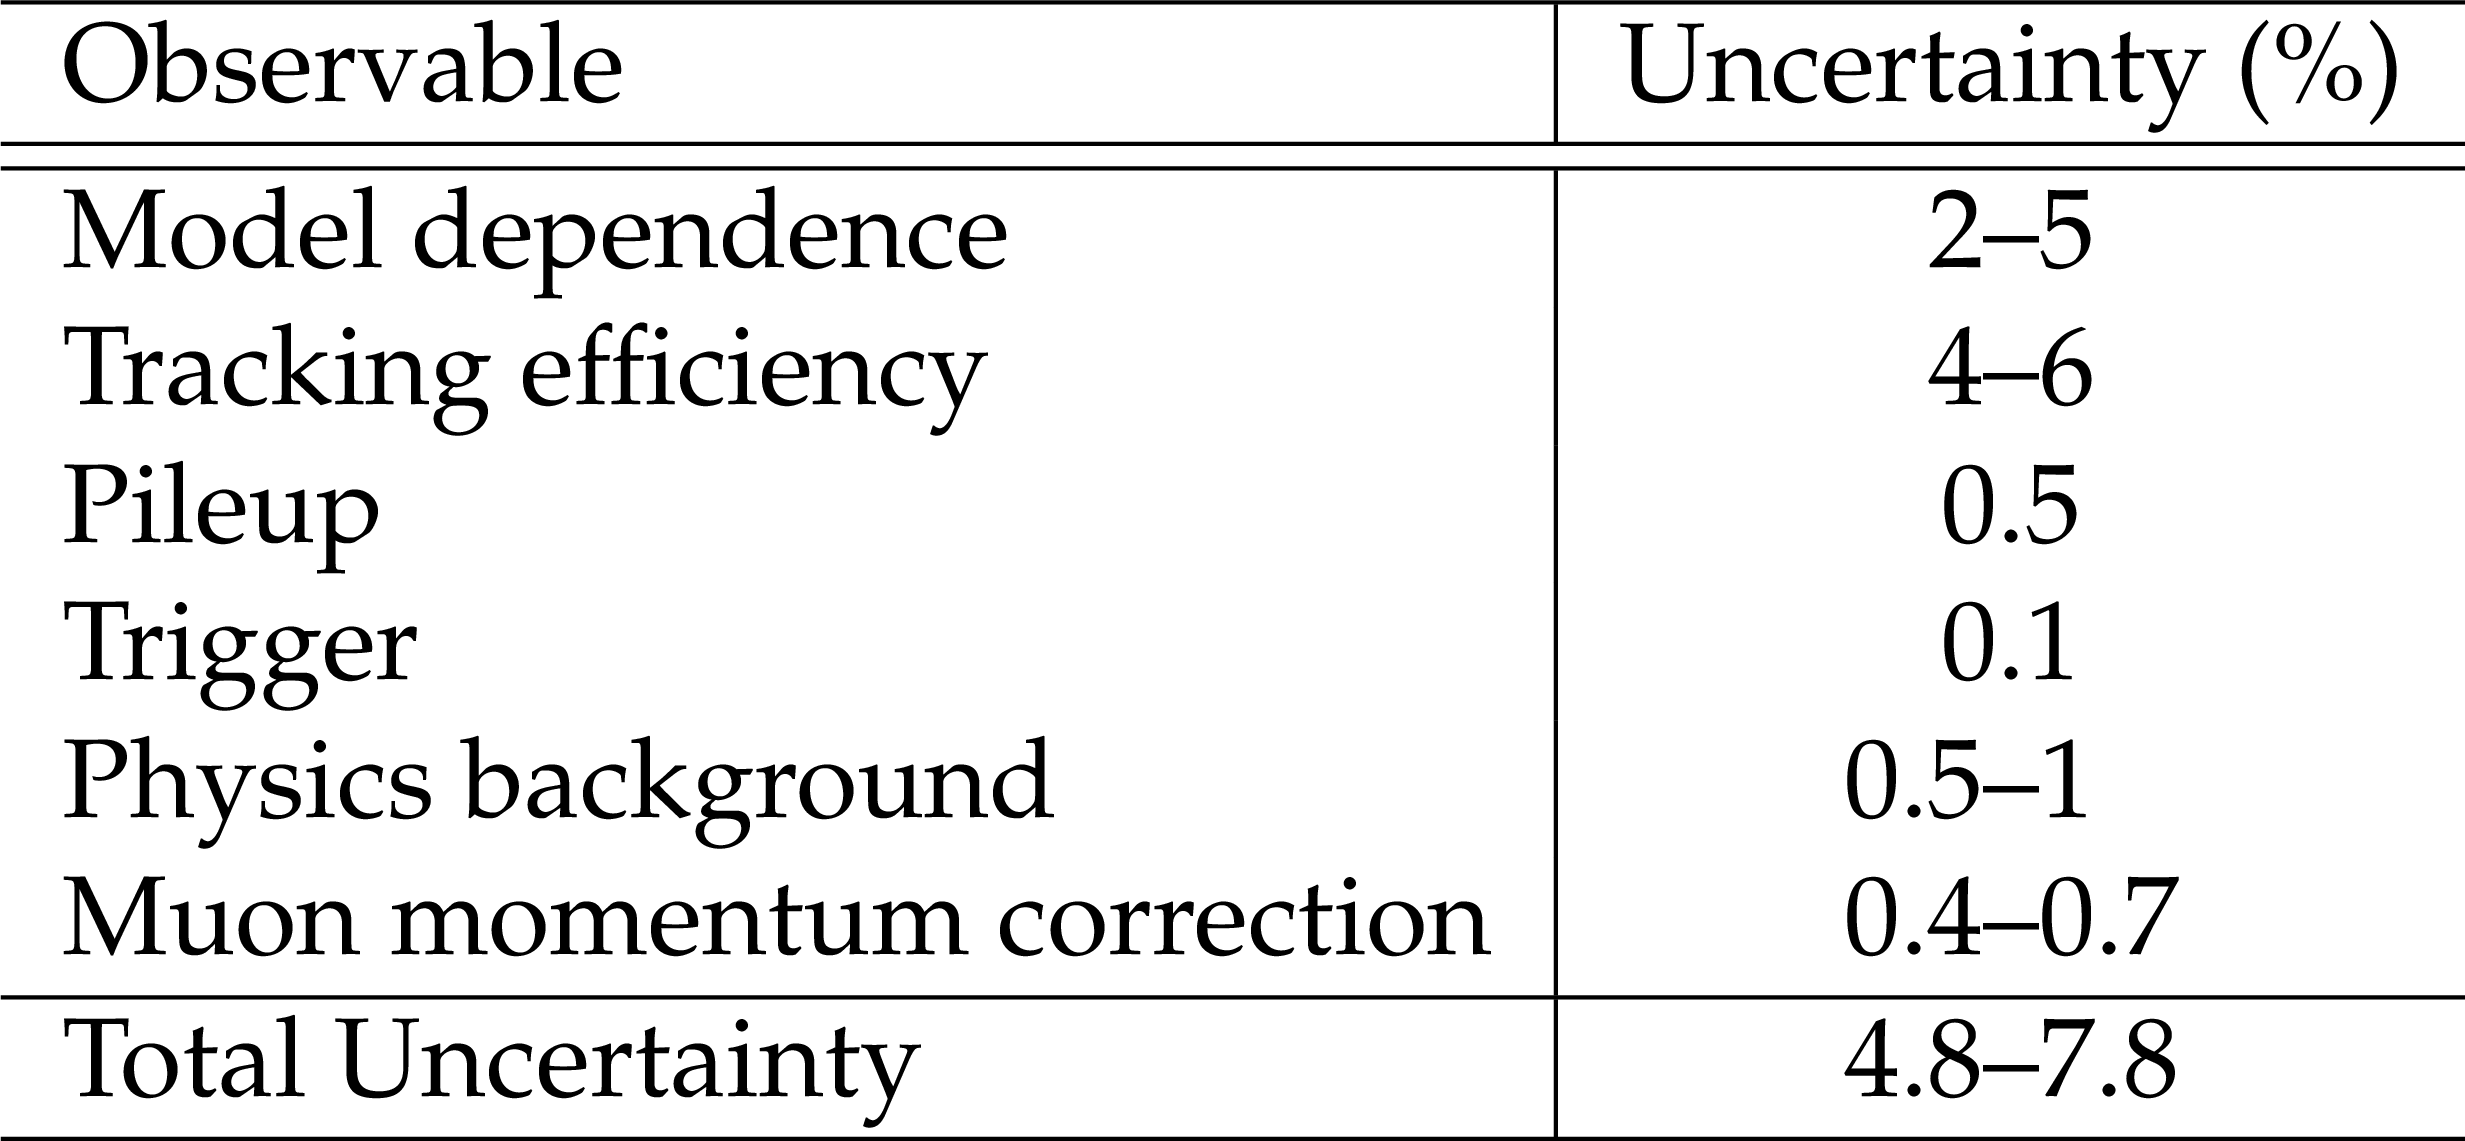
Table 1:
Summary of the systematic uncertainties in the particle and $\Sigma {p_{\mathrm {T}}} $ densities. |
| Summary |
| This paper presents a measurement of the underlying event (UE) activity using inclusive Z boson production events in proton-proton collisions at a center-of-mass energy of 13 TeV. The data correspond to an integrated luminosity of 2.1 fb$^{-1}$. The UE activity, quantified in terms of charged particle and $\Sigma {p_{\mathrm{T}}}$ densities, is measured as a function of the ${p_{\mathrm{T}}}$ of the muon pair from the Z boson decay. The distributions are corrected for detector effects and compared to various model predictions. The MadGraph and POWHEG generators, with parton showering and hadronization modeled with PYTHIA{8} using the CUET8PM1 tune, reproduce the measurements within 5%. The combination of POWHEG and HERWIG{++} (tune EE5C) overestimates the measurements by 10-15%. The present results are also compared with previous measurements at 1.96 and 7 TeV. The UE activity almost doubles as the collision energy increases from 1.96 to 13 TeV. Monte Carlo event generators provide a reasonable description of the evolution of the UE activity as the collision energy rises from 1.96 to 13 TeV, although they tend to underestimate its increase in the 1.96-7 TeV range. The overall good description of the UE activity in Z boson events by Monte Carlo generators previously tuned to minimum-bias and leading track/jet UE measurements, confirms the universality of the physical processes producing the underlying event in pp collisions at high energies. |
| References | ||||
| 1 | CMS Collaboration | Measurement of the underlying event activity at the LHC with $ \sqrt{s} = $ 7 TeV and comparison with $ \sqrt{s} = $ 0.9 TeV | JHEP 09 (2011) 109 | CMS-QCD-10-010 1107.0330 |
| 2 | CMS Collaboration | Measurement of the underlying event activity using charged-particle jets in proton-proton collisions at $ \sqrt{s} = $ 2.76 TeV | JHEP 09 (2015) 137 | CMS-FSQ-12-025 1507.07229 |
| 3 | CMS Collaboration | Measurement of the underlying event in the Drell--Yan process in proton-proton collisions at $ \sqrt{s} = $ 7 TeV | EPJC 72 (2012) 2080 | CMS-QCD-11-012 1204.1411 |
| 4 | ALICE Collaboration | Underlying event measurements in pp collisions at $ \sqrt{s}= $ 0.9 and 7 TeV with the ALICE experiment at the LHC | JHEP 07 (2012) 116 | 1112.2082 |
| 5 | ATLAS Collaboration | Measurement of underlying event characteristics using charged particles in pp collisions at $ \sqrt{s} = $ 900 GeV and 7 TeV with the ATLAS detector | PRD 83 (2011) 112001 | 1012.0791 |
| 6 | ATLAS Collaboration | Measurements of underlying-event properties using neutral and charged particles in pp collisions at 900 GeV and 7 TeV with the ATLAS detector at the LHC | EPJC 71 (2011) 1636 | 1103.1816 |
| 7 | ATLAS Collaboration | Measurement of the dependence of transverse energy production at large pseudorapidity on the hard-scattering kinematics of proton-proton collisions at $ \sqrt{s} = $ 2.76 TeV with ATLAS | PLB 756 (2016) 10 | 1512.00197 |
| 8 | ATLAS Collaboration | Measurement of distributions sensitive to the underlying event in inclusive Z-boson production in pp collisions at $ \sqrt{s} = $ 7 TeV with the ATLAS detector | EPJC 74 (2014) 3195 | 1409.3433 |
| 9 | CDF Collaboration | Studying the underlying event in Drell--Yan and high transverse momentum jet production at the Tevatron | PRD 82 (2010) 034001 | 1003.3146 |
| 10 | T. Sjostrand and M. Van Zijl | A multiple interaction model for the event structure in hadron collisions | PRD 36 (1987) 2019 | |
| 11 | L. Frankfurt, M. Strikman, and C. Weiss | Transverse nucleon structure and diagnostics of hard parton-parton processes at LHC | PRD 83 (2011) 054012 | 1009.2559 |
| 12 | R. Kumar, M. Bansal, S. Bansal, and J. B. Singh | New observables for multiple-parton interactions measurements using Z+jets processes at the LHC | PRD 93 (2016), no. 5, 054019 | 1602.05392 |
| 13 | J. Alwall et al. | The automated computation of tree-level and next-to-leading order differential cross sections, and their matching to parton shower simulations | JHEP 07 (2014) 079 | 1405.0301 |
| 14 | S. Frixione, P. Nason, and C. Oleari | Matching NLO QCD computations with parton shower simulations: the powheg method | JHEP 11 (2007) 070 | 0709.2092 |
| 15 | K. Hamilton, P. Nason, and G. Zanderighi | MINLO: multi-scale improved NLO | JHEP 10 (2012) 155 | 1206.3572 |
| 16 | F. Maltoni and T. Stelzer | MadEvent: automatic event generation with MadGraph | JHEP 02 (2003) 027 | hep-ph/0208156 |
| 17 | J. Alwall et al. | MadGraph 5: going beyond | JHEP 06 (2011) 128 | 1106.0522 |
| 18 | T. Sjostrand, S. Mrenna, and P. Z. Skands | A brief introduction to PYTHIA 8.1 | CPC 178 (2008) 852 | 0710.3820 |
| 19 | CMS Collaboration | Event generator tunes obtained from underlying event and multiparton scattering measurements | EPJC 76 (2016) 155 | CMS-GEN-14-001 1512.00815 |
| 20 | NNPDF Collaboration | Parton distributions for the LHC Run II | JHEP 04 (2015) 040 | 1410.8849 |
| 21 | GEANT4 Collaboration | GEANT4---a simulation toolkit | NIMA 506 (2003) 250 | |
| 22 | M. Bahr et al. | Herwig++ physics and manual | EPJC 58 (2008) 639 | 0803.0883 |
| 23 | CMS Collaboration | Description and performance of track and primary-vertex reconstruction with the CMS tracker | JINST 9 (2014) P10009 | CMS-TRK-11-001 1405.6569 |
| 24 | CMS Collaboration | Performance of CMS muon reconstruction in pp collision events at $ \sqrt{s} = $ 7 TeV | JINST 7 (2012) P10002 | CMS-MUO-10-004 1206.4071 |
| 25 | CMS Collaboration | The CMS experiment at the CERN LHC | JINST 3 (2008) S08004 | CMS-00-001 |
| 26 | CMS Collaboration | Particle-flow reconstruction and global event description with the CMS detector | JINST 12 (2017), no. 10, P10003 | CMS-PRF-14-001 1706.04965 |
| 27 | A. Bodek et al. | Extracting muon momentum scale corrections for hadron collider experiments | EPJC 72 (2012) 2194 | 1208.3710 |
| 28 | CMS Collaboration | The CMS trigger system | JINST 12 (2017) P01020 | |
| 29 | CMS Collaboration | CMS tracking performance results from early LHC operation | EPJC 70 (2010) 1165 | CMS-TRK-10-001 1007.1988 |
| 30 | G. D'Agostini | A multidimensional unfolding method based on Bayes' theorem | NIMA 362 (1995) 487 | |
| 31 | CMS Collaboration | Measurement of tracking efficiency | ||
|
|
Compact Muon Solenoid LHC, CERN |
|

|

|

|

|

|