

Compact Muon Solenoid
LHC, CERN
| CMS-FSQ-16-011 ; CERN-EP-2018-187 | ||
| Measurement of charged particle spectra in minimum-bias events from proton-proton collisions at $\sqrt{s} = $ 13 TeV | ||
| CMS Collaboration | ||
| 29 June 2018 | ||
| Eur. Phys. J. C 78 (2018) 697 | ||
| Abstract: Pseudorapidity, transverse momentum, and multiplicity distributions are measured in the pseudorapidity range $|{\eta}| < $ 2.4 for charged particles with transverse momenta satisfying ${p_{\mathrm{T}}} > $ 0.5 GeV in proton-proton collisions at a center-of-mass energy of $\sqrt{s} = $ 13 TeV. Measurements are presented in three different event categories. The most inclusive of the categories corresponds to an inelastic pp data set, while the other two categories are exclusive subsets of the inelastic sample that are either enhanced or depleted in single diffractive dissociation events. The measurements are compared to predictions from Monte Carlo event generators used to describe high-energy hadronic interactions in collider and cosmic-ray physics. | ||
| Links: e-print arXiv:1806.11245 [hep-ex] (PDF) ; CDS record ; inSPIRE record ; HepData record ; CADI line (restricted) ; | ||
| Figures | |

png pdf |
Figure 1:
From top to bottom, left to right: pseudorapidity, $ {p_{\mathrm {T}}} $, leading $ {p_{\mathrm {T}}} $, integrated leading $ {p_{\mathrm {T}}} $, and multiplicity of charged particles per event for the inelastic (circles), NSD-enhanced (triangles), SD-enhanced (diamonds), and SD-One-Side enhanced (crosses) event samples. The band encompassing the data points represent the total systematic uncertainty, while the statistical uncertainty is included as a vertical bar for each data point. |

png pdf |
Figure 1-a:
Distribution of the pseudorapidity of charged particles per event for the inelastic (circles), NSD-enhanced (triangles), SD-enhanced (diamonds), and SD-One-Side enhanced (crosses) event samples. The band encompassing the data points represent the total systematic uncertainty, while the statistical uncertainty is included as a vertical bar for each data point. |
png pdf |
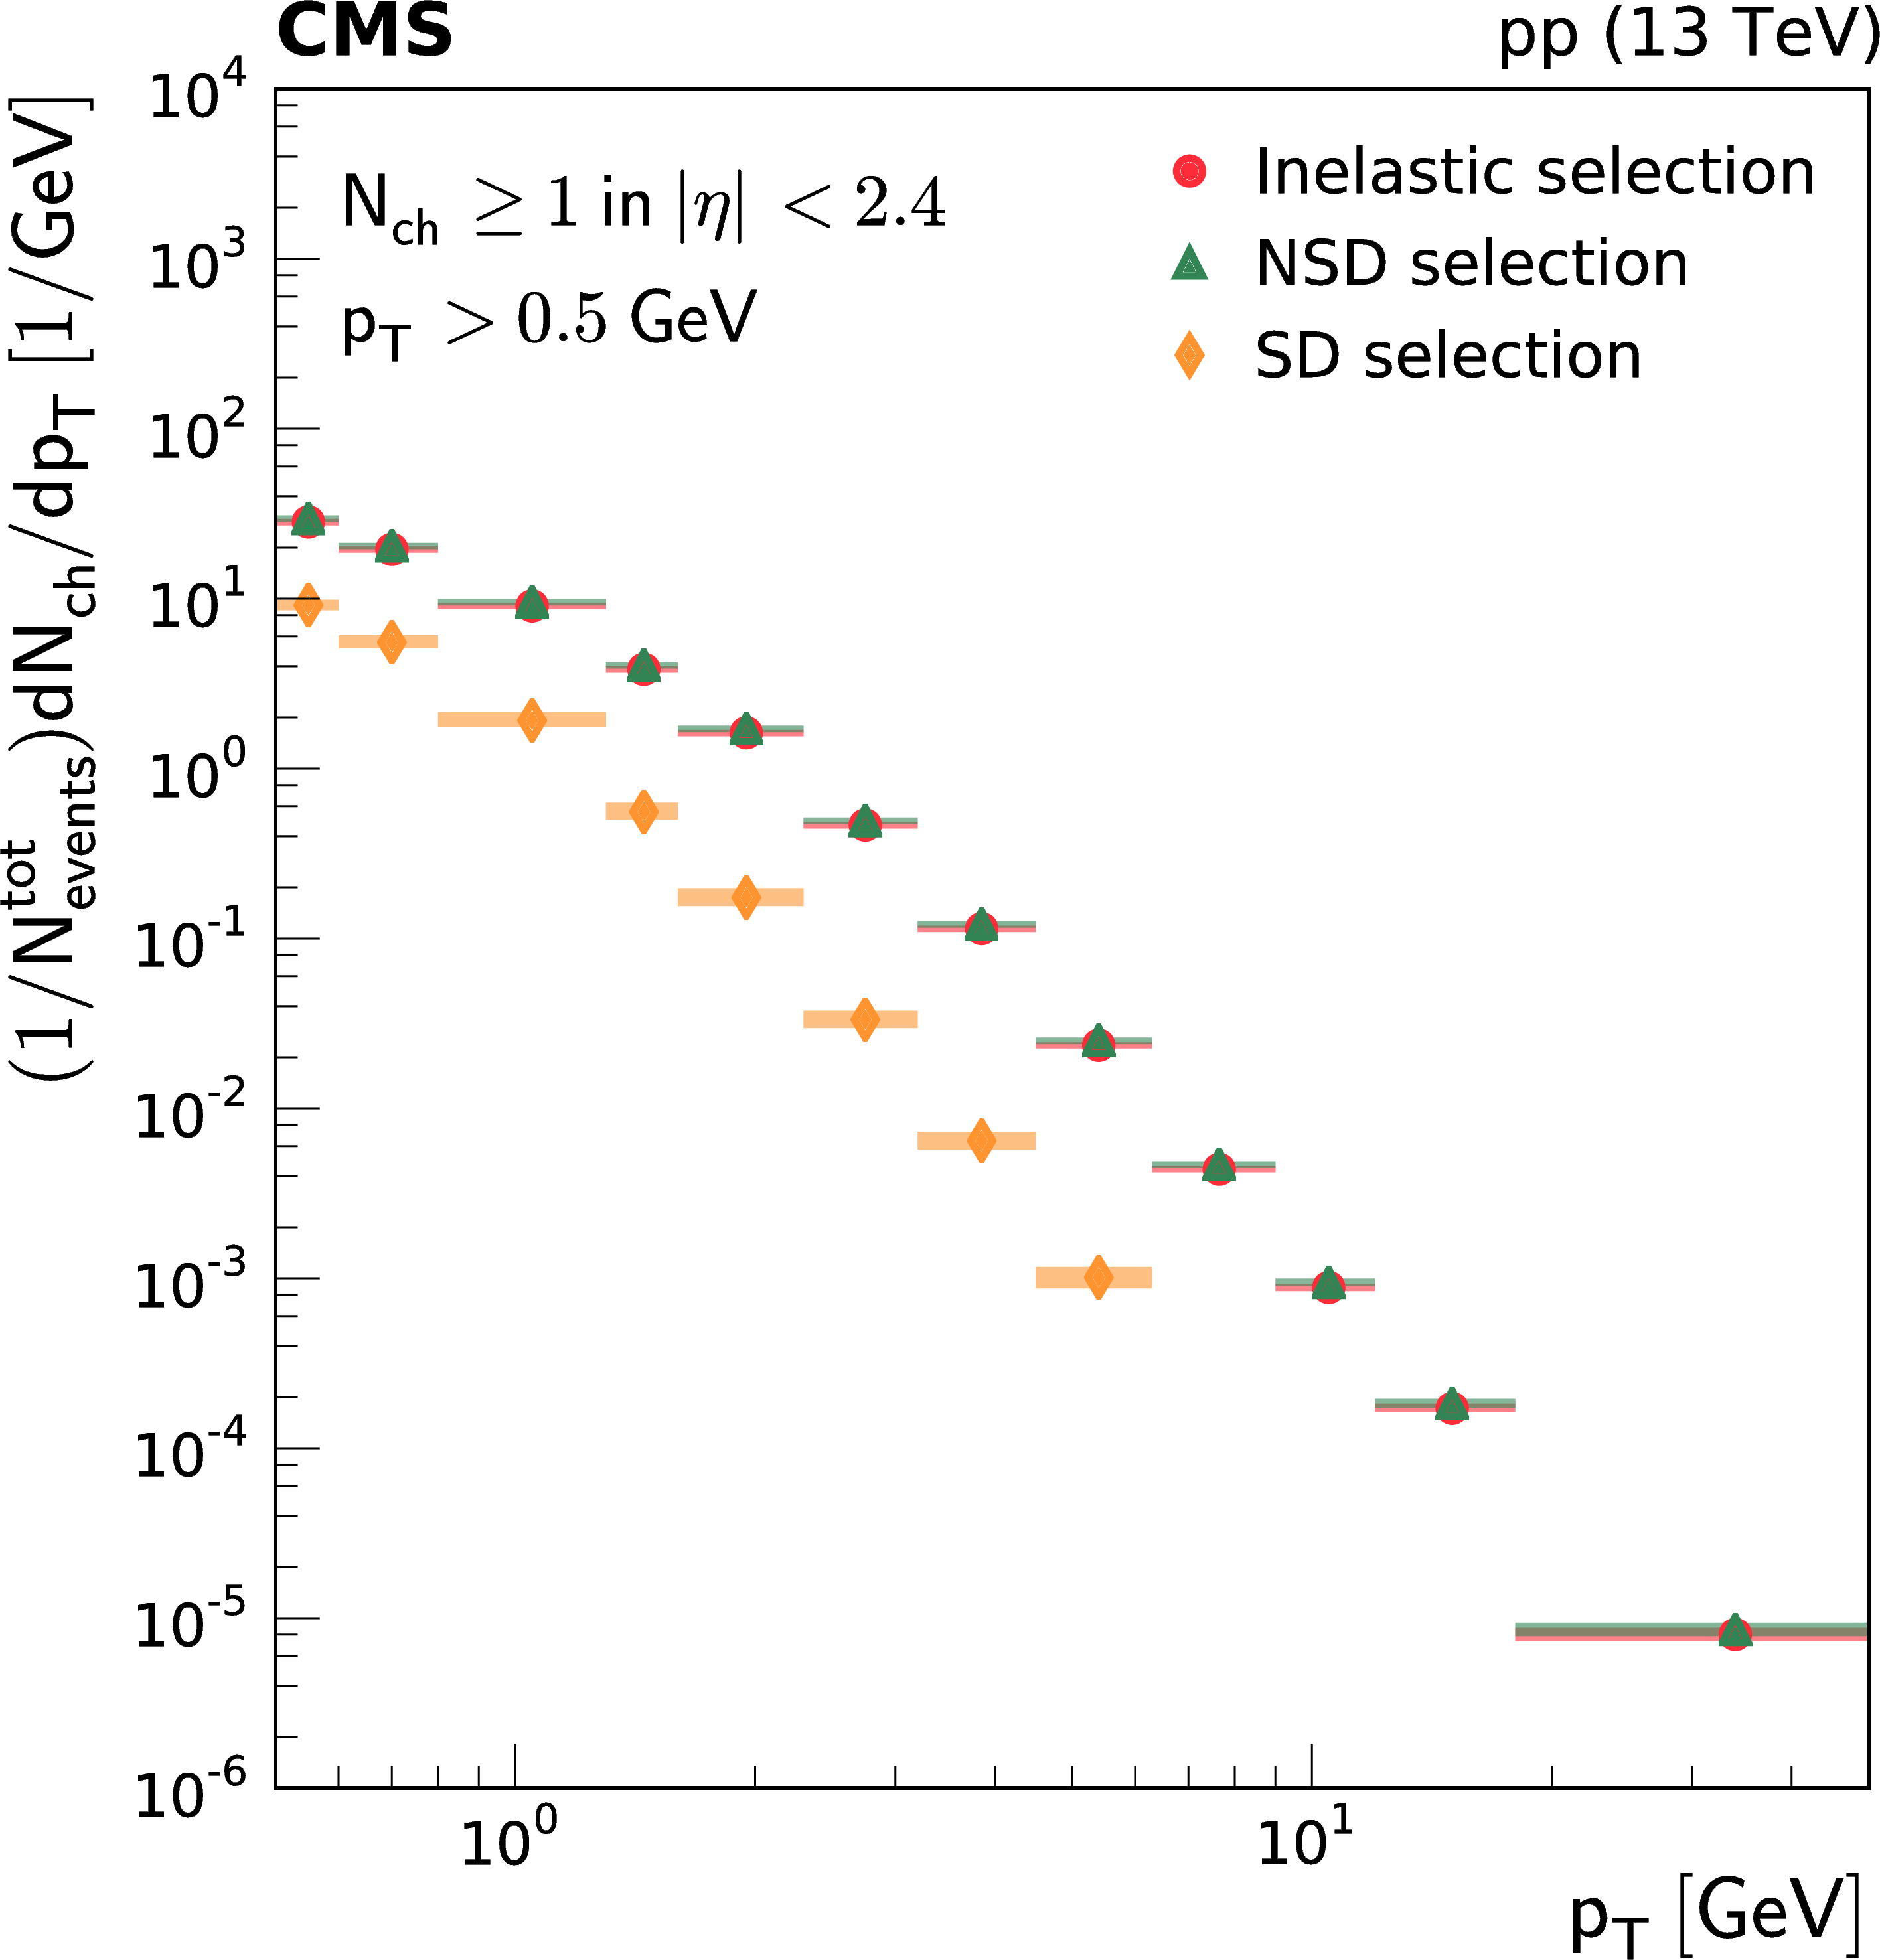
Figure 1-b:
Distribution of $ {p_{\mathrm {T}}} $ of charged particles per event for the inelastic (circles), NSD-enhanced (triangles), SD-enhanced (diamonds), and SD-One-Side enhanced (crosses) event samples. The band encompassing the data points represent the total systematic uncertainty, while the statistical uncertainty is included as a vertical bar for each data point. |
png pdf |
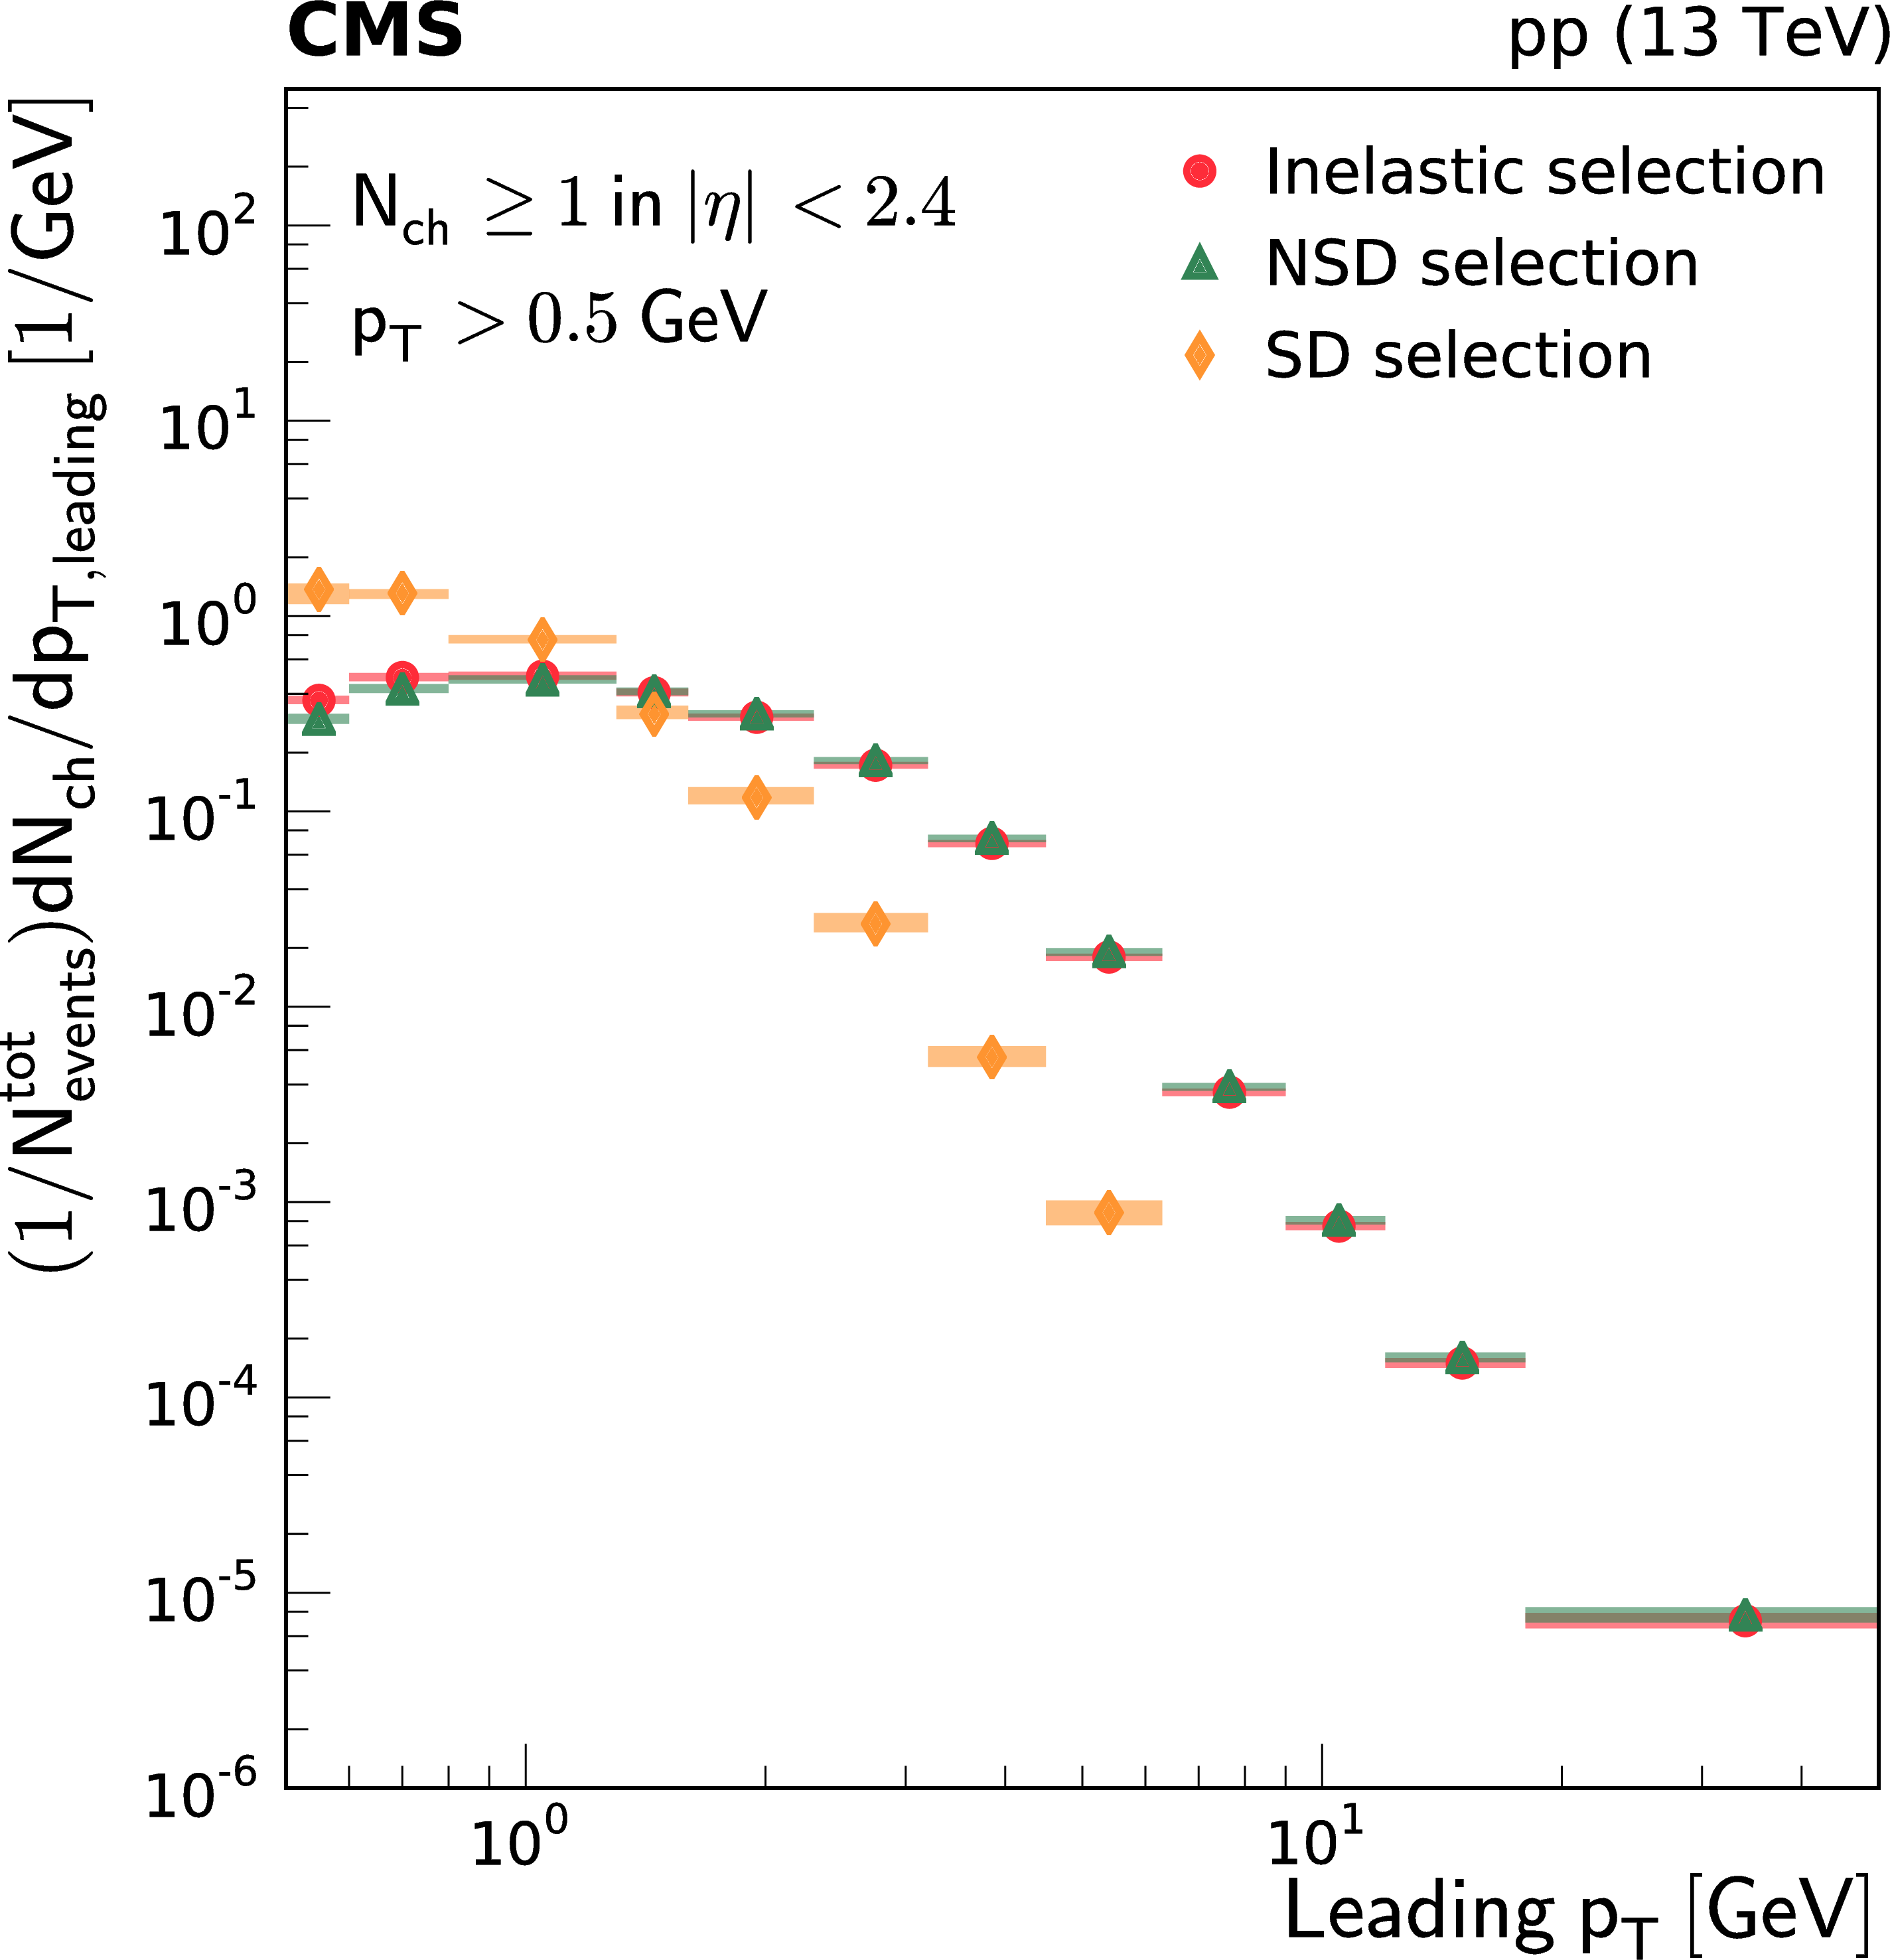
Figure 1-c:
Distribution of the leading $ {p_{\mathrm {T}}} $ of charged particles per event for the inelastic (circles), NSD-enhanced (triangles), SD-enhanced (diamonds), and SD-One-Side enhanced (crosses) event samples. The band encompassing the data points represent the total systematic uncertainty, while the statistical uncertainty is included as a vertical bar for each data point. |

png pdf |
Figure 1-d:
Distribution of the integrated leading $ {p_{\mathrm {T}}} $ of charged particles per event for the inelastic (circles), NSD-enhanced (triangles), SD-enhanced (diamonds), and SD-One-Side enhanced (crosses) event samples. The band encompassing the data points represent the total systematic uncertainty, while the statistical uncertainty is included as a vertical bar for each data point. |

png pdf |
Figure 1-e:
Distribution of the multiplicity of charged particles per event for the inelastic (circles), NSD-enhanced (triangles), SD-enhanced (diamonds), and SD-One-Side enhanced (crosses) event samples. The band encompassing the data points represent the total systematic uncertainty, while the statistical uncertainty is included as a vertical bar for each data point. |

png pdf |
Figure 2:
Charged particle pseudorapidity densities averaged over both positive and negative $ {\eta} $ ranges. Top to bottom, left to right: inelastic, NSD-, SD-, and SD-One-Side enhanced event samples. The measurements are compared to the predictions of the PYTHIA 8 CUETM1 (long dashes), PYTHIA 8 MBR4C (continuous line), and epos LHC (short dashes) event generators. The band encompassing the data points represent the total systematic uncertainty, while the statistical uncertainty is included as a vertical bar for each data point. The lower panels show the corresponding MC-to-data ratios. |
png pdf |
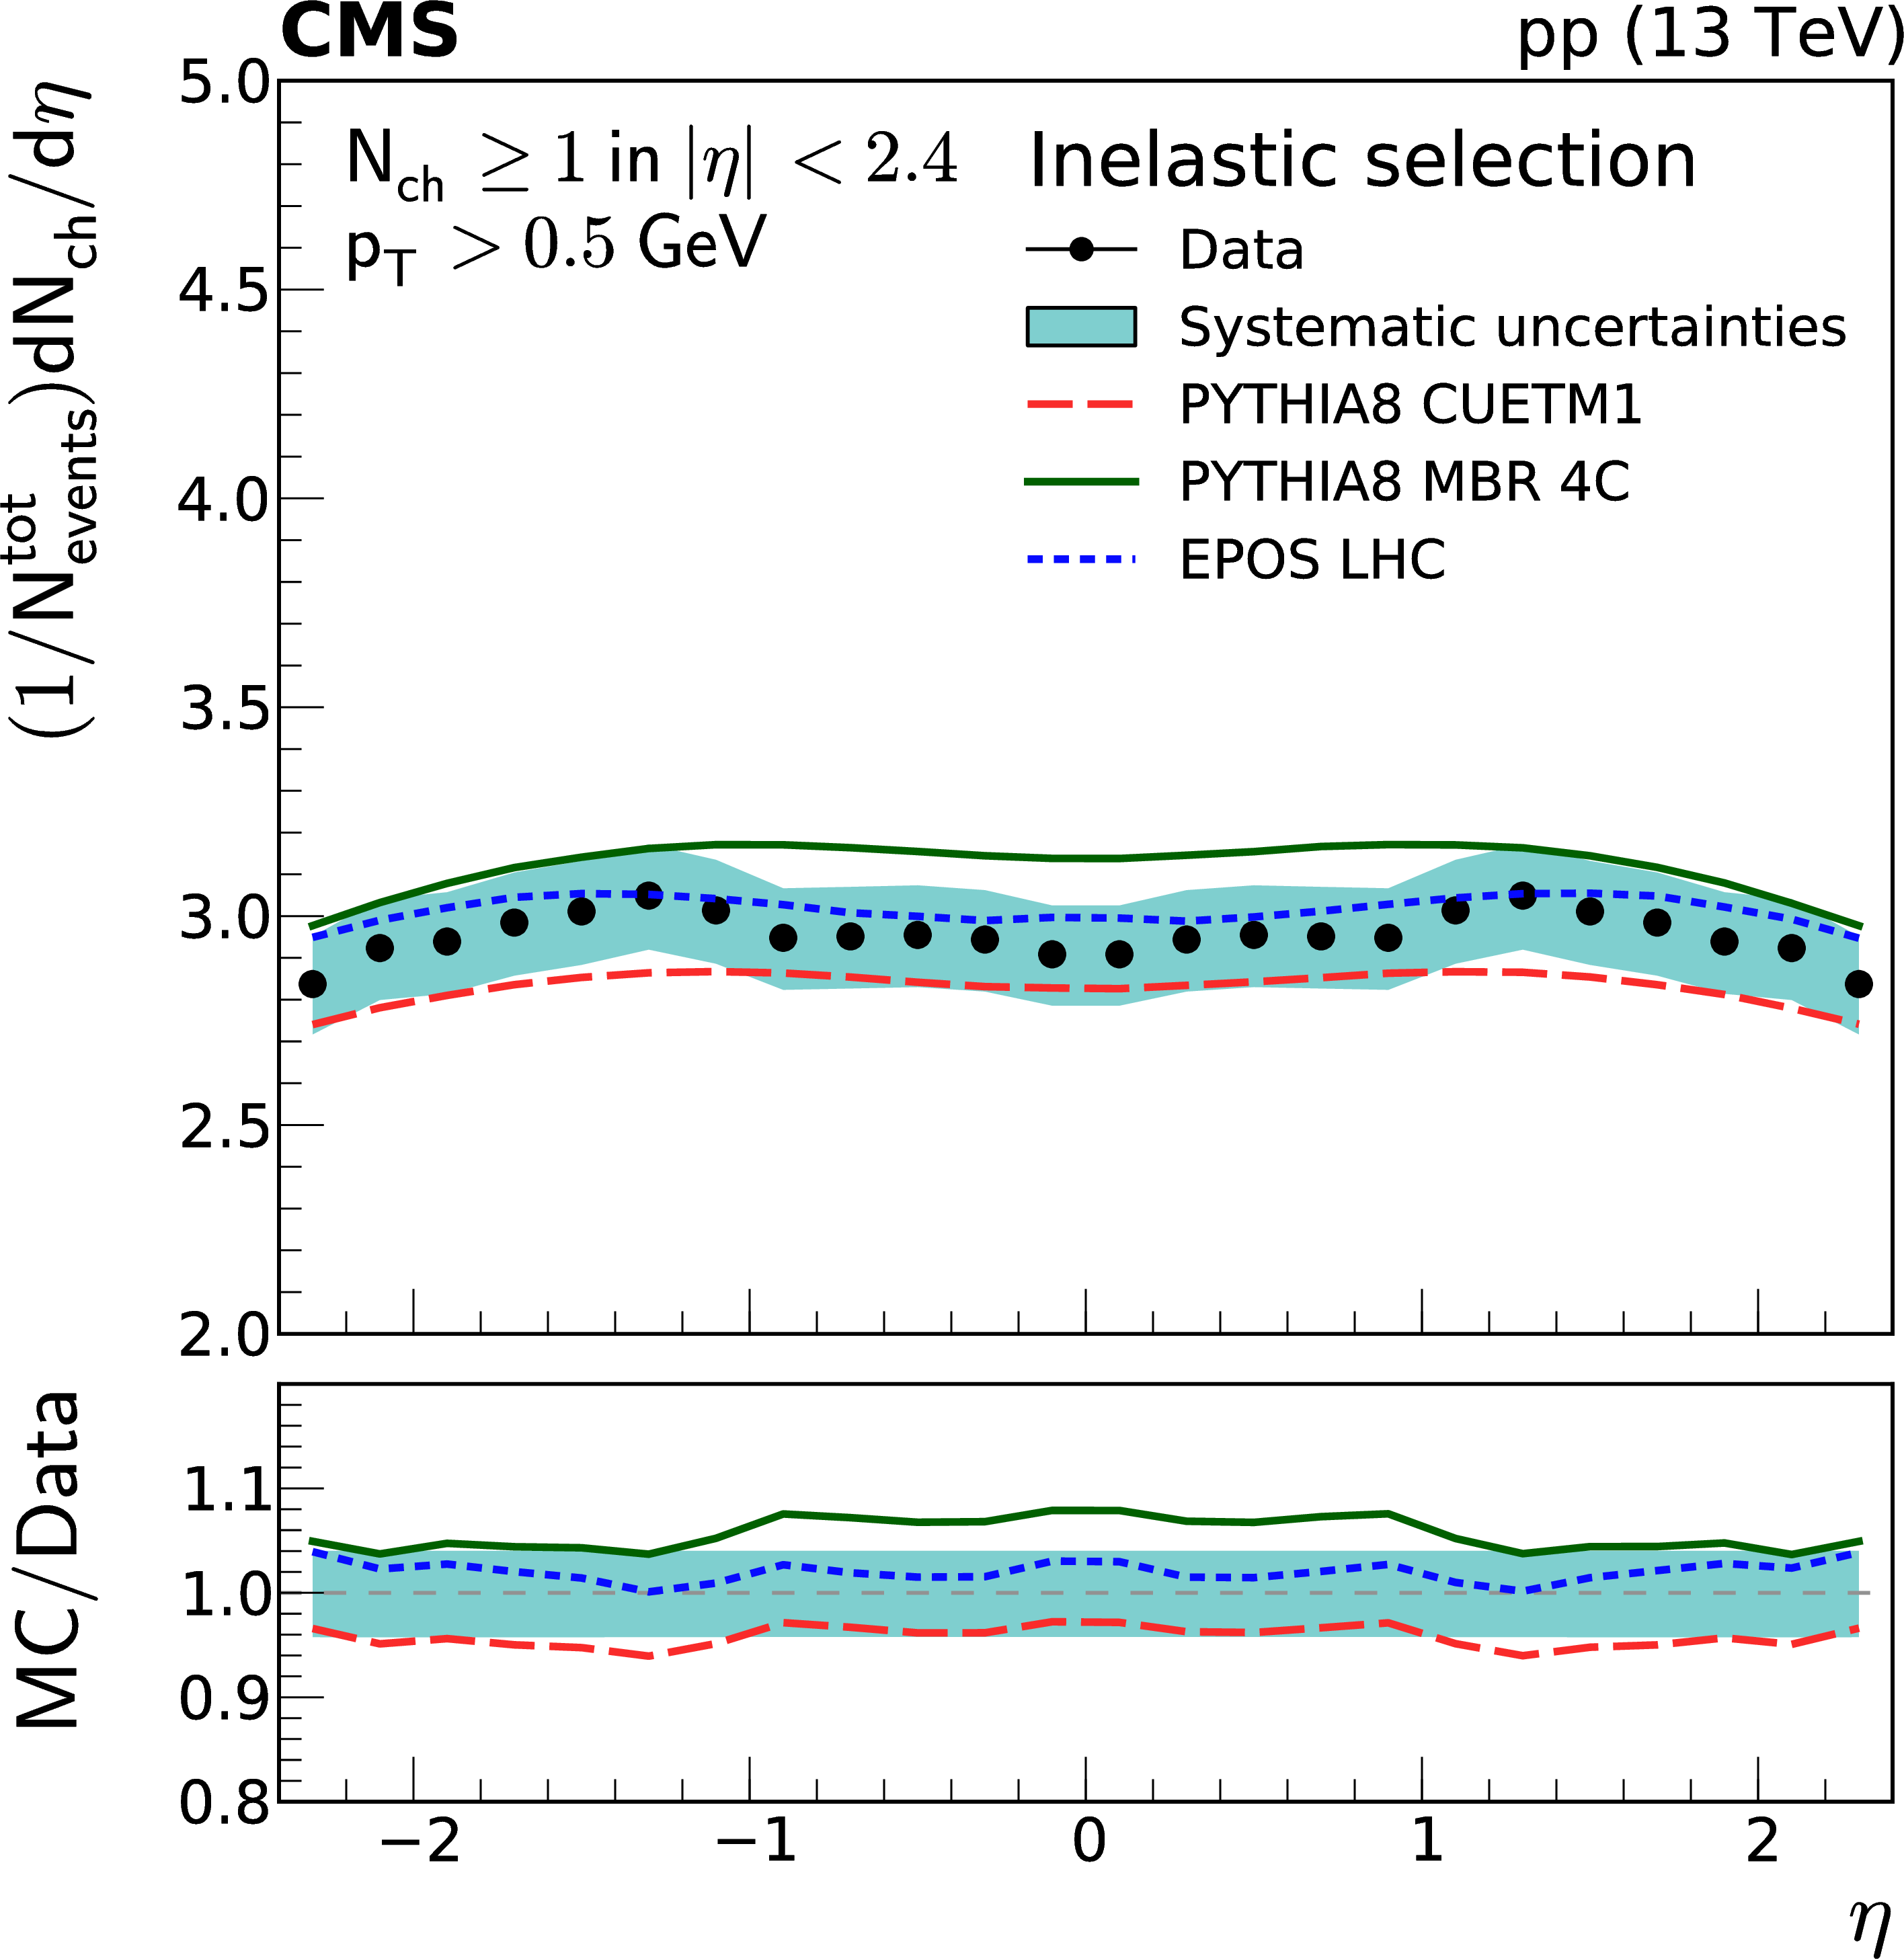
Figure 2-a:
Charged particle pseudorapidity densities averaged over both positive and negative $ {\eta} $ ranges: inelastic enhanced event samples. The measurements are compared to the predictions of the PYTHIA 8 CUETM1 (long dashes), PYTHIA 8 MBR4C (continuous line), and epos LHC (short dashes) event generators. The band encompassing the data points represent the total systematic uncertainty, while the statistical uncertainty is included as a vertical bar for each data point. The lower panel shows the corresponding MC-to-data ratios. |

png pdf |
Figure 2-b:
Charged particle pseudorapidity densities averaged over both positive and negative $ {\eta} $ ranges: NSD-enhanced event samples. The measurements are compared to the predictions of the PYTHIA 8 CUETM1 (long dashes), PYTHIA 8 MBR4C (continuous line), and epos LHC (short dashes) event generators. The band encompassing the data points represent the total systematic uncertainty, while the statistical uncertainty is included as a vertical bar for each data point. The lower panel shows the corresponding MC-to-data ratios. |

png pdf |
Figure 2-c:
Charged particle pseudorapidity densities averaged over both positive and negative $ {\eta} $ ranges: SD-enhanced event samples. The measurements are compared to the predictions of the PYTHIA 8 CUETM1 (long dashes), PYTHIA 8 MBR4C (continuous line), and epos LHC (short dashes) event generators. The band encompassing the data points represent the total systematic uncertainty, while the statistical uncertainty is included as a vertical bar for each data point. The lower panel shows the corresponding MC-to-data ratios. |

png pdf |
Figure 2-d:
Charged particle pseudorapidity densities averaged over both positive and negative $ {\eta} $ ranges: SD-One-Side enhanced event samples. The measurements are compared to the predictions of the PYTHIA 8 CUETM1 (long dashes), PYTHIA 8 MBR4C (continuous line), and epos LHC (short dashes) event generators. The band encompassing the data points represent the total systematic uncertainty, while the statistical uncertainty is included as a vertical bar for each data point. The lower panel shows the corresponding MC-to-data ratios. |

png pdf |
Figure 3:
Charged particle multiplicity distributions of the inelastic (left), and NSD-enhanced (right) event samples. The measurements are compared to the predictions of the PYTHIA 8 CUETM1 (long dashes), PYTHIA 8 MBR4C (continuous line), and epos LHC (short dashes) event generators. The band encompassing the data points represent the total systematic uncertainty, while the statistical uncertainty is included as a vertical bar for each data point. The lower panels show the corresponding MC-to-data ratios. |

png pdf |
Figure 3-a:
Charged particle multiplicity distributions of the inelastic event sample. The measurements are compared to the predictions of the PYTHIA 8 CUETM1 (long dashes), PYTHIA 8 MBR4C (continuous line), and epos LHC (short dashes) event generators. The band encompassing the data points represent the total systematic uncertainty, while the statistical uncertainty is included as a vertical bar for each data point. The lower panel shows the corresponding MC-to-data ratios. |

png pdf |
Figure 3-b:
Charged particle multiplicity distributions of the NSD-enhanced event sample. The measurements are compared to the predictions of the PYTHIA 8 CUETM1 (long dashes), PYTHIA 8 MBR4C (continuous line), and epos LHC (short dashes) event generators. The band encompassing the data points represent the total systematic uncertainty, while the statistical uncertainty is included as a vertical bar for each data point. The lower panel shows the corresponding MC-to-data ratios. |

png pdf |
Figure 4:
Charged particle transverse-momentum densities of inelastic (top left), NSD-enhanced (top right), and SD-enhanced (bottom) event samples. The measurements are compared to the predictions of the PYTHIA 8 CUETM1 (long dashes), PYTHIA 8 MBR4C (continuous line), and epos LHC (short dashes) event generators. The band encompassing the data points represent the total systematic uncertainty, while the statistical uncertainty is included as a vertical bar for each data point. The lower panels show the corresponding MC-to-data ratios. |
png pdf |
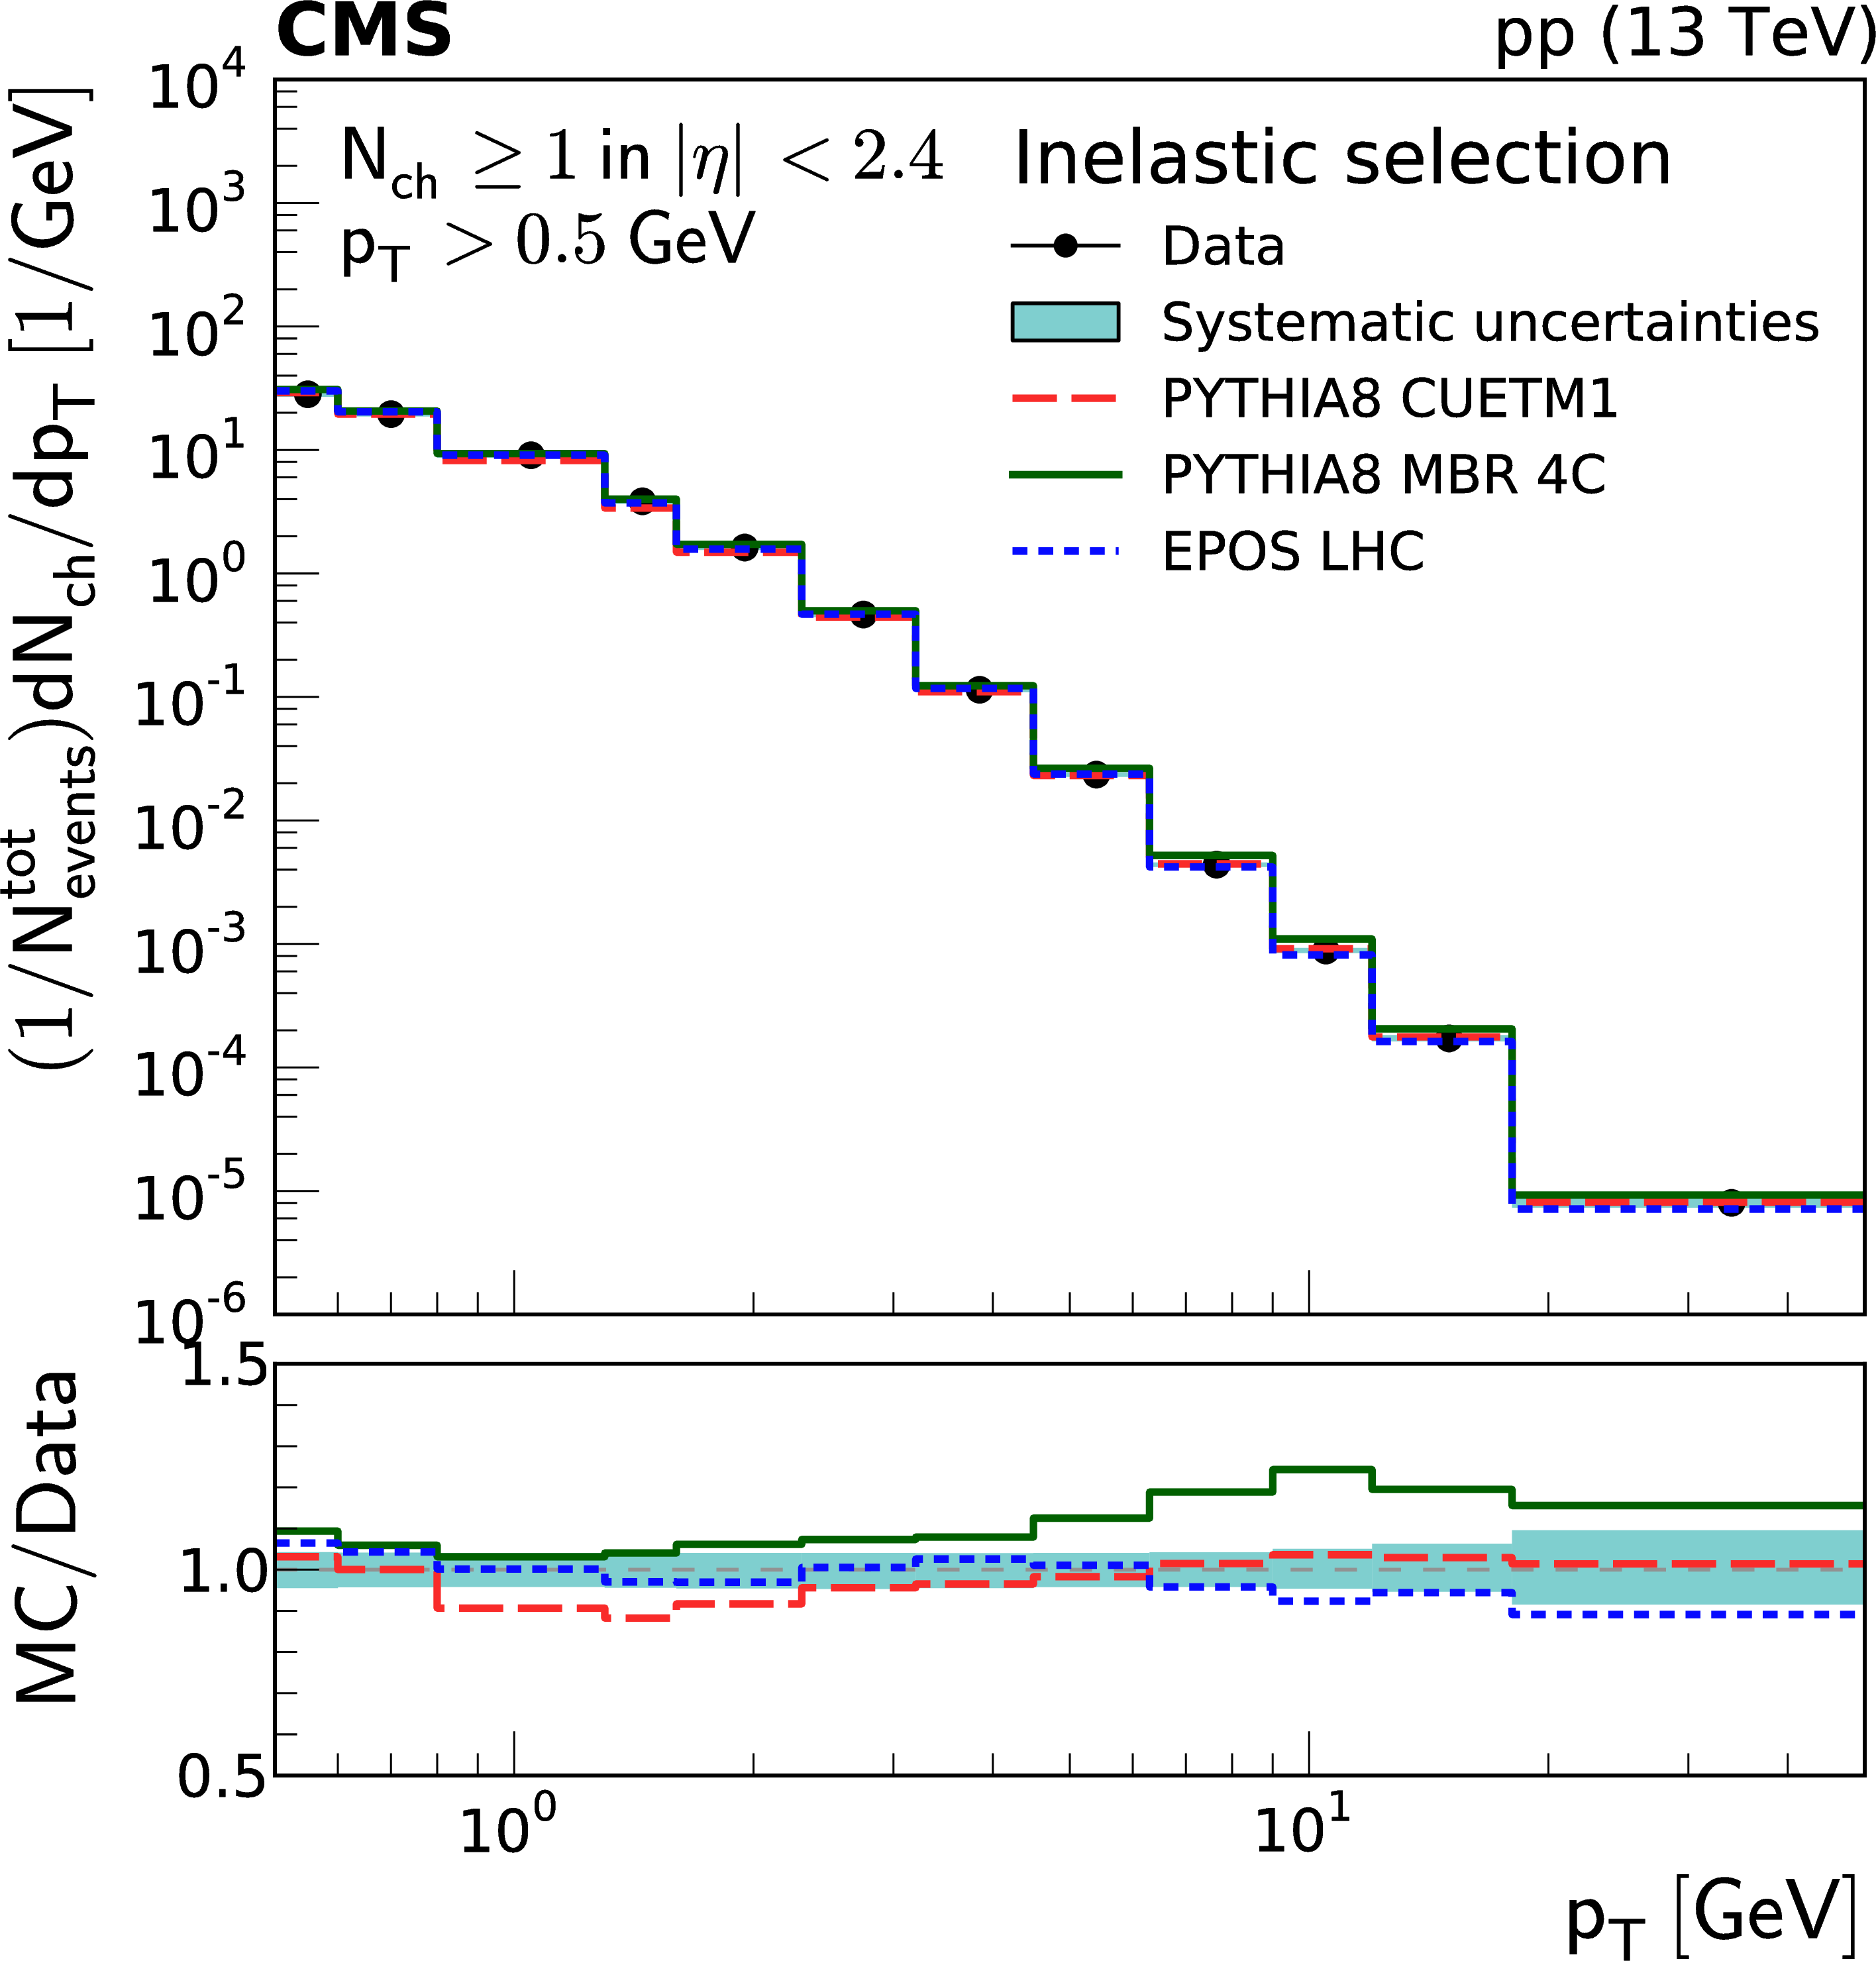
Figure 4-a:
Charged particle transverse-momentum densities of the inelastic event sample. The measurements are compared to the predictions of the PYTHIA 8 CUETM1 (long dashes), PYTHIA 8 MBR4C (continuous line), and epos LHC (short dashes) event generators. The band encompassing the data points represent the total systematic uncertainty, while the statistical uncertainty is included as a vertical bar for each data point. The lower panel shows the corresponding MC-to-data ratios. |

png pdf |
Figure 4-b:
Charged particle transverse-momentum densities of the NSD-enhanced event sample. The measurements are compared to the predictions of the PYTHIA 8 CUETM1 (long dashes), PYTHIA 8 MBR4C (continuous line), and epos LHC (short dashes) event generators. The band encompassing the data points represent the total systematic uncertainty, while the statistical uncertainty is included as a vertical bar for each data point. The lower panel shows the corresponding MC-to-data ratios. |

png pdf |
Figure 4-c:
Charged particle transverse-momentum densities of the SD-enhanced event sample. The measurements are compared to the predictions of the PYTHIA 8 CUETM1 (long dashes), PYTHIA 8 MBR4C (continuous line), and epos LHC (short dashes) event generators. The band encompassing the data points represent the total systematic uncertainty, while the statistical uncertainty is included as a vertical bar for each data point. The lower panel shows the corresponding MC-to-data ratios. |

png pdf |
Figure 5:
Leading charged particle $ {p_{\mathrm {T}}} $ distributions of inelastic (top left), NSD-enhanced (top right), and SD-enhanced (bottom) event samples. The measurements are compared to the predictions of the PYTHIA 8 CUETM1 (long dashes), PYTHIA 8 MBR4C (continuous line), and epos LHC (short dashes) event generators. The band encompassing the data points represent the total systematic uncertainty, while the statistical uncertainty is included as a vertical bar for each data point. The lower panels show the corresponding MC-to-data ratios. |

png pdf |
Figure 5-a:
Leading charged particle $ {p_{\mathrm {T}}} $ distributions of the inelastic event samples. The measurements are compared to the predictions of the PYTHIA 8 CUETM1 (long dashes), PYTHIA 8 MBR4C (continuous line), and epos LHC (short dashes) event generators. The band encompassing the data points represent the total systematic uncertainty, while the statistical uncertainty is included as a vertical bar for each data point. The lower panel shows the corresponding MC-to-data ratios. |

png pdf |
Figure 5-b:
Leading charged particle $ {p_{\mathrm {T}}} $ distributions of the NSD-enhanced event samples. The measurements are compared to the predictions of the PYTHIA 8 CUETM1 (long dashes), PYTHIA 8 MBR4C (continuous line), and epos LHC (short dashes) event generators. The band encompassing the data points represent the total systematic uncertainty, while the statistical uncertainty is included as a vertical bar for each data point. The lower panel shows the corresponding MC-to-data ratios. |

png pdf |
Figure 5-c:
Leading charged particle $ {p_{\mathrm {T}}} $ distributions of the SD-enhanced event samples. The measurements are compared to the predictions of the PYTHIA 8 CUETM1 (long dashes), PYTHIA 8 MBR4C (continuous line), and epos LHC (short dashes) event generators. The band encompassing the data points represent the total systematic uncertainty, while the statistical uncertainty is included as a vertical bar for each data point. The lower panel shows the corresponding MC-to-data ratios. |
png pdf |
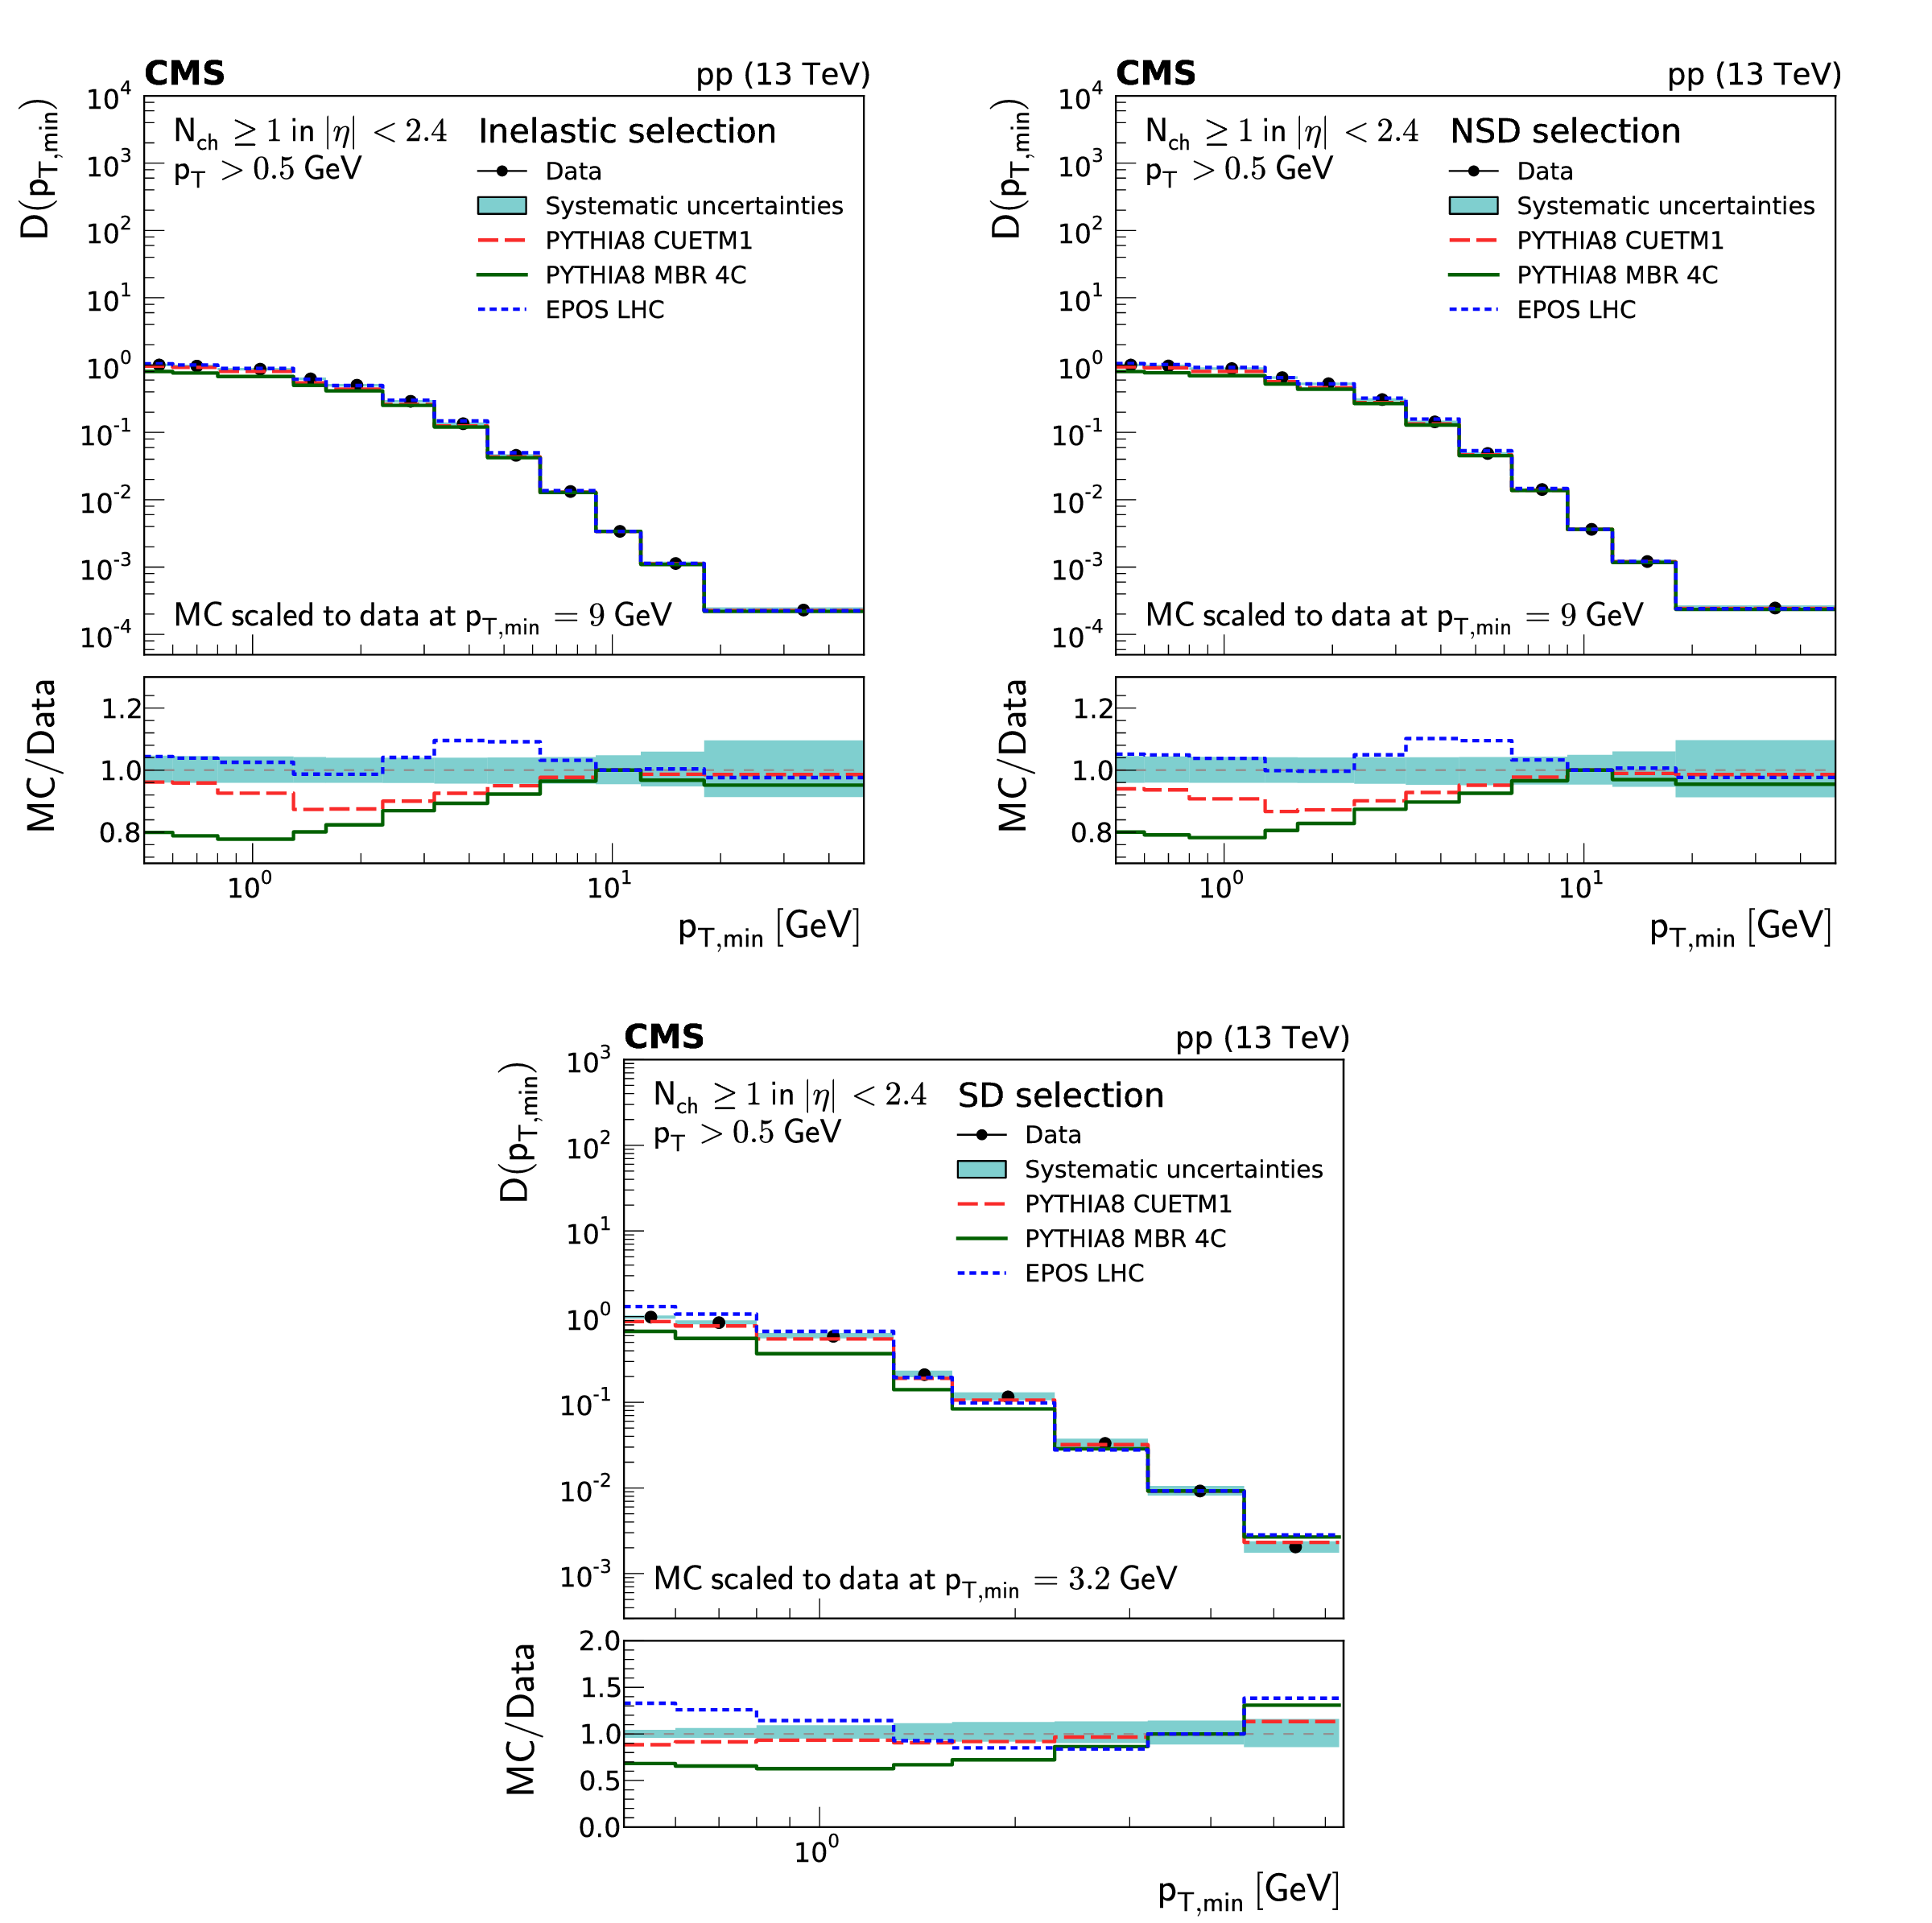
Figure 6:
Integrated leading charged particle $ {p_{\mathrm {T}}} $ distributions as a function of ${p_{\text {T,min}}}$ for inelastic (top left), NSD-enhanced (top right), and SD-enhanced (bottom) event samples. The measurements are compared to the predictions of the PYTHIA 8 CUETM1 (long dashes), PYTHIA 8 MBR4C (continuous line), and epos LHC (short dashes) event generators. The band encompassing the data points represent the total systematic uncertainty, while the statistical uncertainty is included as a vertical bar for each data point. The lower panels show the corresponding MC-to-data ratios. |

png pdf |
Figure 6-a:
Integrated leading charged particle $ {p_{\mathrm {T}}} $ distribution as a function of ${p_{\text {T,min}}}$ for inelastic event sample. The measurements are compared to the predictions of the PYTHIA 8 CUETM1 (long dashes), PYTHIA 8 MBR4C (continuous line), and epos LHC (short dashes) event generators. The band encompassing the data points represent the total systematic uncertainty, while the statistical uncertainty is included as a vertical bar for each data point. The lower panel shows the corresponding MC-to-data ratios. |

png pdf |
Figure 6-b:
Integrated leading charged particle $ {p_{\mathrm {T}}} $ distribution as a function of ${p_{\text {T,min}}}$ for NSD-enhanced |

png pdf |
Figure 6-c:
Integrated leading charged particle $ {p_{\mathrm {T}}} $ distribution as a function of ${p_{\text {T,min}}}$ for SD-enhanced event sample. The measurements are compared to the predictions of the PYTHIA 8 CUETM1 (long dashes), PYTHIA 8 MBR4C (continuous line), and epos LHC (short dashes) event generators. The band encompassing the data points represent the total systematic uncertainty, while the statistical uncertainty is included as a vertical bar for each data point. The lower panel shows the corresponding MC-to-data ratios. |
| Tables | |

png pdf |
Table 1:
Summary of stable-particle level definitions for each of the event samples, corresponding to the inelastic, the NSD-enhanced, and SD-enhanced categories. Charged particles are selected with $ {p_{\mathrm {T}}} > $ 0.5 GeV and $ | \eta | < $ 2.4. Forward trigger particles correspond to those with energy $ E > $ 5 GeV located in side$^-$ (defined as $-5 < \eta < -3$) and/or side$^+$ (defined as 3 $ < \eta < 5$). Similarly, a {veto} corresponds to the absence of a trigger particle with $ E > $ 5 GeV in side$^-$ and/or side$^+$. |

png pdf |
Table 2:
Summary of systematic uncertainties per observable for each of the event samples. The observables are (presented as rows, from top to bottom) pseudorapidity, multiplicity, transverse momentum, leading transverse momentum, and the integral of the latter. The columns, from left to right, represent the following event samples: Inelastic, NSD-enhanced and SD-enhanced. For each observable the respective sources of uncertainty are listed. These are, from top to bottom: the tracking efficiency, the pileup modelling, the event selection and the model dependence. The final value in each case represents the total systematic uncertainty. |
| Summary |
| Charged particle distributions measured with the CMS detector in minimum bias proton-proton collisions at a center-of-mass energy of $\sqrt{s} = $ 13 TeV have been presented. Charged particles are selected with transverse momenta satisfying ${p_{\mathrm{T}}} > $ 0.5 GeV in the pseudorapidity range $|{\eta}| < $ 2.4. The measured distributions, corrected for detector effects, are presented for three different event samples selected according to the maximum particle energy in the range 3 $ < |{\eta}| < $ 5. The event samples correspond to an inelastic sample, a sample dominated by nonsingle diffractive dissociation events (NSD-enhanced sample), and an event sample enriched by single diffractive dissociation events (SD-enhanced sample). |
| References | ||||
| 1 | UA5 Collaboration | Scaling of pseudorapidity distributions at centre-of-mass energies up to 0.9 TeV | Z. Phys. C 33 (1986) 1 | |
| 2 | UA4 Collaboration | Pseudorapidity distribution of charged particles in diffraction dissociation events at the CERN SPS collider | PLB 166 (1986) 459 | |
| 3 | UA1 Collaboration | A study of the general characteristics of proton-antiproton collisions at $ \sqrt{s} = $ 0.2 to 0.9 TeV | NPB 335 (1990) 261 | |
| 4 | CDF Collaboration | Pseudorapidity distributions of charged particles produced in $ \textrm{p\={p}} $ interactions at $ \sqrt{s} = $ 630 GeV and 1800 GeV | PRD 41 (1990) 2330 | |
| 5 | CDF Collaboration | Measurement of particle production and inclusive differential cross sections in $ \rm p\bar{\rm p} $ collisions at $ \sqrt{s} = $ 1.96 TeV | PRD 79 (2009) 112005 | 0904.1098 |
| 6 | ALICE Collaboration | Charged-particle multiplicity measurement in proton-proton collisions at $ \sqrt{s}= $ 0.9 and 2.36 TeV with ALICE at LHC | EPJC 68 (2010) 89 | 1004.3034 |
| 7 | ALICE Collaboration | Charged-particle multiplicity measurement in proton-proton collisions at $ \sqrt{s}= $ 7 TeV with ALICE at LHC | EPJC 68 (2010) 345 | 1004.3514 |
| 8 | ALICE Collaboration | Charged-particle multiplicities in proton-proton collisions at $ \sqrt{s} = $ 0.9 to 8 TeV | EPJC 77 (2017) 33 | 1509.07541 |
| 9 | ALICE Collaboration | Charged-particle multiplicity distributions over a wide pseudorapidity range in proton-proton collisions at $ \sqrt{s}= $ 0.9, 7, and 8 TeV | EPJC 77 (2017) 852 | 1708.01435 |
| 10 | ATLAS Collaboration | Charged-particle multiplicities in $ pp $ interactions at $ \sqrt{s}= $ 900 GeV measured with the ATLAS detector at the LHC | PLB 688 (2010) 21 | 1003.3124 |
| 11 | ATLAS Collaboration | Charged-particle multiplicities in pp interactions measured with the ATLAS detector at the LHC | New J. Phys. 13 (2011) 053033 | 1012.5104 |
| 12 | ATLAS Collaboration | Charged-particle distributions in $ pp $ interactions at $ \sqrt{s}= $ 8 TeV measured with the ATLAS detector | EPJC 76 (2016) 403 | 1603.02439 |
| 13 | CMS Collaboration | Transverse momentum and pseudorapidity distributions of charged hadrons in pp collisions at $ \sqrt{s} = $ 0.9 and 2.36 TeV | JHEP 02 (2010) 041 | CMS-QCD-09-010 1002.0621 |
| 14 | CMS Collaboration | Transverse-momentum and pseudorapidity distributions of charged hadrons in $ pp $ collisions at $ \sqrt{s}= $ 7 TeV | PRL 105 (2010) 022002 | CMS-QCD-10-006 1005.3299 |
| 15 | CMS Collaboration | Charged particle multiplicities in pp interactions at $ \sqrt{s}= $ 0.9 , 2.36, and 7 TeV | JHEP 01 (2011) 079 | CMS-QCD-10-004 1011.5531 |
| 16 | CMS, TOTEM Collaboration | Measurement of pseudorapidity distributions of charged particles in proton-proton collisions at $ \sqrt{s} = $ 8 TeV by the CMS and TOTEM experiments | EPJC 74 (2014) 3053 | 1405.0722 |
| 17 | CMS Collaboration | Production of leading charged particles and leading charged-particle jets at small transverse momenta in pp collisions at $ \sqrt{s} = $ 8 TeV | PRD 92 (2015) 112001 | CMS-FSQ-12-032 1507.00233 |
| 18 | LHCb Collaboration | Measurement of charged particle multiplicities in $ pp $ collisions at $ {\sqrt{s} =7} $ TeV in the forward region | EPJC 72 (2012) 1947 | 1112.4592 |
| 19 | TOTEM Collaboration | Measurement of the forward charged particle pseudorapidity density in $ pp $ collisions at $ \sqrt{s} = $ 7 TeV with the TOTEM experiment | Europhys. Lett. 98 (2012) 31002 | 1205.4105 |
| 20 | CMS Collaboration | Event generator tunes obtained from underlying event and multiparton scattering measurements | EPJC 76 (2016) 155 | CMS-GEN-14-001 1512.00815 |
| 21 | ALICE Collaboration | Pseudorapidity and transverse-momentum distributions of charged particles in proton-proton collisions at $ \sqrt{s}= $ 13 TeV | PLB 753 (2016) 319 | 1509.08734 |
| 22 | ATLAS Collaboration | Charged-particle distributions in $ \sqrt{s} = $ 13 TeV pp interactions measured with the ATLAS detector at the LHC | PLB 758 (2016) 67 | 1602.01633 |
| 23 | ATLAS Collaboration | Charged-particle distributions at low transverse momentum in $ \sqrt{s} = 13 TeV pp $ interactions measured with the ATLAS detector at the LHC | EPJC 76 (2016) 502 | 1606.01133 |
| 24 | CMS Collaboration | Pseudorapidity distribution of charged hadrons in proton-proton collisions at $ \sqrt{s} = $ 13 TeV | PLB 751 (2015) 143 | CMS-FSQ-15-001 1507.05915 |
| 25 | A. Grebenyuk et al. | Jet production and the inelastic pp cross section at the LHC | PRD 86 (2012) 117501 | 1209.6265 |
| 26 | CMS Collaboration | Description and performance of track and primary-vertex reconstruction with the CMS tracker | JINST 9 (2014) P10009 | CMS-TRK-11-001 1405.6569 |
| 27 | CMS Collaboration | The CMS experiment at the CERN LHC | JINST 3 (2008) S08004 | CMS-00-001 |
| 28 | T. Sjostrand, S. Mrenna, and P. Skands | A brief introduction to PYTHIA 8.1 | CPC 178 (2008) 852 | 0710.3820 |
| 29 | P. Z. Skands and D. Wicke | Non-perturbative QCD effects and the top mass at the Tevatron | EPJC 52 (2007) 133 | hep-ph/0703081 |
| 30 | V. N. Gribov and L. N. Lipatov | Deep inelastic e p scattering in perturbation theory | Sov. J. NP 15 (1972) 438.[\it Yad. Fiz. \bf 15 (1972) 781] | |
| 31 | G. Altarelli and G. Parisi | Asymptotic freedom in parton language | NPB 126 (1977) 298 | |
| 32 | Y. L. Dokshitzer | Calculation of the structure functions for deep inelastic scattering and e$ ^+ $e$ ^- $ annihilation by perturbation theory in quantum chromodynamics. | Sov. Phys. JETP 46 (1977) 641.[\it Zh. Eksp. Teor. Fiz. \bf73 (1977) 1216 ] | |
| 33 | B. Andersson, G. Gustafson, G. Ingelman, and T. Sjostrand | Parton fragmentation and string dynamics | PR 97 (1983) 31 | |
| 34 | G. A. Schuler and T. Sjostrand | Hadronic diffractive cross sections and the rise of the total cross section | PRD 49 (1994) 2257 | |
| 35 | H1 Collaboration | Measurement and QCD analysis of the diffractive deep-inelastic scattering cross-section at HERA | EPJC 48 (2006) 715 | hep-ex/0606004 |
| 36 | H1 Collaboration | Dijet cross sections and parton densities in diffractive DIS at HERA | JHEP 10 (2007) 042 | 0708.3217 |
| 37 | P. Newman and M. Wing | The hadronic final state at HERA | Rev. Mod. Phys. 86 (2014) 1037 | 1308.3368 |
| 38 | P. Skands, S. Carrazza, and J. Rojo | Tuning PYTHIA 8.1: the Monash 2013 Tune | EPJC 74 (2014) 3024 | 1404.5630 |
| 39 | NNPDF Collaboration | Unbiased global determination of parton distributions and their uncertainties at NNLO and at LO | NPB 855 (2012) 153 | 1107.2652 |
| 40 | NNPDF Collaboration | Parton distributions with QED corrections | NPB 877 (2013) 290 | 1308.0598 |
| 41 | R. Ciesielski and K. Goulianos | MBR Monte Carlo simulation in PYTHIA8 | PoS ICHEP2012 (2013) 301 | 1205.1446 |
| 42 | R. Corke and T. Sjostrand | Interleaved parton showers and tuning prospects | JHEP 03 (2011) 032 | 1011.1759 |
| 43 | K. A. Goulianos | Diffraction in QCD | in Corfu Summer Institute on Elementary Particle Physics (Corfu 2001) Corfu, Greece, August 31-September 20, 2001 2002 | hep-ph/0203141 |
| 44 | K. A. Goulianos | Hadronic diffraction: Where do we stand? | in Results and perspectives in particle physics. Proceedings, 18th Rencontres de Physique de la Vallee d'Aoste, La Thuile, Italy, February 29-March 6, 2004, p. 251 2004 | hep-ph/0407035 |
| 45 | CMS Collaboration | Measurement of diffraction dissociation cross sections in pp collisions at $ \sqrt{s} = $ 7 TeV | PRD 92 (2015) 012003 | CMS-FSQ-12-005 1503.08689 |
| 46 | K. Werner, F. M. Liu, and T. Pierog | Parton ladder splitting and the rapidity dependence of transverse momentum spectra in deuteron-gold collisions at rhic | PRC 74 (2006) 044902 | hep-ph/0506232 |
| 47 | D. d'Enterria, R. Engel, T. Pierog, S. Ostapchenko, and K. Werner | Constraints from the first lhc data on hadronic event generators for ultra-high energy cosmic-ray physics | Astropart. Phys. 35 (2011) 98 | 1101.5596 |
| 48 | V. N. Gribov | A reggeon diagram technique | Sov. Phys. JETP 26 (1968) 414. [\it Zh. Eksp. Teor. Fiz. \bf 53 (1967) 654] | |
| 49 | T. Pierog et al. | EPOS LHC: Test of collective hadronization with data measured at the CERN Large Hadron Collider | PRC 92 (2015) 034906 | 1306.0121 |
| 50 | T. Pierog | LHC results and high energy cosmic ray interaction models | J. Phys. Conf. Ser. 409 (2013) 012008 | |
| 51 | GEANT4 Collaboration | $ GEANT4--a $ simulation toolkit | NIMA 506 (2003) 250 | |
| 52 | CMS Collaboration | Measurement of long-range near-side two-particle angular correlations in pp collisions at $ \sqrt{s} = $ 13 TeV | PRL 116 (2015) 172302 | CMS-FSQ-15-002 1510.03068 |
| 53 | CMS Collaboration | Track and vertex reconstruction in CMS | Nucl. Inst. Meth. A 582 (2007) 781 | |
| 54 | G. D'Agostini | A Multidimensional unfolding method based on Bayes' theorem | NIMA 362 (1995) 487 | |
| 55 | CMS Collaboration | Measurement of the inclusive $ W $ and $ Z $ production cross sections in pp collisions at $ \sqrt{s}= $ 7 TeV | JHEP 10 (2011) 132 | CMS-EWK-10-005 1107.4789 |
|
|
Compact Muon Solenoid LHC, CERN |
|

|

|

|

|

|