

Compact Muon Solenoid
LHC, CERN
| CMS-HIG-14-027 ; CERN-PH-EP-2015-255 | ||
| Search for the associated production of a Higgs boson with a single top quark in proton-proton collisions at $ \sqrt{s} = $ 8 TeV | ||
| CMS Collaboration | ||
| 28 September 2015 | ||
| JHEP 06 (2016) 177 | ||
| Abstract: This paper presents the search for the production of a Higgs boson in association with a single top quark (tHq), using data collected in proton-proton collisions at a center-of-mass energy of 8 TeV corresponding to an integrated luminosity of 19.7 fb$^{-1}$. The search exploits a variety of Higgs boson decay modes resulting in final states with photons, bottom quarks, and multiple charged leptons, including tau leptons, and employs a variety of multivariate techniques to maximize sensitivity to the signal. The analysis is optimized for the opposite sign of the Yukawa coupling to that in the standard model, corresponding to a large enhancement of the signal cross section. In the absence of an excess of candidate signal events over the background predictions, 95% confidence level observed (expected) upper limits on anomalous tHq production are set, ranging between 600 (450) fb and 1000 (700) fb depending on the assumed diphoton branching fraction of the Higgs boson. This is the first time that results on anomalous tHq production have been reported. | ||
| Links: e-print arXiv:1509.08159 [hep-ex] (PDF) ; CDS record ; inSPIRE record ; CADI line (restricted) ; | ||
| Figures & Tables | Summary | Additional Figures | References | CMS Publications |
|---|
| Figures | |
png pdf |
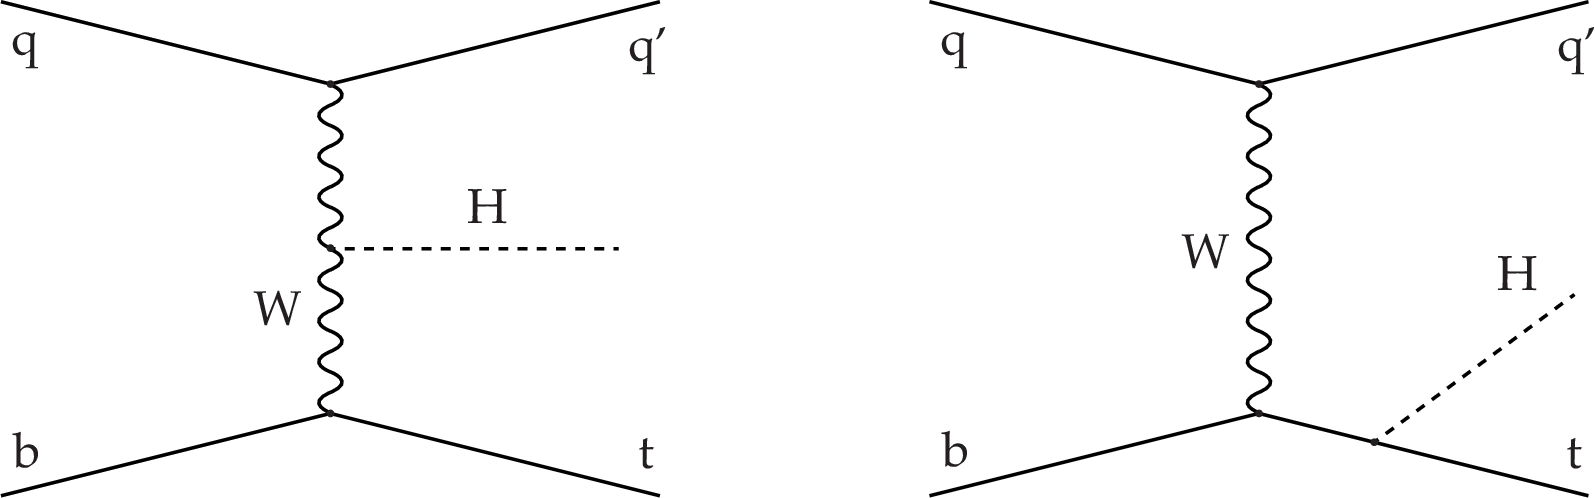
Figure 1:
Dominant Feynman diagrams for the production of ${\mathrm{ t } \mathrm{ H } \mathrm{ q } }$ events: the Higgs boson is typically radiated from the heavier particles of the diagram, i.e. the W boson (left) or the top quark (right). |
png pdf |
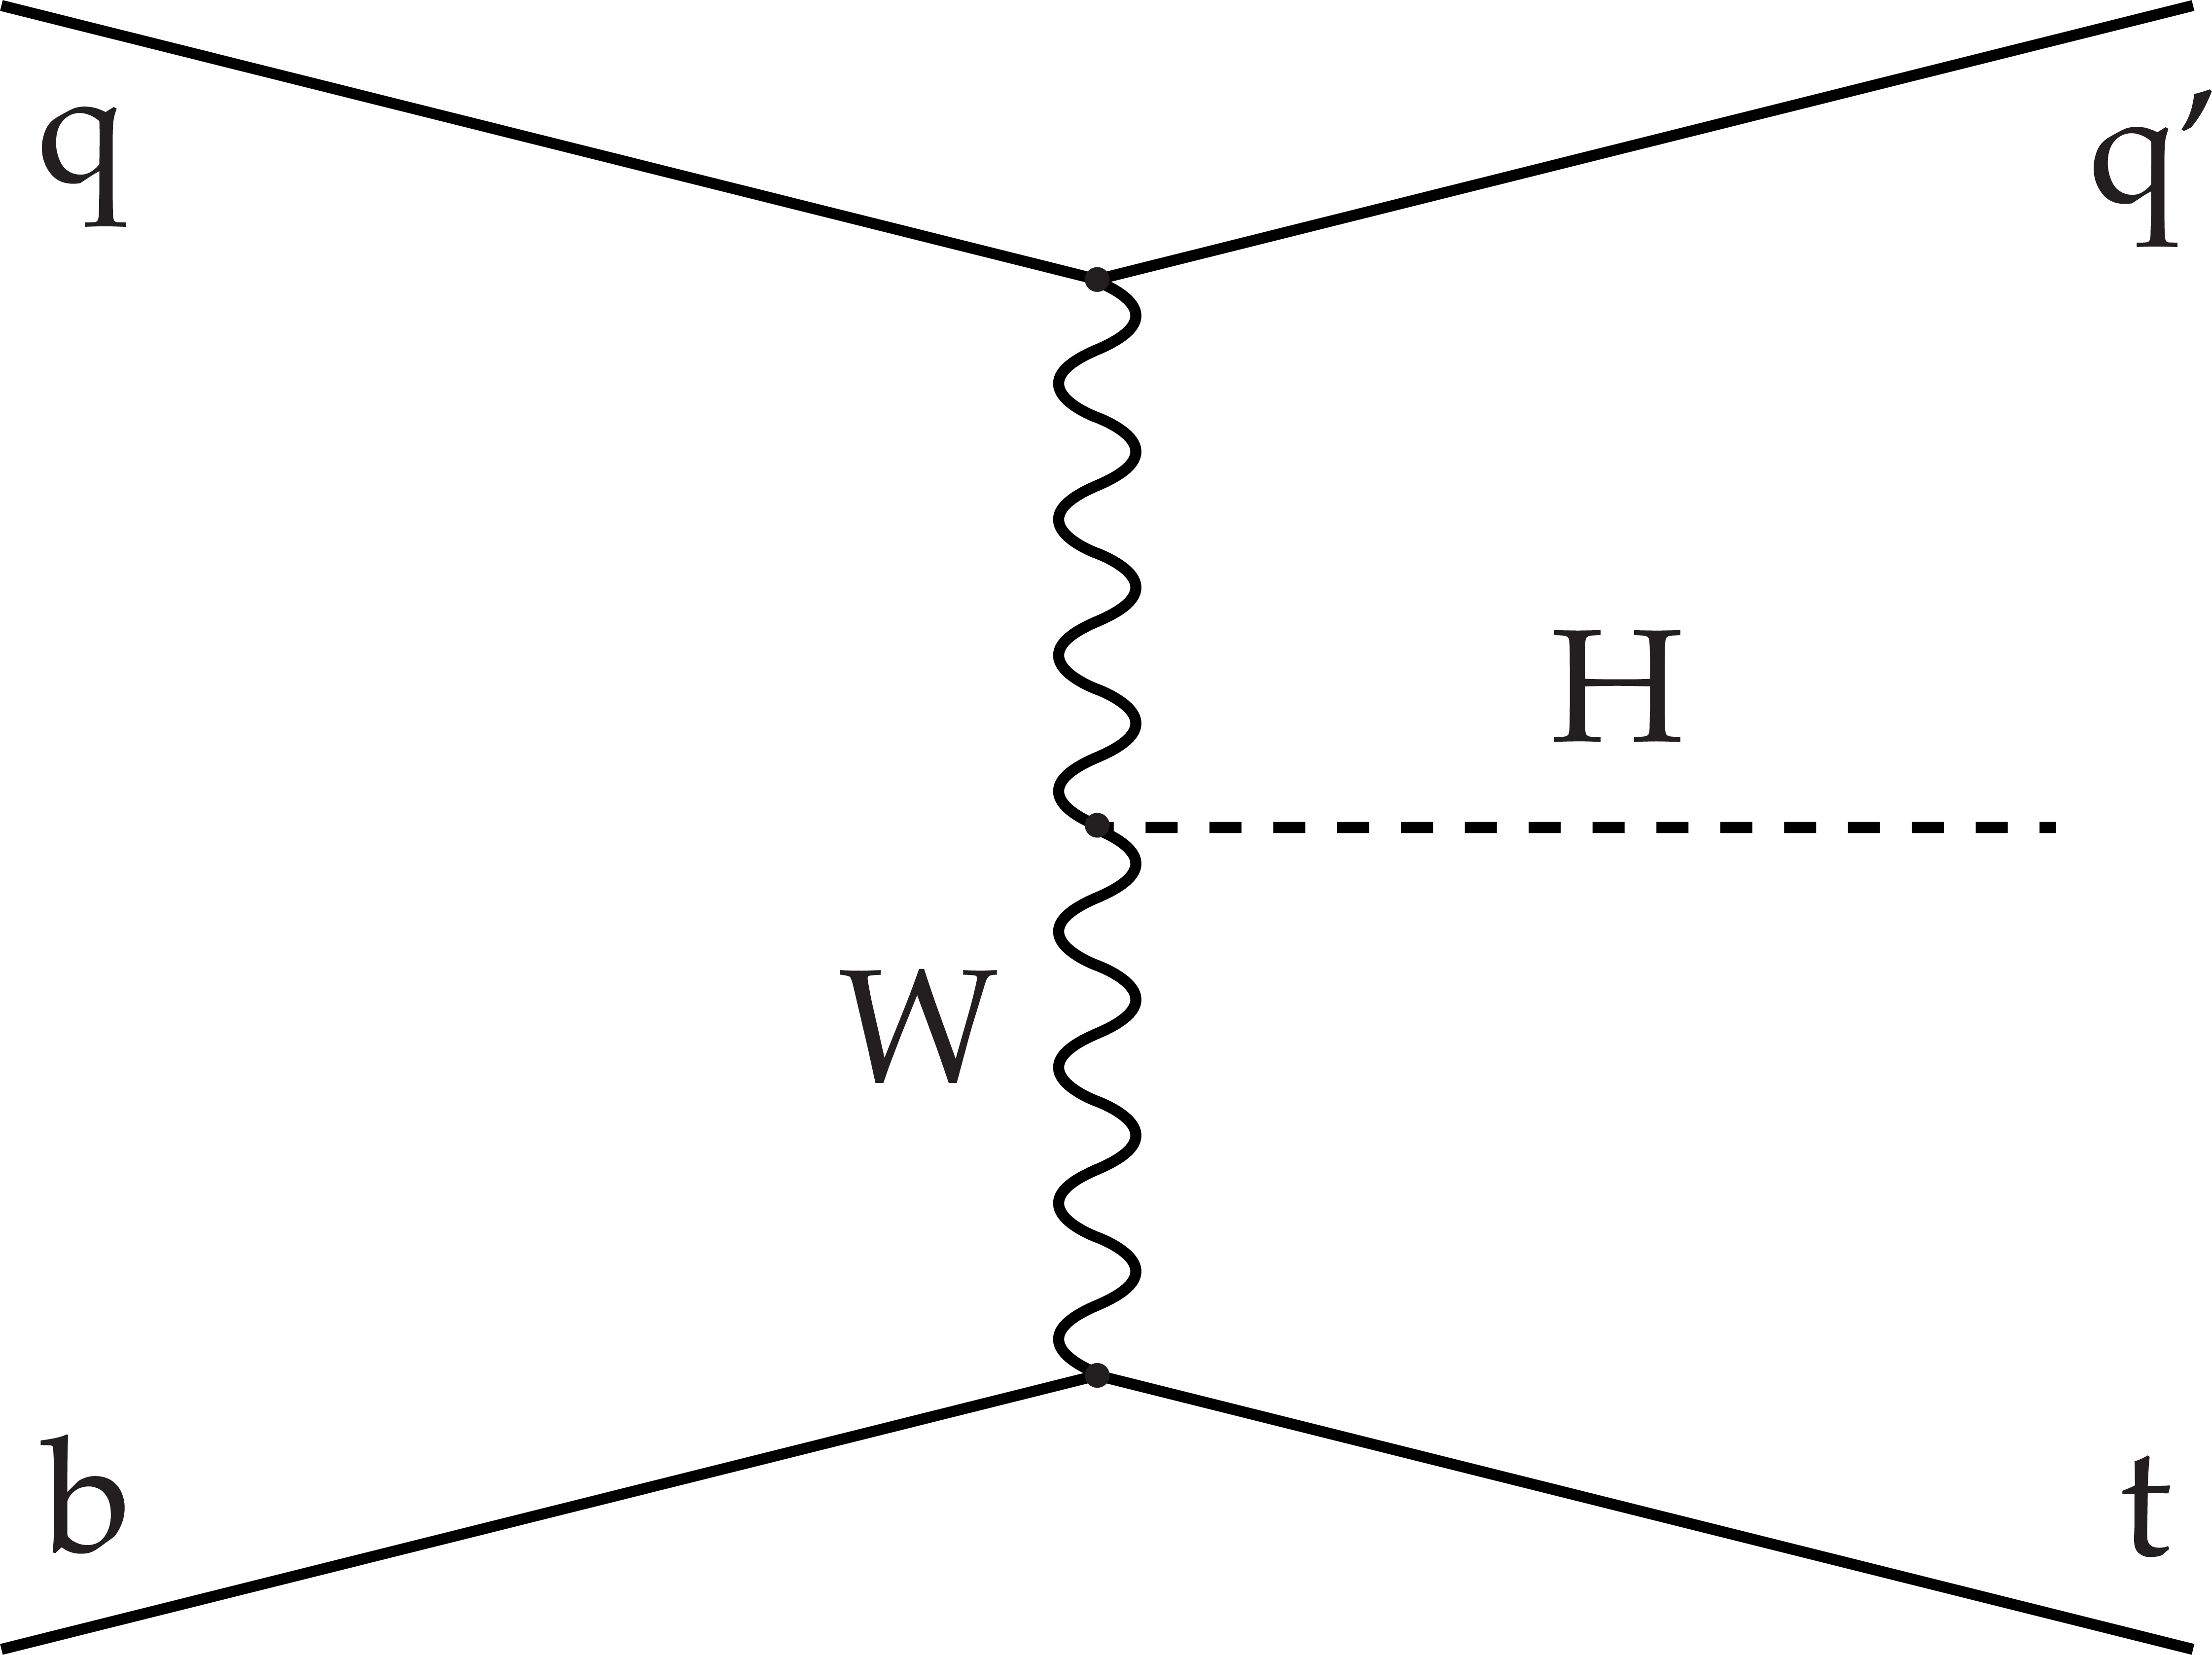
Figure 1-a:
One of the dominant Feynman diagram for the production of ${\mathrm{ t } \mathrm{ H } \mathrm{ q } }$ events: the Higgs boson is typically radiated from the heavier particles of the diagram, here the W boson. |
png pdf |
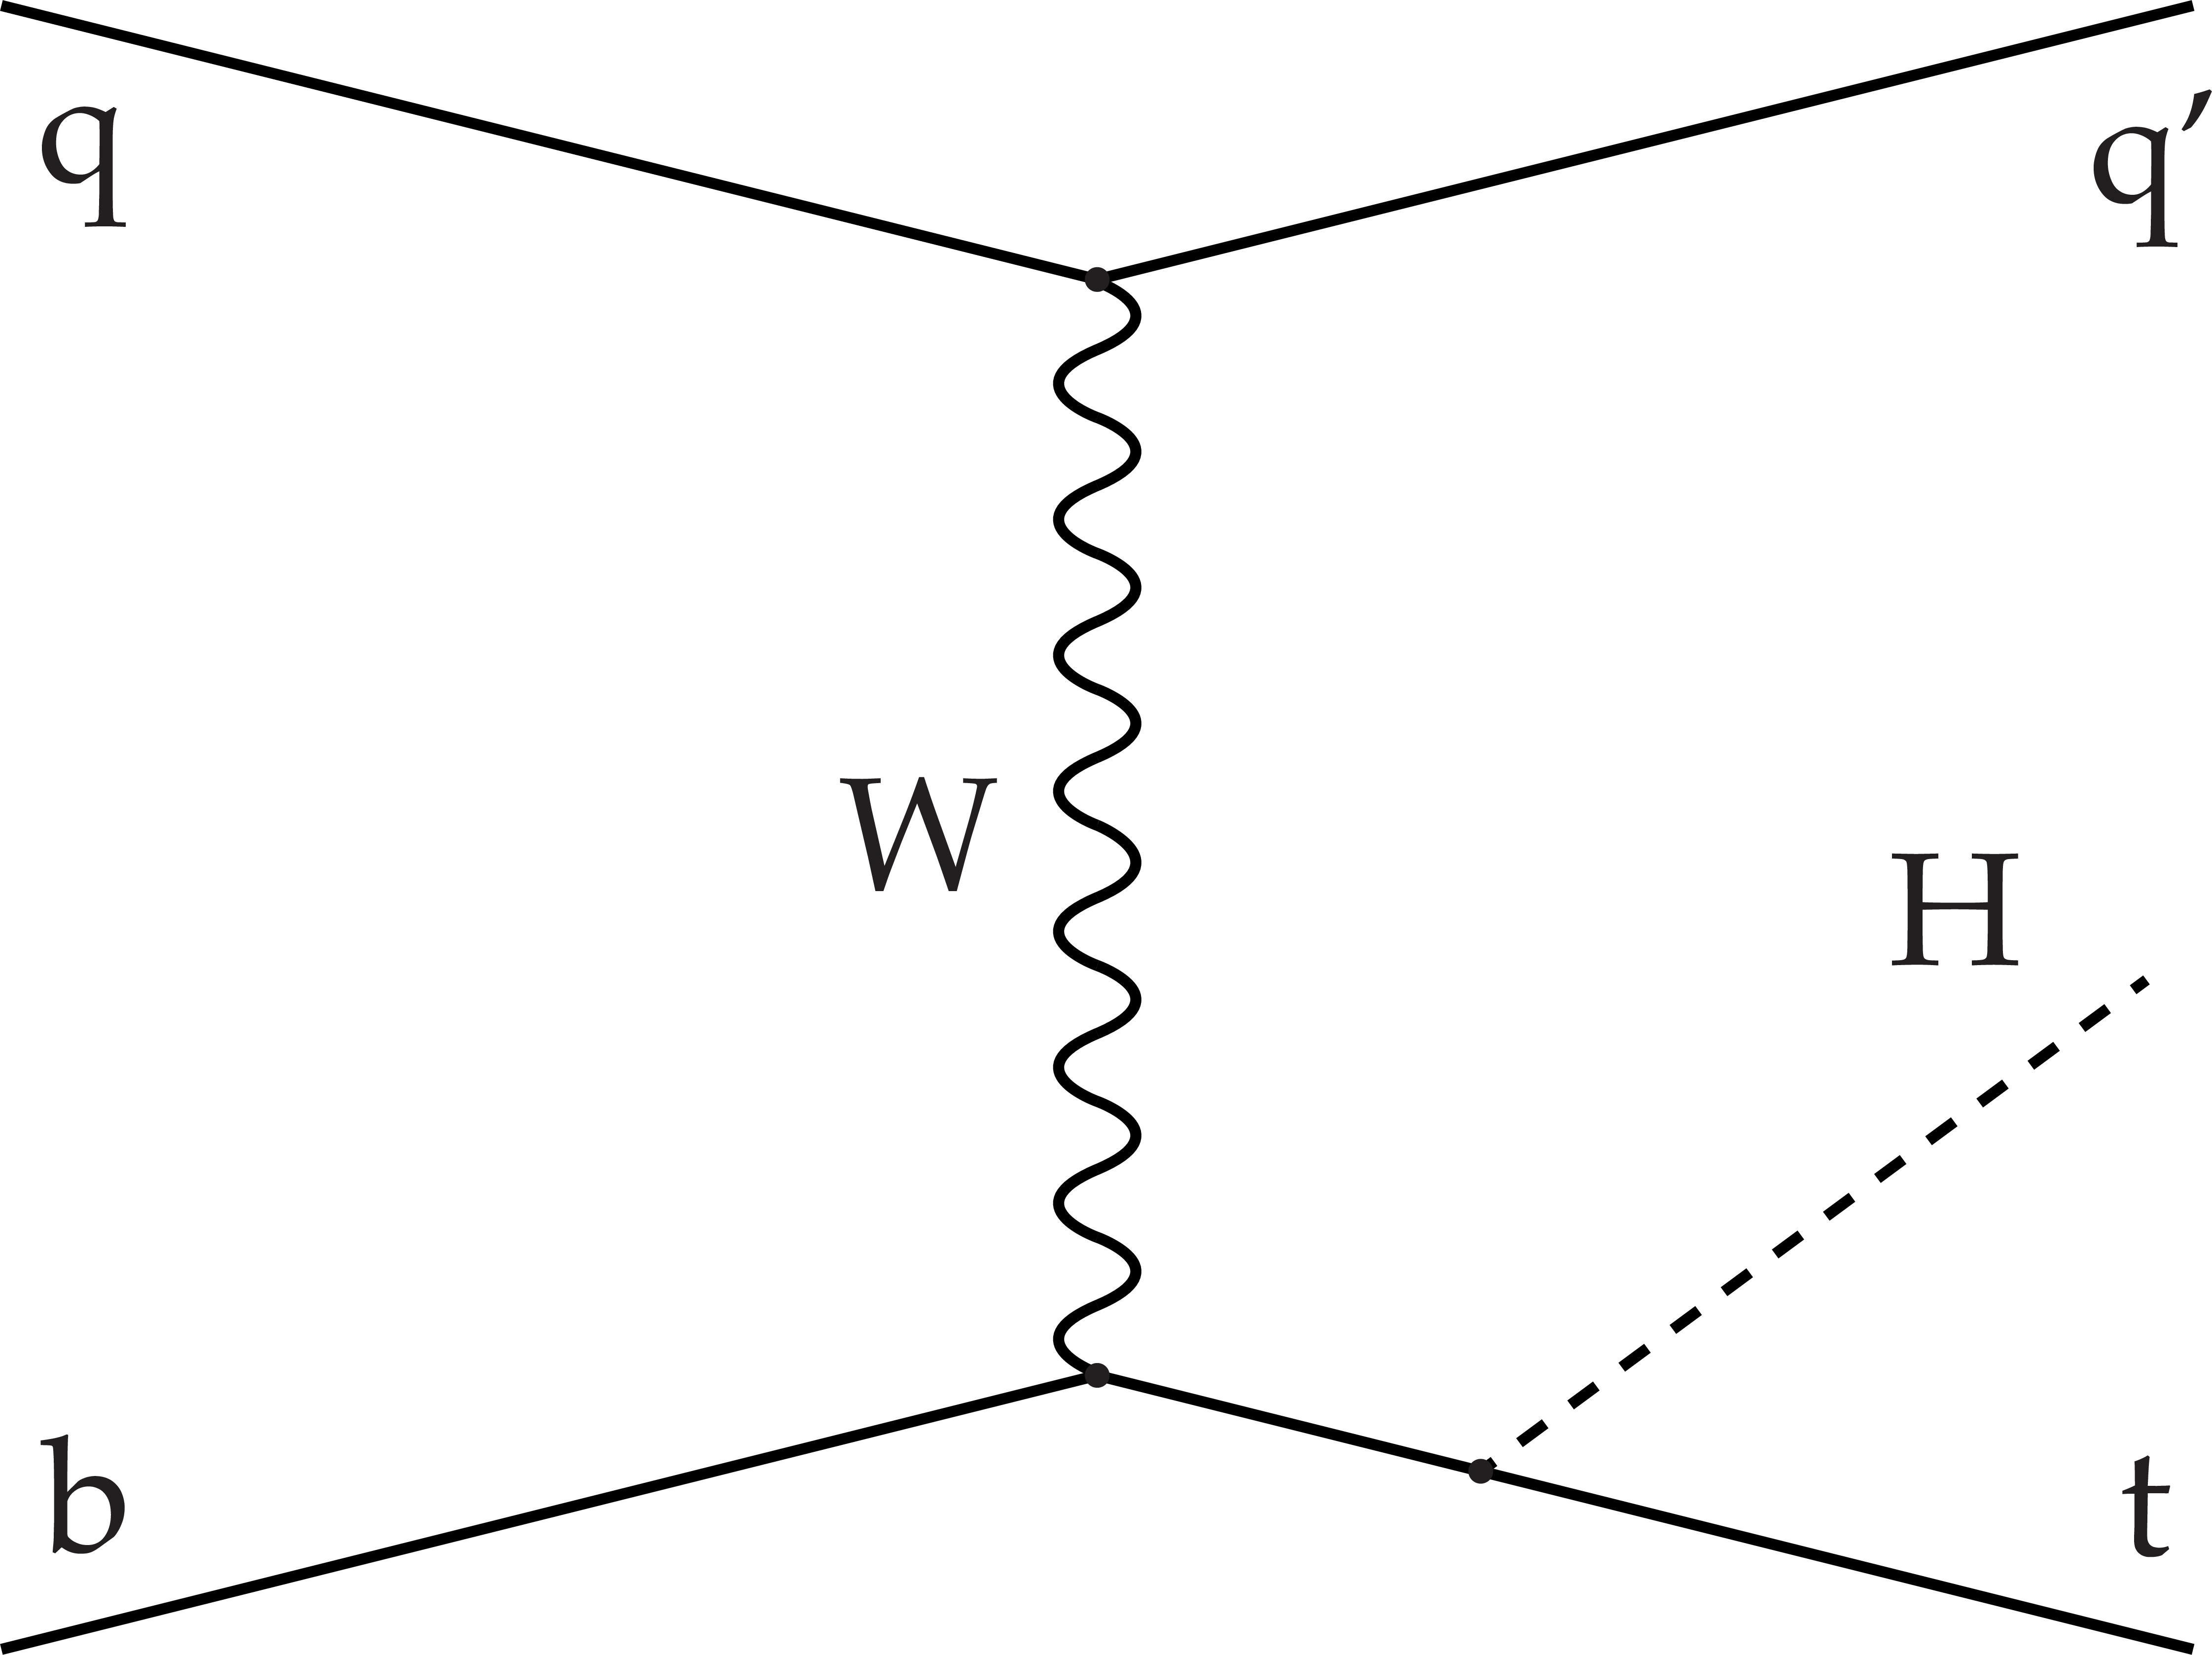
Figure 1-b:
One of the dominant Feynman diagram for the production of ${\mathrm{ t } \mathrm{ H } \mathrm{ q } }$ events: the Higgs boson is typically radiated from the heavier particles of the diagram, here the top quark. |
png pdf |
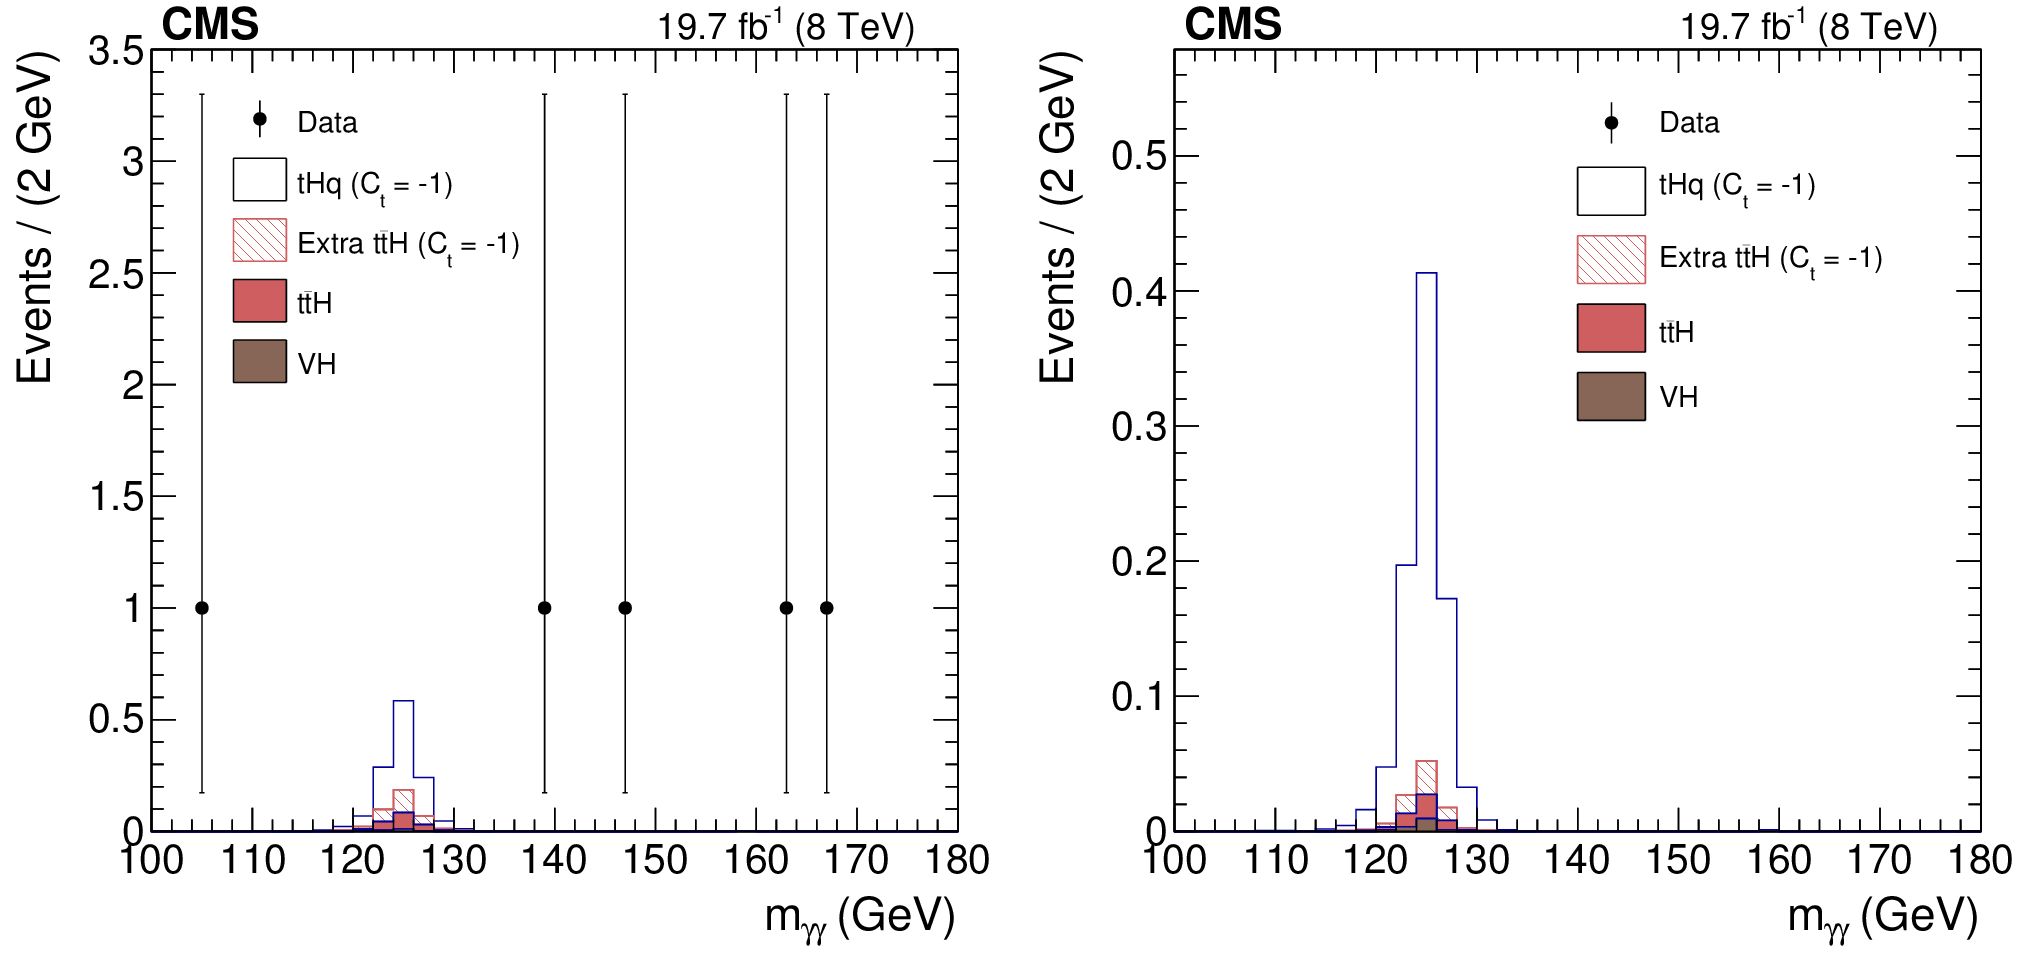
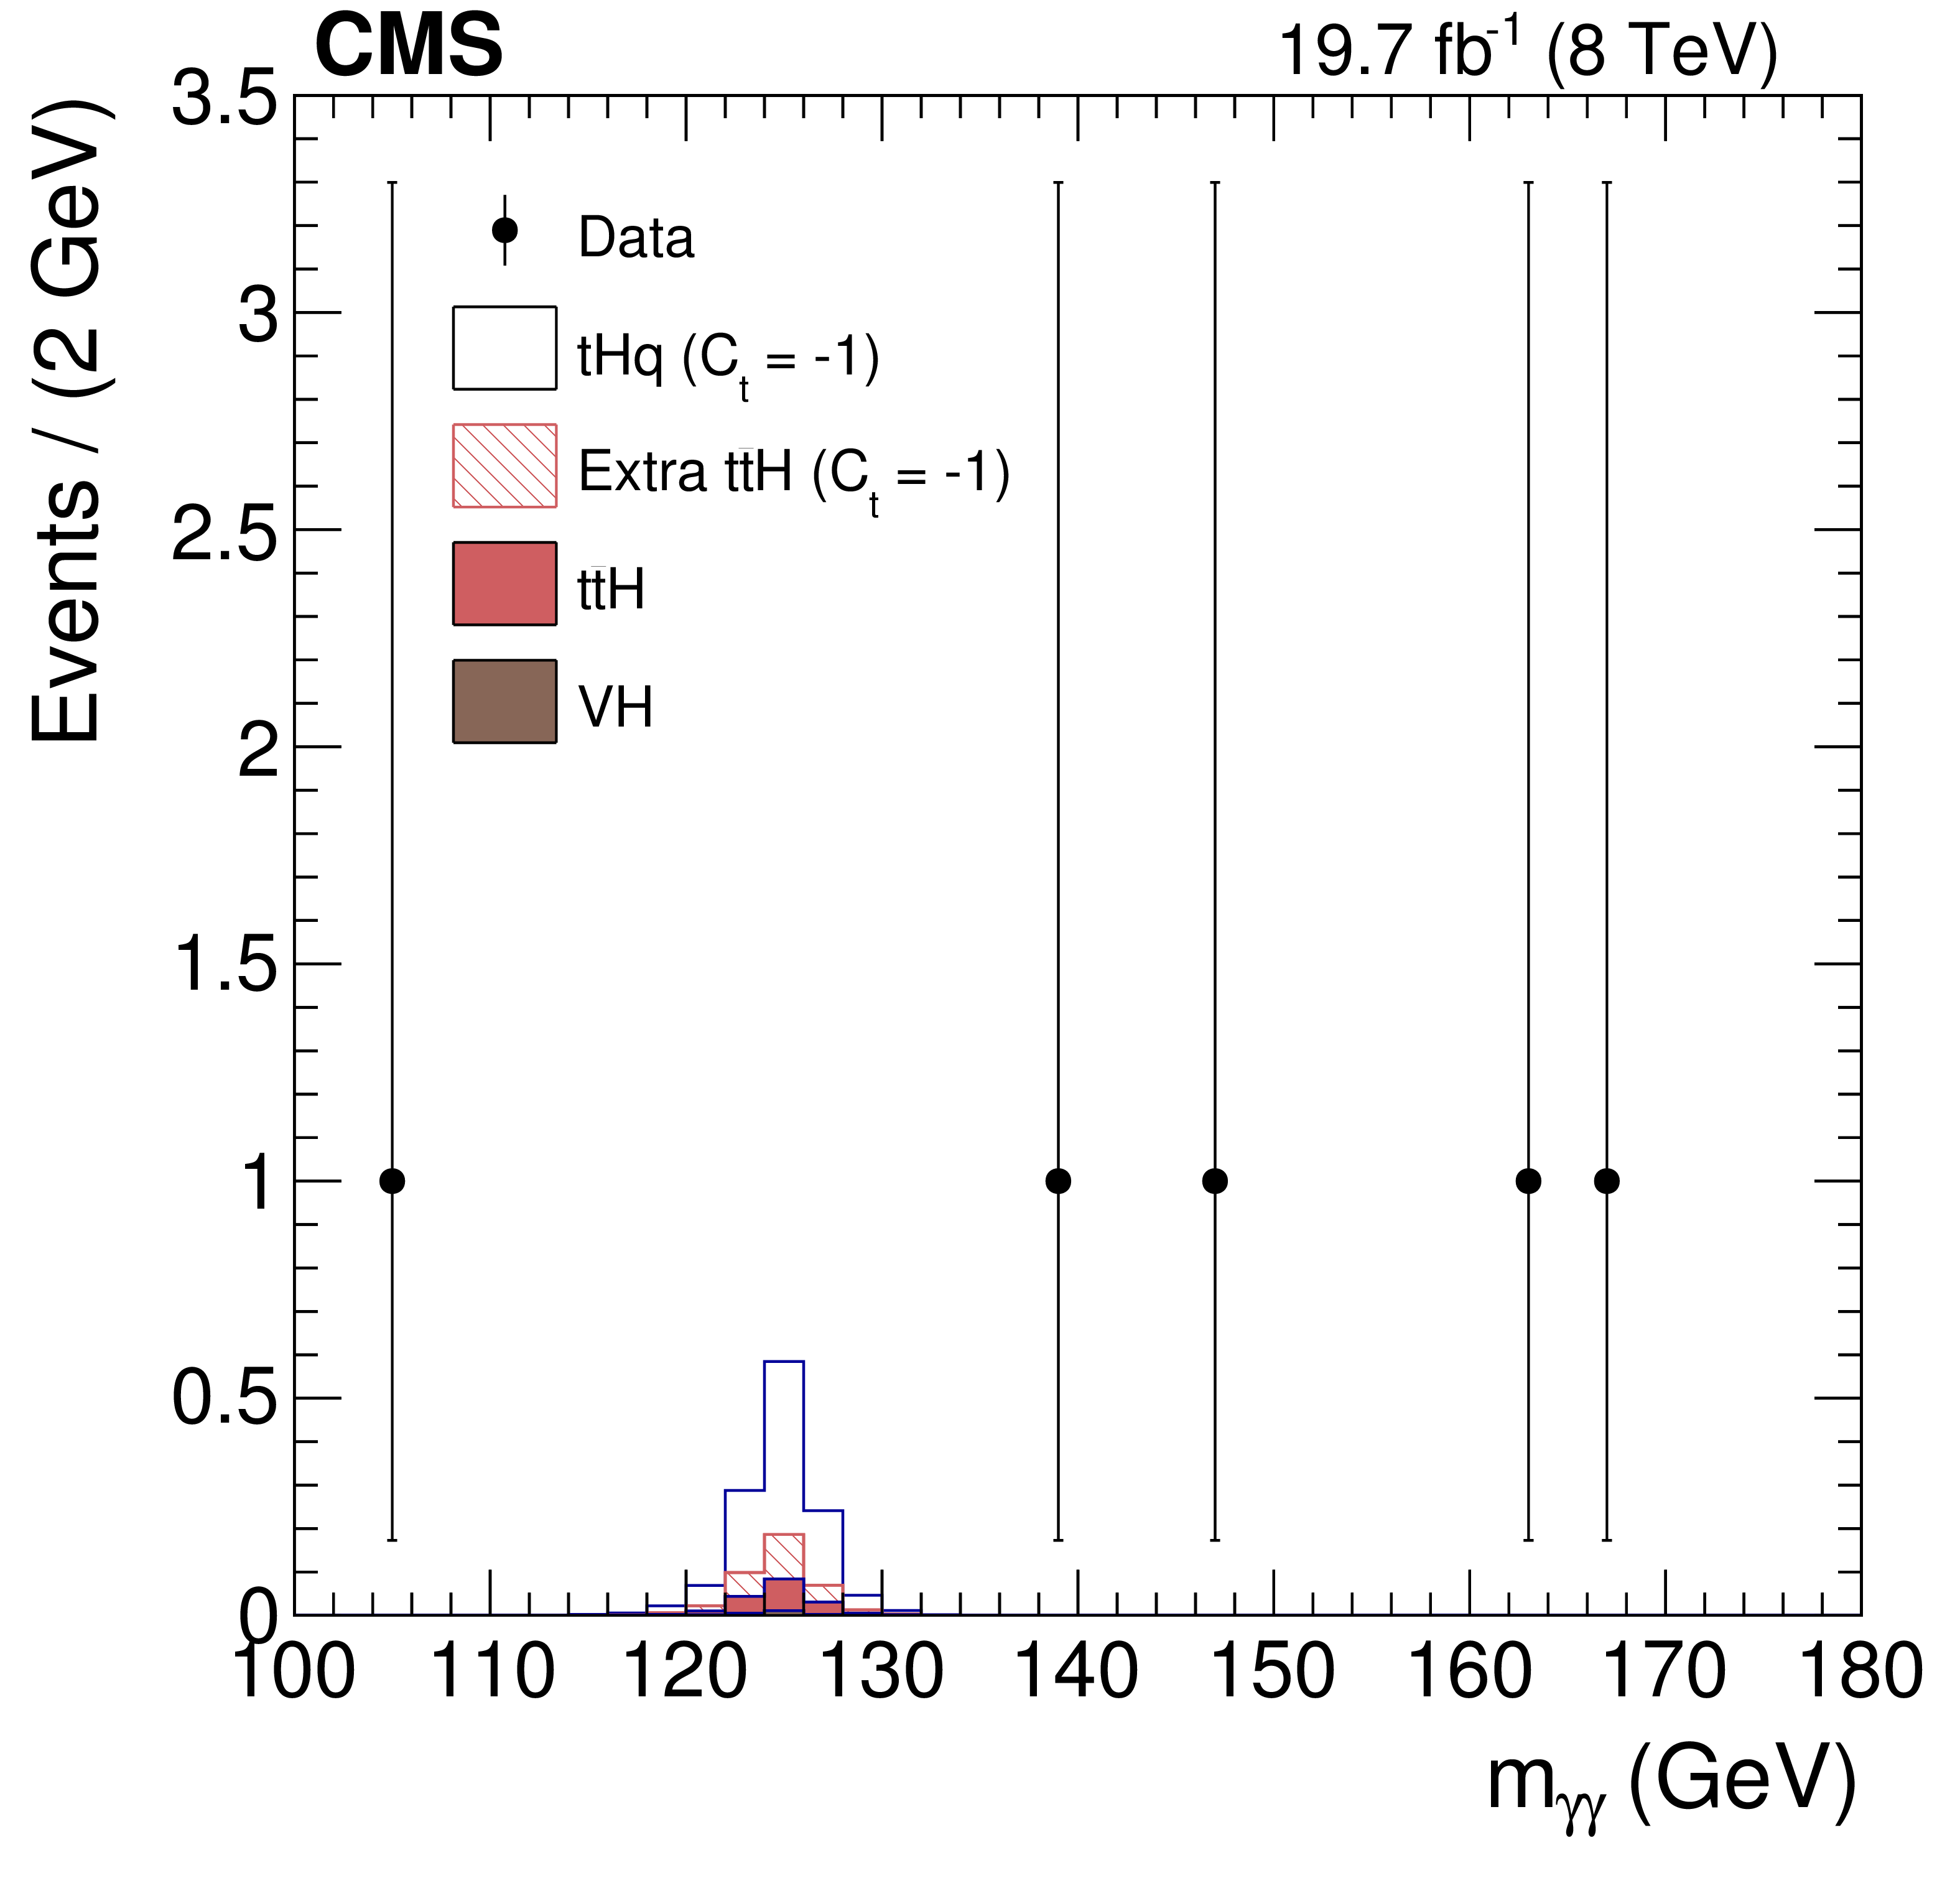
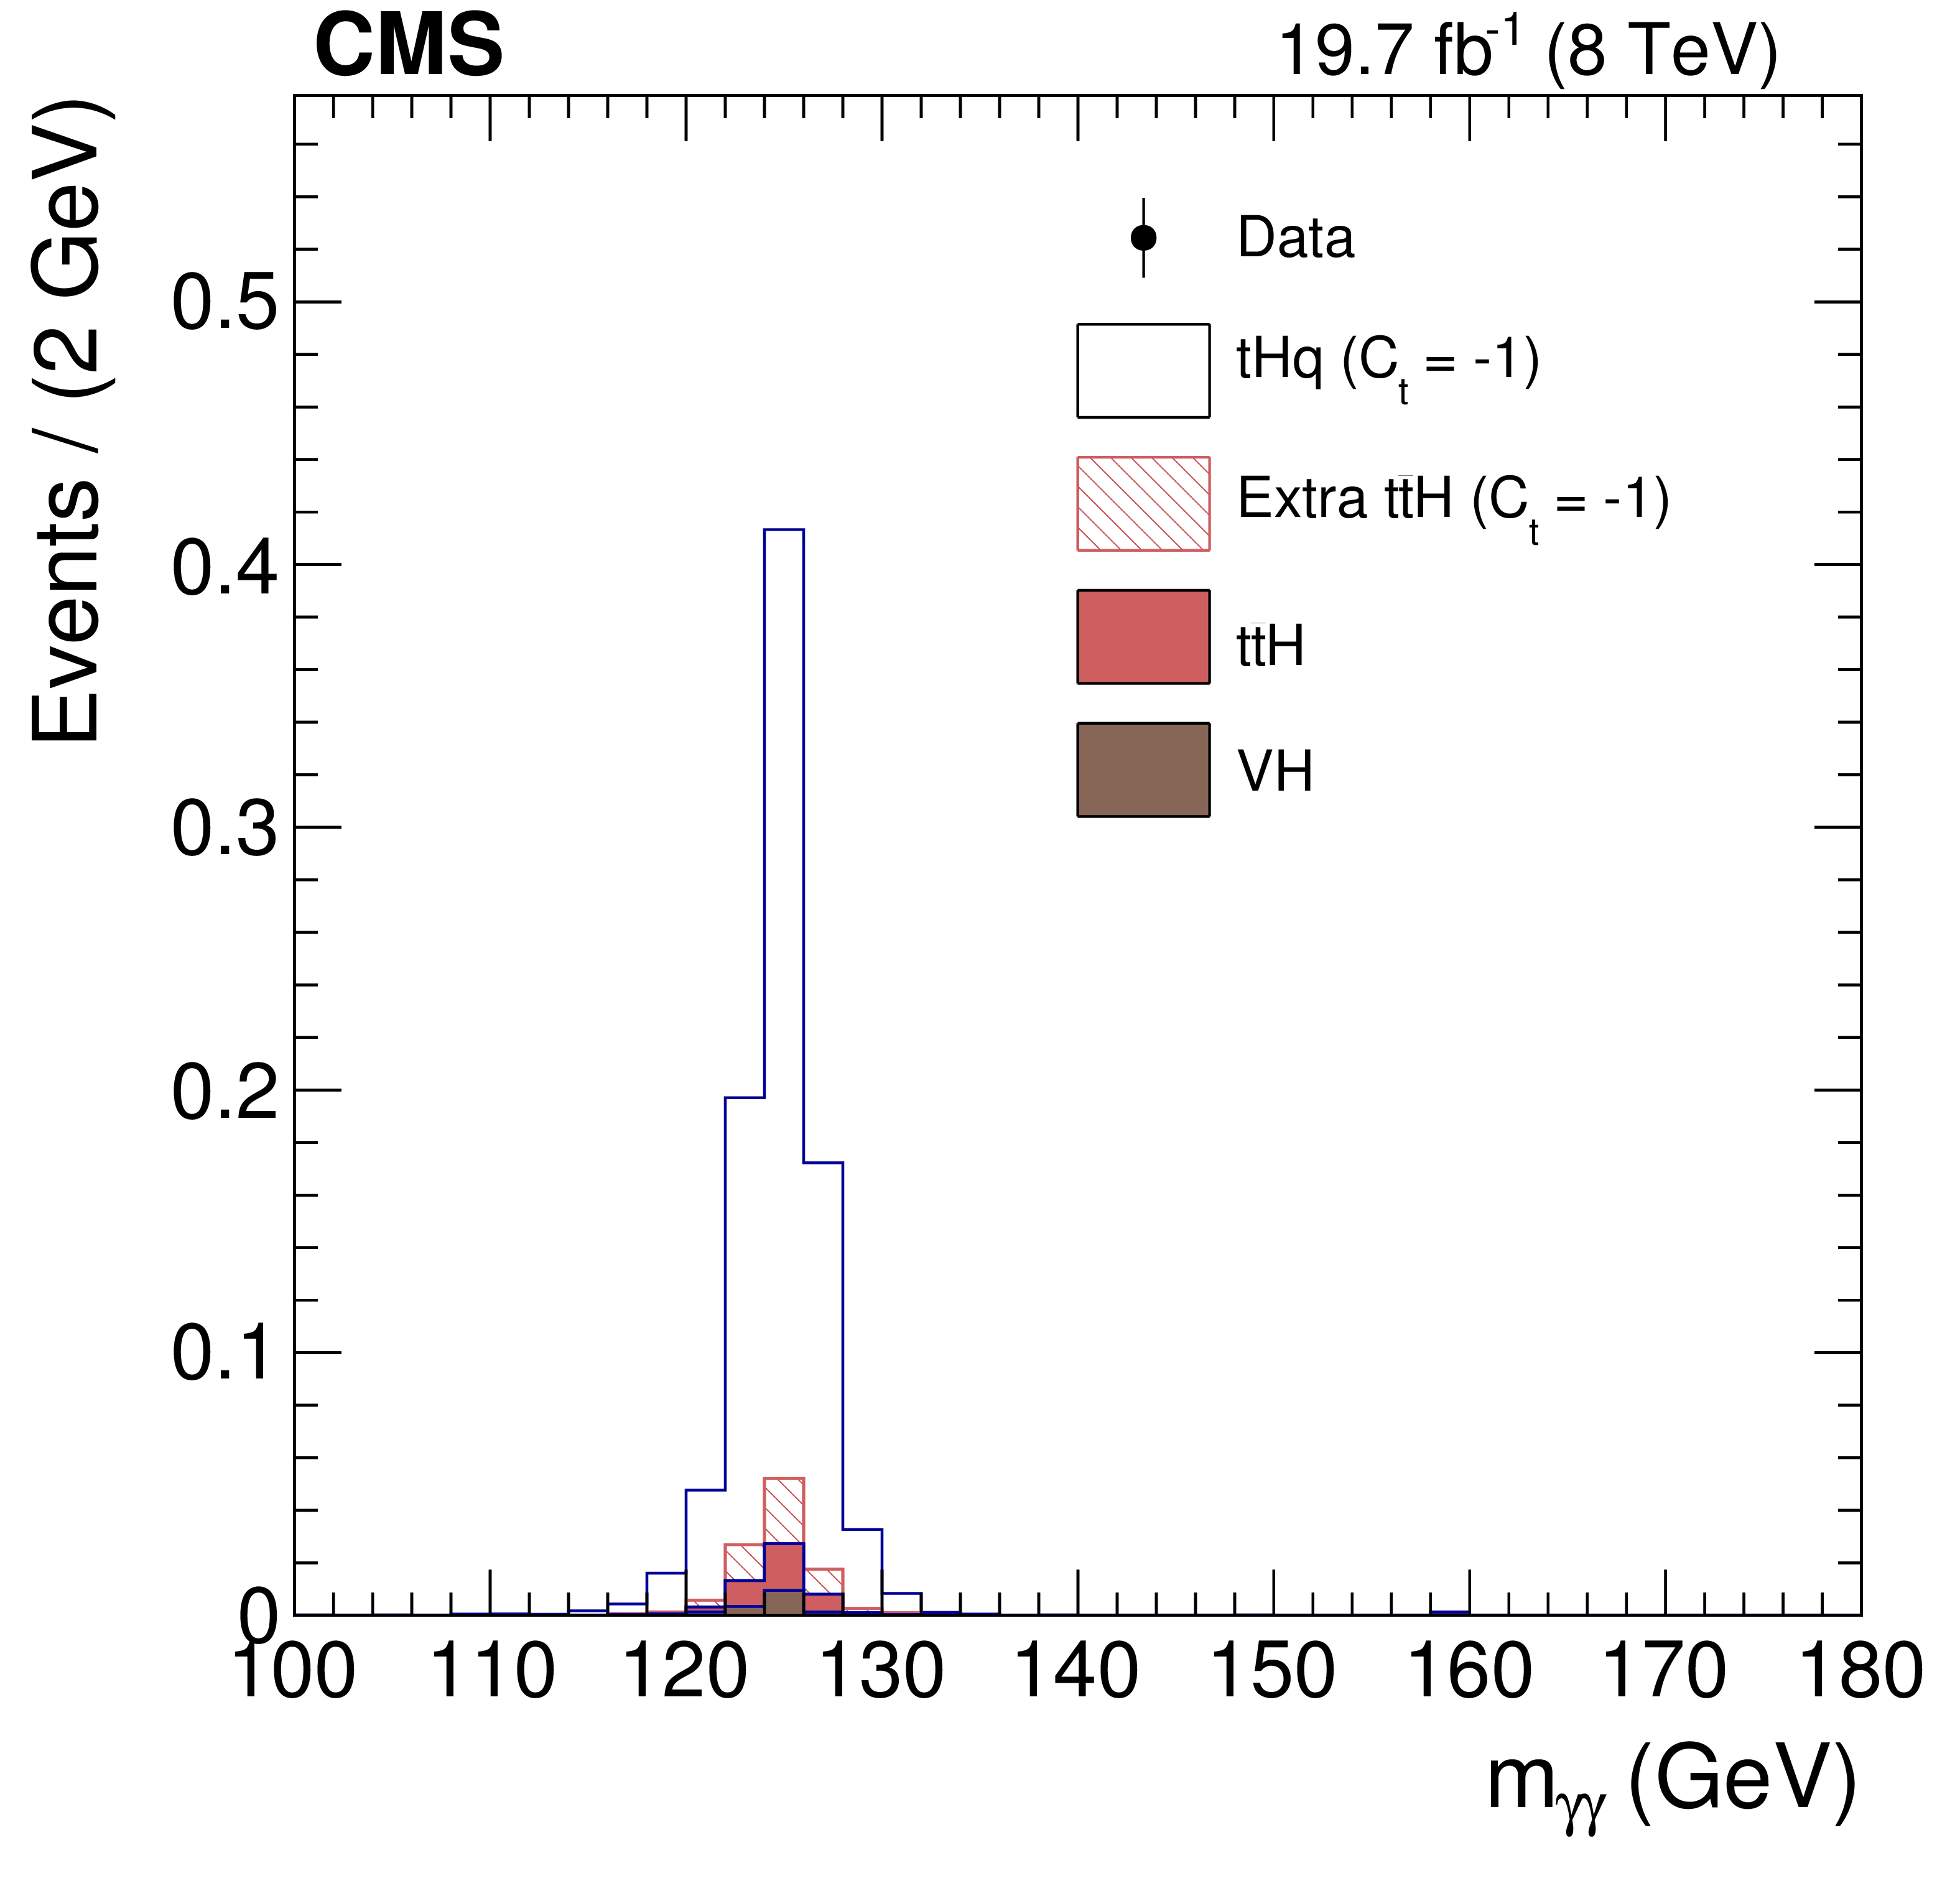
Figure 2:
Invariant mass of the diphoton system for events passing the event selection requirements, but for the likelihood discriminant cut (left), and for events passing the full selection (right). The data (black markers) are compared to the MC simulation (stacked histograms). No events are observed after the requirement on the likelihood discriminant. |
png pdf |
Figure 2-a:
Invariant mass of the diphoton system for events passing the event selection requirements, but for the likelihood discriminant cut. The data (black markers) are compared to the MC simulation (stacked histogram). |
png pdf |
Figure 2-b:
Invariant mass of the diphoton system for events passing the full selection. The MC simulation is shown as a stacked histogram. No events are observed after the requirement on the likelihood discriminant. |

png pdf |
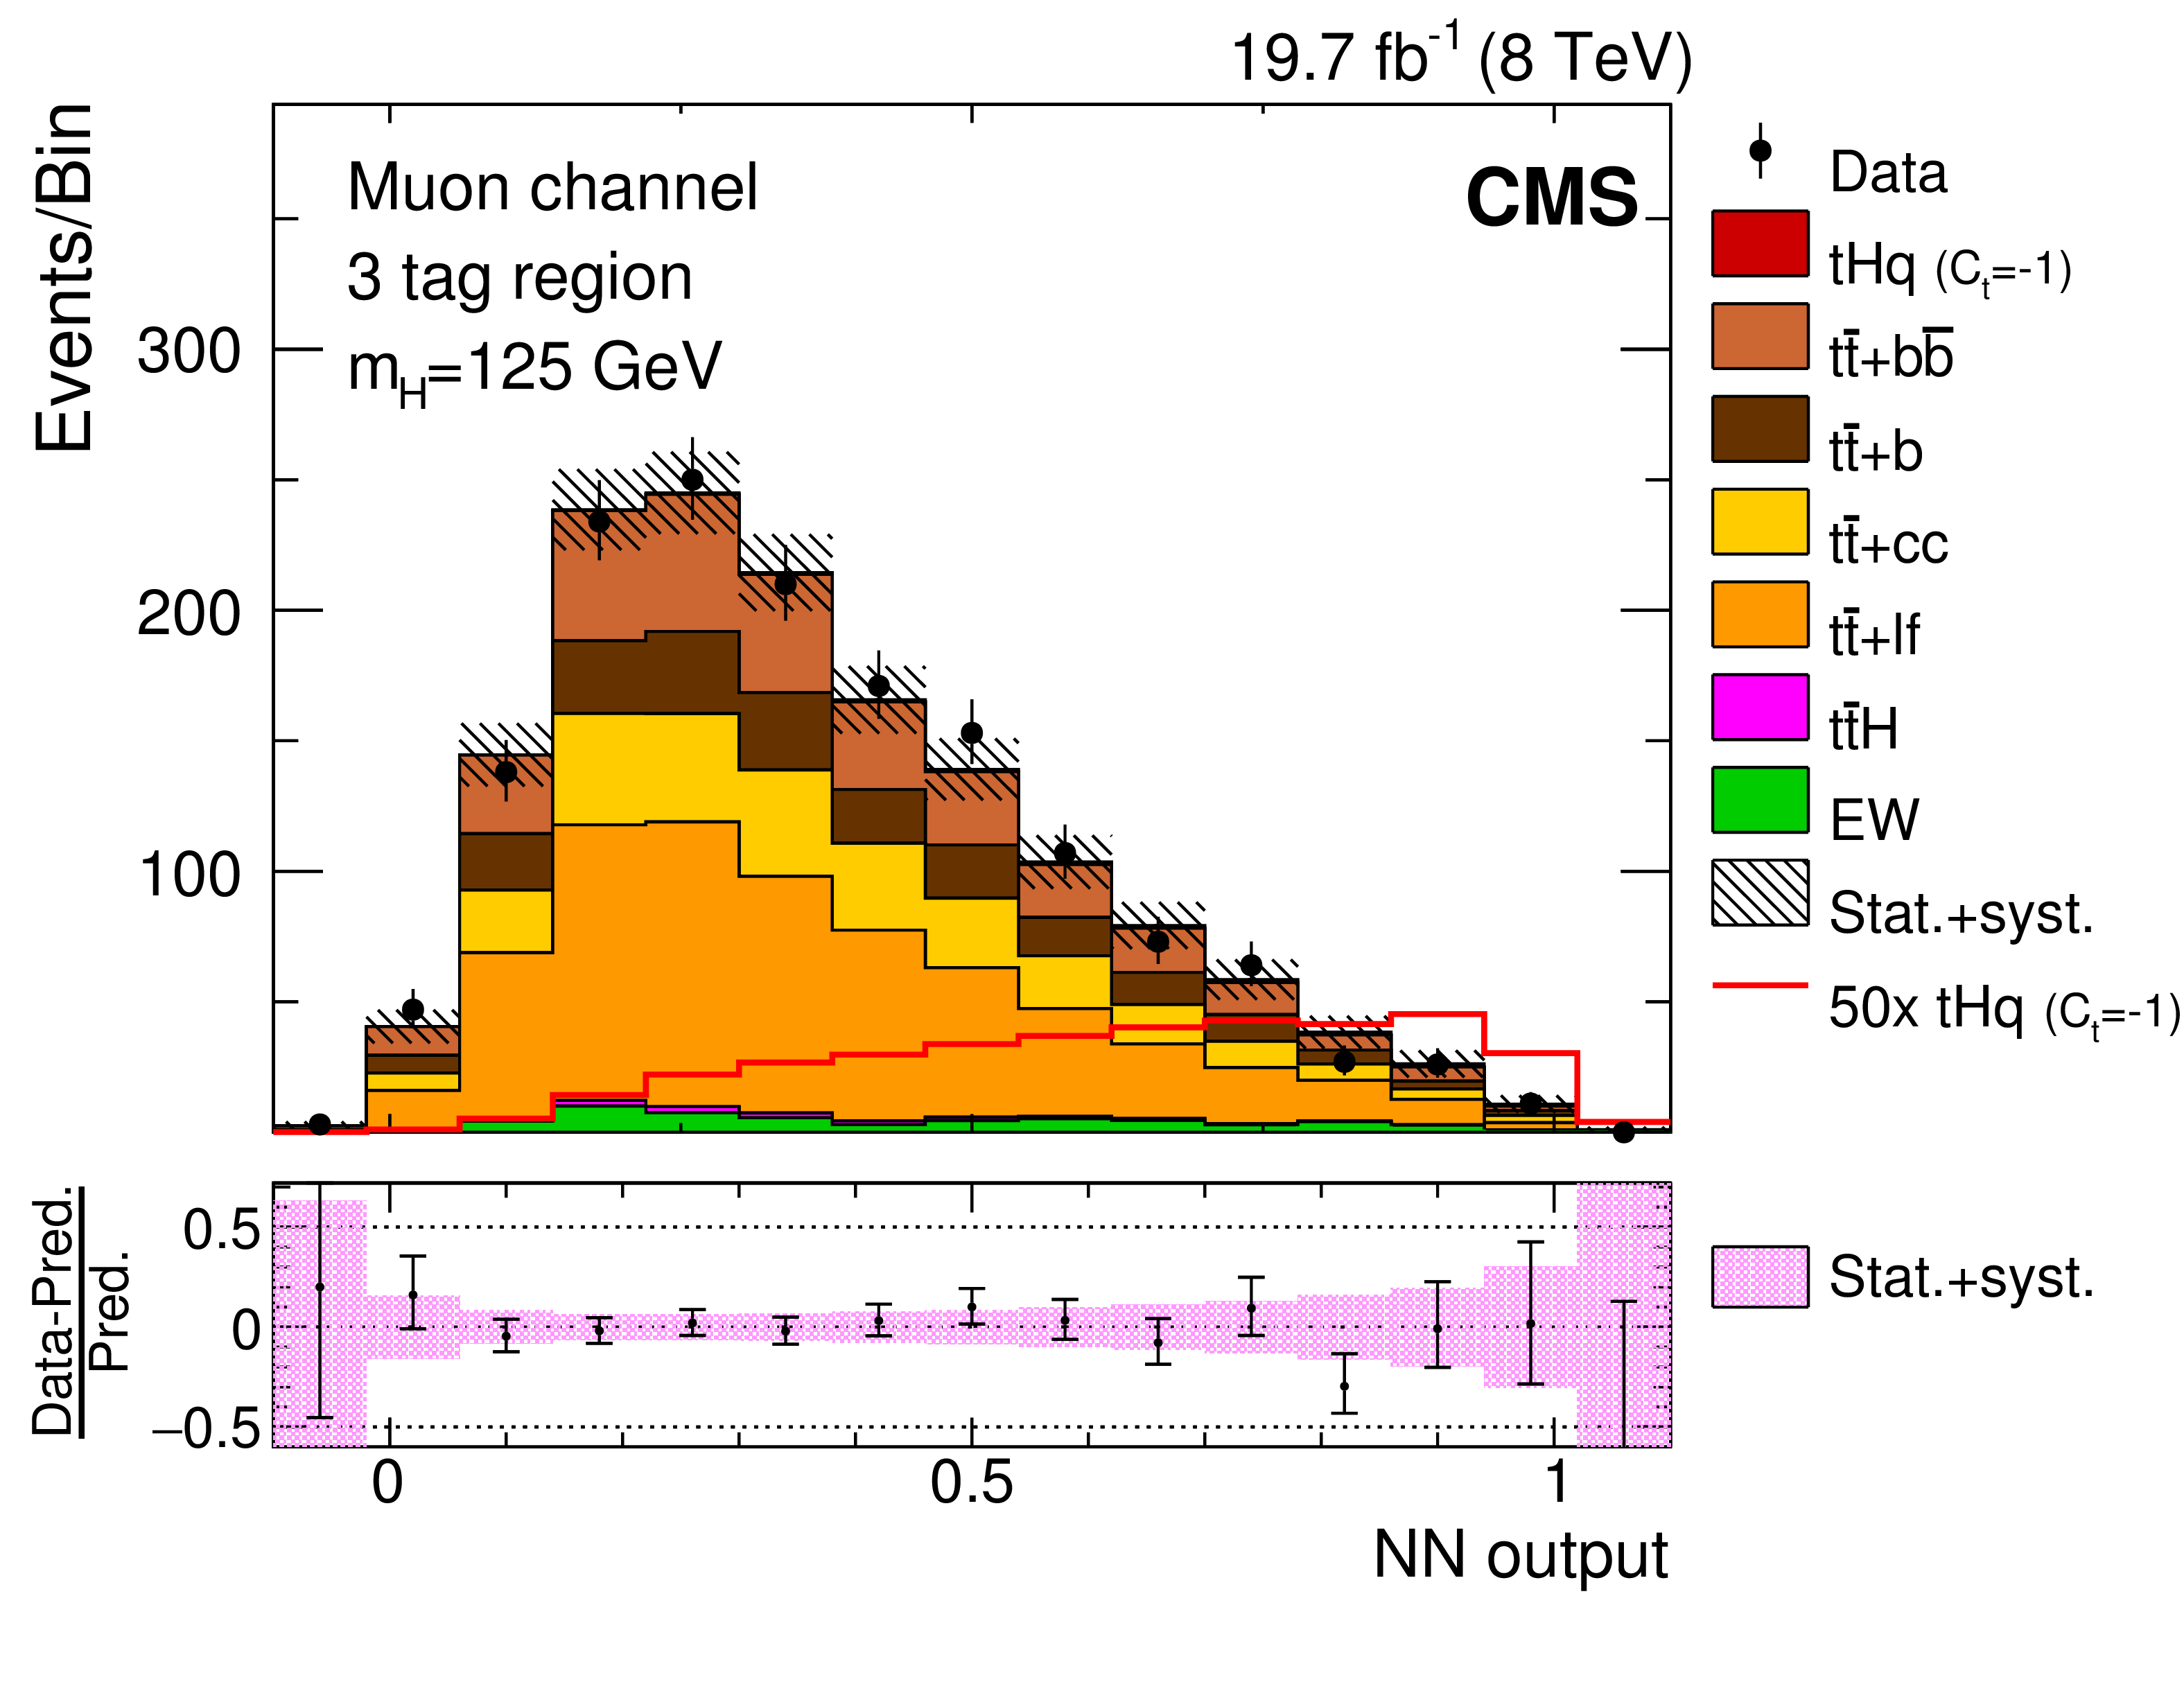
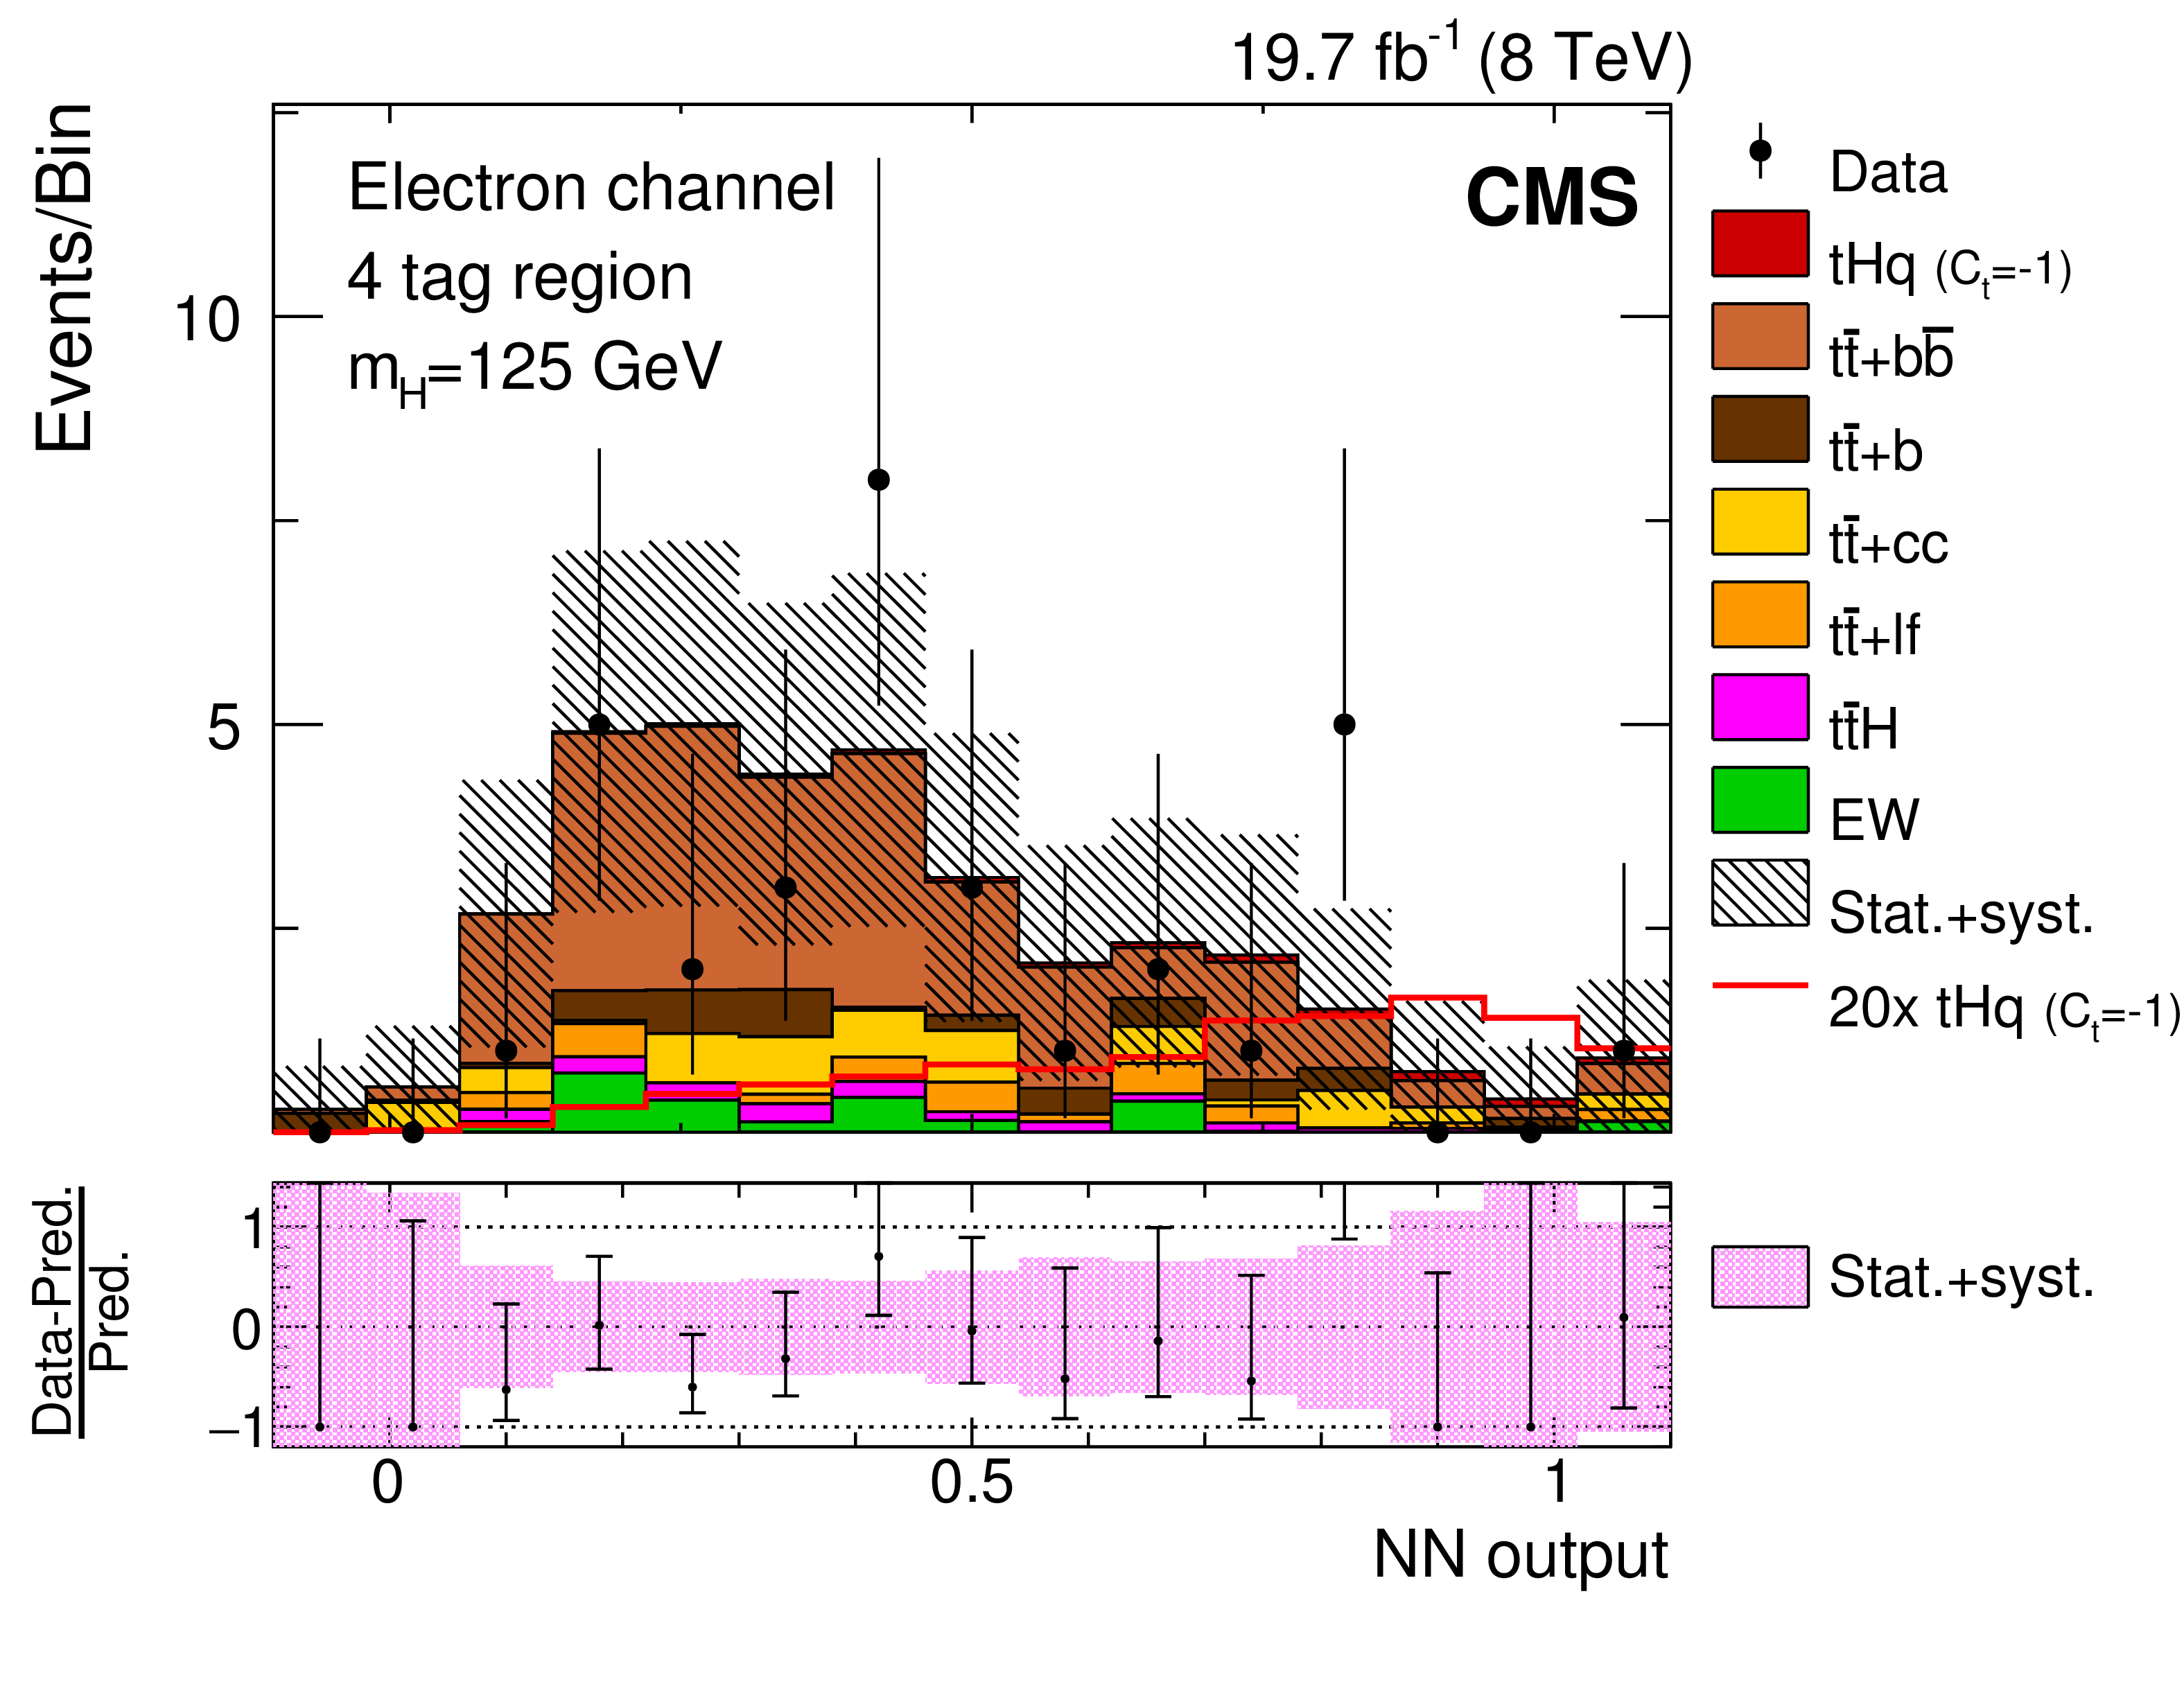
Figure 3:
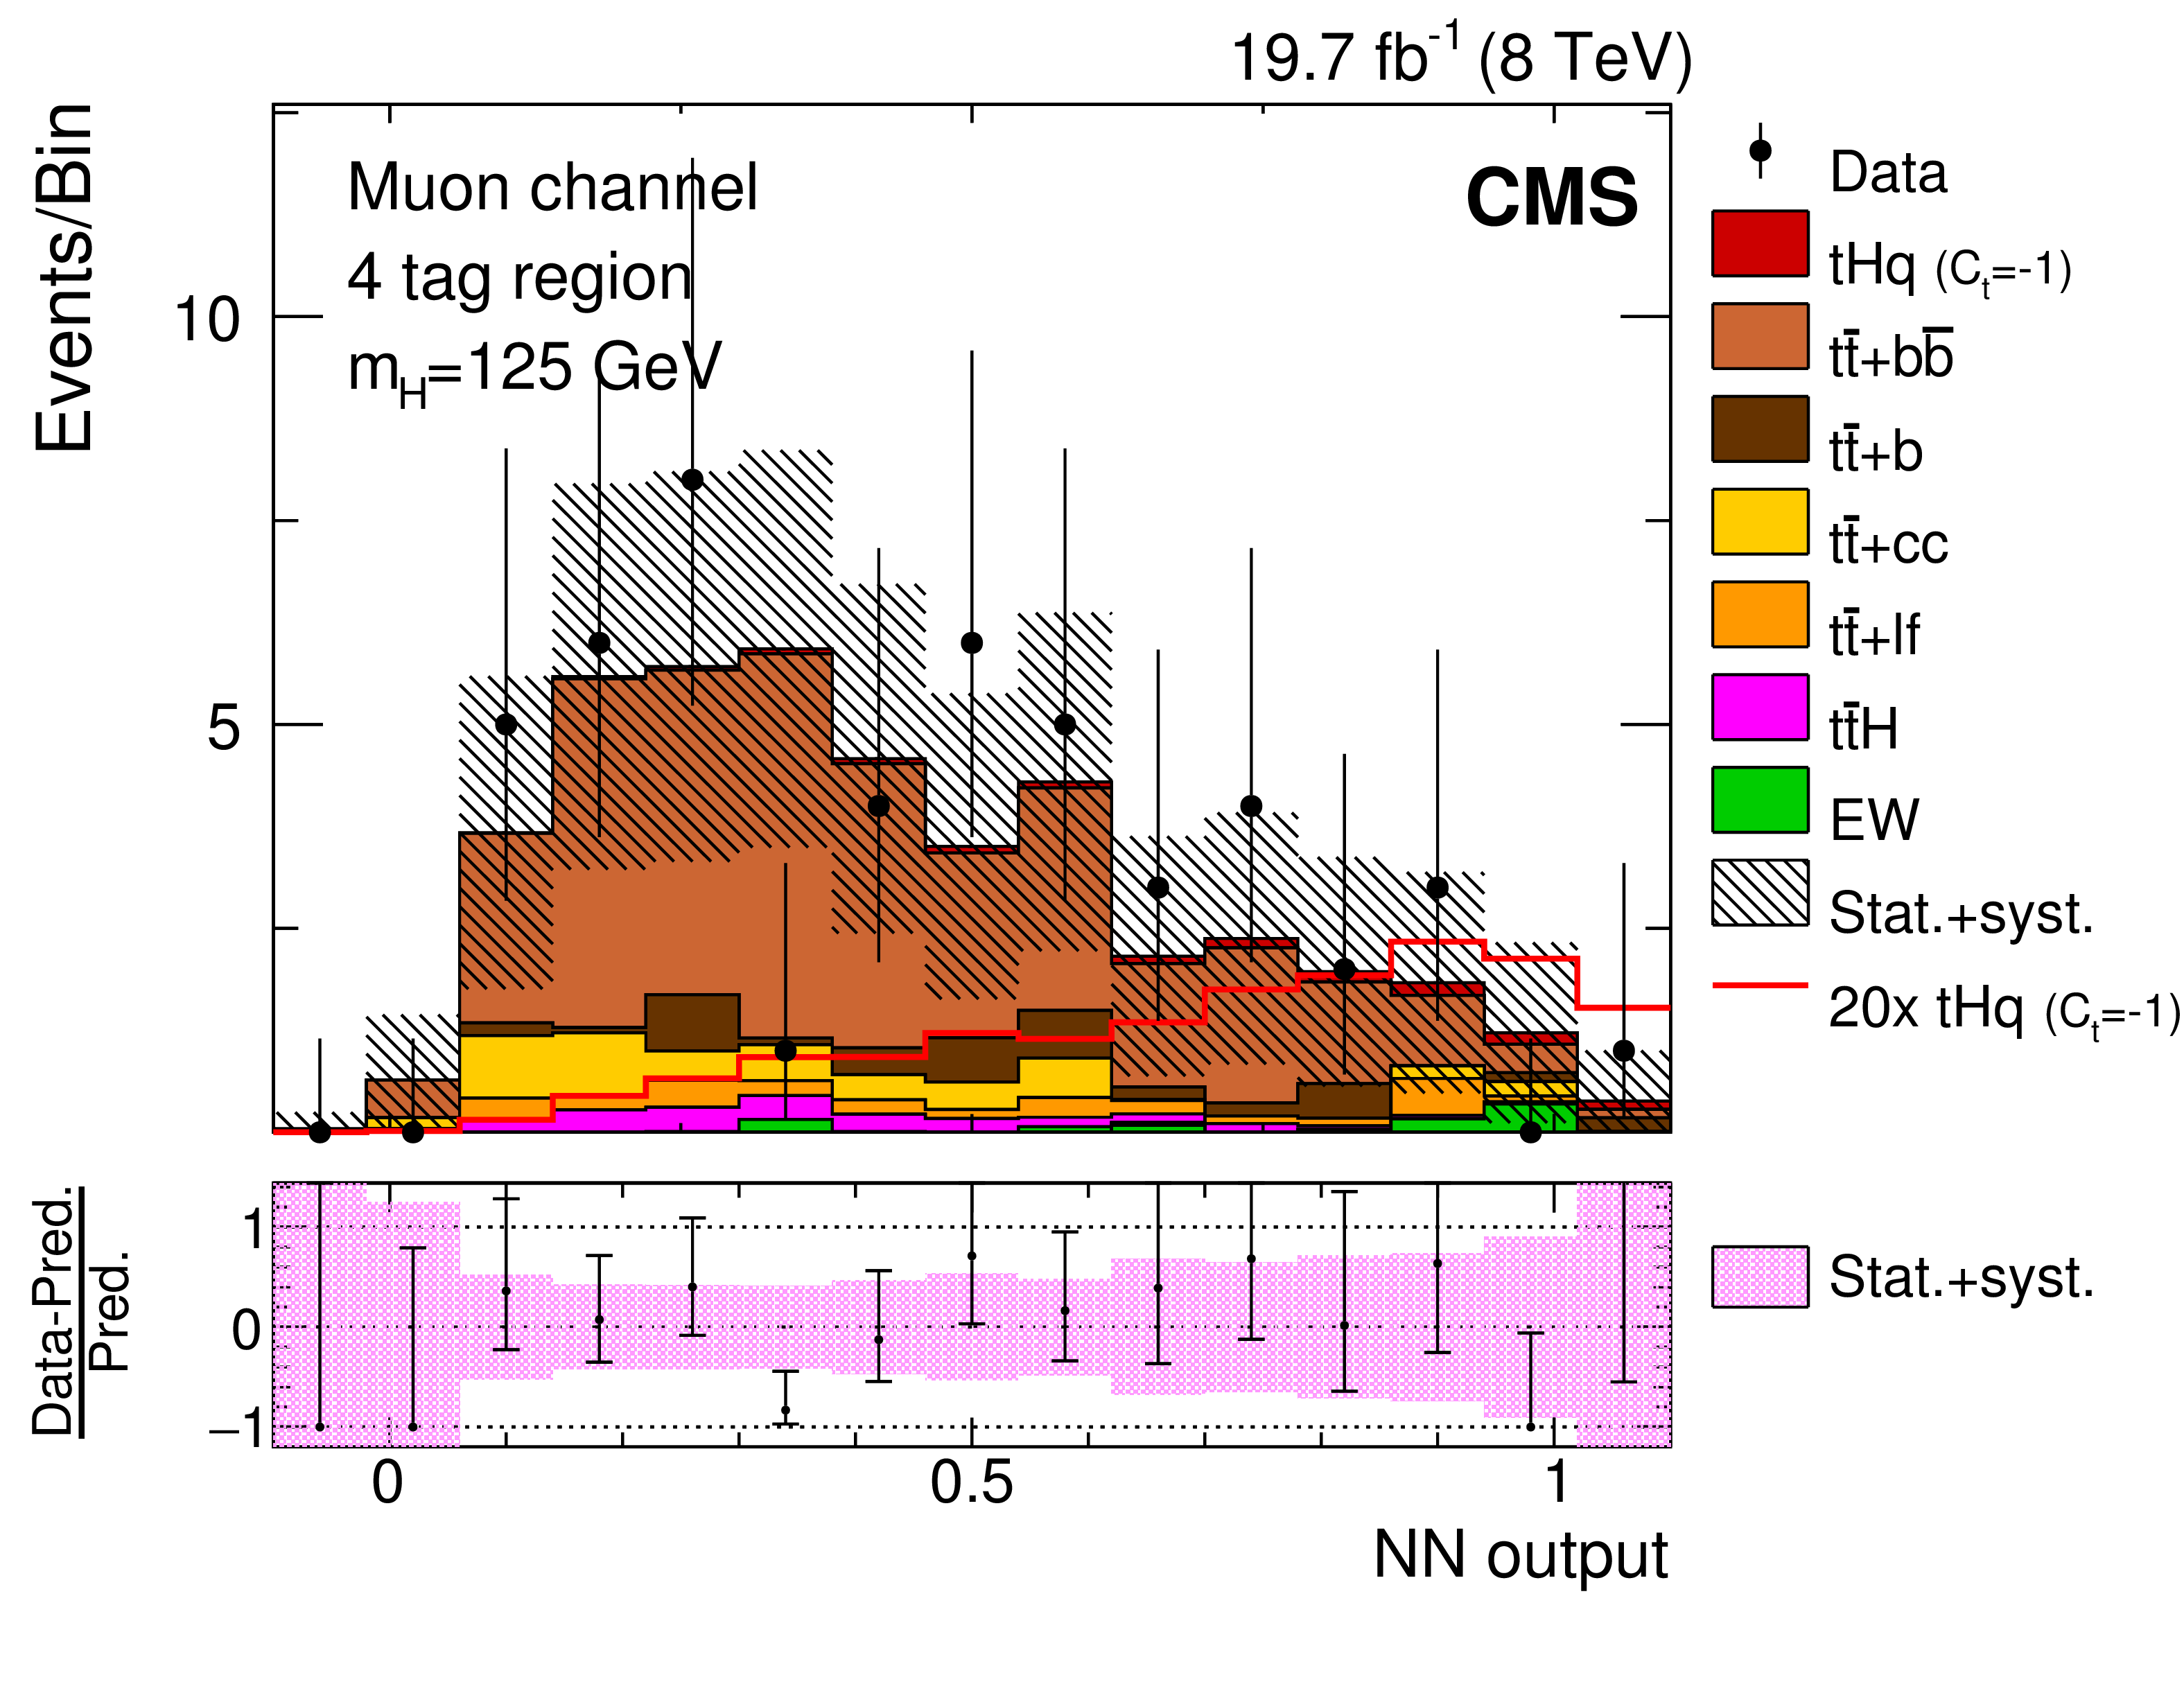
Distributions of the NN output for the $ {\mathrm{ H } \to {\mathrm{ b \bar{b} } } } $ channel for events with three (four) b-tagged jets are shown in the upper (lower) row. The left (right) column shows events containing a high-$ {p_{\mathrm {T}}} $ electron (muon). All backgrounds are normalized to the output of a maximum likelihood fit of the corresponding distributions. ``EW'' indicates electroweak backgrounds: single top quark, $\mathrm{ W } /{\mathrm{ Z } } $ boson plus jets, and di- and tri-boson production. The line shows the expected contribution from the tHq process with $ {C_{\mathrm{ t } }} = -1$ multiplied by the factor indicated in the legend. In the box below each distribution, the ratio of the observed and predicted event yields is shown. The shaded band represents the post-fit systematic and statistical uncertainties. |

png pdf |
Figure 3-a:
Distributions of the NN output for the $ {\mathrm{ H } \to {\mathrm{ b \bar{b} } } } $ channel for events with three (four) b-tagged jets are shown in the upper (lower) row. The left (right) column shows events containing a high-$ {p_{\mathrm {T}}} $ electron (muon). All backgrounds are normalized to the output of a maximum likelihood fit of the corresponding distributions. ``EW'' indicates electroweak backgrounds: single top quark, $\mathrm{ W } /{\mathrm{ Z } } $ boson plus jets, and di- and tri-boson production. The line shows the expected contribution from the tHq process with $ {C_{\mathrm{ t } }} = -1$ multiplied by the factor indicated in the legend. In the box below each distribution, the ratio of the observed and predicted event yields is shown. The shaded band represents the post-fit systematic and statistical uncertainties. |
png pdf |
Figure 3-b:
Distributions of the NN output for the $ {\mathrm{ H } \to {\mathrm{ b \bar{b} } } } $ channel for events with three (four) b-tagged jets are shown in the upper (lower) row. The left (right) column shows events containing a high-$ {p_{\mathrm {T}}} $ electron (muon). All backgrounds are normalized to the output of a maximum likelihood fit of the corresponding distributions. ``EW'' indicates electroweak backgrounds: single top quark, $\mathrm{ W } /{\mathrm{ Z } } $ boson plus jets, and di- and tri-boson production. The line shows the expected contribution from the tHq process with $ {C_{\mathrm{ t } }} = -1$ multiplied by the factor indicated in the legend. In the box below each distribution, the ratio of the observed and predicted event yields is shown. The shaded band represents the post-fit systematic and statistical uncertainties. |
png pdf |
Figure 3-c:
Distributions of the NN output for the $ {\mathrm{ H } \to {\mathrm{ b \bar{b} } } } $ channel for events with three (four) b-tagged jets are shown in the upper (lower) row. The left (right) column shows events containing a high-$ {p_{\mathrm {T}}} $ electron (muon). All backgrounds are normalized to the output of a maximum likelihood fit of the corresponding distributions. ``EW'' indicates electroweak backgrounds: single top quark, $\mathrm{ W } /{\mathrm{ Z } } $ boson plus jets, and di- and tri-boson production. The line shows the expected contribution from the tHq process with $ {C_{\mathrm{ t } }} = -1$ multiplied by the factor indicated in the legend. In the box below each distribution, the ratio of the observed and predicted event yields is shown. The shaded band represents the post-fit systematic and statistical uncertainties. |
png pdf |
Figure 3-d:
Distributions of the NN output for the $ {\mathrm{ H } \to {\mathrm{ b \bar{b} } } } $ channel for events with three (four) b-tagged jets are shown in the upper (lower) row. The left (right) column shows events containing a high-$ {p_{\mathrm {T}}} $ electron (muon). All backgrounds are normalized to the output of a maximum likelihood fit of the corresponding distributions. ``EW'' indicates electroweak backgrounds: single top quark, $\mathrm{ W } /{\mathrm{ Z } } $ boson plus jets, and di- and tri-boson production. The line shows the expected contribution from the tHq process with $ {C_{\mathrm{ t } }} = -1$ multiplied by the factor indicated in the legend. In the box below each distribution, the ratio of the observed and predicted event yields is shown. The shaded band represents the post-fit systematic and statistical uncertainties. |
png pdf |
Figure 4:
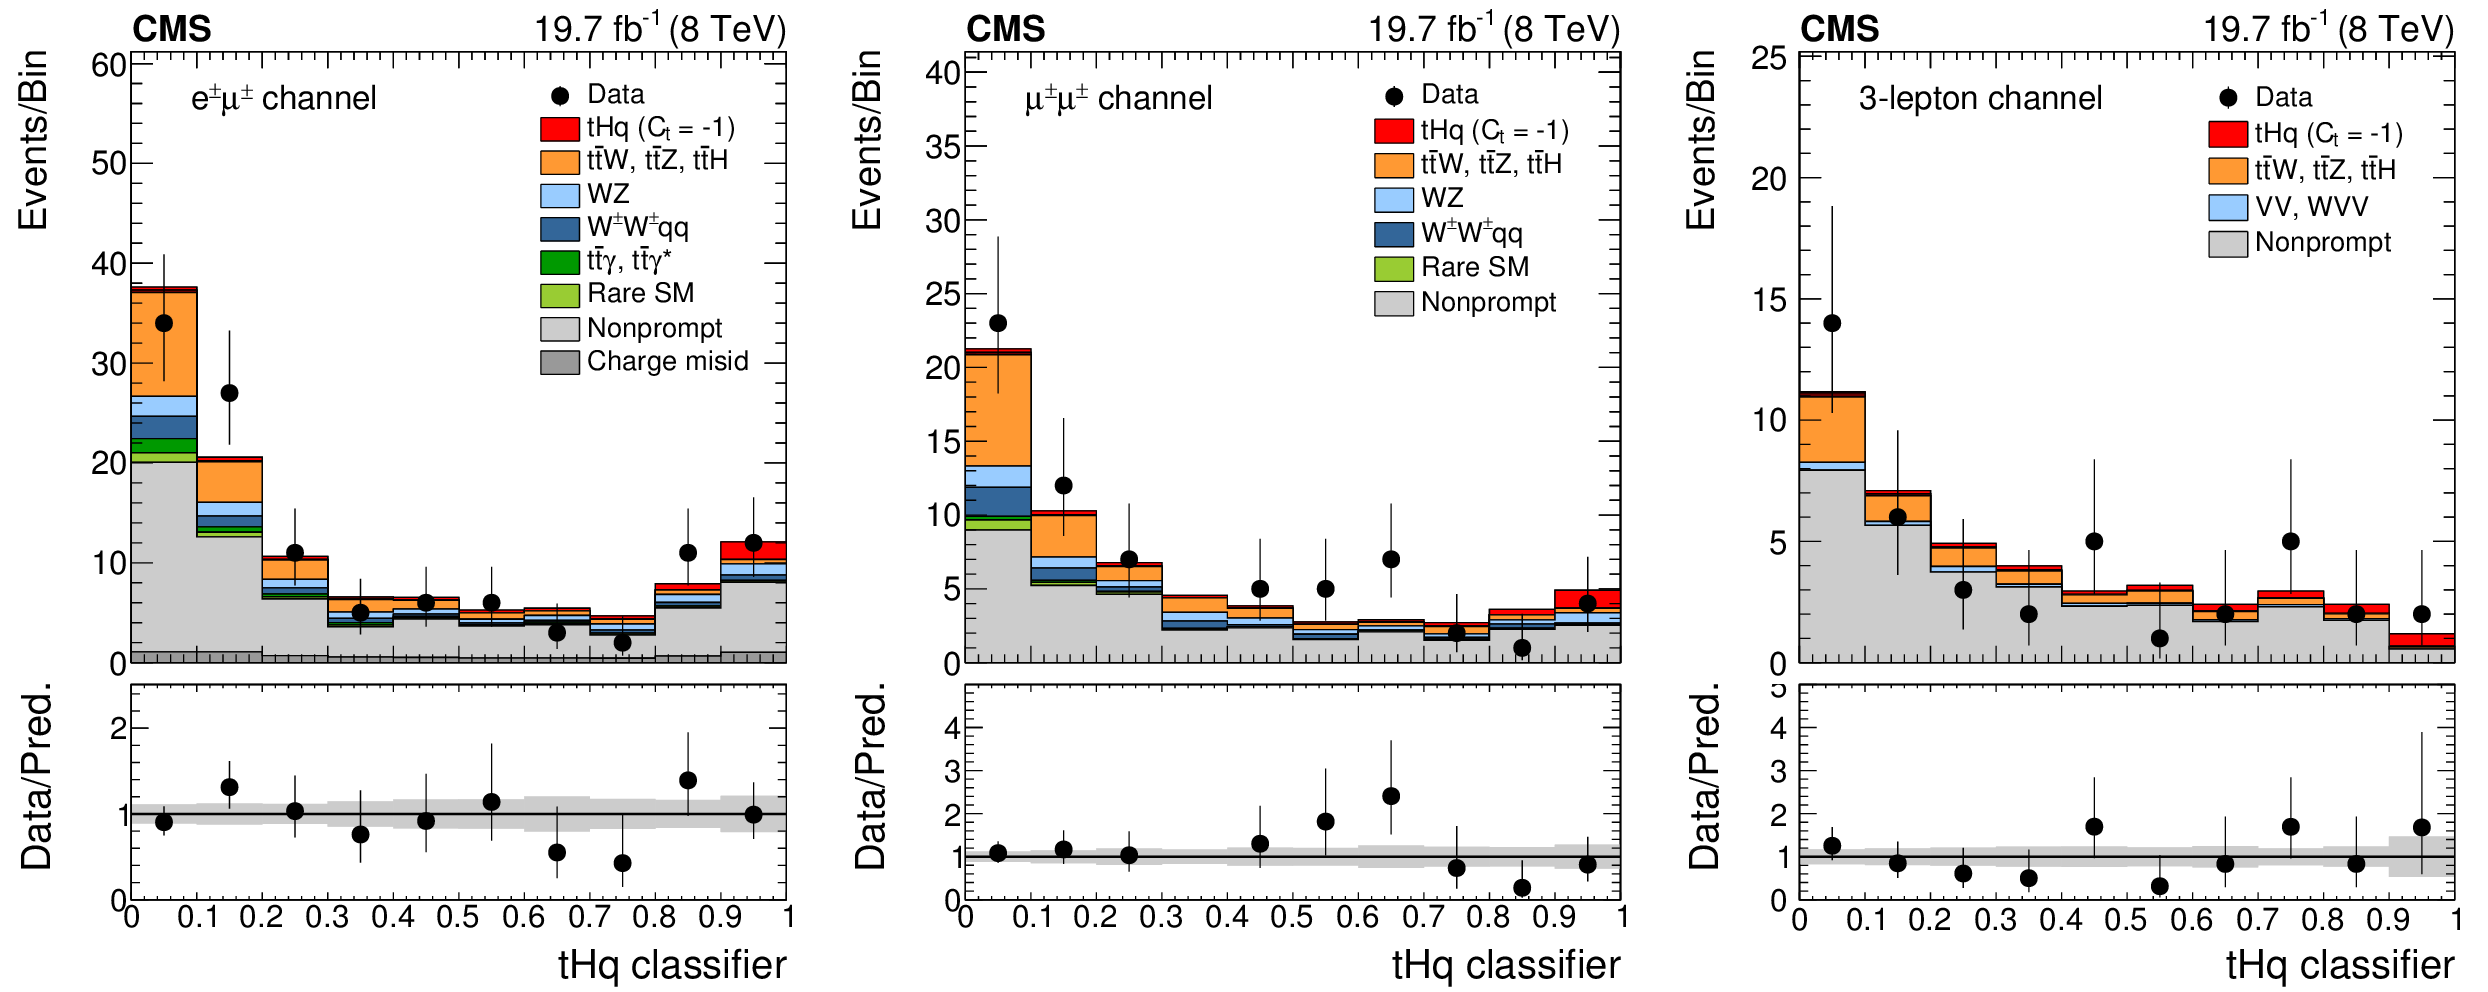
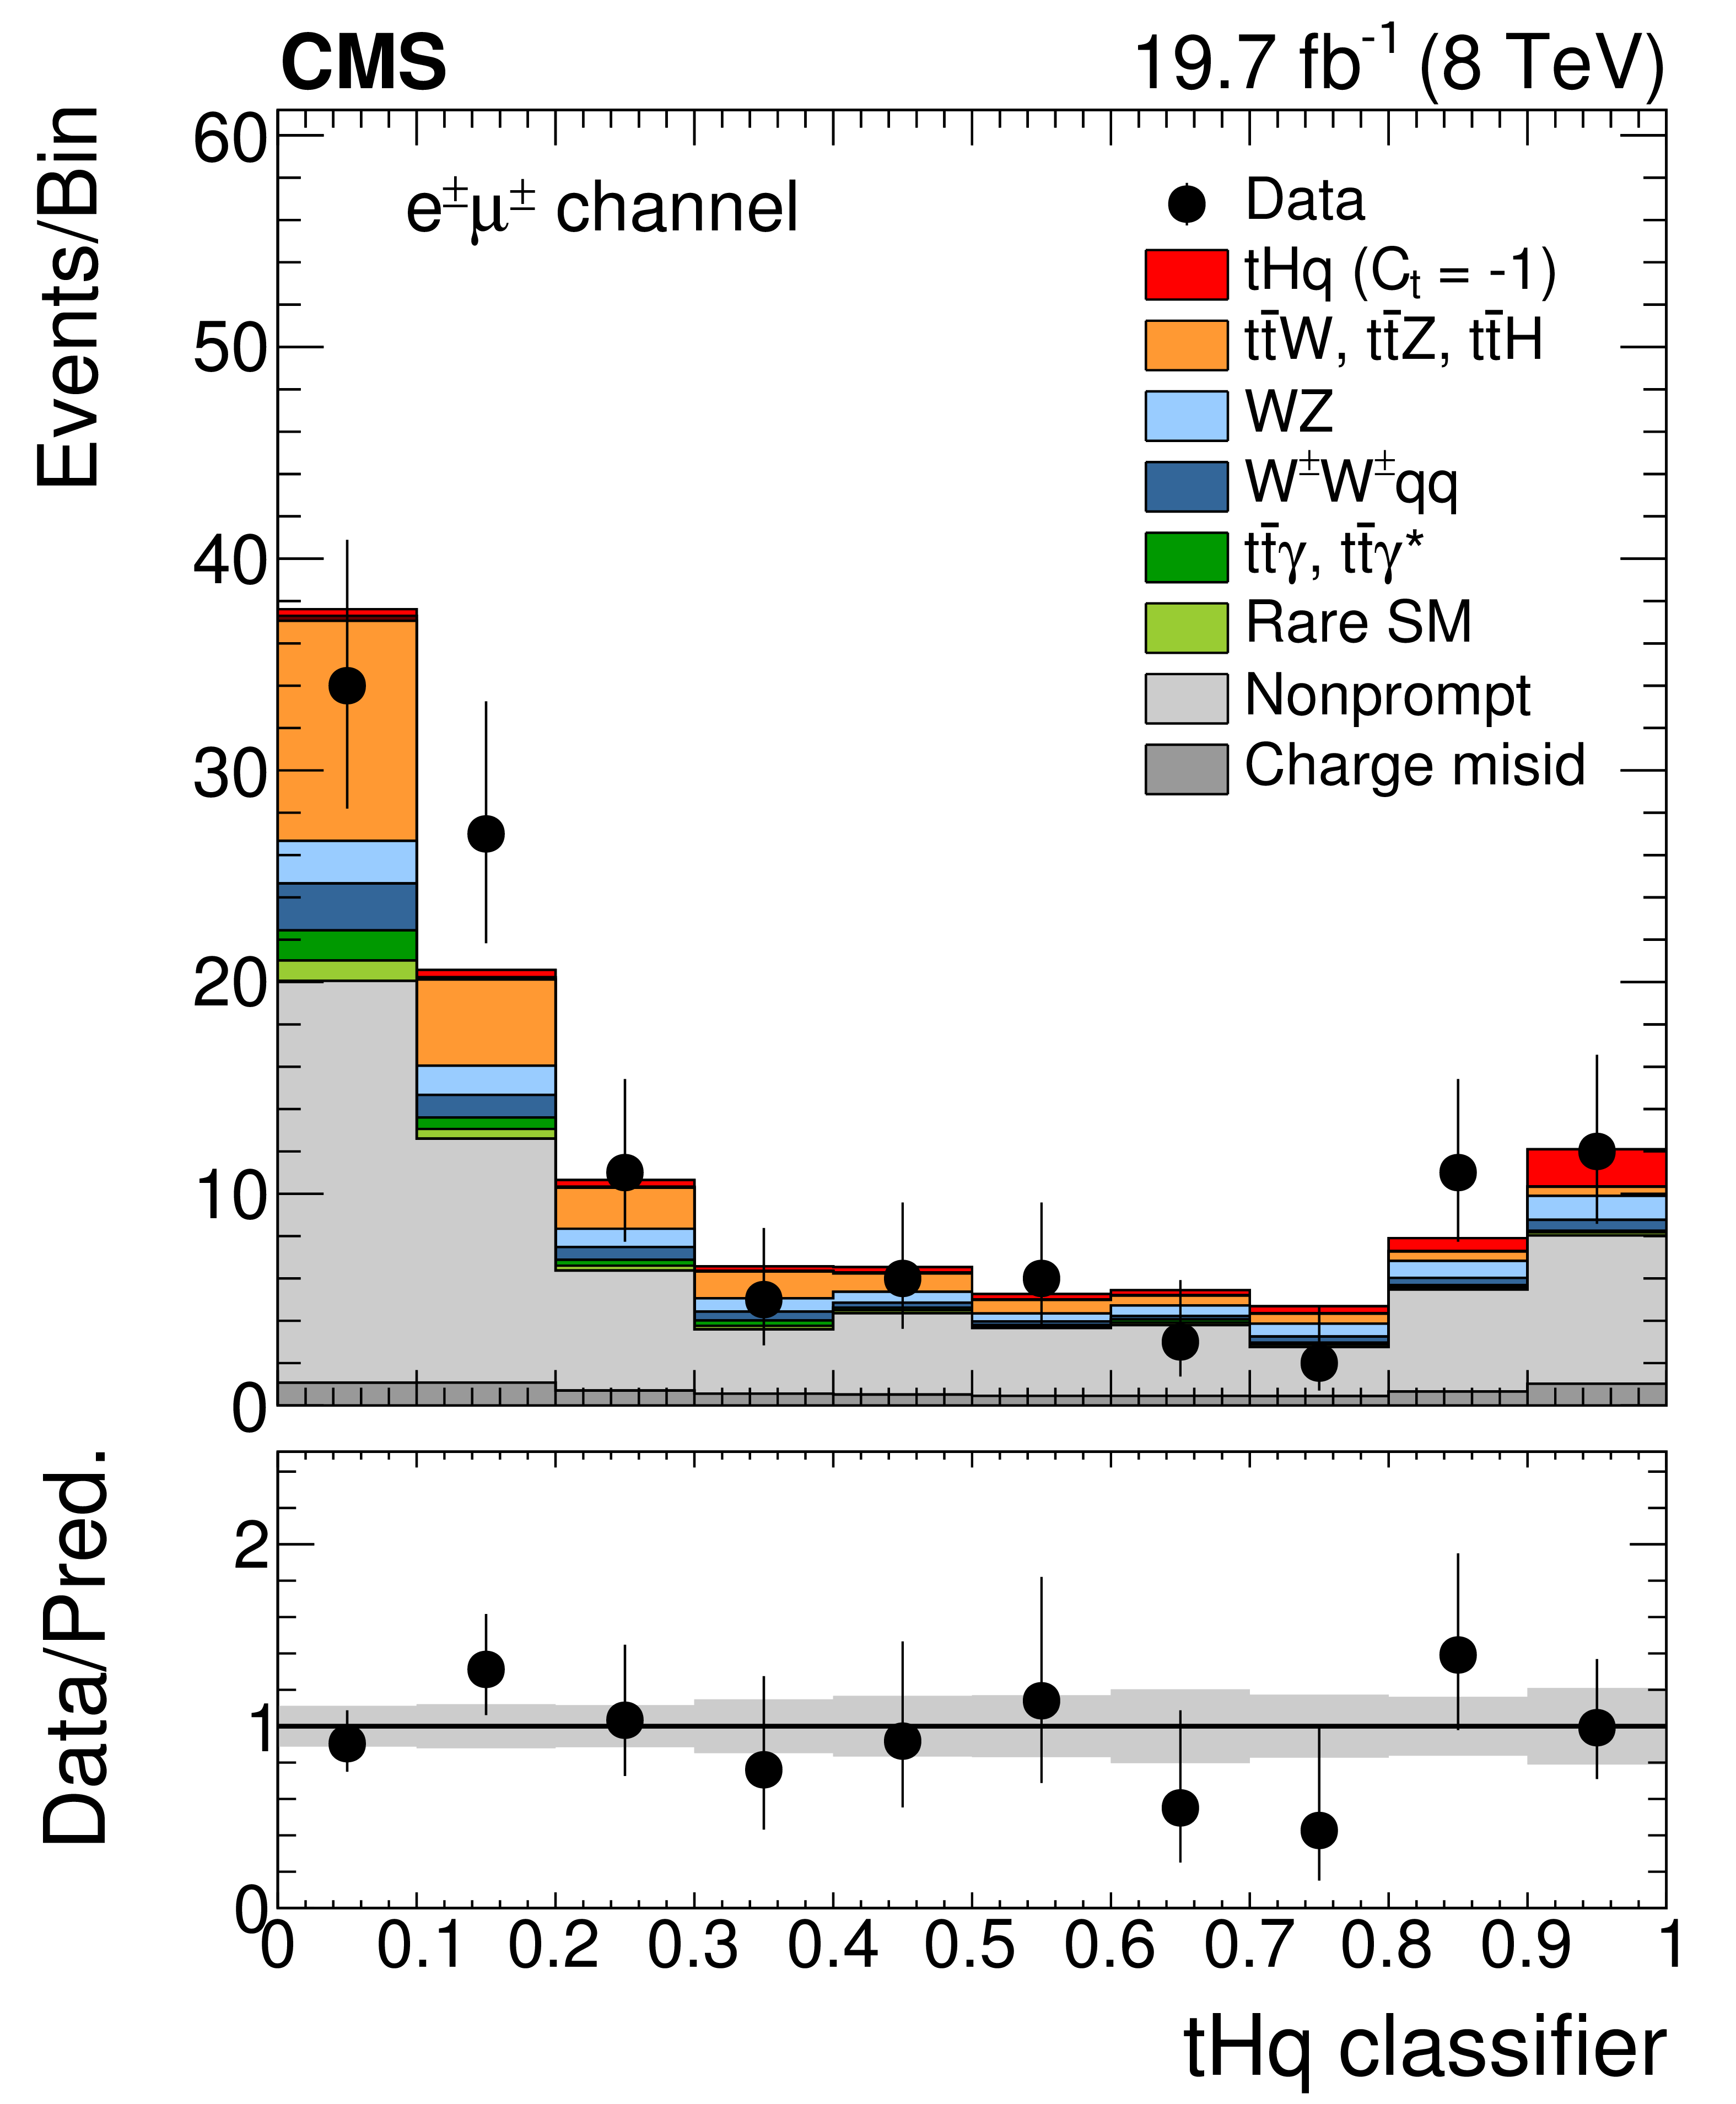
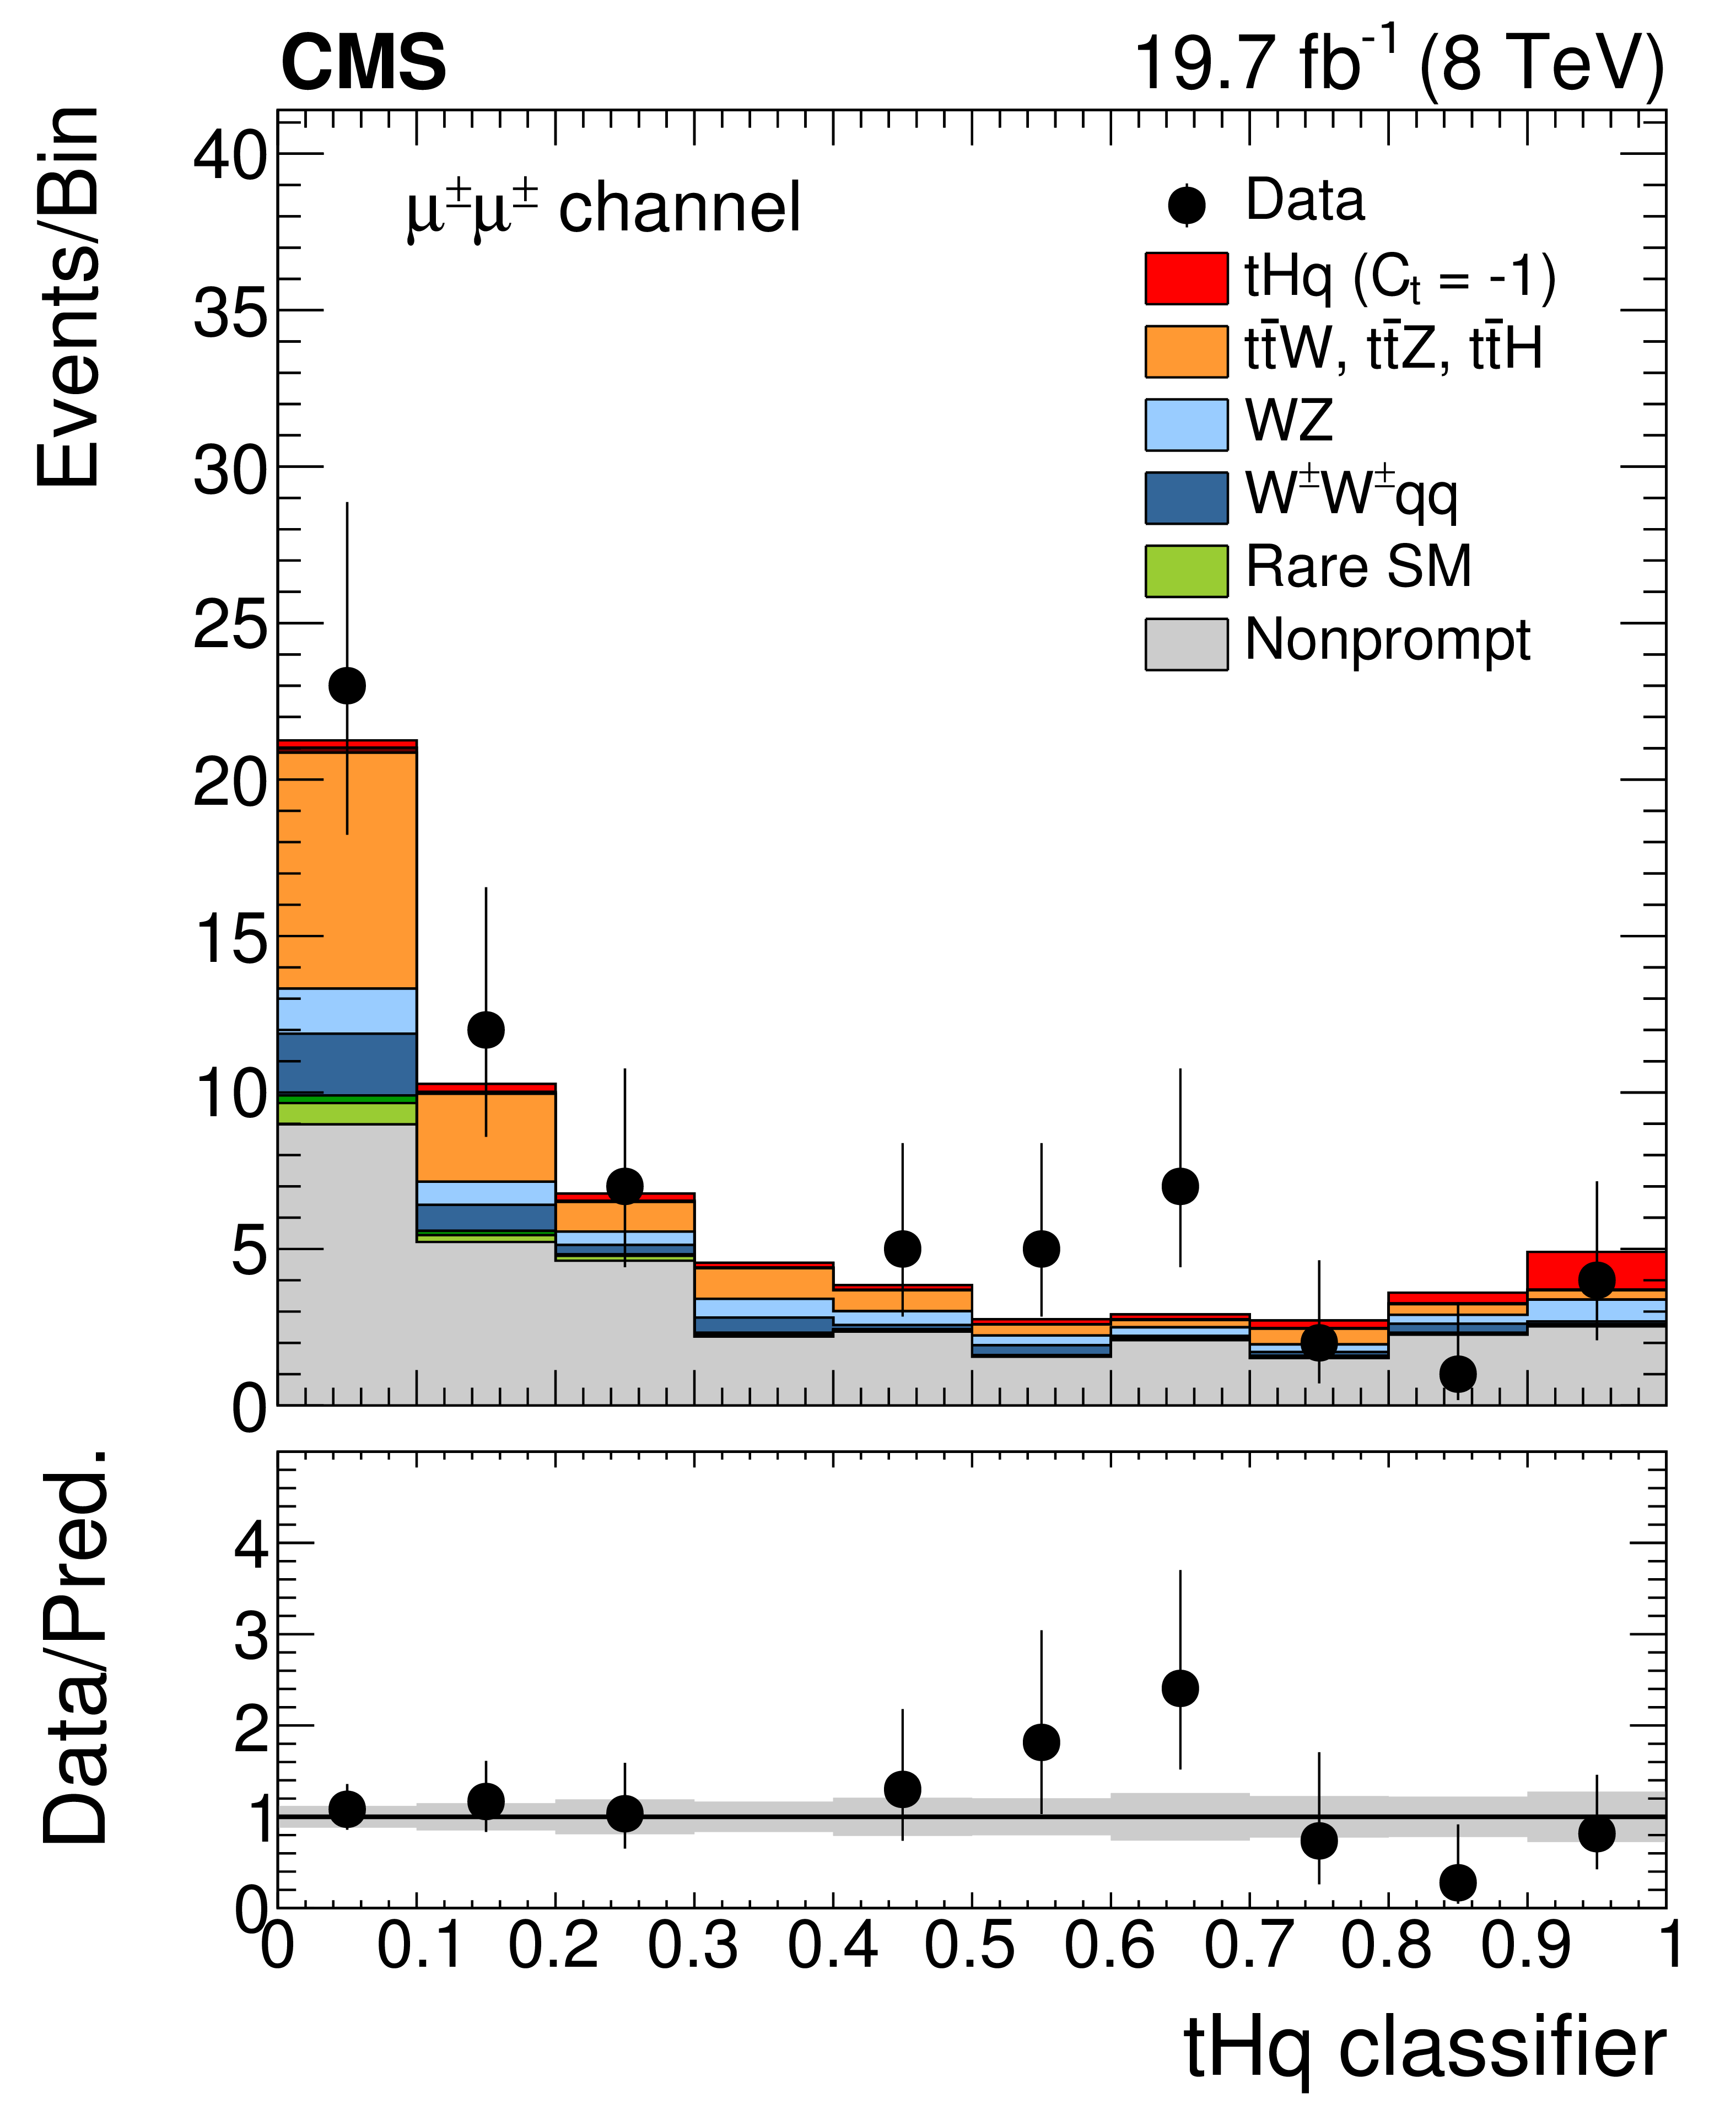
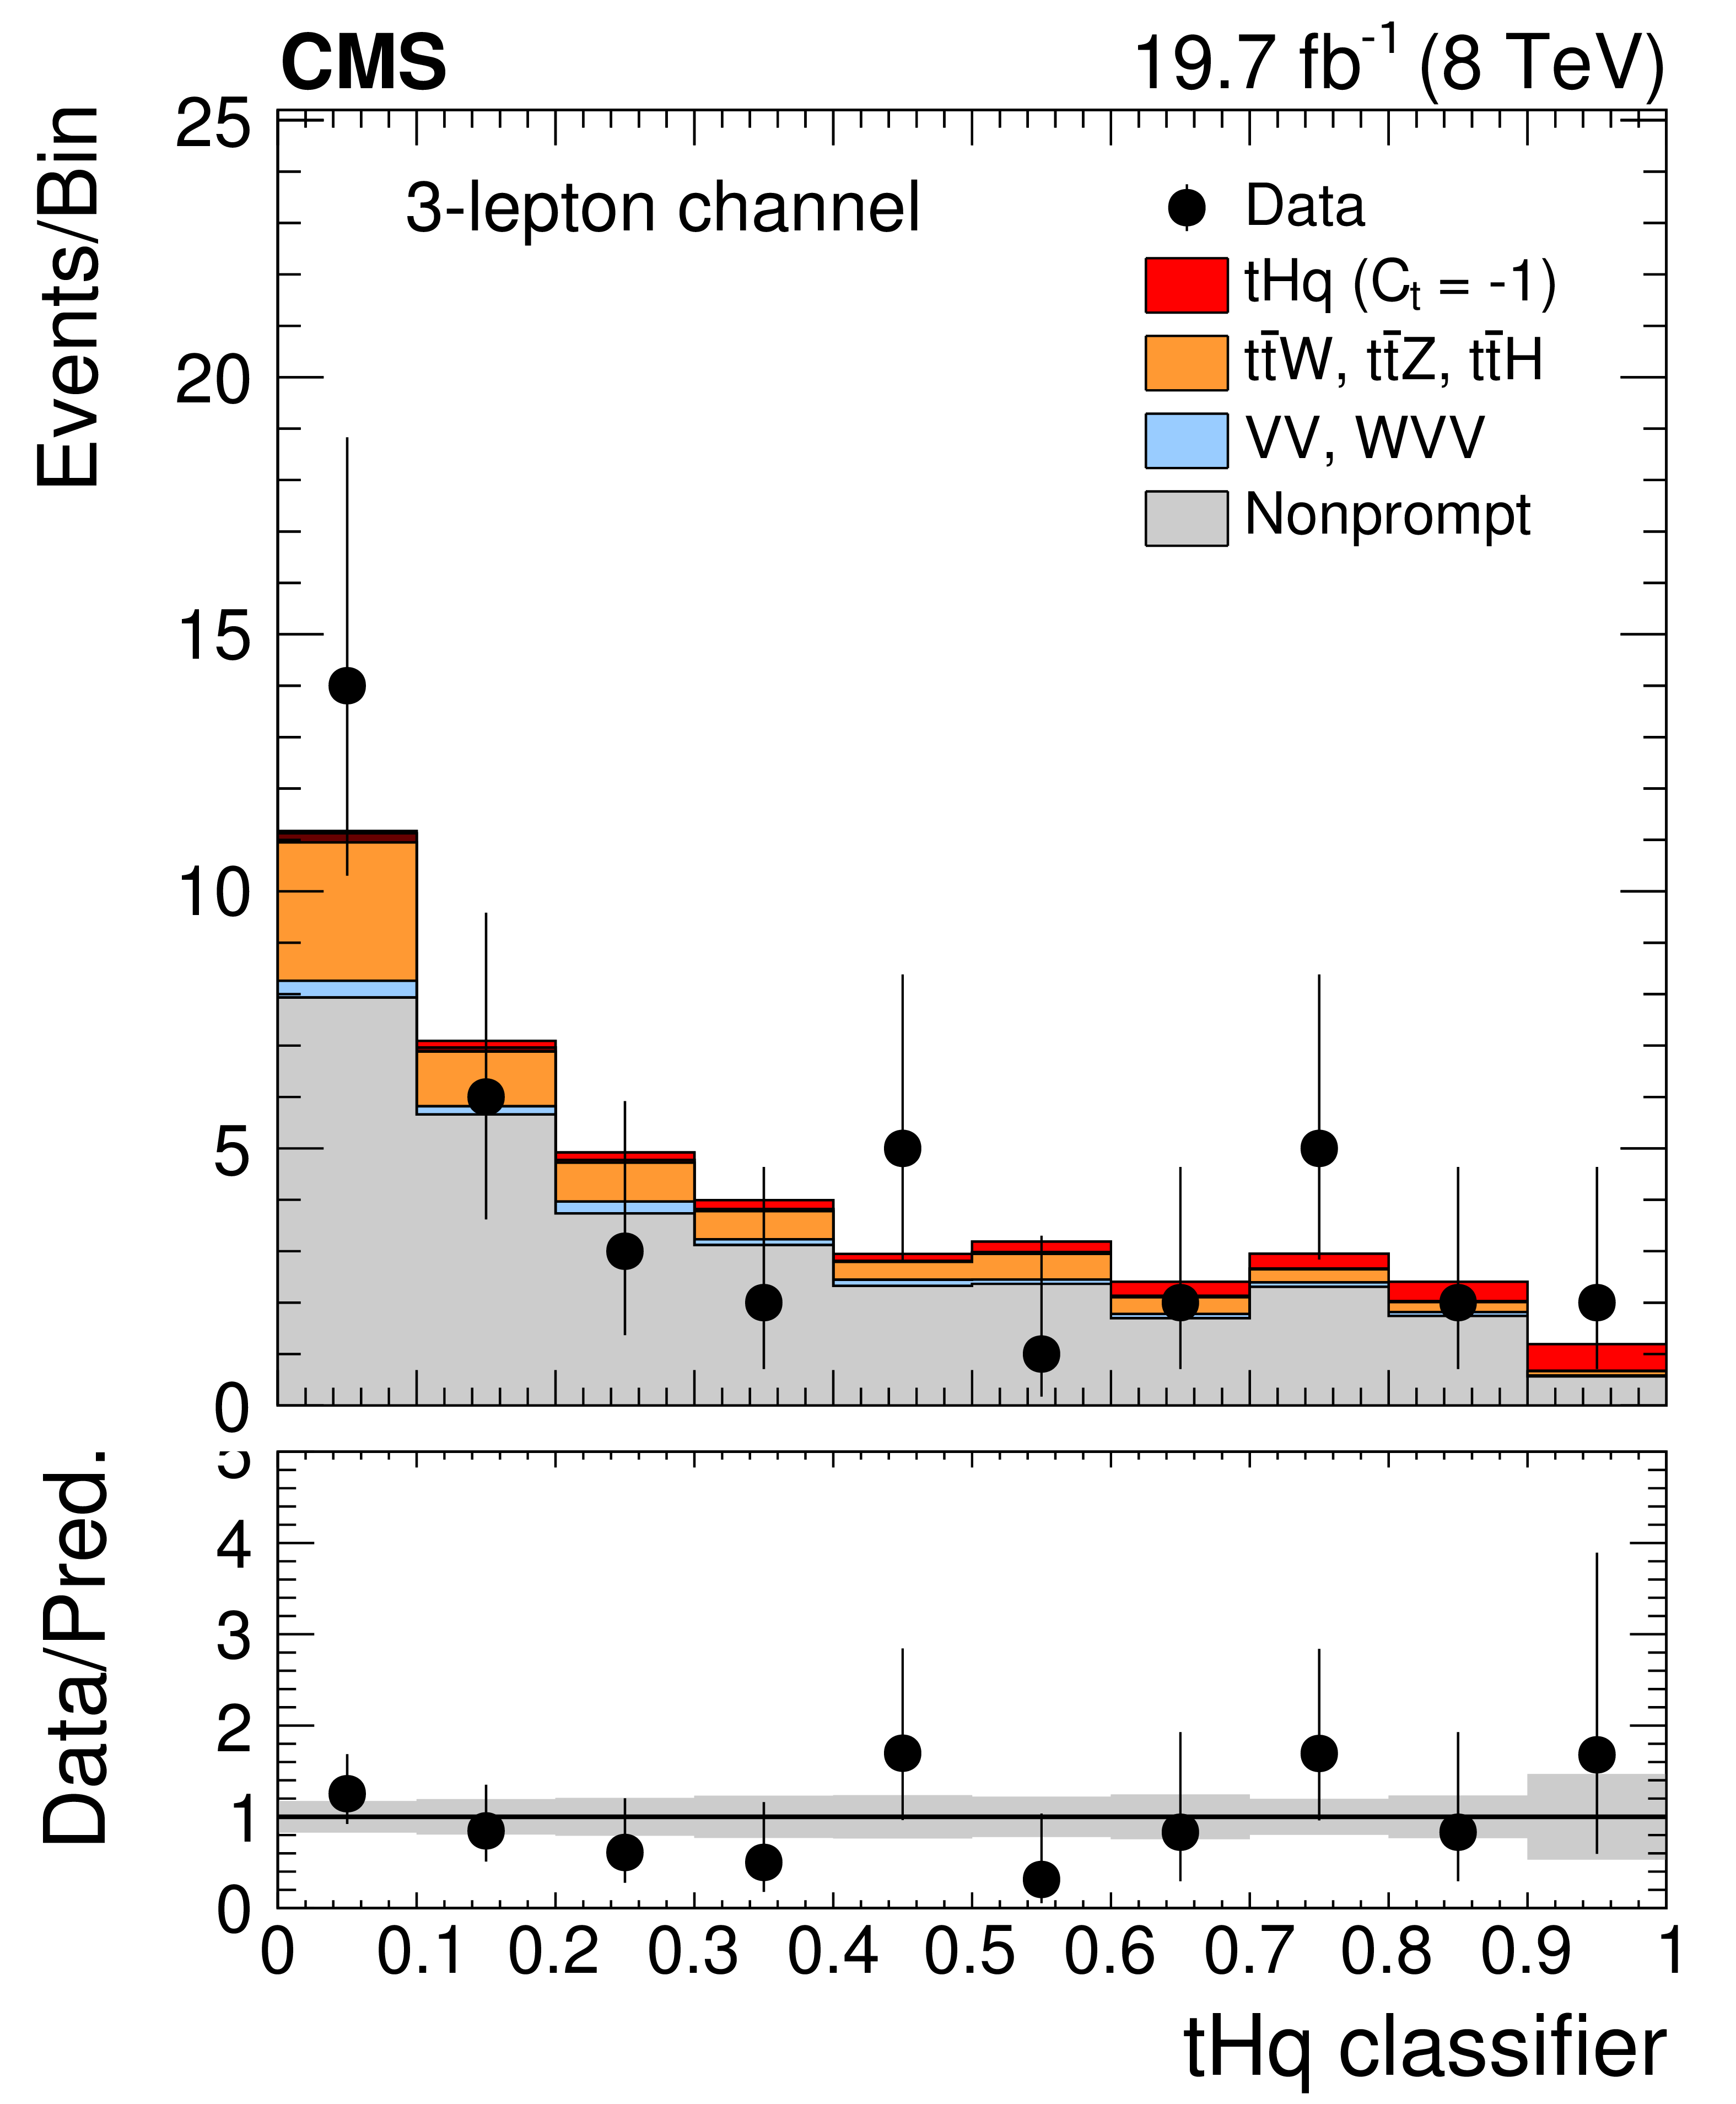
Post-fit Bayes classifier output, for the ${\mathrm{ e } \mu }$ (left), ${\mu \mu }$ (center), and trilepton channel (right). In the box below each distribution, the ratio of the observed and predicted event yields is shown. The gray band represents the post-fit systematic and statistical uncertainties. |
png pdf |
Figure 4-a:
Post-fit Bayes classifier output, for the ${\mathrm{ e } \mu }$ (left), ${\mu \mu }$ (center), and trilepton channel (right). In the box below each distribution, the ratio of the observed and predicted event yields is shown. The gray band represents the post-fit systematic and statistical uncertainties. |
png pdf |
Figure 4-b:
Post-fit Bayes classifier output, for the ${\mathrm{ e } \mu }$ (left), ${\mu \mu }$ (center), and trilepton channel (right). In the box below each distribution, the ratio of the observed and predicted event yields is shown. The gray band represents the post-fit systematic and statistical uncertainties. |
png pdf |
Figure 4-c:
Post-fit Bayes classifier output, for the ${\mathrm{ e } \mu }$ (left), ${\mu \mu }$ (center), and trilepton channel (right). In the box below each distribution, the ratio of the observed and predicted event yields is shown. The gray band represents the post-fit systematic and statistical uncertainties. |
png pdf |
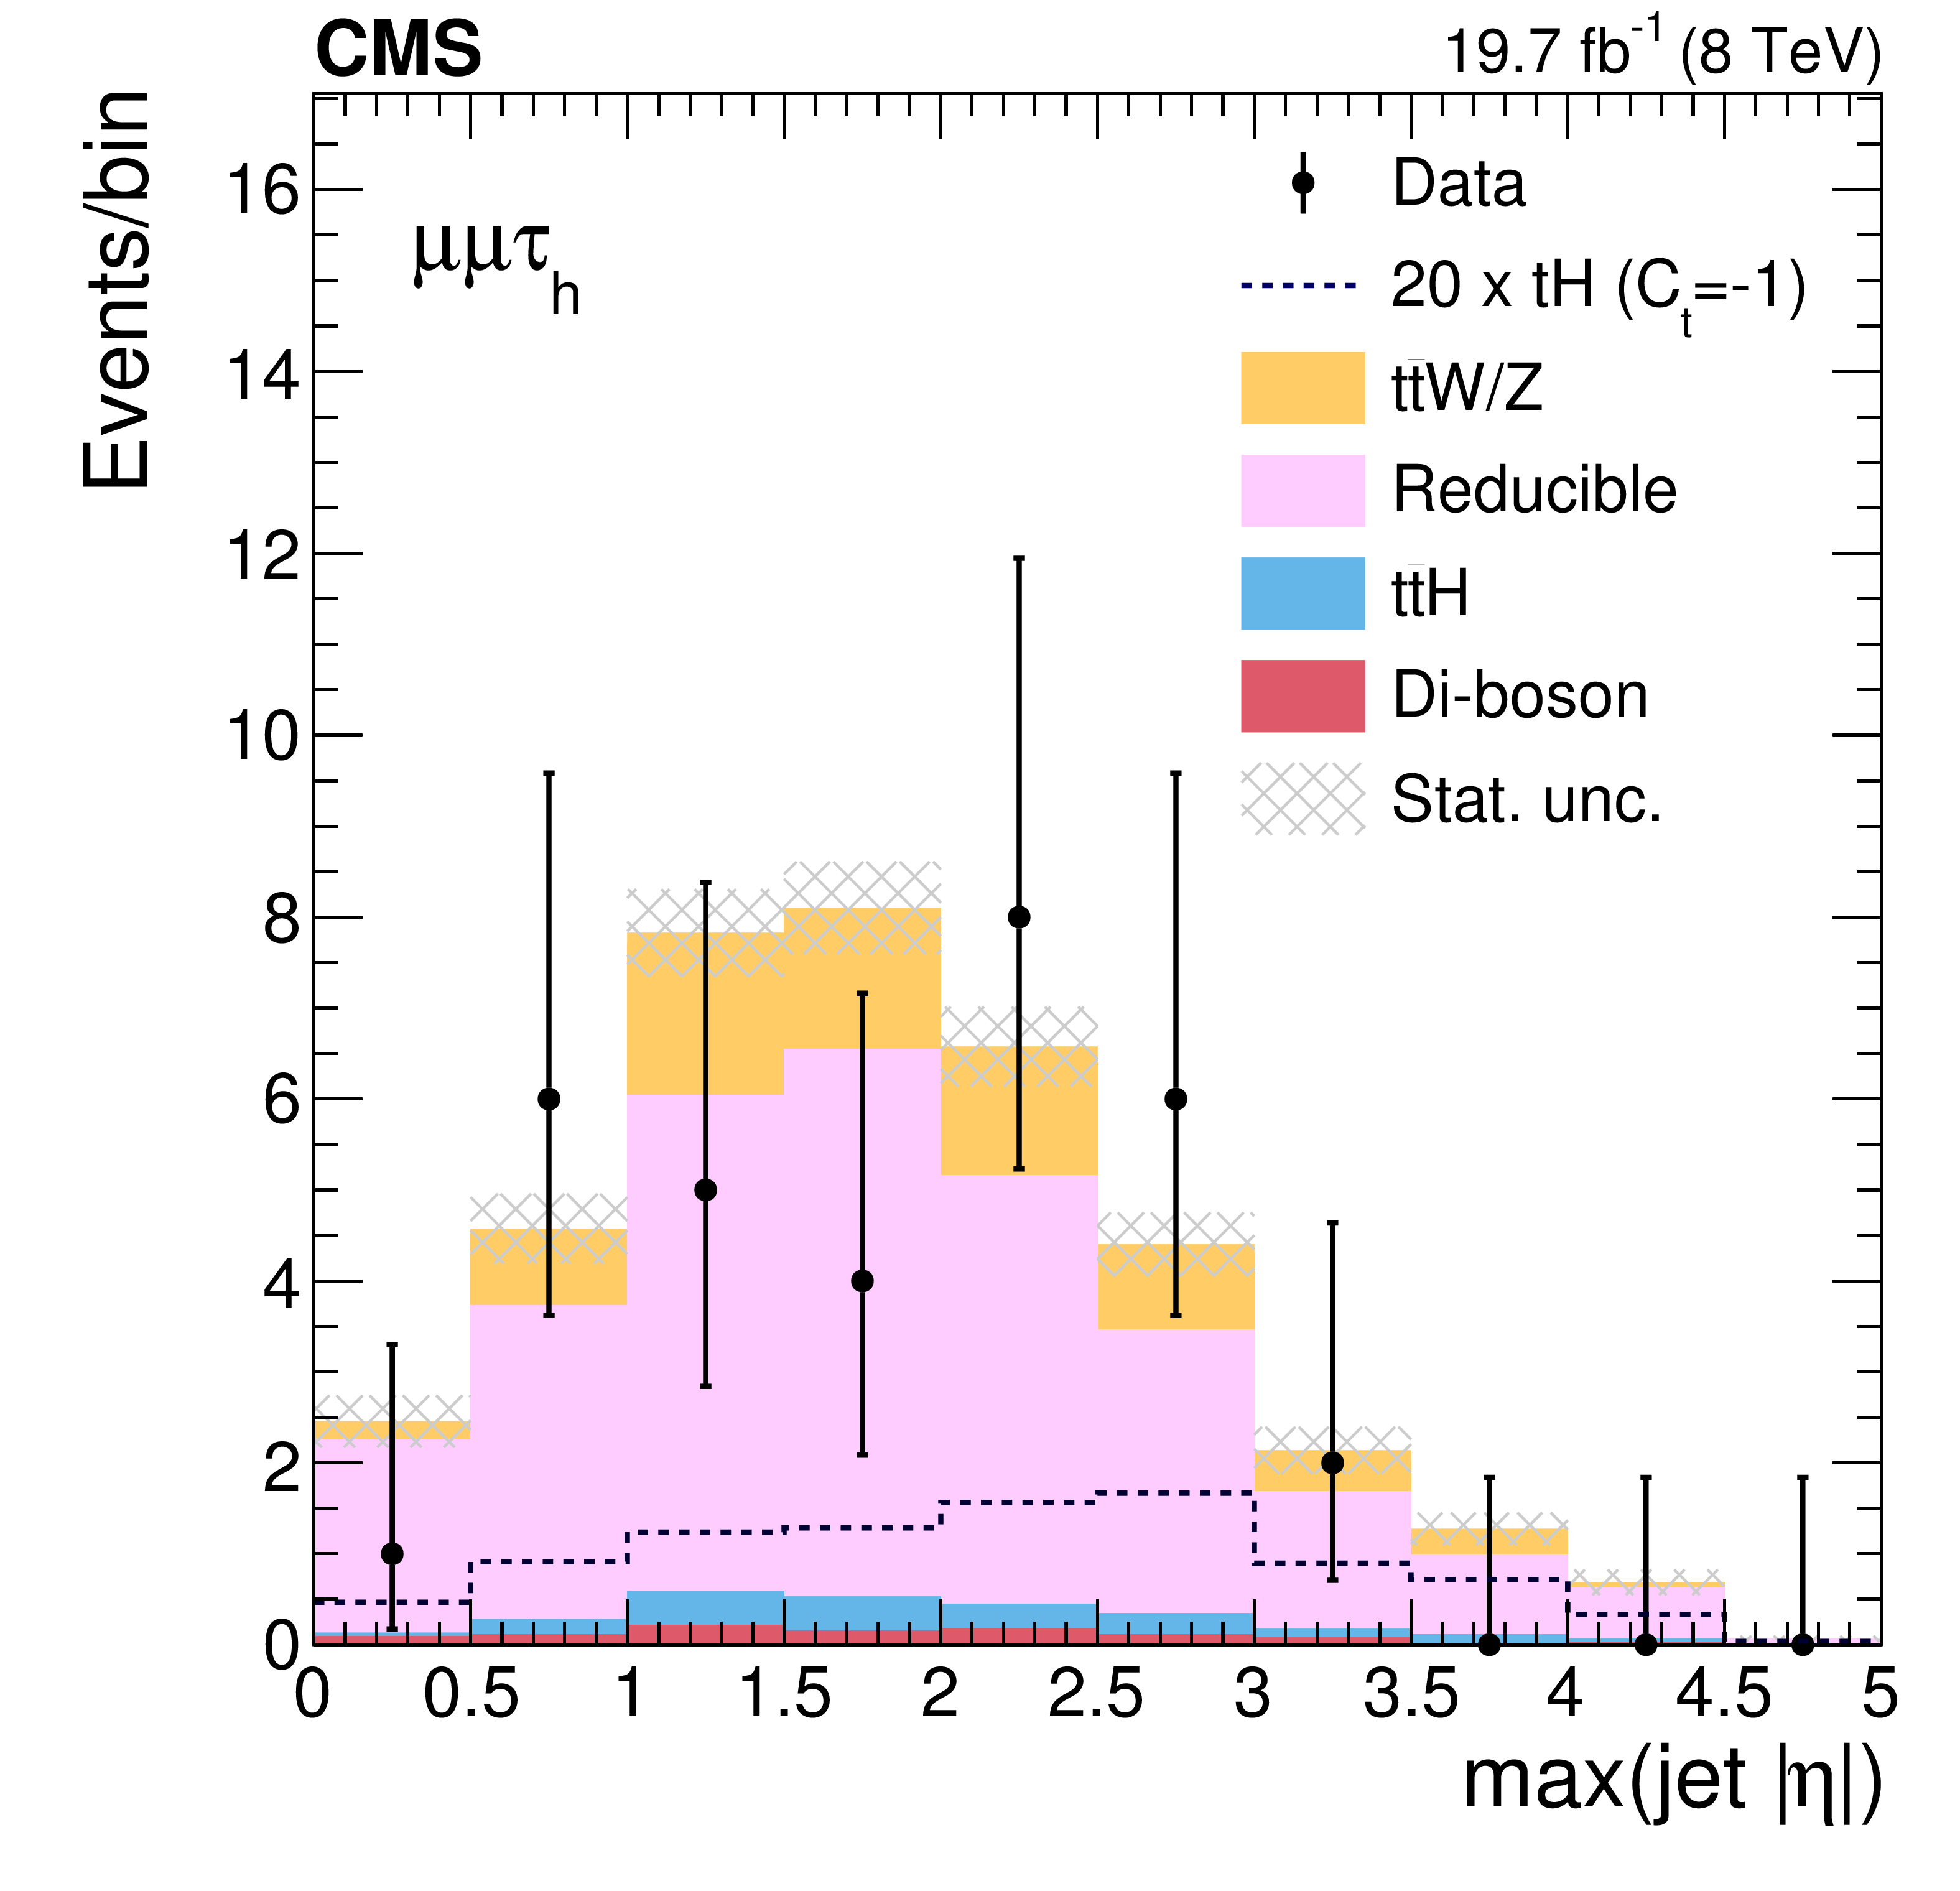
Figure 5:
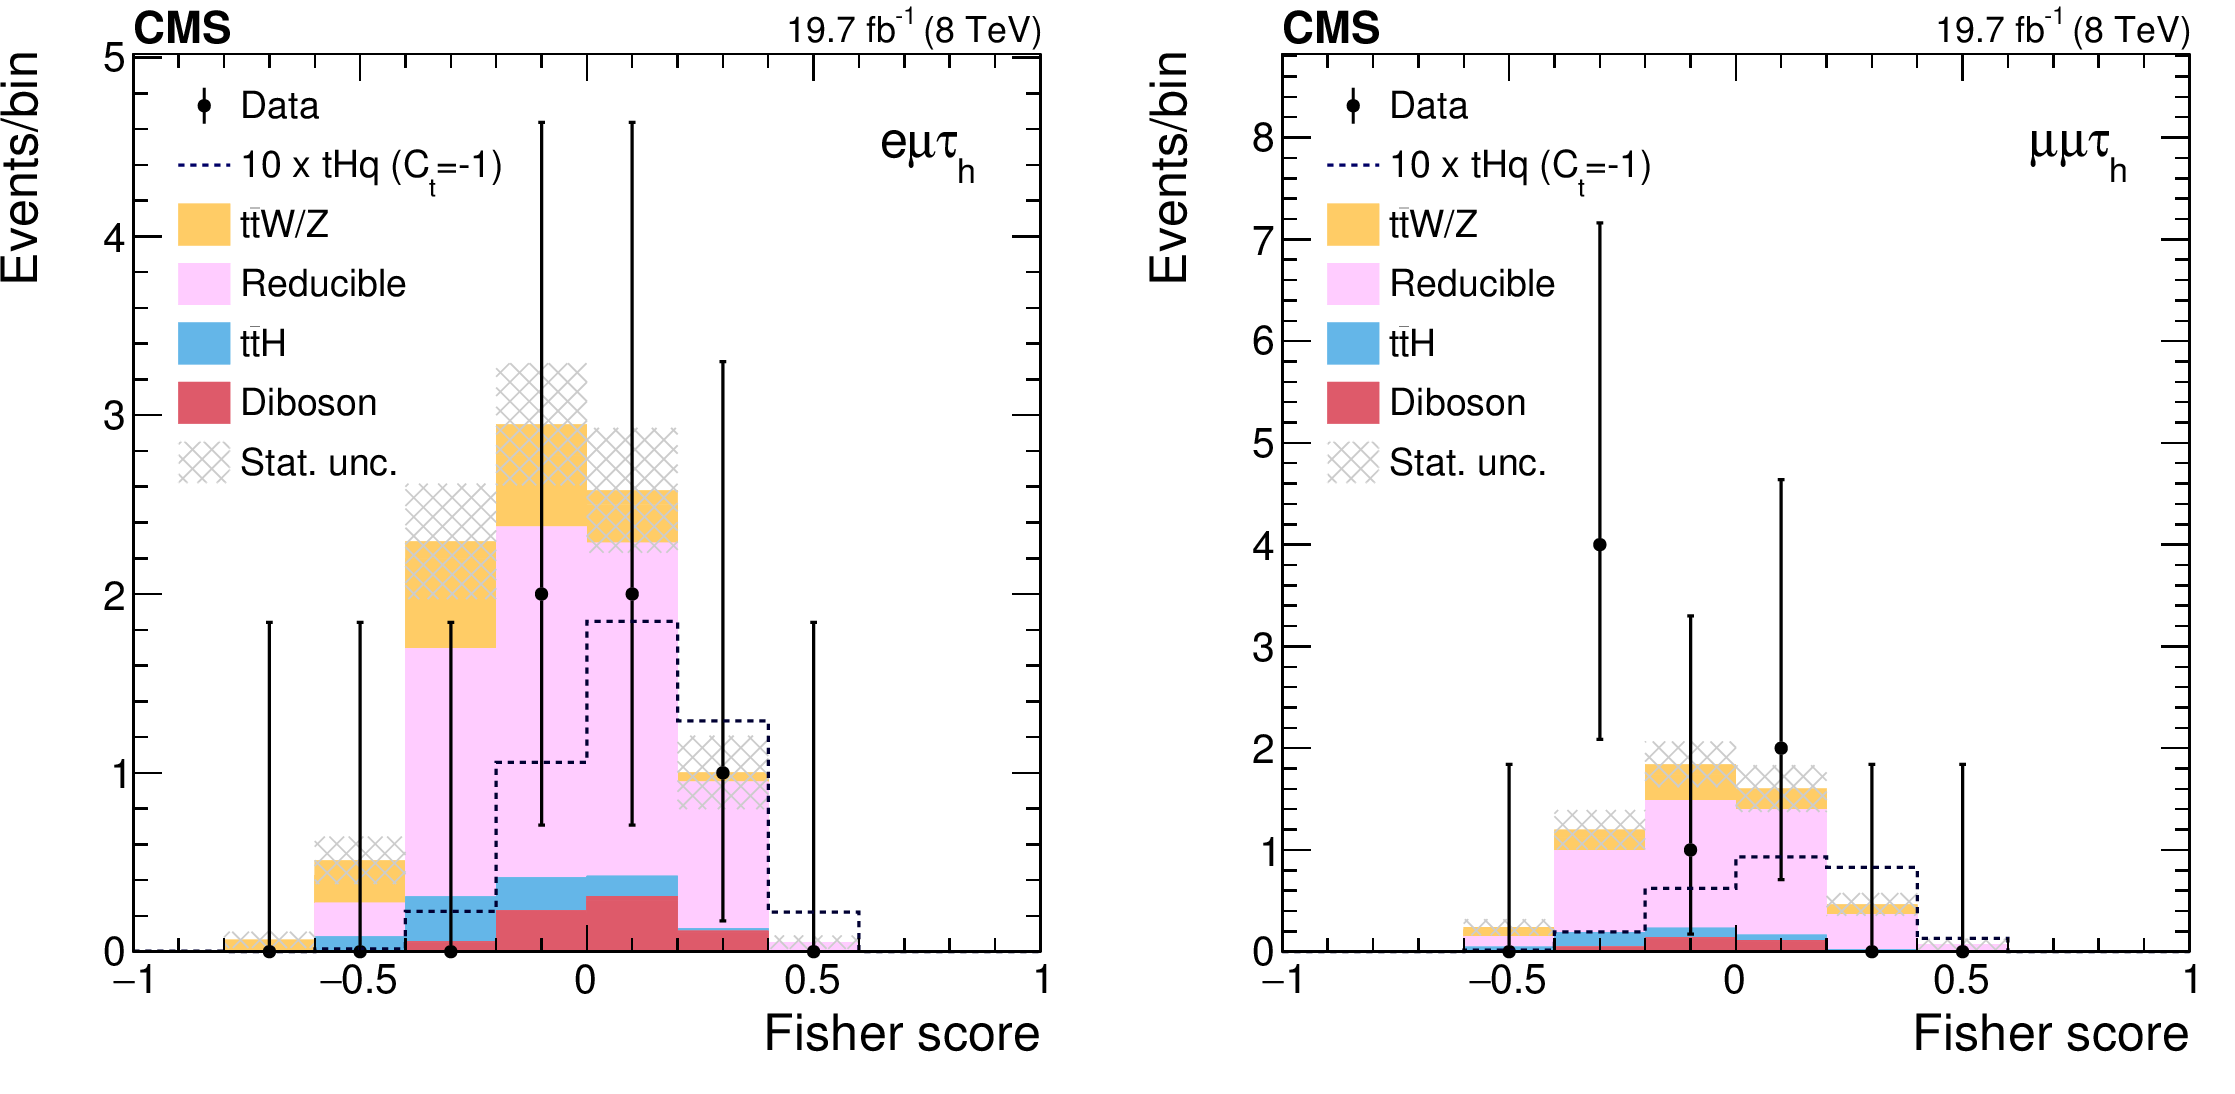
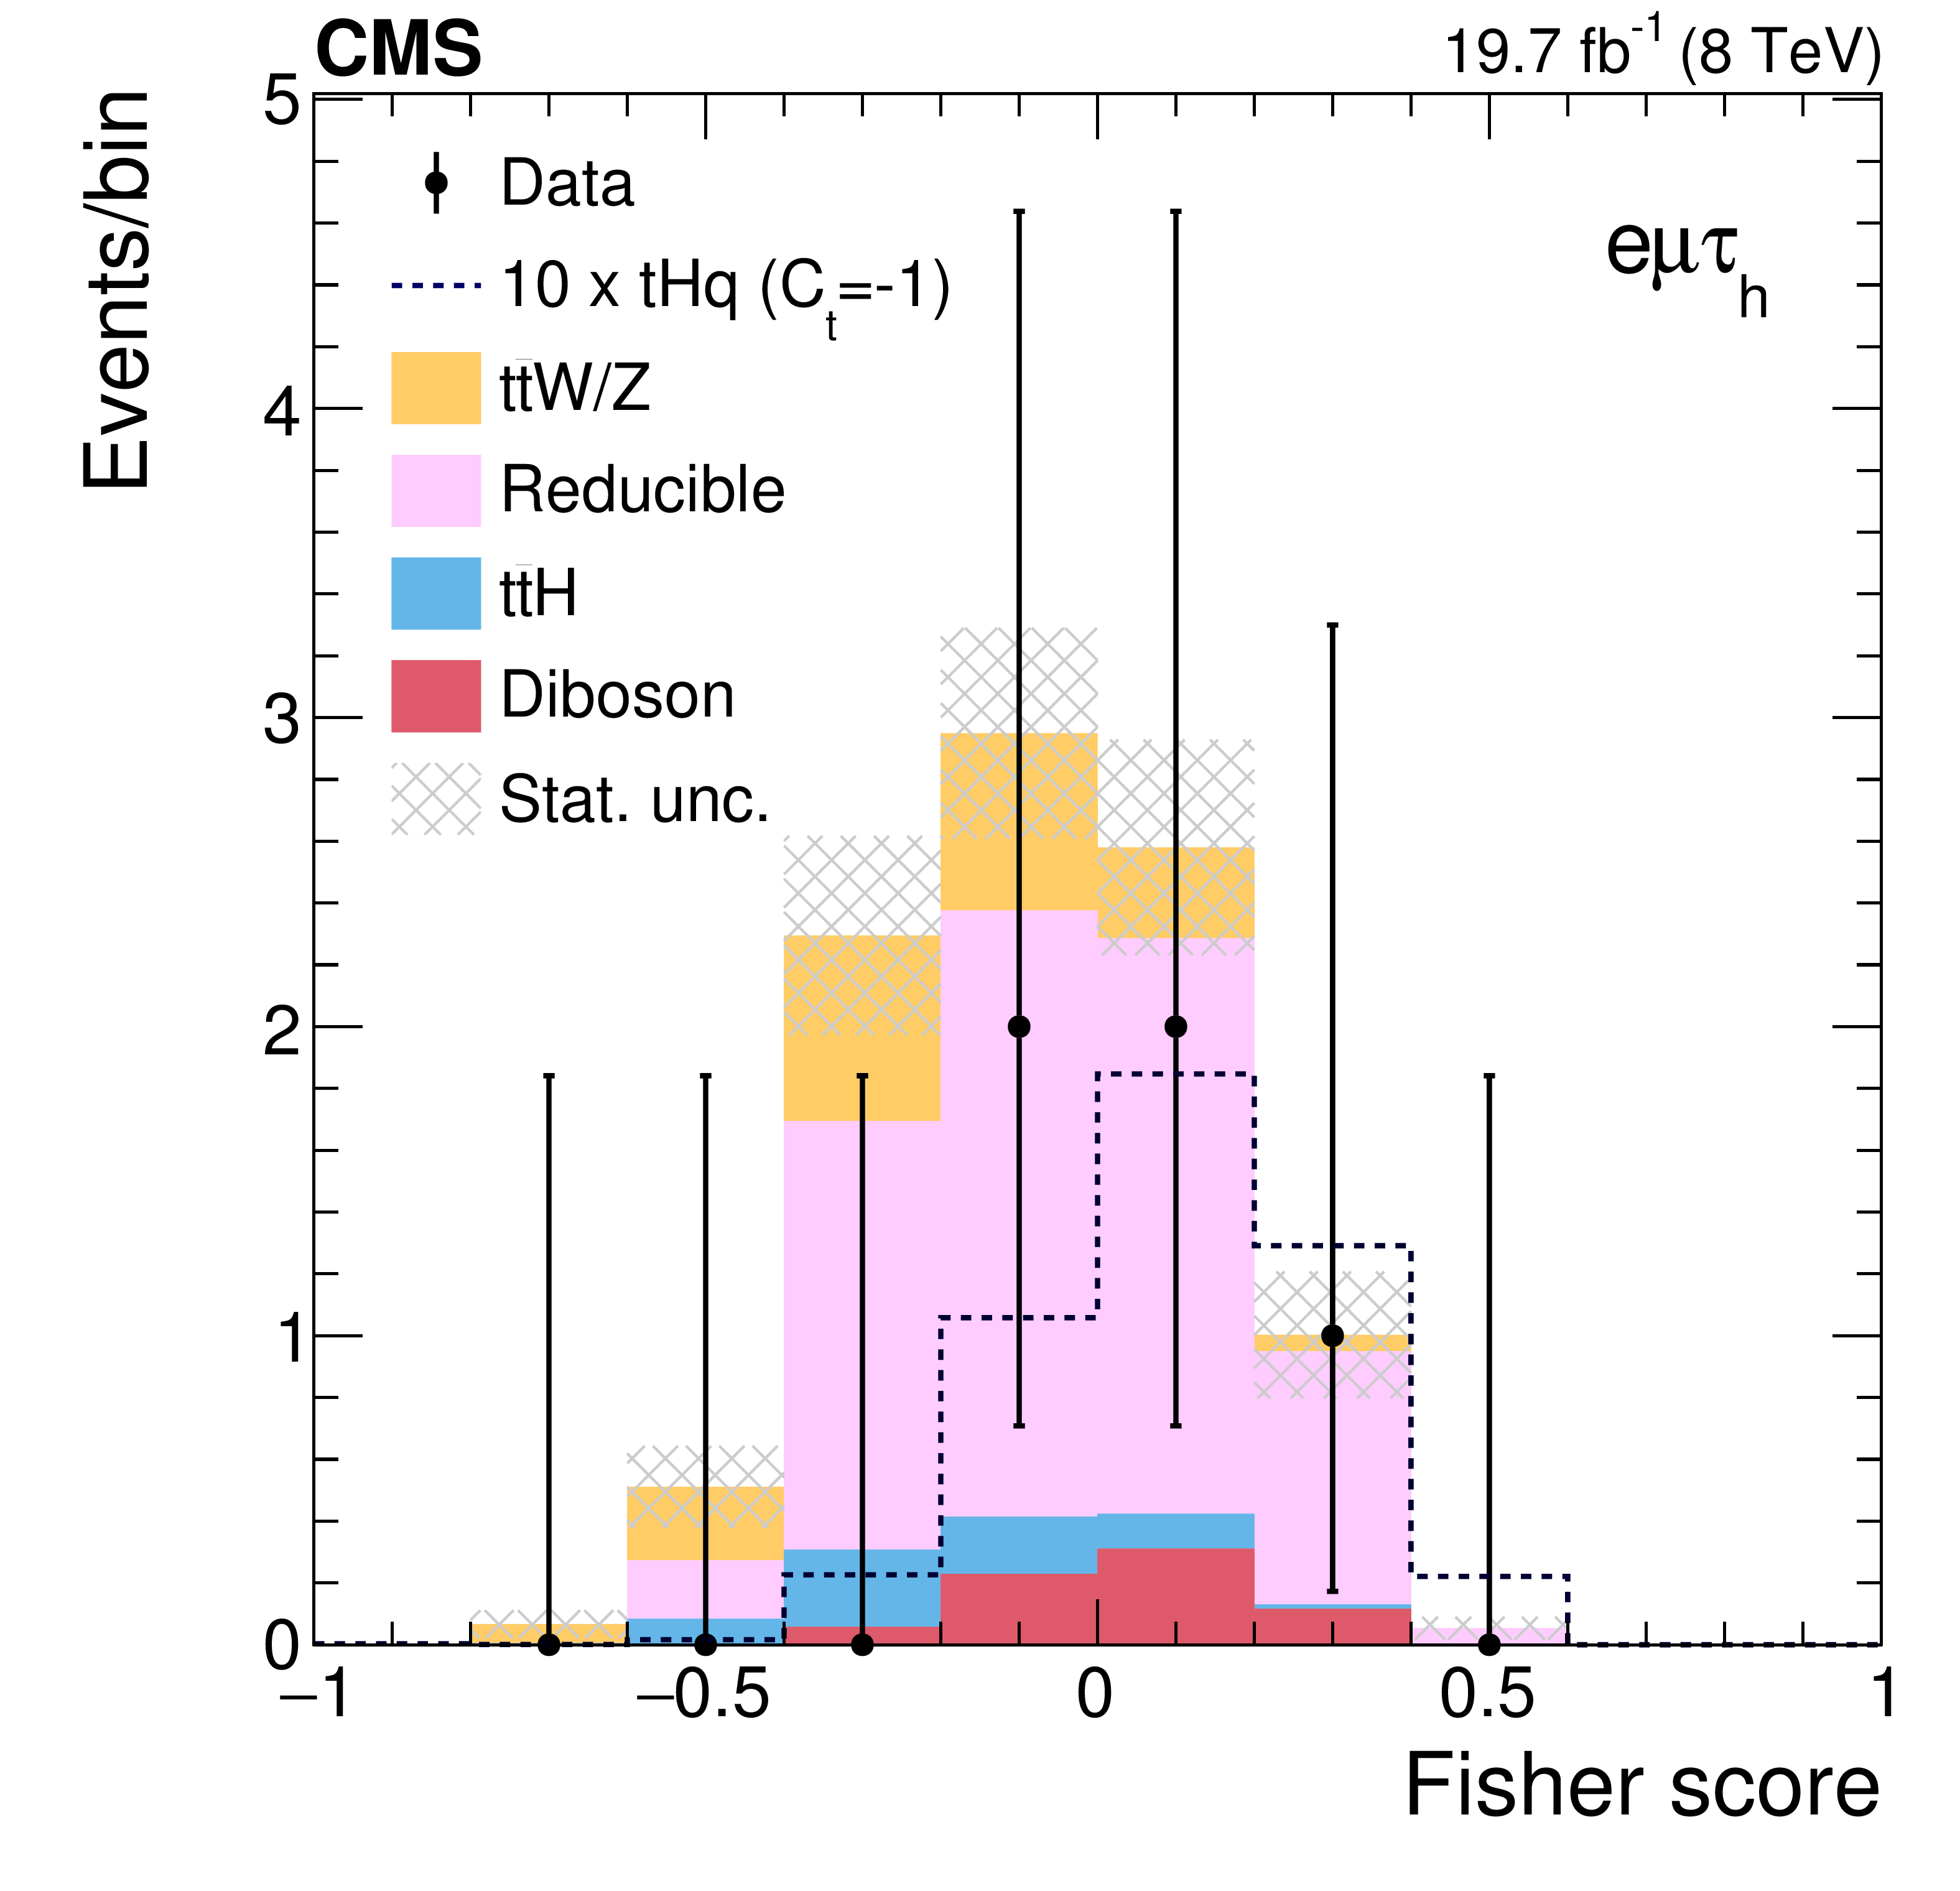
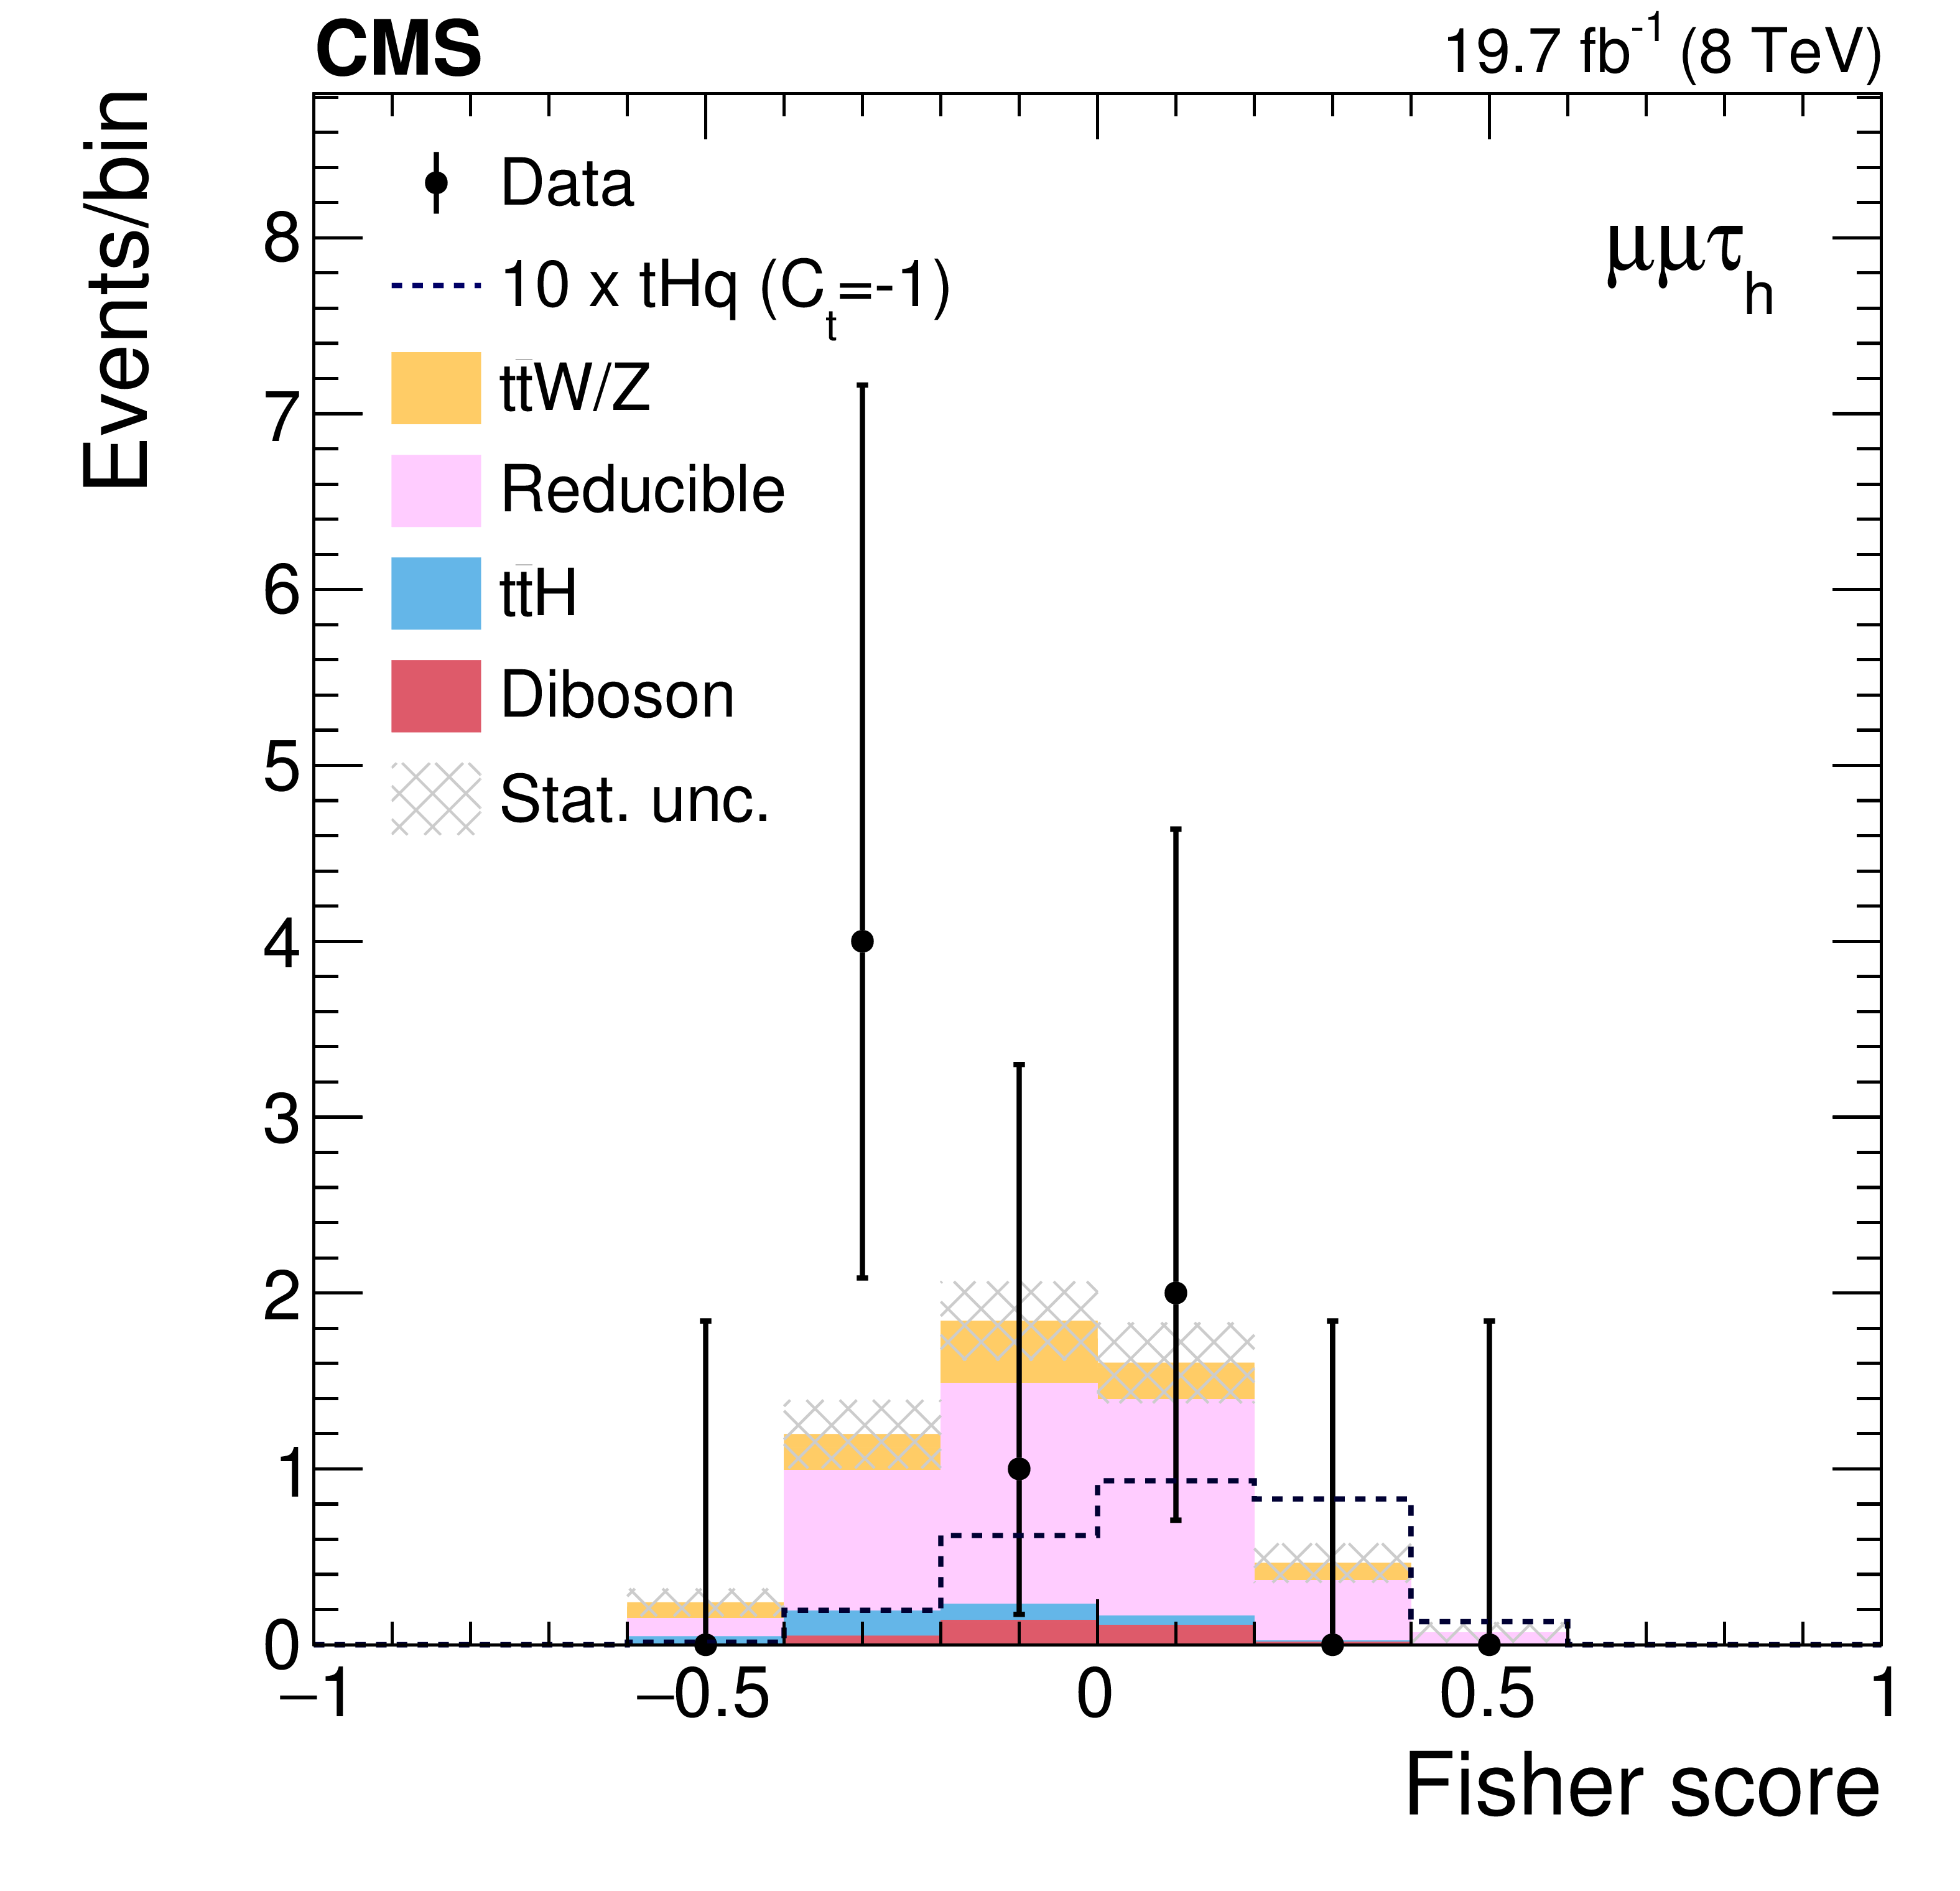
Expected (histograms) and observed (points) distributions of the Fisher discriminant in the $\mathrm{ e } \mu {\tau _\mathrm {h}} $ channel (left) and $\mu \mu {\tau _\mathrm {h}} $ channel (right). The dashed line gives the expected contribution from the ${\mathrm{ t } \mathrm{ H } \mathrm{ q } }$ signal ($ {C_{\mathrm{ t } }} =-1$) case, multiplied by ten. |
png pdf |
Figure 5-a:
Expected (histograms) and observed (points) distributions of the Fisher discriminant in the $\mathrm{ e } \mu {\tau _\mathrm {h}} $ channel (left) and $\mu \mu {\tau _\mathrm {h}} $ channel (right). The dashed line gives the expected contribution from the ${\mathrm{ t } \mathrm{ H } \mathrm{ q } }$ signal ($ {C_{\mathrm{ t } }} =-1$) case, multiplied by ten. |
png pdf |
Figure 5-b:
Expected (histograms) and observed (points) distributions of the Fisher discriminant in the $\mathrm{ e } \mu {\tau _\mathrm {h}} $ channel (left) and $\mu \mu {\tau _\mathrm {h}} $ channel (right). The dashed line gives the expected contribution from the ${\mathrm{ t } \mathrm{ H } \mathrm{ q } }$ signal ($ {C_{\mathrm{ t } }} =-1$) case, multiplied by ten. |
png pdf |
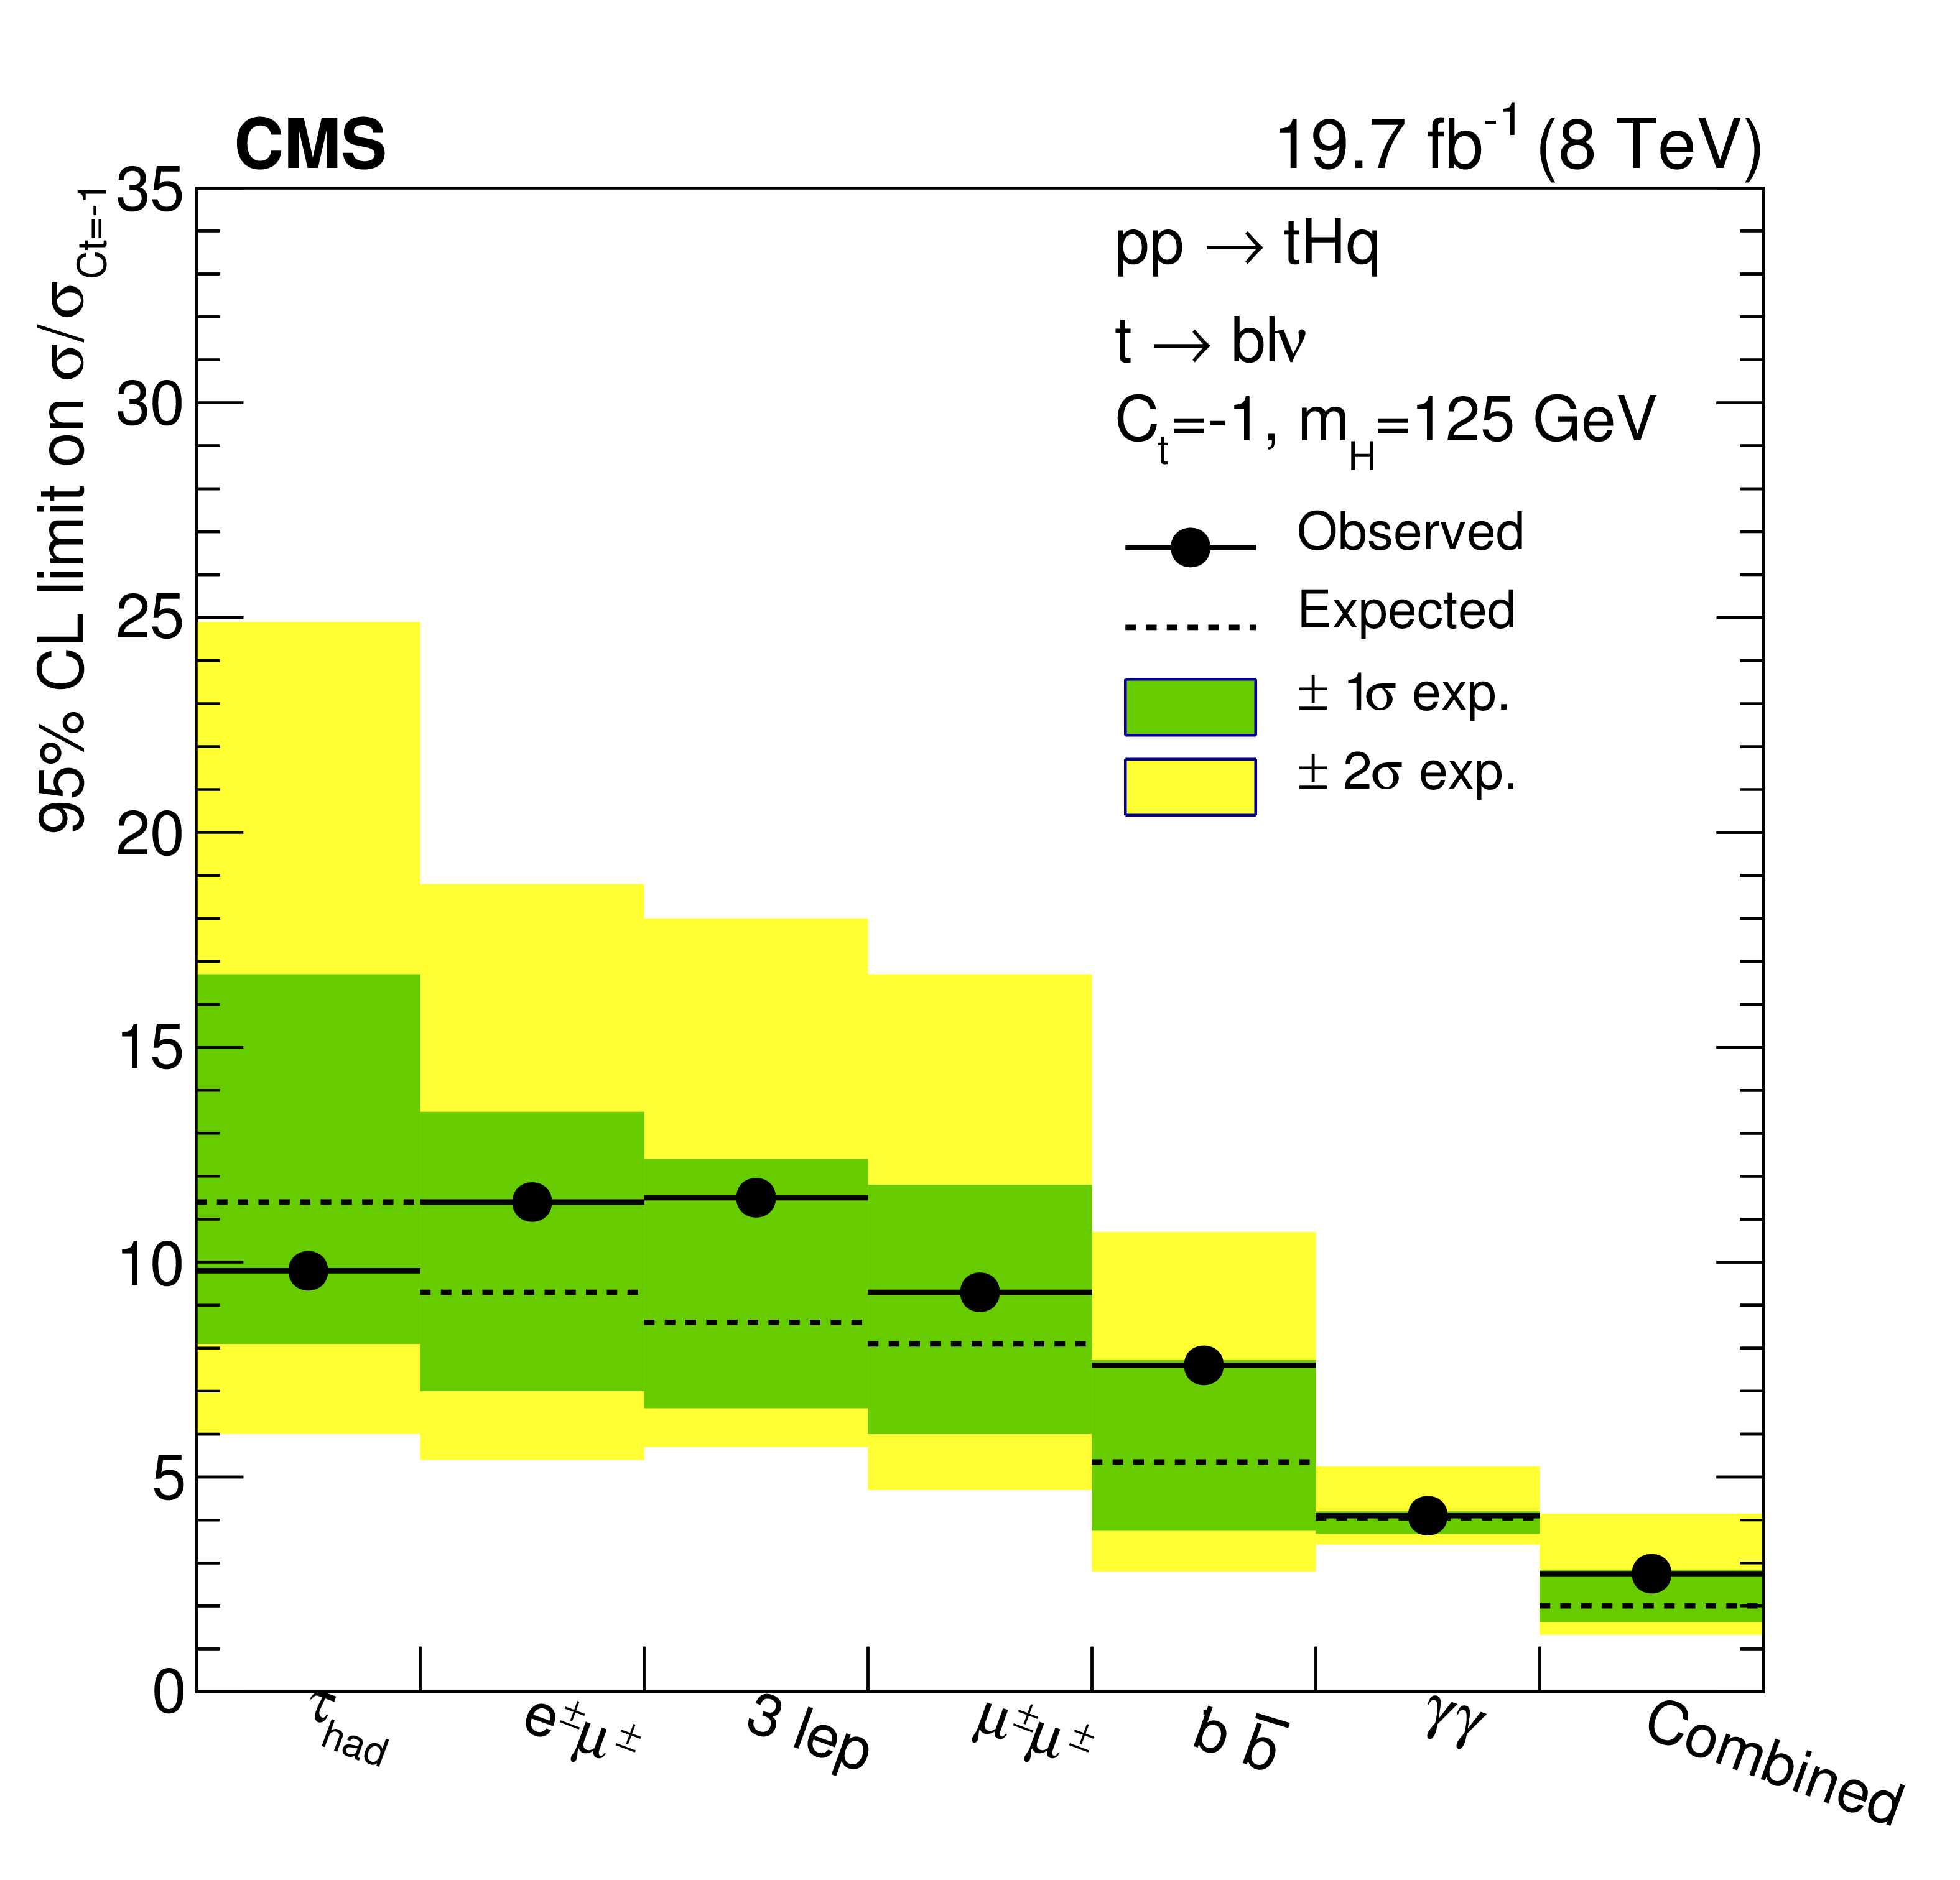
Figure 6:
The 95% CL upper limits on the excess event yields predicted by the enhanced ${\mathrm{ t } \mathrm{ H } \mathrm{ q } } $ cross section and Higgs boson to diphoton branching fraction for $ {C_{\mathrm{ t } }} =-1$. The limits are normalized to the $ {C_{\mathrm{ t } }} =-1$ predictions [57], and are shown for each analysis channel, and combined. The black solid and dotted lines show the observed and background-only expected limits, respectively. The $1\sigma $ and $2\sigma $ bands represent the 1 and 2standard deviation uncertainties on the expected limits. |

png pdf |
Figure 7:
The 95% CL upper limits on the ${\mathrm{ t } \mathrm{ H } \mathrm{ q } } $ production cross section as a function of the assumed Higgs boson to diphoton branching fraction. The black solid and dotted lines show the observed and background-only expected limits, respectively. The $1\sigma $ and $2\sigma $ bands represent the 1 and 2standard deviation uncertainties on the expected limits. The red horizontal line shows the predicted ${\mathrm{ t } \mathrm{ H } \mathrm{ q } } $ cross section for the SM Higgs boson with $m_{\mathrm{ H } } =$ 125 GeV in the $ {C_{\mathrm{ t } }} =-1$ scenario, while the black horizontal line shows the predicted $ {\mathrm{ t } \mathrm{ H } \mathrm{ q } } $ cross section in the SM (i.e. , $ {C_{\mathrm{ t } }} =+1$). |
| Tables | |
png pdf |
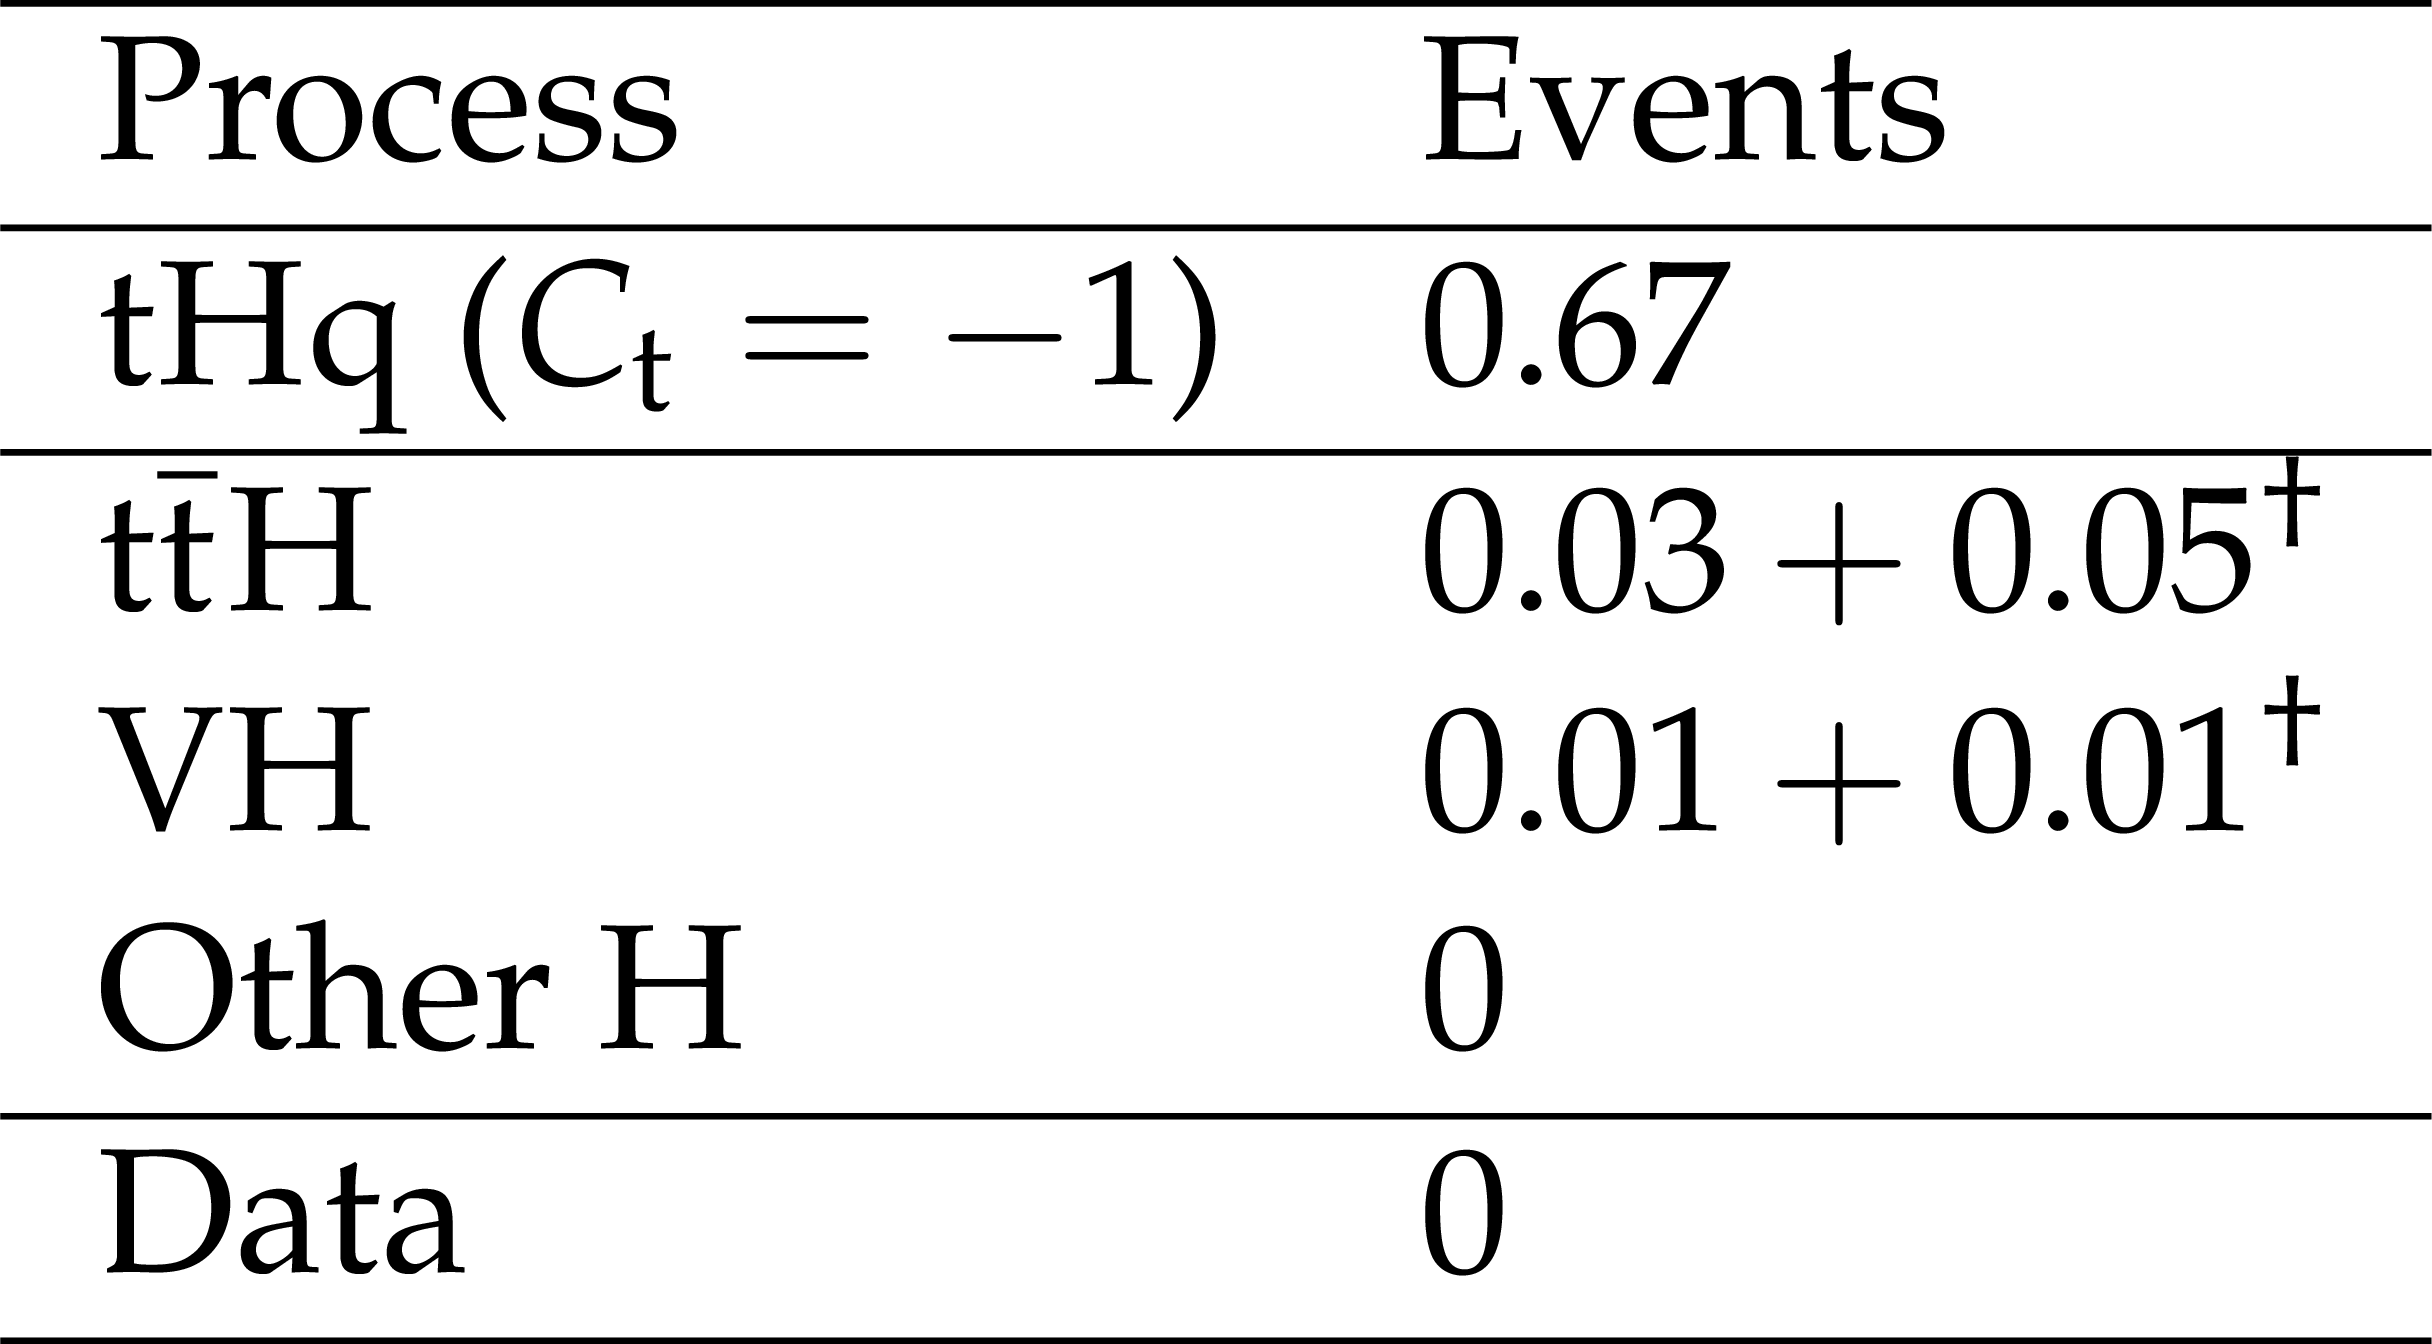
Table 1:
Expected yields for the diphoton analysis, based on simulations. Yields are counted for events with diphoton mass in the 122-128 GeV range. The additional contributions to the ${{\mathrm{ t } {}\mathrm{ \bar{t} } } \mathrm {H}} $ and $\mathrm {VH}$ processes arising from the enhanced Higgs to diphoton branching fraction due to the $ {C_{\mathrm{ t } }} =-1$ assumption are marked with a dagger($^{\dagger }$). |

png pdf |
Table 2:
Data yields and post-fit expected backgrounds after the event pre-selection for single top plus Higgs events appearing in events with ${\mathrm{ e } \mu } $, ${\mu \mu } $, or $\ell \ell \ell $. Contributions from tHq and tHW are shown separately, as well as expected events where the Higgs boson decays to W bosons, or to tau leptons. Uncertainties include systematic and statistical sources. ``Rare SM'' comprises ${\mathrm {VVV}} $, $ {\mathrm{ t } \mathrm{ b } \mathrm {Z}} $, ${\mathrm {ZZ}} $, ${{\mathrm{ t } {}\mathrm{ \bar{t} } } {\mathrm {WW}} } $, and ${\mathrm {WW}}$ processes for the dilepton channels, and ${\mathrm {WVV}}$ for the trilepton channel. |
png pdf |
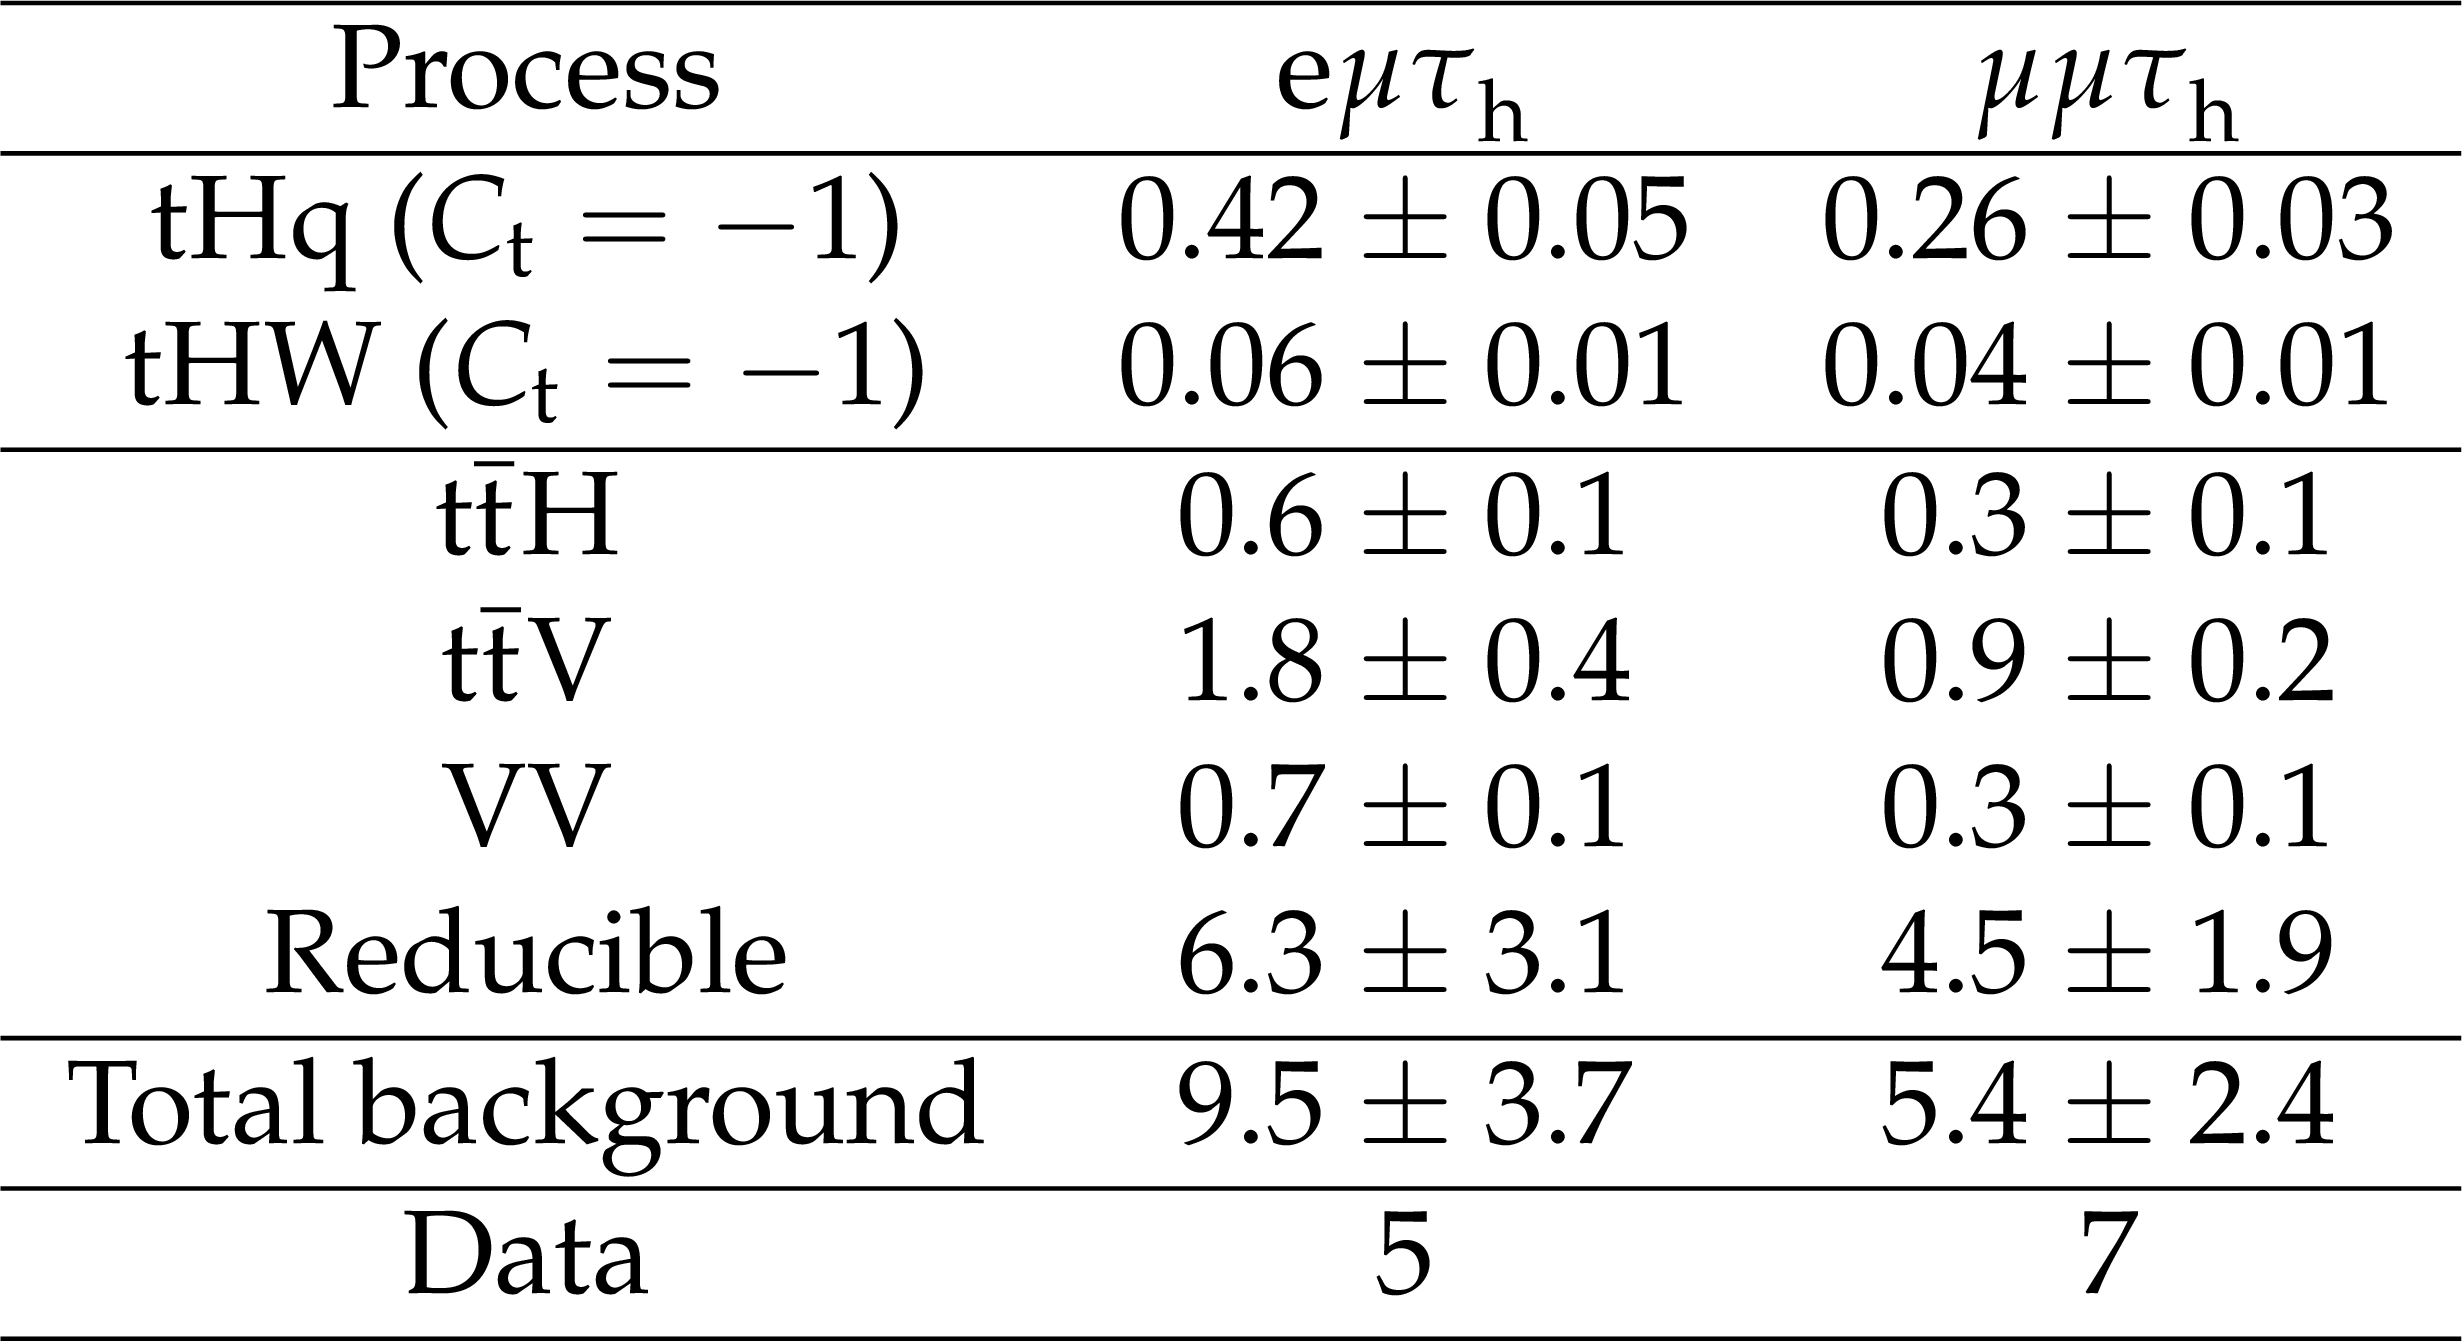
Table 3:
Expected and observed event yields for the $\mathrm{ e } \mu {\tau _\mathrm {h}} $ and $\mu \mu {\tau _\mathrm {h}} $ channels. The given uncertainties include all systematic uncertainties added in quadrature, including uncertainties due to the limited numbers of simulated events or events in control data samples. |
png pdf |
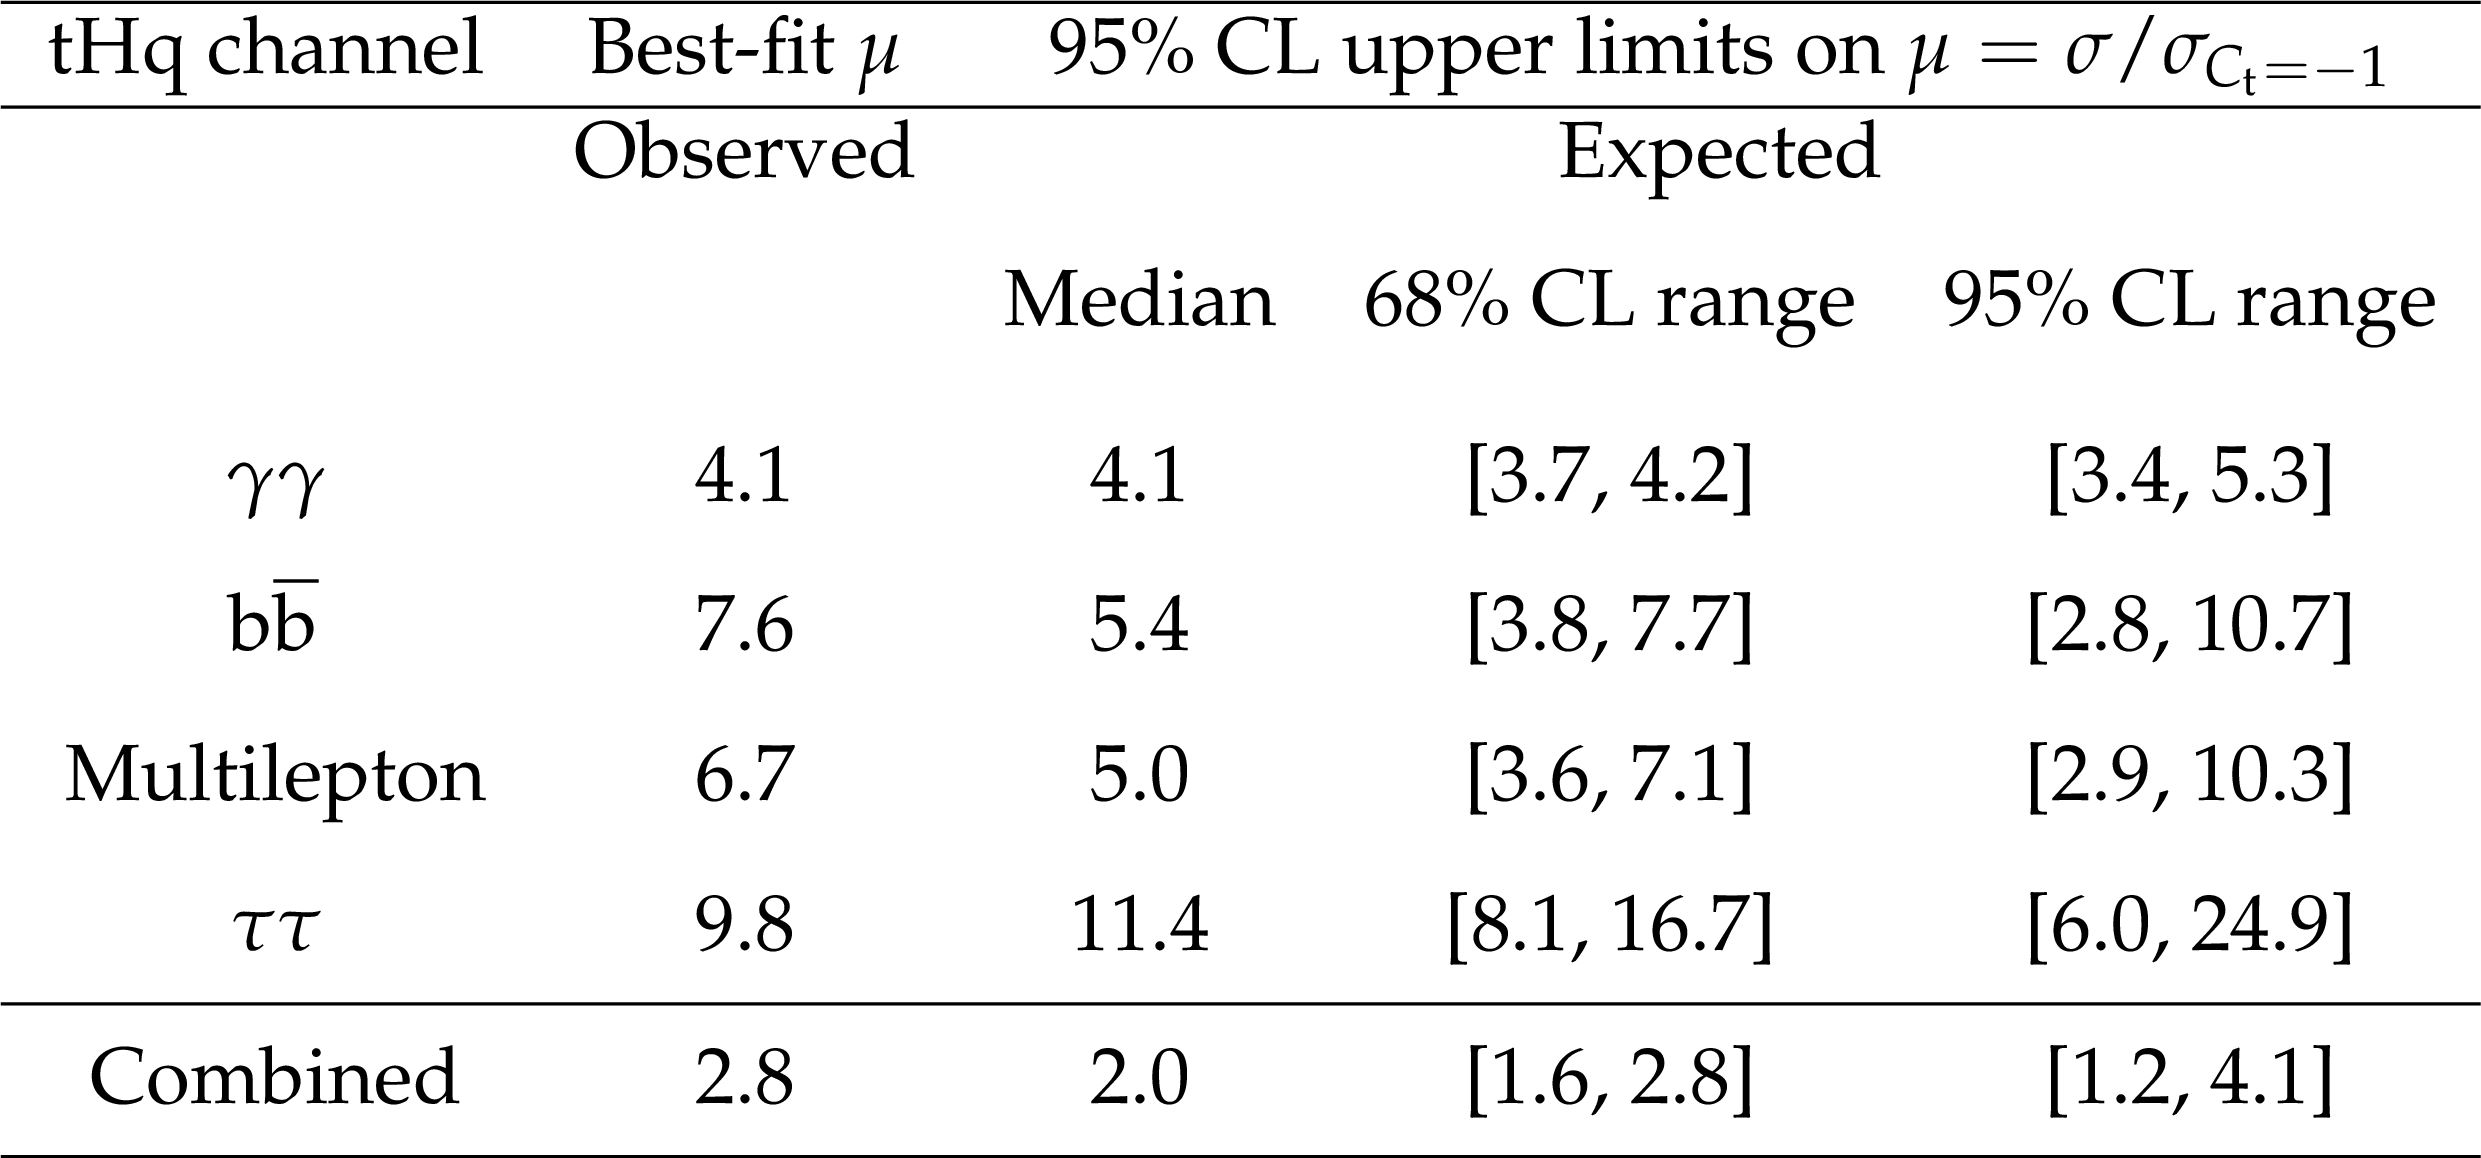
Table 4:
Upper limit on $\mu = \sigma /\sigma _{ {C_{\mathrm{ t } }} =-1}$ for each ${\mathrm{ t } \mathrm{ H } \mathrm{ q } }$ channel. The observed and expected 95% CL upper limits on the signal strength parameter $\mu $ for each ${\mathrm{ t } \mathrm{ H } \mathrm{ q } }$ channel are also shown. |
| Summary |
| The production of the standard-model-like Higgs boson in association with a single top quark has been investigated using data recorded by the CMS experiment at $ \sqrt{s} = $ 8 TeV, corresponding to an integrated luminosity of 19.7 fb$^{-1}$. Signatures resulting from leptonic top quark decay and different decay modes of the Higgs boson have been analyzed. In particular, the searches have been optimized for the $\mathrm{ H } \to \gamma \gamma$, $\mathrm{ H } \to \mathrm{b }\mathrm{ \bar{b} }$, $\mathrm{ H } \to \mathrm{ W }\mathrm{ W }$, and $\mathrm{ H } \to \tau\tau$ decay modes. The results are consistent with the background-only hypothesis. A 95% confidence level limit on the production cross section of a single top quark plus a Higgs boson with a non-standard-model coupling is set ranging from 600 to 1000 fb depending on the assumed diphoton branching fraction of the Higgs boson. This is the first time that results on anomalous ${\mathrm{ t }\mathrm{ H }\mathrm{ q }} $ production have been reported. These results can be combined with other Higgs boson measurements to constrain the coupling of the Higgs boson to SM quarks; they can also be used to probe new physics modifying the top-Higgs couplings. The 13 TeV LHC run will allow a precise determination of both the magnitude and the sign of the top quark Yukawa coupling. |
| Additional Figures | |

png pdf |
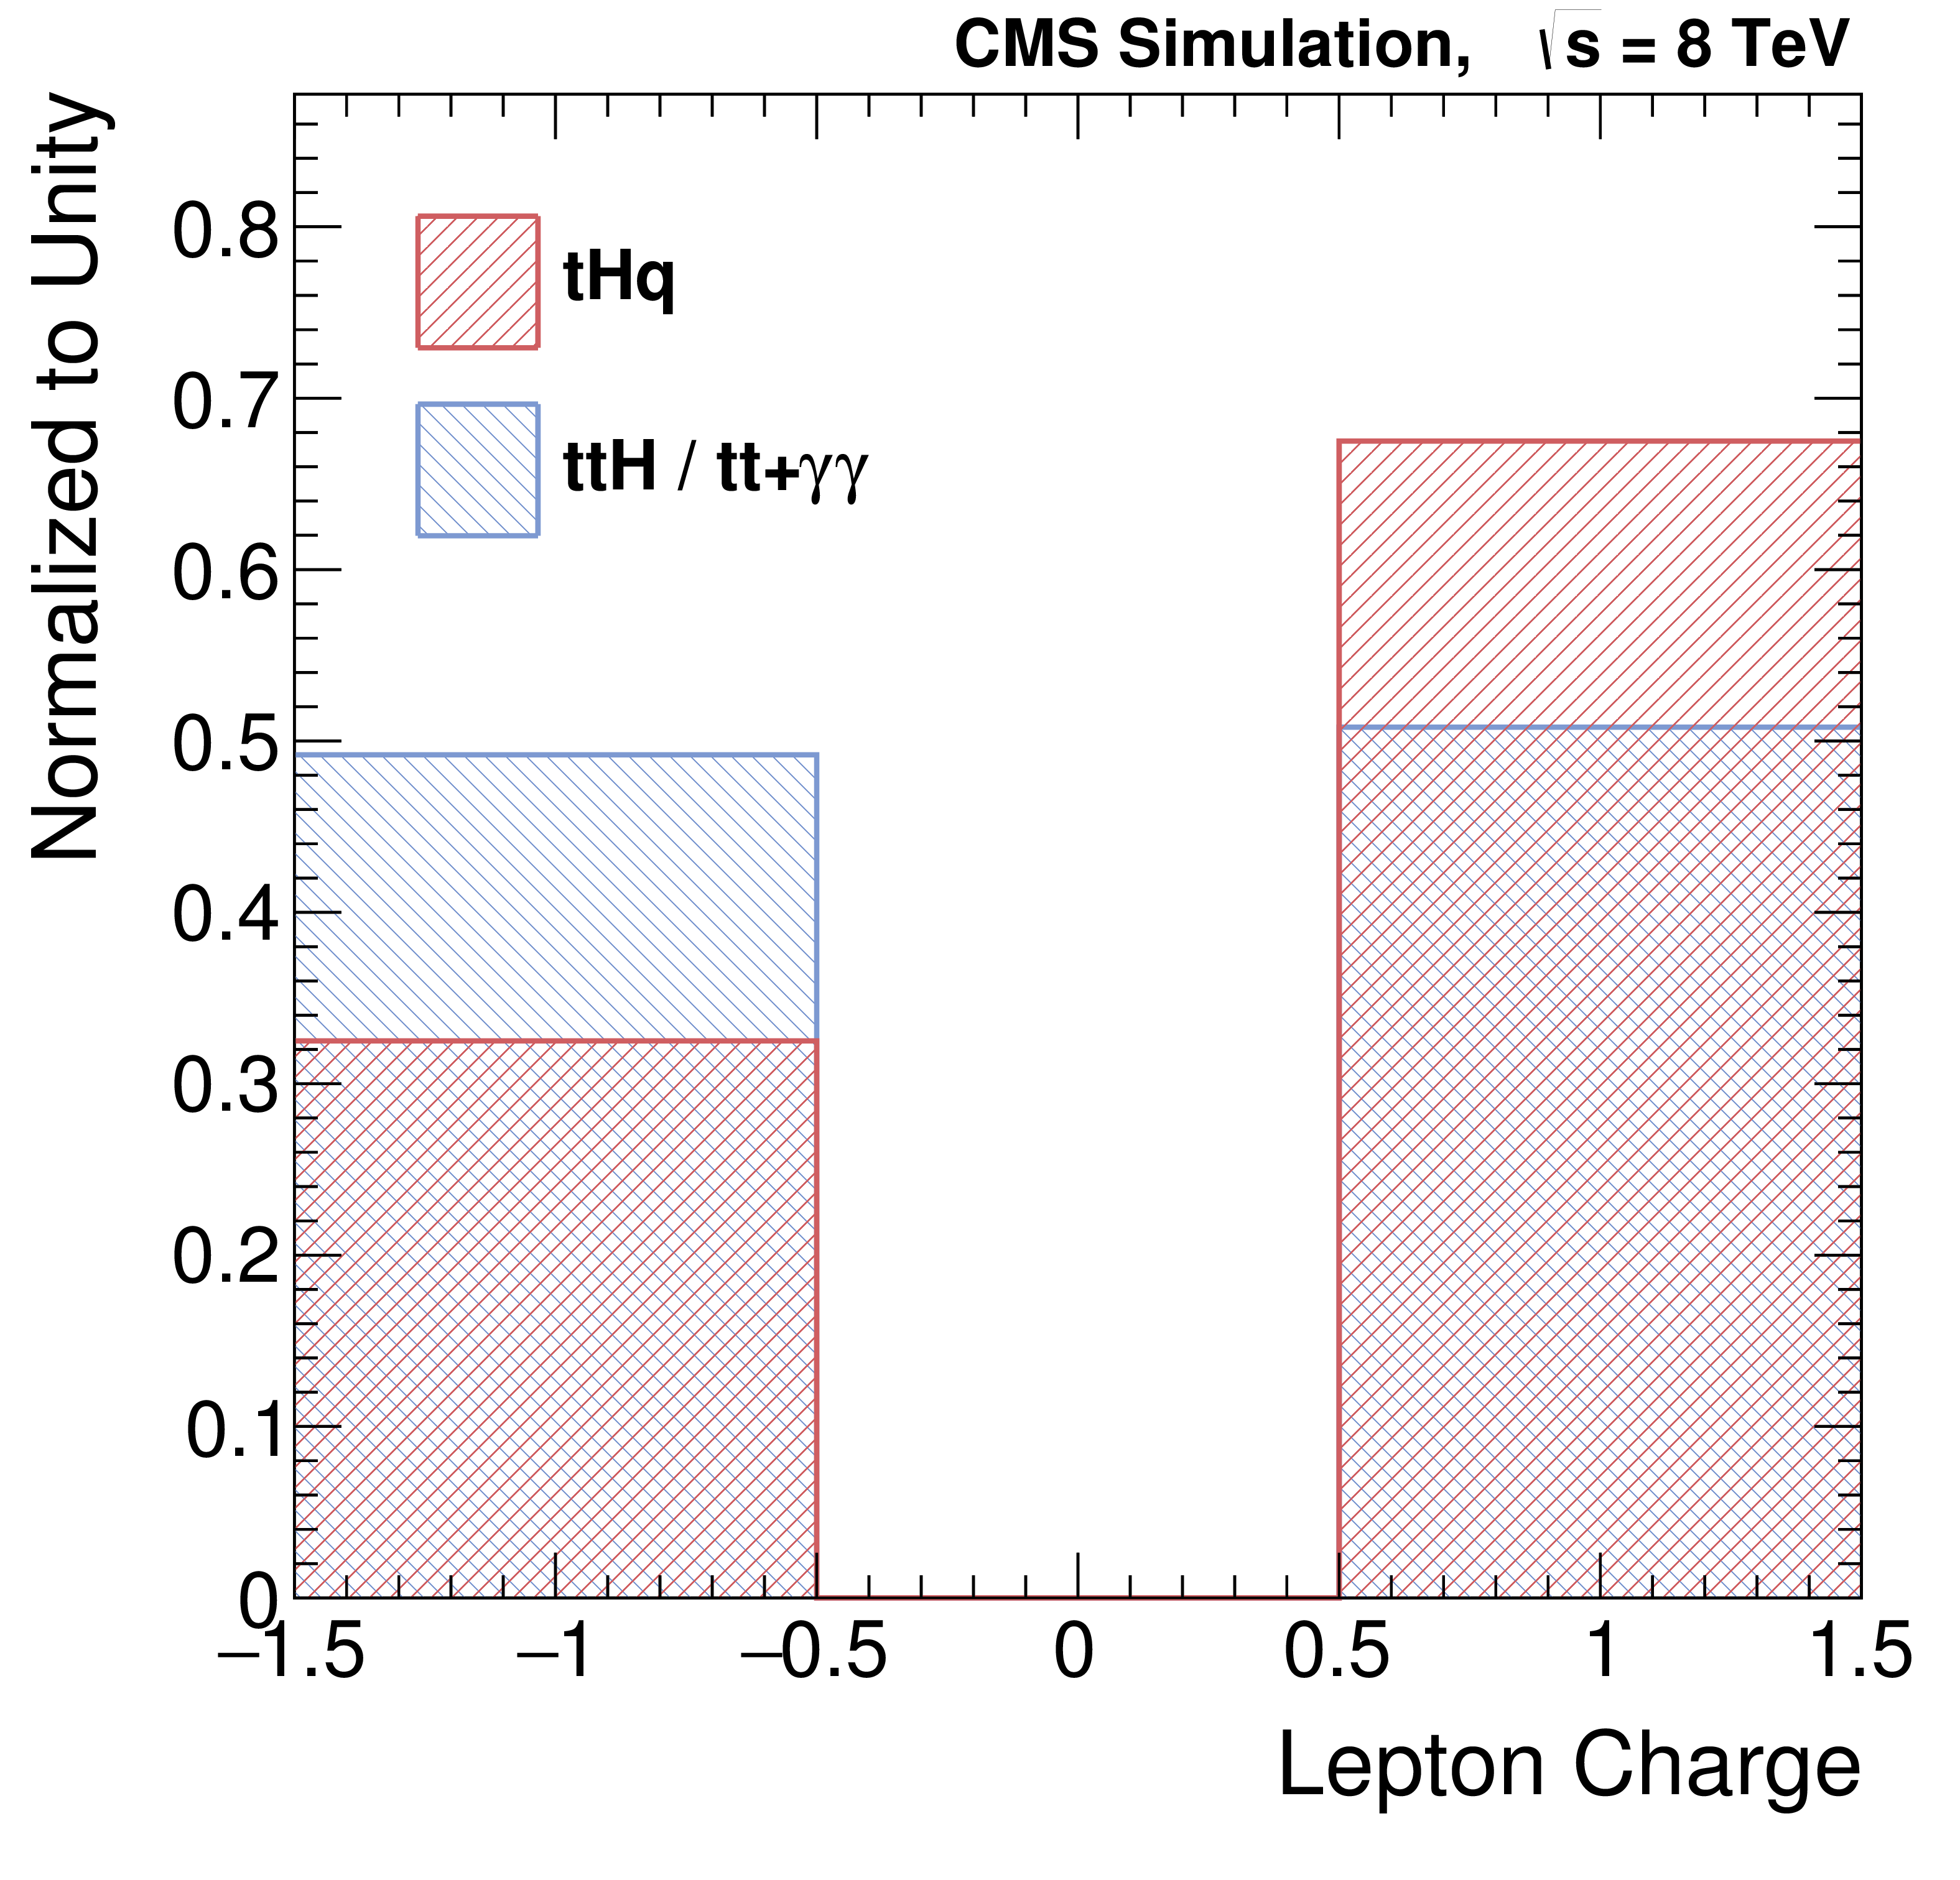
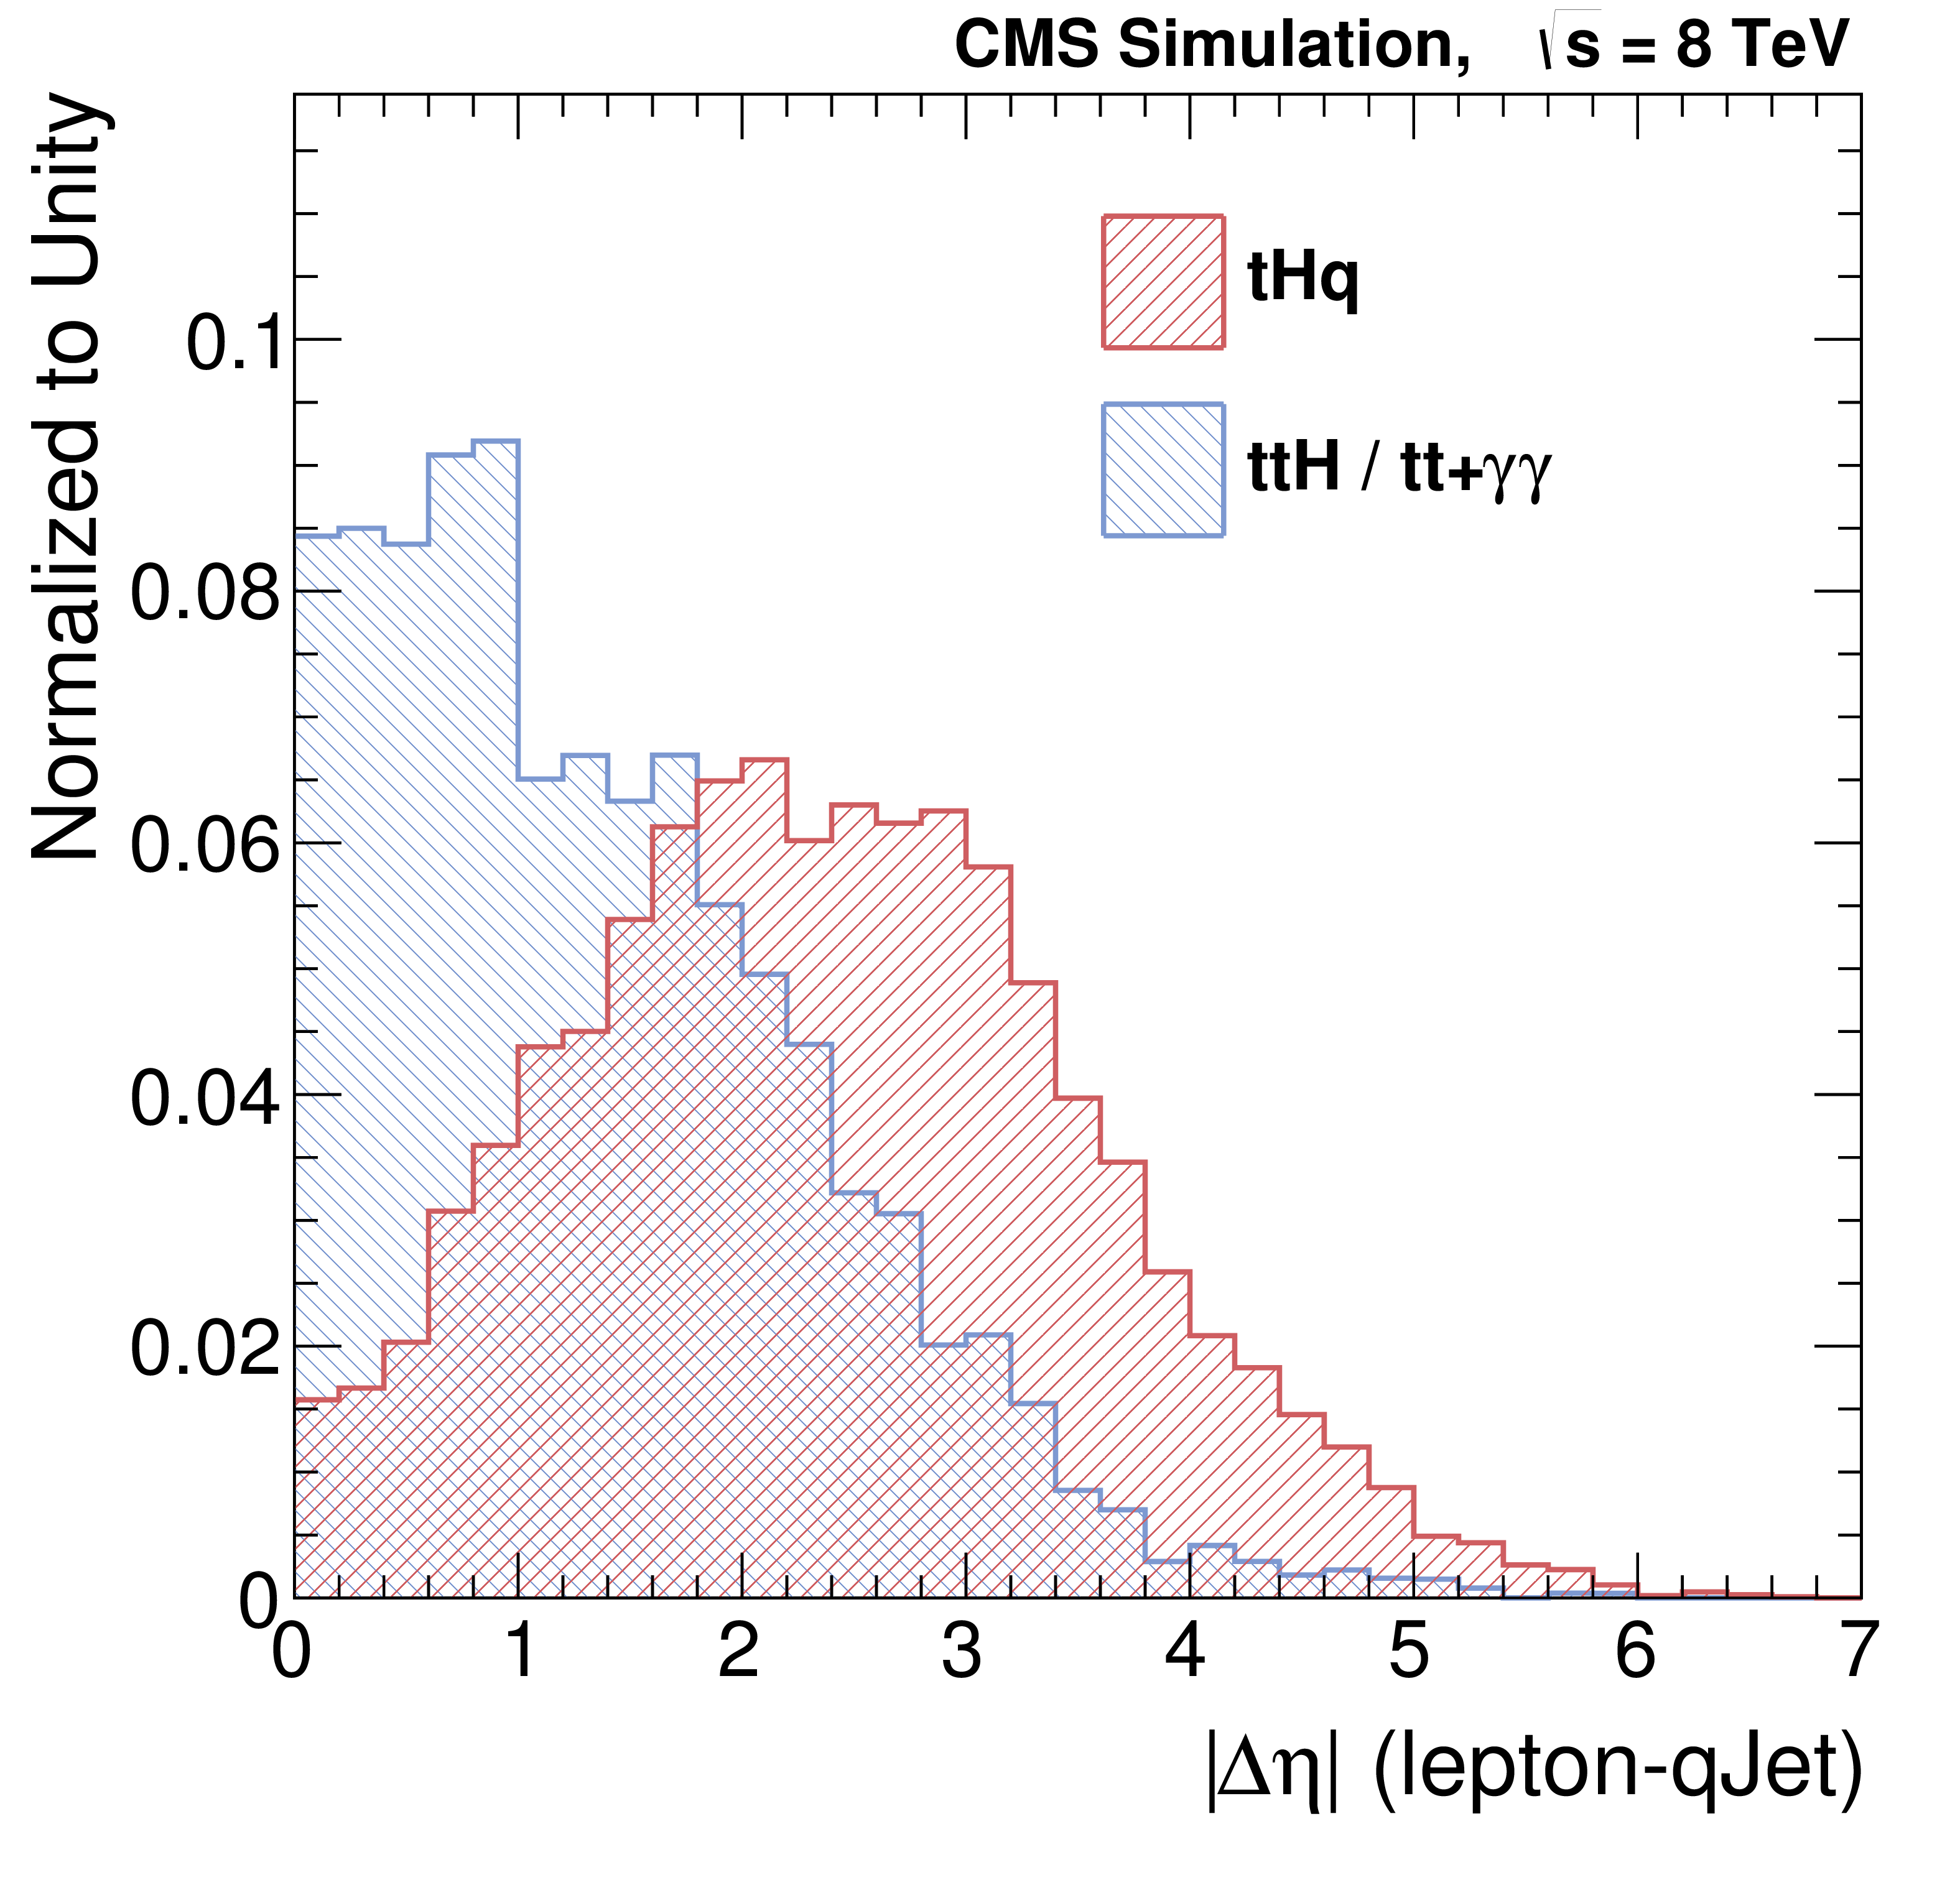
Additional Figure 1:
Sample of input variables to the final discriminant in the ${\mathrm{ H } \to \gamma \gamma }$ analysis. Left: distribution of the electric charge of the reconstructed lepton. Right: distribution of the pseudorapidity difference between the lepton and the forward jet. Both plots are shown after the initial kinematic selection, and both distributions are normalized to unit area. |
png pdf |
Additional Figure 1-a:
Input variable to the final discriminant in the ${\mathrm{ H } \to \gamma \gamma }$ analysis: distribution of the electric charge of the reconstructed lepton. The plot is shown after the initial kinematic selection, and the distribution is normalized to unit area. |
png pdf |
Additional Figure 1-b:
Input variable to the final discriminant in the ${\mathrm{ H } \to \gamma \gamma }$ analysis: distribution of the pseudorapidity difference between the lepton and the forward jet. The plot is shown after the initial kinematic selection, and the distribution is normalized to unit area. |
png pdf |
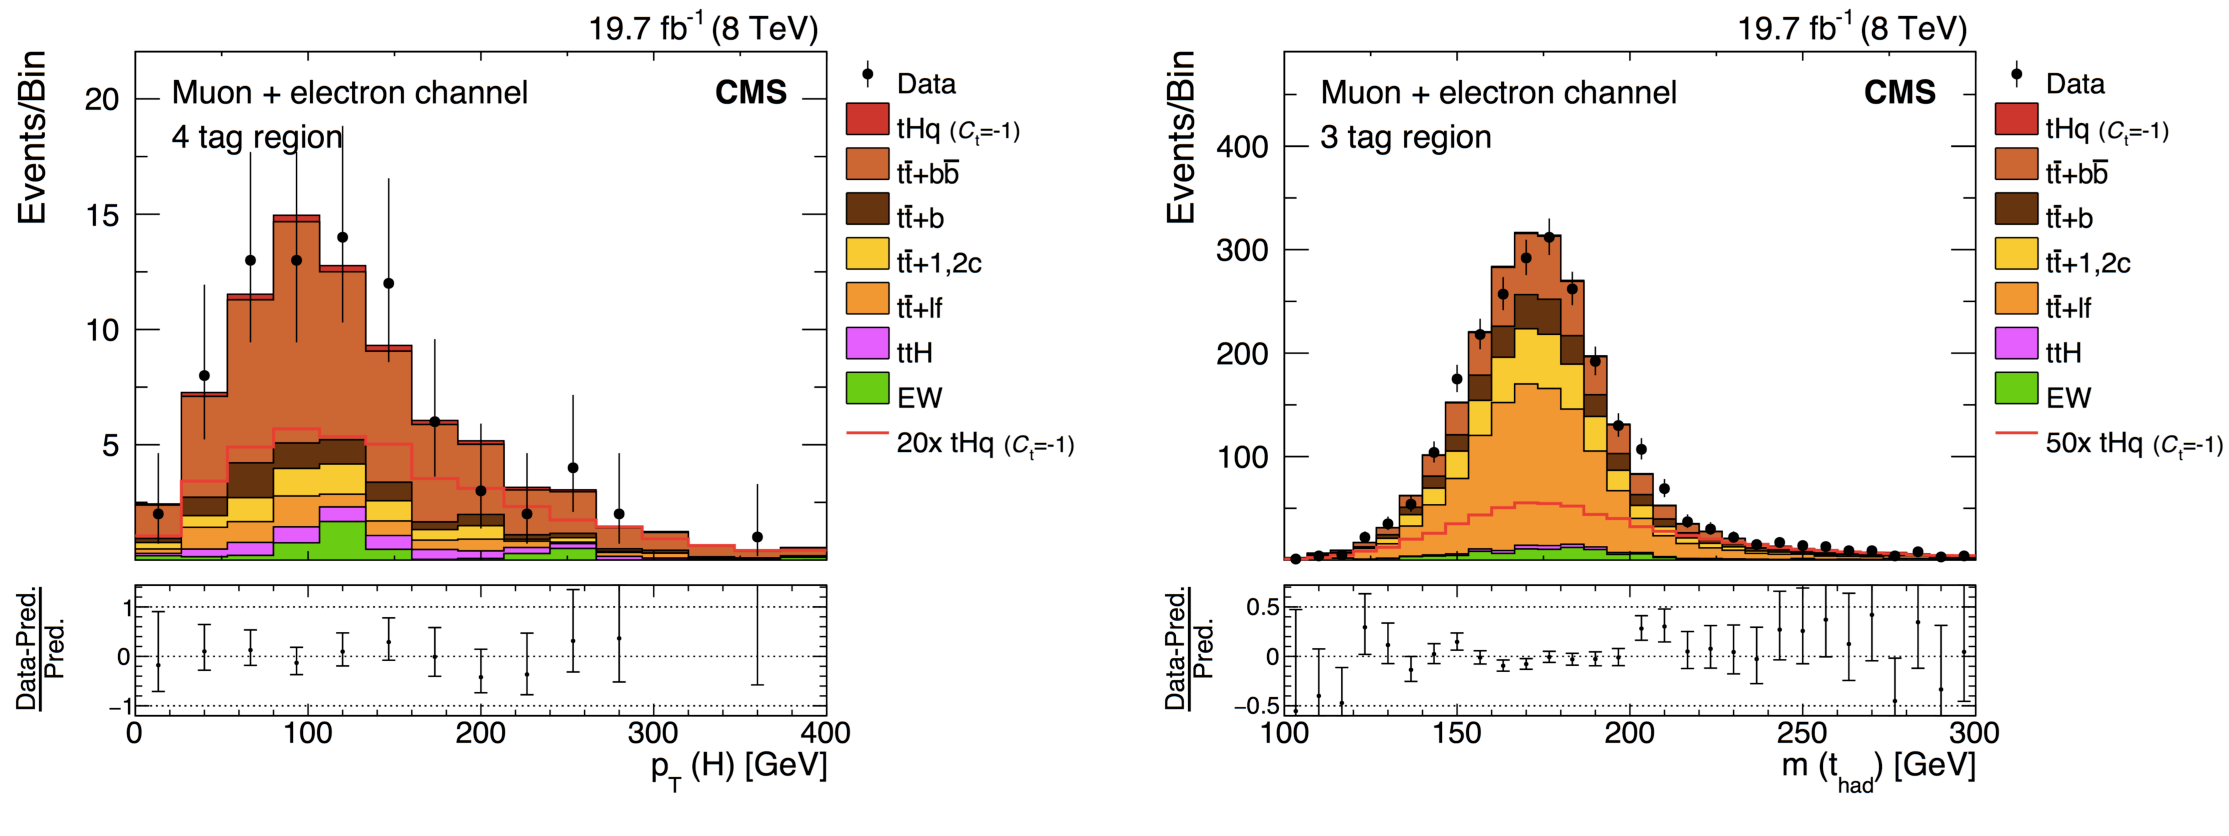
Additional Figure 2:
Sample of input variables to the final discriminant in the ${\mathrm{ H } \to {\mathrm{ b \bar{b} } } }$ channel. Left: distribution of the reconstructed transverse momentum of the $ {\mathrm{ b \bar{b} } } $ system in the signal hypothesis for events with an high transverse momentum electron or muon and four b-tagged jets. Right: distribution of the invariant mass of the tri-jet system under the hypothesis of the presence of a hadronically-decaying top quark for electron/muon events with exactly three b-tagged jets. In both cases the signal is normalized to the rate for the analous coupling hypothesis, and is shown stacked on top of the SM background prediction. It is also shown as a separate histogram, magnified by a factor of 20 (50) in the four-tag (three-tag) sample to enhance visibility. |

png pdf |
Additional Figure 2-a:
Input variable to the final discriminant in the ${\mathrm{ H } \to {\mathrm{ b \bar{b} } } }$ channel: distribution of the reconstructed transverse momentum of the $ {\mathrm{ b \bar{b} } } $ system in the signal hypothesis for events with an high transverse momentum electron or muon and four b-tagged jets. The signal is normalized to the rate for the analous coupling hypothesis, and is shown stacked on top of the SM background prediction. It is also shown as a separate histogram, magnified by a factor of 20 (50) in the four-tag (three-tag) sample to enhance visibility. |
png pdf |
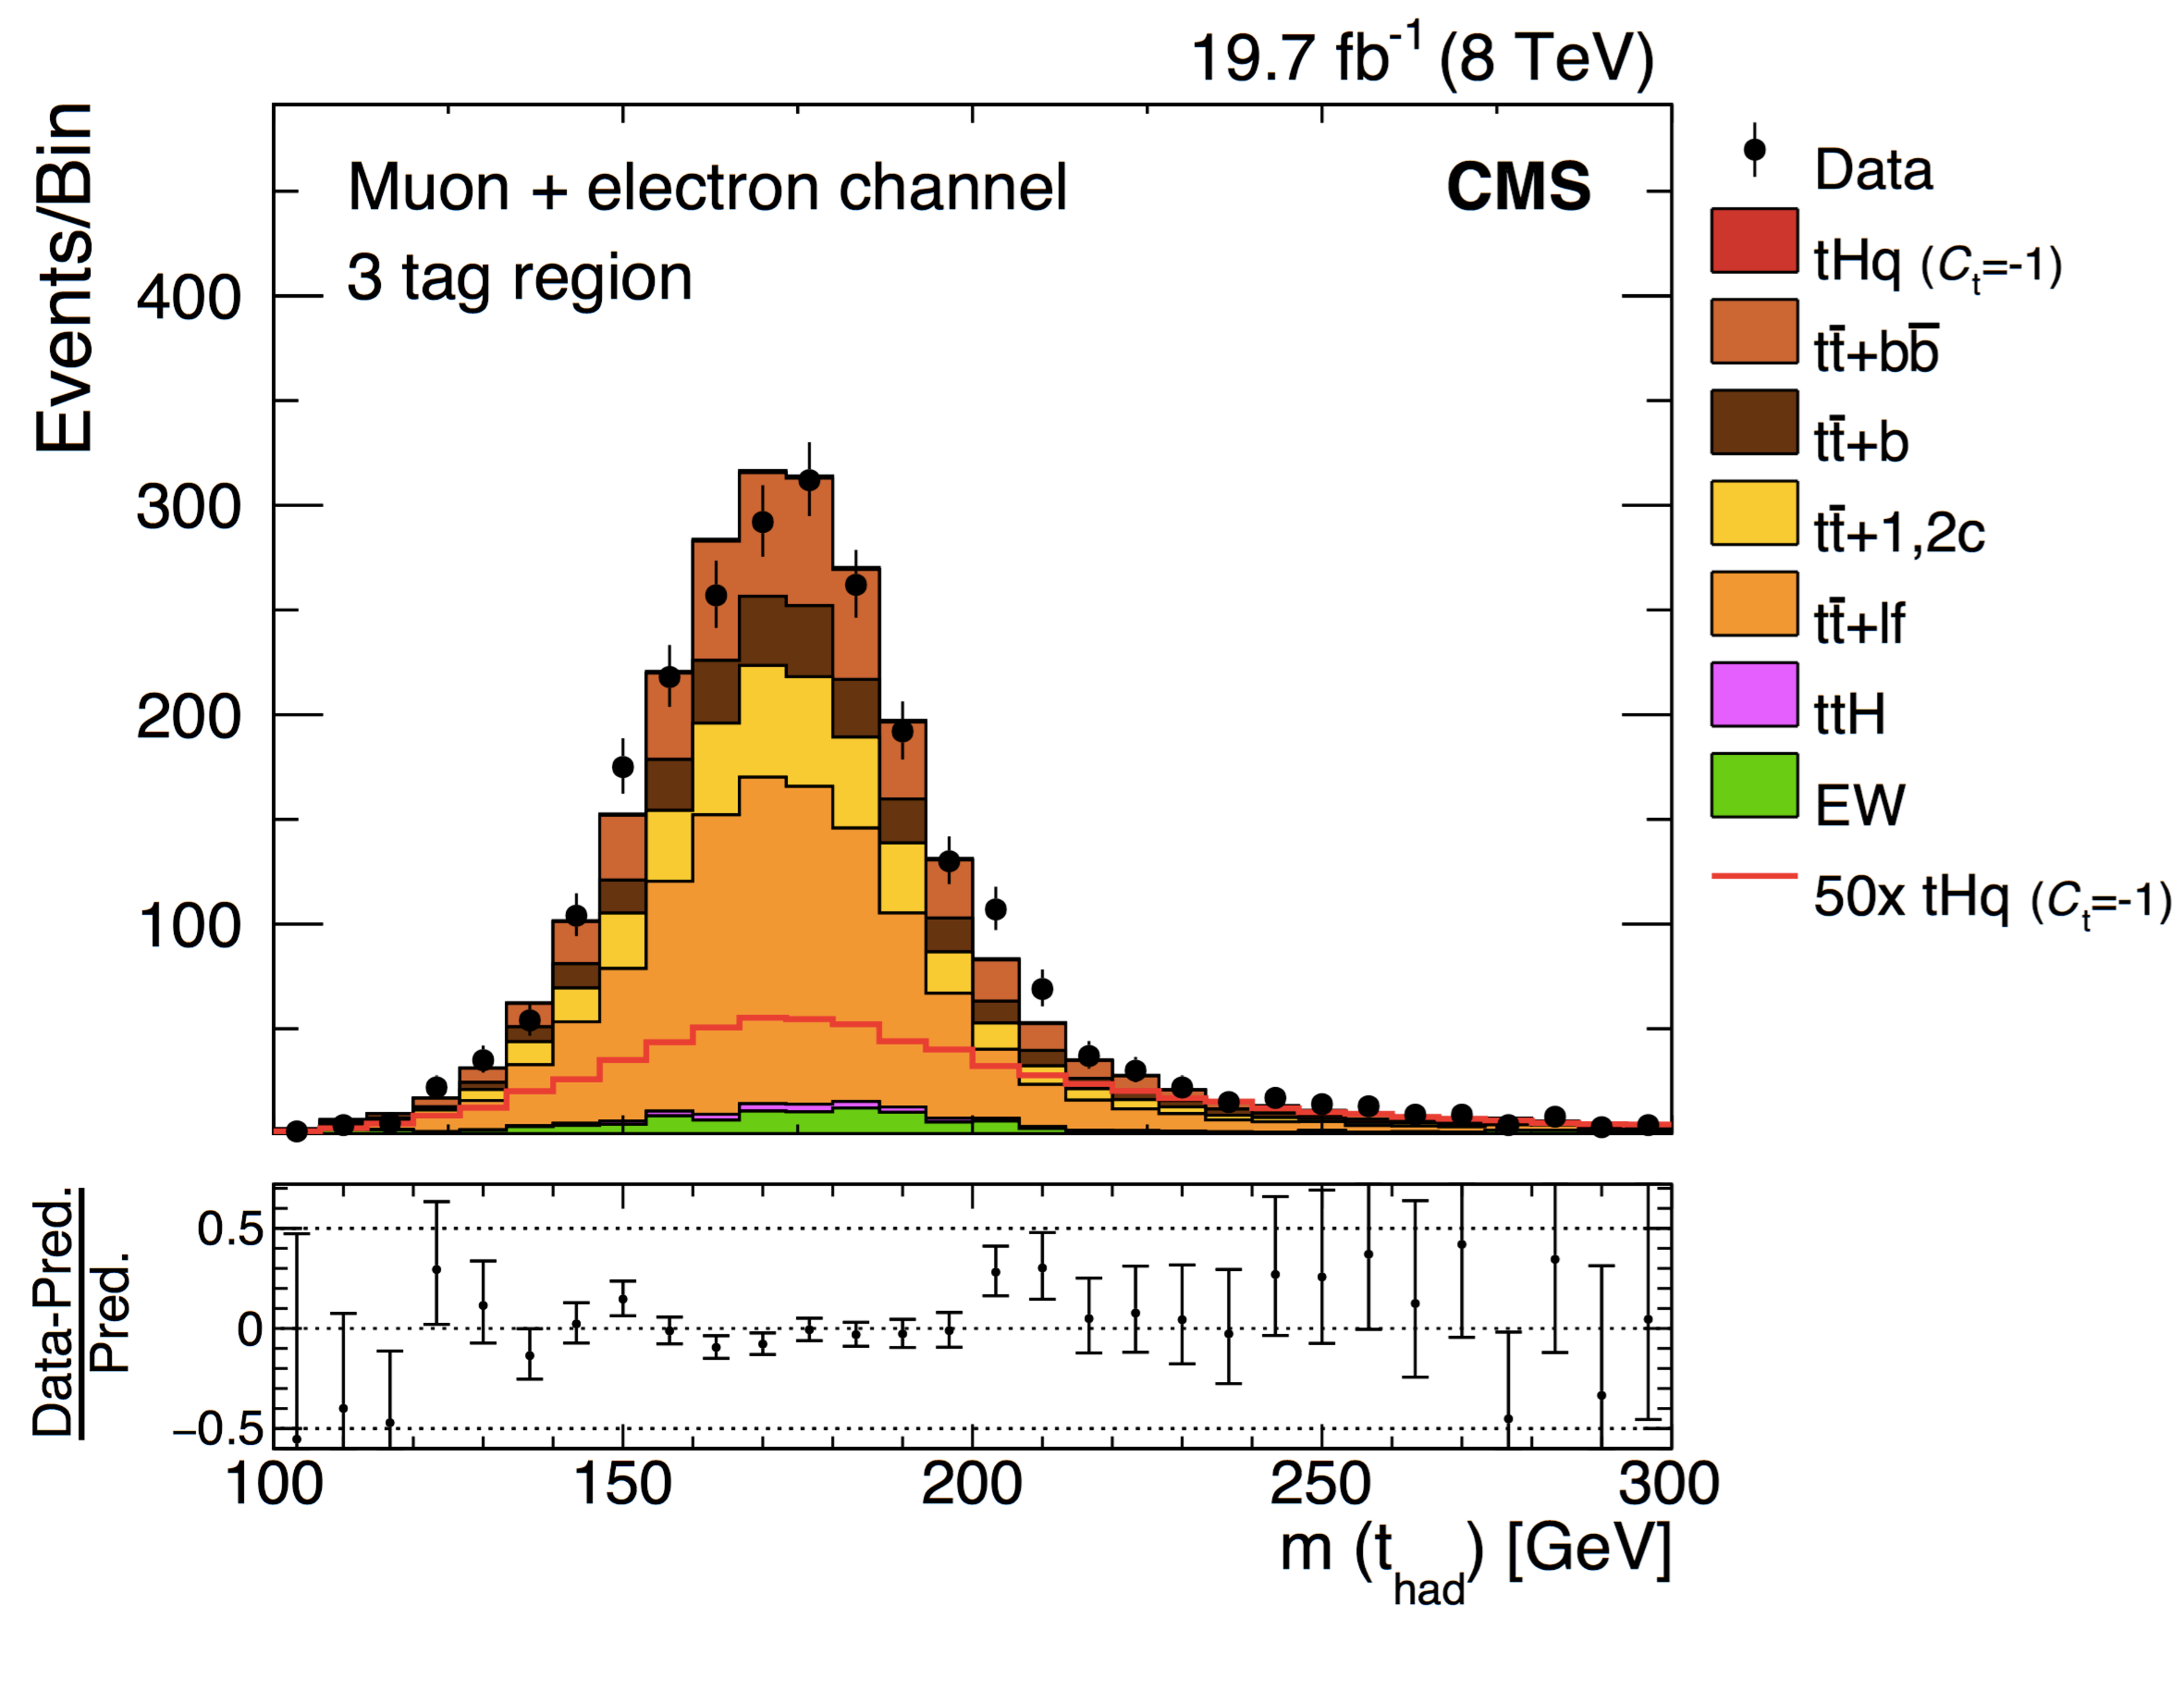
Additional Figure 2-b:
Input variable to the final discriminant in the ${\mathrm{ H } \to {\mathrm{ b \bar{b} } } }$ channel: distribution of the invariant mass of the tri-jet system under the hypothesis of the presence of a hadronically-decaying top quark for electron/muon events with exactly three b-tagged jets. The signal is normalized to the rate for the analous coupling hypothesis, and is shown stacked on top of the SM background prediction. It is also shown as a separate histogram, magnified by a factor of 20 (50) in the four-tag (three-tag) sample to enhance visibility. |
png pdf |
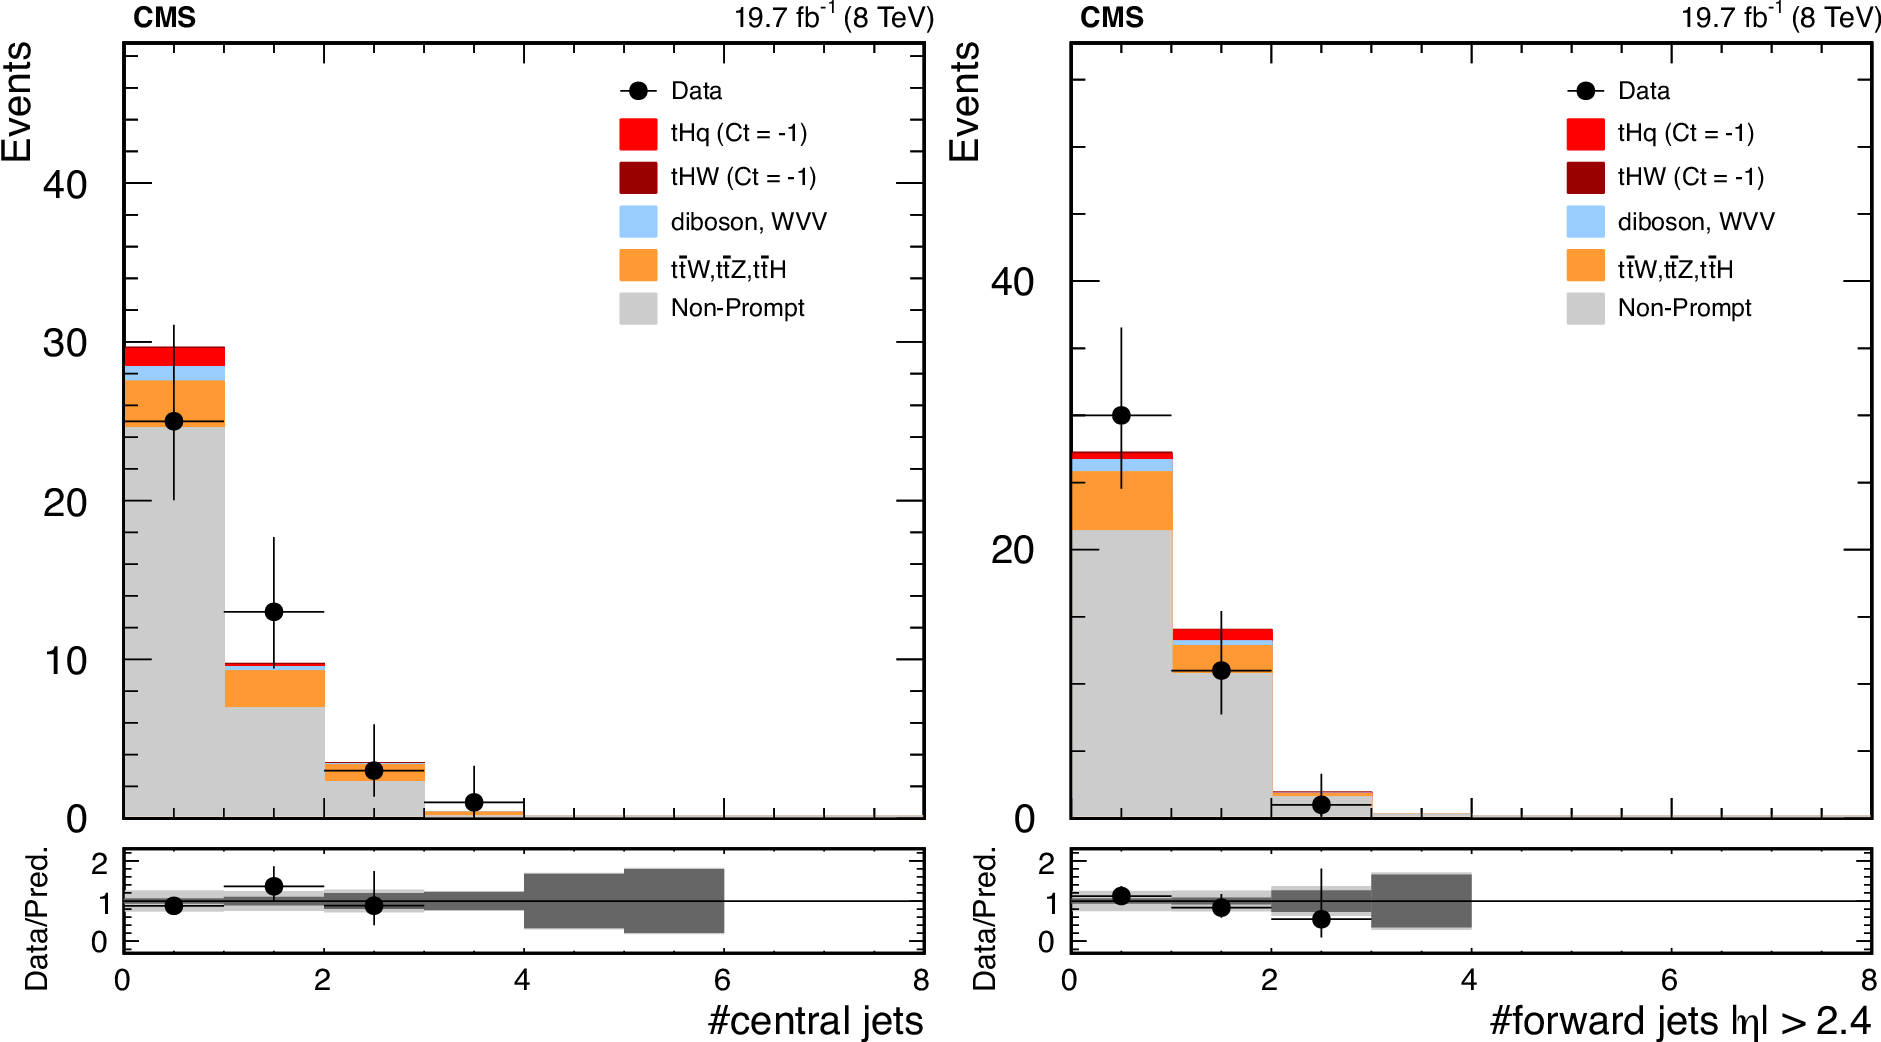
Additional Figure 3:
Sample of input variables to the final discriminant in the ${\mathrm{ H } \to {\mathrm {W}} {\mathrm {W}} }$ analysis. Left: distribution of the number of central jets. Right: distribution of the number of forward jets. The signal contribution is normalized to the prediction of the anomalous coupling hypothesis and stacked on top of the predicted background contributions. The bottom panels show the ratio between data and predictions, together with the statistical and systematic uncertainty bands. |
png pdf |
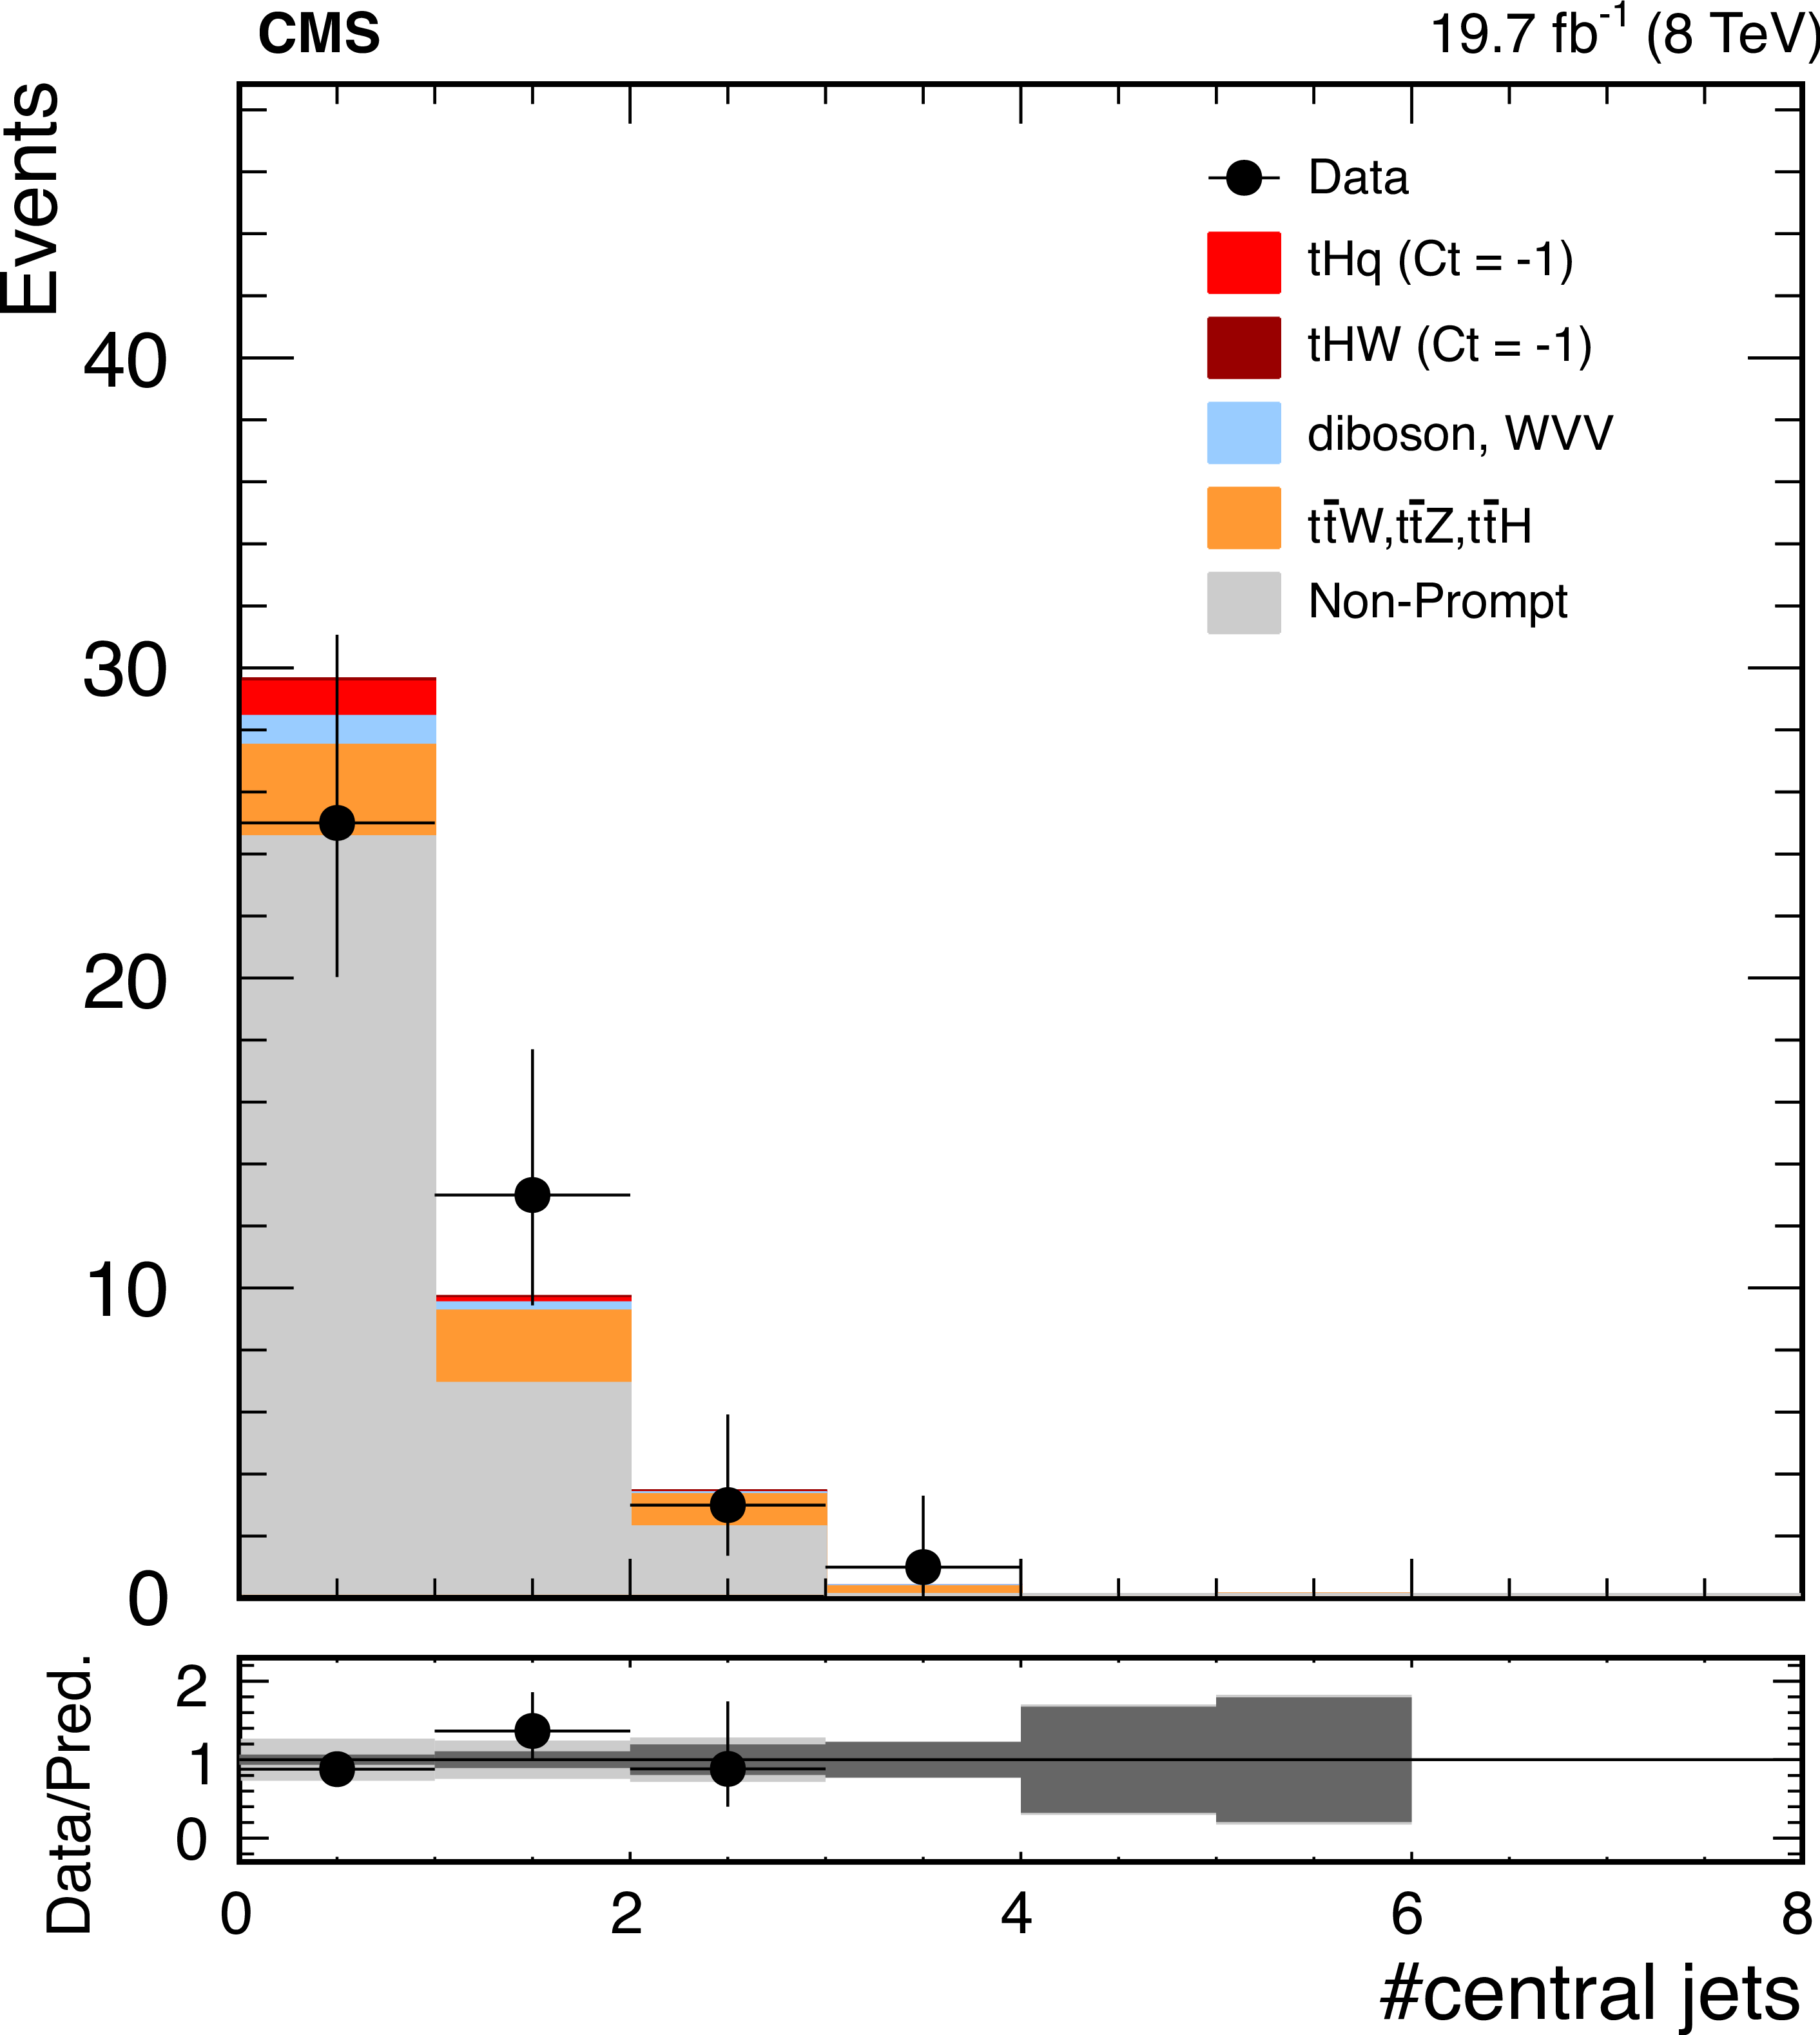
Additional Figure 3-a:
Input variable to the final discriminant in the ${\mathrm{ H } \to {\mathrm {W}} {\mathrm {W}} }$ analysis: distribution of the number of central jets. The signal contribution is normalized to the prediction of the anomalous coupling hypothesis and stacked on top of the predicted background contributions. The bottom panel shows the ratio between data and predictions, together with the statistical and systematic uncertainty bands. |

png pdf |
Additional Figure 3-b:
Input variable to the final discriminant in the ${\mathrm{ H } \to {\mathrm {W}} {\mathrm {W}} }$ analysis: distribution of the number of forward jets. The signal contribution is normalized to the prediction of the anomalous coupling hypothesis and stacked on top of the predicted background contributions. The bottom panel shows the ratio between data and predictions, together with the statistical and systematic uncertainty bands. |
png pdf |
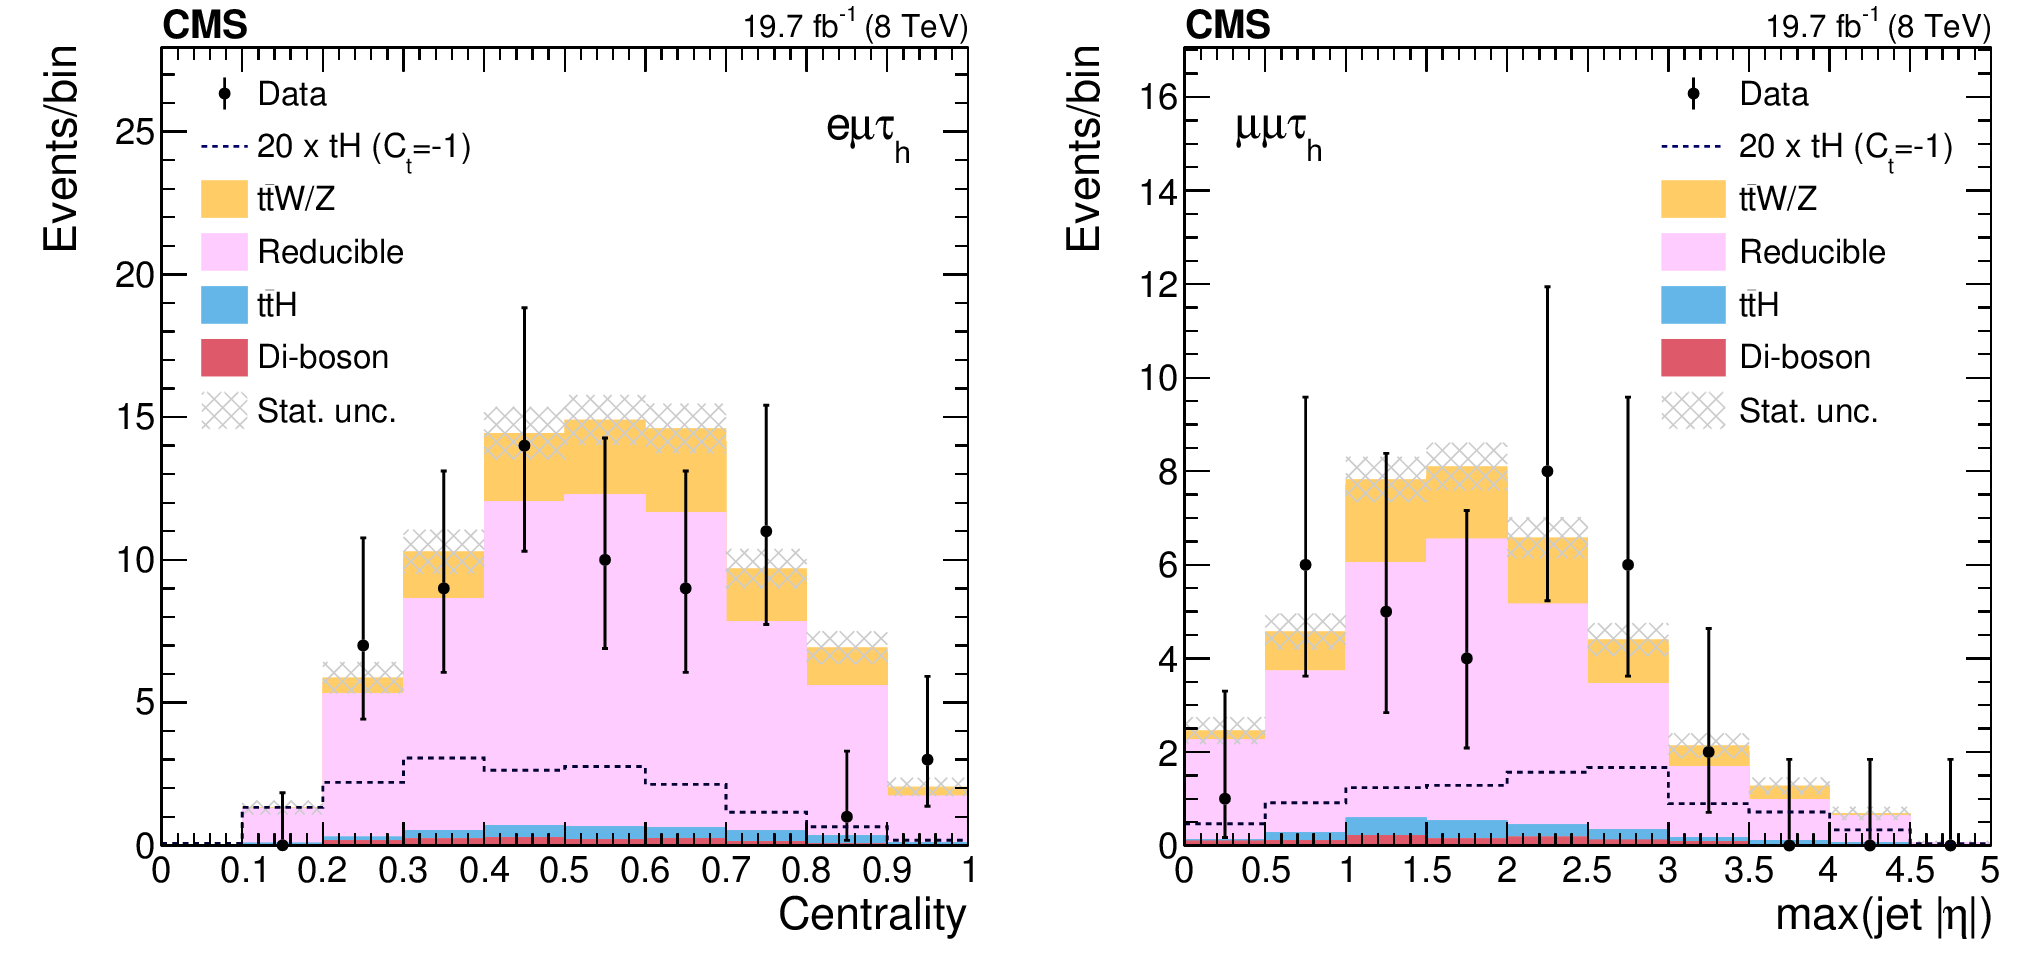
Additional Figure 4:
Sample of input variables to the final discriminant in the $\mathrm{ H } \to \tau \tau $ analysis. The distributions are shown for events failing the tight electron and muon isolation criteria. Left: distribution of the centrality for events with an electron, a muon, and a hadronically-decaying tau lepton. Right: distribution of the rapidity of the most forward jet in events with two muons and a hadronically-decaying tau lepton. The dashed line shows the expected contribution from the ${\mathrm{ t } \mathrm{ H } \mathrm{ q } }$ signal ($ {C_{\mathrm{ t } }} = - 1$) case, multiplied by 20. |
png pdf |
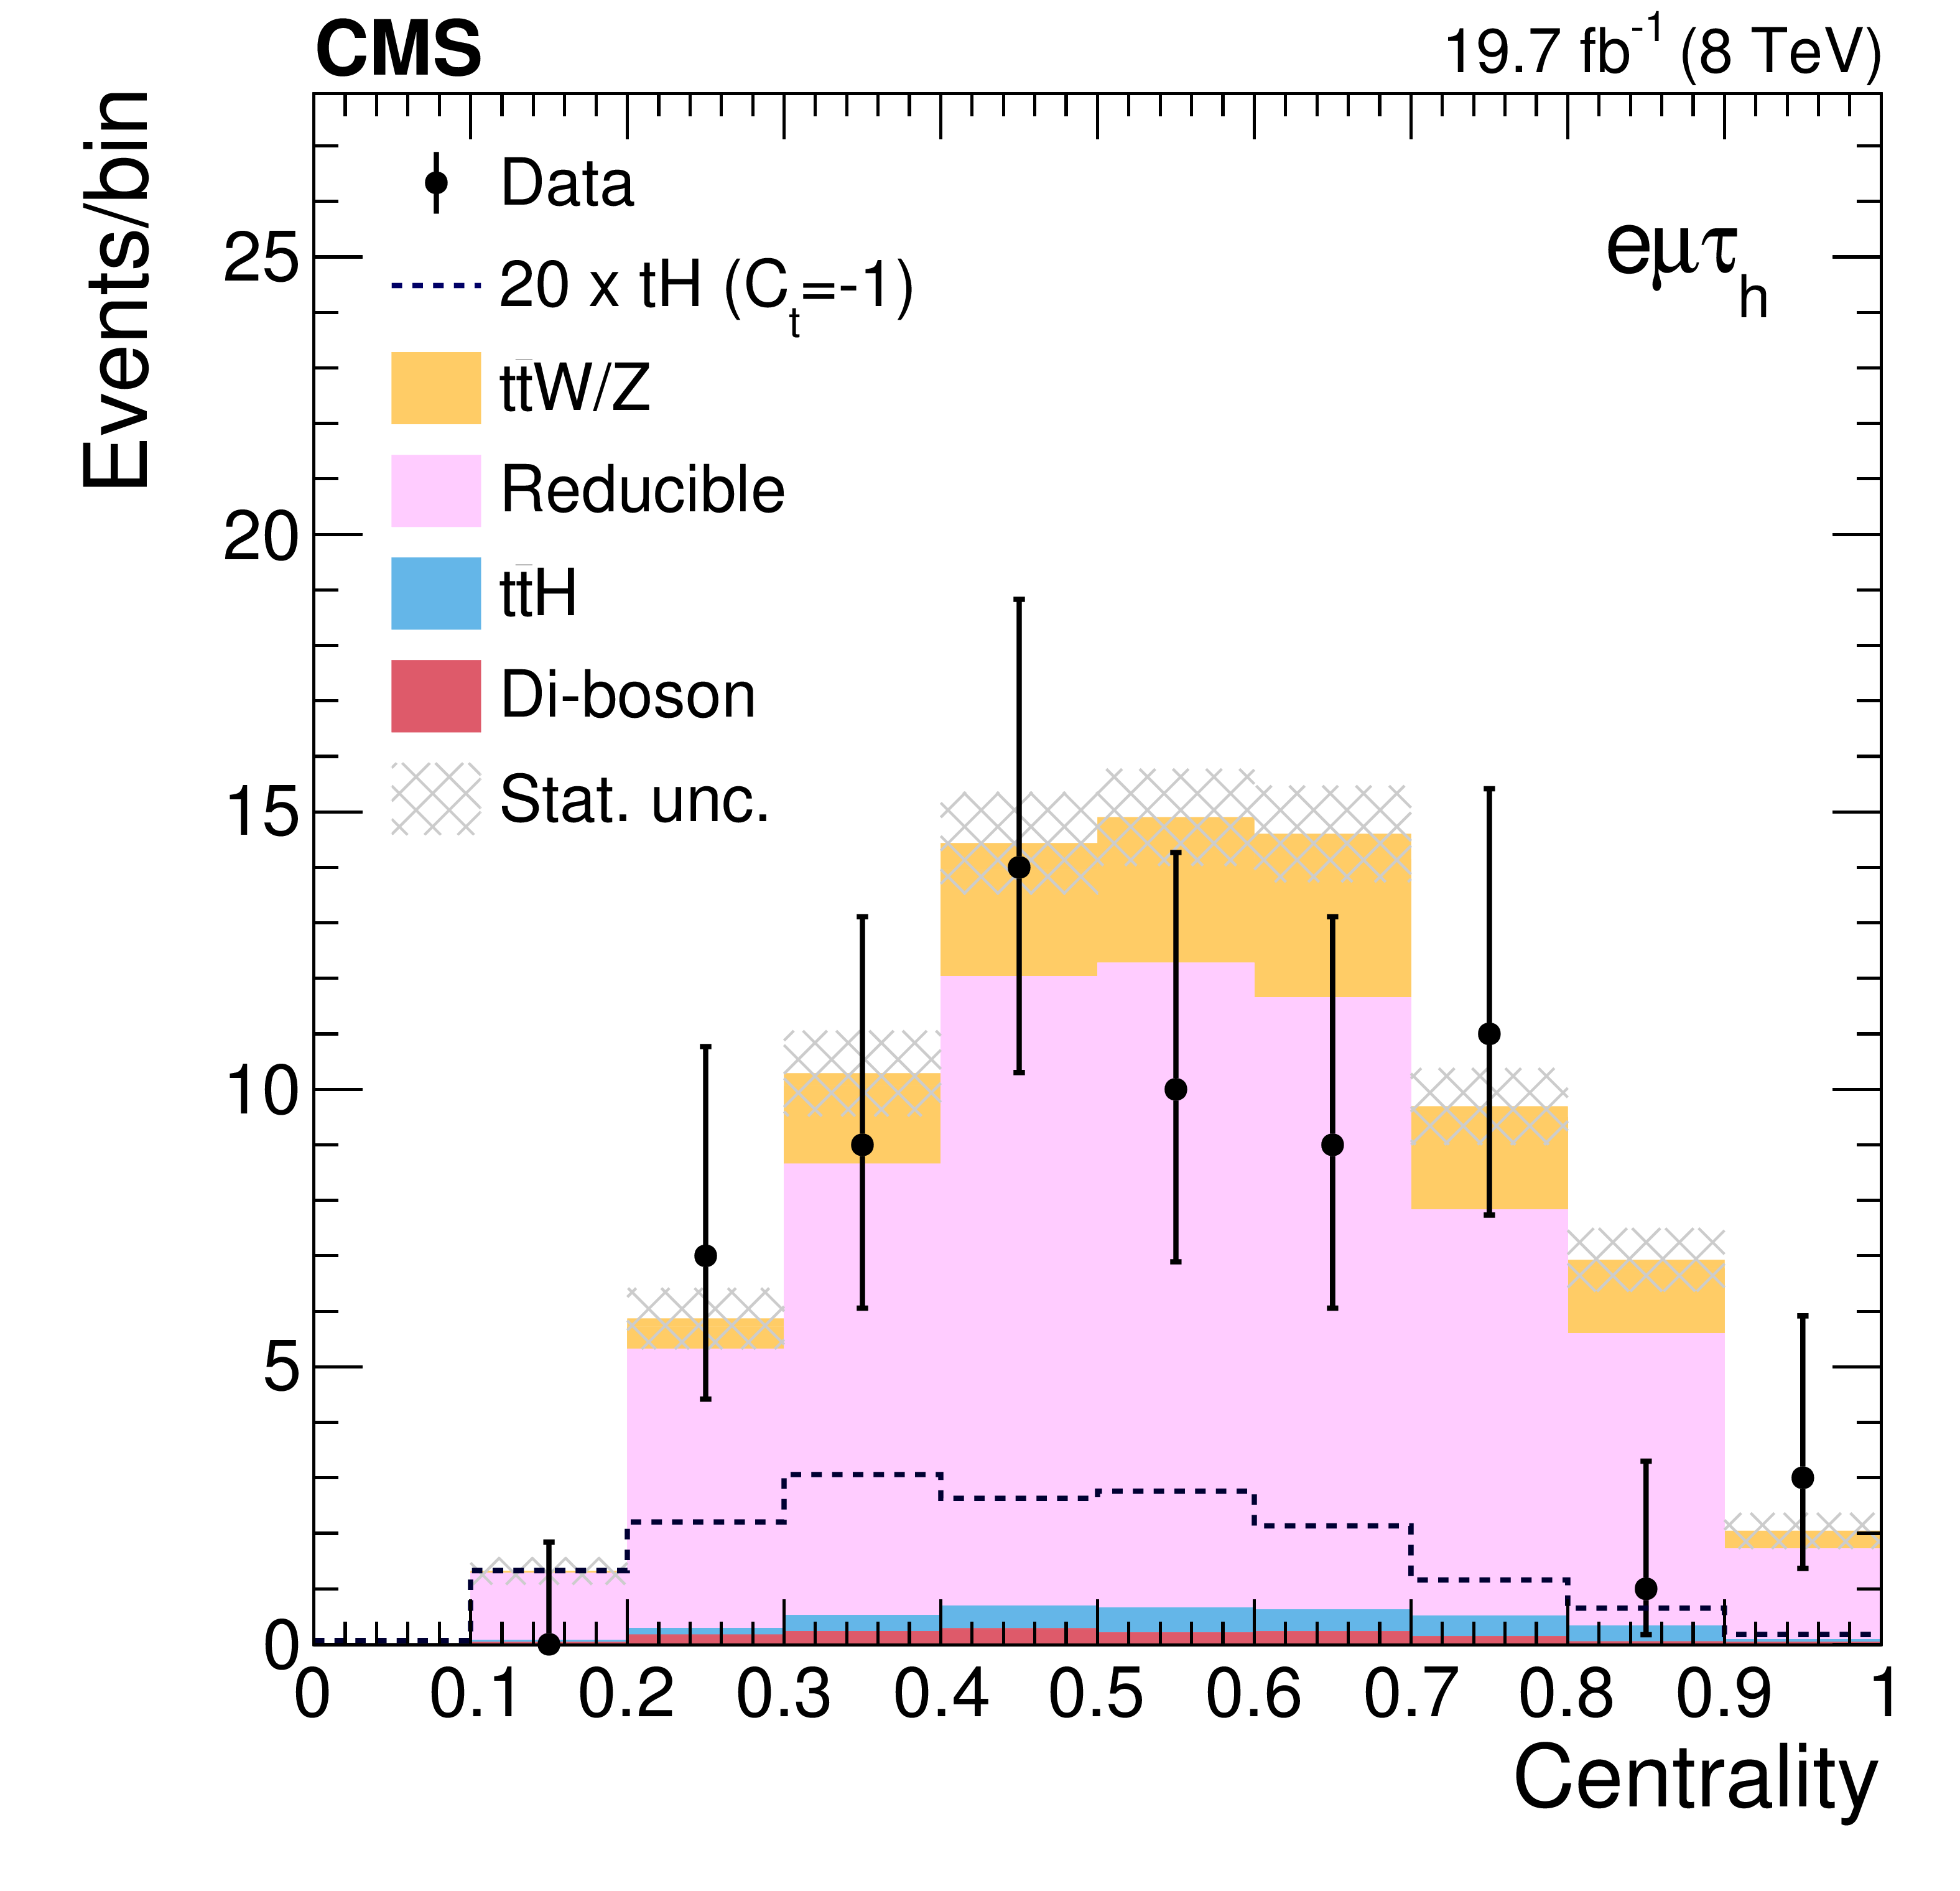
Additional Figure 4-a:
Input variable to the final discriminant in the $\mathrm{ H } \to \tau \tau $ analysis: distribution of the centrality for events with an electron, a muon, and a hadronically-decaying tau lepton.The distribution is shown for events failing the tight electron and muon isolation criteria. The dashed line shows the expected contribution from the ${\mathrm{ t } \mathrm{ H } \mathrm{ q } }$ signal ($ {C_{\mathrm{ t } }} = - 1$) case, multiplied by 20. |
png pdf |
Additional Figure 4-b:
Input variable to the final discriminant in the $\mathrm{ H } \to \tau \tau $ analysis: distribution of the rapidity of the most forward jet in events with two muons and a hadronically-decaying tau lepton. The distribution is shown for events failing the tight electron and muon isolation criteria. The dashed line shows the expected contribution from the ${\mathrm{ t } \mathrm{ H } \mathrm{ q } }$ signal ($ {C_{\mathrm{ t } }} = - 1$) case, multiplied by 20. |
| References | ||||
| 1 | CMS Collaboration | Observation of a new boson at a mass of 125 GeV with the CMS experiment at the LHC | PLB 716 (2012) 30 | CMS-HIG-12-028 1207.7235 |
| 2 | ATLAS Collaboration | Observation of a new particle in the search for the Standard Model Higgs boson with the ATLAS detector at the LHC | PLB 716 (2012) 1 | 1207.7214 |
| 3 | CMS Collaboration | Observation of a new boson with mass near 125 GeV in pp collisions at $ \sqrt{s} $ = 7 and 8 TeV | JHEP 06 (2013) 081 | CMS-HIG-12-036 1303.4571 |
| 4 | CMS Collaboration | Evidence for the direct decay of the 125 GeV Higgs boson to fermions | Nature Phys. 10 (2014) 557 | CMS-HIG-13-033 1401.6527 |
| 5 | ATLAS Collaboration | Evidence for the Higgs-boson Yukawa coupling to tau leptons with the ATLAS detector | JHEP 04 (2015) 117 | 1501.04943 |
| 6 | CDF and D0 Collaborations | Evidence for a Particle Produced in Association with Weak Bosons and Decaying to a Bottom-Antibottom Quark Pair in Higgs Boson Searches at the Tevatron | PRL 109 (2012) 071804 | 1207.6436 |
| 7 | CMS Collaboration | Search for the standard model Higgs boson produced in association with a W or a Z boson and decaying to bottom quarks | PRD 89 (2014) 012003 | |
| 8 | CMS Collaboration | Evidence for the 125 GeV Higgs boson decaying to a pair of $ \tau $ leptons | JHEP 05 (2014) 104 | CMS-HIG-13-004 1401.5041 |
| 9 | ATLAS, CDF, CMS, and D0 Collaborations | First combination of Tevatron and LHC measurements of the top-quark mass | 1403.4427 | |
| 10 | CMS Collaboration | Search for the associated production of the Higgs boson with a top-quark pair | JHEP 09 (2014) 087 | CMS-HIG-13-029 1408.1682 |
| 11 | CMS Collaboration | Search for a standard model Higgs boson produced in association with a top-quark pair and decaying to bottom quarks using a matrix element method | EPJC 75 (2015) 251 | |
| 12 | ATLAS Collaboration | Search for $ \mathrm{ H } \to \gamma\gamma $ produced in association with top quarks and constraints on the Yukawa coupling between the top quark and the Higgs boson using data taken at 7 TeV and 8 TeV with the ATLAS detector | PLB 740 (2015) 222 | 1409.3122 |
| 13 | ATLAS Collaboration | Search for the Standard Model Higgs boson produced in association with top quarks and decaying into $ \mathrm{b }\mathrm{ \bar{b} } $ in pp collisions at $ \sqrt{s} $ = 8 TeV with the ATLAS detector | EPJC 75 (2015) 349 | 1503.05066 |
| 14 | F. Maltoni, K. Paul, T. Stelzer, and S. Willenbrock | Associated production of Higgs and single top at hadron colliders | PRD 64 (2001) 094023 | hep-ph/0106293 |
| 15 | M. Farina et al. | Lifting degeneracies in Higgs couplings using single top production in association with a Higgs boson | JHEP 05 (2013) 022 | 1211.3736 |
| 16 | P. Agrawal, S. Mitra, and A. Shivaji | Effect of Anomalous Couplings on the Associated Production of a Single Top Quark and a Higgs Boson at the LHC | JHEP 12 (2013) 077 | 1211.4362 |
| 17 | S. Biswas, E. Gabrielli, and B. Mele | Single top and Higgs associated production as a probe of the Htt coupling sign at the LHC | JHEP 01 (2013) 088 | 1211.0499 |
| 18 | S. Biswas, E. Gabrielli, F. Margaroli, and B. Mele | Direct constraints on the top-Higgs coupling from the 8 TeV LHC data | JHEP 07 (2013) 073 | 1304.1822 |
| 19 | J. Yue | Enhanced $ thj $ signal at the LHC with $ h\rightarrow \gamma\gamma $ decay and $ \mathcal{CP} $-violating top-Higgs coupling | PLB 744 (2015) 131 | |
| 20 | A. Kobakhidze, L. Wu, and J. Yue | Anomalous top-Higgs couplings and top polarisation in single top and Higgs associated production at the LHC | JHEP 10 (2014) 100 | 1406.1961 |
| 21 | F. Demartin, F. Maltoni, K. Mawatari, and M. Zaro | Higgs production in association with a single top quark at the LHC | EPJC 75 (2015) 267 | 1504.00611 |
| 22 | J. A. Aguilar-Saavedra, R. Benbrik, S. Heinemeyer, and M. Perez-Victoria | Handbook of vector-like quarks: Mixing and single production | PRD 88 (2013) 094010 | 1306.0572 |
| 23 | A. Greljo, J. F. Kamenik, and J. Kopp | Disentangling flavor violation in the top-Higgs sector at the LHC | JHEP 07 (2014) 046 | 1404.1278 |
| 24 | J. Ellis and T. You | Updated Global Analysis of Higgs Couplings | JHEP 06 (2013) 103 | 1303.3879 |
| 25 | CMS Collaboration | The CMS experiment at the CERN LHC | JINST 3 (2008) S08004 | CMS-00-001 |
| 26 | CMS Collaboration | Particle-Flow Event Reconstruction in CMS and Performance for Jets, Taus, and $ E_{T}^{miss} $ | CDS | |
| 27 | CMS Collaboration | Commissioning of the Particle-flow Event Reconstruction with the first LHC collisions recorded in the CMS detector | CDS | |
| 28 | CMS Collaboration | Observation of the diphoton decay of the Higgs boson and measurement of its properties | EPJC 74 (2014) 3076 | CMS-HIG-13-001 1407.0558 |
| 29 | CMS Collaboration | Performance of photon reconstruction and identification with the CMS detector in proton-proton collisions at $ \sqrt{s} $ = 8~$ TeV $ | JINST 10 (2015) P08010 | CMS-EGM-14-001 1502.02702 |
| 30 | CMS Collaboration | Performance of electron reconstruction and selection with the CMS detector in proton-proton collisions at $ \sqrt{s} $ = 8~$ TeV $ | JINST 10 (2015) P06005 | CMS-EGM-13-001 1502.02701 |
| 31 | CMS Collaboration | Performance of CMS muon reconstruction in pp collision events at $ \sqrt{s}=7 $ TeV | JINST 7 (2012) P10002 | CMS-MUO-10-004 1206.4071 |
| 32 | CMS Collaboration | Particle-flow commissioning with muons and electrons from J/$ \Psi $ and W events at 7 TeV | CDS | |
| 33 | M. Cacciari, G. P. Salam, and G. Soyez | The anti-$ k_t $ jet clustering algorithm | JHEP 04 (2008) 063 | 0802.1189 |
| 34 | M. Cacciari, G. P. Salam, and G. Soyez | FastJet user manual | EPJC 72 (2012) 1896 | 1111.6097 |
| 35 | M. Cacciari, G. P. Salam, and G. Soyez | The Catchment Area of Jets | JHEP 04 (2008) 005 | 0802.1188 |
| 36 | CMS Collaboration | Determination of jet energy calibration and transverse momentum resolution in CMS | JINST 6 (2011) P11002 | CMS-JME-10-011 1107.4277 |
| 37 | CMS Collaboration | Performance of $ \tau $-lepton reconstruction and identification in CMS | JINST 7 (2012) P01001 | |
| 38 | CMS Collaboration | Performance of b tagging at $ \sqrt{s}=8 $ TeV in multijet, $ \rm{t}\overline{\rm t} $ and boosted topology events | CMS-PAS-BTV-13-001 | CMS-PAS-BTV-13-001 |
| 39 | CMS Collaboration | Identification of $ \mathrm{b } quark $ jets with the CMS experiment | JINST 8 (2013) P04013 | CMS-BTV-12-001 1211.4462 |
| 40 | J. Alwall et al. | MadGraph 5: going beyond | JHEP 06 (2011) 128 | 1106.0522 |
| 41 | T. Sjostrand, S. Mrenna, and P. Skands | PYTHIA 6.4 physics and manual | JHEP 05 (2006) 026 | hep-ph/0603175 |
| 42 | H.-L. Lai et al. | Uncertainty induced by QCD coupling in the CTEQ global analysis of parton distributions | PRD 82 (2010) 054021 | 1004.4624 |
| 43 | S. Frixione, P. Nason, and C. Oleari | Matching NLO QCD computations with parton shower simulations: the POWHEG method | JHEP 11 (2007) 070 | 0709.2092 |
| 44 | S. Alioli, P. Nason, C. Oleari, and E. Re | A general framework for implementing NLO calculations in shower Monte Carlo programs: the POWHEG BOX | JHEP 06 (2010) 043 | 1002.2581 |
| 45 | GEANT4 Collaboration | GEANT4---a simulation toolkit | NIMA 506 (2003) 250 | |
| 46 | F. Micheli | Searching for new physics in the Higgs sec- tor: the $ \mathrm{H} \to \gamma\gamma $ channel at CMS | PhD thesis, Sapienza University | |
| 47 | A. Popov | Search for anomalous Higgs boson production in association with single top quarks using the CMS detector | PhD thesis, Universit\'e catholique de Louvain | |
| 48 | Helge Voss and Andreas Hocker and Jorg Stelzer and Frerik Tegenfeldt | TMVA, the Toolkit for Multivariate Data Analysis with ROOT | in XIth International Workshop on Advanced Computing and Analysis Techniques in Physics Research (ACAT), p. 40 2007 | physics/0703039 |
| 49 | CMS Collaboration | Measurements of Inclusive $ W $ and $ Z $ Cross Sections in $ pp $ Collisions at $ \sqrt{s}=7 $ TeV | JHEP 01 (2011) 080 | CMS-EWK-10-002 1012.2466 |
| 50 | CMS Collaboration | Energy calibration and resolution of the CMS electromagnetic calorimeter in pp collisions at $ \sqrt{s} $ = 7 TeV | JINST 8 (2013) P09009 | CMS-EGM-11-001 1306.2016 |
| 51 | S. Alekhin et al. | The PDF4LHC Working Group Interim Report | 1101.0536 | |
| 52 | M. Botje et al. | The PDF4LHC Working Group Interim Recommendations | 1101.0538 | |
| 53 | CMS Collaboration | Measurement of the differential cross section for top quark pair production in pp collisions at $ \sqrt{s} = 8 $~TeV | Submitted to EPJC | CMS-TOP-12-028 1505.04480 |
| 54 | CMS Collaboration | CMS Luminosity Based on Pixel Cluster Counting - Summer 2013 Update | CMS-PAS-LUM-13-001 | CMS-PAS-LUM-13-001 |
| 55 | A. L. Read | Presentation of search results: the $ CL_s $ technique | JPG. 28 (2002) 2693 | |
| 56 | T. Junk | Confidence level computation for combining searches with small statistics | NIMA 434 (1999) 435 | hep-ex/9902006 |
| 57 | V. Hirschi et al. | Automation of one-loop QCD corrections | JHEP 05 (2011) 044 | 1103.0621 |
|
|
Compact Muon Solenoid LHC, CERN |
|

|

|

|

|

|