

Compact Muon Solenoid
LHC, CERN
| CMS-HIG-17-012 ; CERN-EP-2018-009 | ||
| Search for a new scalar resonance decaying to a pair of Z bosons in proton-proton collisions at $\sqrt{s} = $ 13 TeV | ||
| CMS Collaboration | ||
| 5 April 2018 | ||
| JHEP 06 (2018) 127 [Erratum] | ||
| Abstract: A search for a new scalar resonance decaying to a pair of Z bosons is performed in the mass range from 130 GeV to 3 TeV, and for various width scenarios. The analysis is based on proton-proton collisions recorded by the CMS experiment at the LHC in 2016, corresponding to an integrated luminosity of 35.9 fb$^{-1}$ at a center-of-mass energy of 13 TeV. The Z boson pair decays are reconstructed using the $ 4 \ell$, $ 2 \ell 2 \mathrm{q} $, and $ 2\ell 2\nu$ final states, where $\ell = $ e or $\mu$. Both gluon fusion and electroweak production of the scalar resonance are considered, with a free parameter describing their relative cross sections. A dedicated categorization of events, based on the kinematic properties of associated jets, and matrix element techniques are employed for an optimal signal and background separation. A description of the interference between signal and background amplitudes for a resonance of an arbitrary width is included. No significant excess of events with respect to the standard model expectation is observed and limits are set on the product of the cross section for a new scalar boson and the branching fraction for its decay to ZZ for a large range of masses and widths. | ||
| Links: e-print arXiv:1804.01939 [hep-ex] (PDF) ; CDS record ; inSPIRE record ; HepData record ; CADI line (restricted) ; | ||
| Figures | |
png pdf |
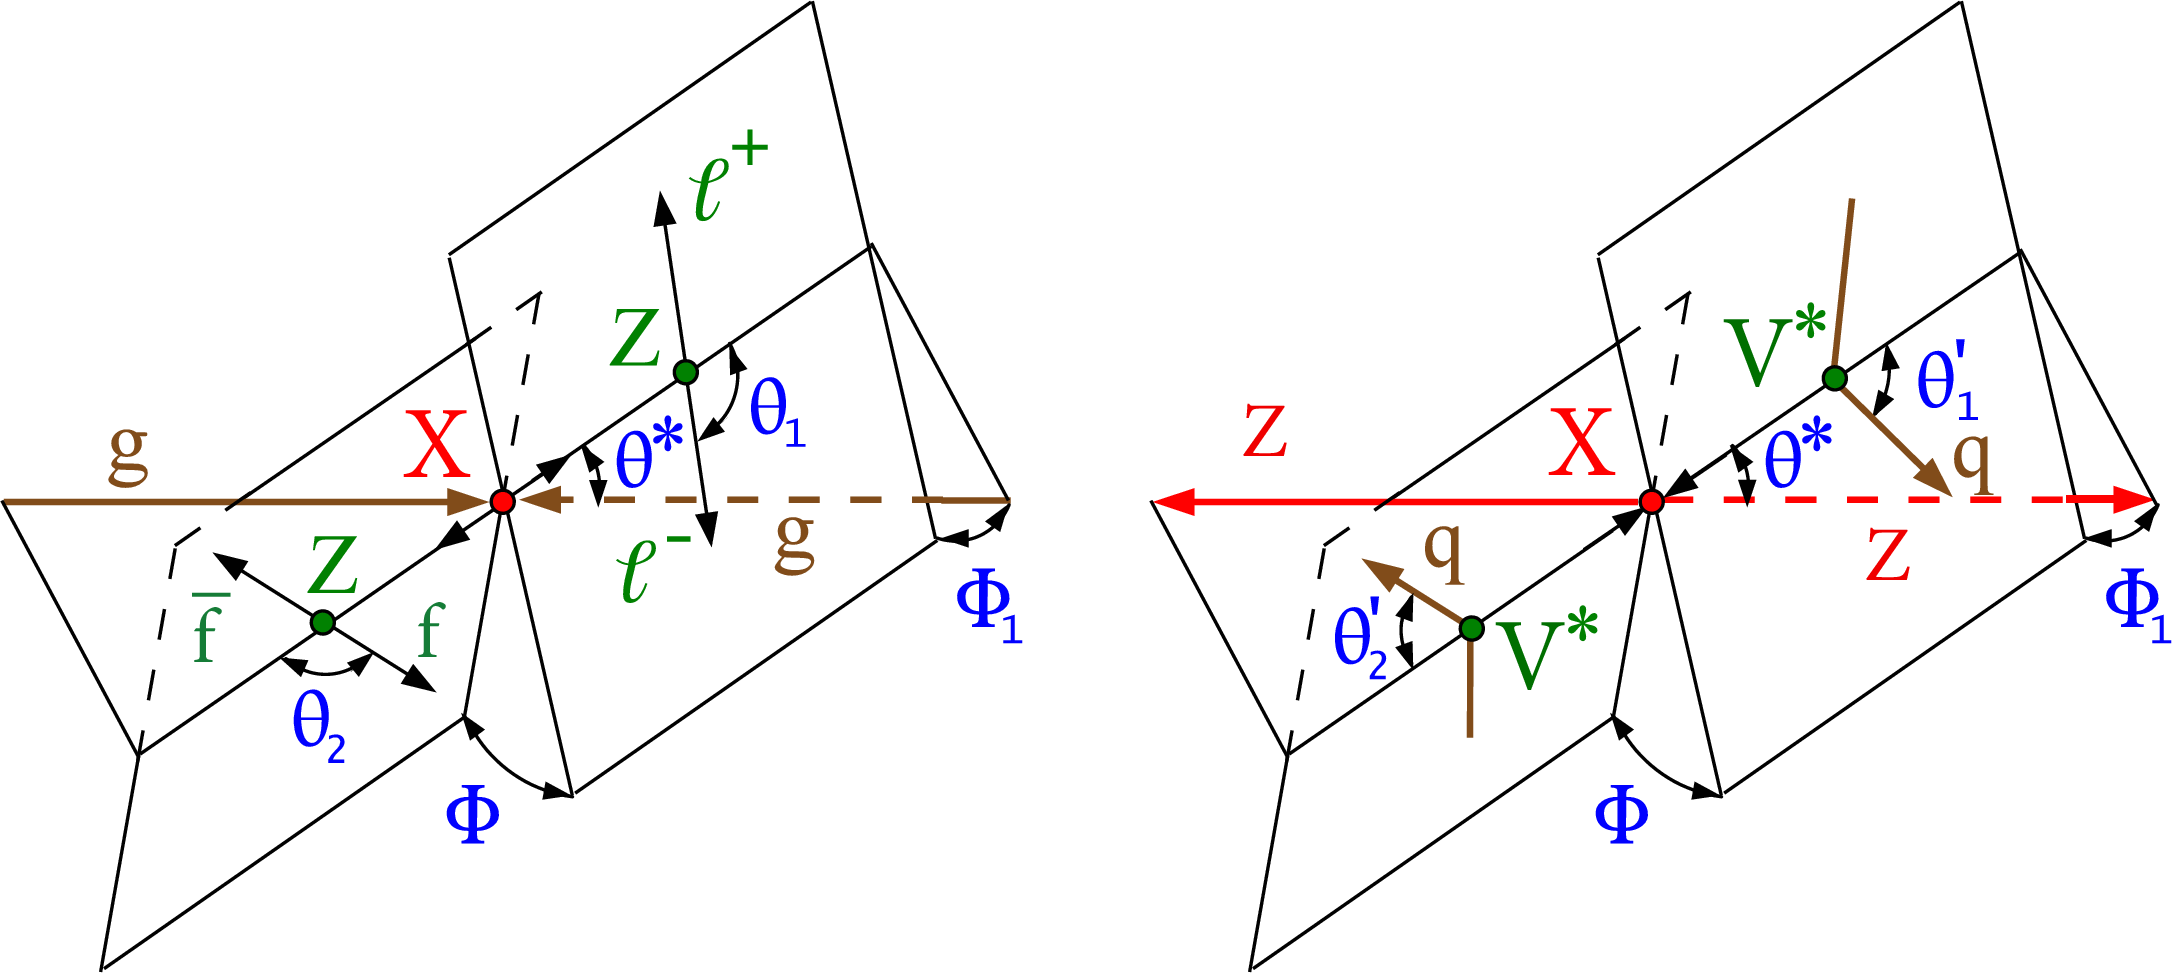
Figure 1:
Illustration of an X boson production from ${{\mathrm {g}} {\mathrm {g}} \mathrm {F}}$, $ {\mathrm {g}} {\mathrm {g}} \to {\mathrm {X}}\to {\mathrm {Z}} {\mathrm {Z}} \to (\ell ^+\ell ^-)(\mathrm{ f\overline {f} })$ (left), and VBF, $ {\mathrm {q}}{{\mathrm {q}}^\prime}\to {\mathrm {q}}{{\mathrm {q}}^\prime} {\mathrm {X}}\to {\mathrm {q}}{{\mathrm {q}}^\prime} {\mathrm {Z}} {\mathrm {Z}} $ (right). The five angles shown in blue and the invariant masses of the two vector bosons shown in green fully characterize either the production or the decay chain. The angles are defined in either the X or V boson rest frames [36,38]. |

png pdf |
Figure 1-a:
Illustration of an X boson production from ${{\mathrm {g}} {\mathrm {g}} \mathrm {F}}$, $ {\mathrm {g}} {\mathrm {g}} \to {\mathrm {X}}\to {\mathrm {Z}} {\mathrm {Z}} \to (\ell ^+\ell ^-)(\mathrm{ f\overline {f} })$. The five angles shown in blue and the invariant masses of the two vector bosons shown in green fully characterize either the production or the decay chain. The angles are defined in either the X or V boson rest frames [36,38]. |

png pdf |
Figure 1-b:
Illustration of an X boson production from VBF, $ {\mathrm {q}}{{\mathrm {q}}^\prime}\to {\mathrm {q}}{{\mathrm {q}}^\prime} {\mathrm {X}}\to {\mathrm {q}}{{\mathrm {q}}^\prime} {\mathrm {Z}} {\mathrm {Z}} $. The five angles shown in blue and the invariant masses of the two vector bosons shown in green fully characterize either the production or the decay chain. The angles are defined in either the X or V boson rest frames [36,38]. |
png pdf |
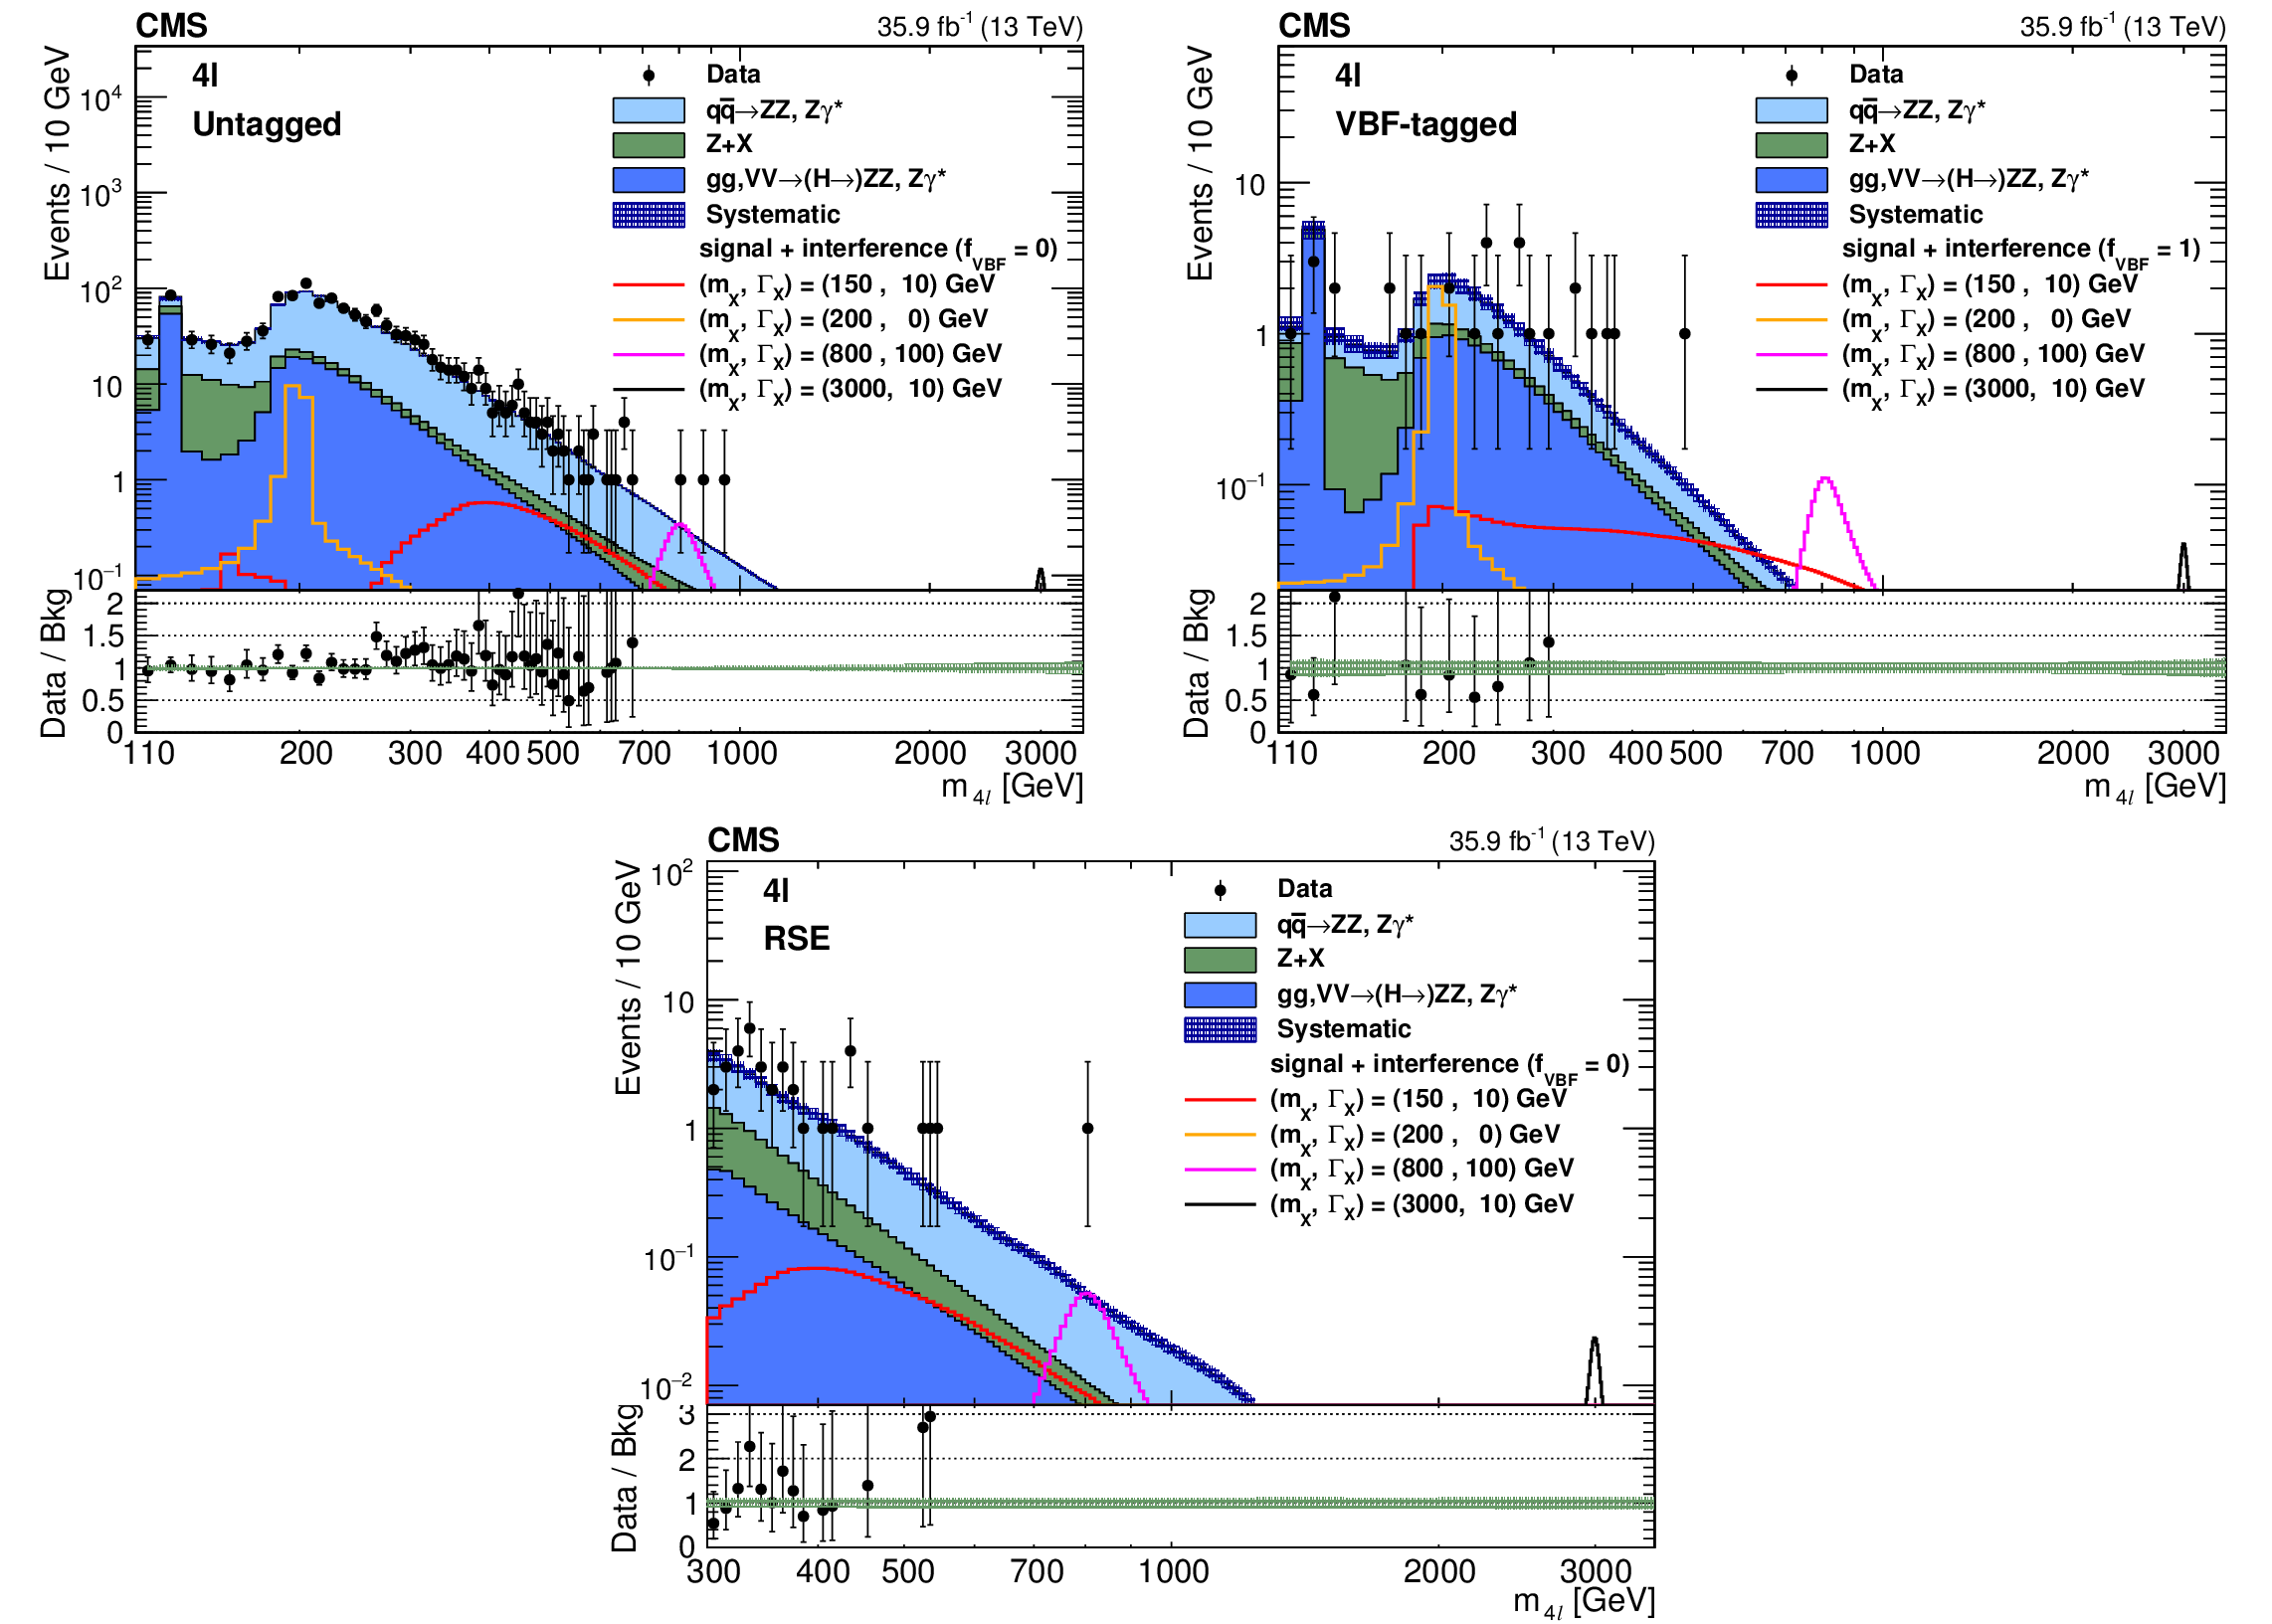
Figure 2:
Distributions of the four lepton invariant mass in the untagged (upper left plot), VBF-tagged (upper right plot) and RSE (lower plot) categories. Signal expectations including the interference effect for several mass and width hypotheses are shown. The signals are normalized to the expected upper limit of the cross section derived from this final state. Lower panels show the ratio between data and background estimation in each case. |
png pdf |
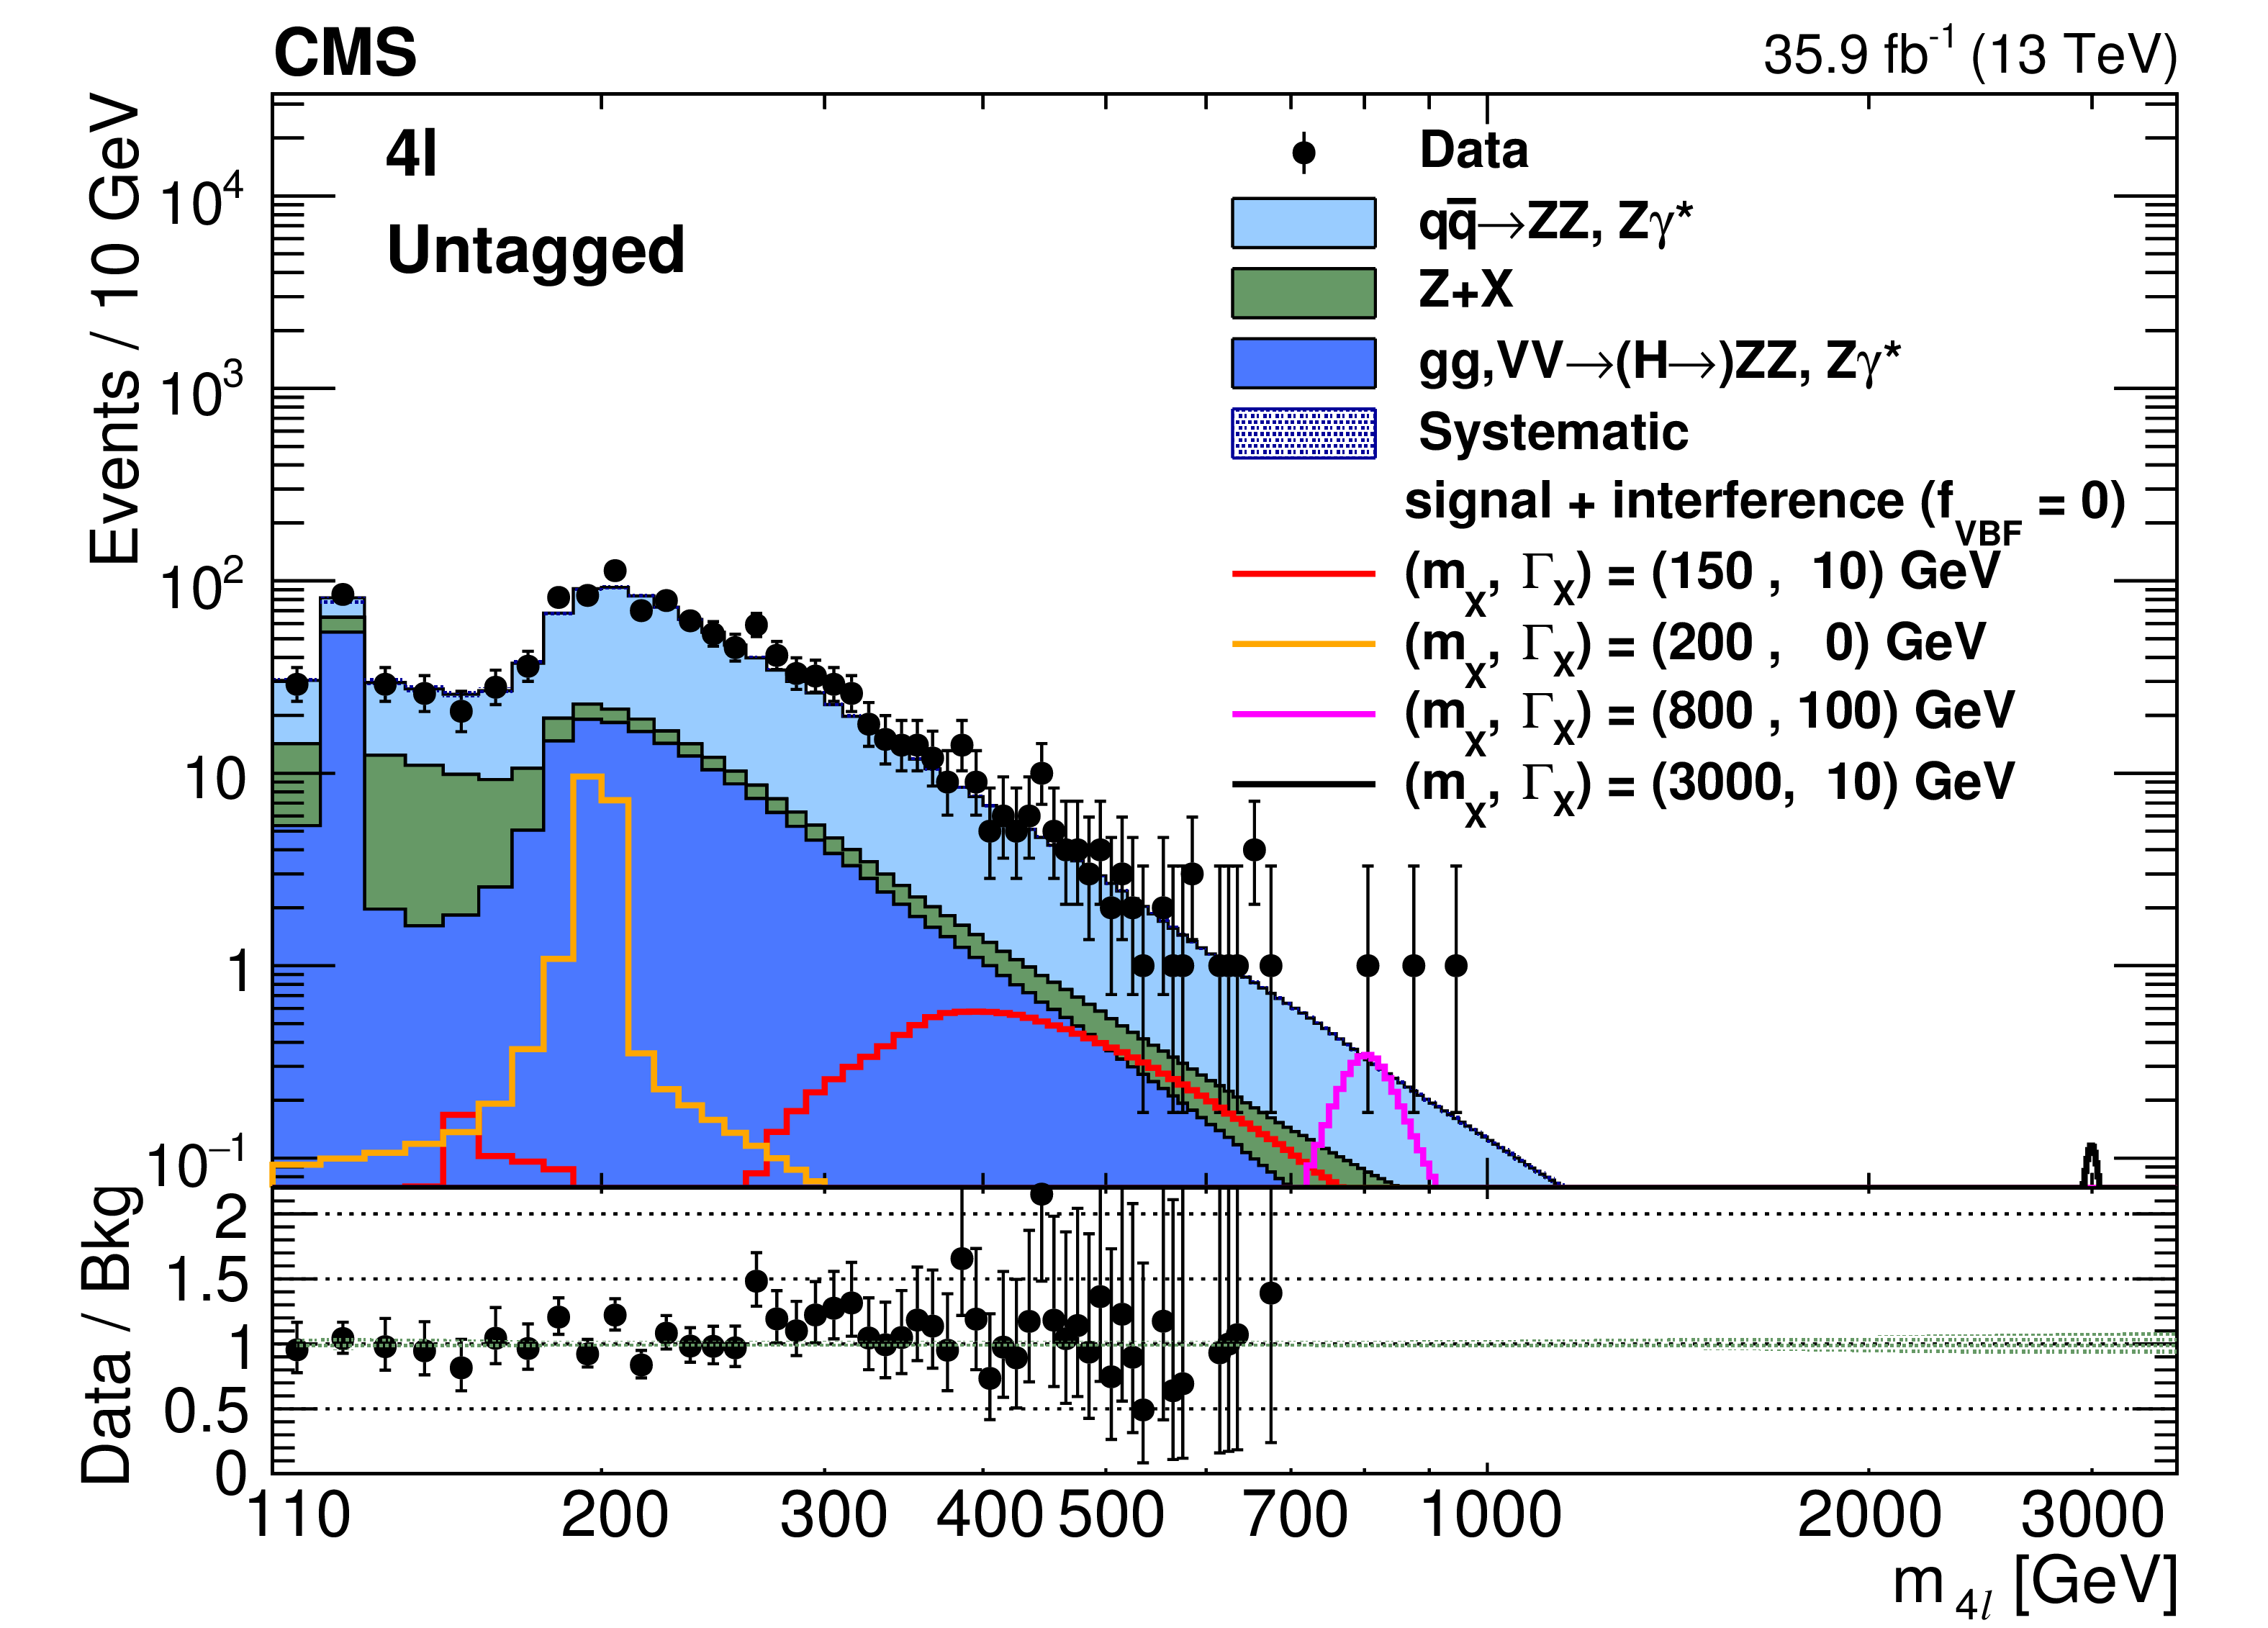
Figure 2-a:
Distribution of the four lepton invariant mass in the untagged category. Signal expectations including the interference effect for several mass and width hypotheses are shown. The signals are normalized to the expected upper limit of the cross section derived from this final state. The lower panel shows the ratio between data and background estimation. |
png pdf |
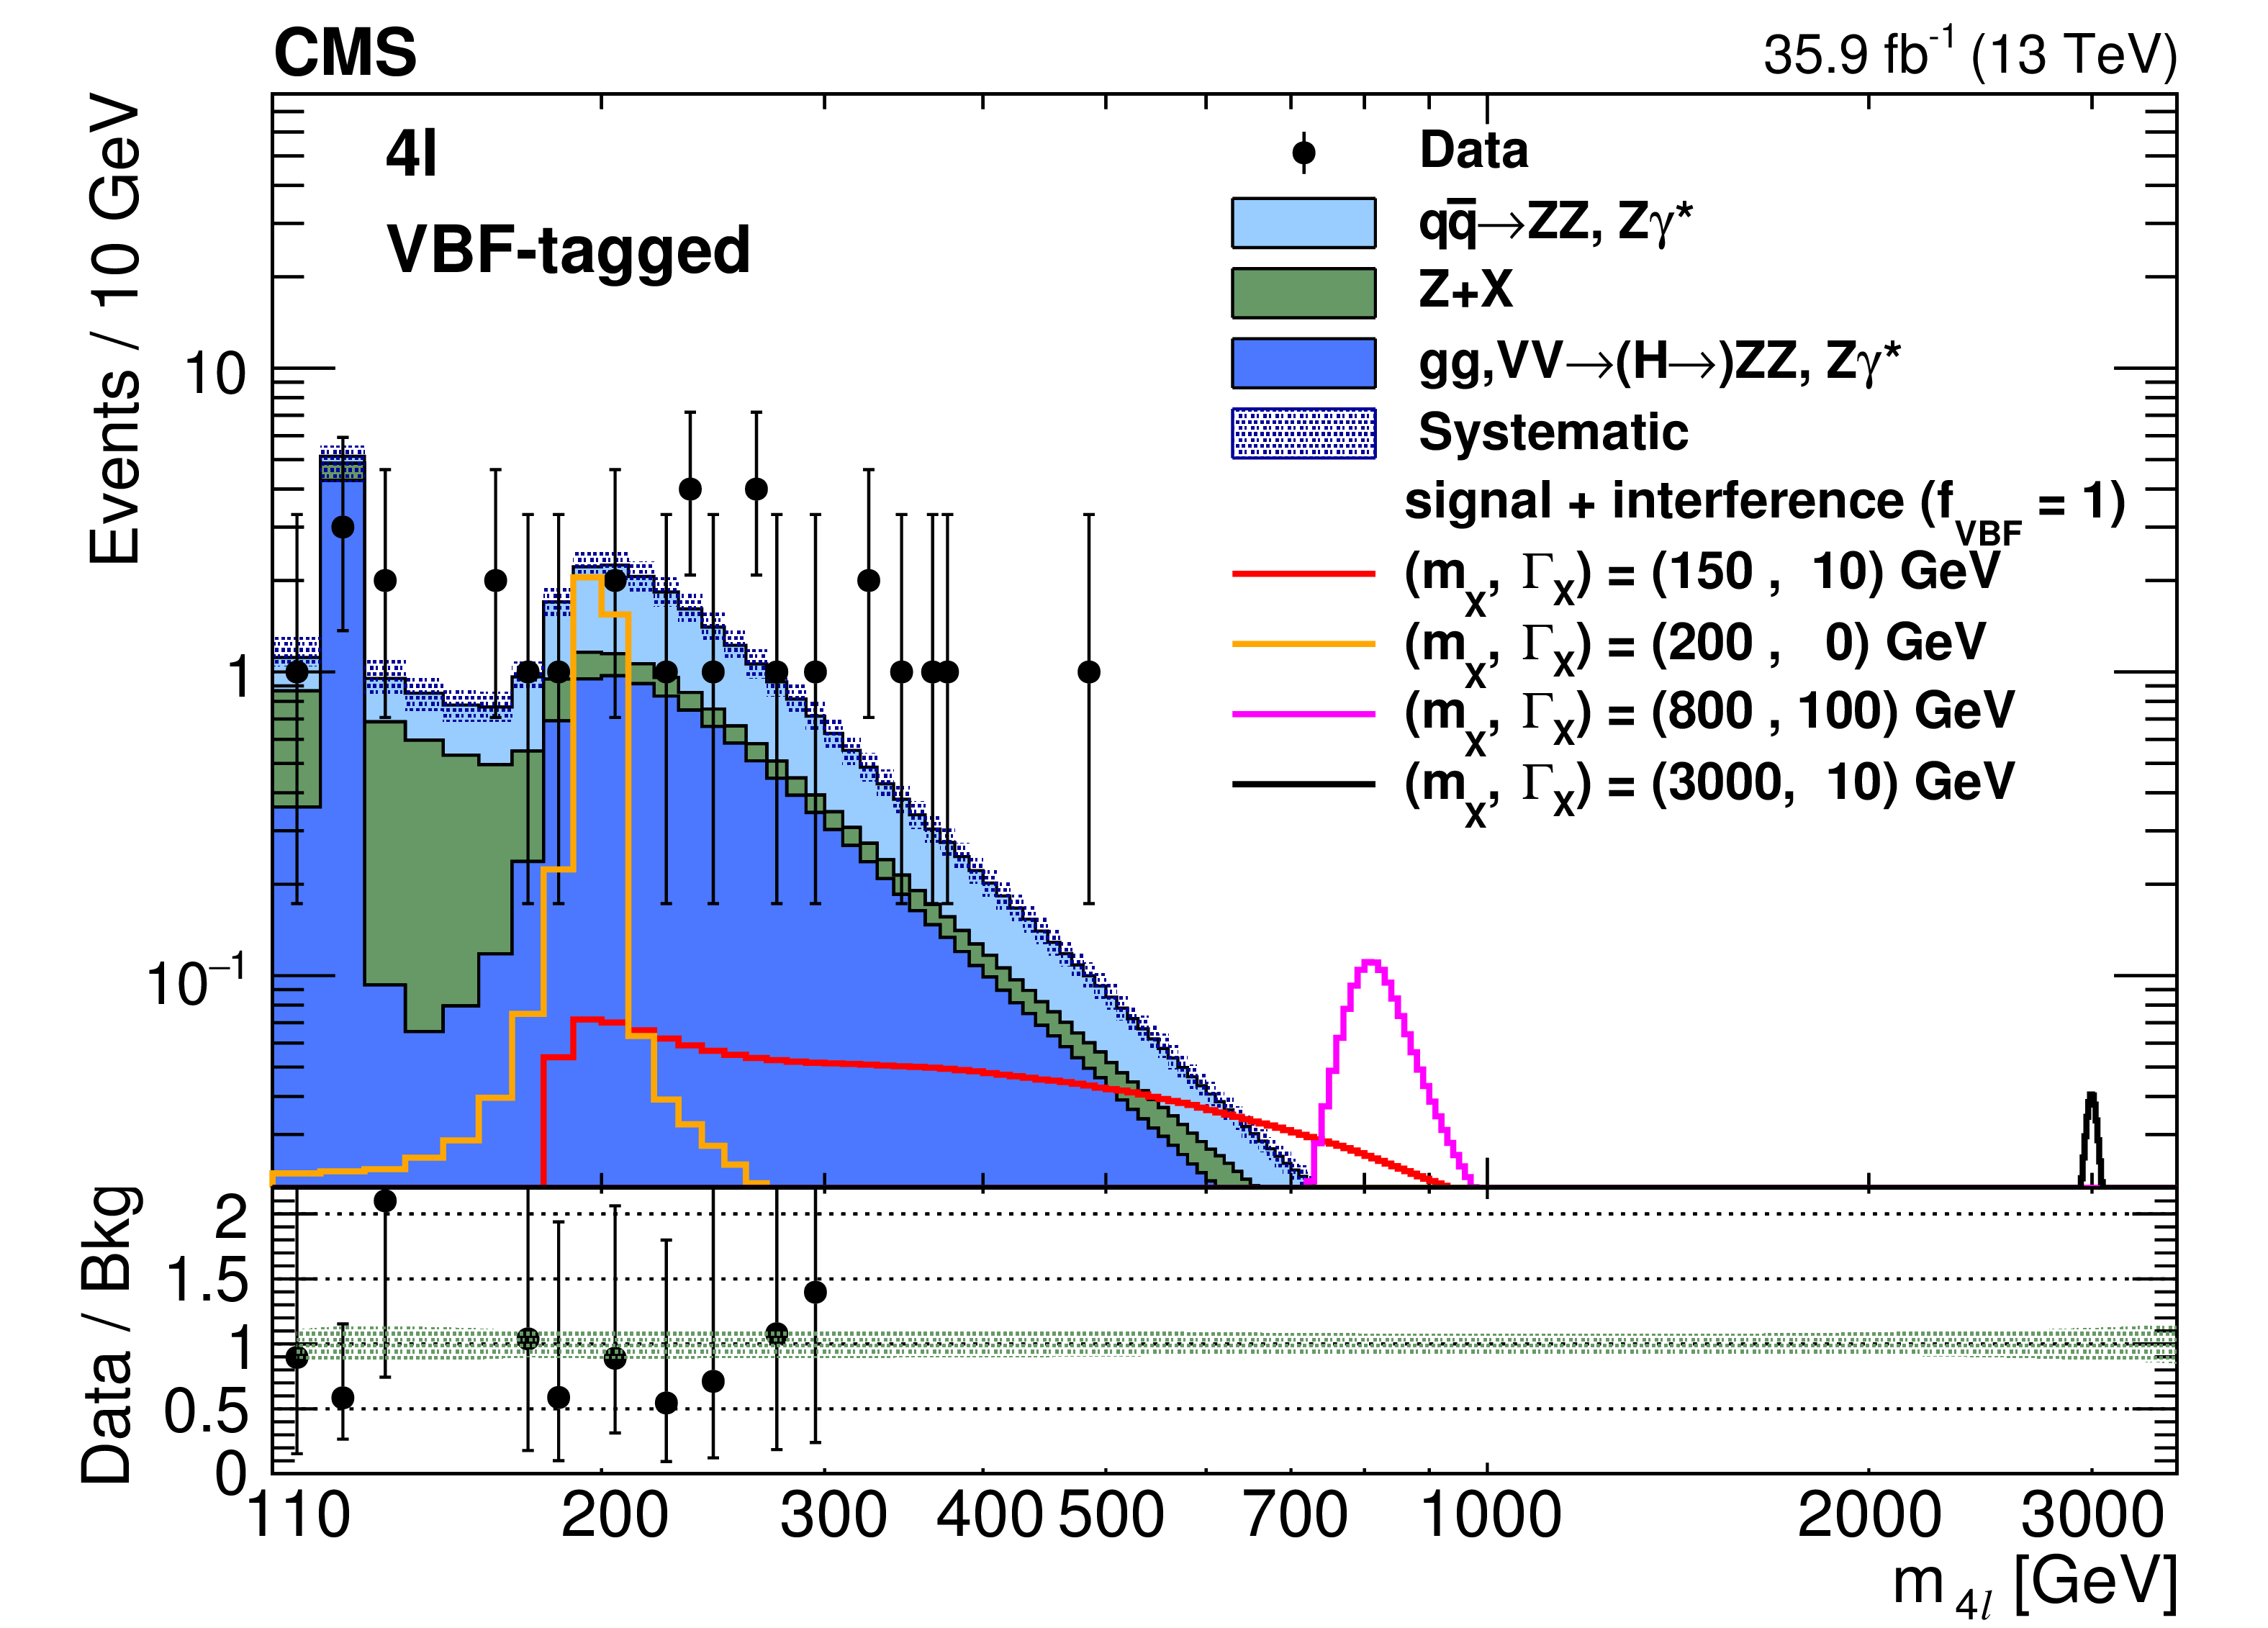
Figure 2-b:
Distribution of the four lepton invariant mass in the VBF-tagged category. Signal expectations including the interference effect for several mass and width hypotheses are shown. The signals are normalized to the expected upper limit of the cross section derived from this final state. The lower panel shows the ratio between data and background estimation. |

png pdf |
Figure 2-c:
Distribution of the four lepton invariant mass in the RSE category. Signal expectations including the interference effect for several mass and width hypotheses are shown. The signals are normalized to the expected upper limit of the cross section derived from this final state. The lower panel shows the ratio between data and background estimation. |

png pdf |
Figure 3:
Distributions of ${\cal D}_{\mathrm {bkg}}^{\mathrm {kin}}$ for all selected events. Signal expectations including the interference effect for several mass and width hypotheses are shown. The signals are normalized to a total of 400 events. |
png pdf |
Figure 4:
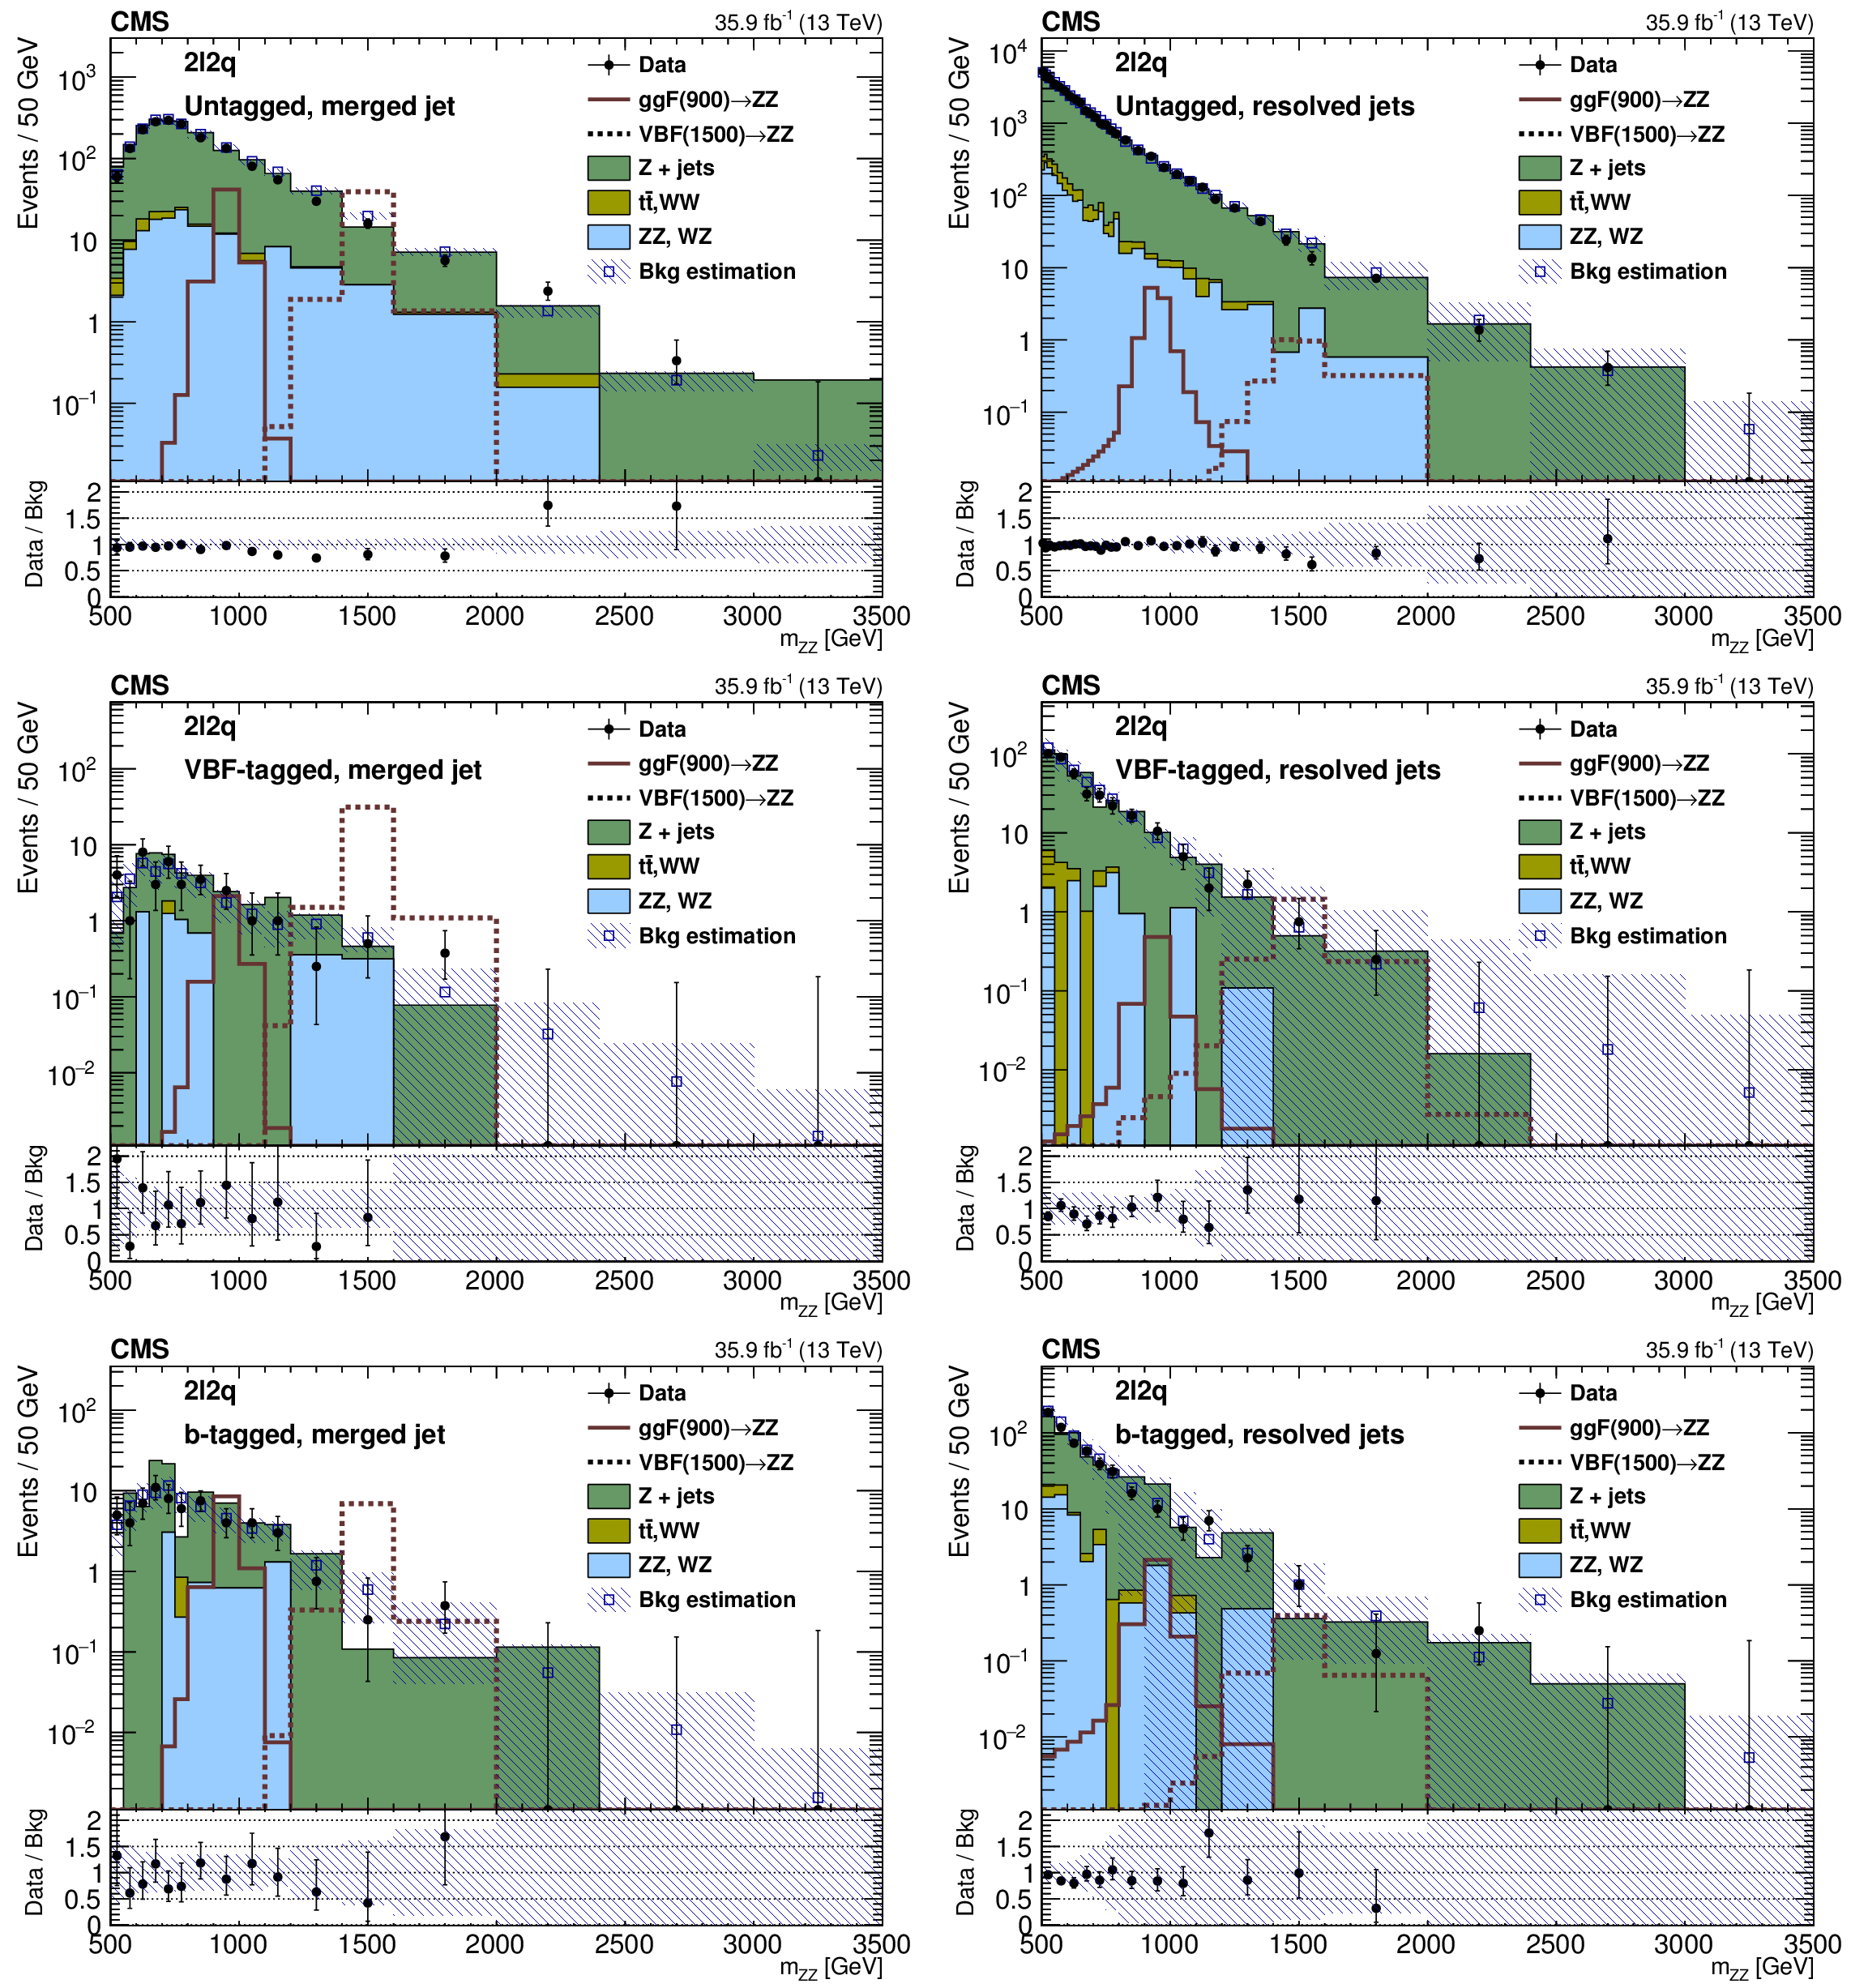
Distributions of the invariant mass ${m_{{\mathrm {Z}} {\mathrm {Z}}}}$ in the signal region for the merged (left) and resolved (right) case for the different categories in the $2{\ell}2 {\mathrm {q}}$ channel. The points represent the data, the stacked histograms the expected backgrounds from simulation, and the open histograms the expected signal. The blue hatched bands refer to the sum of background estimates derived from either simulation or control samples in data, as described in the text. Lower panels show the ratio between data and background estimation in each case. |
png pdf |
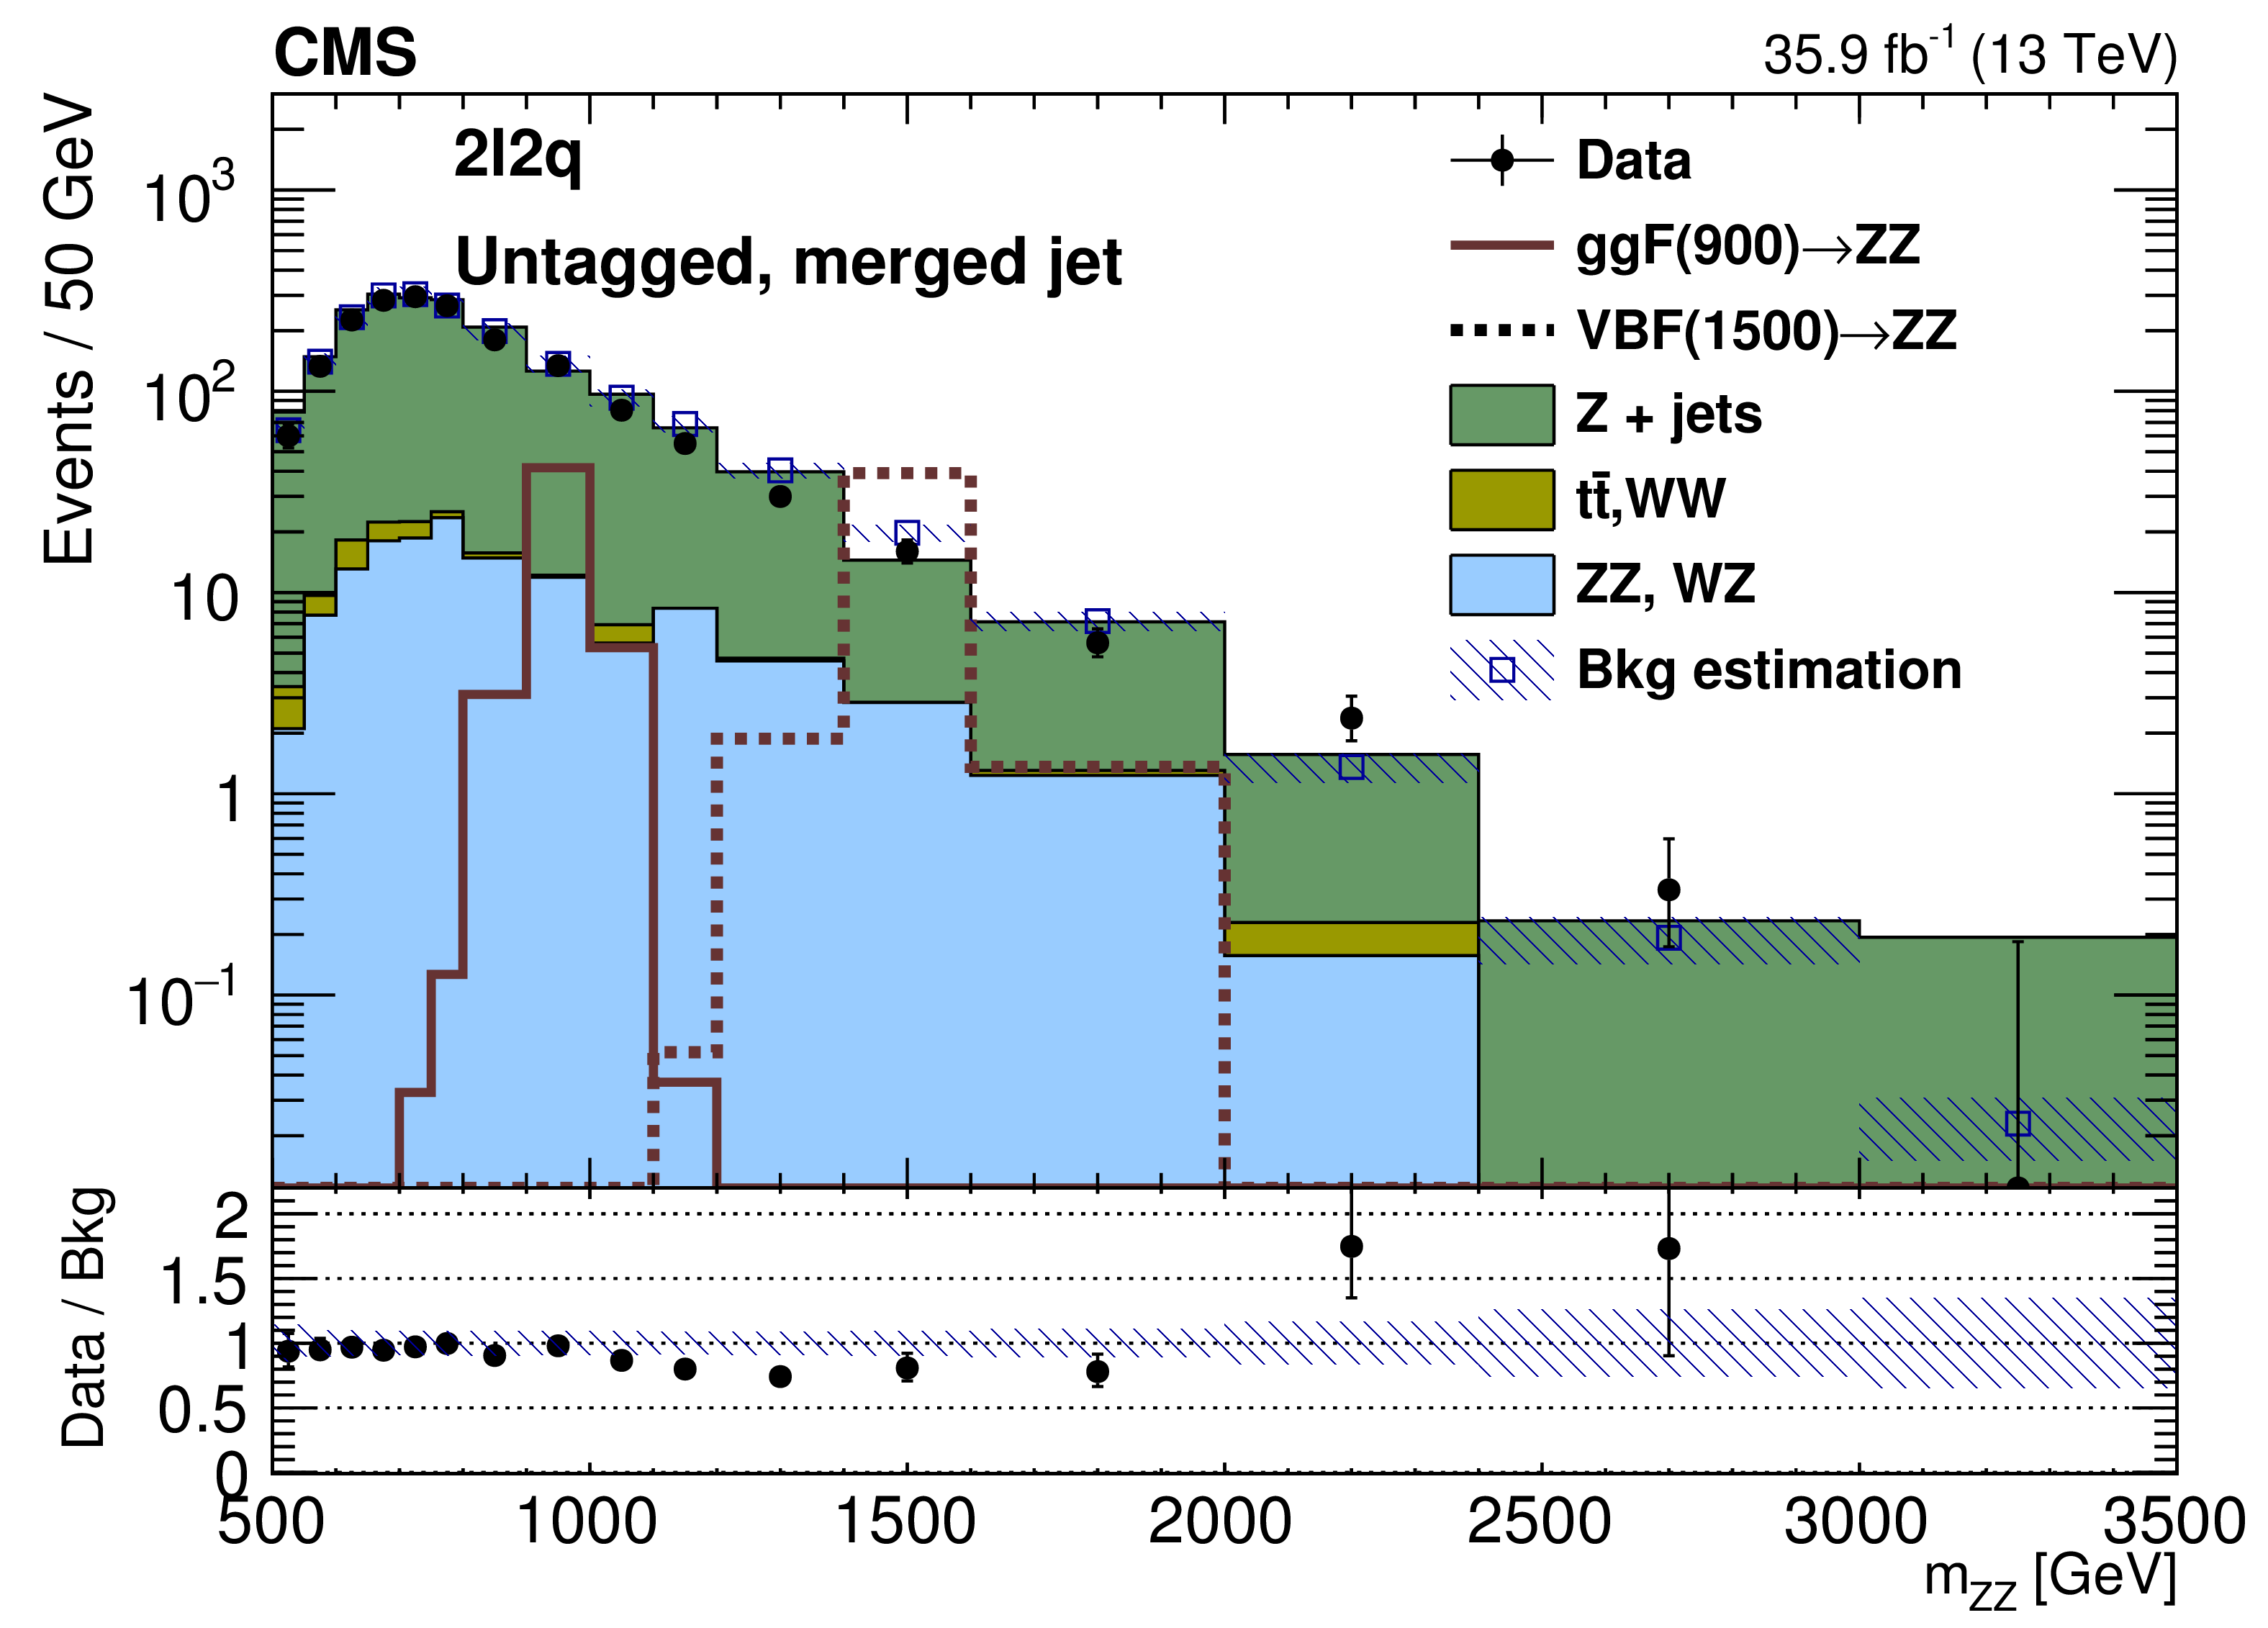
Figure 4-a:
Distribution of the invariant mass ${m_{{\mathrm {Z}} {\mathrm {Z}}}}$ in the signal region for the merged case for the untagged category in the $2{\ell}2 {\mathrm {q}}$ channel. The points represent the data, the stacked histograms the expected backgrounds from simulation, and the open histogram the expected signal. The blue hatched band refers to the sum of background estimates derived from either simulation or control samples in data, as described in the text. The lower panel shows the ratio between data and background estimation. |

png pdf |
Figure 4-b:
Distribution of the invariant mass ${m_{{\mathrm {Z}} {\mathrm {Z}}}}$ in the signal region for the resolved case for the untagged category in the $2{\ell}2 {\mathrm {q}}$ channel. The points represent the data, the stacked histograms the expected backgrounds from simulation, and the open histogram the expected signal. The blue hatched band refers to the sum of background estimates derived from either simulation or control samples in data, as described in the text. The lower panel shows the ratio between data and background estimation. |
png pdf |
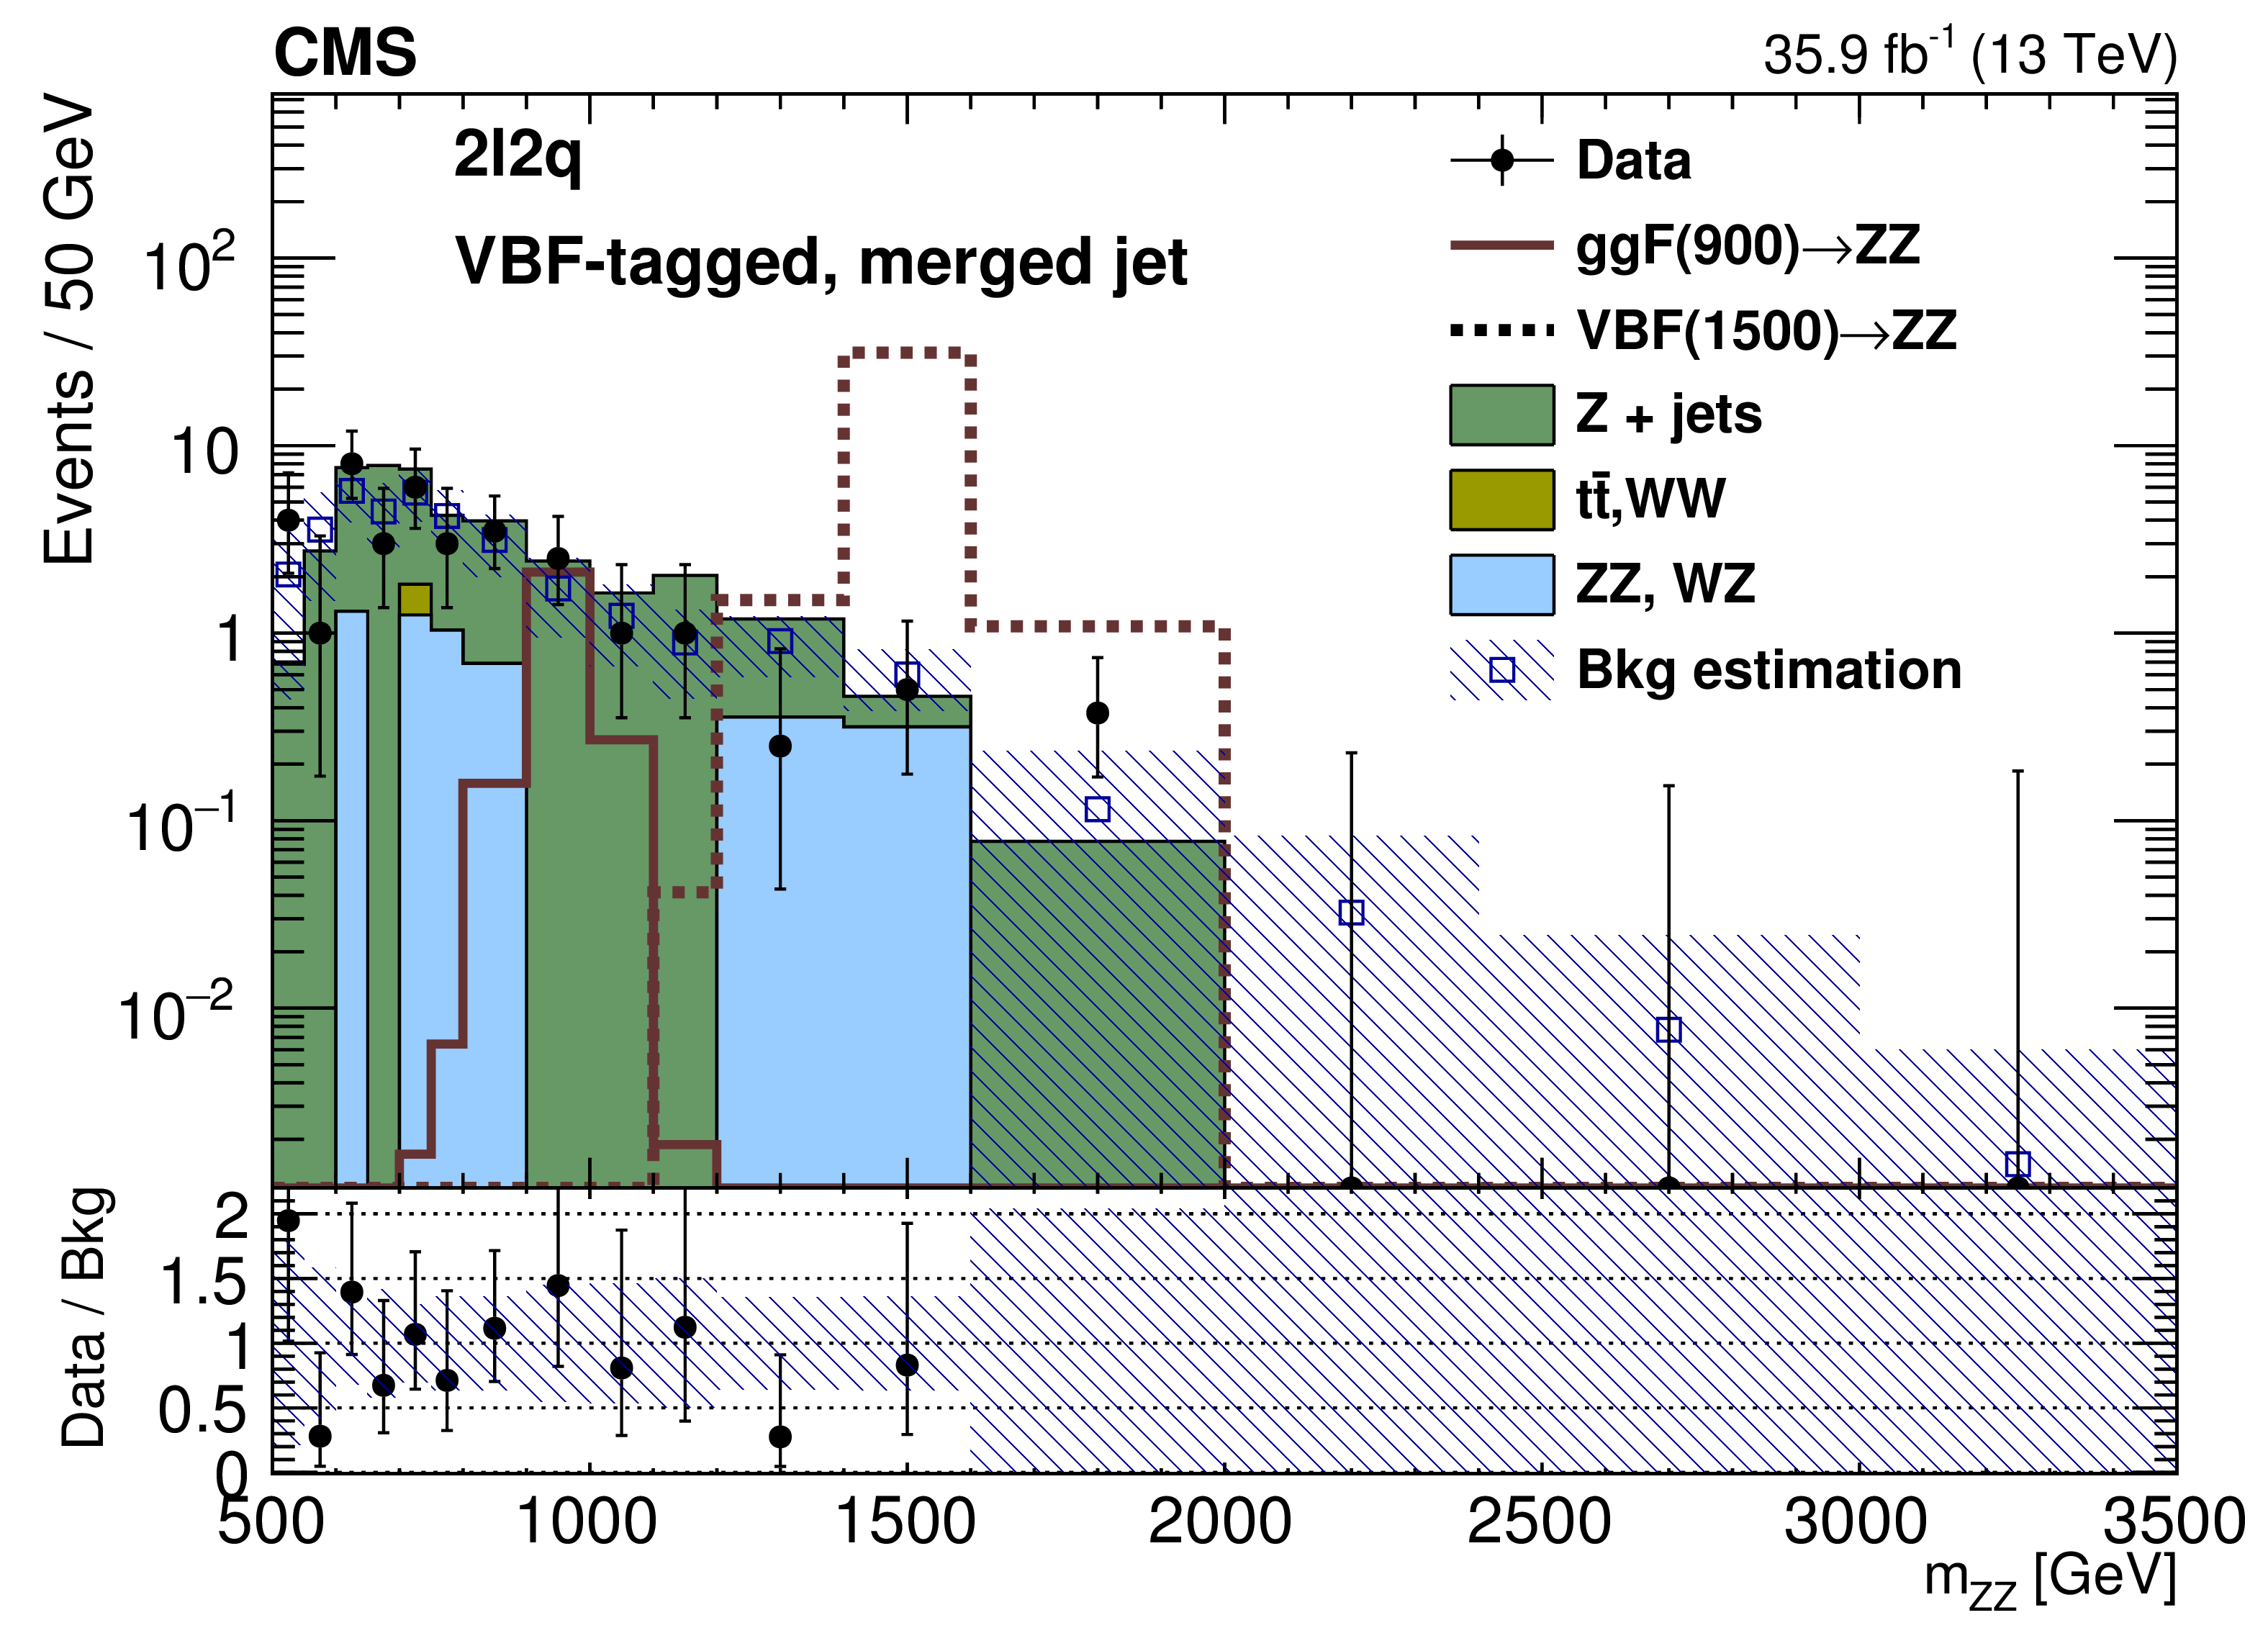
Figure 4-c:
Distribution of the invariant mass ${m_{{\mathrm {Z}} {\mathrm {Z}}}}$ in the signal region for the merged case for the VBF-tagged category in the $2{\ell}2 {\mathrm {q}}$ channel. The points represent the data, the stacked histograms the expected backgrounds from simulation, and the open histogram the expected signal. The blue hatched band refers to the sum of background estimates derived from either simulation or control samples in data, as described in the text. The lower panel shows the ratio between data and background estimation. |

png pdf |
Figure 4-d:
Distribution of the invariant mass ${m_{{\mathrm {Z}} {\mathrm {Z}}}}$ in the signal region for the resolved case for the VBF-tagged category in the $2{\ell}2 {\mathrm {q}}$ channel. The points represent the data, the stacked histograms the expected backgrounds from simulation, and the open histogram the expected signal. The blue hatched band refers to the sum of background estimates derived from either simulation or control samples in data, as described in the text. The lower panel shows the ratio between data and background estimation. |
png pdf |
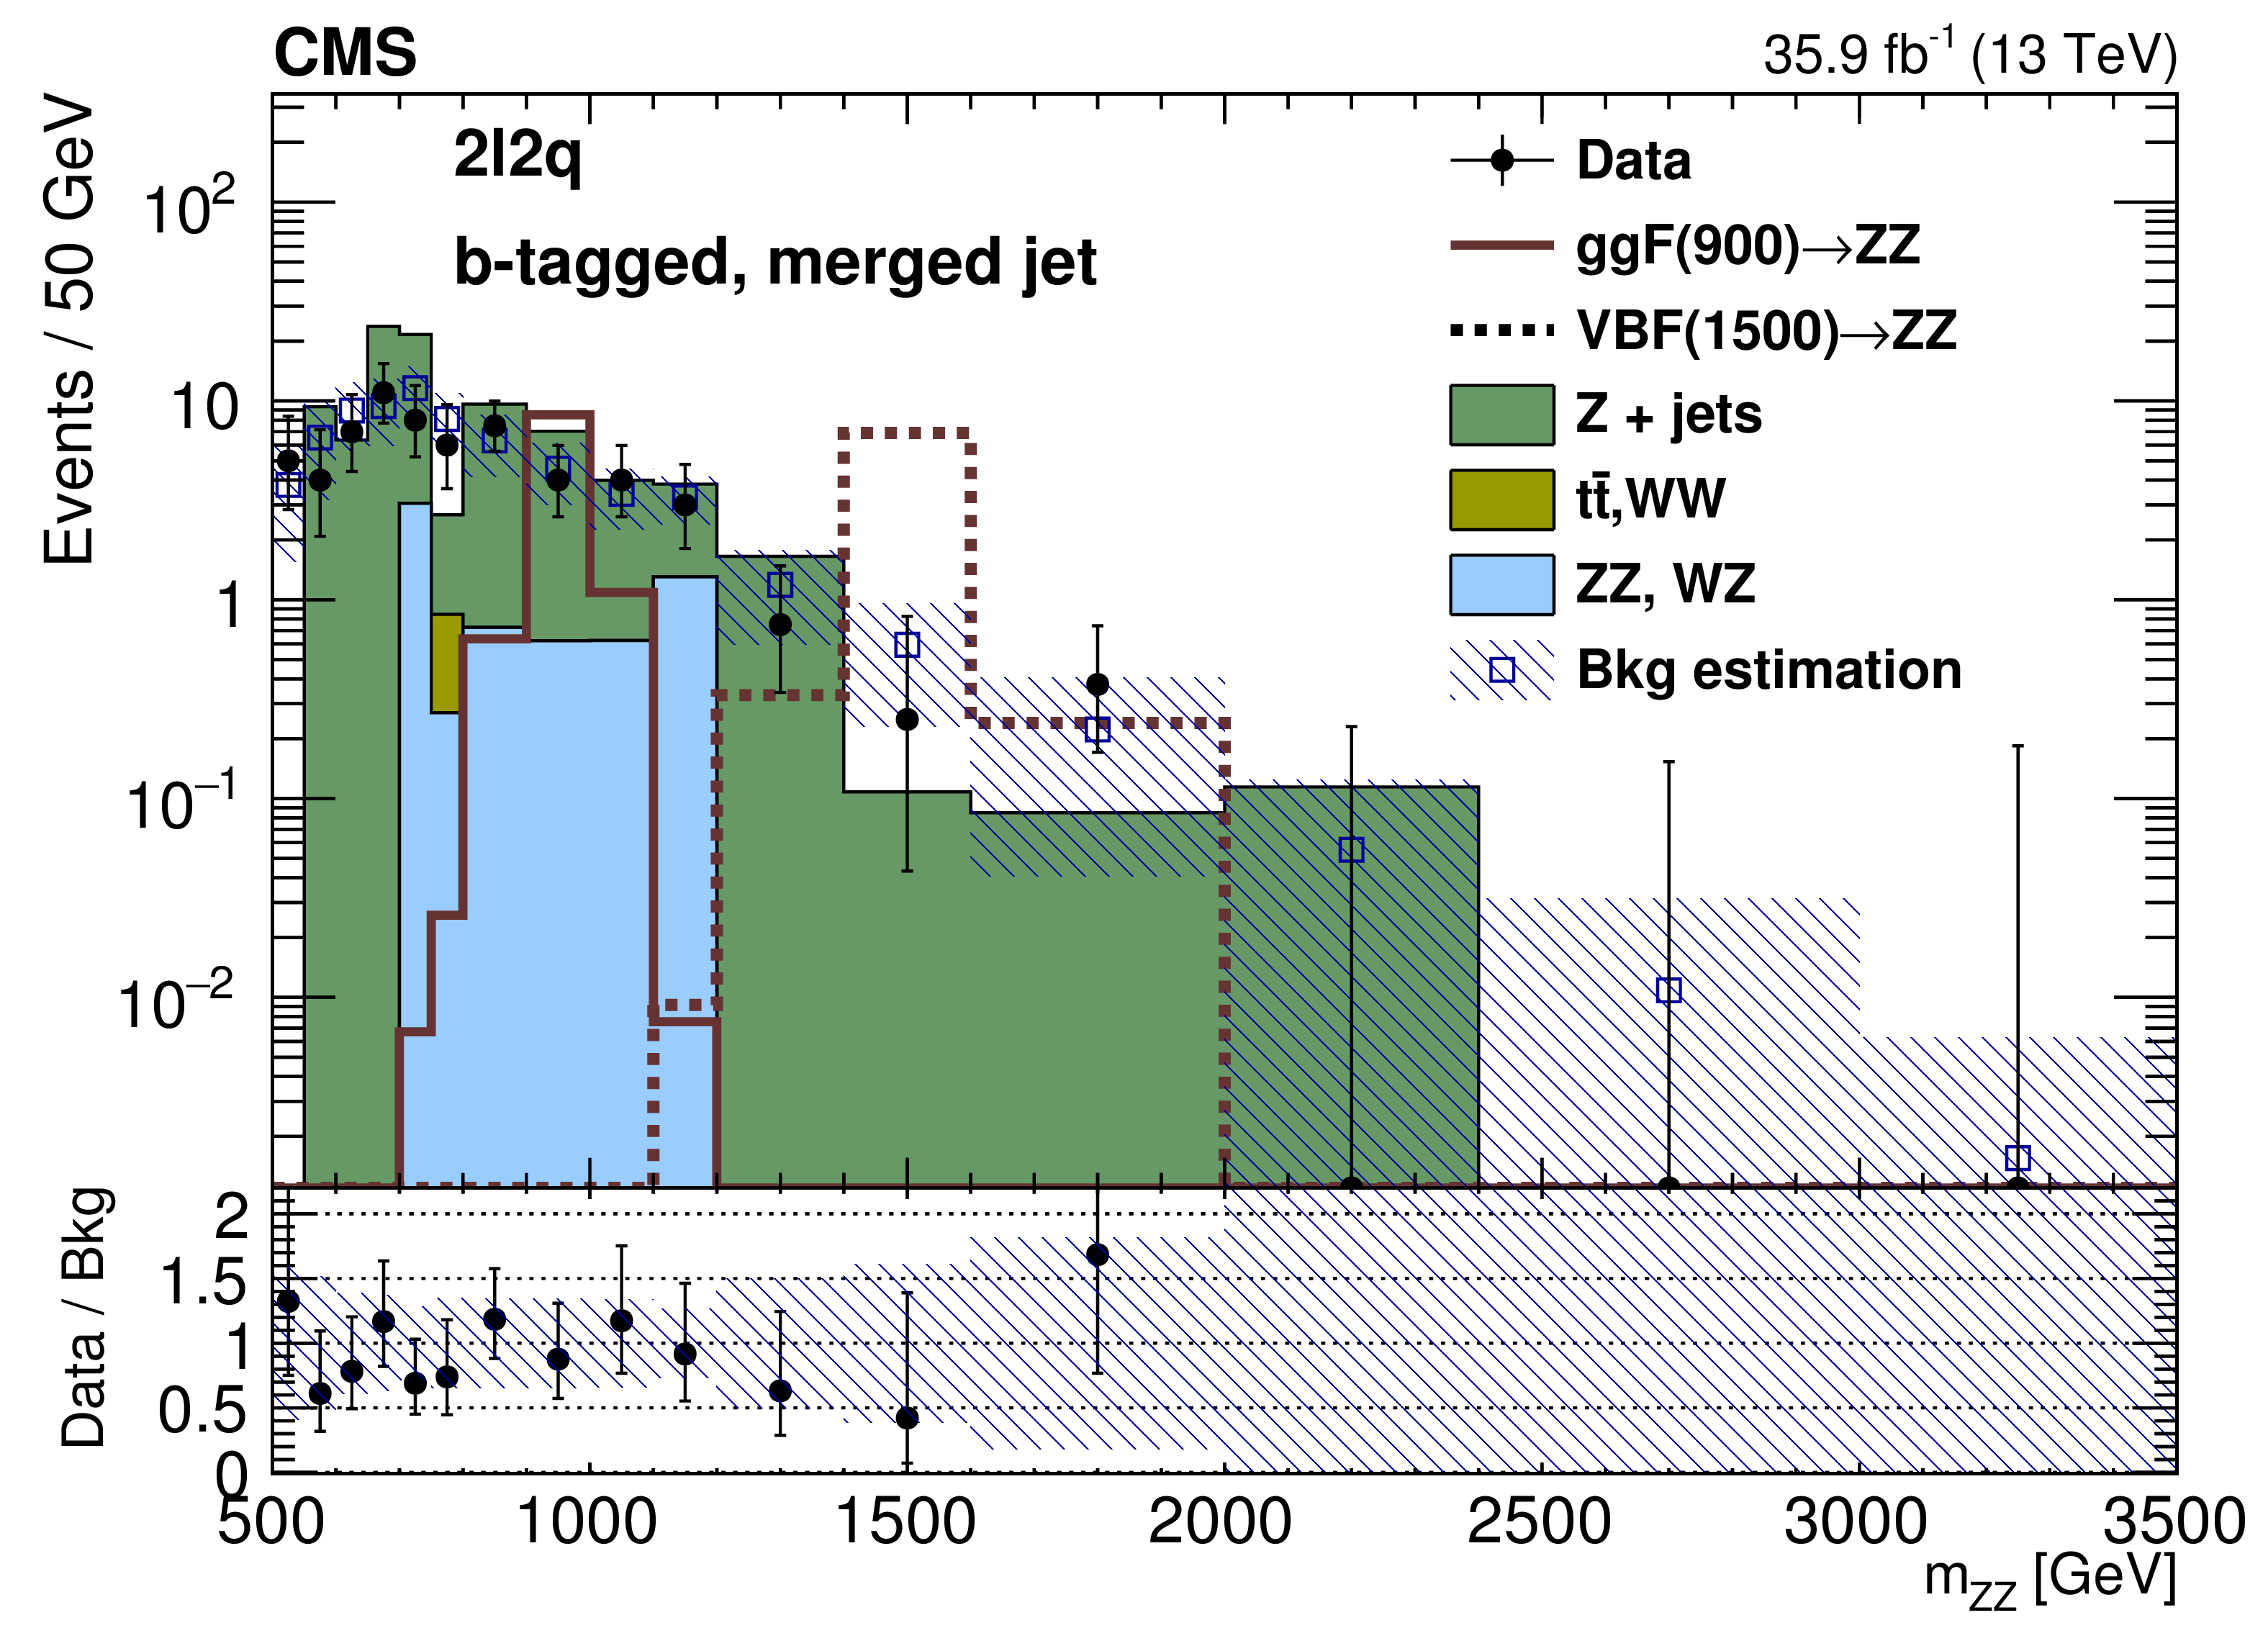
Figure 4-e:
Distribution of the invariant mass ${m_{{\mathrm {Z}} {\mathrm {Z}}}}$ in the signal region for the merged case for the b-tagged category in the $2{\ell}2 {\mathrm {q}}$ channel. The points represent the data, the stacked histograms the expected backgrounds from simulation, and the open histogram the expected signal. The blue hatched band refers to the sum of background estimates derived from either simulation or control samples in data, as described in the text. The lower panel shows the ratio between data and background estimation. |

png pdf |
Figure 4-f:
Distribution of the invariant mass ${m_{{\mathrm {Z}} {\mathrm {Z}}}}$ in the signal region for the resolved case for the b-tagged category in the $2{\ell}2 {\mathrm {q}}$ channel. The points represent the data, the stacked histograms the expected backgrounds from simulation, and the open histogram the expected signal. The blue hatched band refers to the sum of background estimates derived from either simulation or control samples in data, as described in the text. The lower panel shows the ratio between data and background estimation. |
png pdf |
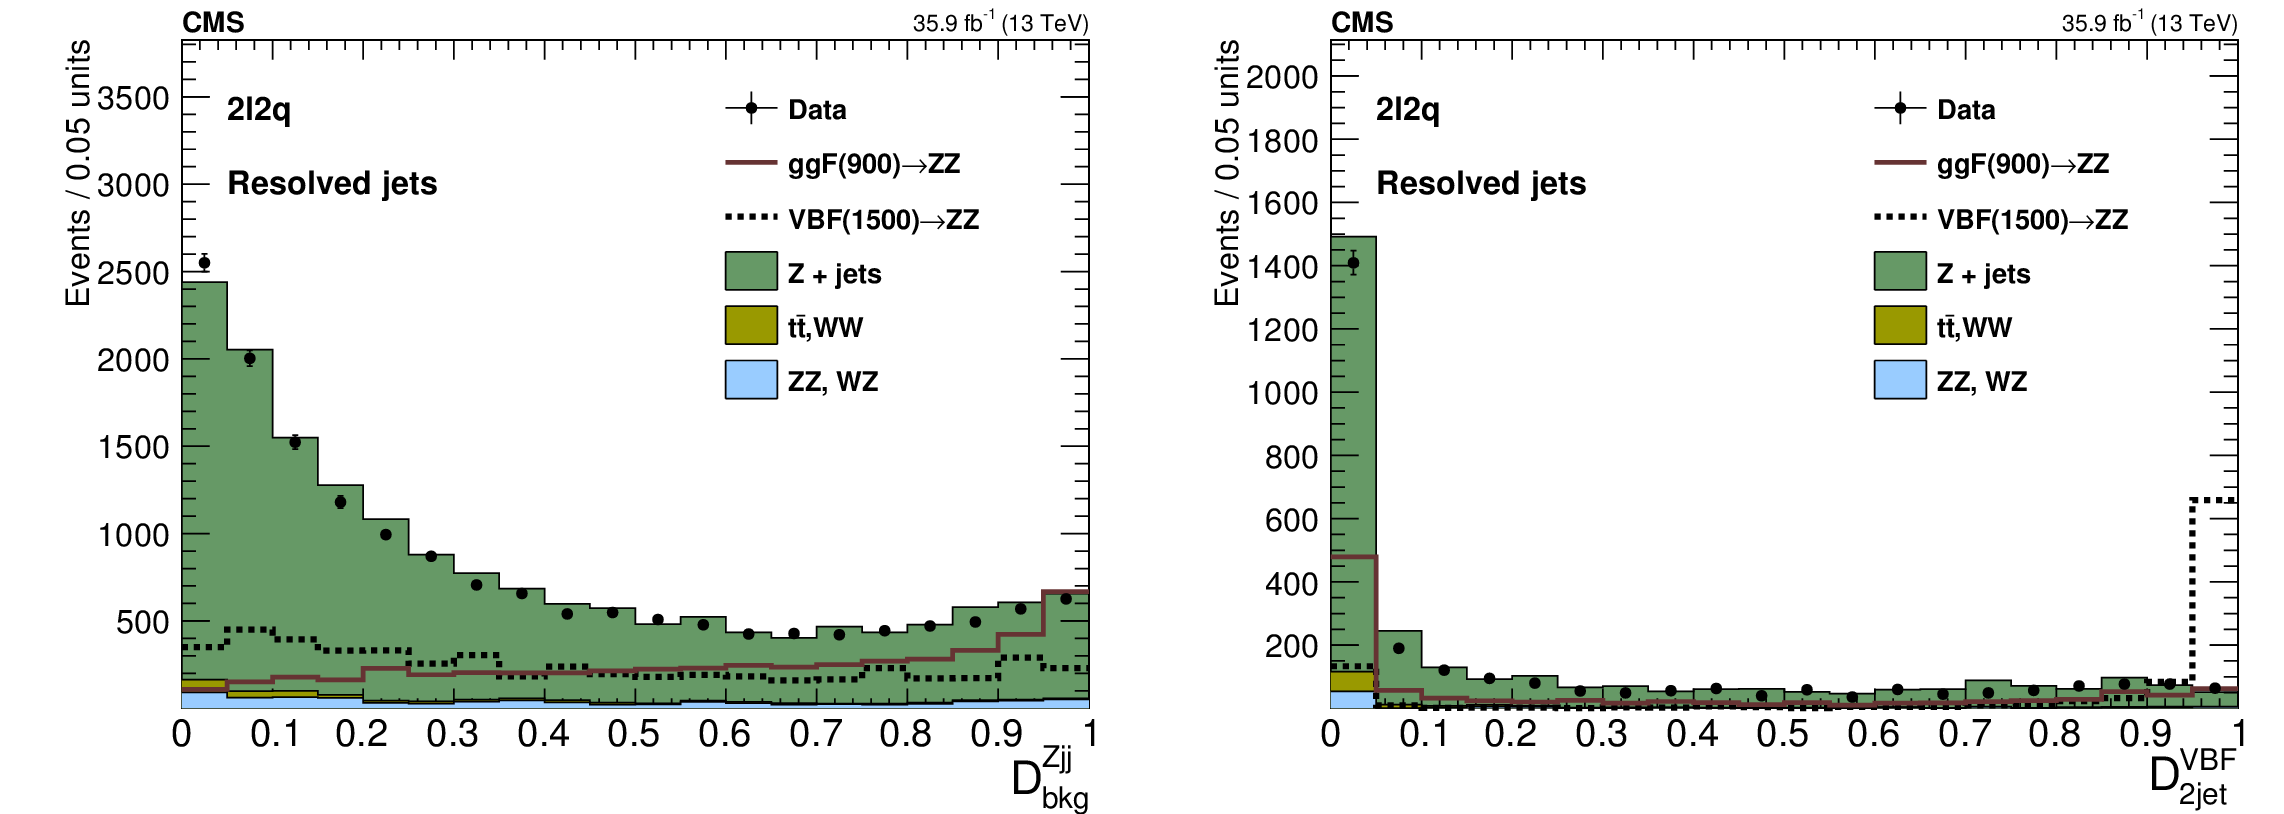
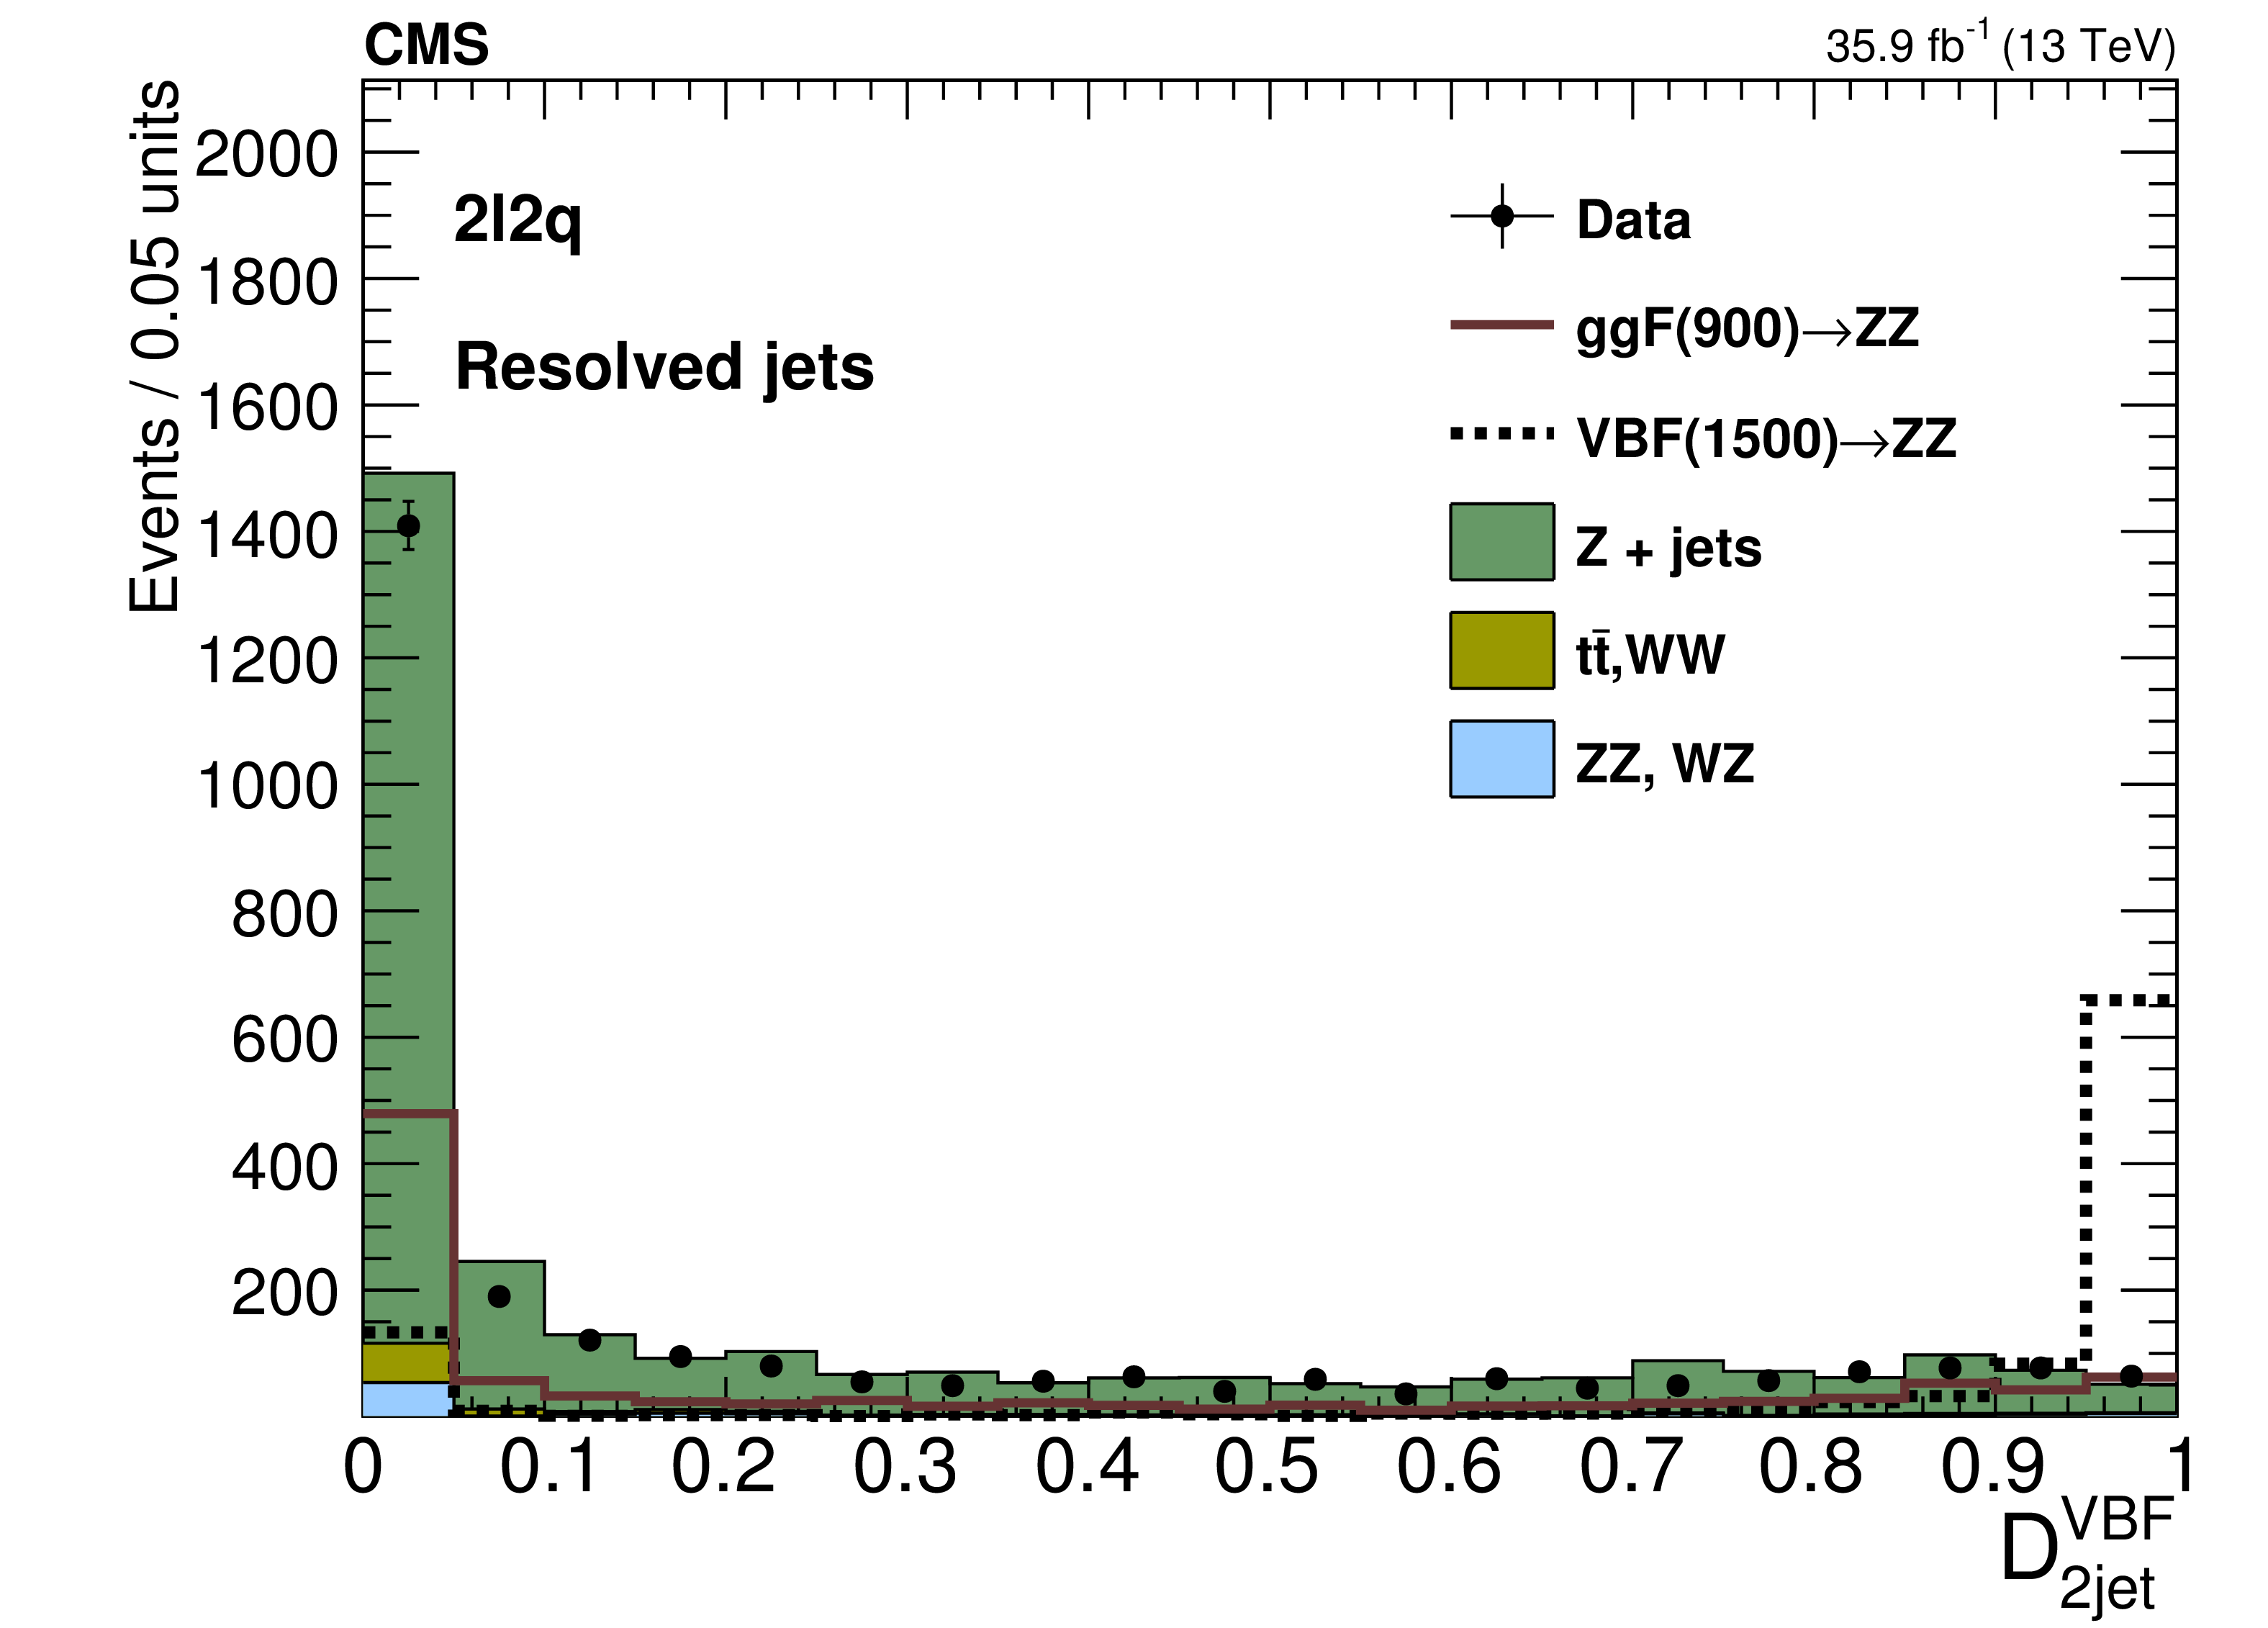
Figure 5:
Distributions of the ${\mathcal {D}_\textrm {bkg}^\textrm {Zjj}}$ (left) and ${\mathcal {D}_\textrm {2jet}^\textrm {VBF}}$ (right) discriminants in the signal region for the resolved selection. The points represent the data, the stacked histograms the expected background from simulation, and the open histograms the expected signal. |

png pdf |
Figure 5-a:
Distribution of the ${\mathcal {D}_\textrm {bkg}^\textrm {Zjj}}$ discriminant in the signal region for the resolved selection. The points represent the data, the stacked histograms the expected background from simulation, and the open histogram the expected signal. |
png pdf |
Figure 5-b:
Distribution of the ${\mathcal {D}_\textrm {2jet}^\textrm {VBF}}$ discriminant in the signal region for the resolved selection. The points represent the data, the stacked histograms the expected background from simulation, and the open histogram the expected signal. |

png pdf |
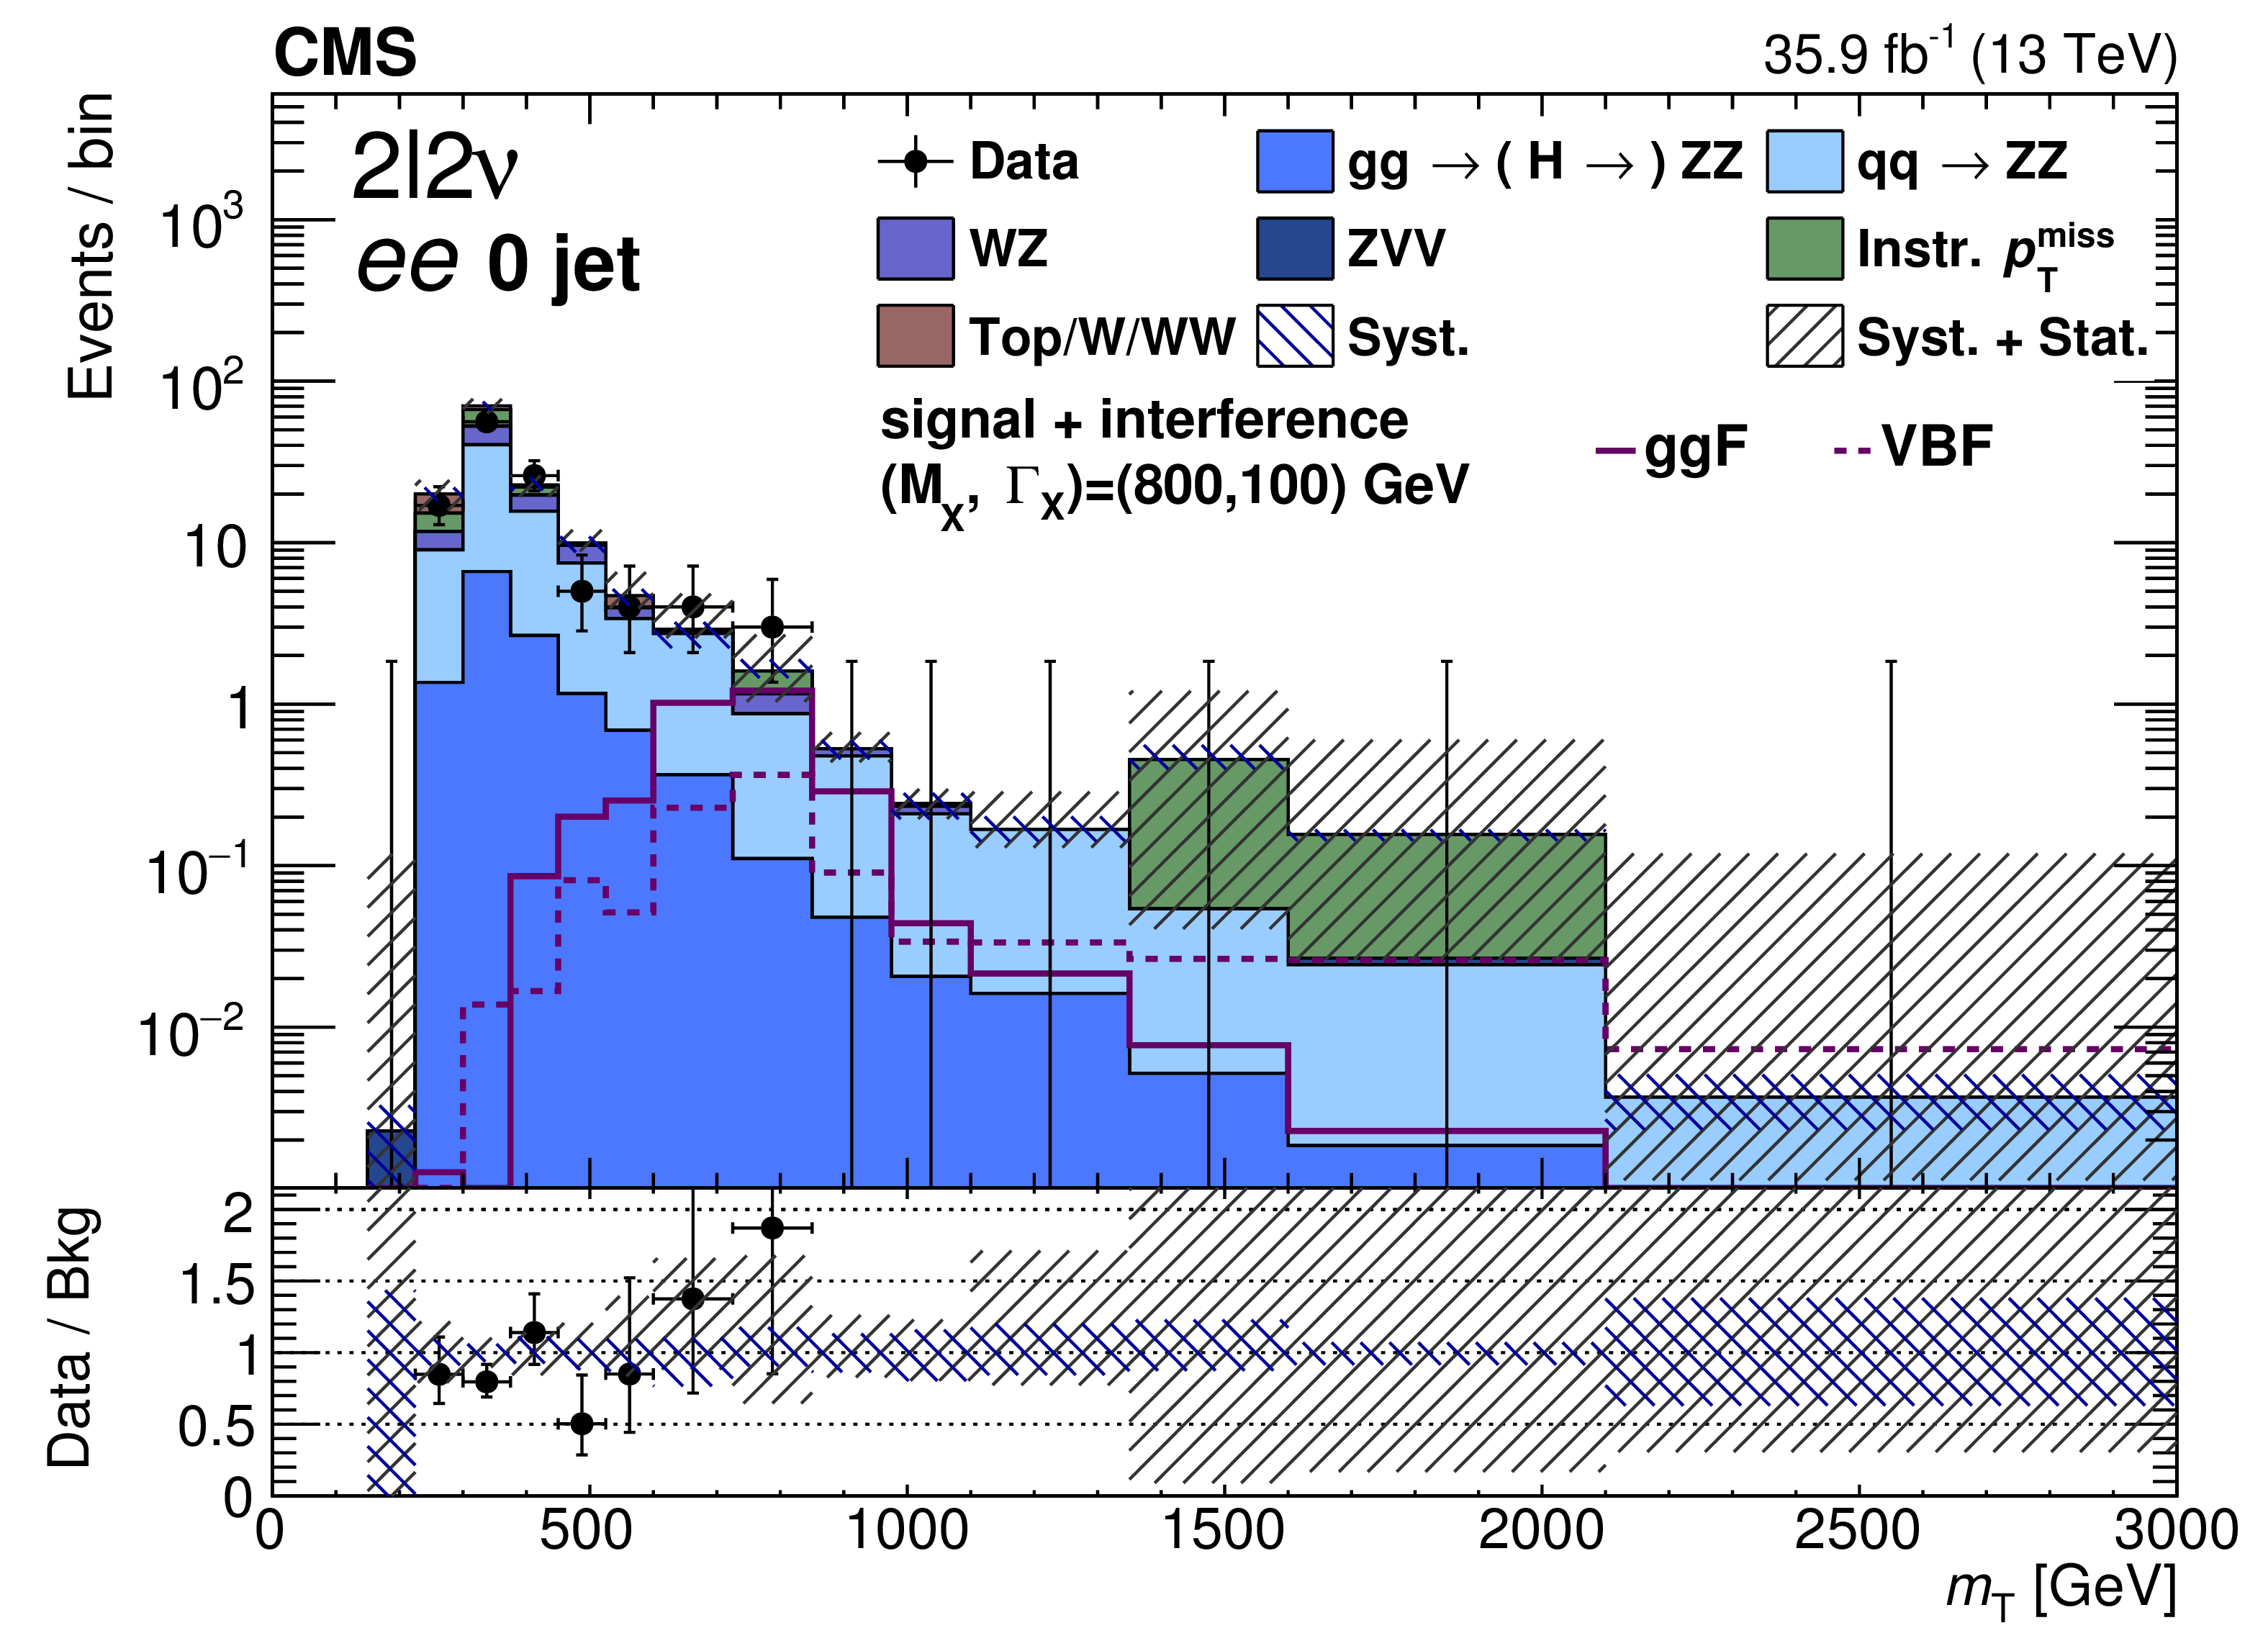
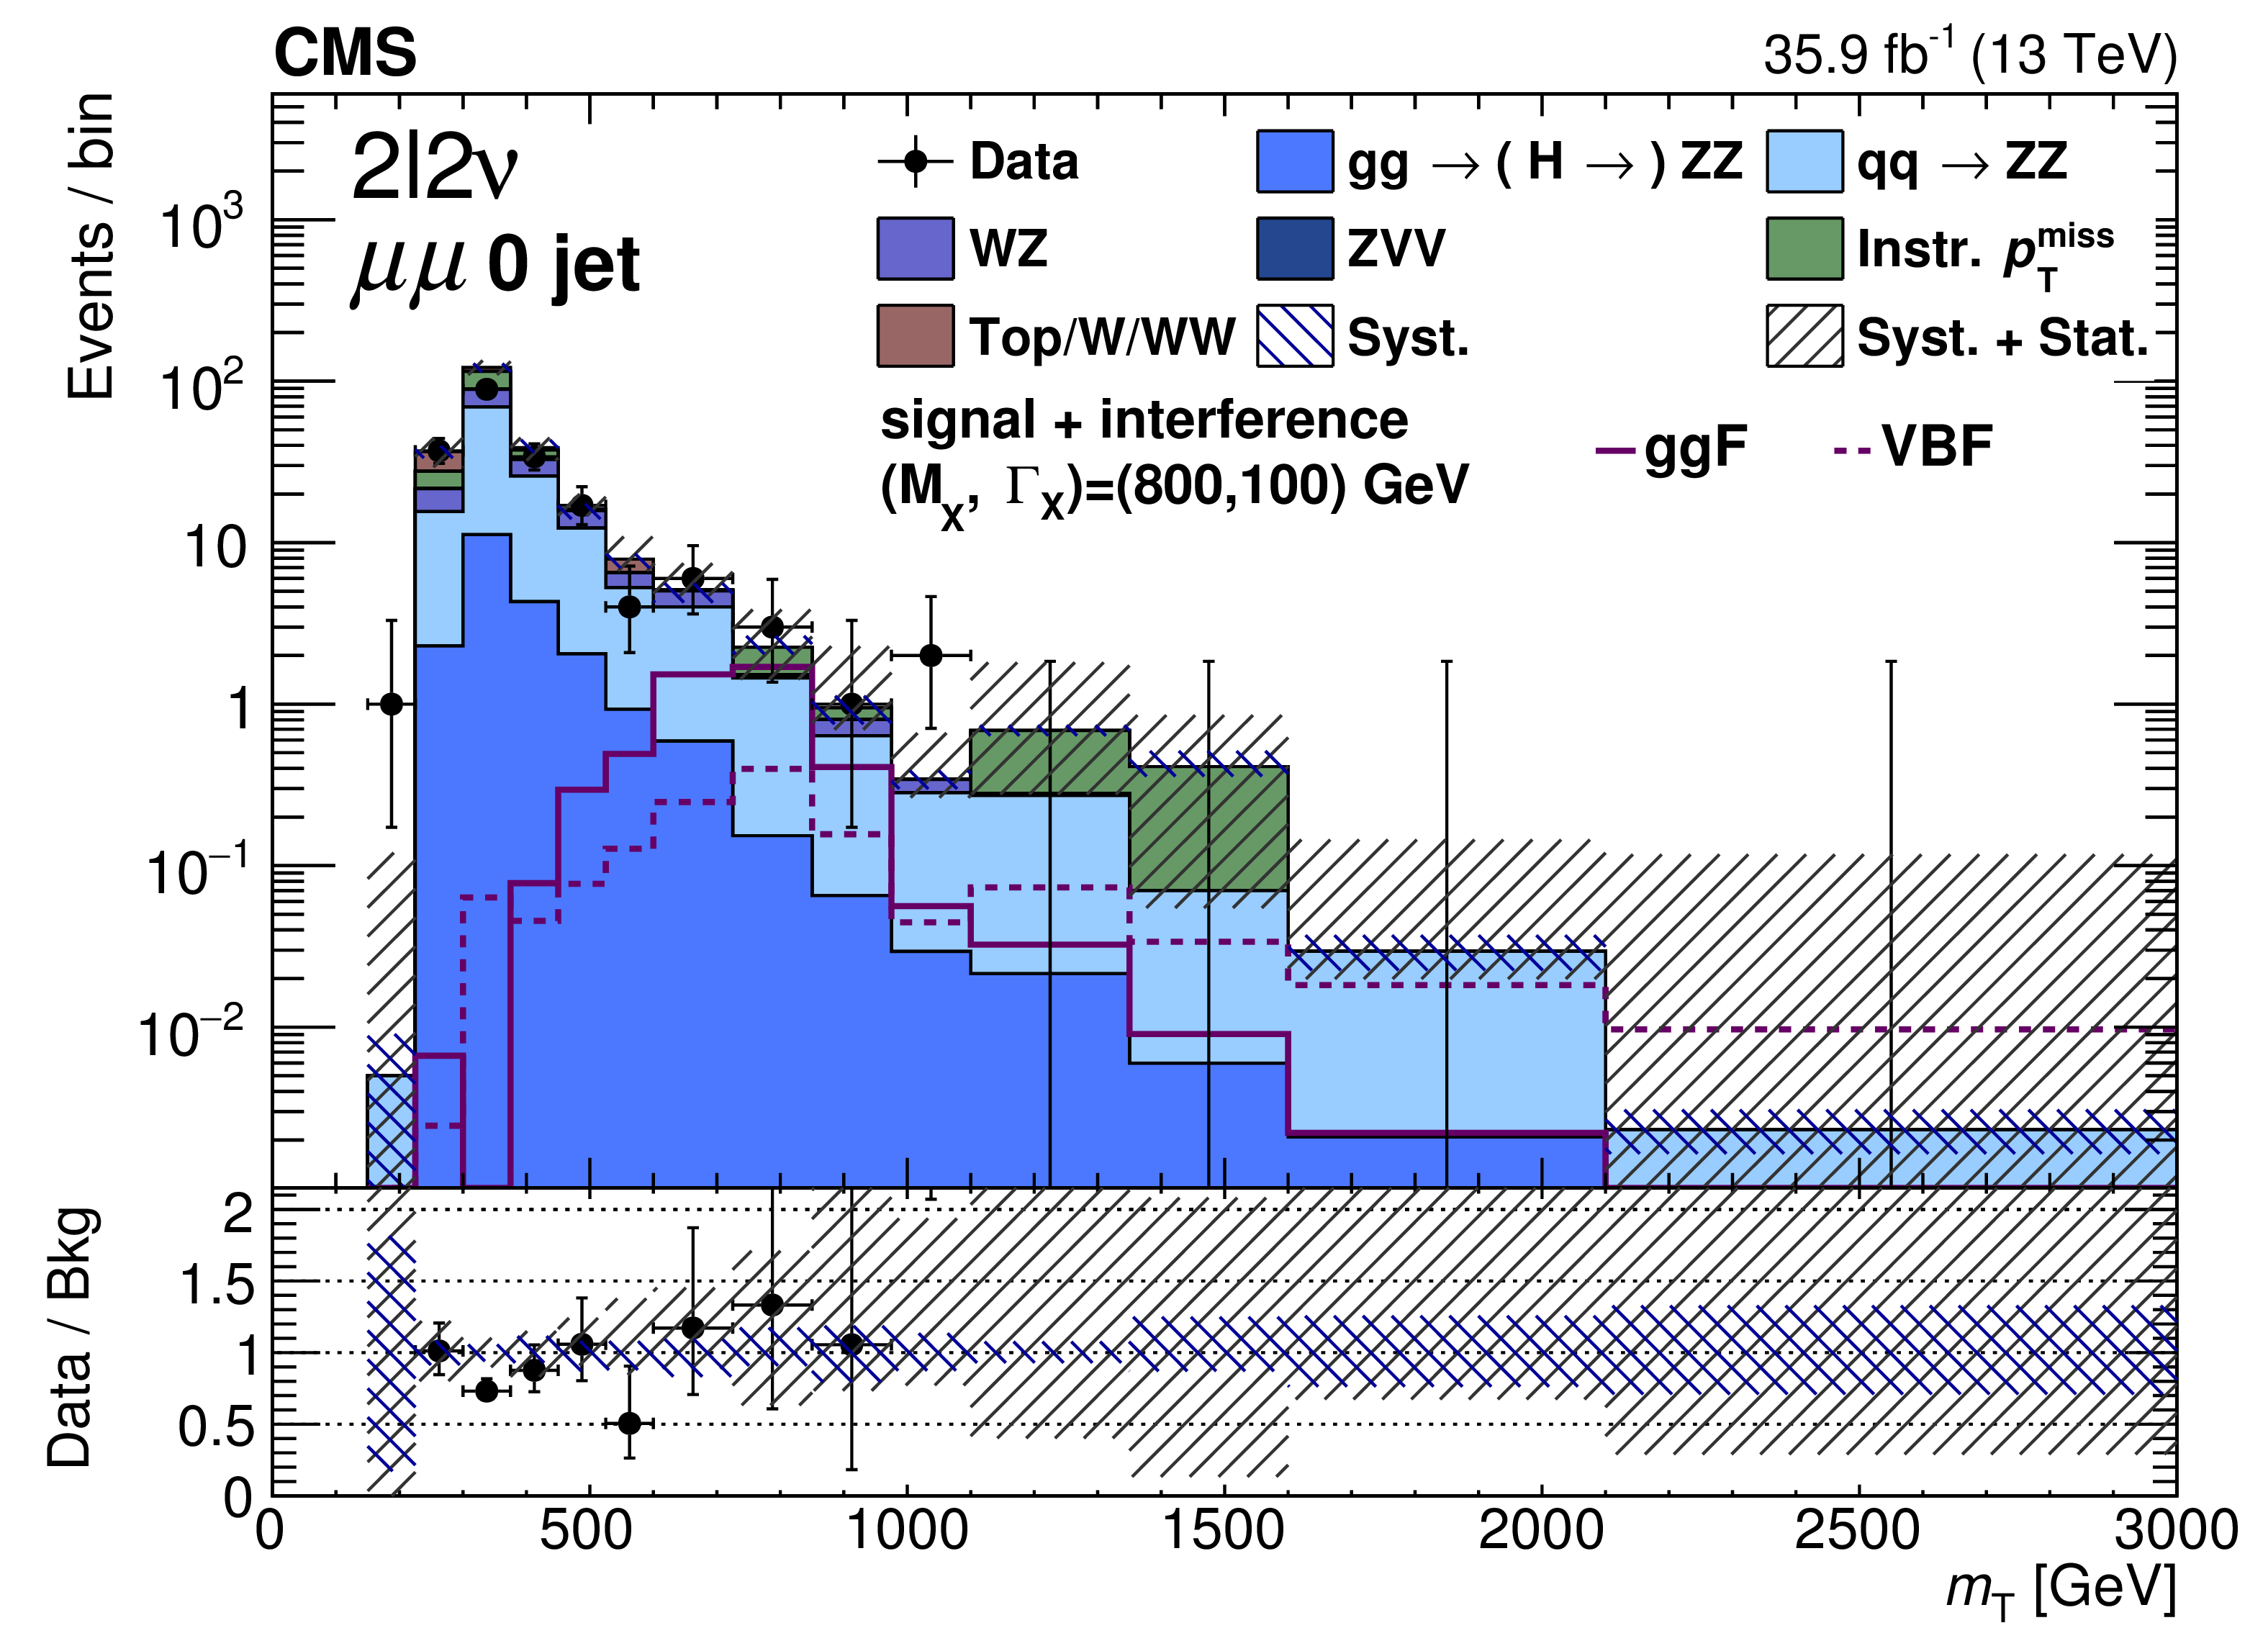
Figure 6:
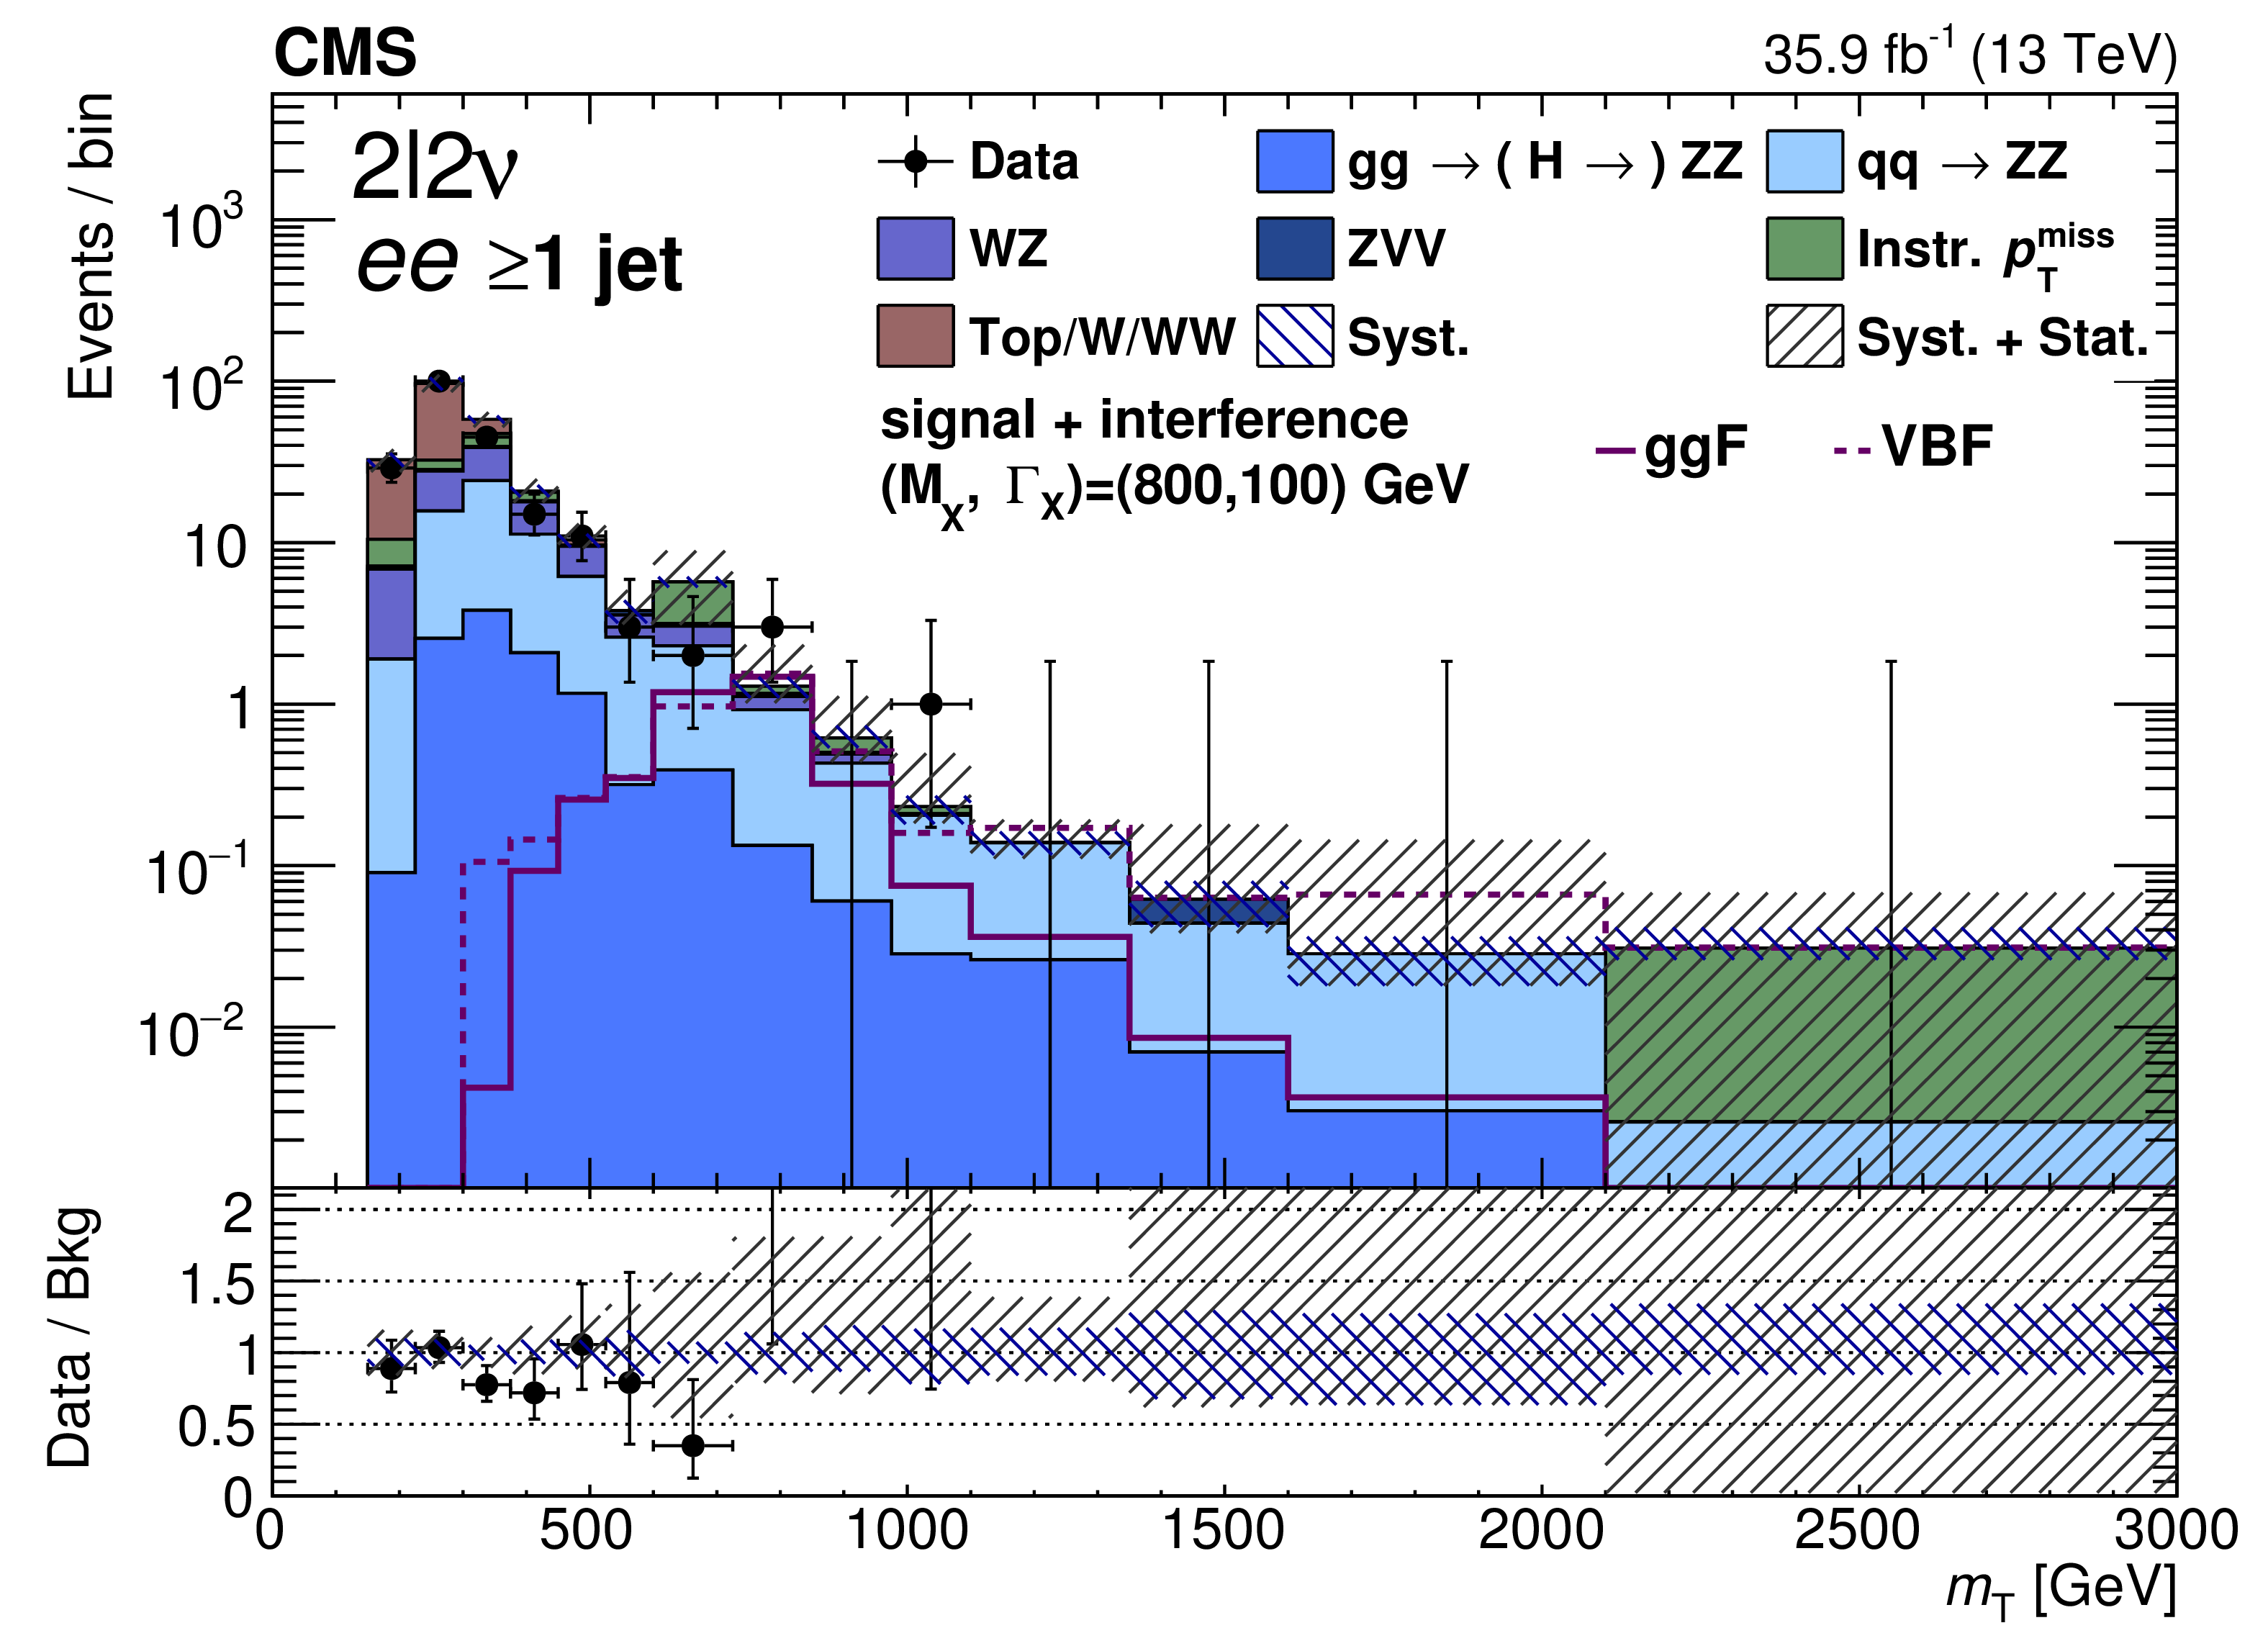
Distributions of the transverse mass ${m_{\mathrm {T}}}$ in the signal region for the different analysis categories for the 2$\ell $2$\nu $ channel, in the ee (left) and $\mu \mu $ final states (right). The points represent the data and the stacked histograms the expected background. The open histograms show the expected gluon fusion and VBF signals for the product of cross section and branching fraction equal to $\sigma ({\mathrm {p}} {\mathrm {p}}\to {\mathrm {H}} \to {\mathrm {Z}} {\mathrm {Z}})= $ 50 fb. Lower panels show the ratio of data to the expected background. The shaded areas show the systematic and total combined statistical and systematic uncertainties in the background estimation. |
png pdf |
Figure 6-a:
Distribution of the transverse mass ${m_{\mathrm {T}}}$ in the signal region for the 0 jet category for the 2$\ell $2$\nu $ channel, in the ee final state. The points represent the data and the stacked histograms the expected background. The open histogram shows the expected gluon fusion and VBF signals for the product of cross section and branching fraction equal to $\sigma ({\mathrm {p}} {\mathrm {p}}\to {\mathrm {H}} \to {\mathrm {Z}} {\mathrm {Z}})= $ 50 fb. The lower panel shows the ratio of data to the expected background. The shaded areas show the systematic and total combined statistical and systematic uncertainties in the background estimation. |
png pdf |
Figure 6-b:
Distribution of the transverse mass ${m_{\mathrm {T}}}$ in the signal region for the 0 jet category for the 2$\ell $2$\nu $ channel, in the $\mu \mu $ final state. The points represent the data and the stacked histograms the expected background. The open histogram shows the expected gluon fusion and VBF signals for the product of cross section and branching fraction equal to $\sigma ({\mathrm {p}} {\mathrm {p}}\to {\mathrm {H}} \to {\mathrm {Z}} {\mathrm {Z}})= $ 50 fb. The lower panel shows the ratio of data to the expected background. The shaded areas show the systematic and total combined statistical and systematic uncertainties in the background estimation. |
png pdf |
Figure 6-c:
Distribution of the transverse mass ${m_{\mathrm {T}}}$ in the signal region for the $\geq$1 jet category for the 2$\ell $2$\nu $ channel, in the ee final state. The points represent the data and the stacked histograms the expected background. The open histogram shows the expected gluon fusion and VBF signals for the product of cross section and branching fraction equal to $\sigma ({\mathrm {p}} {\mathrm {p}}\to {\mathrm {H}} \to {\mathrm {Z}} {\mathrm {Z}})= $ 50 fb. The lower panel shows the ratio of data to the expected background. The shaded areas show the systematic and total combined statistical and systematic uncertainties in the background estimation. |

png pdf |
Figure 6-d:
Distribution of the transverse mass ${m_{\mathrm {T}}}$ in the signal region for the $\geq$1 jet category for the 2$\ell $2$\nu $ channel, in the $\mu \mu $ final state. The points represent the data and the stacked histograms the expected background. The open histogram shows the expected gluon fusion and VBF signals for the product of cross section and branching fraction equal to $\sigma ({\mathrm {p}} {\mathrm {p}}\to {\mathrm {H}} \to {\mathrm {Z}} {\mathrm {Z}})= $ 50 fb. The lower panel shows the ratio of data to the expected background. The shaded areas show the systematic and total combined statistical and systematic uncertainties in the background estimation. |

png pdf |
Figure 6-e:
Distribution of the transverse mass ${m_{\mathrm {T}}}$ in the signal region for the VBF-tagged category for the 2$\ell $2$\nu $ channel, in the ee final state. The points represent the data and the stacked histograms the expected background. The open histogram shows the expected gluon fusion and VBF signals for the product of cross section and branching fraction equal to $\sigma ({\mathrm {p}} {\mathrm {p}}\to {\mathrm {H}} \to {\mathrm {Z}} {\mathrm {Z}})= $ 50 fb. The lower panel shows the ratio of data to the expected background. The shaded areas show the systematic and total combined statistical and systematic uncertainties in the background estimation. |

png pdf |
Figure 6-f:
Distribution of the transverse mass ${m_{\mathrm {T}}}$ in the signal region for the VBF-tagged category for the 2$\ell $2$\nu $ channel, in the $\mu \mu $ final state. The points represent the data and the stacked histograms the expected background. The open histogram shows the expected gluon fusion and VBF signals for the product of cross section and branching fraction equal to $\sigma ({\mathrm {p}} {\mathrm {p}}\to {\mathrm {H}} \to {\mathrm {Z}} {\mathrm {Z}})= $ 50 fb. The lower panel shows the ratio of data to the expected background. The shaded areas show the systematic and total combined statistical and systematic uncertainties in the background estimation. |
png pdf |
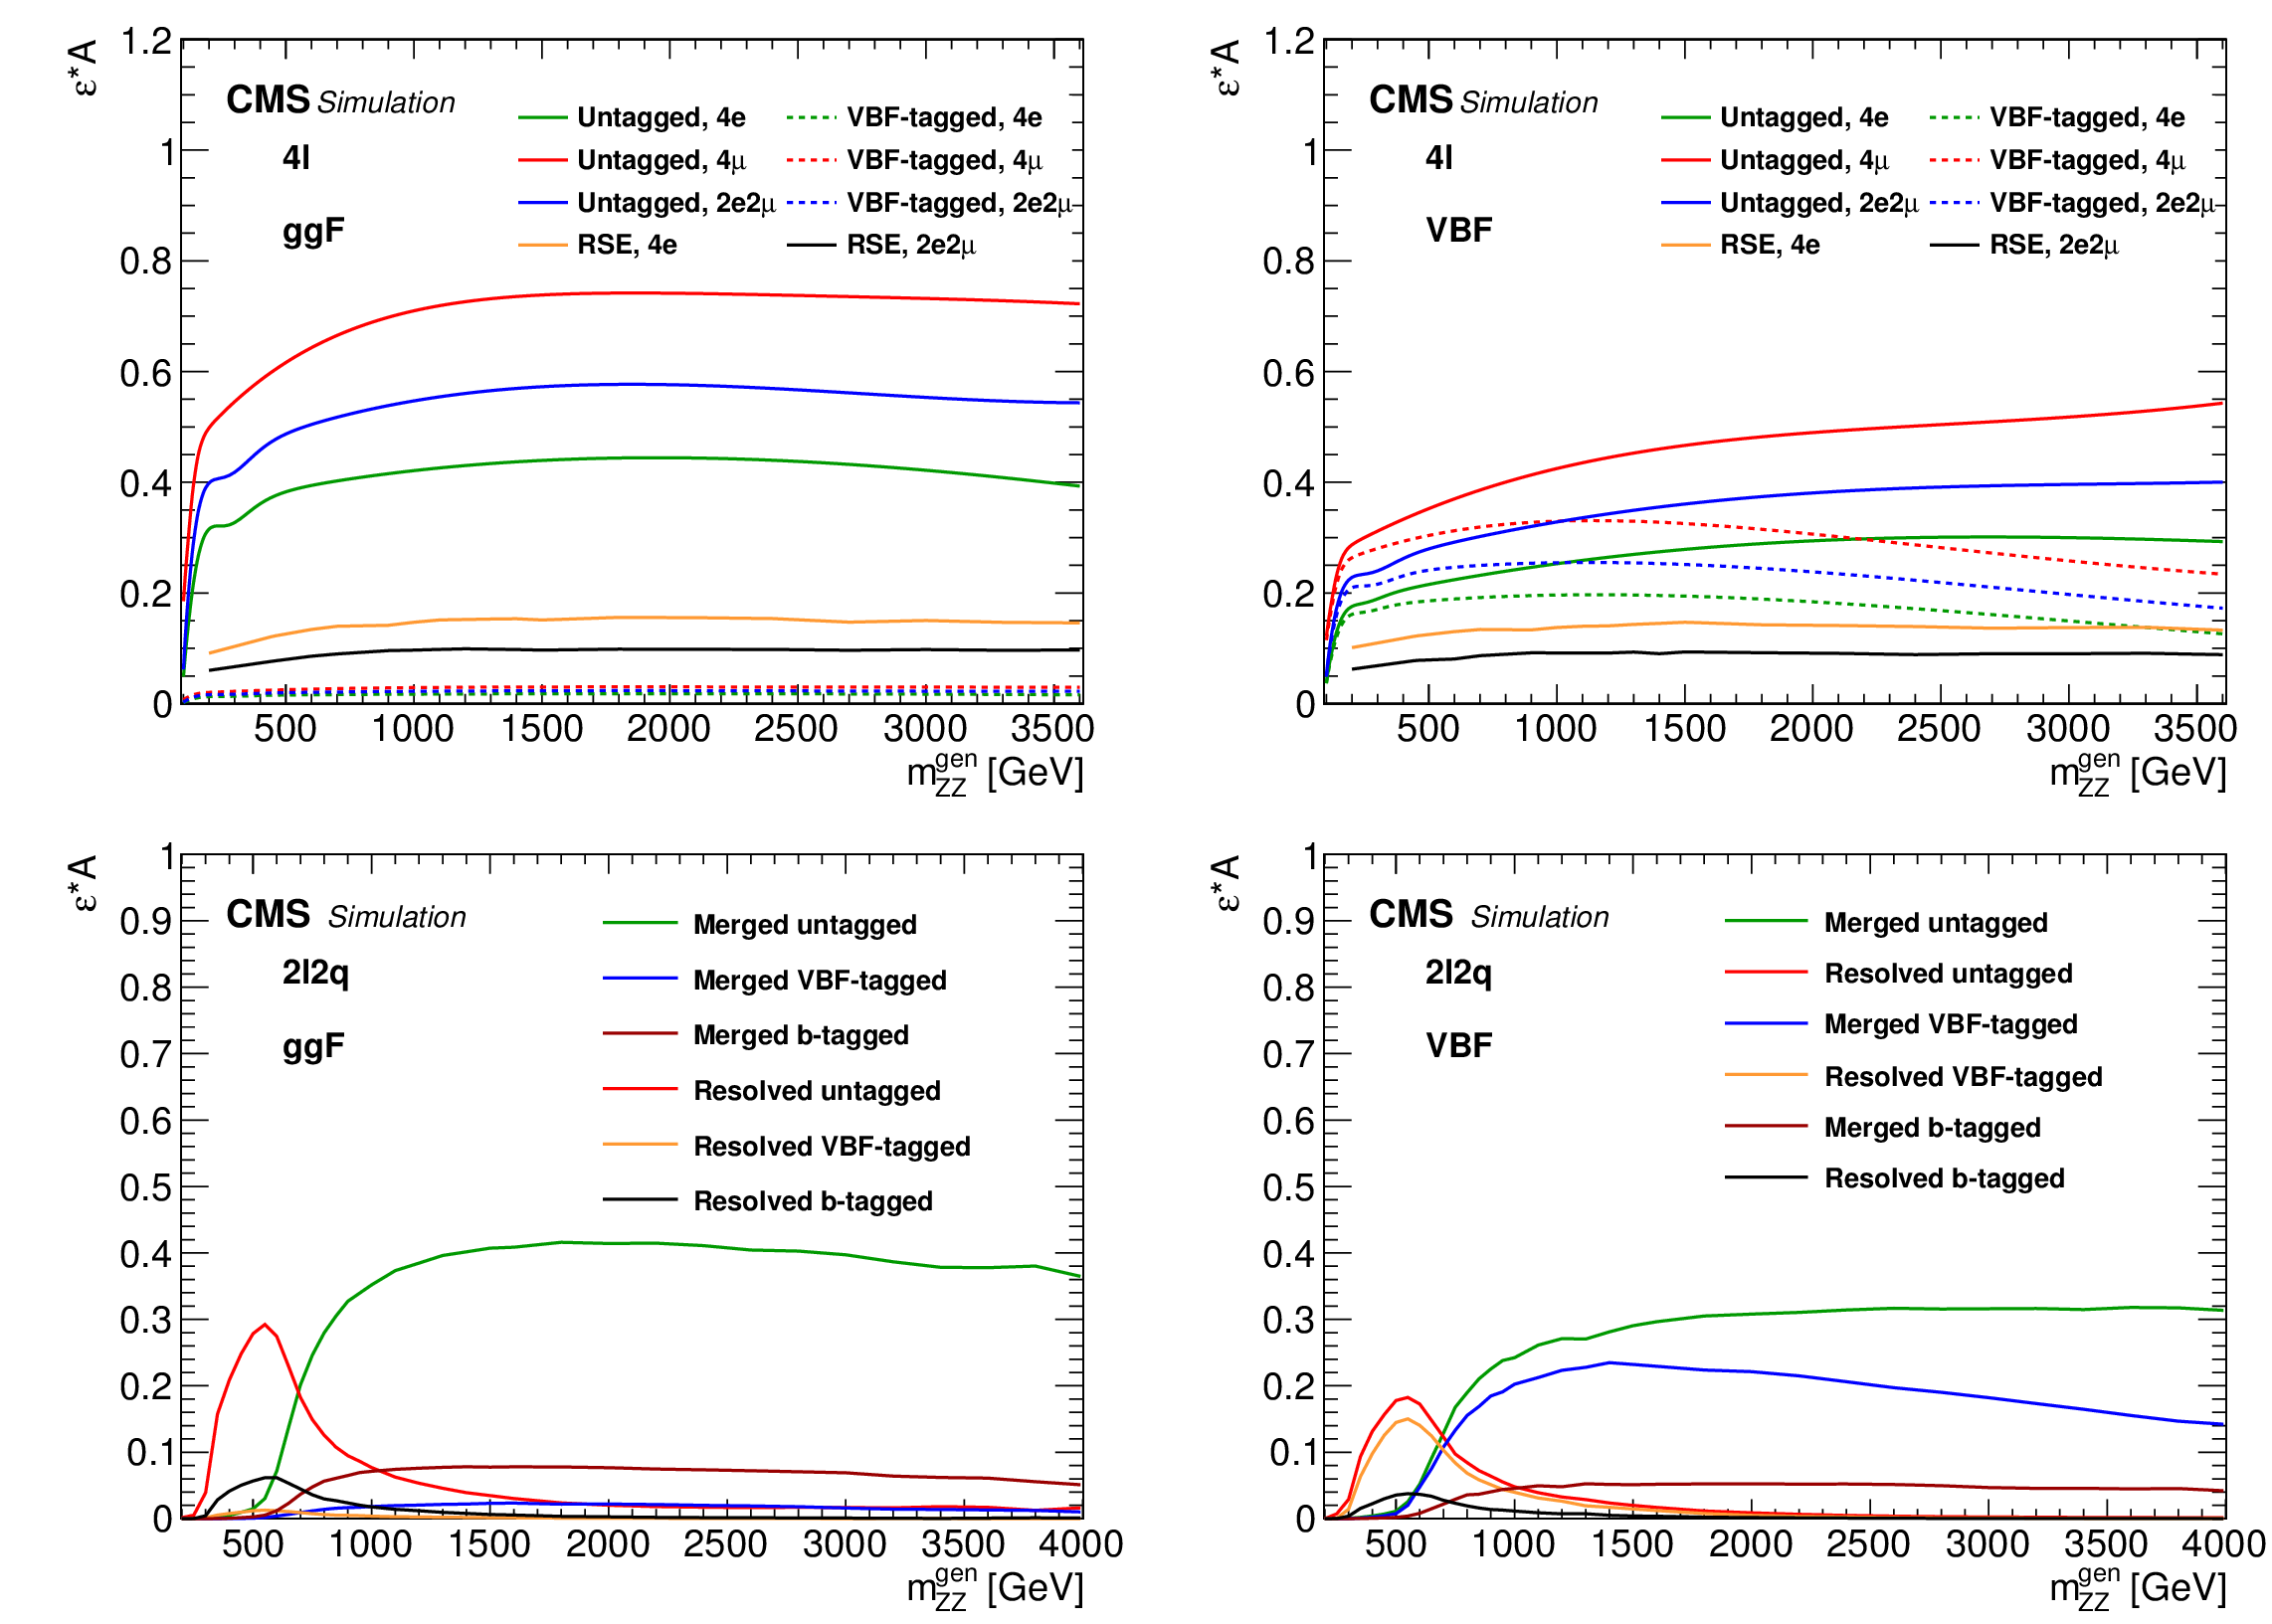
Figure 7:
The product of efficiency and acceptance for signal events to pass the $ {\mathrm {X}}\to {\mathrm {Z}} {\mathrm {Z}}\to 4\ell $ (upper plots) and $ {\mathrm {X}}\to {\mathrm {Z}} {\mathrm {Z}}\to 2\ell 2 {\mathrm {q}}$ (lower plots) selection as a function of the generated mass $m_{{\mathrm {Z}} {\mathrm {Z}}}^{\mathrm {Gen}}$, from ${{\mathrm {g}} {\mathrm {g}} \mathrm {F}}$ (left) and VBF (right) production modes. |
png pdf |
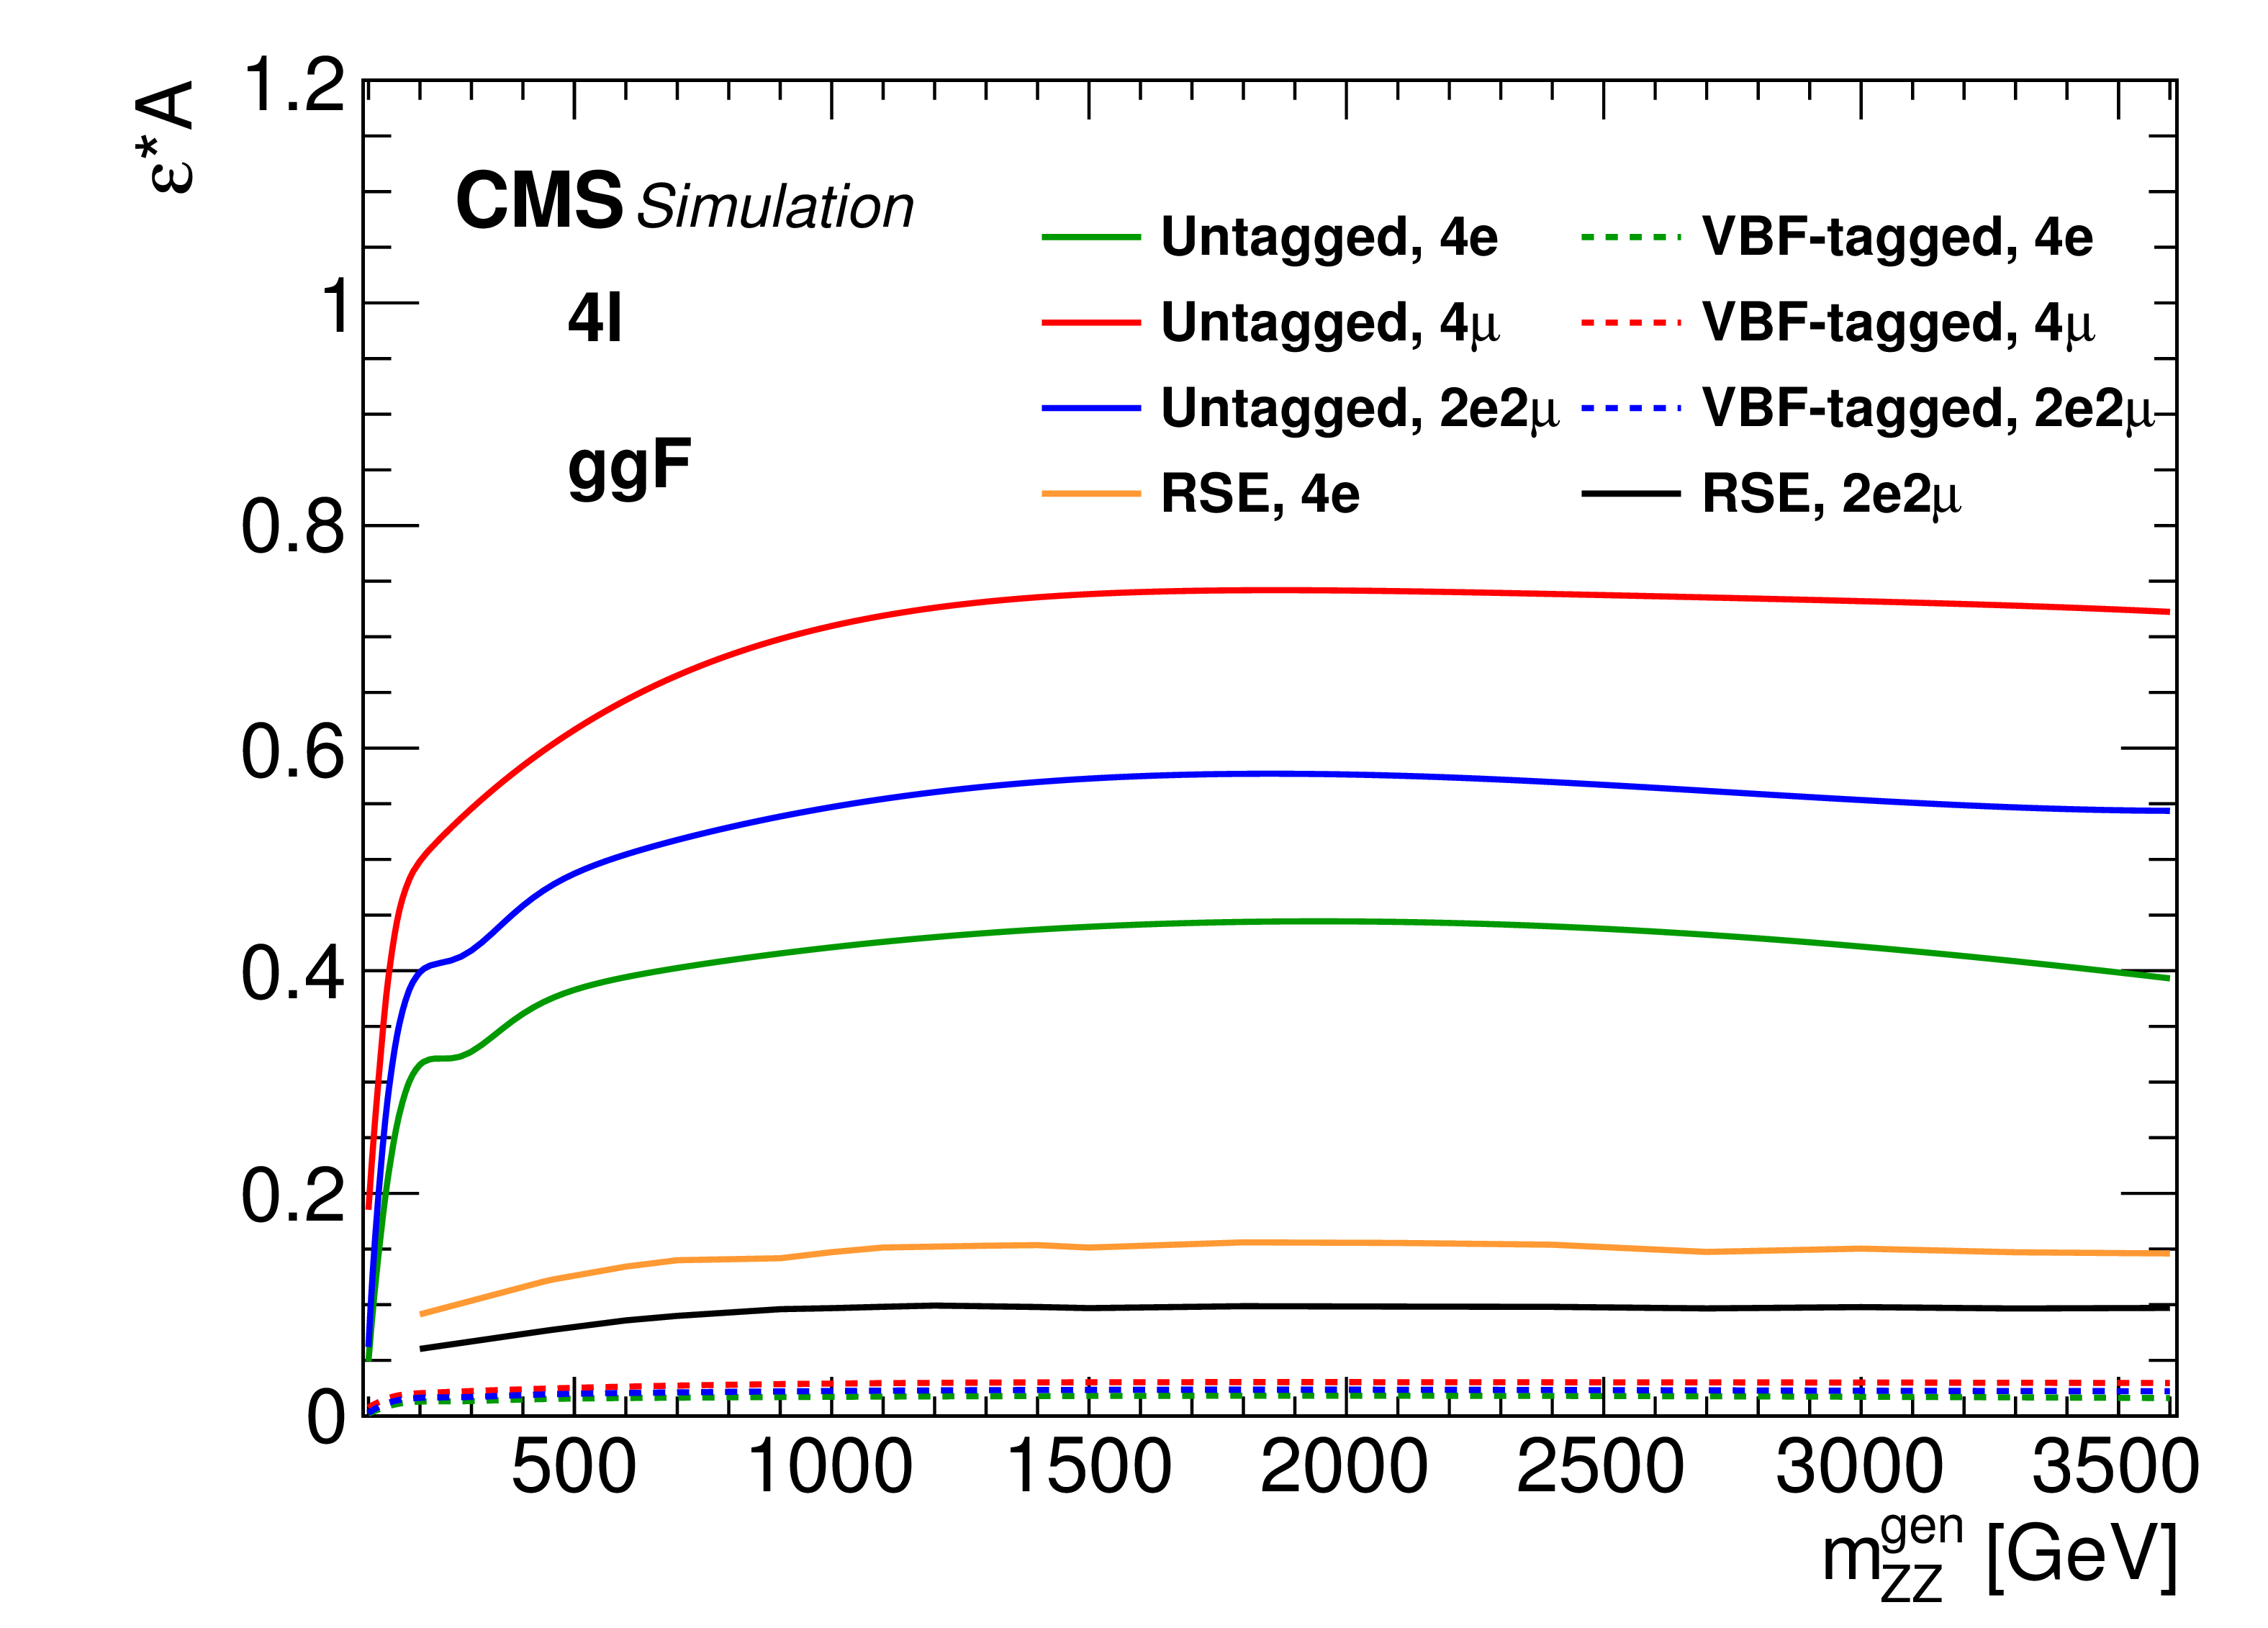
Figure 7-a:
The product of efficiency and acceptance for signal events to pass the $ {\mathrm {X}}\to {\mathrm {Z}} {\mathrm {Z}}\to 4\ell $ selection as a function of the generated mass $m_{{\mathrm {Z}} {\mathrm {Z}}}^{\mathrm {Gen}}$, from the ${{\mathrm {g}} {\mathrm {g}} \mathrm {F}}$ production mode. |
png pdf |
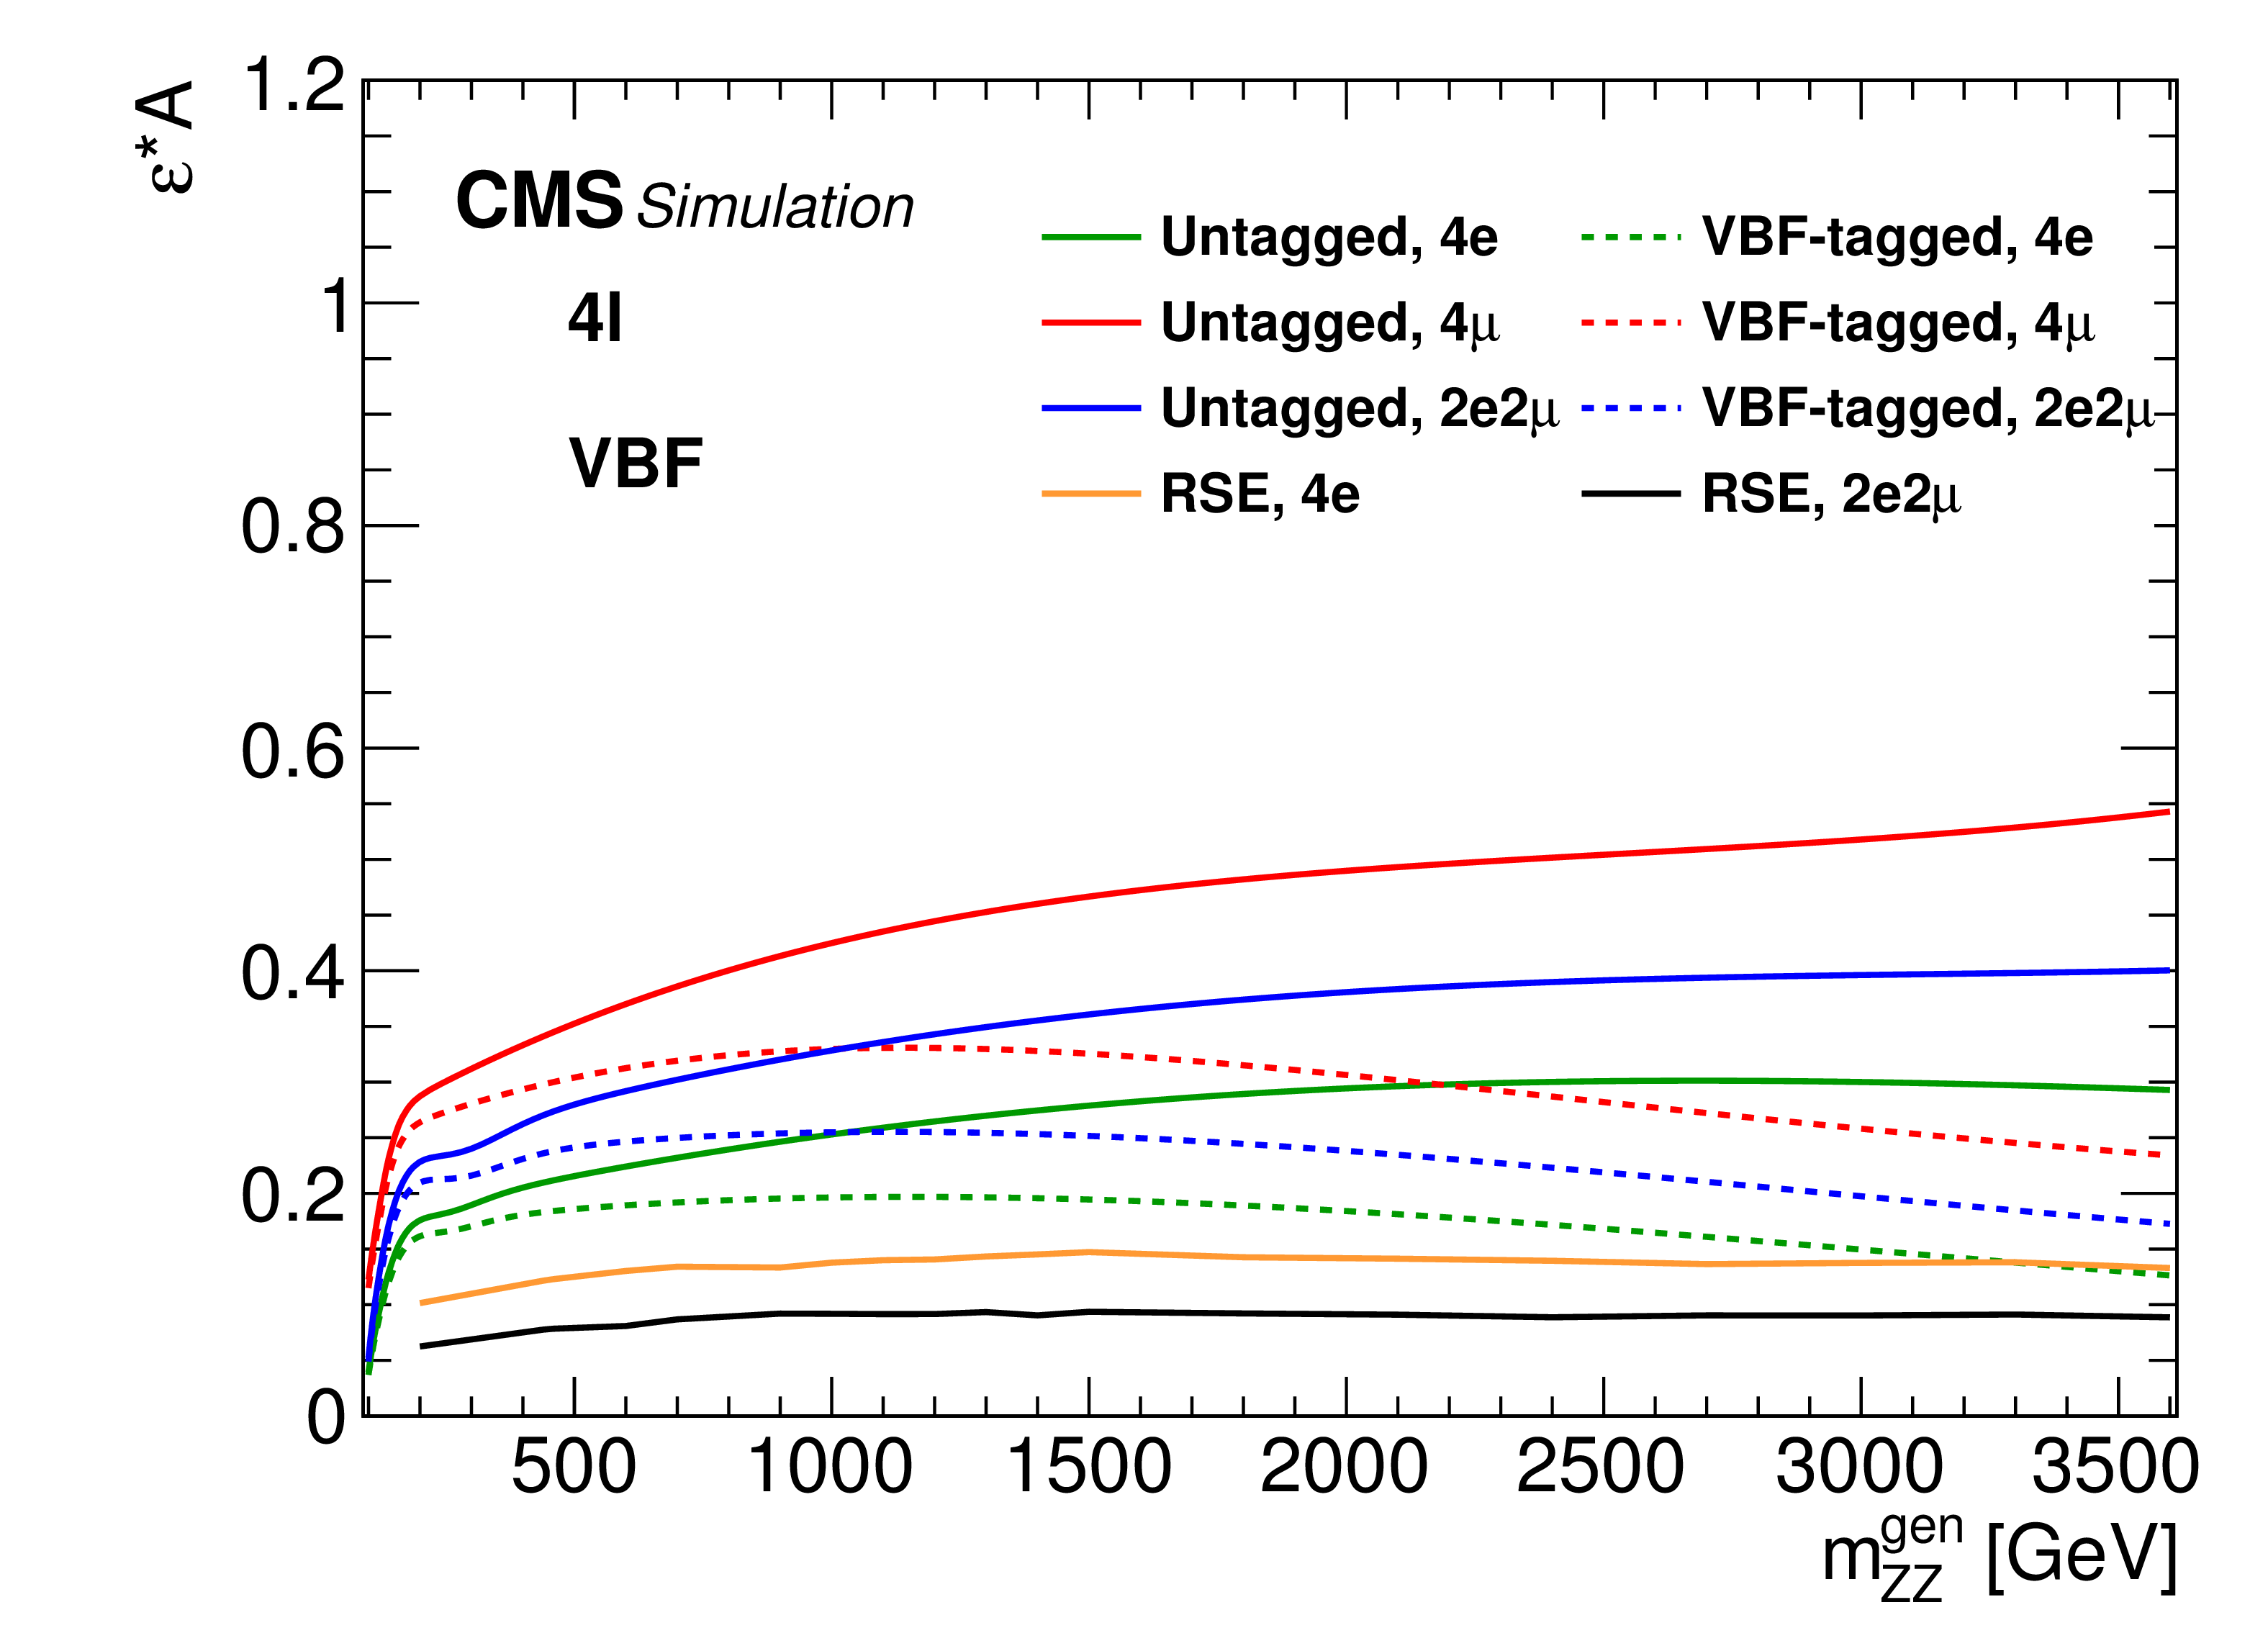
Figure 7-b:
The product of efficiency and acceptance for signal events to pass the $ {\mathrm {X}}\to {\mathrm {Z}} {\mathrm {Z}}\to 4\ell $ selection as a function of the generated mass $m_{{\mathrm {Z}} {\mathrm {Z}}}^{\mathrm {Gen}}$, from the VBF production mode. |

png pdf |
Figure 7-c:
The product of efficiency and acceptance for signal events to pass the $ {\mathrm {X}}\to {\mathrm {Z}} {\mathrm {Z}}\to 2\ell 2 {\mathrm {q}}$ selection as a function of the generated mass $m_{{\mathrm {Z}} {\mathrm {Z}}}^{\mathrm {Gen}}$, from the ${{\mathrm {g}} {\mathrm {g}} \mathrm {F}}$ production mode. |

png pdf |
Figure 7-d:
The product of efficiency and acceptance for signal events to pass the $ {\mathrm {X}}\to {\mathrm {Z}} {\mathrm {Z}}\to 2\ell 2 {\mathrm {q}}$ selection as a function of the generated mass $m_{{\mathrm {Z}} {\mathrm {Z}}}^{\mathrm {Gen}}$, from the VBF production mode. |

png pdf |
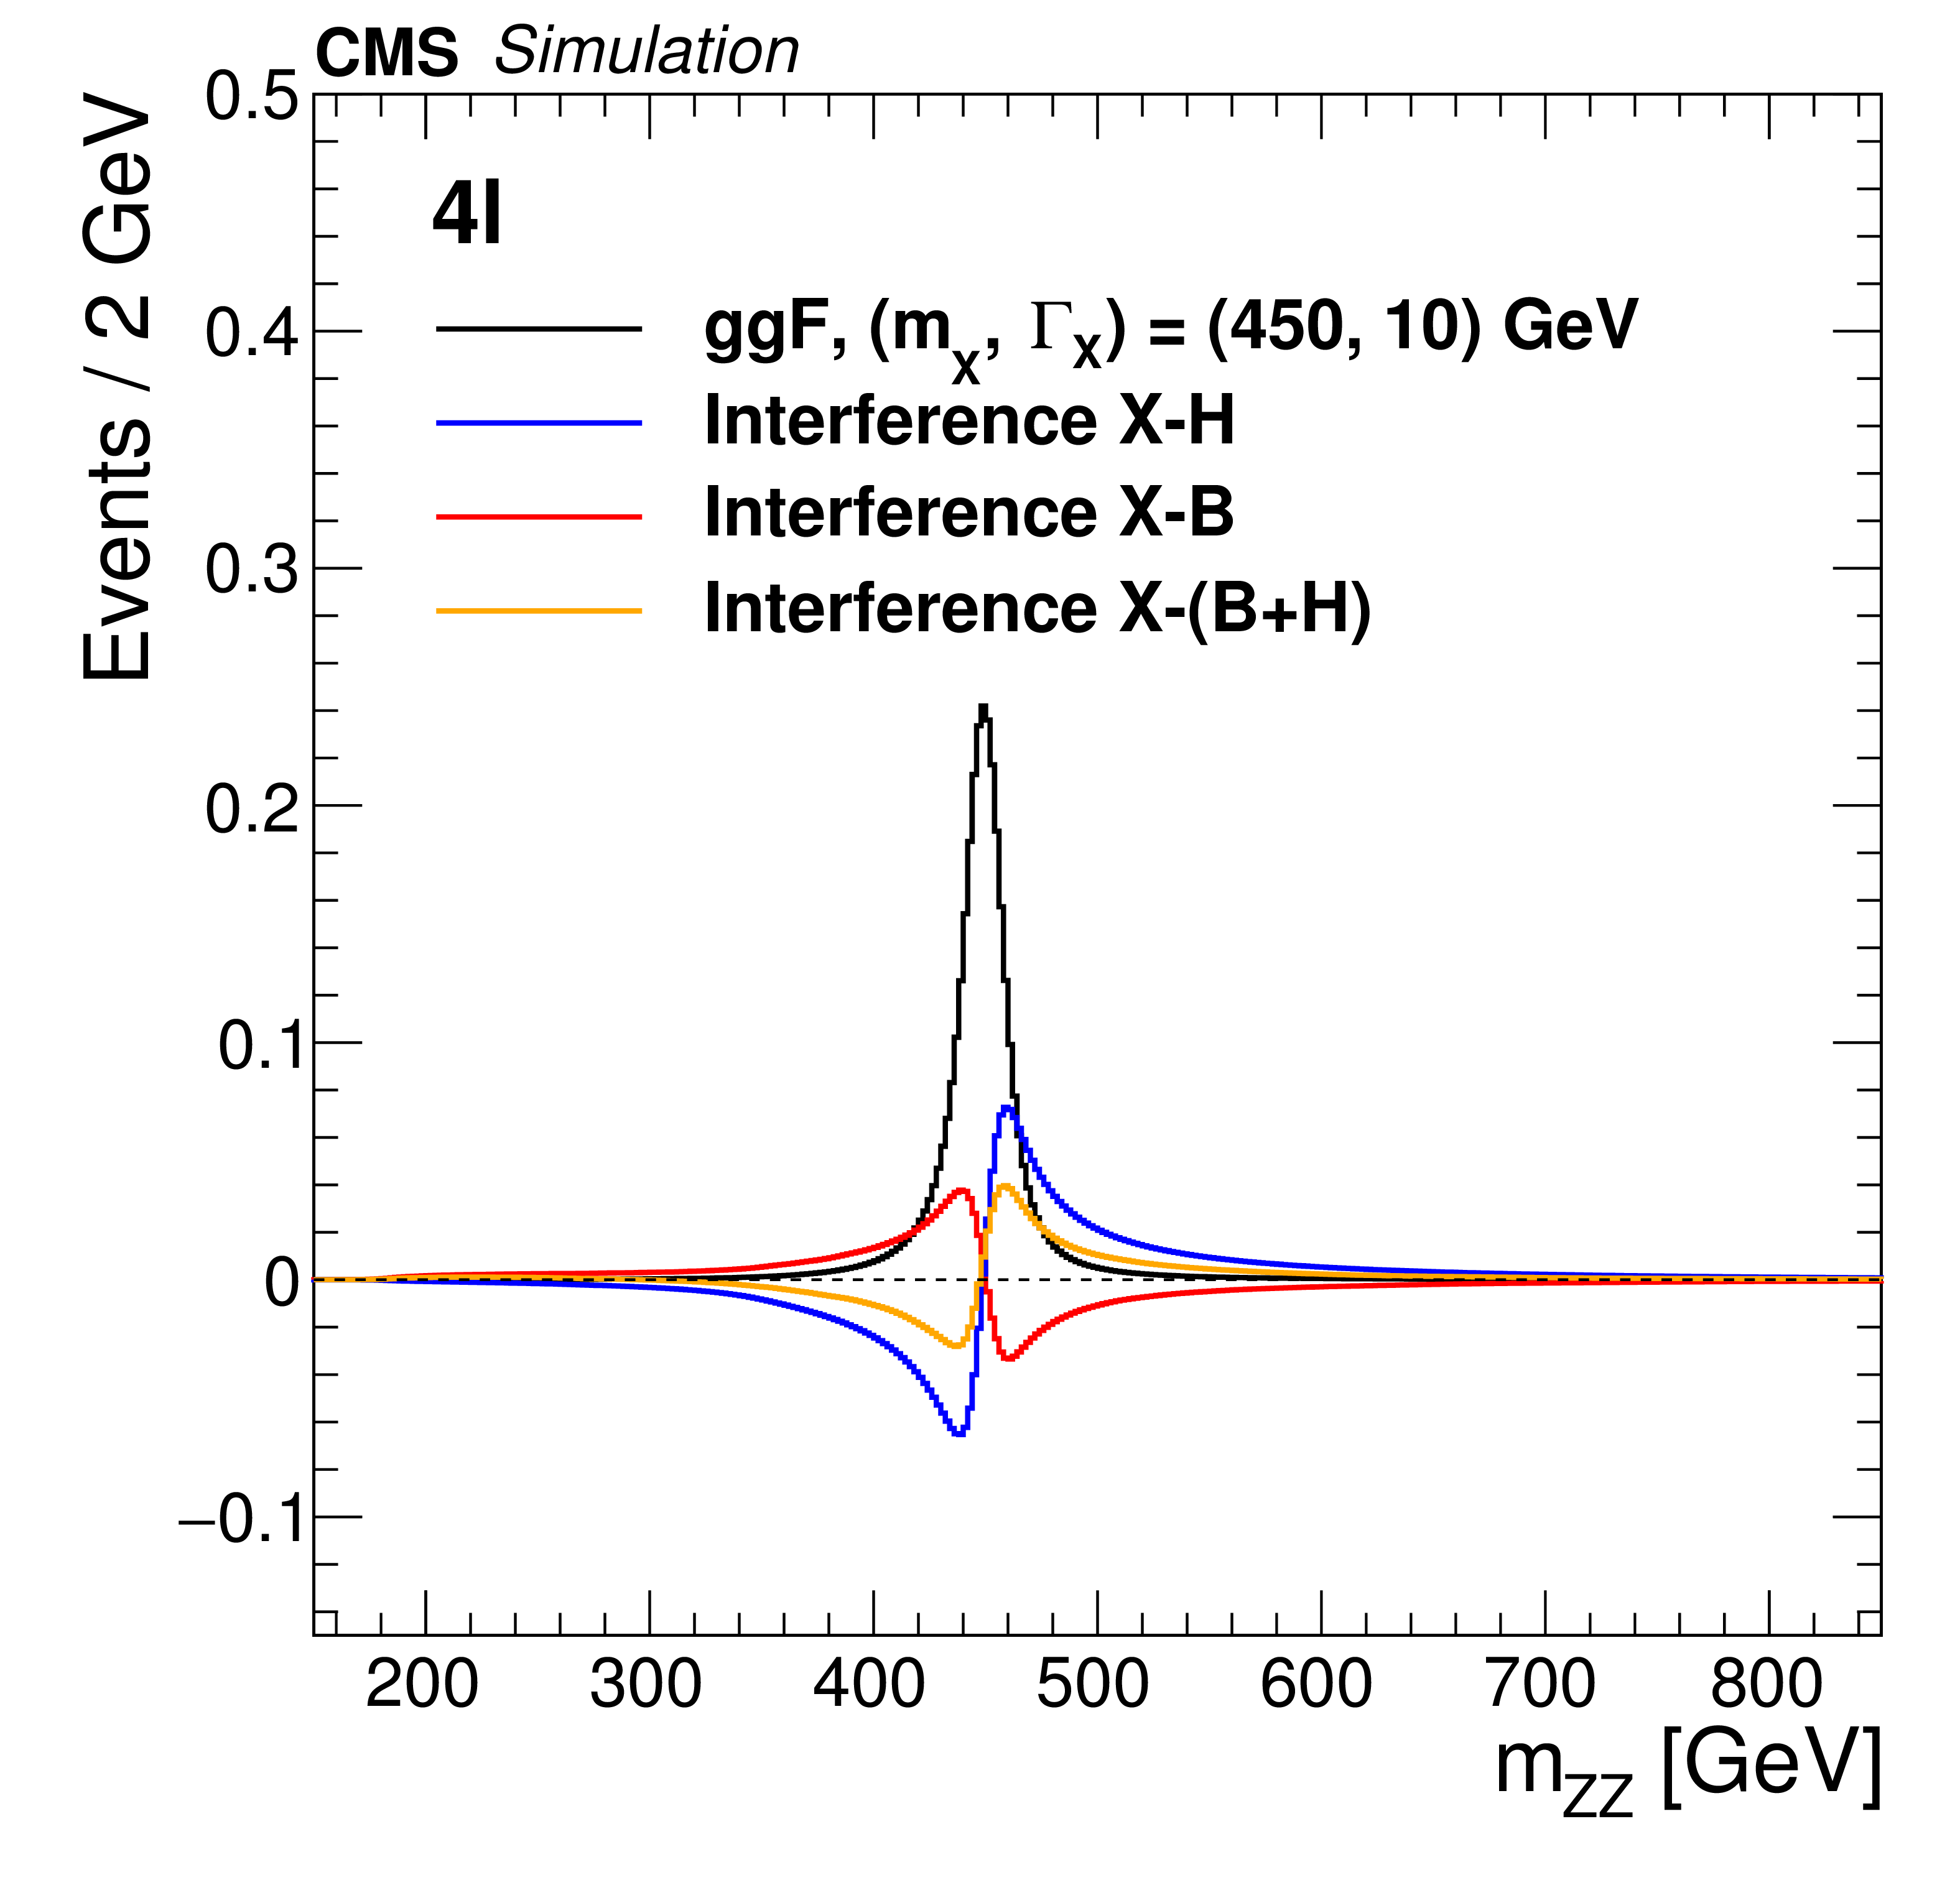
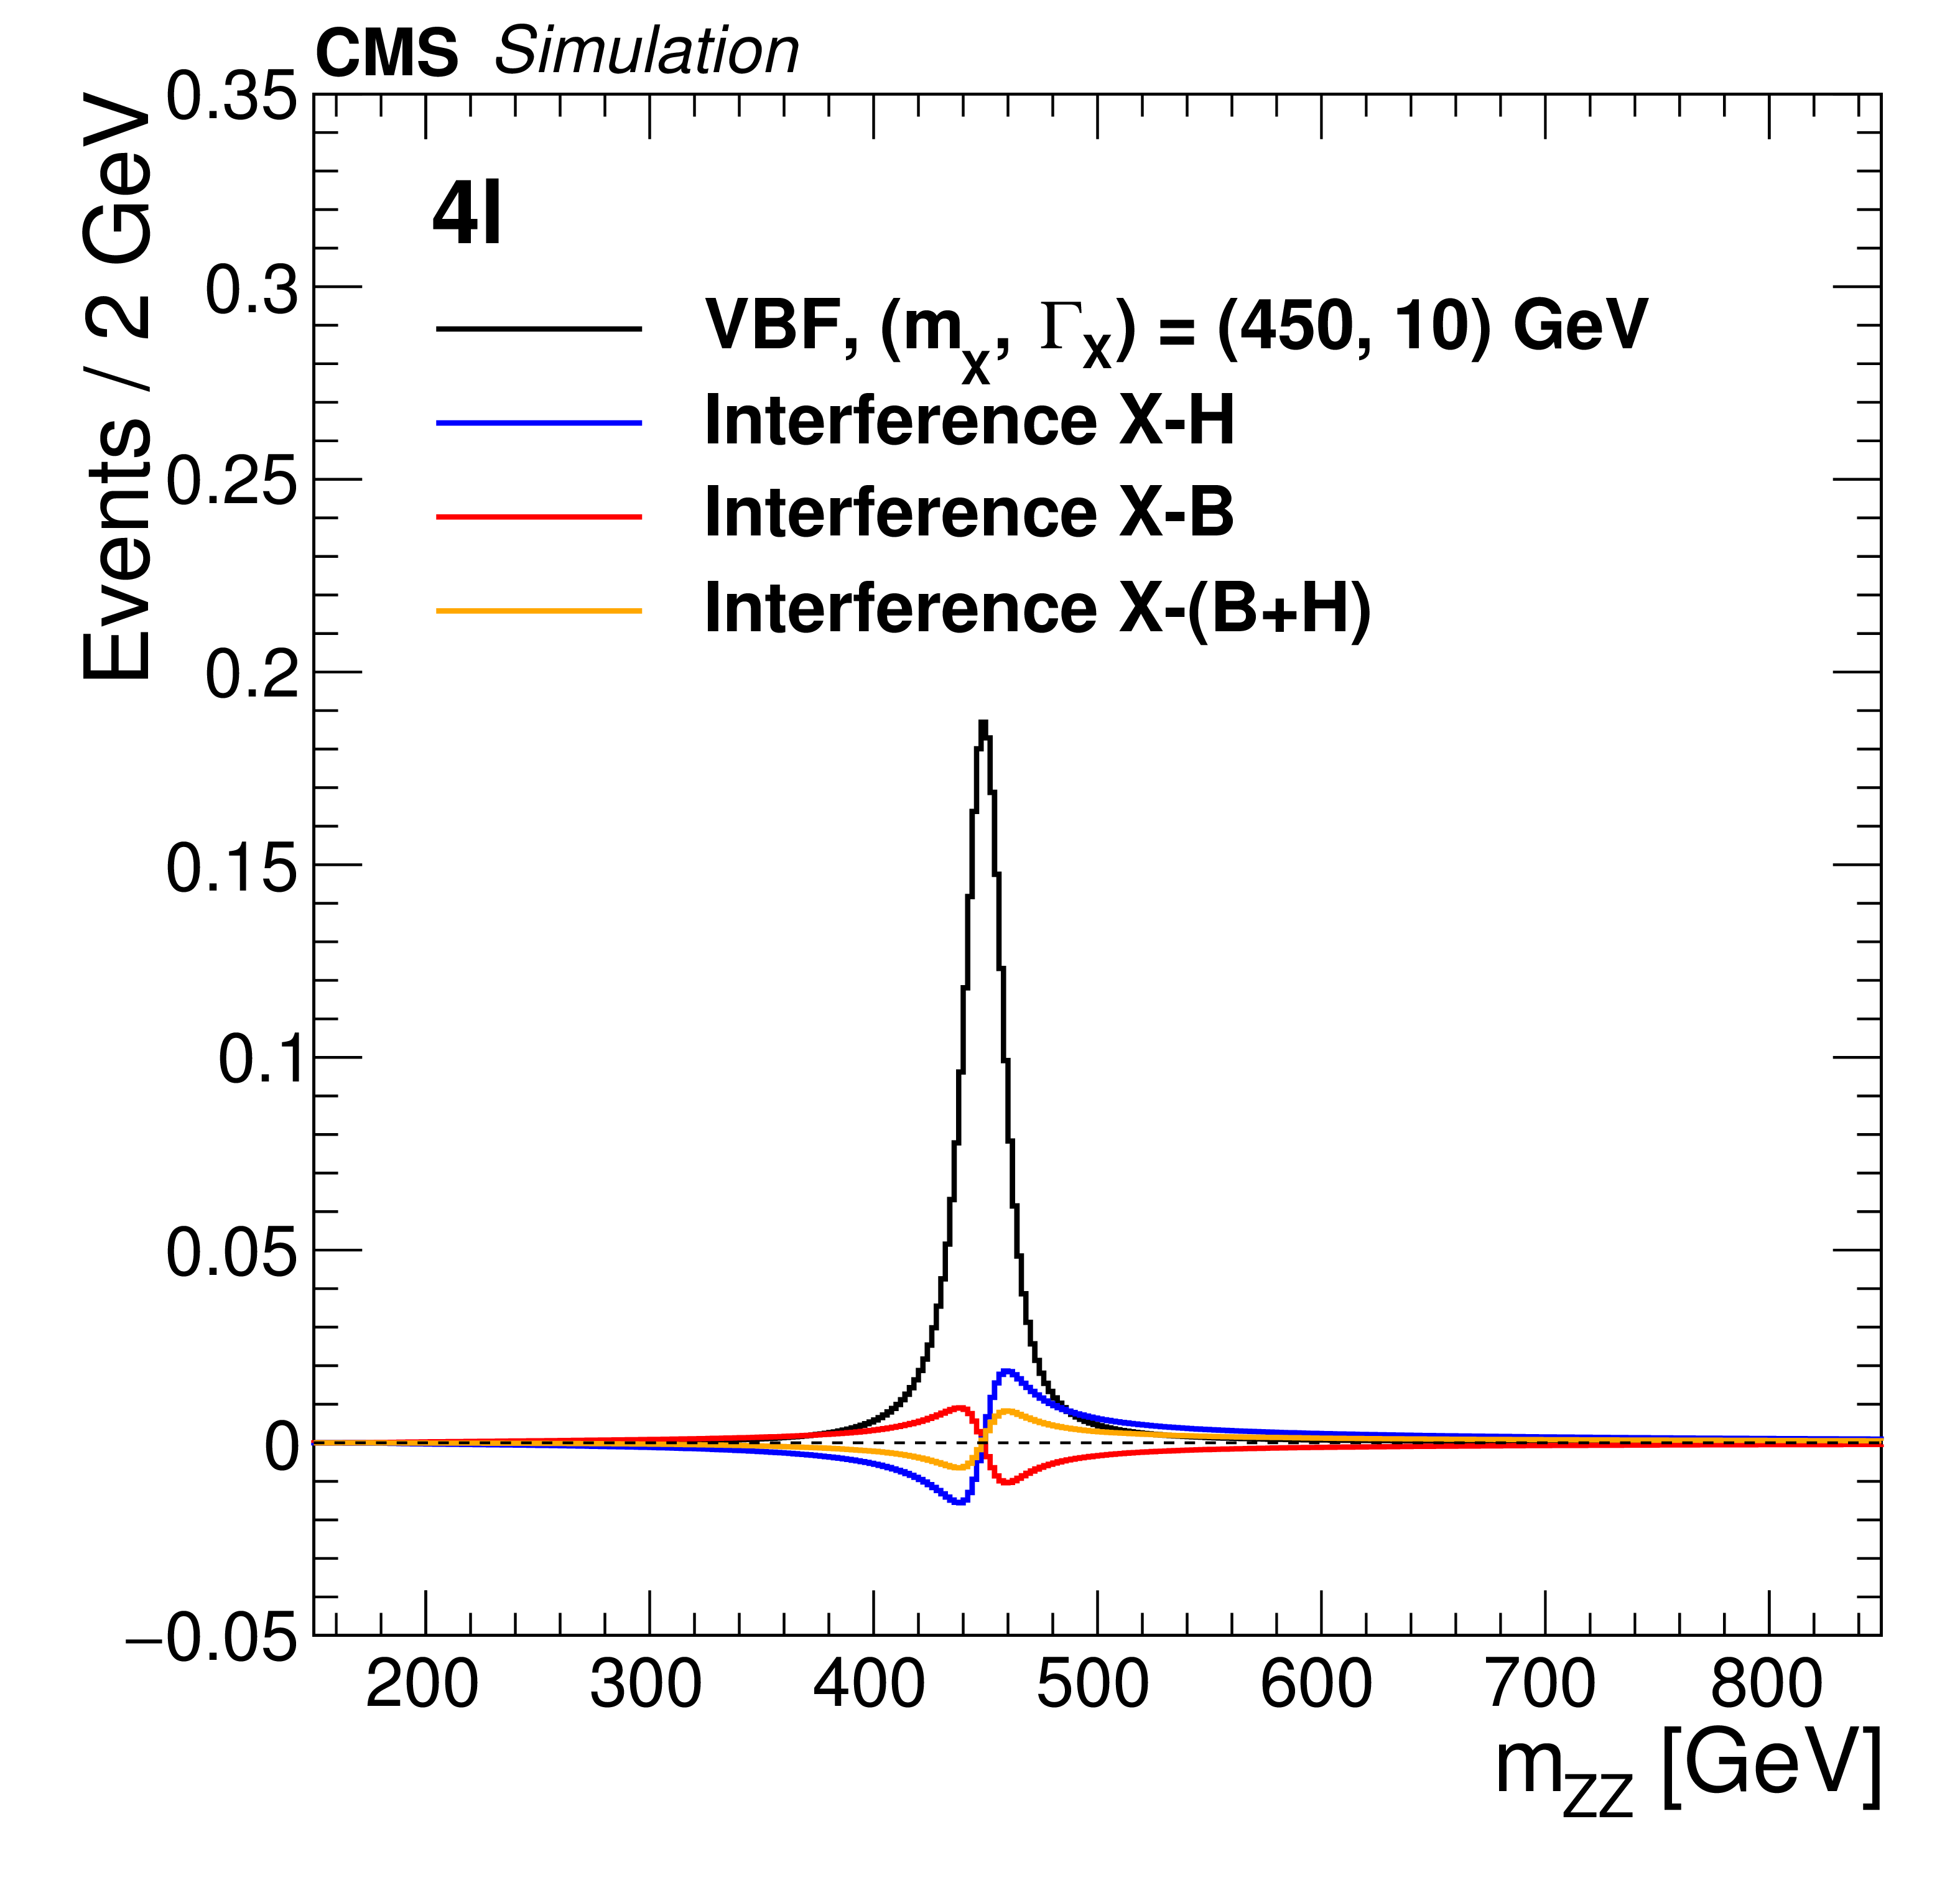
Figure 8:
Parameterizations of the four lepton invariant mass for ${{\mathrm {g}} {\mathrm {g}} \mathrm {F}}$ (left) and VBF (right) production modes, for $ {m_{{\mathrm {X}}}} = $ 450 GeV, $ {\Gamma _{{\mathrm {X}}}} = $ 10 GeV. The interference contributions from H(125) and $ {\mathrm {g}} {\mathrm {g}} \to {\mathrm {Z}} {\mathrm {Z}}$ or $\mathrm{V} {\mathrm {V}}\to {\mathrm {Z}} {\mathrm {Z}}$ background are also shown. The signal cross section used corresponds to the limit obtained in the $4\ell $ final state. |
png pdf |
Figure 8-a:
Parameterizations of the four lepton invariant mass for the ${{\mathrm {g}} {\mathrm {g}} \mathrm {F}}$ production mode, for $ {m_{{\mathrm {X}}}} = $ 450 GeV, $ {\Gamma _{{\mathrm {X}}}} = $ 10 GeV. The interference contributions from H(125) and $ {\mathrm {g}} {\mathrm {g}} \to {\mathrm {Z}} {\mathrm {Z}}$ or $\mathrm{V} {\mathrm {V}}\to {\mathrm {Z}} {\mathrm {Z}}$ background are also shown. The signal cross section used corresponds to the limit obtained in the $4\ell $ final state. |
png pdf |
Figure 8-b:
Parameterizations of the four lepton invariant mass for the VBF production mode, for $ {m_{{\mathrm {X}}}} = $ 450 GeV, $ {\Gamma _{{\mathrm {X}}}} = $ 10 GeV. The interference contributions from H(125) and $ {\mathrm {g}} {\mathrm {g}} \to {\mathrm {Z}} {\mathrm {Z}}$ or $\mathrm{V} {\mathrm {V}}\to {\mathrm {Z}} {\mathrm {Z}}$ background are also shown. The signal cross section used corresponds to the limit obtained in the $4\ell $ final state. |
png pdf |
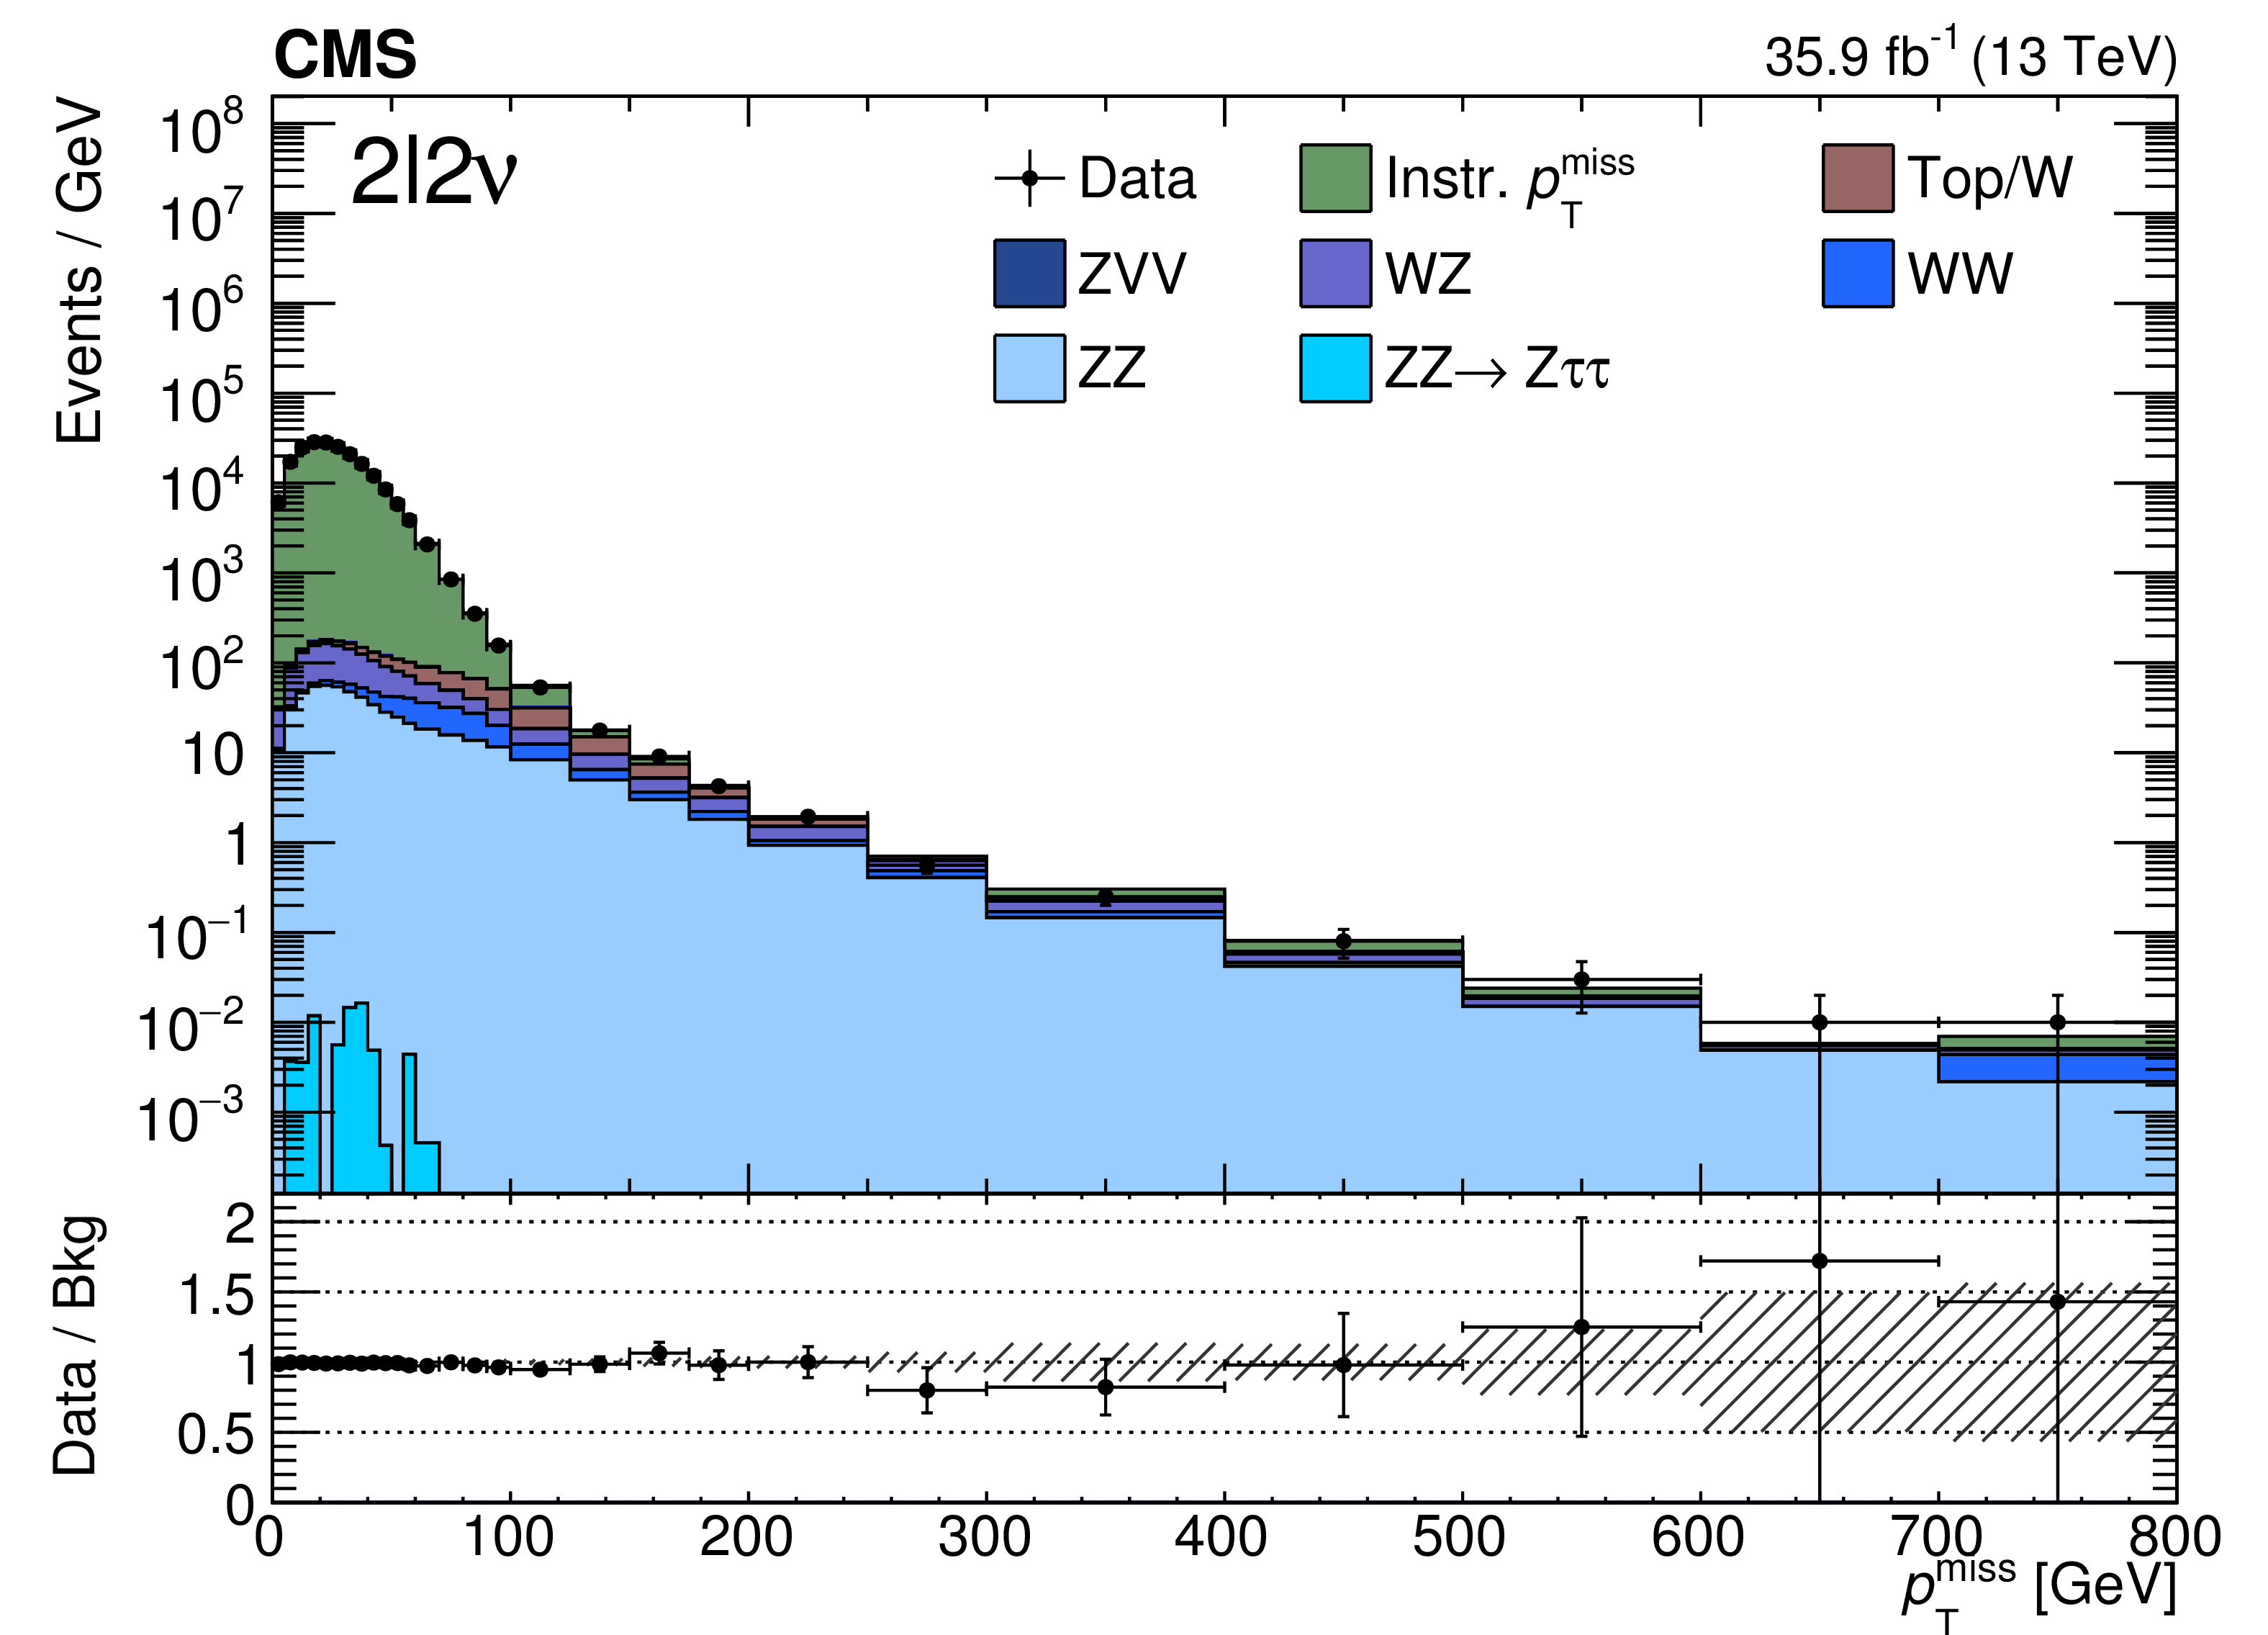
Figure 9:
Distribution of the missing transverse energy ${{p_{\mathrm {T}}} ^\text {miss}}$ in the dilepton signal region. The points represent the data and the stacked histograms the expected backgrounds. The lower panel shows the ratio between data and background estimation. |

png pdf |
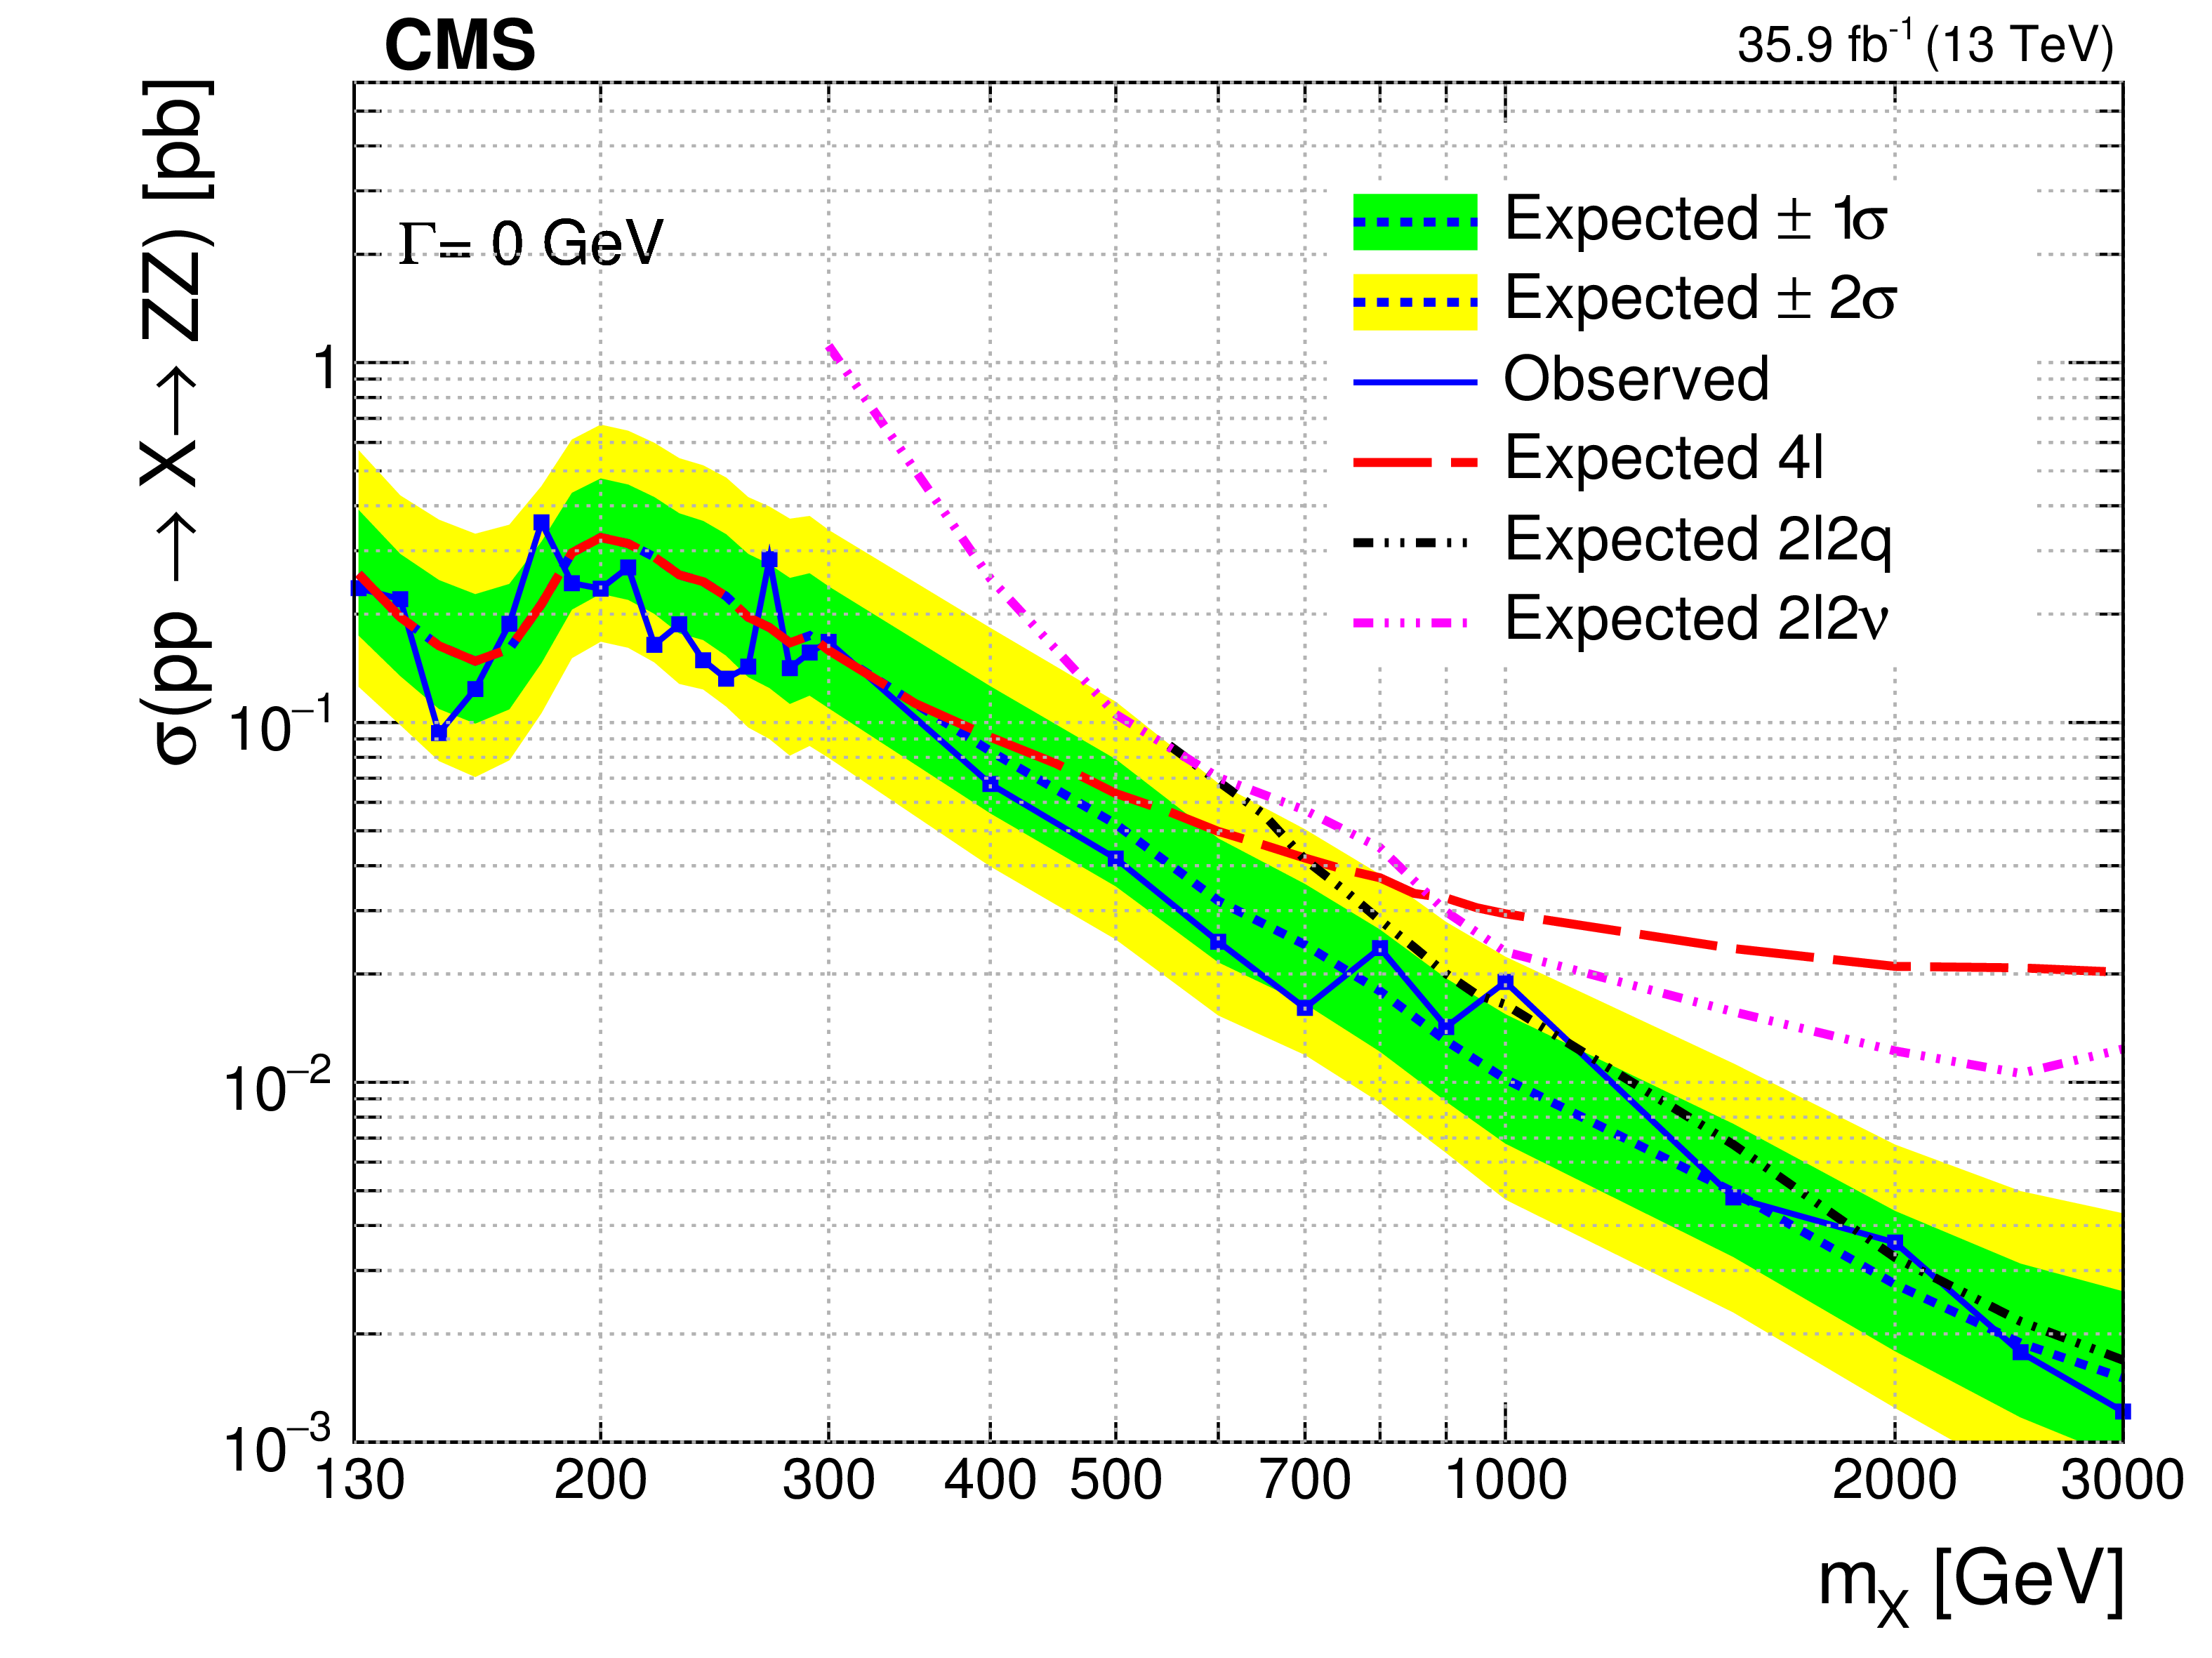
Figure 10:
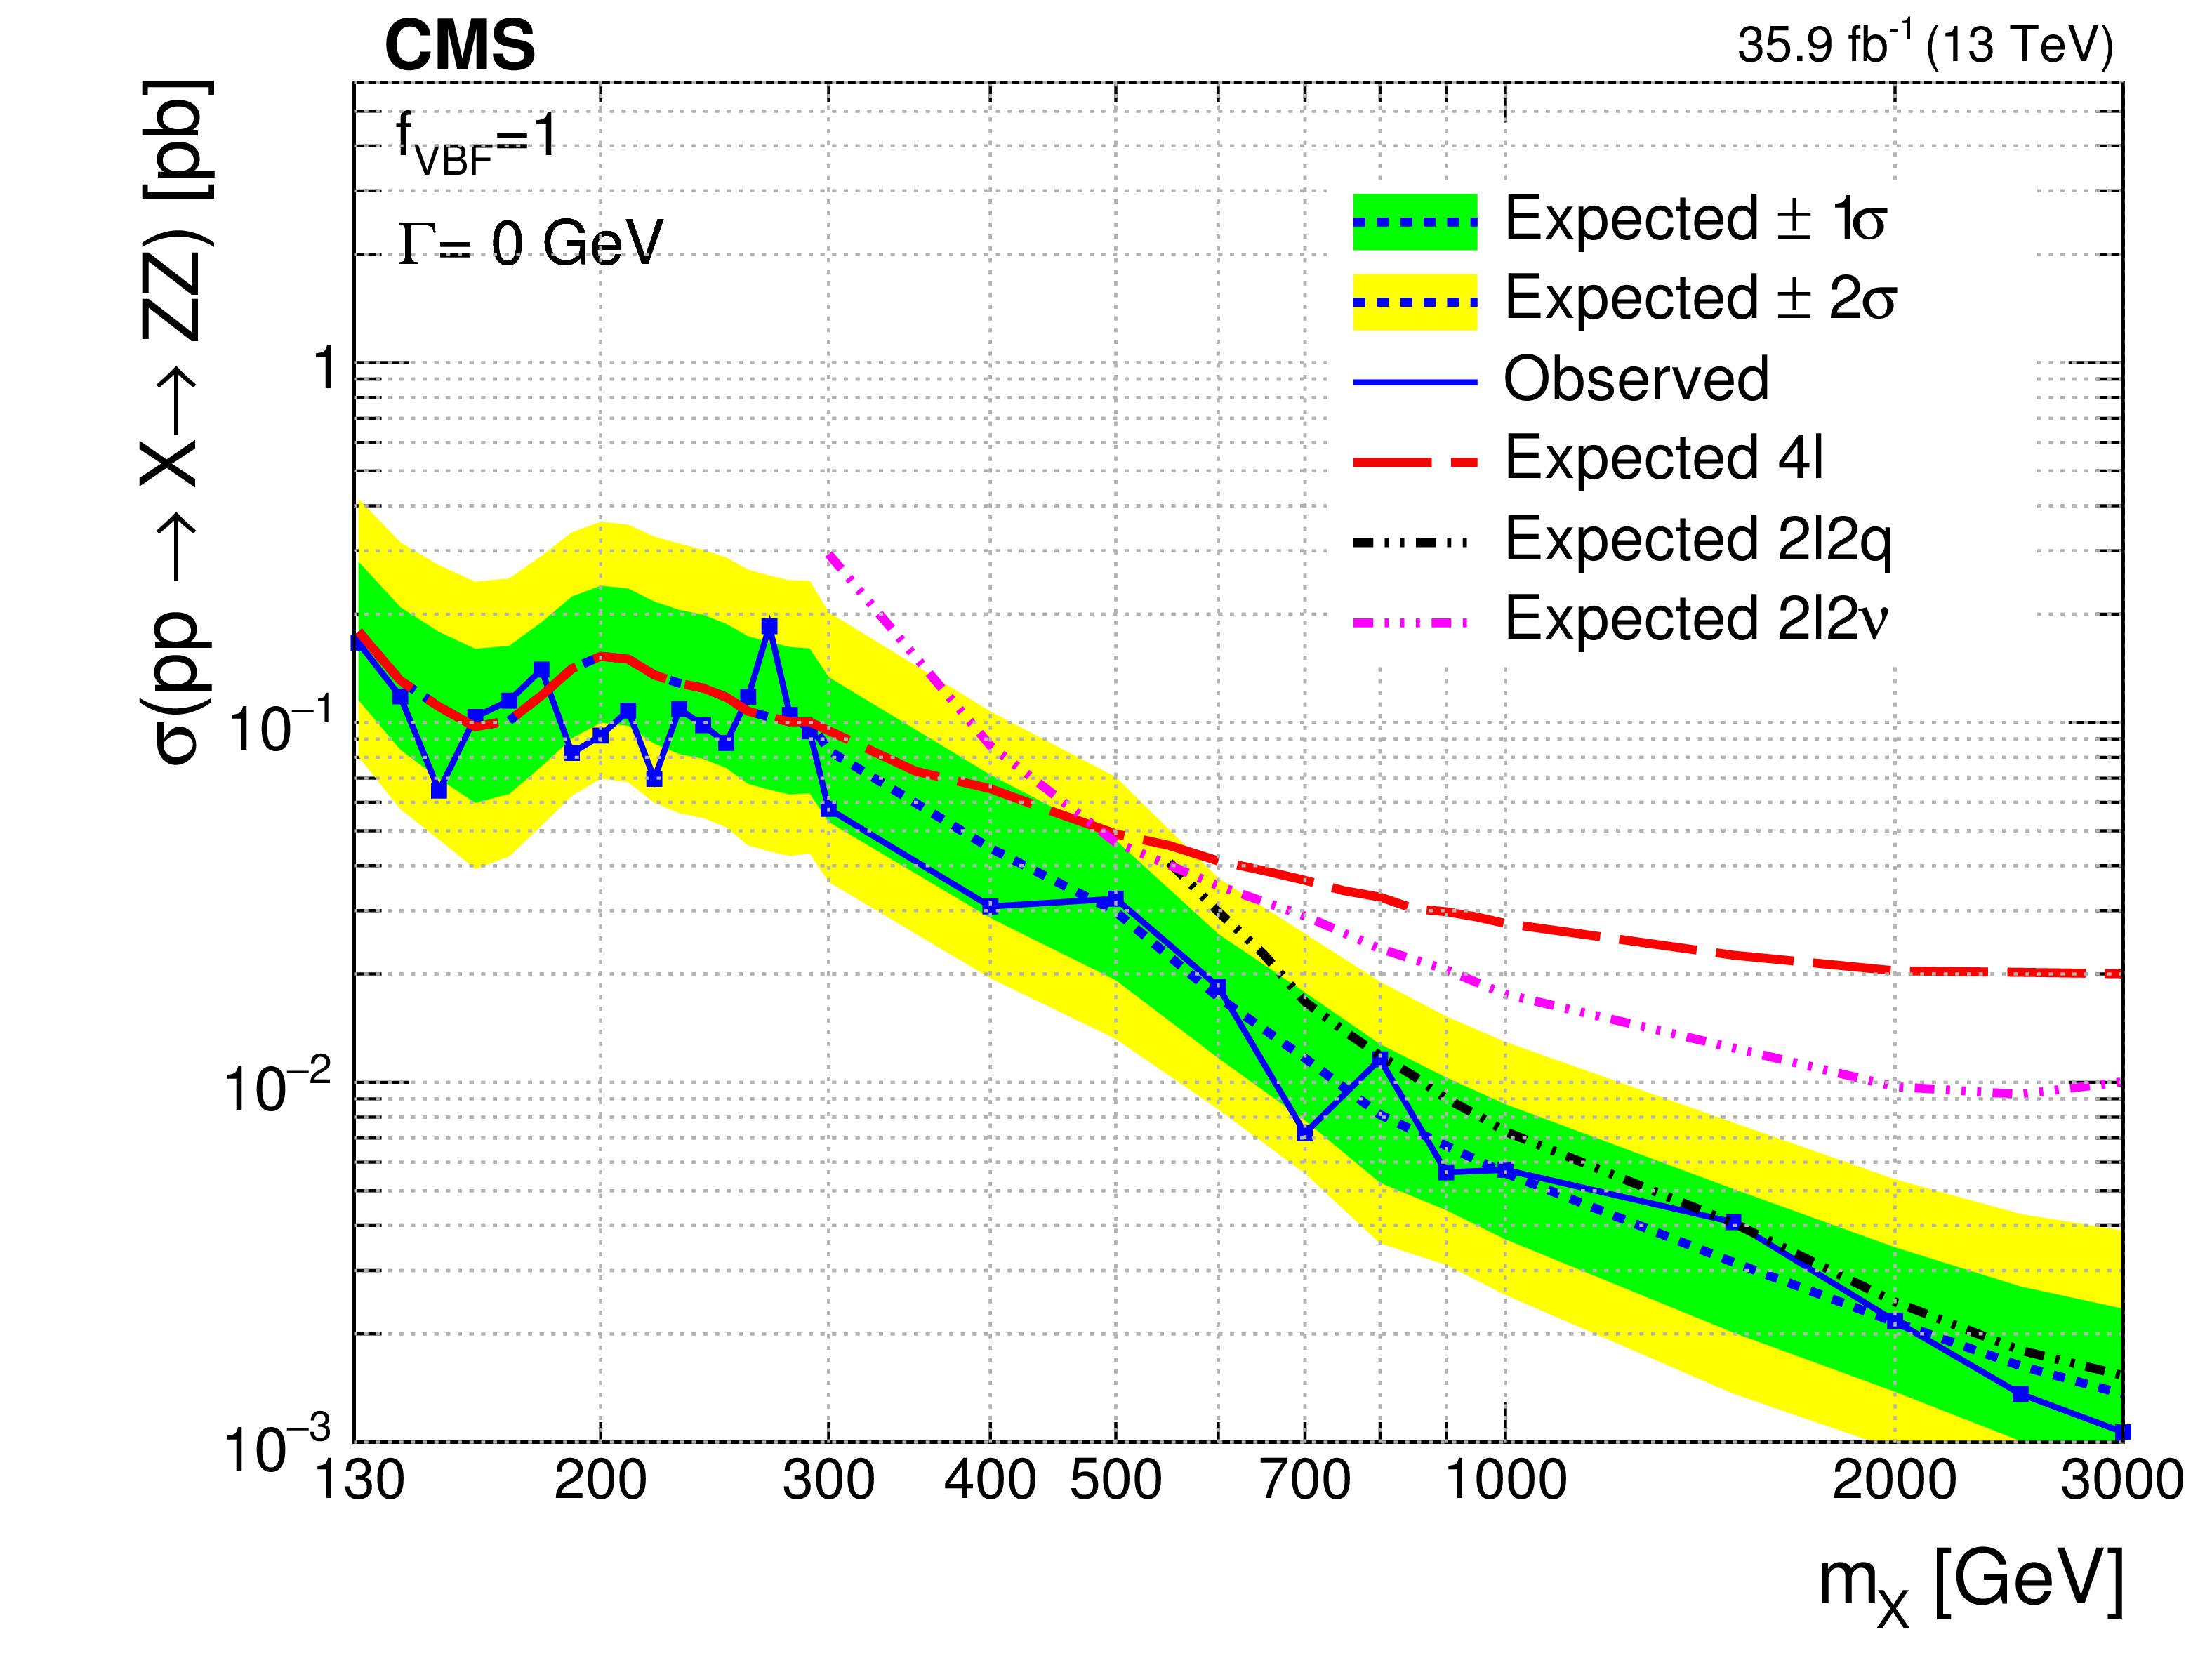
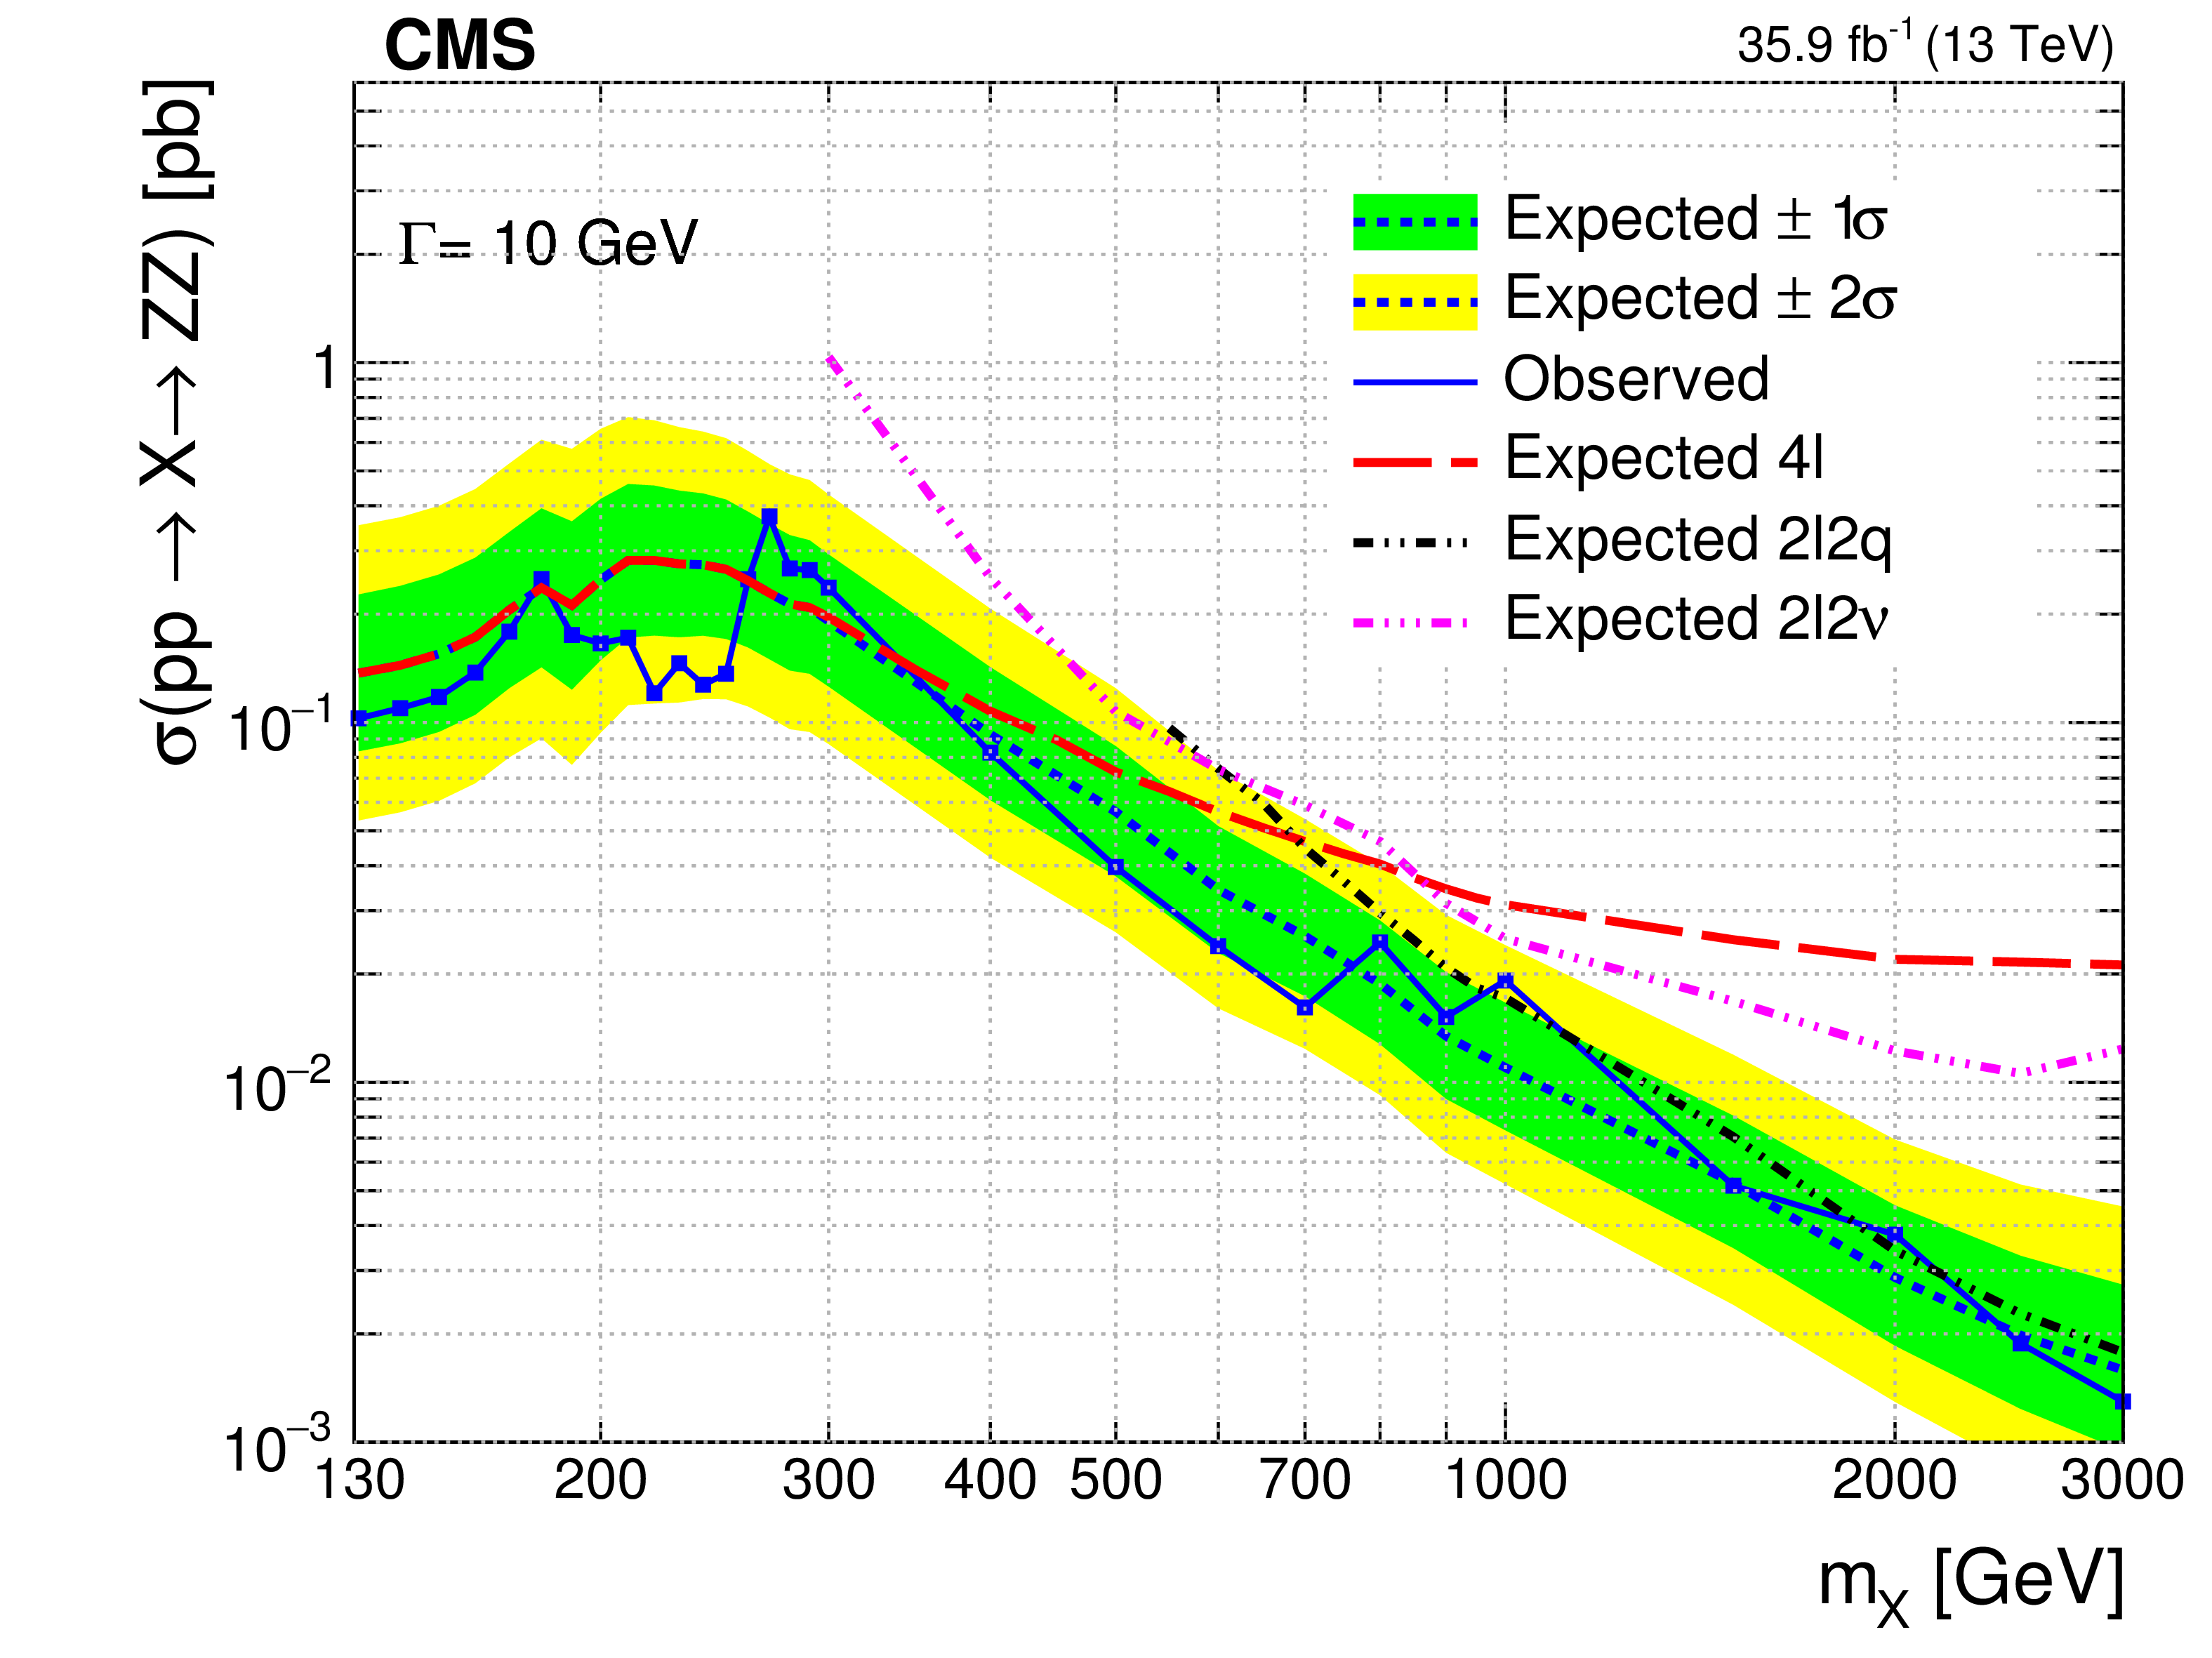
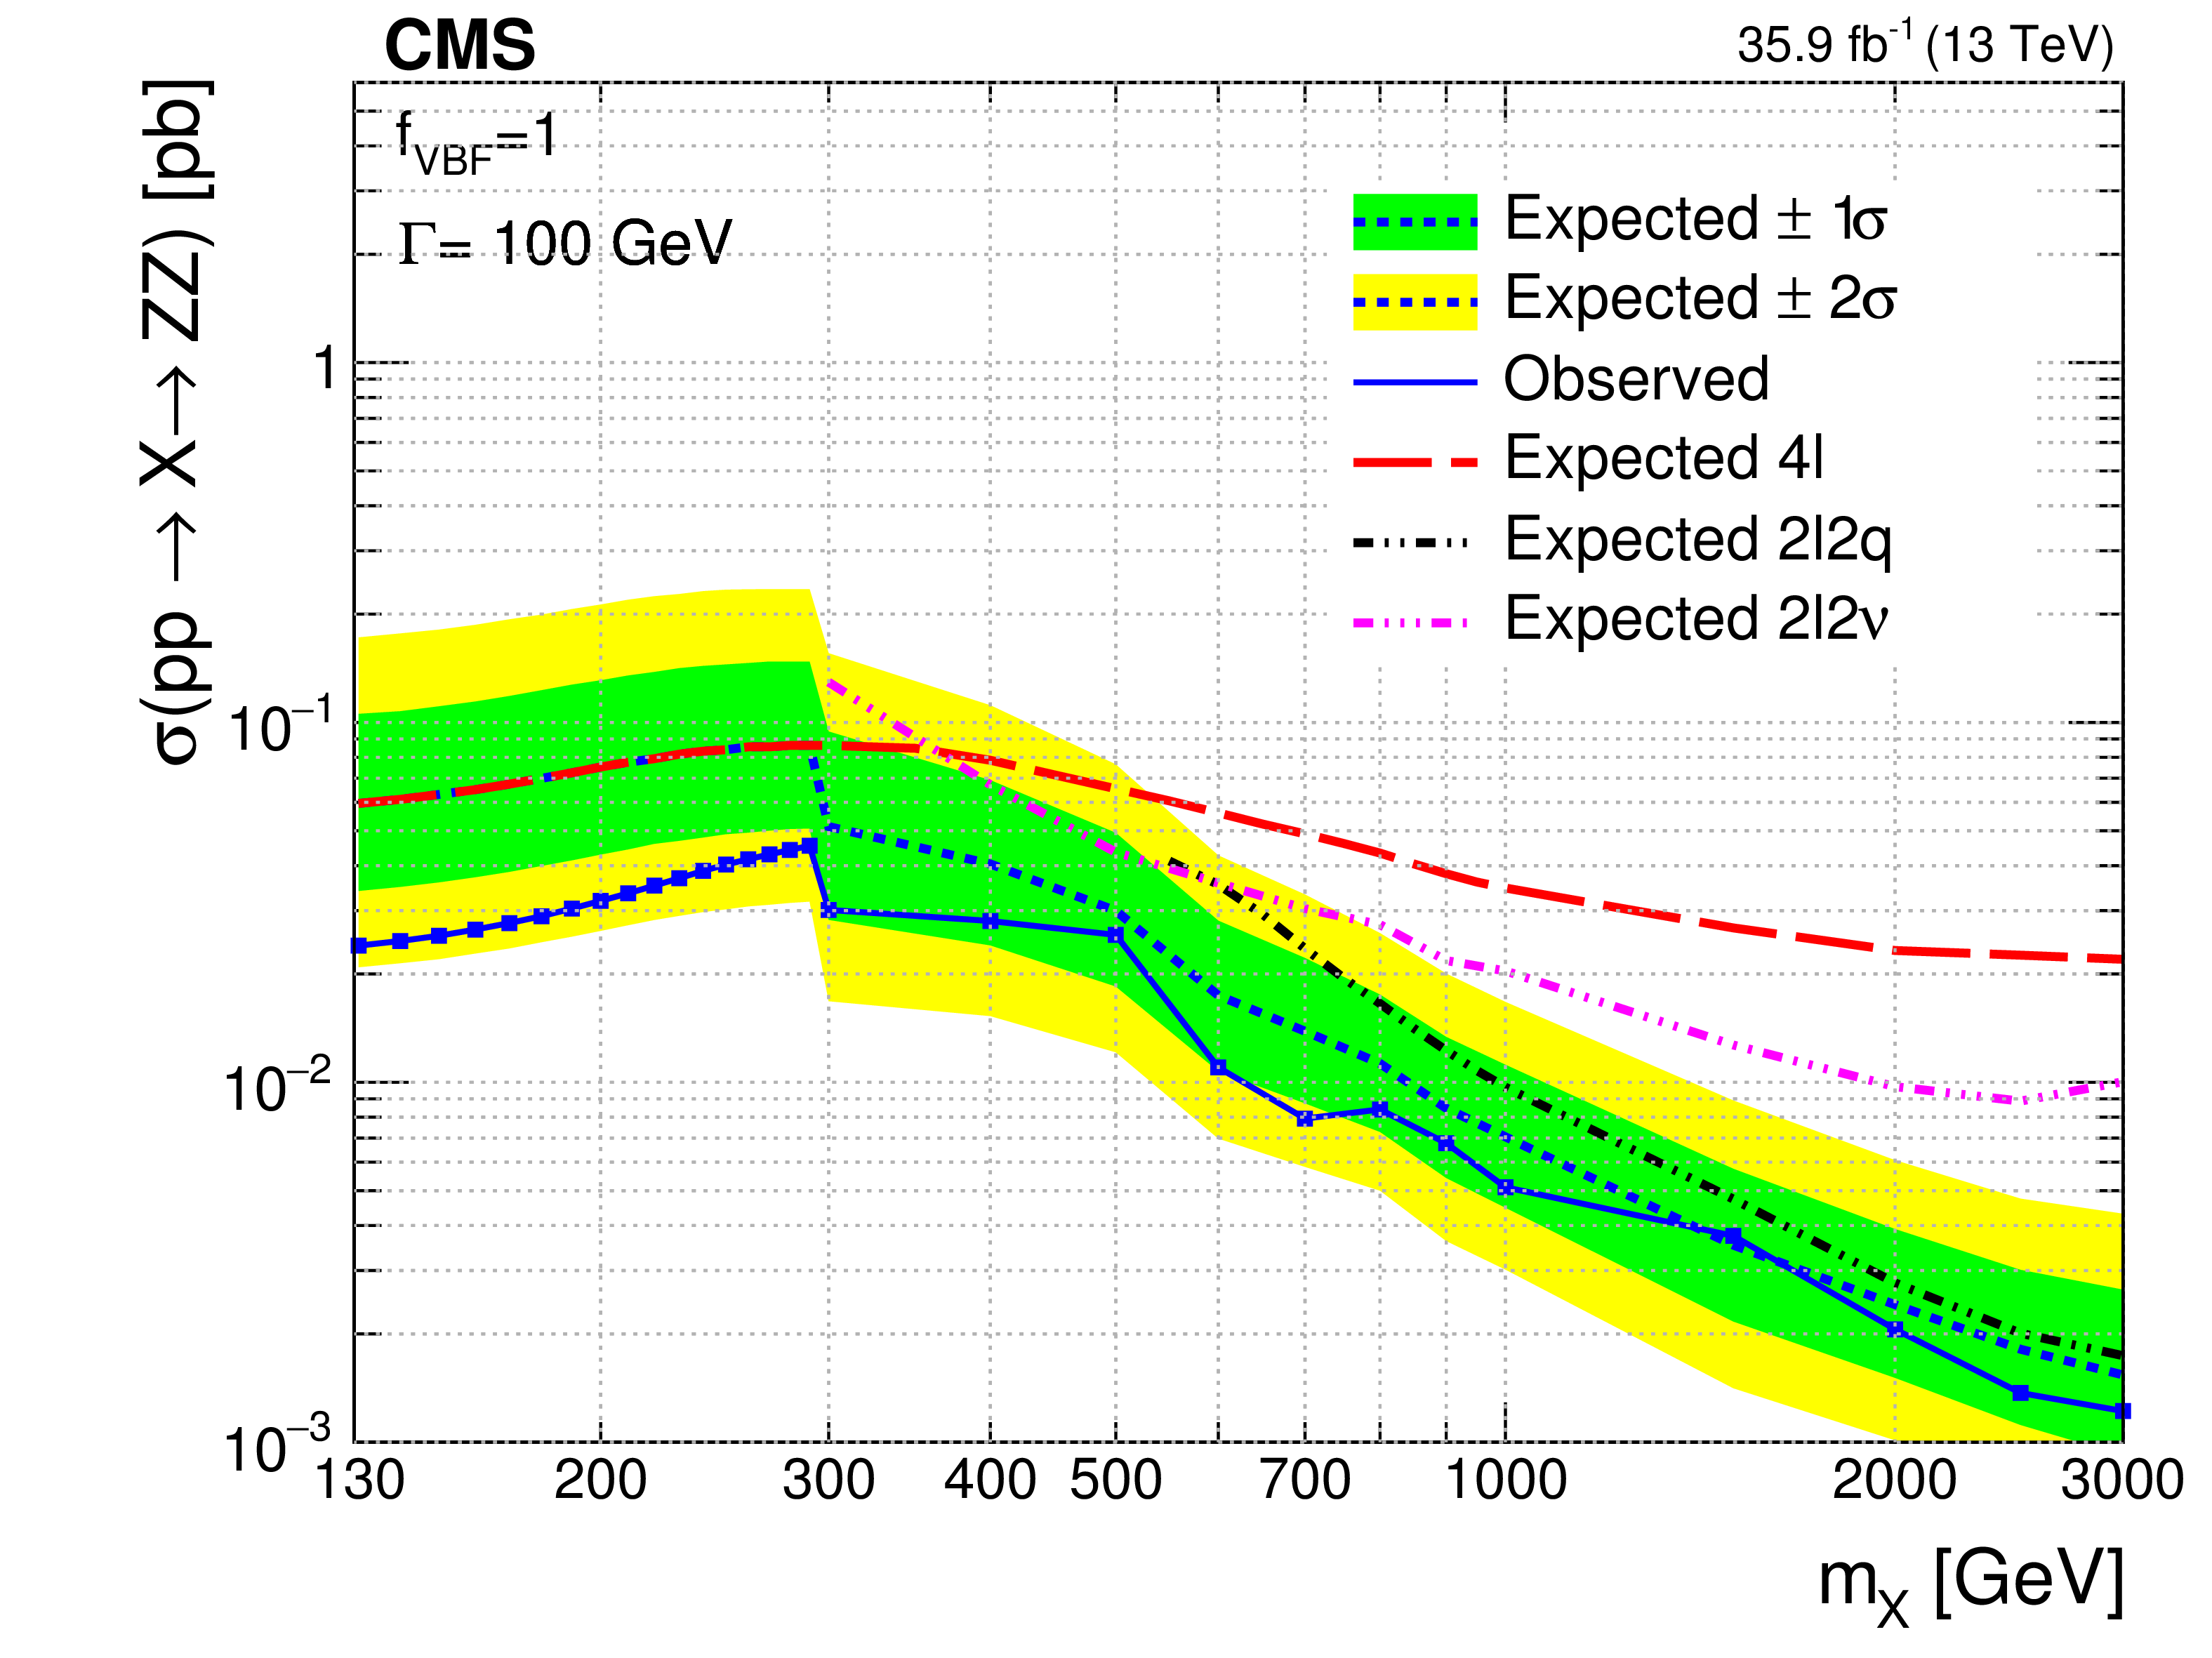
Expected and observed upper limits at the 95% CL on the $ {\mathrm {p}} {\mathrm {p}}\to {\mathrm {X}}\to {\mathrm {Z}} {\mathrm {Z}}$ cross section as a function of $m_ {\mathrm {X}}$ and for several $\Gamma _ {\mathrm {X}}$ values with $f_{\mathrm {VBF}}$ as a free parameter (left) and fixed to 1 (right). The results are shown for $4\ell $, $2\ell 2 {\mathrm {q}}$, and $2\ell 2\nu $ channels separately and combined. The reported cross section corresponds to the signal only contribution in the absence of interference. |
png pdf |
Figure 10-a:
Expected and observed upper limits at the 95% CL on the $ {\mathrm {p}} {\mathrm {p}}\to {\mathrm {X}}\to {\mathrm {Z}} {\mathrm {Z}}$ cross section as a function of $m_ {\mathrm {X}}$ and for $\Gamma _ {\mathrm {X}}= $ 0 GeV with $f_{\mathrm {VBF}}$ as a free parameter. The results are shown for $4\ell $, $2\ell 2 {\mathrm {q}}$, and $2\ell 2\nu $ channels separately and combined. The reported cross section corresponds to the signal only contribution in the absence of interference. |
png pdf |
Figure 10-b:
Expected and observed upper limits at the 95% CL on the $ {\mathrm {p}} {\mathrm {p}}\to {\mathrm {X}}\to {\mathrm {Z}} {\mathrm {Z}}$ cross section as a function of $m_ {\mathrm {X}}$ and for $\Gamma _ {\mathrm {X}}= $ 0 GeV with $f_{\mathrm {VBF}}$ fixed to 1. The results are shown for $4\ell $, $2\ell 2 {\mathrm {q}}$, and $2\ell 2\nu $ channels separately and combined. The reported cross section corresponds to the signal only contribution in the absence of interference. |
png pdf |
Figure 10-c:
Expected and observed upper limits at the 95% CL on the $ {\mathrm {p}} {\mathrm {p}}\to {\mathrm {X}}\to {\mathrm {Z}} {\mathrm {Z}}$ cross section as a function of $m_ {\mathrm {X}}$ and for $\Gamma _ {\mathrm {X}}= $ 10 GeV with $f_{\mathrm {VBF}}$ as a free parameter. The results are shown for $4\ell $, $2\ell 2 {\mathrm {q}}$, and $2\ell 2\nu $ channels separately and combined. The reported cross section corresponds to the signal only contribution in the absence of interference. |

png pdf |
Figure 10-d:
Expected and observed upper limits at the 95% CL on the $ {\mathrm {p}} {\mathrm {p}}\to {\mathrm {X}}\to {\mathrm {Z}} {\mathrm {Z}}$ cross section as a function of $m_ {\mathrm {X}}$ and for $\Gamma _ {\mathrm {X}}= $ 10 GeV with $f_{\mathrm {VBF}}$ fixed to 1. The results are shown for $4\ell $, $2\ell 2 {\mathrm {q}}$, and $2\ell 2\nu $ channels separately and combined. The reported cross section corresponds to the signal only contribution in the absence of interference. |

png pdf |
Figure 10-e:
Expected and observed upper limits at the 95% CL on the $ {\mathrm {p}} {\mathrm {p}}\to {\mathrm {X}}\to {\mathrm {Z}} {\mathrm {Z}}$ cross section as a function of $m_ {\mathrm {X}}$ and for $\Gamma _ {\mathrm {X}}= $ 100 GeV with $f_{\mathrm {VBF}}$ as a free parameter. The results are shown for $4\ell $, $2\ell 2 {\mathrm {q}}$, and $2\ell 2\nu $ channels separately and combined. The reported cross section corresponds to the signal only contribution in the absence of interference. |
png pdf |
Figure 10-f:
Expected and observed upper limits at the 95% CL on the $ {\mathrm {p}} {\mathrm {p}}\to {\mathrm {X}}\to {\mathrm {Z}} {\mathrm {Z}}$ cross section as a function of $m_ {\mathrm {X}}$ and for $\Gamma _ {\mathrm {X}}= $ 100 GeV with $f_{\mathrm {VBF}}$ fixed to 1. The results are shown for $4\ell $, $2\ell 2 {\mathrm {q}}$, and $2\ell 2\nu $ channels separately and combined. The reported cross section corresponds to the signal only contribution in the absence of interference. |

png pdf |
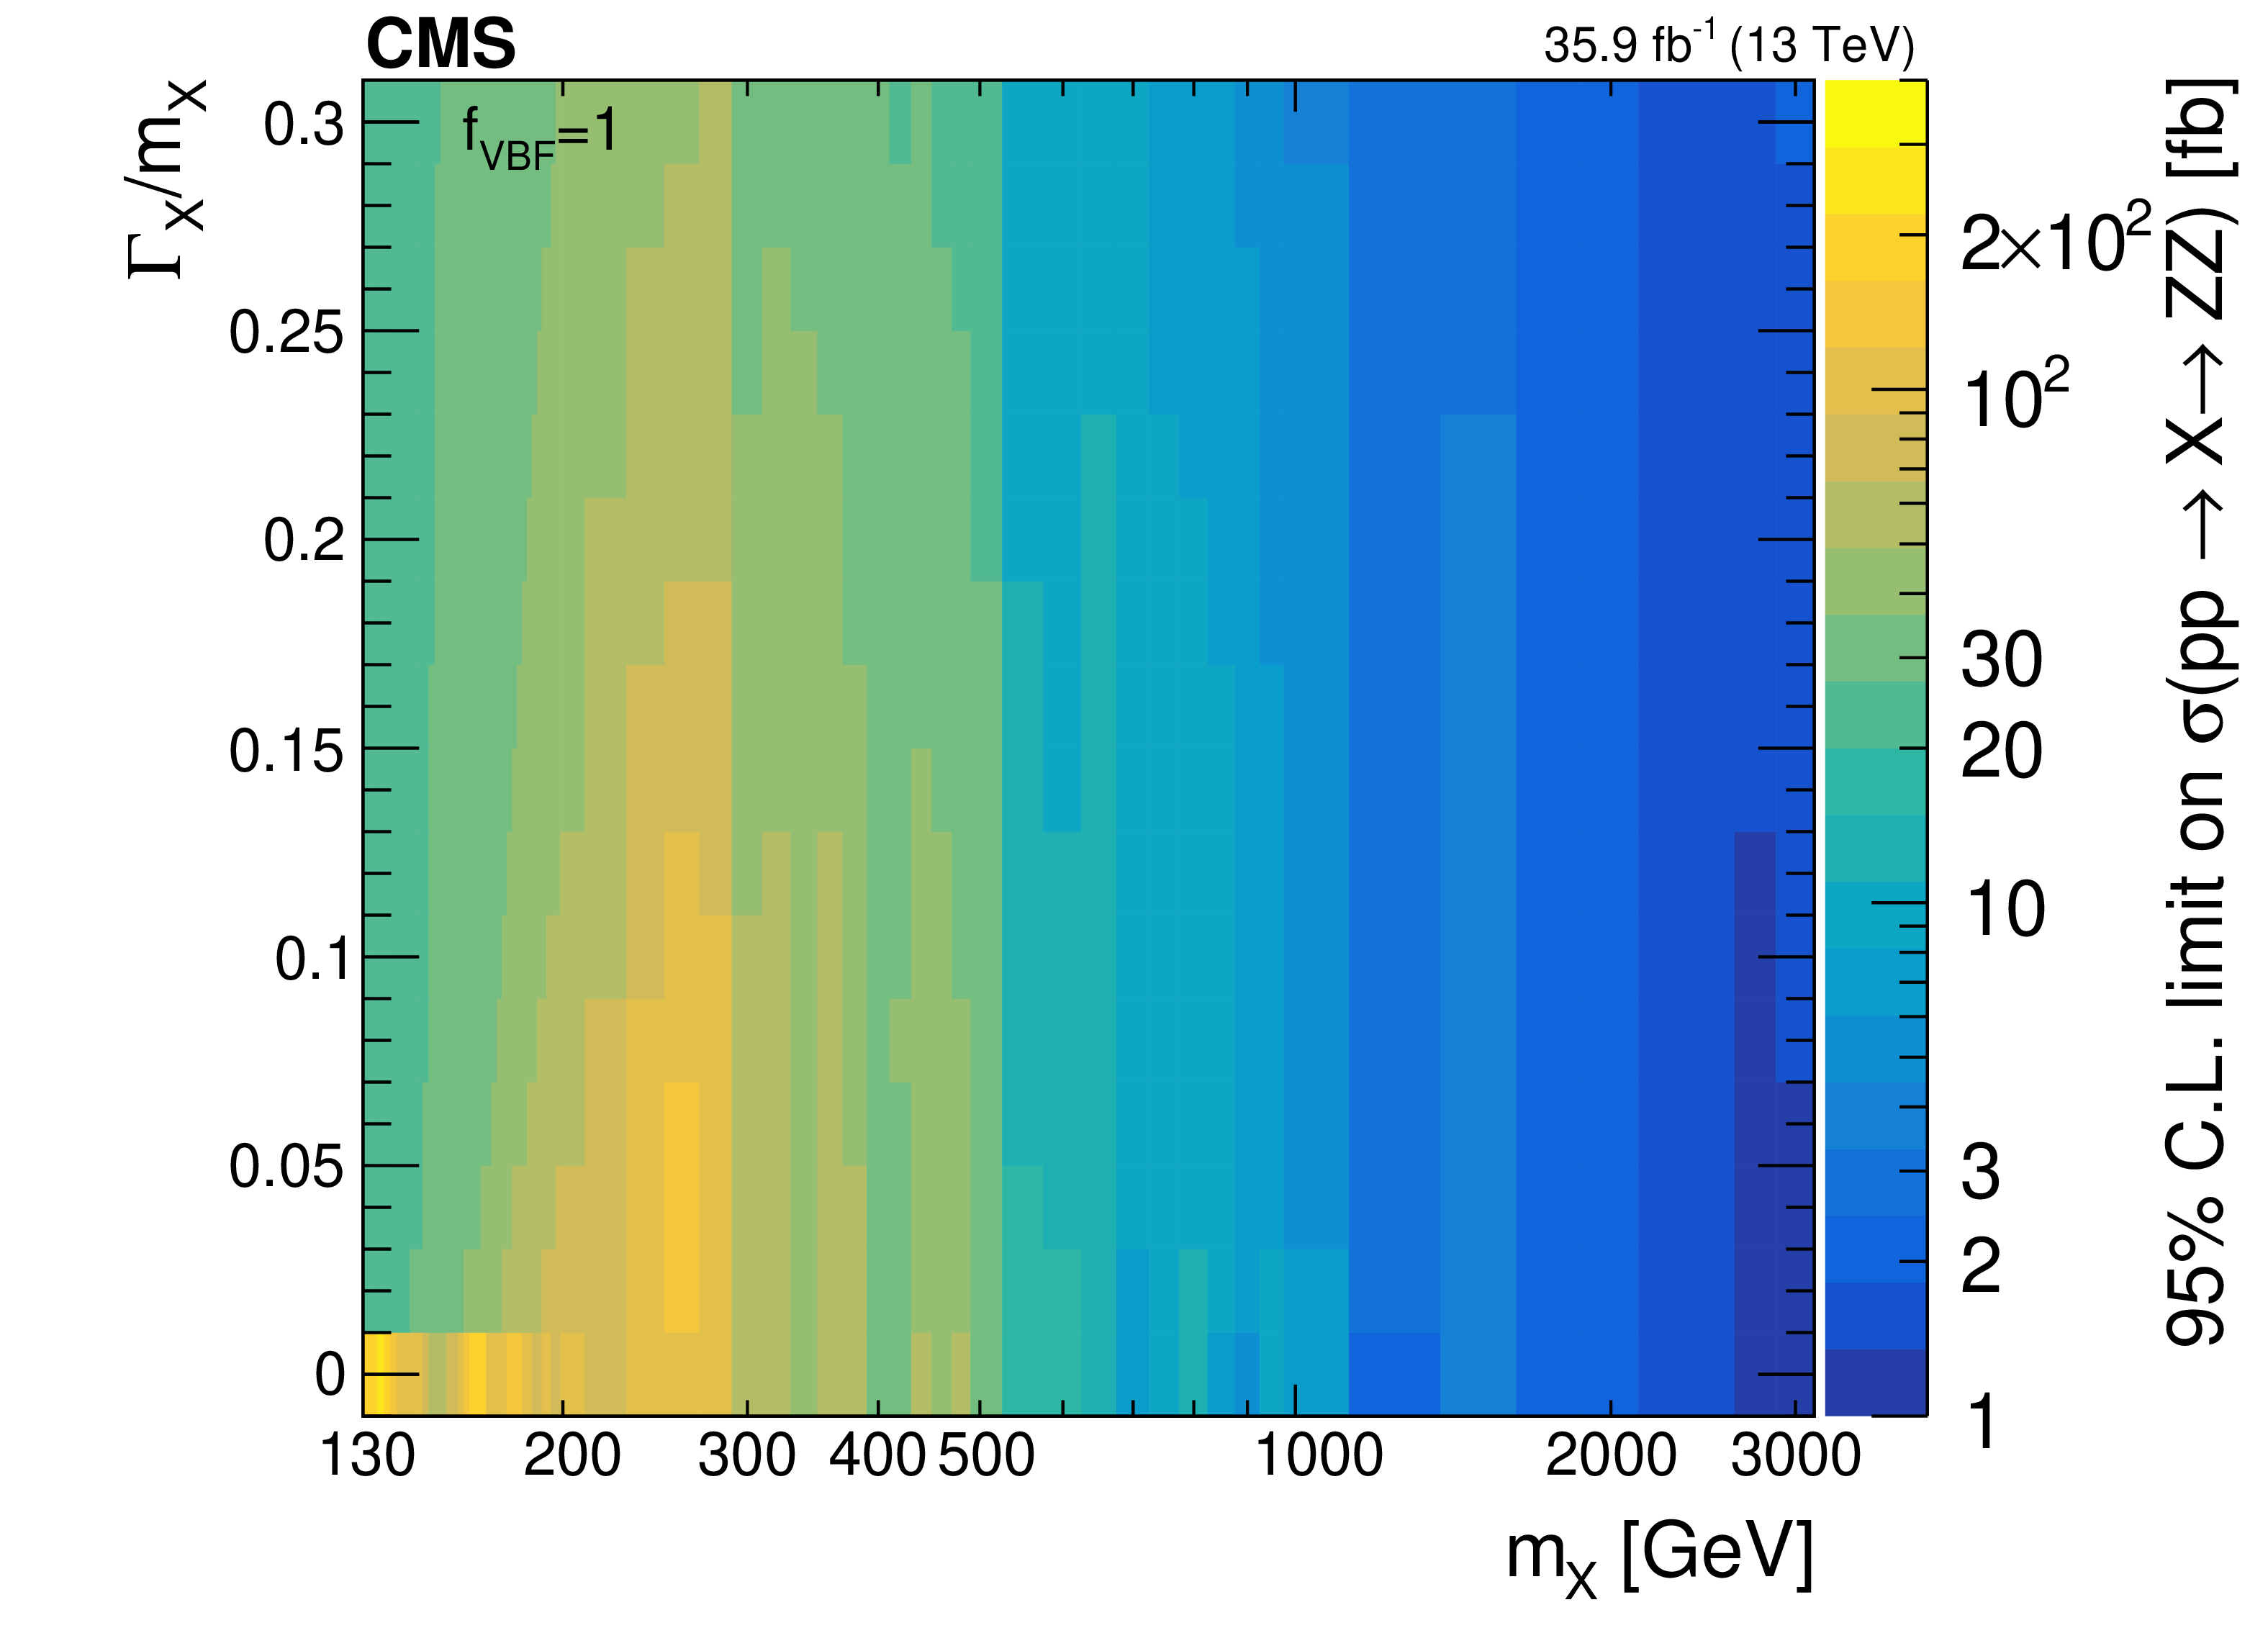
Figure 11:
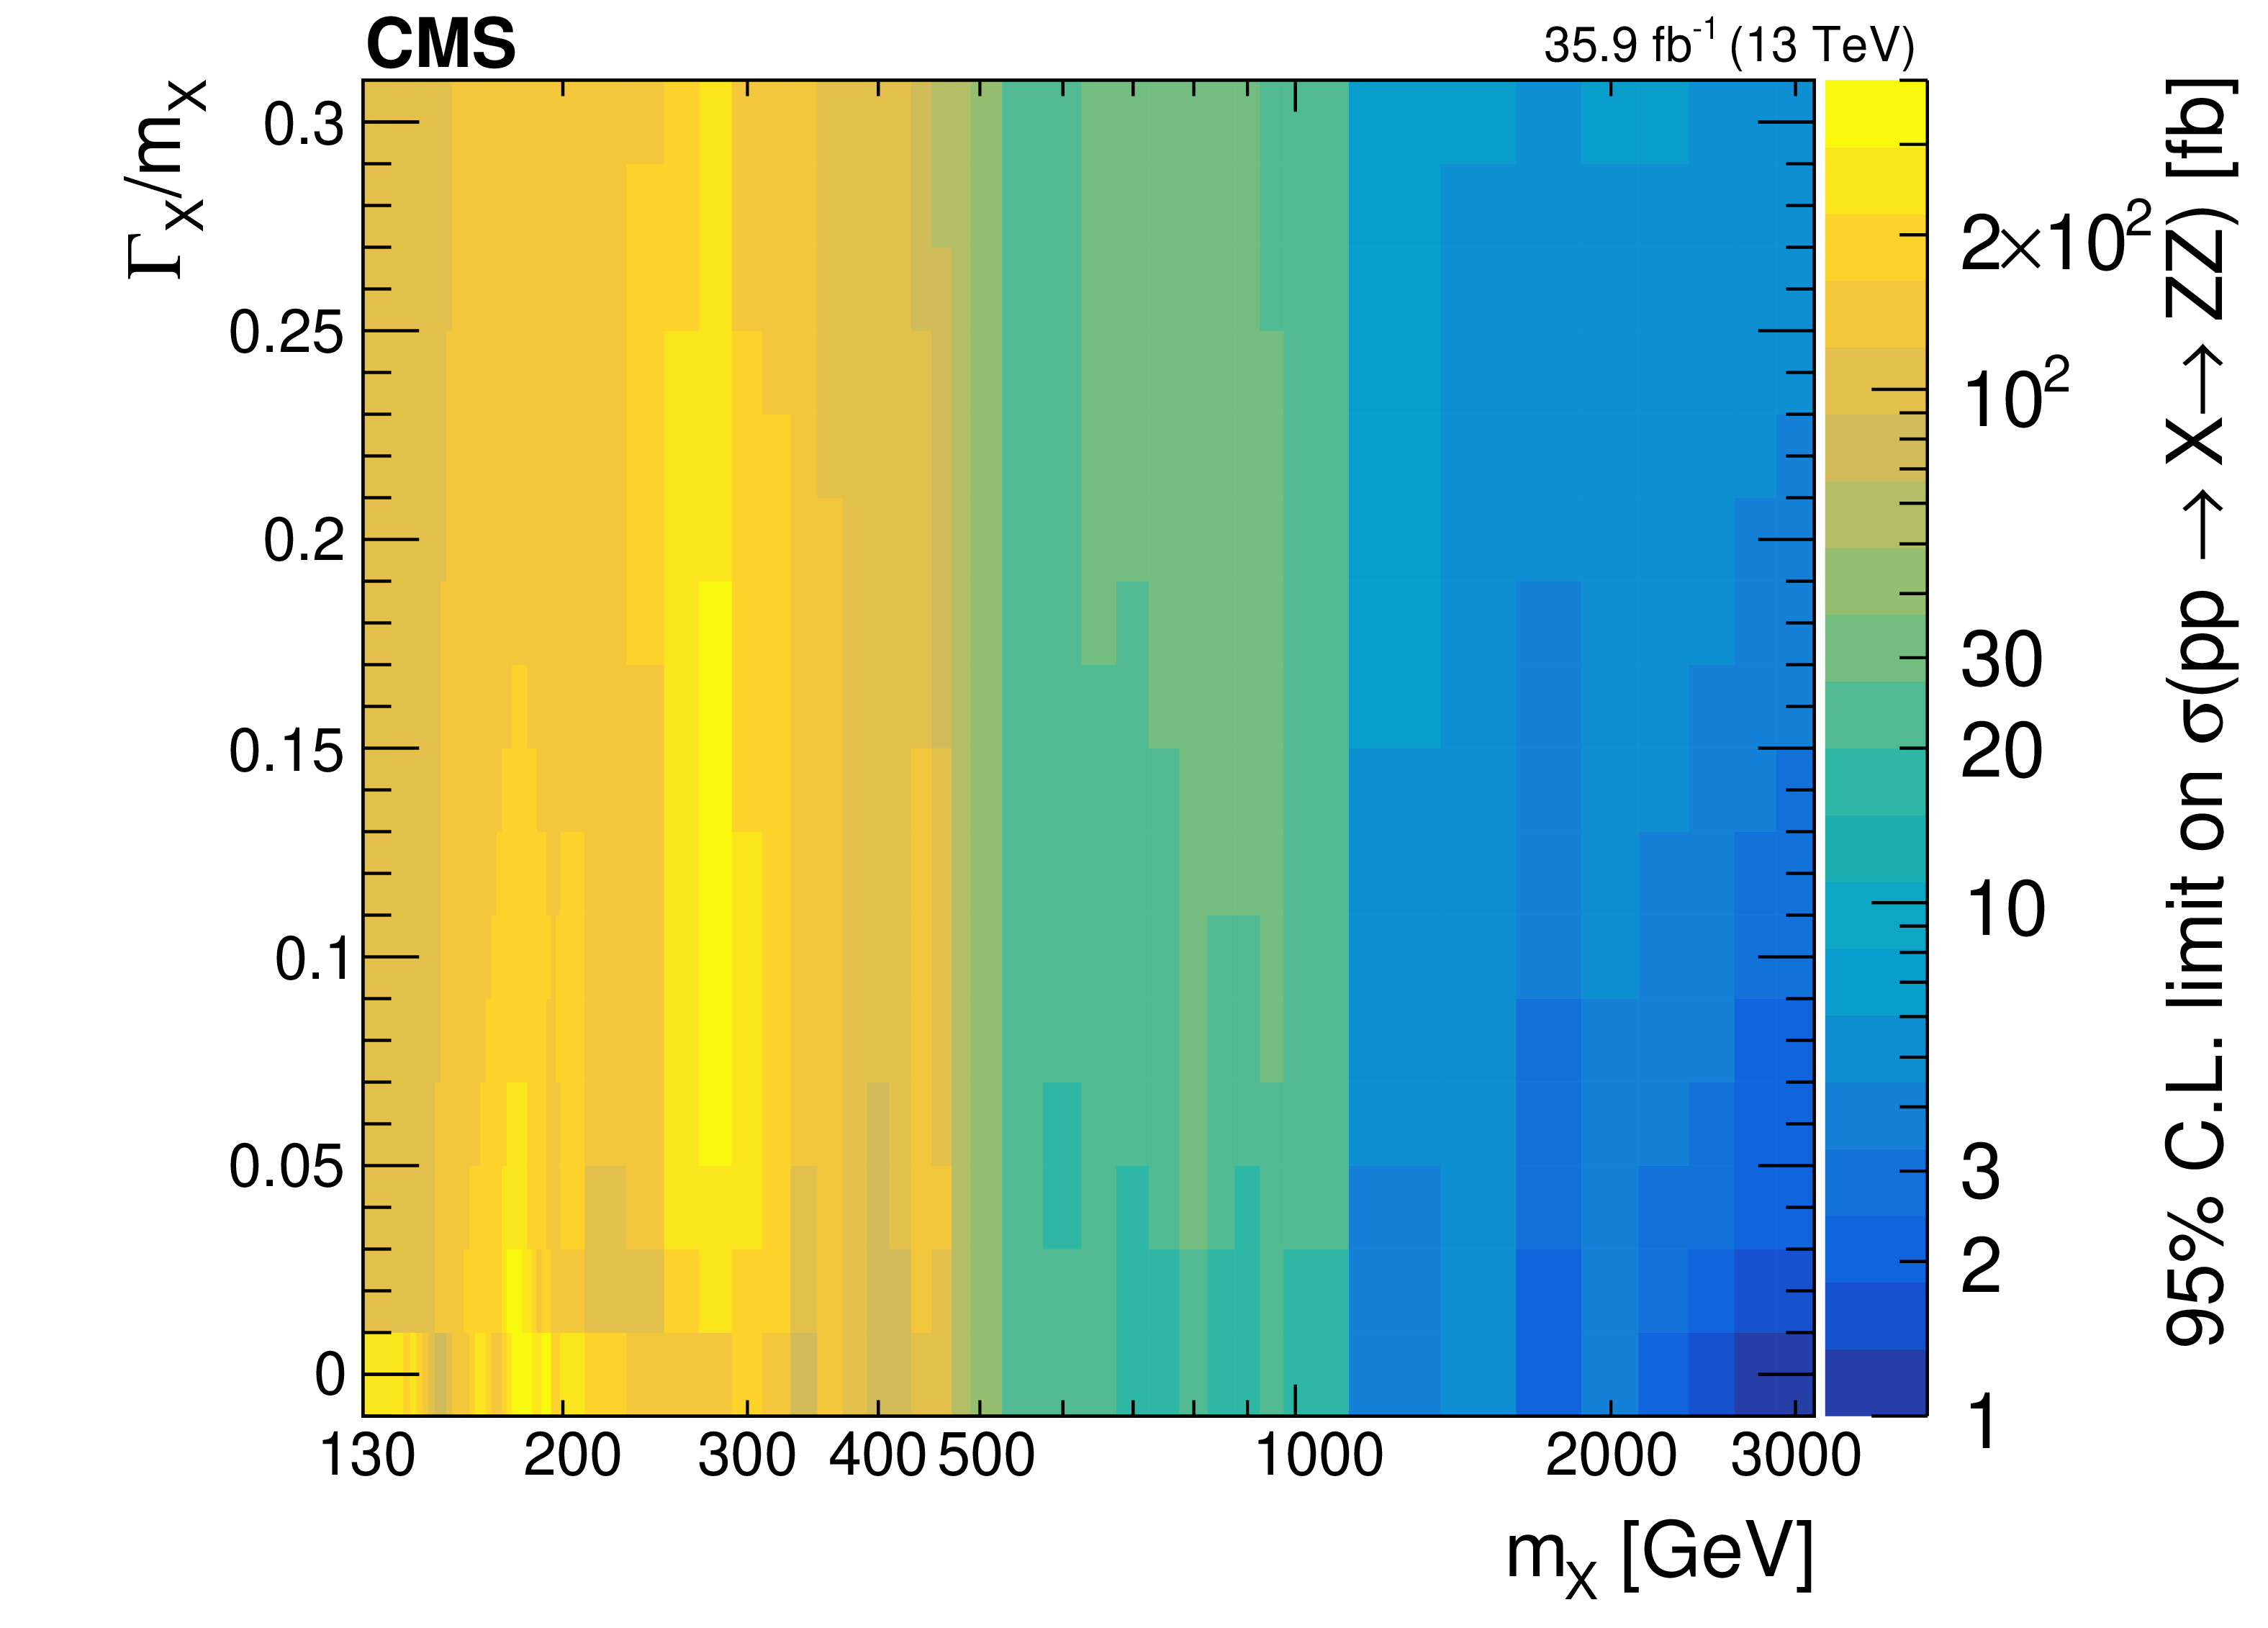
Observed upper limits at the 95% CL on the $ {\mathrm {p}} {\mathrm {p}}\to {\mathrm {X}}\to {\mathrm {Z}} {\mathrm {Z}}$ cross section as a function of $m_ {\mathrm {X}}$ and $\Gamma _ {\mathrm {X}}/m_ {\mathrm {X}}$ values with $f_{\mathrm {VBF}}$ as a free parameter (left) and fixed to 1 (right). The results are shown for the $4\ell $, $2\ell 2 {\mathrm {q}}$, and $2\ell 2\nu $ channels combined. The reported cross section corresponds to the signal only contribution in the absence of interference. |
png pdf |
Figure 11-a:
Observed upper limits at the 95% CL on the $ {\mathrm {p}} {\mathrm {p}}\to {\mathrm {X}}\to {\mathrm {Z}} {\mathrm {Z}}$ cross section as a function of $m_ {\mathrm {X}}$ and $\Gamma _ {\mathrm {X}}/m_ {\mathrm {X}}$ values with $f_{\mathrm {VBF}}$ as a free parameter. The results are shown for the $4\ell $, $2\ell 2 {\mathrm {q}}$, and $2\ell 2\nu $ channels combined. The reported cross section corresponds to the signal only contribution in the absence of interference. |
png pdf |
Figure 11-b:
Observed upper limits at the 95% CL on the $ {\mathrm {p}} {\mathrm {p}}\to {\mathrm {X}}\to {\mathrm {Z}} {\mathrm {Z}}$ cross section as a function of $m_ {\mathrm {X}}$ and $\Gamma _ {\mathrm {X}}/m_ {\mathrm {X}}$ values with $f_{\mathrm {VBF}}$ fixed to 1. The results are shown for the $4\ell $, $2\ell 2 {\mathrm {q}}$, and $2\ell 2\nu $ channels combined. The reported cross section corresponds to the signal only contribution in the absence of interference. |
| Tables | |
png pdf |
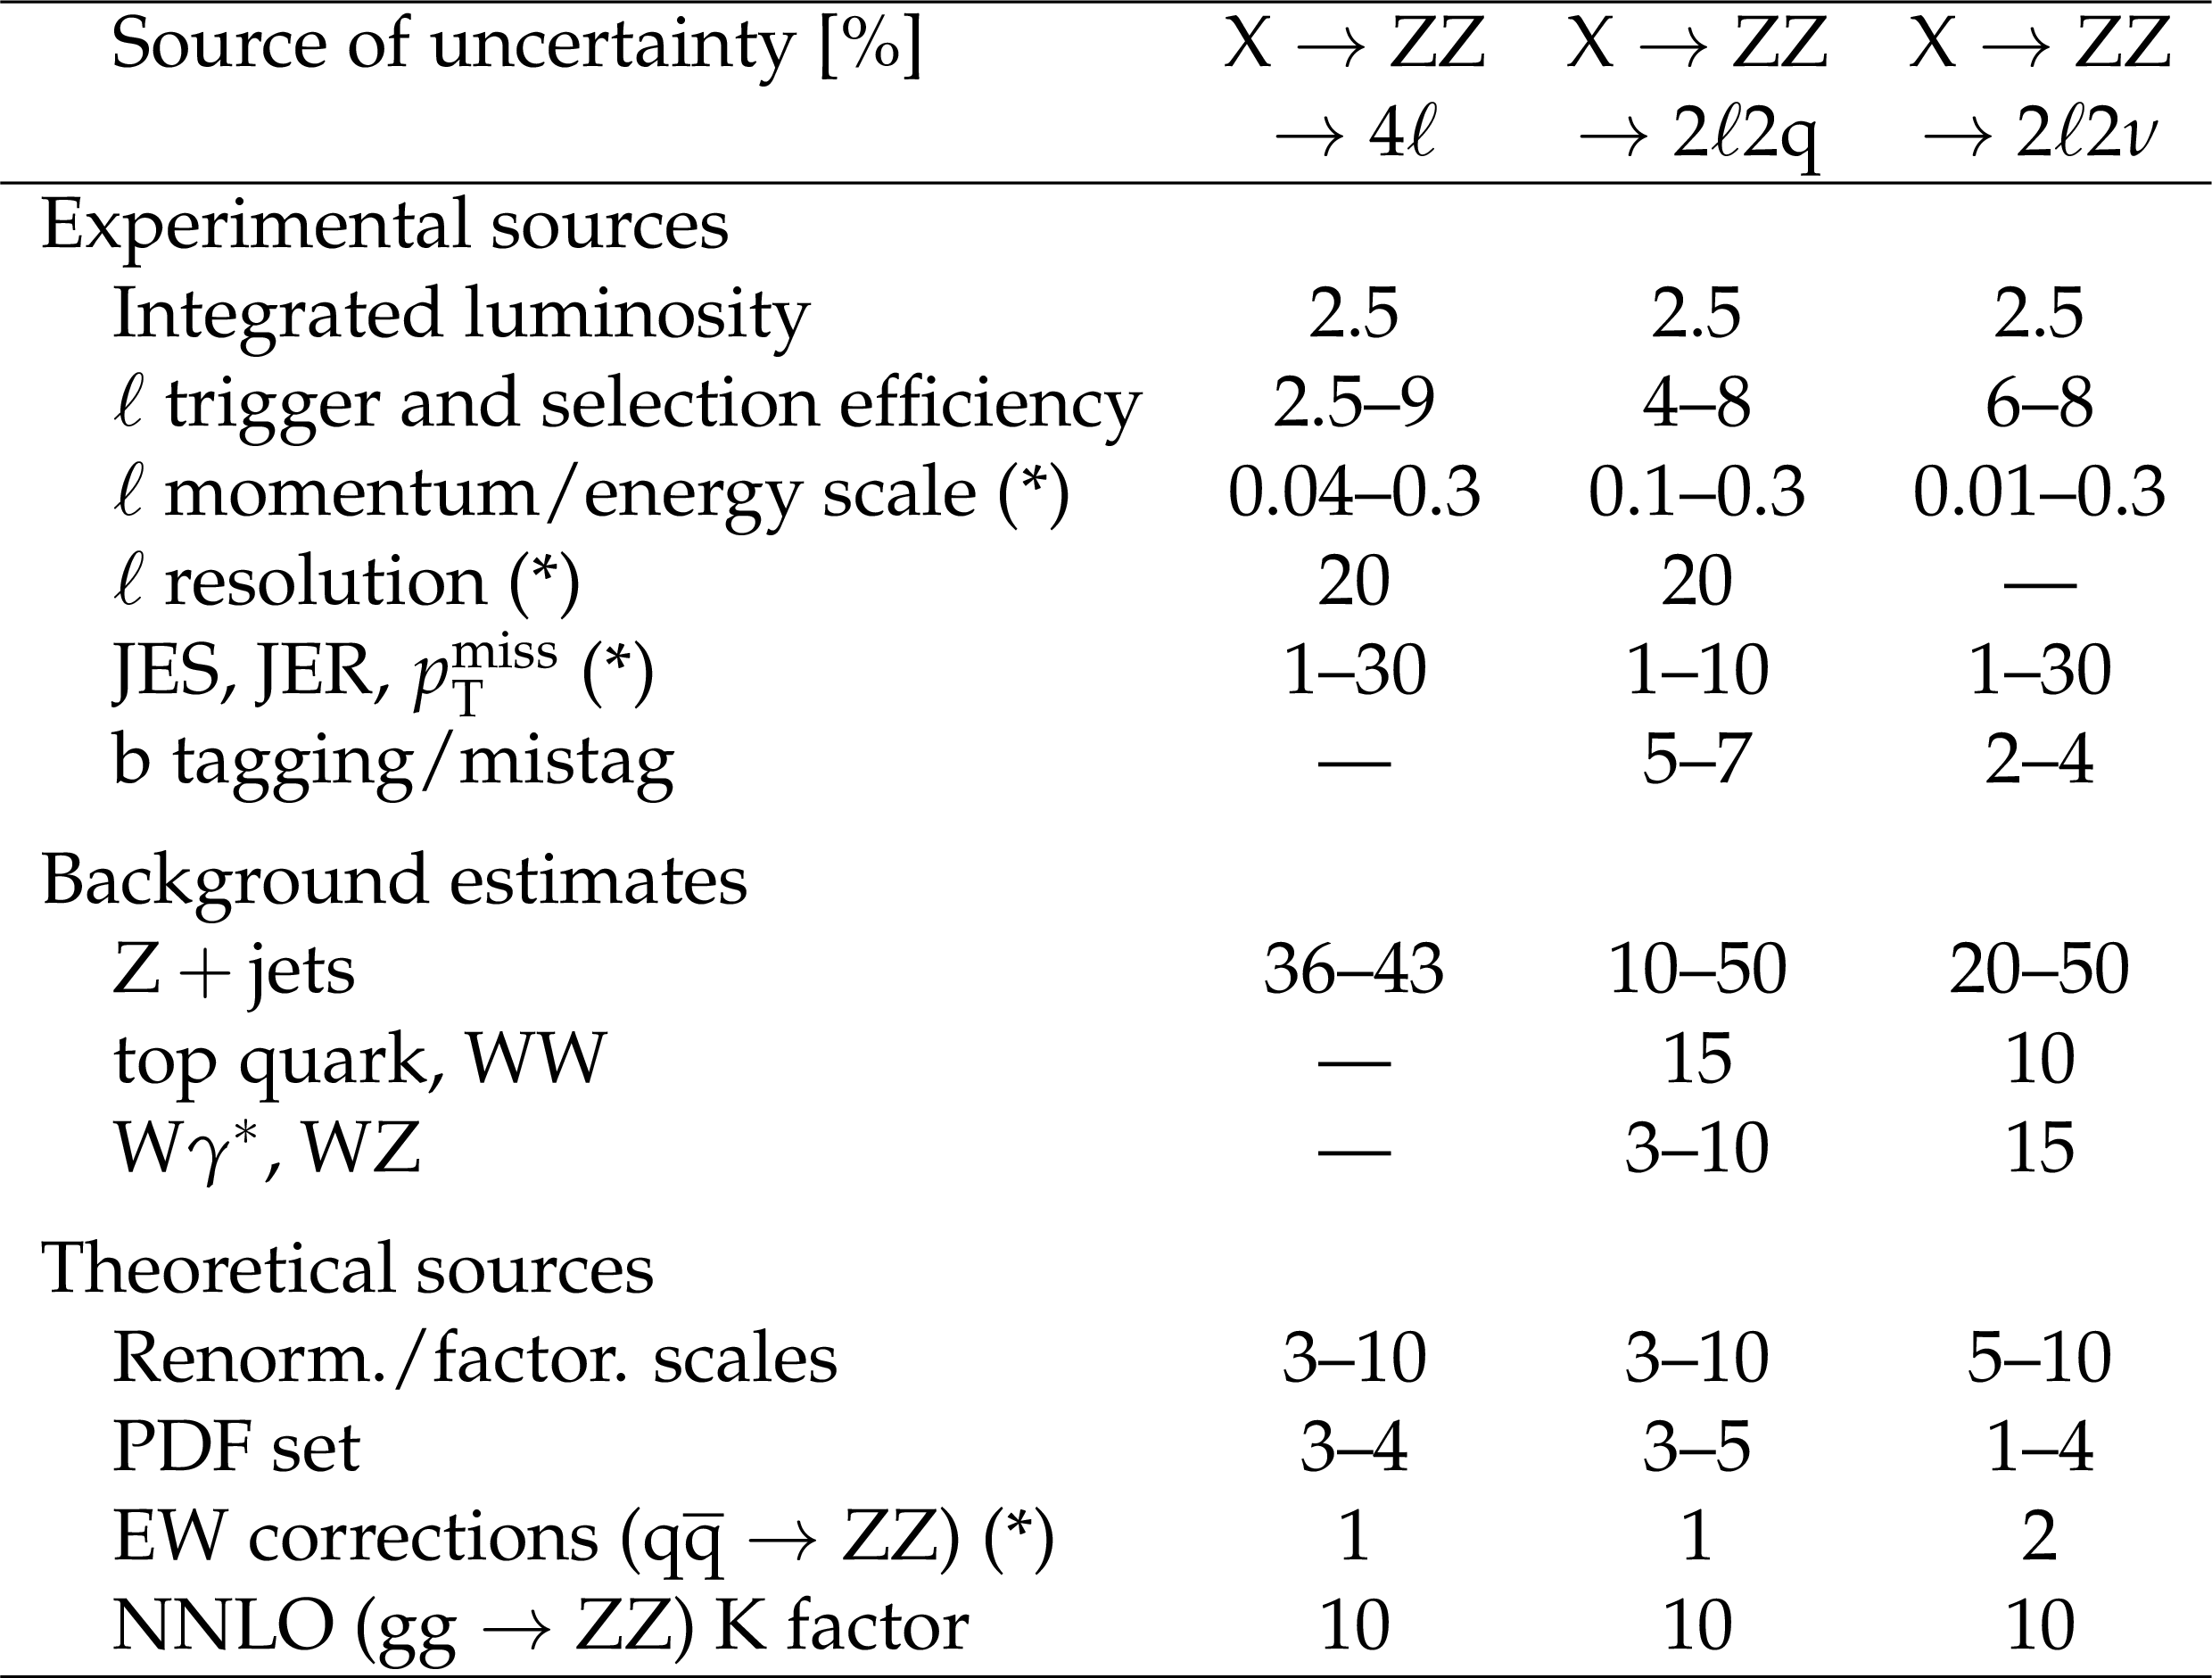
Table 1:
Sources of uncertainties considered in each of the channels included in this analysis. Uncertainties are given in percent. The numbers shown as ranges represent the uncertainties in different final states or categories. Most uncertainties affect the normalizations of the background estimations or simulated event yields, and those that affect the shape of kinematic distributions as well are labeled with (*). |
| Summary |
| A search for a new scalar resonance decaying to a pair of Z bosons is performed for a range of masses between 130 GeV and 3 TeV with the full data set recorded by the CMS experiment at 13 TeV during 2016 and corresponding to an integrated luminosity of 35.9 fb$^{-1}$. Three final states $\mathrm{Z}\mathrm{Z}\to 4\ell$, $2\ell2\mathrm{q}$, and $2\ell2\nu$ are combined in the analysis, where $\ell = $ e or $\mu$. Both gluon fusion and electroweak production of the scalar resonance are considered with a free parameter describing their relative cross sections. A dedicated categorization of events based on the kinematic properties of the associated jets is used to improve the sensitivity of the search. A description of the interference between signal and background amplitudes for a resonance of an arbitrary width is included. No significant excess of events over the SM expectation is observed and limits are set on the product of the cross section and the branching fraction for its decay to ZZ for a wide range of masses and widths, and for different production mechanisms. |
| References | ||||
| 1 | S. L. Glashow | Partial-symmetries of weak interactions | NP 22 (1961) 579 | |
| 2 | F. Englert and R. Brout | Broken symmetry and the mass of gauge vector mesons | PRL 13 (1964) 321 | |
| 3 | P. W. Higgs | Broken symmetries, massless particles and gauge fields | PL12 (1964) 132 | |
| 4 | P. W. Higgs | Broken symmetries and the masses of gauge bosons | PRL 13 (1964) 508 | |
| 5 | G. S. Guralnik, C. R. Hagen, and T. W. B. Kibble | Global conservation laws and massless particles | PRL 13 (1964) 585 | |
| 6 | S. Weinberg | A model of leptons | PRL 19 (1967) 1264 | |
| 7 | A. Salam | Weak and electromagnetic interactions | in Elementary particle physics: relativistic groups and analyticity, Stockholm, 1968, Proceedings of the eighth Nobel symposium | |
| 8 | ATLAS Collaboration | Observation of a new particle in the search for the standard model Higgs boson with the ATLAS detector at the LHC | PLB 716 (2012) 1 | 1207.7214 |
| 9 | CMS Collaboration | Observation of a new boson at a mass of 125 GeV with the CMS experiment at the LHC | PLB 716 (2012) 30 | CMS-HIG-12-028 1207.7235 |
| 10 | CMS Collaboration | Observation of a new boson with mass near 125 GeV in pp collisions at $ \sqrt{s} = $ 7 and 8 TeV | JHEP 06 (2013) 081 | CMS-HIG-12-036 1303.4571 |
| 11 | CMS Collaboration | Study of the mass and spin-parity of the Higgs boson candidate via its decays to Z boson pairs | PRL 110 (2013) 081803 | CMS-HIG-12-041 1212.6639 |
| 12 | CMS Collaboration | Measurement of the properties of a Higgs boson in the four-lepton final state | PRD 89 (2014) 092007 | CMS-HIG-13-002 1312.5353 |
| 13 | CMS Collaboration | Constraints on the spin-parity and anomalous HVV couplings of the Higgs boson in proton collisions at 7 and 8 TeV | PRD 92 (2015) 012004 | CMS-HIG-14-018 1411.3441 |
| 14 | ATLAS Collaboration | Evidence for the spin-0 nature of the Higgs boson using ATLAS data | PLB 726 (2013) 120 | 1307.1432 |
| 15 | ATLAS Collaboration | Study of the spin and parity of the Higgs boson in diboson decays with the ATLAS detector | EPJC 75 (2015) 476 | 1506.05669 |
| 16 | G. C. Branco et al. | Theory and phenomenology of two-Higgs-doublet models | PR 516 (2012) 1 | 1106.0034 |
| 17 | C. Caillol, B. Clerbaux, J.-M. Fr\'ere, and S. Mollet | Precision versus discovery: A simple benchmark | EPJPlus 129 (2014) 93 | 1304.0386 |
| 18 | CMS Collaboration | Search for a Higgs boson in the mass range from 145 to 1000 GeV decaying to a pair of W or Z bosons | JHEP 10 (2015) 144 | CMS-HIG-13-031 1504.00936 |
| 19 | ATLAS Collaboration | Search for an additional, heavy Higgs boson in the H $ \rightarrow $ ZZ decay channel at $ \sqrt{s} = $ 8 TeV in pp collision data with the ATLAS detector | EPJC 76 (2016) 45 | 1507.05930 |
| 20 | ATLAS Collaboration | Search for a high-mass Higgs boson decaying to a W boson pair in pp collisions at $ \sqrt{s} = $ 8 TeV with the ATLAS detector | JHEP 01 (2016) 032 | 1509.00389 |
| 21 | N. Kauer and G. Passarino | Inadequacy of zero-width approximation for a light Higgs boson signal | JHEP 08 (2012) 116 | 1206.4803 |
| 22 | S. Goria, G. Passarino, and D. Rosco | The Higgs boson lineshape | NPB 864 (2012) 530 | 1112.5517 |
| 23 | CMS Collaboration | The CMS experiment at the CERN LHC | JINST 3 (2008) S08004 | CMS-00-001 |
| 24 | CMS Collaboration | Particle-flow reconstruction and global event description with the CMS detector | JINST 12 (2017) P10003 | CMS-PRF-14-001 1706.04965 |
| 25 | M. Cacciari, G. P. Salam, and G. Soyez | The anti-$ {k_{\mathrm{T}}} $ jet clustering algorithm | JHEP 04 (2008) 063 | 0802.1189 |
| 26 | M. Cacciari, G. P. Salam, and G. Soyez | FastJet user manual | EPJC 72 (2012) 1896 | 1111.6097 |
| 27 | CMS Collaboration | Performance of CMS muon reconstruction in pp collision events at $ \sqrt{s} = $ 7 TeV | JINST 7 (2012) P10002 | CMS-MUO-10-004 1206.4071 |
| 28 | CMS Collaboration | The CMS trigger system | JINST 12 (2017) P01020 | CMS-TRG-12-001 1609.02366 |
| 29 | CMS Collaboration | Performance of electron reconstruction and selection with the CMS detector in proton-proton collisions at $ \sqrt{s} = $ 8 TeV | JINST 10 (2015) P06005 | CMS-EGM-13-001 1502.02701 |
| 30 | CMS Collaboration | Jet energy scale and resolution in the CMS experiment in pp collisions at 8 TeV | JINST 12 (2017) P02014 | CMS-JME-13-004 1607.03663 |
| 31 | S. Frixione, P. Nason, and C. Oleari | Matching NLO QCD computations with parton shower simulations: the POWHEG method | JHEP 11 (2007) 070 | 0709.2092 |
| 32 | E. Bagnaschi, G. Degrassi, P. Slavich, and A. Vicini | Higgs production via gluon fusion in the POWHEG approach in the SM and in the MSSM | JHEP 02 (2012) 088 | 1111.2854 |
| 33 | P. Nason and C. Oleari | NLO Higgs boson production via vector-boson fusion matched with shower in POWHEG | JHEP 02 (2010) 037 | 0911.5299 |
| 34 | P. Nason | A New method for combining NLO QCD with shower Monte Carlo algorithms | JHEP 11 (2004) 040 | hep-ph/0409146 |
| 35 | S. Alioli, P. Nason, C. Oleari, and E. Re | A general framework for implementing NLO calculations in shower Monte Carlo programs: the POWHEG BOX | JHEP 06 (2010) 043 | 1002.2581 |
| 36 | Y. Gao et al. | Spin determination of single-produced resonances at hadron colliders | PRD 81 (2010) 075022 | 1001.3396 |
| 37 | S. Bolognesi et al. | Spin and parity of a single-produced resonance at the LHC | PRD 86 (2012) 095031 | 1208.4018 |
| 38 | I. Anderson et al. | Constraining anomalous HVV interactions at proton and lepton colliders | PRD 89 (2014) 035007 | 1309.4819 |
| 39 | A. V. Gritsan, R. Roentsch, M. Schulze, and M. Xiao | Constraining anomalous Higgs boson couplings to the heavy flavor fermions using matrix element techniques | PRD 94 (2016) 055023 | 1606.03107 |
| 40 | J. M. Campbell and R. K. Ellis | MCFM for the Tevatron and the LHC | NPPS 205 (2010) 10 | 1007.3492 |
| 41 | J. M. Campbell, R. K. Ellis, and C. Williams | Vector boson pair production at the LHC | JHEP 07 (2011) 018 | 1105.0020 |
| 42 | J. M. Campbell, R. K. Ellis, and C. Williams | Bounding the Higgs width at the LHC using full analytic results for $ \mathrm{g}\mathrm{g}\to \mathrm{e^-}\mathrm{e^+} \mu^- \mu^+ $ | JHEP 04 (2014) 060 | 1311.3589 |
| 43 | A. Ballestrero et al. | PHANTOM: a Monte Carlo event generator for six parton final states at high energy colliders | CPC 180 (2009) 401 | 0801.3359 |
| 44 | NNPDF Collaboration | Parton distributions for the LHC run II | JHEP 04 (2015) 040 | 1410.8849 |
| 45 | S. Catani and M. Grazzini | An NNLO subtraction formalism in hadron collisions and its application to Higgs boson production at the LHC | PRL 98 (2007) 222002 | hep-ph/0703012 |
| 46 | M. Grazzini | NNLO predictions for the Higgs boson signal in the H $ \rightarrow WW \rightarrow \ell\nu \ell\nu $ and H$ \rightarrow ZZ \rightarrow 4\ell $ decay channels | JHEP 02 (2008) 043 | 0801.3232 |
| 47 | M. Grazzini and H. Sargsyan | Heavy-quark mass effects in Higgs boson production at the LHC | JHEP 09 (2013) 129 | 1306.4581 |
| 48 | F. Caola, K. Melnikov, R. Roentsch, and L. Tancredi | QCD corrections to ZZ production in gluon fusion at the LHC | PRD 92 (2015) 094028 | 1509.06734 |
| 49 | K. Melnikov and M. Dowling | Production of two Z-bosons in gluon fusion in the heavy top quark approximation | PLB 744 (2015) 43 | 1503.01274 |
| 50 | C. Anastasiou et al. | High precision determination of the gluon fusion Higgs boson cross-section at the LHC | JHEP 05 (2016) 058 | 1602.00695 |
| 51 | D. de Florian et al. | Handbook of LHC Higgs Cross Sections: 4. Deciphering the Nature of the Higgs Sector | CERN-2017-002-M | 1610.07922 |
| 52 | P. Nason and G. Zanderighi | WW, WZ, and ZZ production in the POWHEG-BOX-V2 | EPJC 74 (2014) 2702 | 1311.1365 |
| 53 | J. Alwall et al. | The automated computation of tree-level and next-to-leading order differential cross sections, and their matching to parton shower simulations | JHEP 07 (2014) 079 | 1405.0301 |
| 54 | T. Sjostrand, S. Mrenna, and P. Z. Skands | A brief introduction to PYTHIA 8.1 | CPC 178 (2008) 852 | hep-ph/0710.3820 |
| 55 | M. Grazzini, S. Kallweit, D. Rathlev, and M. Wiesemann | WZ production at hadron colliders in NNLO QCD | PLB 761 (2016) 179 | 1604.08576 |
| 56 | R. Frederix and S. Frixione | Merging meets matching in MC@NLO | JHEP 12 (2012) 061 | 1209.6215 |
| 57 | S. Frixione, P. Nason, and G. Ridolfi | A positive-weight next-to-leading-order Monte Carlo for heavy flavour hadroproduction | JHEP 09 (2007) 126 | 0707.3088 |
| 58 | CMS Collaboration | Event generator tunes obtained from underlying event and multiparton scattering measurements | EPJC 76 (2016) 155 | hep-ph/1512.00815 |
| 59 | S. Agostinelli et al. | GEANT4---a simulation toolkit | NIMA 506 (2003) 250 | |
| 60 | CMS Collaboration | Limits on the Higgs boson lifetime and width from its decay to four charged leptons | PRD 92 (2015) 072010 | CMS-HIG-14-036 1507.06656 |
| 61 | M. Cacciari and G. P. Salam | Pileup subtraction using jet areas | PLB 659 (2008) 119 | 0707.1378 |
| 62 | M. Cacciari, G. P. Salam, and G. Soyez | The catchment area of jets | JHEP 04 (2008) 005 | 0802.1188 |
| 63 | CMS Collaboration | Measurements of properties of the Higgs boson decaying into the four-lepton final state in pp collisions at $ \sqrt{s}= $ 13 TeV | JHEP 11 (2017) 047 | CMS-HIG-16-041 1706.09936 |
| 64 | R. Fruhwirth | Application of Kalman filtering to track and vertex fitting | NIMA 262 (1987) 444 | |
| 65 | CMS Collaboration | Measurement of the inclusive W and Z production cross sections in pp collisions at $ \sqrt{s} = $ 7 TeV | JHEP 10 (2011) 132 | CMS-EWK-10-005 1107.4789 |
| 66 | CMS Collaboration | Identification of b-quark jets with the CMS experiment | JINST 8 (2013) P04013 | CMS-BTV-12-001 1211.4462 |
| 67 | CMS Collaboration | Identification of b quark jets at the CMS experiment in the LHC Run 2 | CMS-PAS-BTV-15-001 | CMS-PAS-BTV-15-001 |
| 68 | Particle Data Group, C. Patrignani et al. | Review of particle physics | CPC 40 (2016) 100001 | |
| 69 | S. D. Ellis, C. K. Vermilion, and J. R. Walsh | Recombination algorithms and jet substructure: Pruning as a tool for heavy particle searches | PRD 81 (2010) 094023 | hep-ph/0912.0033 |
| 70 | J. M. Butterworth, A. R. Davison, M. Rubin, and G. P. Salam | Jet substructure as a new Higgs search channel at the LHC | PRL 100 (2008) 242001 | hep-ph/0802.2470 |
| 71 | J. M. Butterworth, A. R. Davison, M. Rubin, and G. P. Salam | Maximizing boosted top identification by minimizing N-subjettiness | JHEP 02 (2012) 093 | hep-ph/1108.2701 |
| 72 | M. Grazzini, S. Kallweit, and D. Rathlev | ZZ production at the LHC: Fiducial cross sections and distributions in NNLO QCD | PLB 750 (2015) 407 | 1507.06257 |
| 73 | S. Gieseke, T. Kasprzik, and J. H. Kuehn | Vector-boson pair production and electroweak corrections in HERWIG++ | EPJC 74 (2014) 2988 | 1401.3964 |
| 74 | A. Manohar, P. Nason, G. P. Salam, and G. Zanderighi | How bright is the proton? A precise determination of the photon parton distribution function | PRL 117 (2016) 242002 | 1607.04266 |
| 75 | J. Baglio, L. D. Ninh, and M. M. Weber | Massive gauge boson pair production at the LHC: a next-to-leading order story | PRD 88 (2013) 113005 | 1307.4331 |
| 76 | S. Frixione et al. | Electroweak and QCD corrections to top-pair hadroproduction in association with heavy bosons | JHEP 06 (2015) 184 | 1504.03446 |
| 77 | S. Frixione et al. | Weak corrections to Higgs hadroproduction in association with a top-quark pair | JHEP 09 (2014) 065 | 1407.0823 |
| 78 | L. Landau | On the energy loss of fast particles by ionization | J. Phys. (USSR) 8 (1944)201 | |
| 79 | M. Bahr et al. | Herwig++ physics and manual | EPJC 58 (2008) 639 | 0803.0883 |
| 80 | T. Junk | Confidence level computation for combining searches with small statistics | NIMA 434 (1999) 435 | hep-ex/9902006 |
| 81 | A. L. Read | Presentation of search results: The CL$ _\mathrm{s} $ technique | JPG 28 (2002) 2693 | |
| 82 | G. Cowan, K. Cranmer, E. Gross, and O. Vitells | Asymptotic formulae for likelihood-based tests of new physics | EPJC 71 (2011) 1554 | 1007.1727 |
|
|
Compact Muon Solenoid LHC, CERN |
|

|

|

|

|

|