

Compact Muon Solenoid
LHC, CERN
| CMS-MUO-16-001 ; CERN-EP-2018-058 | ||
| Performance of the CMS muon detector and muon reconstruction with proton-proton collisions at $\sqrt{s} = $ 13 TeV | ||
| CMS Collaboration | ||
| 12 April 2018 | ||
| JINST 13 (2018) P06015 | ||
| Abstract: The CMS muon detector system, muon reconstruction software, and high-level trigger underwent significant changes in 2013-2014 in preparation for running at higher LHC collision energy and instantaneous luminosity. The performance of the modified system is studied using proton-proton collision data at center-of-mass energy $\sqrt{s} = $ 13 TeV, collected at the LHC in 2015 and 2016. The measured performance parameters, including spatial resolution, efficiency, and timing, are found to meet all design specifications and are well reproduced by simulation. Despite the more challenging running conditions, the modified muon system is found to perform as well as, and in many aspects better than, previously. | ||
| Links: e-print arXiv:1804.04528 [physics.ins-det] (PDF) ; CDS record ; inSPIRE record ; CADI line (restricted) ; | ||
| Figures | |
png pdf |
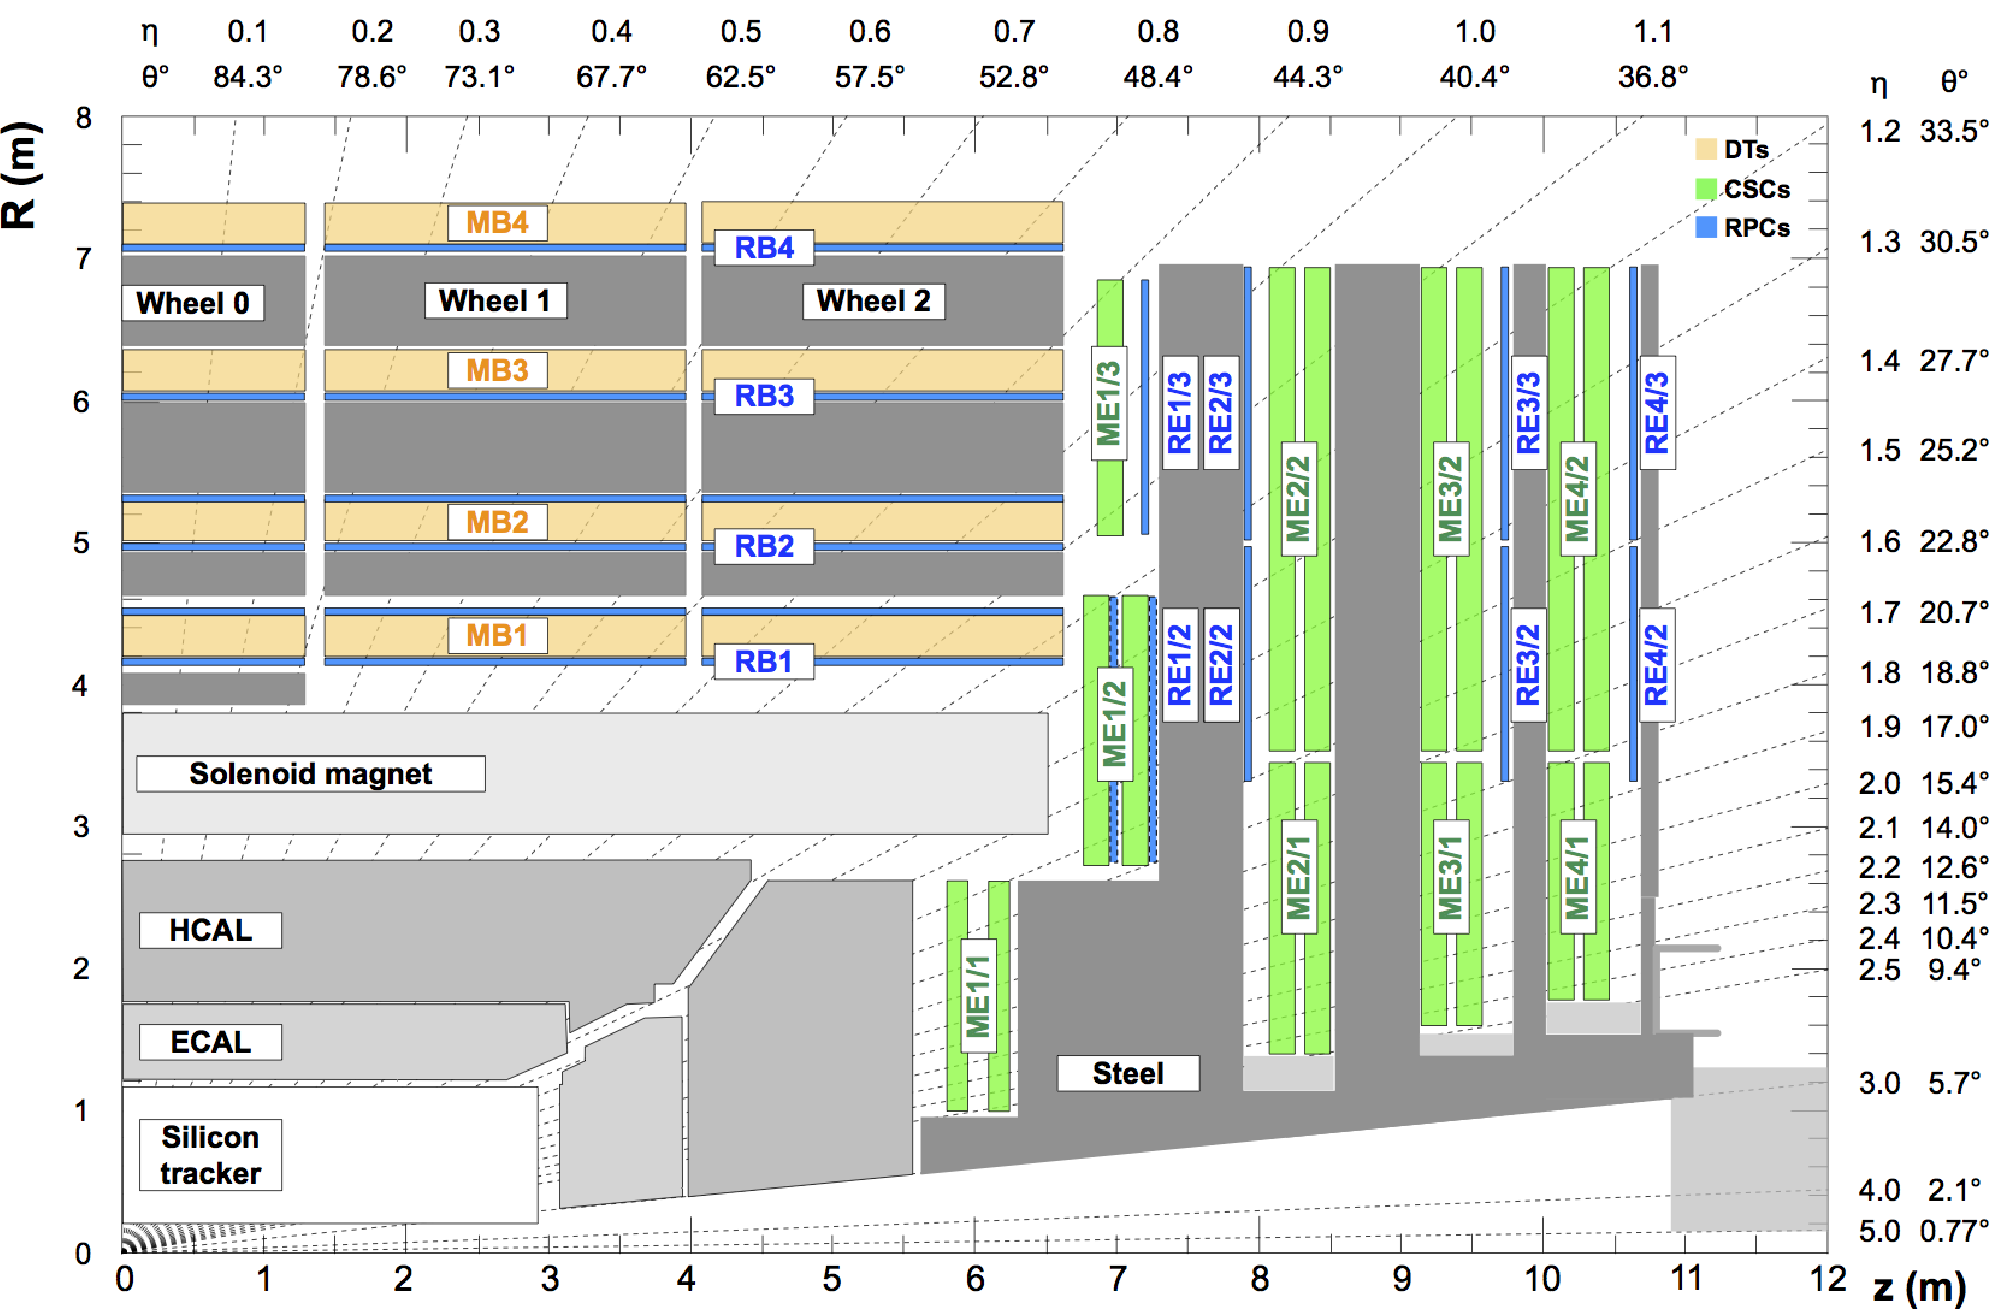
Figure 1:
An $ R $-$ z $ cross section of a quadrant of the CMS detector with the axis parallel to the beam ($ z $) running horizontally and the radius ($ R $) increasing upward. The interaction point is at the lower left corner. The locations of the various muon stations and the steel flux-return disks (dark areas) are shown. The drift tube stations (DTs) are labeled MB ("Muon Barrel'') and the cathode strip chambers (CSCs) are labeled ME ("Muon Endcap''). Resistive plate chambers (RPCs) are mounted in both the barrel and endcaps of CMS, where they are labeled RB and RE, respectively. |
png pdf |
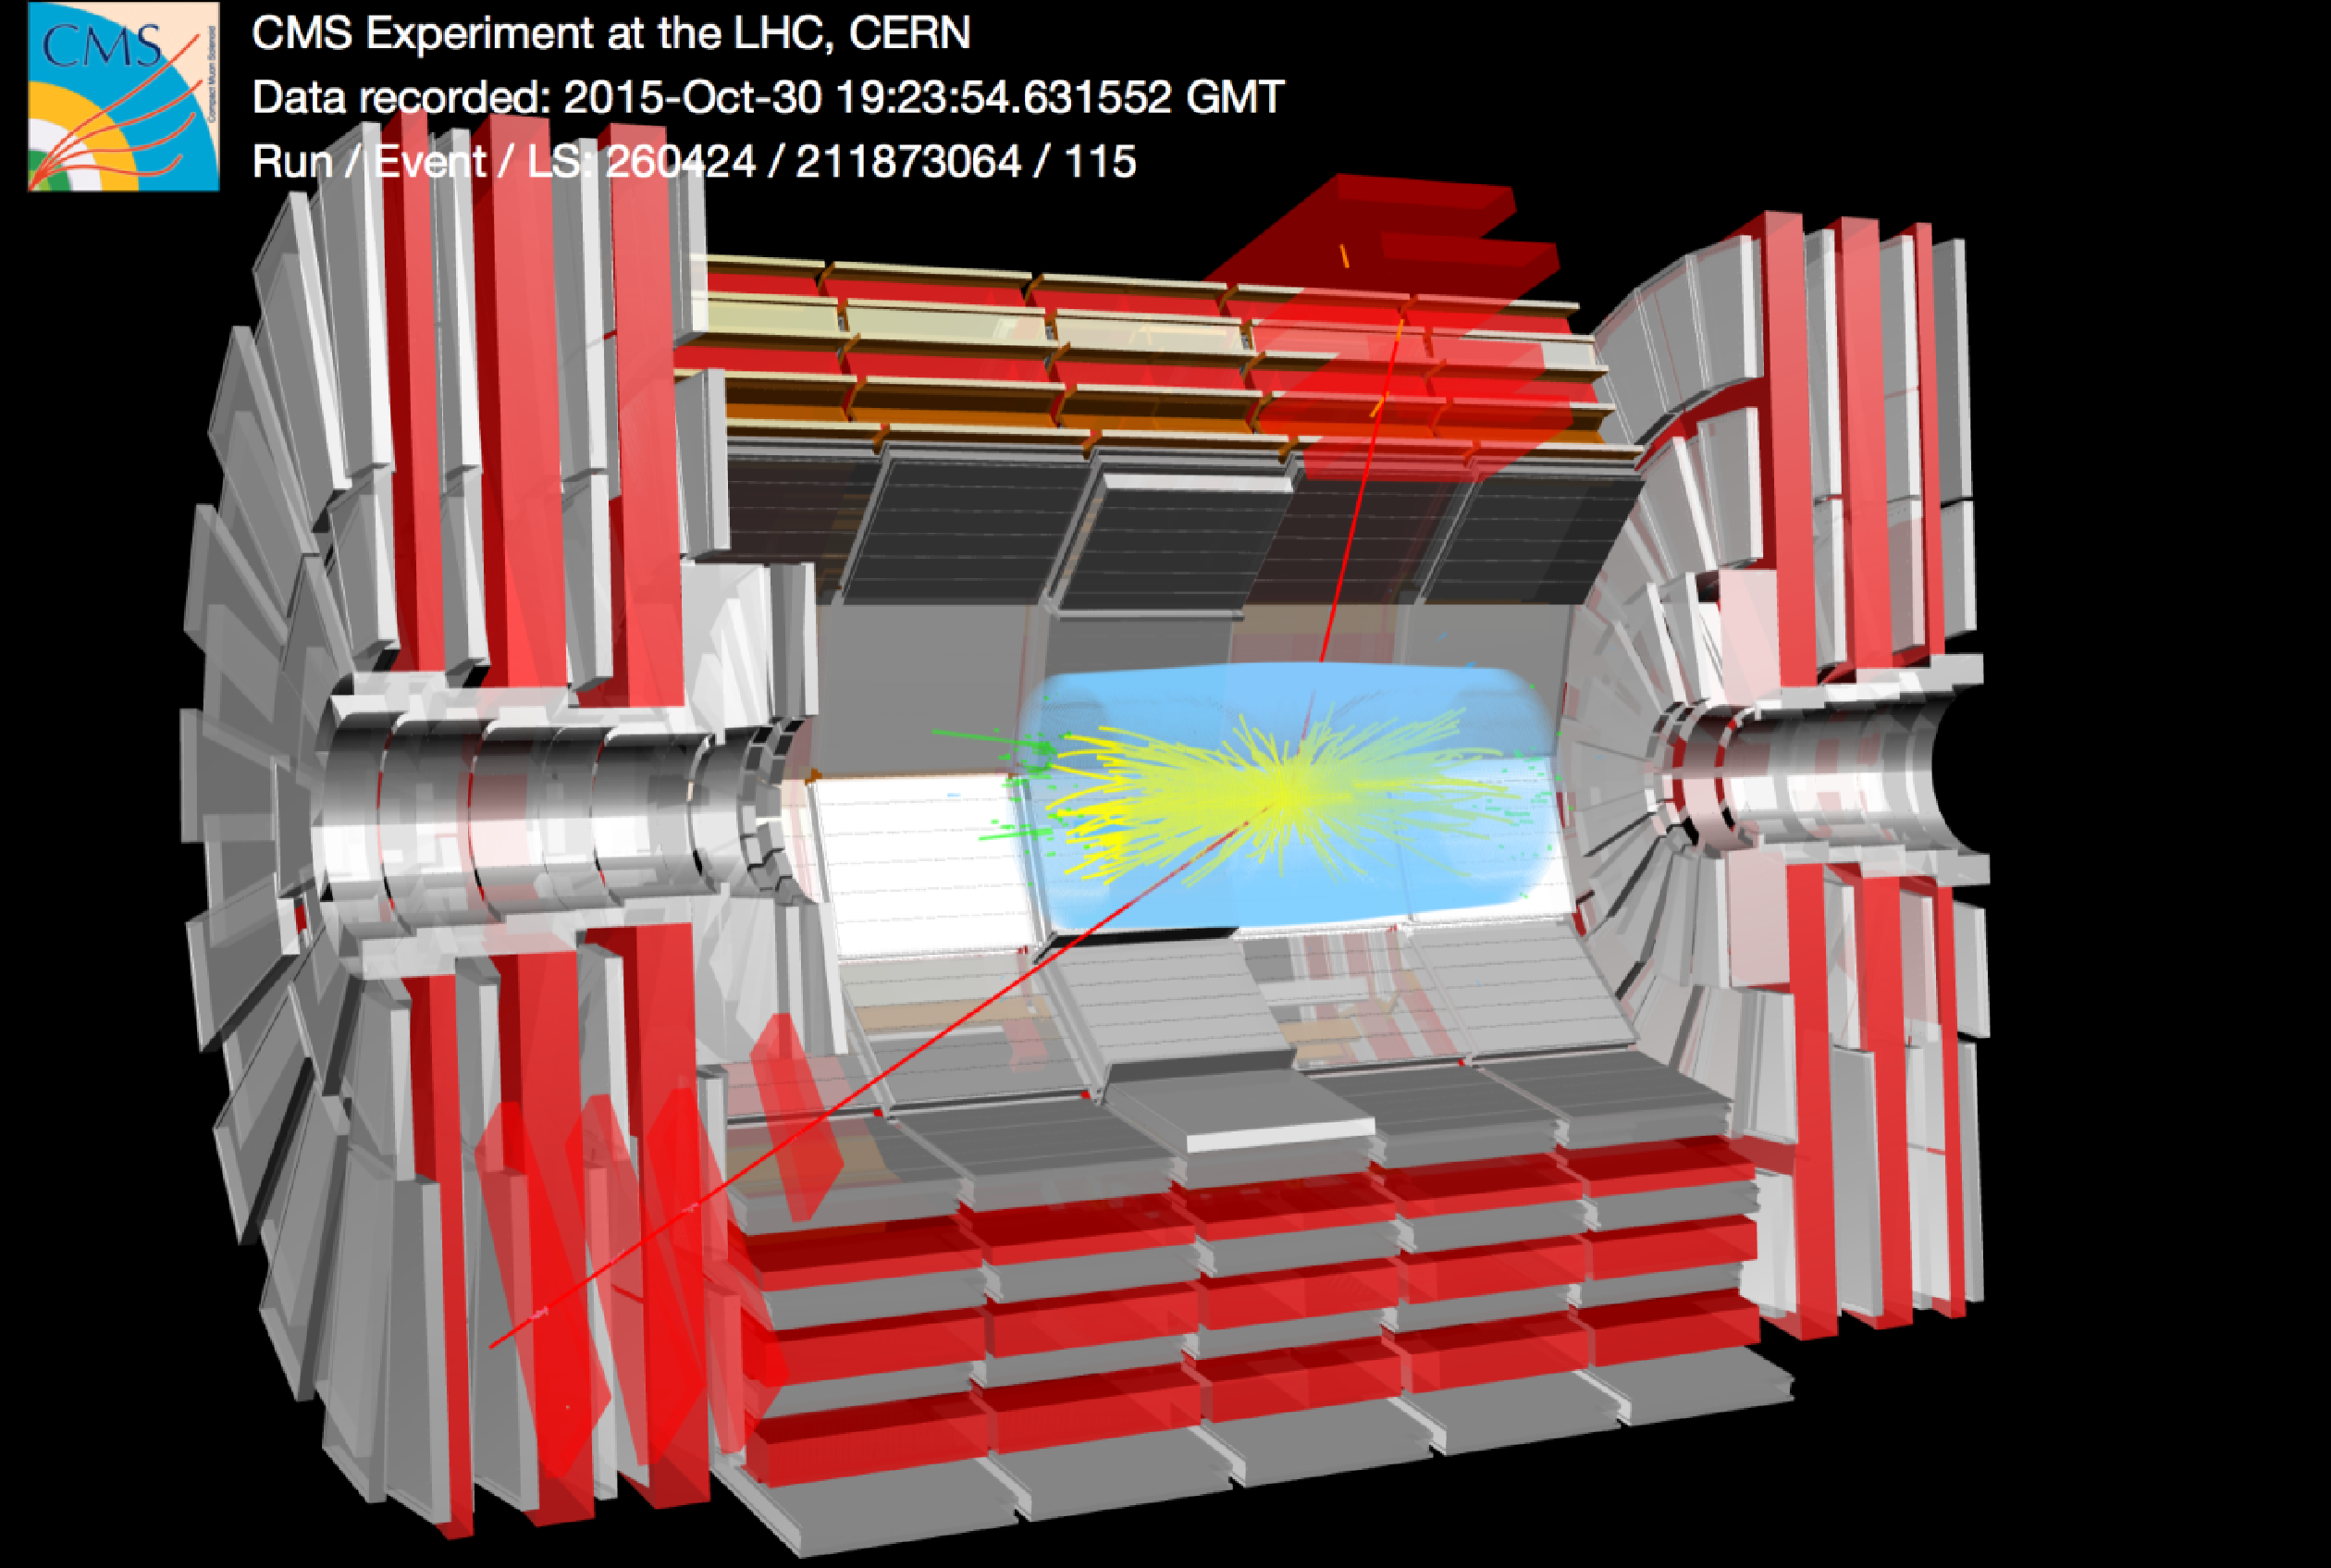
Figure 2:
A pp collision event with two reconstructed muon tracks superimposed on a cutaway image of the CMS detector. The image has been rotated around the y axis, which makes the inner tracker appear offset relative to its true position in the center of the detector. The four layers of muon chambers are interleaved with three layers of the steel flux-return yoke. The reconstructed invariant mass of the muon pair is 2.4 TeV. One muon is reconstructed in the barrel with a transverse momentum ($ {p_{\mathrm {T}}} $) of 0.7 TeV, while the second muon is reconstructed in the endcap with $ {p_{\mathrm {T}}} $ of 1.0 TeV. |
png pdf |
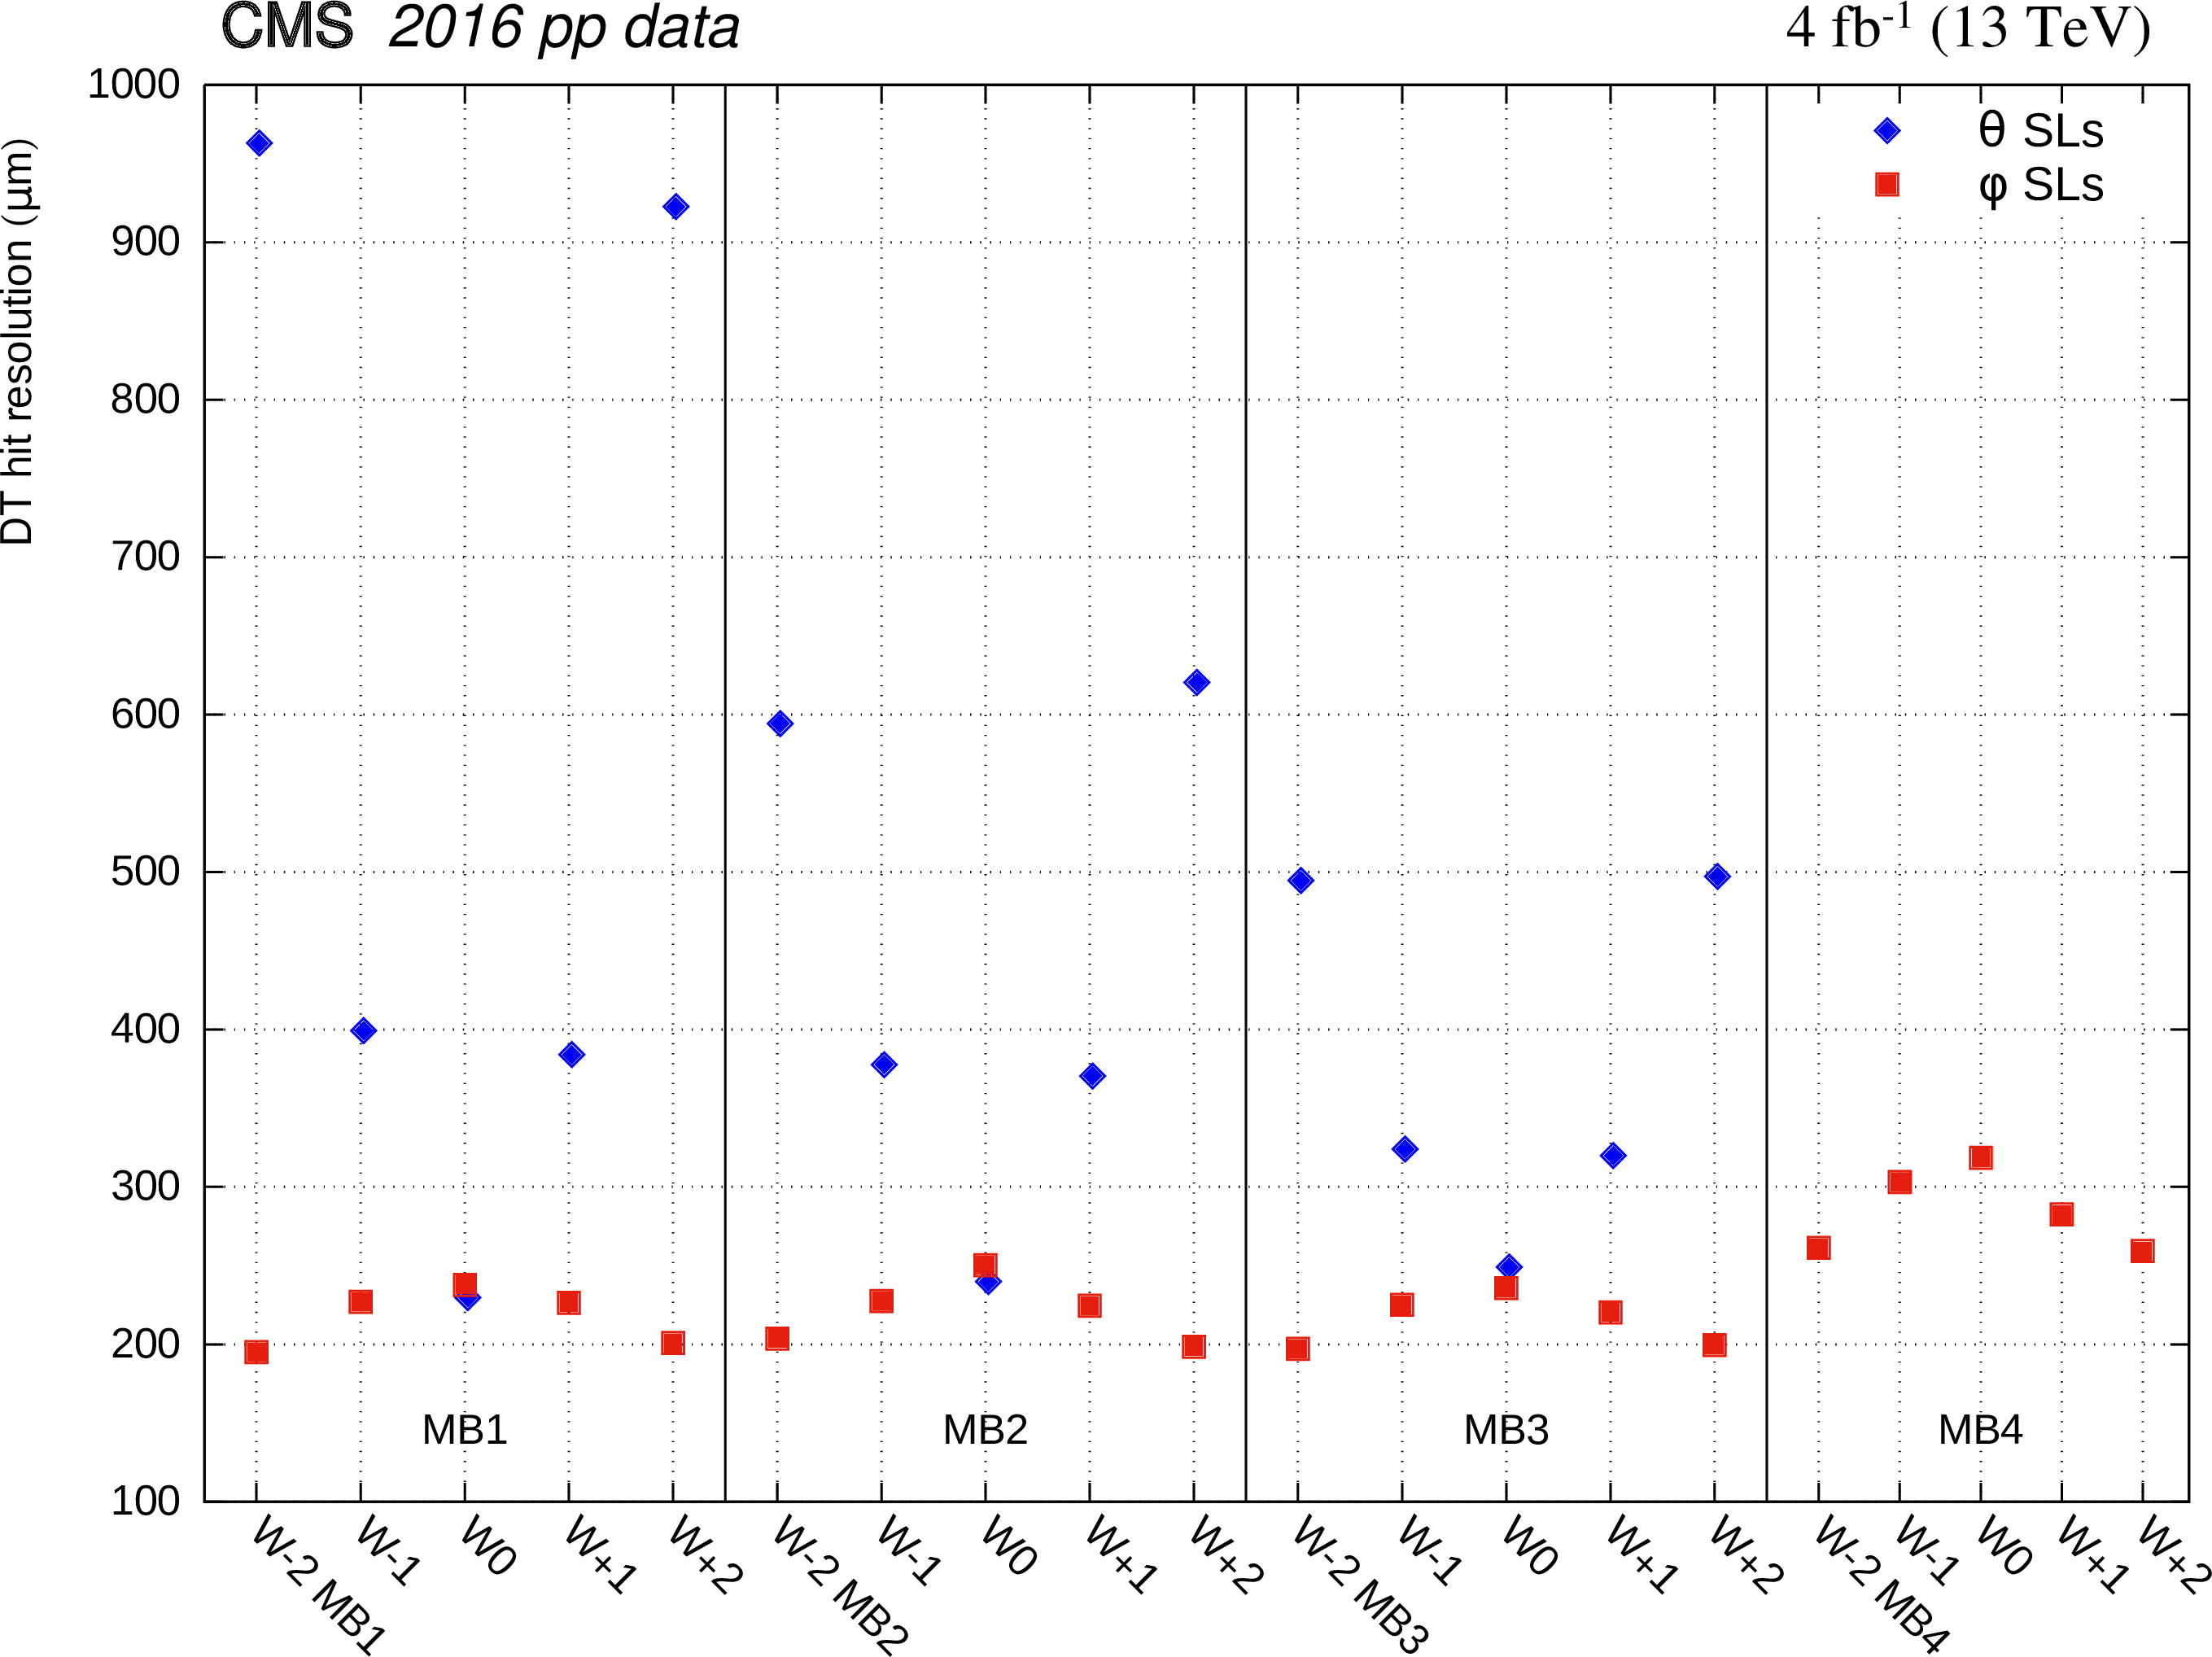
Figure 3:
Reconstructed hit resolution for DT $\phi $ superlayers (squares) and DT $\theta $ superlayers (diamonds) measured with the 2016 data, plotted as a function of station and wheel. The uncertainties in these values are smaller than the marker size in the figure. |
png pdf |
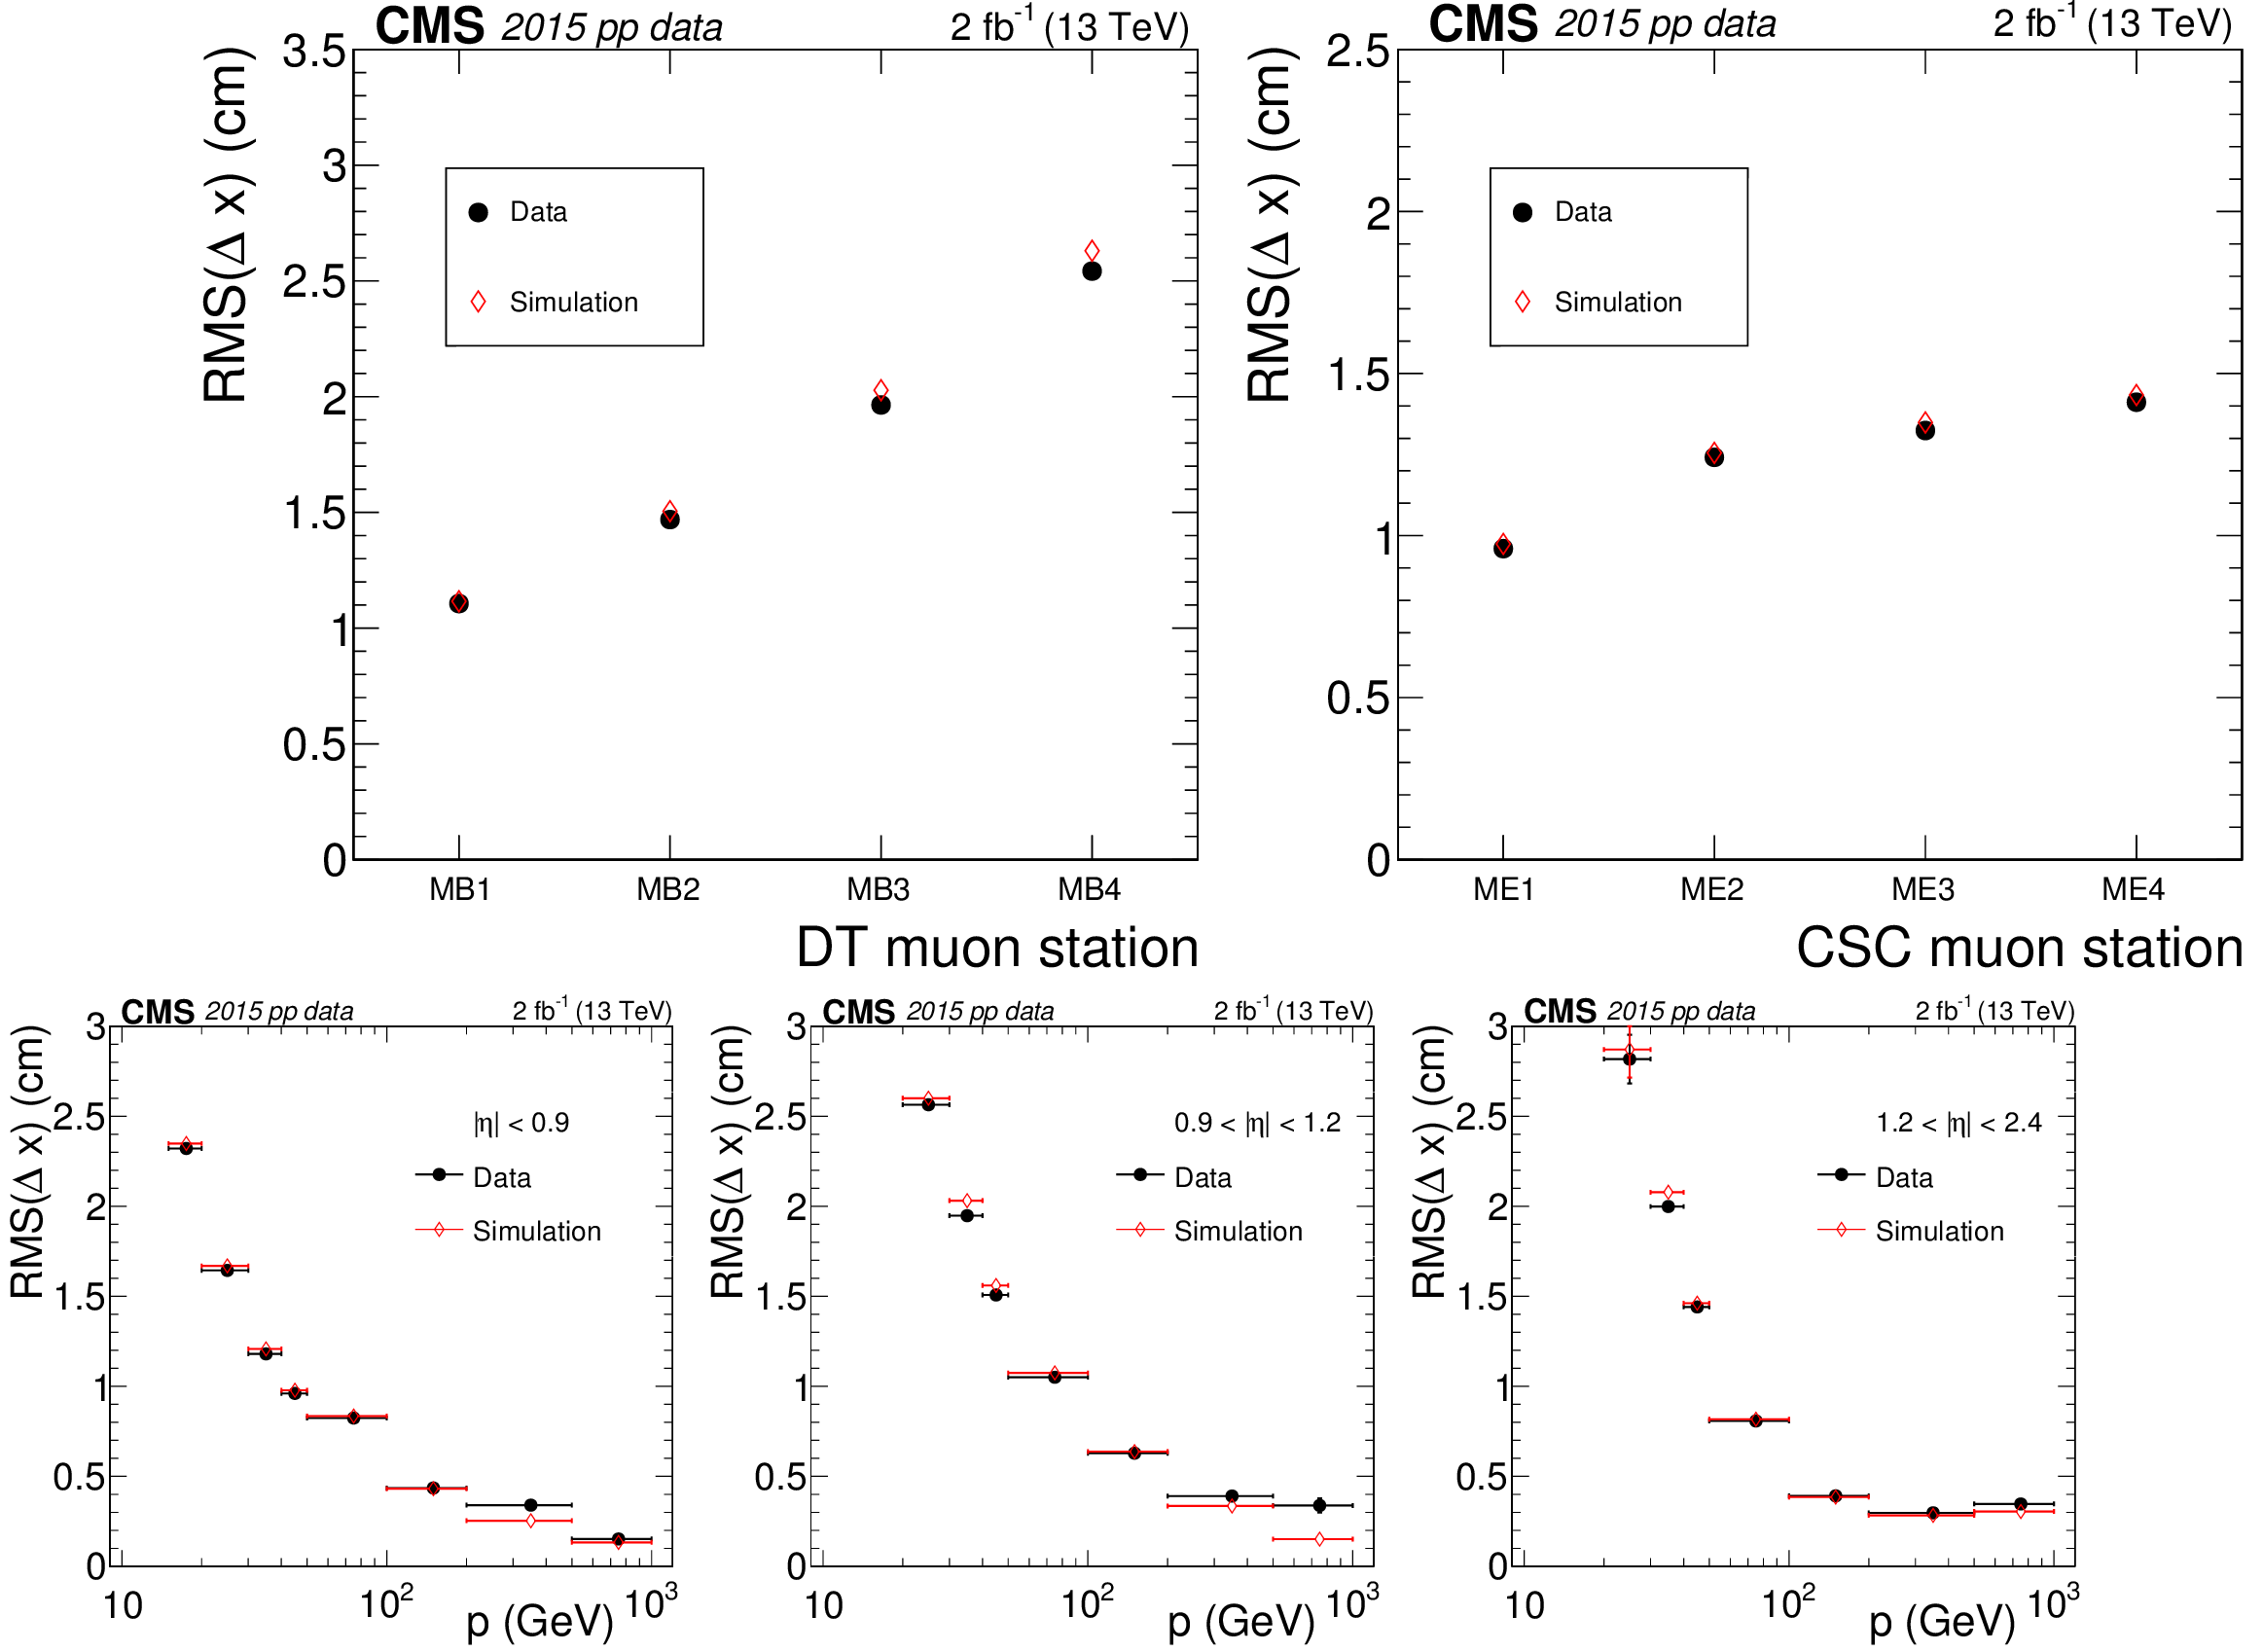
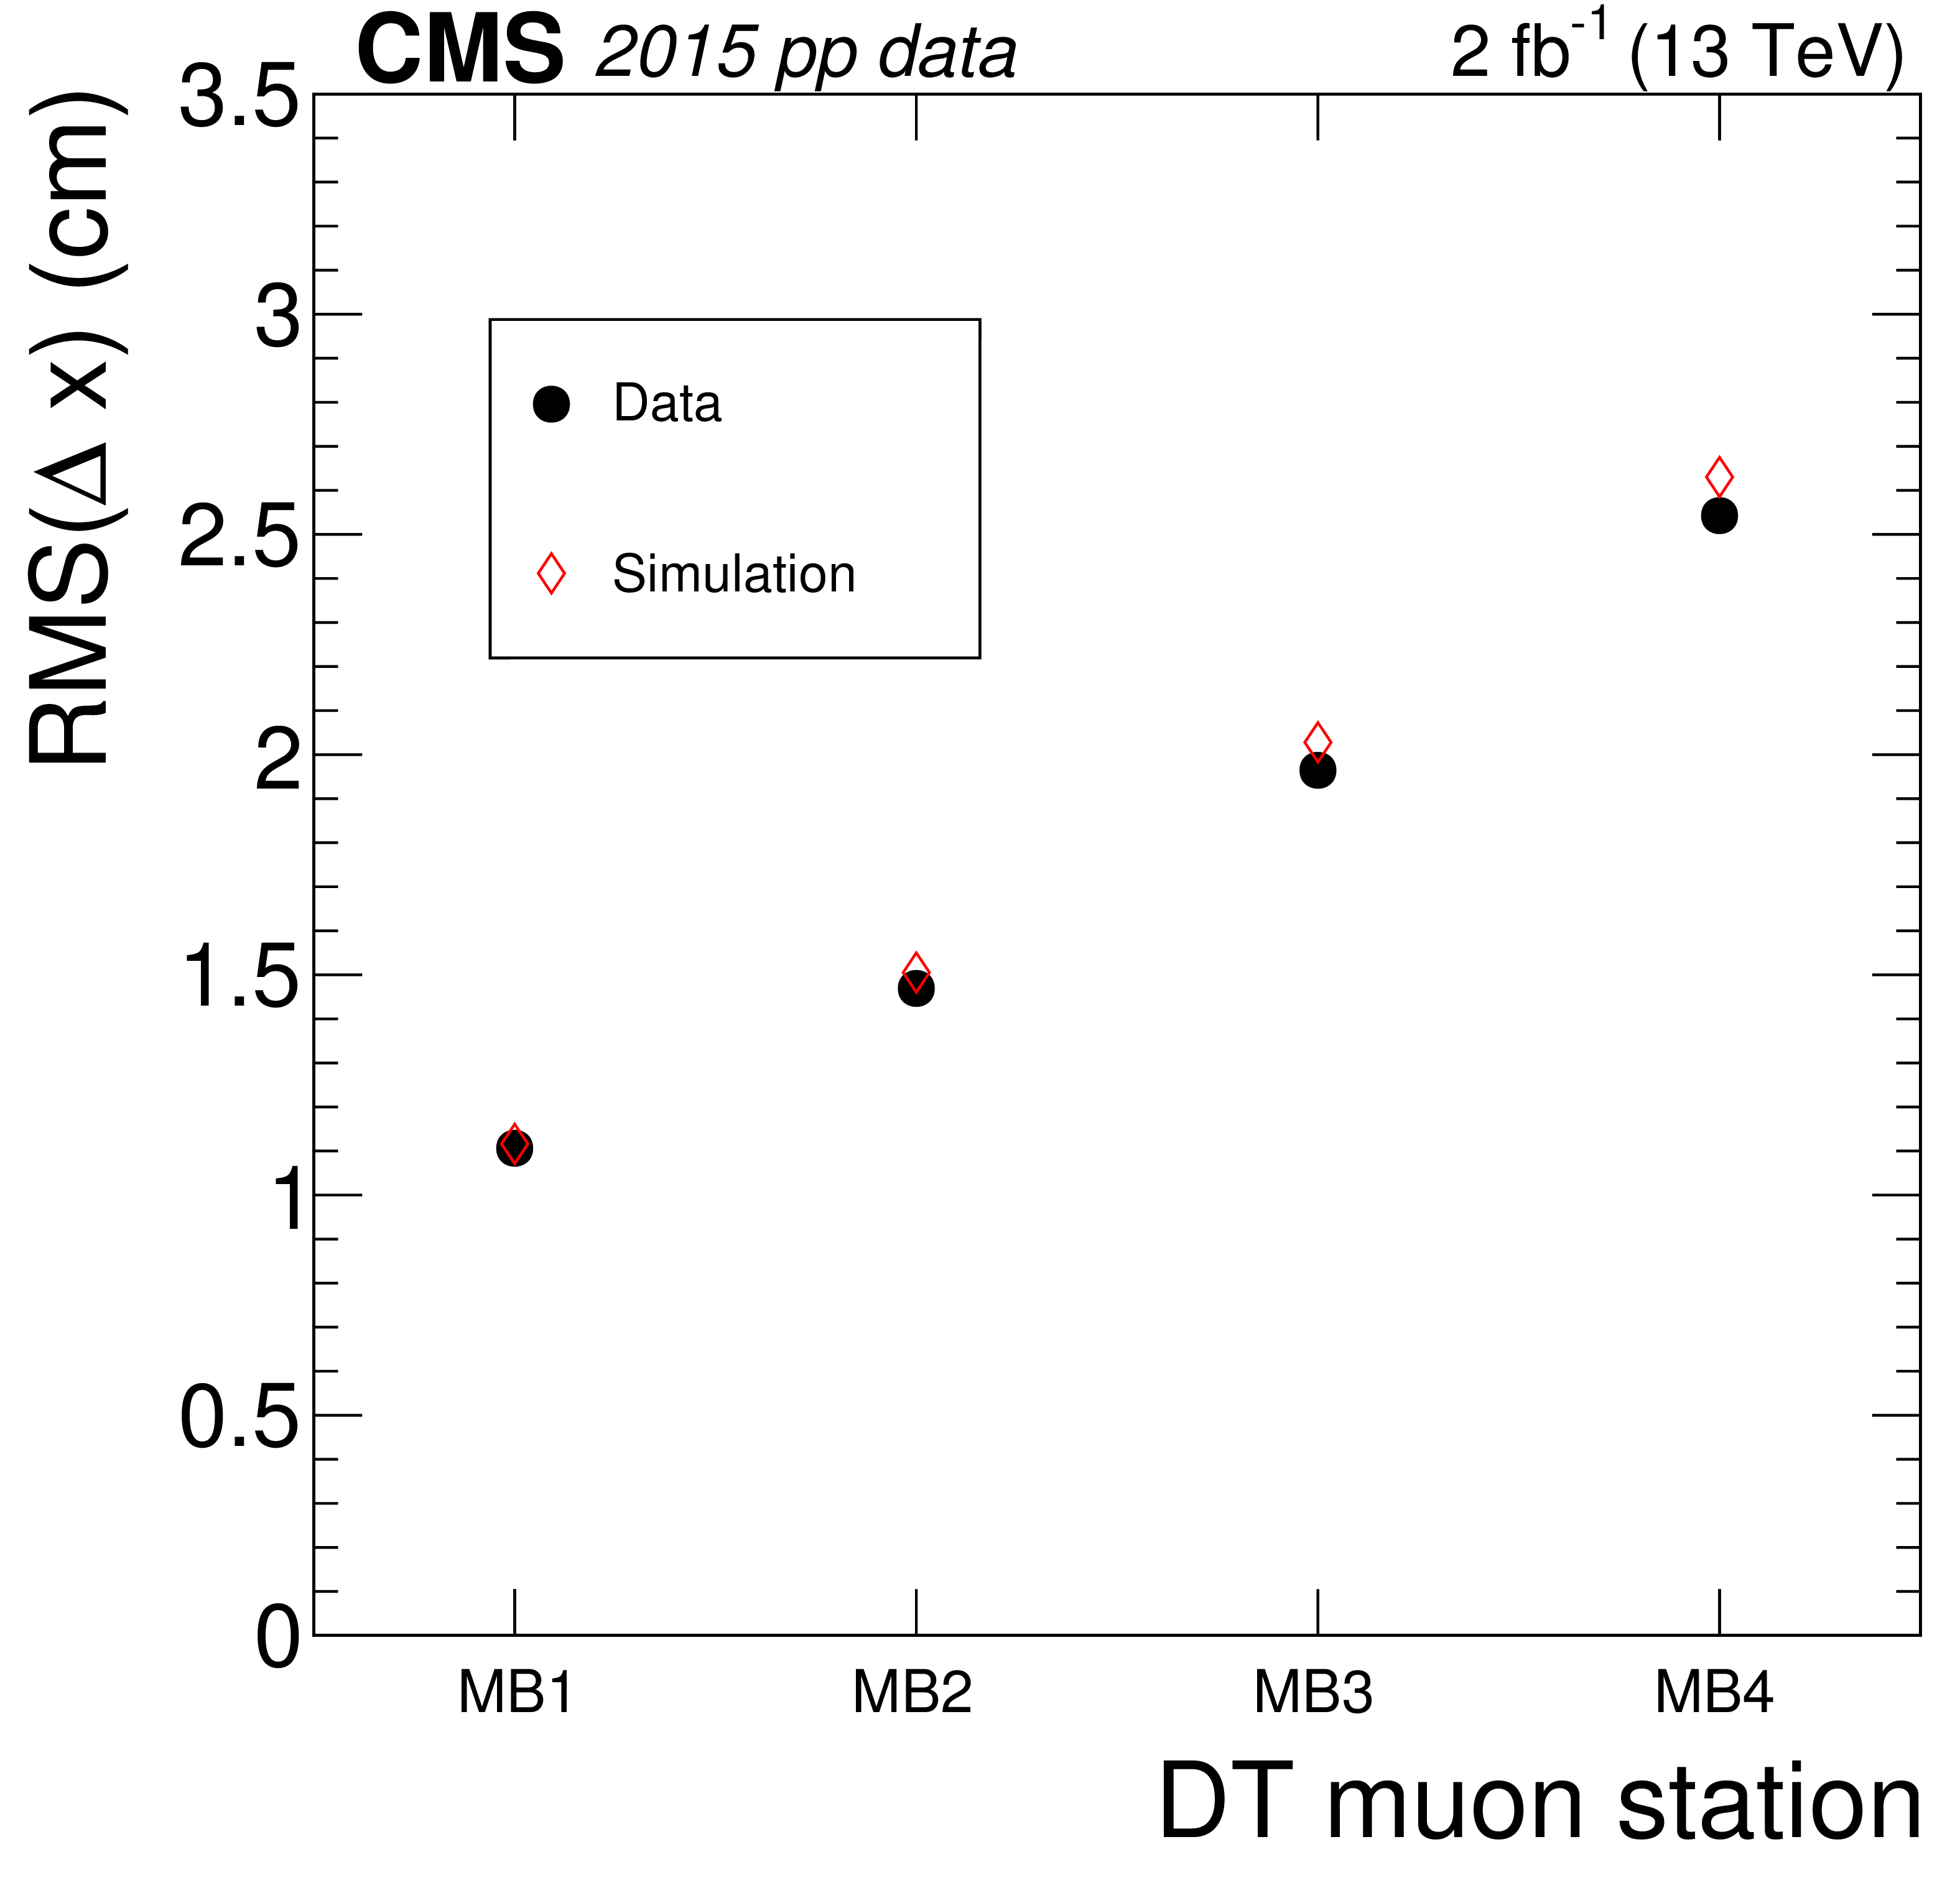
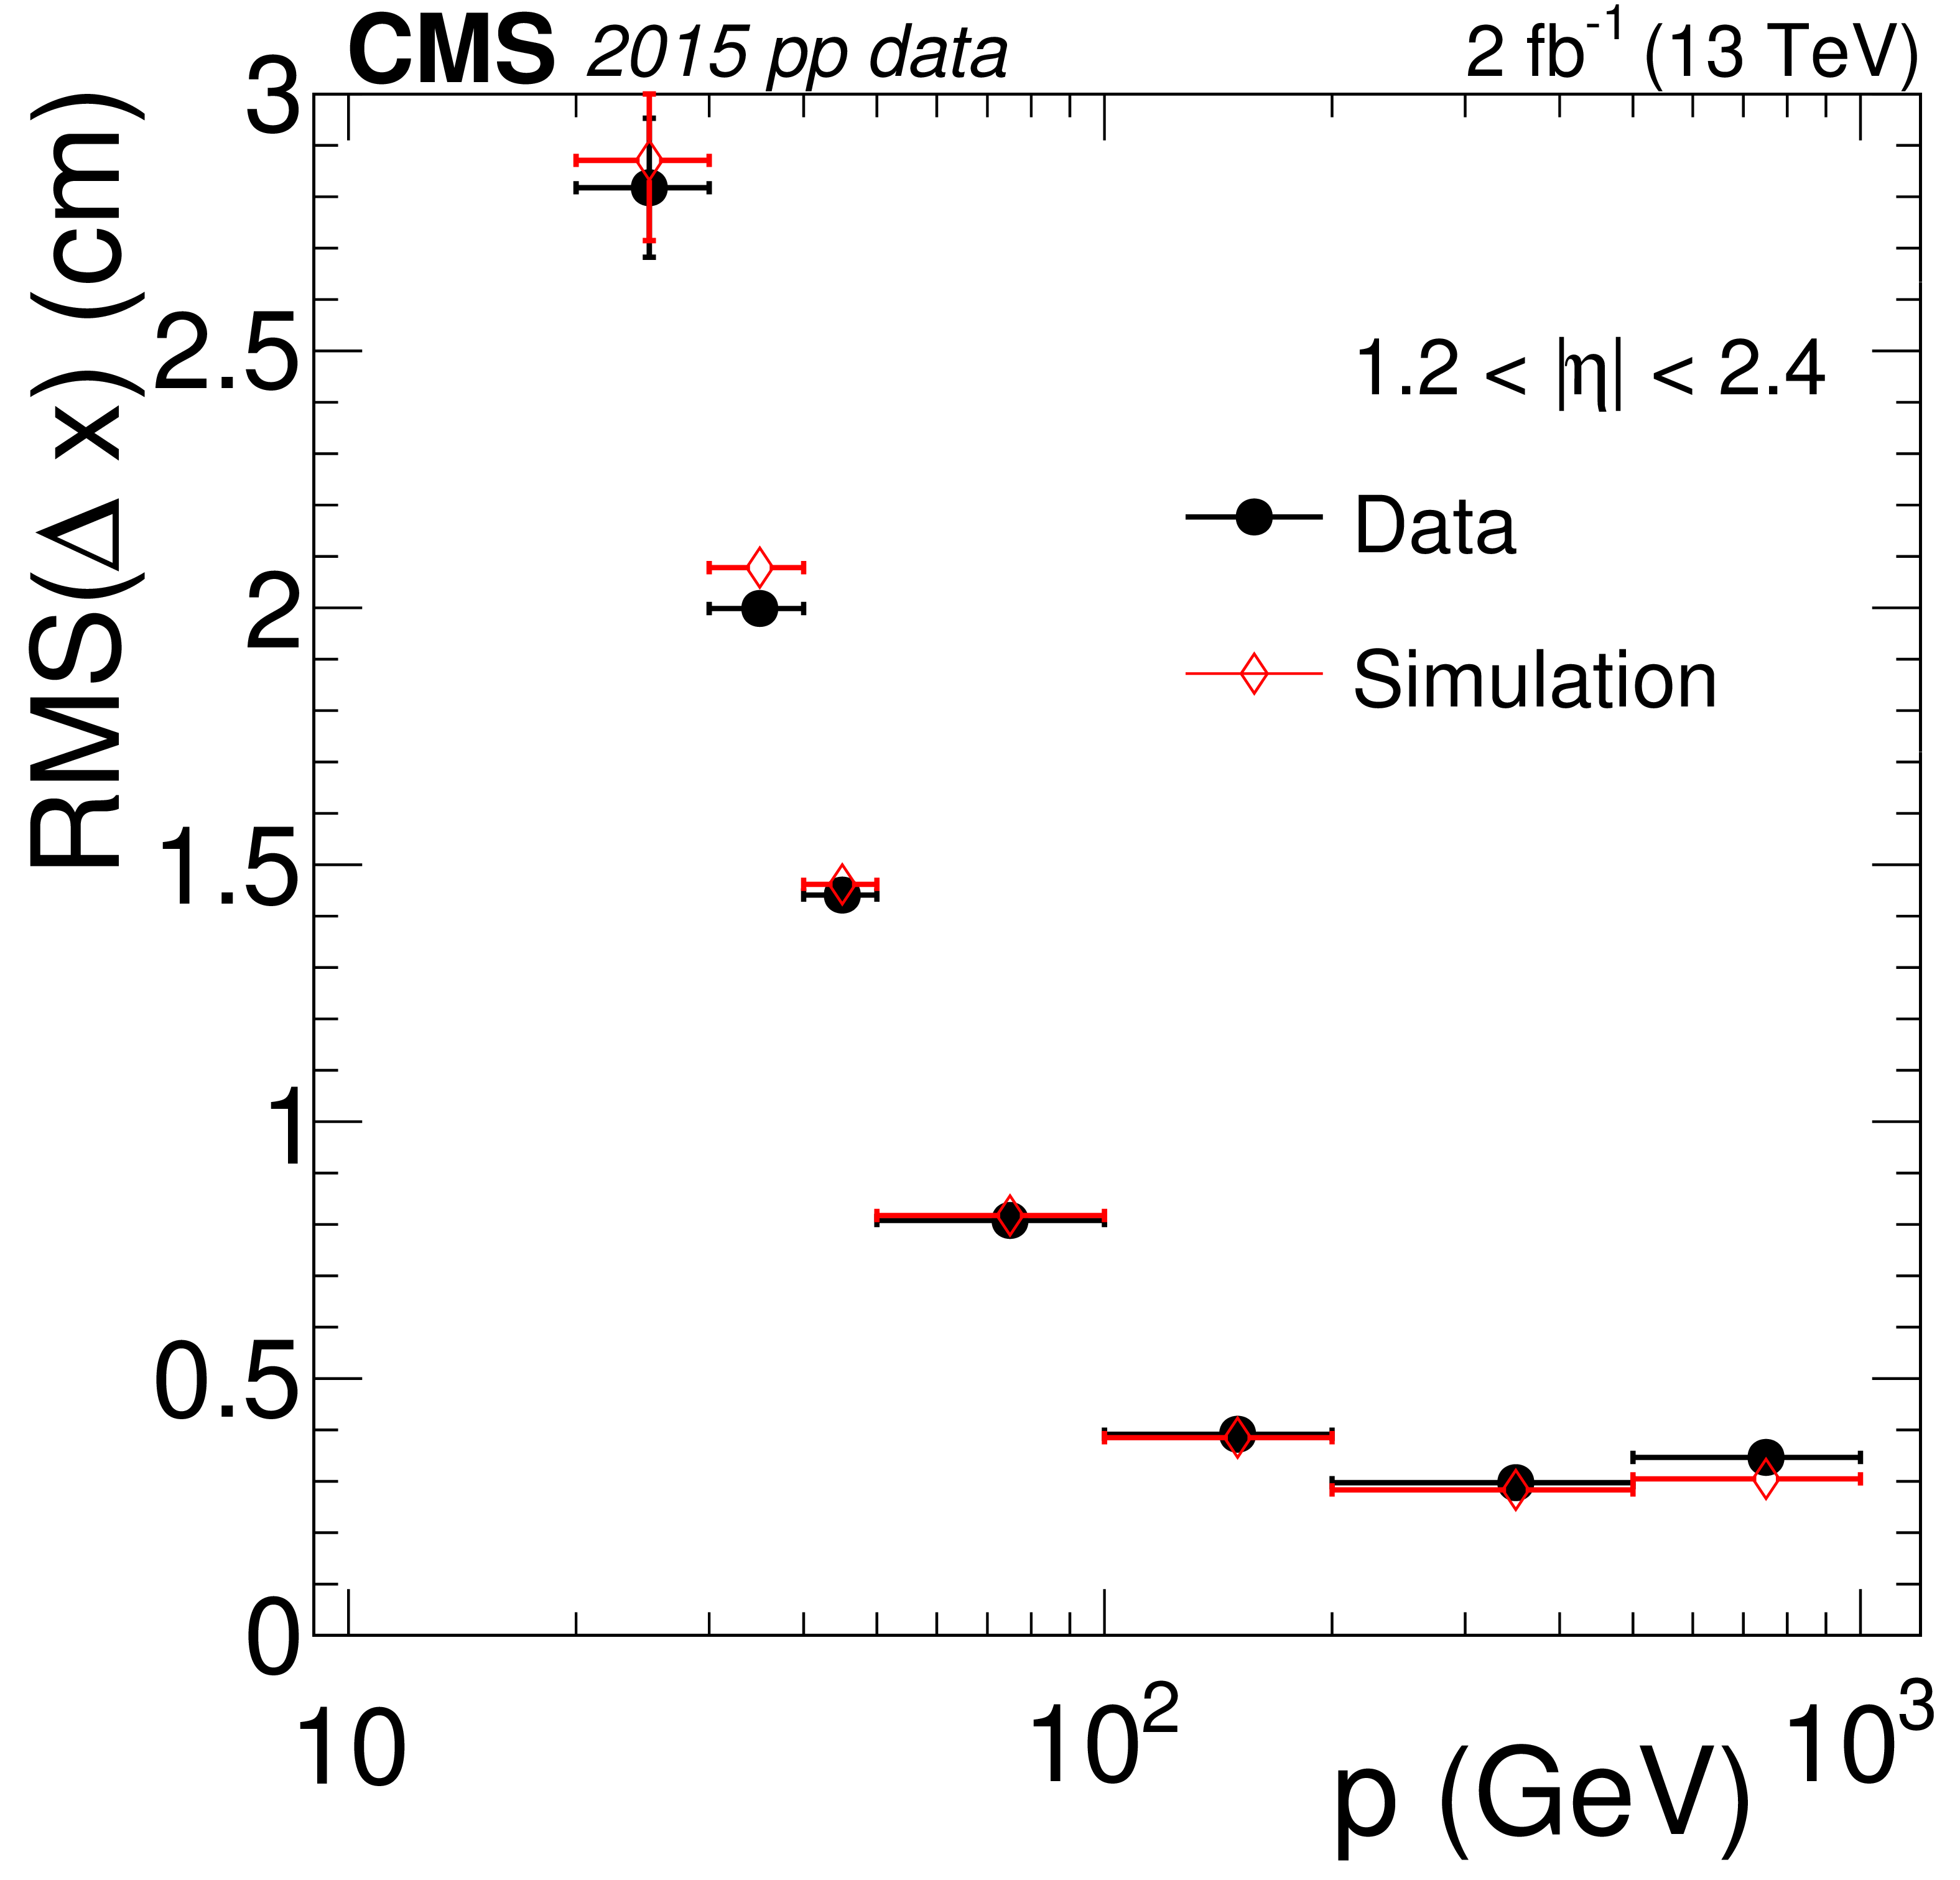
Figure 4:
The RMS of transverse residuals between reconstructed segments and propagated tracker tracks, measured in 2015 data. Results are plotted as a function of: (upper left) MB station in the DTs; (upper right) ME station in the CSCs; (lower left) momentum $p$ in station 1 of the barrel region ($ | \eta | \le $ 0.9); (lower center) momentum $p$ in station 1 of the overlap region ($0.9 \le | \eta | \le $ 1.2); (lower right) momentum $p$ in station 1 of the endcap region (1.2 $ \le | \eta | \le $ 2.4). The vertical error bars represent the statistical uncertainties of the RMS, and are smaller than the marker size for most data points. |
png pdf |
Figure 4-a:
The RMS of transverse residuals between reconstructed segments and propagated tracker tracks, measured in 2015 data. Results are plotted as a function of MB station in the DTs. The vertical error bars represent the statistical uncertainties of the RMS, and are smaller than the marker size for most data points. |
png pdf |
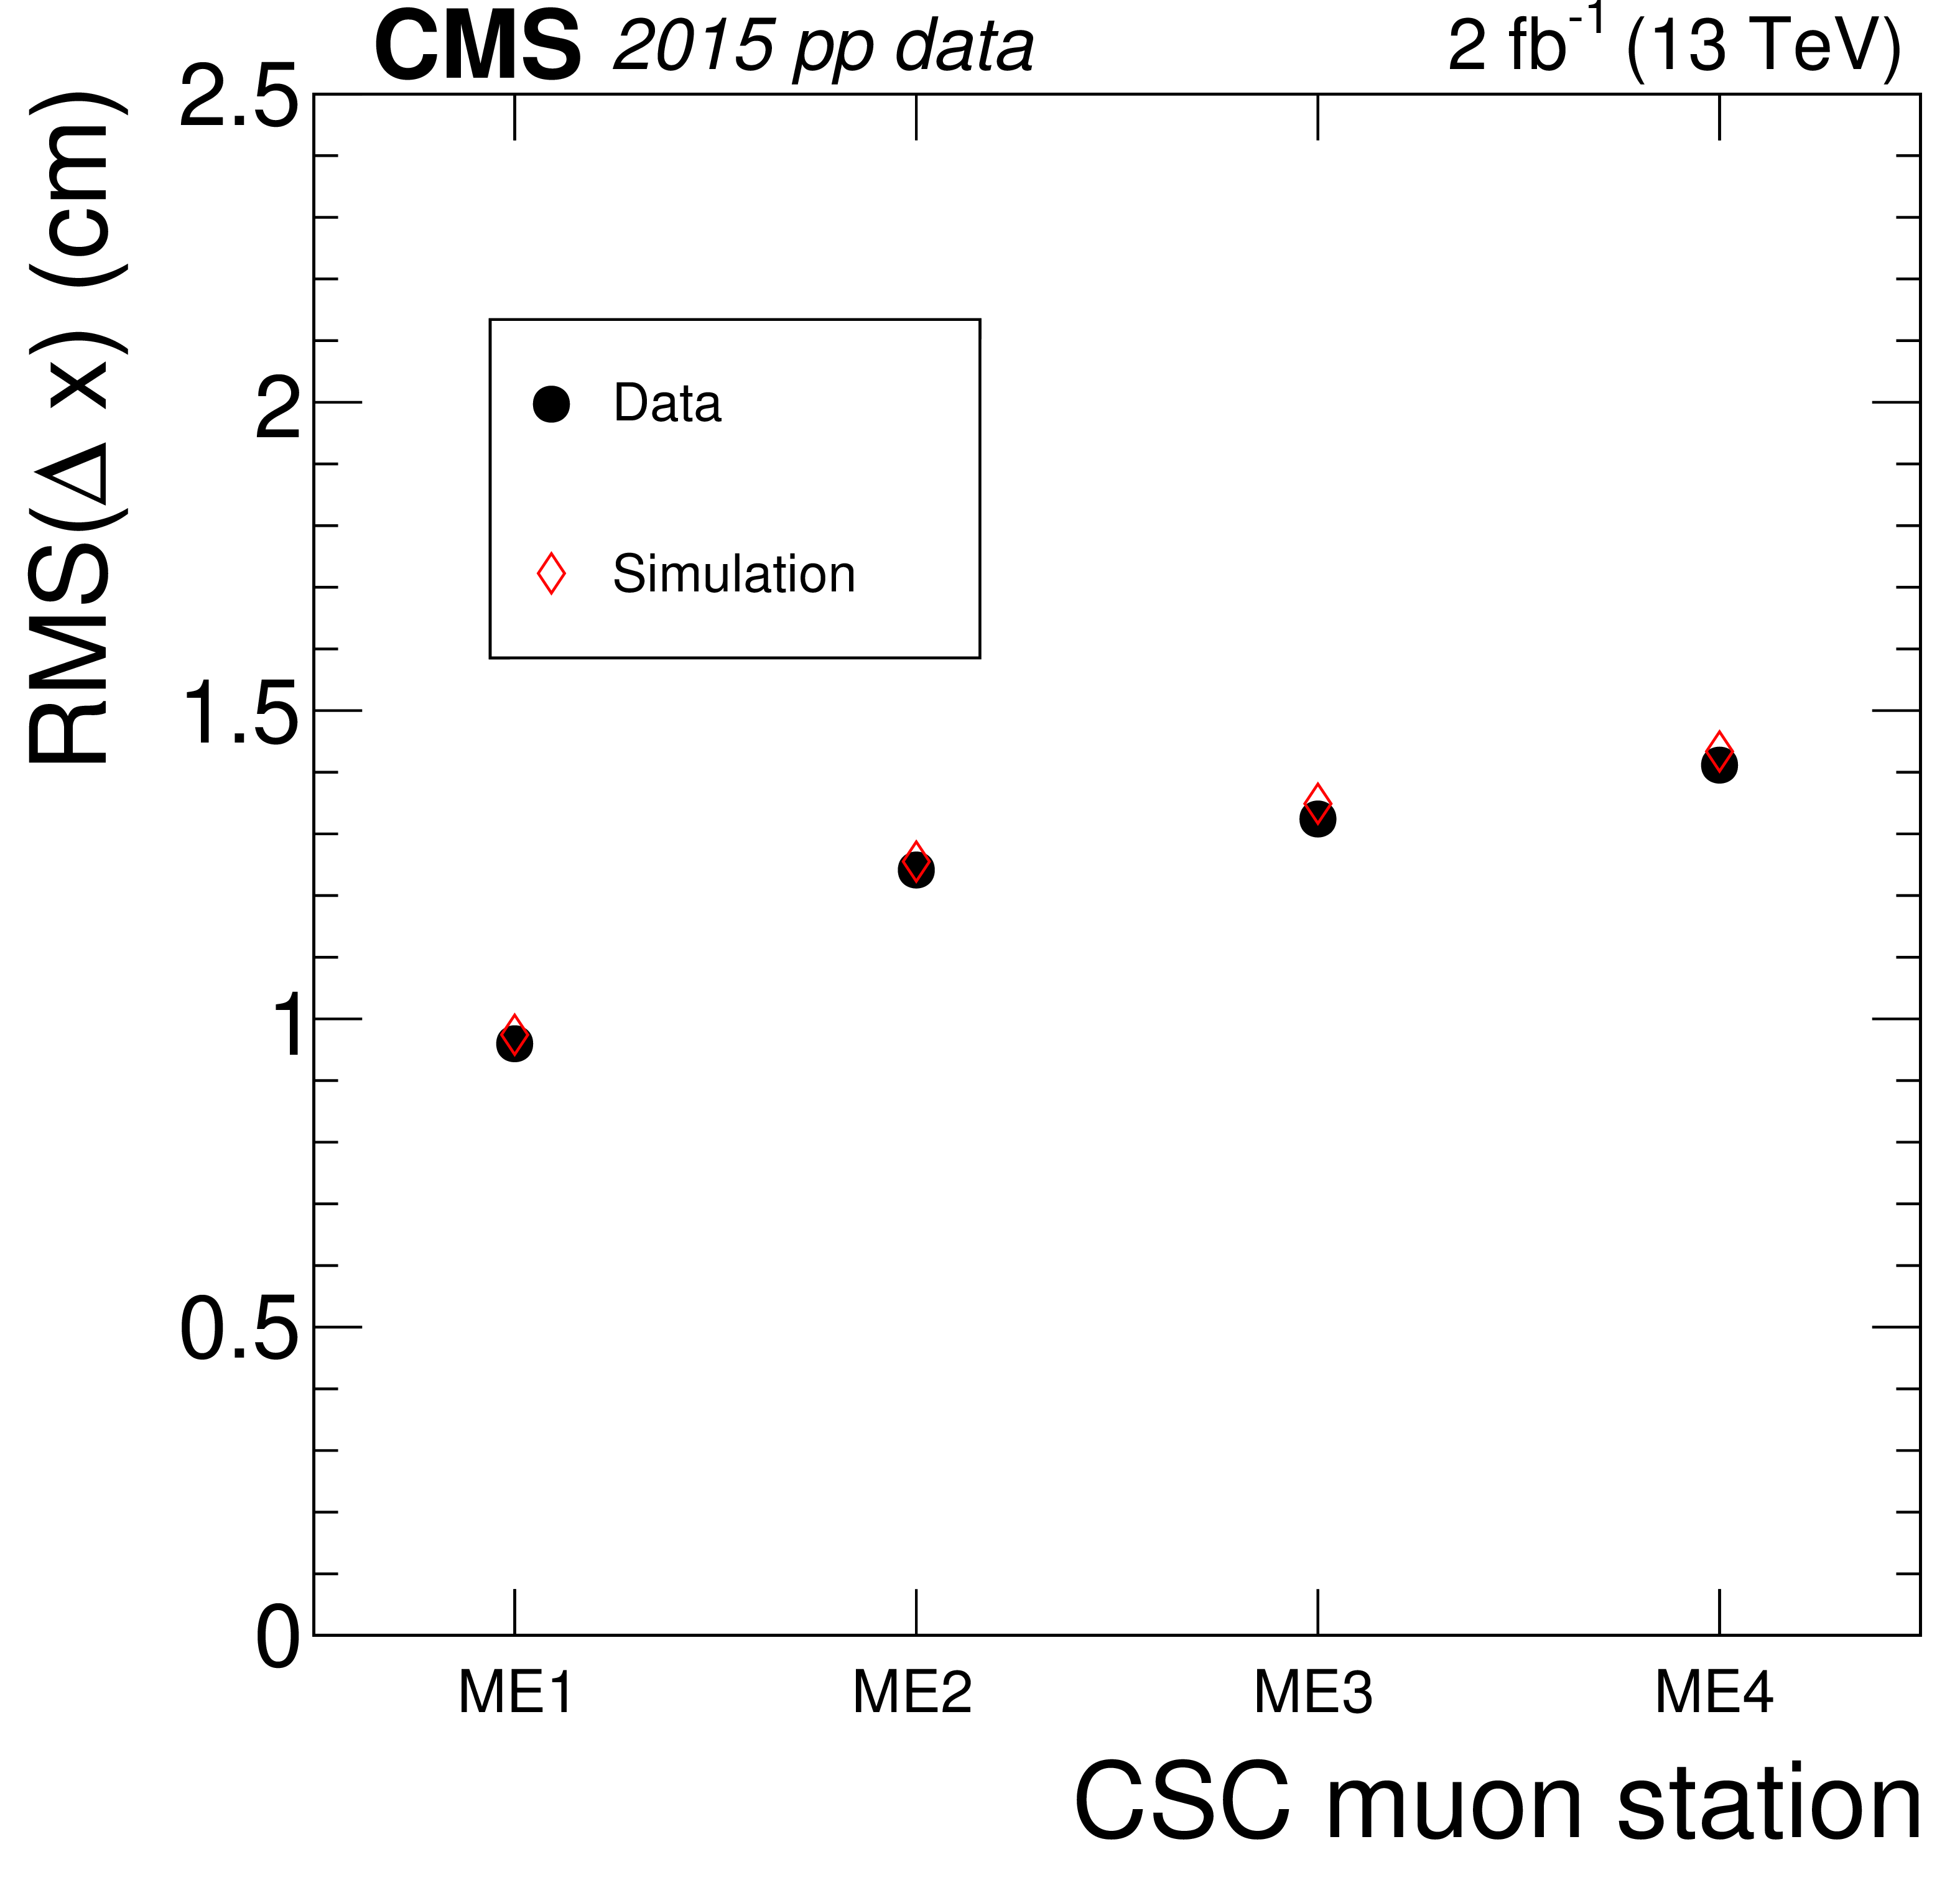
Figure 4-b:
The RMS of transverse residuals between reconstructed segments and propagated tracker tracks, measured in 2015 data. Results are plotted as a function of ME station in the CSCs. The vertical error bars represent the statistical uncertainties of the RMS, and are smaller than the marker size for most data points. |
png pdf |
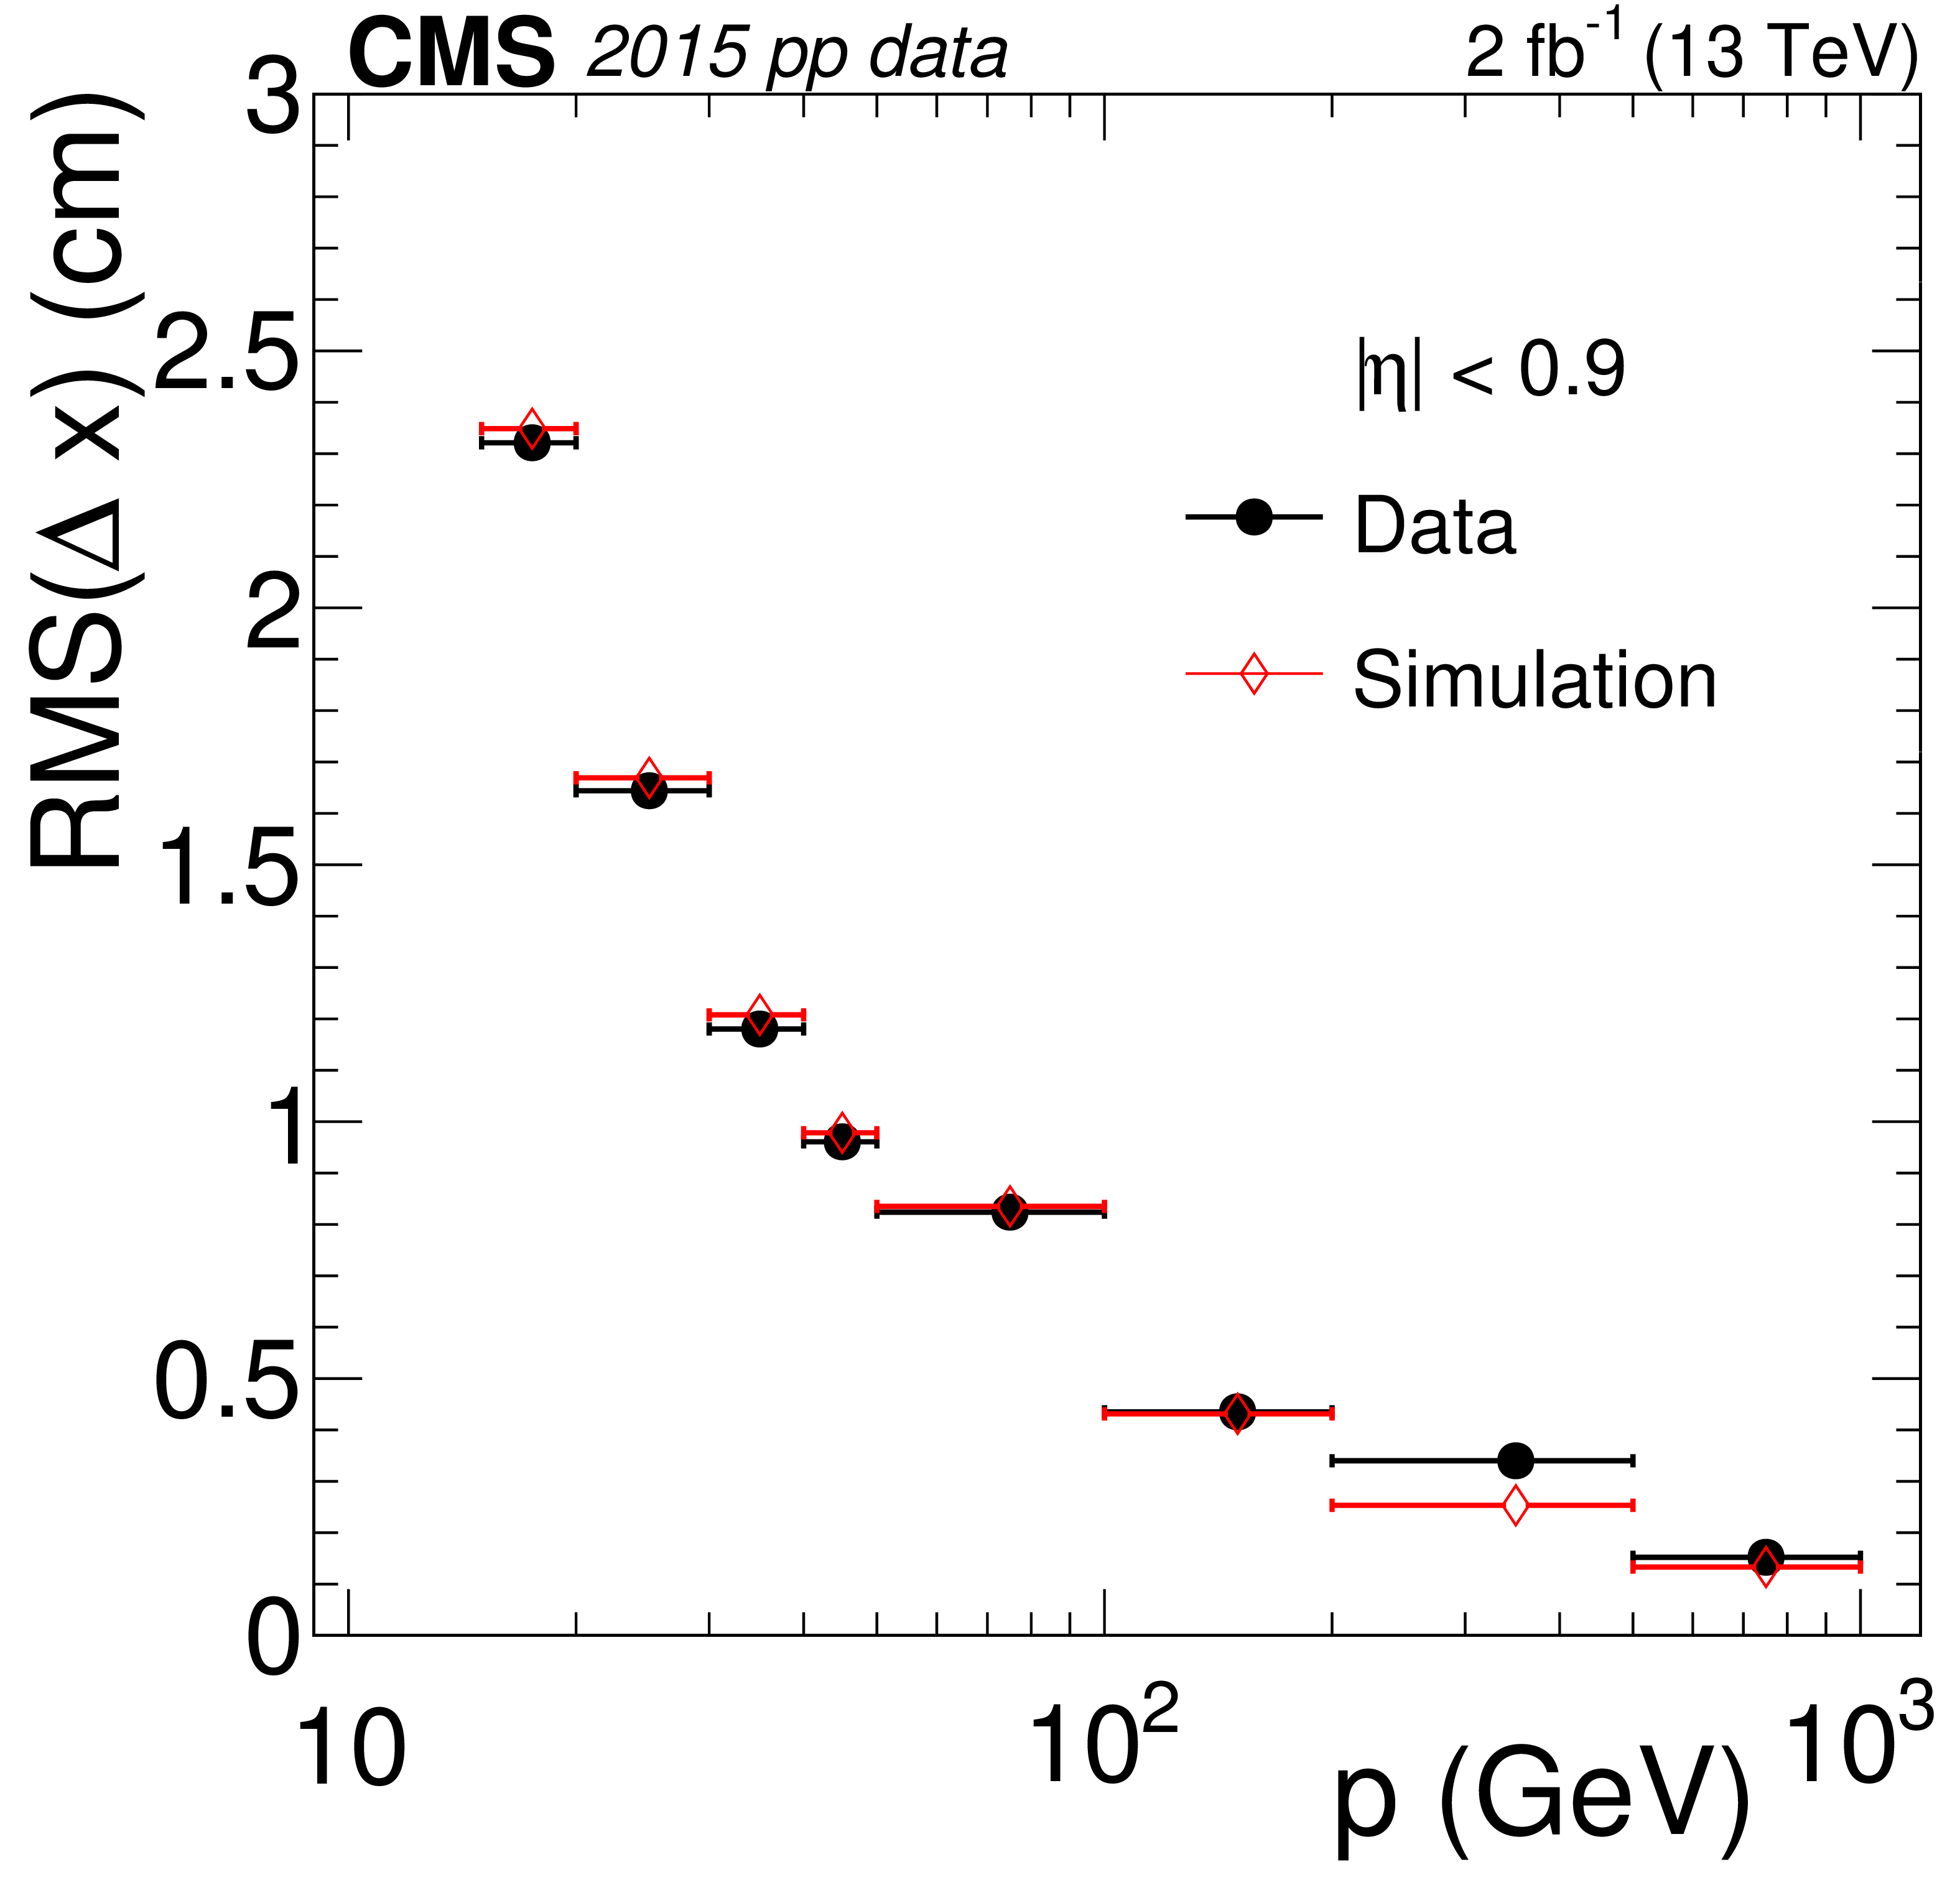
Figure 4-c:
The RMS of transverse residuals between reconstructed segments and propagated tracker tracks, measured in 2015 data. Results are plotted as a function of momentum $p$ in station 1 of the barrel region ($ | \eta | \le $ 0.9). The vertical error bars represent the statistical uncertainties of the RMS, and are smaller than the marker size for most data points. |
png pdf |
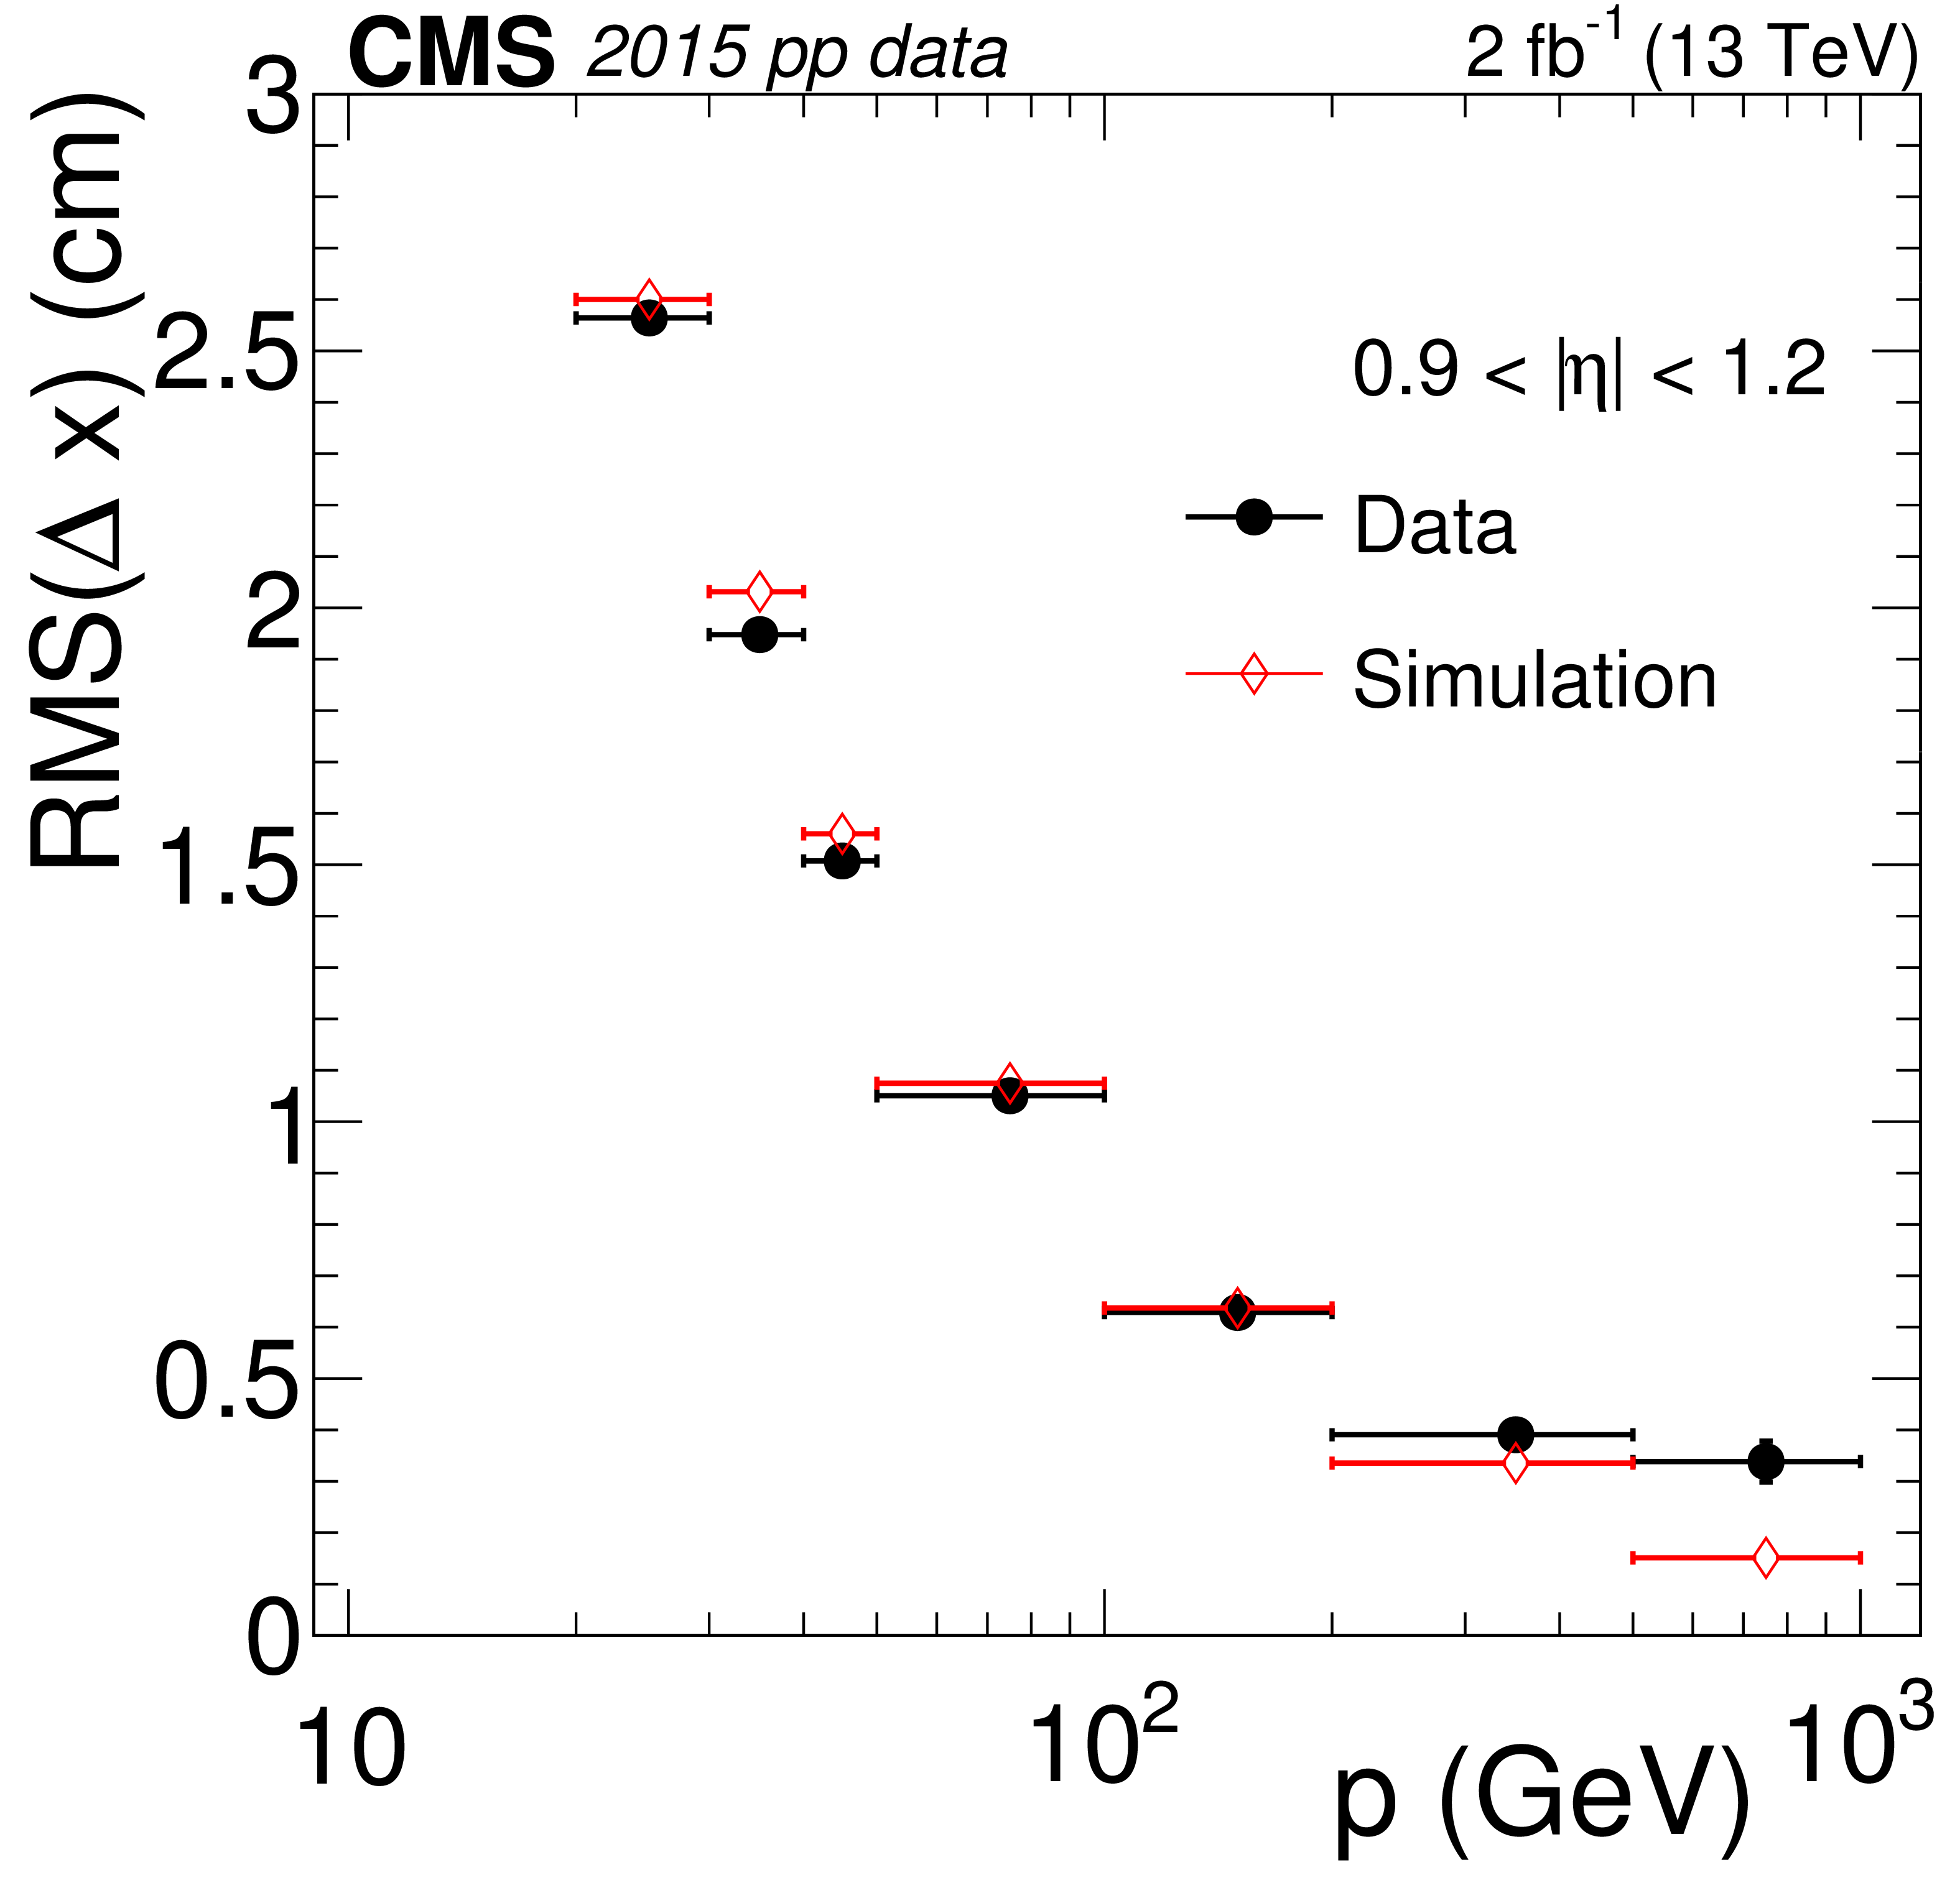
Figure 4-d:
The RMS of transverse residuals between reconstructed segments and propagated tracker tracks, measured in 2015 data. Results are plotted as a function of momentum $p$ in station 1 of the overlap region ($0.9 \le | \eta | \le $ 1.2). The vertical error bars represent the statistical uncertainties of the RMS, and are smaller than the marker size for most data points. |
png pdf |
Figure 4-e:
The RMS of transverse residuals between reconstructed segments and propagated tracker tracks, measured in 2015 data. Results are plotted as a function of momentum $p$ in station 1 of the endcap region (1.2 $ \le | \eta | \le $ 2.4). The vertical error bars represent the statistical uncertainties of the RMS, and are smaller than the marker size for most data points. |
png pdf |
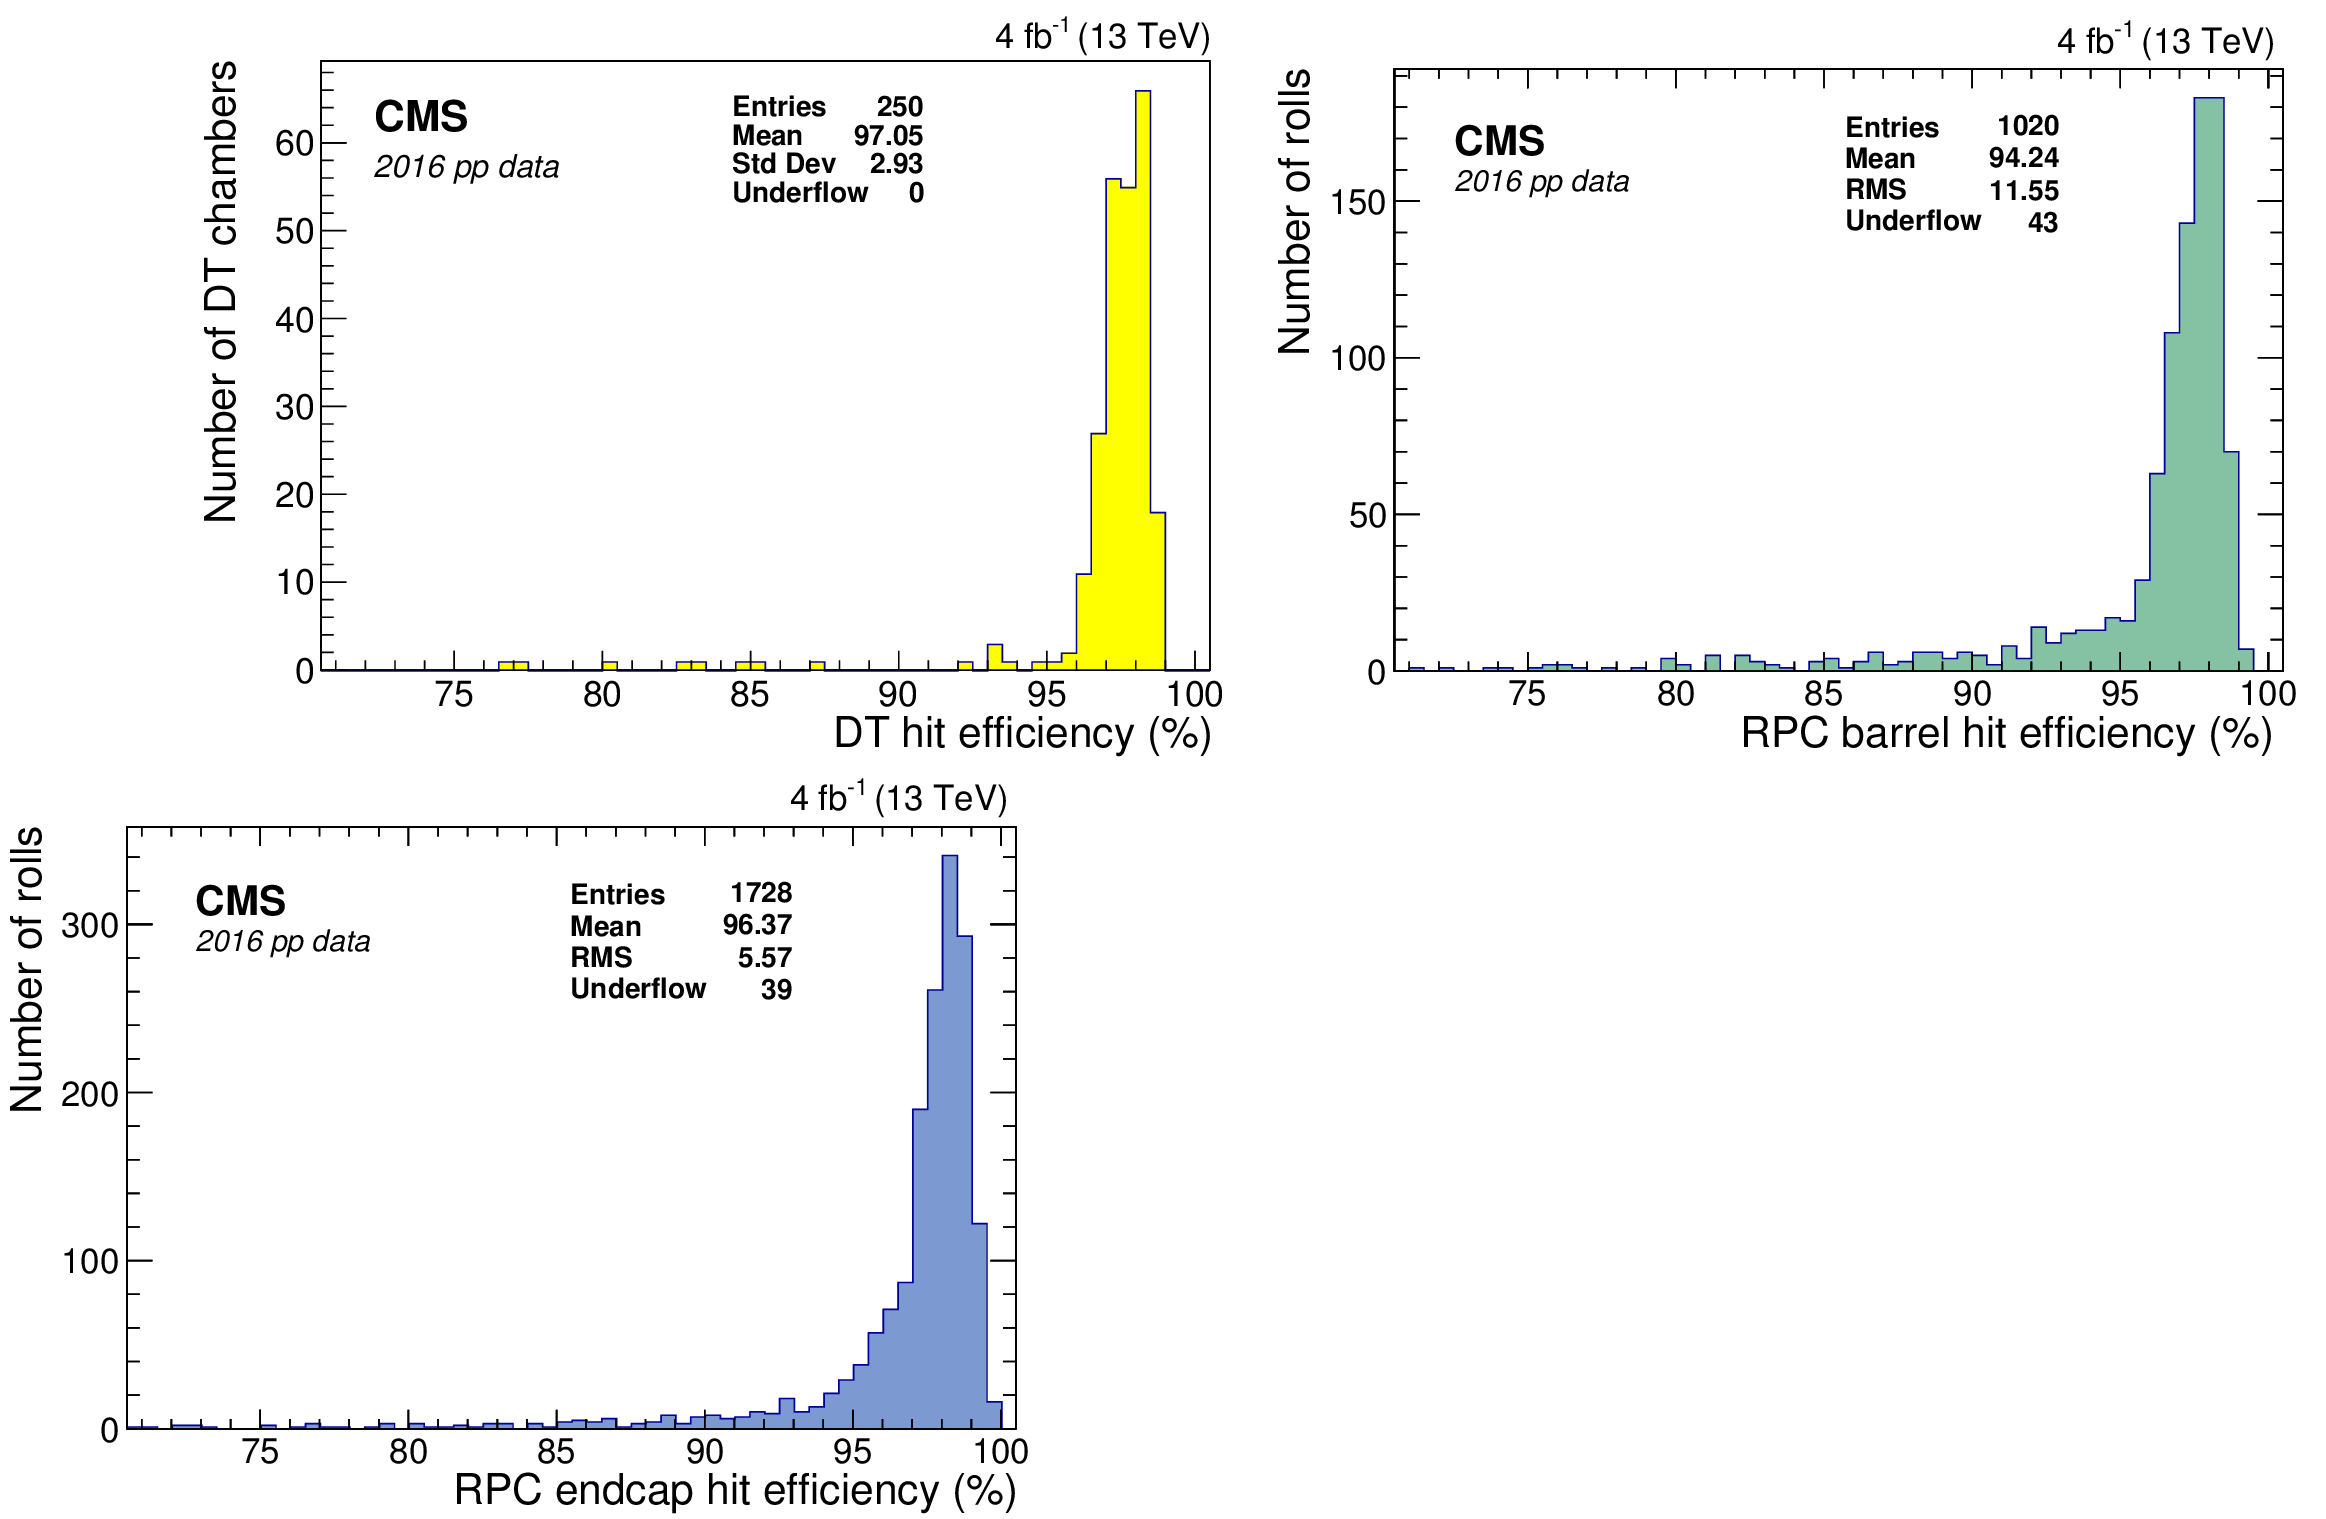
Figure 5:
Hit reconstruction efficiency measured with the 2016 data in (upper left) DT, (upper right) RPC barrel, and (lower) RPC endcap chambers. |
png pdf |
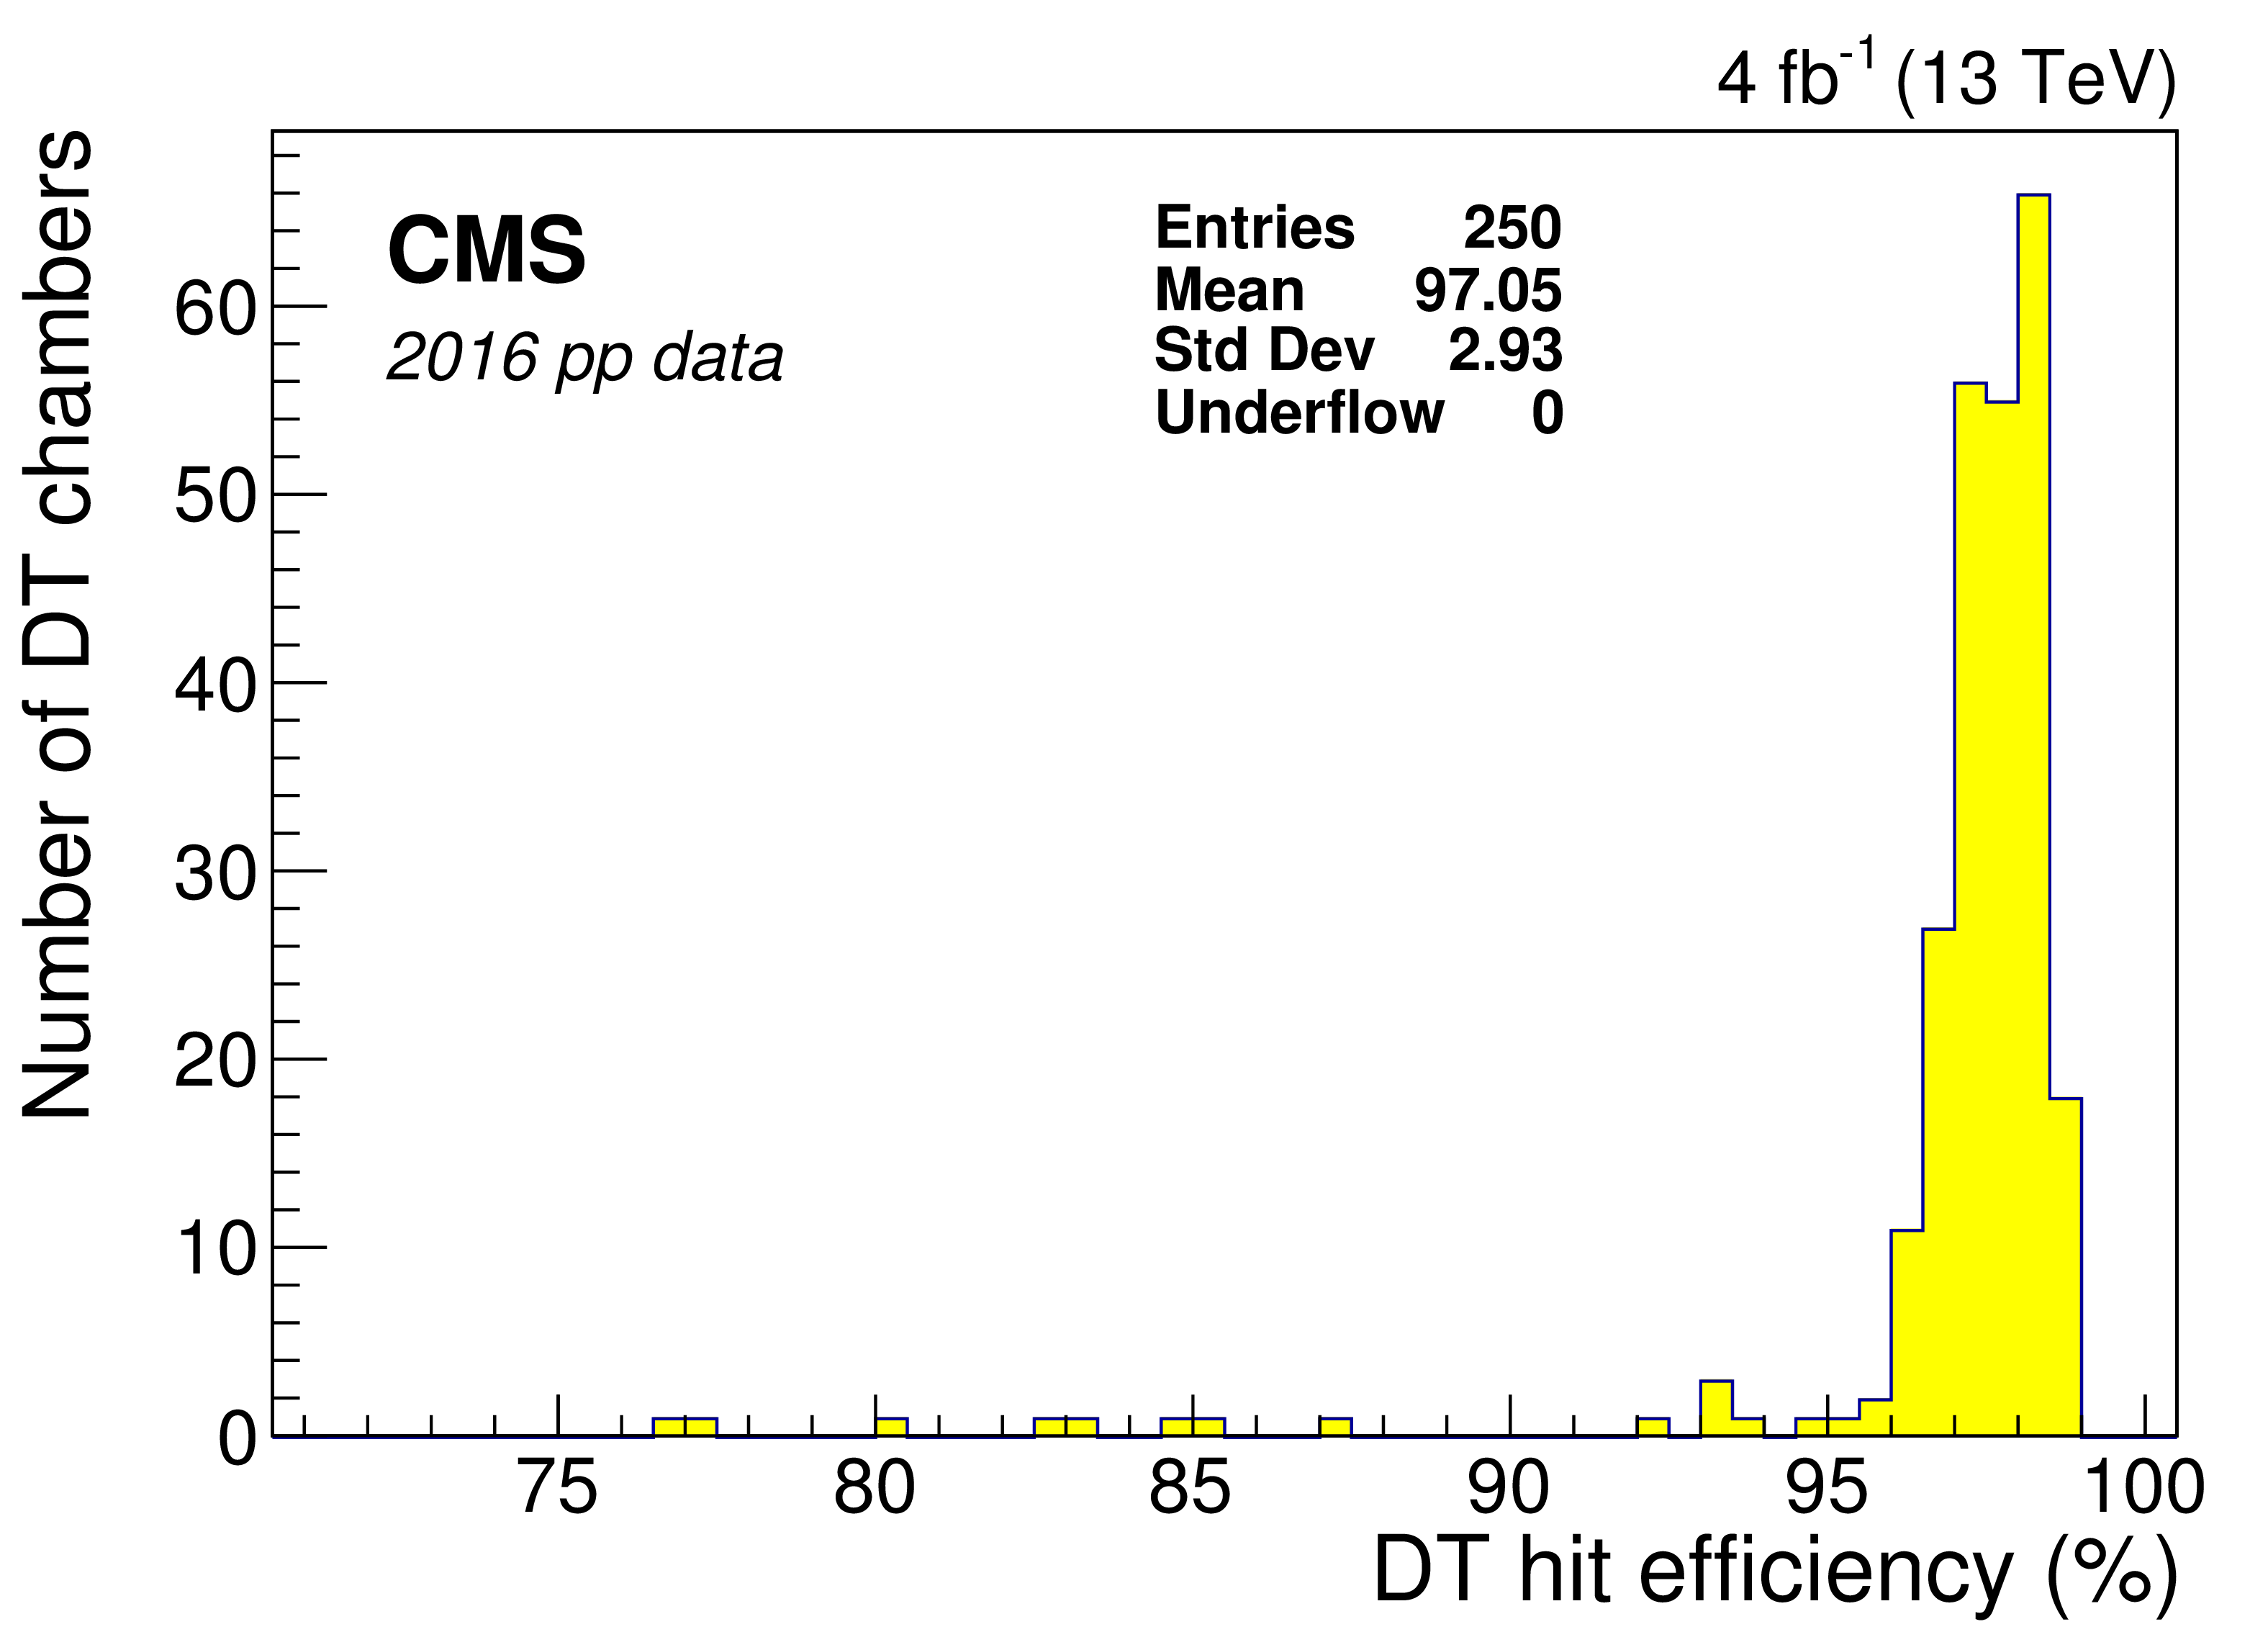
Figure 5-a:
Hit reconstruction efficiency measured with the 2016 data in DT chambers. |

png pdf |
Figure 5-b:
Hit reconstruction efficiency measured with the 2016 data in RPC barrel chambers. |
png pdf |
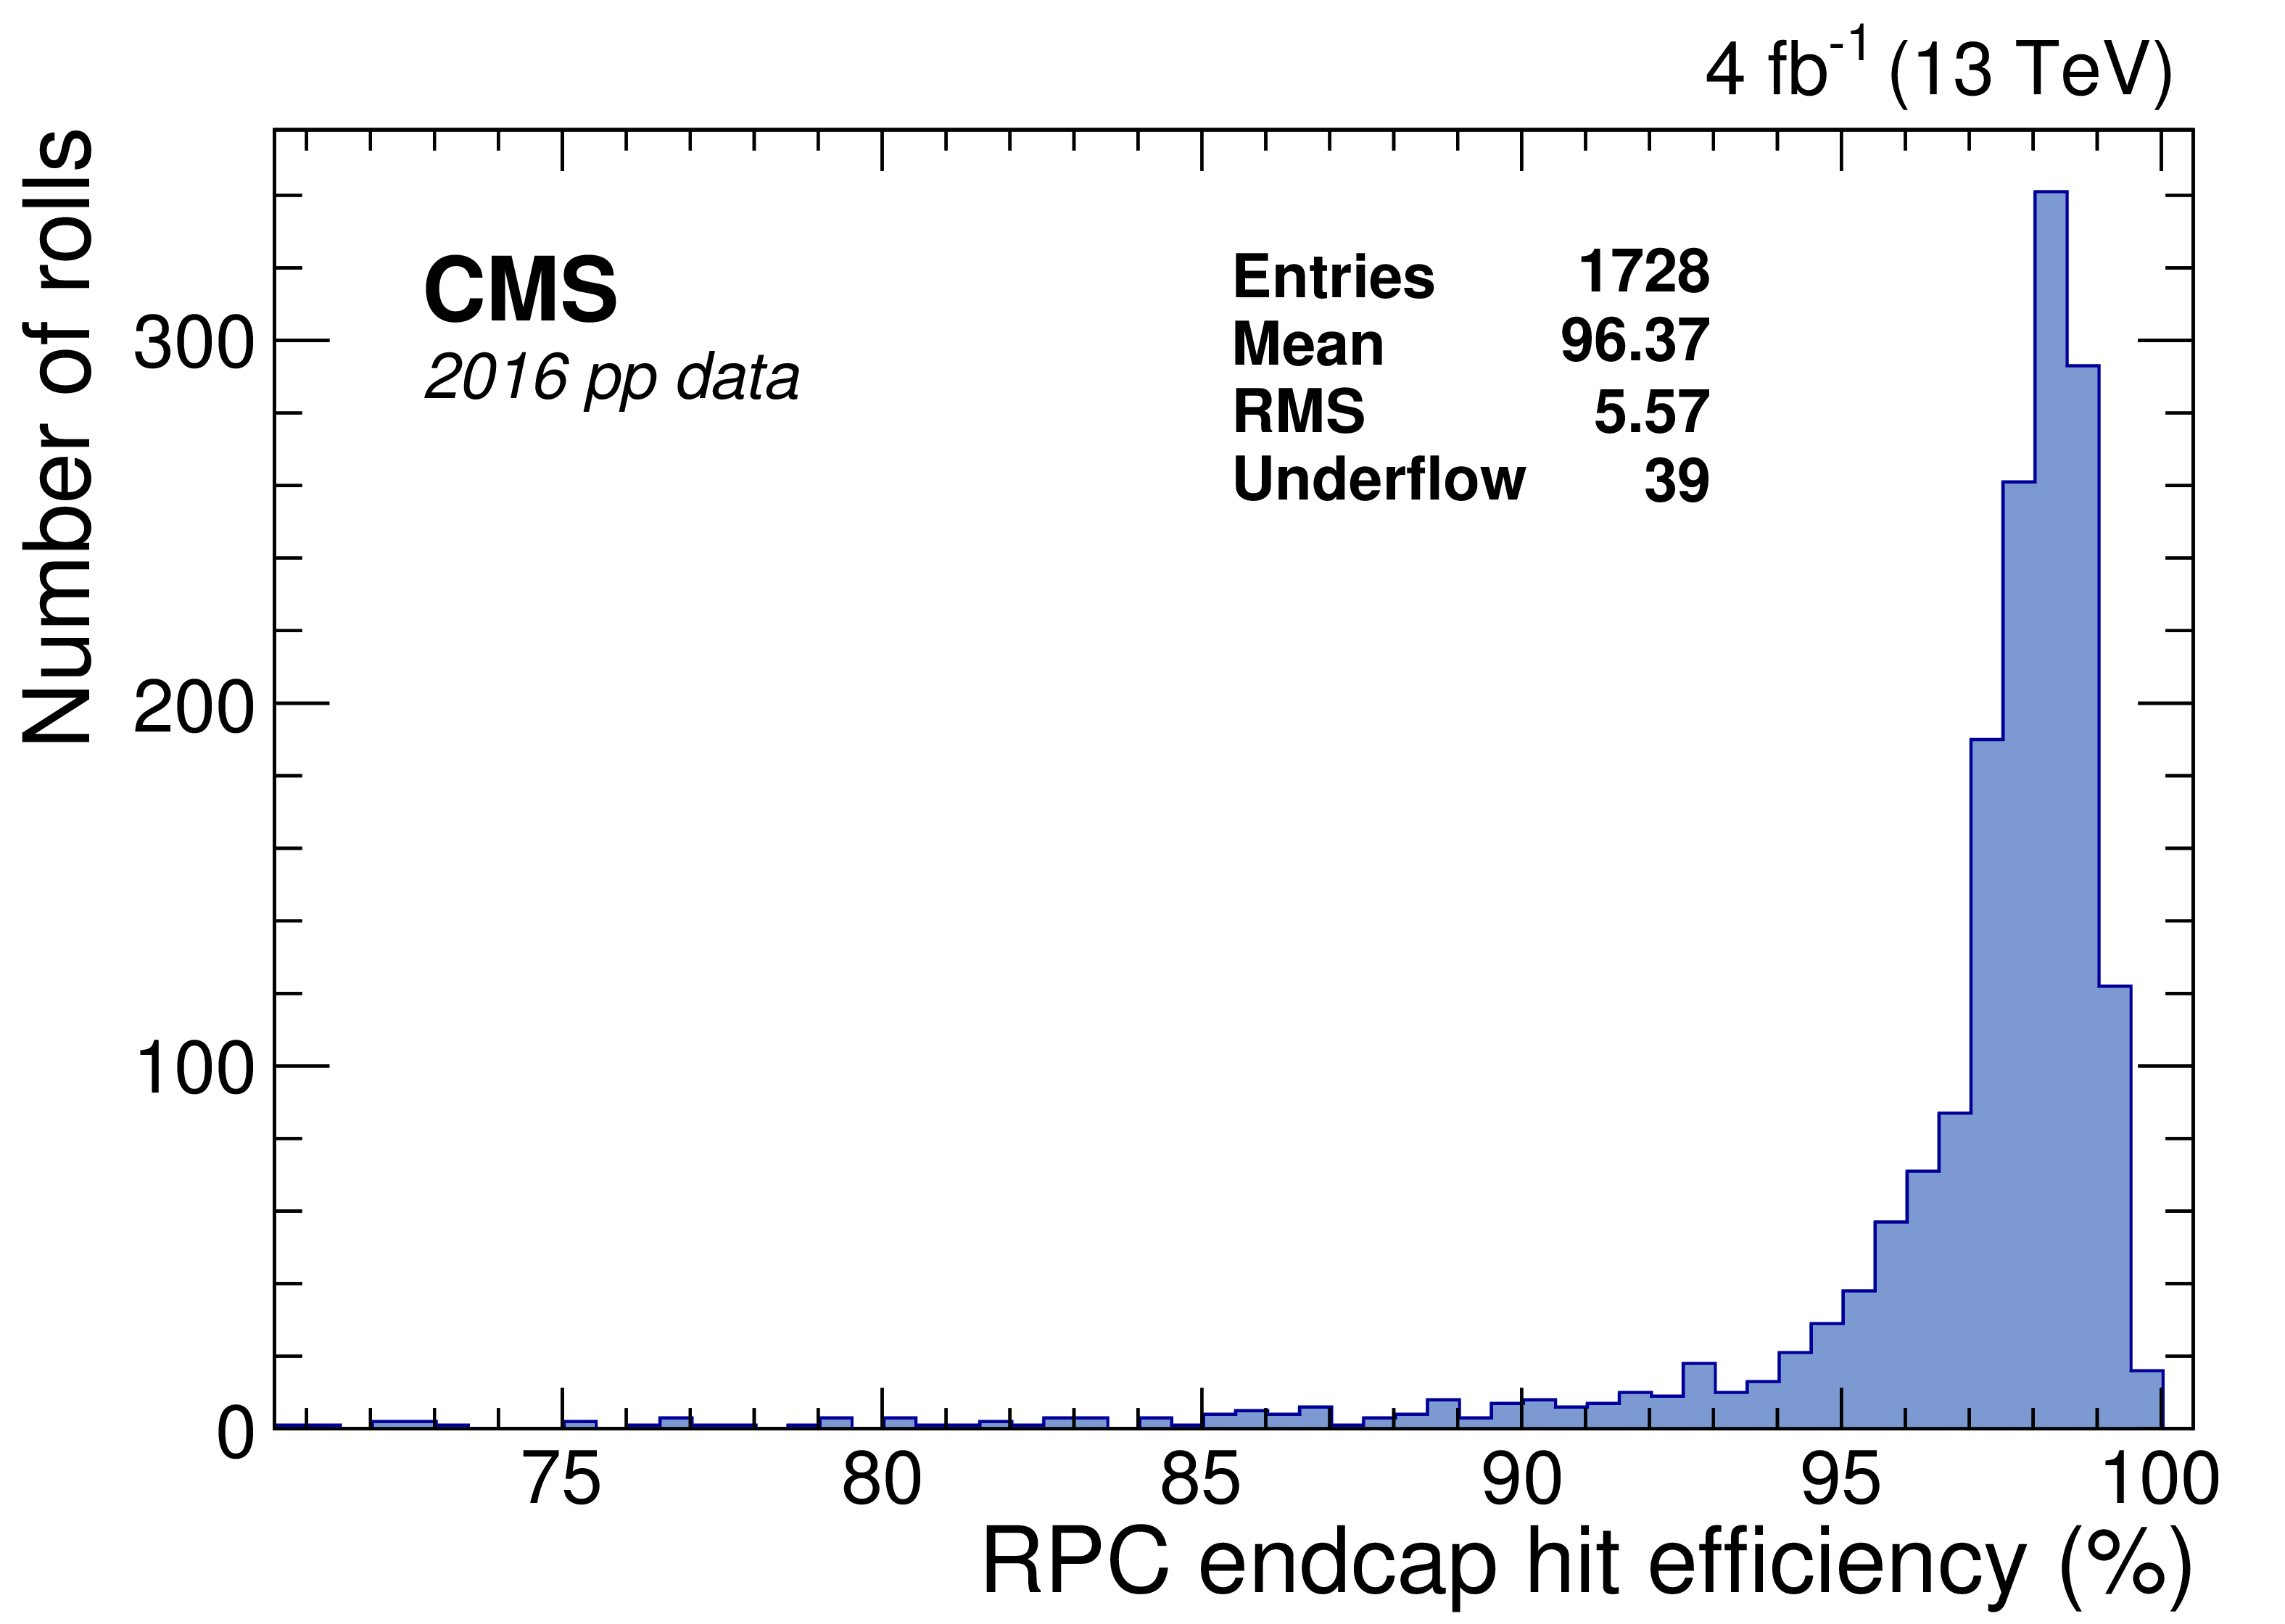
Figure 5-c:
Hit reconstruction efficiency measured with the 2016 data in RPC endcap chambers. |
png pdf |
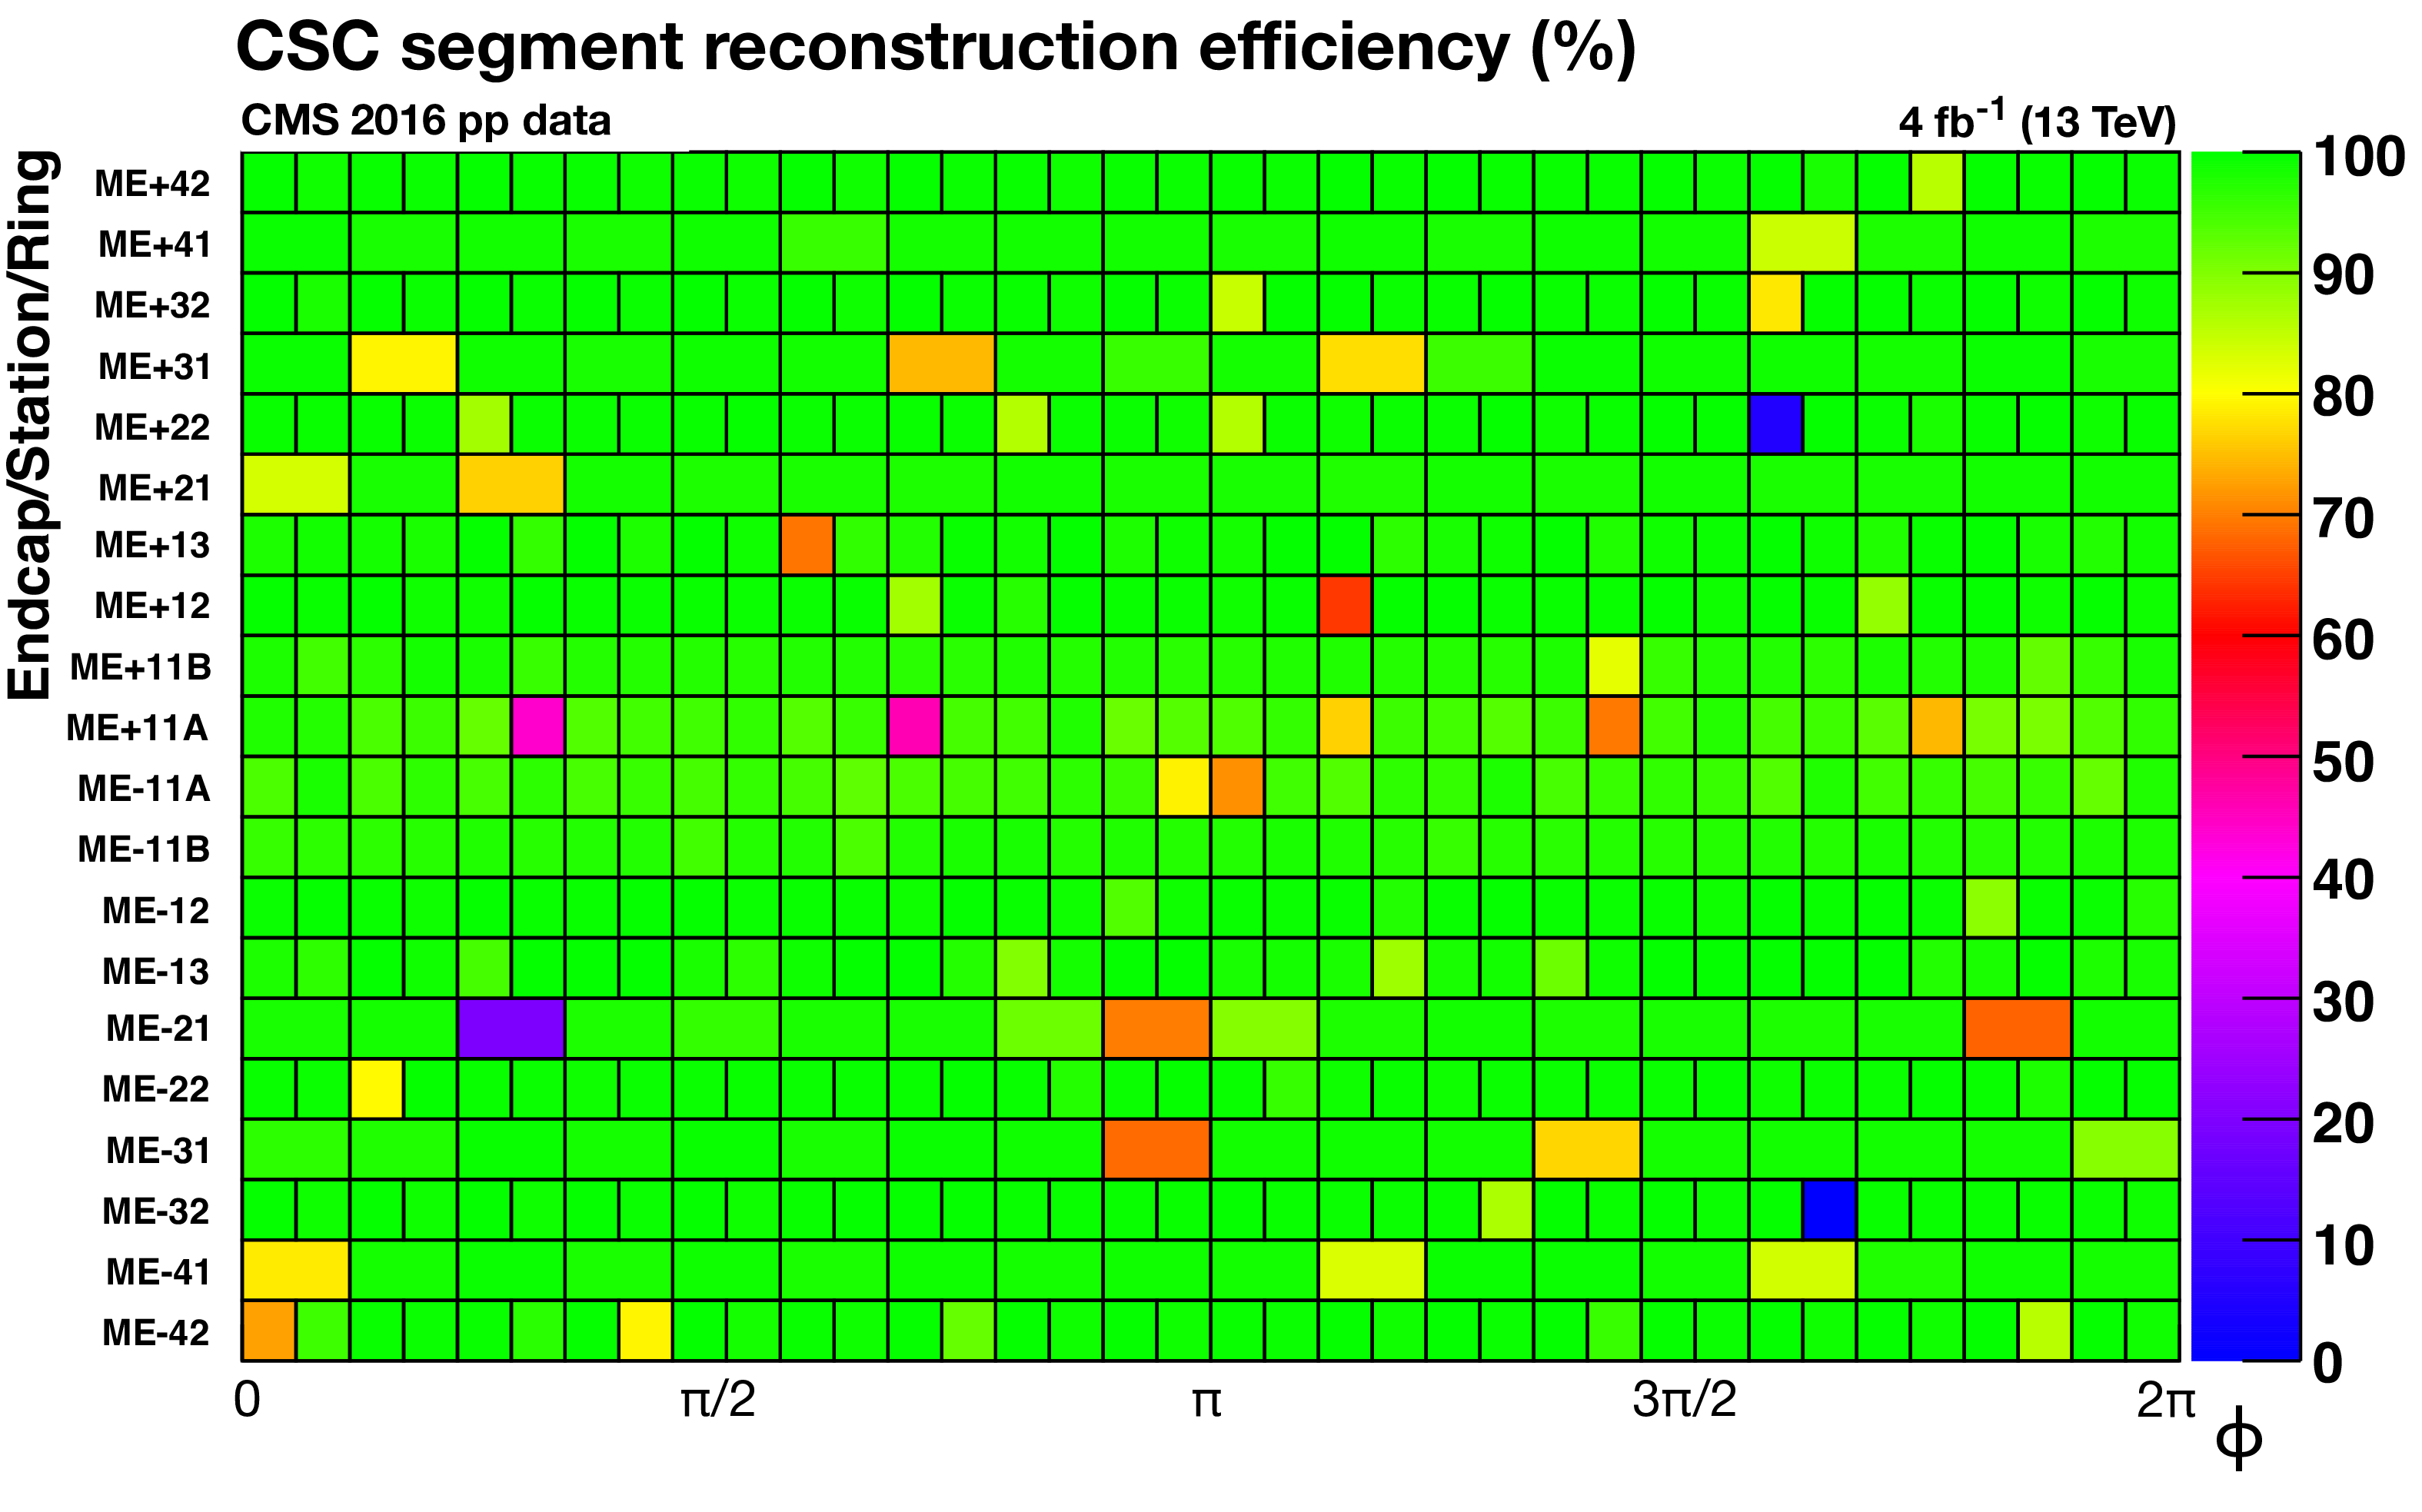
Figure 6:
The efficiency (in percent) of each CSC in the CMS endcap muon detector to provide a locally reconstructed track segment as measured from 2016 data. |
png pdf |
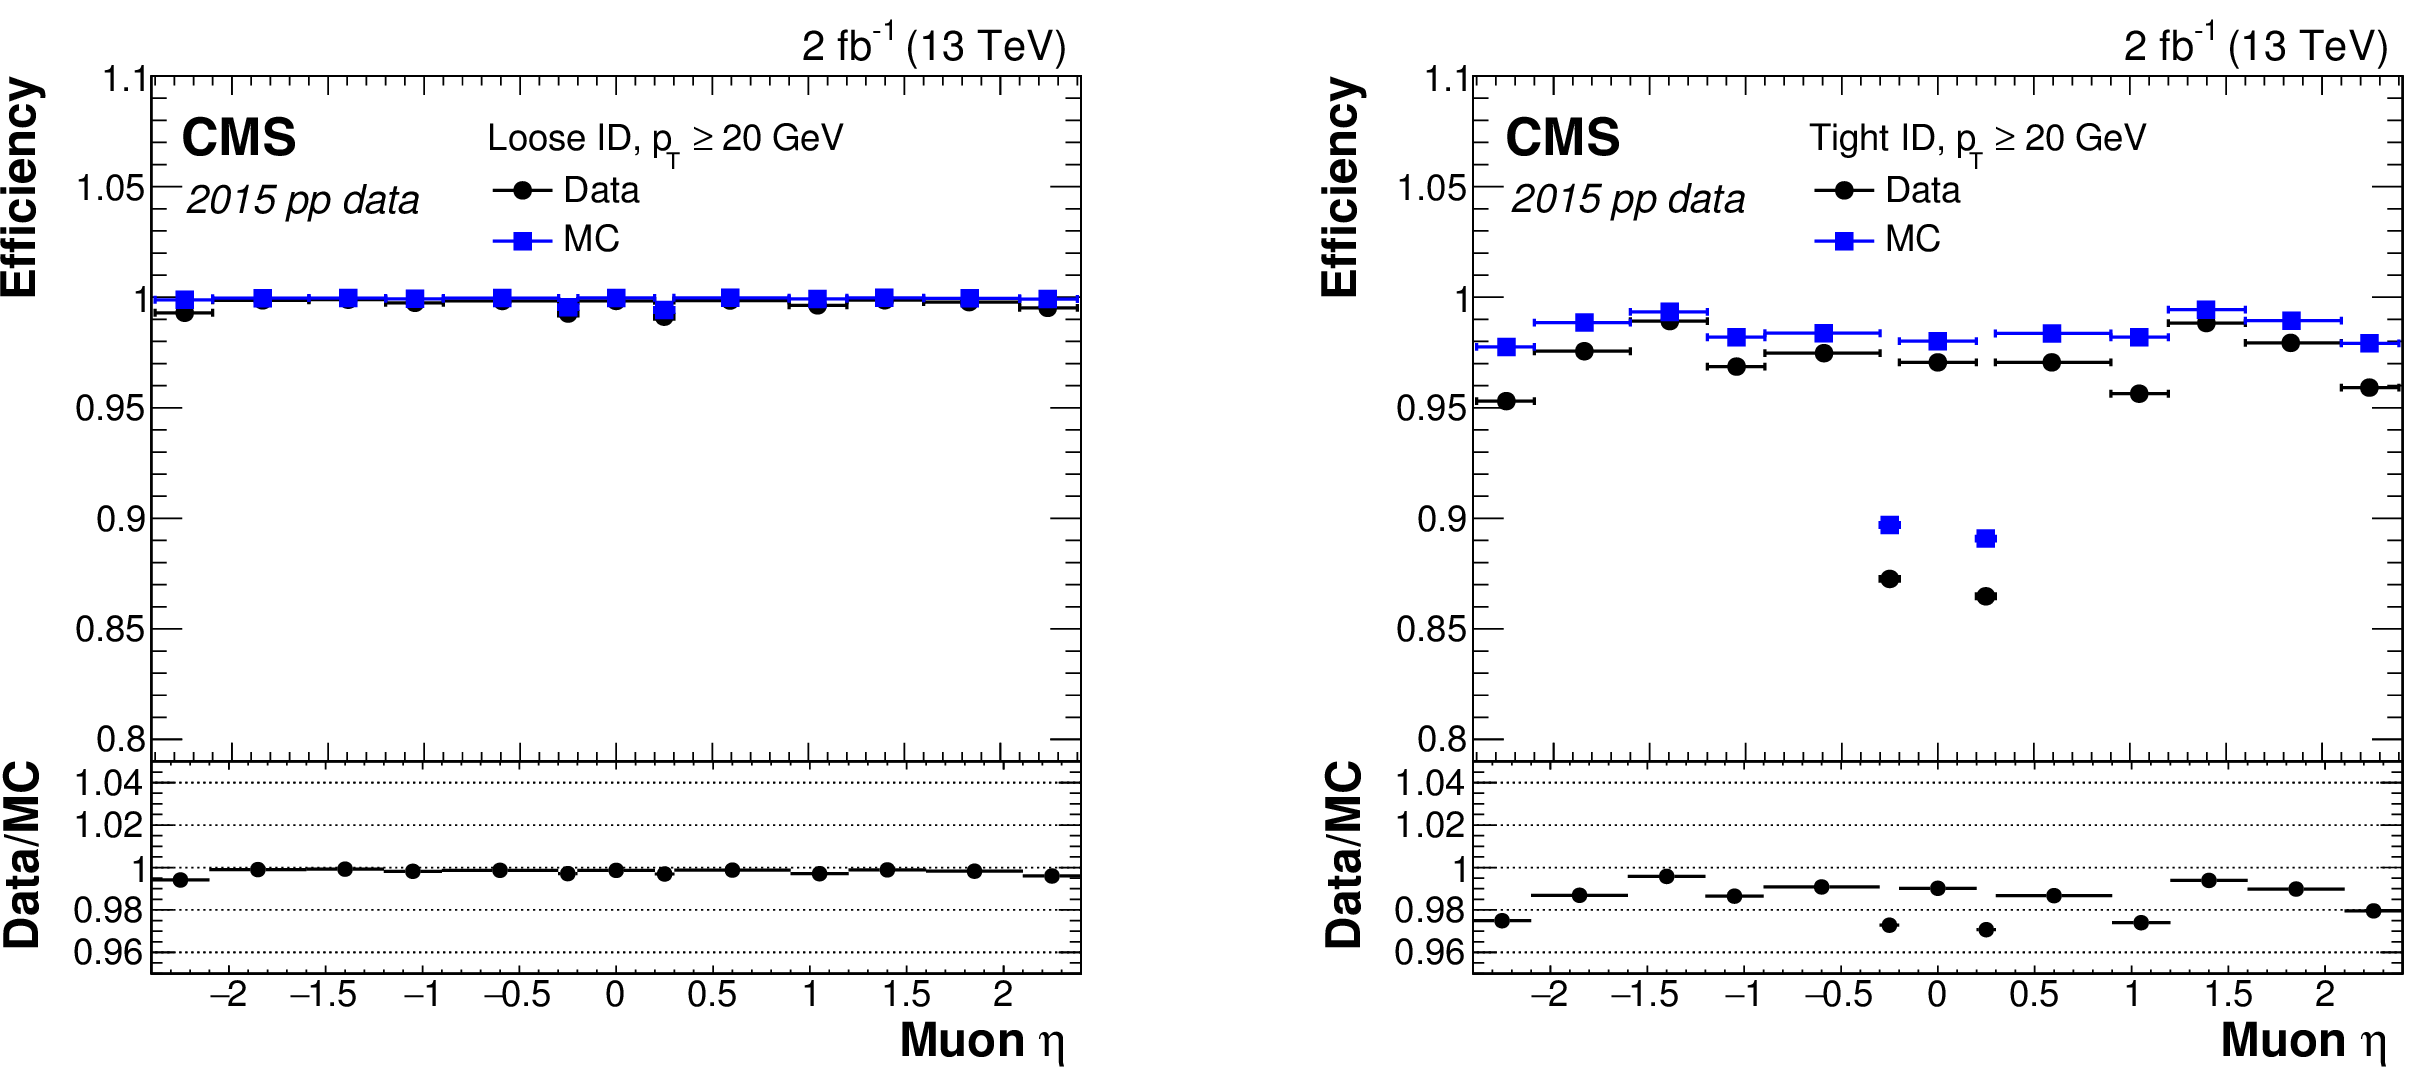
Figure 7:
Tag-and-probe efficiency for muon reconstruction and identification in 2015 data (circles), simulation (squares), and the ratio (bottom inset) for loose (left) and tight (right) muons with $ {p_{\mathrm {T}}} > $ 20 GeV. The statistical uncertainties are smaller than the symbols used to display the measurements. |
png pdf |
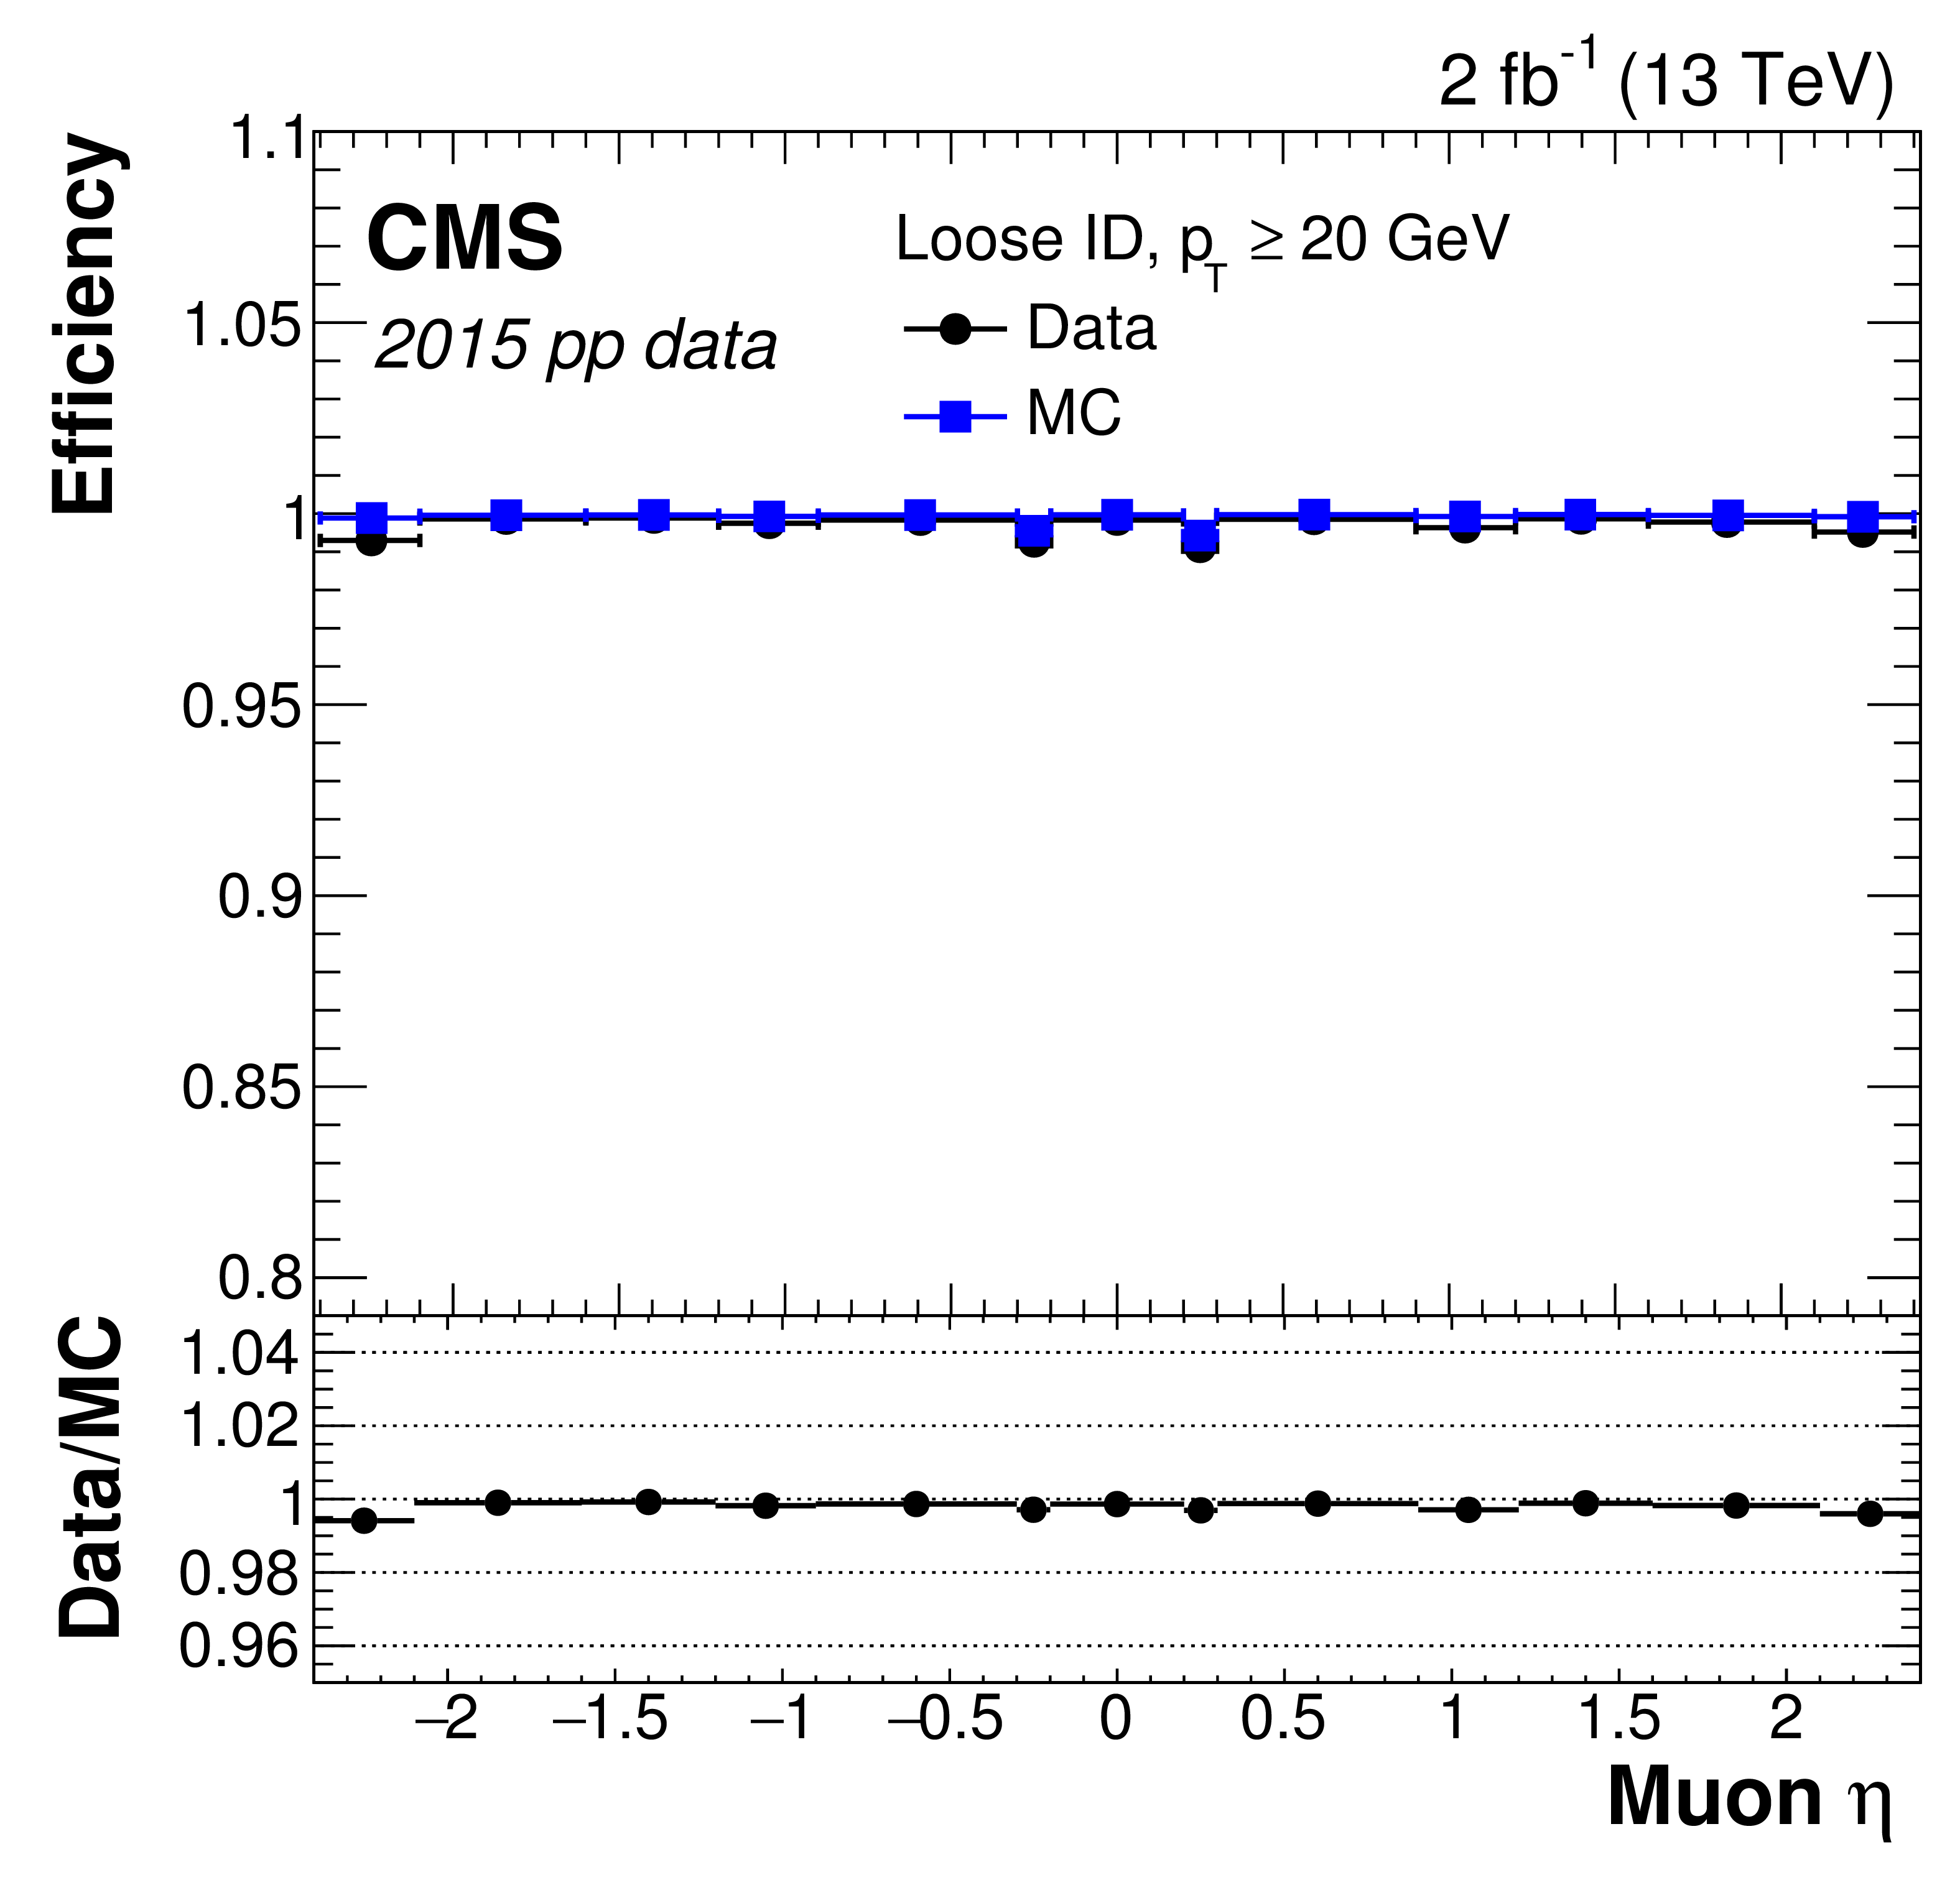
Figure 7-a:
Tag-and-probe efficiency for muon reconstruction and identification in 2015 data (circles), simulation (squares), and the ratio (bottom inset) for loose muons with $ {p_{\mathrm {T}}} > $ 20 GeV. The statistical uncertainties are smaller than the symbols used to display the measurements. |
png pdf |
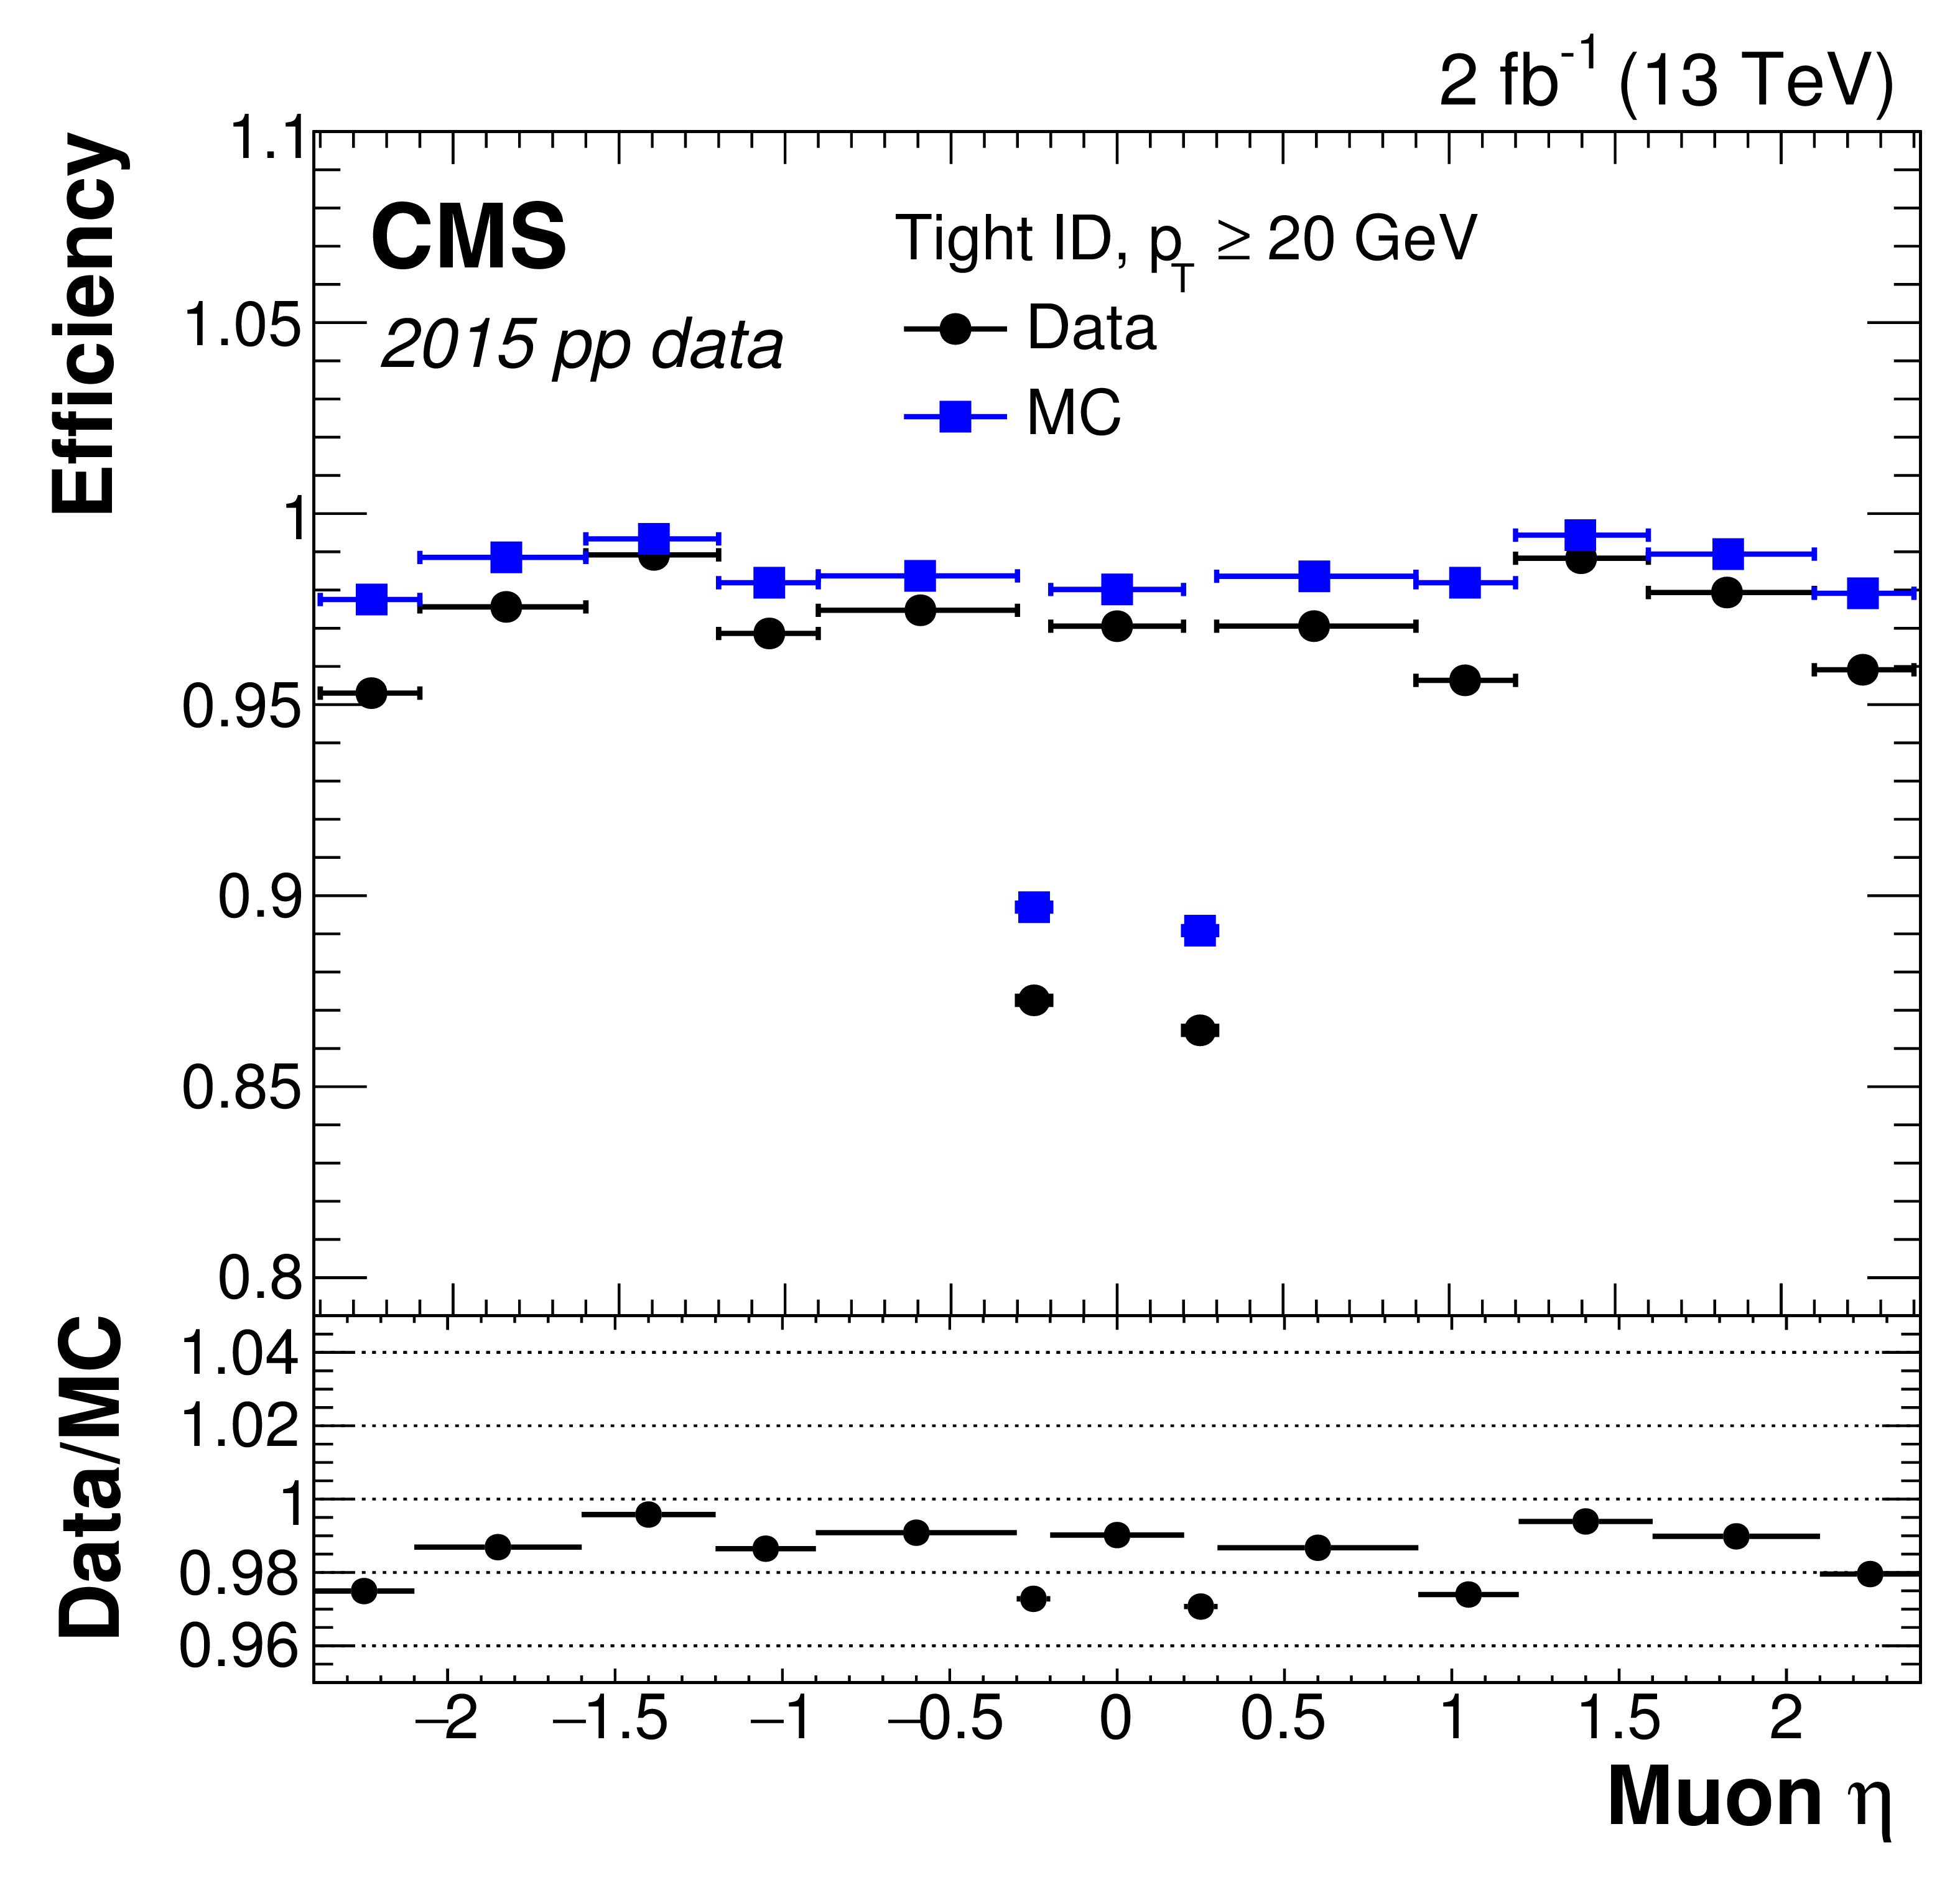
Figure 7-b:
Tag-and-probe efficiency for muon reconstruction and identification in 2015 data (circles), simulation (squares), and the ratio (bottom inset) for tight muons with $ {p_{\mathrm {T}}} > $ 20 GeV. The statistical uncertainties are smaller than the symbols used to display the measurements. |
png pdf |
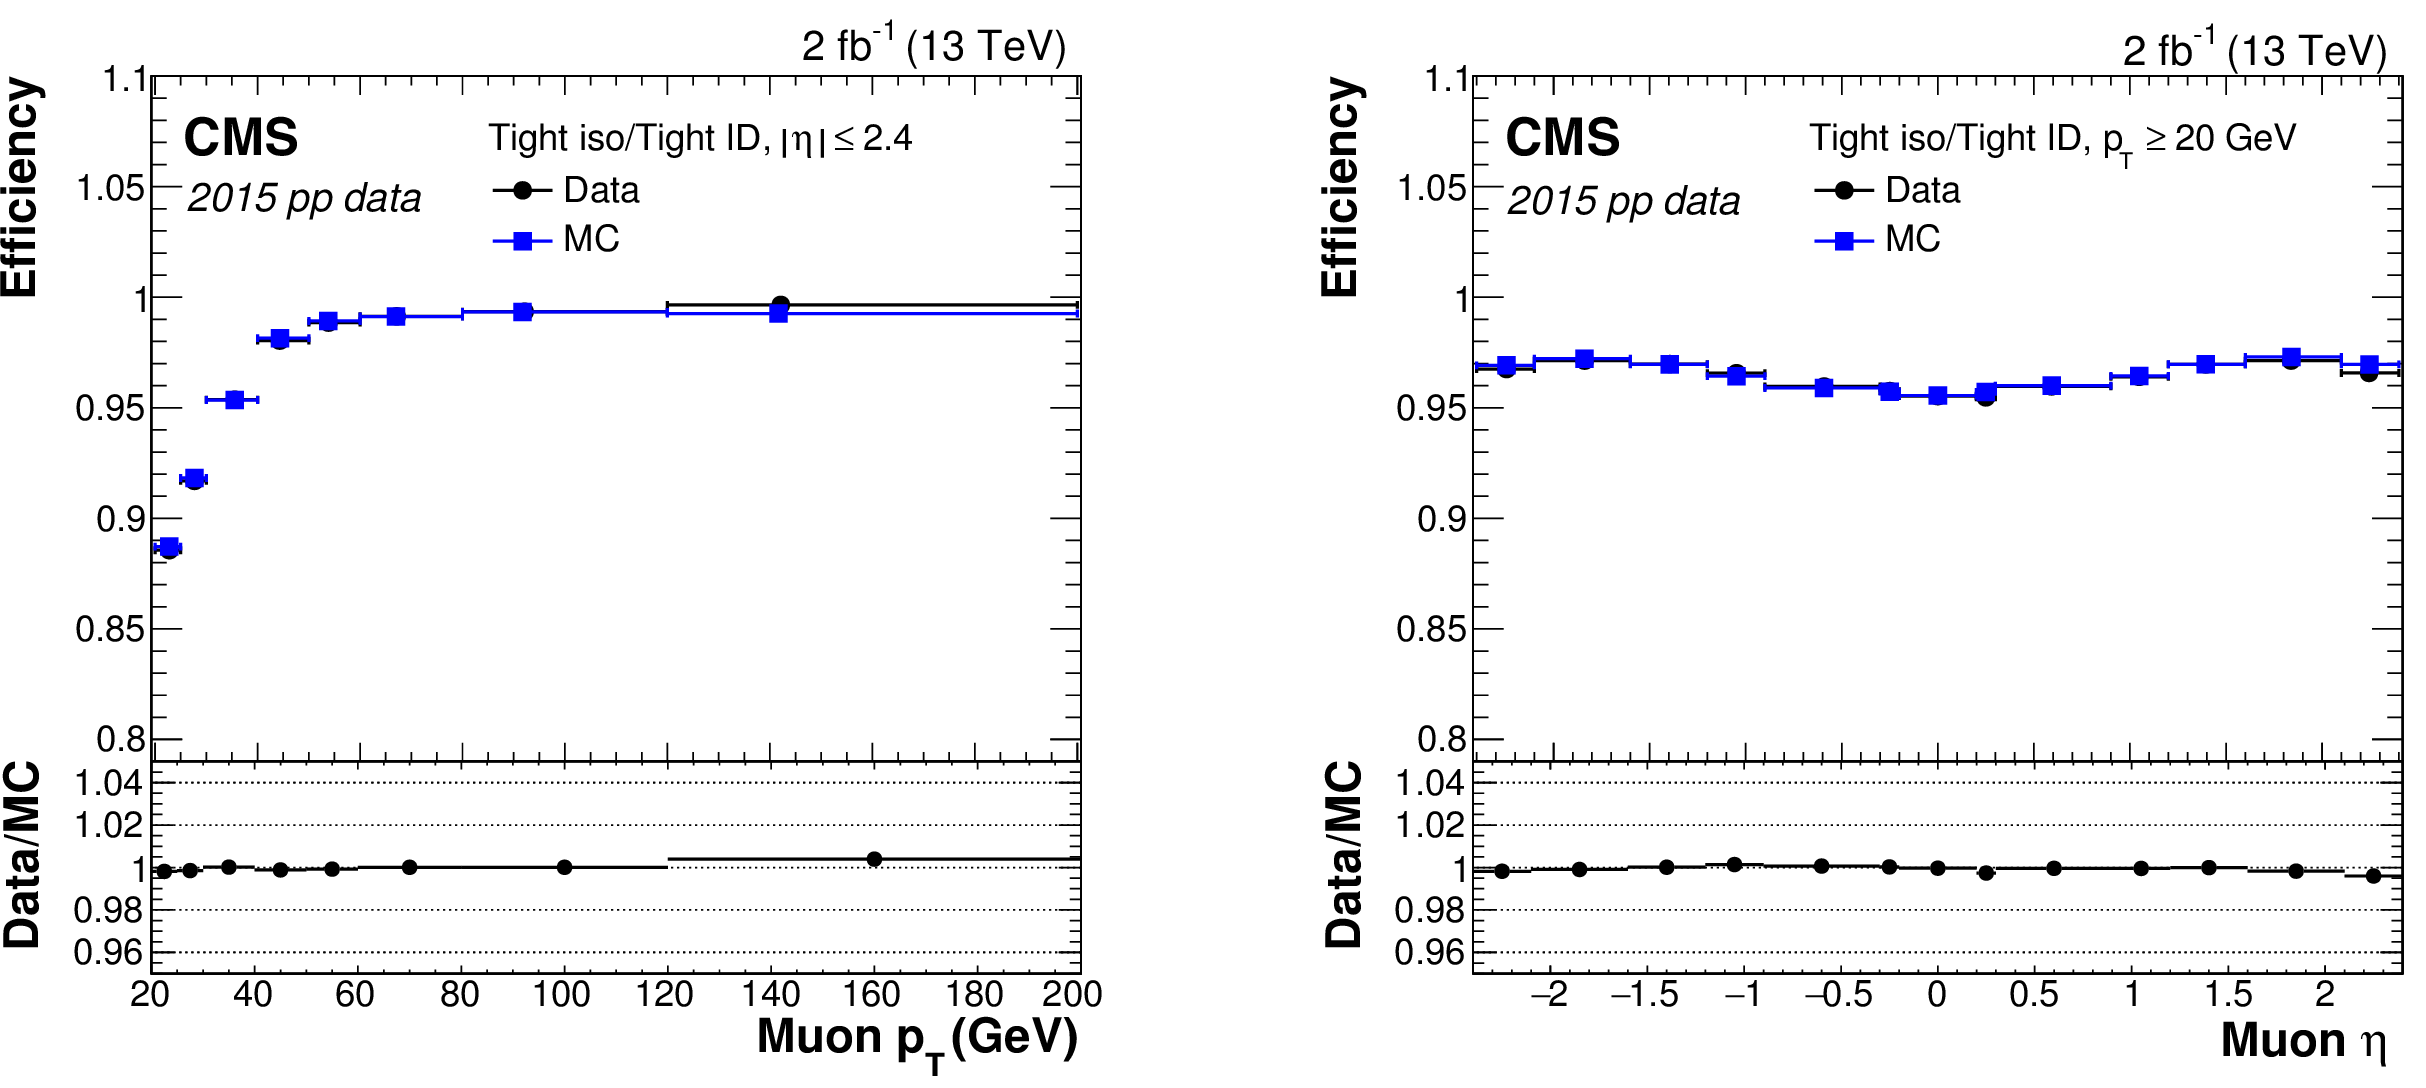
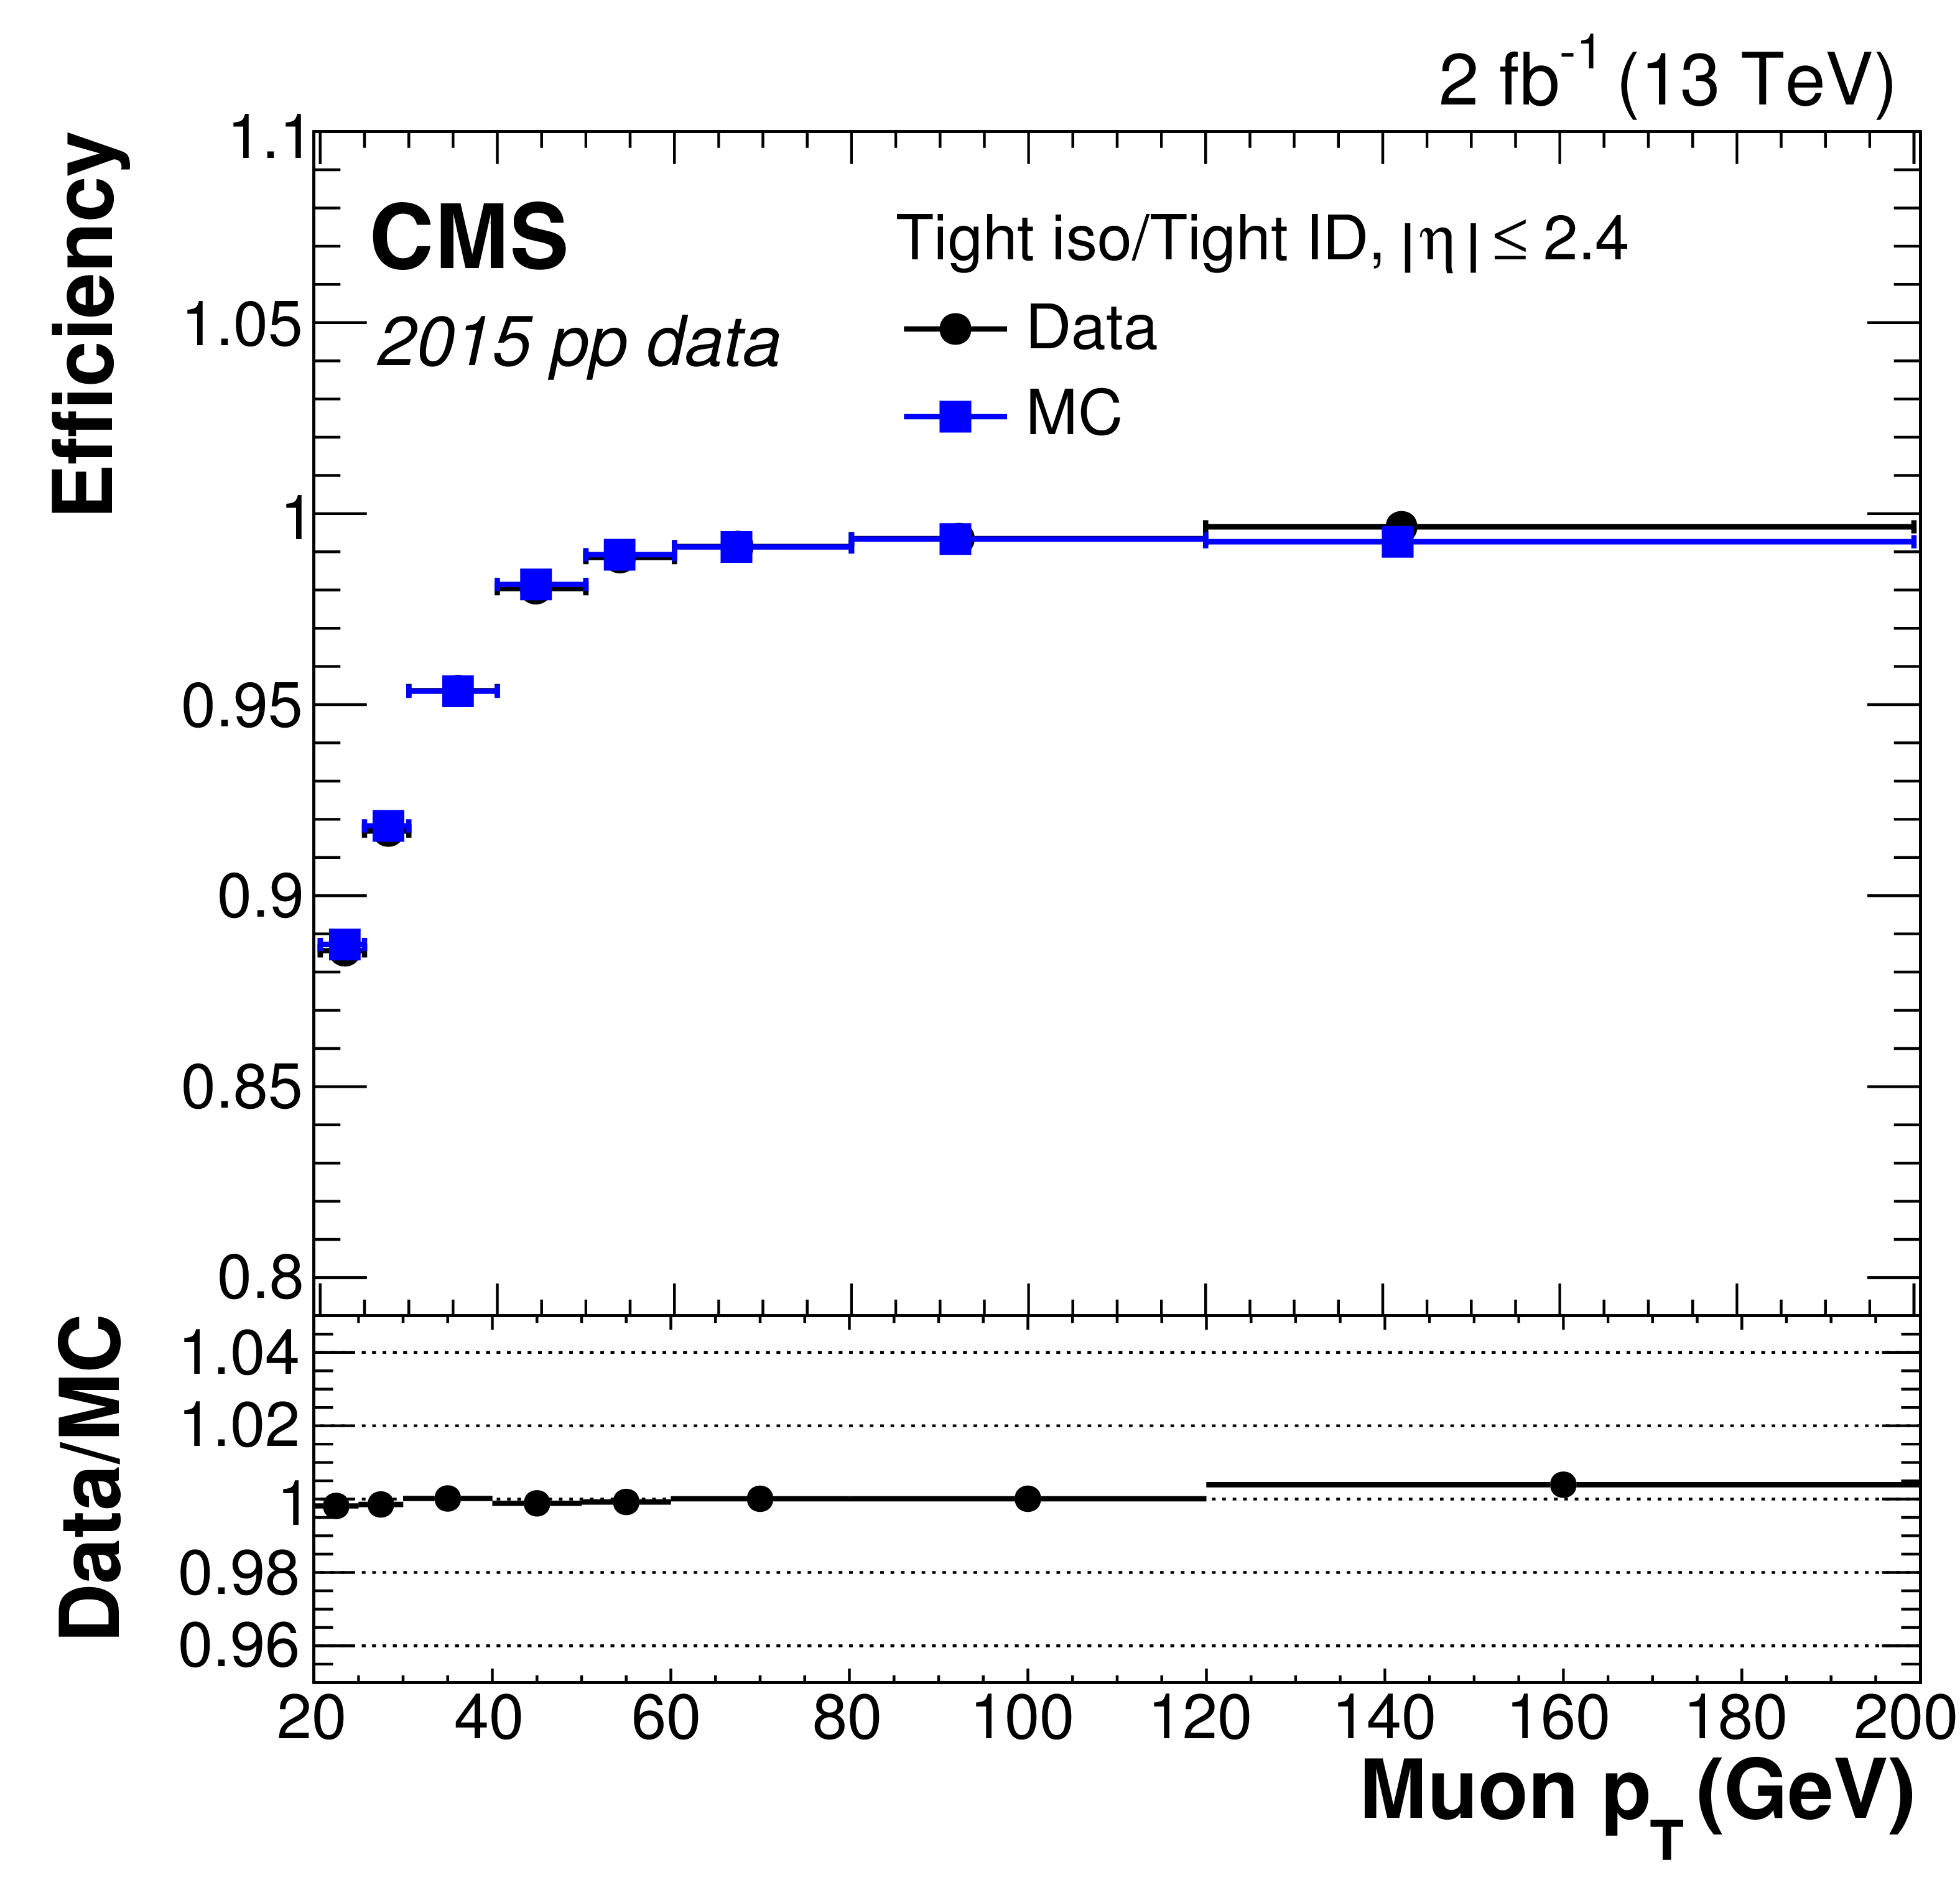
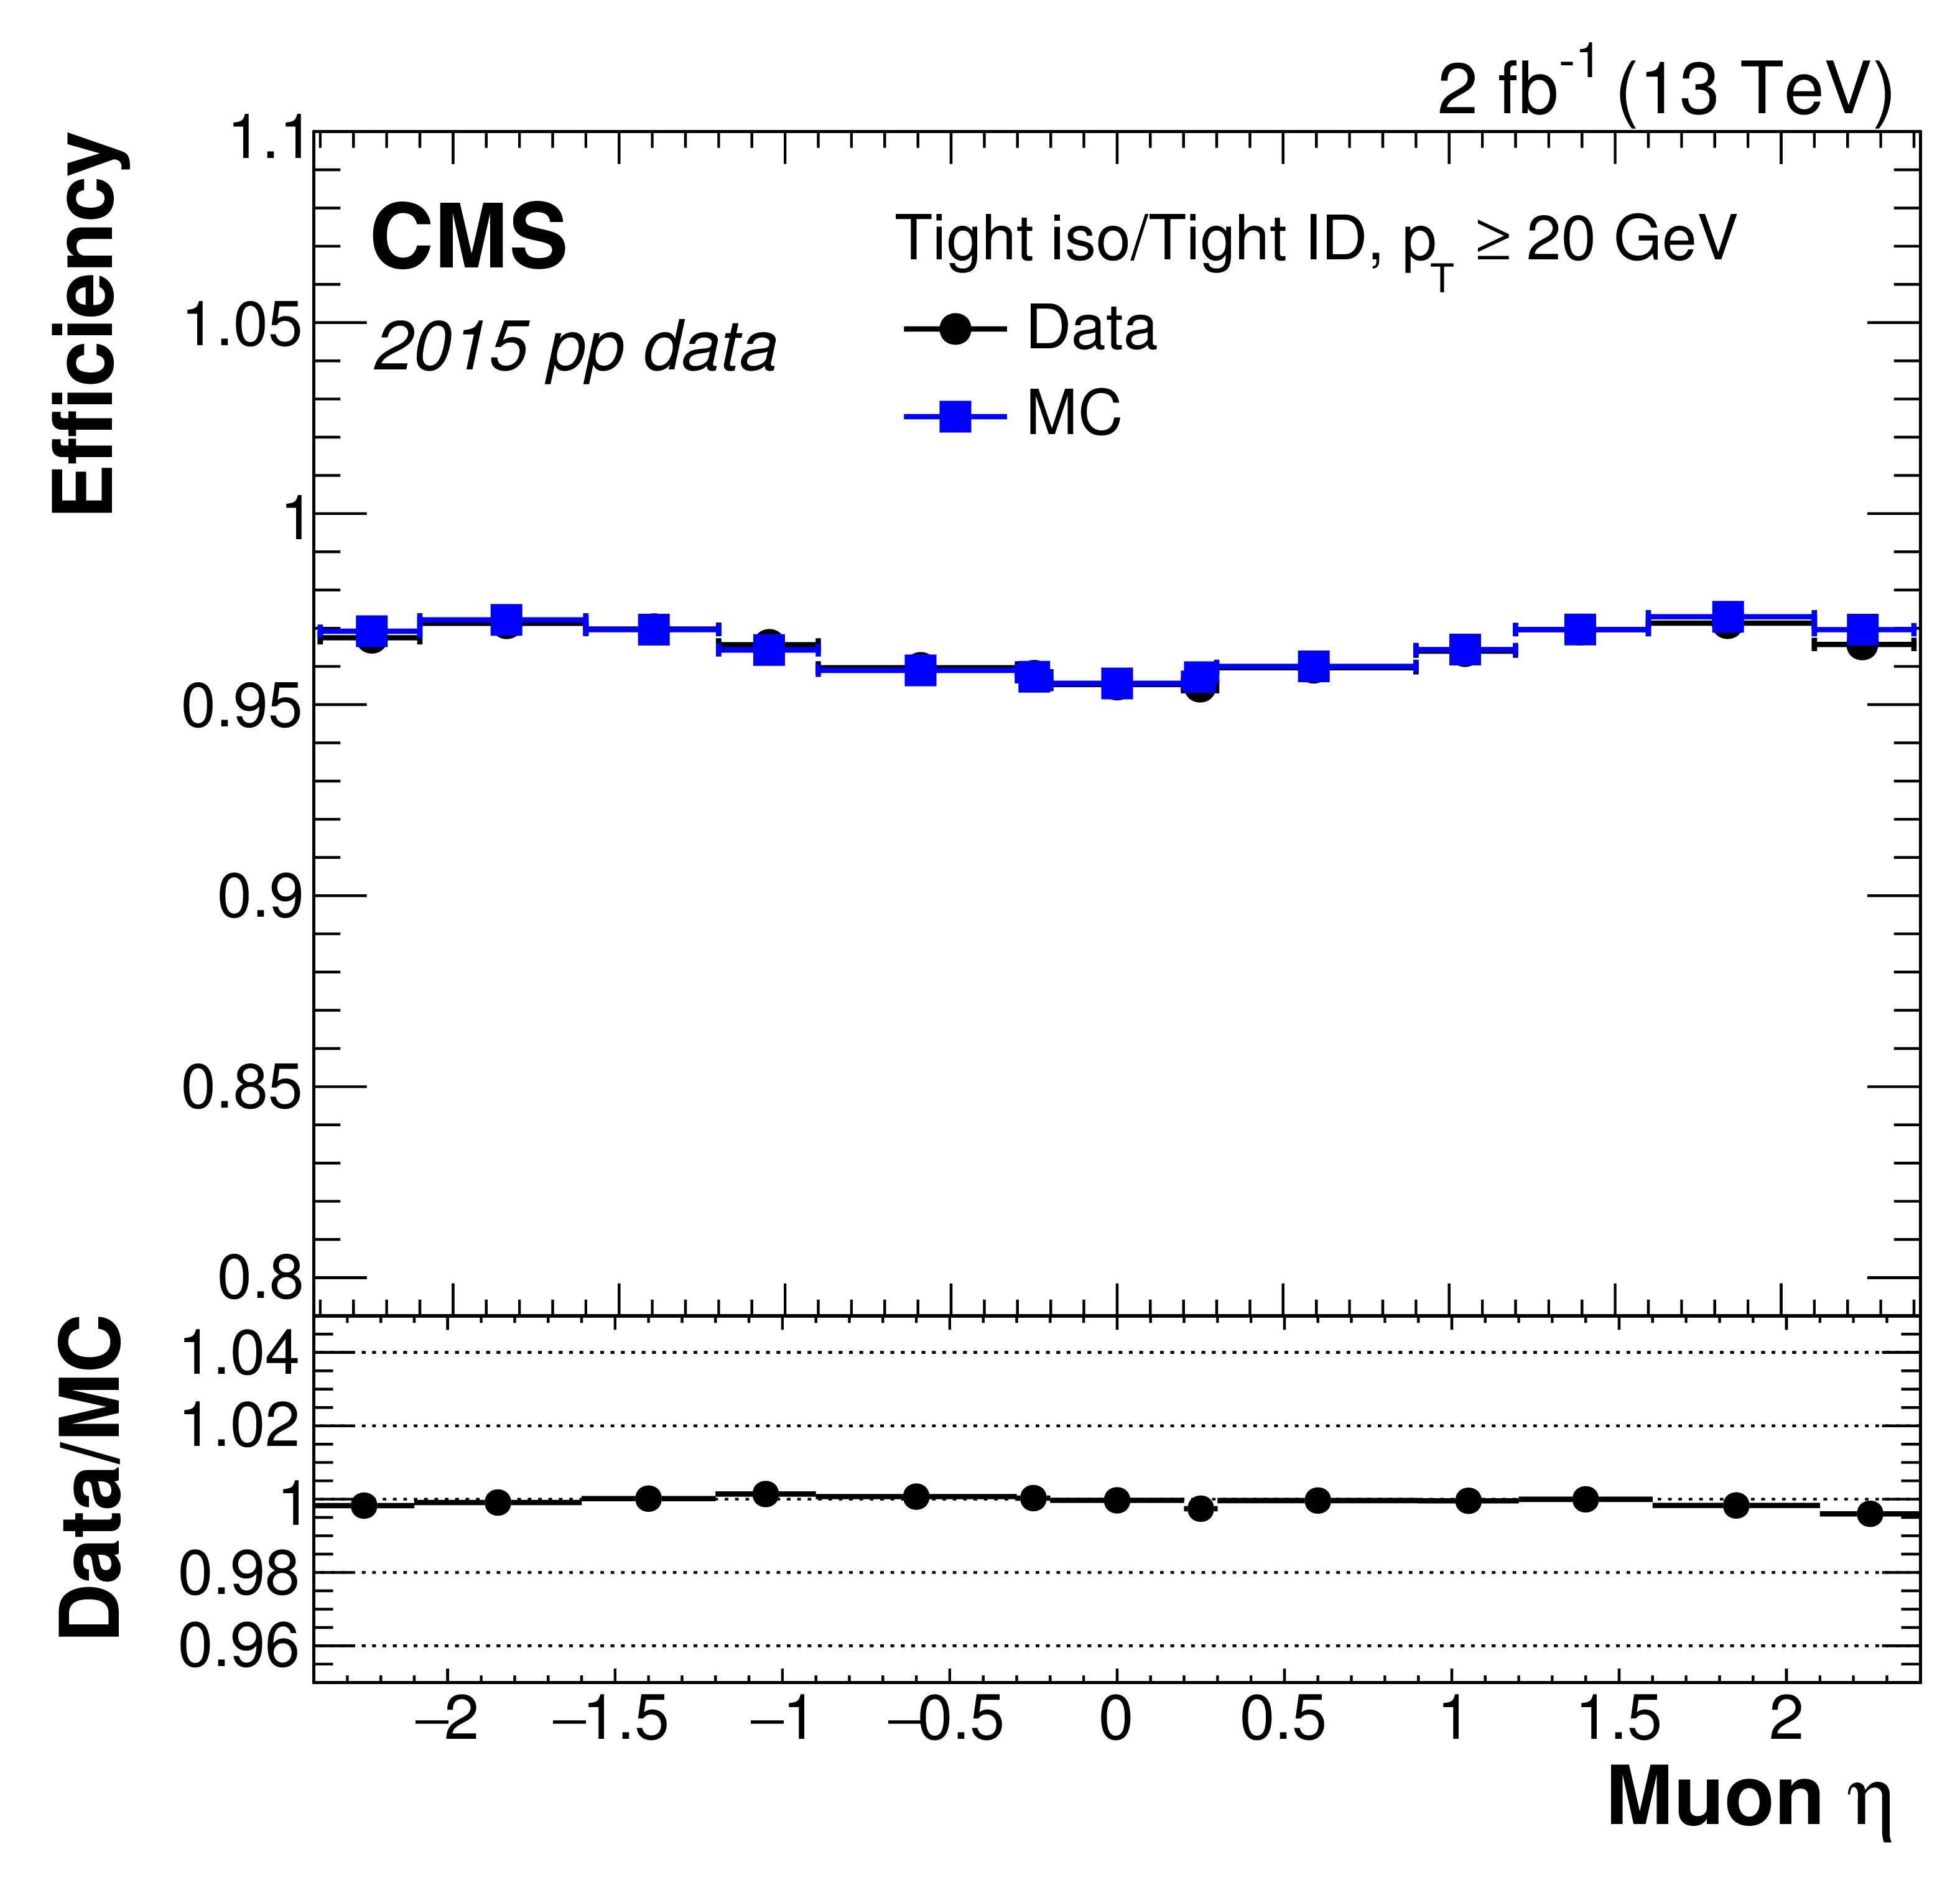
Figure 8:
Tag-and-probe efficiency for the tight PF isolation working point on top of the tight ID (left) versus $ {p_{\mathrm {T}}} $ for muons in the acceptance of the muon spectrometer, and (right) versus pseudorapidity for muons with $ {p_{\mathrm {T}}} > $ 20 GeV, for 2015 data (circles), simulation (squares), and the ratio (bottom inset). The statistical uncertainties are smaller than the symbols used to display the measurements. |
png pdf |
Figure 8-a:
Tag-and-probe efficiency for the tight PF isolation working point on top of the tight ID versus $ {p_{\mathrm {T}}} $ for muons in the acceptance of the muon spectrometer, for 2015 data (circles), simulation (squares), and the ratio (bottom inset). The statistical uncertainties are smaller than the symbols used to display the measurements. |
png pdf |
Figure 8-b:
Tag-and-probe efficiency for the tight PF isolation working point on top of the tight ID versus pseudorapidity for muons with $ {p_{\mathrm {T}}} > $ 20 GeV, for 2015 data (circles), simulation (squares), and the ratio (bottom inset). The statistical uncertainties are smaller than the symbols used to display the measurements. |
png pdf |
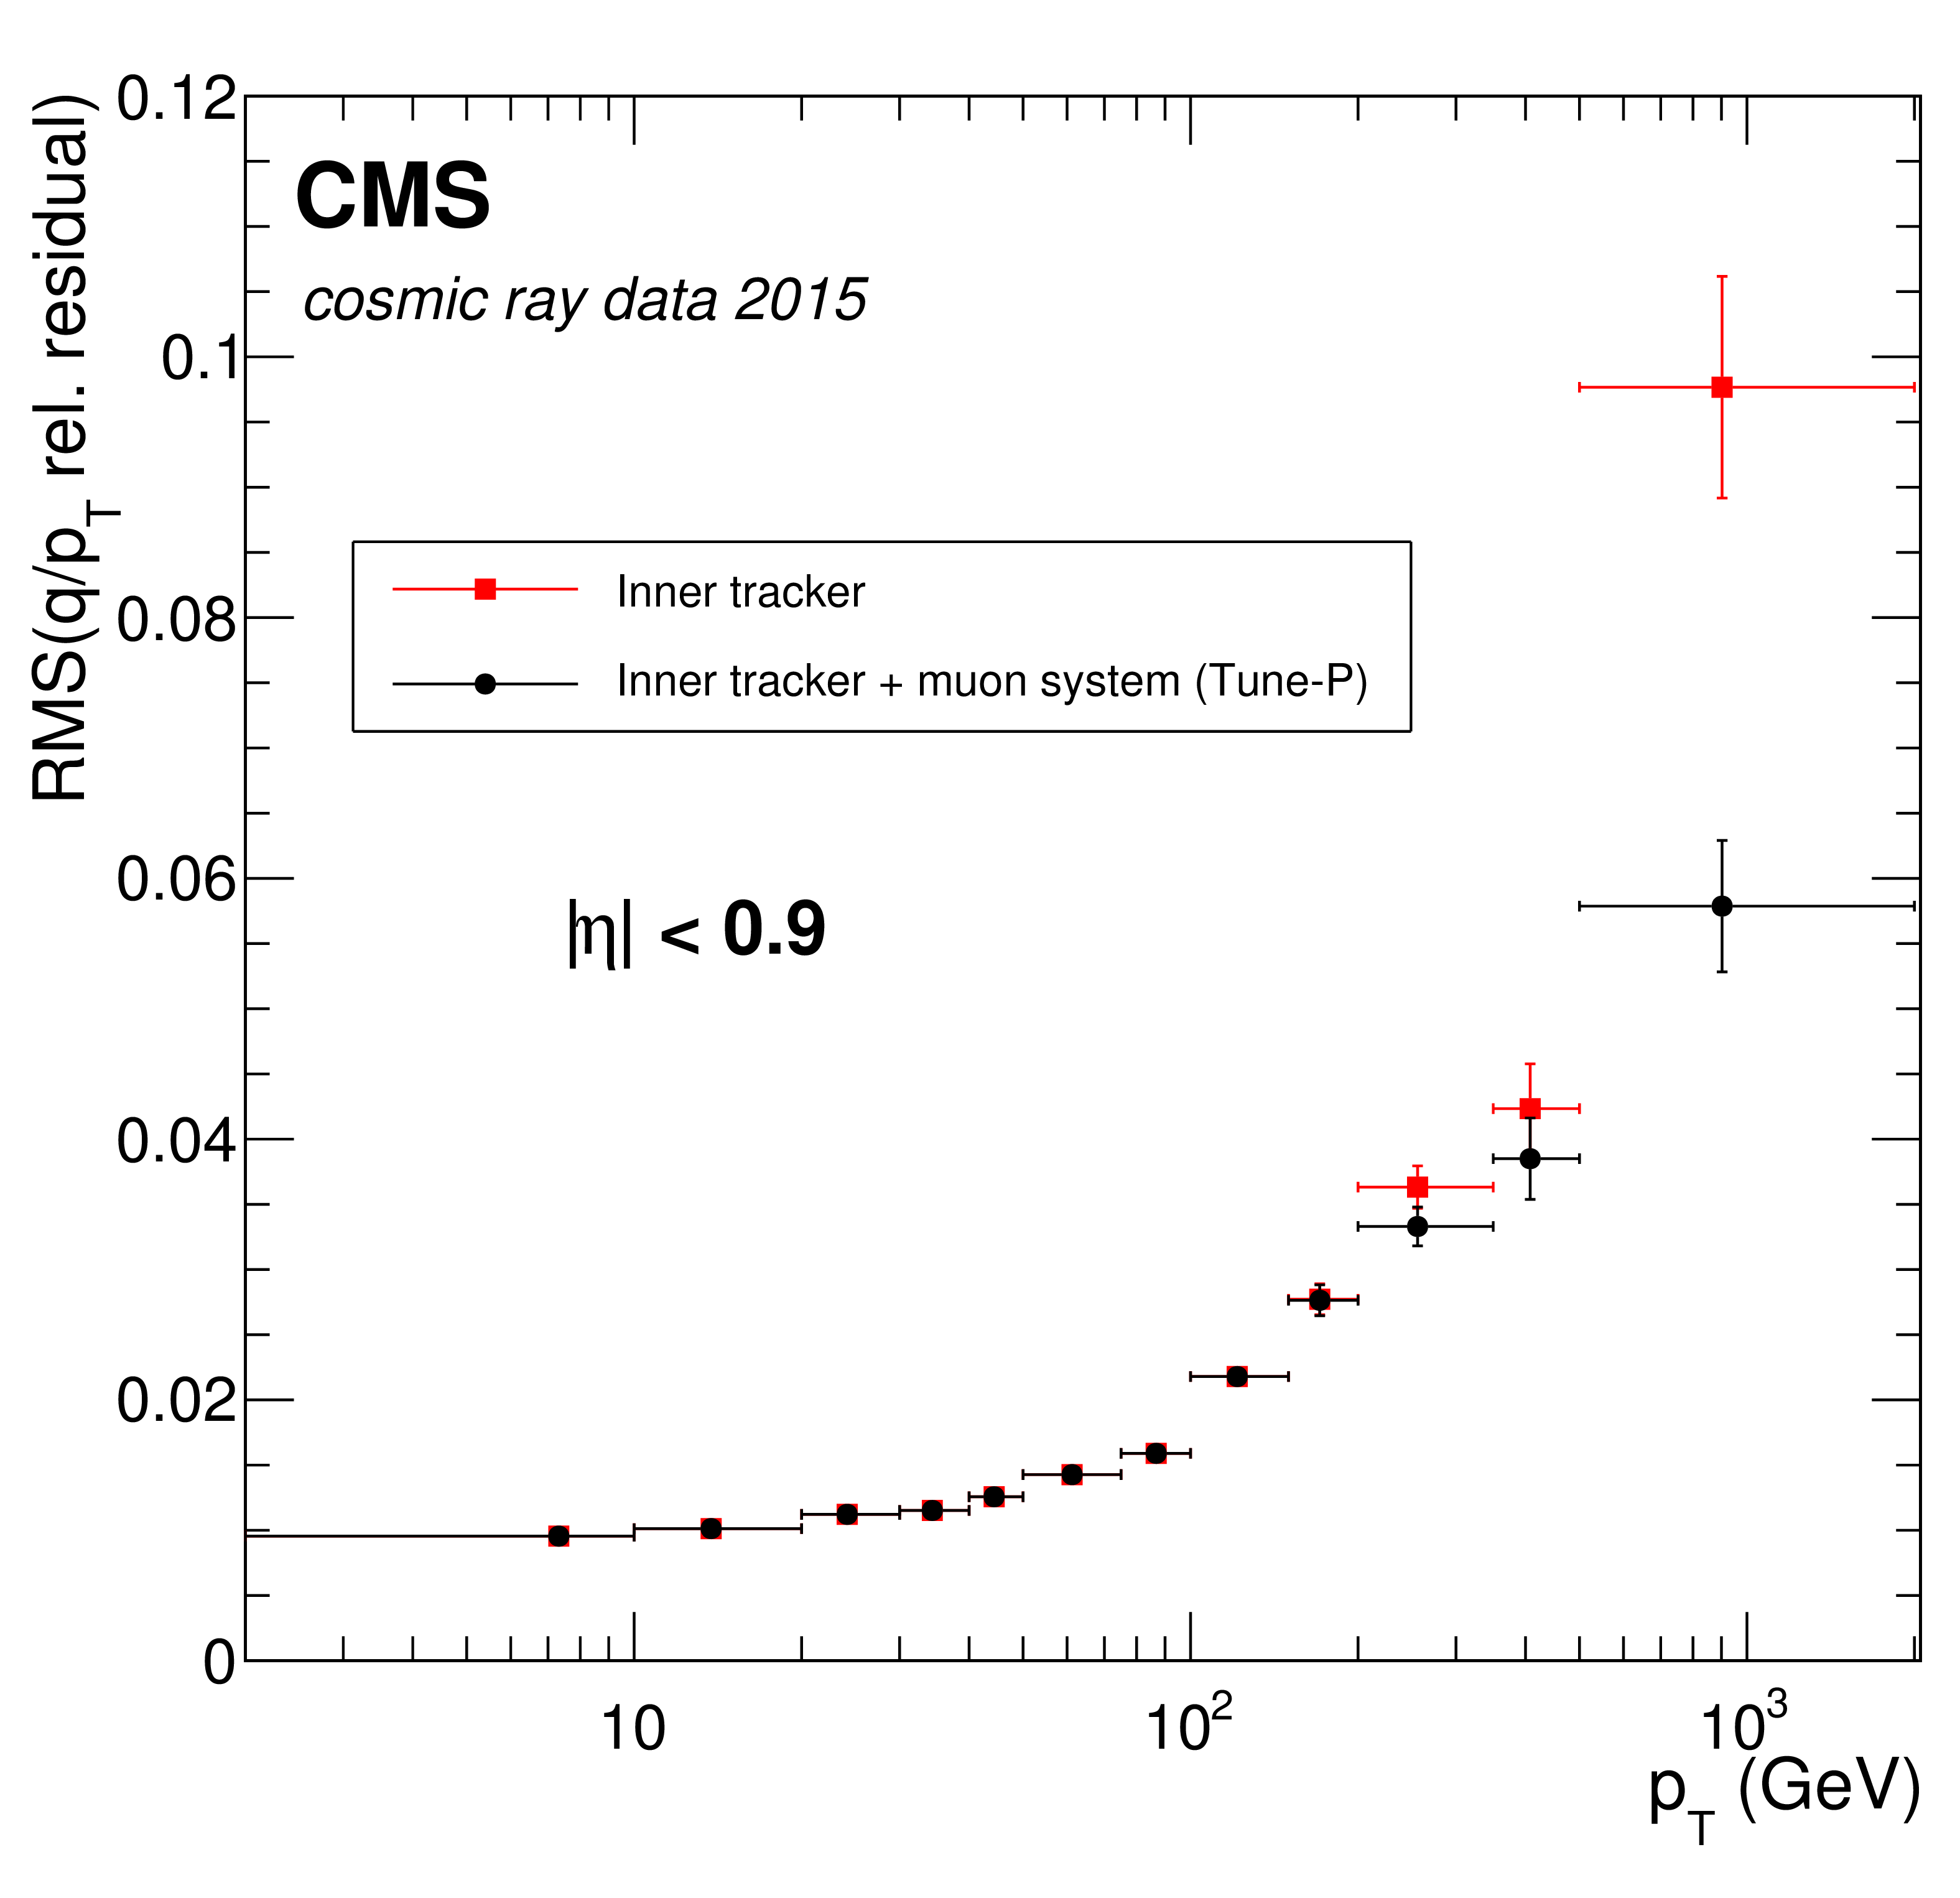
Figure 9:
The RMS of $R(q/ {p_{\mathrm {T}}})$ as a function of $ {p_{\mathrm {T}}} $ for cosmic rays recorded in 2015, using the inner tracker fit only (squares) and including the muon system using the Tune-P algorithm (circles). The vertical error bars represent the statistical uncertainties of the RMS. |
png pdf |
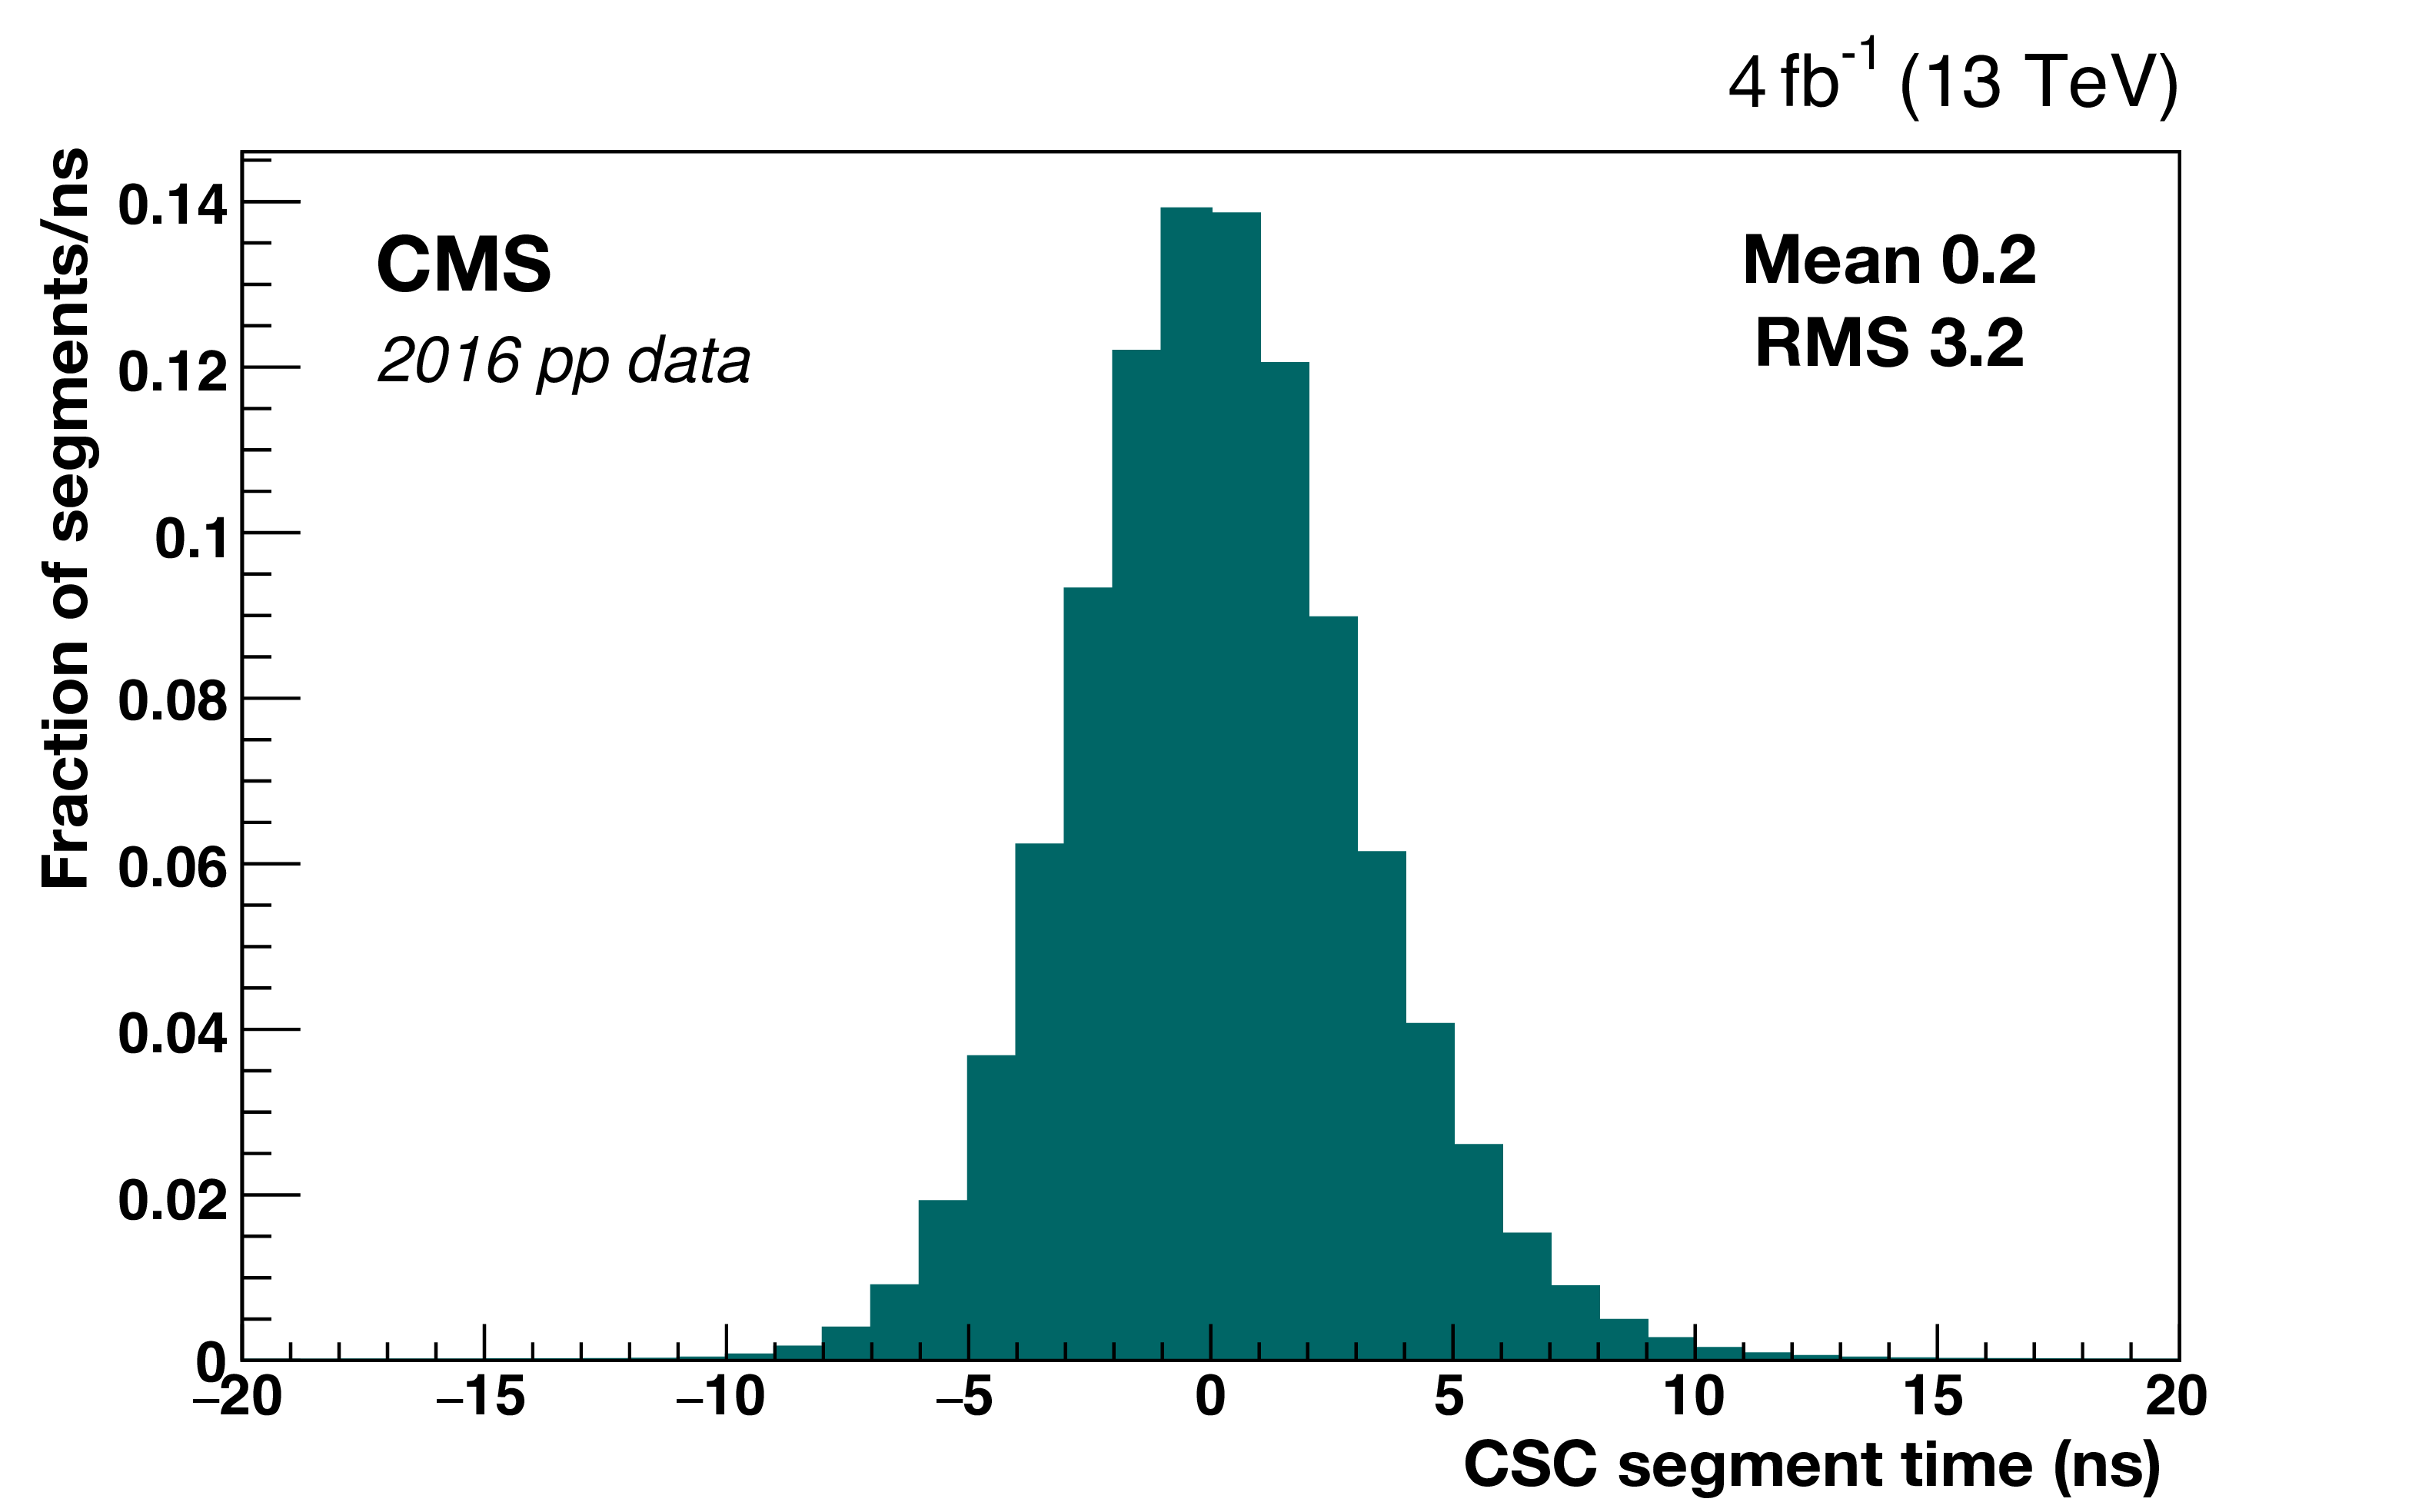
Figure 10:
Distribution of times from reconstructed CSC segments measured with the 2016 data. |

png pdf |
Figure 11:
Time-at-vertex distribution for standalone-muons in the barrel, using the times measured by DT chambers in 2016 data. |
png pdf |
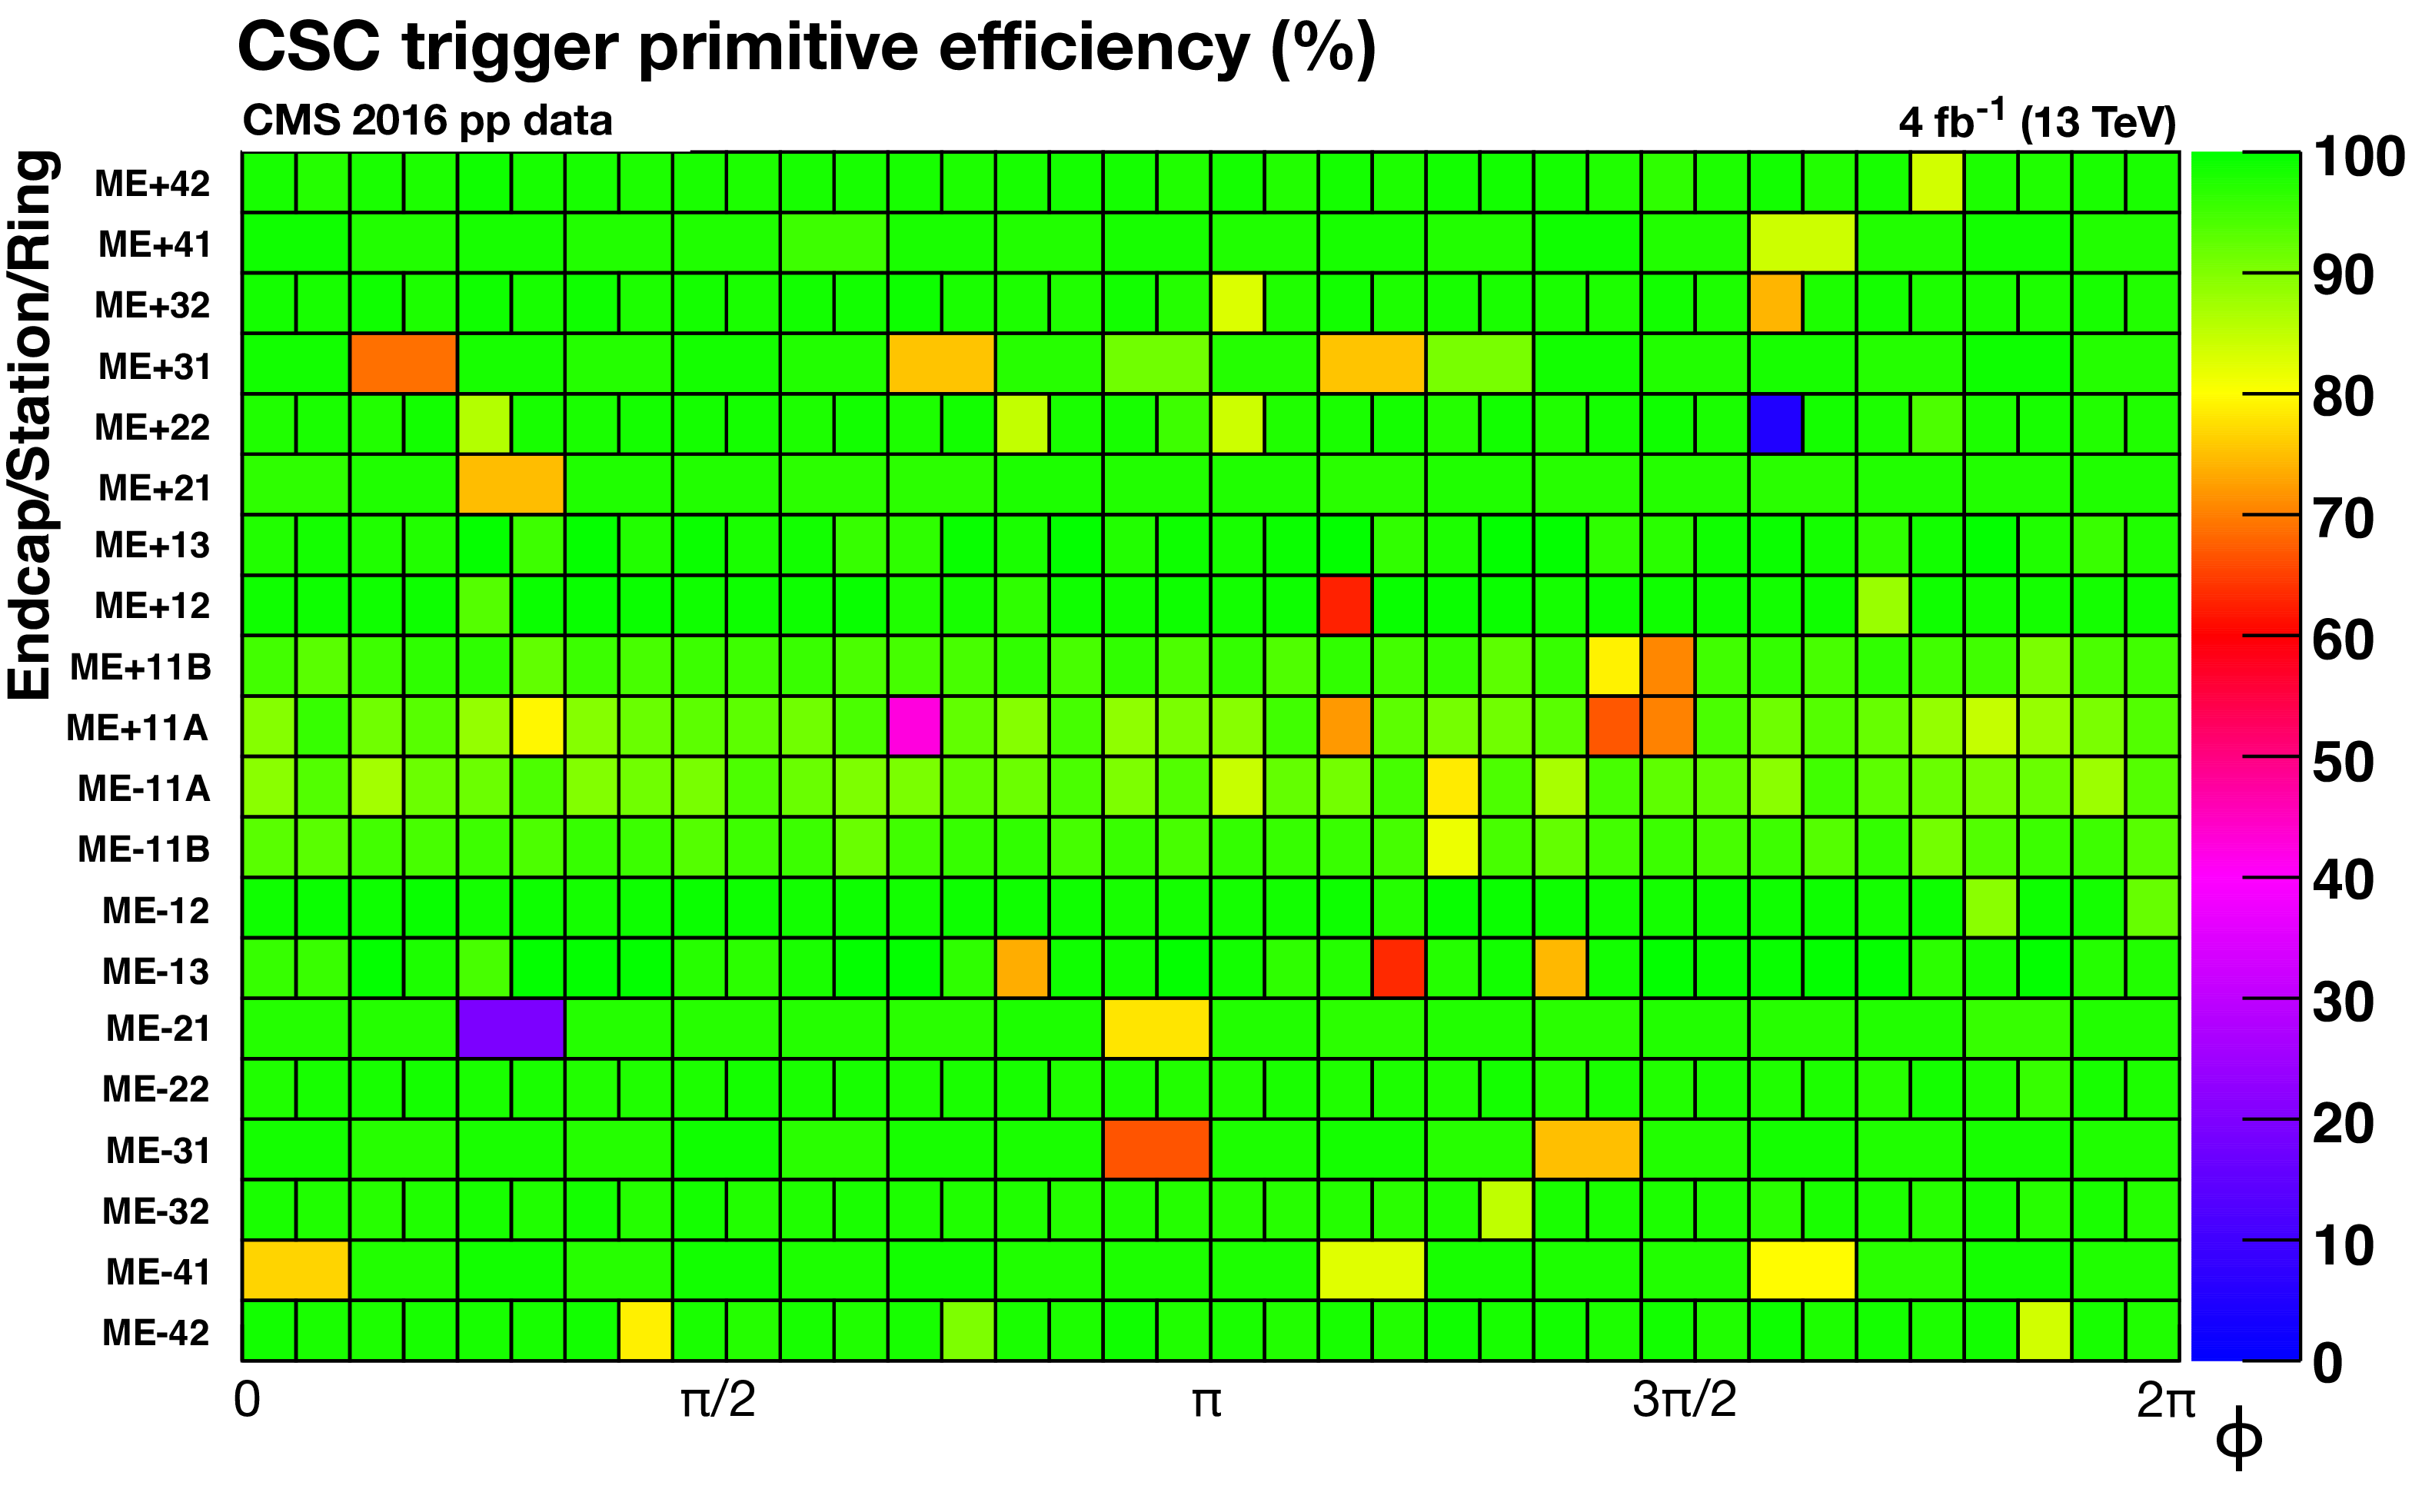
Figure 12:
The efficiency (in percent) of each CSC to provide a trigger primitive, measured with the 2016 data. |
png pdf |
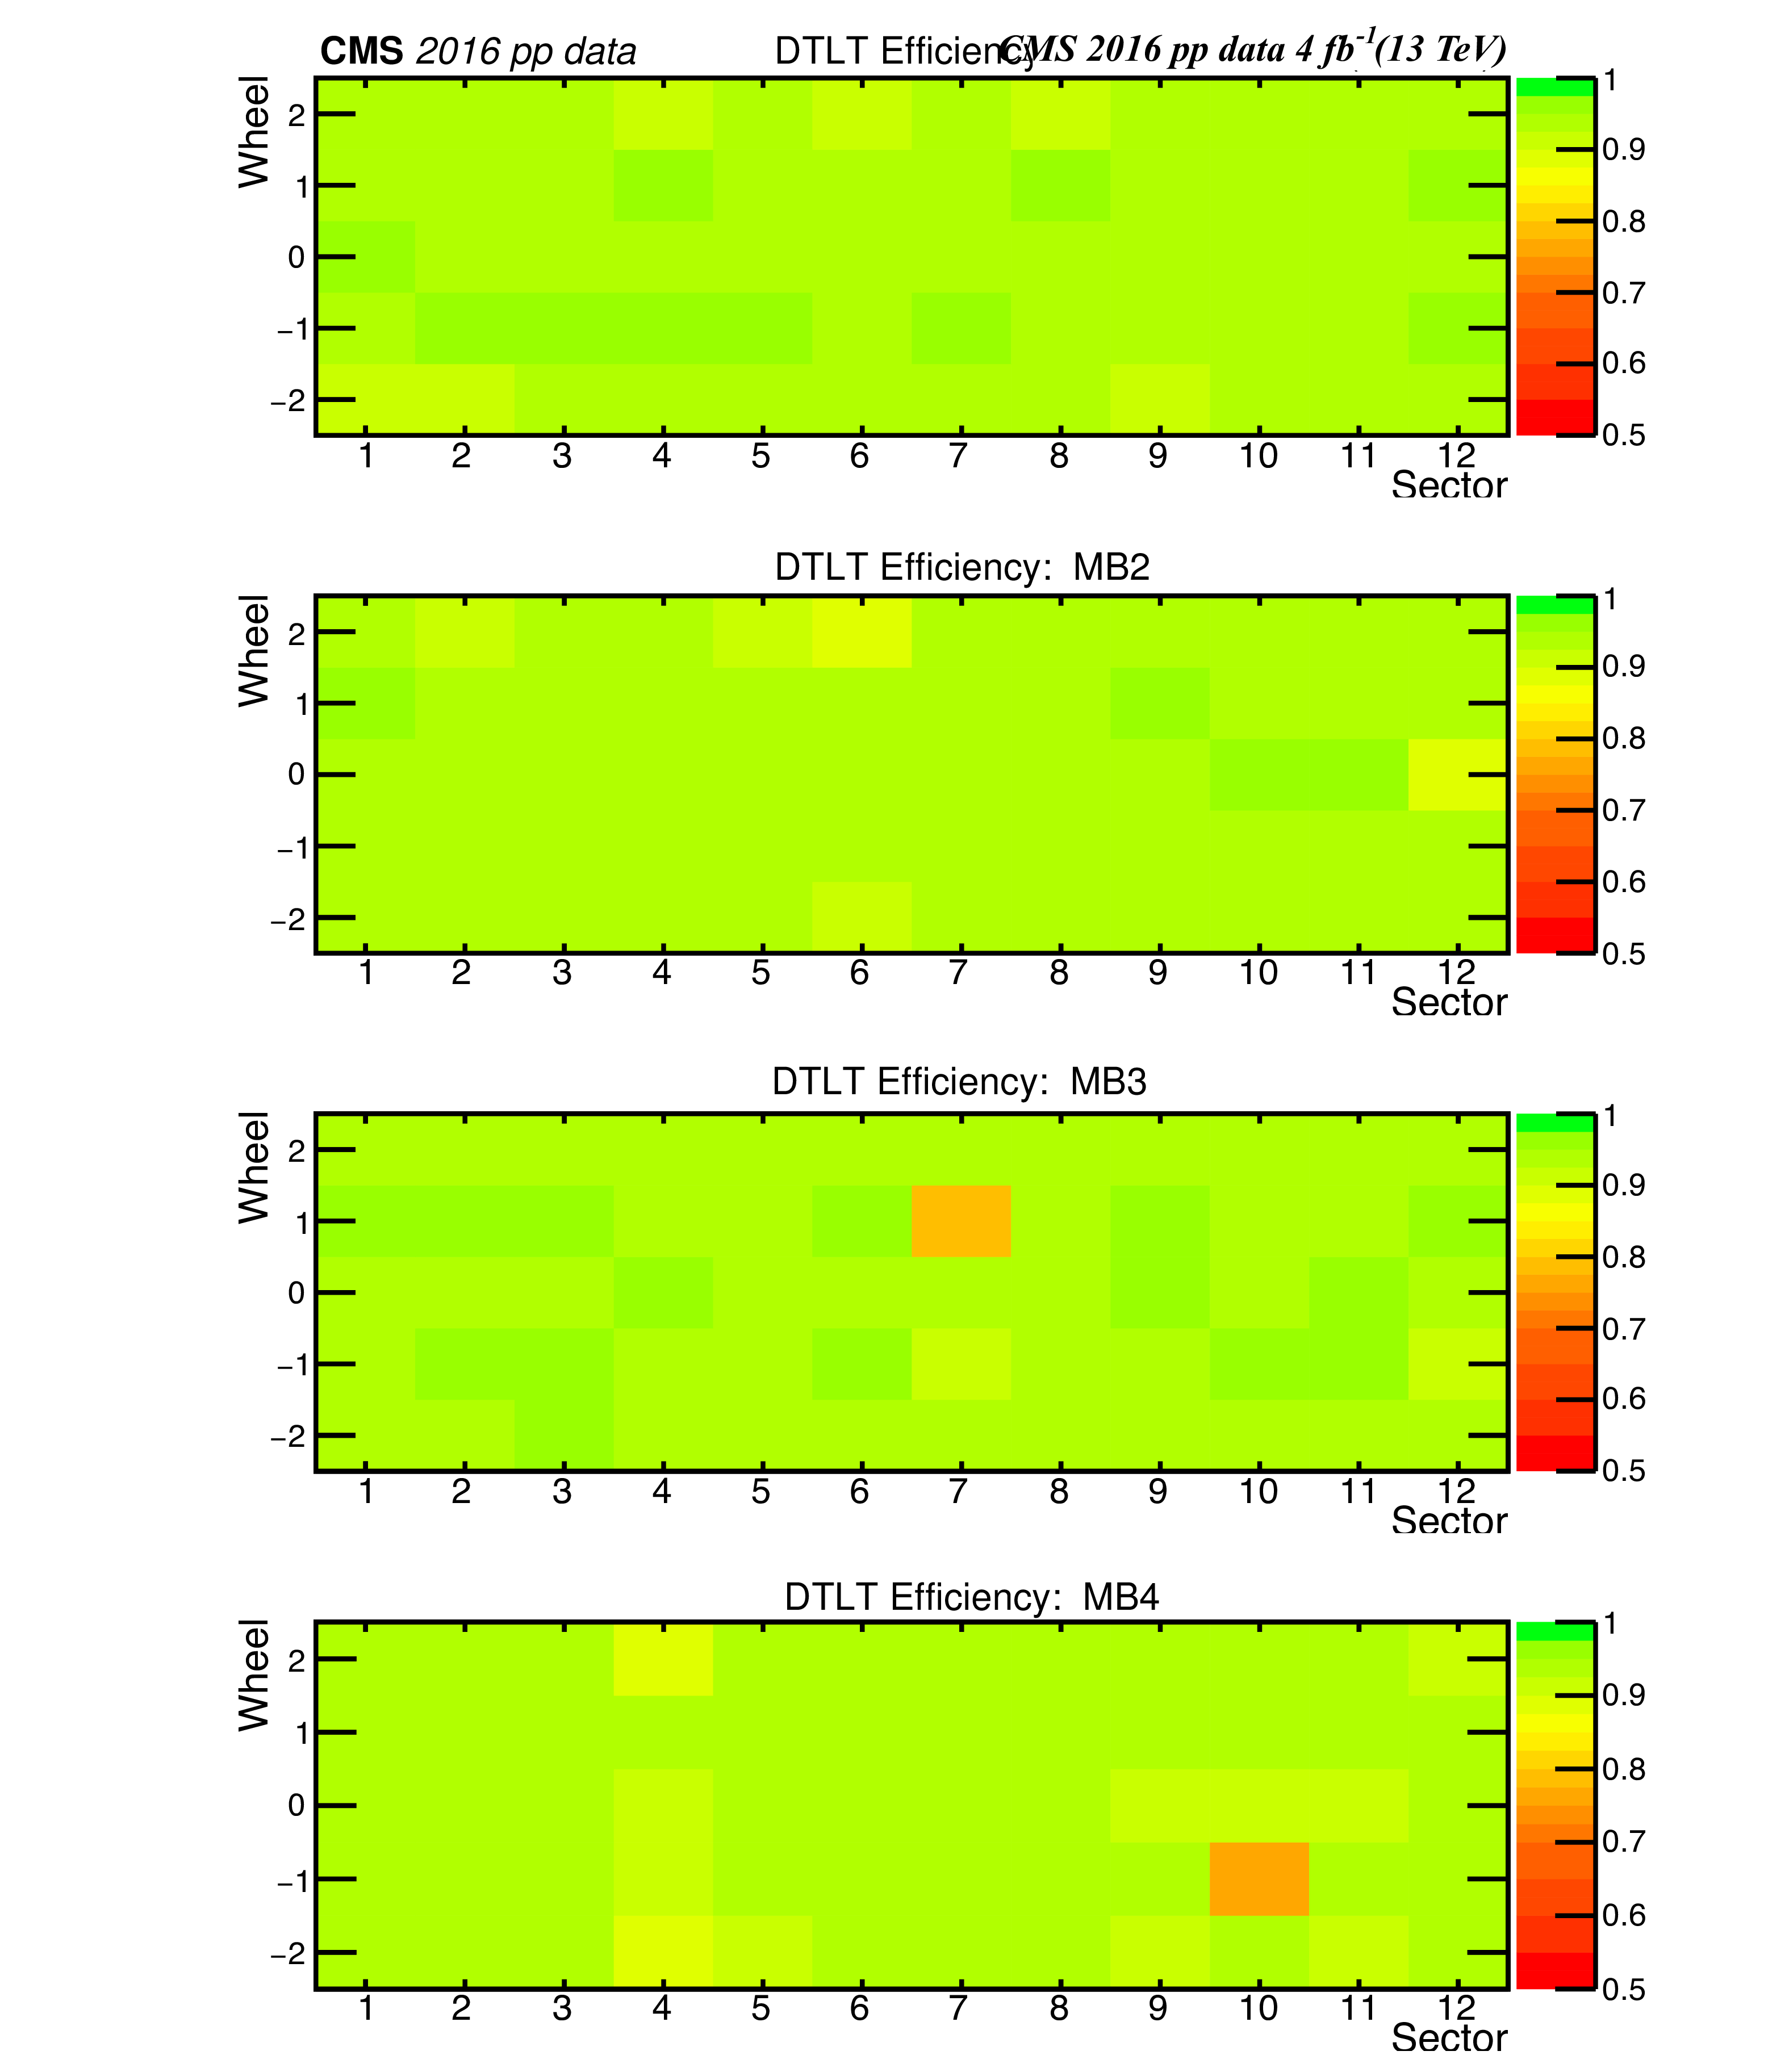
Figure 13:
Efficiency map for the DT local trigger ($\phi $ view) for each chamber, measured with the 2016 data. Each map represents one station. The z-axis color indicates the efficiency, the wheel number is on the vertical axis, and the $\phi $ sector number is on the horizontal axis. |
png pdf |
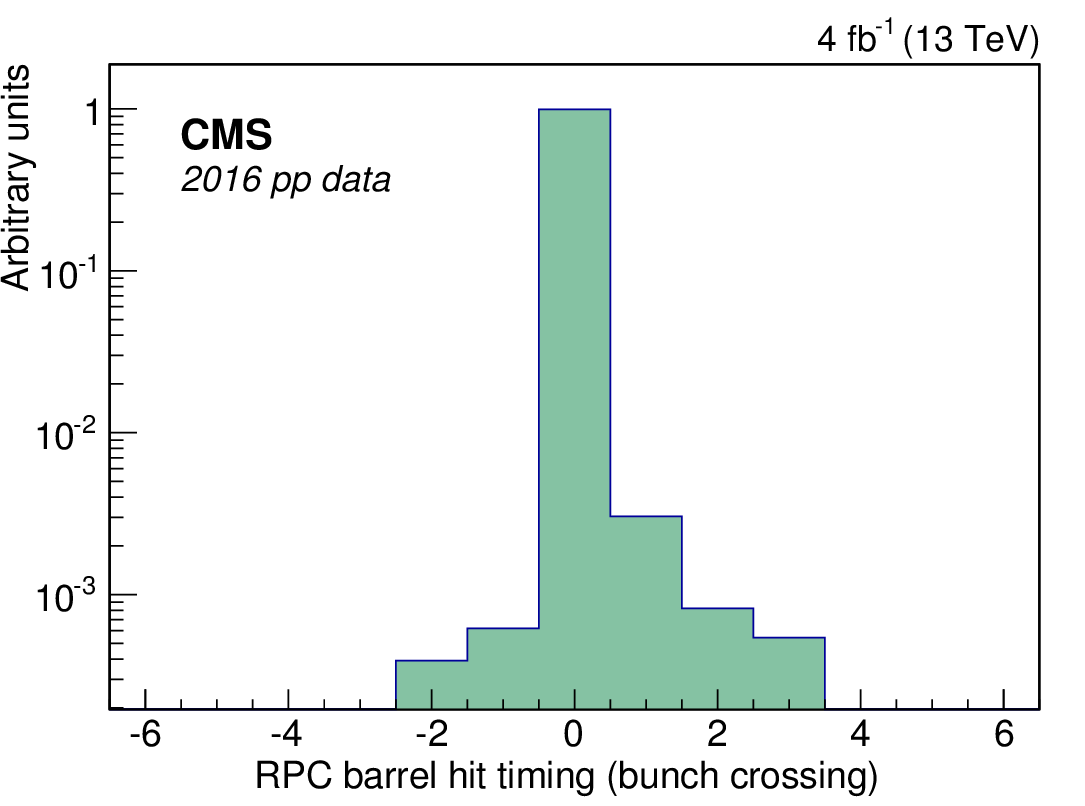
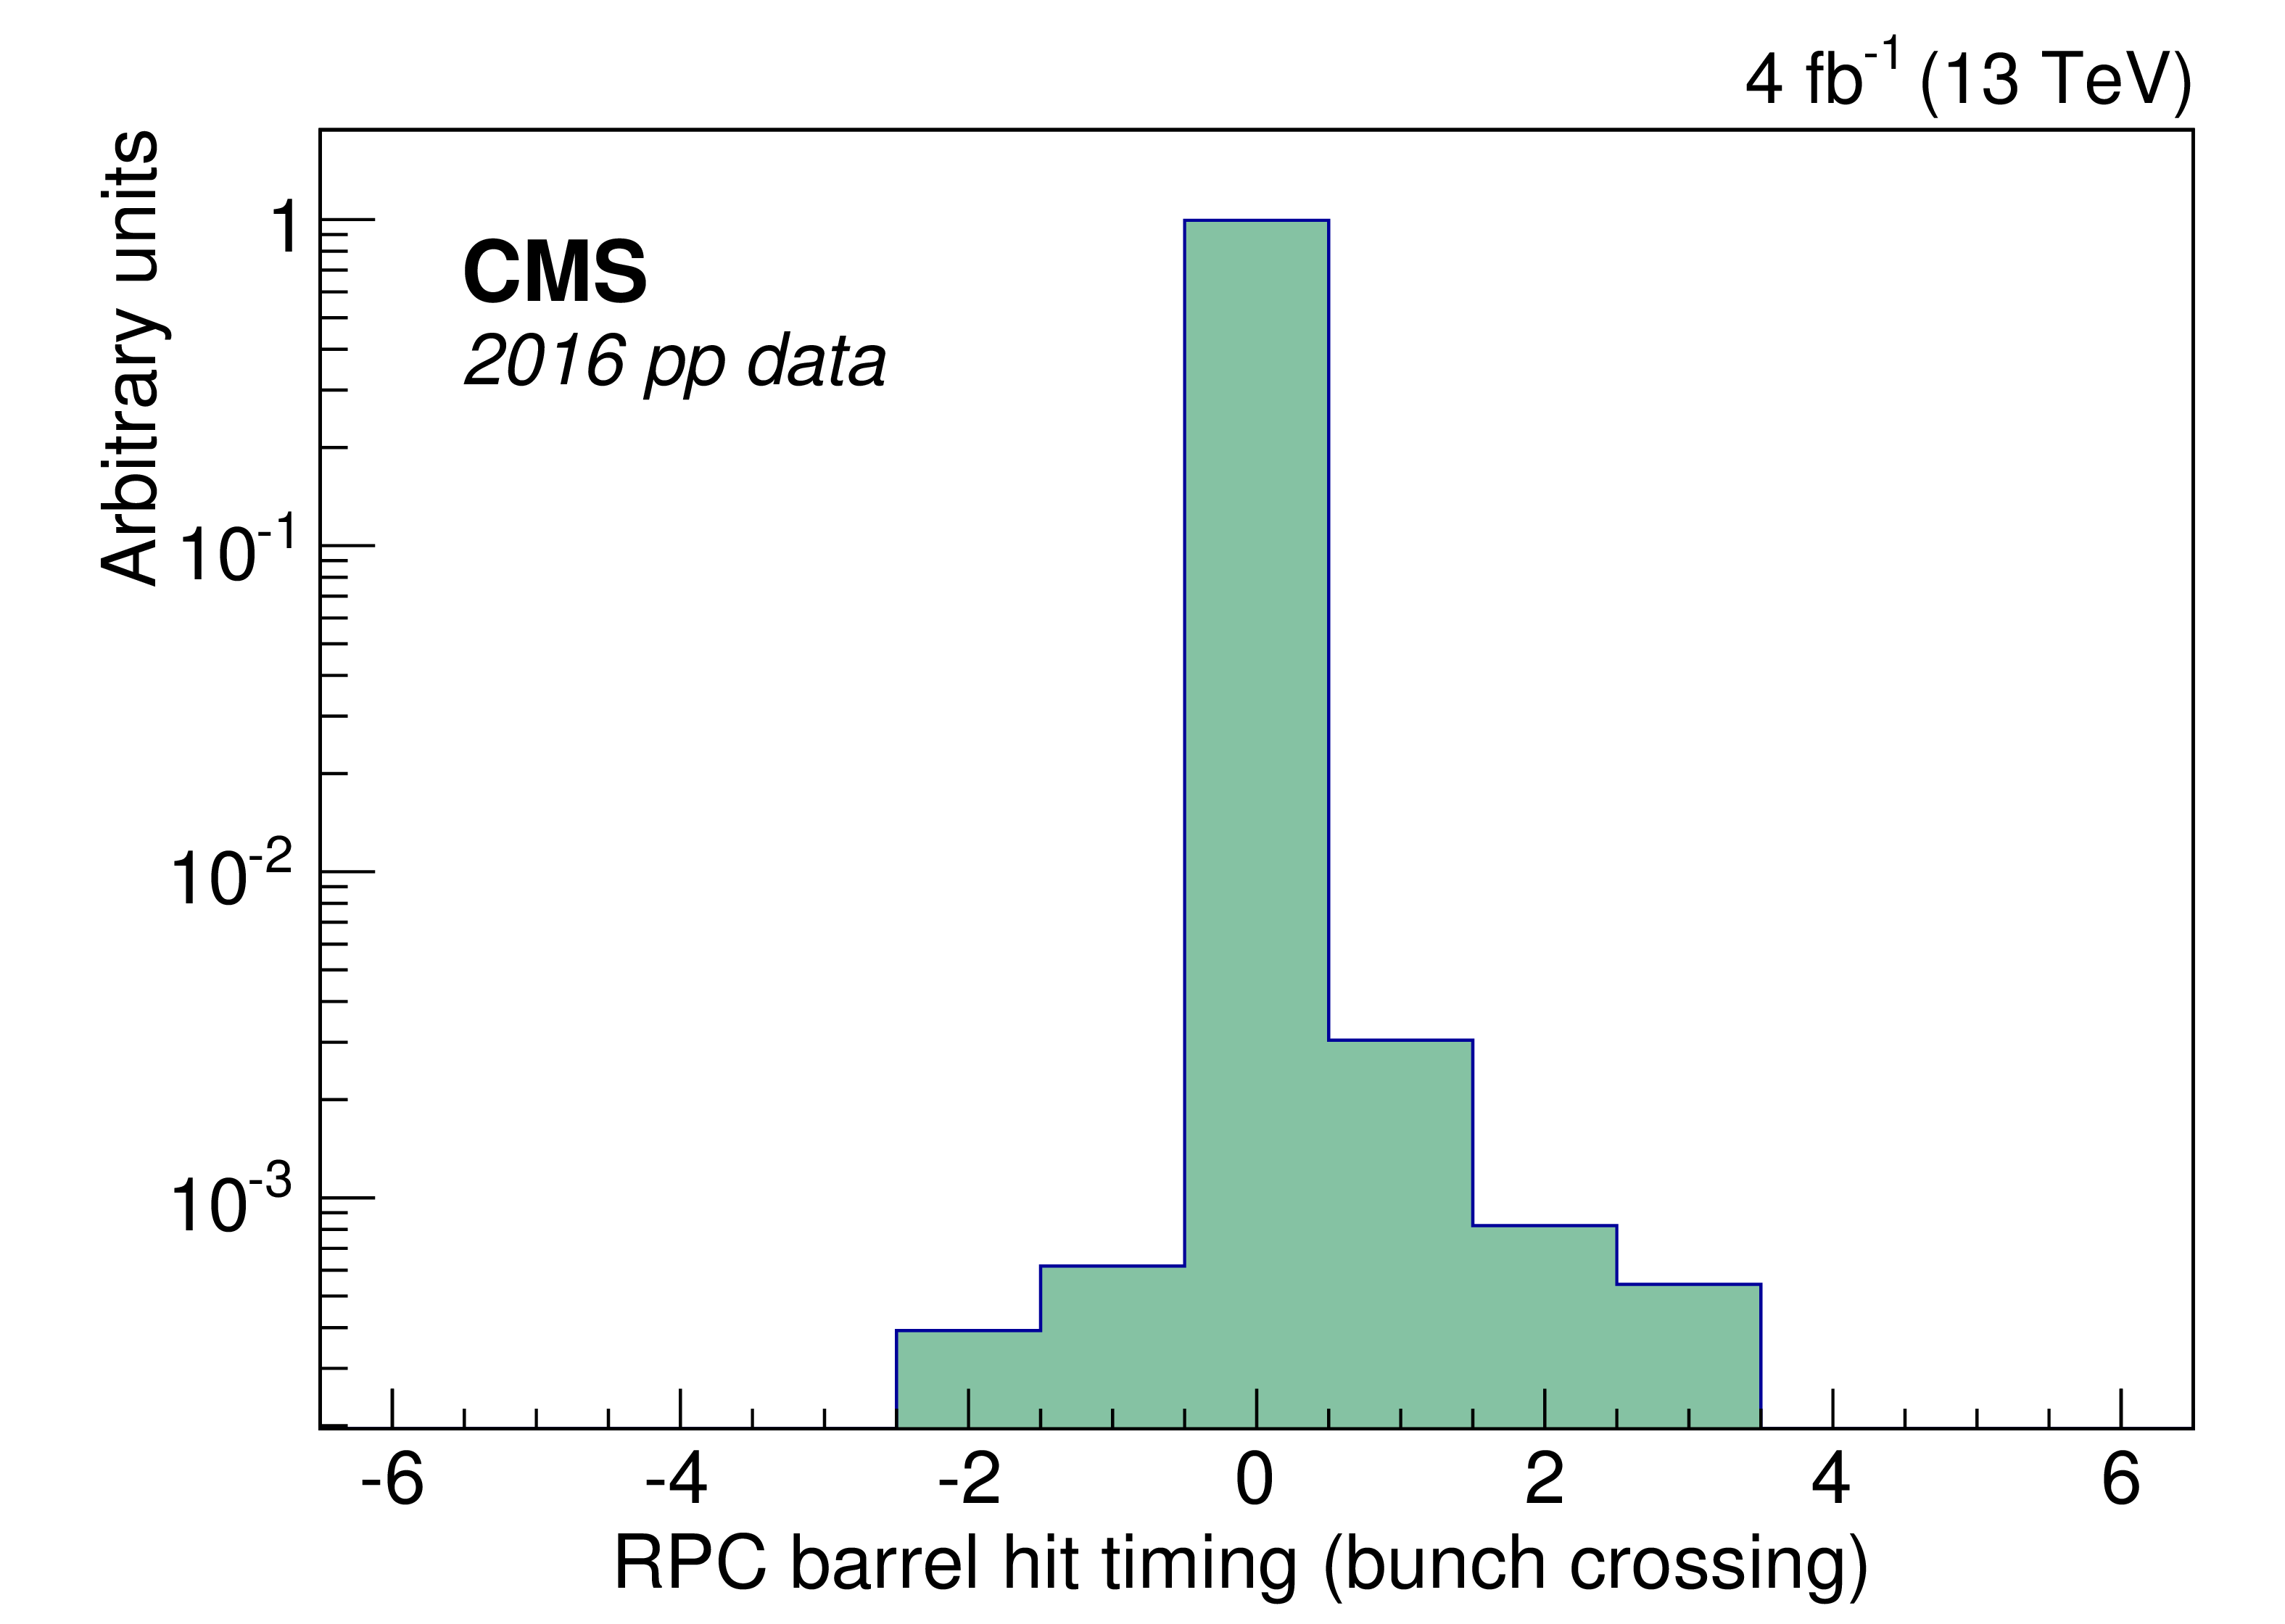
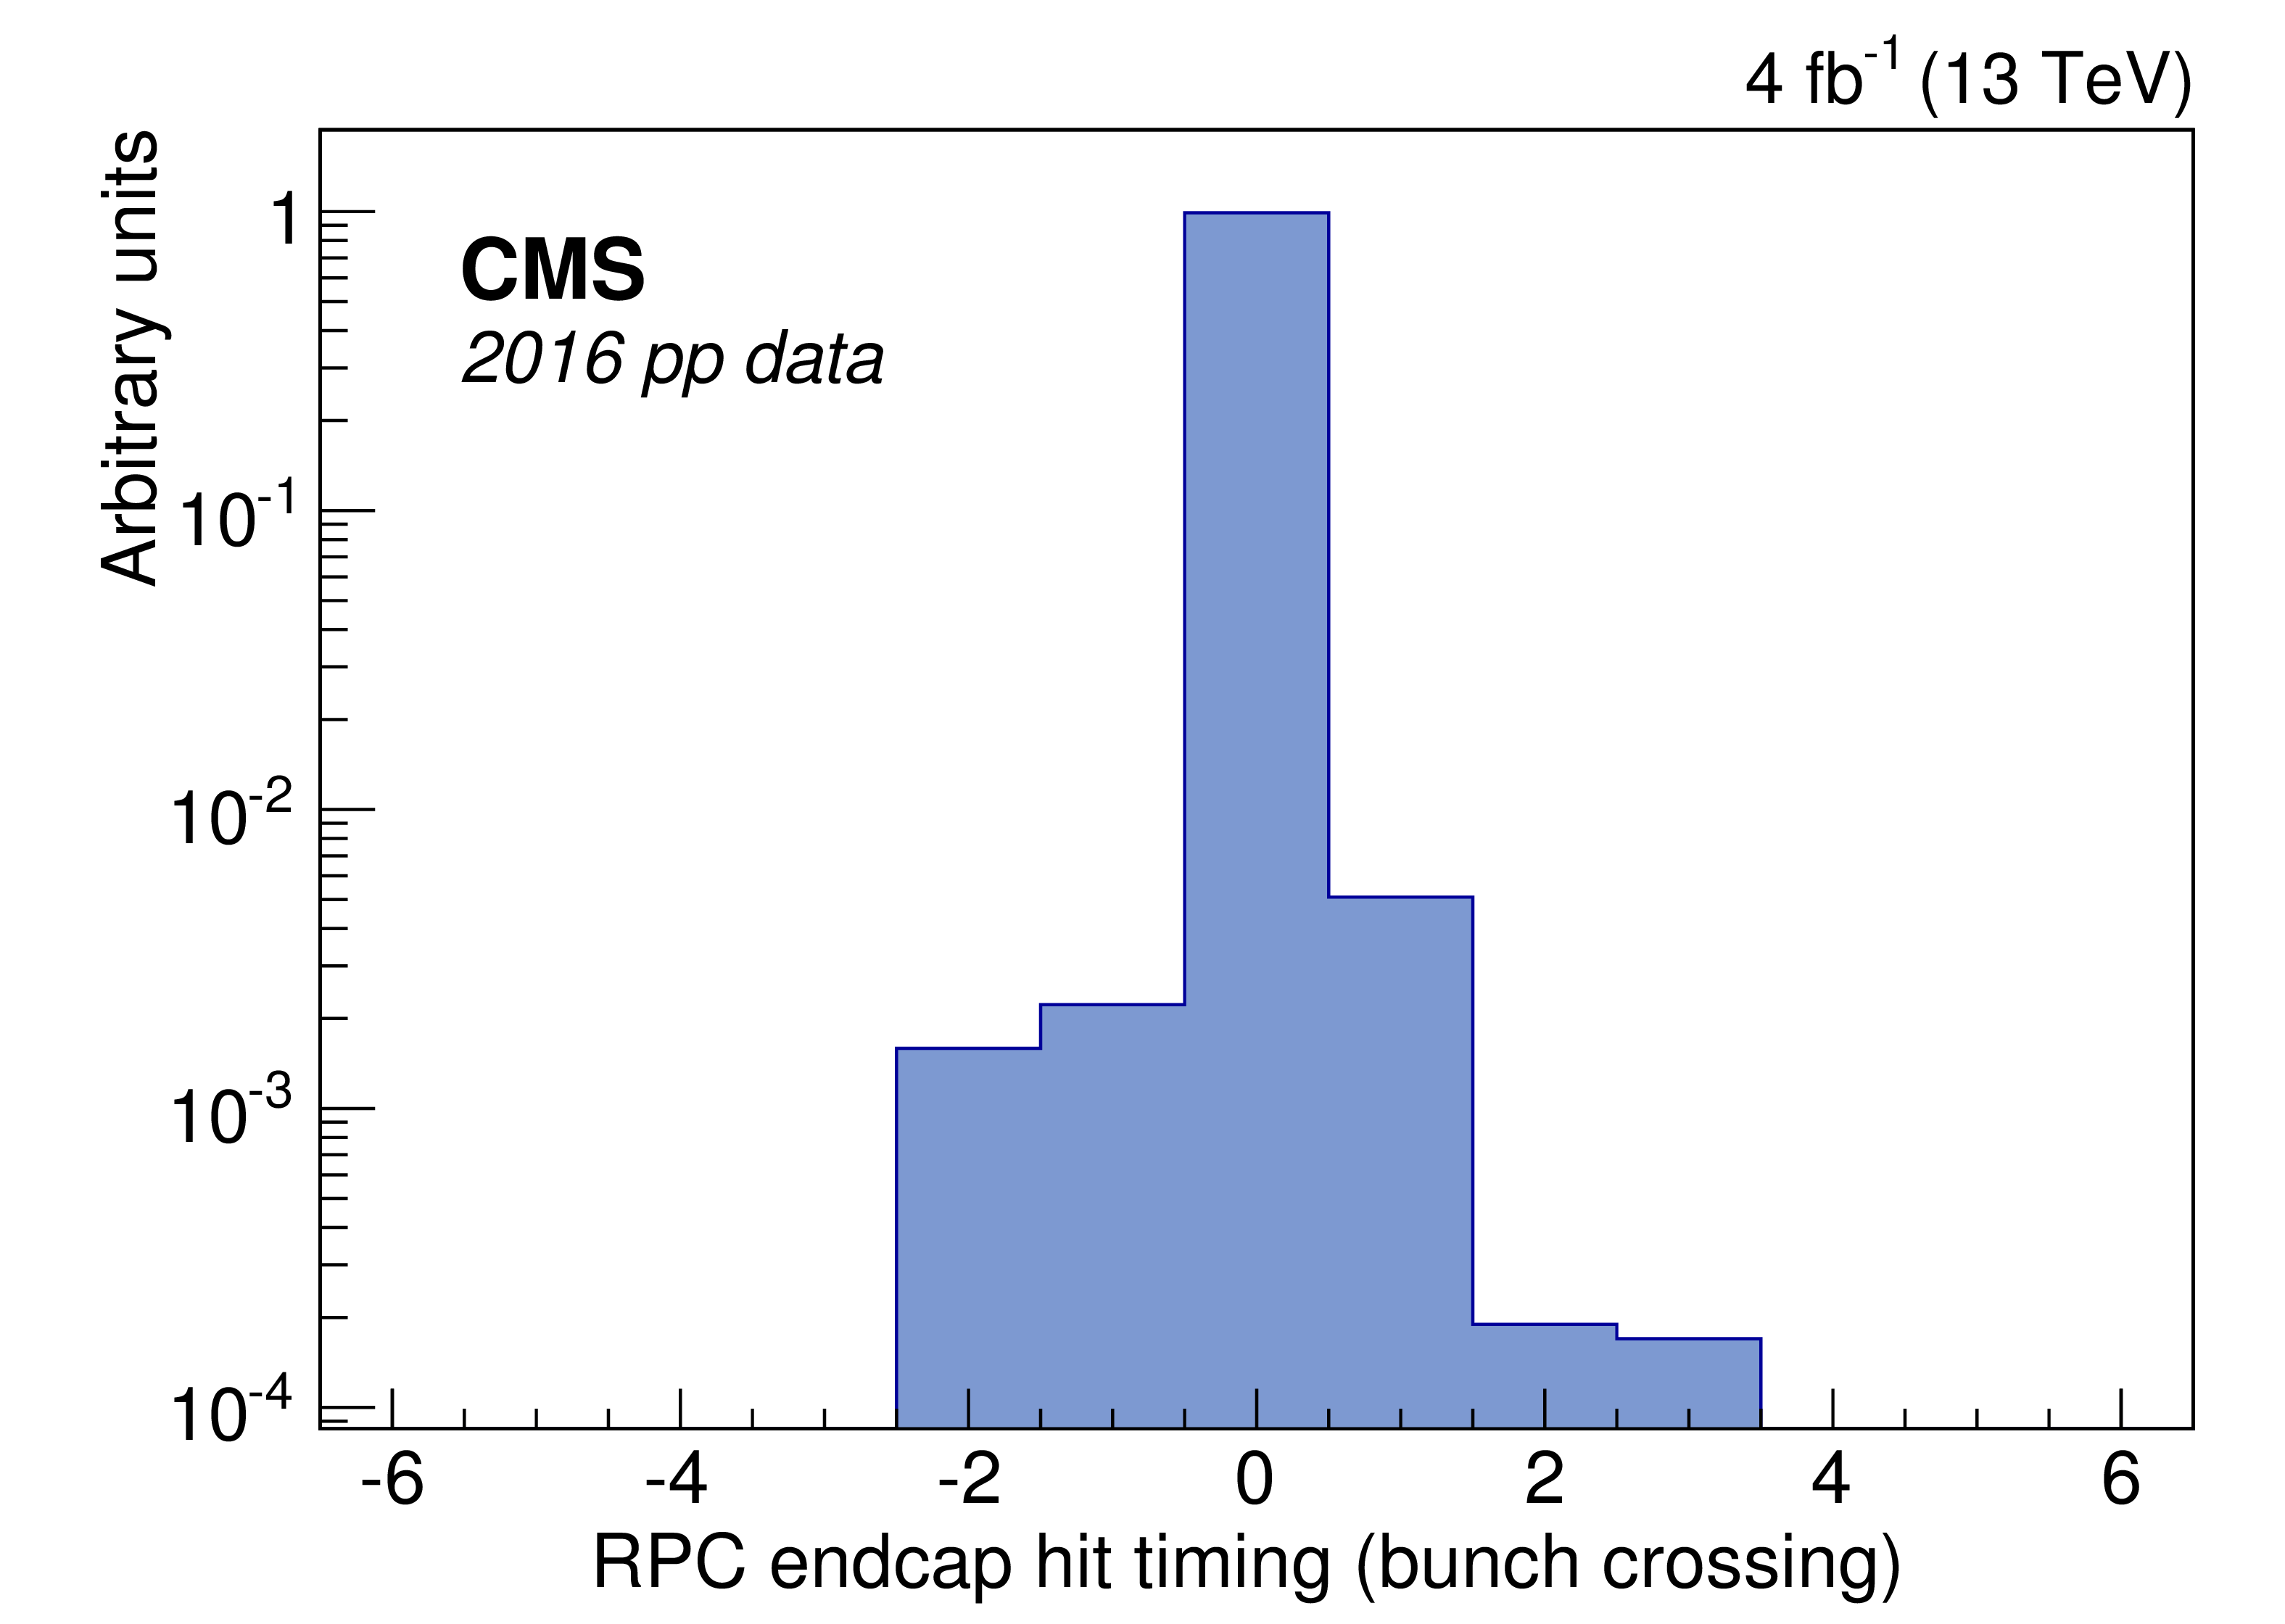
Figure 14:
The bunch crossing distribution from reconstructed RPC hits in the barrel (left) and in one endcap (right), using the 2016 data. |
png pdf |
Figure 14-a:
The bunch crossing distribution from reconstructed RPC hits in the barrel, using the 2016 data. |
png pdf |
Figure 14-b:
The bunch crossing distribution from reconstructed RPC hits in one endcap, using the 2016 data. |
png pdf |
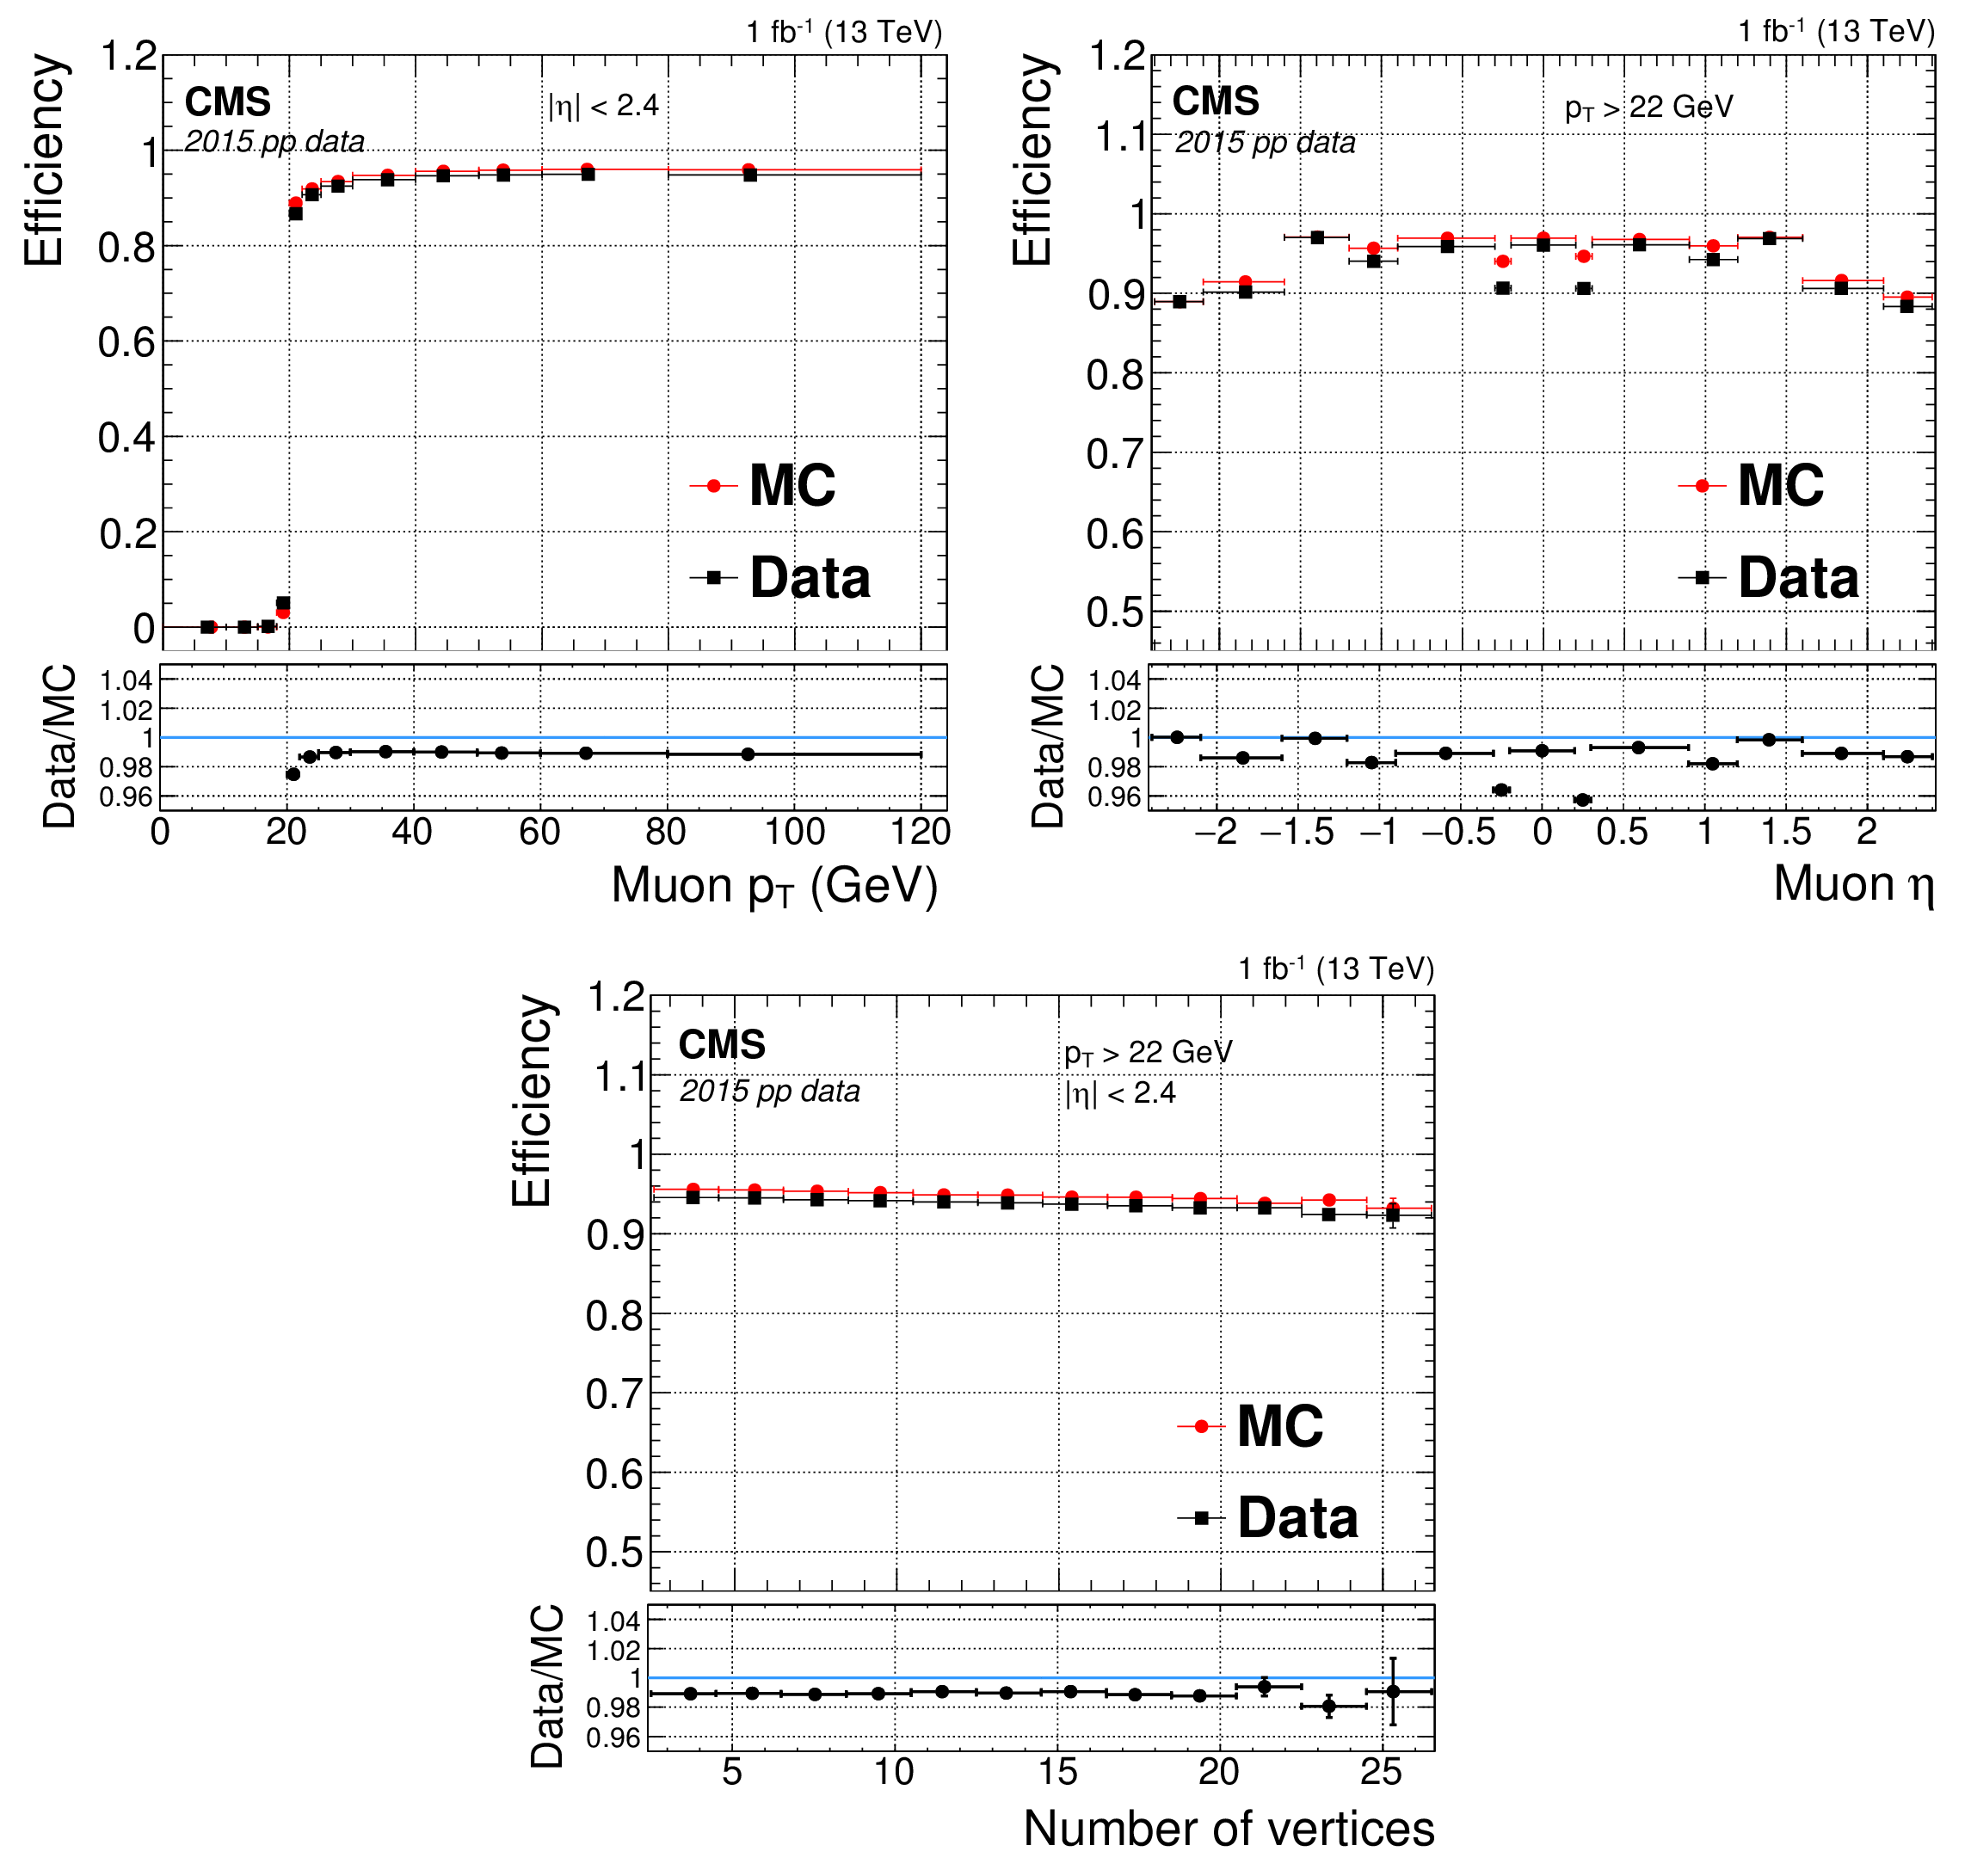
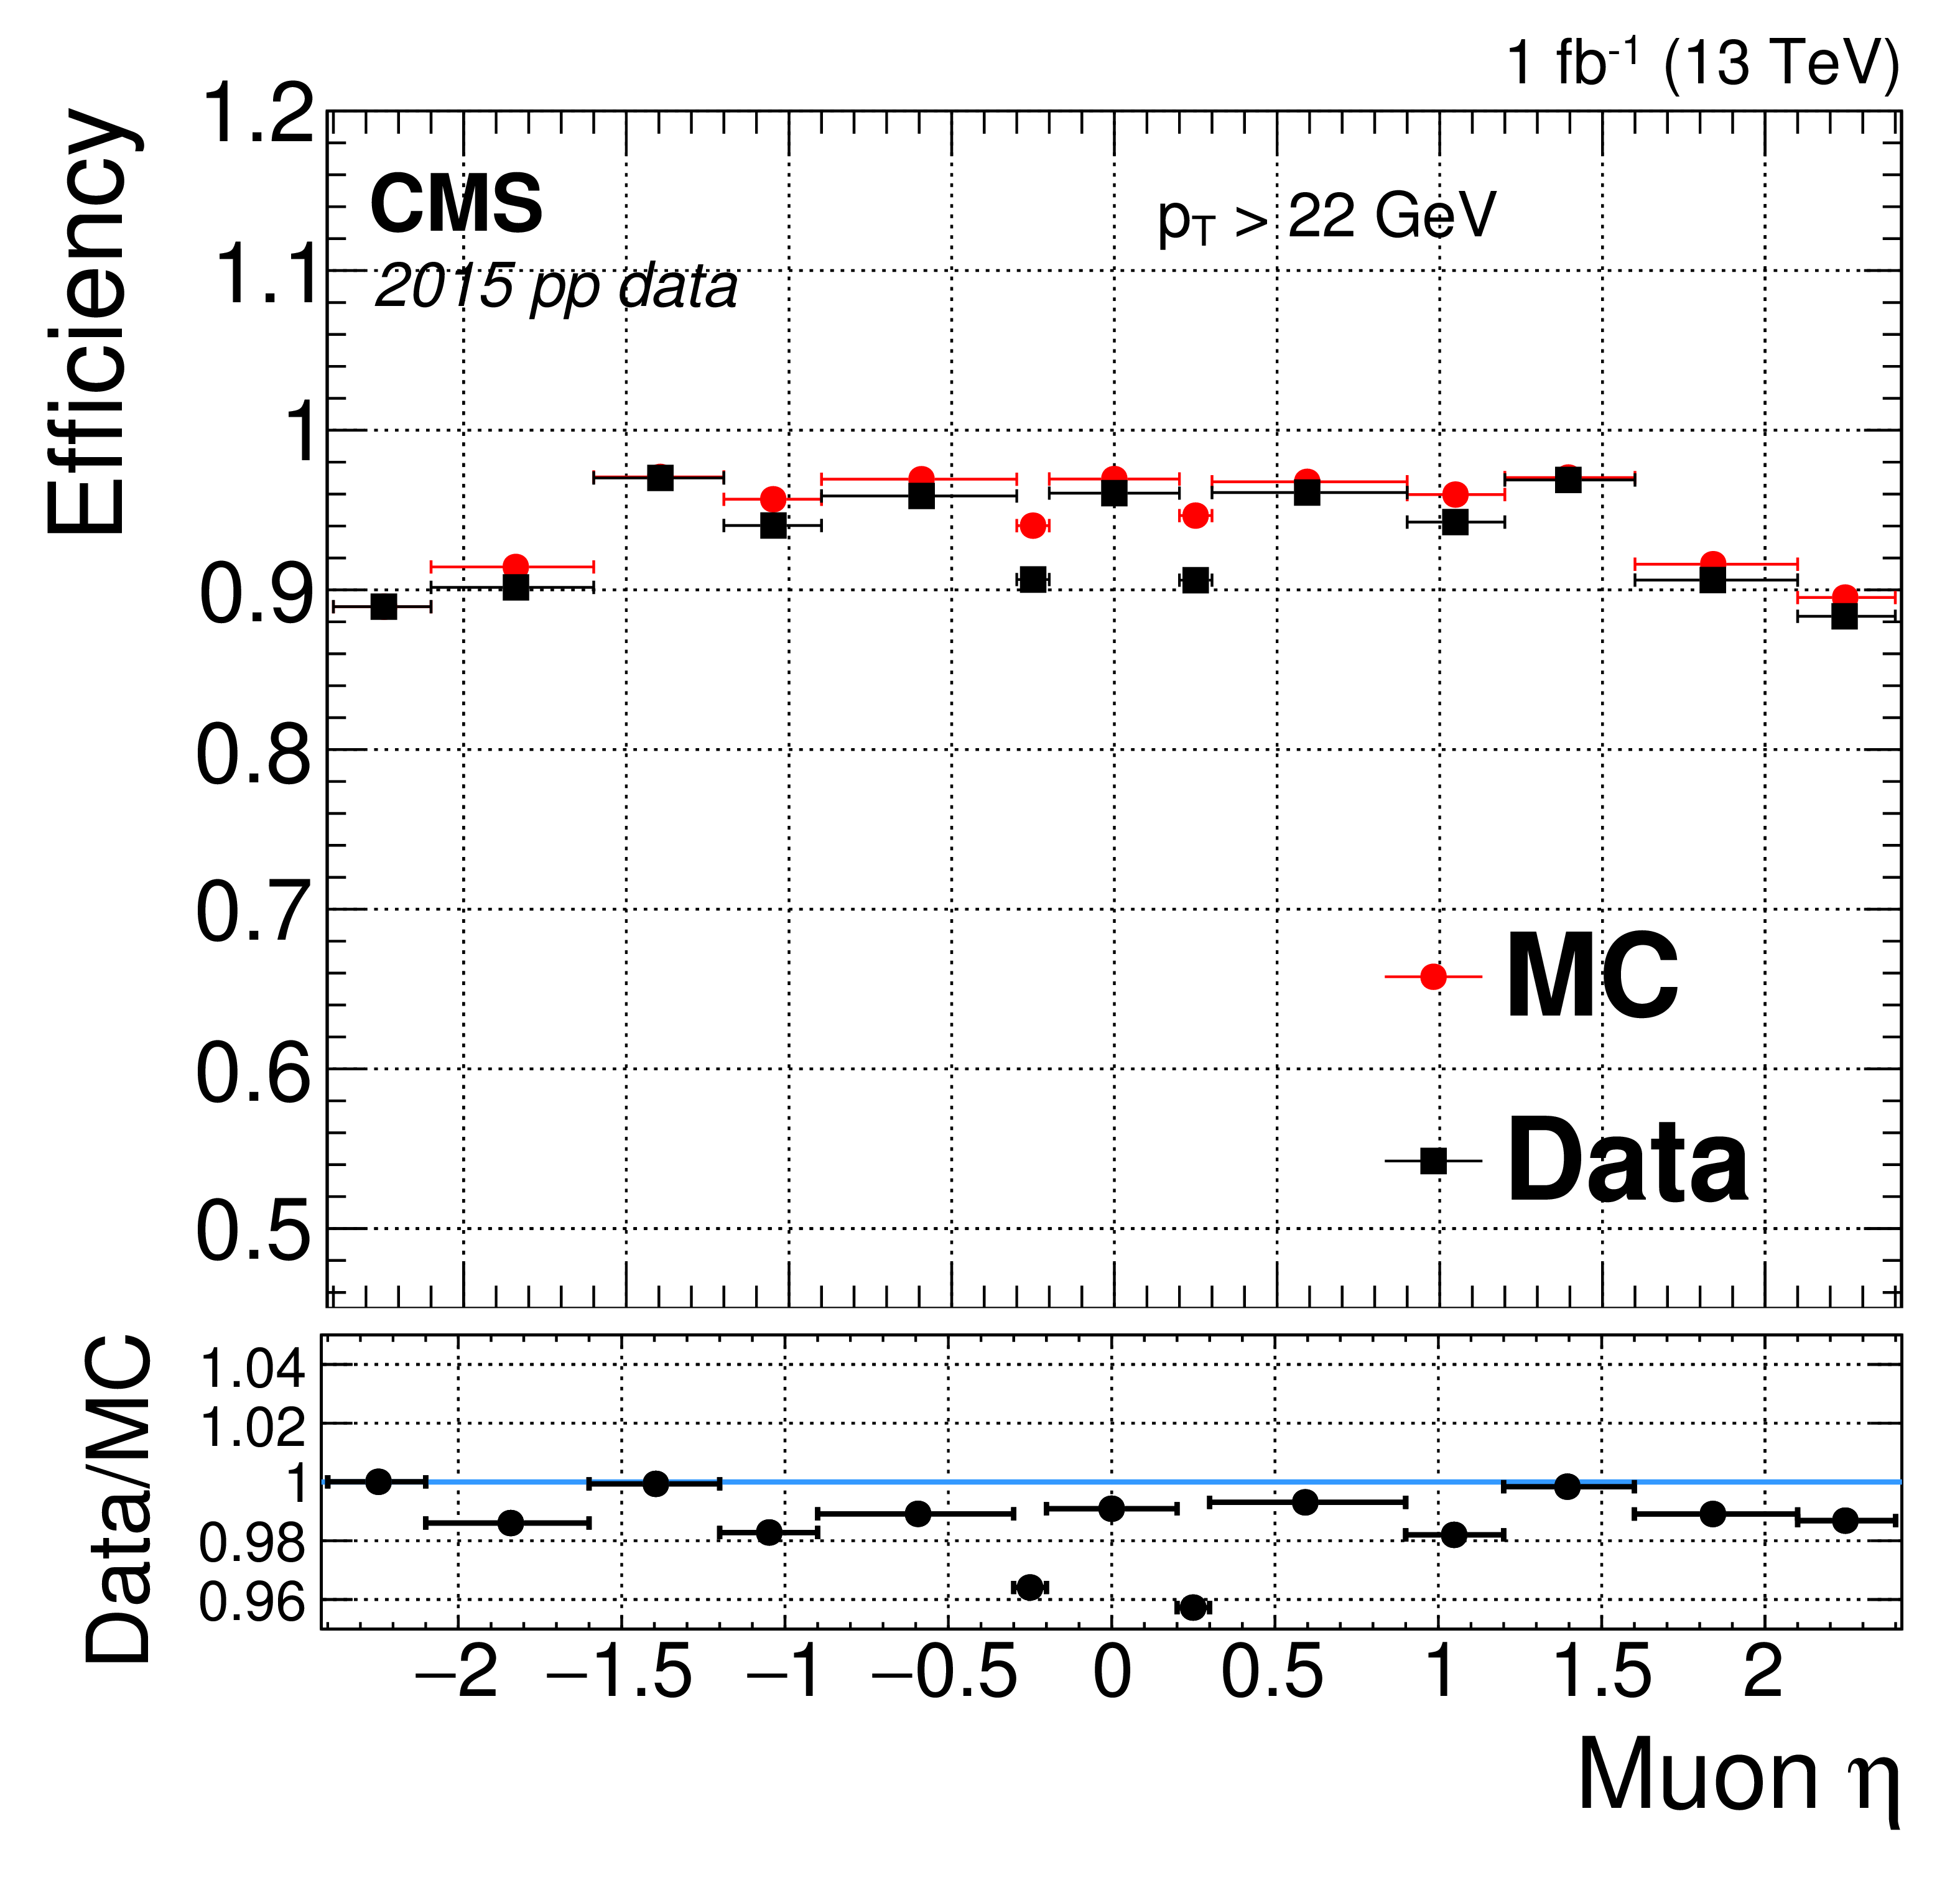
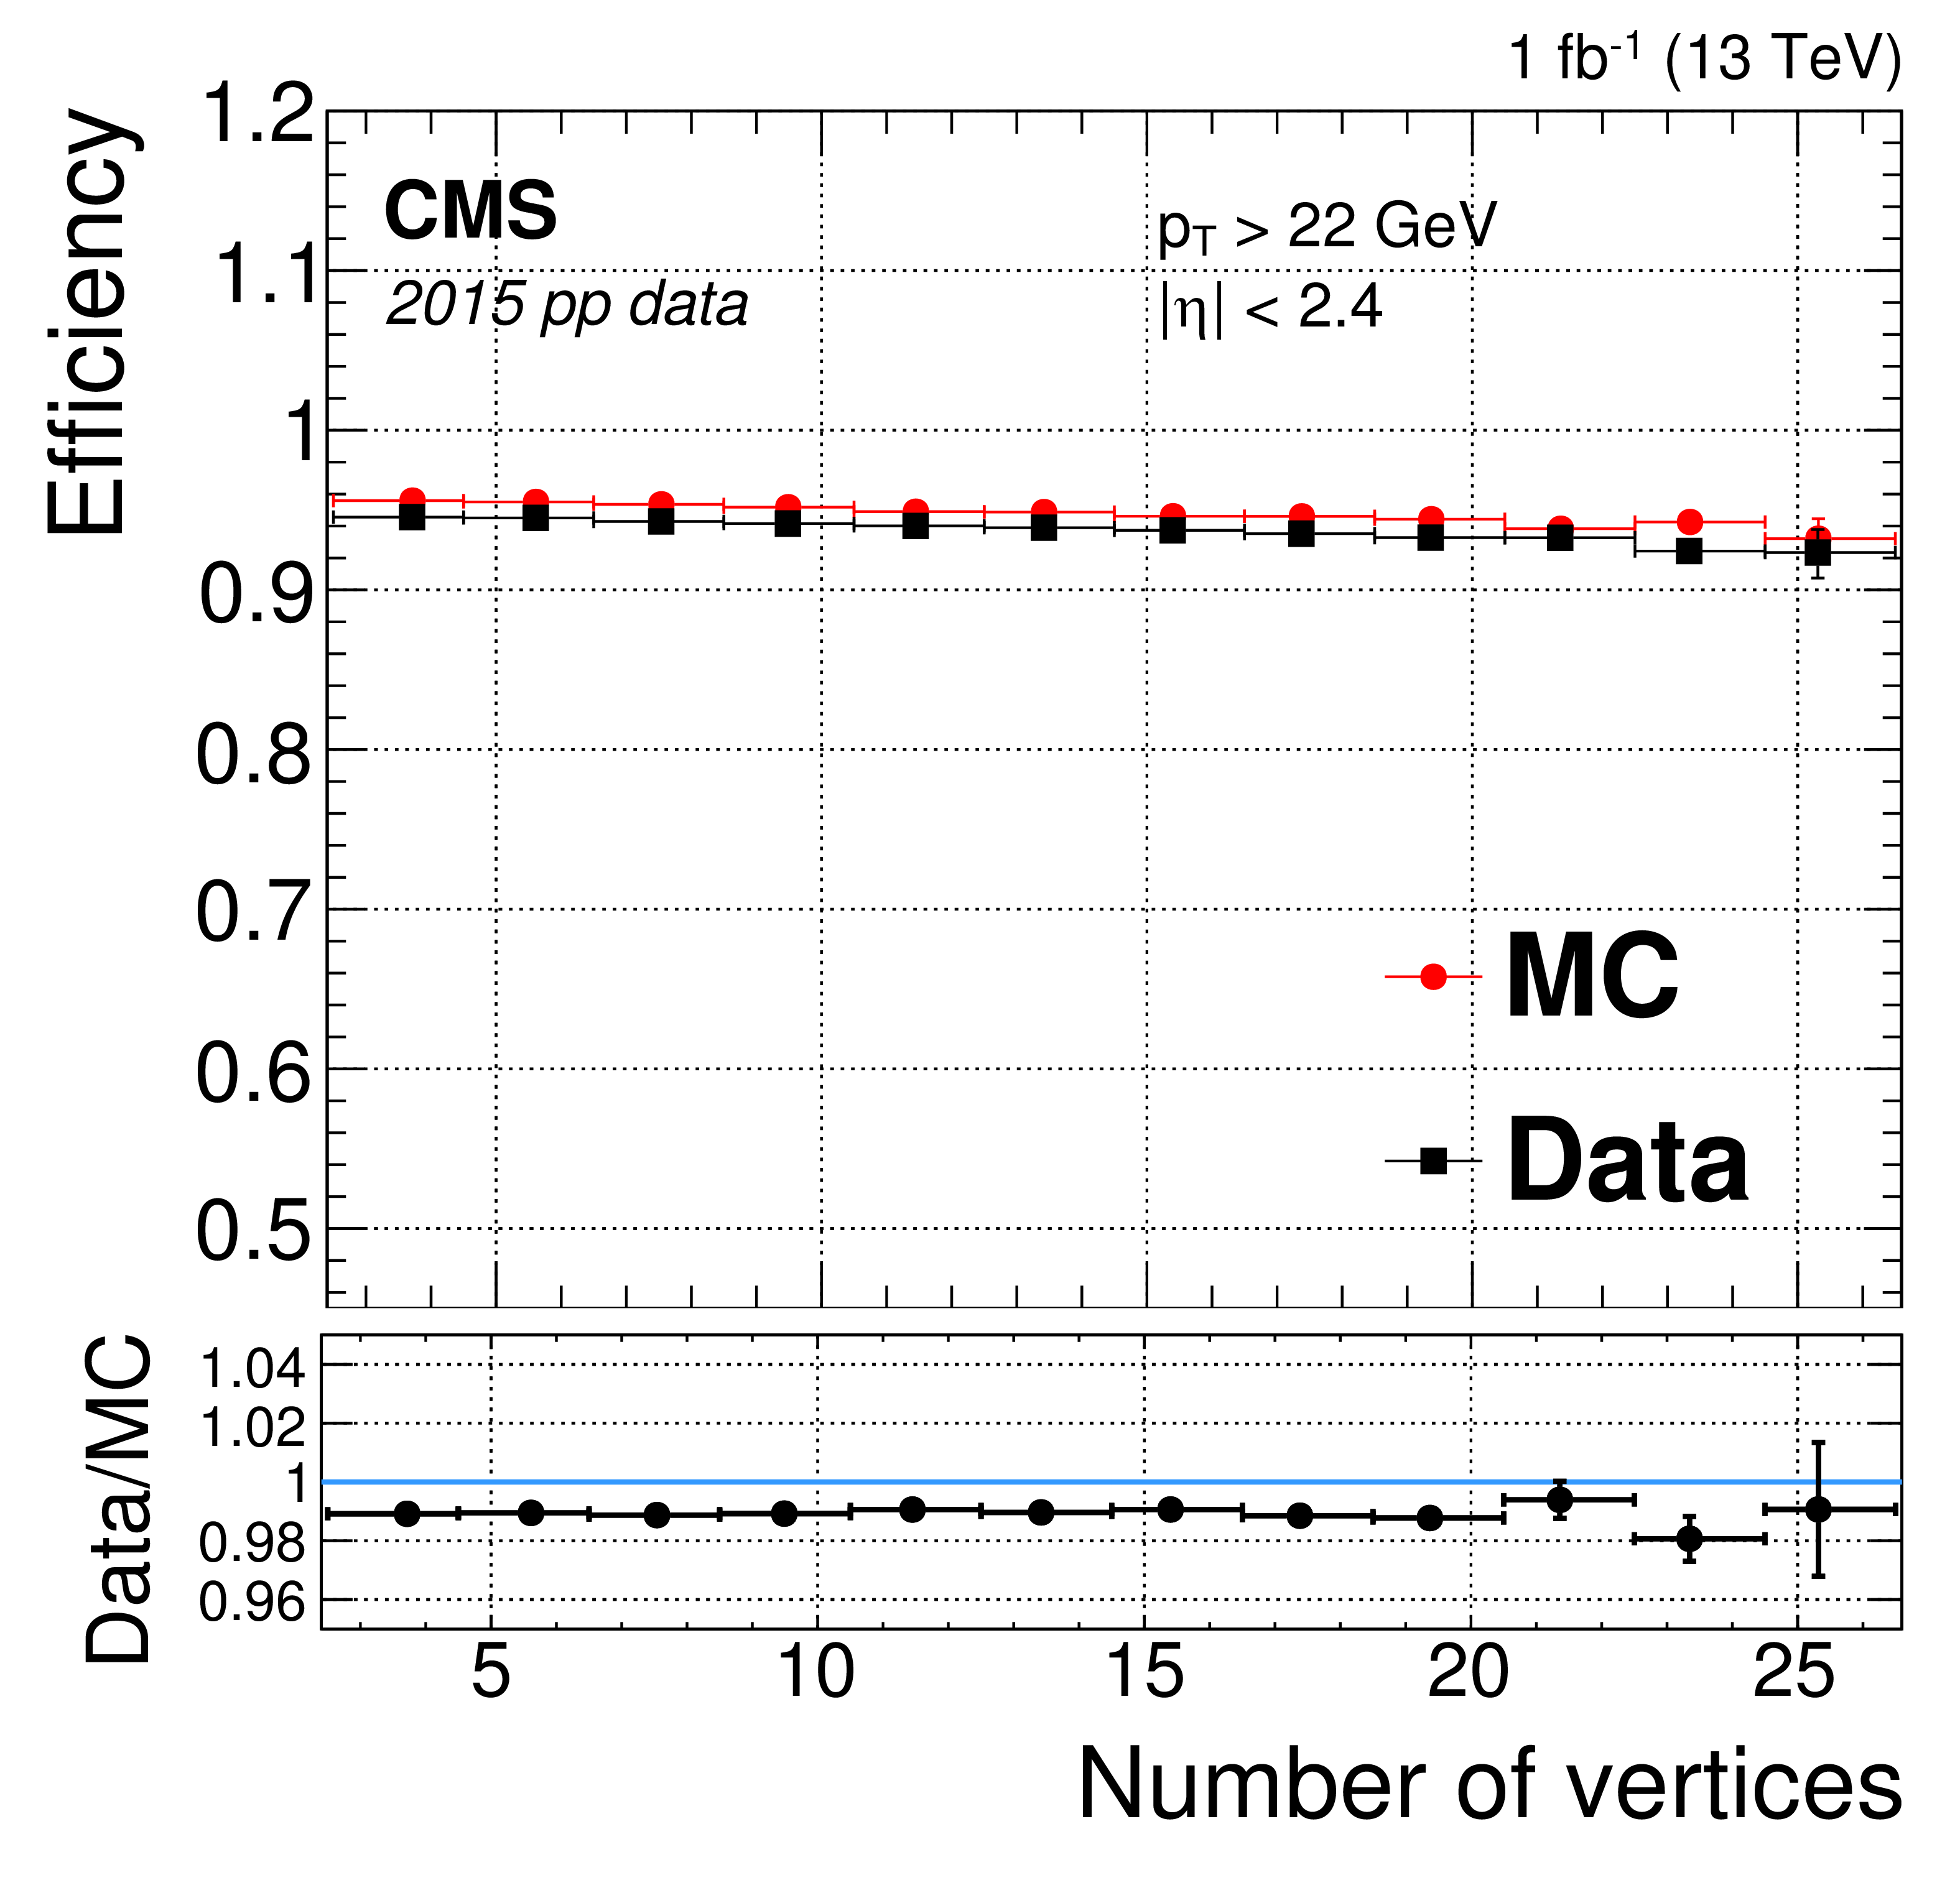
Figure 15:
Isolated single-muon trigger efficiency measured with 2015 data (squares), simulation (circles), and the ratio (bottom inset). Results are plotted as a function of offline reconstructed muon $ {p_{\mathrm {T}}} $ (upper left), $\eta $ (upper right), and number of primary vertices (lower). The statistical uncertainties in these values are smaller than the marker size in the figure. |
png pdf |
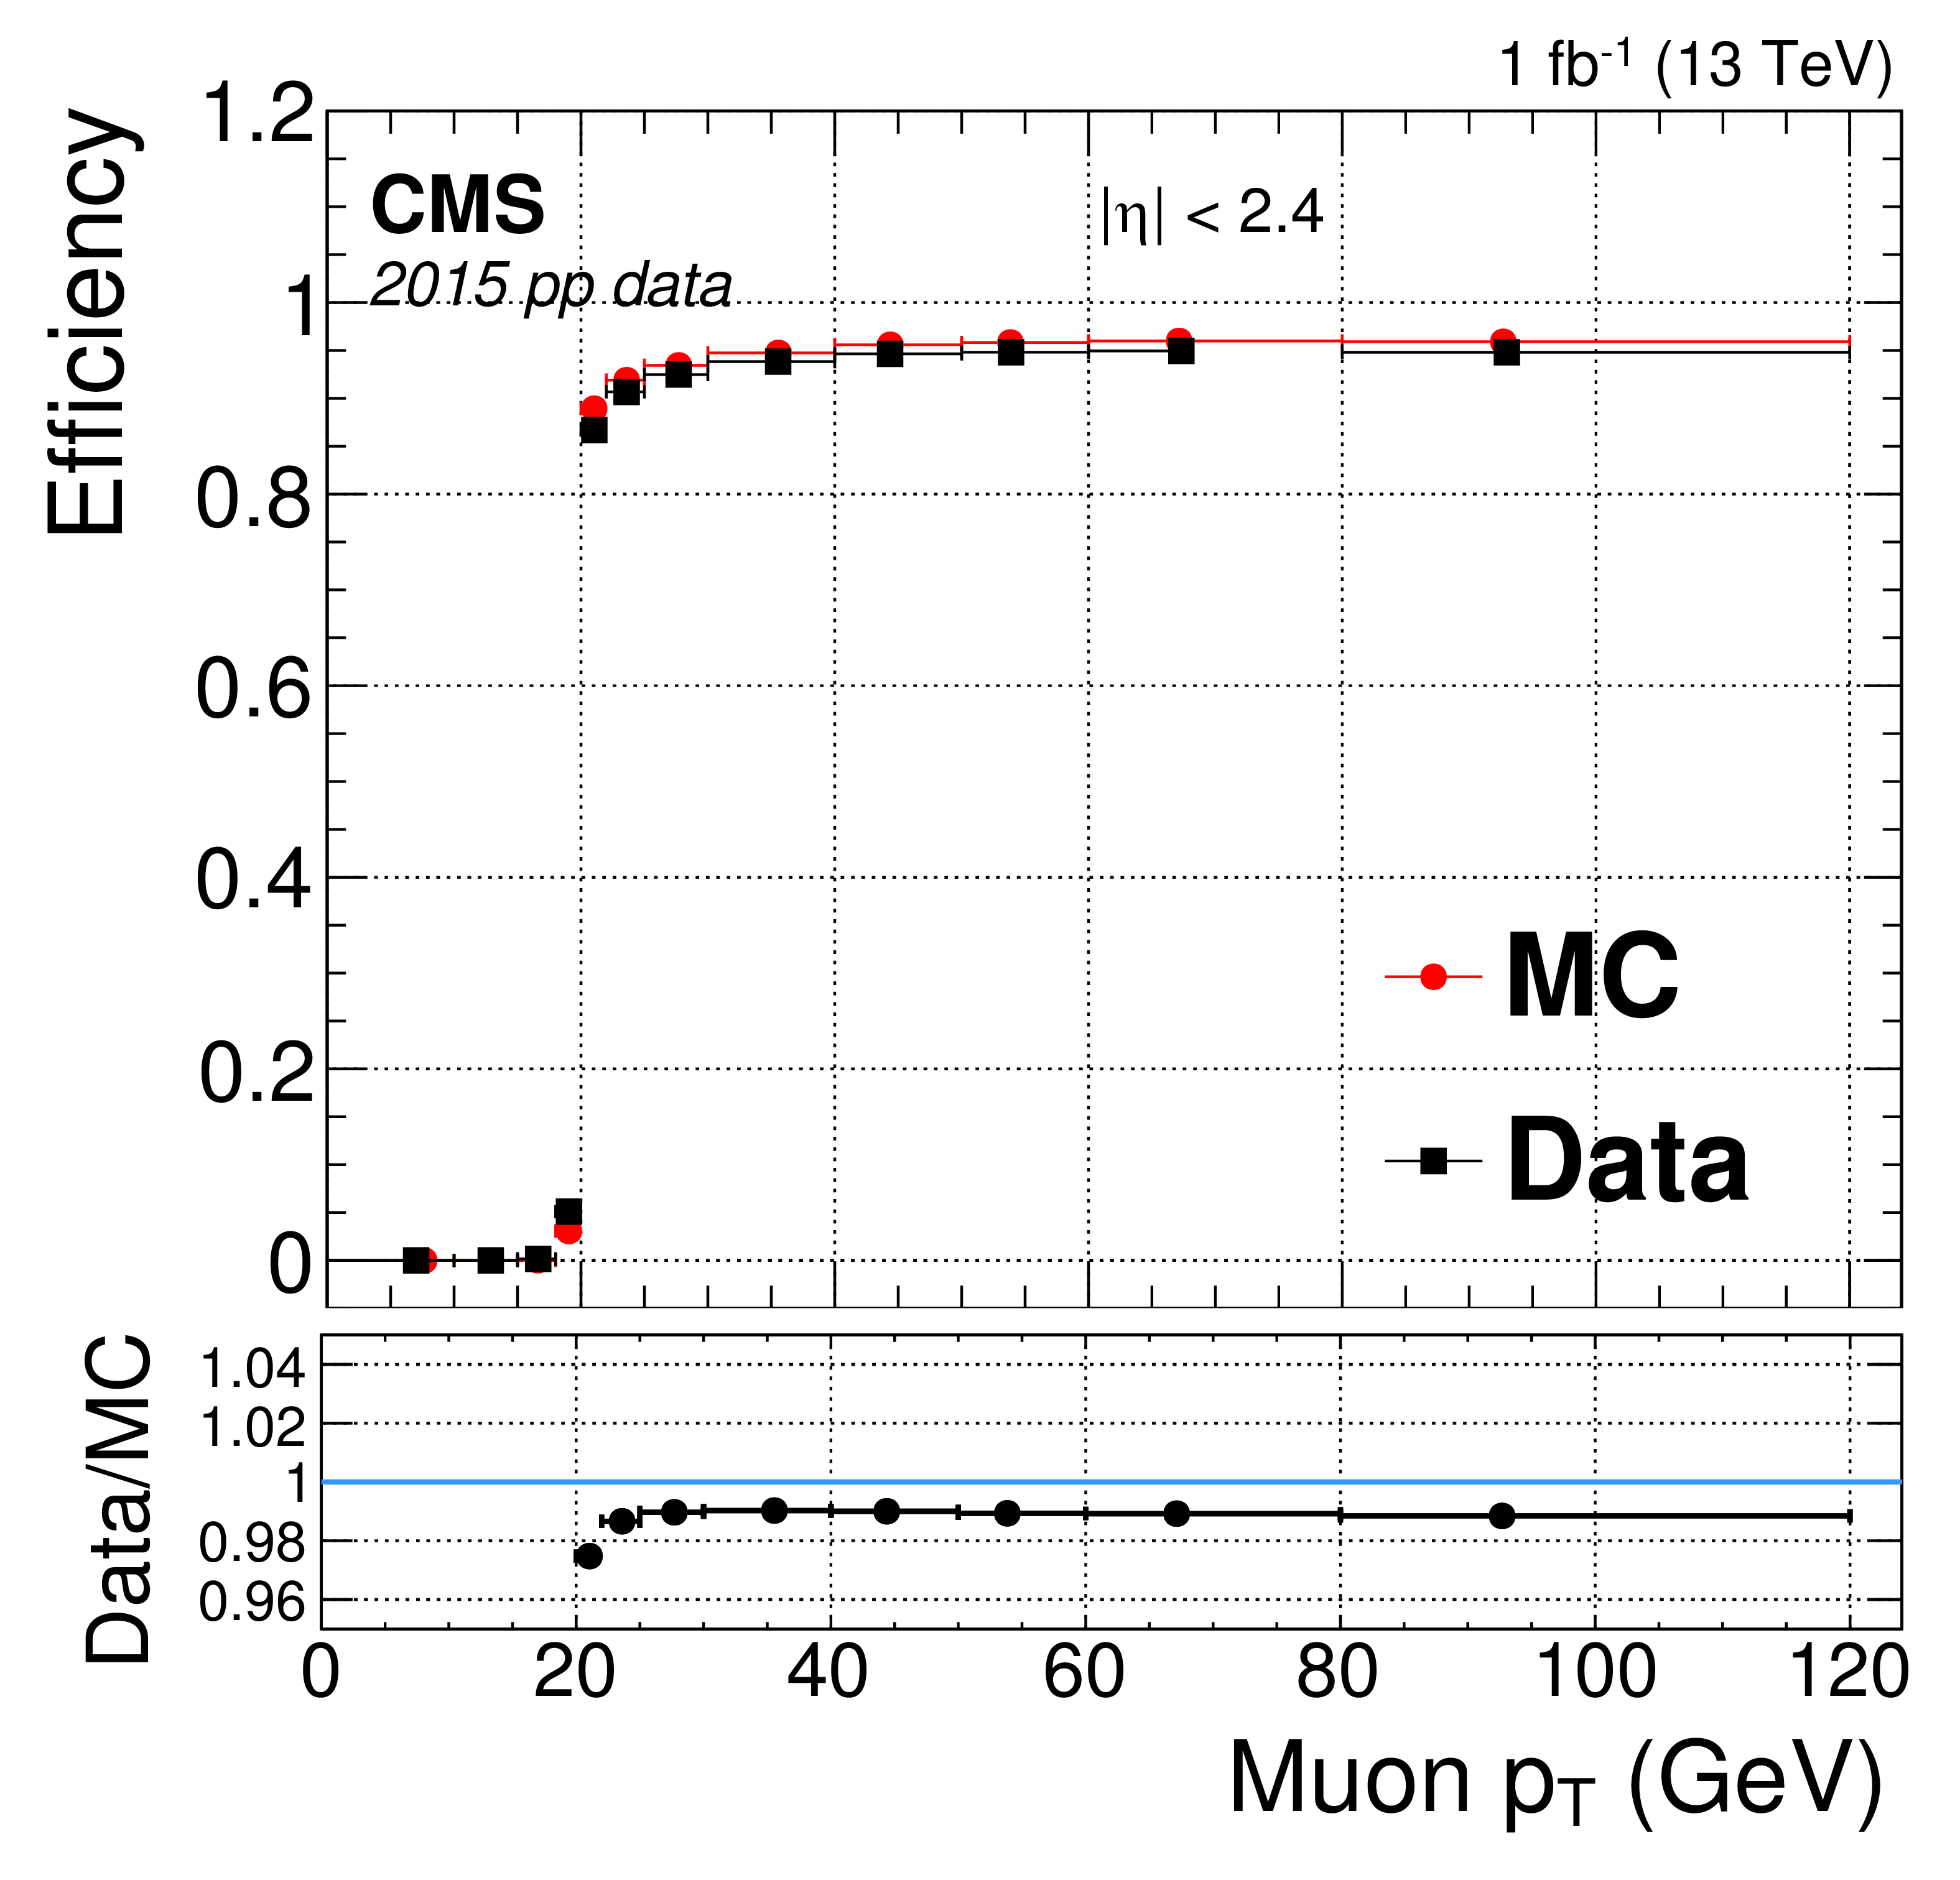
Figure 15-a:
Isolated single-muon trigger efficiency measured with 2015 data (squares), simulation (circles), and the ratio (bottom inset). Results are plotted as a function of offline reconstructed muon $ {p_{\mathrm {T}}} $. The statistical uncertainties in these values are smaller than the marker size in the figure. |
png pdf |
Figure 15-b:
Isolated single-muon trigger efficiency measured with 2015 data (squares), simulation (circles), and the ratio (bottom inset). Results are plotted as a function of offline reconstructed muon $\eta $. The statistical uncertainties in these values are smaller than the marker size in the figure. |
png pdf |
Figure 15-c:
Isolated single-muon trigger efficiency measured with 2015 data (squares), simulation (circles), and the ratio (bottom inset). Results are plotted as a function of offline reconstructed number of primary vertices. The statistical uncertainties in these values are smaller than the marker size in the figure. |
png pdf |
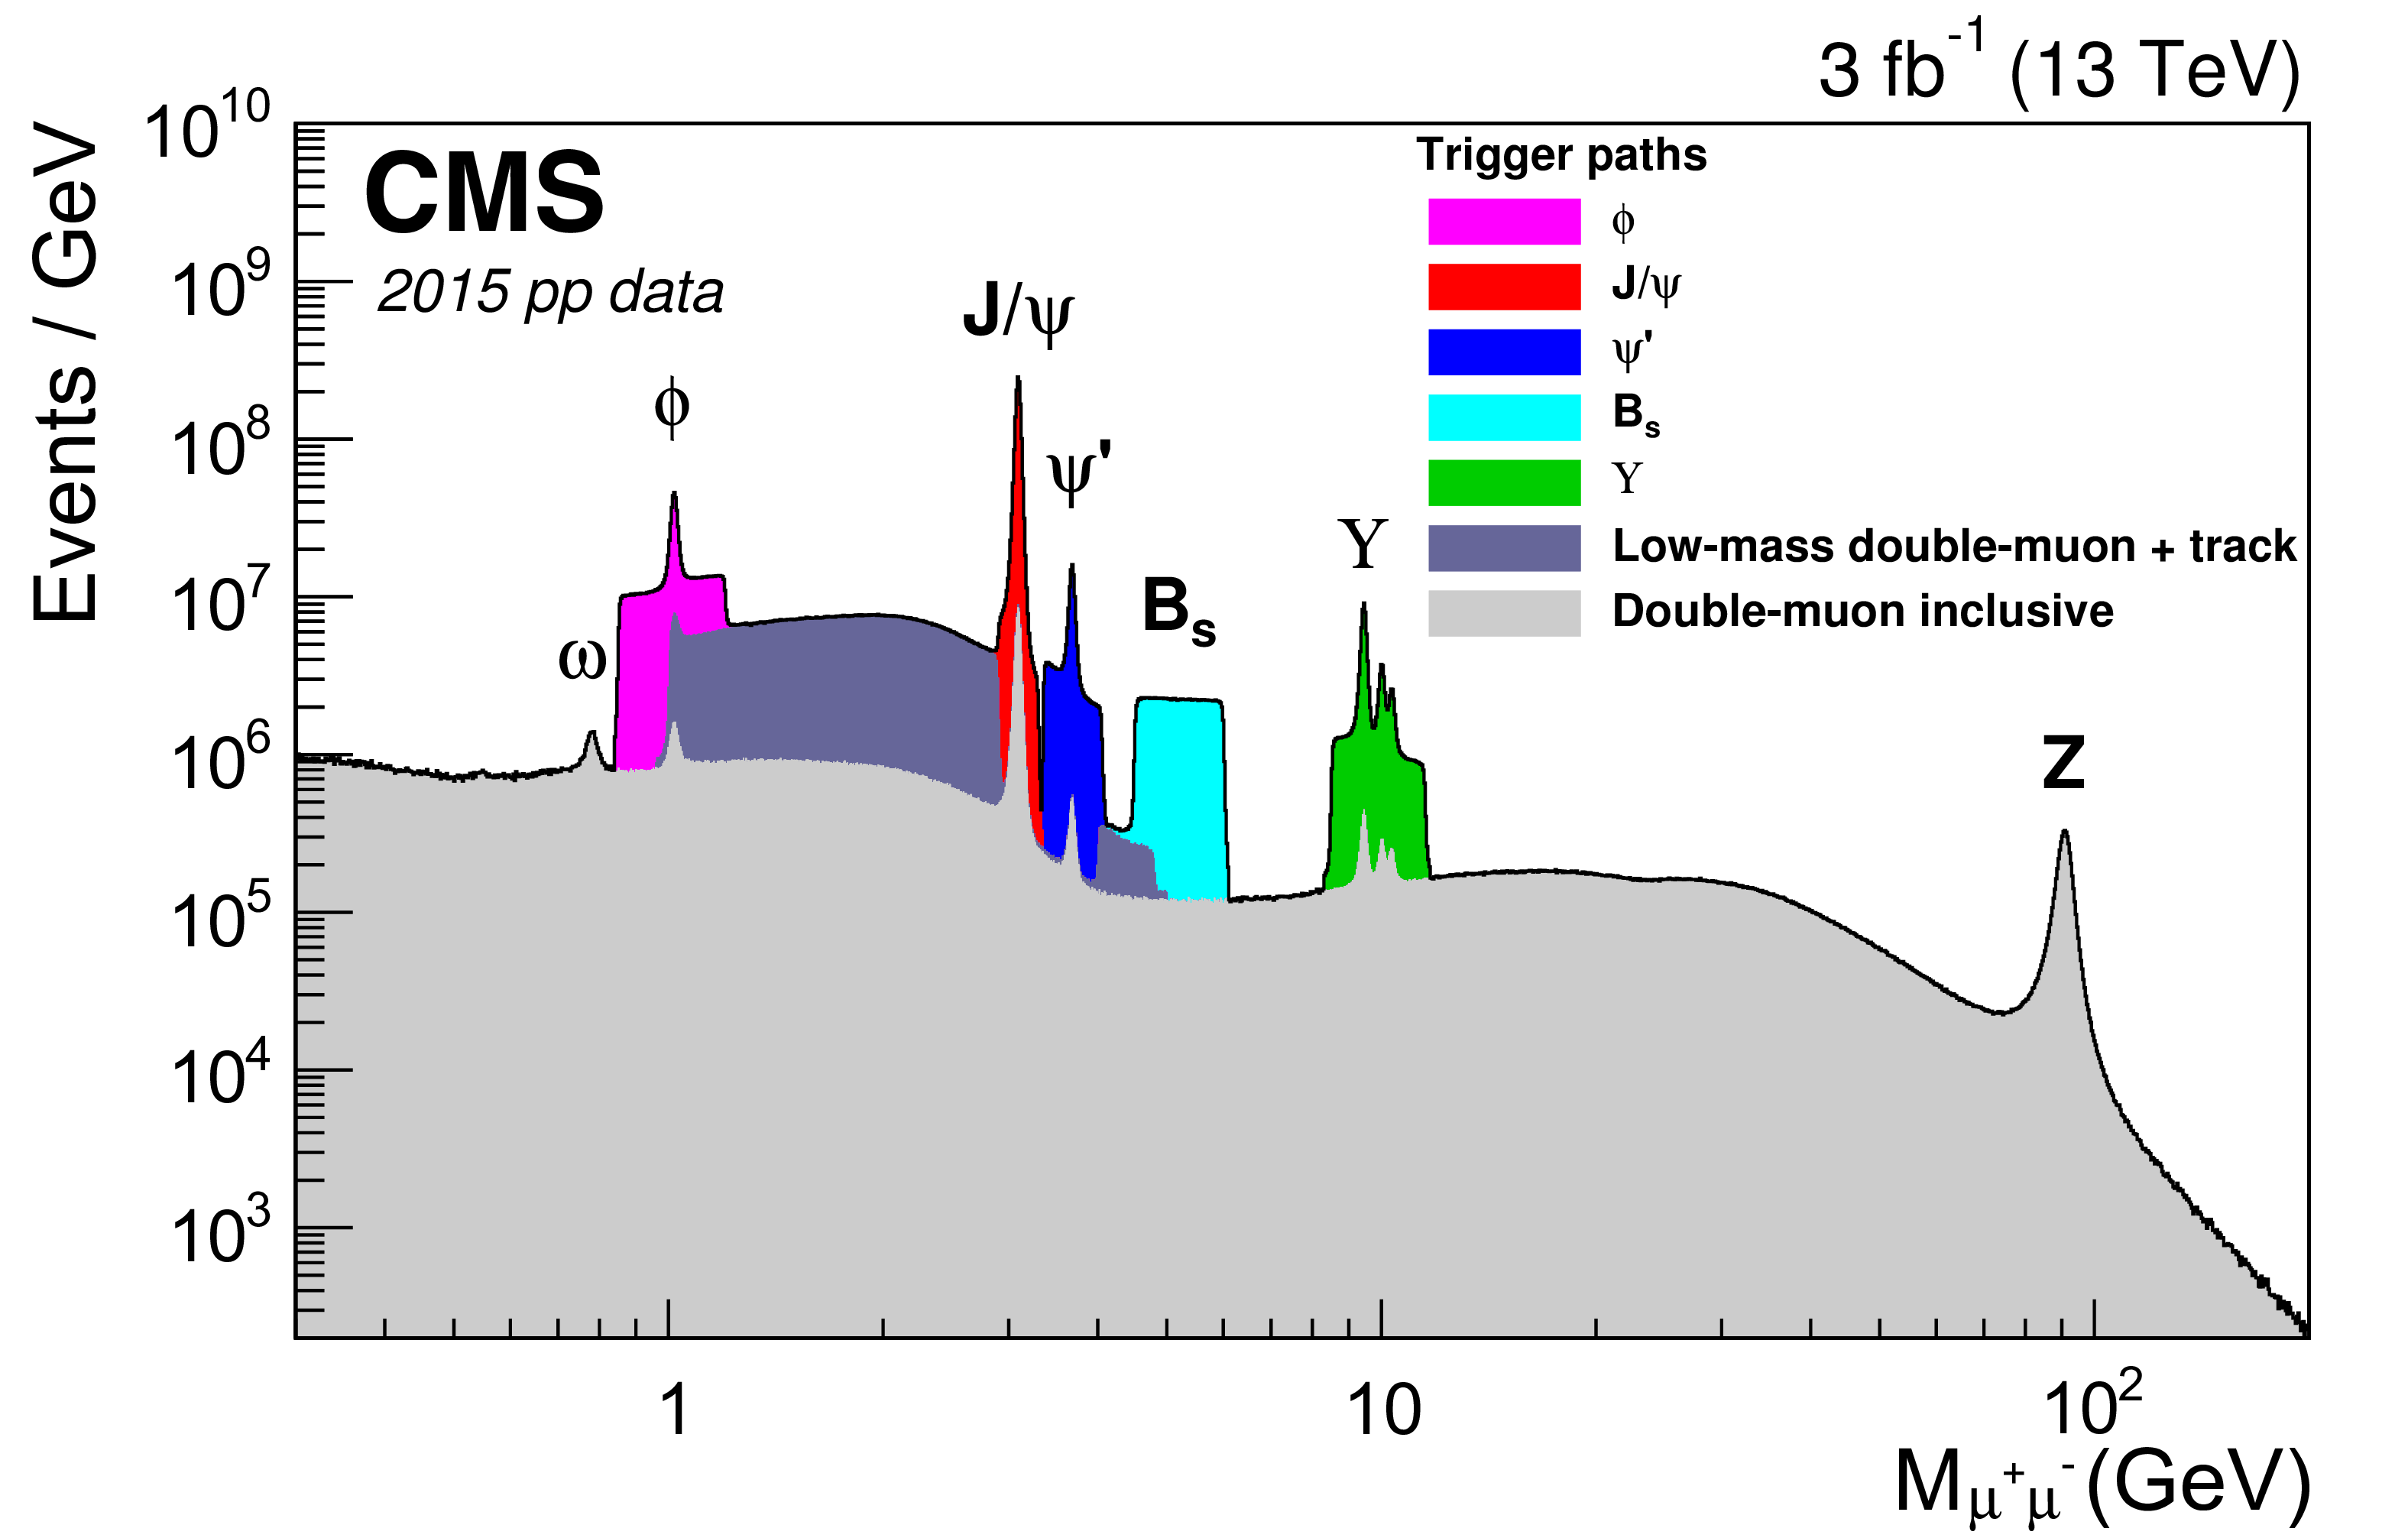
Figure 16:
The dimuon invariant mass distribution reconstructed by the CMS HLT. Data were collected in 2015 with the inclusive double-muon trigger algorithm (gray), as well as triggers dedicated to selecting resonances at low masses. |
| Tables | |
png pdf |
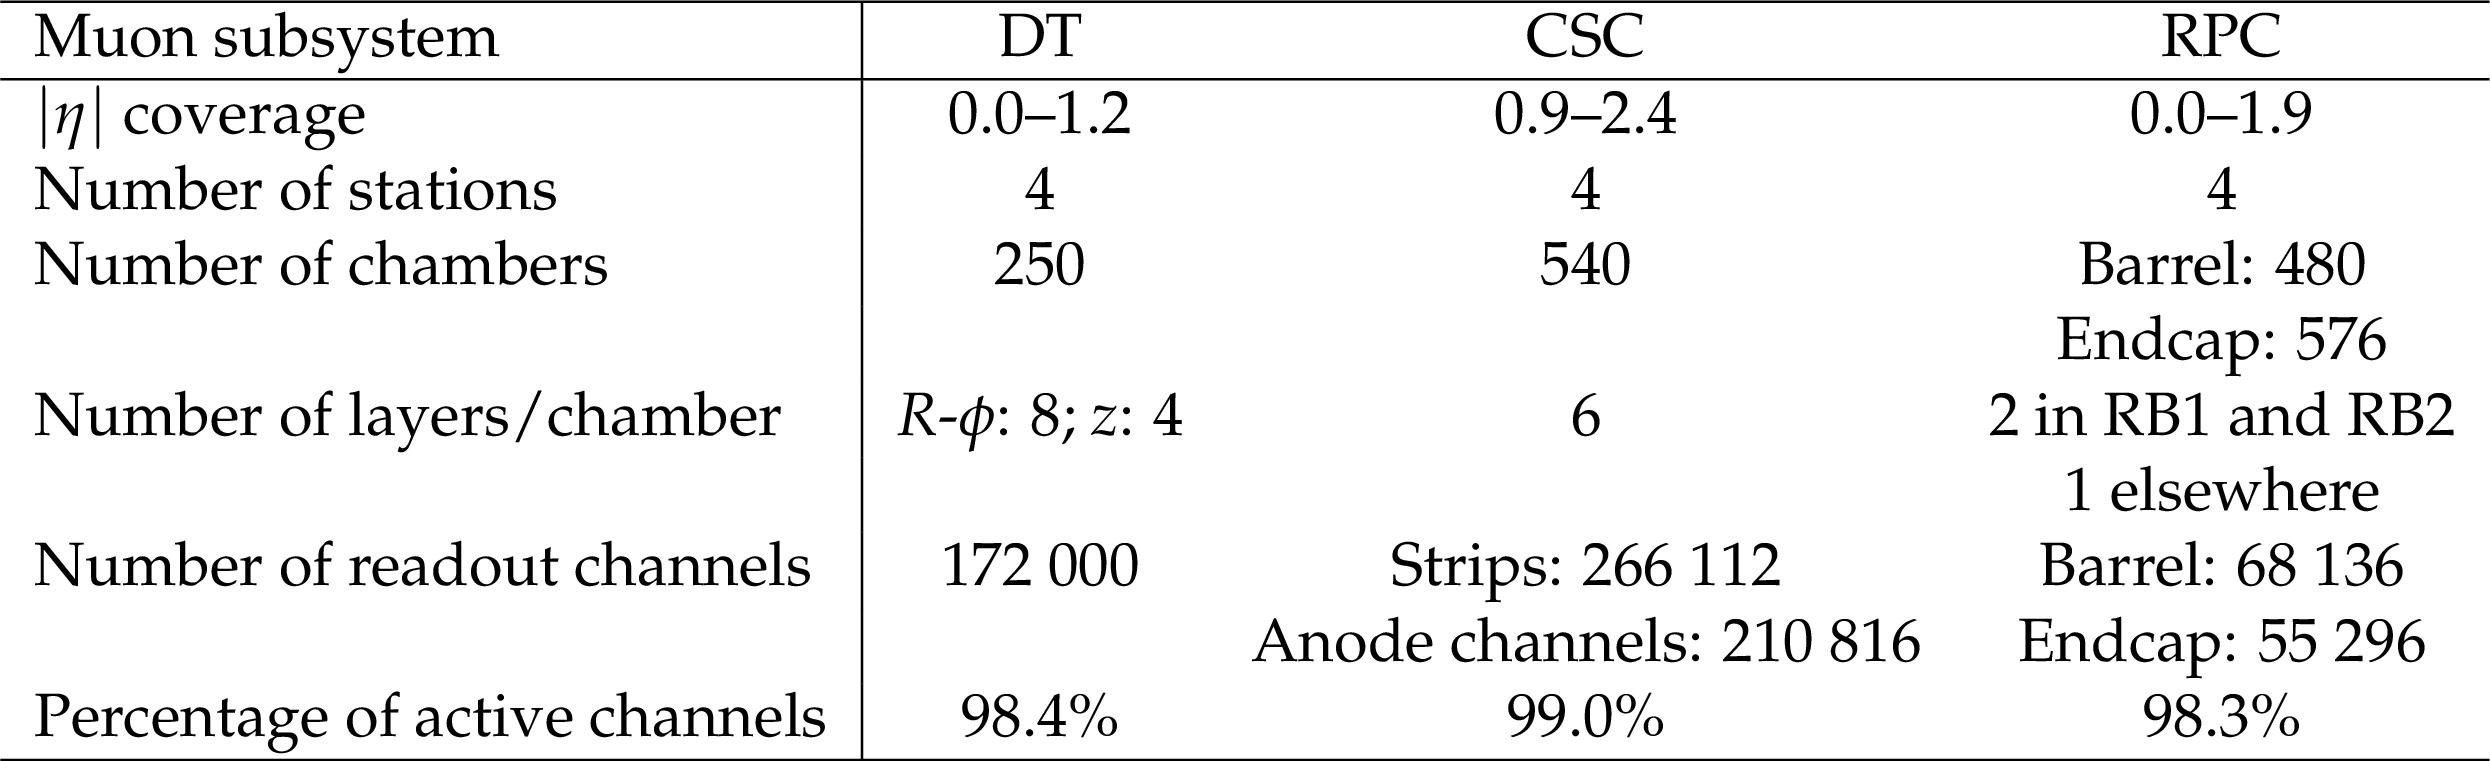
Table 1:
Properties and parameters of the CMS muon subsystems during the 2016 data collection period. |
png pdf |
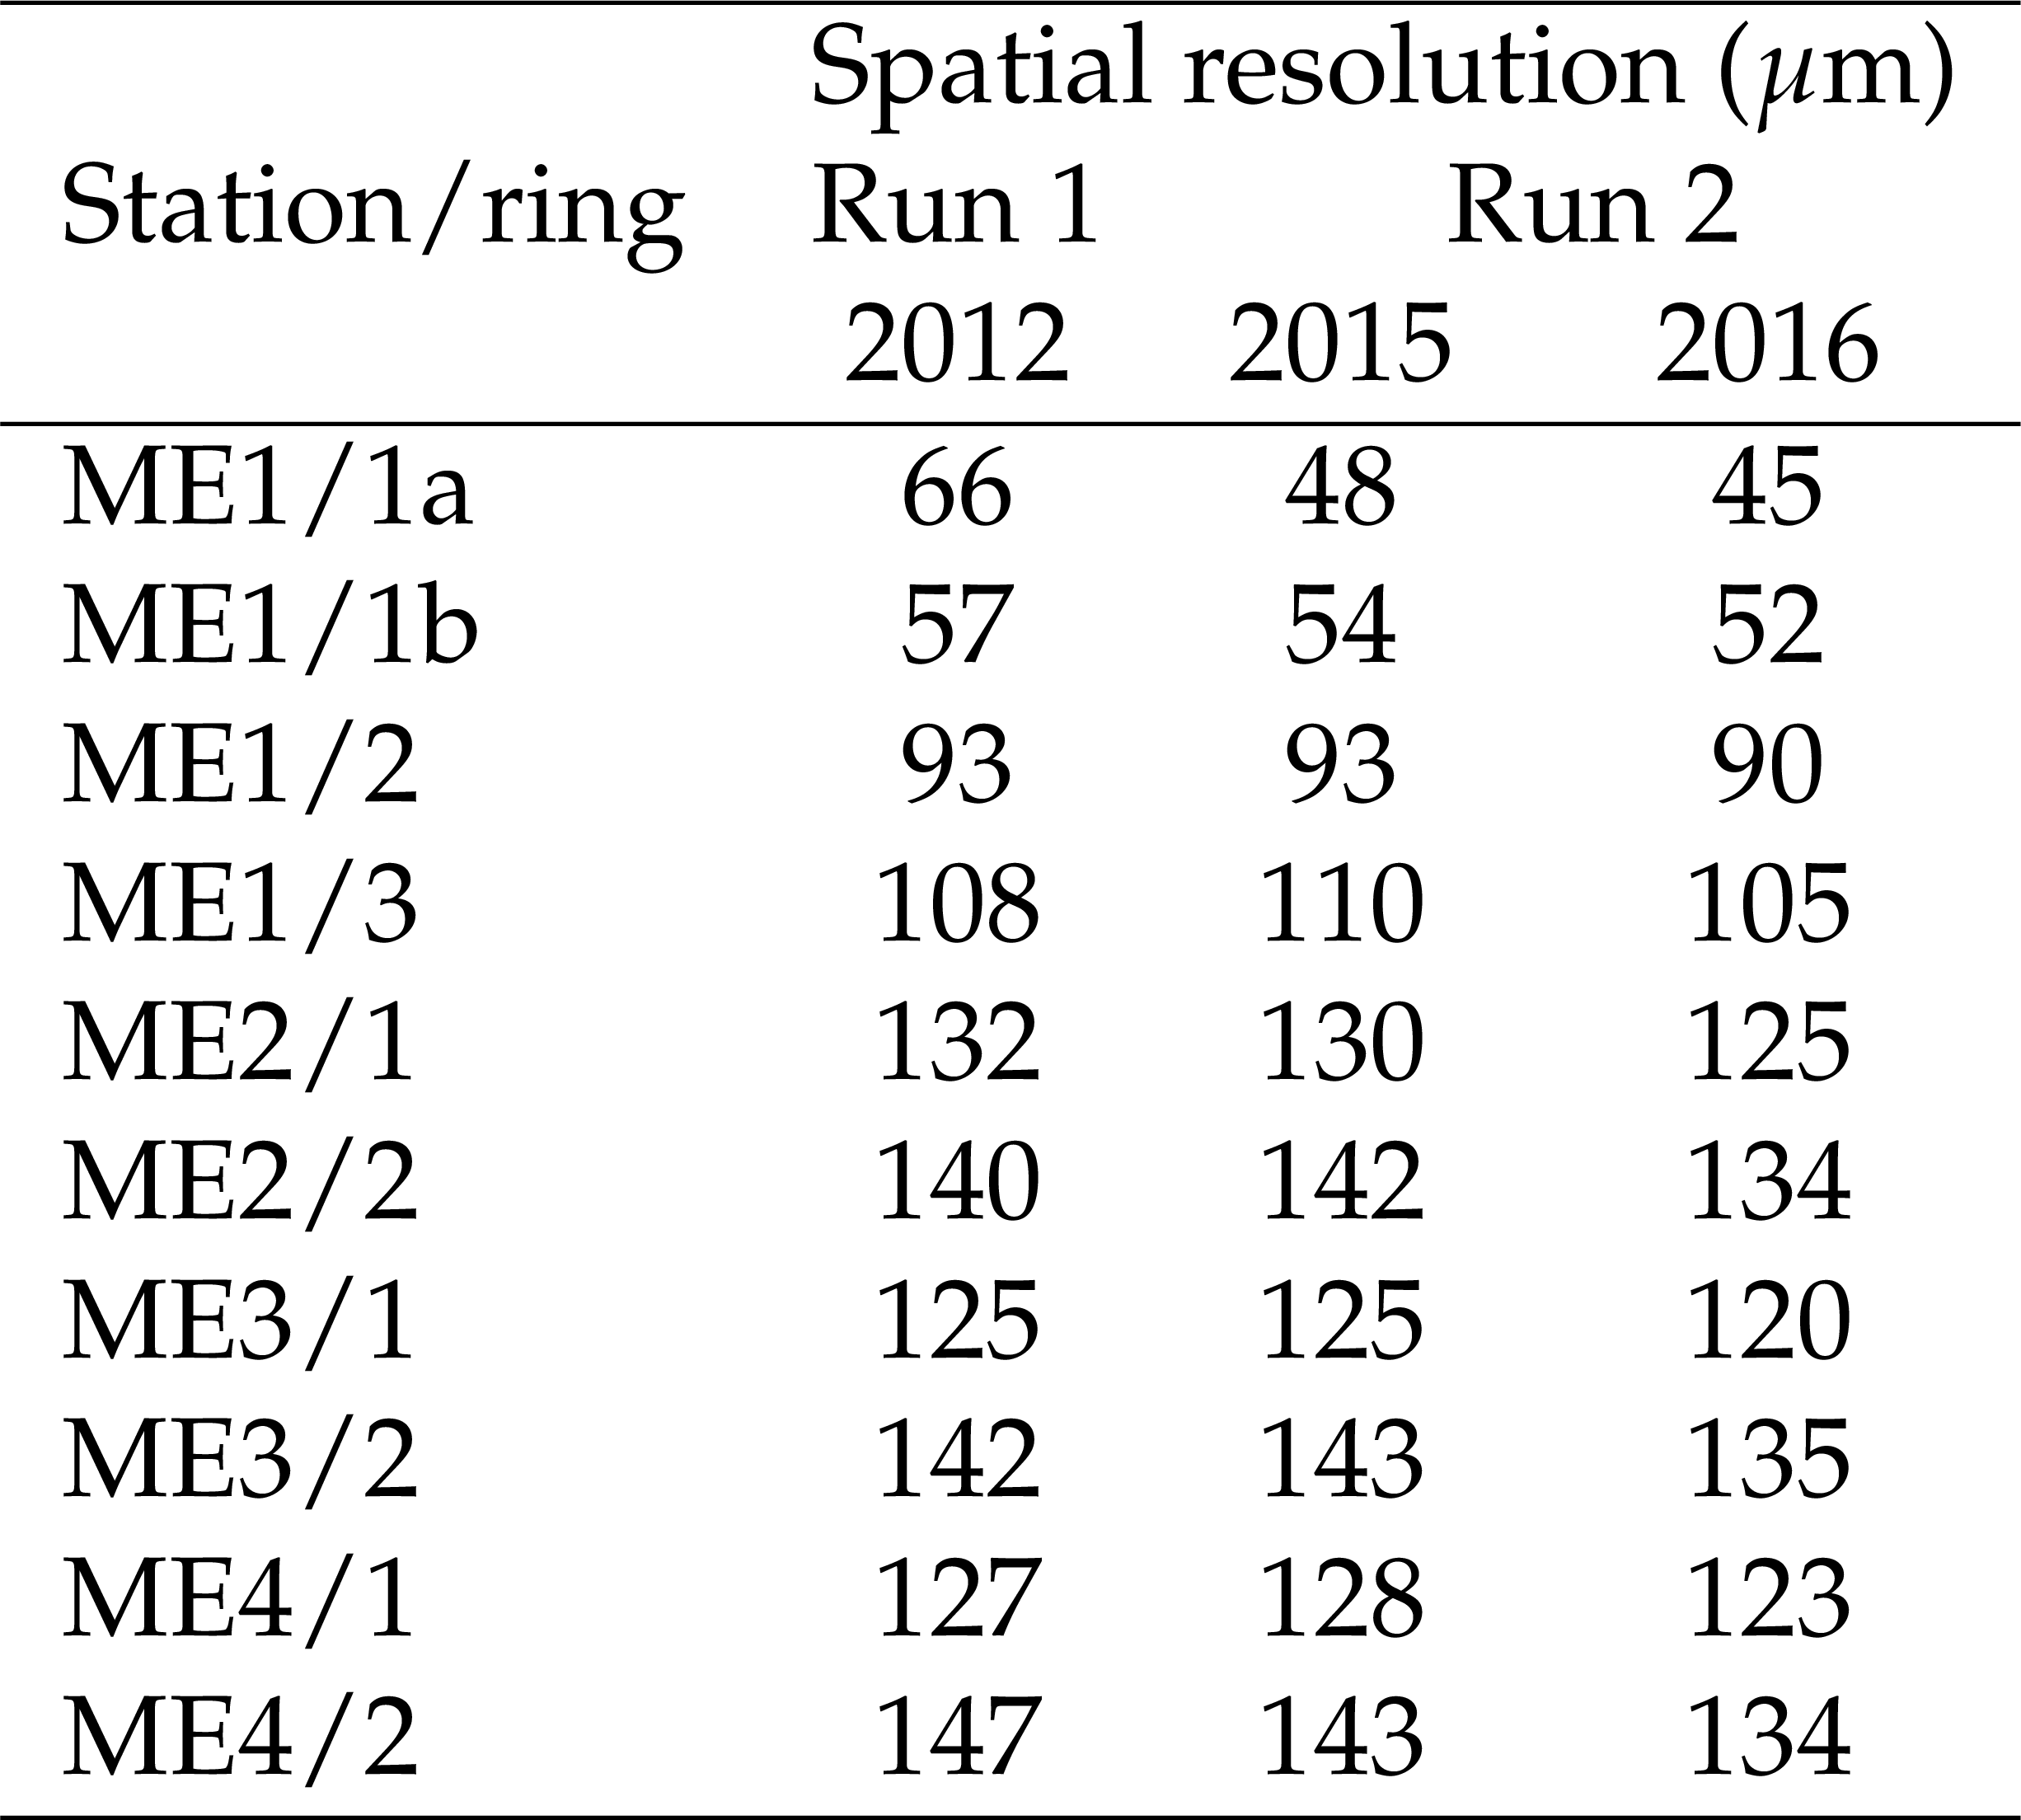
Table 2:
CSC transverse spatial resolution per station (6 hits) measured for all chamber types with 2016 data, compared to those measured in 2015 and 2012. |
png pdf |
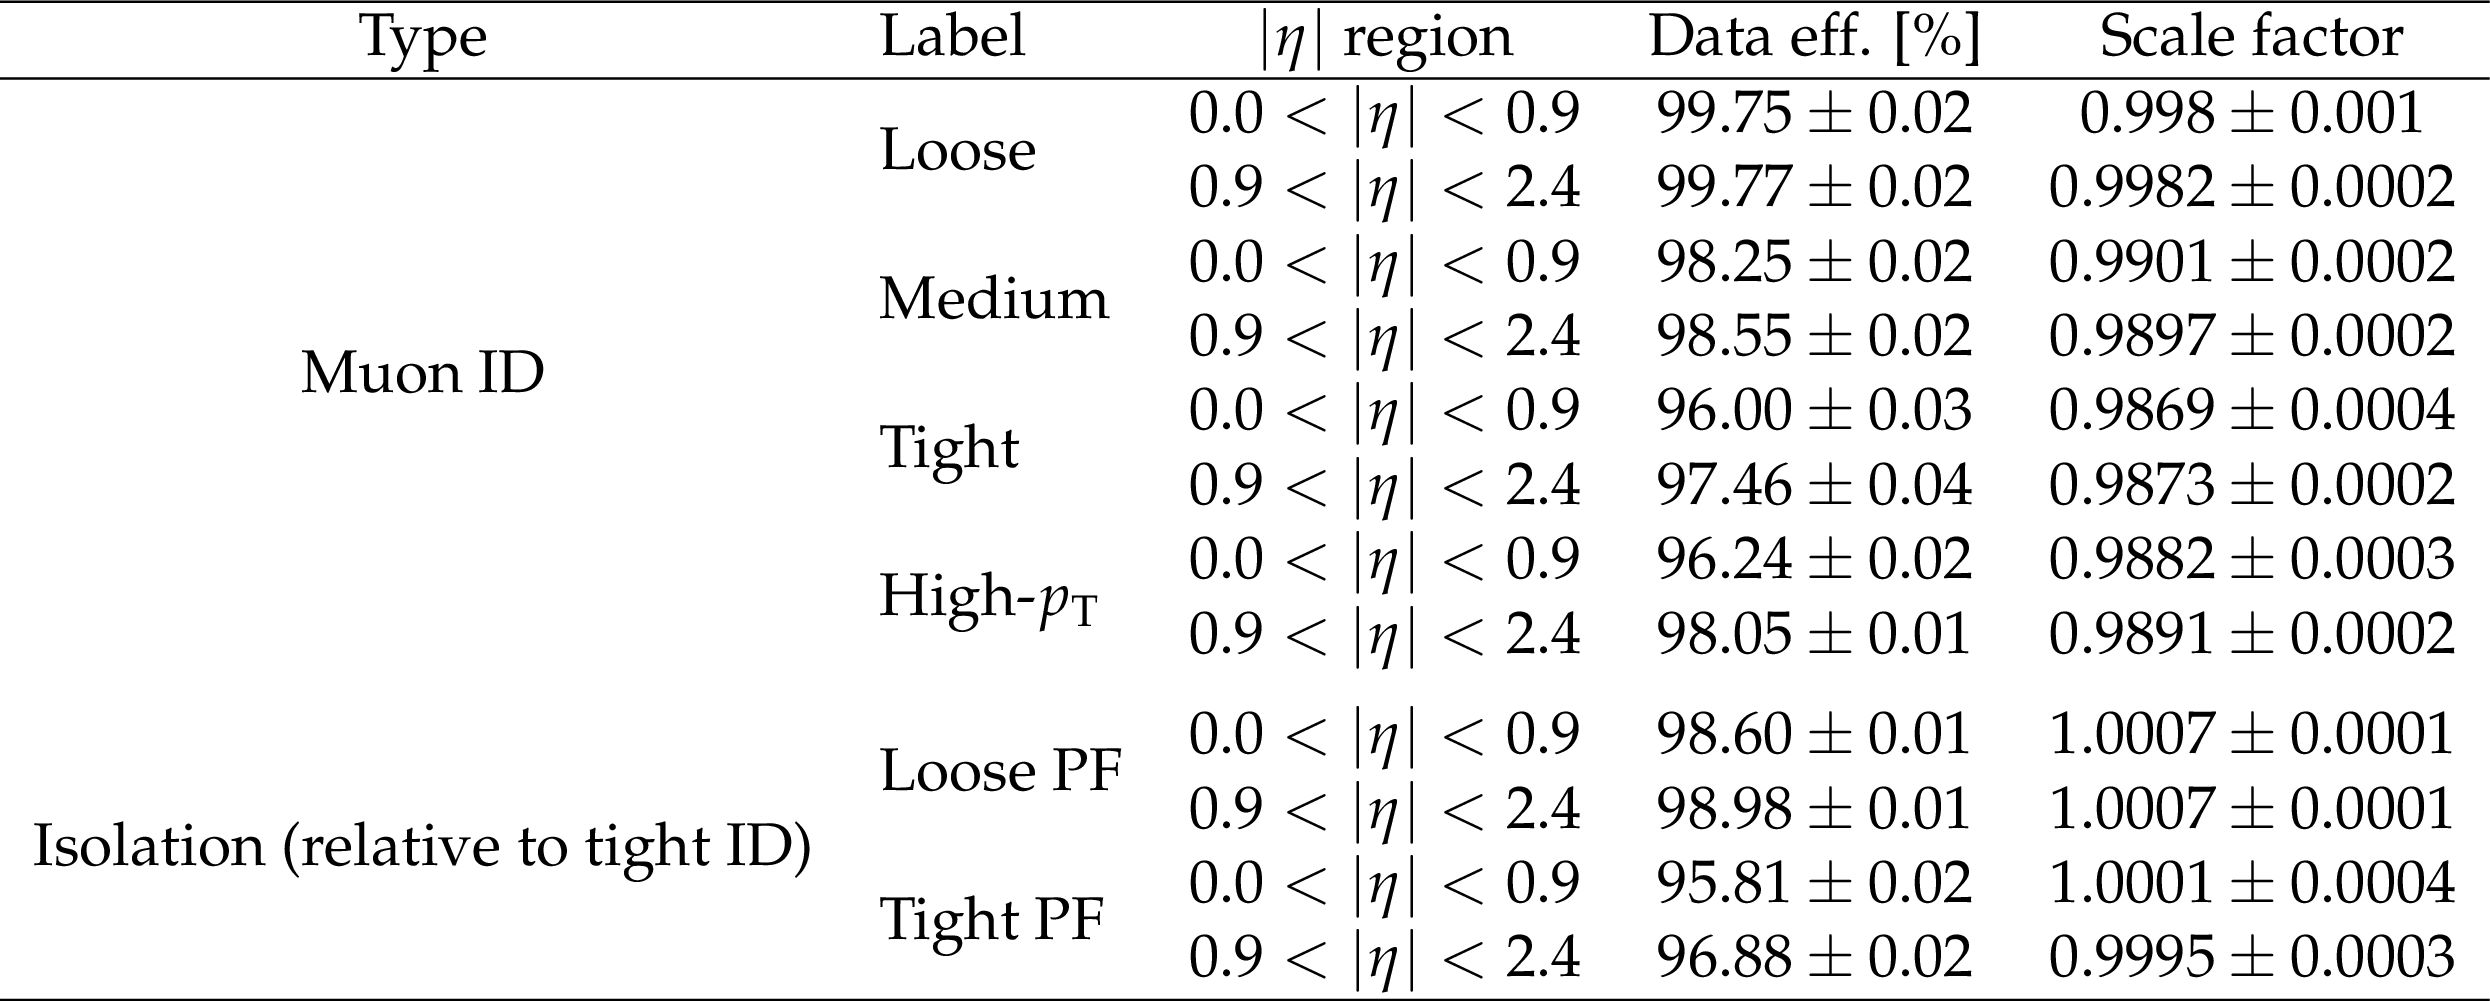
Table 3:
Efficiencies for several reconstruction+ID algorithms and isolation criteria (relative to tight ID) for muons with $ {p_{\mathrm {T}}} > $ 20 GeV. The corresponding scale factors are for 2015 data relative to simulation. The uncertainties in the scale factors stem from the statistical uncertainties in the fitting procedure. Systematic uncertainties are described in the text. |

png pdf |
Table 4:
Measurement of the momentum scale bias in 2015 data, obtained with the generalized endpoint method using muons with $ {p_{\mathrm {T}}} > $ 200 GeV from pp collision data. Results are presented in three $\eta $ bins corresponding to the barrel and endcap regions. |
png pdf |
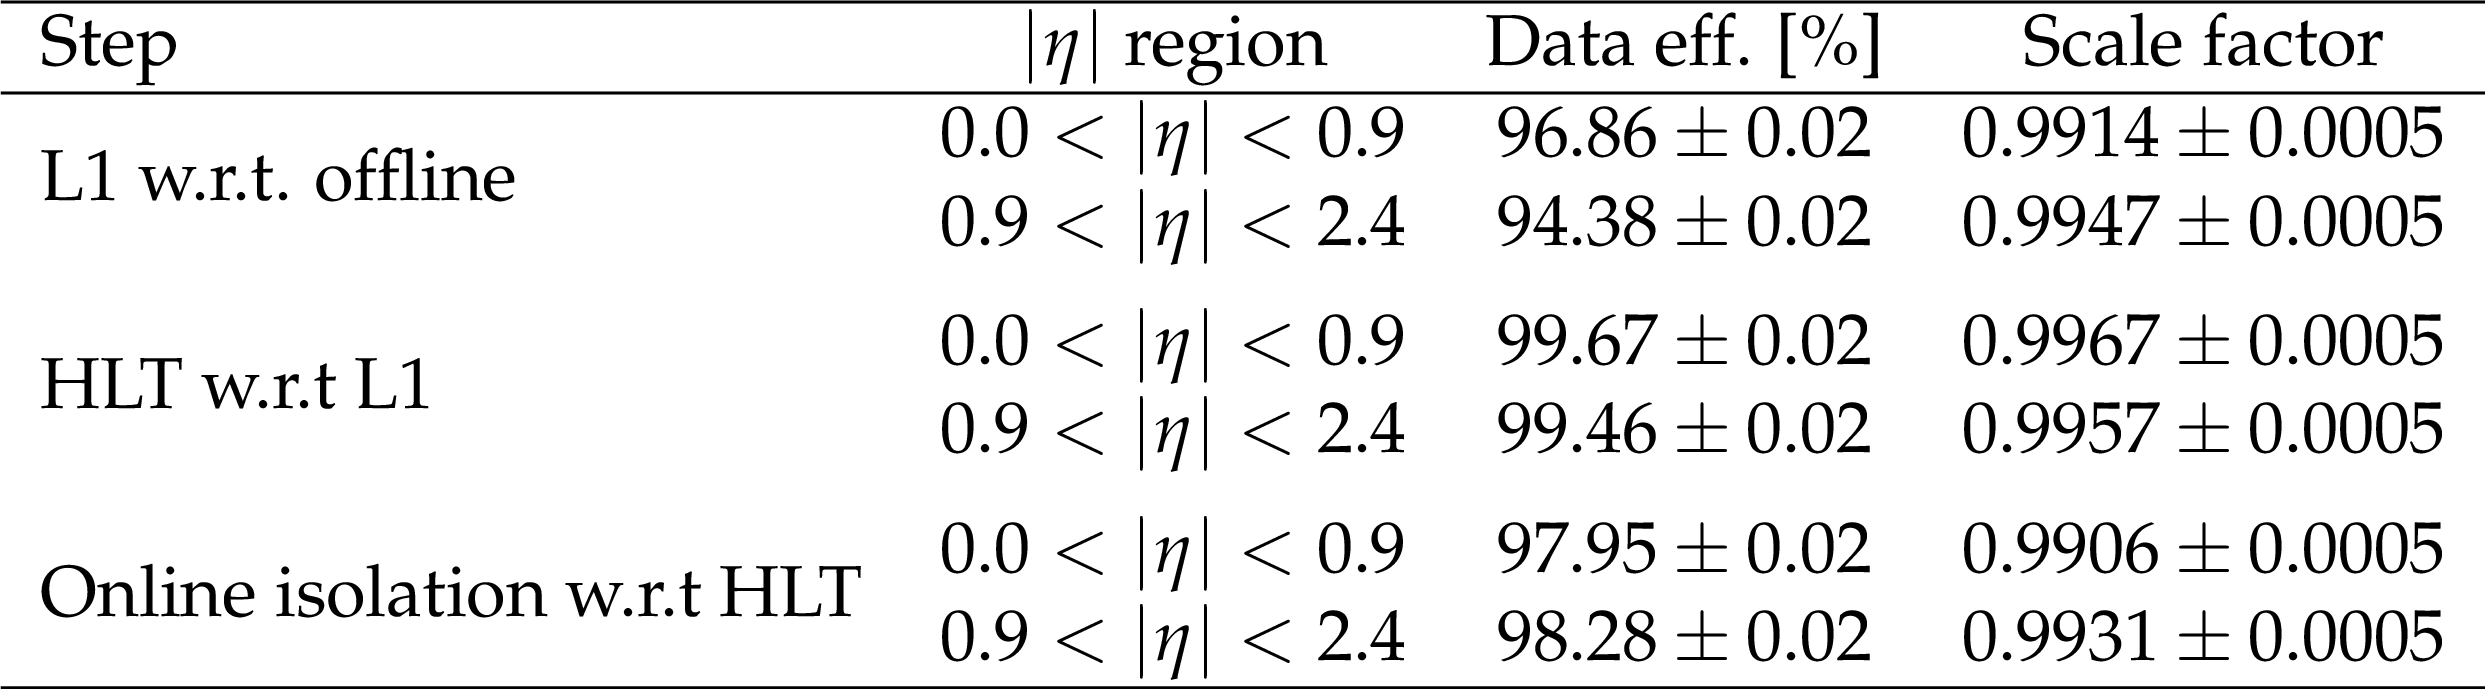
Table 5:
Contributions to the isolated single-muon trigger efficiency in 2015 data, integrated over $ {p_{\mathrm {T}}} > $ 22 GeV. The first two rows show the level-1 efficiency ($ {p_{\mathrm {T}}} $ threshold 16 GeV) with respect to offline muons. The second two rows show the HLT efficiency ($ {p_{\mathrm {T}}} $ threshold 20 GeV) with respect to offline muons geometrically matched to L1 candidates. The last two rows show the online isolation efficiency with respect to offline muons firing HLT. The uncertainties in these values are statistical. |
| Summary |
| The performance of the CMS muon detector and reconstruction software has been studied using data from proton-proton collisions at center-of-mass energy $\sqrt{s} = $ 13 TeV, collected in 2015 and 2016 during LHC Run 2. These results are compared to the previously published results collected in 2010 at $\sqrt{s} = $ 7 TeV with instantaneous luminosities about a factor of 40 lower. Important modifications to many components of the muon system were made before Run 2 in anticipation of the higher collision energy and the increased luminosity. These included modifications to drift tubes, cathode strip chambers, and resistive plate chambers, as well as improved algorithms for the high-level trigger and offline reconstruction. Although not comprehensive, a set of representative figures of merit for the system performance include: reconstructed hit spatial resolution $\approx $ 50-300 $\mu$m; reconstructed hit efficiency $\approx $ 94-99%; segment timing resolution $< $ 3 ns; segment efficiency $\approx $ 97%; trigger bunch crossing identification $> $ 99%; trigger efficiency $> $ 90%; muon timing resolution $\approx $ 1.4 ns; muon reconstruction and identification efficiency $> $ 96%; muon isolation efficiency $> $ 95%. As a result of the improvements to the detector and the reconstruction algorithms, and despite the higher luminosity and pileup in Run~2, the muon performance is better than, or at least as good as, it was in 2010. Detector performance remains within the design specifications and the muon reconstruction results are well reproduced by Monte Carlo simulation. |
| References | ||||
| 1 | CMS Collaboration | The performance of the CMS muon detector in proton-proton collisions at $ \sqrt{s} = $ 7 TeV at the LHC | JINST 8 (2013) P11002 | CMS-MUO-11-001 1306.6905 |
| 2 | CMS Collaboration | Performance of CMS muon reconstruction in $ {\mathrm{p}}{\mathrm{p}} $ collision events at $ \sqrt{s} = $ 7 TeV | JINST 7 (2012) P10002 | CMS-MUO-10-004 1206.4071 |
| 3 | CMS Collaboration | The CMS muon project: technical design report | CDS | |
| 4 | CMS Collaboration | The CMS experiment at the CERN LHC | JINST 3 (2008) S08004 | CMS-00-001 |
| 5 | CMS Collaboration | CMS TriDAS project: technical design report, volume 1: The trigger systems | CDS | |
| 6 | CMS Collaboration | The CMS trigger system | JINST 12 (2017) P01020 | CMS-TRG-12-001 1609.02366 |
| 7 | R. Alemany-Fernandez et al. | Operation and configuration of the LHC in Run 1 | CERN Accelerator Note CERN-ACC-NOTE-2013-0041, CERN | |
| 8 | G. Papotti et al. | Operation of the LHC with protons at high luminosity and high energy | in Proc. of International Particle Accelerator Conference (IPAC 2016) Busan, Korea, May | |
| 9 | J. Wenninger | Approaching the nominal performance at the LHC | in Proc. of International Particle Accelerator Conference (IPAC 2017) Copenhagen, Denmark, May | |
| 10 | CMS Collaboration | CMS technical design report for the level-1 trigger upgrade | CDS | |
| 11 | A. Triossi et al. | The CMS barrel muon trigger upgrade | JINST 12 (2017) C01095 | |
| 12 | \'A. Navarro-Tobar et al. | Phase 1 upgrade of the CMS drift tubes read-out system | JINST 12 (2017) C03070 | |
| 13 | CMS Collaboration | Validation of the mean-timer algorithm for DT local reconstruction and muon time measurement, using 2012 data | CDS | |
| 14 | CMS Collaboration | Description and performance of track and primary-vertex reconstruction with the CMS tracker | JINST 9 (2014) P10009 | 1405.6569 |
| 15 | CMS Collaboration | Performance of CMS muon reconstruction in cosmic-ray events | JINST 5 (2010) T03022 | CMS-CFT-09-014 0911.4994 |
| 16 | R. Fruhwirth | Application of Kalman filtering to track and vertex fitting | NIMA 262 (1987) 444 | |
| 17 | CMS Collaboration | Particle-flow reconstruction and global event description with the CMS detector | JINST 12 (2017) P10003 | CMS-PRF-14-001 1706.04965 |
| 18 | CMS Collaboration | Technical proposal for the Phase-II upgrade of the CMS detector | CMS-PAS-TDR-15-002 | CMS-PAS-TDR-15-002 |
| 19 | J. Alwall et al. | The automated computation of tree-level and next-to-leading order differential cross sections, and their matching to parton shower simulations | JHEP 07 (2014) 079 | 1405.0301 |
| 20 | E. Re | Single-top Wt-channel production matched with parton showers using the POWHEG method | EPJC 71 (2011) 1547 | 1009.2450 |
| 21 | T. Sjostrand, S. Mrenna, and P. Z. Skands | PYTHIA 6.4 physics and manual | JHEP 05 (2006) 026 | hep-ph/0603175 |
| 22 | T. Sjostrand et al. | An introduction to $ PYTHIA $ 8.2 | CPC 191 (2015) 159 | 1410.3012 |
| 23 | CMS Collaboration | Event generator tunes obtained from underlying event and multiparton scattering measurements | EPJC 76 (2016) 155 | CMS-GEN-14-001 1512.00815 |
| 24 | NNPDF Collaboration | Parton distributions for the LHC Run II | JHEP 04 (2015) 040 | 1410.8849 |
| 25 | GEANT4 Collaboration | GEANT4--a simulation toolkit | NIMA 506 (2003) 250 | |
| 26 | A. C. Rencher and G. B. Schaalje | Linear models in statistics | John Wiley \& Sons, Inc., New York | |
| 27 | CMS Collaboration | Alignment of the CMS tracker with LHC and cosmic ray data | JINST 9 (2014) P06009 | CMS-TRK-11-002 1403.2286 |
| 28 | CMS Collaboration | CMS physics technical design report, volume II: physics performance | JPG 34 (2007) 995 | |
| 29 | A. Bodek et al. | Extracting muon momentum scale corrections for hadron collider experiments | EPJC 72 (2012) 2194 | 1208.3710 |
| 30 | CMS Collaboration | W-like measurement of the $ \mathrm{Z} $ boson mass using dimuon events collected in $ {\mathrm{p}}{\mathrm{p}} $ collisions at $ \sqrt{s} = $ 7 TeV | CMS-PAS-SMP-14-007 | CMS-PAS-SMP-14-007 |
| 31 | CMS Collaboration | Search for heavy long-lived charged particles in $ {\mathrm{p}}{\mathrm{p}} $ collisions at $ \sqrt{s} = $ 7 TeV | PLB 713 (2012) 408 | CMS-EXO-11-022 1205.0272 |
| 32 | M. Cacciari, G. P. Salam, and G. Soyez | FastJet user manual | EPJC 72 (2012) 1896 | 1111.6097 |
| 33 | M. Abbrescia et al. | Beam test results on double-gap resistive plate chambers proposed for CMS experiment | NIMA 414 (1998) 135 | |
| 34 | CMS Collaboration | Measurement of inclusive $ \mathrm{W} $ and $ \mathrm{Z} $ boson production cross sections in $ {\mathrm{p}}{\mathrm{p}} $ collisions at $ \sqrt{s} = $ 8 TeV | PRL 112 (2014) 191802 | CMS-SMP-12-011 1402.0923 |
| 35 | CMS Collaboration | Measurement of inclusive $ \mathrm{W} $ and $ \mathrm{Z} $ boson production cross sections in $ {\mathrm{p}}{\mathrm{p}} $ collisions at $ \sqrt{s} = $ 13 TeV | CMS-PAS-SMP-15-004 | CMS-PAS-SMP-15-004 |
|
|
Compact Muon Solenoid LHC, CERN |
|

|

|

|

|

|