

Compact Muon Solenoid
LHC, CERN
| CMS-SMP-13-008 ; CERN-EP-2017-029 | ||
| Search for anomalous couplings in boosted $\mathrm{ WW/WZ }\to\ell\nu\mathrm{ q \bar{q} }$ production in proton-proton collisions at $ \sqrt{s} = $ 8 TeV | ||
| CMS Collaboration | ||
| 17 March 2017 | ||
| Phys. Lett. B 772 (2017) 21 | ||
| Abstract: This Letter presents a search for new physics manifested as anomalous triple gauge boson couplings in WW and WZ diboson production in proton-proton collisions. The search is performed using events containing a W boson that decays leptonically and a W or Z boson whose decay products are merged into a single reconstructed jet. The data, collected at $ \sqrt{s} = $ 8 TeV with the CMS detector at the LHC, correspond to an integrated luminosity of 19 fb$^{-1}$. No evidence for anomalous triple gauge couplings is found and the following 95% confidence level limits are set on their values: $\lambda$ ($ [-0.011,0.011]$), $\Delta{\kappa_\gamma}$ ($ [-0.044,0.063]$), and $\Delta{g_1^{\mathrm{ Z }}}$ ($ [-0.0087,0.024]$). These limits are also translated into their effective field theory equivalents: $c_{\mathrm{ WWW }}/\Lambda^2$ ($ [-2.7,2.7]$ TeV$^{-2}$), $c_\mathrm{B}/\Lambda^2$ ($ [-14,17]$ TeV$^{-2}$), and $c_{\mathrm{ W }}/\Lambda^2$ ($ [-2.0,5.7]$ TeV$^{-2}$). | ||
| Links: e-print arXiv:1703.06095 [hep-ex] (PDF) ; CDS record ; inSPIRE record ; HepData record ; CADI line (restricted) ; | ||
| Figures | |
png pdf |
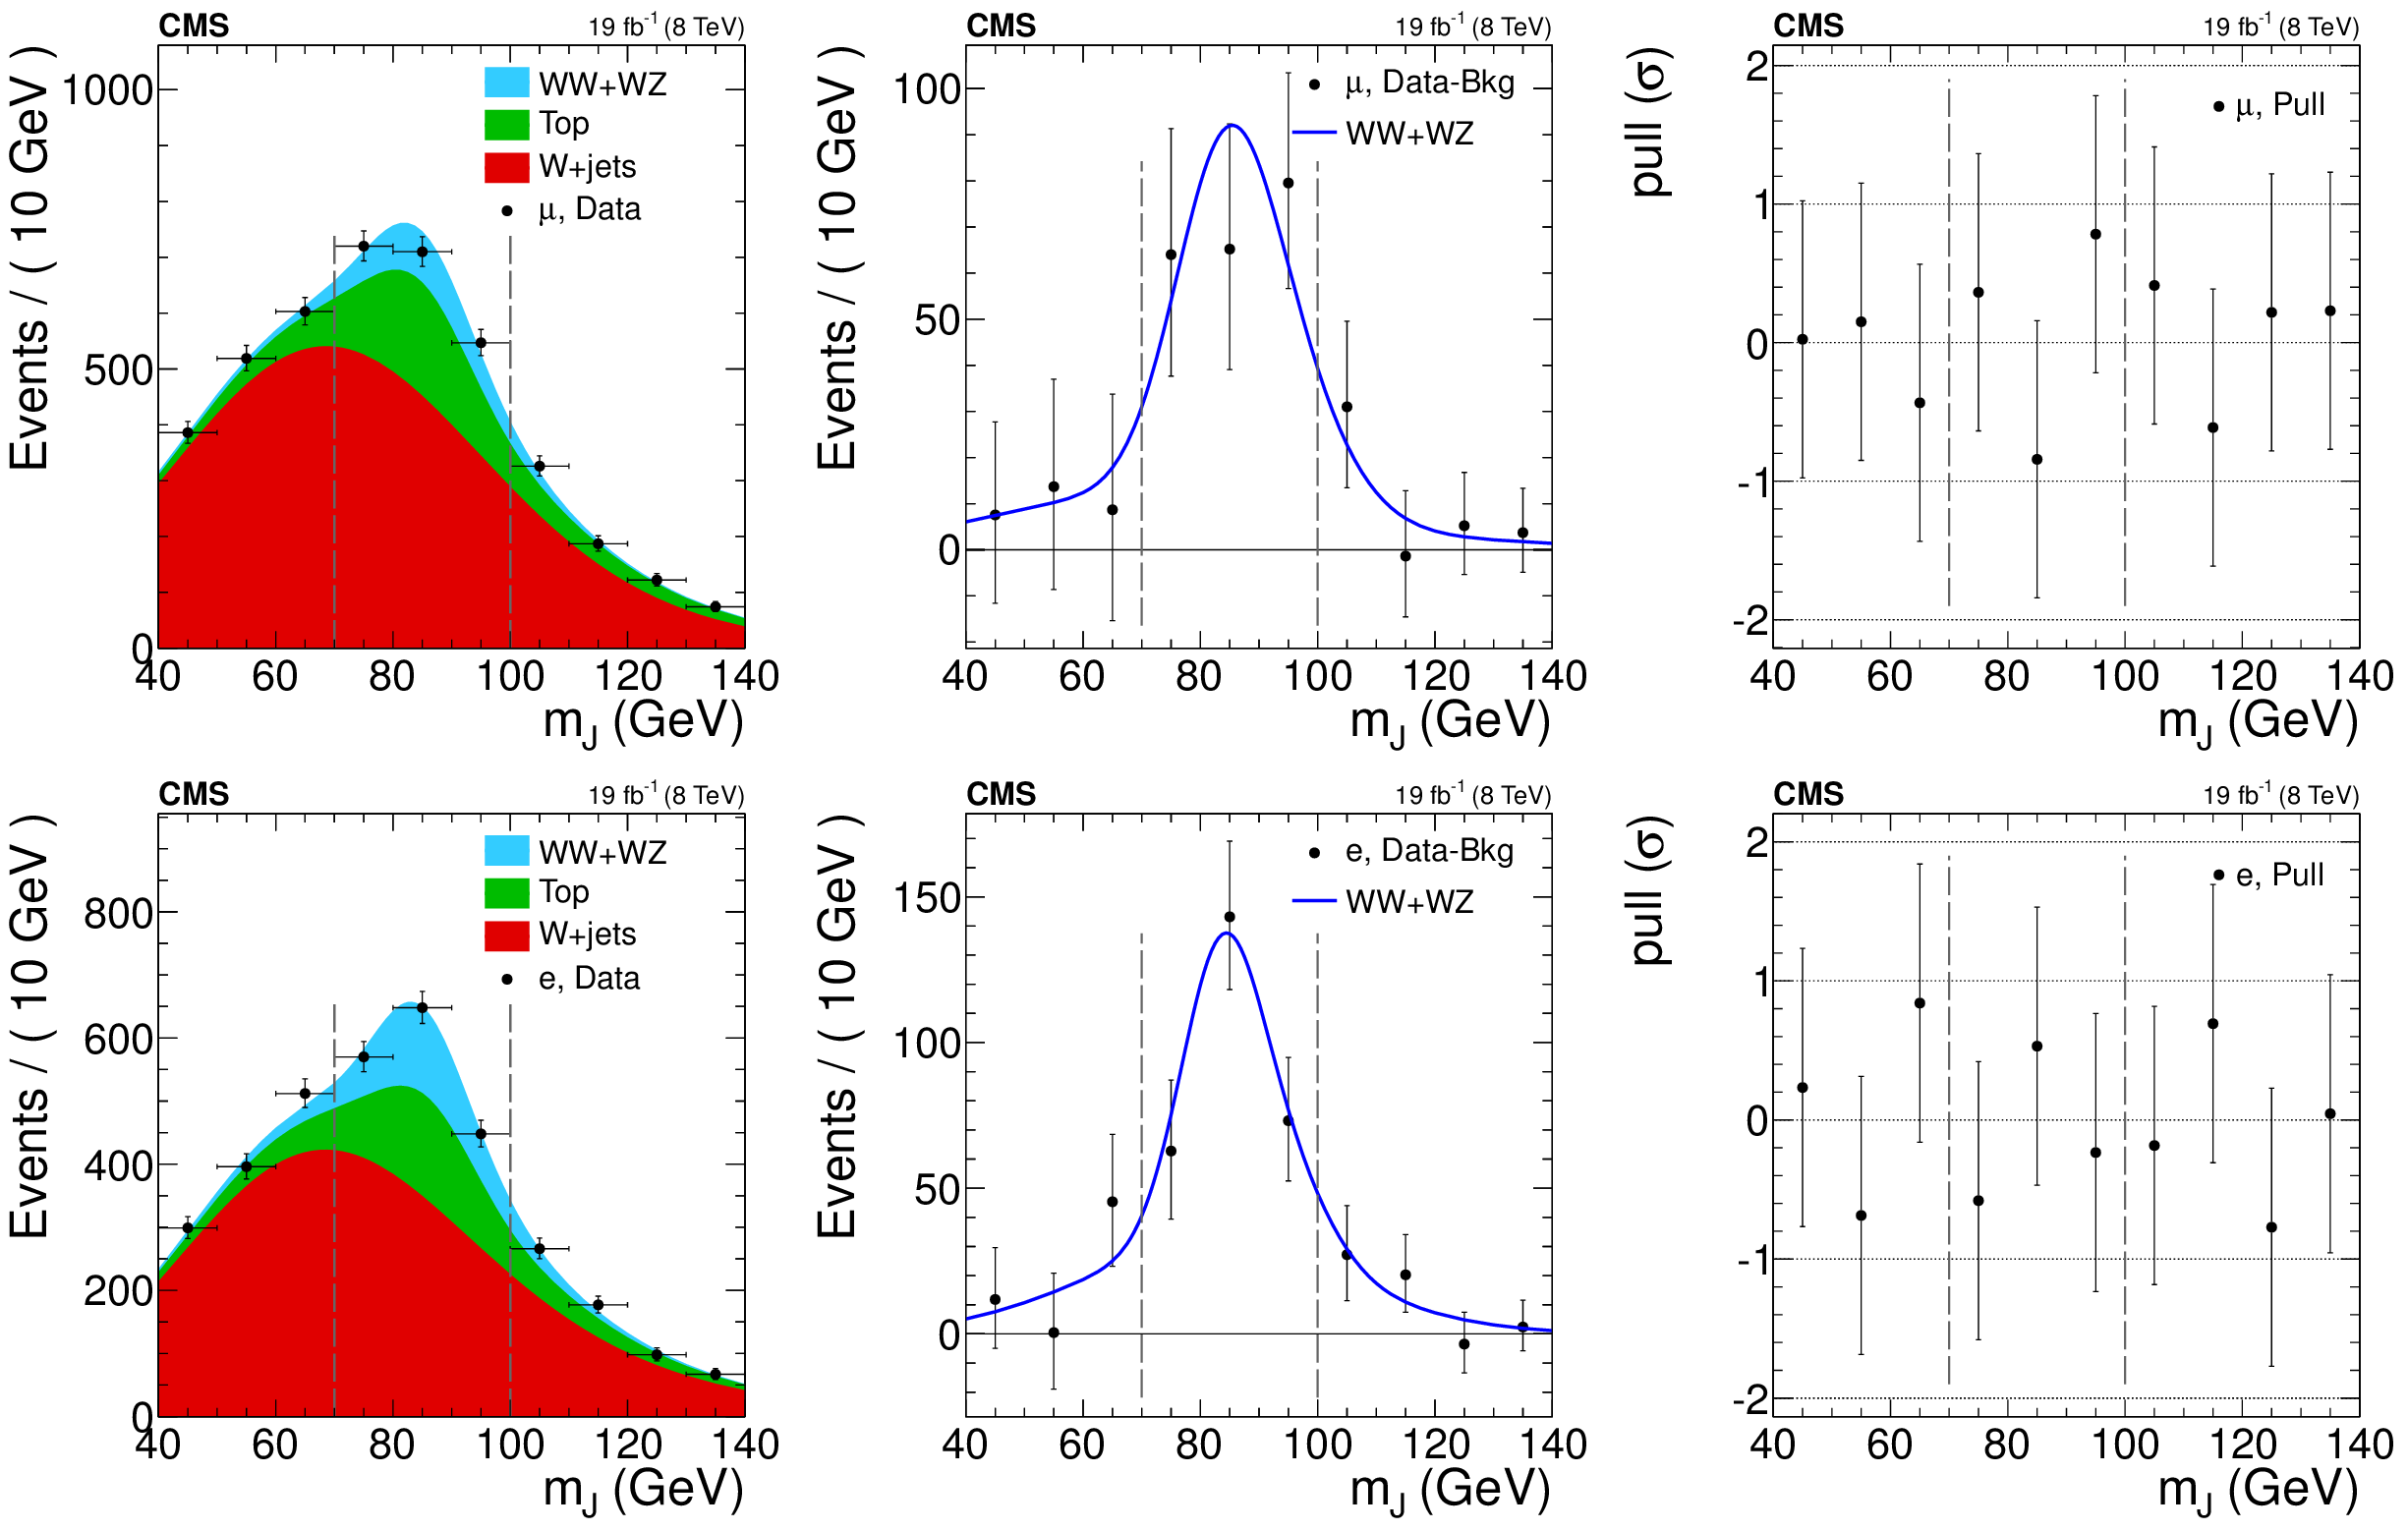
Figure 1:
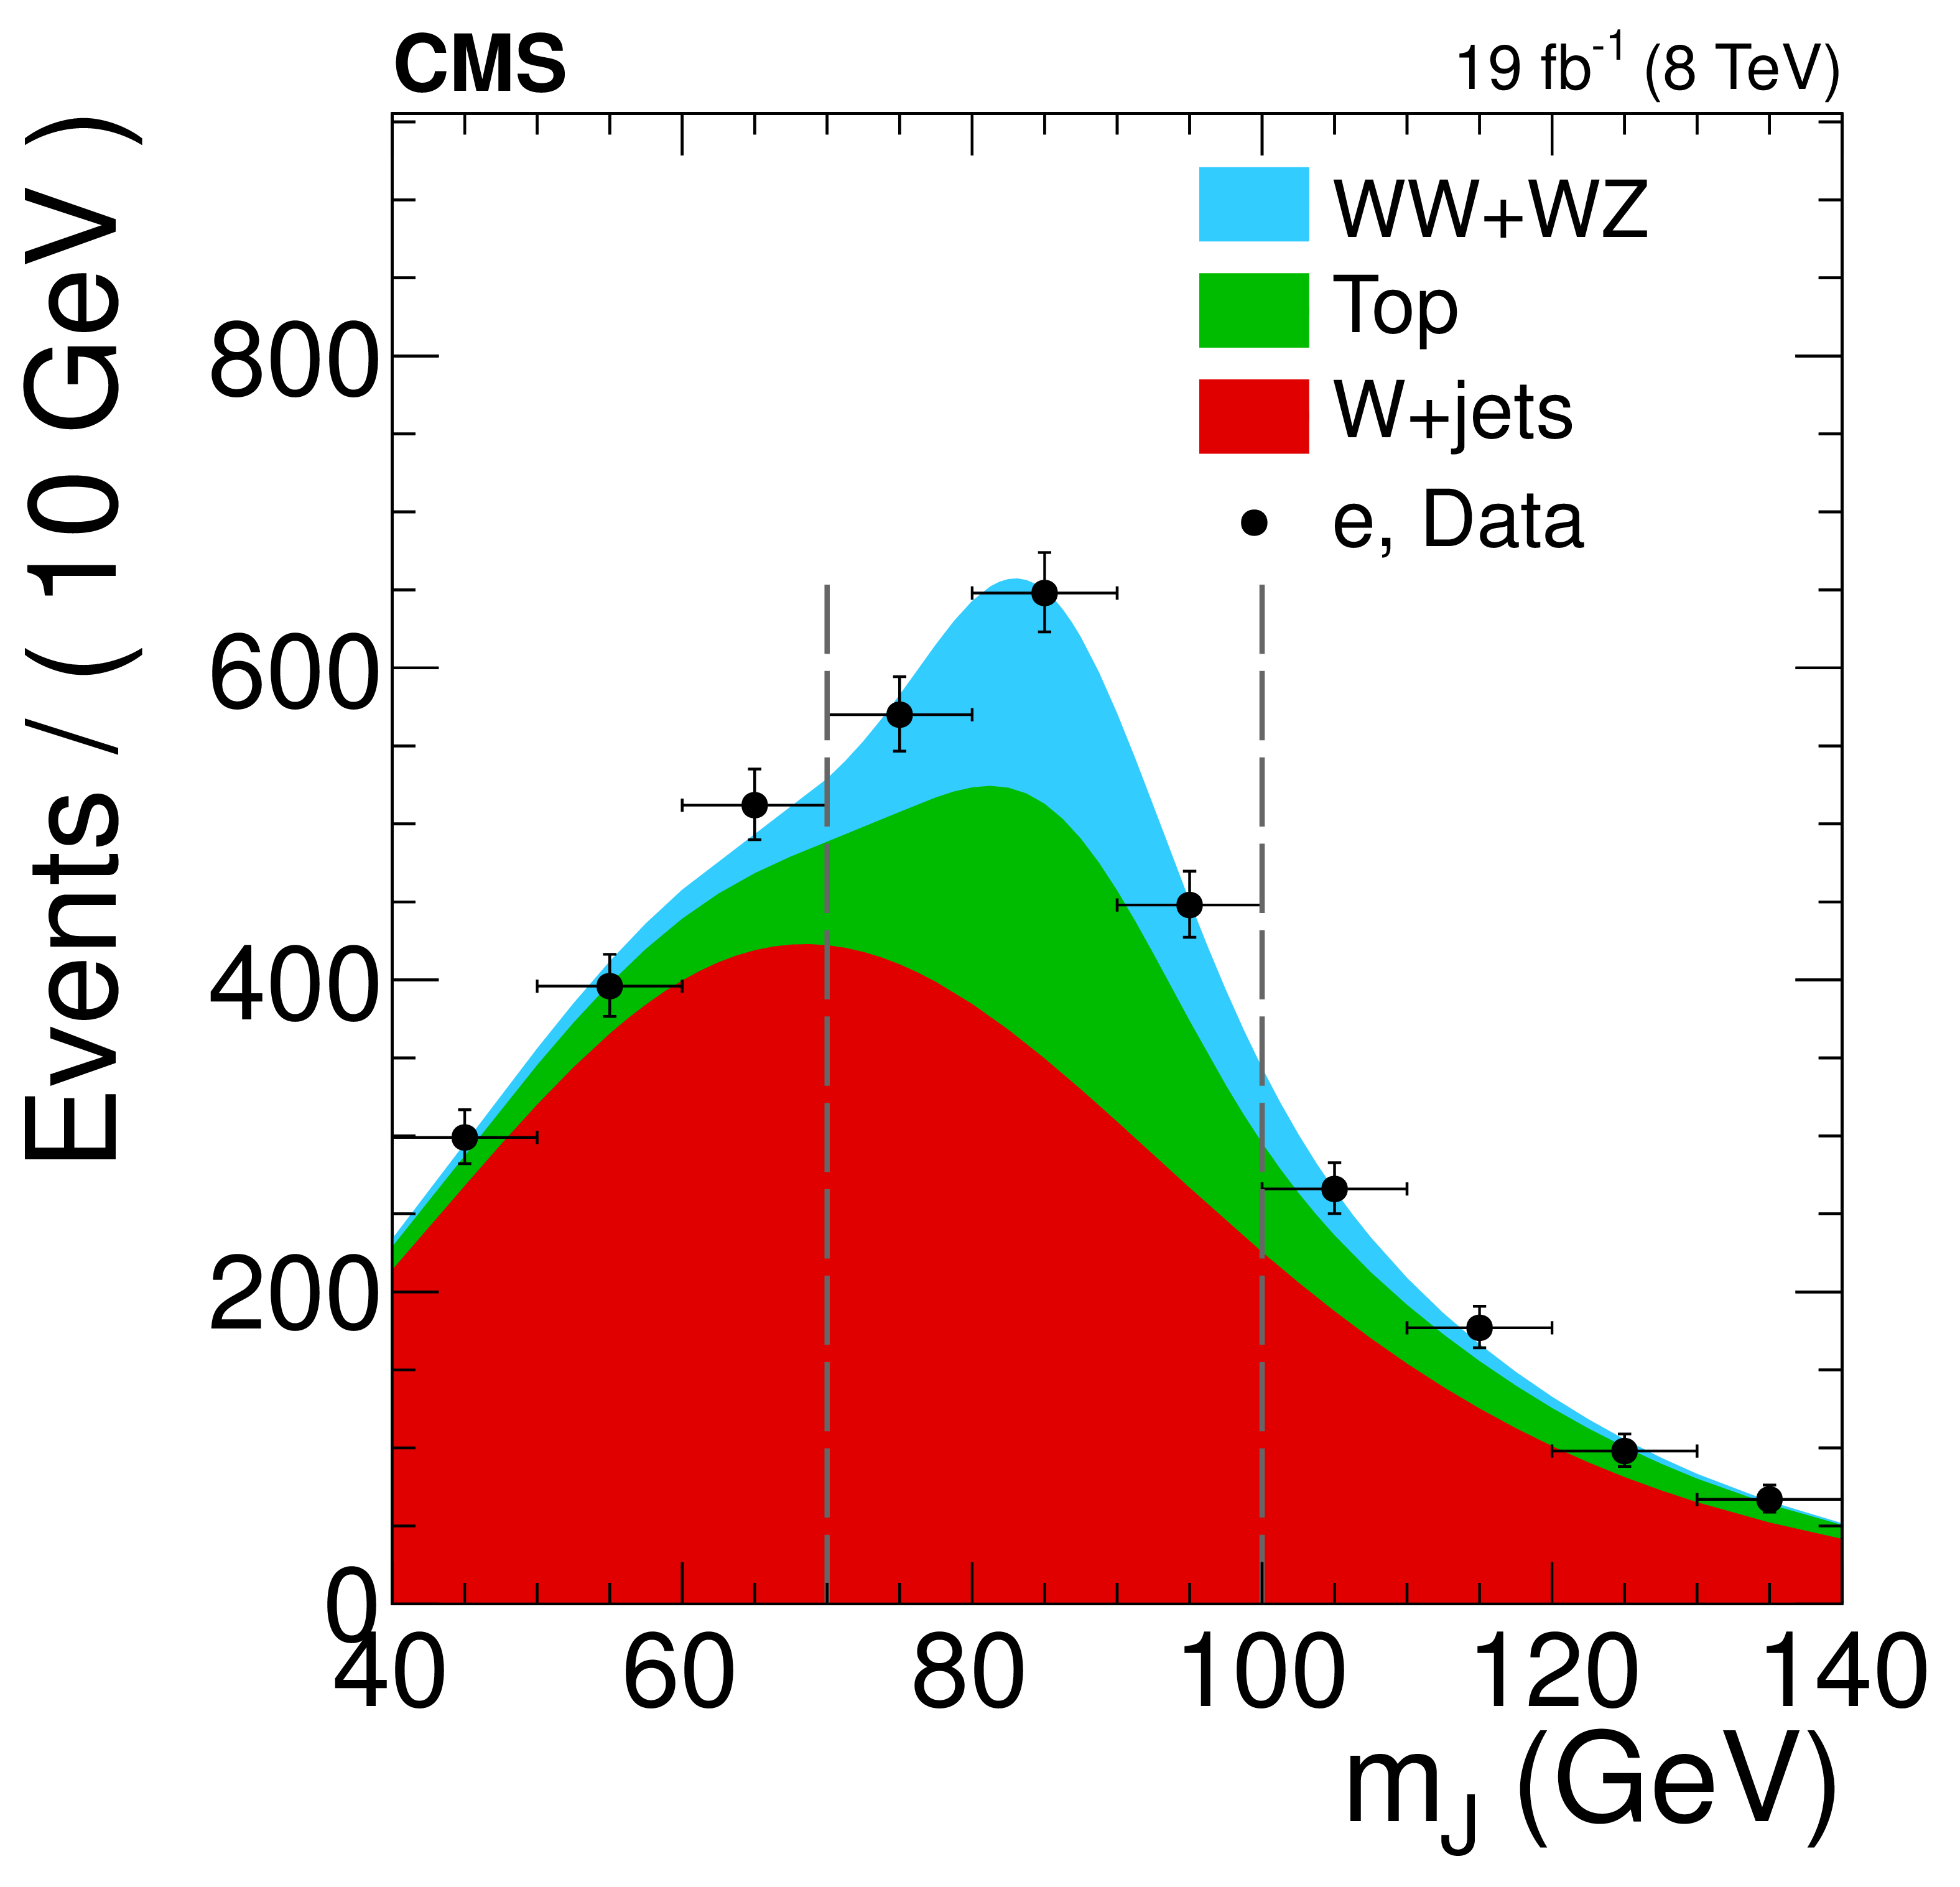
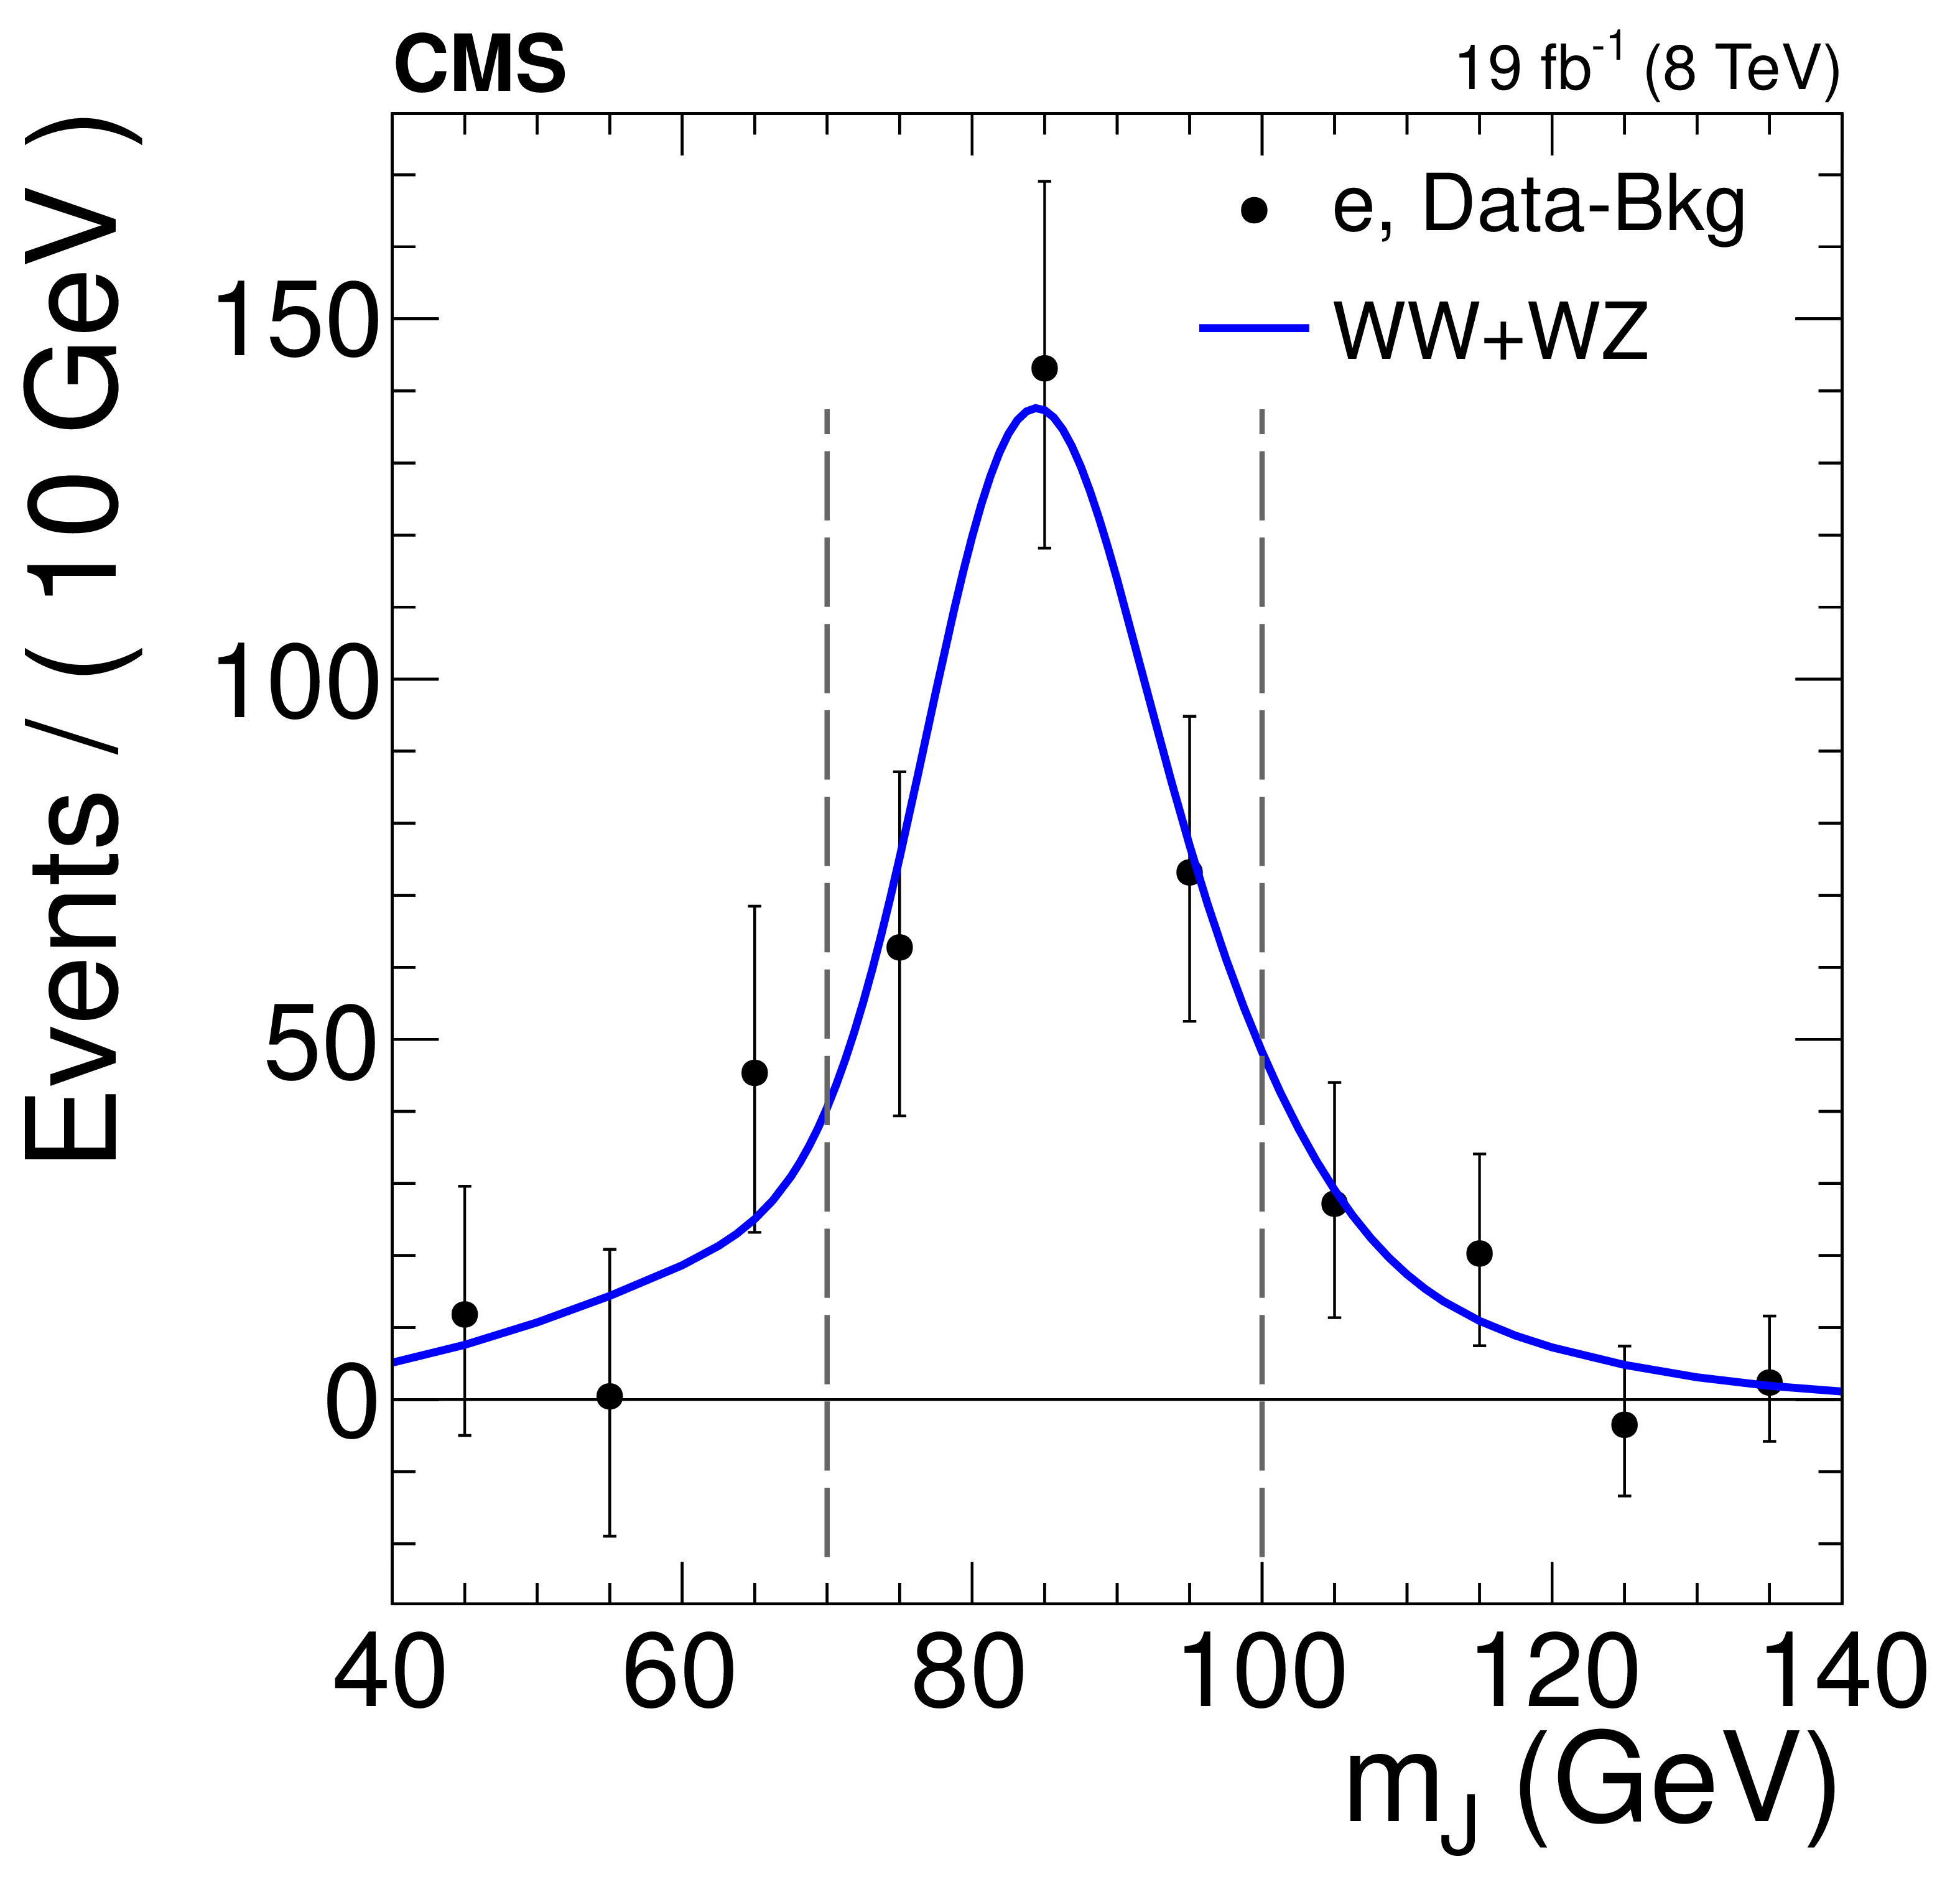
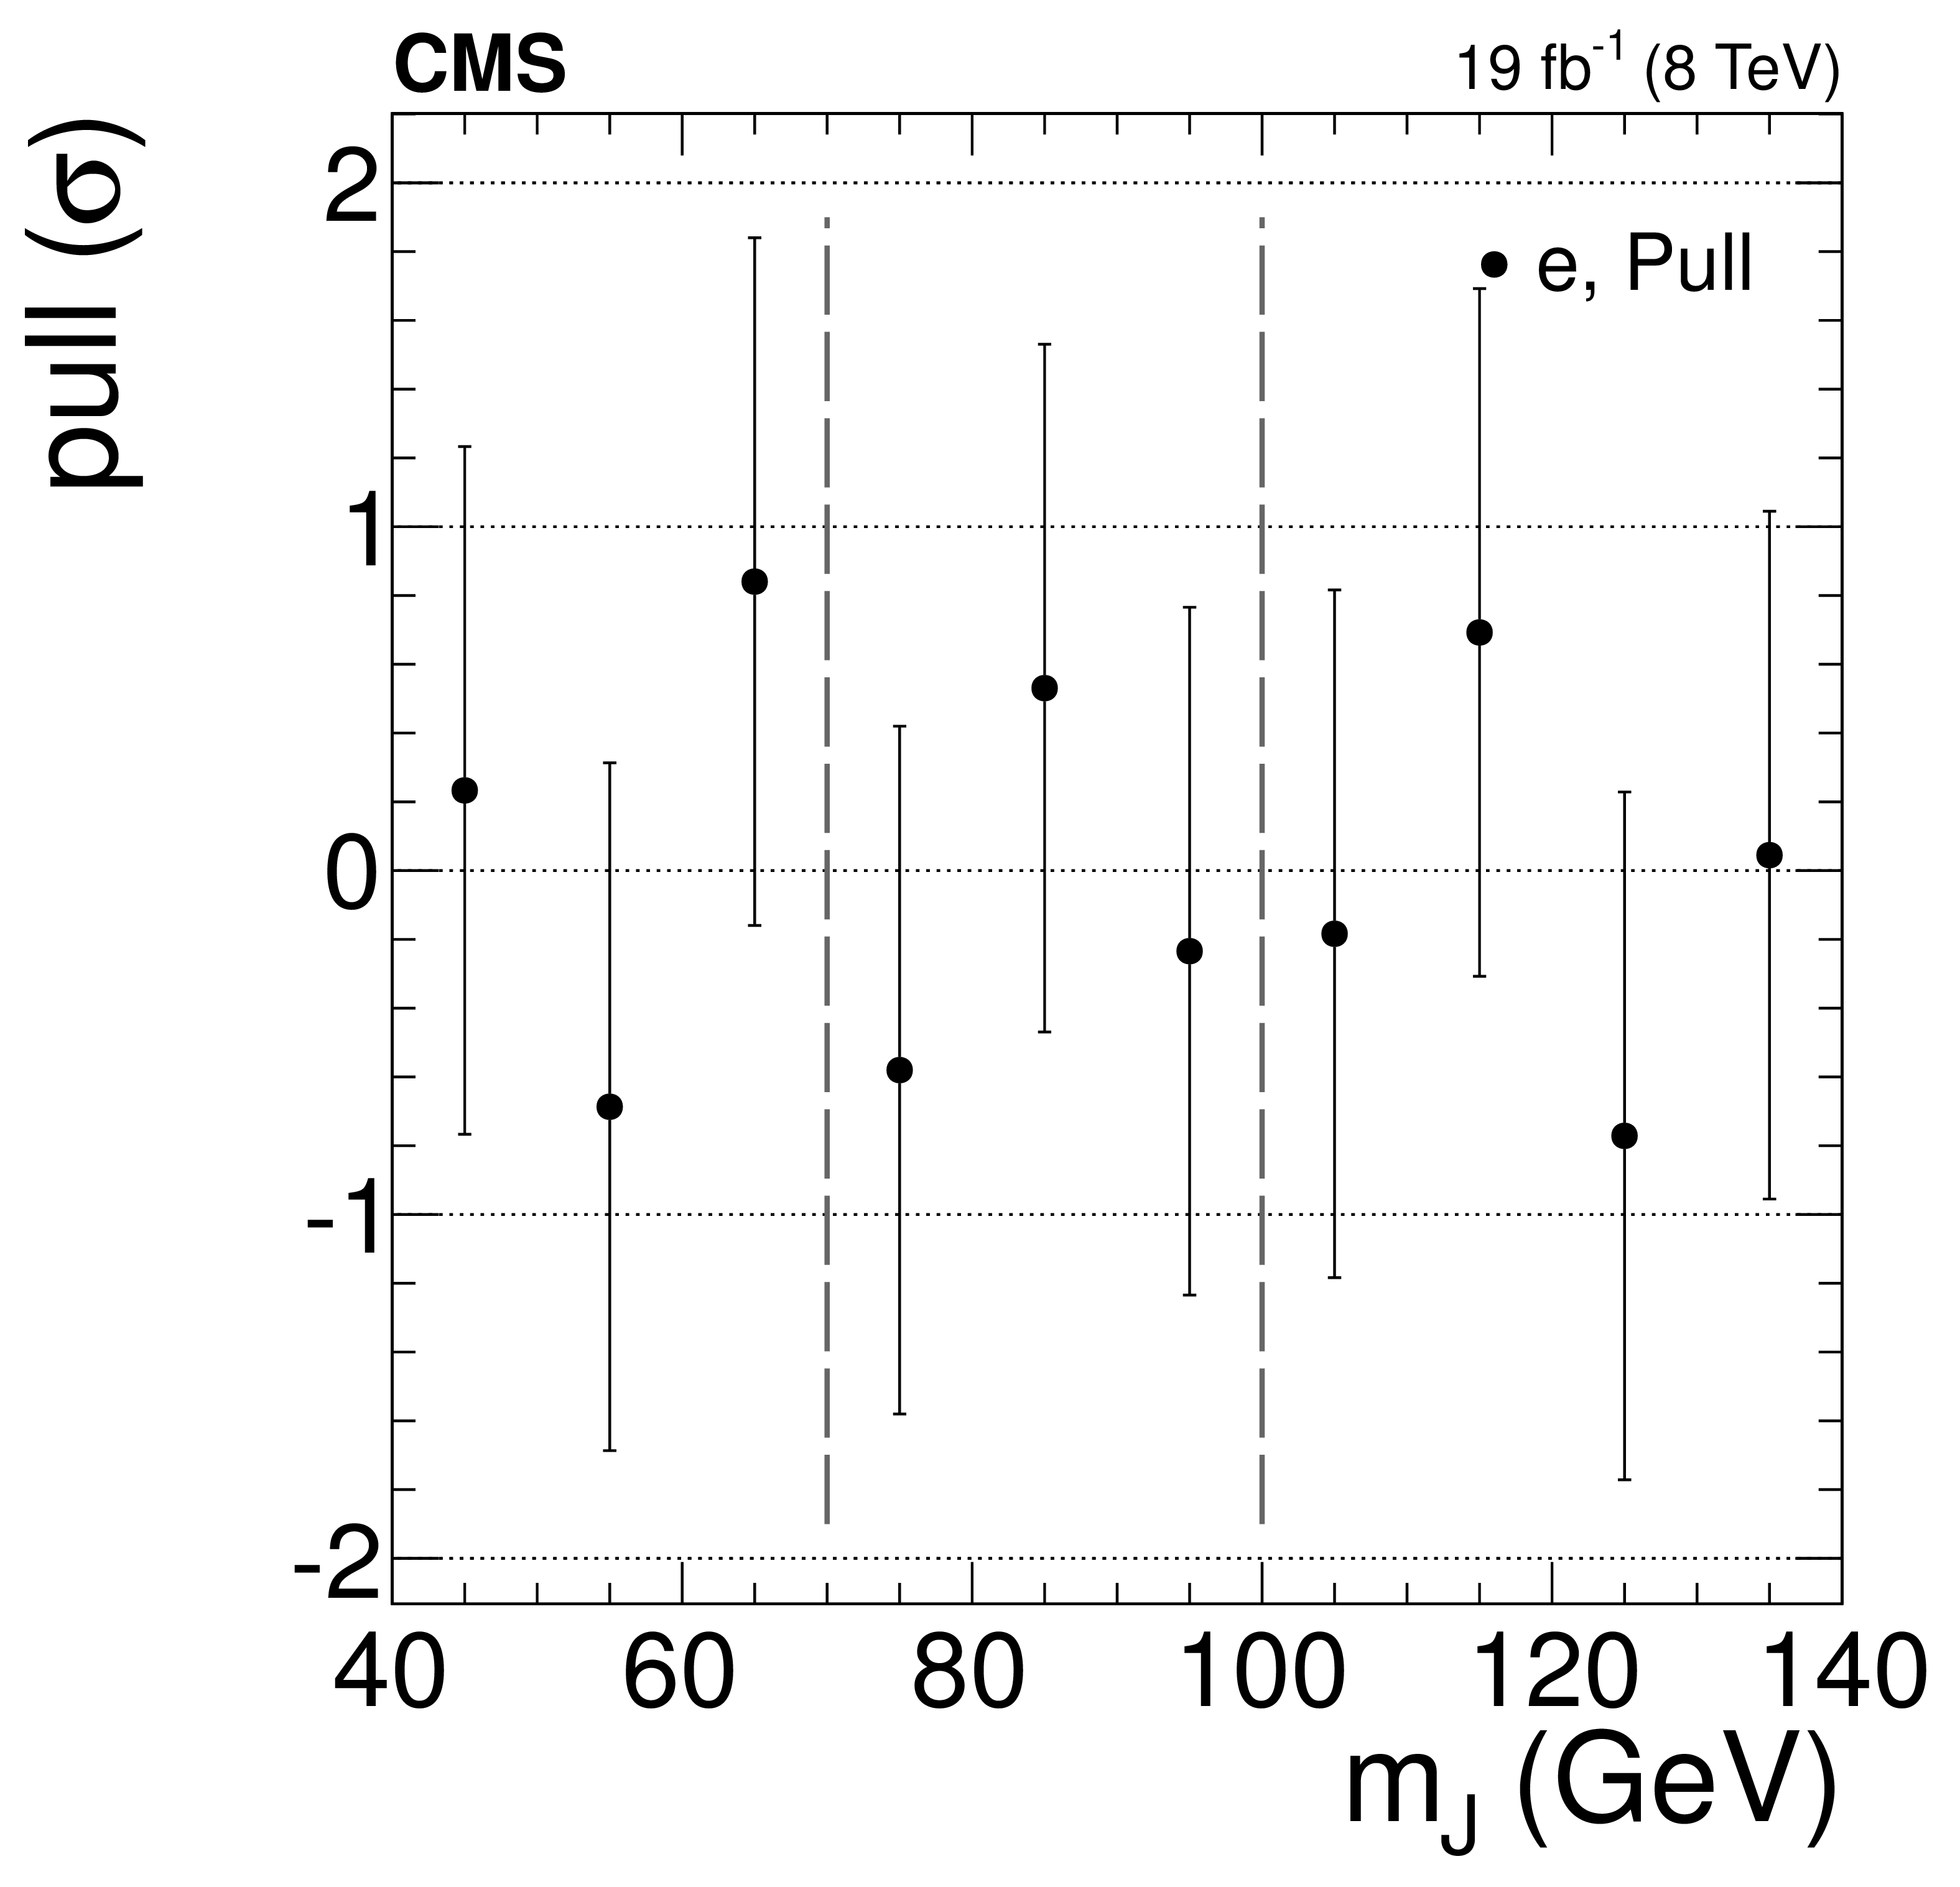
Post-fit distributions of the merged jet invariant mass for muons (top) and electrons (bottom) with the estimates of the relevant backgrounds. The merged jet invariant mass is plotted for all events (left), after subtraction of all components except the diboson (center), and the subsequent normalized residual or pull distributions: (data $-$ fit)/(fit uncertainty) (right). The error bars represent statistical uncertainties. The dashed vertical lines mark the signal region of 70 $ < m_{J} < $ 100 GeV, from which the the ${p_{\mathrm {T}}} $ distribution normalizations are extracted. |
png pdf |
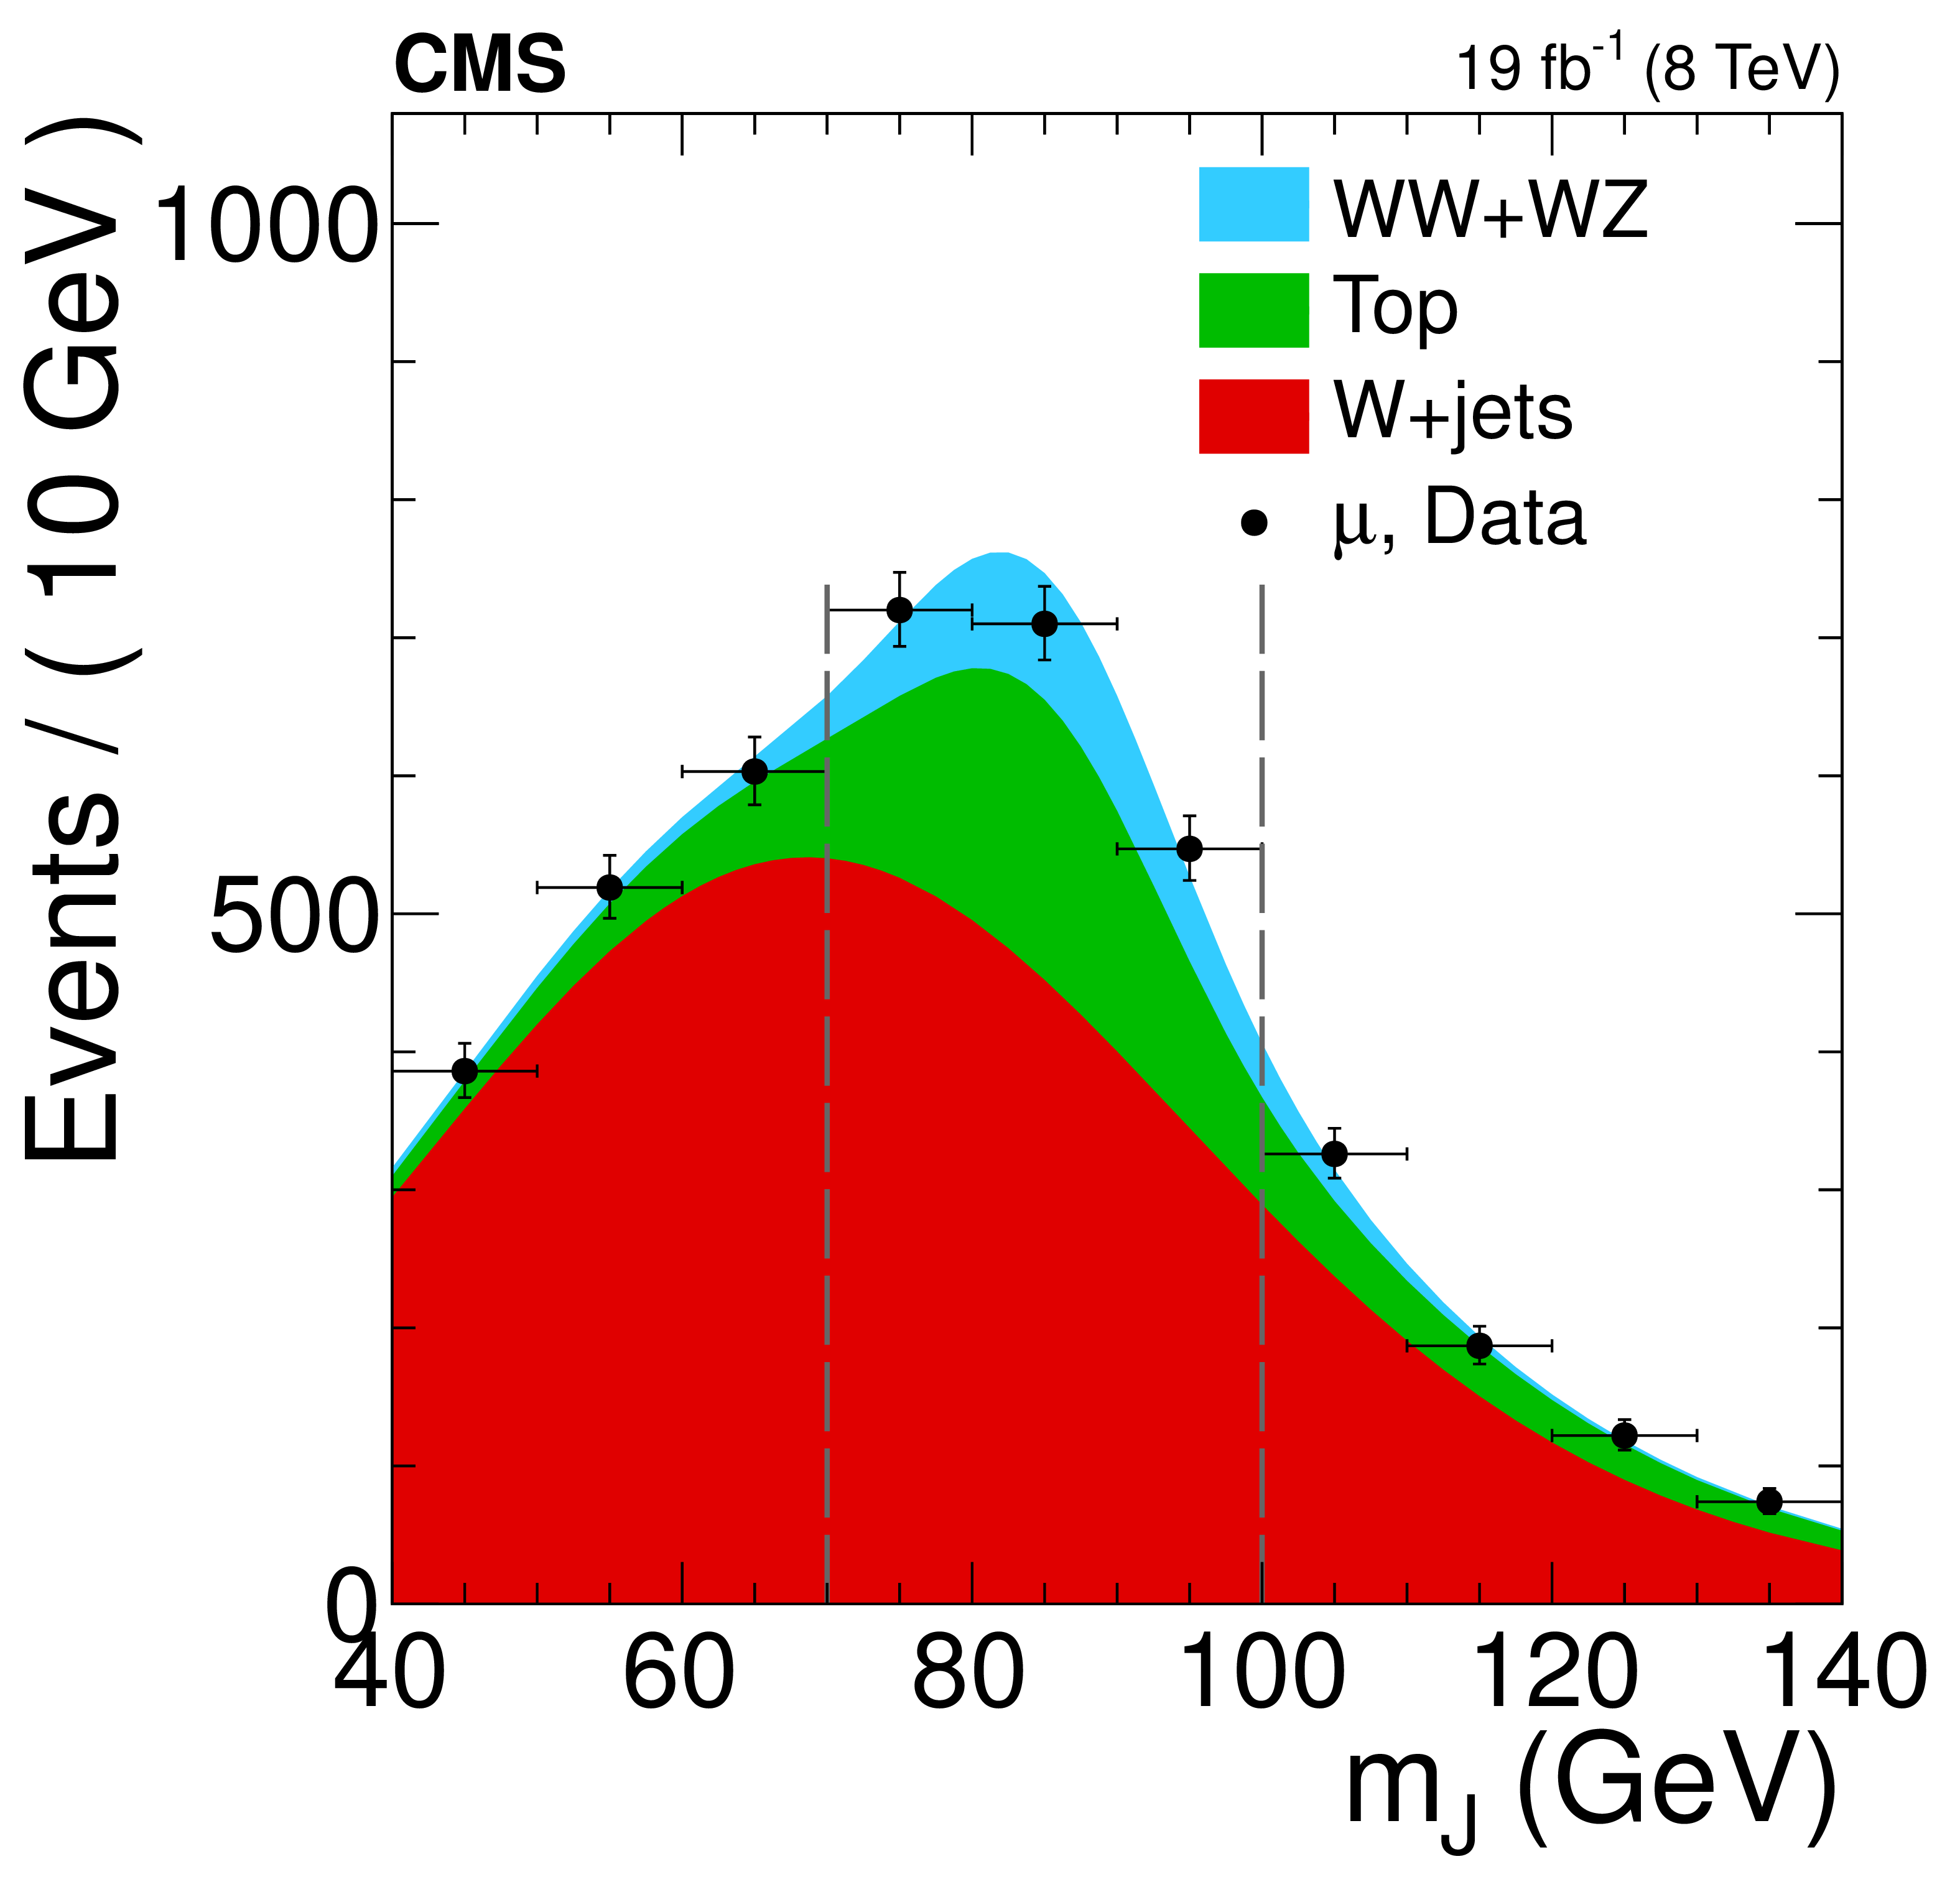
Figure 1-a:
Post-fit distributions of the merged jet invariant mass for muons with the estimates of the relevant backgrounds. The merged jet invariant mass is plotted for all events. The error bars represent statistical uncertainties. The dashed vertical lines mark the signal region of 70 $ < m_{J} < $ 100 GeV, from which the the ${p_{\mathrm {T}}} $ distribution normalizations are extracted. |
png pdf |
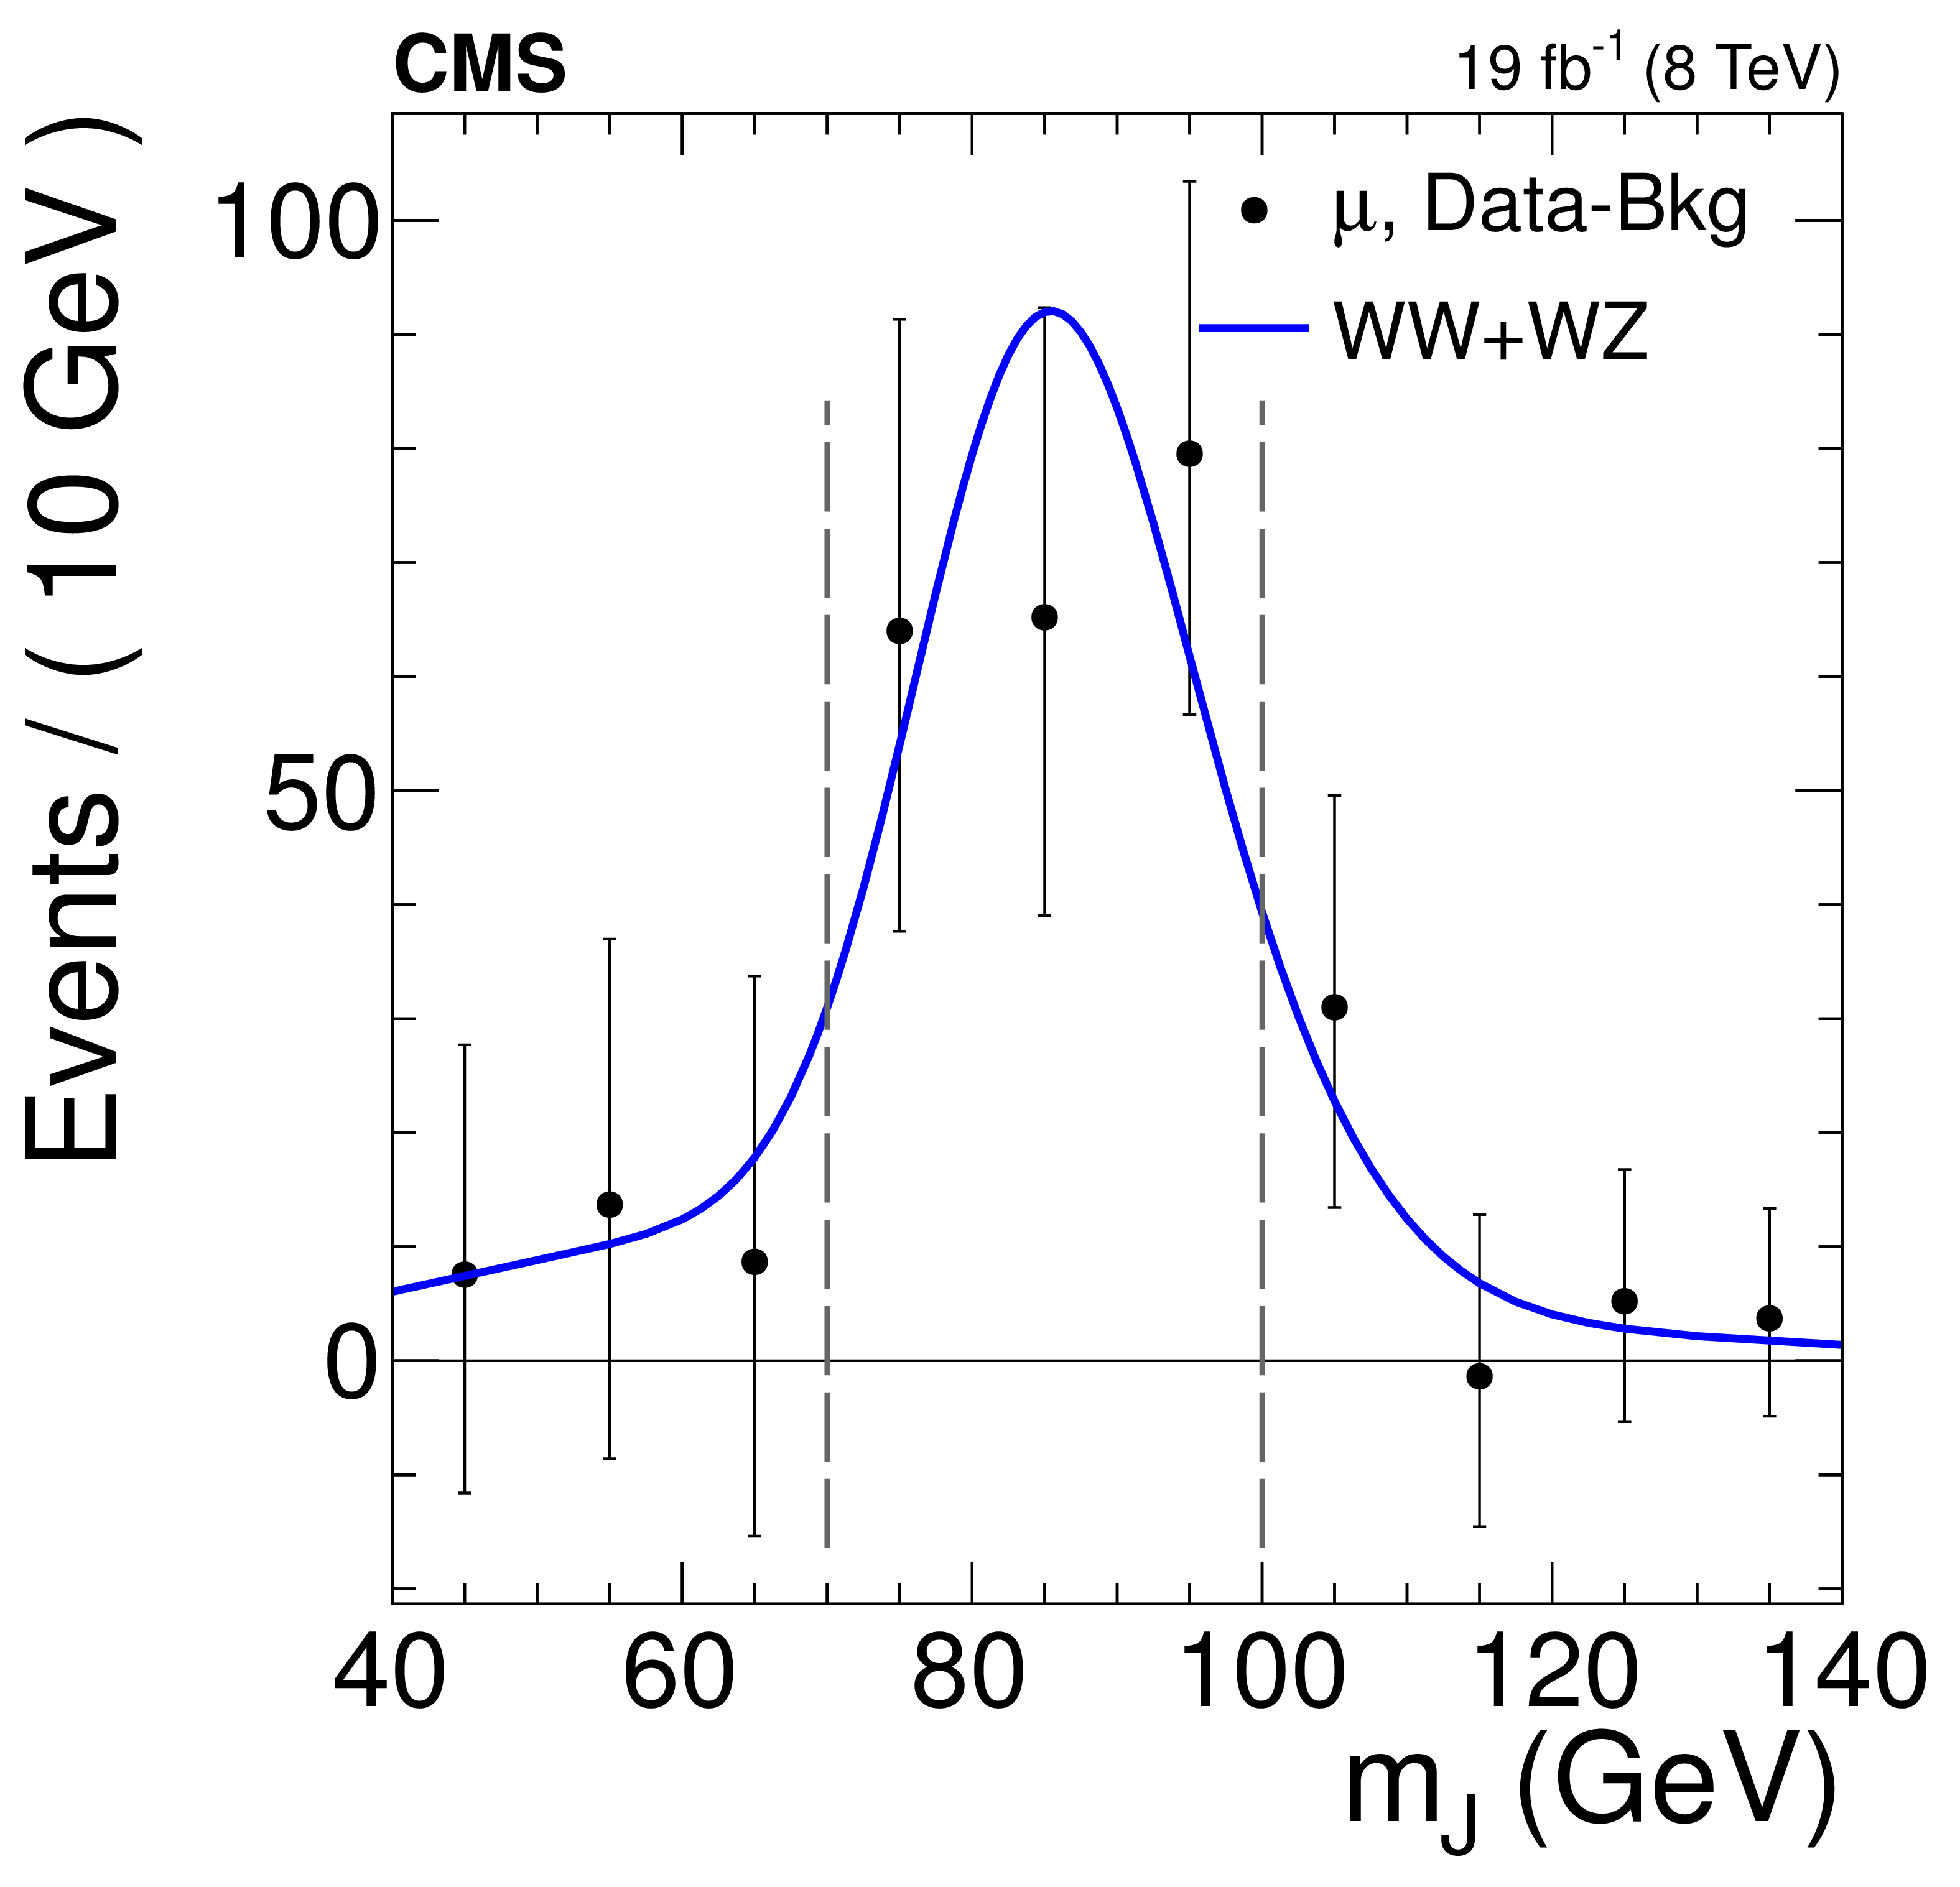
Figure 1-b:
Post-fit distributions of the merged jet invariant mass for muons with the estimates of the relevant backgrounds. The merged jet invariant mass is plotted after subtraction of all components except the diboson. The error bars represent statistical uncertainties. The dashed vertical lines mark the signal region of 70 $ < m_{J} < $ 100 GeV, from which the the ${p_{\mathrm {T}}} $ distribution normalizations are extracted. |
png pdf |
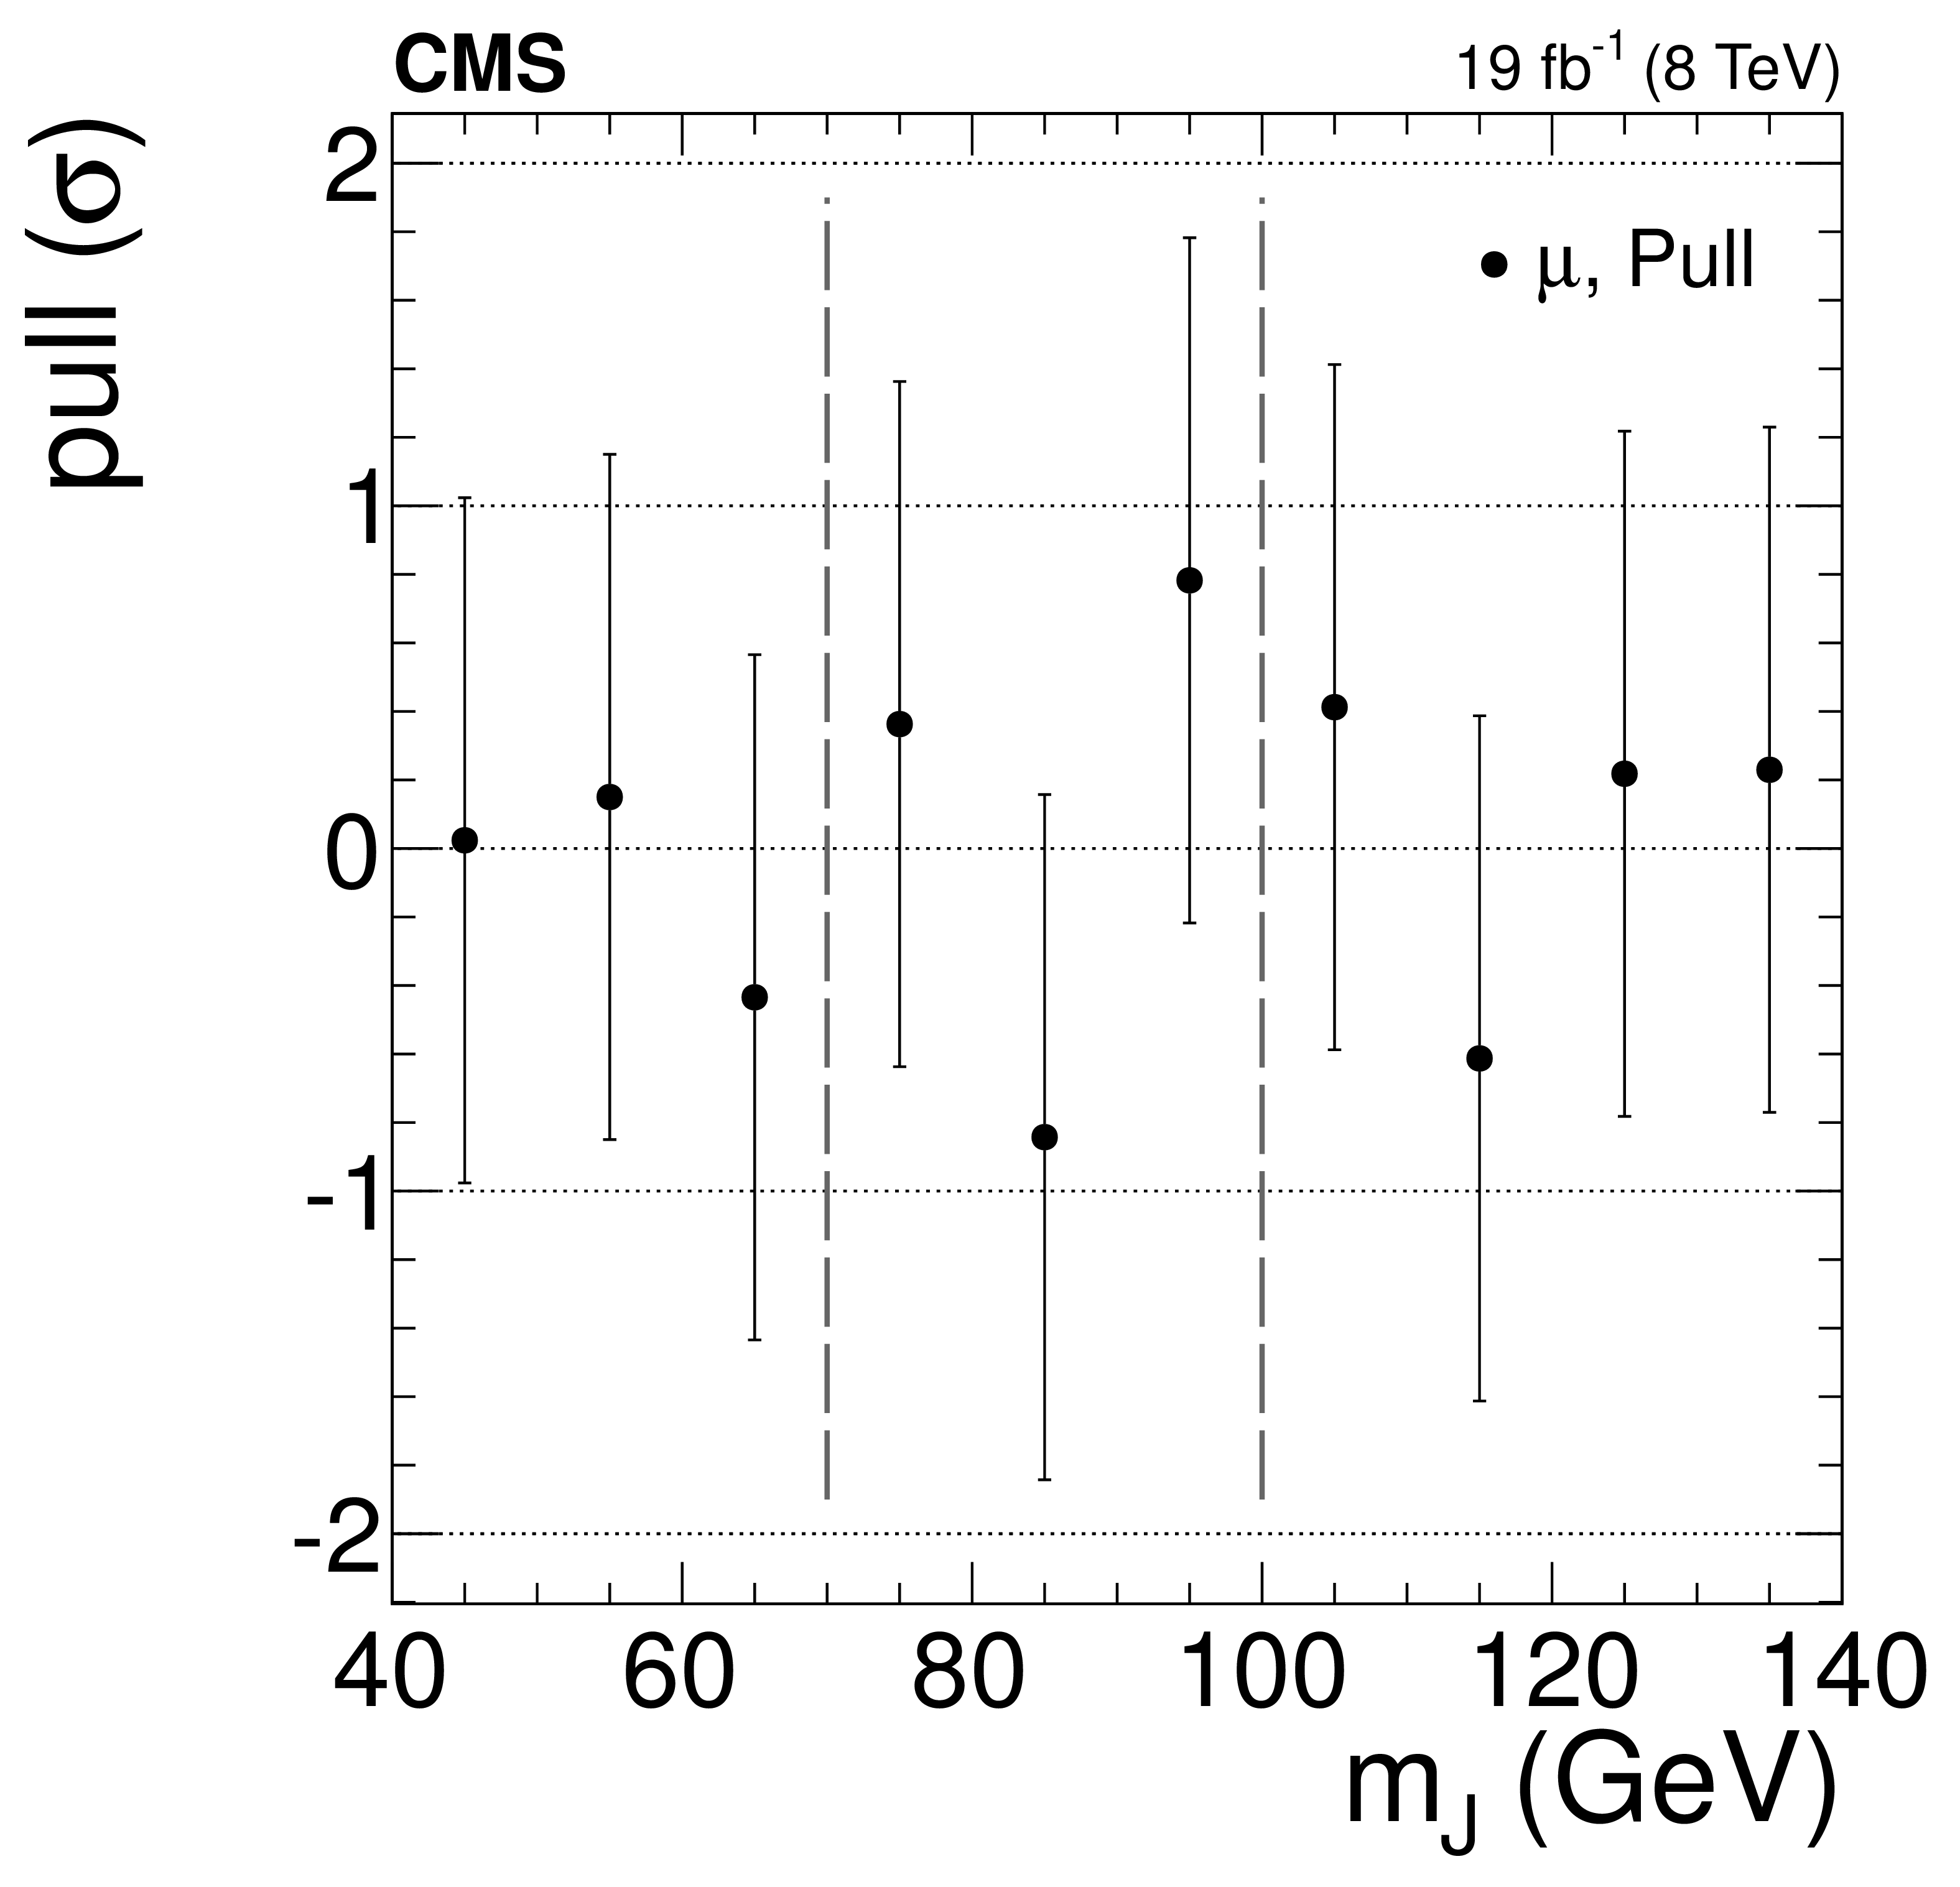
Figure 1-c:
Post-fit distributions of the merged jet invariant mass for muons with the estimates of the relevant backgrounds: subsequent normalized residual or pull distributions: (data $-$ fit)/(fit uncertainty). The error bars represent statistical uncertainties. The dashed vertical lines mark the signal region of 70 $ < m_{J} < $ 100 GeV, from which the the ${p_{\mathrm {T}}} $ distribution normalizations are extracted. |
png pdf |
Figure 1-d:
Post-fit distributions of the merged jet invariant mass for electrons with the estimates of the relevant backgrounds. The merged jet invariant mass is plotted for all events. The error bars represent statistical uncertainties. The dashed vertical lines mark the signal region of 70 $ < m_{J} < $ 100 GeV, from which the the ${p_{\mathrm {T}}} $ distribution normalizations are extracted. |
png pdf |
Figure 1-e:
Post-fit distributions of the merged jet invariant mass for electrons with the estimates of the relevant backgrounds. The merged jet invariant mass is plotted after subtraction of all components except the diboson. The error bars represent statistical uncertainties. The dashed vertical lines mark the signal region of 70 $ < m_{J} < $ 100 GeV, from which the the ${p_{\mathrm {T}}} $ distribution normalizations are extracted. |
png pdf |
Figure 1-f:
Post-fit distributions of the merged jet invariant mass for electrons with the estimates of the relevant backgrounds: subsequent normalized residual or pull distributions: (data $-$ fit)/(fit uncertainty). The error bars represent statistical uncertainties. The dashed vertical lines mark the signal region of 70 $ < m_{J} < $ 100 GeV, from which the the ${p_{\mathrm {T}}} $ distribution normalizations are extracted. |
png pdf |
Figure 2:
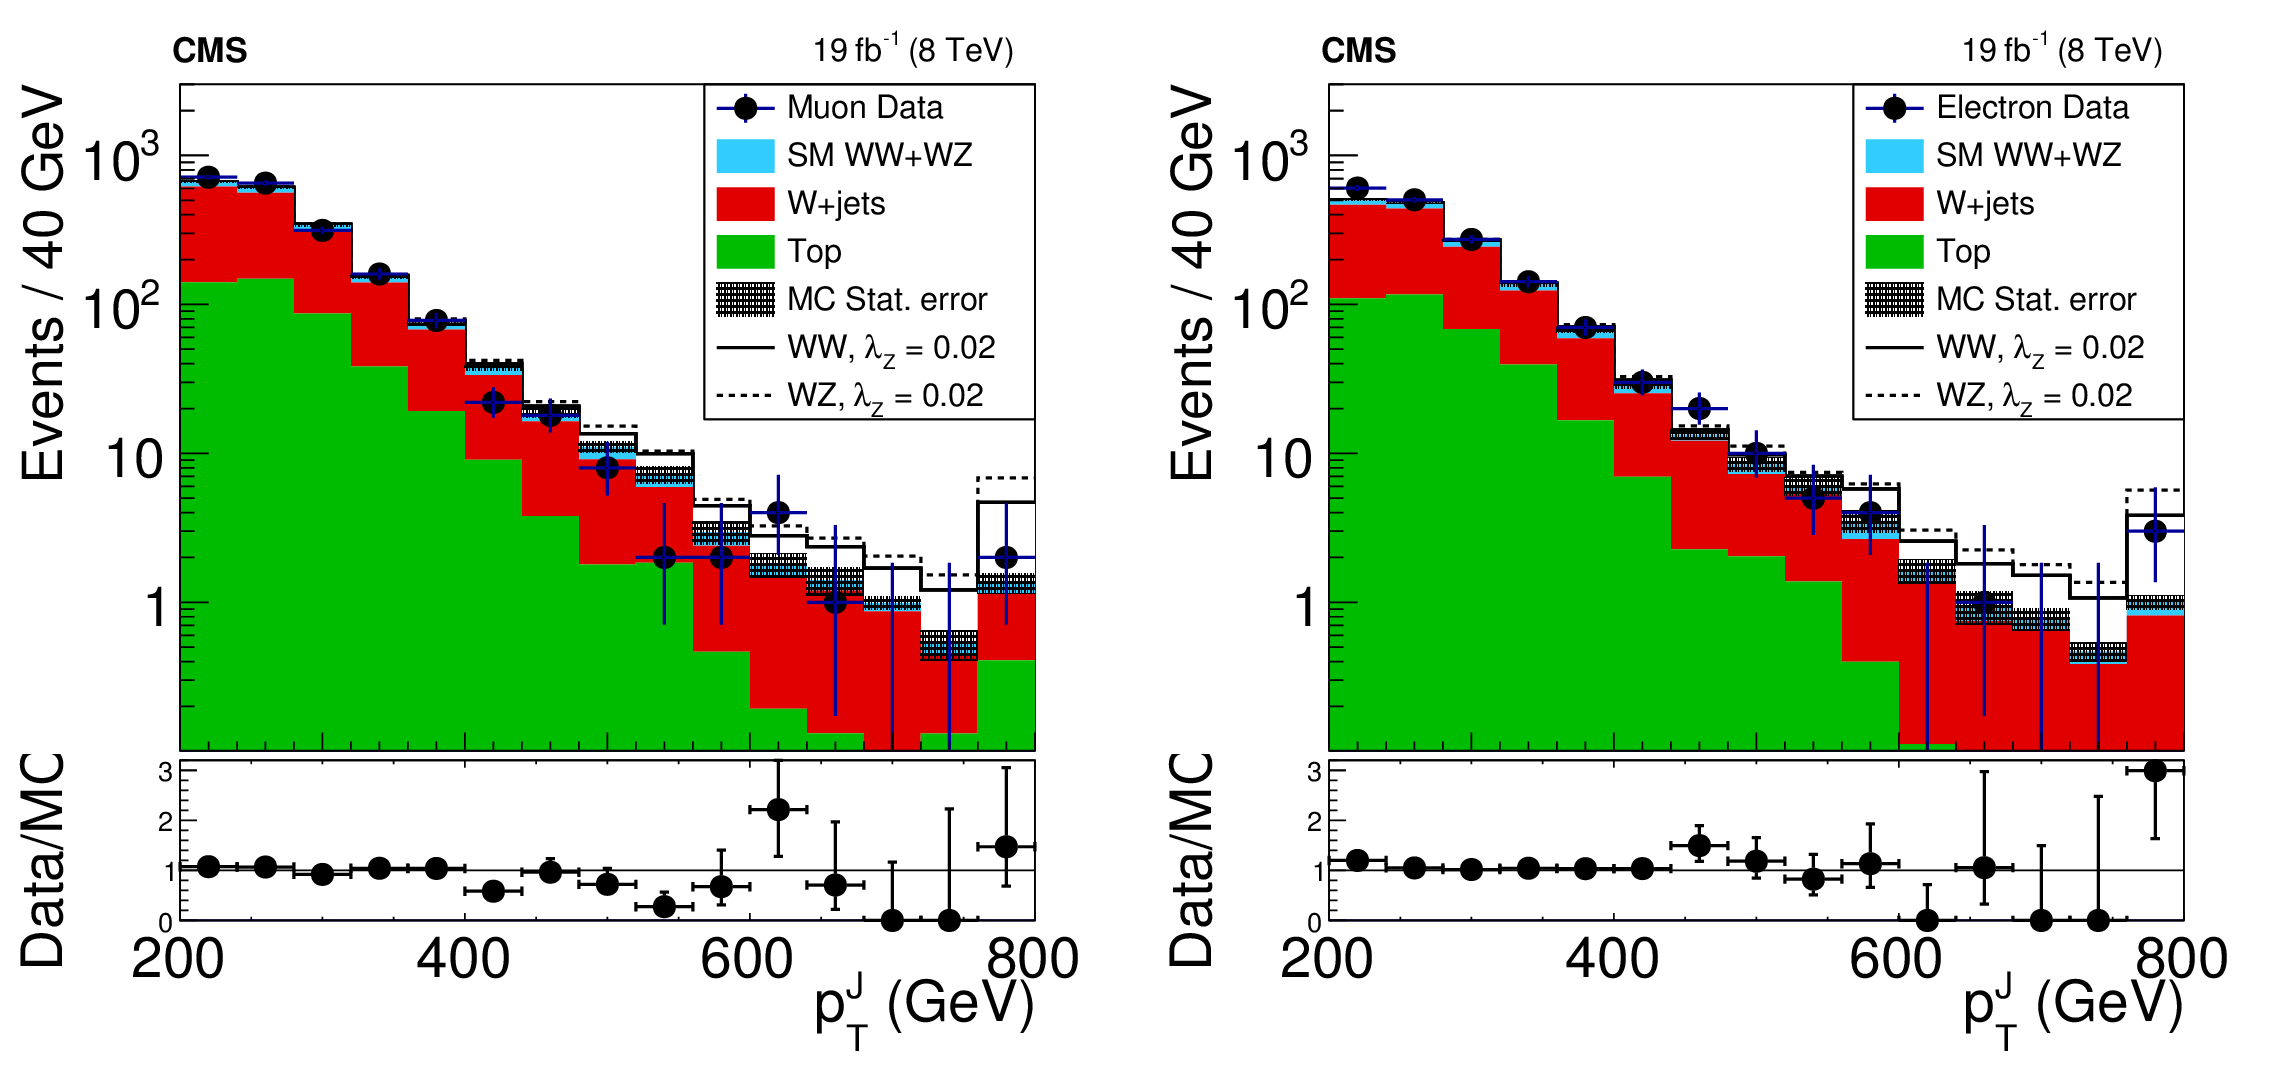
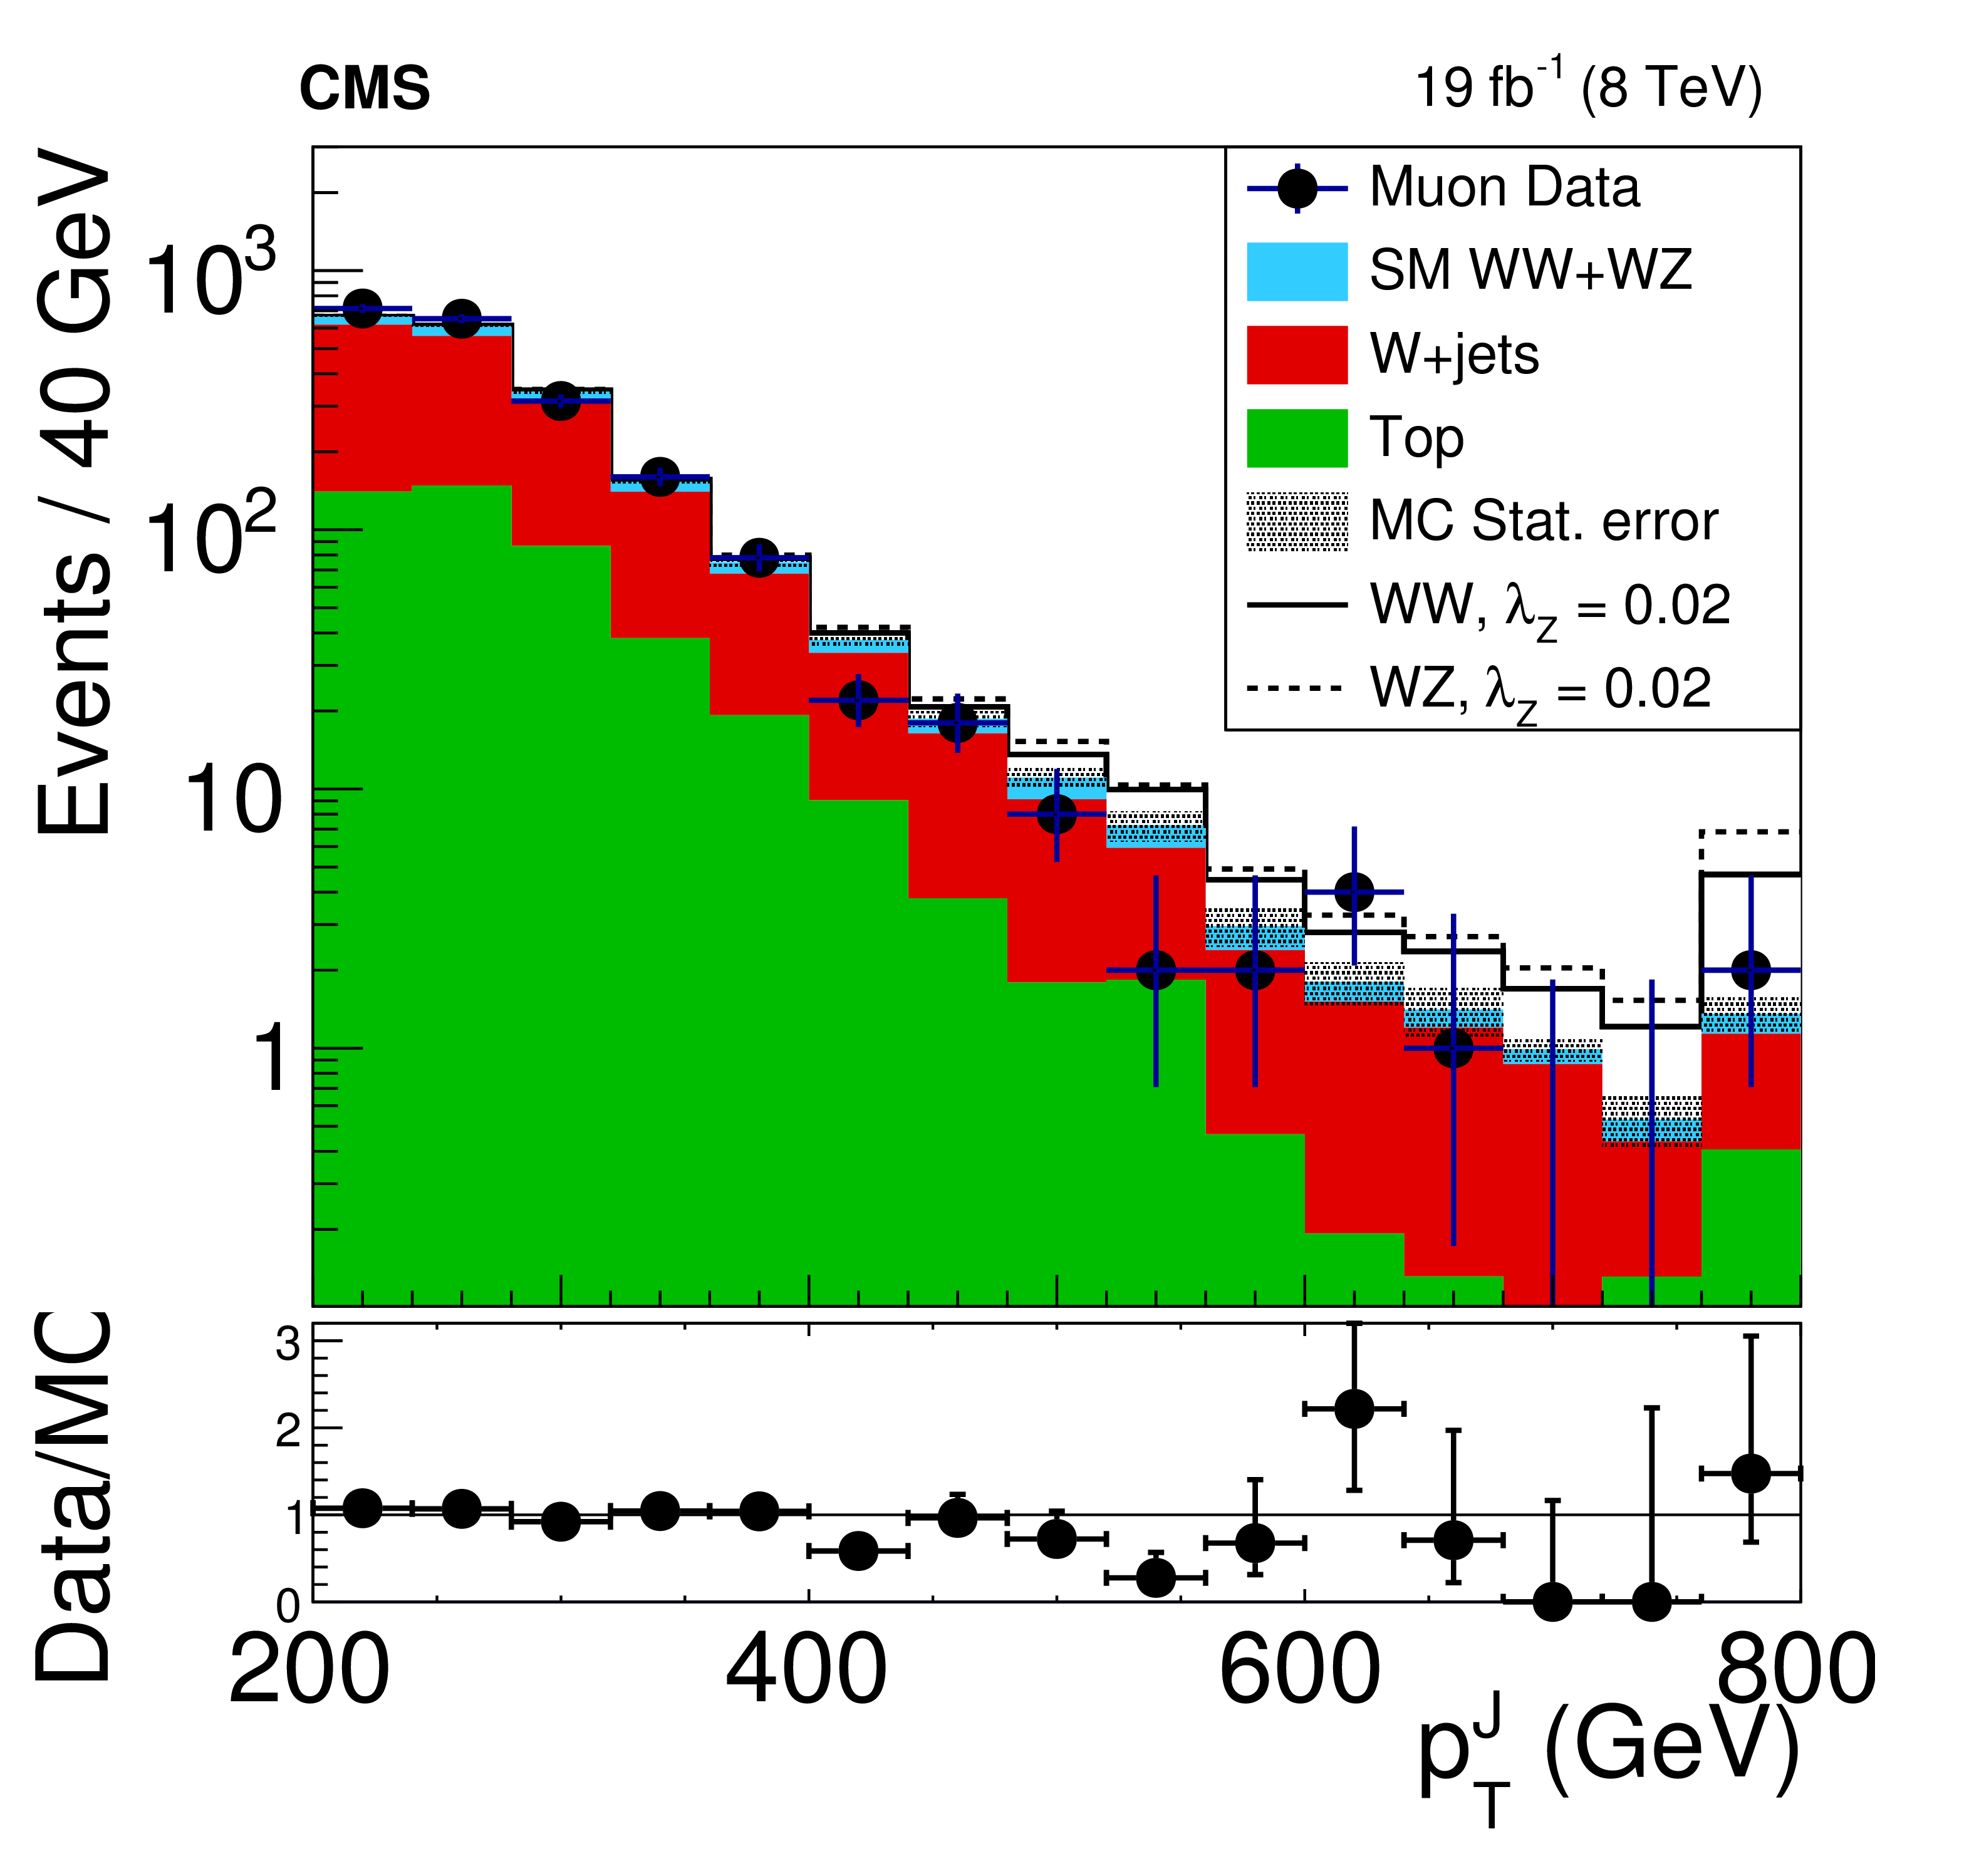
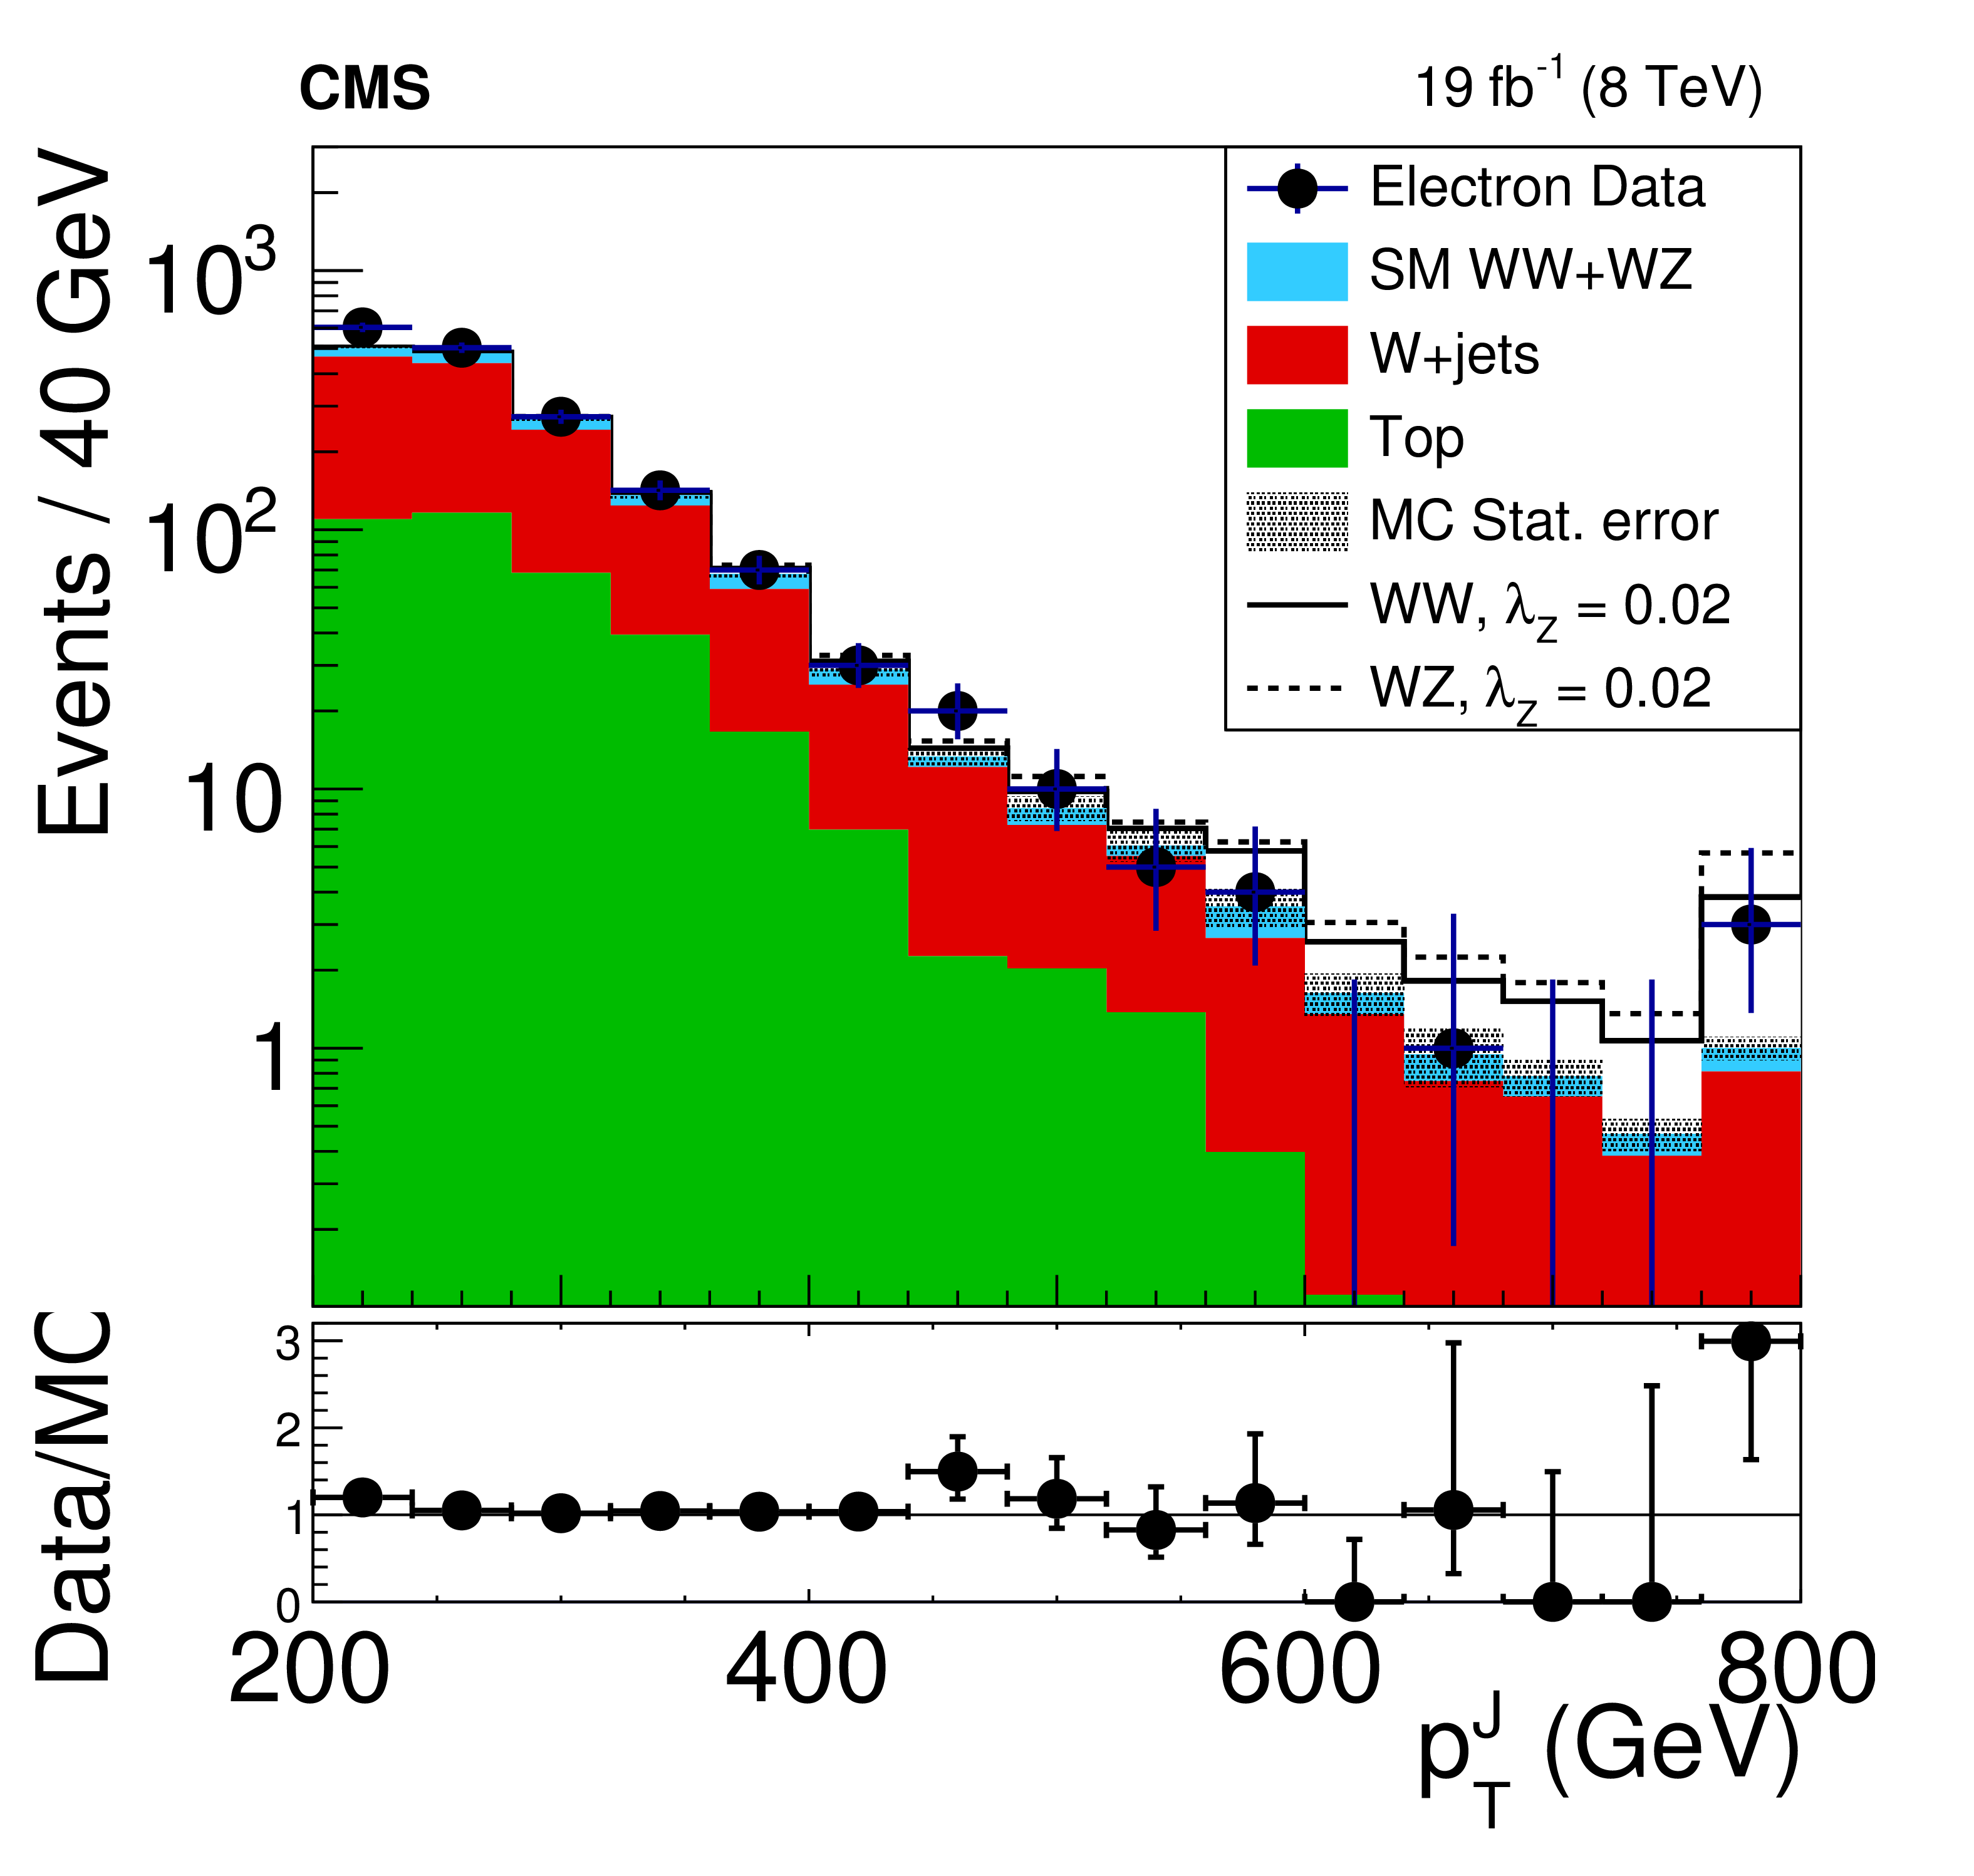
$\mathrm{V}_\text {had}$ ${p_{\mathrm {T}}}$ distributions for the muon (left) and electron (right) channels after full selection and with the requirement 70 $ < m_{J} < $ 100 GeV. The MC errors are purely statistical. Examples of the effects of aTGCs are shown by the solid and dotted lines. Below we show the data/MC ratio. The last bin includes the overflow. |
png pdf |
Figure 2-a:
$\mathrm{V}_\text {had}$ ${p_{\mathrm {T}}}$ distributions for the muon channel after full selection and with the requirement 70 $ < m_{J} < $ 100 GeV. The MC errors are purely statistical. Examples of the effects of aTGCs are shown by the solid and dotted lines. Below we show the data/MC ratio. The last bin includes the overflow. |
png pdf |
Figure 2-b:
$\mathrm{V}_\text {had}$ ${p_{\mathrm {T}}}$ distributions for the electron channel after full selection and with the requirement 70 $ < m_{J} < $ 100 GeV. The MC errors are purely statistical. Examples of the effects of aTGCs are shown by the solid and dotted lines. Below we show the data/MC ratio. The last bin includes the overflow. |

png pdf |
Figure 3:
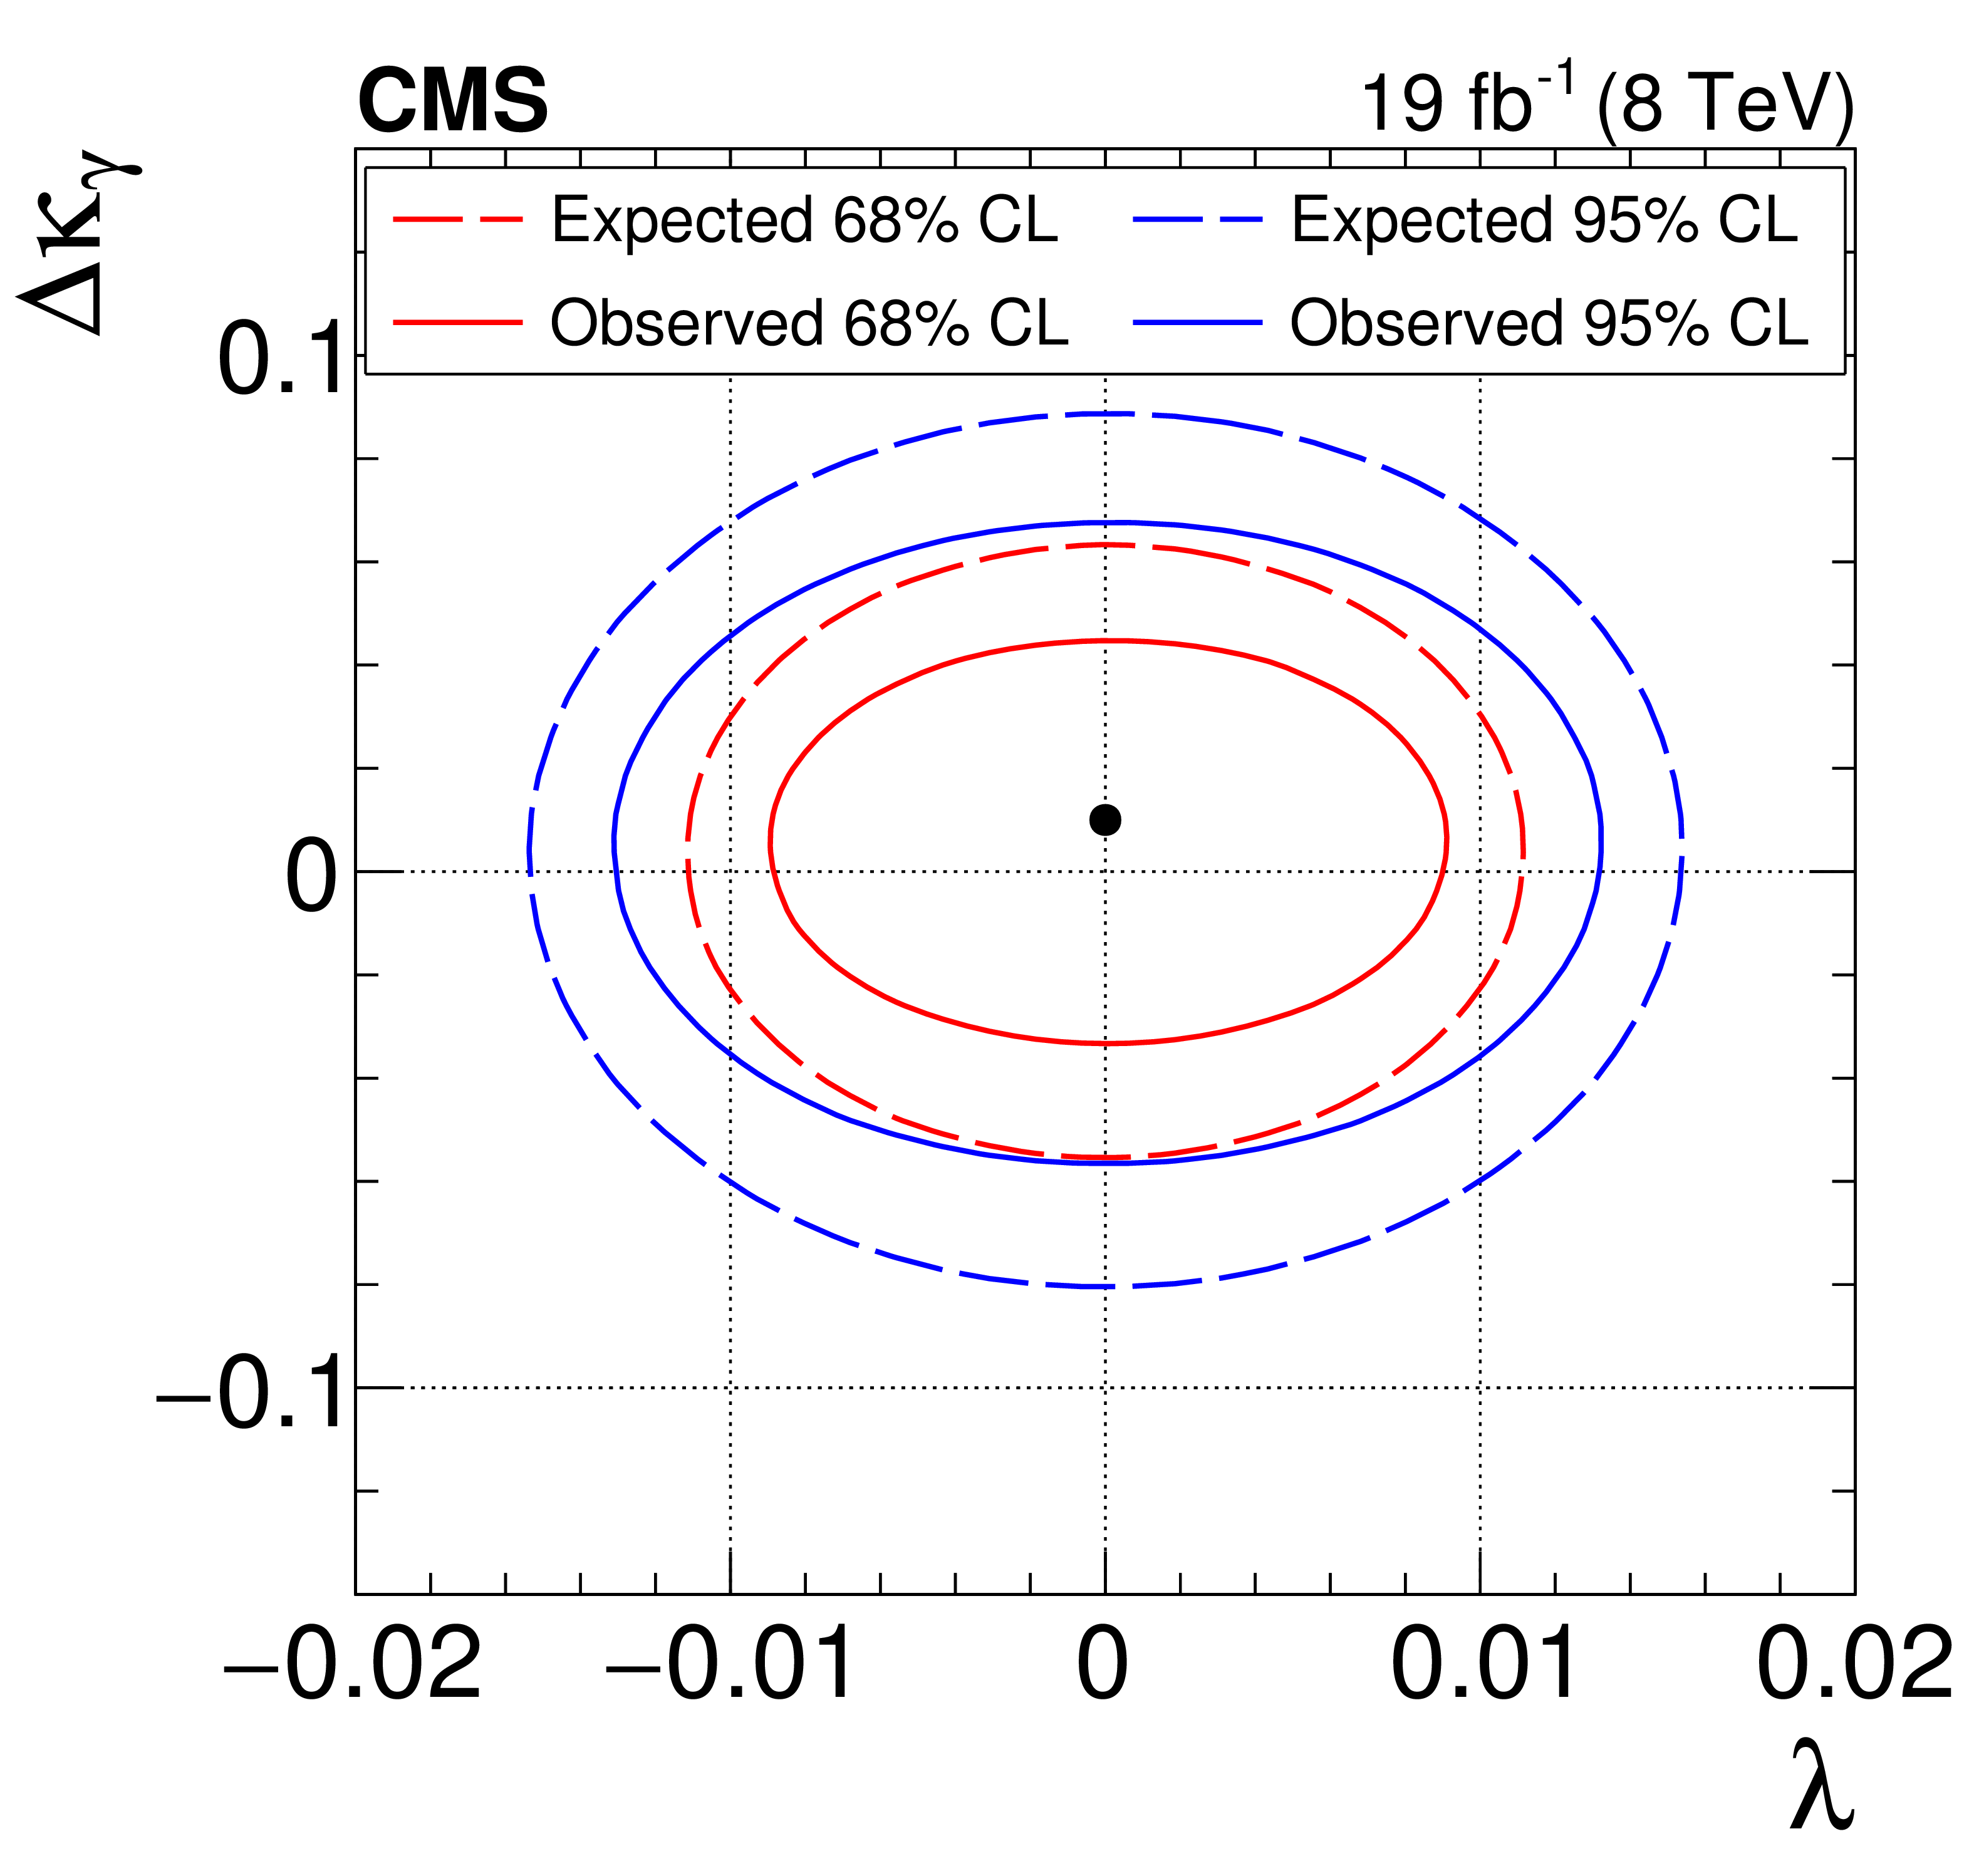
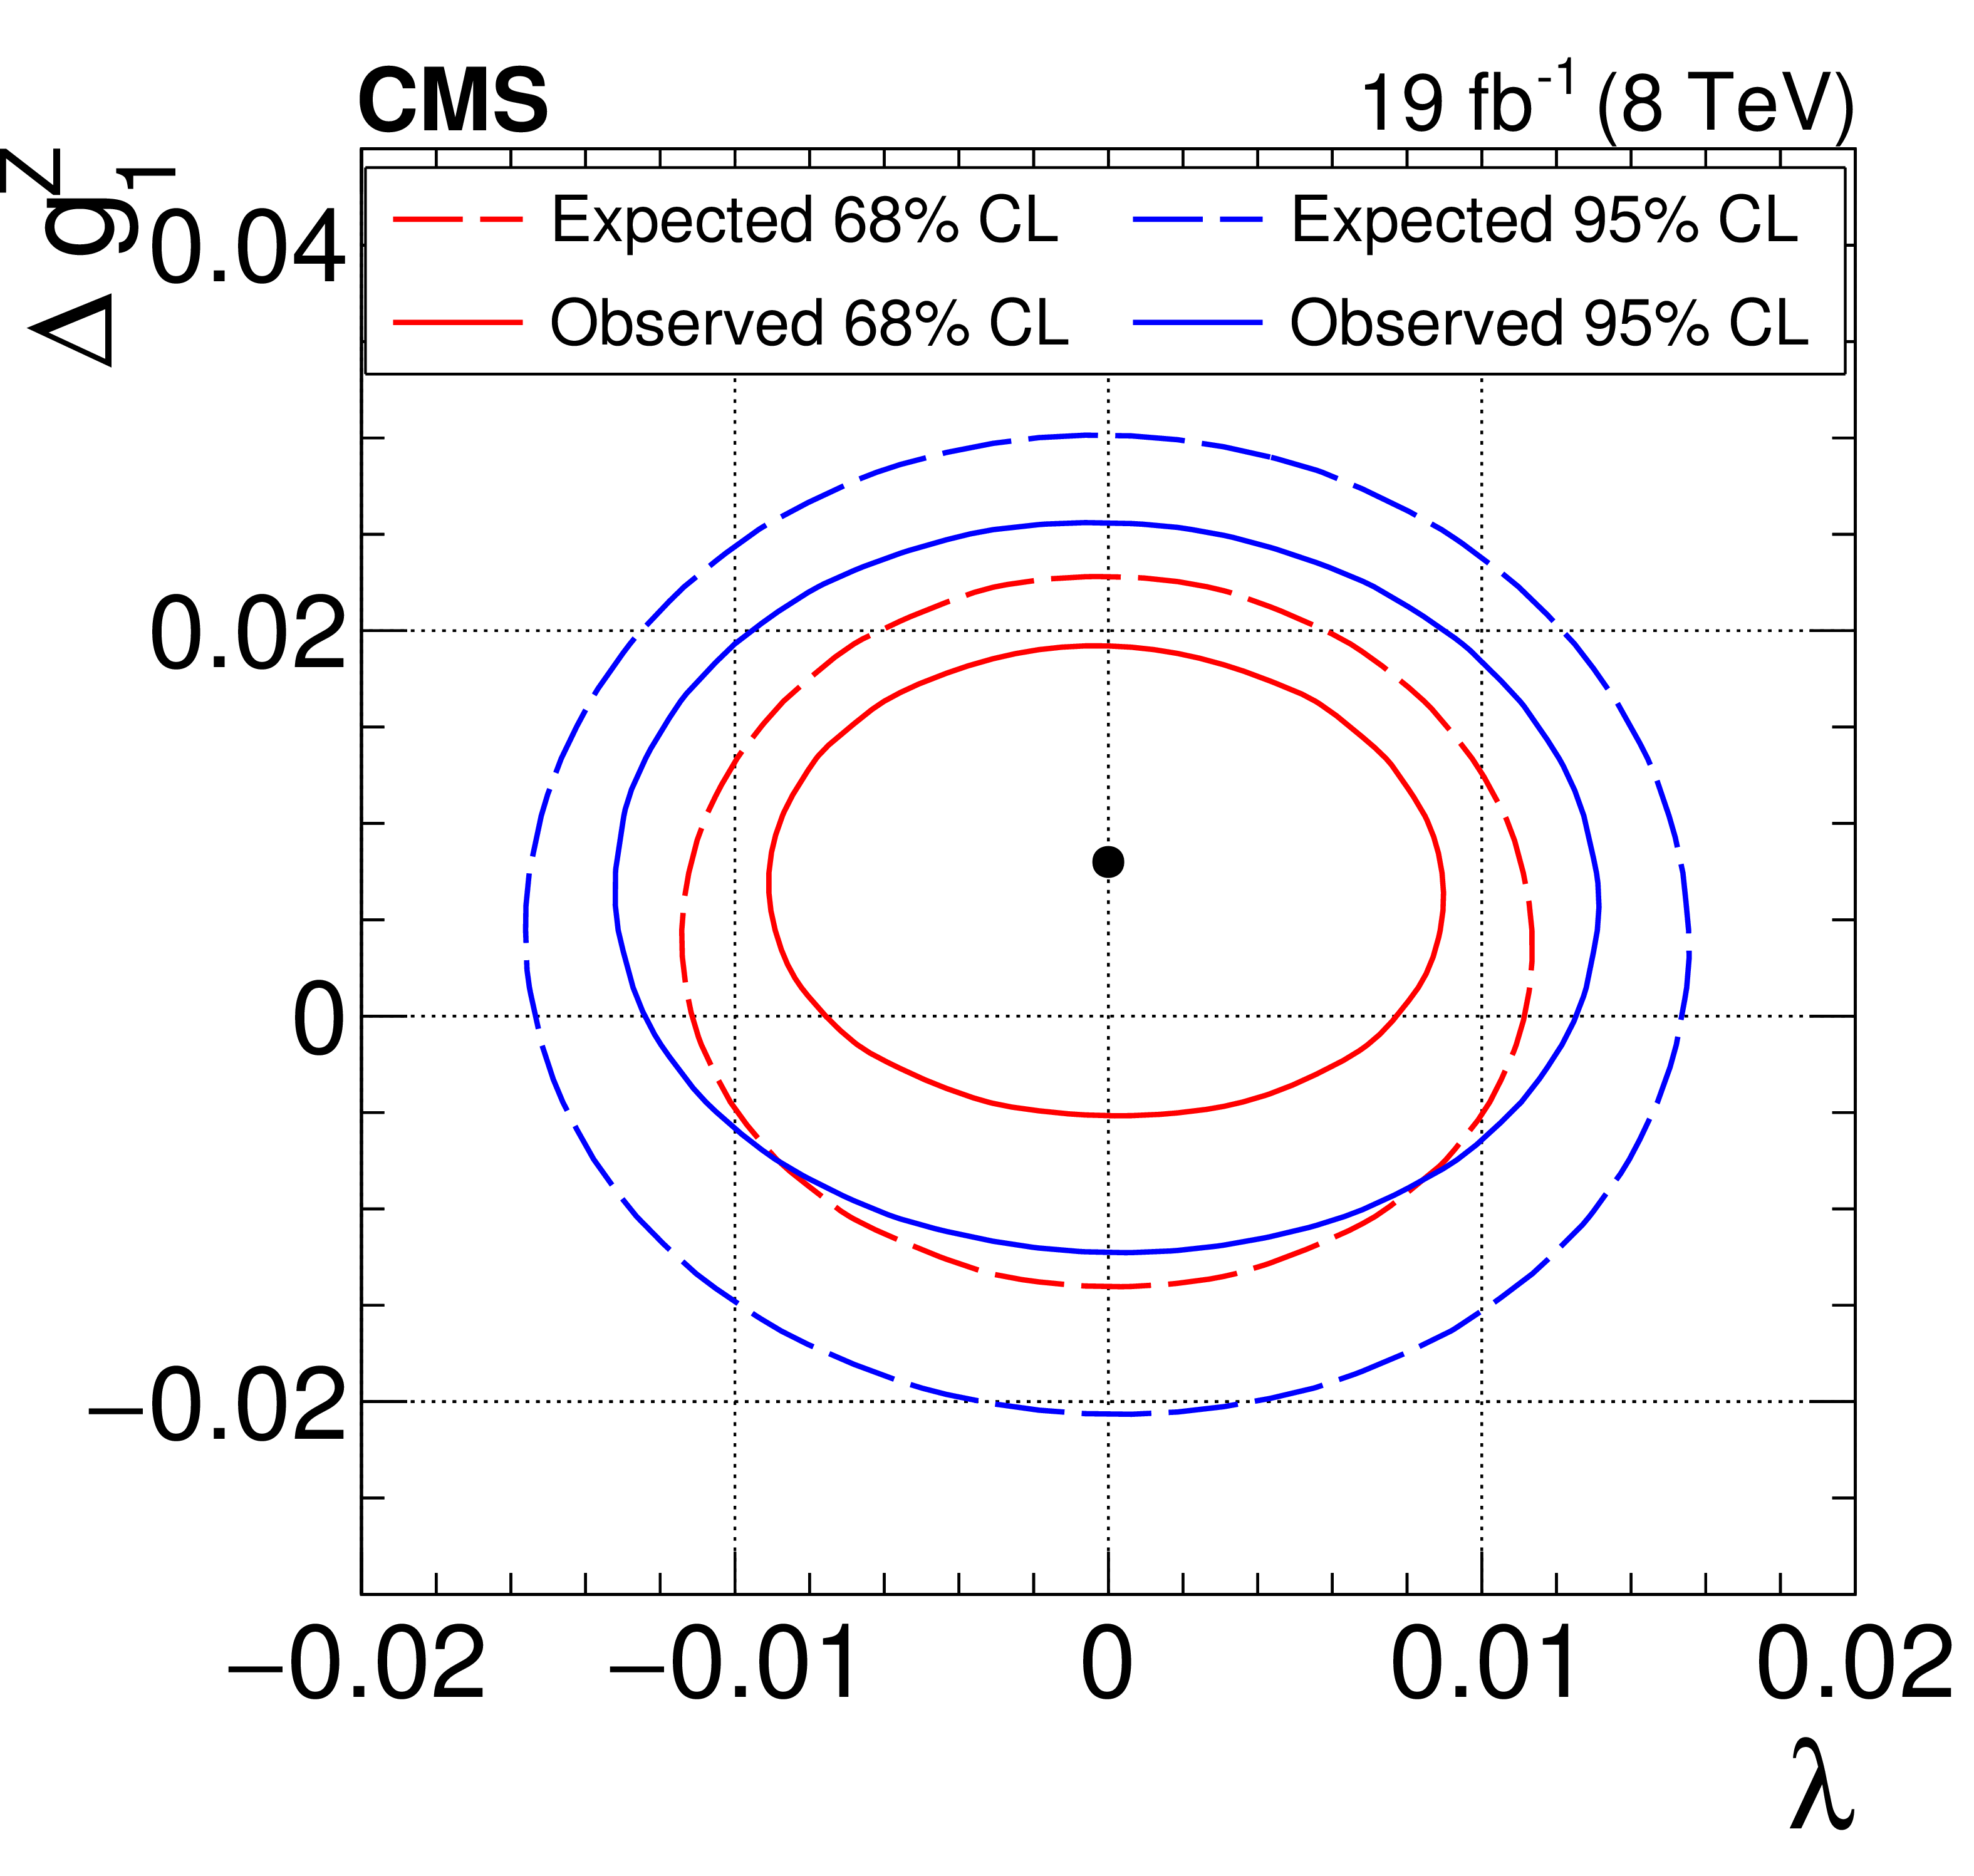
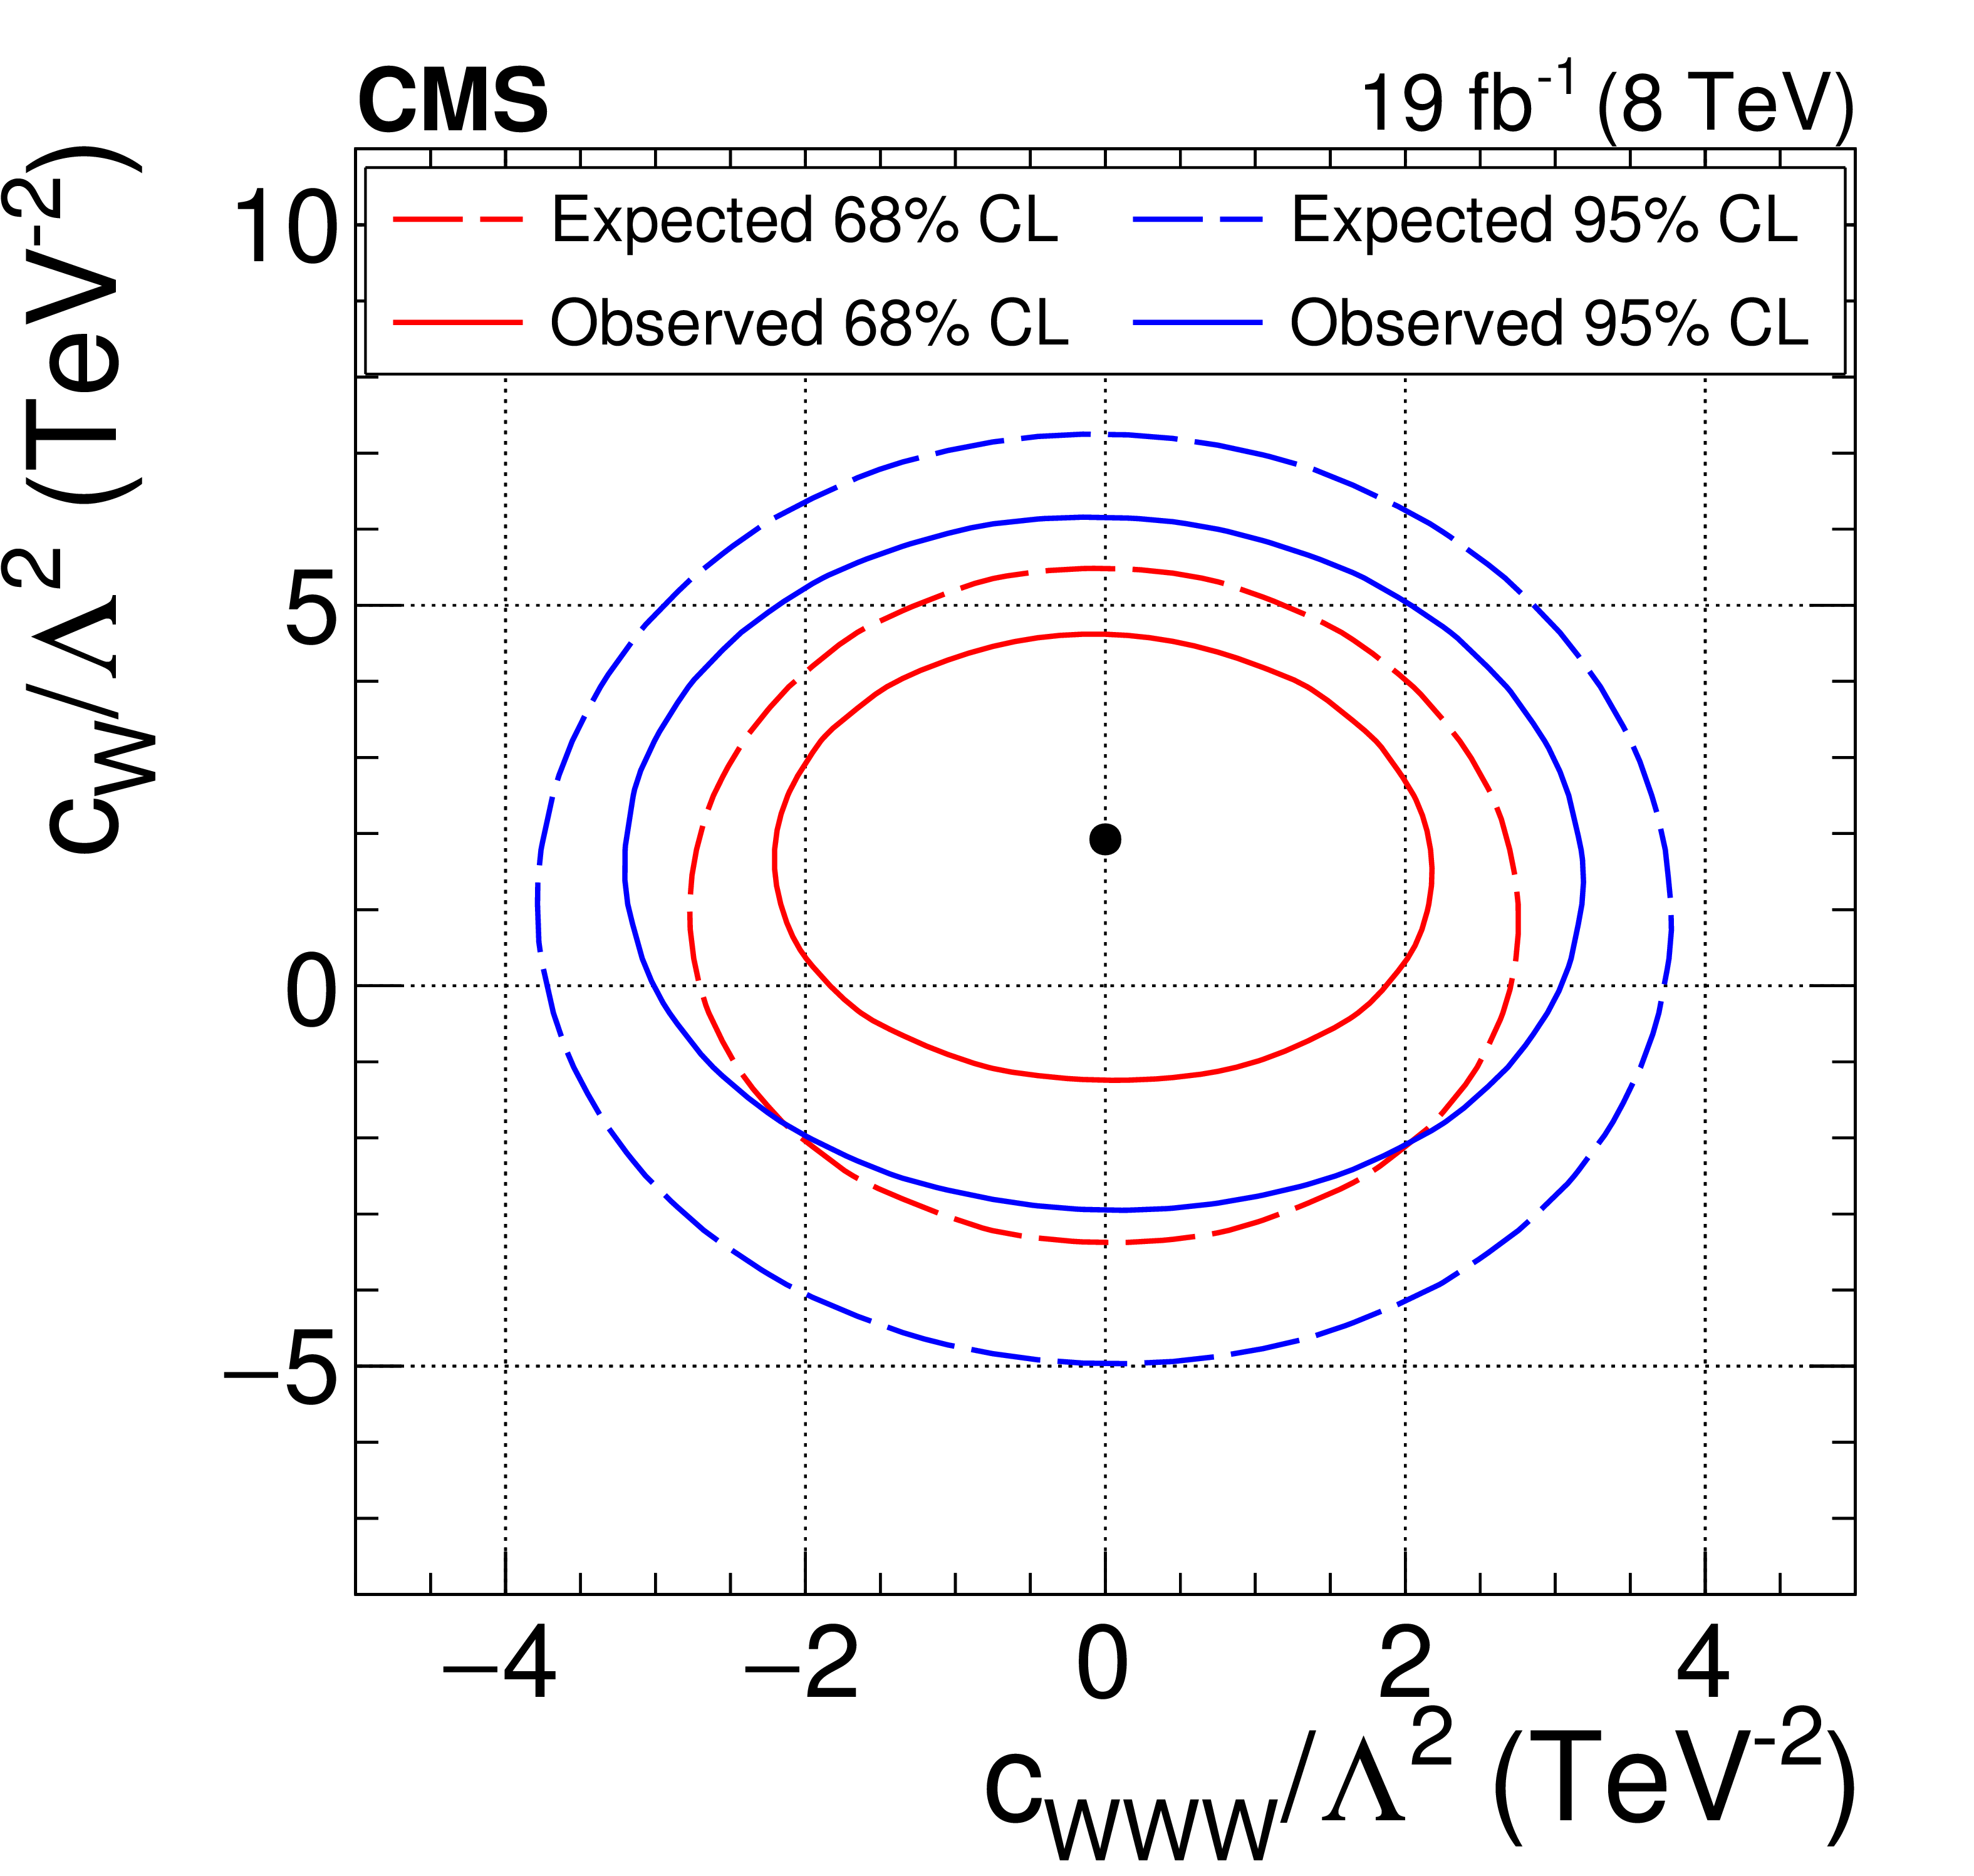
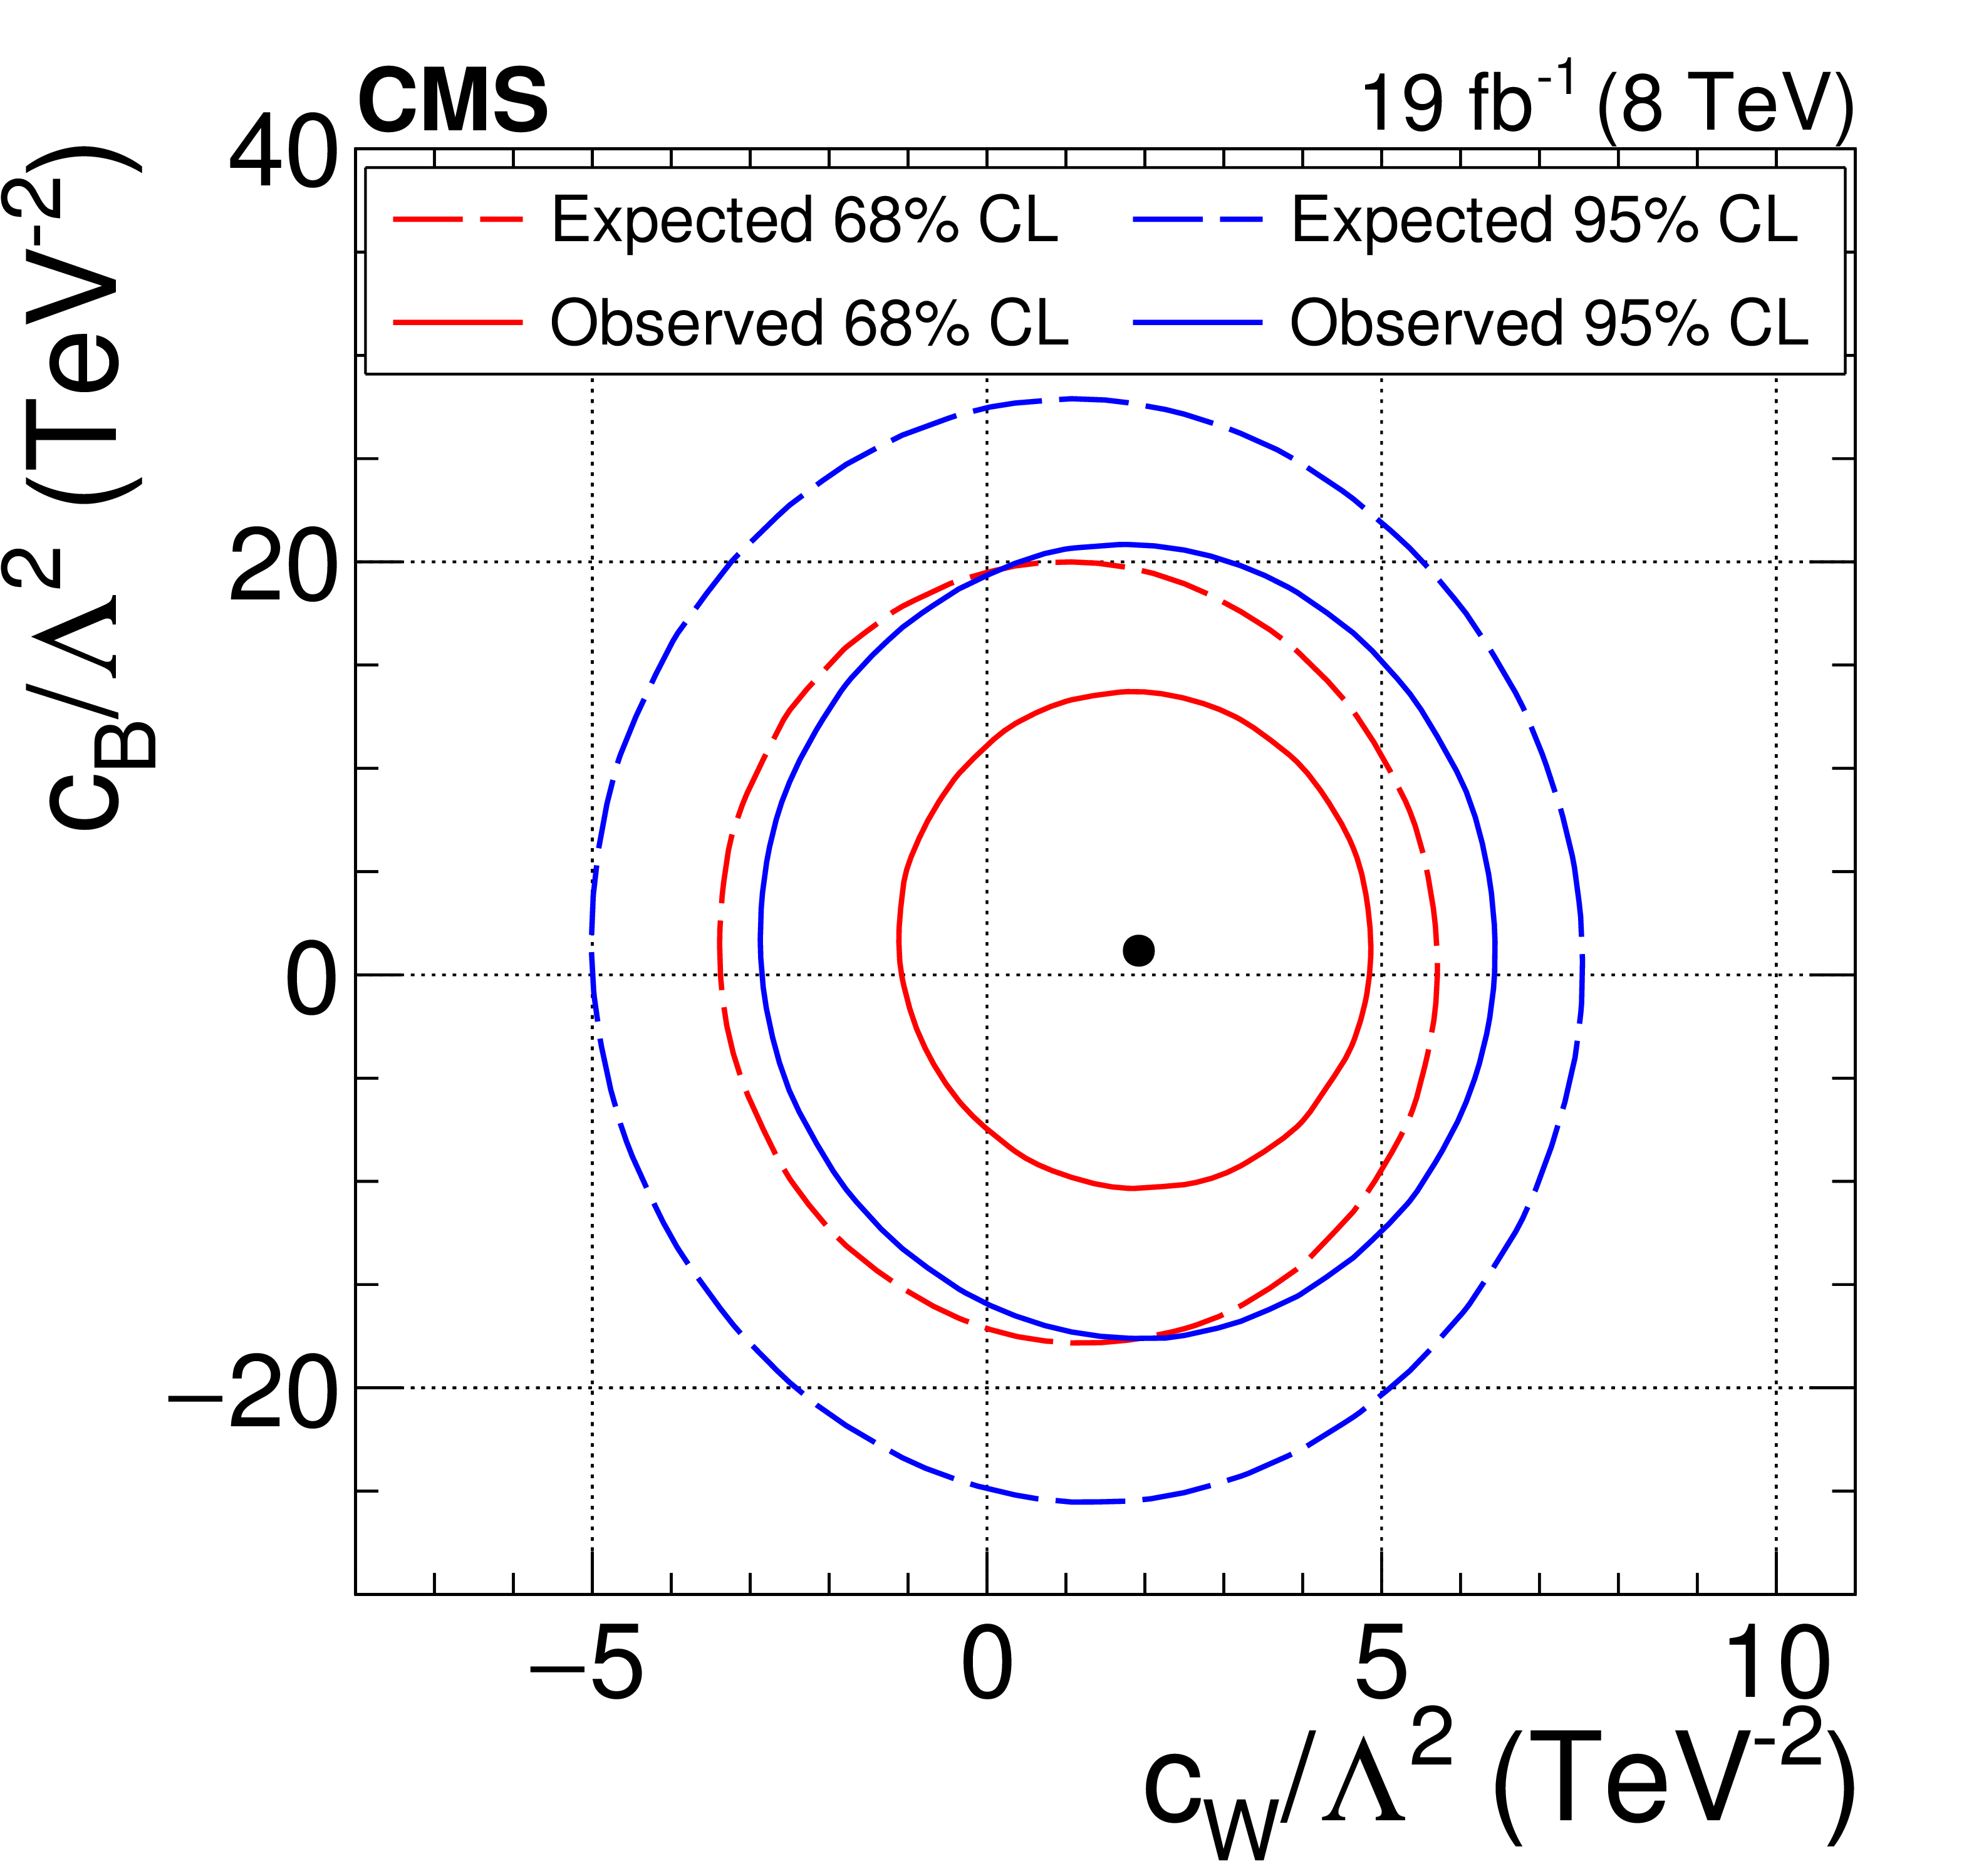
The 68 and 95% CL observed and expected exclusion contours in $\Delta \mathrm{NLL}$ are depicted for three pairwise combinations of the aTGC parameters in the LEP parametrization (top) and in the EFT formulation (bottom). The black dot represents the best fit point. |
png pdf |
Figure 3-a:
The 68 and 95% CL observed and expected exclusion contours in $\Delta \mathrm{NLL}$ are depicted for the ($\lambda$, $\Delta{\kappa_\gamma}$) combination of aTGC parameters in the LEP parametrization. The black dot represents the best fit point. |
png pdf |
Figure 3-b:
The 68 and 95% CL observed and expected exclusion contours in $\Delta \mathrm{NLL}$ are depicted for the ($\lambda$, $\Delta{g_1^{\mathrm{ Z }}}$) combination of aTGC parameters in the LEP parametrization. The black dot represents the best fit point. |

png pdf |
Figure 3-c:
The 68 and 95% CL observed and expected exclusion contours in $\Delta \mathrm{NLL}$ are depicted for the ($\Delta{\kappa_\gamma}$, $\Delta{g_1^{\mathrm{ Z }}}$) combination of aTGC parameters in the LEP parametrization. The black dot represents the best fit point. |

png pdf |
Figure 3-d:
The 68 and 95% CL observed and expected exclusion contours in $\Delta \mathrm{NLL}$ are depicted for the ($c_{\mathrm{ WWW }}/\Lambda^2$, $c_\mathrm{B}/\Lambda^2$) combination of aTGC parameters in the EFT formulation. The black dot represents the best fit point. |
png pdf |
Figure 3-e:
The 68 and 95% CL observed and expected exclusion contours in $\Delta \mathrm{NLL}$ are depicted for the ($c_{\mathrm{ WWW }}/\Lambda^2$, $c_{\mathrm{ W }}/\Lambda^2$) combination of aTGC parameters in the EFT formulation. The black dot represents the best fit point. |
png pdf |
Figure 3-f:
The 68 and 95% CL observed and expected exclusion contours in $\Delta \mathrm{NLL}$ are depicted for the ($c_{\mathrm{ W }}/\Lambda^2$, $c_\mathrm{B}/\Lambda^2$) combination of aTGC parameters in the EFT formulation. The black dot represents the best fit point. |
| Tables | |
png pdf |
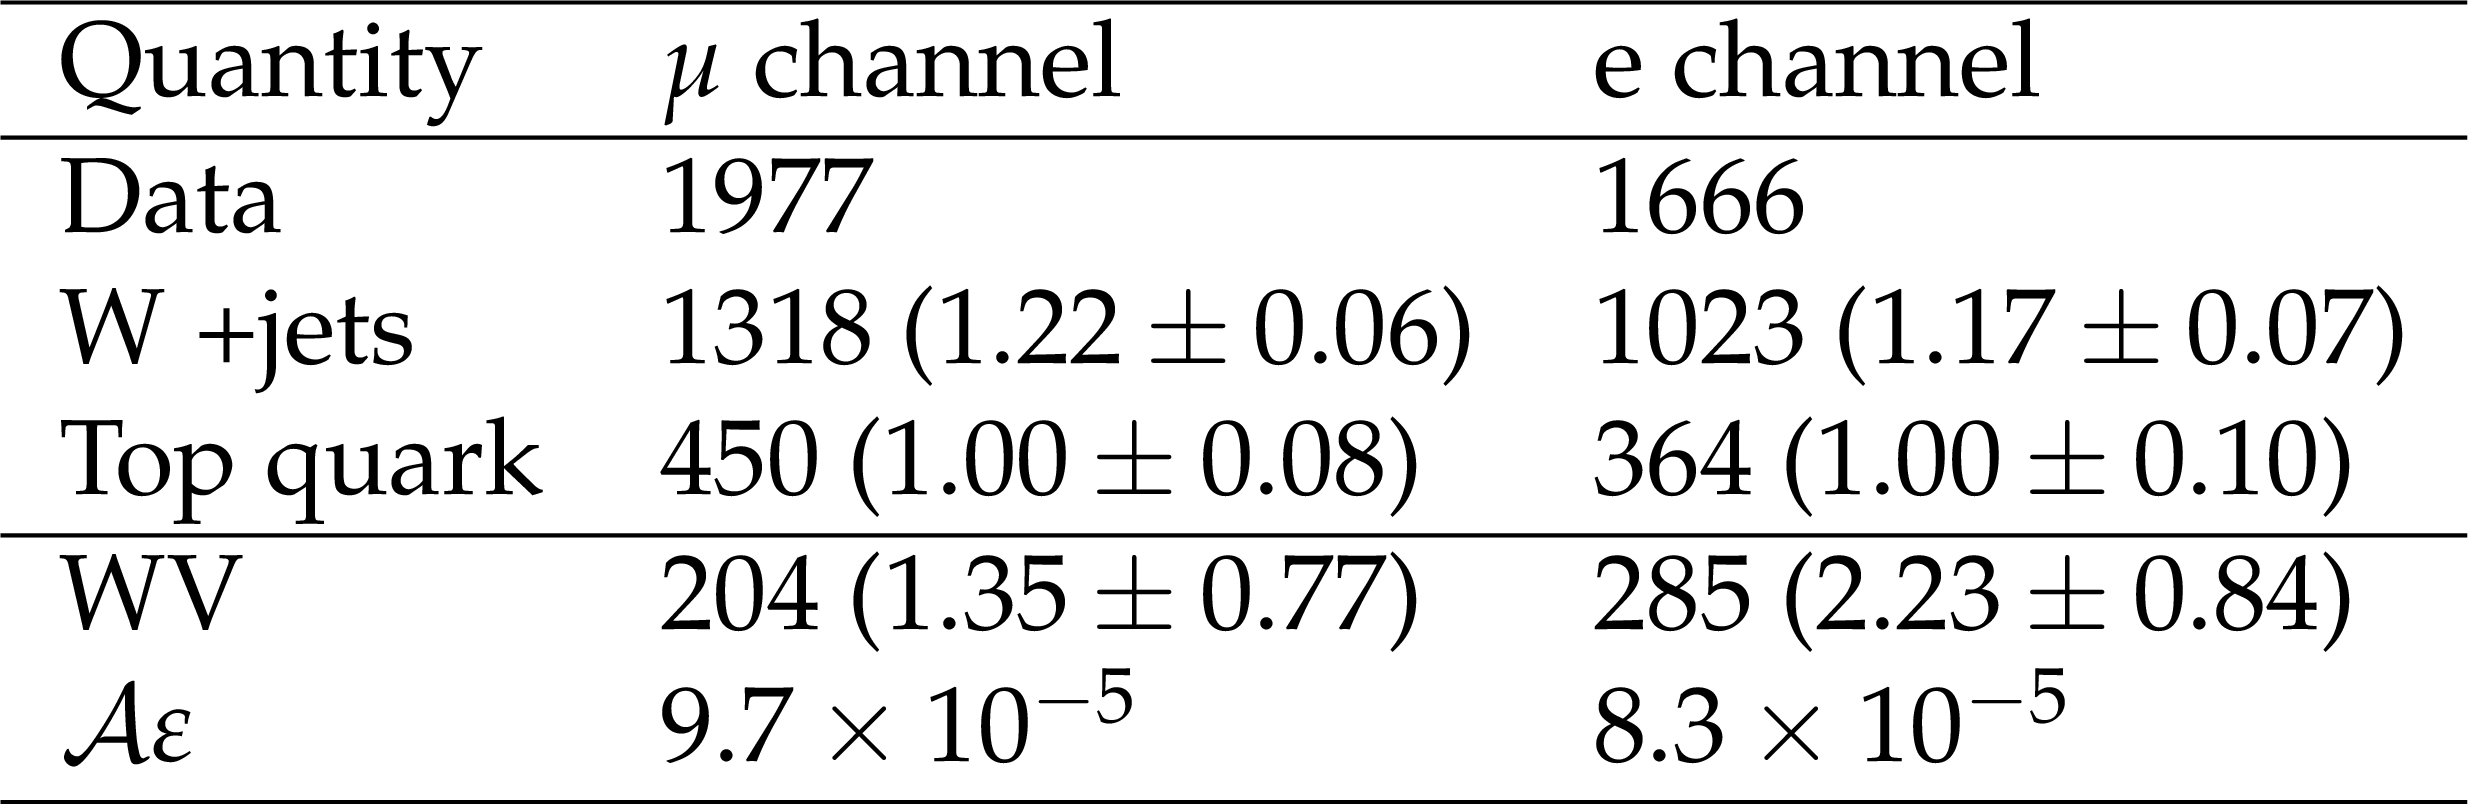
Table 1:
Observed event yields and associated ratios (in parentheses) with respect to the pre-fit values extracted in the signal region (70 $ < m_J < $ 100 GeV). The term $\mathcal {A}\varepsilon $ (acceptance$\times $efficiency) includes W and Z branching fractions [37]. |
png pdf |
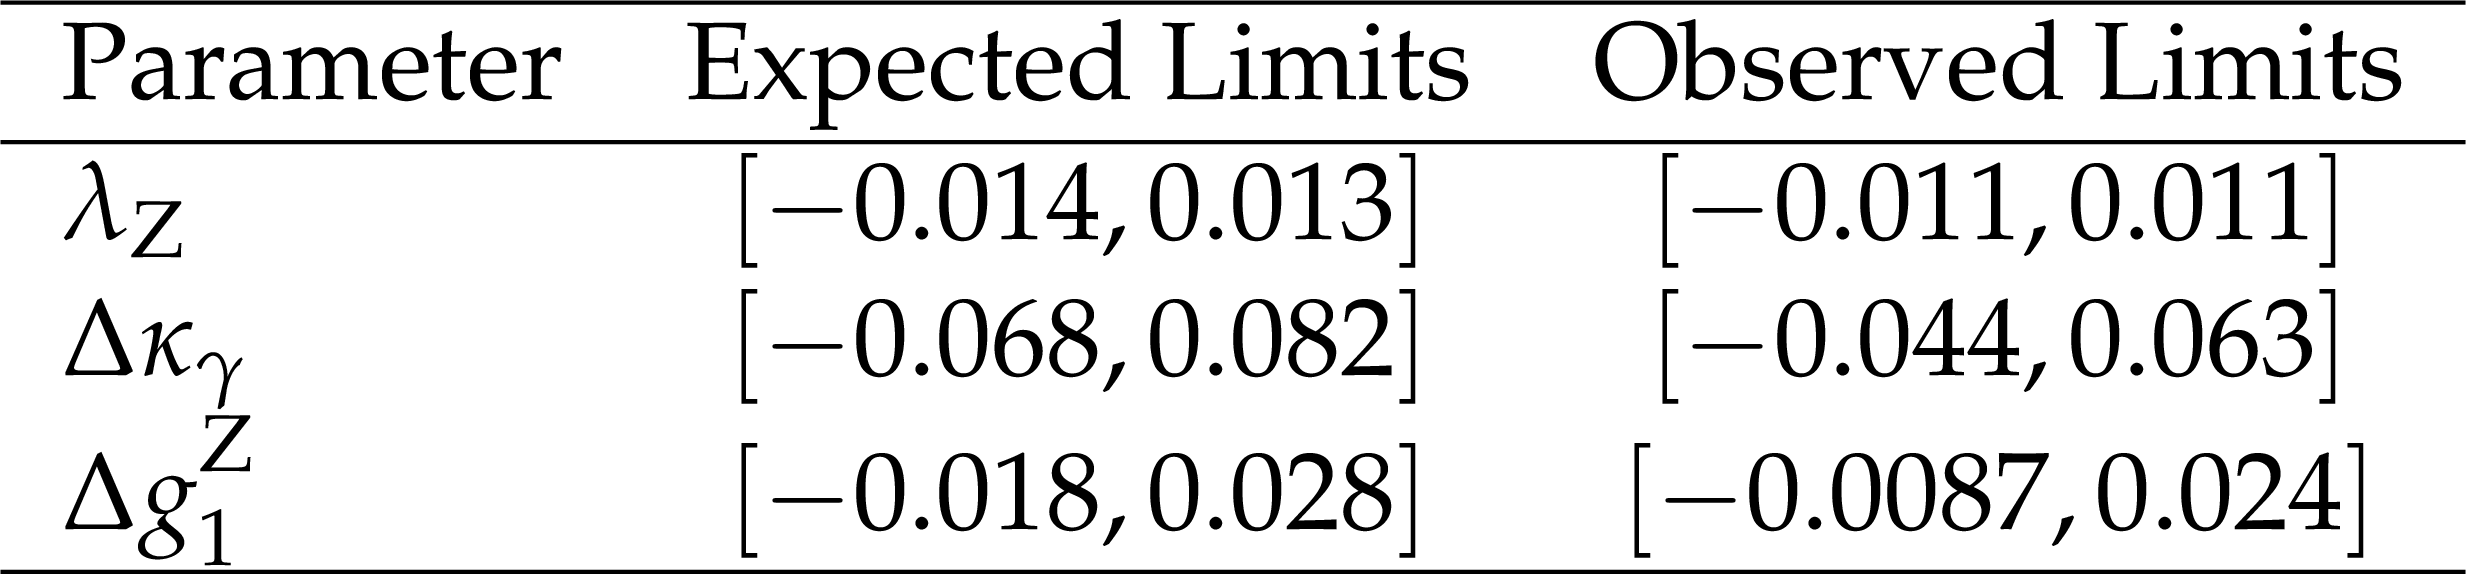
Table 2:
Summary of expected and observed one-dimensional limits in the LEP parametrization. Each number pair represents the observed 95% confidence interval for that parameter. |

png pdf |
Table 3:
Summary of one-dimensional limits in the EFT formulation for this analysis (*) compared to previous results. |
| Summary |
| In summary, our limits are consistent with the SM prediction and improve upon the sensitivity of the fully leptonic 8 TeV results [6,7] and the combined LEP experiments [37,42]. |
| References | ||||
| 1 | L. J. Dixon, Z. Kunszt, and A. Signer | Vector boson pair production in hadronic collisions at order $ \alpha_s $ : lepton correlations and anomalous couplings | PRD 60 (1999) 114037 | hep-ph/9907305 |
| 2 | K. Hagiwara, S. Ishihara, R. Szalapski, and D. Zeppenfeld | Low energy effects of new interactions in the electroweak boson sector | PRD 48 (1993) 2182 | |
| 3 | C. Degrande et al. | Effective Field Theory: A Modern Approach to Anomalous Couplings | Annals Phys. 335 (2013) 21 | 1205.4231 |
| 4 | CMS Collaboration | Measurement of the sum of $ W W $ and $ WZ $ production with $ W+ $dijet events in pp collisions at $ \sqrt{s}=7 $ TeV | EPJC 73 (2013) 2283 | CMS-SMP-12-015 1210.7544 |
| 5 | ATLAS Collaboration | Measurement of the WW+WZ cross section and limits on anomalous triple gauge couplings using final states with one lepton, missing transverse momentum, and two jets with the ATLAS detector at $ \sqrt{\rm{s}} = 7 $ TeV | JHEP 01 (2015) 049 | 1410.7238 |
| 6 | CMS Collaboration | Measurement of the $ \text{W}^+\text{W}^- $ cross section in pp collisions at $ \sqrt{s} = $ 8 TeV and limits on anomalous gauge couplings | EPJC 76 (2016) 401 | CMS-SMP-14-016 1507.03268 |
| 7 | ATLAS Collaboration | Measurement of total and differential $ W^+W^- $ production cross sections in proton-proton collisions at $ \sqrt{s}= $ 8 TeV with the ATLAS detector and limits on anomalous triple-gauge-boson couplings | JHEP 09 (2016) 029 | 1603.01702 |
| 8 | CMS Collaboration | The CMS experiment at the CERN LHC | JINST 3 (2008) S08004 | CMS-00-001 |
| 9 | J. Alwall et al. | MadGraph 5: going beyond | JHEP 06 (2011) 128 | 1106.0522 |
| 10 | P. Nason | A New method for combining NLO QCD with shower Monte Carlo algorithms | JHEP 11 (2004) 040 | hep-ph/0409146 |
| 11 | S. Frixione, P. Nason, and C. Oleari | Matching NLO QCD computations with Parton Shower simulations: the POWHEG method | JHEP 11 (2007) 070 | 0709.2092 |
| 12 | S. Alioli, P. Nason, C. Oleari, and E. Re | A general framework for implementing NLO calculations in shower Monte Carlo programs: the POWHEG BOX | JHEP 06 (2010) 043 | 1002.2581 |
| 13 | S. Frixione, P. Nason, and G. Ridolfi | A Positive-weight next-to-leading-order Monte Carlo for heavy flavour hadroproduction | JHEP 09 (2007) 126 | 0707.3088 |
| 14 | S. Alioli, P. Nason, C. Oleari, and E. Re | NLO single-top production matched with shower in POWHEG: $ s $- and $ t $-channel contributions | JHEP 09 (2009) 111, , [Erratum: \DOI10.1007/JHEP02(2010)011] | 0907.4076 |
| 15 | J. Alwall et al. | The automated computation of tree-level and next-to-leading order differential cross sections, and their matching to parton shower simulations | JHEP 07 (2014) 079 | 1405.0301 |
| 16 | P. Artoisenet, R. Frederix, O. Mattelaer, and R. Rietkerk | Automatic spin-entangled decays of heavy resonances in Monte Carlo simulations | JHEP 03 (2013) 015 | 1212.3460 |
| 17 | S. Jadach, Z. W\cas, R. Decker, and J. H. Kuhn | The tau decay library TAUOLA, version 2.4 | CPC 76 (1993) 361 | |
| 18 | T. Sjostrand, S. Mrenna, and P. Skands | PYTHIA 6.4 physics and manual | JHEP 05 (2006) 026 | hep-ph/0603175 |
| 19 | CMS Collaboration | Study of the underlying event at forward rapidity in pp collisions at $ \sqrt{s} $ = 0.9, 2.76, and 7 TeV | JHEP 04 (2013) 072 | CMS-FWD-11-003 1302.2394 |
| 20 | CMS Collaboration | Event generator tunes obtained from underlying event and multiparton scattering measurements | EPJC 76 (2016) 155 | CMS-GEN-14-001 1512.00815 |
| 21 | J. Alwall et al. | Comparative study of various algorithms for the merging of parton showers and matrix elements in hadronic collisions | EPJC 53 (2008) 473 | 0706.2569 |
| 22 | J. Pumplin et al. | New generation of parton distributions with uncertainties from global QCD analysis | JHEP 07 (2002) 012 | hep-ph/0201195 |
| 23 | H.-L. Lai et al. | New parton distributions for collider physics | PRD 82 (2010) 074024 | 1007.2241 |
| 24 | GEANT4 Collaboration | GEANT4---a simulation toolkit | NIMA 506 (2003) 250 | |
| 25 | CMS Collaboration | Particle--Flow Event Reconstruction in CMS and Performance for Jets, Taus, and $ E_{\mathrm{T}}^{\text{miss}} $ | CDS | |
| 26 | CMS Collaboration | Commissioning of the Particle-flow Event Reconstruction with the first LHC collisions recorded in the CMS detector | CDS | |
| 27 | CMS Collaboration | The performance of the CMS muon detector in proton-proton collisions at $ \sqrt{s} = 7 $ TeV at the LHC | JINST 8 (2013) P11002 | CMS-MUO-11-001 1306.6905 |
| 28 | CMS Collaboration | Performance of electron reconstruction and selection with the CMS detector in proton-proton collisions at $ \sqrt{s} $ = 8 TeV | JINST 10 (2015) P06005 | CMS-EGM-13-001 1502.02701 |
| 29 | M. Cacciari, G. P. Salam, and G. Soyez | The anti-$ k_t $ jet clustering algorithm | JHEP 04 (2008) 063 | 0802.1189 |
| 30 | M. Cacciari, G. P. Salam, and G. Soyez | FastJet user manual | EPJC 72 (2012) 1896 | 1111.6097 |
| 31 | Y. L. Dokshitzer, G. D. Leder, S. Moretti, and B. R. Webber | Better jet clustering algorithms | JHEP 08 (1997) 001 | hep-ph/9707323 |
| 32 | CMS Collaboration | Identification of b-quark jets with the CMS experiment | JINST 8 (2013) P04013 | CMS-BTV-12-001 1211.4462 |
| 33 | CMS Collaboration | Studies of jet mass in dijet and W/Z$ + $jet events | JHEP 05 (2013) 090 | |
| 34 | S. D. Ellis, C. K. Vermilion, and J. R. Walsh | Recombination algorithms and jet substructure: pruning as a tool for heavy particle searches | PRD 81 (2010) 094023 | 0912.0033 |
| 35 | J. Thaler and K. Van Tilburg | Identifying boosted objects with N-subjettiness | JHEP 03 (2011) 015 | 1011.2268 |
| 36 | CMS Collaboration | Search for massive resonances decaying into pairs of boosted bosons in semi-leptonic final states at $ \sqrt{s} = $ 8 TeV | JHEP 08 (2014) 174 | CMS-EXO-13-009 1405.3447 |
| 37 | Particle Data Group, C. Patrignani et al. | Review of Particle Physics | CPC 40 (2016) 100001 | |
| 38 | J. M. Campbell and R. K. Ellis | MCFM for the Tevatron and the LHC | NPPS 205--206 (2010) 10 | 1007.3492 |
| 39 | CMS Collaboration | Search for a Higgs boson in the mass range from 145 to 1000 GeV decaying to a pair of W or Z bosons | JHEP 10 (2015) 144 | CMS-HIG-13-031 1504.00936 |
| 40 | CMS Collaboration | CMS Luminosity Based on Pixel Cluster Counting - Summer 2013 Update | CMS-PAS-LUM-13-001 | CMS-PAS-LUM-13-001 |
| 41 | ATLAS and CMS Collaborations, LHC Higgs Combination Group | Procedure for the LHC Higgs boson search combination in Summer 2011 | Technical Report ATL-PHYS-PUB 2011-11, CMS-NOTE 2011-005 | |
| 42 | ALEPH, DELPHI, L3, OPAL, LEP Electroweak Collaboration | Electroweak measurements in electron-positron collisions at W-boson-pair energies at LEP | PR 532 (2013) 119 | 1302.3415 |
| 43 | CMS Collaboration | Measurement of the WZ production cross section in pp collisions at $ \sqrt{s} $ = 7 and 8 TeV and search for anomalous triple gauge couplings at $ \sqrt{s} $ = 8 TeV | Submitted to EPJC | CMS-SMP-14-014 1609.05721 |
| 44 | ATLAS Collaboration | Measurements of $ W^\pm Z $ production cross sections in $ pp $ collisions at $ \sqrt{s} = 8 $ TeV with the ATLAS detector and limits on anomalous gauge boson self-couplings | PRD 93 (2016) 092004 | 1603.02151 |
|
|
Compact Muon Solenoid LHC, CERN |
|

|

|

|

|

|