

Compact Muon Solenoid
LHC, CERN
| CMS-SMP-17-003 ; CERN-EP-2018-253 | ||
| Event shape variables measured using multijet final states in proton-proton collisions at $\sqrt{s} = $ 13 TeV | ||
| CMS Collaboration | ||
| 2 November 2018 | ||
| JHEP 12 (2018) 117 | ||
| Abstract: The study of global event shape variables can provide sensitive tests of predictions for multijet production in proton-proton collisions. This paper presents a study of several event shape variables calculated using jet four momenta in proton-proton collisions at a centre-of-mass energy of 13 TeV and uses data recorded with the CMS detector at the LHC corresponding to an integrated luminosity of 2.2 fb$^{-1}$. After correcting for detector effects, the resulting distributions are compared with several theoretical predictions. The agreement generally improves as the energy, represented by the average transverse momentum of the two leading jets, increases. | ||
| Links: e-print arXiv:1811.00588 [hep-ex] (PDF) ; CDS record ; inSPIRE record ; HepData record ; CADI line (restricted) ; | ||
| Figures | |
png pdf |
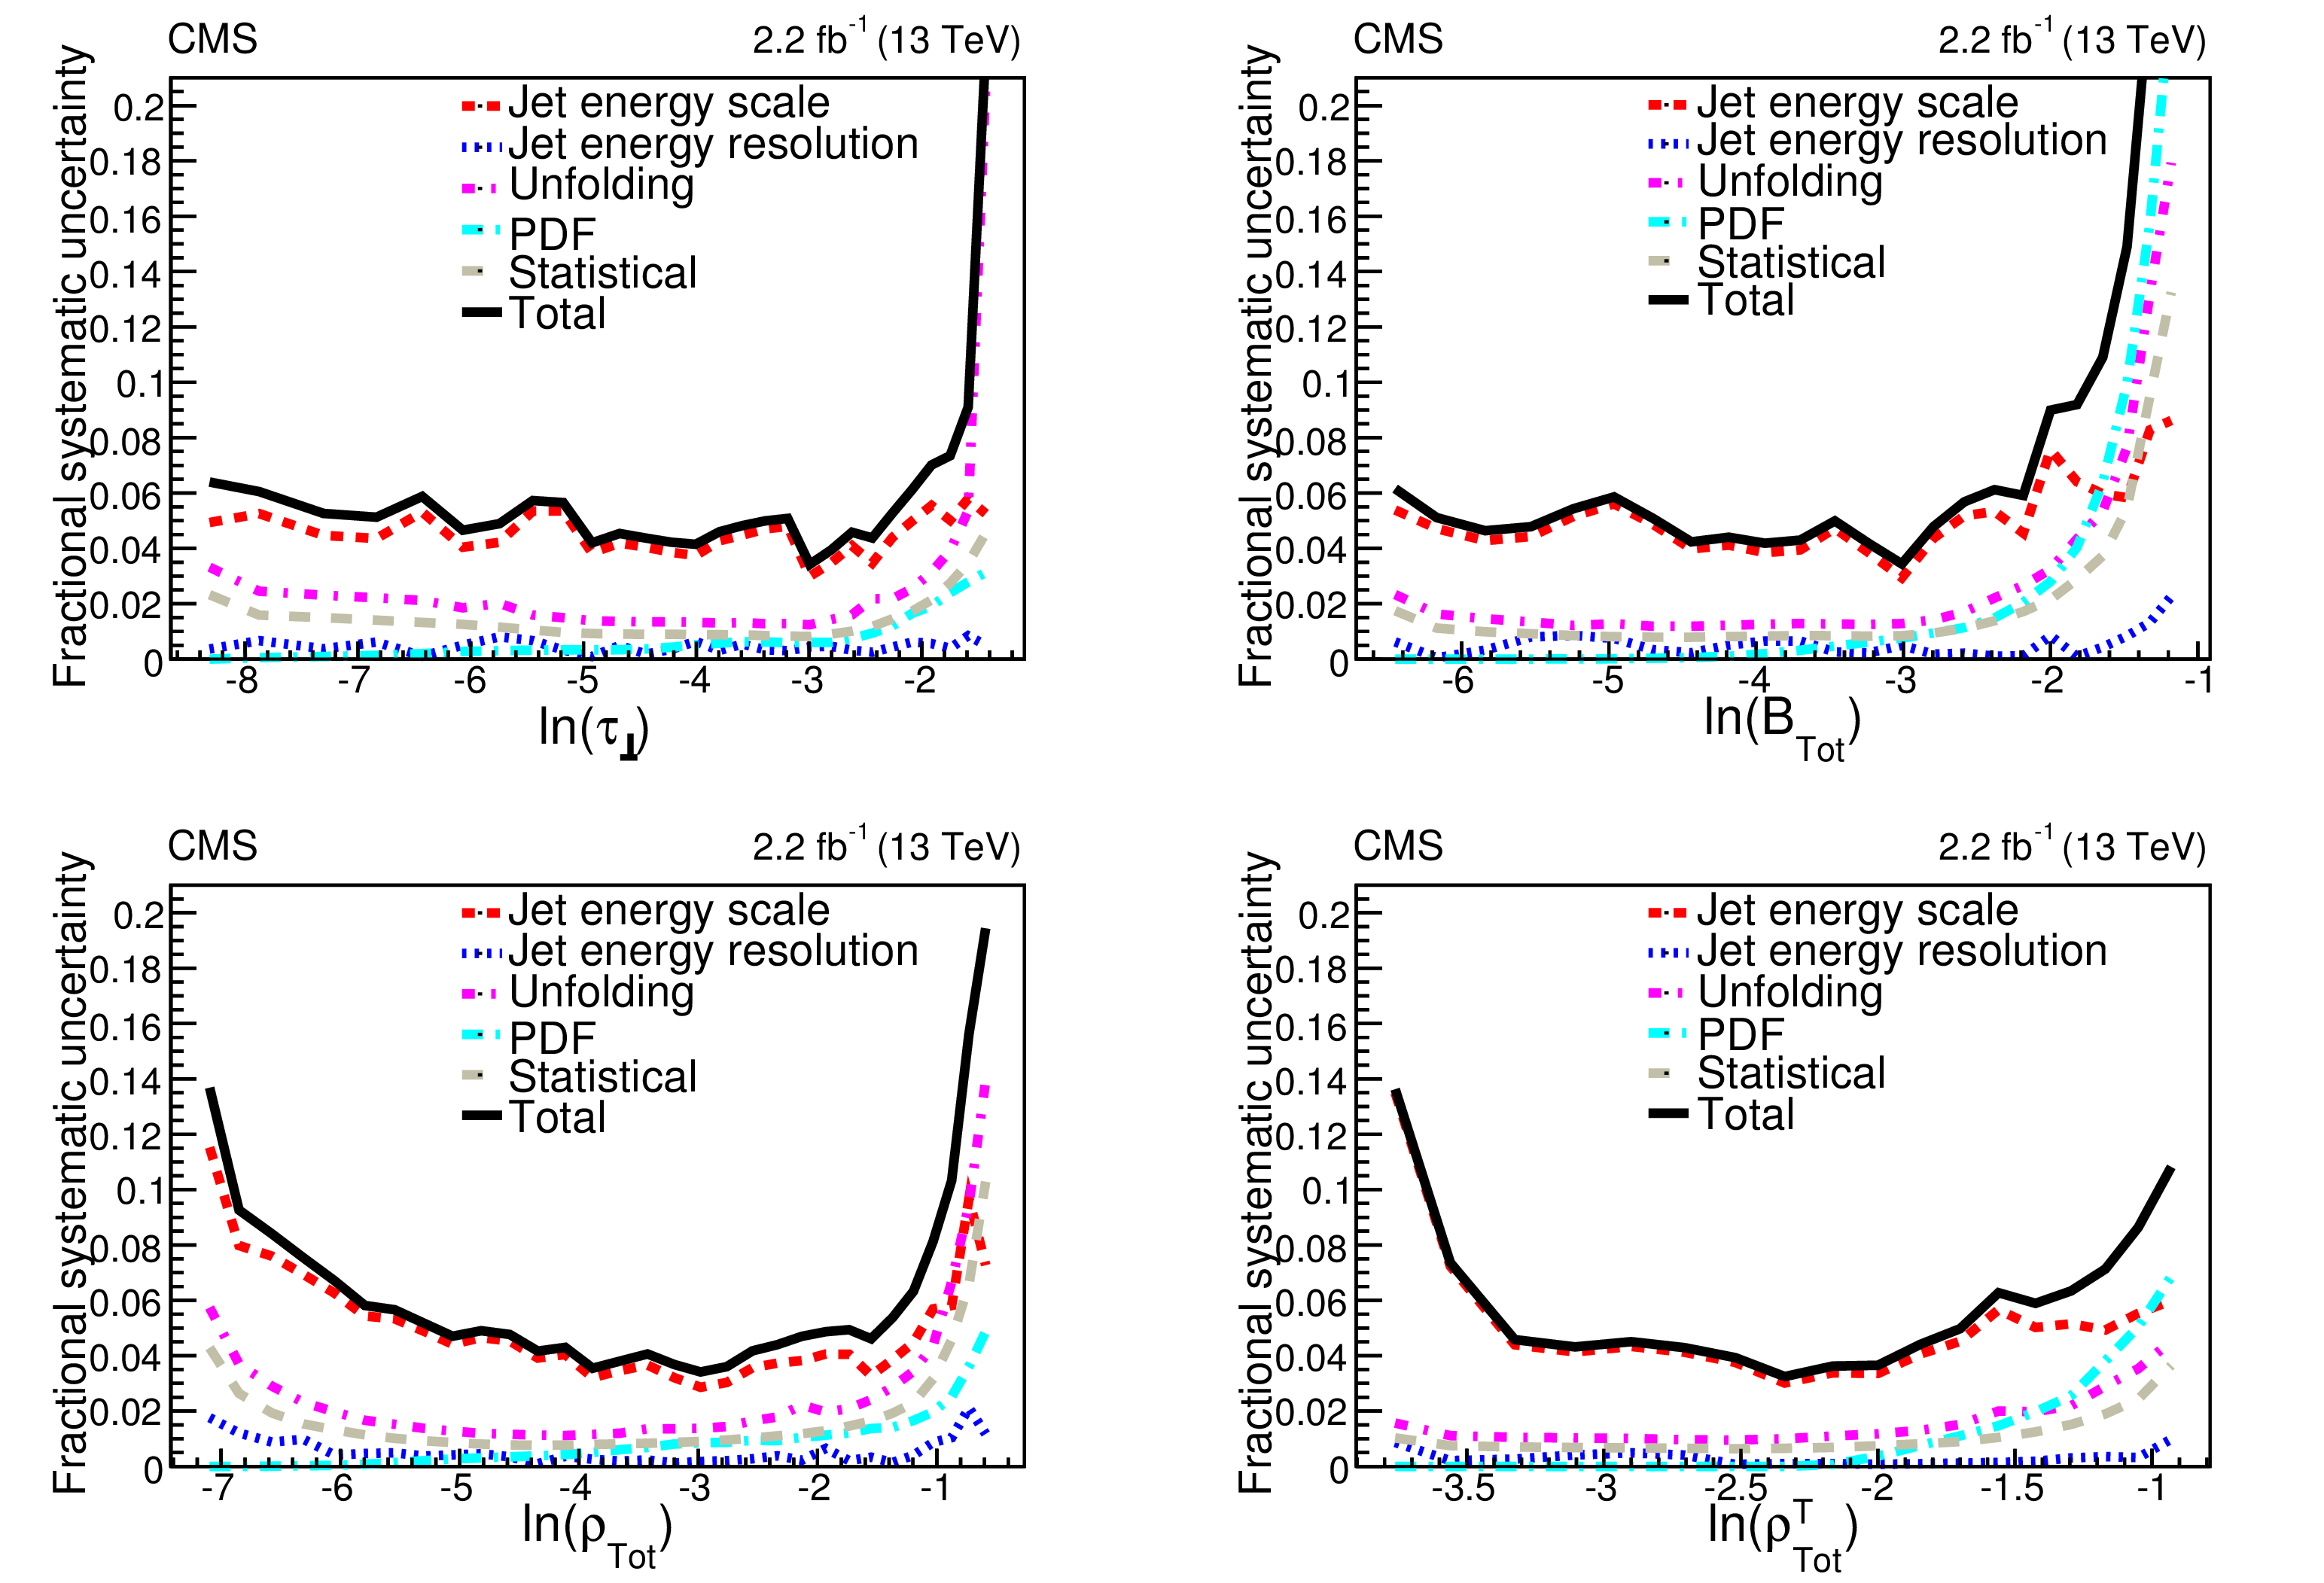
Figure 1:
Total uncertainty (black line) for the four event shape variables: the complement of transverse thrust ($ {\tau _{\perp}} $) (upper left), total jet broadening ($ {B_{\mathrm {Tot}}} $) (upper right), total jet mass ($ {\rho _{\mathrm {Tot}}} $) (lower left) and total transverse jet mass ($ {\rho _{\mathrm {Tot}}^{\mathrm {T}}} $) (lower right) evaluated with jets for 225 $ < {H_{\mathrm {T},2}} < $ 298 GeV. The contributions from different sources are also shown in each plot: JES (red dashed line), JER (blue dotted line), unfolding (pink dash-dotted line), PDF (light-blue dash-dotted line) and statistics (grey dashed line). |
png pdf |
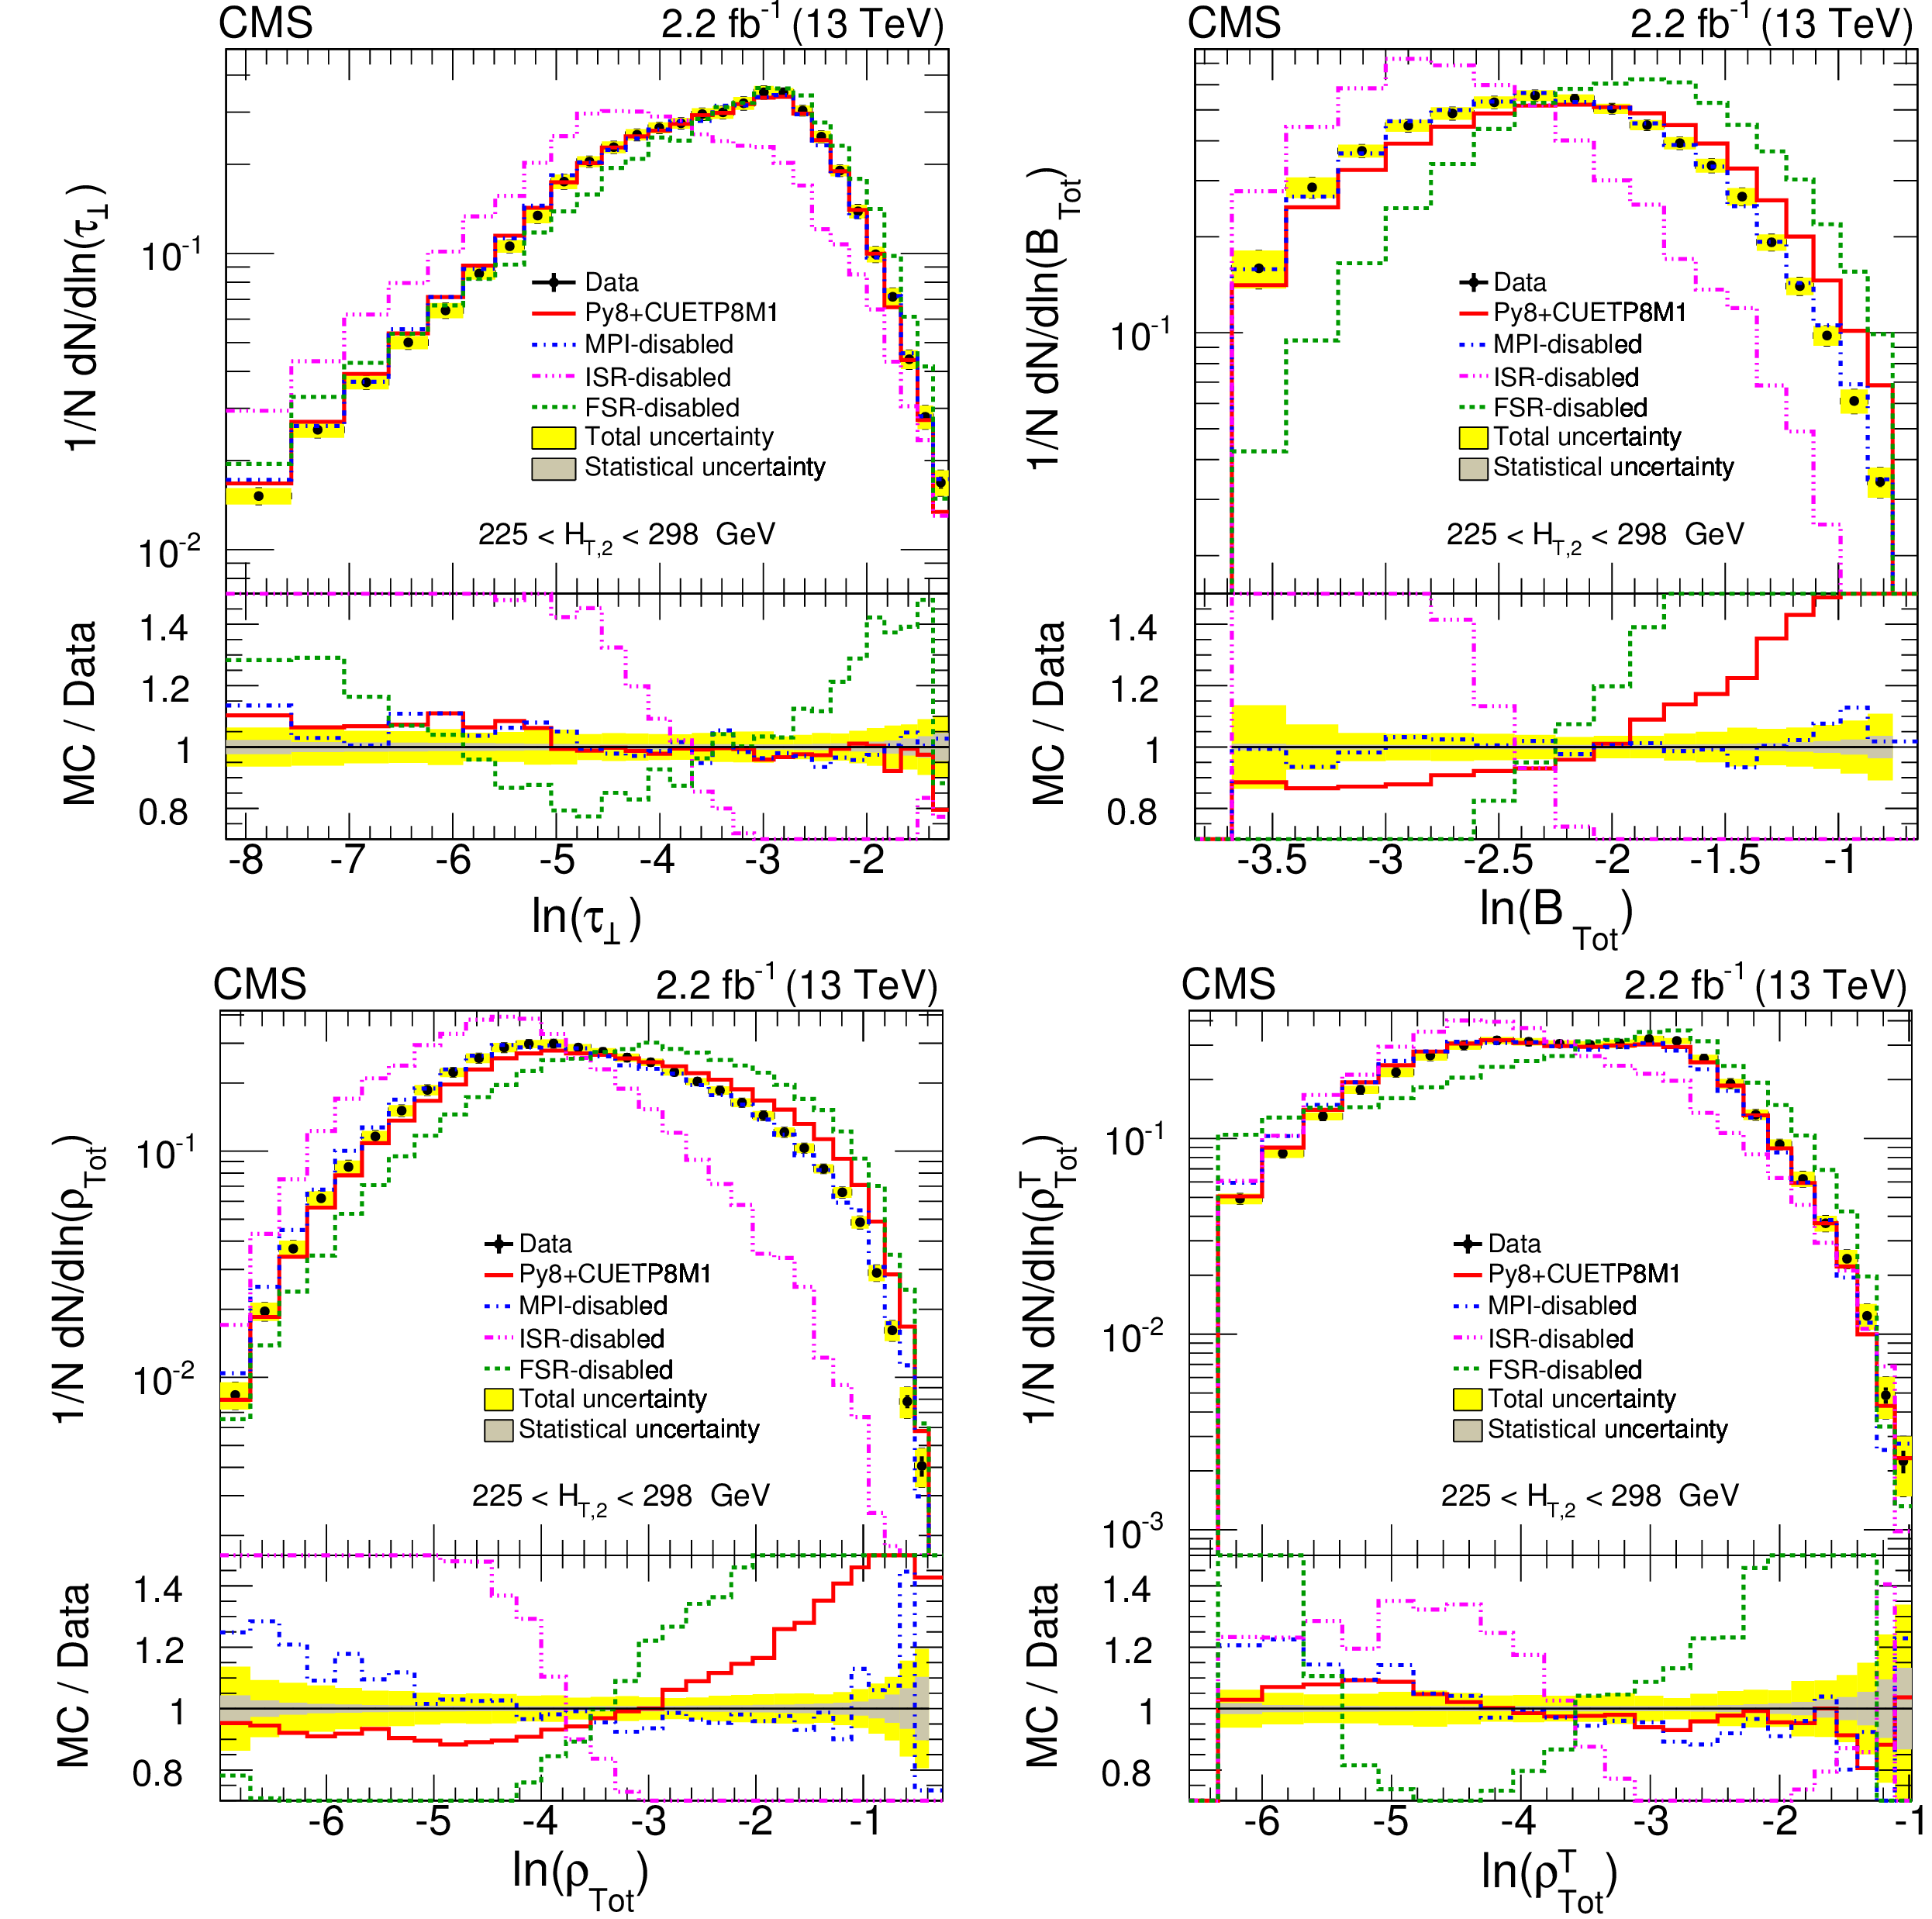
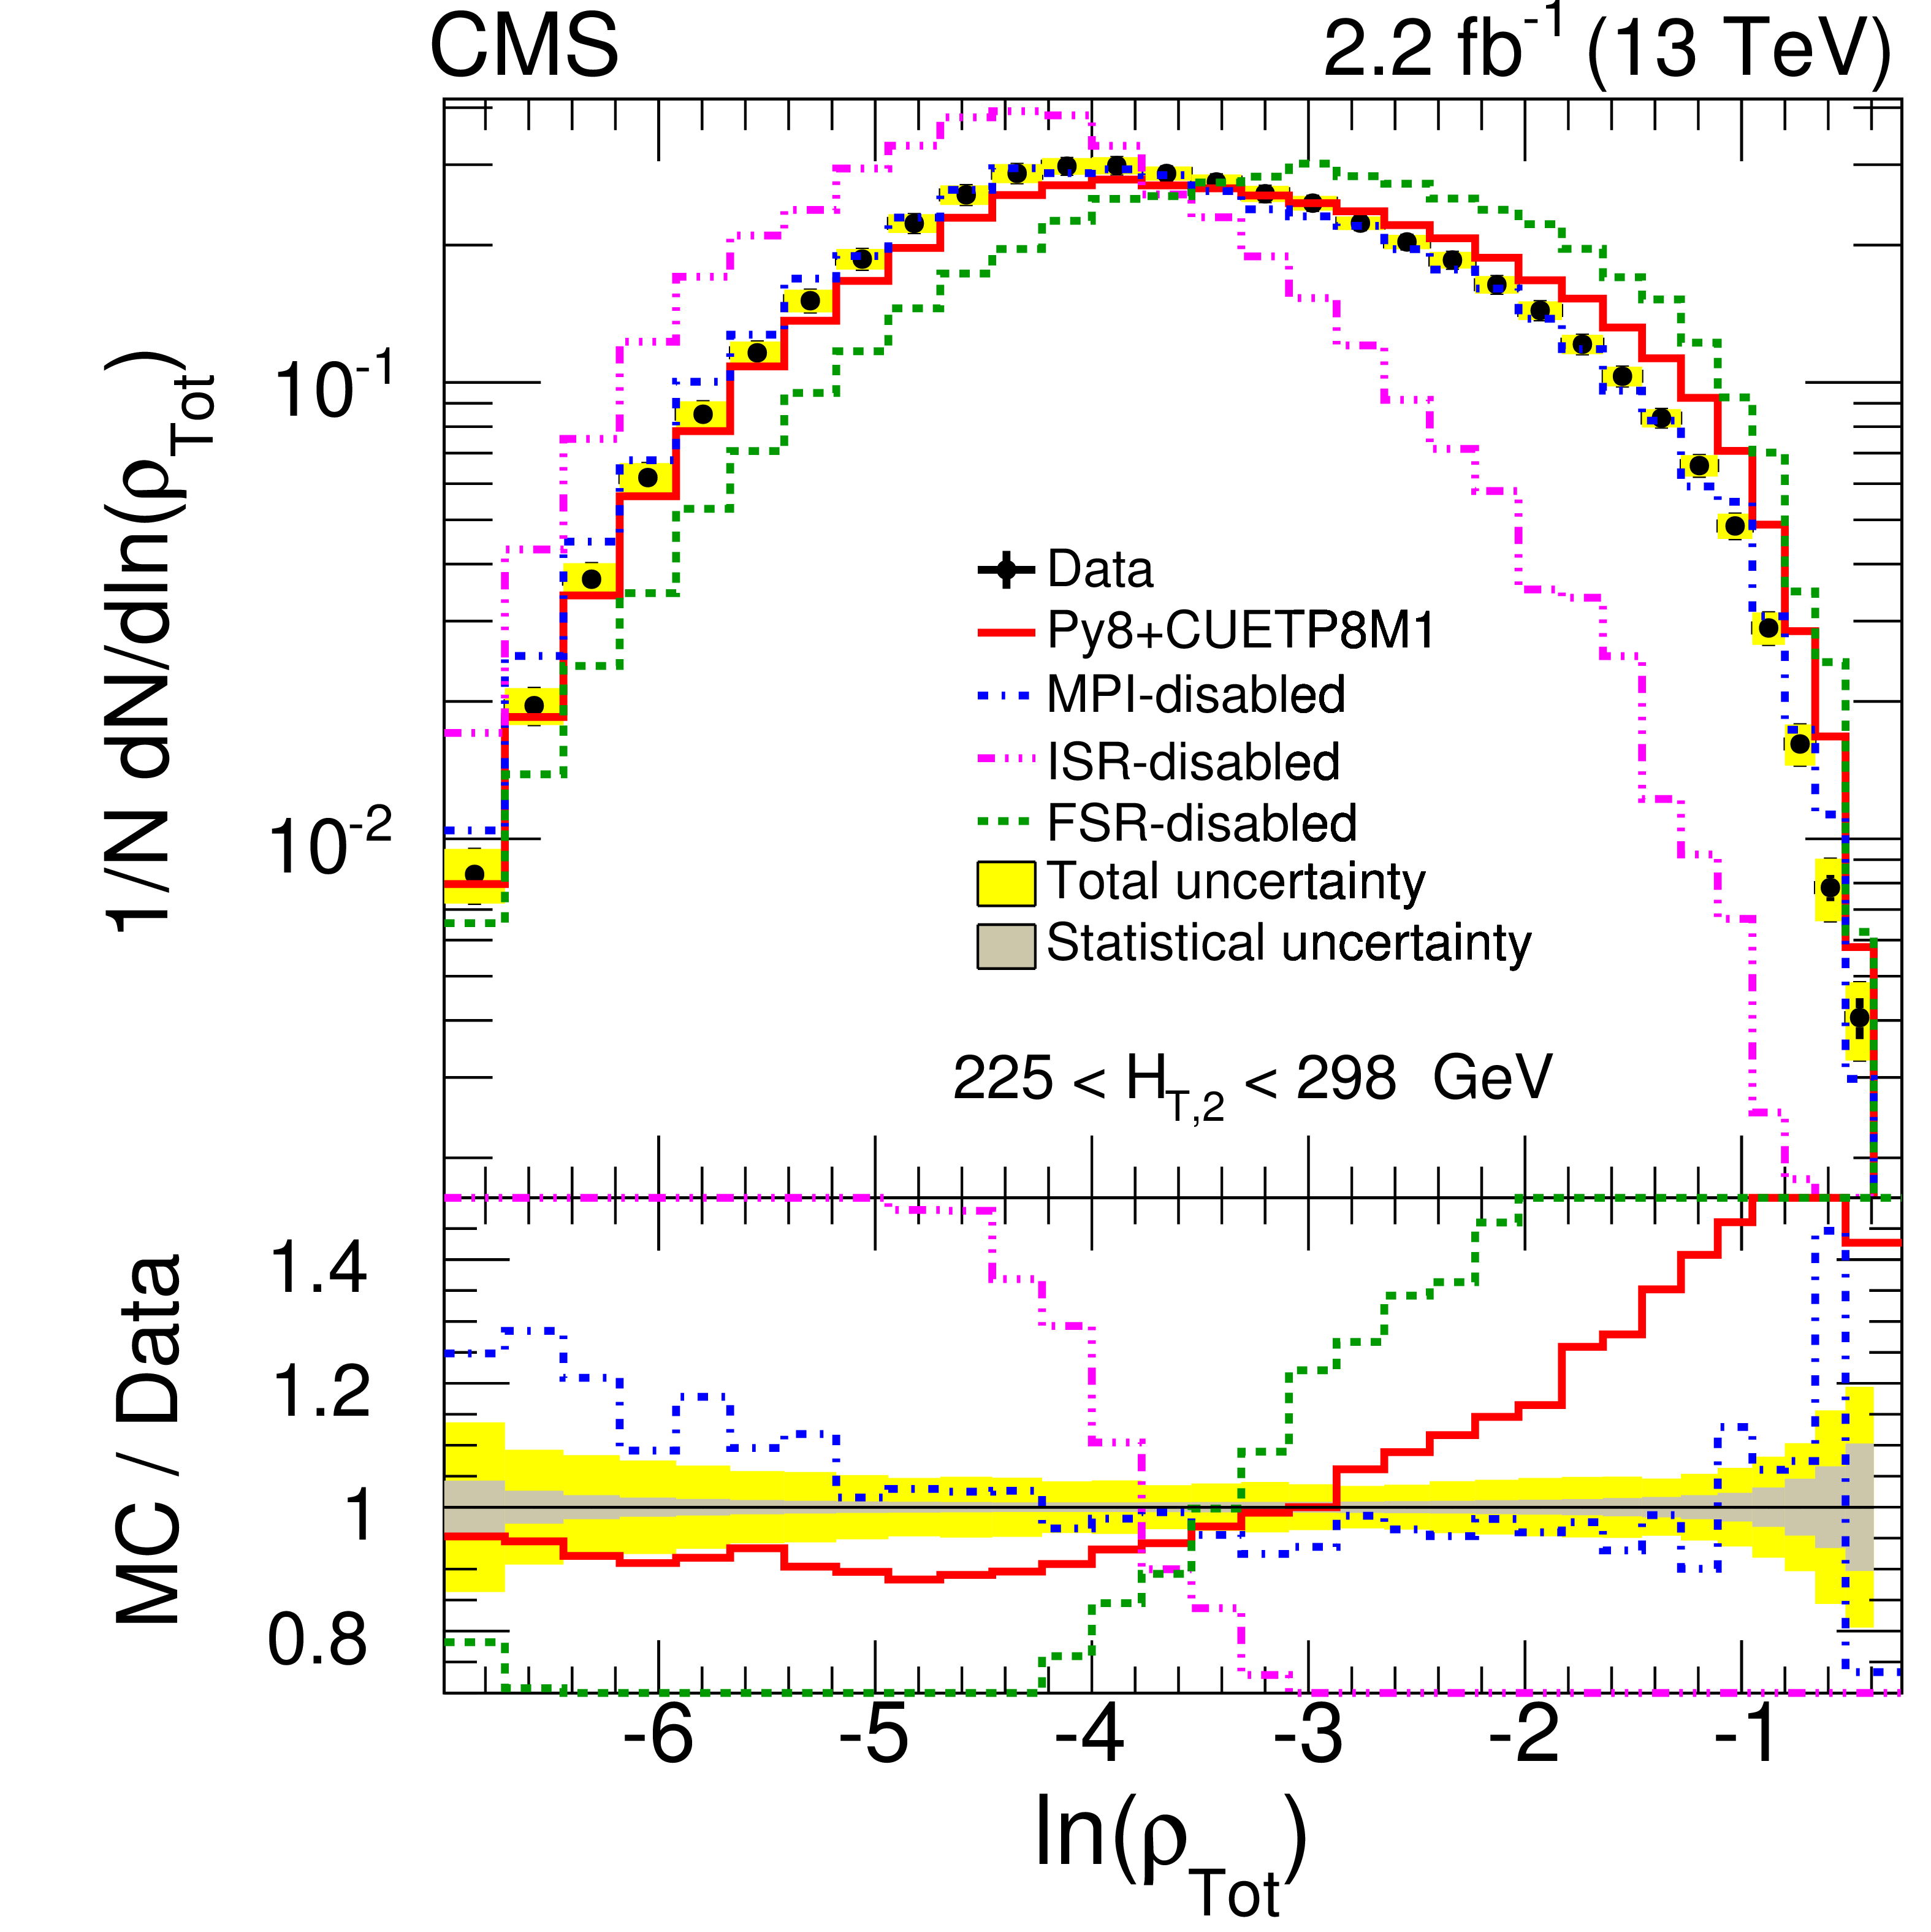
Figure 2:
The effects of MPI, ISR, and FSR in PYTHIA8 CUETP8M1 on $ {\tau _{\perp}} $ (upper left), $ {B_{\mathrm {Tot}}} $ (upper right), $ {\rho _{\mathrm {Tot}}} $ (lower left) and $ {\rho _{\mathrm {Tot}}^{\mathrm {T}}} $ (lower right) for a typical range 225 $ < {H_{\mathrm {T},2}} < $ 298 GeV. The ratio plots for simulation (MC) with respect to data are shown in the lower panel of each plot. The inner gray band represents the statistical uncertainty and the yellow band represents the total uncertainty (systematic + statistical) in each plot. |
png pdf |
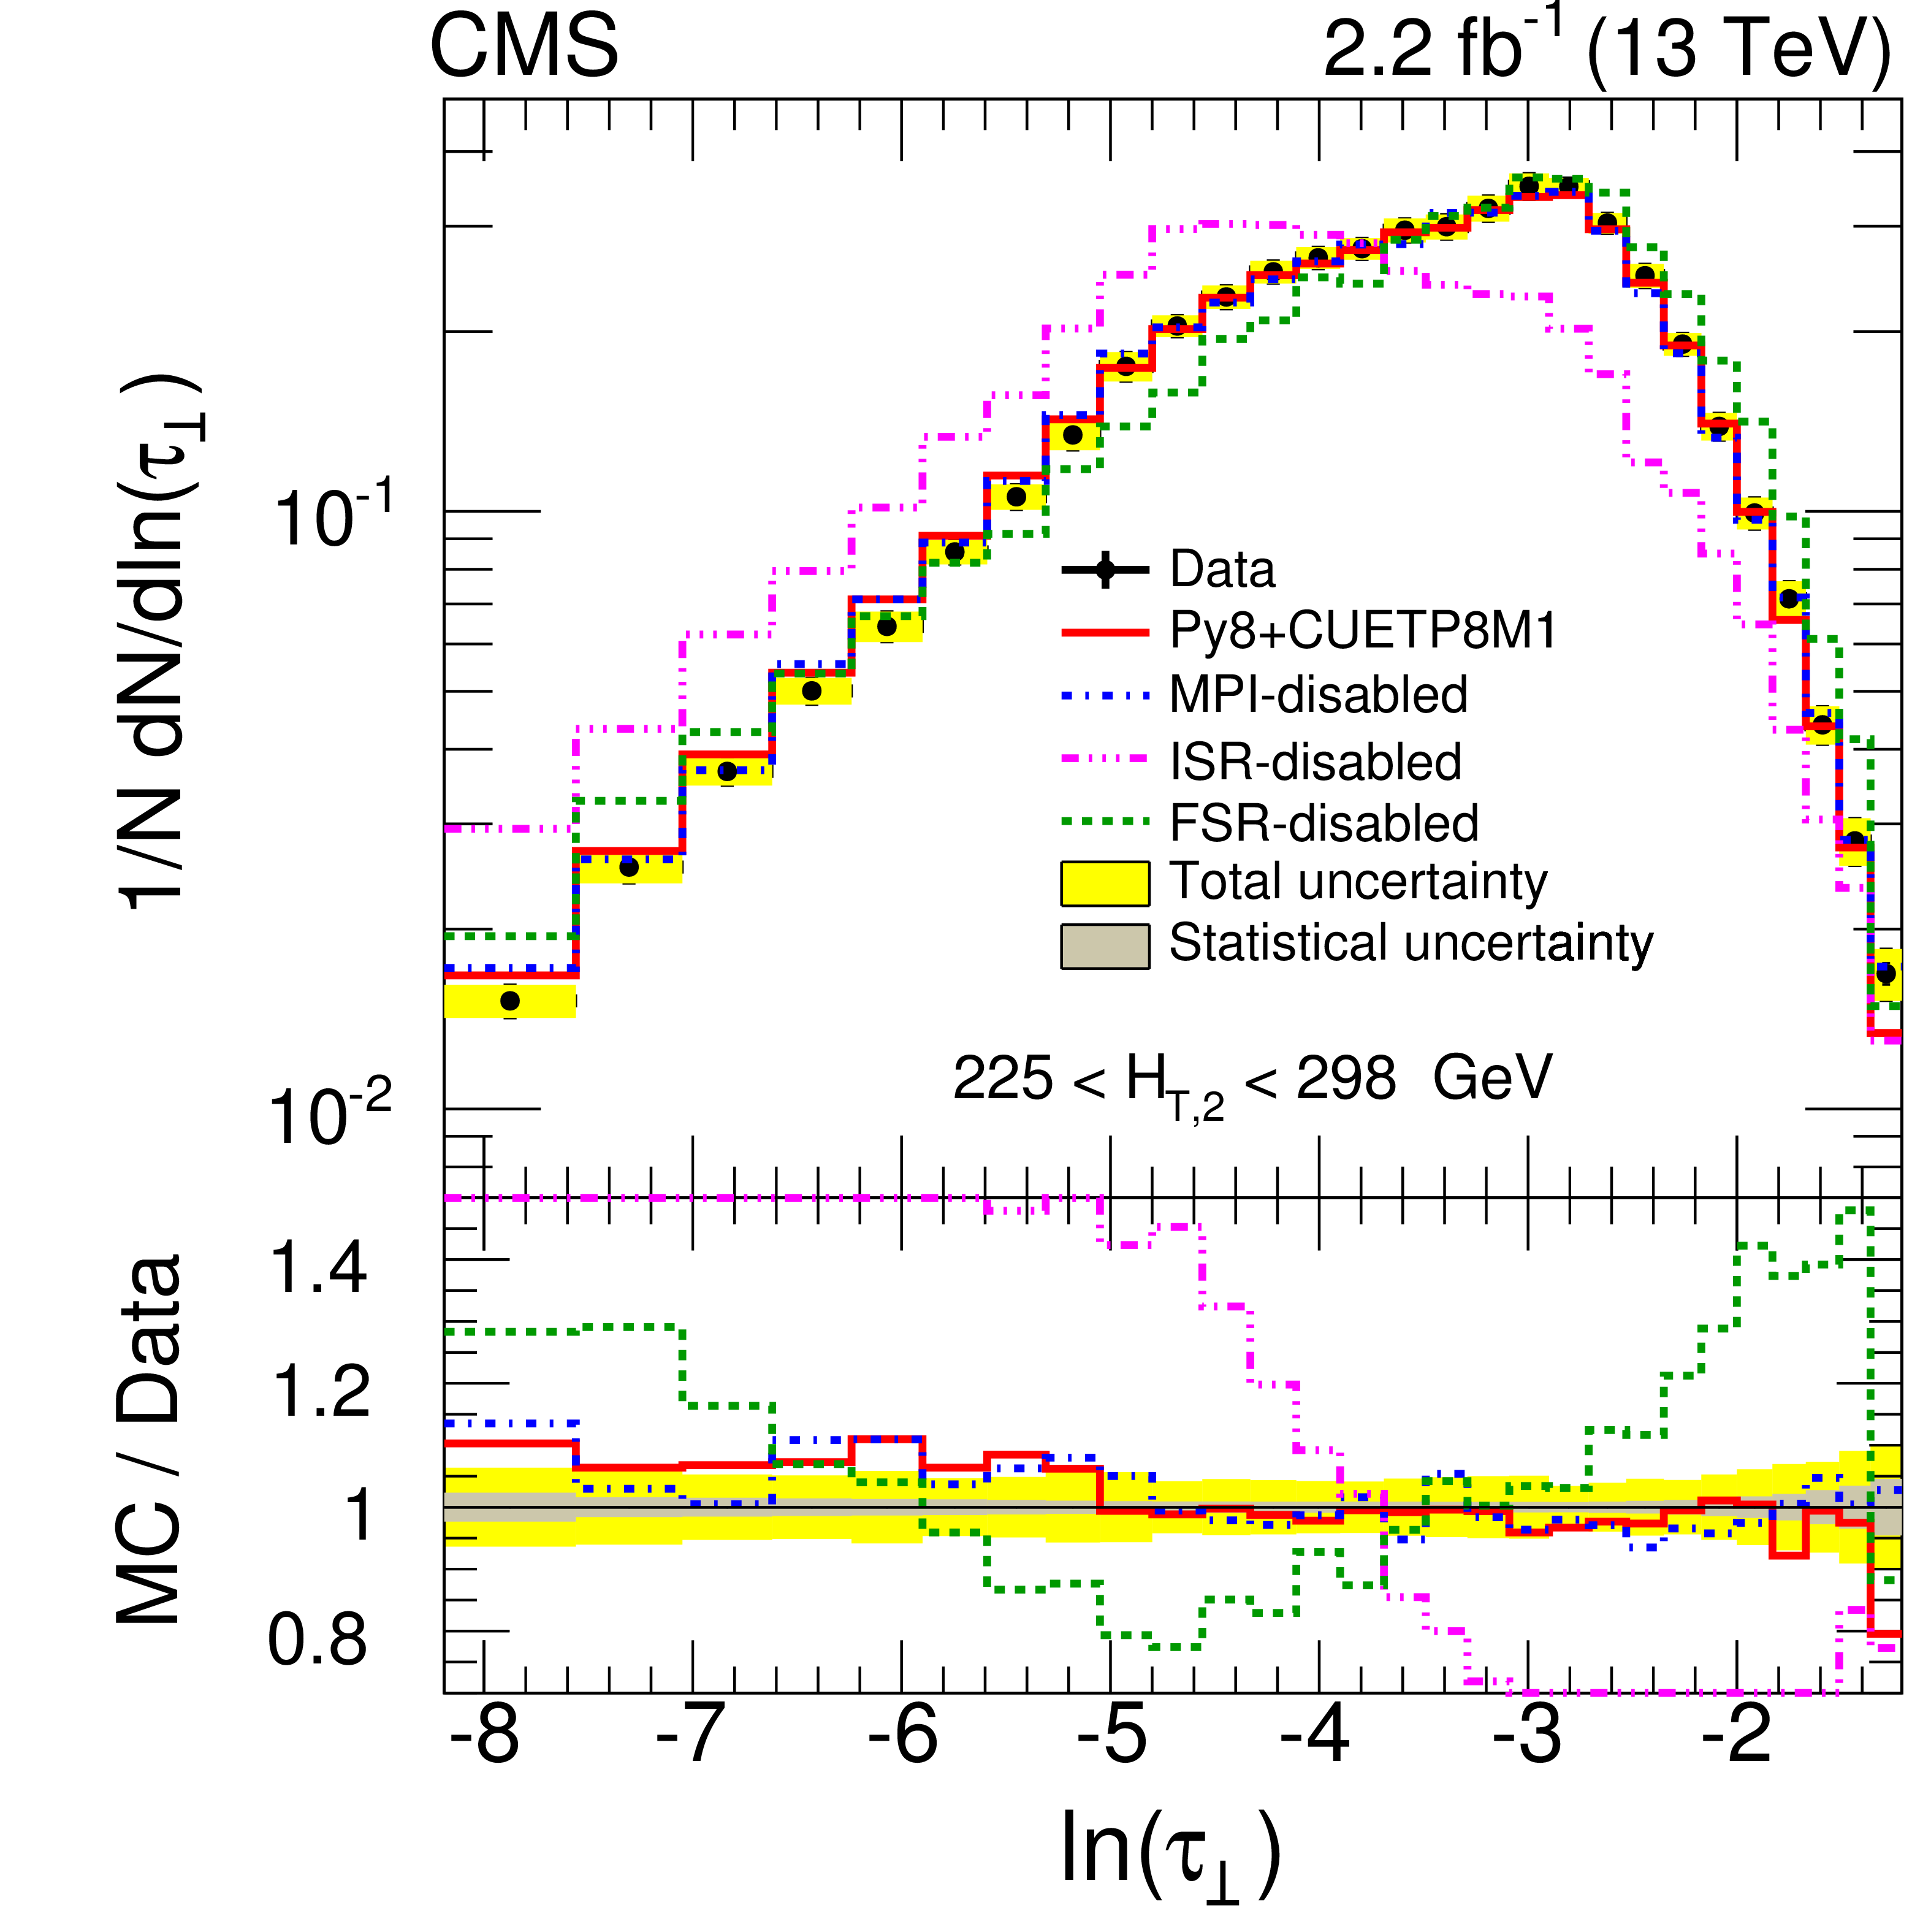
Figure 2-a:
The effects of MPI, ISR, and FSR in PYTHIA8 CUETP8M1 on $ {\tau _{\perp}} $ for a typical range 225 $ < {H_{\mathrm {T},2}} < $ 298 GeV. The ratio plot for simulation (MC) with respect to data are shown in the lower panel. The inner gray band represents the statistical uncertainty and the yellow band represents the total uncertainty (systematic + statistical). |
png pdf |
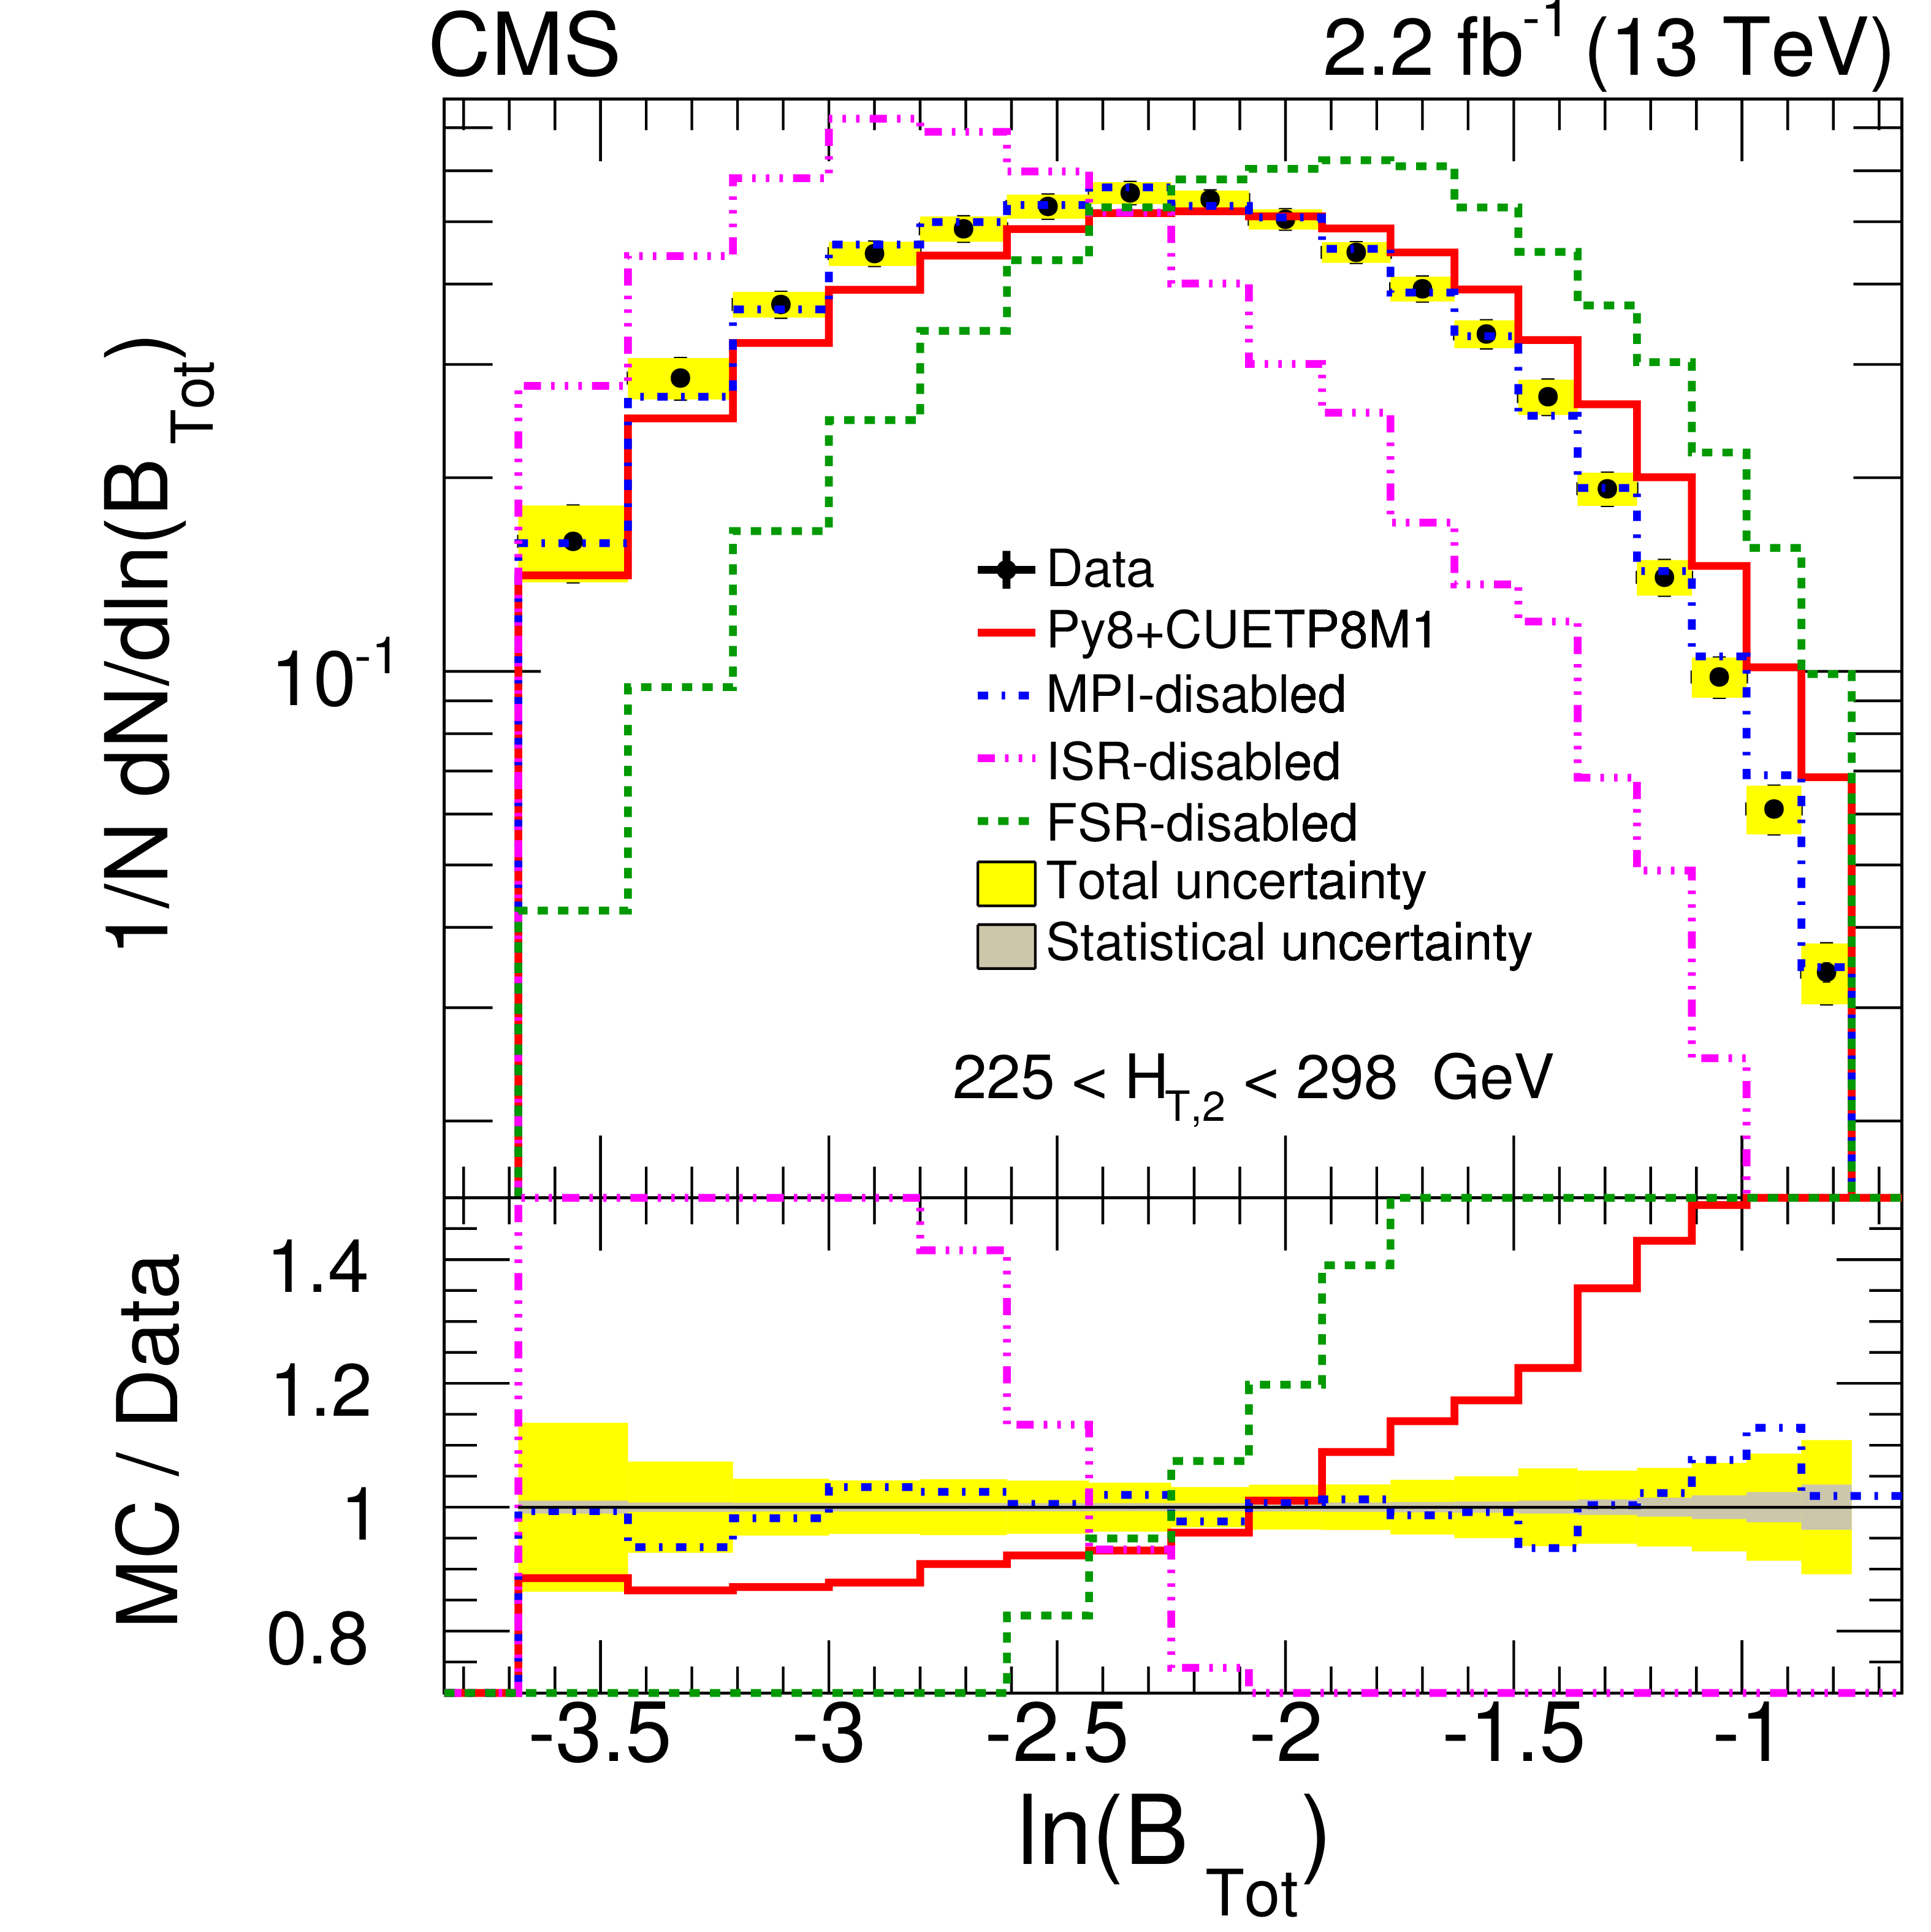
Figure 2-b:
The effects of MPI, ISR, and FSR in PYTHIA8 CUETP8M1 on $ {B_{\mathrm {Tot}}} $ for a typical range 225 $ < {H_{\mathrm {T},2}} < $ 298 GeV. The ratio plot for simulation (MC) with respect to data are shown in the lower panel. The inner gray band represents the statistical uncertainty and the yellow band represents the total uncertainty (systematic + statistical). |
png pdf |
Figure 2-c:
The effects of MPI, ISR, and FSR in PYTHIA8 CUETP8M1 on $ {\rho _{\mathrm {Tot}}} $ for a typical range 225 $ < {H_{\mathrm {T},2}} < $ 298 GeV. The ratio plot for simulation (MC) with respect to data are shown in the lower panel. The inner gray band represents the statistical uncertainty and the yellow band represents the total uncertainty (systematic + statistical). |

png pdf |
Figure 2-d:
The effects of MPI, ISR, and FSR in PYTHIA8 CUETP8M1 on $ {\rho _{\mathrm {Tot}}^{\mathrm {T}}} $ for a typical range 225 $ < {H_{\mathrm {T},2}} < $ 298 GeV. The ratio plot for simulation (MC) with respect to data are shown in the lower panel. The inner gray band represents the statistical uncertainty and the yellow band represents the total uncertainty (systematic + statistical). |
png pdf |
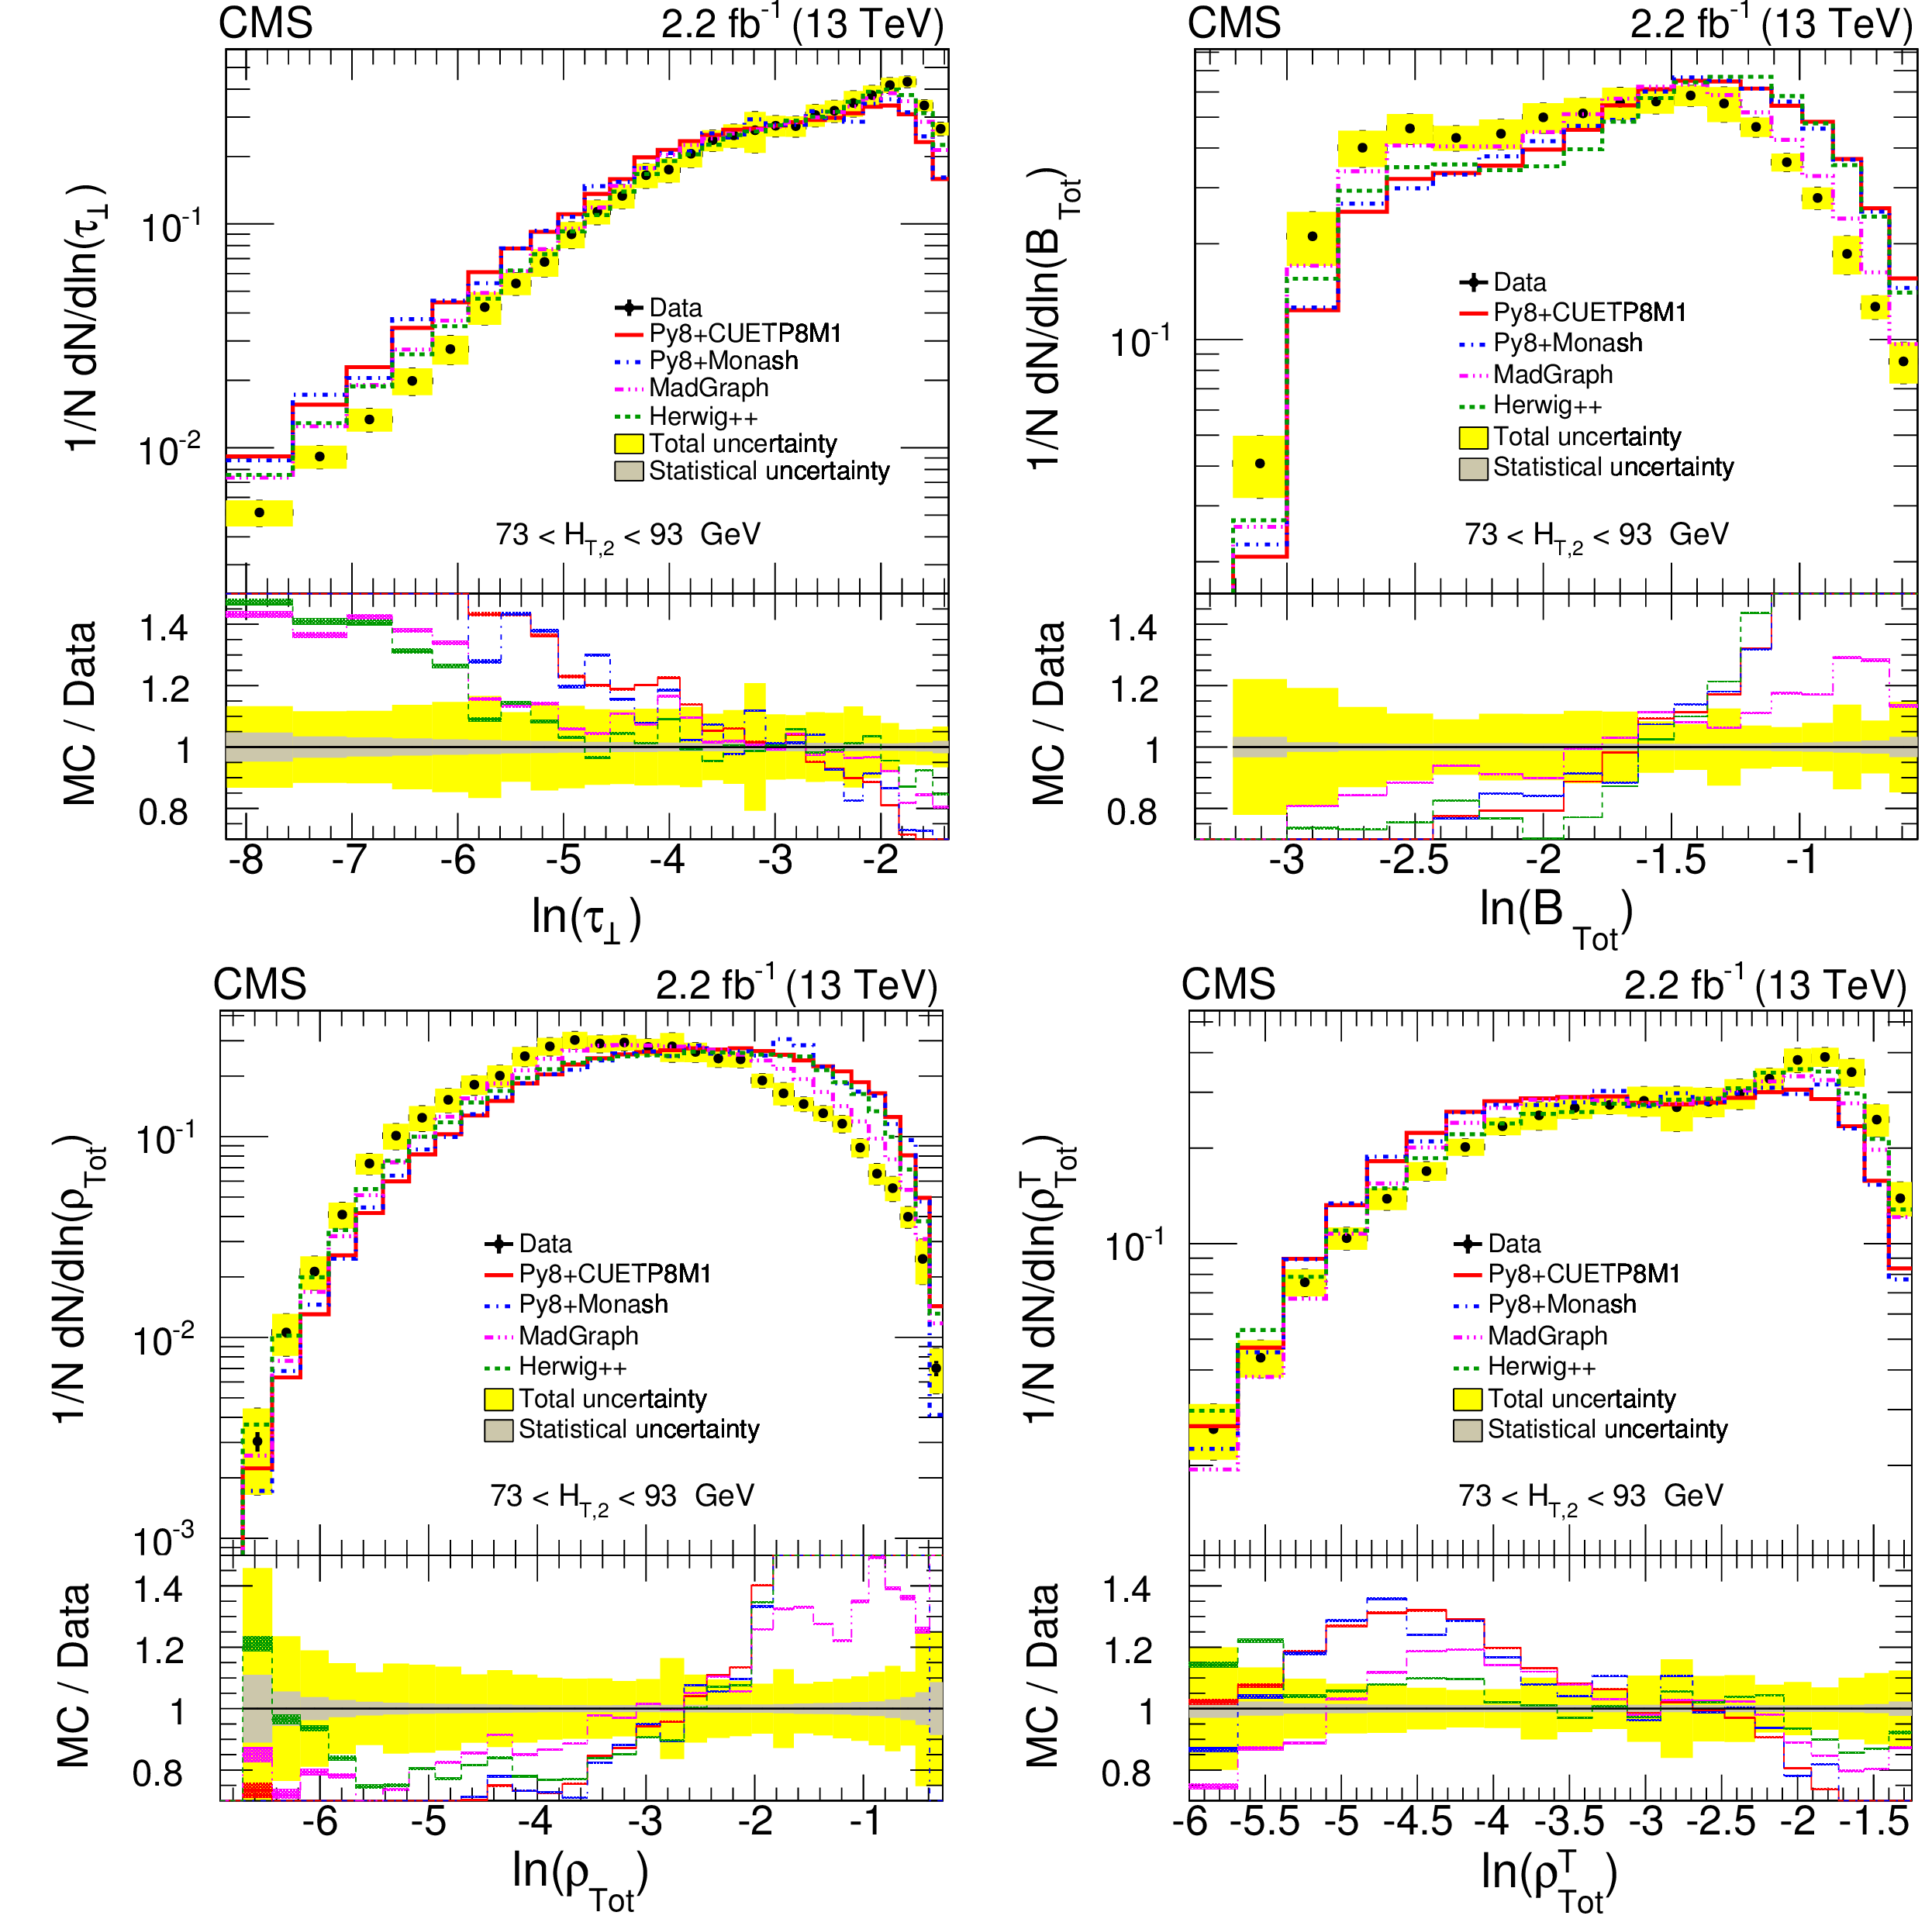
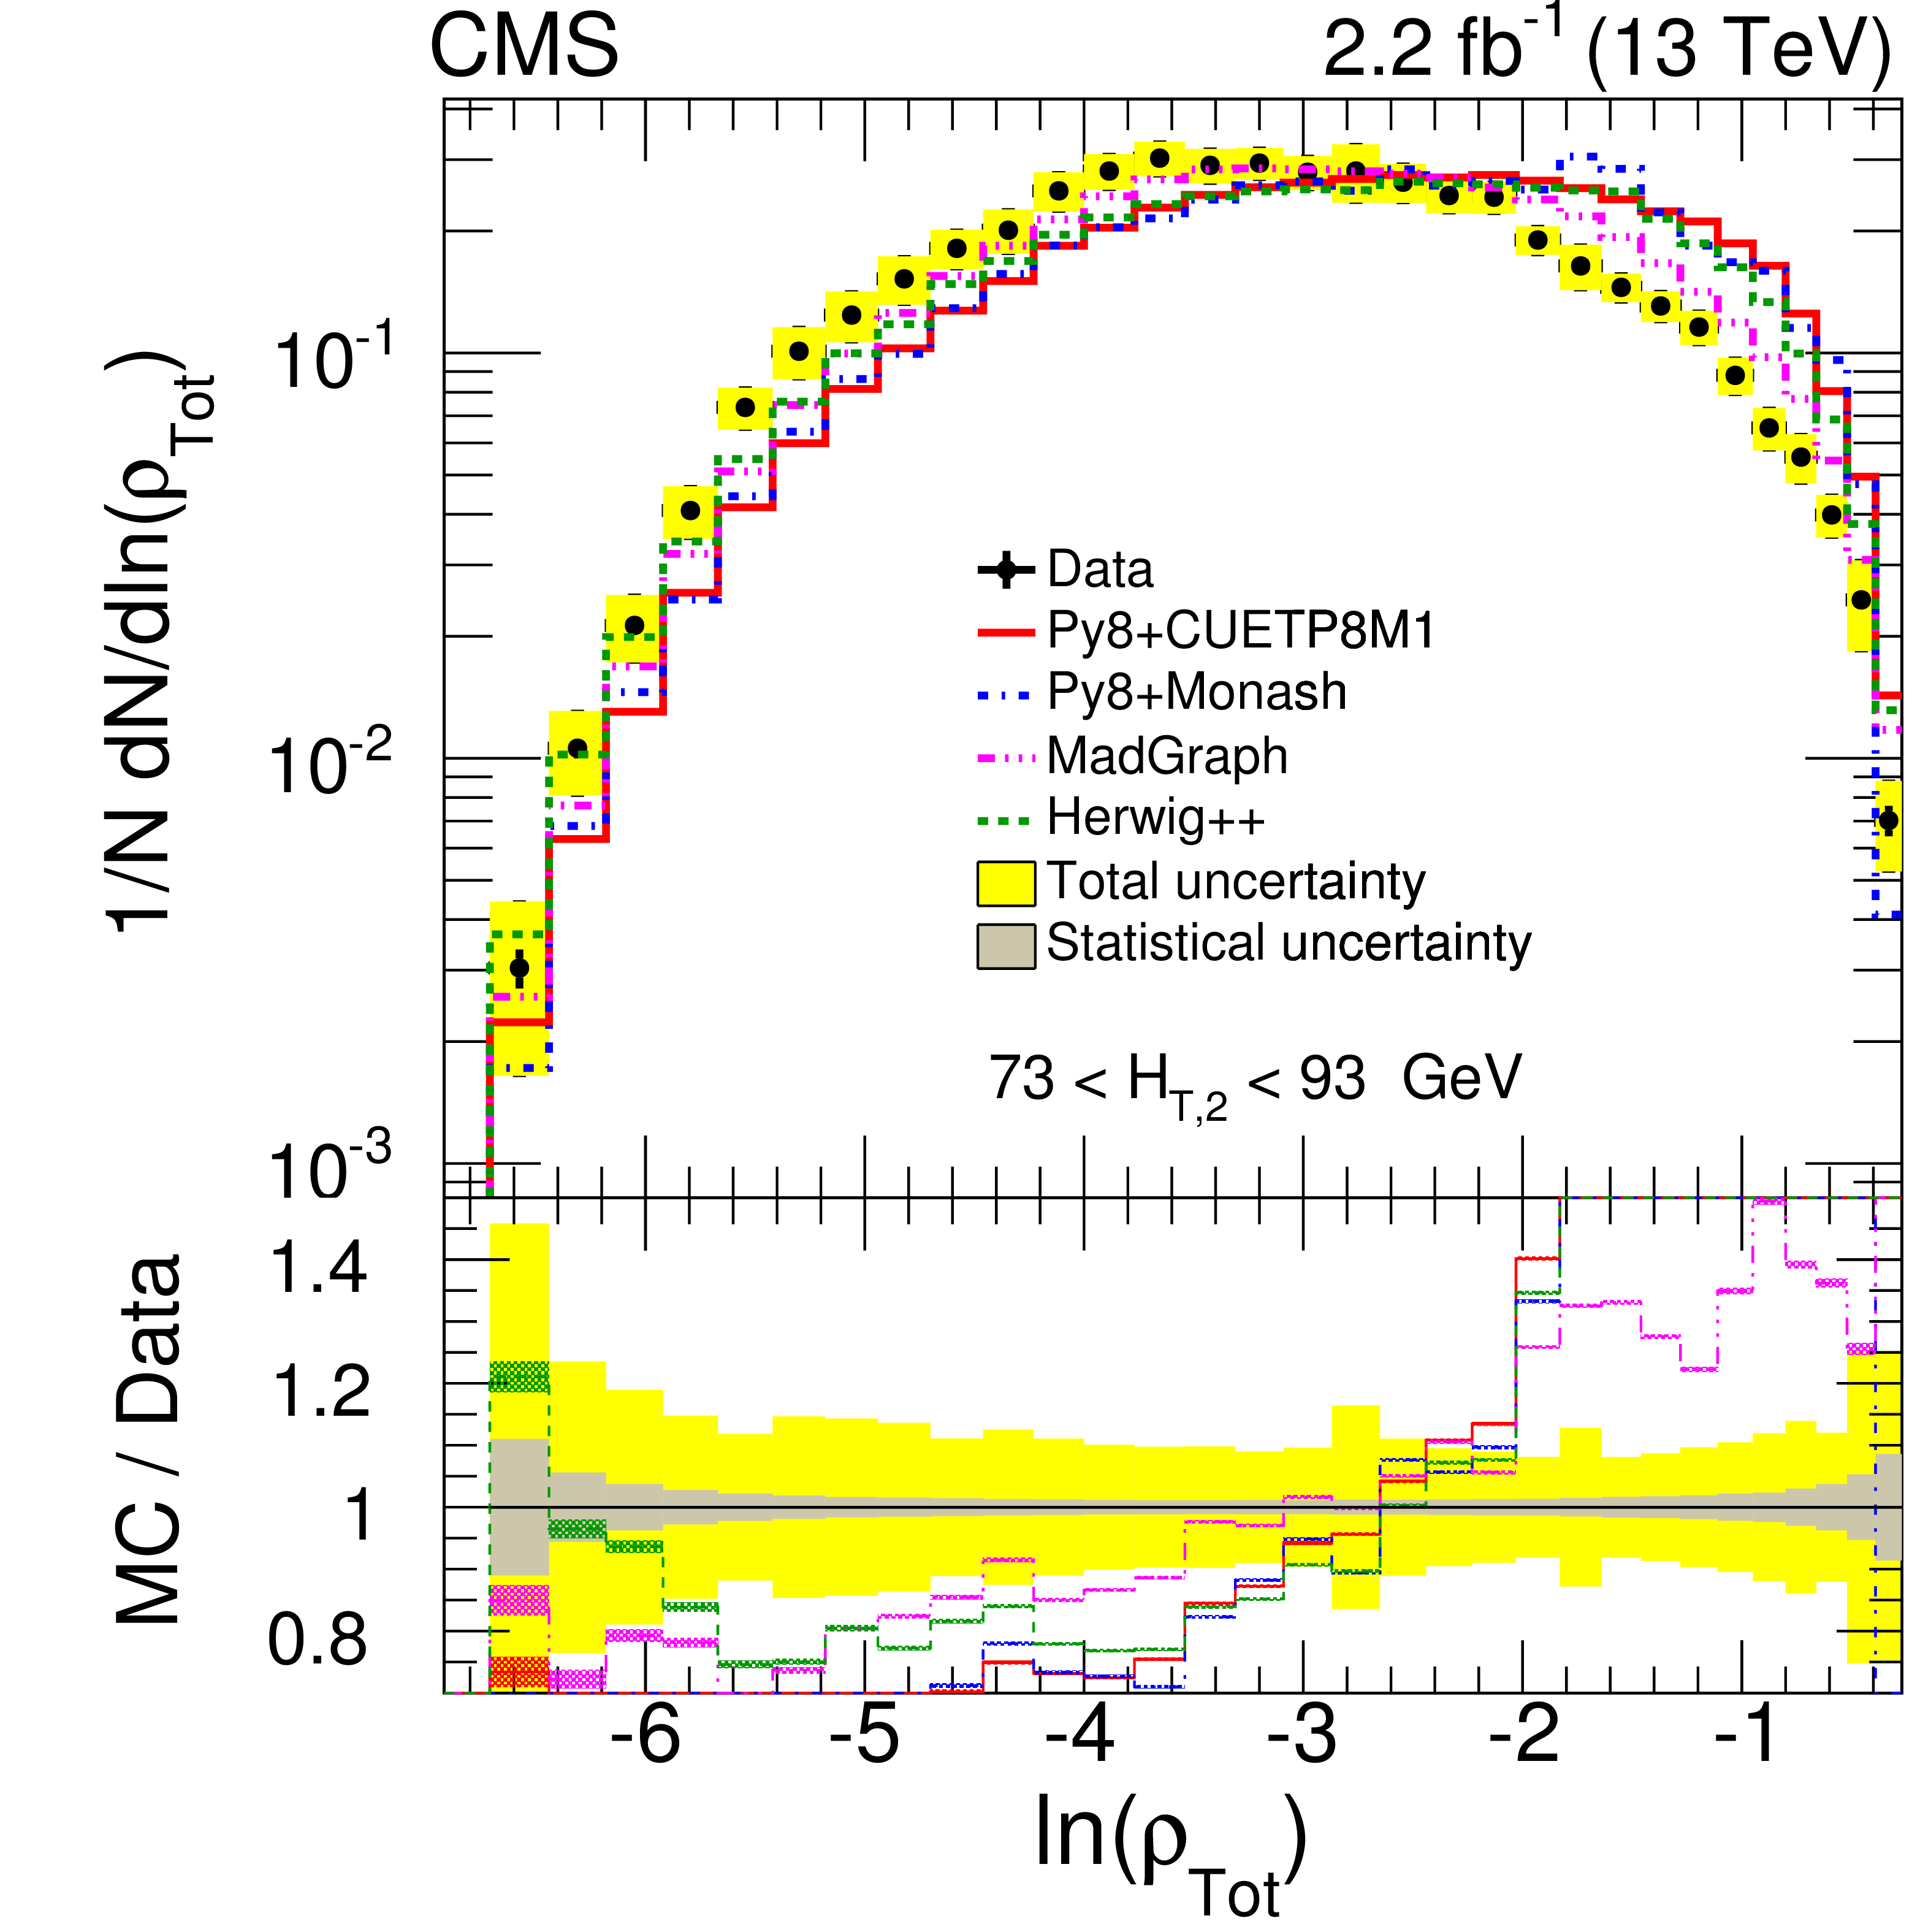
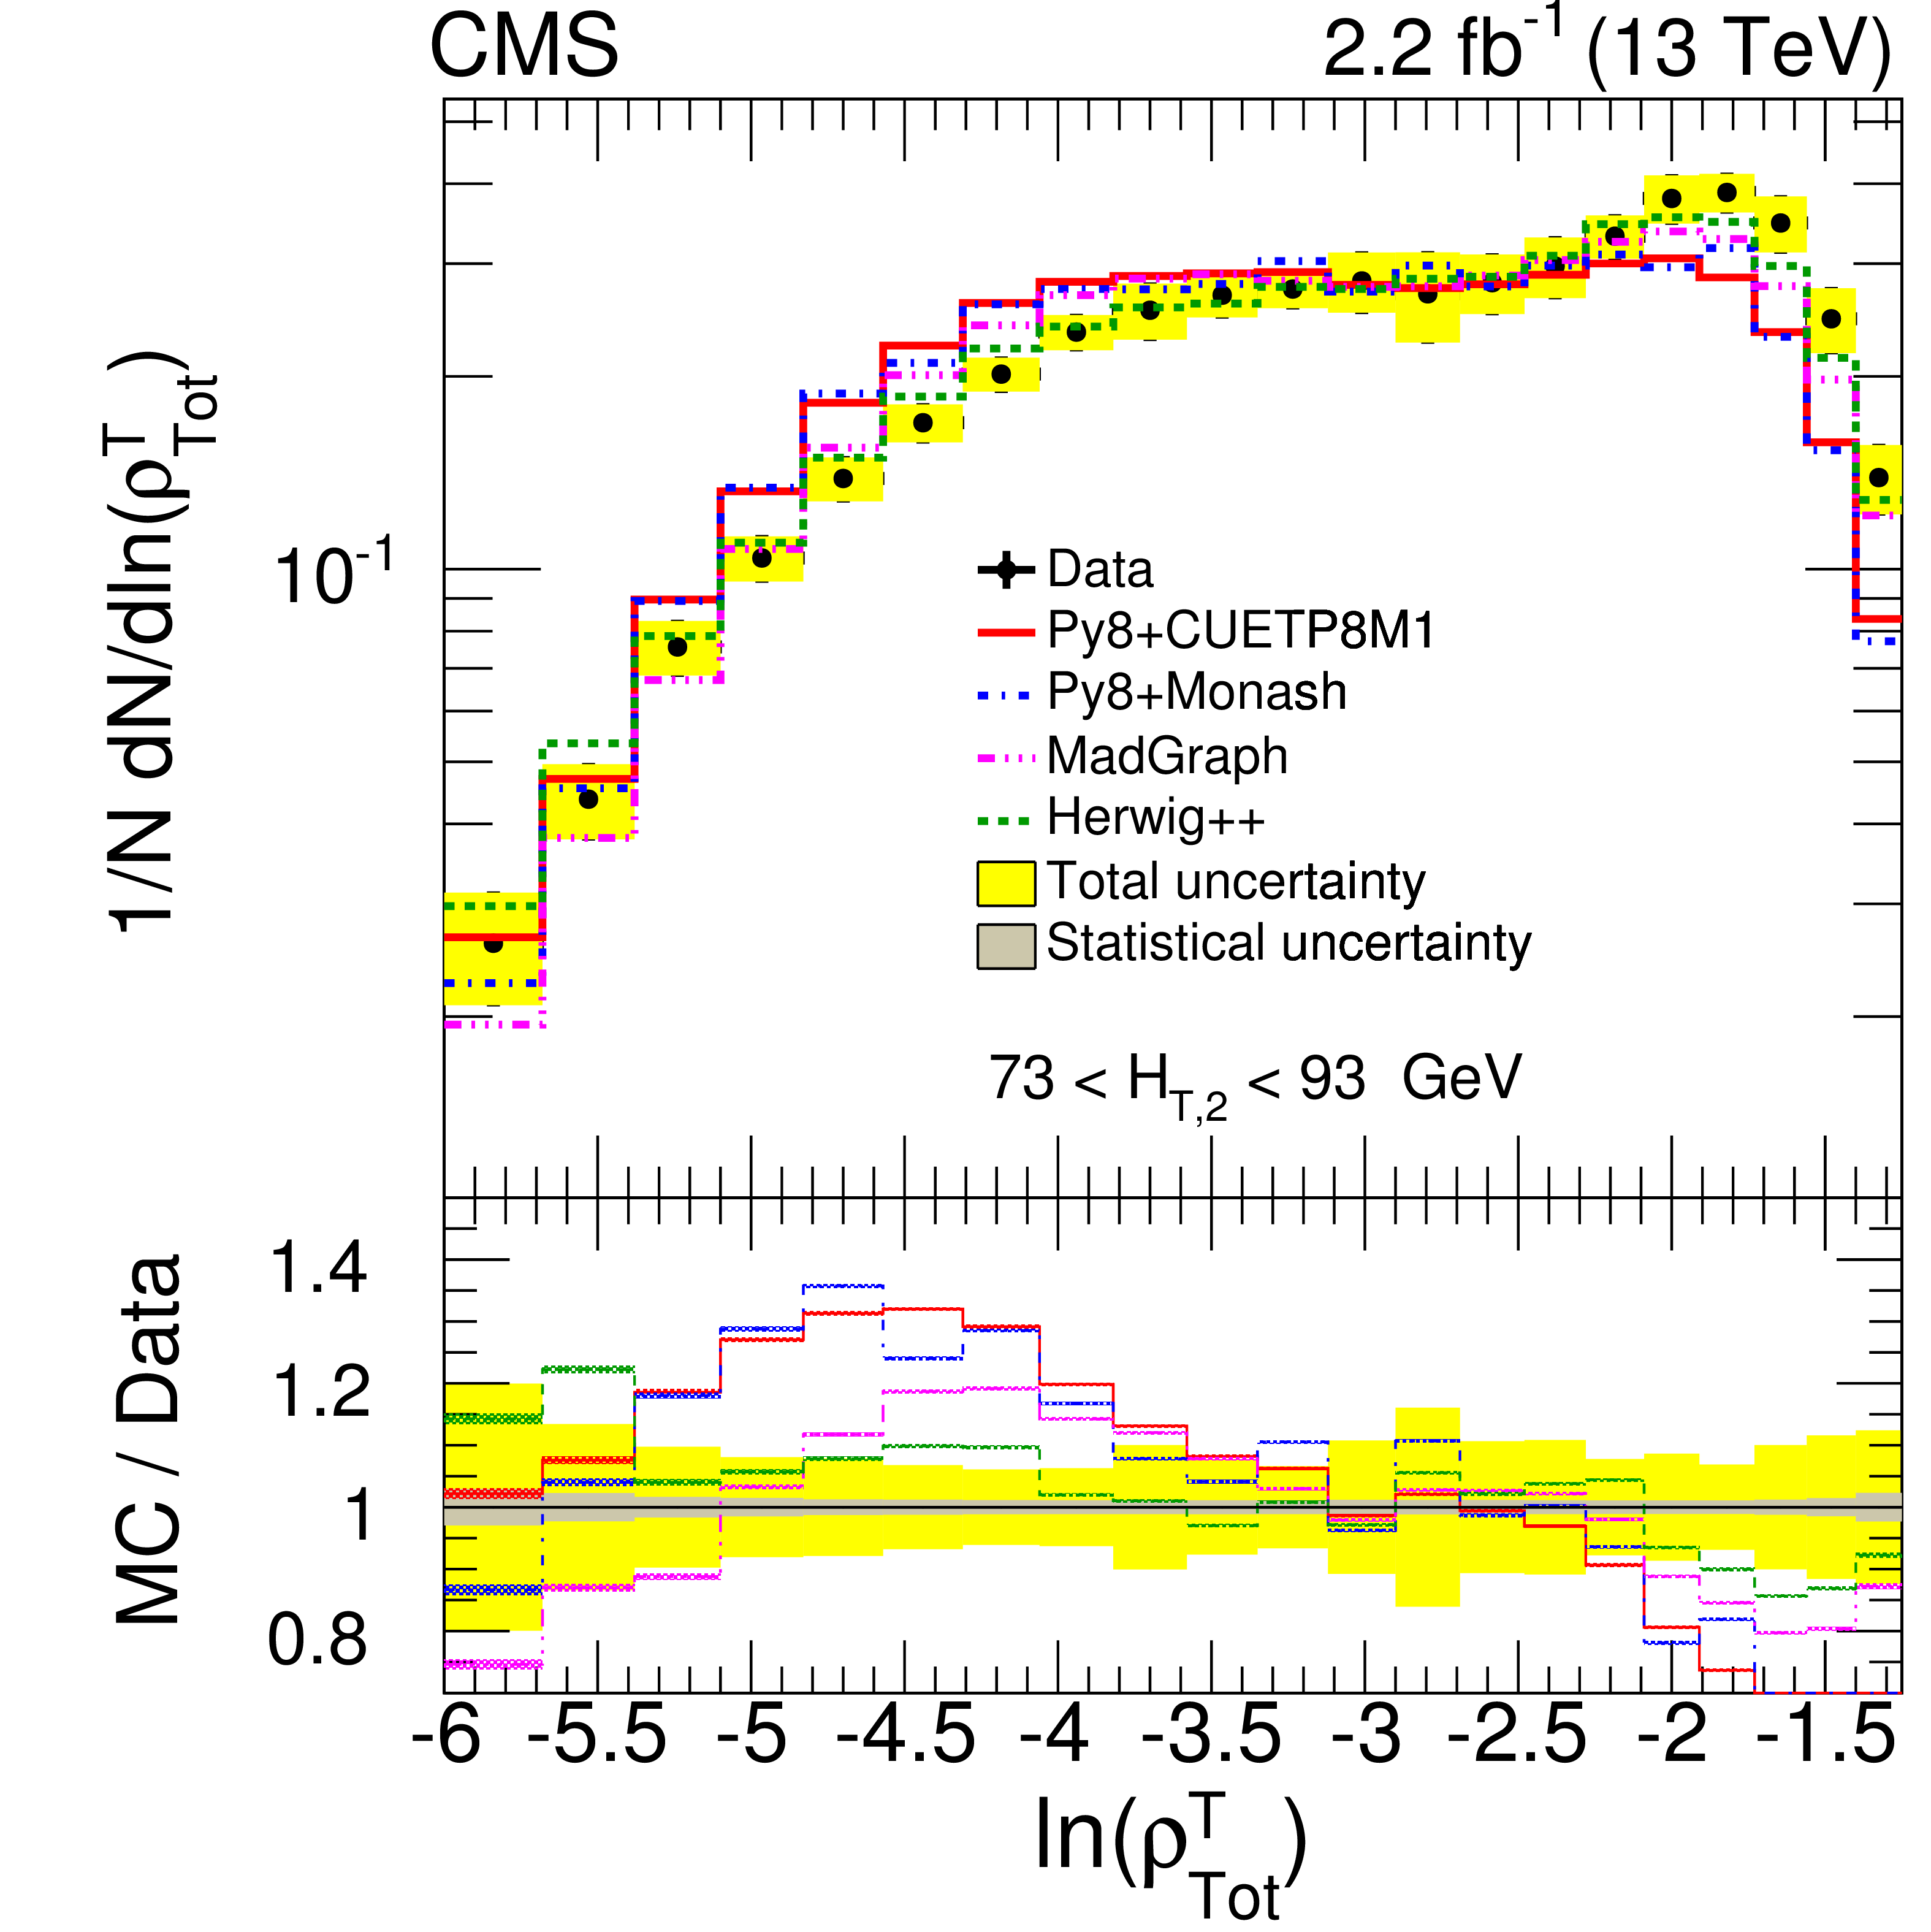
Figure 3:
Normalized differential distributions of unfolded data compared with theoretical (MC) predictions of PYTHIA8 CUETP8M1 (red line), PYTHIA8 Monash (blue dash-dotted line), MadGraph5_amc@nlo (pink dash-dot-dotted line) and HERWIG++ (brown dash-dot-dotted line) as a function of ESV: complement of transverse thrust ($ {\tau _{\perp}} $) (upper left), total jet broadening ($ {B_{\mathrm {Tot}}} $) (upper right), total jet mass ($ {\rho _{\mathrm {Tot}}} $) (lower left) and total transverse jet mass ($ {\rho _{\mathrm {Tot}}^{\mathrm {T}}} $) (lower right) for 73 $ < {H_{\mathrm {T},2}} < $ 93 GeV. In each ratio plot, the inner gray band represents statistical uncertainty and the yellow band represents the total uncertainty (systematic and statistical components added in quadrature) on data and the MC predictions include only statistical uncertainty. |
png pdf |
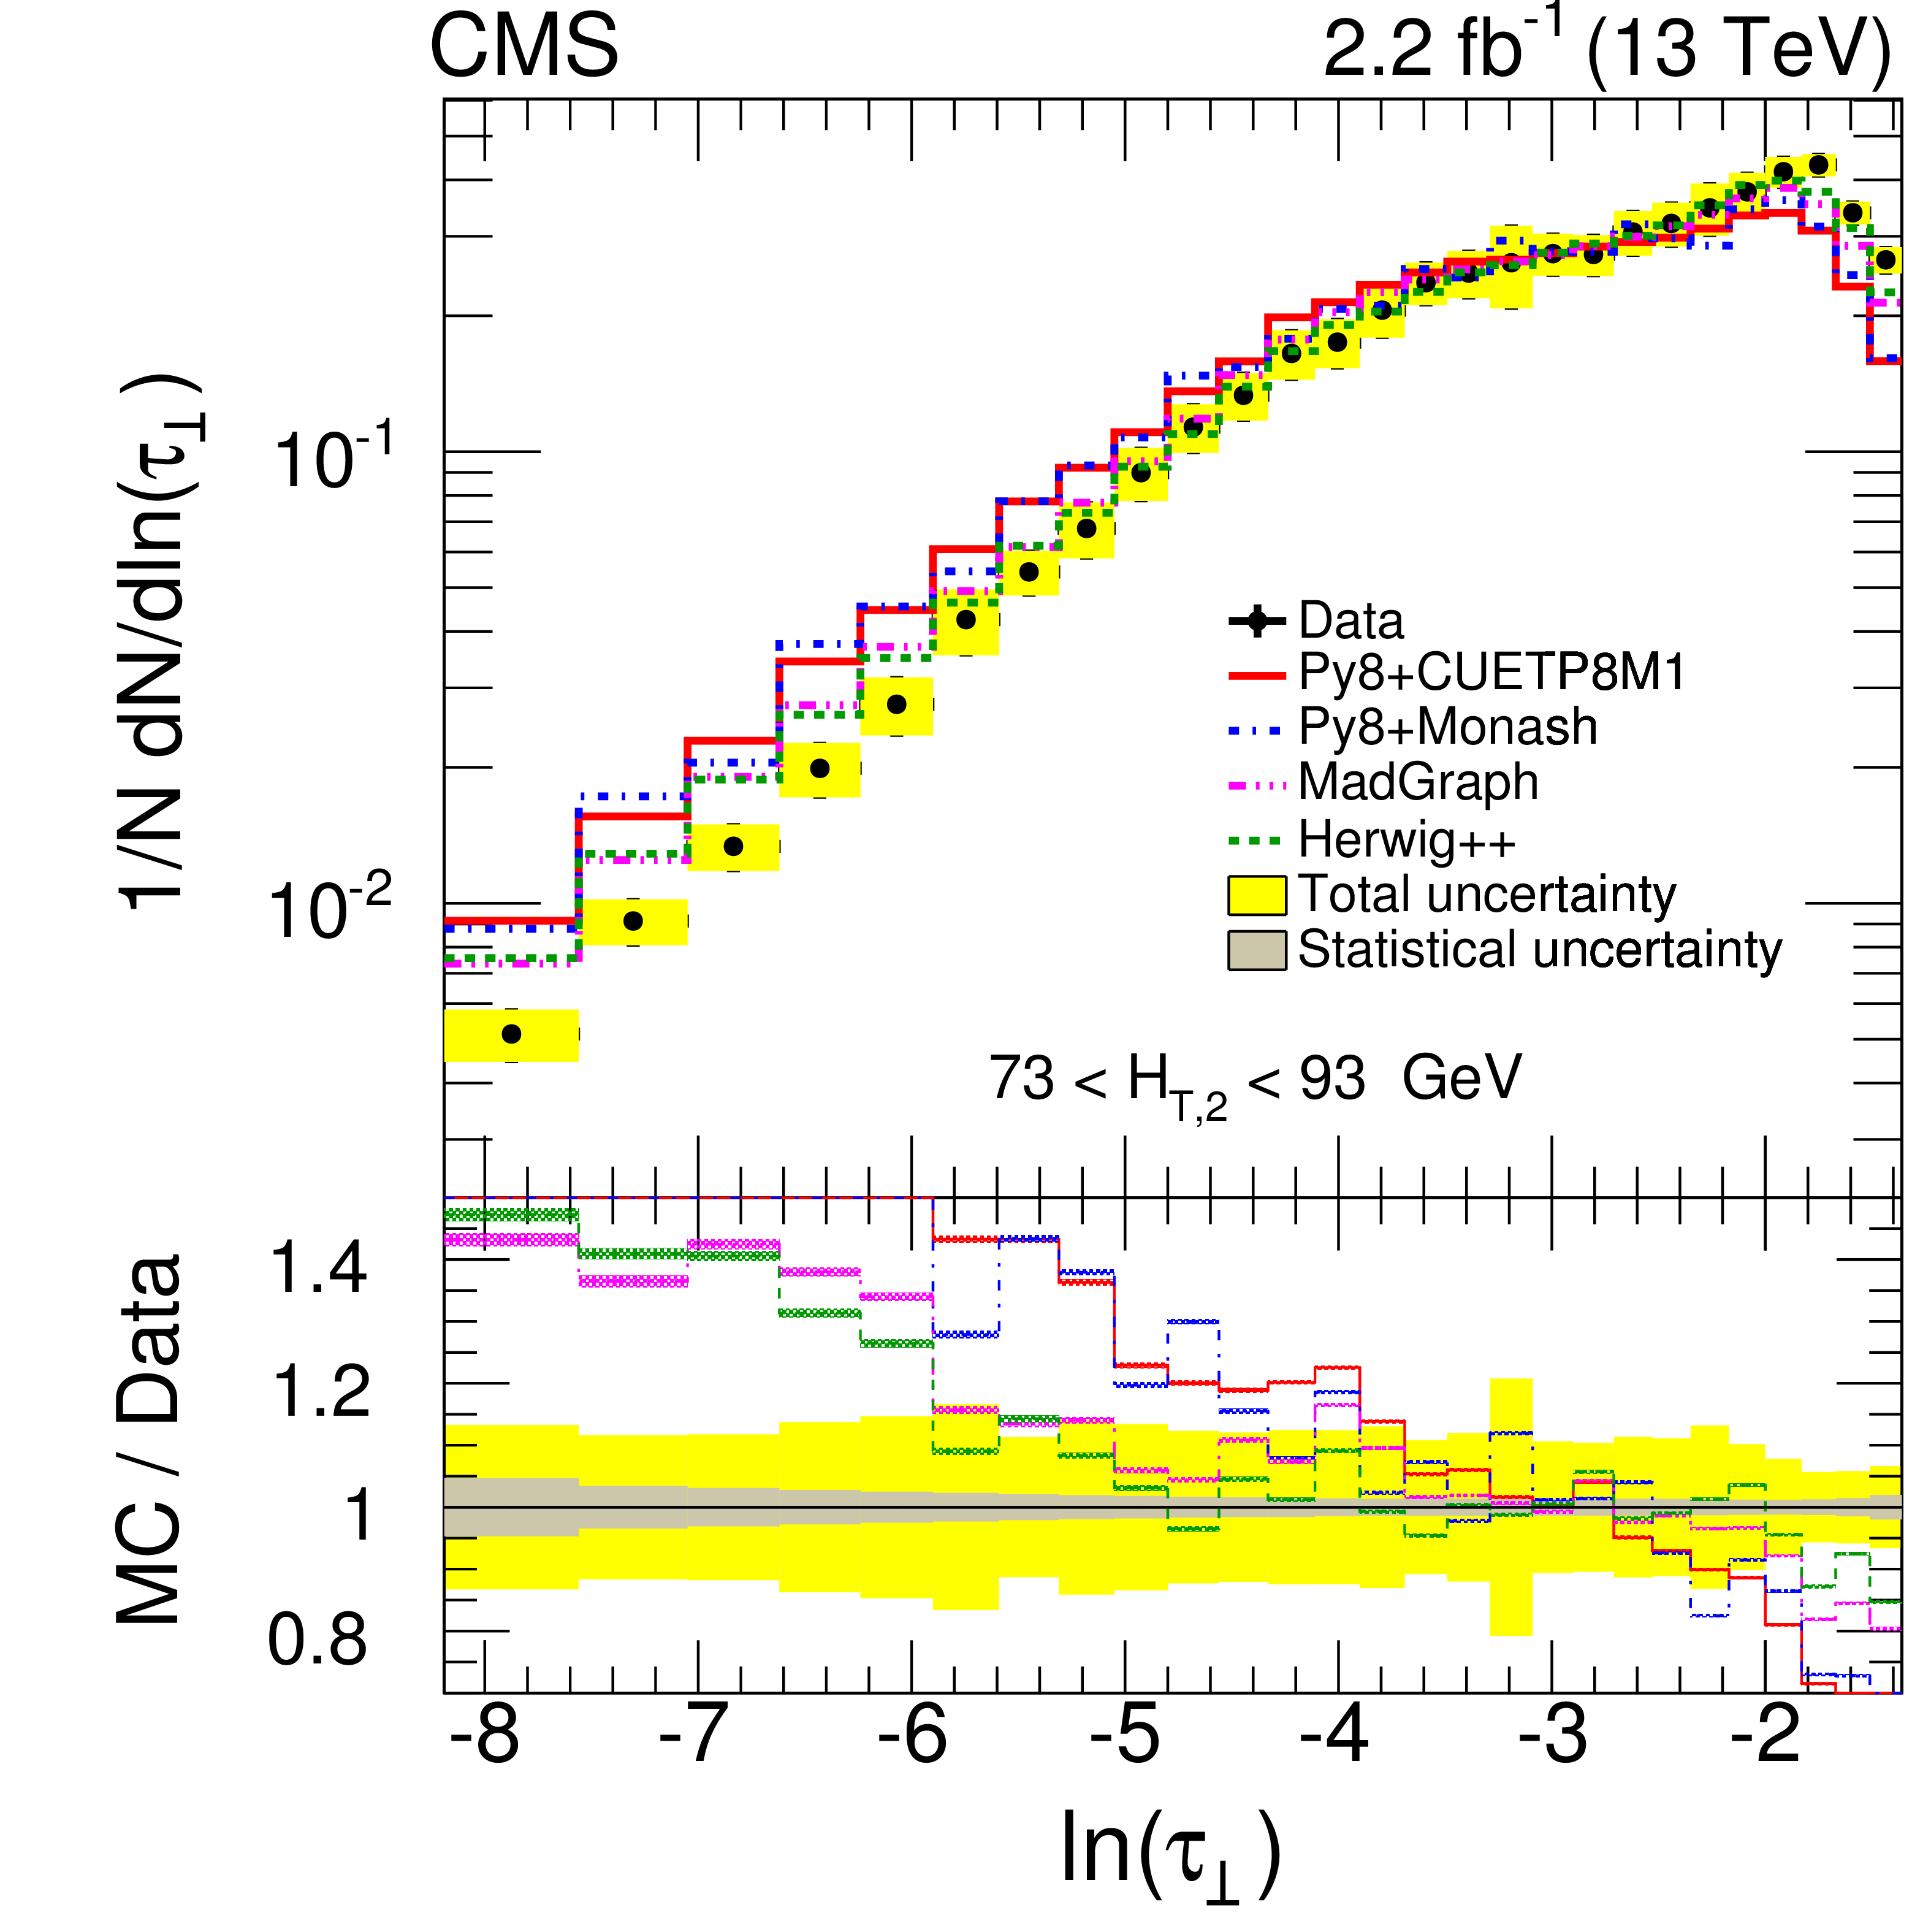
Figure 3-a:
Normalized differential distributions of unfolded data compared with theoretical (MC) predictions of PYTHIA8 CUETP8M1 (red line), PYTHIA8 Monash (blue dash-dotted line), MadGraph5_amc@nlo (pink dash-dot-dotted line) and HERWIG++ (brown dash-dot-dotted line) as a function of ESV: complement of transverse thrust ($ {\tau _{\perp}} $) for 73 $ < {H_{\mathrm {T},2}} < $ 93 GeV. In the ratio plot, the inner gray band represents statistical uncertainty and the yellow band represents the total uncertainty (systematic and statistical components added in quadrature) on data and the MC predictions include only statistical uncertainty. |
png pdf |
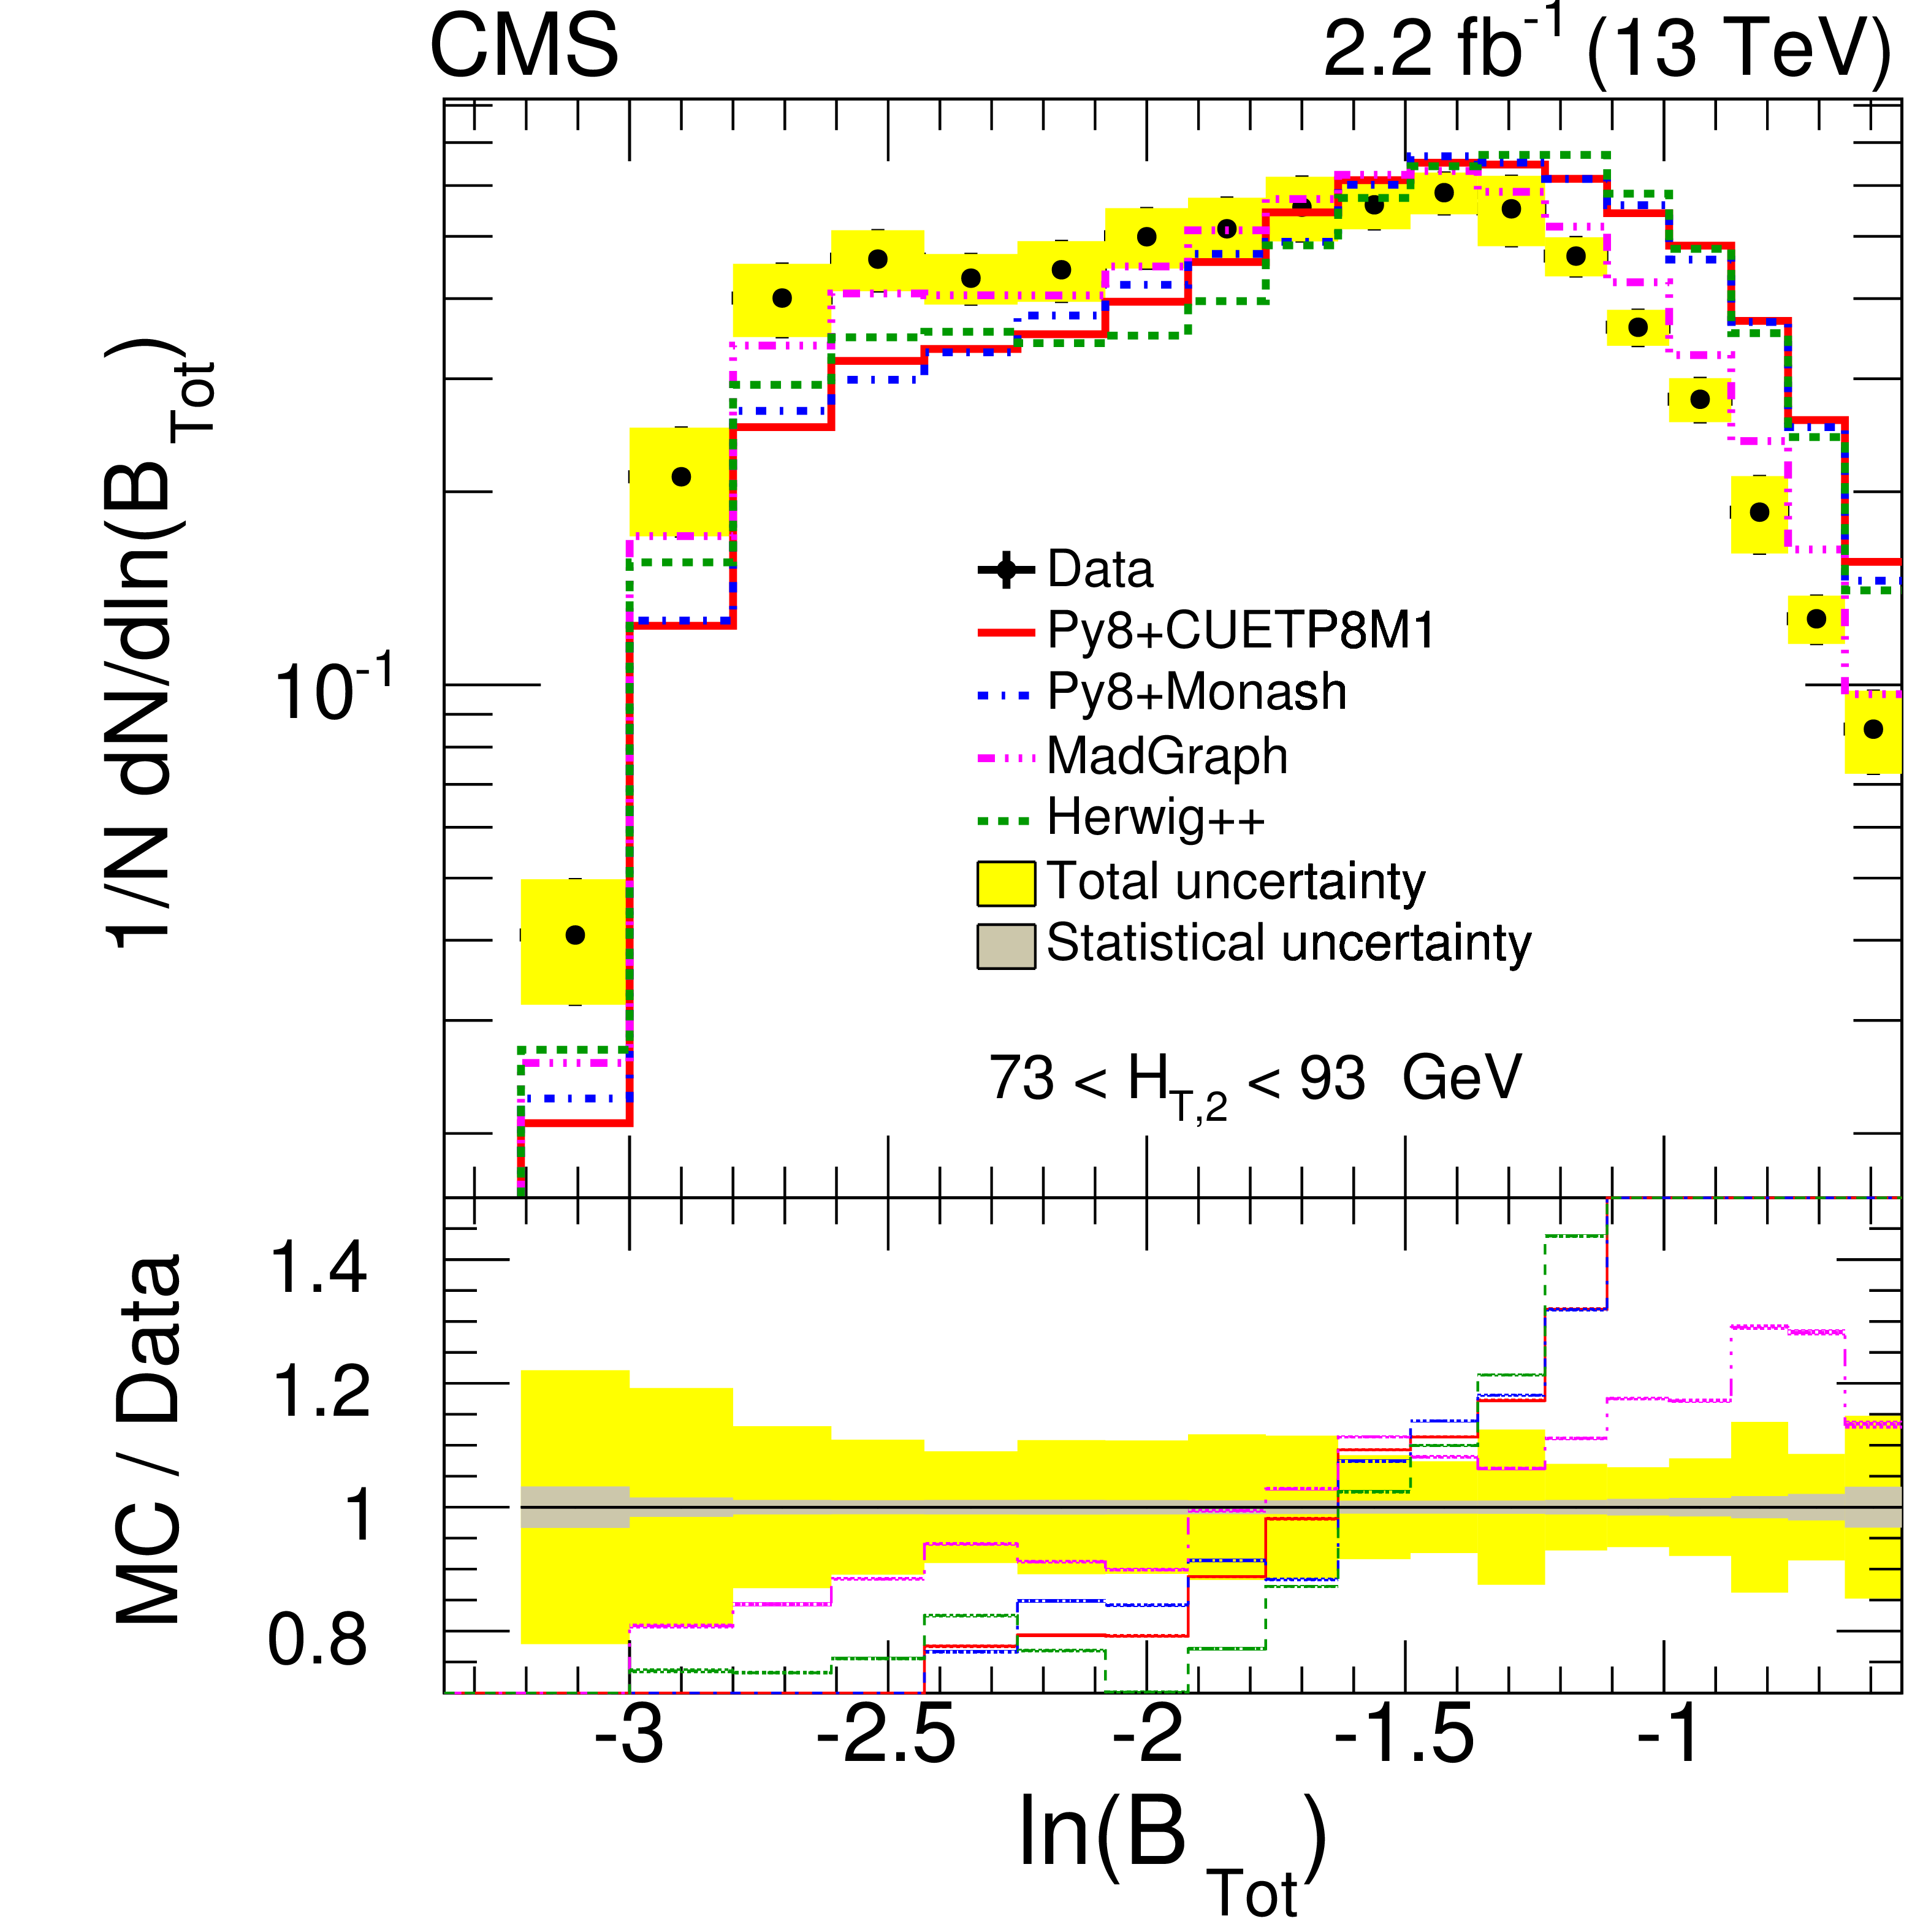
Figure 3-b:
Normalized differential distributions of unfolded data compared with theoretical (MC) predictions of PYTHIA8 CUETP8M1 (red line), PYTHIA8 Monash (blue dash-dotted line), MadGraph5_amc@nlo (pink dash-dot-dotted line) and HERWIG++ (brown dash-dot-dotted line) as a function of ESV: total jet broadening ($ {B_{\mathrm {Tot}}} $) for 73 $ < {H_{\mathrm {T},2}} < $ 93 GeV. In the ratio plot, the inner gray band represents statistical uncertainty and the yellow band represents the total uncertainty (systematic and statistical components added in quadrature) on data and the MC predictions include only statistical uncertainty. |
png pdf |
Figure 3-c:
Normalized differential distributions of unfolded data compared with theoretical (MC) predictions of PYTHIA8 CUETP8M1 (red line), PYTHIA8 Monash (blue dash-dotted line), MadGraph5_amc@nlo (pink dash-dot-dotted line) and HERWIG++ (brown dash-dot-dotted line) as a function of ESV: total jet mass ($ {\rho _{\mathrm {Tot}}} $) for 73 $ < {H_{\mathrm {T},2}} < $ 93 GeV. In the ratio plot, the inner gray band represents statistical uncertainty and the yellow band represents the total uncertainty (systematic and statistical components added in quadrature) on data and the MC predictions include only statistical uncertainty. |
png pdf |
Figure 3-d:
Normalized differential distributions of unfolded data compared with theoretical (MC) predictions of PYTHIA8 CUETP8M1 (red line), PYTHIA8 Monash (blue dash-dotted line), MadGraph5_amc@nlo (pink dash-dot-dotted line) and HERWIG++ (brown dash-dot-dotted line) as a function of ESV: total transverse jet mass ($ {\rho _{\mathrm {Tot}}^{\mathrm {T}}} $) for 73 $ < {H_{\mathrm {T},2}} < $ 93 GeV. In the ratio plot, the inner gray band represents statistical uncertainty and the yellow band represents the total uncertainty (systematic and statistical components added in quadrature) on data and the MC predictions include only statistical uncertainty. |
png pdf |
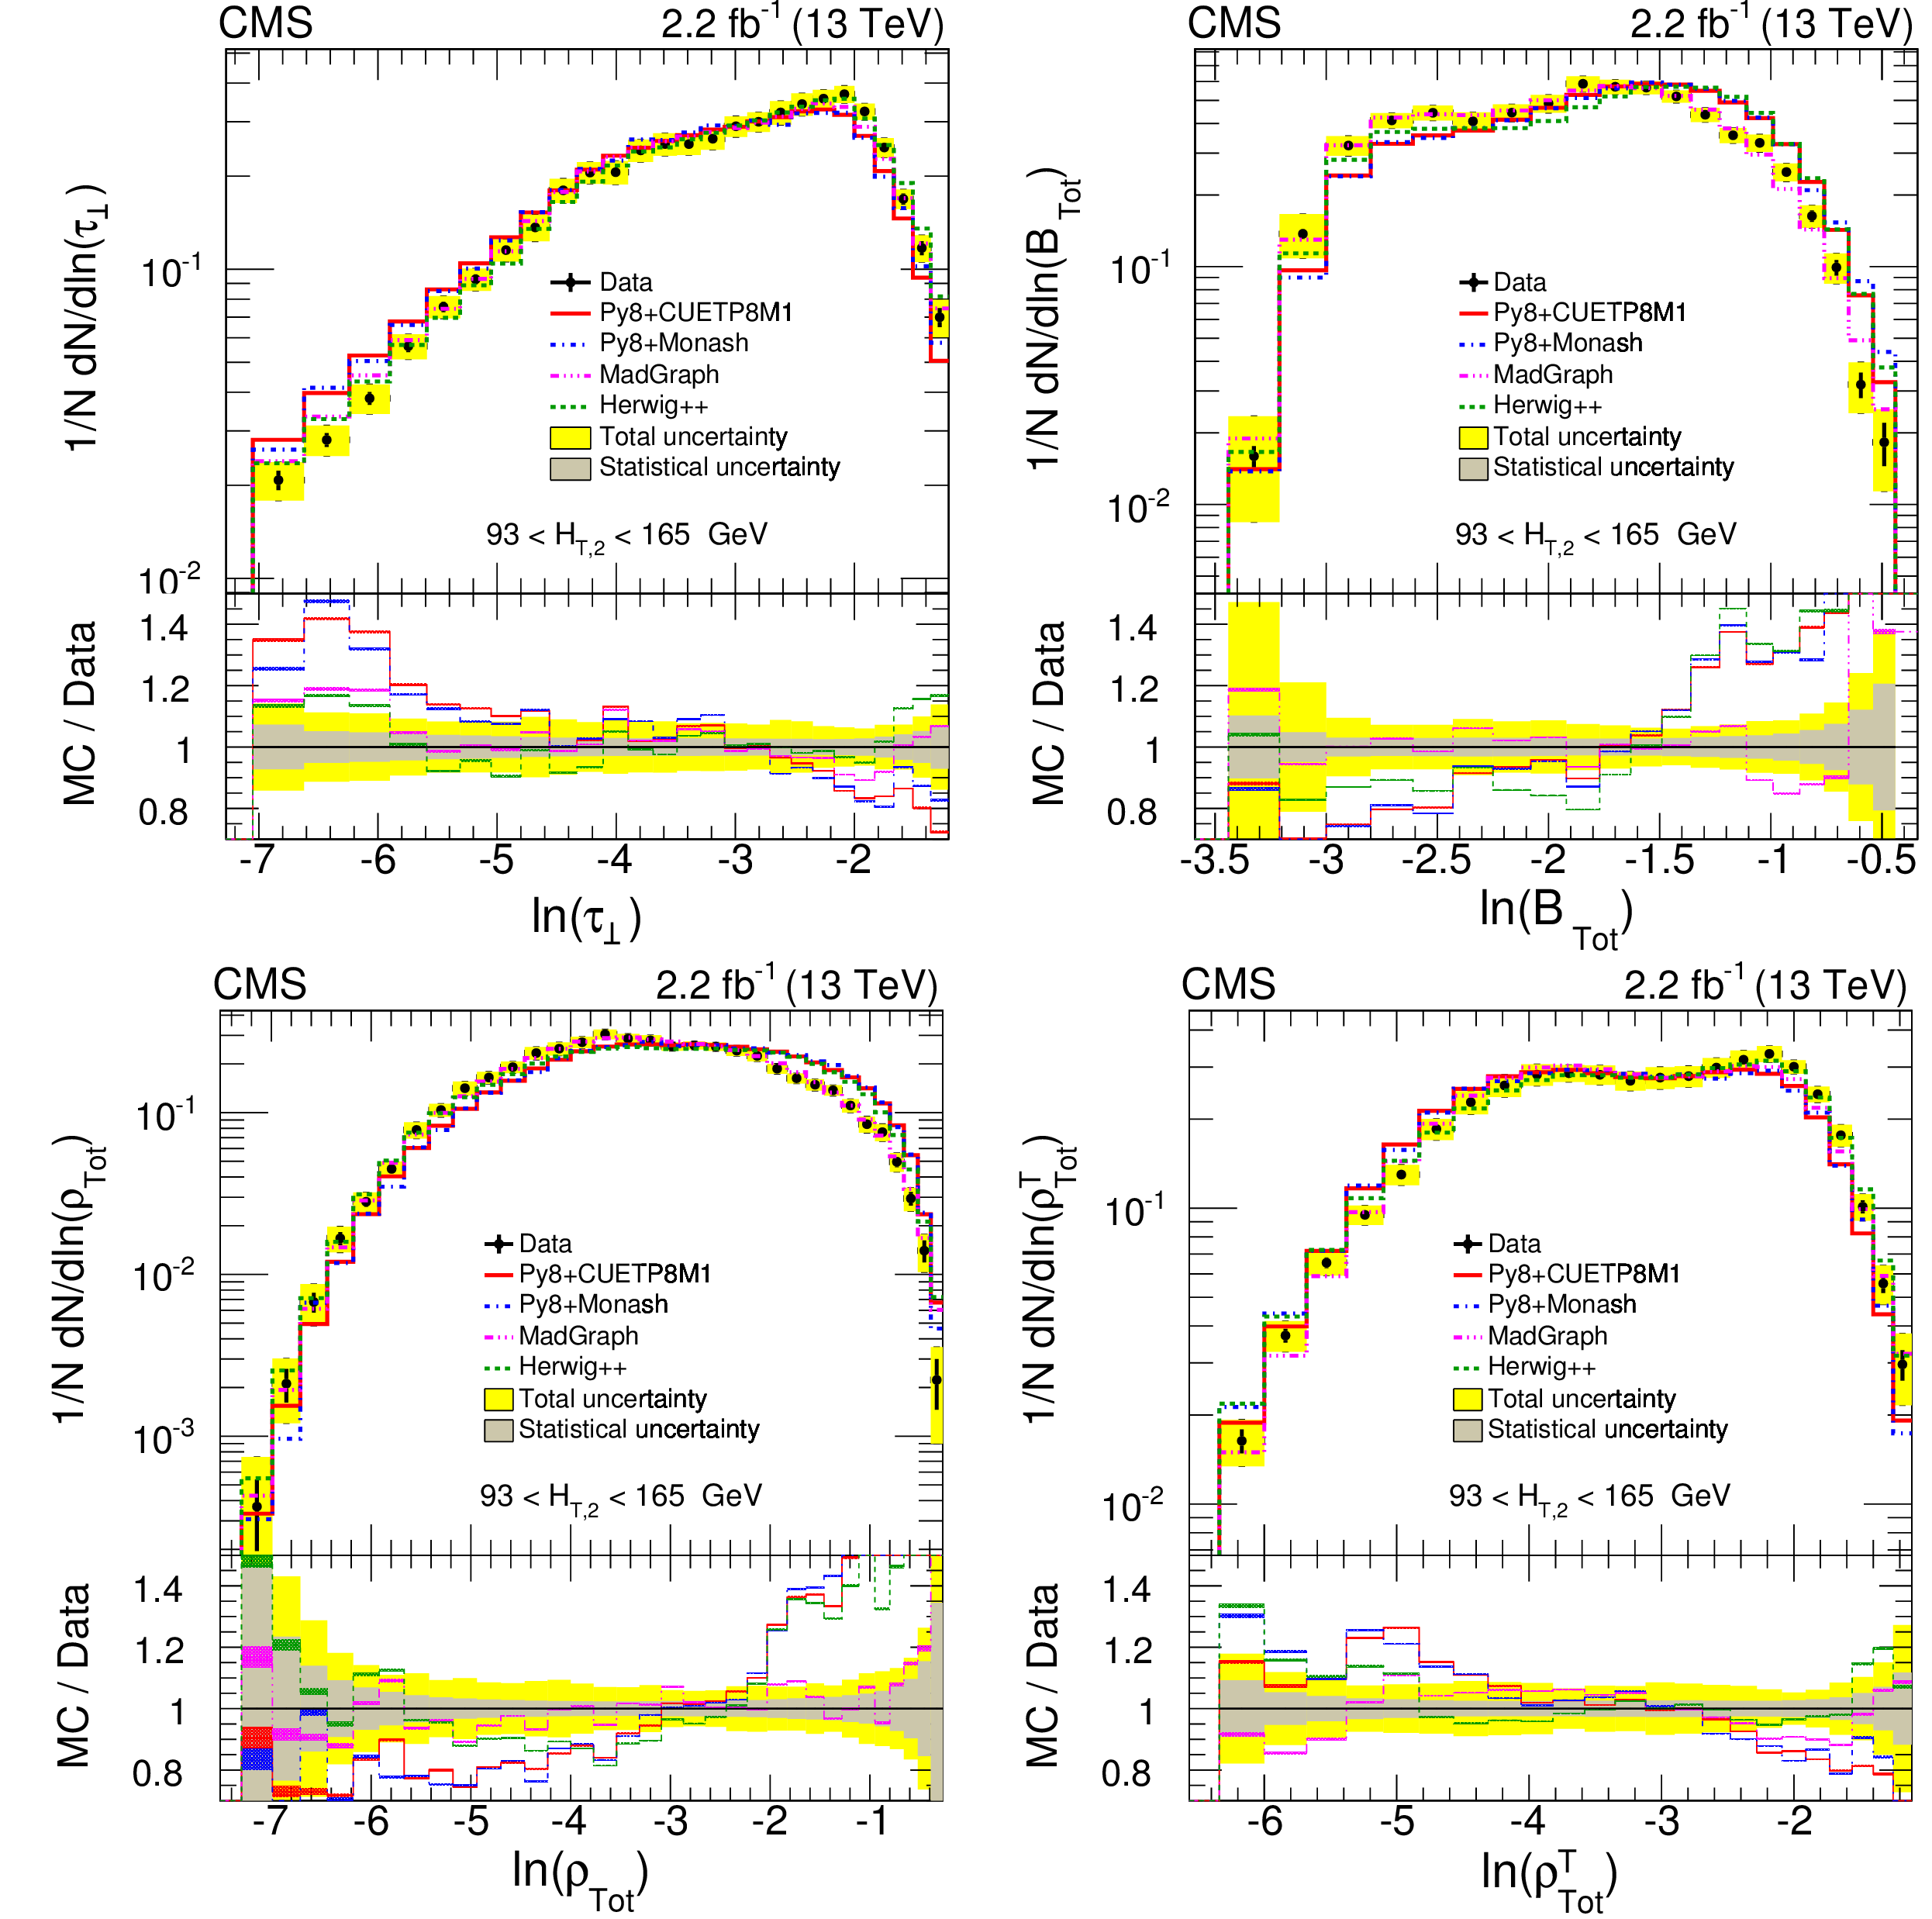
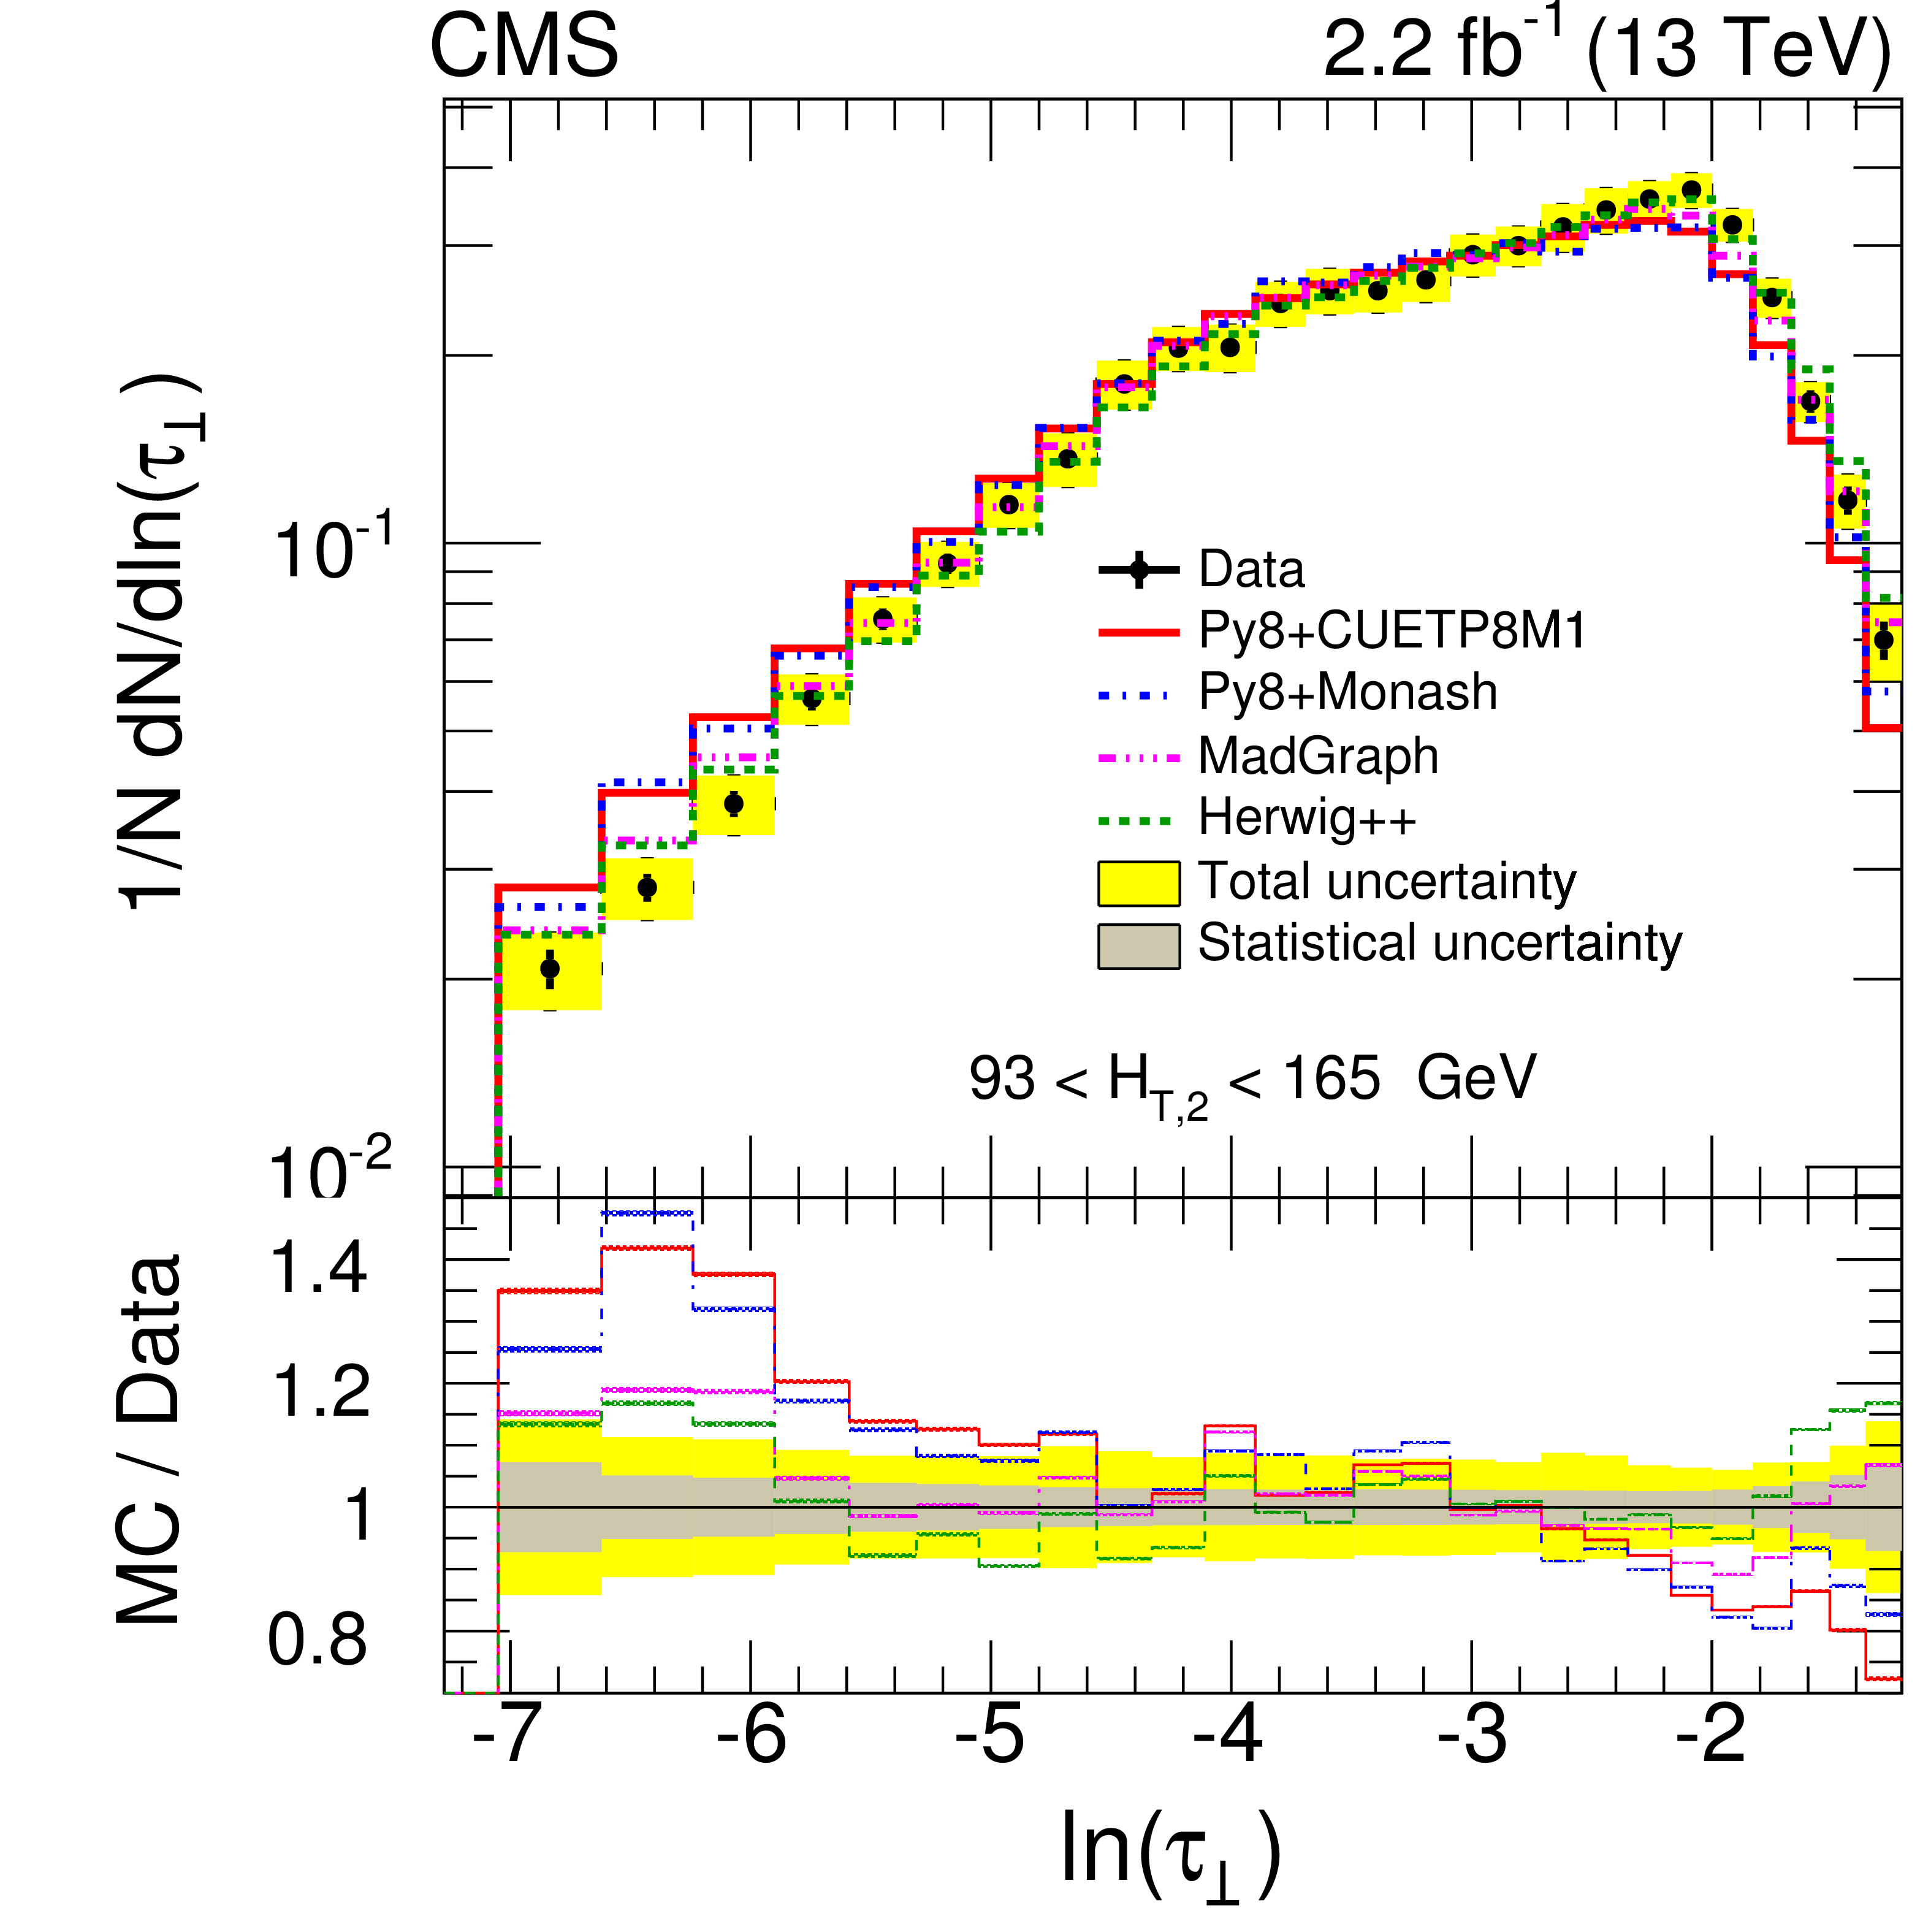
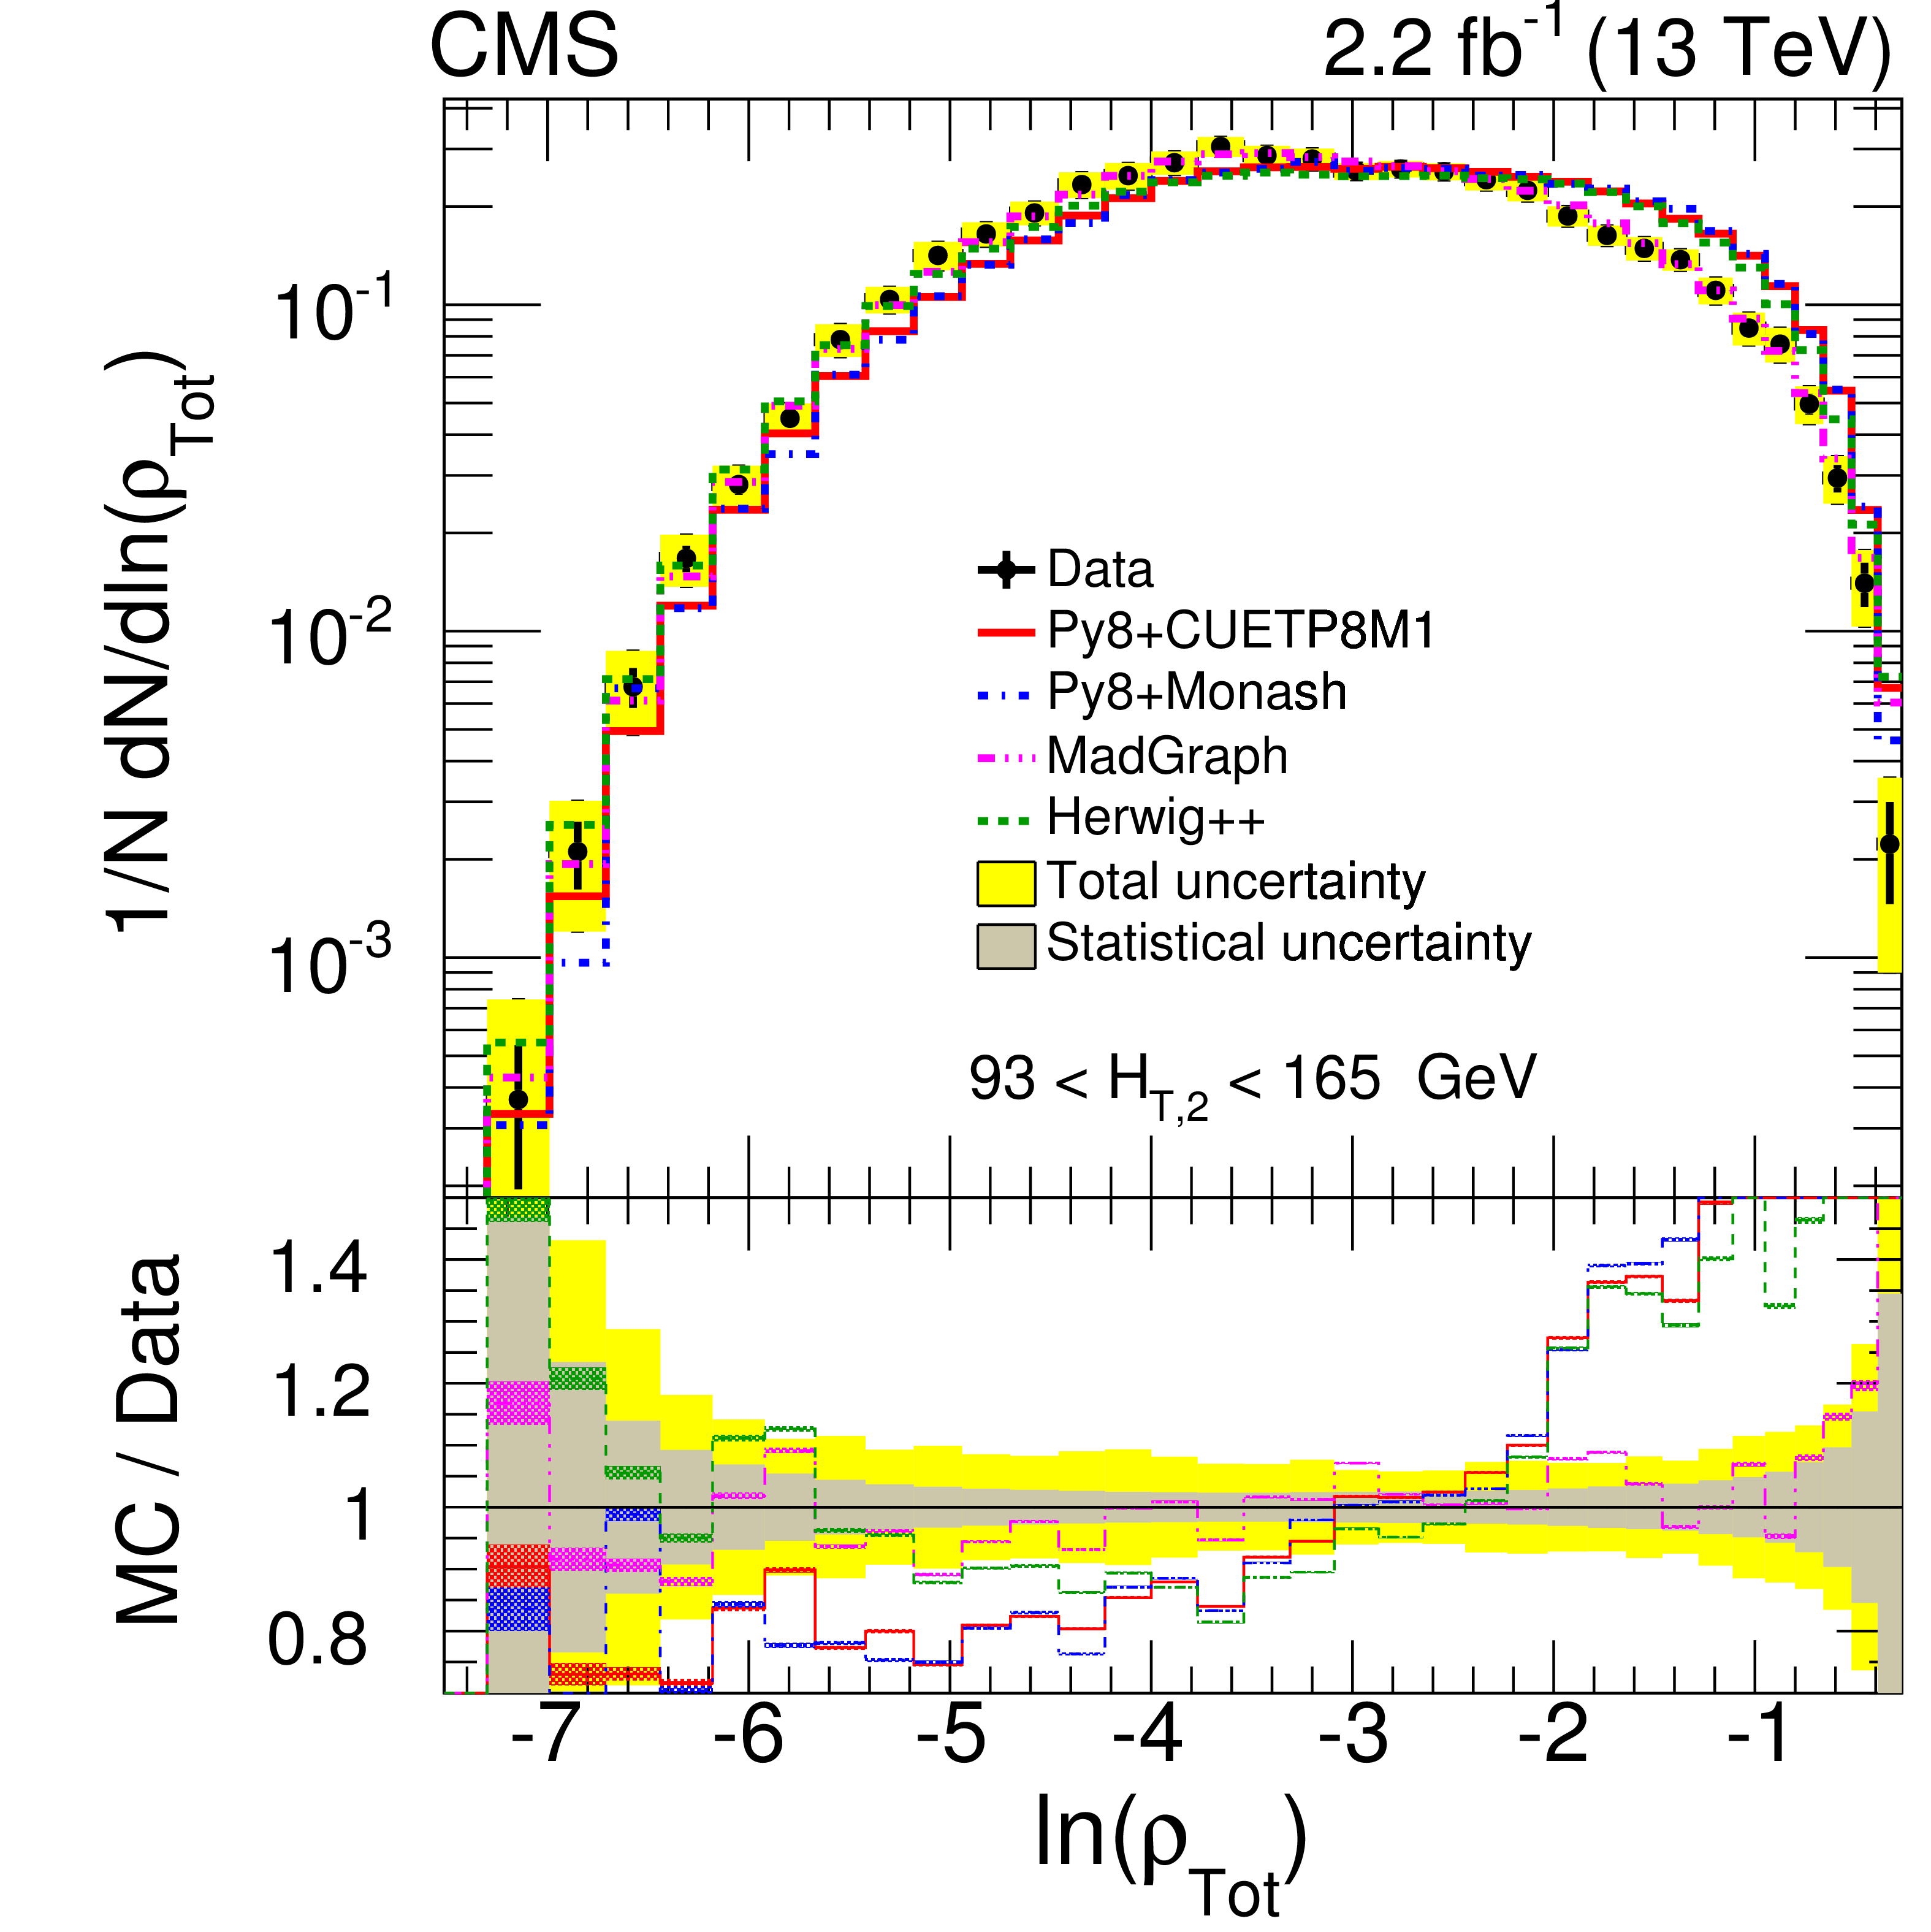
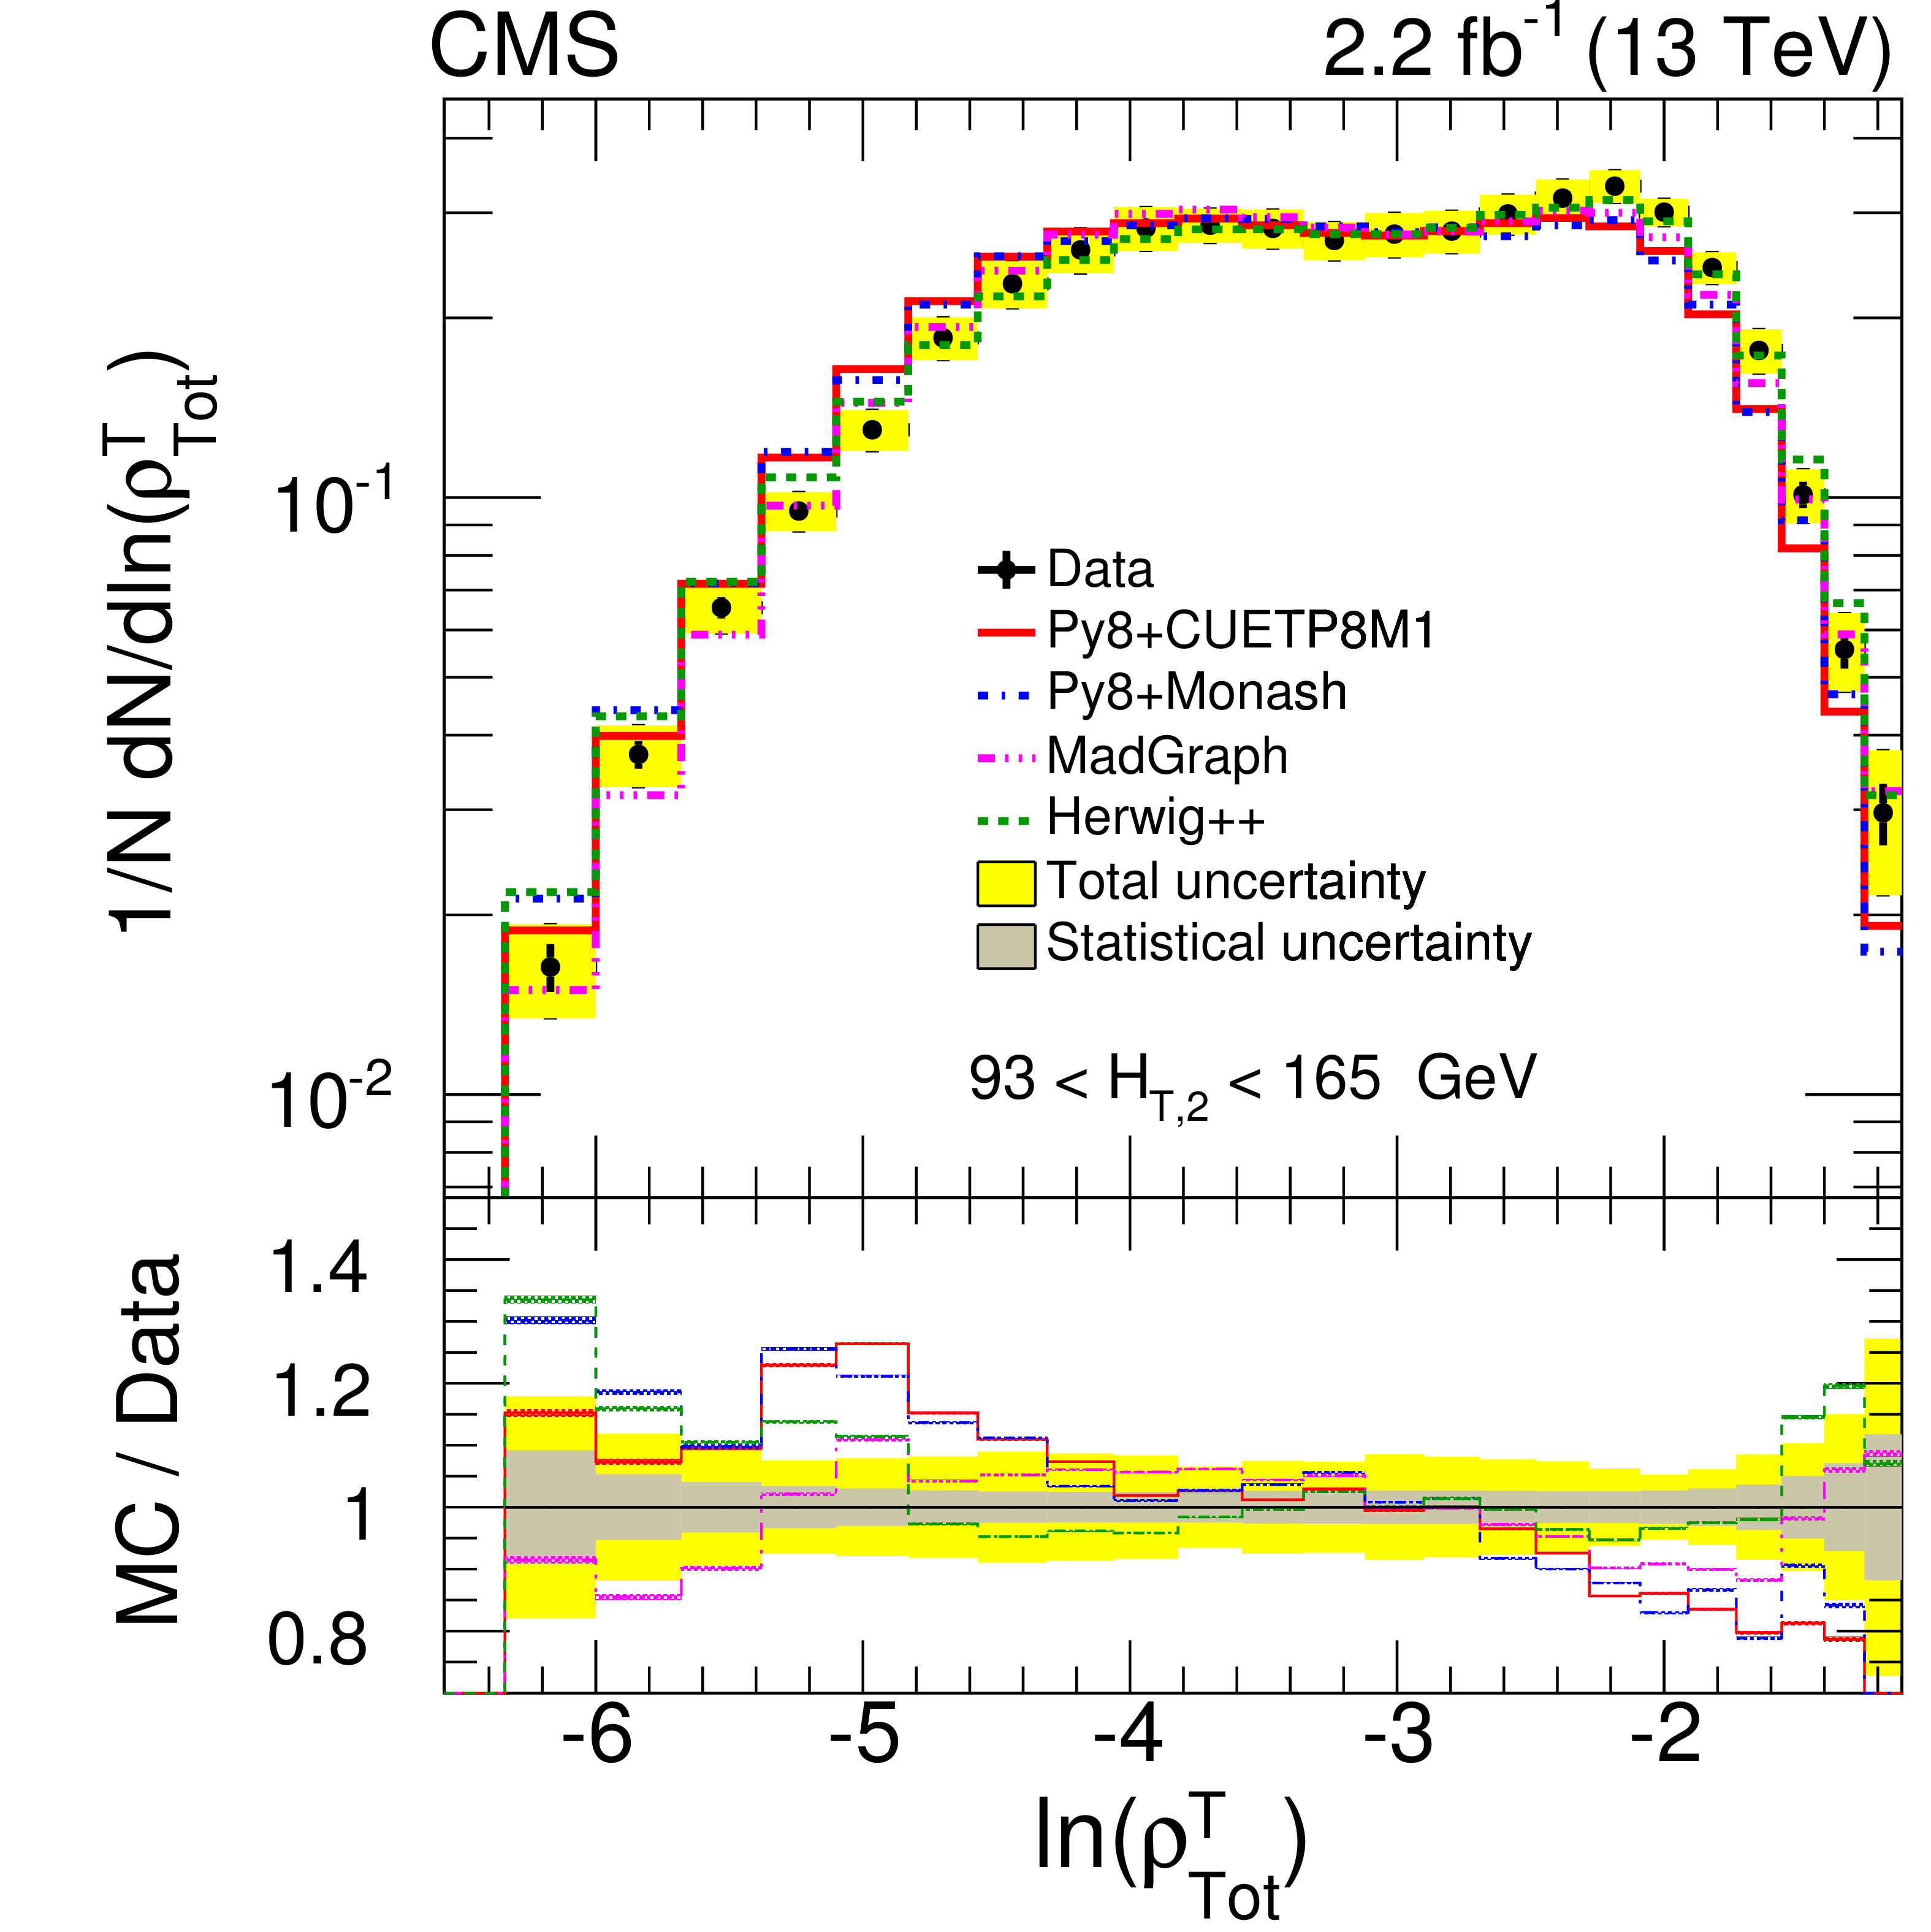
Figure 4:
Normalized differential distributions of unfolded data compared with theoretical (MC) predictions of PYTHIA8 CUETP8M1 (red line), PYTHIA8 Monash (blue dash-dotted line), MadGraph5_amc@nlo (pink dash-dot-dotted line) and HERWIG++ (brown dash-dot-dotted line) as a function of ESV: complement of transverse thrust ($ {\tau _{\perp}} $) (upper left), total jet broadening ($ {B_{\mathrm {Tot}}} $) (upper right), total jet mass ($ {\rho _{\mathrm {Tot}}} $) (lower left) and total transverse jet mass ($ {\rho _{\mathrm {Tot}}^{\mathrm {T}}} $) (lower right) for 93 $ < {H_{\mathrm {T},2}} < $ 165 GeV. In each ratio plot, the inner gray band represents statistical uncertainty and the yellow band represents the total uncertainty (systematic and statistical components added in quadrature) on data and the MC predictions include only statistical uncertainty. |
png pdf |
Figure 4-a:
Normalized differential distributions of unfolded data compared with theoretical (MC) predictions of PYTHIA8 CUETP8M1 (red line), PYTHIA8 Monash (blue dash-dotted line), MadGraph5_amc@nlo (pink dash-dot-dotted line) and HERWIG++ (brown dash-dot-dotted line) as a function of ESV: complement of transverse thrust ($ {\tau _{\perp}} $) for 93 $ < {H_{\mathrm {T},2}} < $ 165 GeV. In the plot, the inner gray band represents statistical uncertainty and the yellow band represents the total uncertainty (systematic and statistical components added in quadrature) on data and the MC predictions include only statistical uncertainty. |

png pdf |
Figure 4-b:
Normalized differential distributions of unfolded data compared with theoretical (MC) predictions of PYTHIA8 CUETP8M1 (red line), PYTHIA8 Monash (blue dash-dotted line), MadGraph5_amc@nlo (pink dash-dot-dotted line) and HERWIG++ (brown dash-dot-dotted line) as a function of ESV: total jet broadening ($ {B_{\mathrm {Tot}}} $) for 93 $ < {H_{\mathrm {T},2}} < $ 165 GeV. In the plot, the inner gray band represents statistical uncertainty and the yellow band represents the total uncertainty (systematic and statistical components added in quadrature) on data and the MC predictions include only statistical uncertainty. |
png pdf |
Figure 4-c:
Normalized differential distributions of unfolded data compared with theoretical (MC) predictions of PYTHIA8 CUETP8M1 (red line), PYTHIA8 Monash (blue dash-dotted line), MadGraph5_amc@nlo (pink dash-dot-dotted line) and HERWIG++ (brown dash-dot-dotted line) as a function of ESV: total jet mass ($ {\rho _{\mathrm {Tot}}} $) for 93 $ < {H_{\mathrm {T},2}} < $ 165 GeV. In the plot, the inner gray band represents statistical uncertainty and the yellow band represents the total uncertainty (systematic and statistical components added in quadrature) on data and the MC predictions include only statistical uncertainty. |
png pdf |
Figure 4-d:
Normalized differential distributions of unfolded data compared with theoretical (MC) predictions of PYTHIA8 CUETP8M1 (red line), PYTHIA8 Monash (blue dash-dotted line), MadGraph5_amc@nlo (pink dash-dot-dotted line) and HERWIG++ (brown dash-dot-dotted line) as a function of ESV: total transverse jet mass ($ {\rho _{\mathrm {Tot}}^{\mathrm {T}}} $) for 93 $ < {H_{\mathrm {T},2}} < $ 165 GeV. In the plot, the inner gray band represents statistical uncertainty and the yellow band represents the total uncertainty (systematic and statistical components added in quadrature) on data and the MC predictions include only statistical uncertainty. |

png pdf |
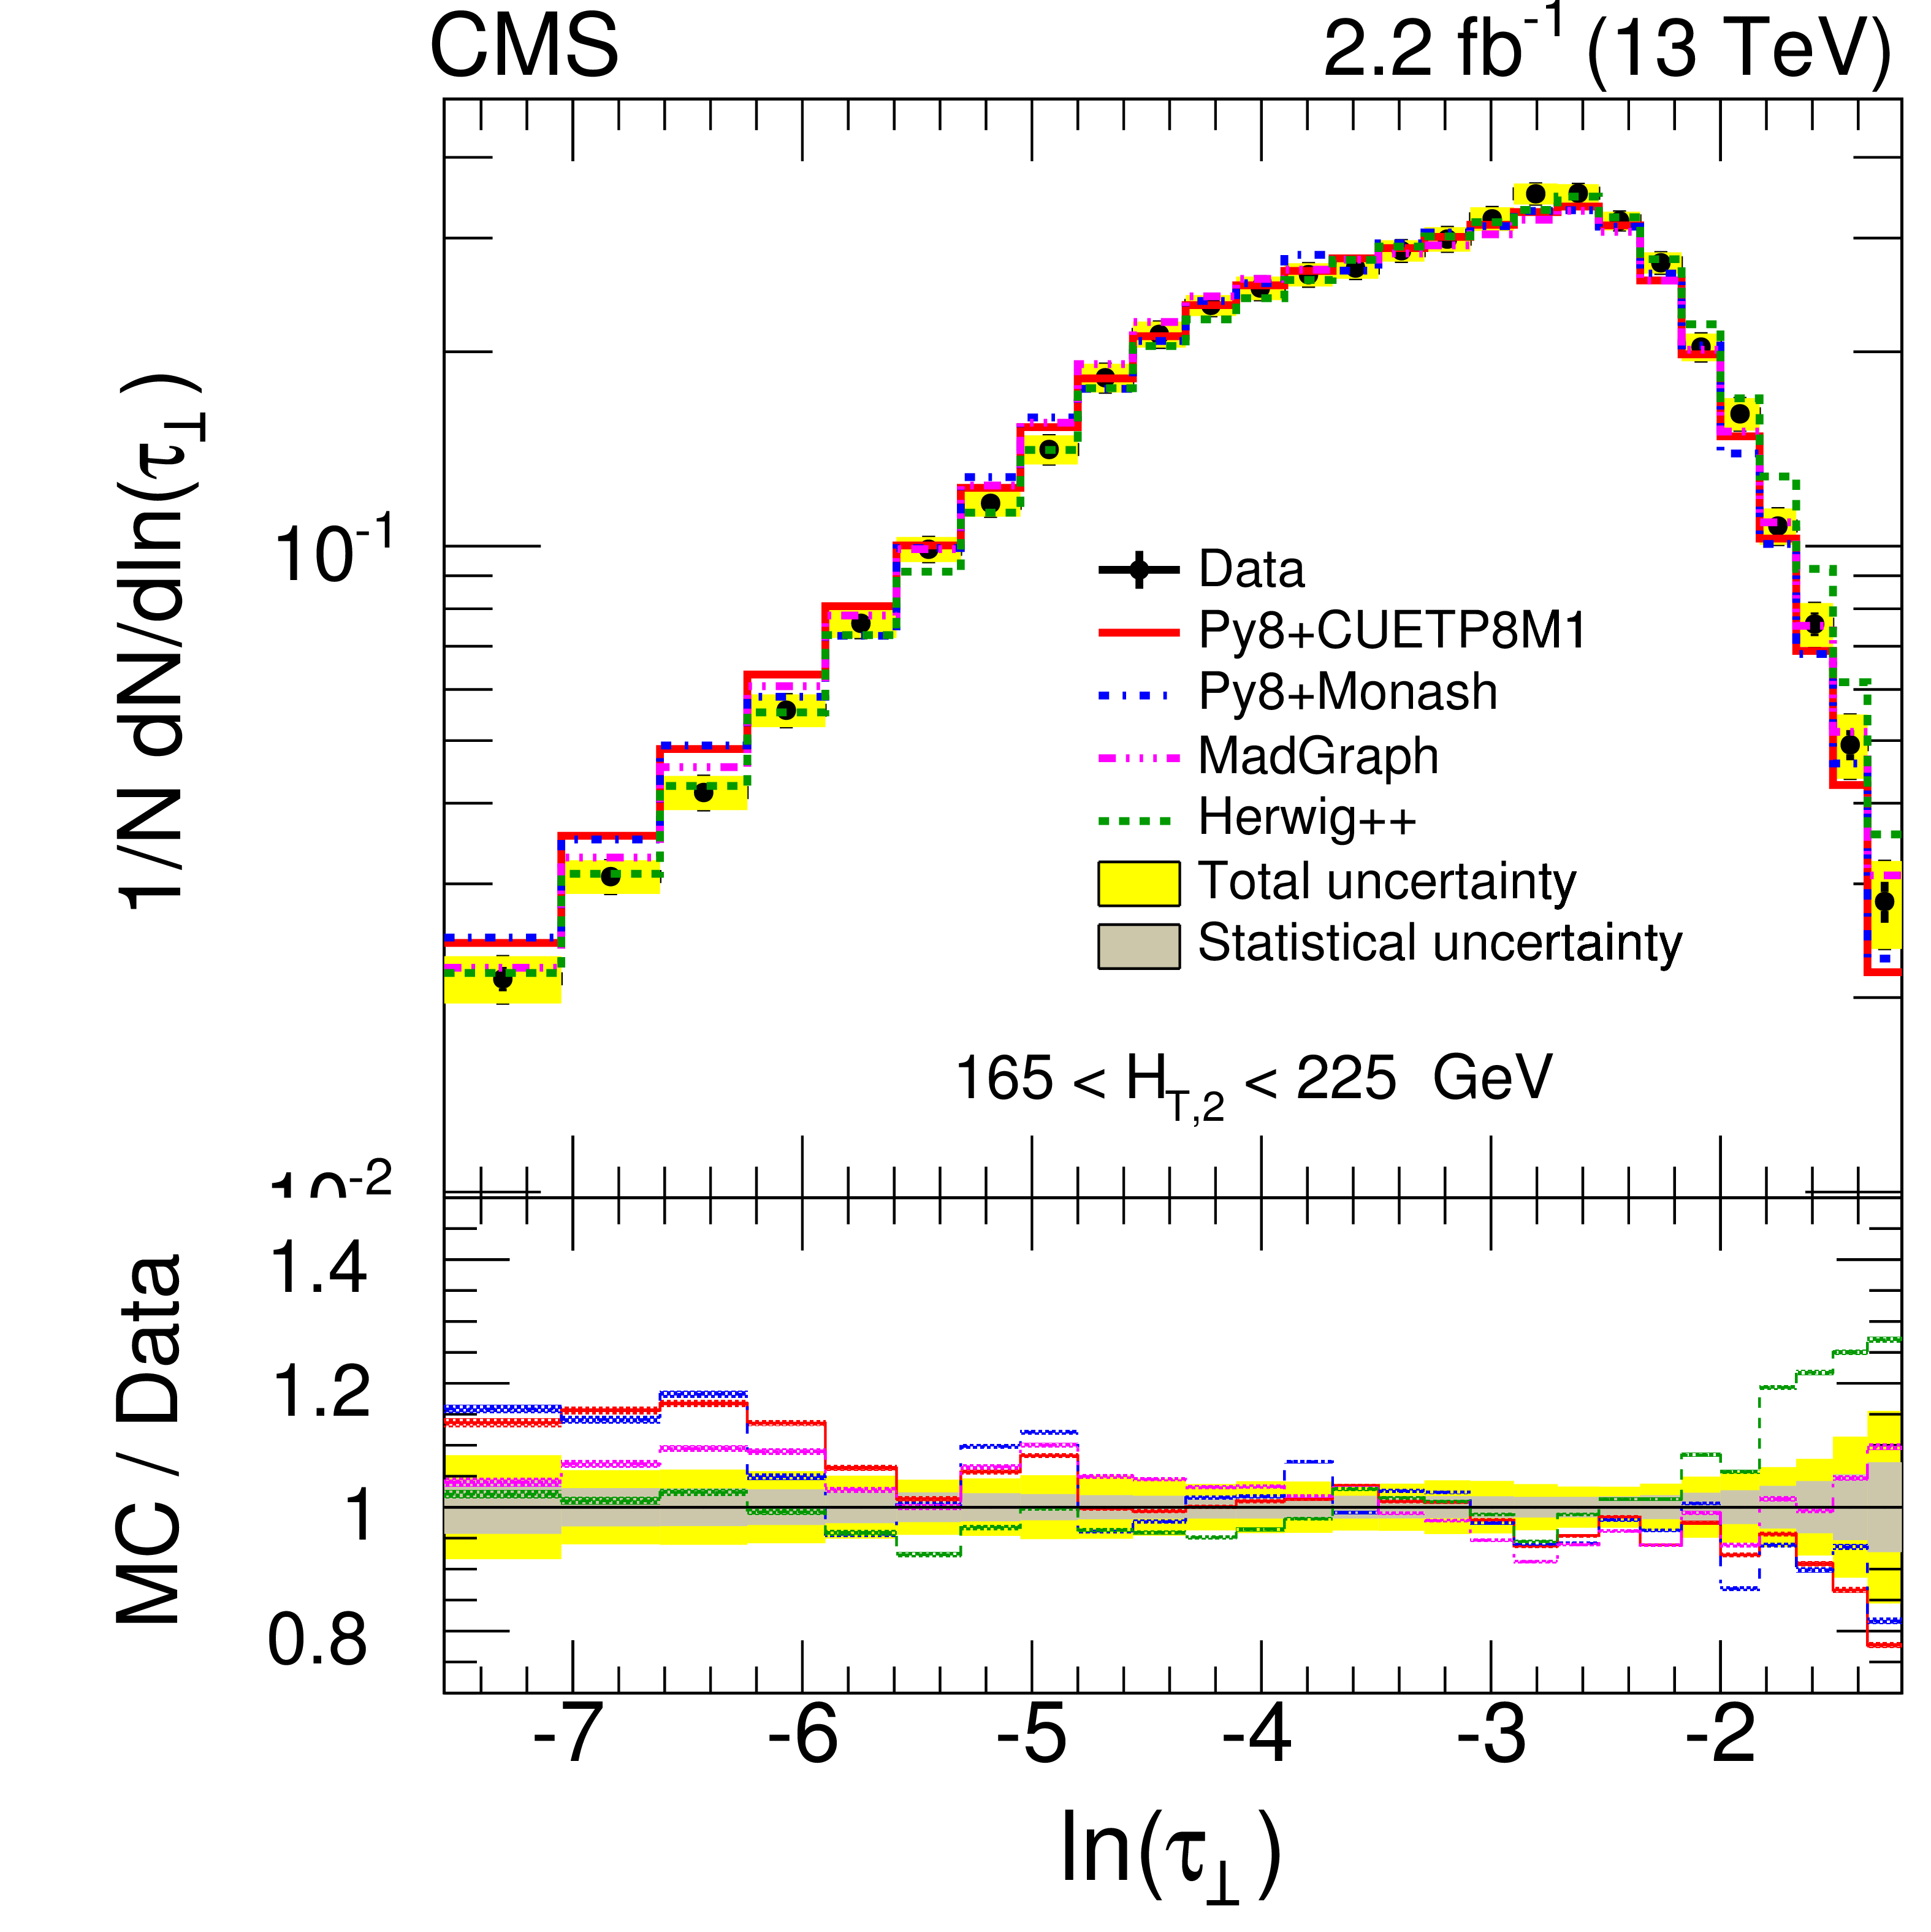
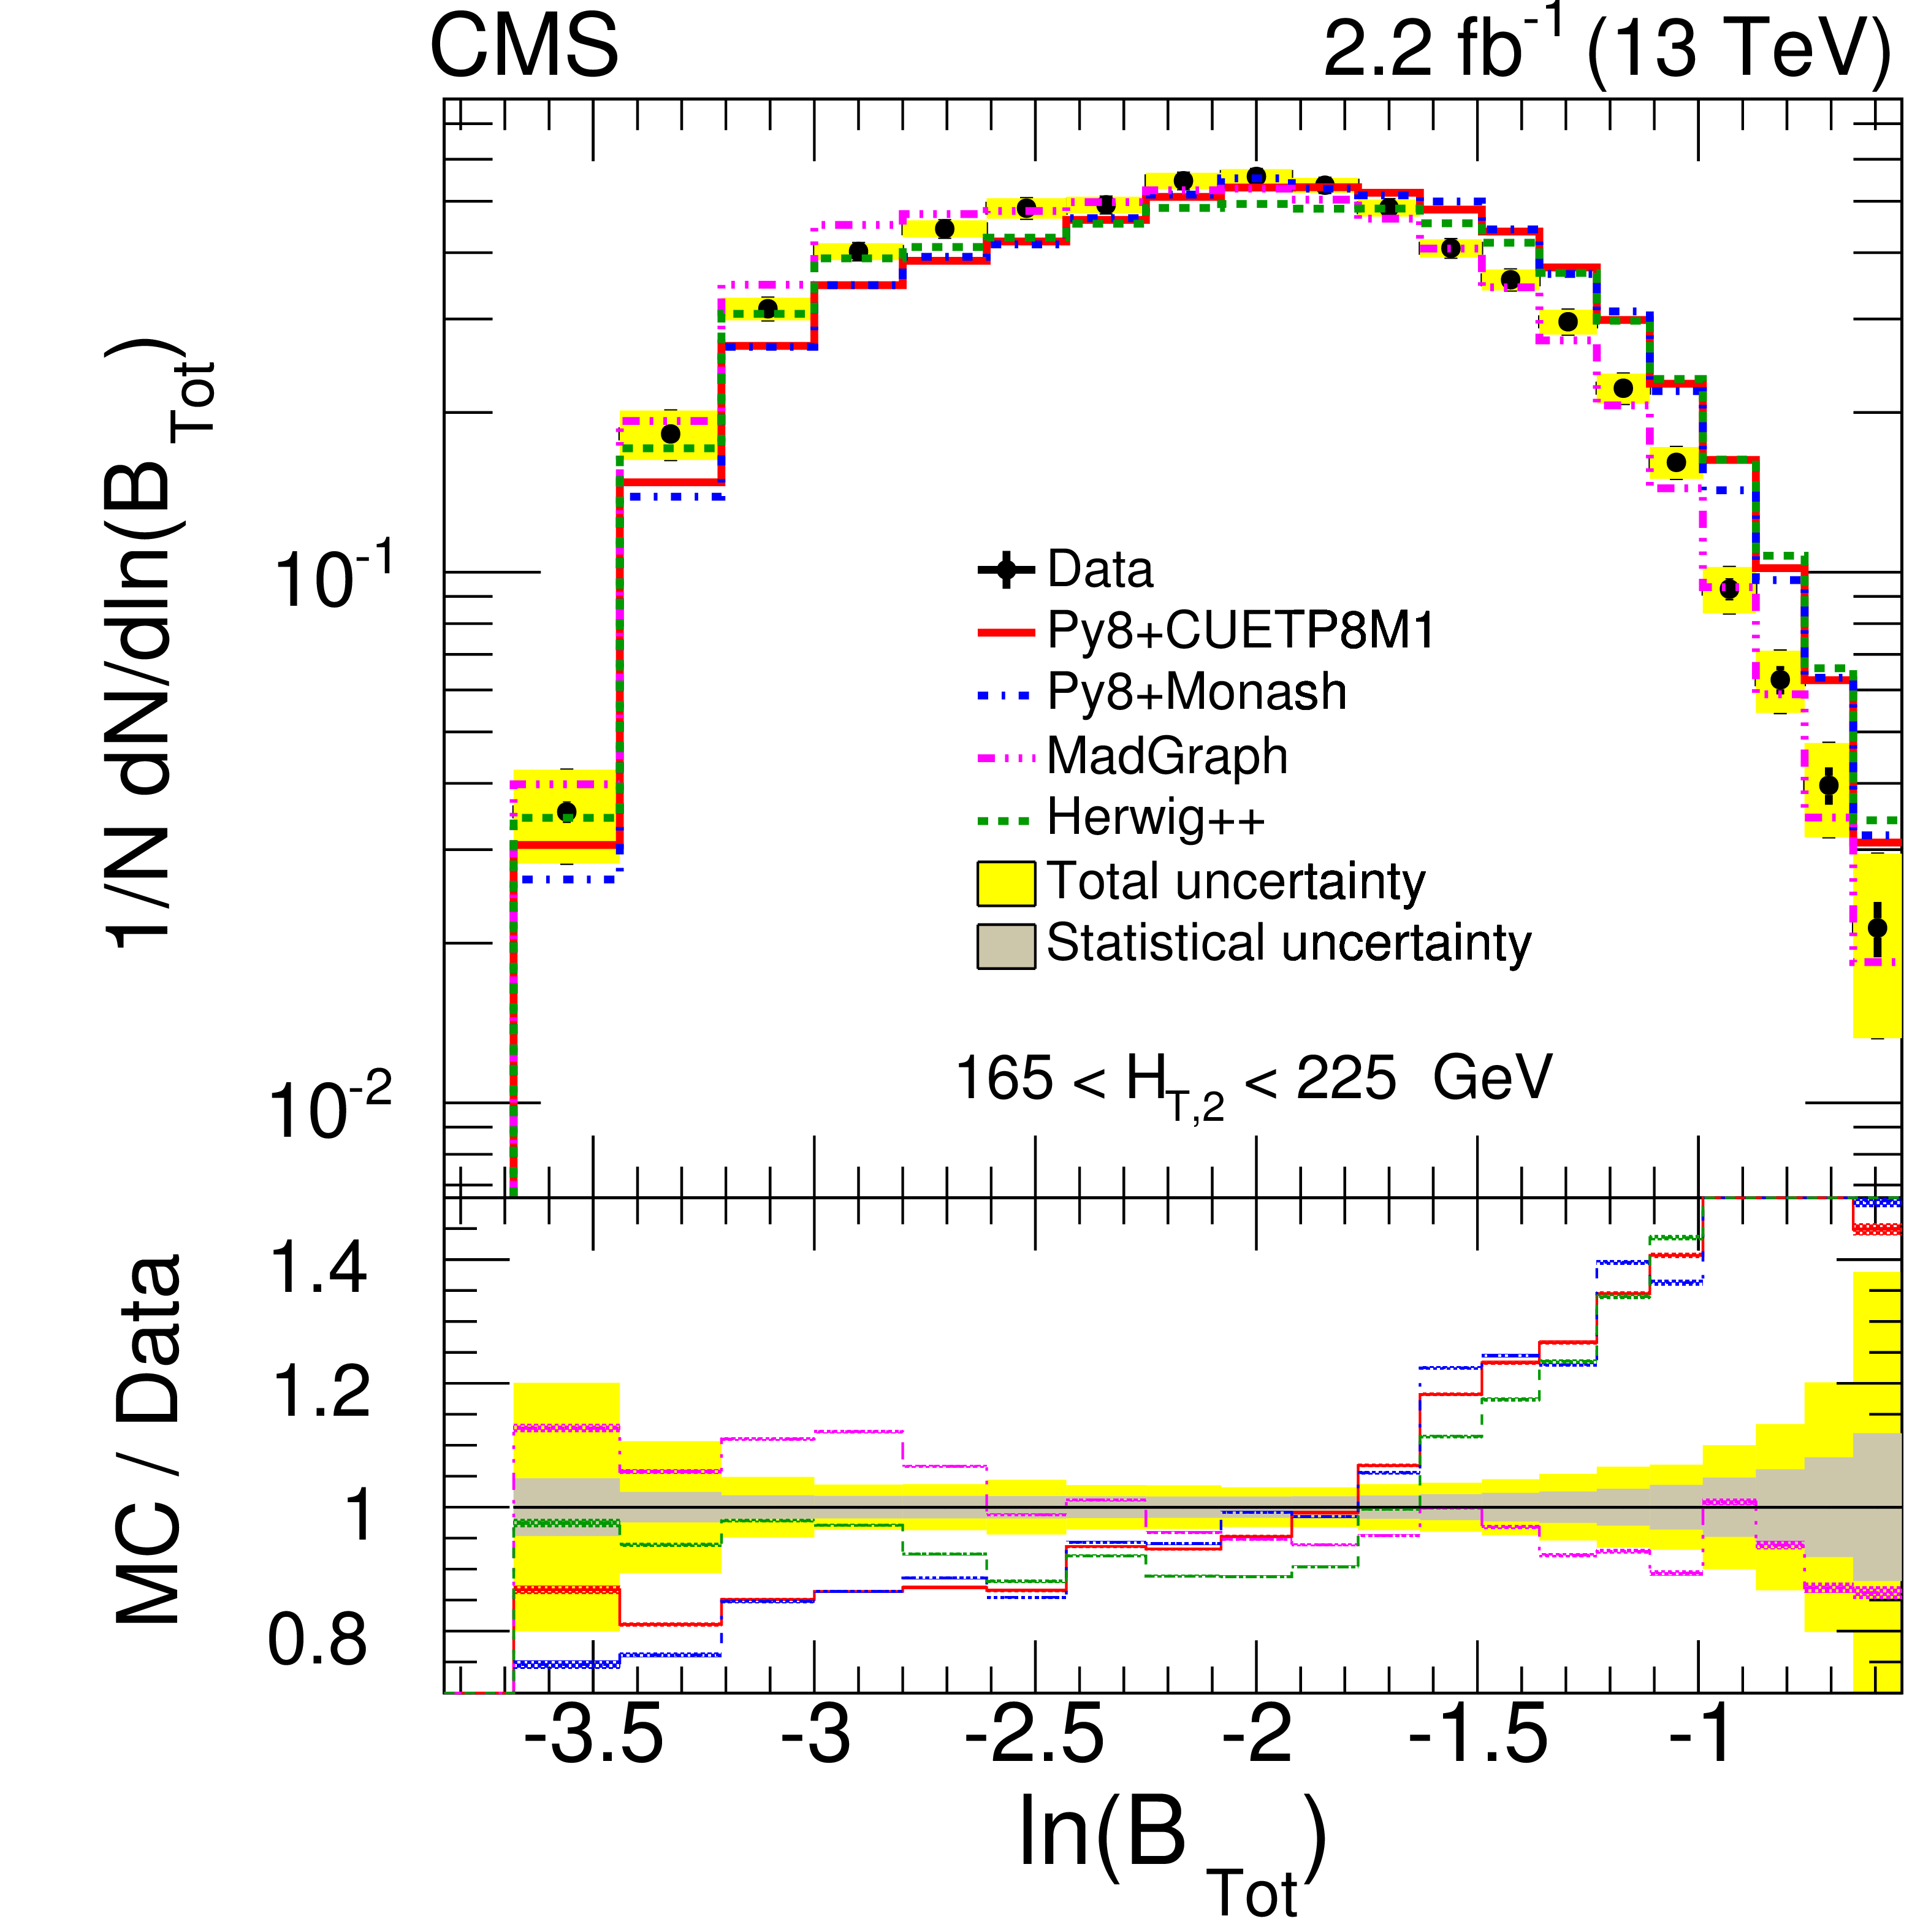
Figure 5:
Normalized differential distributions of unfolded data compared with theoretical (MC) predictions of PYTHIA8 CUETP8M1 (red line), PYTHIA8 Monash (blue dash-dotted line), MadGraph5_amc@nlo (pink dash-dot-dotted line) and HERWIG++ (brown dash-dot-dotted line) as a function of ESV: complement of transverse thrust ($ {\tau _{\perp}} $) (upper left), total jet broadening ($ {B_{\mathrm {Tot}}} $) (upper right), total jet mass ($ {\rho _{\mathrm {Tot}}} $) (lower left) and total transverse jet mass ($ {\rho _{\mathrm {Tot}}^{\mathrm {T}}} $) (lower right) for 165 $ < {H_{\mathrm {T},2}} < $ 225 GeV. In each ratio plot, the inner gray band represents statistical uncertainty and the yellow band represents the total uncertainty (systematic and statistical components added in quadrature) on data and the MC predictions include only statistical uncertainty. |
png pdf |
Figure 5-a:
Normalized differential distributions of unfolded data compared with theoretical (MC) predictions of PYTHIA8 CUETP8M1 (red line), PYTHIA8 Monash (blue dash-dotted line), MadGraph5_amc@nlo (pink dash-dot-dotted line) and HERWIG++ (brown dash-dot-dotted line) as a function of ESV: complement of transverse thrust ($ {\tau _{\perp}} $) for 165 $ < {H_{\mathrm {T},2}} < $ 225 GeV. In each ratio plot, the inner gray band represents statistical uncertainty and the yellow band represents the total uncertainty (systematic and statistical components added in quadrature) on data and the MC predictions include only statistical uncertainty. |
png pdf |
Figure 5-b:
Normalized differential distributions of unfolded data compared with theoretical (MC) predictions of PYTHIA8 CUETP8M1 (red line), PYTHIA8 Monash (blue dash-dotted line), MadGraph5_amc@nlo (pink dash-dot-dotted line) and HERWIG++ (brown dash-dot-dotted line) as a function of ESV: total jet broadening ($ {B_{\mathrm {Tot}}} $) for 165 $ < {H_{\mathrm {T},2}} < $ 225 GeV. In each ratio plot, the inner gray band represents statistical uncertainty and the yellow band represents the total uncertainty (systematic and statistical components added in quadrature) on data and the MC predictions include only statistical uncertainty. |
png pdf |
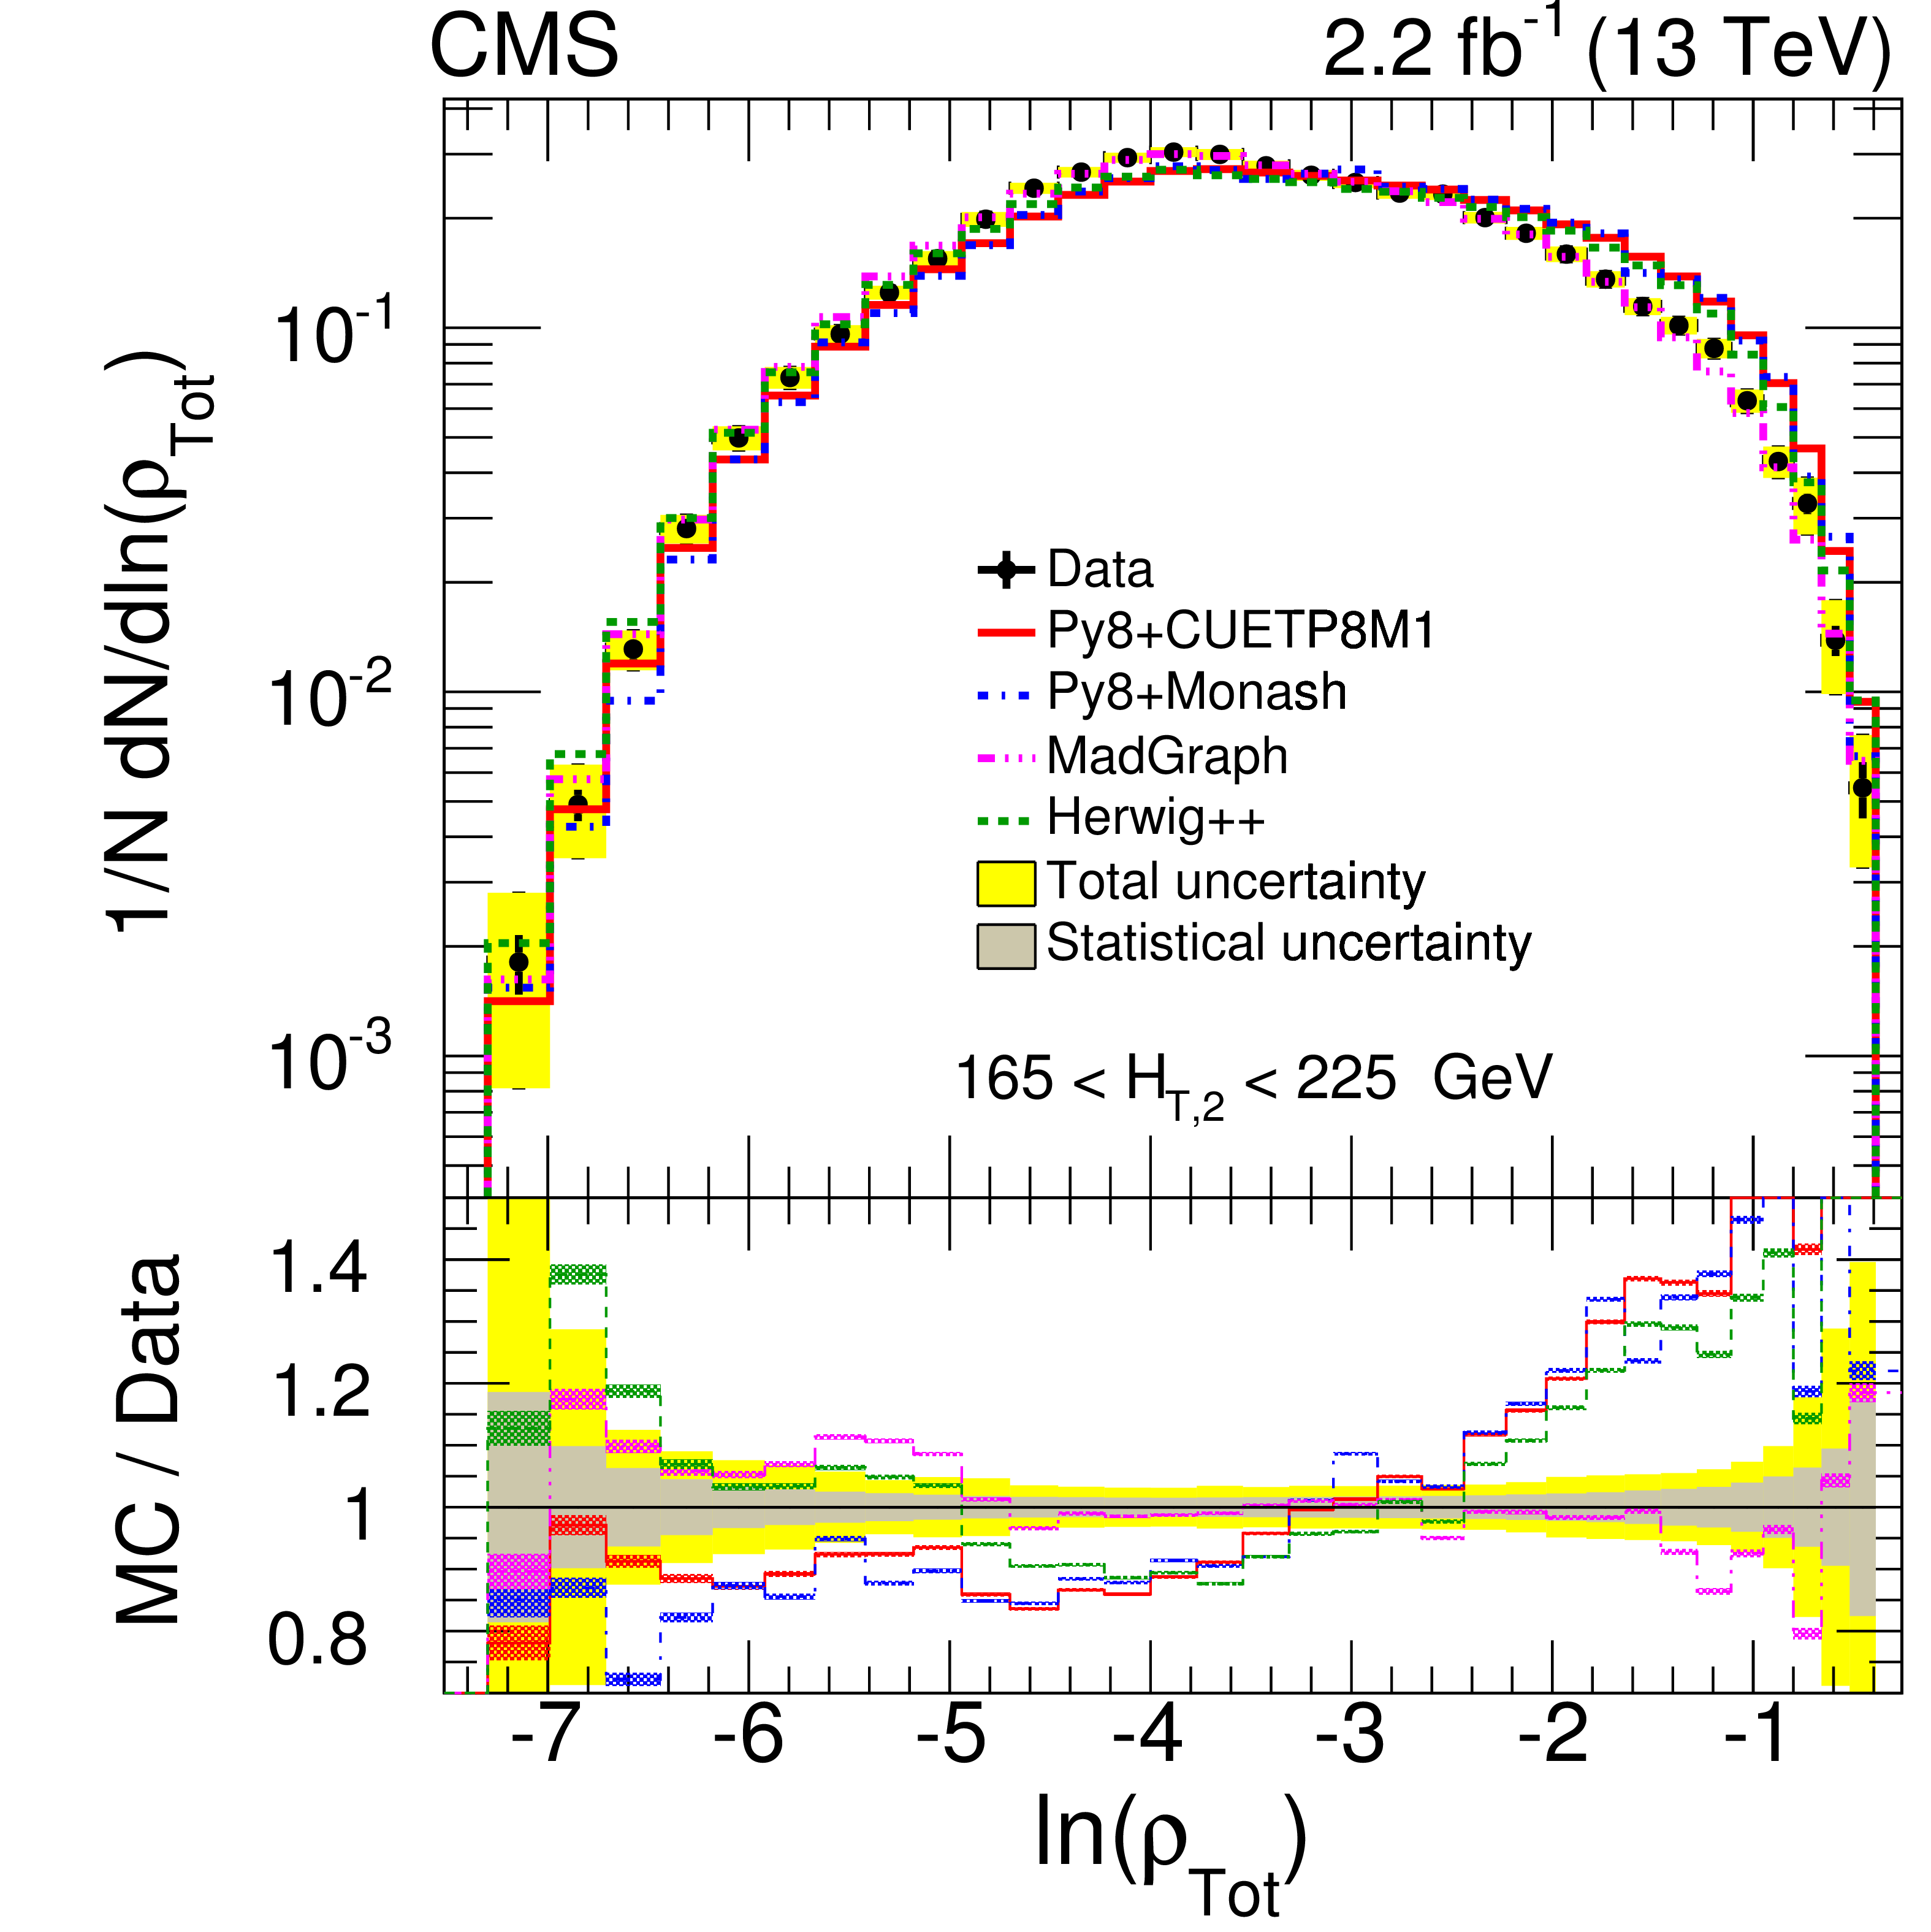
Figure 5-c:
Normalized differential distributions of unfolded data compared with theoretical (MC) predictions of PYTHIA8 CUETP8M1 (red line), PYTHIA8 Monash (blue dash-dotted line), MadGraph5_amc@nlo (pink dash-dot-dotted line) and HERWIG++ (brown dash-dot-dotted line) as a function of ESV: total jet mass ($ {\rho _{\mathrm {Tot}}} $) for 165 $ < {H_{\mathrm {T},2}} < $ 225 GeV. In each ratio plot, the inner gray band represents statistical uncertainty and the yellow band represents the total uncertainty (systematic and statistical components added in quadrature) on data and the MC predictions include only statistical uncertainty. |
png pdf |
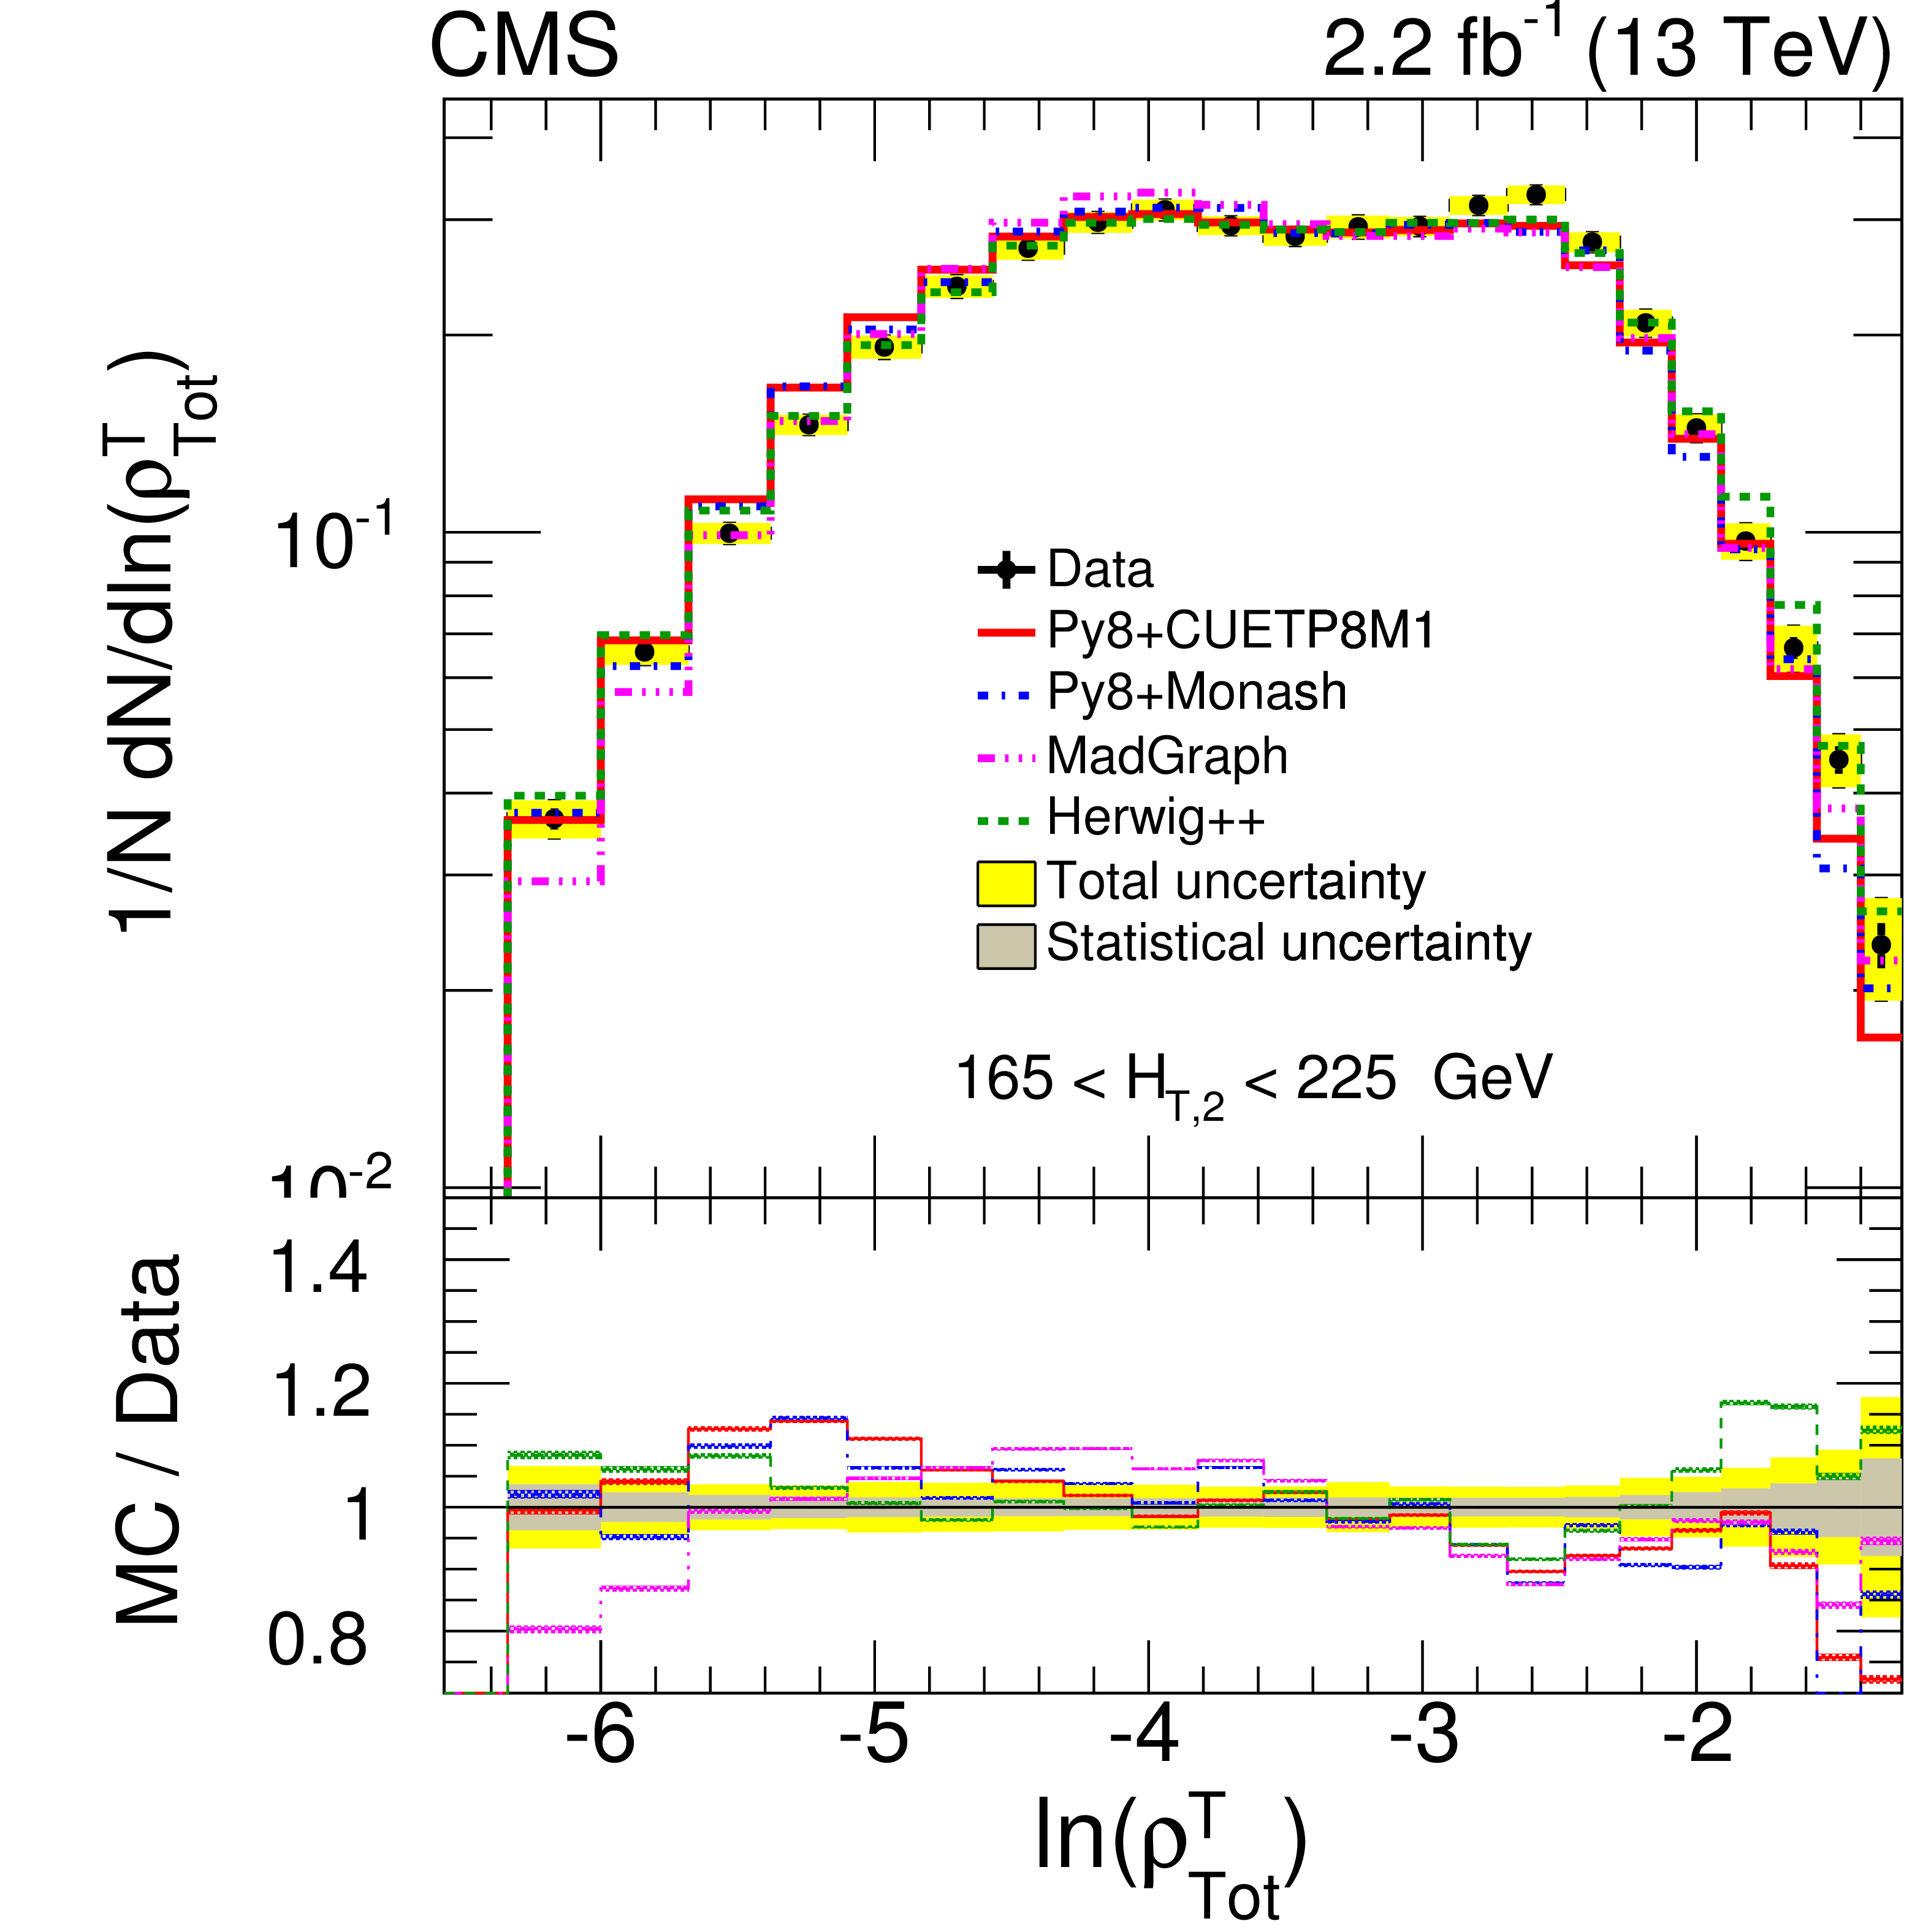
Figure 5-d:
Normalized differential distributions of unfolded data compared with theoretical (MC) predictions of PYTHIA8 CUETP8M1 (red line), PYTHIA8 Monash (blue dash-dotted line), MadGraph5_amc@nlo (pink dash-dot-dotted line) and HERWIG++ (brown dash-dot-dotted line) as a function of ESV: total transverse jet mass ($ {\rho _{\mathrm {Tot}}^{\mathrm {T}}} $) for 165 $ < {H_{\mathrm {T},2}} < $ 225 GeV. In each ratio plot, the inner gray band represents statistical uncertainty and the yellow band represents the total uncertainty (systematic and statistical components added in quadrature) on data and the MC predictions include only statistical uncertainty. |
png pdf |
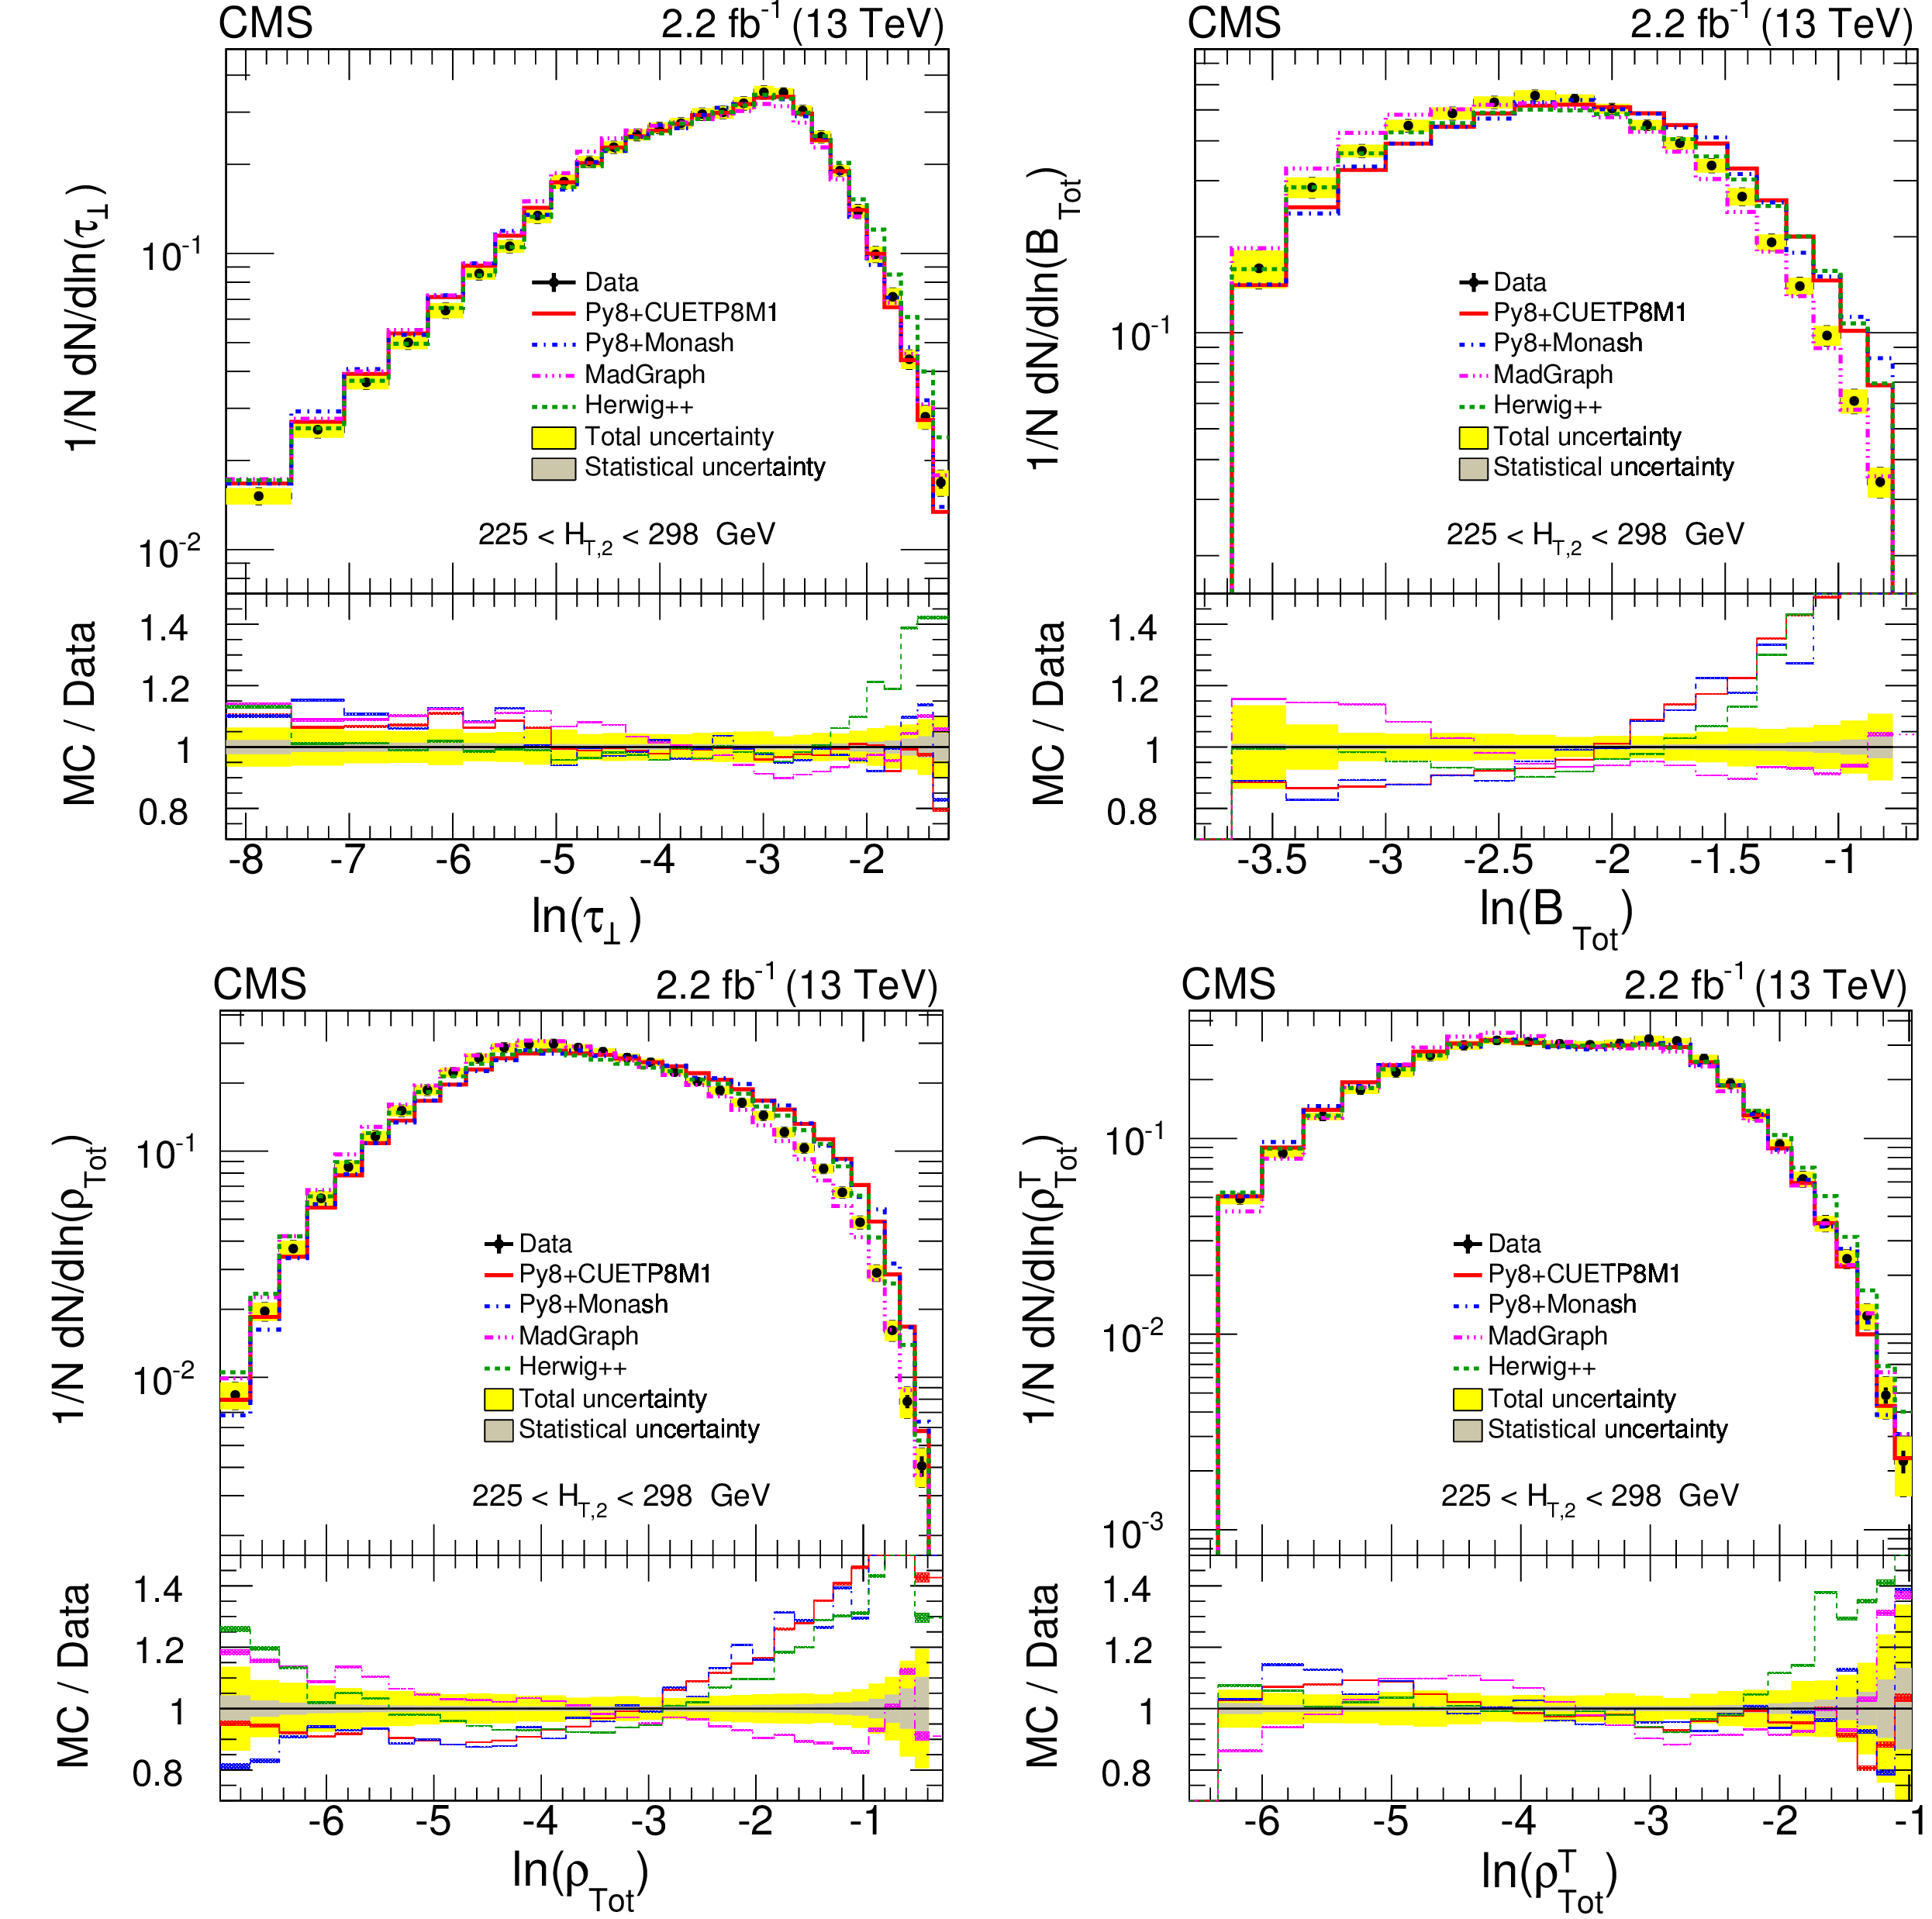
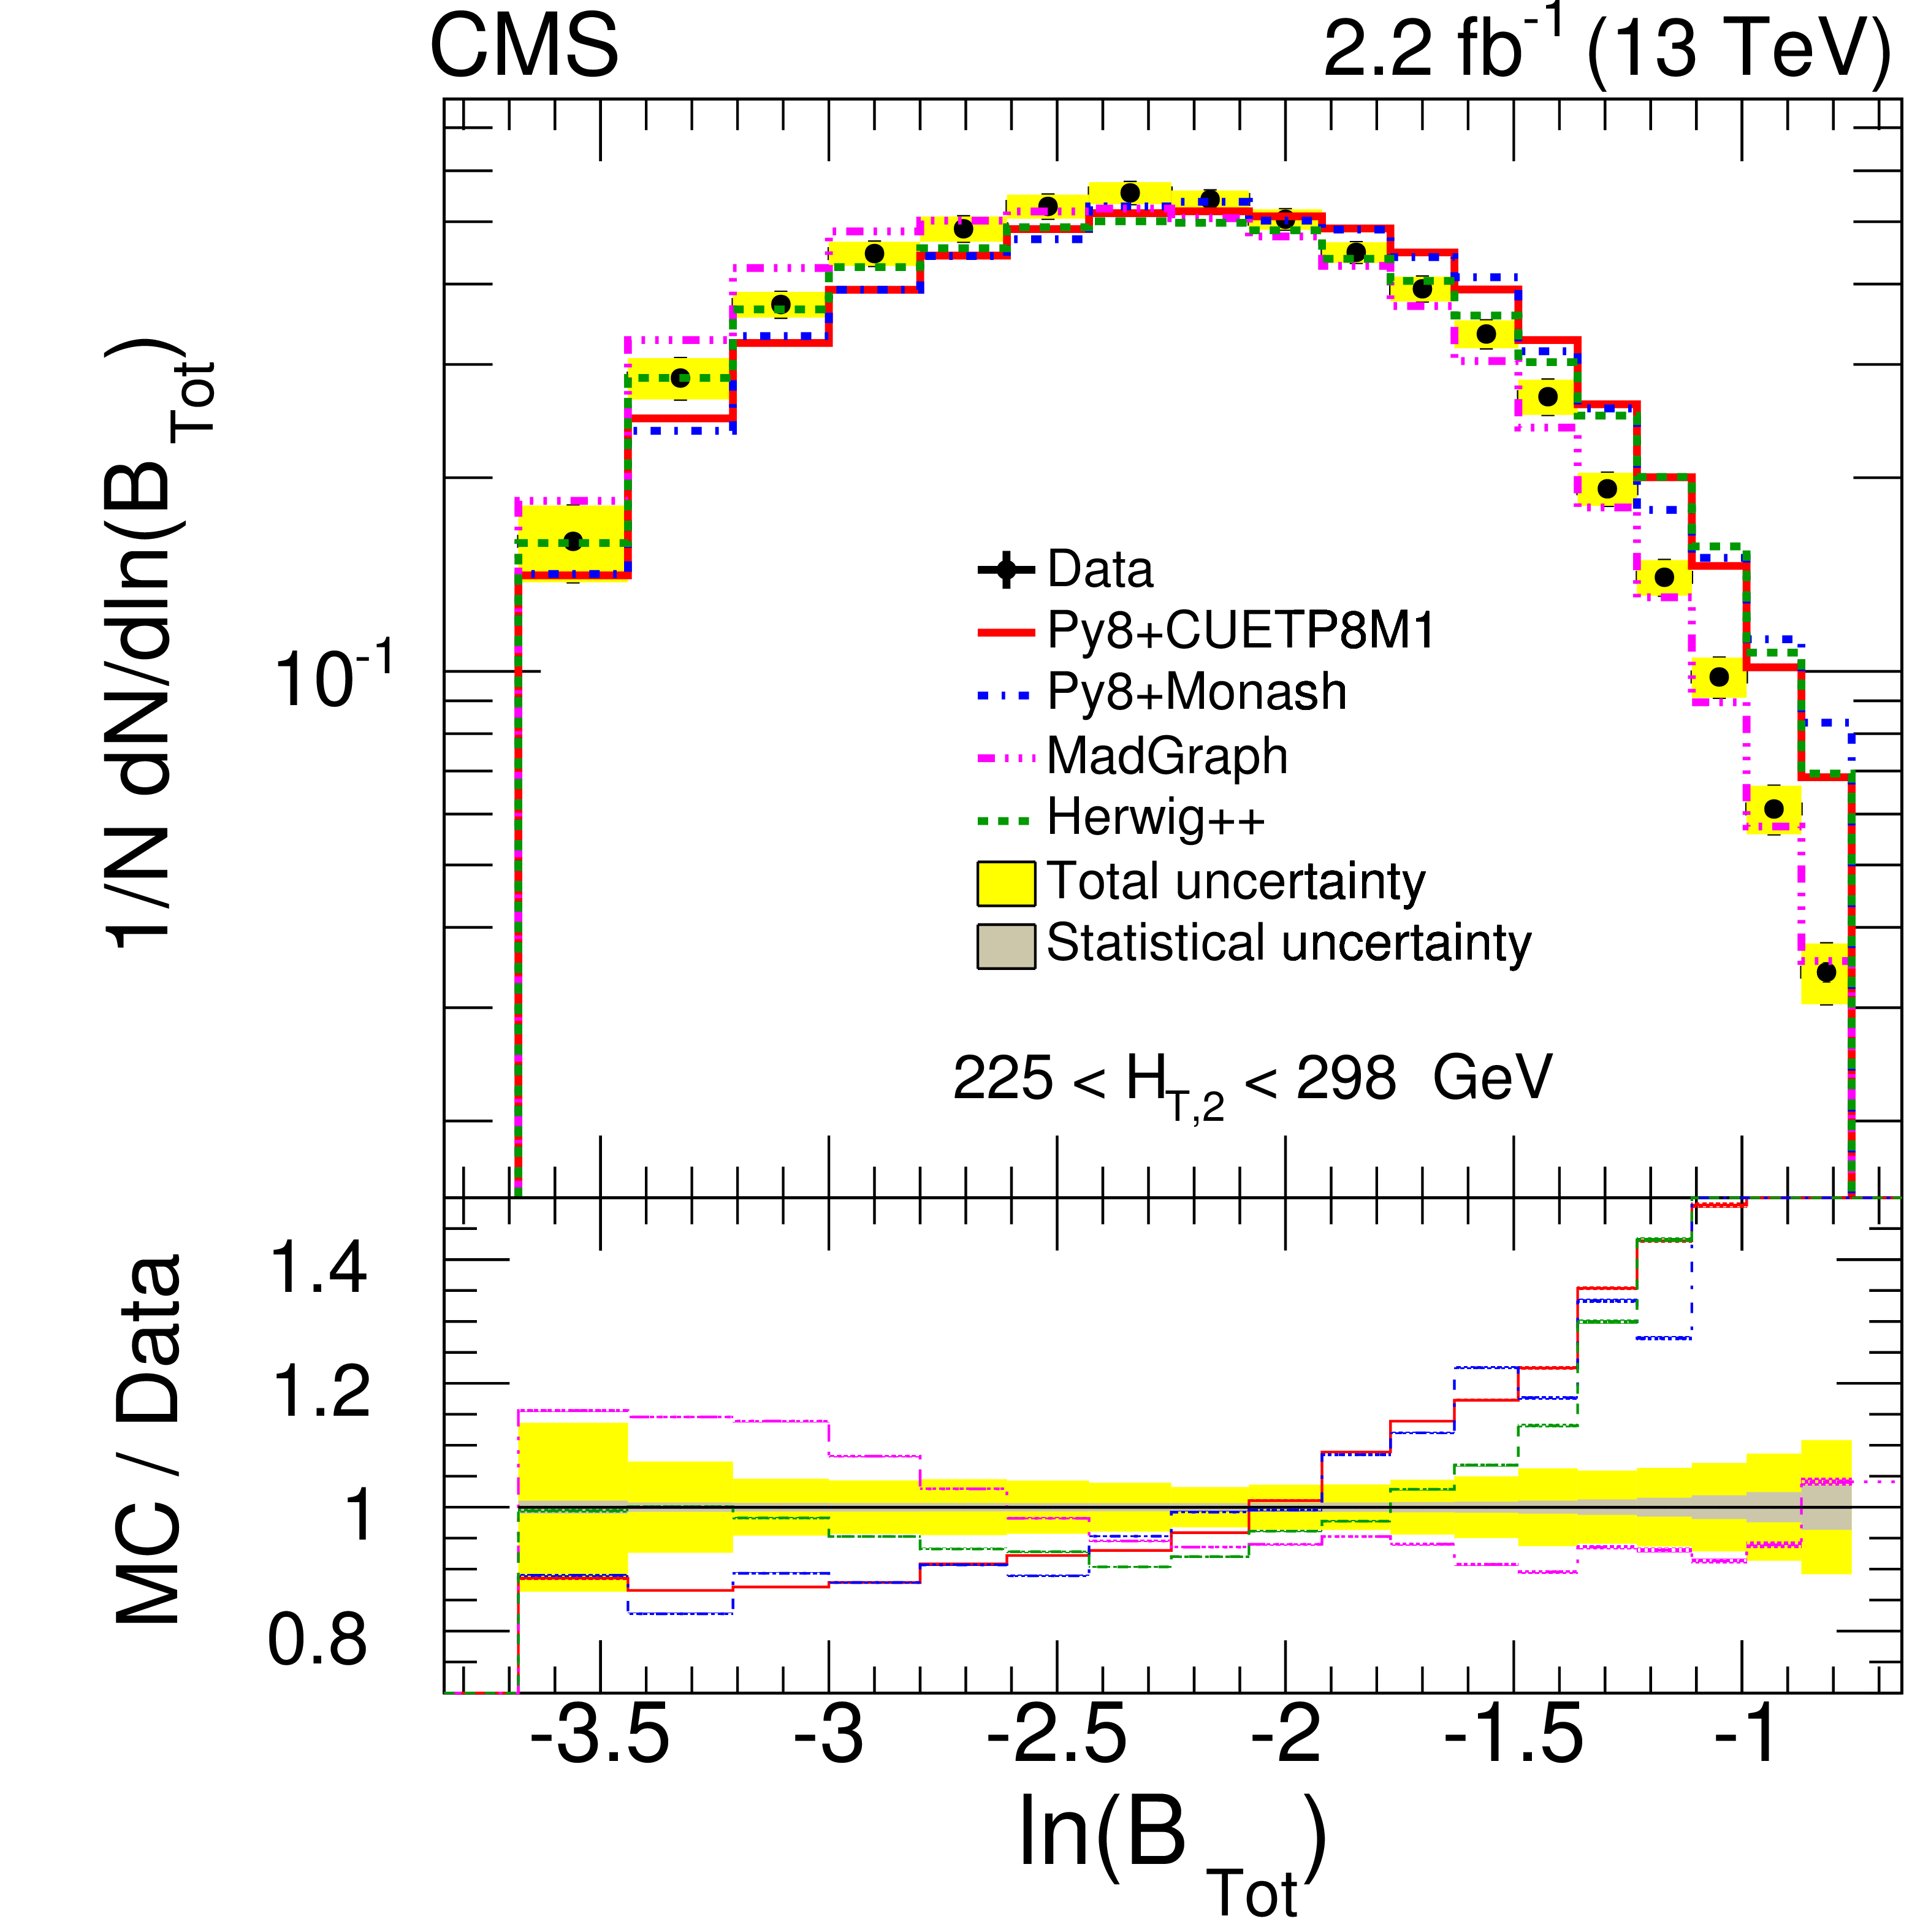
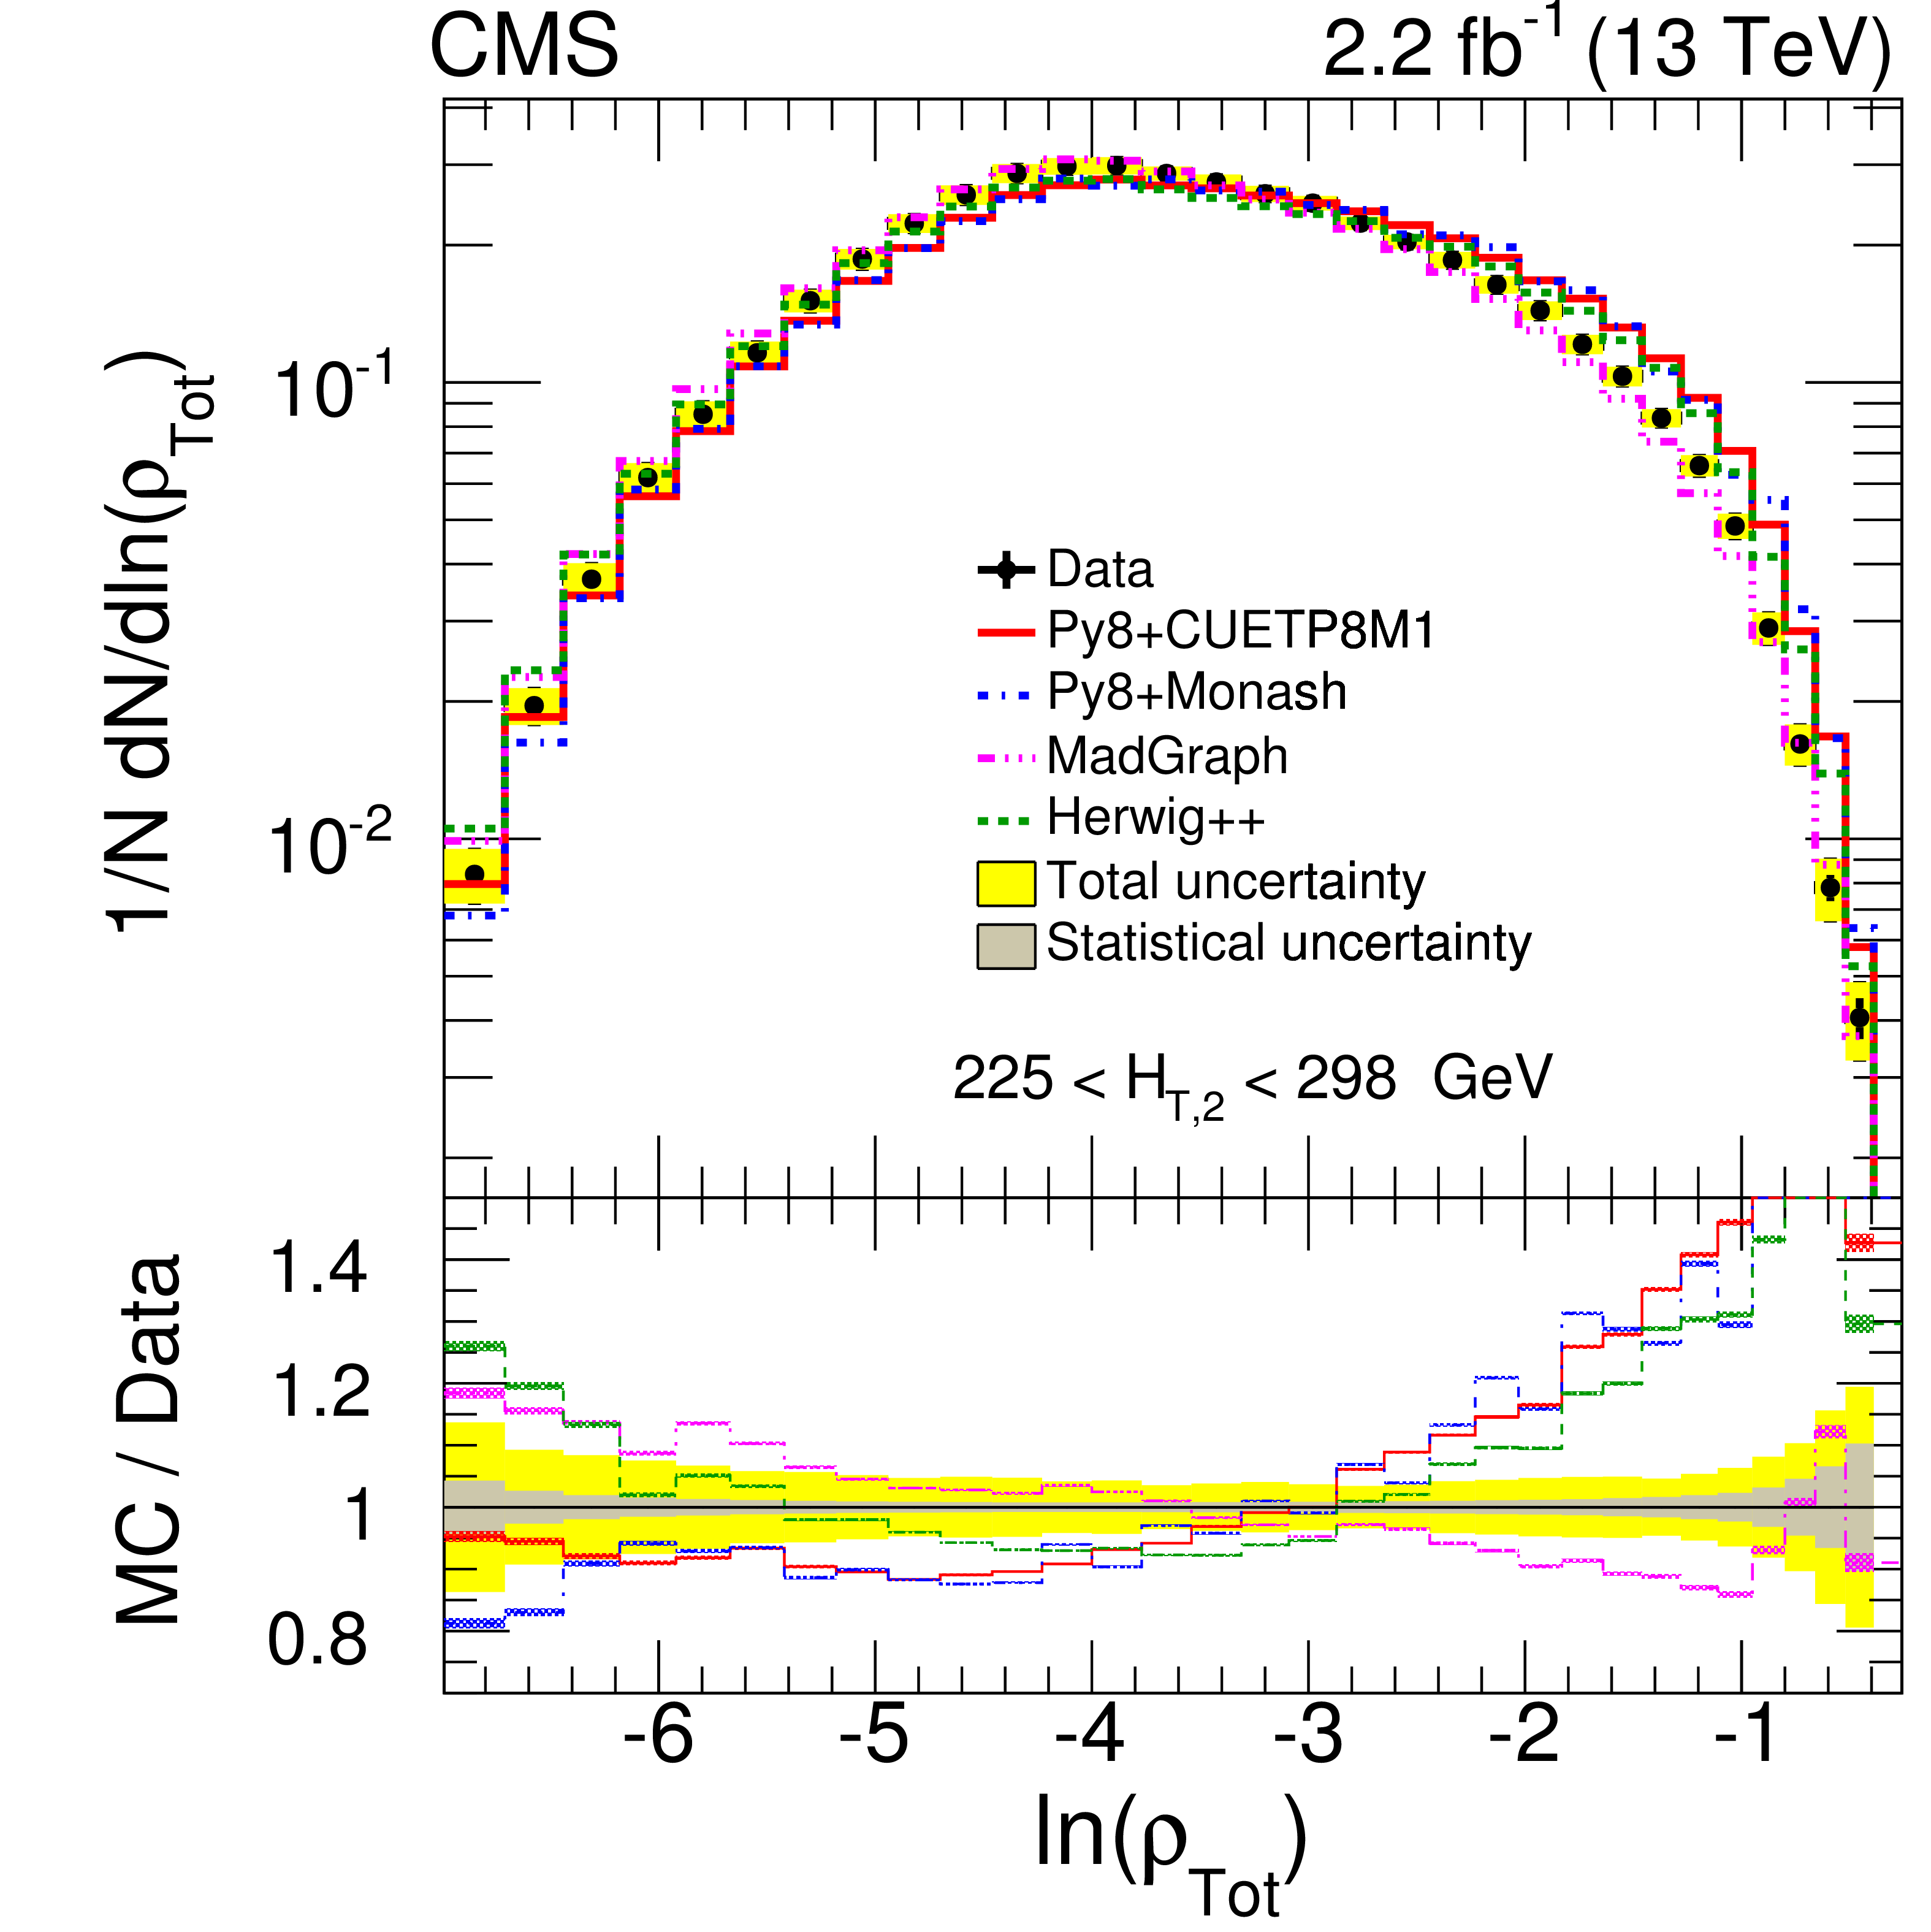
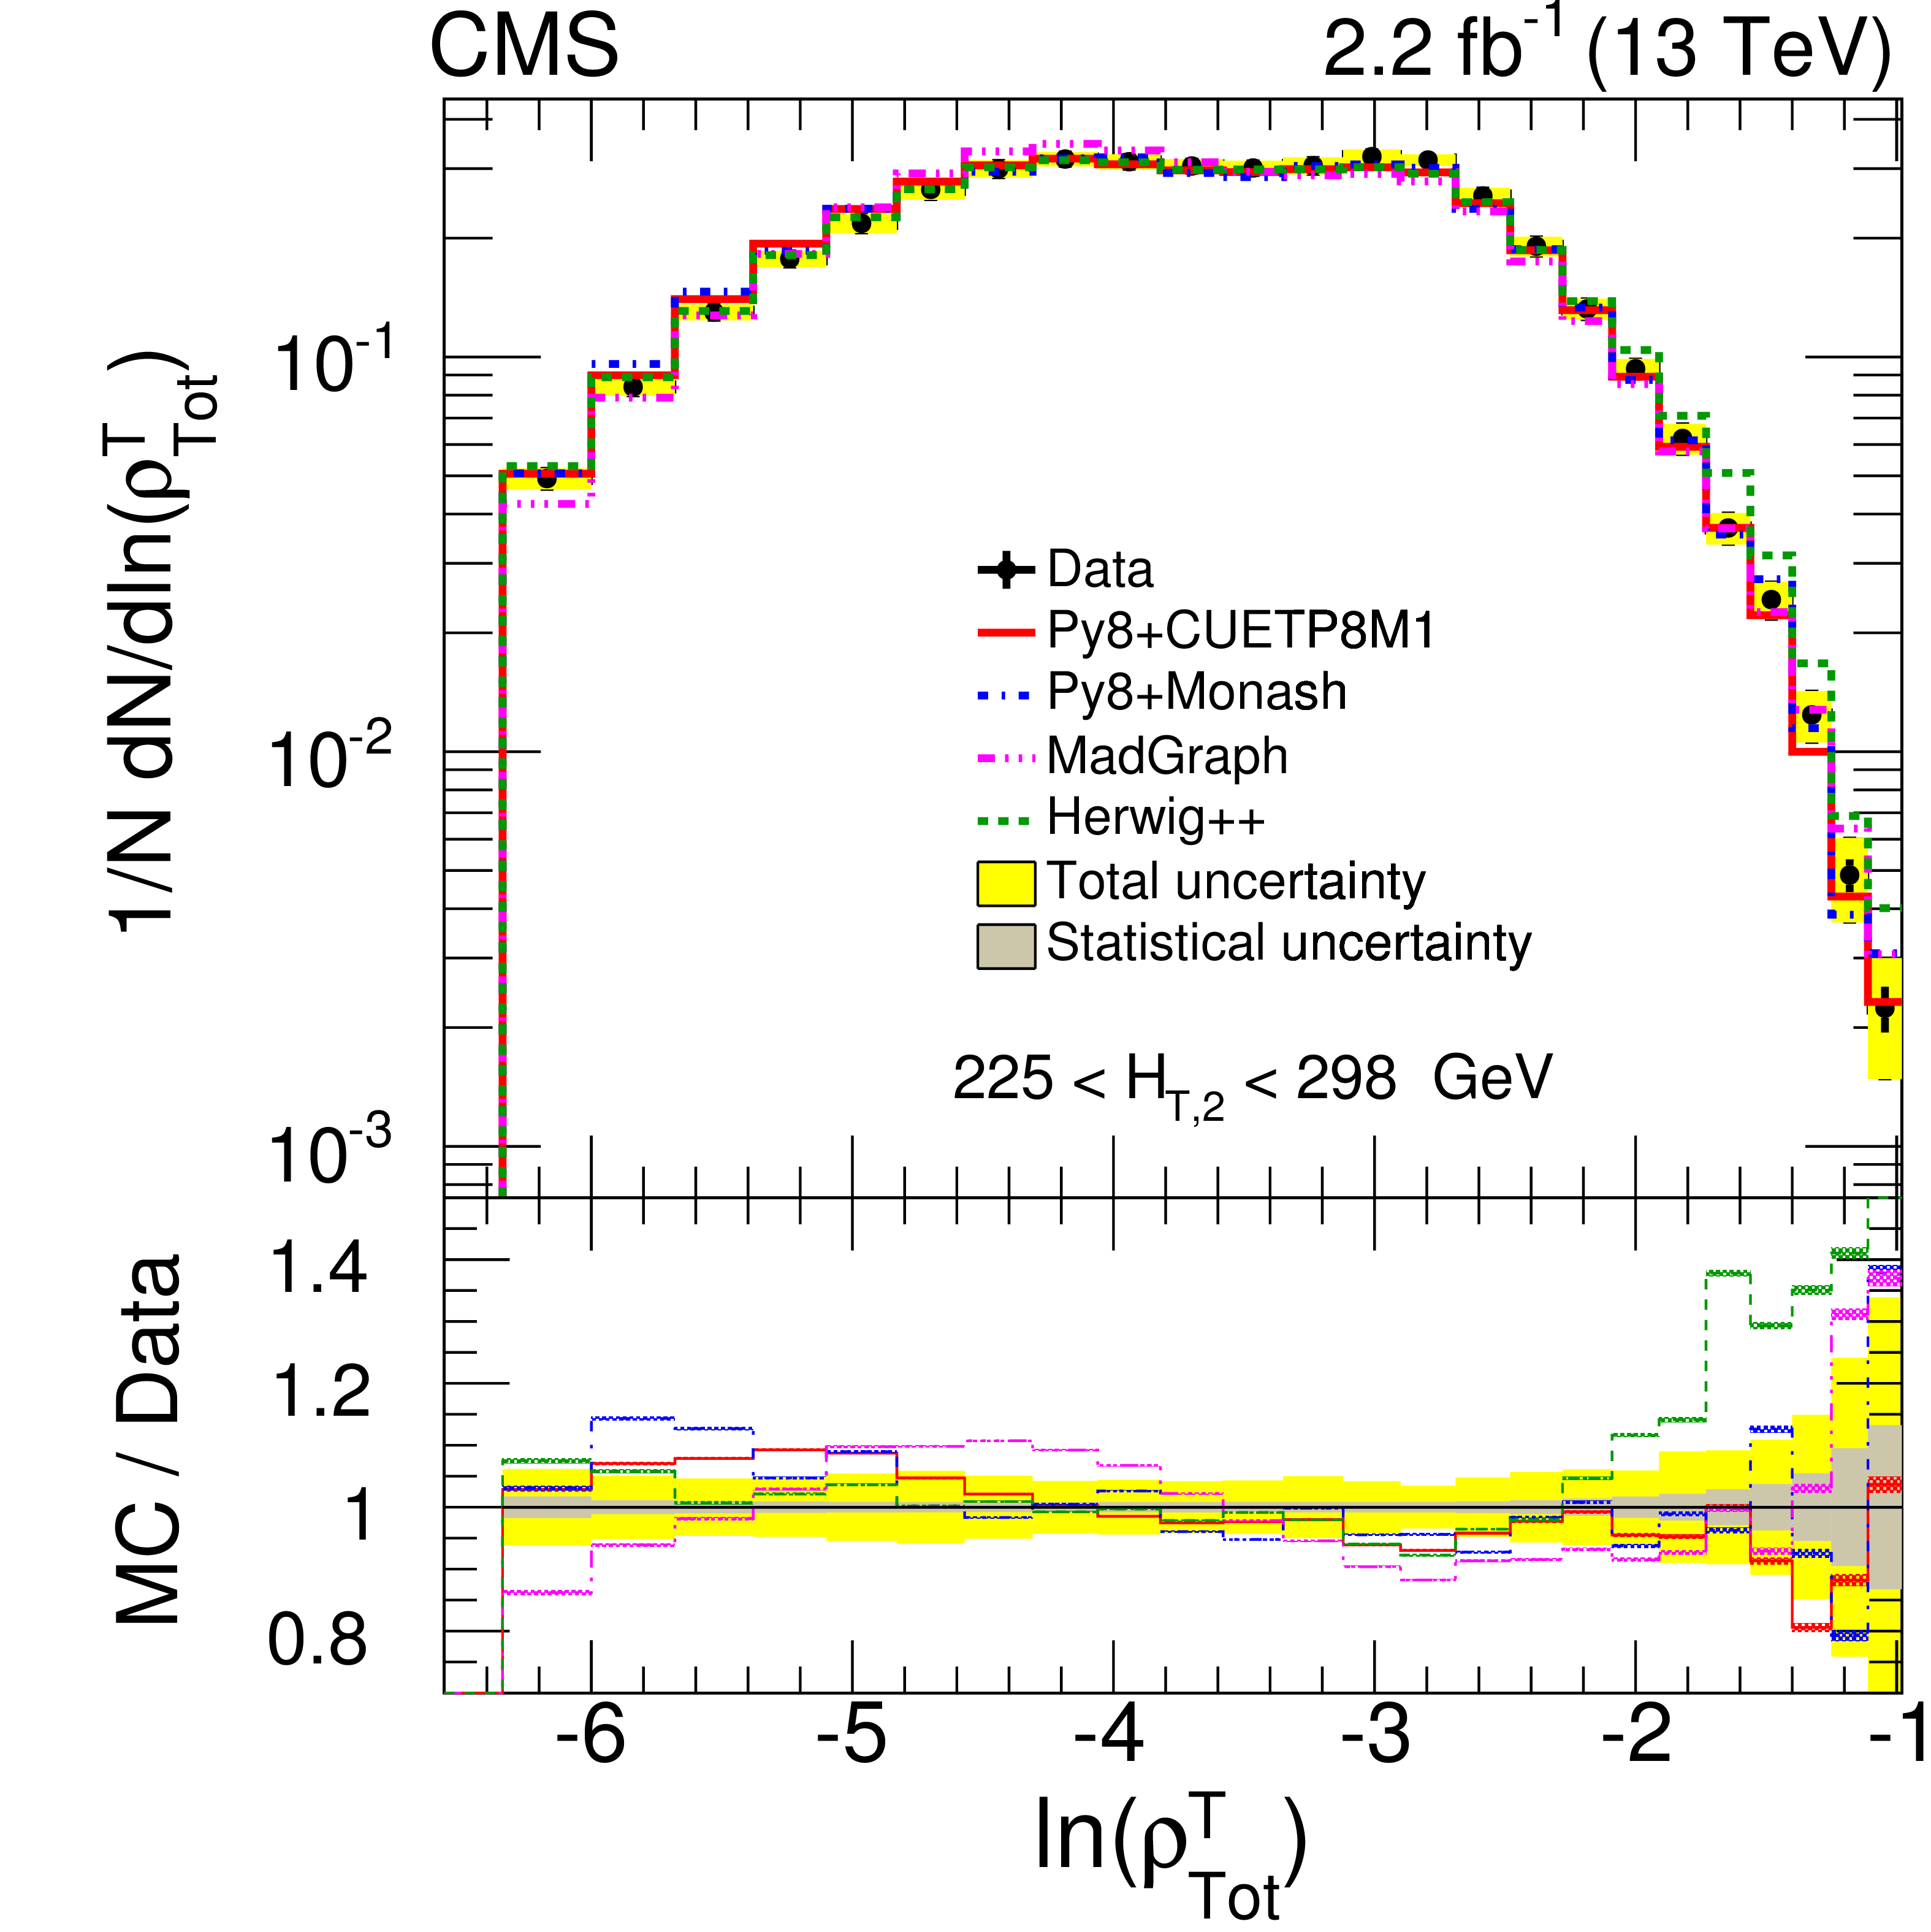
Figure 6:
Normalized differential distributions of unfolded data compared with theoretical (MC) predictions of PYTHIA8 CUETP8M1 (red line), PYTHIA8 Monash (blue dash-dotted line), MadGraph5_amc@nlo (pink dash-dot-dotted line) and HERWIG++ (brown dash-dot-dotted line) as a function of ESV: complement of transverse thrust ($ {\tau _{\perp}} $) (upper left), total jet broadening ($ {B_{\mathrm {Tot}}} $) (upper right), total jet mass ($ {\rho _{\mathrm {Tot}}} $) (lower left) and total transverse jet mass ($ {\rho _{\mathrm {Tot}}^{\mathrm {T}}} $) (lower right) for 225 $ < {H_{\mathrm {T},2}} < $ 298 GeV. In each ratio plot, the inner gray band represents statistical uncertainty and the yellow band represents the total uncertainty (systematic and statistical components added in quadrature) on data and the MC predictions include only statistical uncertainty. |
png pdf |
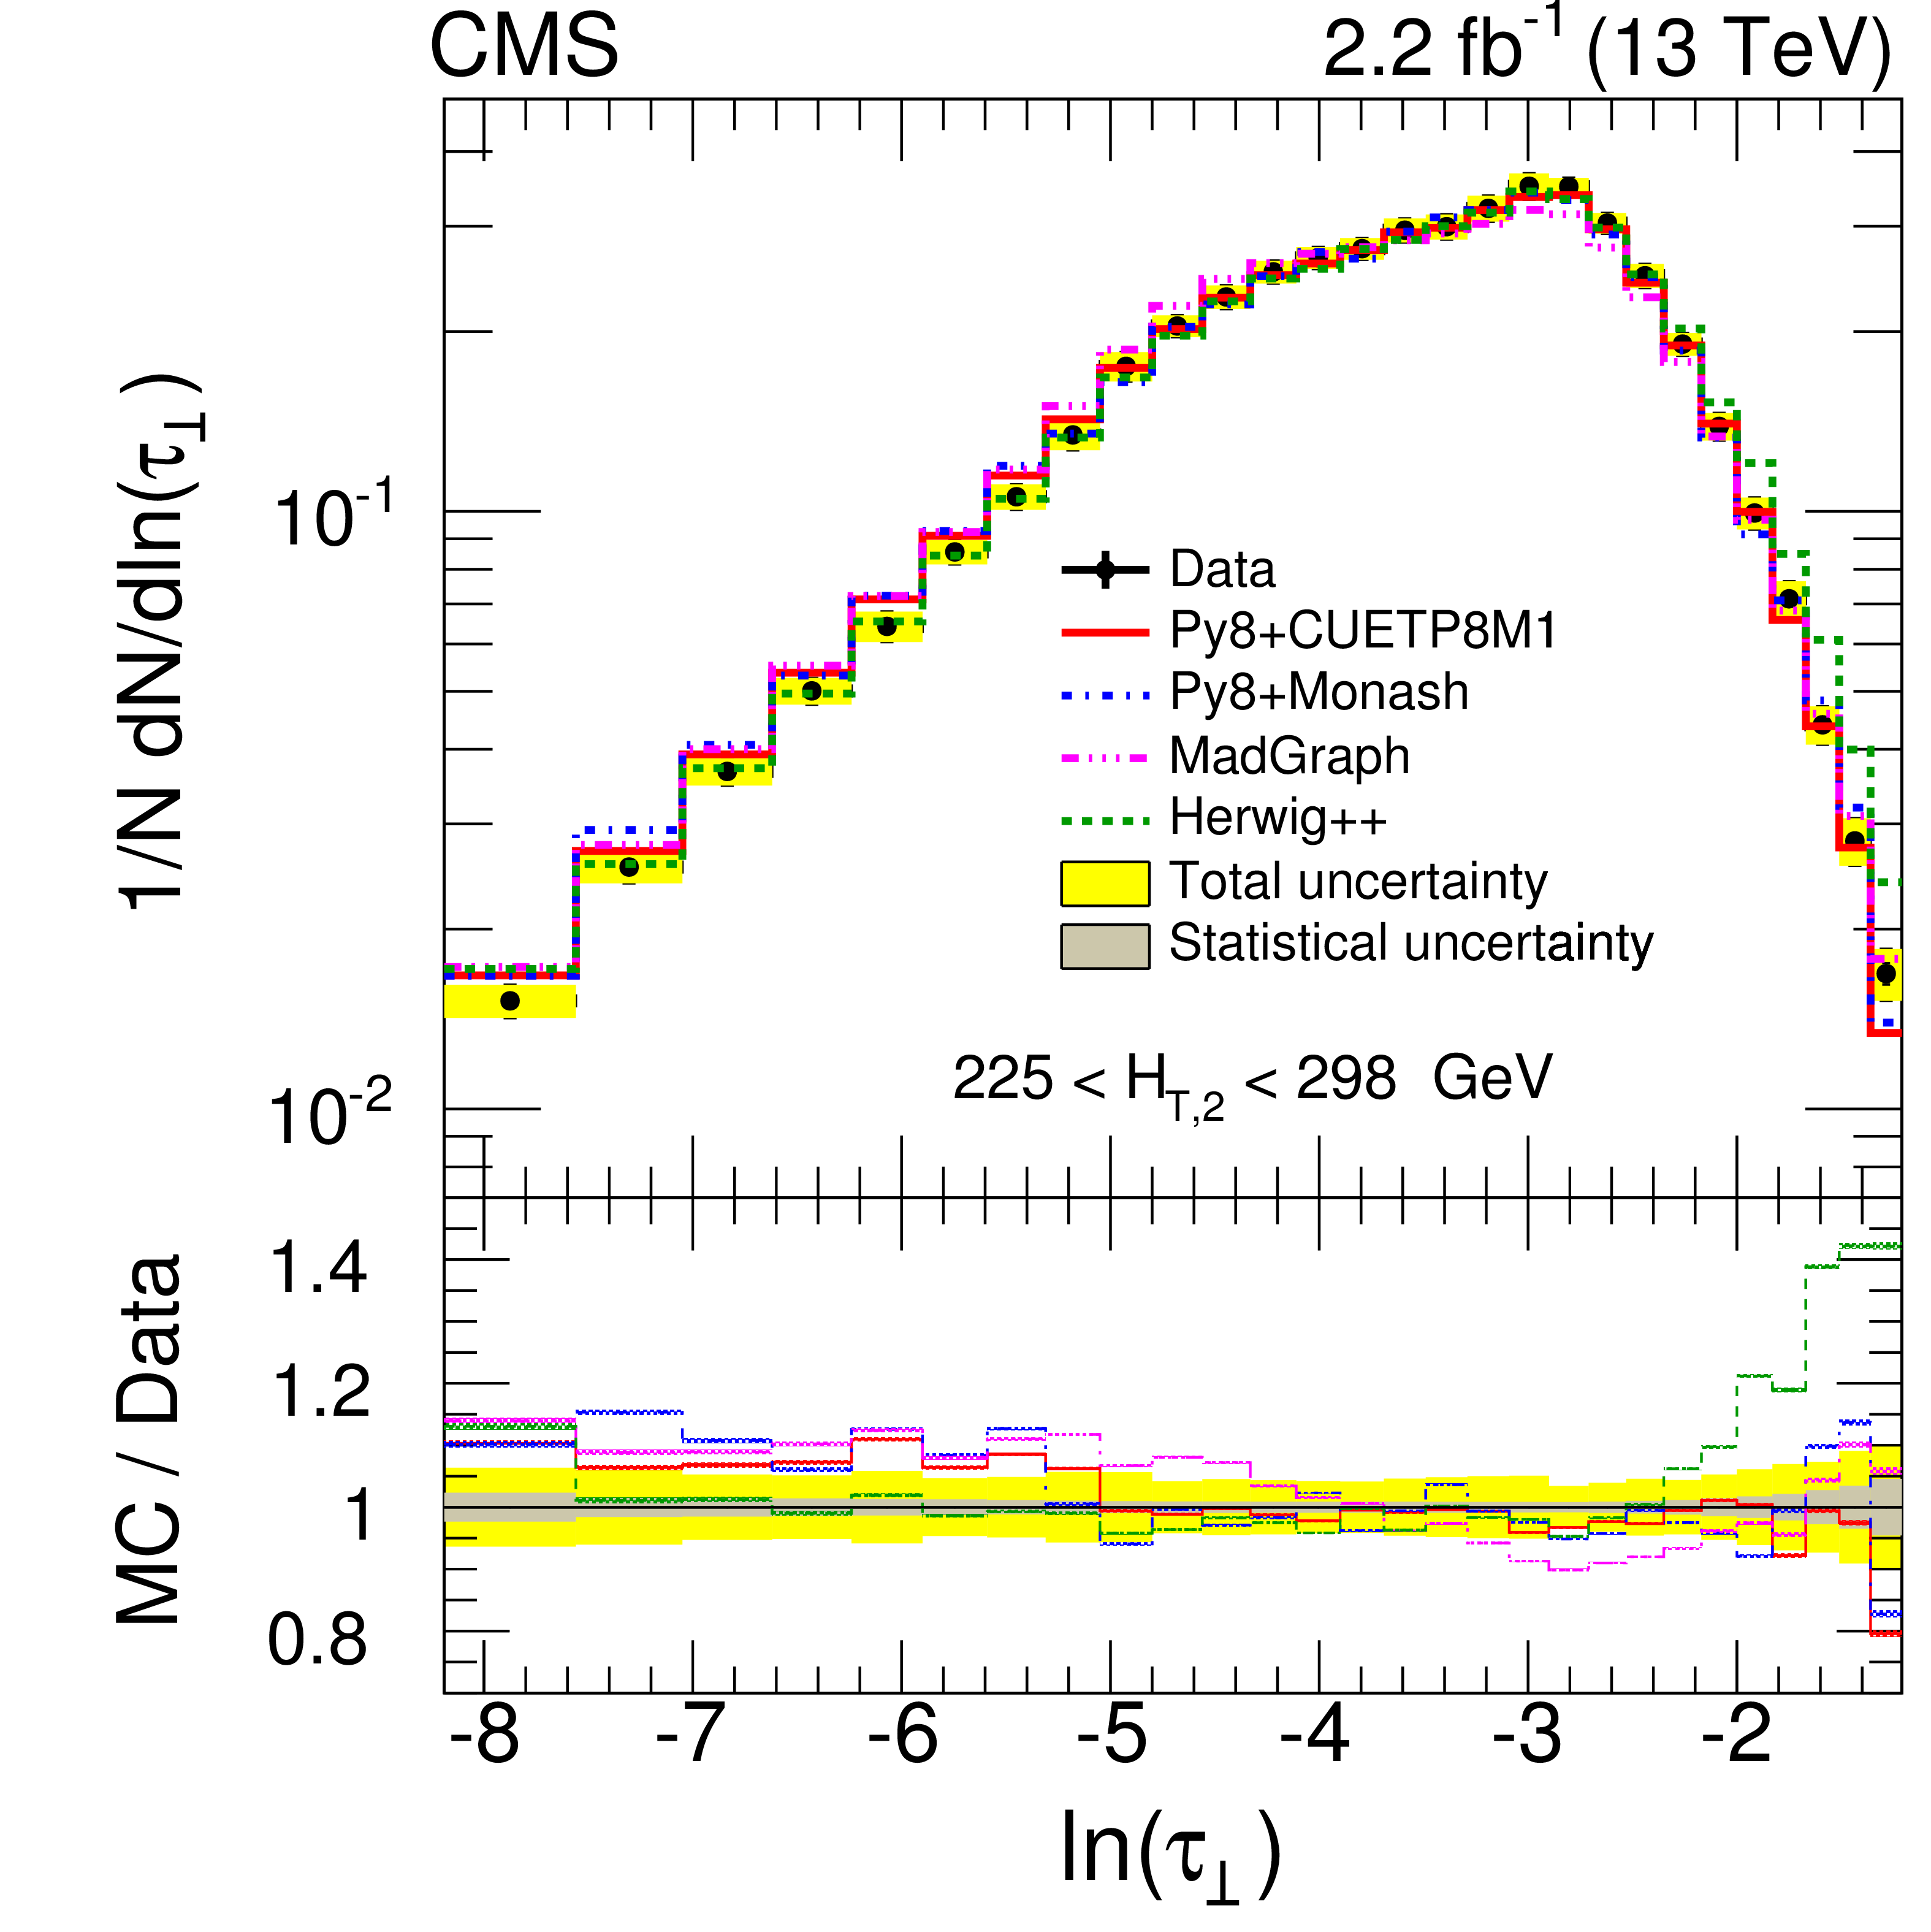
Figure 6-a:
Normalized differential distributions of unfolded data compared with theoretical (MC) predictions of PYTHIA8 CUETP8M1 (red line), PYTHIA8 Monash (blue dash-dotted line), MadGraph5_amc@nlo (pink dash-dot-dotted line) and HERWIG++ (brown dash-dot-dotted line) as a function of ESV: complement of transverse thrust ($ {\tau _{\perp}} $) for 225 $ < {H_{\mathrm {T},2}} < $ 298 GeV. In the plot, the inner gray band represents statistical uncertainty and the yellow band represents the total uncertainty (systematic and statistical components added in quadrature) on data and the MC predictions include only statistical uncertainty. |
png pdf |
Figure 6-b:
Normalized differential distributions of unfolded data compared with theoretical (MC) predictions of PYTHIA8 CUETP8M1 (red line), PYTHIA8 Monash (blue dash-dotted line), MadGraph5_amc@nlo (pink dash-dot-dotted line) and HERWIG++ (brown dash-dot-dotted line) as a function of ESV: total jet broadening ($ {B_{\mathrm {Tot}}} $) for 225 $ < {H_{\mathrm {T},2}} < $ 298 GeV. In the plot, the inner gray band represents statistical uncertainty and the yellow band represents the total uncertainty (systematic and statistical components added in quadrature) on data and the MC predictions include only statistical uncertainty. |
png pdf |
Figure 6-c:
Normalized differential distributions of unfolded data compared with theoretical (MC) predictions of PYTHIA8 CUETP8M1 (red line), PYTHIA8 Monash (blue dash-dotted line), MadGraph5_amc@nlo (pink dash-dot-dotted line) and HERWIG++ (brown dash-dot-dotted line) as a function of ESV: total jet mass ($ {\rho _{\mathrm {Tot}}} $) for 225 $ < {H_{\mathrm {T},2}} < $ 298 GeV. In the plot, the inner gray band represents statistical uncertainty and the yellow band represents the total uncertainty (systematic and statistical components added in quadrature) on data and the MC predictions include only statistical uncertainty. |
png pdf |
Figure 6-d:
Normalized differential distributions of unfolded data compared with theoretical (MC) predictions of PYTHIA8 CUETP8M1 (red line), PYTHIA8 Monash (blue dash-dotted line), MadGraph5_amc@nlo (pink dash-dot-dotted line) and HERWIG++ (brown dash-dot-dotted line) as a function of ESV: total transverse jet mass ($ {\rho _{\mathrm {Tot}}^{\mathrm {T}}} $) for 225 $ < {H_{\mathrm {T},2}} < $ 298 GeV. In the plot, the inner gray band represents statistical uncertainty and the yellow band represents the total uncertainty (systematic and statistical components added in quadrature) on data and the MC predictions include only statistical uncertainty. |
png pdf |
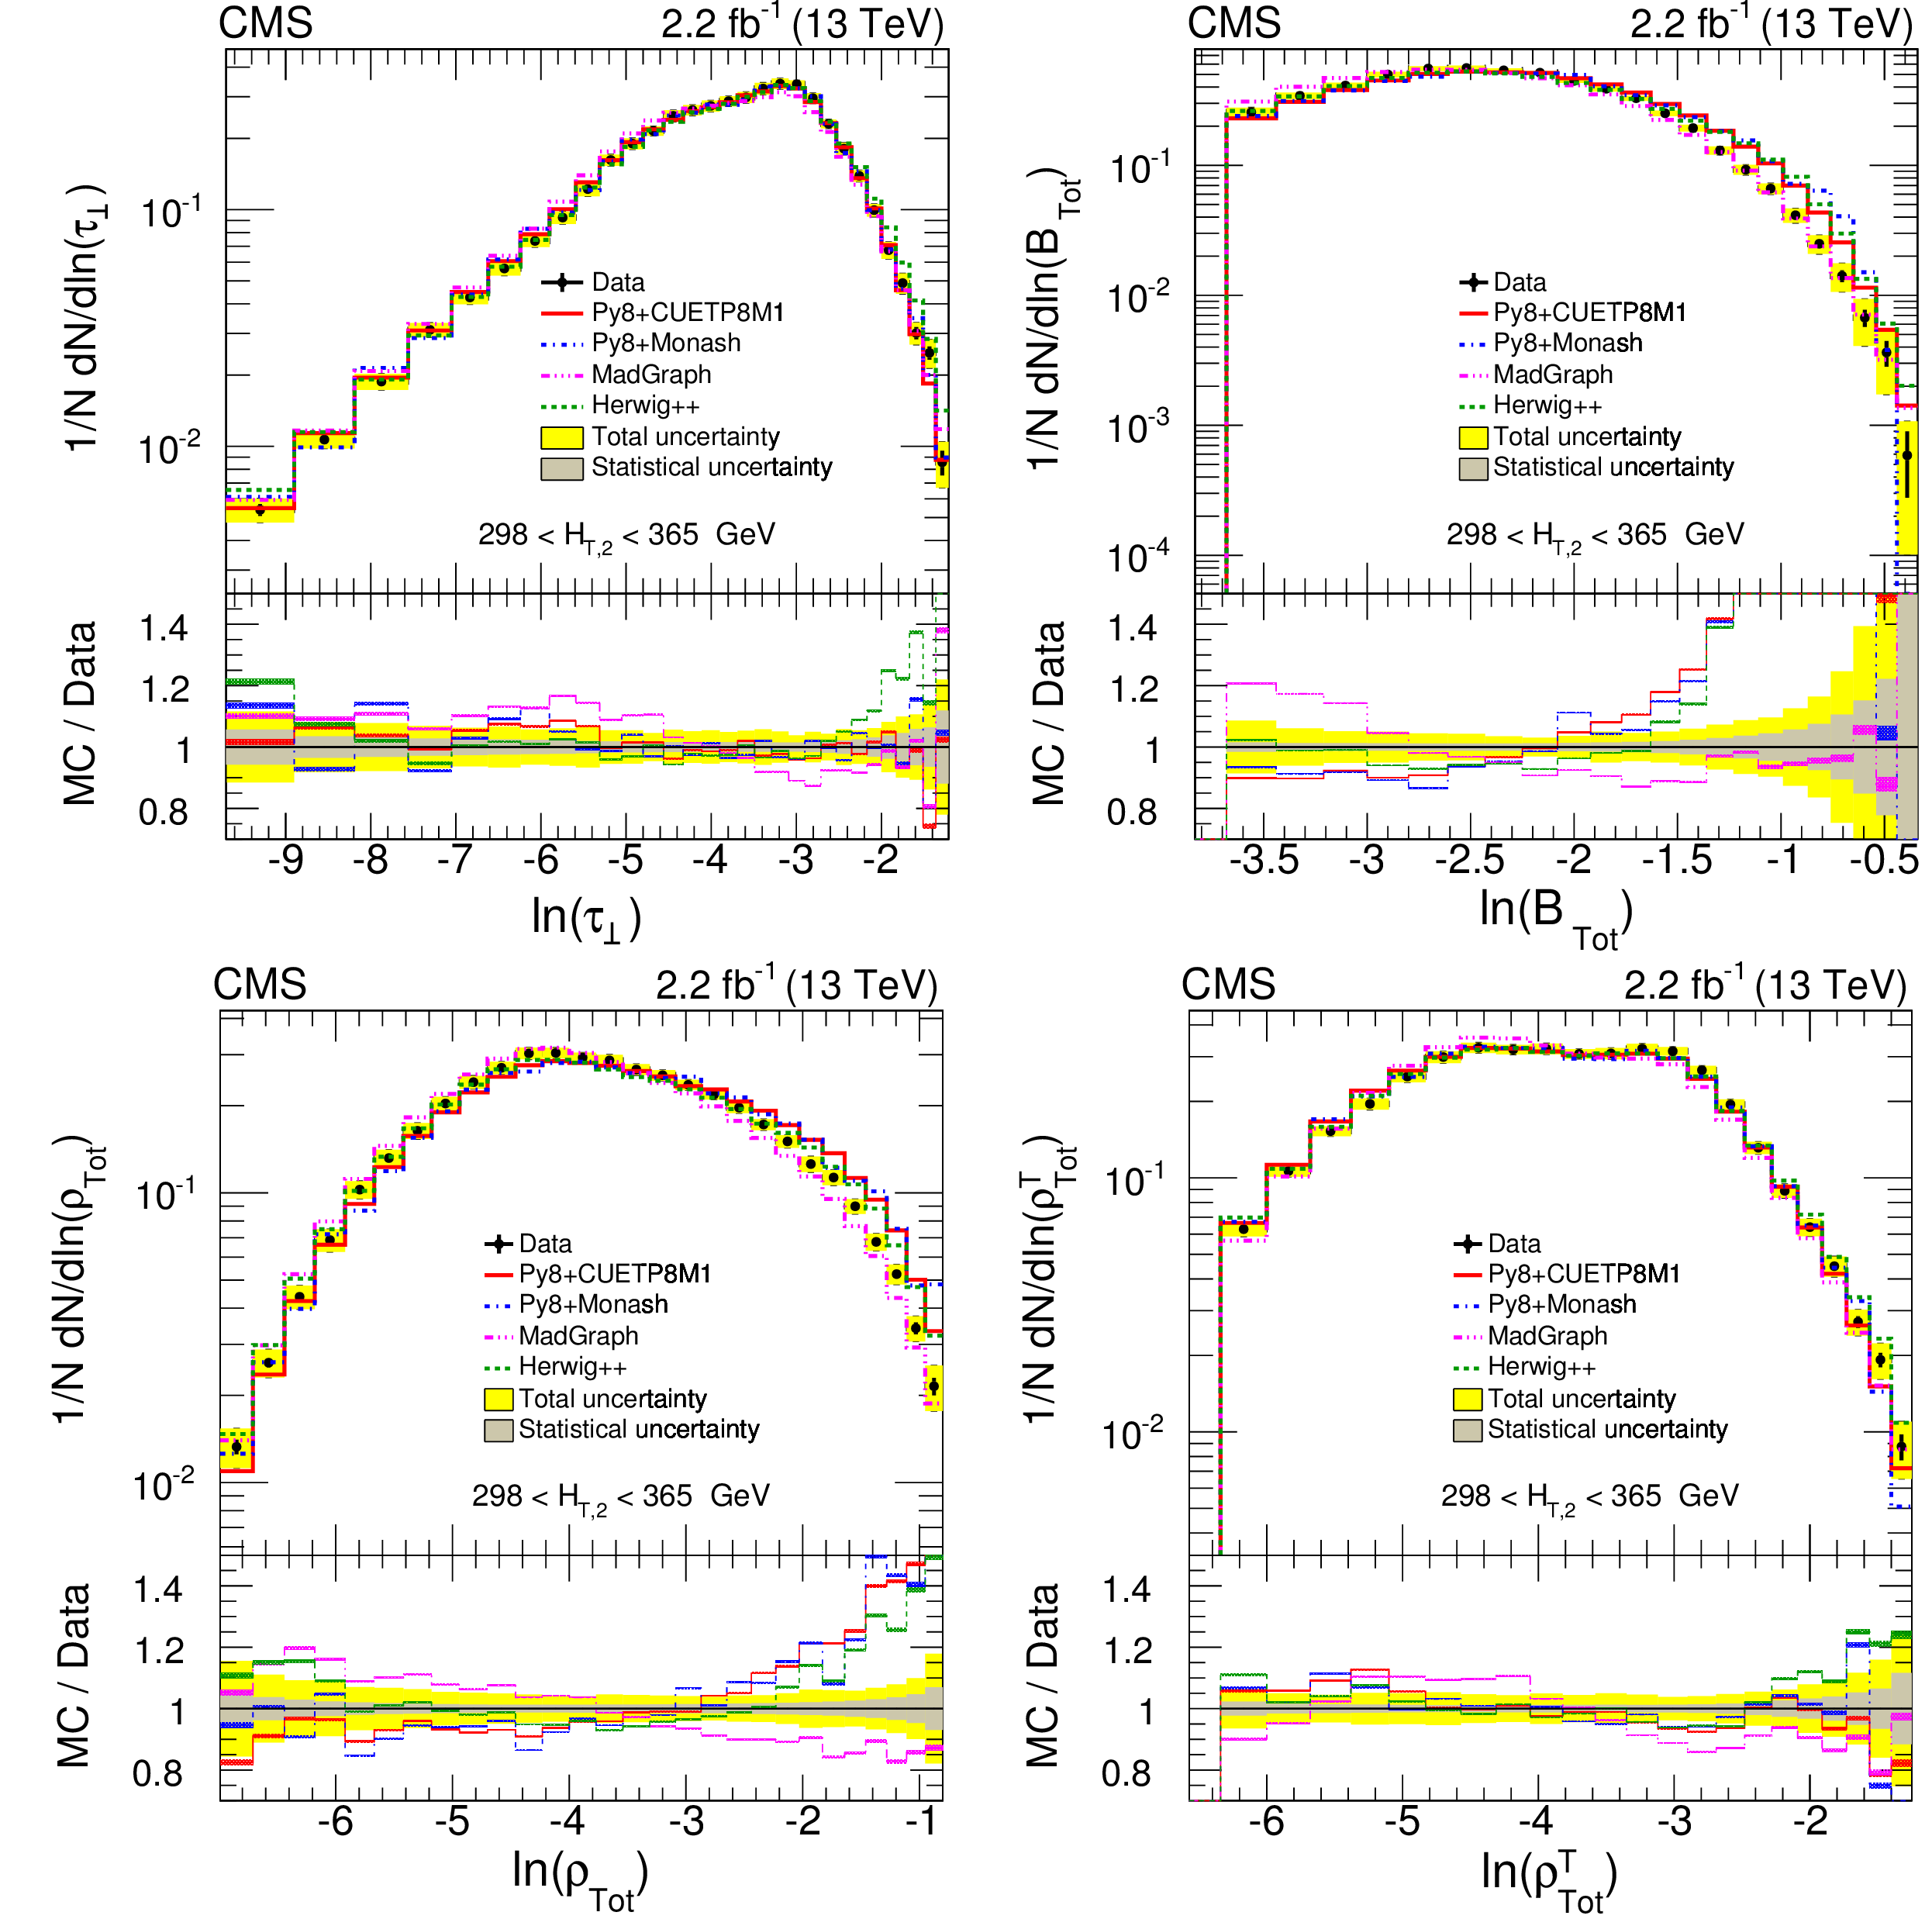
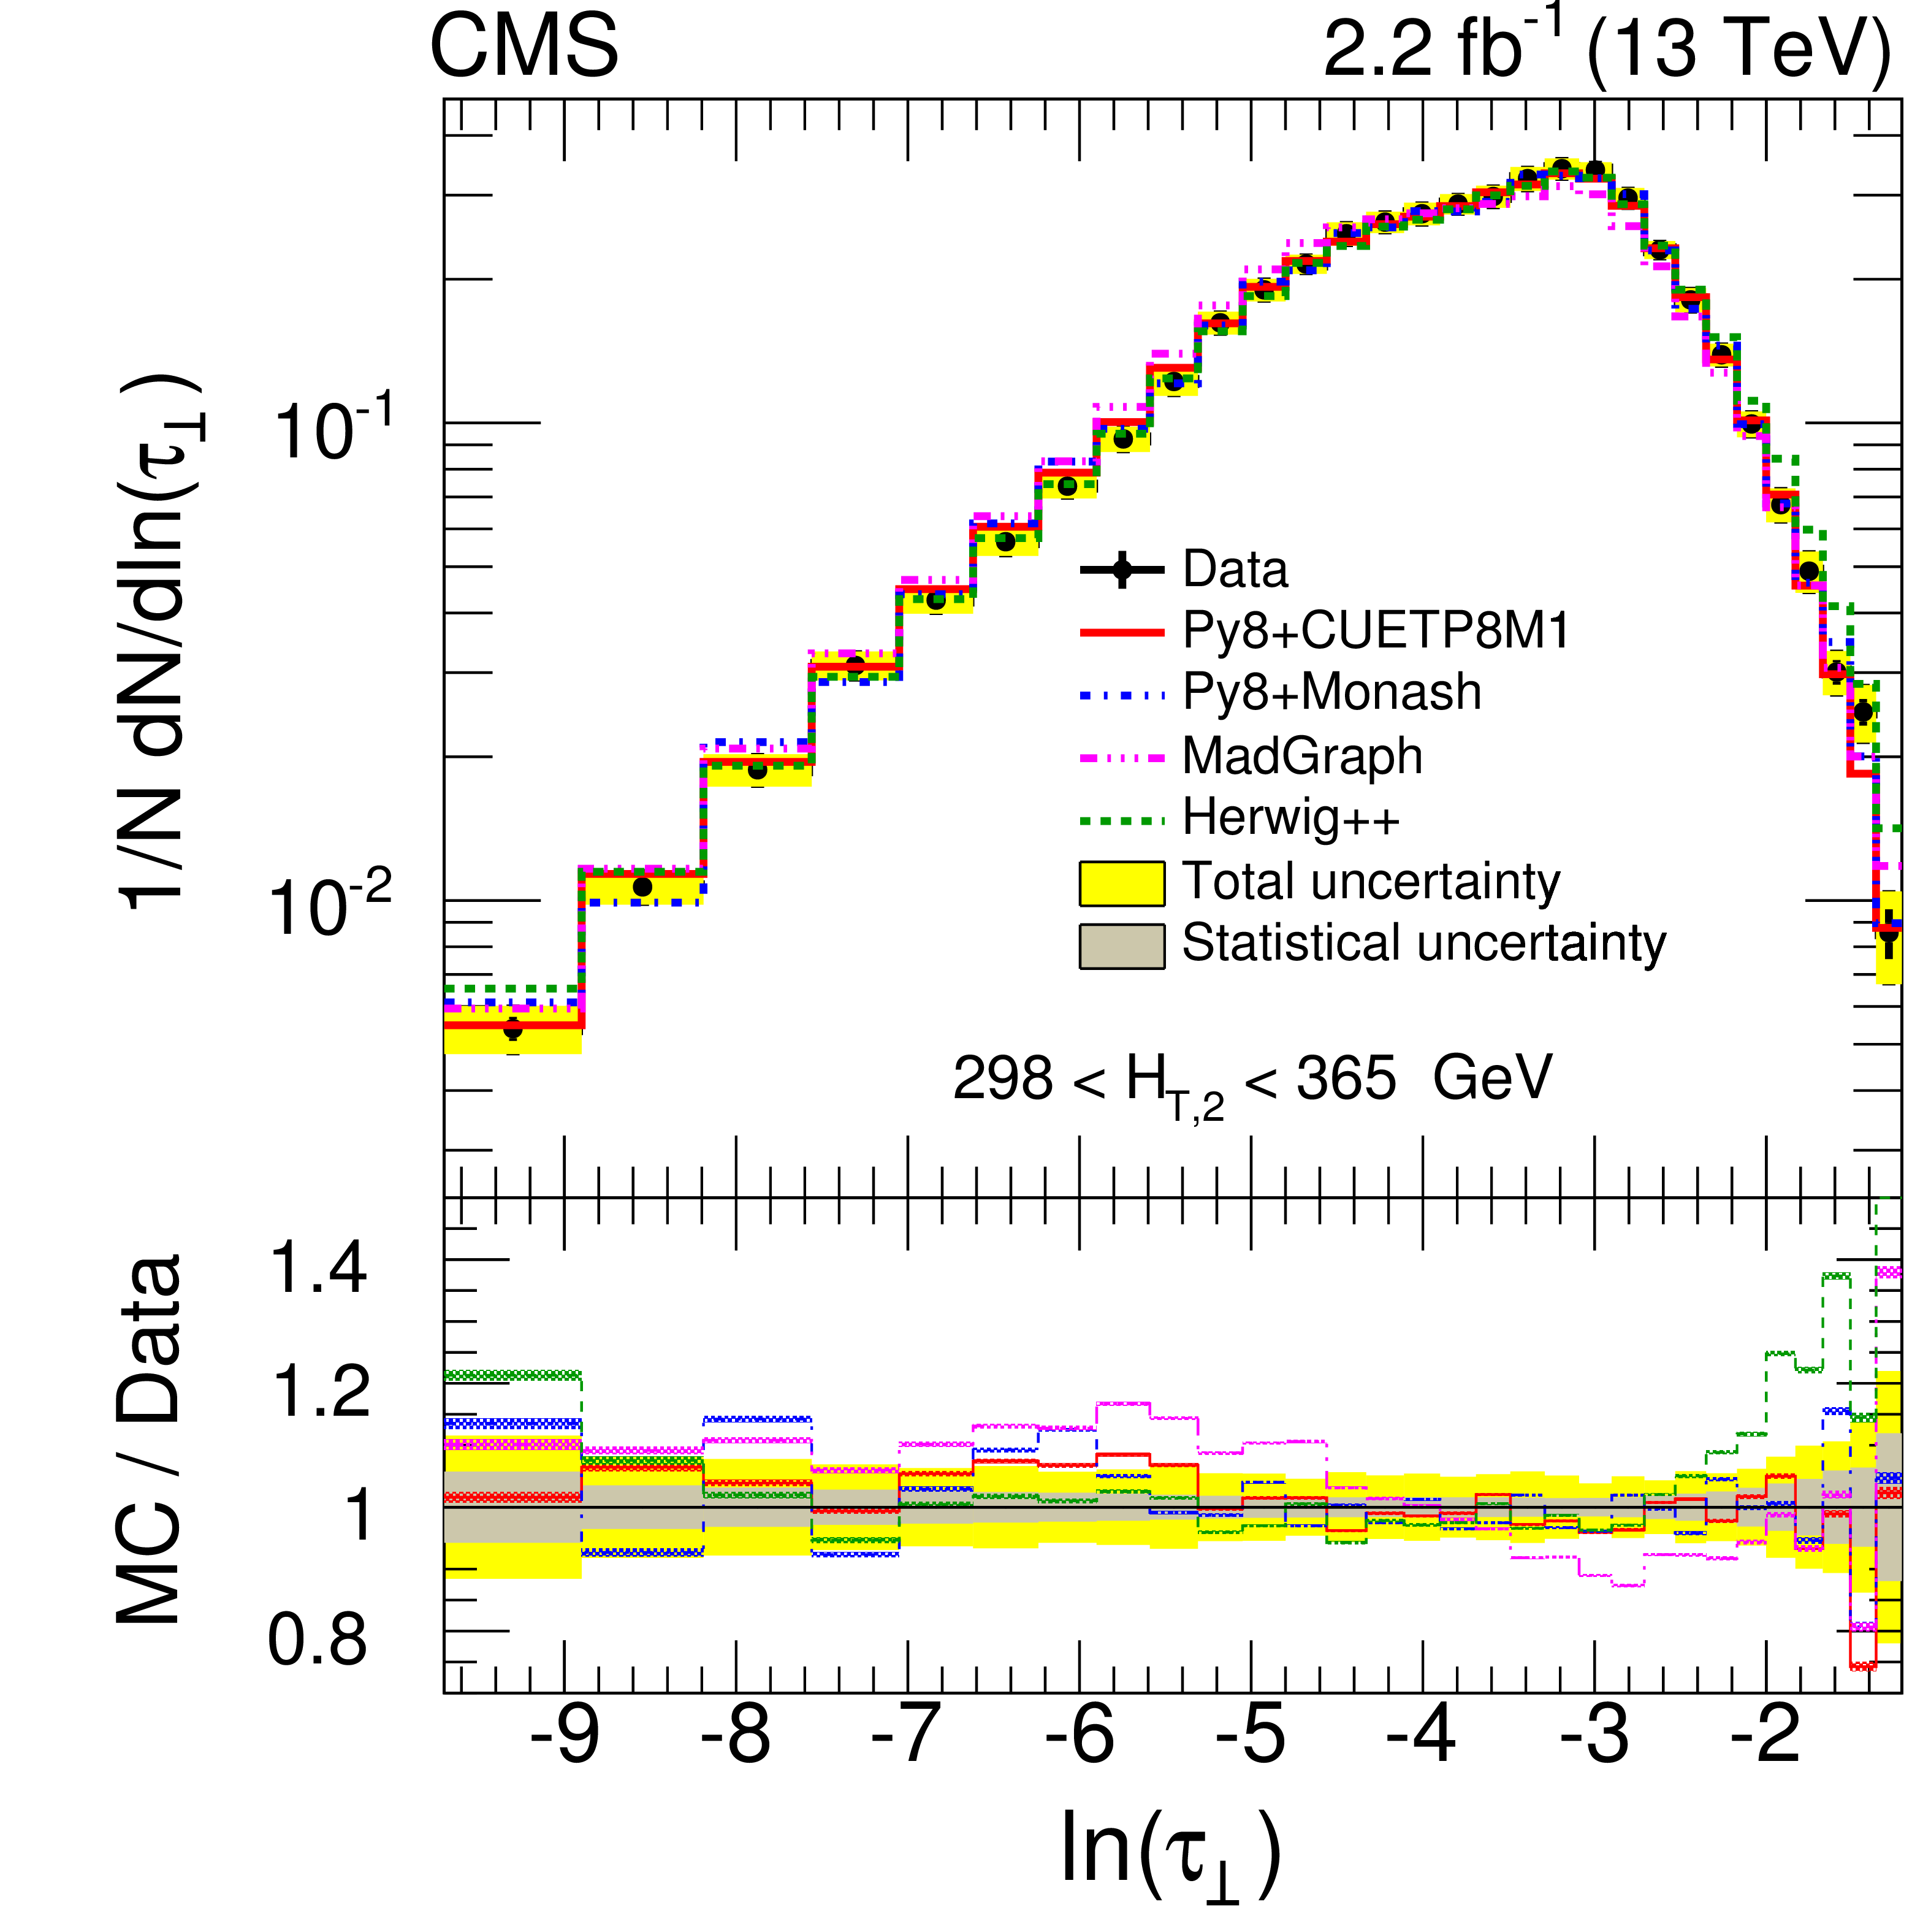
Figure 7:
Normalized differential distributions of unfolded data compared with theoretical (MC) predictions of PYTHIA8 CUETP8M1 (red line), PYTHIA8 Monash (blue dash-dotted line), MadGraph5_amc@nlo (pink dash-dot-dotted line) and HERWIG++ (brown dash-dot-dotted line) as a function of ESV: complement of transverse thrust ($ {\tau _{\perp}} $) (upper left), total jet broadening ($ {B_{\mathrm {Tot}}} $) (upper right), total jet mass ($ {\rho _{\mathrm {Tot}}} $) (lower left) and total transverse jet mass ($ {\rho _{\mathrm {Tot}}^{\mathrm {T}}} $) (lower right) for 298 $ < {H_{\mathrm {T},2}} < $ 365 GeV. In each ratio plot, the inner gray band represents statistical uncertainty and the yellow band represents the total uncertainty (systematic and statistical components added in quadrature) on data and the MC predictions include only statistical uncertainty. |
png pdf |
Figure 7-a:
Normalized differential distributions of unfolded data compared with theoretical (MC) predictions of PYTHIA8 CUETP8M1 (red line), PYTHIA8 Monash (blue dash-dotted line), MadGraph5_amc@nlo (pink dash-dot-dotted line) and HERWIG++ (brown dash-dot-dotted line) as a function of ESV: complement of transverse thrust ($ {\tau _{\perp}} $) for 298 $ < {H_{\mathrm {T},2}} < $ 365 GeV. In each ratio plot, the inner gray band represents statistical uncertainty and the yellow band represents the total uncertainty (systematic and statistical components added in quadrature) on data and the MC predictions include only statistical uncertainty. |

png pdf |
Figure 7-b:
Normalized differential distributions of unfolded data compared with theoretical (MC) predictions of PYTHIA8 CUETP8M1 (red line), PYTHIA8 Monash (blue dash-dotted line), MadGraph5_amc@nlo (pink dash-dot-dotted line) and HERWIG++ (brown dash-dot-dotted line) as a function of ESV: total jet broadening ($ {B_{\mathrm {Tot}}} $) for 298 $ < {H_{\mathrm {T},2}} < $ 365 GeV. In each ratio plot, the inner gray band represents statistical uncertainty and the yellow band represents the total uncertainty (systematic and statistical components added in quadrature) on data and the MC predictions include only statistical uncertainty. |

png pdf |
Figure 7-c:
Normalized differential distributions of unfolded data compared with theoretical (MC) predictions of PYTHIA8 CUETP8M1 (red line), PYTHIA8 Monash (blue dash-dotted line), MadGraph5_amc@nlo (pink dash-dot-dotted line) and HERWIG++ (brown dash-dot-dotted line) as a function of ESV: total jet mass ($ {\rho _{\mathrm {Tot}}} $) for 298 $ < {H_{\mathrm {T},2}} < $ 365 GeV. In each ratio plot, the inner gray band represents statistical uncertainty and the yellow band represents the total uncertainty (systematic and statistical components added in quadrature) on data and the MC predictions include only statistical uncertainty. |

png pdf |
Figure 7-d:
Normalized differential distributions of unfolded data compared with theoretical (MC) predictions of PYTHIA8 CUETP8M1 (red line), PYTHIA8 Monash (blue dash-dotted line), MadGraph5_amc@nlo (pink dash-dot-dotted line) and HERWIG++ (brown dash-dot-dotted line) as a function of ESV: total transverse jet mass ($ {\rho _{\mathrm {Tot}}^{\mathrm {T}}} $) for 298 $ < {H_{\mathrm {T},2}} < $ 365 GeV. In each ratio plot, the inner gray band represents statistical uncertainty and the yellow band represents the total uncertainty (systematic and statistical components added in quadrature) on data and the MC predictions include only statistical uncertainty. |
png pdf |
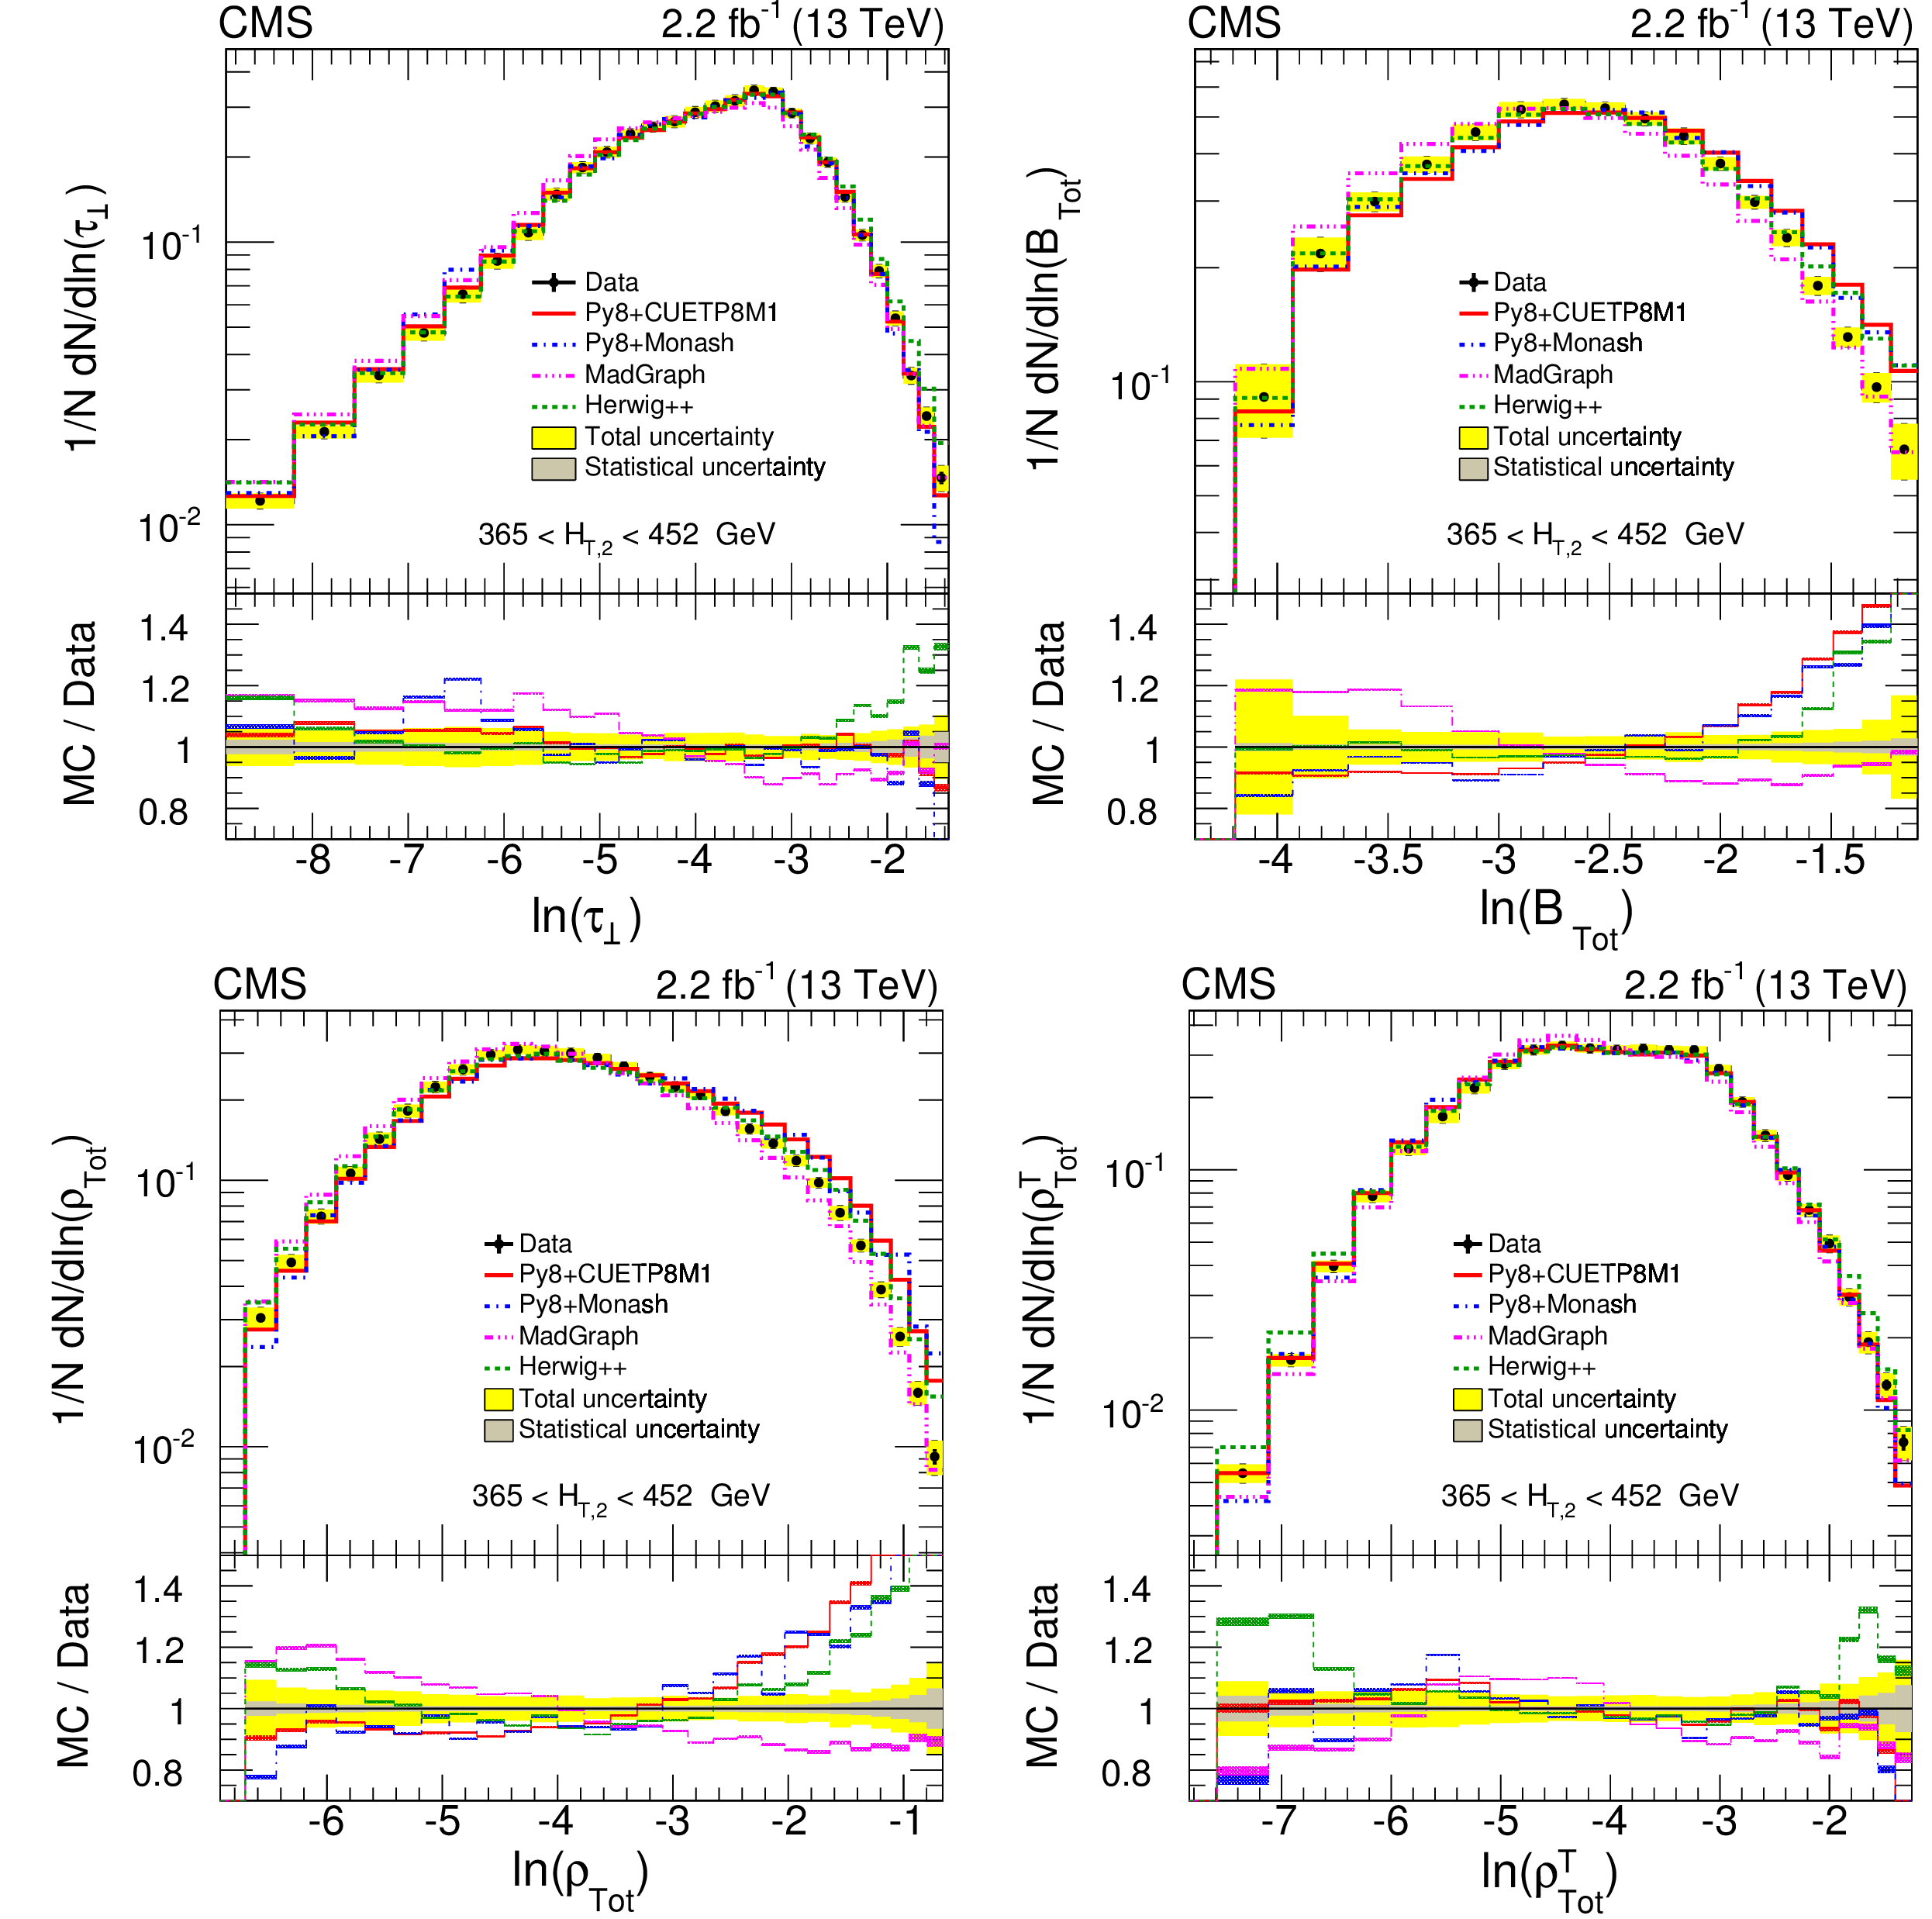
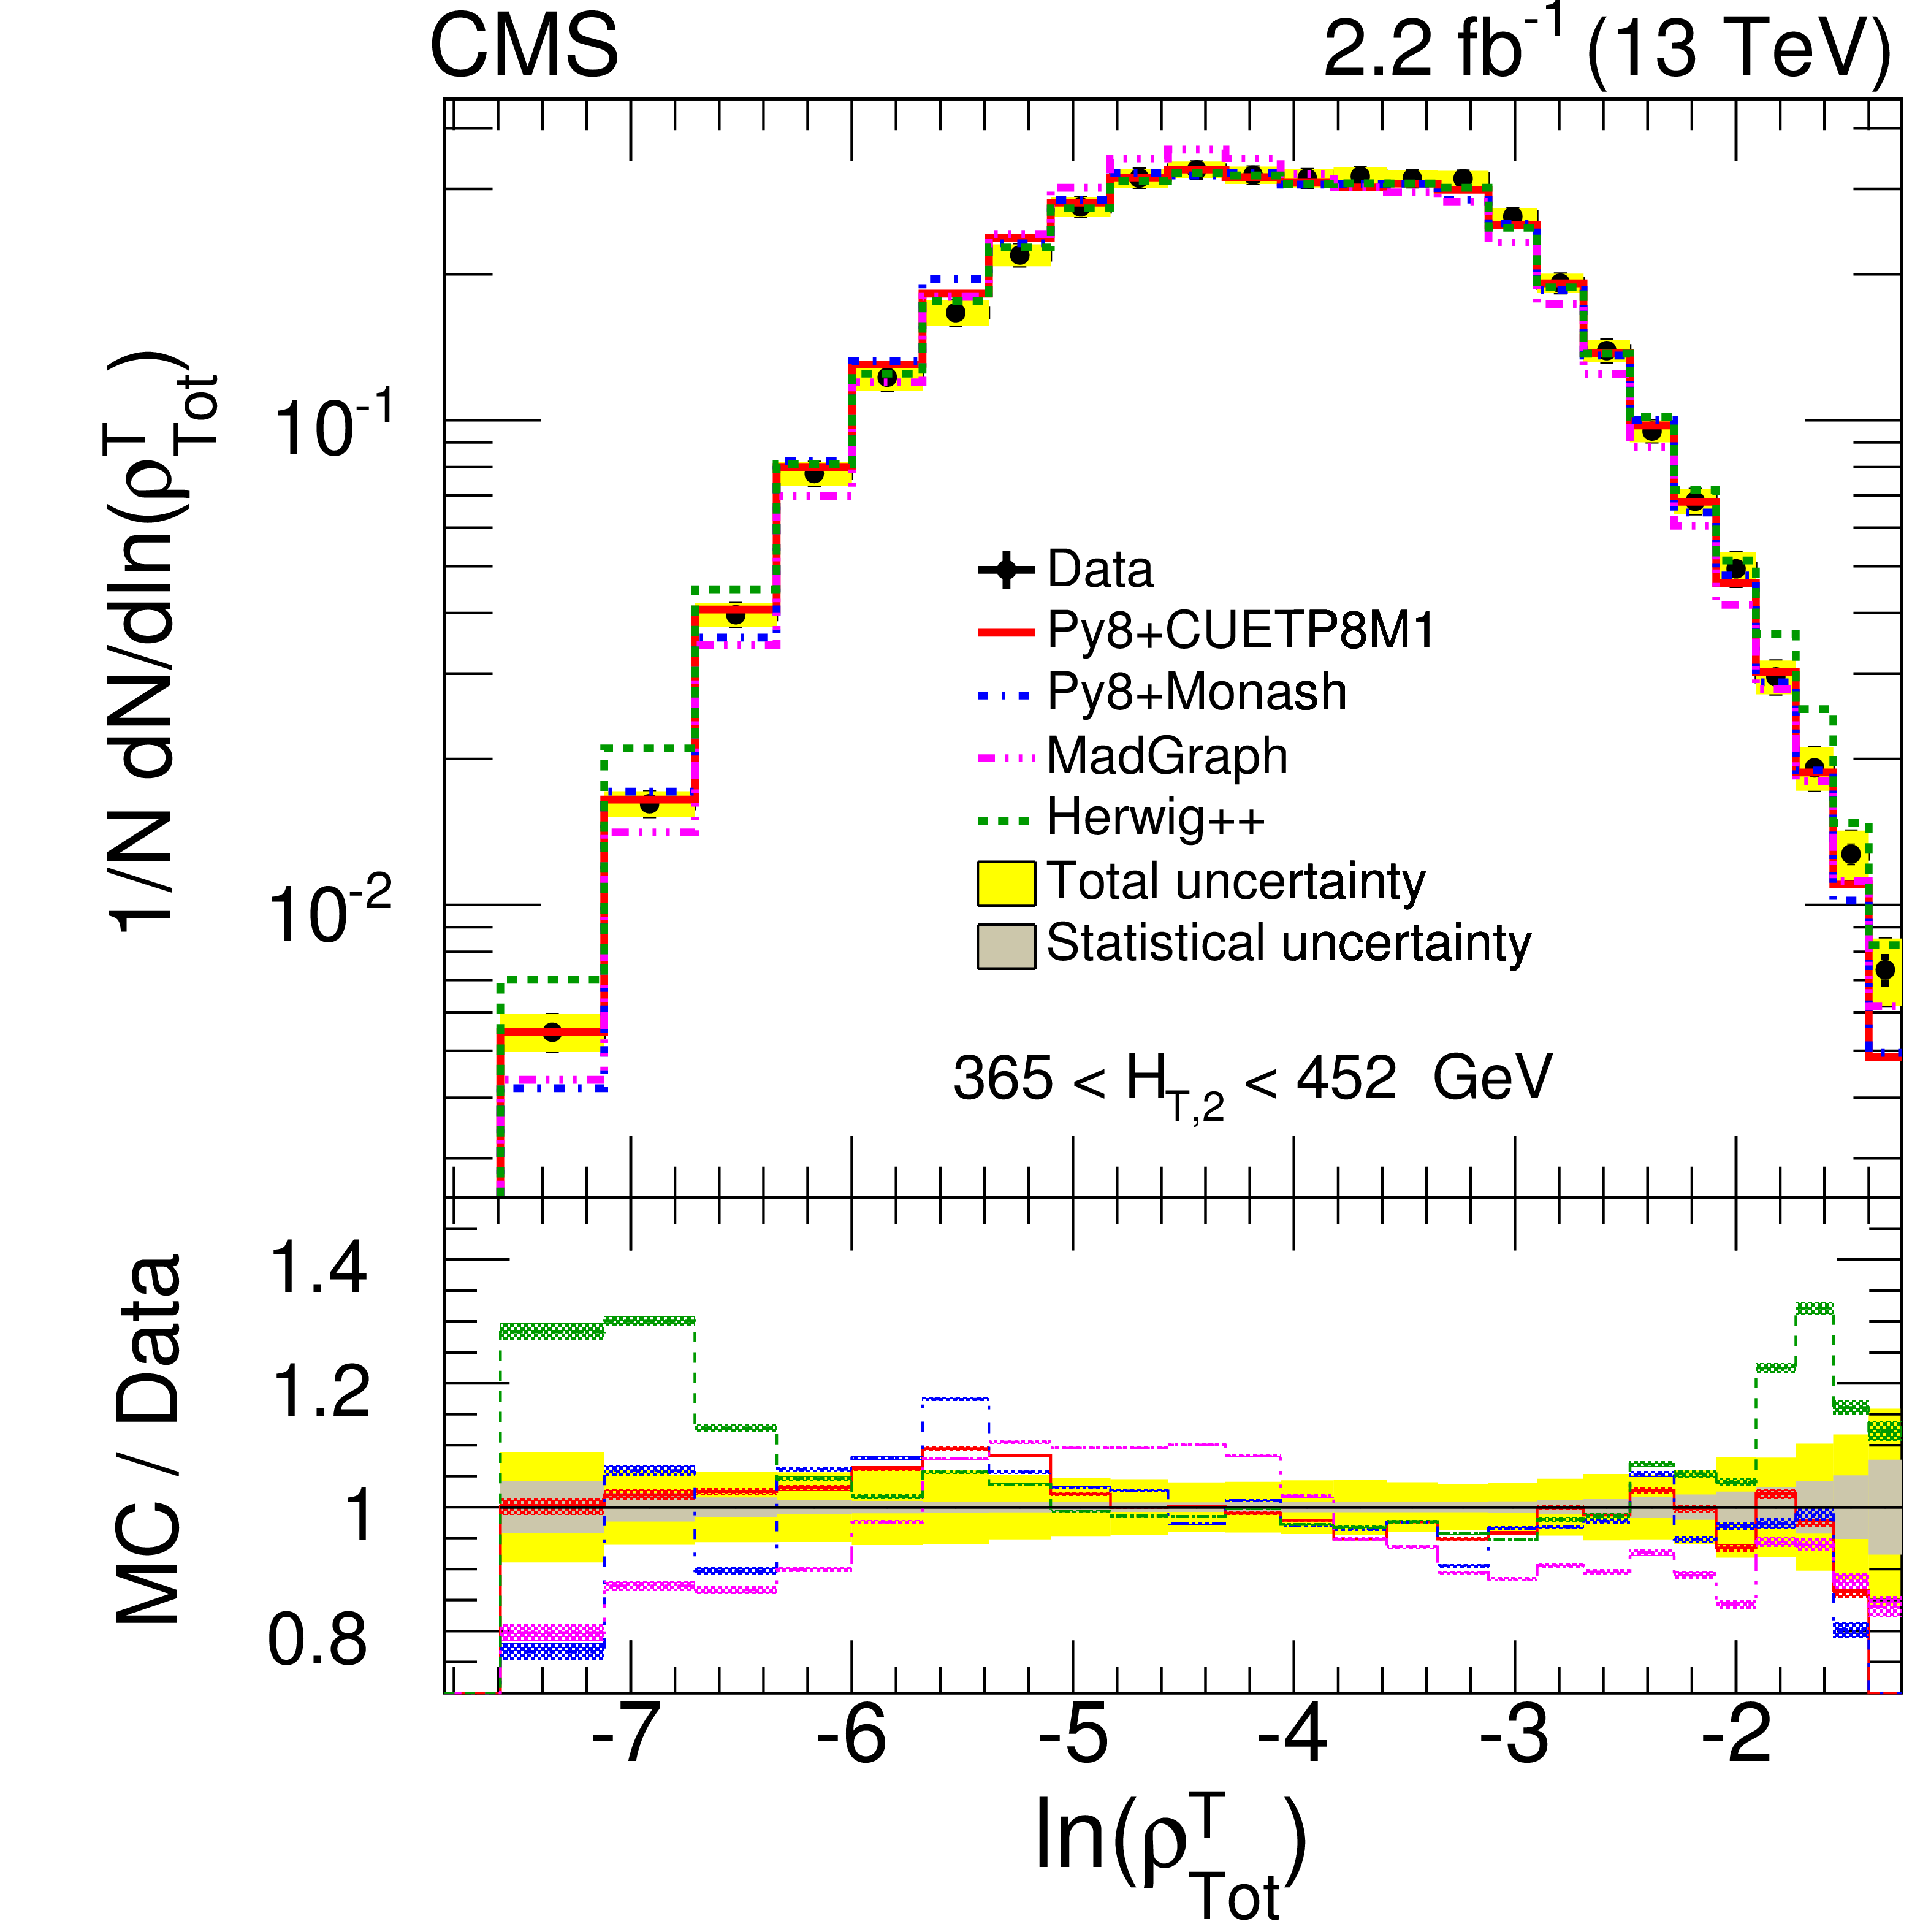
Figure 8:
Normalized differential distributions of unfolded data compared with theoretical (MC) predictions of PYTHIA8 CUETP8M1 (red line), PYTHIA8 Monash (blue dash-dotted line), MadGraph5_amc@nlo (pink dash-dot-dotted line) and HERWIG++ (brown dash-dot-dotted line) as a function of ESV: complement of transverse thrust ($ {\tau _{\perp}} $) (upper left), total jet broadening ($ {B_{\mathrm {Tot}}} $) (upper right), total jet mass ($ {\rho _{\mathrm {Tot}}} $) (lower left) and total transverse jet mass ($ {\rho _{\mathrm {Tot}}^{\mathrm {T}}} $) (lower right) for 365 $ < {H_{\mathrm {T},2}} < $ 452 GeV. In each ratio plot, the inner gray band represents statistical uncertainty and the yellow band represents the total uncertainty (systematic and statistical components added in quadrature) on data and the MC predictions include only statistical uncertainty. |
png pdf |
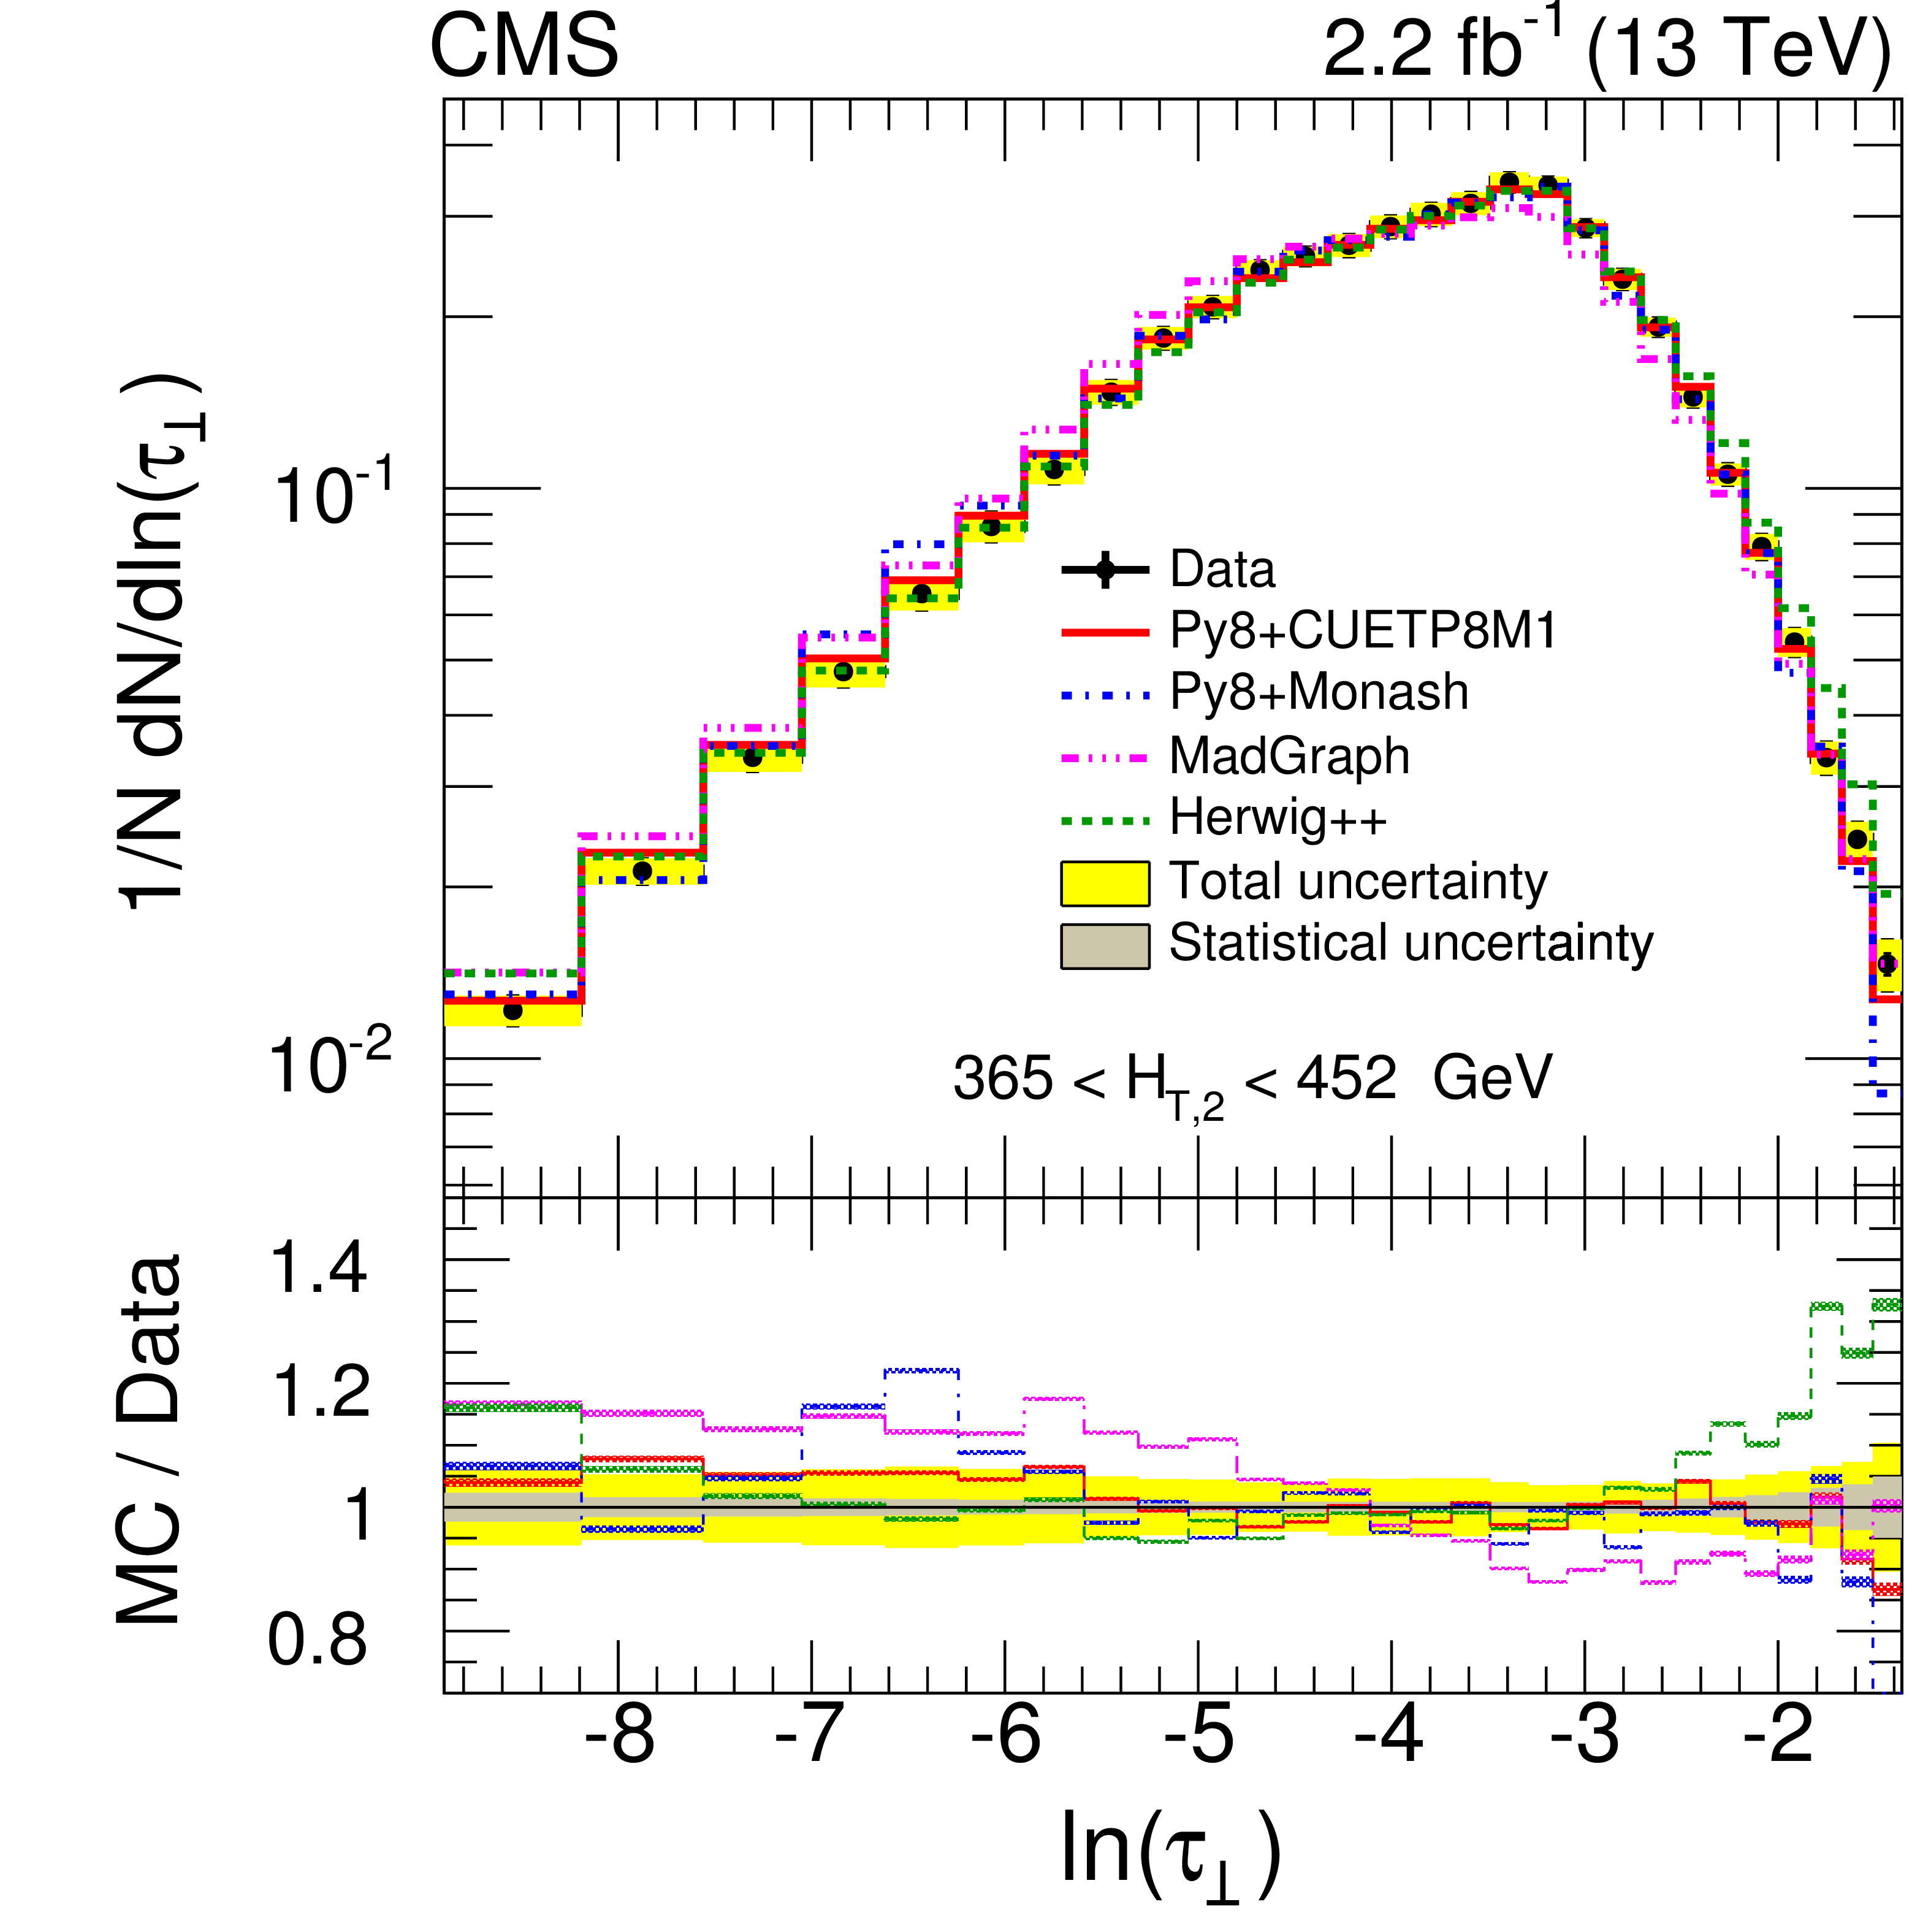
Figure 8-a:
Normalized differential distributions of unfolded data compared with theoretical (MC) predictions of PYTHIA8 CUETP8M1 (red line), PYTHIA8 Monash (blue dash-dotted line), MadGraph5_amc@nlo (pink dash-dot-dotted line) and HERWIG++ (brown dash-dot-dotted line) as a function of ESV: complement of transverse thrust ($ {\tau _{\perp}} $) for 365 $ < {H_{\mathrm {T},2}} < $ 452 GeV. In the ratio plot, the inner gray band represents statistical uncertainty and the yellow band represents the total uncertainty (systematic and statistical components added in quadrature) on data and the MC predictions include only statistical uncertainty. |
png pdf |
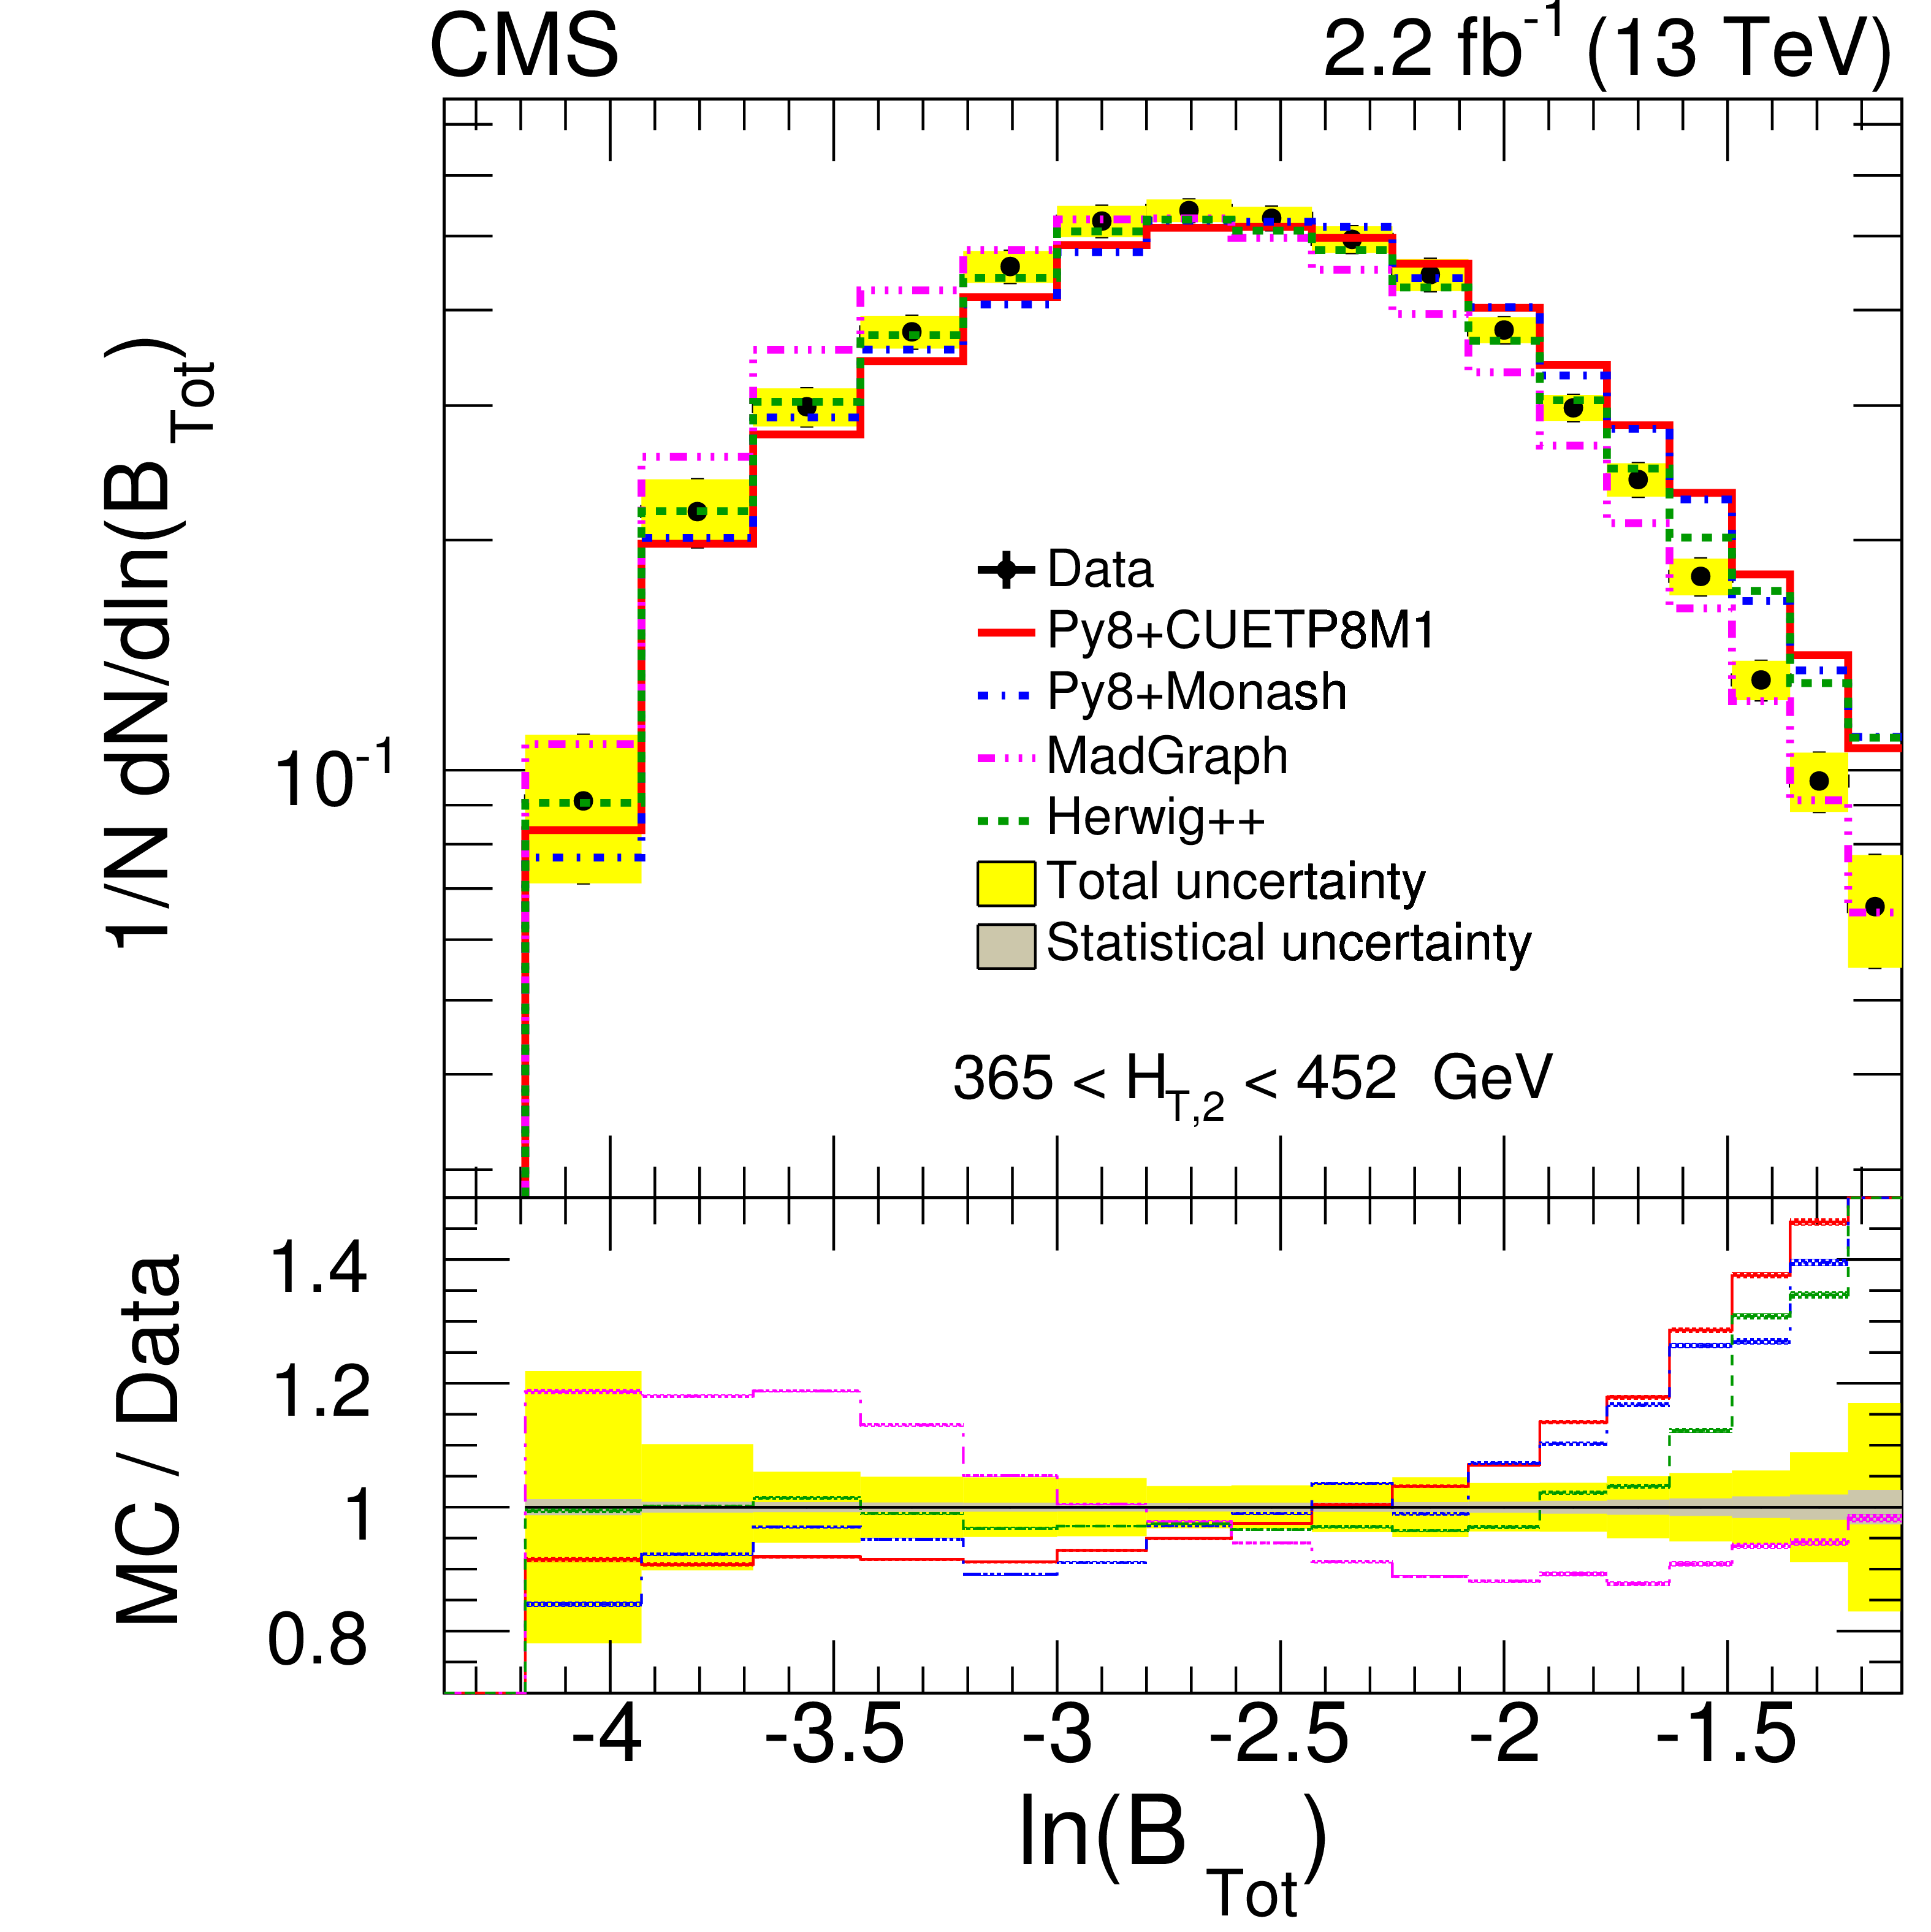
Figure 8-b:
Normalized differential distributions of unfolded data compared with theoretical (MC) predictions of PYTHIA8 CUETP8M1 (red line), PYTHIA8 Monash (blue dash-dotted line), MadGraph5_amc@nlo (pink dash-dot-dotted line) and HERWIG++ (brown dash-dot-dotted line) as a function of ESV: total jet broadening ($ {B_{\mathrm {Tot}}} $) for 365 $ < {H_{\mathrm {T},2}} < $ 452 GeV. In the ratio plot, the inner gray band represents statistical uncertainty and the yellow band represents the total uncertainty (systematic and statistical components added in quadrature) on data and the MC predictions include only statistical uncertainty. |

png pdf |
Figure 8-c:
Normalized differential distributions of unfolded data compared with theoretical (MC) predictions of PYTHIA8 CUETP8M1 (red line), PYTHIA8 Monash (blue dash-dotted line), MadGraph5_amc@nlo (pink dash-dot-dotted line) and HERWIG++ (brown dash-dot-dotted line) as a function of ESV: total jet mass ($ {\rho _{\mathrm {Tot}}} $) for 365 $ < {H_{\mathrm {T},2}} < $ 452 GeV. In the ratio plot, the inner gray band represents statistical uncertainty and the yellow band represents the total uncertainty (systematic and statistical components added in quadrature) on data and the MC predictions include only statistical uncertainty. |
png pdf |
Figure 8-d:
Normalized differential distributions of unfolded data compared with theoretical (MC) predictions of PYTHIA8 CUETP8M1 (red line), PYTHIA8 Monash (blue dash-dotted line), MadGraph5_amc@nlo (pink dash-dot-dotted line) and HERWIG++ (brown dash-dot-dotted line) as a function of ESV: total transverse jet mass ($ {\rho _{\mathrm {Tot}}^{\mathrm {T}}} $) for 365 $ < {H_{\mathrm {T},2}} < $ 452 GeV. In the ratio plot, the inner gray band represents statistical uncertainty and the yellow band represents the total uncertainty (systematic and statistical components added in quadrature) on data and the MC predictions include only statistical uncertainty. |

png pdf |
Figure 9:
Normalized differential distributions of unfolded data compared with theoretical (MC) predictions of PYTHIA8 CUETP8M1 (red line), PYTHIA8 Monash (blue dash-dotted line), MadGraph5_amc@nlo (pink dash-dot-dotted line) and HERWIG++ (brown dash-dot-dotted line) as a function of ESV: complement of transverse thrust ($ {\tau _{\perp}} $) (upper left), total jet broadening ($ {B_{\mathrm {Tot}}} $) (upper right), total jet mass ($ {\rho _{\mathrm {Tot}}} $) (lower left) and total transverse jet mass ($ {\rho _{\mathrm {Tot}}^{\mathrm {T}}} $) (lower right) for 452 $ < {H_{\mathrm {T},2}} < $ 557 GeV. In each ratio plot, the inner gray band represents statistical uncertainty and the yellow band represents the total uncertainty (systematic and statistical components added in quadrature) on data and the MC predictions include only statistical uncertainty. |

png pdf |
Figure 9-a:
Normalized differential distributions of unfolded data compared with theoretical (MC) predictions of PYTHIA8 CUETP8M1 (red line), PYTHIA8 Monash (blue dash-dotted line), MadGraph5_amc@nlo (pink dash-dot-dotted line) and HERWIG++ (brown dash-dot-dotted line) as a function of ESV: complement of transverse thrust ($ {\tau _{\perp}} $) for 452 $ < {H_{\mathrm {T},2}} < $ 557 GeV. In each ratio plot, the inner gray band represents statistical uncertainty and the yellow band represents the total uncertainty (systematic and statistical components added in quadrature) on data and the MC predictions include only statistical uncertainty. |

png pdf |
Figure 9-b:
Normalized differential distributions of unfolded data compared with theoretical (MC) predictions of PYTHIA8 CUETP8M1 (red line), PYTHIA8 Monash (blue dash-dotted line), MadGraph5_amc@nlo (pink dash-dot-dotted line) and HERWIG++ (brown dash-dot-dotted line) as a function of ESV: total jet broadening ($ {B_{\mathrm {Tot}}} $) for 452 $ < {H_{\mathrm {T},2}} < $ 557 GeV. In each ratio plot, the inner gray band represents statistical uncertainty and the yellow band represents the total uncertainty (systematic and statistical components added in quadrature) on data and the MC predictions include only statistical uncertainty. |
png pdf |
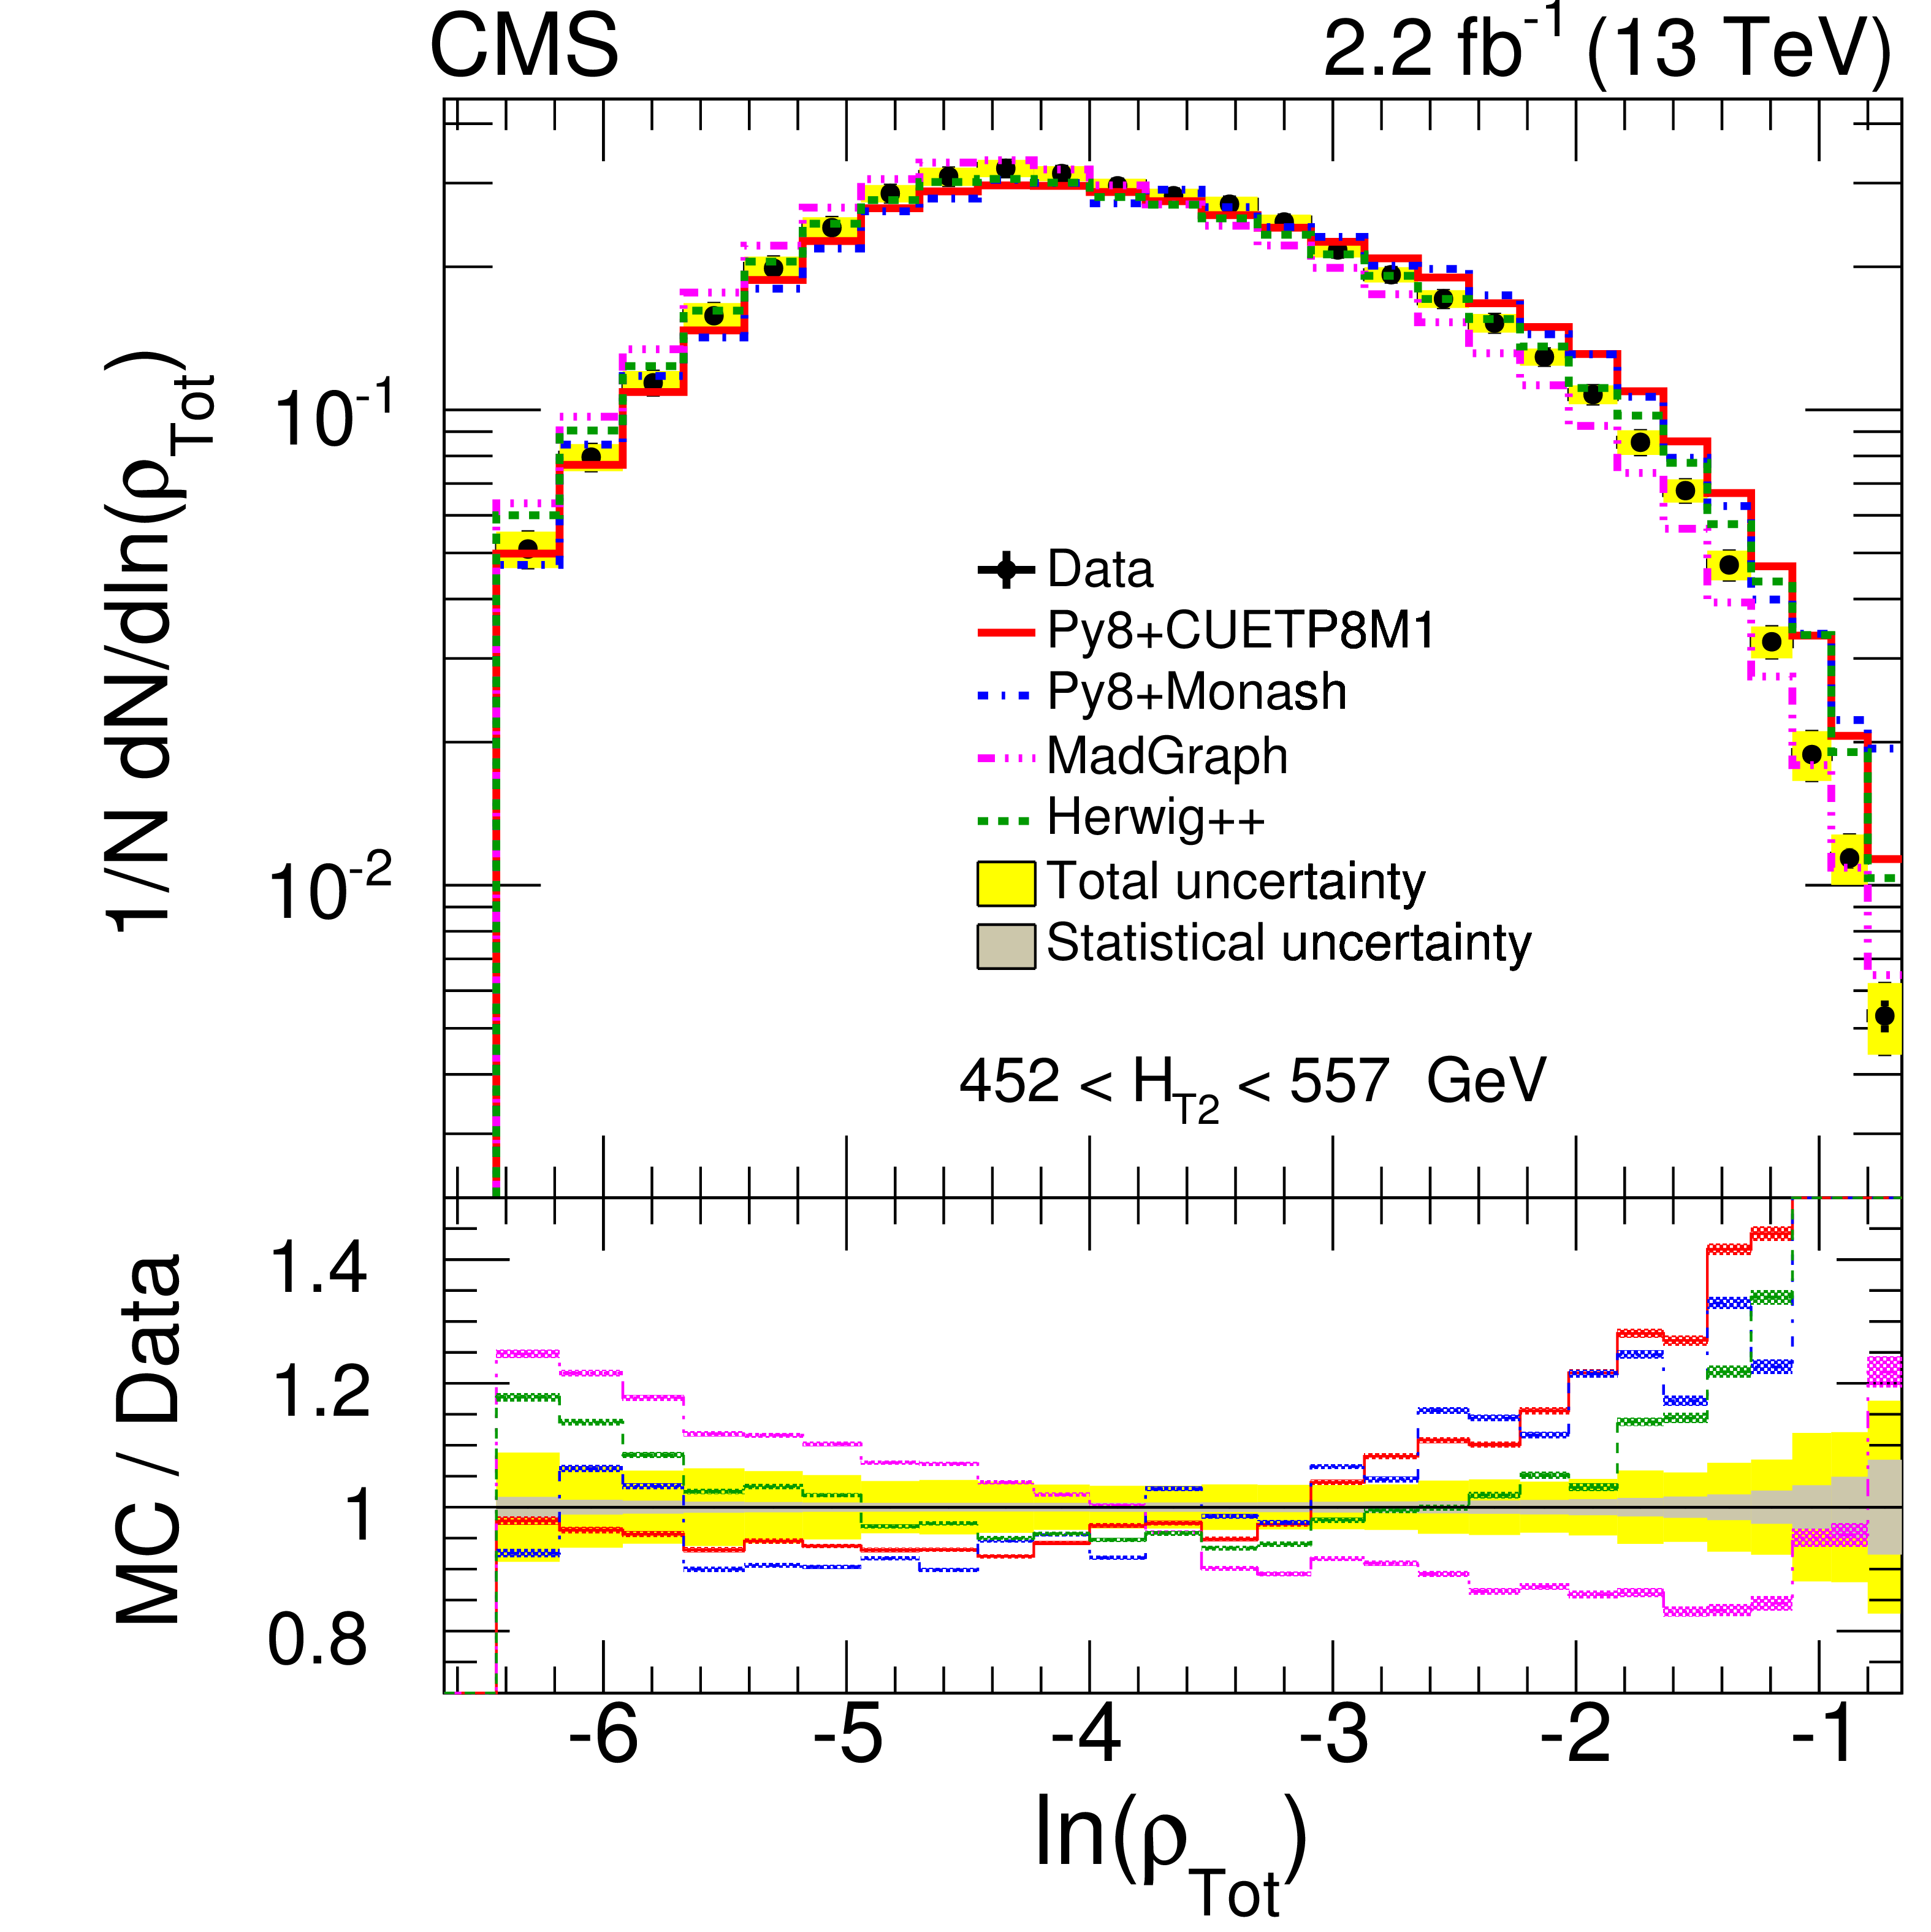
Figure 9-c:
Normalized differential distributions of unfolded data compared with theoretical (MC) predictions of PYTHIA8 CUETP8M1 (red line), PYTHIA8 Monash (blue dash-dotted line), MadGraph5_amc@nlo (pink dash-dot-dotted line) and HERWIG++ (brown dash-dot-dotted line) as a function of ESV: total jet mass ($ {\rho _{\mathrm {Tot}}} $) for 452 $ < {H_{\mathrm {T},2}} < $ 557 GeV. In each ratio plot, the inner gray band represents statistical uncertainty and the yellow band represents the total uncertainty (systematic and statistical components added in quadrature) on data and the MC predictions include only statistical uncertainty. |
png pdf |
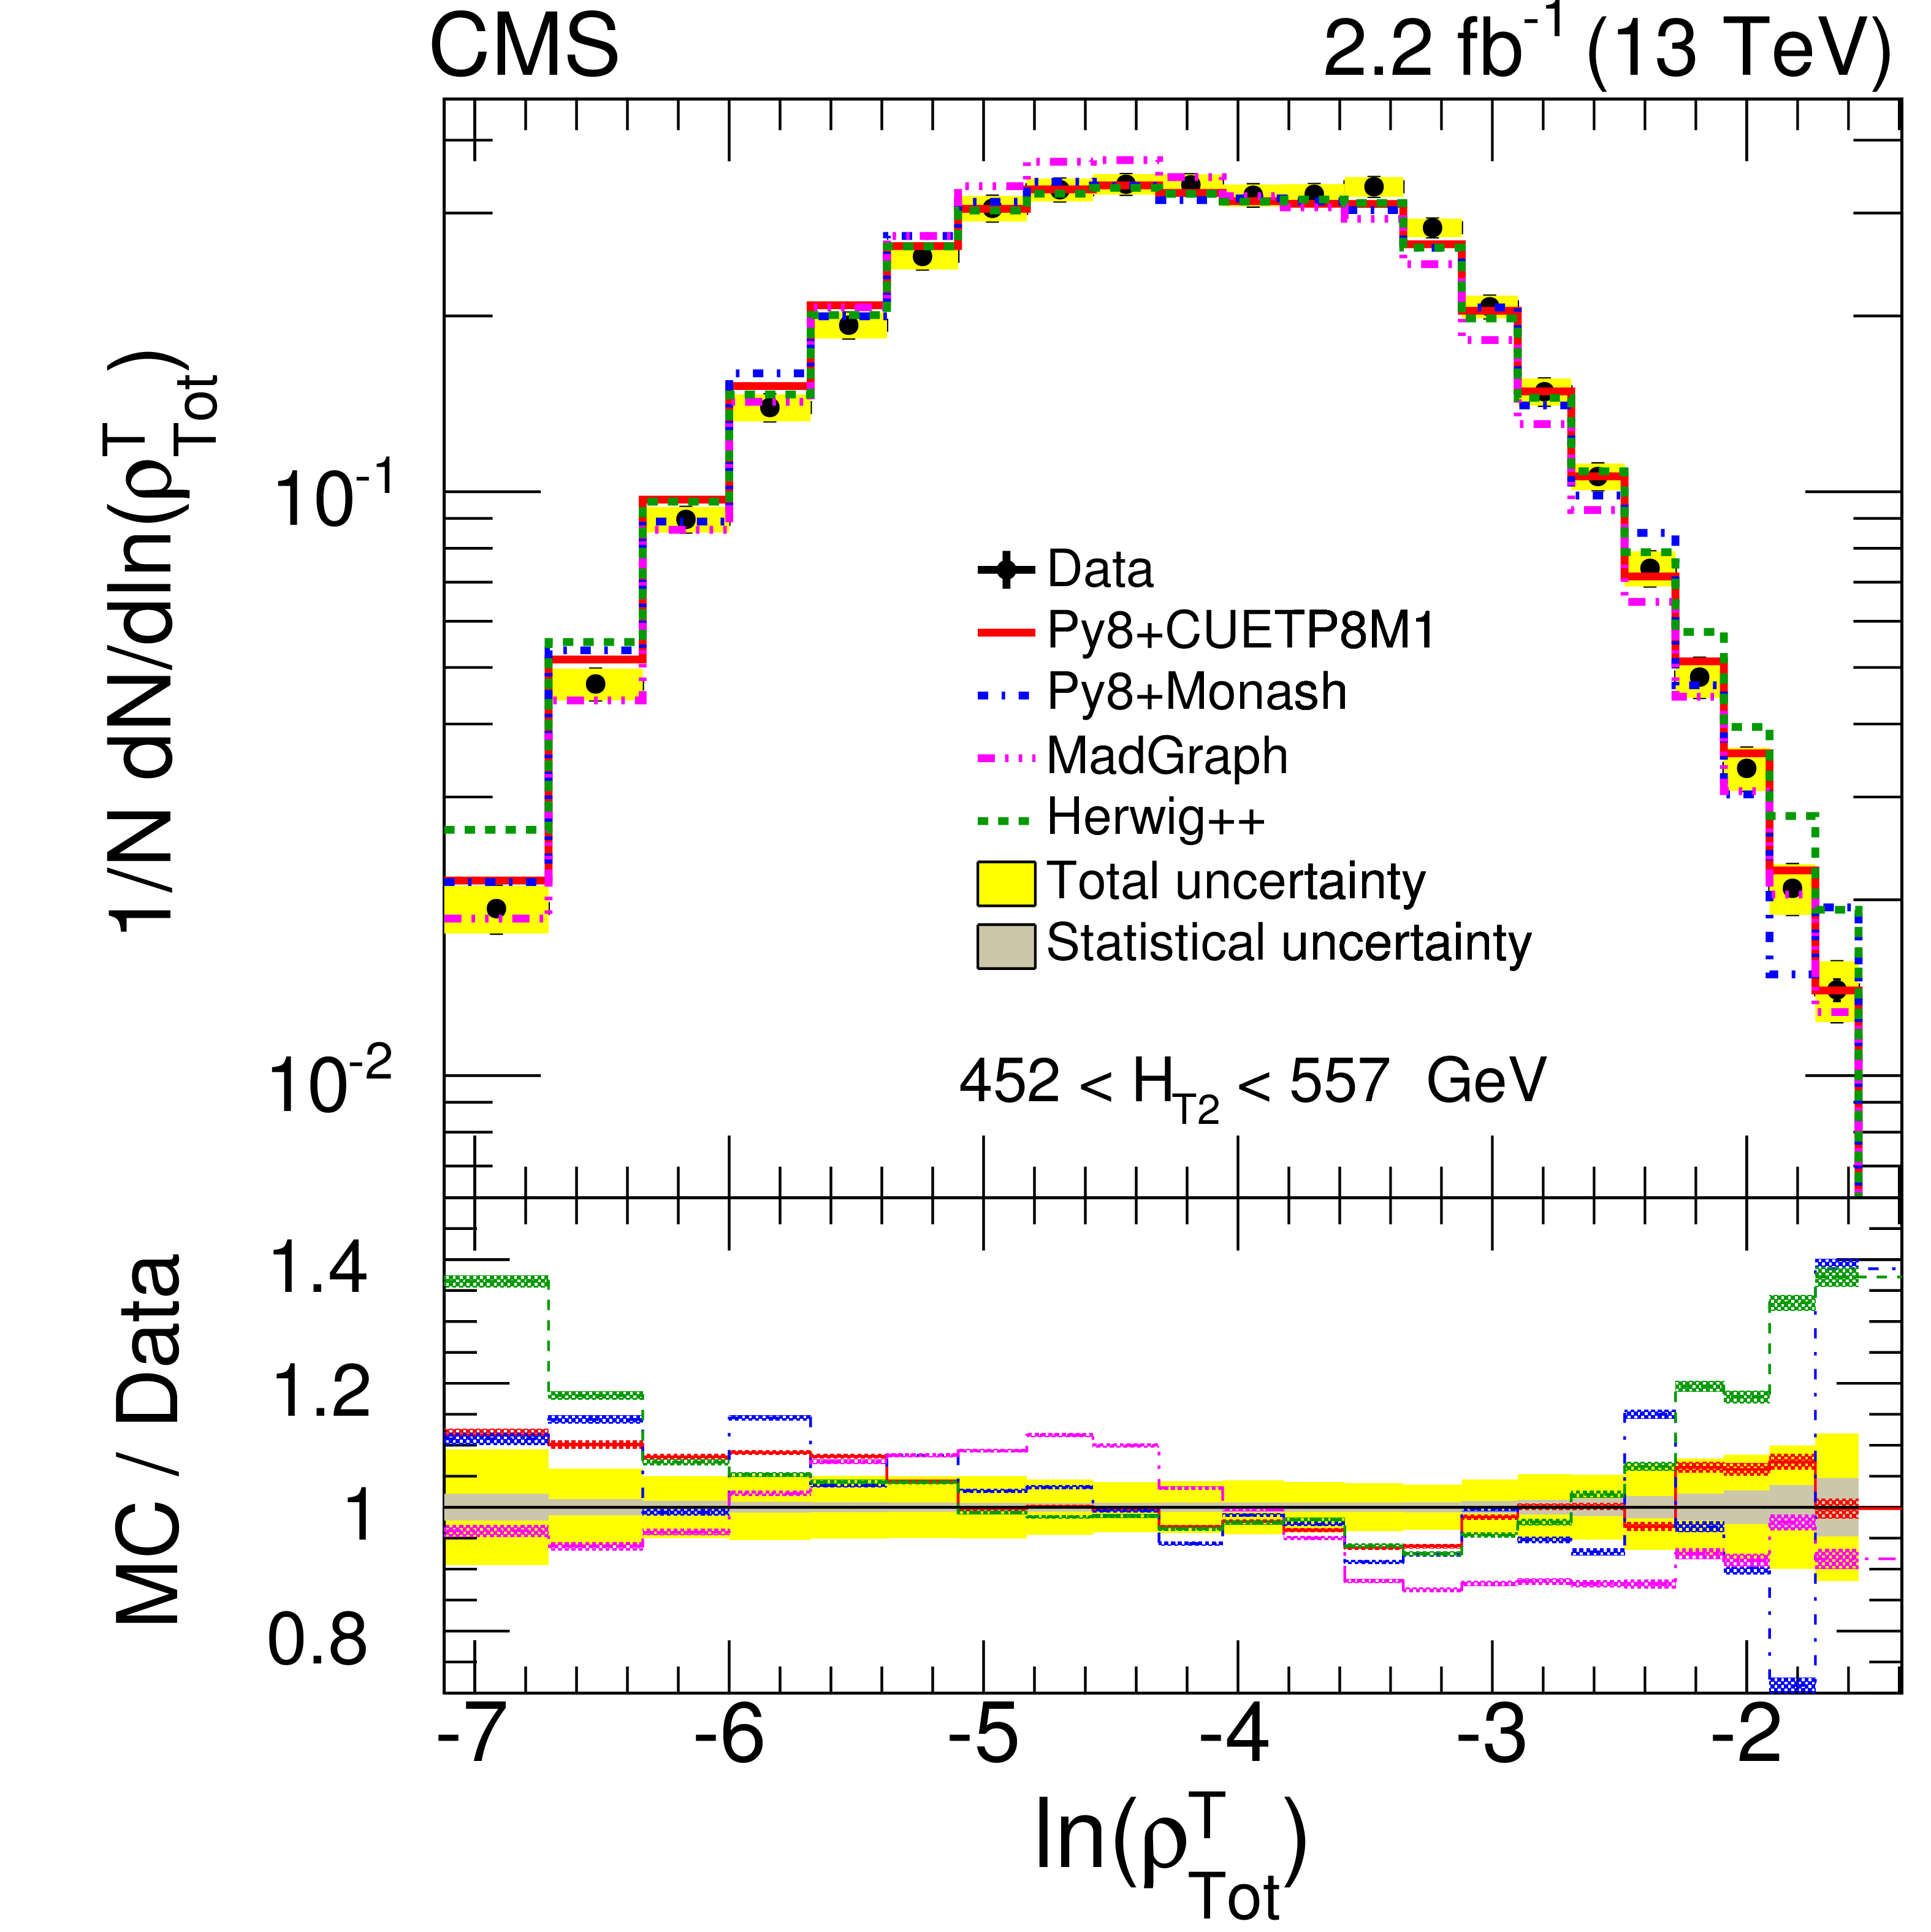
Figure 9-d:
Normalized differential distributions of unfolded data compared with theoretical (MC) predictions of PYTHIA8 CUETP8M1 (red line), PYTHIA8 Monash (blue dash-dotted line), MadGraph5_amc@nlo (pink dash-dot-dotted line) and HERWIG++ (brown dash-dot-dotted line) as a function of ESV: total transverse jet mass ($ {\rho _{\mathrm {Tot}}^{\mathrm {T}}} $) for 452 $ < {H_{\mathrm {T},2}} < $ 557 GeV. In each ratio plot, the inner gray band represents statistical uncertainty and the yellow band represents the total uncertainty (systematic and statistical components added in quadrature) on data and the MC predictions include only statistical uncertainty. |

png pdf |
Figure 10:
Normalized differential distributions of unfolded data compared with theoretical (MC) predictions of PYTHIA8 CUETP8M1 (red line), PYTHIA8 Monash (blue dash-dotted line), MadGraph5_amc@nlo (pink dash-dot-dotted line) and HERWIG++ (brown dash-dot-dotted line) as a function of ESV: complement of transverse thrust ($ {\tau _{\perp}} $) (upper left), total jet broadening ($ {B_{\mathrm {Tot}}} $) (upper right), total jet mass ($ {\rho _{\mathrm {Tot}}} $) transverse jet mass ($ {\rho _{\mathrm {Tot}}^{\mathrm {T}}} $) (lower left) and total transverse jet mass ($ {\rho _{\mathrm {Tot}}^{\mathrm {T}}} $) (lower right) for $ {H_{\mathrm {T},2}} > $ 557 GeV. In each ratio plot, the inner gray band represents statistical uncertainty and the yellow band represents the total uncertainty (systematic and statistical components added in quadrature) on data and the MC predictions include only statistical uncertainty. |
png pdf |
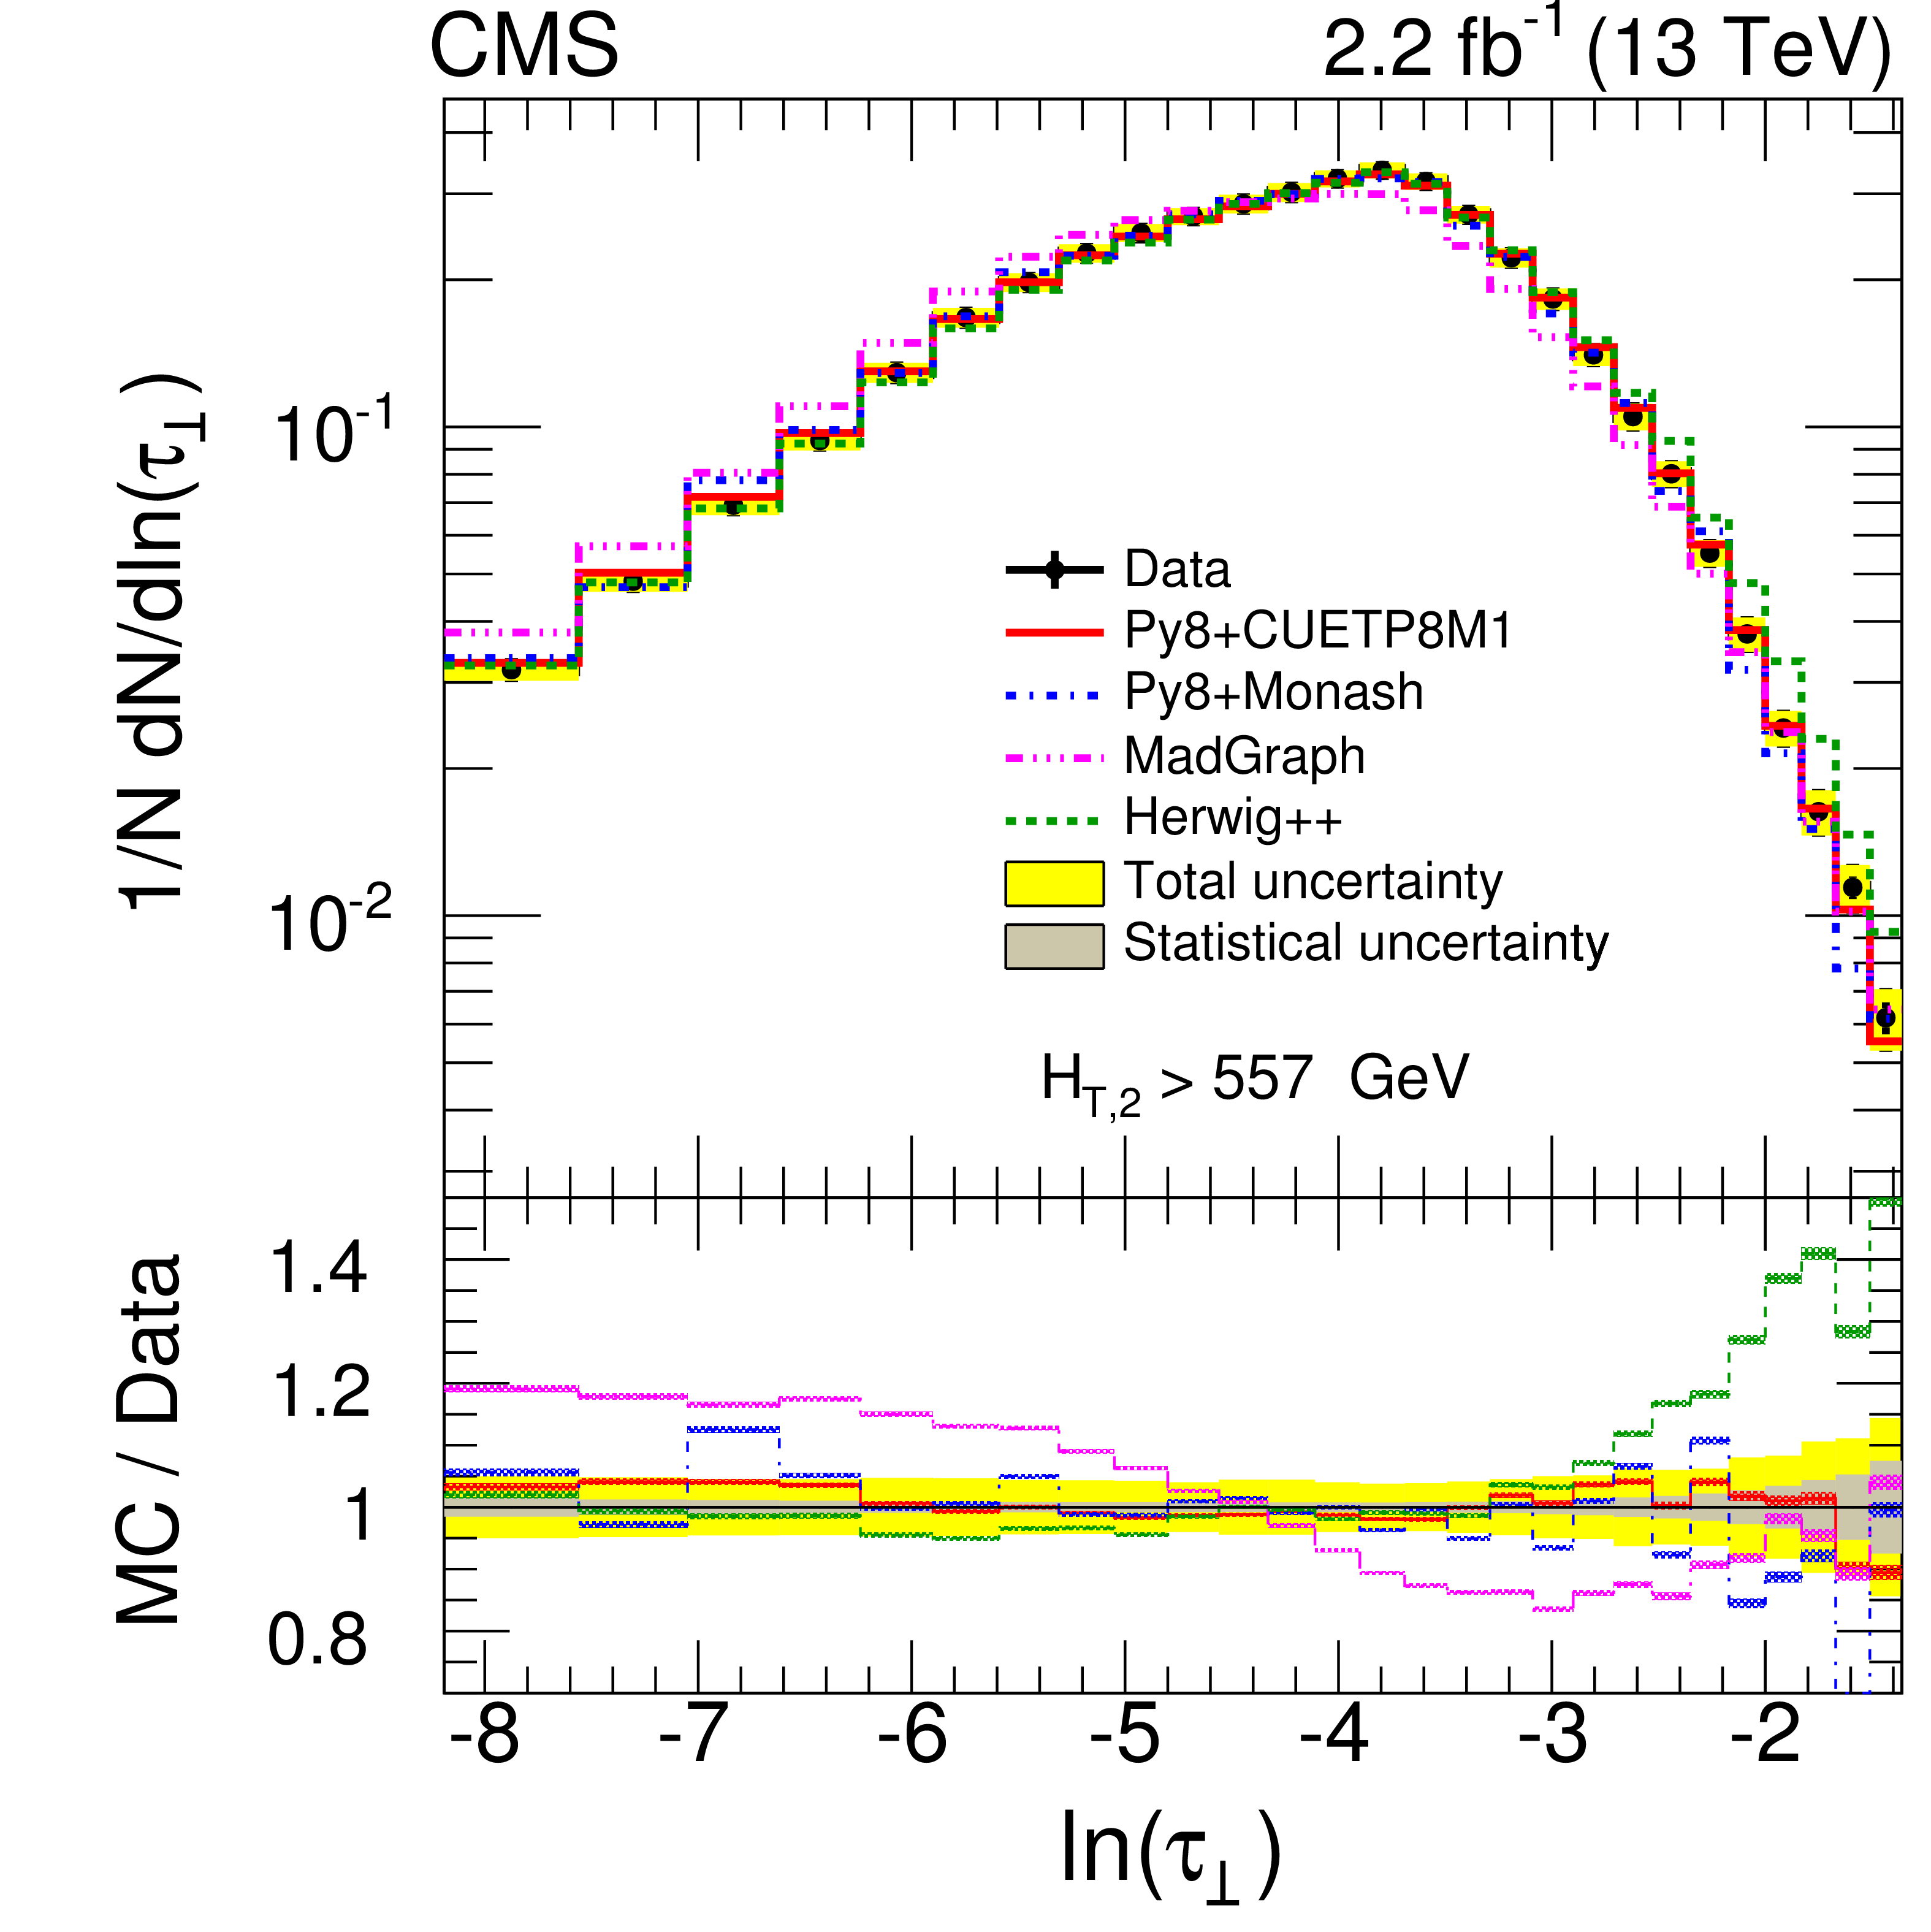
Figure 10-a:
Normalized differential distributions of unfolded data compared with theoretical (MC) predictions of PYTHIA8 CUETP8M1 (red line), PYTHIA8 Monash (blue dash-dotted line), MadGraph5_amc@nlo (pink dash-dot-dotted line) and HERWIG++ (brown dash-dot-dotted line) as a function of ESV: complement of transverse thrust ($ {\tau _{\perp}} $) for $ {H_{\mathrm {T},2}} > $ 557 GeV. In each ratio plot, the inner gray band represents statistical uncertainty and the yellow band represents the total uncertainty (systematic and statistical components added in quadrature) on data and the MC predictions include only statistical uncertainty. |
png pdf |
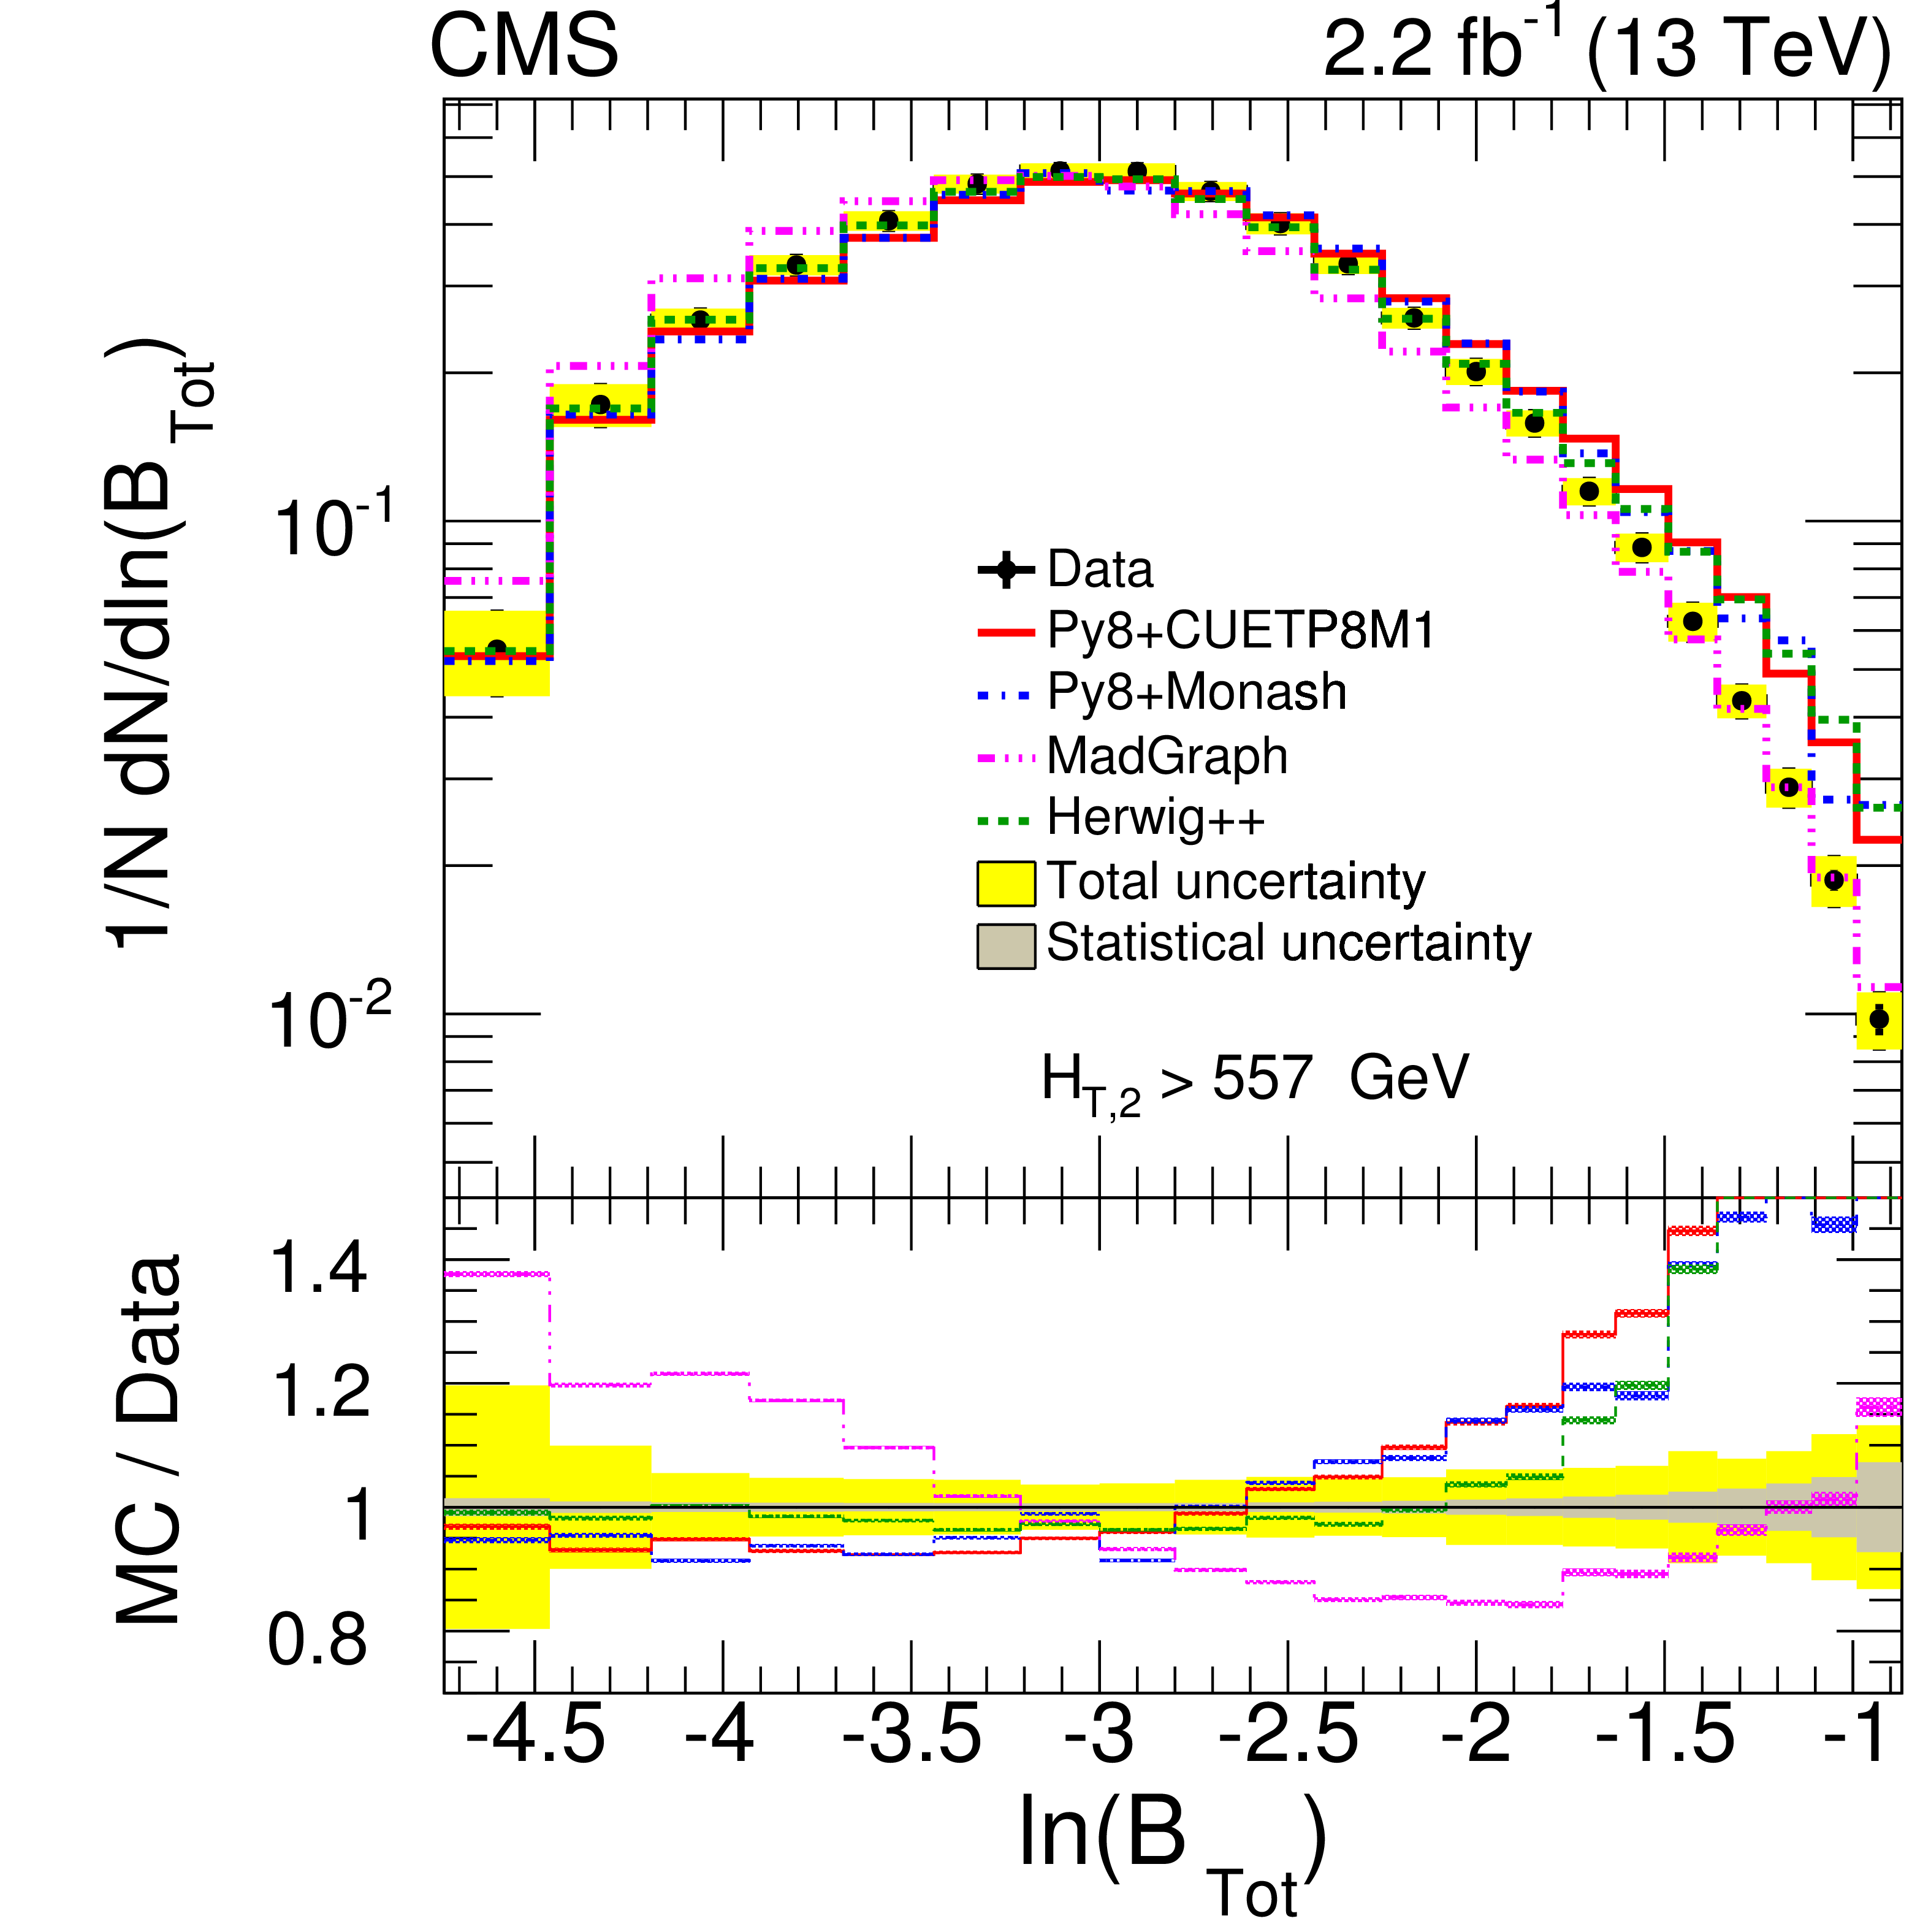
Figure 10-b:
Normalized differential distributions of unfolded data compared with theoretical (MC) predictions of PYTHIA8 CUETP8M1 (red line), PYTHIA8 Monash (blue dash-dotted line), MadGraph5_amc@nlo (pink dash-dot-dotted line) and HERWIG++ (brown dash-dot-dotted line) as a function of ESV: total jet broadening ($ {B_{\mathrm {Tot}}} $) for $ {H_{\mathrm {T},2}} > $ 557 GeV. In each ratio plot, the inner gray band represents statistical uncertainty and the yellow band represents the total uncertainty (systematic and statistical components added in quadrature) on data and the MC predictions include only statistical uncertainty. |
png pdf |
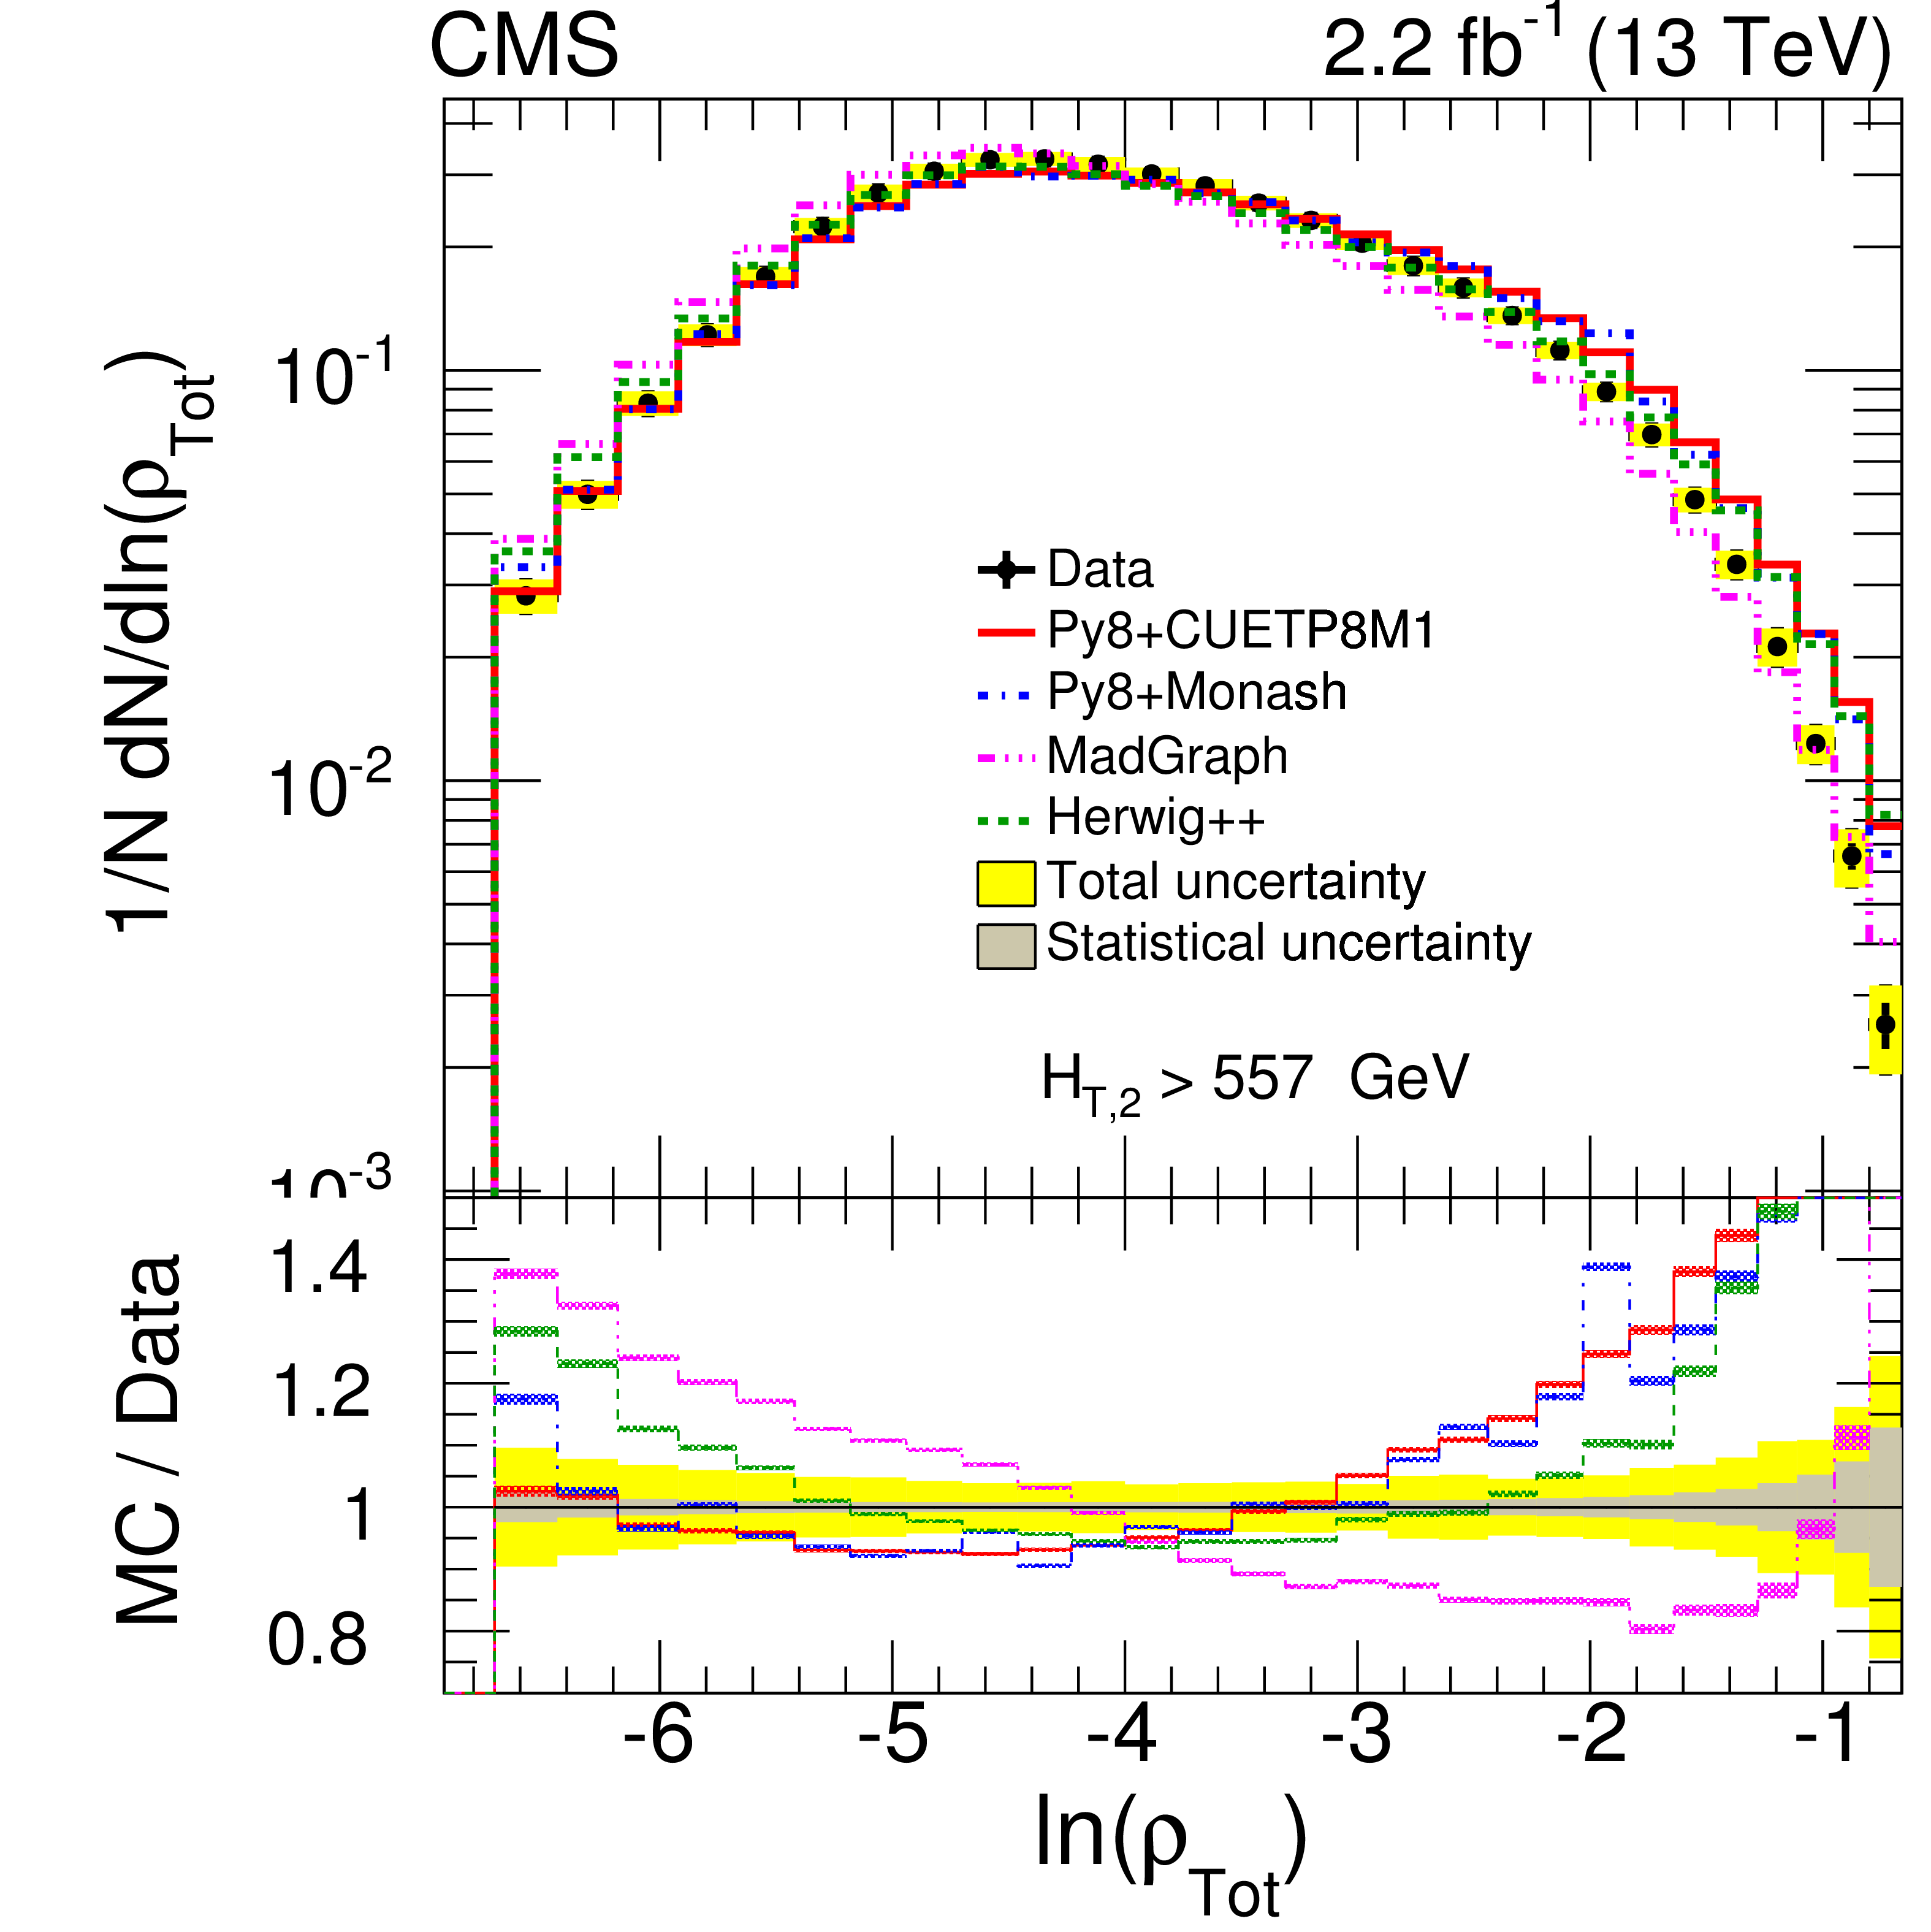
Figure 10-c:
Normalized differential distributions of unfolded data compared with theoretical (MC) predictions of PYTHIA8 CUETP8M1 (red line), PYTHIA8 Monash (blue dash-dotted line), MadGraph5_amc@nlo (pink dash-dot-dotted line) and HERWIG++ (brown dash-dot-dotted line) as a function of ESV: total jet mass ($ {\rho _{\mathrm {Tot}}} $) transverse jet mass ($ {\rho _{\mathrm {Tot}}^{\mathrm {T}}} $) for $ {H_{\mathrm {T},2}} > $ 557 GeV. In each ratio plot, the inner gray band represents statistical uncertainty and the yellow band represents the total uncertainty (systematic and statistical components added in quadrature) on data and the MC predictions include only statistical uncertainty. |
png pdf |
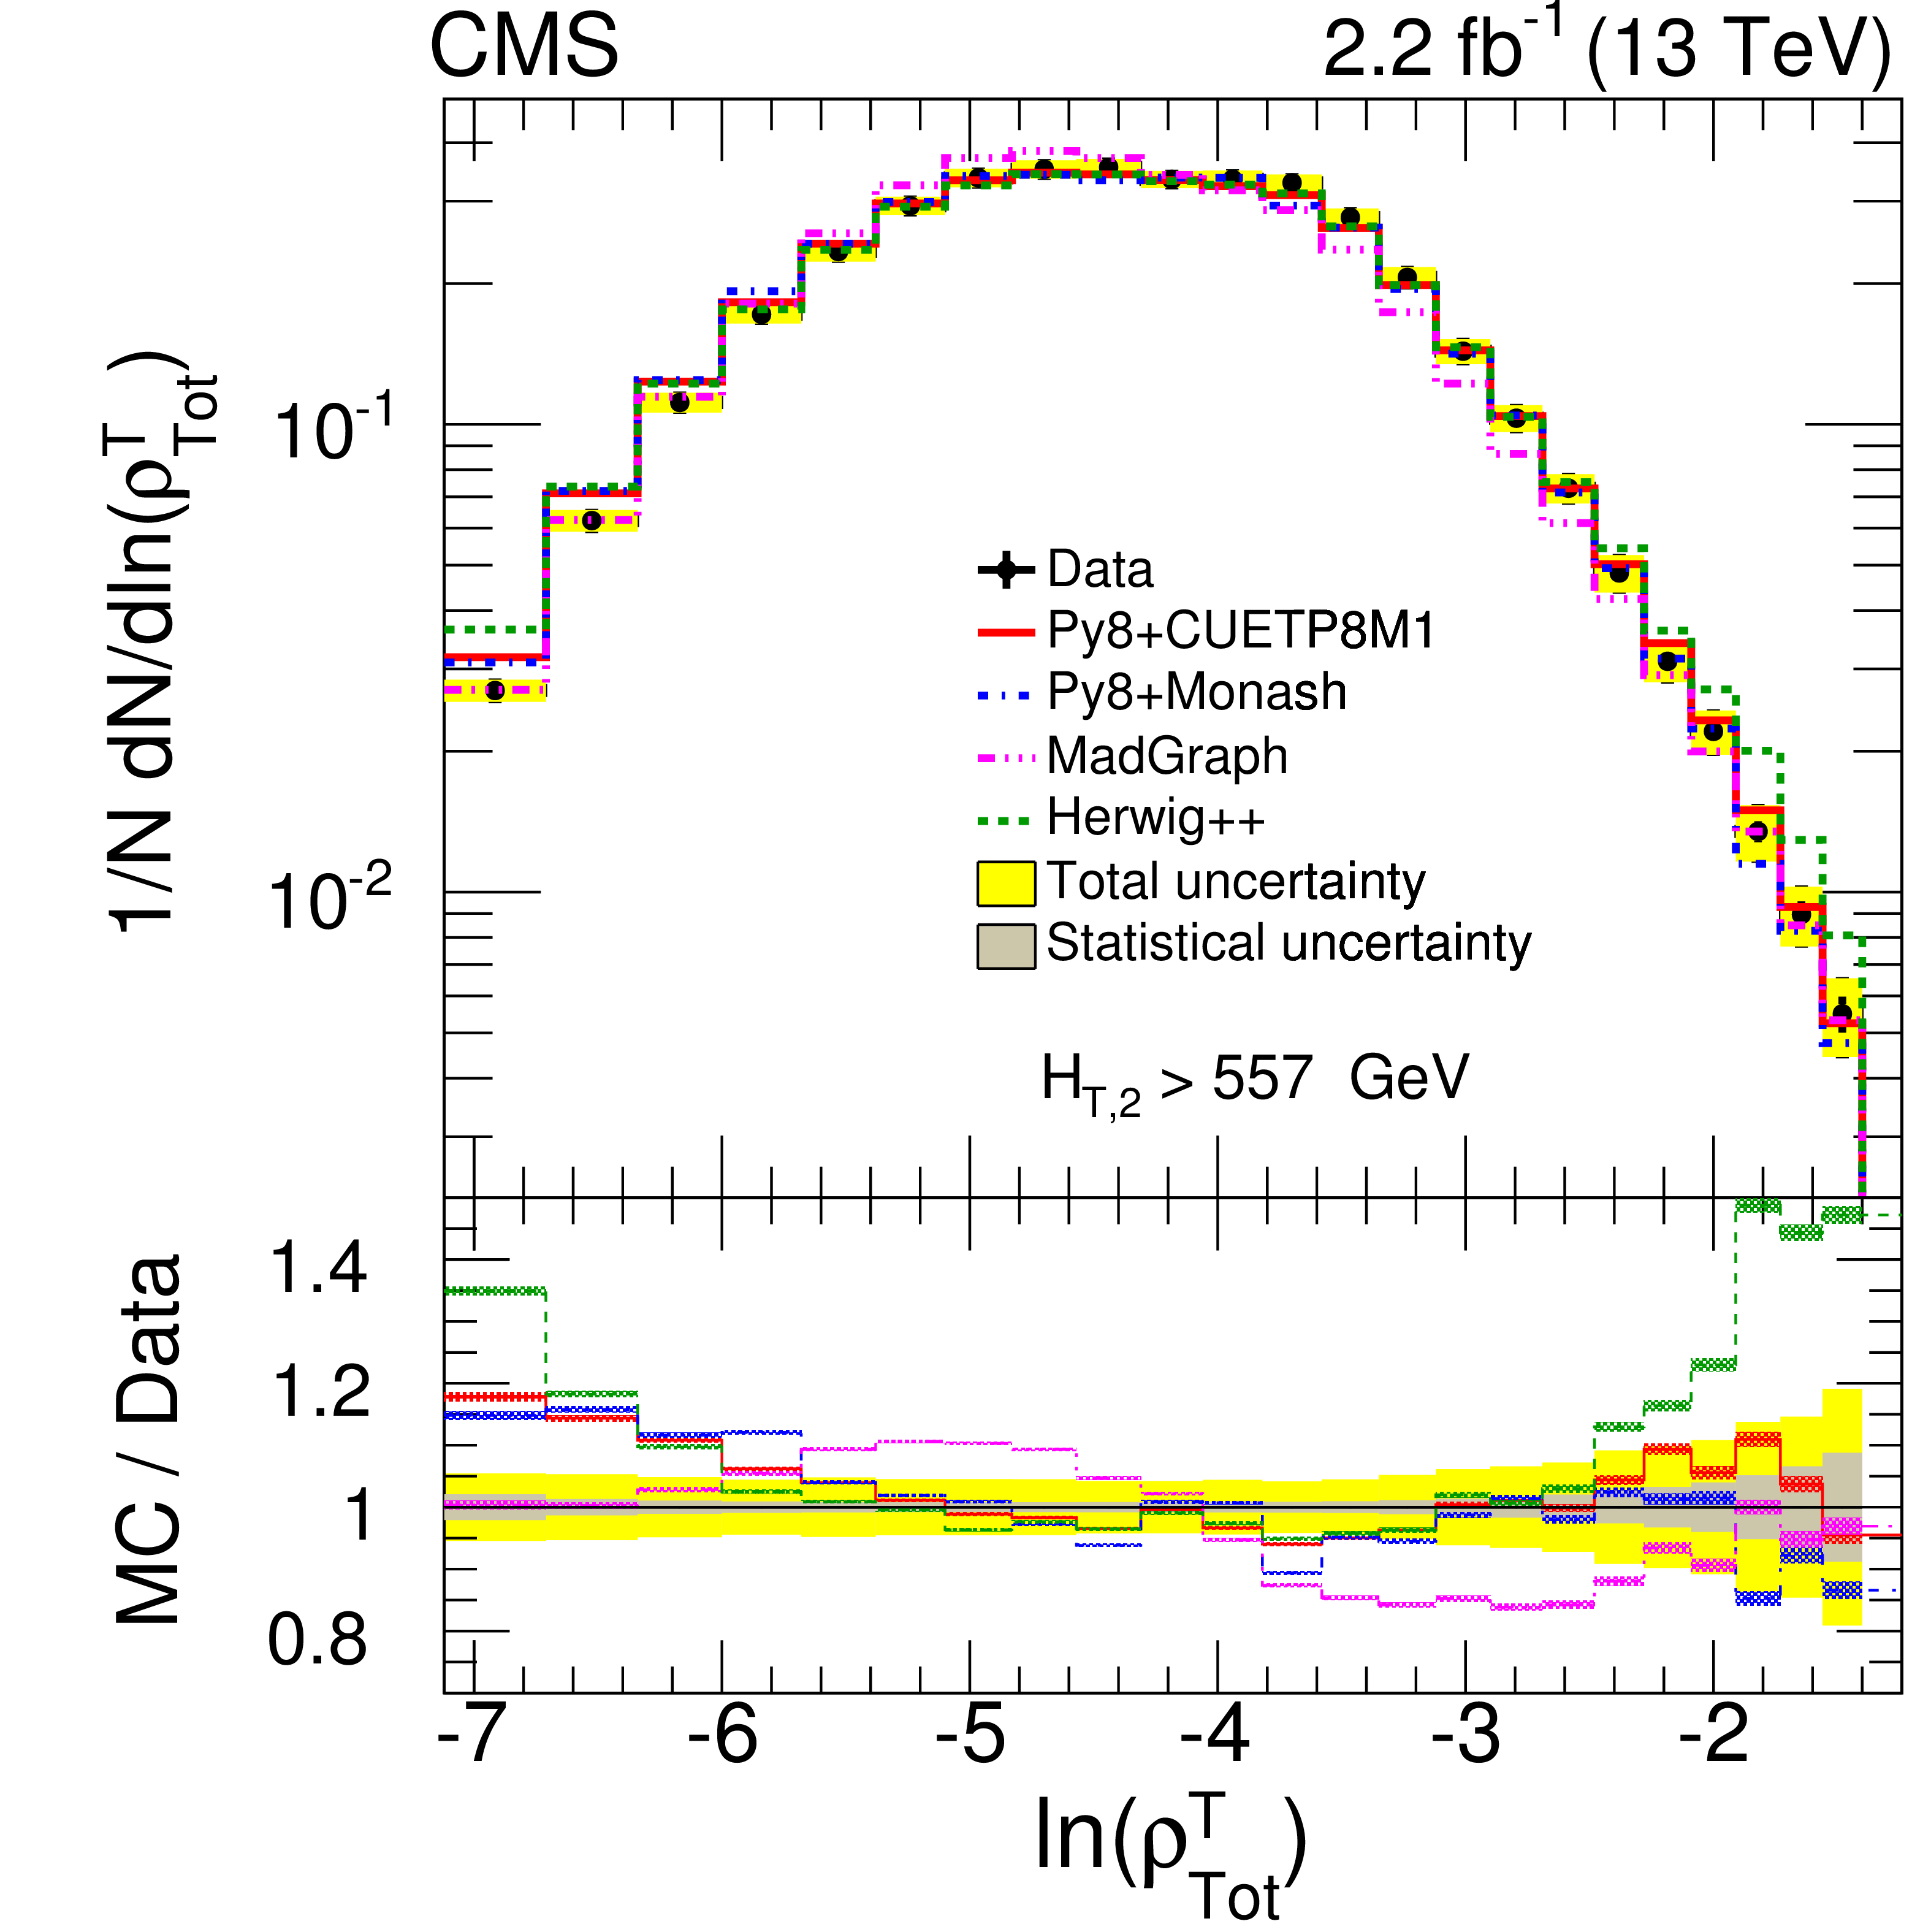
Figure 10-d:
Normalized differential distributions of unfolded data compared with theoretical (MC) predictions of PYTHIA8 CUETP8M1 (red line), PYTHIA8 Monash (blue dash-dotted line), MadGraph5_amc@nlo (pink dash-dot-dotted line) and HERWIG++ (brown dash-dot-dotted line) as a function of ESV: total transverse jet mass ($ {\rho _{\mathrm {Tot}}^{\mathrm {T}}} $) for $ {H_{\mathrm {T},2}} > $ 557 GeV. In each ratio plot, the inner gray band represents statistical uncertainty and the yellow band represents the total uncertainty (systematic and statistical components added in quadrature) on data and the MC predictions include only statistical uncertainty. |
png pdf |
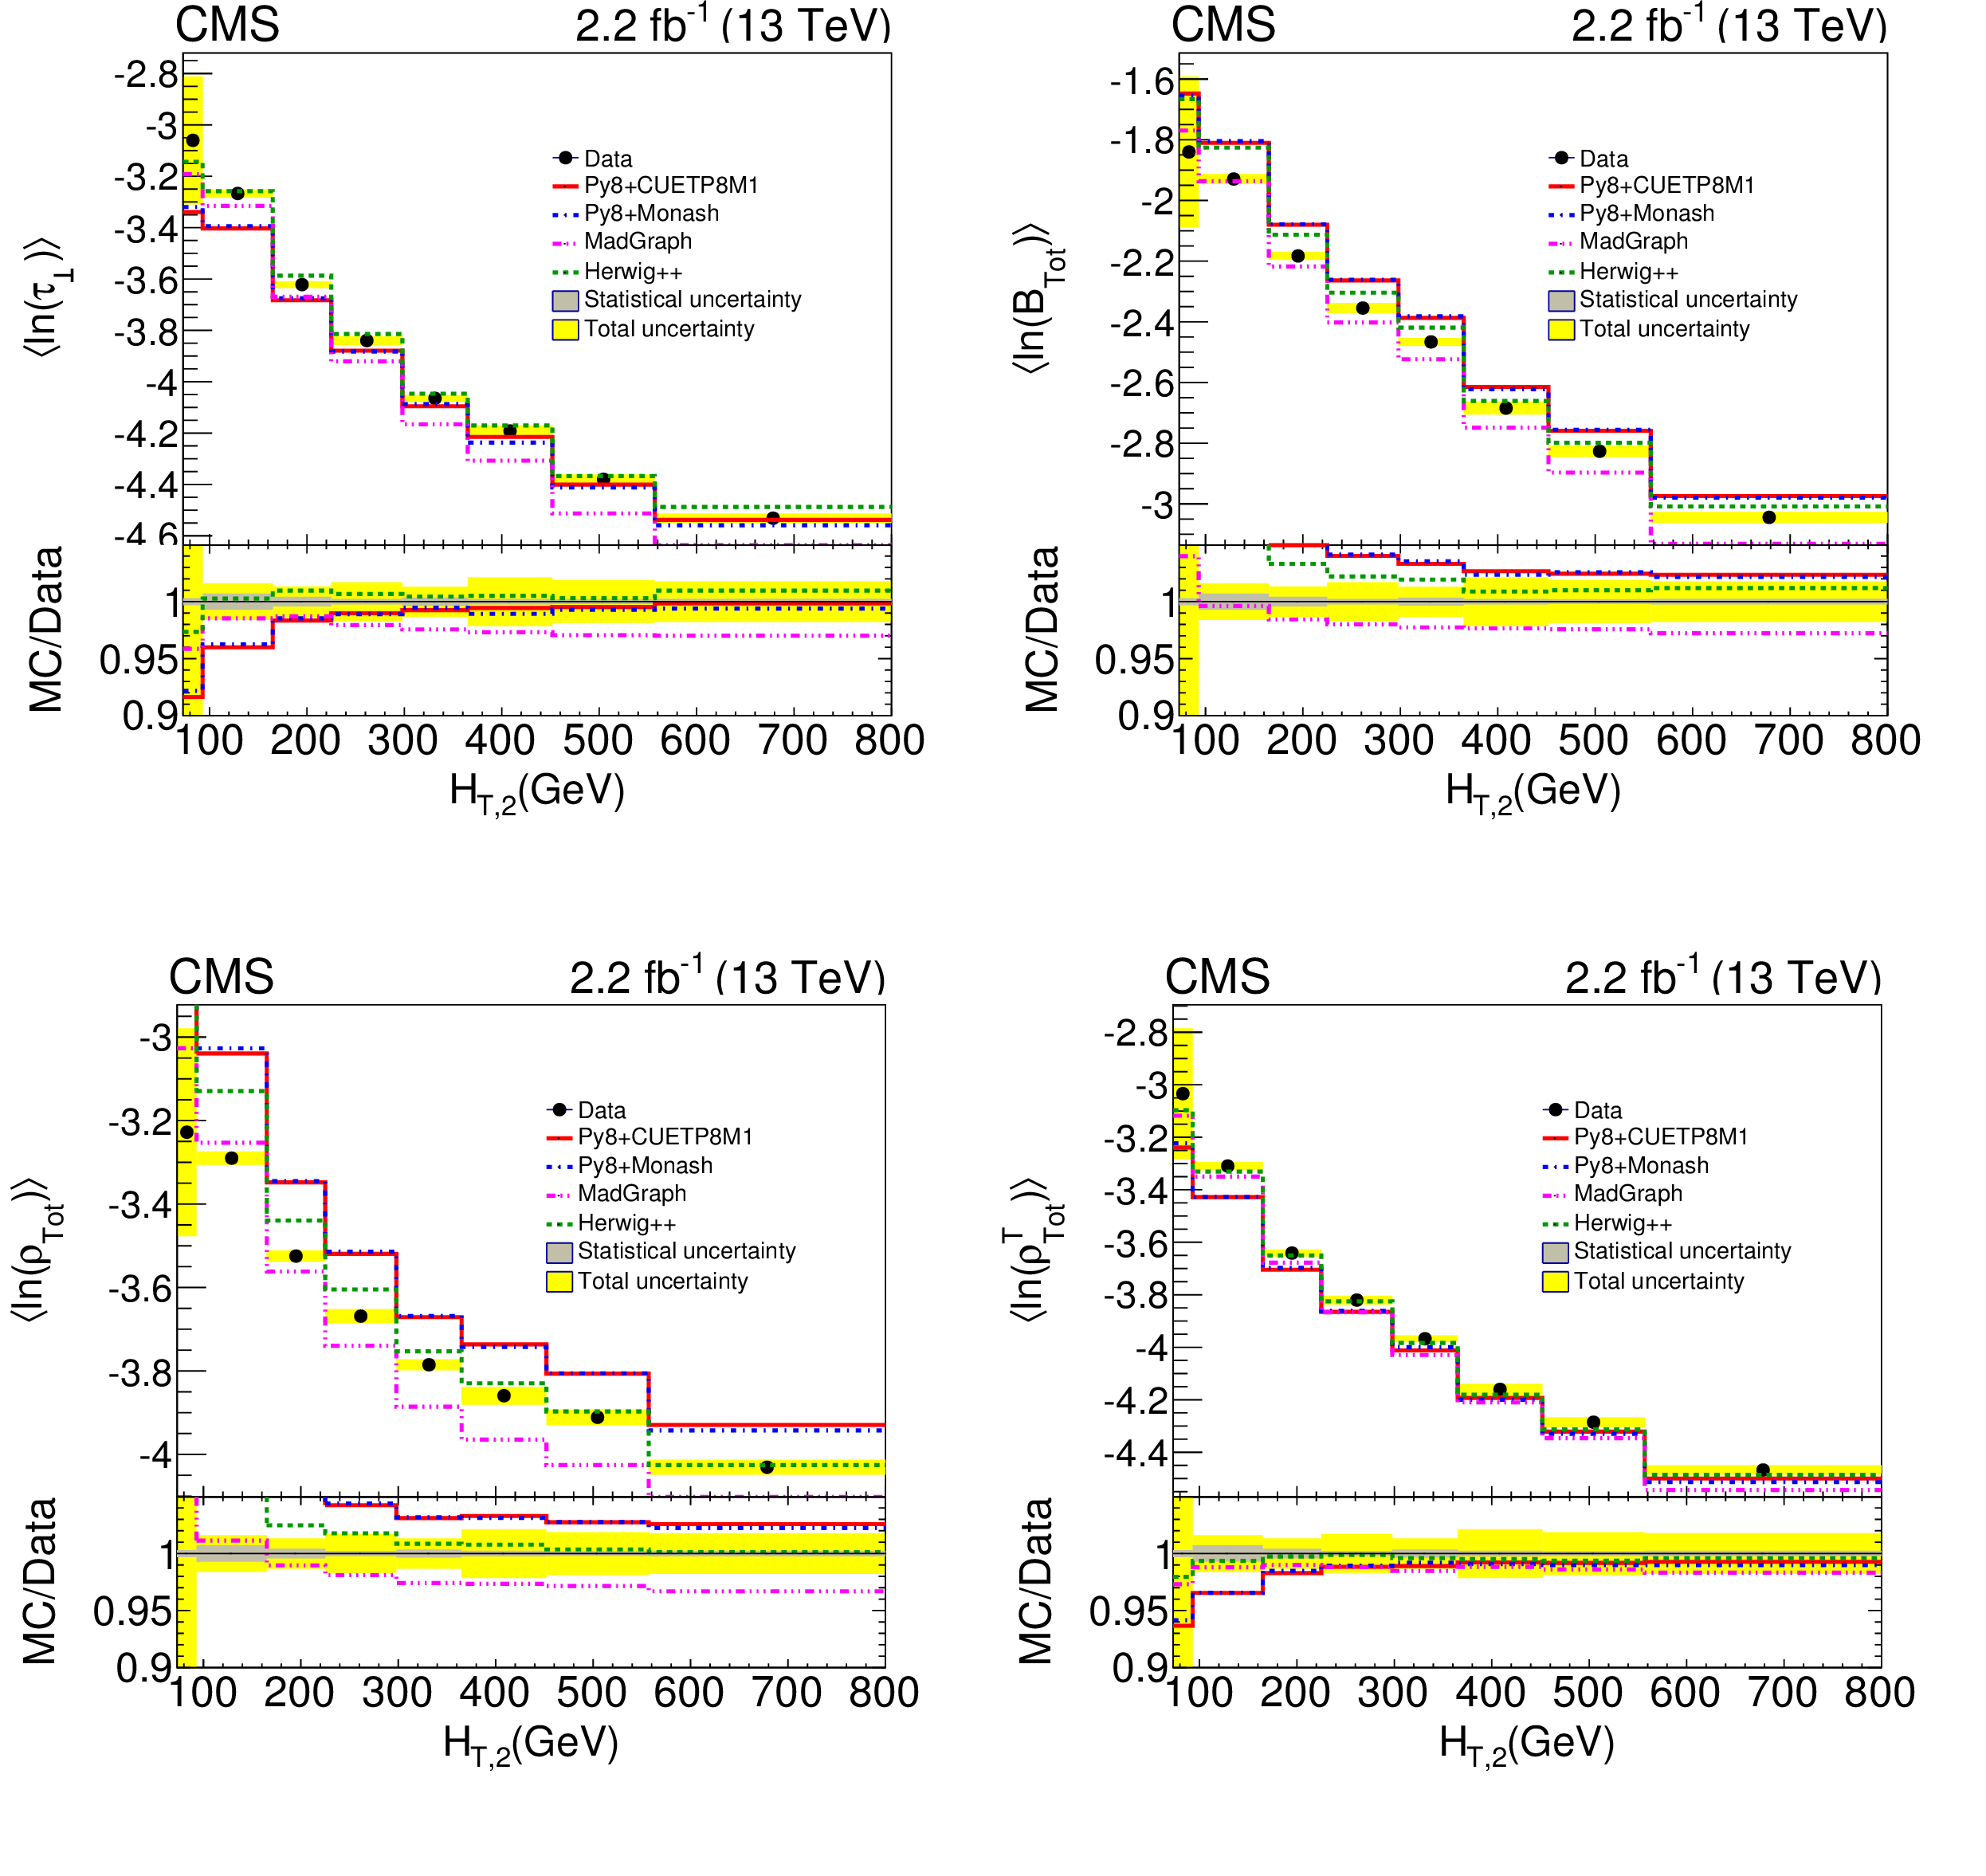
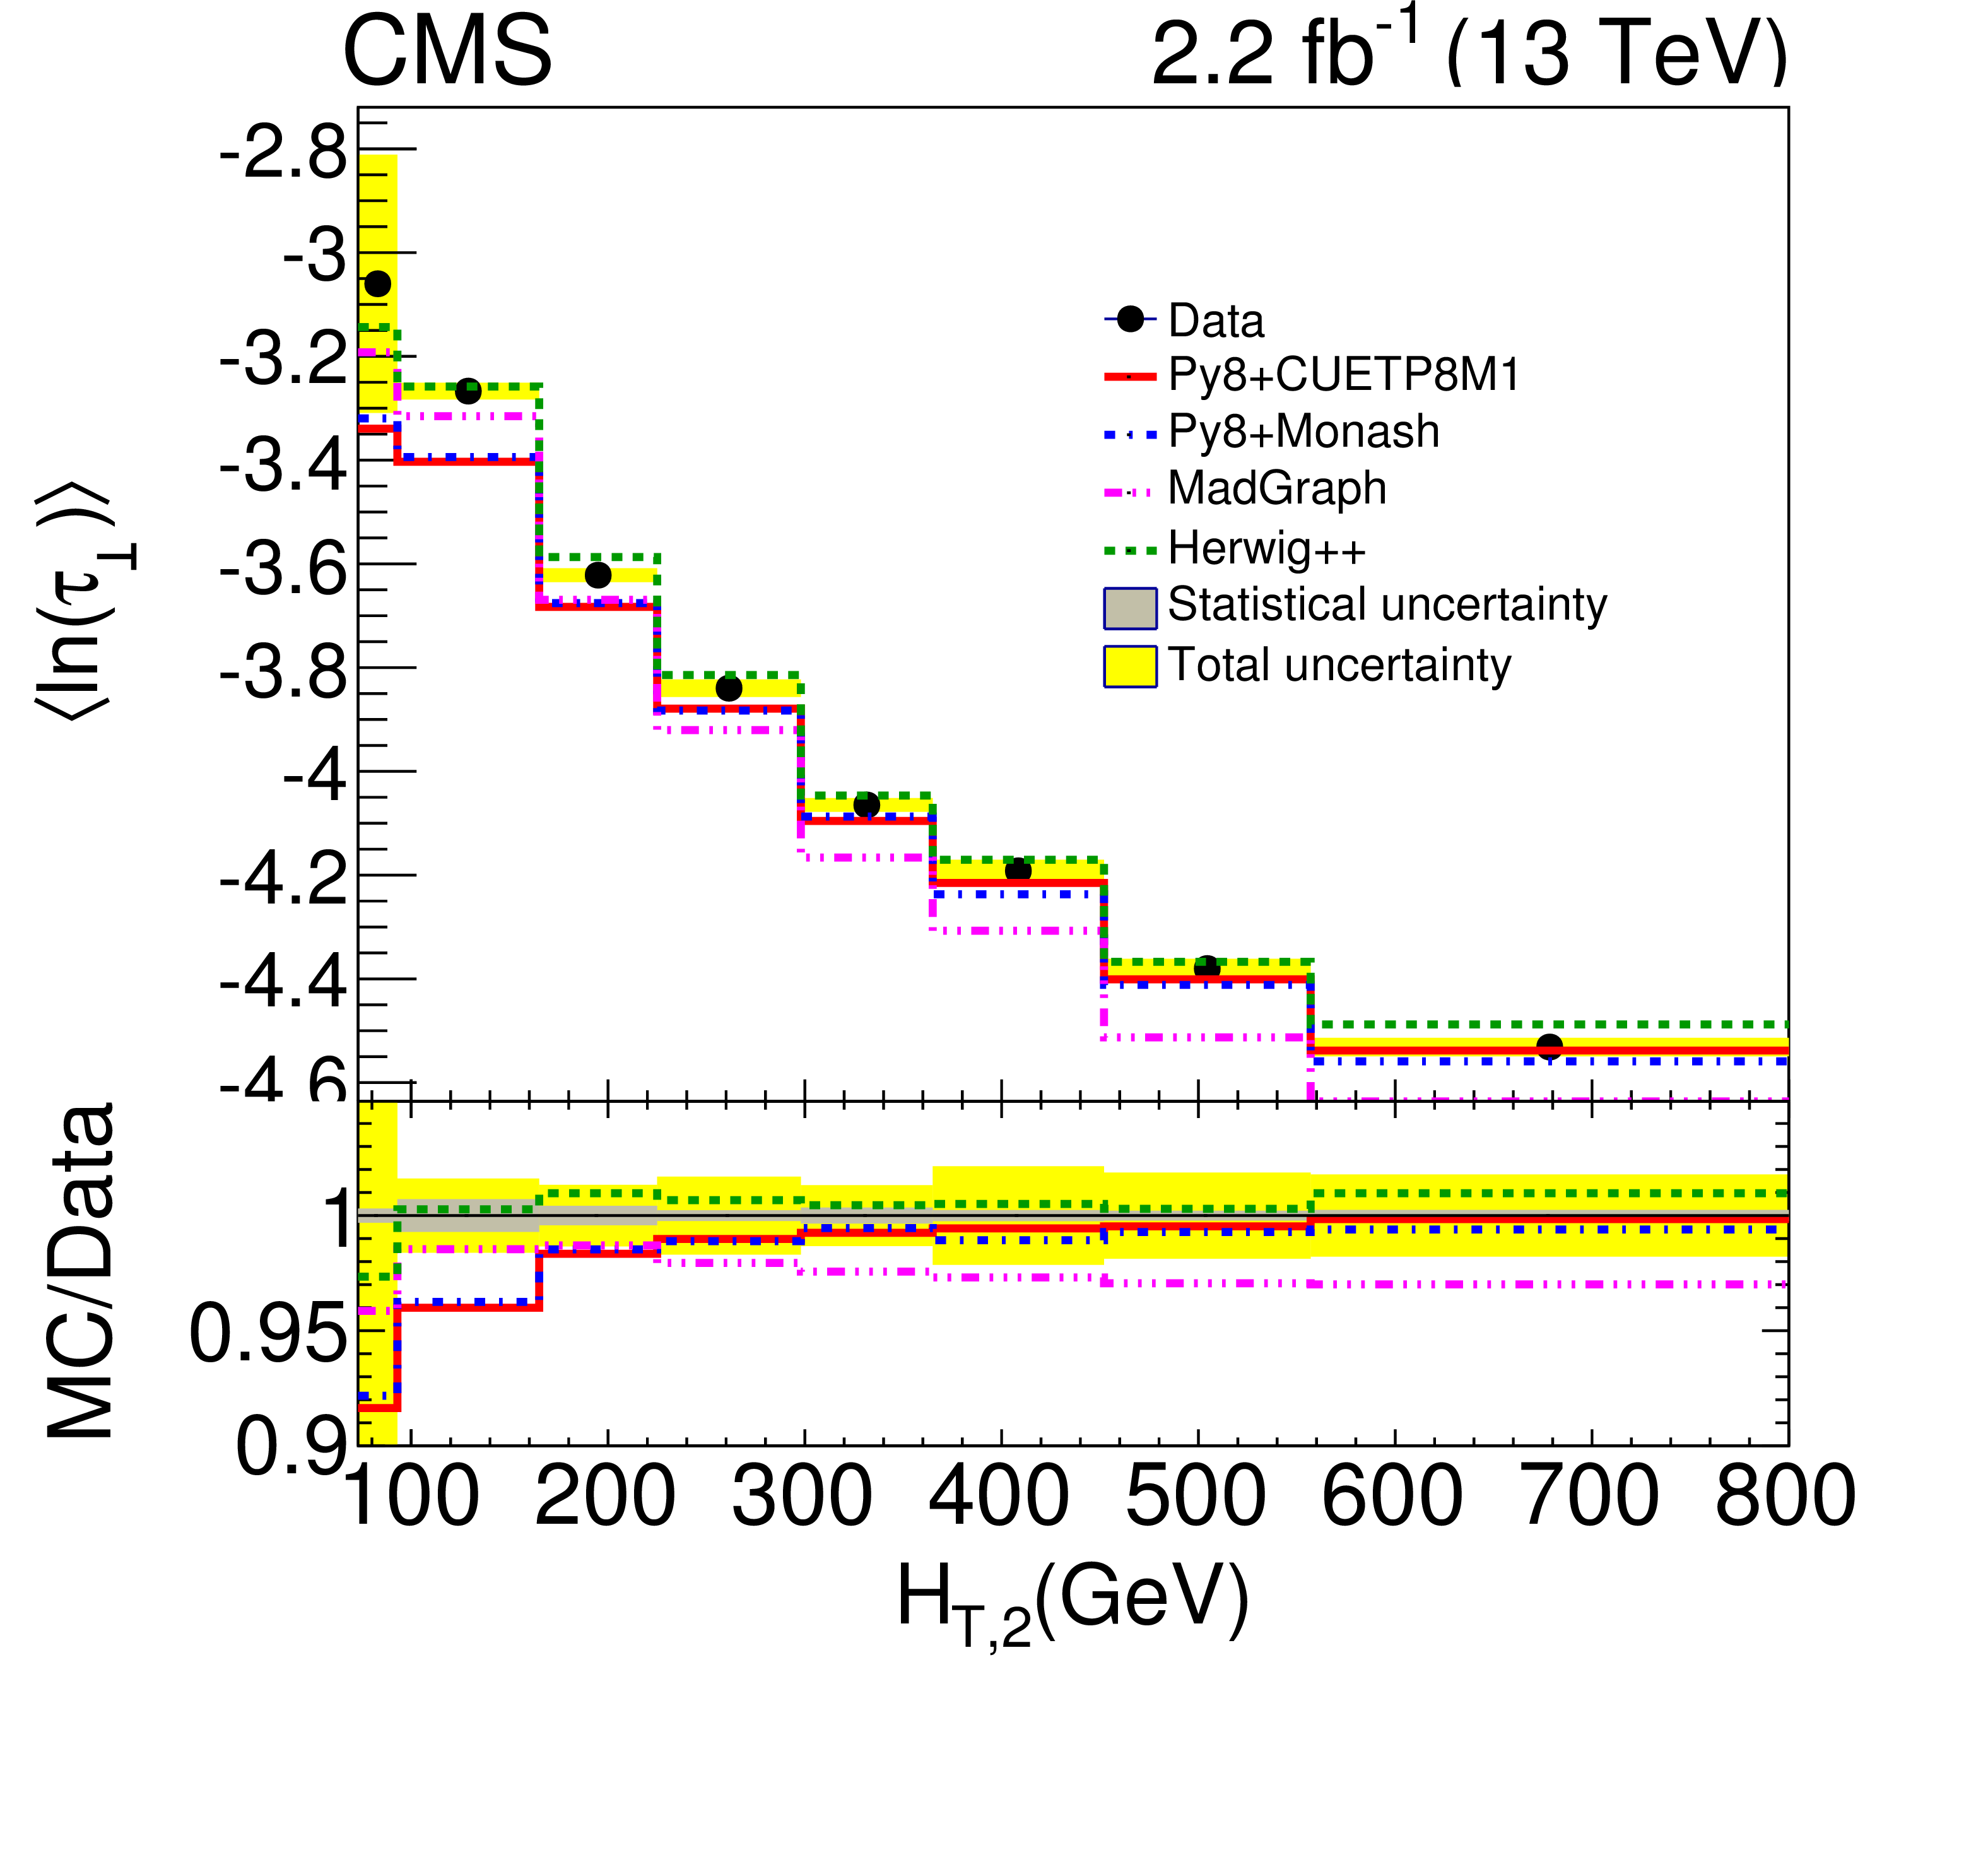
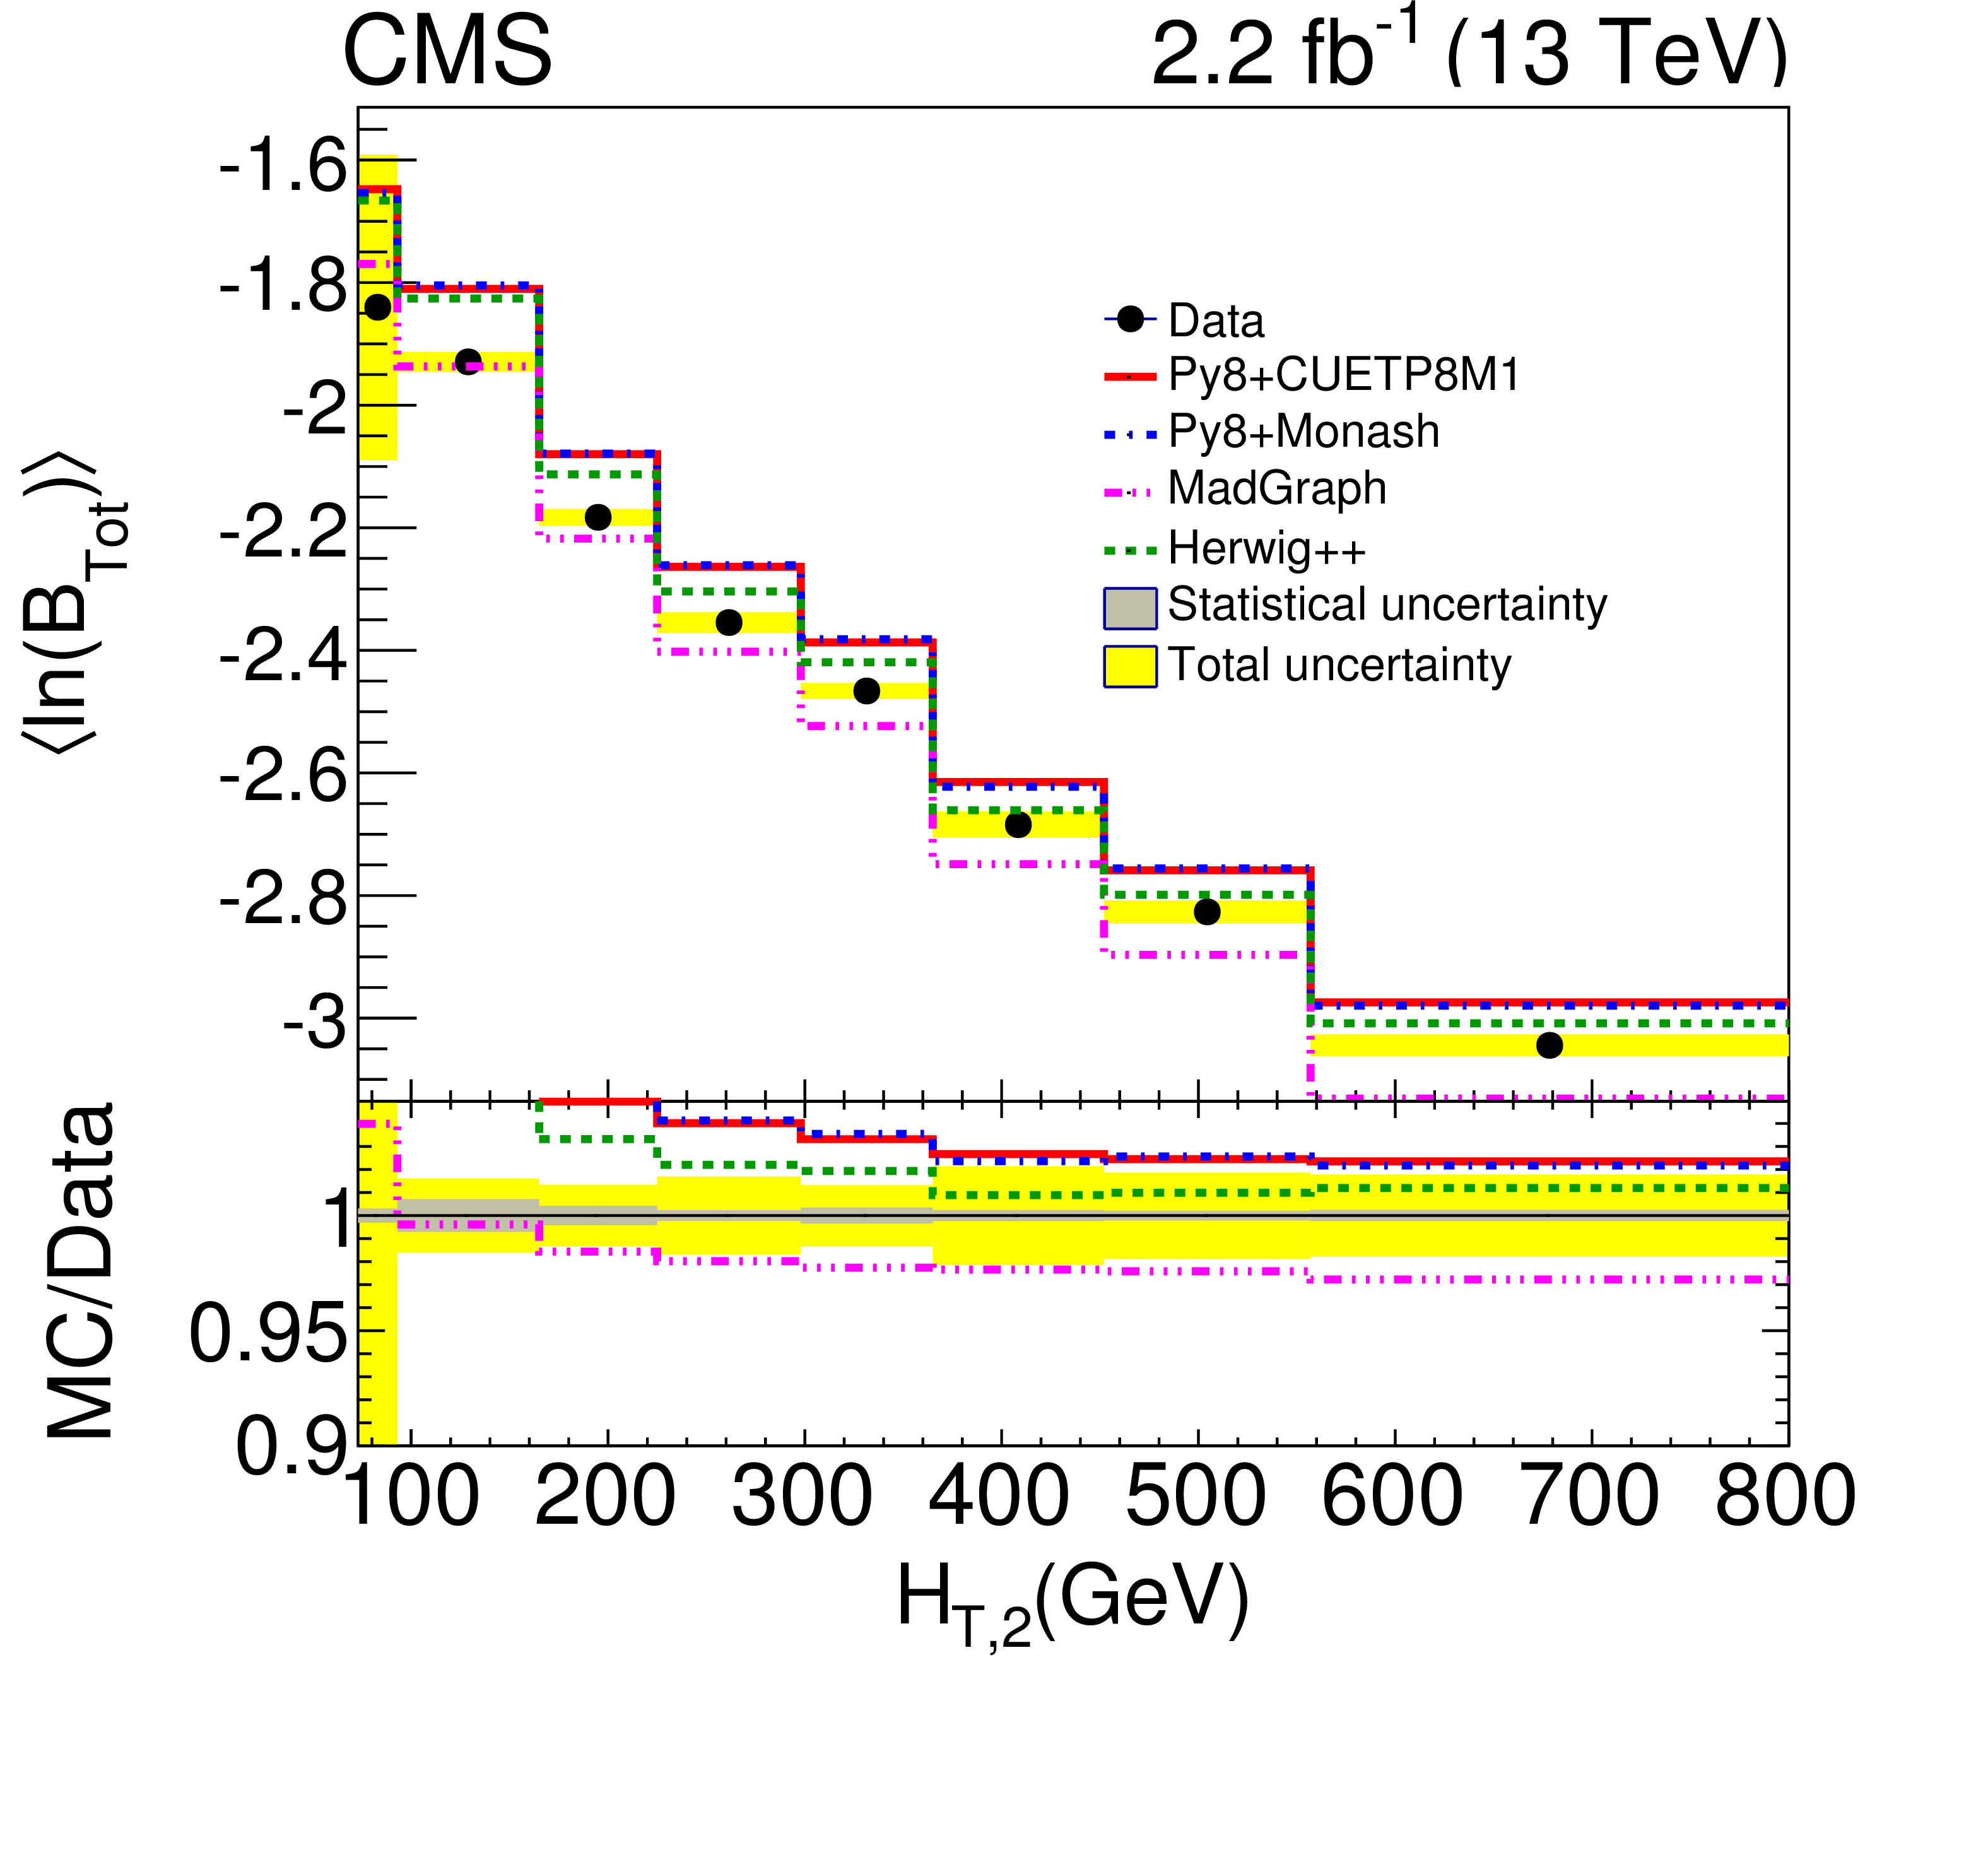
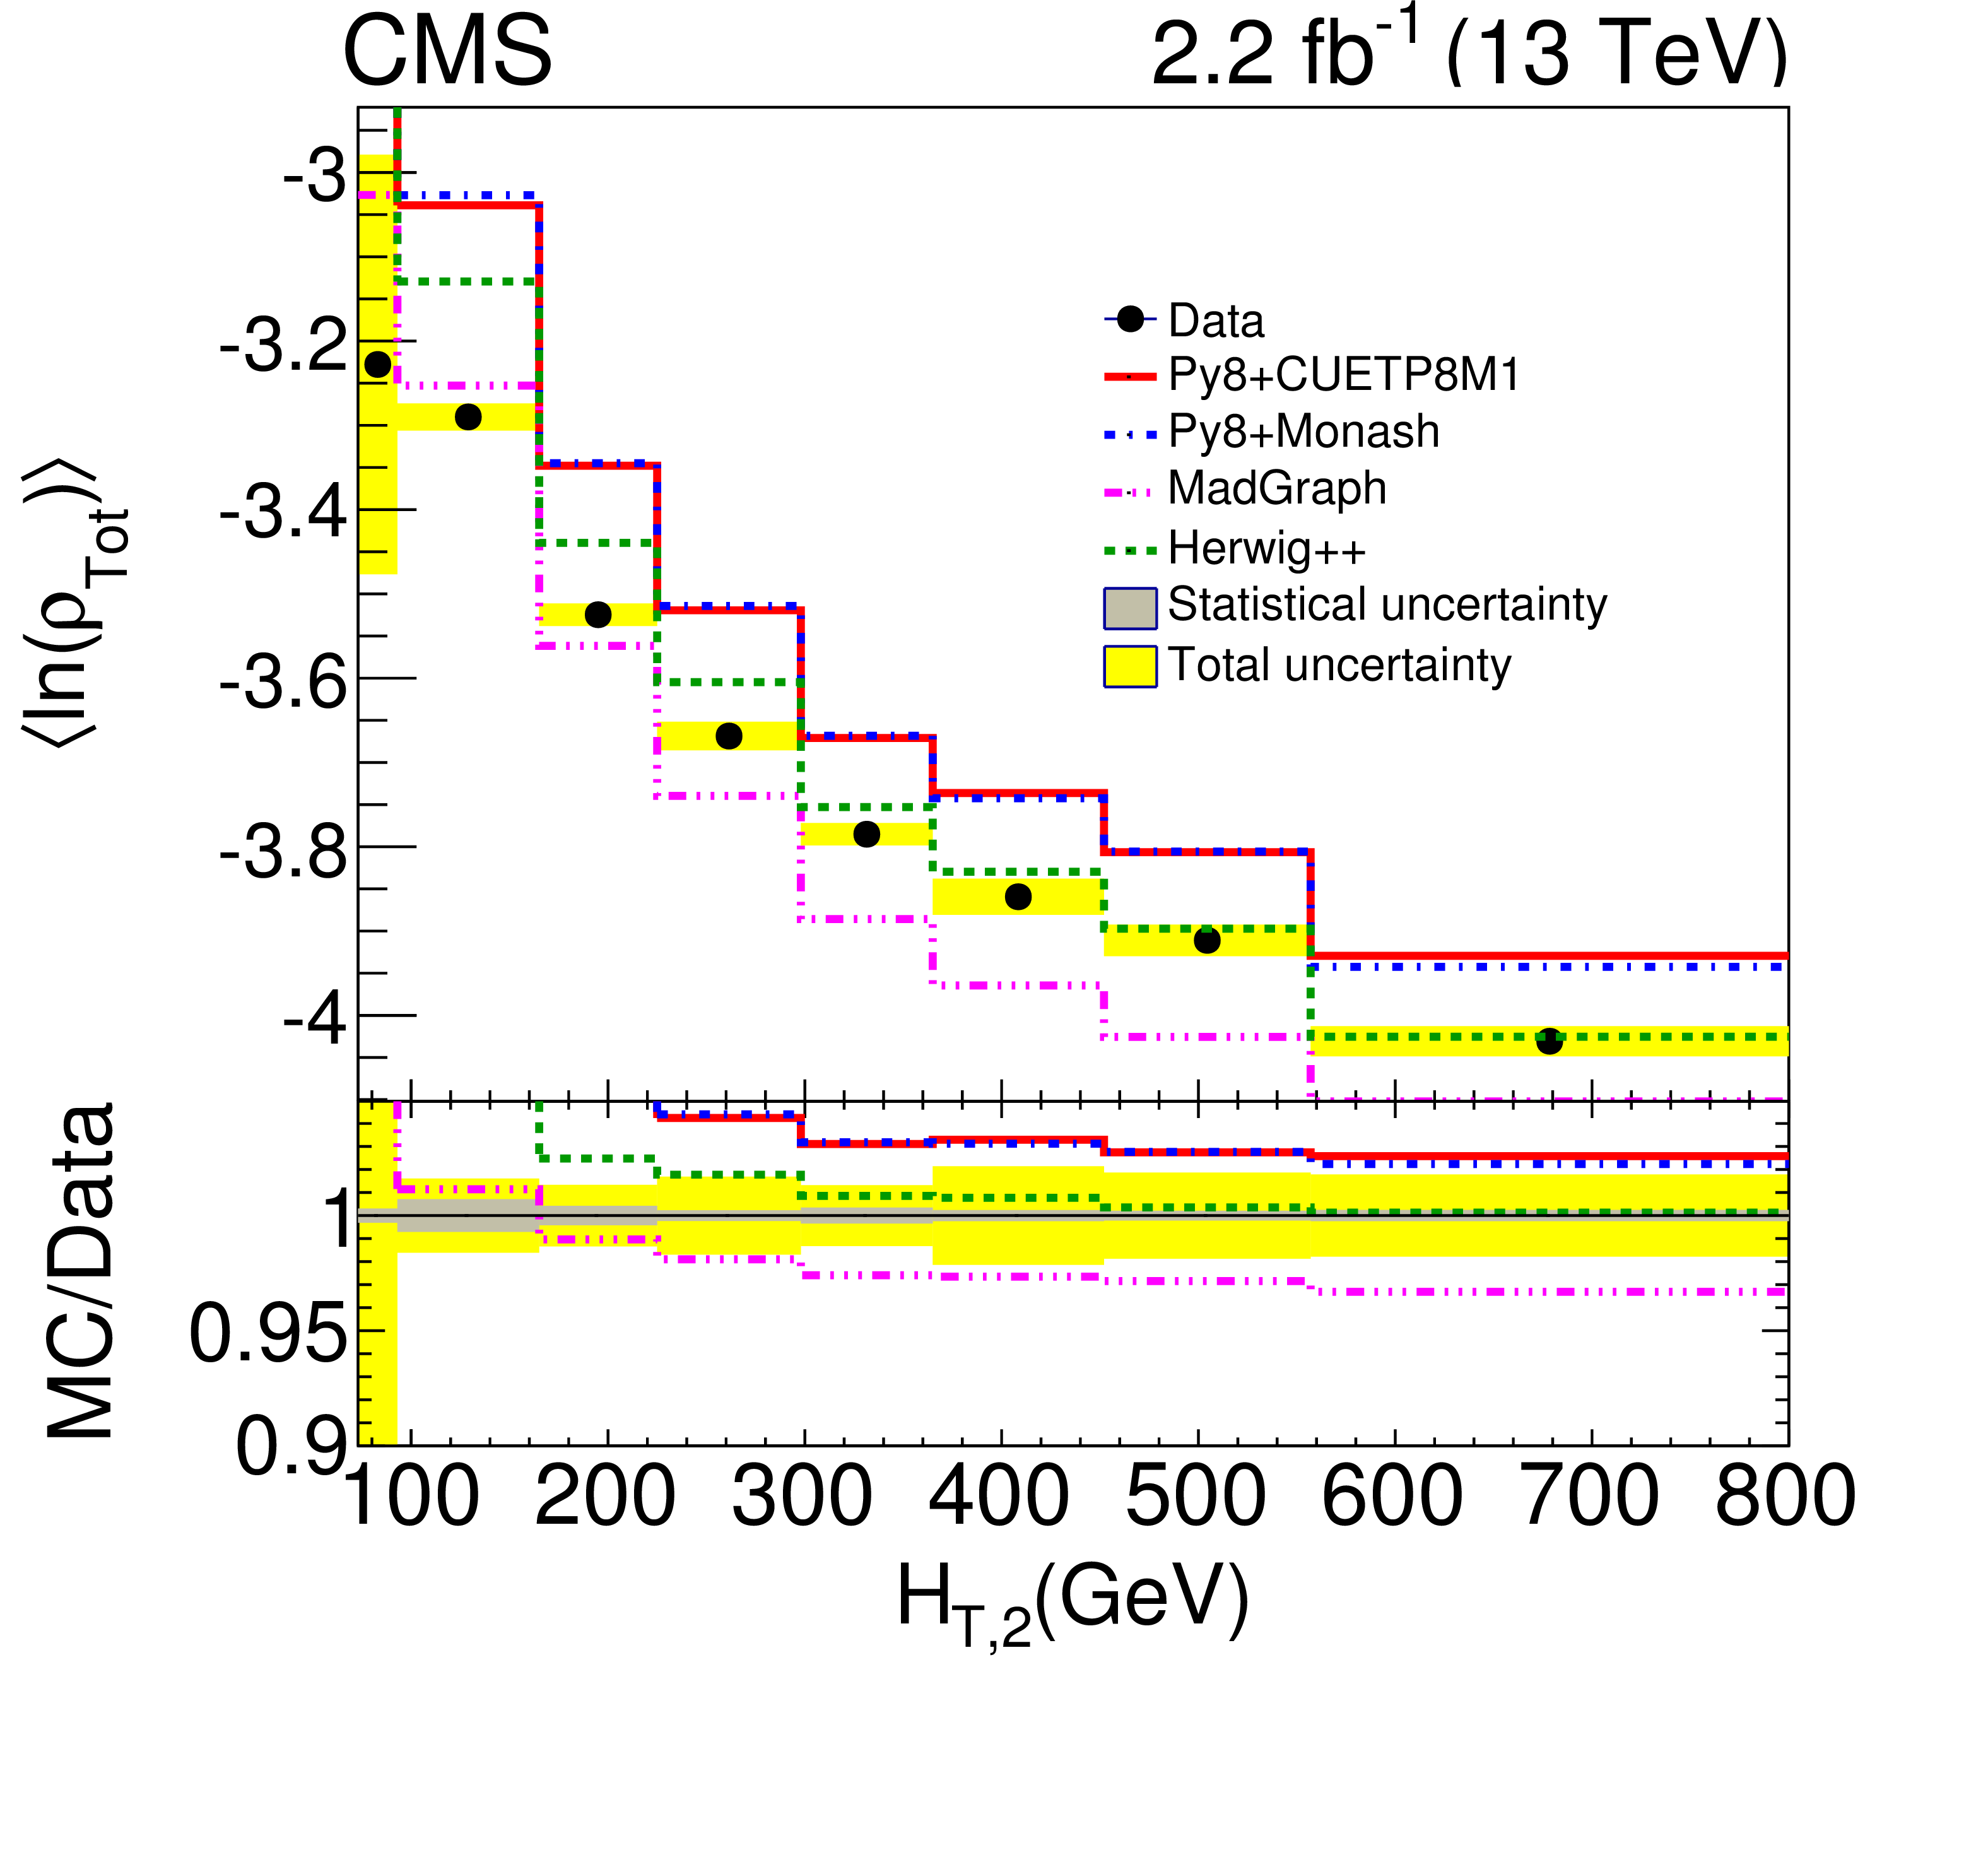
Figure 11:
The evolution of the mean of $ {\tau _{\perp}} $ (upper left), $ {B_{\mathrm {Tot}}} $ (upper right), $ {\rho _{\mathrm {Tot}}} $ (lower left) and $ {\rho _{\mathrm {Tot}}^{\mathrm {T}}} $ (lower right) with increasing $ {H_{\mathrm {T},2}} $. The ratio plots with respect to data are presented in the bottom panel to compare predictions of PYTHIA8 CUETP8M1 (red line), PYTHIA8 Monash (blue dash-dotted line), MadGraph5_amc@nlo (pink dash-dot-dotted line) and HERWIG++ (brown dash-dot-dotted line). The yellow band represents the total uncertainty (systematic and statistical components added in quadrature). |
png pdf |
Figure 11-a:
The evolution of the mean of $ {\tau _{\perp}} $ with increasing $ {H_{\mathrm {T},2}} $. The ratio plot with respect to data is presented in the bottom panel to compare predictions of PYTHIA8 CUETP8M1 (red line), PYTHIA8 Monash (blue dash-dotted line), MadGraph5_amc@nlo (pink dash-dot-dotted line) and HERWIG++ (brown dash-dot-dotted line). The yellow band represents the total uncertainty (systematic and statistical components added in quadrature). |
png pdf |
Figure 11-b:
The evolution of the mean of $ {B_{\mathrm {Tot}}} $ with increasing $ {H_{\mathrm {T},2}} $. The ratio plot with respect to data is presented in the bottom panel to compare predictions of PYTHIA8 CUETP8M1 (red line), PYTHIA8 Monash (blue dash-dotted line), MadGraph5_amc@nlo (pink dash-dot-dotted line) and HERWIG++ (brown dash-dot-dotted line). The yellow band represents the total uncertainty (systematic and statistical components added in quadrature). |
png pdf |
Figure 11-c:
The evolution of the mean of $ {\rho _{\mathrm {Tot}}} $ with increasing $ {H_{\mathrm {T},2}} $. The ratio plot with respect to data is presented in the bottom panel to compare predictions of PYTHIA8 CUETP8M1 (red line), PYTHIA8 Monash (blue dash-dotted line), MadGraph5_amc@nlo (pink dash-dot-dotted line) and HERWIG++ (brown dash-dot-dotted line). The yellow band represents the total uncertainty (systematic and statistical components added in quadrature). |

png pdf |
Figure 11-d:
The evolution of the mean of $ {\rho _{\mathrm {Tot}}^{\mathrm {T}}} $ with increasing $ {H_{\mathrm {T},2}} $. The ratio plot with respect to data is presented in the bottom panel to compare predictions of PYTHIA8 CUETP8M1 (red line), PYTHIA8 Monash (blue dash-dotted line), MadGraph5_amc@nlo (pink dash-dot-dotted line) and HERWIG++ (brown dash-dot-dotted line). The yellow band represents the total uncertainty (systematic and statistical components added in quadrature). |
| Tables | |
png pdf |
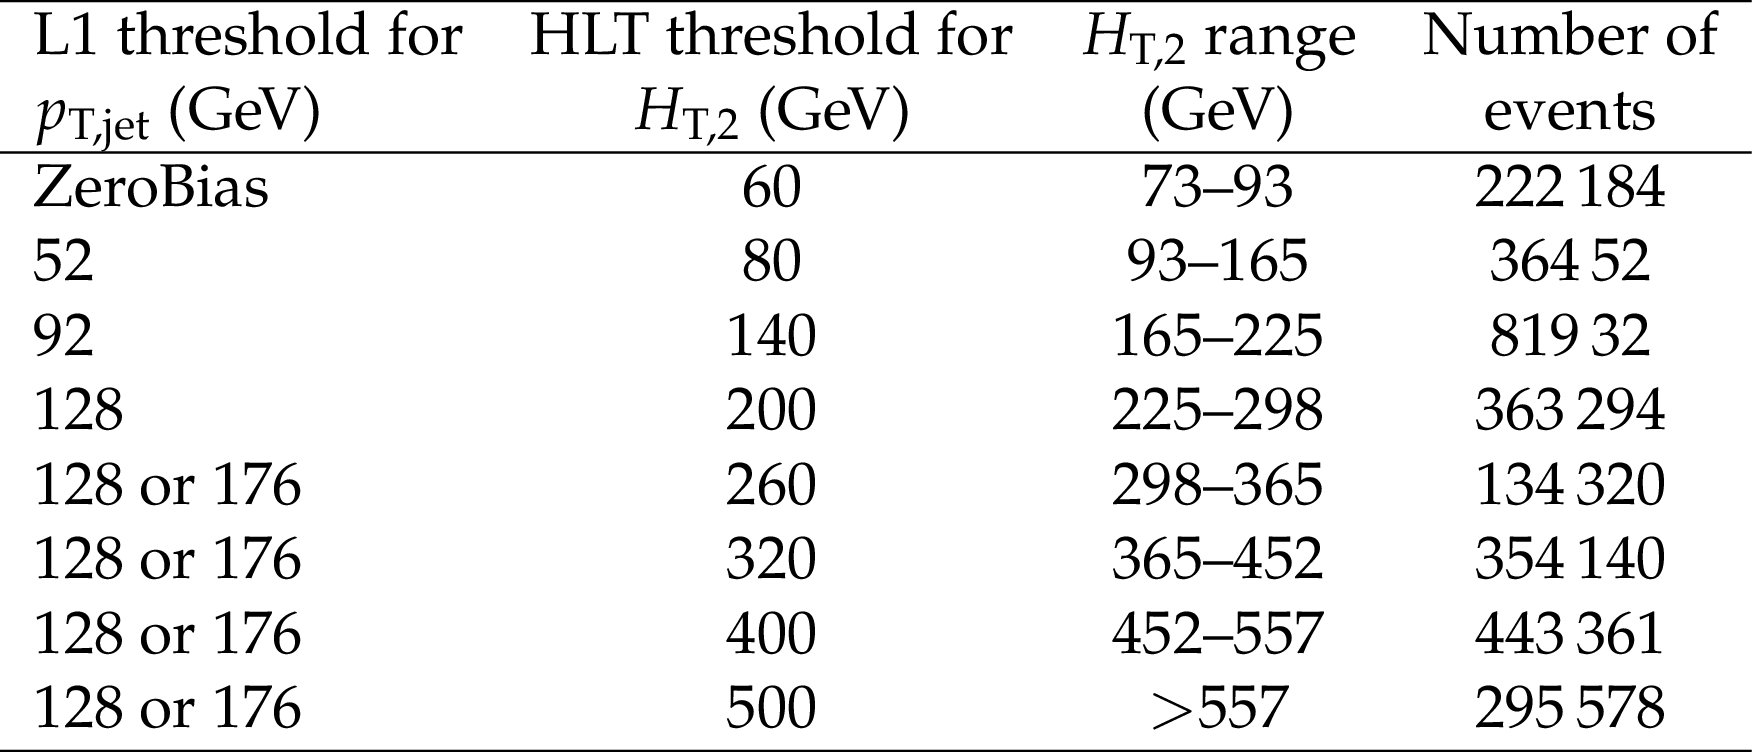
Table 1:
L1 trigger thresholds, HLT thresholds, $ {H_{\mathrm {T},2}} $ range and number of events used in the analysis. |
| Summary |
| This paper presents the first measurement at $\sqrt{s} = $ 13 TeV of four event shape variables: complement of transverse thrust ($\tau_{\perp}$), total jet broadening ($B_{\text{Tot}}$), total jet mass ($\rho_{\text{Tot}}$), and total transverse jet mass ($\rho^{\mathrm{T}}_{\text{Tot}}$) using proton-proton collision data. It also covers a wider range of energy than the analysis at $\sqrt{s} = $ 7 TeV [19,22]. Data are compared with theoretical predictions from event generators PYTHIA8, HERWIG++, and MadGraph5+MCatNLO+PYTHIA8. The PYTHIA8 generator describes the flow of energy in the transverse plane well as seen in the $\tau_{\perp}$ and $\rho^{\mathrm{T}}_{\text{Tot}}$ distributions. HERWIG++ and MadGraph5+MCatNLO show good agreement with the data for all the four event shape variables and are better than PYTHIA8 in predicting $\rho_{\text{Tot}}$ and $B_{\text{Tot}}$. A study of the effects of initial state radiation, final state radiation, and multiple parton interactions in PYTHIA8 is also presented. |
| References | ||||
| 1 | A. Banfi, G. P. Salam, and G. Zanderighi | Resummed event shapes at hadron-hadron colliders | JHEP 08 (2004) 062 | hep-ph/0407287 |
| 2 | A. Banfi, G. P. Salam, and G. Zanderighi | Phenomenology of event shapes at hadron colliders | JHEP 06 (2010) 038 | 1001.4082 |
| 3 | M. Dasgupta and G. P. Salam | Event shapes in $ \mathrm{e^{+}e^{-}} $ annihilation and deep inelastic scattering | JPG 30 (2004) R143 | hep-ph/0312283 |
| 4 | M. Rubin, G. P. Salam, and S. Sapeta | Giant QCD K-factors beyond NLO | JHEP 09 (2010) 084 | 1006.2144 |
| 5 | R. W. L. Jones et al. | Theoretical uncertainties on $ \alpha{_s} $ from event shape variables in $ \mathrm{e^{+}e^{-}} $ annihilations | JHEP 12 (2003) 007 | hep-ph/0312016 |
| 6 | G. Dissertori et al. | First determination of the strong coupling constant using NNLO predictions for hadronic event shapes in $ \mathrm{e^{+} e^{-}} $ annihilations | JHEP 02 (2008) 040 | 0712.0327 |
| 7 | G. Dissertori et al. | Determination of the strong coupling constant using matched NNLO+NLLA predictions for hadronic event shapes in $ \mathrm{e^{+}e^{-}} $ annihilations | JHEP 08 (2009) 036 | 0906.3436 |
| 8 | R. M. Chatterjee, M. Guchait, and D. Sengupta | Probing supersymmetry using event shape variables at 8 TeV LHC | PRD 86 (2012) 075014 | 1206.5770 |
| 9 | A. Datta, A. Datta, and S. Poddar | Enriching the exploration of the mUED model with event shape variables at the CERN LHC | PLB 712 (2012) 219 | 1111.2912 |
| 10 | P. Konar and P. Roy | Event shape discrimination of supersymmetry from large extra dimensions at a linear collider | PLB 634 (2006) 295 | hep-ph/0509161 |
| 11 | ALEPH Collaboration | Studies of QCD at $ \mathrm{e^{+}e^{-}} $ centre-of-mass energies between 91 GeV and 209 GeV | EPJC 35 (2004) 457 | |
| 12 | DELPHI Collaboration | Tuning and test of fragmentation models based on identified particles and precision event shape data | Z. Phys. C 73 (1996) 11 | |
| 13 | L3 Collaboration | Study of hadronic events and measurements of $ \alpha_{s} $ between 30 GeV and 91 GeV | PLB 411 (1997) 339 | |
| 14 | L3 Collaboration | Studies of hadronic event structure in $ \mathrm{e^{+}e^{-}} $ annihilation from 30 GeV to 209 GeV with the L3 detector | PR 399 (2004) 71 | hep-ex/0406049 |
| 15 | OPAL Collaboration | A determination of $ \alpha_{s} $ (M (Z0)) at LEP using resummed QCD calculations | Z. Phys. C 59 (1993) 1 | |
| 16 | H1 Collaboration | Measurement of event shape variables in deep-inelastic scattering at HERA | EPJC 46 (2006) 343 | hep-ex/0512014 |
| 17 | CDF Collaboration | Measurement of event ehapes in proton-antiproton collisions at center-of-mass energy 1.96 TeV | PRD 83 (2011) 112007 | 1103.5143 |
| 18 | T. Sjostrand, S. Mrenna, and P. Z. Skands | PYTHIA 6.4 Physics and manual | JHEP 05 (2006) 026 | hep-ph/0603175 |
| 19 | CMS Collaboration | First measurement of hadronic event shapes in pp collisions at $ \sqrt{s} = $ 7 TeV | PLB 699 (2011) 48 | CMS-QCD-10-013 1102.0068 |
| 20 | CMS Collaboration | Event shapes and azimuthal correlations in Z+jets events in pp collisions at $ \sqrt{s} = $ 7 TeV | PLB 722 (2013) 238 | CMS-EWK-11-021 1301.1646 |
| 21 | CMS Collaboration | Jet and underlying event properties as a function of charged-particle multiplicity in proton–proton collisions at $ \sqrt{s} = $ 7 TeV | EPJC 73 (2013) 2674 | CMS-FSQ-12-022 1310.4554 |
| 22 | CMS Collaboration | Study of hadronic event-shape variables in multijet final states in pp collisions at $ \sqrt{s} = $ 7 TeV | JHEP 10 (2014) 087 | CMS-SMP-12-022 1407.2856 |
| 23 | ATLAS Collaboration | Measurement of event shapes at large momentum transfer with the ATLAS detector in $ pp $ collisions at $ \sqrt{s} = $ 7 TeV | EPJC 72 (2012) 2211 | 1206.2135 |
| 24 | ATLAS Collaboration | Measurement of charged-particle event shape variables in $ \sqrt{s} = $ 7 TeV proton-proton interactions with the ATLAS detector | PRD 88 (2013) 032004 | 1207.6915 |
| 25 | ATLAS Collaboration | Measurement of event-shape observables in $ Z \rightarrow \ell^{+} \ell^{-} $ events in $ pp $ collisions at $ \sqrt{s} = $ 7 TeV with the ATLAS detector at the LHC | EPJC 76 (2016) 375 | 1602.08980 |
| 26 | ALICE Collaboration | Transverse sphericity of primary charged particles in minimum bias proton-proton collisions at $ \sqrt{s} = $ 0.9 , 2.76 and 7 TeV | EPJC 72 (2012) 2124 | 1205.3963 |
| 27 | T. Sjostrand et al. | An introduction to PYTHIA 8.2 | CPC 191 (2015) 159 | 1410.3012 |
| 28 | J. Alwall et al. | MadGraph/MadEvent v4: the new web generation | JHEP 09 (2007) 028 | 0706.2334 |
| 29 | J. Alwall et al. | MadGraph 5: Going beyond | JHEP 06 (2011) 128 | 1106.0522 |
| 30 | J. Bellm et al. | Herwig 7.0/Herwig++ 3.0 release note | EPJC 76 (2016) 196 | 1512.01178 |
| 31 | CMS Collaboration | The CMS experiment at the CERN LHC | JINST 3 (2008) S08004 | CMS-00-001 |
| 32 | CMS Collaboration | Particle-flow reconstruction and global event description with the CMS detector | JINST 12 (2017) P10003 | CMS-PRF-14-001 1706.04965 |
| 33 | M. Cacciari, G. P. Salam, and G. Soyez | The anti-$ {k_{\mathrm{T}}} $ jet clustering algorithm | JHEP 04 (2008) 063 | 0802.1189 |
| 34 | M. Cacciari, G. P. Salam, and G. Soyez | FastJet User Manual | EPJC 72 (2012) 1896 | 1111.6097 |
| 35 | CMS Collaboration | Determination of jet energy calibration and transverse momentum resolution in CMS | JINST 6 (2011) P11002 | CMS-JME-10-011 1107.4277 |
| 36 | NNPDF Collaboration | Parton distributions for the LHC Run II | JHEP 04 (2015) 040 | 1410.8849 |
| 37 | CMS Collaboration | Event generator tunes obtained from underlying event and multiparton scattering measurements | EPJC 76 (2016) 155 | CMS-GEN-14-001 1512.00815 |
| 38 | P. Skands, S. Carrazza, and J. Rojo | Tuning PYTHIA 8.1: the Monash 2013 Tune | EPJC 74 (2014) 3024 | 1404.5630 |
| 39 | J. Alwall et al. | Comparative study of various algorithms for the merging of parton showers and matrix elements in hadronic collisions | EPJC 53 (2008) 473 | 0706.2569 |
| 40 | T. Adye | Unfolding algorithms and tests using RooUnfold | in PHYSTAT 2011 Workshop on Statistical Issues Related to Discovery Claims in Search Experiments and Unfolding, H. Prosper and L. Lyons, eds., p. 313 Geneva, Switzerland | 1105.1160 |
| 41 | G. D'Agostini | A multidimensional unfolding method based on Bayes' theorem | NIMA 362 (1995) 487 | |
| 42 | A. Hocker and V. Kartvelishvili | SVD approach to data unfolding | NIMA 372 (1996) 469 | hep-ph/9509307 |
| 43 | CMS Collaboration | Jet energy scale and resolution in the CMS experiment in pp collisions at 8 TeV | JINST 12 (2017) P02014 | CMS-JME-13-004 1607.03663 |
|
|
Compact Muon Solenoid LHC, CERN |
|

|

|

|

|

|