

Compact Muon Solenoid
LHC, CERN
| CMS-SUS-17-009 ; CERN-EP-2018-132 | ||
| Search for supersymmetric partners of electrons and muons in proton-proton collisions at $\sqrt{s} = $ 13 TeV | ||
| CMS Collaboration | ||
| 14 June 2018 | ||
| Phys. Lett. B 790 (2019) 005 | ||
| Abstract: A search for direct production of the supersymmetric (SUSY) partners of electrons or muons is presented in final states with two opposite-charge, same-flavour leptons (electrons and muons), no jets, and large missing transverse momentum. The data sample corresponds to an integrated luminosity of 35.9 fb$^{-1}$ of proton-proton collisions at $\sqrt{s} = $ 13 TeV, collected with the CMS detector at the LHC in 2016. The search uses the ${M_{\text{T}}}$ two variable, which generalises the transverse mass for systems with two invisible objects and provides a discrimination against standard model backgrounds containing W bosons. The observed yields are consistent with the expectations from the standard model. The search is interpreted in the context of simplified SUSY models and probes slepton masses up to approximately 290, 400, and 450 GeV, assuming right-handed only, left-handed only, and both right- and left-handed sleptons (mass degenerate selectrons and smuons), and a massless lightest supersymmetric particle. Limits are also set on selectrons and smuons separately. These limits show an improvement on the existing limits of approximately 150 GeV. | ||
| Links: e-print arXiv:1806.05264 [hep-ex] (PDF) ; CDS record ; inSPIRE record ; CADI line (restricted) ; | ||
| Figures & Tables | Summary | Additional Figures & Tables | References | CMS Publications |
|---|
| Additional information on efficiencies needed for reinterpretation of these results are available here. Additional technical material for CMS speakers can be found here. |
| Figures | |

png pdf |
Figure 1:
Diagram of slepton pair production with direct decays into leptons and the lightest neutralino. |
png pdf |
Figure 2:
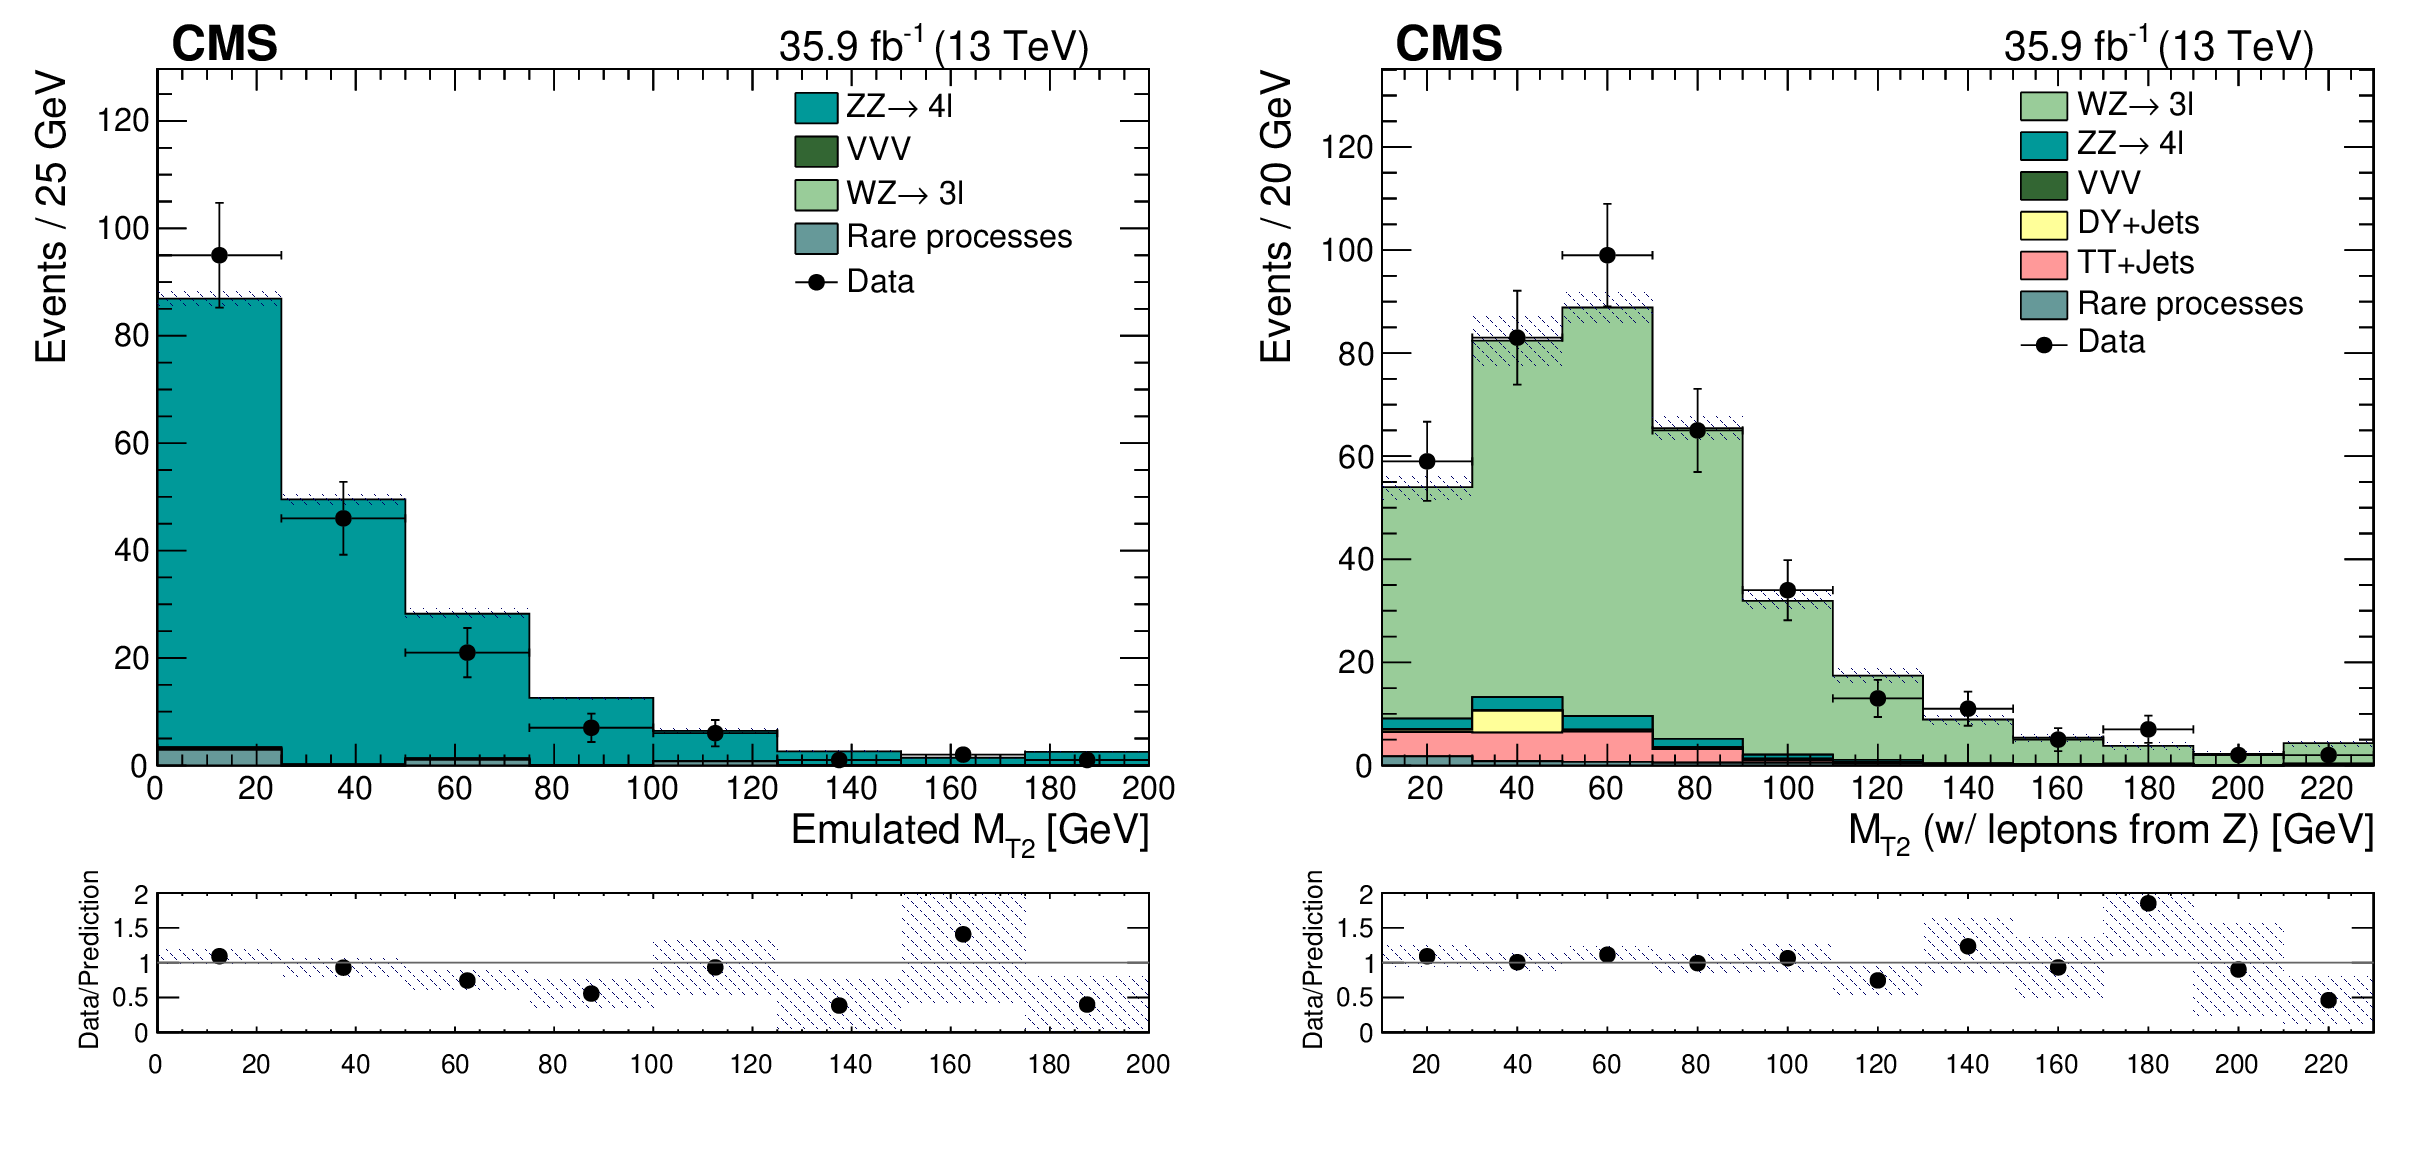
Upper: Distribution of ${M_{\text {T2}}}$ for the ZZ (left) and WZ (right) CRs, in simulation (coloured histograms) and with the corresponding event counts observed in data (black points). Lower: Ratio of data to simulation, with the filled band representing the statistical uncertainty on the data and the simulations. |

png pdf |
Figure 2-a:
Upper: Distribution of ${M_{\text {T2}}}$ for the ZZ CR, in simulation (coloured histograms) and with the corresponding event counts observed in data (black points). Lower: Ratio of data to simulation, with the filled band representing the statistical uncertainty on the data and the simulations. |

png pdf |
Figure 2-b:
Upper: Distribution of ${M_{\text {T2}}}$ for the WZ CR, in simulation (coloured histograms) and with the corresponding event counts observed in data (black points). Lower: Ratio of data to simulation, with the filled band representing the statistical uncertainty on the data and the simulations. |

png pdf |
Figure 3:
Upper: Distribution of ${{p_{\mathrm {T}}} ^\text {miss}}$ for the resulting SM background yields estimated in the analysis SR (coloured histograms) with the corresponding event counts observed in data (black points), selecting only SF events. Lower: Ratio of data to SM prediction, with the filled band representing the statistical uncertainty on the data and the estimated backgrounds and the systematic uncertainty on the estimated backgrounds. |
png pdf |
Figure 4:
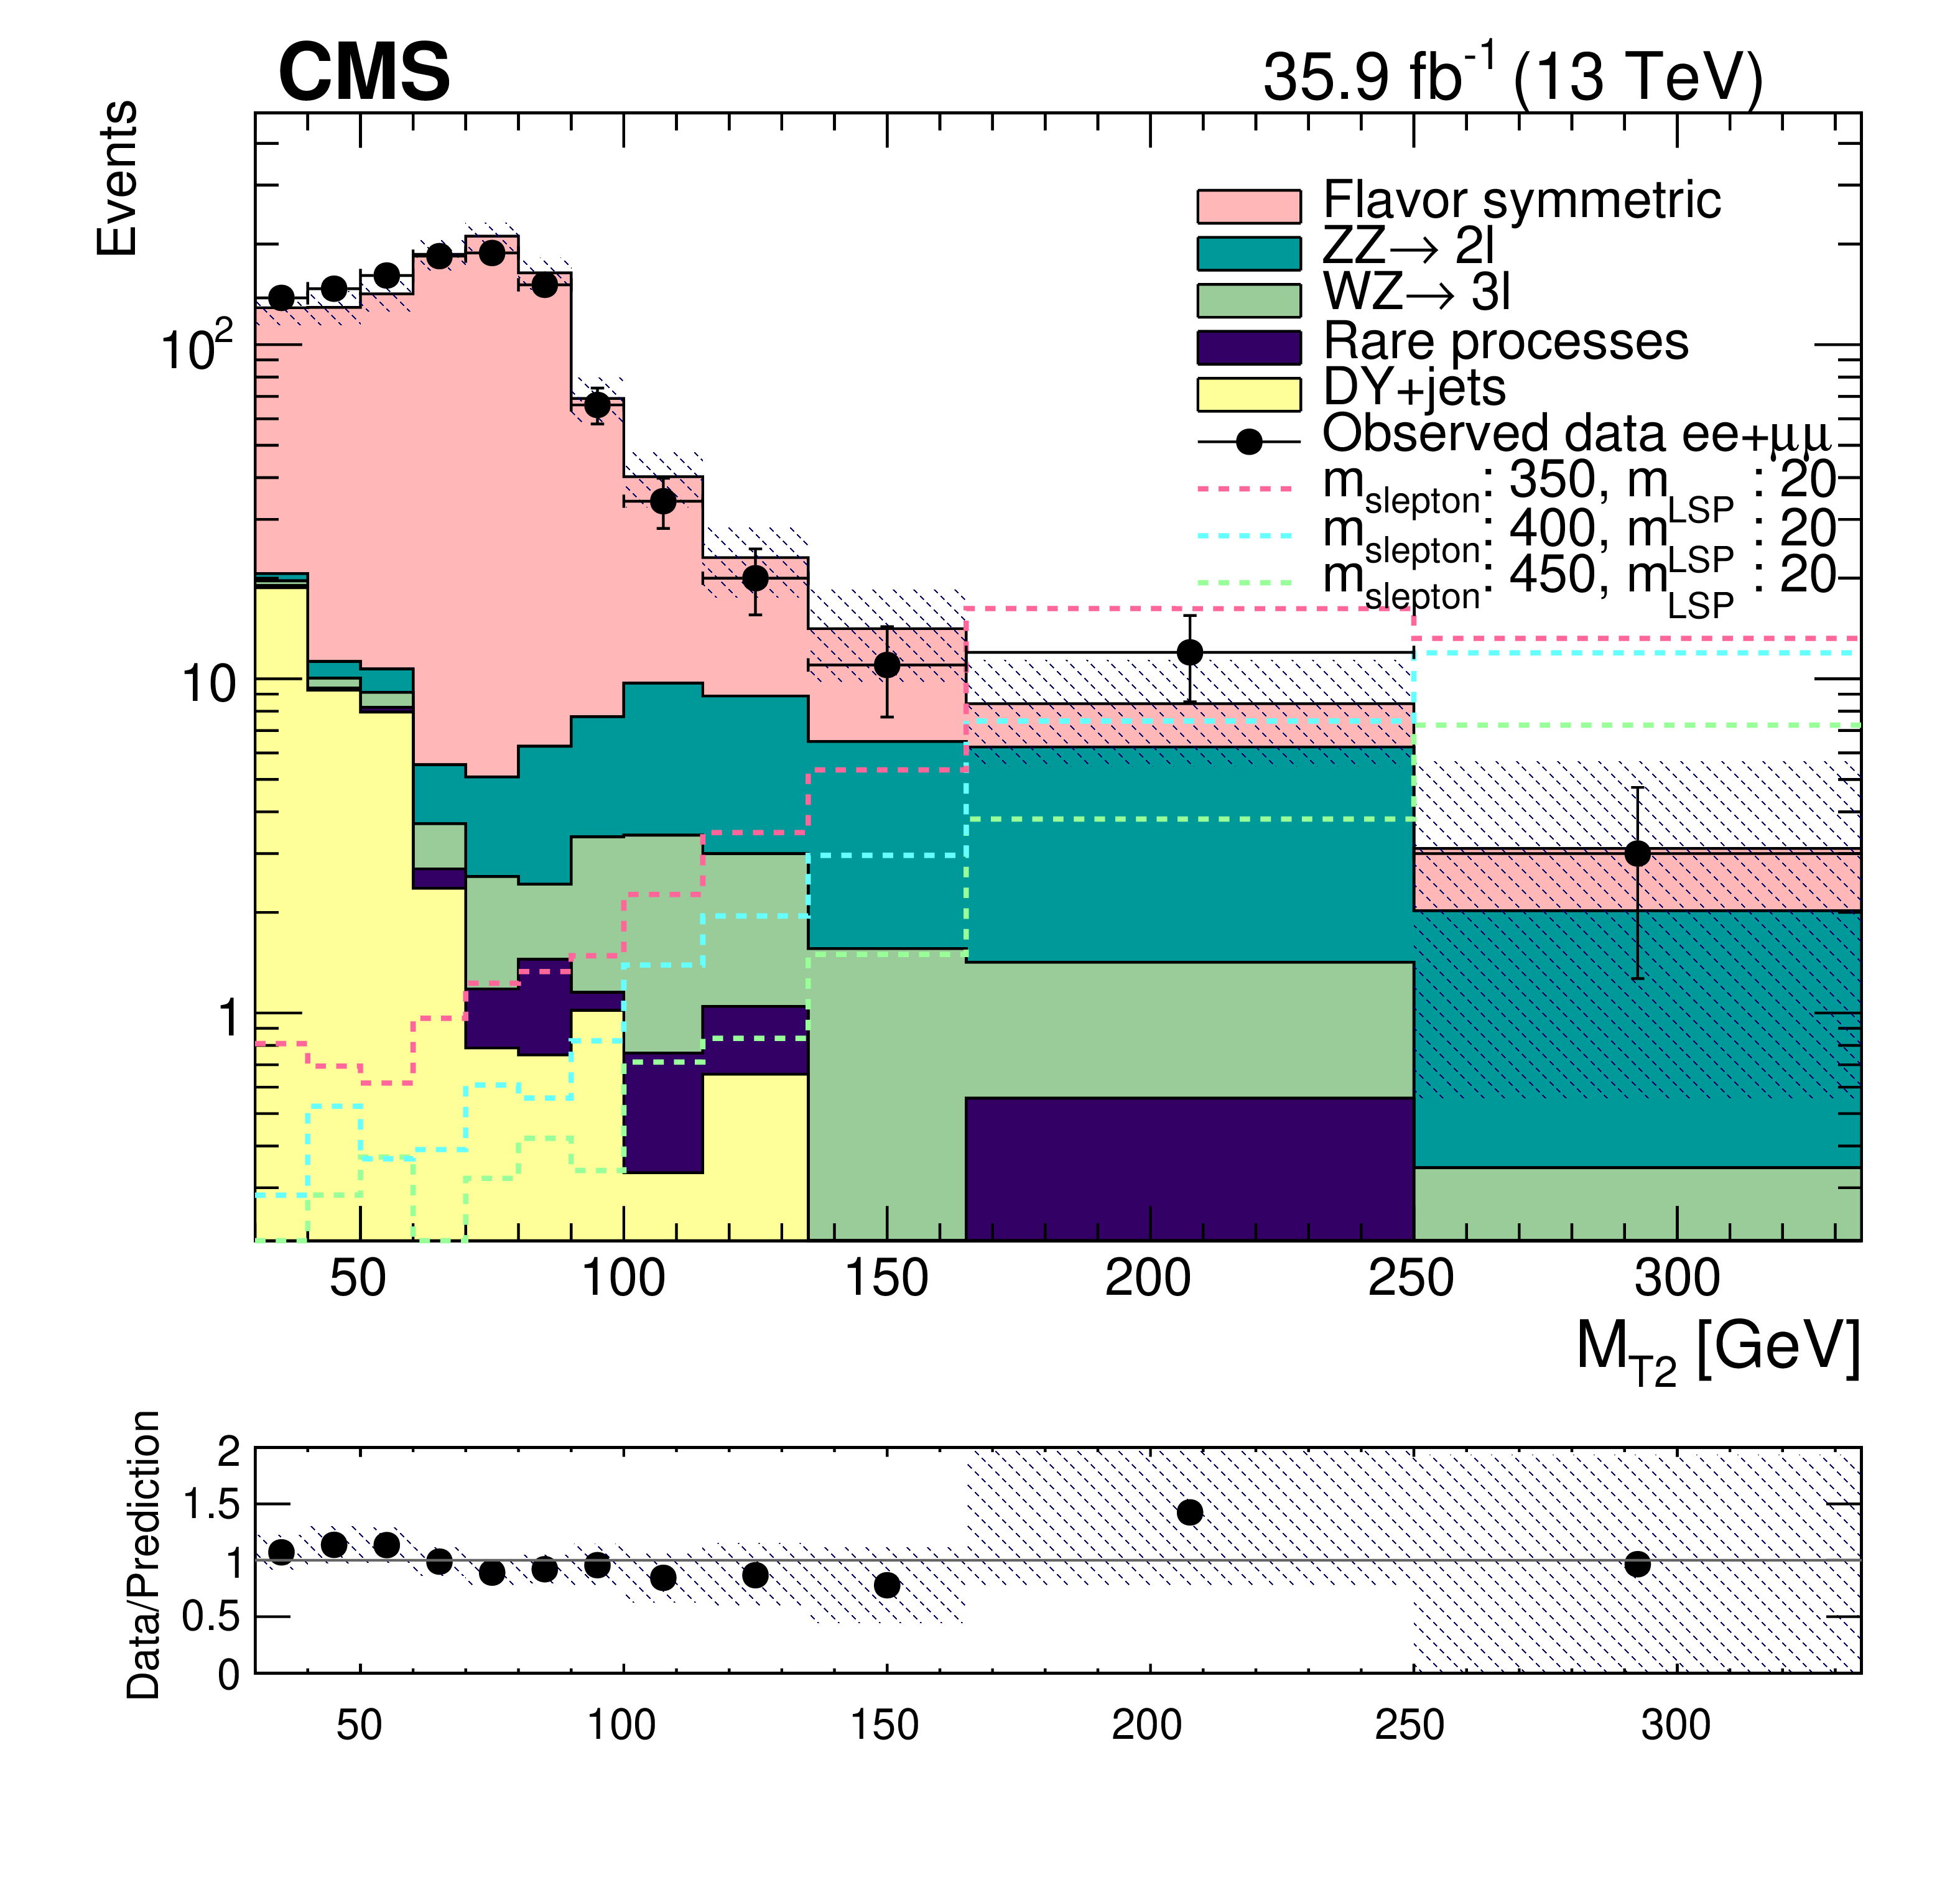
Upper: Distribution of ${M_{\text {T2}}}$ for the resulting SM background yields estimated in the analysis SR (coloured histograms) with the corresponding event counts observed in data (black points), and three signal scenarios (hatched lines), selecting only SF events and assuming the production of both left and right-handed sleptons. Lower: Ratio of data to SM prediction, with the filled band representing the statistical uncertainty on the data and the estimated backgrounds and the systematic uncertainty on the estimated backgrounds. |
png pdf |
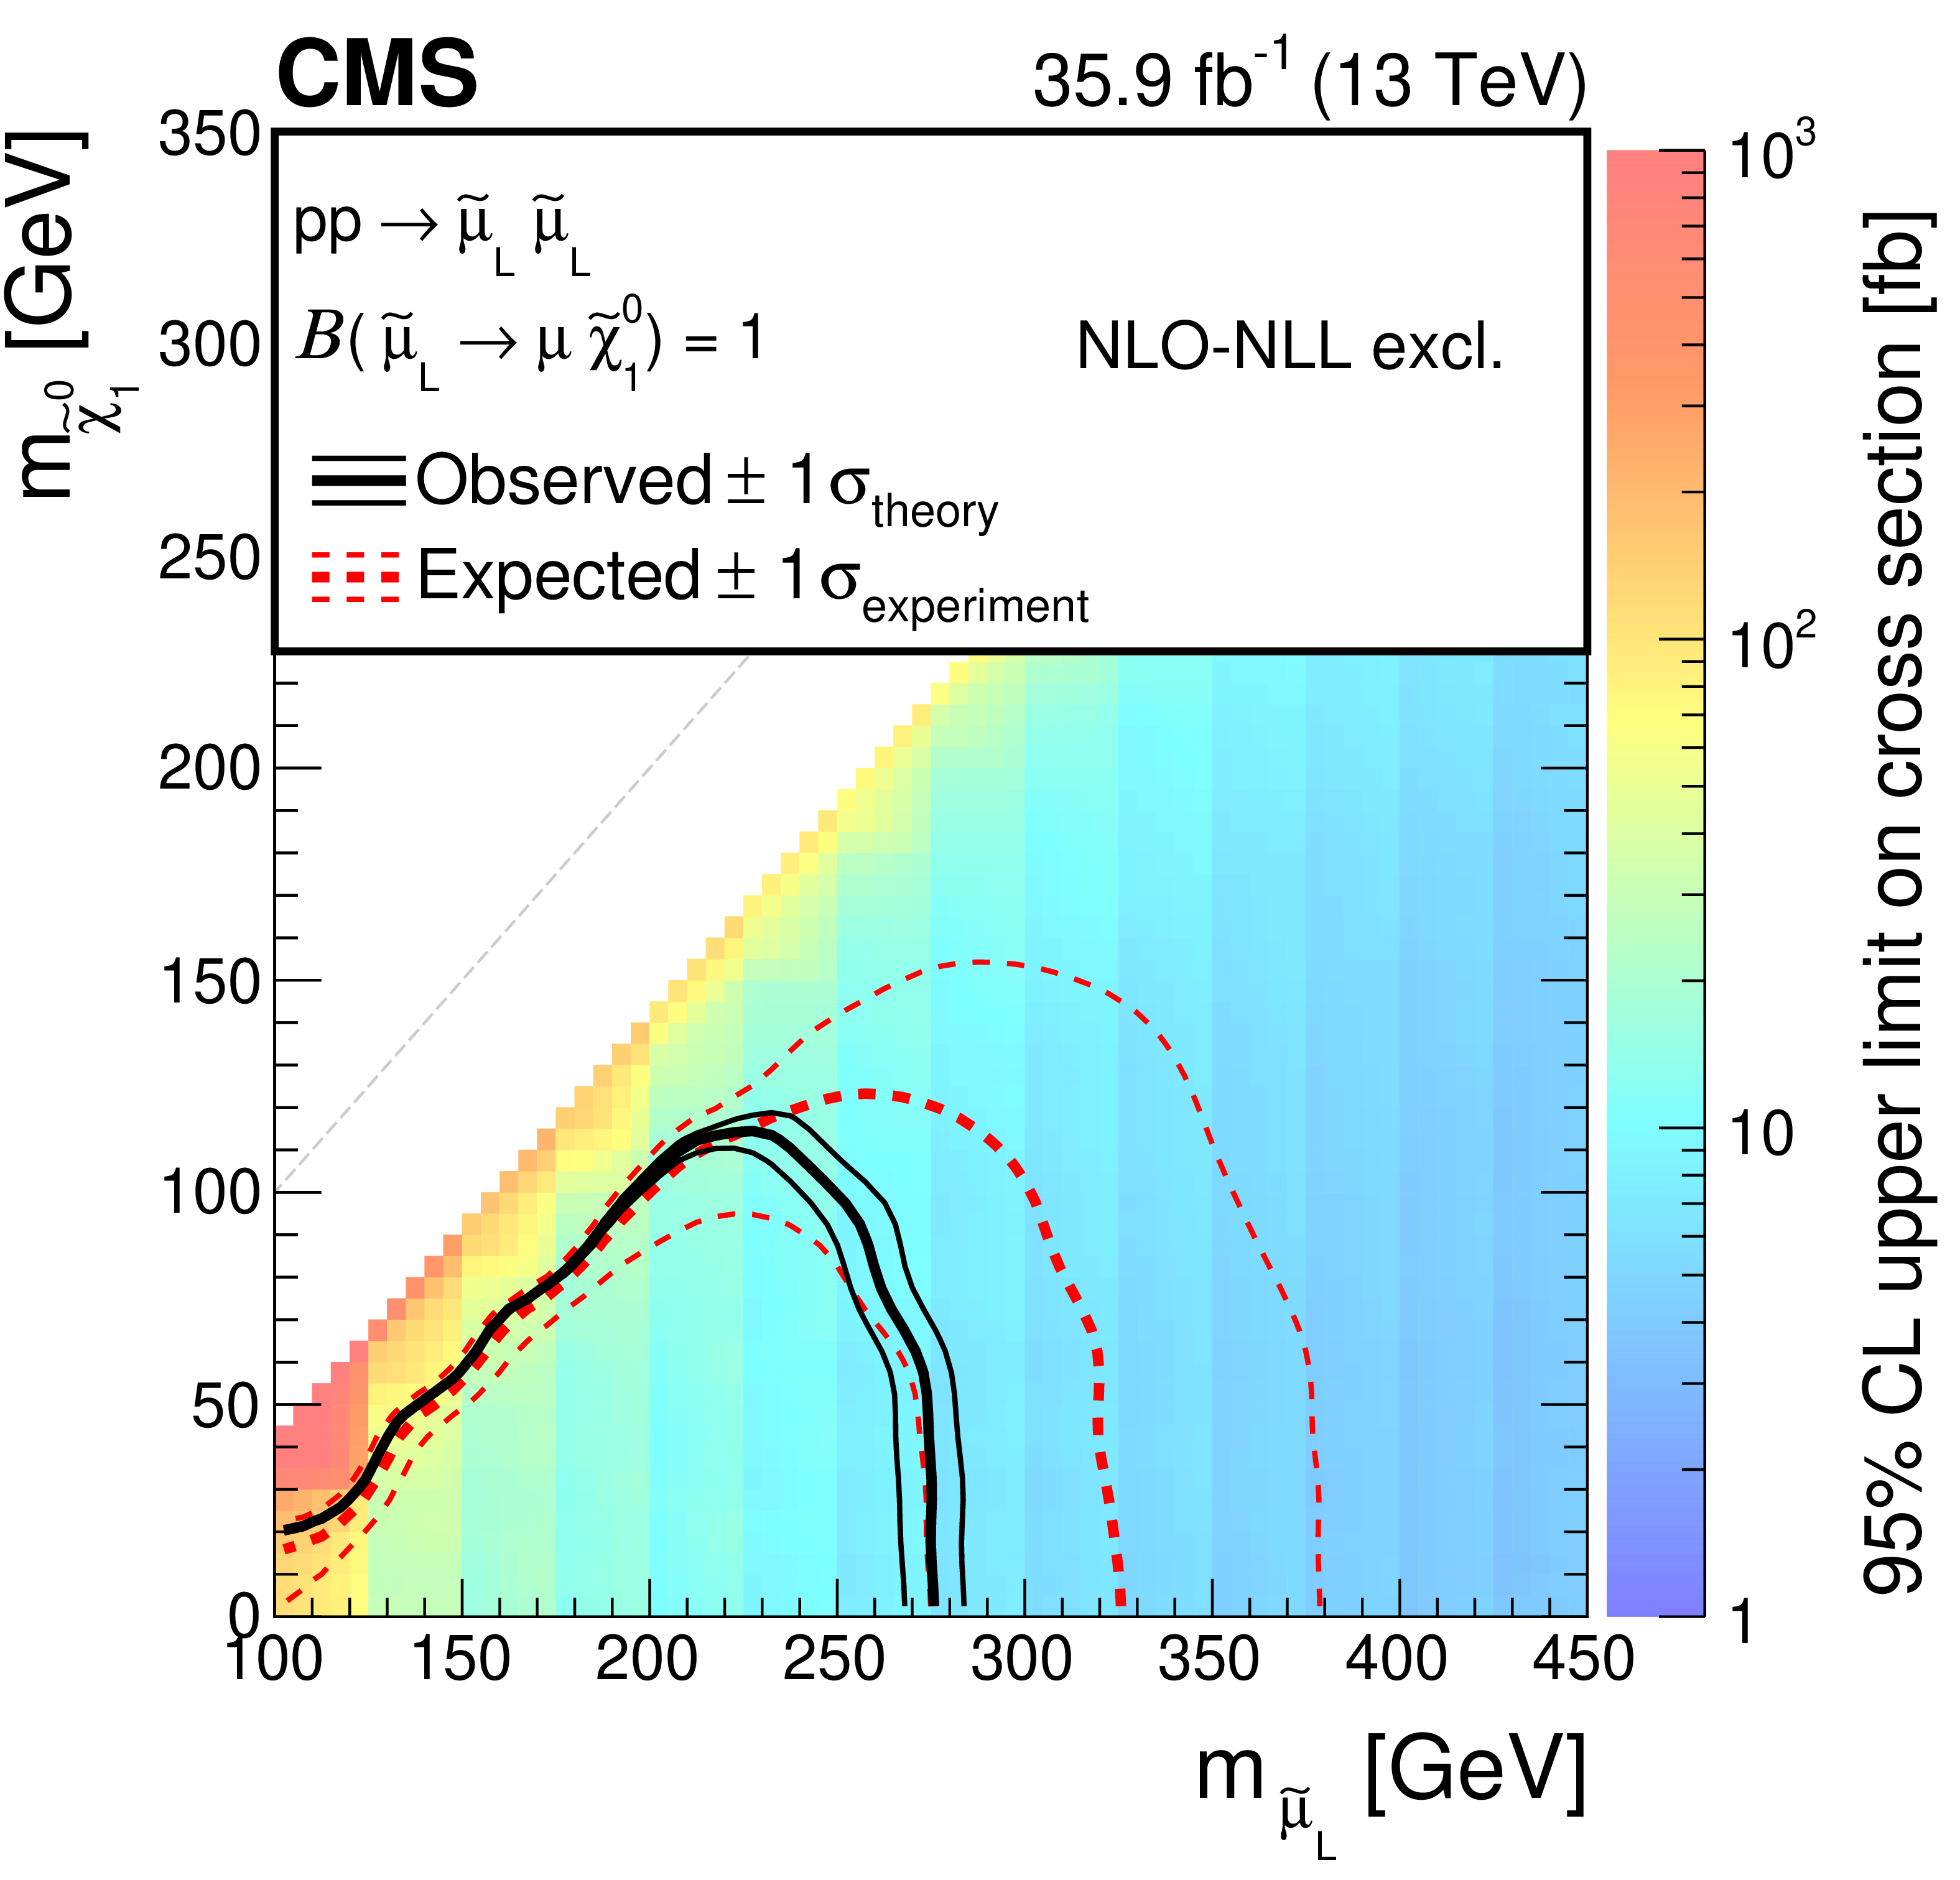
Figure 5:
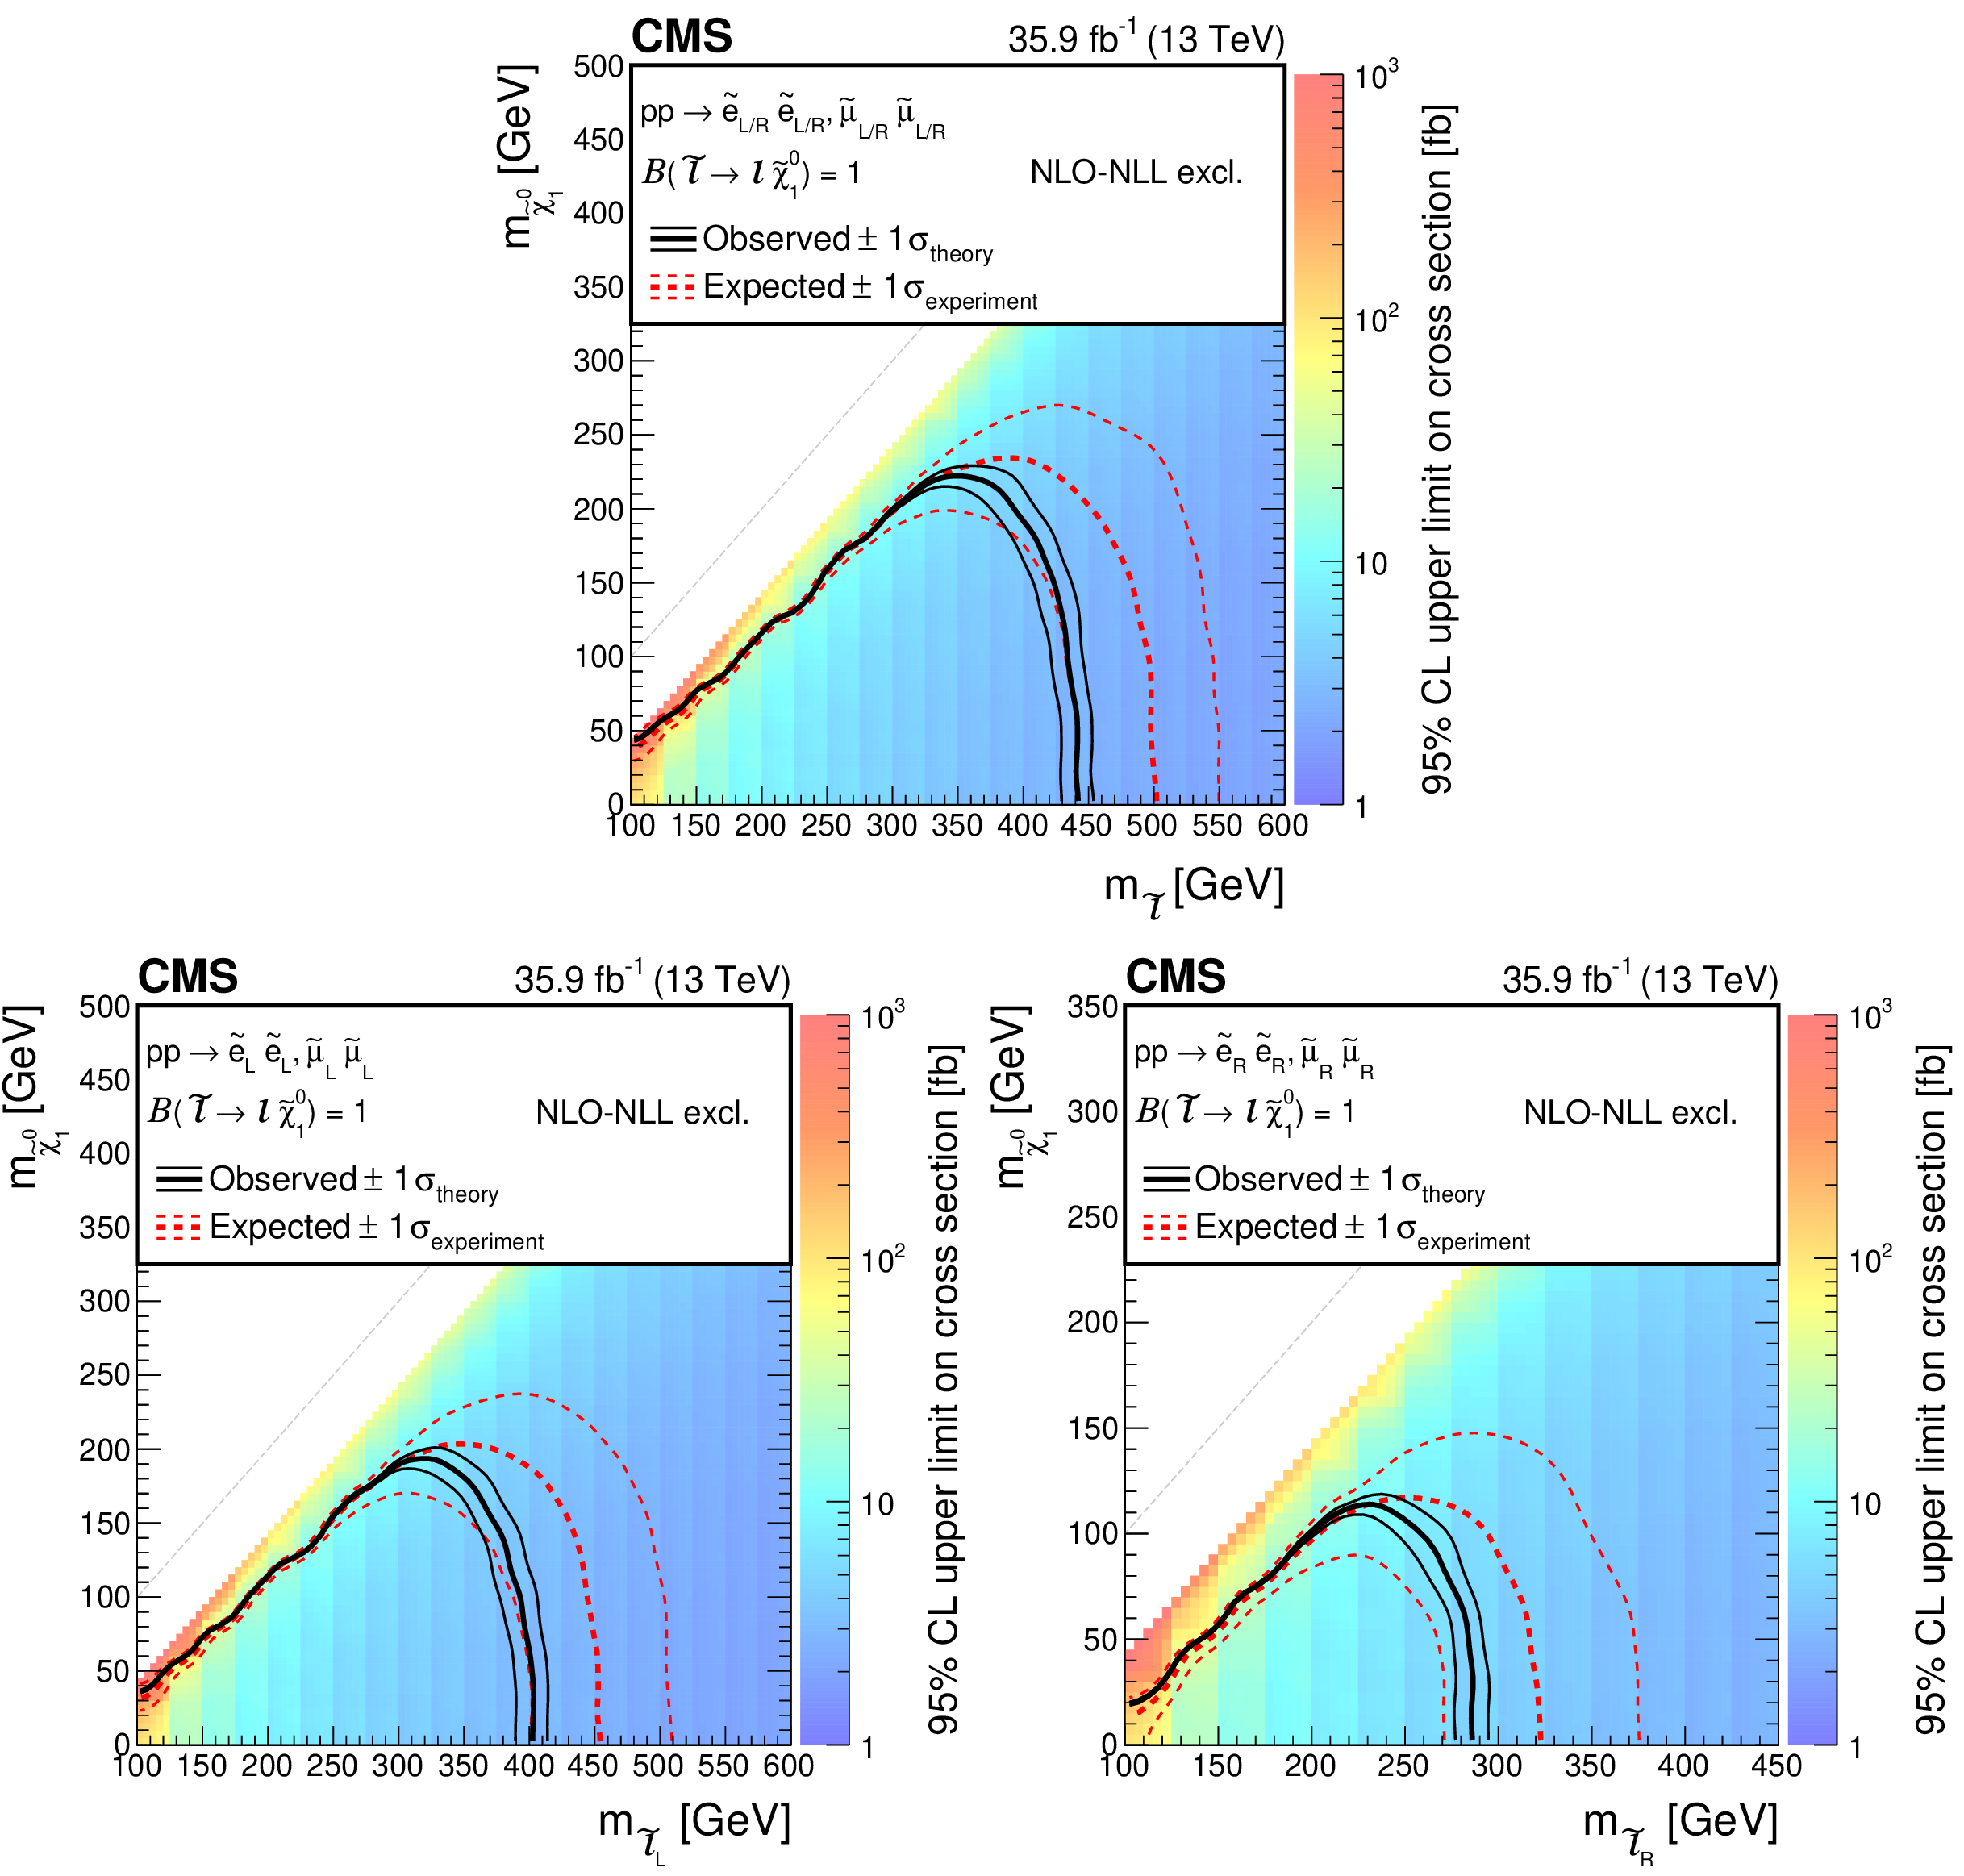
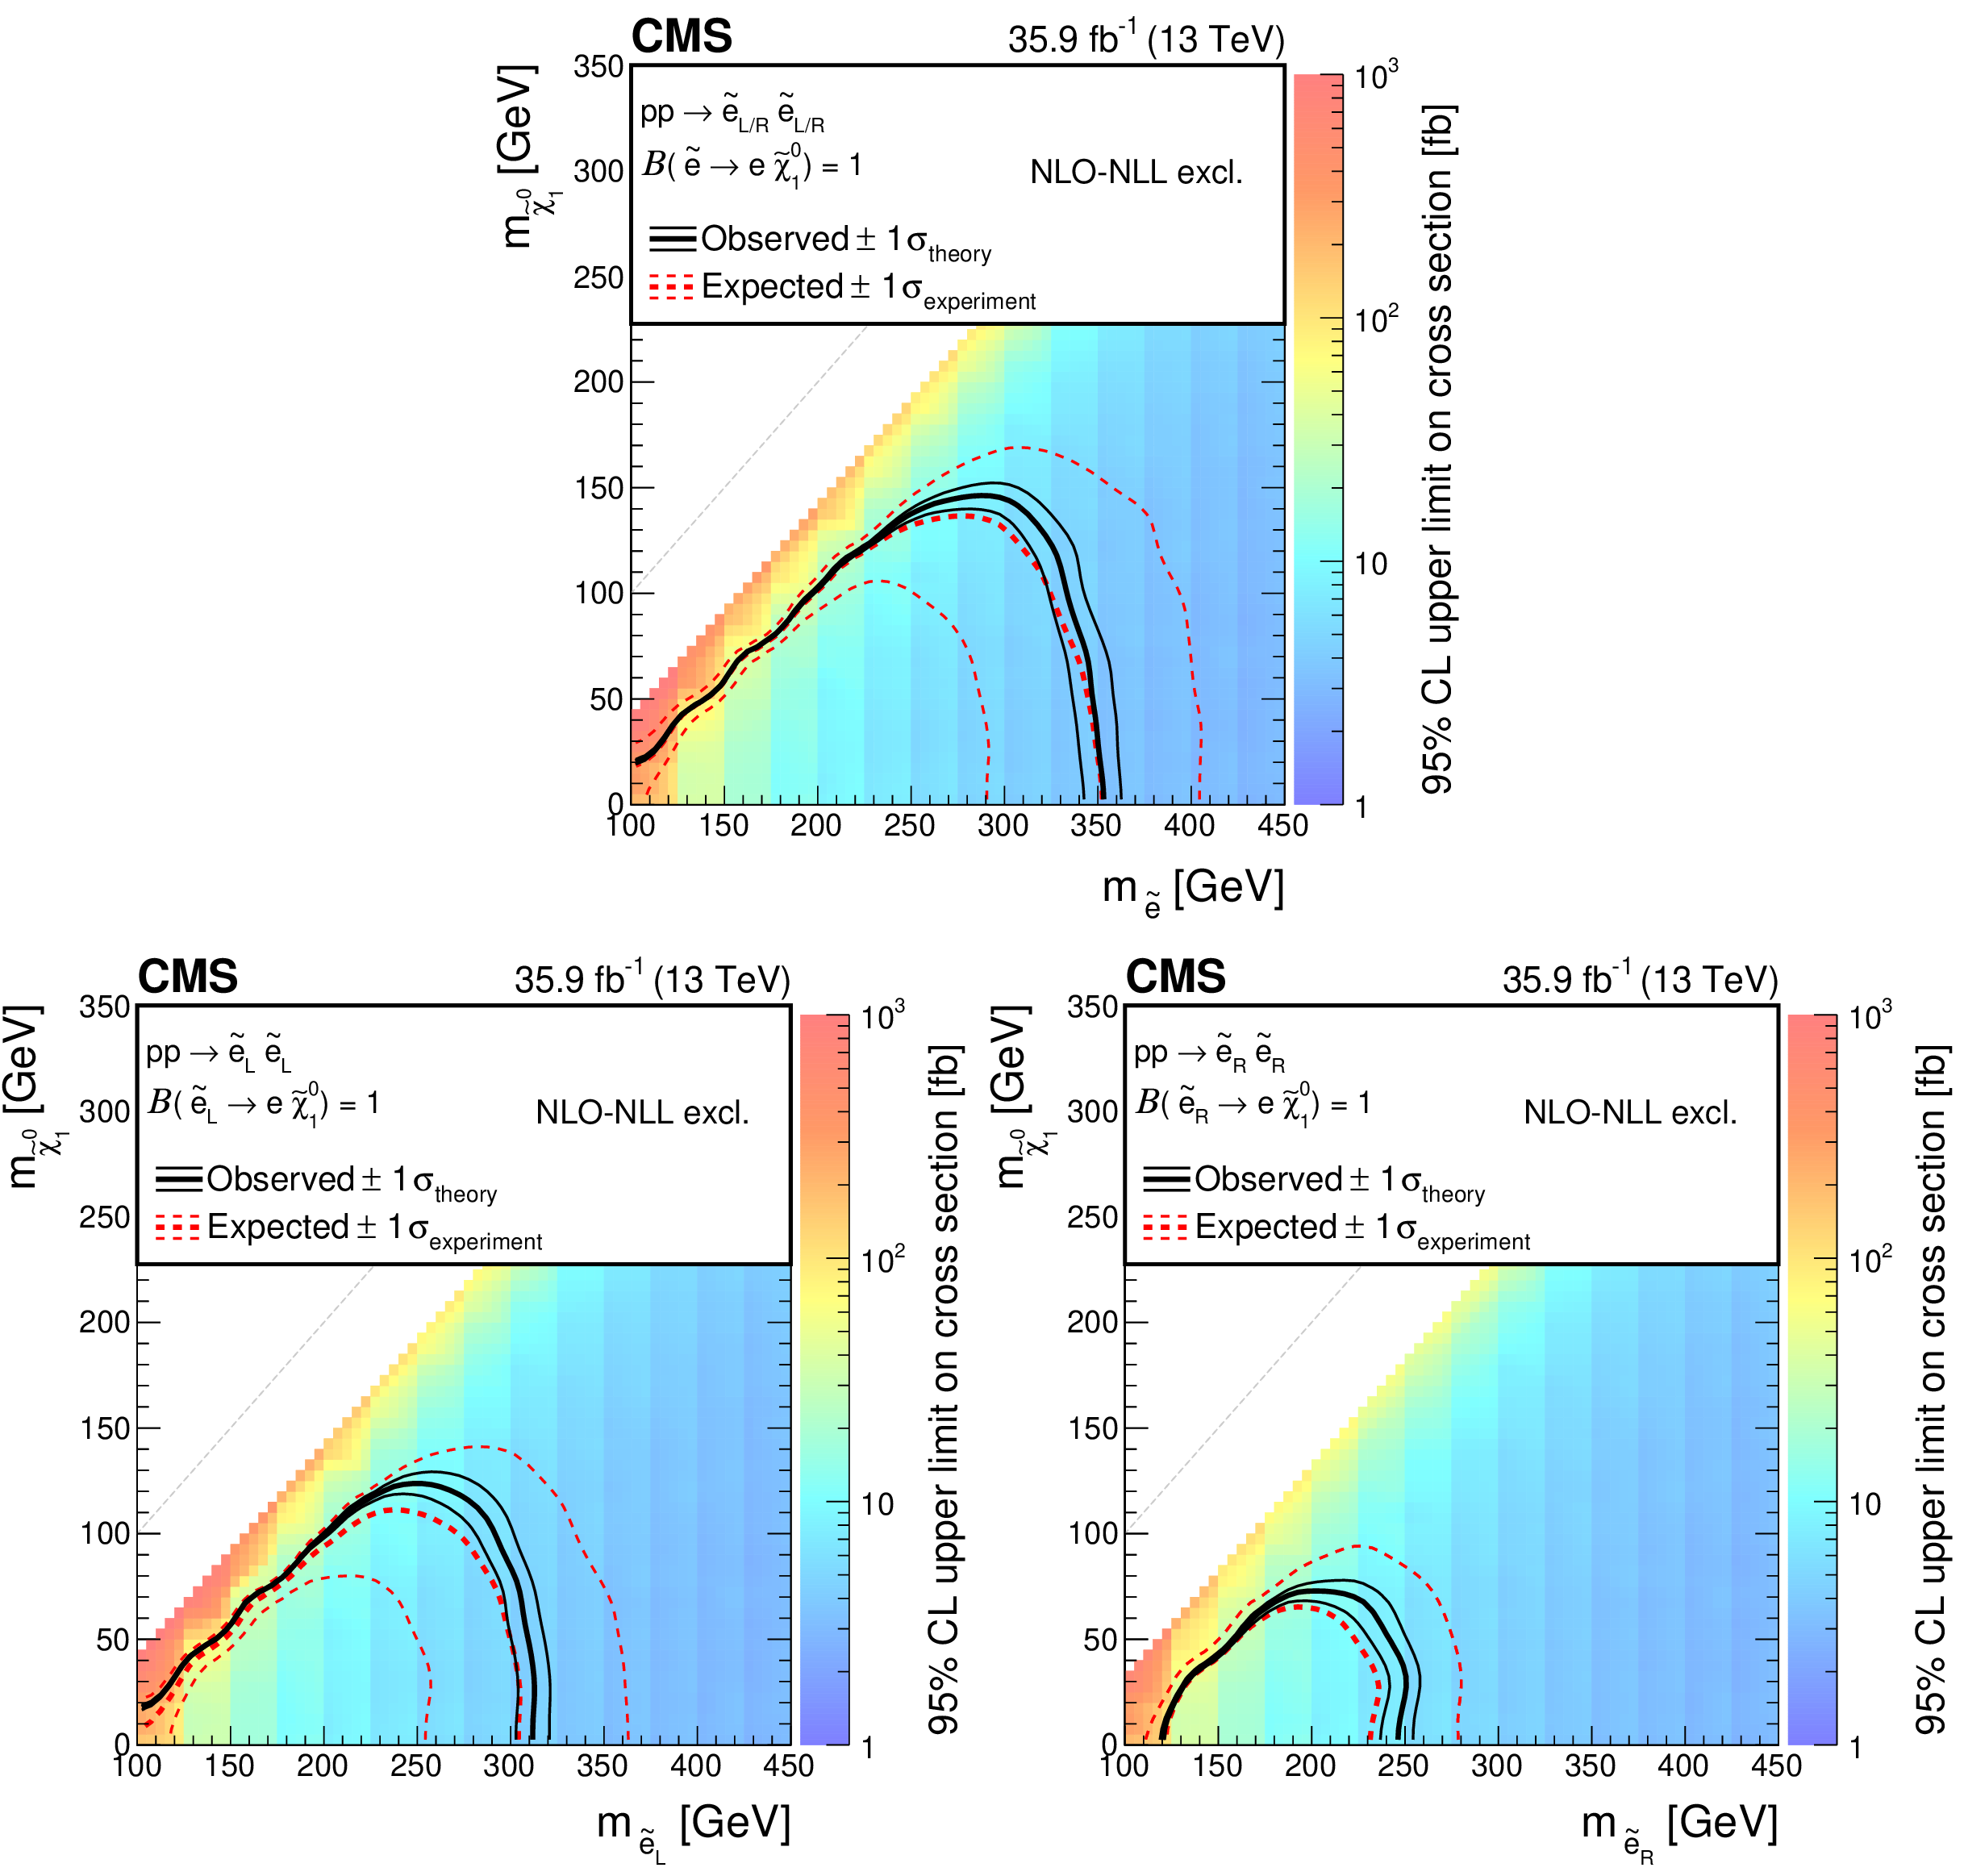
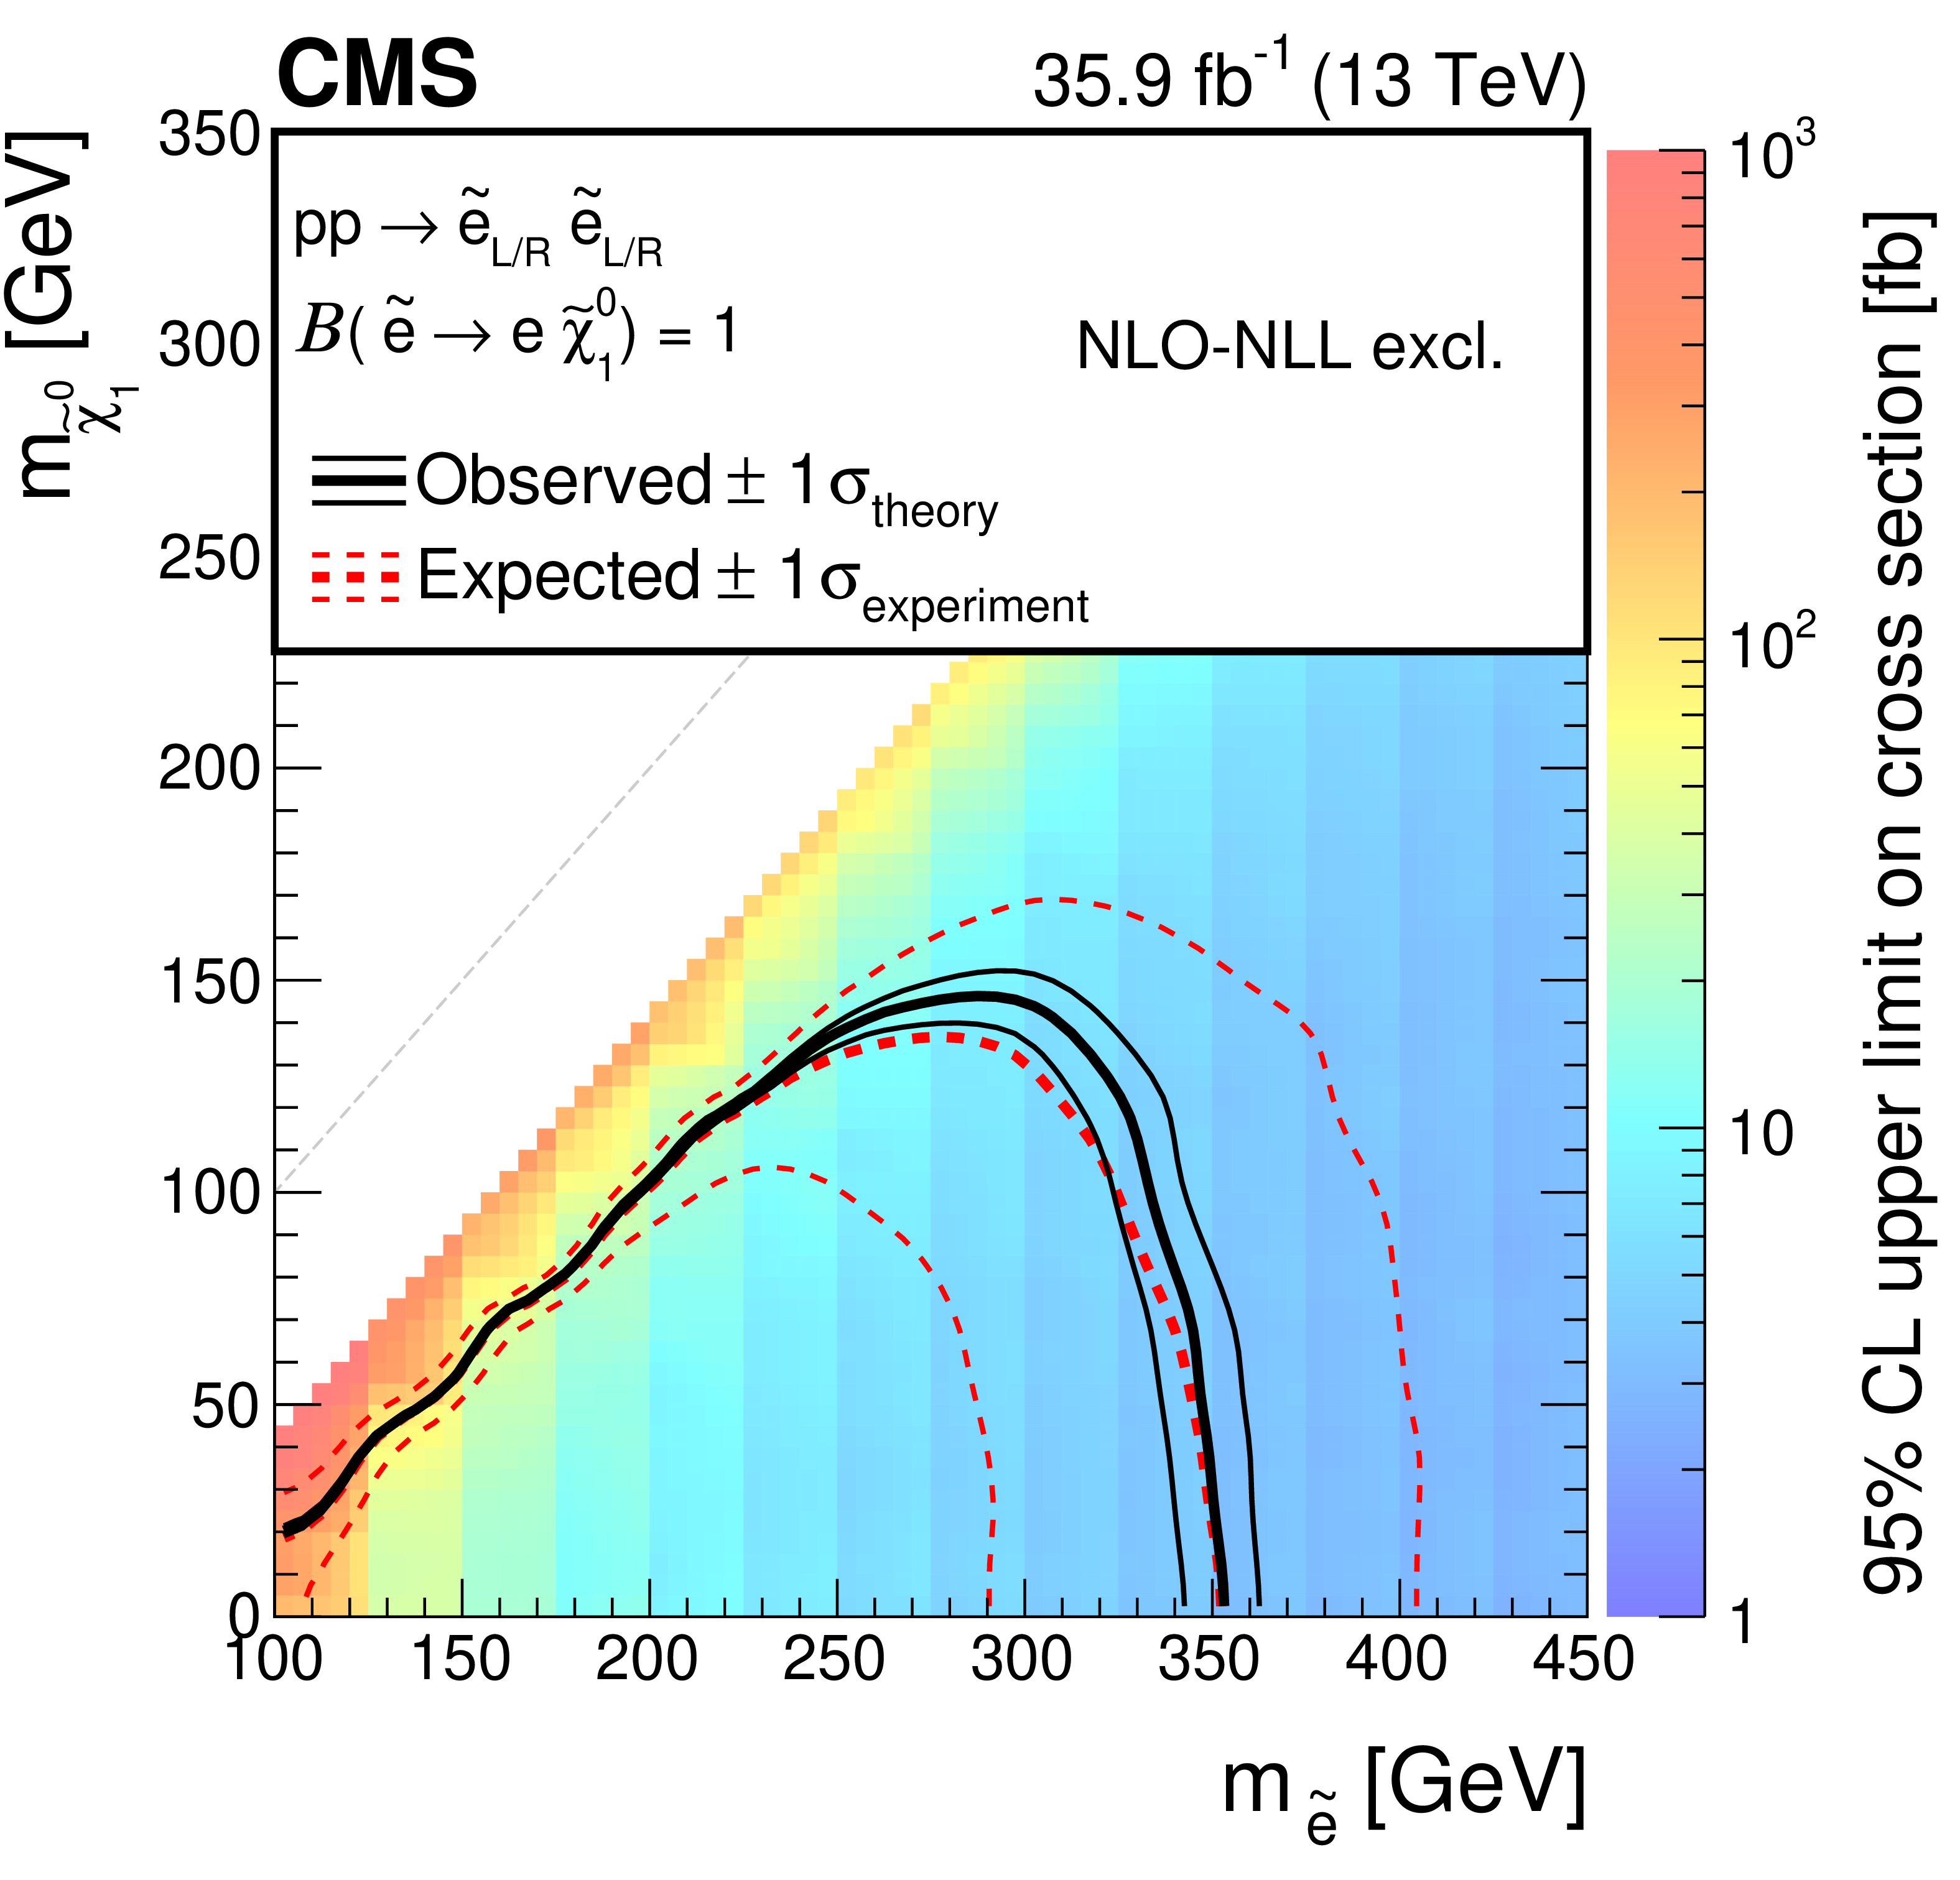
Cross section upper limit and exclusion contours at 95% CL for direct slepton production of two flavours, selectrons and smuons, as a function of the ${\tilde{\chi}^{0}_{1}}$ and ${\tilde{\ell}}$ masses, assuming the production of both left- and right-handed sleptons (upper) or production of only left- (lower left) or right-handed (lower right). The region under the thick red dotted (black solid) line is excluded by the expected (observed) limit. The thin red dotted curves indicate the regions containing 95% of the distribution of limits expected under the background-only hypothesis. The thin solid black curves show the change in the observed limit due to variation of the signal cross sections within their theoretical uncertainties. |

png pdf root |
Figure 5-a:
Cross section upper limit and exclusion contours at 95% CL for direct slepton production of two flavours, selectrons and smuons, as a function of the ${\tilde{\chi}^{0}_{1}}$ and ${\tilde{\ell}}$ masses, assuming the production of both left- and right-handed sleptons. The region under the thick red dotted (black solid) line is excluded by the expected (observed) limit. The thin red dotted curves indicate the regions containing 95% of the distribution of limits expected under the background-only hypothesis. The thin solid black curves show the change in the observed limit due to variation of the signal cross sections within their theoretical uncertainties. |

png pdf root |
Figure 5-b:
Cross section upper limit and exclusion contours at 95% CL for direct slepton production of two flavours, selectrons and smuons, as a function of the ${\tilde{\chi}^{0}_{1}}$ and ${\tilde{\ell}}$ masses, assuming the production of left-handed sleptons. The region under the thick red dotted (black solid) line is excluded by the expected (observed) limit. The thin red dotted curves indicate the regions containing 95% of the distribution of limits expected under the background-only hypothesis. The thin solid black curves show the change in the observed limit due to variation of the signal cross sections within their theoretical uncertainties. |
png pdf root |
Figure 5-c:
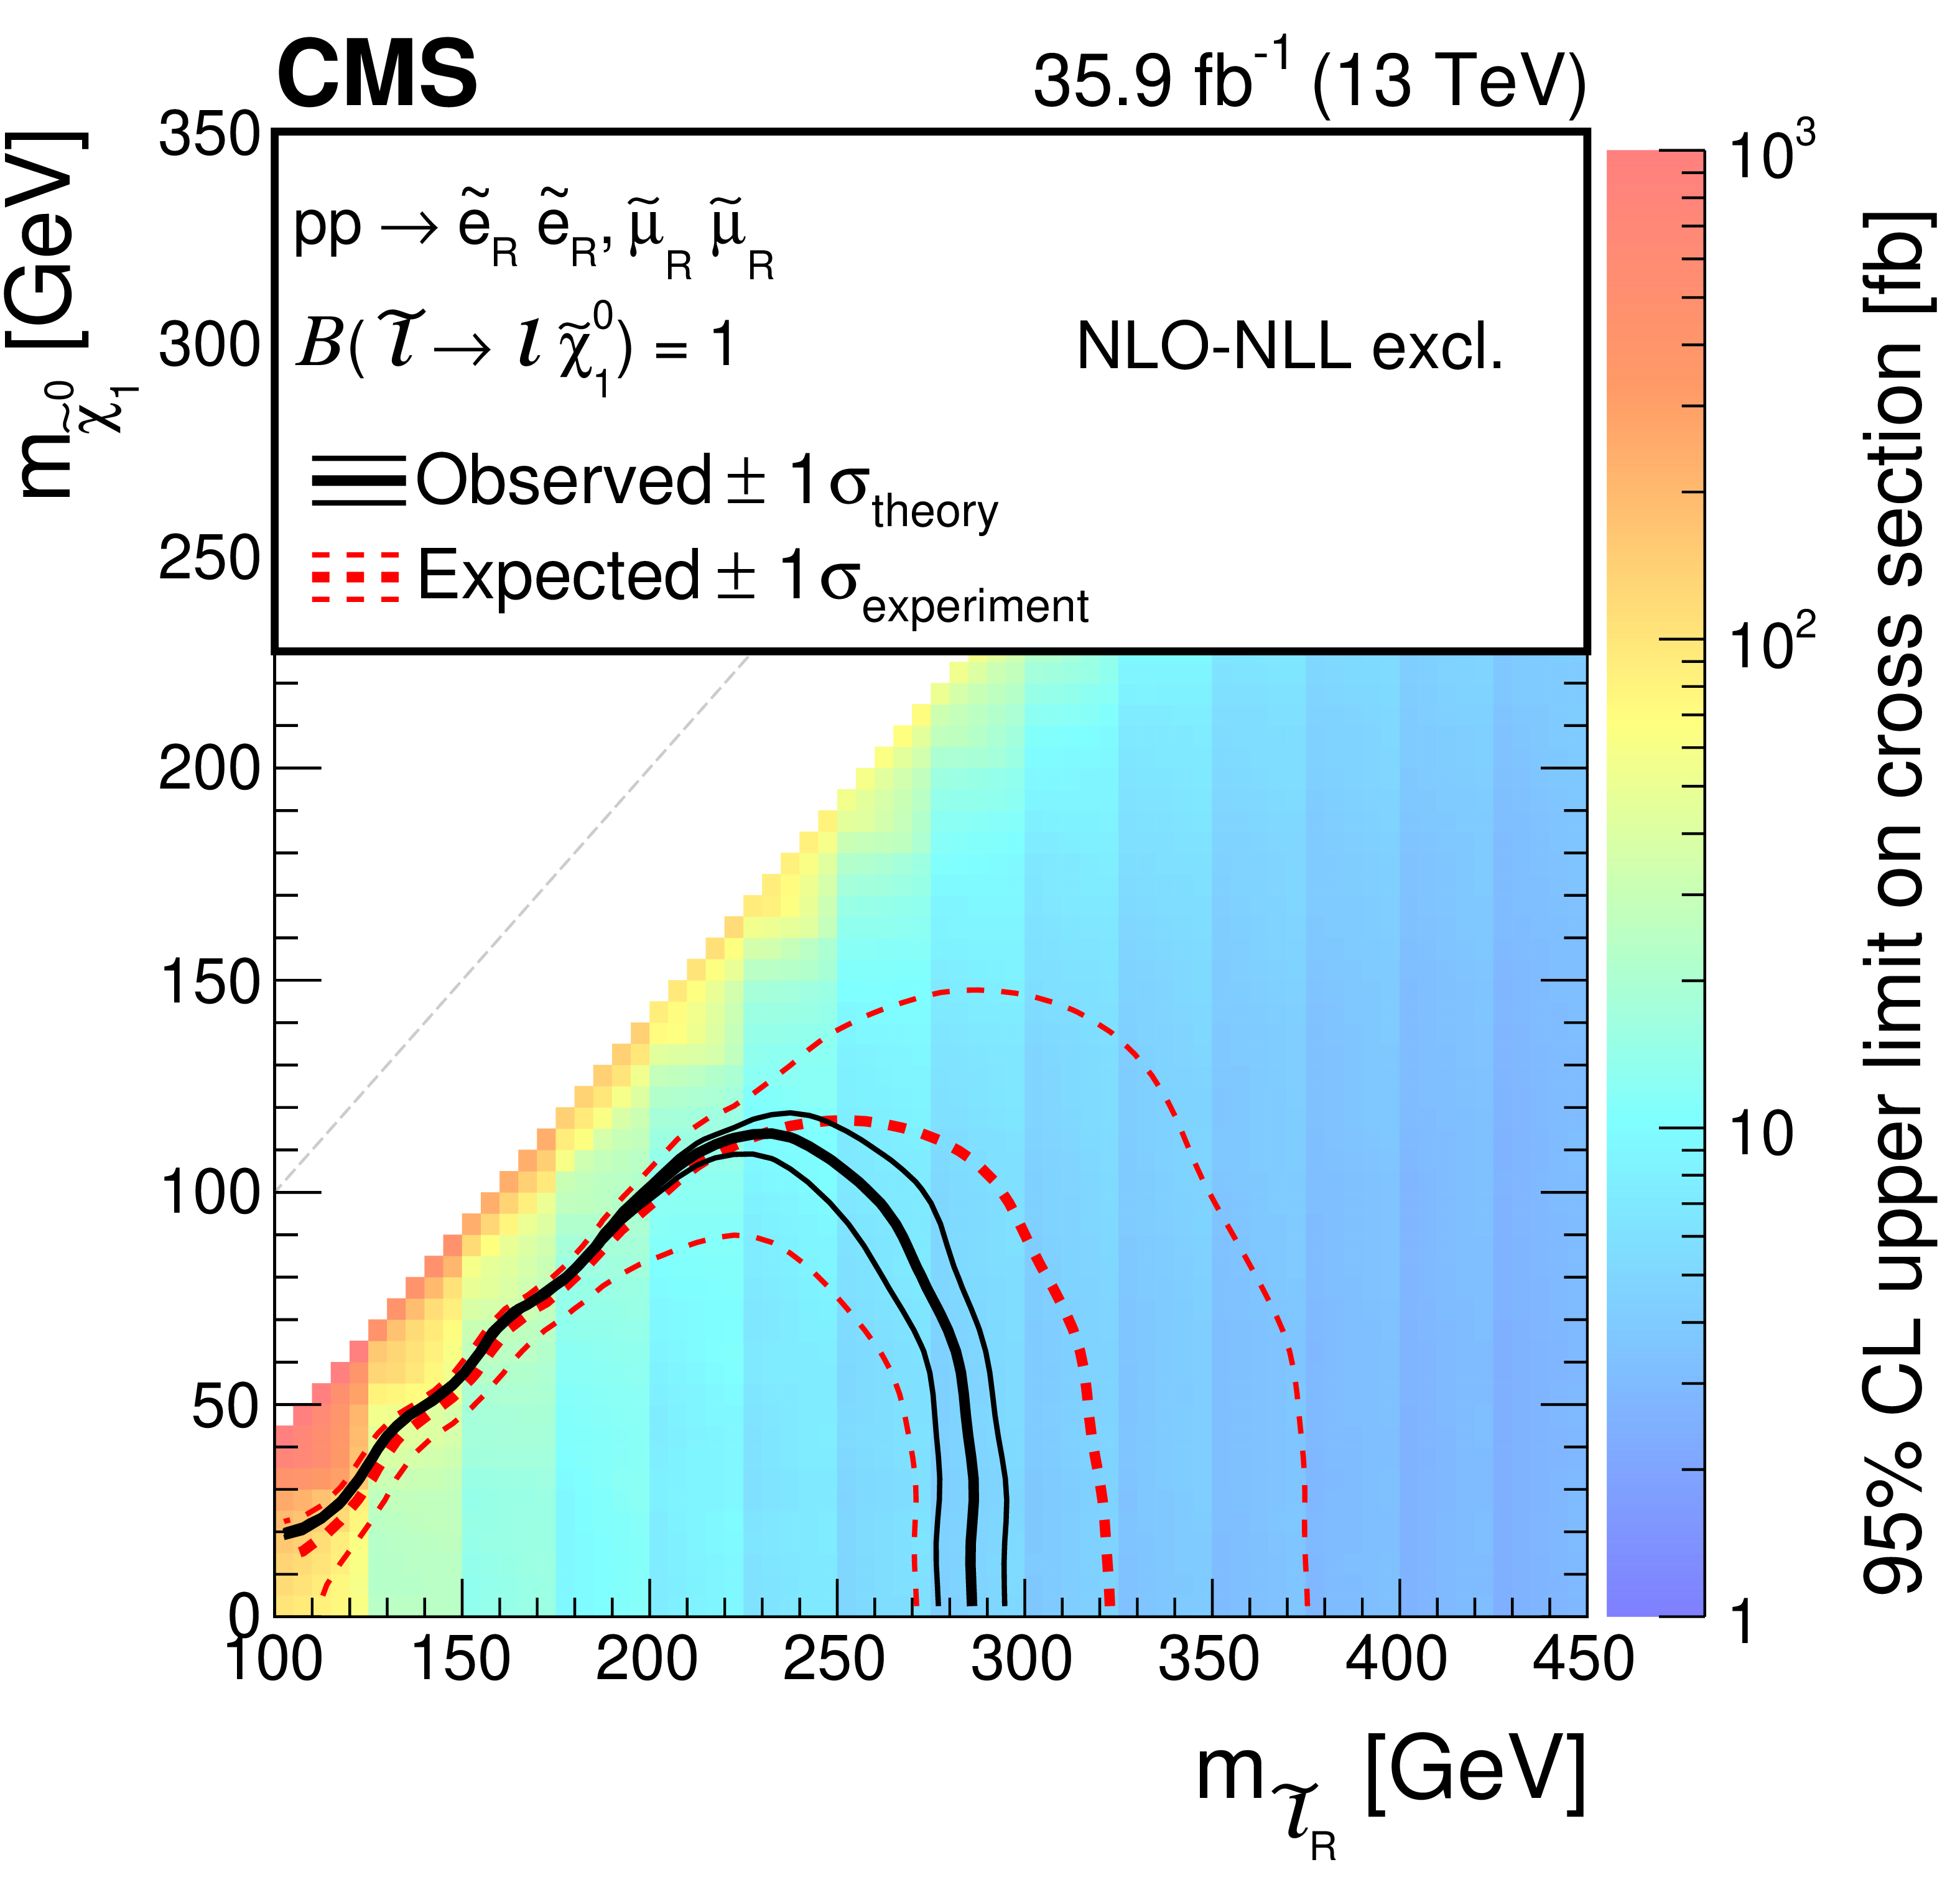
Cross section upper limit and exclusion contours at 95% CL for direct slepton production of two flavours, selectrons and smuons, as a function of the ${\tilde{\chi}^{0}_{1}}$ and ${\tilde{\ell}}$ masses, assuming the production of right-handed sleptons. The region under the thick red dotted (black solid) line is excluded by the expected (observed) limit. The thin red dotted curves indicate the regions containing 95% of the distribution of limits expected under the background-only hypothesis. The thin solid black curves show the change in the observed limit due to variation of the signal cross sections within their theoretical uncertainties. |
png pdf |
Figure 6:
Cross section upper limit and exclusion contours at 95% CL for direct selectron production as a function of the ${\tilde{\chi}^{0}_{1}}$ and ${\tilde{\ell}}$ masses, assuming the production of both left- and right-handed selectrons (upper), or production of only left- (lower left) or right-handed (lower right) selectrons. The region under the thick red dotted (black solid) line is excluded by the expected (observed) limit. The thin red dotted curves indicate the regions containing 95% of the distribution of limits expected under the background-only hypothesis. For the right-handed selectrons, only the $+1\sigma $ expected line (thin red dotted curve) is shown as no exclusion can be made at $-1\sigma $. The thin solid black curves show the change in the observed limit due to variation of the signal cross sections within their theoretical uncertainties. |
png pdf root |
Figure 6-a:
Cross section upper limit and exclusion contours at 95% CL for direct selectron production as a function of the ${\tilde{\chi}^{0}_{1}}$ and ${\tilde{\ell}}$ masses, assuming the production of both left- and right-handed selectrons. The region under the thick red dotted (black solid) line is excluded by the expected (observed) limit. The thin red dotted curves indicate the regions containing 95% of the distribution of limits expected under the background-only hypothesis. For the right-handed selectrons, only the $+1\sigma $ expected line (thin red dotted curve) is shown as no exclusion can be made at $-1\sigma $. The thin solid black curves show the change in the observed limit due to variation of the signal cross sections within their theoretical uncertainties. |

png pdf root |
Figure 6-b:
Cross section upper limit and exclusion contours at 95% CL for direct selectron production as a function of the ${\tilde{\chi}^{0}_{1}}$ and ${\tilde{\ell}}$ masses, assuming the production of left-handed selectrons. The region under the thick red dotted (black solid) line is excluded by the expected (observed) limit. The thin red dotted curves indicate the regions containing 95% of the distribution of limits expected under the background-only hypothesis. For the right-handed selectrons, only the $+1\sigma $ expected line (thin red dotted curve) is shown as no exclusion can be made at $-1\sigma $. The thin solid black curves show the change in the observed limit due to variation of the signal cross sections within their theoretical uncertainties. |

png pdf root |
Figure 6-c:
Cross section upper limit and exclusion contours at 95% CL for direct selectron production as a function of the ${\tilde{\chi}^{0}_{1}}$ and ${\tilde{\ell}}$ masses, assuming the production of right-handed selectrons. The region under the thick red dotted (black solid) line is excluded by the expected (observed) limit. The thin red dotted curves indicate the regions containing 95% of the distribution of limits expected under the background-only hypothesis. For the right-handed selectrons, only the $+1\sigma $ expected line (thin red dotted curve) is shown as no exclusion can be made at $-1\sigma $. The thin solid black curves show the change in the observed limit due to variation of the signal cross sections within their theoretical uncertainties. |
png pdf |
Figure 7:
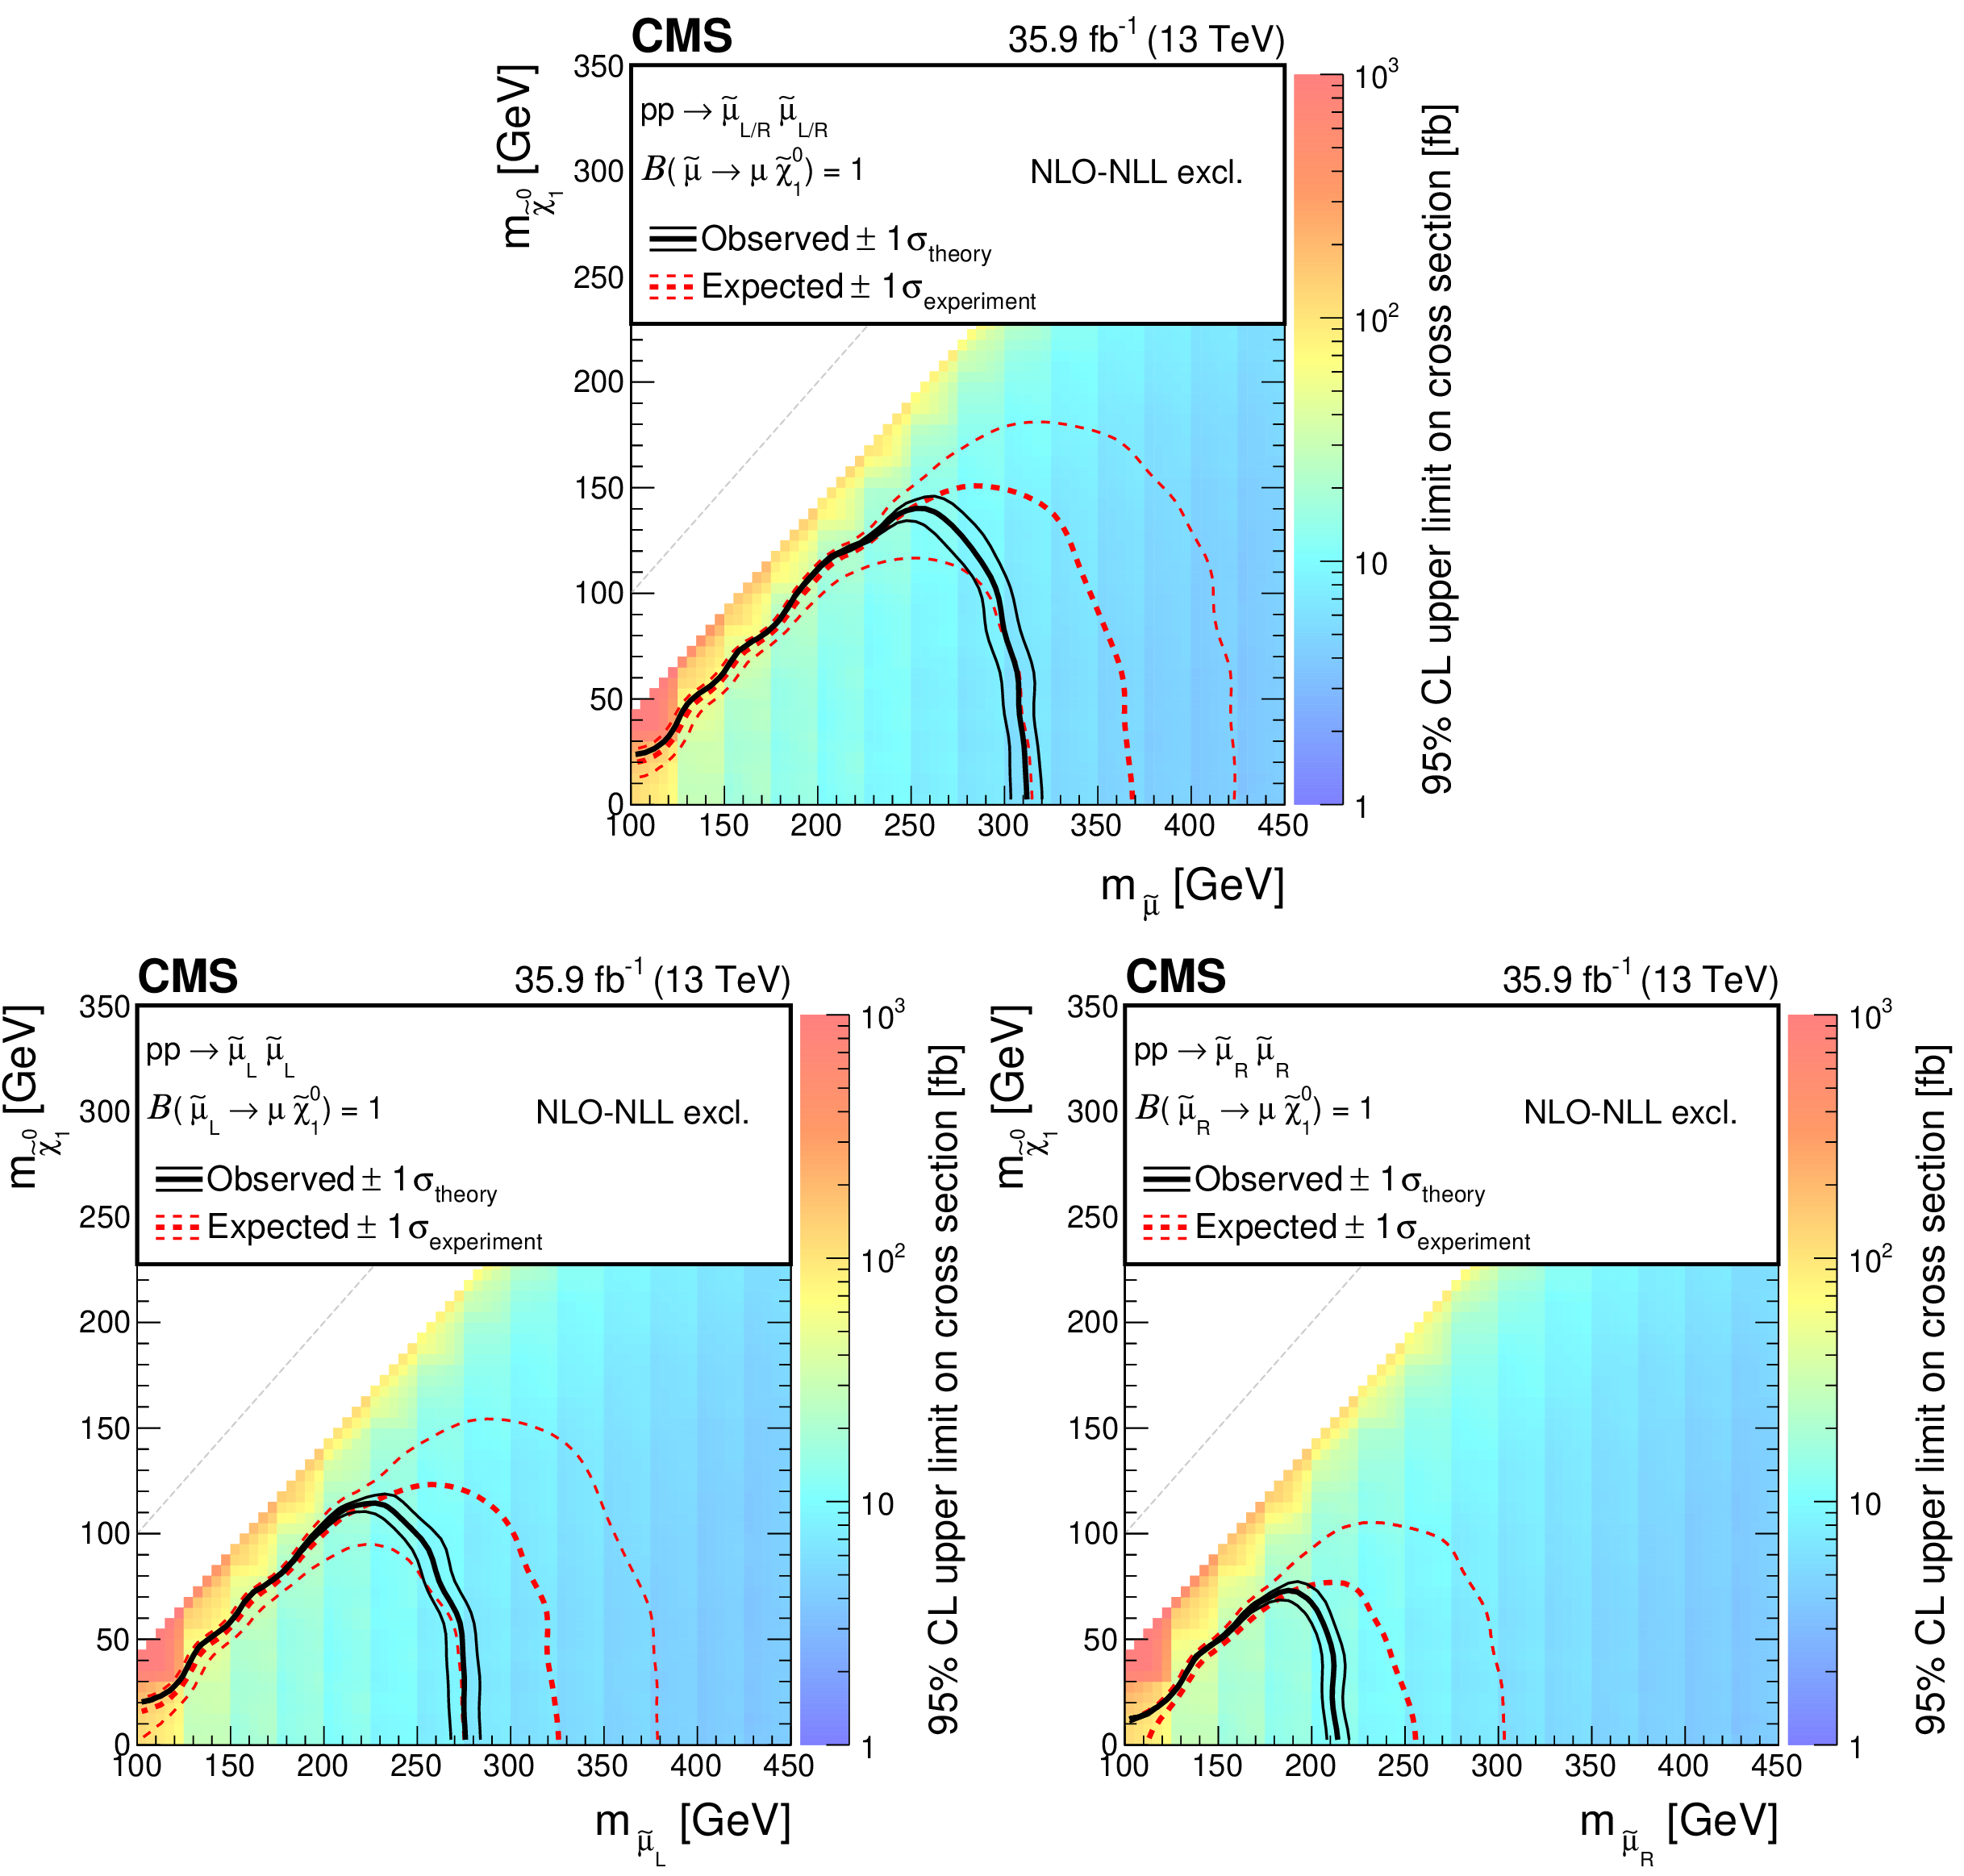
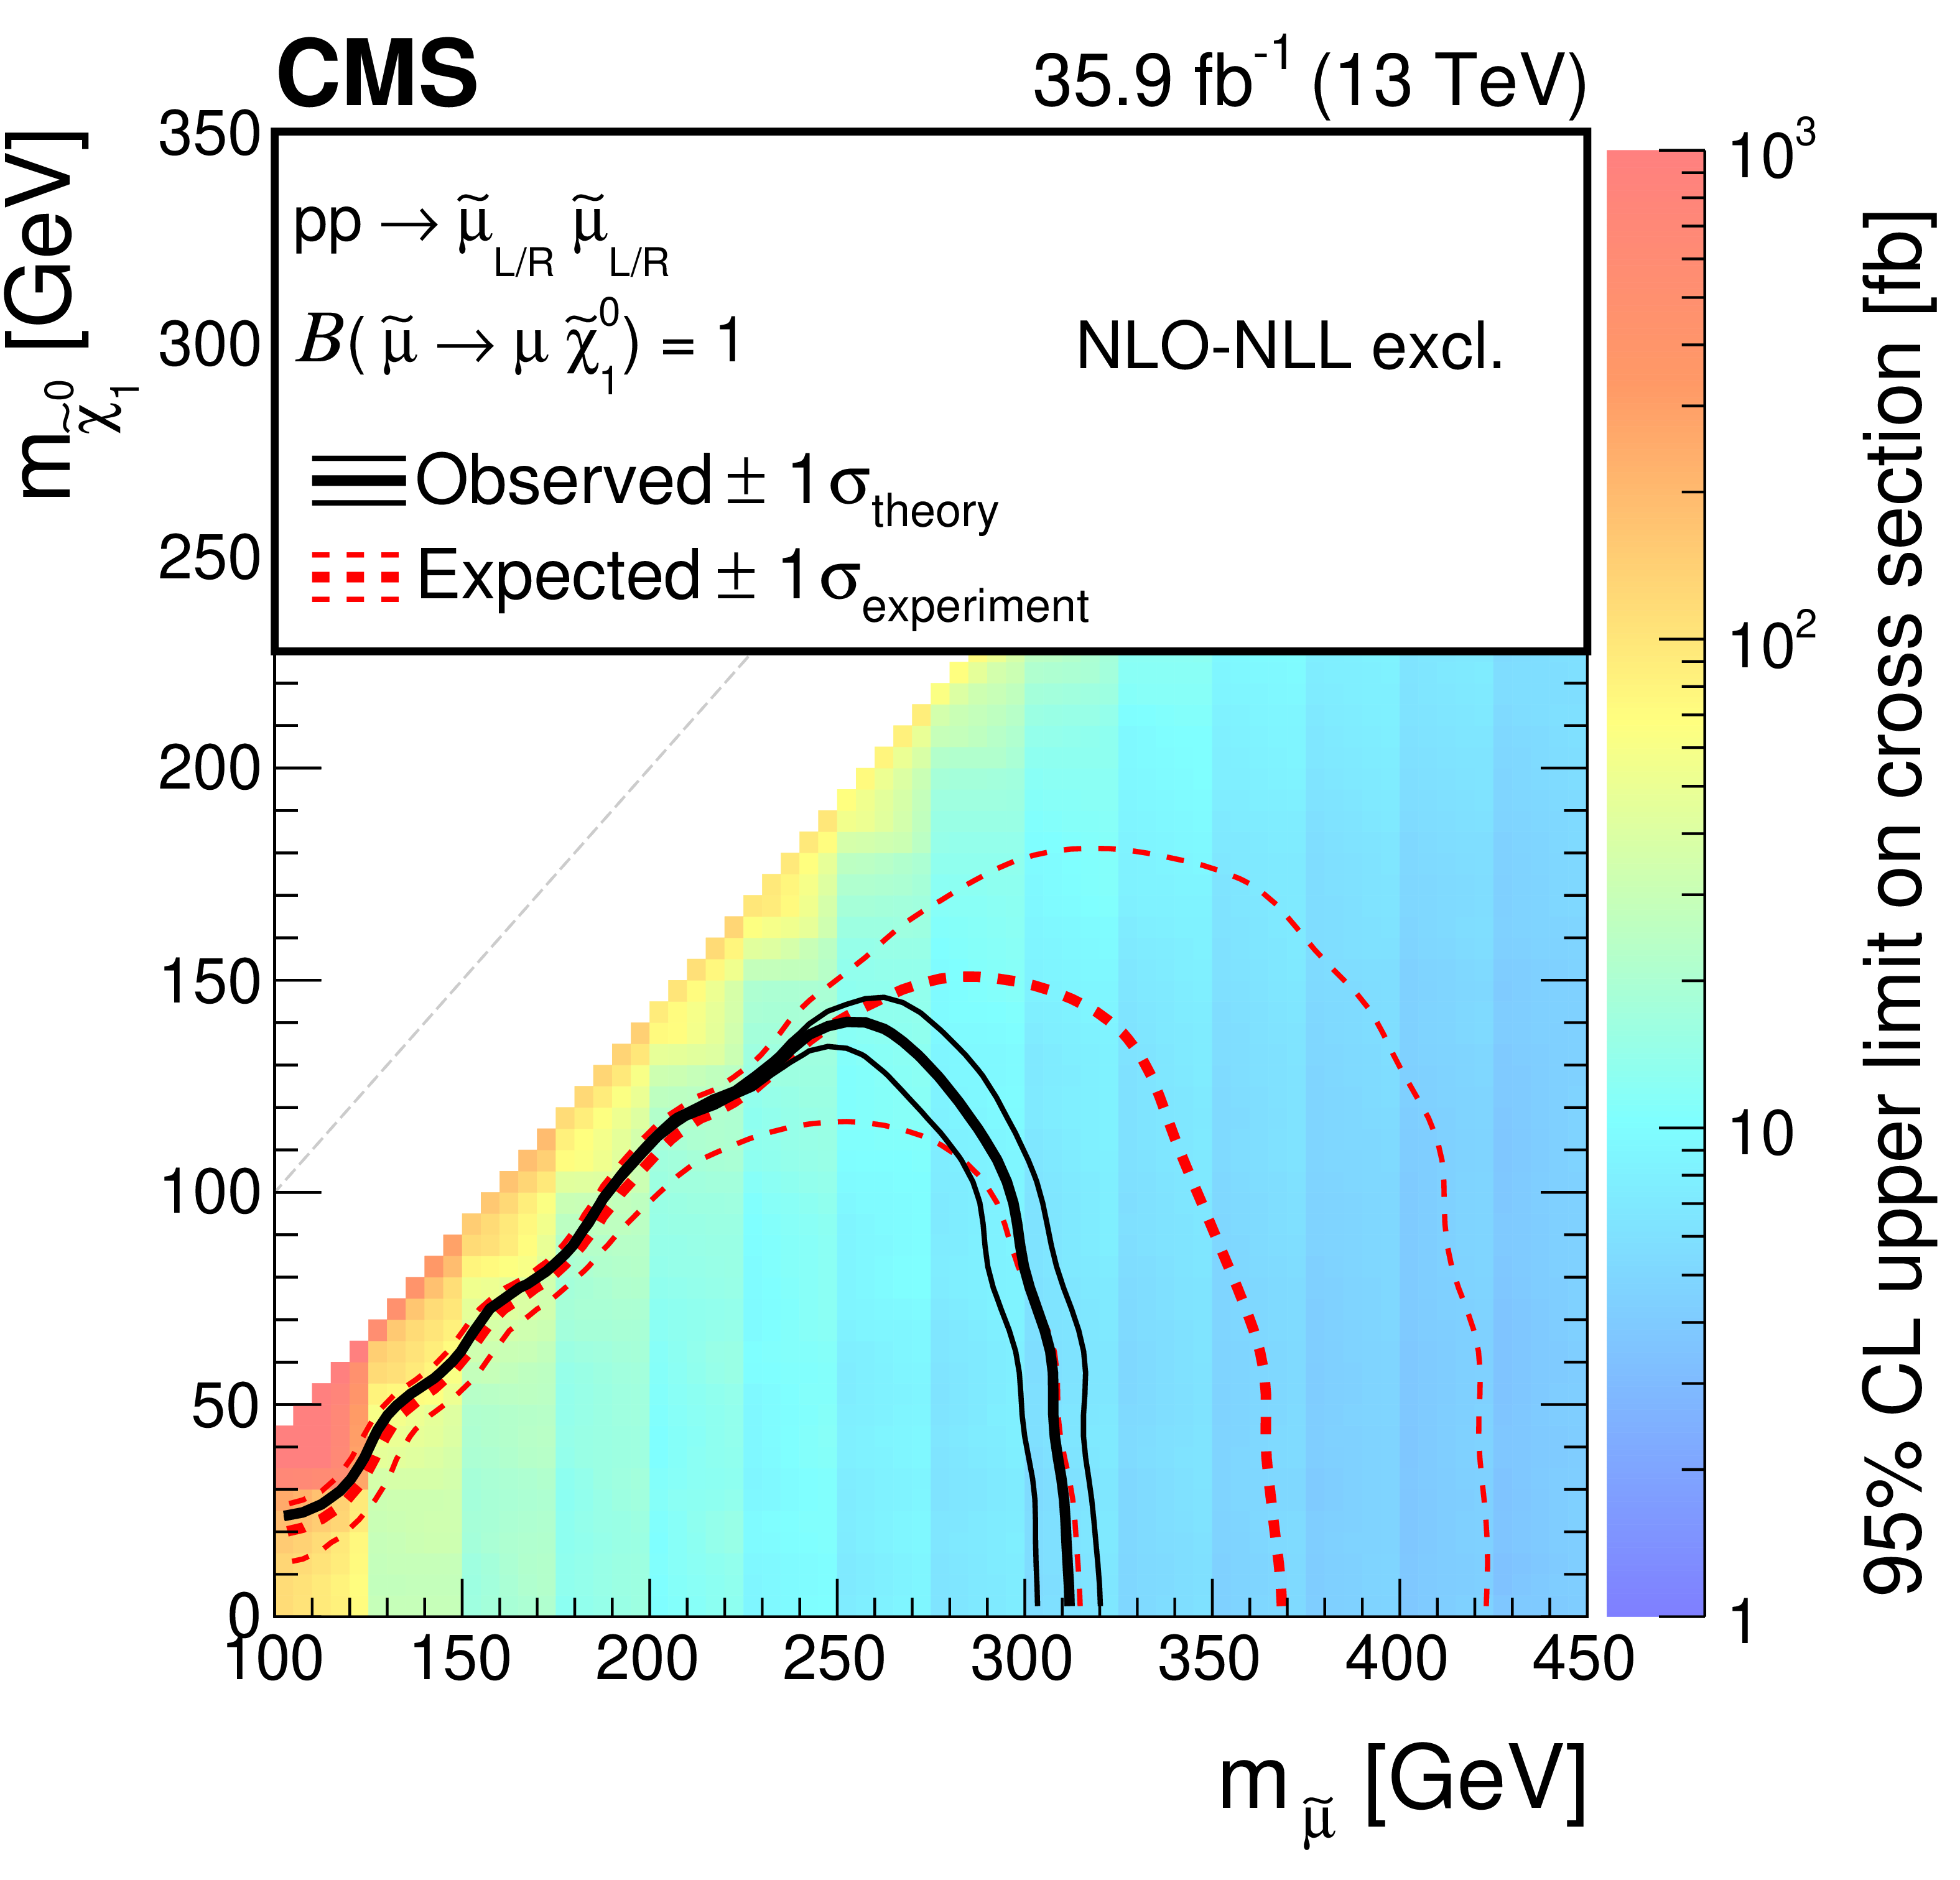
Cross section upper limit and exclusion contours at 95% CL for direct smuon production as a function of the ${\tilde{\chi}^{0}_{1}}$ and ${\tilde{\ell}}$ masses, assuming the production of both left- and right-handed smuons (upper), or production of only left- (lower left) or right-handed (lower right) smuons. The region under the thick red dotted (black solid) line is excluded by the expected (observed) limit. The thin red dotted curves indicate the regions containing 95% of the distribution of limits expected under the background-only hypothesis. For the right-handed smuons, only the $+1\sigma $ expected line (thin red dotted curve) is shown as no exclusion can be made at $-1\sigma $. The thin solid black curves show the change in the observed limit due to variation of the signal cross sections within their theoretical uncertainties. |
png pdf root |
Figure 7-a:
Cross section upper limit and exclusion contours at 95% CL for direct smuon production as a function of the ${\tilde{\chi}^{0}_{1}}$ and ${\tilde{\ell}}$ masses, assuming the production of both left- and right-handed smuons. The region under the thick red dotted (black solid) line is excluded by the expected (observed) limit. The thin red dotted curves indicate the regions containing 95% of the distribution of limits expected under the background-only hypothesis. For the right-handed smuons, only the $+1\sigma $ expected line (thin red dotted curve) is shown as no exclusion can be made at $-1\sigma $. The thin solid black curves show the change in the observed limit due to variation of the signal cross sections within their theoretical uncertainties. |
png pdf root |
Figure 7-b:
Cross section upper limit and exclusion contours at 95% CL for direct smuon production as a function of the ${\tilde{\chi}^{0}_{1}}$ and ${\tilde{\ell}}$ masses, assuming the production of left-handed smuons. The region under the thick red dotted (black solid) line is excluded by the expected (observed) limit. The thin red dotted curves indicate the regions containing 95% of the distribution of limits expected under the background-only hypothesis. For the right-handed smuons, only the $+1\sigma $ expected line (thin red dotted curve) is shown as no exclusion can be made at $-1\sigma $. The thin solid black curves show the change in the observed limit due to variation of the signal cross sections within their theoretical uncertainties. |

png pdf root |
Figure 7-c:
Cross section upper limit and exclusion contours at 95% CL for direct smuon production as a function of the ${\tilde{\chi}^{0}_{1}}$ and ${\tilde{\ell}}$ masses, assuming the production of right-handed smuons. The region under the thick red dotted (black solid) line is excluded by the expected (observed) limit. The thin red dotted curves indicate the regions containing 95% of the distribution of limits expected under the background-only hypothesis. For the right-handed smuons, only the $+1\sigma $ expected line (thin red dotted curve) is shown as no exclusion can be made at $-1\sigma $. The thin solid black curves show the change in the observed limit due to variation of the signal cross sections within their theoretical uncertainties. |
| Tables | |

png pdf |
Table 1:
The predicted SM background contributions, their sum and the observed number of SF events in data. The yields expected for several signal scenarios are provided as a reference. The uncertainties associated with the background yields stem from statistical and systematic sources. The last bin is inclusive above 300 GeV. |

png pdf |
Table 2:
The predicted SM background contributions, their sum and the observed number of dielectron (upper) and dimuon (lower) events in data. The uncertainties associated with the yields stem from statistical and systematic sources. The last bin is inclusive above 300 GeV. |

png pdf |
Table 3:
List of systematic uncertainties taken into account for the signal yields. |
| Summary |
| A search for direct slepton (selectron or smuon) production, in events with opposite-charge, same-flavour leptons, no jets, and missing transverse momentum has been presented. The data comprise a sample of proton-proton collisions collected with the CMS detector in 2016 at a centre-of-mass energy of 13 TeV, corresponding to an integrated luminosity of 35.9 fb$^{-1}$. Observations are in agreement with Standard Model expectations within the statistical and systematic uncertainties. Exclusion limits are provided assuming right-handed only, left-handed only and right-and left-handed two flavour slepton production scenarios (mass degenerate selectrons and smuons). Slepton masses up to 290, 400 and 450 GeV respectively are excluded at 95% confidence level, assuming a massless LSP. Exclusion limits are also provided assuming a massless LSP and right-handed only, left-handed only and right-and left-handed single flavour production scenarios, excluding selectron (smuon) masses up to 250, 310 and 350 GeV (210, 280 and 310 GeV), respectively. These results improve the previous exclusion limits measured by the CMS experiment at a centre-of-mass energy of 8 TeV by 100-150 GeV in slepton masses. |
| Additional Figures | |
png pdf |
Additional Figure 1:
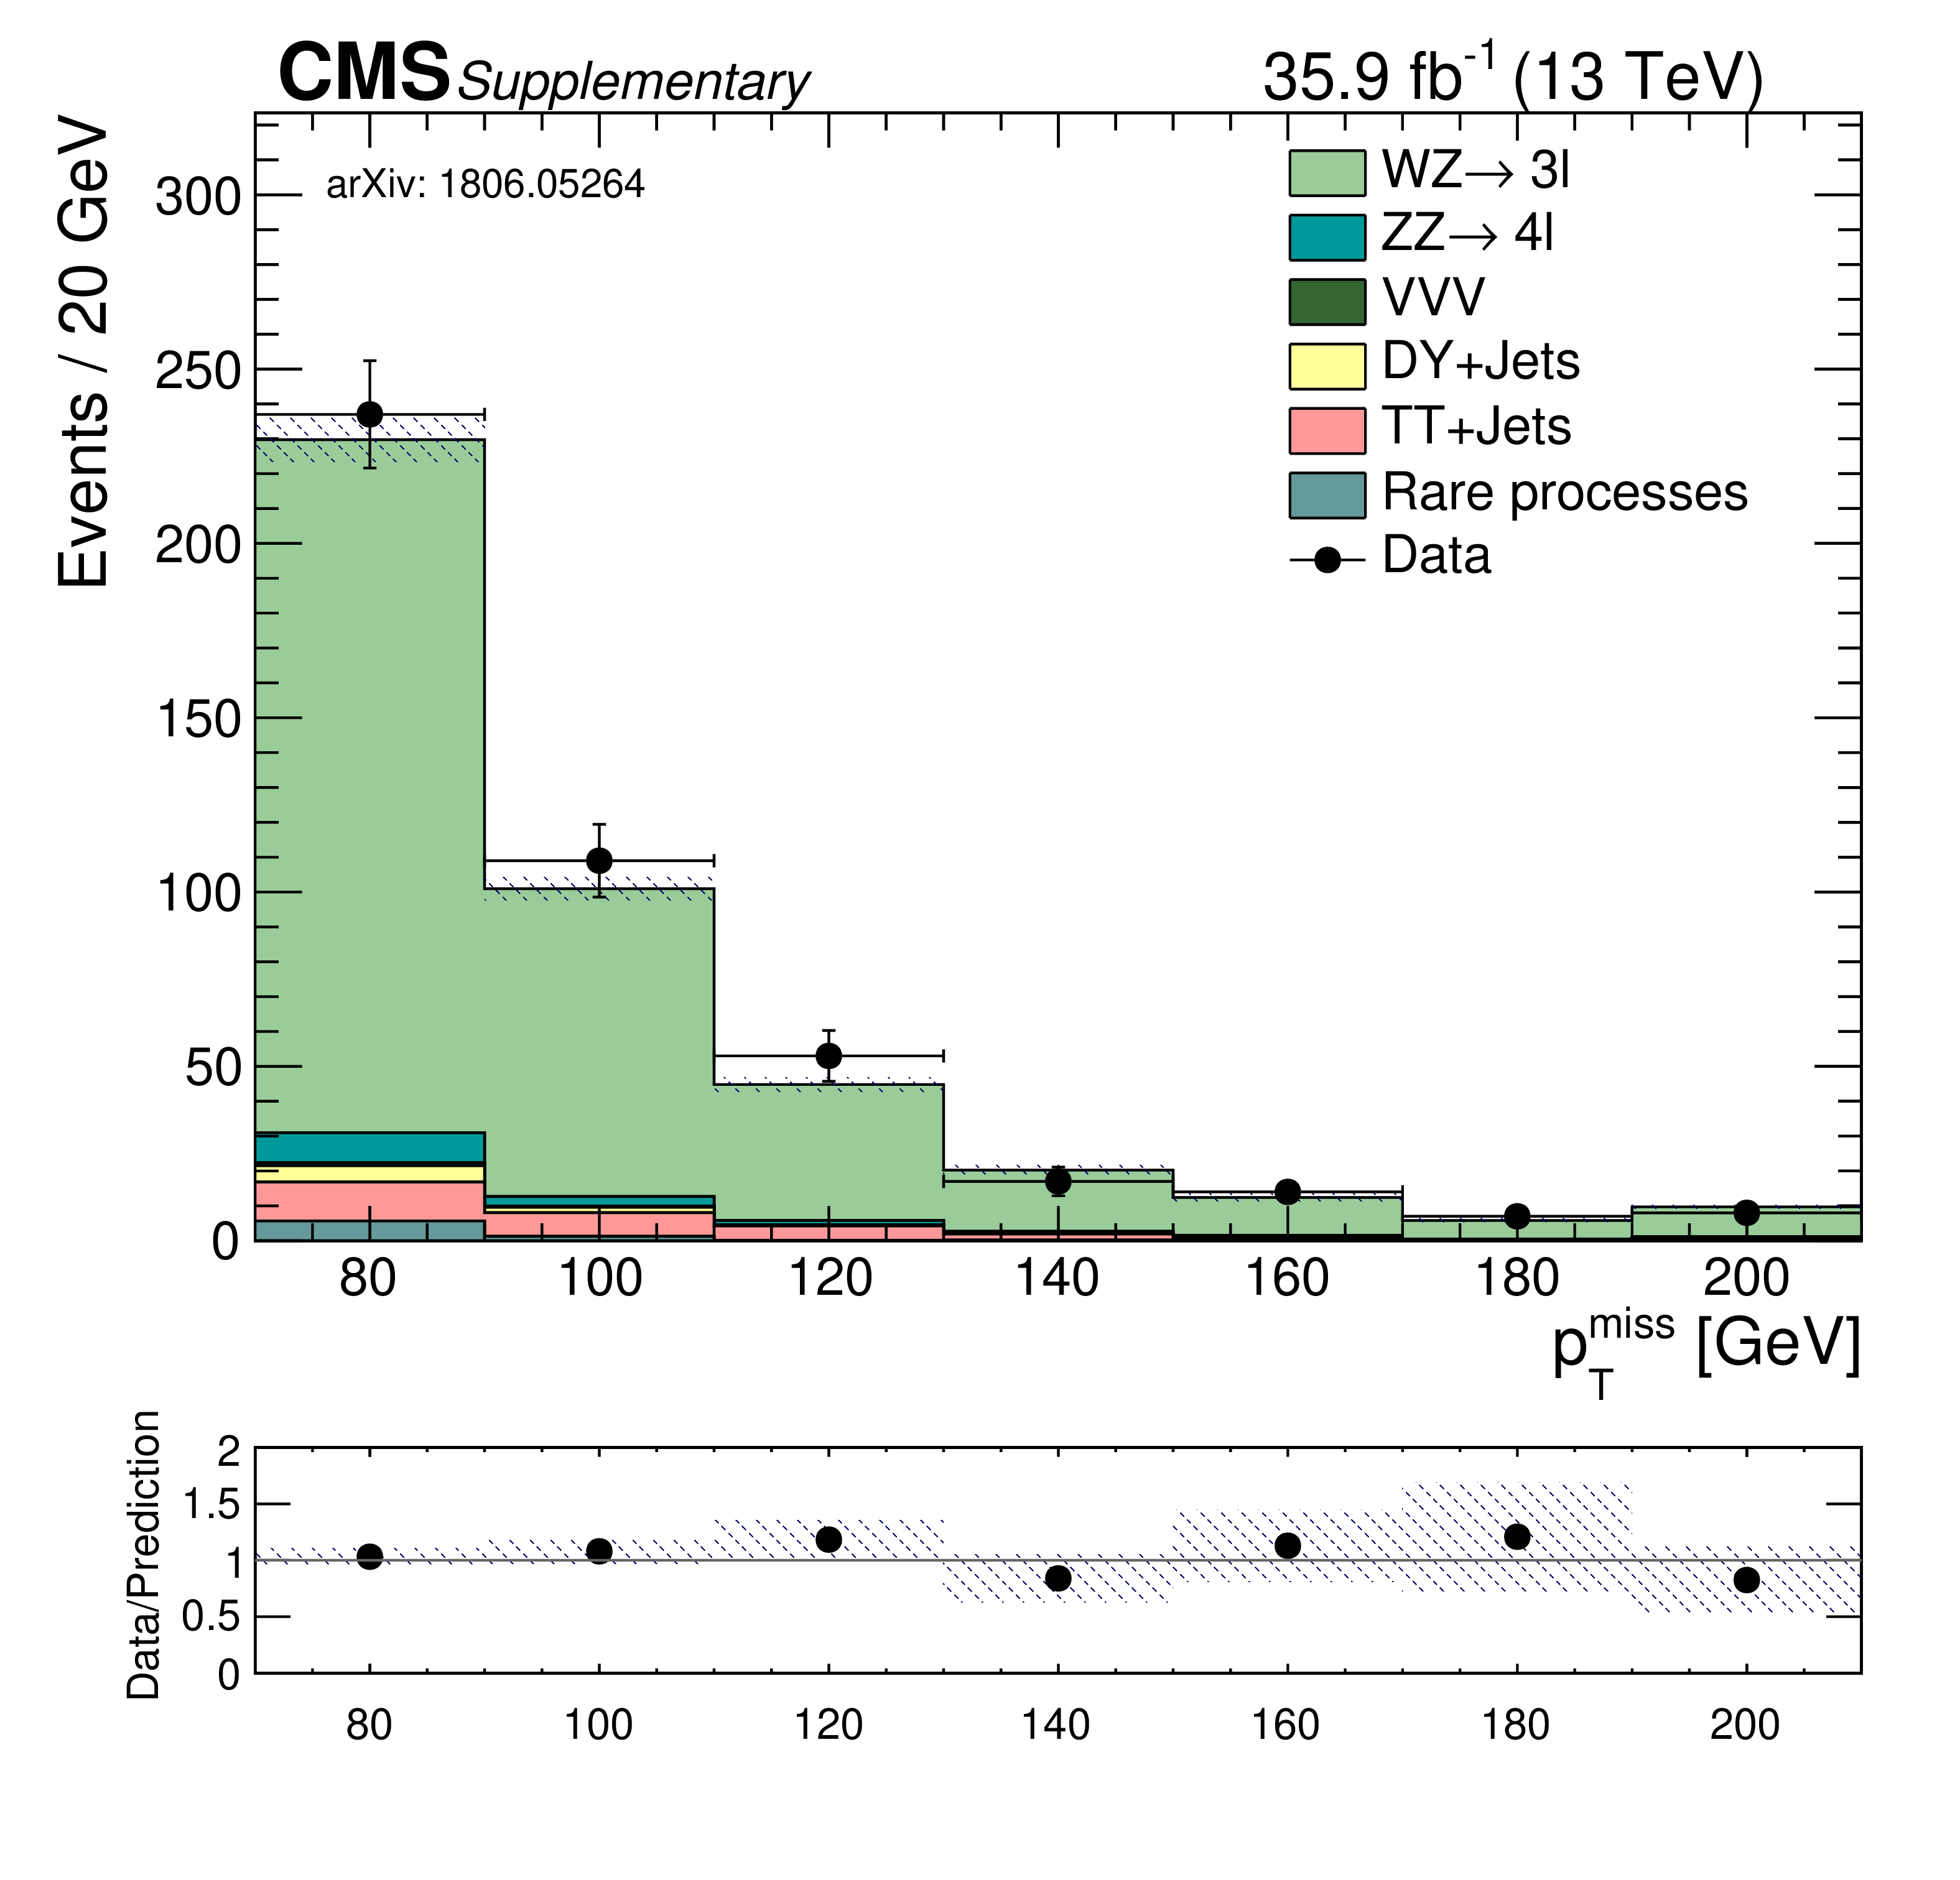
The ${{p_{\mathrm {T}}} ^\text {miss}}$ distributions in the WZ control region. The data are shown as black markers and the estimated SM backgrounds as stacked histograms. |

png pdf |
Additional Figure 2:
The invariant mass distribution in the ZZ control region constructed with the two leptons that have the invariant mass closest to the Z boson mass. The data are shown as black markers and the estimated SM backgrounds as stacked histograms. |

png pdf |
Additional Figure 3:
The covariance matrices for the background predictions in same-flavor signal region. |

png pdf |
Additional Figure 4:
The covariance matrices for the background predictions in dielectron signal region. |

png pdf |
Additional Figure 5:
The covariance matrices for the background predictions in dimuon signal region. |
| Additional Tables | |

png pdf |
Additional Table 1:
Cut flow table for the direct slepton production in the same flavor signal region, with a slepton mass of 400 GeV and LSP mass of 20 GeV. |

png pdf |
Additional Table 2:
Cut flow table for the direct selectron production in the dielectron signal region, with a selectron mass of 400 GeV and LSP mass of 20 GeV. |

png pdf |
Additional Table 3:
Cut flow table for the direct smuon production in the dimuon signal region, with a smuon mass of 400 GeV and LSP mass of 20 GeV. |
| References | ||||
| 1 | P. Ramond | Dual theory for free fermions | PRD 3 (1971) 2415 | |
| 2 | Y. A. Gol'fand and E. P. Likhtman | Extension of the algebra of Poincare group generators and violation of P invariance | JEPTL 13 (1971)323 | |
| 3 | A. Neveu and J. H. Schwarz | Factorizable dual model of pions | NPB 31 (1971) 86 | |
| 4 | D. V. Volkov and V. P. Akulov | Possible universal neutrino interaction | JEPTL 16 (1972)438 | |
| 5 | J. Wess and B. Zumino | A Lagrangian model invariant under supergauge transformations | PLB 49 (1974) 52 | |
| 6 | J. Wess and B. Zumino | Supergauge transformations in four dimensions | NPB 70 (1974) 39 | |
| 7 | P. Fayet | Supergauge invariant extension of the Higgs mechanism and a model for the electron and its neutrino | NPB 90 (1975) 104 | |
| 8 | H. P. Nilles | Supersymmetry, supergravity and particle physics | Phys. Rep. 110 (1984) 1 | |
| 9 | G. R. Farrar and P. Fayet | Phenomenology of the production, decay, and detection of new hadronic states associated with supersymmetry | PLB 76 (1978) 575 | |
| 10 | D. Alves et al. | Simplified models for LHC new physics searches | JPG 39 (2012) 105005 | 1105.2838 |
| 11 | CMS Collaboration | Interpretation of searches for supersymmetry with simplified models | PRD 88 (2013) 052017 | CMS-SUS-11-016 1301.2175 |
| 12 | ATLAS Collaboration | Search for direct production of charginos, neutralinos and sleptons in final states with two leptons and missing transverse momentum in $ pp $ collisions at $ \sqrt{s} = $ 8 TeV with the ATLAS detector | JHEP 05 (2014) 071 | 1403.5294 |
| 13 | CMS Collaboration | Searches for electroweak production of charginos, neutralinos, and sleptons decaying to leptons and W, Z, and Higgs bosons in pp collisions at 8 TeV | EPJC 74 (2014) 3036 | CMS-SUS-13-006 1405.7570 |
| 14 | ATLAS Collaboration | Search for electroweak production of supersymmetric particles in final states with two or three leptons at $ \sqrt{s}= $ 13 TeV with the ATLAS detector | 1803.02762 | |
| 15 | ATLAS Collaboration | Search for electroweak production of supersymmetric states in scenarios with compressed mass spectra at $ \sqrt{s}= $ 13 TeV with the ATLAS detector | PRD 97 (2018), no. 5, 052010 | 1712.08119 |
| 16 | CMS Collaboration | The CMS experiment at the CERN LHC | JINST 3 (2008) S08004 | CMS-00-001 |
| 17 | J. Alwall et al. | The automated computation of tree-level and next-to-leading order differential cross sections, and their matching to parton shower simulations | JHEP 07 (2014) 079 | 1405.0301 |
| 18 | M. Czakon and A. Mitov | Top++: A program for the calculation of the top-pair cross-section at hadron colliders | CPC 185 (2014) 2930 | 1112.5675 |
| 19 | M. Grazzini, S. Kallweit, D. Rathlev, and M. Wiesemann | $ \mathrm{W}^\pm\mathrm{Z} $ production at the LHC: fiducial cross sections and distributions in NNLO QCD | JHEP 05 (2017) 139 | 1703.09065 |
| 20 | F. Cascioli et al. | ZZ production at hadron colliders in NNLO QCD | PLB 735 (2014) 311 | 1405.2219 |
| 21 | F. Caola, K. Melnikov, R. Rontsch, and L. Tancredi | QCD corrections to ZZ production in gluon fusion at the LHC | PRD 92 (2015) 094028 | 1509.06734 |
| 22 | J. M. Campbell, R. K. Ellis, M. Czakon, and S. Kirchner | Two loop correction to interference in $ \mathrm{g}\mathrm{g} \to \mathrm{Z}\mathrm{Z} $ | JHEP 08 (2016) 011 | 1605.01380 |
| 23 | T. Binoth, G. Ossola, C. G. Papadopoulos, and R. Pittau | NLO QCD corrections to tri-boson production | JHEP 06 (2008) 082 | 0804.0350 |
| 24 | D. T. Nhung, L. D. Ninh, and M. M. Weber | NLO corrections to WWZ production at the LHC | JHEP 12 (2013) 096 | 1307.7403 |
| 25 | S. Yong-Bai et al. | NLO QCD + NLO EW corrections to WZZ productions with leptonic decays at the LHC | JHEP 10 (2015) 186 | 1507.03693 |
| 26 | W. Hong et al. | NLO QCD+EW corrections to ZZZ production with subsequent leptonic decays at the LHC | JPG 43 (2016) 115001 | 1610.05876 |
| 27 | S. Yong-Bai et al. | NLO QCD and electroweak corrections to WWW production at the LHC | PRD 95 (2017) 073005 | 1605.00554 |
| 28 | S. Dittmaier, A. Huss, and G. Knippen | Next-to-leading-order QCD and electroweak corrections to WWW production at proton-proton colliders | JHEP 09 (2017) 034 | 1705.03722 |
| 29 | W. Beenakker et al. | Production of charginos, neutralinos, and sleptons at hadron colliders | PRL 83 (Nov, 1999) 3780--3783 | |
| 30 | B. Fuks, M. Klasen, D. R. Lamprea, and M. Rothering | Gaugino production in proton-proton collisions at a center-of-mass energy of 8 TeV | JHEP 10 (2012) 081 | 1207.2159 |
| 31 | B. Fuks, M. Klasen, D. R. Lamprea, and M. Rothering | Precision predictions for electroweak superpartner production at hadron colliders with Resummino | EPJC 73 (2013) 2480 | 1304.0790 |
| 32 | J. M. Campbell and R. K. Ellis | MCFM for the Tevatron and the LHC | NPPS 205 (2010) 10 | 1007.3492 |
| 33 | T. Melia, P. Nason, R. Rontsch, and G. Zanderighi | $ \mathrm{W}^+ \mathrm{W}^- $, $ \mathrm{W} \mathrm{Z} $ and $ \mathrm{Z} \mathrm{Z} $ production in the POWHEG BOX | JHEP 11 (2011) 078 | 1107.5051 |
| 34 | P. Nason and G. Zanderighi | $ \mathrm{W}^+ \mathrm{W}^- $, $ \mathrm{W} \mathrm{Z} $ and $ \mathrm{Z} \mathrm{Z} $ production in the POWHEG-BOX-V2 | EPJC 74 (2014) 2702 | 1311.1365 |
| 35 | J. M. Campbell, R. K. Ellis, P. Nason, and E. Re | Top-pair production and decay at NLO matched with parton showers | JHEP 04 (2015) 114 | 1412.1828 |
| 36 | E. Re | Single-top Wt-channel production matched with parton showers using the POWHEG method | EPJC 71 (2011) 1547 | 1009.2450 |
| 37 | NNPDF Collaboration | Parton distributions for the LHC Run II | JHEP 04 (2015) 040 | 1410.8849 |
| 38 | T. Sjostrand, S. Mrenna, and P. Z. Skands | A Brief Introduction to PYTHIA 8.1 | CPC 178 (2008) 852 | 0710.3820 |
| 39 | P. Skands, S. Carrazza, and J. Rojo | Tuning PYTHIA 8.1: the Monash 2013 tune | EPJC 74 (2014) 3024 | 1404.5630 |
| 40 | CMS Collaboration | Event generator tunes obtained from underlying event and multiparton scattering measurements | EPJC 76 (2016) 155 | CMS-GEN-14-001 1512.00815 |
| 41 | J. Alwall et al. | Comparative study of various algorithms for the merging of parton showers and matrix elements in hadronic collisions | EPJC 53 (2008) 473 | 0706.2569 |
| 42 | R. Frederix and S. Frixione | Merging meets matching in MC@NLO | JHEP 12 (2012) 061 | 1209.6215 |
| 43 | GEANT4 Collaboration | GEANT4 --- a simulation toolkit | NIMA 506 (2003) 250 | |
| 44 | S. Abdullin et al. | The fast simulation of the CMS detector at LHC | J. Phys. Conf. Ser. 331 (2011) 032049 | |
| 45 | CMS Collaboration | Particle-flow reconstruction and global event description with the CMS detector | JINST 12 (2017) P10003 | CMS-PRF-14-001 1706.04965 |
| 46 | M. Cacciari, G. P. Salam, and G. Soyez | The anti-$ {k_{\mathrm{T}}} $ jet clustering algorithm | JHEP 04 (2008) 063 | 0802.1189 |
| 47 | M. Cacciari, G. P. Salam, and G. Soyez | FastJet user manual | EPJC 72 (2012) 1896 | 1111.6097 |
| 48 | CMS Collaboration | Performance of electron reconstruction and selection with the CMS detector in proton-proton collisions at $ \sqrt{s} = $ 8 TeV | JINST 10 (2015) P06005 | CMS-EGM-13-001 1502.02701 |
| 49 | CMS Collaboration | Performance of the CMS muon detector and muon reconstruction with proton-proton collisions at $ \sqrt{s}= $ 13 TeV | JINST 13 (2018), no. 06, P06015 | CMS-MUO-16-001 1804.04528 |
| 50 | K. Rehermann and B. Tweedie | Efficient identification of boosted semileptonic top quarks at the LHC | JHEP 03 (2011) 059 | 1007.2221 |
| 51 | M. Cacciari and G. P. Salam | Dispelling the N$ ^3 $ myth for the $ k_t $ jet-finder | PLB 641 (2006) 57 | hep-ph/0512210 |
| 52 | CMS Collaboration | Determination of jet energy calibration and transverse momentum resolution in CMS | JINST 6 (2011) P11002 | CMS-JME-10-011 1107.4277 |
| 53 | M. Cacciari and G. P. Salam | Pileup subtraction using jet areas | PLB 659 (2008) 119 | 0707.1378 |
| 54 | C. G. Lester and D. J. Summers | Measuring masses of semi-invisibly decaying particle pairs produced at hadron colliders | PLB 463 (1999) 99 | hep-ph/9906349 |
| 55 | A. Barr, C. Lester, and P. Stephens | A variable for measuring masses at hadron colliders when missing energy is expected; $ m_{T2} $: the truth behind the glamour | JPG 29 (2003) 2343 | hep-ph/0304226 |
| 56 | CMS Collaboration | Search for new phenomena in final states with two opposite-charge, same-flavor leptons, jets, and missing transverse momentum in pp collisions at $ \sqrt{s} = $ 13 TeV | Submitted to JHEP | CMS-SUS-16-034 1709.08908 |
| 57 | A. Bierweiler, T. Kasprzik, and J. H. Kuhn | Vector-boson pair production at the LHC to $ \mathcal{O}(\alpha^3) $ accuracy | JHEP 12 (2013) 071 | 1305.5402 |
| 58 | S. Gieseke, T. Kasprzik, and J. H. Kuhn | Vector-boson pair production and electroweak corrections in HERWIG++ | EPJC 74 (2014) 2988 | 1401.3964 |
| 59 | J. Baglio, L. D. Ninh, and M. M. Weber | Massive gauge boson pair production at the LHC: A next-to-leading order story | PRD 88 (2013) 113005 | 1307.4331 |
| 60 | T. Junk | Confidence level computation for combining searches with small statistics | NIMA 434 (1999) 435 | hep-ex/9902006 |
| 61 | A. L. Read | Presentation of search results: the CL$ _\text{s} $ technique | JPG 28 (2002) 2693 | |
| 62 | ATLAS and CMS Collaborations | Procedure for the LHC Higgs boson search combination in summer 2011 | CMS-NOTE-2011-005 | |
| 63 | G. Cowan, K. Cranmer, E. Gross, and O. Vitells | Asymptotic formulae for likelihood-based tests of new physics | EPJC 71 (2011) 1554 | 1007.1727 |
| 64 | CMS Collaboration | CMS Luminosity Measurements for the 2016 Data Taking Period | CMS-PAS-LUM-17-001 | CMS-PAS-LUM-17-001 |
| 65 | CMS Collaboration | Measurement of the inelastic proton-proton cross section at $ \sqrt{s}= $ 13 TeV | JHEP 07 (2018) 161 | CMS-FSQ-15-005 1802.02613 |
| 66 | A. Kalogeropoulos and J. Alwall | The SysCalc code: A tool to derive theoretical systematic uncertainties | 1801.08401 | |
| 67 | I. W. Stewart and F. J. Tackmann | Theory uncertainties for Higgs mass and other searches using jet bins | PRD 85 (2012) 034011 | 1107.2117 |
|
|
Compact Muon Solenoid LHC, CERN |
|

|

|

|

|

|