

Compact Muon Solenoid
LHC, CERN
| CMS-TOP-12-030 ; CERN-EP-2016-062 | ||
| Measurement of the top quark mass using charged particles in pp collisions at $ \sqrt{s} = $ 8 TeV | ||
| CMS Collaboration | ||
| 21 March 2016 | ||
| Phys. Rev. D 93 (2016) 092006 | ||
| Abstract: A novel technique for measuring the mass of the top quark that uses only the kinematic properties of its charged decay products is presented. Top quark pair events with final states with one or two charged leptons and hadronic jets are selected from the data set of 8 TeV proton-proton collisions, corresponding to an integrated luminosity of 19.7 fb$^{-1}$. By reconstructing secondary vertices inside the selected jets and computing the invariant mass of the system formed by the secondary vertex and an isolated lepton, an observable is constructed that is sensitive to the top quark mass that is expected to be robust against the energy scale of hadronic jets. The main theoretical systematic uncertainties, concerning the modeling of the fragmentation and hadronization of b quarks and the reconstruction of secondary vertices from the decays of b hadrons, are studied. A top quark mass of 173.68 $\pm$ 0.20 (stat) $^{+1.58}_{-0.97}$ (syst) GeV is measured. The overall systematic uncertainty is dominated by the uncertainty in the b quark fragmentation and the modeling of kinematic properties of the top quark. | ||
| Links: e-print arXiv:1603.06536 [hep-ex] (PDF) ; CDS record ; inSPIRE record ; HepData record ; CADI line (restricted) ; | ||
| Figures | |
png pdf |
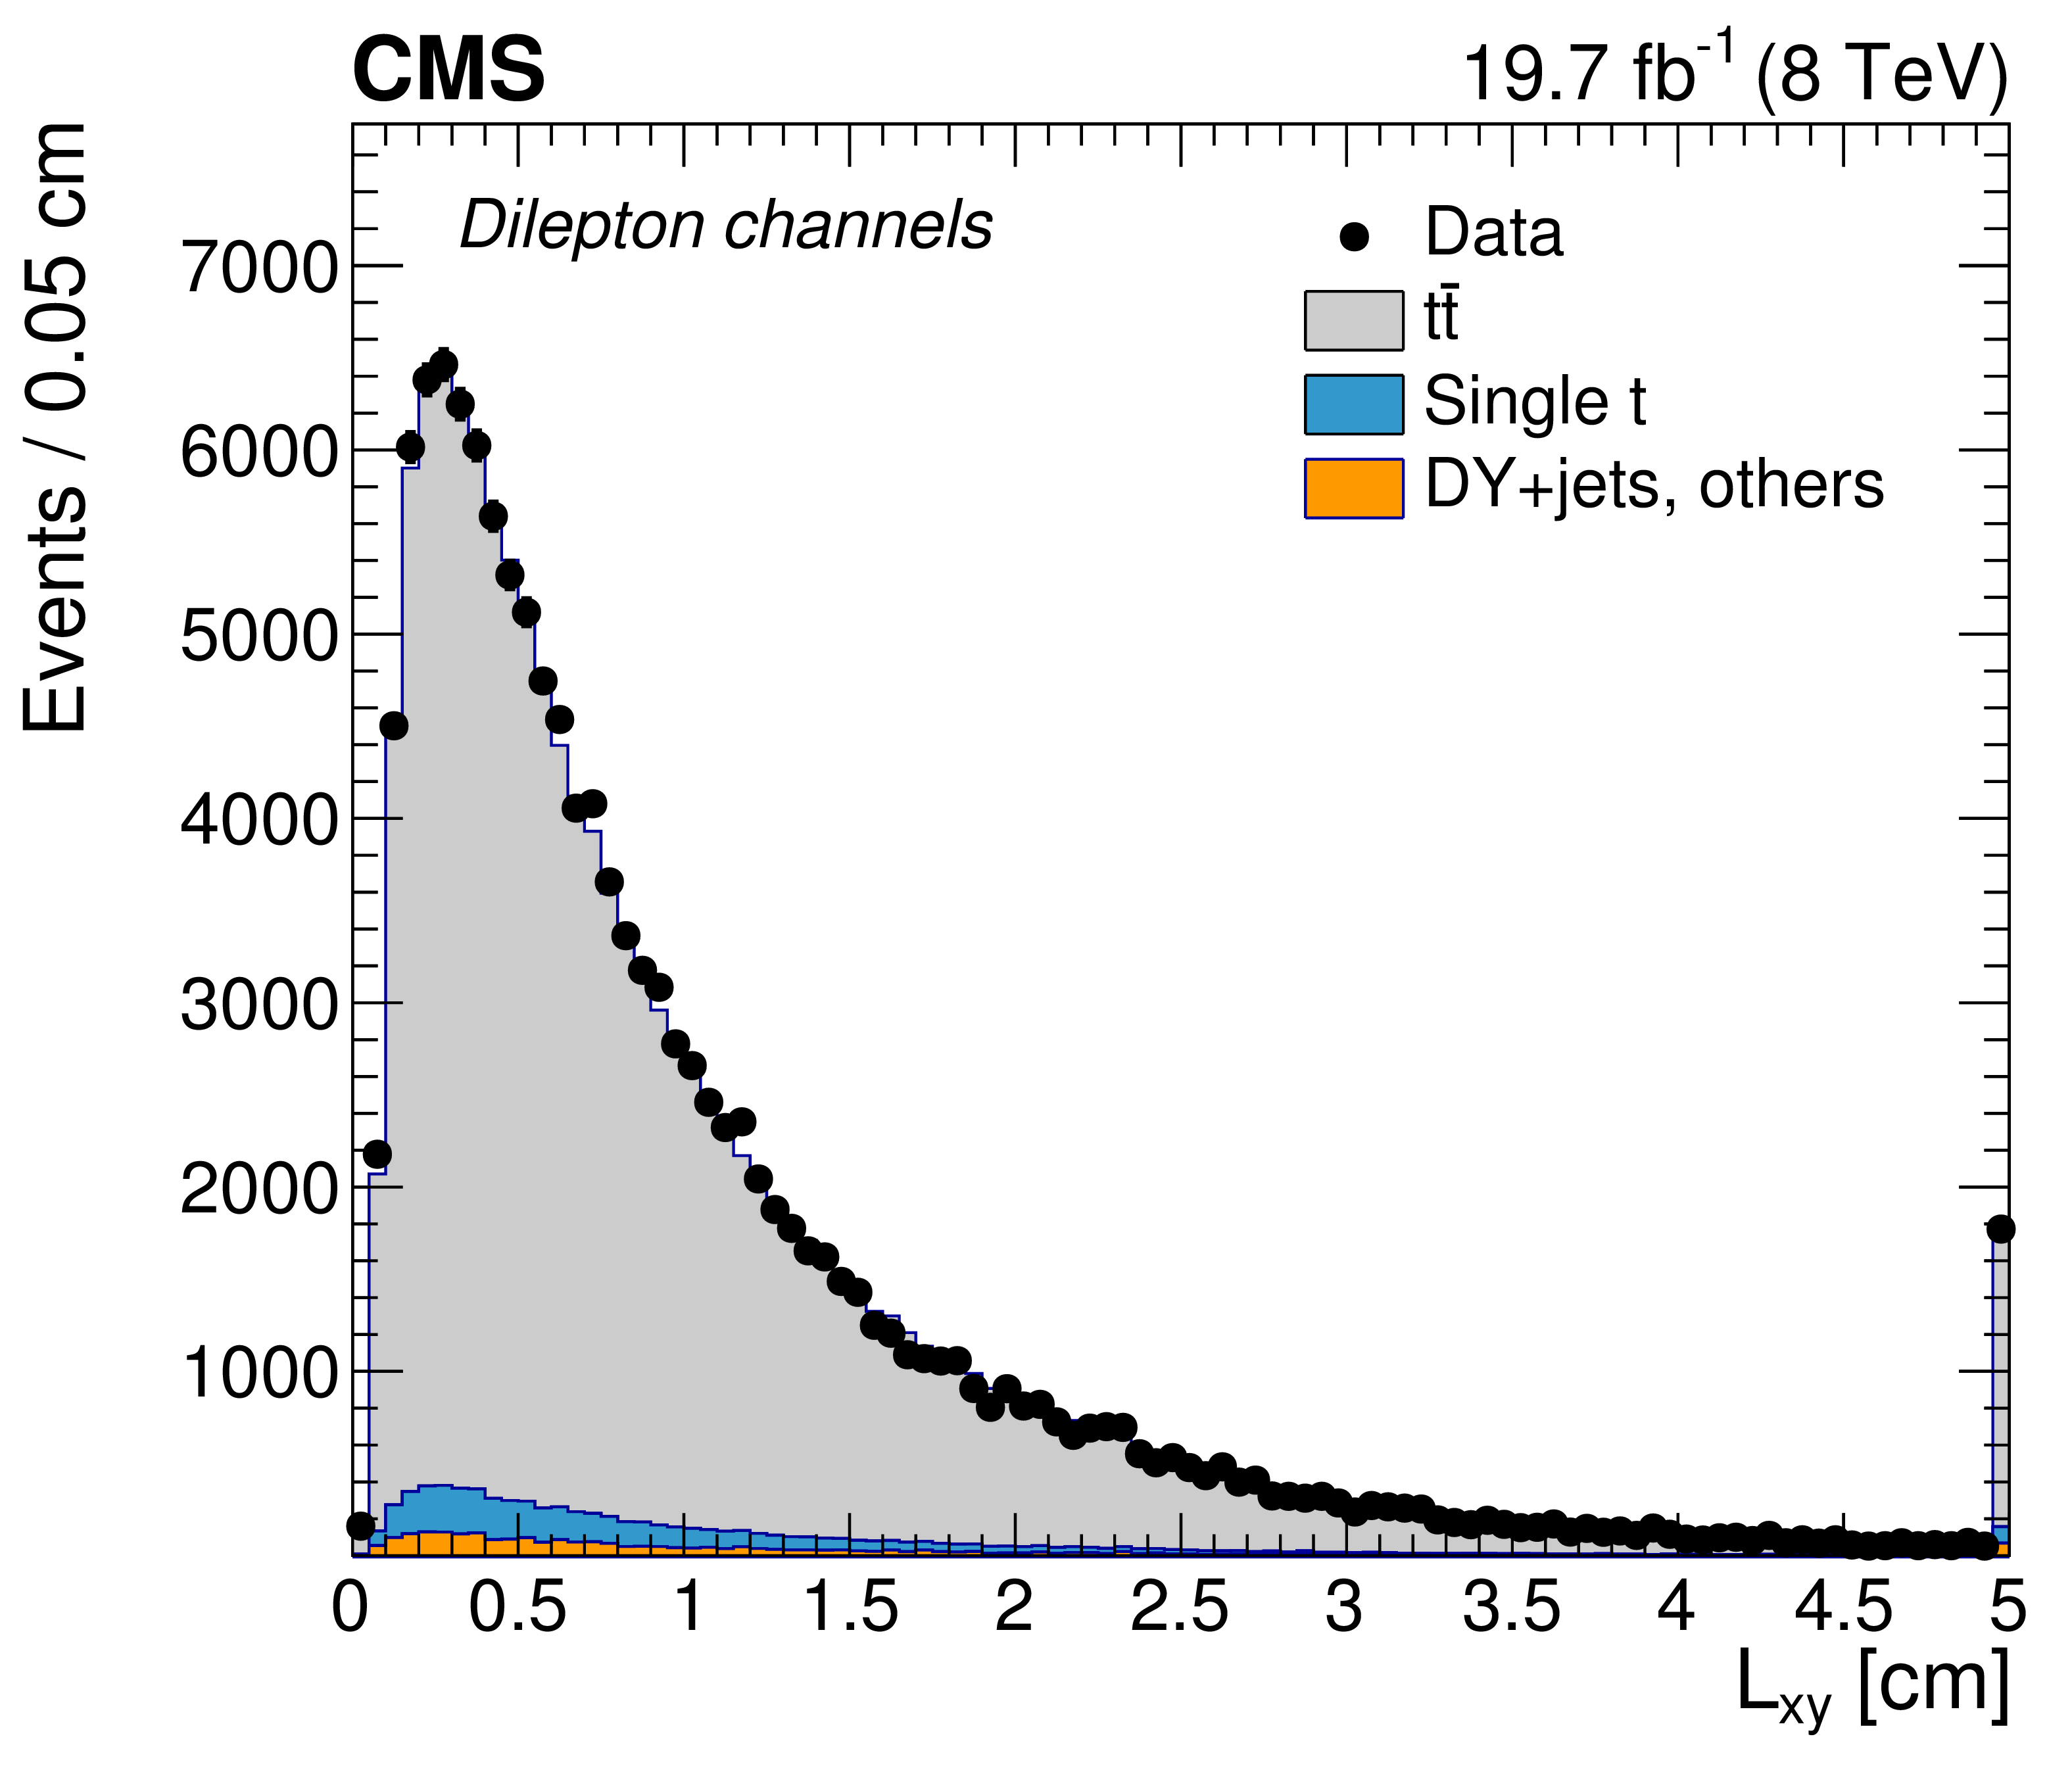
Figure 1-a:
Distributions of the transverse decay length of secondary vertices with respect to the primary vertex in dilepton (a) and semileptonic channels (b). The expectations from simulation and estimates from the data for the multijet background are compared to the reconstructed data. The last bin contains the overflow events. |
png pdf |
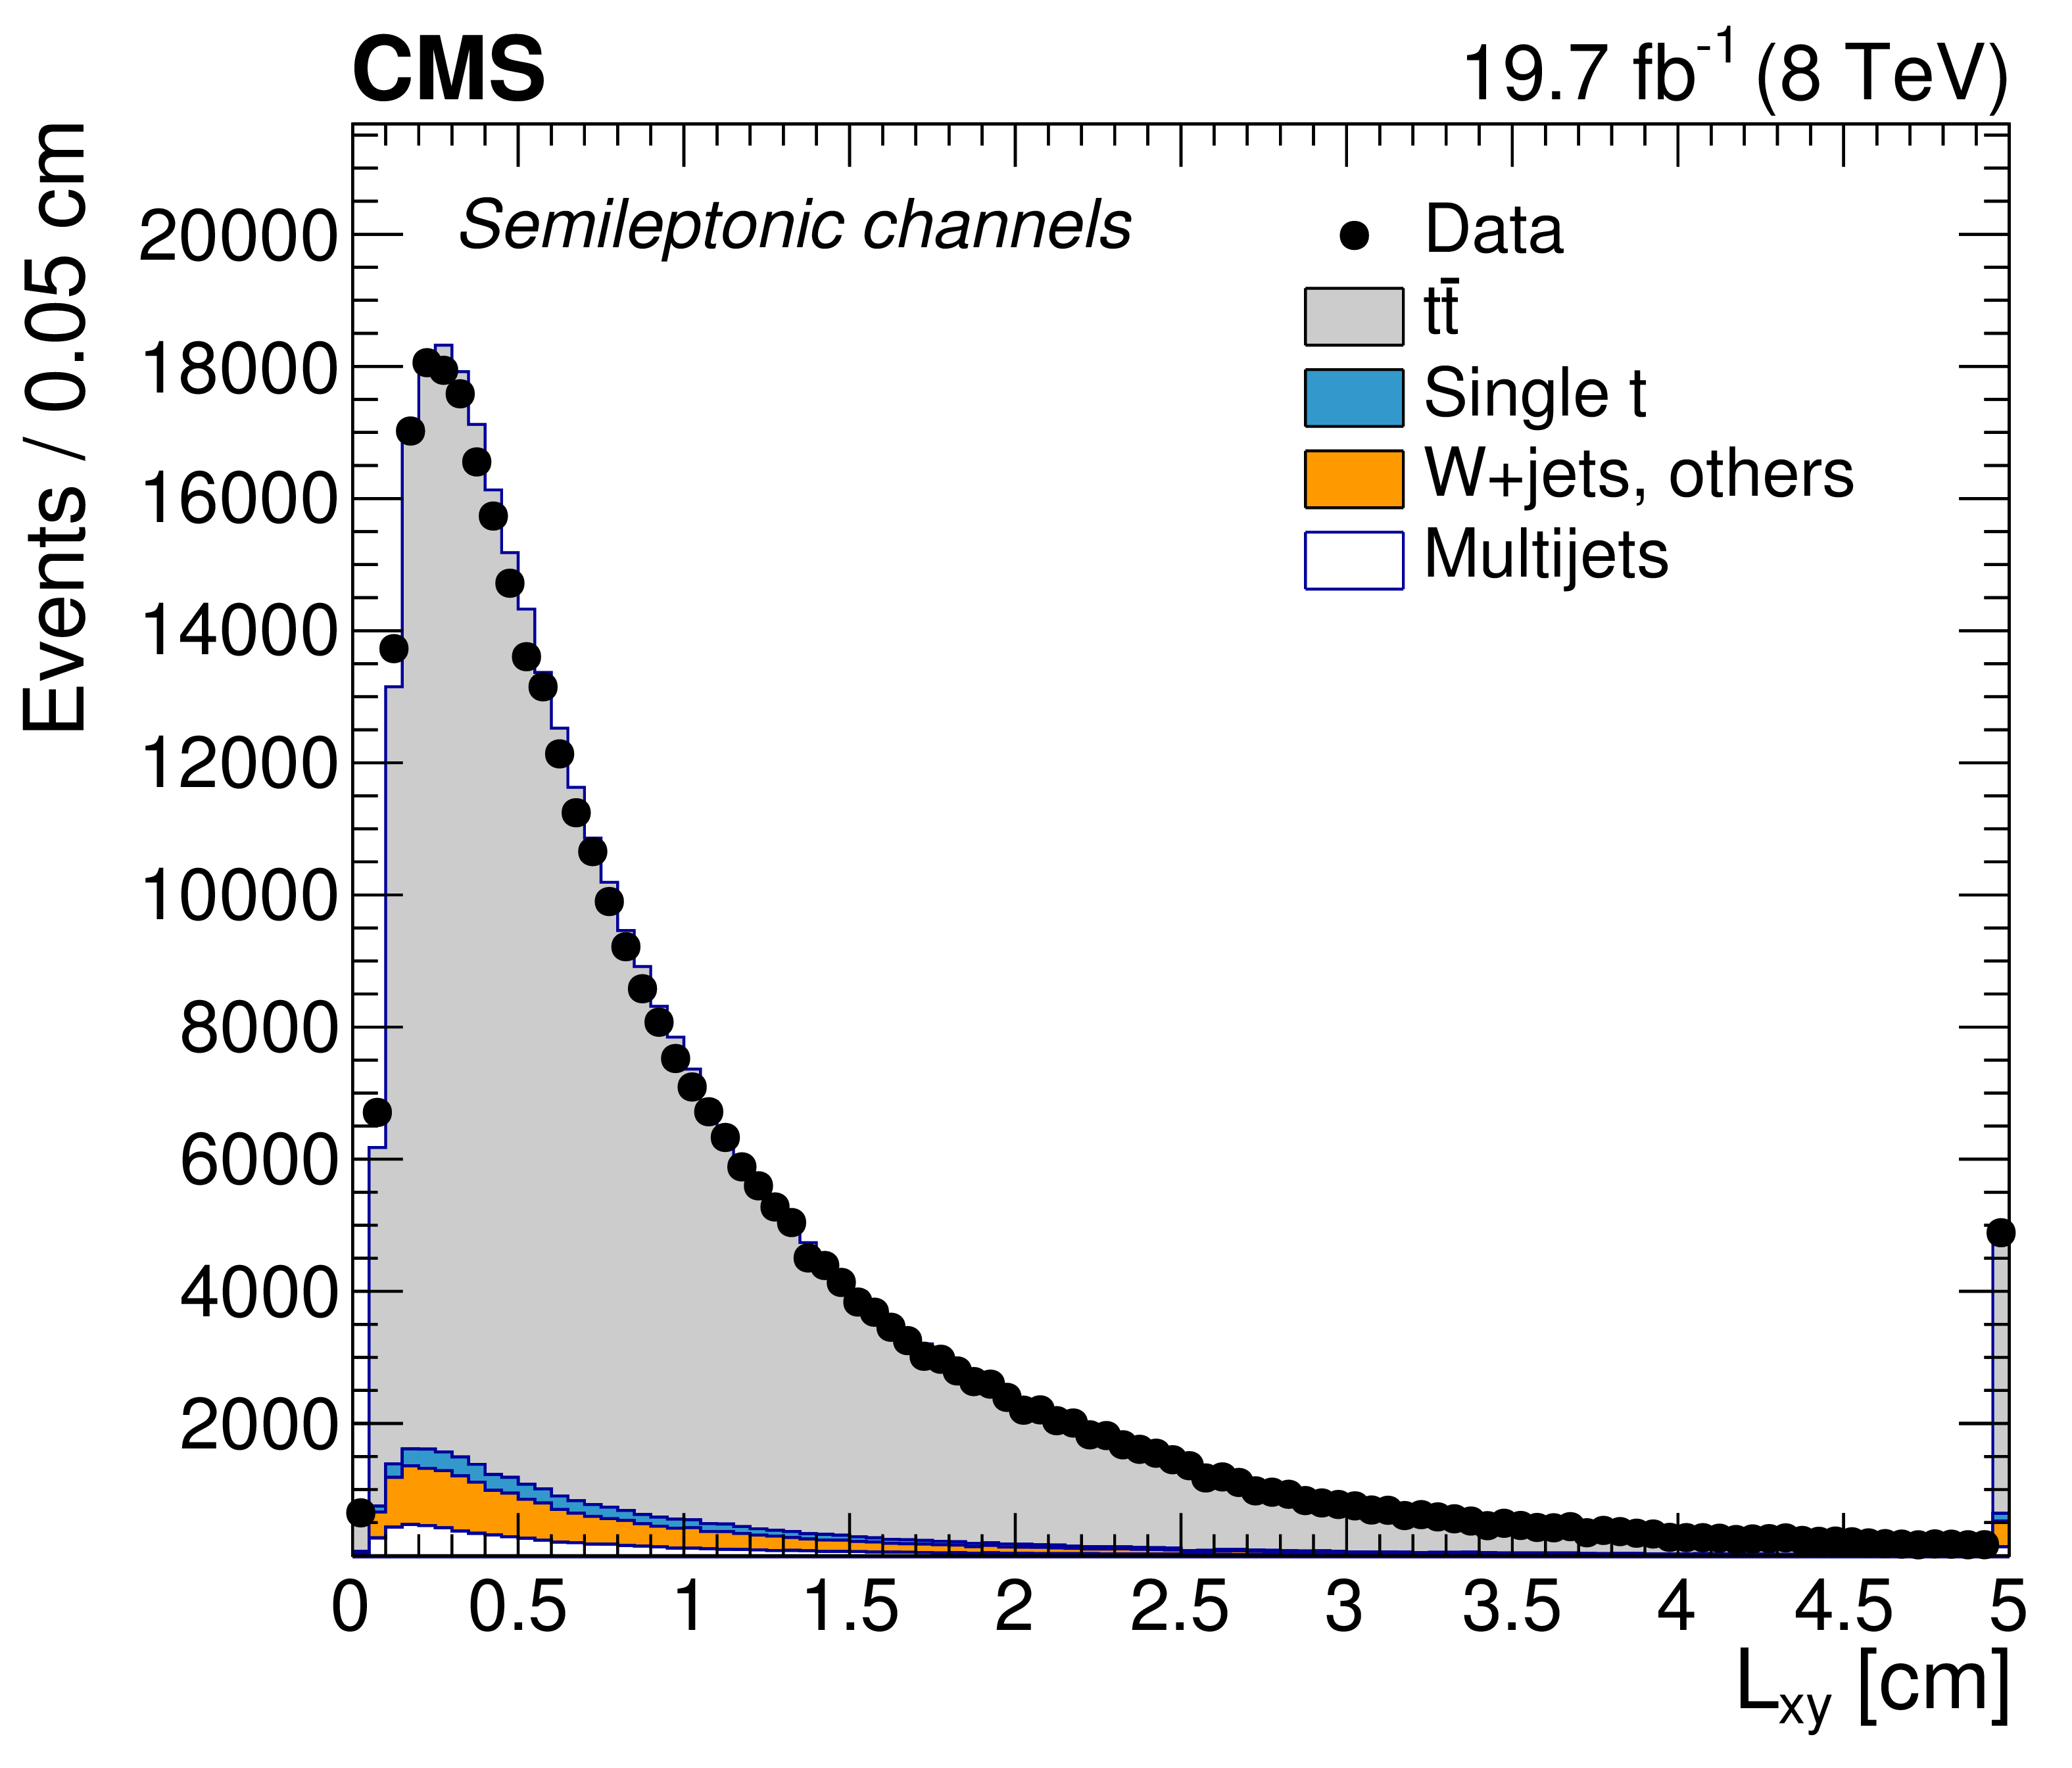
Figure 1-b:
Distributions of the transverse decay length of secondary vertices with respect to the primary vertex in dilepton (a) and semileptonic channels (b). The expectations from simulation and estimates from the data for the multijet background are compared to the reconstructed data. The last bin contains the overflow events. |

png pdf |
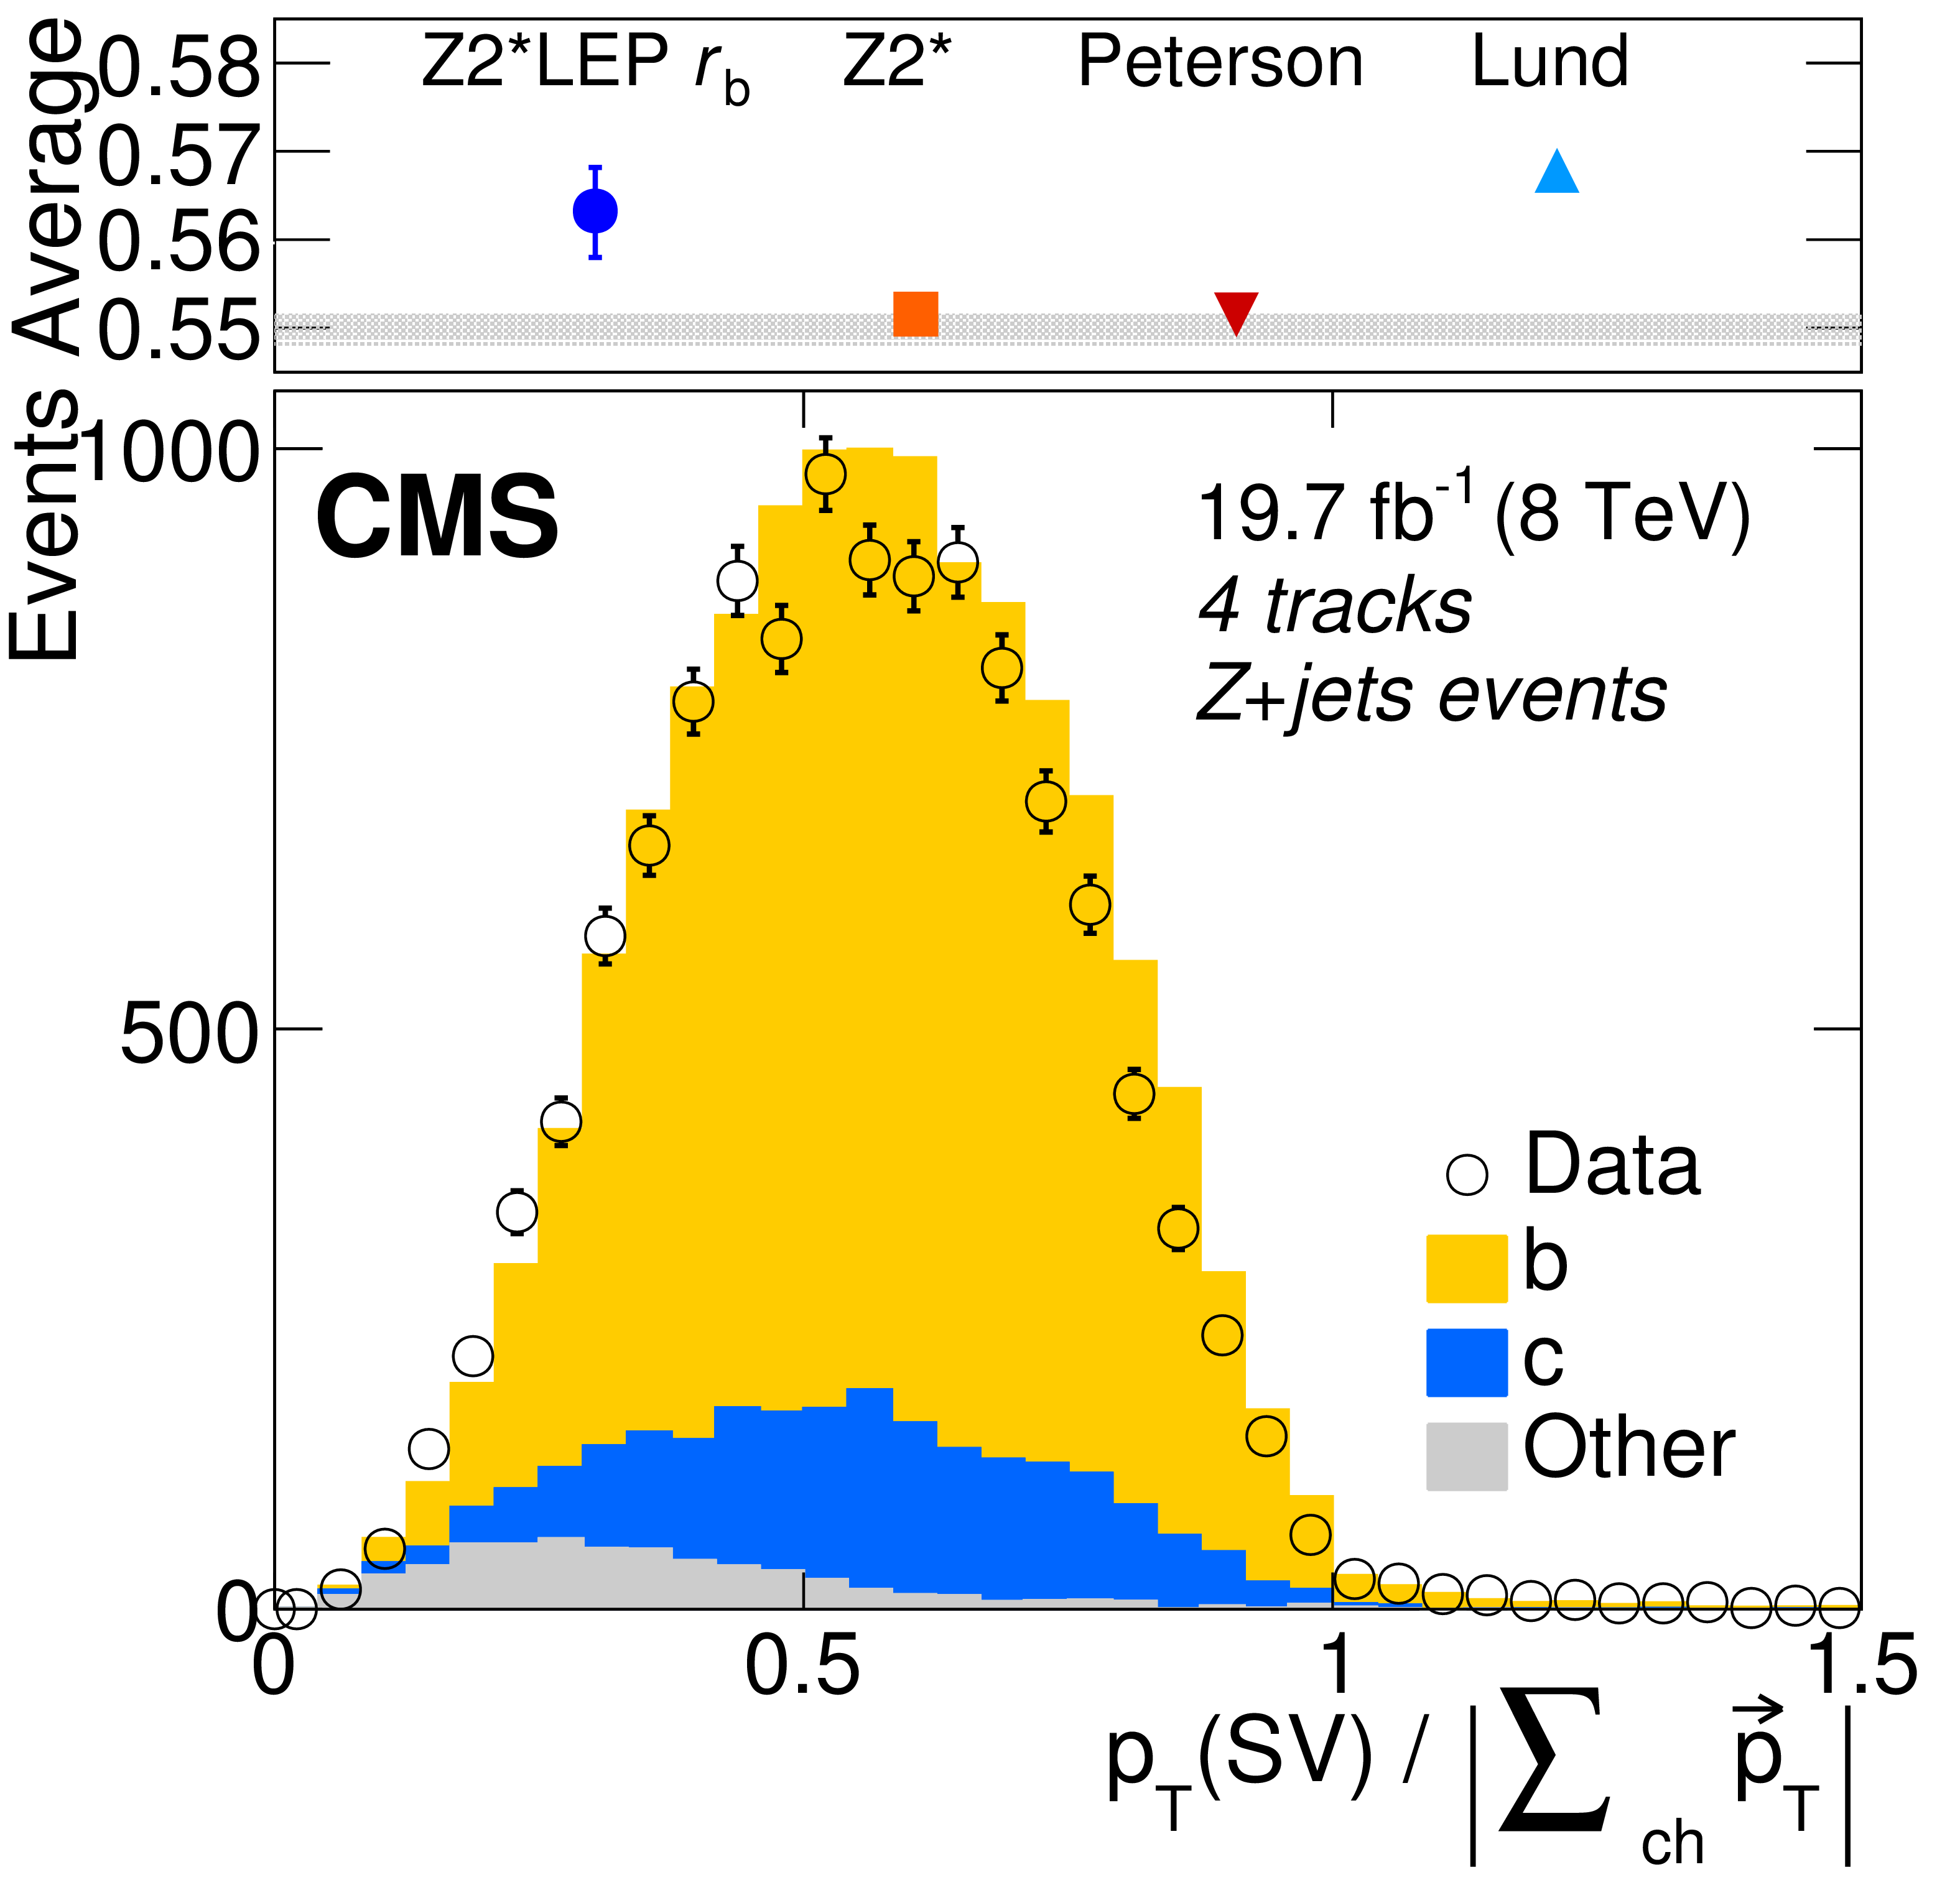
Figure 2-a:
Distributions of the ratio of the transverse momentum of secondary vertices to the charged component of the jet with three, four, and five tracks (from (a,d) to (b,e) to (c,f)) in Z+jets dilepton (a,b,c) and $ {\mathrm{ t \bar{t} } } $ dilepton events (d,e,f), compared to the expected shape using the Z2* LEP $r_{\mathrm{ b } }$ fragmentation tune. In each plot, the top panels compare the average of the distribution measured in data and its statistical uncertainty (shaded area) with that expected from different choices of the b quark fragmentation function in PYTHIA. For Z2* LEP $r_{\mathrm{ b } }$ , the error bar represents the $\pm $ variations of Z2* LEP $r_{\mathrm{ b } }$ . |
png pdf |
Figure 2-b:
Distributions of the ratio of the transverse momentum of secondary vertices to the charged component of the jet with three, four, and five tracks (from (a,d) to (b,e) to (c,f)) in Z+jets dilepton (a,b,c) and $ {\mathrm{ t \bar{t} } } $ dilepton events (d,e,f), compared to the expected shape using the Z2* LEP $r_{\mathrm{ b } }$ fragmentation tune. In each plot, the top panels compare the average of the distribution measured in data and its statistical uncertainty (shaded area) with that expected from different choices of the b quark fragmentation function in PYTHIA. For Z2* LEP $r_{\mathrm{ b } }$ , the error bar represents the $\pm $ variations of Z2* LEP $r_{\mathrm{ b } }$ . |
png pdf |
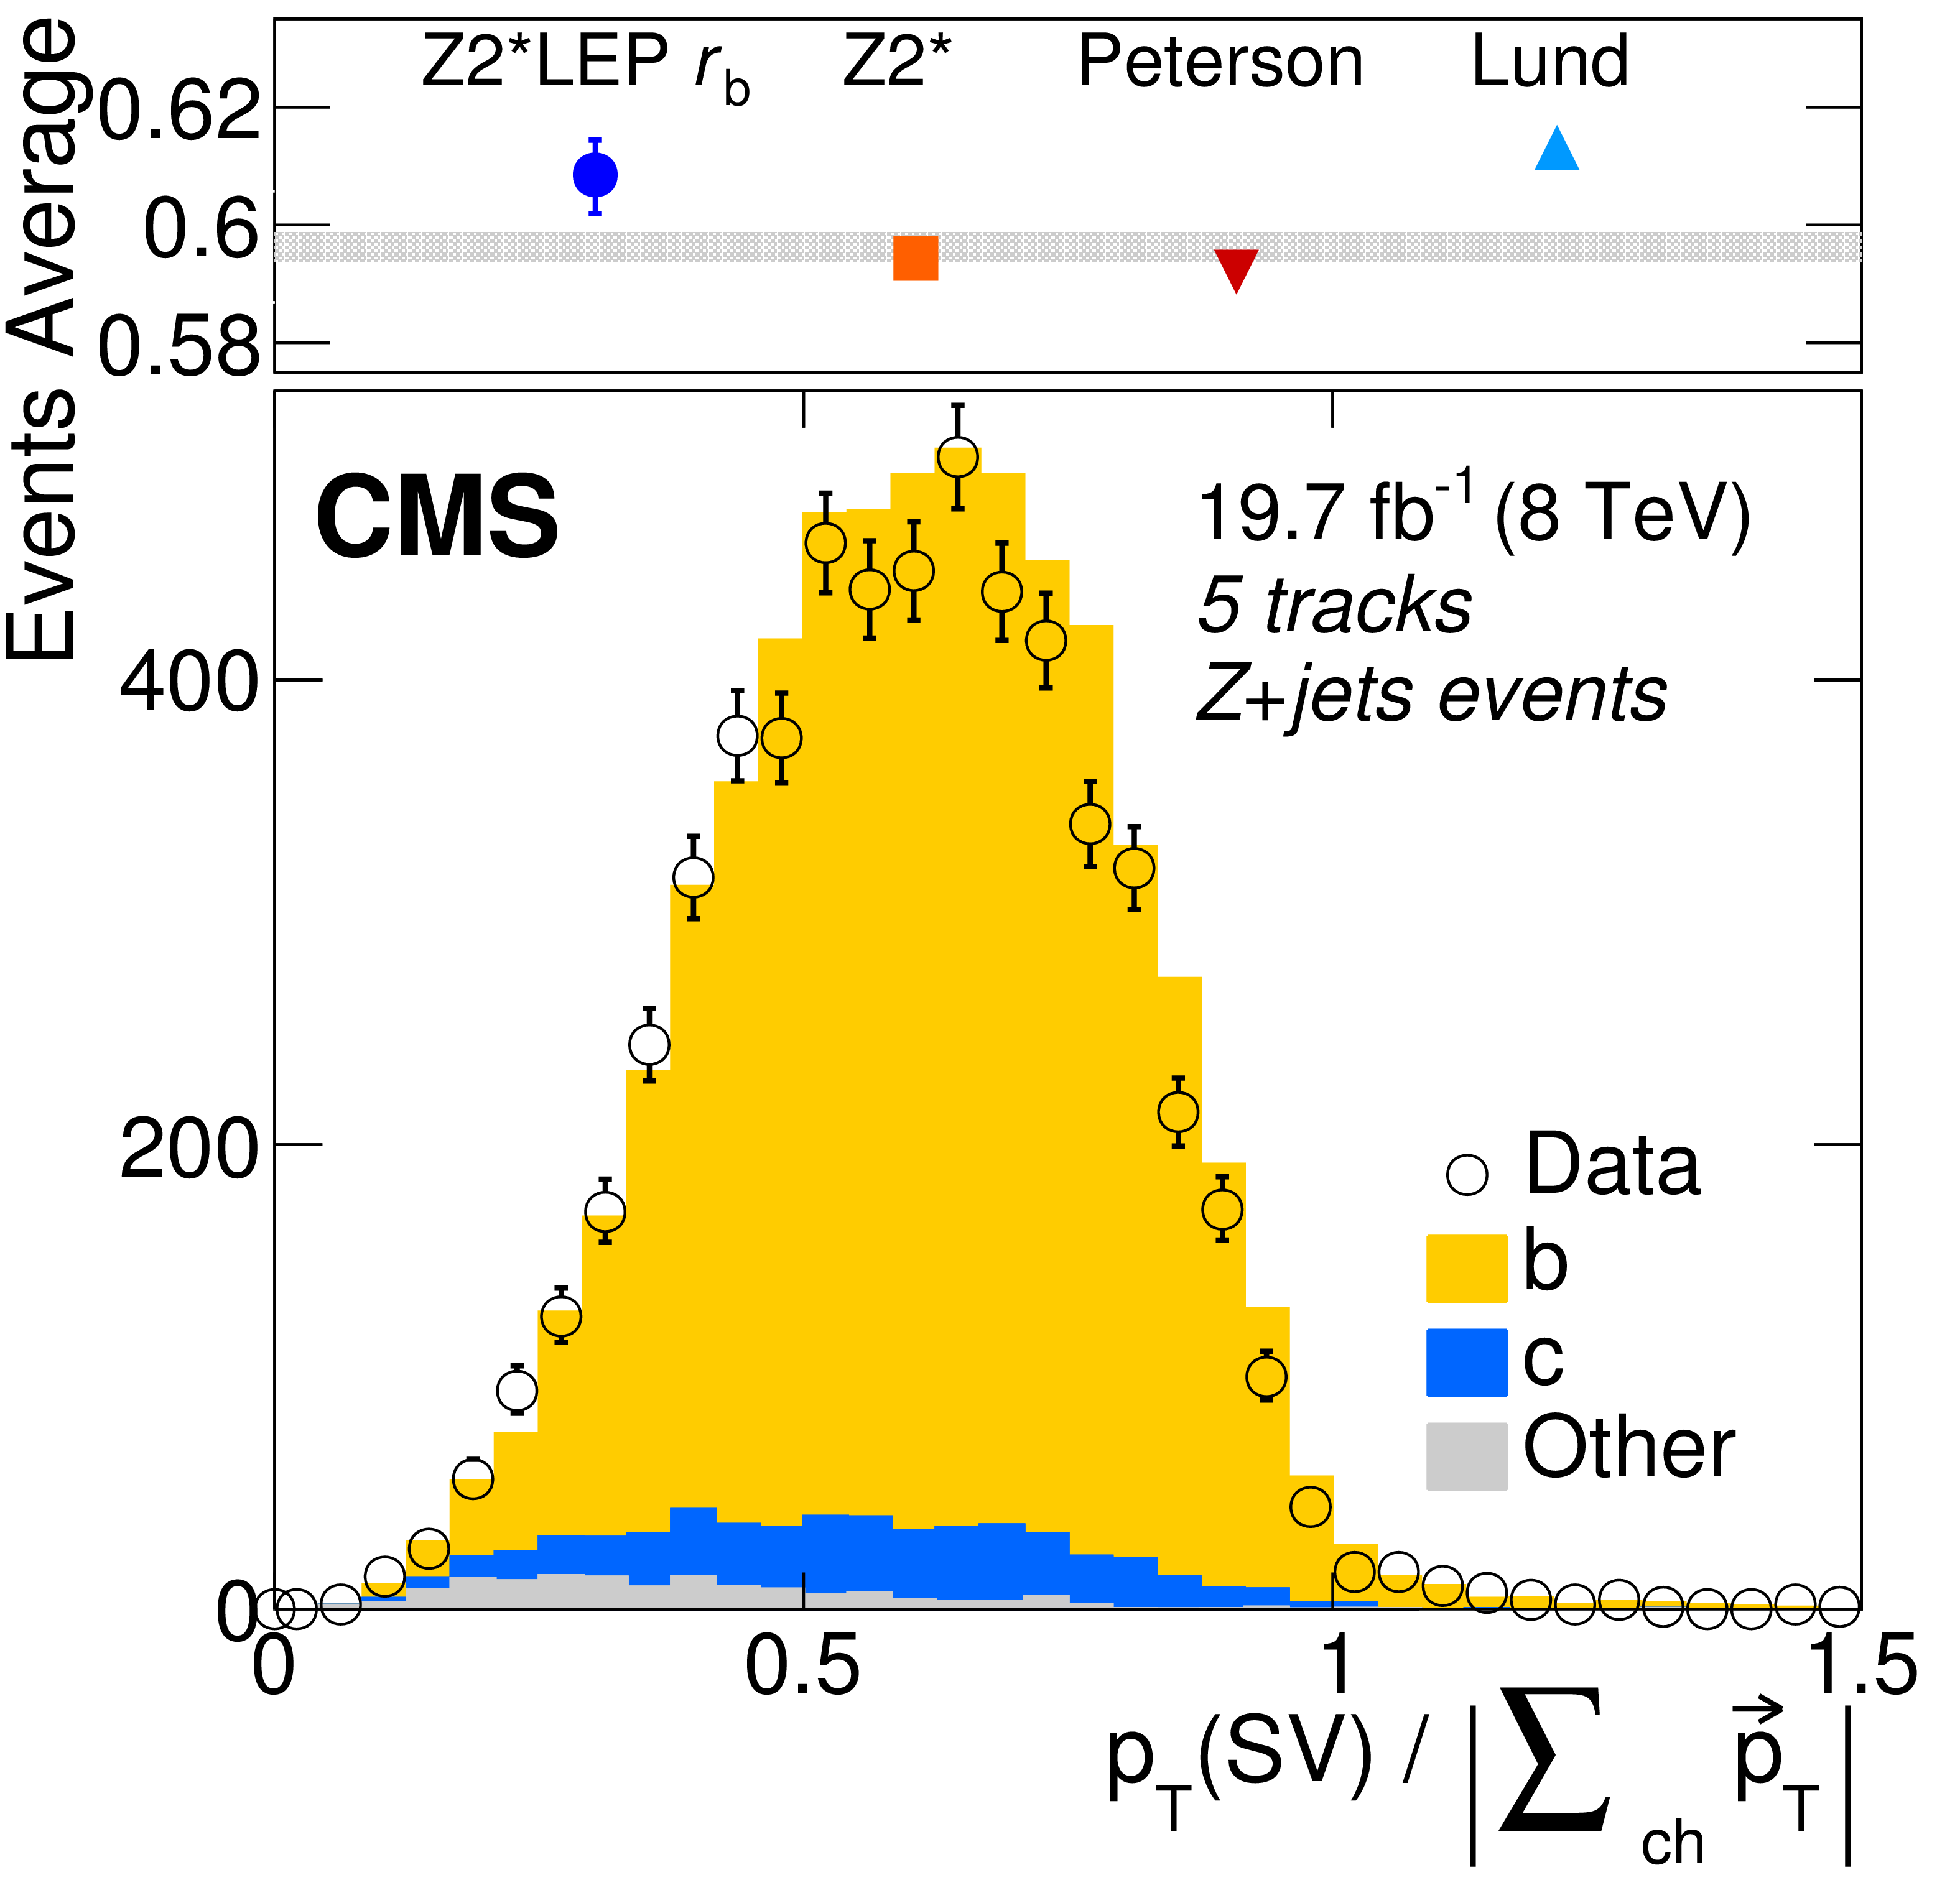
Figure 2-c:
Distributions of the ratio of the transverse momentum of secondary vertices to the charged component of the jet with three, four, and five tracks (from (a,d) to (b,e) to (c,f)) in Z+jets dilepton (a,b,c) and $ {\mathrm{ t \bar{t} } } $ dilepton events (d,e,f), compared to the expected shape using the Z2* LEP $r_{\mathrm{ b } }$ fragmentation tune. In each plot, the top panels compare the average of the distribution measured in data and its statistical uncertainty (shaded area) with that expected from different choices of the b quark fragmentation function in PYTHIA. For Z2* LEP $r_{\mathrm{ b } }$ , the error bar represents the $\pm $ variations of Z2* LEP $r_{\mathrm{ b } }$ . |

png pdf |
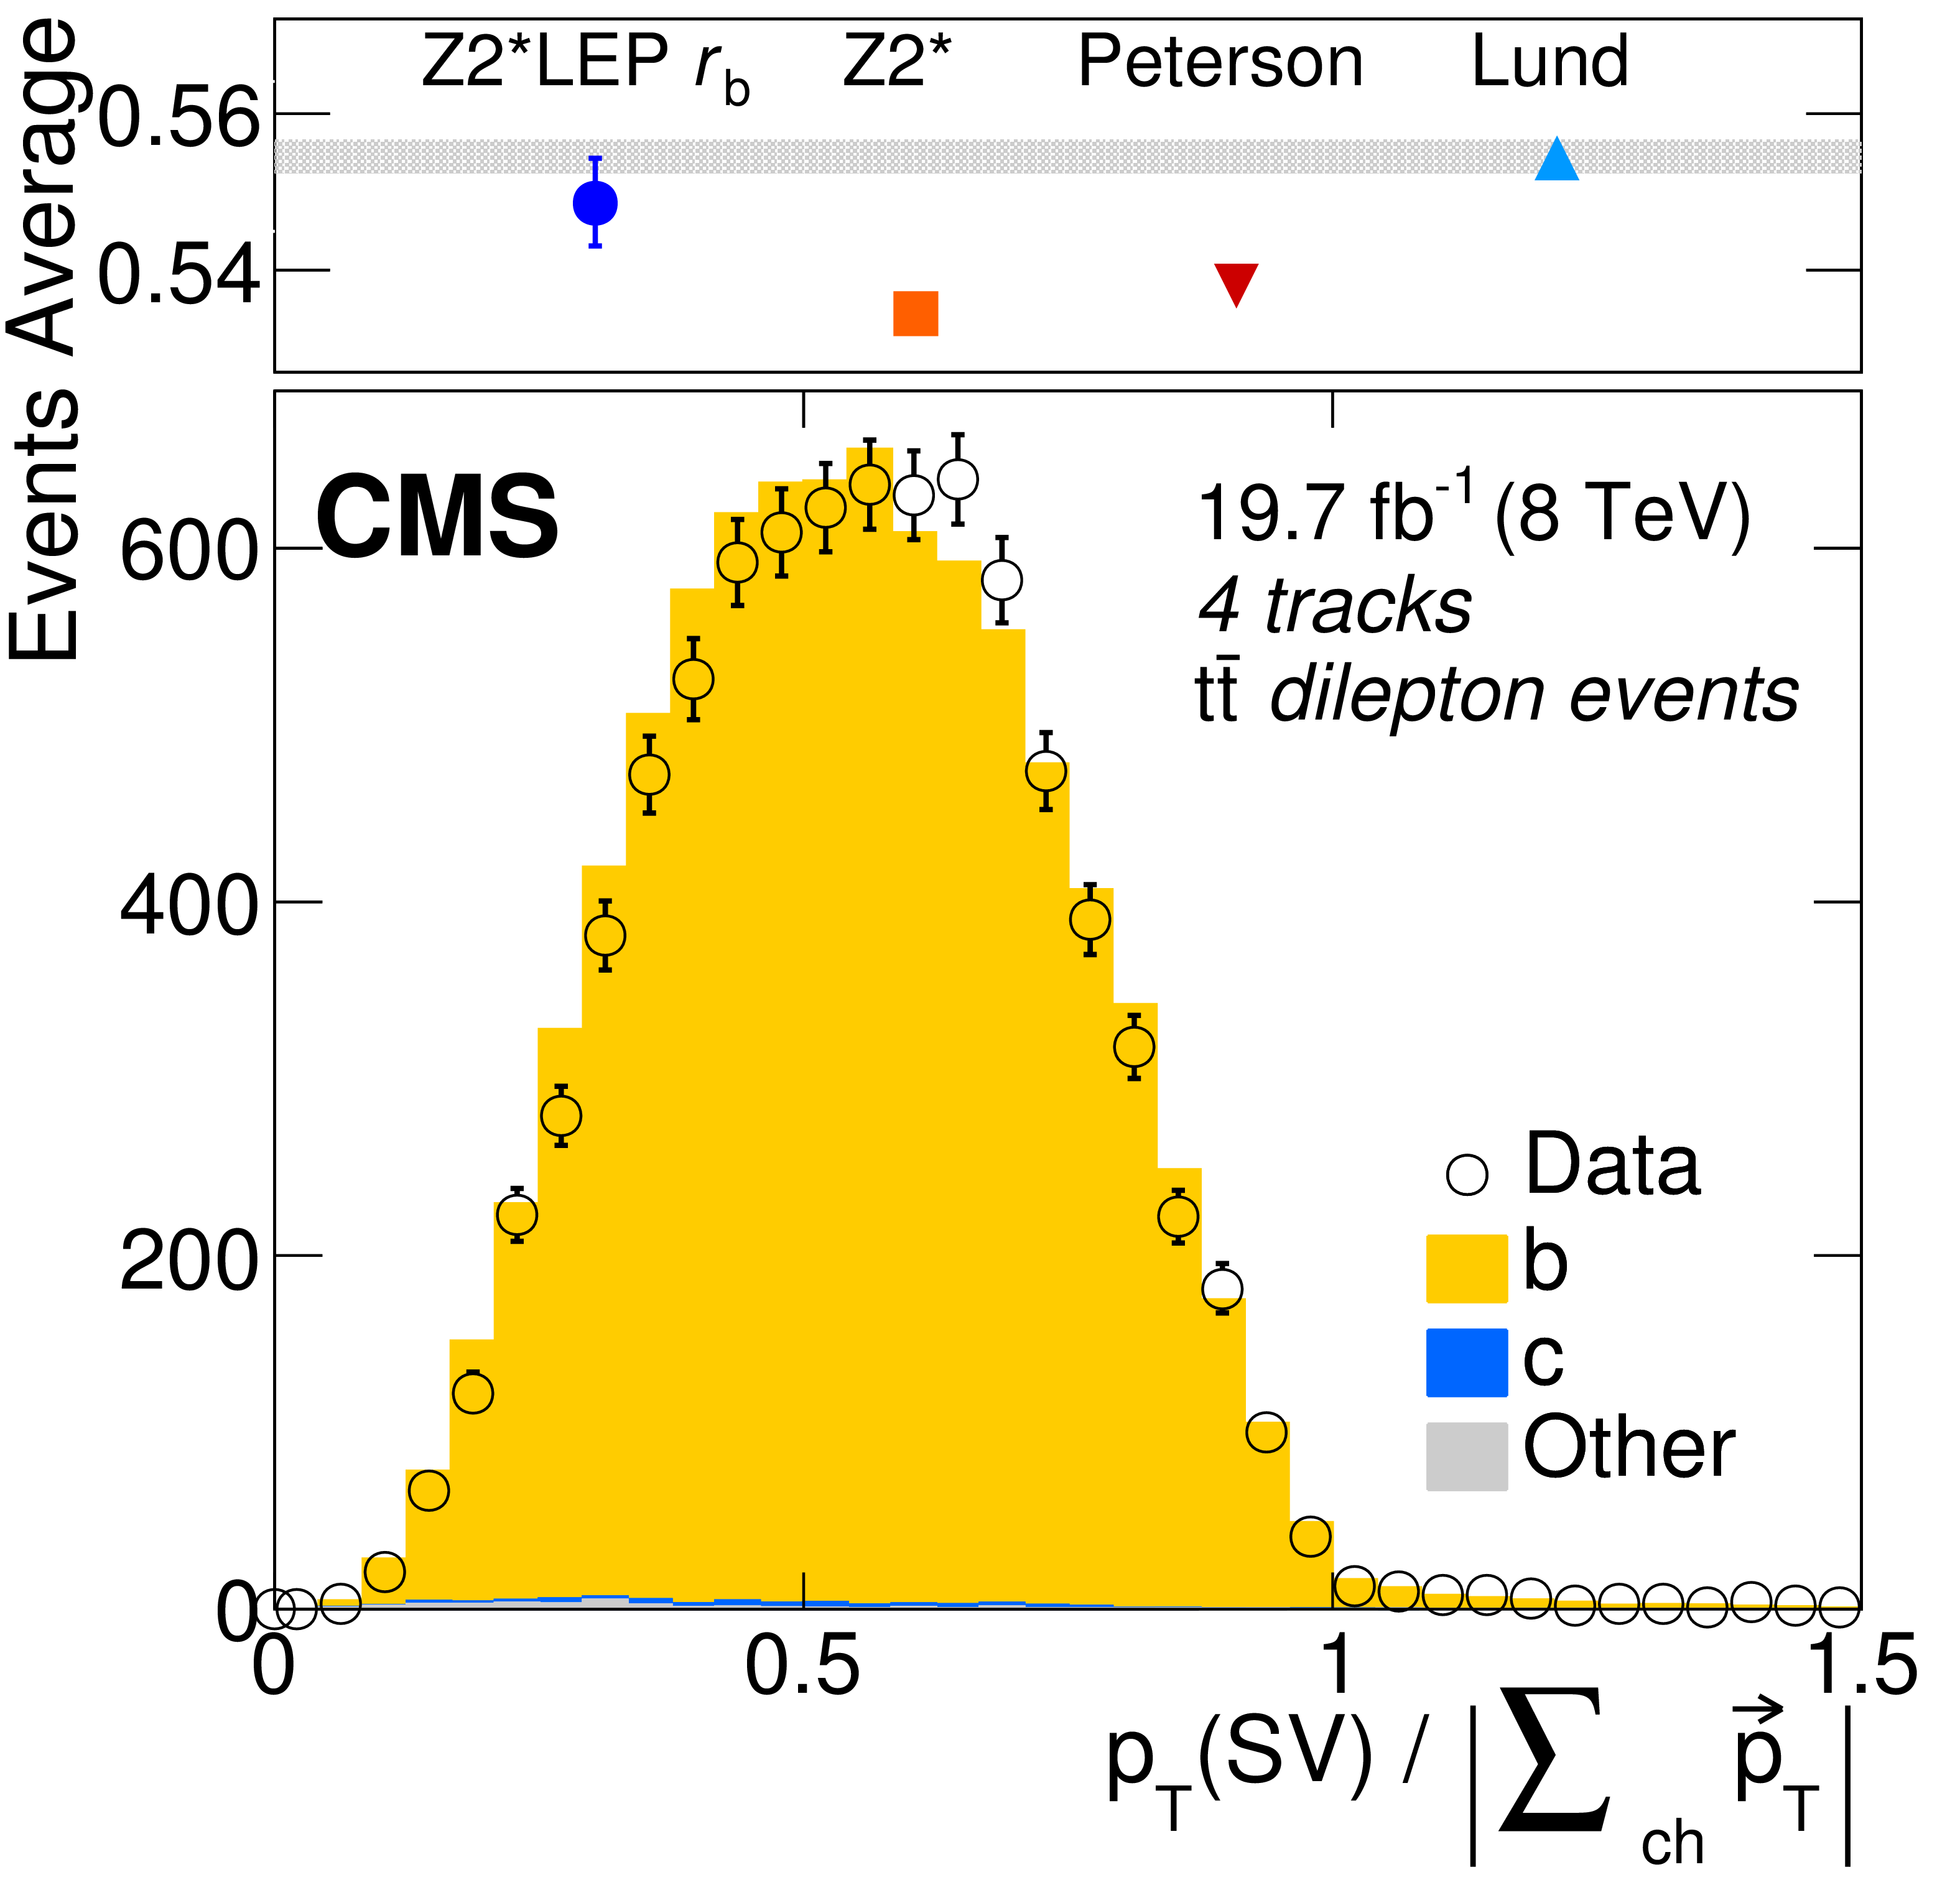
Figure 2-d:
Distributions of the ratio of the transverse momentum of secondary vertices to the charged component of the jet with three, four, and five tracks (from (a,d) to (b,e) to (c,f)) in Z+jets dilepton (a,b,c) and $ {\mathrm{ t \bar{t} } } $ dilepton events (d,e,f), compared to the expected shape using the Z2* LEP $r_{\mathrm{ b } }$ fragmentation tune. In each plot, the top panels compare the average of the distribution measured in data and its statistical uncertainty (shaded area) with that expected from different choices of the b quark fragmentation function in PYTHIA. For Z2* LEP $r_{\mathrm{ b } }$ , the error bar represents the $\pm $ variations of Z2* LEP $r_{\mathrm{ b } }$ . |
png pdf |
Figure 2-e:
Distributions of the ratio of the transverse momentum of secondary vertices to the charged component of the jet with three, four, and five tracks (from (a,d) to (b,e) to (c,f)) in Z+jets dilepton (a,b,c) and $ {\mathrm{ t \bar{t} } } $ dilepton events (d,e,f), compared to the expected shape using the Z2* LEP $r_{\mathrm{ b } }$ fragmentation tune. In each plot, the top panels compare the average of the distribution measured in data and its statistical uncertainty (shaded area) with that expected from different choices of the b quark fragmentation function in PYTHIA. For Z2* LEP $r_{\mathrm{ b } }$ , the error bar represents the $\pm $ variations of Z2* LEP $r_{\mathrm{ b } }$ . |
png pdf |
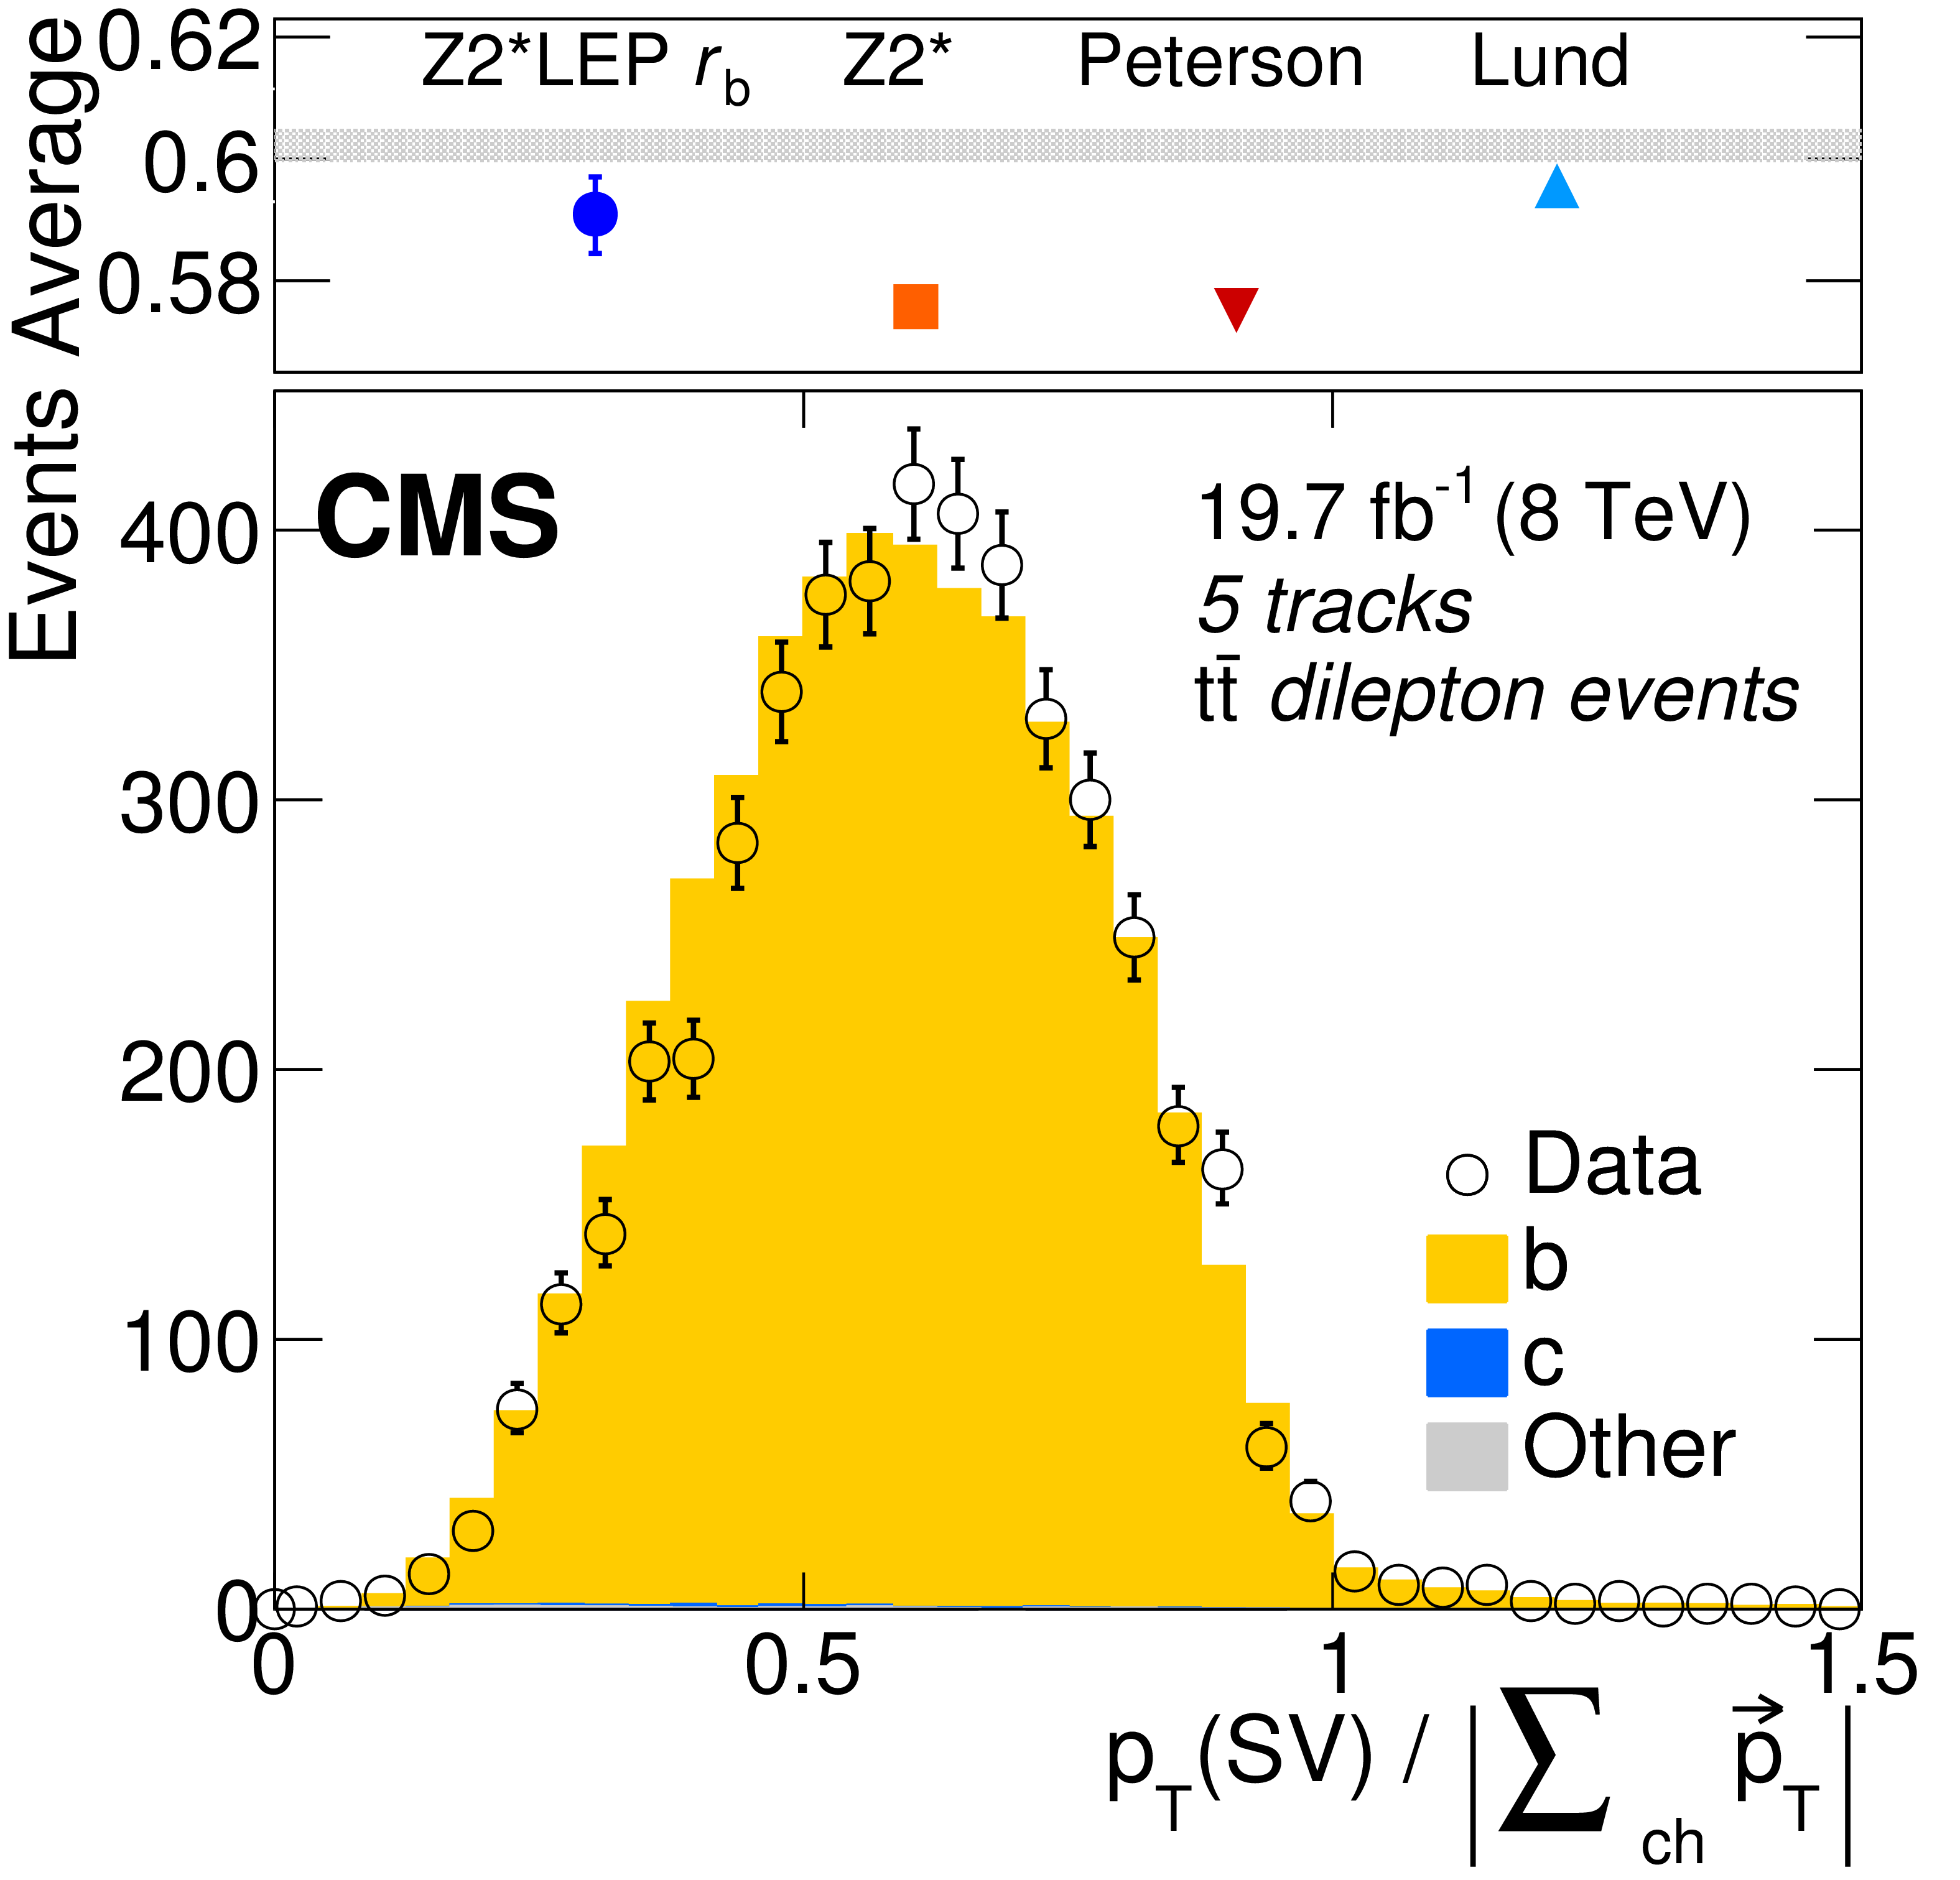
Figure 2-f:
Distributions of the ratio of the transverse momentum of secondary vertices to the charged component of the jet with three, four, and five tracks (from (a,d) to (b,e) to (c,f)) in Z+jets dilepton (a,b,c) and $ {\mathrm{ t \bar{t} } } $ dilepton events (d,e,f), compared to the expected shape using the Z2* LEP $r_{\mathrm{ b } }$ fragmentation tune. In each plot, the top panels compare the average of the distribution measured in data and its statistical uncertainty (shaded area) with that expected from different choices of the b quark fragmentation function in PYTHIA. For Z2* LEP $r_{\mathrm{ b } }$ , the error bar represents the $\pm $ variations of Z2* LEP $r_{\mathrm{ b } }$ . |
png pdf |
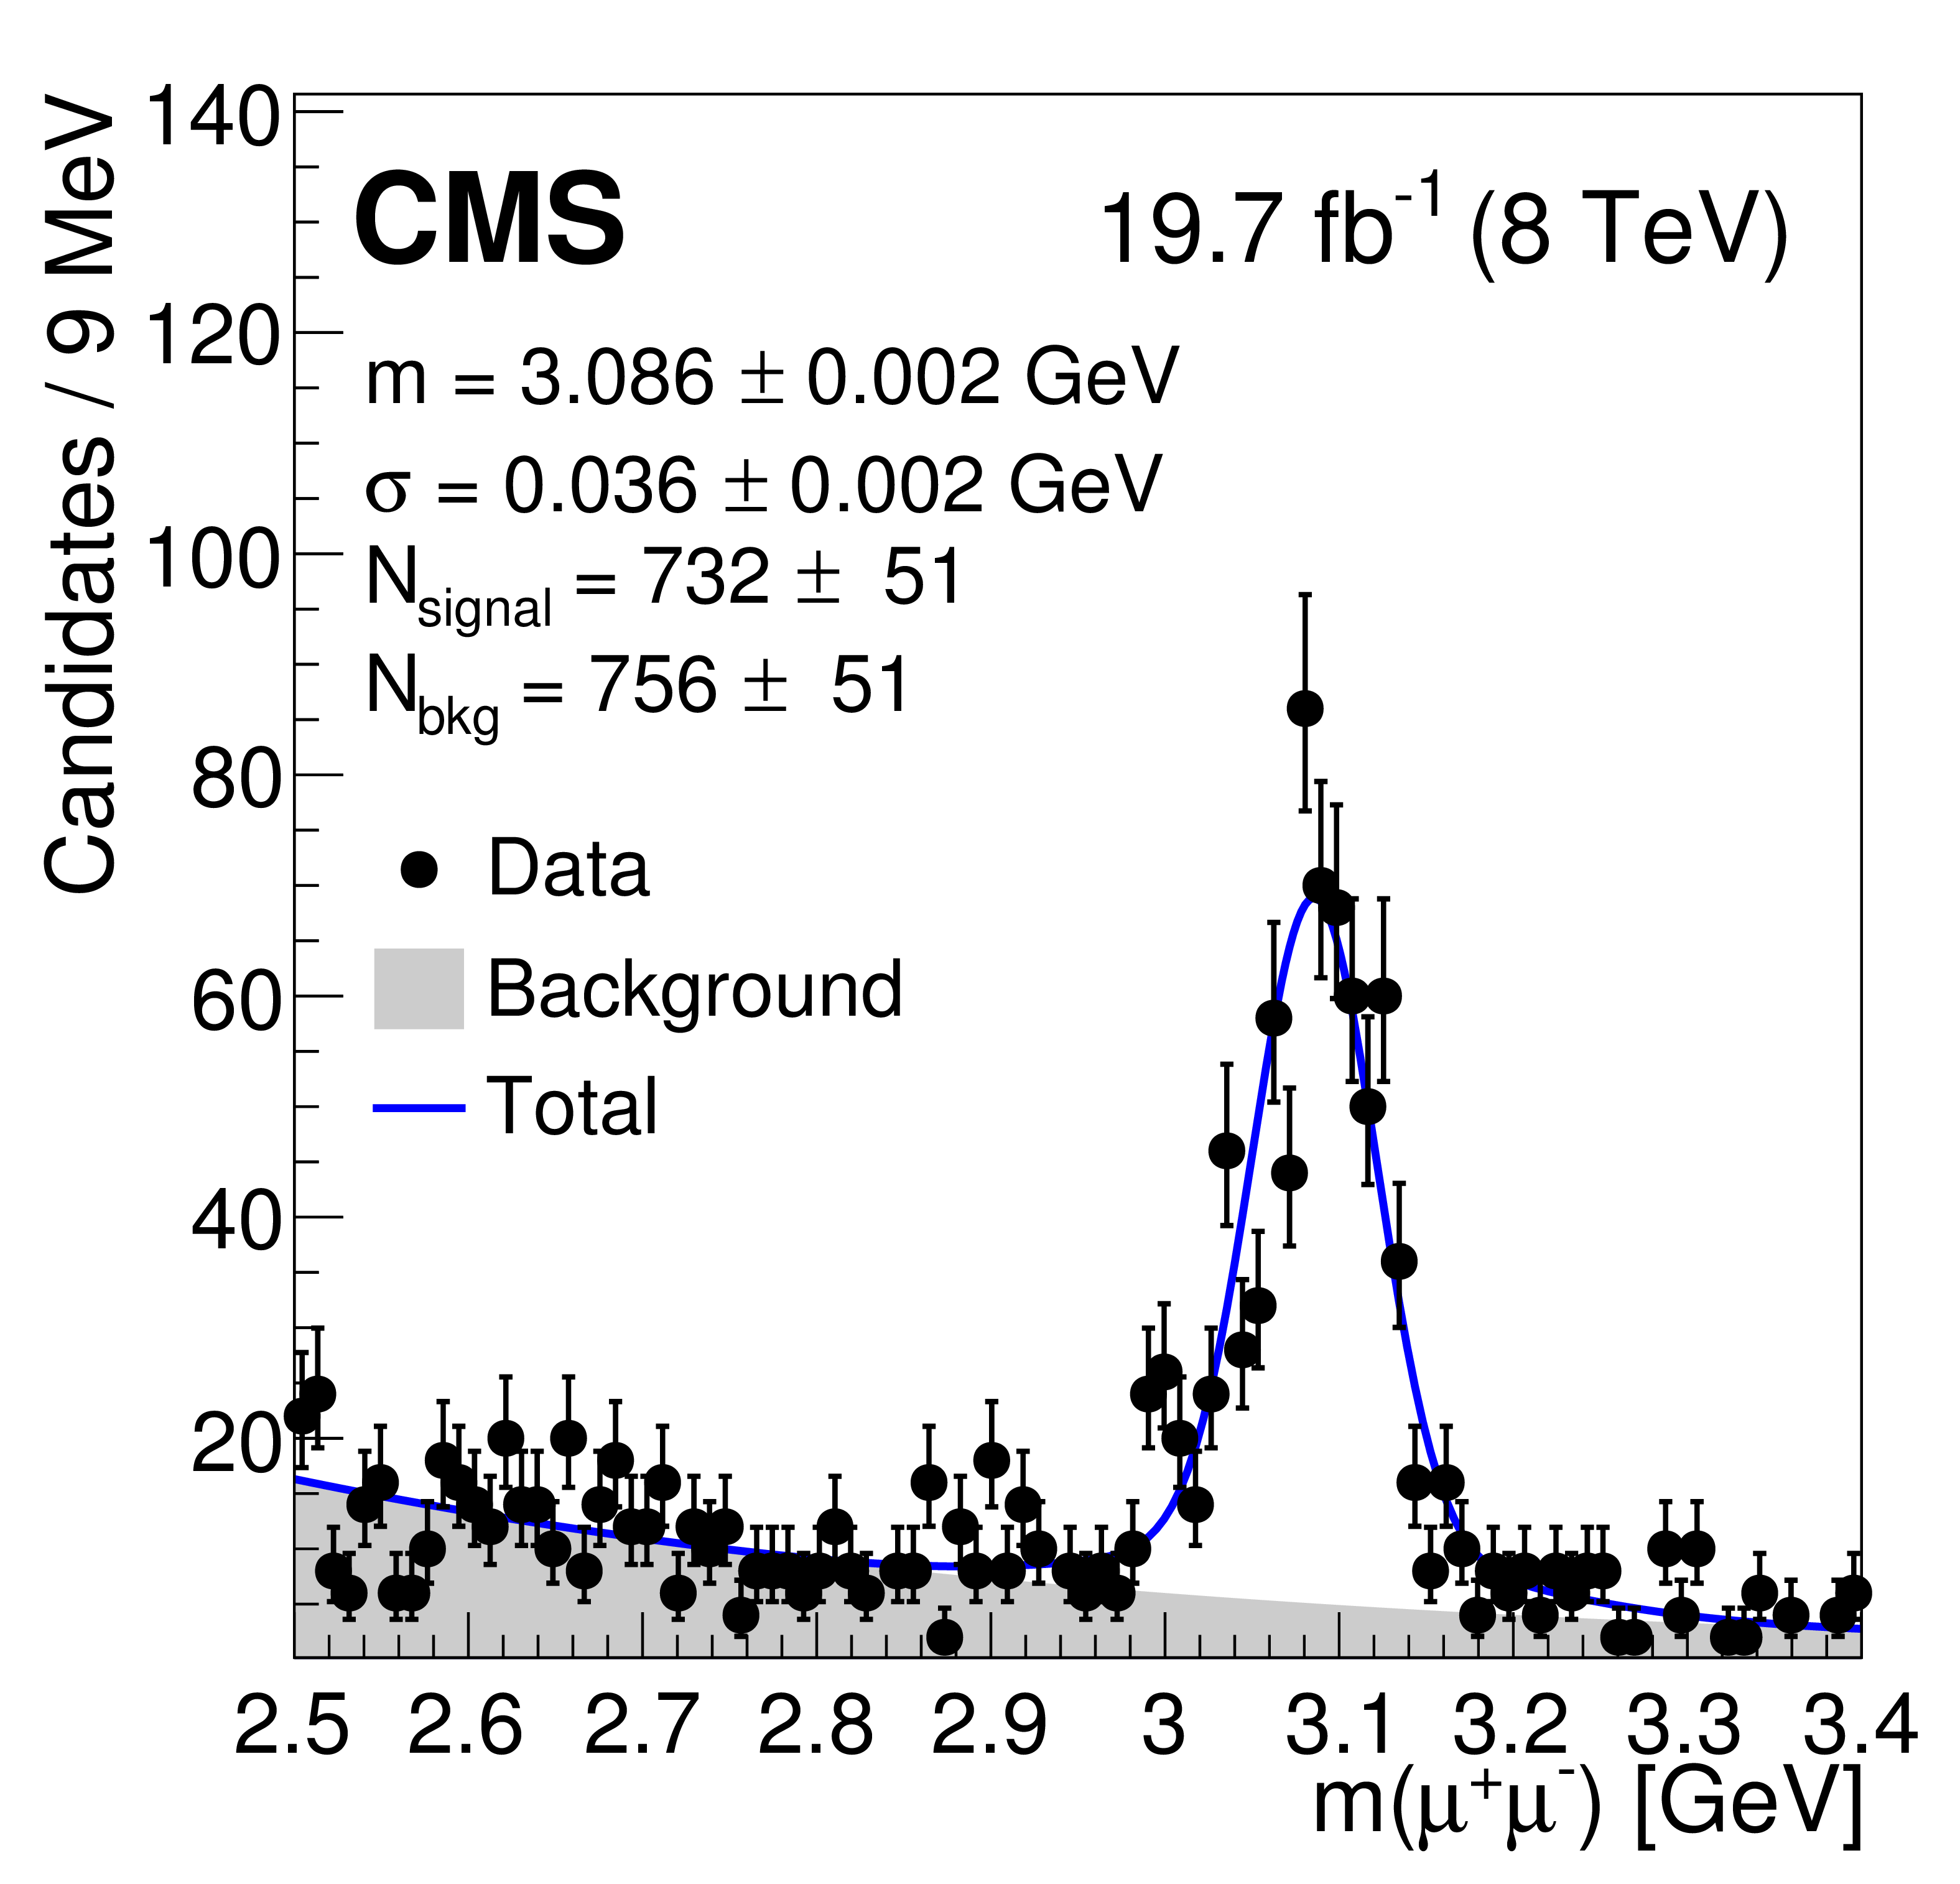
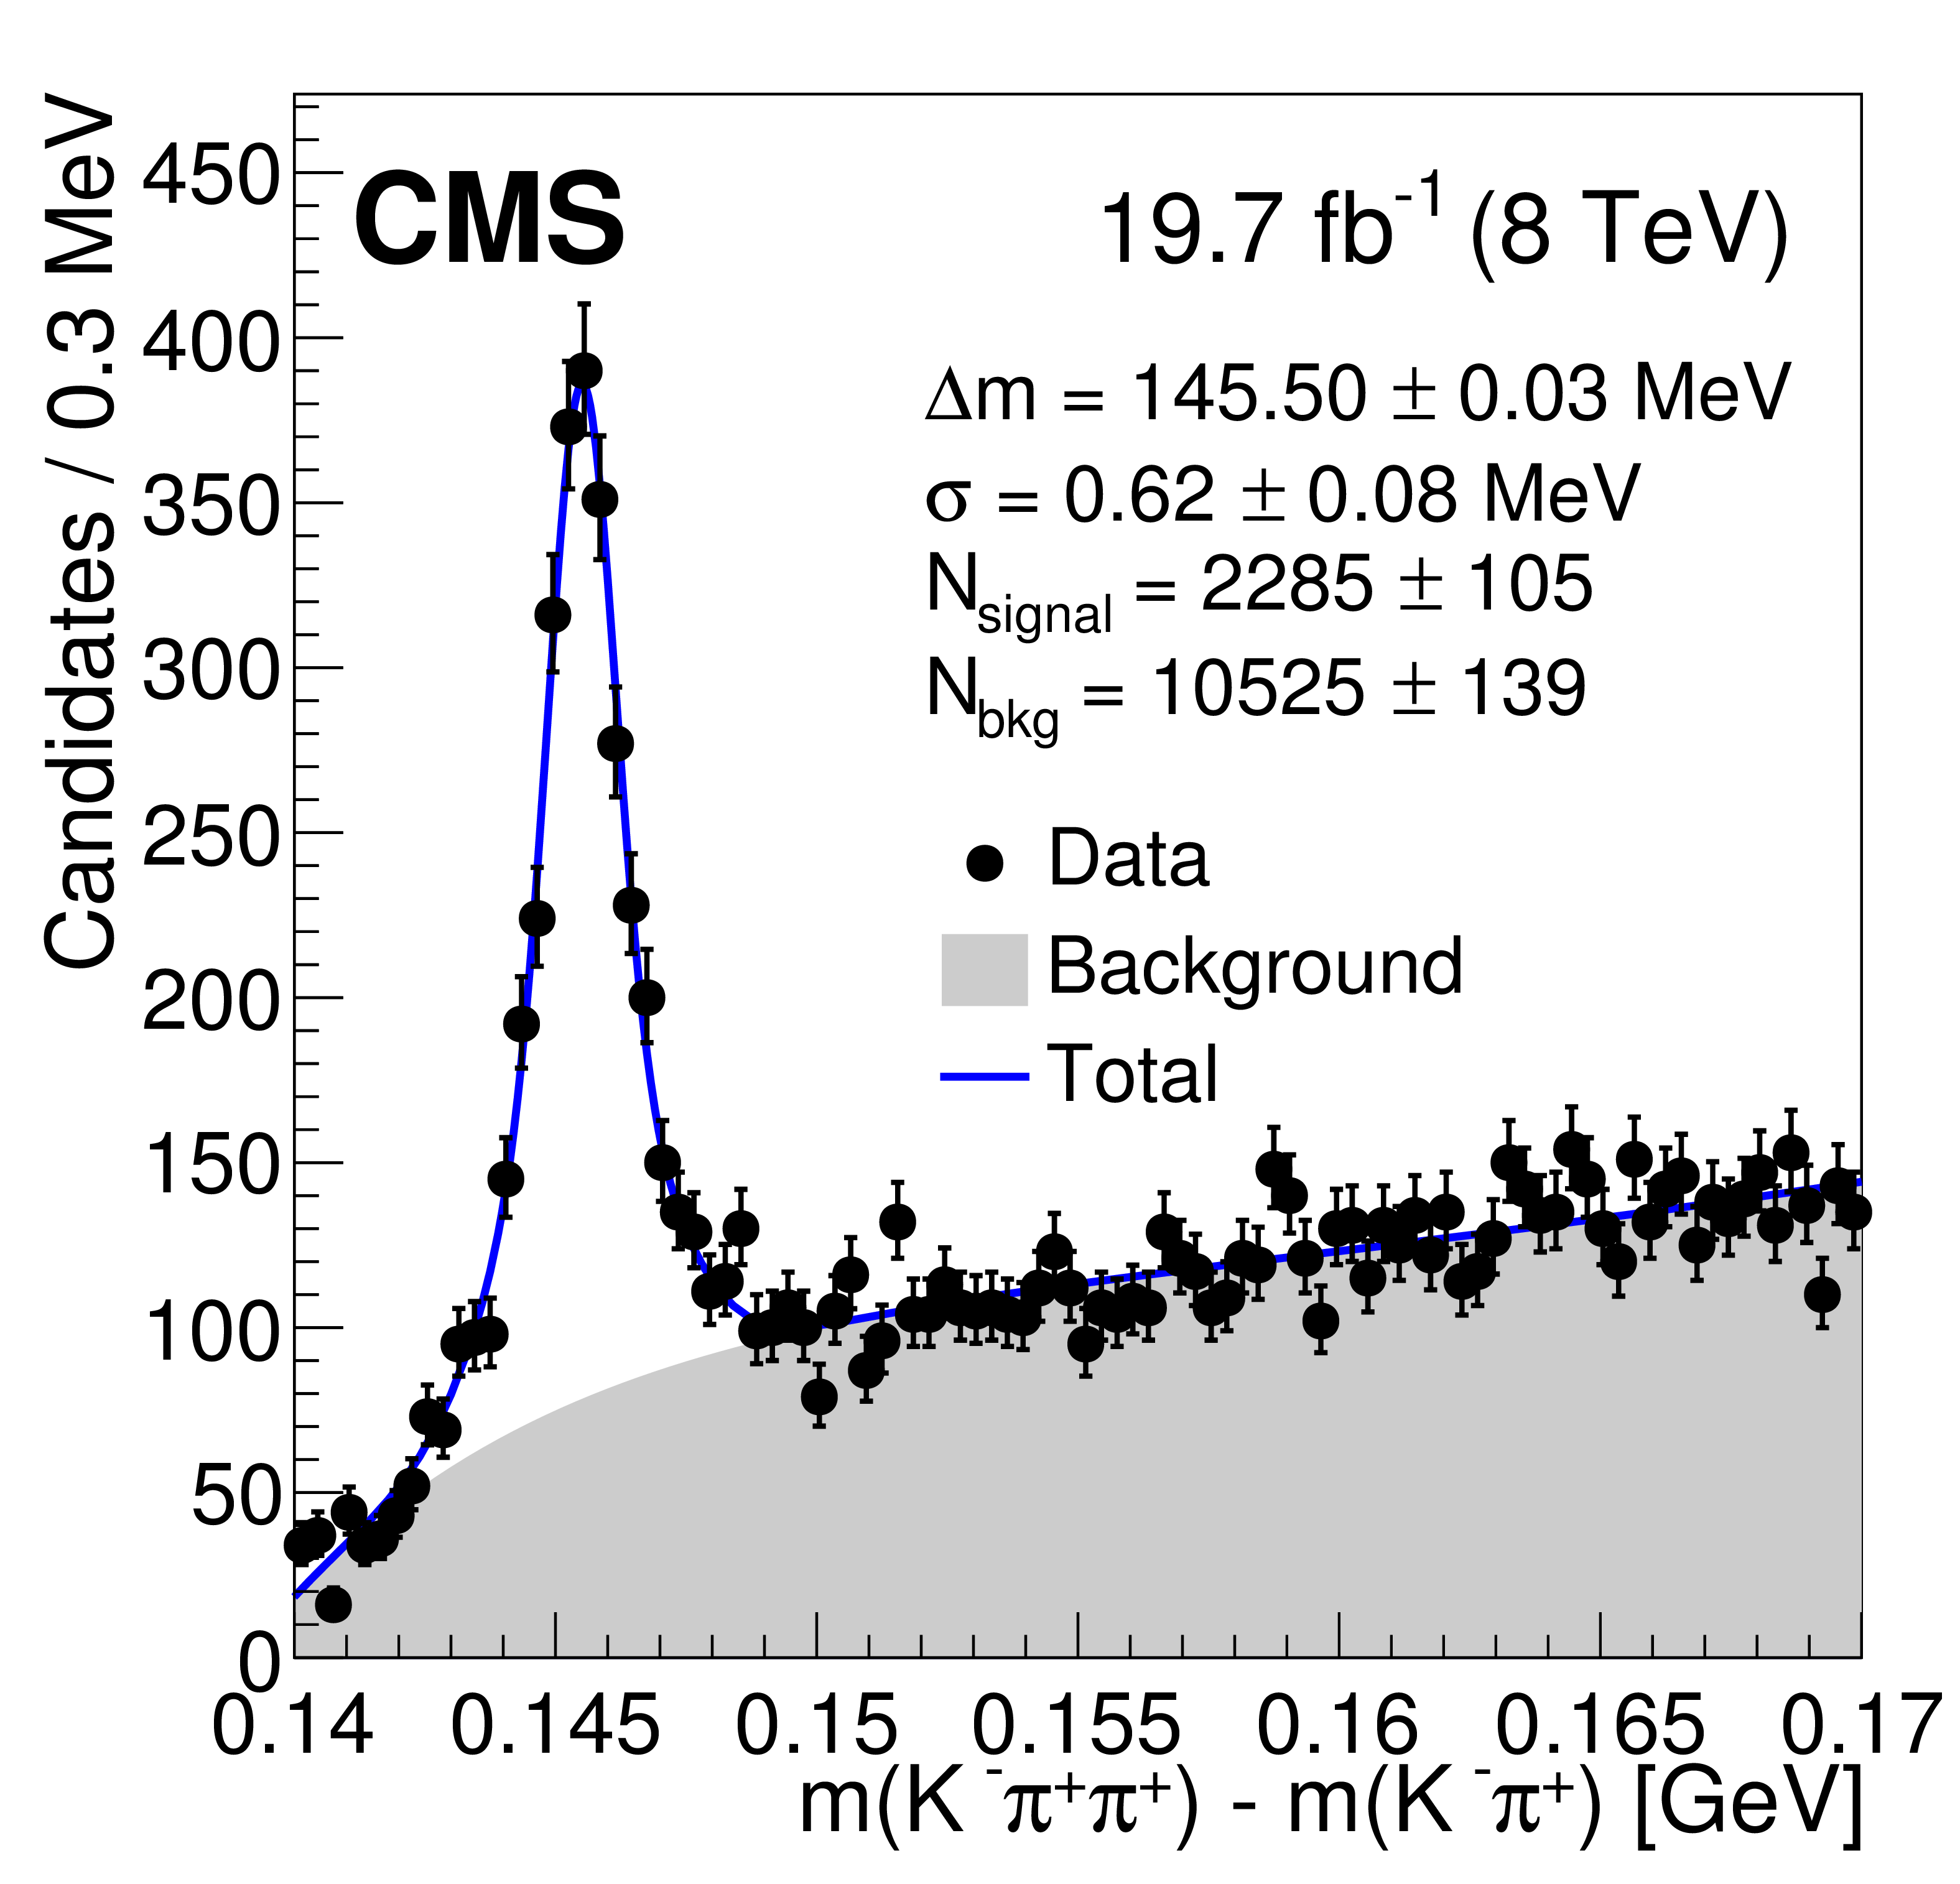
Figure 3-a:
Fits to the invariant mass peaks of the three considered charmed mesons in ${\mathrm{ t \bar{t} } } $ events in the data, as described in the text: $\mathrm{ J } / \psi $ (a), $ \mathrm{D}^0 $ (b), and $ \mathrm{D}^{*}(2010)^+ $ (c). |
png pdf |
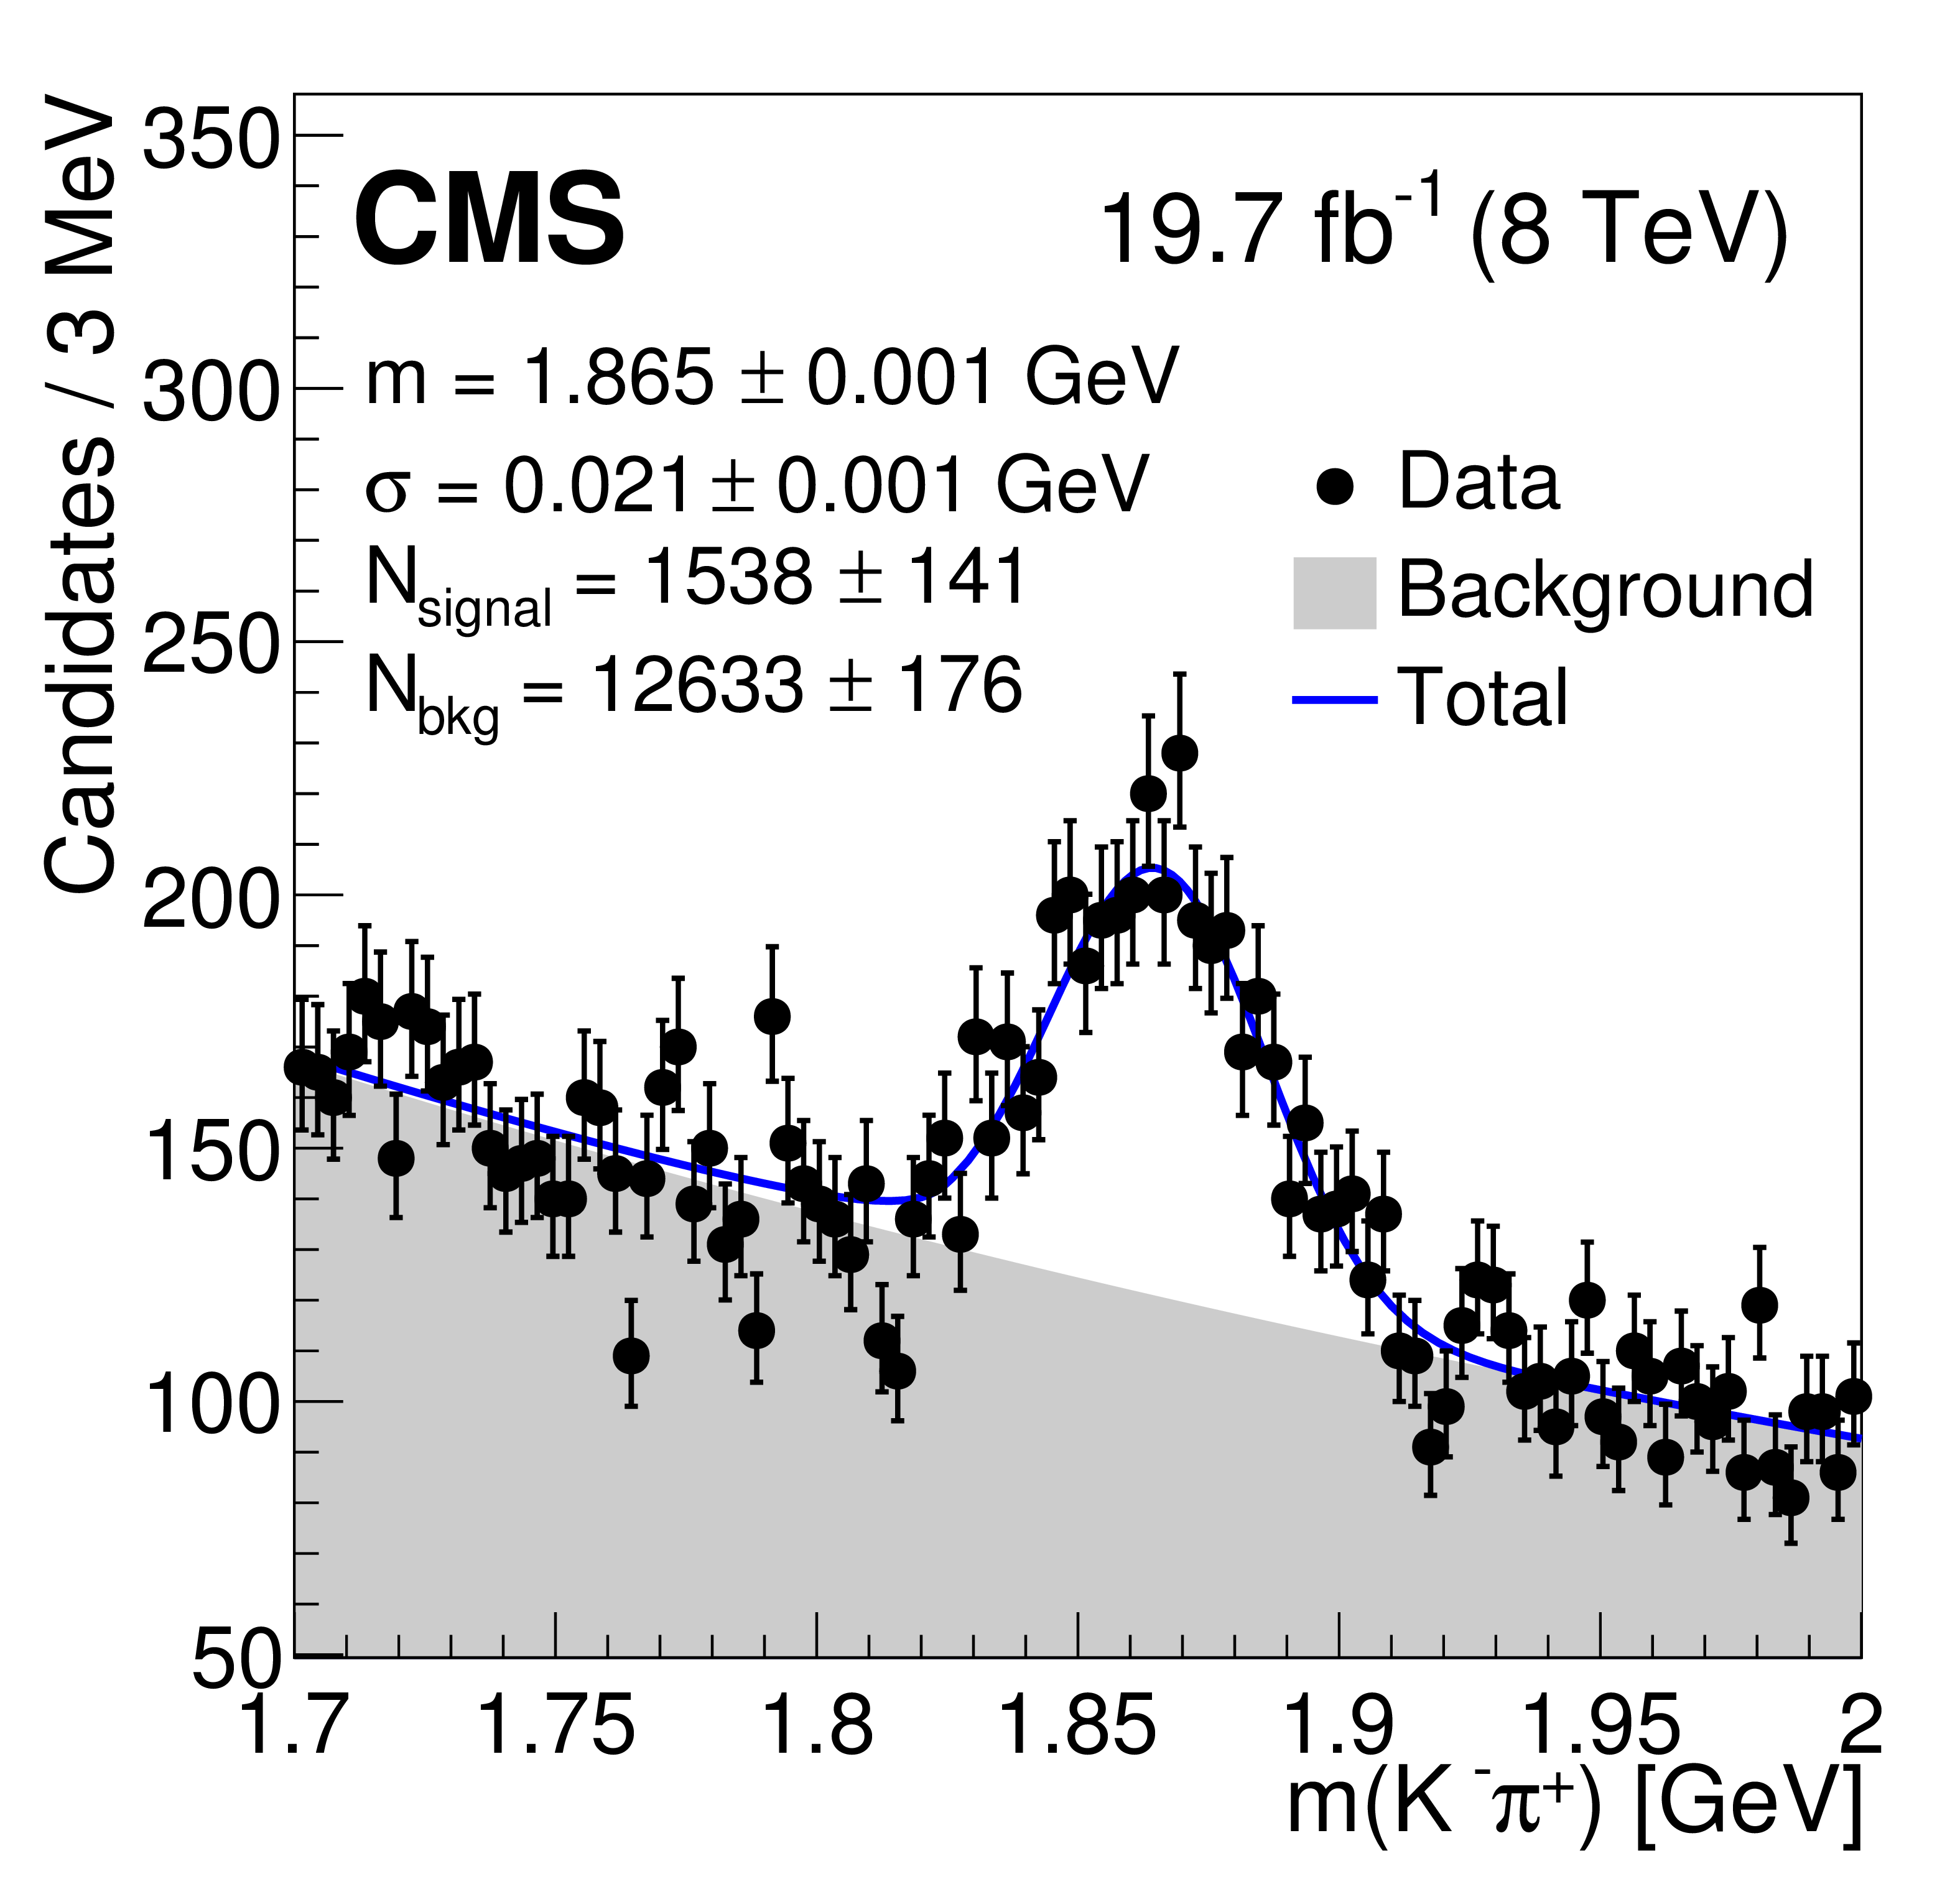
Figure 3-b:
Fits to the invariant mass peaks of the three considered charmed mesons in ${\mathrm{ t \bar{t} } } $ events in the data, as described in the text: $\mathrm{ J } / \psi $ (a), $ \mathrm{D}^0 $ (b), and $ \mathrm{D}^{*}(2010)^+ $ (c). |
png pdf |
Figure 3-c:
Fits to the invariant mass peaks of the three considered charmed mesons in ${\mathrm{ t \bar{t} } } $ events in the data, as described in the text: $\mathrm{ J } / \psi $ (a), $ \mathrm{D}^0 $ (b), and $ \mathrm{D}^{*}(2010)^+ $ (c). |
png pdf |
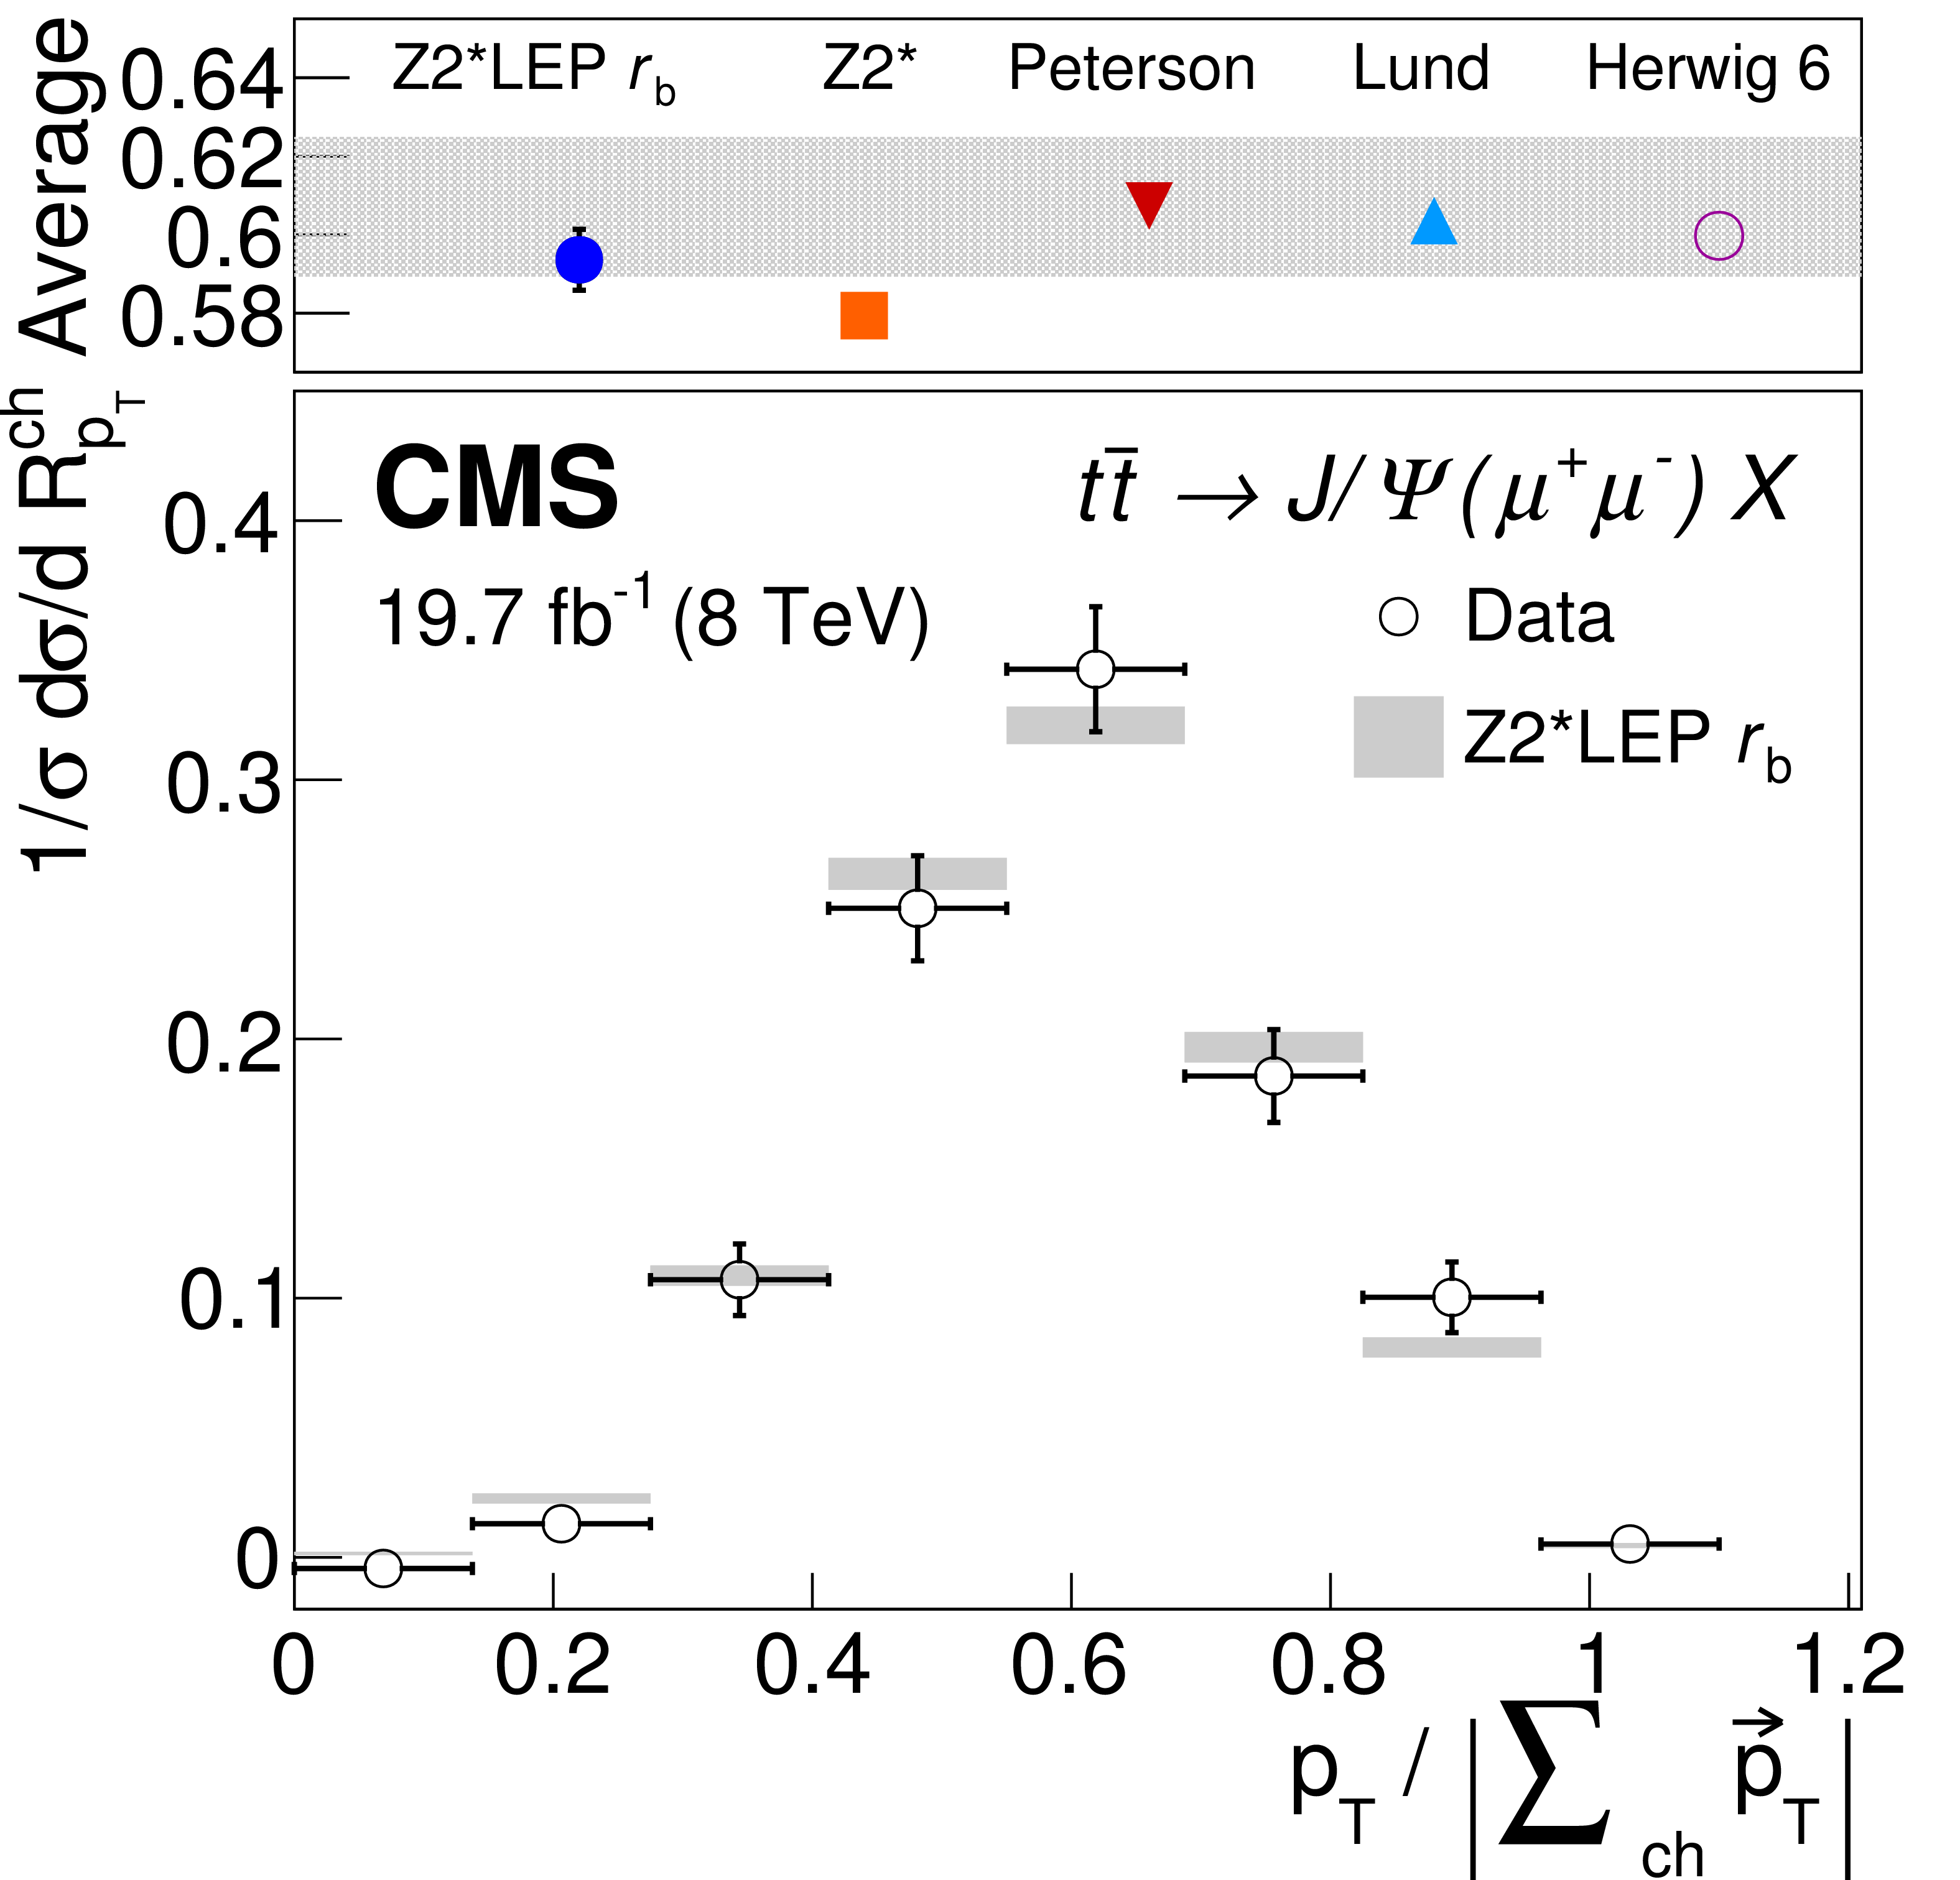
Figure 4-a:
Distribution of the relative transverse momentum of $\mathrm{ J } / \psi $ (a), $ \mathrm{D}^0 $ (b), and $ \mathrm{D}^{*}(2010)^+ $ (c) meson candidates with respect to the charged components of the jet in ${\mathrm{ t \bar{t} } } $ events for the data and the nominal Z2* LEP $r_{\mathrm{ b } }$ fragmentation function. The top panels show the average of the distributions observed in the data and its statistical uncertainty (shaded area), as well as expectations obtained with different b quark fragmentation functions and with an alternative generator setup using HERWIG 6 with the AUET2 tune. |
png pdf |
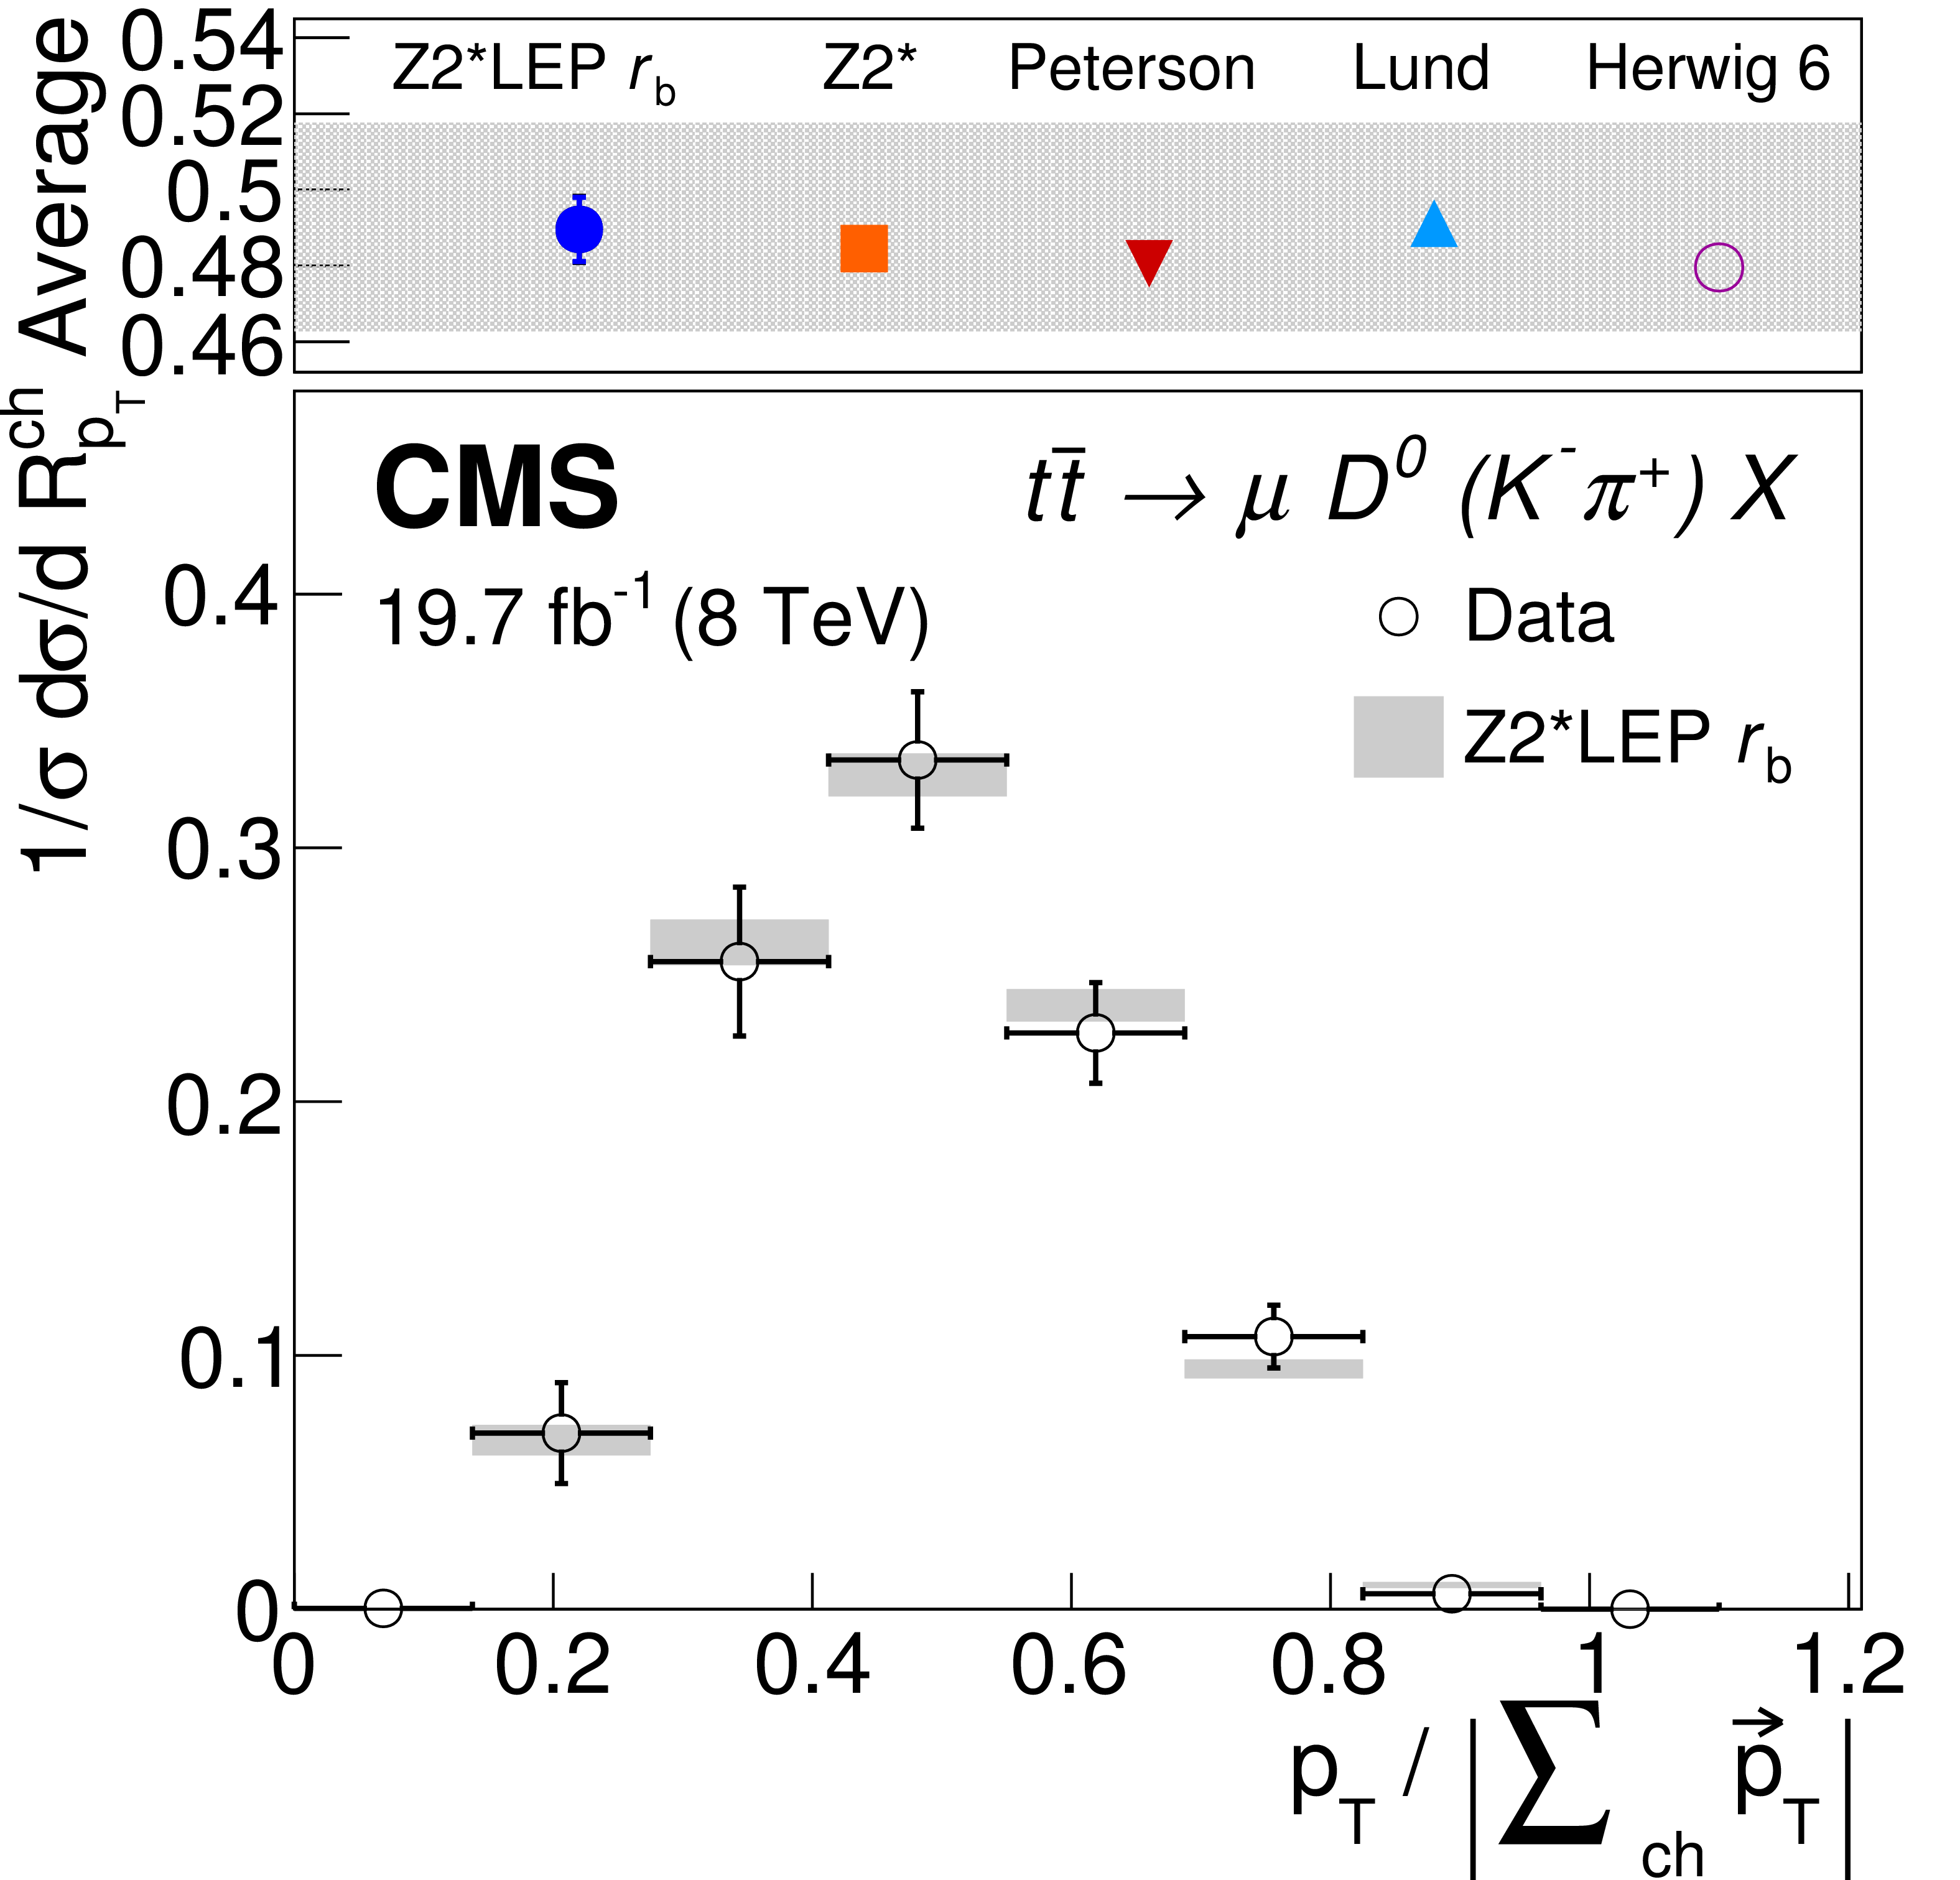
Figure 4-b:
Distribution of the relative transverse momentum of $\mathrm{ J } / \psi $ (a), $ \mathrm{D}^0 $ (b), and $ \mathrm{D}^{*}(2010)^+ $ (c) meson candidates with respect to the charged components of the jet in ${\mathrm{ t \bar{t} } } $ events for the data and the nominal Z2* LEP $r_{\mathrm{ b } }$ fragmentation function. The top panels show the average of the distributions observed in the data and its statistical uncertainty (shaded area), as well as expectations obtained with different b quark fragmentation functions and with an alternative generator setup using HERWIG 6 with the AUET2 tune. |
png pdf |
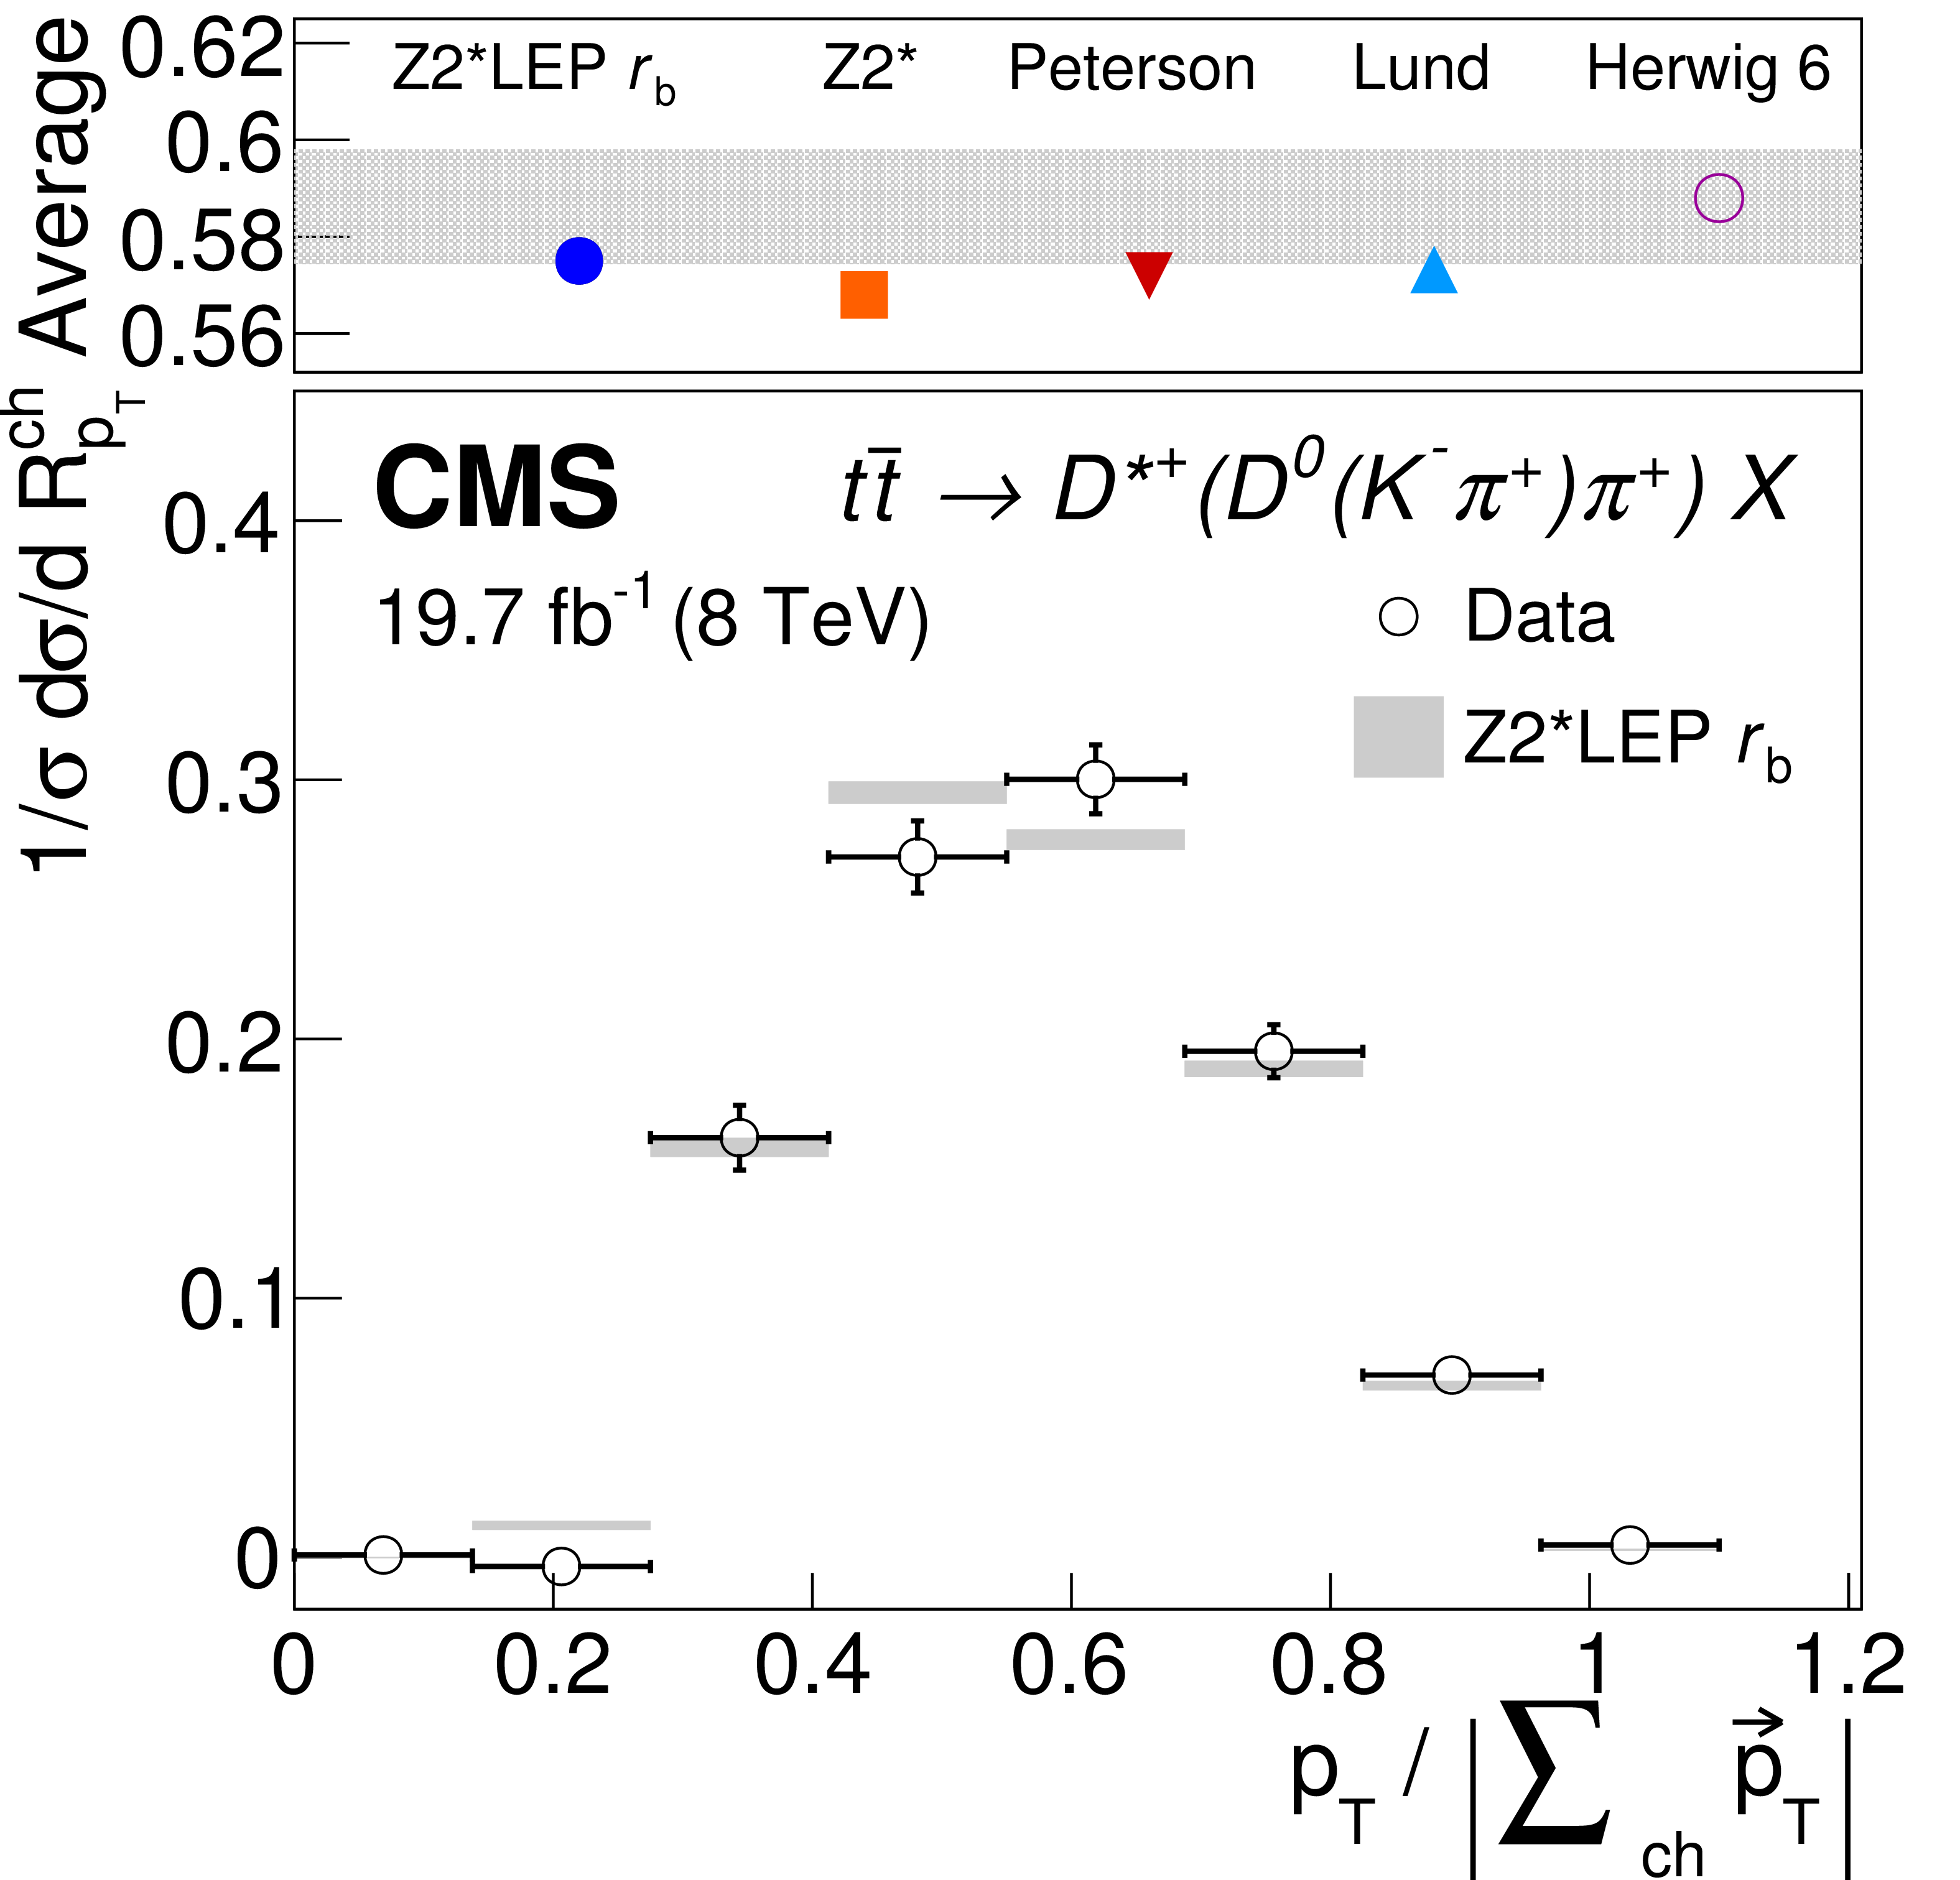
Figure 4-c:
Distribution of the relative transverse momentum of $\mathrm{ J } / \psi $ (a), $ \mathrm{D}^0 $ (b), and $ \mathrm{D}^{*}(2010)^+ $ (c) meson candidates with respect to the charged components of the jet in ${\mathrm{ t \bar{t} } } $ events for the data and the nominal Z2* LEP $r_{\mathrm{ b } }$ fragmentation function. The top panels show the average of the distributions observed in the data and its statistical uncertainty (shaded area), as well as expectations obtained with different b quark fragmentation functions and with an alternative generator setup using HERWIG 6 with the AUET2 tune. |

png pdf |
Figure 5:
Lepton-SV invariant mass distribution for a combination of all five channels, for a simulation of three different top quark mass values (166.5, 172.5, and 178.5 GeV), and the observed data distribution. Note that all possible lepton-vertex combinations for each event enter the distribution. |
png pdf |
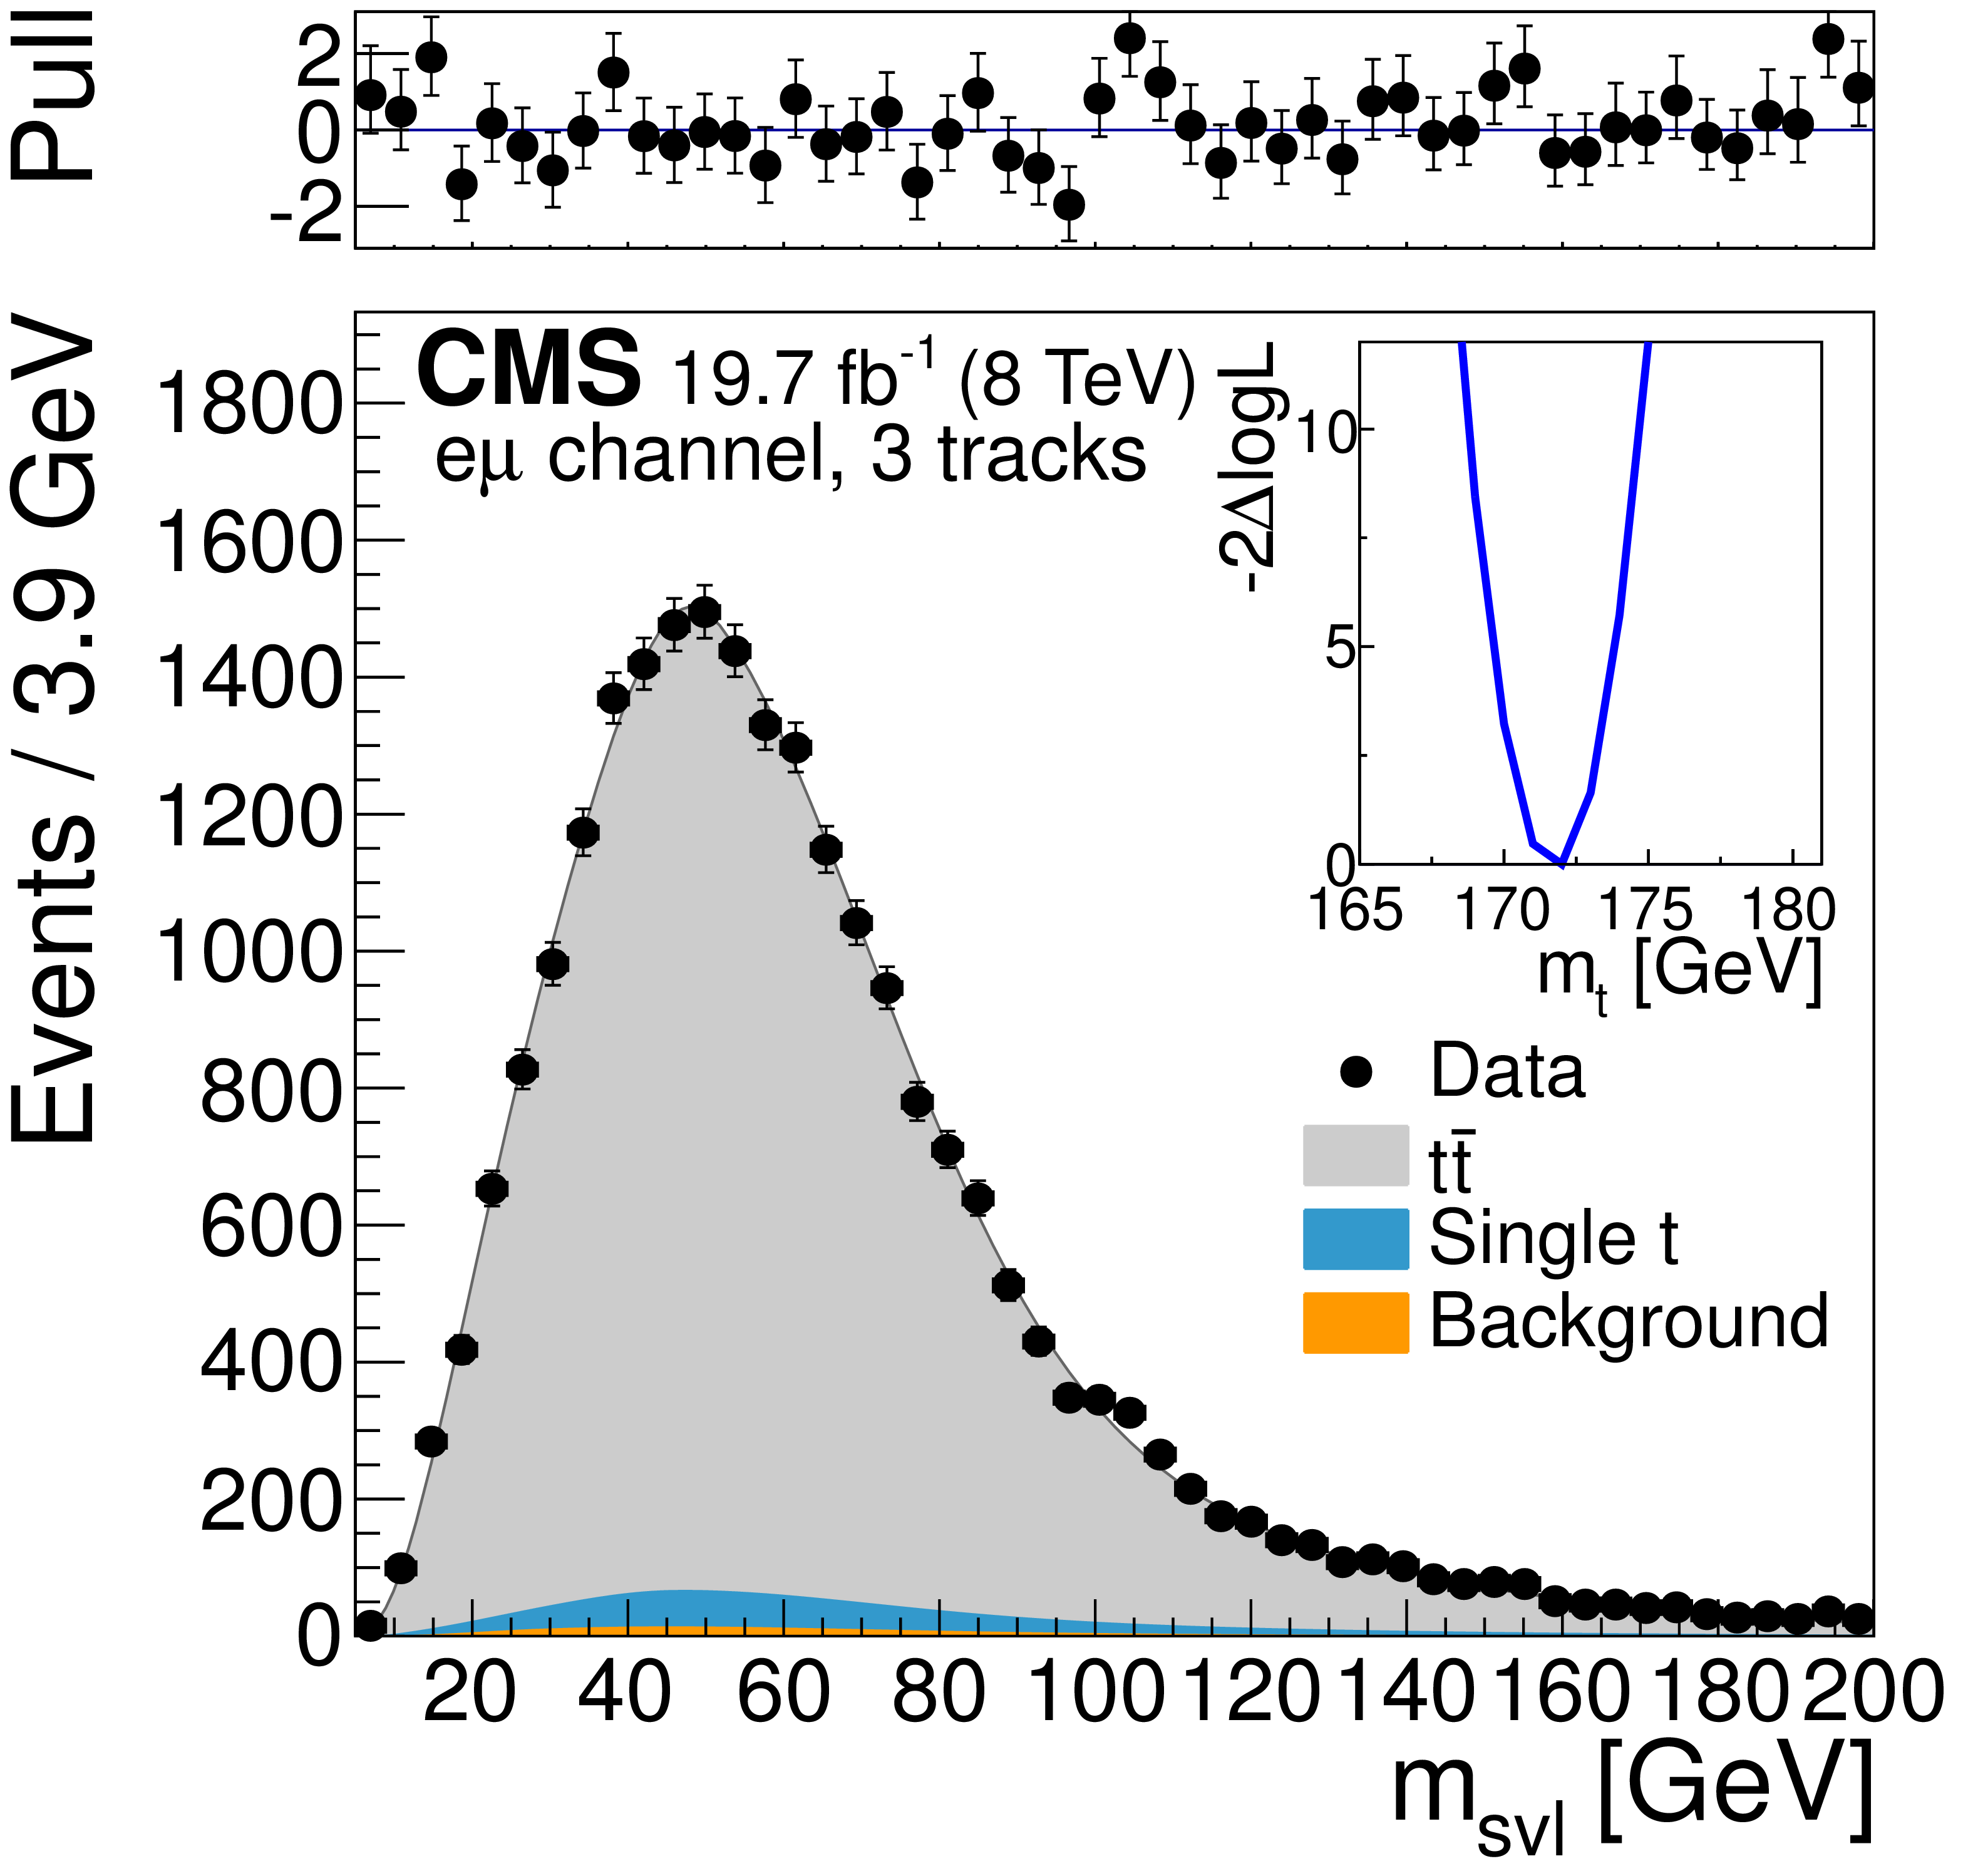
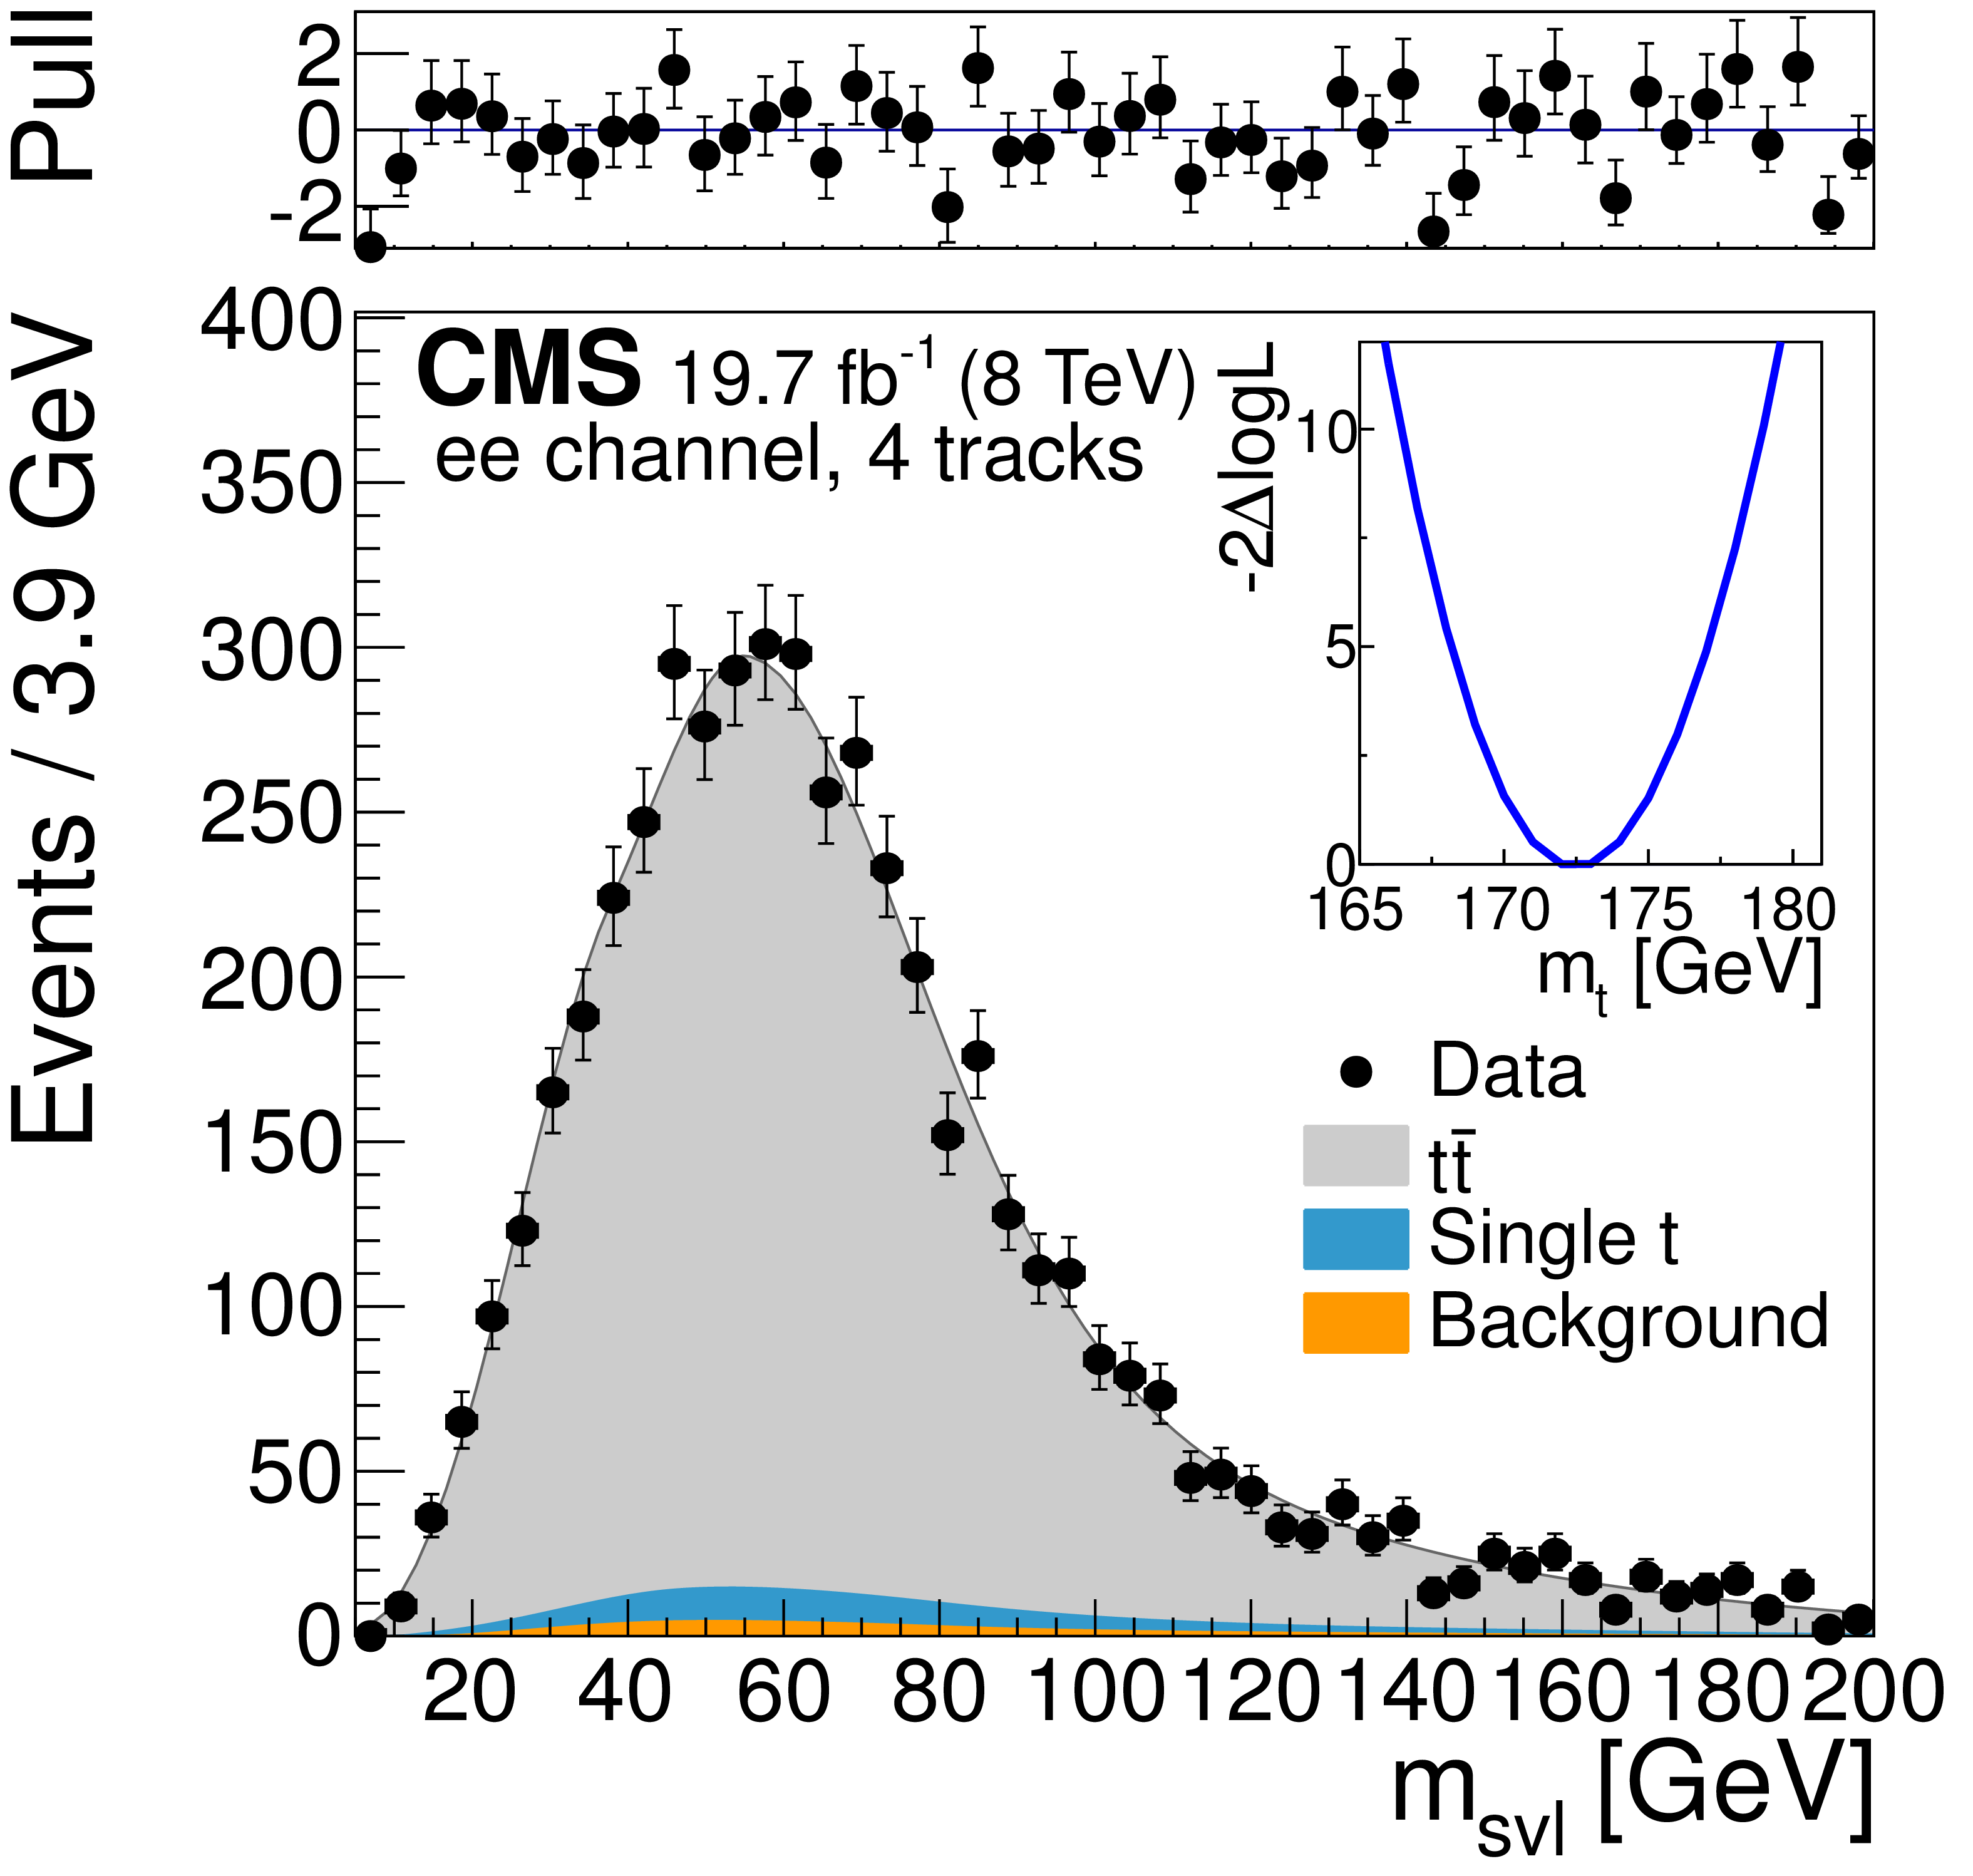
Figure 6-a:
Template fits to the observed ${m_{\mathrm {svl}}} $ distributions for the three dilepton channels ($ {\mathrm{ e } \mu } $, ${\mathrm{ e } \mathrm{ e } } $, ${\mu \mu } $ from (a,b,c) to (d,e,f) to (g,h,i)), and for exactly three, four, and five tracks assigned to the secondary vertex (from (a,d,g) to (b,e,h) to (c,f,i)). The top panels show the bin-by-bin difference between the observed data and the fit result, divided by the statistical uncertainty (pull). The inset shows the scan of the negative log-likelihood as a function of the calibrated top quark mass, accounting only for the statistical uncertainty, when performed exclusively in each event category. |
png pdf |
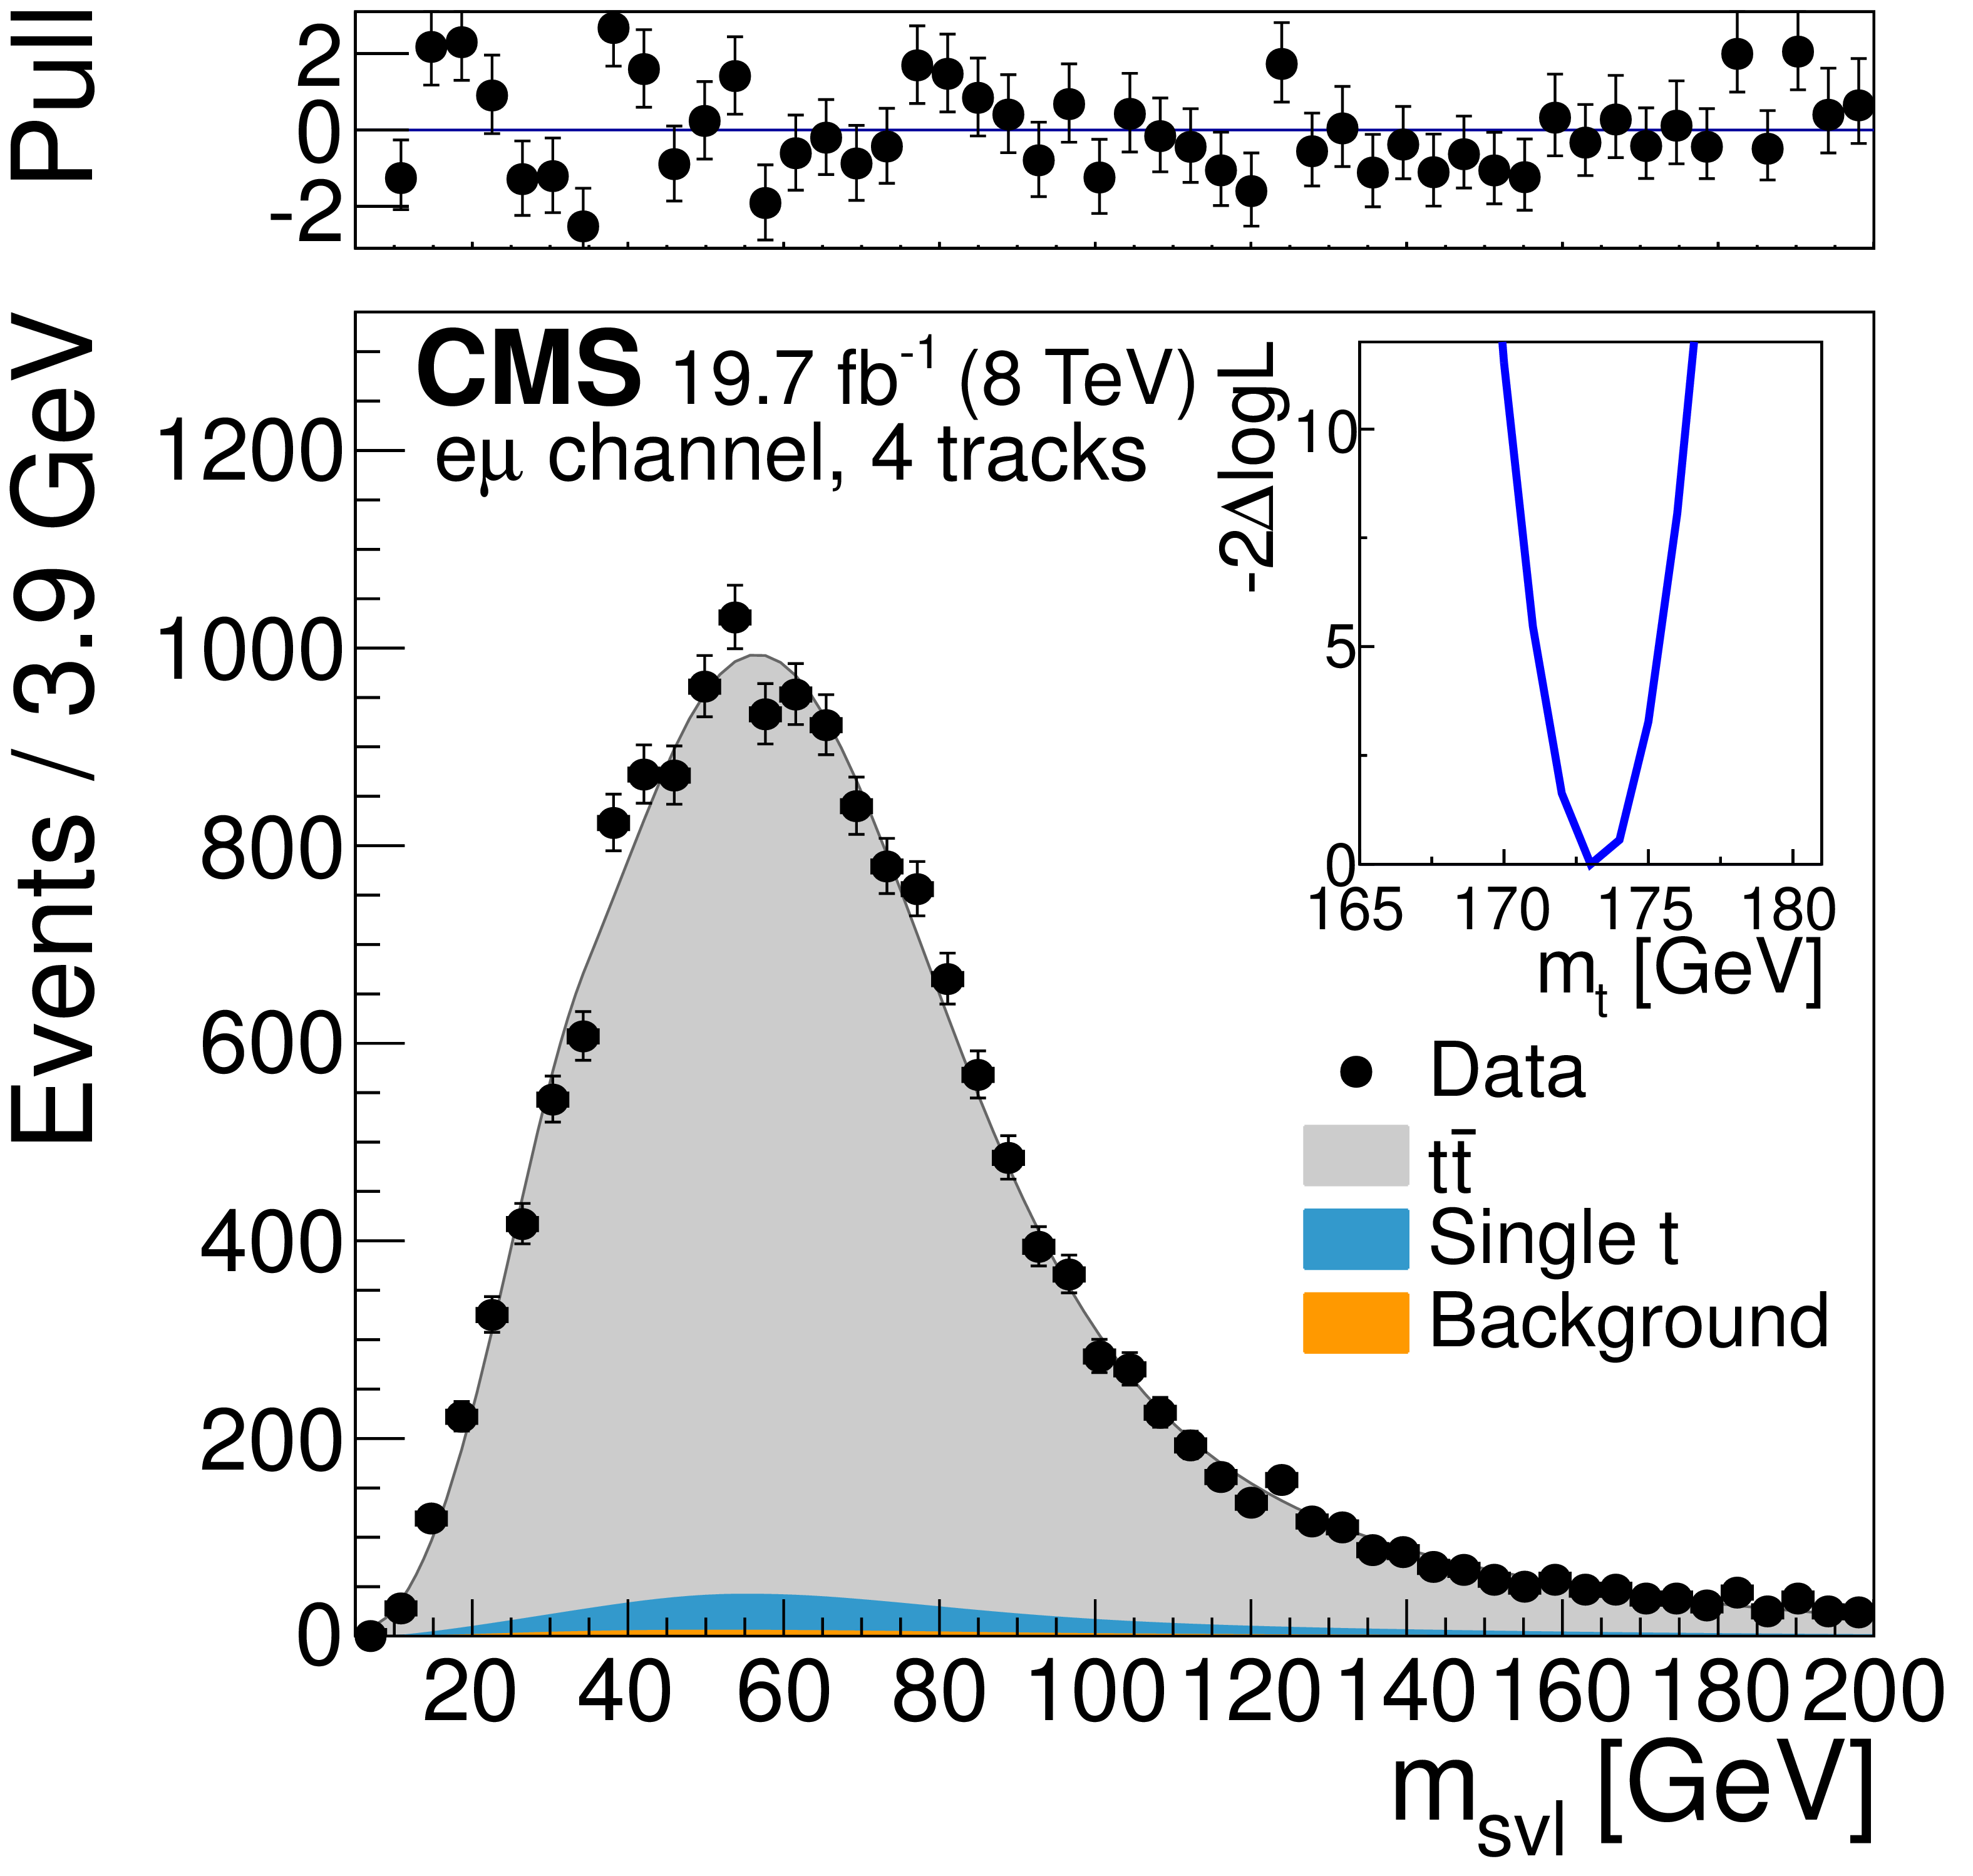
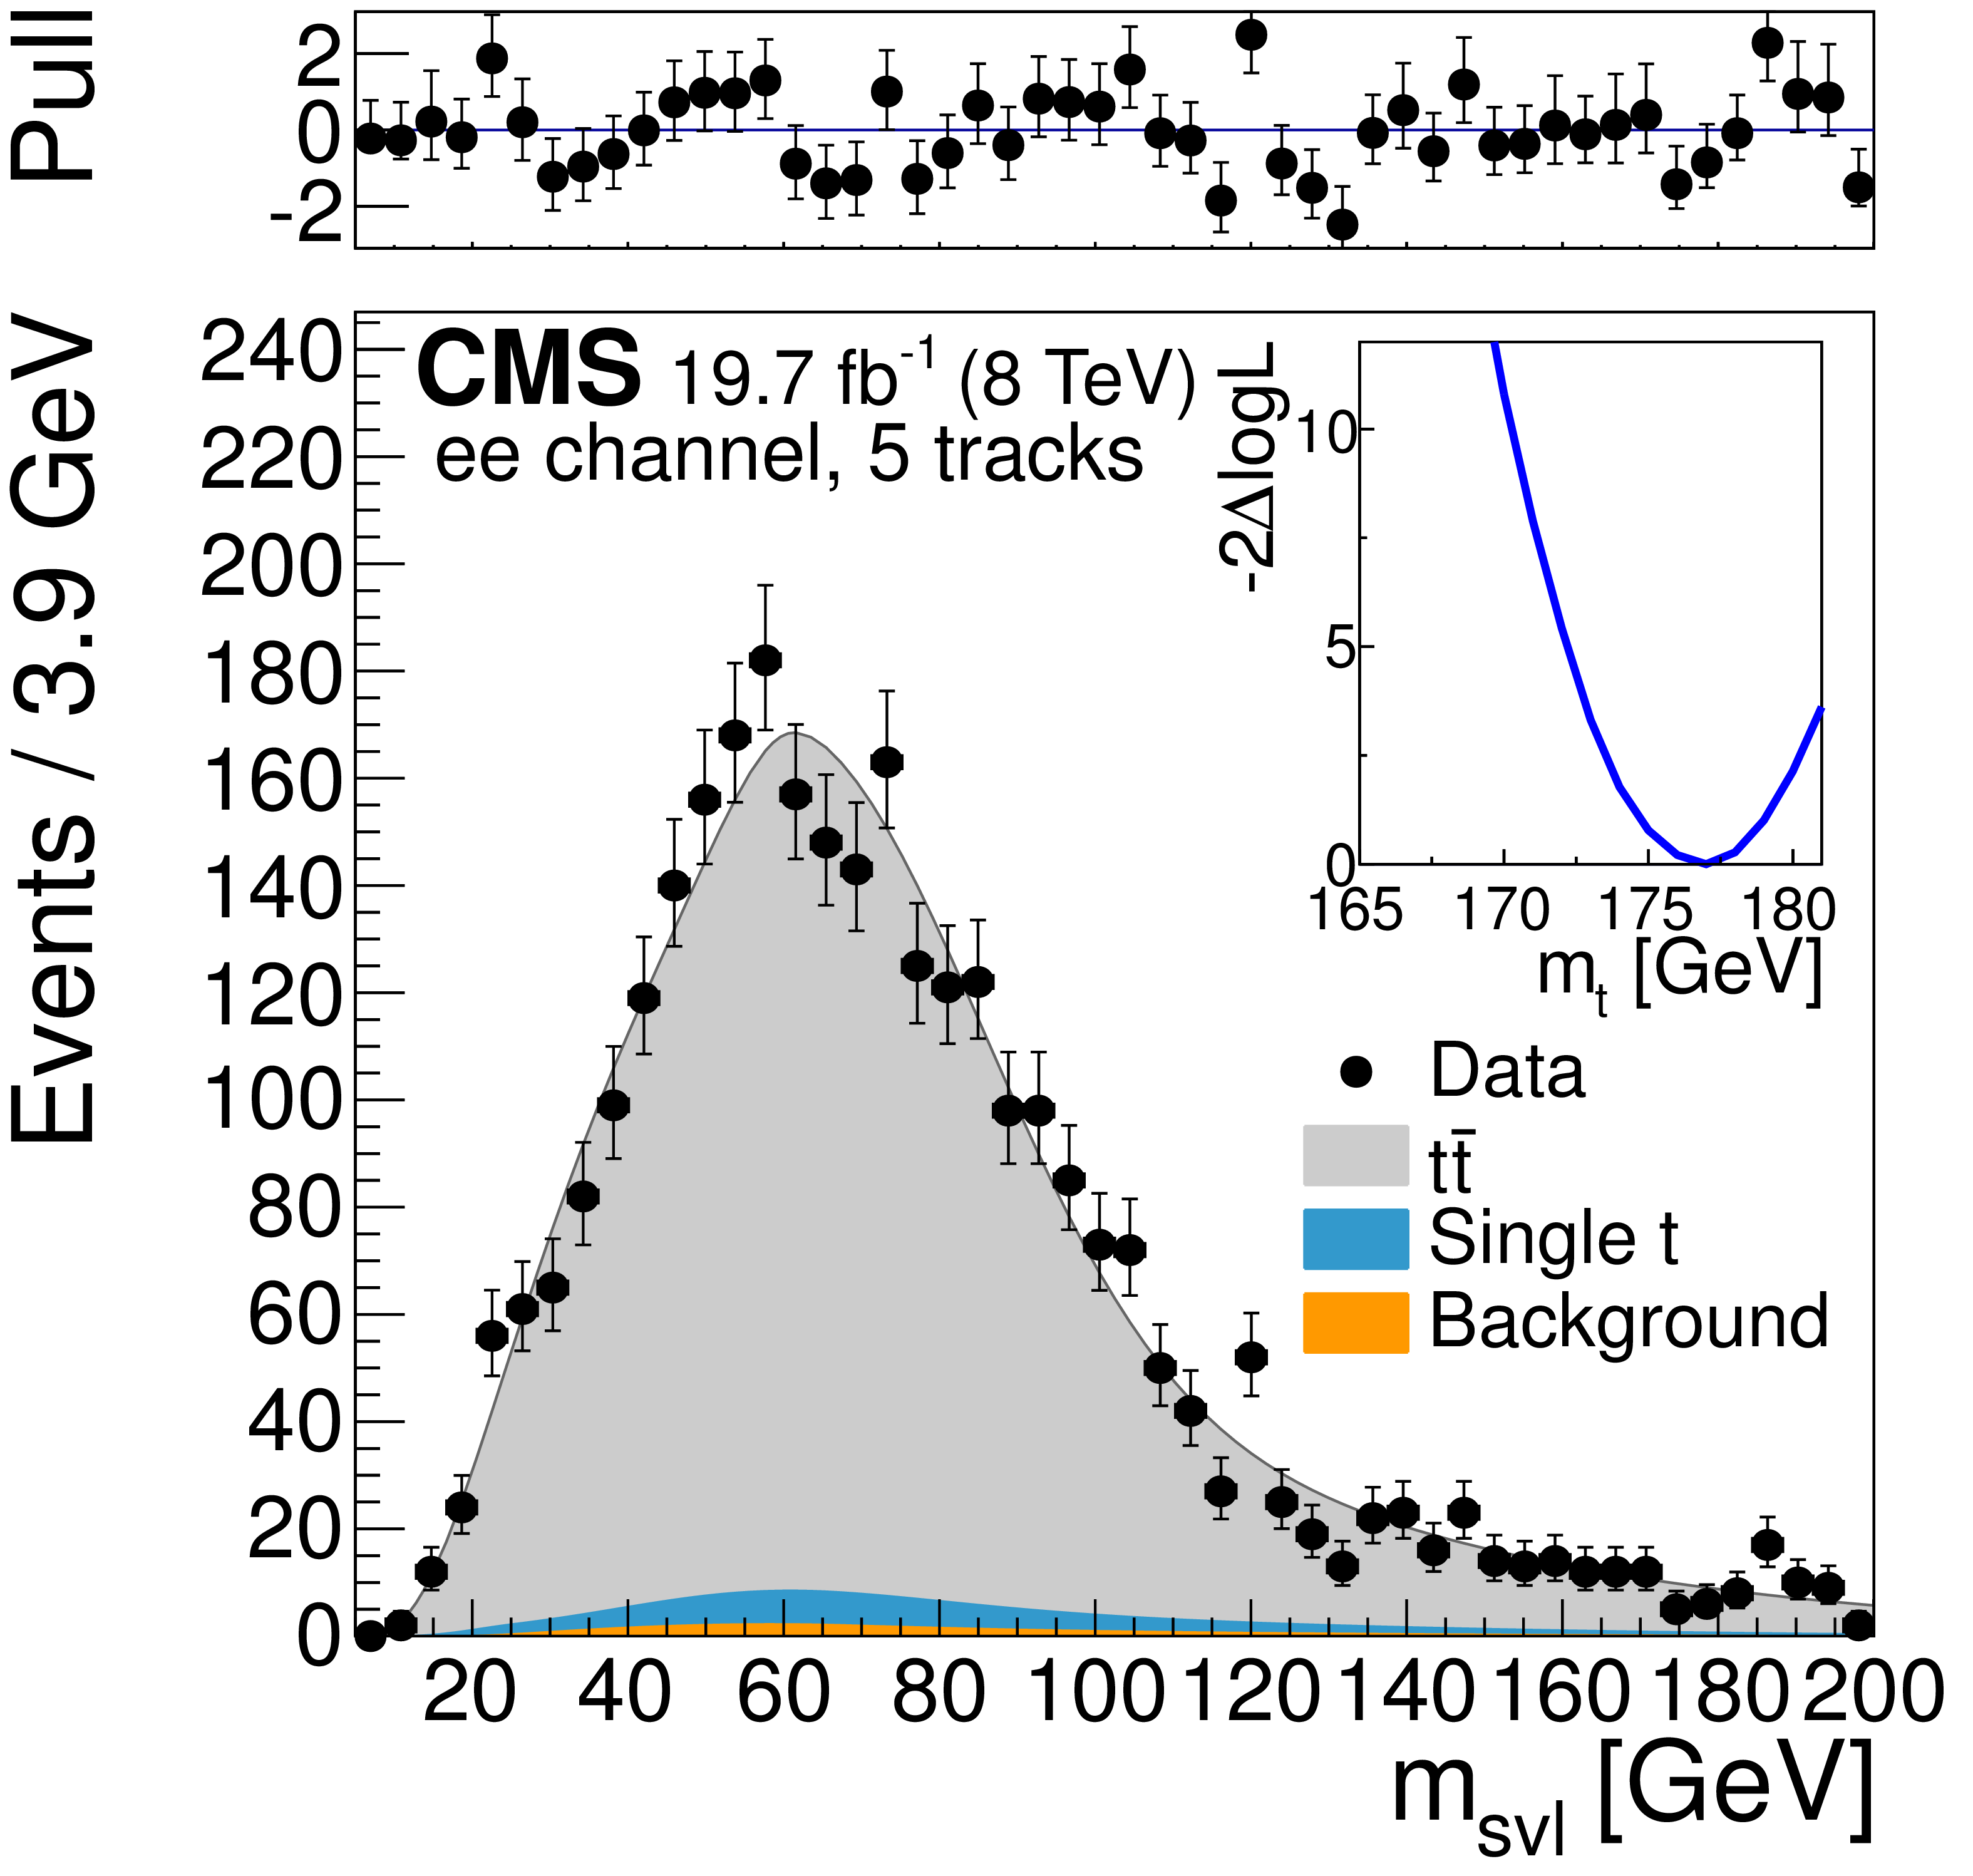
Figure 6-b:
Template fits to the observed ${m_{\mathrm {svl}}} $ distributions for the three dilepton channels ($ {\mathrm{ e } \mu } $, ${\mathrm{ e } \mathrm{ e } } $, ${\mu \mu } $ from (a,b,c) to (d,e,f) to (g,h,i)), and for exactly three, four, and five tracks assigned to the secondary vertex (from (a,d,g) to (b,e,h) to (c,f,i)). The top panels show the bin-by-bin difference between the observed data and the fit result, divided by the statistical uncertainty (pull). The inset shows the scan of the negative log-likelihood as a function of the calibrated top quark mass, accounting only for the statistical uncertainty, when performed exclusively in each event category. |
png pdf |
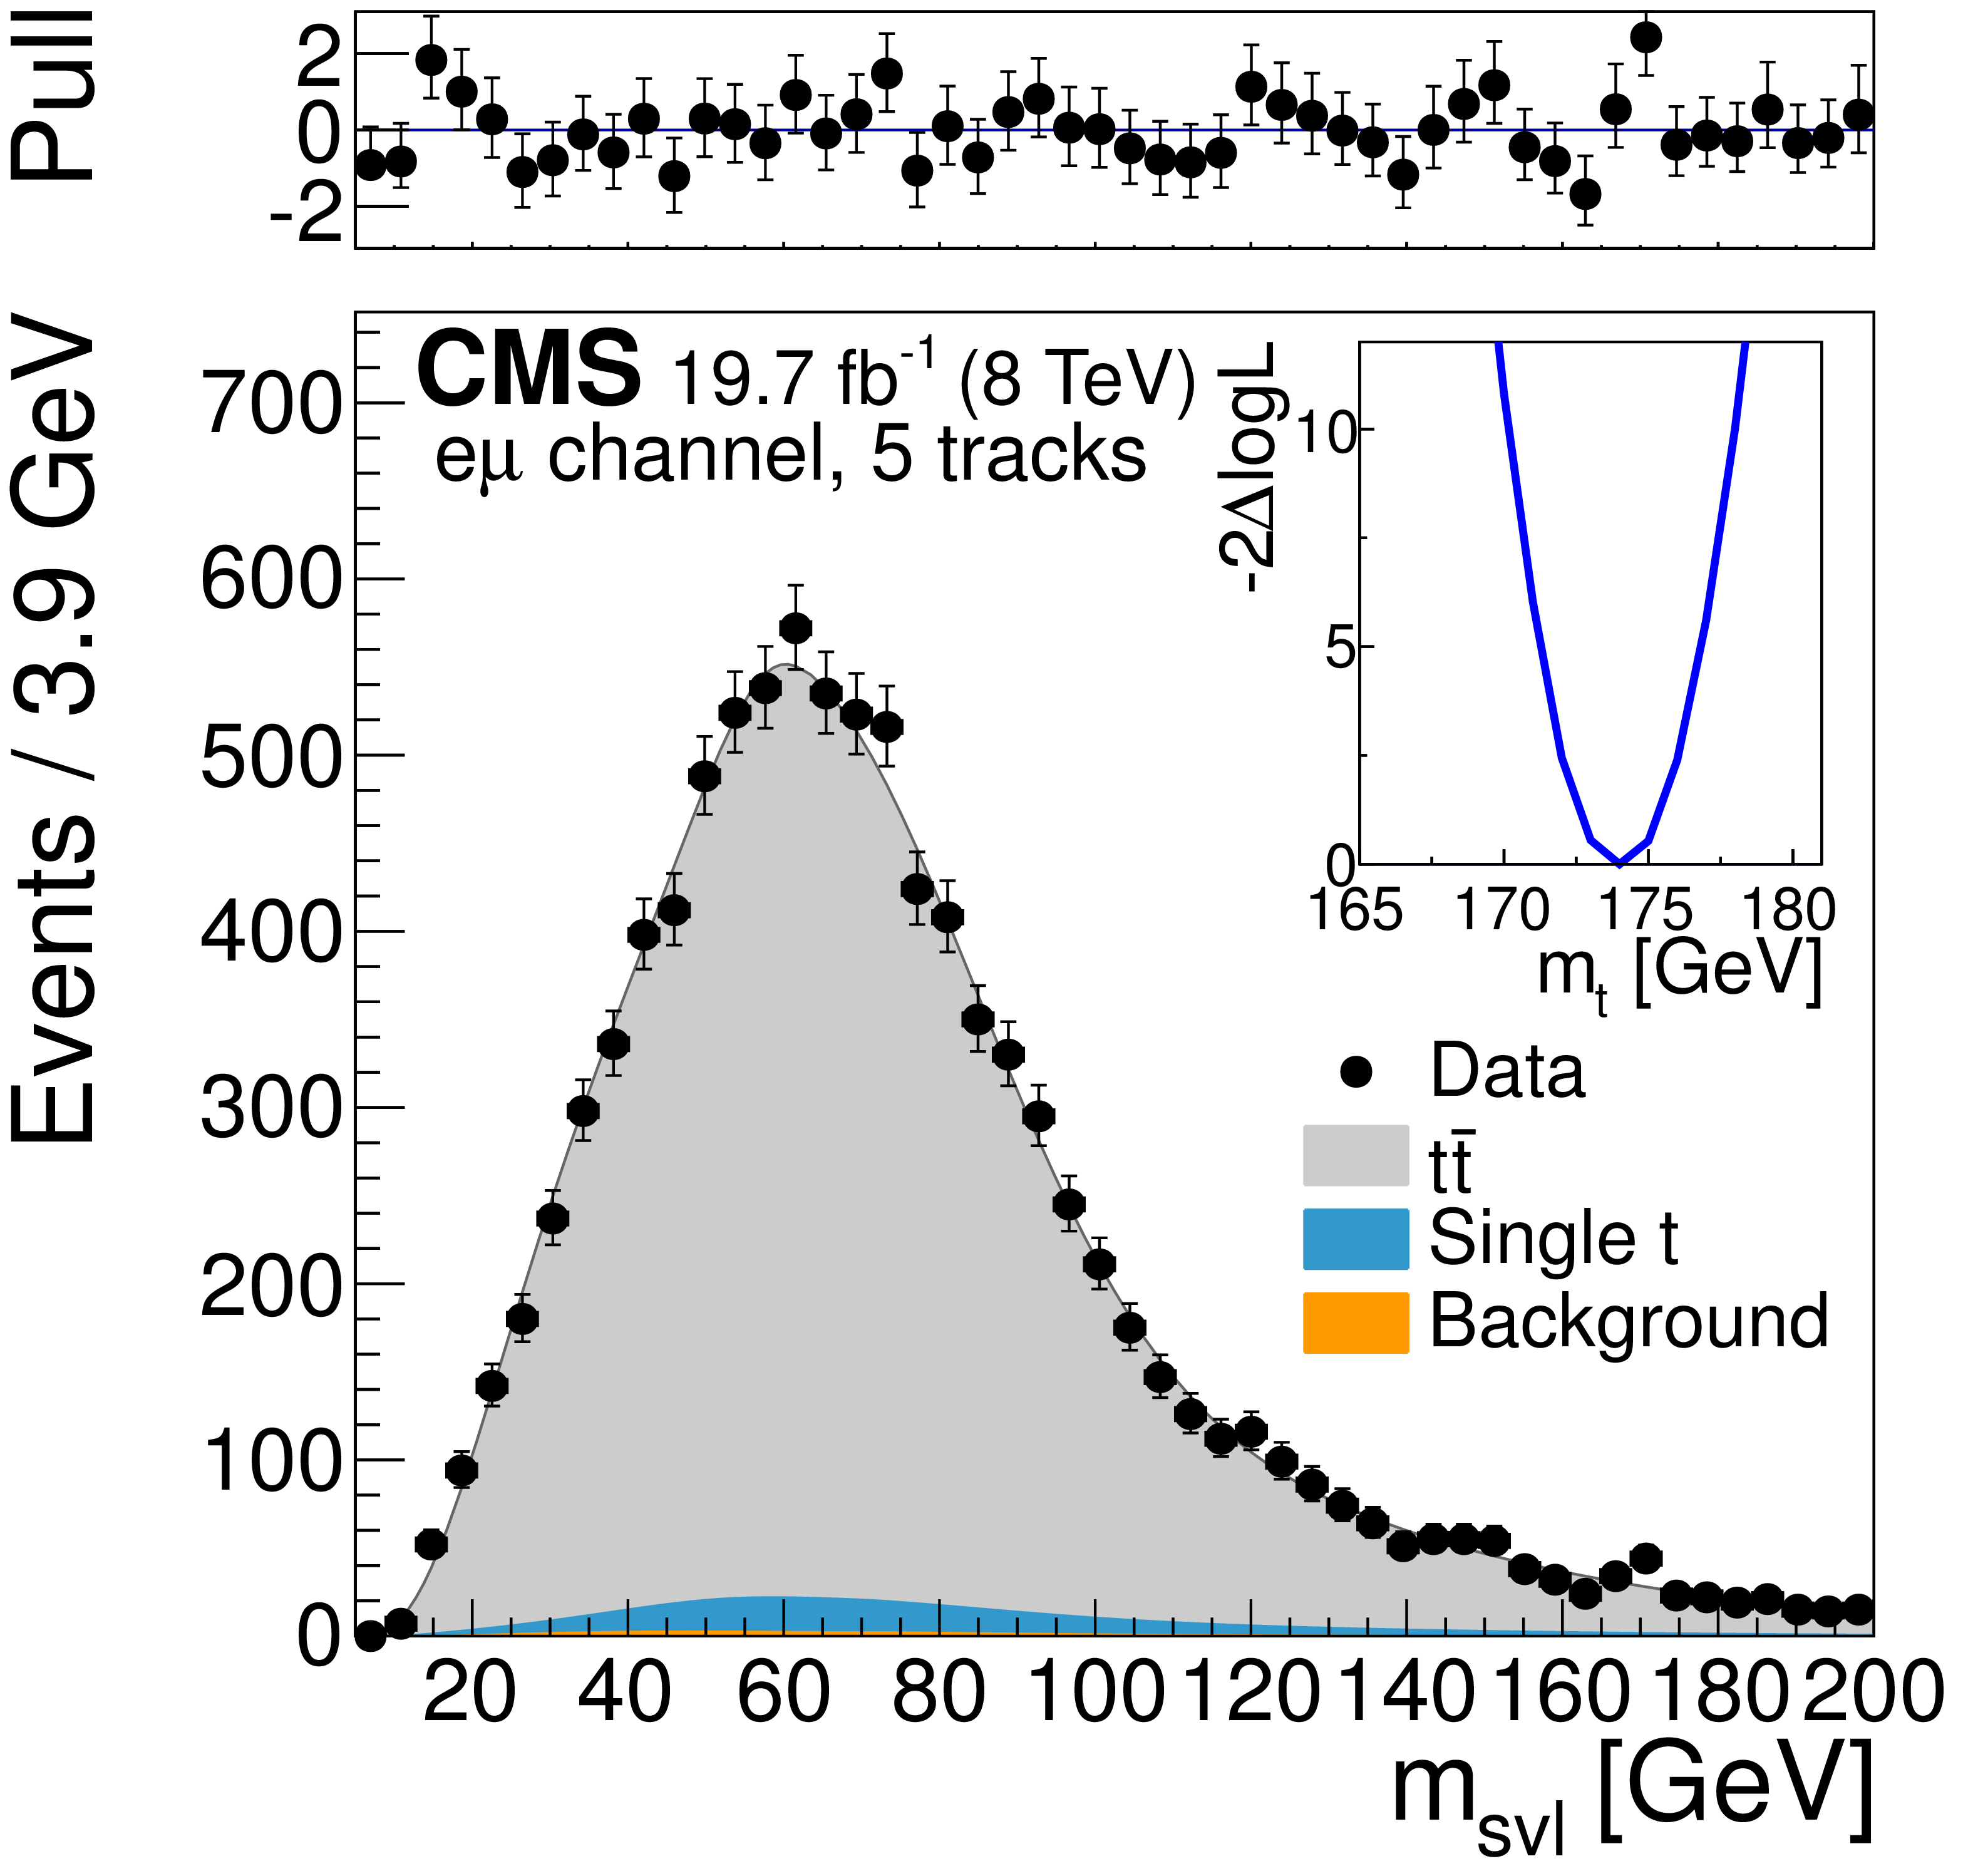
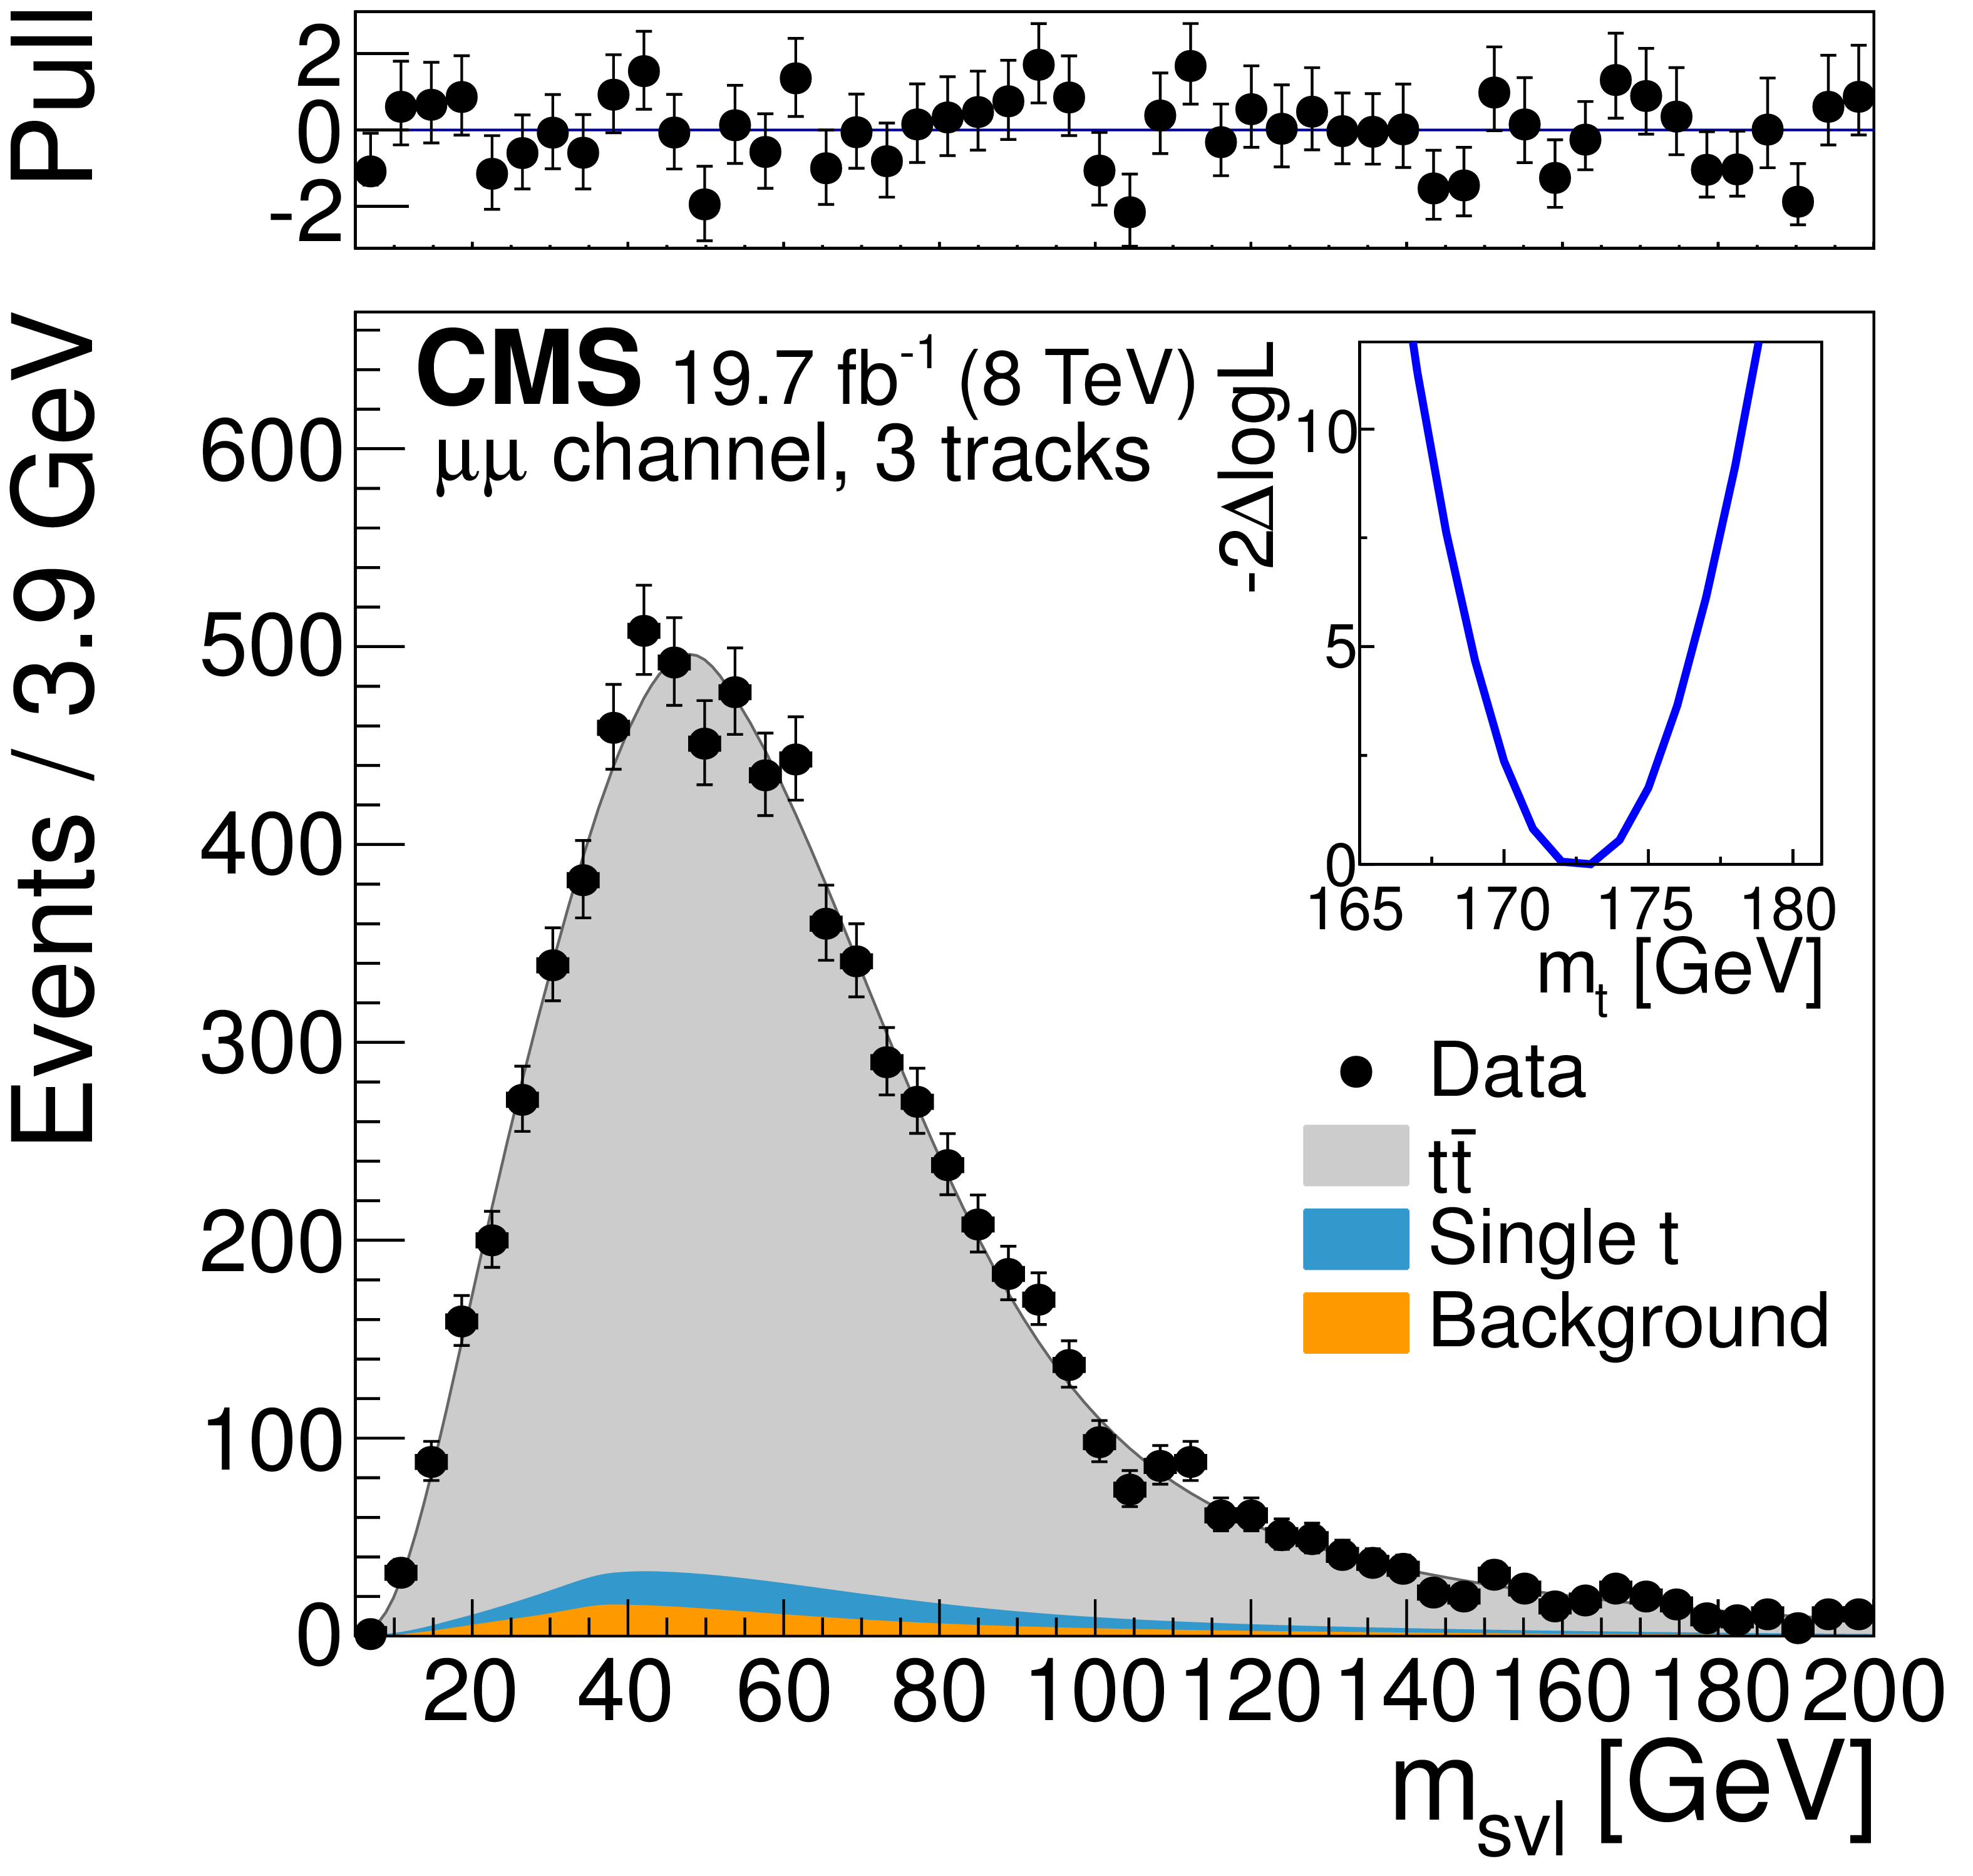
Figure 6-c:
Template fits to the observed ${m_{\mathrm {svl}}} $ distributions for the three dilepton channels ($ {\mathrm{ e } \mu } $, ${\mathrm{ e } \mathrm{ e } } $, ${\mu \mu } $ from (a,b,c) to (d,e,f) to (g,h,i)), and for exactly three, four, and five tracks assigned to the secondary vertex (from (a,d,g) to (b,e,h) to (c,f,i)). The top panels show the bin-by-bin difference between the observed data and the fit result, divided by the statistical uncertainty (pull). The inset shows the scan of the negative log-likelihood as a function of the calibrated top quark mass, accounting only for the statistical uncertainty, when performed exclusively in each event category. |
png pdf |
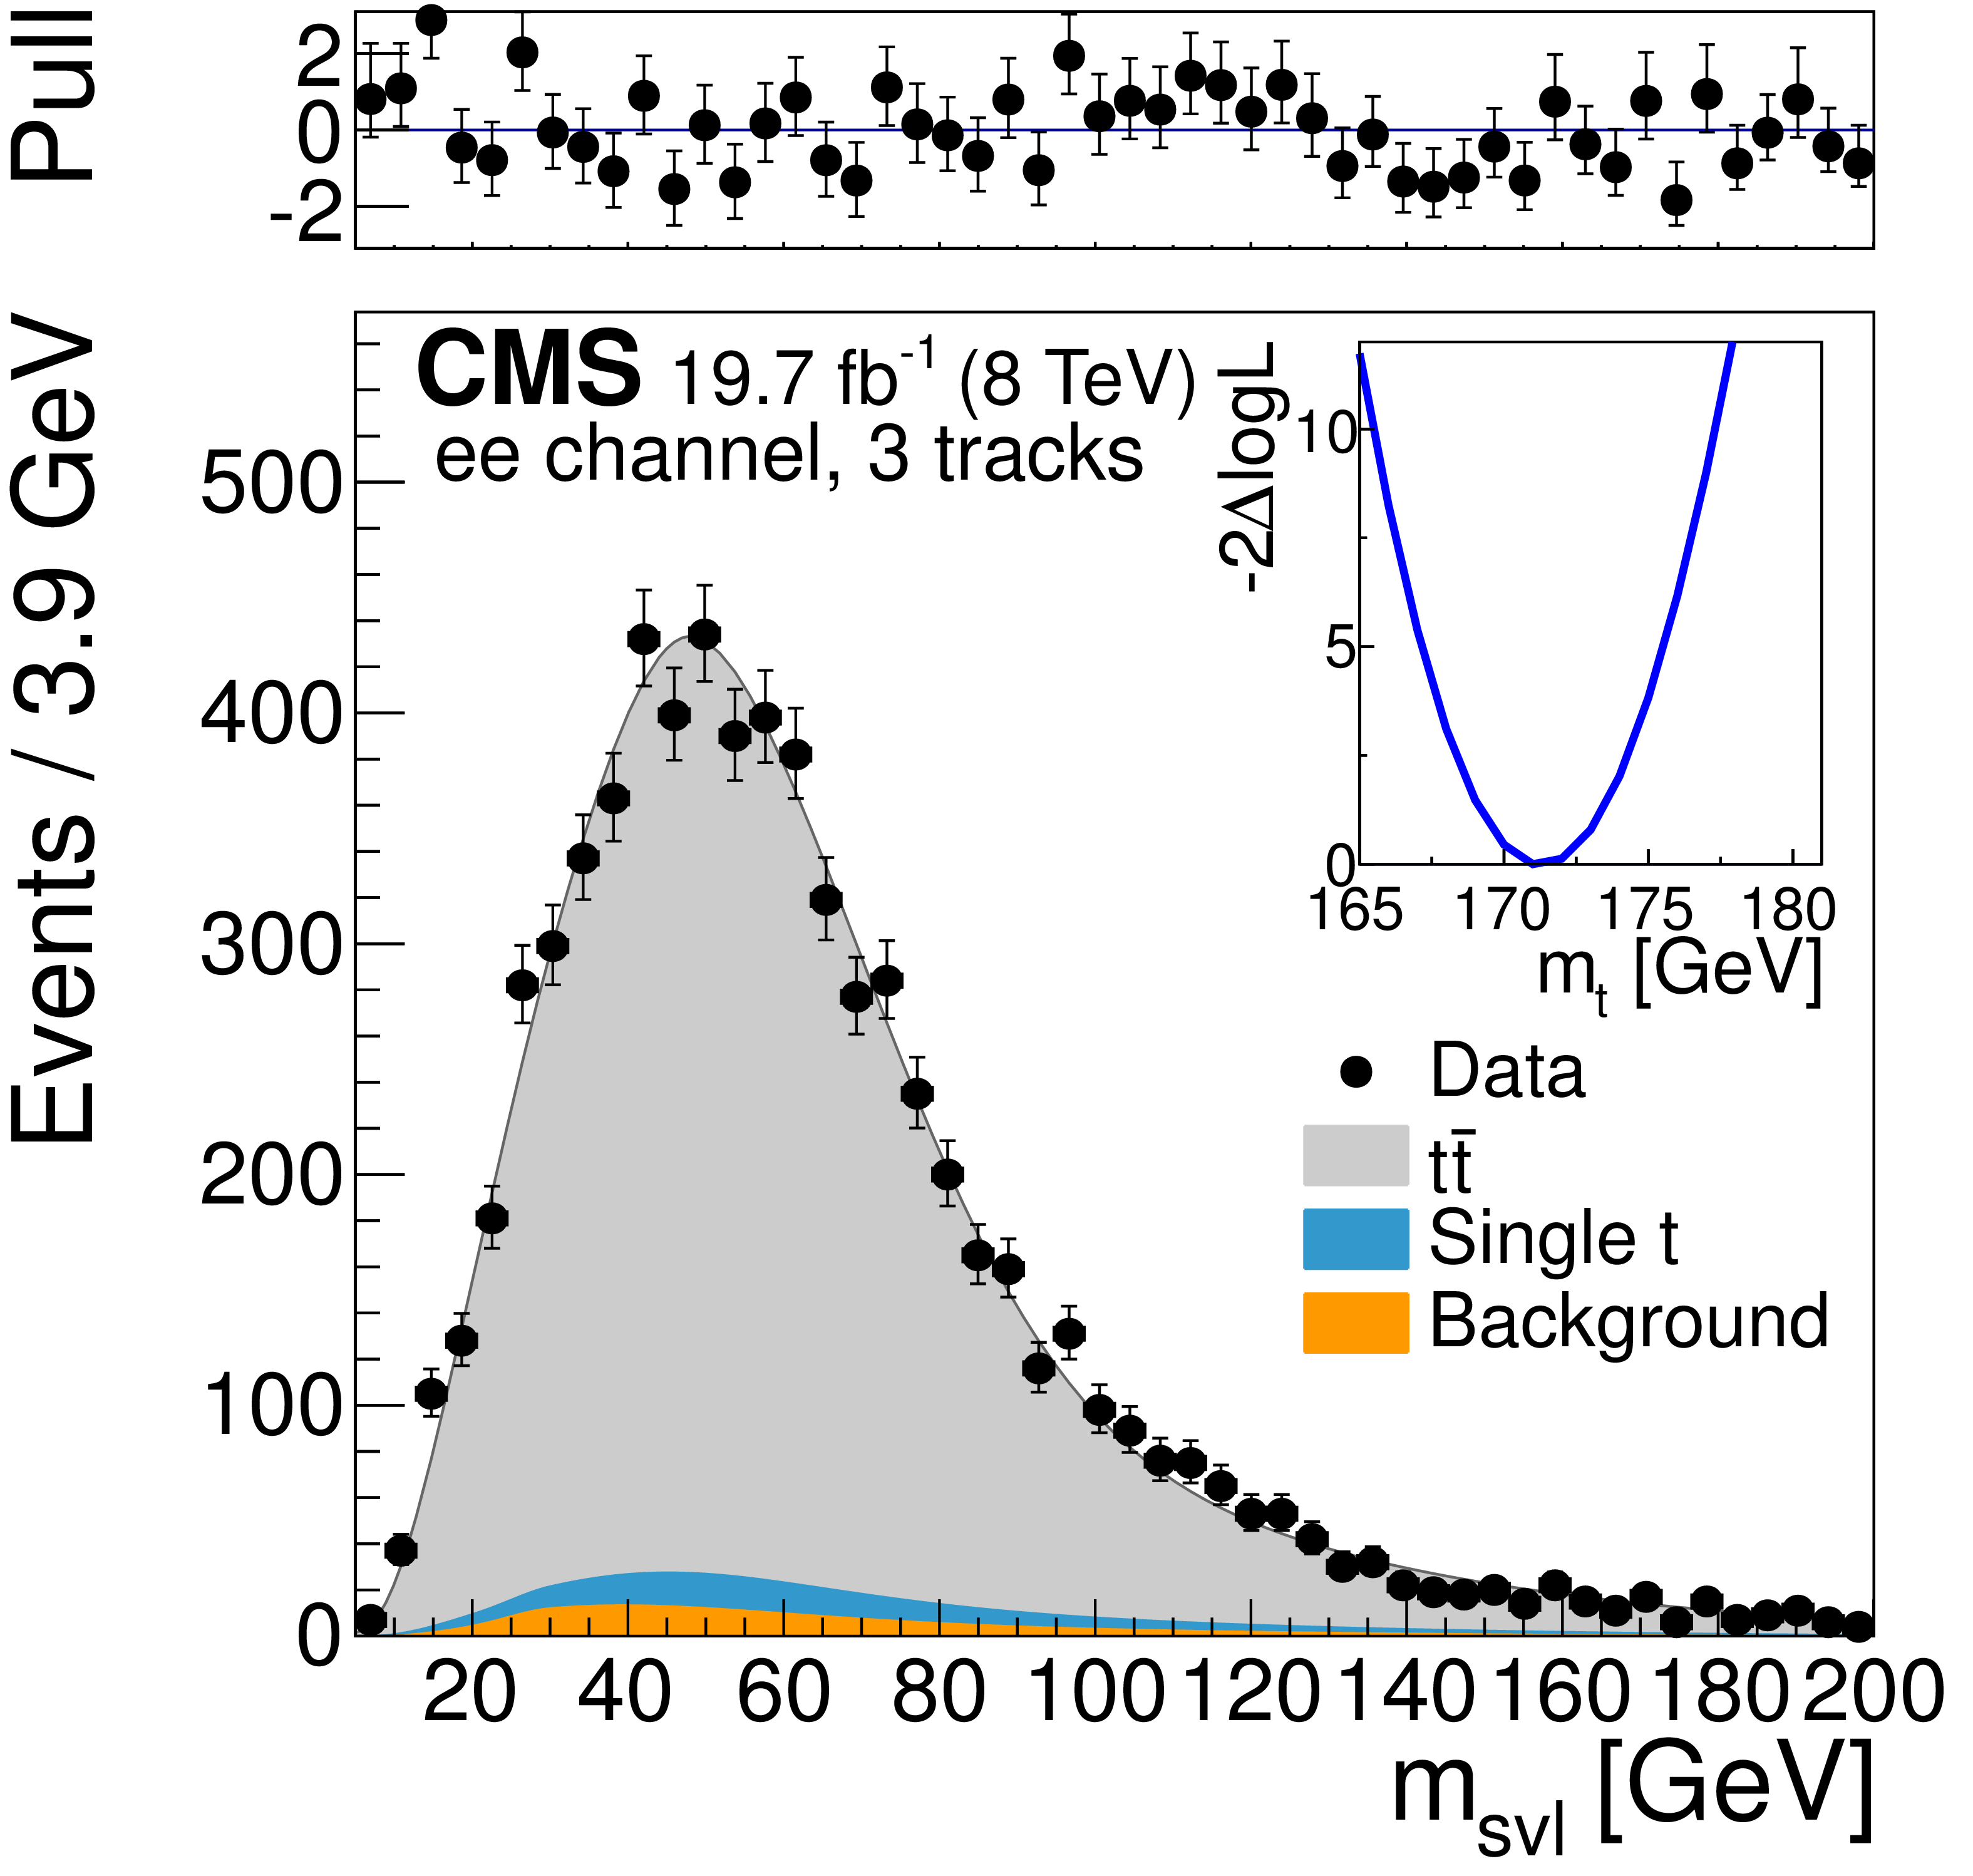
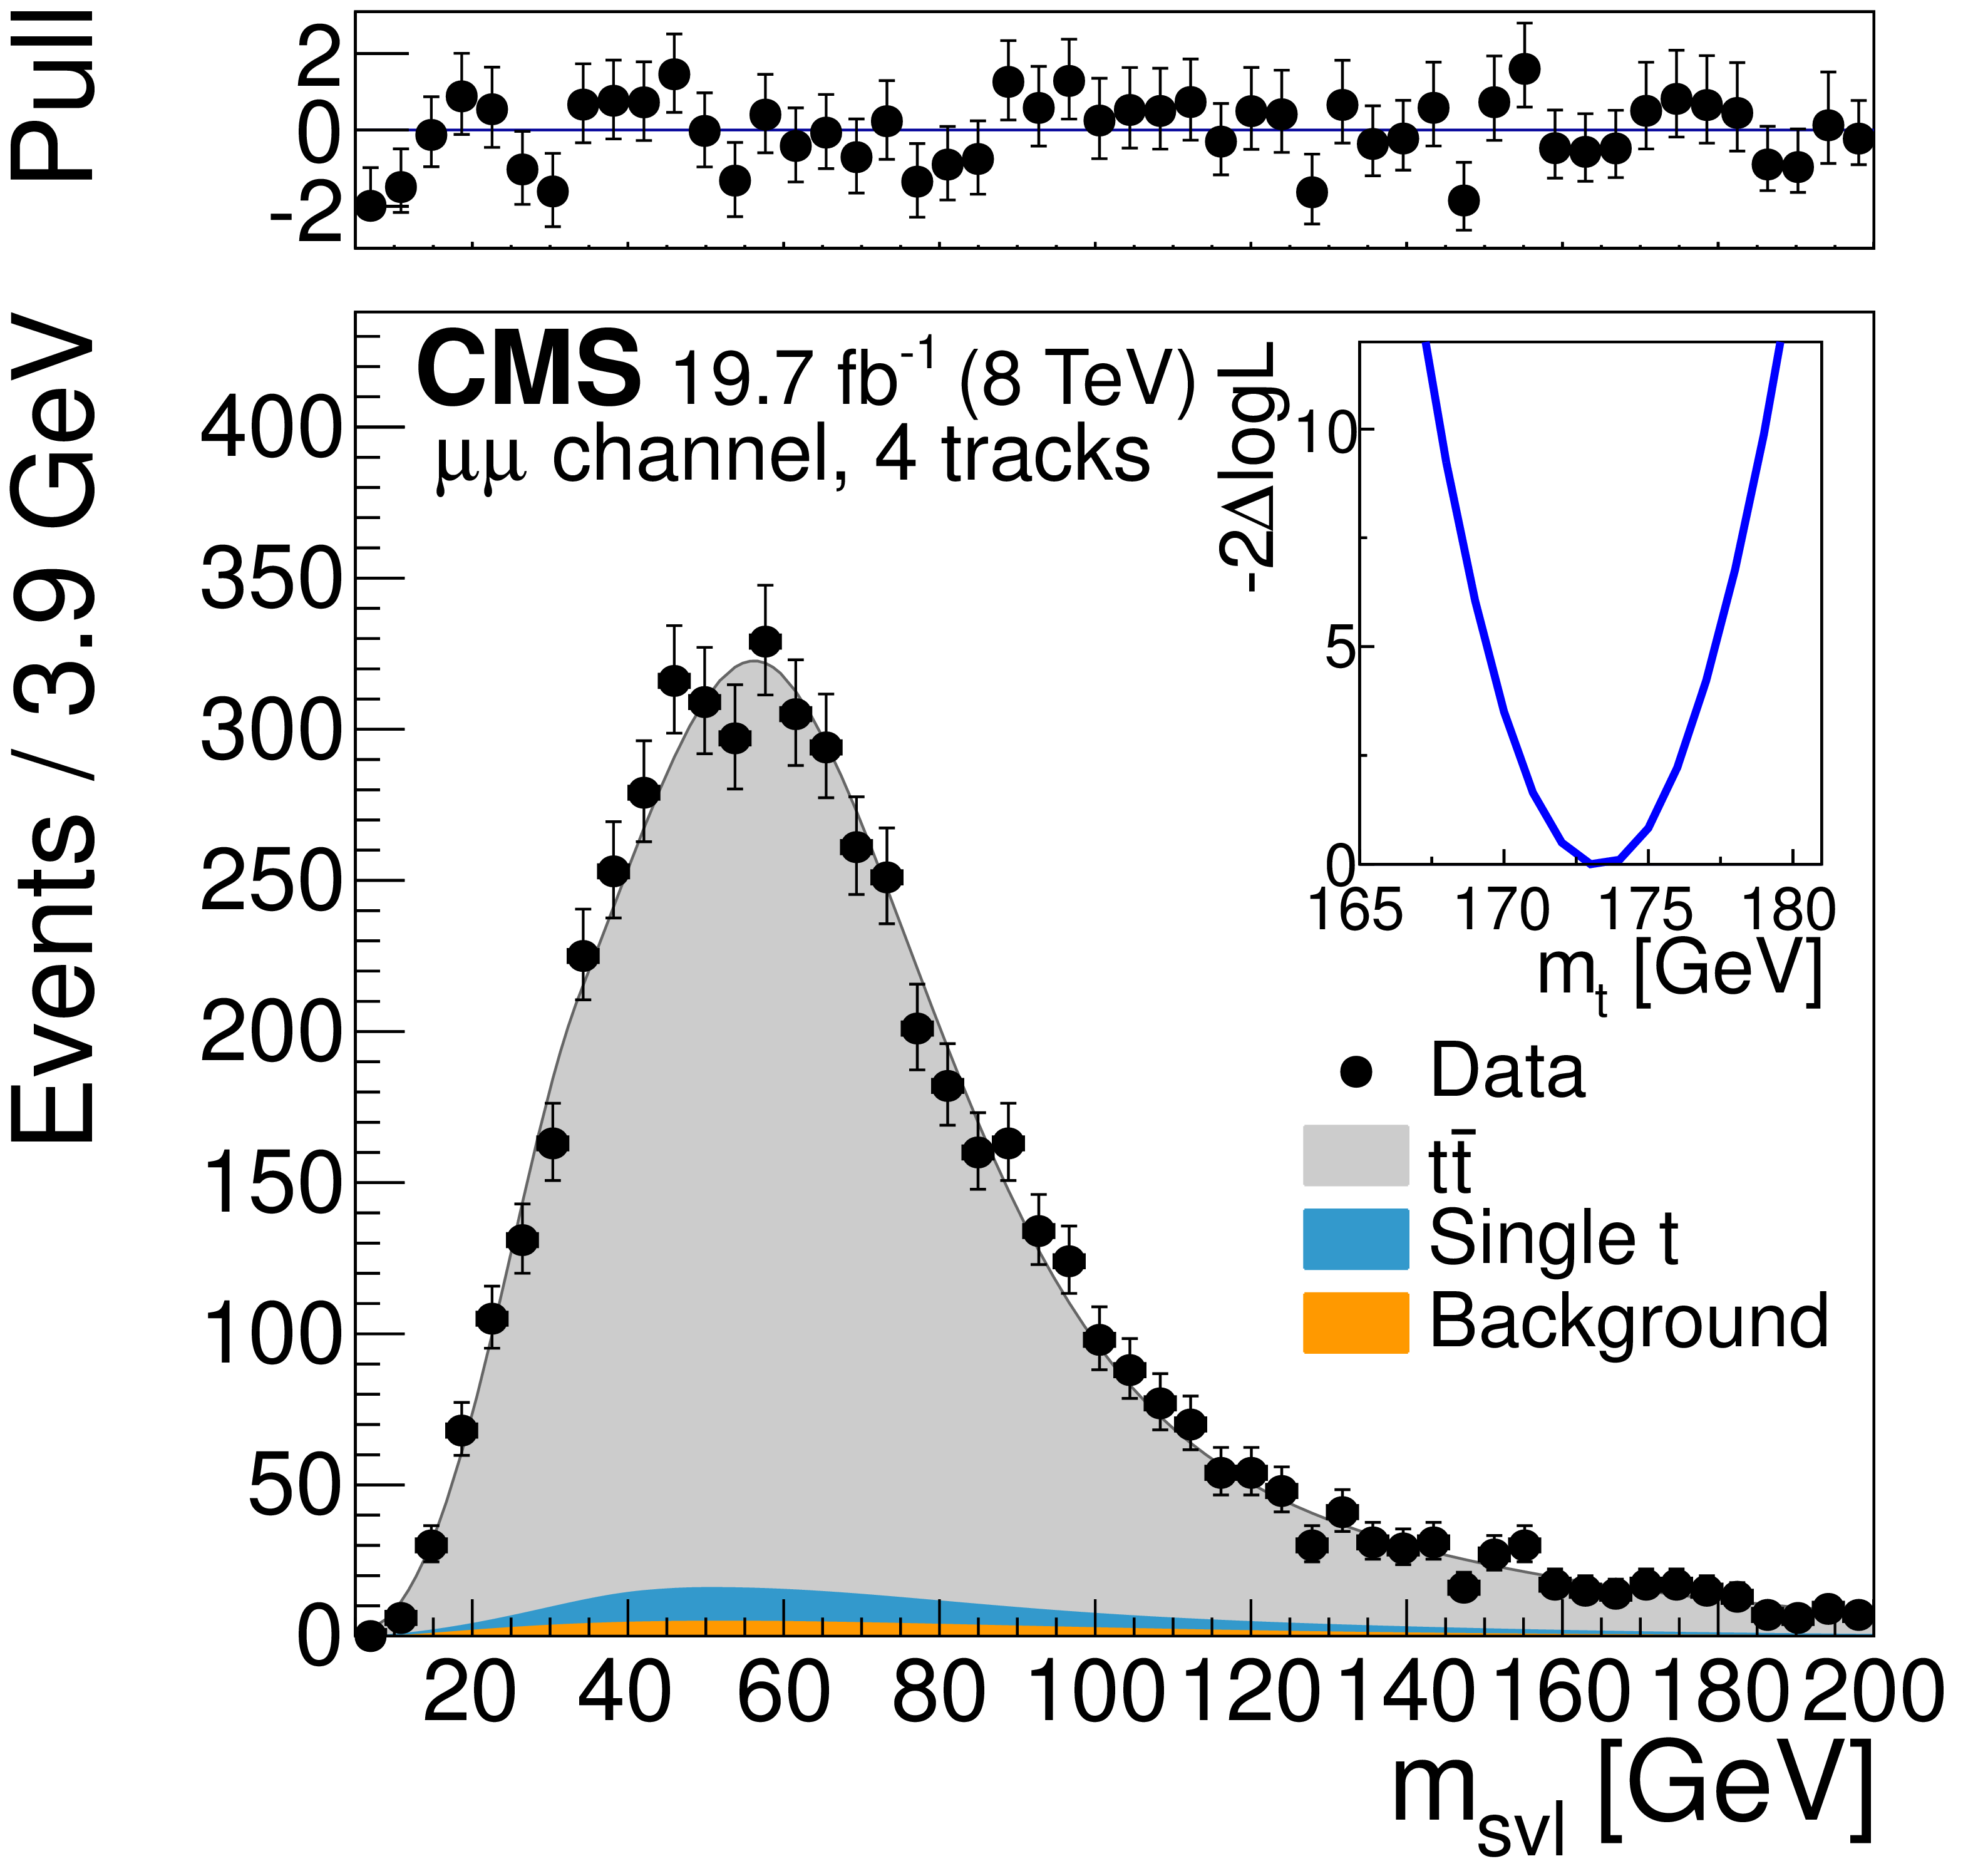
Figure 6-d:
Template fits to the observed ${m_{\mathrm {svl}}} $ distributions for the three dilepton channels ($ {\mathrm{ e } \mu } $, ${\mathrm{ e } \mathrm{ e } } $, ${\mu \mu } $ from (a,b,c) to (d,e,f) to (g,h,i)), and for exactly three, four, and five tracks assigned to the secondary vertex (from (a,d,g) to (b,e,h) to (c,f,i)). The top panels show the bin-by-bin difference between the observed data and the fit result, divided by the statistical uncertainty (pull). The inset shows the scan of the negative log-likelihood as a function of the calibrated top quark mass, accounting only for the statistical uncertainty, when performed exclusively in each event category. |
png pdf |
Figure 6-e:
Template fits to the observed ${m_{\mathrm {svl}}} $ distributions for the three dilepton channels ($ {\mathrm{ e } \mu } $, ${\mathrm{ e } \mathrm{ e } } $, ${\mu \mu } $ from (a,b,c) to (d,e,f) to (g,h,i)), and for exactly three, four, and five tracks assigned to the secondary vertex (from (a,d,g) to (b,e,h) to (c,f,i)). The top panels show the bin-by-bin difference between the observed data and the fit result, divided by the statistical uncertainty (pull). The inset shows the scan of the negative log-likelihood as a function of the calibrated top quark mass, accounting only for the statistical uncertainty, when performed exclusively in each event category. |
png pdf |
Figure 6-f:
Template fits to the observed ${m_{\mathrm {svl}}} $ distributions for the three dilepton channels ($ {\mathrm{ e } \mu } $, ${\mathrm{ e } \mathrm{ e } } $, ${\mu \mu } $ from (a,b,c) to (d,e,f) to (g,h,i)), and for exactly three, four, and five tracks assigned to the secondary vertex (from (a,d,g) to (b,e,h) to (c,f,i)). The top panels show the bin-by-bin difference between the observed data and the fit result, divided by the statistical uncertainty (pull). The inset shows the scan of the negative log-likelihood as a function of the calibrated top quark mass, accounting only for the statistical uncertainty, when performed exclusively in each event category. |
png pdf |
Figure 6-g:
Template fits to the observed ${m_{\mathrm {svl}}} $ distributions for the three dilepton channels ($ {\mathrm{ e } \mu } $, ${\mathrm{ e } \mathrm{ e } } $, ${\mu \mu } $ from (a,b,c) to (d,e,f) to (g,h,i)), and for exactly three, four, and five tracks assigned to the secondary vertex (from (a,d,g) to (b,e,h) to (c,f,i)). The top panels show the bin-by-bin difference between the observed data and the fit result, divided by the statistical uncertainty (pull). The inset shows the scan of the negative log-likelihood as a function of the calibrated top quark mass, accounting only for the statistical uncertainty, when performed exclusively in each event category. |
png pdf |
Figure 6-h:
Template fits to the observed ${m_{\mathrm {svl}}} $ distributions for the three dilepton channels ($ {\mathrm{ e } \mu } $, ${\mathrm{ e } \mathrm{ e } } $, ${\mu \mu } $ from (a,b,c) to (d,e,f) to (g,h,i)), and for exactly three, four, and five tracks assigned to the secondary vertex (from (a,d,g) to (b,e,h) to (c,f,i)). The top panels show the bin-by-bin difference between the observed data and the fit result, divided by the statistical uncertainty (pull). The inset shows the scan of the negative log-likelihood as a function of the calibrated top quark mass, accounting only for the statistical uncertainty, when performed exclusively in each event category. |

png pdf |
Figure 6-i:
Template fits to the observed ${m_{\mathrm {svl}}} $ distributions for the three dilepton channels ($ {\mathrm{ e } \mu } $, ${\mathrm{ e } \mathrm{ e } } $, ${\mu \mu } $ from (a,b,c) to (d,e,f) to (g,h,i)), and for exactly three, four, and five tracks assigned to the secondary vertex (from (a,d,g) to (b,e,h) to (c,f,i)). The top panels show the bin-by-bin difference between the observed data and the fit result, divided by the statistical uncertainty (pull). The inset shows the scan of the negative log-likelihood as a function of the calibrated top quark mass, accounting only for the statistical uncertainty, when performed exclusively in each event category. |
png pdf |
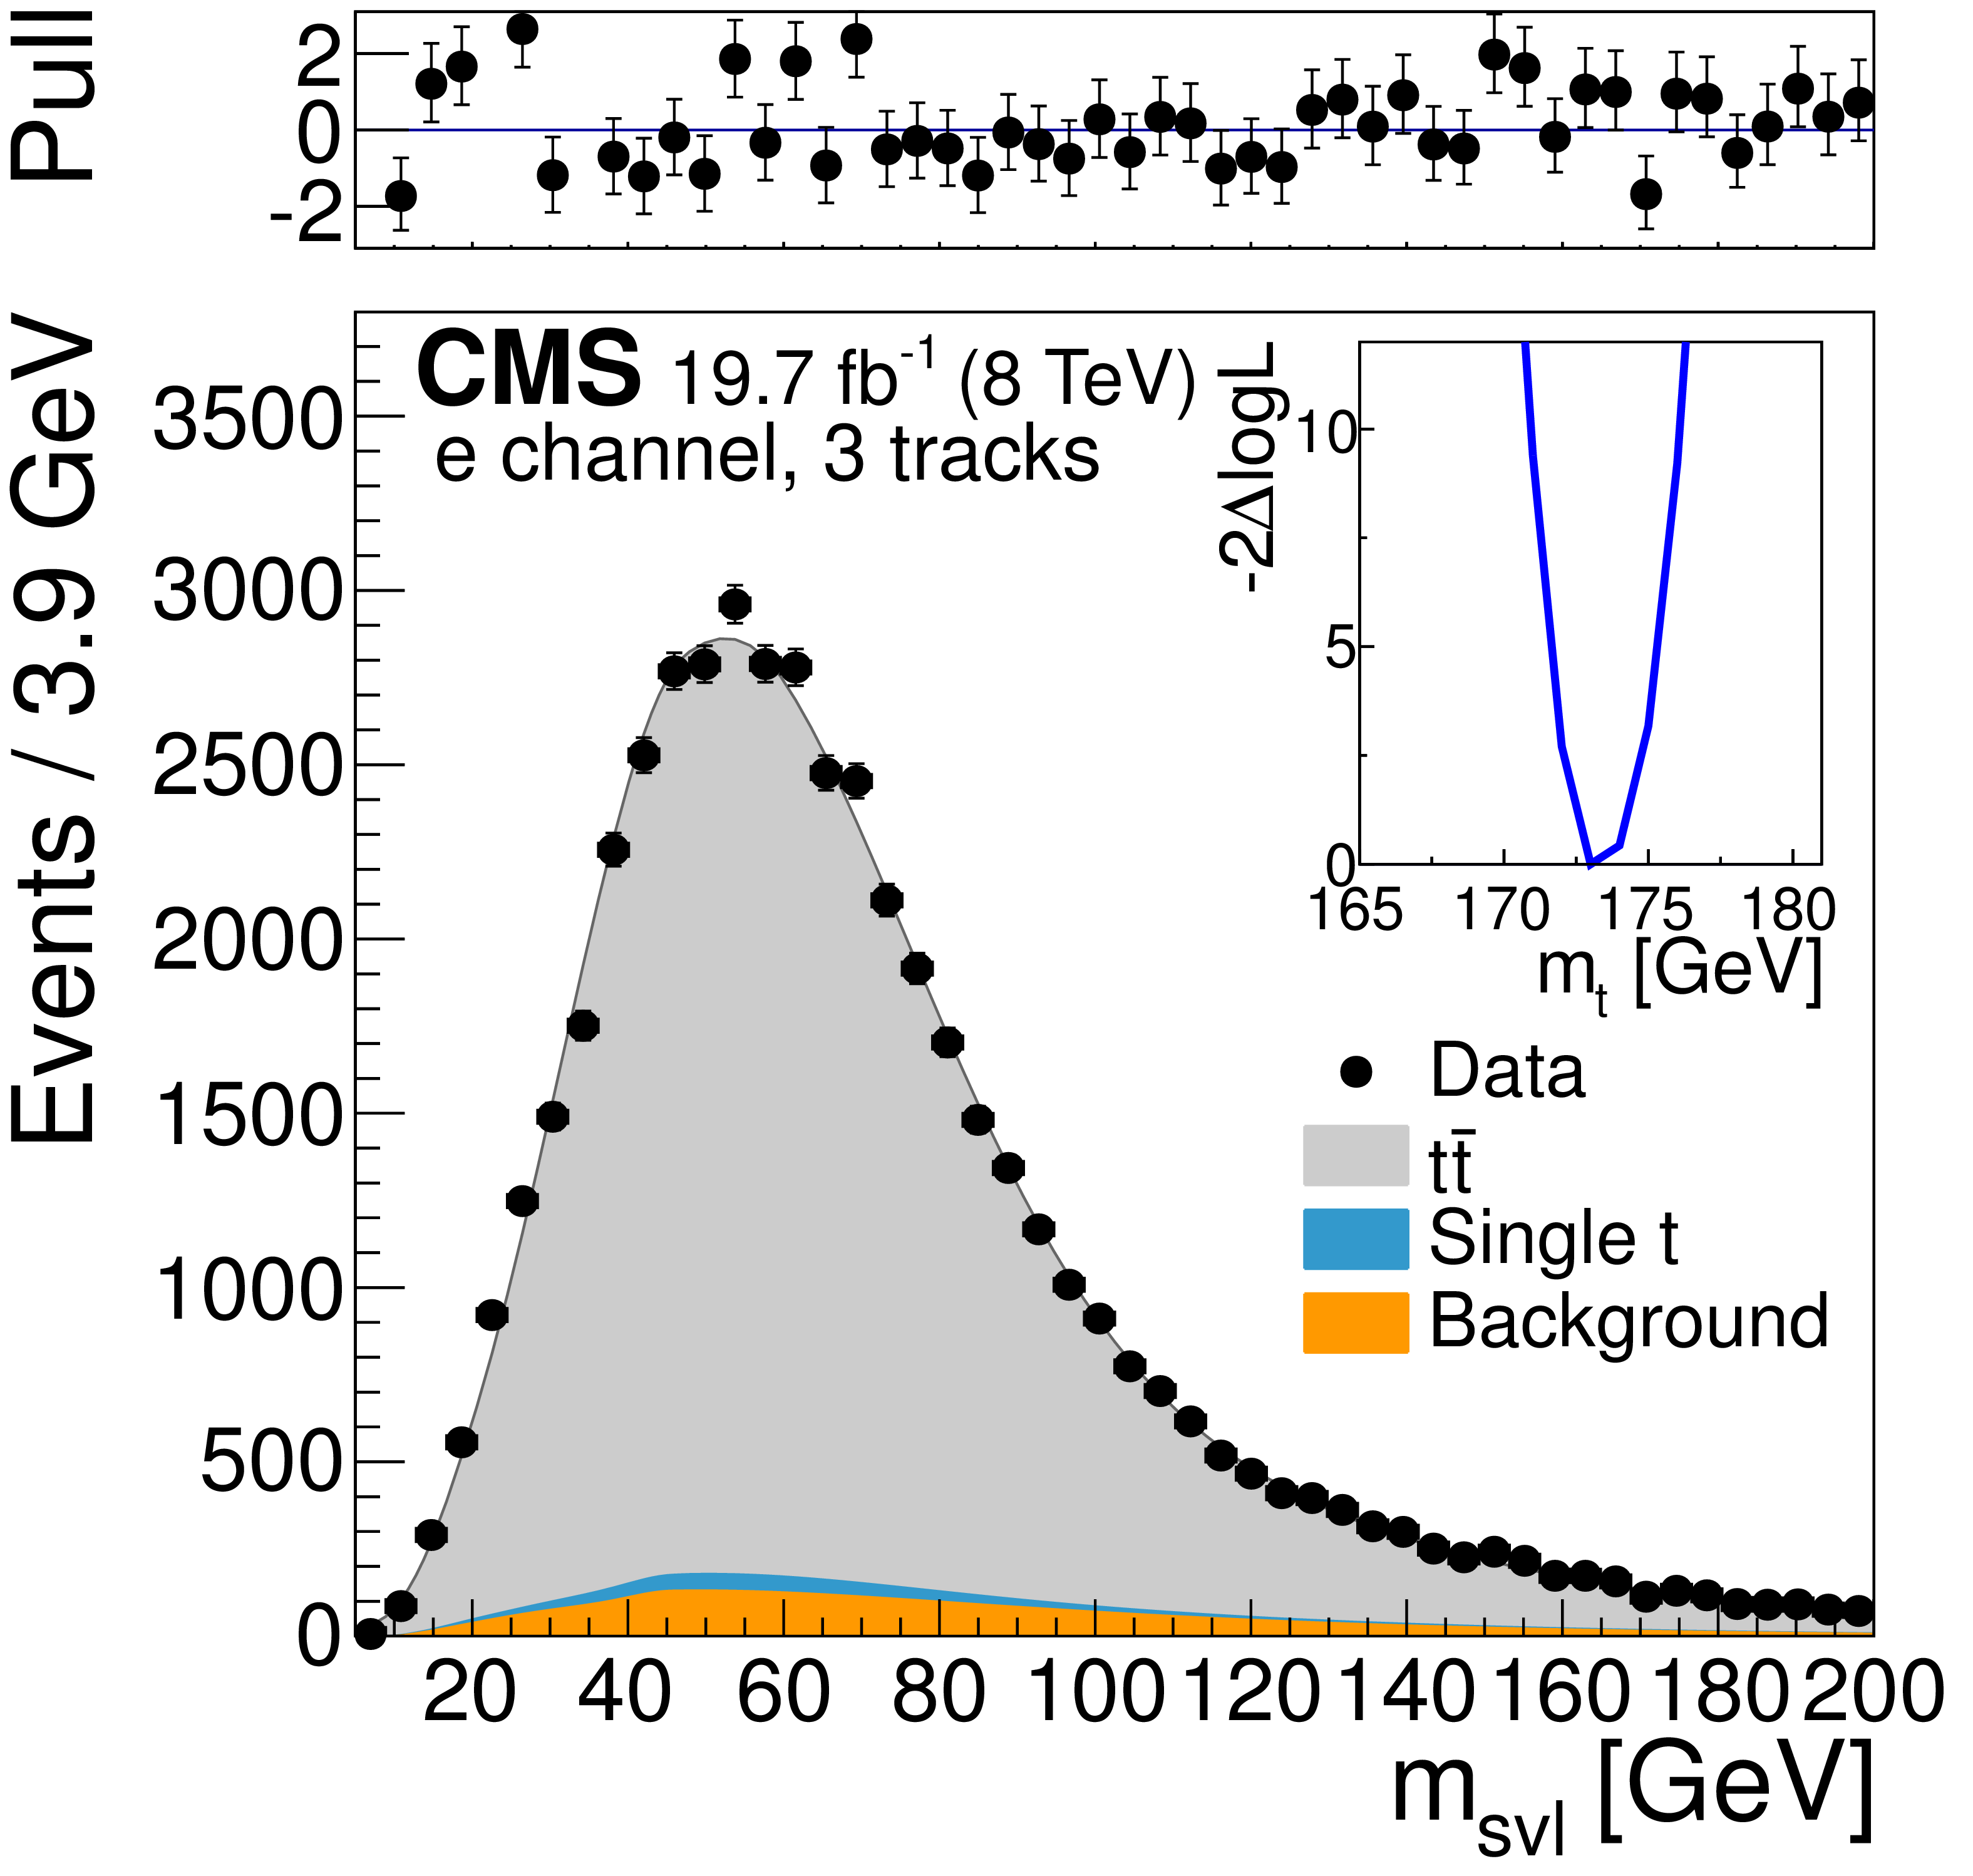
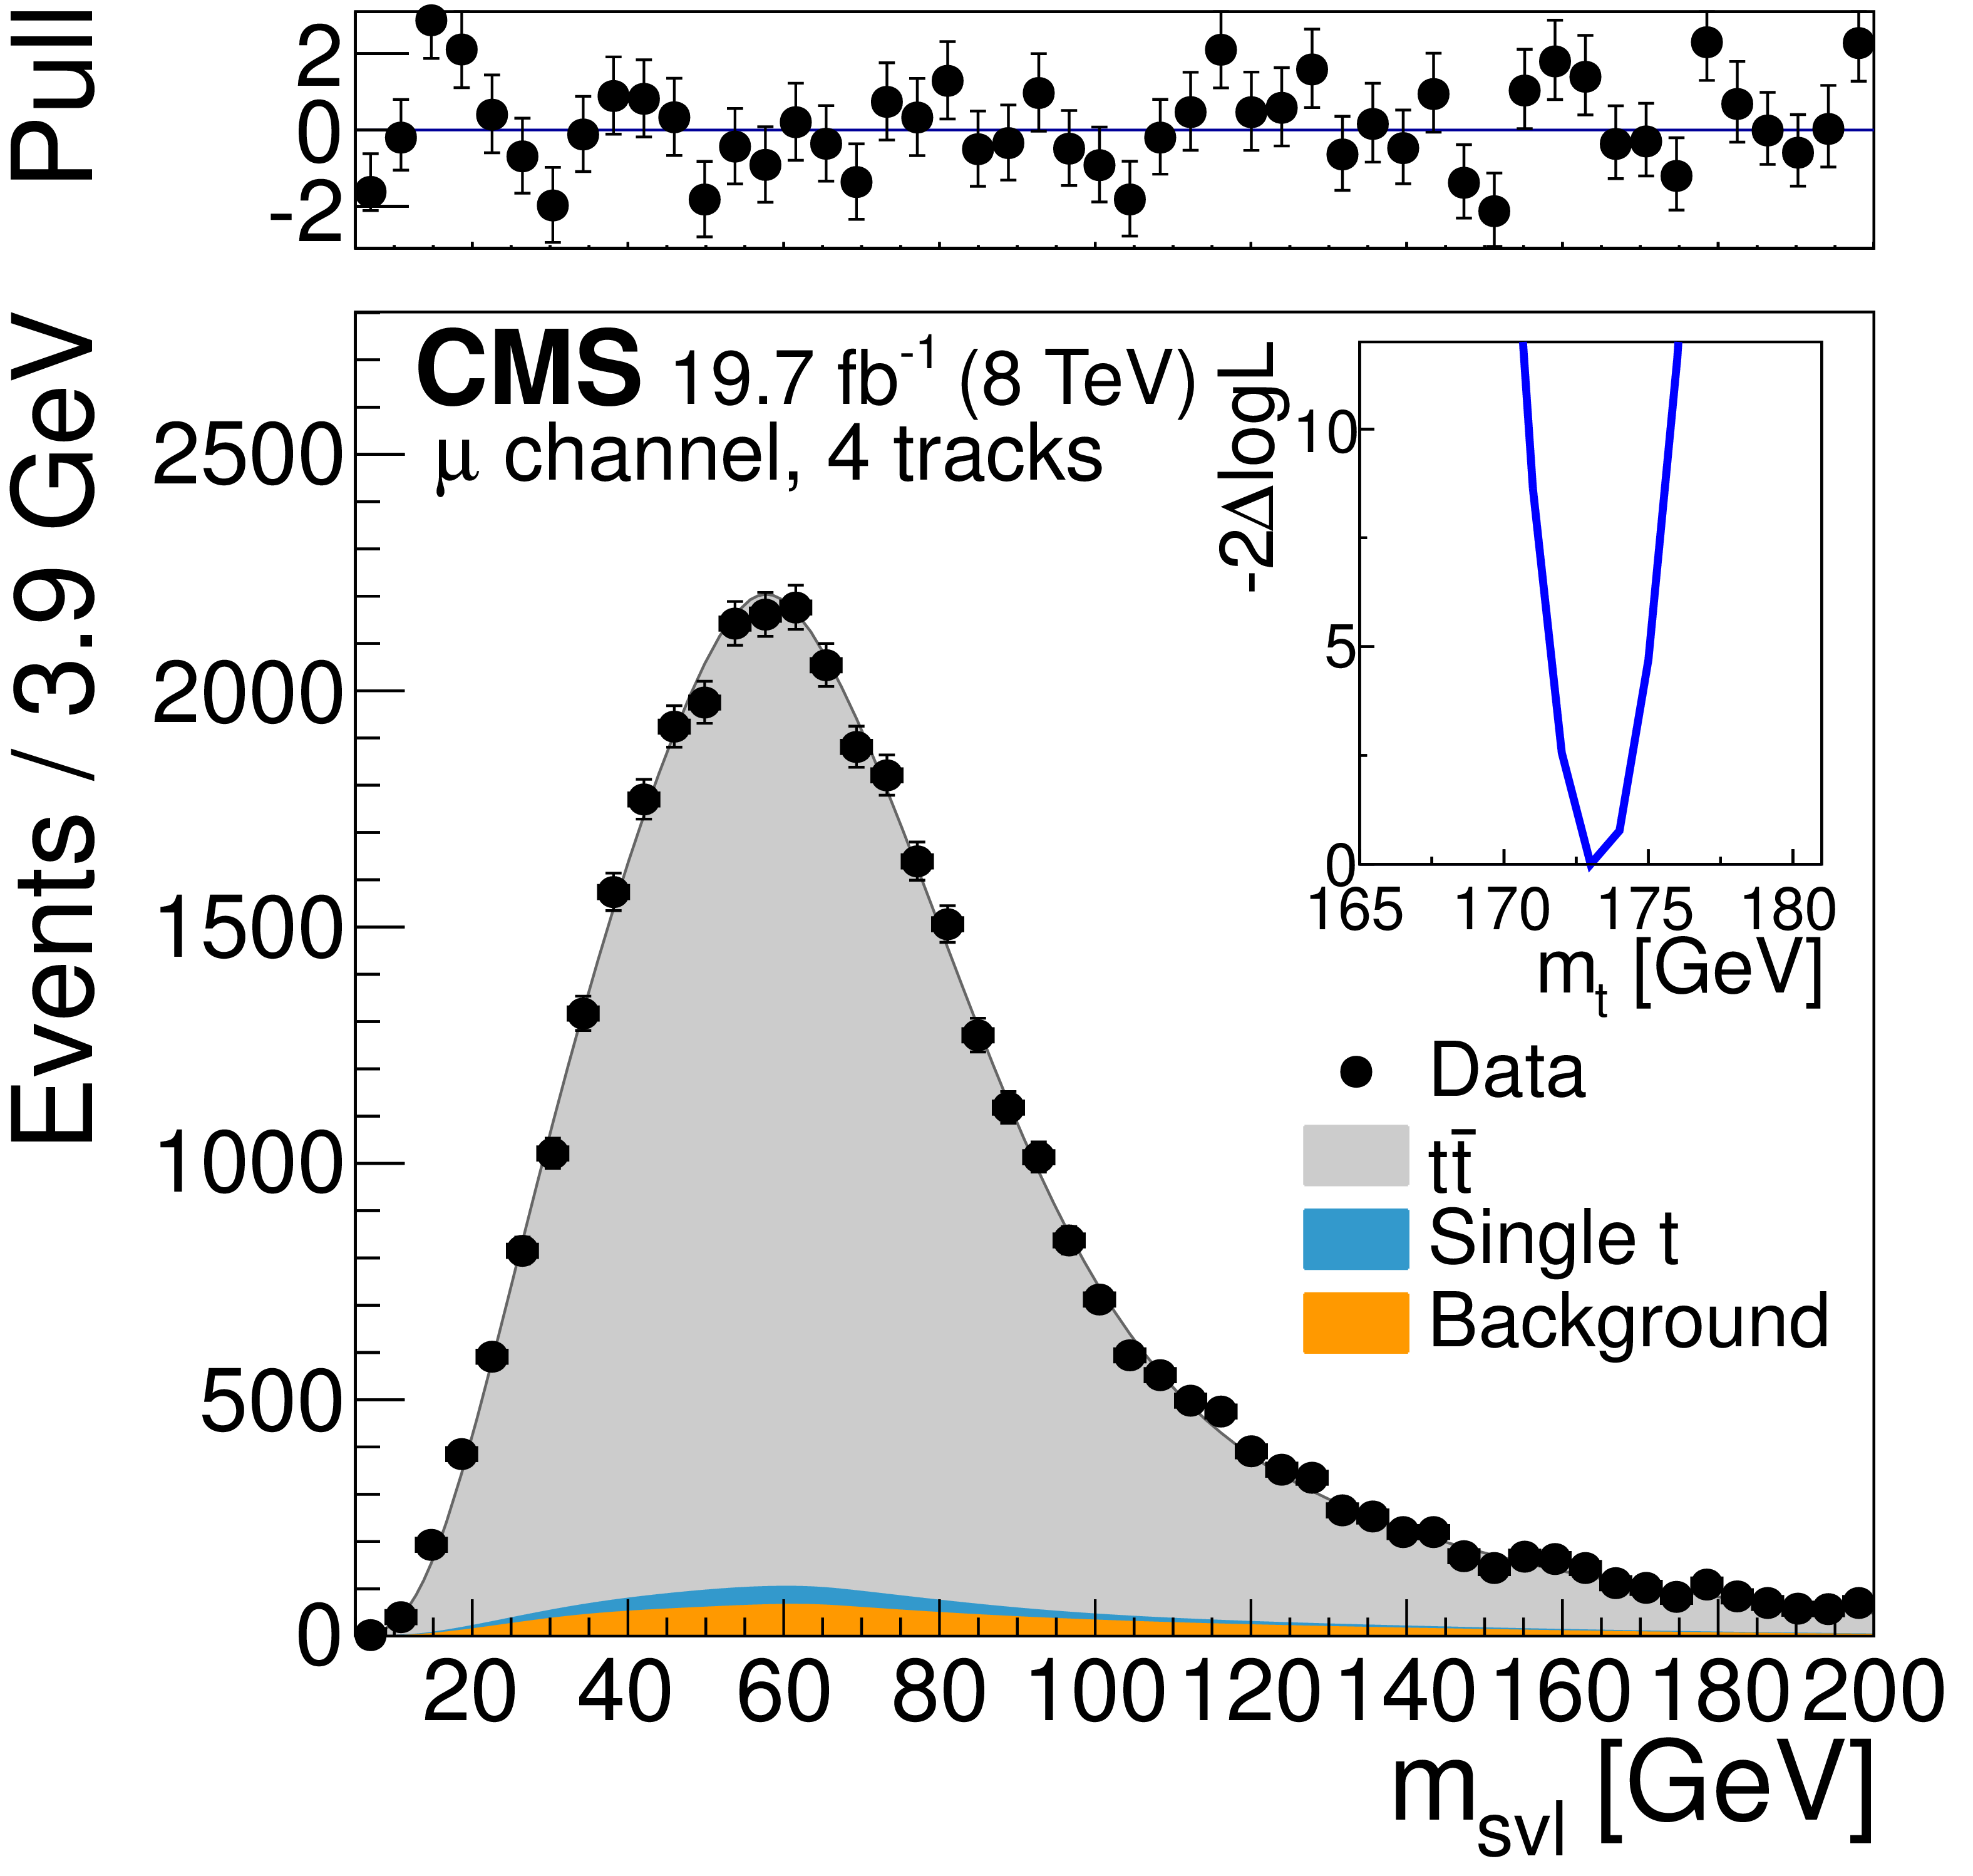
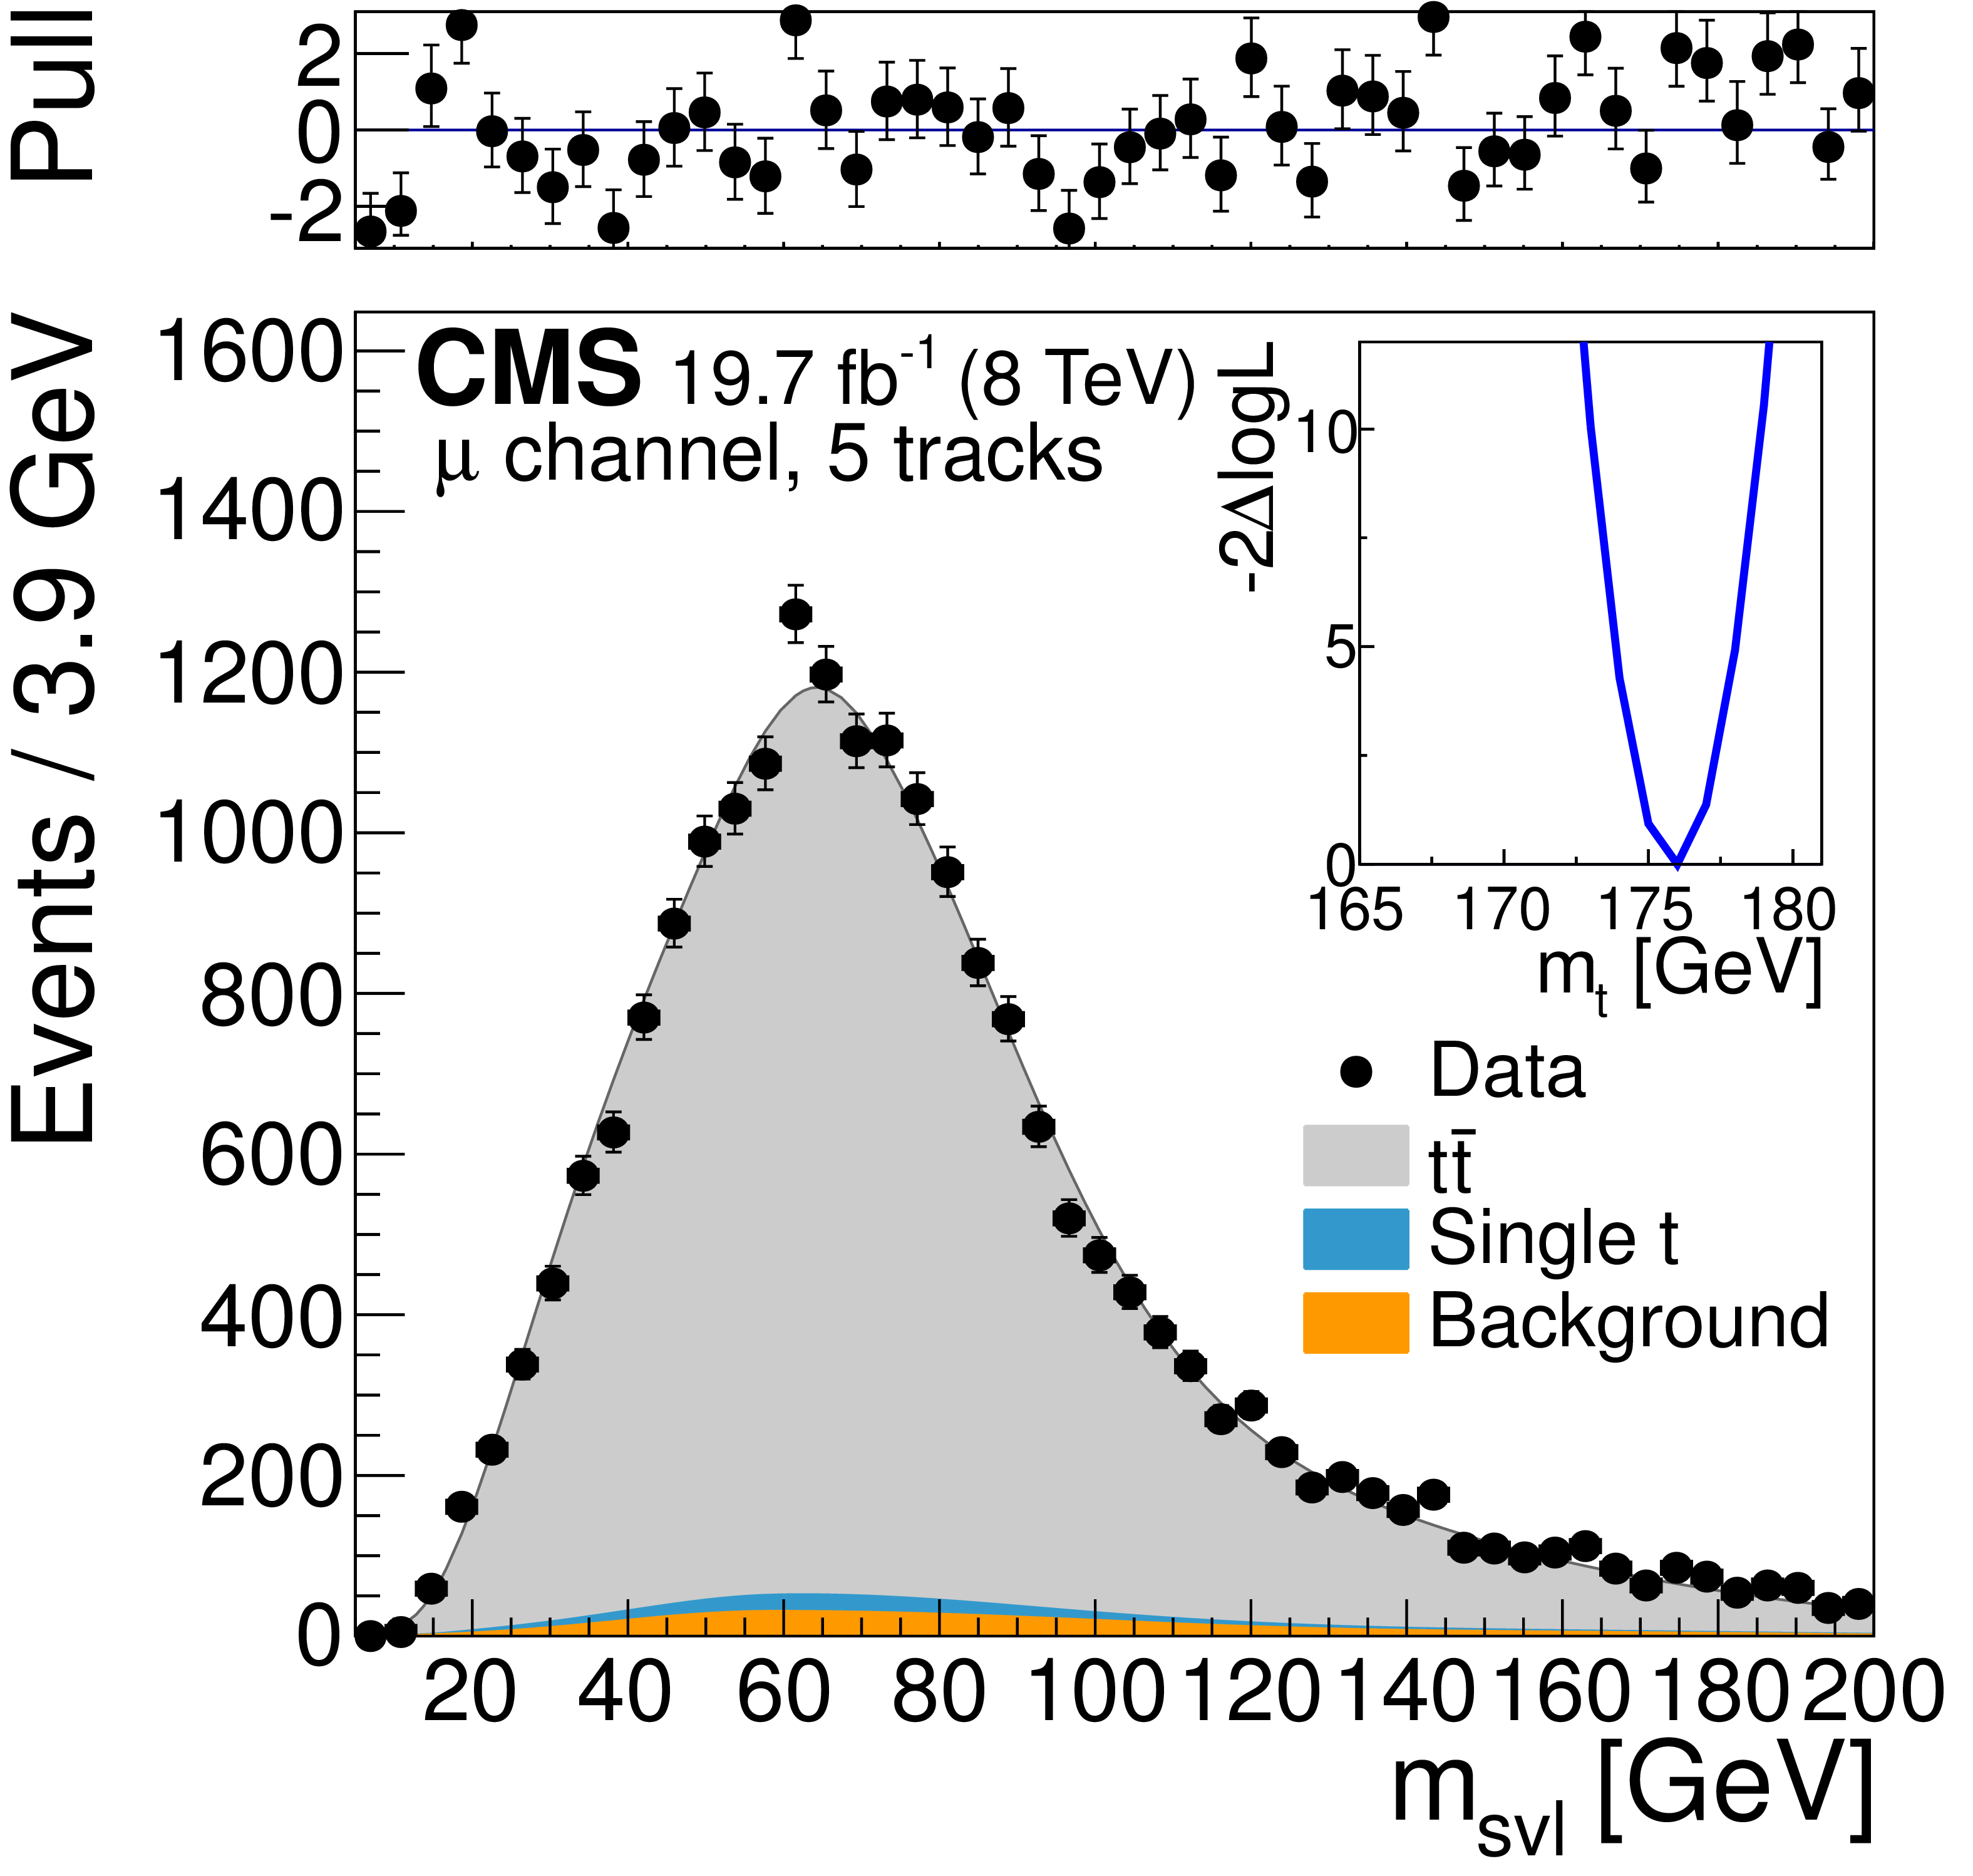
Figure 7-a:
Template fits to the observed ${m_{\mathrm {svl}}} $ distributions for the semileptonic channels ($ {\mathrm{ e } } $ and ${\mu } $ from (a,b,c) to (d,e,f) to (g,h,i)), and for exactly three, four, and five tracks assigned to the secondary vertex (from (a,d,g) to (b,e,h) to (c,f,i)). The top panels show the bin-by-bin difference between the observed data and the fit result, divided by the statistical uncertainty (pull). The inset shows the scan of the negative log-likelihood as a function of the calibrated top quark mass, accounting only for the statistical uncertainty, when performed exclusively in each event category. |
png pdf |
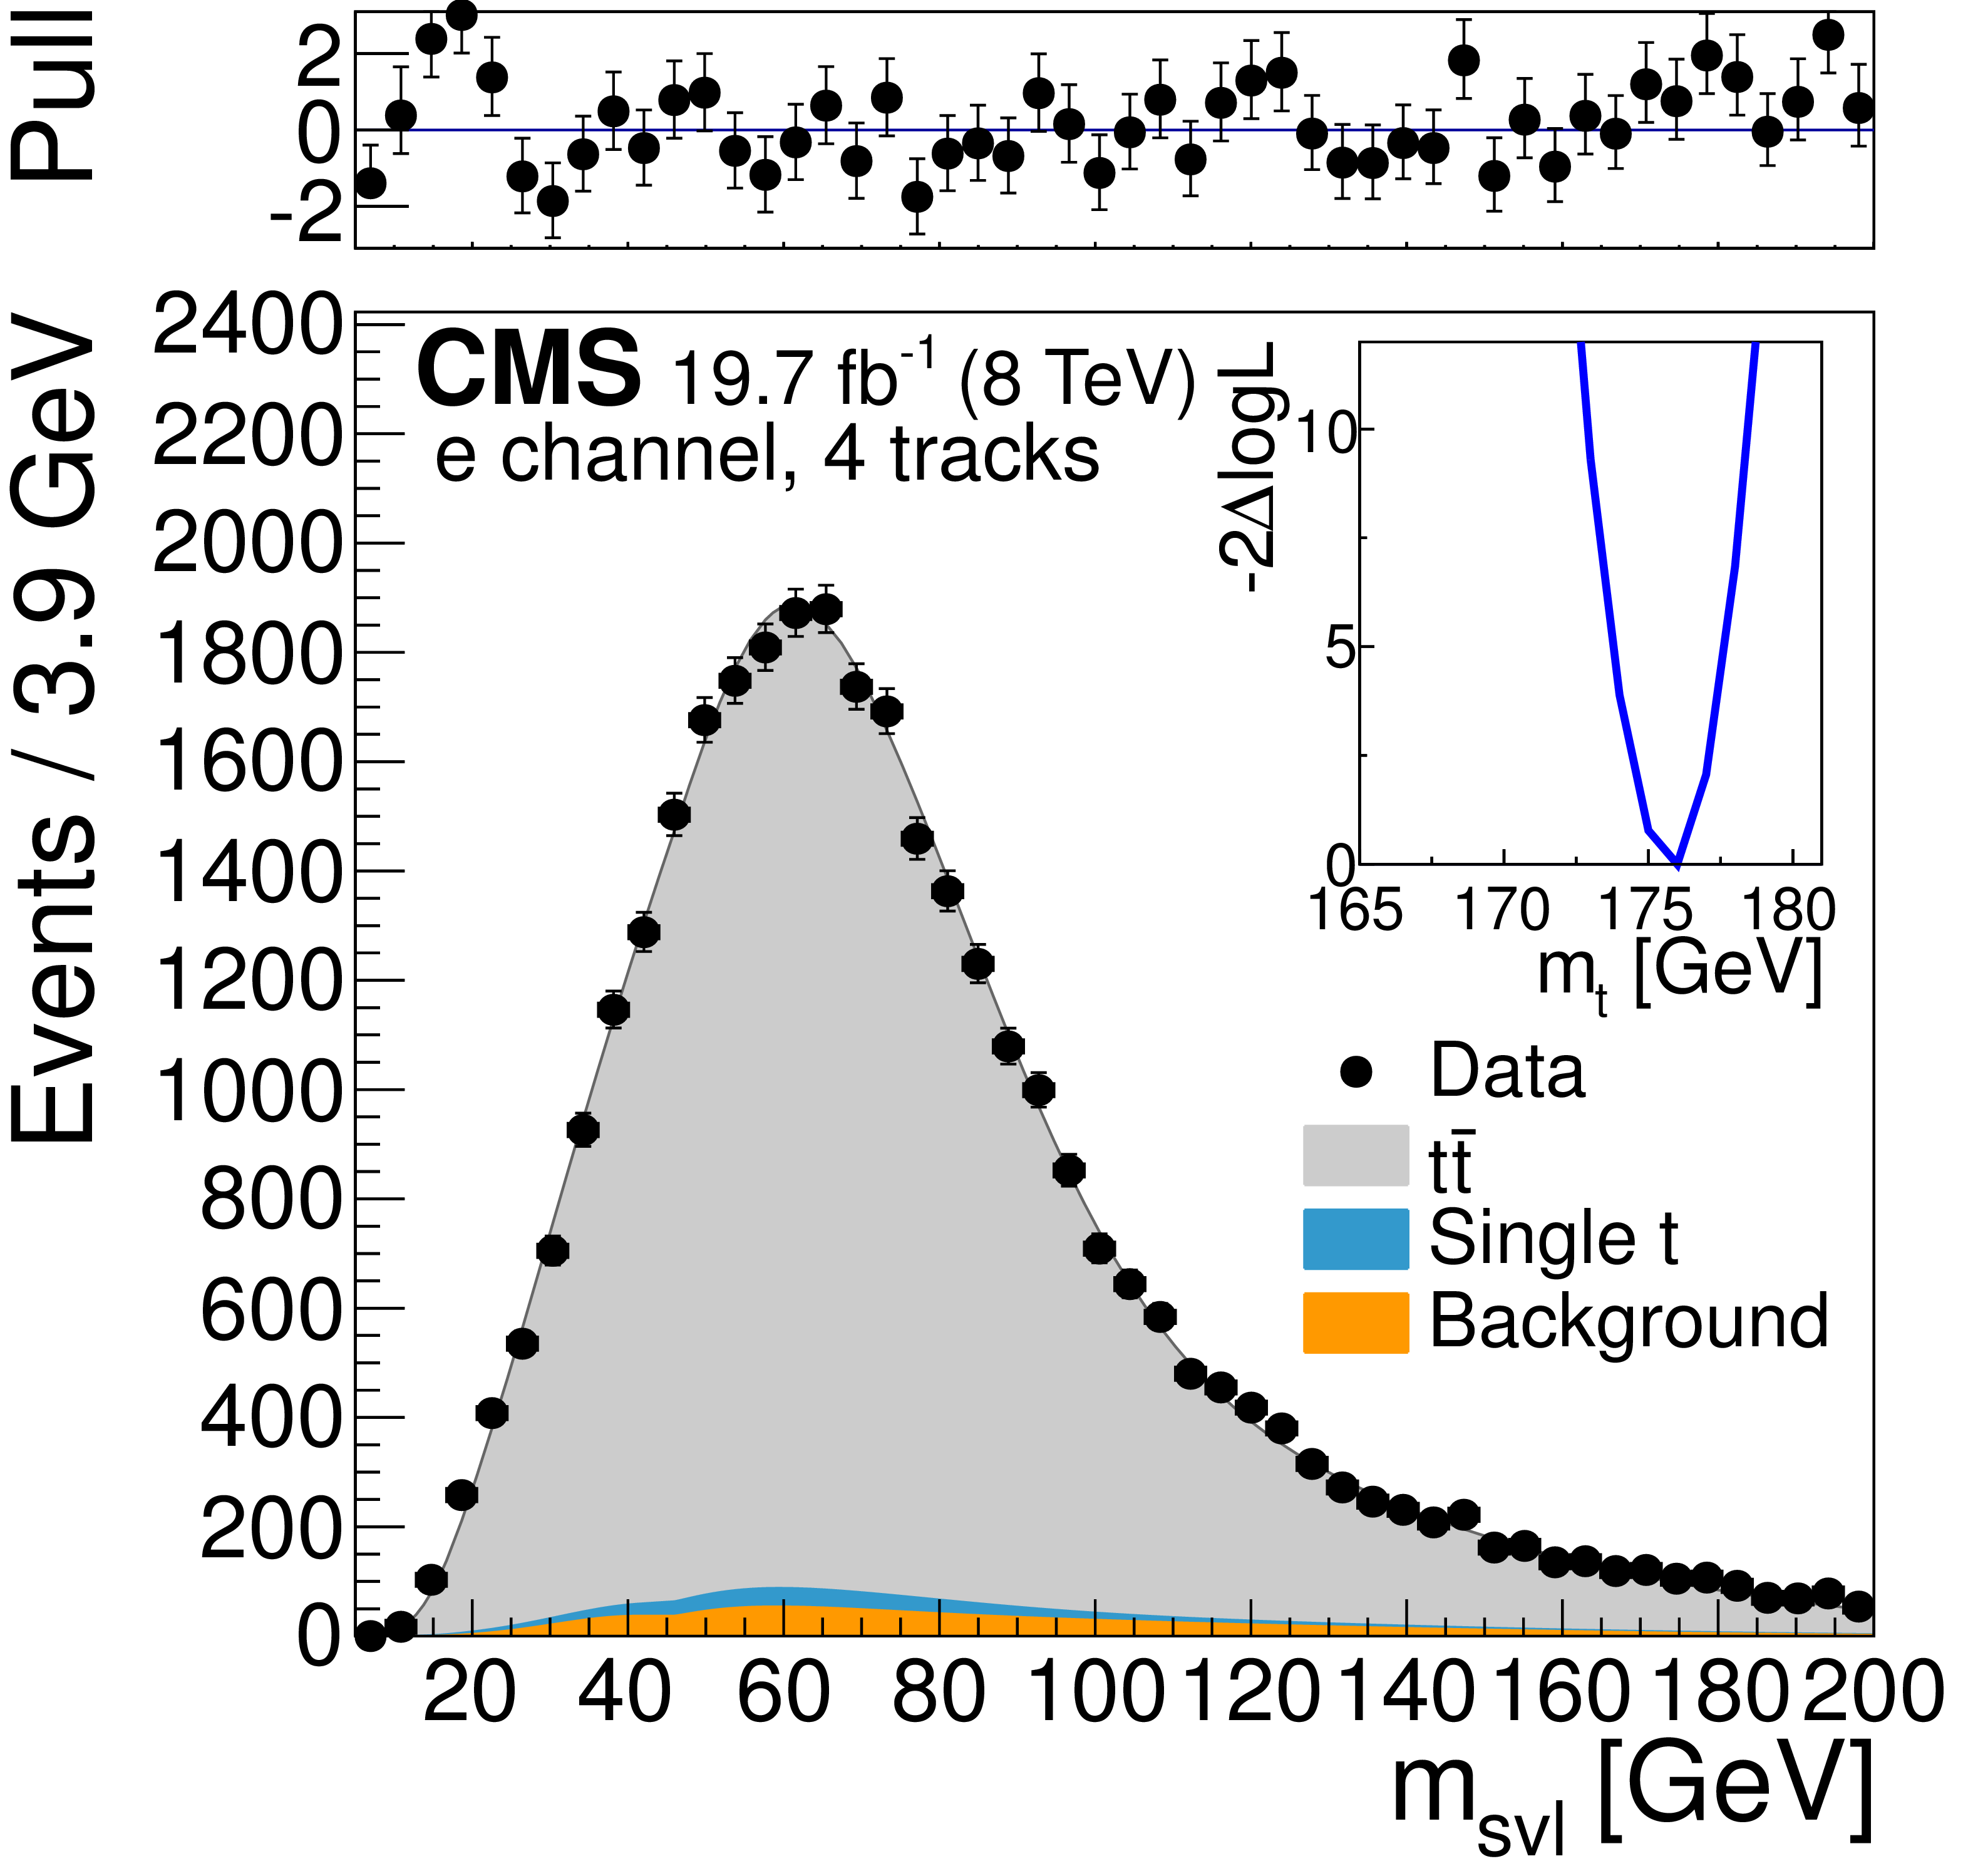
Figure 7-b:
Template fits to the observed ${m_{\mathrm {svl}}} $ distributions for the semileptonic channels ($ {\mathrm{ e } } $ and ${\mu } $ from (a,b,c) to (d,e,f) to (g,h,i)), and for exactly three, four, and five tracks assigned to the secondary vertex (from (a,d,g) to (b,e,h) to (c,f,i)). The top panels show the bin-by-bin difference between the observed data and the fit result, divided by the statistical uncertainty (pull). The inset shows the scan of the negative log-likelihood as a function of the calibrated top quark mass, accounting only for the statistical uncertainty, when performed exclusively in each event category. |
png pdf |
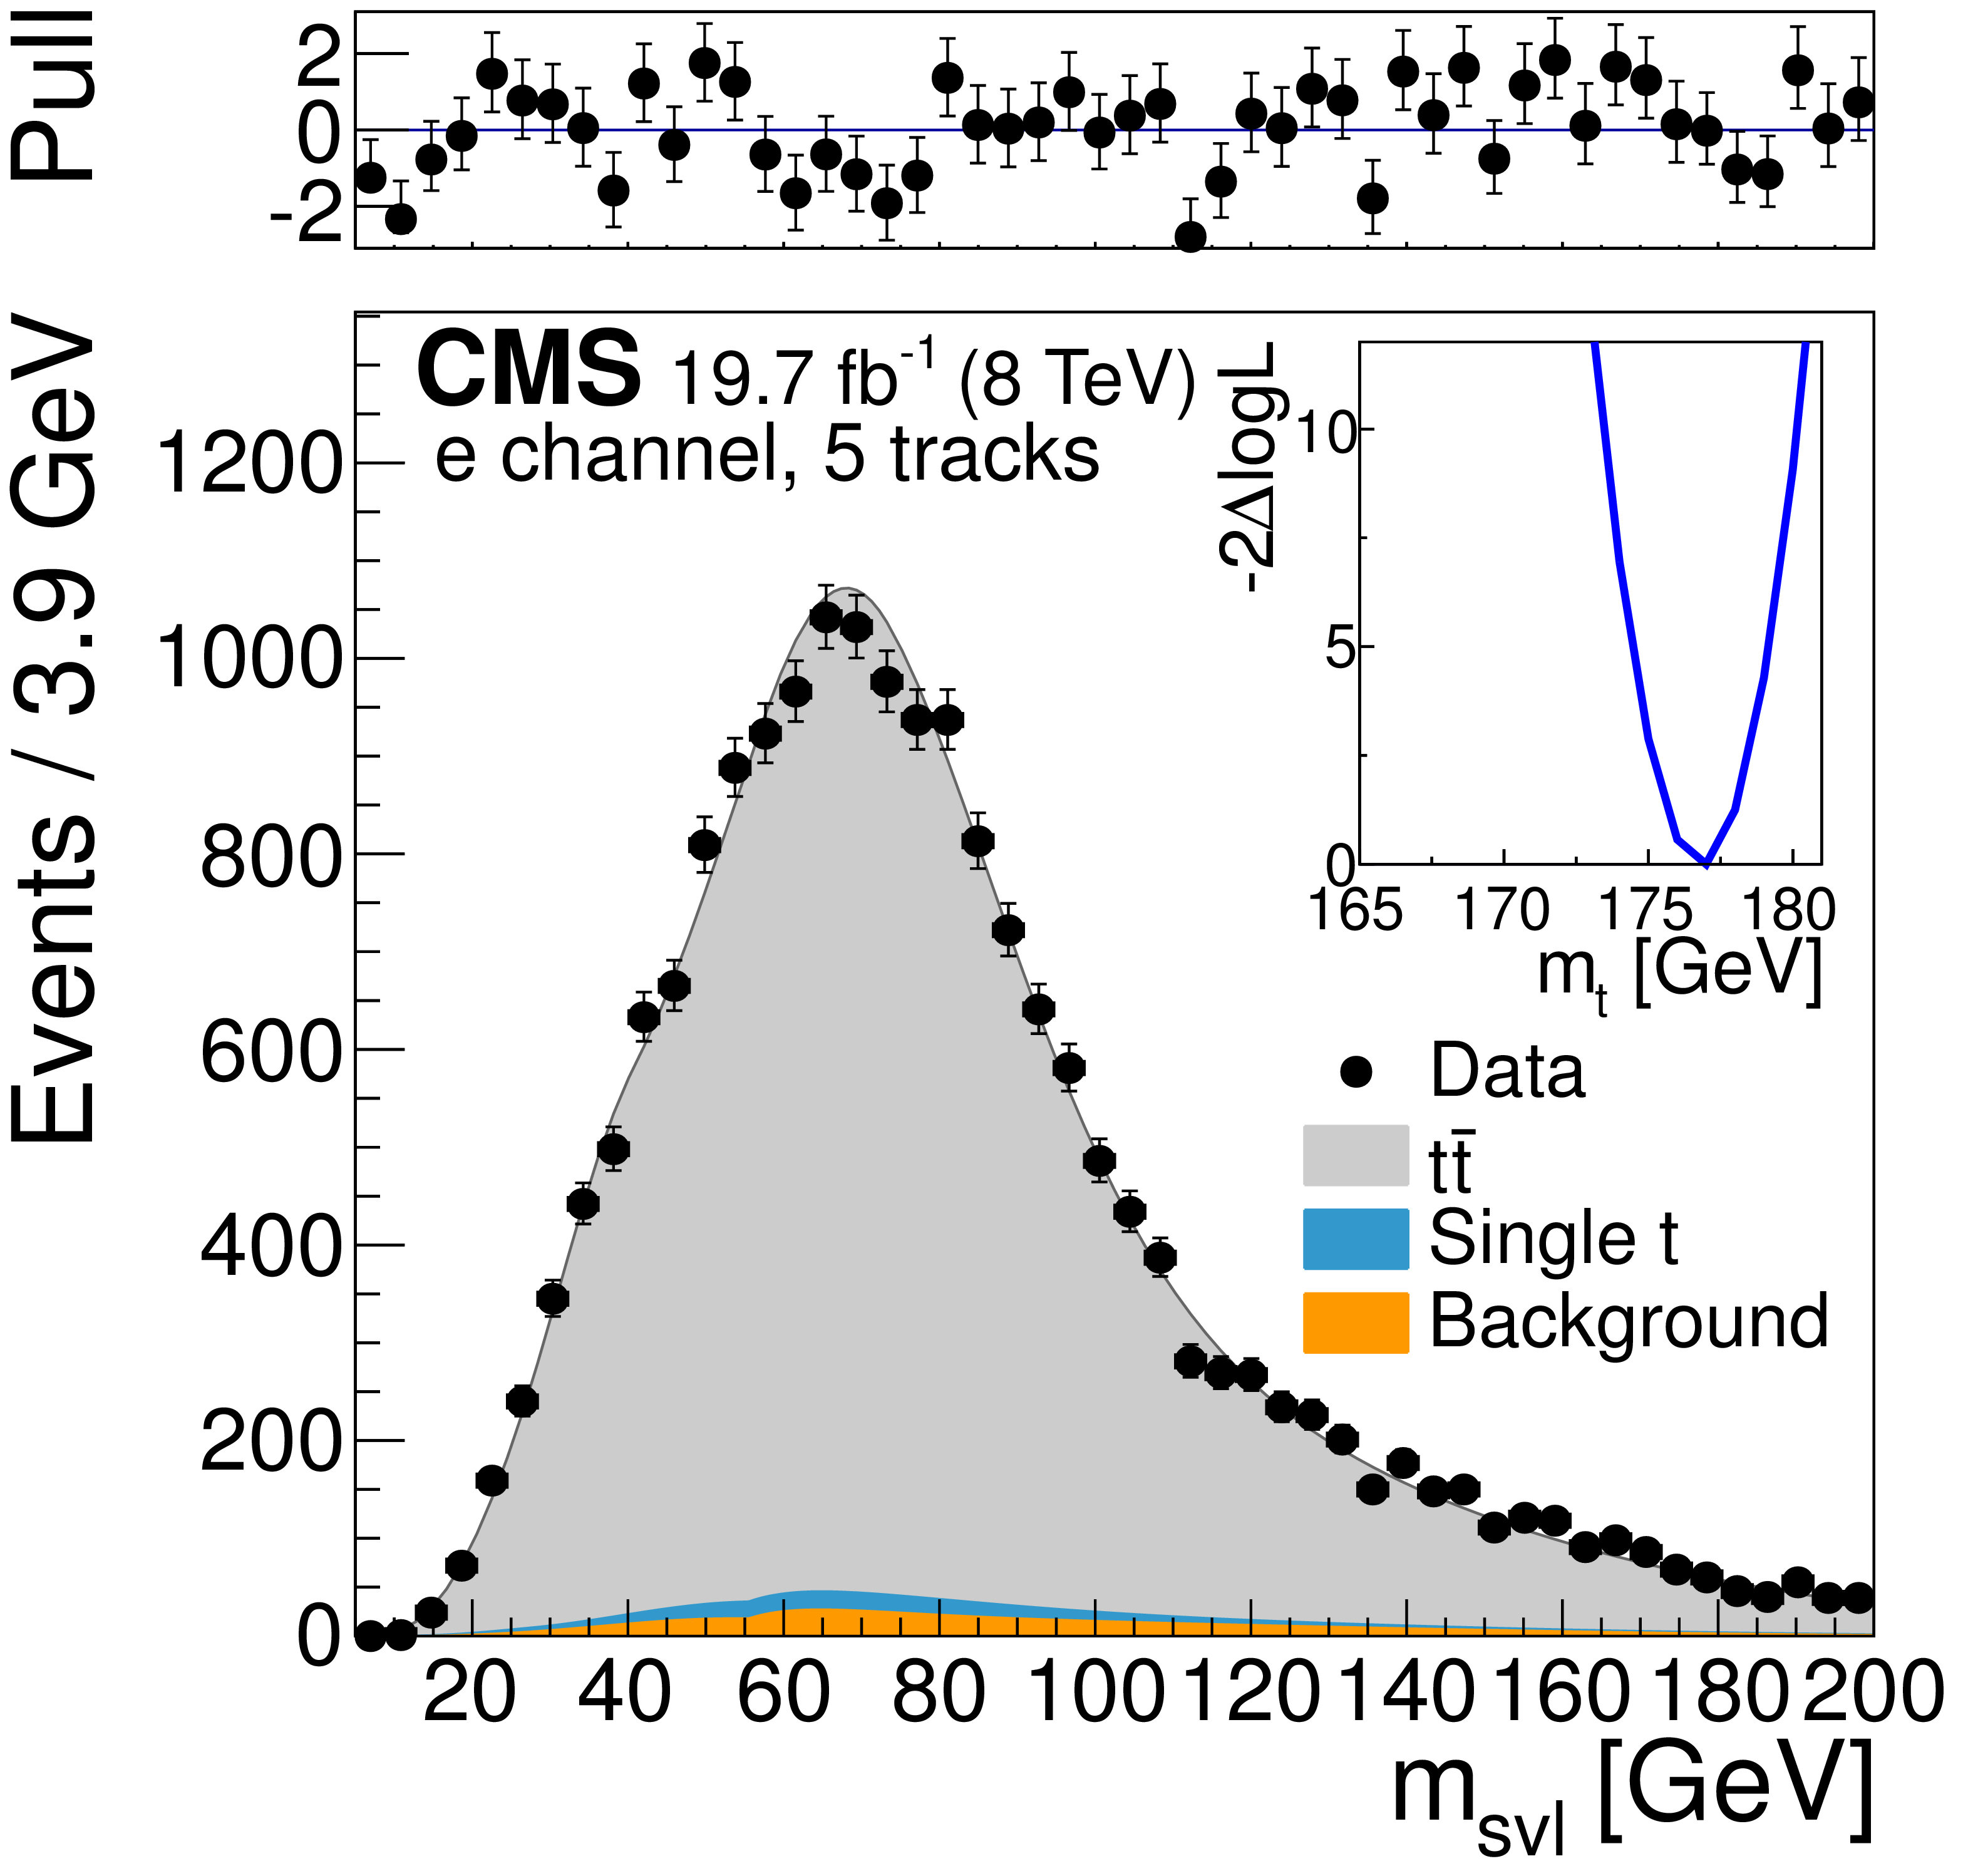
Figure 7-c:
Template fits to the observed ${m_{\mathrm {svl}}} $ distributions for the semileptonic channels ($ {\mathrm{ e } } $ and ${\mu } $ from (a,b,c) to (d,e,f) to (g,h,i)), and for exactly three, four, and five tracks assigned to the secondary vertex (from (a,d,g) to (b,e,h) to (c,f,i)). The top panels show the bin-by-bin difference between the observed data and the fit result, divided by the statistical uncertainty (pull). The inset shows the scan of the negative log-likelihood as a function of the calibrated top quark mass, accounting only for the statistical uncertainty, when performed exclusively in each event category. |
png pdf |
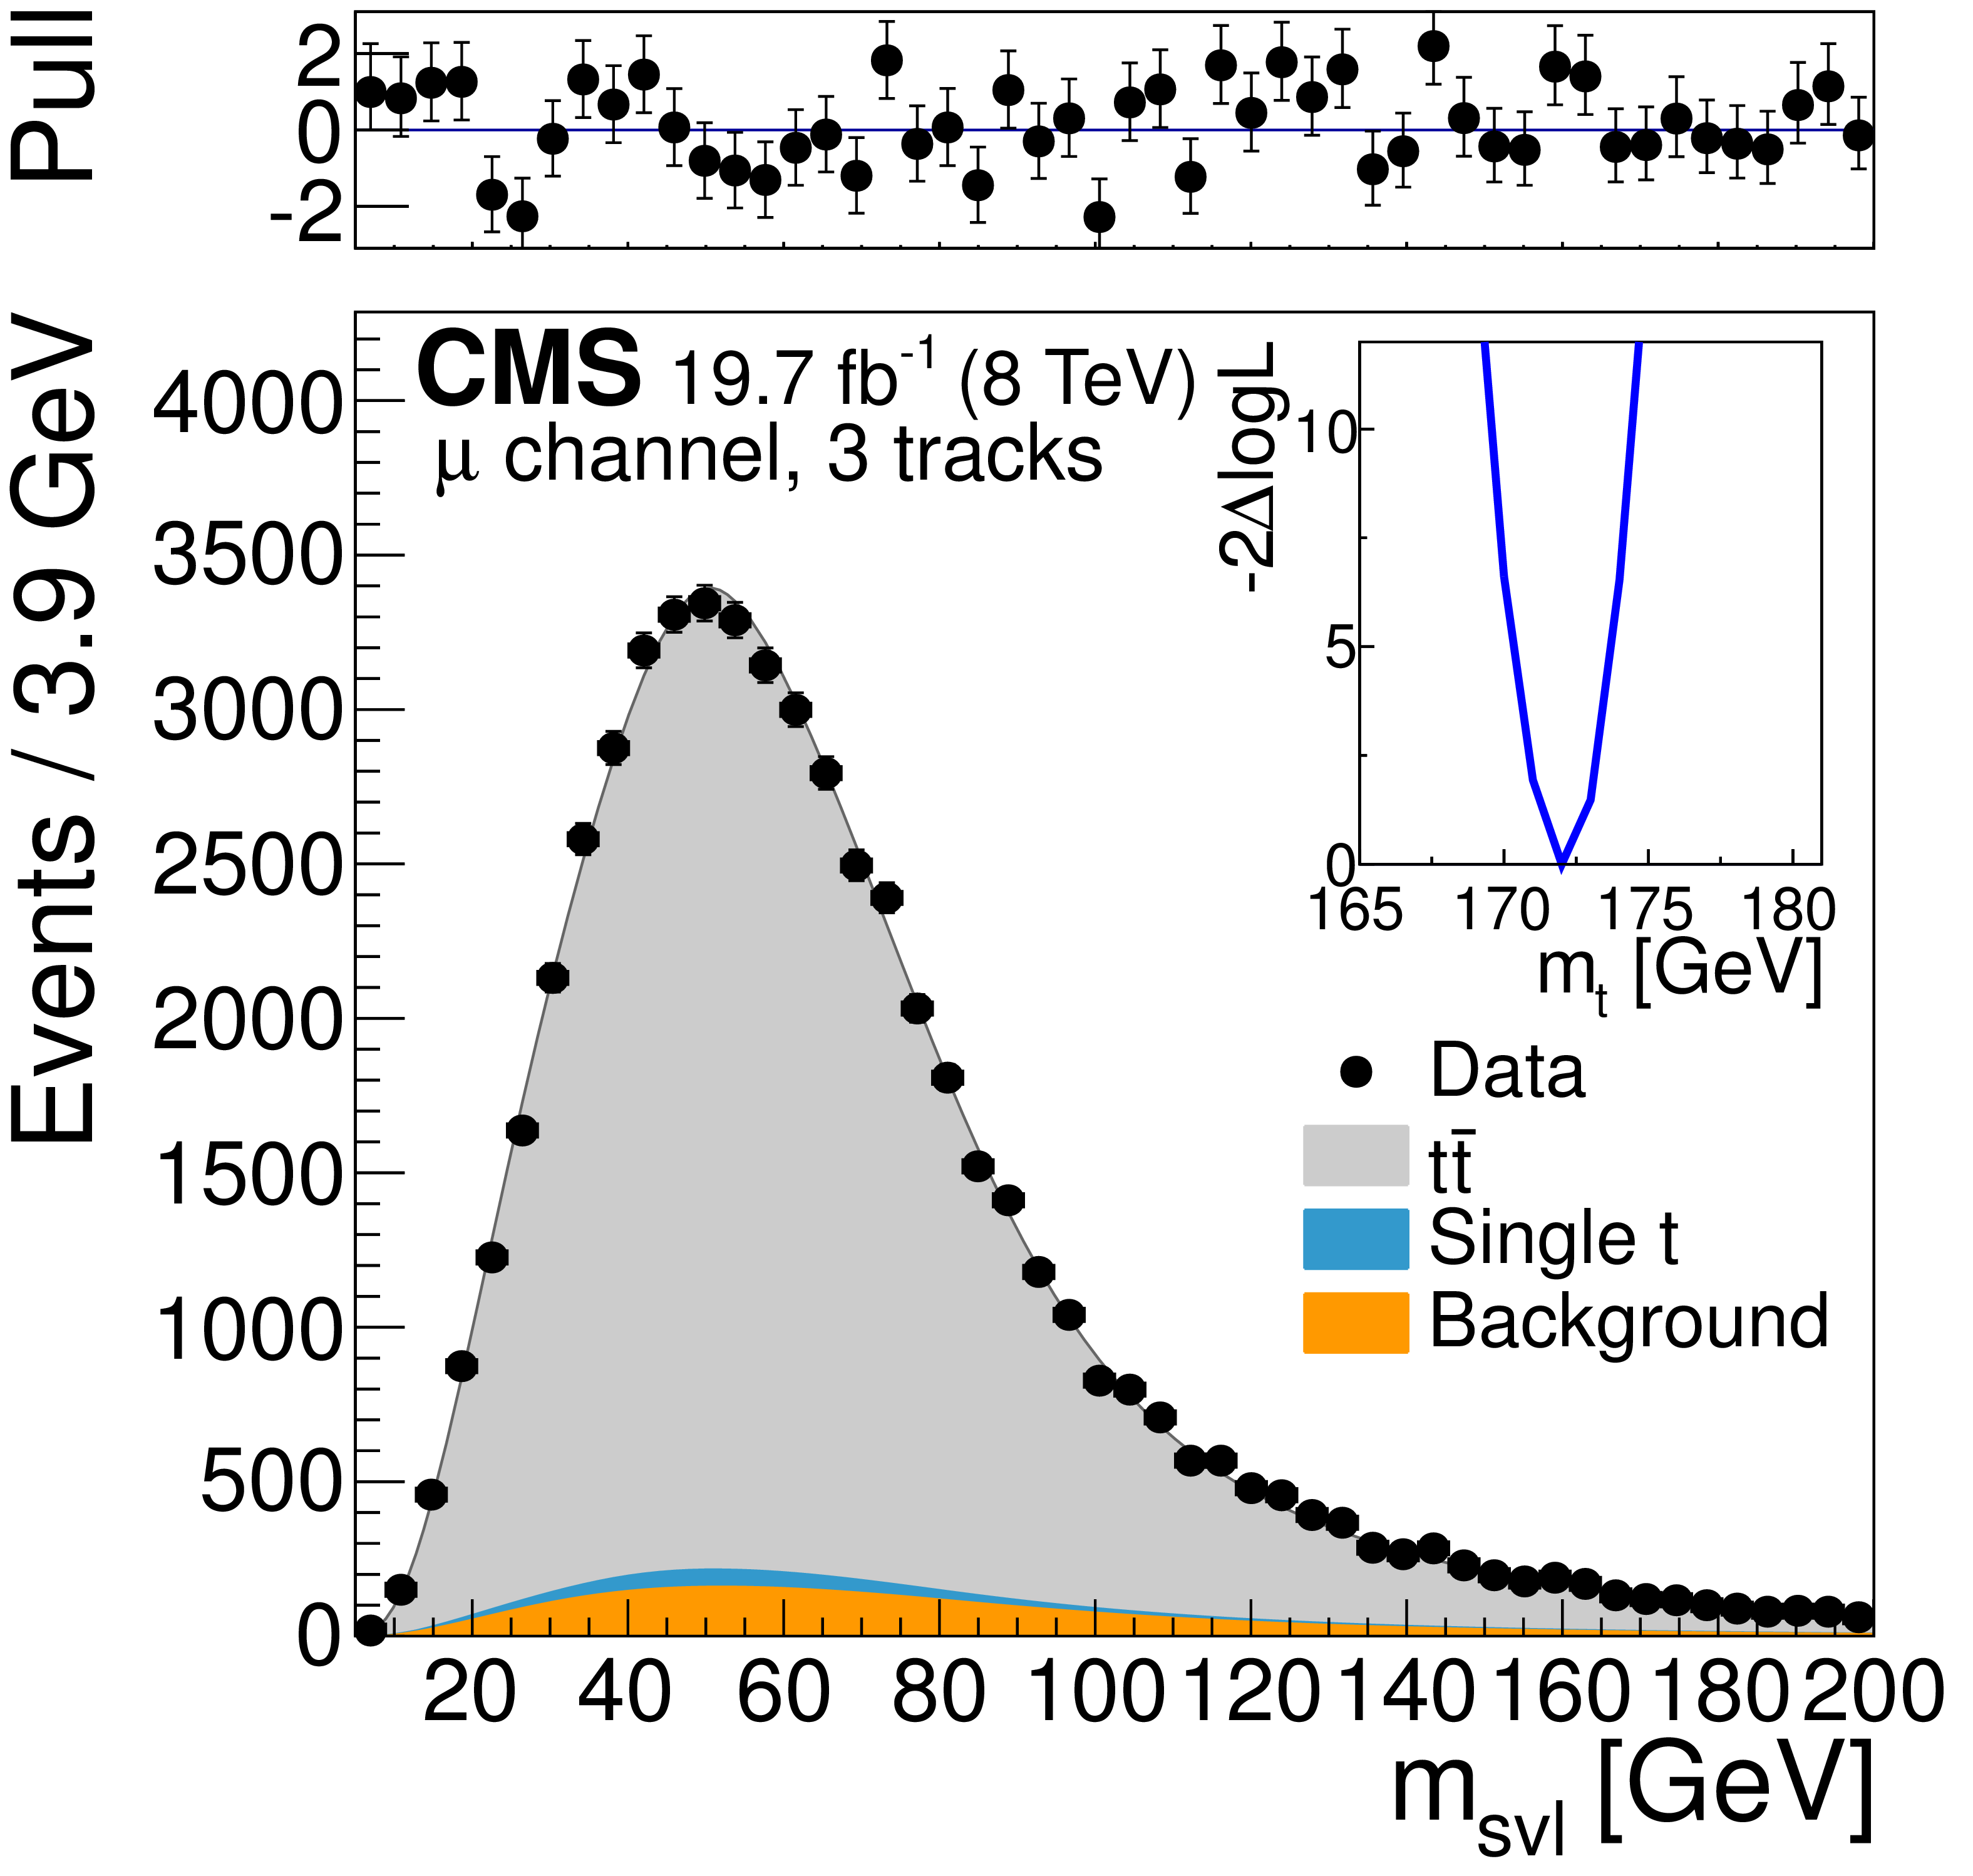
Figure 7-d:
Template fits to the observed ${m_{\mathrm {svl}}} $ distributions for the semileptonic channels ($ {\mathrm{ e } } $ and ${\mu } $ from (a,b,c) to (d,e,f) to (g,h,i)), and for exactly three, four, and five tracks assigned to the secondary vertex (from (a,d,g) to (b,e,h) to (c,f,i)). The top panels show the bin-by-bin difference between the observed data and the fit result, divided by the statistical uncertainty (pull). The inset shows the scan of the negative log-likelihood as a function of the calibrated top quark mass, accounting only for the statistical uncertainty, when performed exclusively in each event category. |
png pdf |
Figure 7-e:
Template fits to the observed ${m_{\mathrm {svl}}} $ distributions for the semileptonic channels ($ {\mathrm{ e } } $ and ${\mu } $ from (a,b,c) to (d,e,f) to (g,h,i)), and for exactly three, four, and five tracks assigned to the secondary vertex (from (a,d,g) to (b,e,h) to (c,f,i)). The top panels show the bin-by-bin difference between the observed data and the fit result, divided by the statistical uncertainty (pull). The inset shows the scan of the negative log-likelihood as a function of the calibrated top quark mass, accounting only for the statistical uncertainty, when performed exclusively in each event category. |
png pdf |
Figure 7-f:
Template fits to the observed ${m_{\mathrm {svl}}} $ distributions for the semileptonic channels ($ {\mathrm{ e } } $ and ${\mu } $ from (a,b,c) to (d,e,f) to (g,h,i)), and for exactly three, four, and five tracks assigned to the secondary vertex (from (a,d,g) to (b,e,h) to (c,f,i)). The top panels show the bin-by-bin difference between the observed data and the fit result, divided by the statistical uncertainty (pull). The inset shows the scan of the negative log-likelihood as a function of the calibrated top quark mass, accounting only for the statistical uncertainty, when performed exclusively in each event category. |
png pdf |
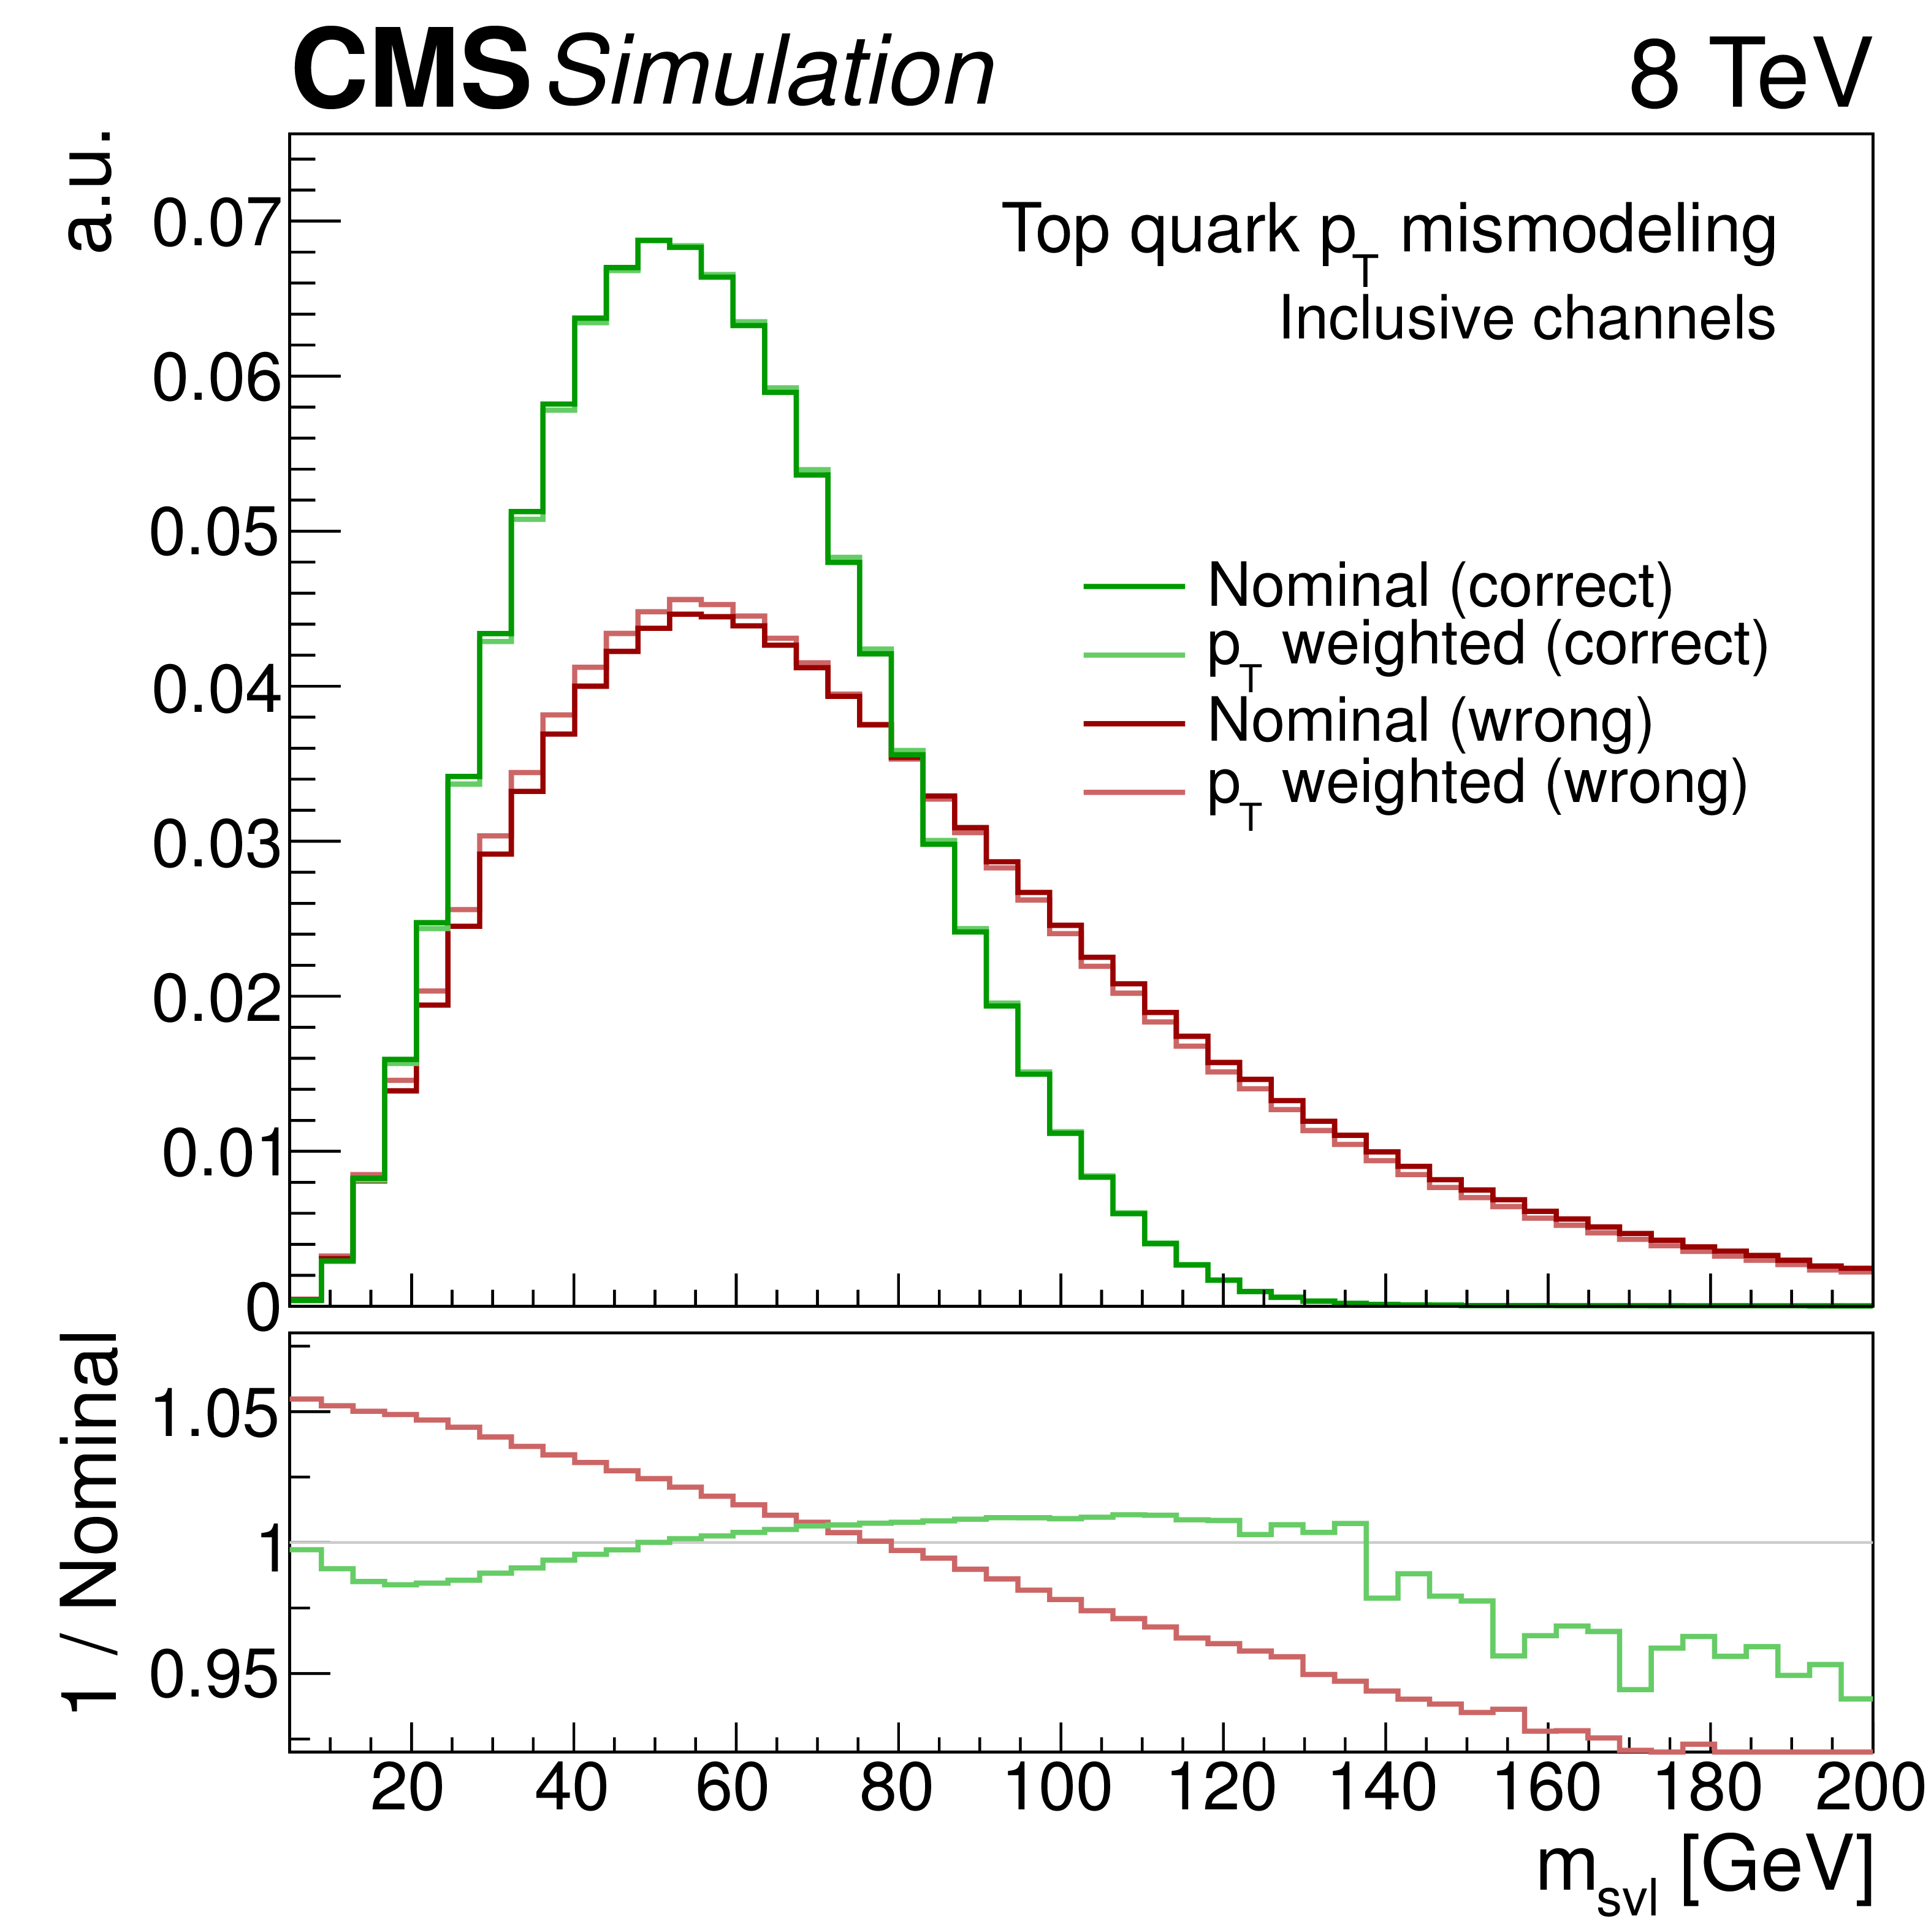
Figure 8-a:
Variation of the simulated ${m_{\mathrm {svl}}} $ shape with systematic effects: reweighting of the simulated top quark ${p_{\mathrm {T}}} $ shape to the observed distribution, separately for correct and wrong lepton-vertex pairings (a); and different b quark fragmentation function shapes (b). The bottom panels in the two plots show the ratios between the top quark ${p_{\mathrm {T}}} $ reweighted and nominal shapes for the correct and wrong pairings (a), and between the various fragmentation models and the central Z2* LEP $r_{\mathrm{ b } }$ tune (b). |
png pdf |
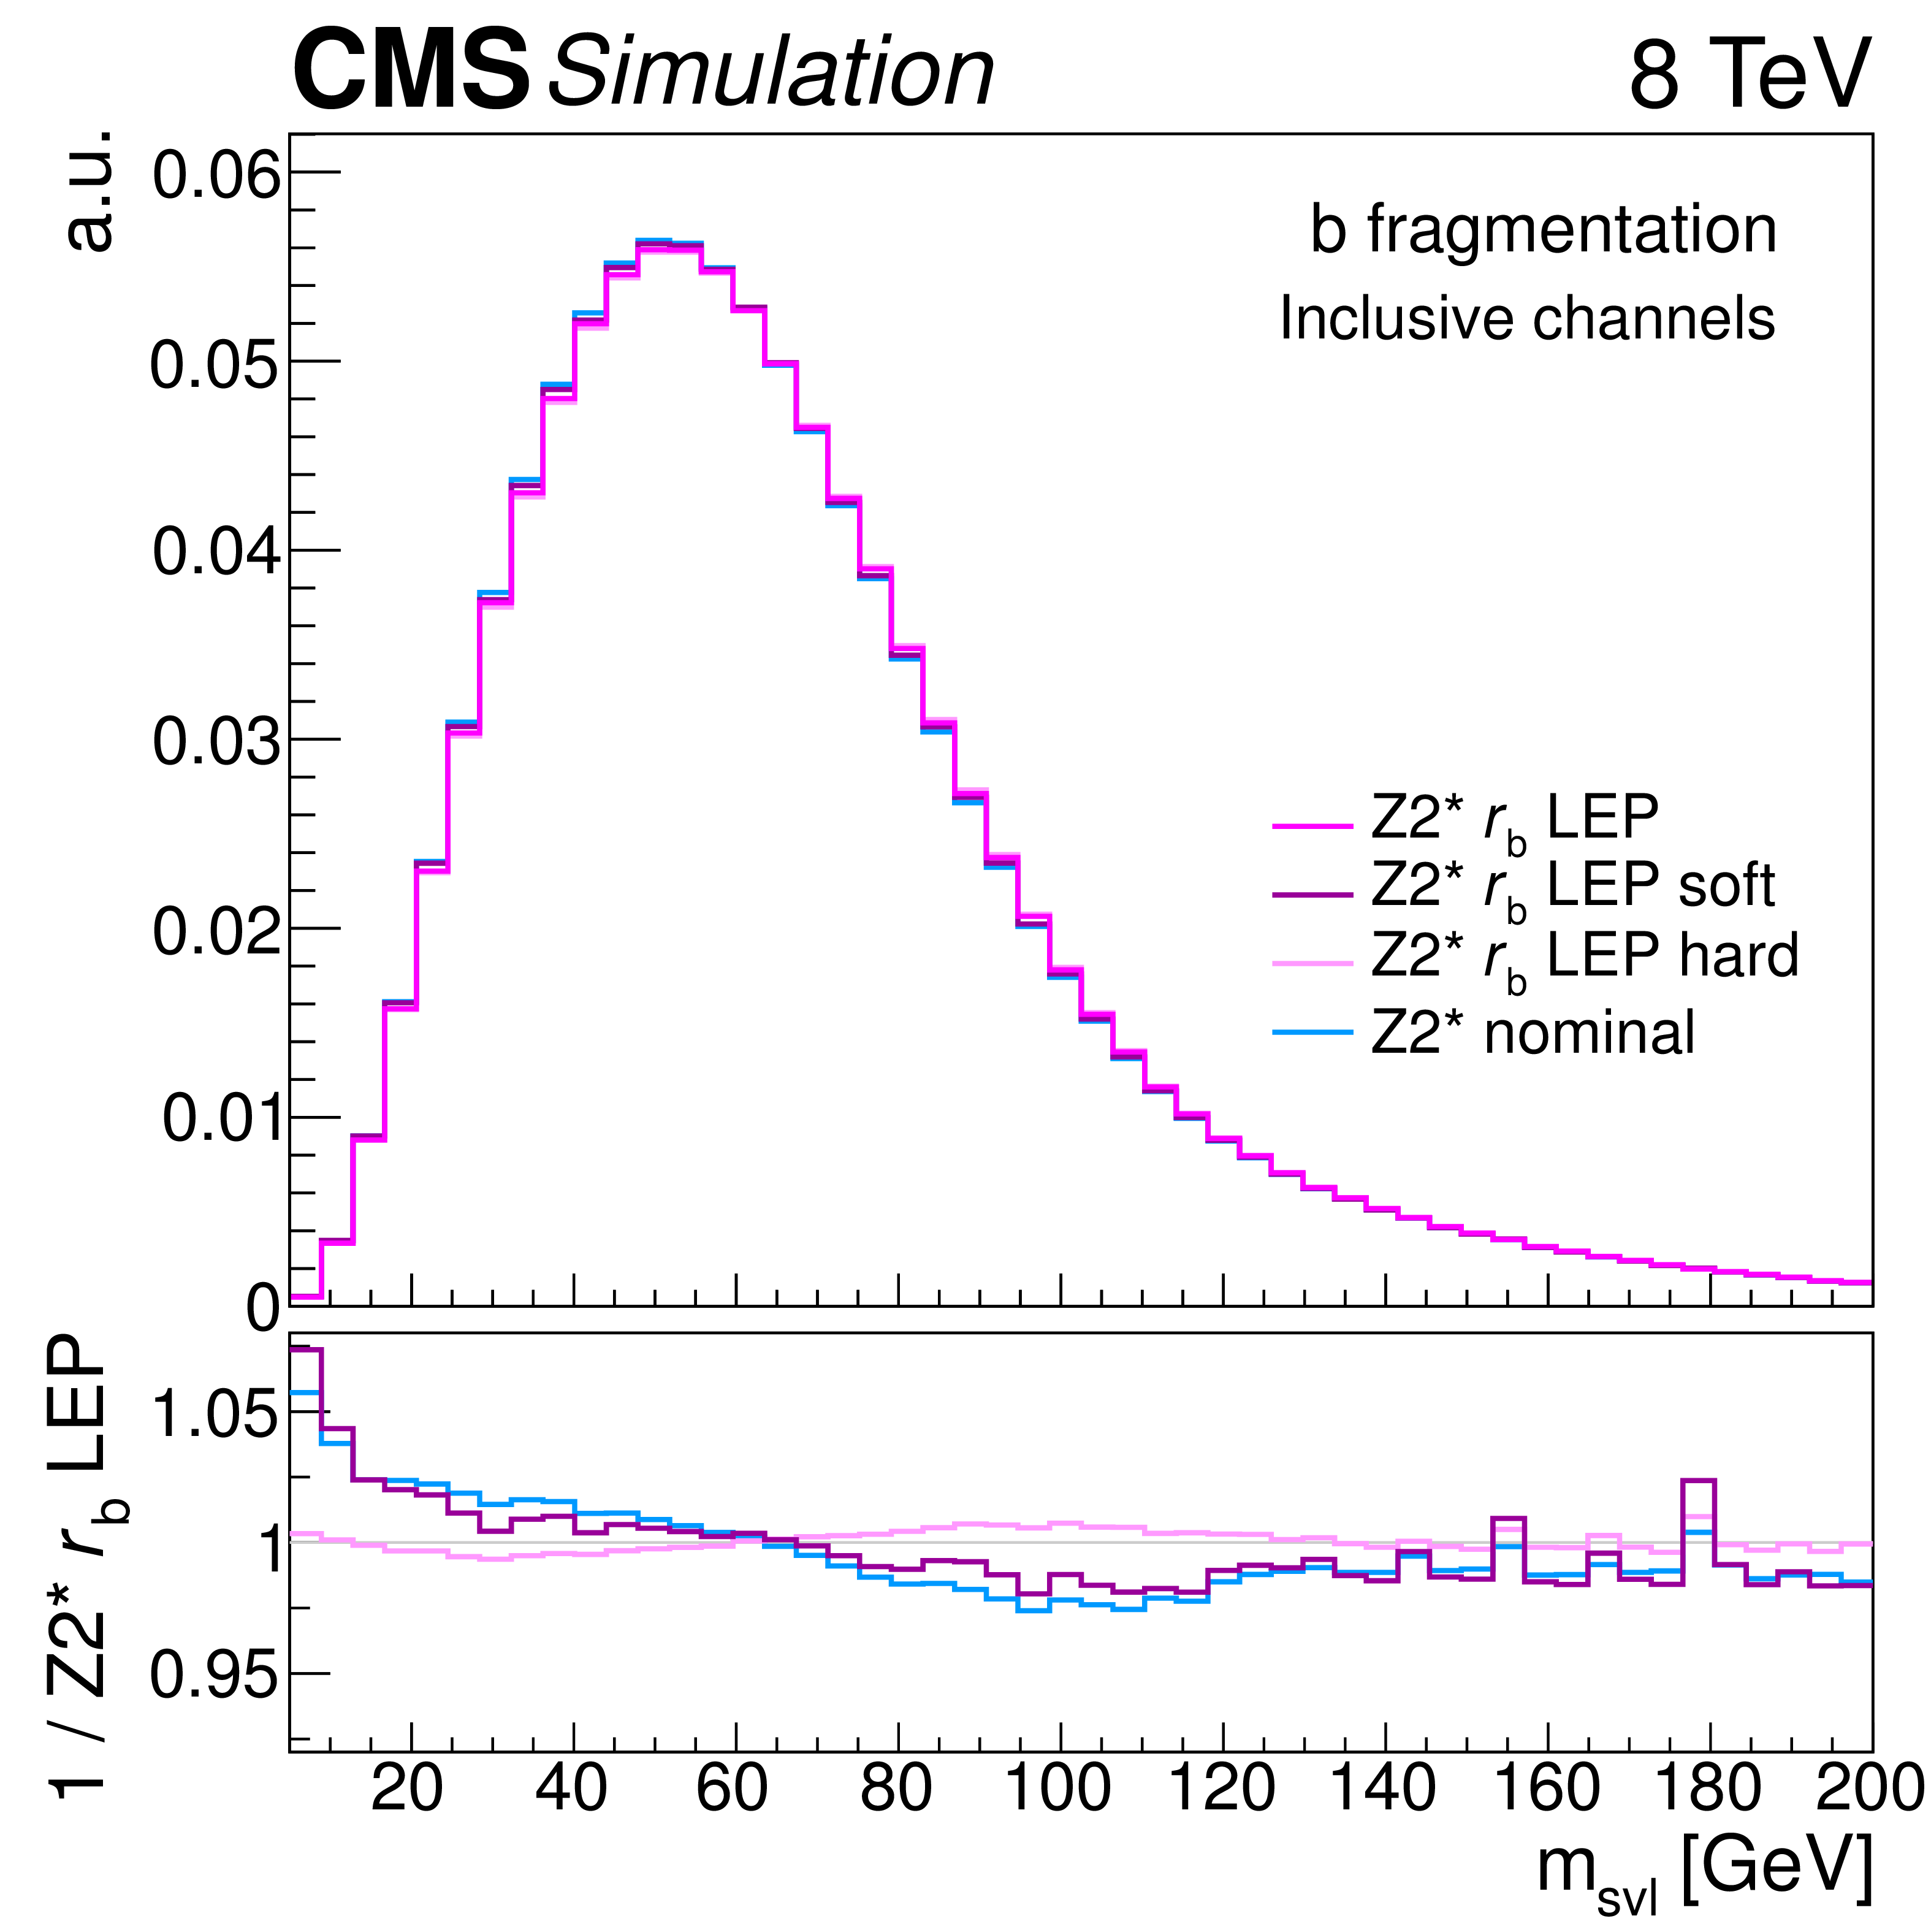
Figure 8-b:
Variation of the simulated ${m_{\mathrm {svl}}} $ shape with systematic effects: reweighting of the simulated top quark ${p_{\mathrm {T}}} $ shape to the observed distribution, separately for correct and wrong lepton-vertex pairings (a); and different b quark fragmentation function shapes (b). The bottom panels in the two plots show the ratios between the top quark ${p_{\mathrm {T}}} $ reweighted and nominal shapes for the correct and wrong pairings (a), and between the various fragmentation models and the central Z2* LEP $r_{\mathrm{ b } }$ tune (b). |
png pdf |
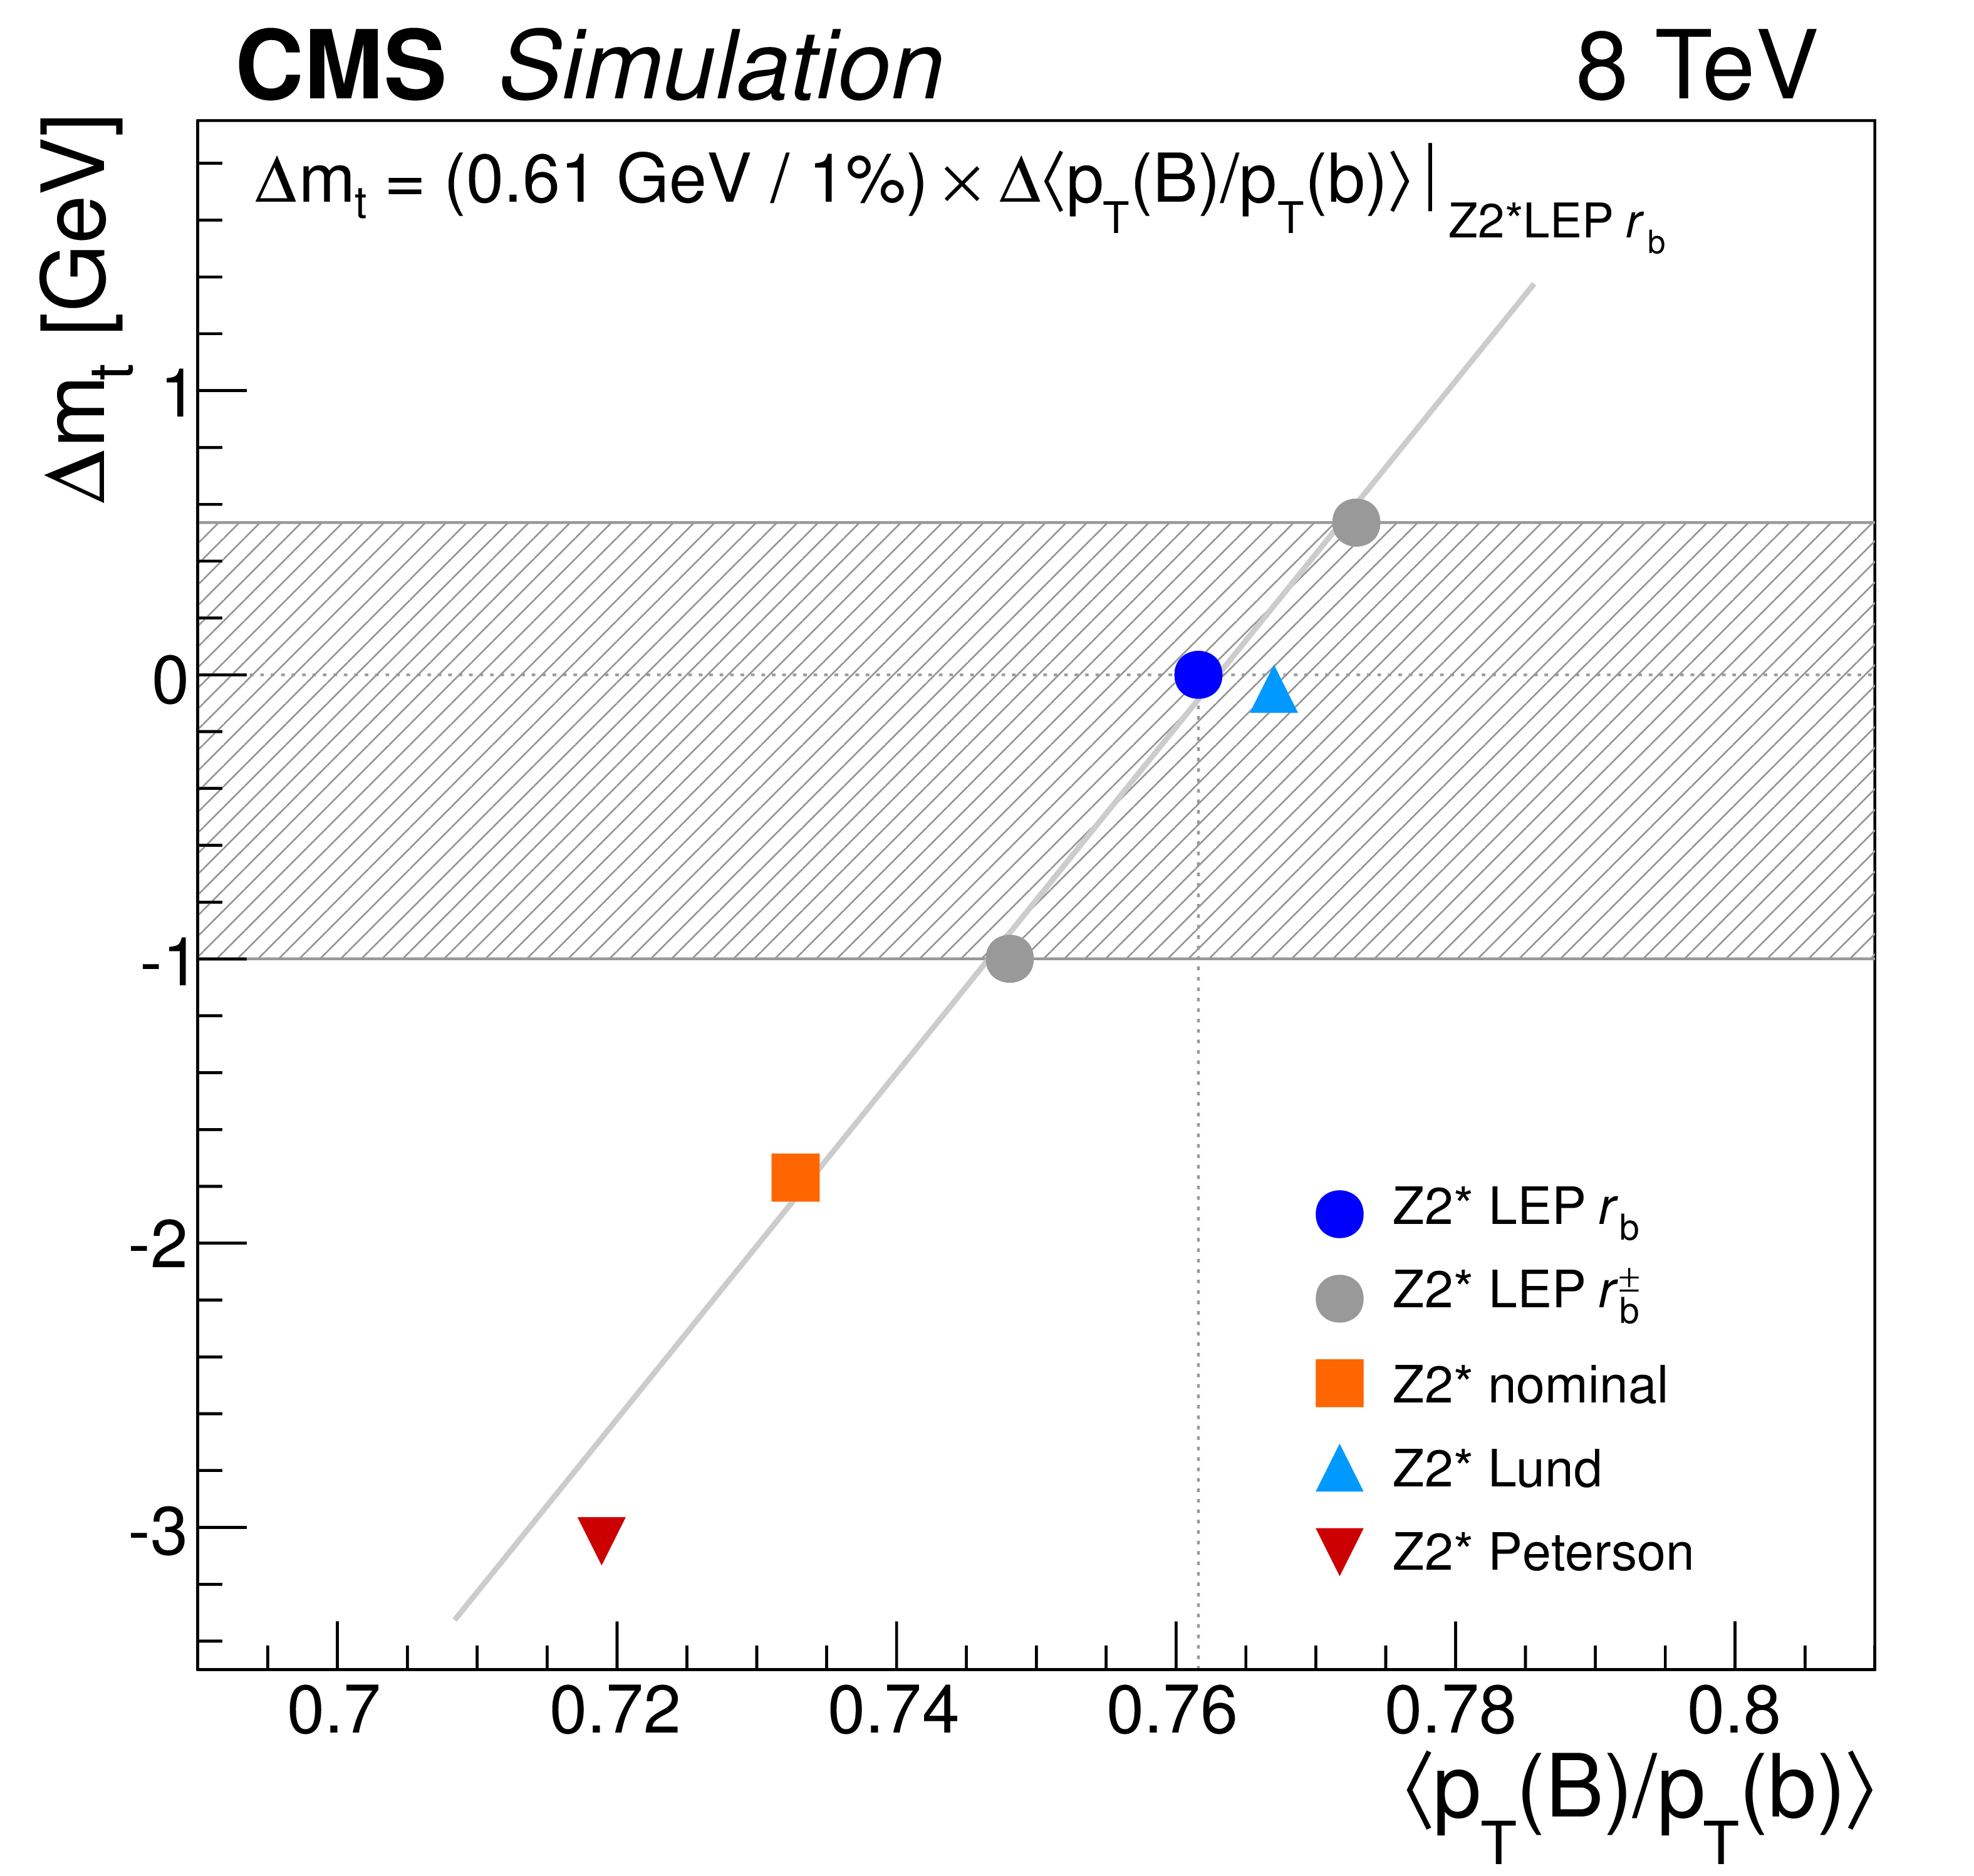
Figure 9:
Impact of the average b quark fragmentation, $< {p_{\mathrm {T}}} (\mathrm{B} )/ {p_{\mathrm {T}}} ( \mathrm{b} ) > $, on the extracted ${m_{\mathrm{ t } }}$ value, for various different fragmentation shapes. The horizontal band represents the contribution of the b quark fragmentation model to the systematic uncertainty in the measurement of the top quark mass, which is estimated from the Z2* LEP $r_{\mathrm{ b } }$ ${\pm }$ variations. A linear fit to the effects on the different variations (the line in the figure) suggests a relative change in the measured top quark mass of 0.61 GeV for each percent change in average momentum transfer. |
png pdf |
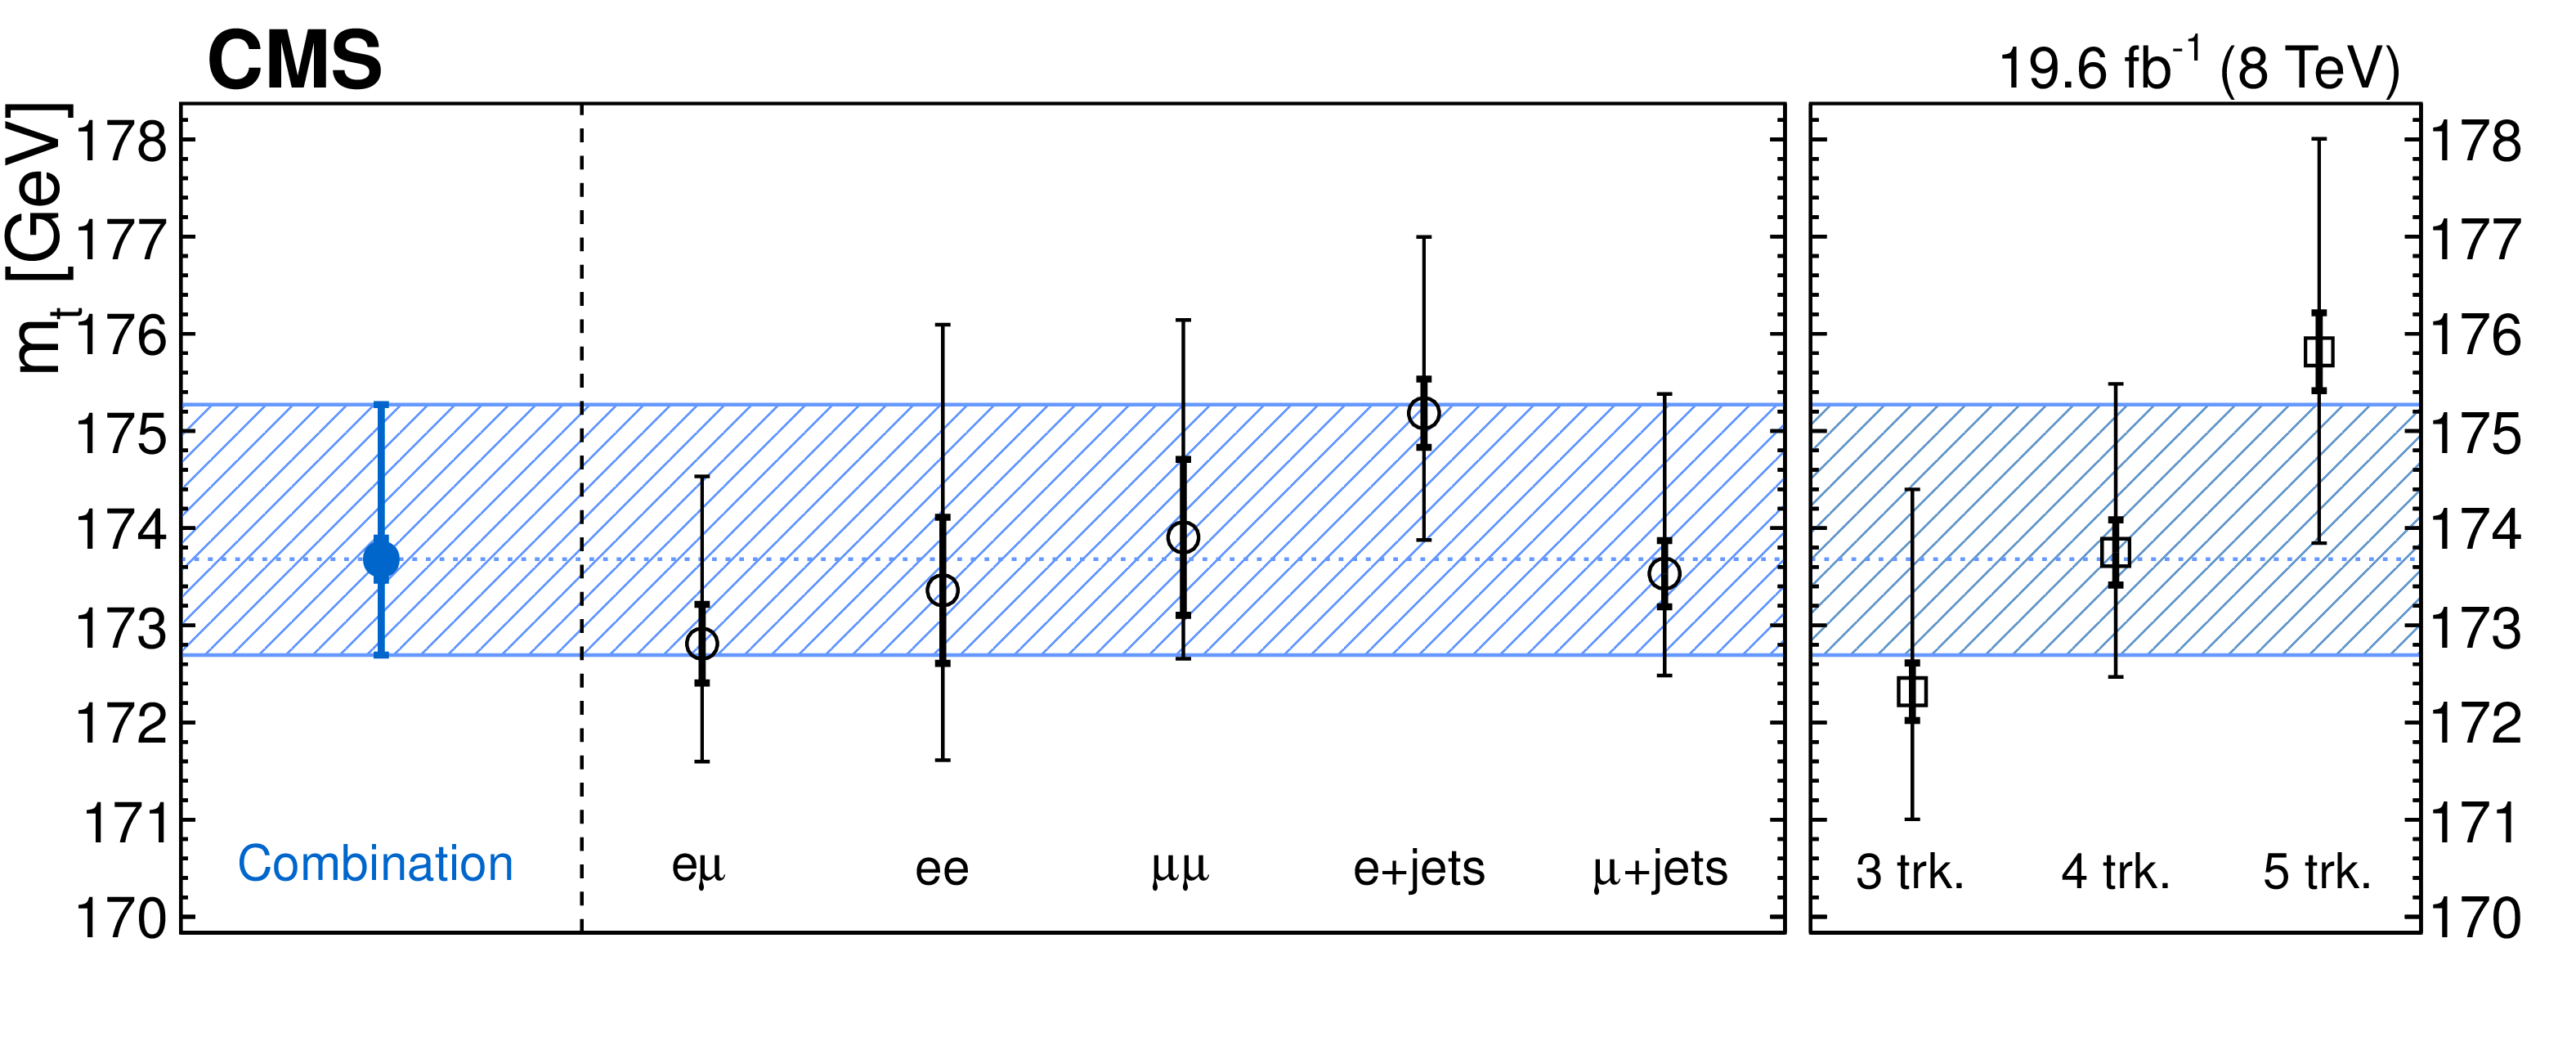
Figure 10:
Results of the ${m_{\mathrm{ t } }}$ measurement in the individual channels and their combination. Smaller and thicker error bars show the statistical uncertainty, whereas the thinner bars show the combined statistical and systematic uncertainty. The right panel shows the extracted mass when performing the analysis in separate track multiplicity bins, combining the lepton channels. |
| Tables | |
png pdf |
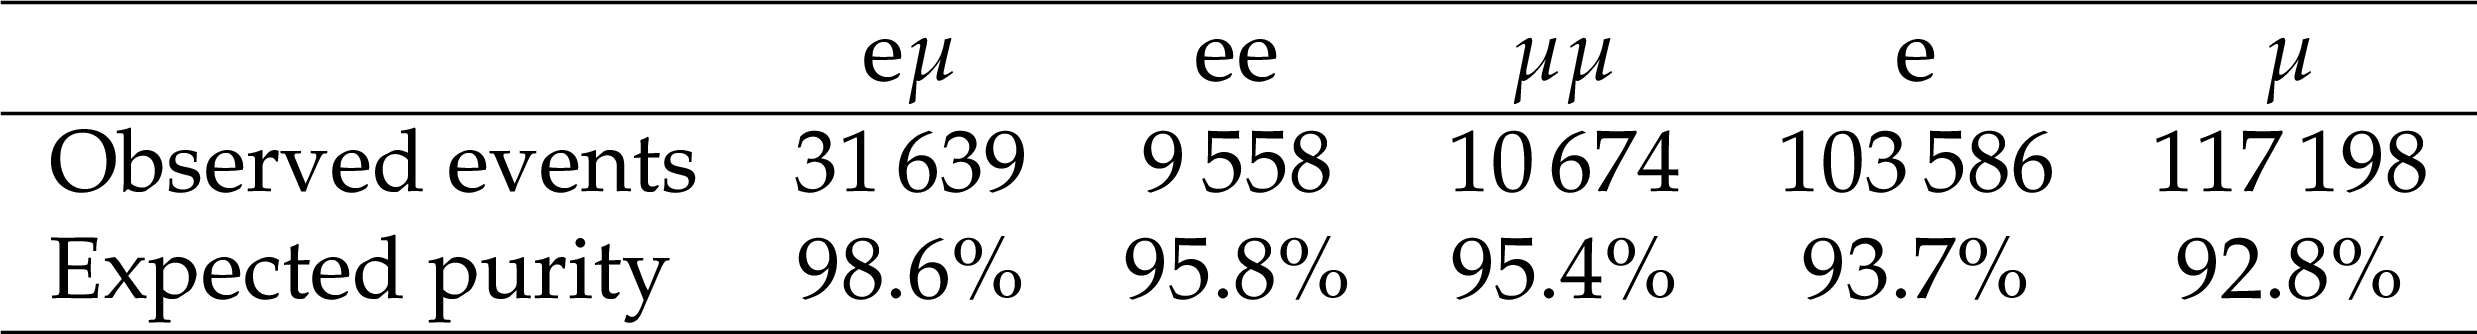
Table 1:
Number of observed events and expected purity of top quark production ($ {\mathrm{ t \bar{t} } } $ and single top quarks) for the five channels investigated in this analysis. |
png pdf |
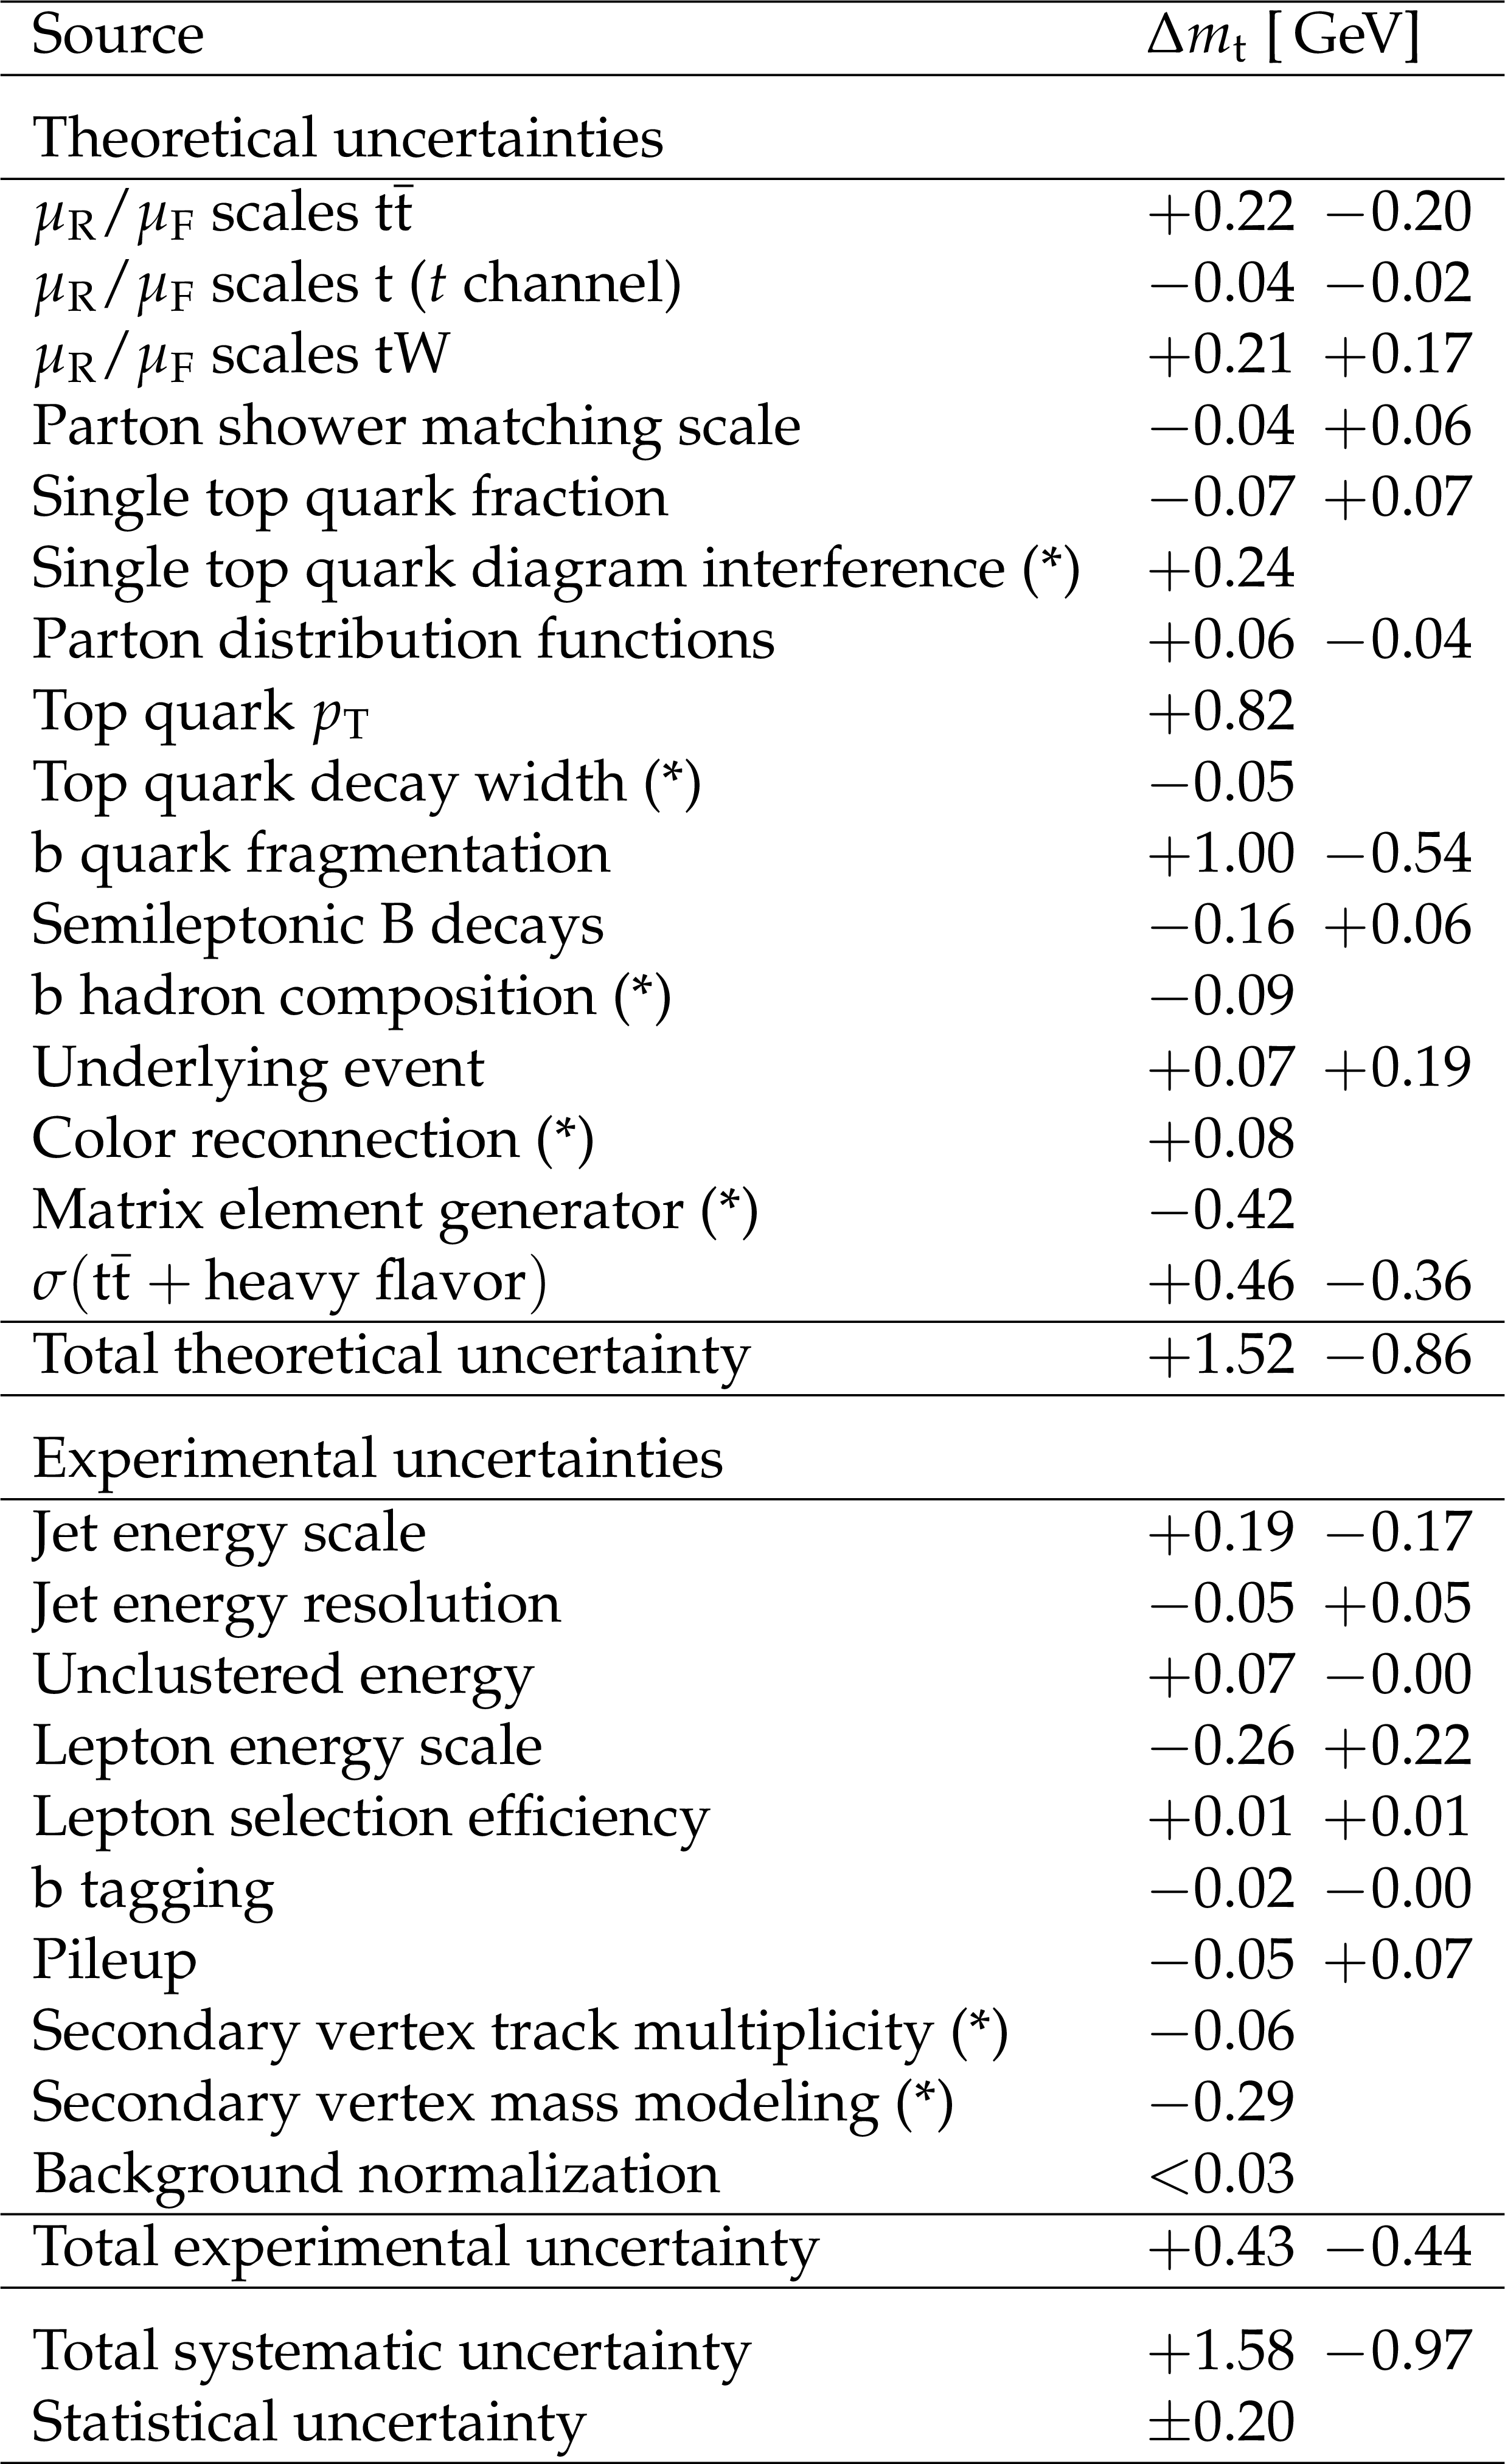
Table 2:
Summary of the systematic uncertainties in the final measurement. In cases where there are two variations of one source of uncertainty, the first and second numbers correspond, respectively, to the down and up variations. The total uncertainties are taken as the separate quadratic sum of all positive and negative shifts. For the contributions marked with a (*), the shift of the single variation including its sign is given, but the uncertainty is counted symmetrically in both up and down directions for the total uncertainty calculation. |
| Summary |
|
A novel measurement of the top quark mass has been presented, using an observable that relies entirely on the reconstruction of charged particles. It shows minimal sensitivity to experimental sources of uncertainty. The final result yields a value of $ m_{\mathrm{t}} =$ 173.68 $^{+1.59}_{-0.99}$ GeV, equivalent to a precision of well below one percent. The overall uncertainty is dominated by the b quark fragmentation modeling uncertainty of $+1.00/-0.54$ GeV and the uncertainty in the modeling of the top quark $p_{\mathrm{T}}$ of +0.82 GeV. Experimental uncertainties related to the understanding of jet energy scales only affect the event acceptance and are therefore virtually irrelevant to the final result. Studies of the b quark fragmentation with reconstructed secondary vertices and inclusively reconstructed charm quark mesons are used to select the central b quark fragmentation shape and to validate the systematic uncertainty. With the significantly larger data sets becoming available for analysis from the current 13 TeV run of the LHC, this method could be extended to constrain the b quark fragmentation, using the properties of the secondary vertices or charmed mesons, while measuring the top quark mass. This is expected to lead to a significant reduction of the overall uncertainty. Furthermore, theoretical uncertainties related to kinematic properties of top quarks and scale choices in QCD calculations are expected to decrease with the next generation of Monte Carlo event generators. Finally, this result is complementary to standard measurements relying on kinematic properties of jets. The precision of such analyses is typically limited by the uncertainty from the modeling of hadronization effects, influencing the understanding of the jet energy scale, while not much affected by the choice of b quark fragmentation model and the modeling of top quark kinematic properties. Therefore, a combination of this result with standard measurements could optimally benefit from independent sources of systematic uncertainties. |
| References | ||||
| 1 | CDF Collaboration | Observation of top quark production in $ \mathrm{ \bar{p} } \mathrm{ p } $ collisions | PRL 74 (1995) 2626 | hep-ex/9503002 |
| 2 | D0 Collaboration | Observation of the top quark | PRL 74 (1995) 2632 | hep-ex/9503003 |
| 3 | CMS Collaboration | Measurement of the top quark mass in $ \mathrm{ t \bar{t} }\ $ events with lepton+jets final states in pp collisions at $ \sqrt{s}=7 $ TeV | JHEP 12 (2012) 105 | CMS-TOP-11-015 1209.2319 |
| 4 | CMS Collaboration | Measurement of the top quark mass in all-jets $ \mathrm{ t \bar{t} }\ $ events in pp collisions at $ \sqrt{s} = $ 7 TeV | EPJC 74 (2014) 2758 | CMS-TOP-11-017 1307.4617 |
| 5 | ATLAS Collaboration | Measurement of the top quark mass in the $ \mathrm{ t \bar{t} }\rightarrow \text{ lepton+jets } $ and $ \mathrm{ t \bar{t} }\rightarrow \text{ dilepton } $ channels using $ \sqrt{s} = $ 7 TeV ATLAS data | EPJC 75 (2015) 330 | 1503.05427 |
| 6 | CMS Collaboration | Measurement of the top quark mass in $ \mathrm{ t \bar{t} }\ $ events with dilepton final states in pp collisions at $ \sqrt{s} = $ 7 TeV | EPJC 72 (2012) 2202 | CMS-TOP-11-016 1209.2393 |
| 7 | ATLAS, CDF, CMS, and D0 Collaborations | First combination of Tevatron and LHC measurements of the top quark mass | 1403.4427 | |
| 8 | CMS Collaboration | Measurement of the top quark mass using proton-proton data at $ \sqrt{s} = 7 $ and $ 8 TeV $ | Submitted to PRD | CMS-TOP-14-022 1509.04044 |
| 9 | C. S. Hill, J. R. Incandela, and J. M. Lamb | A method for measurement of the top quark mass using the mean decay length of $ \mathrm{b}\ $ hadrons in $ \mathrm{ t \bar{t} }\ $ events | PRD 71 (2005) 054029 | hep-ex/0501043 |
| 10 | CDF Collaboration | Measurement of the top quark mass in $ \mathrm{ p } \mathrm{ \bar{p} } $ Collisions at $ \sqrt{s} = $ 1.96 TeV using the decay length technique | PRD 75 (2007) 071102 | hep-ex/0612061 |
| 11 | CDF Collaboration | Measurements of the top quark mass using charged particle tracking | PRD 81 (2010) 032002 | 0910.0969 |
| 12 | S. Frixione and A. Mitov | Determination of the top quark mass from leptonic observables | JHEP 09 (2014) 012 | 1407.2763 |
| 13 | CMS Collaboration | Measurement of masses in the $ \mathrm{ t \bar{t} }\ $ system by kinematic endpoints in pp collisions at $ \sqrt{s} = $ 7 TeV | EPJC 73 (2013) 2494 | CMS-TOP-11-027 1304.5783 |
| 14 | CMS Collaboration | Measurement of the $ \mathrm{ t \bar{t} }\ $ production cross section in the $ \mathrm{ e } \mu $ channel in proton-proton collisions at $ \sqrt{s} = 7 $ and 8 TeV | Submitted to JHEP | CMS-TOP-13-004 1603.02303 |
| 15 | A. Kharchilava | Top mass determination in leptonic final states with $ \mathrm{J} / \psi $ | PLB 476 (2000) 73 | hep-ph/9912320 |
| 16 | CMS Collaboration | The CMS experiment at the CERN LHC | JINST 3 (2008) S08004 | CMS-00-001 |
| 17 | M. Czakon, P. Fiedler, and A. Mitov | Total top-quark pair-production cross section at hadron colliders through $ \mathcal{O}(\alpha_S^4) $ | PRL 110 (2013) 252004 | 1303.6254 |
| 18 | J. Alwall et al. | The automated computation of tree-level and next-to-leading order differential cross sections, and their matching to parton shower simulations | JHEP 07 (2014) 079 | 1405.0301 |
| 19 | T. Sj\"ostrand, S. Mrenna, and P. Z. Skands | PYTHIA 6.4 physics and manual | JHEP 05 (2006) 026 | hep-ph/0603175 |
| 20 | Z. Was | TAUOLA the library for tau lepton decay, and KKMC / KORALB / KORALZ /... status report | NPPS 98 (2001) 96 | hep-ph/0011305 |
| 21 | J. Pumplin et al. | New generation of parton distributions with uncertainties from global QCD analysis | JHEP 07 (2002) 012 | hep-ph/0201195 |
| 22 | CMS Collaboration | Measurement of the underlying event activity at the LHC with $ \sqrt{s} = $ 7 TeV and comparison with $ \sqrt{s} = $ 0.9 TeV | JHEP 09 (2011) 109 | CMS-QCD-10-010 1107.0330 |
| 23 | R. Field | Early LHC underlying event data - findings and surprises | in Hadron collider physics. Proceedings, 22nd Conference, HCP 2010, Toronto, Canada, August 23-27, 2010 2010 | 1010.3558 |
| 24 | M. L. Mangano, M. Moretti, F. Piccinini, and M. Treccani | Matching matrix elements and shower evolution for top-quark production in hadronic collisions | JHEP 01 (2007) 013 | hep-ph/0611129 |
| 25 | GEANT4 Collaboration | GEANT4---a simulation toolkit | NIMA 506 (2003) 250 | |
| 26 | R. Gavin, Y. Li, F. Petriello, and S. Quackenbush | $ \mathrm{ W } $ physics at the LHC with FEWZ 2.1 | CPC 184 (2013) 208 | 1201.5896 |
| 27 | P. Nason | A new method for combining NLO QCD with shower Monte Carlo algorithms | JHEP 11 (2004) 040 | hep-ph/0409146 |
| 28 | S. Frixione, P. Nason, and C. Oleari | Matching NLO QCD computations with parton shower simulations: the POWHEG method | JHEP 11 (2007) 070 | 0709.2092 |
| 29 | S. Alioli, P. Nason, C. Oleari, and E. Re | A general framework for implementing NLO calculations in shower Monte Carlo programs: the POWHEG BOX | JHEP 06 (2010) 043 | 1002.2581 |
| 30 | S. Alioli, P. Nason, C. Oleari, and E. Re | NLO single-top production matched with shower in POWHEG: $ s $- and $ t $-channel contributions | JHEP 09 (2009) 111, , [Erratum: \DOI10.1007/JHEP02(2010)011] | 0907.4076 |
| 31 | E. Re | Single-top $ \mathrm{ W } \mathrm{ t } $-channel production matched with parton showers using the POWHEG method | EPJC 71 (2011) 1547 | 1009.2450 |
| 32 | N. Kidonakis | Single top and top pair production | 1212.2844 | |
| 33 | R. Gavin, Y. Li, F. Petriello, and S. Quackenbush | FEWZ 2.0: A code for hadronic $ \mathrm{ Z } $ production at next-to-next-to-leading order | CPC 182 (2011) 2388 | 1011.3540 |
| 34 | Y. Li and F. Petriello | Combining QCD and electroweak corrections to dilepton production in FEWZ | PRD 86 (2012) 094034 | 1208.5967 |
| 35 | J. M. Campbell and R. K. Ellis | MCFM for the Tevatron and the LHC | NPPS 205-206 (2010) 10 | 1007.3492 |
| 36 | CMS Collaboration | Measurements of the $ \mathrm{ t \bar{t} }\ $ production cross section in lepton+jets final states in pp collisions at 8$ TeV $ and ratio of 8 to 7$ TeV $ cross sections | Submitted to EPJC | CMS-TOP-12-006 1602.09024 |
| 37 | CMS Collaboration | Particle--flow event reconstruction in CMS and performance for jets, taus, and $ E_{\mathrm{T}}^{\text{miss}} $ | CDS | |
| 38 | CMS Collaboration | Commissioning of the particle--flow event reconstruction with the first LHC collisions recorded in the CMS detector | CDS | |
| 39 | CMS Collaboration | Performance of electron reconstruction and selection with the CMS detector in proton-proton collisions at $ \sqrt{s} = $ 8 TeV | JINST 10 (2015) | CMS-EGM-13-001 1502.02701 |
| 40 | CMS Collaboration | The performance of the CMS muon detector in proton-proton collisions at $ \sqrt{s} = $ 7 TeV at the LHC | JINST 8 (2013) | CMS-MUO-11-001 1306.6905 |
| 41 | M. Cacciari, G. P. Salam, and G. Soyez | The anti-$ k_t $ jet clustering algorithm | JHEP 04 (2008) 063 | 0802.1189 |
| 42 | M. Cacciari, G. P. Salam, and G. Soyez | The catchment area of jets | JHEP 04 (2008) 005 | 0802.1188 |
| 43 | M. Cacciari and G. P. Salam | Pileup subtraction using jet areas | PLB 659 (2008) 119 | 0707.1378 |
| 44 | R. Fr\"uhwirth, W. Waltenberger, and P. Vanlaer | Adaptive vertex fitting | JPG 34 (2007) N343 | |
| 45 | CMS Collaboration | Identification of $ \mathrm{ b } $-quark jets with the CMS experiment | JINST 8 (2013) P04013 | CMS-BTV-12-001 1211.4462 |
| 46 | ALEPH Collaboration | Study of the fragmentation of $ \mathrm{ b } $ quarks into $ \mathrm{B} $ mesons at the $ \mathrm{ Z } $ peak | PLB 512 (2001) 30 | hep-ex/0106051 |
| 47 | OPAL Collaboration | Inclusive analysis of the $ \mathrm{ b } $ quark fragmentation function in $ \mathrm{ Z } $ decays at LEP | EPJC 29 (2003) 463 | hep-ex/0210031 |
| 48 | DELPHI Collaboration | A study of the $ \mathrm{ b } $-quark fragmentation function with the DELPHI detector at LEP I and an averaged distribution obtained at the $ \mathrm{ Z } $ Pole | EPJC 71 (2011) 1557 | 1102.4748 |
| 49 | SLD Collaboration | Precise measurement of the $ \mathrm{ b } $ quark fragmentation function in $ \mathrm{ Z } $ boson decays | PRL 84 (2000) 4300 | hep-ex/9912058 |
| 50 | SLD Collaboration | Measurement of the $ \mathrm{ b } $ quark fragmentation function in $ \mathrm{ Z } $ decays | PRD 65 (2002) 092006, , [Erratum: \DOI10.1103/PhysRevD.65.092006] | hep-ex/0202031 |
| 51 | CDF Collaboration | Measurement of $ \mathrm{b}\ $ quark fragmentation fractions in $ \mathrm{ p } \mathrm{ \bar{p} } $ collisions at $ \sqrt{s} = $ 1.8 TeV | PRL 84 (2000) 1663 | hep-ex/9909011 |
| 52 | A. Buckley et al. | Systematic event generator tuning for the LHC | EPJC 65 (2010) 331 | 0907.2973 |
| 53 | M. Seidel | Precise measurement of the top-quark mass at the CMS experiment using the ideogram method | PhD thesis, U. Hamburg, Dept. Phys. | |
| 54 | B. Andersson, G. Gustafson, G. Ingelman, and T. Sj\"ostrand | Parton fragmentation and string dynamics | PR 97 (1983) 31 | |
| 55 | B. R. Webber | A QCD model for jet fragmentation including soft gluon interference | Nucl. Phys. B 238 (1984) 492 | |
| 56 | J.-C. Winter, F. Krauss, and G. Soff | A modified cluster hadronization model | EPJC 36 (2004) 381 | hep-ph/0311085 |
| 57 | M. J. Oreglia | A study of the reactions $\psi' \to \gamma\gamma \psi$ | PhD thesis, Stanford University, 1980 SLAC Report SLAC-R-236, see Appendix D | |
| 58 | Particle Data Group, K. A. Olive et al. | Review of Particle Physics | CPC 38 (2014) 090001 | |
| 59 | M. Pivk and F. R. Le Diberder | sPlot: A statistical tool to unfold data distributions | NIMA 555 (2005) 356 | physics/0402083 |
| 60 | G. Corcella et al. | HERWIG 6: an event generator for hadron emission reactions with interfering gluons (including supersymmetric processes) | JHEP 01 (2001) 010 | hep-ph/0011363 |
| 61 | ATLAS Collaboration | New ATLAS event generator tunes to 2010 data | Technical Report ATL-PHYS-PUB-2011-008 | |
| 62 | CMS Collaboration | Measurement of $ \mathrm{ t \bar{t} }\ $ production with additional jet activity, including $ \mathrm{ b } $ quark jets, in the dilepton channel using pp collisions at $ \sqrt{s} = $ 8 TeV | CMS-TOP-12-041 1510.03072 |
|
| 63 | CMS Collaboration | Observation of the associated production of a single top quark and a $ \mathrm{ W } $ boson in pp collisions at $ \sqrt{s} = $ 8 TeV | PRL 112 (2014) 231802 | CMS-TOP-12-040 1401.2942 |
| 64 | CMS Collaboration | Measurement of the $ t $-channel single-top-quark production cross section and of the $ | V_{tb} | $ CKM matrix element in pp collisions at $ \sqrt{s} = $ 8 TeV | JHEP 06 (2014) | CMS-TOP-12-038 1403.7366 |
| 65 | S. Frixione et al. | Single-top hadroproduction in association with a $ \mathrm{ W } $ boson | JHEP 07 (2008) 029 | 0805.3067 |
| 66 | A. S. Belyaev, E. E. Boos, and L. V. Dudko | Single top quark at future hadron colliders: Complete signal and background study | PRD 59 (1999) 075001 | |
| 67 | C. D. White, S. Frixione, E. Laenen, and F. Maltoni | Isolating $ \mathrm{ W } \mathrm{ t } $ production at the LHC | JHEP 11 (2009) 074 | 0908.0631 |
| 68 | T. M. P. Tait | The $ \mathrm{t}\mathrm{ W }^- $ mode of single top production | PRD 61 (1999) 034001 | |
| 69 | CMS Collaboration | Measurement of the differential cross section for top quark pair production in pp collisions at $ \sqrt{s} = $ 8 TeV | EPJC 75 (2015) 542 | CMS-TOP-12-028 1505.04480 |
| 70 | CMS Collaboration | Measurement of the ratio $ B(\mathrm{t}\ \to \mathrm{ W }\mathrm{b})/B(\mathrm{t}\ \to \mathrm{ W }\mathrm{q} ) $ in $ \mathrm{ p }\mathrm{ p } $ collisions at $ \sqrt{s} = $ 8 TeV | PLB 736 (2014) 33 | CMS-TOP-12-035 1404.2292 |
| 71 | T. Gleisberg et al. | Event generation with SHERPA 1.1 | JHEP 02 (2009) 007 | 0811.4622 |
| 72 | P. Z. Skands | Tuning Monte Carlo generators: the Perugia tunes | PRD 82 (2010) 074018 | 1005.3457 |
| 73 | S. Frixione, P. Nason, and G. Ridolfi | The POWHEG-hvq manual version 1.0 | 0707.3081 | |
| 74 | J. M. Campbell and R. K. Ellis | Top-quark processes at NLO in production and decay | JPG 42 (2015) 015005 | 1204.1513 |
| 75 | ATLAS Collaboration | Measurements of fiducial cross-sections for $ \mathrm{ t \bar{t} }\ $ production with one or two additional $ \mathrm{ b } $-jets in pp collisions at $ \sqrt{s} = $ 8 TeV using the ATLAS detector | EPJC 76 (2016) 11 | 1508.06868 |
|
|
Compact Muon Solenoid LHC, CERN |
|

|

|

|

|

|