

Compact Muon Solenoid
LHC, CERN
| CMS-TOP-12-031 ; CERN-EP-2016-249 | ||
| Measurement of the mass difference between top quark and antiquark in pp collisions at $ \sqrt{s} = $ 8 TeV | ||
| CMS Collaboration | ||
| 29 October 2016 | ||
| Phys. Lett. B 770 (2017) 50 | ||
| Abstract: The invariance of the standard model (SM) under the CPT transformation predicts equality of particle and antiparticle masses. This prediction is tested by measuring the mass difference between the top quark and antiquark ($\Delta m_{\mathrm{t}} = m_{\mathrm{t}} - m_{\overline{\mathrm{t}}}$) that are produced in pp collisions at a center-of-mass energy of 8 TeV, using events with a muon or an electron and at least four jets in the final state. The analysis is based on data corresponding to an integrated luminosity of 19.6 fb$^{-1}$ collected by the CMS experiment at the LHC, and yields a value of $\Delta m_{\mathrm{t}} = -0.15 \pm 0.19\, \mathrm{(stat)} \pm 0.09\, \mathrm{(syst)}$ GeV, which is consistent with the SM expectation. This result is significantly more precise than previously reported measurements. | ||
| Links: e-print arXiv:1610.09551 [hep-ex] (PDF) ; CDS record ; inSPIRE record ; CADI line (restricted) ; | ||
| Figures | |
png pdf |
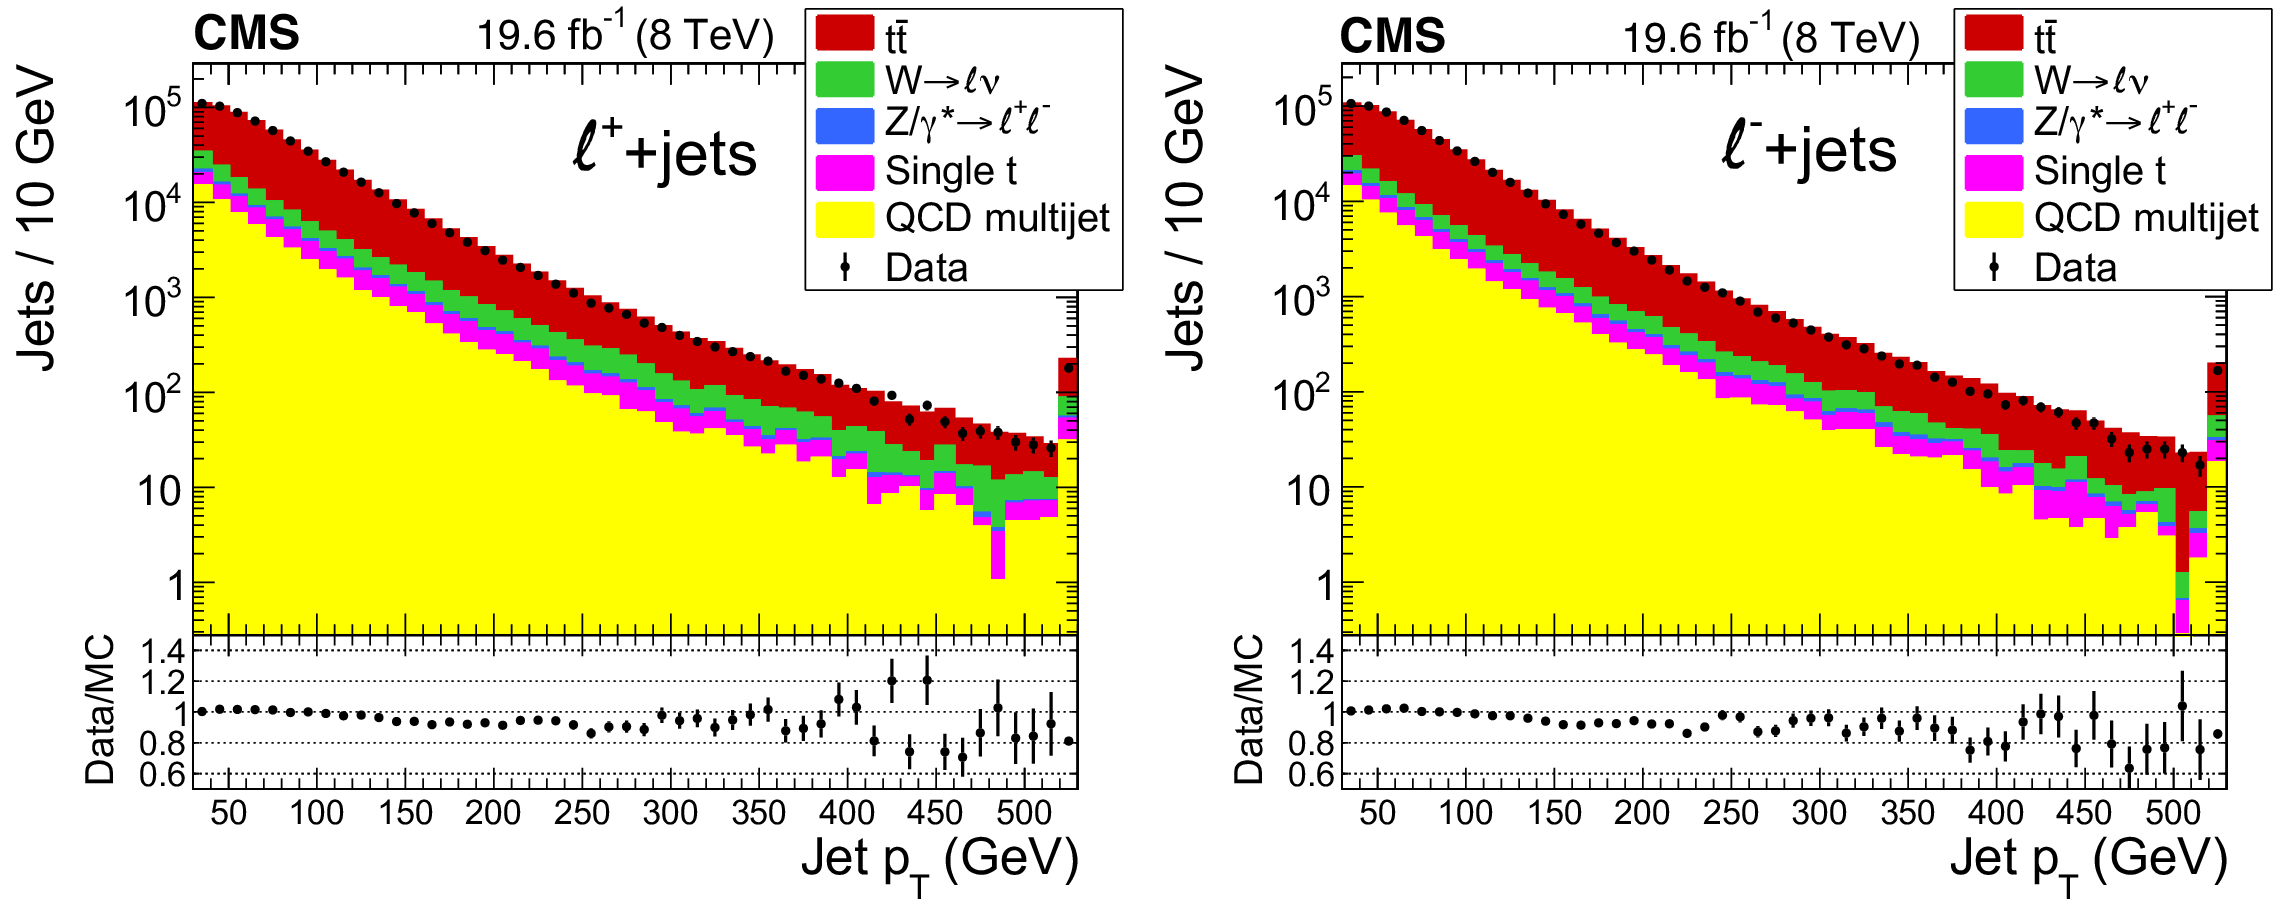
Figure 1:
Comparison of the data to simulation for the transverse momenta of the four leading jets in each event for $\ell ^+$+jets events (left) and $\ell ^-$+jets events (right). The last bin of each distribution includes all jets with $ {p_{\mathrm {T}}} > $ 530 GeV. The bin-by-bin ratio of the observed to the simulated spectra one is shown at the bottom of each plot. The uncertainties are purely statistical. The total simulated event yields are normalized to the observed yields in the data, while keeping the relative fractions of the individual components fixed. |
png pdf |
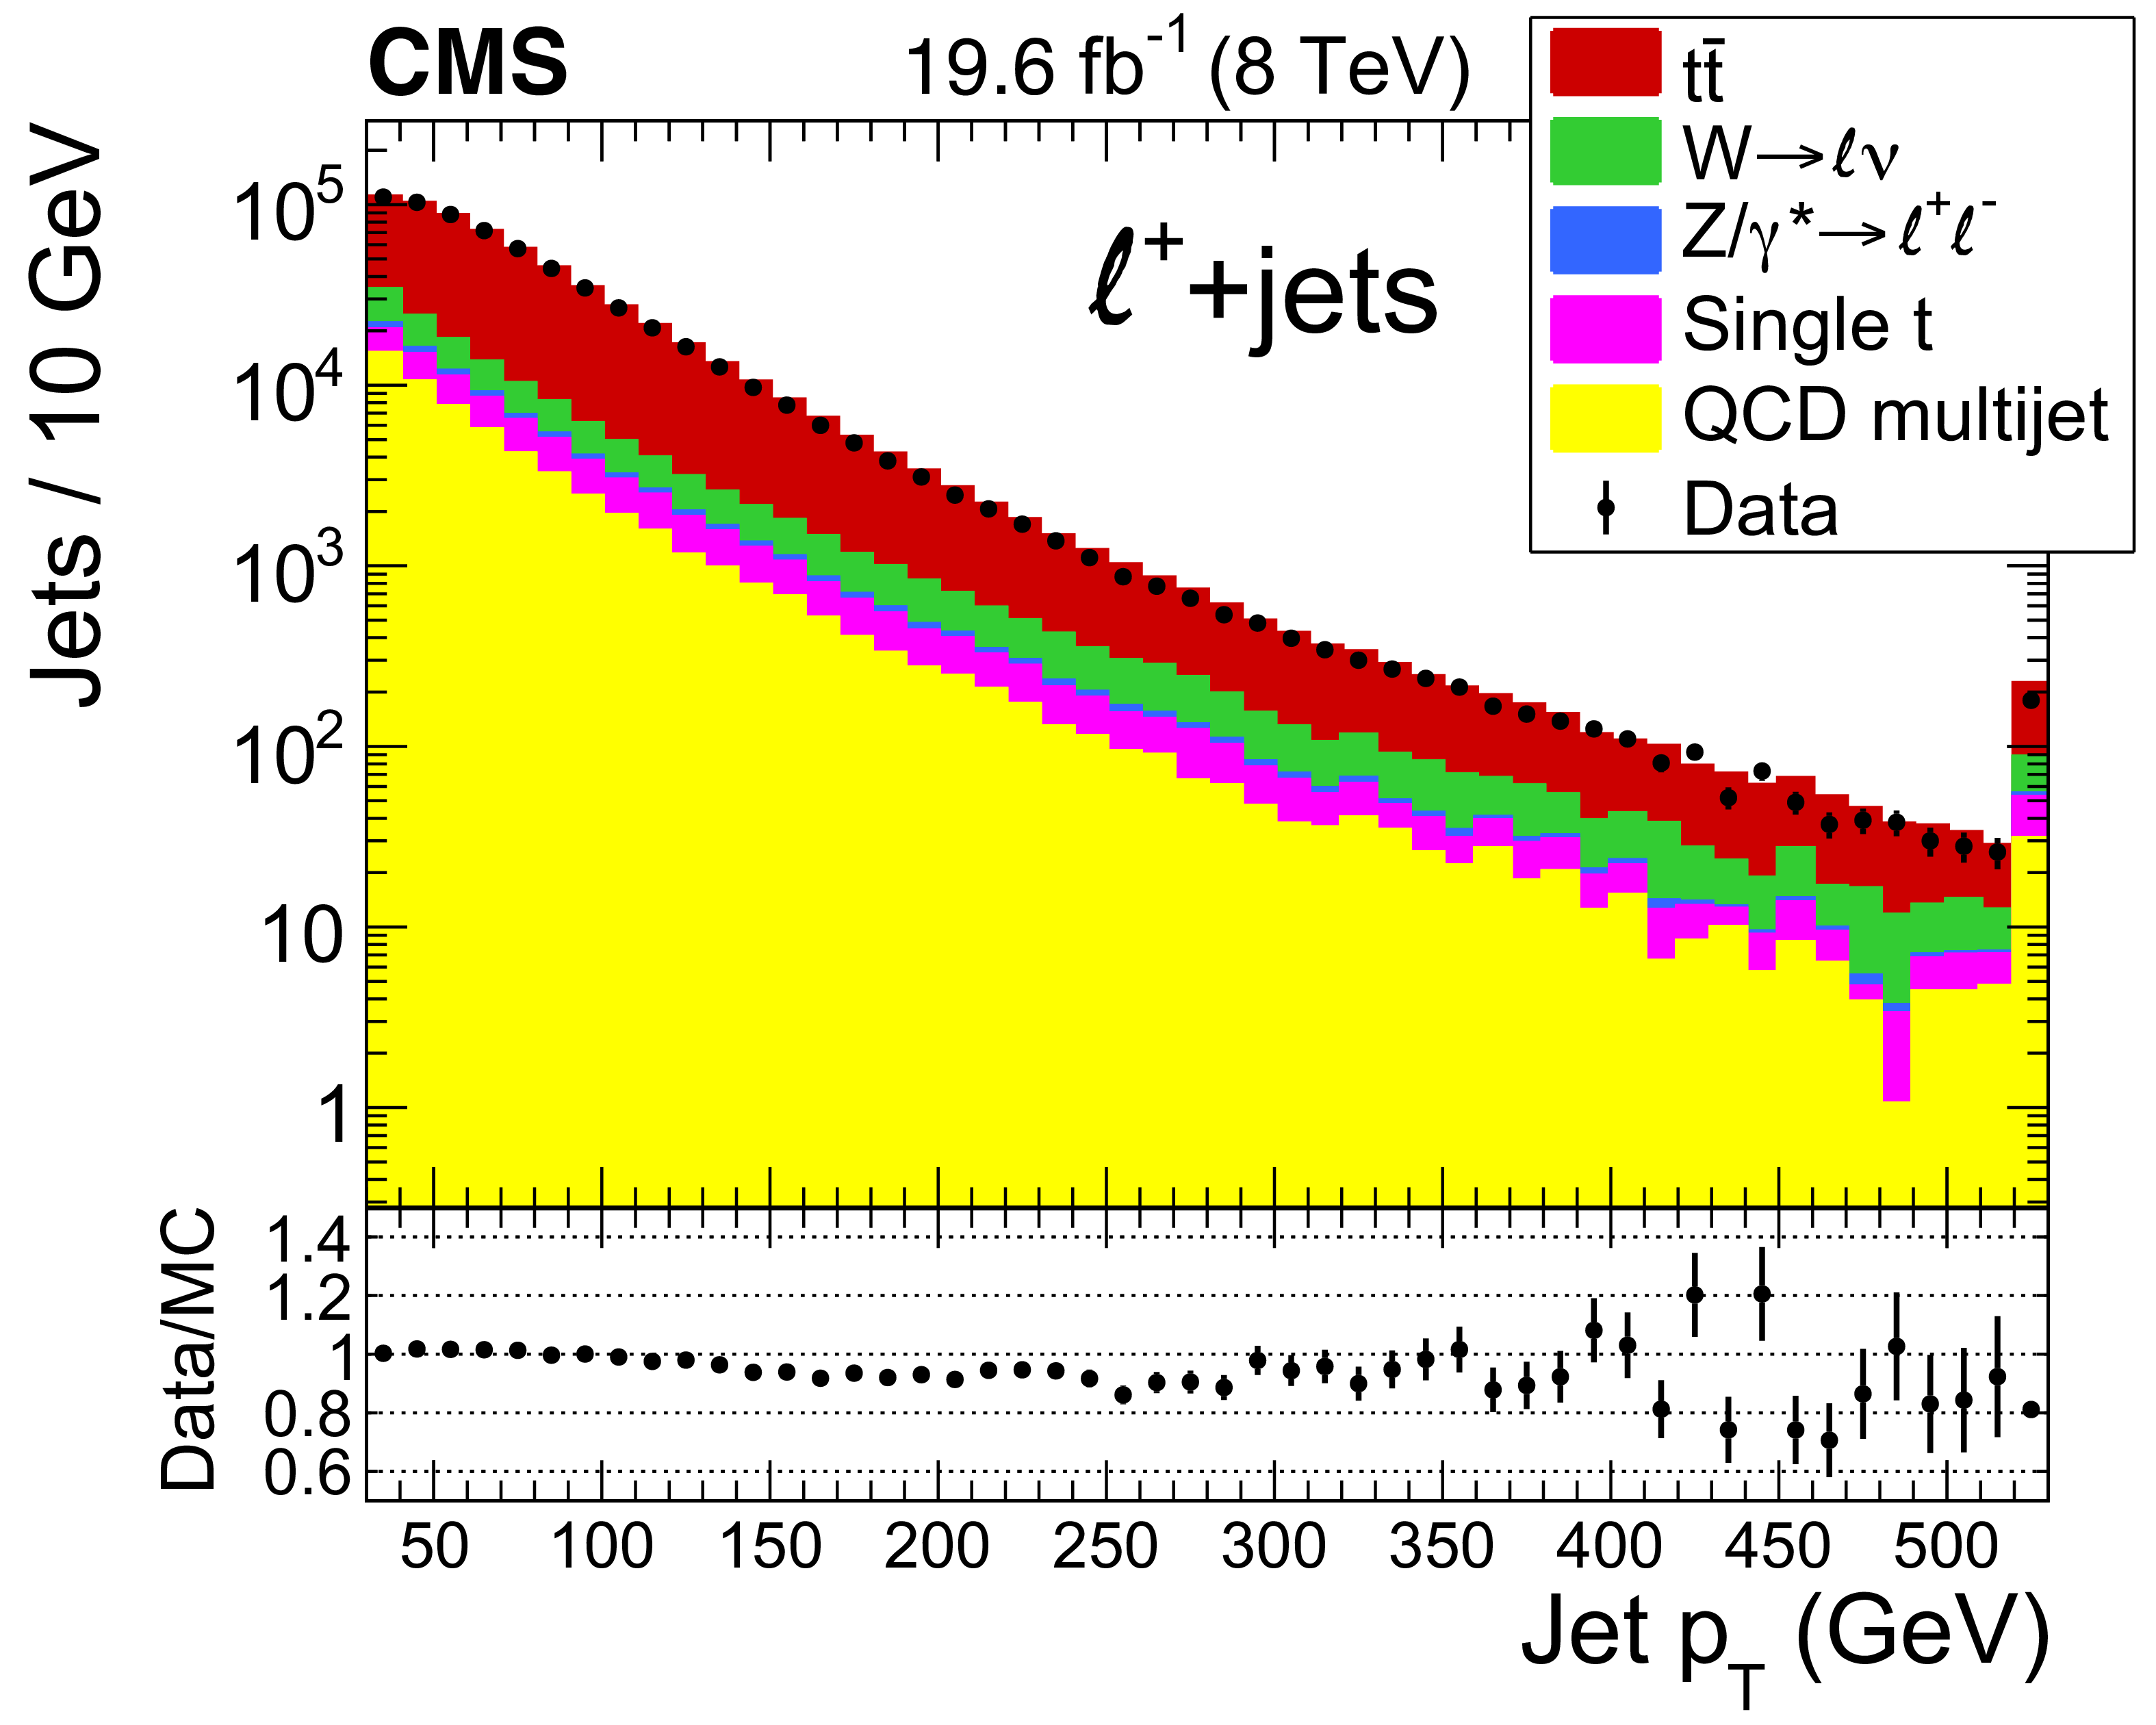
Figure 1-a:
Comparison of the data to simulation for the transverse momenta of the four leading jets in each event for $\ell ^+$+jets events. The last bin of each distribution includes all jets with $ {p_{\mathrm {T}}} > $ 530 GeV. The bin-by-bin ratio of the observed to the simulated spectra one is shown at the bottom of each plot. The uncertainties are purely statistical. The total simulated event yields are normalized to the observed yields in the data, while keeping the relative fractions of the individual components fixed. |

png pdf |
Figure 1-b:
Comparison of the data to simulation for the transverse momenta of the four leading jets in each event for $\ell ^-$+jets events. The last bin of each distribution includes all jets with $ {p_{\mathrm {T}}} > $ 530 GeV. The bin-by-bin ratio of the observed to the simulated spectra one is shown at the bottom of each plot. The uncertainties are purely statistical. The total simulated event yields are normalized to the observed yields in the data, while keeping the relative fractions of the individual components fixed. |
png pdf |
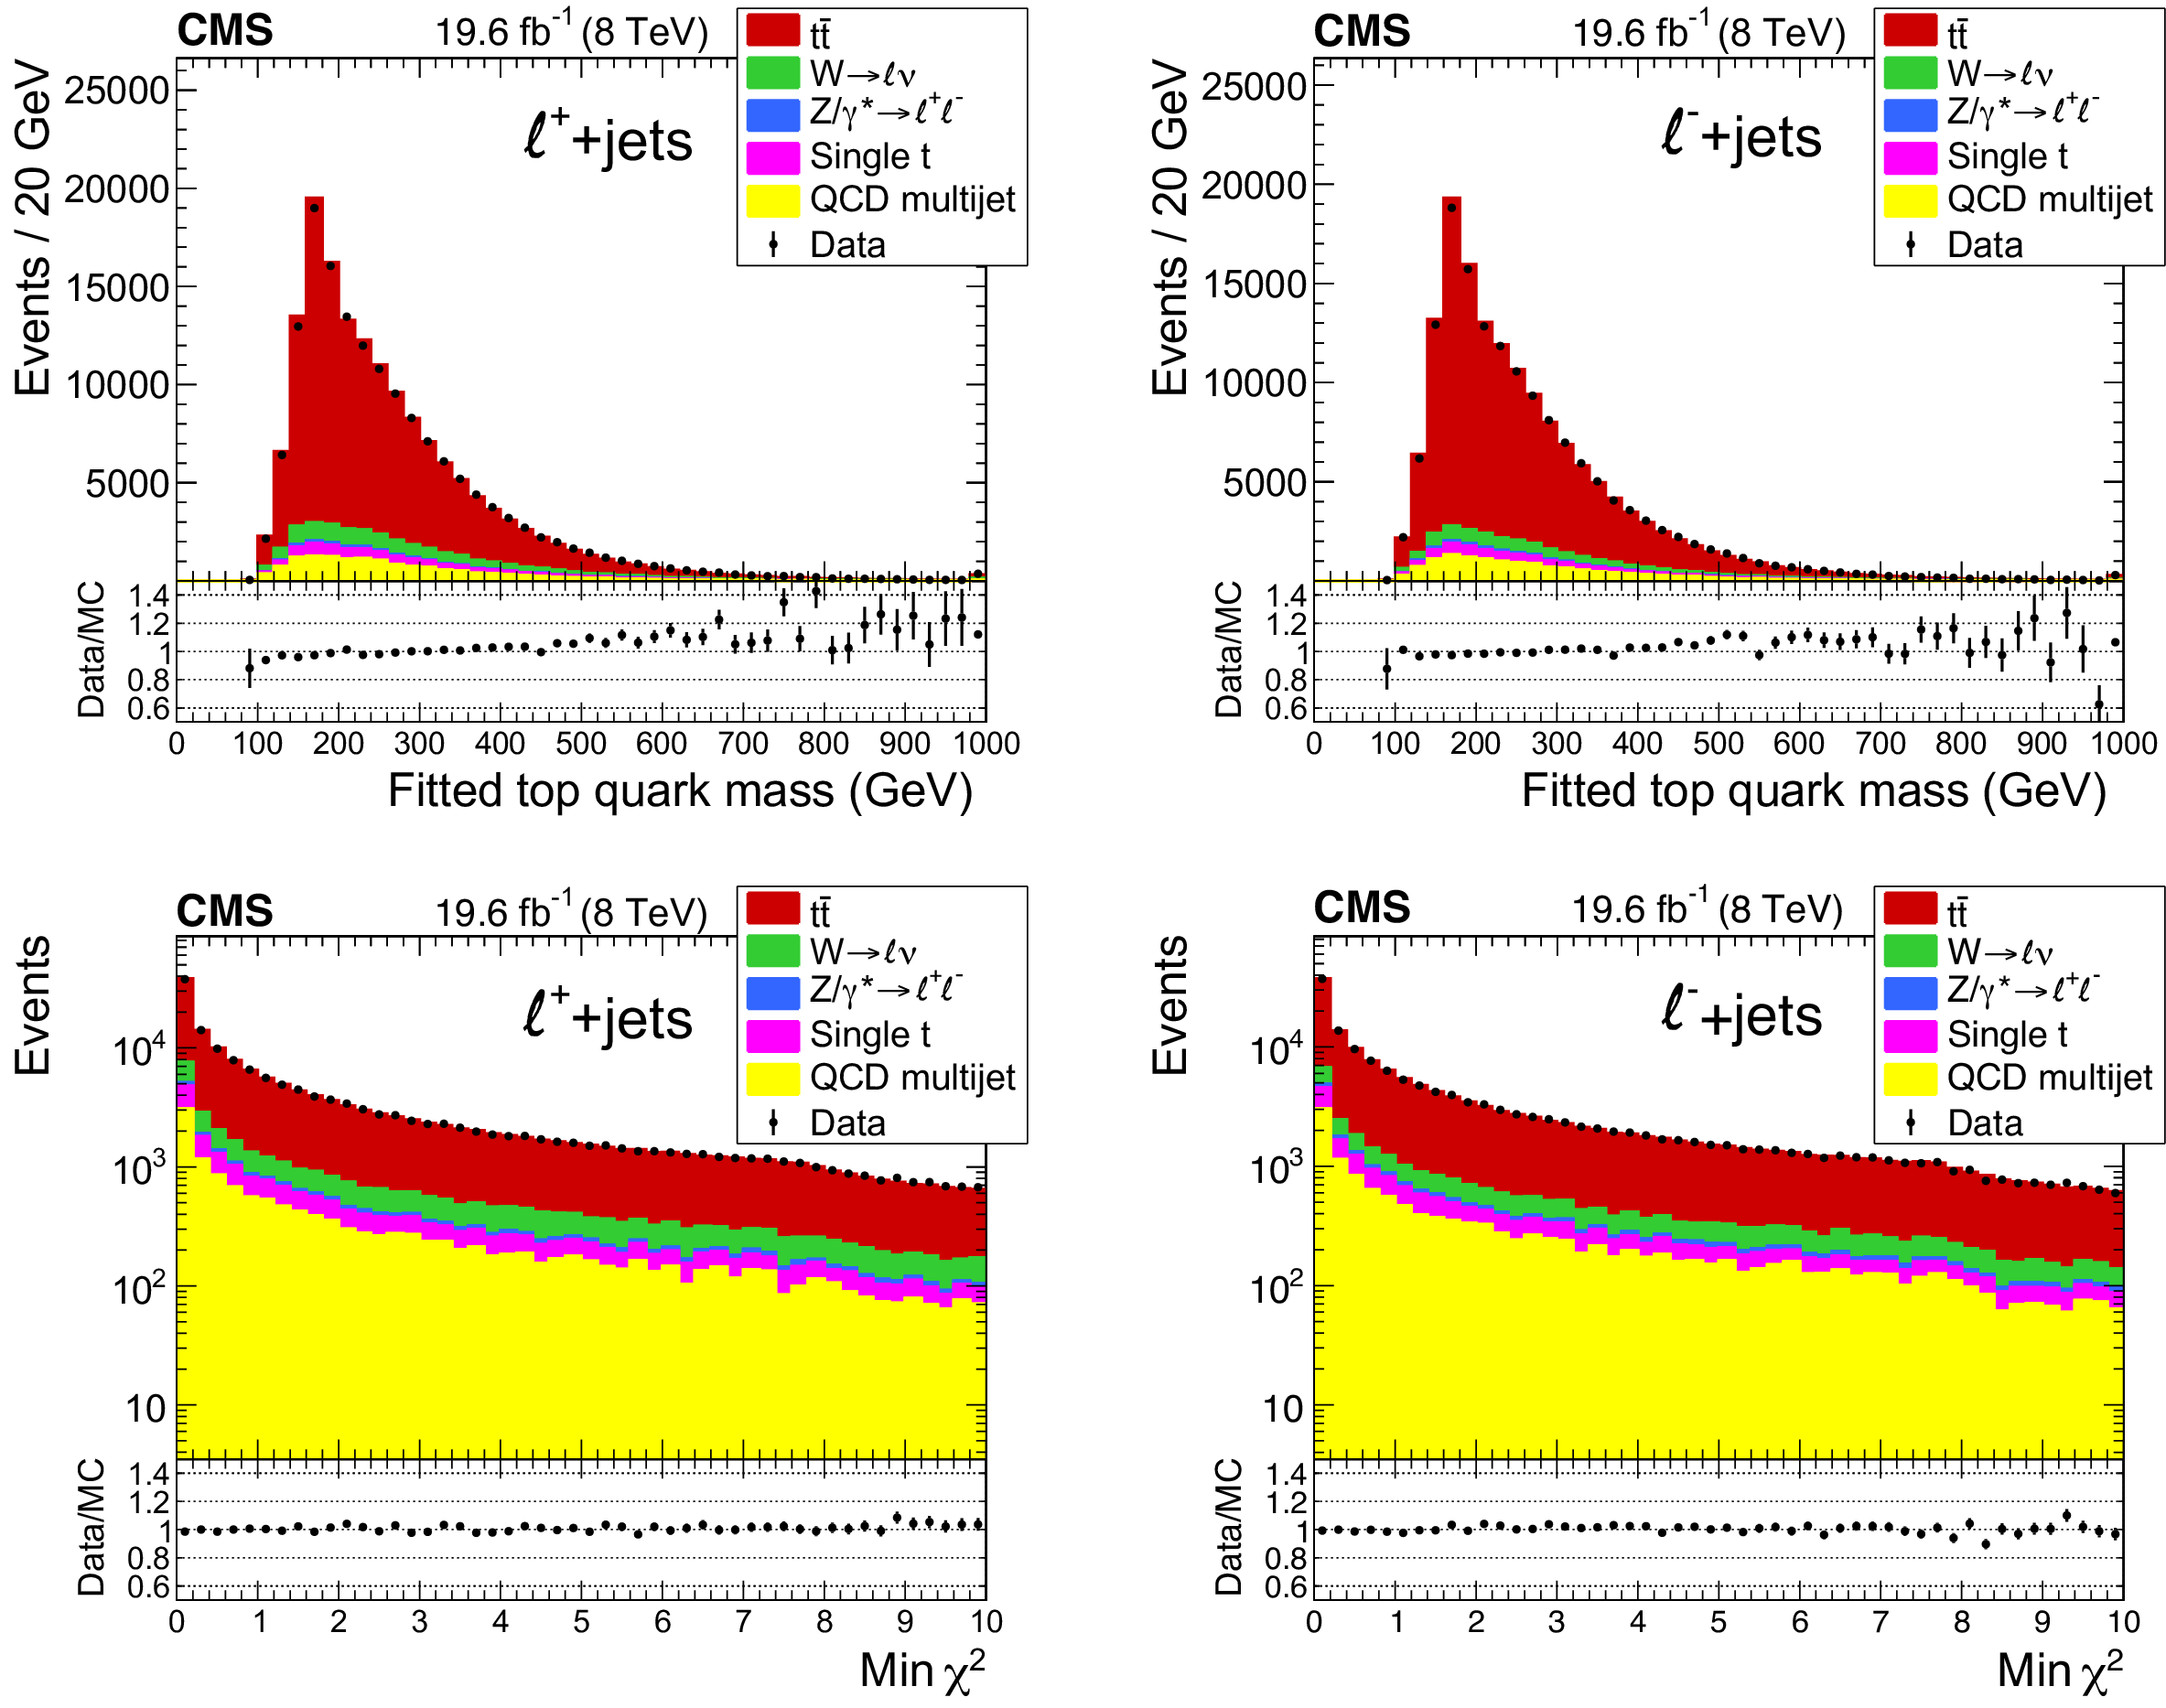
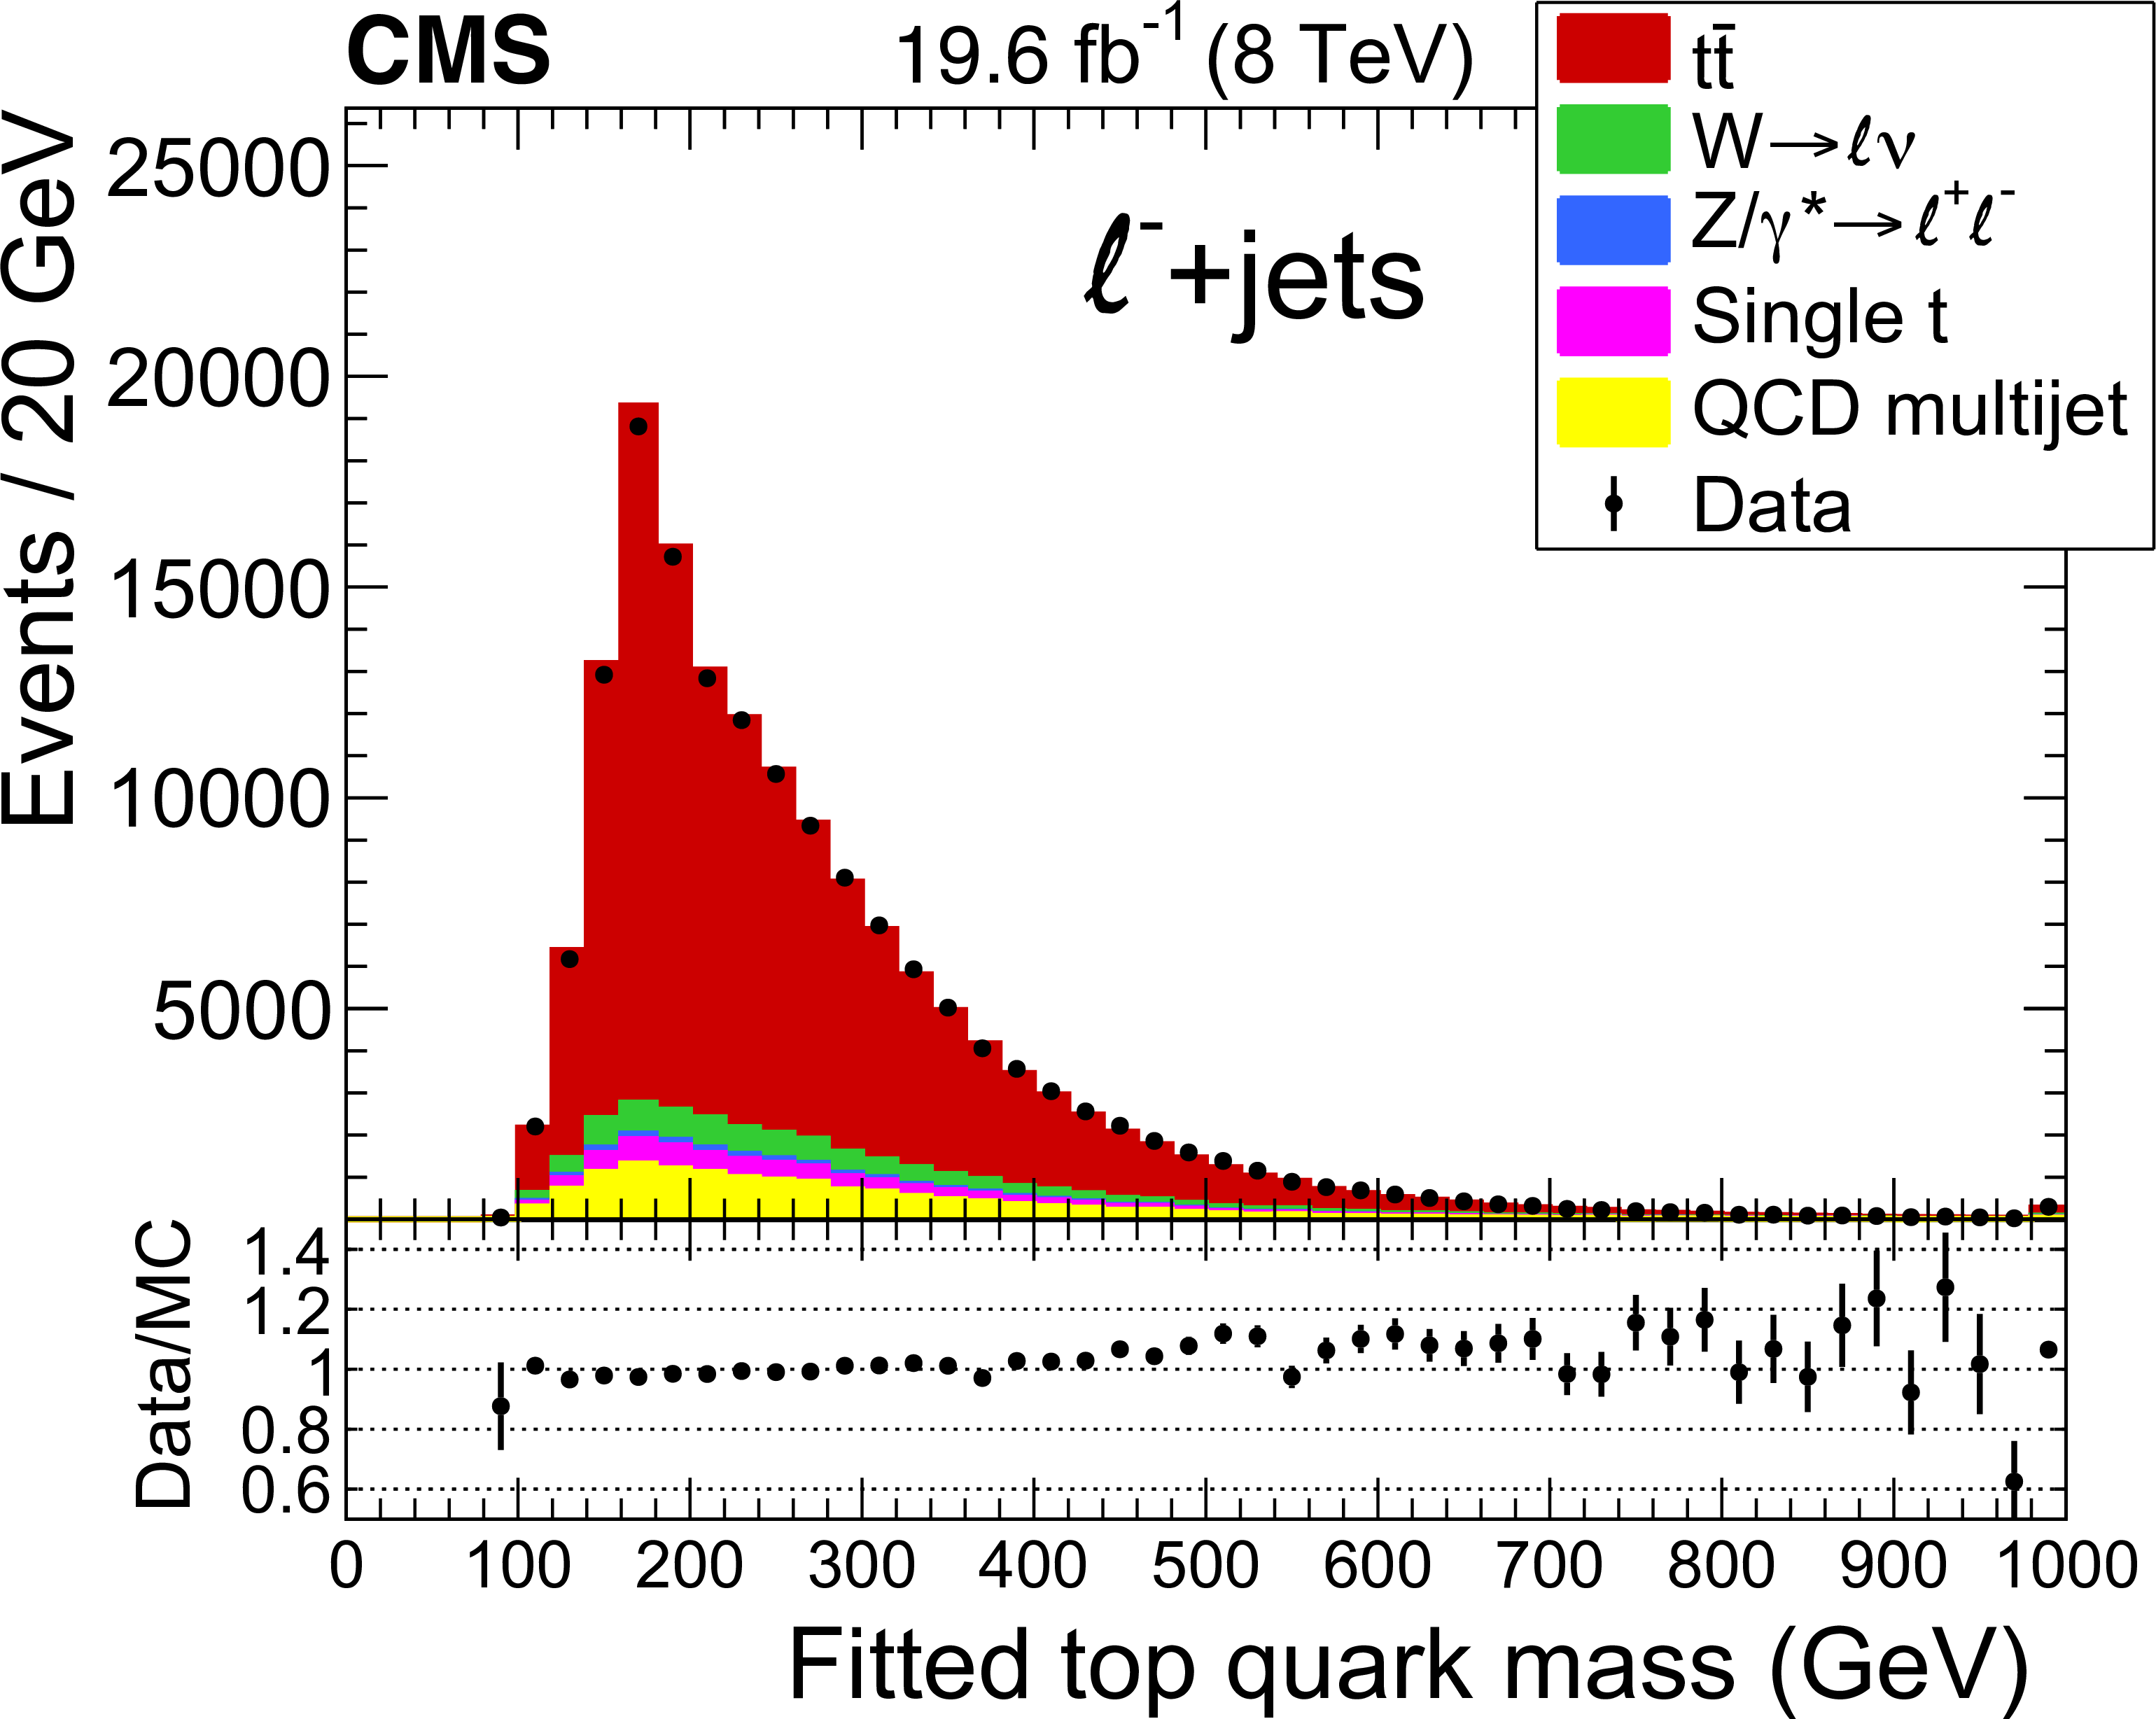
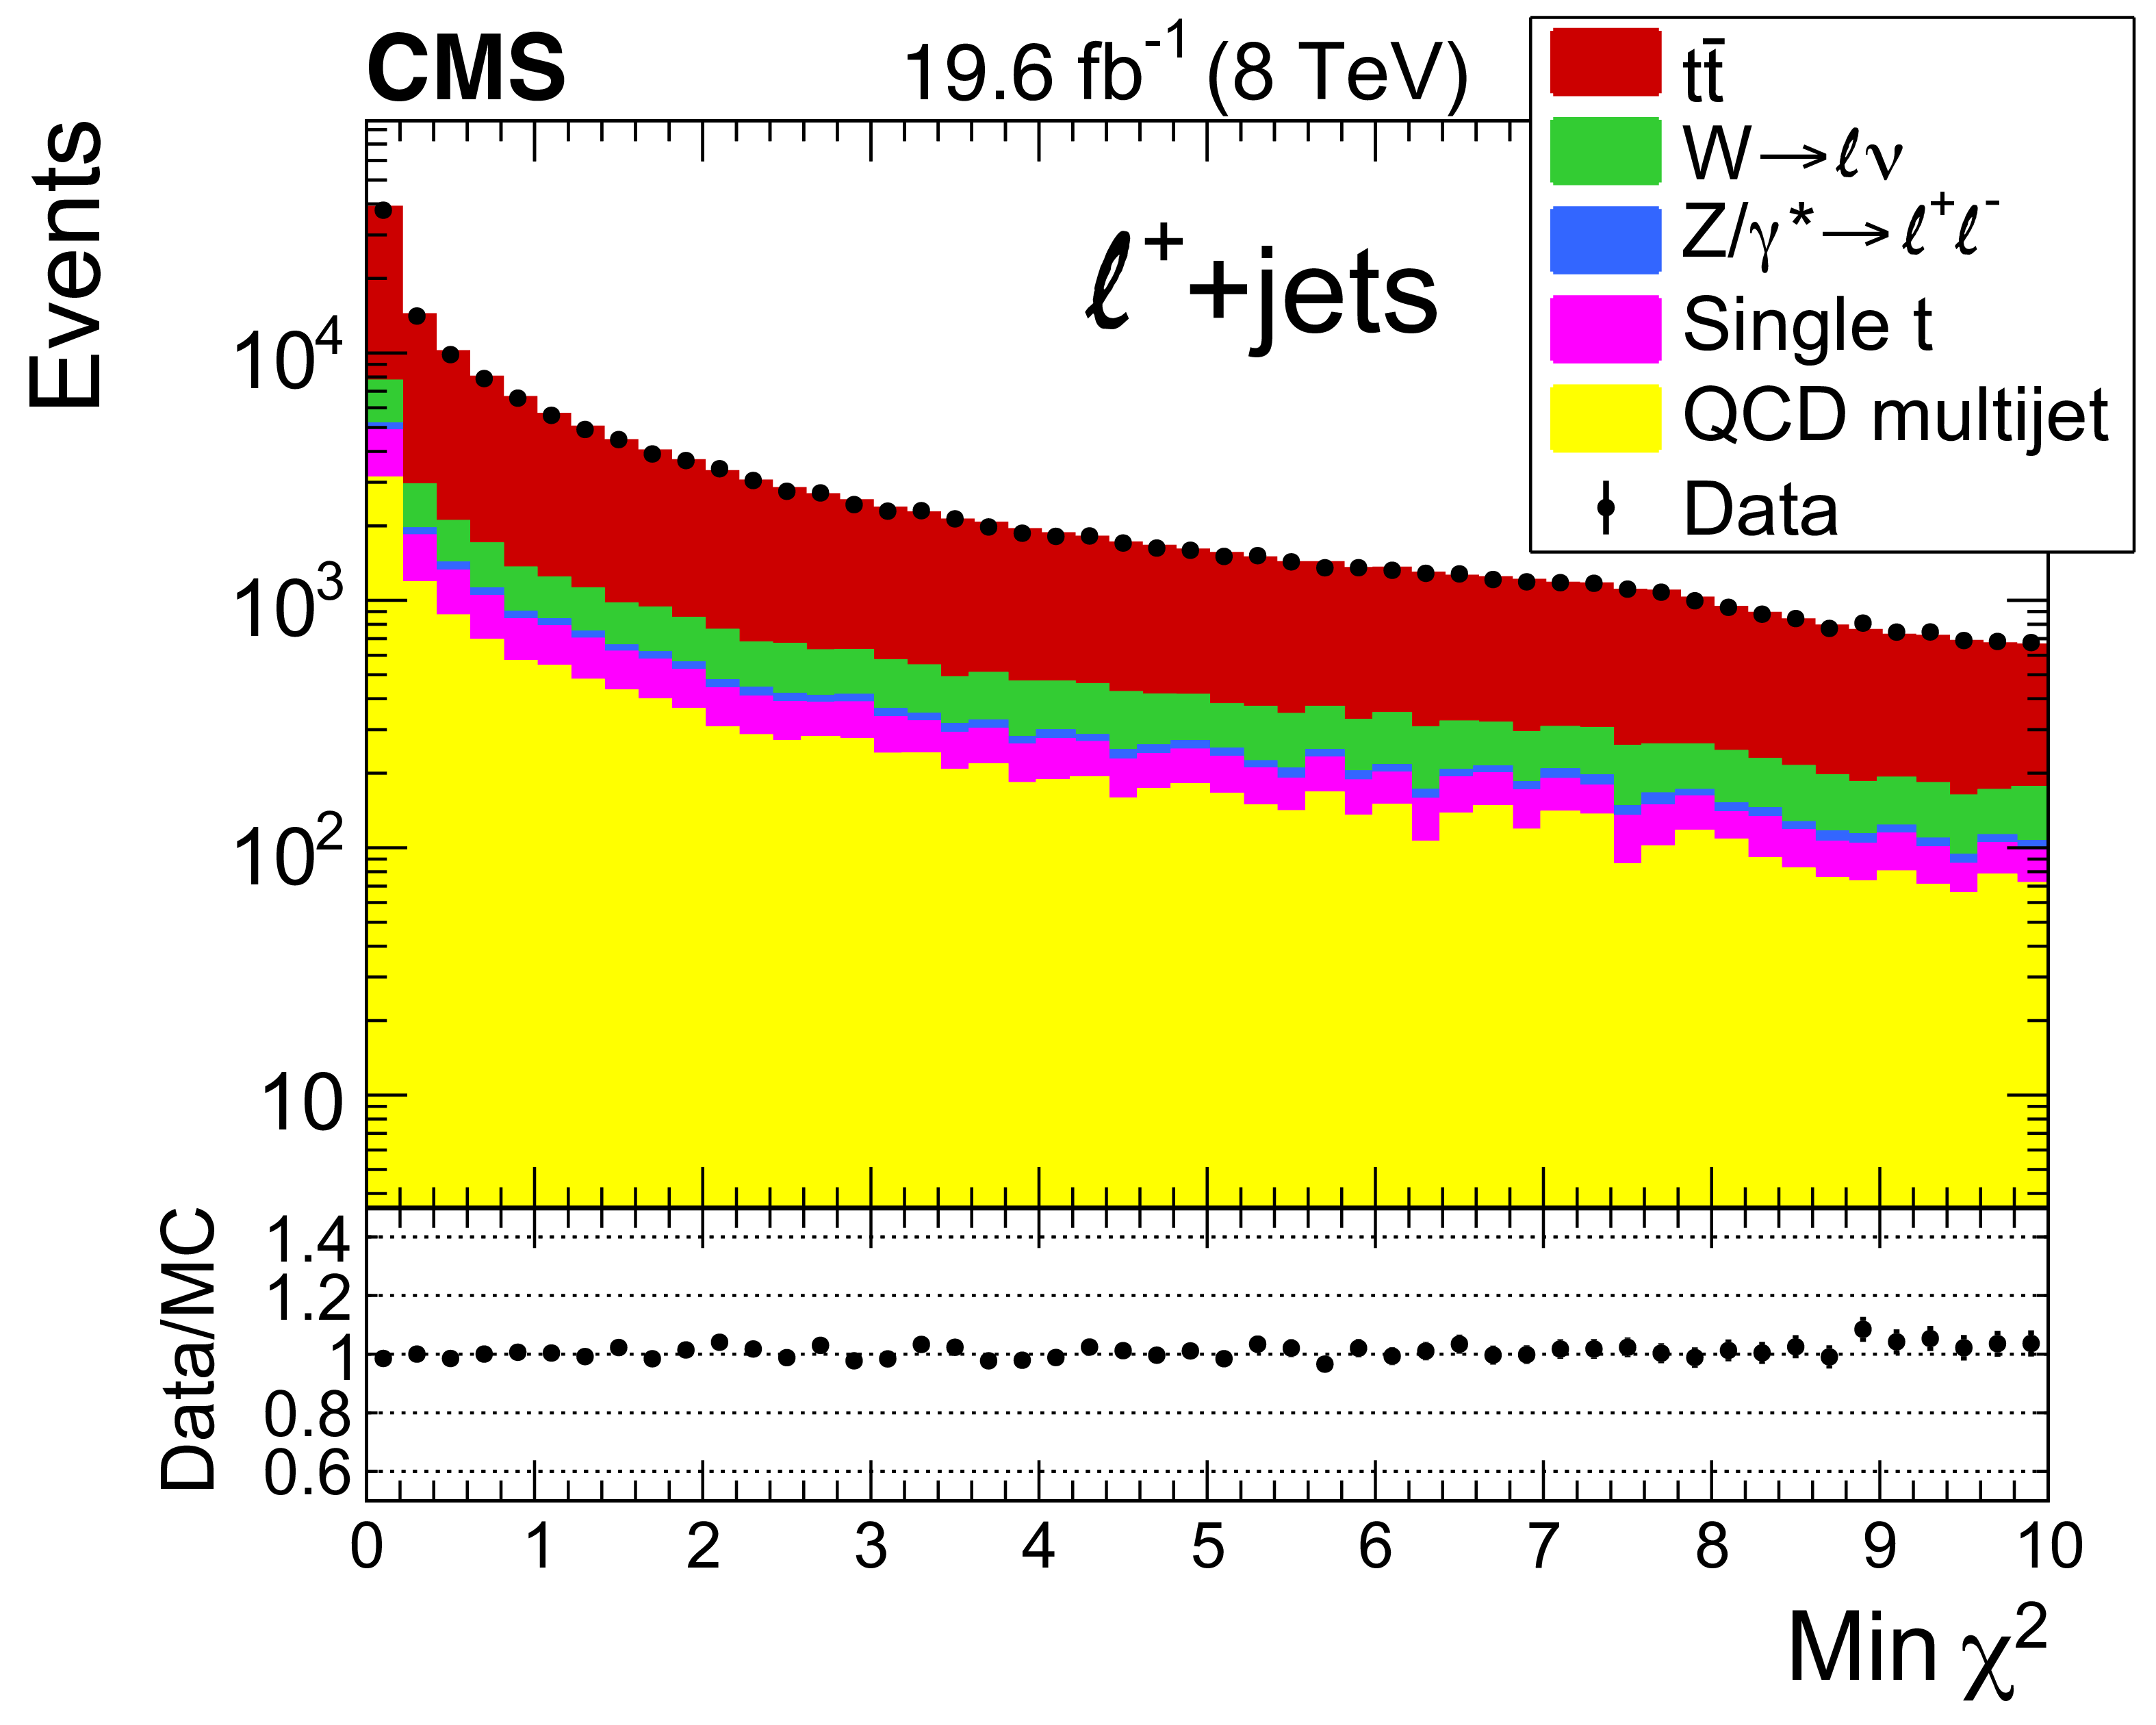
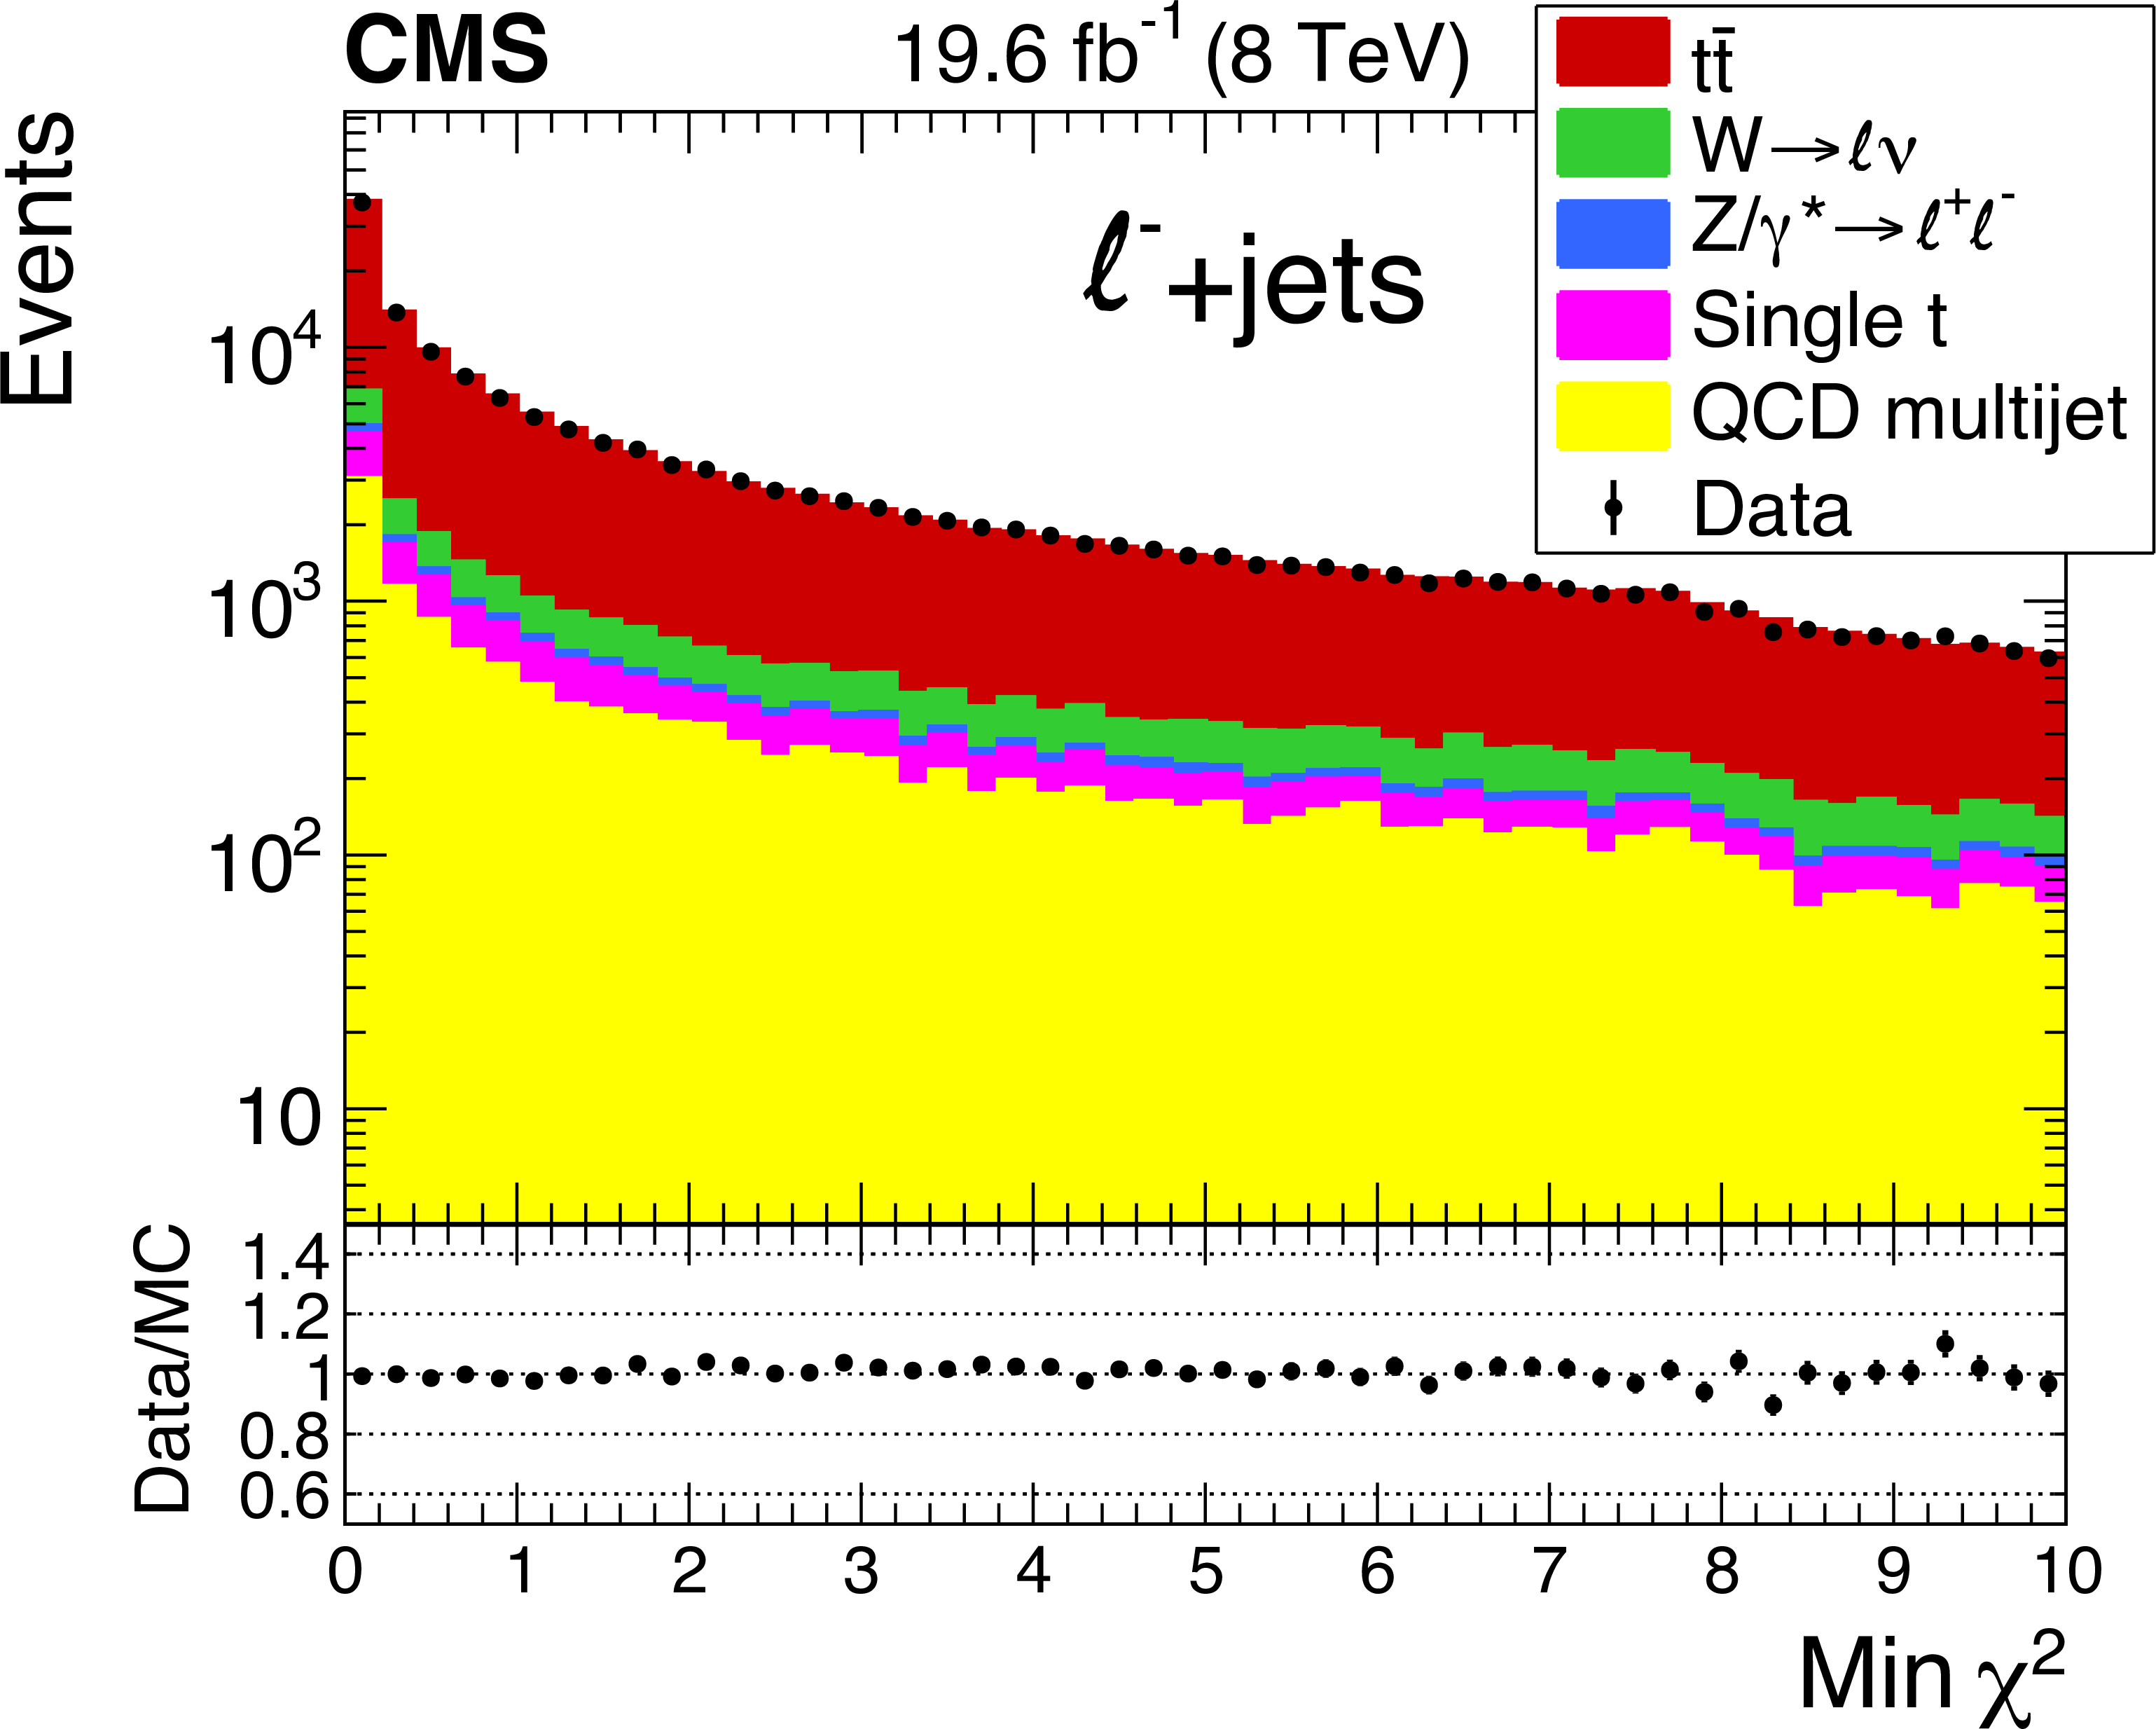
Figure 2:
Comparison between the data and simulation for the fitted top quark mass of the jet-quark assignment with the smallest $\chi ^2$ (top) and these smallest $\chi ^2$ values (bottom), for $\ell ^+$+jets events (left) and $\ell ^-$+jets events (right). The last bin of the top quark mass distributions includes all masses above 980 GeV. The bin-by-bin ratio of the observed spectrum to the simulated one is shown at the bottom of each plot. The uncertainties are purely statistical. |
png pdf |
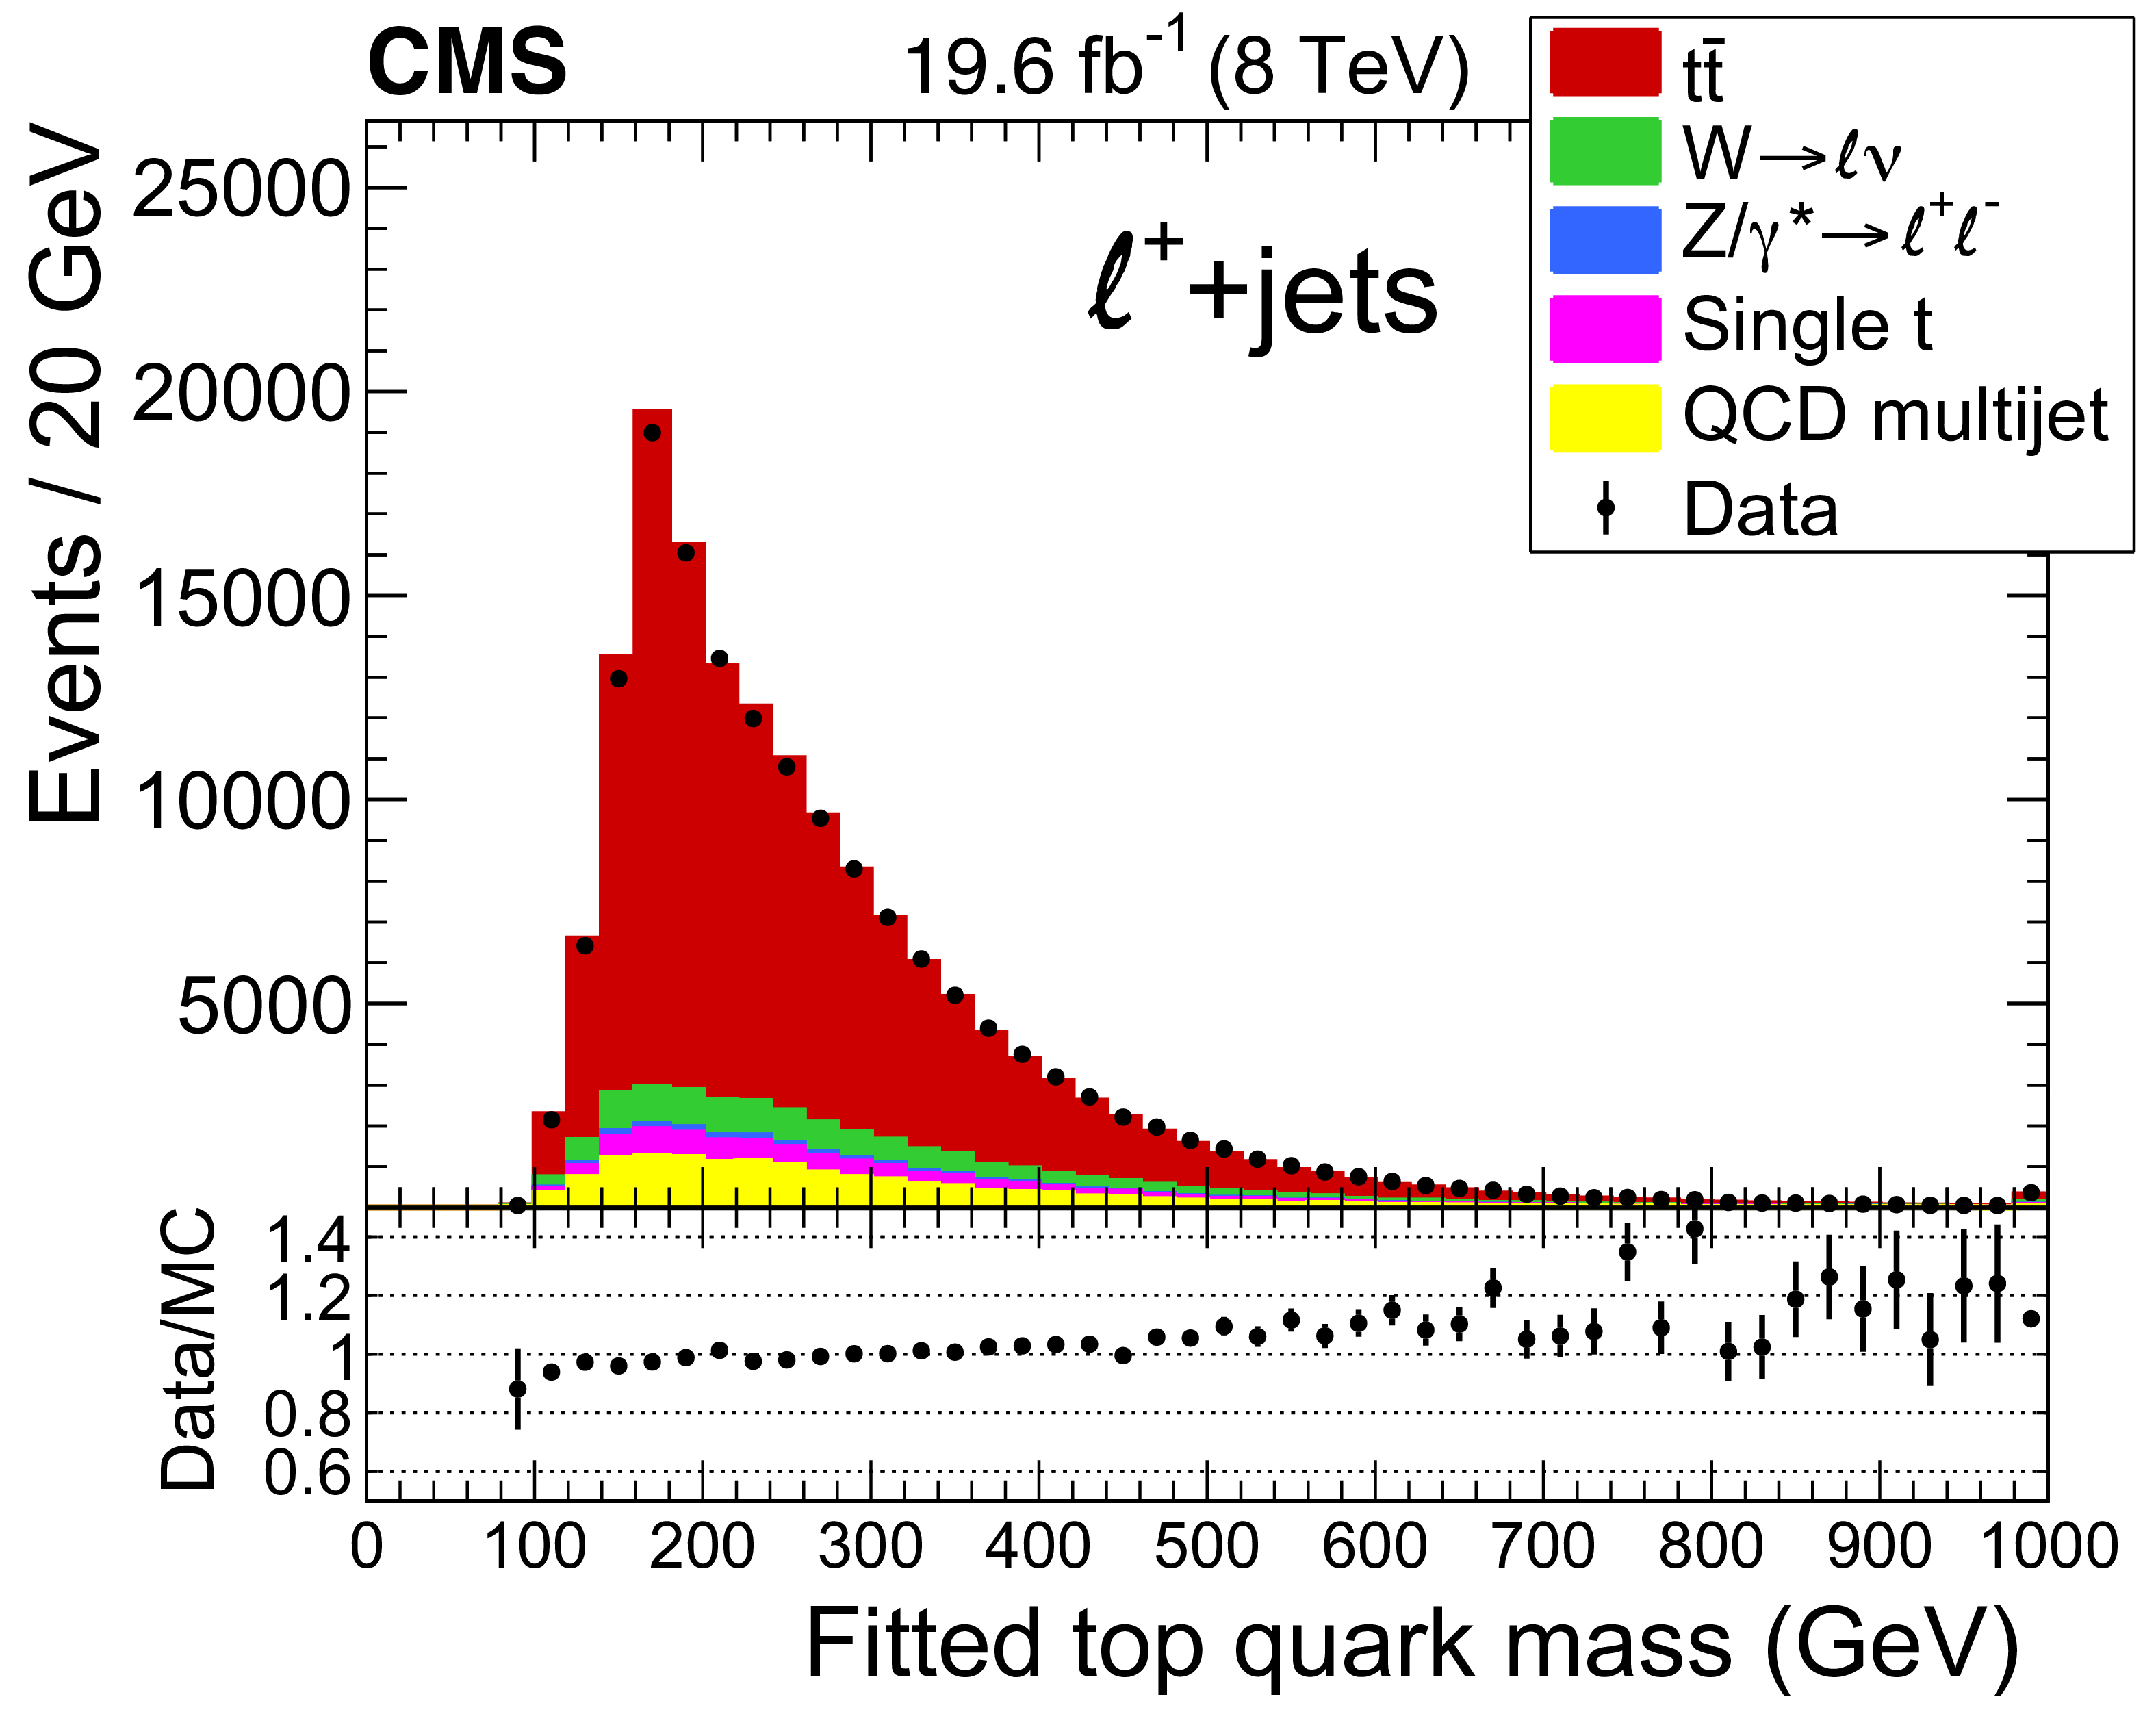
Figure 2-a:
Comparison between the data and simulation for the fitted top quark mass of the jet-quark assignment with the smallest $\chi ^2$, for $\ell ^+$+jets events. The last bin of the distribution includes all masses above 980 GeV. The bin-by-bin ratio of the observed spectrum to the simulated one is shown at the bottom of the plot. The uncertainties are purely statistical. |
png pdf |
Figure 2-b:
Comparison between the data and simulation for the fitted top quark mass of the jet-quark assignment with the smallest $\chi ^2$, for $\ell ^-$+jets events. The last bin of the distribution includes all masses above 980 GeV. The bin-by-bin ratio of the observed spectrum to the simulated one is shown at the bottom of the plot. The uncertainties are purely statistical. |
png pdf |
Figure 2-c:
Comparison between the data and simulation for the smallest $\chi ^2$ values, for $\ell ^+$+jets events. The bin-by-bin ratio of the observed distribution to the simulated one is shown at the bottom of the plot. The uncertainties are purely statistical. |
png pdf |
Figure 2-d:
Comparison between the data and simulation for the smallest $\chi ^2$ values, for $\ell ^-$+jets events. The bin-by-bin ratio of the observed distribution to the simulated one is shown at the bottom of the plot. The uncertainties are purely statistical. |
png pdf |
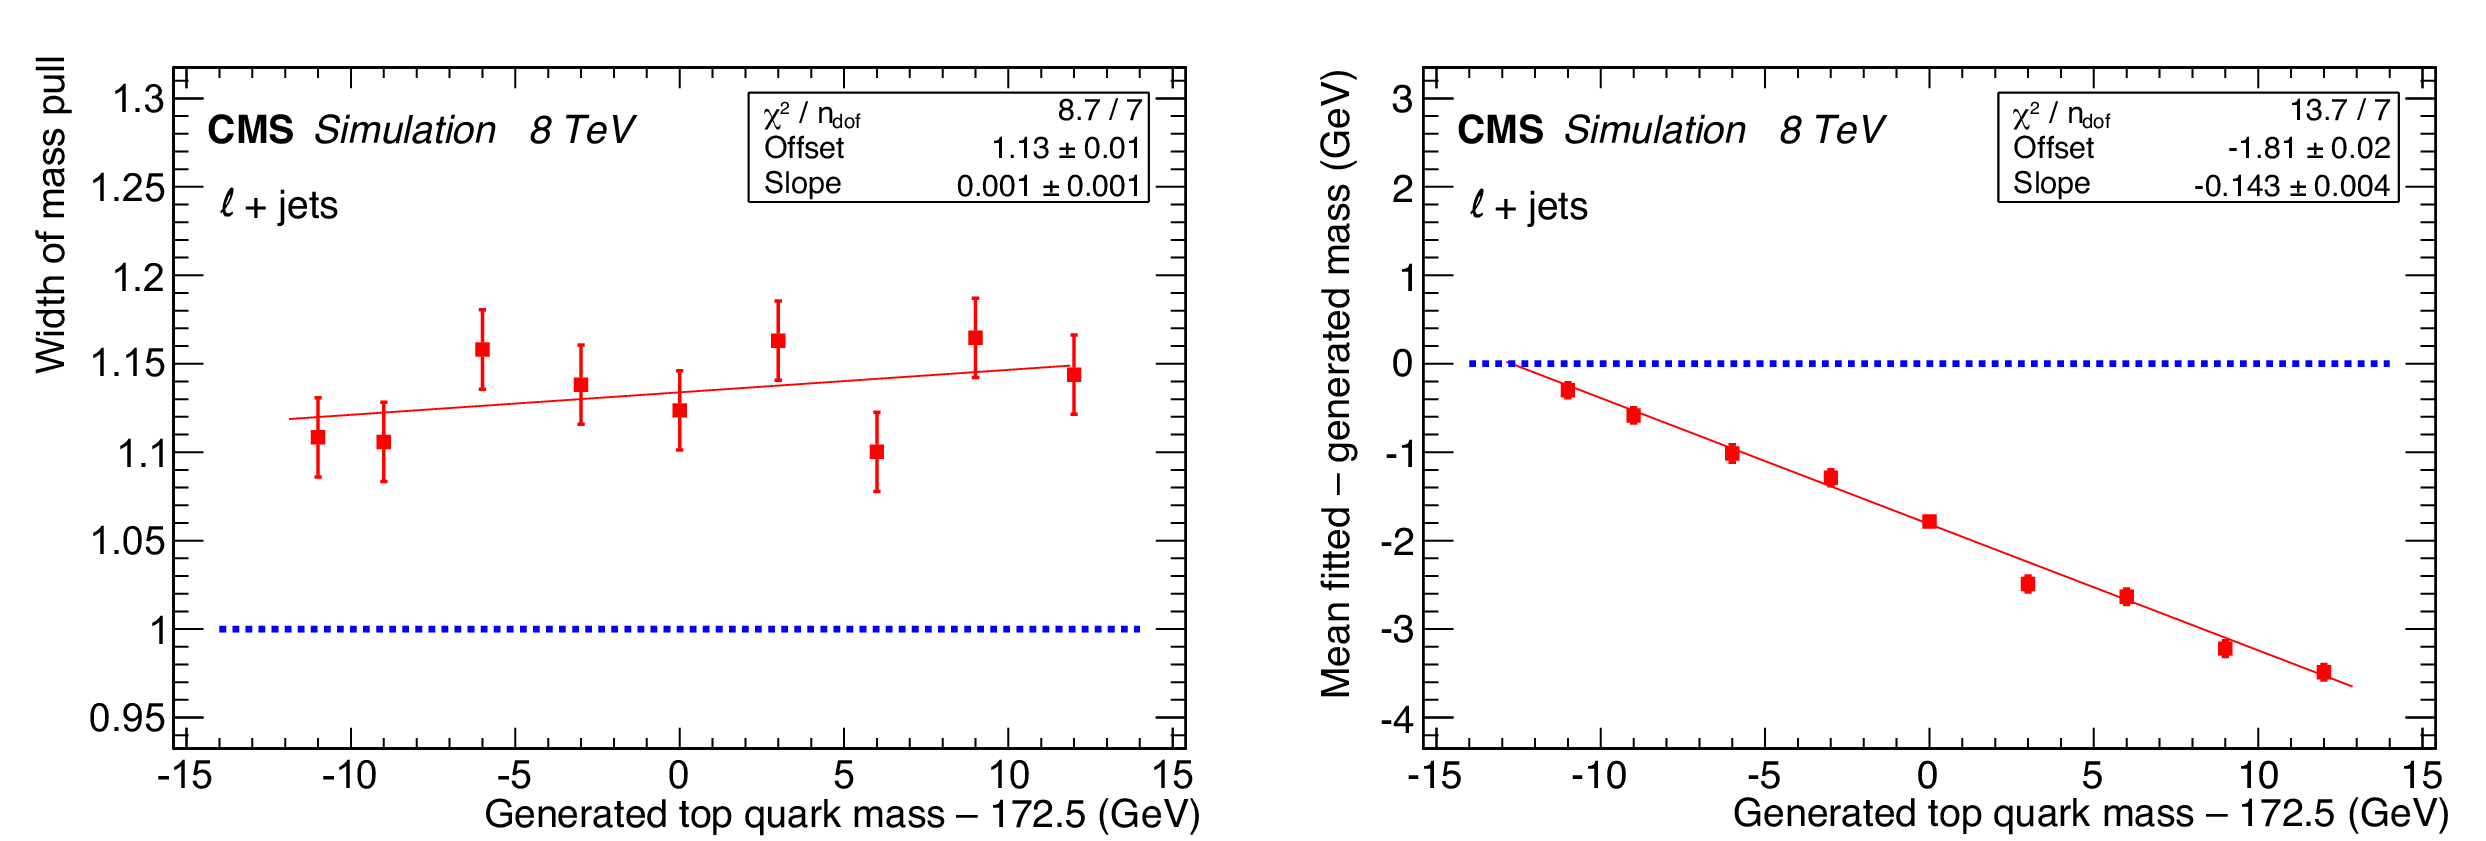
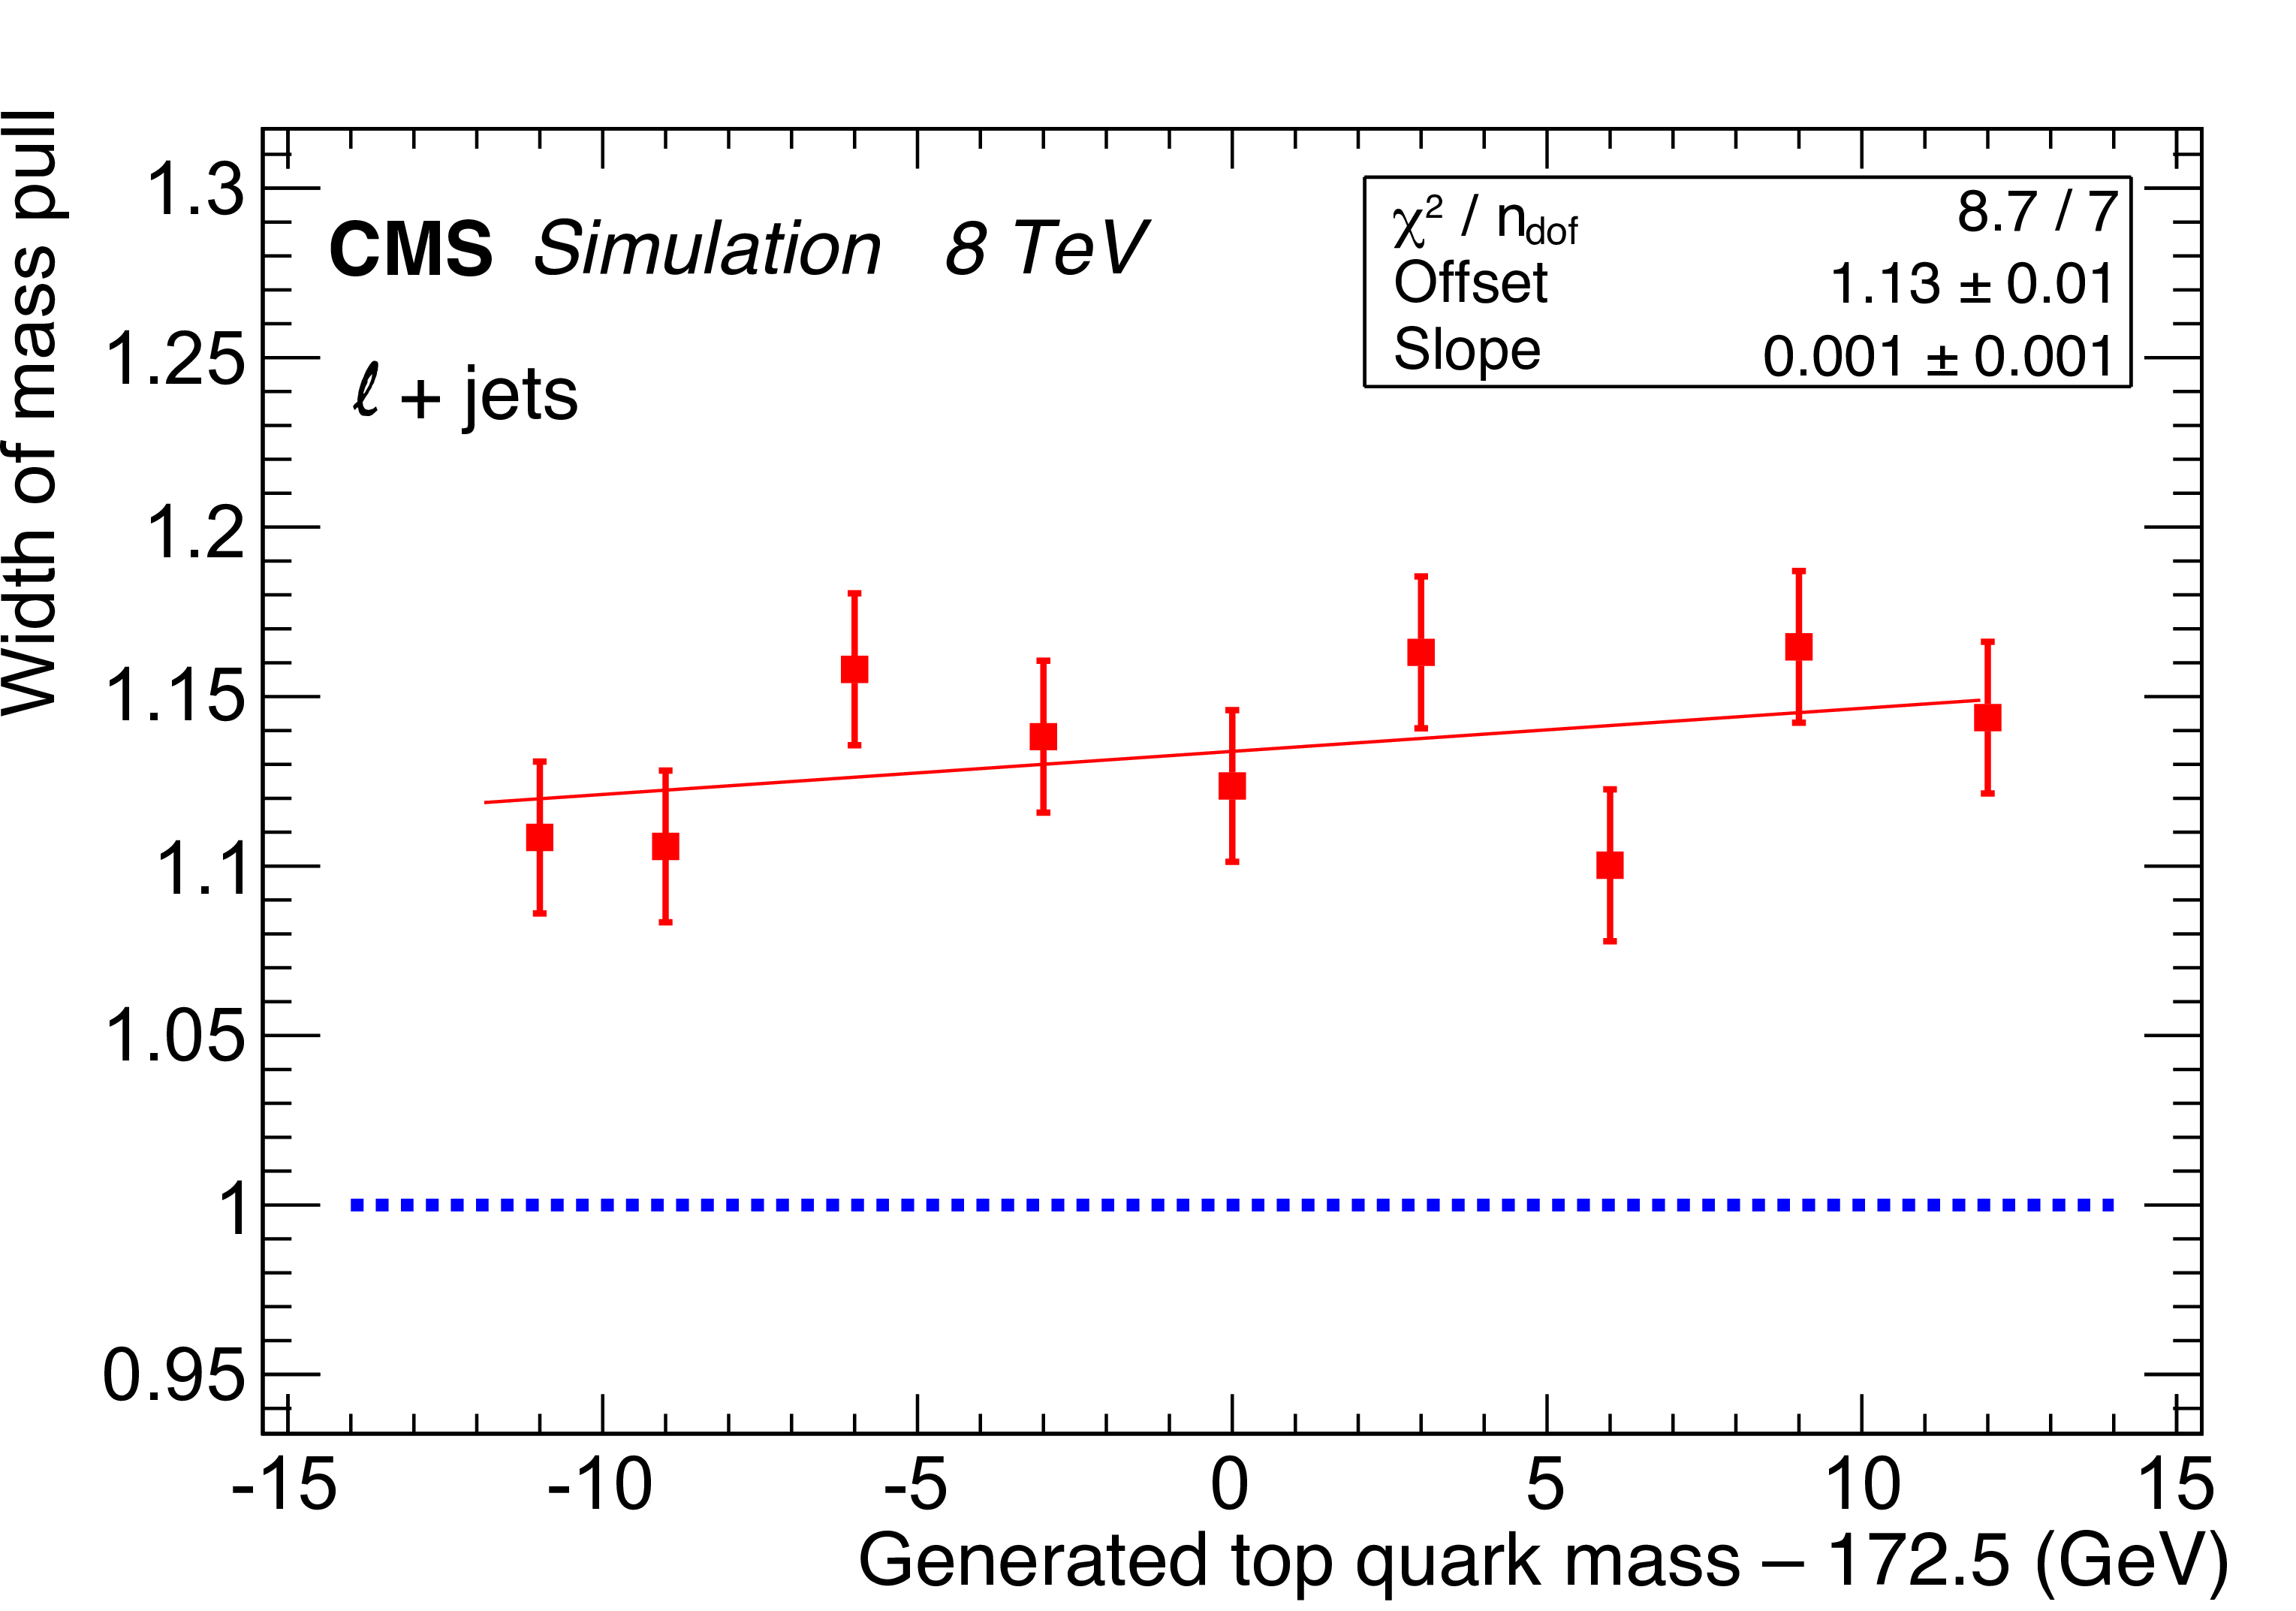
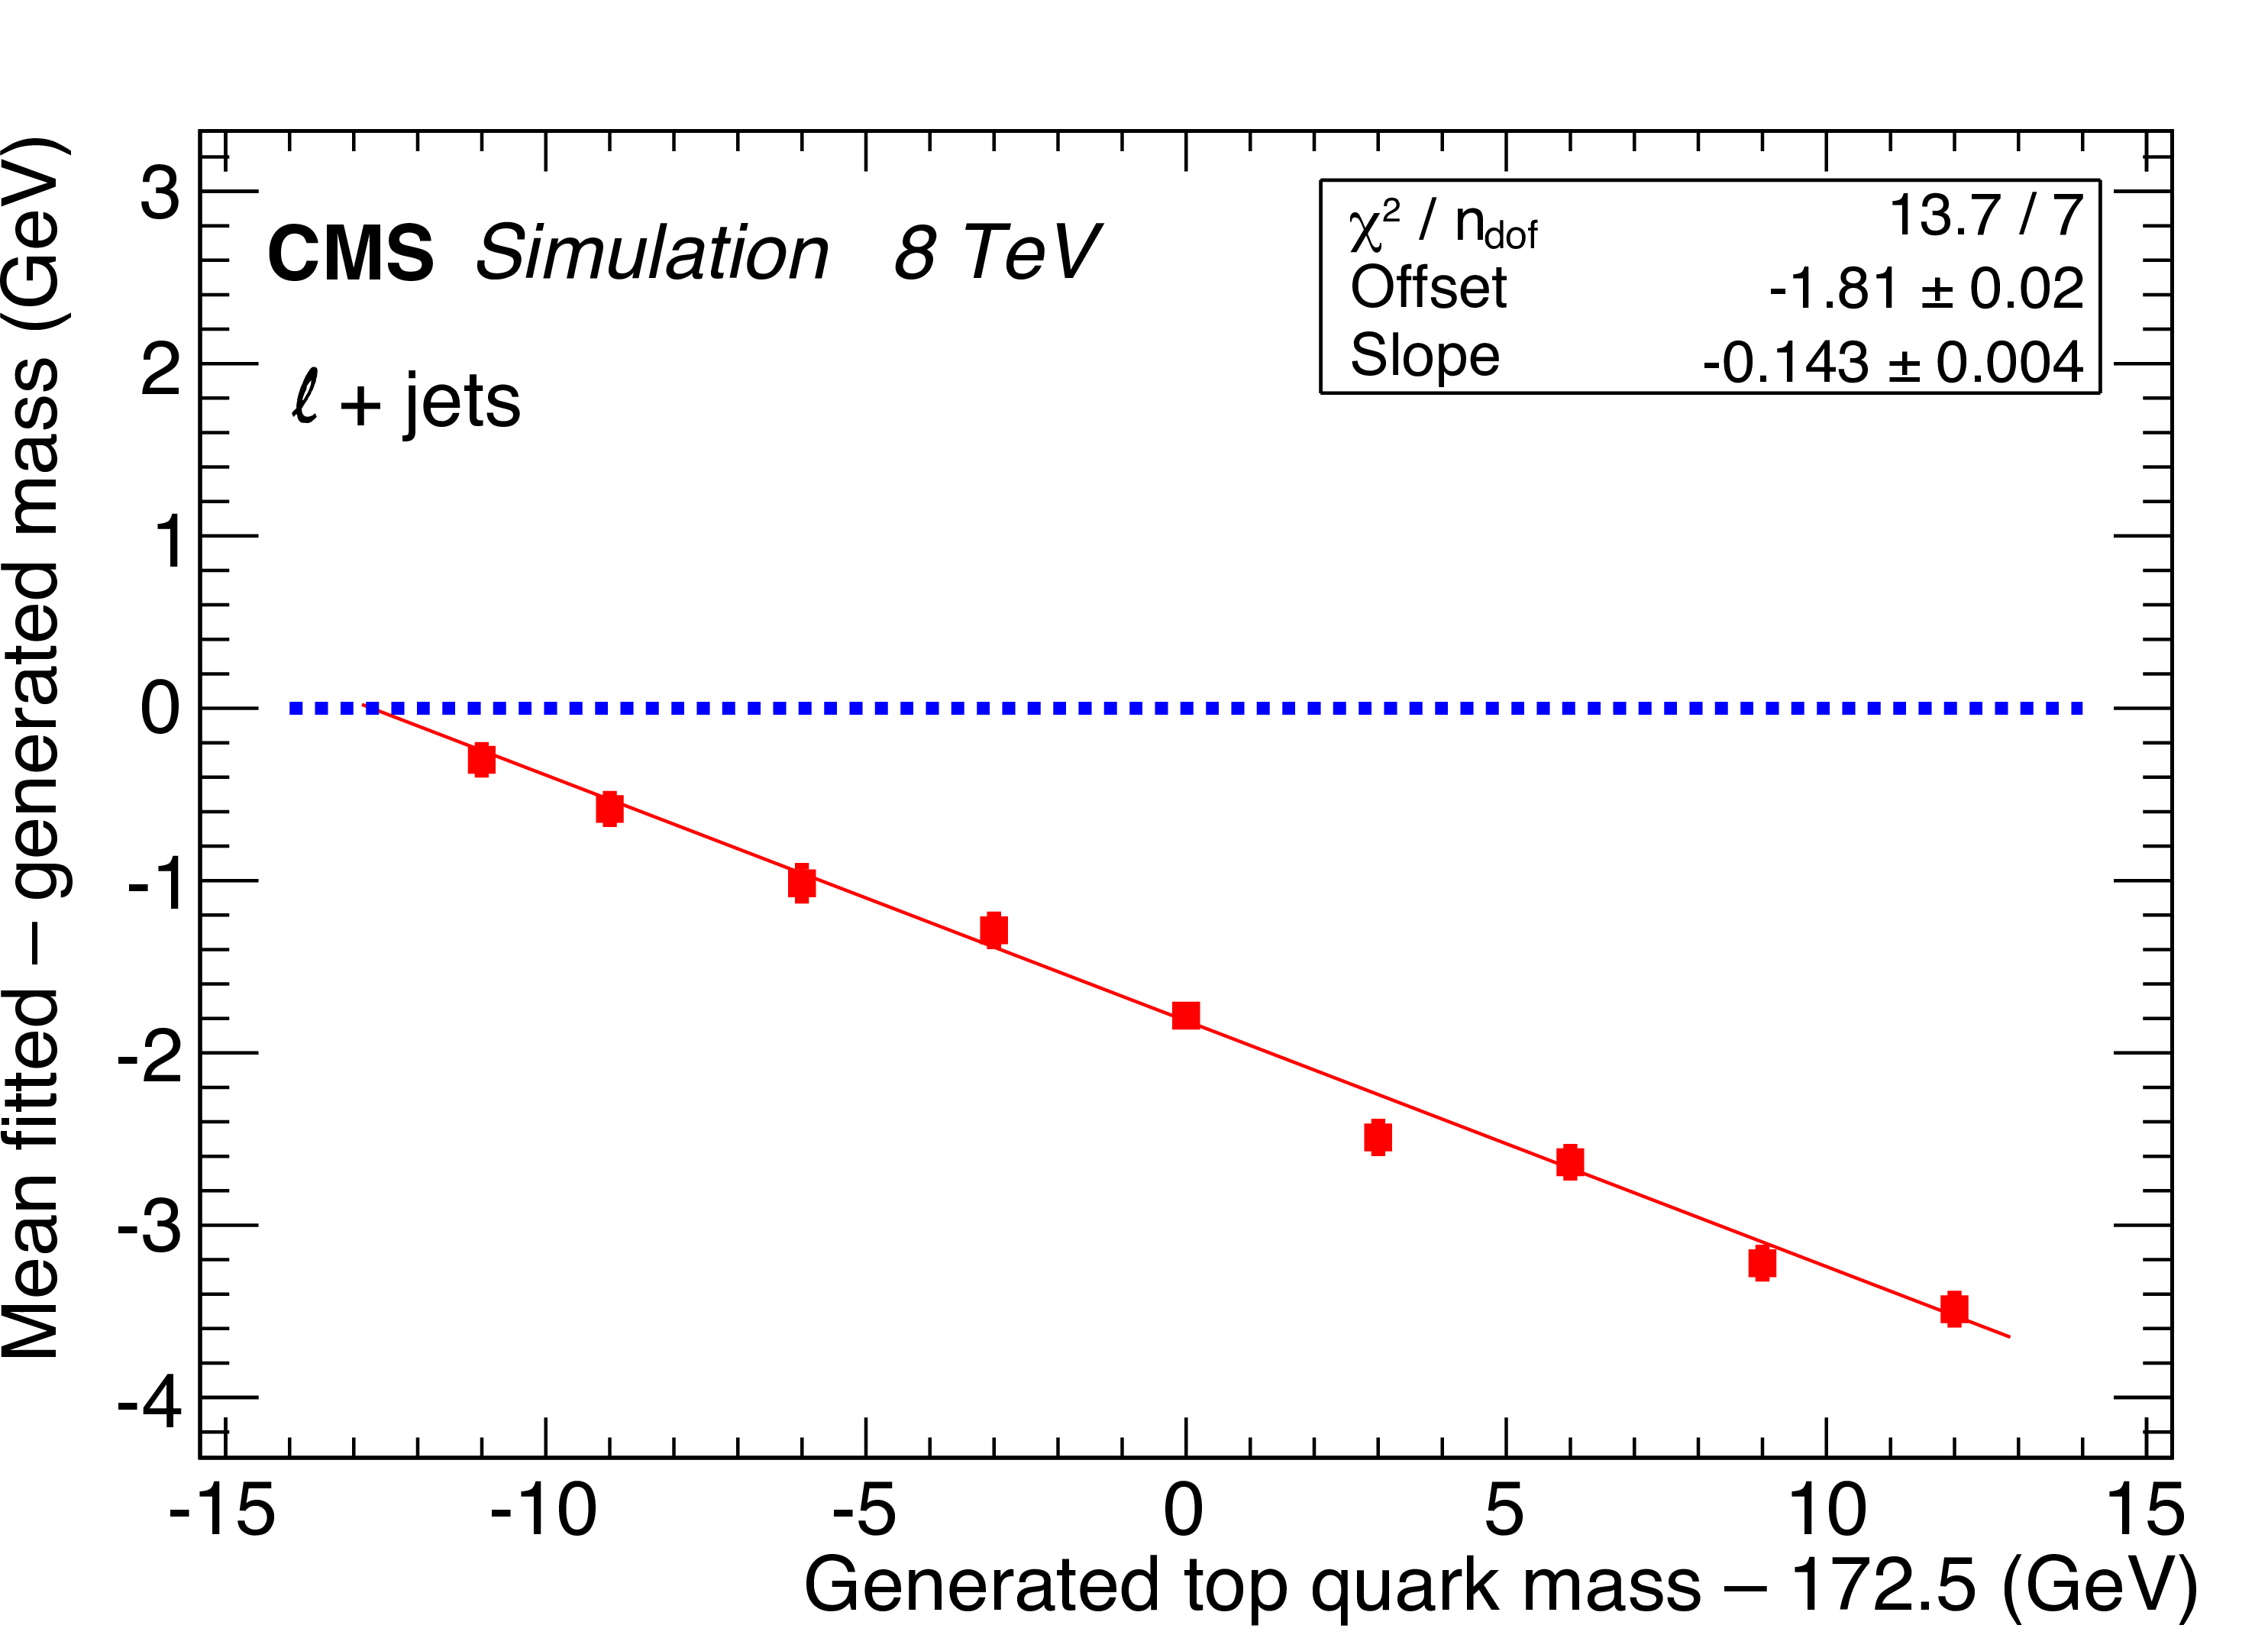
Figure 3:
Width of the pull distribution (left) and bias on the estimated top quark mass (right) as a function of the generated top quark mass for $\ell $+jets events. The dashed blue line represents the ideal outcome. |
png pdf |
Figure 3-a:
Width of the pull distribution as a function of the generated top quark mass for $\ell $+jets events. The dashed blue line represents the ideal outcome. |
png pdf |
Figure 3-b:
Bias on the estimated top quark mass as a function of the generated top quark mass for $\ell $+jets events. The dashed blue line represents the ideal outcome. |
png pdf |
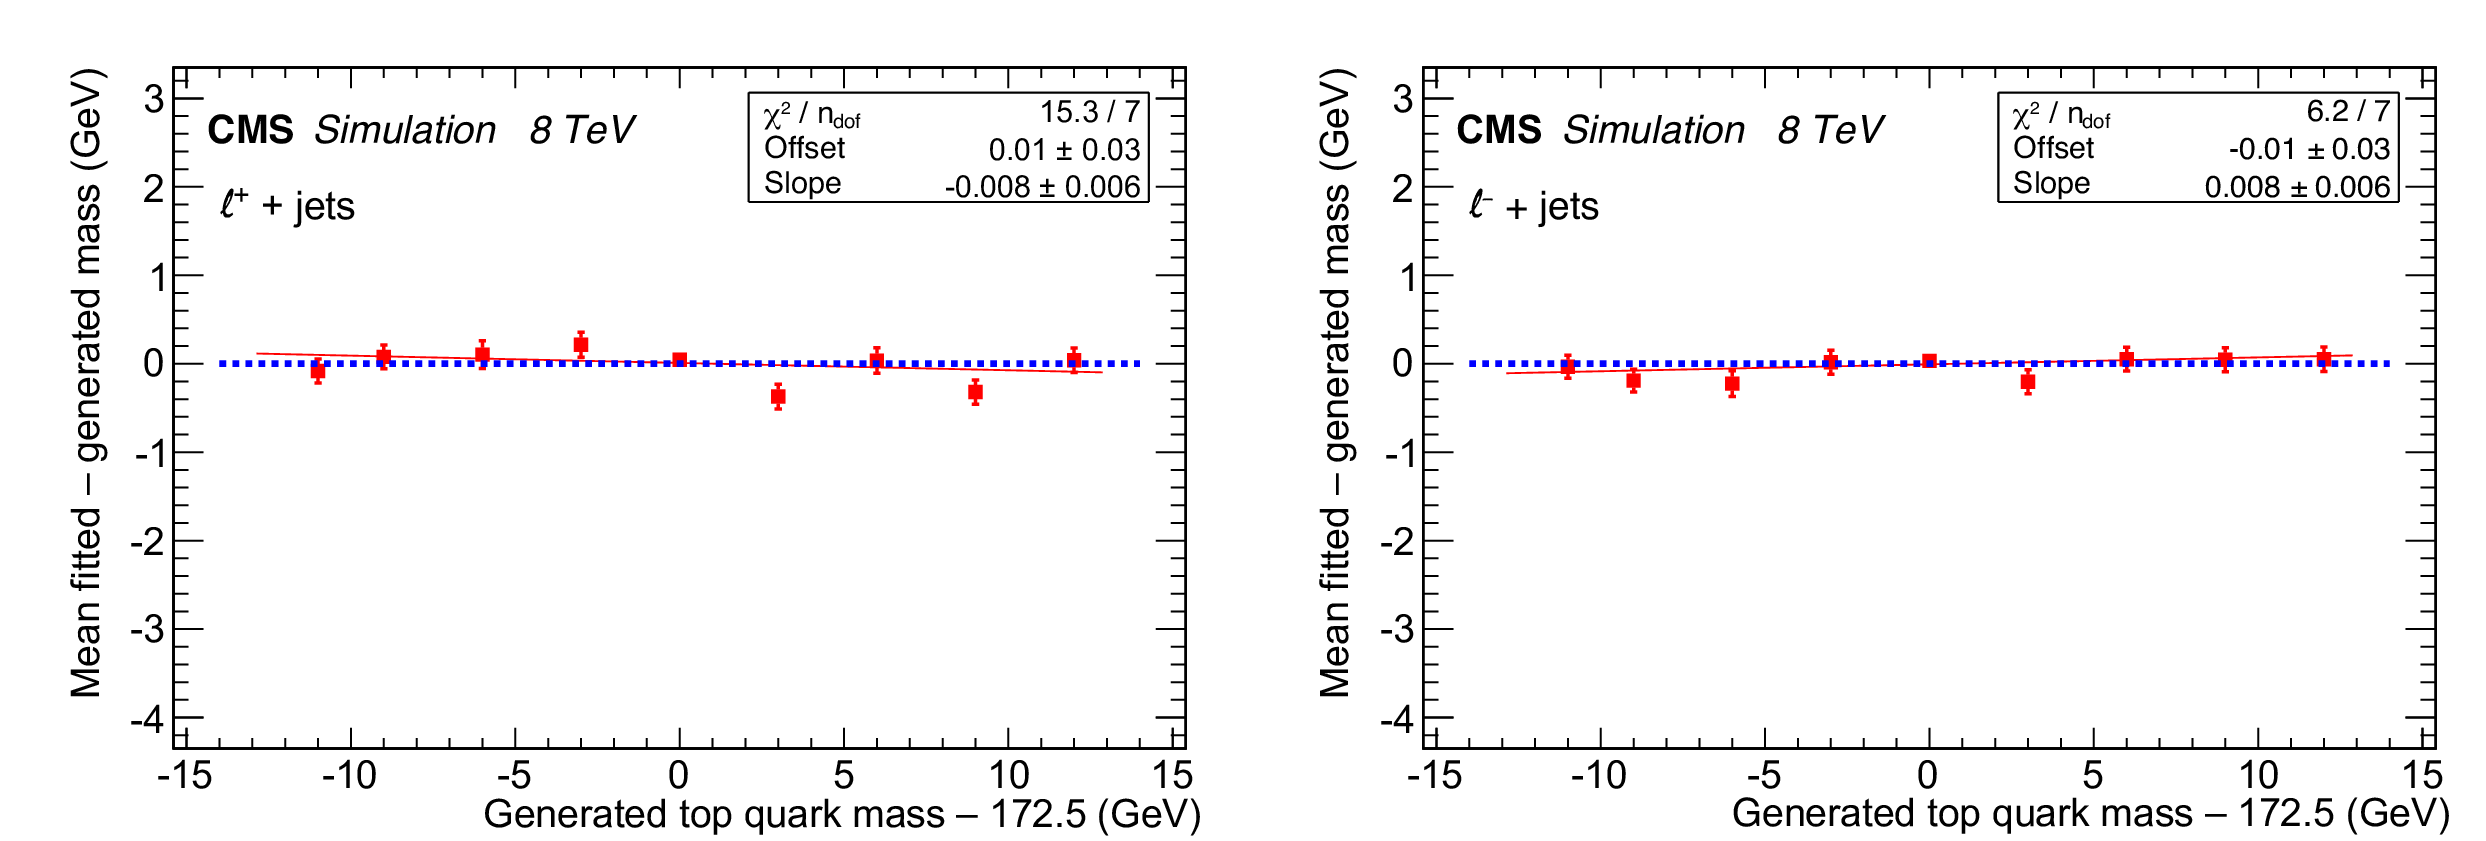
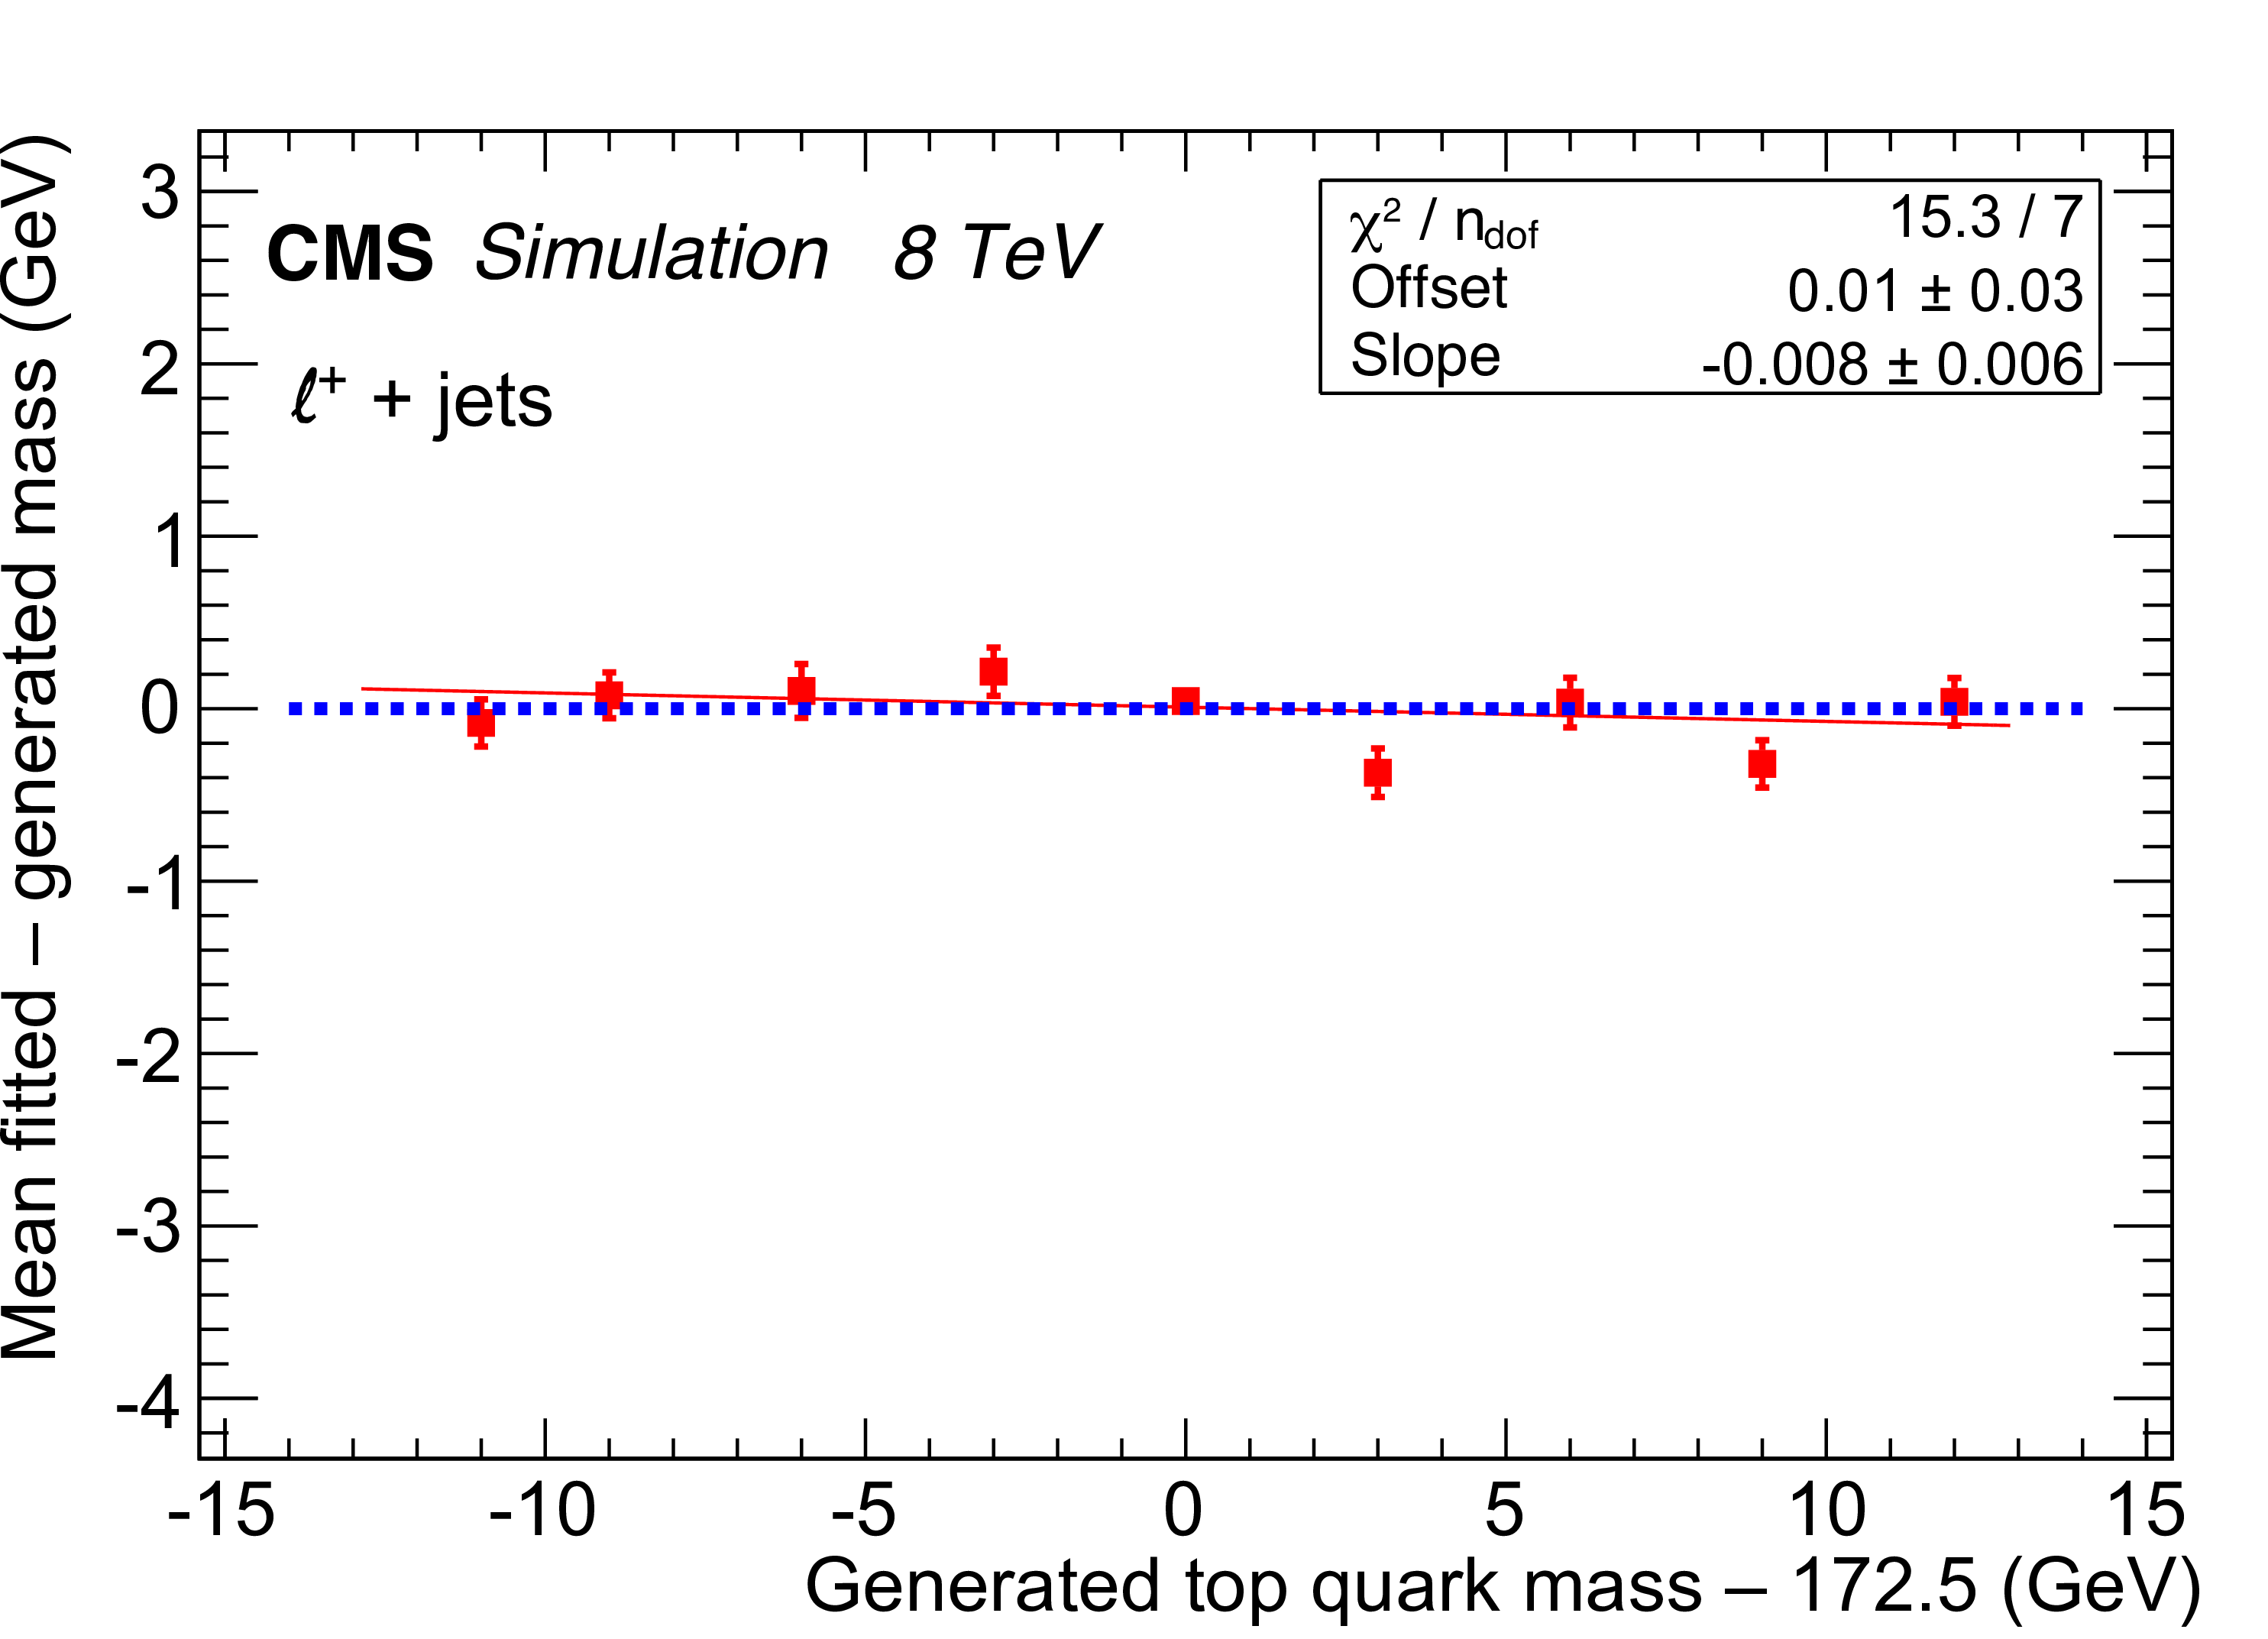
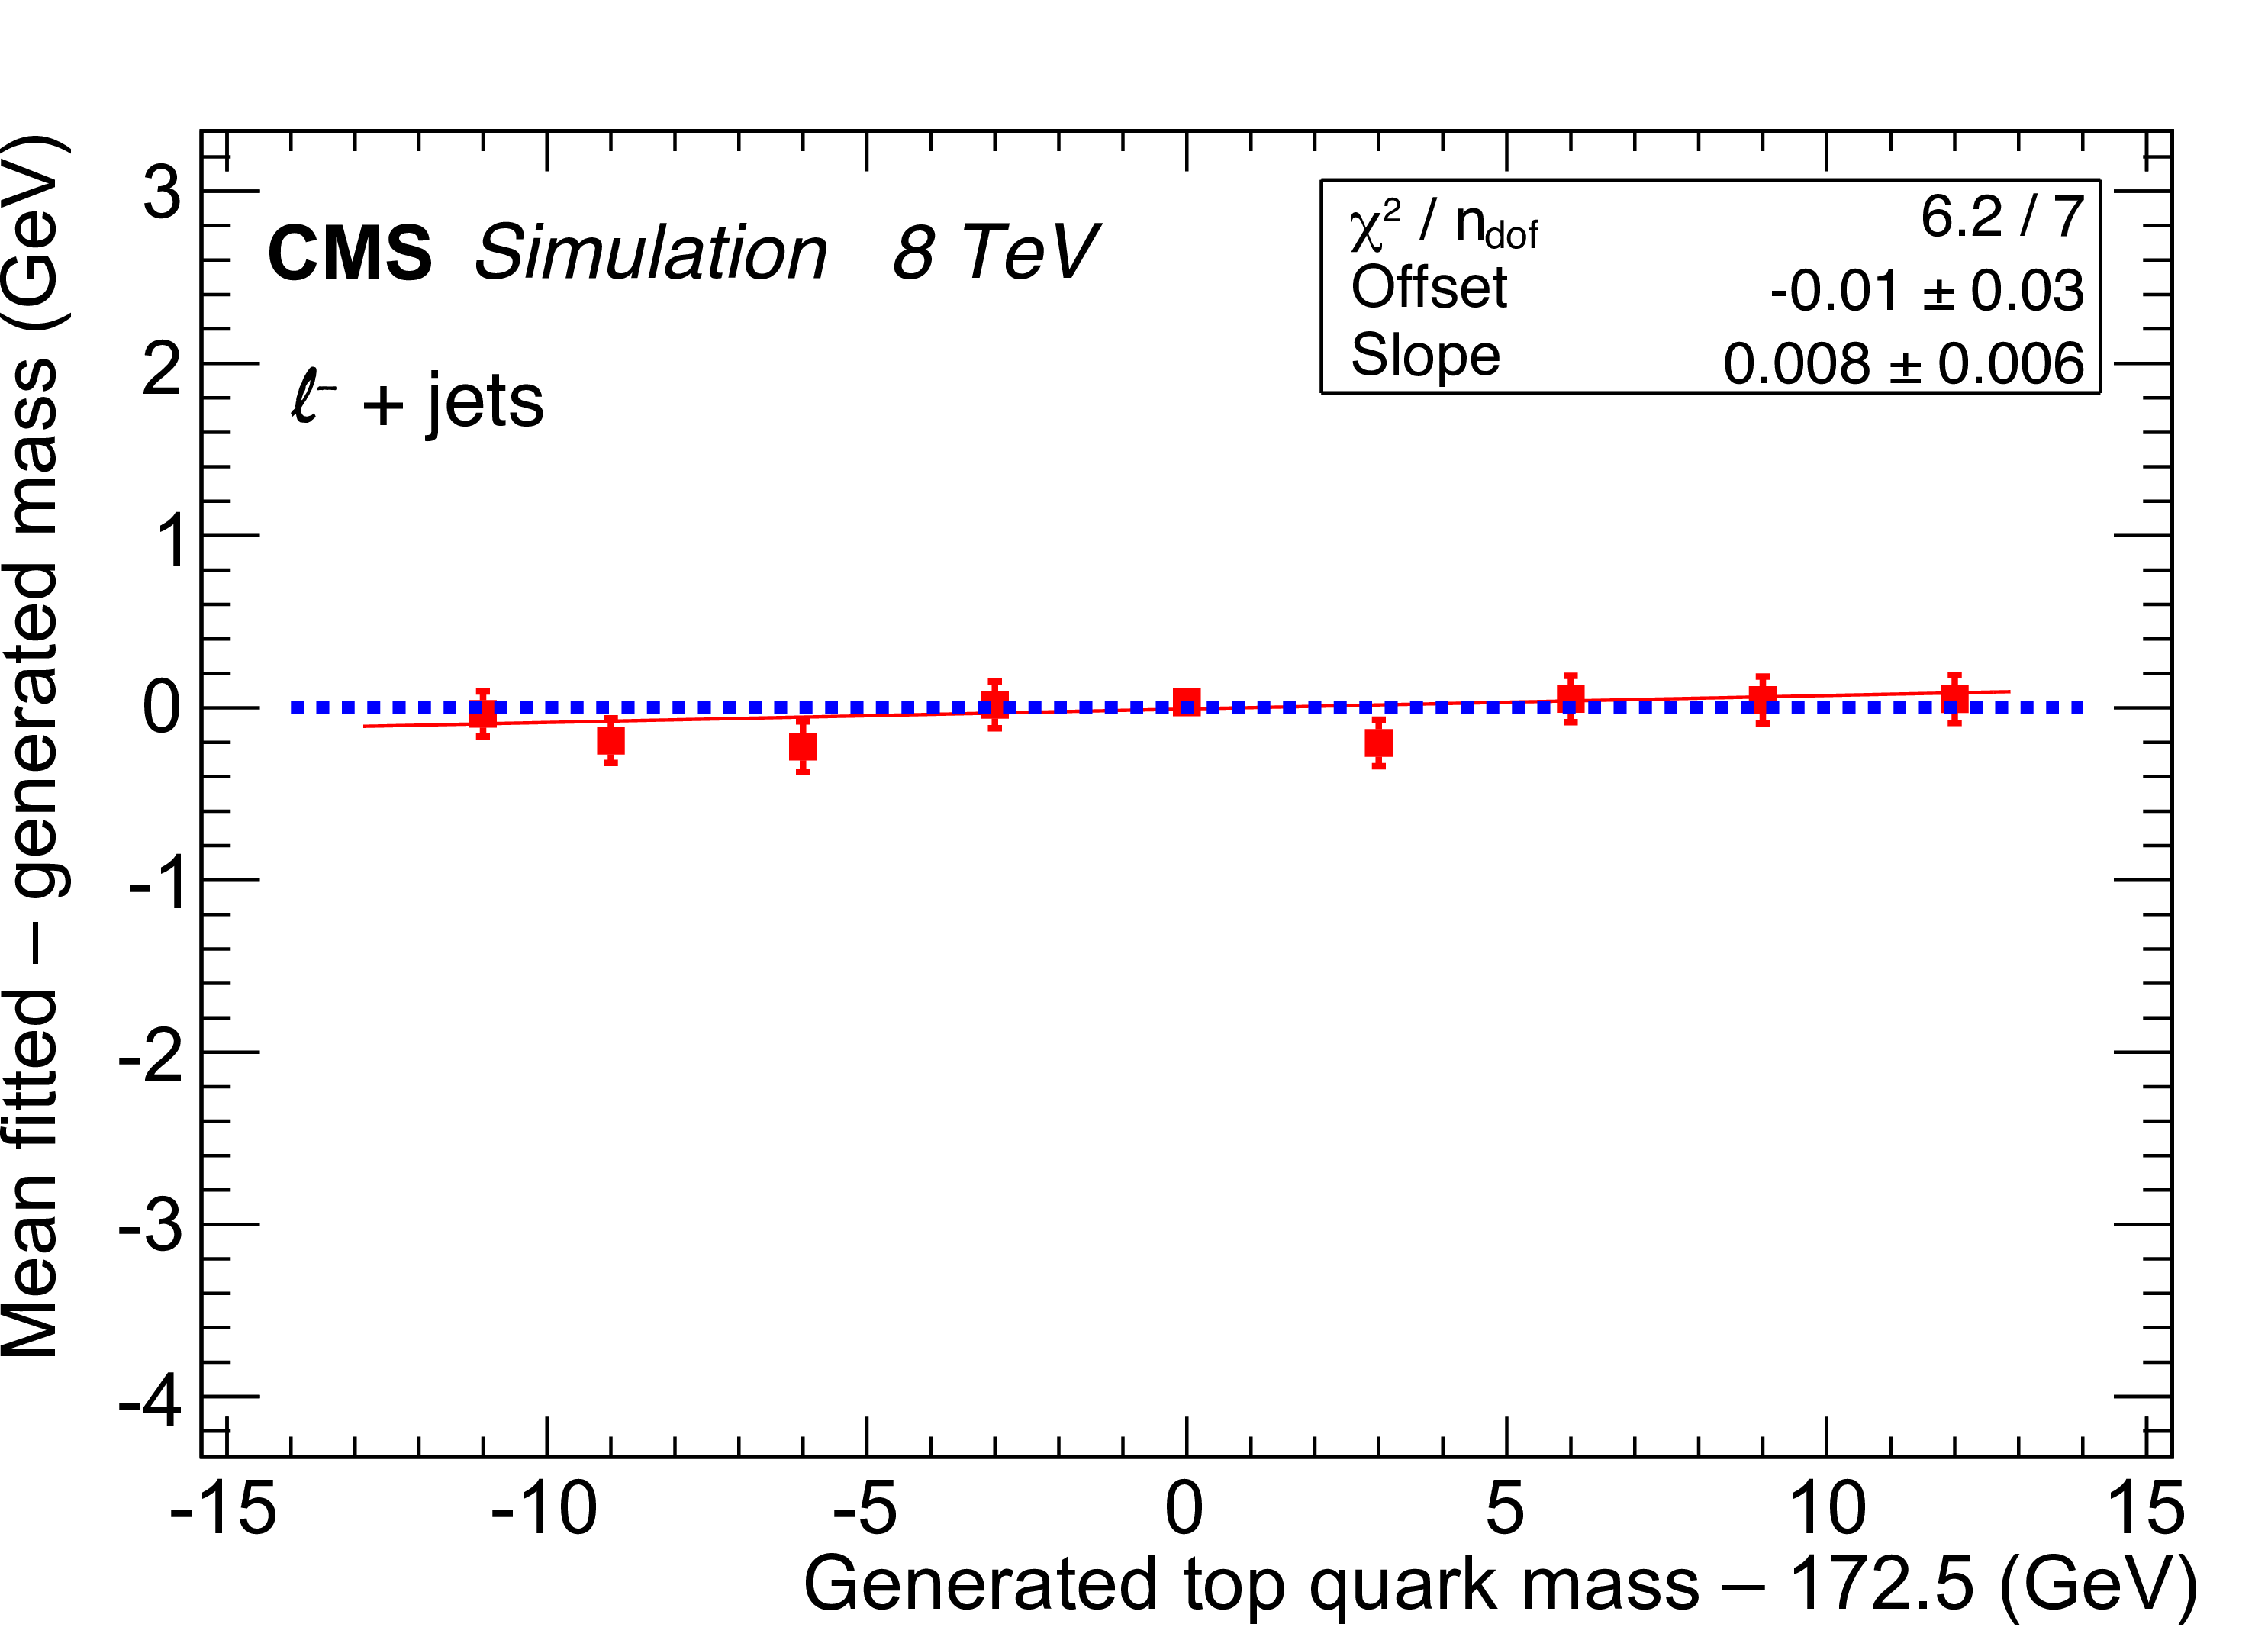
Figure 4:
Residual bias on the estimated top quark mass as a function of the generated top quark mass using $\ell ^+$+jets events (left) and $\ell ^-$+jets events (right) after the inclusive $\ell $+jets calibration. The dashed blue line represents the ideal outcome. |
png pdf |
Figure 4-a:
Residual bias on the estimated top quark mass as a function of the generated top quark mass using $\ell ^+$+jets events after the inclusive $\ell $+jets calibration. The dashed blue line represents the ideal outcome. |
png pdf |
Figure 4-b:
Residual bias on the estimated top quark mass as a function of the generated top quark mass using $\ell ^-$+jets events after the inclusive $\ell $+jets calibration. The dashed blue line represents the ideal outcome. |
| Tables | |
png pdf |
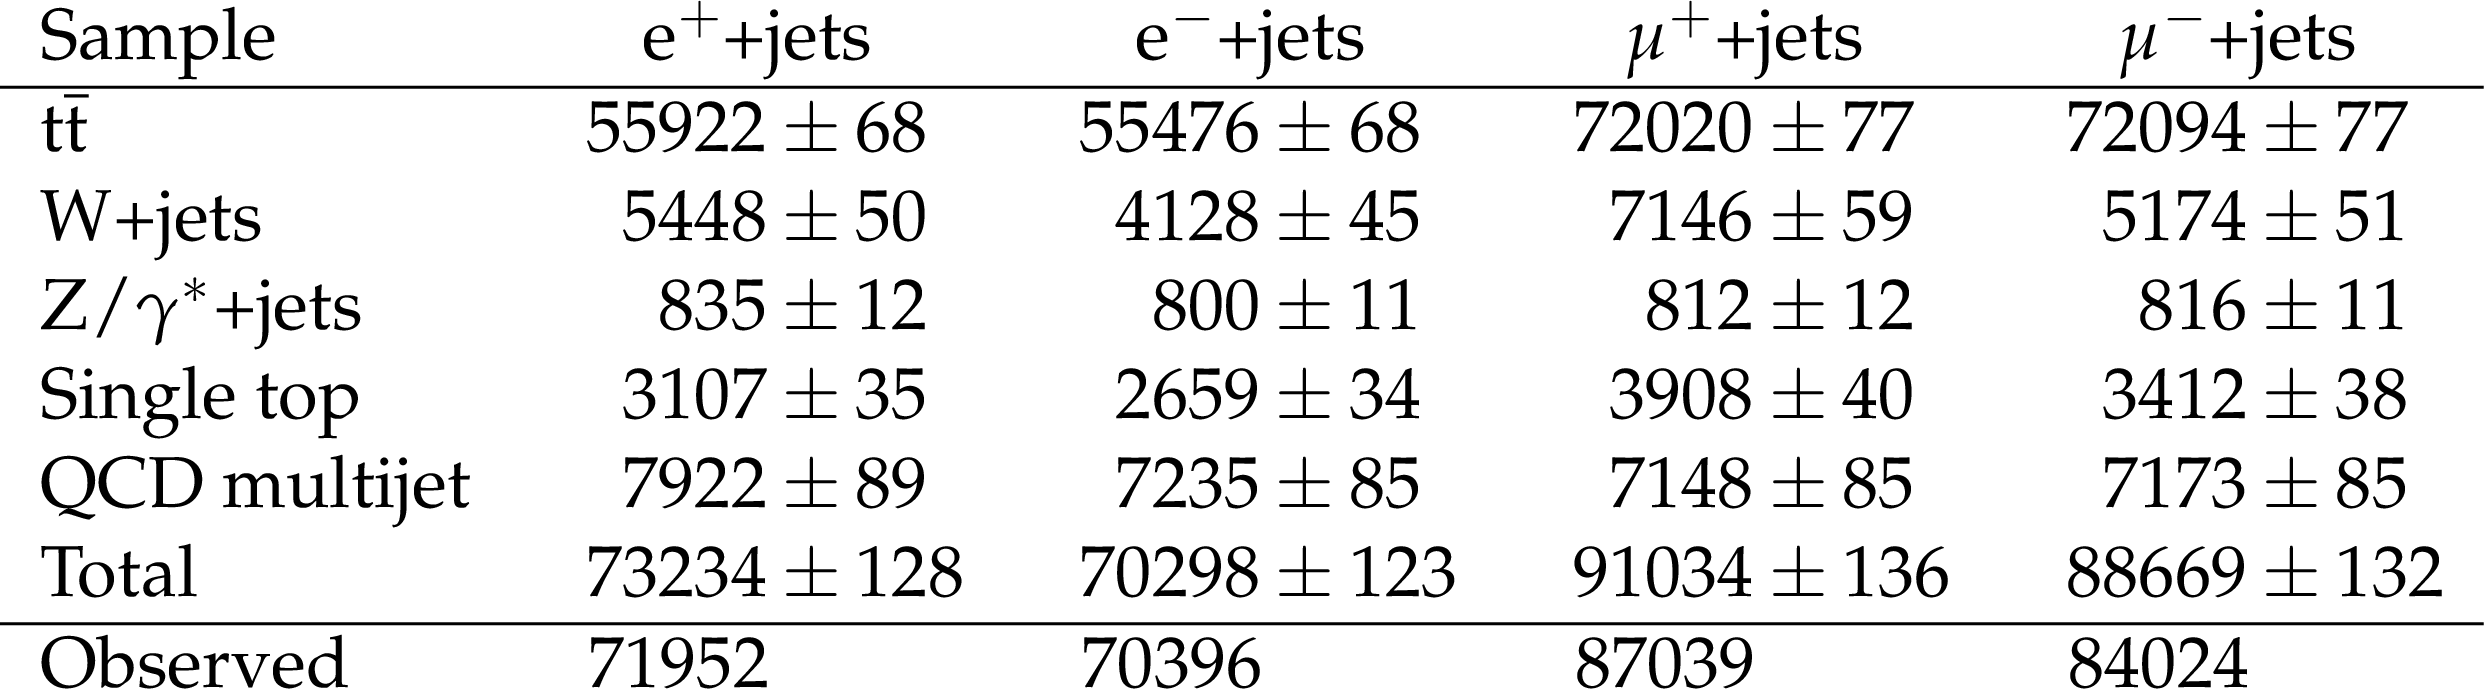
Table 1:
Expected and observed yield of events passing the full selection of $\mathrm{ e }^{+} $+jets, $\mathrm{ e }^{-} $+jets, $\mu^{+} $+jets, and $\mu^{-} $+jets channels. Simulations are used to obtain the expected number of events except for the QCD multijet background, which is derived from data, as described in the text. The uncertainties on the event numbers are statistical and reflect the limited number of events in simulation or data for the individual processes. |
png pdf |
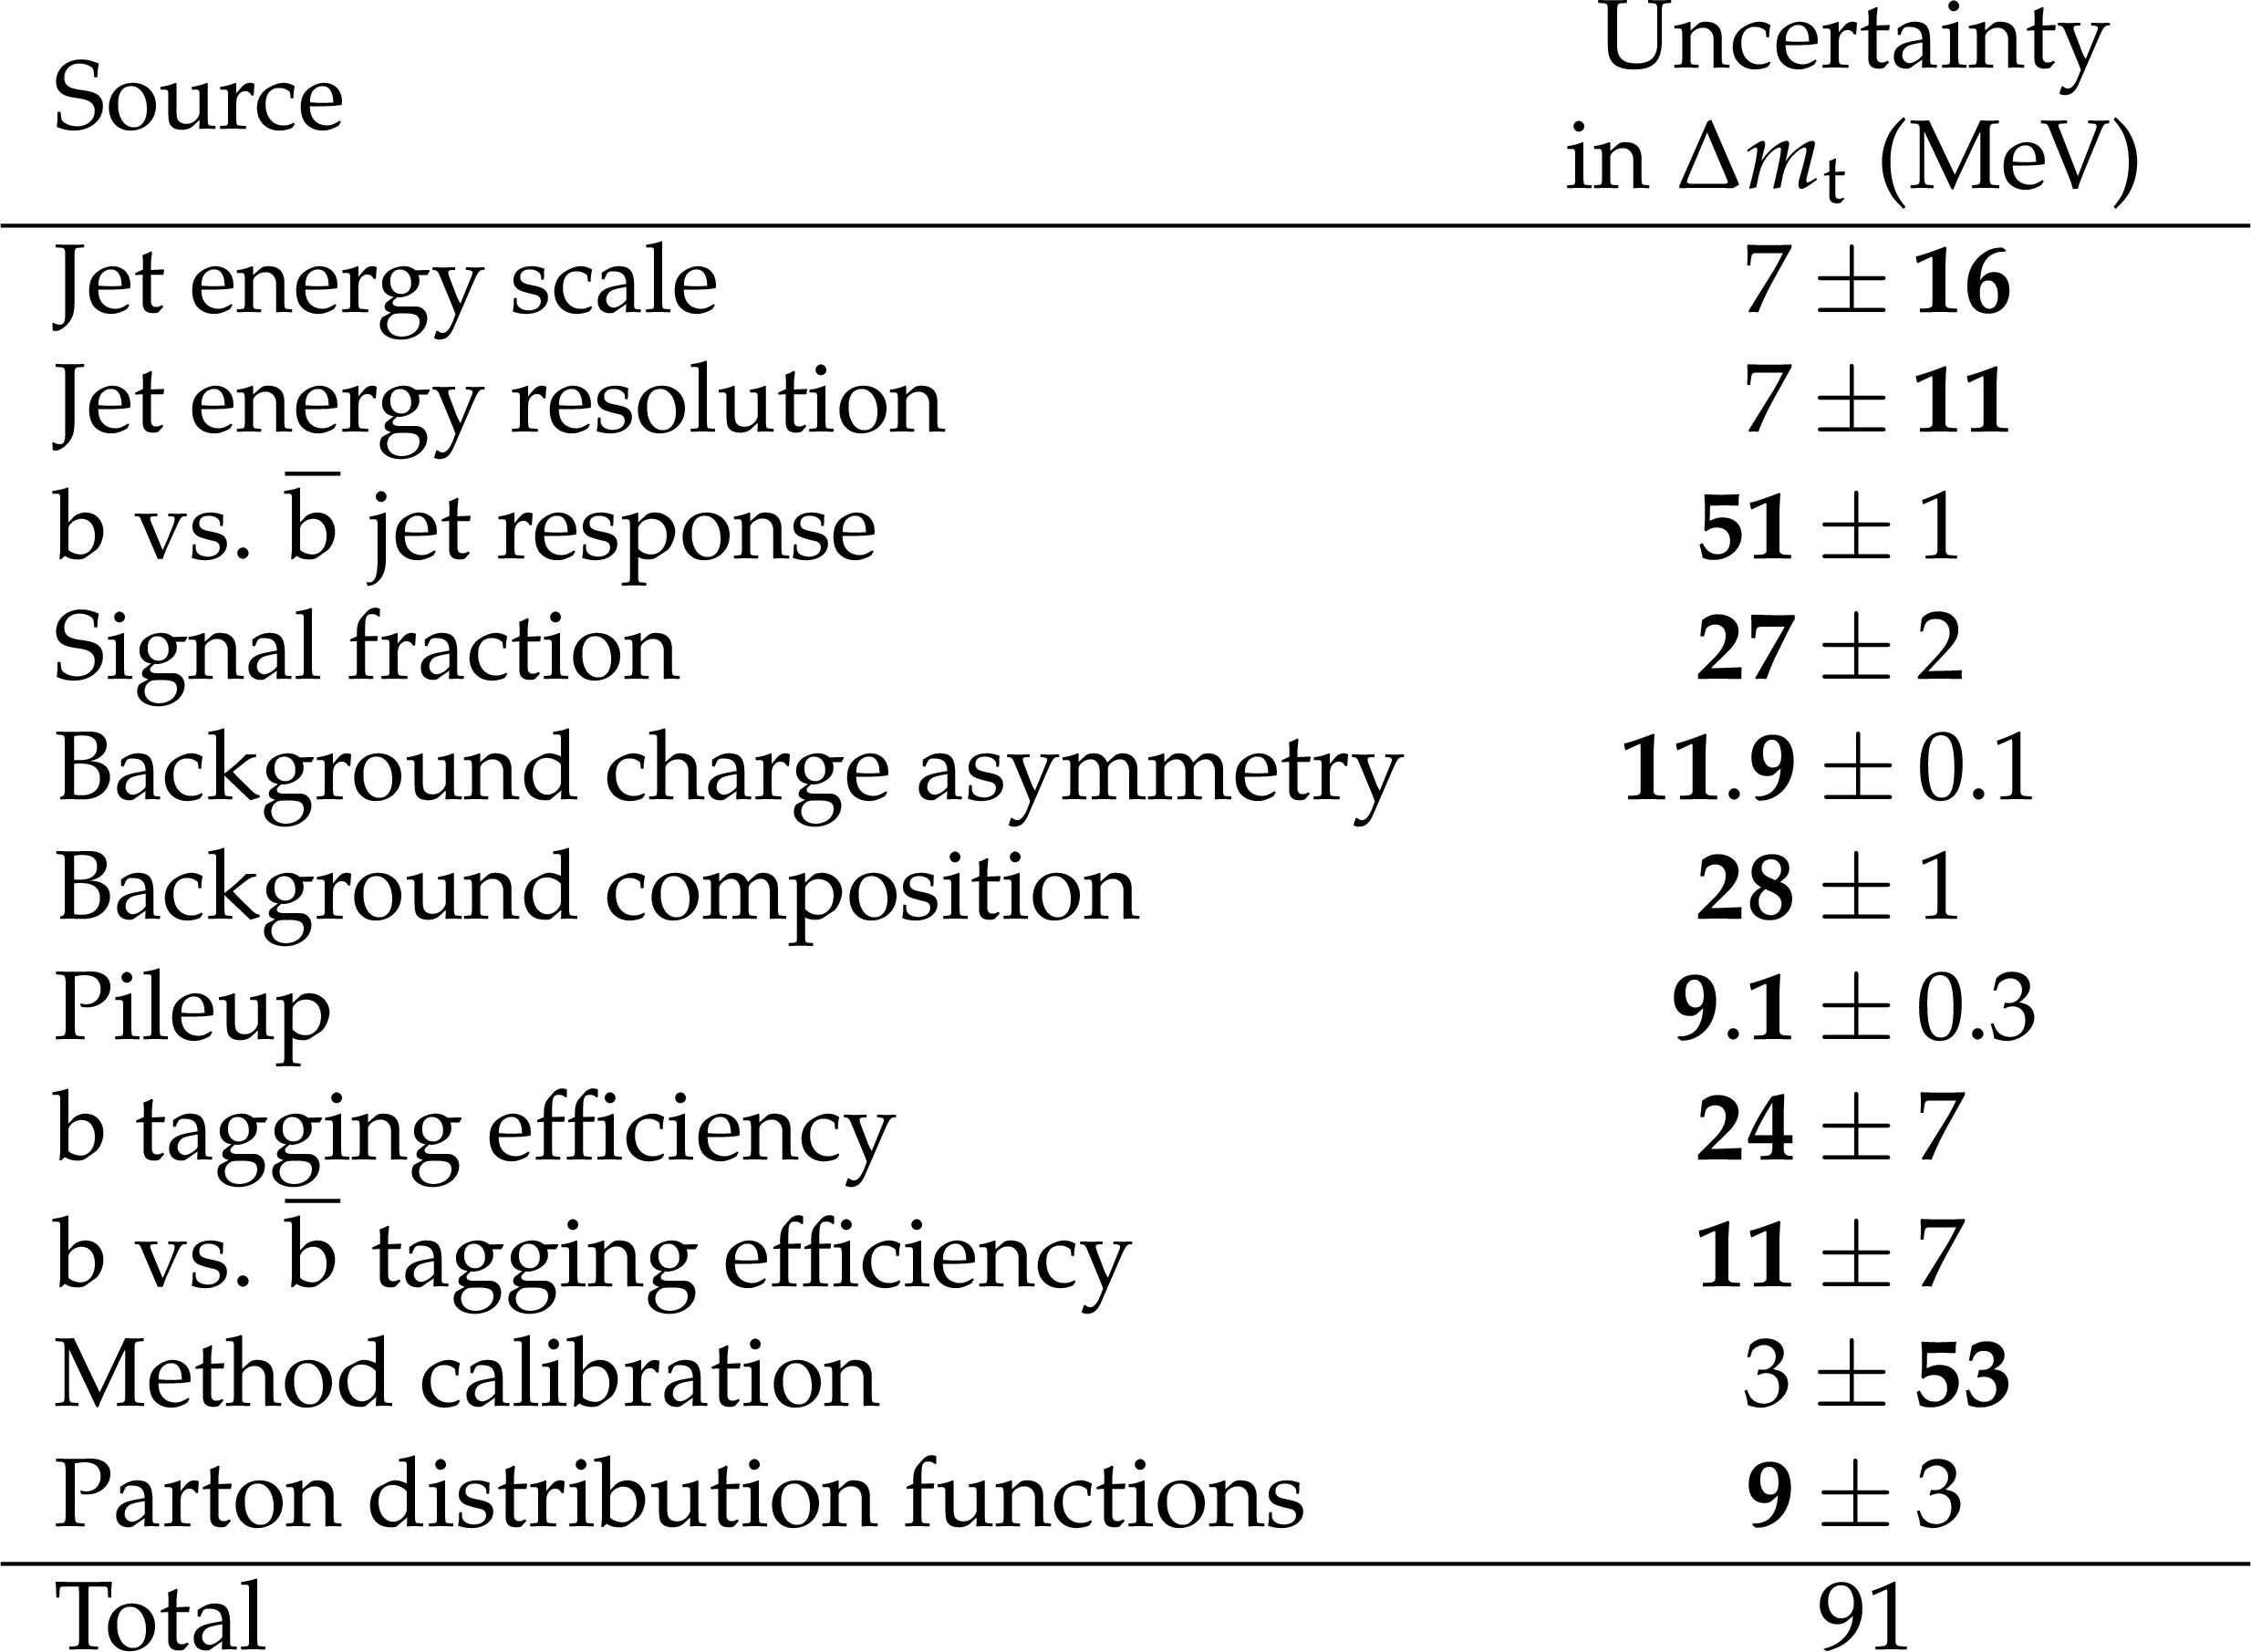
Table 2:
Summary of systematic uncertainties on $\Delta m_{\mathrm{ t } }$. For each contribution, the first value is the observed systematic shift, whereas the second number is the uncertainty of the shift due to the limited number of generated events. In all cases, the larger among the two is considered as the final systematic uncertainty and is indicated in the bold font. The total uncertainty is obtained from the sum in quadrature of the individual terms. |
| Summary |
| Data collected by the CMS experiment in pp collisions at $ \sqrt{s} = $ 8 TeV and corresponding to an integrated luminosity of 19.6$\pm$0.5 fb$^{-1}$ have been used to measure the difference in mass between the top quark and antiquark. The measured value is $\Delta m_{\mathrm{t}} = -0.15 \pm 0.19\, \mathrm{(stat)} \pm 0.09\, \mathrm{(syst)}$ GeV. This result improves in precision upon previously reported measurements [9-12] by more than a factor of two. It is in agreement with the expectations from CPT invariance, requiring equal particle and antiparticle masses. |
| References | ||||
| 1 | S. Glashow | Partial-symmetries of weak interactions | Nucl. Phys. 22 (1961) 579 | |
| 2 | S. Weinberg | A model of leptons | PRL 19 (1967) 1264 | |
| 3 | A. Salam | Weak and electromagnetic interactions | Conf. Proc. C 680519 (1968) 367 | |
| 4 | Particle Data Group, C. Patrignani et al. | Review of particle physics | CPC 40 (2016) 100001 | |
| 5 | D. Colladay and V. A. Kosteleck\'y | CPTviolation and the standard model | PRD 55 (1997) 6760 | |
| 6 | G. Barenboim and J. Lykken | A model of CPT violation for neutrinos | PLB 554 (2003) 73 | |
| 7 | R. S. Raghavan | A new model of solar neutrinos in manifest violation of CPT invariance | JCAP 0308 (2003) 002 | |
| 8 | V. A. Kosteleck\'y and R. Potting | CPT and strings | Nucl. Phys. B 359 (1991) 545 | |
| 9 | CDF Collaboration | Measurement of the mass difference between top and anti-top quarks at CDF | PRD 106 (2013) 152001 | 1103.2782 |
| 10 | D0 Collaboration | Direct measurement of the mass difference between top and antitop quarks | PRD 84 (2011) 052005 | 1106.2063 |
| 11 | CMS Collaboration | Measurement of the mass difference between top and antitop quarks | JHEP 06 (2012) 109, ,%\%CITATION = ARXIV:1204.2807;\%\% | CMS-TOP-11-019 1204.2807 |
| 12 | ATLAS Collaboration | Measurement of the mass difference between top and anti-top quarks in $ pp $ collisions at $ \sqrt{s} = $ 7 TeV using the ATLAS detector | PLB 728 (2013) 363 | 1310.6527 |
| 13 | CMS Collaboration | The CMS experiment at the CERN LHC | JINST 3 (2008) S08004,.%\%CITATION = JINST,3,S08004;\%\% | CMS-00-001 |
| 14 | DELPHI Collaboration | Measurement of the mass and width of the $ \mathrm{ W }\ $ boson in $ \mathrm{ e }^{+}\mathrm{ e }^{-} $ collisions at $ \sqrt{s} = $ 161-209 GeV | EPJD 55 (2008) 1, ,%\%CITATION = 0803.2534;\%\% | 0803.2534 |
| 15 | CMS Collaboration | Performance of CMS muon reconstruction in pp collision events at $ \sqrt{s} = $ 7 TeV | JINST 7 (2012) P10002 | CMS-MUO-10-004 1206.4071 |
| 16 | CMS Collaboration | Energy calibration and resolution of the CMS electromagnetic calorimeter in pp collisions at $ \sqrt{s} = $ 7 TeV | JINST 8 (2013) P09009 | CMS-EGM-11-001 1306.2016 |
| 17 | CMS Collaboration | Performance of electron reconstruction and selection with the CMS detector in proton-proton collisions at $ \sqrt{s} = $ 8 TeV | JINST 10 (2015) P06005 | CMS-EGM-13-001 1502.02701 |
| 18 | CMS Collaboration | CMS luminosity based on pixel cluster counting---Summer 2013 update | CMS-PAS-LUM-13-001 | CMS-PAS-LUM-13-001 |
| 19 | J. Alwall et al. | MadGraph 5: going beyond | JHEP 06 (2011) 128 | 1106.0522 |
| 20 | T. Sjostrand, S. Mrenna, and P. Skands | PYTHIA 6.4 physics and manual | JHEP 05 (2006) 026 | hep-ph/0603175 |
| 21 | S. Frixione, P. Nason, and C. Oleari | Matching NLO QCD computations with parton shower simulations: the POWHEG method | JHEP 11 (2007) 070 | 0709.2092 |
| 22 | S. Alioli, P. Nason, C. Oleari, and E. Re | A general framework for implementing NLO calculations in shower Monte Carlo programs: the POWHEG BOX | JHEP 06 (2010) 043 | 1002.2581 |
| 23 | S. Alioli, P. Nason, C. Oleari, and E. Re | NLO single-top production matched with shower in POWHEG: $ s $- and $ t $-channel contributions | JHEP 09 (2009) 111, , [Erratum: \DOI10.1007/JHEP02(2010)011] | 0907.4076 |
| 24 | E. Re | Single-top Wt-channel production matched with parton showers using the POWHEG method | EPJC 71 (2011) 1547 | 1009.2450 |
| 25 | S. Frixione and B. R. Webber | The MC@NLO 3.4 event generator | 0812.0770 | |
| 26 | G. Corcella et al. | HERWIG 6: an event generator for hadron emission reactions with interfering gluons (including supersymmetric processes) | JHEP 01 (2001) 010 | hep-ph/0011363 |
| 27 | GEANT4 Collaboration | GEANT4---a simulation toolkit | NIMA 506 (2003) 250 | |
| 28 | K. Melnikov and F. Petriello | Electroweak gauge boson production at hadron colliders through $ \mathcal{O}(\alpha_s^2 $) | PRD 74 (2006) 114017 | hep-ph/0609070 |
| 29 | M. Czakon, P. Fiedler, and A. Mitov | The total top quark pair production cross-section at hadron colliders through $ \mathcal{O}(\alpha_s^4) $ | PRL 110 (2013) 252004 | 1303.6254 |
| 30 | N. Kidonakis | NNLL threshold resummation for top-pair and single-top production | 1210.7813 | |
| 31 | CMS Collaboration | Commissioning of the particle-flow reconstruction in minimum-bias and jet events from pp collisions at 7 TeV | CDS | |
| 32 | M. Cacciari, G. P. Salam, and G. Soyez | The anti-$ k_t $ jet clustering algorithm | JHEP 04 (2008) 063, ,%\%CITATION = 0802.1189;\%\% | 0802.1189 |
| 33 | CMS Collaboration | Determination of jet energy calibration and transverse momentum resolution in CMS | JINST 6 (2011) 11002 | CMS-JME-10-011 1107.4277 |
| 34 | CMS Collaboration | Missing transverse energy performance of the CMS detector | JINST 6 (2011) 09001 | CMS-JME-10-009 1106.5048 |
| 35 | CMS Collaboration | Measurement of the $ \mathrm{ t \bar{t} }\ $ production cross section in the $ \mathrm{ e } \mu $ channel in proton-proton collisions at $ \sqrt{s} = $ 7 and 8 TeV | Submitted to JHEP | CMS-TOP-13-004 1603.02303 |
| 36 | CMS Collaboration | Identification of b-quark jets with the CMS experiment | JINST 8 (2013) 04013, ,%\%CITATION = ARXIV:1204.2807;\%\% | CMS-BTV-12-001 1211.4462 |
| 37 | CMS Collaboration | Measurement of differential top-quark pair production cross sections in pp colisions at $ \sqrt{s} = $ 7 TeV | EPJC 73 (2013) 2339 | CMS-TOP-11-013 1211.2220 |
| 38 | CMS Collaboration | Measurement of the differential cross section for top quark pair production in pp collisions at $ \sqrt{s} = $ 8 TeV | EPJC 75 (2015) 542 | CMS-TOP-12-028 1505.04480 |
| 39 | CMS Collaboration | Measurement of the $ \mathrm{t}\overline{{\mathrm{t}}} $ production cross section in the all-jets final state in pp collisions at $ \sqrt{s} = $ 8 TeV | EPJC 76 (2016) 128 | CMS-TOP-14-018 1509.06076 |
| 40 | CMS Collaboration | Measurement of the top quark mass using proton-proton data at $ \sqrt{s} = $ 7 TeV and 8 TeV | PRD 93 (2016) 072044 | CMS-TOP-14-022 1509.04044 |
| 41 | P. Van Mulders | Calibration of the jet energy scale using top quark events at the LHC | PhD thesis, Vrije Universiteit, Brussel, 2010 | |
| 42 | J. D'Hondt et al. | Fitting of event topologies with external kinematic constraints in CMS | CMS Note 2006/023 | |
| 43 | S. Blyweert | Measurement of the top-quark mass and the mass difference between top and anti-top quarks at the LHC | PhD thesis, Vrije Universiteit, Brussel, 2014 | |
| 44 | The ATLAS, CDF, CMS and D0 Collaborations | First combination of Tevatron and LHC measurements of the top-quark mass | 1403.4427 | |
| 45 | R. G. Miller | The jackknife---a review | Biometrika 61 (1974) 1 | |
| 46 | CMS Collaboration | Measurements of the $ \mathrm{ t \bar{t} }\ $ production cross section in lepton+jets final states in pp collisions at 8$ TeV $ and ratio of 8 to 7 TeV cross sections | CMS-TOP-12-006 1602.09024 |
|
| 47 | CMS Collaboration | Measurement of the lepton charge asymmetry in inclusive W production in pp collisions at $ \sqrt{s} = $ 7 TeV | JHEP 04 (2011) 050 | CMS-EWK-10-006 1103.3470 |
| 48 | CMS Collaboration | Measurement of inclusive W and Z boson production cross sections in pp collisions at $ \sqrt{s} = $ 8 TeV | PRL 112 (2014) 191802 | CMS-SMP-12-011 1402.0923 |
| 49 | CMS Collaboration | Measurement of the $ t $-channel single-top-quark production cross section and of the $ |V_{\mathrm{t }\mathrm{b }}| $ CKM matrix element in pp collisions at $ \sqrt{s} = $ 8 TeV | JHEP 06 (2014) 090 | CMS-TOP-12-038 1403.7366 |
| 50 | P. M. Nadolsky et al. | Implications of CTEQ global analysis for collider observables | PRD 78 (2008) 013004 | 0802.0007 |
|
|
Compact Muon Solenoid LHC, CERN |
|

|

|

|

|

|