

Compact Muon Solenoid
LHC, CERN
| CMS-TOP-12-042 ; CERN-EP-2016-139 | ||
| Measurement of the differential cross sections for top quark pair production as a function of kinematic event variables in pp collisions at $\sqrt{s} = $ 7 and 8 TeV | ||
| CMS Collaboration | ||
| 4 July 2016 | ||
| Phys. Rev. D 94 (2016) 052006 | ||
| Abstract: Measurements are reported of the normalized differential cross sections for top quark pair production with respect to four kinematic event variables: the missing transverse energy; the scalar sum of the jet transverse momentum ($p_{\mathrm{T}}$); the scalar sum of the $p_{\mathrm{T}}$ of all objects in the event; and the $p_{\mathrm{T}}$ of leptonically decaying W bosons from top quark decays. The data sample, collected using the CMS detector at the LHC, consists of 5.0 fb$^{-1}$ of proton-proton collisions at $ \sqrt{s} = $ 7 TeV and 19.7 fb$^{-1}$ at $ \sqrt{s} = $ 8 TeV. Top quark pair events containing one electron or muon are selected. The results are presented after correcting for detector effects to allow direct comparison with theoretical predictions. No significant deviations from the predictions of several standard model event simulation generators are observed. | ||
| Links: e-print arXiv:1607.00837 [hep-ex] (PDF) ; CDS record ; inSPIRE record ; HepData record ; CADI line (restricted) ; | ||
| Figures | |

png pdf |
Figure 1-a:
The observed distributions of ${E_{\mathrm {T}}^{\text {miss}}} $ (a,b) and ${H_{\mathrm {T}}}$ (c,d) in the $ \sqrt{s} = $ 8 TeV electron+jets (a,c) and muon+jets (b,d) data samples, compared to predictions from simulation. The points are the data histograms, with the vertical bars showing the statistical uncertainty, and the predictions from the simulation are the solid histograms. The shaded region shows the uncertainty in the values from simulation. These include contributions from the statistical uncertainty and the uncertainty in the ${\mathrm{ t \bar{t} } }$ cross section. The lower plots show the ratio of the number of events from data and the prediction from the MC simulation. |

png pdf |
Figure 1-b:
The observed distributions of ${E_{\mathrm {T}}^{\text {miss}}} $ (a,b) and ${H_{\mathrm {T}}}$ (c,d) in the $ \sqrt{s} = $ 8 TeV electron+jets (a,c) and muon+jets (b,d) data samples, compared to predictions from simulation. The points are the data histograms, with the vertical bars showing the statistical uncertainty, and the predictions from the simulation are the solid histograms. The shaded region shows the uncertainty in the values from simulation. These include contributions from the statistical uncertainty and the uncertainty in the ${\mathrm{ t \bar{t} } }$ cross section. The lower plots show the ratio of the number of events from data and the prediction from the MC simulation. |

png pdf |
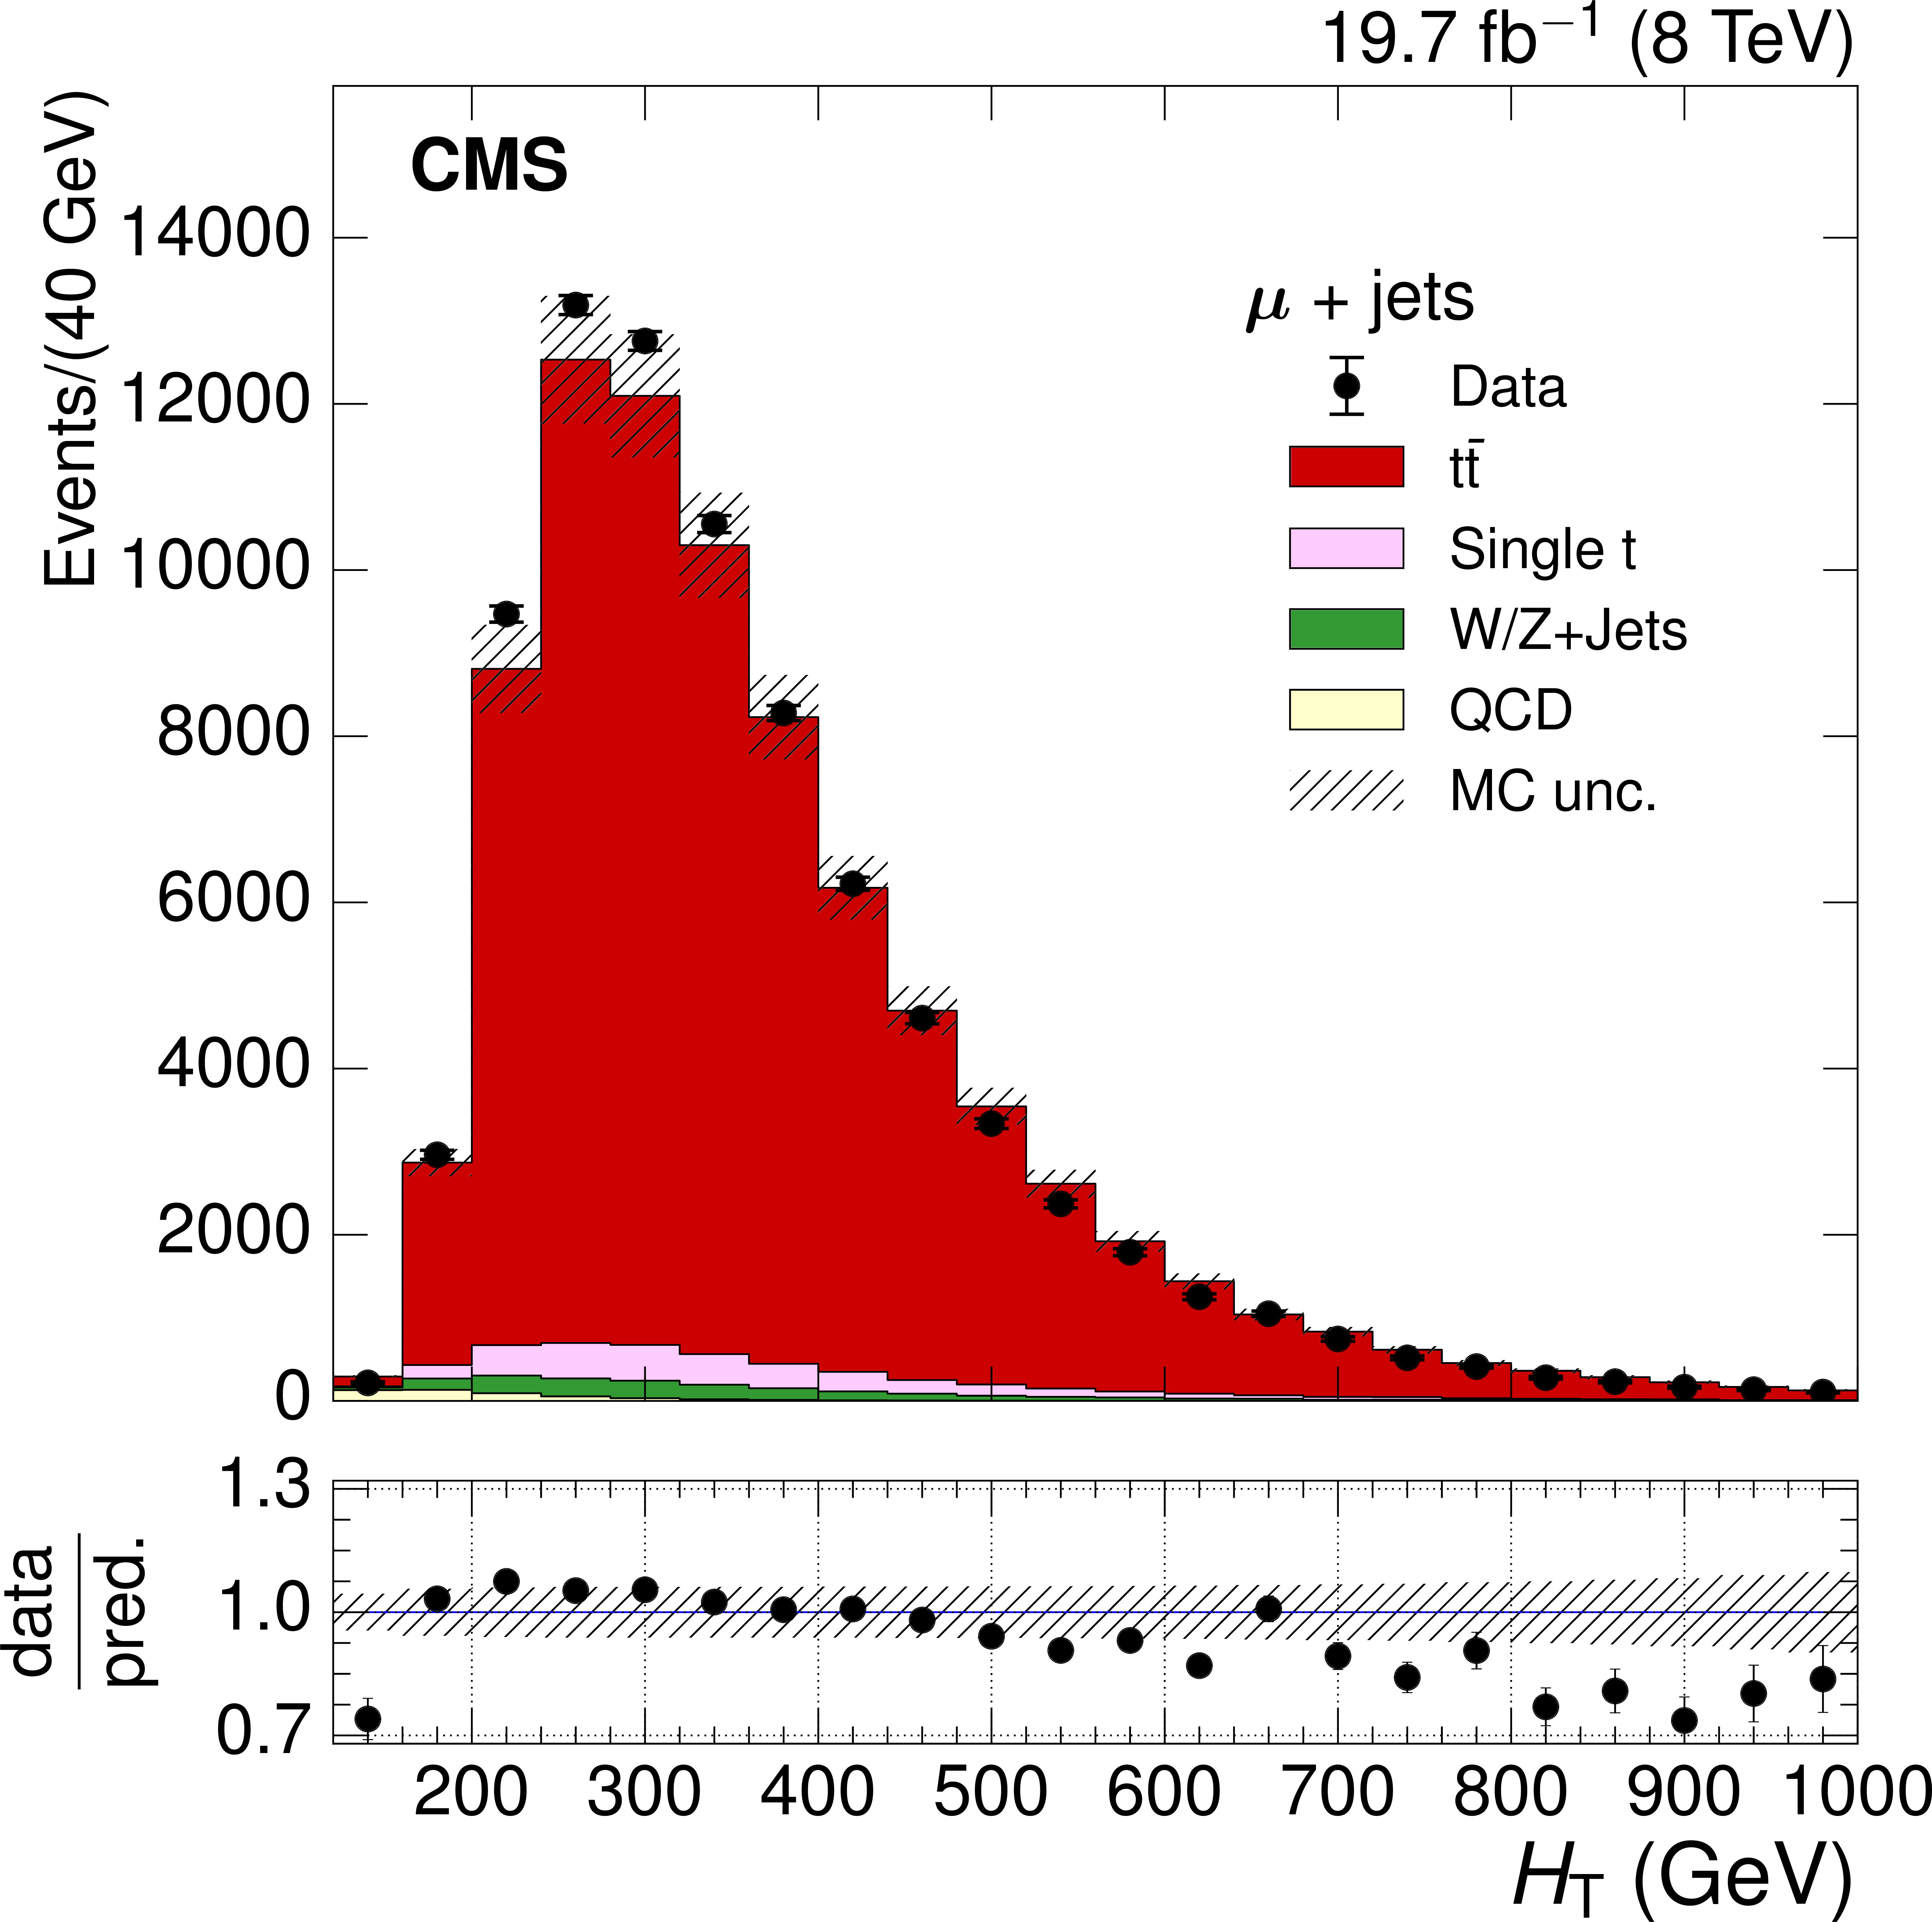
Figure 1-c:
The observed distributions of ${E_{\mathrm {T}}^{\text {miss}}} $ (a,b) and ${H_{\mathrm {T}}}$ (c,d) in the $ \sqrt{s} = $ 8 TeV electron+jets (a,c) and muon+jets (b,d) data samples, compared to predictions from simulation. The points are the data histograms, with the vertical bars showing the statistical uncertainty, and the predictions from the simulation are the solid histograms. The shaded region shows the uncertainty in the values from simulation. These include contributions from the statistical uncertainty and the uncertainty in the ${\mathrm{ t \bar{t} } }$ cross section. The lower plots show the ratio of the number of events from data and the prediction from the MC simulation. |
png pdf |
Figure 1-d:
The observed distributions of ${E_{\mathrm {T}}^{\text {miss}}} $ (a,b) and ${H_{\mathrm {T}}}$ (c,d) in the $ \sqrt{s} = $ 8 TeV electron+jets (a,c) and muon+jets (b,d) data samples, compared to predictions from simulation. The points are the data histograms, with the vertical bars showing the statistical uncertainty, and the predictions from the simulation are the solid histograms. The shaded region shows the uncertainty in the values from simulation. These include contributions from the statistical uncertainty and the uncertainty in the ${\mathrm{ t \bar{t} } }$ cross section. The lower plots show the ratio of the number of events from data and the prediction from the MC simulation. |

png pdf |
Figure 2-a:
The observed distributions of ${S_\mathrm {T}} $ (a,b) and ${ p_\mathrm {T}^{\mathrm {W}} }$ (c,d) in the $ \sqrt{s} = $ 8 TeV electron+jets (a,c) and muon+jets (b,d) data samples, compared to predictions from simulation. The points are the data histograms, with the vertical bars showing the statistical uncertainty, and the predictions from the simulation are the solid histograms. The shaded region shows the uncertainty in the values from simulation. These include contributions from the statistical uncertainty and the uncertainty in the ${\mathrm{ t \bar{t} } }$ cross section. The lower plots show the ratio of the number of events from data and the prediction from the MC simulation. |
png pdf |
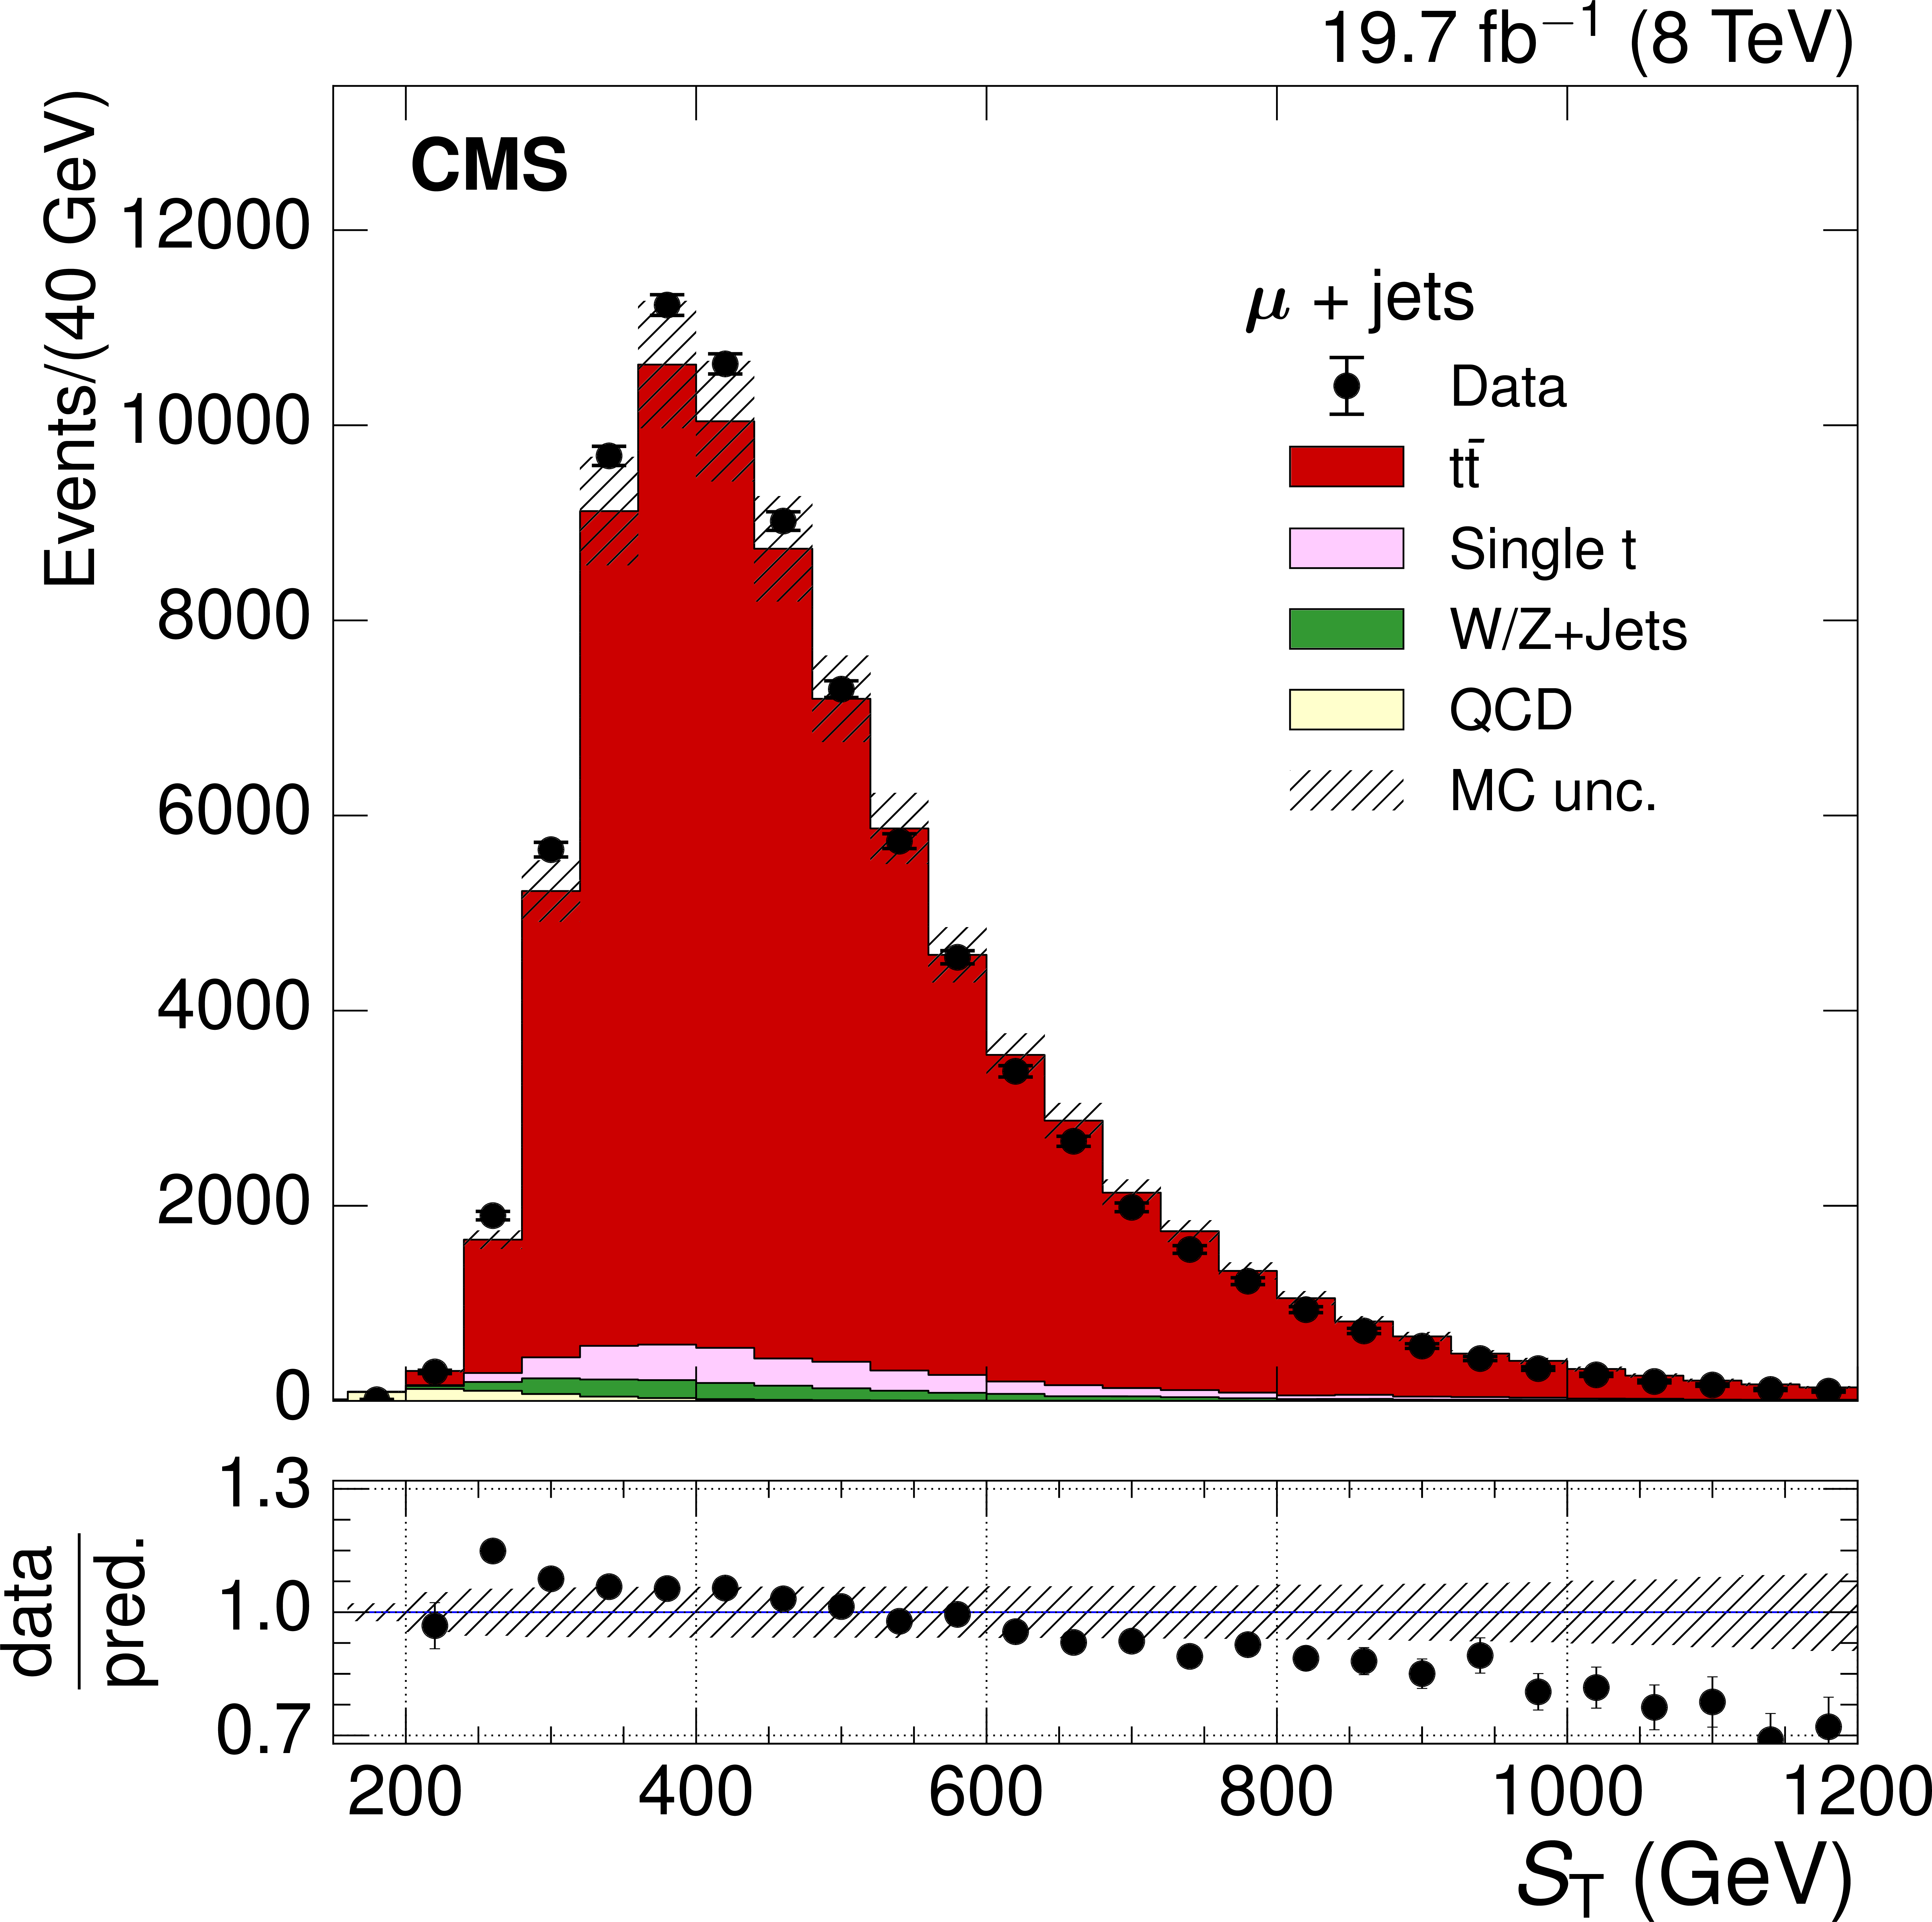
Figure 2-b:
The observed distributions of ${S_\mathrm {T}} $ (a,b) and ${ p_\mathrm {T}^{\mathrm {W}} }$ (c,d) in the $ \sqrt{s} = $ 8 TeV electron+jets (a,c) and muon+jets (b,d) data samples, compared to predictions from simulation. The points are the data histograms, with the vertical bars showing the statistical uncertainty, and the predictions from the simulation are the solid histograms. The shaded region shows the uncertainty in the values from simulation. These include contributions from the statistical uncertainty and the uncertainty in the ${\mathrm{ t \bar{t} } }$ cross section. The lower plots show the ratio of the number of events from data and the prediction from the MC simulation. |
png pdf |
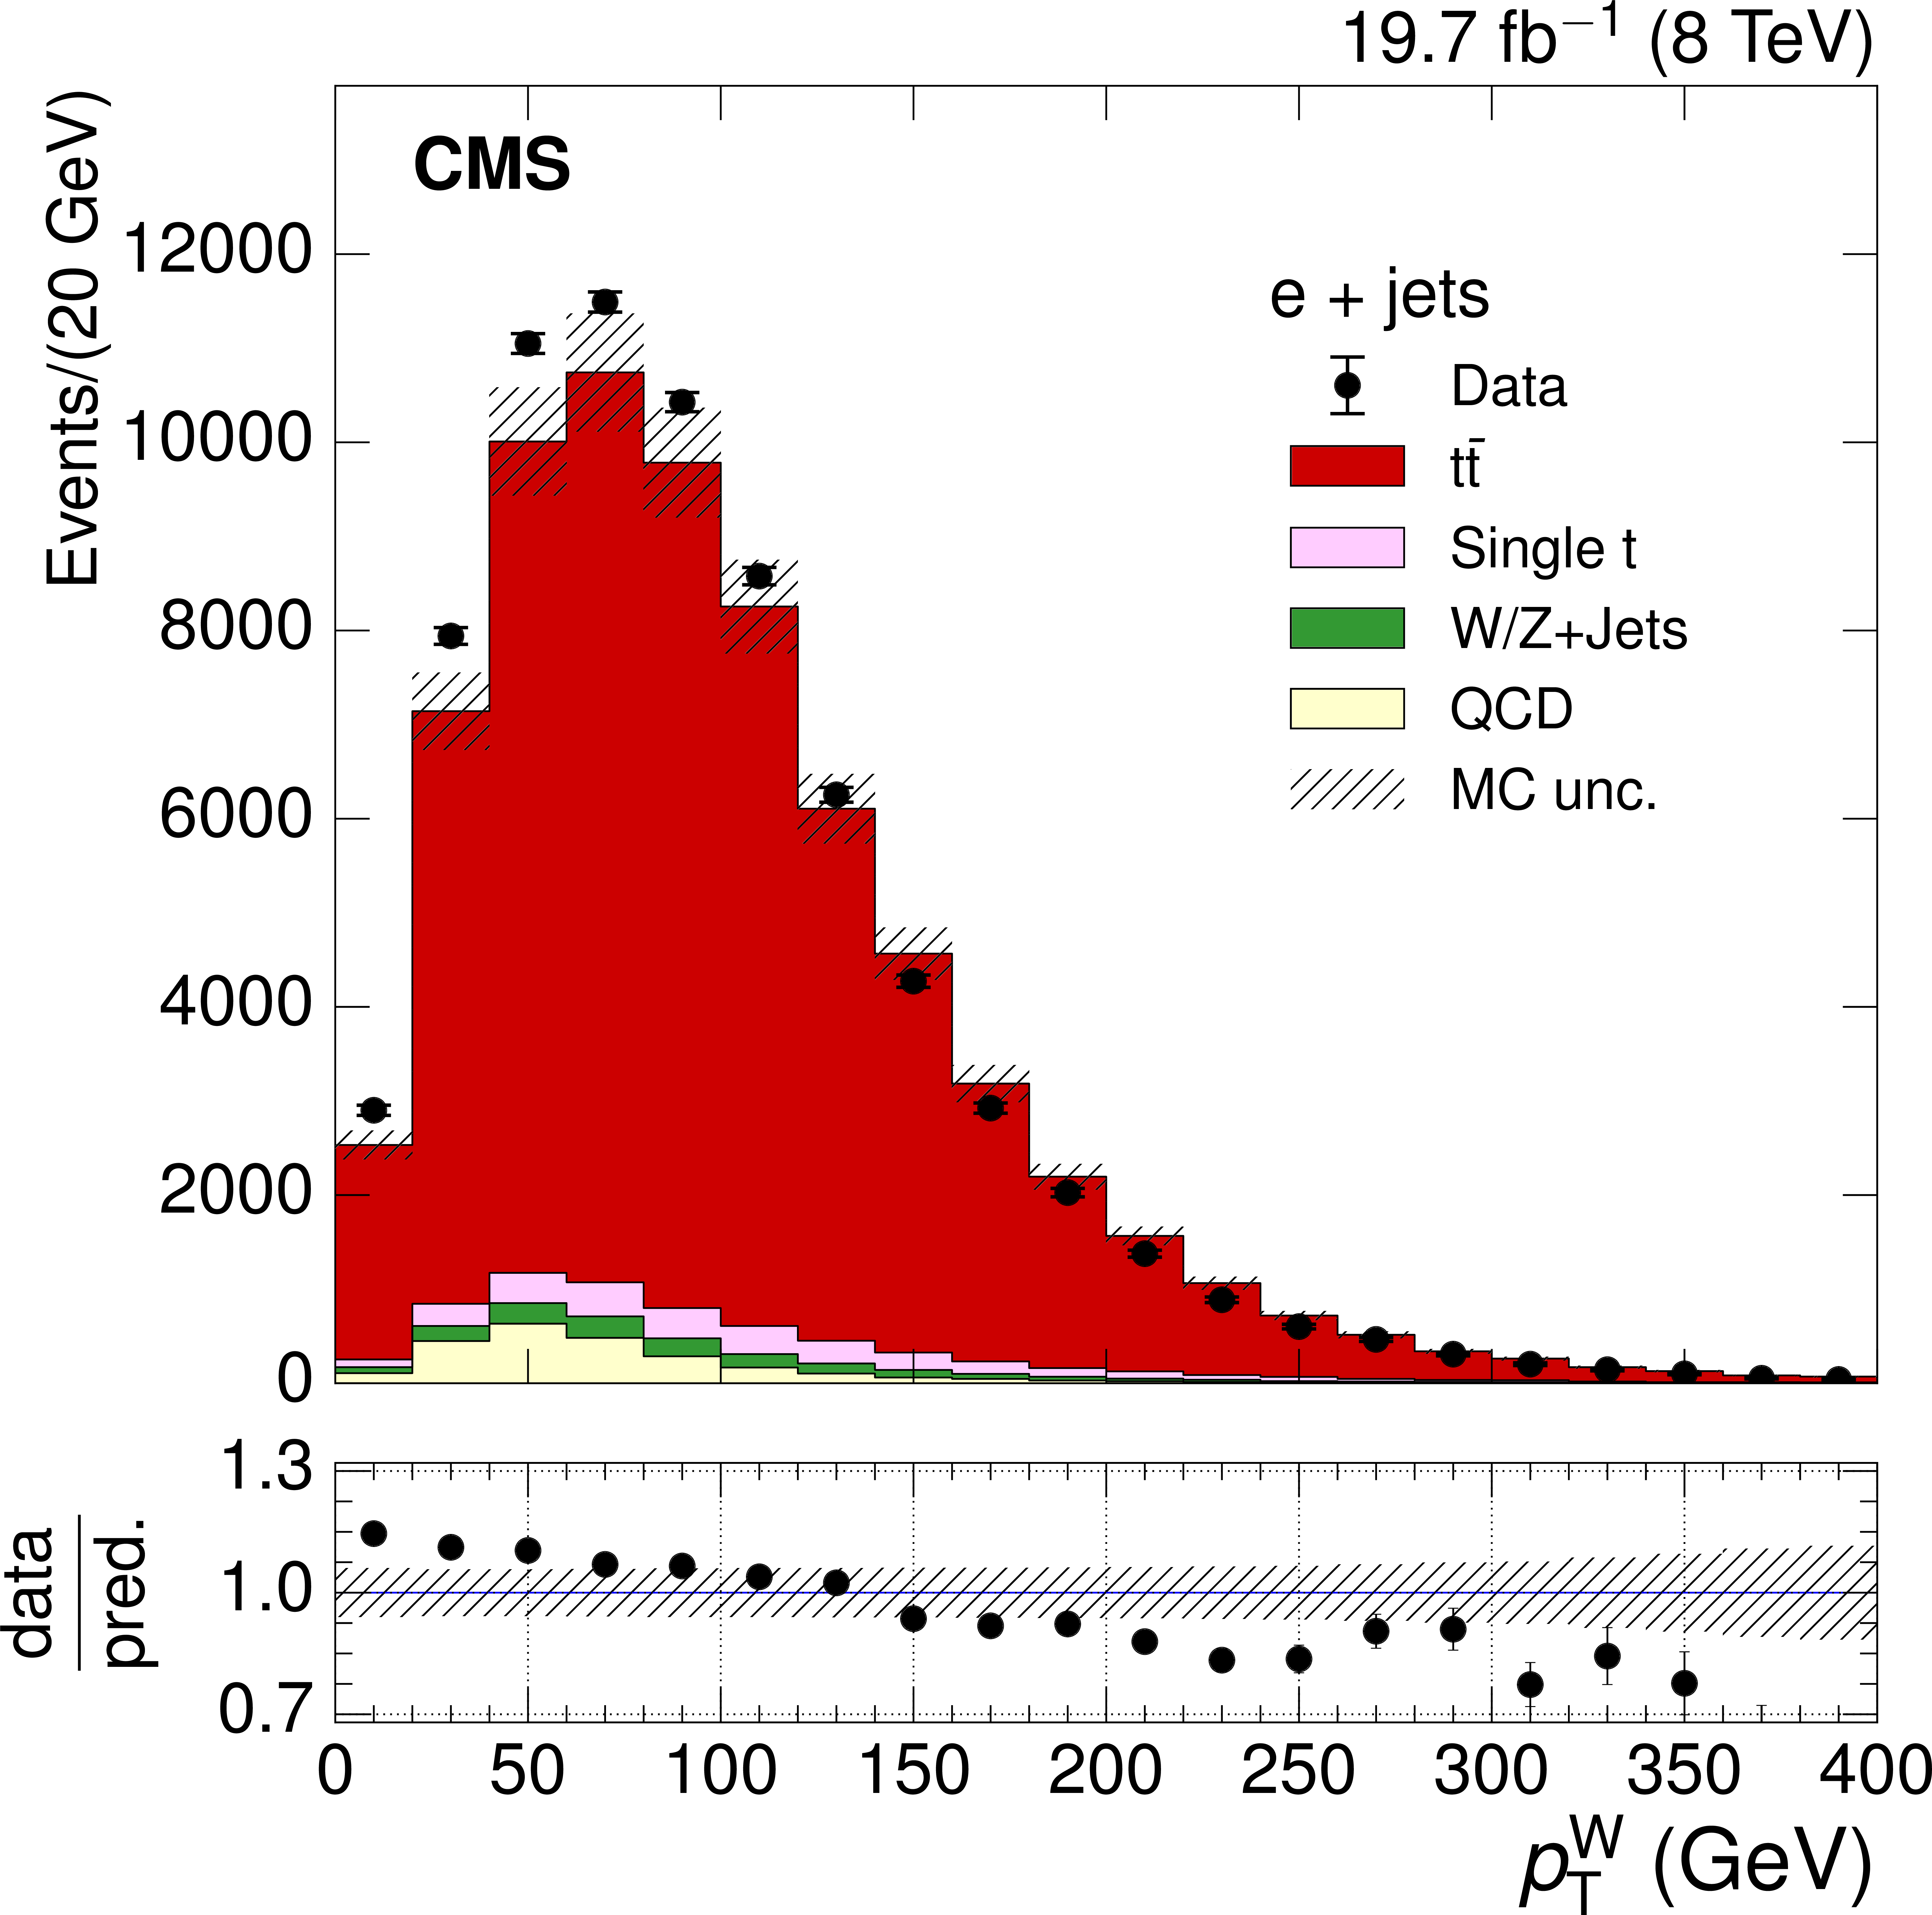
Figure 2-c:
The observed distributions of ${S_\mathrm {T}} $ (a,b) and ${ p_\mathrm {T}^{\mathrm {W}} }$ (c,d) in the $ \sqrt{s} = $ 8 TeV electron+jets (a,c) and muon+jets (b,d) data samples, compared to predictions from simulation. The points are the data histograms, with the vertical bars showing the statistical uncertainty, and the predictions from the simulation are the solid histograms. The shaded region shows the uncertainty in the values from simulation. These include contributions from the statistical uncertainty and the uncertainty in the ${\mathrm{ t \bar{t} } }$ cross section. The lower plots show the ratio of the number of events from data and the prediction from the MC simulation. |
png pdf |
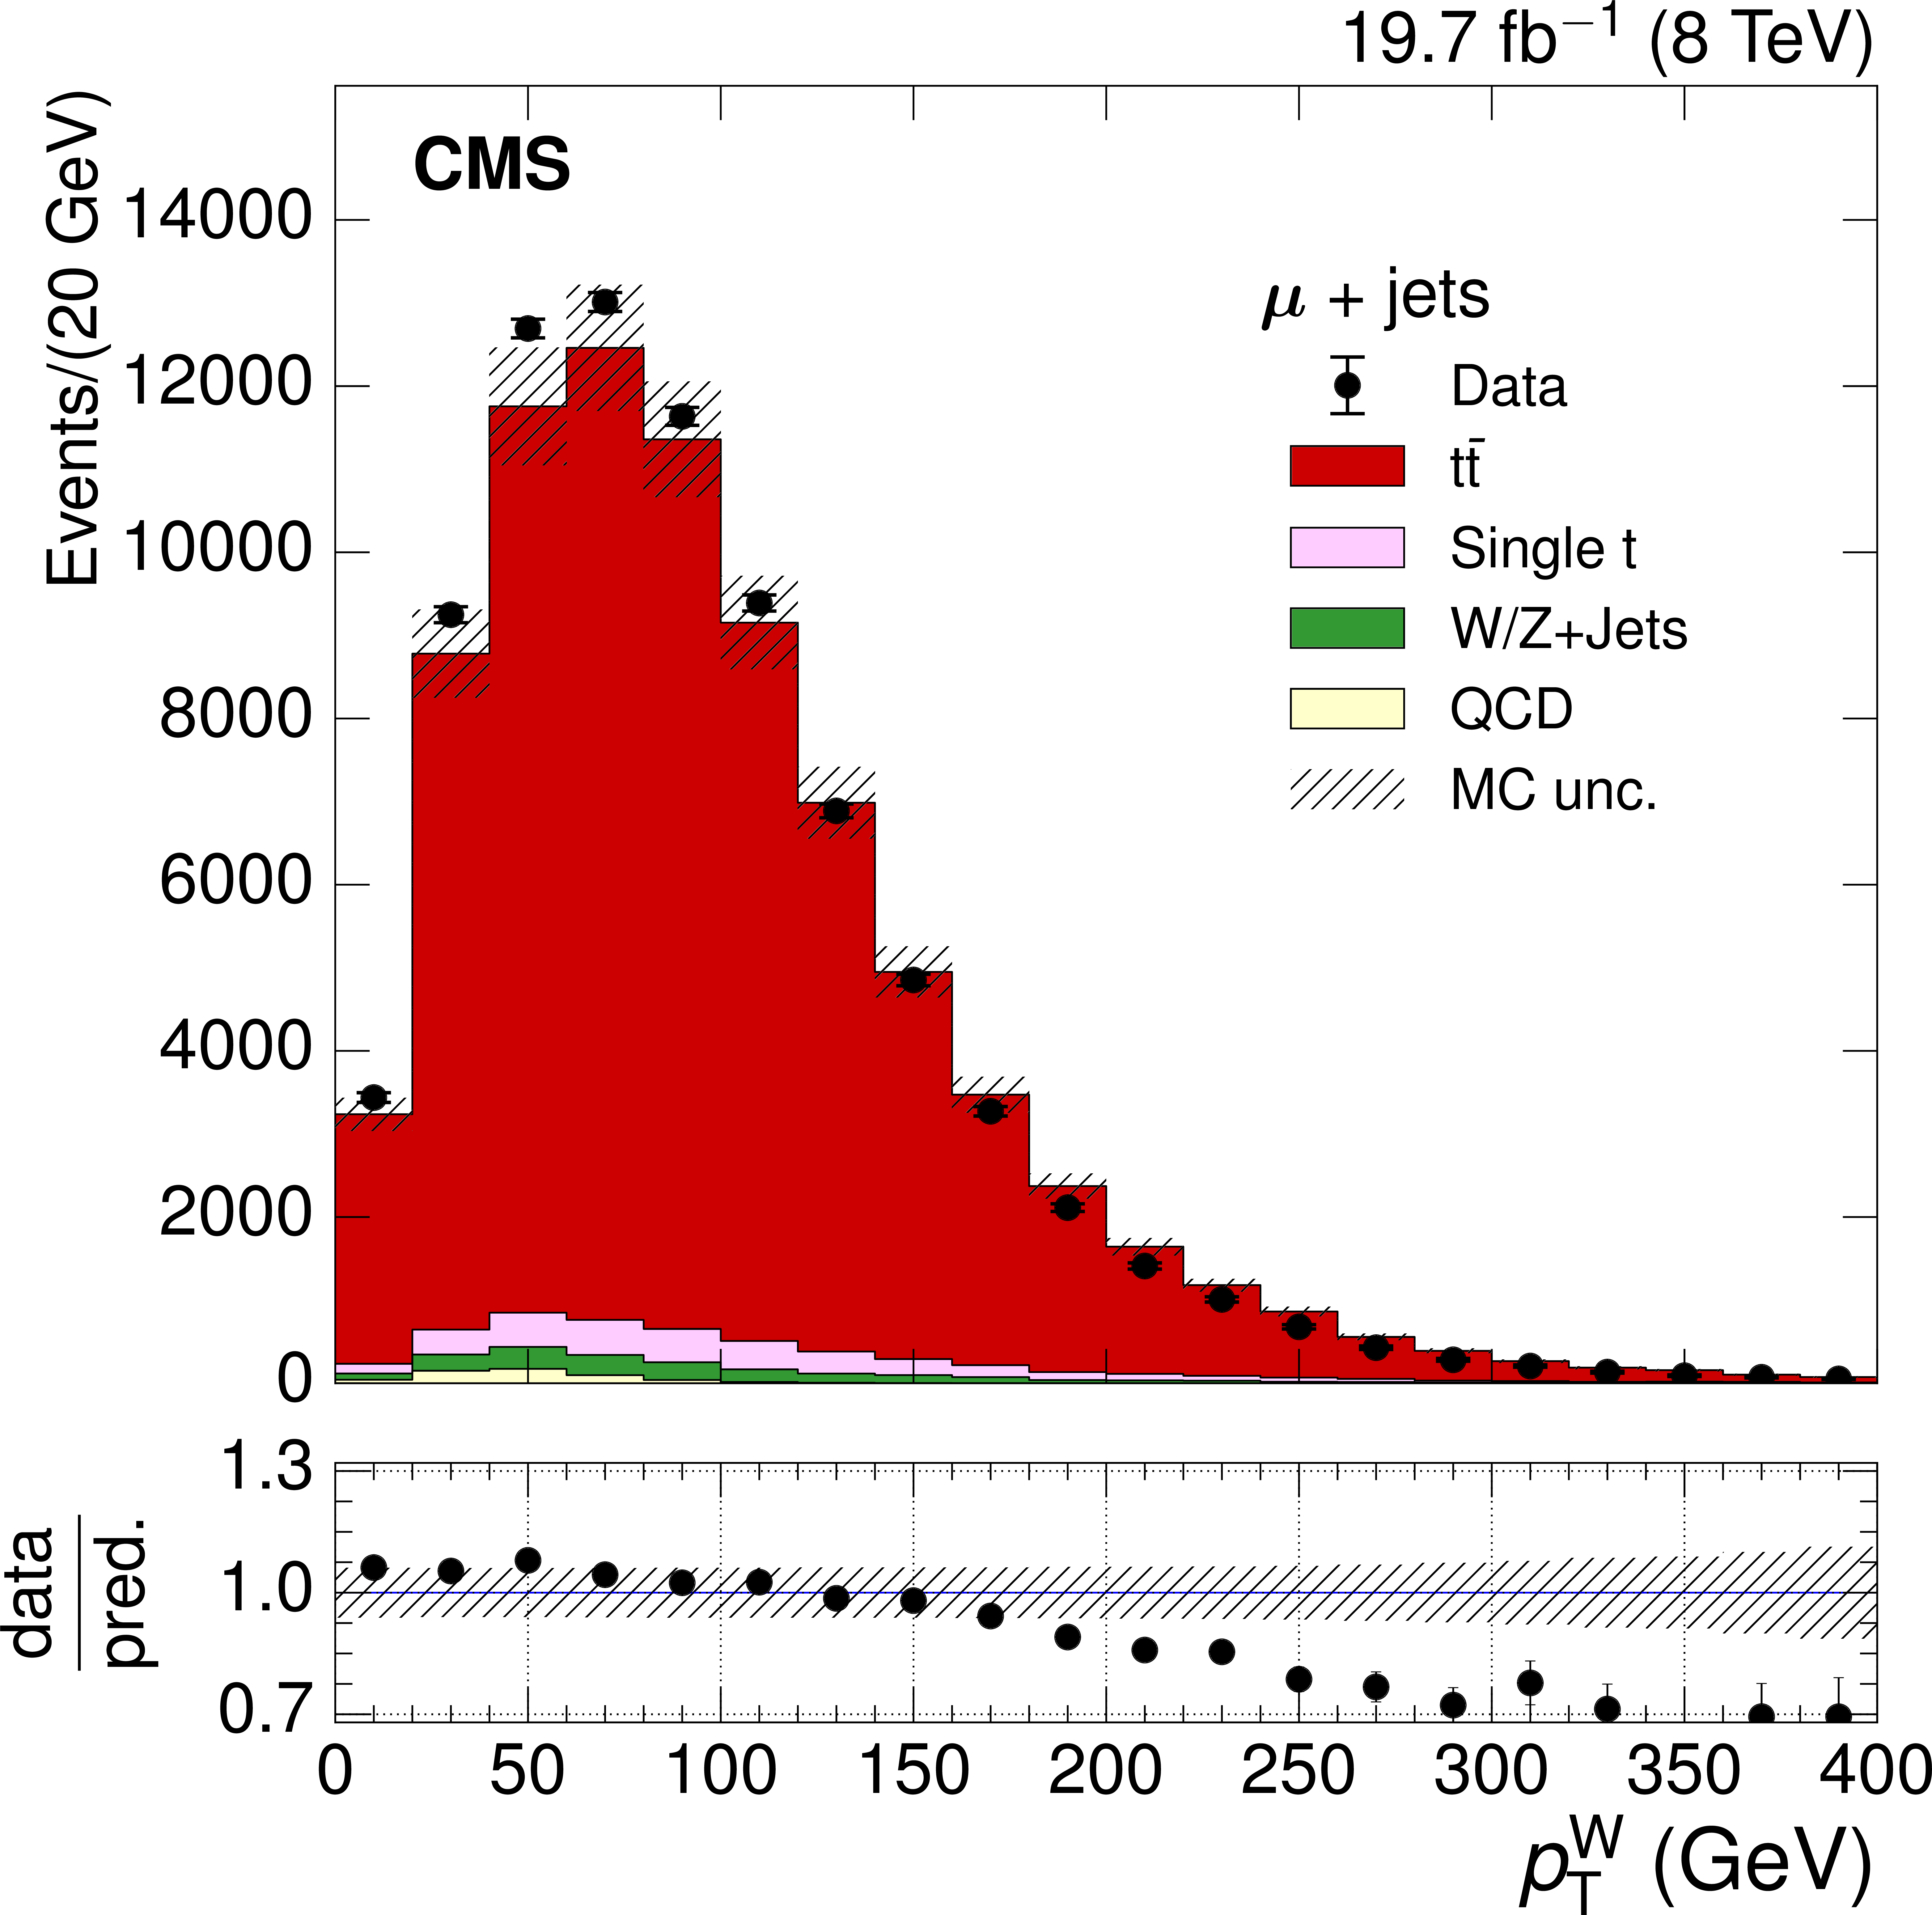
Figure 2-d:
The observed distributions of ${S_\mathrm {T}} $ (a,b) and ${ p_\mathrm {T}^{\mathrm {W}} }$ (c,d) in the $ \sqrt{s} = $ 8 TeV electron+jets (a,c) and muon+jets (b,d) data samples, compared to predictions from simulation. The points are the data histograms, with the vertical bars showing the statistical uncertainty, and the predictions from the simulation are the solid histograms. The shaded region shows the uncertainty in the values from simulation. These include contributions from the statistical uncertainty and the uncertainty in the ${\mathrm{ t \bar{t} } }$ cross section. The lower plots show the ratio of the number of events from data and the prediction from the MC simulation. |
png pdf |
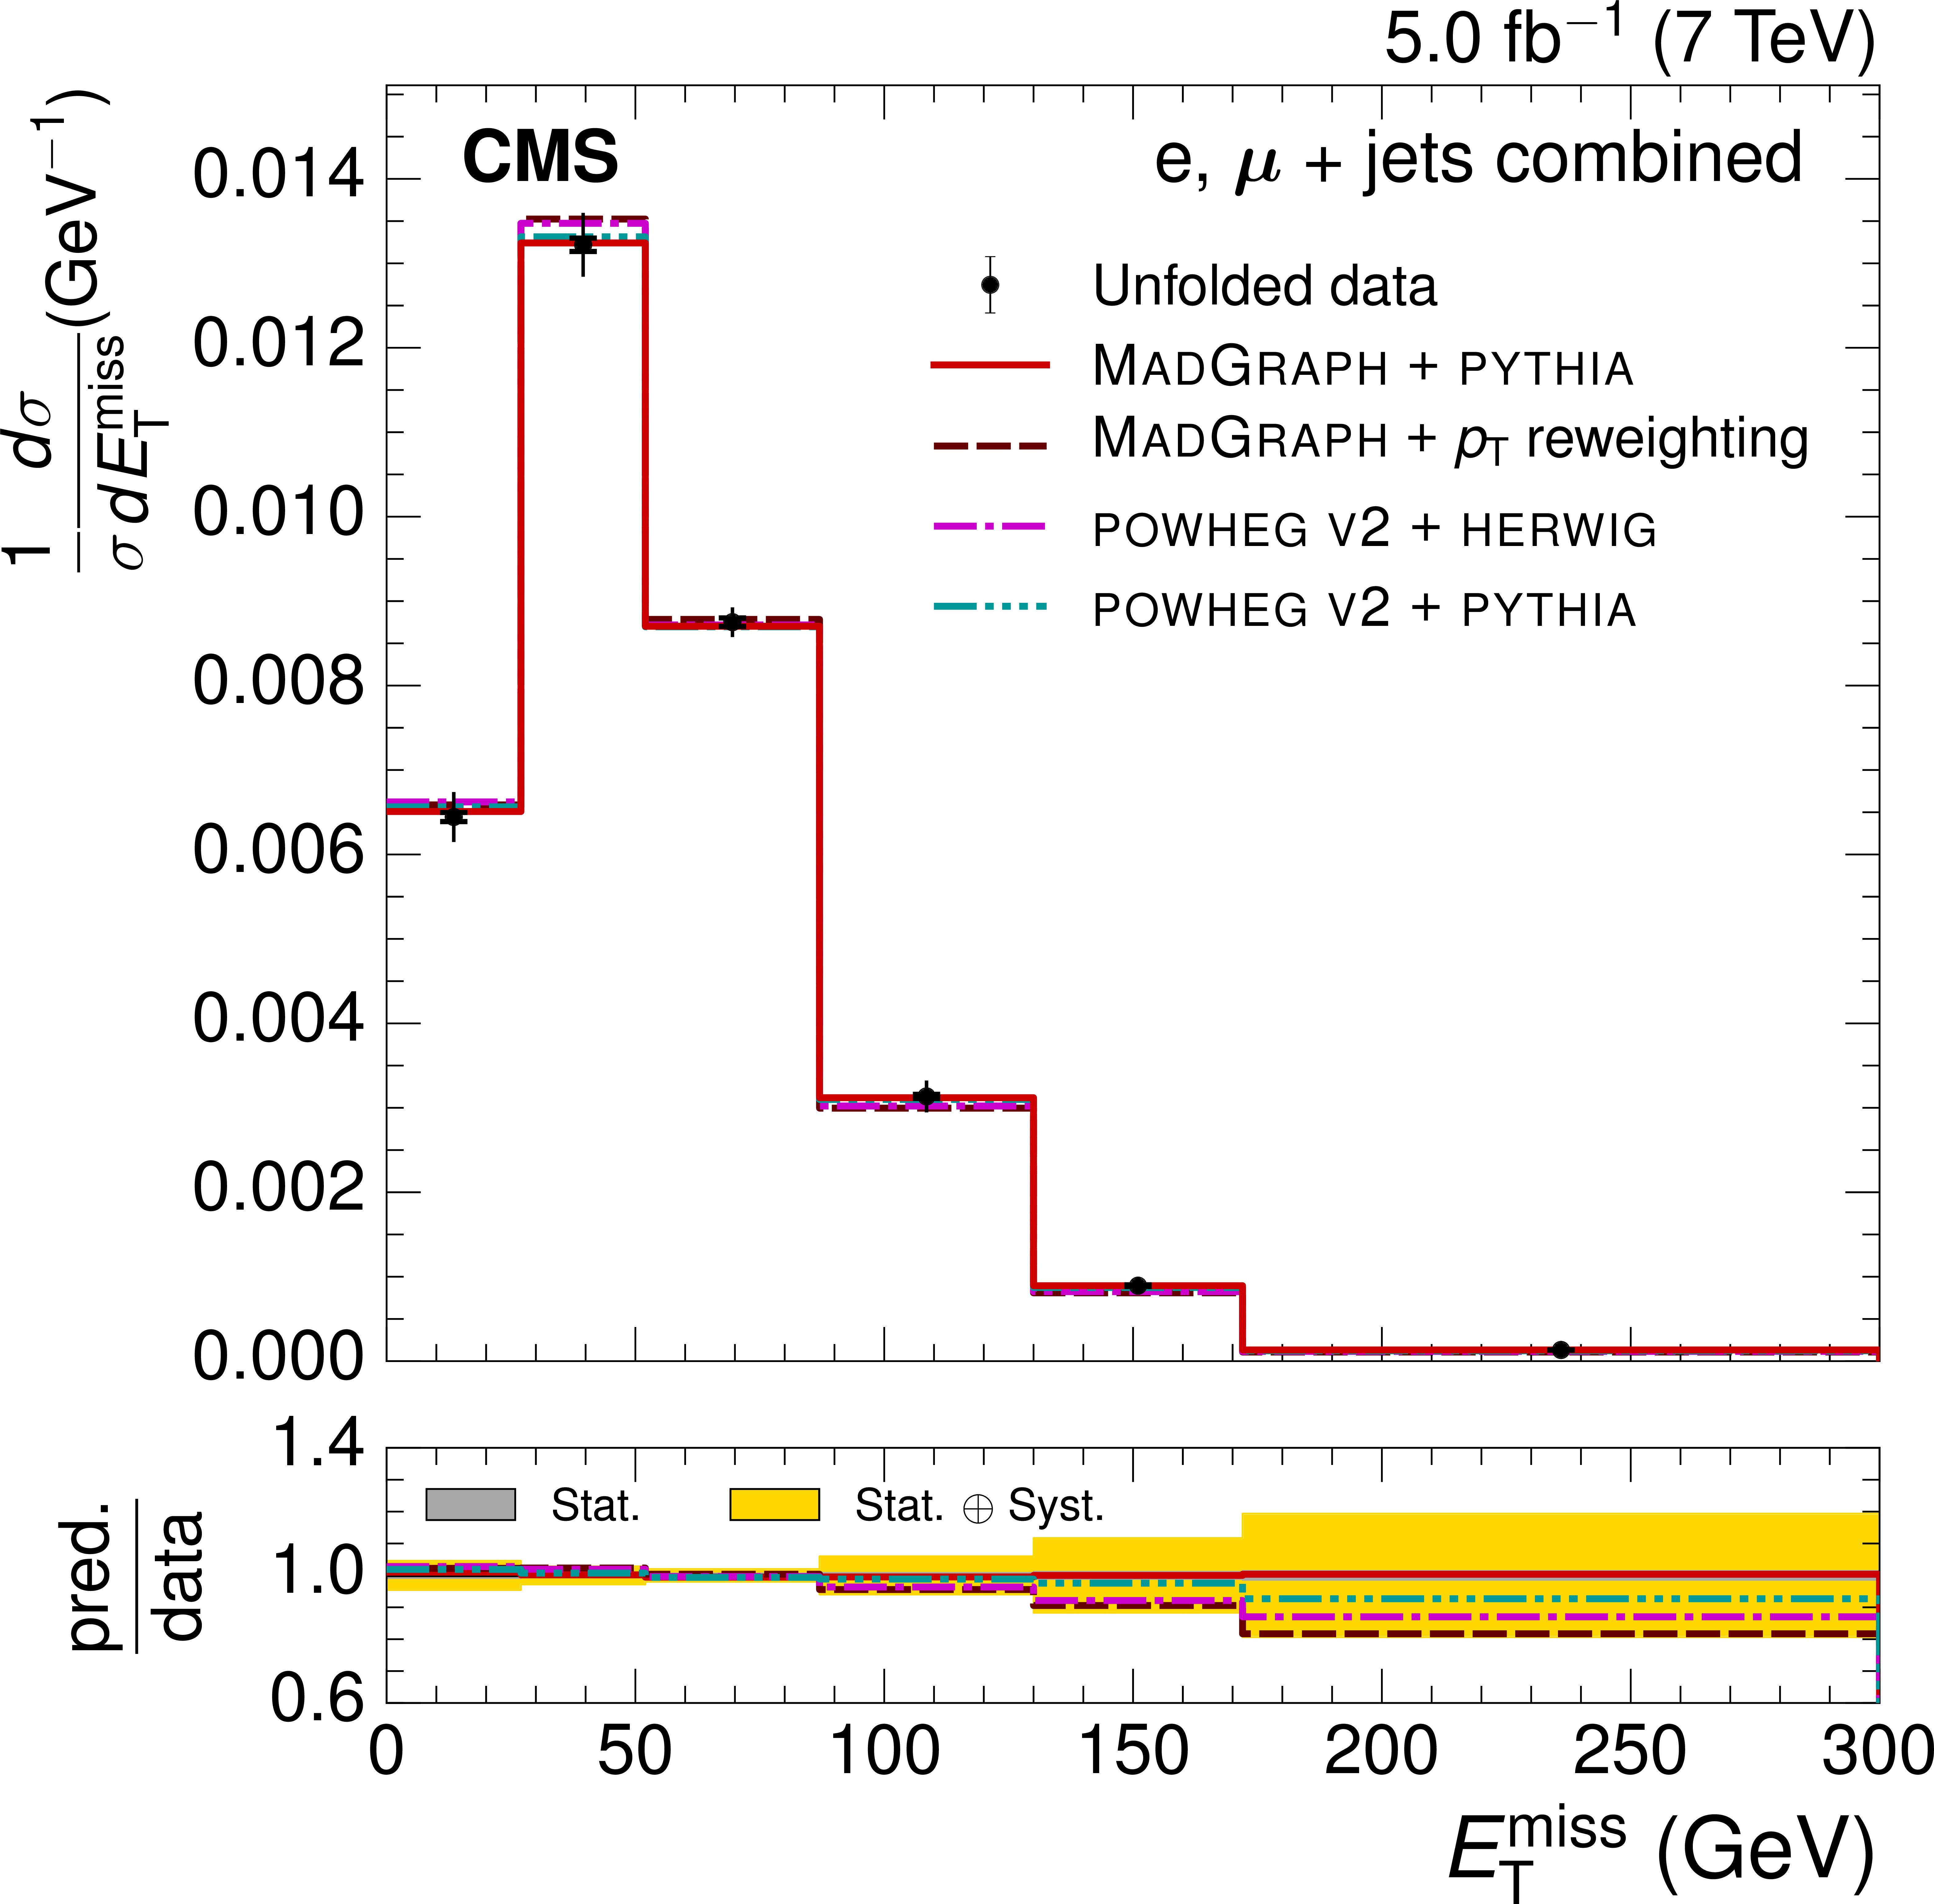
Figure 3-a:
Normalized ${E_{\mathrm {T}}^{\text {miss}}}$ (a,b) and ${H_{\mathrm {T}}}$ (c,d) differential ${\mathrm{ t \bar{t} } }$ cross sections from the combined electron and muon data at $ \sqrt{s} = $ 7 TeV. The vertical bars on the data points represent the statistical and systematic uncertainties added in quadrature. The inner section of the vertical bars, denoted by the tick marks, show the statistical uncertainty. a,c: comparison with different simulation event generators: MadGraph+PYTHIA (both the default and after reweighting the top quark ${p_{\mathrm {T}}}$ spectrum), POWHEG v2+HERWIG, and POWHEG v2+PYTHIA. b,d: comparison with predictions from the MadGraph+PYTHIA event generator found by varying the matching threshold and renormalization scales ($\mu _{\mathrm {R}}$, $\mu _{\mathrm {F}}$) up and down by a factor of two. The lower plots show the ratio of the predictions to the data, with the statistical and total uncertainties in the ratios indicated by the two shaded bands. |
png pdf |
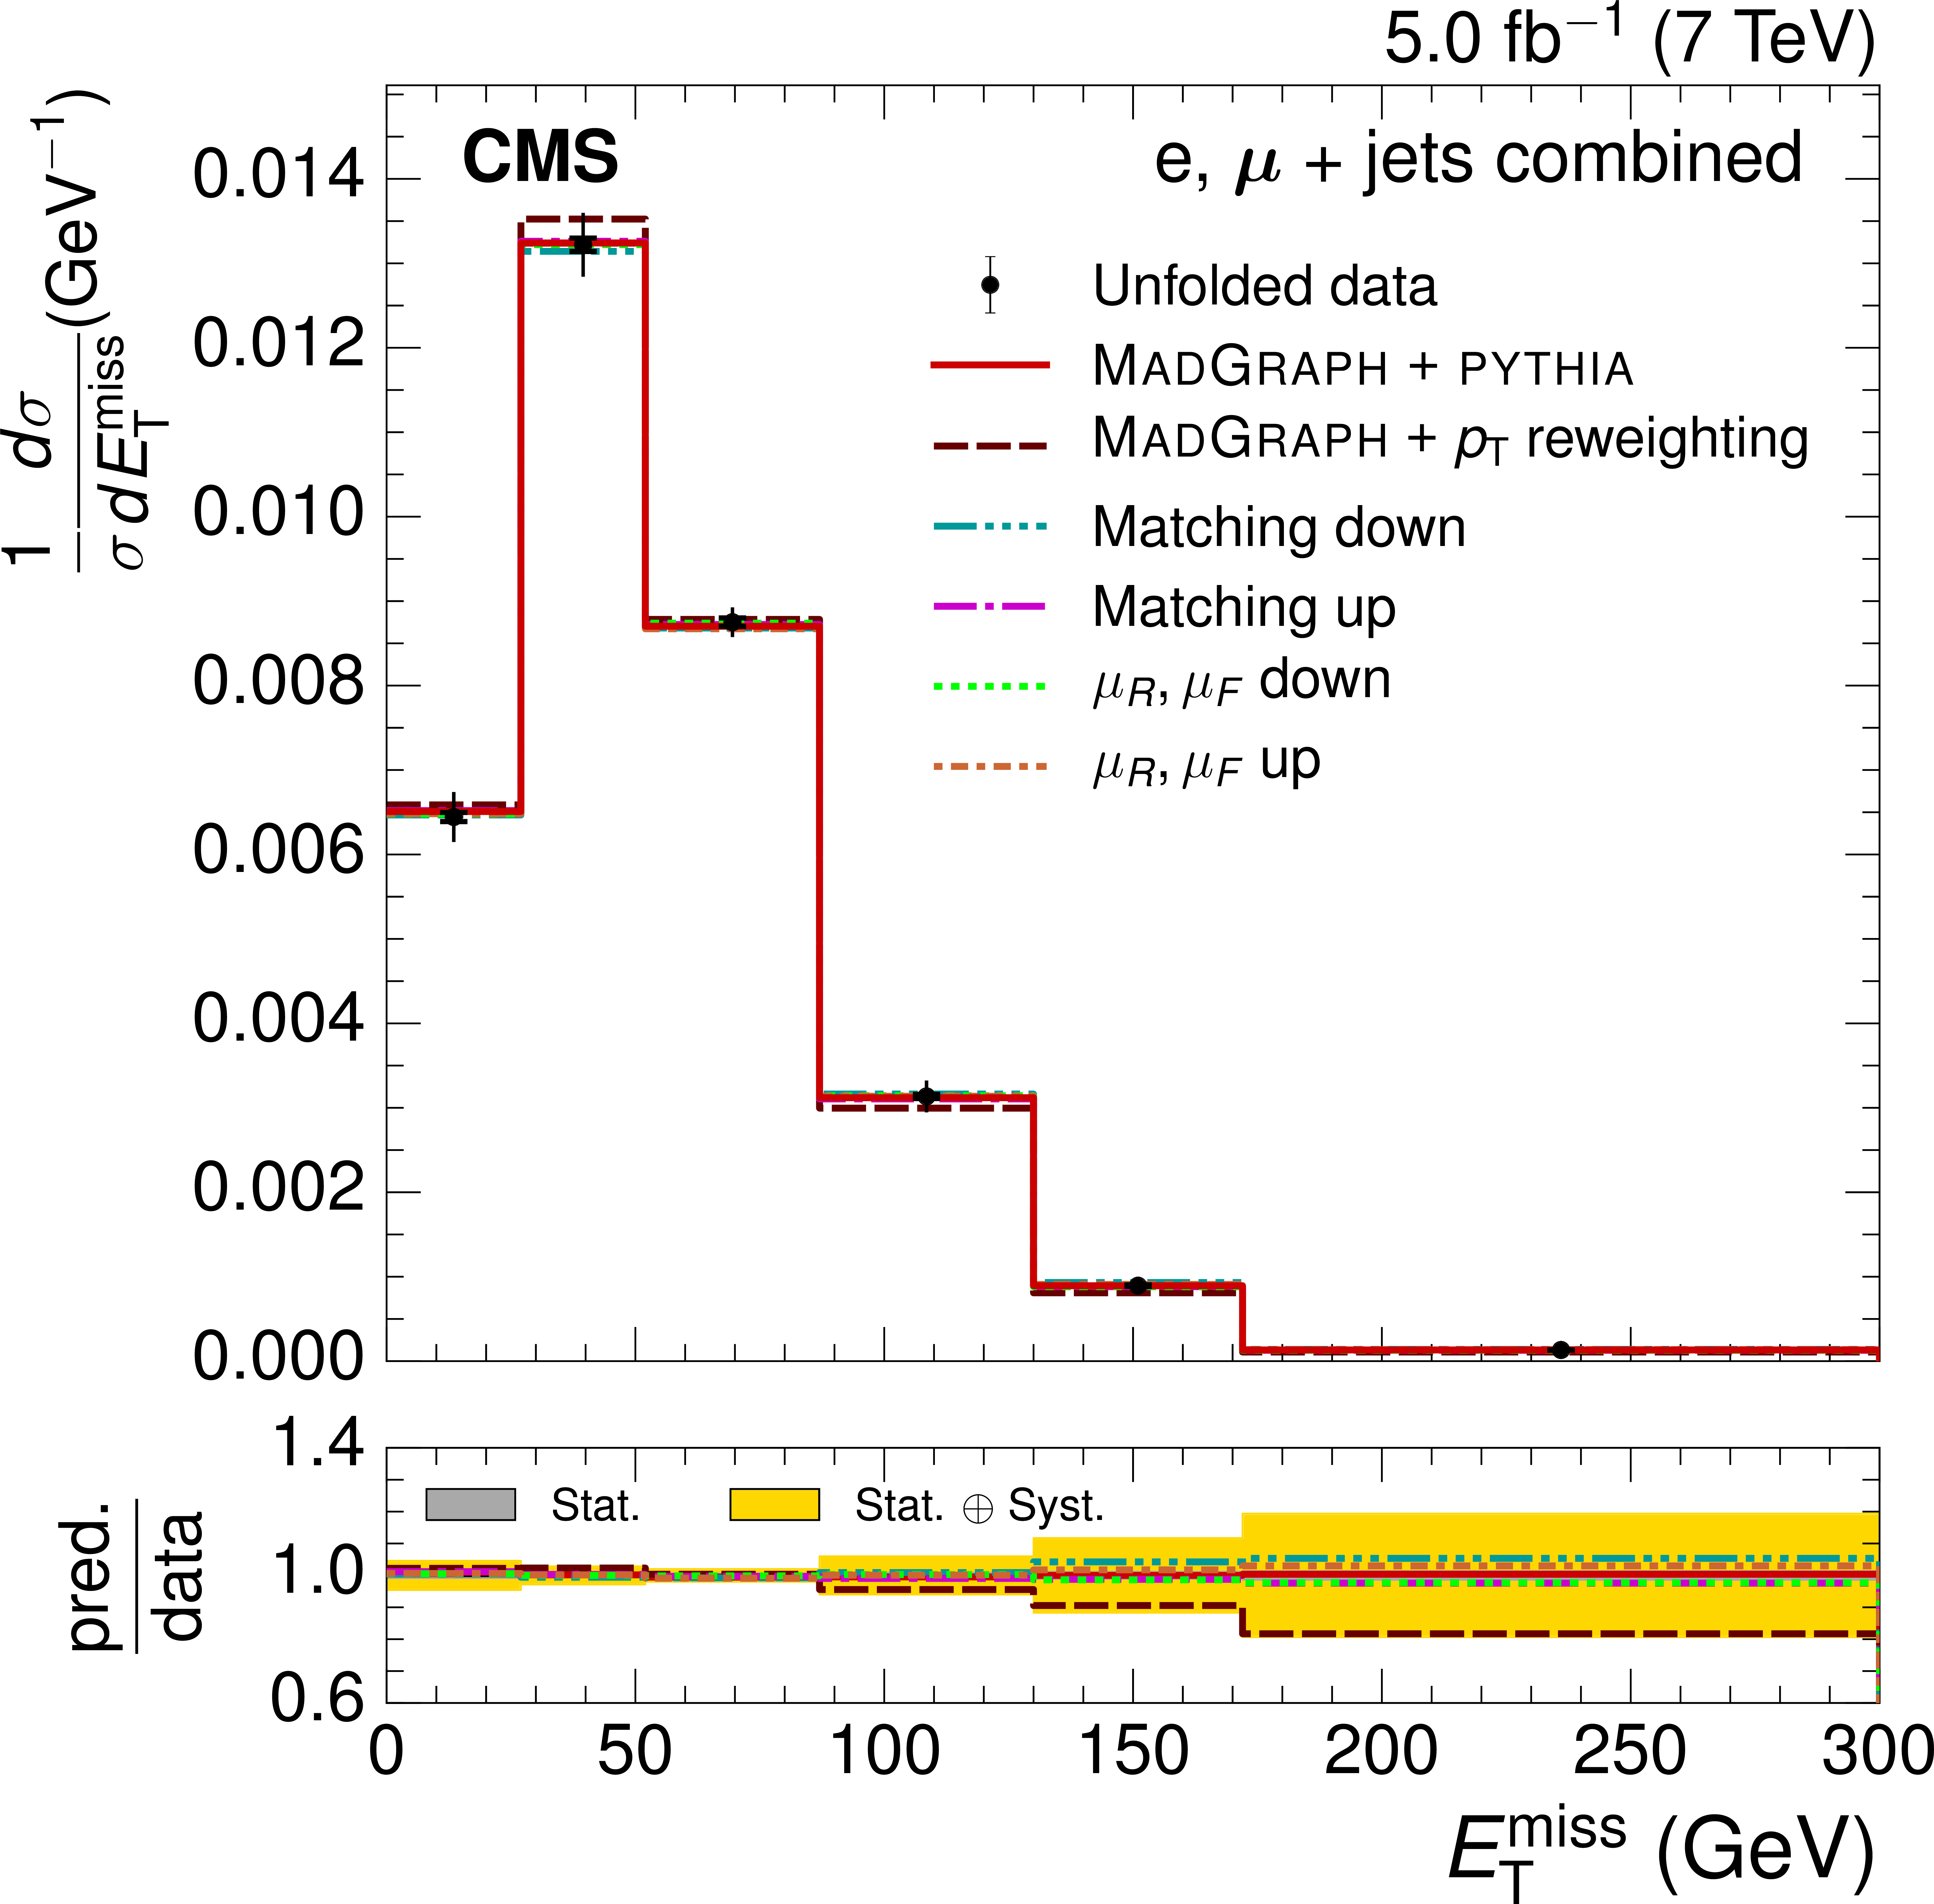
Figure 3-b:
Normalized ${E_{\mathrm {T}}^{\text {miss}}}$ (a,b) and ${H_{\mathrm {T}}}$ (c,d) differential ${\mathrm{ t \bar{t} } }$ cross sections from the combined electron and muon data at $ \sqrt{s} = $ 7 TeV. The vertical bars on the data points represent the statistical and systematic uncertainties added in quadrature. The inner section of the vertical bars, denoted by the tick marks, show the statistical uncertainty. a,c: comparison with different simulation event generators: MadGraph+PYTHIA (both the default and after reweighting the top quark ${p_{\mathrm {T}}}$ spectrum), POWHEG v2+HERWIG, and POWHEG v2+PYTHIA. b,d: comparison with predictions from the MadGraph+PYTHIA event generator found by varying the matching threshold and renormalization scales ($\mu _{\mathrm {R}}$, $\mu _{\mathrm {F}}$) up and down by a factor of two. The lower plots show the ratio of the predictions to the data, with the statistical and total uncertainties in the ratios indicated by the two shaded bands. |
png pdf |
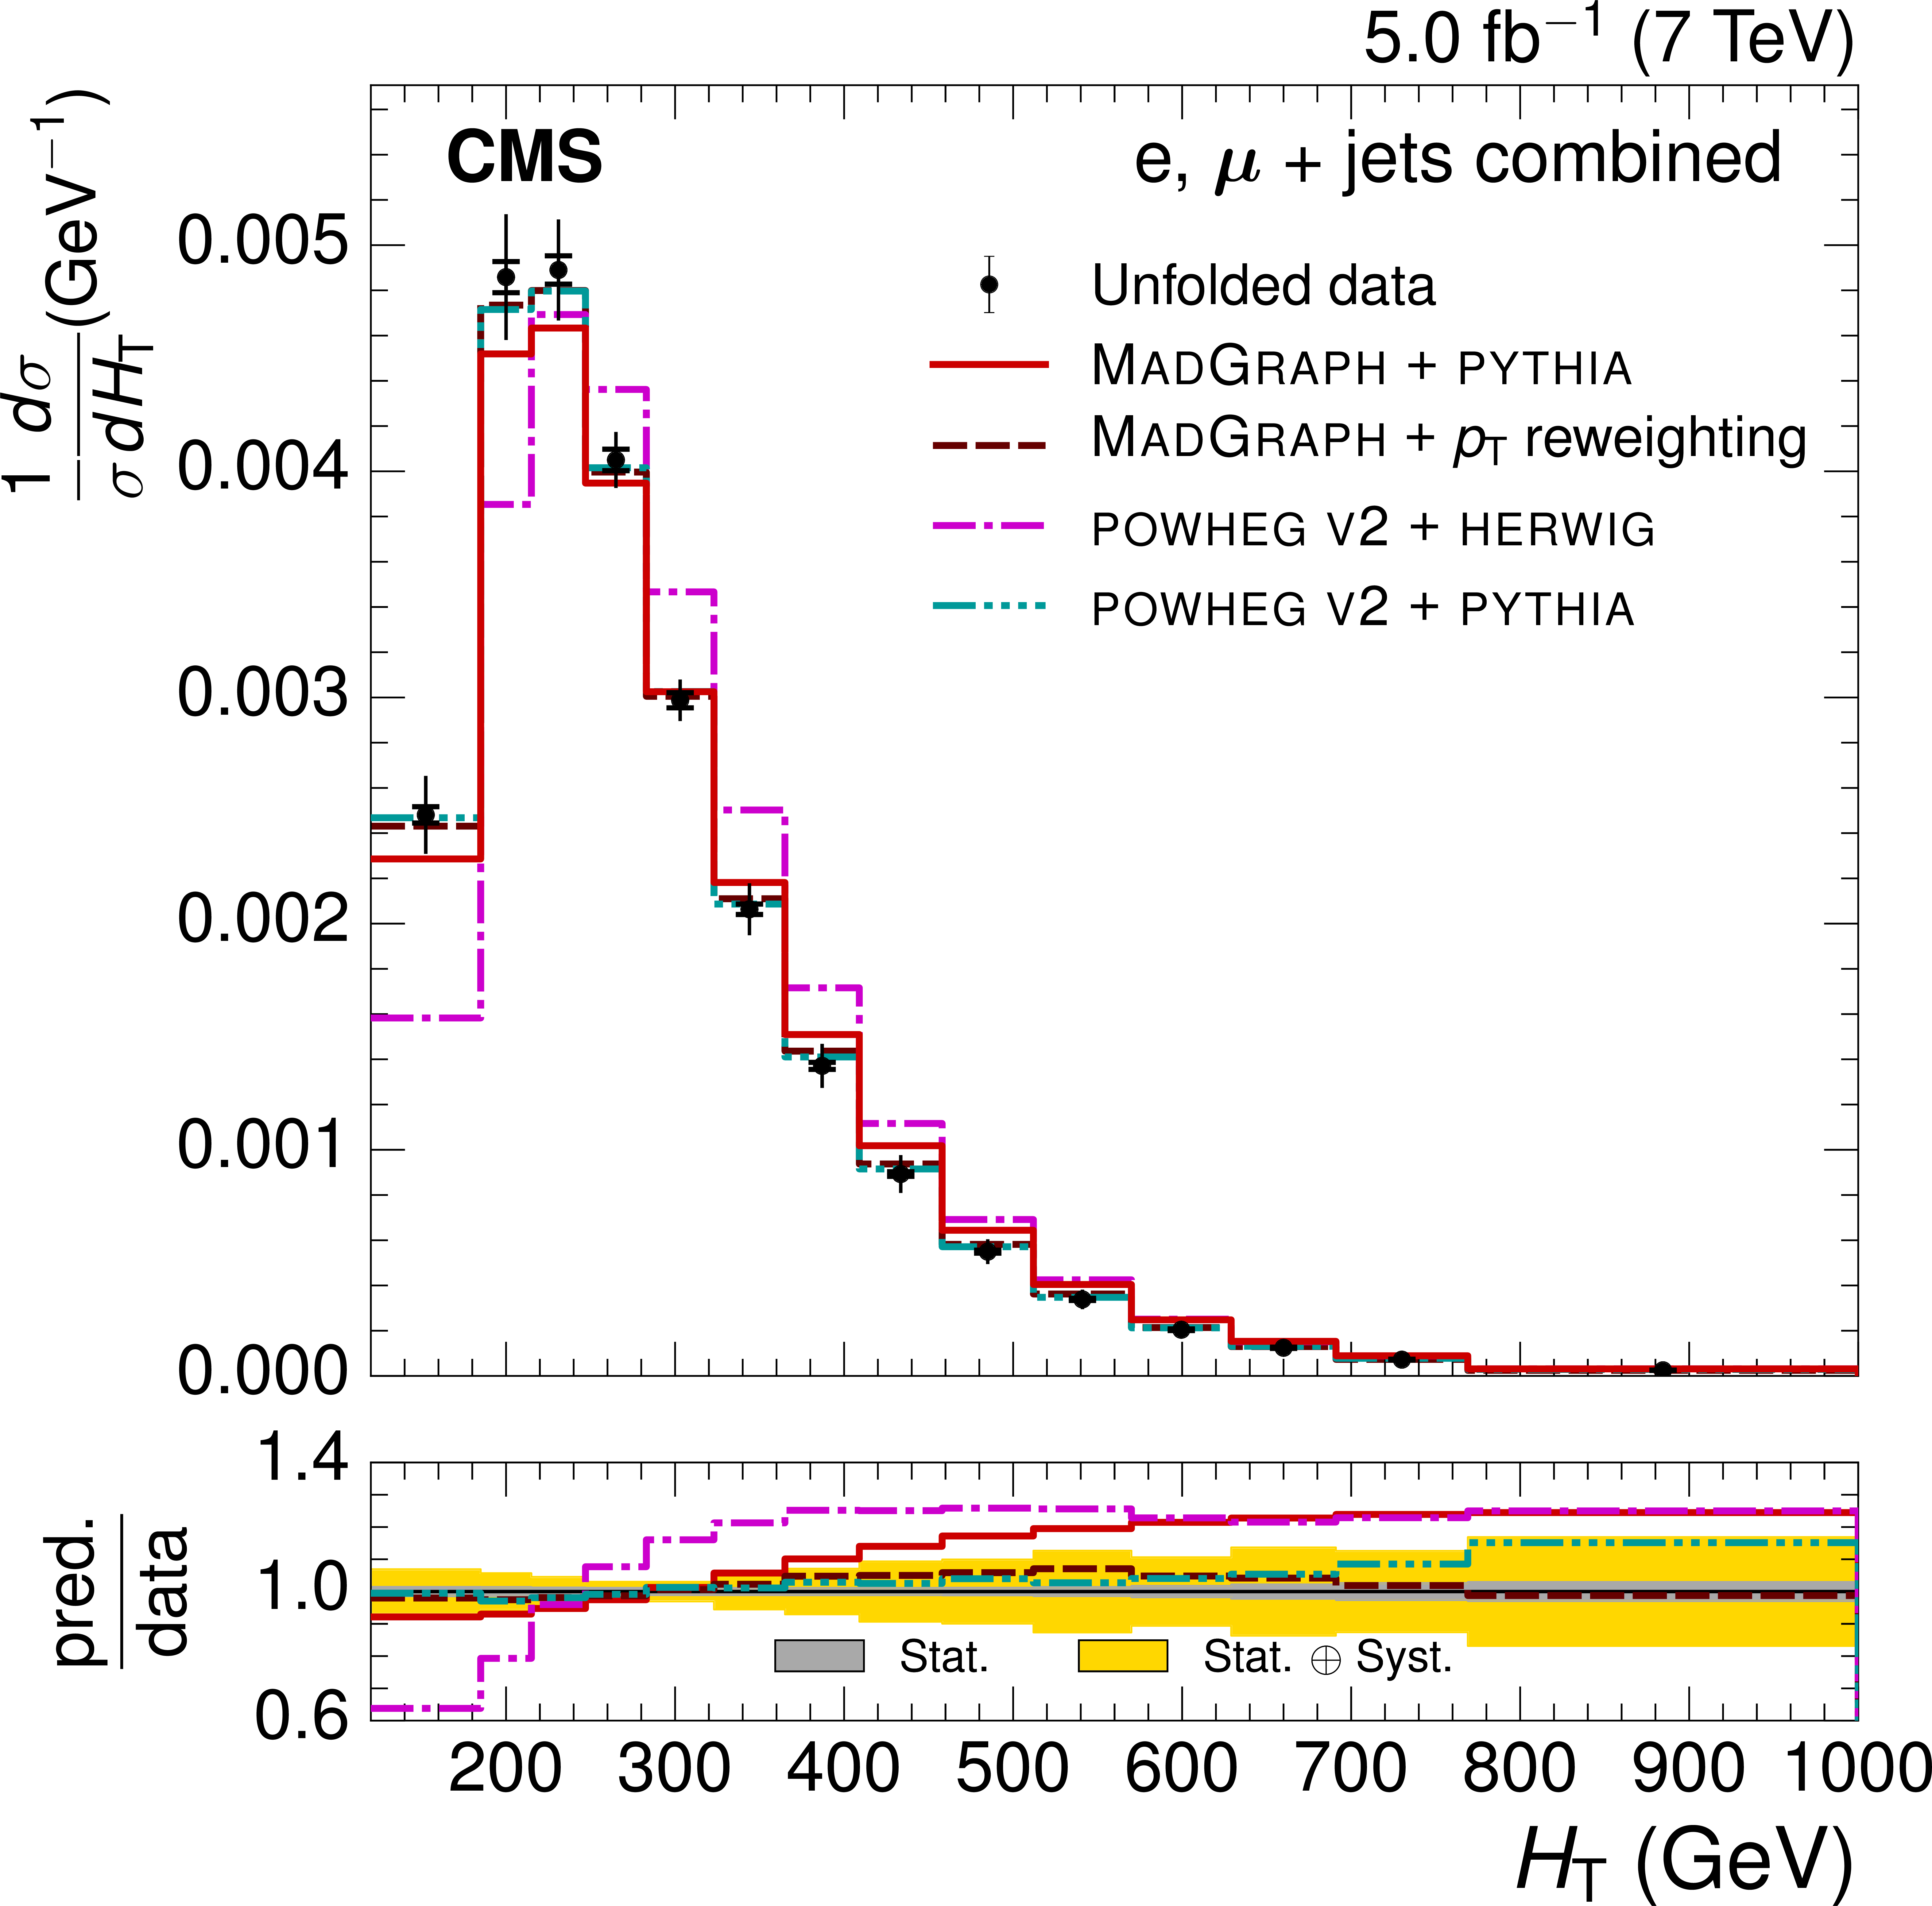
Figure 3-c:
Normalized ${E_{\mathrm {T}}^{\text {miss}}}$ (a,b) and ${H_{\mathrm {T}}}$ (c,d) differential ${\mathrm{ t \bar{t} } }$ cross sections from the combined electron and muon data at $ \sqrt{s} = $ 7 TeV. The vertical bars on the data points represent the statistical and systematic uncertainties added in quadrature. The inner section of the vertical bars, denoted by the tick marks, show the statistical uncertainty. a,c: comparison with different simulation event generators: MadGraph+PYTHIA (both the default and after reweighting the top quark ${p_{\mathrm {T}}}$ spectrum), POWHEG v2+HERWIG, and POWHEG v2+PYTHIA. b,d: comparison with predictions from the MadGraph+PYTHIA event generator found by varying the matching threshold and renormalization scales ($\mu _{\mathrm {R}}$, $\mu _{\mathrm {F}}$) up and down by a factor of two. The lower plots show the ratio of the predictions to the data, with the statistical and total uncertainties in the ratios indicated by the two shaded bands. |
png pdf |
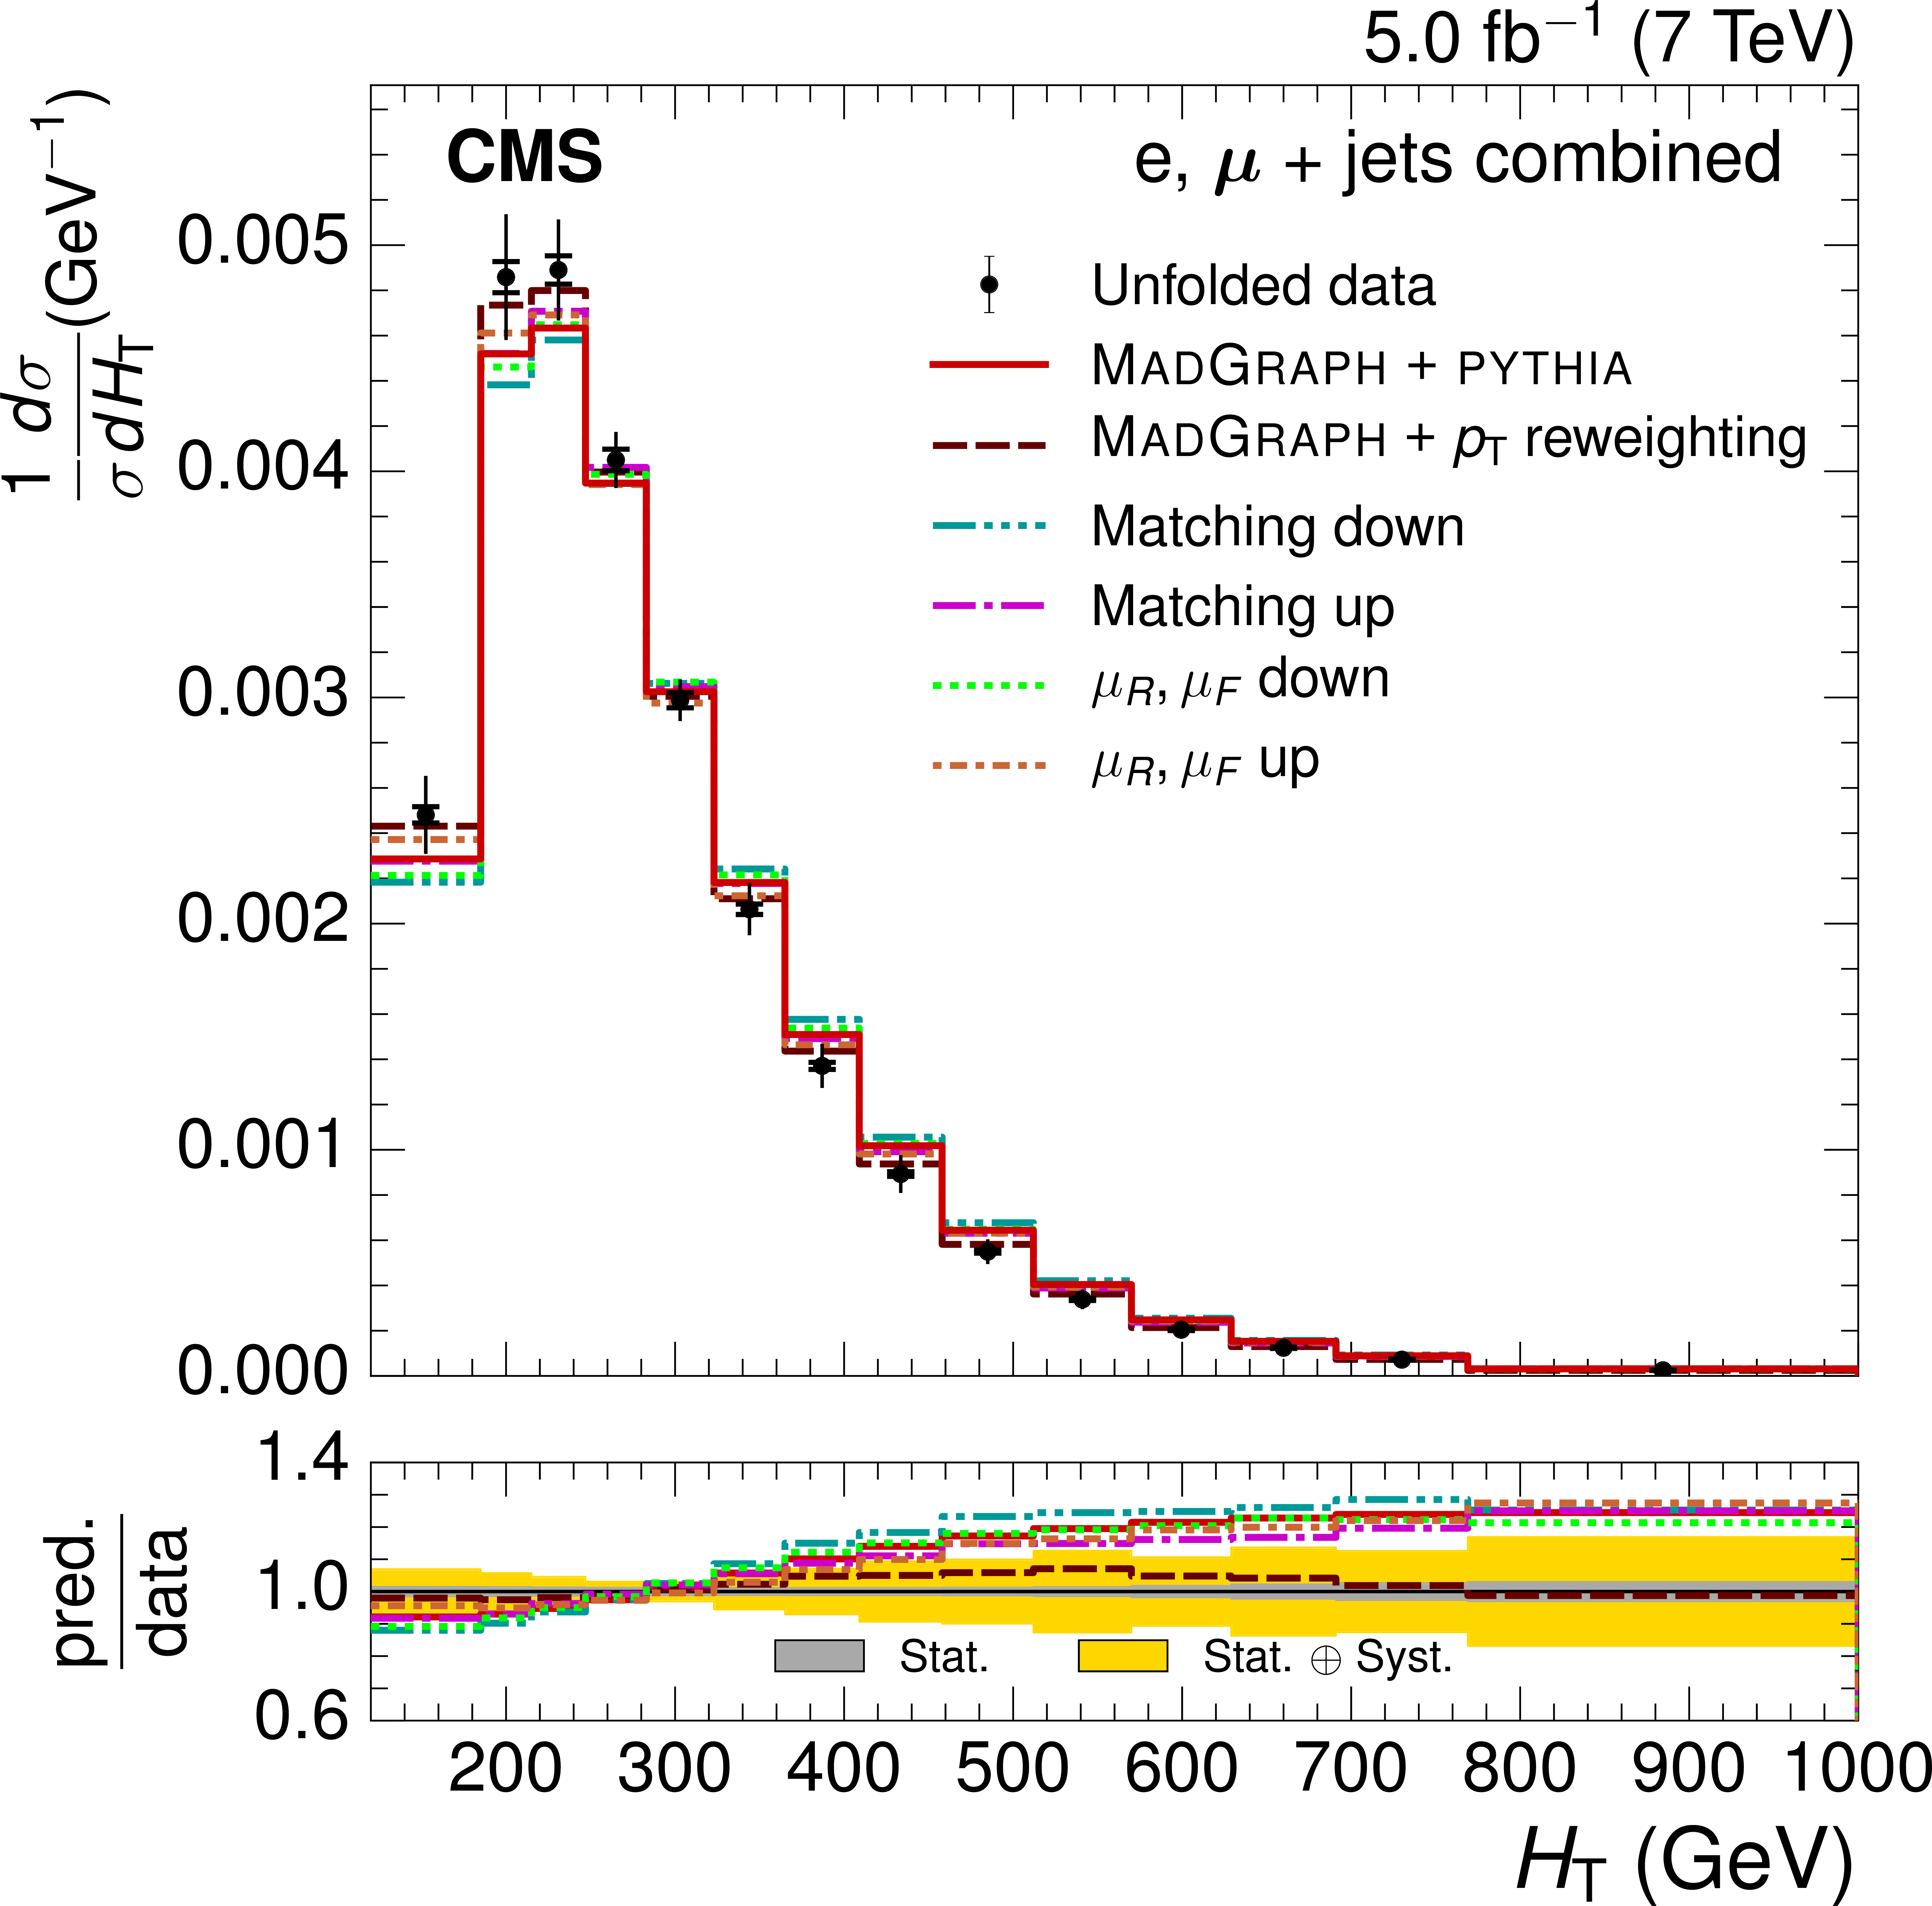
Figure 3-d:
Normalized ${E_{\mathrm {T}}^{\text {miss}}}$ (a,b) and ${H_{\mathrm {T}}}$ (c,d) differential ${\mathrm{ t \bar{t} } }$ cross sections from the combined electron and muon data at $ \sqrt{s} = $ 7 TeV. The vertical bars on the data points represent the statistical and systematic uncertainties added in quadrature. The inner section of the vertical bars, denoted by the tick marks, show the statistical uncertainty. a,c: comparison with different simulation event generators: MadGraph+PYTHIA (both the default and after reweighting the top quark ${p_{\mathrm {T}}}$ spectrum), POWHEG v2+HERWIG, and POWHEG v2+PYTHIA. b,d: comparison with predictions from the MadGraph+PYTHIA event generator found by varying the matching threshold and renormalization scales ($\mu _{\mathrm {R}}$, $\mu _{\mathrm {F}}$) up and down by a factor of two. The lower plots show the ratio of the predictions to the data, with the statistical and total uncertainties in the ratios indicated by the two shaded bands. |
png pdf |
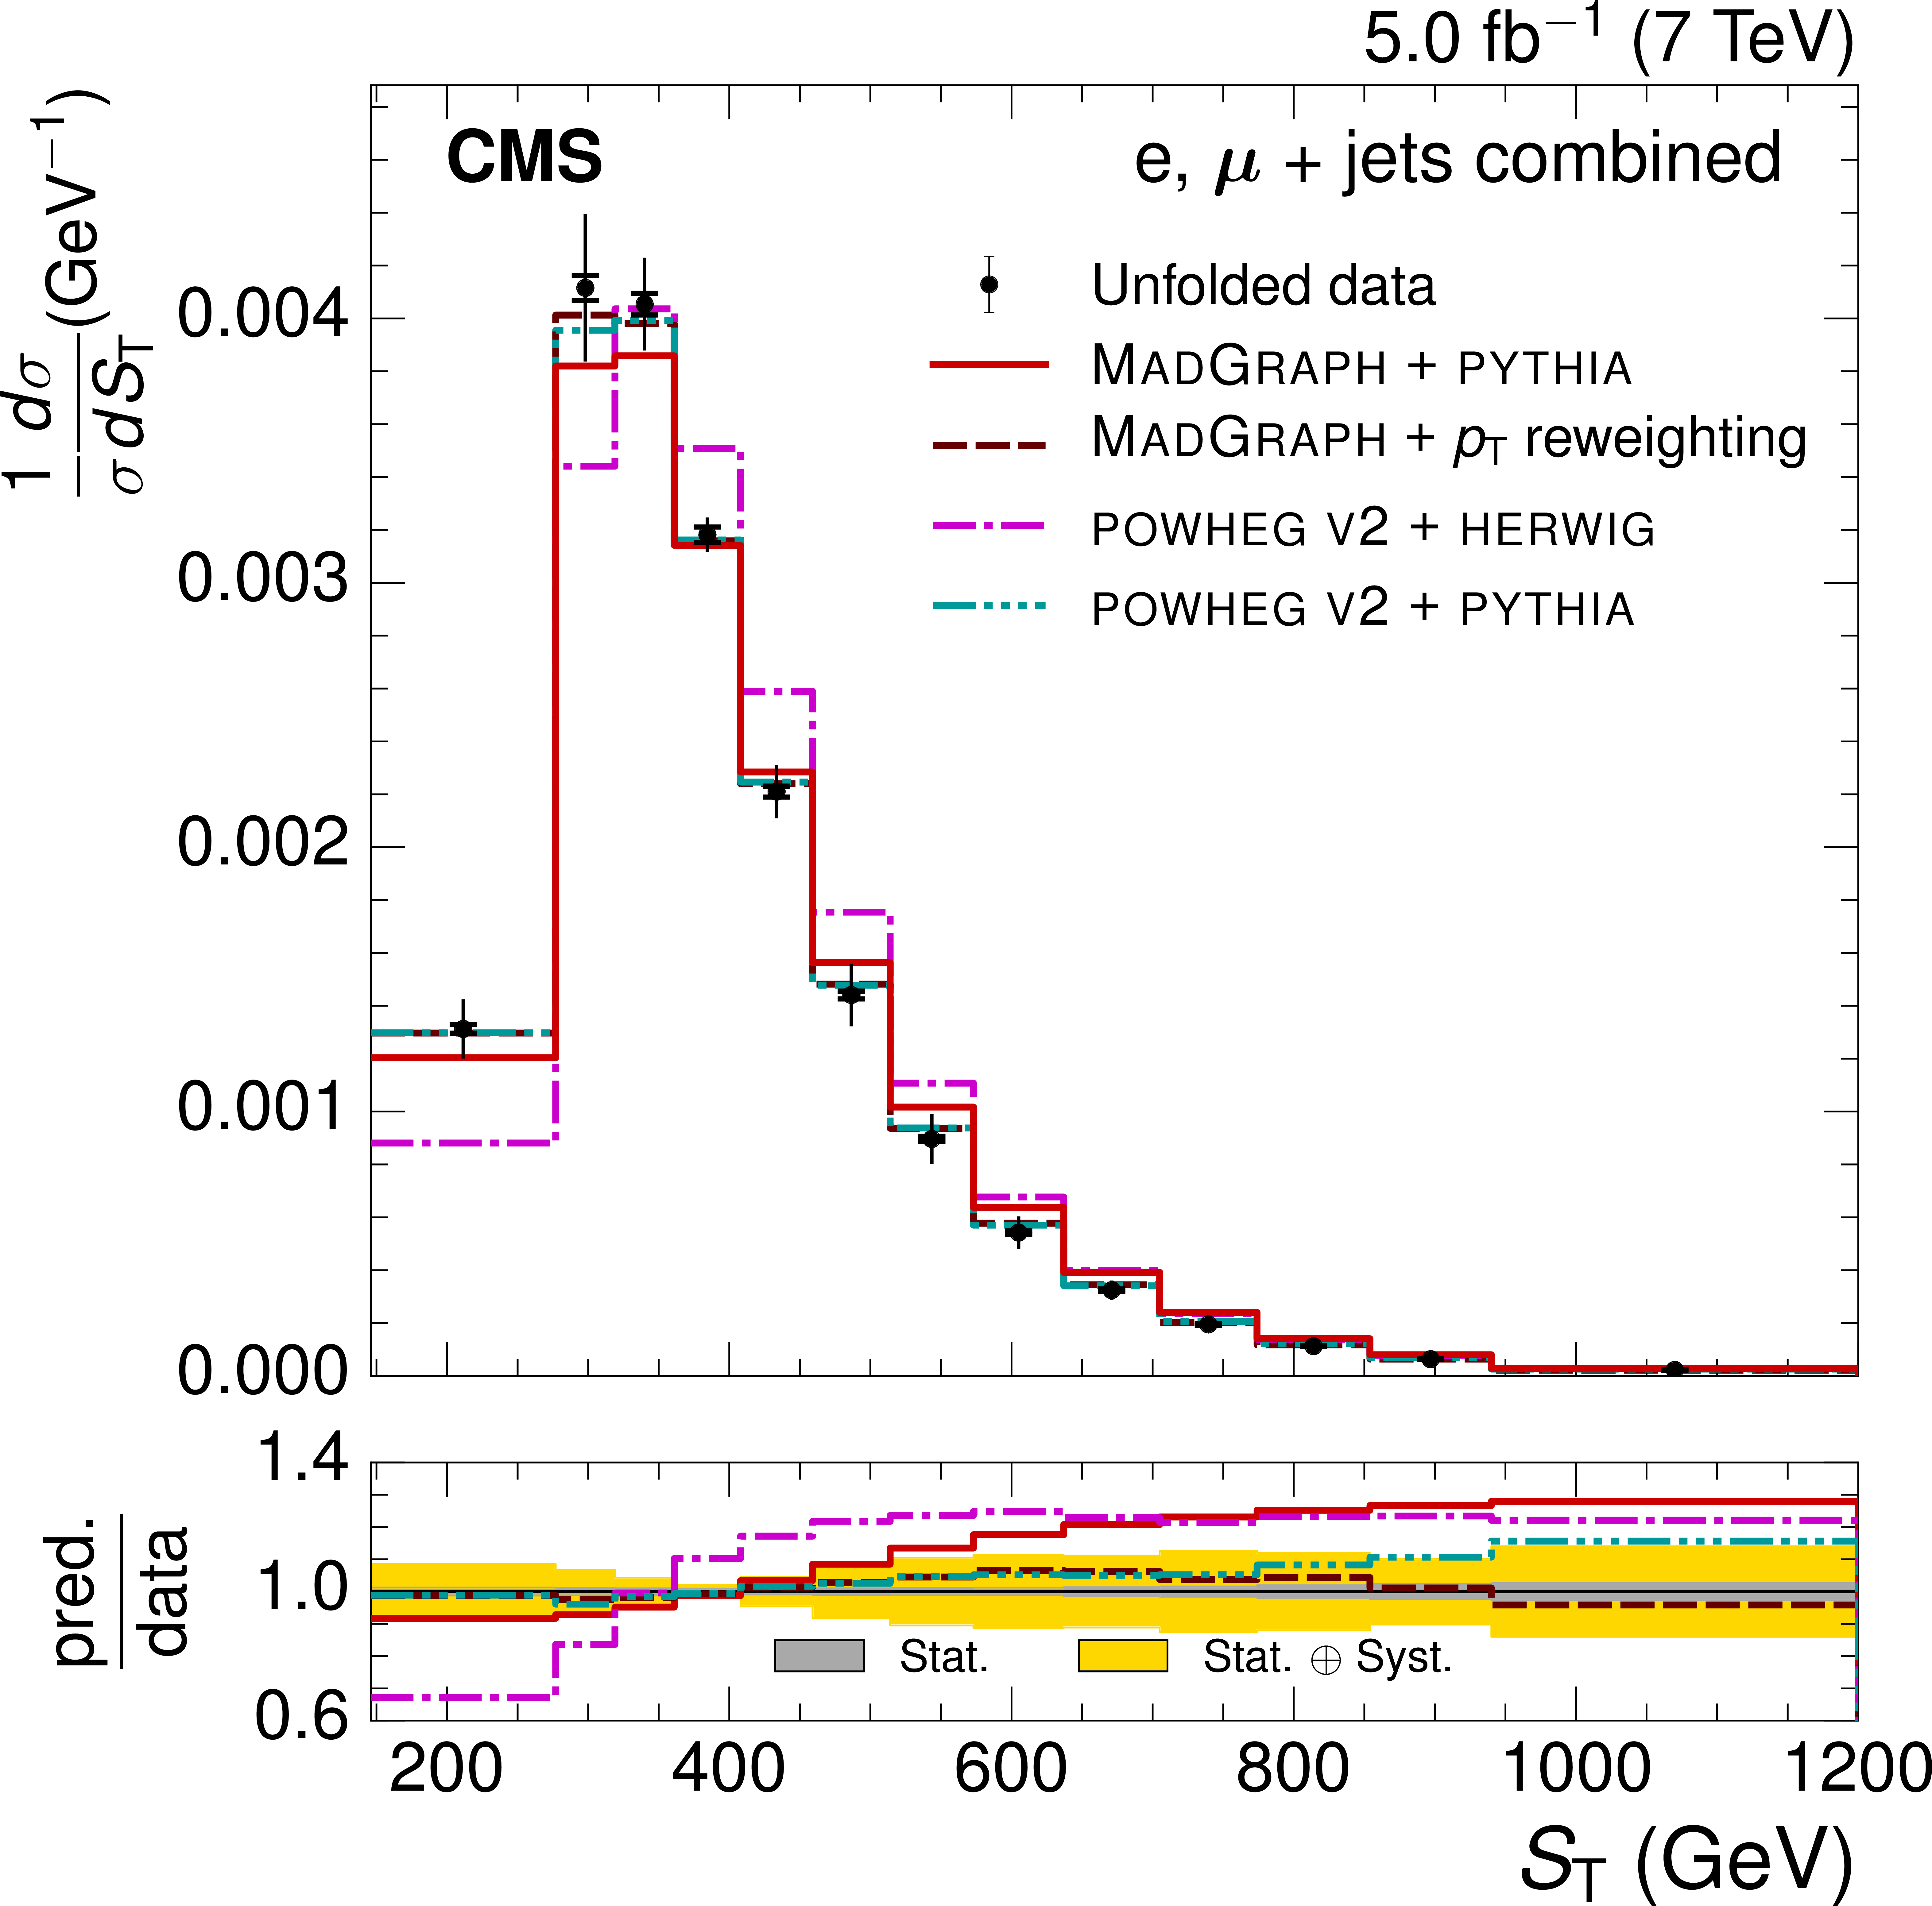
Figure 4-a:
Normalized ${S_\mathrm {T}}$ (a,b) and ${ p_\mathrm {T}^{\mathrm {W}} }$ (c,d) differential ${\mathrm{ t \bar{t} } }$ cross sections from combined electron and muon data at $ \sqrt{s} = $ 7 TeV. The vertical bars on the data points represent the statistical and systematic uncertainties added in quadrature. The inner section of the vertical bars, denoted by the tick marks, show the statistical uncertainty. a,c: comparison with different simulation event generators: MadGraph+PYTHIA (both the default and after reweighting the top quark ${p_{\mathrm {T}}}$ spectrum), POWHEG v2+HERWIG, and POWHEG v2+PYTHIA. b,d: comparison with predictions from the MadGraph+PYTHIA event generator found by varying the matching threshold and renormalization scales ($\mu _{\mathrm {R}}$, $\mu _{\mathrm {F}}$) up and down by a factor of two. The lower plots show the ratio of the predictions to the data, with the statistical and total uncertainties in the ratios indicated by the two shaded bands. |
png pdf |
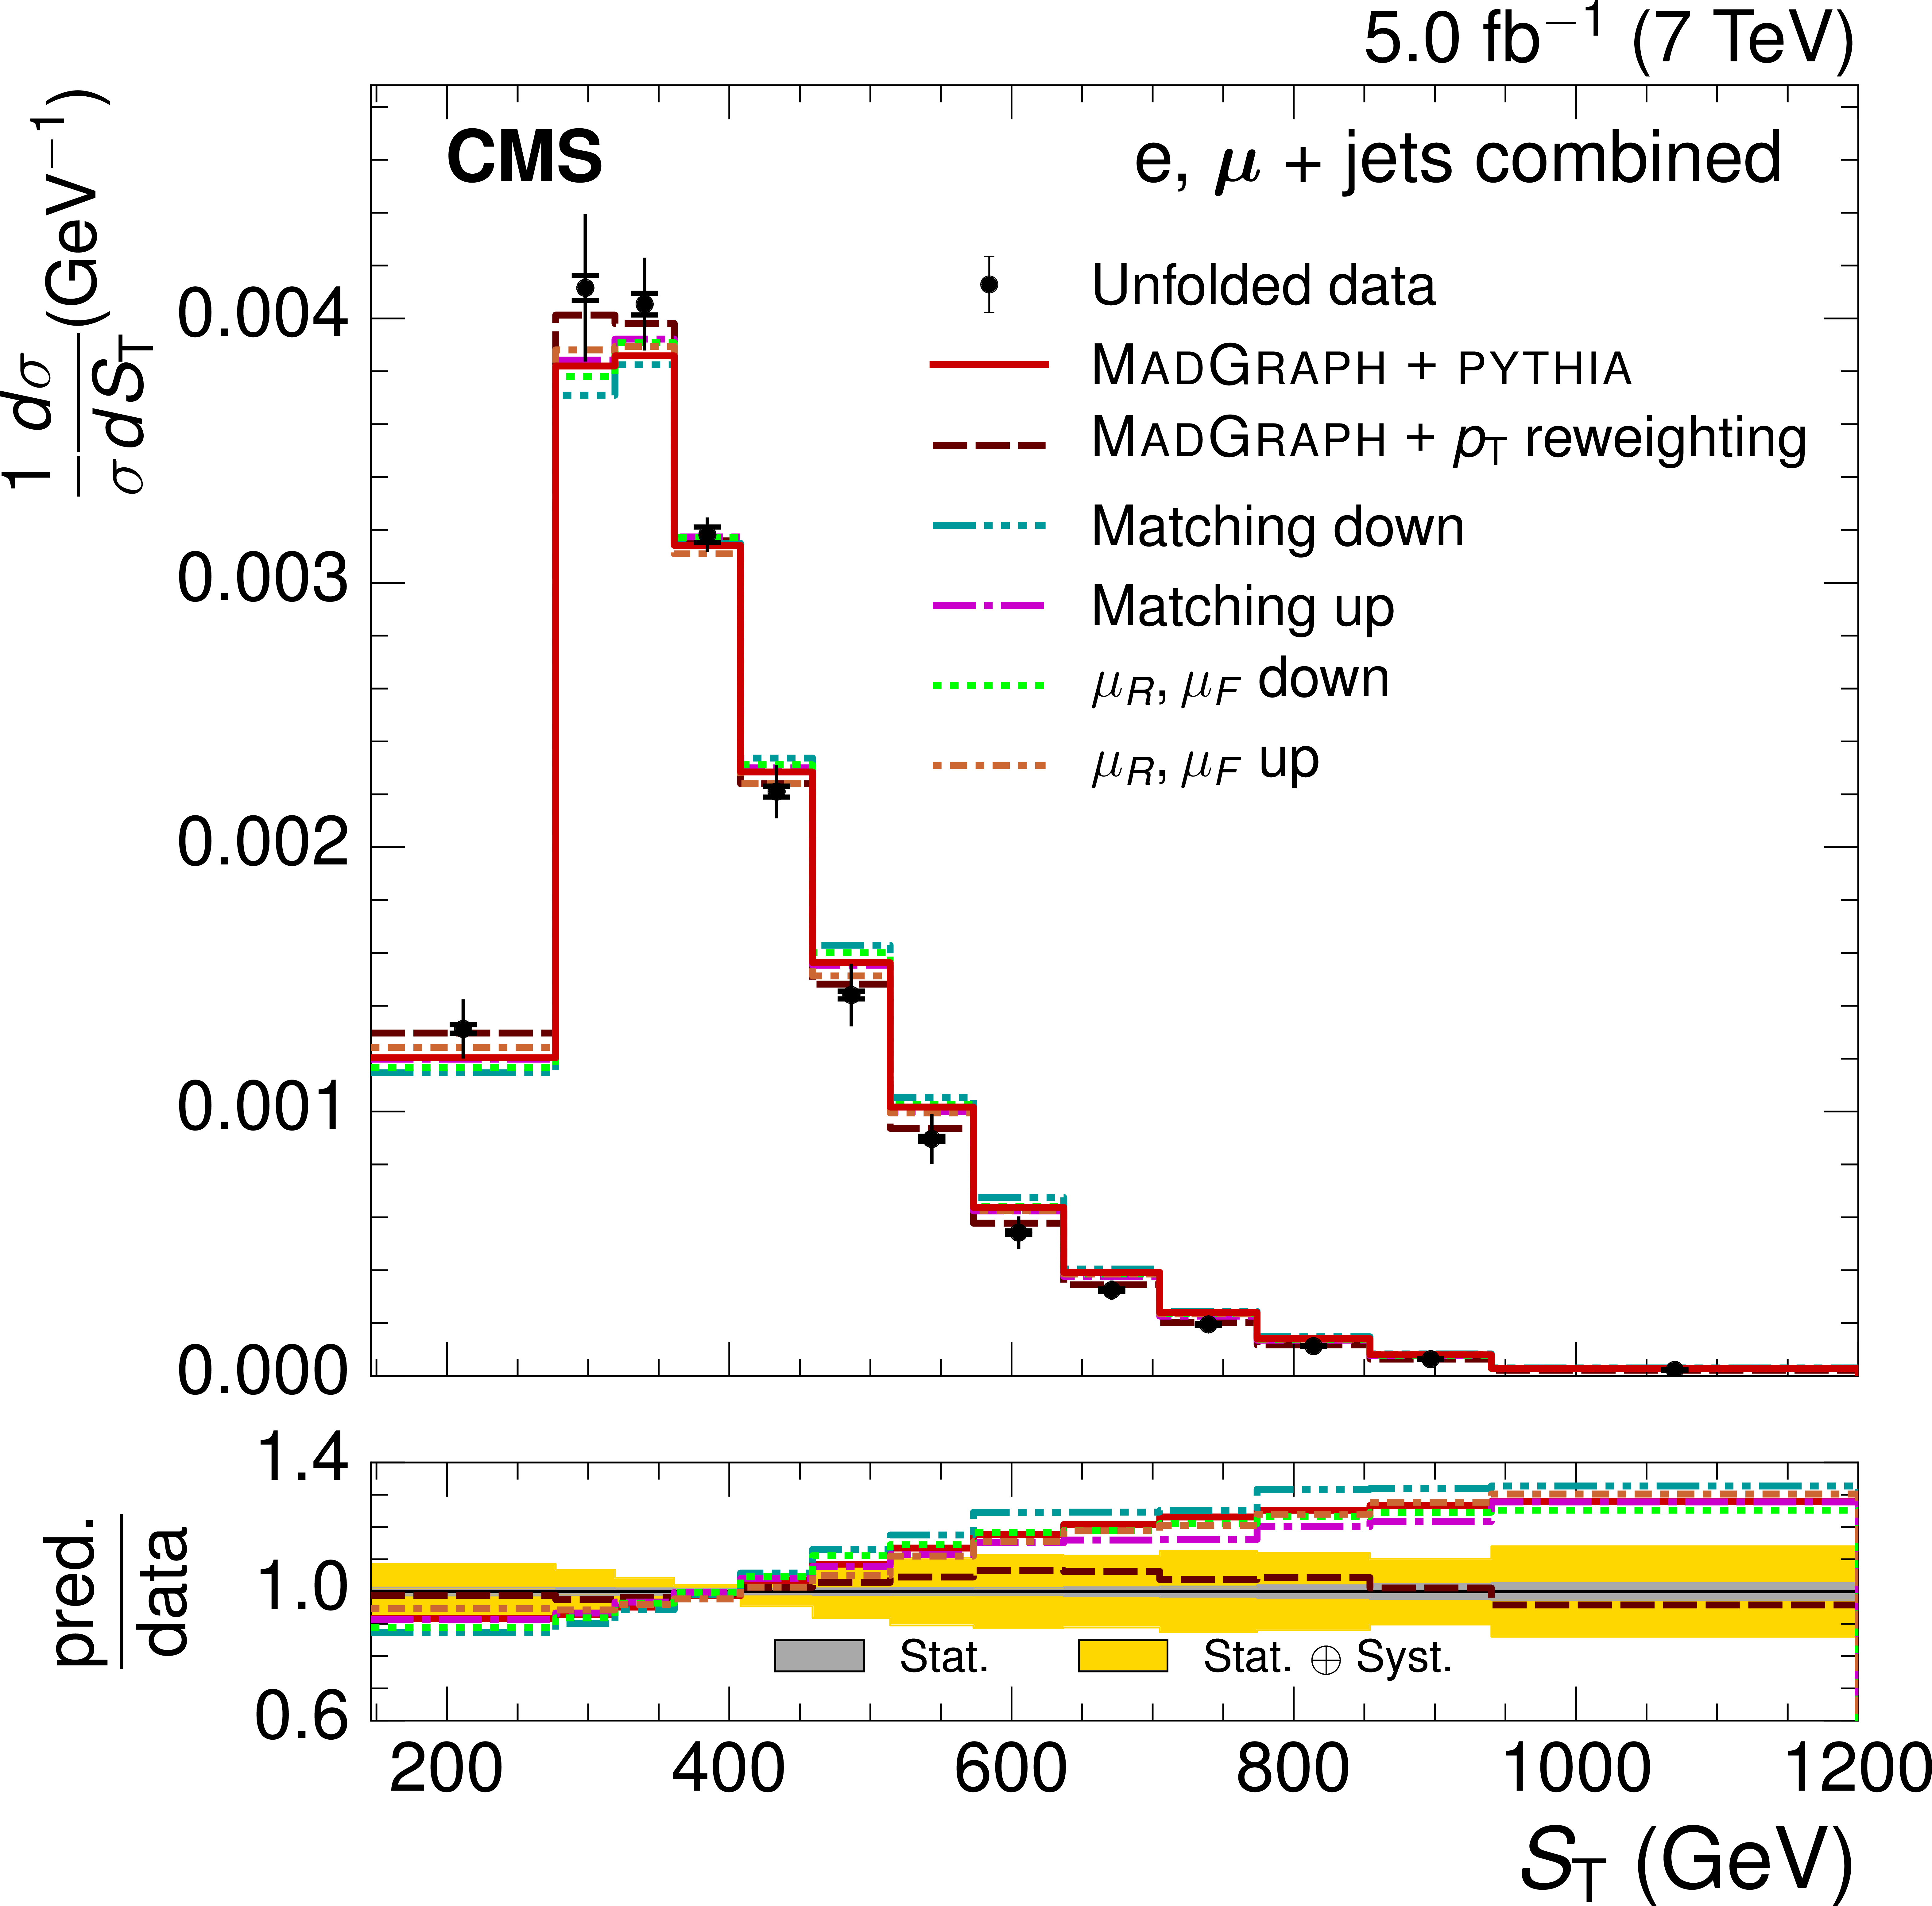
Figure 4-b:
Normalized ${S_\mathrm {T}}$ (a,b) and ${ p_\mathrm {T}^{\mathrm {W}} }$ (c,d) differential ${\mathrm{ t \bar{t} } }$ cross sections from combined electron and muon data at $ \sqrt{s} = $ 7 TeV. The vertical bars on the data points represent the statistical and systematic uncertainties added in quadrature. The inner section of the vertical bars, denoted by the tick marks, show the statistical uncertainty. a,c: comparison with different simulation event generators: MadGraph+PYTHIA (both the default and after reweighting the top quark ${p_{\mathrm {T}}}$ spectrum), POWHEG v2+HERWIG, and POWHEG v2+PYTHIA. b,d: comparison with predictions from the MadGraph+PYTHIA event generator found by varying the matching threshold and renormalization scales ($\mu _{\mathrm {R}}$, $\mu _{\mathrm {F}}$) up and down by a factor of two. The lower plots show the ratio of the predictions to the data, with the statistical and total uncertainties in the ratios indicated by the two shaded bands. |
png pdf |
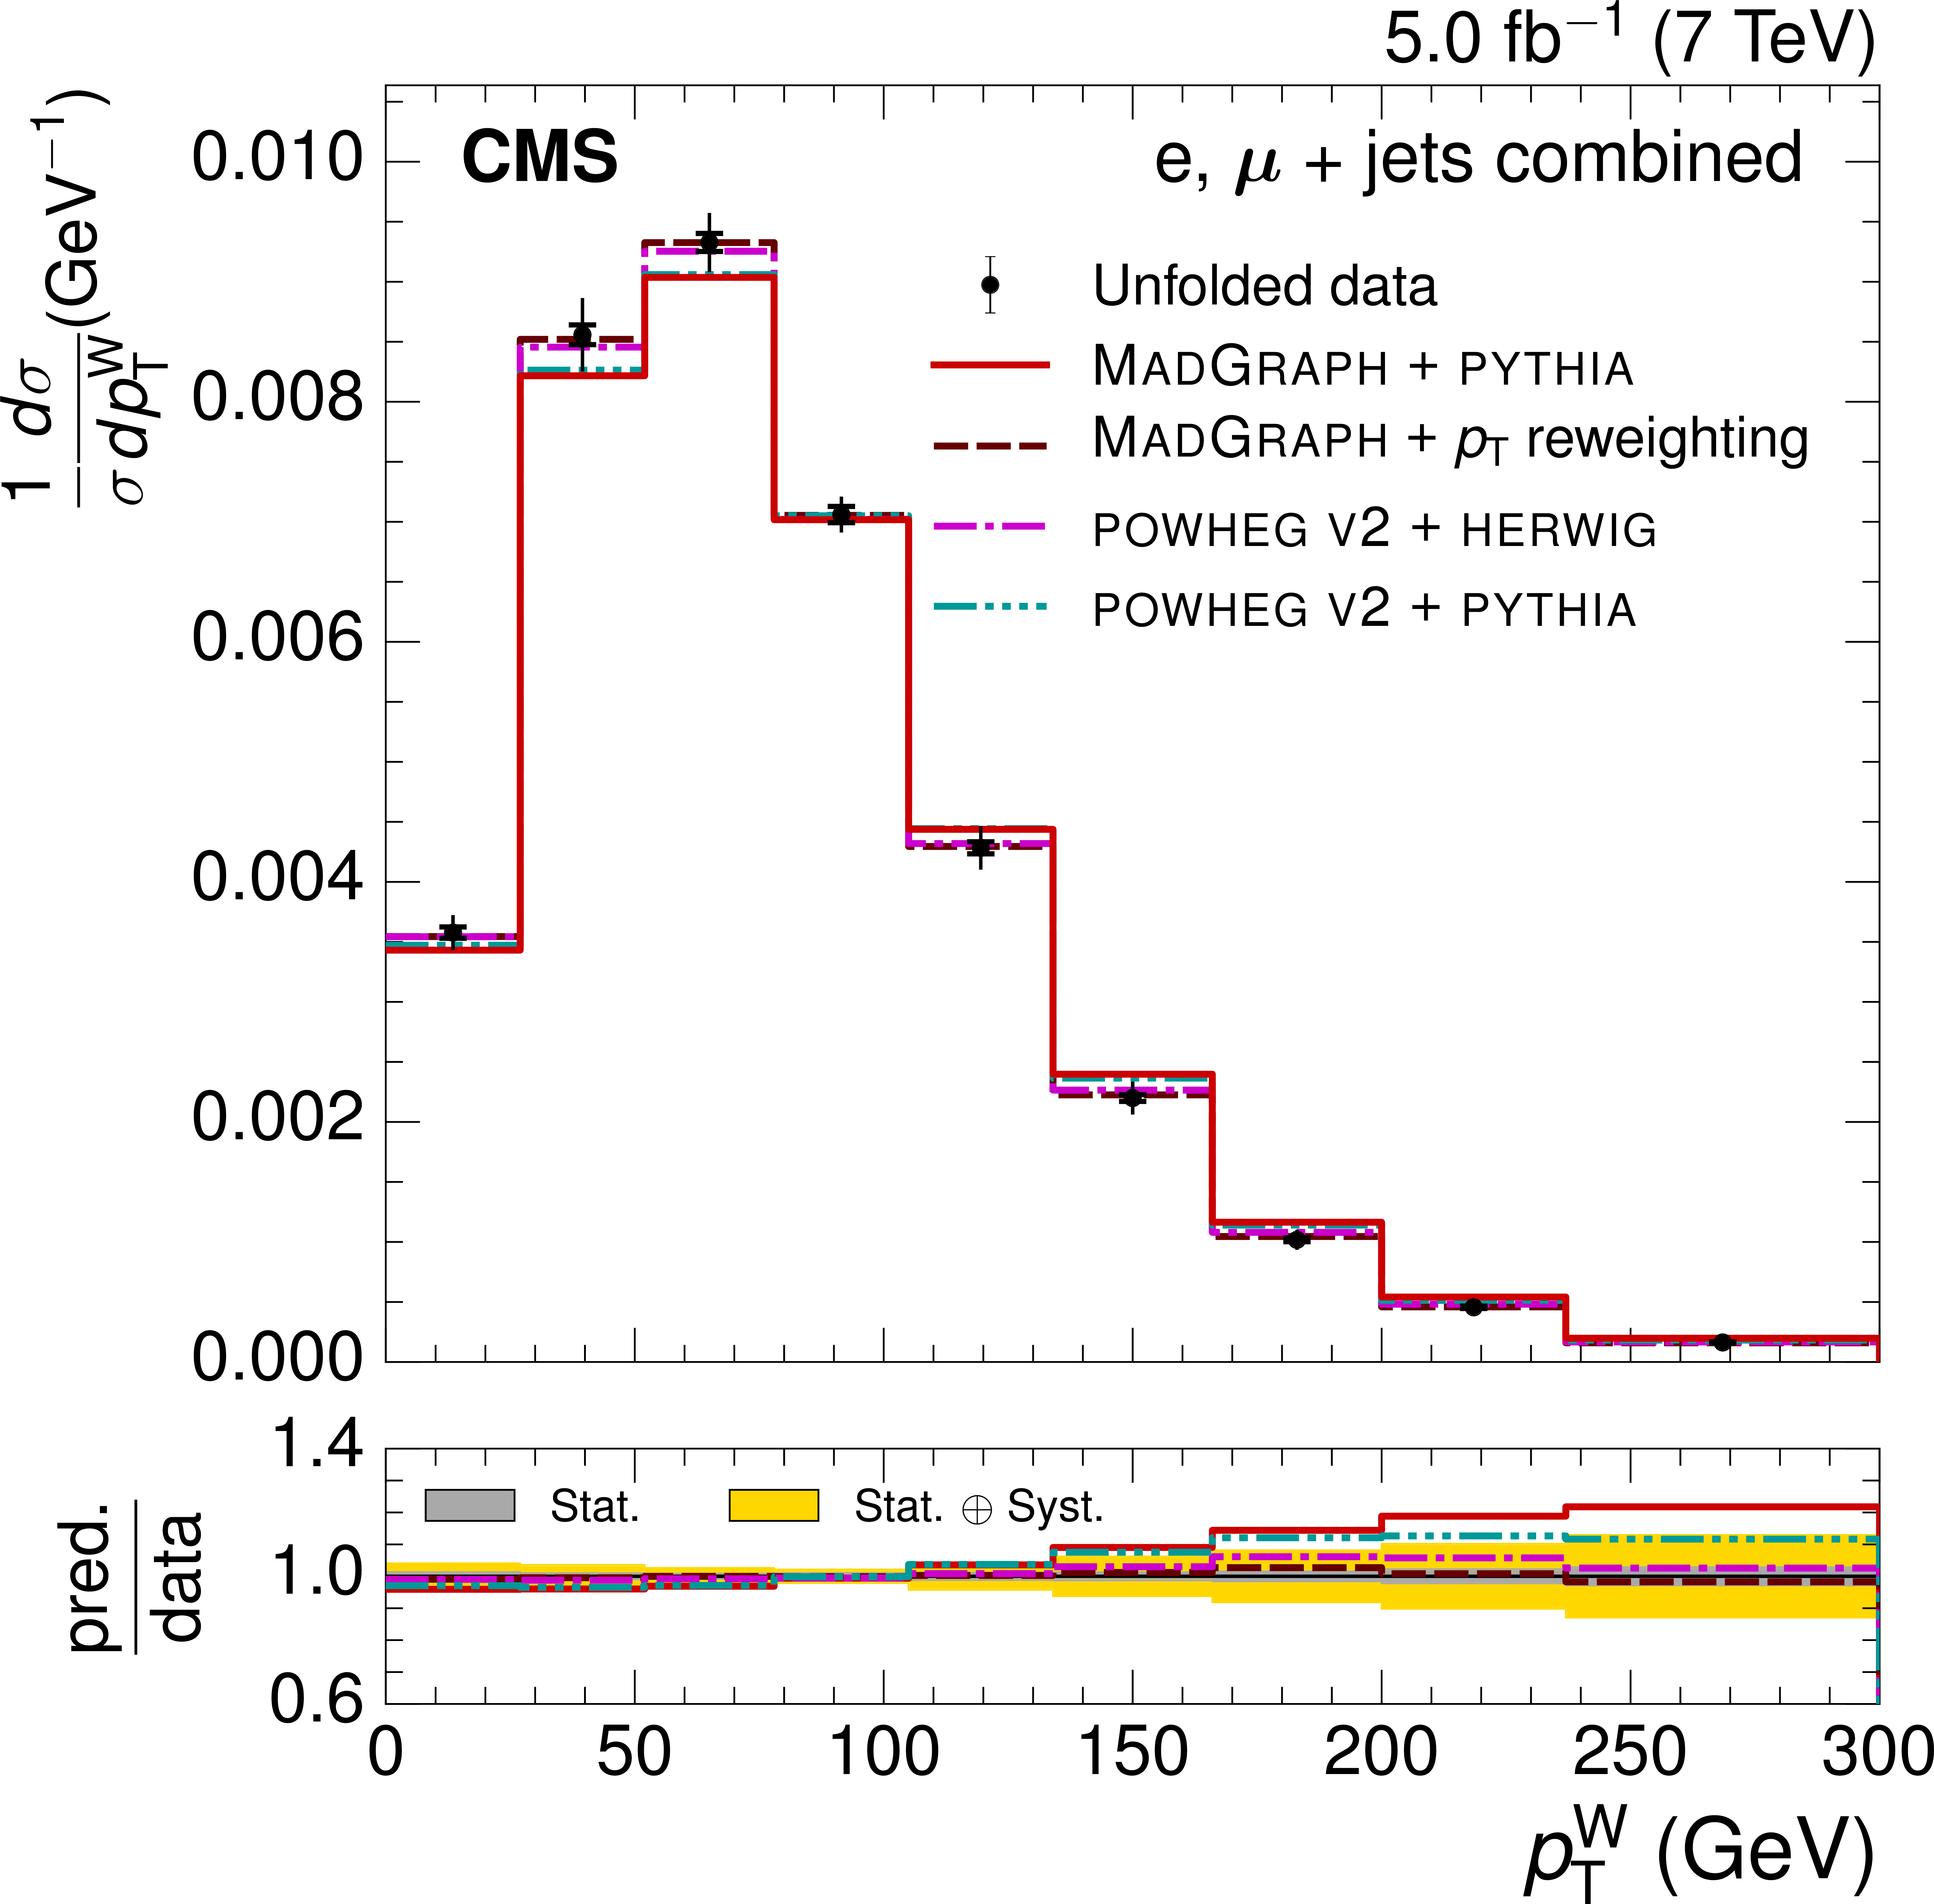
Figure 4-c:
Normalized ${S_\mathrm {T}}$ (a,b) and ${ p_\mathrm {T}^{\mathrm {W}} }$ (c,d) differential ${\mathrm{ t \bar{t} } }$ cross sections from combined electron and muon data at $ \sqrt{s} = $ 7 TeV. The vertical bars on the data points represent the statistical and systematic uncertainties added in quadrature. The inner section of the vertical bars, denoted by the tick marks, show the statistical uncertainty. a,c: comparison with different simulation event generators: MadGraph+PYTHIA (both the default and after reweighting the top quark ${p_{\mathrm {T}}}$ spectrum), POWHEG v2+HERWIG, and POWHEG v2+PYTHIA. b,d: comparison with predictions from the MadGraph+PYTHIA event generator found by varying the matching threshold and renormalization scales ($\mu _{\mathrm {R}}$, $\mu _{\mathrm {F}}$) up and down by a factor of two. The lower plots show the ratio of the predictions to the data, with the statistical and total uncertainties in the ratios indicated by the two shaded bands. |
png pdf |
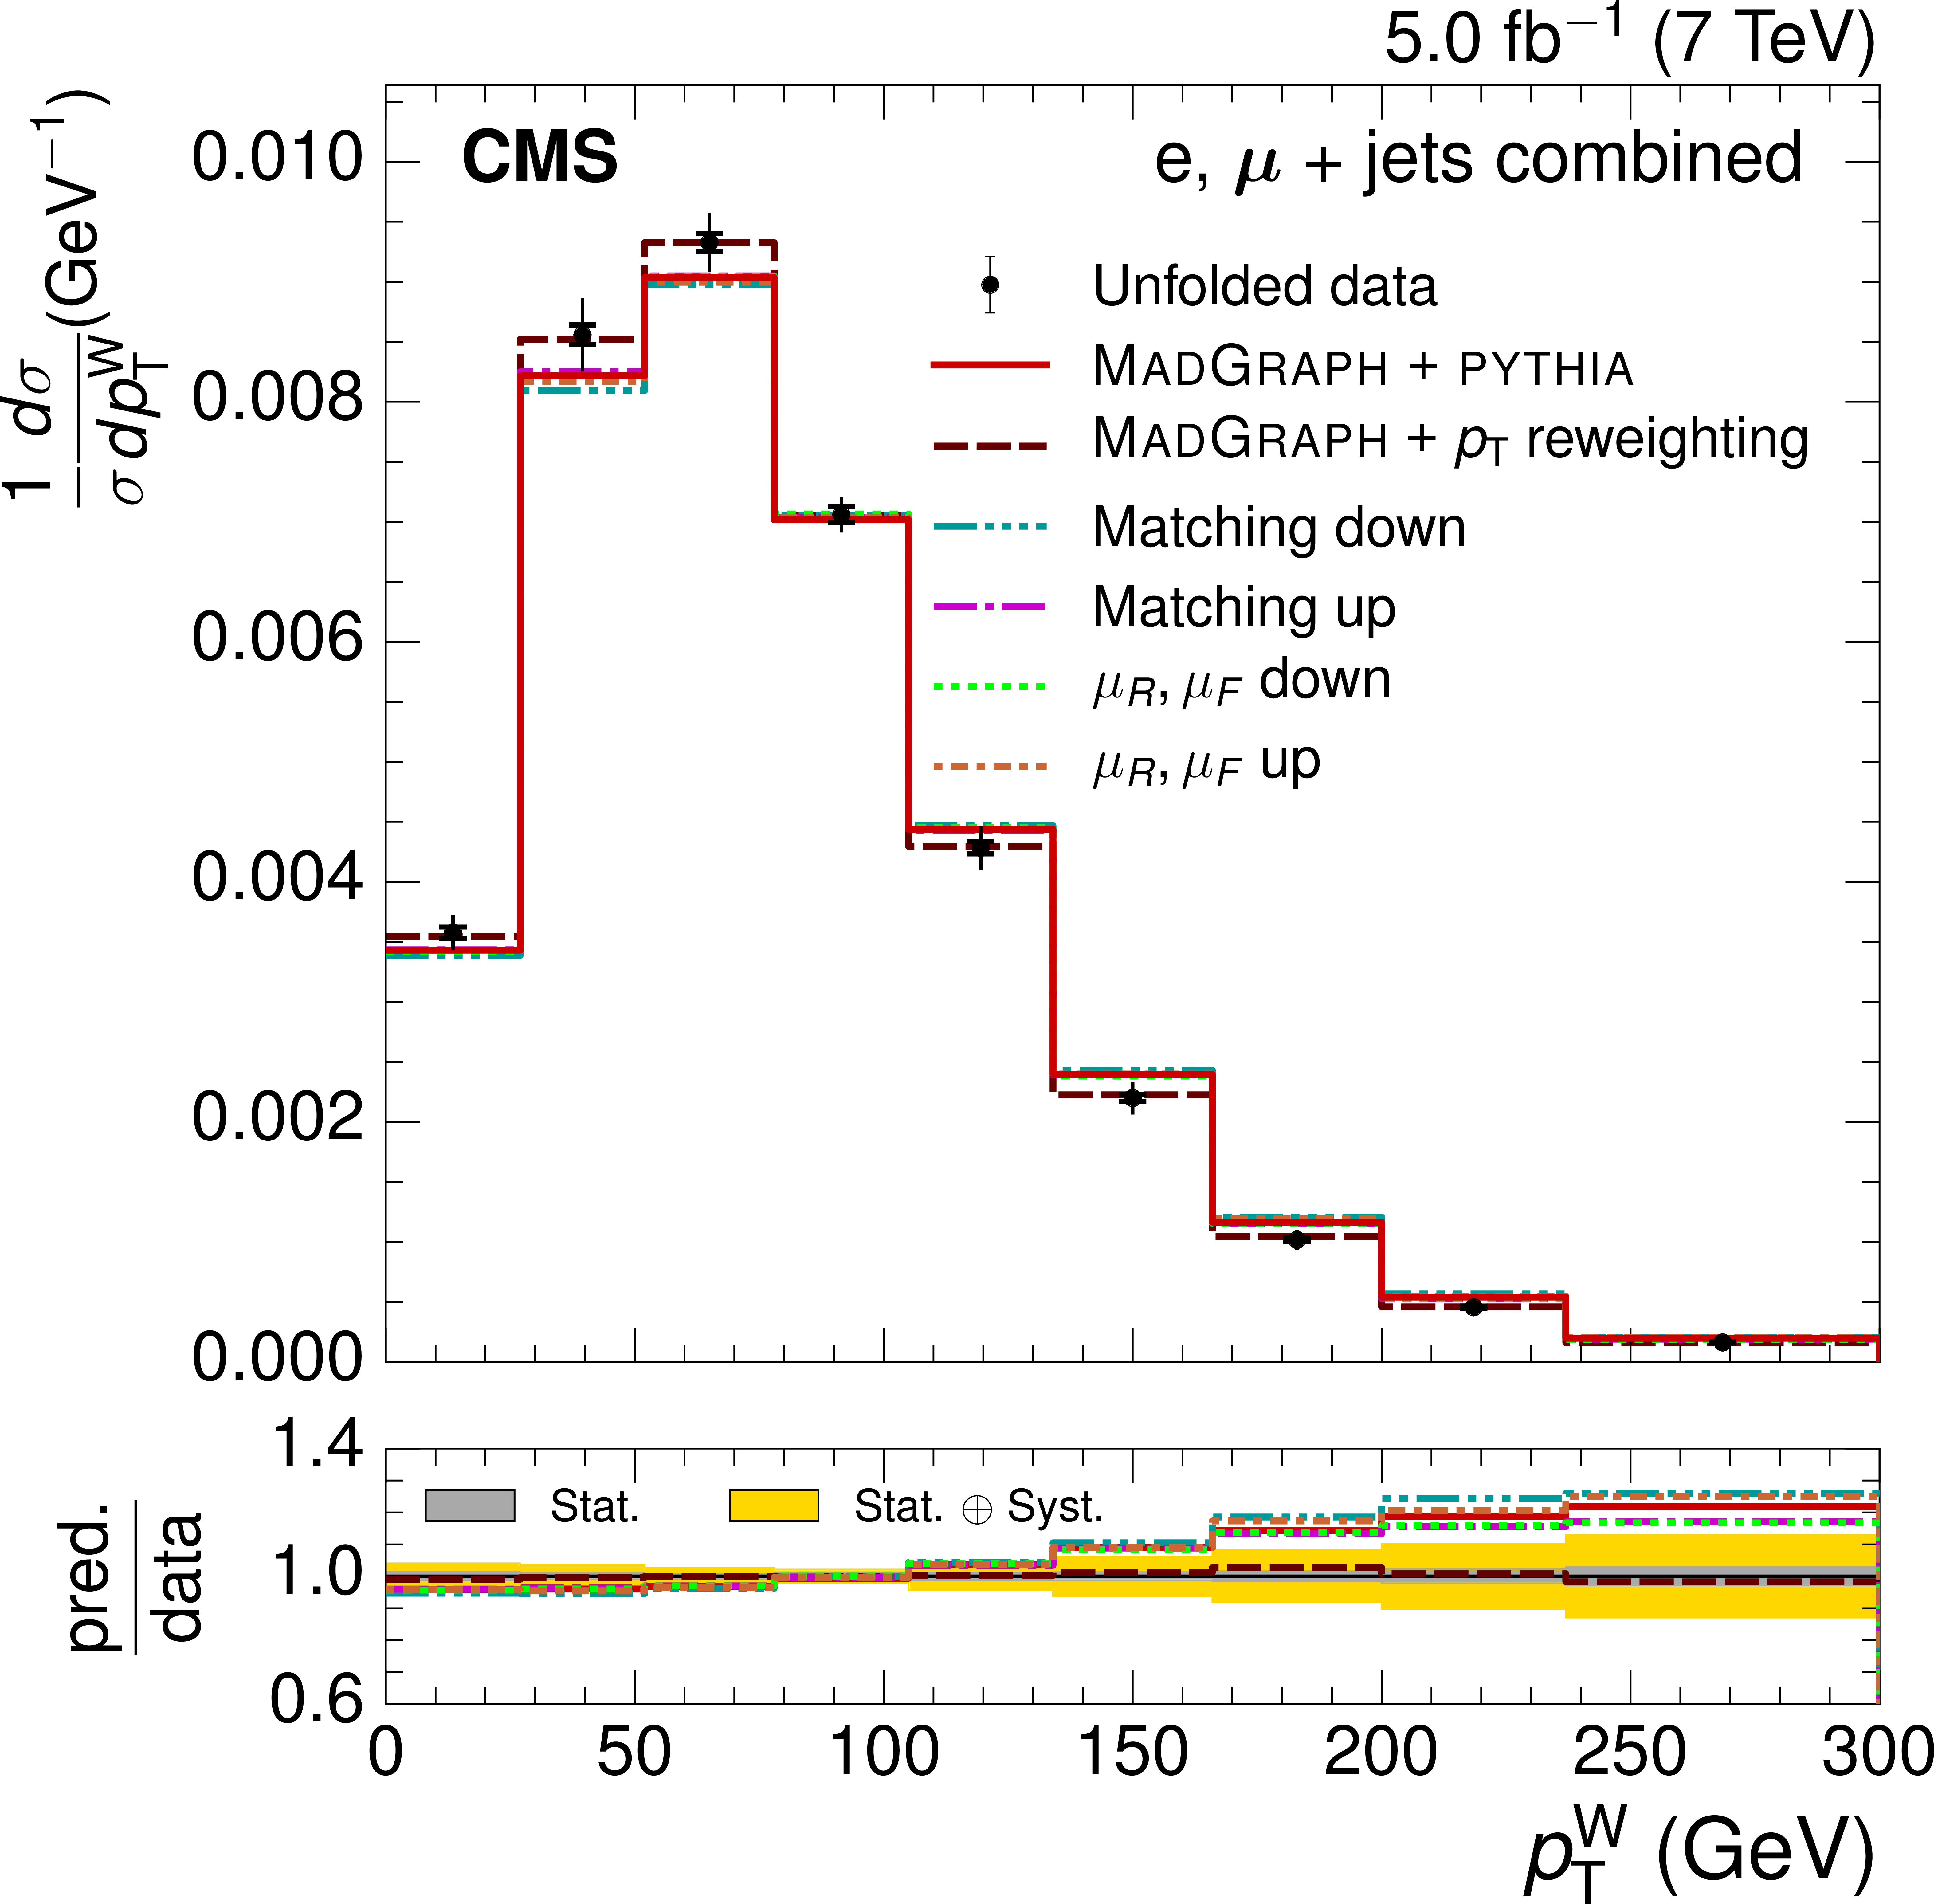
Figure 4-d:
Normalized ${S_\mathrm {T}}$ (a,b) and ${ p_\mathrm {T}^{\mathrm {W}} }$ (c,d) differential ${\mathrm{ t \bar{t} } }$ cross sections from combined electron and muon data at $ \sqrt{s} = $ 7 TeV. The vertical bars on the data points represent the statistical and systematic uncertainties added in quadrature. The inner section of the vertical bars, denoted by the tick marks, show the statistical uncertainty. a,c: comparison with different simulation event generators: MadGraph+PYTHIA (both the default and after reweighting the top quark ${p_{\mathrm {T}}}$ spectrum), POWHEG v2+HERWIG, and POWHEG v2+PYTHIA. b,d: comparison with predictions from the MadGraph+PYTHIA event generator found by varying the matching threshold and renormalization scales ($\mu _{\mathrm {R}}$, $\mu _{\mathrm {F}}$) up and down by a factor of two. The lower plots show the ratio of the predictions to the data, with the statistical and total uncertainties in the ratios indicated by the two shaded bands. |
png pdf |
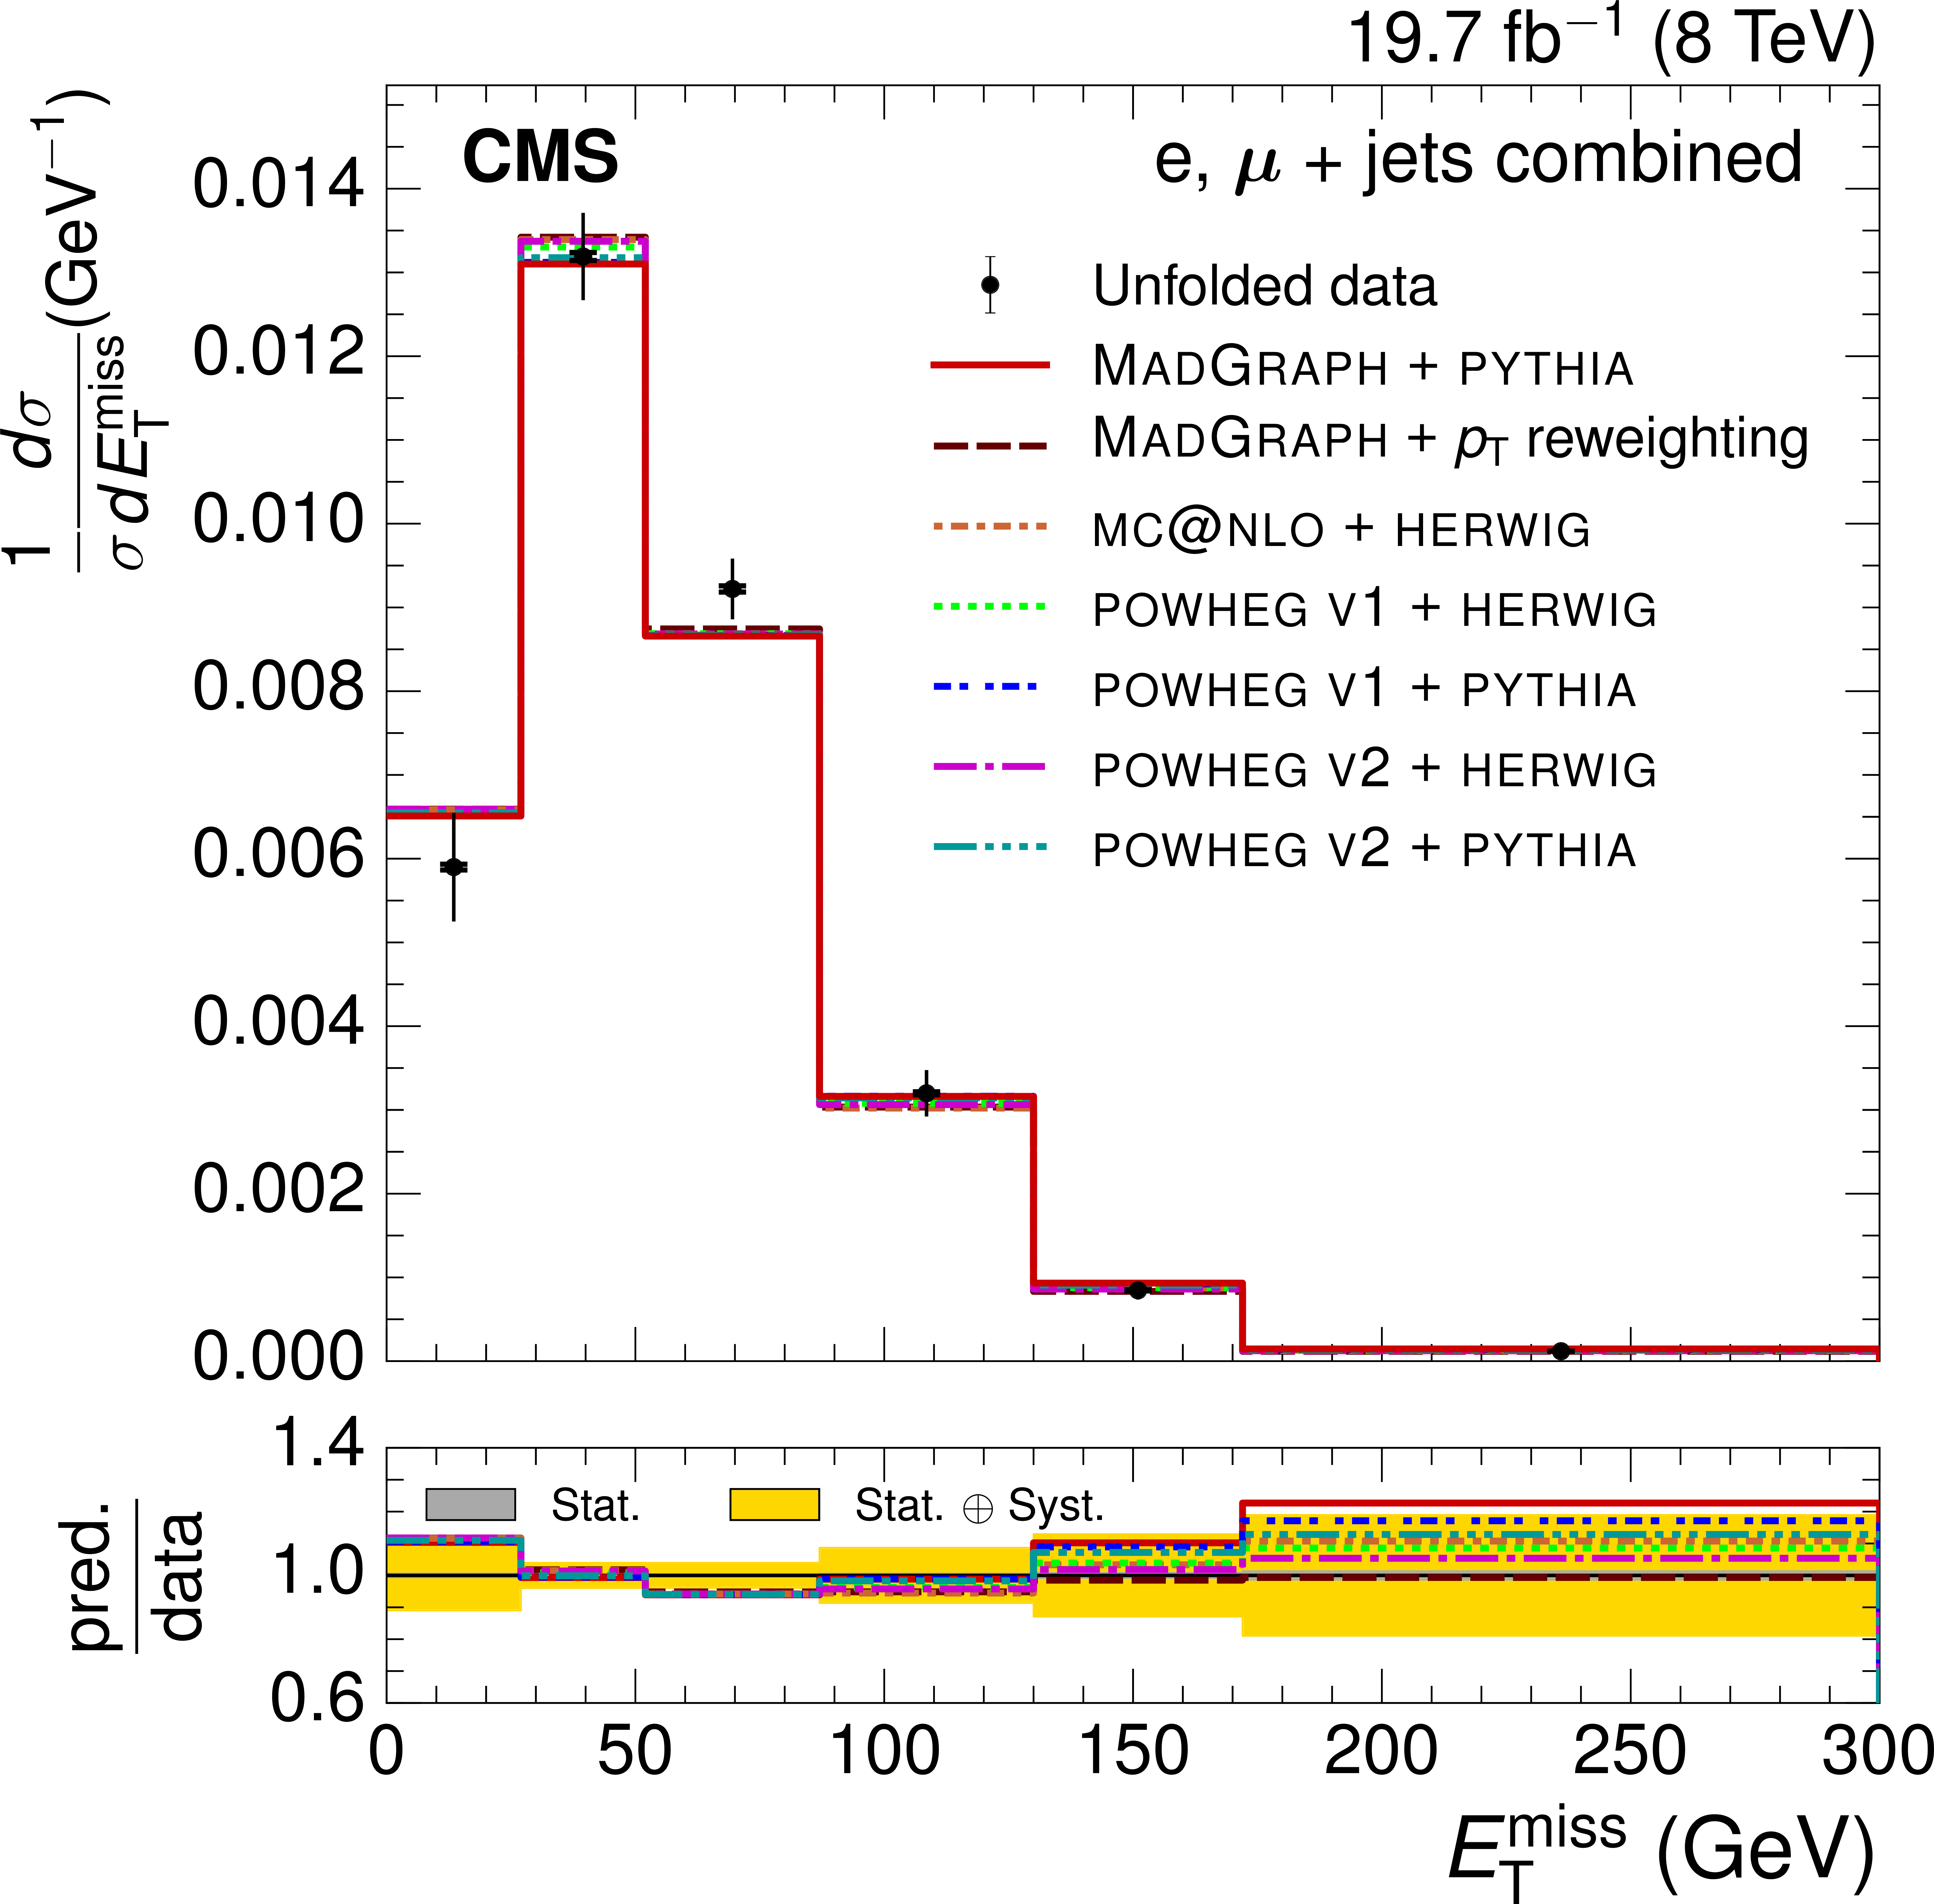
Figure 5-a:
Normalized ${E_{\mathrm {T}}^{\text {miss}}}$ (a,b) and ${H_{\mathrm {T}}}$ (c,d) differential ${\mathrm{ t \bar{t} } }$ cross sections from combined electron and muon data at $ \sqrt{s} = $ 8 TeV. The vertical bars on the data points represent the statistical and systematic uncertainties added in quadrature. The inner section of the vertical bars, denoted by the tick marks, show the statistical uncertainty. a,c: comparison with different simulation event generators: MadGraph+PYTHIA (both the default and after reweighting the top quark ${p_{\mathrm {T}}}$ spectrum), MC@NLO+HERWIG, POWHEG v1+HERWIG, POWHEG v1+PYTHIA, POWHEG v2+HERWIG, and POWHEG v2+PYTHIA. b,d: comparison with predictions from the PYTHIA event generator found by varying the matching threshold and renormalization scales ($\mu _{\mathrm {R}}$, $\mu _{\mathrm {F}}$) up and down by a factor of two. The lower plots show the ratio of the predictions to the data, with the statistical and total uncertainties in the ratios indicated by the two shaded bands. |
png pdf |
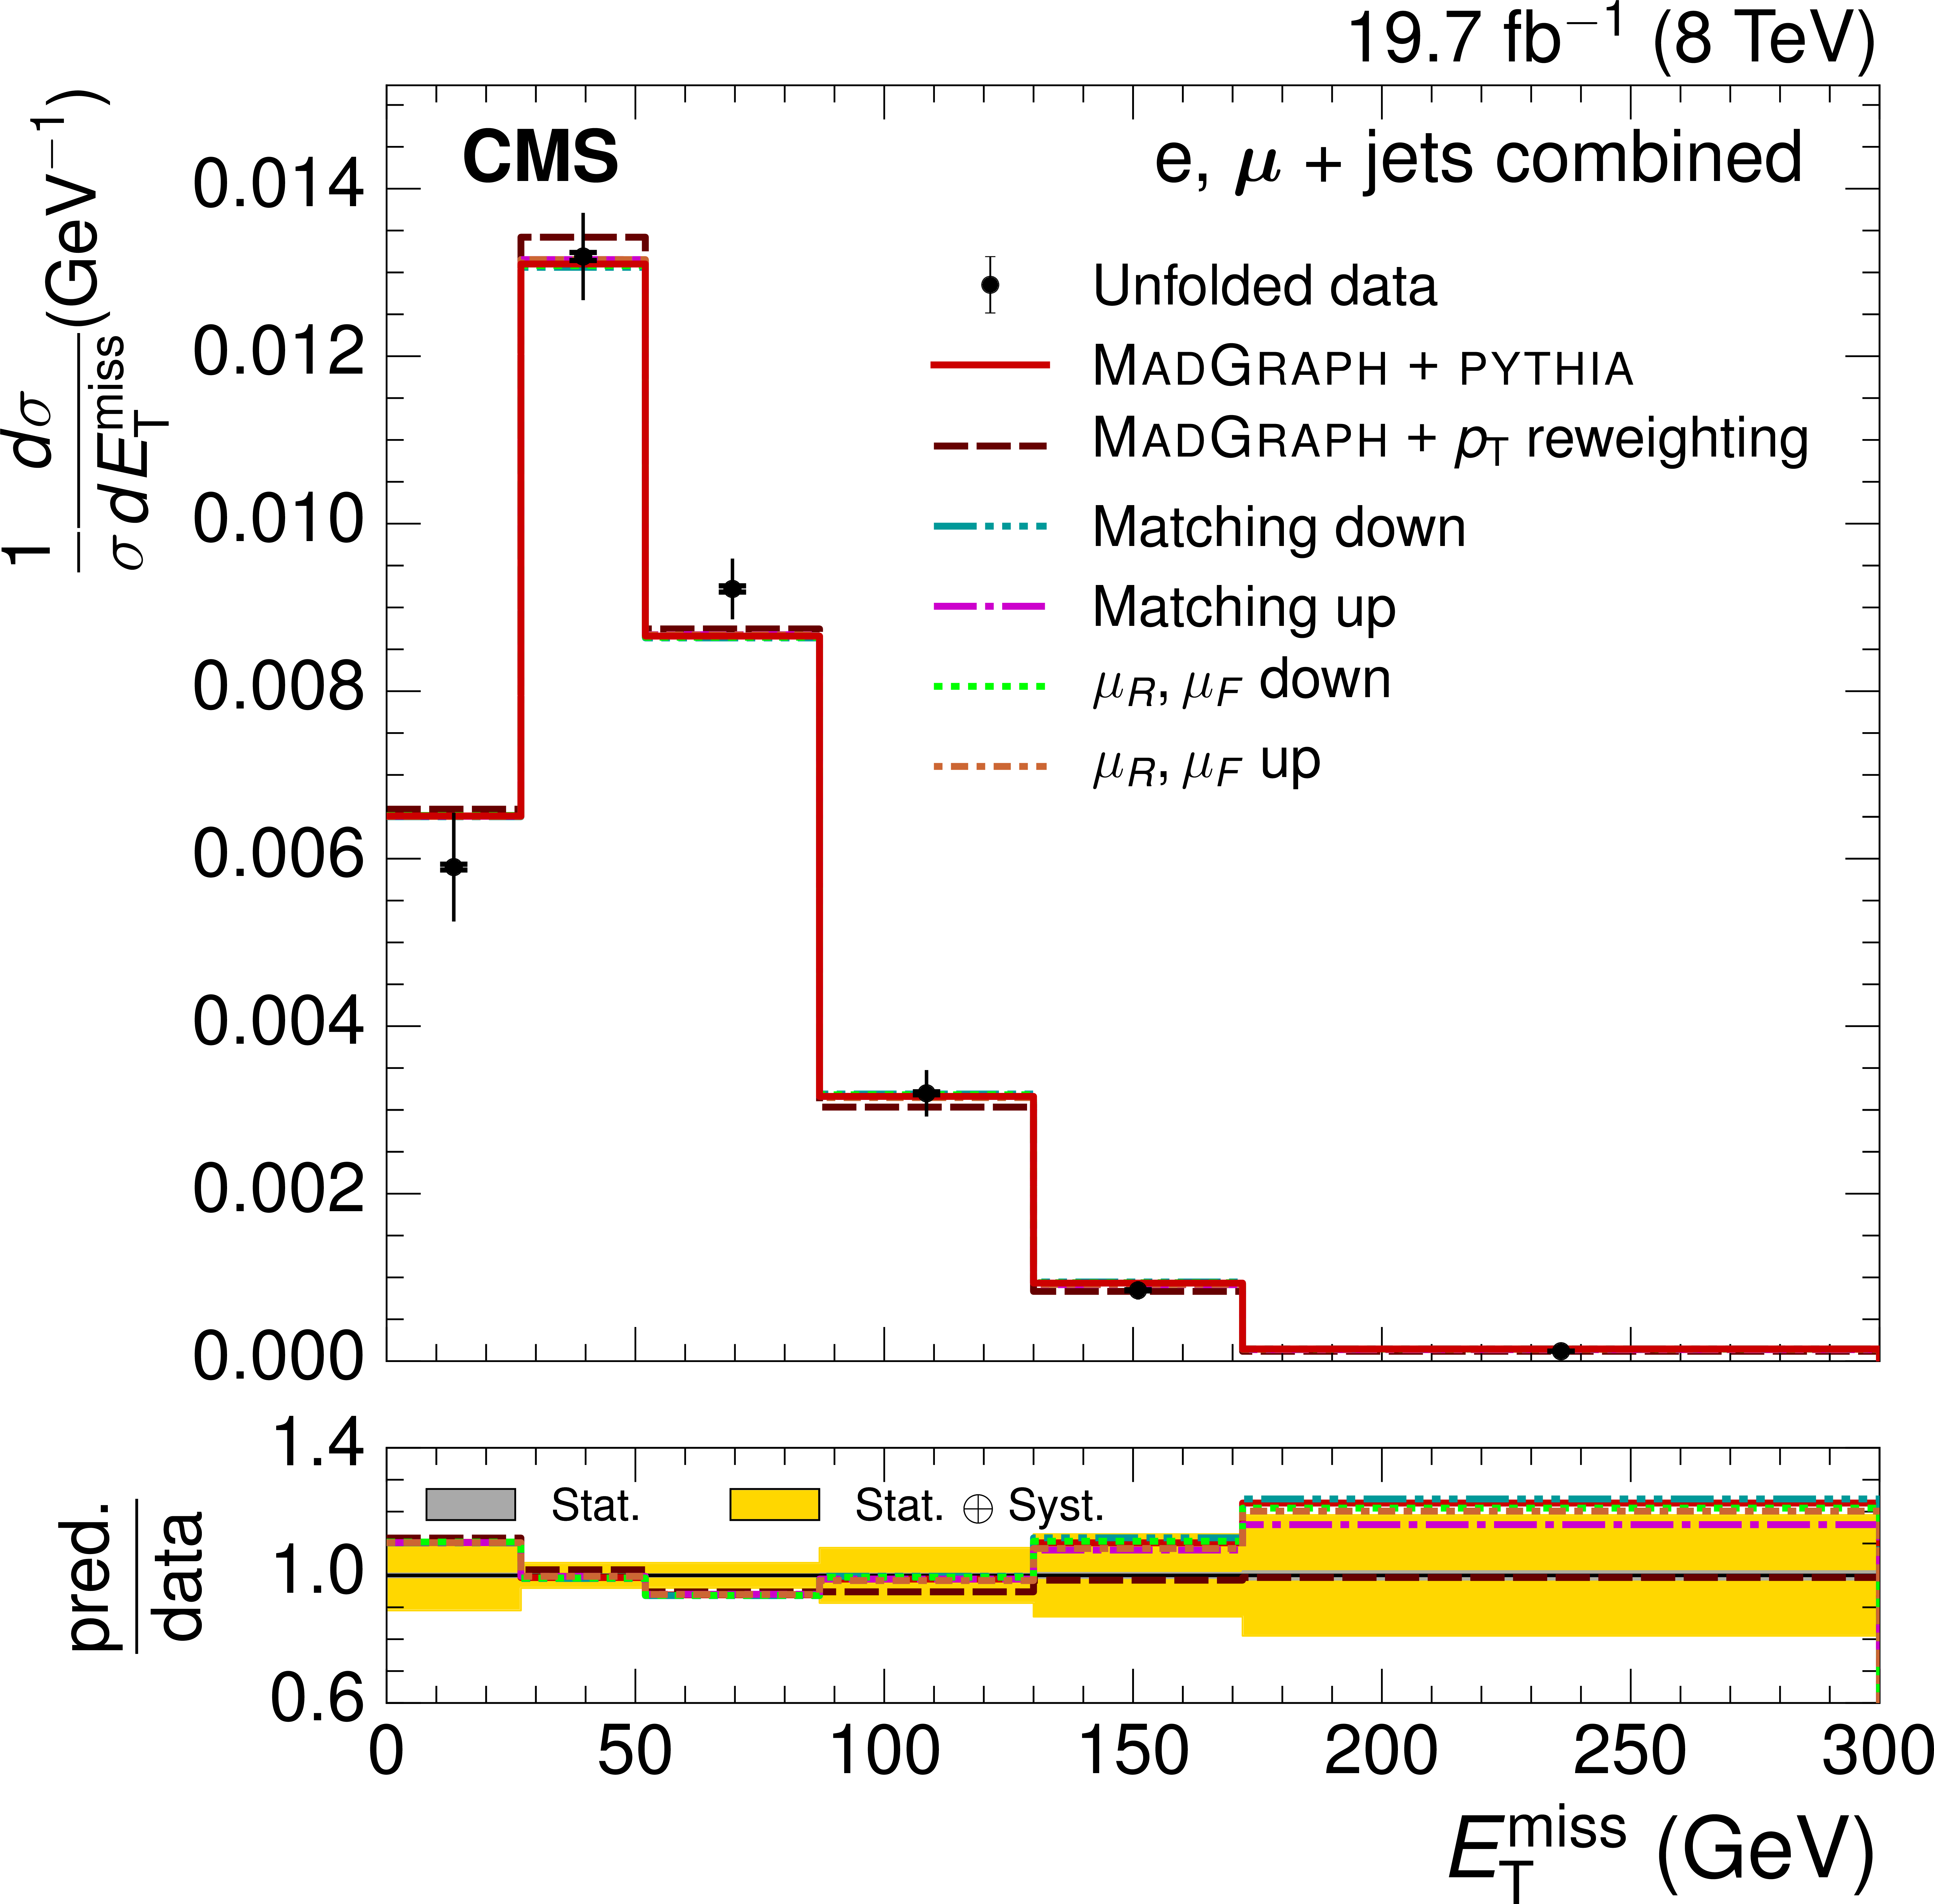
Figure 5-b:
Normalized ${E_{\mathrm {T}}^{\text {miss}}}$ (a,b) and ${H_{\mathrm {T}}}$ (c,d) differential ${\mathrm{ t \bar{t} } }$ cross sections from combined electron and muon data at $ \sqrt{s} = $ 8 TeV. The vertical bars on the data points represent the statistical and systematic uncertainties added in quadrature. The inner section of the vertical bars, denoted by the tick marks, show the statistical uncertainty. a,c: comparison with different simulation event generators: MadGraph+PYTHIA (both the default and after reweighting the top quark ${p_{\mathrm {T}}}$ spectrum), MC@NLO+HERWIG, POWHEG v1+HERWIG, POWHEG v1+PYTHIA, POWHEG v2+HERWIG, and POWHEG v2+PYTHIA. b,d: comparison with predictions from the PYTHIA event generator found by varying the matching threshold and renormalization scales ($\mu _{\mathrm {R}}$, $\mu _{\mathrm {F}}$) up and down by a factor of two. The lower plots show the ratio of the predictions to the data, with the statistical and total uncertainties in the ratios indicated by the two shaded bands. |
png pdf |
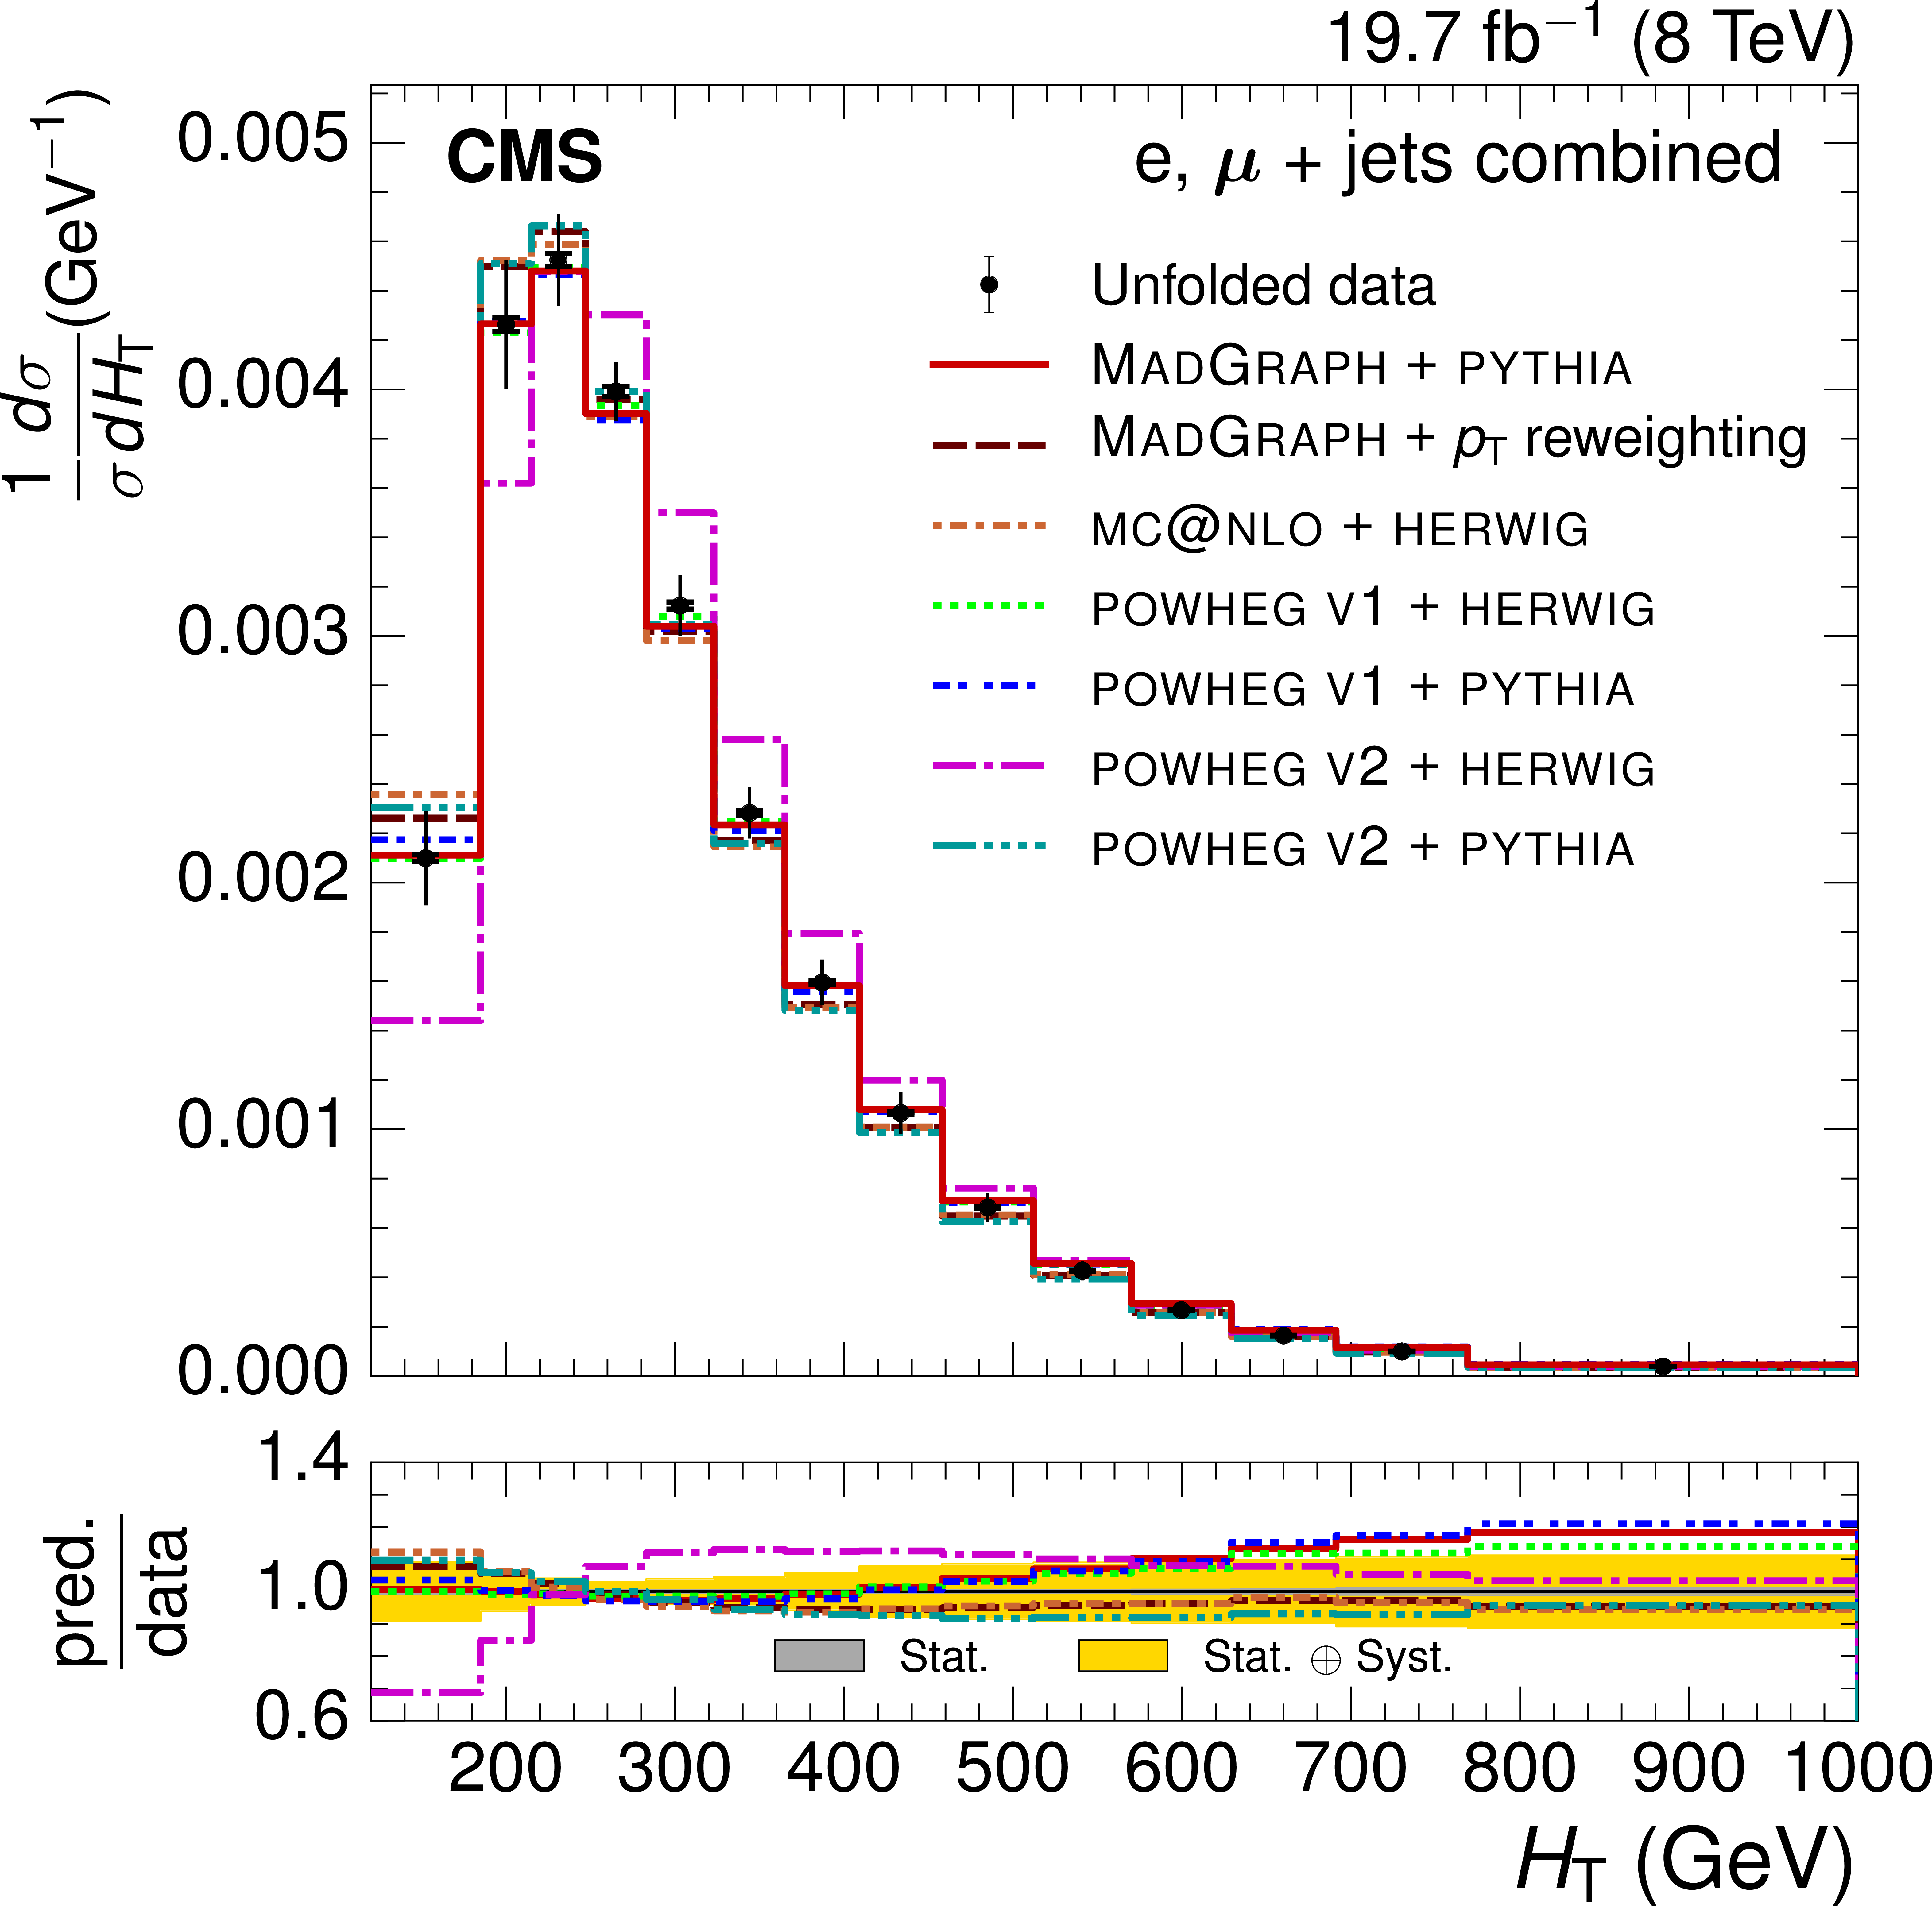
Figure 5-c:
Normalized ${E_{\mathrm {T}}^{\text {miss}}}$ (a,b) and ${H_{\mathrm {T}}}$ (c,d) differential ${\mathrm{ t \bar{t} } }$ cross sections from combined electron and muon data at $ \sqrt{s} = $ 8 TeV. The vertical bars on the data points represent the statistical and systematic uncertainties added in quadrature. The inner section of the vertical bars, denoted by the tick marks, show the statistical uncertainty. a,c: comparison with different simulation event generators: MadGraph+PYTHIA (both the default and after reweighting the top quark ${p_{\mathrm {T}}}$ spectrum), MC@NLO+HERWIG, POWHEG v1+HERWIG, POWHEG v1+PYTHIA, POWHEG v2+HERWIG, and POWHEG v2+PYTHIA. b,d: comparison with predictions from the PYTHIA event generator found by varying the matching threshold and renormalization scales ($\mu _{\mathrm {R}}$, $\mu _{\mathrm {F}}$) up and down by a factor of two. The lower plots show the ratio of the predictions to the data, with the statistical and total uncertainties in the ratios indicated by the two shaded bands. |
png pdf |
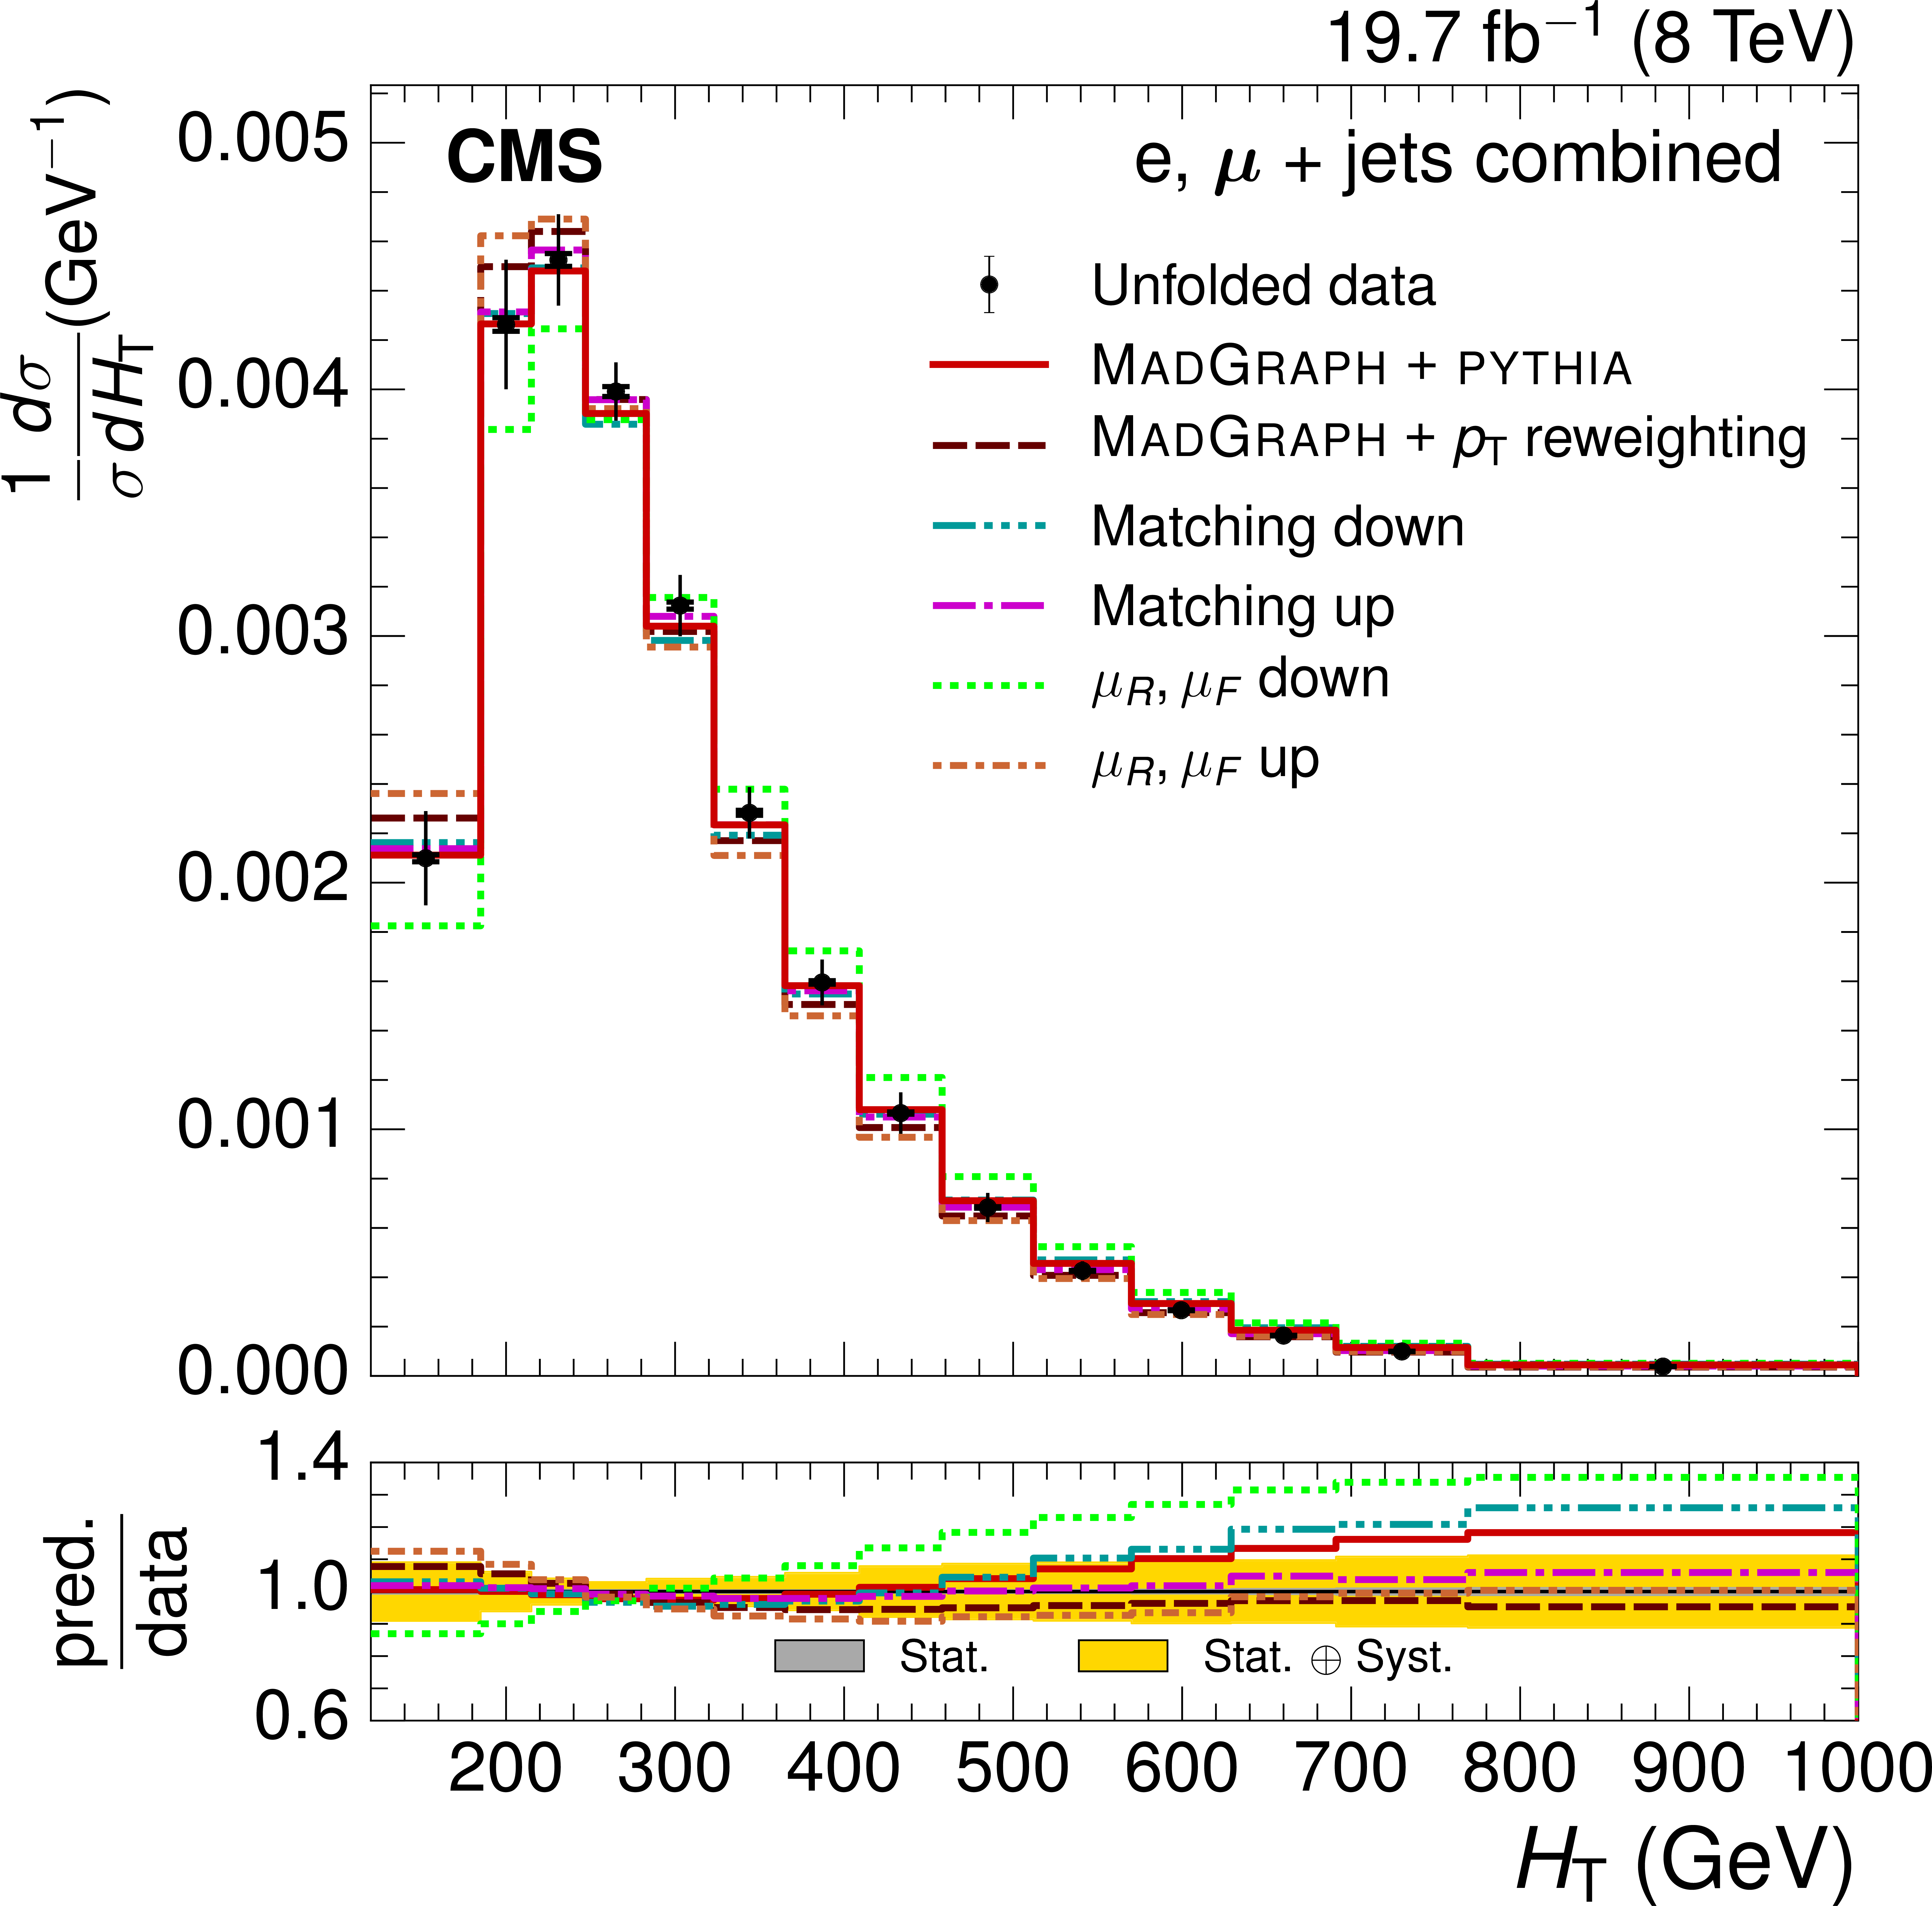
Figure 5-d:
Normalized ${E_{\mathrm {T}}^{\text {miss}}}$ (a,b) and ${H_{\mathrm {T}}}$ (c,d) differential ${\mathrm{ t \bar{t} } }$ cross sections from combined electron and muon data at $ \sqrt{s} = $ 8 TeV. The vertical bars on the data points represent the statistical and systematic uncertainties added in quadrature. The inner section of the vertical bars, denoted by the tick marks, show the statistical uncertainty. a,c: comparison with different simulation event generators: MadGraph+PYTHIA (both the default and after reweighting the top quark ${p_{\mathrm {T}}}$ spectrum), MC@NLO+HERWIG, POWHEG v1+HERWIG, POWHEG v1+PYTHIA, POWHEG v2+HERWIG, and POWHEG v2+PYTHIA. b,d: comparison with predictions from the PYTHIA event generator found by varying the matching threshold and renormalization scales ($\mu _{\mathrm {R}}$, $\mu _{\mathrm {F}}$) up and down by a factor of two. The lower plots show the ratio of the predictions to the data, with the statistical and total uncertainties in the ratios indicated by the two shaded bands. |

png pdf |
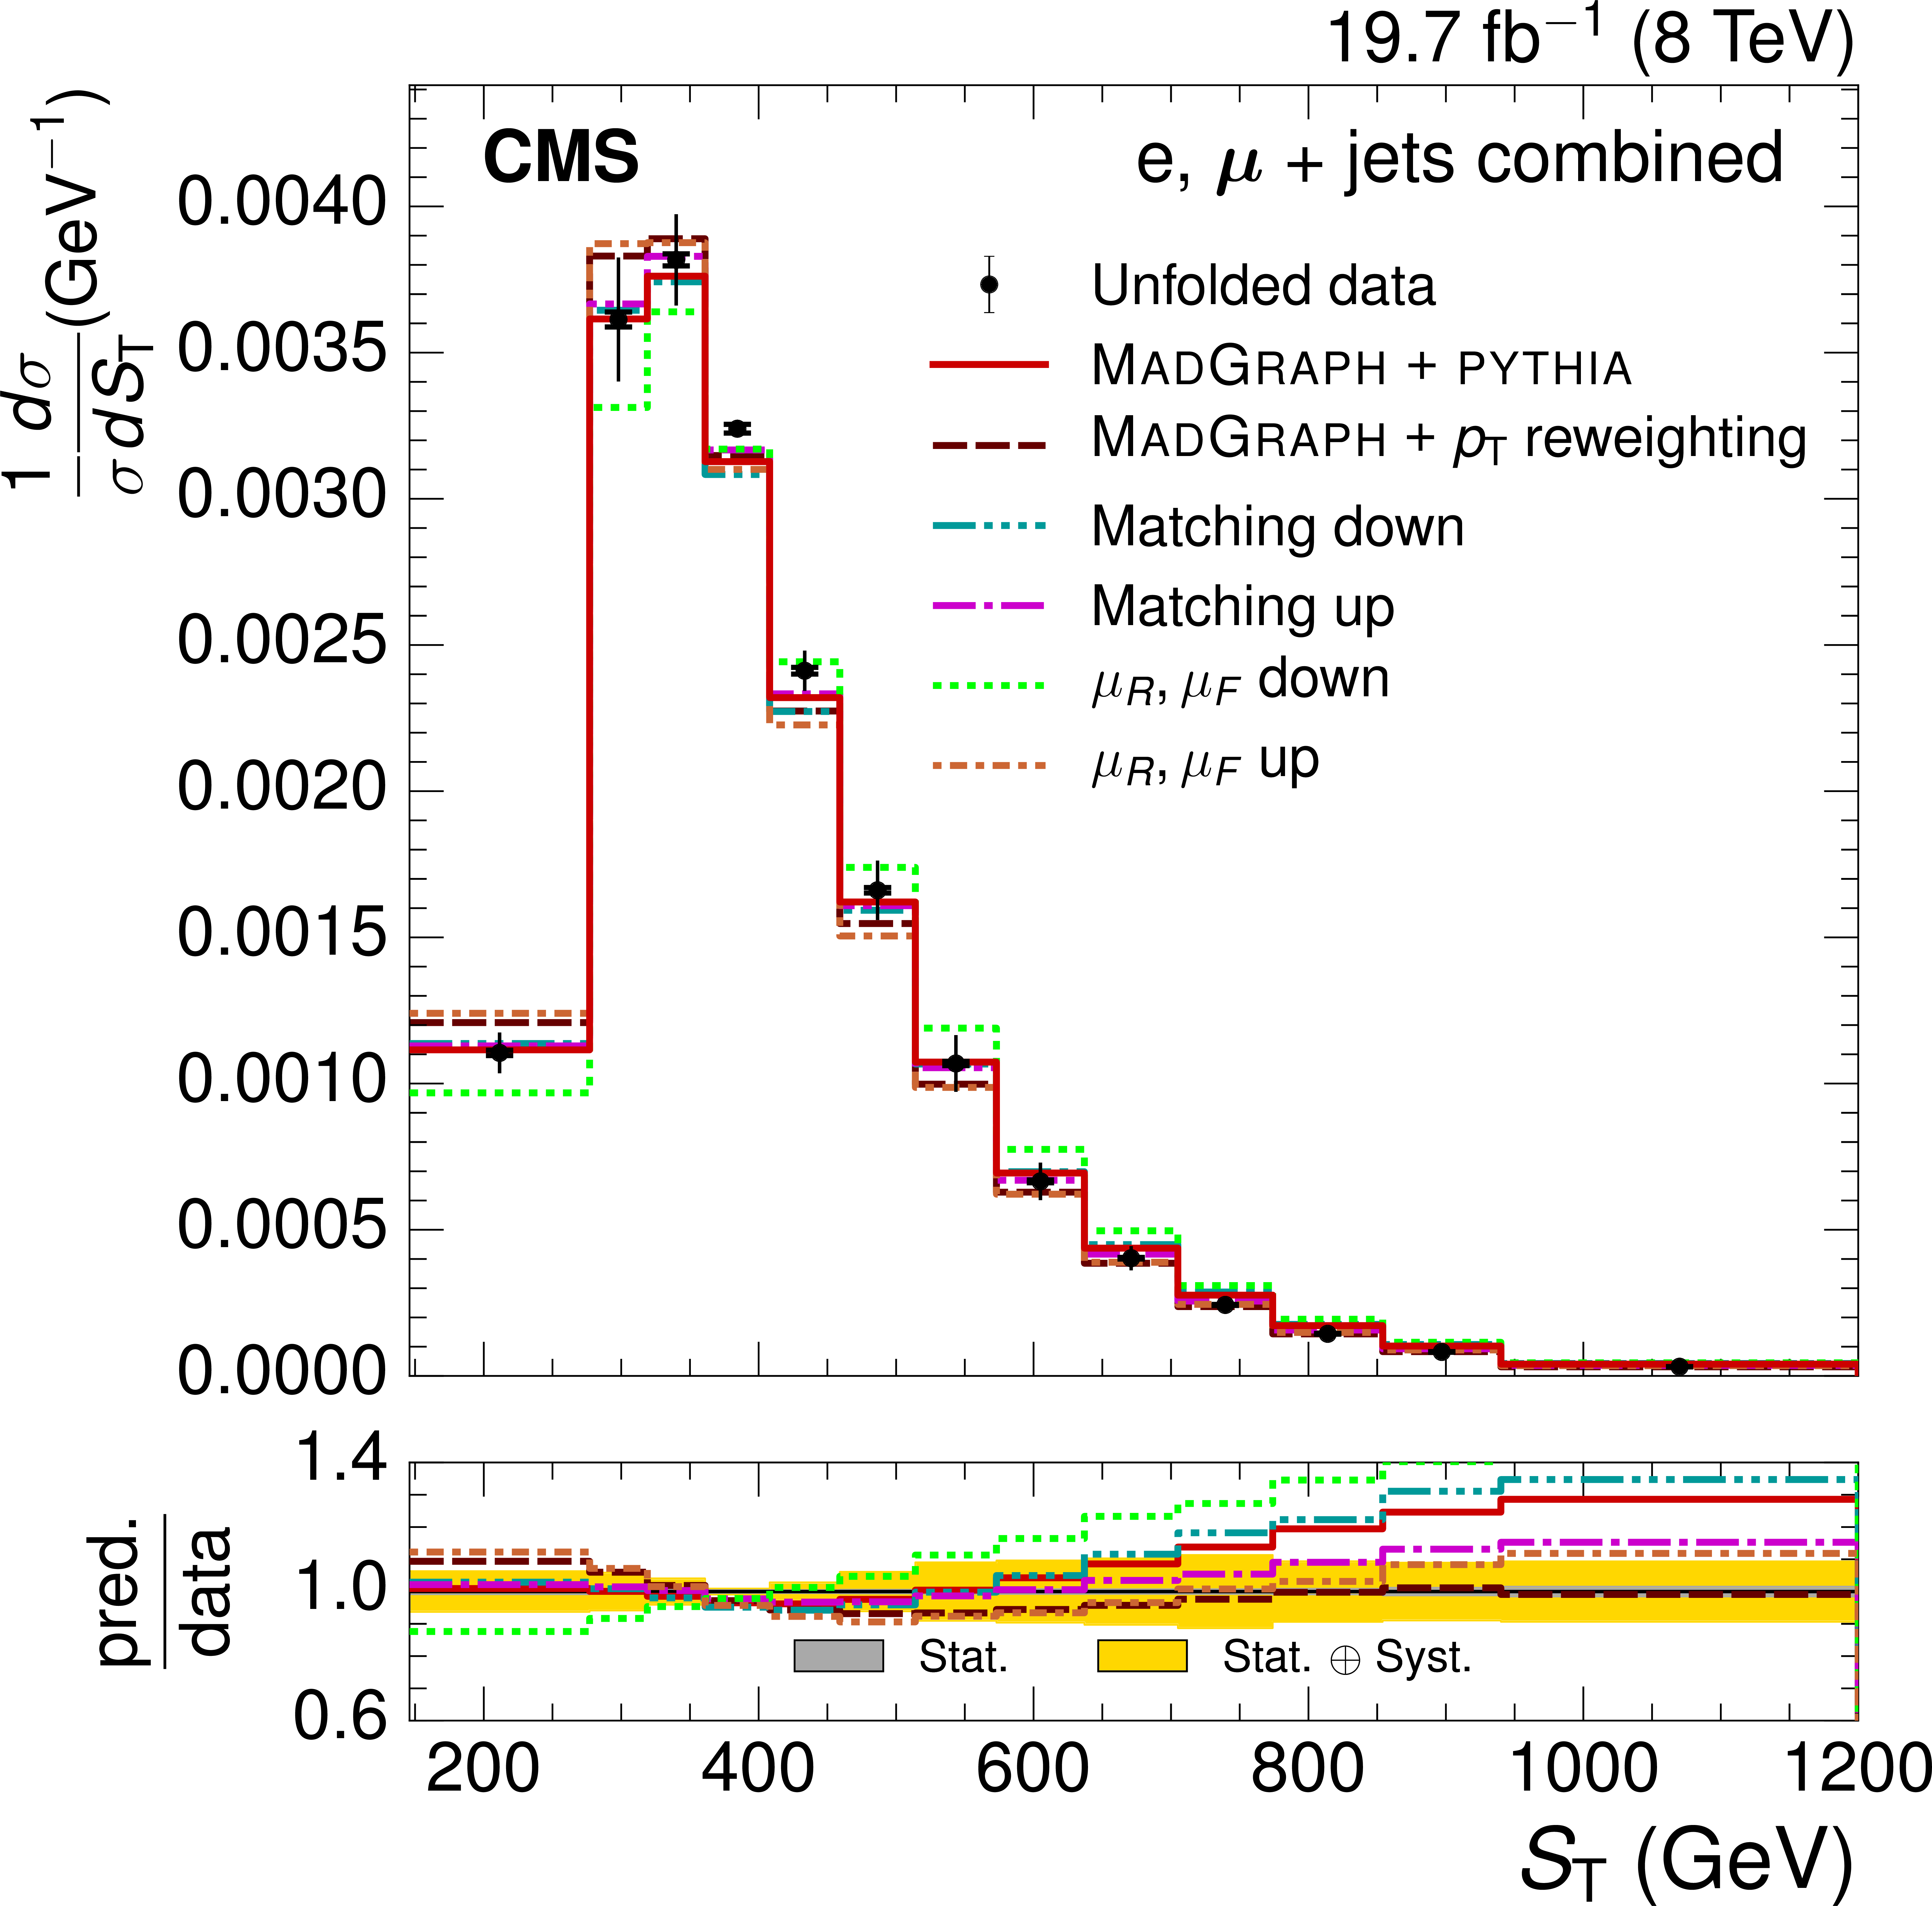
Figure 6-a:
Normalized ${S_\mathrm {T}}$ (a,b) and ${ p_\mathrm {T}^{\mathrm {W}} }$ (c,d) differential ${\mathrm{ t \bar{t} } }$ cross sections from combined electron and muon data at $ \sqrt{s} = $ 8 TeV. The vertical bars on the data points represent the statistical and systematic uncertainties added in quadrature. The inner section of the vertical bars, denoted by the tick marks, show the statistical uncertainty. a,c: comparison with different simulation event generators: MadGraph+PYTHIA (both the default and after reweighting the top quark $ {p_{\mathrm {T}}}$ spectrum), MC@NLO+HERWIG, POWHEG v1+HERWIG, POWHEG v1+PYTHIA, POWHEG v2+HERWIG, and POWHEG v2+PYTHIA. b,d: comparison with predictions from the MadGraph+PYTHIA event generator found by varying the matching threshold and renormalization scales ($\mu _{\mathrm {R}}$, $\mu _{\mathrm {F}}$) up and down by a factor of two. The lower plots show the ratio of the predictions to the data, with the statistical and total uncertainties in the ratios indicated by the two shaded bands. |
png pdf |
Figure 6-b:
Normalized ${S_\mathrm {T}}$ (a,b) and ${ p_\mathrm {T}^{\mathrm {W}} }$ (c,d) differential ${\mathrm{ t \bar{t} } }$ cross sections from combined electron and muon data at $ \sqrt{s} = $ 8 TeV. The vertical bars on the data points represent the statistical and systematic uncertainties added in quadrature. The inner section of the vertical bars, denoted by the tick marks, show the statistical uncertainty. a,c: comparison with different simulation event generators: MadGraph+PYTHIA (both the default and after reweighting the top quark $ {p_{\mathrm {T}}}$ spectrum), MC@NLO+HERWIG, POWHEG v1+HERWIG, POWHEG v1+PYTHIA, POWHEG v2+HERWIG, and POWHEG v2+PYTHIA. b,d: comparison with predictions from the MadGraph+PYTHIA event generator found by varying the matching threshold and renormalization scales ($\mu _{\mathrm {R}}$, $\mu _{\mathrm {F}}$) up and down by a factor of two. The lower plots show the ratio of the predictions to the data, with the statistical and total uncertainties in the ratios indicated by the two shaded bands. |
png pdf |
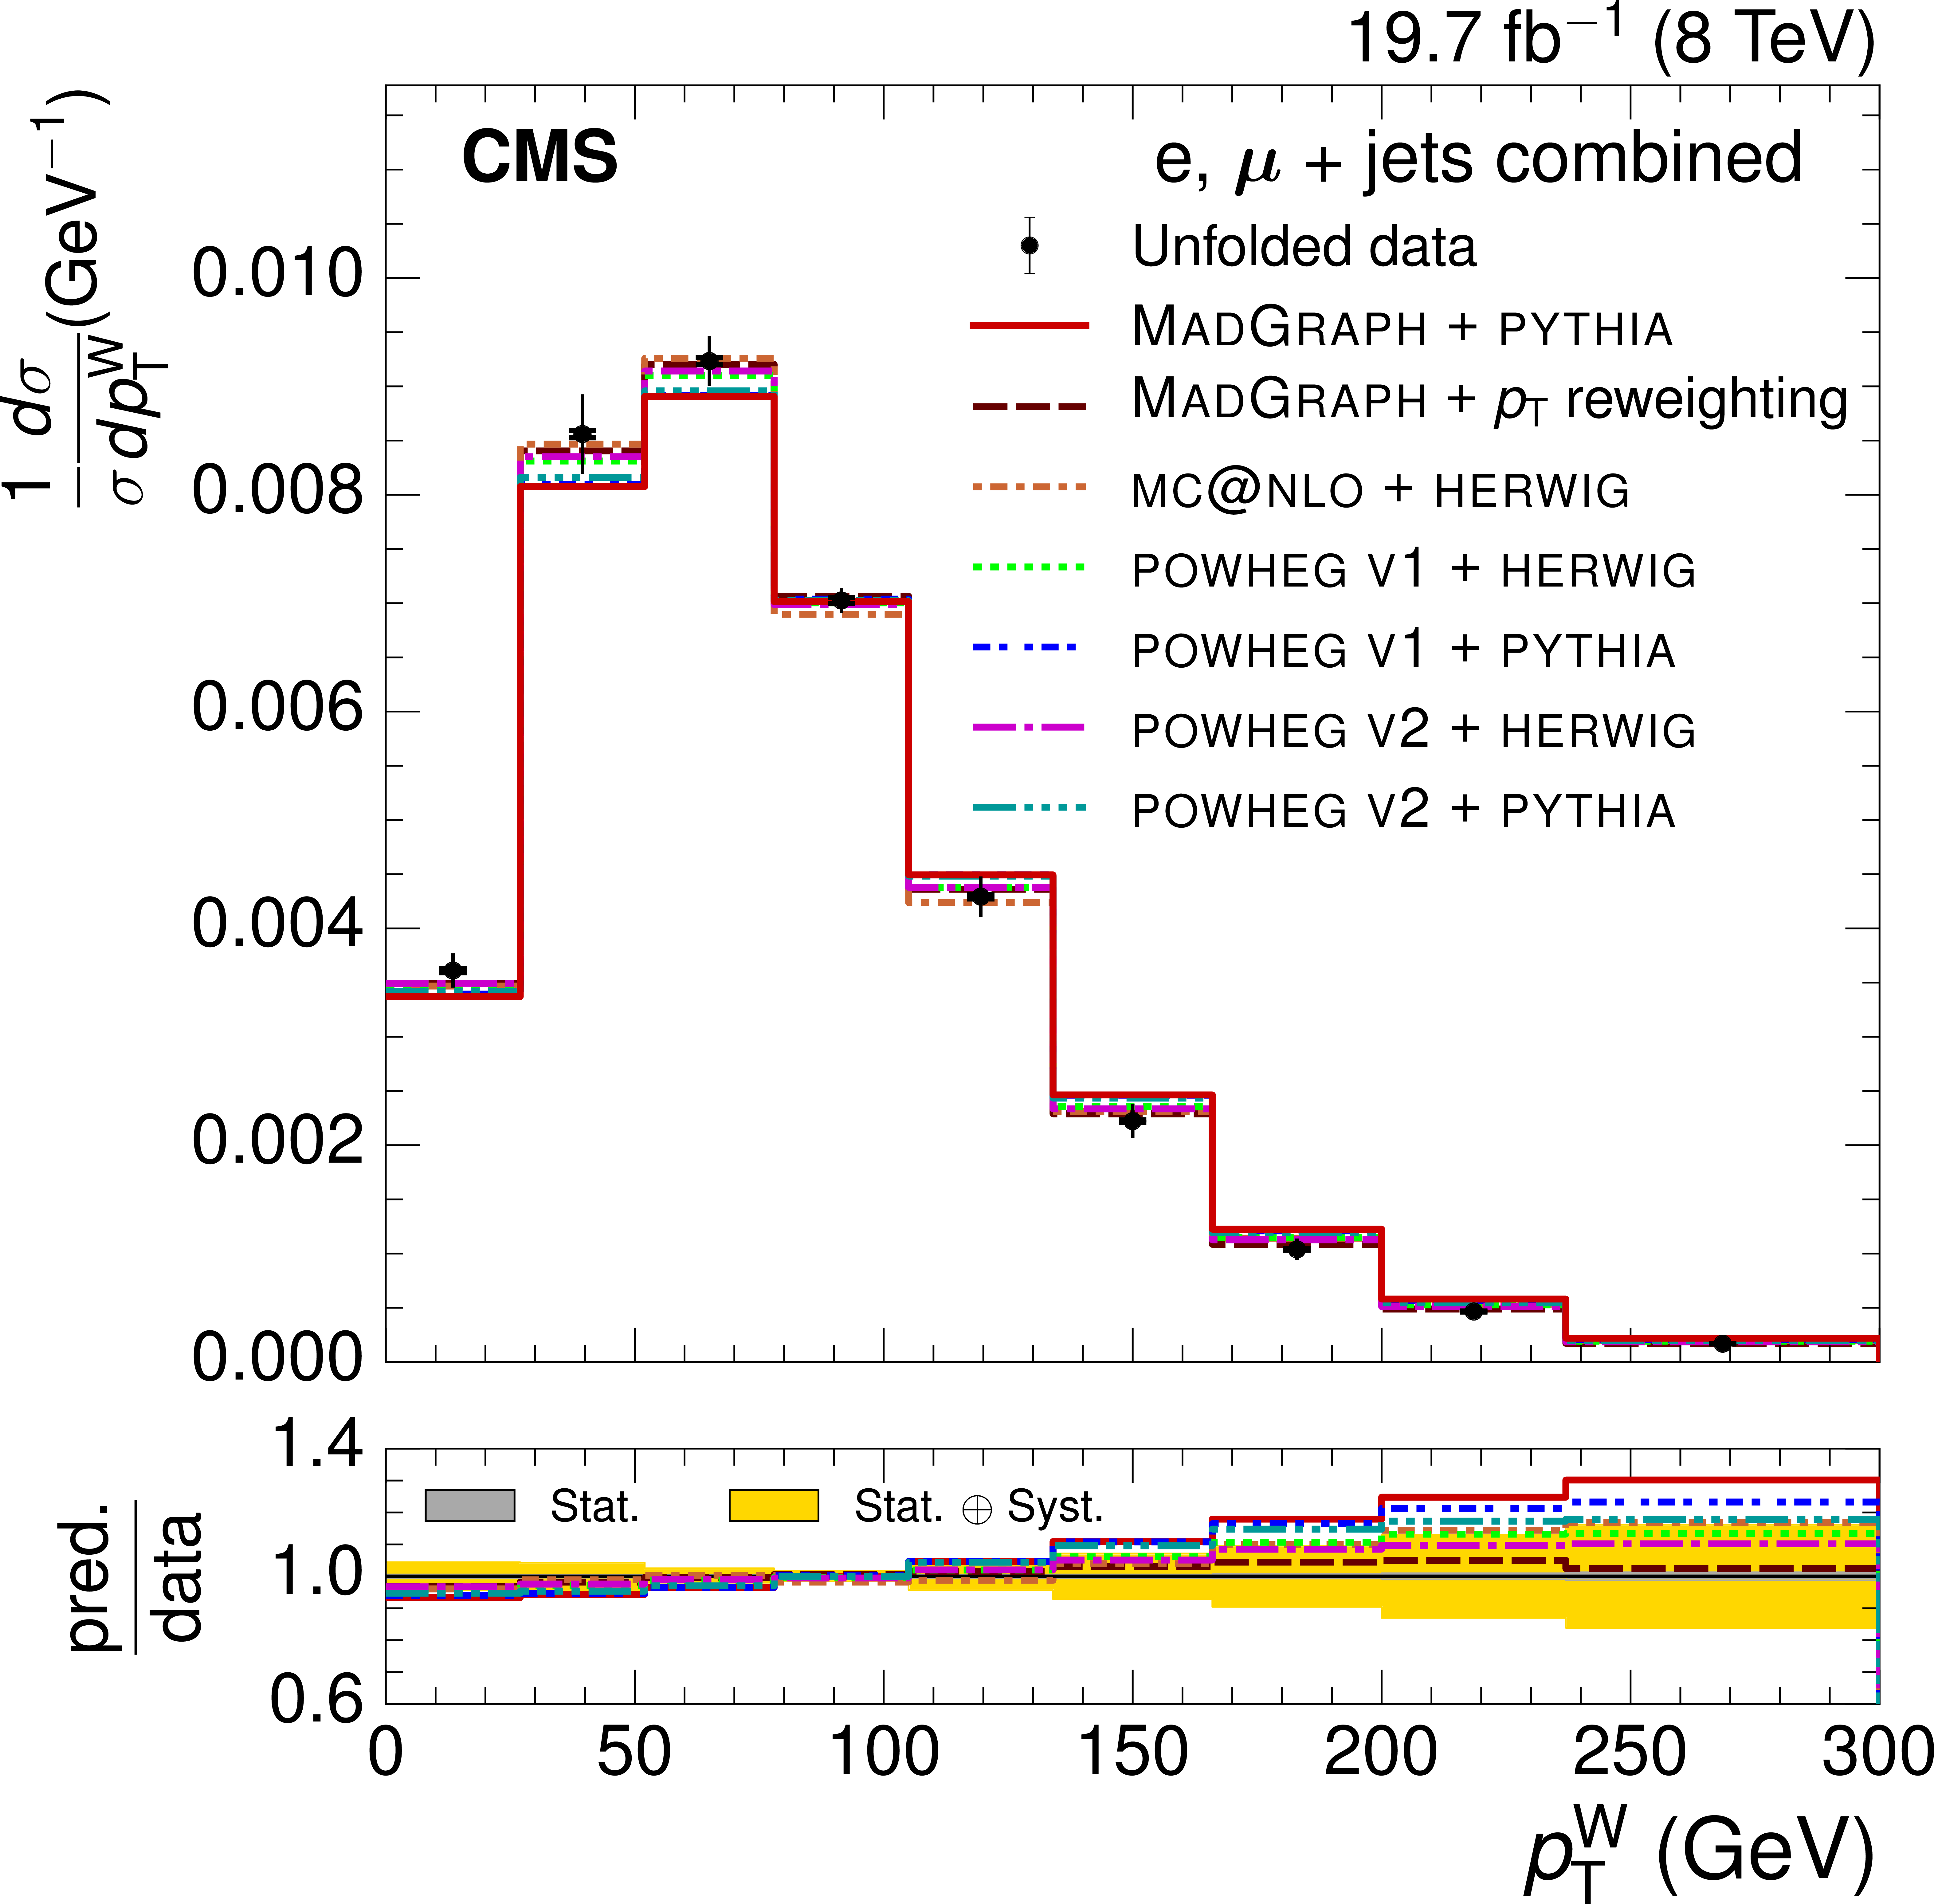
Figure 6-c:
Normalized ${S_\mathrm {T}}$ (a,b) and ${ p_\mathrm {T}^{\mathrm {W}} }$ (c,d) differential ${\mathrm{ t \bar{t} } }$ cross sections from combined electron and muon data at $ \sqrt{s} = $ 8 TeV. The vertical bars on the data points represent the statistical and systematic uncertainties added in quadrature. The inner section of the vertical bars, denoted by the tick marks, show the statistical uncertainty. a,c: comparison with different simulation event generators: MadGraph+PYTHIA (both the default and after reweighting the top quark $ {p_{\mathrm {T}}}$ spectrum), MC@NLO+HERWIG, POWHEG v1+HERWIG, POWHEG v1+PYTHIA, POWHEG v2+HERWIG, and POWHEG v2+PYTHIA. b,d: comparison with predictions from the MadGraph+PYTHIA event generator found by varying the matching threshold and renormalization scales ($\mu _{\mathrm {R}}$, $\mu _{\mathrm {F}}$) up and down by a factor of two. The lower plots show the ratio of the predictions to the data, with the statistical and total uncertainties in the ratios indicated by the two shaded bands. |
png pdf |
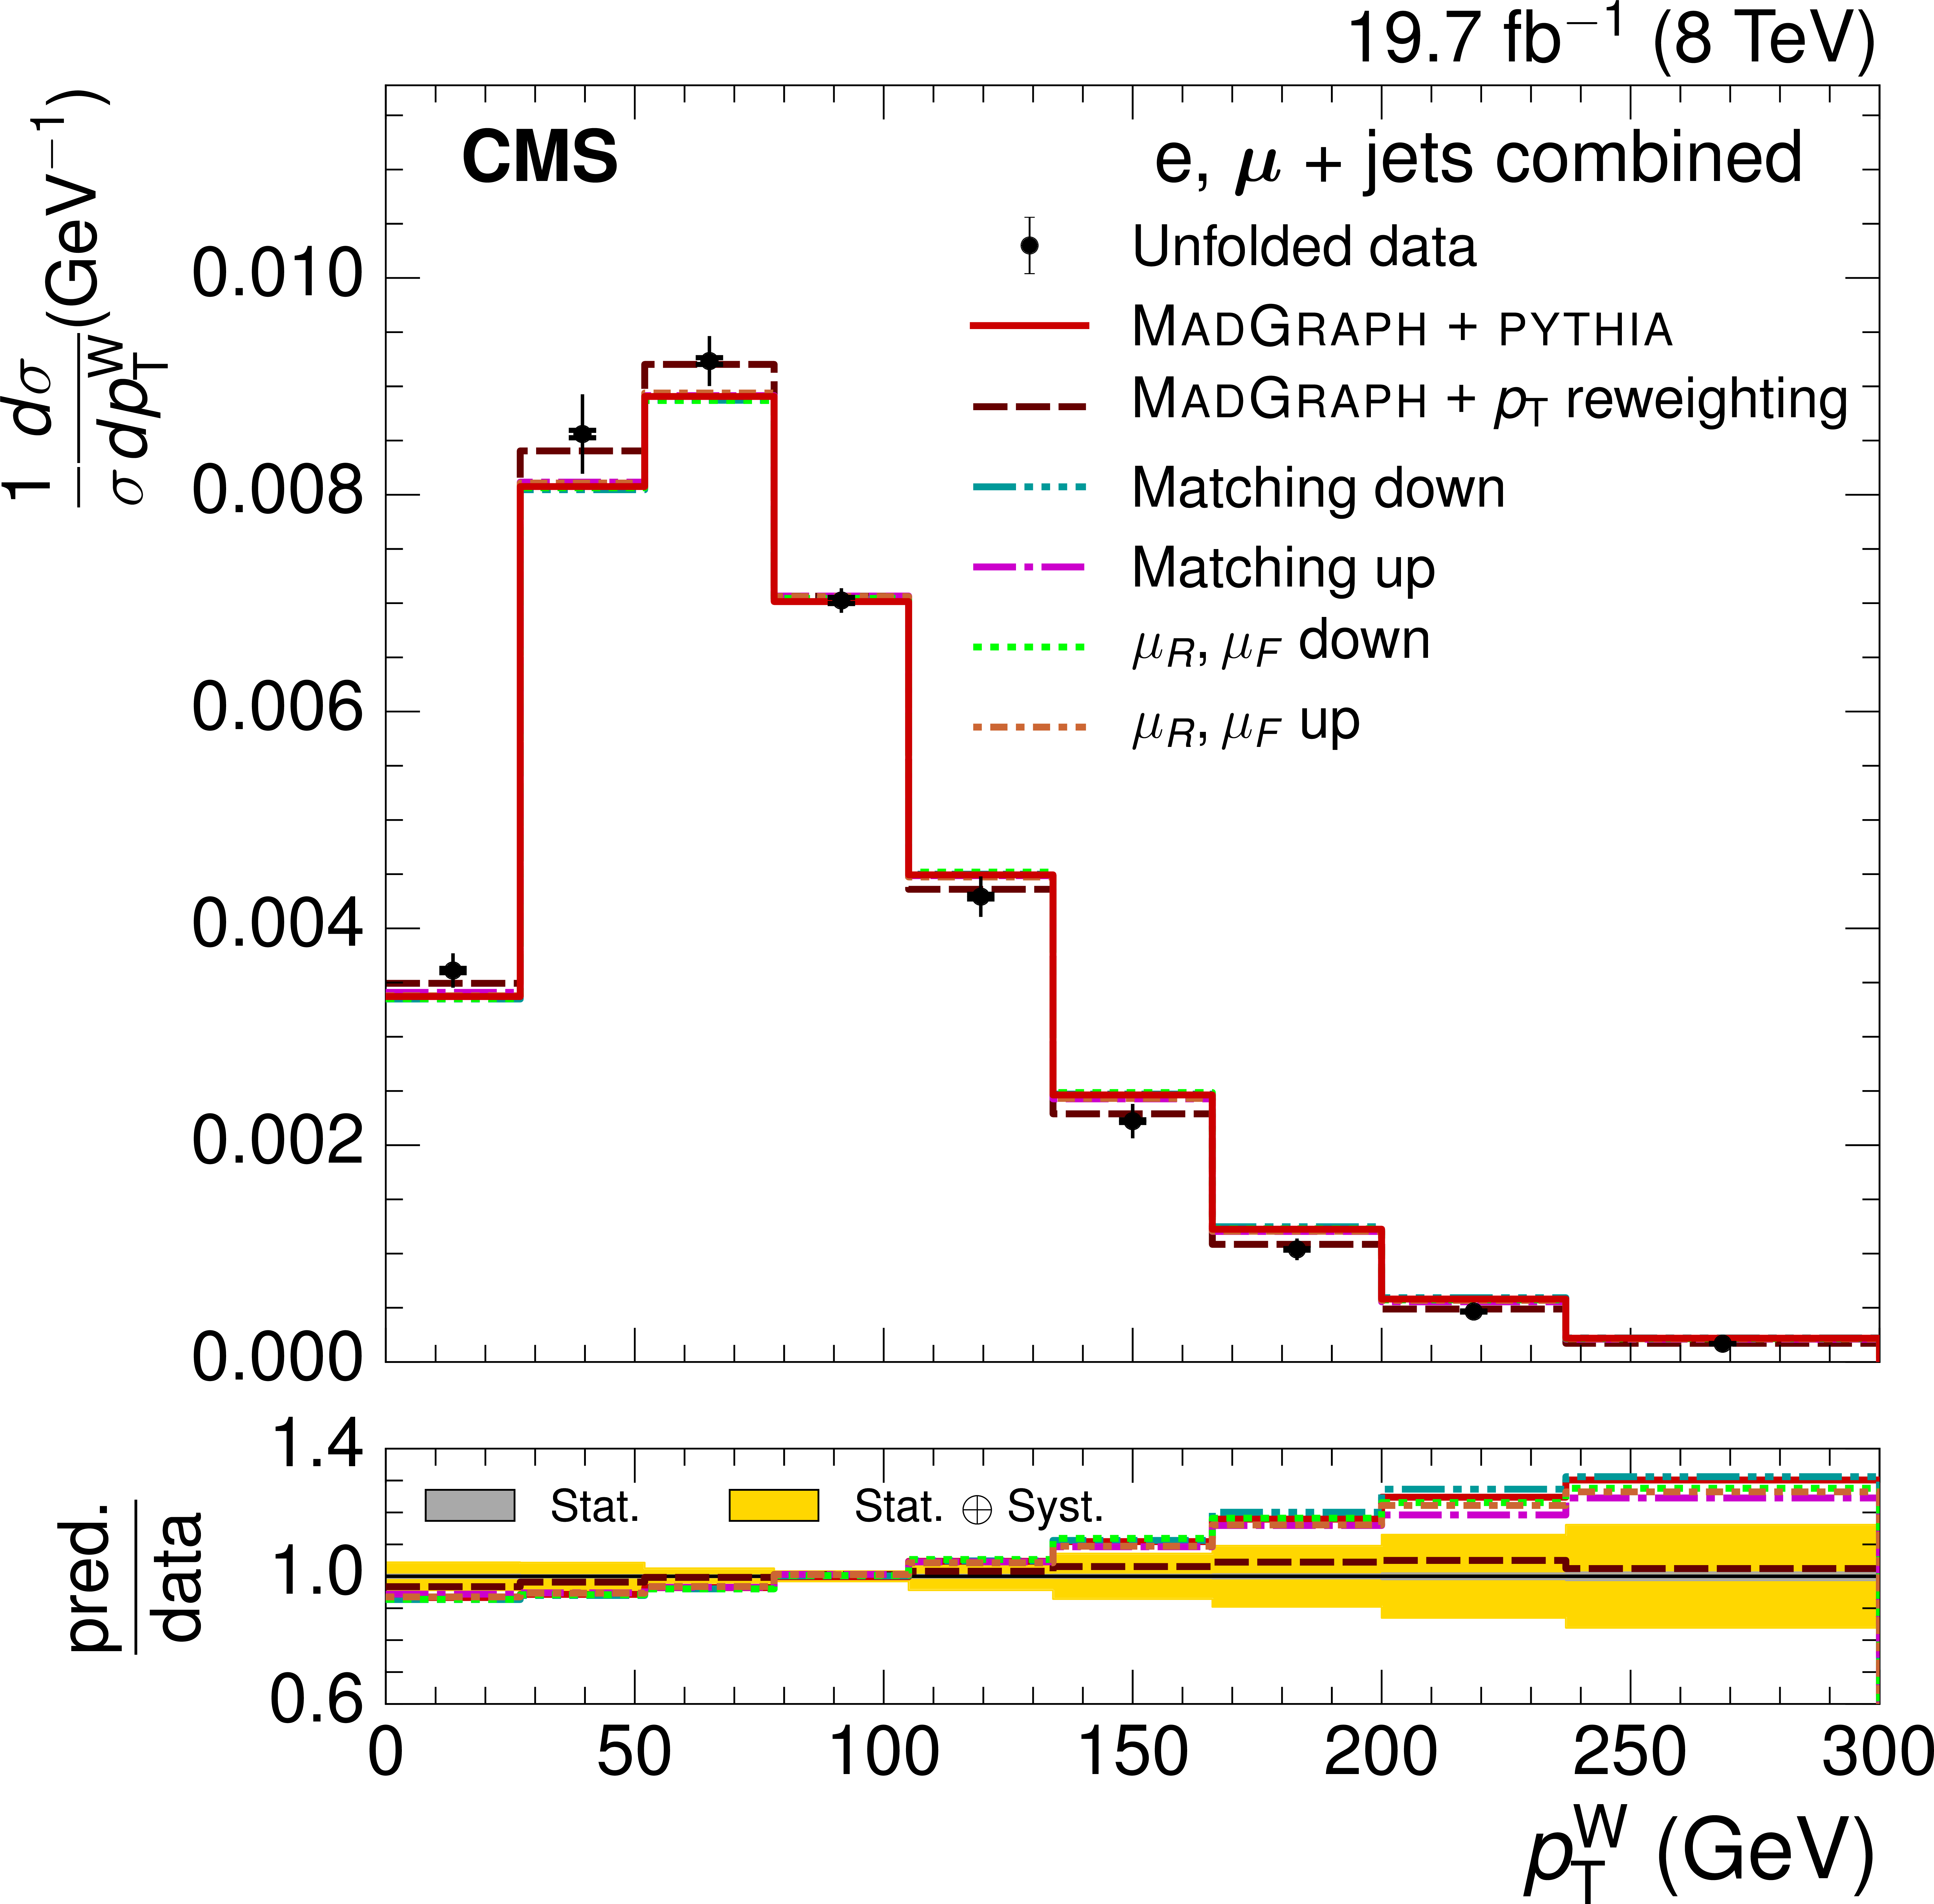
Figure 6-d:
Normalized ${S_\mathrm {T}}$ (a,b) and ${ p_\mathrm {T}^{\mathrm {W}} }$ (c,d) differential ${\mathrm{ t \bar{t} } }$ cross sections from combined electron and muon data at $ \sqrt{s} = $ 8 TeV. The vertical bars on the data points represent the statistical and systematic uncertainties added in quadrature. The inner section of the vertical bars, denoted by the tick marks, show the statistical uncertainty. a,c: comparison with different simulation event generators: MadGraph+PYTHIA (both the default and after reweighting the top quark $ {p_{\mathrm {T}}}$ spectrum), MC@NLO+HERWIG, POWHEG v1+HERWIG, POWHEG v1+PYTHIA, POWHEG v2+HERWIG, and POWHEG v2+PYTHIA. b,d: comparison with predictions from the MadGraph+PYTHIA event generator found by varying the matching threshold and renormalization scales ($\mu _{\mathrm {R}}$, $\mu _{\mathrm {F}}$) up and down by a factor of two. The lower plots show the ratio of the predictions to the data, with the statistical and total uncertainties in the ratios indicated by the two shaded bands. |
| Tables | |

png pdf |
Table 1:
Typical relative systematic uncertainties in percent (median values) in the normalized ${\mathrm{ t \bar{t} } }$ differential cross section measurement as a function of the four kinematic event variables at a center-of-mass energy of 8 TeV (combination of electron and muon channels). Typical values of the total systematic uncertainty are also shown. |

png pdf |
Table A1:
Normalized $\mathrm{t\bar{t}}$ differential cross section measurements with respect to the $H_{\mathrm{T}}$ variable at a center-of-mass energy of 7 TeV (combination of electron and muon channels). The rightmost three columns show the relative uncertainties on the measured values, in percent. The statistical and systematic uncertainties are listed separately, and are combined in quadrature to give the overall relative uncertainty. |
png pdf |
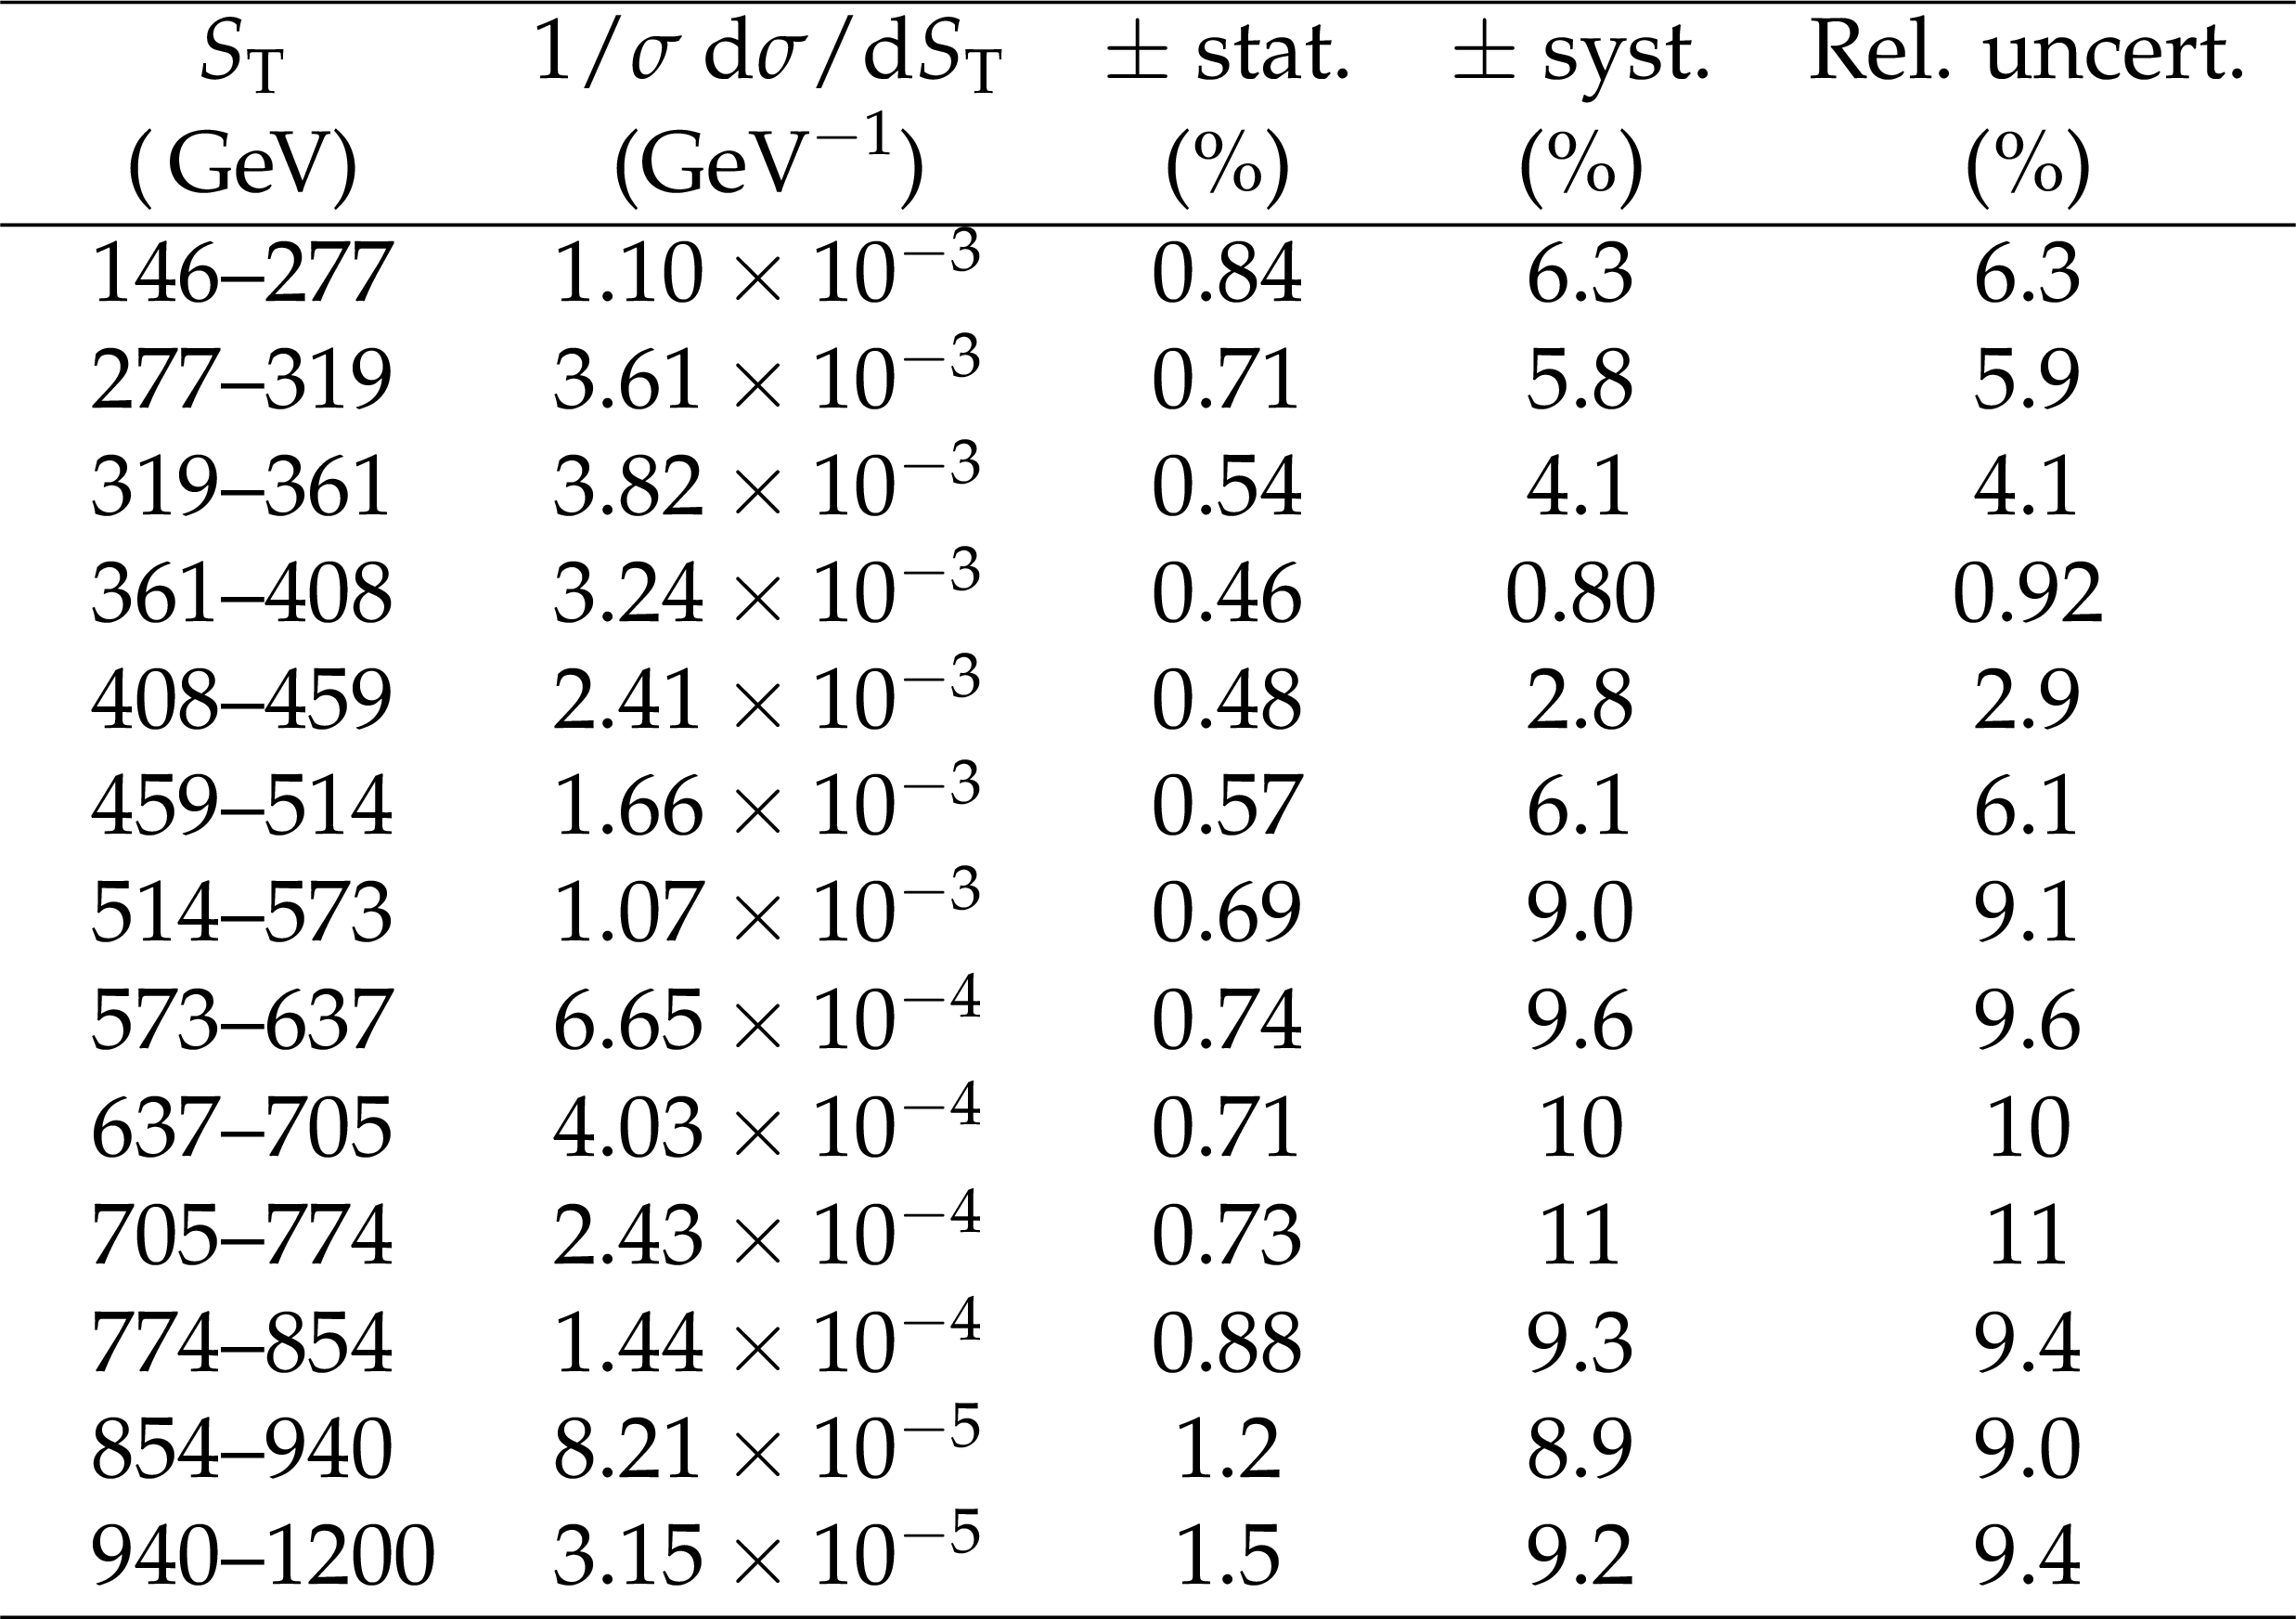
Table A2:
Normalized $\mathrm{t\bar{t}}$ differential cross section measurements with respect to the $S_{\mathrm{T}}$ variable at a center-of-mass energy of 7 TeV (combination of electron and muon channels). The rightmost three columns show the relative uncertainties on the measured values, in percent. The statistical and systematic uncertainties are listed separately, and are combined in quadrature to give the overall relative uncertainty. |
png pdf |
Table A3:
Normalized $\mathrm{t\bar{t}}$ differential cross section measurements with respect to the $p_{\mathrm{T}}^{\mathrm{W}}$ variable at a center-of-mass energy of 7 TeV (combination of electron and muon channels). The rightmost three columns show the relative uncertainties on the measured values, in percent. The statistical and systematic uncertainties are listed separately, and are combined in quadrature to give the overall relative uncertainty. |
png pdf |
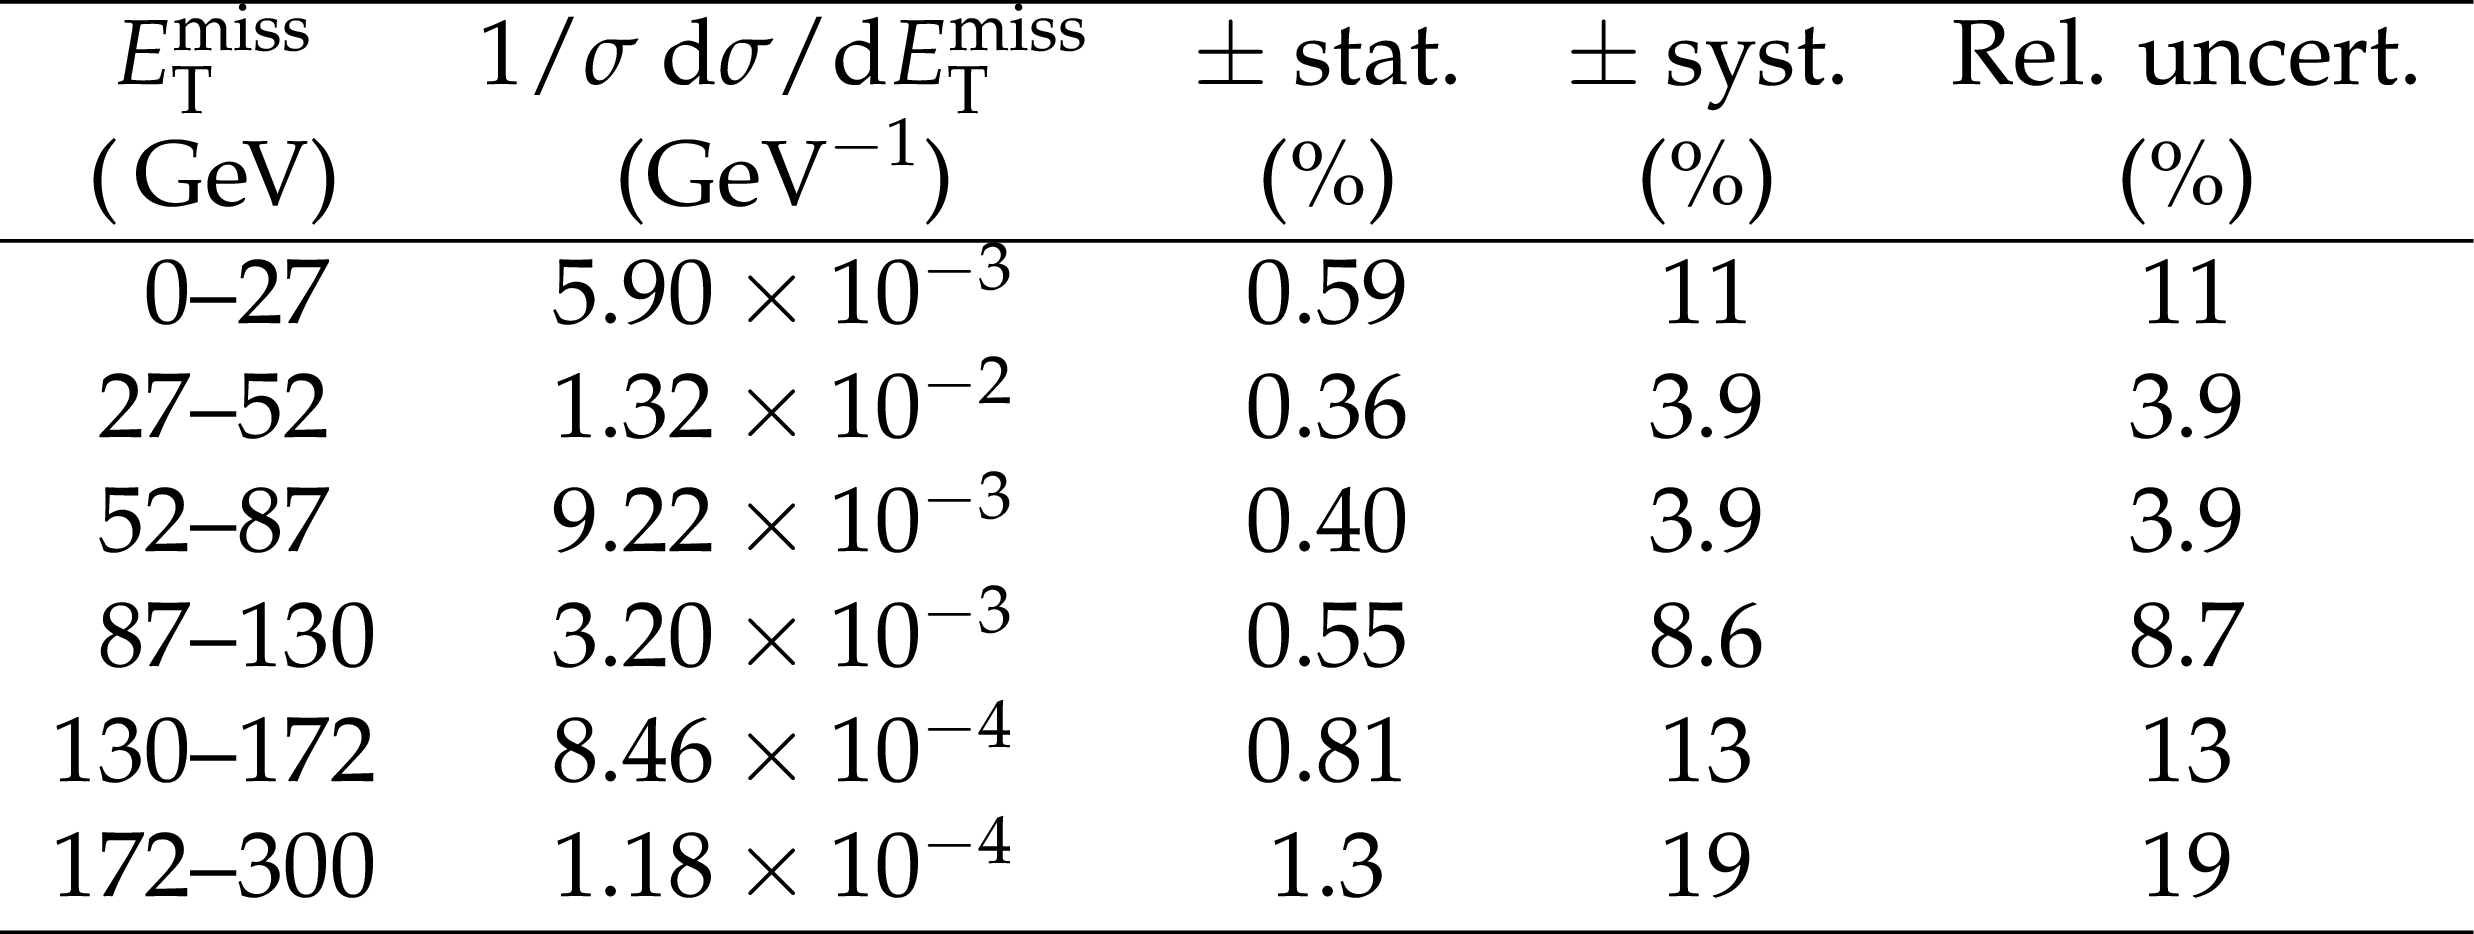
Table A4:
Normalized $\mathrm{t\bar{t}}$ differential cross section measurements with respect to the $E_{\mathrm{T}}^{\text{miss}}$ variable at a center-of-mass energy of 8 TeV (combination of electron and muon channels). The rightmost three columns show the relative uncertainties on the measured values, in percent. The statistical and systematic uncertainties are listed separately, and are combined in quadrature to give the overall relative uncertainty. |
png pdf |
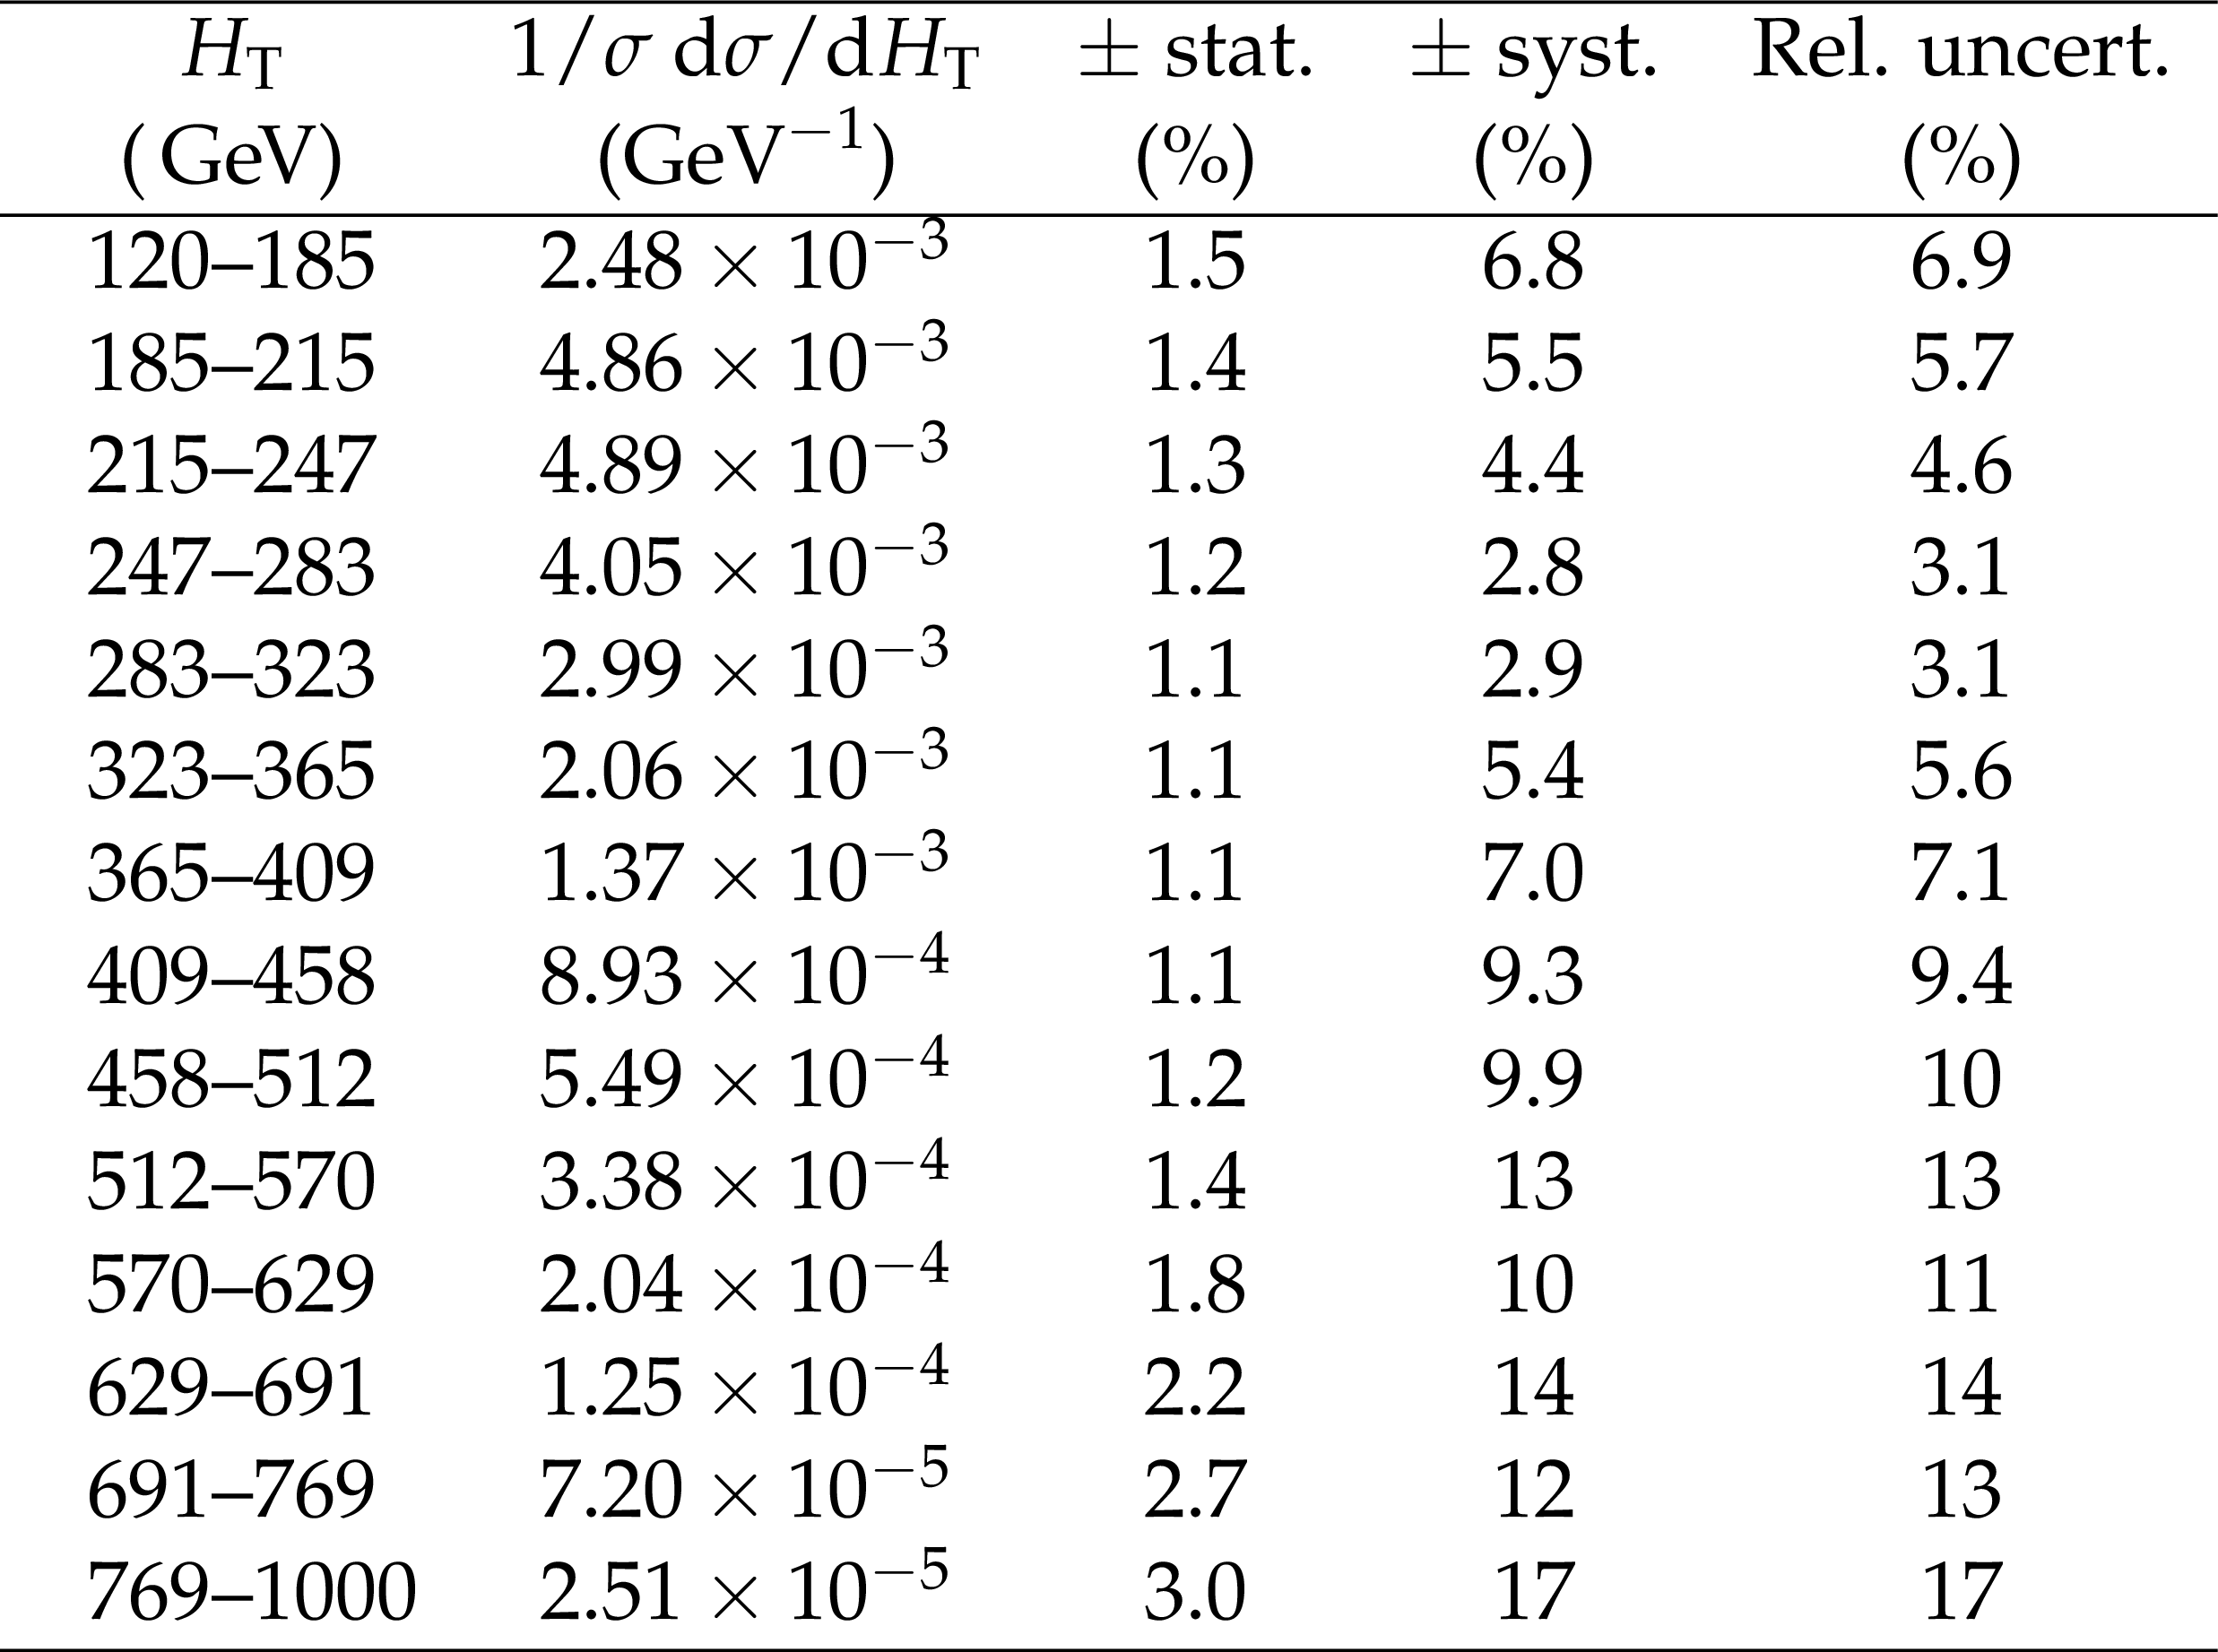
Table A5:
Normalized $\mathrm{t\bar{t}}$ differential cross section measurements with respect to the $H_{\mathrm{T}}$ variable at a center-of-mass energy of 8 TeV (combination of electron and muon channels). The rightmost three columns show the relative uncertainties on the measured values, in percent. The statistical and systematic uncertainties are listed separately, and are combined in quadrature to give the overall relative uncertainty. |

png pdf |
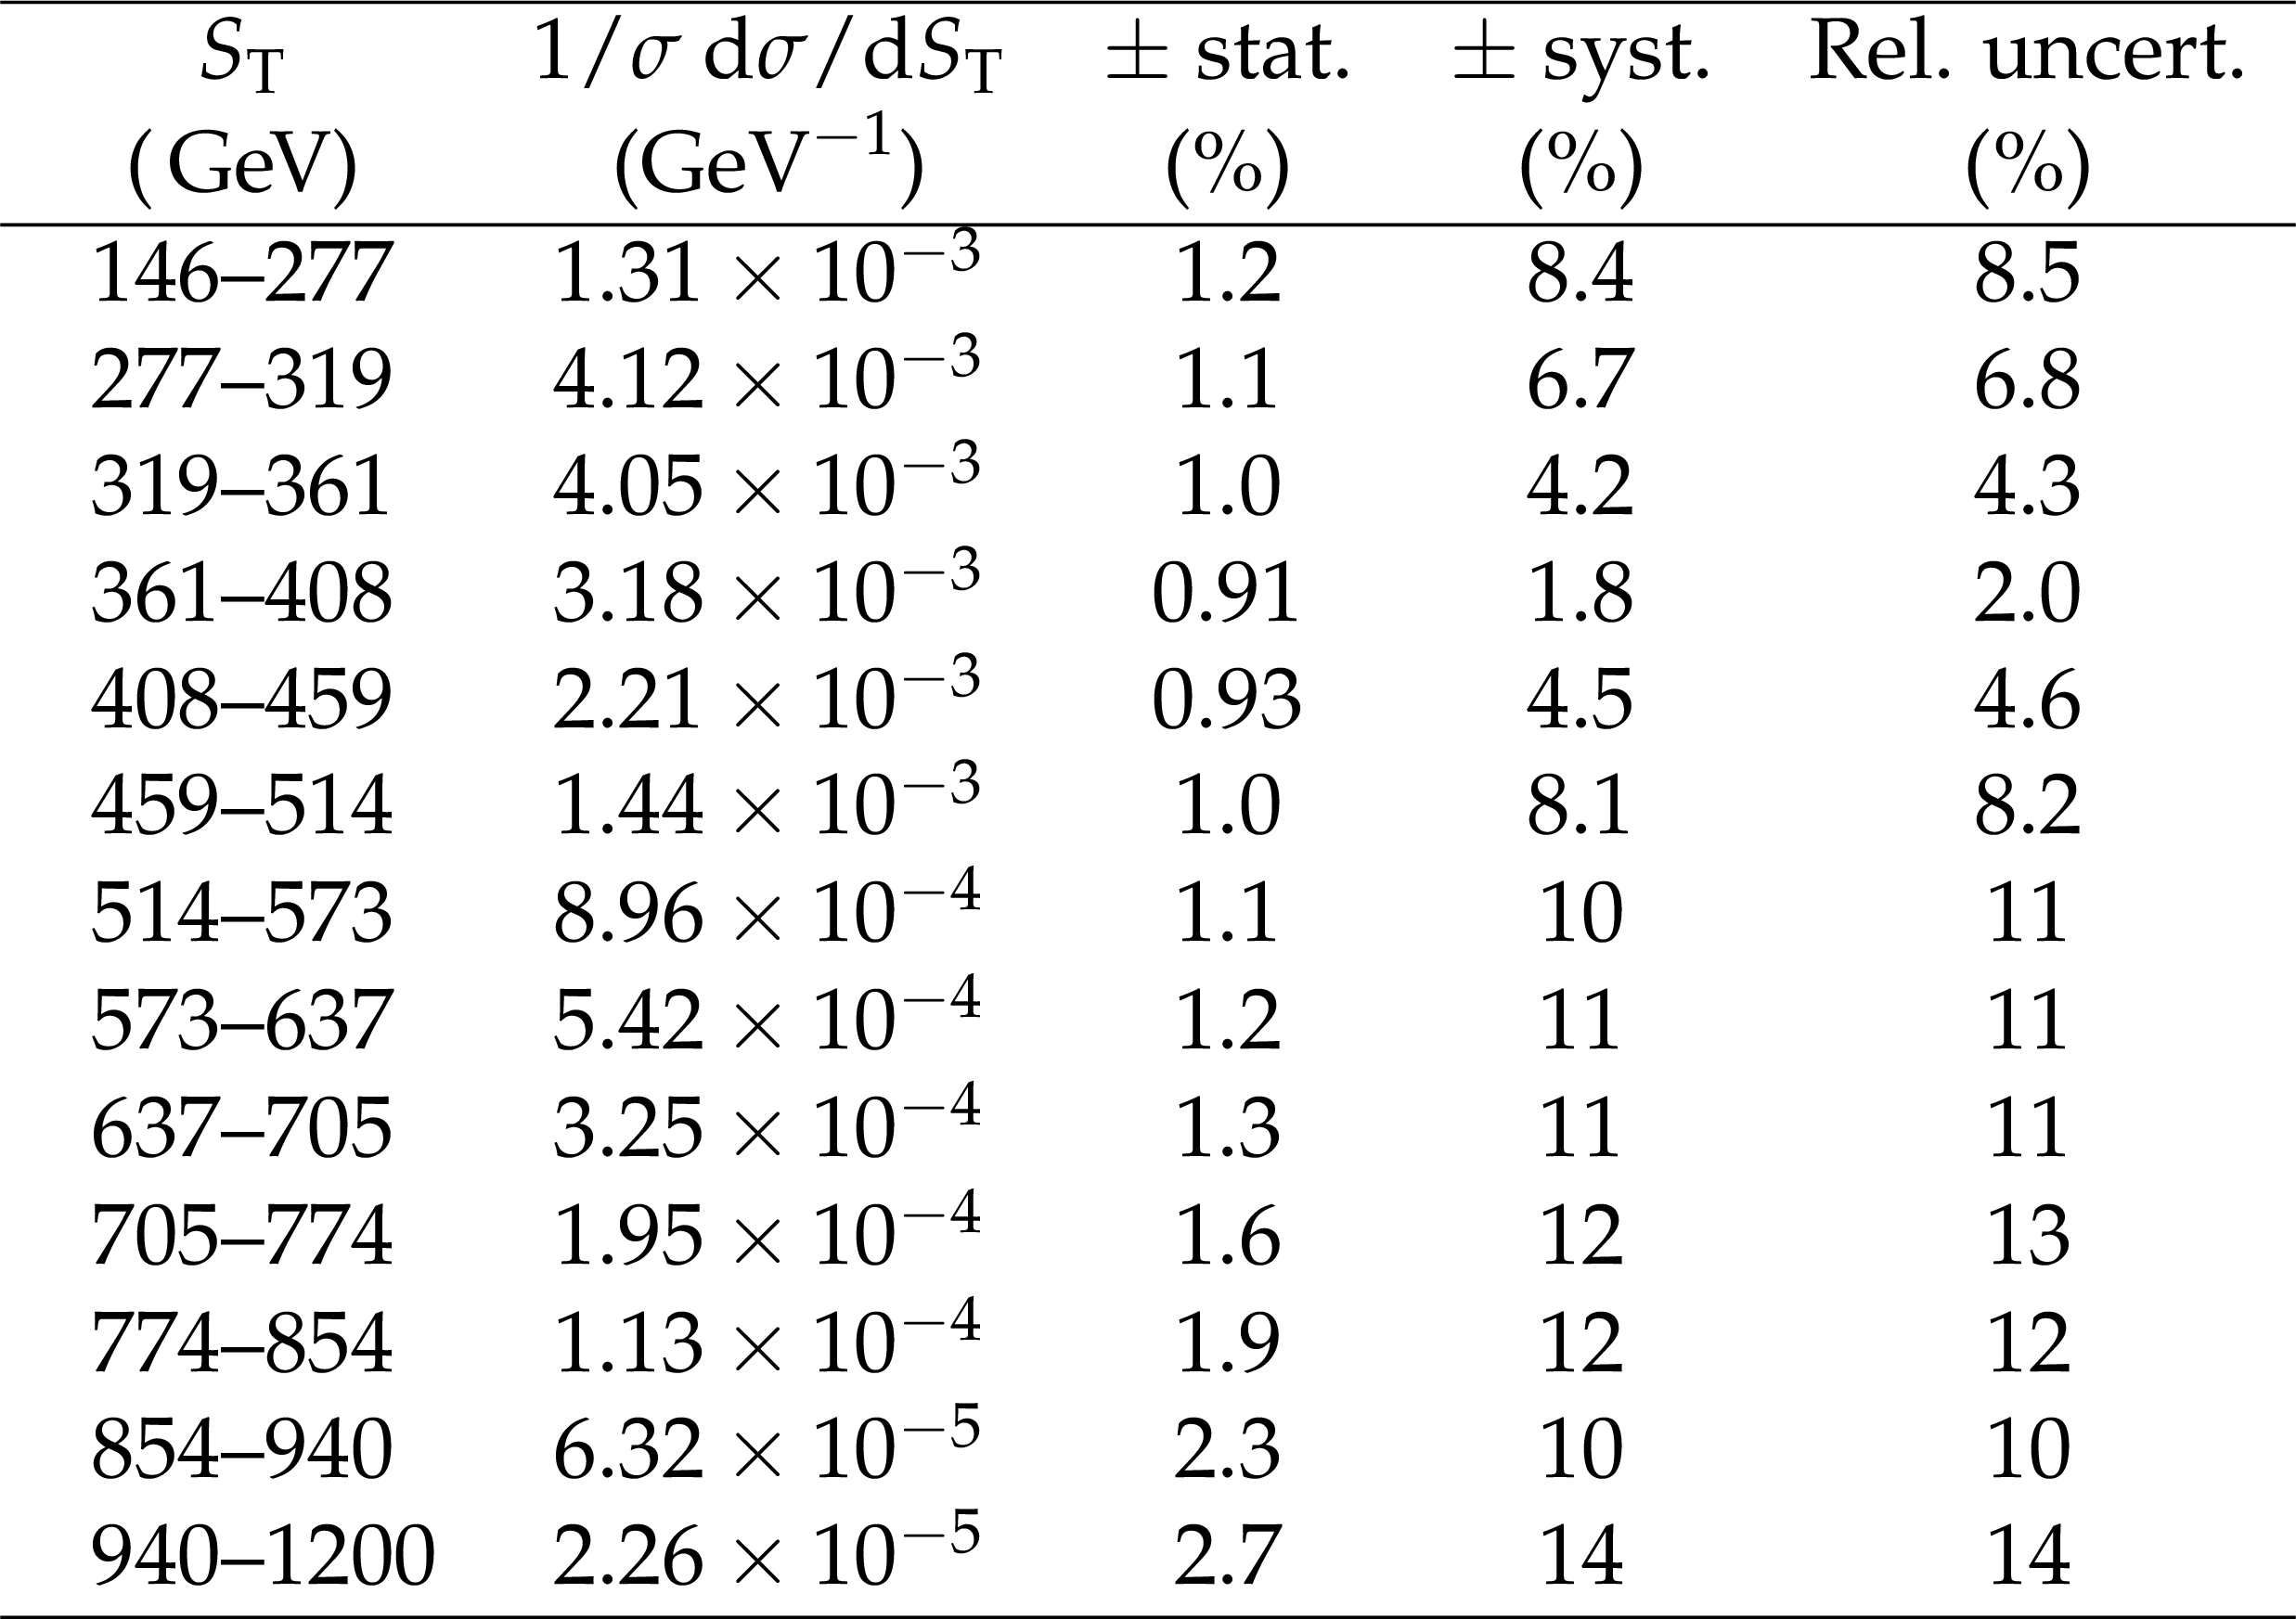
Table A6:
Normalized $\mathrm{t\bar{t}}$ differential cross section measurements with respect to the $S_{\mathrm{T}}$ variable at a center-of-mass energy of 8 TeV (combination of electron and muon channels). The rightmost three columns show the relative uncertainties on the measured values, in percent. The statistical and systematic uncertainties are listed separately, and are combined in quadrature to give the overall relative uncertainty. |
png pdf |
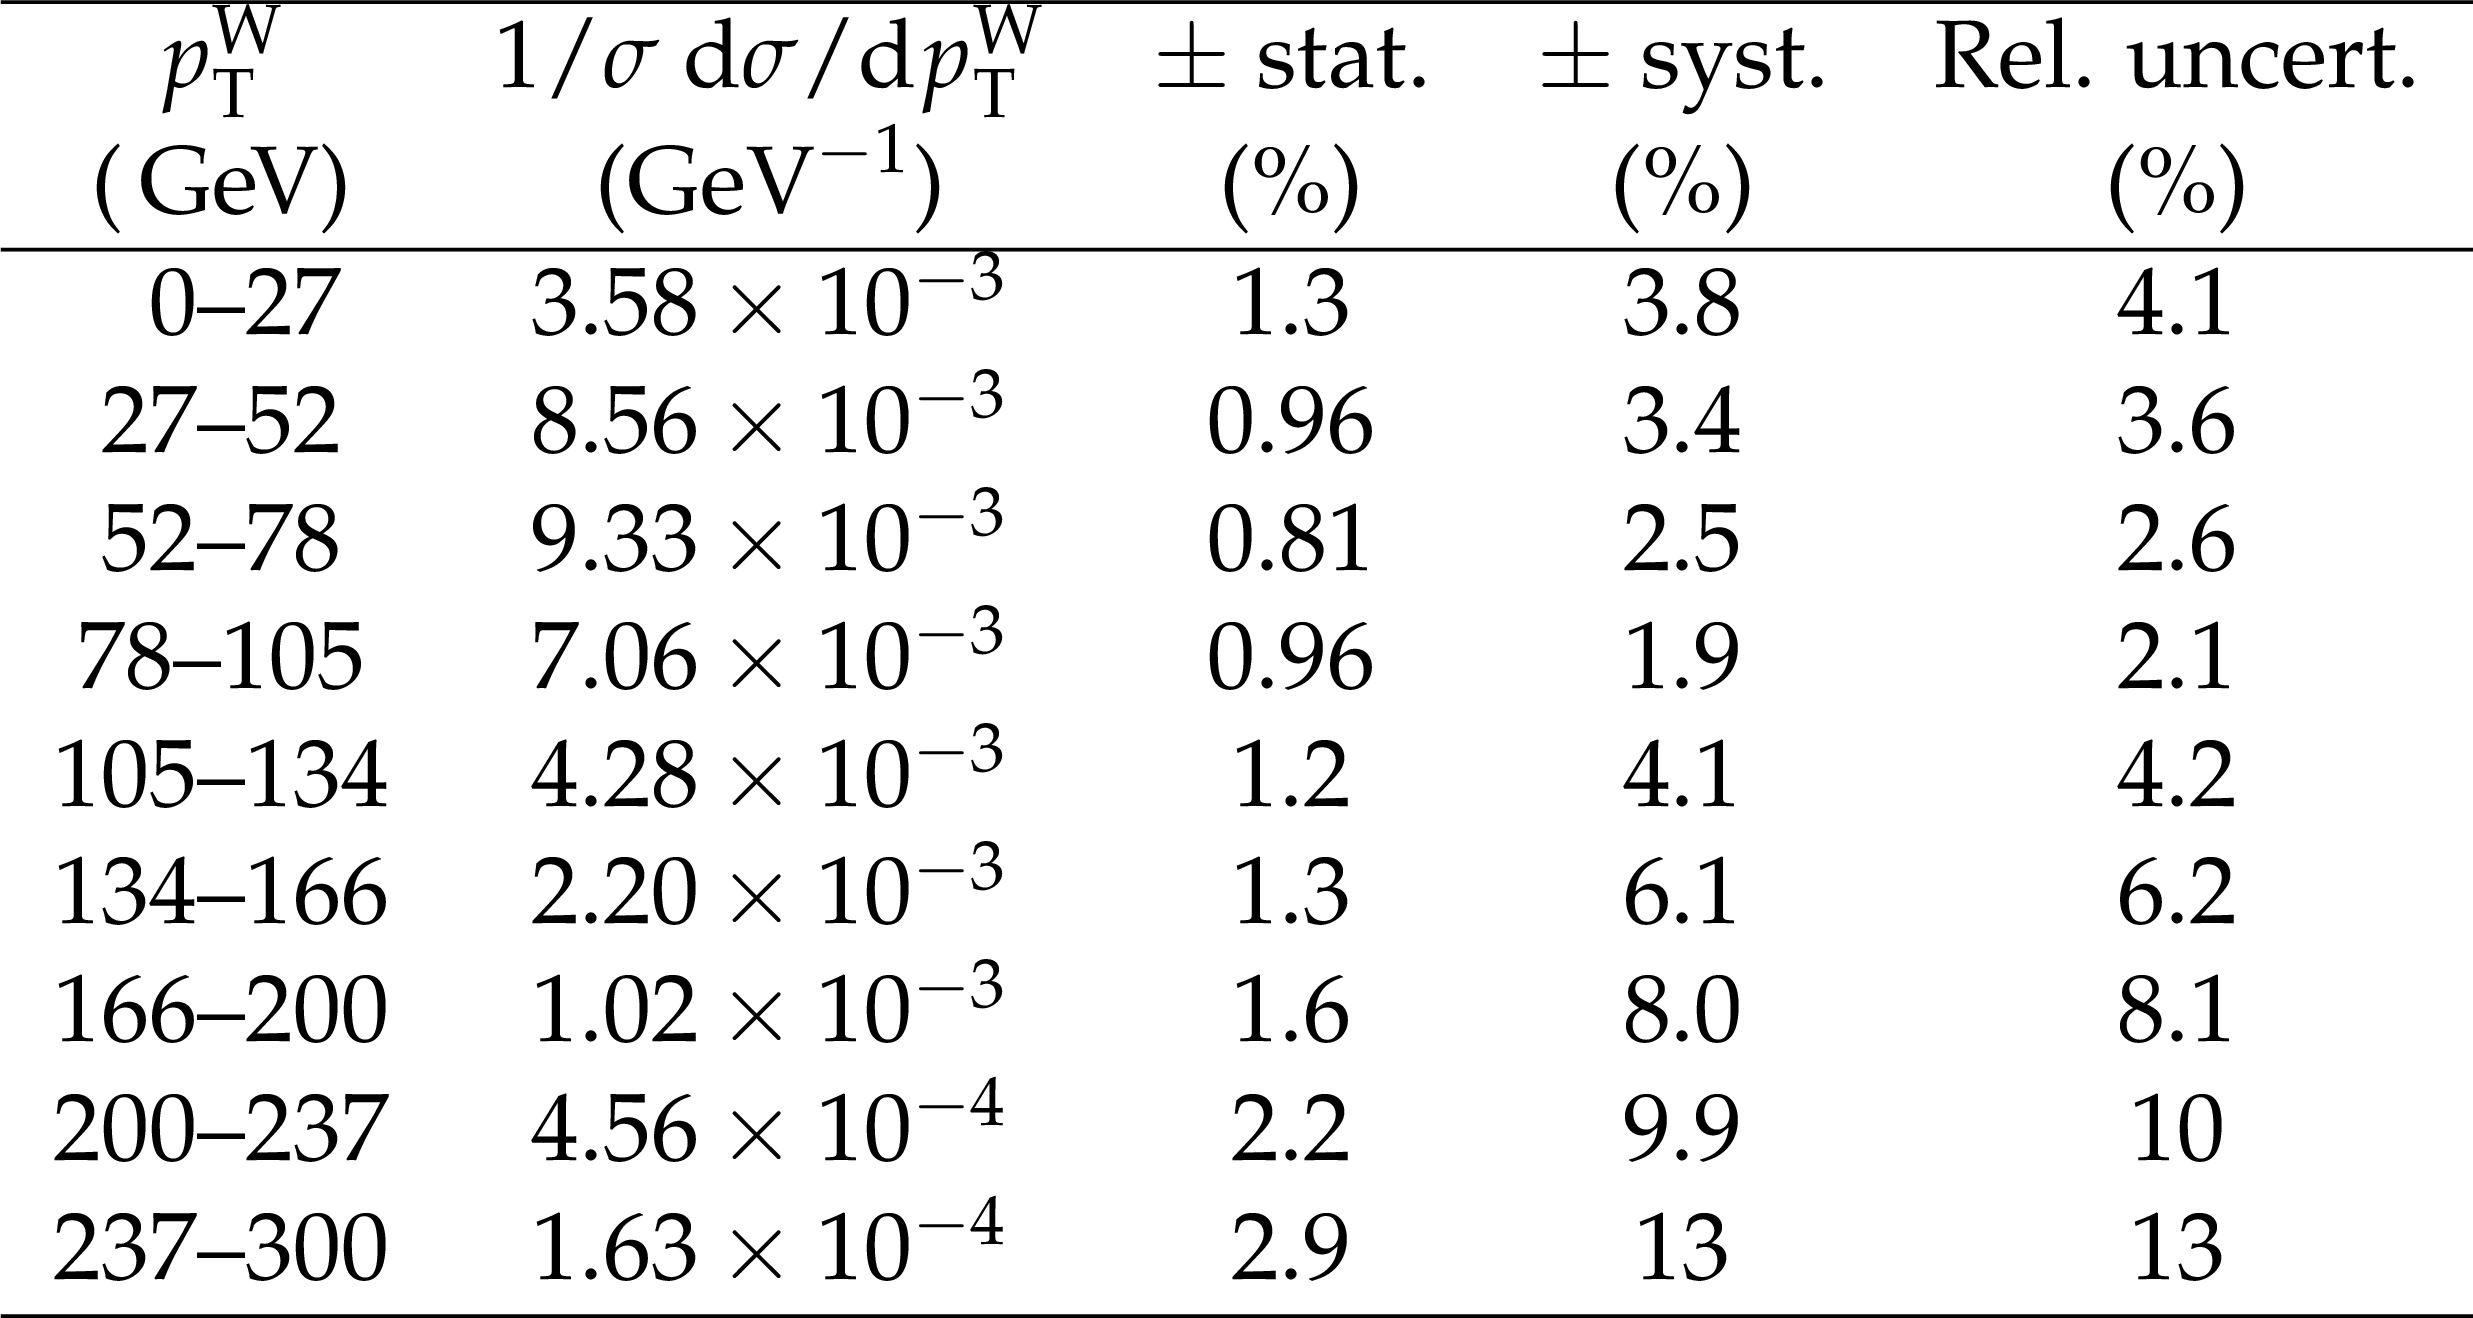
Table A7:
Normalized $\mathrm{t\bar{t}}$ differential cross section measurements with respect to the $p_{\mathrm{T}}^{\mathrm{W}}$ variable at a center-of-mass energy of 8 TeV (combination of electron and muon channels). The rightmost three columns show the relative uncertainties on the measured values, in percent. The statistical and systematic uncertainties are listed separately, and are combined in quadrature to give the overall relative uncertainty. |
| Summary |
|
A measurement of the normalized differential cross section of top quark pair production with respect to the four kinematic event variables $E_{\mathrm{T}}^{\text{miss}}$, $H_{\mathrm{T}}$, ${S_\mathrm{T}} $, and $p_{\mathrm{T}}^{\mathrm{W}}$ has been performed in pp collisions at a center-of-mass energy of 7 TeV using 5.0 fb$^{-1}$ and at 8 TeV using 19.7 fb$^{-1}$ of data collected by the CMS experiment. This study confirms previous CMS findings that the observed top quark $p_{\mathrm{T}}$ spectrum is softer than predicted by the MadGraph, POWHEG, and MCatNLO event generators, but otherwise there is broad consistency between the MC event generators and observation. This result provides confidence in the description of $\mathrm{ t \bar{t} }$ production in the SM and its implementation in the most frequently used simulation packages. |
| References | ||||
| 1 | CMS Collaboration | The CMS experiment at the CERN LHC | JINST 3 (2008) S08004 | CMS-00-001 |
| 2 | CDF Collaboration | First measurement of the $ \mathrm{ t \bar{t} } $ differential cross section $ \rd \sigma/\rd M_{\mathrm{ t \bar{t} }} $ in $ \mathrm{ p }\mathrm{ \bar{p} } $ collisions at $ \sqrt{s} = $ 1.96 TeV | PRL 102 (2009) 222003 | 0903.2850 |
| 3 | D0 Collaboration | Measurement of differential $ \mathrm{ t \bar{t} } $ production cross sections in $ \mathrm{ p }\mathrm{ \bar{p} } $ collisions | PRD 90 (2014) 092006 | 1401.5785 |
| 4 | CMS Collaboration | Measurement of differential top-quark pair production cross sections in $ \mathrm{ p }\mathrm{ p } $ colisions at $ \sqrt{s} = $ 7 TeV | EPJC 73 (2013) 2339 | CMS-TOP-11-013 1211.2220 |
| 5 | CMS Collaboration | Measurement of the differential cross section for top quark pair production in $ \mathrm{ p }\mathrm{ p } $ collisions at $ \sqrt{s} = $ 8 TeV | EPJC 75 (2015) 542 | CMS-TOP-12-028 1505.04480 |
| 6 | CMS Collaboration | Measurement of $ \mathrm{ t \bar{t} } $ production with additional jet activity, including $ \mathrm{ b } $ quark jets, in the dilepton channel using $ \mathrm{ p }\mathrm{ p } $ collisions at $ \sqrt{s} = $ 8 TeV | Accepted in EPJC | CMS-TOP-12-041 1510.03072 |
| 7 | CMS Collaboration | Measurement of the differential $ \mathrm{ t \bar{t} } $ production cross section for high-$ p_{\mathrm{T}} $ top quarks in $ \mathrm{ e } $/$ \mu $+jets final states at 8$ TeV $ | CMS-PAS-TOP-14-012 | CMS-PAS-TOP-14-012 |
| 8 | ATLAS Collaboration | Differential $ \mathrm{ t \bar{t} } $ cross-section measurements as a function of observables constructed from final-state particles using $ \mathrm{ p }\mathrm{ p } $ collisions at $ \sqrt{s} = $ 7 TeV in the ATLAS detector | JHEP 06 (2015) 100 | 1502.05923 |
| 9 | ATLAS Collaboration | Measurement of the differential cross-section of highly boosted top quarks as a function of their transverse momentum in $ \sqrt{s} = $ 8 TeV proton-proton collisions using the ATLAS detector | PRD 93 (2016) 032009 | 1510.03818 |
| 10 | J. Alwall et al. | The automated computation of tree-level and next-to-leading order differential cross sections, and their matching to parton shower simulations | JHEP 07 (2014) 079 | 1405.0301 |
| 11 | M. Czakon and A. Mitov | Top++: a program for the calculation of the top-pair cross-section at hadron colliders | CPC 185 (2014) 2930 | 1112.5675 |
| 12 | M. Botje et al. | The PDF4LHC Working Group interim recommendations | 1101.0538 | |
| 13 | S. Alekhin et al. | The PDF4LHC Working Group interim report | 1101.0536 | |
| 14 | A. D. Martin, W. J. Stirling, R. S. Thorne, and G. Watt | Uncertainties on $ \alpha_{S} $ in global PDF analyses and implications for predicted hadronic cross sections | EPJC 64 (2009) 653 | 0905.3531 |
| 15 | J. Gao et al. | CT10 next-to-next-to-leading order global analysis of QCD | PRD 89 (2014) 033009 | 1302.6246 |
| 16 | NNPDF Collaboration | Parton distributions with LHC data | Nucl. Phys. B 867 (2013) 244 | 1207.1303 |
| 17 | T. Sj\"ostrand, S. Mrenna, and P. Skands | PYTHIA 6.4 physics and manual | JHEP 05 (2006) 026 | hep-ph/0603175 |
| 18 | S. H\"oche et al. | Matching parton showers and matrix elements | in HERA and the LHC: A Workshop on the implications of HERA for LHC physics: Proceedings Part A 2006 | hep-ph/0602031 |
| 19 | GEANT4 Collaboration | GEANT4---a simulation toolkit | NIMA 506 (2003) 250 | |
| 20 | P. Nason | A new method for combining NLO QCD with shower Monte Carlo algorithms | JHEP 11 (2004) 040 | hep-ph/0409146 |
| 21 | S. Frixione, P. Nason, and C. Oleari | Matching NLO QCD computations with parton shower simulations: the POWHEG method | JHEP 11 (2007) 070 | 0709.2092 |
| 22 | S. Alioli, P. Nason, C. Oleari, and E. Re | A general framework for implementing NLO calculations in shower Monte Carlo programs: the POWHEG BOX | JHEP 06 (2010) 043 | 1002.2581 |
| 23 | S. Frixione and B. R. Webber | Matching NLO QCD computations and parton shower simulations | JHEP 06 (2002) 029 | hep-ph/0204244 |
| 24 | G. Corcella et al. | HERWIG 6: an event generator for hadron emission reactions with interfering gluons (including supersymmetric processes) | JHEP 01 (2001) 010 | hep-ph/0011363 |
| 25 | S. Alioli, P. Nason, C. Oleari, and E. Re | NLO single-top production matched with shower in POWHEG: $ s $- and $ t $-channel contributions | JHEP 09 (2009) 111, , [Erratum: \DOI10.1007/JHEP02(2010)011] | 0907.4076 |
| 26 | E. Re | Single-top $ \mathrm{ W }\mathrm{ t } $-channel production matched with parton showers using the POWHEG method | EPJC 71 (2011) 1547 | 1009.2450 |
| 27 | K. Melnikov and F. Petriello | Electroweak gauge boson production at hadron colliders through $ \mathcal{O}(\alpha_{s}^2) $ | PRD 74 (2006) 114017 | hep-ph/0609070 |
| 28 | K. Melnikov and F. Petriello | $ \mathrm{ W } $ boson production cross section at the large hadron collider with $ \mathcal{O}( \alpha_{s}^{2} ) $ corrections | PRL 96 (2006) 231803 | |
| 29 | N. Kidonakis | NNLL threshold resummation for top-pair and single-top production | Phys. Part. Nucl. 45 (2014) 714 | 1210.7813 |
| 30 | J. Pumplin et al. | New generation of parton distributions with uncertainties from global QCD analysis | JHEP 07 (2002) 012 | hep-ph/0201195 |
| 31 | H.-L. Lai et al. | New parton distributions for collider physics | PRD 82 (2010) 074024 | 1007.2241 |
| 32 | CMS Collaboration | Measurement of the underlying event activity at the LHC with $ \sqrt{s} = $ 7 TeV and comparison with $ \sqrt{s} = $ 0.9 TeV | JHEP 09 (2011) 109 | CMS-QCD-10-010 1107.0330 |
| 33 | ATLAS Collaboration | ATLAS tunes of PYTHIA 6 and Pythia 8 for MC11 | Technical Report ATL-PHYS-PUB-2011-009, CERN | |
| 34 | P. Bartalini, R. Chierici, and A. de Roeck | Guidelines for the estimation of theoretical uncertainties at the LHC | CMS-NOTE-2005-013 | |
| 35 | CMS Collaboration | Description and performance of track and primary-vertex reconstruction with the CMS tracker | JINST 9 (2014) P10009 | CMS-TRK-11-001 1405.6569 |
| 36 | CMS Collaboration | Particle-flow event reconstruction in CMS and performance for jets, taus, and $ \met $ | CDS | |
| 37 | CMS Collaboration | Commissioning of the particle-flow reconstruction in minimum-bias and jet events from $ \mathrm{ p }\mathrm{ p } $ collisions at 7$ TeV $ | CDS | |
| 38 | CMS Collaboration | Performance of electron reconstruction and selection with the CMS detector in proton-proton collisions at $ \sqrt{s} = $ 8 TeV | JINST 10 (2015) P06005 | CMS-EGM-13-001 1502.02701 |
| 39 | CMS Collaboration | Performance of CMS muon reconstruction in $ \mathrm{ p }\mathrm{ p } $ collision events at $ \sqrt{s} = $ 7 TeV | JINST 7 (2012) P10002 | CMS-MUO-10-004 1206.4071 |
| 40 | M. Cacciari, G. P. Salam, and G. Soyez | The anti-$ k_t $ jet clustering algorithm | JHEP 04 (2008) 063 | hep-ph/0802.1189 |
| 41 | CMS Collaboration | Determination of jet energy calibration and transverse momentum resolution in CMS | JINST 6 (2011) P11002 | CMS-JME-10-011 1107.4277 |
| 42 | M. Cacciari, G. P. Salam, and G. Soyez | The catchment area of jets | JHEP 04 (2008) 005 | 0802.1188 |
| 43 | M. Cacciari and G. P. Salam | Pileup subtraction using jet areas | PLB 659 (2008) 119 | 0707.1378 |
| 44 | CMS Collaboration | Measurement of the ratio of the inclusive 3-jet cross section to the inclusive 2-jet cross section in $ \mathrm{ p }\mathrm{ p } $ collisions at $ \sqrt{s} = $ 7 TeV and first determination of the strong coupling constant in the TeV range | EPJC 73 (2013) 2604 | CMS-QCD-11-003 1304.7498 |
| 45 | CMS Collaboration | Identification of $ \mathrm{ b } $-quark jets with the CMS experiment | JINST 8 (2013) P04013 | CMS-BTV-12-001 1211.4462 |
| 46 | CMS Collaboration | Performance of the CMS missing transverse momentum reconstruction in $ \mathrm{ p }\mathrm{ p } $ data at $ \sqrt{s} = $ 8 TeV | JINST 10 (2015) P02006 | CMS-JME-13-003 1411.0511 |
| 47 | A. H\"ocker and V. Kartvelishvili | SVD approach to data unfolding | NIMA 372 (1996) 469 | hep-ph/9509307 |
| 48 | T. Adye | Unfolding algorithms and tests using RooUnfold | in Proceedings of the PHYSTAT 2011 Workshop, CERN-2011-006, p. 313 2011 | 1105.1160 |
| 49 | Particle Data Group, K. A. Olive et al. | Review of Particle Physics | CPC 38 (2014) 090001 | |
| 50 | CMS Collaboration | Measurements of inclusive $ \mathrm{ W } $ and $ \mathrm{ Z } $ cross sections in $ \mathrm{ p }\mathrm{ p } $ collisions at $ \sqrt{s} = $ 7 TeV | JHEP 01 (2011) 080 | CMS-EWK-10-002 1012.2466 |
| 51 | CMS Collaboration | Evidence for the 125 GeV Higgs boson decaying to a pair of $ \tau $ leptons | JHEP 05 (2014) 104 | CMS-HIG-13-004 1401.5041 |
| 52 | CMS Collaboration | Measurement of the inelastic proton-proton cross section at $ \sqrt{s} = $ 7 TeV | PLB 722 (2013) 5 | CMS-FWD-11-001 1210.6718 |
|
|
Compact Muon Solenoid LHC, CERN |
|

|

|

|

|

|