

Compact Muon Solenoid
LHC, CERN
| CMS-TOP-17-003 ; CERN-EP-2017-309 | ||
| Search for the flavor-changing neutral current interactions of the top quark and the Higgs boson which decays into a pair of b quarks at $\sqrt{s} = $ 13 TeV | ||
| CMS Collaboration | ||
| 6 December 2017 | ||
| JHEP 06 (2018) 102 | ||
| Abstract: A search for flavor-changing neutral currents (FCNC) in events with the top quark and the Higgs boson is presented. The Higgs boson decay to a pair of b quarks is considered. The data sample corresponds to an integrated luminosity of 35.9 fb$^{-1}$ recorded by the CMS experiment at the LHC in proton-proton collisions at $ \sqrt{s} = $ 13 TeV. Two channels are considered: single top quark FCNC production in association with the Higgs boson (${\mathrm{p}}{\mathrm{p}} \to \mathrm{t}\mathrm{H}$), and top quark pair production with FCNC decay of the top quark ($\mathrm{t} \to \mathrm{q}\mathrm{H}$). Final states with one isolated lepton and at least three reconstructed jets, among which at least two are associated with b quarks, are studied. No significant deviation is observed from the predicted background. Observed (expected) upper limits at 95% confidence level are set on the branching fractions of top quark decays, $\mathcal{B}(\mathrm{t} \to \mathrm{u}\mathrm{H}) < $ 0.47% (0.34%) and $\mathcal{B}(\mathrm{t} \to \mathrm{c}\mathrm{H}) < $ 0.47% (0.44%), assuming a single nonzero FCNC coupling. | ||
| Links: e-print arXiv:1712.02399 [hep-ex] (PDF) ; CDS record ; inSPIRE record ; CADI line (restricted) ; | ||
| Figures | |
png pdf |
Figure 1:
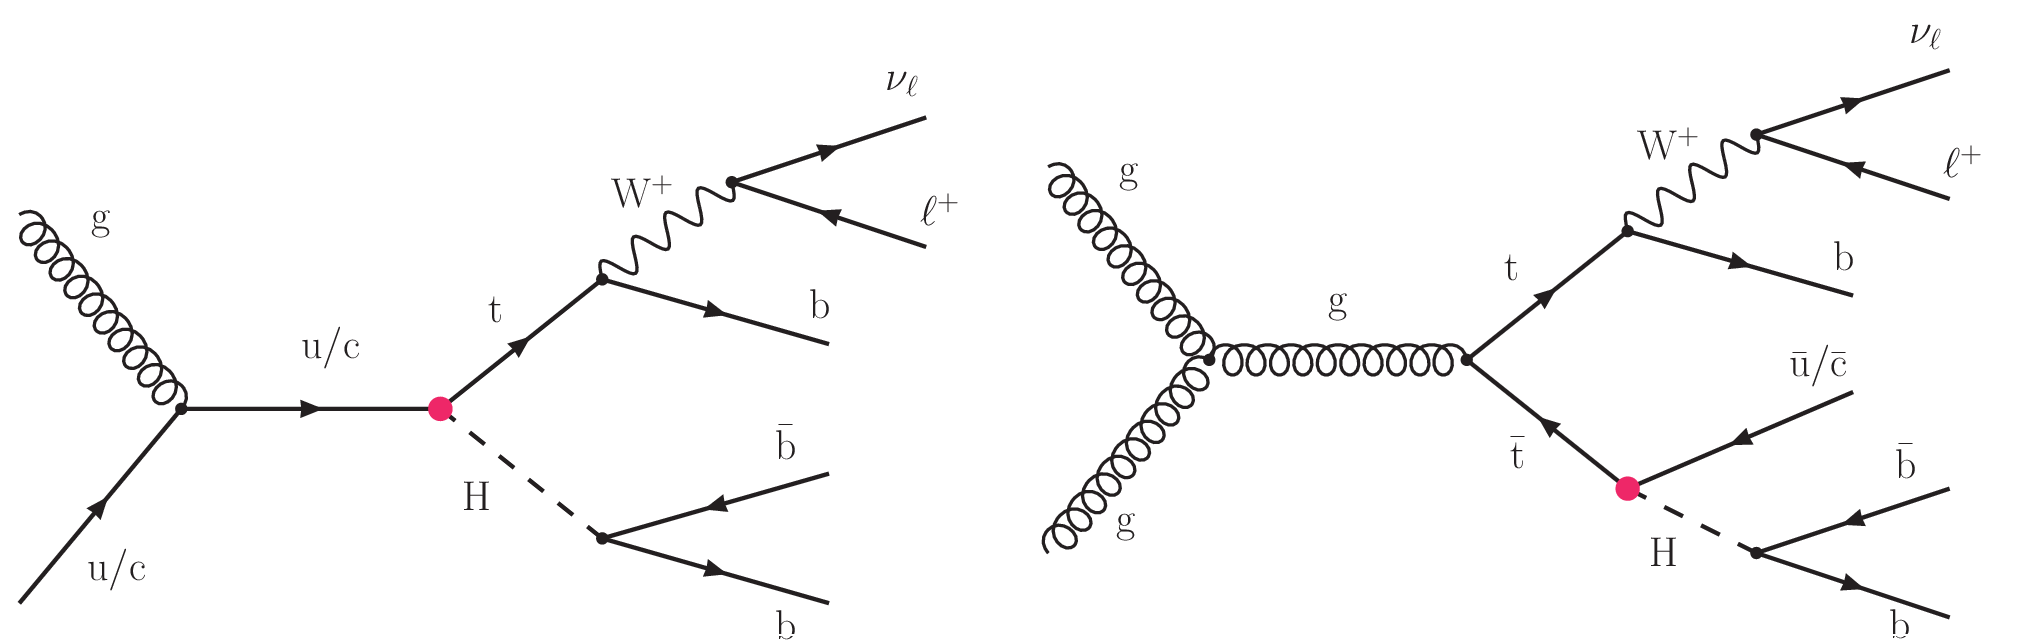
Representative Feynman diagrams for FCNC $\mathrm{t} \mathrm{H} $ processes: associated production of the top quark with the Higgs boson (left), and FCNC decay of the top antiquark in $ {\mathrm{t} {}\mathrm{\bar{t}}} $ events (right). The FCNC vertex is indicated by the bullet. |

png pdf |
Figure 1-a:
Representative Feynman diagrams for FCNC $\mathrm{t} \mathrm{H} $ processes: associated production of the top quark with the Higgs boson (left), and FCNC decay of the top antiquark in $ {\mathrm{t} {}\mathrm{\bar{t}}} $ events (right). The FCNC vertex is indicated by the bullet. |

png pdf |
Figure 1-b:
Representative Feynman diagrams for FCNC $\mathrm{t} \mathrm{H} $ processes: associated production of the top quark with the Higgs boson (left), and FCNC decay of the top antiquark in $ {\mathrm{t} {}\mathrm{\bar{t}}} $ events (right). The FCNC vertex is indicated by the bullet. |
png pdf |
Figure 2:
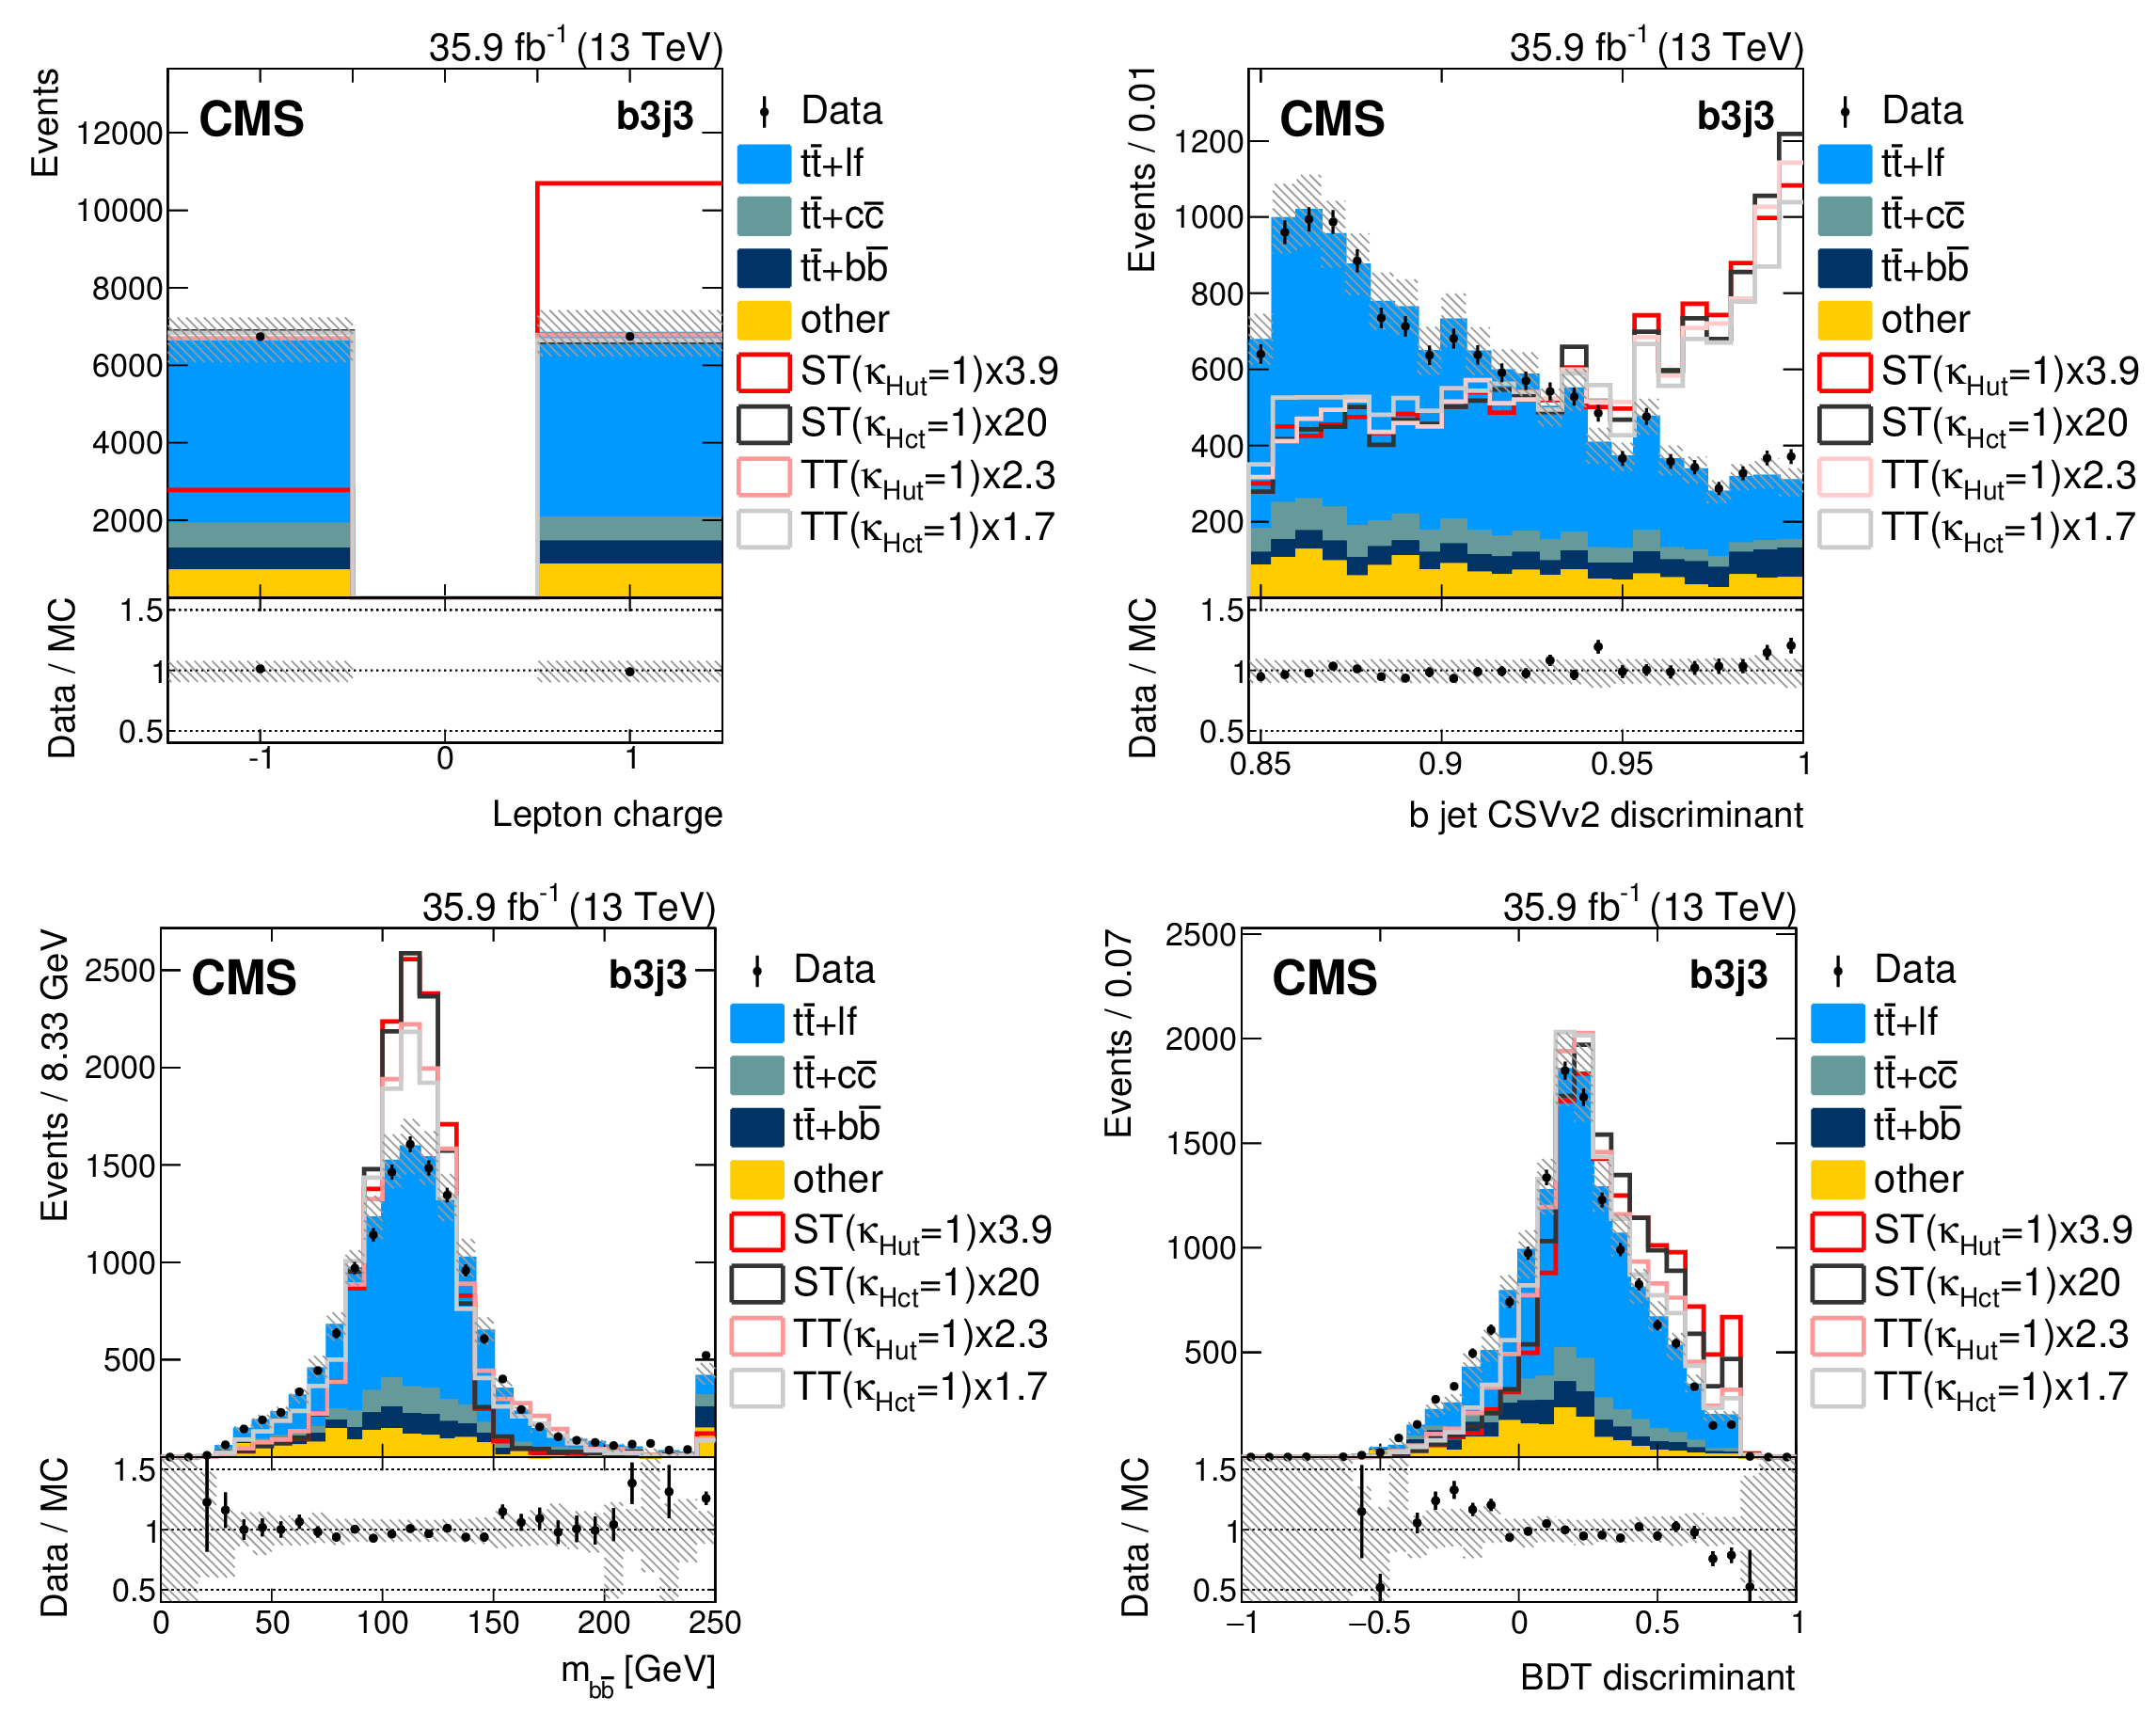
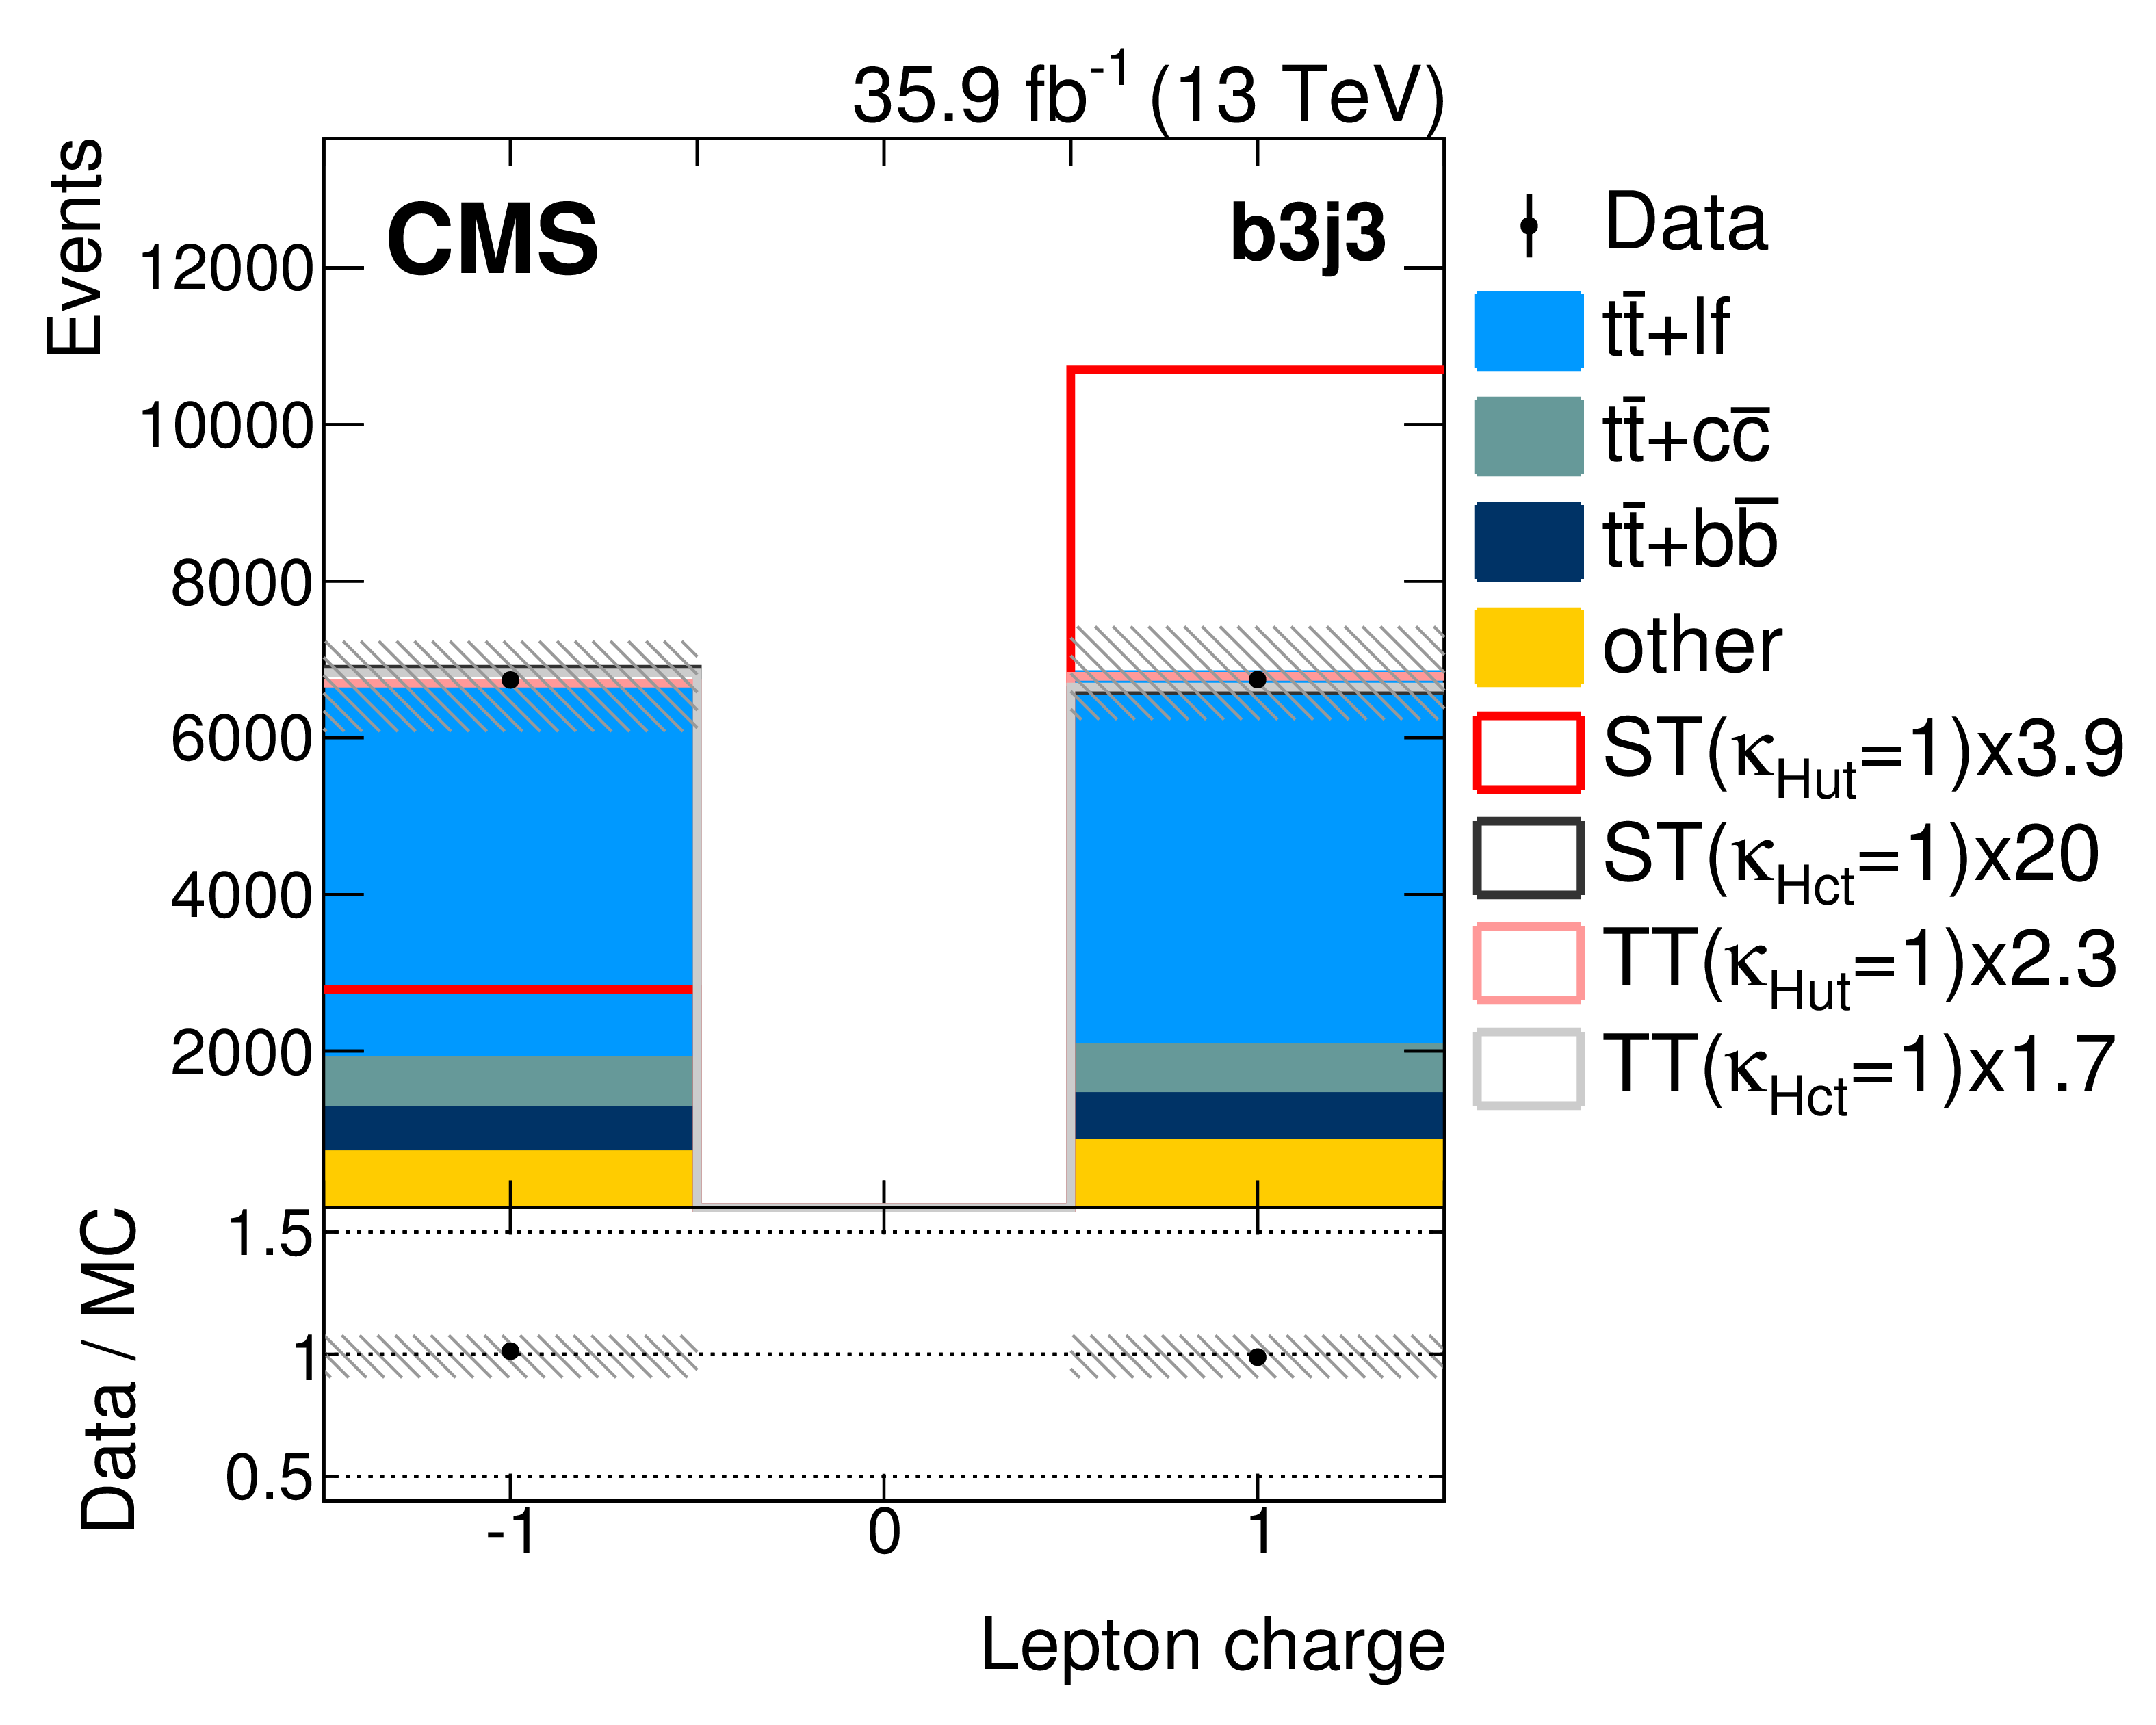
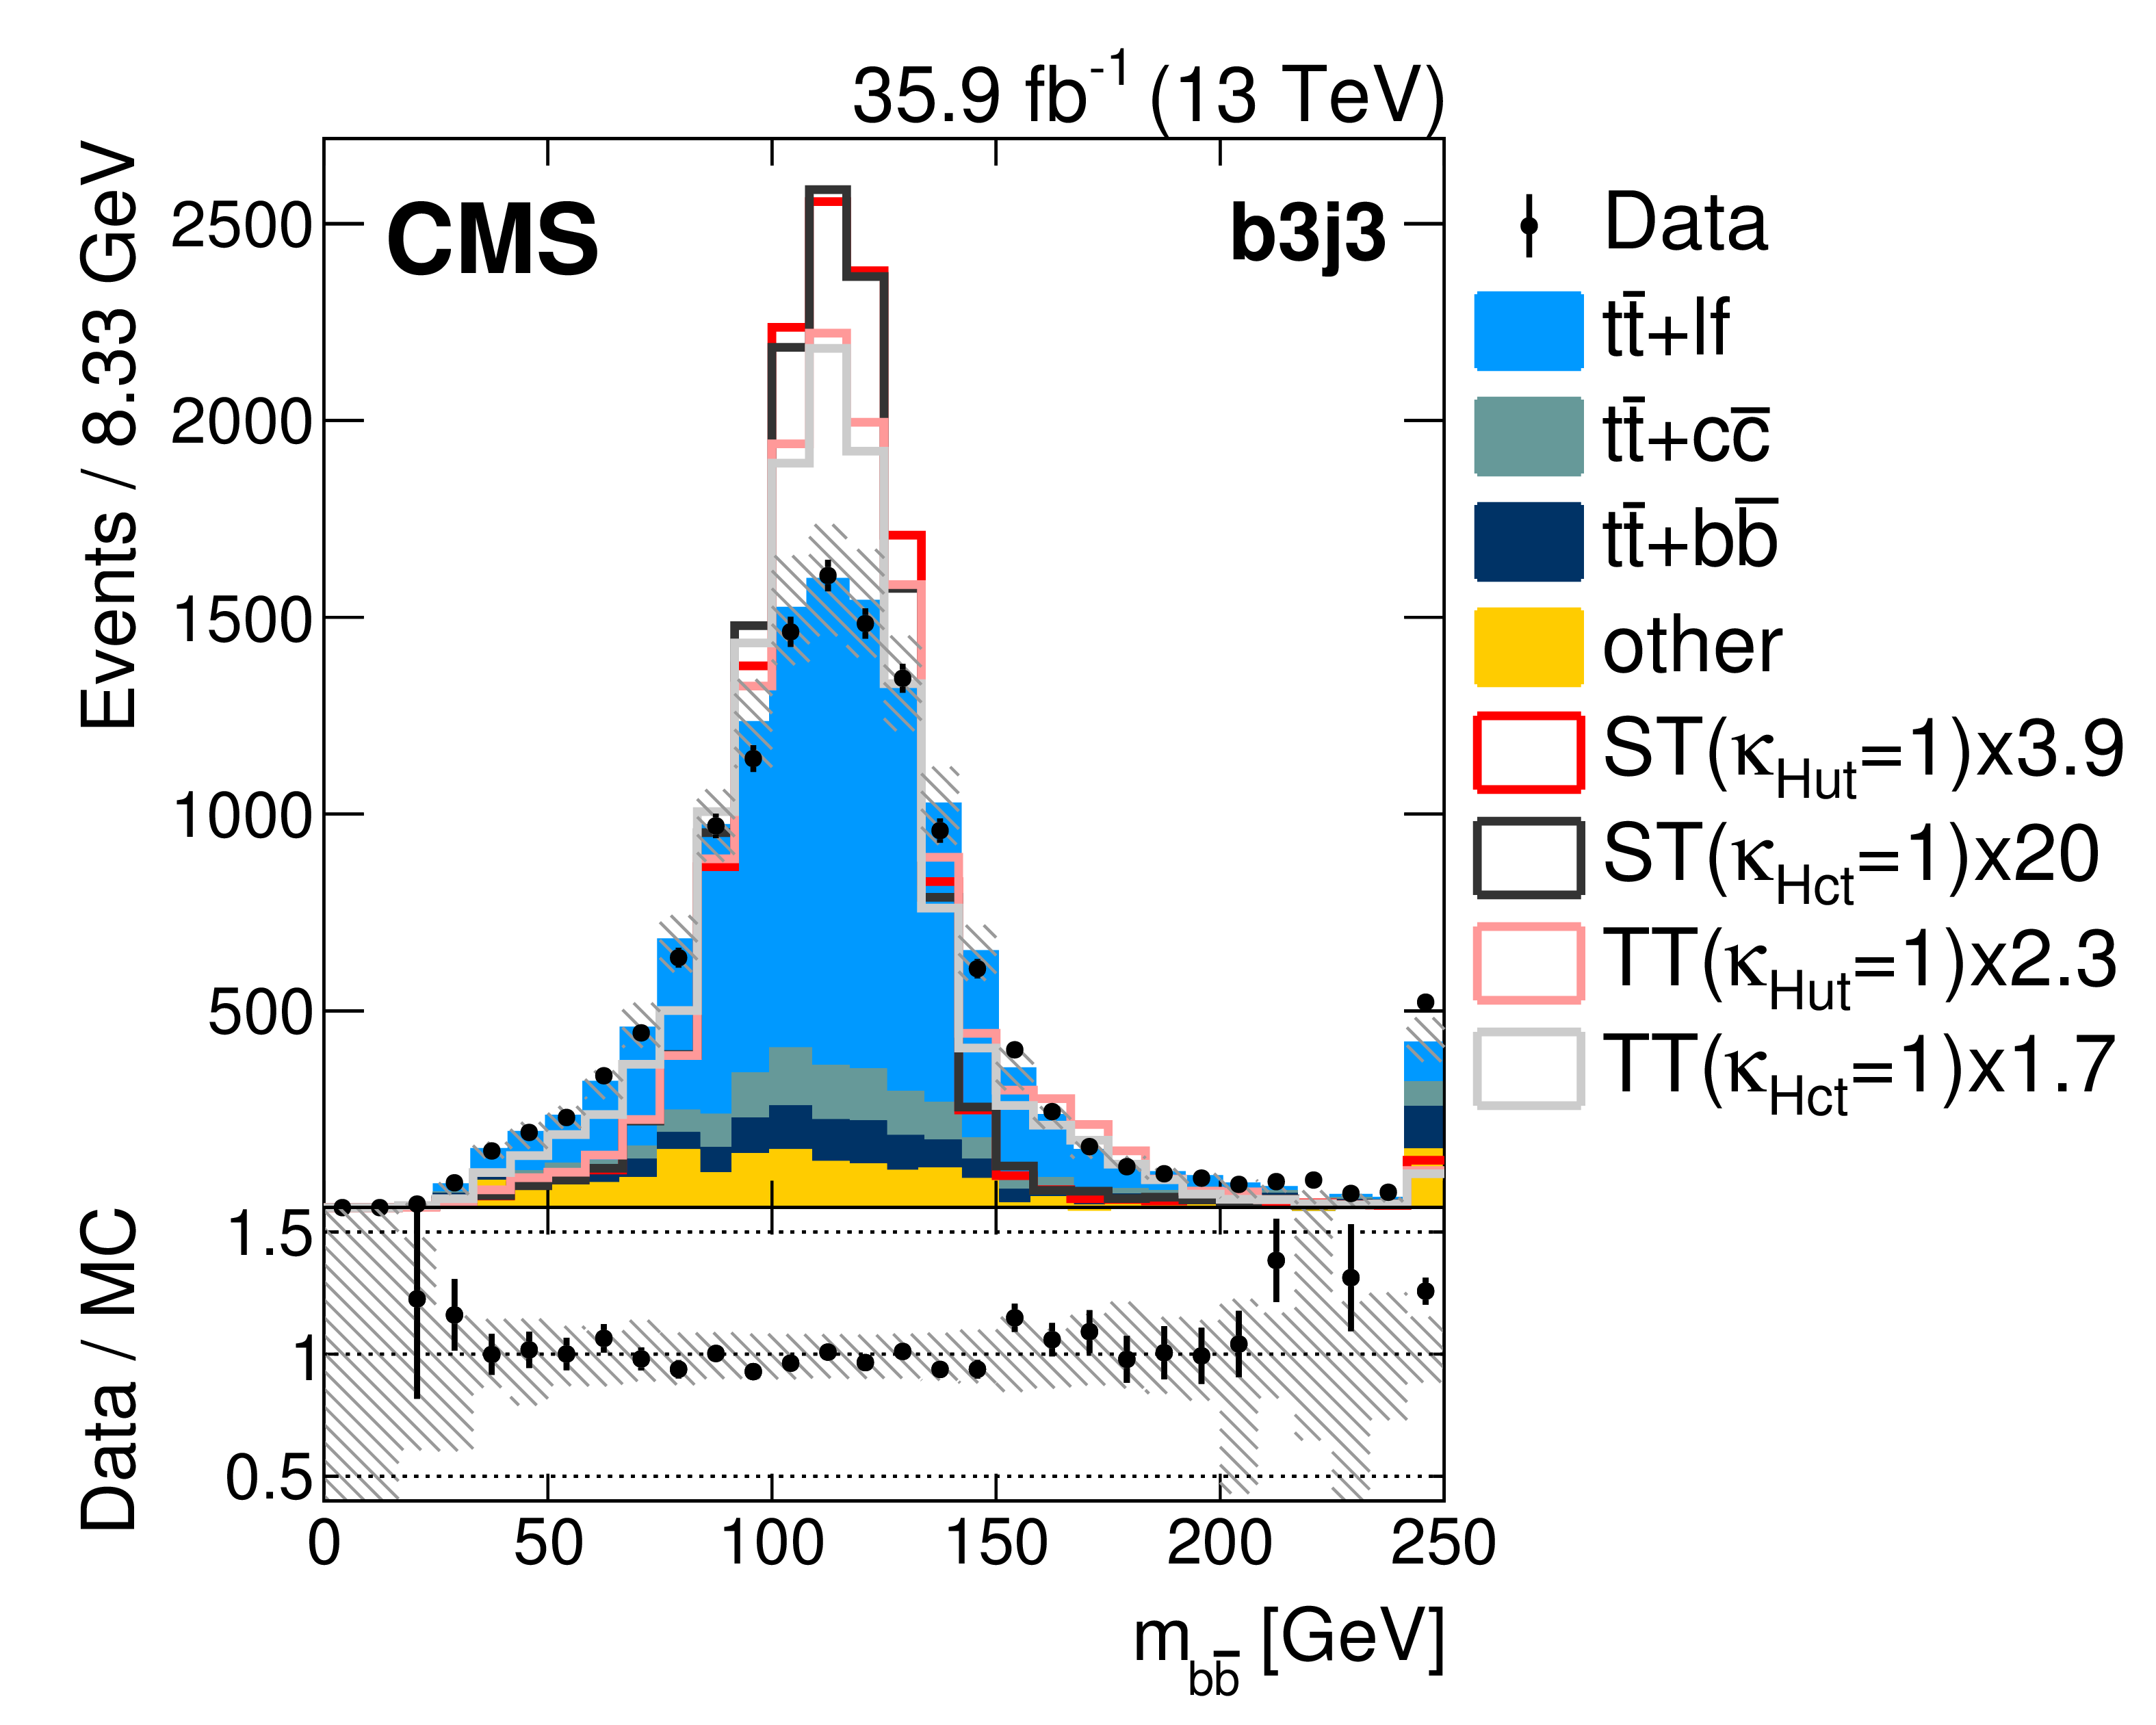
Comparison between data and simulation for the most discriminating BDT input variables in the b3j3 category: lepton charge (upper left), CSVv2 discriminant value for one of the reconstructed b jets assigned to Higgs boson decay (upper right), reconstructed invariant mass of two b jets associated with the Higgs boson decay (lower left), and the maximum BDT discriminant value from the b jet assignment procedure (lower right). The last bin in the distribution for the reconstructed mass of the Higgs boson includes the overflows. The shaded area corresponds to the total uncertainty in the predicted background. The data-to-simulation ratio is also shown. |
png pdf |
Figure 2-a:
Comparison between data and simulation for the most discriminating BDT input variables in the b3j3 category: lepton charge (upper left), CSVv2 discriminant value for one of the reconstructed b jets assigned to Higgs boson decay (upper right), reconstructed invariant mass of two b jets associated with the Higgs boson decay (lower left), and the maximum BDT discriminant value from the b jet assignment procedure (lower right). The last bin in the distribution for the reconstructed mass of the Higgs boson includes the overflows. The shaded area corresponds to the total uncertainty in the predicted background. The data-to-simulation ratio is also shown. |

png pdf |
Figure 2-b:
Comparison between data and simulation for the most discriminating BDT input variables in the b3j3 category: lepton charge (upper left), CSVv2 discriminant value for one of the reconstructed b jets assigned to Higgs boson decay (upper right), reconstructed invariant mass of two b jets associated with the Higgs boson decay (lower left), and the maximum BDT discriminant value from the b jet assignment procedure (lower right). The last bin in the distribution for the reconstructed mass of the Higgs boson includes the overflows. The shaded area corresponds to the total uncertainty in the predicted background. The data-to-simulation ratio is also shown. |
png pdf |
Figure 2-c:
Comparison between data and simulation for the most discriminating BDT input variables in the b3j3 category: lepton charge (upper left), CSVv2 discriminant value for one of the reconstructed b jets assigned to Higgs boson decay (upper right), reconstructed invariant mass of two b jets associated with the Higgs boson decay (lower left), and the maximum BDT discriminant value from the b jet assignment procedure (lower right). The last bin in the distribution for the reconstructed mass of the Higgs boson includes the overflows. The shaded area corresponds to the total uncertainty in the predicted background. The data-to-simulation ratio is also shown. |
png pdf |
Figure 2-d:
Comparison between data and simulation for the most discriminating BDT input variables in the b3j3 category: lepton charge (upper left), CSVv2 discriminant value for one of the reconstructed b jets assigned to Higgs boson decay (upper right), reconstructed invariant mass of two b jets associated with the Higgs boson decay (lower left), and the maximum BDT discriminant value from the b jet assignment procedure (lower right). The last bin in the distribution for the reconstructed mass of the Higgs boson includes the overflows. The shaded area corresponds to the total uncertainty in the predicted background. The data-to-simulation ratio is also shown. |
png pdf |
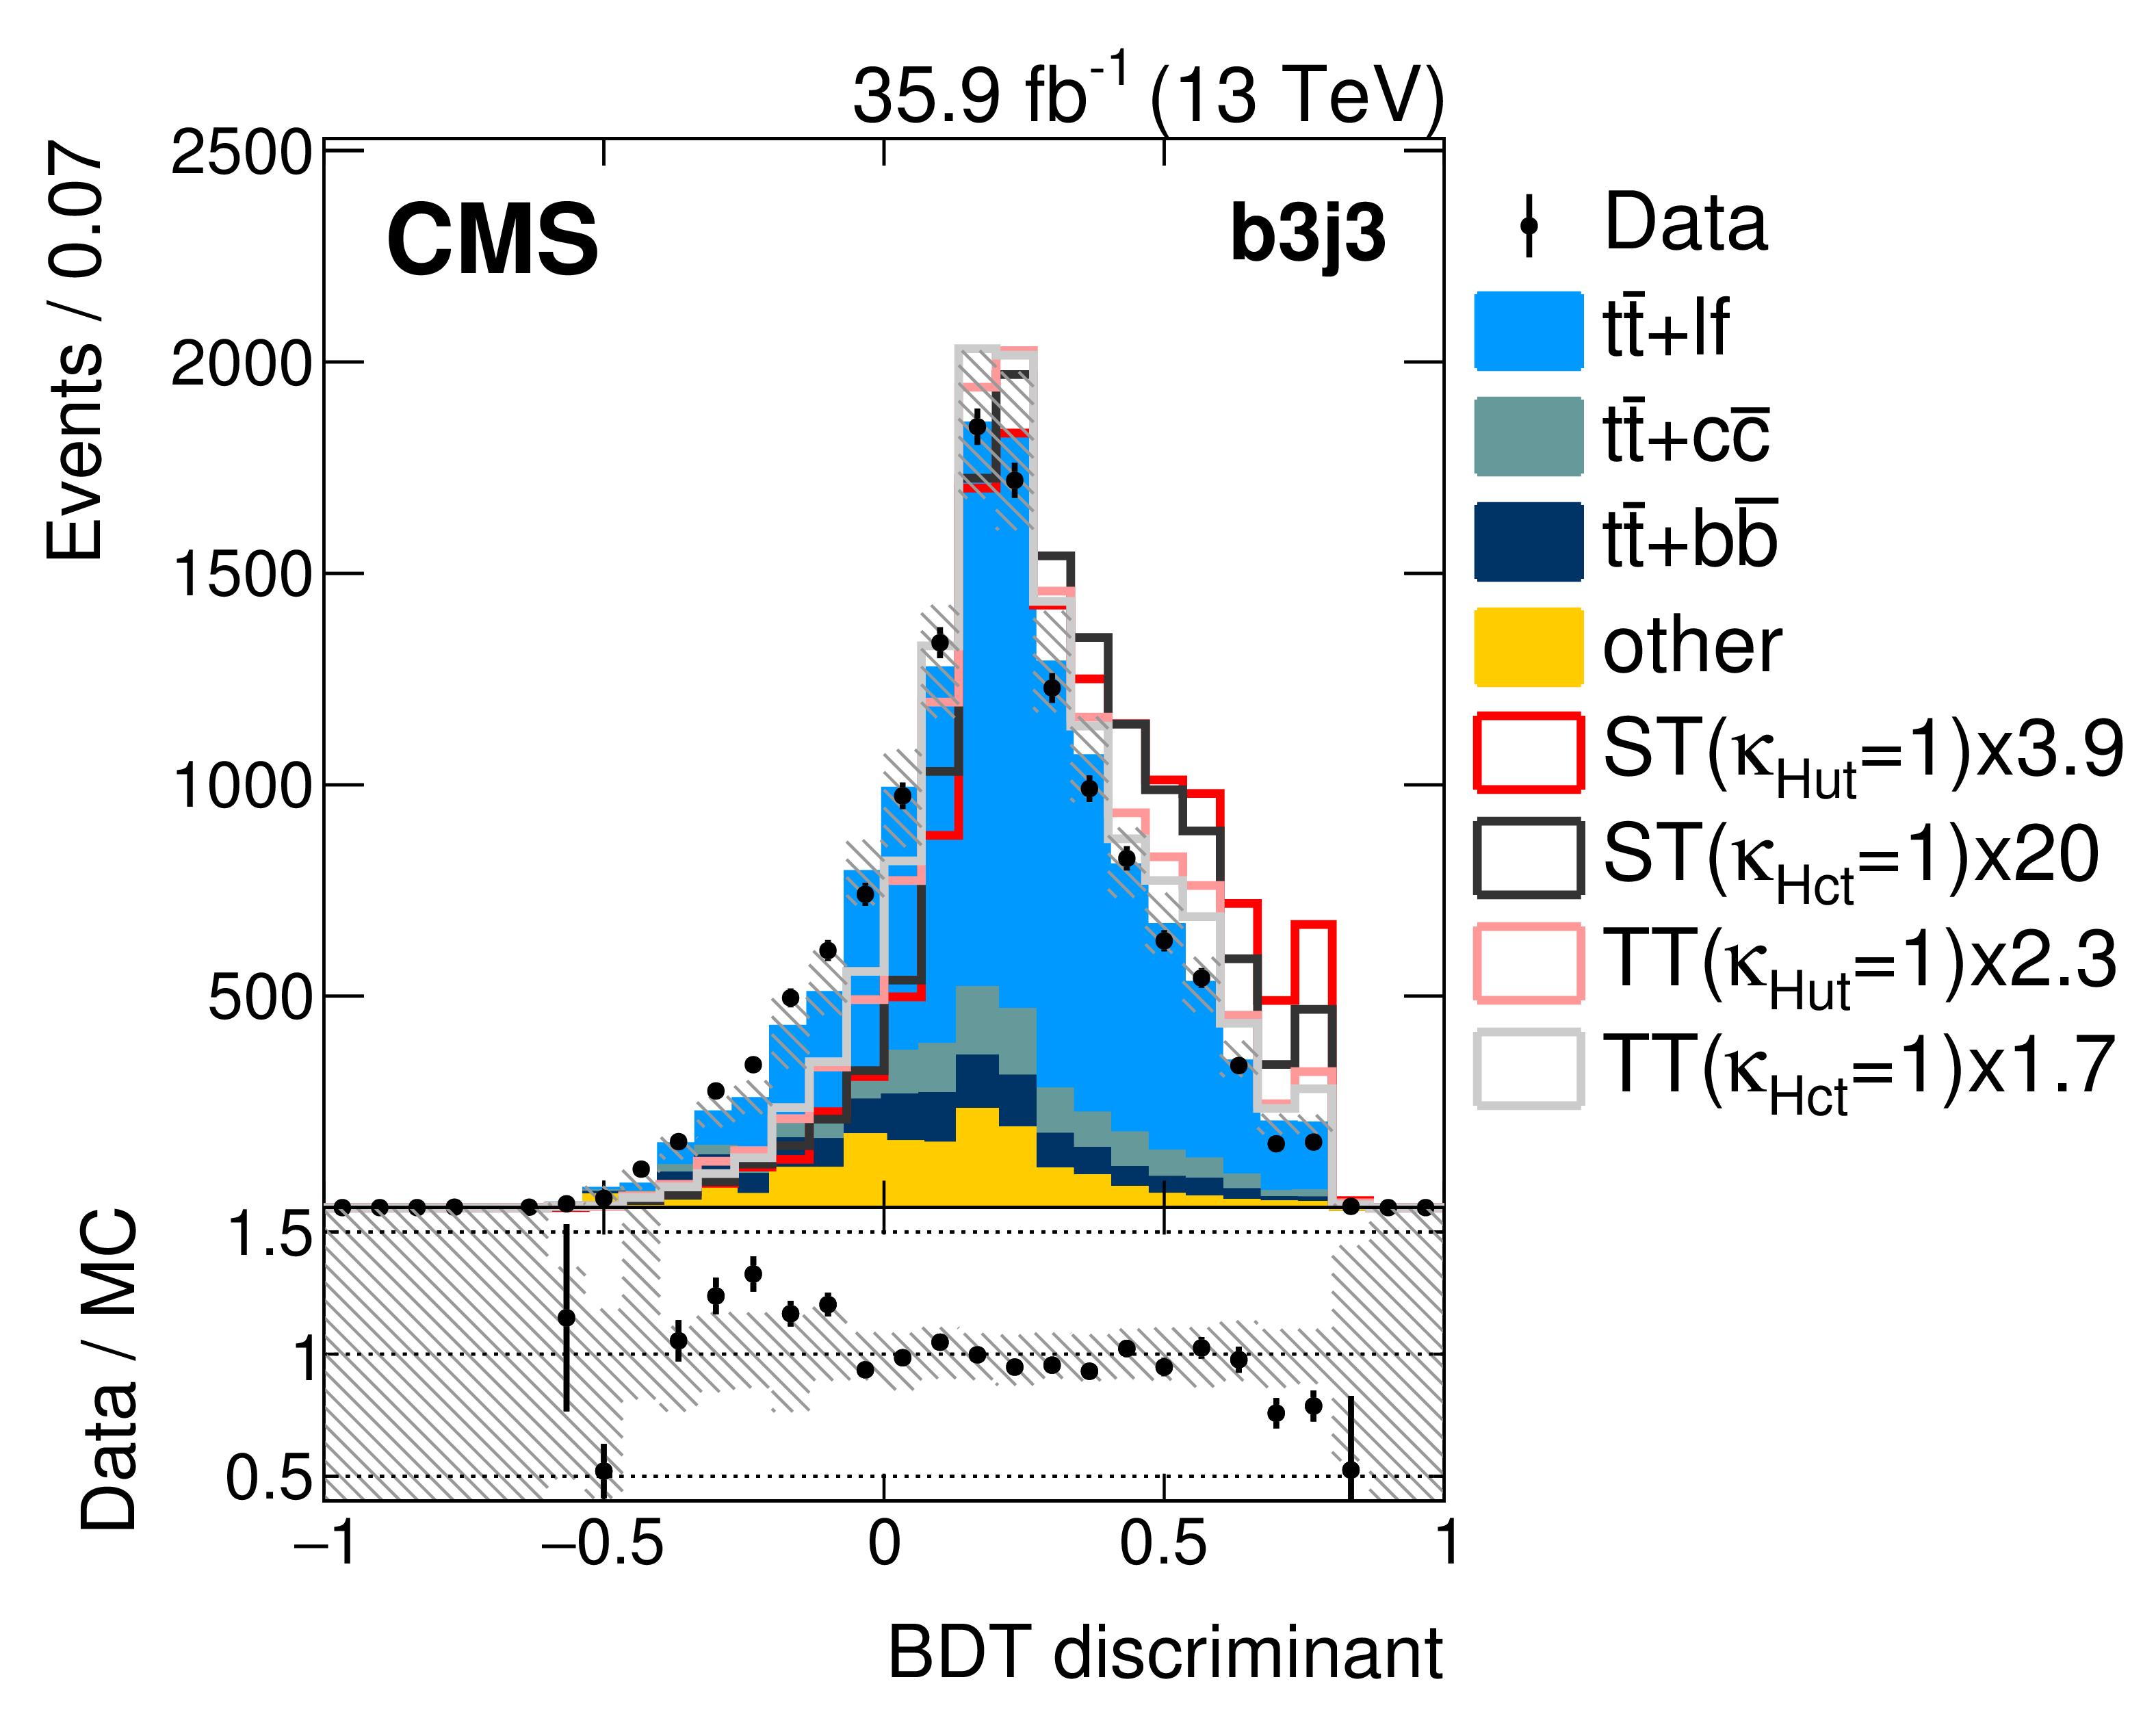
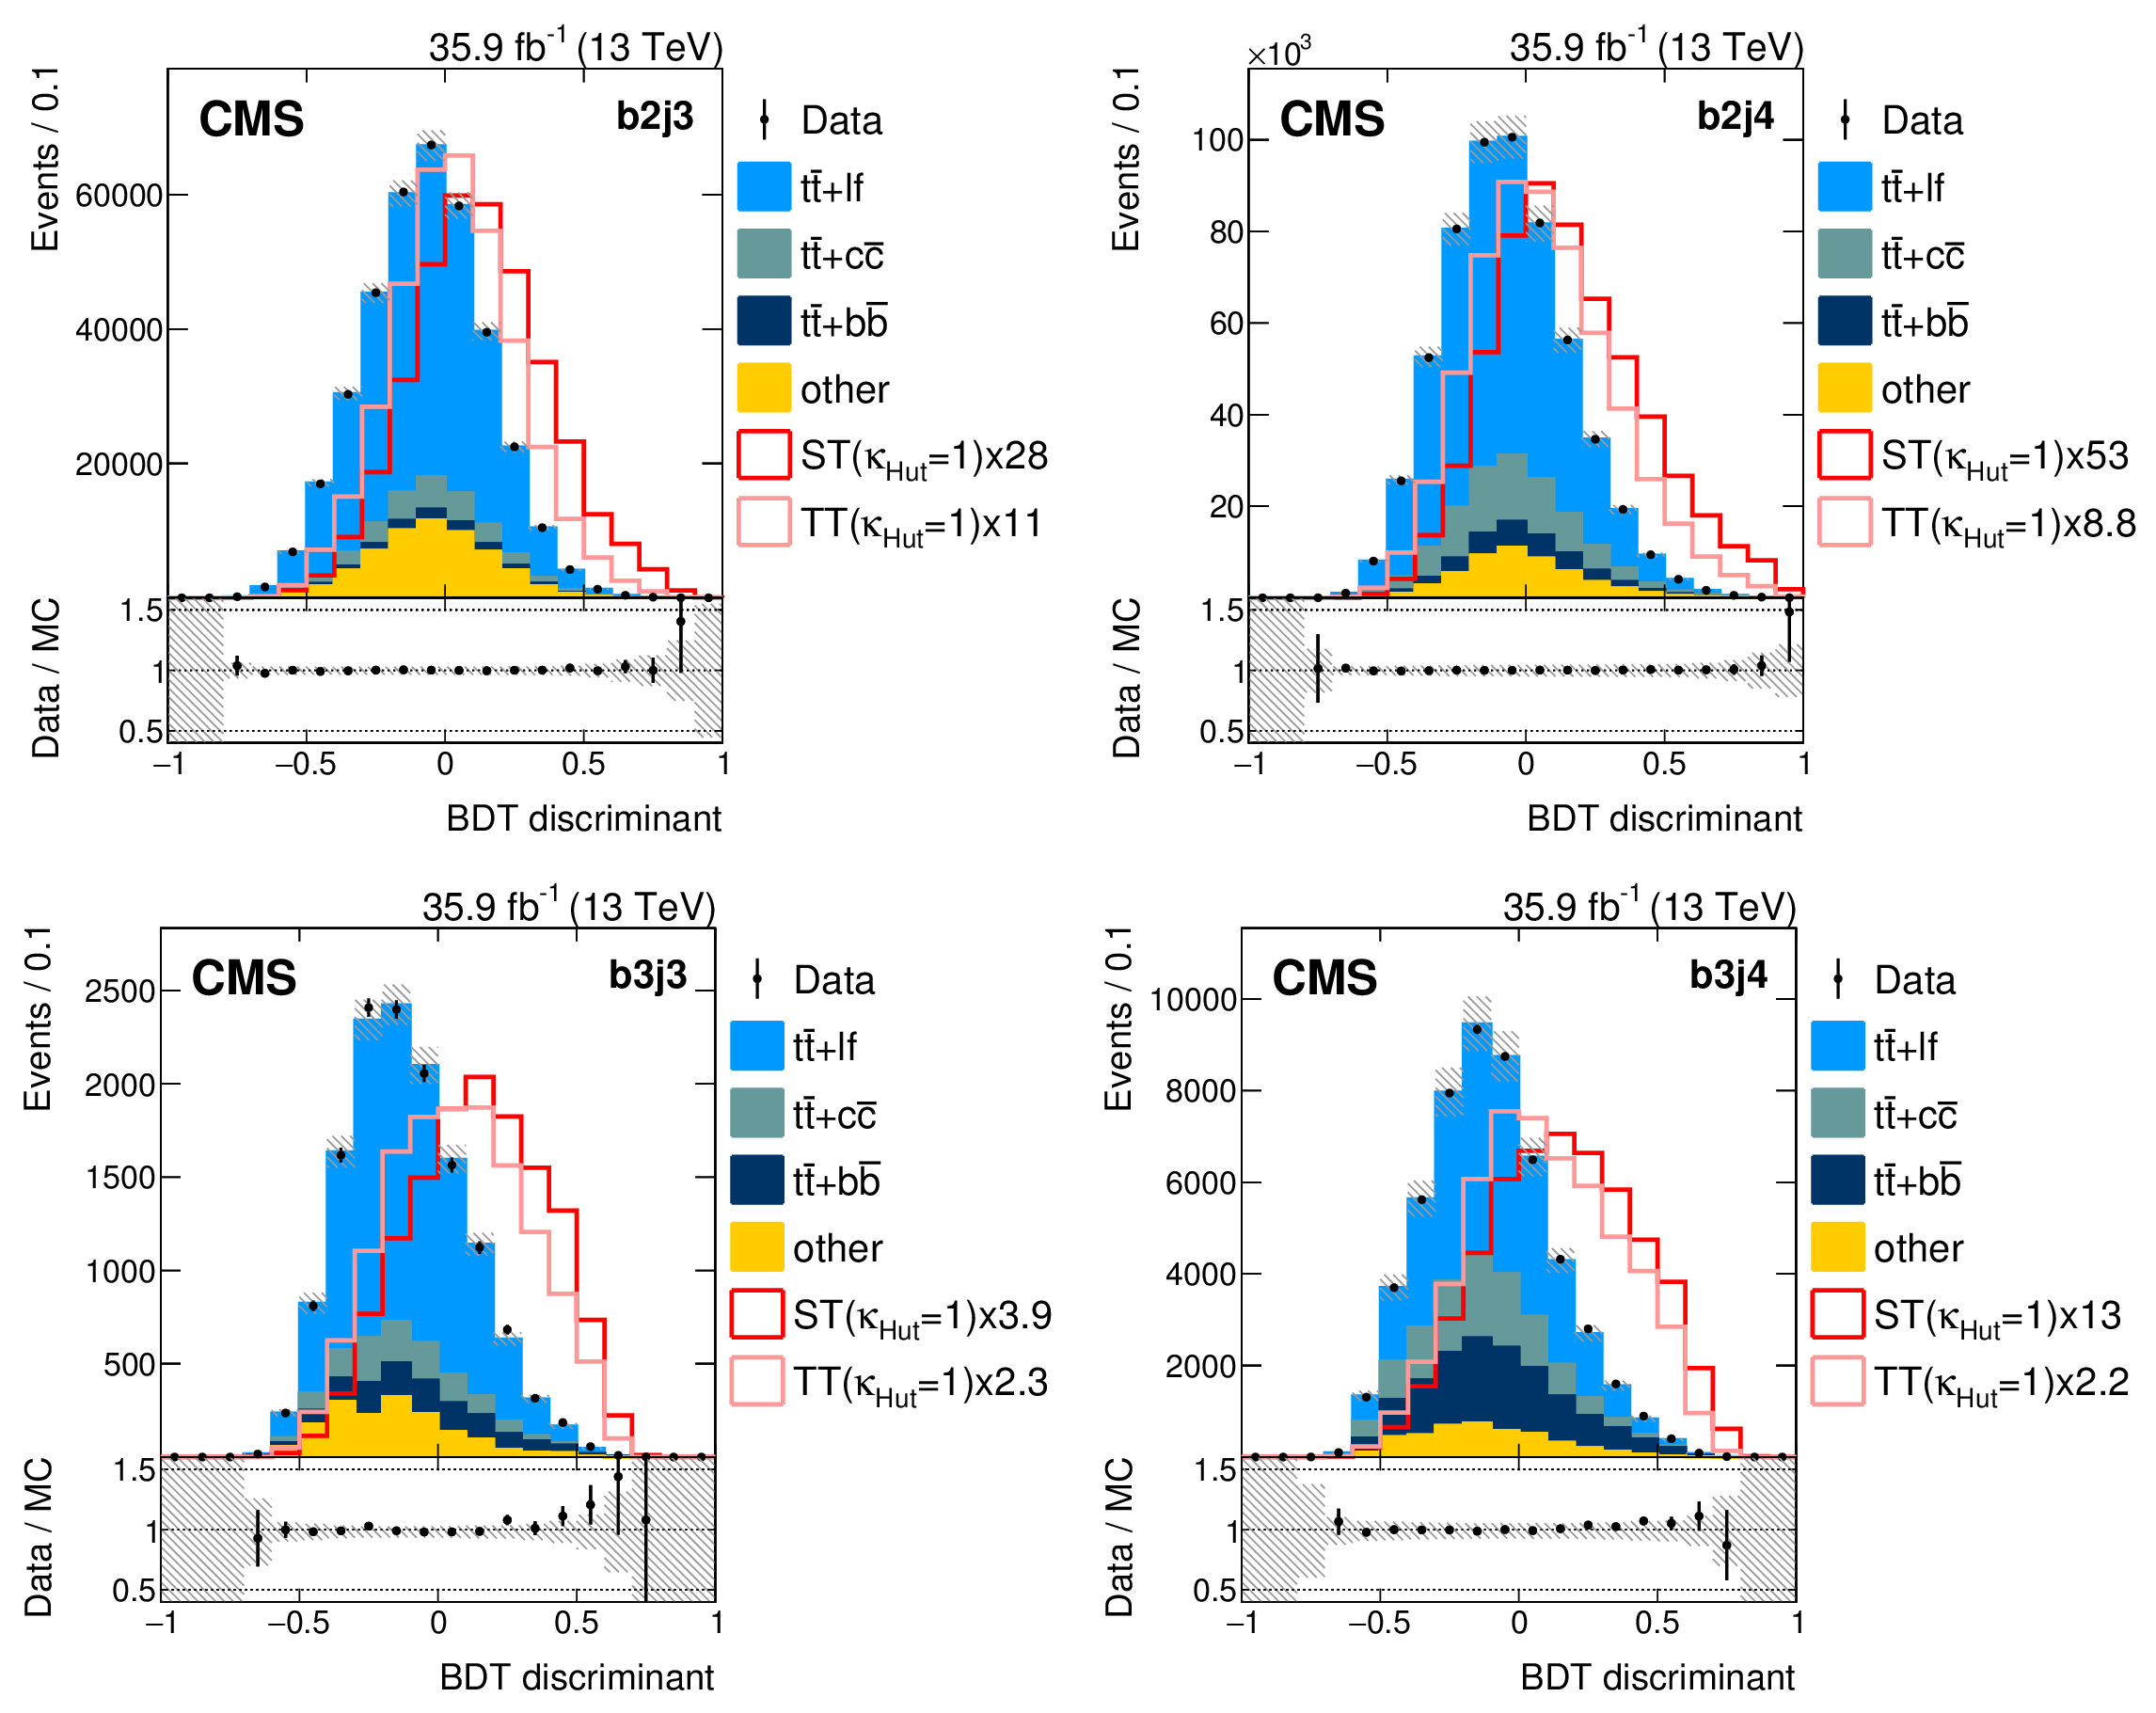
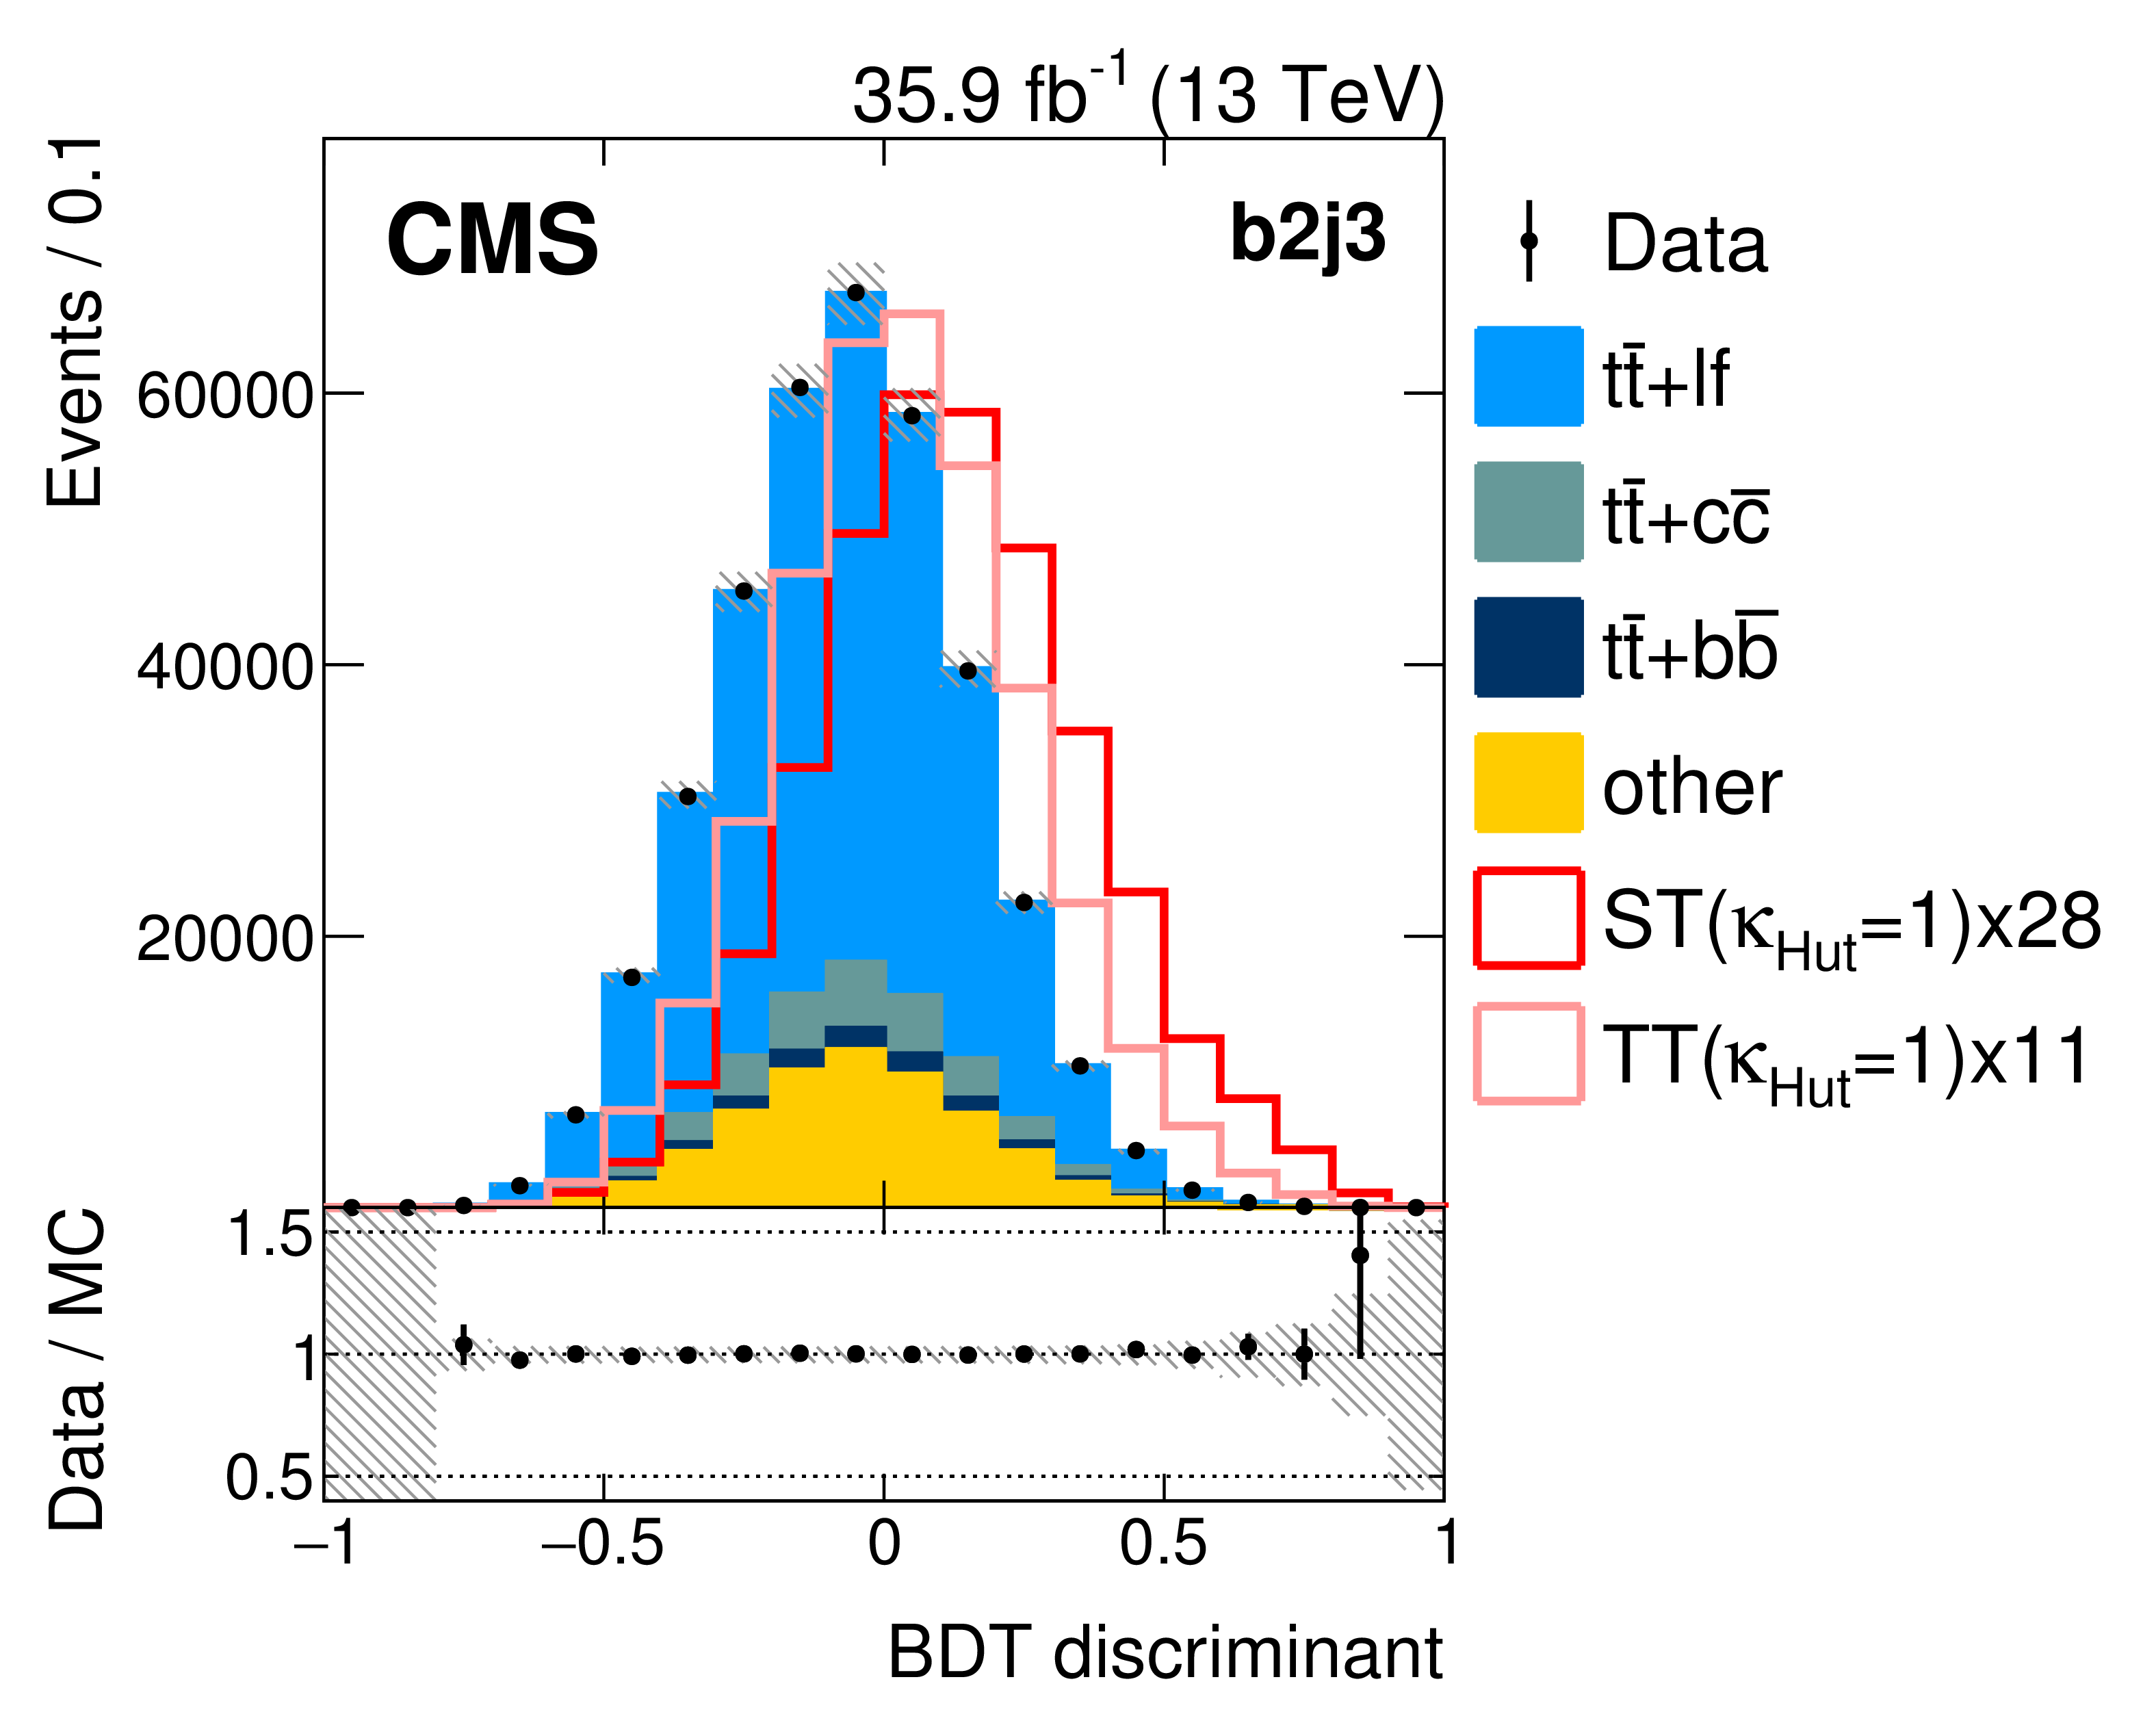
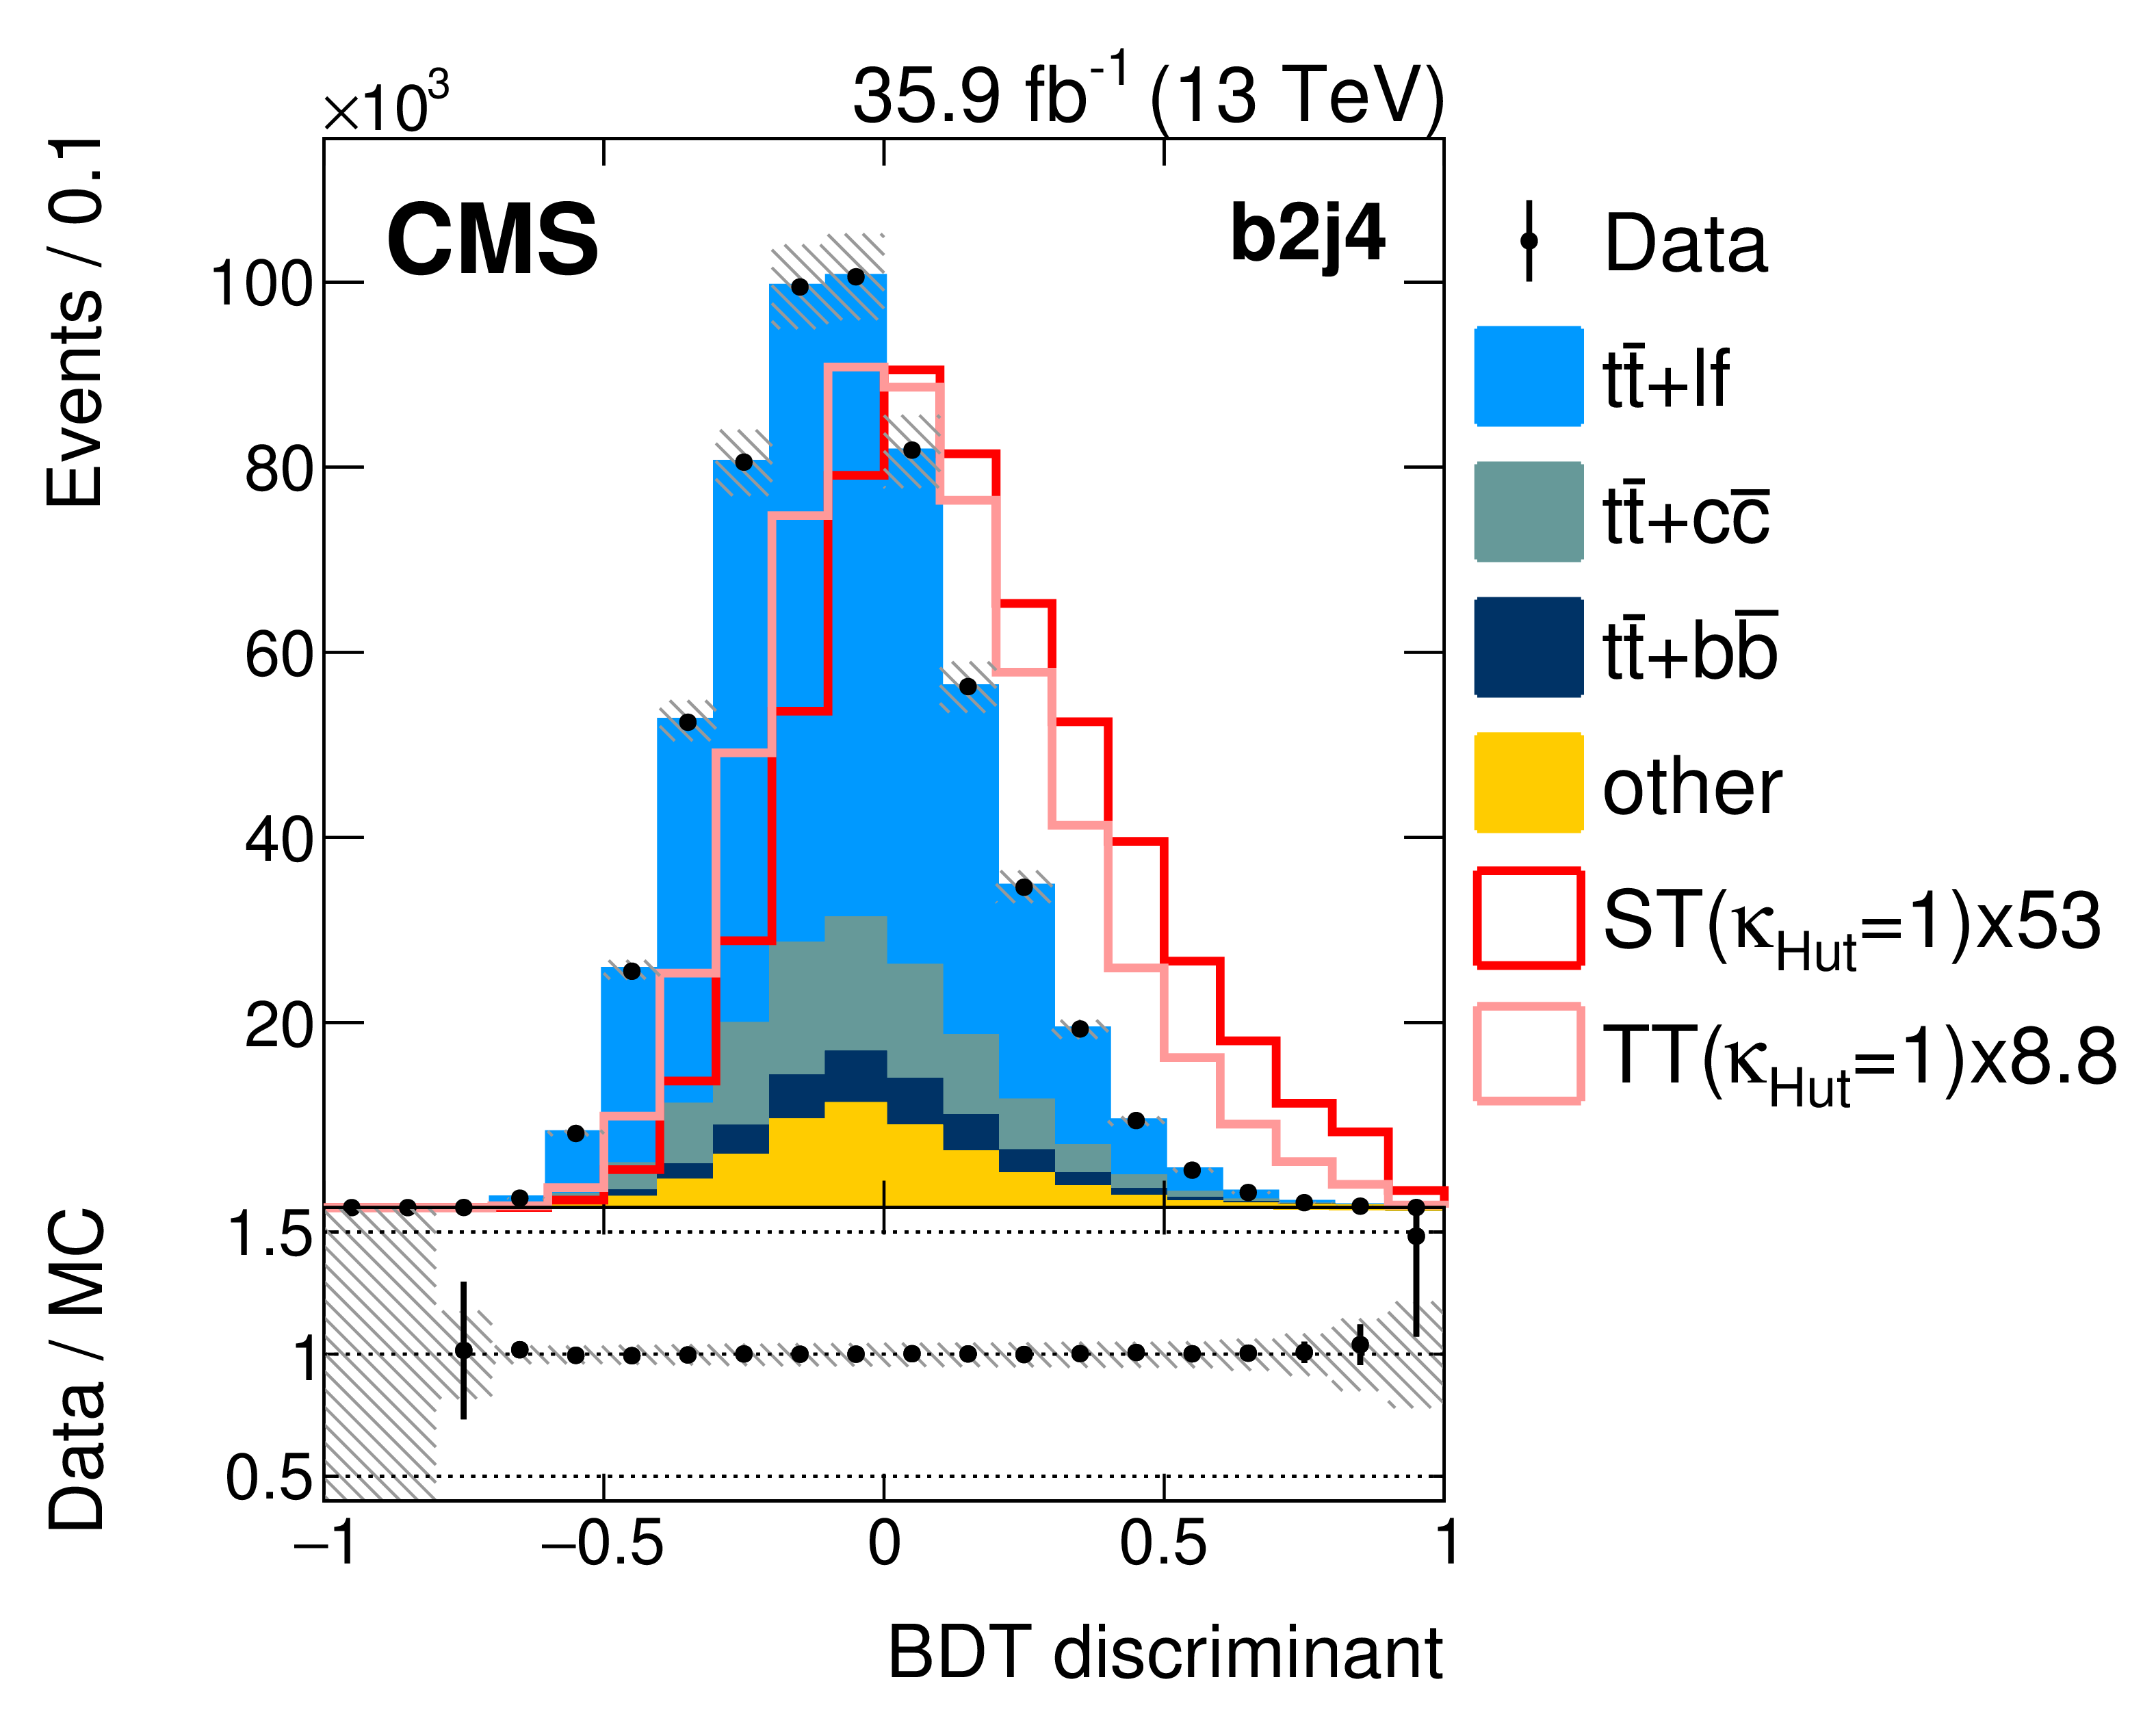
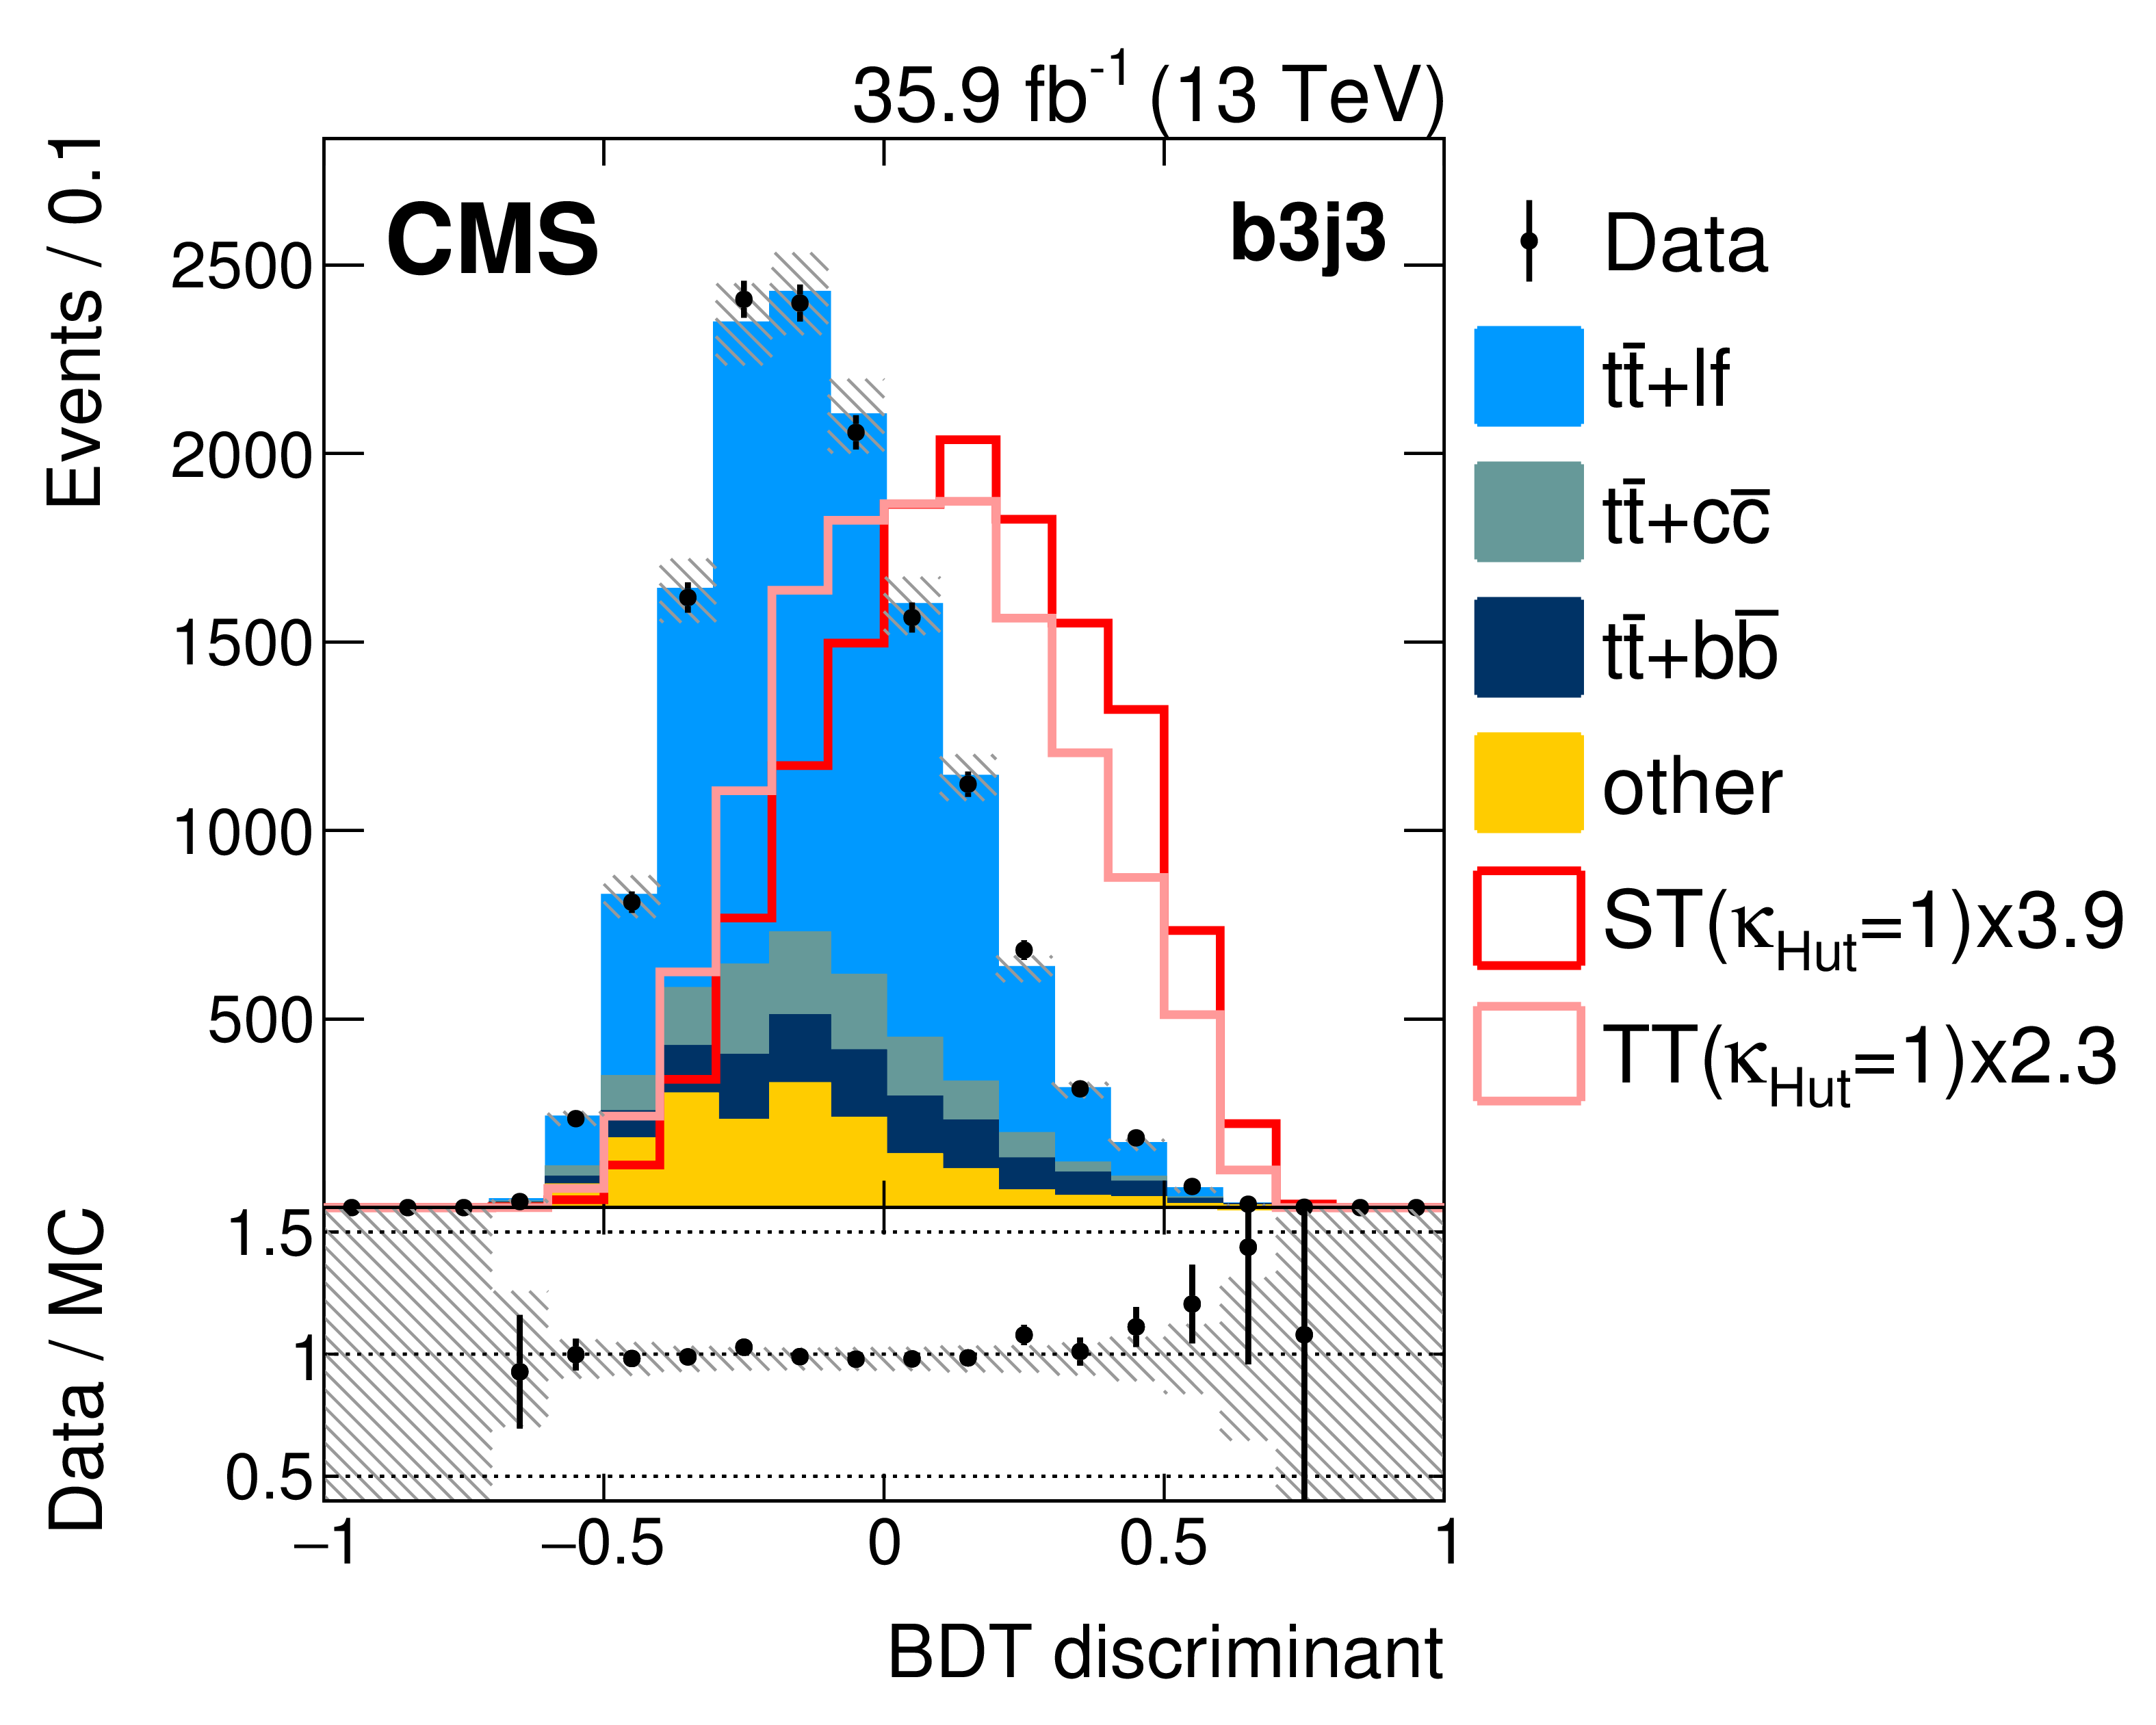
Figure 3:
The BDT discriminant distributions for different jet categories for Hut training after the fit to data. All background processes are constrained to the SM expectation in the fit. The shaded area corresponds to the total uncertainty in the predicted background. The data-to-simulation ratio is also shown. |
png pdf |
Figure 3-a:
The BDT discriminant distributions for different jet categories for Hut training after the fit to data. All background processes are constrained to the SM expectation in the fit. The shaded area corresponds to the total uncertainty in the predicted background. The data-to-simulation ratio is also shown. |
png pdf |
Figure 3-b:
The BDT discriminant distributions for different jet categories for Hut training after the fit to data. All background processes are constrained to the SM expectation in the fit. The shaded area corresponds to the total uncertainty in the predicted background. The data-to-simulation ratio is also shown. |
png pdf |
Figure 3-c:
The BDT discriminant distributions for different jet categories for Hut training after the fit to data. All background processes are constrained to the SM expectation in the fit. The shaded area corresponds to the total uncertainty in the predicted background. The data-to-simulation ratio is also shown. |

png pdf |
Figure 3-d:
The BDT discriminant distributions for different jet categories for Hut training after the fit to data. All background processes are constrained to the SM expectation in the fit. The shaded area corresponds to the total uncertainty in the predicted background. The data-to-simulation ratio is also shown. |
png pdf |
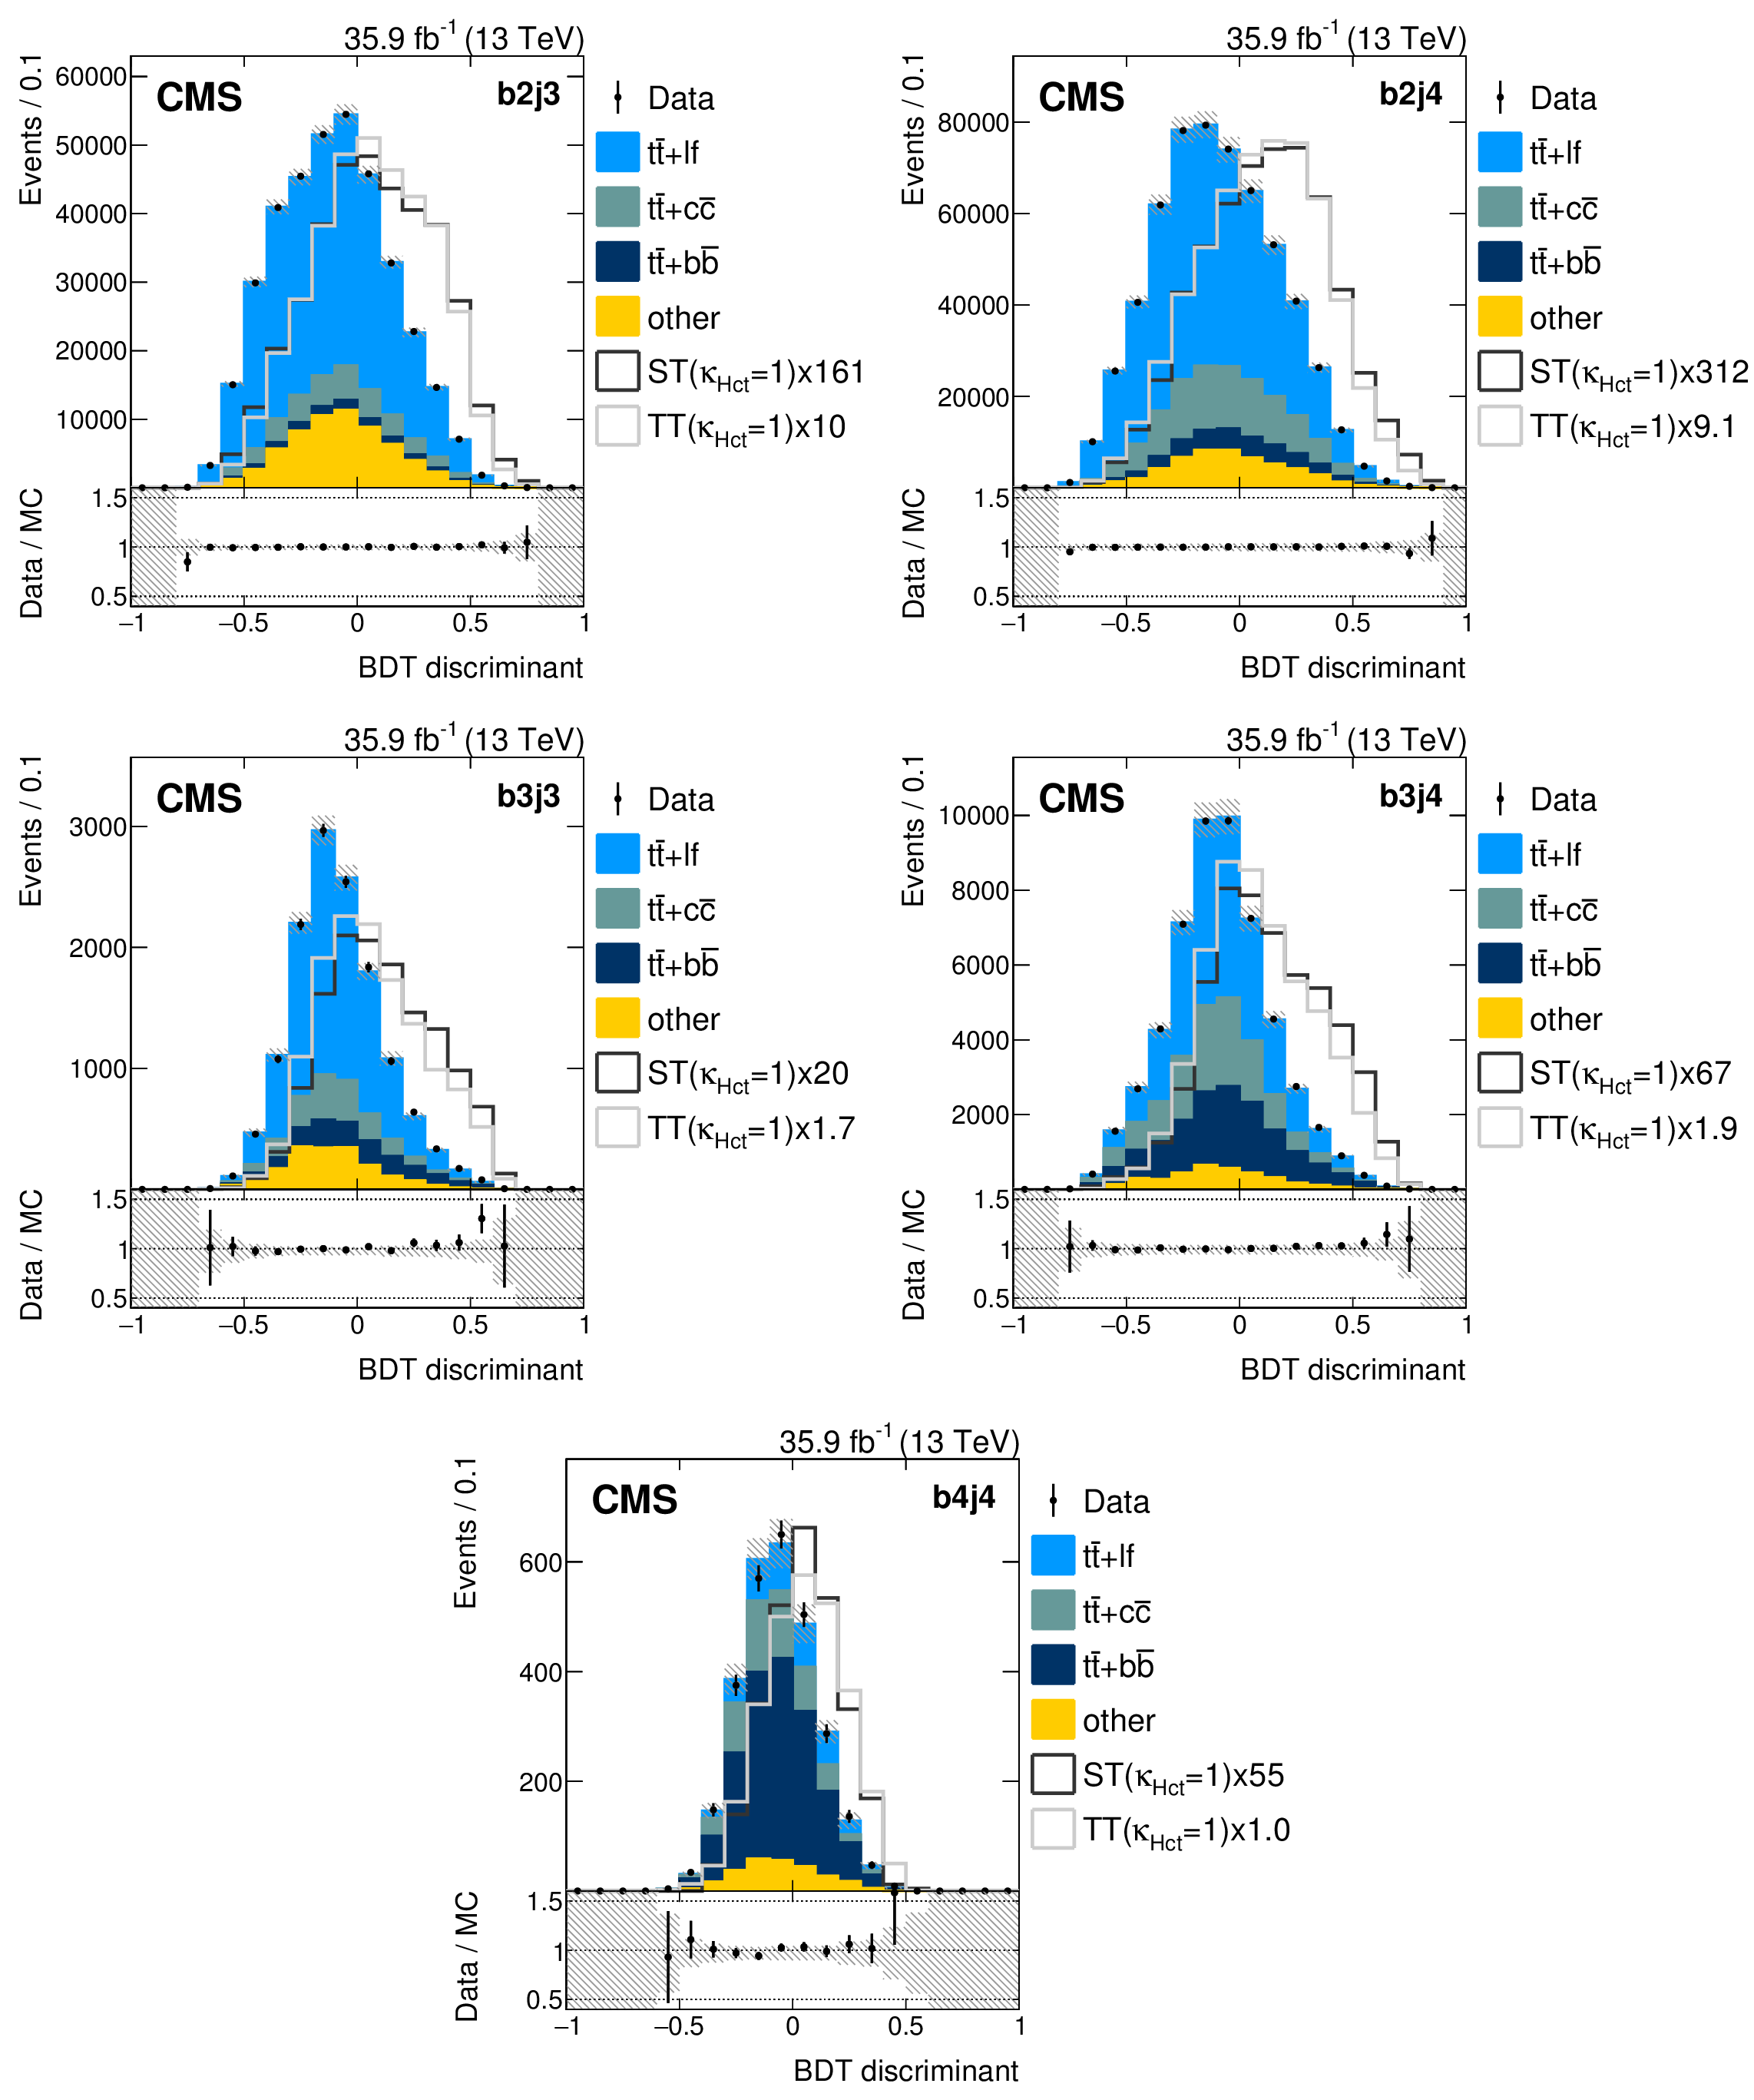
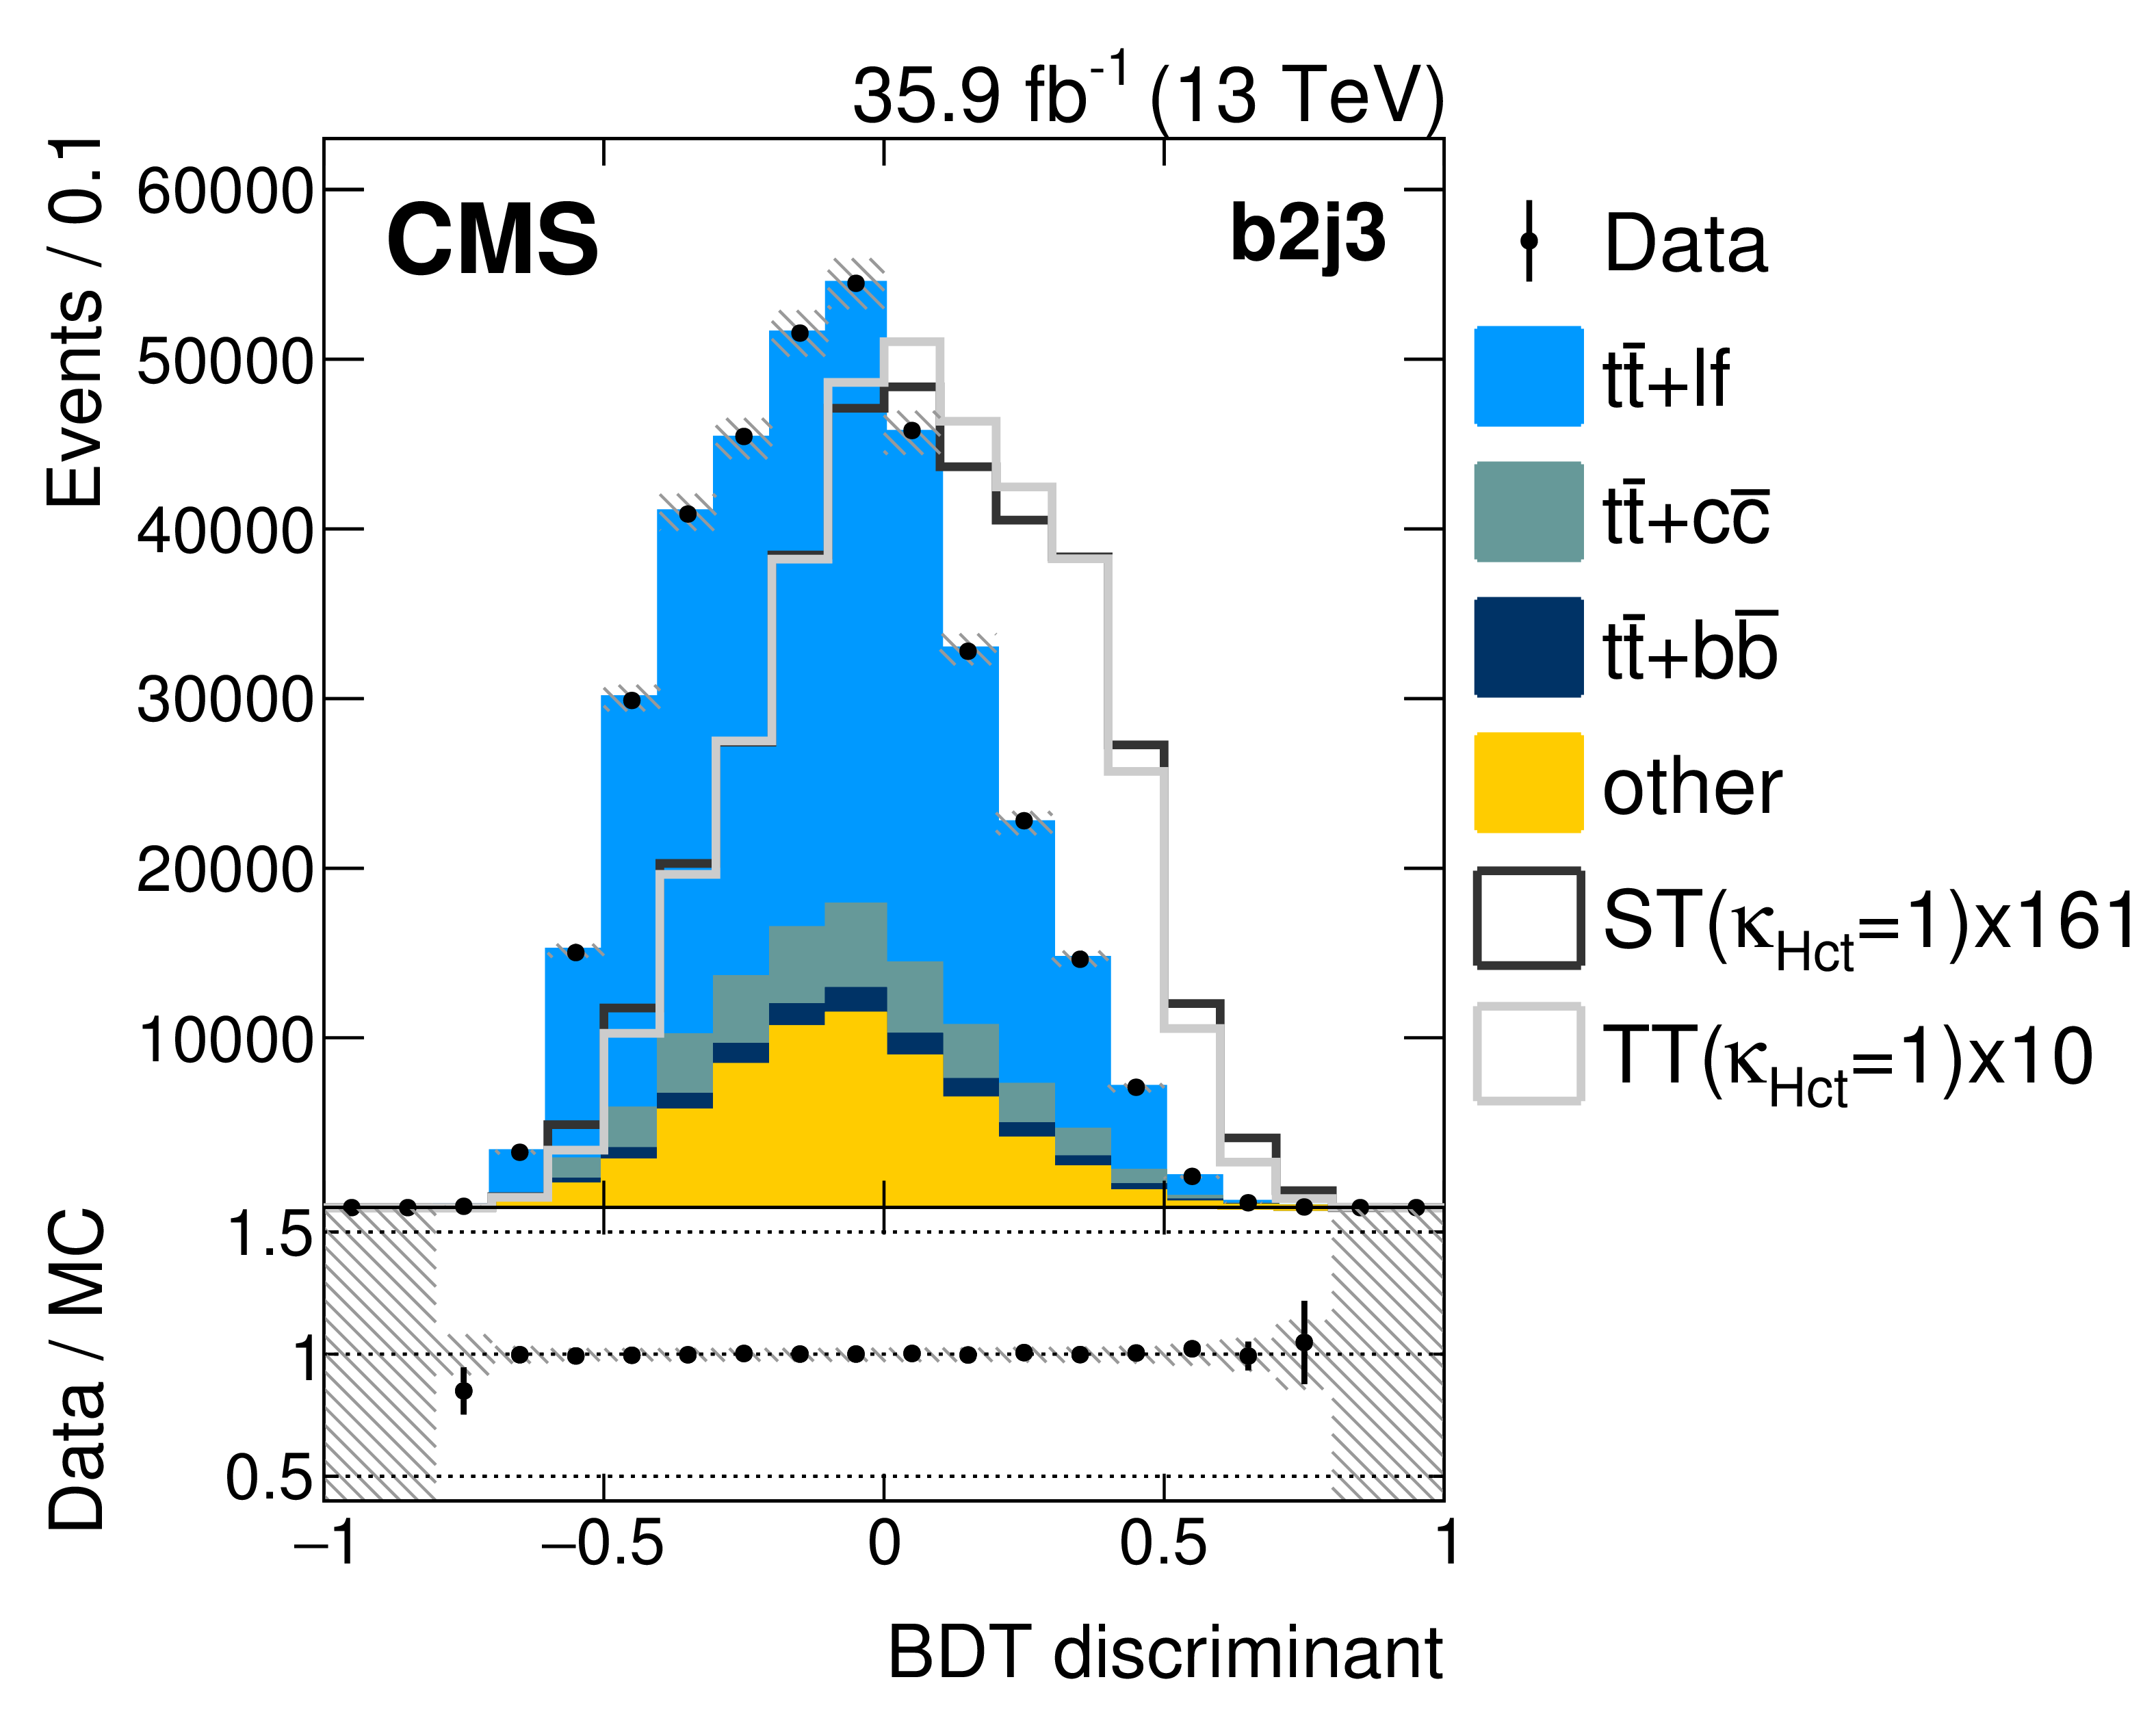
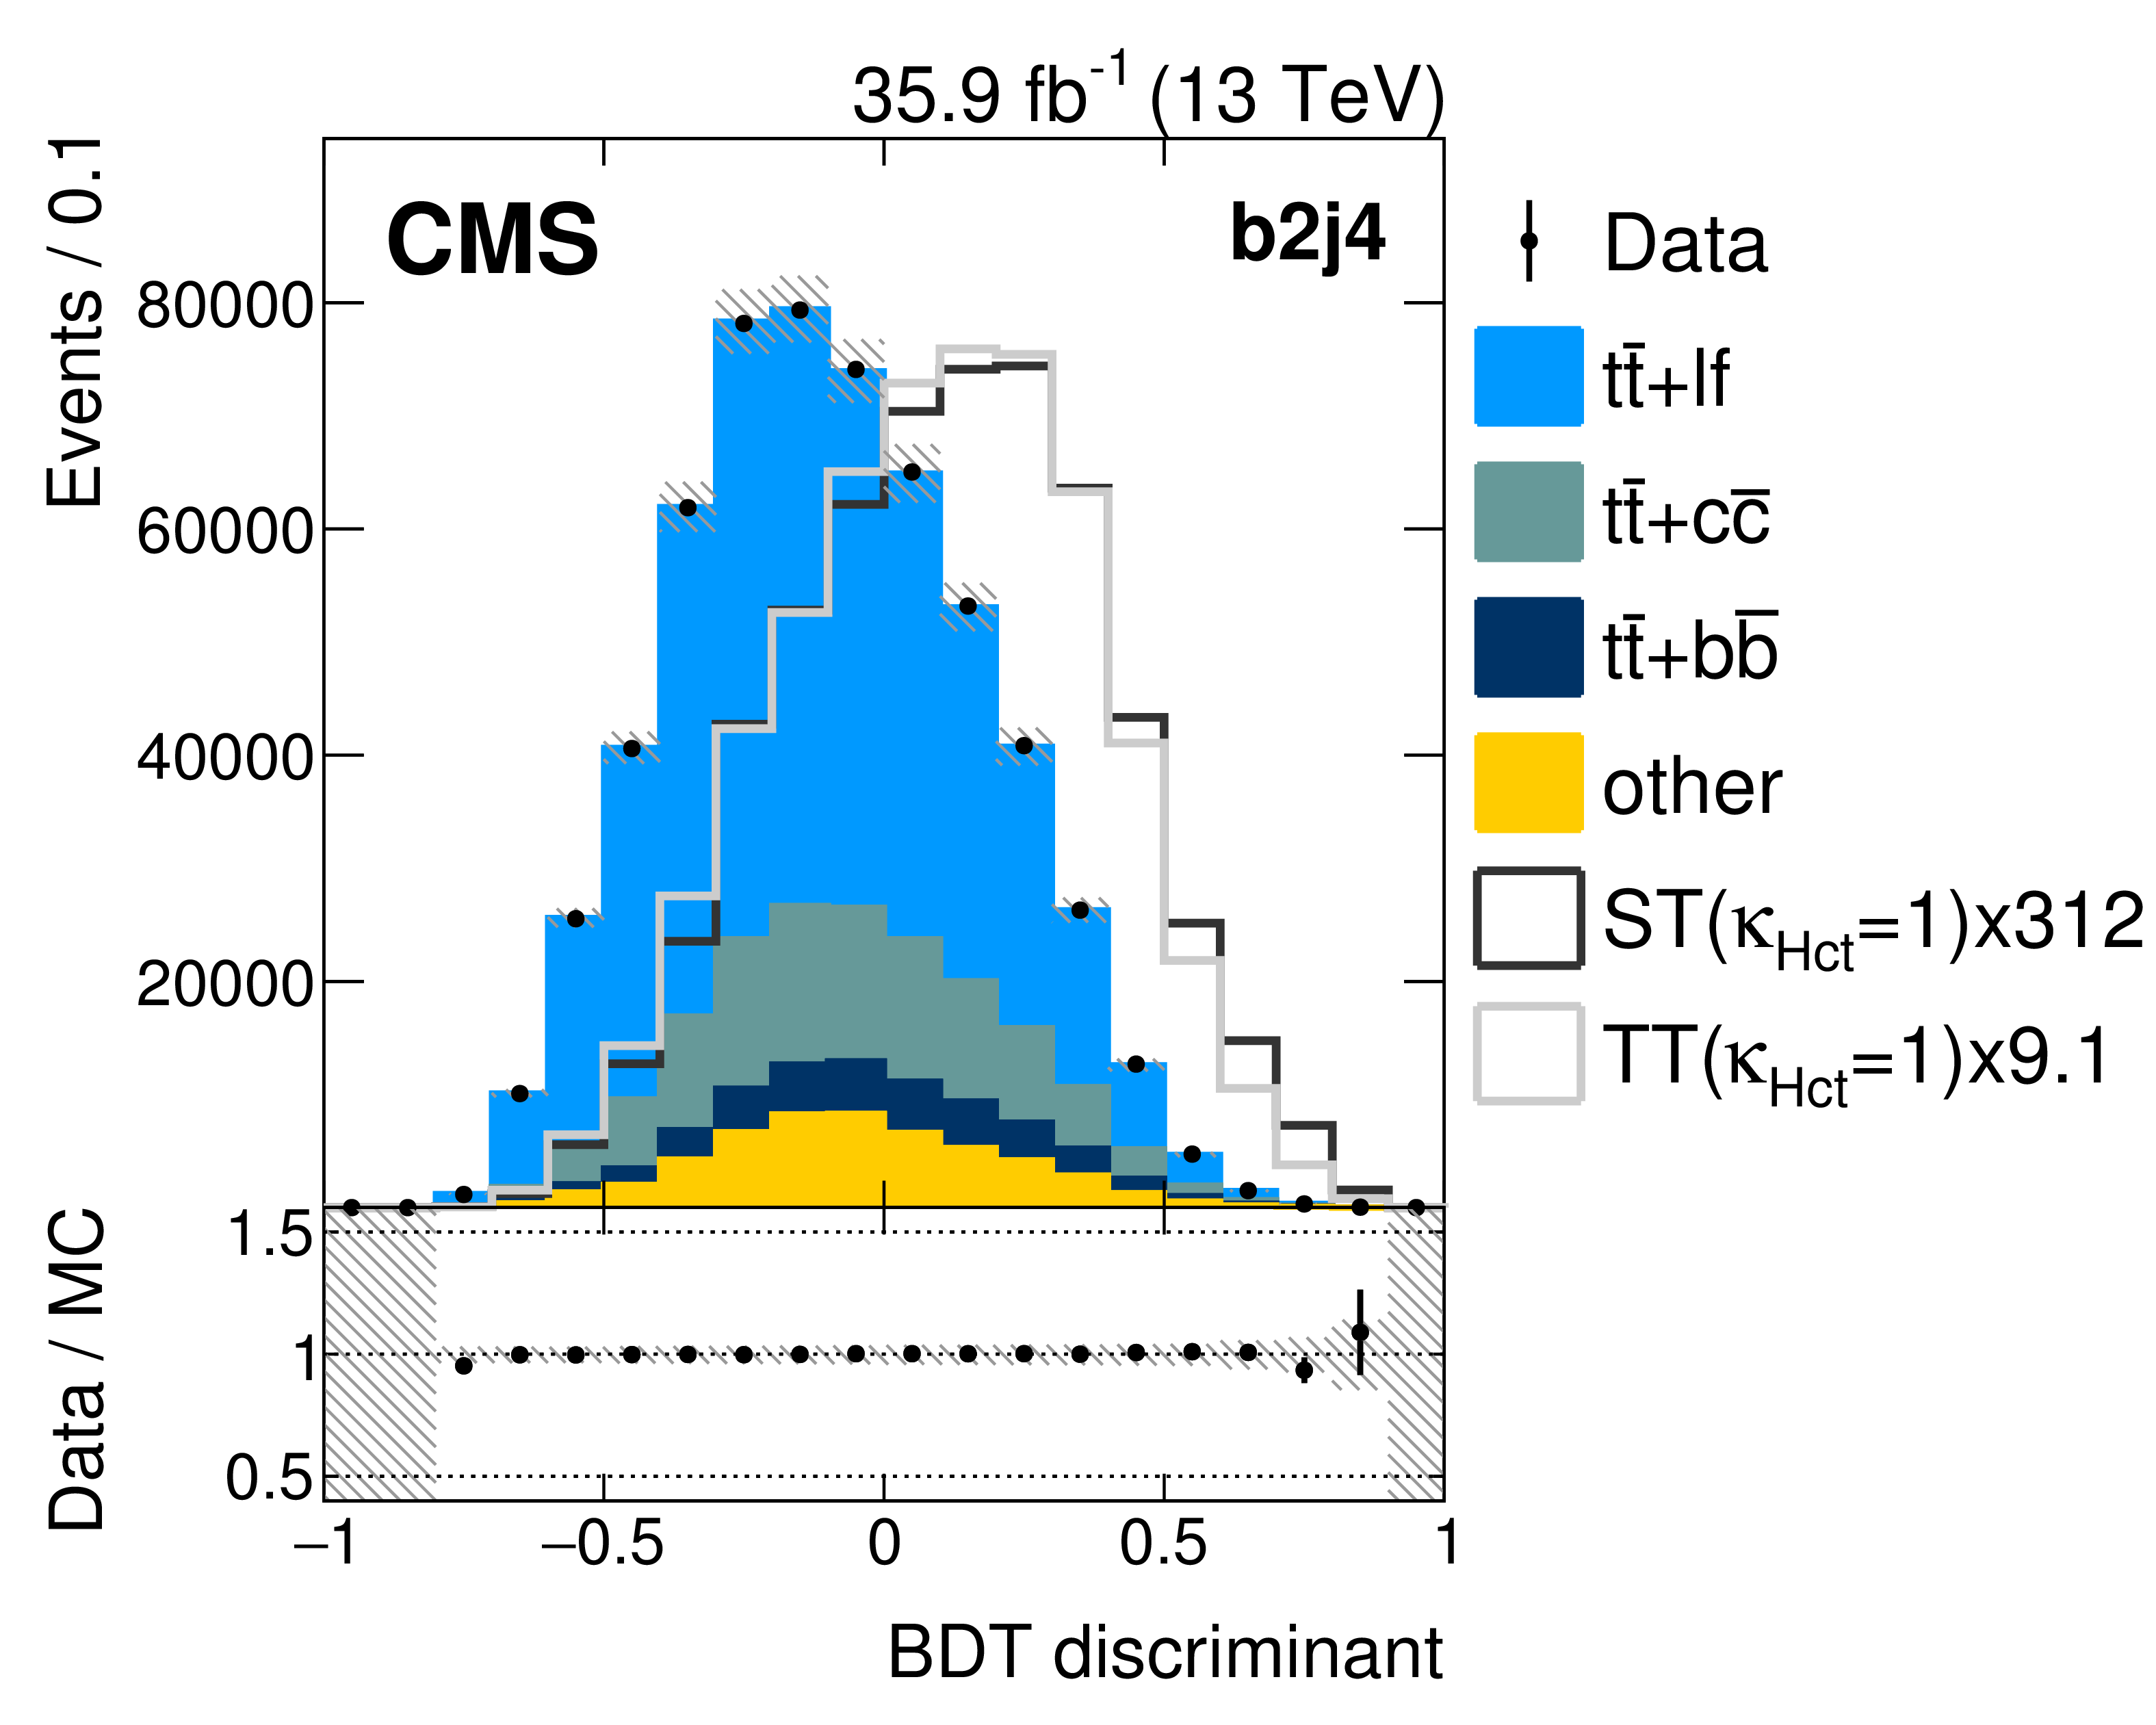
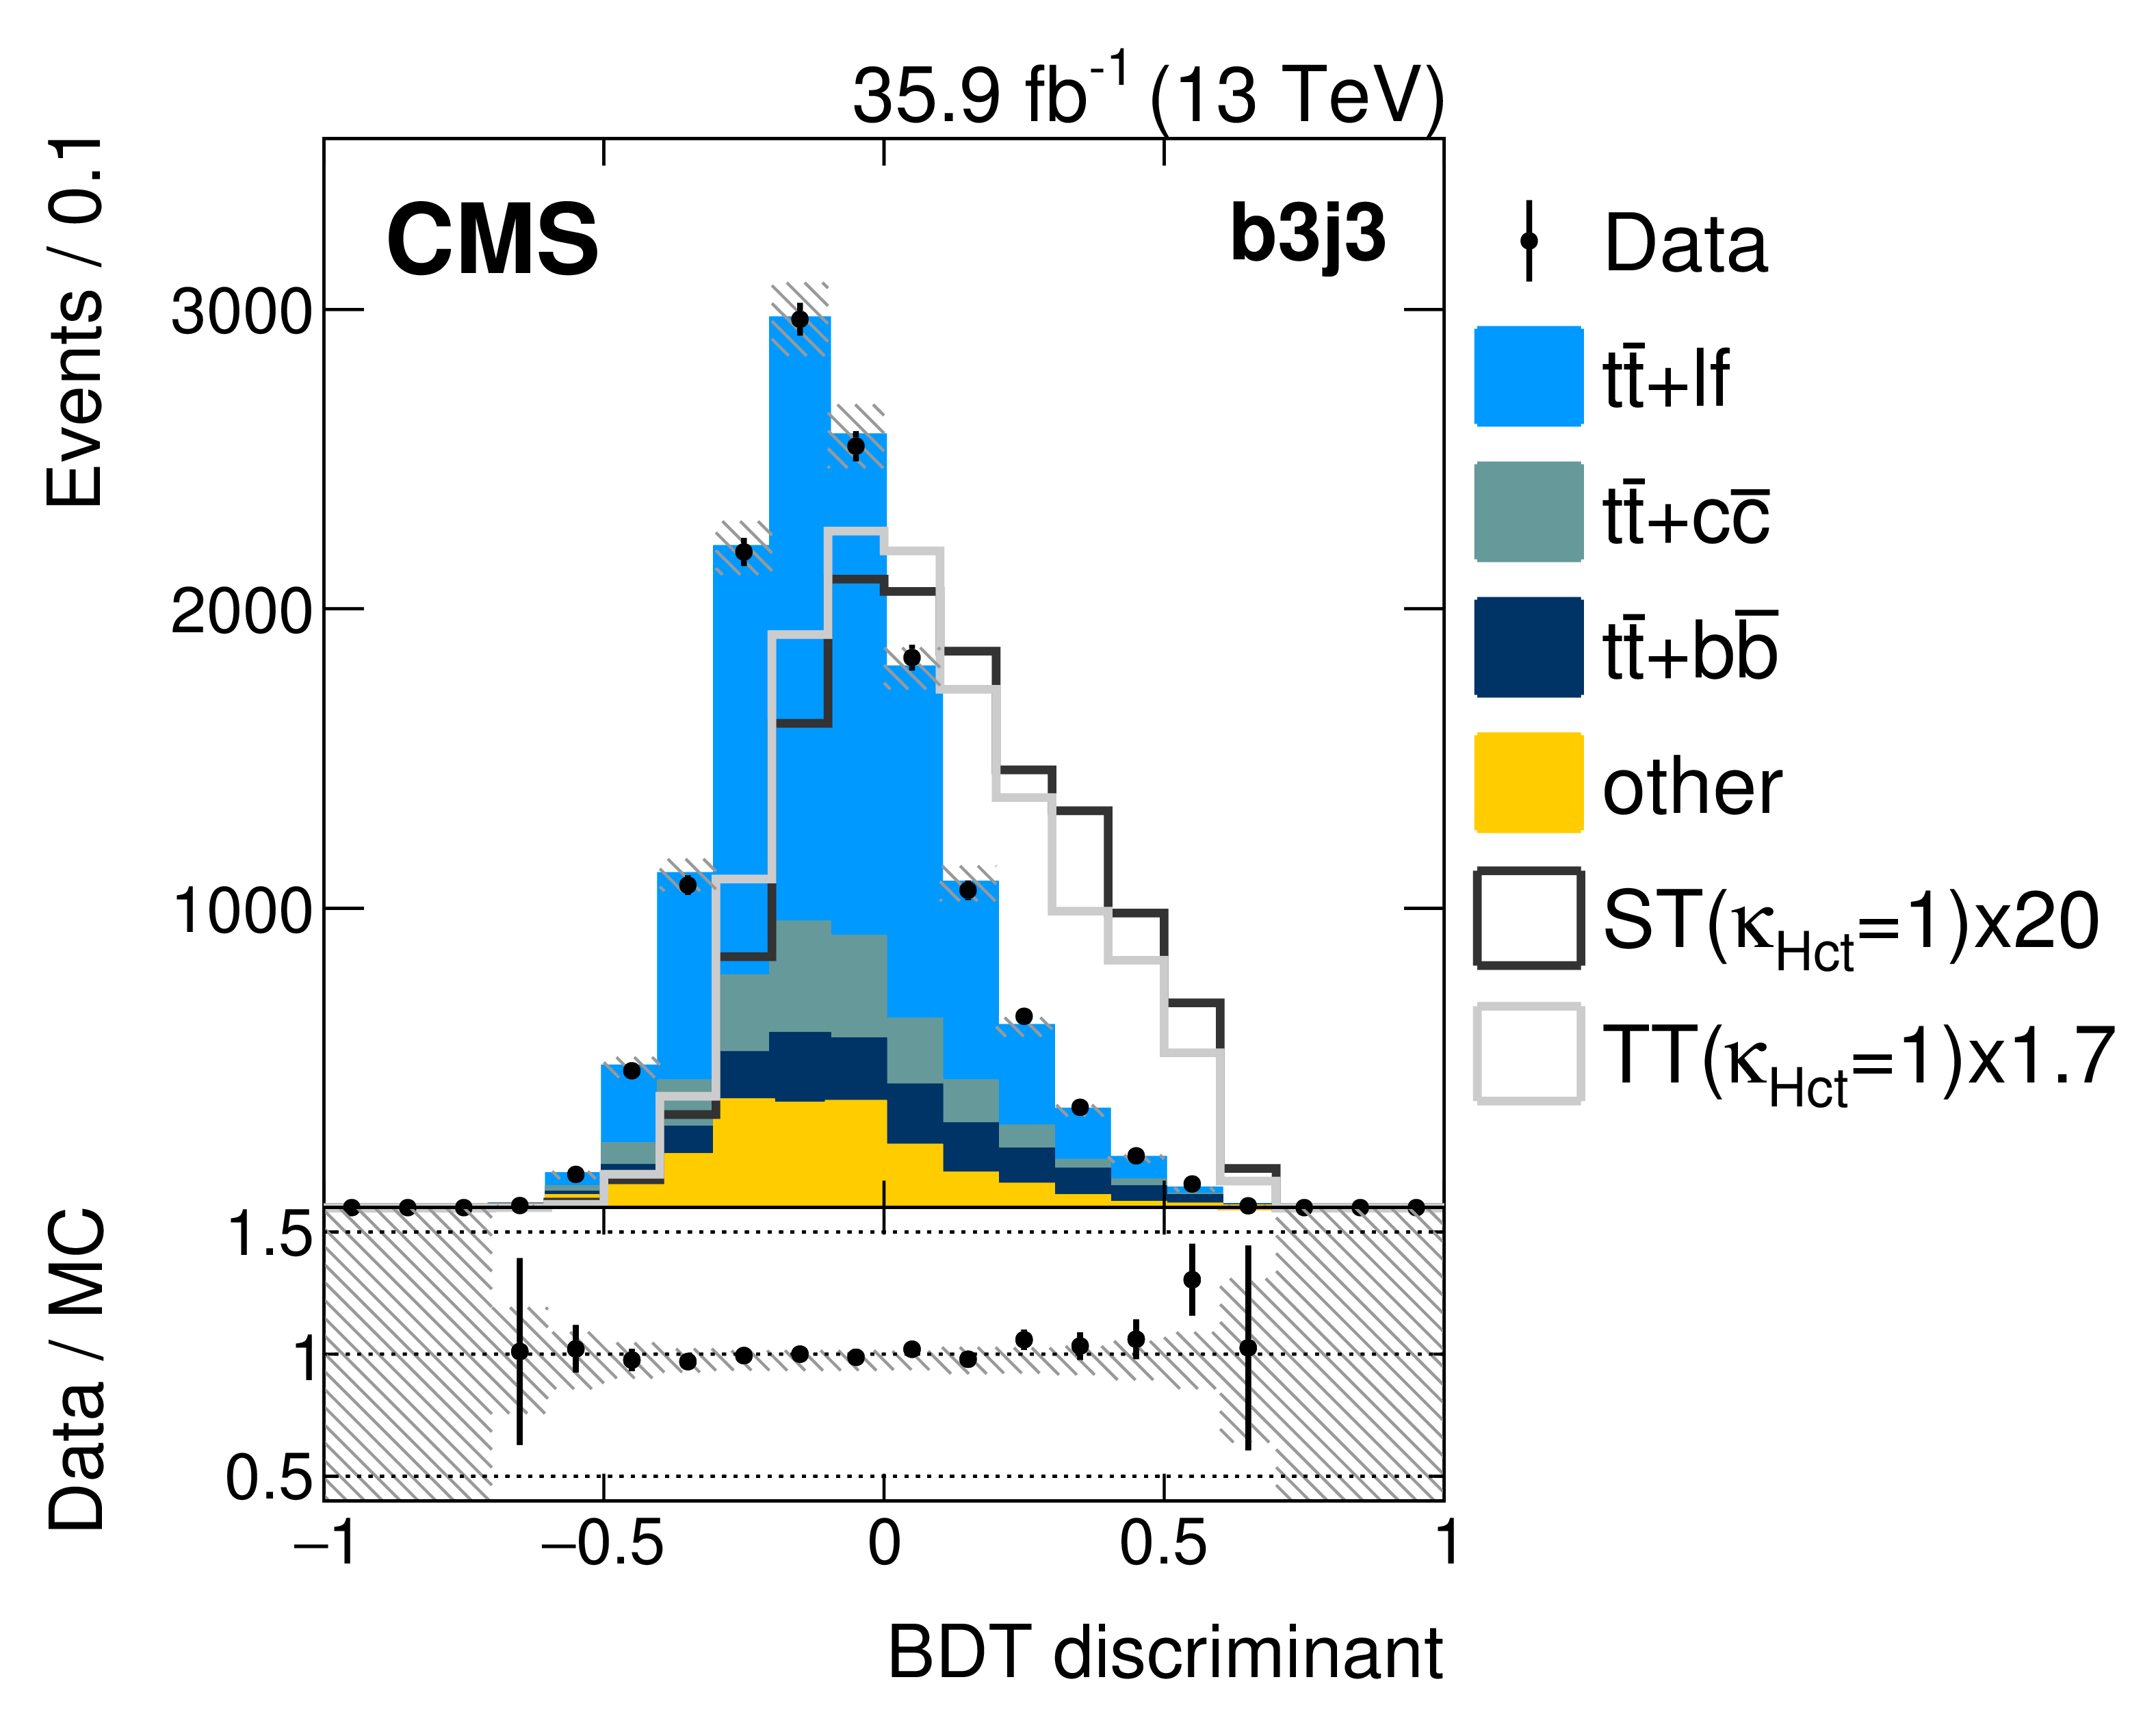
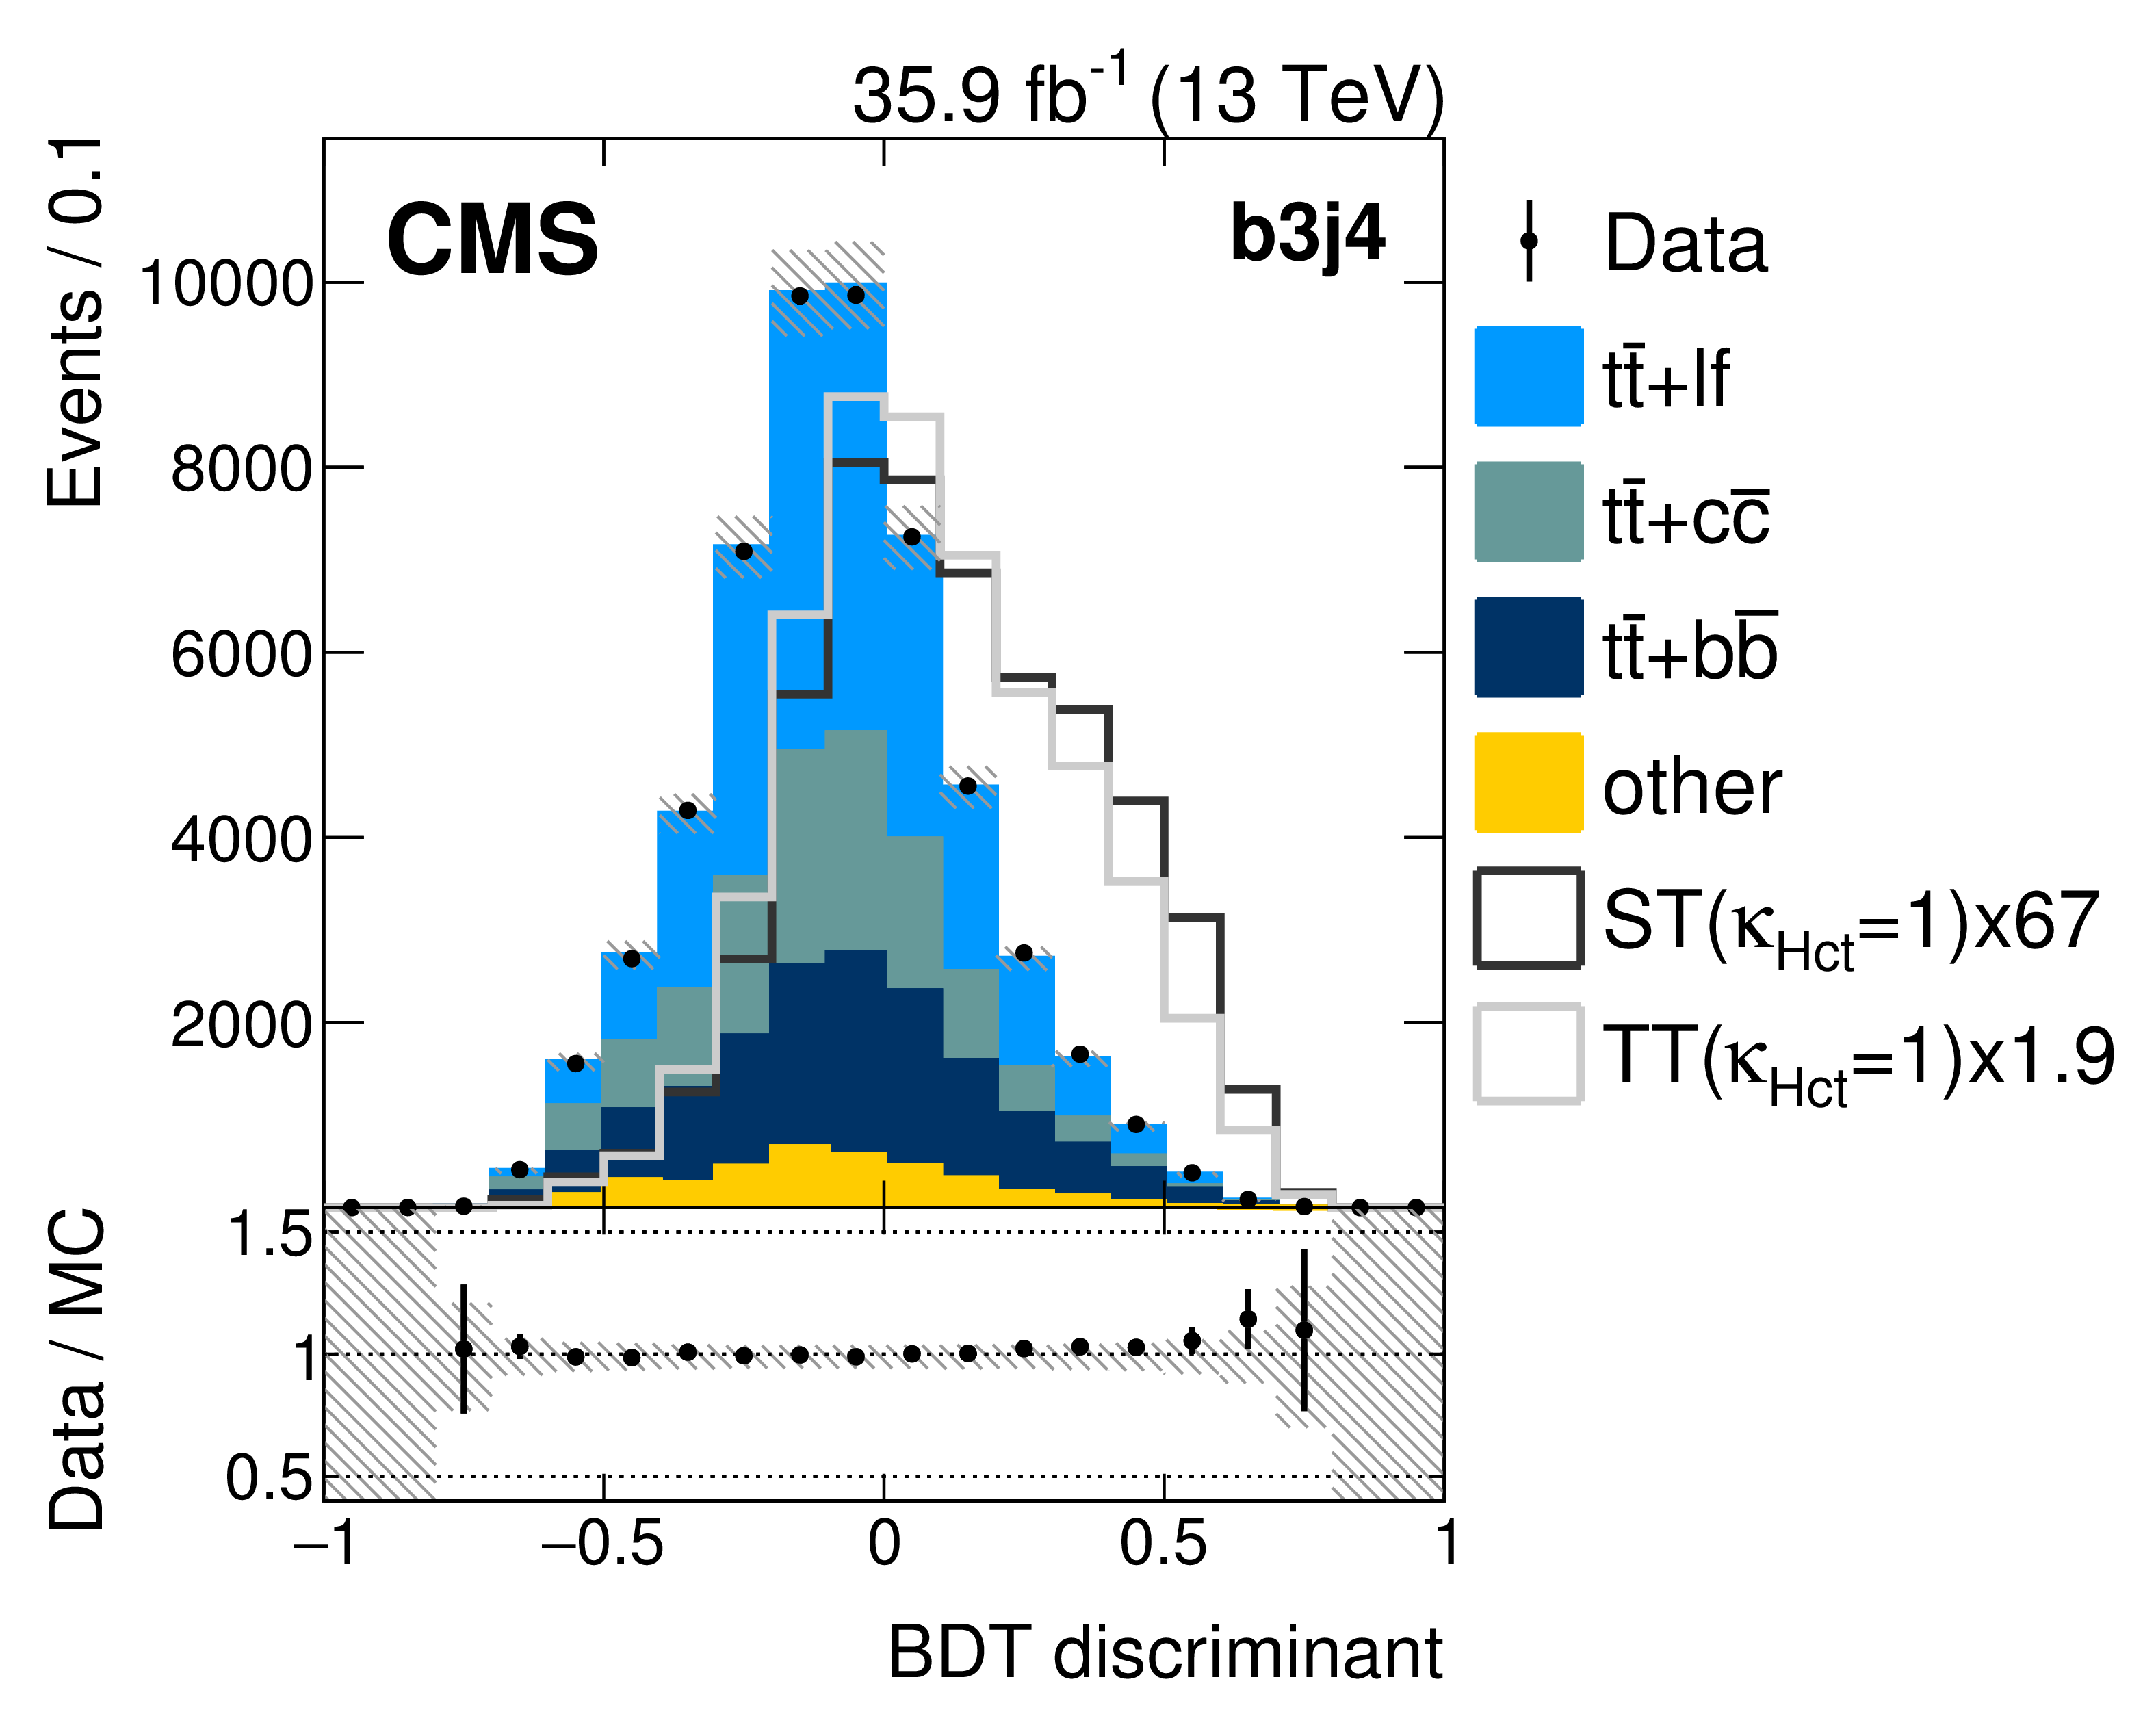
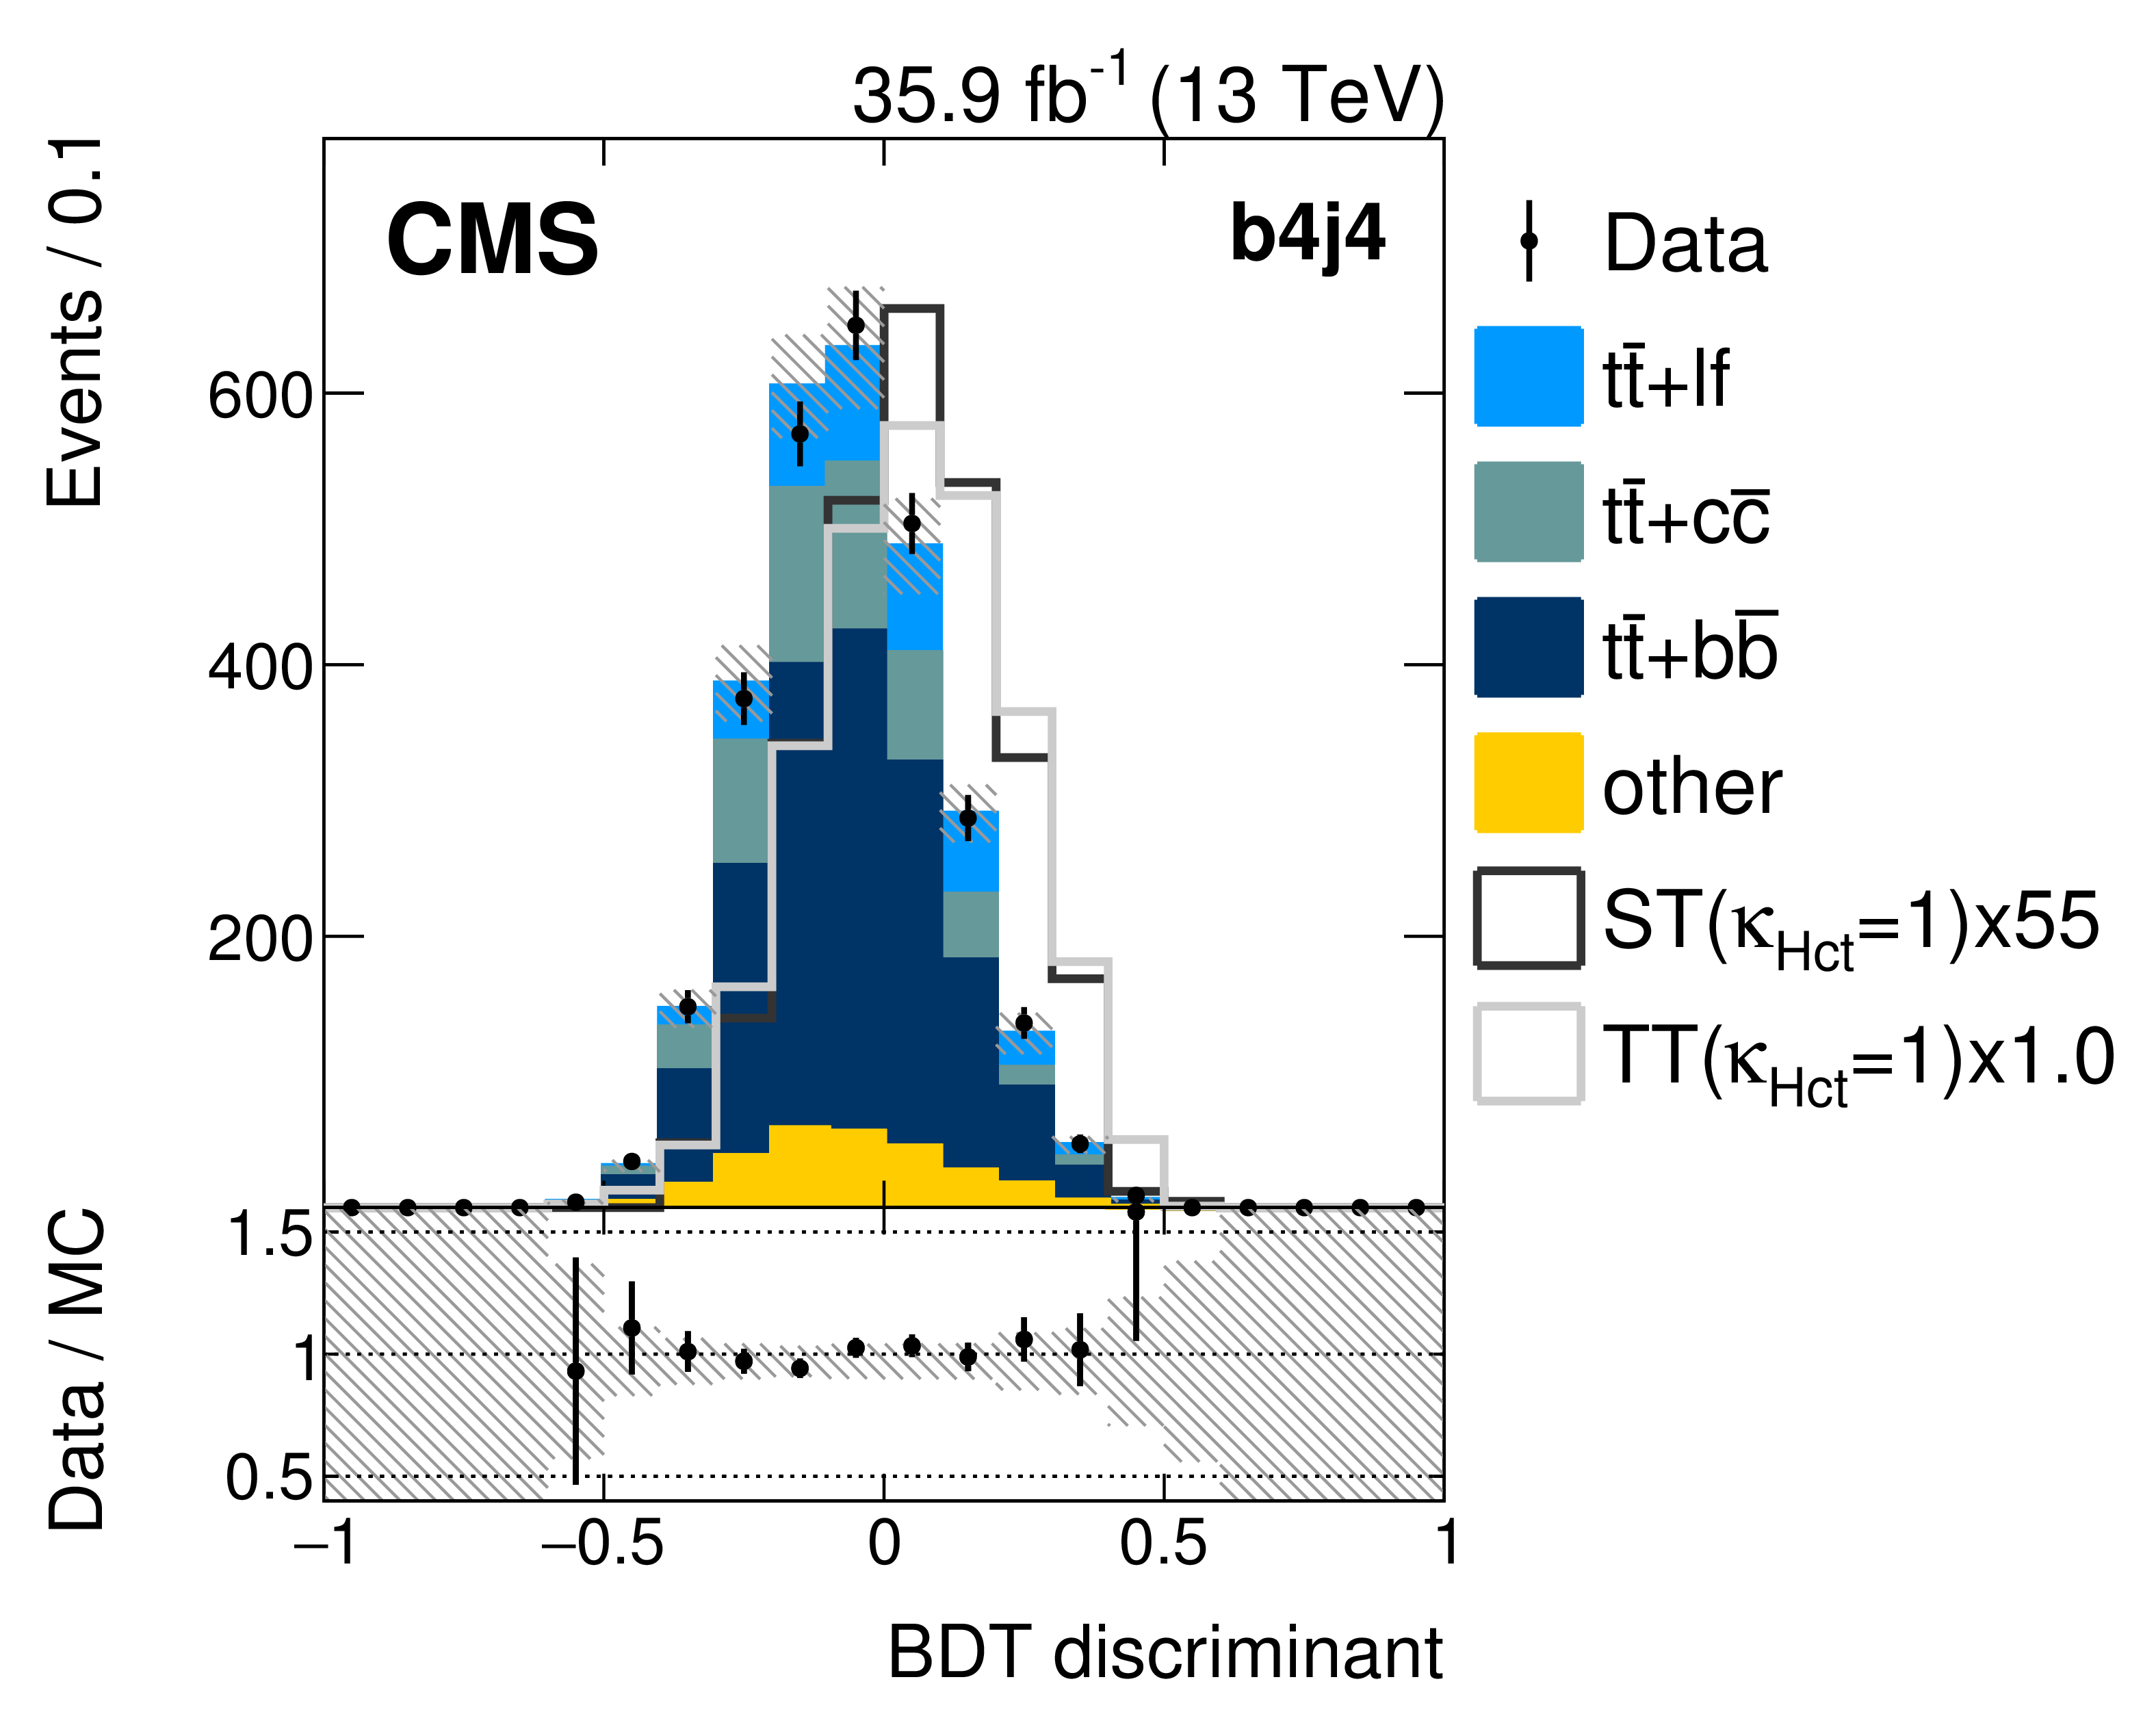
Figure 4:
The BDT discriminant distributions for different jet categories for Hct training after the fit to data. All background processes are constrained to the SM expectation in the fit. The shaded area corresponds to the total uncertainty in the predicted background. The data-to-simulation ratio is also shown. |
png pdf |
Figure 4-a:
The BDT discriminant distributions for different jet categories for Hct training after the fit to data. All background processes are constrained to the SM expectation in the fit. The shaded area corresponds to the total uncertainty in the predicted background. The data-to-simulation ratio is also shown. |
png pdf |
Figure 4-b:
The BDT discriminant distributions for different jet categories for Hct training after the fit to data. All background processes are constrained to the SM expectation in the fit. The shaded area corresponds to the total uncertainty in the predicted background. The data-to-simulation ratio is also shown. |
png pdf |
Figure 4-c:
The BDT discriminant distributions for different jet categories for Hct training after the fit to data. All background processes are constrained to the SM expectation in the fit. The shaded area corresponds to the total uncertainty in the predicted background. The data-to-simulation ratio is also shown. |
png pdf |
Figure 4-d:
The BDT discriminant distributions for different jet categories for Hct training after the fit to data. All background processes are constrained to the SM expectation in the fit. The shaded area corresponds to the total uncertainty in the predicted background. The data-to-simulation ratio is also shown. |
png pdf |
Figure 4-e:
The BDT discriminant distributions for different jet categories for Hct training after the fit to data. All background processes are constrained to the SM expectation in the fit. The shaded area corresponds to the total uncertainty in the predicted background. The data-to-simulation ratio is also shown. |
png pdf |
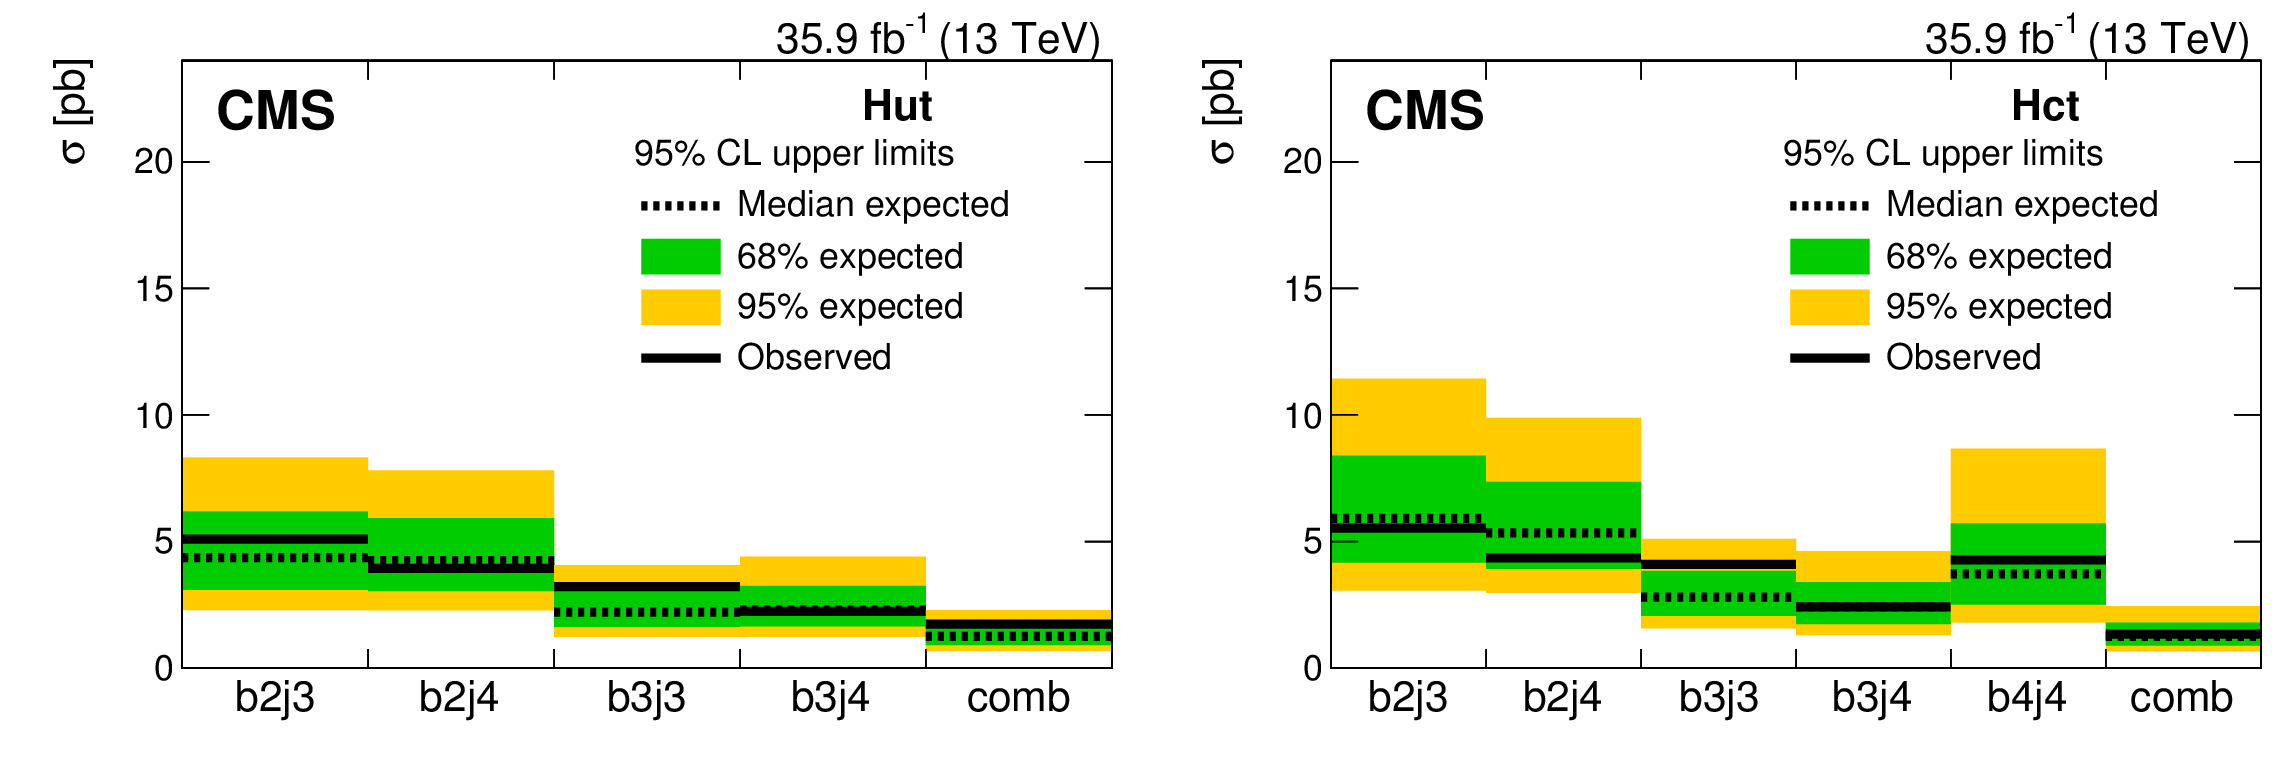
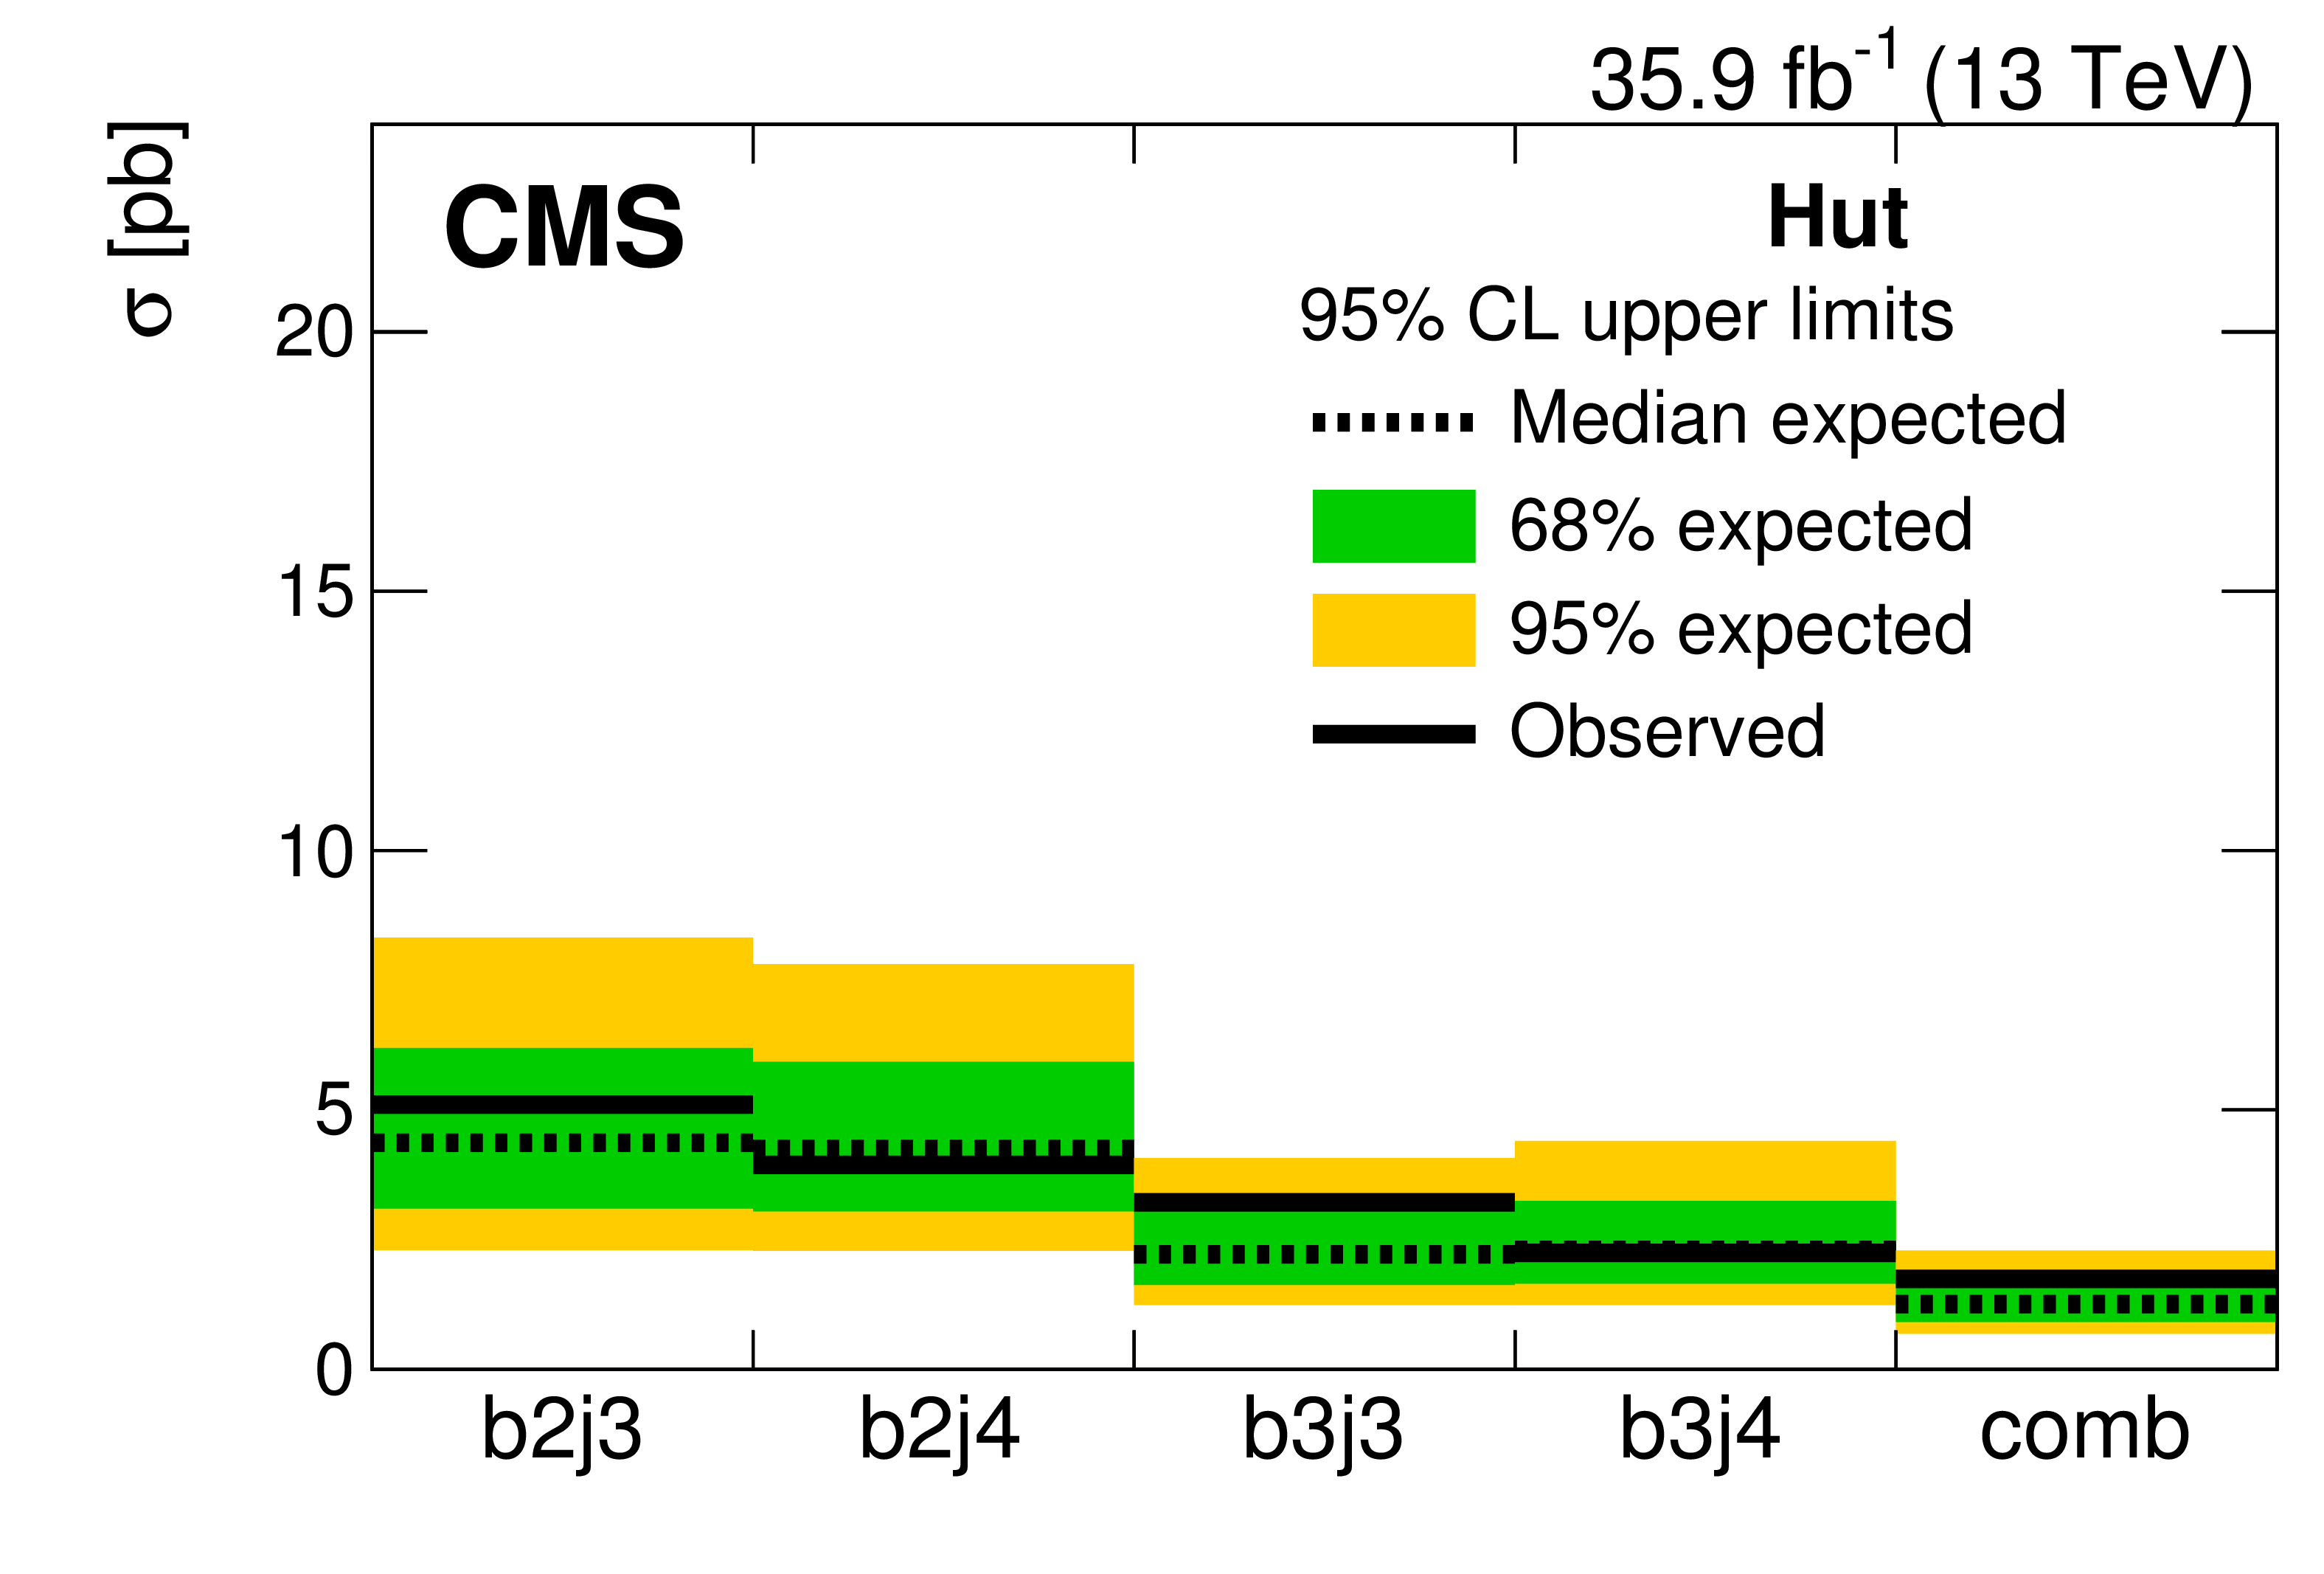
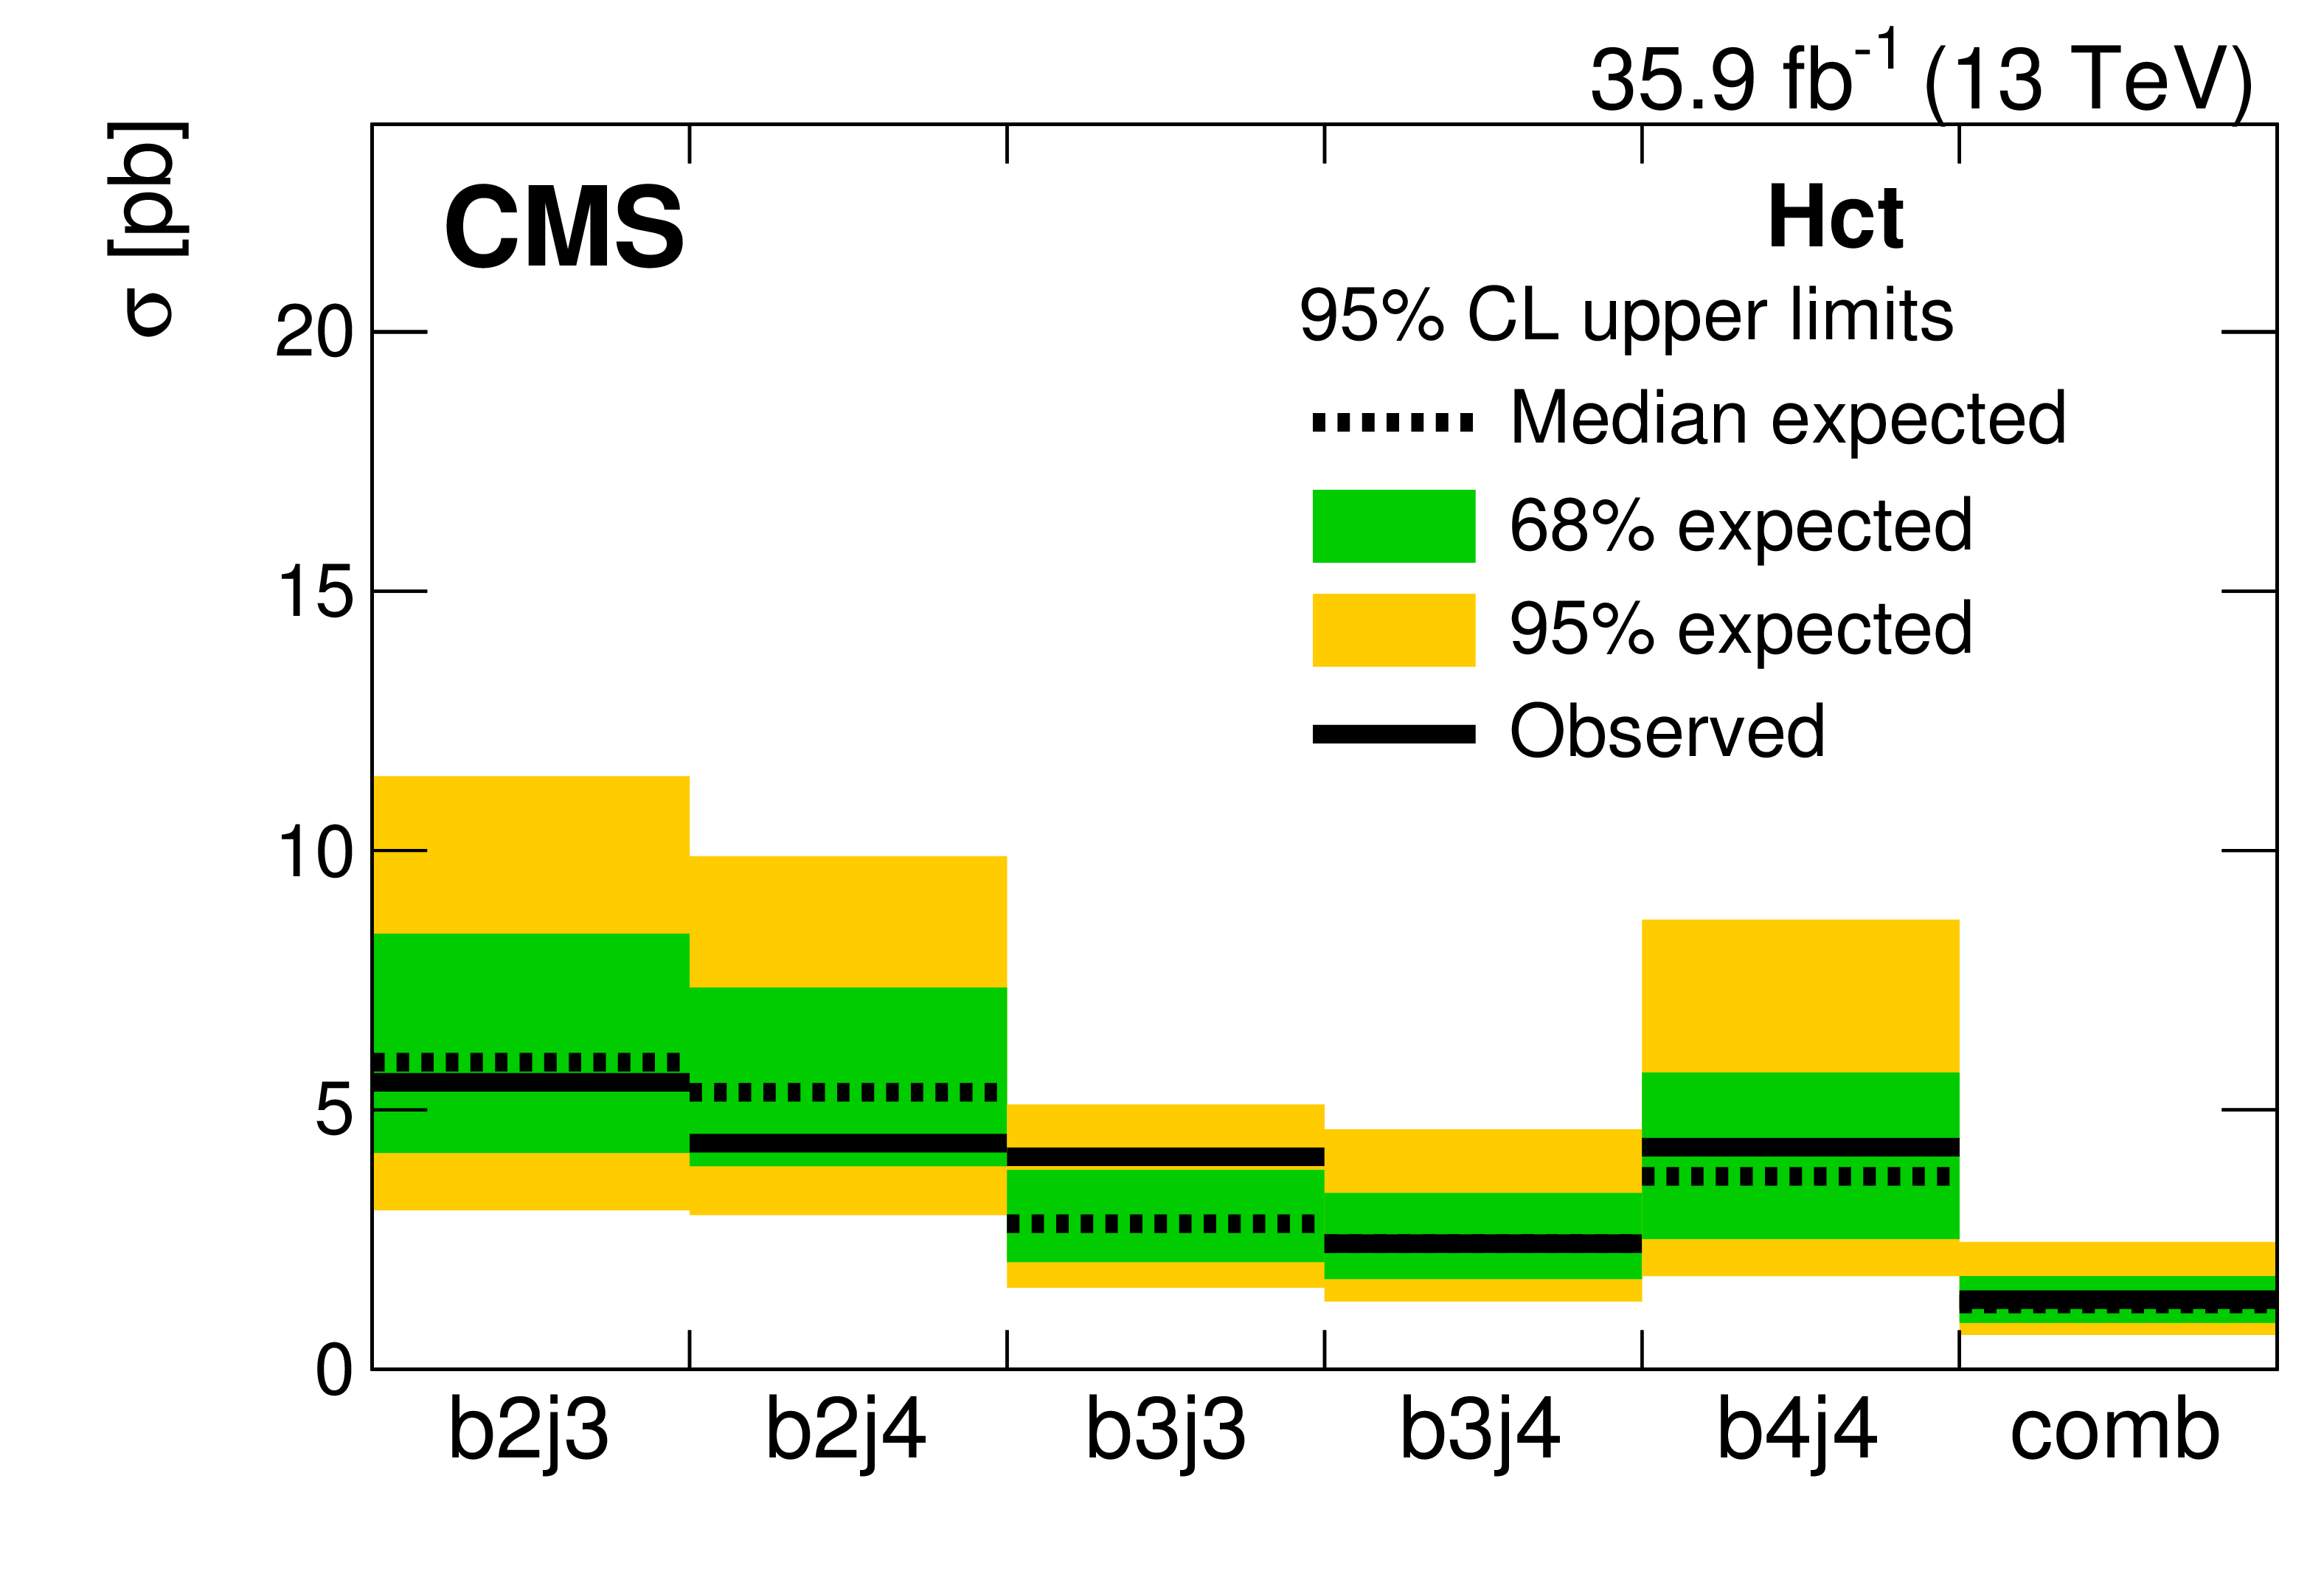
Figure 5:
Excluded signal cross section at 95% CL per event category for Hut (left) and Hct (right). |
png pdf |
Figure 5-a:
Excluded signal cross section at 95% CL per event category for Hut (left) and Hct (right). |
png pdf |
Figure 5-b:
Excluded signal cross section at 95% CL per event category for Hut (left) and Hct (right). |
png pdf |
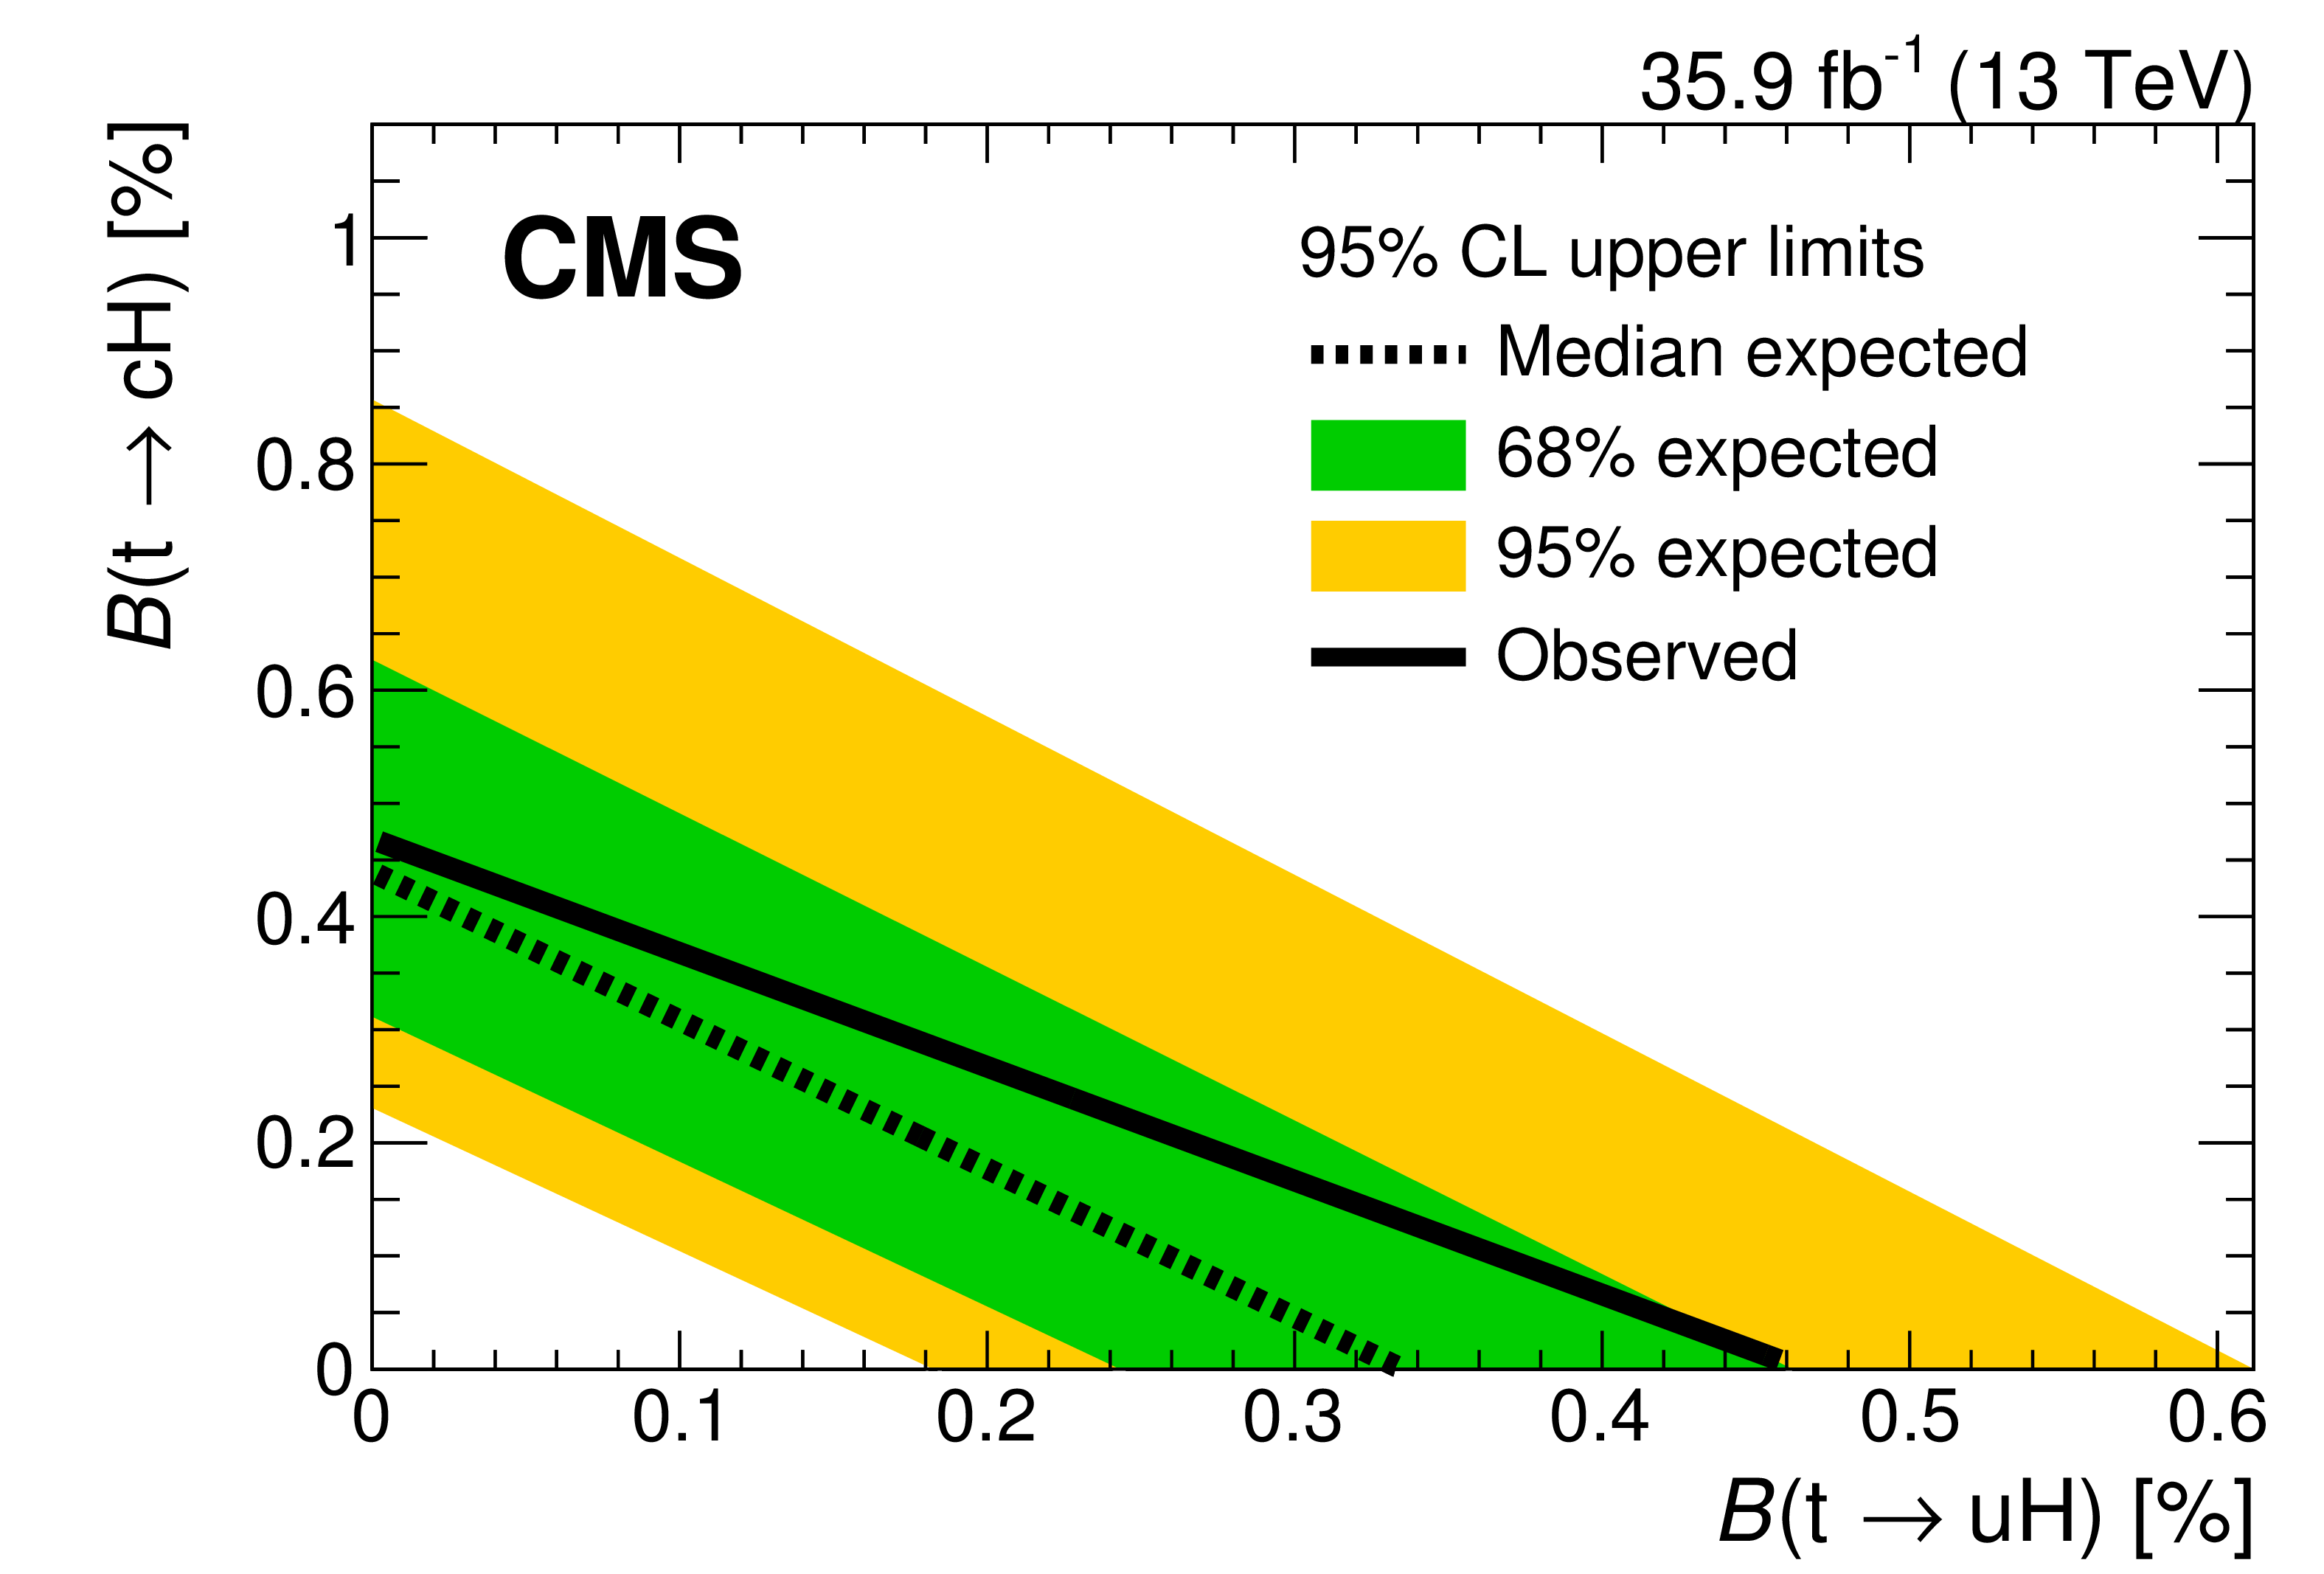
Figure 6:
Upper limits on $\mathcal {B}(\mathrm{t} \to \mathrm{u} \mathrm{H})$ and $\mathcal {B}(\mathrm{t} \to \mathrm{c} \mathrm{H})$ at 95% CL. |
png pdf |
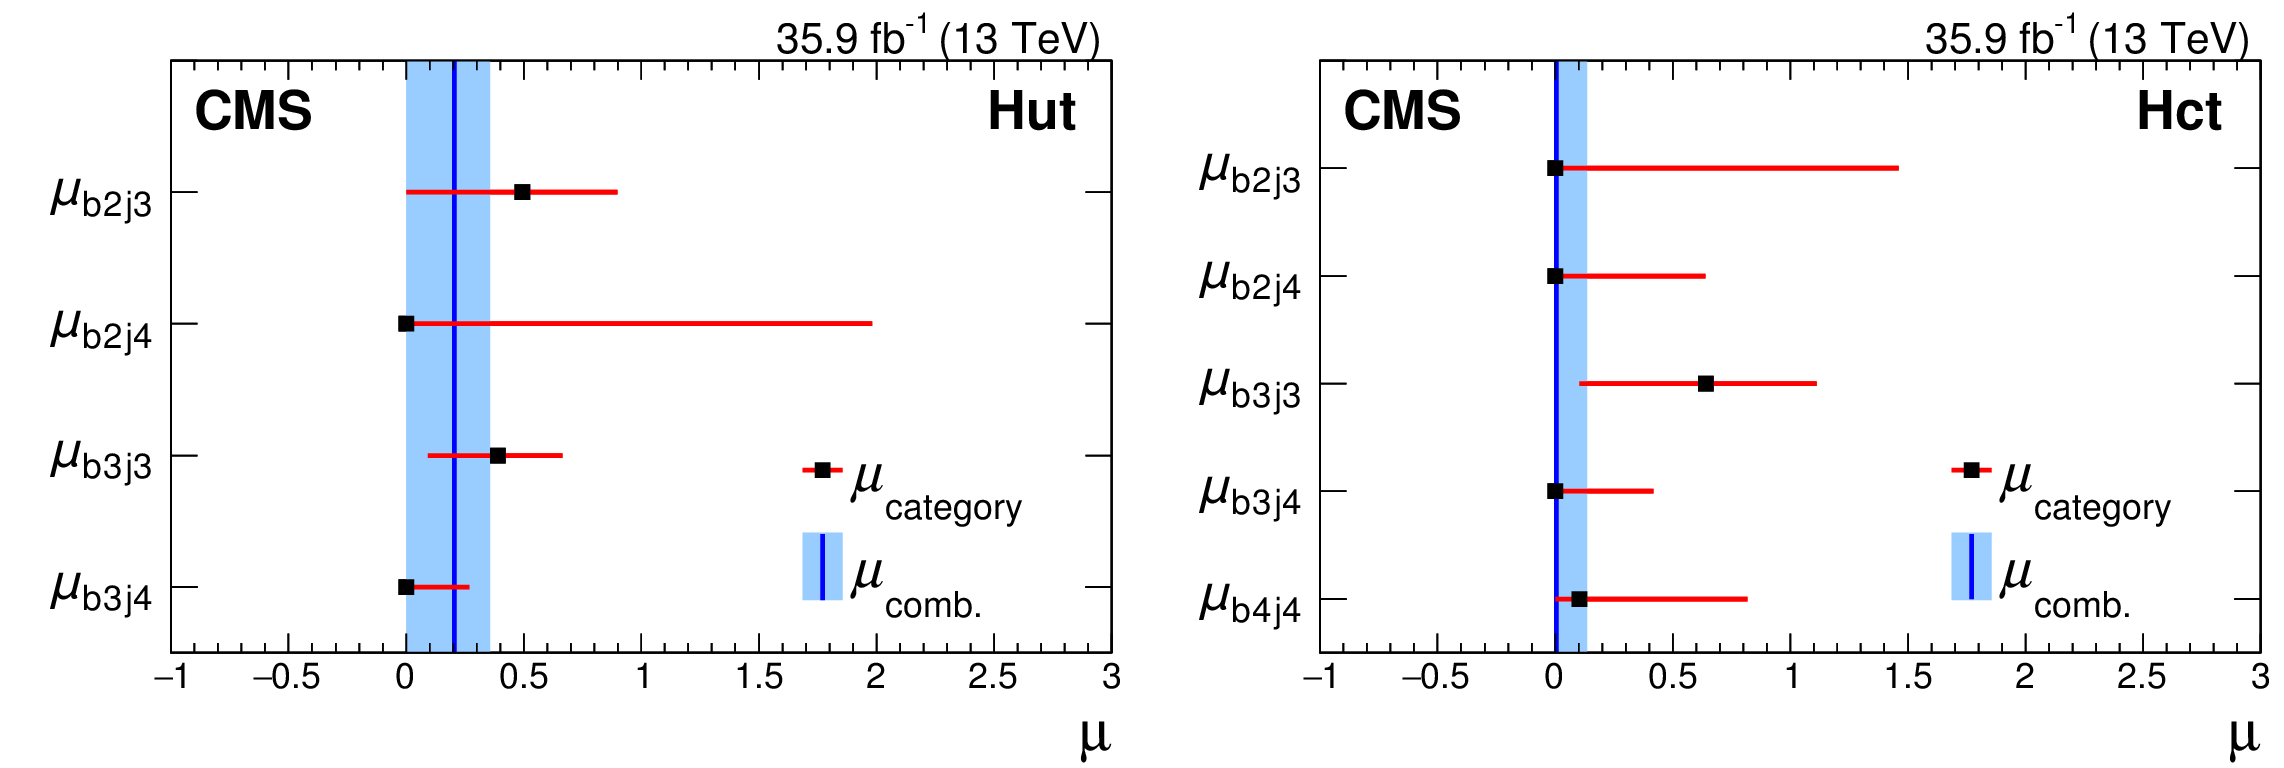
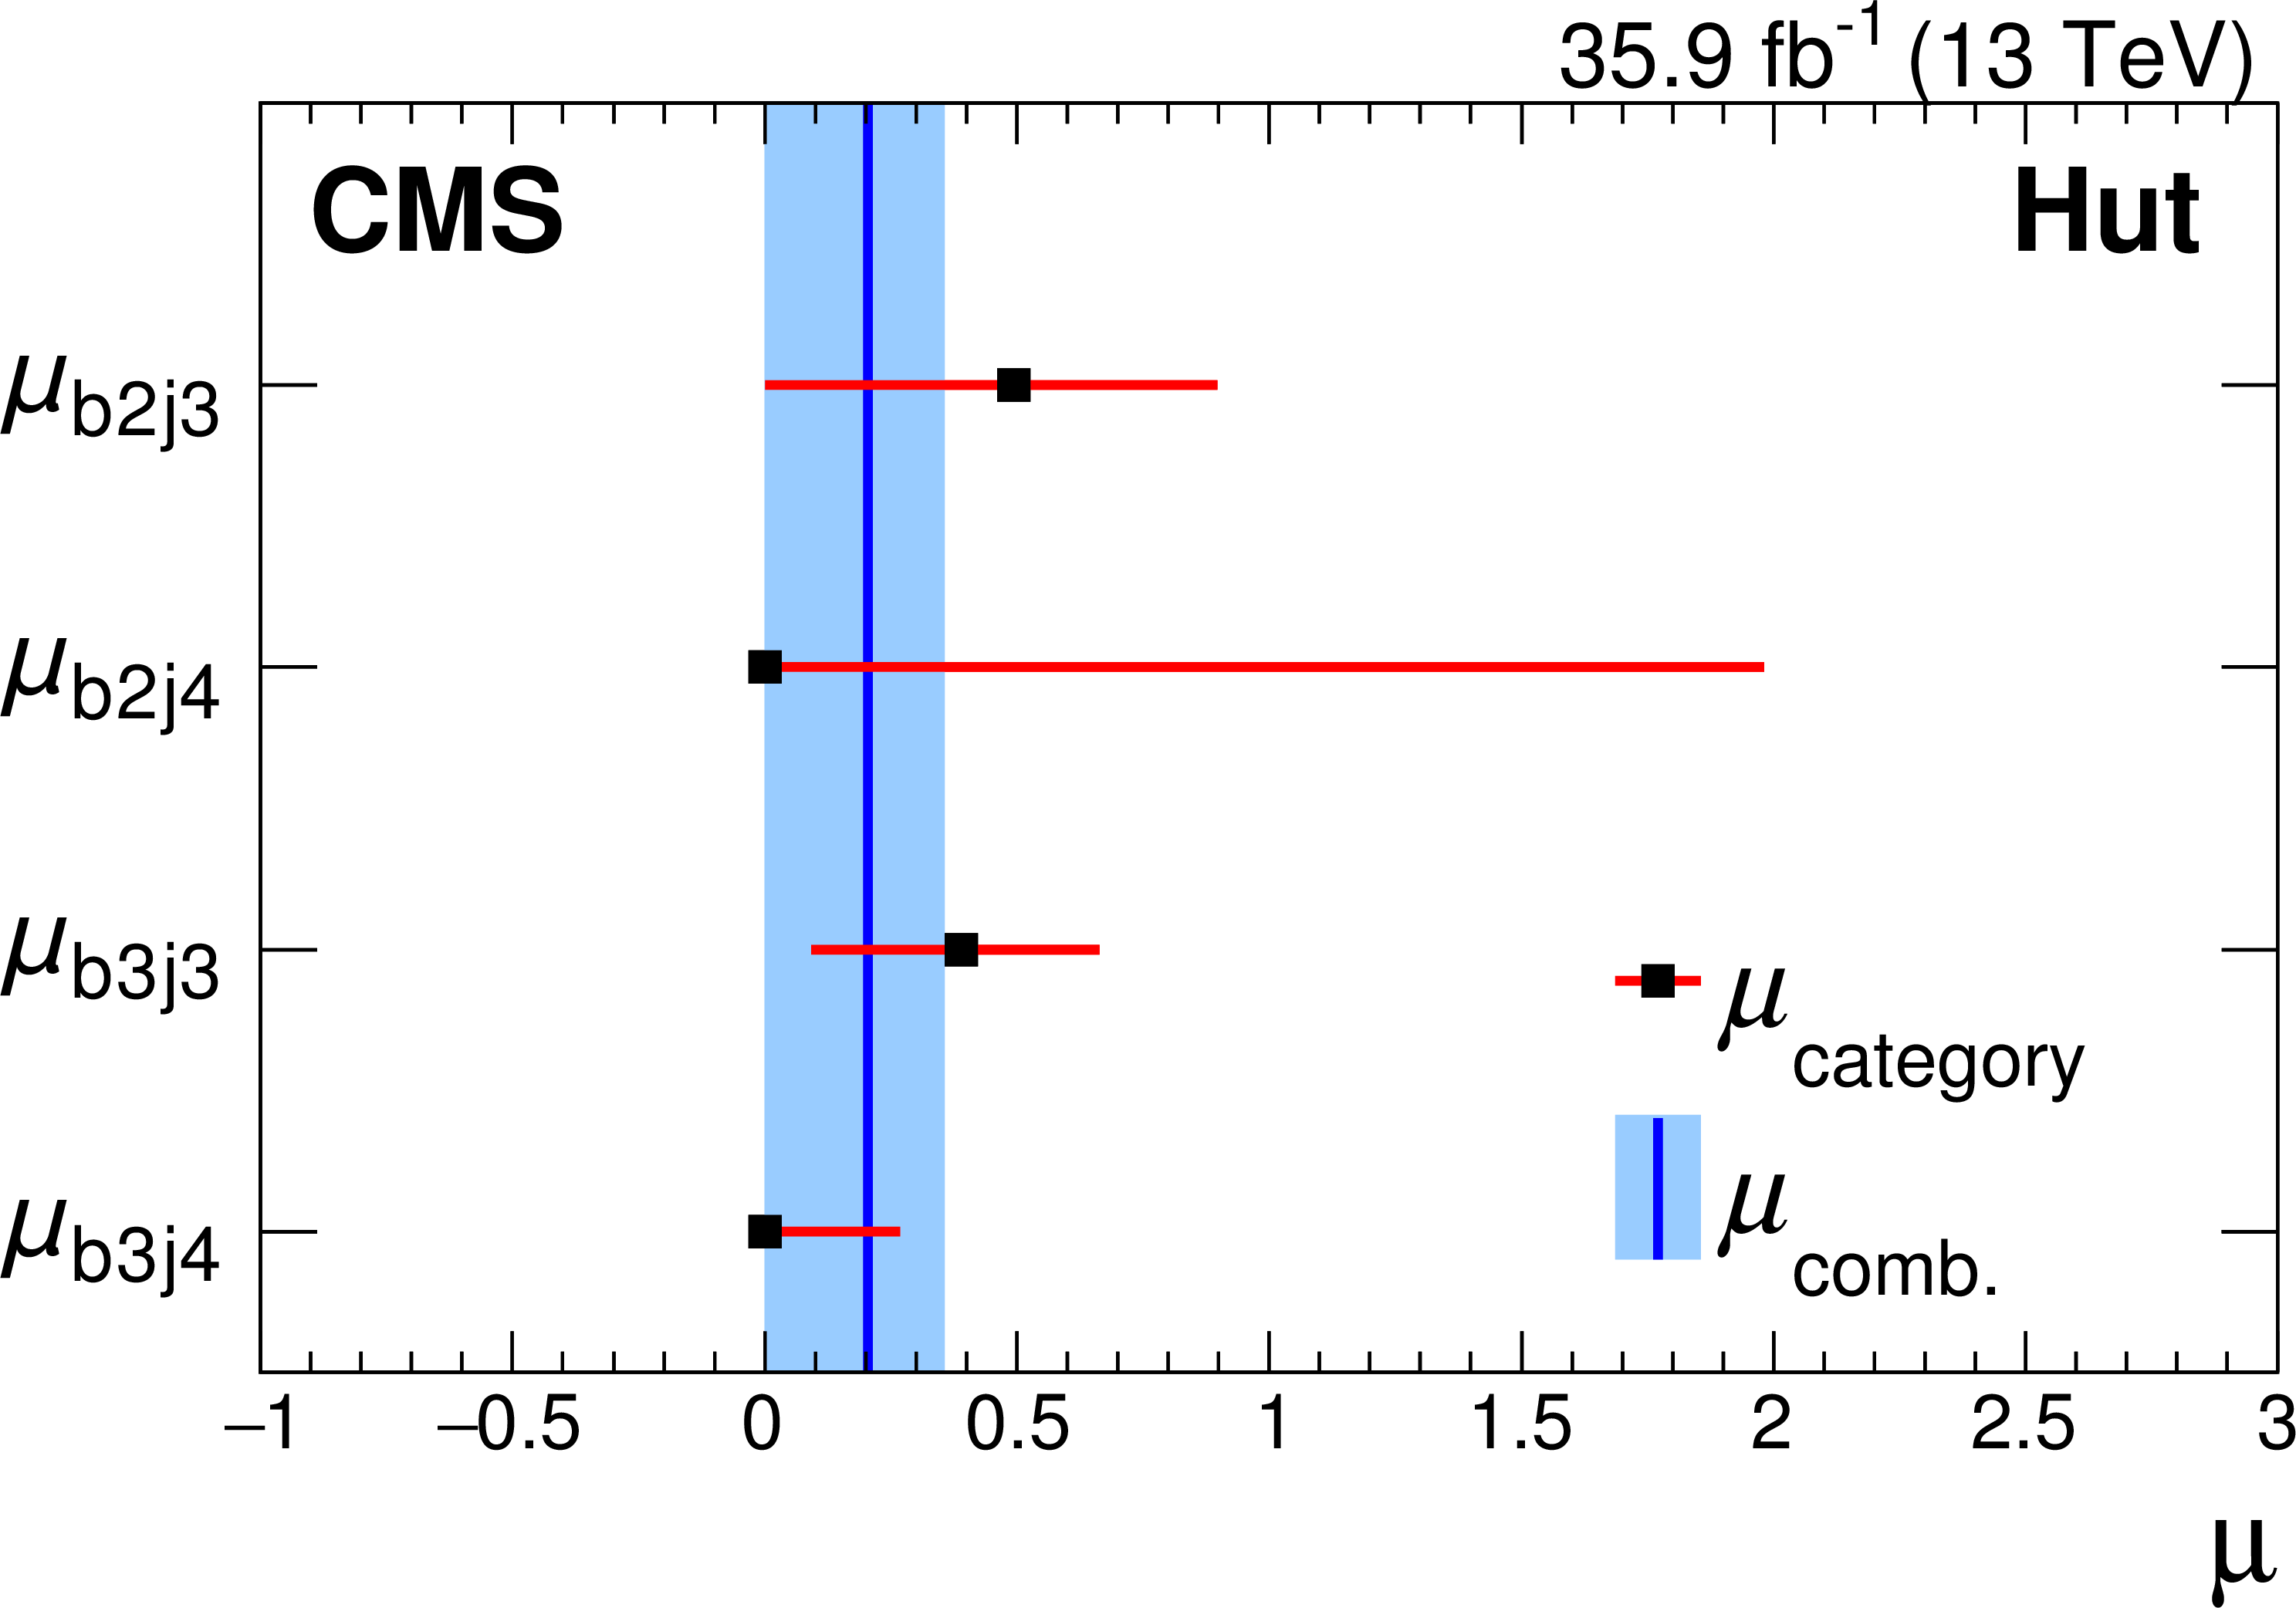
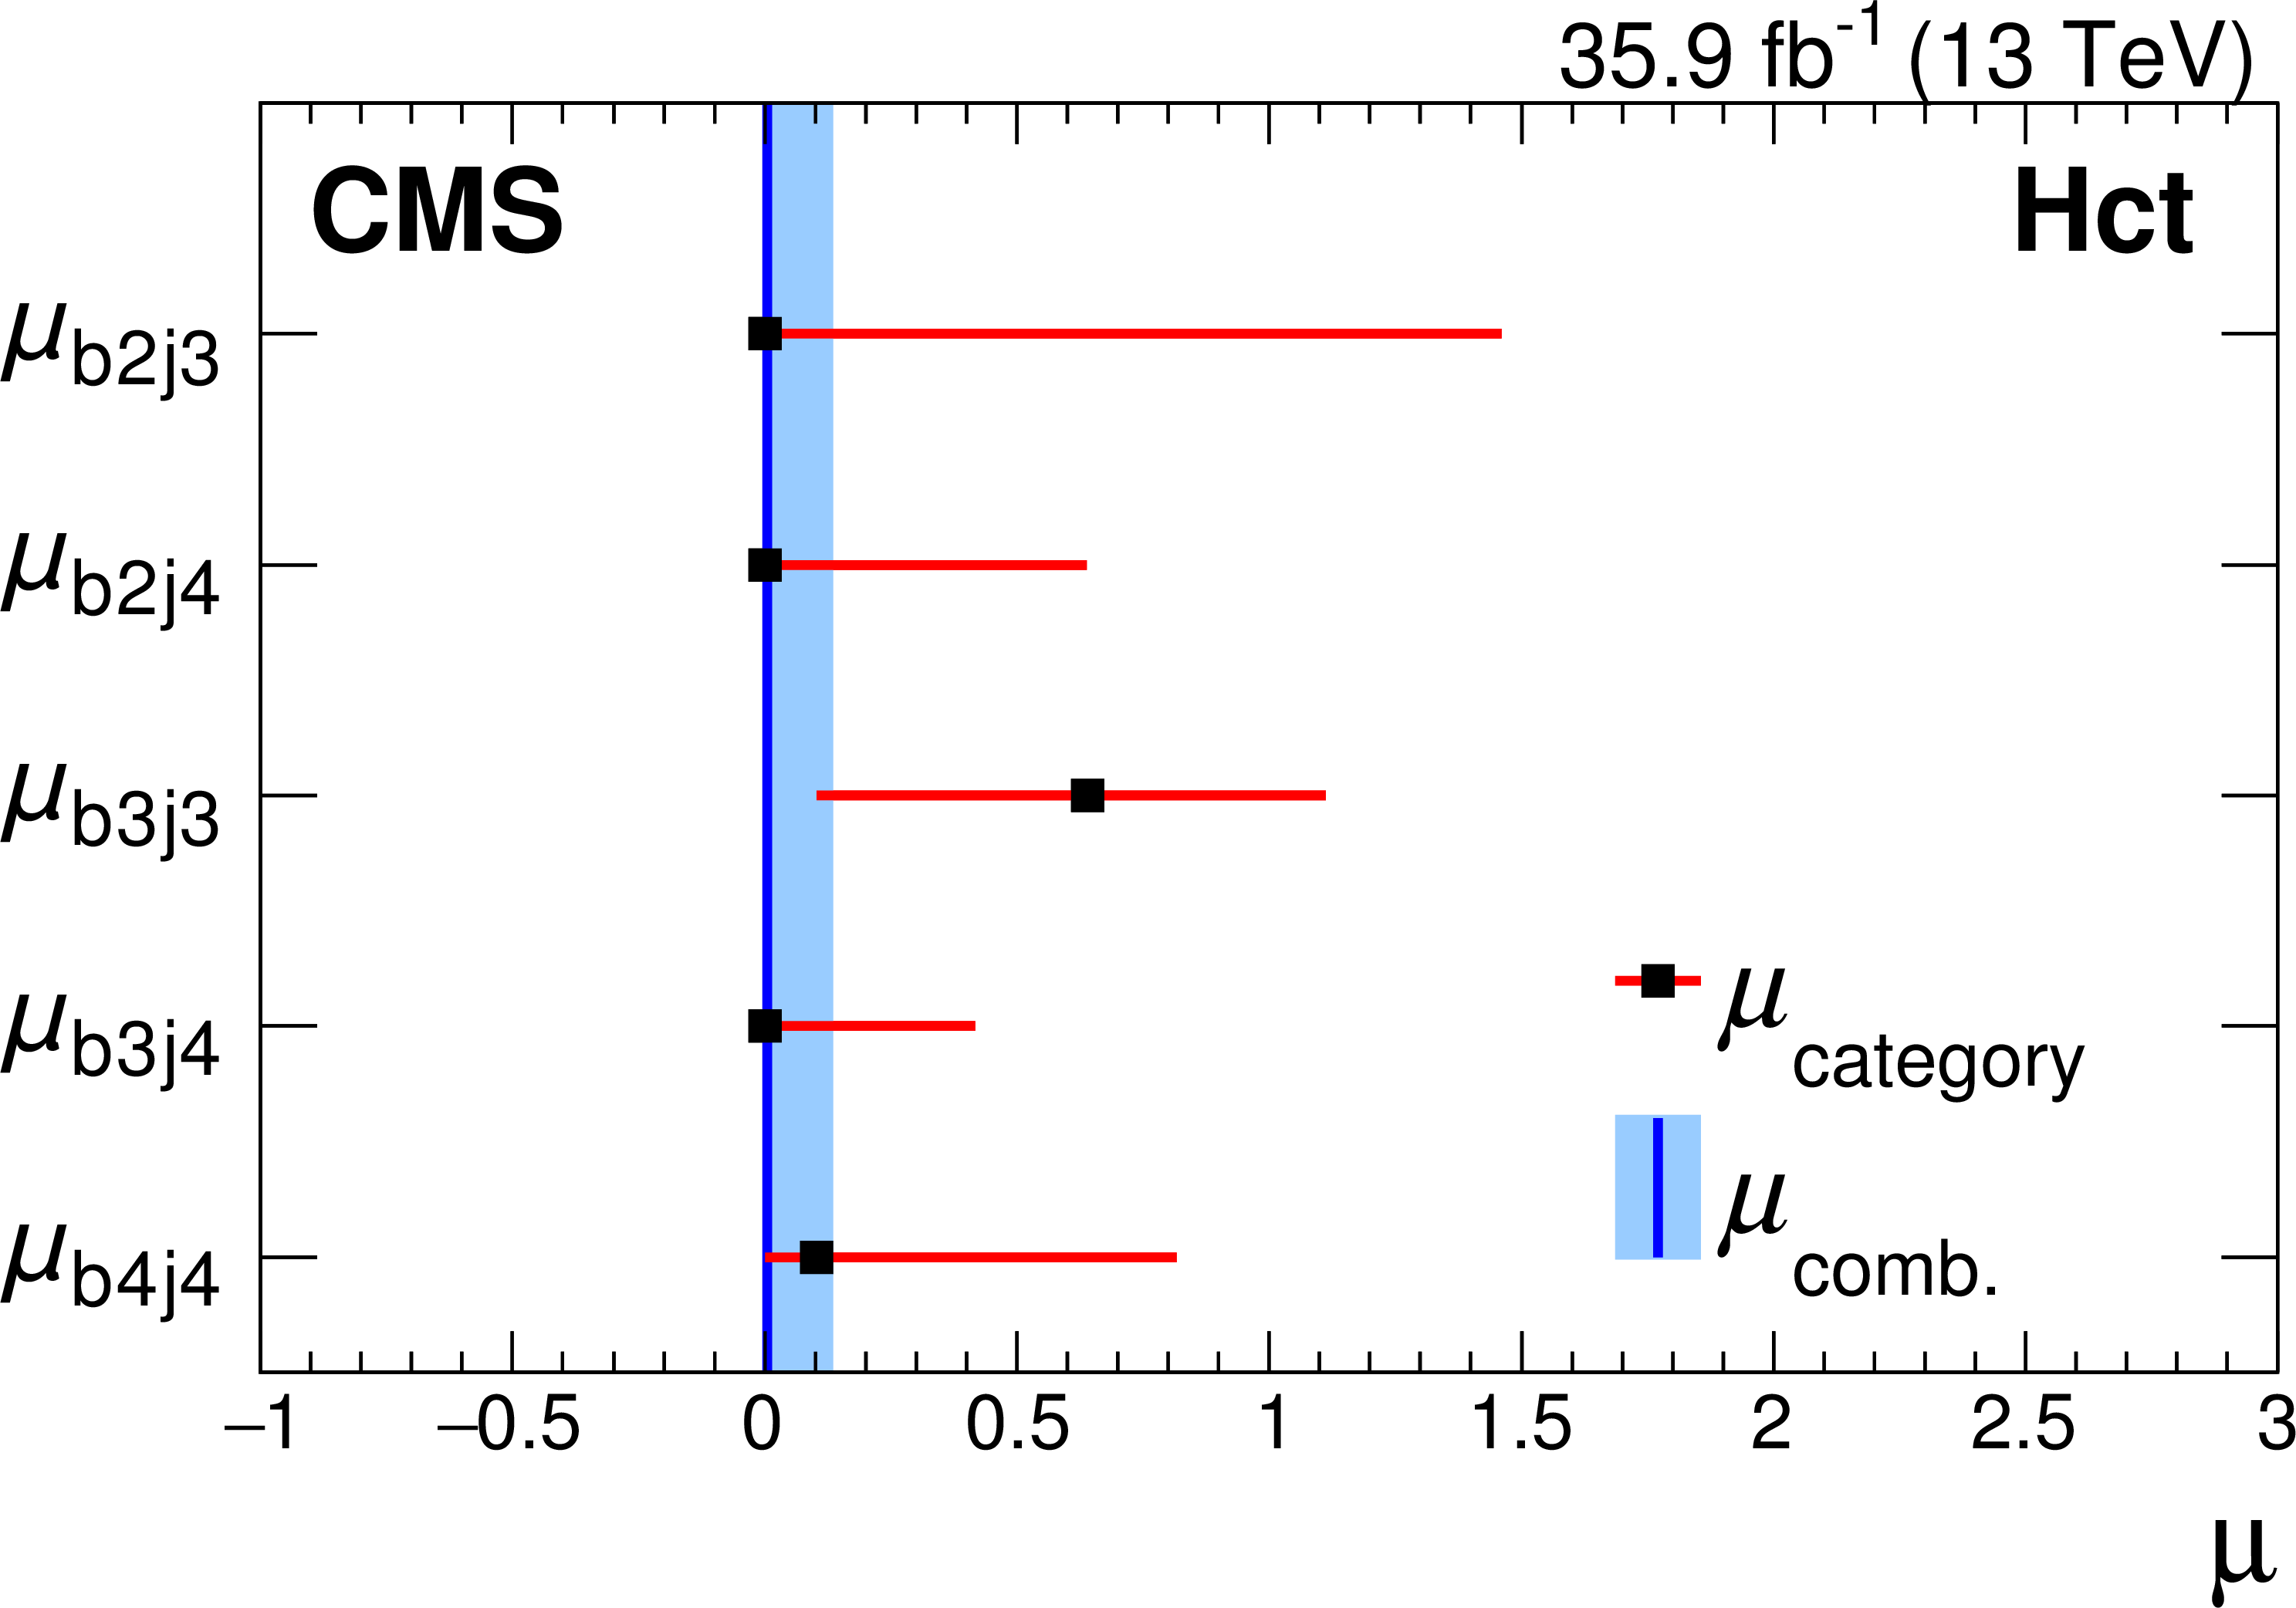
Figure 7:
The best fit signal strength ($\mu $) for Hut (left) and Hct (right), which is restricted to positive values in the fit. |
png pdf |
Figure 7-a:
The best fit signal strength ($\mu $) for Hut (left) and Hct (right), which is restricted to positive values in the fit. |
png pdf |
Figure 7-b:
The best fit signal strength ($\mu $) for Hut (left) and Hct (right), which is restricted to positive values in the fit. |
| Tables | |

png pdf |
Table 1:
Number of events in each category together with its total relative uncertainty as obtained from the fit to data for Hut. |

png pdf |
Table 2:
Number of events in each category together with its total relative uncertainty as obtained from the fit to data for Hct. |
| Summary |
| A search for flavor-changing neutral currents in events with a top quark and the Higgs boson, corresponding to a data sample of 35.9 fb$^{-1}$ collected in proton-proton collisions at $\sqrt{s} = $ 13 TeV, is presented. This is the first search to probe $\mathrm{t}\mathrm{H}$ flavor-changing neutral current couplings in both associated production of a top quark with the Higgs boson and in top quark decays. Observed (expected) upper limits at 95% confidence level are set on the branching fractions of top quark decays, $\mathcal{B}(\mathrm{t} \to \mathrm{u}\mathrm{H}) < $ 0.47% (0.34%) and $\mathcal{B}(\mathrm{t} \to \mathrm{c}\mathrm{H}) < $ 0.47% (0.44%). These results provide a significant improvement over the previous limits set by CMS in the $\mathrm{H} \to \mathrm{b\bar{b}}$ channel, as well as represent the best limits for $\mathcal{B}(\mathrm{t} \to \mathrm{u}\mathrm{H})$ at CMS. |
| References | ||||
| 1 | ATLAS Collaboration | Observation of a new particle in the search for the Standard Model Higgs boson with the ATLAS detector at the LHC | PLB 716 (2012) 1 | 1207.7214 |
| 2 | CMS Collaboration | Observation of a new boson at a mass of 125 GeV with the CMS experiment at the LHC | PLB 716 (2012) 30 | CMS-HIG-12-028 1207.7235 |
| 3 | CMS Collaboration | Observation of a new boson with mass near 125 GeV in pp collisions at $ \sqrt{s}= $ 7 and 8 TeV | JHEP 06 (2013) 081 | CMS-HIG-12-036 1303.4571 |
| 4 | ATLAS and CMS Collaboration | Measurements of the Higgs boson production and decay rates and constraints on its couplings from a combined ATLAS and CMS analysis of the LHC $ pp $ collision data at $ \sqrt{s}= $ 7 and 8 TeV | JHEP 08 (2016) 045 | 1606.02266 |
| 5 | S. L. Glashow, J. Iliopoulos, and L. Maiani | Weak interactions with lepton-hadron symmetry | PRD 2 (1970) 1285 | |
| 6 | G. Eilam, J. L. Hewett, and A. Soni | Rare decays of the top quark in the standard and two Higgs doublet models | PRD 44 (1991) 1473 | |
| 7 | B. Mele, S. Petrarca, and A. Soddu | A new evaluation of the $ \mathrm{t} \rightarrow \mathrm{cH} $ decay width in the standard model | PLB 435 (1998) 401 | hep-ph/9805498 |
| 8 | J. A. Aguilar-Saavedra | Top flavor-changing neutral interactions: theoretical expectations and experimental detection | Acta Phys. Polon. B 35 (2004) 2695 | hep-ph/0409342 |
| 9 | F. Larios, R. Martinez, and M. A. Perez | New physics effects in the flavor-changing neutral couplings of the top quark | Int. J. Mod. Phys. A 21 (2006) 3473 | hep-ph/0605003 |
| 10 | ATLAS Collaboration | Search for flavour-changing neutral current top quark decays $ \mathrm{t} \rightarrow \mathrm{Hq} $ in pp collisions at $ \sqrt{s} = $ 8 TeV with the ATLAS detector | JHEP 12 (2015) 061 | 1509.06047 |
| 11 | ATLAS Collaboration | Search for top quark decays $ \mathrm{t} \rightarrow \mathrm{qH} $, with $ \mathrm{H} \rightarrow \gamma\gamma $, in $ \sqrt{s} = $ 13 ~TeV pp collisions using the ATLAS detector | Submitted to JHEP | 1707.01404 |
| 12 | CMS Collaboration | Search for top quark decays via Higgs-boson-mediated flavor-changing neutral currents in pp collisions at $ \sqrt{s} = $ 8 TeV | JHEP 02 (2017) 079 | CMS-TOP-13-017 1610.04857 |
| 13 | NNPDF Collaboration | Parton distributions with LHC data | NPB 867 (2013) 244 | 1207.1303 |
| 14 | CMS Collaboration | CMS luminosity measurement for the 2016 data taking period | CMS-PAS-LUM-17-001 | CMS-PAS-LUM-17-001 |
| 15 | CMS Collaboration | The CMS experiment at the CERN LHC | JINST 3 (2008) S08004 | CMS-00-001 |
| 16 | J. Alwall et al. | The automated computation of tree-level and next-to-leading order differential cross sections, and their matching to parton shower simulations | JHEP 07 (2014) 079 | 1405.0301 |
| 17 | M. L. Mangano, M. Moretti, F. Piccinini, and M. Treccani | Matching matrix elements and shower evolution for top-quark production in hadronic collisions | JHEP 01 (2007) 013 | hep-ph/0611129 |
| 18 | J. Alwall et al. | Comparative study of various algorithms for the merging of parton showers and matrix elements in hadronic collisions | EPJC 53 (2008) 473 | 0706.2569 |
| 19 | A. Alloul et al. | FeynRules 2.0---a complete toolbox for tree-level phenomenology | CPC 185 (2014) 2250 | 1310.1921 |
| 20 | C. Degrande et al. | UFO --- the universal FeynRules output | CPC 183 (2012) 1201 | 1108.2040 |
| 21 | P. Nason | A new method for combining NLO QCD with shower Monte Carlo algorithms | JHEP 11 (2004) 040 | hep-ph/0409146 |
| 22 | S. Frixione, P. Nason, and C. Oleari | Matching NLO QCD computations with parton shower simulations: the POWHEG method | JHEP 11 (2007) 070 | 0709.2092 |
| 23 | S. Alioli, P. Nason, C. Oleari, and E. Re | A general framework for implementing NLO calculations in shower Monte Carlo programs: the POWHEG BOX | JHEP 06 (2010) 043 | 1002.2581 |
| 24 | S. Alioli, S.-O. Moch, and P. Uwer | Hadronic top-quark pair-production with one jet and parton showering | JHEP 01 (2012) 137 | 1110.5251 |
| 25 | M. Czakon and A. Mitov | Top++: a program for the calculation of the top-pair cross-section at hadron colliders | CPC 185 (2014) 2930 | 1112.5675 |
| 26 | M. Aliev et al. | HATHOR---HAdronic Top and Heavy quarks crOss section calculatoR | CPC 182 (2011) 1034 | 1007.1327 |
| 27 | P. Kant et al. | HatHor for single top-quark production: Updated predictions and uncertainty estimates for single top-quark production in hadronic collisions | CPC 191 (2015) 74 | 1406.4403 |
| 28 | N. Kidonakis | Two-loop soft anomalous dimensions for single top quark associated production with a $ \mathrm{W^{-}} $ or $ \mathrm{H^{-}} $ | PRD 82 (2010) 054018 | 1005.4451 |
| 29 | L. Barz\`e, G. Montagna, P. Nason, O. Nicrosini, F. Piccinini, and A. Vicini | Neutral current Drell--Yan with combined QCD and electroweak corrections in the POWHEG BOX | EPJC 73 (2013) 2474 | 1302.4606 |
| 30 | T. Sjostrand, S. Mrenna, and P. Skands | A brief introduction to PYTHIA 8.1 | Comp. Phys. Commun. 178 (2008) 852 | 0710.3820 |
| 31 | CMS Collaboration | Event generator tunes obtained from underlying event and multiparton scattering measurements | EPJC 76 (2016) 155 | CMS-GEN-14-001 1512.00815 |
| 32 | CMS Collaboration | Investigations of the impact of the parton shower tuning in Pythia 8 in the modelling of $ \mathrm{t\bar{t}} $ at $ \sqrt{s} = $ 8 and 13 TeV | CMS-PAS-TOP-16-021 | CMS-PAS-TOP-16-021 |
| 33 | NNPDF Collaboration | Parton distributions for the LHC Run II | JHEP 04 (2015) 040 | 1410.8849 |
| 34 | GEANT4 Collaboration | GEANT4---a simulation toolkit | NIMA 506 (2003) 250 | |
| 35 | CMS Collaboration | Particle-flow reconstruction and global event description with the CMS detector | JINST 12 (2017) P10003 | CMS-PRF-14-001 1706.04965 |
| 36 | M. Cacciari, G. P. Salam, and G. Soyez | The anti-$ k_t $ jet clustering algorithm | JHEP 04 (2008) 063 | 0802.1189 |
| 37 | M. Cacciari, G. P. Salam, and G. Soyez | FastJet user manual | EPJC 72 (2012) 1896 | 1111.6097 |
| 38 | CMS Collaboration | Determination of jet energy calibration and transverse momentum resolution in CMS | JINST 6 (2011) P11002 | CMS-JME-10-011 1107.4277 |
| 39 | CMS Collaboration | Identification of b quark jets at the CMS experiment in the LHC Run 2 | CMS-PAS-BTV-15-001 | CMS-PAS-BTV-15-001 |
| 40 | T. Hastie, R. Tibshirani, and J. Friedman | Springer-Verlag New York, 2009 ISBN 978-0-387-84858-7 | ||
| 41 | H. Voss, A. Hocker, J. Stelzer, and F. Tegenfeldt | TMVA, the toolkit for multivariate data analysis with ROOT | in XIth International Workshop on Advanced Computing and Analysis Techniques in Physics Research (ACAT), p. 40 2007 | physics/0703039 |
| 42 | J. Butterworth et al. | PDF4LHC recommendations for LHC Run II | JPG 43 (2016) 023001 | 1510.03865 |
| 43 | A. D. Martin, W. J. Stirling, R. S. Thorne, and G. Watt | Uncertainties on $ \alpha_S $ in global PDF analyses and implications for predicted hadronic cross sections | EPJC 64 (2009) 653 | 0905.3531 |
| 44 | J. Gao et al. | CT10 next-to-next-to-leading order global analysis of QCD | PRD 89 (2014) 033009 | 1302.6246 |
| 45 | J. R. Christiansen and P. Z. Skands | String formation beyond leading colour | JHEP 08 (2015) 003 | 1505.01681 |
| 46 | S. Argyropoulos and T. Sjostrand | Effects of color reconnection on $ \mathrm{t\bar{t}} $ final states at the LHC | JHEP 11 (2014) 043 | 1407.6653 |
| 47 | CMS Collaboration | Jet energy scale and resolution in the CMS experiment in pp collisions at 8 TeV | JINST 12 (2016) P02014 | CMS-JME-13-004 1607.03663 |
| 48 | CMS Collaboration | Measurement of differential cross sections for top quark pair production using the lepton+jets final state in proton-proton collisions at 13 TeV | PRD 95 (2017) 092001 | |
| 49 | A. Bredenstein, A. Denner, S. Dittmaier, and S. Pozzorini | NLO QCD corrections to $ \mathrm{pp} \rightarrow \mathrm{t\overline{t}b\overline{b}+X} $ at the LHC | PRL 103 (2009) 012002 | 0905.0110 |
| 50 | A. Read | Presentation of search results: the $ CL_{s} $ technique | JPG 28 (2002) 2693 | |
| 51 | T. Junk | Confidence level computation for combining searches with small statistics | NIMA 434 (1999) 435 | hep-ex/9902006 |
| 52 | G. Cowan, K. Cranmer, E. Gross, and O. Vitells | Asymptotic formulae for likelihood-based tests of new physics | EPJC 71 (2011) 1554 | 1007.1727 |
|
|
Compact Muon Solenoid LHC, CERN |
|

|

|

|

|

|