

Compact Muon Solenoid
LHC, CERN
| CMS-PAS-B2G-17-019 | ||
| Search for resonant and non-resonant production of Higgs boson pairs in the four b quark final state using boosted jets in proton-proton collisions at $\sqrt{s}= $ 13 TeV | ||
| CMS Collaboration | ||
| June 2018 | ||
| Abstract: A search is presented for the pair production of the standard model Higgs boson using data from proton-proton collisions at a centre-of-mass energy of 13 TeV, collected by the CMS experiment at the CERN LHC in 2016, and corresponding to an integrated luminosity of 35.9 fb$^{-1}$. The final state consists of two b quark-antiquark pairs, with at least one Higgs boson highly Lorentz-boosted and reconstructed as a single large-area jet. The observations are consistent with the standard model prediction. Upper limits on the product of the cross sections and branching fractions of narrow bulk gravitons and radions, in warped extra-dimensional models, are set between 67 and 1.1 fb at 95% confidence level, for masses in the range 750-3000 GeV. The upper limit on the product of the standard model Higgs boson pair production cross section and the branching fraction to b quark-antiquark pairs is 1980 fb at 95% confidence level. Limits are also set for twelve benchmark models of beyond standard model non-resonant Higgs boson pair production cross sections. | ||
|
Links:
CDS record (PDF) ;
inSPIRE record ;
CADI line (restricted) ;
These preliminary results are superseded in this paper, JHEP 01 (2019) 040. The superseded preliminary plots can be found here. |
||
| Figures | |

png pdf |
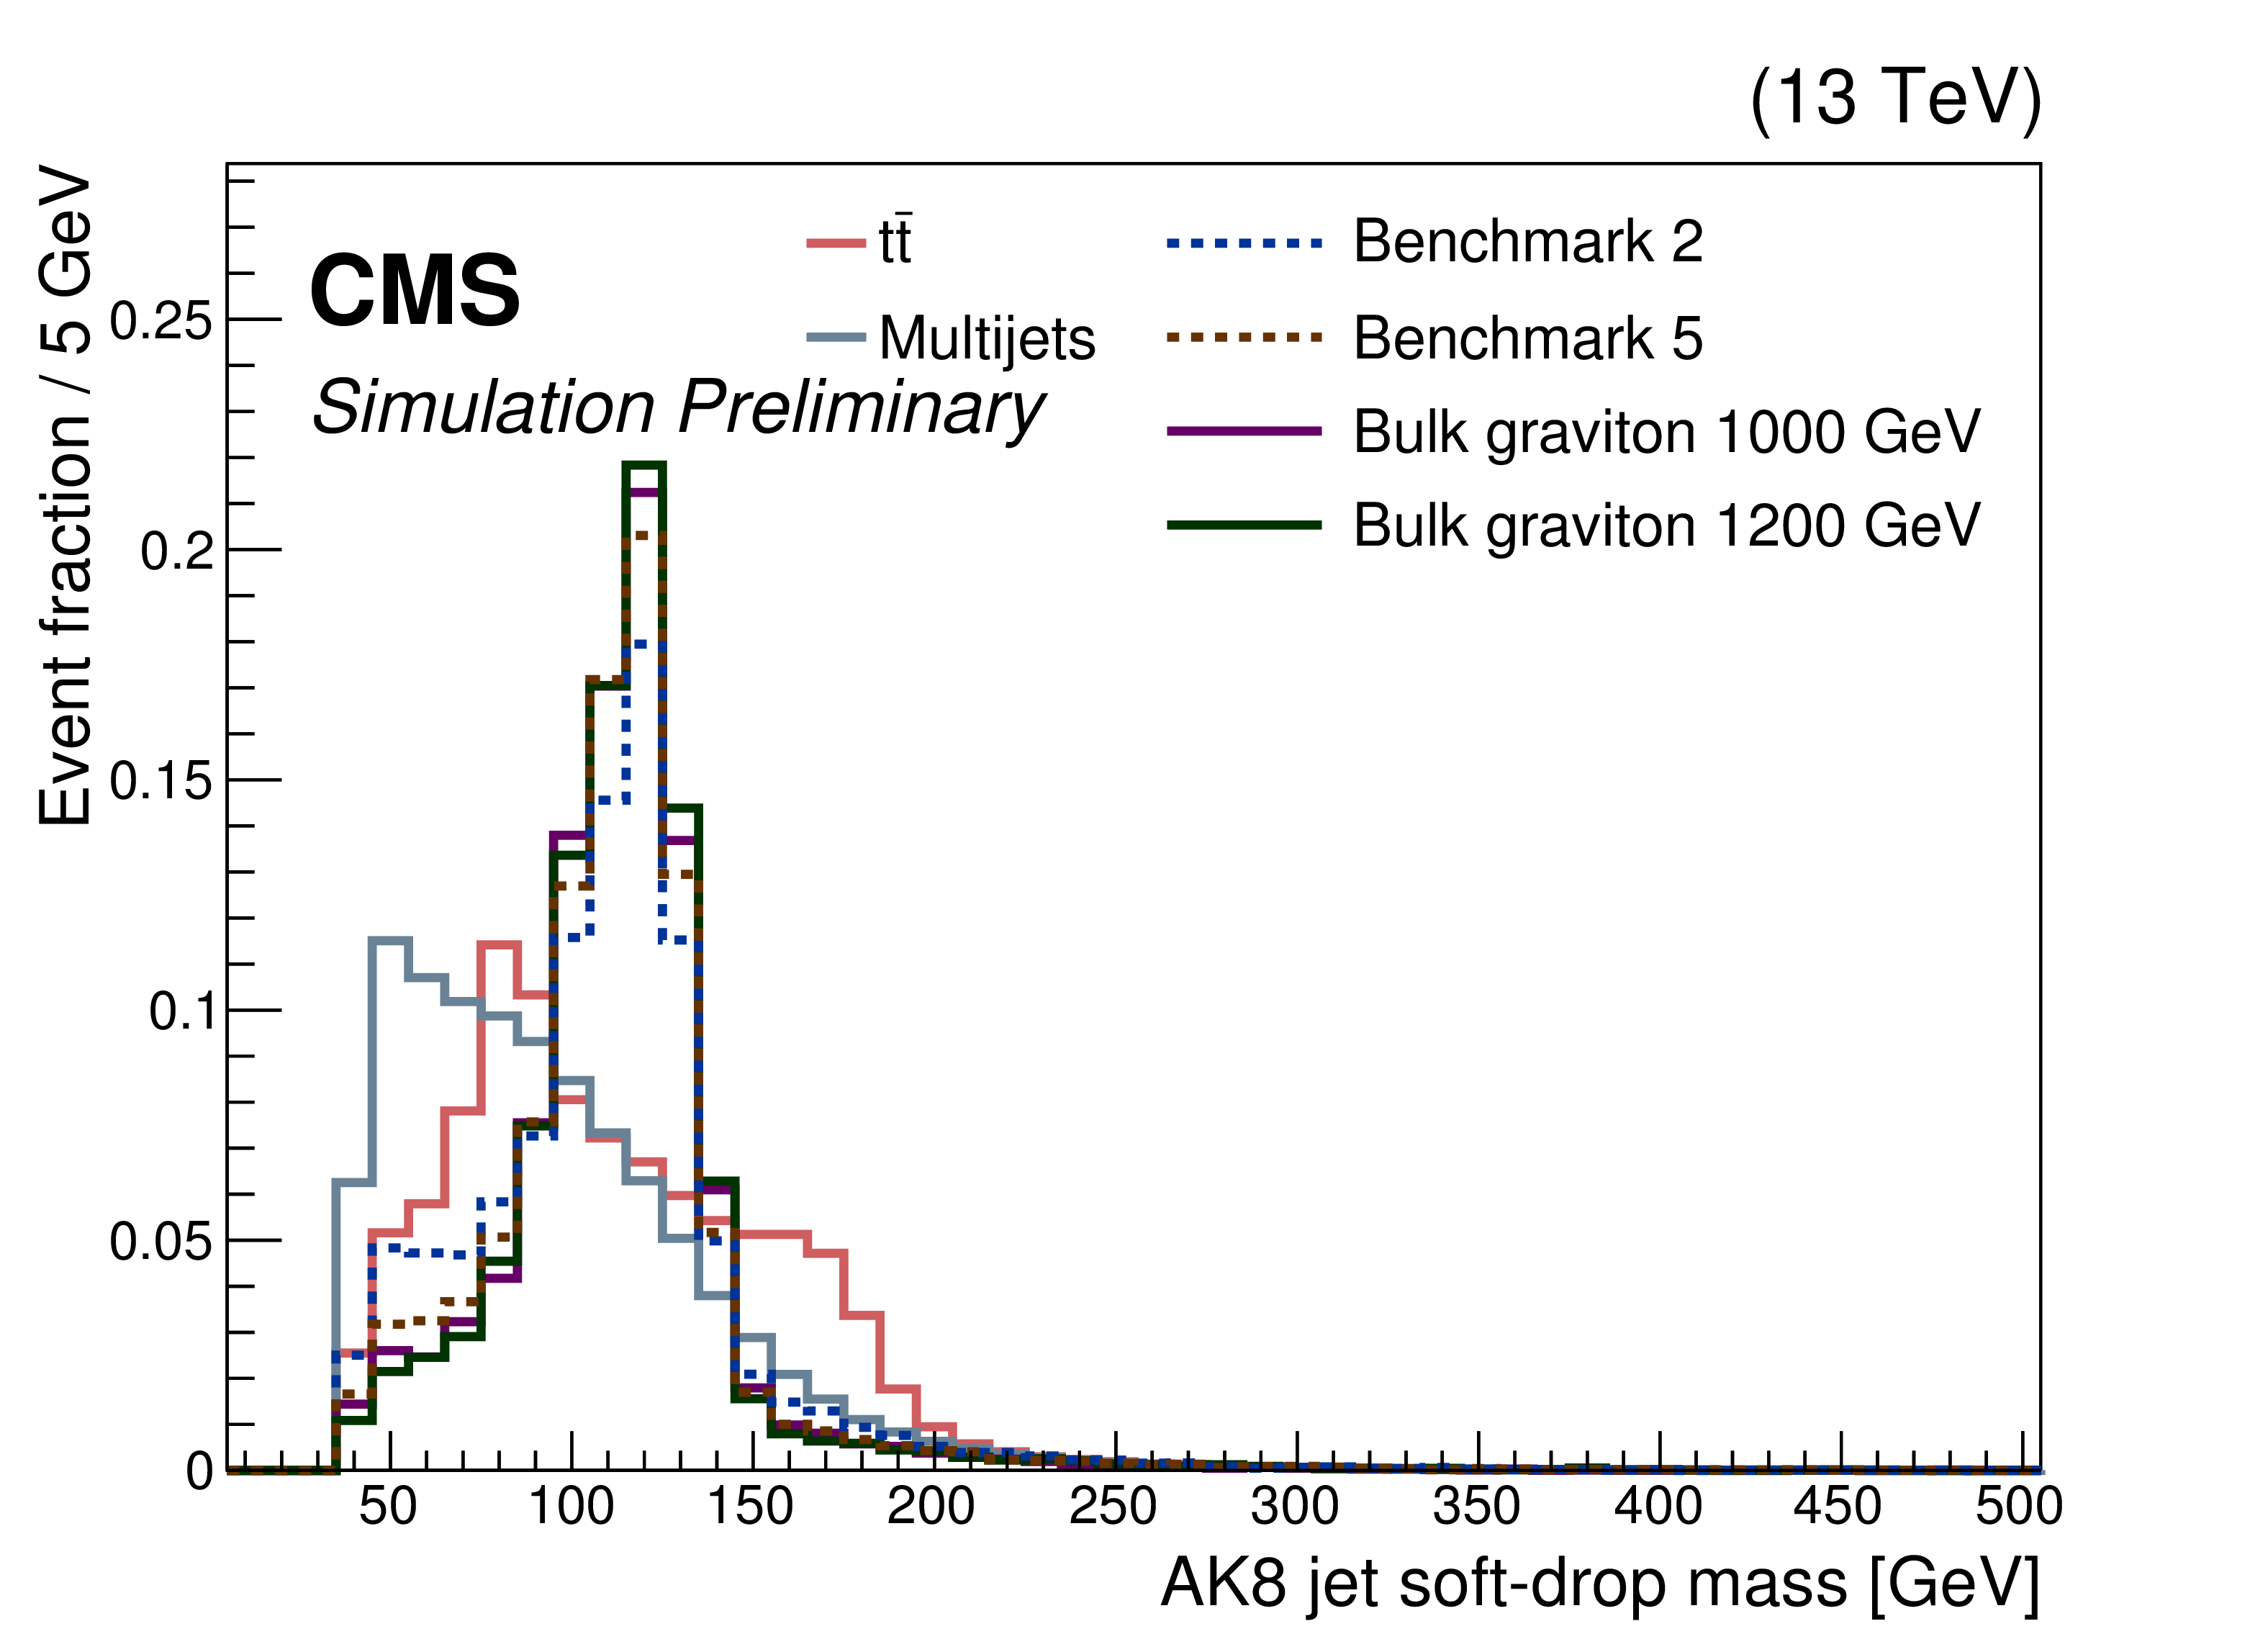
Figure 1:
For AK8 jets in semi-resolved events, the distributions of the soft-drop mass (upper left), $ {\tau _{21}} $ (upper right), and the double-b tagger (lower). The multijet and ${{\mathrm {t}\overline {\mathrm {t}}}} $+jets background components are shown separately, along with the simulated signals for bulk gravitons of masses 1000 and 1200 GeV and the non-resonant benchmark models 2 and 5. The distributions are normalized to unity. The selection is as follows: AK8 jets with $ {p_{\mathrm {T}}} > $ 300 GeV, AK4 jets with $ {p_{\mathrm {T}}} > $ 30 GeV, AK8 and AK4 jets with $|\eta | < 2.4$, AK8 jet soft-drop mass $ > $ 40 GeV, AK4 jets DeepCSV discriminator $ > 0.2219$, $\Delta R < 1.5$ separation between the AK4 jets, and $\Delta R > 0.8$ separation between the AK8 jet and each AK4 jet. |
png pdf |
Figure 1-a:
For AK8 jets in semi-resolved events, the distributions of the soft-drop mass (upper left), $ {\tau _{21}} $ (upper right), and the double-b tagger (lower). The multijet and ${{\mathrm {t}\overline {\mathrm {t}}}} $+jets background components are shown separately, along with the simulated signals for bulk gravitons of masses 1000 and 1200 GeV and the non-resonant benchmark models 2 and 5. The distributions are normalized to unity. The selection is as follows: AK8 jets with $ {p_{\mathrm {T}}} > $ 300 GeV, AK4 jets with $ {p_{\mathrm {T}}} > $ 30 GeV, AK8 and AK4 jets with $|\eta | < 2.4$, AK8 jet soft-drop mass $ > $ 40 GeV, AK4 jets DeepCSV discriminator $ > 0.2219$, $\Delta R < 1.5$ separation between the AK4 jets, and $\Delta R > 0.8$ separation between the AK8 jet and each AK4 jet. |

png pdf |
Figure 1-b:
For AK8 jets in semi-resolved events, the distributions of the soft-drop mass (upper left), $ {\tau _{21}} $ (upper right), and the double-b tagger (lower). The multijet and ${{\mathrm {t}\overline {\mathrm {t}}}} $+jets background components are shown separately, along with the simulated signals for bulk gravitons of masses 1000 and 1200 GeV and the non-resonant benchmark models 2 and 5. The distributions are normalized to unity. The selection is as follows: AK8 jets with $ {p_{\mathrm {T}}} > $ 300 GeV, AK4 jets with $ {p_{\mathrm {T}}} > $ 30 GeV, AK8 and AK4 jets with $|\eta | < 2.4$, AK8 jet soft-drop mass $ > $ 40 GeV, AK4 jets DeepCSV discriminator $ > 0.2219$, $\Delta R < 1.5$ separation between the AK4 jets, and $\Delta R > 0.8$ separation between the AK8 jet and each AK4 jet. |

png pdf |
Figure 1-c:
For AK8 jets in semi-resolved events, the distributions of the soft-drop mass (upper left), $ {\tau _{21}} $ (upper right), and the double-b tagger (lower). The multijet and ${{\mathrm {t}\overline {\mathrm {t}}}} $+jets background components are shown separately, along with the simulated signals for bulk gravitons of masses 1000 and 1200 GeV and the non-resonant benchmark models 2 and 5. The distributions are normalized to unity. The selection is as follows: AK8 jets with $ {p_{\mathrm {T}}} > $ 300 GeV, AK4 jets with $ {p_{\mathrm {T}}} > $ 30 GeV, AK8 and AK4 jets with $|\eta | < 2.4$, AK8 jet soft-drop mass $ > $ 40 GeV, AK4 jets DeepCSV discriminator $ > 0.2219$, $\Delta R < 1.5$ separation between the AK4 jets, and $\Delta R > 0.8$ separation between the AK8 jet and each AK4 jet. |
png pdf |
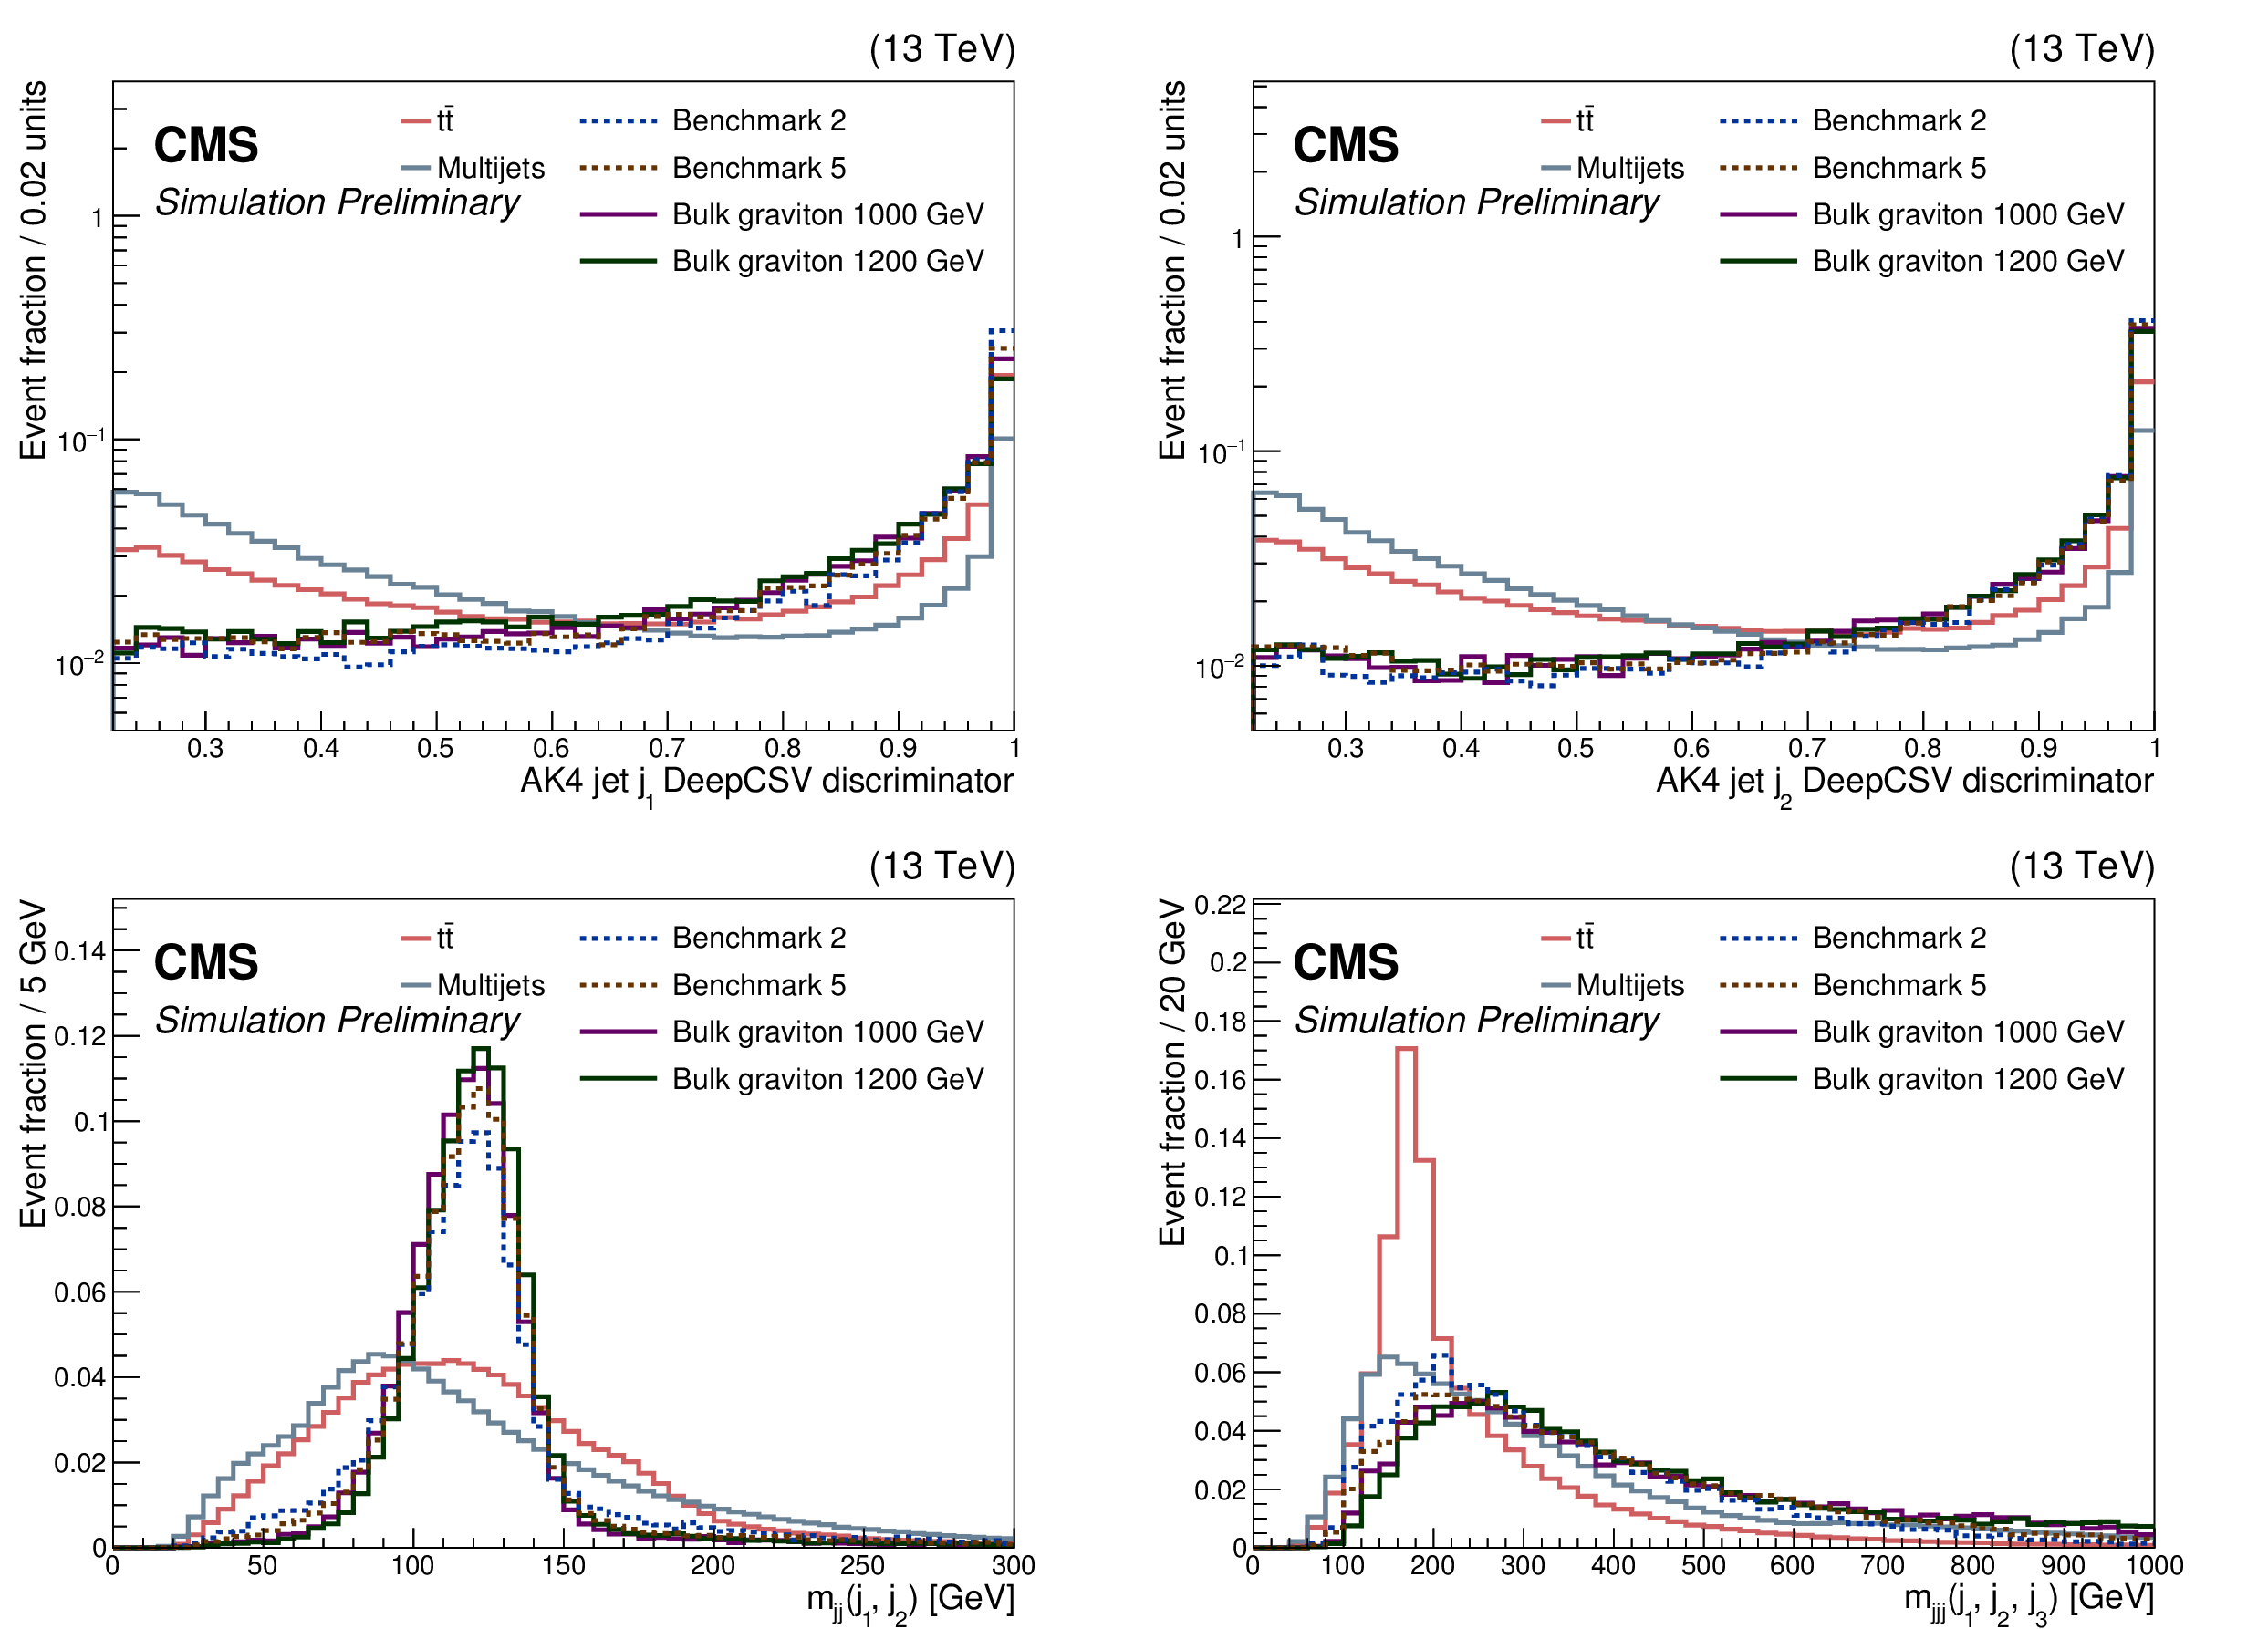
Figure 2:
The distributions of the DeepCSV discriminators for the leading j$_{1}$ (upper left) and $2^{\text {nd}}$ AK4 jets j$_{2}$ (upper right), ranked by the DeepCSV discriminator values, the invariant mass of j$_{1}$ and j$_{2}$ ($ {m_{\text {$jj$}}} (\text {j$_{1}$, j$_{2}$})$) (lower left), and the invariant mass of j$_{1}$, j$_{2}$, and their nearest AK4 jet j$_{3}$ ($ {m_{\text {$Jjj$}}} (\text {j$_{1}$, j$_{2}$, j$_{3}$})$) (lower right). The multijet and ${{\mathrm {t}\overline {\mathrm {t}}}} $+jets background components are shown separately, along with the simulated signals for bulk gravitons of masses 1000 and 1200 GeV and the non-resonant benchmark models 2 and 5. The distributions are normalized to unity. The selection is as follows: AK8 jets with $ {p_{\mathrm {T}}} > $ 300 GeV, AK4 jets with $ {p_{\mathrm {T}}} > $ 30 GeV, AK8 and AK4 jets with $|\eta | < 2.4$, AK8 jet soft-drop mass $ > $ 40 GeV, AK4 jets DeepCSV discriminator $ > 0.2219$, $\Delta R < 1.5$ separation between the AK4 jets, and $\Delta R > 0.8$ separation between the AK8 jet and each AK4 jet. |
png pdf |
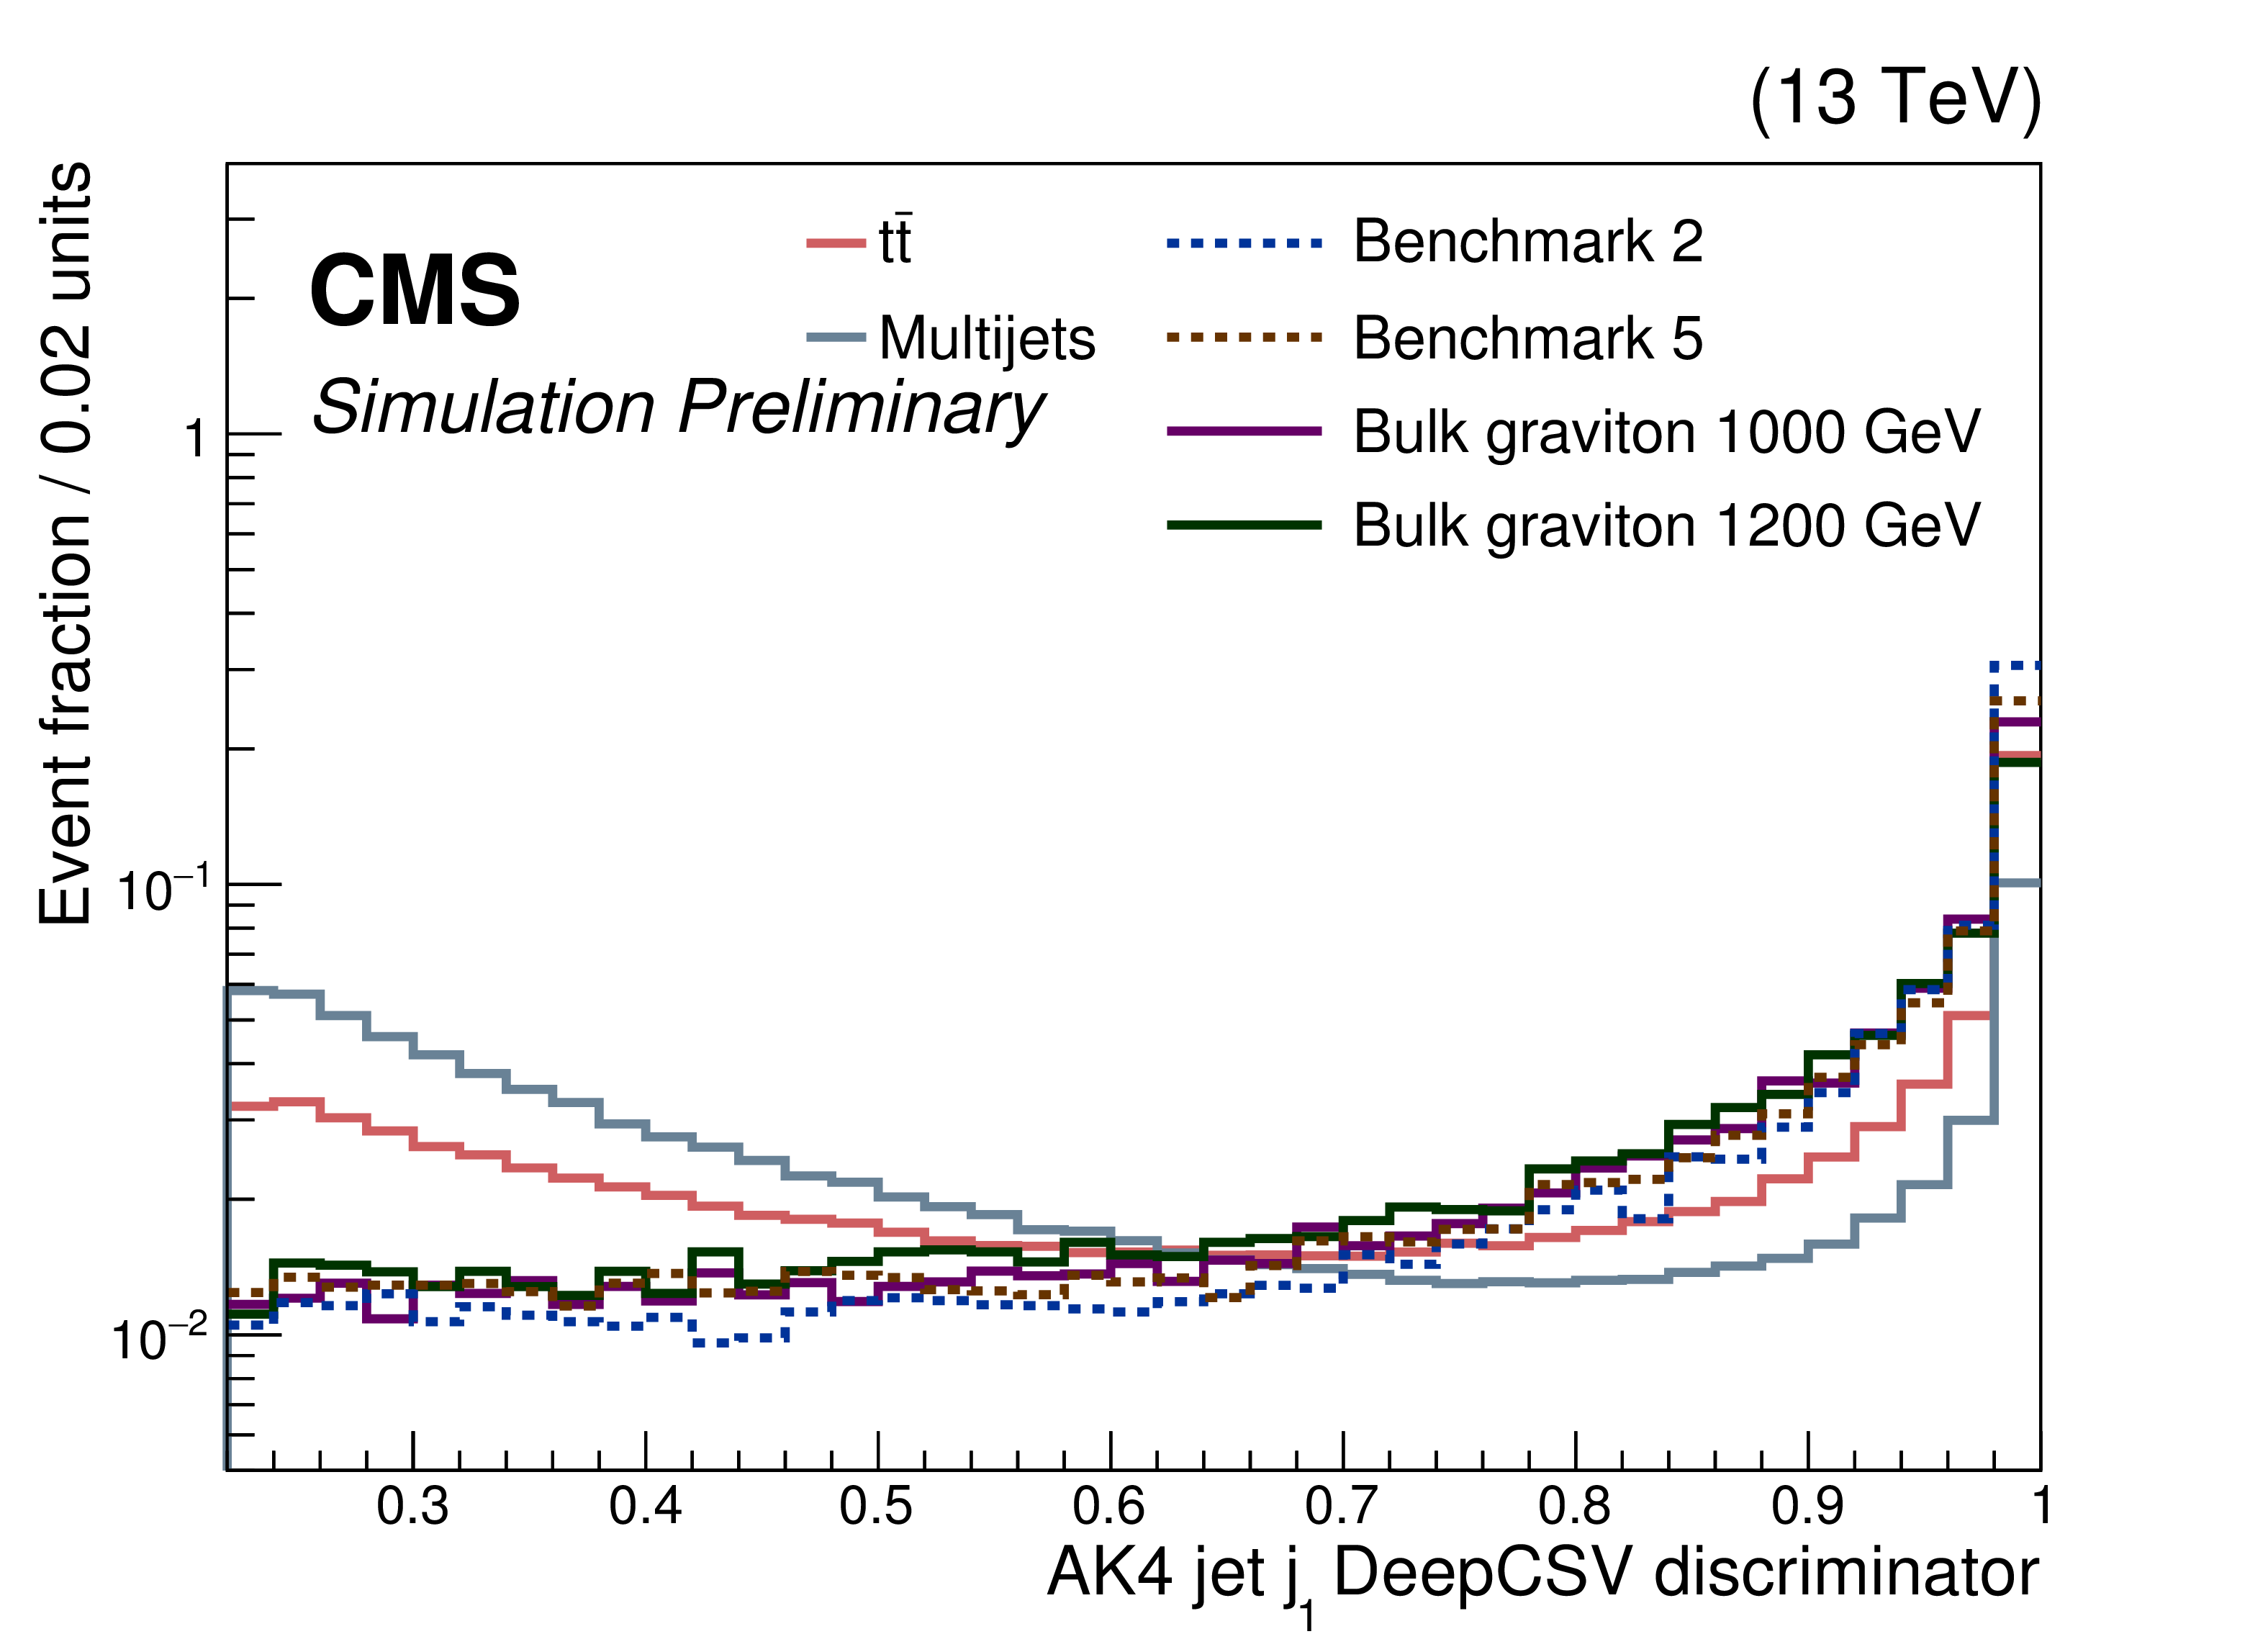
Figure 2-a:
The distributions of the DeepCSV discriminators for the leading j$_{1}$ (upper left) and $2^{\text {nd}}$ AK4 jets j$_{2}$ (upper right), ranked by the DeepCSV discriminator values, the invariant mass of j$_{1}$ and j$_{2}$ ($ {m_{\text {$jj$}}} (\text {j$_{1}$, j$_{2}$})$) (lower left), and the invariant mass of j$_{1}$, j$_{2}$, and their nearest AK4 jet j$_{3}$ ($ {m_{\text {$Jjj$}}} (\text {j$_{1}$, j$_{2}$, j$_{3}$})$) (lower right). The multijet and ${{\mathrm {t}\overline {\mathrm {t}}}} $+jets background components are shown separately, along with the simulated signals for bulk gravitons of masses 1000 and 1200 GeV and the non-resonant benchmark models 2 and 5. The distributions are normalized to unity. The selection is as follows: AK8 jets with $ {p_{\mathrm {T}}} > $ 300 GeV, AK4 jets with $ {p_{\mathrm {T}}} > $ 30 GeV, AK8 and AK4 jets with $|\eta | < 2.4$, AK8 jet soft-drop mass $ > $ 40 GeV, AK4 jets DeepCSV discriminator $ > 0.2219$, $\Delta R < 1.5$ separation between the AK4 jets, and $\Delta R > 0.8$ separation between the AK8 jet and each AK4 jet. |

png pdf |
Figure 2-b:
The distributions of the DeepCSV discriminators for the leading j$_{1}$ (upper left) and $2^{\text {nd}}$ AK4 jets j$_{2}$ (upper right), ranked by the DeepCSV discriminator values, the invariant mass of j$_{1}$ and j$_{2}$ ($ {m_{\text {$jj$}}} (\text {j$_{1}$, j$_{2}$})$) (lower left), and the invariant mass of j$_{1}$, j$_{2}$, and their nearest AK4 jet j$_{3}$ ($ {m_{\text {$Jjj$}}} (\text {j$_{1}$, j$_{2}$, j$_{3}$})$) (lower right). The multijet and ${{\mathrm {t}\overline {\mathrm {t}}}} $+jets background components are shown separately, along with the simulated signals for bulk gravitons of masses 1000 and 1200 GeV and the non-resonant benchmark models 2 and 5. The distributions are normalized to unity. The selection is as follows: AK8 jets with $ {p_{\mathrm {T}}} > $ 300 GeV, AK4 jets with $ {p_{\mathrm {T}}} > $ 30 GeV, AK8 and AK4 jets with $|\eta | < 2.4$, AK8 jet soft-drop mass $ > $ 40 GeV, AK4 jets DeepCSV discriminator $ > 0.2219$, $\Delta R < 1.5$ separation between the AK4 jets, and $\Delta R > 0.8$ separation between the AK8 jet and each AK4 jet. |

png pdf |
Figure 2-c:
The distributions of the DeepCSV discriminators for the leading j$_{1}$ (upper left) and $2^{\text {nd}}$ AK4 jets j$_{2}$ (upper right), ranked by the DeepCSV discriminator values, the invariant mass of j$_{1}$ and j$_{2}$ ($ {m_{\text {$jj$}}} (\text {j$_{1}$, j$_{2}$})$) (lower left), and the invariant mass of j$_{1}$, j$_{2}$, and their nearest AK4 jet j$_{3}$ ($ {m_{\text {$Jjj$}}} (\text {j$_{1}$, j$_{2}$, j$_{3}$})$) (lower right). The multijet and ${{\mathrm {t}\overline {\mathrm {t}}}} $+jets background components are shown separately, along with the simulated signals for bulk gravitons of masses 1000 and 1200 GeV and the non-resonant benchmark models 2 and 5. The distributions are normalized to unity. The selection is as follows: AK8 jets with $ {p_{\mathrm {T}}} > $ 300 GeV, AK4 jets with $ {p_{\mathrm {T}}} > $ 30 GeV, AK8 and AK4 jets with $|\eta | < 2.4$, AK8 jet soft-drop mass $ > $ 40 GeV, AK4 jets DeepCSV discriminator $ > 0.2219$, $\Delta R < 1.5$ separation between the AK4 jets, and $\Delta R > 0.8$ separation between the AK8 jet and each AK4 jet. |
png pdf |
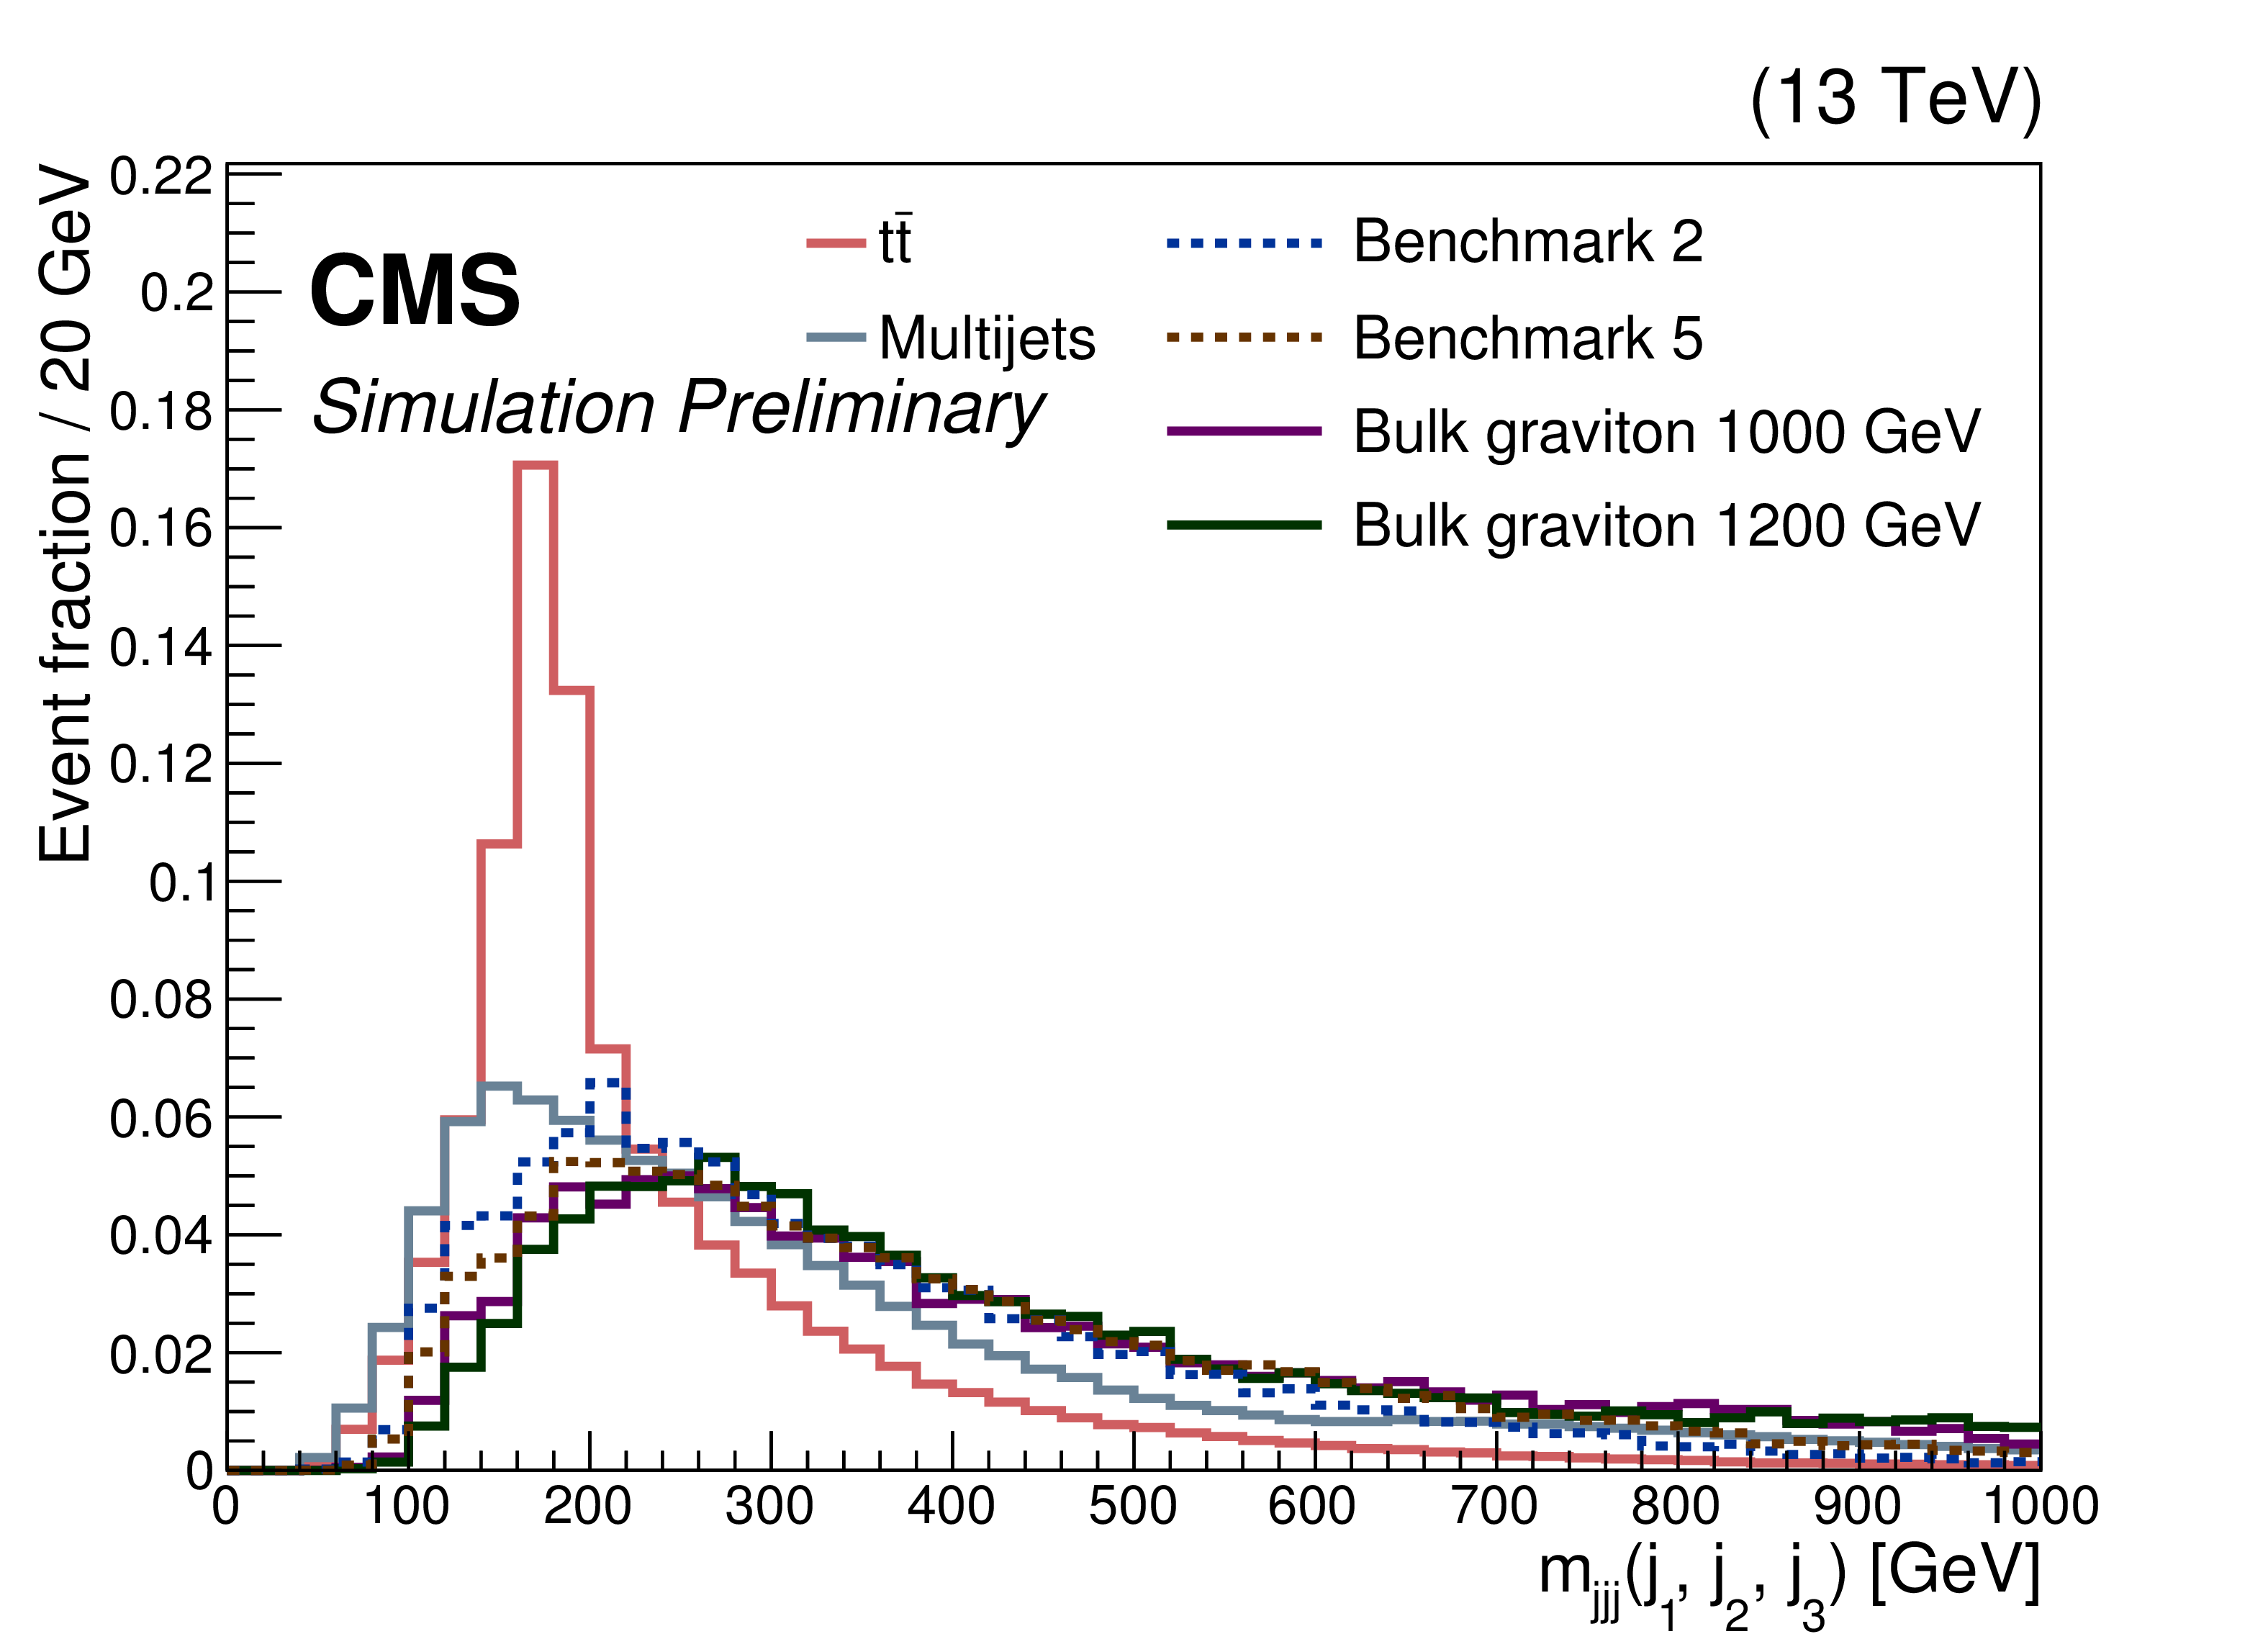
Figure 2-d:
The distributions of the DeepCSV discriminators for the leading j$_{1}$ (upper left) and $2^{\text {nd}}$ AK4 jets j$_{2}$ (upper right), ranked by the DeepCSV discriminator values, the invariant mass of j$_{1}$ and j$_{2}$ ($ {m_{\text {$jj$}}} (\text {j$_{1}$, j$_{2}$})$) (lower left), and the invariant mass of j$_{1}$, j$_{2}$, and their nearest AK4 jet j$_{3}$ ($ {m_{\text {$Jjj$}}} (\text {j$_{1}$, j$_{2}$, j$_{3}$})$) (lower right). The multijet and ${{\mathrm {t}\overline {\mathrm {t}}}} $+jets background components are shown separately, along with the simulated signals for bulk gravitons of masses 1000 and 1200 GeV and the non-resonant benchmark models 2 and 5. The distributions are normalized to unity. The selection is as follows: AK8 jets with $ {p_{\mathrm {T}}} > $ 300 GeV, AK4 jets with $ {p_{\mathrm {T}}} > $ 30 GeV, AK8 and AK4 jets with $|\eta | < 2.4$, AK8 jet soft-drop mass $ > $ 40 GeV, AK4 jets DeepCSV discriminator $ > 0.2219$, $\Delta R < 1.5$ separation between the AK4 jets, and $\Delta R > 0.8$ separation between the AK8 jet and each AK4 jet. |
png pdf |
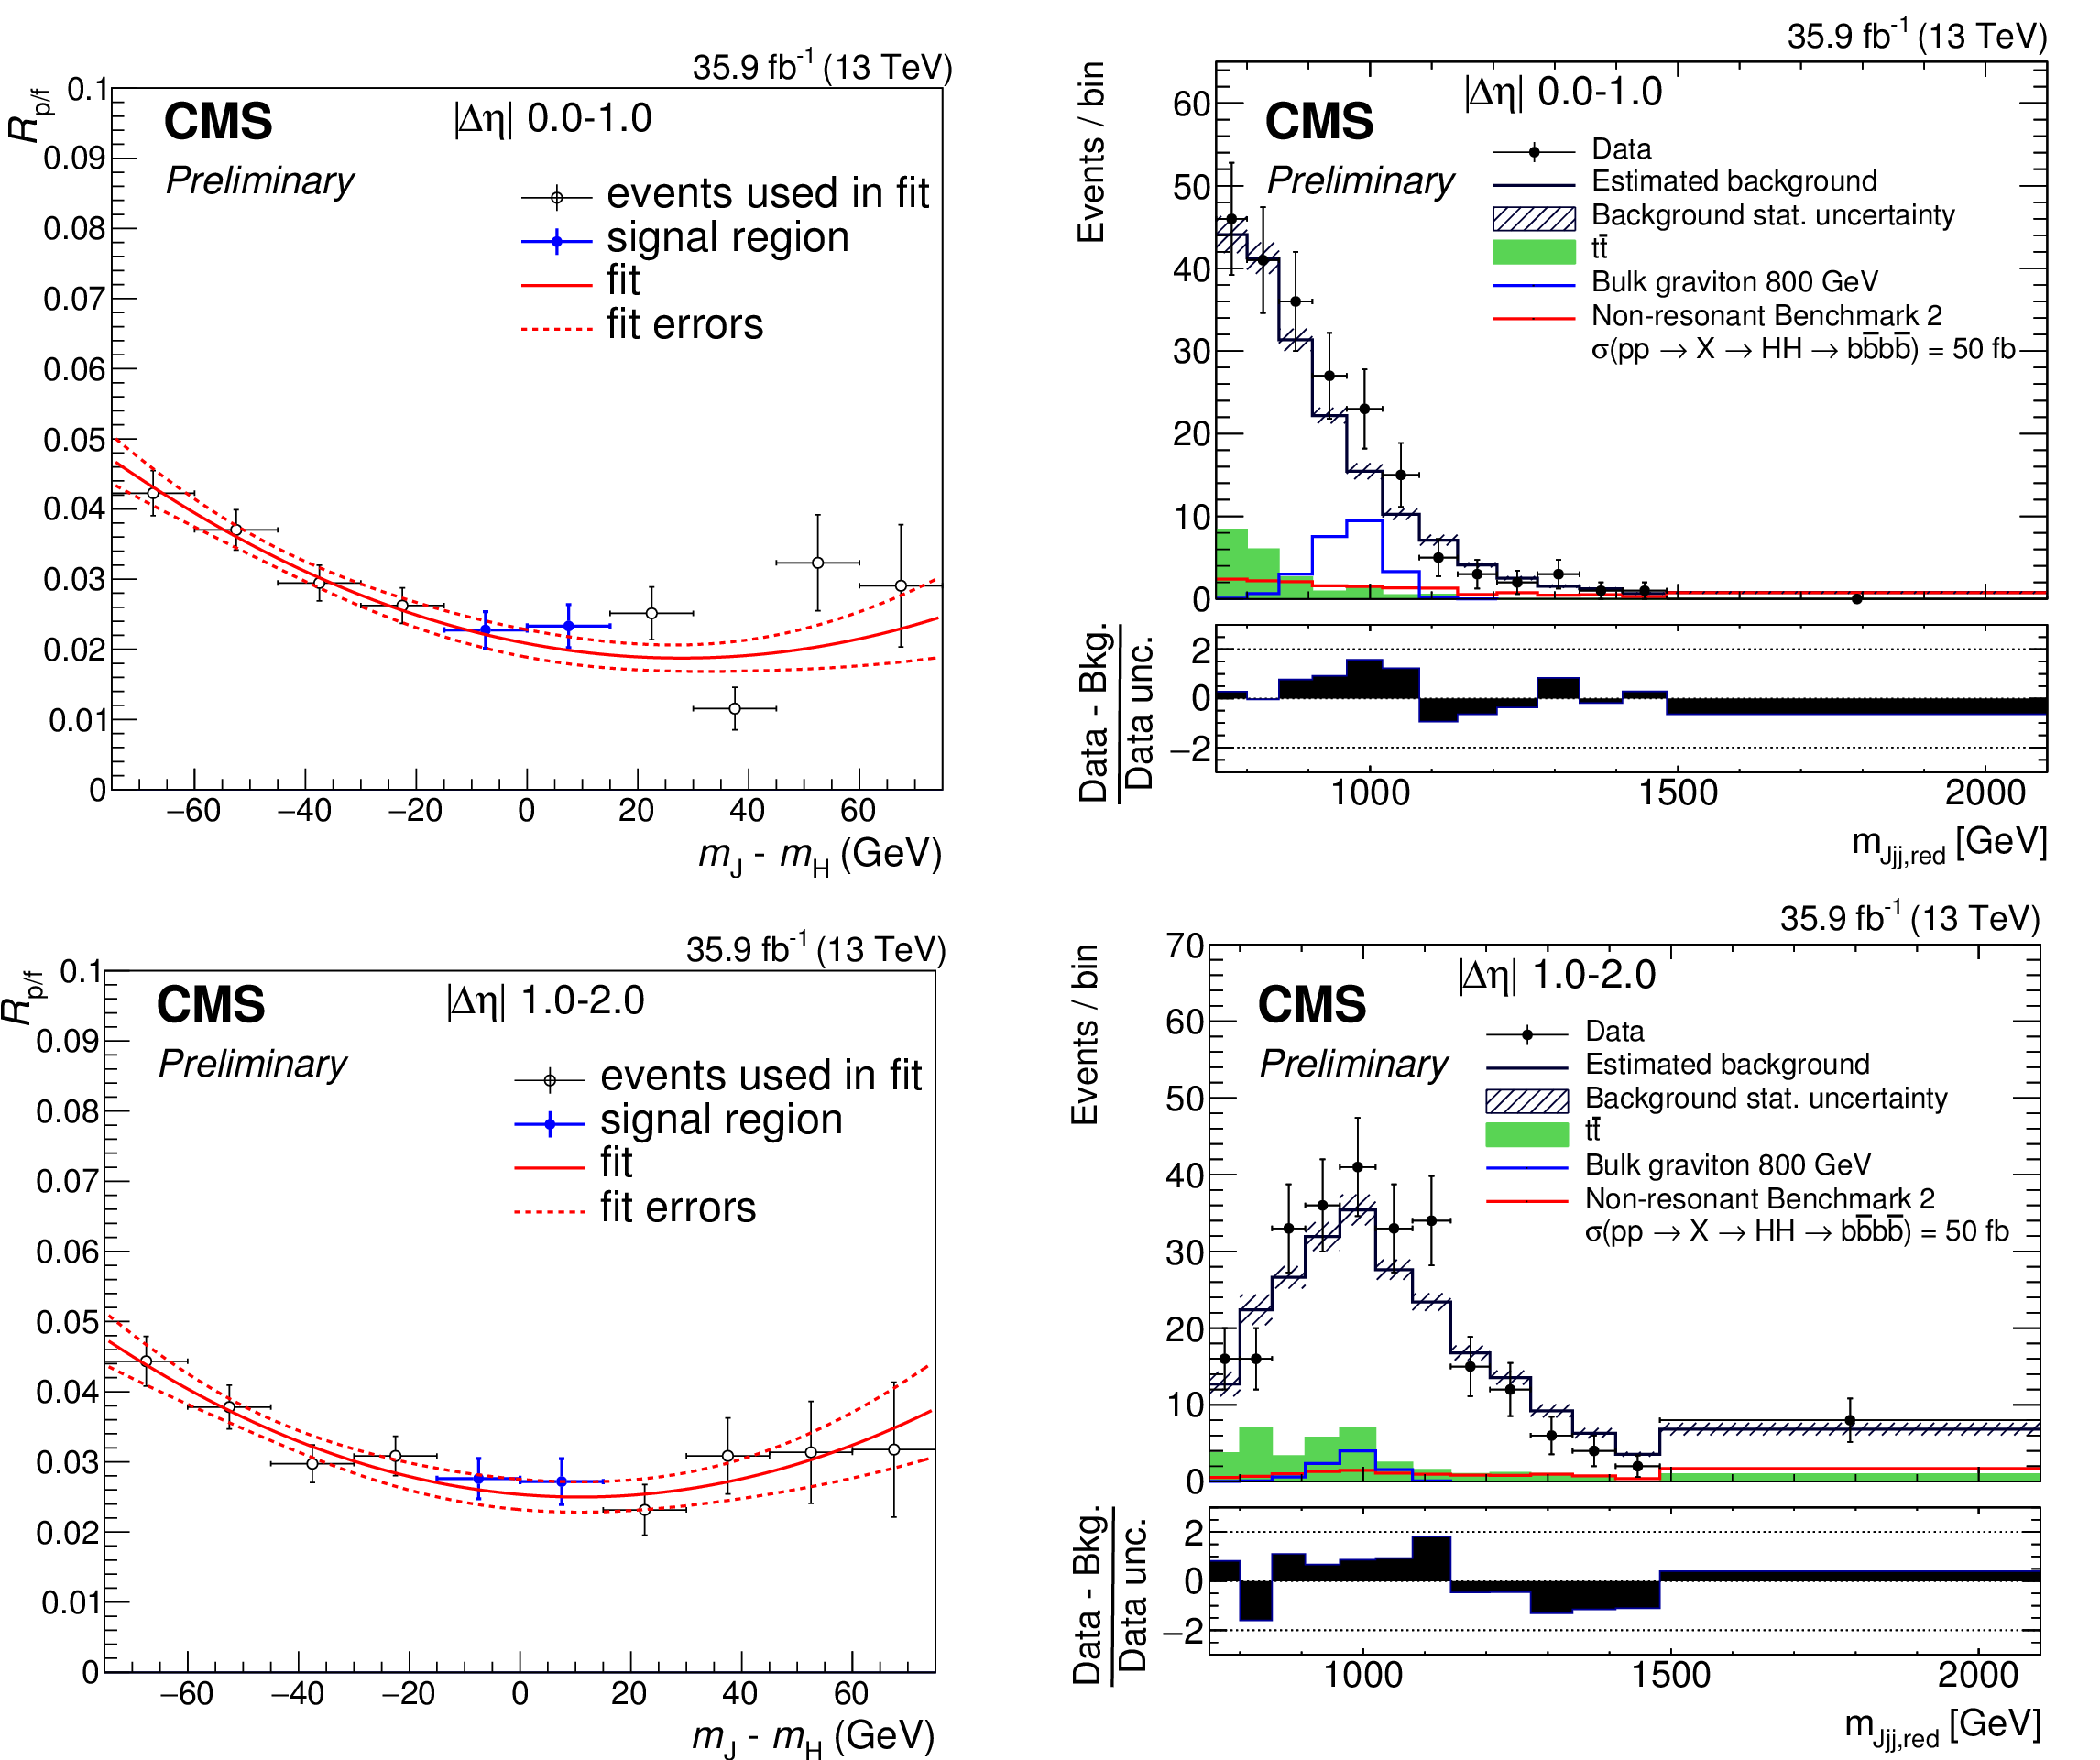
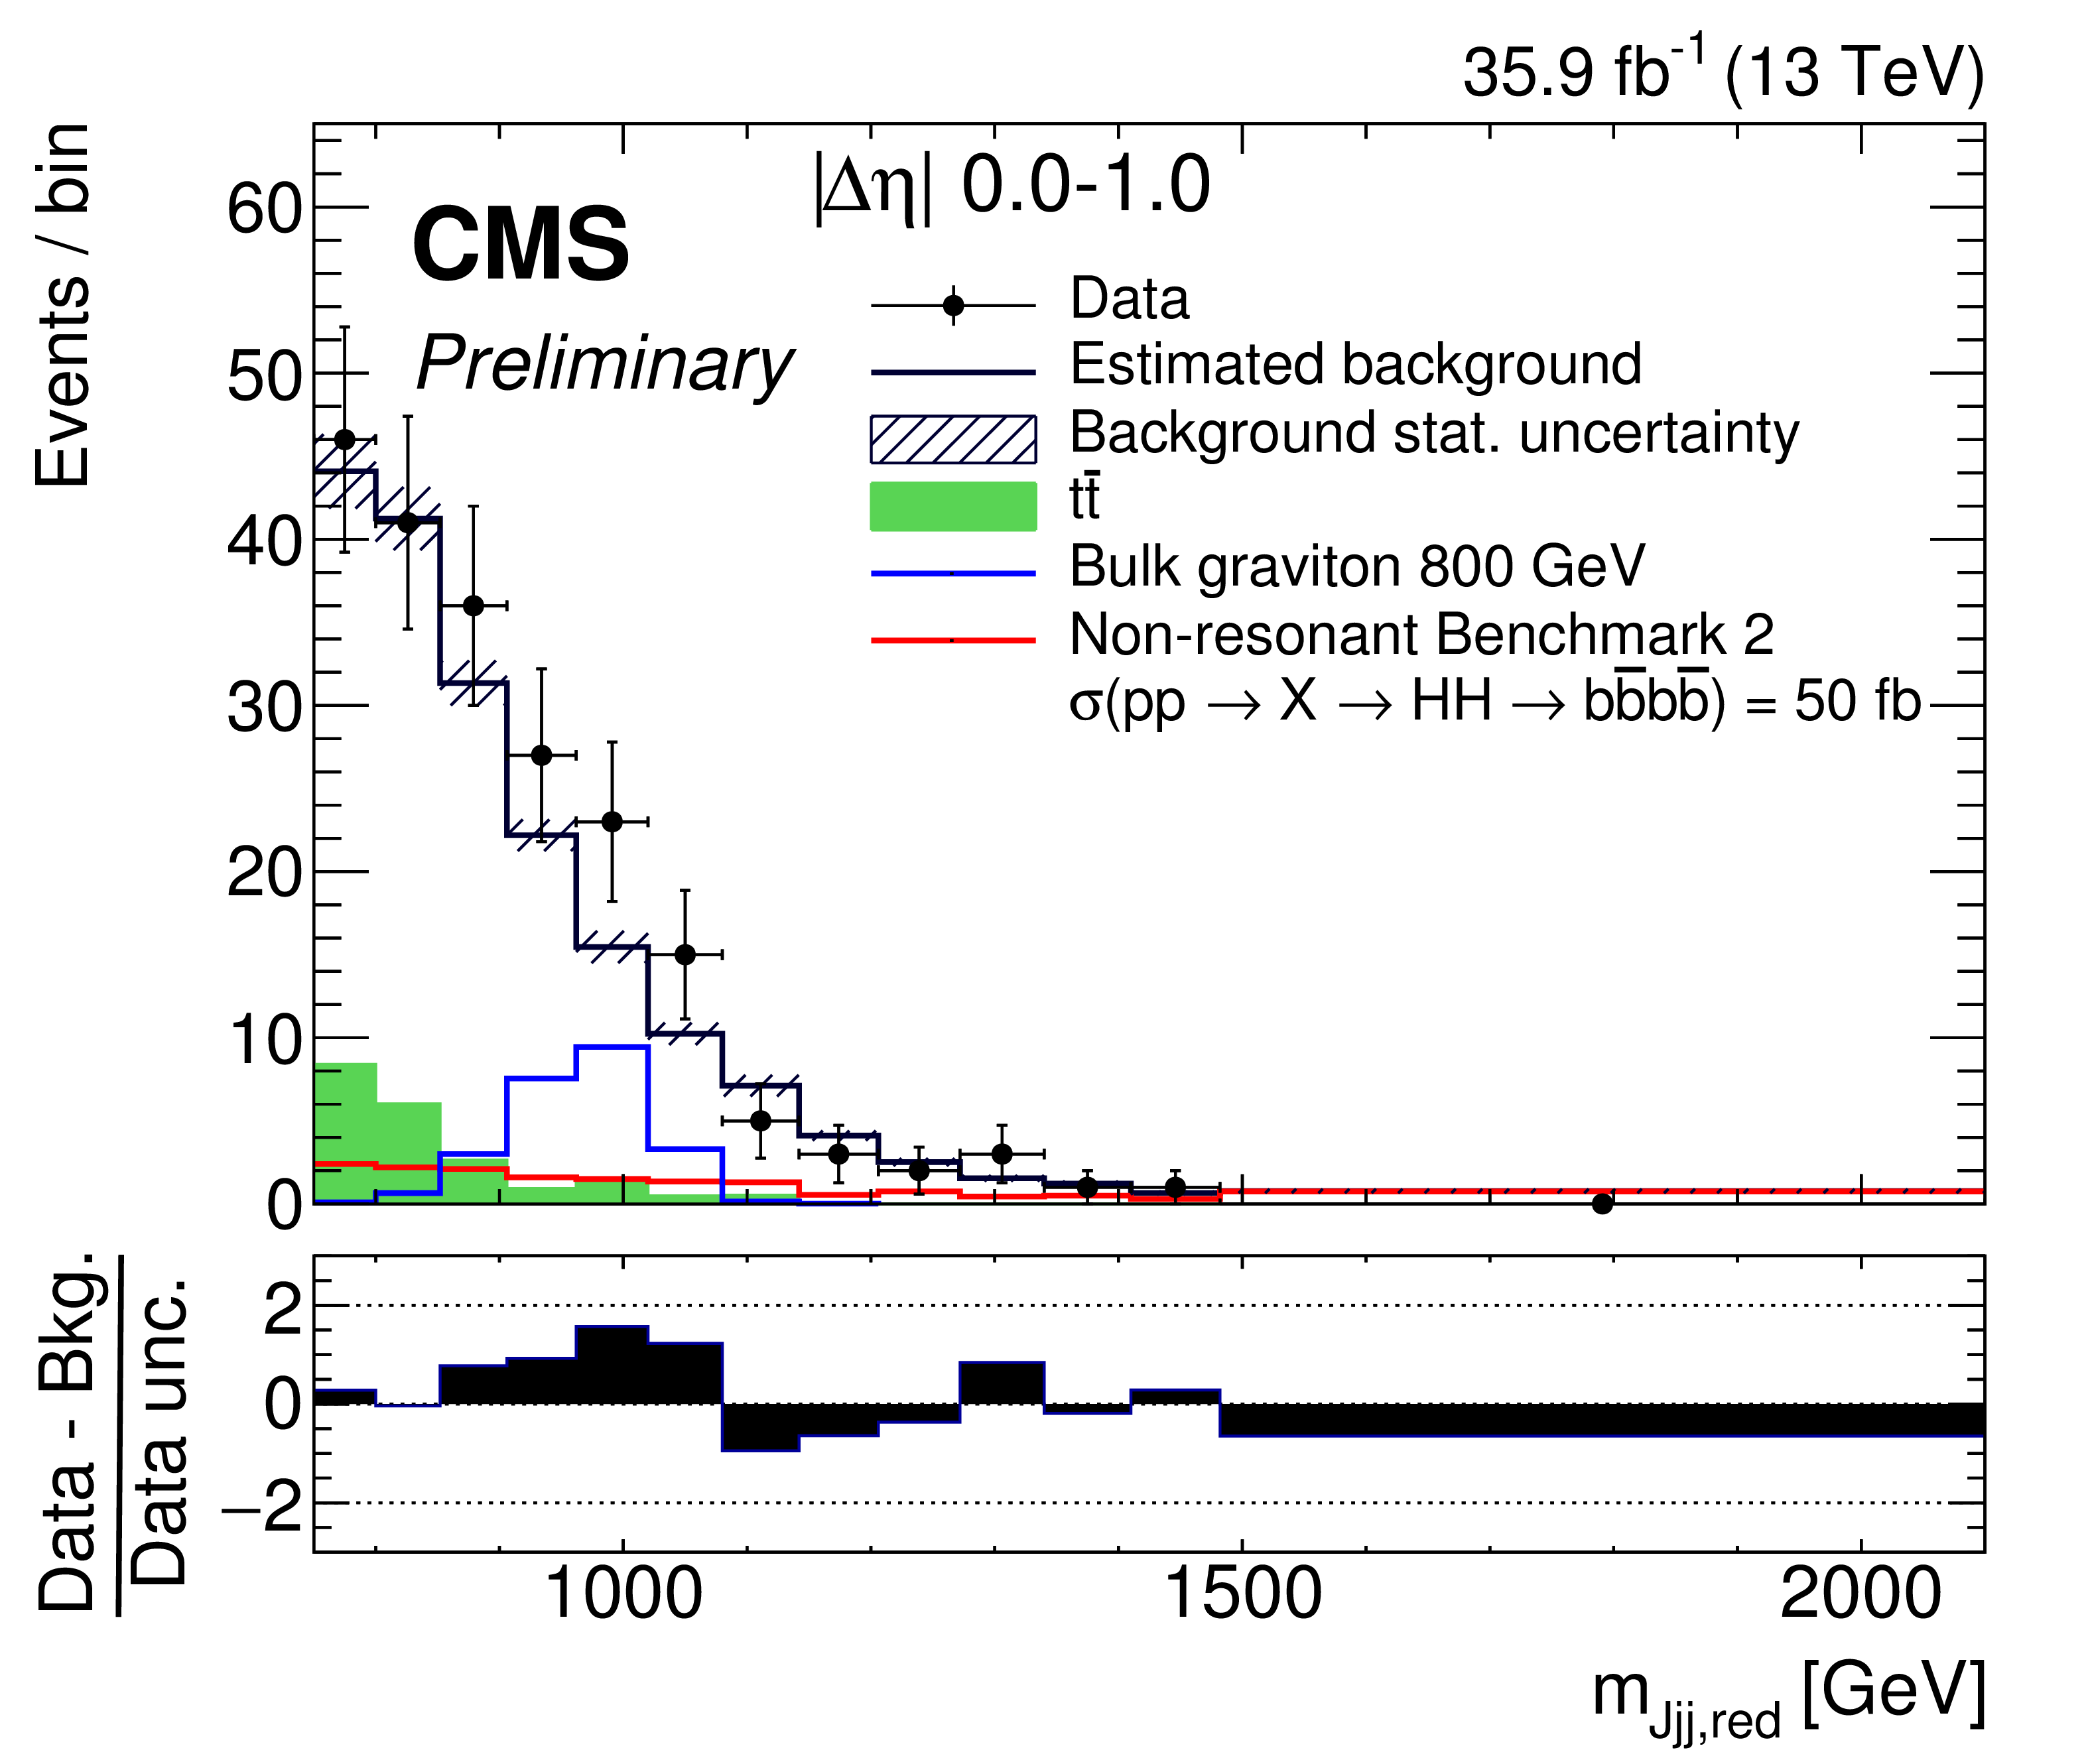
Figure 3:
Left: The double-b tagger pass-fail ratio $R_\text {p/f}$ of the leading-$ {p_{\mathrm {T}}} $ AK8 jet in semi-resolved events as a function of the difference between the soft-drop mass and the Higgs boson mass, $m_{J} - {m_{{\mathrm {H}}}} $. The measured ratio in different bins of $m_{J} - {m_{{\mathrm {H}}}} $ is used in the fit (red solid line), except in the region around $m_{J} - {m_{{\mathrm {H}}}} = 0$, which corresponds to the signal region (blue markers). The fitted function is interpolated to obtain $R_\text {p/f}$ in the signal region. Right: The reduced mass distribution $ {m_{\text {$Jjj$,red}}} $ in the data (black markers) with the estimated background represented as the black histogram. The ${{\mathrm {t}\overline {\mathrm {t}}}} $+jets contribution from simulation is represented in green. The rest of the background is multijets, calculated by applying the $R_\text {p/f}$ to the antitag region. The total background, before fitting the background model to the data, is depicted using the shaded region. The signal distributions for a bulk graviton with a mass of 800 GeV (blue) and the non-resonant benchmark 2 model (red) are also shown. For the upper and lower figures, the pseudorapidity intervals are $ | \Delta \eta | < 1.0$ and 1.0 $ < | \Delta \eta | < 2.0$, respectively. |

png pdf |
Figure 3-a:
Left: The double-b tagger pass-fail ratio $R_\text {p/f}$ of the leading-$ {p_{\mathrm {T}}} $ AK8 jet in semi-resolved events as a function of the difference between the soft-drop mass and the Higgs boson mass, $m_{J} - {m_{{\mathrm {H}}}} $. The measured ratio in different bins of $m_{J} - {m_{{\mathrm {H}}}} $ is used in the fit (red solid line), except in the region around $m_{J} - {m_{{\mathrm {H}}}} = 0$, which corresponds to the signal region (blue markers). The fitted function is interpolated to obtain $R_\text {p/f}$ in the signal region. Right: The reduced mass distribution $ {m_{\text {$Jjj$,red}}} $ in the data (black markers) with the estimated background represented as the black histogram. The ${{\mathrm {t}\overline {\mathrm {t}}}} $+jets contribution from simulation is represented in green. The rest of the background is multijets, calculated by applying the $R_\text {p/f}$ to the antitag region. The total background, before fitting the background model to the data, is depicted using the shaded region. The signal distributions for a bulk graviton with a mass of 800 GeV (blue) and the non-resonant benchmark 2 model (red) are also shown. For the upper and lower figures, the pseudorapidity intervals are $ | \Delta \eta | < 1.0$ and 1.0 $ < | \Delta \eta | < 2.0$, respectively. |
png pdf |
Figure 3-b:
Left: The double-b tagger pass-fail ratio $R_\text {p/f}$ of the leading-$ {p_{\mathrm {T}}} $ AK8 jet in semi-resolved events as a function of the difference between the soft-drop mass and the Higgs boson mass, $m_{J} - {m_{{\mathrm {H}}}} $. The measured ratio in different bins of $m_{J} - {m_{{\mathrm {H}}}} $ is used in the fit (red solid line), except in the region around $m_{J} - {m_{{\mathrm {H}}}} = 0$, which corresponds to the signal region (blue markers). The fitted function is interpolated to obtain $R_\text {p/f}$ in the signal region. Right: The reduced mass distribution $ {m_{\text {$Jjj$,red}}} $ in the data (black markers) with the estimated background represented as the black histogram. The ${{\mathrm {t}\overline {\mathrm {t}}}} $+jets contribution from simulation is represented in green. The rest of the background is multijets, calculated by applying the $R_\text {p/f}$ to the antitag region. The total background, before fitting the background model to the data, is depicted using the shaded region. The signal distributions for a bulk graviton with a mass of 800 GeV (blue) and the non-resonant benchmark 2 model (red) are also shown. For the upper and lower figures, the pseudorapidity intervals are $ | \Delta \eta | < 1.0$ and 1.0 $ < | \Delta \eta | < 2.0$, respectively. |

png pdf |
Figure 3-c:
Left: The double-b tagger pass-fail ratio $R_\text {p/f}$ of the leading-$ {p_{\mathrm {T}}} $ AK8 jet in semi-resolved events as a function of the difference between the soft-drop mass and the Higgs boson mass, $m_{J} - {m_{{\mathrm {H}}}} $. The measured ratio in different bins of $m_{J} - {m_{{\mathrm {H}}}} $ is used in the fit (red solid line), except in the region around $m_{J} - {m_{{\mathrm {H}}}} = 0$, which corresponds to the signal region (blue markers). The fitted function is interpolated to obtain $R_\text {p/f}$ in the signal region. Right: The reduced mass distribution $ {m_{\text {$Jjj$,red}}} $ in the data (black markers) with the estimated background represented as the black histogram. The ${{\mathrm {t}\overline {\mathrm {t}}}} $+jets contribution from simulation is represented in green. The rest of the background is multijets, calculated by applying the $R_\text {p/f}$ to the antitag region. The total background, before fitting the background model to the data, is depicted using the shaded region. The signal distributions for a bulk graviton with a mass of 800 GeV (blue) and the non-resonant benchmark 2 model (red) are also shown. For the upper and lower figures, the pseudorapidity intervals are $ | \Delta \eta | < 1.0$ and 1.0 $ < | \Delta \eta | < 2.0$, respectively. |

png pdf |
Figure 3-d:
Left: The double-b tagger pass-fail ratio $R_\text {p/f}$ of the leading-$ {p_{\mathrm {T}}} $ AK8 jet in semi-resolved events as a function of the difference between the soft-drop mass and the Higgs boson mass, $m_{J} - {m_{{\mathrm {H}}}} $. The measured ratio in different bins of $m_{J} - {m_{{\mathrm {H}}}} $ is used in the fit (red solid line), except in the region around $m_{J} - {m_{{\mathrm {H}}}} = 0$, which corresponds to the signal region (blue markers). The fitted function is interpolated to obtain $R_\text {p/f}$ in the signal region. Right: The reduced mass distribution $ {m_{\text {$Jjj$,red}}} $ in the data (black markers) with the estimated background represented as the black histogram. The ${{\mathrm {t}\overline {\mathrm {t}}}} $+jets contribution from simulation is represented in green. The rest of the background is multijets, calculated by applying the $R_\text {p/f}$ to the antitag region. The total background, before fitting the background model to the data, is depicted using the shaded region. The signal distributions for a bulk graviton with a mass of 800 GeV (blue) and the non-resonant benchmark 2 model (red) are also shown. For the upper and lower figures, the pseudorapidity intervals are $ | \Delta \eta | < 1.0$ and 1.0 $ < | \Delta \eta | < 2.0$, respectively. |

png pdf |
Figure 4:
The upper limits for a bulk graviton (left) and radion (right), combining the fully-merged selection and the semi-resolved selection (where the events used in the fully-merged analysis are not considered in the semi-resolved analysis). The inner (green) and the outer (yellow) bands indicate the regions containing the 68% and 95%, respectively, of the distribution of limits expected under the background-only hypothesis. The theoretical prediction is shown as the blue line. |

png pdf |
Figure 4-a:
The upper limits for a bulk graviton (left) and radion (right), combining the fully-merged selection and the semi-resolved selection (where the events used in the fully-merged analysis are not considered in the semi-resolved analysis). The inner (green) and the outer (yellow) bands indicate the regions containing the 68% and 95%, respectively, of the distribution of limits expected under the background-only hypothesis. The theoretical prediction is shown as the blue line. |

png pdf |
Figure 4-b:
The upper limits for a bulk graviton (left) and radion (right), combining the fully-merged selection and the semi-resolved selection (where the events used in the fully-merged analysis are not considered in the semi-resolved analysis). The inner (green) and the outer (yellow) bands indicate the regions containing the 68% and 95%, respectively, of the distribution of limits expected under the background-only hypothesis. The theoretical prediction is shown as the blue line. |

png pdf |
Figure 5:
The observed and expected upper limits for non-resonant $ {\mathrm {H}} {\mathrm {H}} $ production in the standard model (Benchmark 0) and other benchmark models (1-12), combining the fully-merged selection and the semi-resolved selection (where the events used in the fully-merged analysis are not considered in the semi-resolved analysis). The inner (green) and the outer (yellow) bands indicate the regions containing the 68% and 95%, respectively, of the distribution of limits expected under the background-only hypothesis. |
| Tables | |

png pdf |
Table 1:
Parameter values of the final benchmark models selected with a twelve cluster model, along with the SM parameter values. |

png pdf |
Table 2:
Summary of the selection criteria for semi-resolved $ {\mathrm {H}} {\mathrm {H}} \to {{\mathrm {b}} {\overline {\mathrm {b}}}} {{\mathrm {b}} {\overline {\mathrm {b}}}} $ events. |

png pdf |
Table 3:
Summary of systematic uncertainties in the signal and background yields, for both the semi-resolved analysis and the fully merged analysis, taken from Ref.\nobreakspace {} [25]. |

png pdf |
Table 4:
Observed and expected limits for the non-resonant benchmark models (1-12) and SM pair production (denoted 0), combining fully-merged and semi-resolved (where the events used in the fully-merged analysis are not considered in the semi-resolved analysis) results. |

png pdf |
Table 5:
Combined expected and observed upper limits of fully-merged and semi-resolved analyses for a bulk graviton (where the events used in the fully-merged analysis are not considered in the semi-resolved analysis). |

png pdf |
Table 6:
Combined expected and observed upper limits of fully-merged and semi-resolved channels for a radion (where the events used in the fully-merged analysis are not considered in the semi-resolved analysis). |
| Summary |
|
A search is presented for the pair production of standard model Higgs bosons ($\mathrm{H}\mathrm{H}$), both decaying to a bottom quark-antiquark pair ($\mathrm{b\bar{b}}$), using data from proton-proton collisions at a centre-of-mass energy of 13 TeV, and corresponding to an integrated luminosity of 35.9 fb$^{-1}$. The search is dedicated to the phase space where at least one of the Higgs bosons has a high transverse momentum, so that the $\mathrm{H}\to\mathrm{b\bar{b}}$ decay products are collimated to form a single jet, an $\mathrm{H}$ jet, adding sensitivity to the search for $\mathrm{H}\mathrm{H}\to\mathrm{b\bar{b}}\mathrm{b\bar{b}}$ by filling in the phase space between the fully resolved [26] and the fully merged regimes [25], in the search for a Kaluza-Klein bulk graviton and a Randall-Sundrum radion. Such cases may arise either when a massive resonance produced in proton-proton collisions decays to $\mathrm{H}\mathrm{H}$, or through beyond standard model effects in the Higgs boson self-coupling, at a scale above the reach of the current collider energies. The events are classified according to whether both or only one Higgs boson is boosted enough to form a $\mathrm{H}$ jet. This paper augments the resonance search with the case where the events have a semi-resolved topology, with only one $\mathrm{H}$ jet, while the other ${\mathrm{H}\to\mathrm{b\bar{b}}} $ has a lower boost. The combined upper limits range from 67.0 to 1.4 fb at 95% confidence level for bulk gravitons and radions in the mass range 0.75-3 TeV. Depending on the mass of the resonance, these limits improve upon the results of the fully merged search [25] by up to 55% for the radion and up to 18% for the bulk graviton. Furthermore, both the merged and semi-resolved events are used to search for non-resonant Higgs boson pair production and upper limits are set in a range from 4520 to 36.7 fb at 95% confidence level on the product of the production cross section and the branching fraction in different scenarios using an effective field theory approach for the anomalous Higgs boson self-couplings. Upper limits on the non-resonant standard model Higgs boson production cross section multiplied by the branching fraction are placed at 1980 fb at 95% confidence level. These are the first results on the limits on the Higgs boson self-couplings using boosted topologies and set the most stringent limits to date on benchmarks 2, 5, 8, 9, and 11 [16,75]. |
| References | ||||
| 1 | ATLAS Collaboration | Observation of a new particle in the search for the Standard Model Higgs boson with the ATLAS detector at the LHC | PLB 716 (2012) 01 | 1207.7214 |
| 2 | CMS Collaboration | Observation of a new boson at a mass of 125 GeV with the CMS experiment at the LHC | PLB 716 (2012) 30 | CMS-HIG-12-028 1207.7235 |
| 3 | CMS Collaboration | Observation of a new boson with mass near 125 GeV in pp collisions at $ \sqrt{s} = $ 7 and 8 TeV | JHEP 06 (2013) 081 | CMS-HIG-12-036 1303.4571 |
| 4 | D. de Florian et al. | Handbook of LHC Higgs cross sections: 4. deciphering the nature of the Higgs sector | CERN-2017-002-M, CERN | 1610.07922 |
| 5 | D. de Florian and J. Mazzitelli | Higgs boson pair production at next-to-next-to-leading order in QCD | PRL 111 (2013) 201801 | 1309.6594 |
| 6 | J. Baglio et al. | The measurement of the Higgs self-coupling at the LHC: theoretical status | JHEP 04 (2013) 151 | 1212.5581 |
| 7 | L. Randall and R. Sundrum | A large mass hierarchy from a small extra dimension | PRL 83 (1999) 3370 | hep-ph/9905221 |
| 8 | R. Grober and M. Muhlleitner | Composite Higgs Boson Pair Production at the LHC | JHEP 06 (2011) 020 | 1012.1562 |
| 9 | W. D. Goldberger and M. B. Wise | Modulus stabilization with bulk fields | PRL 83 (1999) 4922 | hep-ph/9907447 |
| 10 | O. DeWolfe, D. Z. Freedman, S. S. Gubser, and A. Karch | Modeling the fifth dimension with scalars and gravity | PRD 62 (2000) 046008 | hep-th/9909134 |
| 11 | C. Csaki, M. Graesser, L. Randall, and J. Terning | Cosmology of brane models with radion stabilization | PRD 62 (2000) 045015 | hep-ph/9911406 |
| 12 | H. Davoudiasl, J. L. Hewett, and T. G. Rizzo | Phenomenology of the Randall-Sundrum gauge hierarchy model | PRL 84 (2000) 2080 | hep-ph/9909255 |
| 13 | C. Csaki, M. L. Graesser, and G. D. Kribs | Radion dynamics and electroweak physics | PRD 63 (2001) 065002 | hep-th/0008151 |
| 14 | K. Agashe, H. Davoudiasl, G. Perez, and A. Soni | Warped gravitons at the LHC and beyond | PRD 76 (2007) 036006 | hep-ph/0701186 |
| 15 | G. F. Giudice, R. Rattazzi, and J. D. Wells | Graviscalars from higher dimensional metrics and curvature Higgs mixing | NPB 595 (2001) 250 | hep-ph/0002178 |
| 16 | A. Carvalho et al. | Higgs Pair Production: Choosing Benchmarks With Cluster Analysis | JHEP 04 (2016) 126 | 1507.02245 |
| 17 | ATLAS Collaboration | Search for Higgs boson pair production in the $ \gamma\gamma b\bar{b} $ final state using $ pp $ collision data at $ \sqrt{s}= $ 8 TeV from the ATLAS detector | PRL 114 (2015) 081802 | 1406.5053 |
| 18 | ATLAS Collaboration | Searches for Higgs boson pair production in the $ hh\to bb\tau\tau, \gamma\gamma WW^*, \gamma\gamma bb, bbbb $ channels with the ATLAS detector | PRD 92 (2015) 092004 | 1509.04670 |
| 19 | ATLAS Collaboration | Search for pair production of Higgs bosons in the $ b\bar{b}b\bar{b} $ final state using proton--proton collisions at $ \sqrt{s} = $ 13 TeV with the ATLAS detector | PRD 94 (2016) 052002 | 1606.04782 |
| 20 | CMS Collaboration | Searches for heavy Higgs bosons in two-Higgs-doublet models and for $ t \rightarrow ch $ decay using multilepton and diphoton final states in $ pp $ collisions at 8 TeV | PRD 90 (2014) 112013 | CMS-HIG-13-025 1410.2751 |
| 21 | CMS Collaboration | Search for resonant pair production of Higgs bosons decaying to two bottom quark-antiquark pairs in proton-proton collisions at 8 TeV | PLB 749 (2015) 560 | CMS-HIG-14-013 1503.04114 |
| 22 | CMS Collaboration | Searches for a heavy scalar boson H decaying to a pair of 125 GeV Higgs bosons hh or for a heavy pseudoscalar boson A decaying to Zh, in the final states with $ \text{h} \to \tau \tau $ | PLB 755 (2016) 217 | CMS-HIG-14-034 1510.01181 |
| 23 | CMS Collaboration | Search for two Higgs bosons in final states containing two photons and two bottom quarks in proton-proton collisions at 8 TeV | PRD 94 (2016) 052012 | CMS-HIG-13-032 1603.06896 |
| 24 | CMS Collaboration | Search for heavy resonances decaying to two Higgs bosons in final states containing four b quarks | EPJC 76 (2016) 371 | CMS-EXO-12-053 1602.08762 |
| 25 | CMS Collaboration | Search for a massive resonance decaying to a pair of Higgs bosons in the four b quark final state in proton-proton collisions at $ \sqrt{s}= $ 13 TeV | PLB 781 (2018) 244 | 1710.04960 |
| 26 | CMS Collaboration Collaboration | Search for resonant pair production of Higgs bosons decaying to bottom quark-antiquark pairs in proton-proton collisions at 13 TeV | CMS-PAS-HIG-17-009, CERN, Geneva | |
| 27 | CMS Collaboration | The CMS experiment at the CERN LHC | JINST 3 (2008) S08004 | CMS-00-001 |
| 28 | CMS Collaboration | The CMS trigger system | JINST 12 (2017) P01020 | CMS-TRG-12-001 1609.02366 |
| 29 | CMS Collaboration | Particle-flow reconstruction and global event description with the CMS detector | JINST 12 (2017) P10003 | CMS-PRF-14-001 1706.04965 |
| 30 | M. Cacciari, G. P. Salam, and G. Soyez | The anti-$ k_t $ jet clustering algorithm | JHEP 04 (2008) 063 | 0802.1189 |
| 31 | M. Cacciari, G. P. Salam, and G. Soyez | FastJet user manual | EPJC 72 (2012) 1896 | 1111.6097 |
| 32 | M. Cacciari and G. P. Salam | Pileup subtraction using jet areas | PLB 659 (2008) 119 | 0707.1378 |
| 33 | CMS Collaboration | Determination of jet energy calibration and transverse momentum resolution in CMS | JINST 6 (2011) P11002 | CMS-JME-10-011 1107.4277 |
| 34 | CMS Collaboration | Jet energy scale and resolution in the CMS experiment in pp collisions at 8 TeV | JINST 12 (2017) P02014 | CMS-JME-13-004 1607.03663 |
| 35 | CMS Collaboration | Jet energy scale and resolution performances with 13 TeV data | CDS | |
| 36 | D. Bertolini, P. Harris, M. Low, and N. Tran | Pileup per particle identification | JHEP 10 (2014) 059 | 1407.6013 |
| 37 | G. P. Salam | Towards jetography | EPJC 67 (2010) 637 | 0906.1833 |
| 38 | M. Dasgupta, A. Fregoso, S. Marzani, and G. P. Salam | Towards an understanding of jet substructure | JHEP 09 (2013) 029 | 1307.0007 |
| 39 | A. J. Larkoski, S. Marzani, G. Soyez, and J. Thaler | Soft drop | JHEP 05 (2014) 146 | 1402.2657 |
| 40 | CMS Collaboration | Jet algorithms performance in 13 TeV data | CMS-PAS-JME-16-003 | CMS-PAS-JME-16-003 |
| 41 | J. Alwall et al. | The automated computation of tree-level and next-to-leading order differential cross sections, and their matching to parton shower simulations | JHEP 07 (2014) 079 | 1405.0301 |
| 42 | NNPDF Collaboration | Parton distributions for the LHC Run II | JHEP 04 (2015) 040 | 1410.8849 |
| 43 | L. A. Harland-Lang, A. D. Martin, P. Motylinski, and R. S. Thorne | Parton distributions in the LHC era: MMHT 2014 PDFs | EPJC 75 (2015) 204 | 1412.3989 |
| 44 | A. Buckley et al. | LHAPDF6: parton density access in the LHC precision era | EPJC 75 (2015) 132 | 1412.7420 |
| 45 | S. Carrazza, J. I. Latorre, J. Rojo, and G. Watt | A compression algorithm for the combination of PDF sets | EPJC 75 (2015) 474 | 1504.06469 |
| 46 | J. Butterworth et al. | PDF4LHC recommendations for LHC Run II | JPG 43 (2016) 023001 | 1510.03865 |
| 47 | T. Sjostrand et al. | An Introduction to PYTHIA 8.2 | CPC 191 (2015) 159 | 1410.3012 |
| 48 | M. Bahr et al. | Herwig++ physics and manual | EPJC 58 (2008) 639 | 0803.0883 |
| 49 | CMS Collaboration | Event generator tunes obtained from underlying event and multiparton scattering measurements | EPJC 76 (2016) 155 | CMS-GEN-14-001 1512.00815 |
| 50 | S. Gieseke, C. Rohr, and A. Siodmok | Colour reconnections in Herwig++ | EPJC 72 (2012) 2225 | 1206.0041 |
| 51 | S. Frixione, G. Ridolfi, and P. Nason | A positive-weight next-to-leading-order monte carlo for heavy flavour hadroproduction | JHEP 09 (2007) 126 | 0707.3088 |
| 52 | S. Frixione, P. Nason, and C. Oleari | Matching NLO QCD computations with Parton Shower simulations: the POWHEG method | JHEP 11 (2007) 070 | 0709.2092 |
| 53 | S. Alioli, P. Nason, C. Oleari, and E. Re | A general framework for implementing NLO calculations in shower Monte Carlo programs: the POWHEG BOX | JHEP 06 (2010) 043 | 1002.2581 |
| 54 | P. Skands, S. Carrazza, and J. Rojo | Tuning PYTHIA 8.1: the Monash 2013 Tune | EPJC 74 (2014) 3024 | 1404.5630 |
| 55 | CMS Collaboration | Measurement of the top quark mass with lepton+jets final states in pp collisions at $ \sqrt{s}= $ 13 TeV | CMS-PAS-TOP-17-007 | CMS-PAS-TOP-17-007 |
| 56 | M. Czakon and A. Mitov | Top++: A Program for the Calculation of the Top-Pair Cross-Section at Hadron Colliders | CPC 185 (2014) 2930 | 1112.5675 |
| 57 | GEANT4 Collaboration | GEANT4---a simulation toolkit | NIMA 506 (2003) 250 | |
| 58 | J. Allison et al. | Geant4 developments and applications | IEEE Trans. Nucl. Sci. 53 (2006) 270 | |
| 59 | CMS Collaboration | Measurement of the inelastic proton-proton cross section at $ \sqrt{s} = $ 13 TeV | Submitted to JHEP | CMS-FSQ-15-005 1802.02613 |
| 60 | D. Krohn, J. Thaler, and L.-T. Wang | Jet trimming | JHEP 02 (2010) 084 | 0912.1342 |
| 61 | ATLAS and CMS Collaborations | Combined measurement of the Higgs boson mass in $ pp $ collisions at $ \sqrt{s}= $ 7 and 8 tev with the ATLAS and CMS experiments | PRL 114 (2015) 191803 | 1503.07589 |
| 62 | CMS Collaboration | Measurements of properties of the Higgs boson decaying into the four-lepton final state in pp collisions at sqrt(s) = 13 TeV | Submitted to JHEP | CMS-HIG-16-041 1706.09936 |
| 63 | J. Thaler and K. Van Tilburg | Maximizing boosted top identification by minimizing N-subjettiness | JHEP 02 (2012) 093 | 1108.2701 |
| 64 | CMS Collaboration | Identification of heavy-flavour jets with the CMS detector in pp collisions at 13 TeV | JINST (2017) | CMS-BTV-16-002 1712.07158 |
| 65 | CMS Collaboration | CMS luminosity measurement for the 2016 data taking period | CMS-PAS-LUM-17-001 | |
| 66 | R. Barlow and C. Beeston | Fitting using finite Monte Carlo samples | CPC 77 (1993) 219 | |
| 67 | J. S. Conway | Incorporating nuisance parameters in likelihoods for multisource spectra | in Proceedings, PHYSTAT 2011 Workshop on Statistical Issues Related to Discovery Claims in Search Experiments and Unfolding, CERN, Geneva, Switzerland 17-20 January 2011, p. 115 2011 | 1103.0354 |
| 68 | A. L. Read | Presentation of search results: The $ CL_s $ technique | JPG 28 (2002) 2693 | |
| 69 | T. Junk | Confidence level computation for combining searches with small statistics | NIMA 434 (1999) 435 | hep-ex/9902006 |
| 70 | G. Cowan, K. Cranmer, E. Gross, and O. Vitells | Asymptotic formulae for likelihood-based tests of new physics | EPJC 71 (2011) 1554 | 1007.1727 |
| 71 | A. L. Fitzpatrick, J. Kaplan, L. Randall, and L.-T. Wang | Searching for the Kaluza-Klein Graviton in Bulk RS Models | JHEP 09 (2007) 013 | hep-ph/0701150 |
| 72 | A. Oliveira | Gravity particles from Warped Extra Dimensions, a review. Part I - KK Graviton | 1404.0102 | |
| 73 | CMS Collaboration Collaboration | Search for Higgs boson pair production in the final state containing two photons and two bottom quarks in proton-proton collisions at $ \sqrt{s}= $ 13 TeV | CMS-PAS-HIG-17-008, CERN, Geneva | |
| 74 | CMS Collaboration | Search for Higgs boson pair production in events with two bottom quarks and two tau leptons in proton-proton collisions at $ \sqrt{s} = $ 13 TeV | PLB 778 (2018) 101 | CMS-HIG-17-002 1707.02909 |
| 75 | A. Carvalho et al. | Higgs pair production: choosing benchmarks with cluster analysis | JHEP 2016 (2016), no. 4, 126 | |
|
|
Compact Muon Solenoid LHC, CERN |
|

|

|

|

|

|